Embed Size (px)
Citation preview


REPORT OF THEJOINT LEGISLATIVEAUDIT AND REVIEW COMMISSION ON
Correctional Issues in Virginia:Final Summary Report
TO THE GOVERNOR ANDTHE GENERAL ASSEMBLY OF VIRGINIA
House Document No. 18COMMONWEALTH OF VIRGINIARICHMOND1987
Members of theJoint Legislative Audit and Review Commission
ChairmanSenator Hunter B. Andrews
Vice Chairman
Delegate Theodore V. Morrison, JI.
Senator Peter K. BabalasDelegate Robert B. Ball, SI.Senator John C. Buchanan
Delegate Vincent F. Callahan, Jr.Delegate Lacey E. PutneyDelegate Ford C. Quillen
Delegate Alson H. Smith, JI.Senator William A. TrubanDelegate William T. Wilson
Mr. Walter S. Kucharski, Auditor of Public Acounts
DirectorPhilip A. Leone

PREFACE
In response to a mandate in the 1983 Appropriations Act, JLARC begana series of studies on correctional issues in Virginia. These studies also addressedthe mandate of SJR 35 of the 1982 session, which directed JLARC to assessagencies and activities under the functional area of Administration of Justice. Thisis the ninth and final report in the series. In addition to this summary report,studies have been performed in the areas of staffing, forecasting, securityprocedures, community corrections, and the Department of Corrections' capitaloutlay program.
The summary report focuses on "the big picture" in corrections. And,despite the notoriety of the area, there are some very positive developments.Escapes are at an all-time low. The system experienced only one "perimeter"escape in FY 1986. The Virginia correctional system is not under court order, asare those in many other states. Rehabilitative and educational programs, whileneeding further improvement, seem to be receiving increased attention. On theother hand, leadership discontinuity in the department has created some problemsand exacerbated others.
Major findings of the report series on these topics are included in thissummary report. In addition, several recommendations have been added which didnot fit neatly into any of the other reports. For example, a separate Public SafetySecretariat is recommended.
During the past two years the Department of Corrections hasimplemented a number of the recommendations made in earlier reports. Thedevelopment and use of a system-wide security procedures manual is particularlynoteworthy.
Much remains to be done. Expanded capacity is especially needed.Improved services and staffing in field units is necessary. And the departmentneeds to further develop written policies and procedures to promote consistency andto protect itself against the potential effects of future staff turnovers.
I would like to thank all the State and local correctional staff who havehelped the JLARC staff in preparing these reports. Without their interest andcooperation, this study series could not have been completed.
a:tA~one.........---
Director
December 24, 1986

TABLE OF CONTENTS
INTRODUCTION 1
MANAGEMENT
DOC Escapes Are At an All-Time Low 5Frequent Changes in Leadership Adversely Affect Operations 6Reorganizations Have Improved DOC's Operations 8A Separate Public Safety Secretariat Is Needed 9
INMATE POPULATION
Jail And Prison Populations To Increase 11Increased Capacity Needed In Both State and Local
Correctional Facilities 13Virginia Needs A Censensus Inmate Forecasting Process .17Improved Capital Outlay Planning Is Needed , .19Distribution of Inmate Population Needs Review 22Non-Contruction Initiatives Needed : 22Capacity Calculations Need Revision 24
SECURITY AND NONSECURITY STAFFING
Virginia's Major Institutions Have Sufficient SecurityStaff, But Higher Populations Will Require More Staff.. 27
Field Unit Staffing Is Insufficient For Security and Programs 28Staff Management Needs Improvement. .30
CORRECTIONAL PROGRAMS AND SERVICES
Prison Services Show Improvement.. 33More Emphasis Should Be Placed on Improving
Rehabilitative Programs 34Separation of Educational Programs Has Been Beneficial .36Diversion Program Shows Promise .38
OTHER CONCERNS
More Extensive Use of Unit Management Should Be Explored .41Changes in Inmate Classification System Should
Be Considered .42Separation of Youth Services Should Be Considered 43
APPENDIX 45

Chapter One: INTRODUCTION
r KEY: ------------,
Figure 1
Major Trends in CorrectionsFY 1975 - FY 1987
DOC DIRECTORS
1. Jack F. Davis 4. Robert M. Landon2. T. Don Hutto 5. Allyn R. Sielaff3. Raymond Procunier 6. Edward M. Murray
- PopulationCapadty
1. 2. 3. 4. 5. 6.
""" -::-:~7".'
7' •
J.po-
1\...... f-
oU> 600Q>
g. 500
"tTI 400
"6 300
J; 200E~ 100
o75 76 77 78 79 80 81 82 83 84 85 86 87
Fiscal Years
DOC -- Since 1974Creation of the Department of
Corrections in 1974 marked the beginning of anew era for the corrections function. Figure Isummarizes the major trends involving thetenure of six department directors, the capacityand population of the adult incarcerated
c: 12000o
:N 10000
"g- 8000"---g 6000
'">. 4000-13[ 2000
'"()
Virginia has provided for confinementof lawbreakers since early colonial times.Legislation establishing a penal system wasadopted as early as 1635. The "publick gaol"constructed in 1701 at Williamsburg was laterused to confine prisoners who could not beheld safely in other jails throughout the newcolony. When Richmond became the capital ofthe Commonwealth in 1779, the HenricoCounty jail was enlarged for State use. Theneed for a larger, more secure State facilitysoon became clear. In 1796 the GeneralAssembly established the Penitentiary at thelocation which is still in use. Construction ofthe facility, based on a solitary confinementapproach recommended by Thomas Jefferson,began in 1797. This building remained in useuntil the 1900s.
During the 20th century, the Stateprison system has alternated between being anindependent agency and being housed within alarger organization. This trend began with the1908 establishment of the Board of Charitiesand Corrections, and continued in the 1920swhen the Board of Public Welfare was grantedbudgetary authority over the penal facilities.
A major realignment of correctionalactivities occurred in 1942 when the Department of Corrections was established andassigned administrative control and supervision of the prison system. The independenceof the corrections function lasted only until1948, when it was again merged into a singleDepartment of Welfare and Institutions. Thisarrangement lasted until 1974, when thewelfare and corrections functions were againseparated into independent departments.
I
Introduction
population, and the number of inmate escapessince 1974.
As illustrated, the department's fIrstdirector, Mr. Jack F. Davis, was appointed in1974. At that time DOC operated six majorinstitutions and 28 fIeld units with anoperational capacity of 5,521, while the inmatepopulation was approximately 5,300. Thenumber of escapes was at its highest point(513) for the 12-year period in 1974. Mr.Davis made many administrative reforms andimprovements in the department's operation,including bringing in new staff, implementingmodern management practices, and assertingmore central offIce control over institutions,before his resignation in 1977. By this timethe number of escapes was dramaticallyreduced to 94.
When Mr. T. Don Hutto, the secondDOC director, took over in 1977, thedepartment had added four major institutions(Deep Meadow, Deerfield, Staunton, and St.Brides) and was preparing to openMecklenburg. The adult system capacity wasincreased to 7,996 with the addition of thesefIve institutions. During this same period theinmate population increased to 6,709. Thedepartment was reorganized in 1978,decentralizing operational authority over allinstitutions and community services throughthe creation of fIve regional offIces. DOCcontinues to operate four of the regionaloffIces, as one was closed in 1984.
When the third director, Mr. RaymondProcunier, was appointed, Marion CorrectionalCenter had been operating for two years andBrunswick and Buckingham would openwithin the year. The inmate population hadincreased to 8,788 and the system capacity was9,256 during 1982. The number of escapes,which had hovered around 85 for severalyears, increased to 123 in both fIscal years1981 and 1982. Mr. Procllnierreorganized thetop levels of DOC before resigning after 13months as director.
Mr. Robert M. Landon served as thedeputy director for adult services prior to hisappointment as DOC's fourth director. In1983, the adult inmate population stood at9,463, which was about 200 over the
2
operational capacity of the system (9,256). Infiscal year 1983 the total number of escapeshad been reduced to 80. In 1984, however,the much-publicized death-row escape of sixinmates and the subsequent escapes and prisonuprisings brought the department under intensescrutiny. There were a total of 108 escapes infiscal year 1984. Mr. Landon resigned 18months after his appointment.
Mr. Allyn R. Sielaff, the deputysecretary ofpublic safety, was appointed as thefIfth DOC director in November 1984.Nottoway Correctional Center had opened andDeep Meadow, a prison consisting of trailers,had been closed. The inmate population(9,783) exceeded the system capacity (9,356)by over 400 inmates. The department wasallowed to hire 132 additional security staffand purchase additional security equipment forthe institutions. Training for correctionaloffIcers was also increased, and a program toencourage the professional development ofadministrators was reestablished. The numberof escapes was reduced to 54 for fIscal year1985. Mr. Sielaff resigned after 13 months asdirector.
In February 1986, Mr. Edward W.Murray was appointed the sixth director of theVirginia Department of Corrections. Mr.Murray had worked within the department for15 years, serving as the deputy director foradult services just before his appointment asdirector. In June 1986 the inmate populationof 10,902 exceeded the system's operationalcapacity of 10,117 by 785. Despite this levelof overcrowding, the number of escapes haddecreased to a 12-year low of 39 during fIscalyear 1986.
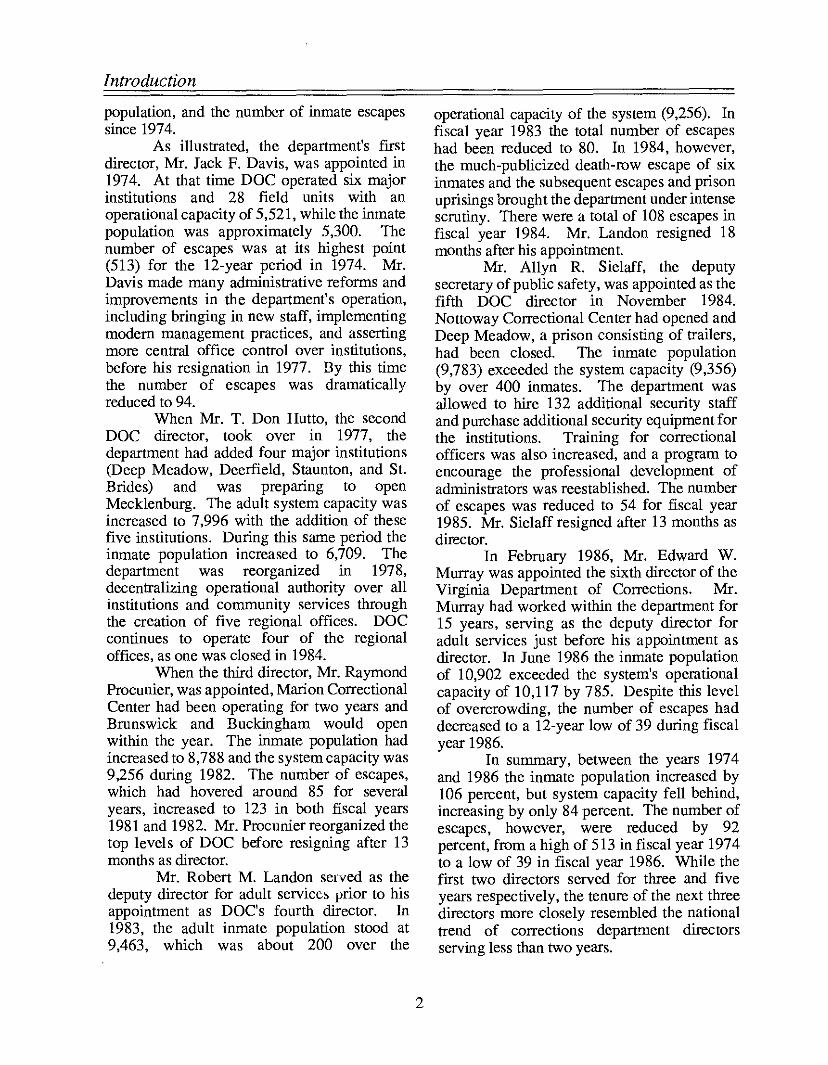
In summary, between the years 1974and 1986 the inmate population increased by106 percent, but system capacity fell behind,increasing by only 84 percent. The number ofescapes, however, were reduced by 92percent, from a high of 513 in fiscal year 1974to a low of 39 in fIscal year 1986. While thefirst two directors served for three and fIveyears respectively, the tenure of the next threedirectors more closely resembled the nationaltrend of corrections departrnent directorsserving less than two years.
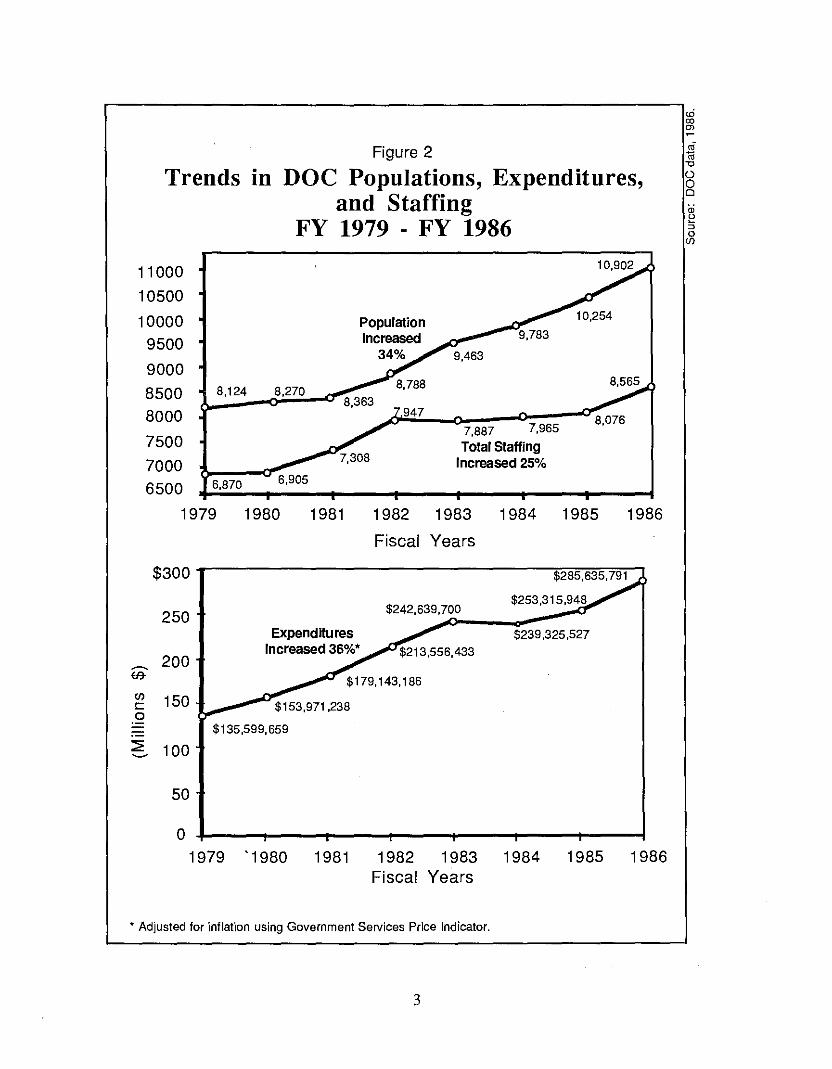
Figure 2
Trends in DOC Populations, Expenditures,and Staffing
FY 1979 . FY 1986
8,565
1985 19861983 198419821981
8,270
1980
8,124
11000
10500
10000
9500
9000
8500
8000 ~.J!9~47~-e""'_""'~=-~8,0767,887 7,965
7500 Total Staffing7000 Increased 25%
6500 ~:6;,;,,-8;.;7-0::::6_,9_0_5 ""' """__-1
1979
Fiscal Years
$300
250Expenditures
Increased 36%'~
200fJ7
(J) 150c $153,971,2380
.- $135,599,659
~ 100~
$285,635,791
$242,63-.:.9;.;.,7°0° ---
$239,325,527
50
o1979 '1980 1981 1982 1983 1984
Fiscal Years1985 1986
• Adjusted for inflation using Government Services Price Indicator.
3

Introduction
The previous discussion has centeredaround the major trends in the adultinstitutional area. DOC is also responsible foradult community corrections, and institutionaland community corrections for juveniles. Thenumber of adults supervised under communityalternatives (probation, parole, and communitydiversion incentive programs) has steadilyincreased from just over 10,000 to over20,000 during the 12-year period. In contrast,juvenile populations have decreased during thesame time span. In 1974, there were over13,000 juveniles on probation or in aftercareand approximately 1,200 in correctionalhalfway houses and institutions. These figureshad decreased to under 10,000 juveniles incommunity supervision and about 1,000 ininstitutional care by 1986.
Total DOC expenditures and staff forthe period are shown in Figure 2. As seen inthe figure, expenditures (when adjusted forinflation by the Government Services PriceIndicator) rose 36 percent, while staffingincreased 25 percent. By comparison, theconfined adult population increased 34 percentfrom 8,124 to 10,902 during this time period.
4
This report focuses on major issueswhich have been addressed in JLARC's seriesof reports on corrections in Virginia. Thesereports were mandated by the 1983-1985Appropriations Acts. Previous reports addressed:
• central office and regional staffing,• prison population, forecasting, and
capacity,• security staffing and procedures in
major institutions,• nonsecurity staffing,• local jail population forecasting,• the Community Diversion Incentive
Program,• the Department of Correctional
Education, and• the DOC capital outlay process and
prison design.
This final summary report supplements, butdoes not replace, the conclusions andrecommendations of previous reports.
Chapter Two: MANAGEMENT,ORGANIZATION,
ANDLEADERSHIP
~1illllllllillJ~hU1ITIthrJ~~ ~ 76 71 n ro 00 ~ ~ ~ ~ ~ 00
FISCAL YEARS
Summary of FindingsJLARC staff reviewed DOC's security
policies and procedures as well as specificsecurity problems at each major adultinstitution. JLARC staff found that DOClacked documented security policies and didnot provide adequate guidance to institutionalstaff. Although multiple sources of policyguidance existed, institutions generally
KEy'----------,
1»<_1 Total Number of Escapes
rrm Number 01 PerimeterEscapes
Figure 3Trends in Escapes
FY 1974 - FY 1986
1SO
100
550
IIJ 400w~
< 350~w 300~0:: 250~~ 200z
450
513500
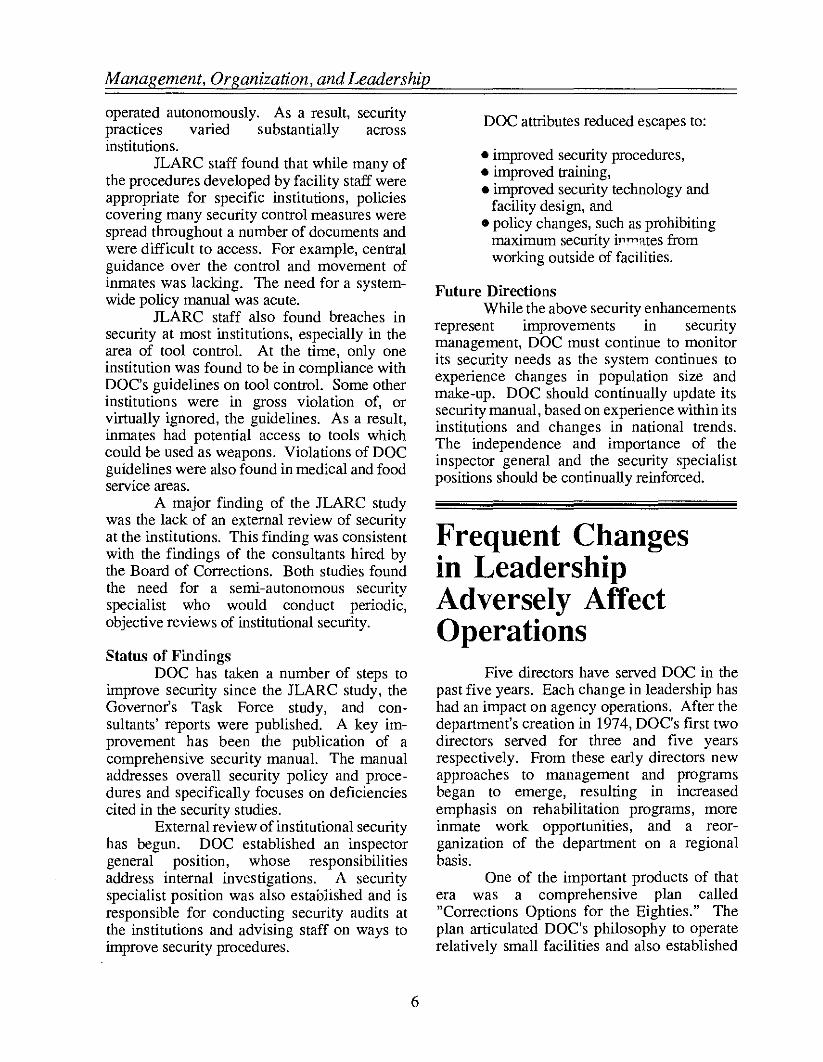
DOC Escapes AreAt An All-TimeLow
Escapes from DOC prisons havedecreased dramatically. As Figure 3 indicates,the number of escapes from 1974 to 1986 wasreduced 92 percent, from 513 to 39. Of theescapes that occurred in FY 1986, only oneresulted from an inmate penetrating externalperimeter security. Most were "walk aways"from correctional field units.
The 1984 Memorial Day escape of sixinmates from Mecklenburg's death row and aseries of inmate disturbances during thesummer of that year brought DOC's securityprocedures under intense review. In additionto the JLARC staff review of securitypractices, the Board of Corrections contractedwith three consultants to study various aspectsof security operations. DOC also contractedwith a consultant to review existing securitytechnology and to recommend new securityenhancements.
5
Management, Organization, and Leadership
operated autonomously. As a result, securitypractices varied substantially acrossinstitutions.
JLARC staff found that while many ofthe procedures developed by facility staff wereappropriate for specific institutions, policiescovering many security control measures werespread throughout a number of documents andwere difficult to access. For example, centralguidance over the control and movement ofinmates was lacking. The need for a systemwide policy manual was acute.
JLARC staff also found breaches insecurity at most institutions, especially in thearea of tool control. At the time, only oneinstitution was found to be in compliance withDOC's guidelines on tool control. Some otherinstitutions were in gross violation of, orvirtually ignored, the guidelines. As a result,inmates had potential access to tools whichcould be used as weapons. Violations of DOCguidelines were also found in medical and foodservice areas.
A major finding of the JLARC studywas the lack of an external review of securityat the institutions. This finding was consistentwith the findings of the consultants hired bythe Board of Corrections. Both studies foundthe need for a semi-autonomous securityspecialist who would conduct periodic,objective reviews of institutional security.
Status of FindingsDOC has taken a number of steps to
improve security since the JLARC study, theGovernor's Task Force study, and consultants' reports were published. A key improvement has been the publication of acomprehensive security manual. The manualaddresses overall security policy and procedures and specifically focuses on deficienciescited in the security studies.
External review of institutional securityhas begun. DOC established an inspectorgeneral position, whose responsibilitiesaddress internal investigations. A securityspecialist position was also established and isresponsible for conducting security audits atthe institutions and advising staff on ways toimprove security procedures.
6
DOC attributes reduced escapes to:
• improved security procedures,• improved training,• improved security technology and
facility design, and• policy changes, such as prohibiting
maximum security i,,"'ates fromworking outside of facilities.
Future DirectionsWhile the above security enhancements
represent improvements in securitymanagement, DOC must continue to monitorits security needs as the system continues toexperience changes in population size andmake-up. DOC should continually update itssecurity manual, based on experience within itsinstitutions and changes in national trends.The independence and importance of theinspector general and the security specialistpositions should be continually reinforced.
Frequent Changesin LeadershipAdversely AffectOperations
Five directors have served DOC in thepast five years. Each change in leadership hashad an impact on agency operations. After thedepartment's creation in 1974, DOC's first twodirectors served for three and five yearsrespectively. From these early directors newapproaches to management and programsbegan to emerge, resulting in increasedemphasis on rehabilitation programs, moreinmate work opportunities, and a reorganization of the department on a regionalbasis.
One of the important products of thatera was a comprehensive plan called"Corrections Options for the Eighties." Theplan articulated DOC's philosophy to operaterelatively small facilities and also established

the foundation for the management structure ofthe department.
The next three directors' tenures,beginning in 1982, saw a series of furtherchanges in organizational structures and theshifting of key administrative positions.Because each director had a limited opportunityto carry out his programs, long-term planningsuffered. Most apparent, however, were theirdifferent philosophies for meeting criticalbedspace needs. As a result, each new directorpresented to the legislature a substantiallydifferent plan on what capital outlays would beneeded to add bedspace to the system.
The individual preferences andphilosophies of DOC's directors have alsobeen apparent in prison design and selection.For example, one director put forth the 500bed Medium Security Institutions (MSls) asthe most efficient way to house the population.His successor proposed using a group offacilities totalling 2,400 beds at one site. Thekey changes initiated by the different directorsare summarized in Table 1.
Lack of continuity has also affectedmany DOC programs. Several directors fo-
Management, Organization, and Leadership
cused almost exclusively on security of theinstitutions and placed little emphasis oninmate rehabilitation programs. With suchchanges in emphasis, nonsecurity staff tendedto be added or cut with each change.
A more subtle effect of discontinuity inleadership is the lack of direction given tosubordinates. As new personnel are placed inleadership positions, it takes time foradjustments and new policies to bedisseminated throughout the system. Confusion over existing versus new policies wasoften articulated during the course of JLARC'sstudy series. A key weakness in the department which surfaced during this time was thelack of written policies and procedures.Administrators accustomed to relying on theunwritten organizational memory of long-termemployees lacked that guidance when turnoveroccurred.
Future DirectionsThe successful operation of the
Department of Corrections is dependent uponconsistent direction and policy. While frequentchanges in leadership may be the unavoidable
7

Management, Organization, and Leadership
nature of the profession, steps can be taken toensure continuity of direction and programs.
Further development of a comprehensive, long-range master plan for thedepartment, encompassing key functions andgoals, will promote consistency. More writtenprocedures and policies at the operational levelwould also improve continuity during times ofchange.
ReorganizationsHave ImprovedDOC's Operations
As early as 1977, three years after theDepartment of Corrections was created, astudy was conducted to assess the efficiency ofDOC's organizational structure. The resultingreport, "Corrections Options for the Eighties,"recommended a number of organ-izationalchanges, including the establishment of aregional structure. The report alsorecommended a number of central officechanges to realign the department alongfunctional lines.
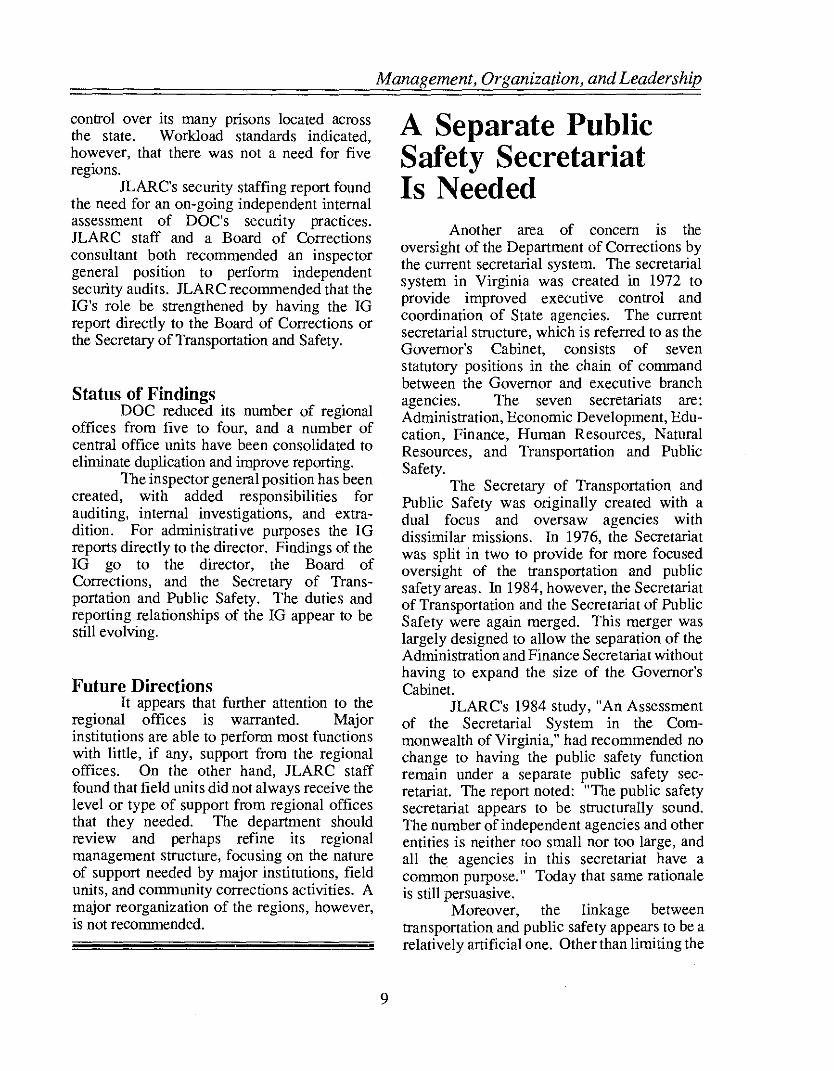
The five regions and most of thefunctional changes were implemented. In theensuing years, numerous other organizationalchanges have occurred. The current structure,as detailed in Figure 4, reflects a functionalapproach and gives equal status to DOC's threeprimary operational areas: adult, youth, andcommunity services. In l oR6 the DeputyDirector for Administration was also designated as Chief of Staff and became the secondranking administrator at DOC.
Summary of FindingsTwo JLARC reports addressed the
issue of organizational structure, "Central andRegional Office Staffing in the Department ofCorrections," and "Security Staffing andProcedures in Virginia's Prisons." The centraland regional offices report recommendedchanging the reporting relationship of theinternal auditing unit from the deputy directorof resource management to the director ofDOC. This change would promote theindependence and objectivity of the internalauditor.
JLARC staff found that DOC'sregional structure had achieved its majorobjectives and gave the department better
,--------------------------------------,'5Figure 4 E
Department of Corrections Organizational Chart i
Board ofCorrect"ons
Secretary of Transportationand Public Safety
-----------------.11
11111
1
--IInspector General
Deputy DirectorAdministrationChief of Staf
8
control over its many prisons located acrossthe state. Workload standards indicated,however, that there was not a need for fiveregIOns.
JLARC's security staffing report foundthe need for an on-going independent internalassessment of DOC's security practices.JLARC staff and a Board of Correctionsconsultant both recommended an inspectorgeneral position to perform independentsecurity audits. JLARC recommended that theIG's role be strengthened by having the IGreport directly to the Board of Corrections orthe Secretary of Transportation and Safety.
Status of FindingsDOC reduced its number of regional
offices from five to four, and a number ofcentral office units have been consolidated toeliminate duplication and improve reporting.
The inspector general position has beencreated, with added responsibilities forauditing, internal investigations, and extradition. For administrative purposes the IGreports directly to the director. Findings of theIG go to the director, the Board ofCorrections, and the Secretary of Transportation and Public Safety. The duties andreporting relationships of the IG appear to bestill evolving.
Future DirectionsIt appears that further attention to the
regional offices is warranted. Majorinstitutions are able to perform most functionswith little, if any, support from the regionaloffices. On the other hand, JLARC stafffound that field units did not always receive thelevel or type of support from regional officesthat they needed. The department shouldreview and perhaps refine its regionalmanagement structure, focusing on the natureof support needed by major institutions, fieldunits, and community corrections activities. Amajor reorganization of the regions, however,is not recommended.
Management, Organization, and Leadership
A Separate PublicSafety SecretariatIs Needed
Another area of concern is theoversight of the Department of Corrections bythe current secretarial system. The secretarialsystem in Virginia was created in 1972 toprovide improved executive control andcoordination of State agencies. The currentsecretarial structure, which is referred to as theGovernor's Cabinet, consists of sevenstatutory positions in the chain of commandbetween the Governor and executive branchagencies. The seven secretariats are:Administration, Economic Development, Education, Finance, Human Resources, NaturalResources, and Transportation and PublicSafety.
The Secretary of Transportation andPublic Safety was originally created with adual focus and oversaw agencies withdissimilar missions. In 1976, the Secretariatwas split in two to provide for more focusedoversight of the transportation and publicsafety areas. In 1984, however, the Secretariatof Transportation and the Secretariat of PublicSafety were again merged. This merger waslargely designed to allow the separation of theAdministration and Finance Secretarial withouthaving to expand the size of the Governor'sCabinet.
JLARC's 1984 study, "An Assessmentof the Secretarial System in the Commonwealth of Virginia," had recommended nochange to having the public safety functionremain under a separate public safety secretariat. The report noted: "The public safetysecretariat appears to be structurally sound.The number of independent agencies and otherentities is neither too small nor too large, andall the agencies in this secretariat have acommon purpose." Today that same rationaleis still persuasive.
Moreover, the linkage betweentransportation and public safety appears to be arelatively artificial one. Other than limiting the
9

Management, Organization, and Leadership
number of secretatiats, the rationale forcombining the areas of public safety andtransportation seems relatively tenuous. Bothareas are distinct, fundamental constitutionalprerogatives of government The purposesand actions of each area are independent of theother. Moreover, both are areas of major Stateinitiatives and will probably remain so throughthe rest of this century.
The General Assembly recentlyapproved the Governor's highway transportation proposal to provide over $400million annually to improve Virginia's roadsover the next ten years. DOC is also in need ofa greatly expanded capital outlay program,some of which is already under way. Thus,
the responsibilities of the Secretary ofTransportation and Public Safety have increased significantly and will continue toincrease for the foreseeable future.
Given such factors, the GeneralAssembly may wish to separate the functionalresponsibilities of public safety from those oftransportation. As exemplill1"J in 2igure 5,this separation could be effected in a number ofways.
Recommendation. The General Assemblyshould consider splitting the Secretariat ofTransportation and Public Safety to establish aseparate Secretary ofPubic Safety.
10
Secretaryof
TransjXlrtation
Secretary ofEconomic
Development
~"o
(f)
Chapter Three:
Jail And PrisonPopulations ToIncrease
Jail and prison populations areexpected to continue increasing throughout theremainder of the 1980s. This expectedincrease reflects national trends and Virginia'sstatus as a population growth state.
Two forecasts were prepared to predictinmate growth in the State. One modelpredicts State responsibility inmates (onlythose prisoners who are supposed to beincarcerated in State prisons). The secondmodel predicts the total State inmatepopulation. The local jail forecast is inferredfrom the second model by subtracting Stateresponsibility prisoners from the total inmatepopulation. Both forecasts show substantialincreases over existing populations.
The State responsibility model isoperated by the Department of Corrections
INMATEPOPULATION
using a methodology jointly modified by DOCand JLARC staff. The model is called theSimulated Losses/Admissions Model II(SLAM II). This model calls for a Stateresponsibility inmate population of 13,372 inJune 1990 (Figure 6). This represents a 23percent increase over the June 1986 prisonpopulation of 10,902.
The total inmate popula.tion wasforecast by JLARC staff using an ARlMAmodel (Autoregressive Integrated MovingAverage). The ARIMA model forecasts a June1990 total inmate population of 21,169 asshown in Figure 6. This is a 19 percentincrease over the June 1986 actual populationof 17,782. By subtracting the Stateresponsibility forecast for 1990 (13,372) fromthe total inmate forecast (21,169), the local jailresponsibility is predicted to be 7,797. Amuch higher jail population is actuallyexpected, however, because State prisons willlack the capacity to hold all State responsibilityinmates unless significant additions to Statecapacity occur. Capacity concerns are discussed in the following section.
11
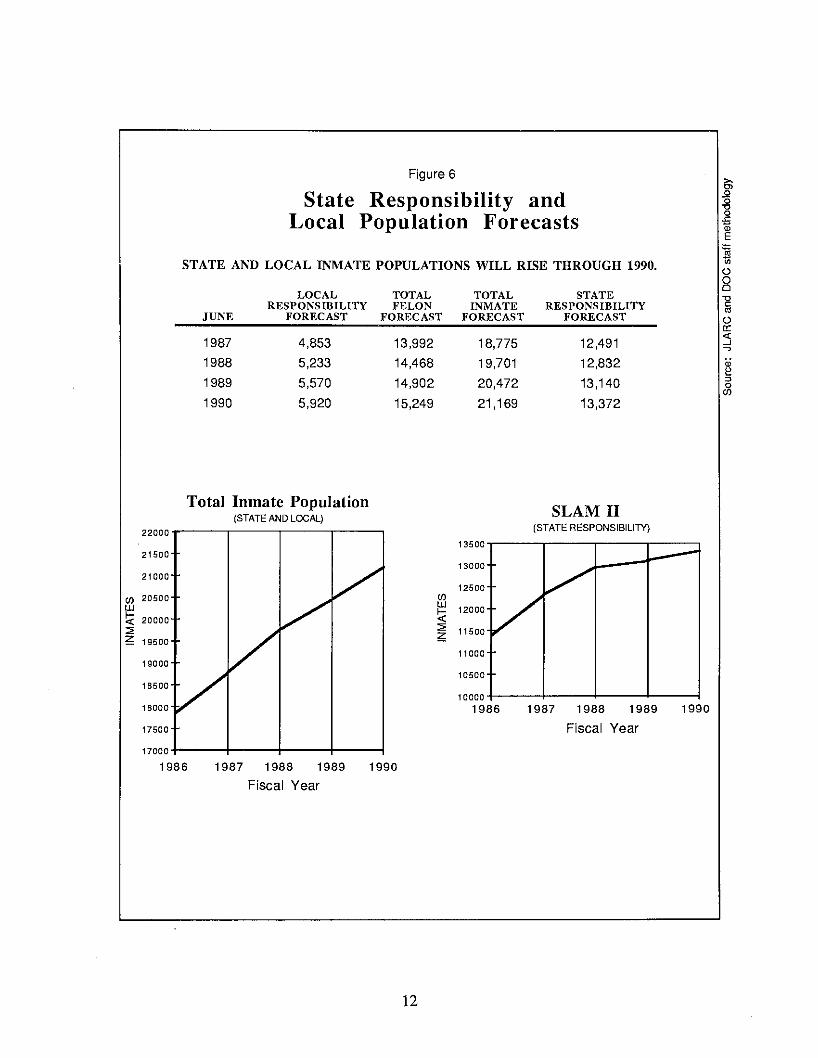
Figure 6
State Responsibility andLocal Population Forecasts
STATE AND LOCAL INMATE POPULATIONS WILL RISE THROUGH 1990.
LOCAL TOTAL TOTAL STATERESPONSIBILITY FELON INMATE RESPONSIBILITY
JUNE FORECAST FORECAST FORECAST FORECAST
1987 4,853 13,992 18,775 12,491
1988 5,233 14,468 19,701 12,832
1989 5,570 14,902 20,472 13,140
1990 5,920 15,249 21,169 13,372
1;;.Q.g~'"E~()
8
Total Inmate Population(STATE AND LOCAL)
22000 .,..---,------,----,------,
SLAM II(STATE RESPONSIBILITY)
-v~
21500
21000
(IJ 20500W
~ 20000::;;~ 19500
19000
18500
18000
17500
13500
13000
12500(/)W
12000~::;; 11500~
11000
10500
10000
1986 1987 1988 1989
Fiscal Year
1990
19901987 1988 1989
Fiscal Year
17000+---+---+----1----11986
12
Increased CapacityNeeded in BothState and LocalCorrectionalFacilities
Inmate population levels forecast for1990 demand new initiatives to expandcapacity or to otherwise relieve crowding inVirginia's correctional facilities. The 1990forecast of 21,169 represents a 19 percentincrease over the June 1986 total inmatepopulation of 17,782. This increase willfurther stress prisons and jails that are alreadyovercrowded.
Of the projected 21,169 inmates,13,372 will be State responsibility inmates and7,797 will be the responsibility of localities.Because State prisons will not be able tohandle all State responsibility prisoners, jail
Inmate Population
populations will exceed 7,797 unless newState facilities are available. Given currentState prison capacity expansion plans, jailpopulations will rise to 8,814 in 1990 fromtheir June 1986 level of 6,880 (a 28 percentincrease).
A forecast 1990 jail popGlation of8,814 is especially disturbing since thecapacity of the local jails is only 6,551. (DOCrates jail capacity even lower, at 5,696.) Localplans call for the addition of at least 832 bedsby the end of 1987, but those additions stillleave local jails short by approximately 1,400beds in 1990. Between now and 1990,overcrowding in jails and prisons could beroutine.
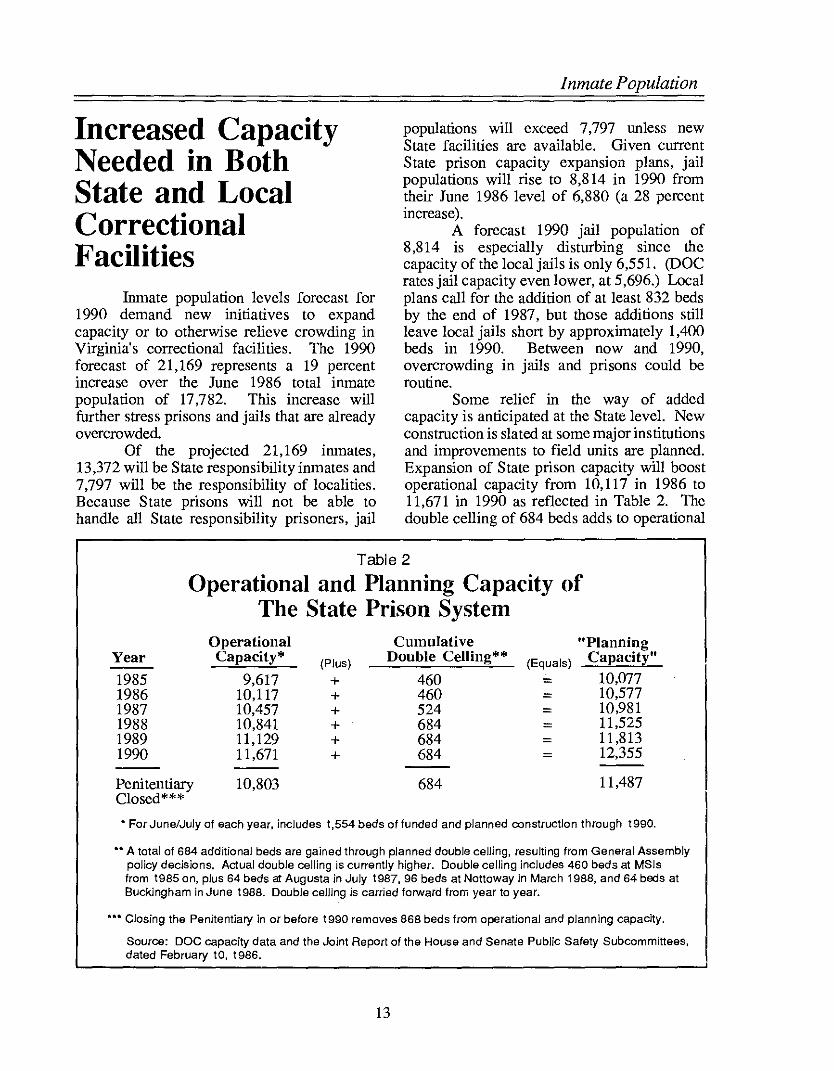
Some relief in the way of addedcapacity is anticipated at the State level. Newconstruction is slated at some major institutionsand improvements to field units are planned.Expansion of State prison capacity will boostoperational capacity from 10,117 in 1986 to11,671 in 1990 as reflected in Table 2. Thedouble ceiling of 684 beds adds to operational
Table 2
Operational and Planning Capacity ofThe State Prison System
Operational Cumulative "PlanningYear Capacity* (Plus) Double Celling** (Equals) Capacity"
1985 9,617 + 460 = 10,0771986 10,117 + 460 = 10,5771987 10,457 + 524 = 10,9811988 10,841 + 684 = 11,5251989 11,129 + 684 = 11,8131990 11,671 + 684 = 12,355
Penitentiary 10,803 684 11,487Closed***
• For June/July of each year, includes t,554 beds of funded and planned construction through t990.
•• A total of 684 additional beds are gained through planned double ceiling, resulting from General Assemblypolicy decisions. Actual double ceiling is currently higher. Double ceiling includes 460 beds at MSlsfrom t985 on, plus 64 beds at Augusta in July t987, 96 beds at Nottoway in March 1988, and 64 beds atBuckingham inJune t988. Double ceJJing is carried forward from year to year.
... Closing the Penitentiary in or before t990 removes 868 beds from operational and planning capacity.
Source: DOC capacity data and the Joint Report of the House and Senate Public Safety Subcommittees,dated February to, t986.
13
Inmate Population
capacity and gives the State a possible planningr"pacity of 12,355 in 1990. This level ofdouble celling is regarded by JLARC staff asacceptable, even on a long-term basis. Adding684 double celled beds to operational capacityresults in a "planning capacity," which can beused as a baseline for determining futureconstruction needs.
State prisons can operate at an evenhigher level-- emergency utilization level-- ona short-term basis. Building plans should notbe based on this highest level, however, bothfor management purposes and because some ofthat capacity should be held in reserve foremergencies and for changes or errors in theforecast. The planning capacity is still approximately 1,000 beds short of housing the1990 forecast State responsibility population of13,372.
Closure of the State Penitentiary priorto 1990 will furtber constrict prison capacityby deleting 868 beds from the system.Planning capacity would then drop to 11,487beds, causing a deficit of 1,885.
Current State policy calls foraddressing a bed shortfall by diverting 550inmates through community-based programsand backing up 300 inmates into local jails. Asnoted in the middle column of Figure 7, thiswould still leave an unmet need of 1,035 beds.If operational capacity (including somemandated double celling) is used as thecapacity base, the unmet need ill 10/90 wouldbe 1,719 beds (as shown in the left column ofFigure 7).
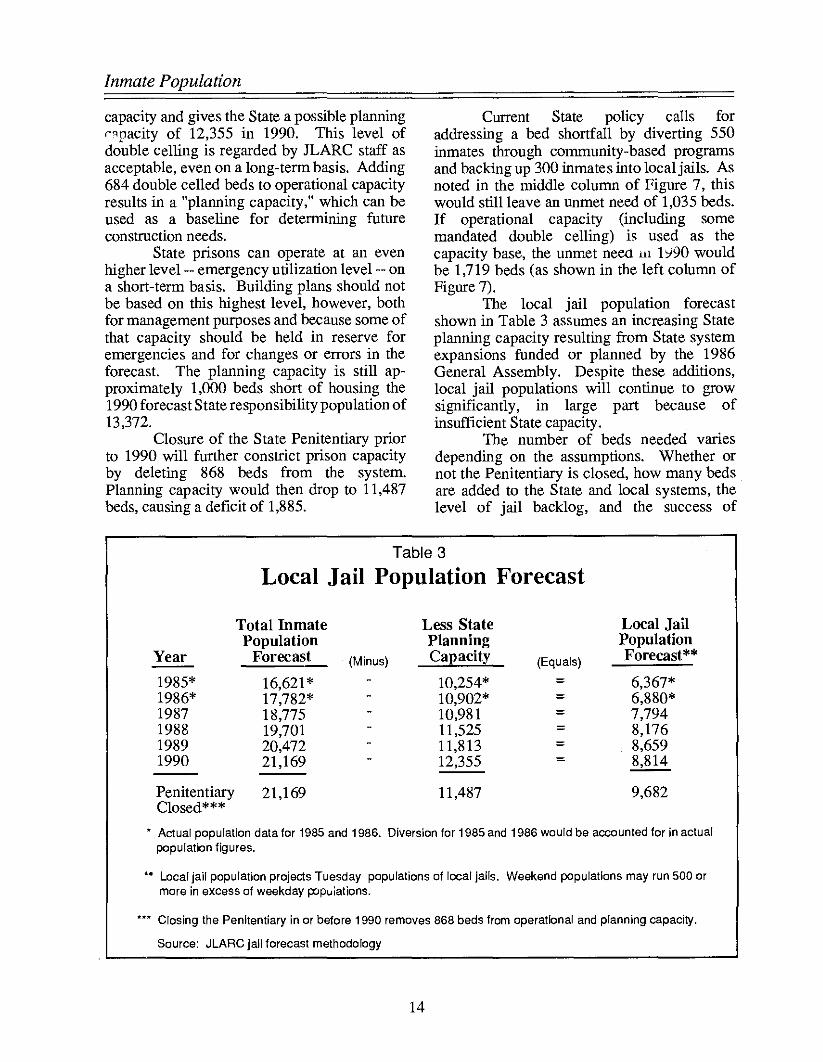
The local jail population forecastshown in Table 3 assumes an increasing Stateplanning capacity resulting from State systemexpansions funded or planned by the 1986General Assembly. Despite these additions,local jail populations will continue to growsignificantly, in large part because ofinsufficient State capacity.
The number of beds needed variesdepending on the assumptions. Whether ornot the Penitentiary is closed, how many bedsare added to the State and local systems, thelevel of jail backlog, and the success of
Table 3
Local Jail Population Forecast
Total Inmate Less State Local JailPopulation Planning Population
Year Forecast (Minus) Capacity (Equals) Forecast**
1985* 16,621 * 10,254* = 6,367*1986* 17,782* 10,902* = 6,880*1987 18,775 10,981 = 7,7941988 19,701 11,525 = 8,1761989 20,472 11,813 = 8,6591990 21,169 12,355 = 8,814
Penitentiary 21,169 11,487 9,682Closed***
• Actual population data for 1985 and 1986. Diversion for 1985 and 1986 would be accounted for in actualpopulation figures.
.. Local jail population projects Tuesday populations of local jails. Weekend pcpulations may run 500 ormore in excess of weekday J'XlPuiations.
... Closing the Penitentiary in or before 1990 removes 868 beds from operational and planning capacity.
Source: JLARC jail forecast methodology
14

Figure 7
.,..-- PLA..'·..·NED DNERSION (550)
iI"-- PLA..'>iNED BACKLOG (300)
......... POTENTIAL ~UXMET NEED 0::~
USING 1E\1PORARYE.\1ERGE.'\ey CAPACITY
FORECASTFOR 1990TOTAL 21.169
iN~
~.
~
§s~ 1990STA1E~ lEMPQRARY~ E.\1ERGENCY~
" CAPACITY ......< 12,462~~
POTE..,\'TIAL910JAf" BACKLOG
t
JAn... FELONS1,877
LOCA.LRESPOXSIBll.JTY5,920
Beds Needed at"Temporary Emergency
Capacity" ***
j ..-- PLAID.'ED DNERSION (550).- PLA.;'\7\'ED BACKLOG (300)>POTENTIAL ~
I;S\iET NEED 0::~USIS"G PLA.'\~lXG
CAPAQTY
iN~
2§~~ 1990STA1E~ PLA,'l:';1NG~ CAPACITY ....~
"11,487
<~~
POTEr.'l'TIAL1,885JAR- BACKLOG
JAn... FELONS1,877
LOCALRESPONSIBll.JTY5,920
Beds Needed at"Planning Capacity" **
FORECASTFOR 1990
TOTAL 21,169
J...- PLANNED DIVERSION (550).- PLA..'\"1\'ED BACKLOG (300)
POTE;'>iTIAL~UNMET NEED :Q,71])USING OPERATIONALCAPACiTY
FORECASTFOR 1990
TOTAL 21,169
iN~
~.
~
§s~ 1990STA1E
~OPf'RATIONALCAPACITY"'
" 10,803<~~
POlElmAL2,569JAn... BACKLOG
JAll...FELOXS1,877
LOCALRESPONSIBILITY5,920
Beds Needed at"Operational Capacity"*
I 1990 Bed Needs ifu'"~,i-uoo
~u'"~,
I
~
VI
.. OpcratiOllal CHi'ilCily illClu1ks l'urrClll opcratil1nal capacity (les5 Penitentiary) pi us plllnncd aililitiollS to opt'r1l1iollal C<ipaci~'.
tt Plallllillg capacilY l'ljU:lls IyS6 lli"-Talil1nal capacity (10,117) plliS 1,554 lldtlilions to 0pt'lalic1nlll CllPllcily thn1llgh, IYYO, plus dllUblc bunking6f\4 bl'tl spaccs. hom tilis 10131 (12}55) lile capaOly 01 the Slale PCllllCfltlllT}' is suhtrlll;ted (8ili') leaving a planmllg capaCity of 11,487.
~"t TCllll'(lLiry I :LHL'l~l'llCY (~:ljl,l~'ily ill I')l)(j ~ 15,330) k~s stix Ix',1" frllm I\'llil~'lltiarydosillg. lndUlks t'u ntl~'ll and pllHlll<:d,
>..~
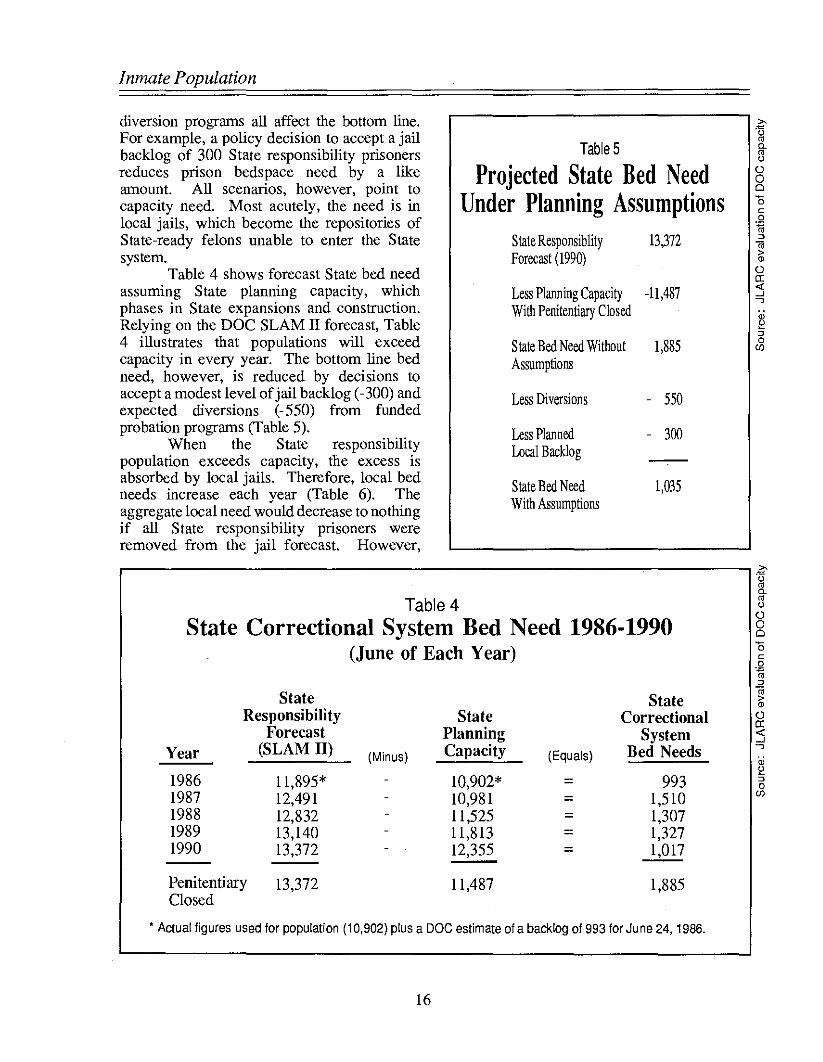
uroTable 5 Q.
rou
Projected State Bed Need 000
Under Planning Assumptions "6c0.~
State Responsiblity 13,372 "<;
Forecast (1990) >"0a:
Less Planning Capacity -11,487 <i....J..,
With Penitentiary Closed ;,;!!"State Bed Need Without 1,885 0
(f)
Assumptions
Less Diversions 550
Less Planned 300Local Backlog
State Bed Need 1,035With Assumptions
Table 4State Correctional System Bed Need 1986·1990
(June of Each Year)
State StateResponsibility State Correctional
Forecast Planning SystemYear (SLAM II) (Minus) Capacity (Equals) Bed Needs
1986 11,895* 10,902* = 9931987 12,491 10,981 = 1,5101988 12,832 11,525 = 1,3071989 13,140 11,813 = 1,3271990 13,372 12,355 = 1,017
Penitentiary 13,372 11,487 1,885Closed
Inmate Population
diversion programs all affect the bottom line.For example, a policy decision to accept a jailbacklog of 300 State responsibility prisonersreduces prison bedspace need by a likeamount. All scenarios, however, point tocapacity need. Most acutely, the need is inlocal jails, which become the repositories ofState-ready felons unable to enter the Statesystem.
Table 4 shows forecast State bed needassuming State planning capacity, whichphases in State expansions and construction.Relying on the DOC SLAM II forecast, Table4 illustrates that populations will exceedcapacity in every year. The bottom line bedneed, however, is reduced by decisions toaccept a modest level of jail backlog (-300) andexpected diversions (-550) from fundedprobation programs (Table 5).
When the State responsibilitypopulation exceeds capacity, the excess isabsorbed by local jails. Therefore, local bedneeds increase each year (Table 6). Theaggregate local need would decrease to nothingif all State responsibility prisoners wereremoved from the jail forecast. However,
~---------------------------------...,.~
Iirouo8"6c
.~
"]oa:<i....J..,"!!"o
(f)
• Actual figures used for population (10,902) plus a DOC estimate of a backlog of 993 for June 24, 1986.
16

Inmate Population
Table 6
Local Jail Bed Need 1986·1990(June of Each Year)
Local Jail AggregatePopulation Local Local
Year Forecast (Minus) Capacity (Equals) Bed Need**
1986* 6,880" 6,551 = 3291987 7,794 6,941 = 8531988 8,176 7,383 = 7931989 8,659 7,383 = 1,2761990 8,814 7,383 = 1,431
• Actual.. Aggregate local bed need is 0 ~ all State responsibility ',nmates are housed in State prisons.
()a:::s...,CD
"'"o'"
numerous individual localities would stillexperience overcrowding, because they lacksufficient capacity for their own prisoners.Local capacity may increase more rapidly thancurrently expected, however, iflocalities speedup their own construction plans in response toovercrowding. Fourteen localities indicated toJLARC staff that they had a total of 642 bedsthat were provisionally planned, but unfunded.
Virginia Needs AConsensus InmateForecastingProcess
Accurate and reliable forecasts ofinmate populations are essential to soundcorrectional planning. A number of elementsdepend on the validity of forecasts, includingcapital outlay planning, staffing needs, andpotential jail backlog. Accurate forecasts arealso needed to develop realistic State budgets.
17
In conclusion, planned capacityadditions at the State and local levels, whileeasing crowding and increasing capacitysomewhat, will still not meet the predicteddemand for confinement space. Additionalconstruction is needed at both the State andlocal levels in order to reduce overcrowding.Non-construction initiatives to handleove=owding are also needed.
DOC began forecasting inmatepopulations in 1977. Problems were evidentwith the original method, however, whichproduced a series of over-projections. A newmodel, the Simulated Losses/AdmissionsModel (SLAM II), was adopted in 1982 and isstill in use, with some modifications.
SLAM II is a reasonably valid methodfor assessing trends that influence the inmatepopulation, and the model perforrus reasonablywell. DOC has the responsibility for maintaining the model, updating its data base, andproviding adequate resources to operate themodel. DOC can also adapt the model whenpolicy changes occur that affect model asumptions.

Inmate Population
Summary of JLARC FindingsDOC's forecast was reviewed in
JLARC's April 1985 report, "Virginia'sCorrectional System: Population Forecastingand Capacity." The report contained atechnical analysis of the SLAM II model. Thestaff review found a number of technical errorsin the methods used in the forecast. Thetechnical errors included lack of data to supportcertain assumptions built into the model,unjustified manual adjustments to the model,and the use of a one-year period to predict longterm trends. The report also criticized thecomplexity of the model, which restricts itsability to estimate the impact of the policychanges in the system. Based on thesetechnical corrections and refinements, thereport provided an alternative forecast.
Beyond a critique of the model, theGeneral Assembly was interested in thedevelopment of a single reliable number onwhich to base policy decisions. To achievethis objective, DOC and JLARC staff workedto develop a technically adequate forecastmethodology which addressed DOC interestsand the concerns of the JLARC report. Thisobjective was accomplished, and a forecastbased on the joint methodology was released inlate 1985.
At that time, the modified SLAM IImodel was predicting 12,334 Stateresponsibility inmates for June 1990. Duringthe past year, however, admissions havesteadily increased, and a new forecastproduced by DOC in September 1986 calls fora 1990 population of 13,372, an increase of1,038 over the 1985 forecast. While a smallerchange in the forecast would be preferable, theone-year increase does illustrate theresponsiveness of the model.
Future DirectionsWorking with JLARC staff, DOC has
improved the SLAM II methodology. Thereare concerns, however, with the forecast'saccuracy. Within the past two years SLAM IIhas produced three 1990 forecasts, eachincreasing the previous forecast.
18
The present responsibility forforecasting inmate populations lies principallywith the Department of Corrections (forecastsof local jail populations were prepared byJLARC staff for use in its report on jailpopulations and capacity). Except for theJLARC staffs involvement in refining theSLAM II methodology, DOC for the most parthas worked independently to produce Stateresponsibility forecasts. JLARC's involvement in the forecasting process isscheduled to end with this summary report oncorrections.
A more open, participative processshould be considered as a means of promotingforecast accuracy and understanding. Theprocess for producing and validating theforecasts should be expanded to include moreparticipants. Such a consensus forecastprocess is currently used in Florida.
Florida has established a "ConsensusReview Committee" which helps strengthenthe validity of its forecasts by:
(1) setting and testing majorassumptions that go into the model;
(2) studying historical fluctuations inprison populations;
(3) establishing a system of data basesfrom various criminal justicesources;
(4) providing a fornm for review andmonitoring of the process; and
(5) ensuring that the publishedforecasts have been reached basedon some consensus and review.
One advantage of such an outsidereview group is that it provides an opportunityto compare and predict the impact of futurepopulations on other elements within thecriminal justice system.
Such a process could have value inVirginia. It would ensure that key actors in thecriminal justice system have input into the

forecast. Moreover, such a group wouldpromote general understanding of the forecastand the assumptions which drive it.
The need for such understanding hasbeen demonstrated in recent weeks as groupssuch as the Board of Corrections and SheriffsLiaison committee have: (I) criticized JLARCfor a forecast that is in fact a DOC product, and(2) requested inclusion offactors that are eitheralready accounted for in the forecast ortechnically inappropriate. More long-termparticipation of such groups could potentiallyclarify such misunderstandings.
To provide a broad spectrum of input,a consensus review committe.~ could haverepresentatives from the courts, jails, theDepartment of Criminal Justice Services, andother State agencies, such as the Department ofPlanning and Budget and the Parole Board.Representation could also be affordedinterested legislative committees and the CrimeCommission.
The consensus review committee couldbe headed by the Department of Planning andBudget, which by statute (Code of Virginiasection 2.1-391), has responsibility to prepareshort- and long-term population projections foruse by the General Assembly and Stateagencies. DPB also has statutory authority forcoordinating, reviewing, monitoring, andevaluating data used by other State agencies.
Because DPB has statutory responsibility to perform many of the functionsproposed for the peer review committee, theGovernor may wish to make DPB theresponsible agency for coordinating andproviding staff support to the review process.It may also be advisable for DPB to developfuture total inmate forecasts for predicting jailpopulations. Such forecasts would be usefulin predicting State costs for activities fundedthrough the Compensation Board budget.
DOC should also continue to developand refine its forecasting practices. Inparticular, alternatives to SLAM II should beexplored and developed.
Recommendation. Future forecasts of Stateinmate populations should be produced using aconsensus forecast review committee. The
19
Inmate Population
consensus forecast committee should beestablished by the Department ofPlanning andBudget. The committee should consist ofrepresentatives of State agencies, the courts,localities, and other interested parties.
Improved CapitalOutlay Planning isNeeded
DOC currently operates 16 majorinstitutions, which housed approximately8,000 of DOC's 11,100 inmates in October1986. Five of these major institutions wereconstructed between 1975 and 1986 at a costof $113 million. This construction added2,335 cells and has eased crowding andcontributed to Virginia's avoidance of federalintervention in the operation of its prisonsystem.
According to the American CivilLiberties Union, in February 1986 prisons in34 states and the District of Columbia were~nder court order to reduce overcrowding orImprove related living conditions. WithinVirginia, no DOC institutions are under courtorder, and only three major institutions areoperating under consent decrees at this time.
DOC should utilize its recentexperience in designing and operatinginstitutions, along with the experience of otherstates, in determining future facility designs.Cost-effective operation has become aparticularly important consideration with thelimited resources that states now haveavailable. A number of innovative designs andoperating procedures are being used tominimize the capital and operating costs ofcorrectional facilities.
Summary of FindingsA 1986 JLARC staff study of DOC's
capital outlay planning process found that thedepartment needs to (1) strengthen its longrange planning capabilities, (2) continue to

Inmate Population
improve the effectiveness of prison designsused in constructing new institutions, and (3)develop better mechanisms for projecting itsmaintenance needs.
DOC will need to strengthen planningand management related to its capital outlayprocess to be able to complete the ambitiousconstruction scheduled during the next twobiennia. The 1986 General Assembly approved a plan to construct an additional 1,470cells by 1990. This substantial bedspaceincrease was based on the 1985 forecast of12,337 State responsibility inmates by 1990.The forecast was updated in 1986, projectingan inmate population of 13,372 by 1990.Thus, an even larger construction program willprobably be needed. As part of improving itscapital process, DOC should prepare a comprehensive ten-year plan, strengthen its capitalimprovements program, and develop a comprehensive policy manual for use by capitaloutlay staff.
The JLARC staff study also noted thatthe effectiveness of DOC's prison designs hadimproved since the construction of Mecklenburg and Brunswick. The department usedthree significantly different designs inconstructing its last five major institutions:Mecklenburg, Brunswick and the prototype forBuckingham, Nottoway, and Augusta. Mecklenburg and Brunswick were designed forspecific inmate populations: Mecklenburg forthe most disruptive inmates in the system andBrunswick for lower custody inmates.
The prototype design, however, wasnot intended to accommodate a specific type ofinmate population. Instead the design was tobe used for a more general population ofinmates, while providing the security neededfor maximum custody inmates. This providedfor flexibility in housing inmates of varioussecurity classifications and for relatively costeffective operation.
Mecklenburg was designed as a supermaximum security institution emphasizingclose supervision of inmates in small groupsand restricted inmate movement. Mecklenburg's design has limited the institution'sflexibility in housing general population in-
20
mates and has increased staffmg requirementsand operating costs.
The operating costs and staffing ratiosfor 15 of Virginia's major institutions areshown on a per-inmate basis in Table 7. Asillustrated, Mecklenburg had the secondhighest staffing ratio and operating costs on aper-inmate basis. The staffing ratio of 1.19and annual operating costs of $33,274 werebasically twice the system-wide averages of.59 staff and $17,728 per inmate. DOCshould make changes needed to improve thecost effectiveness of Mecklenburg's operation.
Brunswick was designed for minimumto medium security inmates. Its campus-likedesign employed open areas and glass toprovide an attnosphere of normalcy believed tobe conducive to inmate rehabilitation. Theminimum security building materials used andvisibility constraints have limited theinstitution's usefulness in housing "C" custodyinmates.
Buckingham, Nottoway, and Augusta,which were not designed to house specificinmate populations, have the needed flexibilityto house minimum to maximum securityinmates in a relatively cost-effective manner.For example, visibility, which is important inmaintaining security within correctionalinstitutions, is generally good within theprototype institutions.
Double ceIling in the institutions hasillustrated the need for DOC to build flexibilityinto the support areas so that inmatepopulations larger than the design capacity canbe housed.
DOC also needs to accurately budgetfor the "ordinary" maintenance needs of itsinstitutions as well as project the size of thelarger needs which should be funded throughthe capital outlay process. At present, theamount spent on maintenance in the previousyear is the primary basis for determining thecurrent year's maintenance budget. DOCshould develop a better means of projecting itsmaintenance budget needs.
To summarize, the JLARC staff studyrecommended that DOC strengthen itsplanning. In selecting any future prison

Inmate Population
Table 7
Comparison of Operating Expendituresfor Adult Institutions
AverageInmate
Population FY 1986 Cost Per Staff PerInstitutions FY 1986 Expenses Inmate Inmate
1. Marion 160 $ 5,523,748 $ 34,523 1.202. Mecklenburg 308 10,210,796 33,152 1.193. YOC 80 2,242,275 28,028 1.094. Powhatan 694 15,511,350 22,351 0.765. Penitentiary 862 16,178,144 18,768 0.556. Bland 454 8,010,143 17,643 0.547. James River 326 5,539,922 16,994 0.538. Staunton 543 8,951,743 16,486 0.599. Deerfield 310 4,880,207 15,743 0.57
10. Nottoway 698 10,643,017 15,248 0.5211. Brunswick 696 10,325,182 14,835 0.5512. Buckingham 714 10,267,515 14,380 0.5213. S1. Brides 443 5,945,823 13,422 0.4214. Southampton 526 6,994,494 13,297 0.4315. VCCW 373 4,779,140 12,813 0.41
TOTAL 7,187 $126,003,499 $ 17,532 0.59
Source; JLARC staff analysis of DOC Population Summary and Per Capita Statement of Adu~ Facilities
designs, the department should maximizeflexibility and cost-effectiveness and exploreinnovations in design, construction, andmanagement techniques that have beensuccessfully employed in other states. It willalso be important for DOC to protect its largecapital investment through regular maintenancein the coming years. This will involveperforming preventive maintenance on ascheduled basis as well as accurately budgetingfor future maintenance needs.
Future DirectionsAs previously noted, the most recent
inmate population forecast projected a Stateresponsibility figure of 13,372 by 1990.Thus, an additionall,035 inmates are expectedwhich were not planned for in the construction
21
program approved by the General Assemblyduring the 1986 session. In consideringpossible facility designs for any new construction, DOC should compare the potentialcost-effectiveness of larger facilities with the500-person prisons that have typically beenconstructed in Virginia.
Potential staffing and cost efficienciesrelated to operating larger facilities have beenillustrated by double ceiling in several ofVirginia's prisons. For example, staffingrequired for security posts such as guardtowers and control booths will be the sameregardless of the size of the inmate population.Similarly, the number of nonsecurity positionsmay often remain the same. Currently threemajor institutions have substantial doubleceiling: Brunswick, Buckingham, and Nottoway.

Inmate Population
Distribution ofInmate PopulationNeeds Review
Virginia's system of 45 adult correctional facilities is one of the most fragmented inthe nation. The large number of facilities isintended both to provide institutions of manageable size and to house inmates near theirhomes.
While the objective of having smallerinstitutions has been met, the goal of housinginmates near their homes has not been fullyrealized. As Figure 8 indicates, inmate comntitrnents in the northern region of the Staterepresent 17.4 percent of the State inmatepopulation. Yet the northern region has no
Non-ConstructionInitiatives areNeeded
Both State prisons and local jails willlack sufficient capacity to house theirpopulations during the next several years.Even if additional beds are approved andfunded, overcrowding will exist in the interim.Inmates in crowded jails and prisons oftenmust sleep on mattresses on the floor, wait inline to use showers and toilet facilities, andenjoy fewer program opportunities. Jail andprison administrators also feel the effects ofovercrowding. They are challenged to managepersonnel and resources to fit the needs of theexpanded population.
Expansion of State and local facilitycapacity can eventually ameliorate crowdedconditions. Until new facilities can be opened,however, corrections adntinistrators must dealwith the sometimes volatile effects of crowdedconditions.
To a limited extent, short-term overcrowding can be reduced by the transfer of
22
major State institutions. (A major Washington, D.C., facility -- Lorton Reformatory -- islocated in Northern Virginia, however.)Conversely, the central and eastern regionshave disproportionate shares of inmates. Thecentral region, for example, had 18.2 percentof the comntitments for FY 1986 but housedover one-third of the inmate population.
A number of factors may contribute tothis distribution imbalance: (1) site selection isdependent on local support for an institution;(2) availability of existing State-ownedproperty in the central region has made it easierto locate there; and (3) the central region iscloser to the DOC main offices.
As DOC plans for additional bedspace,it should look closely at the distribution of itsfacilities statewide. Available sites for locatingfacilities in the northern region should becarefully sought.
inmates between jails, improved intakeprocessing, and effective jail management.Over the long term, overcrowding can bereduced through diversion programs andchanges in sentencing practices, as well as newconstruction.
Summary of FindingsAlthough most jails are operating over
capacity, some jails periodically have excesscapacity. Some jurisdictions presently haveinformal procedures for the transfer of inmatesfrom crowded jails to less crowded facilities.This process, however, is not institutionalizedand depends on the goodwill of the receivingsheriff. The Director of the Department ofCorrections has the statutory authority totransfer State responsibility inmates betweenjails. Through the use of this authority, DOCcould alleviate some of the most severecrowding. The transfer authority, however,has never been used.
The General Assembly may wish todirect the Director of the Department ofCorrections to use his authority to transferState responsibility inmates to jails that haveunder-utilized capacity. To effect such

Figure 8,--------------------------------,0
'"'"
Inmate Population in Virginia's Prisons
o 0
ooo
I. Noll.".,J. hrTU..tlU')'K. r."lIItuL. SMtllh..lpteI!M. st. Brld..N. 511UlloiO. W.....'. CnttrP. '{DC
MAJOR INSTlTUTlONS: - --,
KEY: ,
PRISON' POPULATION:
®l MAJORINSTTTUI1ON
o FIELD UNITS
• OTHER
Distribution of Inmate PopulationBased on Place of Residence
23

Inmate Population
transfers smoothly, the departroent should giveconsideration to transfer incentive programsinvolving, for example, transportationassistance, intake priority consideration, oradditional payments. In any programs involving additional payments, considerationshould be given to developing a programwhich does not dampen current voluntaryexchanges between jails which the State doesnot finance.
State-level improvements in inmatemanagement would also ease inmatepopulation pressure in local jails. DOC'sinmate intake system should be based on bettermeasures of jail capacity to further prioritizeintake from crowded jails. Beds are currentlyallocated to jails depending on the number offelons in jails with greater than six months toserve. Therefore, larger jails that house morefelons are allocated more State beds. Theintake allocation should be dependent on thepercentage of a jail's capacity occupied byfelons with more than six months to serve.Under such a system smaller jails wouldreceive fair treatment.
Another intake problem involves theDOC Warrant Section, which processes thedocuments necessary for inmate intake.Processing delays have resulted in the slowreception of inmates from local jails. Strongconsideration should be given to replacementof the temporary positions within the warrantsection with permanent staff. The benefits ofsuch replacement could be realized in moretimely court order processing, lower staffturnover, and improved efficiency.
Opportunities for improving jailmanagement also exist. Many jails haveadopted creative means of managingovercrowding, which should be shared withother jails. At the State level this has beenaccomplished in part through the formation ofthe Sheriffs Liaison Committee. A recentconference on jail crowding hosted by theSecretary of Transportation and Public Safetyalso provided a valuable forum for sharingideas.
Due to the organizational structure andmission of DOC, DOC jail managers have the
. opportunity to observe new and more efficient
24
means of handling jail populations andovercrowding at the local level. Since it is theresponsibility of the jail managers to provideassistance to jail operators, DOC jail managersshould identify effective techniques used inlocalities to manage overcrowding, and shouldregularly disseminate this information tosheriffs.
Future DirectionsIn addition to capacity expansion, State
and local governments should look carefully atdiversion programs and at the sentencing ofconvicted felons. Sentencing and paroleeligibility disparities result in such anamoliesas a felon with a 12-month jail sentenceserving significantly more time than a felonwith a two-year prison sentence. Otherelements of the criminal justice system, such ascourt management practices, could also bestudied regarding their effects on the jail andprison inmate populations.
CapacityCalculationsNeed Revision
In general, the capacity of acorrectional system refers to the number ofinmates which the system can accommodateunder certain assumptions. Although ACAcapacity guidelines exist, the capacity of afacility is essentially a policy decision.Facilities "designed" for one number ofinmates often hold a higher number safely forextended periods of time.
Capacity is not an absolute concept. Itis dependent on design, staffing, inmate type,and other factors, including the level of riskthat is deemed acceptable. An institution thataccepts no inmate incidents will have asignificantly lower capacity than an institutionwhere a certain level of incidents are thought tobe inevitable.

One confusing aspect of capacity is thatdifferent terms are often used. DOC has usedvarious terms in representing the capacity ofthe corrections system, including designcapacity, budgeted capacity, operationalcapacity, and temporary emergency capacity.Each term has a different meaning. The keycapacity term used by DOC is operationalcapacity, or the level at which DOC has judgedthat a facility can be safely operated.Generally, DOC's operational capacity figuresinclude no double celling of inmates. This isconsistent with American CorrectionsAssociation (ACA) standards which callforthesingle occupancy of cells.
Summary of FindingsJLARC staff found that DOC's
approach to defining capacity generallyunderstated the capacity of the system. Twoproblems were noted with the department'soperational capacity ratings -- inconsistencyand unwillingness to count any double celling.
The inconsistency of DOC capacityratings is principally seen in the rating ofdormitory space. As noted in JLARC's 1985study of capacity and forecasting, squarefootage in prison dormitories ranged from 33square feet per inmate at New Kent (a stickcamp) to 81 square feet at Bland (a majorinstitution). This variation reflects thesubjective nature of establishing capacity.
DOC does not count any double cellingin its operational capacity of the system. TheMSIs, for example, have a rated capacity of500, far below the level at which they normallyoperate. Consequently these institutions arealways shown to be significantly overcapacity. At the same time, there is considerable skepticism by policymakers regarding the 500 capacity level, because the institutions routinely and safely operate above thislevel.
Since the release of JLARC's 1985report on DOC capacity, the department haspromulgated a capacity rating termed"temporary emergency capacity." This numberrepresents the maximum number of inmates afacility can hold based on bedspace, squarefootage, program space, and infrastructure
25
Inmate Population
constraints. This level is intended for shortterm operation and should not be viewed as apermanent capacity level. Temporary emergency capacity is a useful measure of the upperlimits of DOC capacity.
Neither operational capacity nortemporary emergency capacity are usefulmeasures for capital outlay planning purposes,however. Operational capacity is too low andtemporary emergency capacity is too high.JLARC staff recommends instead the use of a"planning capacity" number, which reflectsdouble celling approximately 25 percent ofMSI general population cells. In 1990, the"planning capacity" for the system would be684 beds above operational capacity.
Planning capacity is a number onwhich forecast-driven construction plans couldbe based. Were the forecast to be low, DOCcould utilize temporary emergency capacity.Were the forecast to be high, DOC could dropdown to operational capacity levels. Capacitycomparisons are shown in Table 8.
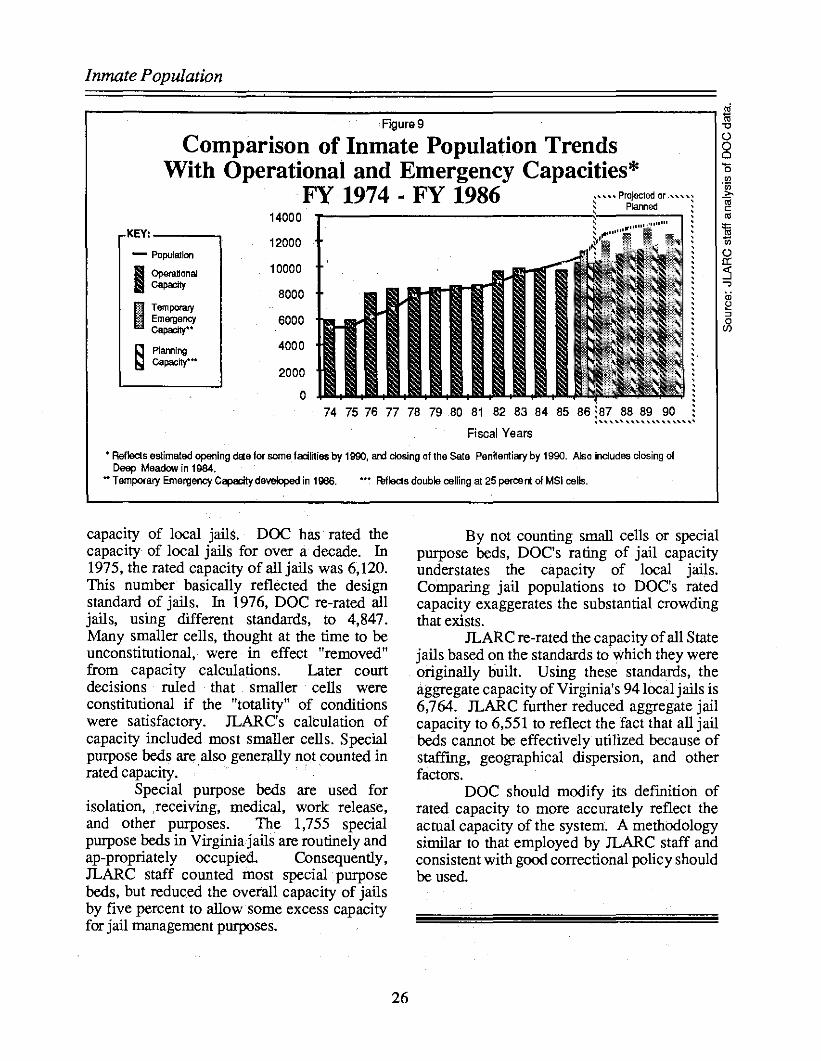
Forecast increases in the Stateresponsibility population will exceed all threecapacity measures (Figure 9), unless additionalprison beds are built, inmates are diverted fromincarceration, or inmates are backed up intolocal jails.
Jail CapacityA similar problem is evident in DOC's
rating of jail capacity. "Rated capacity" is theDepartment of Corrections' rating of the
.;iii
Table 8 -00
Capacity Comparisons 0Cl
'0
'"Temporary "inOperational "Planning >-
Emergency CiiYear Capacity Capacity" Capacity c:
'"1986 10,117 10,577 11,545:l=
'"1987 10,457 10,981 11,956 u;1988 010,841 11,525 12,500 a:1989 11,129 11,813 12,788 -0:1990 ...J
11,671 12,355 13,330 ....,;,;
If Penitentiary 10,803 11,487 12,462 !!Closed in 1990 :>
0C/)
Inmate Population
,"-"-"-' Projected or ."-"-"-"-'~ Planned ~, ', '~ j~"'" ~
j . ~
:
85 86j87 88 89 90 ~,,,-,,-,,-,,-,,-,,-,,-,,-,,-,,-,,-,,-,,-,,-,,-,,-,,-,,-,
74 75 76 77 78 79 80 81 82 83 84
Fiscal Years
6000
4000
2000
a
14000
12000
10000
8000
KEY: __--.
- PopulB1lon
I=n~
B· Tem po!1iI}'EmergencyCopaclly"
~ Planning~ capacity'"
r---------------------------------.....,~Figure 9 -c()
Comparison of Inmate Population Trends 8With Operational and Emergency Capacities*
.FY 1974 . FY 1986
• Reflects estimated opening dcte for some. fa:::ilnies by 1900, ard closing of the Sate Pen~enticry by 1990. Also ilcIudes closing ofDeep Meadow in 1984.
.. TemporB!)' Emergency Cepecltydeveloped in 1006. ,.. Fllflects double ceiling at 25 percent of MSI cells.
capacity of local jails. DOC has rated thecapacity of local jails for over a decade. In1975, the rated capacity of all jails was 6,120.This number basically reflected the designstandard of jails. In 1976, DOC re-rated alljails, using different standards, to 4,847.Many smaller cells, thought at the time to beunconstitutional, were in effect "removed"from capacity calculations. Later courtdecisions ruled that smaller cells wereconstitutional if the "totality" of conditionswere satisfactory. JLARC's calculation ofcapacity included most smaller cells. Specialpurpose beds are also generally not counted inrated capacity. .
Special purpose beds are used forisolation, ,receiving, medical, work release,and other purposes. The 1,755 specialpurpose beds in Virginia jails are routinely andap-propriately occupied. Consequently,JLARC staff counted most special purposebeds, but reduced the overall capacity of jailsby five percent to allow some excess capacityfor jail management purposes.
By not counting small cells or specialpurpose beds, DOC's rating of jail capacityunderstates the capacity of local jails.Comparing jail populations to DOC's ratedcapacity exaggerates the substantial crowdingthat exists.
JLARC re-rated the capacity ofall Statejails based on the standards towhich they wereoriginally built. Using these standards, theaggregate capacity of Virginia's 94 local jails is6,764. JLARC further reduced aggregate jailcapacity to 6,551 to reflect the fact that all jailbeds cannot be effectively utilized because ofstaffmg, geographical dispersion, and otherfactors.
DOC should modify its defmition ofrated capacity to more accurately reflect theactual capacity of the system. A methodologysimilar to that employed by JLARC staff andconsistent with good correctional policy shouldbe used.
26

Chapter Four: SECURITY ANDNONSECURITY
STAFFING
Virginia's MajorInstitutions HaveSufficient SecurityStaff, But HigherPopulations WillRequire More Staff
The adequacy of staffmg in Virginia'sadult correctional institutions h(ls beena majorpolicy issue in the 1980s. Comprehensivereviews of staffing by JLARC and a task forceappointed by the Governor found securitystaffing to be generally adequate. Both studiesrecommended substantial changes in staffingpractices, however.
In many respects the JLARC staffingstudy and the Governor's Task Force staffingstudy had parallel findings. Both studiesrecommended revising the staffing formula andimproving post audits -- the method used toassess security staffing needs. DOC hasconsolidated the recommendations of bothreports and developed an action plan forimplementing them.
The overall level of security staff inVirginia's adult prisons has shown a steadyincrease since 1974. For the most part,
27
however, those staff increases reflect theopening of 12 new facilities since 1974. Thedepartment now operates 45 adult facilities, alarge number relative to most other states. Asindicated in Table 9, the number of securitystaff increased 33 percent, from 3,222 to4,287 between fiscal years 1981 and 1986,with the largest increases in FY 1982 whenfour institutions were added to the system.Except for increases due to the opening of newfacilities, there have been limited staffincreases during this time period.
Table 9DOC Security FTE sFY 1981 . FY 1986
FY Security FTE s Total Positions
June 30,1981 3222 7307
June 30,1982 3614 7947
June 30,1983 3876 8201
June 30,1984 3974 8342
June 30,1985 3949 8160
June 30, 1986 4287 8638

Security and Nonsecurity Staffing
Summary of FindingsJLARC's security staffmg study
focused on individual assessments of eachinstitution's security staffing. The study alsoincluded reviews of DOC's method forassessing the need for security personnel, theapplication of the staffing formula, and thepost audit process.
Overall, JLARC staff found that themajor institutions had adequate securitypersonnel. Increases in security staffing willbe required, however, since the adult prisonpopulation has increased from 9,454 at thetime of the review to over 11,100 in October1986. Other JLARC fmdings revealed thatextensive variation existed in how institutionalstaff conducted post audits, which resulted ininconsistent staffing levels and inadequatejustification for staff. It was also found thatDOC's staffing formula did not accuratelyreflect available work hours of securitypersonnel and that institutional staff applied theformula inconsistently.
A number of systemwide issues relatedto staffing were also raised. The use ofovertime by security personnel was found tobe excessive, poorly monitored, andinsufficiently documented. Wardens have hadwide discretion in deciding when to useovertime, and this discretion has led tosubstantial variation in the amounts ofovertimeused among facilities. Misclassification ofDOC employees was also a problem; securitystaff were found to be performing nonsecurityfunctions in,many cases.
Future DirectionsA number of improvements are being
made in the staffing area. DOC has developedan action plan for simultaneously implementingthe findings of the two staffing studies. Thedepartment has published and disseminatednew guidelines on how post audits should beconducted. DOC is also in the process ofconducting comprehensive post assessments ateach major institution to determine securityneeds and appropriate staffing based onchanges in populations at most facilities. Inaddition, the 1986 session of the General
28
Assembly mandated that DOC adjust staffinglevels based on the Governor's Task Forcestudy.
DOC should continue to implementrecommendations of the JLARC andGovernor's Task Force studies, particularly inthe areas of post audits, overtime, andmisclassification. As the incarceratedpopulation increases, corollary increases insecurity and nonsecurity staffing will benecessary. Even infill of existing institutionswill require both kinds of staff. As facilitiesare expanded and new facilities are built, DOCshould ensure that staffing economies receivehigh priority. Where possible, securitytechnology enhancements, institutional designimprovements, and more efficient operatingprocedures should be effected to providestaffmg economies.
Field Unit Staffingis Insufficient forSecurity andPrograms
Virginia's system of field units, longconsidered housing for low-risk felons, isexperiencing increases and changes in itsinmate population. Once viewed as temporaryfacilities, field units have for all practicalpurposes become a permanent part of theprison system. The role of these facilities nowseems to be changing also. As a result,additional staff may be needed in many ofDOC's 27 field units.
Most of the field units are located inrural areas of the State, as Figure 10 indicates.Field units were intended to be less restrictiveenvironments than the major institutions, andinmates assigned to these facilities wereassumed to pose less of a security risk.Generally, most inmates in the field units aresupposed to be within two or three years ofparole. The population, however, seems to be

Figure 10
Department of CorrectionsField Unit Locations
KEy: -,
ED Field Unit
r....r- Regional Boundaries
hardening. According to DOC staff, manyinmates housed in the field units are servinglonger sentences and have been convicted ofmore serious crimes. Also, in FY 1986, thepopulation of field units increased 13 percent,from 2,544 to 2,884 inmates.
Summary of FindingsStaffmg in Virginia's field units was
found to be generally insufficient to provideadequate security or programs. In manyinstances only three officers were assignedduring night shifts to control an entire facility.Security staffing during day shifts wasgenerally lean, but adequate. A major problem, however, was the use of security officersas food service supervisors, a practice whichshould be discontinued.
Nonsecurity staff and programs at fieldunits have received limited attention over theyears. In FY 1985 the ratio of inmates tononsecurity staff in the field units was 17.6 to1, compared to a ratio of 6.5 to 1 in the majorinstitutions. Inmates assigned to field unitslack many of the educational, training,counseling, and recreational opportunities thattheir counterparts in major institutions receive.Because inmates assigned to the field units areusually closer to parole, it can be argued thatmore, rather than less, services and counselingshould be available in order to prepare inmatesfor life outside of prison.
29
Security and Nonsecurity Staffing
A major nonsecurity concern is thelevel of individual counseling that inmates infield units receive. At the time of the JLARCstaff review, the number of inmates percounselor in the field units was 93 to 1,compared to 58 to 1 in the major institutions.Because of these excessive workloads,counselors spent most of their time preparingparole mes and on other administrative tasks,and had little time for actual counseling. Thus,inmates did not receive the attention theyneeded prior to release from prison.
To address the problems caused byinsufficient field unit staffing, JLARC staffrecommended an increase of 77 staff in fieldunits: 51 nonsecurity staff and 26 correctionalofficers (Table 10).
Status of FindingsIn conjunction with its response to the
Governor's Task Force staffing recommendations, DOC has prepared an action plan torespond to the staffing recommendations inJLARC's report. A separate action plan hasbeen developed to carry out JLARC's recommendations on nonsecurity positions.
Additional positions, both security andnonsecurity, are expected to be included inDOC's budget request during the 1987 sessionof the General Assembly. The additionalcounseling positions recommended by JLARCstaff will be included in the budget sub-

Security and Nonsecurity Staffing
Table 10
Field Unit Staffing Needs
Nonsecurity
Food Service Supervisors 20Counselors 28Nurses 3*
Subtotal (Nonsecurity) 51
Security
Correctional Officers 26
Total for Field Units 77
* Three full-time equivalent (FTE) IOsitions are needed tobring six part-time positions up to six full-time positions.
nnsslon. While DOC is taking steps toimprove staffing levels, much remains to bedone to improve services and programsavailable to inmates in the field units. A levelof services comparable to those in majorinstitutions should be made available topersons housed in the field units. Suchservices should include counseling, training,and educational opportunities. To accomplishthese objectives, DOC should considerestablishing special-purpose field units toconcentrate on specific missions, such asinmate education.
Future DirectionsMany of the field units currently used
in Virginia have been in existence for over 70years. Although field unit inmates are nolonger used to build roads, the facilities are stillin use because of the lack of available bedspacein major institutions. This situation is unlikelyto change in the near future. Currently, 25percent of the adult inmate population ishoused in field units. In the short term, closing
30
field units may not be practical because of thecurrent overcrowding of the system. As DOCplans for bedspaces in the future, however, itshould seriously consider replacement of manyof its field units, especially the "stick camps."While DOC has expressed interest in closingthe stick camps, it may be wiser to replacethem with more modern, secure facilities,given the probability of increased populationsin the future and the difficulty in obtaining newsites for DOC prisons. A definite plan forreplacing these facilities should be developed,however. As part of its master planningprocess, DOC should also begin to developplans for upgrading services and programs infield units to make them comparable to those inthe major institutions.
Staff ManagementNeedsImprovement
Since becoming a separate agency in1974, the Department of Corrections hasexperienced substantial growth in the size of itsstaff. Staffing has increased to the point thatDOC is now the third largest State agency interms of personnel.
As Figure 11 indicates, the totalnumber of DOC employees increased from4,182 in FY 1974 to 8,564 in FY 1986.Periods of employee growth reflect theincreasing responsibility of DOC in managingand operating the State's adult and youthcorrections system. As staffing levels havegrown, so has the challenge of managingDOC's diverse personnel system.
JLARC staff identified a number ofstaff management concerns that DOC needs toaddress, including (1) assessing staffinglevels, (2) controlling overtime, and (3)limiting misclassification of personnel. Theseconcerns, if addressed in a comprehensivemanpower plan, could result in bettermanagement and efficiency.
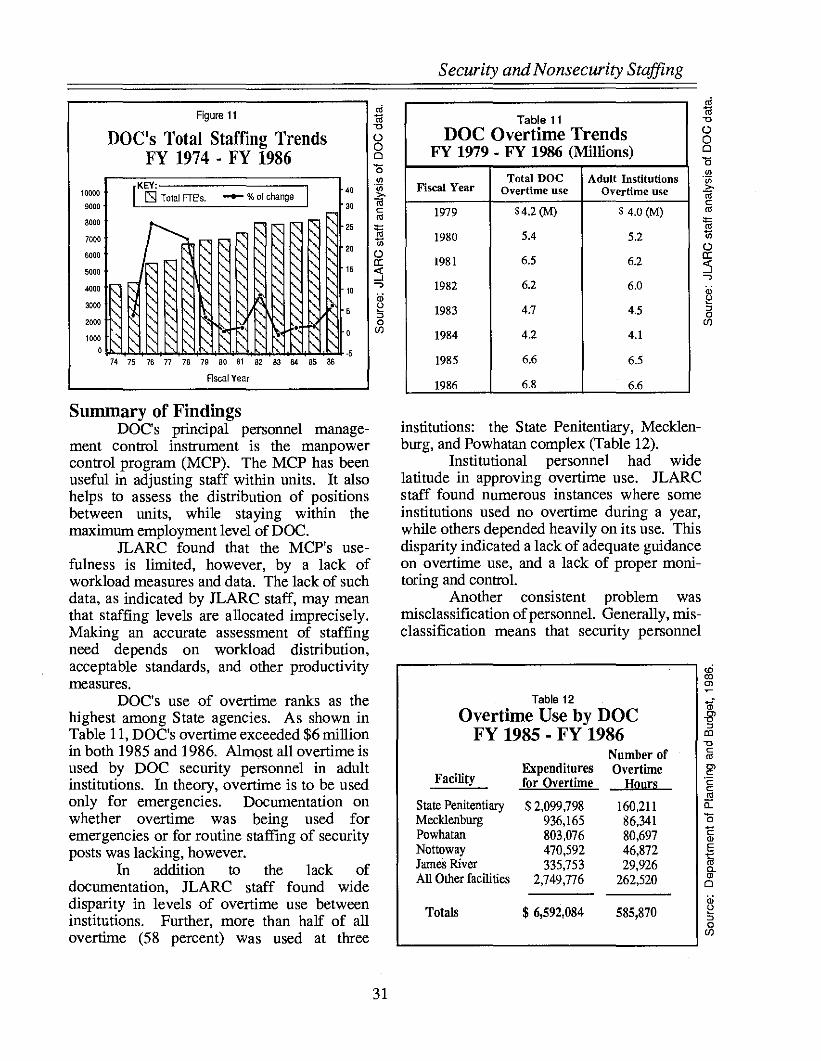
Security and Nonsecurity Staffing
Figure 11 Table 11DOC Overtime Trends
FY 1979 • FY 1986 (Millions)
Fiscal YearTotal DOC Adult Institutions
Overtime use Overtime use
1979 $4.2 (M) $ 4.0 (M)
1980 5.4 5.2
1981 6.5 6.2
1982 6.2 6.0
1983 4.7 4.5
1984 4.2 4.1
1985 6.6 6.5
1986 6.8 6.6
25
20
10
40
30
KEY;
I[ ~ Talai FTE's. -+- % of change
~~:-<::'" r::
r<
~~~ ~"~~
:-<::~~~ ~~ ~" ~1,,~
'J ~~ ,,~ ~ ~~~ ~~ ~ .
• "~K ~~ "" •
" "l"" ~~.~
N n n n 78 79 80 81 ~ ~ M ~ ~
Rscal Year
DOC's Total Staffing TrendsFY 1974 • FY 1986
10000
9000
8000
7000
6000
5000
4000
3000
2000
1000
o
Summary of FindingsDOC's principal personnel manage
ment control instrument is the manpowercontrol program (MCP). The MCP has beenuseful in adjusting staff within units. It alsohelps to assess the distribution of positionsbetween units, while staying within themaximum employment level of DOC.
JLARC found that the MCP's usefulness is limited, however, by a lack ofworkload measures and data. The lack of suchdata, as indicated by JLARC staff, may meanthat staffing levels are allocated imprecisely.Making an accurate assessment of staffingneed depends on workload distribution,acceptable standards, and other productivitymeasures.
DOC's use of overtime ranks as thehighest among State agencies. As shown inTable 11, DOC's overtime exceeded $6 millionin both 1985 and 1986. Almost all overtime isused by DOC security personnel in adultinstitutions. In theory, overtime is to be usedonly for emergencies. Documentation onwhether overtime was being used foremergencies or for routine staffing of securityposts was lacking, however.
In addition to the lack ofdocumentation, JLARC staff found widedisparity in levels of overtime use betweeninstitutions. Further, more than half of allovertime (58 percent) was used at three
institutions: the State Penitentiary, Mecklenburg, and Powhatan complex (Table 12).
Institutional personnel had widelatitude in approving overtime use. JLARCstaff found numerous instances where someinstitutions used no overtime during a year,while others depended heavily on its use. Thisdisparity indicated a lack of adequate guidanceon overtime use, and a lack of proper monitoring and controL
Another consistent problem wasmisclassification ofpersonneL Generally, misclassification means that security personnel
<Dco
'"Table 12 of
Overtime Use by DOC -8'FY 1985 • FY 1986 "'"-0
Number of c:
'"Expenditures Overtime '"Facility c:for Overtime Hours 'c
c:
'"Stale Penitentiary $ 2,099,798 160,211 a:Mecklenburg 936,165 86,341 aPowhatan 803,076 80,697 C
Q)
Nottoway 470,592 46,872 Et
James River 335,753 29,926 '"0-All Other facilities 2,749,776 262,520 Q)
0
a;Totals $ 6,592,084 585,870 l:!
"aCfJ
31

Security andNonsecurity Staffing
are being used to perform nonsecurityfunctions, such as operating canteens andmailrooms. Throughout DOC's adult institutions, security and nonsecurity personnelhave been used full-time to perform dutiesoutside their regular classification. JLARCstaff identified 85 misclassified security positions, and the Governor's Task Force studyidentified 166 such positions.
Security staff assigned to nonsecurityfunctions generally draw more pay than properly assigned nonsecurity personneL Misclassification unnecessarily increases staffing
32
expenditures, can adversely affect employeemorale, and also inflates security staff-toinmate ratios.
Future DirectionsDOC should continue to develop its
manpower control program. Managementshould also continue to focus attention oneliminating misclassification and significantlyreducing unnecessary overtime. These initiatives should be addressed in an improved manpower control program.

Chapter Five: CORRECTIONALPROGRAMS
AND SERVICES
Prison ServicesShow Improvement
The provision of services to prisonersis an important component of DOC's mission.Virginia's corrections system provides manyservices to prisoners to promote their healthand welfare and to ensure adequate livingconditions. Medical, food, and mental healthservices are three integral components of theservice system. During its reviews, theJLARC staff found evident improvements ineach of these areas.
Medical services have been expandedso that each major institution has a medical unitthat can treat most minor medical problems.Each medical unit has a staff that includes aphysician and a team of nurses. Medicalpersonnel provide some form of coverage on a24-hour basis. In addition, DOC has established several regional medical units thatprovide services for specialized medical needsand for extended infmnary care.
Food services are an integral part ofprison life. Daily meals are focal points of an
33
inmate's routine. Problems in this area haveoften sparked broader disturbances. Modemcooking and serving equipment are used at allmajor institutions. In FY 1985, DOC's inmatepopulation of 9,700 was served approximatelyeight million meals. Standard menus areprepared and have helped to reduce the unitcost per meal systemwide. Food servicesoperations generally meet all health andsanitation standards of the State.
Corrections is currently expanding intoa broader range of mental health services. In1984 the General Assembly approvedadditional mental health positions for DOC inan effort to improve DOC's mental healthprogram. The Secretary of Transportation andPublic Safety recently established a task forceto study and recommend an improved systemfor identifying, treating, andaccommodating inhouse inmates who suffer mental illnesses.Severely mentally ill inmates will still be sentto the Department of Mental Health and MentalRetardation for treatment.
DOC also provides a number of otherservices to inmates, including laundry,warehouse, purchasing, and inmate accountingservices.

Correctional Programs and Services
Summary of FindingsWhile JLARC's studies did not directly
assess the level or quality of correctionsservices, staffing assessments were madewhich involved the observation of most serviceareas.
In medical, food, and mental healthservices, staff were found to be generallyadequate. Indeed, medical services at someinstitutions were found to have comparativelymore staff than other institutions. Adjustmentsin staffing levels at those institutions wererecommended. In some instances, physiciansand dentists were found to be working lessthan the hours they were employed to work.Elimination of this practice by DOC in July1986 should reduce some unnecessary medicalcosts.
Future DirectionsThe growth of the corrections system
will require expanded support services andincreased costs. To control costs and yetmaintain adequate services, DOC should studythe potential effectiveness of privatization ofsome services. In the medical services areaJLARC staff found that contracted service~may be more cost effective at some majorinstitutions than employing full-timephysicians. In addition, because of the rurallocation of many DOC facilities, some servicearrangements could potentially benefit thesurrounding communities as well as the DOCinstitutions.
For example, the administrator of aprivate medical center in Southeastern Virginiahas proposed that DOC's institutions in thatarea enter into a joint agreement with themedical center on employing physicians.Under the proposal DOC and the privatemedical center would share the cost and time ofthe physicians. Such an arrangement couldpotentially attract qualified physicians to meetthe part-time needs of both parties.
Using inmates to provide institutionalservices in such areas as food preparation andlaundry services has been standard practicethroughout the history of corrections. Workprograms reduce inmate idleness, reduceinstitutional costs, and provide valuable
34
training in work habits and skills. Workinginmates can also substitute for, or supplement,regular staff. DOC should consider utilizinginmates wherever possible to provide, orimprove, institutional services.
More EmphasisShould be Placedon ImprovingRehabilitativePrograms
The Department of Corrections hasresponsibility for both public safety (security)and the rehabilitation ofinmates. State law andDOC's mission statement address both securityand rehabilitation as goals of the department.While data are available to measure thedepartment's attainment of its security goal,measuring attainment of rehabilitative goals ismore difficult.
DOC provides a number of programsto inmates that are geared towards making thetransition from prison to release more positive.DOC offers counseling services, recreationalprograms, and job training (enterprises) toinmates. Educational programs are providedby the Department of Correctional Education.All of these programs are designed to give theinmate a feeling of self worth and the trainingand skills necessary to live a crime-free lifeafter release.
Summary of FindingsThe counseling program is designed to
provide inmates with personal developmentplans, on-going case management, andindividual and group counseling. Specialemphasis was placed on counseling programsduring the late 1970s when the federalgovernment made funds available for suchrehabilitation programs. In recent years,however, during a series of department-wide

staffmg reductions, counseling pOSItionsreceived a disproportionate number of cuts.
As a result, inmates receive a limitedamount of individual counseling. Counselorsoften spend most of their time on institutionaladministrative functions, such as preparingdocumentation for parole hearings and servingon institutional discipline and classificationcommittees. While these duties are important,they should not detract from the rehabilitativefunctions for which counselors are needed.
In major institutions, counselorcaseloads ranged from 29 to 74 inmates percounselor. The average caseload was 58inmates per counselor. In field units, theaverage caseload was 93 inmates percounselor. By comparison, the ACA standardis approximately 50 to one. To provideadequate counseling services, JLARC staffrecommended 18 additional counselorpositions in major institutions and 28additional counselors in field units. Theseadditions would reduce counselor workloadsto a level at which meaningful rehabilitativecounseling could take place.
Providing inmates with workopportunities is another major objective ofDOC. Work opportunities are used both as amanagement tool, to keep inmates busy, and asa training tool, to provide inmates with neededjob skills. Many of the prisoners had limitedwork experiences before incarceration. Jobtraining has been related to reducing recidivismby teaching inmates proper work attitudes aswell as specific job skills which are importantupon release from prison.
DOC's goal is for all inmates to havemeaningful work opportunities. In the majorinstitutions, there were 5,049 inmates workingin FY 1985, or about three of every fourinmates.
Some of the most meaningfulemployment is within enterprises, involvingproduction-oriented tasks such as printing,chair construction, and cabinet making.Enterprises have been providing a growingnumber of prison jobs, increasing from 737 inFY 1983 to 1,052 in FY 1986 (Table 13). Inaddition to providing inmate workopportunities, enterprises activities in FY 1986
35
Correctional Programs and Services
ui<Xl
'"Table 13'"Areas of Inmate Employment c
""Ein Major Institutions '";<Number of Percent of "5
Inmates Working >.
"Area Working Population c::l
'"Maintenance 1,462 29.0% 0a:Enterprises 1,052 20.8% <l:
...J
Food Services 947 18.8% ...,Housekeeping 888 17.5% OJ
~
Farming 356 7.1% :l0
Administration 173 3.4% (f)
Support 94 1.9%Medical 77 1.5%
TOTAL 5,049 100.00%
remmed almost $1 million to the General Fundon sales of$16 million.
While improvements in job opportunities are notable, about 25 percent of theadult inmate population is unemployed, and anumber of employed inmates perform jobs thathave little marketable value. For example, jobsemploying inmates in field units primarilyinvolve cutting grass and brush on Virginia'shighways. For many inmates in major institutions' daily work assignments consist onlyof cleaning their cells and the dayroom area
The employment level of inmates alsovaried substantially among institutions. Employment levels ranged from close to fullemployment at James River and Southamptonto 42 percent unemployed at Buckingham.
Each instimtion provides some form ofinmate recreation. Organized recreation programs generally consist of activities such asarts and crafts, weight lifting, intramural teamsports, and games such as pool and tabletennis.
. The availability of recreationalprograms varies significantly among facilities.The older institutions, such as the Penitentiary,Powhatan, James River, and Bland, offerlimited recreational programs. These facilitieslack gymnasiums, which means fewer

Correctional Programs and Services
recreational programs are available during thewinter months and inclement weather.
Future DirectionsDOC needs to place greater emphasis
on its rehabilitative programs. Prisoncrowding will make programs even moreimportant. As the living space available toinmates decreases, daily program andemployment opportunities assist in reducingidleness and maintaining order. The numberof counselors should be increased to provideindividual rehabilitative counseling to inmates.Additional job opportunities are needed,especially at institutions where unemploymentis high. Indoor recreational facilities should beprovided at all major institutions.
To accomplish these objectives, DOCneeds to develop a comprehensive programplan which establishes specific objectives forrehabilitative programs and activities.
Separationof EducationalPrograms has beenBeneficial
The Department of CorrectionalEducation (DCE), formerly the RehabilitativeSchool Authority, was created as a separateState agency in 1974. Reasons for separatingeducational responsibilities from otherresponsibilities of the Department ofCorrections (DOC) included clarifyingmanagement responsibilities for educationalprograms in correctional facilities, ensuringthat funds appropriated for education werespent for those purposes, and promoting thegrowth and improvement of correctionaleducation programs.
The level and types of servicesprovided by DCE have greatly expanded since1974. DCE has established a school at each
.State correctional facility (17 new schools
36
since 1974), started additional vocational andapprenticeship programs, sponsored literacyand college programs, initiated a testingprogram of juveniles and adults (includingtesting for special education eligibility),centralized library services, and standardizedcurricula.
The number of adult inmates enrolledin DCE programs has doubled since 1974.The number of inmates earning a vocationalcertificate or the equivalent of a high schooldiploma by passing the General EducationDevelopment (GED) test has also increased.In the juvenile leaming centers, where schoolenrollment and attendance is mandatory,enrollments have declined as the number ofyouths in the State correctional system hasdeclined. GED and vocational program completions have increased, however (Figure 12).
As the number of programs and DCEschools have increased over the past 12 years,the staffing level has increased from 244 to376. Most of the growth in DCE's staffinglevel has occurred as teachers were added toadult schools.
Summary of FindingsAs presented in the February 1986
report, "Staff and Facility Utilization by theDepartment of Correctional Education,"JLARC found that creating a new agency foreducational programs has worked well. DCEgenerally has upgraded and expandedcorrectional education programs as intended bythe General Assembly. However, literacy andacademic programs were under-utilized inmajor adult facilites. In correctional fieldunits, few educational programs and limitedinstructional hours resulted in low enrollments(nine percent of the field unit population). Injuvenile learning centers, declining populationswarranted a few less staff, althoughrecruitment of teachers with special educationendorsements was needed.
Status of FindingsDCE reports that inmate enrollments in
its academic and literacy volunteers programsare increasing, vocational classes remain filled,

Figure 12
DCE School Enrollments& Program Completions For FY 1975 • FY 1986------------ADULT SCHOOLS YOUTH SCHOOLS
2000
o
3000
2S00
AverageMonthlyTotalEnrollment InAdult Schools& Percent ofPopulation
1000
SIlO
o
1400
'000AcademicStudentEnrollments& Completions
SIlO
o
1400
20%
113
2,98'5(29%)
1,339
634
Numberof GEOCompte1iona
1,338
3000 -
2500 _
AverageMonthly 2000-Tot"al
Enrollment InYouth Schools _& Percent of
Population
1000- 957....- _ ................... 673
YOUTH SCHOOl"s·~500 - 1100% enrOlment tor all ye.rsl
0-I
1400
AI/Mage1000 - 9t6 Monlhty
Academic - - ••"-'.. ",....... AcademicStudent ." ."'.... EnlotlmenlEnrollments __
& CompletIons 671
SOO- I- NumbM
of GEQ 152
COmp~~I~~_S ~----.- - ~T2~~ ..~---~- I
1400
7576 77 78 79 60 8t 828384 8586Fiscal Year
VocationalStudentEnrollments& Completions
soo-----
0-
'000VocationalStudentEnrollments& Completions
SIlOA,1I...ageMonthtyVocatlon8lEnrol1ment
7576 77 78 79 80 81 82 83 84 85 86Fiscal Year
Source: DeE enrollment reports.
37
1000-
, ,
Number ofVocallOnatComplellons

Correctional Programs and Services
and apprenticeship programs are increasing inmajor adult institutions. DCE is planning toadd modular classrooms at three field units andconvert six underutilized teacher positions inthe juvenile leaming centers into field unitinstructors, thereby accommodating 144additional students. Moreover, DOC isconverting the Appalachian Leaming Centerinto a correctional field unit; DCE's school atthat facility will accommodate 70 adultinmates. DCE reports that it is still difficult toattract special education teachers for thejuvenile learning centers, although some salaryincreases were made in recognition of the 12month teaching schedule.
Future DirectionsIn April 1986, Governor Baliles
initiated a "no-read, no-parole" program forincarcerated adults in the custody of DOC.The program generally intends to encourageinmates to achieve minimum readingcompetencies by offering early releaseconsideration. Ultimately, the program intendstofacilitate inmates' more successful and crimefree returns to the community. Increasedenrollments in DCE's literacy and academicprograms already have been realized.
The rehabilitative success of correctional education programs, and ofincarcerationin general, could also be facilitated byimplementing other program initiativesrecommended in the JLARC report. DCE andDOC need to identify and expand incentivesfor participating in educational programs andalleviate institutional barriers that hinderinmates' access to those programs. Moreover,DCE's educational programs need to beintegrally linked with DOC's counseling,alcohol and substance abuse, and othertreatment programs as part of a comprehensivetreatment strategy for individual inmates. Inaddition, increased emphasis on programsdesigned to help inmates make the transitionfrom institutional confmement to theircommunities will better ensure that programsinitiated while incarcerated can be continued inthe community.
Although these program initiatives are. needed in all adult facilities, the greatest need is
38
in the field units. Inmates in field units aregenerally closer to release than those in majoradult institutions. DCE programs and otherDOC treatment programs in field units remainlimited.
The program needs of youths in theleaming centers also should not be overlooked.Appropriate special education services forhandicapped youths (who comprise 45 percentof the learning center population) are needed.Programs that provide and link workopportunities with vocational training deserveexploration. The need to modify curricula andexpand work-release programs is particularlyimportant now that DOC has adopted a form ofdeterminate sentencing for juveniles. Olderyouth with longer stays are anticipated as aresult of this new sentencing procedure.
Diversion ProgramShows Promise
The Community Diversion Incentive(CDI) program was created to provide thejudicial system with additional alternatives forsentencing certain nonviolent offenders whomay require less than incarceration, yet morethan probation. This State-supervised, locallyadministered program diverts offenders fromincarceration into community service work,and in some cases requires restitution for theircrimes. Originally created to serve only Statefelons, the scope of the program wasbroadened in 1982 to include diversions fromlocal jails.
The Department of Corrections is theState agency which oversees the program,while 28 local CDI agencies administer theprogram covering 106 localities. (Note:Diversion opportunities are provided to fivelocalities through New River CommunityAction which is not a CDI program.)
The CDI program appears to bemeeting or working towards its statutorilymandated objectives. As Figure 13 indicates,as of June 30, 1986, 1,768 State felons had

Correctional Programs and Services
Status Of FindingsDOC recently reorganized its
community corrections programs under onedeputy director. New management and operations policies and procedures are being instituted to improve program management and themonitoring of local CDI programs.
DOC recently employed staff todevelop the capability for collecting andreporting statistical data. More frequent and
1986
1986
1986
352
1984 1985
Years
1984 1985
1984 1985
Figure 13
Cumulative CDIDiversions
FY 1983 - FY 1986
Misdemeanan1 = convicted ot misdemeanor(s) which101al1ess 1han a 12-mon1h sen1ence.
Local Felon = convicted of a felony which resul1s injail continemem or sen1ences ot12 mon1hs or less.
,-__Definltfons Used By 1he COl Program: __--,
S1a1e Felon = conviC1ed of a felony and sentenced10 a minimum of one year in 1heS1a1e pen~en1iary.
'800,.-----------..,....~:::I
1600CII 1400'5 1200;E 1000.!! 800m 600
400 355200
0 .......--_---_--........1983
400,.------------_,
350
300
8 250;f 200! 150
'DO50 520l----_---_----11983
8000.---------------,
.!! 7000i 6000cII 5000
~ 4000
:!! 3000::::E 2000
1000o~ --__I
1983
r--------------------, c been diverted from incarceration in State.~ institutions, while an additional 7,360 local~ felons and misdemeanants had been diverted~ from local jails..Q
~ Summary of Findings() The JLARC staff study indicated that~ COl saves the State money, provides increased::JE opportunities for offenders to make restitution,8 and allows local flexibility in responding to"§ punishment for crimes committed. In a~ majority of cases, COl is also reaching its8 target population -- offenders who would beo incarcerated in jailor prison. In some cases,~ however, JLARC staff found that divertees5 seem to more closely resemble the probation
(f) population than the incarcerated population.Some problems with management,
planning, and monitoring of the program werefound during the review. Budgeting andstatistical reporting submissions were oftenfound to be incomplete or unclear.
Several other areas were found toimpede program achievement. Even thoughCOl was specifically designed as an alternativeto incarceration, some judges were found torefer offenders to COl for evaluation prior tosentencing.
DOC had not established a method forassessing whether certain offenders wereunsuited for diversion and tended to terminatefrom the program more frequently. Suchterminations were a burden on the system andan additional expense to DOC.
JLARC staff recommended a period ofprogram consolidation because of problemsassociated with the rapid growth of theprogram, coupled with changes in legislation,diversion criteria, and standards.
39

Correctional Programs and Services
regular meetings are being held with local COlstaff and judges to update them on standardsand program changes.
Future DirectionsAs Virginia's prison population
continues to increase, the COl prograrn canoffer another alternative to incarceration ofnonviolent offenders and spiralling prisoncosts. Future expansion of the COl programcould help to offset some of the bedspaceneeded as Virginia's prison population continues to grow.
In expanding the COl program, DOCshould consider whether COl should beoffered in each jurisdiction for statewidecoverage. Maintaining the current level ofcoverage would deny CDI access to offenders
40
within 25 localities. Given the current need forprison bedspace, every effort should be madeto maximize the use of alternatives toincarceration.
While offering COl in every localitywould ensure equal access to diversionopportunities, some administrative problemscould result. If localities were unwilling toadminister a program, DOC might be forced toadminister the program directly. A DOCadministered program could be viewednegatively by the affected localities. Given theimportance that COl places on localparticipation, this could also have a negativeeffect on programs operating in other areas.
If the decision is made to expand COlstatewide, DOC should increase its efforts topromote voluntary COl program expansion tonon-participating localities.

Chapter Six: OTHERCORRECTIONAL
CONCERNS
The 1970s was a period of organizational development for the Department ofCorrections. Once it was established as a separate agency, DOC began a period of unificationof adult, youth, and community correctionsprograms. The mission and goals of thedepartment changed several times to reflectchanges in corrections philosophy and greaterattention to inmate needs. In the late 1970sDOC underwent a significant reorganizationand adopted a regional management concept.The 1980s began an era of rapid expansion andorganizational discontinuity.
While much has been accomplished inthe dozen years since the creation of thedepartment, more remains to be done. Manyof the issues addressed in JLARC's series ofreports on corrections will carry over into thenext decade. Other issues, not addressed inthe series, will also have an impact on DOC'sability to fulfill its missions. This sectionaddresses some of the future concerns facingcorrections in Virginia. These issues include:unit management, classification of inmates,and the placement of youth services.
41
More ExtensiveUse of UnitManagementShould beExplored
A number of innovative managementtechniques are being used by the federal prisonsystem and other state correctional systems toassist in controlling their inmate populations.One such technique is unit management.
Unit management organizes the livingunits, such as a prison wing, as semiautonomous entities. Each living unit isassigned a fairly stable staff complementincluding at a minimum: a unit manager, acounselor or caseworker, and correctionalofficers (Figure 14). These unit staff areresponsible for controlling the inmates, forplanning and monitoring inmate programs, andfor maintaining the housing units.

Other Correctional Concerns
Figure 14
Unit Management Concept
At least one correctional officer istypically placed within the housing unit towork directly with the inmates. This directcontact by a stable group of correctionalofficers assists in understanding the inmatesand how best to relate to them. Officers tendto serve a programatic, as well as a securityfunction. Such a role is more difficult whenofficers rotate in and out of living units as theirduty assignments change.
Unit management can be particularlyuseful in minimizing the impersonal environment of a large institution. Knowledge ofinmate behavior can assist officers from beingmanipulated by inmates they know little about.One benefit of unit management can beimproved inmate control. A potential dangerof unit management, however, is excessiveidentification with the inmates by thecorrectional officers.
While a modified form of unit management is currently employed at severalVirginia prisons, DOC should consider usingthis management technique more extensively.The use of unit management at largerinstitutions housing over 500 inmates maywarrant special consideration. The federalprison system and a number of states use thismanagement technique and consider it to havepositive effects on institutional control.
Unit Management
• Core Unit Team:• Sergeant (in charge). Corrections Officers- Rehabilitation Counselors
• Team assigned forextended periods oftime
• Security and programstaff work together ondeveloping inmateprograms
Current Practice• No core unit team
• Frequent changes ~ securitystaff rotate between posts.
• Less coordinationbetween security staffand nonsecuritystaff on programs
.~ Changes in Inmate~ Classification! System Should~ Be Considered~is The Department of Corrections has a
(f) centralized inmate classification system thatassigns one of three classifications, "A", "B",or "C" custody to each inmate in the system.An inmate's classification determines the levelof risk assigned, and the level of supervisionthat will be required. "A" custody inmates areminimum security, "B" custody are mediumsecurity, and "C" custody are close securityand maximum security.
As inmates enter the system they areplaced in one of two reception and classification centers, based on age, for a series oftests, interviews, and evaluations. Femalefelons are classified at the Virginia CorrectionalCenter for Women.
Once classified, the inmates aregenerally assigned to an institution based onseveral factors:
(1) the inmate's age,
(2) type of offense committed,
(3) availability of institutional space,
(4) special cadre needs oftheinstitutions.
DOC uses a nine-factor plan to assigninmate classifications. Each custody level hasa range of points, and an inmate is classifiedbased on the total points assigned after the nineobjective criteria are applied. The points canbe adjusted based on a subjective override.The override allows DOC to change aninmate's classification when doubt exists onthe level of risk or the level of supervisionneeded.
Inmates can be reclassified, to lower orhigher risks, at points throughout theirincarceration. Reclassifications occur based on
42

how well inmates adjust to the system andprove their trustworthiness.
DOC's attempt to move inmates intoand through the system is restricted by thenumber of custody levels. The three custodylevel system confines classification of inmatesto low, medium, and high-level risks. Asmany institutional personnel indicated toJLARC staff during institutional visits, a widerclassification system would provide staff moreinformation and greater flexibility whenmanaging inmates. In contrast to Virginia'ssystem, the federal correctional system has sixclassification levels.
Institutional personnel frequently usean informal classification system that offersthem flexibility in assigning inmates within arisk category. This informal system allowsstaff to assign inmates to jobs and otherinstitutional assignments within the frameworkof the current system. Because of the limitednumber of inmate classification categories,inmates are informally designated "hard"(higher risk) and "soft" (lower risk) withinclassifications.
Recommendation. DOC sfwuld assess itscurrent metfwd for classifying inmates andconsider a system that allows for moreflexibility in classification.
Separation ofYouth ServicesShould beConsidered
Juvenile corrections in Virginia hasbeen placed under the umbrella of DOC'sauthority since its creation in 1974. Thequestion of whether this is the best placementfor youth services warrants examination.
According to the 1984 AmericanCorrectional Association directory, 16 states
43
Other Correctional Concerns
had placed youth services within thecorrections department. In 25 states, juvenilecorrections was located within the departmentof human services, and in nine states withinthe department of youth services. The decisionnot to place juvenile corrections within thedepartment responsible for adult corrections ina majority of states may reflect a recognition ofthe differences between the adult and juvenilecorrections.
First, adult corrections focuses onsecure confinement of offenders, while youthservices emphasizes rehabilitation. Second,the number of adult offenders is typically muchgreater. In Virginia, there are twice as manyadults under community supervision and tentimes more adults incarcerated than juveniles.Third, the number of adult offenders has beenincreasing for some years, while the number ofjuvenile offenders has actually decreasedsomewhat.
Considering the number of adultoffenders and the sensitivity of the public toescapes and crimes committed by adults whileunder the corrections department's supervision, adult correctional services demand thebulk of the department's attention and funding.For example, adult services was appropriated64 percent of the DOC's operating fundsduring fiscal years 1985 and 1986. Given theattention demanded by adult institutions,consideration may be warranted for creating aseparate youth services agency or placingyouth services within another existing agency.In a similar vein, a separate correctionaleducation department was created in 1974 toprovide focus on that program area.
In deciding whether to create a separateagency for youth services, consideration mustbe given to the effect that action would have onadministrative costs. Included within administrative costs would be expenses related tooperating a separate central office as well as thefour regional offices that youth servicescurrently shares with DOC's adult services.Youth services is responsible for oversight ofthe court service units, which are locatedthroughout the Commonwealth. This supervision is currently carried out through DOC'sregional office structure.

Other Correctional Concerns
In addition to consideration ofadministrative costs, the overall fundingavailable for youth services as a separateagency should be explored.
A second placement alternative wouldbe to incorporate youth services within anexisting agency. As previously mentioned,half of the states have placed juvenilecorrectional services within their departmentsof human services. The Virginia counterpart tohuman services would be the Department ofSocial Services (DSS). Consideration of thisplacement possibility should include thefollowing questions:
• Is the mission of juvenile correctionsmore closely related to that of DSS thanof DOC?
44
• What effect would placing youthservices under DSS have on theprograms currently operated?
• Would juvenile corrections servicesreceive more attention under DSS thanDOC?
• What regional resources could DSSprovide to support the administrativeneeds of youth services?
There is no obvious answer to thequestion of the best placement for youthservices within Virginia. The potentialadvantages and disadvantages of alternativeplacements should be carefully consideredbefore any decision is made.
APPENDIX:
AGENCY RESPONSES
As part of an extensive data validation process, each State agency involvedin a JLARC review and evaluation effort is given the opportunity to comment on anexposure draft of the report.
Appropriate technical corrections resulting from the written comments havebeen made in the final report. Page references in the agency responses relate to theexposure draft and may not correspond to page numbers in the final report.
Included in this appendix are responses from the following:
• Department of Corrections
• Department of Planning and Budget
45
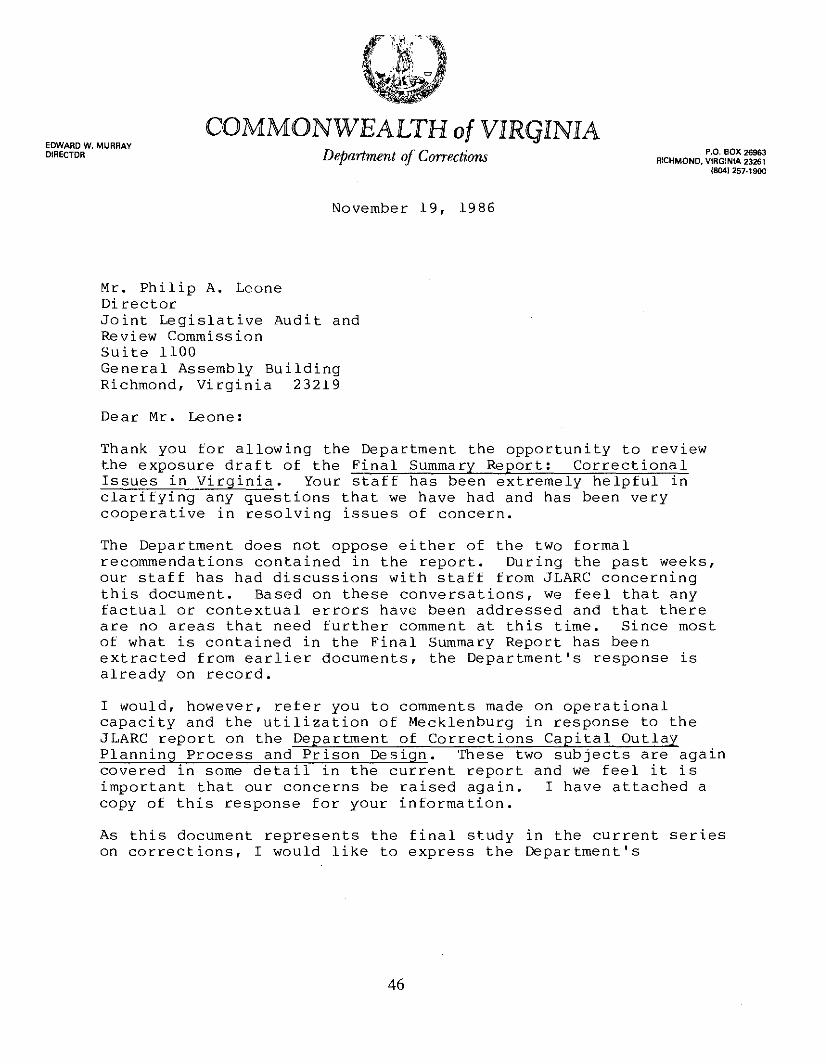
EDWARD W. MURRAYDIRECTOR
COMMONWEALTH of VIRGINIADepartment of Corrections
November 19, 1986
P.O. BOX 26963RICHMOND, VIRGINIA 23261
(804) 257·1900
Mr. Philip A. LeoneDirectorJoint Legislative Audit andReview CommissionSuite 1100General Assembly BuildingRichmond, Virginia 23219
Dear Mr. Leone:
Thank you for allowing the Department the opportunity to reviewthe exposure draft of the Final Summary Report: CorrectionalIssues in Virginia. Your staff has been extremely helpful inclarifying any questions that we have had and has been verycooperative in resolving issues of concern.
The Department does not oppose either of the two formalrecommendations contained in the report. During the past weeks,our staff has had discussions with staff from JLARC concerningthis document. Based on these conversations, we feel that anyfactual or contextual errors have been addressed and that thereare no areas that need further comment at this time. Since mostof what is contained in the Final Summary Report has beenextracted from earlier documents, the Department's response isalready on record.
I would, however, refer you to comments made on operationalcapacity and the utilization of Mecklenburg in response to theJLARC report on the Department of Corrections Capital OutlayPlanning Process and Prison Design. These two subjects are againcovered in some detail in the current report and we feel it isimportant that our concerns be raised again. I have attached acopy of this response for your information.
As this document represents the final study in the current serieson corrections, I would like to express the Department's
46
Mr. Philip A. LeonePage TwoNovember 19, 1986
appreciation to your staff for providing opportunities during theentire length of the study to discuss many critical issues facingCorrections today. If I can be of further assistance, pleascontact my office.
Sincerely,
&~Director .
EWM/jj
Attachment
cc: The Honorable Vivian E. Watts
47
PAUL W. TIMMHECK
DIRECTOR
COMMONWEALTH of VIRGINIADepartment of Planning and Budget
November 7, 19B6
POST OFFICE BOX 1422RICHMOND 23211
{804) 7B6-7455
Mr. Philip Leone, DirectorJoint Legislative Audit and Review CommissionSuite 100General Assembly BuildingRichmond, VA 23219
Dear Phil:
I appreciate the opportunity to comment on your Exposure Draft Reportentitled Final Summary Report: Correctional Issues in Virginia.
The principal recommendation which affects the Department of PlanningBudget calls for us to establish a committee to review the inmate populationforecasts. I concur with your recommendation. The Department of Correctionsshould continue to develop the initial forecast, with DPB taking the lead inreviewing the forecast and in establishing the review process. As you note,this process may include individuals from around the state who areknowledgeable about criminal trends and sentencing practices.
DPB may be the most appropriate agency for developing jail populationforecasts. This forecast is important to the budget of the Compensation Boardand to the capital construction plans of DOC, although each agency isinterested in different aspects of the jail forecast. Under DPB's statutoryauthority set out in §2.1-391 of the Code of Virginia to prepare populationprojections and coordinate statistical data, I will be glad to work with youto transfer the forecasting model and data base to DPB.
In reference to your comment on the separation of youth services fromDOC, I would like to point out that the transfer of appropriations betweenprograms in an agency is authorized by §4-1.D3 of the Appropriations Act. Isuggest your text be altered to reflect the specific amounts which weretransferred; otherwise it sounds like most or all the funds appropriated toyouth services were "diverted" to the adult side of DOC, which is not the case.
Sincerely,
/Ju/Paul W. Timmreck
PWT/14D7D/ws
48

RESEARCH STAFF
Director
Philip A. Leone
Deputy Director
• Kirk Jonas
JLARC STAFF
ADMlNISTRATIVE STAFF
Section Manager
Joan M. Irby, Business Management& Office Services
Administrative Services
Maryann Du Val
Division Chiefs
Barbara A. NewlinGlen S. Tittermary
Section Managers
• John W. Long, Publications & GraphicsGregory J. Rest, Research Methods
Project Team Leaders
Stephen W. Harms• Clarence L. Jackson
Charlotte A. KerrSusan E. MassartRobert B. RotzE.Kim Snead
Project Team Staff
Andrea C. BairdAndrew D. CampbellKaren E. ChappellNolani CourtneyStephen Fox
• Thomas J. KusiakLaura J. McCartyCynthia RobinsonCarl Wilson SchmidtRosemary SkillinKimberly J. Wagner
49
Secretarial Services
Bonnie A. BlickRosemary B. CreekmurJoanne HarwellBetsy M. Jackson
SUPPORT STAFF
Technical Services
• Timothy J. Hendricks, GraphicsR. Jay Landis, Data Processing
• Indicates staffwithprimaryassignments to this project

RECENT REPORTS
Federal Funds: A Summary, January 1981Methodology for a Vehicle Cost Responsibility Study: An Interim Report, January 1981Title XX in Virginia, January 1981Organization and Administration ofSocial Services in Virginia, Apri11981Highway and Transportation Programs in Virginia: A Summary Report, November 1981Organization andAdministration ofthe Department ofHighways and Transportation, November 1981Highway Construction, Maintenance, and Transit Needs in Virginia, November 1981Vehicle Cost Responsibility in Virginia, November 1981Highway Financing in Virginia, November 1981Publications and Public Relations ofState Agencies in Virginia, January 1982Occupational and Professional Regulatory Boards in Virginia, January 1982The CETA Program Administered by Virginia's Balance-of-State Prime Sponsor, May 1982Working Capital Funds in Virginia, June 1982The Occupational and Professional Regulatory System in Virginia, December 1982Interim Report: Equity ofCurrent Provisionsfor Allocating Highway Construction Funds
in Virginia, December 1982Consolidation ofOffice Space in the Roanoke Area, December 1982Staffing and Manpower Planning in the Department ofHighways and Transportation, January 1983Consolidation ofOffice Space in Northern Virginia, January 1983Interim Report: Local Mandates and Financial Resources, January 1983Interim Report: Organization of the Executive Branch, January 1983The Economic Potential and Management ofVirginia's Seafood Industry, January 1983Follow-up Report on the Virginia Department ofHighways and Transportation, January 19831983 Report to the General Assembly, October 1983The Virginia Divisionfor Children, December 1983The Virginia Division ofVolunteerism, December 1983State Mandates on Local Governments and Local Financial Resources, December 1983An Assessment ofStructural Targets in the Executive Branch ofVirginia, January 1984An Assessment of the Secretarial System in the Commonwealth of Virginia, January 1984An Assessment of the Roles ofBoards and Commissions in the Commonwealth
ofVirginia, January 1984Organization of the Executive Branch in Virginia: A Summary Report, January 19841984 Follow-up Report on the Virginia Department ofHighways and Transportation, January 1984InterimReport: Central and Regional Staffing in the Department ofCorrections, May 1984Equity ofCurrent Provisions for Allocating Highway and Transportation Funds
in Virginia, June 1984Special Education in Virginia's Training Centersfor the Mentally Retarded, November 1984Special Education in Virginia's Mental Health Facilities, November 1984Special Report: ADP Contracting at the State Corporation Commission, November 1984Special Report: The Virginia State Library's Contract with The Computer Company, November 1984Special Report: The Virginia Tech Library System, November 1984Interim Progress Report: Review of the Virginia Housing Development Authority, February 1985Special Report: Patent and Copyright Issues in Virginia State Government, March 1985Virginia's Correctional System: Population Forecasting and Capacity, Apri11985The Community Diversion Incentive Program of the Virginia Department of Corrections, Apri11985Security Staffing and Procedures in Virginia's Prisons, July 1985Towns in Virginia, July 1985Local Fiscal Stress and State Aid: A Follow-up, August 19851985 Report to the General Assembly, September 1985The Virginia Housing Development Authority, October 1985Special Report: Cousteau Ocean Center, January 1986Staff and Facility Utilization by the Department ofCorrectional Education, February 1986Costs for the Standards ofQuality - Part I: Assessing SOQ Costs, February 1986Proceedings ofthe Conference on Legislative Oversight, June 1986Staffing ofVirginia's Adult Prisons and Field Units, August 1986Deinstitutionalization and Community Services, October 1986The Capital Outlay Planning Process and Prison Design in the Department ofCorrections, December 1986Organization and Management of The State Corporation Commission, December 1986Local Jail Capacity and Population Forecast, December 1986Correctional Issues in Virginia: Final Summary Report, December 1986
50