Embed Size (px)
Citation preview

REPORT
OF THE
TECHNICAL ADVISORY GROUP
ON DEVELOPMENT OF
HOUSING START-UP INDEX IN INDIA
Reserve Bank of India Mumbai
January 2009

January 30, 2009Dr. Rakesh Mohan Deputy Governor Reserve Bank of India Central Office Mumbai-400001 Dear Sir,
Sub: Report of the Technical Advisory Group on Development of Housing Start-Up Index in India
We are pleased to submit the Report of the Technical Advisory Group on Development of
Housing Start-Up Index in India appointed vide the R.B.I, memorandum dated 31-07-2007

Preface Housing start is considered to be a lead indicator in many developed and developing economies because of the strong forward and backward linkages it has with various sectors. The number of housing starts during a given period reflects the institutional response in a country to the current demand and supply situation in the market, as reflected though operationalisation of the existing building permits into actual starts. This has an impact not only on the construction activities but also on several consumer durables and investment goods sector of the economy. The decision to set up a Technical Advisory Group (TAG) by the Reserve Bank of India to consider bringing out Housing Start up Index (HSUI) on a regular basis is extremely timely. This is particularly so because the current meltdown of the economy at global level as also in many less developed countries have been linked partially to the ‘developments’ in the housing sector. Indeed, these have powerful multiplier effects on the economy, operating through the intersectoral linkages in the production system. It makes a significant impact on financial sectors as well, as has been realized with some amount of concern, in recent months. The members of the TAG consider construction of HSUI and its regular release to be an extremely important and challenging responsibility which has been long overdue. They plead for taking urgent measures to put into operation an institutional structure entrusted with the responsibility of bringing out HSUI, keeping in view the global practices as also the ground reality of India into consideration. This indeed, can become a powerful tool for monitoring the movements in several segments of the economy. The start up coefficients, computed from the data in recent past, reflect institutional and social response to housing permits, in terms of their conversion into actual housing starts. The time required for administrative and procedural clearances after the issuance of permits, to complete the formalities of obtaining loans, organizing materials, construction process etc. can be considered to be somewhat rigid or fixed in the short run. As housing is a long term decision, predictions based on these coefficients, that reflect procedural and social rigidities governing the house construction process, are likely to be fairly reliable. Understandably, the actual housing starts at any point of time are likely to be influenced by a host of other factors like price of building material, interest rates in general and that for housing loans, policy pronouncements, legislations, administrative orders affecting construction sector etc. To an extent, these would affect the demand and supply parameters in the housing market that, in turn, would determine the number of application for permits. The institutional response - in terms of the number of permits actually issued - would have some time lag. It is nonetheless clear that market based factors would get incorporated in the

computation of the index through the key variable – the number of permits issued in recent past, say the last two years. The TAG believes that the HSUI can be used by housing related agencies as the basic or core predictor. These agencies can combine the values of this index with other short term indicators and policy variables to arrive at more detailed projections of housing activity, if they so desire. Let me put on record my gratitude for the keen interest and enthusiasm with which the TAG members have participated in the deliberations and finalisation of the Report. The analytical insights and meticulous care with which they have commented on the conceptual and methodological issues and examined technical aspects of data availability and reliability in the meetings as also through internet communication have been commendable. It is only because of the full cooperation of the members that the complex methodological issues as also those related to institutional grounding could be resolved and the Report submitted within a short time. The members of TAG would put on record sincere thanks to Dr. Rakesh Mohan, Deputy Governor, Reserve Bank of India for envisaging the need of this exercise and providing valuable insights and suggestions during the entire period of the Group’s functioning. Special thanks are for the Directorates of Economics and Statistics (DES), Tamil Nadu, Maharashtra and Delhi that conducted the pilot survey. Thanks are due to the core team comprising Mr. Sanjoy Bose, Director, Dr. A.K. Tripathi, Director, Ms. Sushila Augustine, Director and Mr. Joice John, Research Officer of Department of Statistics and Information Management, RBI for shouldering the total responsibility of analyzing the survey results and preparing the draft of the Report. My special words of appreciation for Ms. Sushila Augustine and Mr. Joice John who always responded to various queries and suggestions without any delay. Our gratitude is to Dr. Amal Kanti Ray, Officer-in-Charge, Department of Statistics and Information Management, RBI for creating an excellent environment and facilities in overseeing the pilot survey, coordinating the Group meetings and making extremely valuable suggestions. January 30, 2009 Amitabh Kundu

CONTENTS
List of Topics Page No. Section-1 Introduction
1.1 Genesis of the TAG 1.2 Report Outline 1.3 Acknowledgements
1
Section-2 International Practices and Domestic Experiences 2.1 Background 2.2 International Practice 2.3 Exploration into Database on Housing Sector in
India
7
Section-3 Methodology 3.1 Background 3.2 Data Collection 3.3 Housing Start Rates 3.4 Compilation of Housing Starts 3.5 Compilation of the HSUI
15
Section –4 Pilot Survey Results and Limitations of Methodology 4.1 Case Study of Coimbatore 4.2 Case Study of Villupuram 4.3 Case Study of Delhi (South) 4.4 Case Study of Saswad 4.5 Case Study of Mumbai 4.6 Compilation of HSUI – An Illustration of the
Methodology 4.7 Difficulties and Limitations of the Exercise
23
Section -5 Recommendations 41 Annexure
1. Memorandum 2. Building Permit Survey in Canada 3. Housing Starts in US 4. Existing information on House Construction in India -
NBO, DES-TN and DES-Delhi 5. Survey Schedule for Municipal Commissioner Offices 6. Definitions 7. Survey Schedule
47
List of Tables and Graphs 78

Abbreviations
CMHC Canada Mortgage and Housing Corporation
CSO Central Statistical Organisation
DES Directorate of Economics and Statistics
DSIM Department of Statistics and Information Management
FSA Floor Space Area
GR Growth Rate
HIG High Income Group
HSRM Housing Start Rate Matrix
HSUI Housing Start Up Index
HUDCO Housing and Urban Development Corporation
LIG Low Income Group
MHU Multiple Housing Unit
MIG Middle Income Group
NBO National Buildings Organisation
NCAER National Council of Applied Economic Research
NHB National Housing Bank
NP Non-permit Survey
NSSO National Sample Survey Organisation
RBI Reserve Bank of India
SBP Survey of Building Permits
SHS Survey of Housing Starts
SHU Single Housing Unit
SOC Survey of Constructions
SUP Survey of Use of Permits
TAG Technical Advisory Group
TN Tamil Nadu
US United States

Section 1 INTRODUCTION
1.1 Genesis of the Technical Advisory Group
1.1.1 House is generally the most important asset of a household and accounts for
a major share of its wealth. Any movements in the housing sector may,
therefore, make a significant impact on economic activities in the country
including on that of the financial sector. The former would have powerful
multiplier effect on the economy operating through the intersectoral linkages
in the production system. The number of housing starts during a given
period reflects the institutional response to the existing number of building
permits, besides the current demand for houses. This would have an impact
on the outlook of the construction industry due to the backward linkages.
Housing starts is considered to be a lead economic indicator because of the
forward-linkages.
1.1.2 Given this perspective, it has been considered necessary to develop a
Housing Start-up Index which can be used as a tool to monitor the
movements in certain segments of the Indian economy on a regular basis.
The index must be constructed through development of an appropriate
methodology after overviewing the international best practices.
Accordingly, the Reserve Bank of India has constituted a Technical Advisory
Group for "Development of Housing Start-up Index" vide, Memorandum
signed by Deputy Governor, Dr. Rakesh Mohan on July 30, 2007 (Annex 1).
1.1.3 The Terms of Reference of the Technical Advisory Group are as given below:
(i) To review base paper on concepts, methodology, approach to generate
the database for construction of the indices and suggest a feasible
methodological framework for construction of HSUI for the Indian
economy, with a view to assist monetary policy formulation, and to
guide and oversee its implementation.

(ii) To recommend modalities of entrusting the work for construction of
HSUI by appropriate external agency or institution, including scope of
work and deliverables.
(iii) To evaluate the work of the external agency/institution and
recommend its acceptance by the Bank.
(iv) Any other issue as deemed necessary for development of the HSUI.
1.1.4 The constitution of the Technical Advisory Group is as follows:
1. Prof. Amitabh Kundu School of Social Sciences Jawaharlal Nehru University New Delhi.
Chairman
2. Dr. R. B. Barman Ex-Executive Director Reserve Bank of India, Mumbai
Vice-Chairman
3. Dr. M. D. Patra Monetary Policy Department Reserve Bank of India Mumbai
Member
4. Shri. S. Sridhar Chairman & Managing Director National Housing Bank New Delhi
Member
5. Dr. S. K. Nath Ex-Director General Central Statistical Organization (CSO) Ministry of Statistics and P.I Government of India New Delhi
Member
6. Shri. D. S. Negi Director (NBO), Ministry of Housing & Urban Poverty Alleviation Government of India New Delhi
Member
7. Shri. K.L Dhingra Chief Managing Director Housing and Urban Development Corporation (HUDCO) New Delhi
Member
8. Shri. S. K. Sinha Ex-Director General and CEO
Member

National Sample Survey Organisation (NSSO) Ministry of Statistics and P.I Government of India New Delhi
9. Shri. D. R. Bhosale Director, Directorate of Economics & Statistics, Govt. of Maharashtra Mumbai
Member
10. Smt. M. Sheela Priya Sp.Commissioner and Director Dept. of Economics & Statistics Govt. of Tamil Nadu Chennai
Member
11. Shri. K. K. Mondal Director, Bureau of Applied Economics & Statistics Govt. of West Bengal Kolkata
Member
12. Dr. B. K. Sharma Director and Chief Registrar (Births and Deaths) Directorate of Economics & Statistics Govt. of National Capital Territory of Delhi New Delhi
Member
13. Chief General Manager (Personal Banking) State Bank of India Mumbai
Member
14. Dr. D. B. Gupta National Council of Applied Economic Research New Delhi
Member
15. Prof. Bharat Ramaswami
Planning Unit, Indian Statistical Institute New Delhi
Member
16. Prof. Abhay Pethe Professor of Urban Economics and Regional Development Department of Economics, Mumbai University Mumbai
Member
17. Dr. Amal Kanti Ray Officer-in-Charge, DSIM Reserve Bank of India, Mumbai
Member Secretary
1.1.5. The Department of Statistics and Information Management (DSIM) (Statistical
Analysis Division) provided the secretarial support to the Technical Advisory
Group.
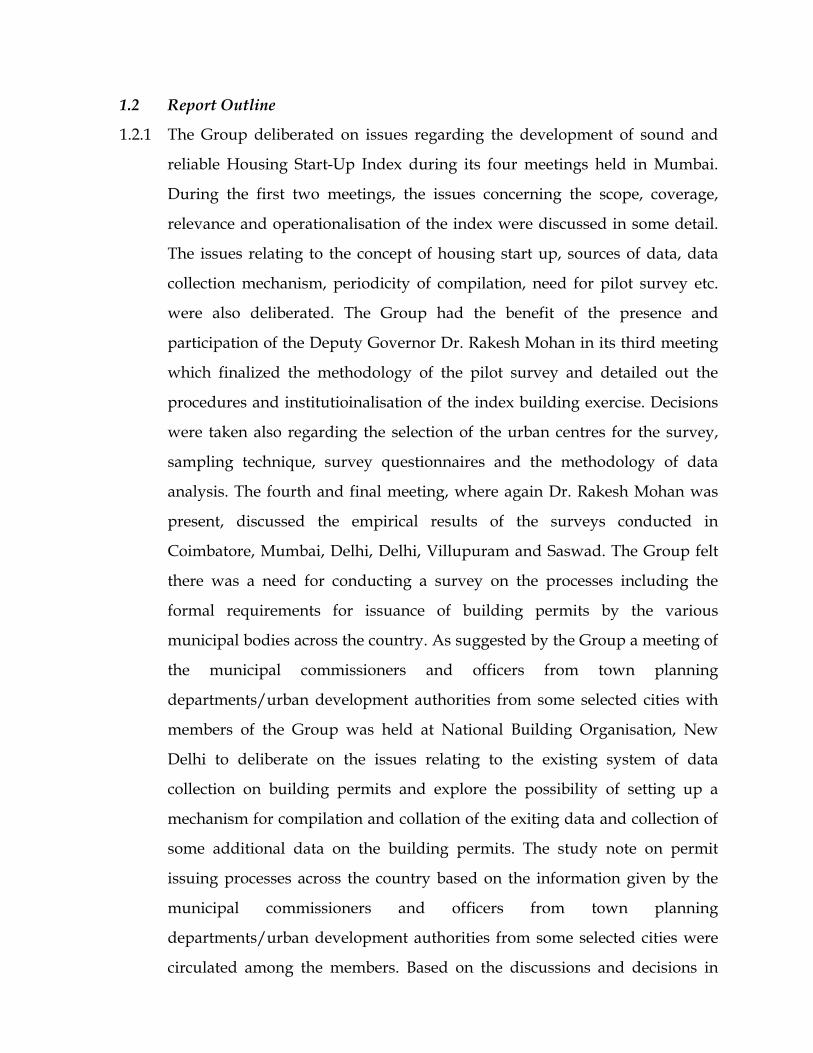
1.2 Report Outline
1.2.1 The Group deliberated on issues regarding the development of sound and
reliable Housing Start-Up Index during its four meetings held in Mumbai.
During the first two meetings, the issues concerning the scope, coverage,
relevance and operationalisation of the index were discussed in some detail.
The issues relating to the concept of housing start up, sources of data, data
collection mechanism, periodicity of compilation, need for pilot survey etc.
were also deliberated. The Group had the benefit of the presence and
participation of the Deputy Governor Dr. Rakesh Mohan in its third meeting
which finalized the methodology of the pilot survey and detailed out the
procedures and institutioinalisation of the index building exercise. Decisions
were taken also regarding the selection of the urban centres for the survey,
sampling technique, survey questionnaires and the methodology of data
analysis. The fourth and final meeting, where again Dr. Rakesh Mohan was
present, discussed the empirical results of the surveys conducted in
Coimbatore, Mumbai, Delhi, Delhi, Villupuram and Saswad. The Group felt
there was a need for conducting a survey on the processes including the
formal requirements for issuance of building permits by the various
municipal bodies across the country. As suggested by the Group a meeting of
the municipal commissioners and officers from town planning
departments/urban development authorities from some selected cities with
members of the Group was held at National Building Organisation, New
Delhi to deliberate on the issues relating to the existing system of data
collection on building permits and explore the possibility of setting up a
mechanism for compilation and collation of the exiting data and collection of
some additional data on the building permits. The study note on permit
issuing processes across the country based on the information given by the
municipal commissioners and officers from town planning
departments/urban development authorities from some selected cities were
circulated among the members. Based on the discussions and decisions in

earlier meetings as also the analysis of the data gathered by NBO, the Group
finalised the methodology for construction of the index on a regular basis and
proposed an institutional structure that would be responsible for its
operationalisation, as presented in this Report.
1.2.2 The Report is divided into five sections. Section 2 discusses international
practices in constructing house construction related indices and the
experiences of building related to data/information base for housing sector in
India. Section 3 gives insight into the methodological issues for construction
of HSUI, taking the empirical context of Indian urban scenario into
consideration. Section 4 presents the pilot survey results and enumerates the
limitations of the data used in this and similar empirical studies in the
country. The recommendations of the Group are presented in Section 5.
1.3 Acknowledgements
1.3.1 Preparation of HSUI being the maiden venture of its kind, the challenges
were many. The contribution by each of the members and their institutions
were crucial in completing the projects in a meaningful manner and all of
them must be sincerely thanked for their efforts. The Group expresses sincere
thanks to Dr. Rakesh Mohan, Deputy Governor, Reserve Bank of India for his
valuable insights and suggestions provided during the entire period of the
Group’s functioning. The Group also thanks Dr P. K. Mohanty of the Ministry
of Housing and Urban Poverty Alleviation, the Joint Secretary in charge of
NBO, for providing information regarding the present system of data
generation in the Ministry and assisting in formalizing a system of data
compilation for HSUI on a regular basis. The Group is thankful to
Shri. Radhey Shyam, former Adviser, DSIM, RBI, Shri. Sangeet Shukla, CGM,
State Bank of India, Shri. T. Prabhakaran, former Director Finance, HUDCO
and Shri. P.K Ray, former Director General and CEO (In charge), NSSO who
were part of this Group in its initial phases. Special thanks are for the
Directorates of Economics and Statistics (DES), Tamil Nadu, Maharashtra and

Delhi that undertook the responsibility of conducting the pilot survey. The
Group is thankful to Dr. M. Murughan and Shri S. Sudalaimuthu of DES –
TN, Shri. K.S.P Rao, Ex-Deputy Director General, NSSO, Shri. Raj Pal,
Principal Adviser, NHB, Smt. Uttara Dasgupta, GM, SBI Shri. K. L Paulson,
DGM, SBI and Shri. Avanish Mishra, NBO for representing their
organizations in various meetings and putting forward invaluable
suggestions as also to Mr. Deepak Gahlowt was a special invitee in the third
meeting to present his work on municipal housing permit system. The Group
is also thankful to Shri. A.B Chakraborty, Adviser, Monetary Policy
Department (MPD), RBI and Dr. O.P Mall, Director, MPD, RBI for their
contributions.
1.3.2 The Group is thankful to Dr. Amal Kanti Ray, Officer-in-Charge, Department
of Statistics and Information Management, RBI for creating an excellent
environment and facilities in overseeing the pilot survey and coordinating the
Group meetings. His continuous persuasion for completion of the Report is
highly appreciated. The Group also recognizes to Shri. Sanjoy Bose, Director,
Dr. A.K. Tripathi, Director, Smt. Sushila Augustine, Director and Shri Joice
John, Research Officer of Department of Statistics and Information
Management, RBI for shouldering the total responsibility of analyzing the
survey results and preparing the Report.
1.3.3 The Group places on record the valuable contributions, encouraging thoughts
and support for design of the survey schedules, conduct of pilot survey and
firming up the methodology for compilation of Housing Start Up Index
(HSUI) by ex-officio members, Dr. R. B. Barman, former Executive Director,
RBI, Dr. S. K. Nath, former Director General, Central Statistical Organization
(CSO) and Shri. S. K. Sinha, former Director General and CEO, National
Sample Survey Organisation (NSSO).
Section 2 INTERNATIONAL PRACTICES AND DOMESTIC EXPERIENCES
2.1 Background
2.1.1 Housing Starts as a Lead indictor: Housing Start indices are considered to be
lead economic indicators because these give an idea regarding the level of
activities in a number of sectors of the economy in immediate future and in
this sense it is forward-looking. A high level of housing activity can trigger
economic growth, cause interest rates to rise and may have inflationary
impact. Similarly, decline in housing activity could slow down the economy,
cause yields and interest rates to fall, dampen investments in linked sectors
and push the real economy into recession. The current meltdown of the
economy is being linked to the crisis emanating from the housing sector. The
developments in the latter have direct causal effect on the real economic
activities as also the financial sector, which amplifies macroeconomic shocks.
Furthermore, these can become autonomous sources of macroeconomic and
financial fluctuations. Because of the high outlays needed to start construction
projects, an increase in housing starts is often taken as an indication of
commitment of related investment in other sectors. It reflects an enhancement
of business and consumer optimism. The housing starts figures provide
insight into the upcoming demand for consumer durables in near future,
since new house constructions/purchases are typically followed by large
expenditures on a wide range of consumer products. Conversely, an economy
that is growing rapidly is noted as having a high demand for housing and
large number of housing starts.
2.1.2 Ripple effect of housing demand: The housing sector has powerful multiplier
effects across the commodity and service markets that impact on the overall
growth performance of the economy. Changes in the rate of housing starts
reflect demand for new dwelling units, impacting on the outlook for
construction industry. As new house/building constructions get started, the
demand for construction materials goes up. Further, employment in the

construction activities rises immediately, causing a higher demand for a large
number of consumption goods including durables, which eventually may
cause the general price rise in the country. Once the houses are sold, these
generate revenues in the hands of the house-builders and open a myriad of
consumption opportunities for the buyer. Refrigerators, washing and drying
machines, furniture, etc. are a few things that new house buyers would often
spend their money on. The economic "ripple effect" in the Indian context has
been noted to be substantial, especially when new houses are coming up at a
rate higher than in the past. In a more specific sense, the housing starts data
carry valuable clues for house-builders, producers and suppliers of
construction materials, banks, lenders, and house furnishings companies, for
their future decisions.
2.2 International Practices
2.2.1 Internationally, countries like Canada, United States, Japan, France, Australia,
and New Zealand are compiling data related to building permits/housing
starts on a regular basis. Most of these countries compile housing starts using
housing permits data, collected either through census or sampling method.
The practices followed in these countries are summarised below.
2.2.2 Statistics Canada publishes data on house permits on a monthly basis. The
monthly Building Permits Survey of the Canadian municipalities collects data
on the value of construction intentions in the non-residential sector; and the
number of dwelling units authorized in the residential sector and their value.
The Survey collects information also on the number of dwelling units
demolished. It covers all the municipalities that issue permits. At present
more than 2,350 Canadian municipalities, representing all provinces and
territories are covered by the survey. Data sources and methodology are
detailed in Annex-2.
2.2.3 Building permits data are widely used as a lead indicator for the construction
industry in Canada; the issuance of a building permit is one of the first steps

in the construction process. Statistics on building permits are essential for the
computation of capital expenditures in building construction, depreciation by
components and estimation of net capital stock on quarterly and annual basis.
The results of this Survey are used by Canada Mortgage and Housing
Corporation (CMHC) as a reference base for conducting a monthly survey of
housing starts and completions. There are, thus, a wide range of users – from
economists in public and private production sectors and development
planners to construction industry analysts and housing market analysts in
Canada.
2.2.4 The United States Census Bureau compiles and publishes data on 'New
Residential Construction' on a monthly basis, based on sample survey. The
purpose of the survey is to provide statistics on the construction of new
privately owned residential structures in the country. The data relate to new
housing units intended for occupancy and maintenance by the occupants.
These include single-family unit as well as multiple-family unit buildings but
exclude hotels, motels, and group residential structures such as nursing
houses and college dormitories. Also excluded are the publicly owned
housing and manufactured mobile housing units. Units in structures built by
private developers with partial public subsidies are all classified as private
housing and hence included in the database.
2.2.5 Statistics on housing units authorized by building permits include those that
are issued under local permit-issuing jurisdictions by a building or zoning
permit agency. Statistics are based upon reports submitted by local building
permit officials in response to a mail survey. Approximately 9,000 of the
20,000 permit issuing places in the United States are surveyed monthly, the
remaining being surveyed annually. Estimates of Housing Units Authorized,
but Not Started; Housing Starts; Housing Units under Construction; and
Housing Completions are obtained from the Survey of Construction (SOC).
SOC comprises two parts: (i) Survey of Use of Permits (SUP) which estimates
the number of new construction in areas that require a building permit and

(ii) Non-permit Survey (NP) estimating the amount of new constructions in
areas that do not require a building permit. Data from both parts of the SOC
are collected by Census field representatives. For SUP, they visit a sample of
permit offices and select a sample of permits issued for new housing. These
permits are then followed through to record the date of their starting and
completion. From these sample surveys, related housing statistics are
estimated. The detailed methodology is presented in Annex-3.
2.2.6 The Japanese Ministry of Land, Infrastructure and Transport announces
Japan's total housing starts every month under official statistics of Japan. The
Housing Starts figure gives insight into consumer activity in Japan, since new
home purchases typically require a large investment for consumers.
2.2.7 In France, the National Institute of Statistics and Economic Studies,
Directorate-General of the Ministry of the Economy, Finance, and Industry,
publishes the information on house starts on monthly basis. The rate of
growth in housing construction is released as percentage change over the
preceding year.
2.2.8 Australian Bureau of Statistics publishes dwelling starts on quarterly basis.
The number, which is officially called Construction of Dwellings, measures
growth in the construction sector and reflects the overall health of the
housing market. The headline number is the percentage change in Dwelling
Starts from the previous month's figure.
2.2.9 Statistics New Zealand, a government department and New Zealand's
national statistical office publishes data on building permits on monthly data.
Building Permits or Building Consents, are issued when a building project is
authorized for construction. Since Building Consents are the earliest signals of
expanded housing supply, this is taken as a lead indicator by most actors in
the housing market. The headline figure is the percentage change in new
consents for house construction in the month.

2.3 Explorations into the Existing Data on House Construction in India
2.3.1 Considerable information on house construction is available from permit
issuing authorities in India, as is the case of several other countries. The
permit issuing authorities in India vary depending on the nature of
settlement, as discussed below:
− Municipal Corporation
− Town Planning Authority
− Tahsildaar (Nagar Parishad / Palika)
− Gram Panchayat
2.3.2 The documents in the hand of the above-mentioned authorities, where the
information related to construction statistics are noted may be mentioned as
follows:
− Building Plan Register
− The individual files for the building permits that contain various
documents like Project Proposal, Building Plan Approval,
Commencement Certificate, Occupancy Certificate and Completion
Certificate.
2.3.3 In view of the diversity of the practices and sources of the information, the
Group examined the existing system and the data collected on construction
related activities at various institutions like, National Buildings Organisation
(NBO) - an organisation under the Ministry of Housing and Urban Poverty
Alleviation- Government of India, DES-Government of Tamil Nadu, DES-
Government of Delhi etc. The purpose was to analyse and assess the
relevance and usability of the existing information for constructing a HSUI.
2.3.4 The NBO collects data on current housing and building construction activities
in public and private sectors, prices of building materials, wage rates of
labour, dates of issuance of building permits and that of completion
certificates and Building Construction Cost Index based on the data from 63
major cities on annual basis with the help of the State Directorate of
Economics and Statistics (DES).
2.3.5 National Building Organization has entrusted the responsibility of collecting
the construction related statistics on a regular basis to the State DESs. The
latter collect and compile information under the guidelines issued by the
NBO. Houses are categorized by their plinth area such as Low Income Group
(LIG), Middle Income Group (MIG) and High Income Group (HIG) and
construction statistics is complied for public and private sectors separately.
Data on construction in public sector includes all projects of Public
Undertakings costing Rupees 2.5 million and above. The data are collected
annually from the divisional offices of the public organizations in a uniform
format prescribed by NBO. Private sector constructions include all
permissions (residential and non-residential) issued by the local bodies. All
the Class I and II towns and 10 per cent of the Class III to VI towns selected at
random are covered under this system.
2.3.6 The details provided by NBO, DES-Tamil Nadu (TN) and Delhi on existing
information system related to new construction activities are placed in
Annex-4. Besides providing details of existing database in Tamil Nadu, DES-
TN also undertook a study and conducted a sample survey on total permits
issued for new constructions in Chennai during 2004-05 to identify the start-
up rates (the proportion of houses started to total building permits issued).
The framework and findings of this quick study are as follows:
• The survey did not include non-residential constructions. Also, addition
and alteration of constructions to the existing buildings were not covered.
New constructions, taken up in an unauthorized manner, were also not
covered in this survey.
• A fairly representative year 2004-05 is selected as the reference year for the
study. As the construction permissions issued by local bodies are valid for
three years, those not reporting any construction at the time of the survey
can be taken to have lapsed. The names and addresses of the permission
holders, numbering about 5792, who were sanctioned the Construction
permissions during the reference year, were collected from the Municipal

Corporation. Individual permission holders were the respondents of this
survey.
• Chennai Corporation has got 10 administrative zones. Variability was
noticed in zone-wise distribution in the number of permissions issued.
Consequently, a stratified random sampling method with proportionate
allocation to the zones was adopted in the pilot survey. Two per cent of
permission holders, numbering about 114 were randomly selected for
detailed data collection. The questionnaires have been canvassed to the
permission holders or their household members.
• Out of 114 building permissions pursued, in 111 cases, house
constructions have started while in 3 cases, this has not happened. Out of
111 cases where house construction had started, only 10 were observed to
have not been completed till the date of the survey.
2.3.7 At the instance of TAG, a meeting of the municipal commissioners and
officers from town planning departments/urban development authorities
from some selected cities with members of the Group was held at NBO, New
Delhi to deliberate on issues relating to the existing system of data collection
on building permits and explore suitable mechanisms for collection,
compilation and collation of data on building permits. The municipal
commissioners/officers present in the meeting were requested to submit the
data as per the Schedule-A and B, Annex-5. Schedule-B is devised in order to
find out the differences in the nature of institutions and variations in the
procedures for issuance of permits across the states and cities in the country.
This annexure includes questionnaires pertaining to the critical issues on
house construction linked processes and practices. Based on the information
from Schedules A and B in Annex- 5, the following points can be made
• Responses from eleven municipal bodies were received in NBO. These
include Ahmedabad, Delhi, Kolkata, Mumbai, Coimbatore, Puri, Bilaspur,
Korba, Bhilai, Agarthala and Bhopal.

• The data on building permissions issued during the quarter April -June
2008 through Schedule A, Annex-5 is received from all the eleven cities.
However information on house construction linked processes and
practices through Schedule-B in Annex-5 is received only from two
centers namely, Puri and Mumbai .
• As regards construction linked processes and practices, the information
(Schedule B, Annex-5 ) is received only from two centres. It is, therefore,
difficult to come to any conclusion regarding the nature of practices
followed in various cities across the country. However, the procedures
adopted in the cities of Puri and Mumbai are similar except a few
exceptions.
• One can derive only a few conclusions from the limited information
(Schedule B, Annex-5) that have been collected and analysed. The attempt
nonetheless revealed that the information required for constructing HSUI
are largely available at the city level and are already being complied,
although not very systematically. One can also argue that the system can
be strengthened to generate whatever additional data requirements may
come up for undertaking the exercise. For this, the inter-institutional
linkages are to be strengthened and there must be political will at the
highest level, backing up the effort.

Section 3 METHODOLOGY
3.1 Background
3.1.1 The Group observed that the present data collection system as organised and
updated by National Building Organization can be strengthened and fine
tuned to have the requisite base data for constructing a housing start-up
index (HSUI) on a quarterly basis.
3.1.2 The objective of the HSUI is to track the changes in the level of construction
activities in housing sector, which can identify and signal growth or
reversionary tendencies in the housing sector. The housing starts in a
particular quarter can be estimated from the permits issued in that quarter
and the various past quarters by using the rates at which the permits have got
converted into starts in the recent past. It would therefore be important to
construct a series of start rates (coefficients) for the permits given during the
preceding quarters based on the information on actual starts after the
issuance of the permits. These coefficients are expected to be different for
different quarters due to the seasonality involved in the housing starts. The
data on housing starts for a two year period or eight quarters has been
considered appropriate for building up the series of coefficients. For the
housing starts, out of the permits given before two years, an 'aggregate
coefficient’ may be calculated based on the actual empirical data. Thus, there
will be nine coefficients for each quarter of the year, eight for the preceding
quarters, and one more for the residual permits that are two-year old. Since
these coefficients are likely to be different for each of the four quarters, one
would end up building up a matrix with four rows and nine columns.
3.1.3 Once the matrix of start-up rates is constructed based on survey data, the
number of house construction started in a particular quarter, say A out of the
permits issued in a preceding quarter, say B, can be obtained by multiplying
the number of housing units authorised through issuance of permits in
quarter B with the corresponding start rate (coefficient) in the matrix.
Aggregation of the nine values thus obtained would give the total number of
housing starts in the quarter A.
3.1.4 The Group decided that the scope of the index should be limited to new built
residential buildings in urban areas of India, whose construction is authorised
through issuance of building permits. Consequently, the pilot surveys
undertaken to estimate the coefficients do not include permits for non-
residential buildings including commercial, institutional and industrial
buildings. Furthermore, the surveys do not include the publicly owned/built
residential housing units. These cover only urban areas because the
residential construction activities here are likely to affect macroeconomic
parameters much more than in the rural areas. Un-authorised constructions
can be excluded from the scope of the analysis. It is possible to assume that
the excluded components are multicollinear with the formal residential units
and hence the index can signal the direction of movement for both.
3.1.5 After overviewing the results of the survey conducted by DES-TN, the Group
felt about the need to conduct a comprehensive pilot surveys in few
cites/town in order to generate housing start coefficients and test their
sturdiness. It is only then that these numbers can be recommended for
application to the information on the number of building permits for
constructing HSUI. The objective of the pilot surveys should be to construct
the Start up Coefficient Matrix with adequate empirical strength so that HSUI
can be constructed on a quarterly basis. It should help in identifying the
difficulties and challenges in this exercise as also sorting out the issues related
to sampling design, selection of variables, weighting pattern, choice of base
year etc.
3.1.6 The Group suggested that the pilot survey, using a common methodology
and schedules, should be conducted in 3 class I cities and 3 small towns. A
subgroup was constituted for designing of the schedules for data collection.
The comments/suggestions on the schedules prepared by the subgroup were
obtained from the members based on which the methodology for data

collection for the pilot study was also finalized. The three class-I cities
identified for the survey were Mumbai, Delhi and Coimbatore. The respective
Directorate of Economic and Statistics (DES) were entrusted with the data
collection job. It was considered important to collect information from one
small town in the states of Maharashtra and Tamil Nadu and one near the
National Capital Territory of Delhi for the calendar years 2003 and 2004. The
choice of two calendar years was made with a view to identify temporal
differences in the start rates as it may help to fix the periodicity for
conducting such surveys for generating the coefficients, to be used for
constructing HSUI. The concerned DESs were requested to conduct the
surveys by selecting the town as per the framework of the project and report
the results to the Group.
3.1.7 The Terms and Definitions used in the study are presented in Annex 6.
3.2 Data Collection
3.2.1 The data related to housing starts were collected in two stages as per the
survey schedule given in Annex-7. The survey schedule has two parts.
3.2.2 Collection of Information on Building Permits: Information on the permits
issued for new residential construction was collected from the permit issuing
authorities in all cities and towns through Schedule –Part I given in Annex-7.
The permits for alterations of the existing building were not included in their
survey. However, the permits given for additional housing units in the
existing building; construction of new building by demolishing the old
existing building were included. The survey excluded all non-residential
buildings, as noted above. However, mixed-use houses like residential cum
commercial, residential cum industrial units etc. were included.
3.2.3 Survey conducted for determining the coefficients of Housing Starts: The
data on housing starts were collected by drawing a sample from the permits
issued for new residential buildings in city during the four quarters in certain
reference year. The reference year was assumed to be two or three years old,
generally coinciding with the period of validity of the license. The survey
tracked these sample permits in order to ascertain in which quarter and year
during the subsequent period, the owner or the builder who obtained the
permit actually started the construction. The information was obtained using
the Schedule –Part II, given in Annex 7.
3.2.4 Sampling method: The sample selection for the survey was based on a
stratified sampling method in which the units in each stratum were randomly
selected. In each administrative/tax zone/ward, the data on permits were
further stratified based on the type of the building (Single Housing Unit
(SHU) or Multiple Housing Unit (MHU)). For example, if a particular centre
had 5 zones, each zone was further stratified into 2 strata. i.e. in total 10
strata. In each such stratum, 5 per cent sample of the total building permits
for new residential construction was selected based on systematic sampling
procedure. If the 5 per cent of the total happens to be fraction, the next integer
was taken as the sample size. If total number of permits in a stratum was less
than 10, then all permits were taken to constitute the sample. If 5 per cent of
the total number of permits in a stratum turned out to be less than 10, then
the sample size was taken as 10.
3.3 Housing Start Rates (coefficients)
3.3.1 The data collected on permits using Schedule –Part I, pertain to four periods
of the reference year (2003 - from the first quarter to the fourth quarter). These
were taken as the starting observations for the survey. It tried to estimate the
number of house constructions started in all the succeeding quarters out of
the sample, staring from the quarter in which the permits were issued till the
latest period. Following international practice, all the house constructions
started after the lapse of two years of issue of permits till two years further
were added together. The last coefficient would indicate the house starts
taking place over for two years - after the lapse of two years. This may be
taken to reflect the coefficient of start ups in a quarter out of all old two year

old permits till two years further. All houses started beyond 4 years of permit
issue were assumed as not started. Based on this data corresponding to
different quarters of the years, 9 start-up rates (1 for the quarter in which
permits were issued, 7 for the 7 succeeding quarters and 1 for all the starts
after 2 years till two years further) were computed. This produces a 4x9
matrix of start rates (coefficients) (see (1) and (2)). This matrix (HSRM) is used
for estimating the number of housing starts in each quarter, using the
methodology described below.
HSRM =
(11,1) (12,1) (13,1) (14,1) (21,1) (22,1) (23,1) (24,1) (..,1)
(1) (1) (1) (1) (1) (1) (1) (1) (1)
(12,2) (13,2) (14,2) (21,2) (22,2) (23,2) (24,2) (31,2) (..,2)
(2) (2) (2) (2) (2) (2) (2) (2) (2)
(
s s s s s s s s sp p p p p p p p p
s s s s s s s s sp p p p p p p p p
s 13,3) (14,3) (21,3) (22,3) (23,3) (24,3) (31,3) (32,3) (..,3)
(3) (3) (3) (3) (3) (3) (3) (3) (3)
(14,4) (21,4) (22,4) (23,4) (24,4) (31,4) (32,4) (33,4) (..,4)
(4) (4) (4) (4) (4) (4) (4) (4) (4)
s s s s s s s sp p p p p p p p p
s s s s s s s s sp p p p p p p p p
⎡⎢⎢
⎣
⎤⎥⎥
⎢ ⎥⎢ ⎥⎢ ⎥⎢ ⎥⎢ ⎥⎢ ⎥⎢ ⎥⎢ ⎥⎢ ⎥⎦
.… (1)
3.3.2 The number of housing starts during the jth quarter of the ith year, for which
permits are issued in the kth quarter of the calendar year is denoted by ( ( , )ij ks ).
The sample number of housing units authorised by building permits in the
kth quarter of the calendar year is ( ( )kp ). Now ( , )
( )
ij k
k
sp
represents the
corresponding housing start coefficient. (.., )
( )
k
k
sp represents the ratio of number
of house constructions started after 8 quarters (including the quarter in which
permit is issued) till two years further out of the total number of permits
issued in kth quarter of the calendar year to the sample number of housing
units authorised by building permits in the kth quarter of the calendar year.
3.3.3 The first start rate coefficient that is to be applied for estimating the housing
starts in a quarter is computed by dividing the number of constructions
started in that quarter for which permits are issued in that quarter itself.
Understandably, many more house constructions would start during this

quarter for which permissions have been obtained in pervious quarters. But
the coefficients in the first row of the matrix HSRM show how the permits
given in the first quarter got converted into housing start in the subsequent
quarters. The second row gives the corresponding coefficients for the second
quarter. To estimate the number of starts in a quarter, therefore the matrix
HSRM is to be transformed. The transformed matrix HSRMtransformed is
obtained by rearranging HSRM.
HSRMtransformed =
(11,1) (21,4) (21,3) (21,2) (21,1) (31,4) (31,3) (31,2) (..,1)
(1) (4) (3) (2) (1) (4) (3) (2) (1)
(12,2) (12,1) (22,4) (22,3) (22,2) (22,2) (32,4) (32,3) (..,2)
(2) (1) (4) (3) (2) (1) (4) (3) (2)
(
s s s s s s s s sp p p p p p p p p
s s s s s s s s sp p p p p p p p p
s 13,3) (13,2) (13,1) (23,4) (23,3) (23,2) (23,1) (33,4) (..,3)
(3) (2) (1) (4) (3) (2) (1) (4) (3)
(14,4) (14,3) (14,2) (14,1) (24,4) (24,3) (24,2) (24,1) (..,4)
(4) (3) (2) (1) (4) (3) (2) (1) (4)
s s s s s s s sp p p p p p p p p
s s s s s s s s sp p p p p p p p p
⎡⎢⎢
⎣
⎤⎥⎥
⎢ ⎥⎢ ⎥⎢ ⎥⎢ ⎥⎢ ⎥⎢ ⎥⎢ ⎥⎢ ⎥⎢ ⎥⎦
…(2)
3.3.4 This matrix HSRMtransformed is to be used for estimating the housing start figure
for a particular quarter. The first row of HSRMtransformed gives the coefficients
of housing start for the first quarter of the calendar year, based on
permissions given in previous quarters. Similarly the second, third and fourth
rows correspond to the second, third and fourth quarters of the calendar year
respectively. The four series of start rates (coefficients) corresponding to the
four quarters are estimated to incorporate the factor of seasonality. This
matrix of start rates can be obtained separately for SHU and MHU and can be
used for estimating the housing start in each quarter separately for SHU and
MHU.
3.4 Compilation of Housing Starts
3.4.1 The number of SHU or MHU house constructions started in a particular
centre during a particular quarter can be obtained by multiplying the start
rates (coefficients) in the HSRMtransformed matrix with the corresponding total
number of housing permits issued (in the current as also the preceding

quarters). The choice of the row or the set of start rates depends on the
quarter for which the housing starts are to be estimated. For example, if we
are interested in estimating the number of housing starts in the third quarter
of the calendar year then the third row of the HSRMtransformed matrix should be
used along with the corresponding figures for housing permits.
3.4.2 This procedure is represented in mathematical form as follows. Let vectortP is a
9x1 vector of which the first eight elements are the number of housing
permits issued in the tth, ( t-1)th, ( t-2)th …( t-7)th quarter. The ninth element is
the sum total number of the number of housing permits issued in the ( t-8)th
to ( t-15)th quarters.
'1 2 3 4 5 6 7 ( 8) ( 15)[ ]vector
t t t t t t t t t t tP P P P P P P P P P− − − − − − − − → −= … (3)
Let Q be a 1x4 vector of seasonal dummies.
[ ]1 2 3 4Q q q q q= … (4)
Where qi = 1 if t corresponds to ith quarter
= 0 otherwise for i = 1, 2, 3, 4
The number of housing starts in the quarter t which is a scalar is given by
vectort transformed tS Q HSRM P= × × … (5)
3.4.3 The number of housing starts can be estimated by two methods: i) by adding
the number of housing starts corresponding to SHU and MHU giving equal
weights; ii) by adding the number of housing starts corresponding to SHU
and MHU giving weights proportional to the average Floor Space Area (FSA)
corresponding to each category.
3.5 Compilation of Housing Start-Up Index
3.5.1 As the number of urban centers in India is quiet large, compiling housing
starts for each and every center and thereby obtaining an All India figure on a
quarterly basis is difficult. As an alternative, a few centers can be chosen and
an index can be developed at All India level using the information obtained
from these selected centers.
3.5.2 The Group proposes that the HSUI may be computed using the housing starts
coefficients estimated for select centres using methodology, as explained in
sections 3.3 and 3.4.
3.5.3 The HSUI is estimated using the formulae given below
01
0 01
n
i i ti
t n
i ii
A SH S U I
A S
=
=
=∑
∑ … (6)
Where n is the number of centres, Ai0 is the average FSA in the ith centre in
the base period; Sit is the number of housing starts in the tth quarter in ith
centre; Si0 is the number of housing starts in the base period in ith centre.
Section 4
PILOT SURVEY RESULTS AND LIMITATIONS OF METHODOLOGY
4.1 The Case study in Coimbatore
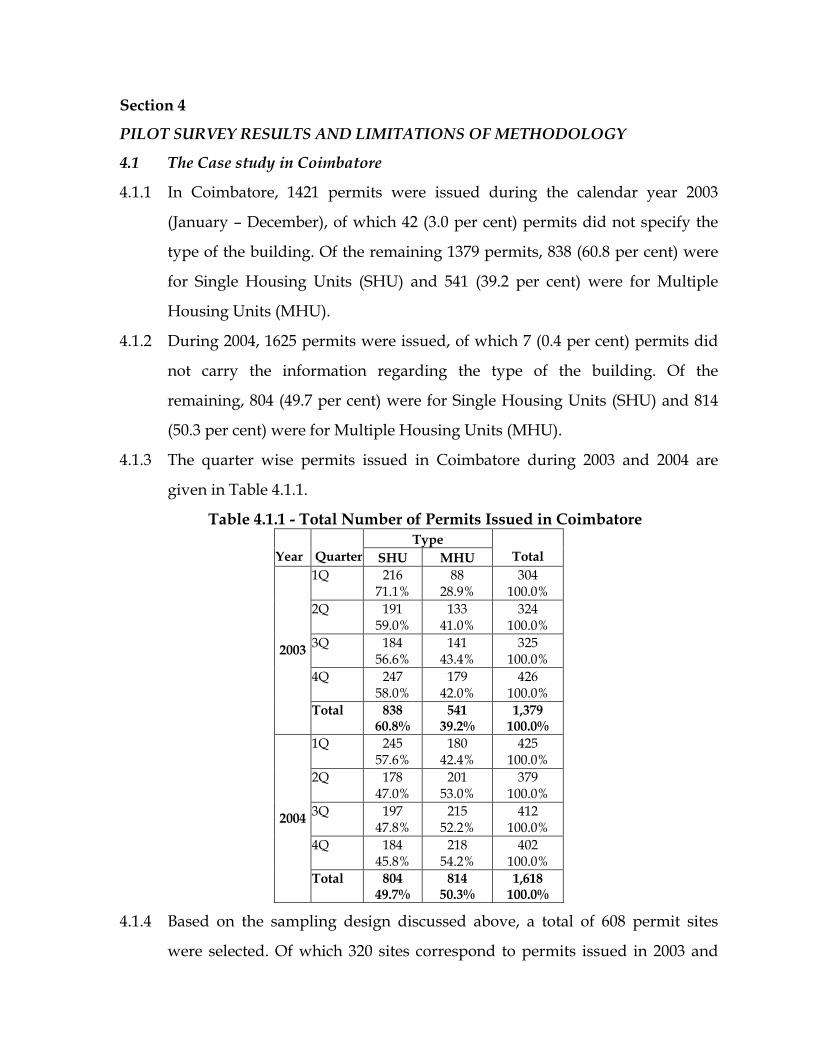
4.1.1 In Coimbatore, 1421 permits were issued during the calendar year 2003
(January – December), of which 42 (3.0 per cent) permits did not specify the
type of the building. Of the remaining 1379 permits, 838 (60.8 per cent) were
for Single Housing Units (SHU) and 541 (39.2 per cent) were for Multiple
Housing Units (MHU).
4.1.2 During 2004, 1625 permits were issued, of which 7 (0.4 per cent) permits did
not carry the information regarding the type of the building. Of the
remaining, 804 (49.7 per cent) were for Single Housing Units (SHU) and 814
(50.3 per cent) were for Multiple Housing Units (MHU).
4.1.3 The quarter wise permits issued in Coimbatore during 2003 and 2004 are
given in Table 4.1.1.
Table 4.1.1 - Total Number of Permits Issued in Coimbatore Type
Year Quarter SHU MHU Total 1Q 216
71.1% 88
28.9% 304
100.0% 2Q 191
59.0% 133
41.0% 324
100.0% 3Q 184
56.6% 141
43.4% 325
100.0% 4Q 247
58.0% 179
42.0% 426
100.0%
2003
Total 838 60.8%
541 39.2%
1,379 100.0%
1Q 245 57.6%
180 42.4%
425 100.0%
2Q 178 47.0%
201 53.0%
379 100.0%
3Q 197 47.8%
215 52.2%
412 100.0%
4Q 184 45.8%
218 54.2%
402 100.0%
2004
Total 804 49.7%
814 50.3%
1,618 100.0%
4.1.4 Based on the sampling design discussed above, a total of 608 permit sites
were selected. Of which 320 sites correspond to permits issued in 2003 and

288 sites to the following year. The zone wise sample permit sites visited are
given in Table 4.1.2.
Table 4.1.2- Sample Number of Buildings covered in Coimbatore Permits issued in
2003 2004 Total
East Zone 80 80 160 West Zone 80 80 160 North Zone 80 80 160 South Zone 80 48 128 Total 320 288 608
4.1.5 Of the 320 permit site visits corresponding to 2003, 182 were for SHU and 138
for MHU. Of the 288 permits given during the year 2004, 174 were for SHU
and 114 for MHU.
4.1.6 Of the 182 building sanctions given in 2003 for SHU, 8 (4.4 per cent) had not
stared construction till the date of visit. Of the 138 permits given for MHU, 3
(2.2 per cent) were yet to start their construction. Similarly, out of 174 and 114
permits issued to SHU and MHU respectively during the calendar year 2004,
9 (5.2 per cent) and 1 (0.9 per cent) had not started their construction.
4.1.7 The frequency distribution of the number of houses in the MHU is given
below in Graph 4.1.1. One permit issued in the year 2004 consisted of a MHU
with 162 housing units, which was revealed during the sample survey. This
was removed from the sample while constructing the start rate matrix
because of its large size affecting the macro results.
Graph 4.1.1 – Distribution of Number of Houses in MHU in Coimbatore
Permit year -2003
0
20
40
60
80
100
120
2 3 4 5 6 7 8 12 14 24
No: of Houses
Freq
uenc
y
Permit year -2004
0
20
40
60
80
100
120
2 3 4 5 6 7 8 12 16 20 24 40 162
No: of Houses
Freq
uenc
y

4.1.8 Table 4.1.3 provides the average Floor Space Area (FSA) in Sq.ft in the 4 zones
for SHU and MHU. The average FSA did not vary much across the zones.
However, the SHU were found to have higher average FSA than MHU.
Table 4.1.3 –Average Floor Space Area in Coimbatore
Average Area (Sq.ft) Zone SHU MHU East 1219 673 West 1112 871 North 1353 612 South 1488 889 Total 1270 785
4.1.9 The per cent distribution of the housing starts for SHU and MHU are given in
Table 4.1.4 and Table 4.1.5 respectively. From theses tables it would be seen
that about 90 per cent of permits issued during 2003 and 2004 got started
within 2 quarters.
Table 4.1.4 - Distribution of Housing Starts (SHU) in Coimbatore (per cent)
Started Issued 1Q2003 2Q2003 3Q2003 4Q2003 1Q2004 2Q2004 3Q2004 4Q2004 1Q2005 2Q2005 3Q2005 Not Started
1Q2003 74.5 10.6 6.4 -- -- 2.1 -- -- -- -- -- 6.4
2Q2003 x 83.0 10.6 2.1 -- -- -- -- -- 2.1 -- 2.1
3Q2003 x x 61.5 28.8 -- 1.9 -- -- -- -- -- 7.7
4Q2003 x x x 66.7 27.8 -- -- -- 5.6 -- -- --
Started
Issued 1Q2004 2Q2004 3Q2004 4Q2004 1Q2005 2Q2005 3Q2005 4Q2005 1Q2006 2Q2006 3Q2006 Not Started
1Q2004 63.6 31.8 2.3 2.3 -- -- -- -- -- -- -- -- 2Q2004 x 60.0 20.0 8.9 2.2 -- -- -- -- -- -- 8.9 3Q2004 x x 57.5 27.5 5.0 -- -- 7.5 -- -- -- 2.5 4Q2004 x x x 57.8 24.4 4.4 2.2 2.2 -- -- -- 8.9
x: Not computable --: Nil/Negligible
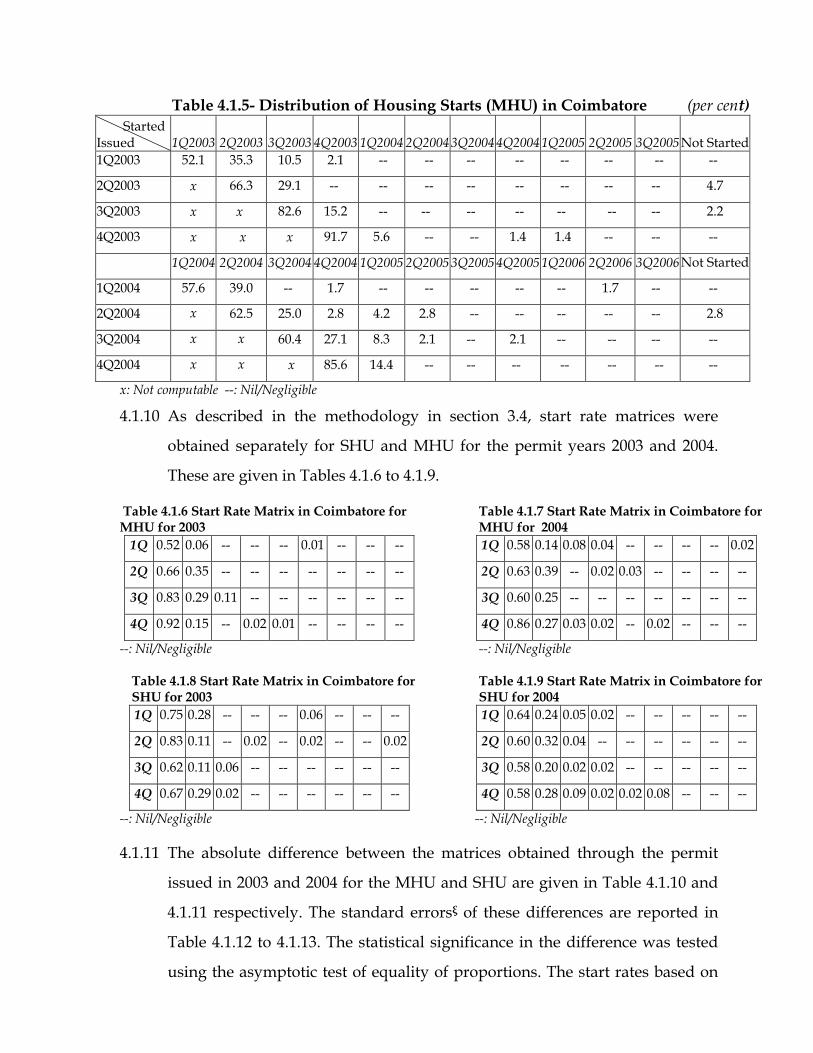
Table 4.1.5- Distribution of Housing Starts (MHU) in Coimbatore (per cent) Started Issued 1Q2003 2Q2003 3Q2003 4Q2003 1Q2004 2Q2004 3Q2004 4Q2004 1Q2005 2Q2005 3Q2005 Not Started 1Q2003 52.1 35.3 10.5 2.1 -- -- -- -- -- -- -- --
2Q2003 x 66.3 29.1 -- -- -- -- -- -- -- -- 4.7
3Q2003 x x 82.6 15.2 -- -- -- -- -- -- -- 2.2
4Q2003 x x x 91.7 5.6 -- -- 1.4 1.4 -- -- --
1Q2004 2Q2004 3Q2004 4Q2004 1Q2005 2Q2005 3Q2005 4Q2005 1Q2006 2Q2006 3Q2006 Not Started
1Q2004 57.6 39.0 -- 1.7 -- -- -- -- -- 1.7 -- --
2Q2004 x 62.5 25.0 2.8 4.2 2.8 -- -- -- -- -- 2.8
3Q2004 x x 60.4 27.1 8.3 2.1 -- 2.1 -- -- -- --
4Q2004 x x x 85.6 14.4 -- -- -- -- -- -- --
x: Not computable --: Nil/Negligible
4.1.10 As described in the methodology in section 3.4, start rate matrices were
obtained separately for SHU and MHU for the permit years 2003 and 2004.
These are given in Tables 4.1.6 to 4.1.9.
Table 4.1.6 Start Rate Matrix in Coimbatore for MHU for 2003
1Q 0.52 0.06 -- -- -- 0.01 -- -- --
2Q 0.66 0.35 -- -- -- -- -- -- --
3Q 0.83 0.29 0.11 -- -- -- -- -- --
4Q 0.92 0.15 -- 0.02 0.01 -- -- -- --
Table 4.1.7 Start Rate Matrix in Coimbatore for MHU for 2004 1Q 0.58 0.14 0.08 0.04 -- -- -- -- 0.02
2Q 0.63 0.39 -- 0.02 0.03 -- -- -- --
3Q 0.60 0.25 -- -- -- -- -- -- --
4Q 0.86 0.27 0.03 0.02 -- 0.02 -- -- --
--: Nil/Negligible Table 4.1.8 Start Rate Matrix in Coimbatore for SHU for 2003 1Q 0.75 0.28 -- -- -- 0.06 -- -- --
2Q 0.83 0.11 -- 0.02 -- 0.02 -- -- 0.02
3Q 0.62 0.11 0.06 -- -- -- -- -- --
4Q 0.67 0.29 0.02 -- -- -- -- -- --
--: Nil/Negligible Table 4.1.9 Start Rate Matrix in Coimbatore for SHU for 2004 1Q 0.64 0.24 0.05 0.02 -- -- -- -- --
2Q 0.60 0.32 0.04 -- -- -- -- -- --
3Q 0.58 0.20 0.02 0.02 -- -- -- -- --
4Q 0.58 0.28 0.09 0.02 0.02 0.08 -- -- --
--: Nil/Negligible --: Nil/Negligible
4.1.11 The absolute difference between the matrices obtained through the permit
issued in 2003 and 2004 for the MHU and SHU are given in Table 4.1.10 and
4.1.11 respectively. The standard errorsξ of these differences are reported in
Table 4.1.12 to 4.1.13. The statistical significance in the difference was tested
using the asymptotic test of equality of proportions. The start rates based on

permits issued in 2003 and 2004 were found to be not statistically different at
1 per cent level of significance, expect for 3 cells for MHU (Table 4.1.10,
4.1.11).
Table 4.1.10 Absolute Difference in 2003 and 2004 Start Rates in Coimbatore for MHU
1Q 0.06 0.09
0.08* 0.04 -- 0.01 -- -- 0.02
2Q 0.04 0.04 -- 0.02 0.03 -- -- -- -- 3Q 0.22
* 0.04 0.11
* -- -- -- -- -- -- 4Q 0.06 0.12 0.03 -- 0.01 0.02 -- -- --
Table 4.1.11 Absolute Difference in 2003 and 2004 Start Rates in Coimbatore for SHU 1Q 0.11 0.03 0.05 0.02 -- 0.06 -- -- -- 2Q 0.23 0.21 0.04 0.02 -- 0.02 -- -- 0.02 3Q 0.04 0.09 0.04 0.02 -- -- -- -- -- 4Q 0.09 0.01 0.07 0.02 0.02 0.08 -- -- --
* Significantly different at 1 per level of significance --: Nil/Negligible
Table 4.1.12 SE$ of Difference of 2003 and 2004 Start Rates in Coimbatore for MHU 1Q 0.07 0.04 0.03 0.02 -- 0.01 -- -- 0.01 2Q 0.08 0.08 -- 0.02 0.02 -- -- -- -- 3Q 0.06 0.06 0.03 -- -- -- -- -- -- 4Q 0.04 0.05 0.02 0.02 0.01 0.01 -- -- --
Table 4.1.13 SE$ in Difference of 2003 and 2004 Start Rates in Coimbatore for SHU
1Q 0.10 0.09 0.03 0.02 -- 0.03 -- -- --
2Q 0.09 0.08 0.03 0.02 -- 0.02 -- -- 0.02
3Q 0.10 0.08 0.04 0.02 -- -- -- -- --
4Q 0.11 0.10 0.05 0.02 0.02 0.04 -- -- --
--: Nil/Negligible --: Nil/Negligible
4.1.12 Given the fact that the indices for the two years are not at variance with each
other, it is decided to combine them. The start rate matrices obtained by
combining the matrices for 2003 and 2004 for SHU and MHU are given in
Table 4.1.14 and 4.1.15 respectively.
Table 4.1.14 Start Rate Matrix@ in Coimbatore for MHU 1Q 0.55 0.10 0.04 0.02 -- 0.01 -- -- 0.01 2Q 0.65 0.37 -- 0.01 0.01 -- -- -- -- 3Q 0.71 0.27 0.05 -- -- -- -- -- -- 4Q 0.89 0.21 0.01 0.02 0.01 0.01 -- -- --
Table 4.1.15 Start Rate Matrix@ in Coimbatore for SHU 1Q 0.69 0.26 0.02 0.01 -- 0.02 -- -- -- 2Q 0.72 0.21 0.02 0.01 -- 0.01 -- -- 0.01 3Q 0.60 0.15 0.04 0.01 -- -- -- -- -- 4Q 0.62 0.28 0.05 0.01 0.01 0.03 -- -- --
--: Nil/Negligible --: Nil/Negligible
4.2 Case Study of Villupuram
4.2.1 In Villupuram, 35 permits were issued in 2003 of which, 19 (54.3 per cent)
were for SHU and 16 (45.7 per cent) were for MHU. Among the 30 permits
issued in 2004, 24 (80 per cent) were for SHU, while only 6 (20 per cent) for
MHU. The numbers of permits disaggregated by different quarters of the
year are given in Table 4.2.1.

4.2.2 All the permit sites were visited for the housing start survey (Schedule Part-
II) as the number of permits was small. It was found that construction had
begun for all the permits given during 2003 for SHU, expect just one case. It
was also found that all the MHU for which permits were given in 2003 and
2004 had exactly 2 housing units.
Table 4.2.1 - Total Number of Permits Issued in Villupuram
Type Year Quarter SHU MHU Total
1Q 2 40.0%
3 60.0%
5 100.0%
2Q 10 58.8%
7 42.2%
17 100.0%
3Q 3 50.0%
3 50.0%
6 100.0%
4Q 4 57.1%
3 42.9%
7 100.0%
2003
Total 19 54.3%
16 45.7%
35 100.0%
1Q 8 80.0%
2 20.0%
10 100.0%
2Q 5 62.5%
3 37.5%
8 100.0%
3Q 4 100.0%
0 0.0%
4 100.0%
4Q 7 87.5%
1 12.5%
8 100.0%
2004
Total 24 80.0%
6 20.0%
30 100.0%
4.2.3 Villupuram being a small centre, the number of permits issued in each
quarter was noted as very small. Consequently, the SHU and MHU units
were combined to obtain a single start rate matrix for the town. The per cent
distribution of the housing starts is given in Table 4.2.2. It is important that
almost 80 per cent of the constructions got started in the same quarter in
which permits were issued.
4.2.4 The average FSA of SHU was found to be 935 sq.ft. MHU were noted to have
a lower average FSA of 381 sq.ft. only.
Table 4.2.2- Distribution of Housing Starts in Villupuram (per cent)
Started Issued 1Q2003 2Q2003 3Q2003 4Q2003 1Q2004 2Q2004 3Q2004 4Q2004 1Q2005 2Q2005 3Q2005 Not Started

1Q2003 100.0 -- -- -- -- -- -- -- -- -- -- -- 2Q2003 x 96.2 -- -- -- -- -- -- -- -- -- 3.8 3Q2003 x x 77.8 22.2 -- -- -- -- -- -- -- -- 4Q2003 x x x 90.0 10.0 -- -- -- -- -- -- -- Started Issued 1Q2004 2Q2004 3Q2004 4Q2004 1Q2005 2Q2005 3Q2005 4Q2005 1Q2006 2Q2006 3Q2006 Not Started 1Q2004 75.0 16.7 18.3 -- -- -- -- -- -- -- -- -- 2Q2004 x 81.8 9.1 9.1 -- -- -- -- -- -- -- -- 3Q2004 x x 100.0 -- -- -- -- -- -- -- -- -- 4Q2004 x x x 88.9 11.1 -- -- -- -- -- -- -- x: Not computable --: Nil/Negligible
4.2.5 Start rate matrices were obtained separately for 2003 and 2004 using the
methodology described in section 3.4. The results are given in Tables 4.2.3
and 4.2.4.
Table 4.2.3 Start Rate Matrix in Villupuram for 2003
1Q 1.00 0.10 -- -- -- -- -- -- -- 2Q 0.96 -- -- -- -- -- -- -- -- 3Q 0.78 -- -- -- -- -- -- -- -- 4Q 0.90 0.22 -- -- -- -- -- -- --
Table 4.2.4 Start Rate Matrix in Villupuram for 2004
1Q 0.75 0.11 -- -- -- -- -- -- -- 2Q 0.82 0.17 -- -- -- -- -- -- -- 3Q 1.00 0.09 0.18 -- -- -- -- -- -- 4Q 0.89 -- 0.09 -- -- -- -- -- --
--: Nil/Negligible --: Nil/Negligible
4.2.6 The absolute differences between the coefficients in the two matrices were
computed as reported in Table 4.2.5. The values of the corresponding
standard errors of the differences are given in 4.2.6. The statistical significance
in the differences was tested using asymptotic test of equality of proportionsξ.
The analysis suggests that the start rates based on permits issued during 2003
and the following year are not significantly different. (Table 4.2.5). The
stability in these coefficients over time thus increases the confidence level in
using these coefficients for making projections for housing starts for future
years.
4.2.7 The start rate matrix obtained by combining the matrices for 2003 and 2004 is
given in Table 4.2.7.
Table 4.2.5 Absolute Difference in 2003 and 2004 Start Rates in Villupuram
Table 4.2.6 SE$ in Difference of 2003 and 2004 Start Rates in Villupuram

1Q 0.25 0.01 -- -- -- -- -- -- -- 2Q 0.14 0.17 -- -- -- -- -- -- -- 3Q 0.22 0.09 0.18 -- -- -- -- -- -- 4Q 0.01 0.22 0.09 -- -- -- -- -- --
1Q 0.13 0.15 -- -- -- -- -- -- -- 2Q 0.12 0.11 -- -- -- -- -- -- -- 3Q 0.14 0.14 0.19 -- -- -- -- -- -- 4Q 0.14 0.13 0.10 -- -- -- -- -- --
* Significantly different at 1 per level of significance --: Nil/Negligible
Table 4.2.7 Start Rate Matrix@ in Villupuram 1Q 0.83 0.11 -- -- -- -- -- -- -- 2Q 0.92 0.11 -- -- -- -- -- -- -- 3Q 0.85 0.03 0.12 -- -- -- -- -- -- 4Q 0.89 0.15 0.03 -- -- -- -- -- --
--: Nil/Negligible
4.3 Case Study of Delhi (South Zone)
4.3.1 Owing to the time and manpower constraints, DES-Government of Delhi,
could conduct the survey only in Delhi-south zone and not in the entire city.
In the selected area- Delhi South Zone, - as many as 147 and 163 permits were
issued during the calendar years of 2003 and 2004 respectively. The quarter
wise details of the permits issued are given in Table 4.3.1.
Table 4.3.1 - Total Number of Permits Issued in Delhi (South) Year Quarter Frequency Percent
1Q 36 24.5 2Q 63 42.9 3Q 30 20.4 4Q 18 12.2
2003 Total 147 100.0
1Q 33 20.2 2Q 40 24.5 3Q 43 26.4 4Q 47 28.8
2004 Total 163 100.0
4.3.2 Of the 310 permits issued, 93 were surveyed through Schedule Part II. Of
these, 4 permits were excluded from the tabulation as there were insufficient
data. Of the remaining 89 permit sites, 47 permit sites correspond to the year
2003 and 42 permit sites to 2004. These were visited for collection of
information pertaining to housing starts.

4.3.3 Of the 47 permits issued in 2003, construction had not stared in just 1 (2.1 per
cent) case till the date of the present survey. Similarly, for 2004 too, only one
(2.4 per cent) holder of the permit had not started construction. The
distribution of the housing starts is given in Table 4.3.2. From theses tables it
could be argued that about 80 per cent of permit holders in both the years
started their work within two quarters of getting their permit.
Table 4.3.2- Distribution of Housing Starts in Delhi (South) (per cent)
Started Issued 1Q2003 2Q2003 3Q2003 4Q2003 1Q2004 2Q2004 3Q2004 4Q2004 1Q2005 2Q2005 3Q2005 Not Started 1Q2003 47.4 23.7 15.8 -- 5.3 -- 7.9 -- -- -- -- --
2Q2003 x 68.8 12.5 -- 9.4 -- -- 9.4 -- -- -- --
3Q2003 x x 43.8 37.5 9.4 9.4 -- -- -- -- -- --
4Q2003 x x x 73.1 3.8 11.5 -- -- -- -- -- 11.5 Started Issued 1Q2004 2Q2004 3Q2004 4Q2004 1Q2005 2Q2005 3Q2005 4Q2005 1Q2006 2Q2006 3Q2006 Not Started 1Q2004 48.6 42.9 -- -- 8.6 -- -- -- -- -- -- --
2Q2004 x 66.7 22.2 11.1 -- -- -- -- -- -- -- --
3Q2004 x x 66.7 25.0 8.3 -- -- -- -- -- -- --
4Q2004 x x x 42.4 39.4 -- 9.1 -- -- -- -- 9.1 x: Not computable --: Nil/Negligible
4.3.4 Start rate matrices obtained separately for 2003 and 2004 using the
methodology described in section 3.4 are given in Tables 4.3.3 and 4.3.4
Table 4.3.3 Start Rate Matrix in Delhi (South) for 2003 1Q 0.47 0.04 0.09 0.09 0.05 -- -- -- -- 2Q 0.69 0.24 0.12 0.09 -- -- -- -- -- 3Q 0.44 0.13 0.16 -- -- -- 0.08 -- -- 4Q 0.73 0.38 0.00 -- -- -- 0.09 -- --
Table 4.3.4 Start Rate Matrix in Delhi (South) for 2004 1Q 0.49 0.39 0.08 -- 0.09 -- -- -- -- 2Q 0.67 0.43 -- -- -- -- -- -- -- 3Q 0.67 0.22 -- 0.09 -- -- -- -- -- 4Q 0.42 0.25 0.11 -- -- -- -- -- --
--: Nil/Negligible --: Nil/Negligible
4.3.5 The absolute difference between the elements of the matrices for the year 2003
and 2004 and the corresponding standard errors are reported in Table 4.3.5
and 4.3.6 respectively. The statistical significance of the difference is tested
using asymptotic test of equality of proportionsξ. The start rates based on
permits issued in 2003 and 2004 are found to be not different at 1 per cent

level of significance. Only in case of 2 cell values, the difference turns Out to
be significant. (Table 4.3.5).
4.3.6 The start rate matrix obtained by combining the matrices for 2003 and 2004 is
given in Table 4.3.7.
Table 4.3.5 Absolute Difference in 2003 and 2004 Start Rates in Delhi (South)
1Q 0.01 0.36* 0.01 0.09 0.03 -- -- -- --
2Q 0.02 0.19 0.12* 0.09 -- -- -- -- --
3Q 0.23 0.10 0.16 0.09 -- -- 0.08 -- -- 4Q 0.31 0.13 0.11 -- -- -- -- -- --
Table 4.3.6 SE$ in Difference of 2003 and 2004 Start Rates in Delhi (South) 1Q 0.12 0.09 0.07 0.05 0.06 -- -- -- -- 2Q 0.12 0.12 0.05 0.05 -- -- -- -- -- 3Q 0.11 0.09 0.06 0.05 -- -- 0.04 -- -- 4Q 0.13 0.13 0.06 -- -- -- 0.06 -- --
* Significantly different at 1 per level of significance --: Nil/Negligible
Table 4.3.7 Start Rate Matrix@ in Delhi (South) 1Q 0.48 0.24 0.09 0.06 0.07 -- -- -- -- 2Q 0.68 0.33 0.05 0.05 -- -- -- -- -- 3Q 0.54 0.16 0.08 0.05 -- -- 0.04 -- -- 4Q 0.56 0.32 0.05 -- -- -- 0.06 -- --
4.4 Case Study of Saswad
4.4.1 In Saswad, of the 44 permits issued in 2003, 38 (86.4 per cent) were for SHU
while 6 (13.6 per cent) were for MHU. Among the 48 permits issued in 2004,
29 (60.4 per cent) were for SHU while 19 (39.6 per cent) were for MHU. The
quarter wise breakup of the permits issued is given in Table 4.4.1. It is found
that in the second quarter in 2003, only one permit was issued.
4.4.2 As the number of permits was small, all the permit sites were covered in the
survey. One permit issued in 2004 was found to be providing no information
on type of the building in the permit document as well as in the sample
survey. Hence this permit was excluded from the analysis.
4.4.3 12.1 per cent of the SHU and 18.2 per cent of MHU for which permits issued
in 2003 had not stared the construction till the date of survey. Similarly, in

case of the permits issued in 2004, for 10.3 per cent of the SHU and 16.7 per
cent of MHU, construction has not started till the date of the survey.
Table 4.4.1 - Total Number of Permits Issued in Saswad Type
Year Quarter SHU MHU Total 1Q 10
83.3% 2
16.7% 12
100% 2Q 1
100% 0
0% 1
100% 3Q 11
84.6% 2
15.4% 13
100% 4Q 16
88.9% 2
11.1% 18
100%
2003
Total 38 88.6%
6 11.4%
44 100%
1Q 7 43.8%
9 56.3%
16 100%
2Q 8 88.9%
1 11.1%
9 100%
3Q 8 50.0%
8 50.0%
16 100%
4Q 6 85.7%
1 14.3%
7 100%
2004
Total 29 60.4%
19 39.6%
48 100%
4.4.4 Saswad being a small centre, the number of permits issued in each quarter
was found to be low. Hence the SHU and MHU were combined together and
a single start rate matrix is compiled. The distribution of the housing starts is
given in Table 4.4.2.
4.4.5 Start rate matrices are obtained separately for 2003 and 2004 using the
methodology described in section 3.4. The results are given in Tables 4.4.3
and 4.4.4
Table 4.4.2- Distribution of Housing Starts in Saswad (per cent)
StartedIssued 1Q2003 2Q2003 3Q2003 4Q2003 1Q2004 2Q2004 3Q2004 4Q2004 1Q2005 2Q2005 3Q2005 Not Started

1Q2003 84.6 15.4 -- -- -- -- -- -- -- -- -- -- 2Q2003 x 100.0 -- -- -- -- -- -- -- -- -- -- 3Q2003 x x 35.3 29.4 -- -- -- -- -- -- 10.8 23.5 4Q2003 x x x 66.7 9.5 -- -- 4.8 -- -- -- 19.0
Started Issued 1Q2004 2Q2004 3Q2004 4Q2004 1Q2005 2Q2005 3Q2005 4Q2005 1Q2006 2Q2006 3Q2006 Not Started
1Q2004 45.8 -- 12.5 8.3 -- -- -- -- -- -- 4.2 29.2 2Q2004 x 33.3 44.4 22.2 -- -- -- -- -- -- -- -- 3Q2004 x x 71.9 8.8 18.4 -- -- 0.9 -- -- -- -- 4Q2004 x x x 71.4 -- -- -- -- -- -- -- 28.6
x: Not computable --: Nil/Negligible
Table 4.4.3 Start Rate Matrix in Saswad for 2003
1Q 0.85 0.10 -- -- -- -- -- -- -- 2Q 1.00 0.15 -- -- -- -- -- -- -- 3Q 0.35 -- -- -- -- -- -- -- 0.11 4Q 0.67 0.29 -- -- 0.05 -- -- -- --
Table 4.4.4 Start Rate Matrix in Saswad for 2004
1Q 0.46 -- 0.18 -- -- -- -- -- 0.04 2Q 0.33 -- -- -- -- -- -- -- -- 3Q 0.72 0.44 0.13 -- -- -- -- -- -- 4Q 0.71 0.09 0.22 0.08 -- 0.01 -- -- --
--: Nil/Negligible --: Nil/Negligible
4.4.6 The absolute difference between the matrices constructed by following the
permits issued in 2003 and 2004 and the corresponding standard errors of the
differences are reported in Table 4.4.5 and 4.4.6 respectively. The statistical
significance in the difference was tested using the asymptotic test of equality
of proportionsξ. At 1 per cent level of significance, the start rates for 2003 and
2004 are found to be significantly different in 5 cells. Also, the extent of
difference is found to be high here (Table 4.4.5).
Table 4.4.5 Absolute Difference in 2003 and 2004 Start Rates in Saswad
1Q 0.39* 0.10 0.18 -- -- -- -- -- 0.04
2Q 0.67* 0.15 -- -- -- -- -- -- --
3Q 0.37*
0.44*
0.13* -- -- -- -- -- 0.11
4Q 0.05 0.21 0.22 0.08 0.05 0.01 -- -- --
Table 4.4.6 SE$ in Difference of 2003 and 2004 Start Rates in Saswad 1Q 0.14 0.08 0.08 -- -- -- -- -- 0.04 2Q 0.16 0.36 -- -- -- -- -- -- -- 3Q 0.12 0.05 0.03 -- -- -- -- -- 0.08 4Q 0.20 0.15 0.16 0.10 0.05 0.04 -- -- --
* Significantly different at 1 per level of significance --: Nil/Negligible 4.4.7 The start rate matrix obtained by combining the matrices for 2003 and 2004 is
given in Table 4.4.7.
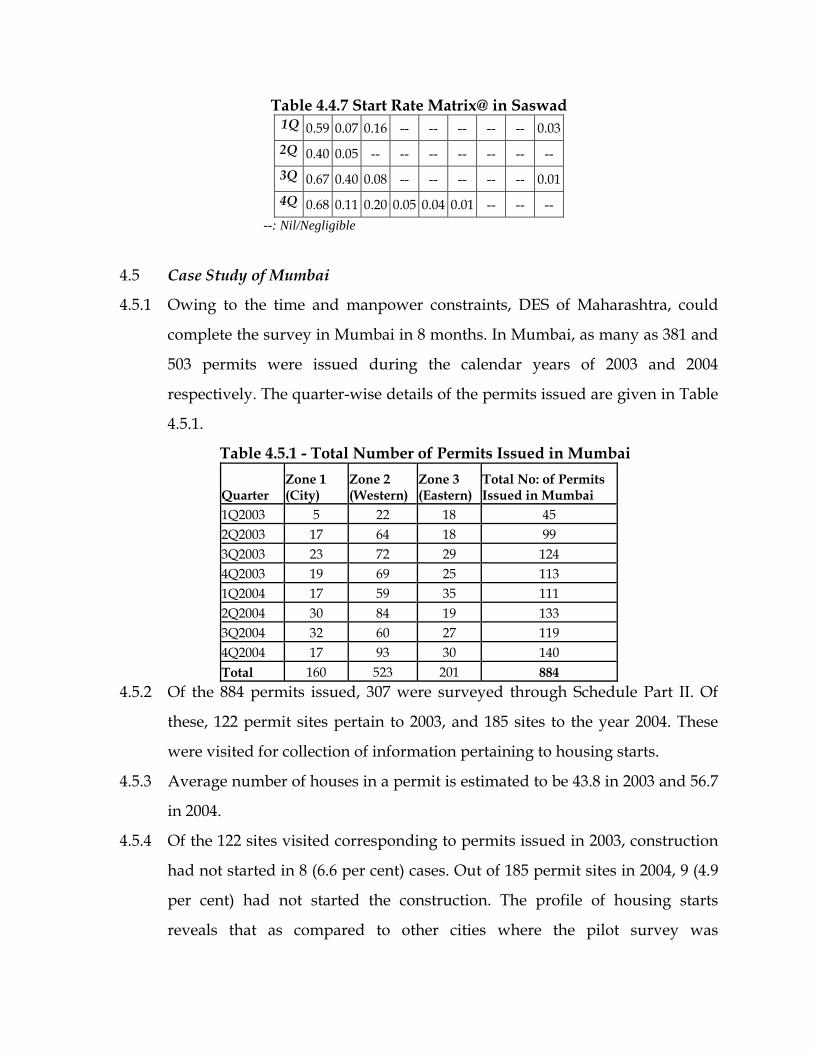
Table 4.4.7 Start Rate Matrix@ in Saswad 1Q 0.59 0.07 0.16 -- -- -- -- -- 0.03 2Q 0.40 0.05 -- -- -- -- -- -- -- 3Q 0.67 0.40 0.08 -- -- -- -- -- 0.01 4Q 0.68 0.11 0.20 0.05 0.04 0.01 -- -- --
--: Nil/Negligible
4.5 Case Study of Mumbai
4.5.1 Owing to the time and manpower constraints, DES of Maharashtra, could
complete the survey in Mumbai in 8 months. In Mumbai, as many as 381 and
503 permits were issued during the calendar years of 2003 and 2004
respectively. The quarter-wise details of the permits issued are given in Table
4.5.1.
Table 4.5.1 - Total Number of Permits Issued in Mumbai
Quarter Zone 1 (City)
Zone 2 (Western)
Zone 3 (Eastern)
Total No: of Permits Issued in Mumbai
1Q2003 5 22 18 45 2Q2003 17 64 18 99 3Q2003 23 72 29 124 4Q2003 19 69 25 113 1Q2004 17 59 35 111 2Q2004 30 84 19 133 3Q2004 32 60 27 119 4Q2004 17 93 30 140 Total 160 523 201 884
4.5.2 Of the 884 permits issued, 307 were surveyed through Schedule Part II. Of
these, 122 permit sites pertain to 2003, and 185 sites to the year 2004. These
were visited for collection of information pertaining to housing starts.
4.5.3 Average number of houses in a permit is estimated to be 43.8 in 2003 and 56.7
in 2004.
4.5.4 Of the 122 sites visited corresponding to permits issued in 2003, construction
had not started in 8 (6.6 per cent) cases. Out of 185 permit sites in 2004, 9 (4.9
per cent) had not started the construction. The profile of housing starts
reveals that as compared to other cities where the pilot survey was

conducted, the start rate in Mumbai is relatively low in first few quarters
(Table 4.5.2)
Table 4.5.2- Distribution of Housing Starts in Mumbai (per cent) Started Issued 1Q2003 2Q2003 3Q2003 4Q2003 1Q2004 2Q2004 3Q2004 4Q2004 1Q2005 2Q2005 3Q2005 Not Started 1Q2003 6.3 41.8 14.8 6.6 9.0 6.9 1.2 -- -- -- 3.4 10.0 2Q2003 x 20.9 27.7 7.3 3.8 6.5 9.2 0.6 12.7 -- 7.5 3.7 3Q2003 x x 21.1 17.4 23.9 3.4 -- 9.7 5.5 -- 13.3 5.6 4Q2003 x x x 12.1 27.7 30.1 -- 0.9 -- 6.3 13.9 9.0 StartedIssued 1Q2004 2Q2004 3Q2004 4Q2004 1Q2005 2Q2005 3Q2005 4Q2005 1Q2006 2Q2006 3Q2006 Not Started 1Q2004 10.6 39.3 1.5 2.1 5.9 20.1 0.1 -- -- -- 2.4 18 2Q2004 x 45.7 12.4 24.9 2.6 5.9 4.3 1.2 -- -- 0.9 2.2 3Q2004 x x 33.3 50.1 0.8 5.2 1 4.4 -- -- 5.2 -- 4Q2004 x x x 48.9 25.9 12.8 6.1 0.7 -- -- 0.6 5.0 x: Not computable --: Nil/Negligible
4.5.5 Start rate matrices obtained separately for 2003 and 2004 are given in Tables
4.5.3 and 4.5.4 Table 4.5.3 Start Rate Matrix in Mumbai for 2003
1Q 0.06 0.28 0.24 0.04 0.09 -- 0.06 0.13 0.03 2Q 0.21 0.42 0.30 0.03 0.07 0.07 0.06 0.00 0.08 3Q 0.21 0.28 0.15 0.00 0.00 0.09 -- 0.14 0.13 4Q 0.12 0.17 0.07 0.07 0.01 0.10 -- -- --
Table 4.5.4 Start Rate Matrix in Mumbai for 2004 1Q 0.11 0.26 0.01 0.03 0.06 -- -- -- 0.02 2Q 0.46 0.39 0.13 0.05 0.06 0.20 -- -- 0.01 3Q 0.33 0.12 0.02 0.06 0.01 0.04 -- 0.01 0.05 4Q 0.49 0.50 0.25 0.02 0.01 0.04 0.01 -- --
--: Nil/Negligible --: Nil/Negligible
4.5.6 The absolute differences between the matrices obtained through the permit
issued in 2003 and 2004 and the corresponding standard errors$ of these
differences are reported in Table 5 and 6 respectively. The statistical
significance in the difference was tested using the asymptotic test of equality
of proportionsξ. At 1 per cent level of significance, the start rates based on
permits issued in 2003 and 2004 were found to be different in quiet a few
cells. (Table 4.5.5).
4.5.7 The matrix obtained by combining the start rate matrices for 2003 and 2004 is
given in Table 4.5.7.

Table 4.5.5 Absolute Difference in 2003 and 2004 Start Rates in Mumbai 1Q 0.05* 0.02 0.23* -- 0.03* -- 0.06* 0.13* -- 2Q 0.25* 0.03 0.17* 0.02 -- 0.13* 0.06* -- 0.07* 3Q 0.12* 0.15* 0.13* 0.06* -- 0.05* -- 0.13* 0.08* 4Q 0.37* 0.33* 0.18* 0.05* -- 0.05* -- -- --
Table 4.5.6 SE$ of Difference of 2003 and 2004 Start Rates in Mumbai 1Q 0.01 0.02 0.01 0.01 0.01 -- 0.01 0.01 0.01 2Q 0.01 0.02 0.01 0.01 0.01 0.01 0.01 0.00 0.01 3Q 0.02 0.02 0.01 0.01 -- 0.01 0.00 0.01 0.01 4Q 0.01 0.01 0.01 0.01 -- 0.01 -- -- --
* Significantly different at 1 per level of significance --: Nil/Negligible
Table 4.5.7 Start Rate Matrix@ in Mumbai 1Q 0.10 0.27 0.09 0.03 0.07 -- 0.02 0.05 0.03 2Q 0.36 0.40 0.20 0.05 0.06 0.17 0.02 -- 0.03 3Q 0.29 0.18 0.05 0.04 -- 0.06 -- 0.06 0.08 4Q 0.35 0.39 0.18 0.03 -- 0.06 -- -- --
--: Nil/Negligible
4.6 Compilation of HSUI – An Illustration of the Methodology
4.6.1 The Housing Starts figure for the quarters corresponding to recent year say
2008 can be obtained based on the methodology given in Section 3.4. For
example if the housing starts figure corresponding to Delhi (South) (C) for
the 4th Quarter of 2008 can be obtained as illustrated below. Let
4 2008 3 2008 1 2007, ,...Q Q QP P P be the permits issued in Delhi(South)(C) for the 4th
Quarter of 2008 and the previous 7 quarters i.e corresponding to 4th Quarter
of 2008, 3rd Quarter 2008……up to 1st Quarter 2007. All the permits issued in
Delhi(South) (C) during 4th Quarter of 2006 to 1st Quarter 2005 will be
cumulated together to obtain the ninth value 9P . As we are interested in
obtaining the housing starts corresponding to 4th Quarter 2008 of Delhi
(South) the start rates are obtained from the 4th row of Start Rate Matrix
corresponding to Delhi (South) (C) (Table 4.3.7). Using the methodology
suggested in Section 3.4 the housing starts for 4th Quarter 2008 of Delhi
(South) (C) can be obtained as:

4 2008 4 2008 3 2008 2 2008 1 2008 4 2007
3 2007 2 2007 1 2007 9
0.56* 0.32* 0.05* 0* 0*
0* 0.06* 0* 0*Q C Q Q Q Q Q
Q Q Q
S P P P P P
P P P P
= + + + +
+ + + +
Similarly the housing starts corresponding to other centers can also be
worked out.
4.6.2 The present section presents the methodology for the compilation of HSUI
within the analytical framework as discussed in the section 3.5. Let there be n
centers. The objective of the exercise is simply to elaborate the steps involved
and understand the empirical difficulties in this effort.
4.6.3 Let HSUI be calculated with 2003 as the base year. The average number of
houses started in 2003 for the n centres say C1, C2, …Cn be
2003 1, 2003 2, 2003, , ,C C CnS S S . The average FSAs pertaining to the year 2003, for n
centres be 2003 1, 2003 2, 2003, , ,C C CnA A A .
4.6.4 Let 4 2008 1, 4 2008 2, 4 2008, , ,Q C Q C Q CnS S S be the Housing Starts complied for the 4th
Quarter 2008 for the n centres C1, C2, …Cn respectively. Then the HSUI for
the 4th Quarter 2008 based on the description given in Section 3.5 can be
calculated based on the formulae:
4 2008 1 2003 1 4 2008 2 2003 2 4 2008 20034 2008
2003 1 2003 1 2003 2 2003 2 2003 2003
* * ** * *
Q C C Q C C Q Cn CnQ
C C C C Cn Cn
S A S A S AHSUI
S A S A S A+ + + +
=+ + + +
4.7 Difficulties and Limitations of the Exercise
4.7.1 All requisite information sought to be collected through Schedule Part I are
available with the permit issuing authorities. Unfortunately, these are not
available in the computerised form in many cases. It therefore became
necessary to cull out the information from the registers and files maintained
mostly in hand written form.

4.7.2 In the permit data, collected through Schedule Part-I (Survey of Building
Permits), the data corresponding to some variables, for example number of
housing units in the building, plinth area of the building and height of the
building are not available even in the registers maintained by the concerned
authorities. Hence the field staff had to go through the individual files for
collecting the requisite information. In some centers (for example, Delhi),
even the files did not contain the required information in several cases.
4.7.3 The information on the number of units in a Multiple Housing Unit (MHU),
for which permission has been given, have been collected through Schedule
Part-I but not very satisfactorily. This is a very important piece of information
for working out housing starts. Importantly, this information was captured in
the survey through Schedule Part-II (Sample Survey of Housing Starts) which
was used for estimating the total number of housing units in the permits.
4.7.4 In case of MHU, it is difficult to ascertain the exact date by which
construction can be taken to have started for each individual housing units.
Hence all the housing units in an MHU are assumed to be started when the
excavation or footing was laid for the building.
4.7.5 Some of the sites for which permits to construct houses were issued were
found to be not occupied at the time of the survey and consequently the Part
II schedule could not be canvassed. In some cases, the builder after handing
over the building to the owner had shifted to a new address. In these cases,
too, certain vital information like time of the building start could not be
collected.
4.7.6 Some divergence was noted in the type of the permit issued as per the official
records and the actual permit document, during the field survey. Some of the
SHU permits were found to MHU and vice versa. However, for the
compilation of the start rate matrices, the data from the field survey (Schedule
Part II) were used.
_____________________ Notes:

ξ Test statistics for testing the equality of proportions is given by [(s1-s2)/SE] which follows N(0,1) asymptotically, where s1 and s2 corresponds to the start rates obtained in 2003 and 2004. $ The SE in the difference of start rates is obtained by SQRT (s1(1-s1)/n1+s2(1-s2)/n2) @ The combined start rate s = (n1s1+n2s2)/(n1+n2).

Section 5
RECOMMENDATIONS
5.1 Objective and Scope
5.1.1 The objective of constructing a Housing Start-Up Index (HSUI) is to measure
the change in the level of activities in housing sector and to identify the
growth/recessionary tendencies in this and related sectors of the economy.
5.1.2 The scope of HSUI would be limited to new built residential units in urban
India, whose construction is authorised through issuance of building permits.
5.1.3 The HSUI may be constructed based on two sets of data
(a) The start up coefficients reflecting the recent experience of conversion
of housing permits into housing starts and (b) the number of permits issued
during the last two years or so. The Group recognized the fact that besides
these, actual housing starts in any quarter are likely to be influenced by a host
of other factors like price of building material, interest rate for housing loans,
policy pronouncements, legislations, administrative orders affecting
construction sector etc. To a certain extent, these factors would affect the
demand and supply parameters of the housing market and consequently the
number of permits issued, with possibly a time lag of a few months. One
could, therefore, argue that these factors are included in the model through
the number of permits.
5.1.4 The start up coefficients, computed from the data in recent past, reflect
institutional and social response to housing permits in terms of their
conversion into actual housing starts. The time required for administrative
and procedural clearance after the issuance of permits, time taken to complete
the formalities of obtaining loans, organizing material, community rituals etc.
are considered to be rigid or fixed, at least in the short run. As housing is a
long term decision, predictions based on these coefficients, that reflect to
some extent procedural and social rigidities governing the house construction
process, are likely to be fairly reliable.

5.1.5 The objective is to release the HSUI that can be used by housing related
agencies as the basic or core predictor. The agencies can combine the index
with other short term indicators and policy variables to come to more
definitive projections of housing activity.
5.2 Periodicity
5.2.1 The Group observes that the present system of data collection, as reported by
National Building Organization along with its formats may be fine tuned to
obtain the requisite data on building permits on a quarterly basis. This would
constitute the basic information for constructing the Housing Start-Up Index.
5.2.2 Conducting a field survey with adequate coverage of the urban centres that
can be representative of the country as a whole would be the first step in
institutionalising a system for regular release of HSUI. The Group
recommends that this survey may be conducted once in three years for
estimating/updating the start rate matrices for each of the selected centres.
These start rates are to be used for computing the housing start figures in
each of these centres using the data on building permits. These can then be
aggregated to construct and release the HSUI on a quarterly basis.
5.2.3 The field survey for estimating the start rate matrices can be done in two
phases. In the first phase, the data on building permits can be collected in the
selected centres using Survey on Building Permits (SBP). The reference year
for this survey would have to be three to four years before the date of
conducting the Survey on the Housing Starts (SHS). The SHS is to be
conducted in the second phase to determine the percentage distribution of the
housing starts over the eight quarters (after the issuance of the permit,
including the quarter of issuing) and thereafter and build start rate matrices
in each of the centres.

5.3 Geographical Coverage
5.3.1 The Group recommends that as an initial effort, the HSUI may be launched
based on such coefficient matrices constructed for 6 Metros and a select
sample of Class I towns based on SBP and SHS. Small towns can be included
at a later stage as it is found from the pilot survey that the number of housing
starts in small centres is relatively less.
5.4 Sampling Method and Tools
5.4.1 The urban centres can be selected based on the number of permits issued as
per the latest available data on building permits, by using probability
proportional to size (PPS) method, so as to adequately represent of the total
building permits issued at All India level. At the initial stage, when the
exercise is limited to large cities only, appropriate adjustment in the method
of city election may be made to make the sample representative of all class I
cities.
5.4.2 Survey of Building Permits: The SBP can be conducted by collecting the
details of all permits issued for new residential construction from permit
issuing authorities of the selected centres, using Schedule –Part 1 given in
Annex 7.
5.4.3 Survey on the Housing Starts: In this survey, a sample of permits issued for
new residential buildings can be identified. The follow-up of this sample
permits can be done by canvassing the Schedule–Part II of the questionnaire,
as given in Annex 7, to the person responsible for the permit or the concerned
builder. Information relating to starting of construction and other necessary
aspects are to be obtained through this survey. A stratified sampling
procedure as described in section 3.2.4 can be adopted for this survey in each
center.

5.5 Estimation
5.5.1 Housing Starts Rate Matrix: From the data collected from Schedule –Part II,
the number of sample houses started in all the succeeding quarters, staring
from the quarter in which the sample permits are issued till the latest period
can be obtained. In all the centres where pilot study has been conducted, it
was noted that within 8 quarters of permit issue, more than 95 per cent of the
construction gets started. Hence, all the housing units where construction
started, after two year of issue of permits (8 quarters including the quarter in
which permits are issued) are added to obtain the final residual aggregative
coefficient. Based on this data corresponding to each quarter of year, 9 start
rates (1 for the quarter in which permits are issued + 7 for the 7 succeeding
quarters + 1 for all the starts after 1 year) corresponding to 4 different
quarters of a year are worked out. Thus we estimate a 4x9 matrix of start rates
(coefficients). This matrix can be transformed as described in section 3.3.3 to
get the housing start rate matrix. The methodology for estimating housing
start figures for release on a regular basis has been discussed in detail in
section 3.3 of this Report.
5.5.2 It is found in the pilot study that the information on the number of housing
units in a MHU is not available in most of the urban centres. The Group
suggested that SHS can also be used to identify the average number of
housing units in a MHU for different cities. This would be useful for
estimating the number of housing units authorised to build through permits,
in cases when the figure is not available in official records relating to issuance
of permits.
5.5.3 Housing Starts: These start rate (coefficient) matrices can be used to obtain
the housing starts for the selected Metros and Class I towns for which the
regular data on building permits can be obtained without any difficulty on
quarterly basis. The number of houses started in a particular centre for a
particular quarter can be obtained by multiplying the start rates coefficients
with the corresponding number of permits issued in that quarter and

preceding quarters. The choice of the set of start rates to be used depends on
the quarter for which the start rates are to be estimated. The methodology for
compiling the housing starts is described in detail in section 3.4 of this Report.
5.5.4 Housing Start-Up Index: Separate HSUI can be compiled for different Classes
of the centre (for example, Metros, Class 1 cities etc.) as well as for All India
level using the year of Survey on Housing Starts as the base year. The
formulae given below can be used to estimate the HSUI for the quarter t.
01
0 01
n
i iti
t n
i ii
A SHSUI
A S
=
=
=∑
∑
Where n is the number of centres, Ai0 is the average FSA of the ith centre in
the base period; Sit is the number of housing starts in the tth quarter in ith
centre; Si0 is the number of housing starts in the base period in ith centre
5.6 Institutional Arrangement
5.6.1 A Standing Committee may be set up by the Reserve Bank of India to launch
this initiative, monitor its progress, commission and overview the surveys for
constructing start up matrices and consider increasing the scope and coverage
of HSUI over time. It would have official members from the Central Statistical
Organisation, office of the Registrar General, Ministry of Housing and Urban
Poverty Alleviation and other concerned government departments, besides a
few experts in the field.
5.6.2 National Buildings Organisation, Ministry of Housing & Urban Poverty
Alleviation, Government of India is the nodal agency for collection and
dissemination of housing and building construction statistics in the country.
The Group recommends that NBO may collect the data on building permits
issued for the new residential buildings in various centres (metros and class I
cities at the first stage) across the country on a quarterly basis under the
overall guidance of the Standing Committee.

5.6.3 Surveys to determine housing starts coefficients may be conducted every
three years to examine the validity the matrix in use and identifying the areas
where further research needs to be done to increase reliability of the
estimates. RBI may coordinate with NSSO and NBO for the survey, based on
which start rate matrices can be constructed for compilation of the HSUI.
5.6.4 An Advisory Committee on HSUI may be formed at NBO to guide and
oversee the entire process of compilation of housing permit data from
concerned local bodies and the Department of Economics and Statistics of the
state governments, as specified by the Standing Committee, on a regular
basis. The Advisory Committee may have members from Reserve Bank of
India, National Statistical Commission, Central Statistical Organisation,
National Sample Survey Organisation, Directorate of Economics and Statistics
of select states that have a large number of Class I cities.


Annex-2
Building Permit Survey in Canada
Target population The Building Permits Survey targets all Canadian municipalities that issue permits. At present more than 2,350 Canadian municipalities, representing all provinces and territories and encompassing 95% of the Canadian population, are covered by the survey. In practice, all urban agglomerations are represented in the survey, as well as a high percentage of rural municipalities. All of these municipalities are surveyed. The municipalities comprising the remaining 5% are not included in the survey, and the figures are not adjusted to represent them. They make up very small portions of the population, and their construction activities have little impact on the total. Non-responding municipalities that issue permits are urged on a regular basis to respond to the survey.
Instrument design The Building Permits Survey questionnaire was designed to capture the basic information included in permits issued by municipalities: permit number, type of project, type of work, value of the work, total building area and the addresses of the builder, the owner and the construction site. The questionnaire has not changed in recent years, since reports received from municipalities suggest that the kind of information included in permits is the same as the kind of information requested in the questionnaire.
Sampling This survey is a census with a cross-sectional design.
Data sources Responding to this survey is mandatory. Data are collected directly from survey respondents. The survey is usually conducted by mail, but to reduce their overhead, a number of municipalities are choosing to file computerized reports electronically. A few municipalities are opting to respond by telephone. The municipal officer responsible for issuing permits is asked to complete a form each month describing all major construction projects. A set of six questionnaires and envelopes is sent out at the respondent's request. Respondents are asked to return the report no later than 10 days after the end of the month. Beginning on the 11th day, non-reporting municipalities are contacted by telephone. The calls continue until the end of the collection period. Non-reporting municipalities are called at least three times. In the last week of each month, municipalities that have failed to file their reports for a number of months in the year are re-contacted in an effort to obtain the missing reports.

Error detection Most reporting and data entry errors are corrected through computerized input and complex data review procedures. Strict quality control procedures are applied to ensure that collection; coding and data processing are as accurate as possible. Checks are also performed on totals and the magnitude of data. Reports that fail to meet the quality standards are subject to verification and are corrected as required. The fact that building permit data are extracted from municipal administrative documents and that a growing number of municipalities are producing computerized reports substantially lowers the risk of reporting errors.
Imputation Data are imputed for municipalities that fail to send in their reports for the current period. The data are calculated automatically, subject to certain constraints, by applying the month-to-month and year-to-year variations in similar values of responding municipalities and the historical pattern of the missing municipalities to the previously used values. At the end of the year, the imputed values are replaced with actual data received from late-reporting municipalities and final estimates are produced. If the actual data are not received, current values that have been imputed are assigned a value of 0 to replace the imputed data. When partial survey data are received (for example, the value of a project is missing), the missing characteristics are imputed on the basis of the average values for similar projects in the municipality's area. No adjustment is made for permit under-valuation or for failure to apply for a permit for construction work.
Quality evaluation The initial purpose of the Building Permits Survey is to collect information about construction intentions. The data and trends from the survey are periodically compared with Canada Mortgage and Housing Corporation data on housing starts and Public and Private Investment Survey data for the non-residential sector. In addition, a number of municipalities publish their own figures for the value of building permits issued. Those figures are matched against the results of the Building Permits Survey. The comparisons are used to assess the quality and consistency of the data series.
Disclosure control Statistics Canada is prohibited by law from releasing any data which would divulge information obtained under the Statistics Act that relates to any identifiable person, business or organization without the prior knowledge or the consent in writing of that person, business or organization. Various confidentiality rules are applied to all data that are released or published to prevent the publication or disclosure of any information deemed confidential. If necessary, data are suppressed to prevent direct or residual disclosure of identifiable data.

Revisions and seasonal adjustments Seasonal adjustment is performed by the X11-ARIMA method, version 2000. Seasonally adjusted data for the total number of housing units and the aggregate value of building permits are obtained indirectly, i.e., by adding up their seasonally adjusted components. The total number of dwelling units is obtained by summing the seasonally adjusted data for single-family and multiple units. The total value of building permits is obtained by summing the following elements: residential, industrial, commercial and institutional. Some series contain no apparent seasonality. In these cases, unadjusted values have been tabulated and aggregated to the adjusted values of the other series. At the end of the year, the seasonally adjusted time series are revised to take into account the most recent seasonal fluctuations. Usually, only the last three years are subjected to this revision process

Annex-3
Housing Starts –United States
I. PURPOSE
The purpose of the New Residential Construction press release is to provide statistics on the construction of new privately-owned residential structures in the United States. Data included in the press release are (1) the number of new housing units authorized by building permits; (2) the number of housing units authorized to be built, but not yet started; (3) the number of housing units started; (4) the number of housing units under construction; and (5) the number of housing units completed. The data relate to new housing units intended for occupancy and maintained by the occupants. They exclude hotels, motels, and group residential structures such as nursing houses and college dormitories. Also excluded are "HUD-code" manufactured (mobile) house units.
II. DEFINITIONS
New Residential Construction
The category of statistics called "New Residential Construction" consists of data on the five phases of a residential construction project. This is 1) housing units authorized to be built by a building or zoning permit; 2) housing units authorized to be built, but not yet started; 3) housing units started; 4) housing units under construction; and 5) housing units completed. New residential construction statistics exclude group quarters (such as dormitories and rooming houses), transient accommodations (such as transient hotels, motels, and tourist courts), "HUD-code" manufactured (mobile) houses, moved or relocated buildings, and housing units created in an existing residential or nonresidential structure. However, in a new building combining residential and nonresidential floor areas, every effort is made to include the residential units in these statistics, even though the primary function of the entire building is for nonresidential purposes. These statistics only include privately-owned buildings. Publicly owned housing units are excluded from the statistics. Units in structures built by private developers with partial public subsidies or which are for sale upon completion to local public housing authorities under the HUD ``Turnkey'' program are all classified as private housing.
Housing Unit
A housing unit, as is a house, an apartment, a group of rooms or a single room intended for occupancy as separate living quarters. Separate living quarters are those in which the occupants live separately from any other individuals in the

building and which have a direct access from the outside of the building or through a common hall. In accordance with this definition, each apartment unit in an apartment building is counted as one housing unit.
"HUD-code" Manufactured (mobile) Houses
A manufactured house is defined as a movable dwelling, 8 feet or more wide and 40 feet or more long, designed to be towed on its own chassis, with transportation gear integral to the unit when it leaves the factory, and without need of a permanent foundation. These houses are built in accordance with the U.S. Department of Housing and Urban Development (HUD) building code. Since these units are typically not covered by the building permits issued in local municipalities, they are excluded from the New Residential Construction statistics.
Building Permits
Statistics on housing units authorized by building permits include housing units issued in local permit-issuing jurisdictions by a building or zoning permit. Not all areas of the country require a building or zoning permit. The statistics only represent those areas that do require a permit. Current surveys indicate that construction is undertaken for all but a very small percentage of housing units authorized by building permits. A major portion typically gets under way during the month of permit issuance and most of the remainder begins within the three following months. Because of this lag, the housing unit authorization statistics do not represent the number of units actually put into construction for the period shown, and should therefore not be directly interpreted as "housing starts."
Housing Units Authorized, but Not Started
Estimates of housing units authorized by a building or zoning permit, but not yet started, are shown in the "authorized, not started" data series. These only represent the areas of the country that require a building or zoning permit.
Housing Starts
The start of construction is when excavation begins for the footings or foundation of a building. All housing units in a multifamily building are defined as being started when excavation for the building has begun. Beginning with statistics for September 1992, estimates of housing starts include units in residential structures being totally rebuilt on an existing foundation. Housing starts are estimated for all areas of the United States, regardless of whether permits are required.

Housing Units Under Construction
Estimates of housing units started, but not yet completed, are shown in the "under construction" data series. Housing units under construction are estimated for all areas of the United States, regardless of whether permits are required.
Housing Completions
One-unit structures are defined as completed when all finished flooring has been installed. If the building is occupied before all construction is finished, it is classified as completed at the time of occupancy. In buildings with two or more housing units, all the units in the building are counted as completed when 50 percent or more of the units are occupied or available for occupancy. Housing completions are estimated for all areas of the United States, regardless of whether permits are required.
Residential Building
A residential building is a building consisting primarily of housing units. In a new building combining residential and nonresidential floor areas, every effort is made to include the residential units in these statistics, even though the primary function of the entire building is for nonresidential purposes.
III. SOURCE OF DATA
III.a. Housing Units Authorized by Building Permits
Statistics are based upon reports submitted by local building permit officials in response to a mail survey. Approximately 9,000 of the 20,000 permit issuing places in the United States are surveyed monthly and remaining are surveyed annually.
The data are obtained using Form C-404, "Report of New Privately-Owned Residential Building or Zoning Permits Issued."
When a report is not received, missing data are either obtained from the Survey of Use of Permits (SUP) which is used to collect information on housing starts, or imputed.
Data for SUP are available only for about 900 places for which Census Bureau field representatives list permits.
Imputations are based on the assumption that the ratio of current month authorizations to those of a year ago should be the same for reporting and non-reporting places.
III.b. Housing Units Authorized, but Not Started; Housing Starts; Housing Units Under Construction; and Housing Completions

Estimates of Housing Units Authorized, but Not Started; Housing Starts; Housing Units Under Construction; and Housing Completions are all obtained from the Survey of Construction (SOC).
SOC is comprised of two parts: (1) Survey of Use of Permits (SUP) which estimates the amount of new construction in areas that require a building permit and (2) Non-permit Survey (NP) which estimates the amount of new construction in areas that do not require a building permit. Less than 3 percent of all new construction takes place in non-permit areas.
Data from both parts of Survey of Construction are collected by Census field representatives. For SUP they visit a sample of permit offices and select a sample of permits issued for new housing.
These permits are then followed through to see when they are started and completed. Each project is also surveyed to collect information on characteristics of the structure. For NP, roads in sampled non-permit land areas are driven at least once every three months to see if there is any new construction. Once new residential construction is found, it is followed up the same as in SUP.
The Census field representatives use interviewing software on laptop computers to collect the data.
Facsimiles of the computer-based questionnaires are provided to respondents to familiarize them with the survey. These facsimiles show the questions that are asked for housing units in single-family buildings - Form SOC-QI/SF.1, and in multiunit buildings Form SOC-QI/MF.1.
IV. GEOGRAPHIC COVERAGE
Most statistics in the New Residential Construction release are tabulated only for the United States and four Census Regions. The Survey of Construction does not have a large enough sample size to make state or local area estimates. The only series that is available at a smaller geographic area is the housing units authorized by building permits. Building permit data are collected from individual permit offices, most of which are municipalities; the remainder are counties, townships, or New England and Middle Atlantic-type towns. Since building permits are public records, local area data are available without any confidentiality problems. From local area data, estimates are tabulated for Counties, States, and Metropolitan Areas.
V. SAMPLE DESIGN
The monthly statistics shown for the United States, regions and states are derived from a sample of 9,000 permit-issuing places selected from a universe of 20,000 such places. Selection of the sample was a multiple step process. All permit-issuing places in the 75 Metropolitan Areas (MAs) having the greatest number of housing units authorized in 2002 were selected with certainty. All permit-issuing places in states with a limited number of permit-issuing places were selected with certainty. Permit-issuing places having special data reporting arrangements were selected with

certainty. The remaining places were stratified by state. Within a state, places were ordered by a weighted average of the numbers of housing units authorized in 2000, 2001, and 2002. Places with a large weighted average, varying by state, were selected with certainty. Other places were selected at the rate of 1 in 10.
VI. COMPILATION OF DATA
VI.a. Housing Units Authorized by Building Permits
Survey forms received are edited for such items as units per building, cost per unit, cost per building, numbers too high or low, etc. Estimates are imputed for missing monthly reporters. Monthly building permits data are available in four basic formats: State, Metropolitan Area (MA), County, and Place. Data are tabbed for the current month and for year-to-date. Year-to-date data include any late reports or corrections from prior months. Monthly data are not revised except for the highest aggregates (US and region) after annual processing. State data includes division, region and US data. These are sample based estimates that represent the entire geographic area. MA tables show all MAs, but most do not include complete counts on a monthly basis. The MAs which are completely covered monthly include the 75 MAs having the greatest number of housing units authorized in 2002. The remaining is just the sum of monthly reporters with no estimate for annual reporters. Annual tables include estimates for all permit areas. Monthly county data are the sum of the places requested to report monthly in a county, and for counties not fully covered by monthly reporters, county totals will be incomplete. Annual county totals include estimates for all permit offices. Monthly place level data include municipalities requested to report monthly. Data for all permit-issuing municipalities are available annually. There is a follow-up for non-reporters in which calls are made to delinquent offices to obtain data or correct address information. At the end of the year a second form is mailed to delinquent offices. If an office is 1-4 months delinquent, a form is sent for each missing month, and if 5 or more months delinquent, an annual form is sent. Annual data are obtained by summing monthly data for monthly reporters and using annual data for annual reporters. If both monthly and annual data exist, the annual data are used. If no annual data are received, but there were some months reported, the sum of the monthly reported and imputed data is used rather than the imputed annual data. Building permits data are not sample based on an annual basis, annual data are tabulated from the entire universe of building permit offices.
Methodology Housing Starts: The compilation of the housing starts series is a multistage process. First, an estimate is made monthly of the number of housing units for which building permits have been issued in all permit-issuing places. Second, for each permit selected in the permit-issuing places, an inquiry is made of the owner or the builder to determine in which month and year the unit(s) covered
by the permit was (were) started. In case the units authorized by permits in a particular month are not started by the end of that month, follow-ups are made in successive months to find out when the units were actually started. Ratios are calculated (by type of structure) of the number of units authorized by permits, based on the Building Permits Survey to the number of units authorized by permits based on estimates generated from the Survey of Construction. Separate ratios are calculated for that month and the prior 11 months. The 13th through 18th month back are summed and a ratio is calculated and all months from 19 months back through 60 months (5 years) are summed to get another ratio. These ratios are then applied to the appropriate estimate of the number of units started, based on the 900 SOC permit offices, in the corresponding months or groups of months to provide ratio adjusted estimates of the number of units started for each month or group of months. Adjustments are made to account for those units started prior to permit authorization and for late reports. These adjustments are based on historical patterns of pre-permit starts and late data. No adjustment is made for units in permit areas built without a permit. Third, units identified as started in the monthly canvass of non-permit areas are weighted appropriately to provide an estimate of total housing starts in areas not covered by building permit systems. Adding this estimate of starts in non-permit areas to the estimate of starts in permit-issuing places results in an estimate of total private housing units started. This same methodology is also used for the estimates of housing units authorized but not started, under construction, and completed. The procedure described above is computed by size of structure. A total of 8 different sets of authorization ratios that change from month-to-month are utilized to calculate the number of housing units started by type of structure in permit places. The rates are calculated for one-unit structures for each of the four regions and for all 2 or more unit structures for each of the four regions. Starts by type of structure in non-permit areas are calculated directly in the estimating procedure described above. Adjustments for Non-Reporting of Characteristics Information on selected characteristics, such as purpose of construction or design type, are not reported by every case in our sample. Cases for which characteristics are not reported have been distributed proportionally to those for which the characteristic was reported.
VII. RELIABILITY OF DATA
VII.a. Housing Units Authorized by Building Permits
The portion of residential construction measurable from building permits records is inherently limited since such records obviously do not reflect construction activity outside of areas subject to local permits requirements. For the nation as a whole, less than 2 percent of all privately owned housing units are constructed in areas not requiring building permits. However, this proportion varies greatly from State to State and among Metropolitan Areas. The reported statistics are influenced by the following factors: 1. Some new residential construction work in building permit jurisdictions escapes recording. However, it is assumed that the number of such unrecorded units is very small. 2. Detailed recent evidence is lacking as to how closely the valuation recorded for building permit purposes approximates the dollar amount of construction work involved. 3. Changes in boundaries of localities due to annexations, new incorporations, etc., result in some problems of comparability over time, even for statistics for the same places. 4. Some building permit jurisdictions close their books a few days before the end of the month, so that the time reference for permits is not in all cases strictly the calendar month. To the extent that most of these limiting factors apply rather consistently over an extended period, they may not seriously impair the usefulness of building permit statistics as prompt indicators of trends in residential construction activity. However, the geographic limitations of the data need to be kept in mind. In addition, the dollar volume of residential construction should be used with caution. Due to the nature of the building permit application, it was felt that the valuations may frequently differ from the true cost of construction. Any attempt to use these figures for inter-area comparisons of construction volume must, at best, be made cautiously and with broad reservations.
VII.a.1. Sampling and Non-sampling Errors The estimates for the United States, Regions, Divisions, and States are based on samples and may differ from statistics, which would have been obtained from a complete census using the same schedule and procedures. An estimate based on a sample survey is subject to both sampling error and non-sampling error. The accuracy of a survey result is determined by the joint effect of these errors. Sampling error reflects the fact that only a particular sample was surveyed rather than the entire population. Estimates of the size of the sampling errors are provided by the standard error of the estimates. Non-sampling errors can be attributed to many sources, including: inability to obtain information about all cases in the sample, definitional difficulties, differences in interpretation of questions, inability or unwillingness of respondents to provide correct information, and errors made in processing data. As derived for these statistics, the estimated relative standard errors include part of the effect of non-sampling errors but do not measure any systematic biases in the data.
The particular sample selected for the Building Permits Survey is one of a large number of similar probability samples that, by chance, might have been selected using the same sample design. Each of the possible samples would probably yield somewhat different results. The standard error of a survey estimate is a measure of the variation of all possible survey estimates around the theoretical, complete coverage value. The relative standard error is defined as the standard error divided by the value being estimated. Statistics on Counties and Metropolitan Areas are not based on samples. Although not subject to sampling variability, they are subject to various non-sampling errors. Explicit measures of their effects generally are not available, but it is believed that most of the significant response and operational errors were detected and corrected in the course of the Bureau's review of the data for reasonableness and consistency.
VII.b. Housing Units Authorized, but Not Started; Housing Starts; Housing Units Under Construction; and Housing Completions
These estimates are based on sample surveys and may differ from statistics which would have been obtained from a complete census using the same schedules and procedures. An estimate based on a sample survey is subject to both sampling error and non-sampling error. The accuracy of a survey result is determined by the joint effects of these errors.
VII.b.1. Sampling Errors Sampling error reflects the fact that only a particular sample was surveyed rather than the entire population. Each sample selected for the Survey of Construction is one of a large number of similar probability samples that, by chance, might have been selected under the same specifications. Estimates derived from the different samples would probably differ from each other. The standard error, or sampling error, of a survey estimate is a measure of the variation among the estimates from all possible samples and, thus, is a measure of the precision with which an estimate from a particular sample approximates the average from all possible samples. Estimates of the standard errors have been computed from the sample data for selected statistics. They are presented in the tables in the form of average relative standard errors. The relative standard error equals the standard error divided by the estimated value to which it refers. The sample estimate and an estimate of its standard error allow us to construct interval estimates with prescribed confidence that the interval includes the average result of all possible samples with the same size and design. For example, suppose the Housing Starts table showed that an estimated 110,000 units in one-unit structures were started in a particular month. Further, suppose that the average relative standard error of this estimate is 3 percent. Multiplying 110,000 by 0.03, we obtain 3,300 as the standard error. This means that we are confident, with 2 chances out of 3 of being correct, that the average estimate from all possible samples of one-unit structures started during the particular month is between 106,700 and 113,300 units. To increase the probability to about 9 chances out of 10 that the interval

contains the average value over all possible samples (this is called a 90-percent confidence interval), multiply 3,300 by 1.6, yielding limits of 104,720 and 115,280 (110,000 units plus or minus 5,280 units). The average estimate of one-unit structures started during the specified month may or may not be contained in any one of these computed intervals; but for a particular sample, one can say that the average estimate from all possible samples is included in the constructed interval with a specified confidence of 90 percent. Ranges of 90-percent confidence intervals for estimated percent changes are shown in the text. When the range of the confidence interval contains zero, it is unclear whether there was an increase or decrease; that is, the change is not statistically significant.
VII.b.2. Non-sampling Errors As calculated for these estimates, the relative standard error estimates sampling variation but does not measure all non-sampling error in the data. Non-sampling error consists of both a variance component and a bias component. Bias is the difference, averaged over all possible samples of the same size and design, between the estimate and the true value being estimated. Non-sampling errors are usually attributed to many possible sources: (1) coverage error - failure to accurately represent all population units in the sample, (2) inability to obtain information about all sample cases, (3) response errors, possibly due to definitional difficulties or misreporting, (4) mistakes in recording or coding the data obtained, and (5) other errors of coverage, collection and non-response, response, processing, or imputing for missing or inconsistent data. These non- sampling errors also occur in complete censuses. Although no direct measures of these errors have been obtained, precautionary steps have been taken in all phases of the collection, processing, and tabulation of the data to minimize their influence. . Another source is the adjustment for units started prior to permit authorization and for late reports. The final estimates of privately owned housing units started are adjusted less than 2 percent for pre-permit starts and late reports.
VIII. SEASONAL ADJUSTMENT
Seasonal adjustment is the process of estimating and removing seasonal effects from a time series to better reveal certain non-seasonal features such as underlying trends and business cycles. Seasonal adjustment procedures estimate effects that occur in the same calendar month with similar magnitude and direction from year-to- year. In series whose seasonal effects come primarily from weather the seasonal factors are estimates of average weather effects for each month. Seasonal adjustment does not account for abnormal weather conditions or for year-to-year changes in weather. Seasonal factors are estimates based on present and past experience.

ANNEX-4
4.1 National Buildings Organization National Buildings Organization collects data on current housing and building construction activities in public and private sectors, prices of building materials, wage rates of labour, building permits and completion certificates issued and Building Construction Cost Index for LIG houses constructed by PWD. This information is being collected from 63 major cities and pertains to only authorized construction activities. There exist serious data gaps relating to current statistics on building activity, consumption of buildings materials, employment of building labour, building costs and methods of financing of housing, schedules are revised as recommended by a High Level Group. They had come out with new Plan Scheme namely “Urban Statistics for HR and Assessments (USHA)” and "Building Related Information And Knowledge Systems (BRIKS). USHA aims at the development and maintenance of national a database, MIS and knowledge repository relating to urban poverty, slums, housing, construction and other urbanization-related statistics. Whereas BRIKS is a software launched by NBO for online transmission of data relating to housing and building construction activities in the country. The important points of the note submitted by NBO is as follows:
• NBO is currently engaged in collection, collation, analysis and dissemination of housing and construction statistics only in urban areas in the country.
• As part of its activities, NBO on an annual basis with the help of the State Directorate of Economics and Statistics (DES) collects data on: i) Current Housing and Building Construction Activities, both in Public
and Private Sector; ii) Prices of Building Materials and Wage Rates of Labour; iii) Building Permits and Completion Certificates Issued; iv) Building Construction Cost Index for LIG houses constructed by PWD.
• The information is collected relating to no. of projects executed/under execution; no. of dwelling units completed; plinth area added; floor area added; investment made during the year; type of buildings completed/under execution by executing agency etc.
• The information from public sector is collected from all Central Public Sector Undertakings (CPSUs), Central Construction Agencies i.e. CPWD, MES, Railways, P & T, State Construction Agencies and State Public Sector Undertakings (SPSUs) with respect to all the projects being executed or completed and costing Rs. 25 lakhs or more (earlier it was Rs. 50,000 or more).
• The data in respect of the private sector are collected on complete enumeration basis from Class I and Class II towns while a sample of 10% are selected from Class III to Class VI towns, separately for each category of towns in each State, which is collected through Local Urban Bodies (earlier data was collected from the towns having population of 10,000 or more).
• The data on Building Permits and Completion Certificates issued are also collected from Municipalities/Development Authorities of the Towns having
a population of 100,000 and above on calendar year basis. Till now the data was being collected from 281 Municipalities on the basis of 1991 census. Now from 2006 onwards the data is being collected from 445 Municipalities as per 2001 census.
• Difficulties faced by NBO includes 1. The data is having a time lag of 3-4 years. 2. Filing of the above information is not mandatory under any law and
therefore information is not available from major part of the country. 3. No information is collected in respect of the unapproved/unauthorized
constructions • NBO is in the process of developing customized software for online data
transmission using a web-based software. Even though NBO has a system of data collection for the building statistics its periodicity and time lag are critical issues to be solved. As put forward by NBO the installation of BRIKS will help to overcome these issues to a certain extent. The building permits data available with NBO can be used for estimating the housing starts data using the start rates obtained through a sample survey. 4.2 Directorate of Economic and Statistics, Government of Tamil Nadu Data available with DES-TN
• Houses are categorized by their plinth area such as Low Income Group (LIG), Middle Income Group (MIG) and High Income Group (HIG).
• Data source: The state departments of Economics and statistics are the field agencies to collect the data. Construction statistics is two fold: Public Sector and Private sector. Construction in Public sector includes all projects of Public undertakings at a cost of 25 lakhs and above. These data are collected annually from the divisional offices of the public organizations. Private sector constructions include all permissions issued by the local bodies. These permissions may be for residential or non-residential. Till the year 2006-07, the data relating to private sector was being collected quarterly. Only from the current year 2007-08, it is changed annually. This existing data collection method may be fine tuned for the purpose of collecting data on Housing start-up also.
• National Building organization has prescribed a format for collection of data on construction of new houses.
• Number of Building permits issued by the local bodies are collected annually by all the Sate Departments of Economics & Statistics under the guidelines issued by the National Building organization. All the Class I and II towns and 10% of Class III to VI towns selected at random are covered under this system. Average numbers of permits issued from the sample class III to VI towns can be adapted to all Class III and class VI towns of the state. By this, number of permits issued in the state in a year can be worked out.
To conclude with, up to the year 2006-07 ,data on construction permits issued by local bodies were being collected by DES from all the 6 Municipal Corporations, 102 Municipalities , 50 Third Grade Municipalities and 325 Town Panchayats having

population 10,000 and above as per 1991 population census. There are 26 Class I , 56 Class II, 163 Class III , 340 Class IV , 214 Class V and 13 Class VI towns in Tamil Nadu. As per the revised guidelines of NBO, from 2007-08, all Class I and Class II towns in the state and 10 % sample of Class III to Class VI towns are covered under this data collection process. And data collected is on new constructions only. A total of 57361 building permits were issued during the year 2005-06 out of which 23,727 are from Corporations and Municipalities 33,634 are from town panchayats. Details on issuance of building permits are available with DES, Tamil Nadu. Computerisation of Urban Local Bodies in Tamil Nadu: All the 6 Municipal Corporations, 102 Municipalities and 50 third grade municipalities are in the process of implementing e-governance in their public services delivery system. Other municipalities and major town panchayats are also computerizing their functions but computerized data on issuance of building licenses and starting of houses construction may not be available with them. 4.3 Directorate of Economic and Statistics, Government of Delhi
• According to 2001 Census, there were 25.54 lakh households in Delhi compared to 18.62 lakh households in 1991.
• There were 33.80 lakh census houses in 2001 of which 30.02 lakh houses were occupied and 3.78 lakh were vacant. Out of the occupied houses only 23.16 lakh (78.18%) were being used exclusively for residential purposes.
• Piped water supply was available to 19.24 lakh households in 2001 as against 14.09 lakh house-holds in 1991.
• Electricity was available to 23.72 lakh (92.86%) households in 2001 and the balance 7.14% households were dependents on Kerosene, Solar Energy etc.
• Toilet facility was available to 11.61 lakh households. 12.55 lakh households were connected with closed drainage and 10.41 lakhs households with open drainage.
• Separate kitchen facility was available to 16.87 lakh households and 17.37 lakh households were using LPG for cooking purposes in 2001.
Type of Settlements • Due to the lack of adequate developed land at affordable prices to different
categories of residents on the one hand and continuous flow of migrants on the other, various types of unplanned settlements have come up in Delhi. Delhi landscape is marked with following types of settlements with distinctive features of each type in terms of level of civic amenities and the status of houses and land.
• Projected population in 2021 in different type of settlements may be seen in the following Table
S.NO Type of Settlement Population % of total estimated population
1. JJ Clusters
20.72 14.8
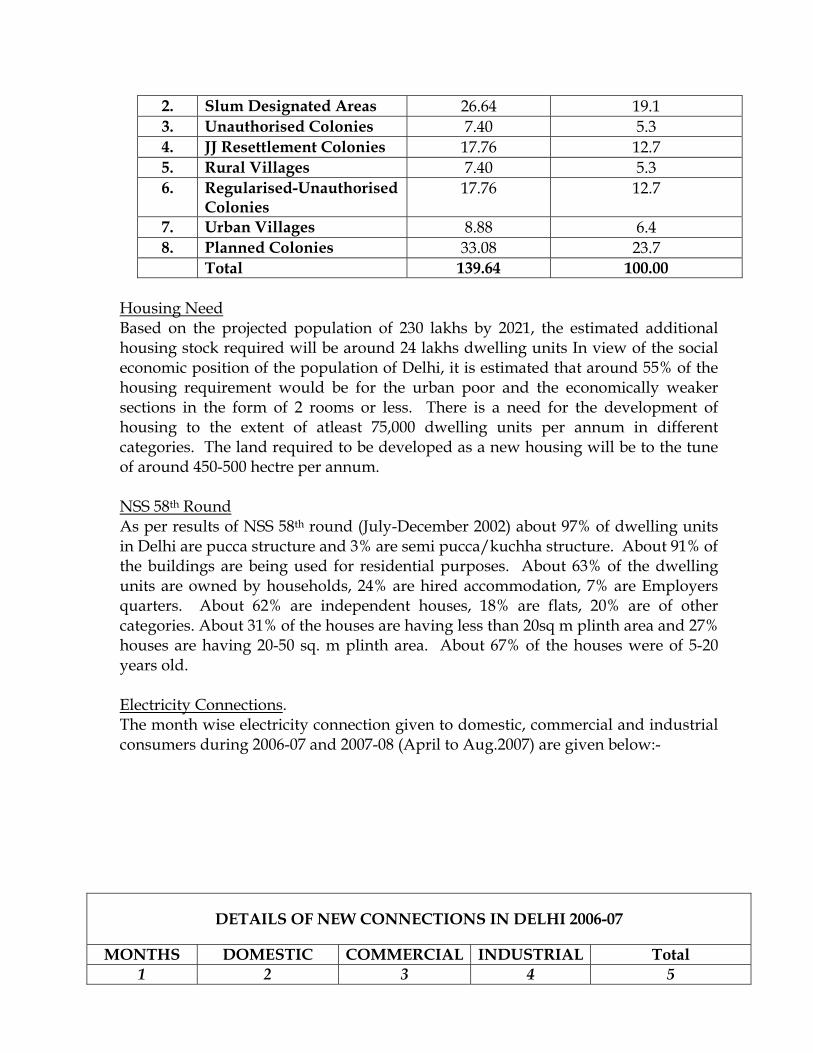
2. Slum Designated Areas 26.64 19.1 3. Unauthorised Colonies 7.40 5.3 4. JJ Resettlement Colonies 17.76 12.7 5. Rural Villages 7.40 5.3 6. Regularised-Unauthorised
Colonies 17.76 12.7
7. Urban Villages 8.88 6.4 8. Planned Colonies 33.08 23.7 Total 139.64 100.00
Housing Need Based on the projected population of 230 lakhs by 2021, the estimated additional housing stock required will be around 24 lakhs dwelling units In view of the social economic position of the population of Delhi, it is estimated that around 55% of the housing requirement would be for the urban poor and the economically weaker sections in the form of 2 rooms or less. There is a need for the development of housing to the extent of atleast 75,000 dwelling units per annum in different categories. The land required to be developed as a new housing will be to the tune of around 450-500 hectre per annum. NSS 58th Round As per results of NSS 58th round (July-December 2002) about 97% of dwelling units in Delhi are pucca structure and 3% are semi pucca/kuchha structure. About 91% of the buildings are being used for residential purposes. About 63% of the dwelling units are owned by households, 24% are hired accommodation, 7% are Employers quarters. About 62% are independent houses, 18% are flats, 20% are of other categories. About 31% of the houses are having less than 20sq m plinth area and 27% houses are having 20-50 sq. m plinth area. About 67% of the houses were of 5-20 years old. Electricity Connections. The month wise electricity connection given to domestic, commercial and industrial consumers during 2006-07 and 2007-08 (April to Aug.2007) are given below:-
DETAILS OF NEW CONNECTIONS IN DELHI 2006-07
MONTHS DOMESTIC COMMERCIAL INDUSTRIAL Total 1 2 3 4 5

Apr. 06 12622 2317 74 15013 May. 06 14272 2981 137 17390 June.06 14939 3116 190 18245 July.07 14709 3221 125 18055 Aug.06 14925 3006 96 18027 Sept.06 14688 3132 109 17929 Oct.06 14236 2703 169 17108 Nov.06 18092 2859 243 21194 Dec.06 18115 3083 179 21377 Jan.07 18319 2856 196 21371 Feb.07 15669 3099 250 19018 Mar.07 17706 3641 233 21580 Total 188292 36014 2001 226307
DETAILS OF NEW CONNECTIONS
(Apr. 2007 to Aug. 2007) MONTHS DOMESTIC COMMERCIAL INDUSTRIAL Total
1 2 3 4 5 Apr. 07 13671 3036 238 16945 May. 07 18554 3681 235 22470 June.07 15491 3143 44 18678 July.07 20452 3885 295 24632 Aug.07 16809 3369 117 20295 Total 84977 17114 929 103020
• It has been observed that during 2006-07 about 2.26 lakh new connections
were given in Delhi. Out of this 1.88 lakhs (84% of the total) were domestic connections.
• The domestic connections varies from 12,000 in April 2006 to the maximum of 18319 in Jan 2007. It is not known whether all the new domestic connection given only for newly constructed houses or some more new connections were given in the existing houses.
Building Plans : In NCT of Delhi there are three local bodies MCD, NDMC and Delhi Cantt. Board. The area and population of these local bodies are as under:-
(As per Census 2001) Local Body Area (In sq. Km) Population (In lakhs) NDMC 42.74 3.02 Delhi Cantt. Board 42.97 1.25 MCD 1397.29 134.23 Total 1483.00 138.51 • Under Type of Settlements in Delhi, only 24% of the total population is residing
under planned colonies and remaining 76% is under unplanned colonies and urban/rural villages etc.

• The Building Plans are sanctioned only for planned areas in Delhi mostly by the MCD.
• The MCD have 12 zones however (In 3 zones namely City, Sadar and Karol Bagh no new building permits were applied)
The Status of number of building plans applied by the residents, sanctioned and number of completion certificate applied/ issued by MCD during 2006-07 are as under:- Name of Zone
Building Plan applied
Building Plans sanctioned
Completion Certificates applied
Completion Certificate issued
Central 444 328 30 22 South 344 222 88 40 Civil Line 284 105 04 - Najafgarh 98 61 16 11 Narela Nil Nil 03 Nil South 336 292 25 3 North 103 58 07 Nil Rohini 588 402 16 01 West 692 376 26 8 Total 2889 1844 215 85

ANNEX- 5
Schedule A 1. Administrative zone /ward of the building 2. Building Permit issue No. 3. Date of the Application for the permission (new house or additional unit) 4. Date of issue of the Permit 5. Name and address of the applicant/key applicant (house owner or
builder) 6. Location of Building (Address) 7. Whether Building contains Single or Multiple Housing Units 8. If Multiple Housing Unit, No. of housing units in the building 9. No. of Storey in the Building (Not including the basement) 10. Use to which the building is to be put 11. Residential/commercial/industrial/other/mixed 12. Total Plinth Area of the building (Sq. ft) 13. Total built up area 14. Breakup of the built up area by use in case of mixed land use 15. In case of extension or rebuilding of a unit, what is the additional area
(new build up area less the area to be forgone or already demolished in the old structure)
16. Height of the building (Ft.)
Schedule B
1. What are the other agencies giving building permission in the same city/urban agglomeration (specify their jurisdictions)
2. What are the documents to be attached for submitting the application. Give details like land ownership paper, site plans, affidavit, including certificates from certified professionals (not to include here permissions to be obtained from any other agency in the city or state)
3. What are the permissions or certificates to be obtained from any other agency before submitting the application or to be attached to that.
4. Are the permissions given in committee meeting held at certain intervals or on day to day basis
5. Is there any other formality to be completed before starting construction once permission is given
6. Is there a maximum stipulated time within which permission (or rejection) has to be accorded.
7. What is the average number of days for giving permission for those who got the permission (give approximate figure based on information since January 2008)

8. How many applications are rejected or referred back for clarification or other formalities (give approximate figure based on information since January 2008)
9. For what period the permission is valid 10. What percentage of permissions fail to get materialized within the stipulated
period (give approximate figure) 11. What is the procedure for renewal or fresh application 12. Can construction begin prior to formal permission or in anticipation of the
permission (mention reasons, circumstances and requirements for that) 13. Does the permission giving agency give permission subsequently in cases
(a) where the construction has started under certain provisions (like a certificate of an architect)
(b) totally illegal construction 14. What are the other milestones in different stages of building construction
when permission giving agency interacts (with the owner or builder) as official requirement such as
(a) At the stage of house start (b) Putting ceiling (c) Getting power connection (d) Getting water connection (e) Completion of construction
15. What percentage of permissions get through the different stages (give approximate figure)
16. What are the implications for non compliance of milestone linked procedures (mentioned in 13) for the builder
17. What are the information sent to Department of Economics and Statistics at the state level
18. How do you think the linkage with DES can be improved

ANNEX-6
Definitions
• Residential Building: A building, which is primarily intended or used for dwelling/housing purposes. Other buildings are non-residential.
• Housing (Dwelling) unit or House: The accommodation availed by a household
for its residential purpose. It may be an entire structure or a part thereof or consisting of more than one structure. There may be cases of more than one household occupying a single structure such as those living in independent flats, in which case, there will be as many housing units as the number of households in the structure. There may also be cases of one household occupying more than one structure (e.g. detached structure for sitting, sleeping, cooking, bathing etc.) for its housing accommodation. In this case, all the structure together constitute a single housing unit.
• New Construction: New construction means the creation of an entirely new
structure, whether or not the site on which it is built was previously occupied.
• Reported permits on residential buildings only include newly owned
residential buildings, which includes all residential buildings owned or partially owned by a private or public company or an individual during the period of construction.
• Reported permits not include commercial buildings, institutional buildings,
industrial buildings and other buildings which include all buildings other than residential, industrial, commercial and institutional buildings e.g. cattle sheds, passenger shelters etc.
• Reported permits not include demolitions, renovations and extensions not
leading to new housing unit/units. • Plinth Area: It means “ground area covered by the building above the plinth
level. In case the building has more than one floor, it means the sum total of plinth areas of all the floors.
• Number of Storey: Number of Storey in building with ground floor only
should be taken as one and it should be taken as ‘two’ if it has ground floor and first floor. It should be given in as similar manner for taller buildings. Barsati etc. on top floor construction may not be counted towards number of storey if covered area in is less than 25 percent of covered area on ground floor.

• Housing Start: Work is begun when the first physical operation, such as, site-operation, delivery of materials and equipment to the site, start of excavation or laying foundation etc. is done after planning and designing stages. All housing units in a multiple housing unit building are defined as being started when excavation for the building has begun. For eg: if a particular building permit contains 50 housing units and the excavation begins for the footing or foundation of that building then it will be considered as 50 housing starts
• Building Completed (Work completed): A building on which work is completed
and which is physically ready for occupation.
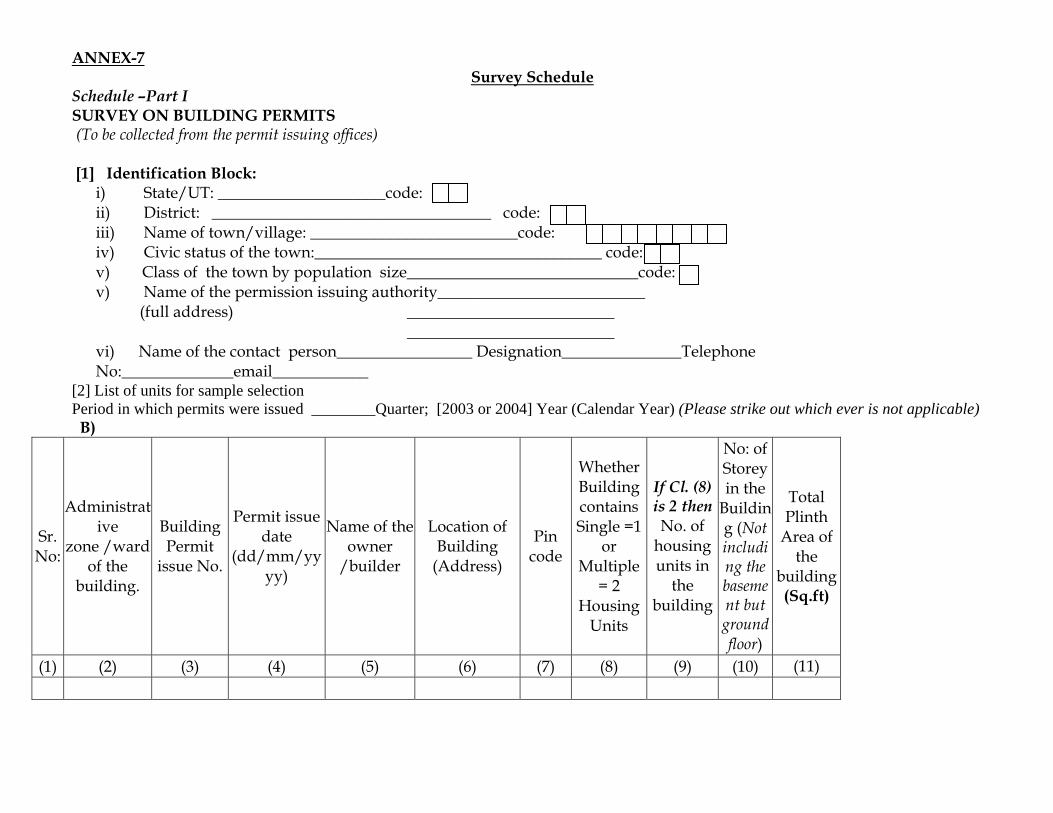
ANNEX-7 Survey Schedule
Schedule –Part I SURVEY ON BUILDING PERMITS (To be collected from the permit issuing offices)
[1] Identification Block:
i) State/UT: _____________________code: ii) District: ___________________________________ code: iii) Name of town/village: __________________________code: iv) Civic status of the town:____________________________________ code: v) Class of the town by population size_____________________________code: v) Name of the permission issuing authority__________________________
(full address) __________________________ __________________________
vi) Name of the contact person_________________ Designation_______________Telephone No:______________email____________
[2] List of units for sample selection Period in which permits were issued ________Quarter; [2003 or 2004] Year (Calendar Year) (Please strike out which ever is not applicable) B)
Sr. No:
Administrative
zone /ward of the
building.
Building Permit
issue No.
Permit issue date
(dd/mm/yyyy)
Name of the owner
/builder
Location of Building
(Address)
Pin code
Whether Building contains Single =1
or Multiple
= 2 Housing
Units
If Cl. (8) is 2 then No. of
housing units in
the building
No: of Storey in the
Building (Not including the basement but ground floor)
Total Plinth
Area of the
building (Sq.ft)
(1) (2) (3) (4) (5) (6) (7) (8) (9) (10) (11)
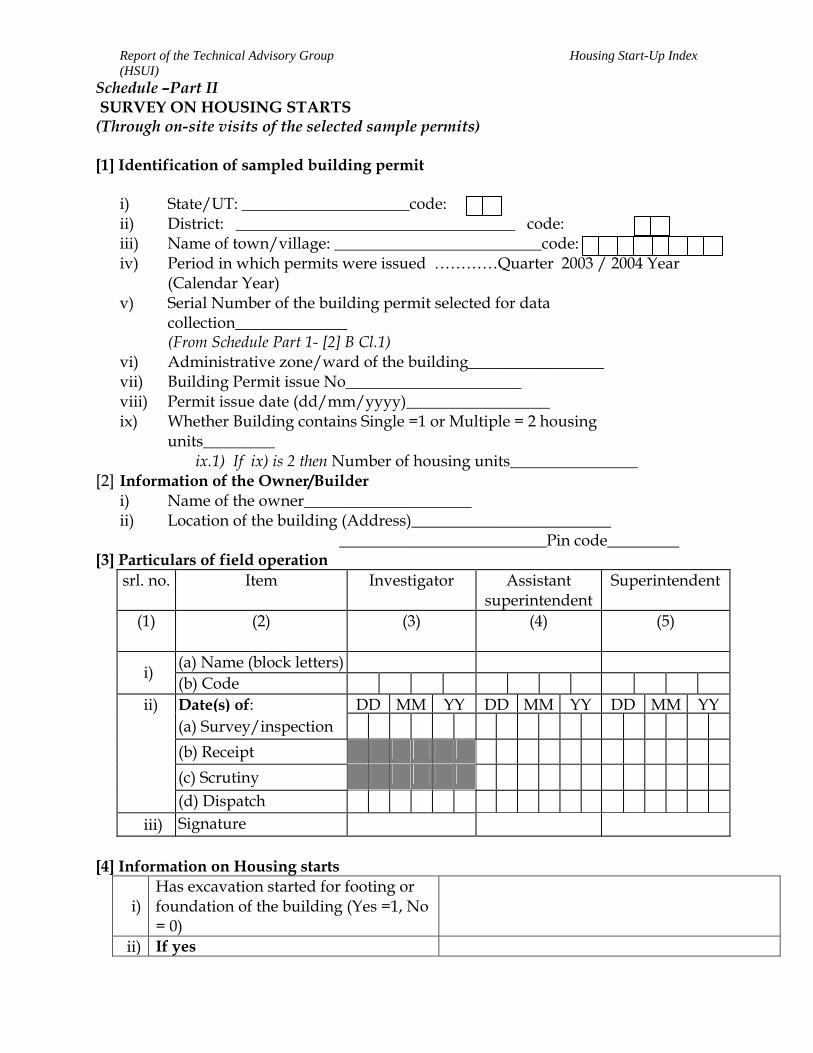
Report of the Technical Advisory Group Housing Start-Up Index (HSUI)
Schedule –Part II SURVEY ON HOUSING STARTS (Through on-site visits of the selected sample permits) [1] Identification of sampled building permit
i) State/UT: _____________________code: ii) District: ___________________________________ code: iii) Name of town/village: __________________________code: iv) Period in which permits were issued …………Quarter 2003 / 2004 Year
(Calendar Year) v) Serial Number of the building permit selected for data
collection______________ (From Schedule Part 1- [2] B Cl.1)
vi) Administrative zone/ward of the building_________________ vii) Building Permit issue No______________________ viii) Permit issue date (dd/mm/yyyy)__________________ ix) Whether Building contains Single =1 or Multiple = 2 housing
units_________ ix.1) If ix) is 2 then Number of housing units________________
[2] Information of the Owner/Builder i) Name of the owner_____________________ ii) Location of the building (Address)_________________________
__________________________Pin code_________ [3] Particulars of field operation
srl. no. Item
Investigator Assistant superintendent
Superintendent
(1) (2) (3)
(4)
(5)
(a) Name (block letters) i) (b) Code Date(s) of: DD MM YY DD MM YY DD MM YY (a) Survey/inspection
(b) Receipt
(c) Scrutiny
ii)
(d) Dispatch iii) Signature
[4] Information on Housing starts
i) Has excavation started for footing or foundation of the building (Yes =1, No = 0)
ii) If yes

(a) When was the building construction started (mm/yyyy)
(b) Number of housing units in the building
(c) Number of storey in the
buildings (Not including the basement but ground floor)
(d) Total plinth area of the buildings (in sq.ft.)
(e) Date of completion (if not
completed expected date) (mm/yyyy)
[5] Remarks by investigator
[6] Comments by supervisory officer(s)

General Instructions 1. Residential Building: A building, which is primarily intended or used for
dwelling/housing purposes. Other buildings are non-residential. 2. Housing (Dwelling) unit: The accommodation availed by a household
for its residential purpose. It may be an entire structure or a part thereof or consisting of more than one structure. There may be cases of more than one household occupying a single structure such as those living in independent flats, in which case, there will be as many housing units as the number of households in the structure. There may also be cases of one household occupying more than one structure (e.g. detached structure for sitting, sleeping, cooking, bathing etc.) for its housing accommodation. In this case, all the structure together constitutes a single housing unit.
3. New Building Construction: New construction means the creation of an entirely new structure, whether or not the site on which it is built was previously occupied.
4. Reported permits on residential buildings should only include newly owned residential buildings, which includes all residential buildings owned or partially owned by a private or private company or an individual during the period of construction.
5. However, in a new building combining residential and nonresidential units (mixed buildings), even though the primary function of the entire building is for nonresidential purposes the permit should be included as the housing units in the mixed building are to be considered for the estimation of housing starts.
6. Reported permits should not include commercial buildings, institutional buildings, industrial buildings and other buildings which include all buildings other than residential, industrial, commercial and institutional buildings e.g. cattle sheds, passenger shelters etc.
7. Reported permits should not include demolitions, renovations and extensions of the existing building.
8. Plinth Area: It means, ground area covered by the building above the plinth level. In case the building has more than one floor, it means the sum total of plinth areas of all the floors.
9. Number of Storey: Number of Storey in building with ground floor only should be taken as one and it should be taken as ‘two’ if it has ground floor and first floor. It should be given in as similar manner for taller buildings. Barsati etc. on top floor construction may not be counted towards number of storey if covered area in is less than 25 percent of covered area on ground floor.
10. Housing start: Work is begun when the first physical operation, such as, site-operation, delivery of materials and equipment to the site, start of excavation or laying foundation etc. is done after planning and designing stages. All housing units in a multiple housing unit building are defined as being started when excavation for the building has begun. For eg: if a particular building permit contains 50 housing units and the excavation
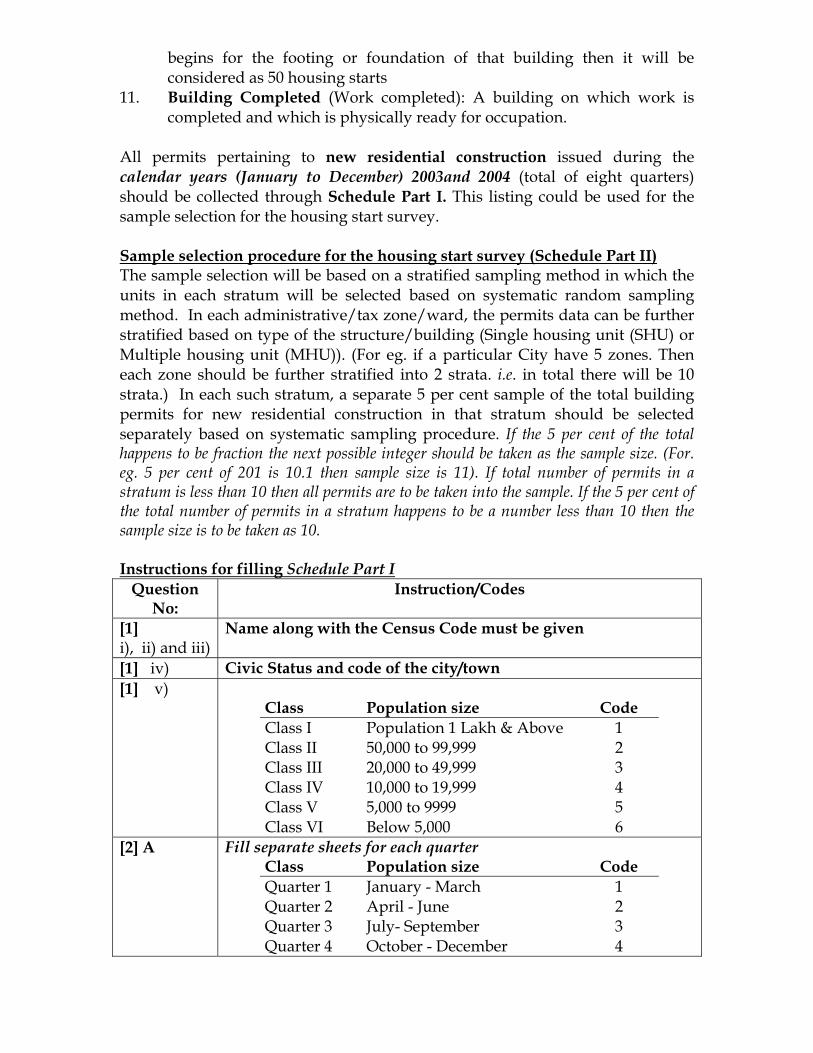
begins for the footing or foundation of that building then it will be considered as 50 housing starts
11. Building Completed (Work completed): A building on which work is completed and which is physically ready for occupation.
All permits pertaining to new residential construction issued during the calendar years (January to December) 2003and 2004 (total of eight quarters) should be collected through Schedule Part I. This listing could be used for the sample selection for the housing start survey. Sample selection procedure for the housing start survey (Schedule Part II) The sample selection will be based on a stratified sampling method in which the units in each stratum will be selected based on systematic random sampling method. In each administrative/tax zone/ward, the permits data can be further stratified based on type of the structure/building (Single housing unit (SHU) or Multiple housing unit (MHU)). (For eg. if a particular City have 5 zones. Then each zone should be further stratified into 2 strata. i.e. in total there will be 10 strata.) In each such stratum, a separate 5 per cent sample of the total building permits for new residential construction in that stratum should be selected separately based on systematic sampling procedure. If the 5 per cent of the total happens to be fraction the next possible integer should be taken as the sample size. (For. eg. 5 per cent of 201 is 10.1 then sample size is 11). If total number of permits in a stratum is less than 10 then all permits are to be taken into the sample. If the 5 per cent of the total number of permits in a stratum happens to be a number less than 10 then the sample size is to be taken as 10. Instructions for filling Schedule Part I
Question No:
Instruction/Codes
[1] i), ii) and iii)
Name along with the Census Code must be given
[1] iv) Civic Status and code of the city/town [1] v)
Class Population size Code Class I Population 1 Lakh & Above 1 Class II 50,000 to 99,999 2 Class III 20,000 to 49,999 3 Class IV 10,000 to 19,999 4 Class V 5,000 to 9999 5 Class VI Below 5,000 6
[2] A
Fill separate sheets for each quarter Class Population size Code Quarter 1 January - March 1 Quarter 2 April - June 2 Quarter 3 July- September 3 Quarter 4 October - December 4
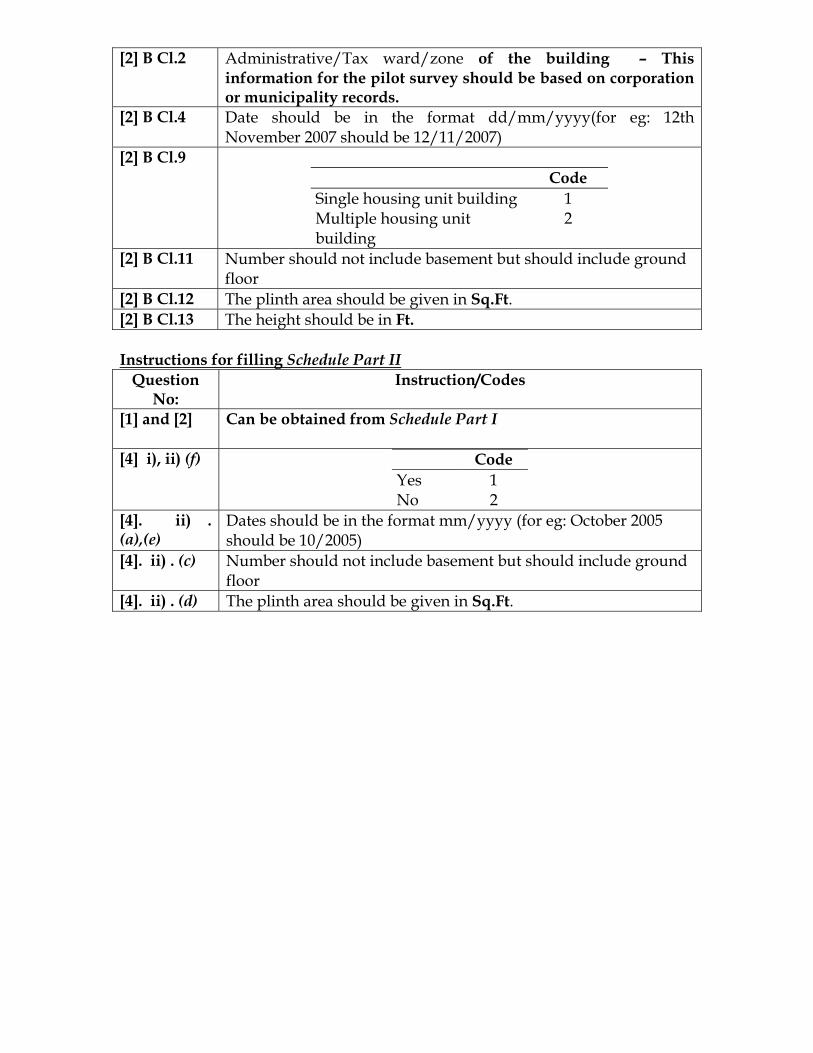
[2] B Cl.2 Administrative/Tax ward/zone of the building – This information for the pilot survey should be based on corporation or municipality records.
[2] B Cl.4 Date should be in the format dd/mm/yyyy(for eg: 12th November 2007 should be 12/11/2007)
[2] B Cl.9 Code Single housing unit building 1 Multiple housing unit building
2
[2] B Cl.11 Number should not include basement but should include ground floor
[2] B Cl.12 The plinth area should be given in Sq.Ft. [2] B Cl.13 The height should be in Ft. Instructions for filling Schedule Part II
Question No:
Instruction/Codes
[1] and [2]
Can be obtained from Schedule Part I
[4] i), ii) (f) Code Yes 1 No 2
[4]. ii) . (a),(e)
Dates should be in the format mm/yyyy (for eg: October 2005 should be 10/2005)
[4]. ii) . (c) Number should not include basement but should include ground floor
[4]. ii) . (d) The plinth area should be given in Sq.Ft.

List of Tables Table 4.1.1 Total Number of Permits Issued – Coimbatore Table 4.1.2 Sample Number of Buildings Visited – Coimbatore Table 4.1.3 Average Floor Space Area – Coimbatore Table 4.1.4 Per cent Distribution of Housing Starts (SHU) – Coimbatore Table 4.1.5 Per cent Distribution of Housing Starts (MHU) – Coimbatore Table 4.1.6 Start Rate Matrix- Coimbatore-MHU- 2003 Table 4.1.7 Start Rate Matrix-Coimbatore - MHU- 2004 Table 4.1.8 Start Rate Matrix-Coimbatore - SHU- 2003 Table 4.1.9 Start Rate Matrix-Coimbatore - SHU- 2004 Table 4.1.10 Absolute Difference in Start Rates – Coimbatore –MHU Table 4.1.11 Absolute Difference in Start Rates-Coimbatore– SHU Table 4.1.12 SE in Difference of Start Rates – Coimbatore- MHU Table 4.1.13 SE in Difference of Start Rates – Coimbatore – SHU Table 4.1.14 Start Rate Matrix -Coimbatore- MHU Table 4.1.15 Start Rate Matrix -Coimbatore- SHU Table 4.2.1 Total Number of Permits Issued –Villupuram Table 4.2.2 Per cent Distribution of Housing Starts –Villupuram Table 4.2.3 Start Rate Matrix –Villupuram –2003 Table 4.2.4 Start Rate Matrix – Villupuram- 2004 Table 4.2.5 Absolute Difference in Start Rates - Villupuram Table 4.2.6 SE in Difference of Start Rates – Villupuram Table 4.2.7 Start Rate Matrix -Villupuram Table 4.3.1 Total Number of Permits Issued -Delhi (South) Table 4.3.2 Per cent Distribution of Housing Starts -Delhi (South) Table 4.3.3 Start Rate Matrix –Delhi (South) – 2003 Table 4.3.4 Start Rate Matrix –Delhi (South)- 2004 Table 4.3.5 Absolute Difference in Start Rates – Delhi (South) Table 4.3.6 SE in Difference of Start Rates – Delhi (South) Table 4.3.7 Start Rate Matrix– Delhi (South) Table 4.4.1 Total Number of Permits Issued –Saswad Table 4.4.2 Per cent Distribution of Housing Starts –Saswad Table 4.4.3 Start Rate Matrix – Saswad- 2003 Table 4.4.4 Start Rate Matrix – Saswad- 2004 Table 4.4.5 Absolute Difference in Start Rates - Saswad Table 4.4.6 SE in Difference of Start Rates –Saswad Table 4.4.7 Start Rate Matrix-Saswad Table 4.5.1 Total Number of Permits Issued –Mumbai Table 4.5.2 Per cent Distribution of Housing Starts –Mumbai Table 4.5.3 Start Rate Matrix – Mumbai- 2003 Table 4.5.4 Start Rate Matrix – Mumbai- 2004 Table 4.5.5 Absolute Difference in Start Rates - Mumbai Table 4.5.6 SE in Difference of Start Rates –Mumbai Table 4.5.7 Start Rate Matrix-Mumbai

List of Graphs
Graph 4.1.1 Distribution of Number of Houses in MHU (year-wise) – Coimbatore