Embed Size (px)
Citation preview
Report
of the
Society of Actuaries
Mortality Improvement
(Life – Reinsurer)
Survey Subcommittee
April 2012
Society of Actuaries 475 N. Martingale Rd., Ste. 600
Schaumburg, IL 60173 Phone: 847-706-3500 Fax: 847-706-3599
Web site: http://www.soa.org
Copyright © 2012 by the Society of Actuaries All rights reserved by the Society of Actuaries. Permission is granted to make brief excerpts for a published review. Permission is also granted to make limited numbers of copies of items in this issue for personal, internal, classroom or other instructional use on the condition that the foregoing copyright notice is used so as to give reasonable notice of the Society’s copyright. This consent for free limited copying without prior consent of the Society does not extend to making copies for general distribution, for advertising or promotional purposes, for inclusion in new collective works or for resale.

2
Table of Contents
Introduction ......................................................................................................................... 3 Executive Summary ............................................................................................................ 5 Section I: Reinsurer Information ........................................................................................ 7 Section II: Generational Mortality Improvement ............................................................... 8 Section III: Durational Mortality Improvement ................................................................ 11 Section IV: Mortality Improvement Questions for Companies with Canadian Reporting Requirements who use Mortality Improvement ............................................................... 35 Appendix 1 - Durational Improvement Factor Results (Question 19) .............................. 37 Appendix 2 - Comparison of Direct Writer and Reinsurer Results .................................. 43 Appendix 3 – List of Participating Companies ................................................................. 45
3
Introduction This report presents the results of the Mortality Improvement Survey for reinsurers of life insurance conducted by the Society of Actuaries (SOA) Committee on Life Insurance Mortality and Underwriting Surveys. The same survey was also sent to direct writers and a similar survey was sent to insurers and reinsurers on the pricing of annuities. Separate reports have been completed for these additional surveys. The survey was conducted in February-March of 2011 and sent to reinsurers in the US and Canada. Sixteen companies completed the survey (11 US, 5 Canadian). The intent of the Survey was to examine mortality improvement practices with respect to reinsurance pricing in both the US and Canada. A few questions were asked about functions other than pricing. The survey included sections on:
Reinsurer Information Generational Mortality Improvement- the process of bringing historical mortality
experience up to the current era. Durational Mortality Improvement- the process of projecting the current era’s
mortality into the future. Mortality Improvement Questions for Companies with Canadian Reporting
Requirements who use Mortality Improvement The report also includes the following appendices:
1. Durational Improvement factors 2. Comparison of Direct Writers and Reinsurers results 3. List of Contributing Companies
The Survey Subcommittee would like to thank all of the companies who participated in the Survey. We also thank those who helped us review this document and offered helpful suggestions and thoughtful comments. Finally, the Survey Subcommittee thanks the Society of Actuaries staff for their help in completing this project, especially Jack Luff and Korrel Rosenberg, without whose help this could not have been completed. Comments about this report and suggestions for future surveys are welcome and can be addressed to the Committee on Life Insurance Mortality and Underwriting Surveys c/o The Society of Actuaries.

4
Mortality Improvement Survey Subcommittee: Gord Gibbins, FSA, Chair Roger Annin, FSA Mary J. Bahna-Nolan, FSA David Bruggeman, FSA Connie Dewar, FSA Scott Morrow, FSA SOA Liaison: Jack Luff, FSA SOA Research Liaison: Korrel Rosenberg Caveat and Disclaimer This study is published by the Society of Actuaries (SOA) and contains information from a variety of sources. It may or may not reflect the experience of any individual company. The study is for informational purposes only and should not be construed as professional or financial advice. The SOA does not recommend or endorse any particular use of the information provided in this study. The SOA makes no warranty, express or implied, or representation whatsoever and assumes no liability in connection with the use or misuse of this study.
5
Executive Summary Section I: Reinsurer Information
Sixteen reinsurers completed the Survey - 11 US-based and five Canadian. The results were combined for most of the analysis.
All but one reinsurer had a total inforce of at least $15 billion, with ten over $50B. Section II: Generational Mortality Improvement
Generational mortality improvement is widely used among reinsurers (14 of 16). The most common variables for generational mortality improvement are gender
and duration, with tobacco distinction third. The most common sources of data used to develop generational mortality
improvement assumptions are population and intercompany mortality studies. Flat percentage was the most common method used to create generational
improvement factors. Eighty-six percent of reinsurers review their generational improvement factor at
least every three years with one-third doing so annually. Section III: Durational Mortality Improvement
Durational mortality improvement is used by all but one reinsurer and for most products.
Gender and duration were the two most common factors by which reinsurers varied their durational mortality improvement factors. Only one reinsurer varied its durational mortality improvement factors by product.
The compound method (1-F)n (F is the improvement factor and n is the length of improvement) was the most common method of calculation and most used factors that are non-zero for X years and then become zero (X varied from 10-40).
Thirteen of the 15 reinsurers indicated a maximum duration at which their company would apply durational factors. The maximum duration was the same for all products. The most common duration was 20 years.
When asked if there was a maximum age at which a company would apply durational mortality factors, the responses were approximately equal (8 yes, 7 no). There was a wide variety of ages given, 90-120.
All but one reinsurer said they did not use a maximum cumulative mortality improvement. Similarly, most reinsurers (12 of 15) indicated they had no minimum mortality level that they would allow with durational mortality improvement.
Many of the reinsurers use a higher durational mortality improvement factor for males versus females and also non-tobacco risks versus tobacco risks.
The mean durational mortality improvement factors are slightly higher for residual standard than preferred.

6
Most reinsurers apply durational mortality improvement to impaired risks and, generally, the same as standard cases.
Canadian reinsurers appear to use larger mortality improvement factors than US reinsurers.
Improvements in medicine and extrapolation of past experience were cited as the key justifications for using durational mortality improvement.
Obesity and diabetes were seen as the top two key factors affecting mortality improvement negatively.
Reinsurers use a variety of sources in developing durational mortality improvement factors, but government reports were the most common.
Results indicate that reinsurers use a variety of methods to create durational mortality factors, but regression based on historical experience was the most often cited.
The majority of reinsurers (72%) updated or reviewed their durational mortality improvement factors at least every three years. Also, 43% indicated they had validated or reviewed previous durational improvement factors. Results of that validation were mixed.
The majority of reinsurers apply the same mortality improvement factors for GAAP, capital modeling and planning/forecasting as they do for pricing. However, it should be noted that there were a few reinsurers who did not apply any mortality improvement to these applications.
Section IV: Mortality Improvement Questions for Companies with Canadian Reporting Requirements who use Mortality Improvement
Only five companies responded to these questions, so answers are very limited.

7
Mortality Improvement as Applied to the Pricing of Life Insurance Products
Section I: Reinsurer Information
1. Please indicate if your company is operating in Canada and/or the US:
Table 1 Company # %
US operating in US only 9 56% Canada operating in Canada only 3 19% Canada operating in Canada and US 2 13% US operating in US and Canada 2 13%
Total # of Companies 16 * *Total does not add to 100% due to rounding.
In total, 16 responses from reinsurers were received. Nine companies operate in the US only, three companies operate in Canada only and four companies operate in both US and Canada. The responses of the four companies operating in the US and Canada did not vary by country. Because of the limited number of responses from each country, the US and Canadian results have been combined for most questions.
2. What is the total face amount of your company’s individual life insurance inforce?
Table 2 In Force (Face) # %
$50 billion and higher 10 63% $15-49.9 billion 5 31% $5.5-14.9 billion 0 0% Less than $5.5 billion 1 6% Total # of Companies 16 100%
All but one of the respondents had individual life insurance inforce of at least $15 billion, and ten of the 16 respondents had inforce of $50 billion or more. Results were reviewed by level of in force (less than $50 billion/ $50 billion and higher) and no material differences were noted by size of reinsurer.
8
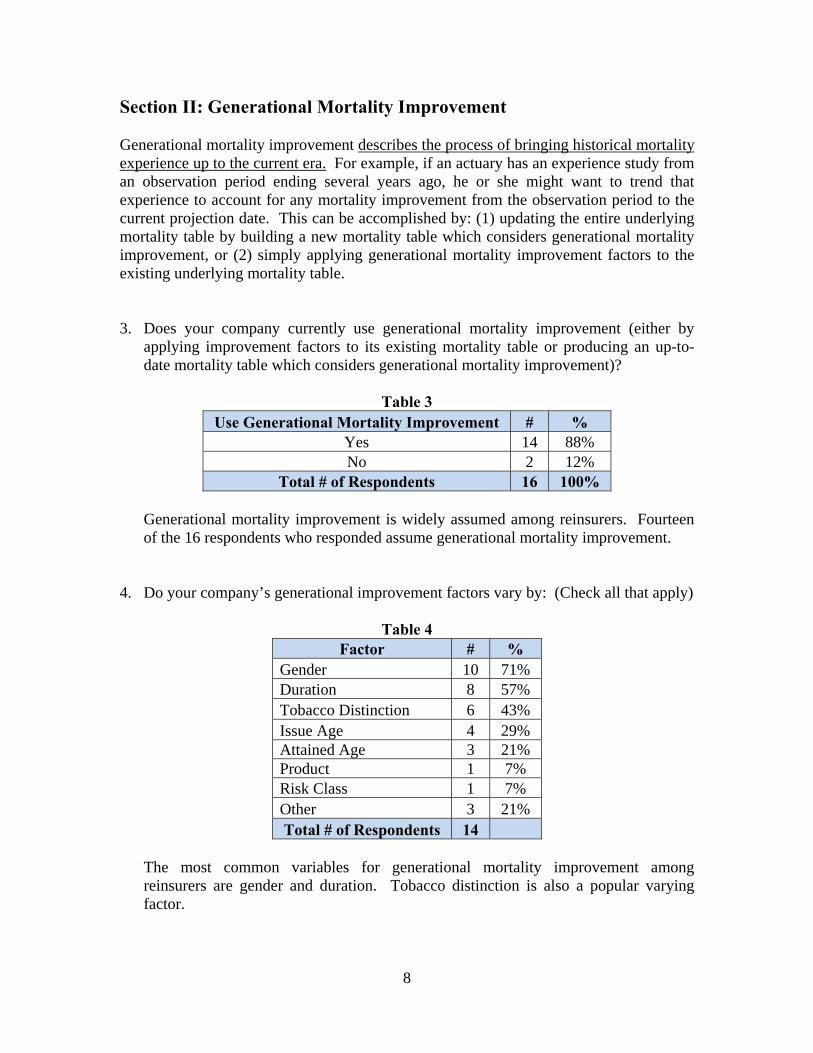
Section II: Generational Mortality Improvement Generational mortality improvement describes the process of bringing historical mortality experience up to the current era. For example, if an actuary has an experience study from an observation period ending several years ago, he or she might want to trend that experience to account for any mortality improvement from the observation period to the current projection date. This can be accomplished by: (1) updating the entire underlying mortality table by building a new mortality table which considers generational mortality improvement, or (2) simply applying generational mortality improvement factors to the existing underlying mortality table.
3. Does your company currently use generational mortality improvement (either by applying improvement factors to its existing mortality table or producing an up-to-date mortality table which considers generational mortality improvement)?
Table 3
Use Generational Mortality Improvement # % Yes 14 88% No 2 12%
Total # of Respondents 16 100%
Generational mortality improvement is widely assumed among reinsurers. Fourteen of the 16 respondents who responded assume generational mortality improvement.
4. Do your company’s generational improvement factors vary by: (Check all that apply)
Table 4 Factor # %
Gender 10 71% Duration 8 57% Tobacco Distinction 6 43% Issue Age 4 29% Attained Age 3 21% Product 1 7% Risk Class 1 7% Other 3 21% Total # of Respondents 14
The most common variables for generational mortality improvement among reinsurers are gender and duration. Tobacco distinction is also a popular varying factor.
9
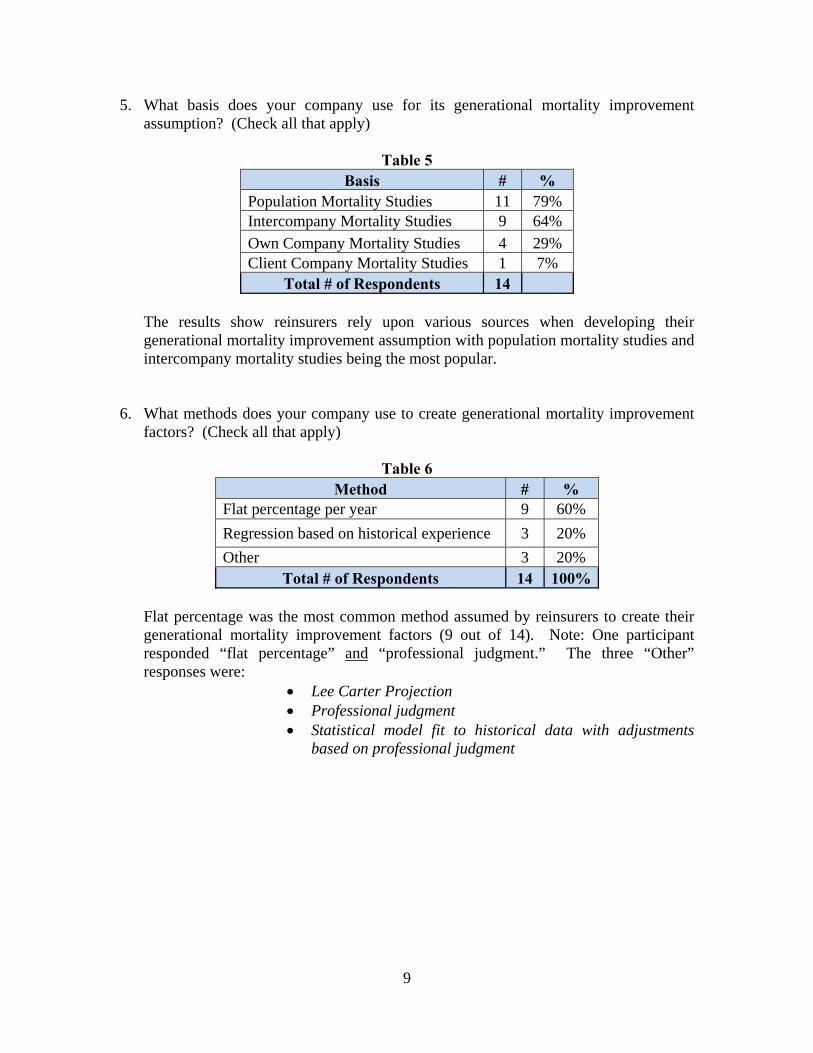
5. What basis does your company use for its generational mortality improvement assumption? (Check all that apply)
Table 5
Basis # % Population Mortality Studies 11 79% Intercompany Mortality Studies 9 64%
Own Company Mortality Studies 4 29% Client Company Mortality Studies 1 7%
Total # of Respondents 14
The results show reinsurers rely upon various sources when developing their generational mortality improvement assumption with population mortality studies and intercompany mortality studies being the most popular.
6. What methods does your company use to create generational mortality improvement factors? (Check all that apply)
Table 6
Method # % Flat percentage per year 9 60%
Regression based on historical experience 3 20%
Other 3 20% Total # of Respondents 14 100%
Flat percentage was the most common method assumed by reinsurers to create their generational mortality improvement factors (9 out of 14). Note: One participant responded “flat percentage” and “professional judgment.” The three “Other” responses were:
Lee Carter Projection Professional judgment Statistical model fit to historical data with adjustments
based on professional judgment

10
7. How often does your company update or review its generational improvement factors and / or the mortality produced by application of such factors?
Table 7 Frequency of Update/Review # %
At least annually 4 29% > 1 year, but at least every 3 years 8 57% > 3 years, but at least every 5 years 0 0% > Less frequently than every 5 years 0 0% No set schedule 2 14%
Total # of Respondents 14 100%
Eighty-six percent of the respondents update or review generational mortality improvement factors at least every three years with almost one third updating or reviewing at least annually. Over half of the respondents update between one and three years.
8. Why doesn’t your company use generational mortality improvement?
Of the two reinsurers who responded they did not use generational mortality improvement, their reasons were:
It should be done by the direct writers To be conservative
11
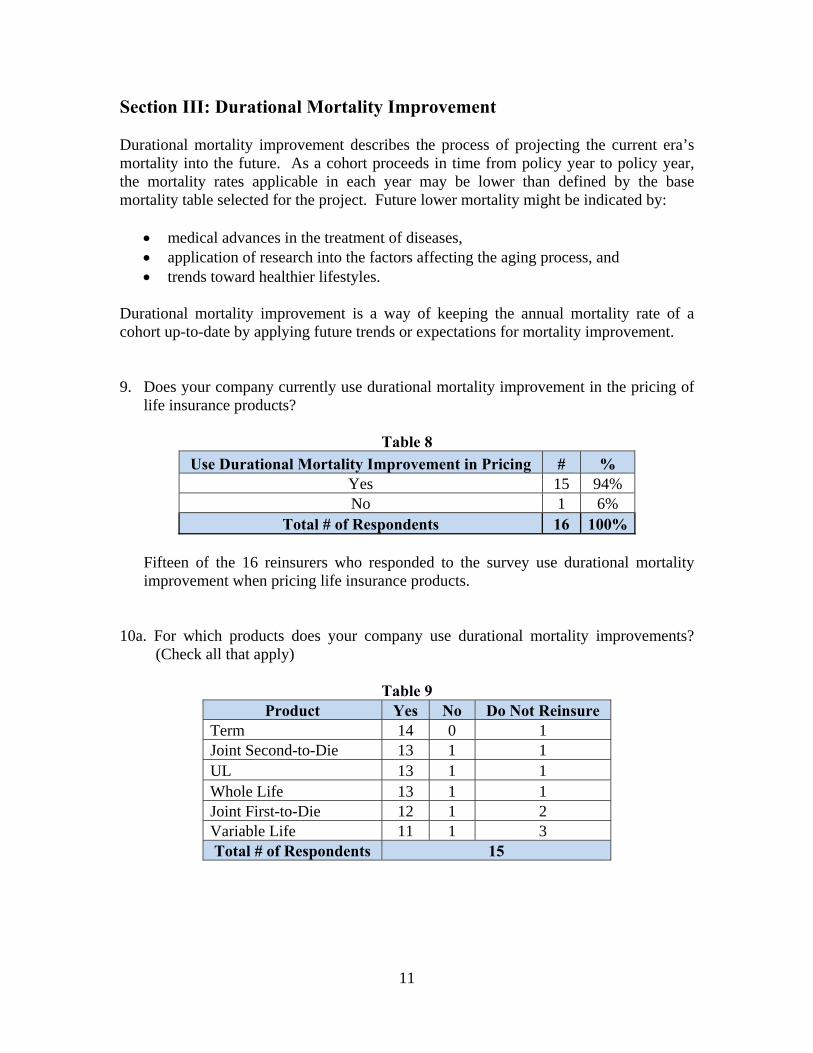
Section III: Durational Mortality Improvement Durational mortality improvement describes the process of projecting the current era’s mortality into the future. As a cohort proceeds in time from policy year to policy year, the mortality rates applicable in each year may be lower than defined by the base mortality table selected for the project. Future lower mortality might be indicated by:
medical advances in the treatment of diseases, application of research into the factors affecting the aging process, and trends toward healthier lifestyles.
Durational mortality improvement is a way of keeping the annual mortality rate of a cohort up-to-date by applying future trends or expectations for mortality improvement. 9. Does your company currently use durational mortality improvement in the pricing of
life insurance products?
Table 8
Use Durational Mortality Improvement in Pricing # % Yes 15 94% No 1 6%
Total # of Respondents 16 100%
Fifteen of the 16 reinsurers who responded to the survey use durational mortality improvement when pricing life insurance products.
10a. For which products does your company use durational mortality improvements?
(Check all that apply)
Table 9 Product Yes No Do Not Reinsure
Term 14 0 1 Joint Second-to-Die 13 1 1 UL 13 1 1 Whole Life 13 1 1 Joint First-to-Die 12 1 2 Variable Life 11 1 3 Total # of Respondents 15

12
10b. For those products that your company uses durational mortality improvement factors, do these factors vary by product?
Table 10
Factors Vary by Product # % Yes 1 7% No 14 93%
Total # of Respondents 15 100%
All but one respondent does not vary durational mortality improvement among the life insurance product types they reinsure.
The one “Yes” response stated durational mortality improvement factors can vary by client/market.
11. By which of the following do your company’s durational mortality improvement
factors vary? (Check all that apply)
Table 11 Factor # %
Duration 10 67% Gender 10 67% Issue Age 6 40% Tobacco Distinction 5 33% Attained Age 3 20% Attained Age/Calendar Year 1 7% Market/Amounts 1 7% UW Risk Class 1 7%
Total # of Respondents 15 As with generational mortality improvement, gender and duration were the two most common factors that reinsurers varied their durational mortality improvement factors.
13
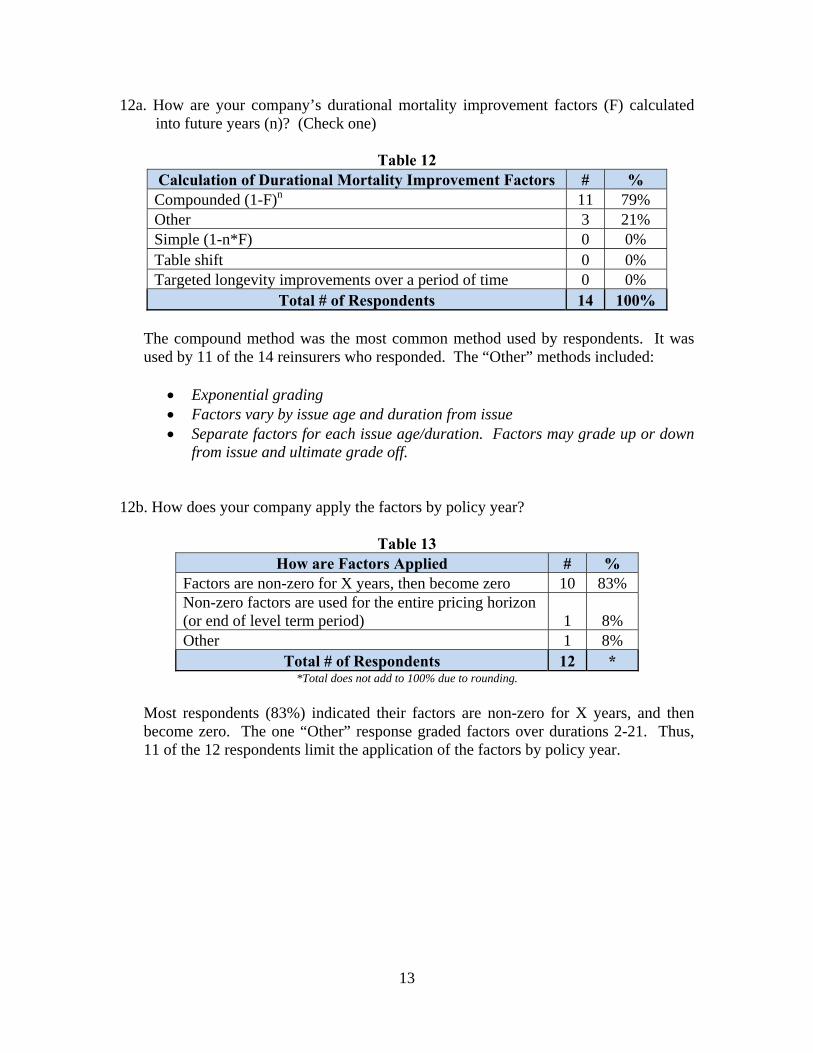
12a. How are your company’s durational mortality improvement factors (F) calculated into future years (n)? (Check one)
Table 12
Calculation of Durational Mortality Improvement Factors # % Compounded (1-F)n 11 79% Other 3 21% Simple (1-n*F) 0 0% Table shift 0 0% Targeted longevity improvements over a period of time 0 0%
Total # of Respondents 14 100% The compound method was the most common method used by respondents. It was used by 11 of the 14 reinsurers who responded. The “Other” methods included:
Exponential grading Factors vary by issue age and duration from issue Separate factors for each issue age/duration. Factors may grade up or down
from issue and ultimate grade off.
12b. How does your company apply the factors by policy year?
Table 13 How are Factors Applied # %
Factors are non-zero for X years, then become zero 10 83% Non-zero factors are used for the entire pricing horizon (or end of level term period) 1 8% Other 1 8%
Total # of Respondents 12 * *Total does not add to 100% due to rounding.
Most respondents (83%) indicated their factors are non-zero for X years, and then become zero. The one “Other” response graded factors over durations 2-21. Thus, 11 of the 12 respondents limit the application of the factors by policy year.
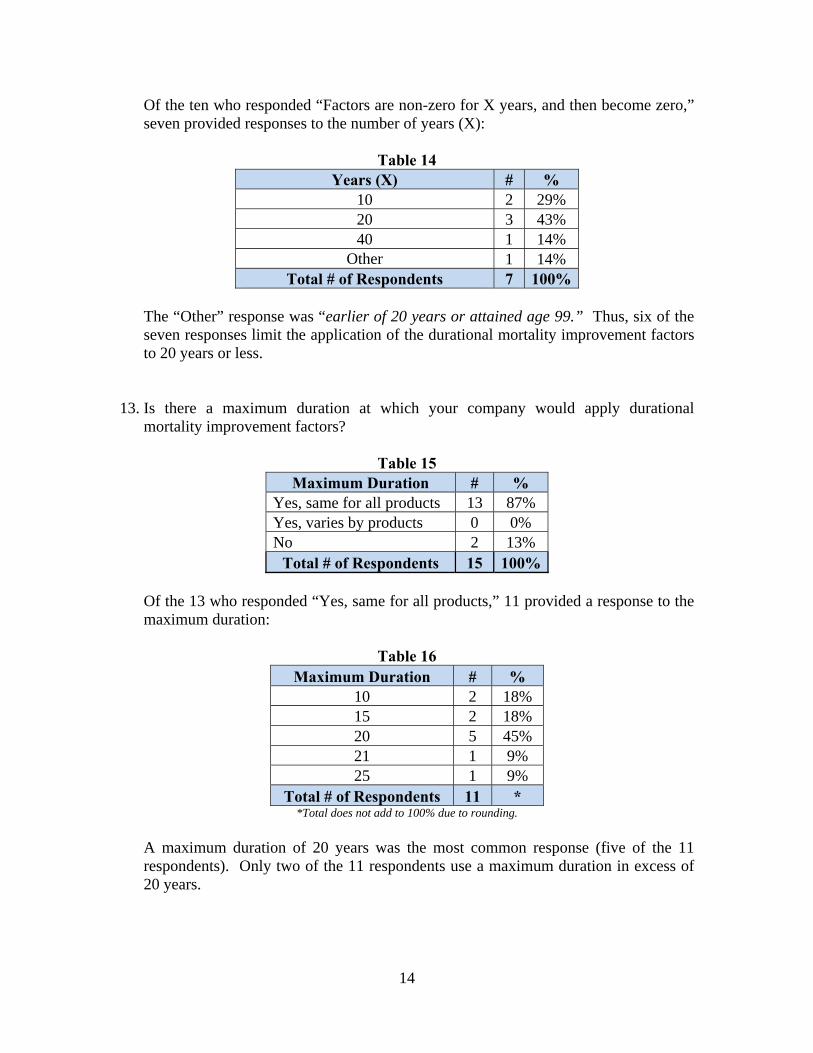
14
Of the ten who responded “Factors are non-zero for X years, and then become zero,” seven provided responses to the number of years (X):
Table 14
Years (X) # % 10 2 29% 20 3 43% 40 1 14%
Other 1 14% Total # of Respondents 7 100%
The “Other” response was “earlier of 20 years or attained age 99.” Thus, six of the seven responses limit the application of the durational mortality improvement factors to 20 years or less.
13. Is there a maximum duration at which your company would apply durational mortality improvement factors?
Table 15
Maximum Duration # % Yes, same for all products 13 87% Yes, varies by products 0 0% No 2 13%
Total # of Respondents 15 100% Of the 13 who responded “Yes, same for all products,” 11 provided a response to the maximum duration:
Table 16
Maximum Duration # % 10 2 18% 15 2 18% 20 5 45% 21 1 9% 25 1 9%
Total # of Respondents 11 * *Total does not add to 100% due to rounding.
A maximum duration of 20 years was the most common response (five of the 11 respondents). Only two of the 11 respondents use a maximum duration in excess of 20 years.

15
14. Is there a maximum attained age at which your company would apply durational mortality improvement factors?
Table 17 Maximum Attained Age # %
Yes, same for all products 8 53% Yes, varies by products 0 0% No 7 47%
Total # of Respondents 15 100% Respondents were evenly split between applying a maximum attained age. Just over half of the respondents do use a maximum attained age and they use the same maximum age for all life insurance product types. The other half did not apply a maximum attained age. Seven out of the eight who responded “Yes, same for all products” provided a response to the maximum attained age:
Table 18 Maximum Attained Age # %
90 1 14% 95 1 14% 99 2 29% 100 1 14% 120 1 14%
Other 1 14% Total # of Respondents 7 *
*Total does not add to 100% due to rounding.
The “Other” response was “94 for Male, 89 for Female.” The range of the maximum attained age was between 89 and 120.
16
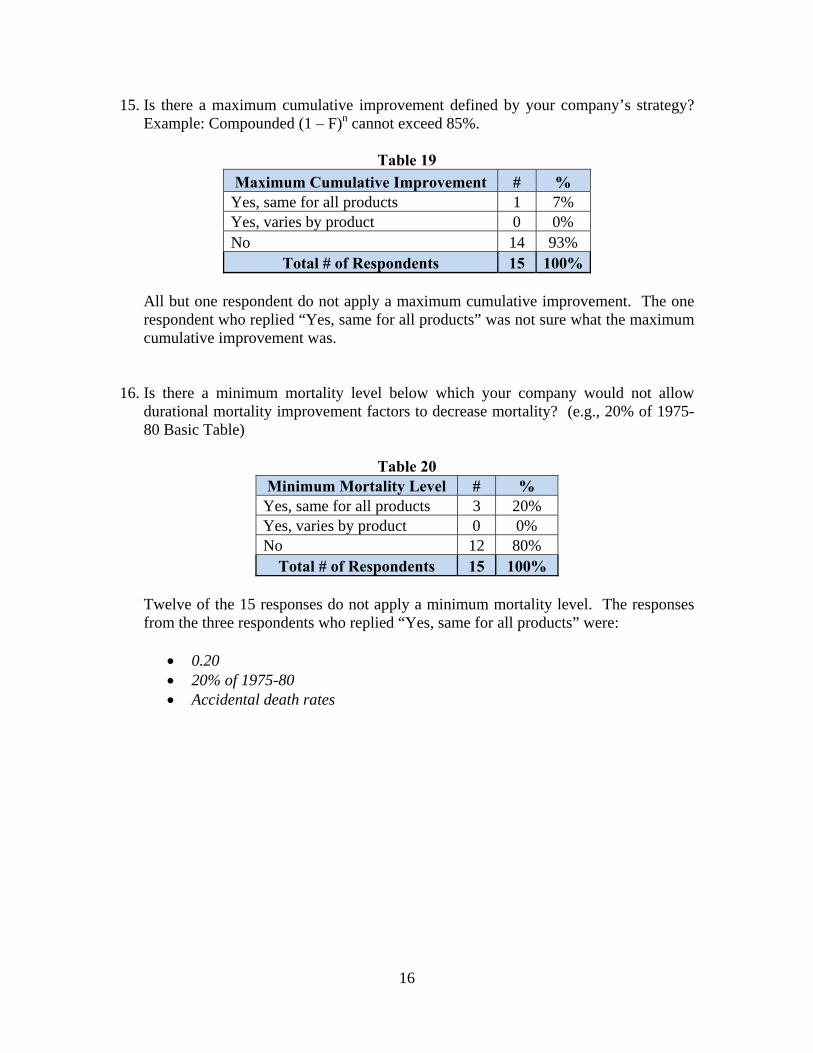
15. Is there a maximum cumulative improvement defined by your company’s strategy? Example: Compounded (1 – F)n cannot exceed 85%.
Table 19
Maximum Cumulative Improvement # % Yes, same for all products 1 7% Yes, varies by product 0 0% No 14 93%
Total # of Respondents 15 100% All but one respondent do not apply a maximum cumulative improvement. The one respondent who replied “Yes, same for all products” was not sure what the maximum cumulative improvement was.
16. Is there a minimum mortality level below which your company would not allow
durational mortality improvement factors to decrease mortality? (e.g., 20% of 1975-80 Basic Table)
Table 20 Minimum Mortality Level # % Yes, same for all products 3 20% Yes, varies by product 0 0% No 12 80%
Total # of Respondents 15 100% Twelve of the 15 responses do not apply a minimum mortality level. The responses from the three respondents who replied “Yes, same for all products” were:
0.20 20% of 1975-80 Accidental death rates
17
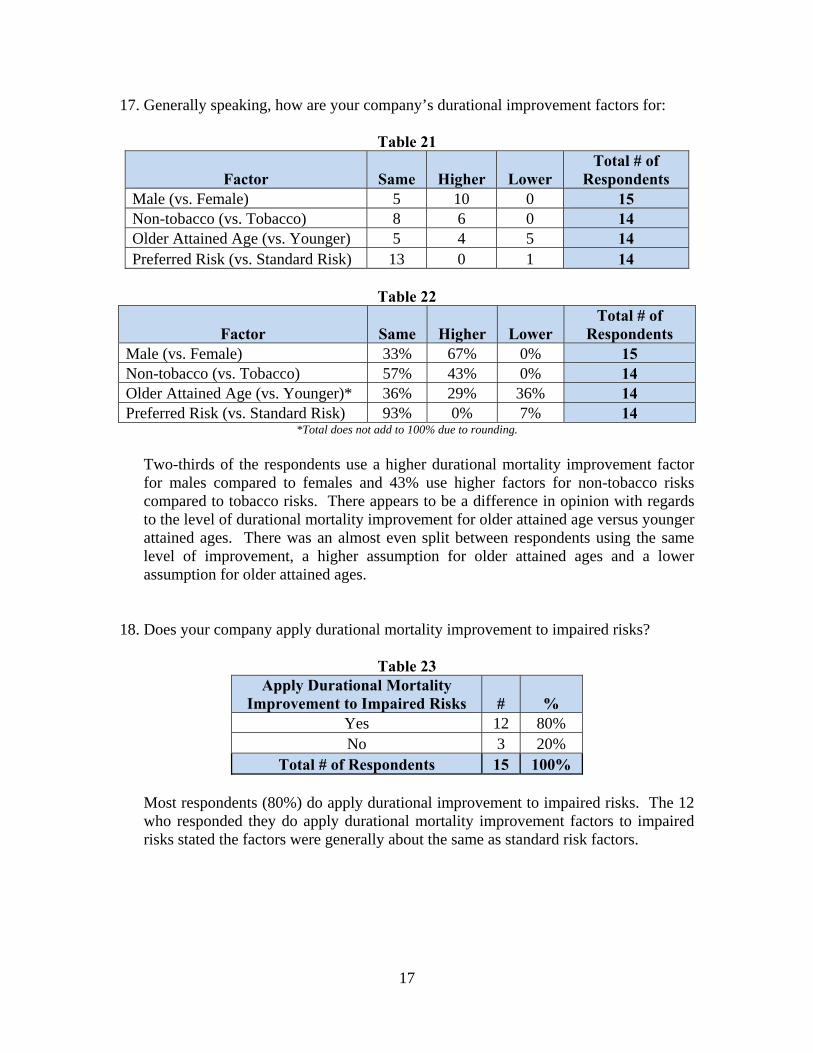
17. Generally speaking, how are your company’s durational improvement factors for:
Table 21
Factor Same Higher Lower Total # of
Respondents Male (vs. Female) 5 10 0 15 Non-tobacco (vs. Tobacco) 8 6 0 14 Older Attained Age (vs. Younger) 5 4 5 14 Preferred Risk (vs. Standard Risk) 13 0 1 14
Table 22
Factor Same Higher Lower Total # of
Respondents Male (vs. Female) 33% 67% 0% 15 Non-tobacco (vs. Tobacco) 57% 43% 0% 14 Older Attained Age (vs. Younger)* 36% 29% 36% 14 Preferred Risk (vs. Standard Risk) 93% 0% 7% 14
*Total does not add to 100% due to rounding.
Two-thirds of the respondents use a higher durational mortality improvement factor for males compared to females and 43% use higher factors for non-tobacco risks compared to tobacco risks. There appears to be a difference in opinion with regards to the level of durational mortality improvement for older attained age versus younger attained ages. There was an almost even split between respondents using the same level of improvement, a higher assumption for older attained ages and a lower assumption for older attained ages.
18. Does your company apply durational mortality improvement to impaired risks?
Table 23
Apply Durational Mortality Improvement to Impaired Risks # %
Yes 12 80% No 3 20%
Total # of Respondents 15 100%
Most respondents (80%) do apply durational improvement to impaired risks. The 12 who responded they do apply durational mortality improvement factors to impaired risks stated the factors were generally about the same as standard risk factors.
18
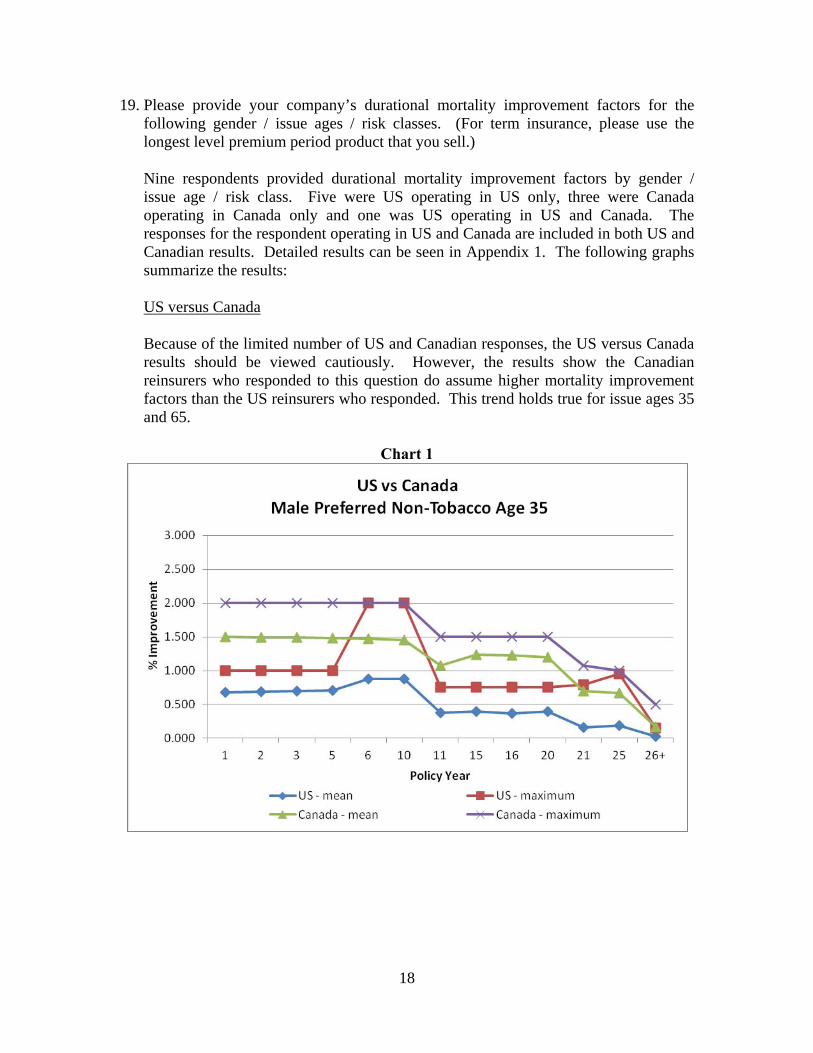
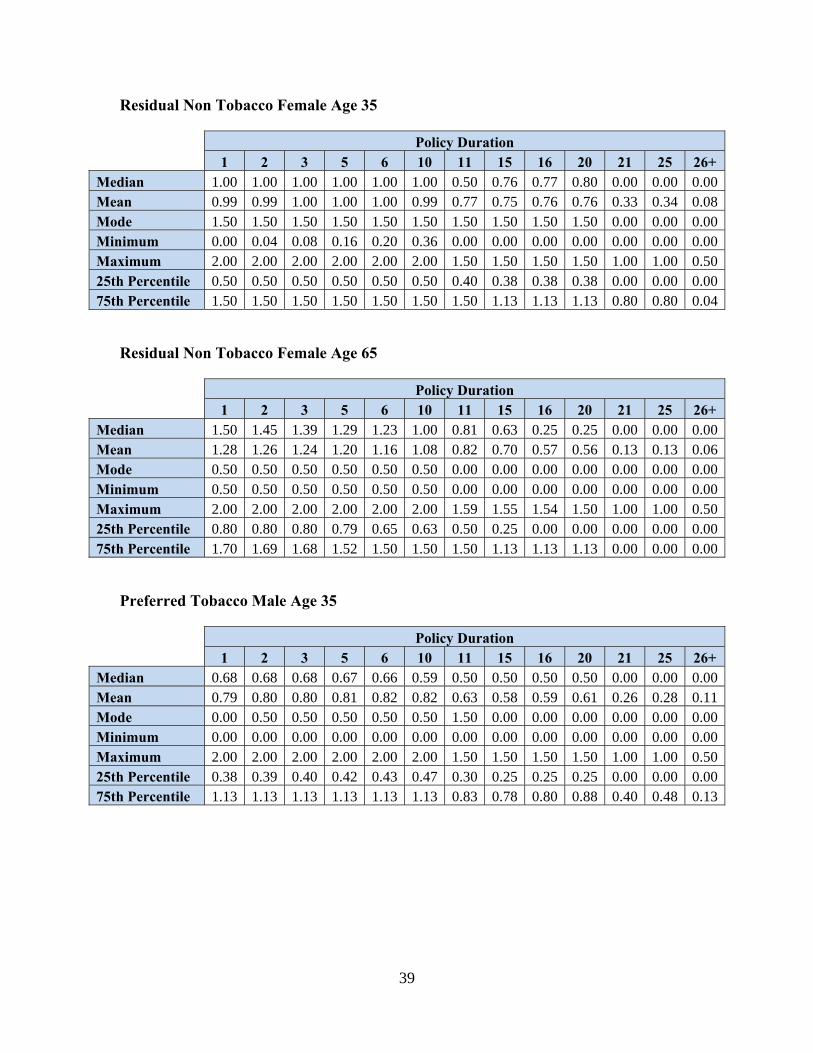
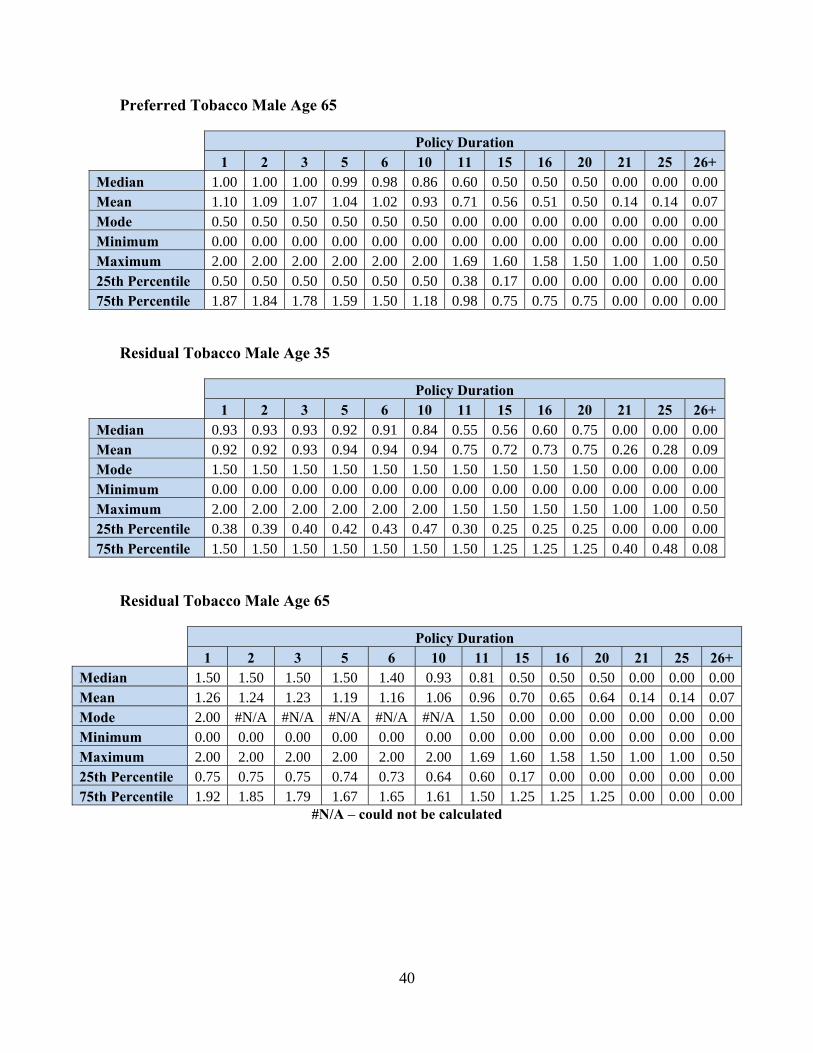
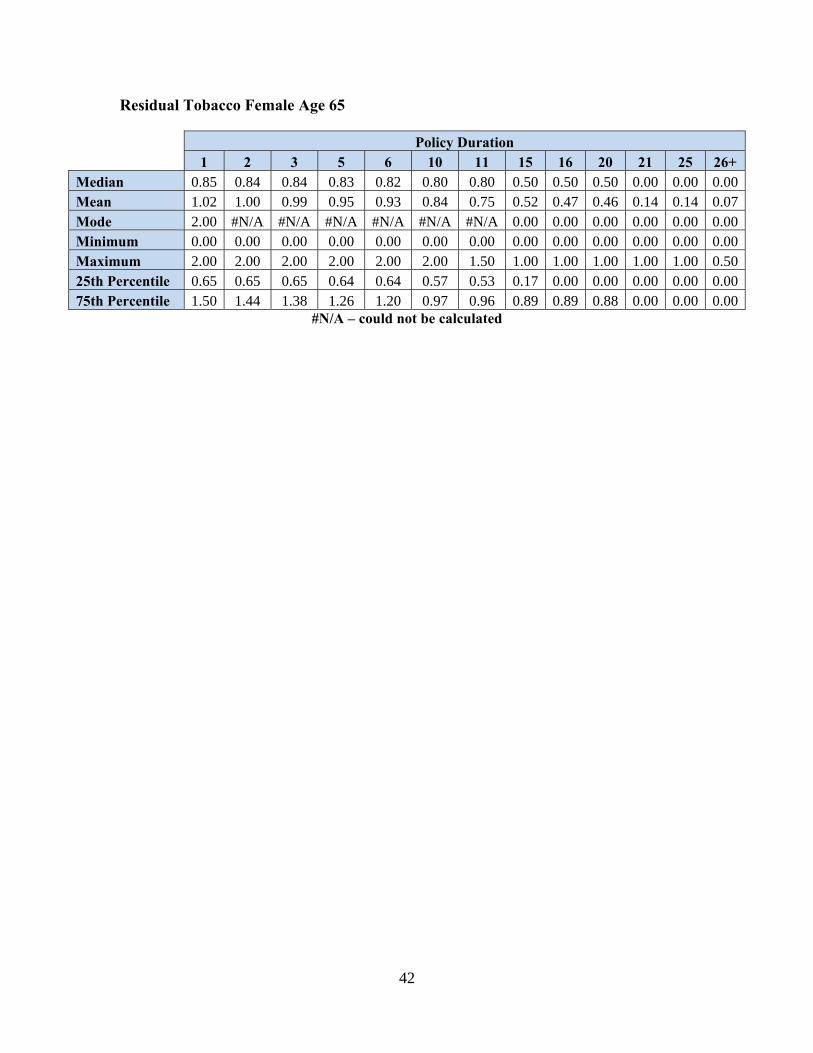
19. Please provide your company’s durational mortality improvement factors for the following gender / issue ages / risk classes. (For term insurance, please use the longest level premium period product that you sell.) Nine respondents provided durational mortality improvement factors by gender / issue age / risk class. Five were US operating in US only, three were Canada operating in Canada only and one was US operating in US and Canada. The responses for the respondent operating in US and Canada are included in both US and Canadian results. Detailed results can be seen in Appendix 1. The following graphs summarize the results:
US versus Canada Because of the limited number of US and Canadian responses, the US versus Canada results should be viewed cautiously. However, the results show the Canadian reinsurers who responded to this question do assume higher mortality improvement factors than the US reinsurers who responded. This trend holds true for issue ages 35 and 65.
Chart 1

19
Chart 2

20
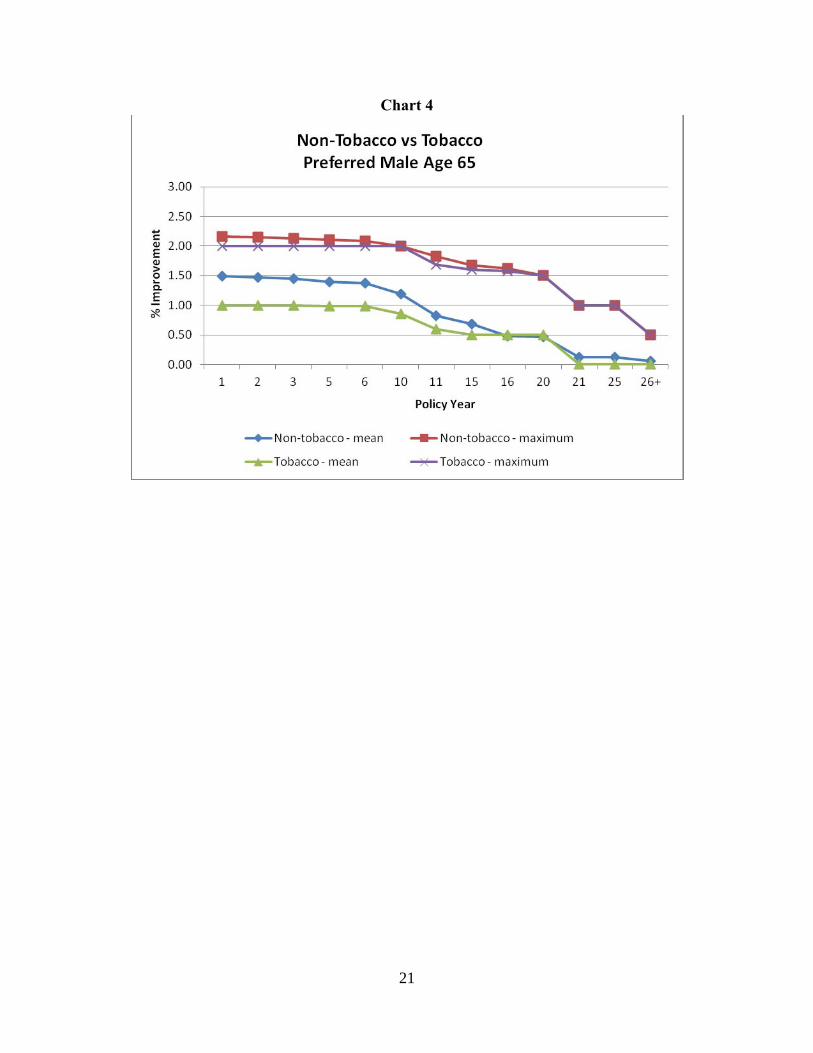
Non-Tobacco versus Tobacco
The mean durational mortality improvement factors are slightly higher for non-tobacco risks versus tobacco risks. The maximum durational mortality improvement factors are identical for non-tobacco and tobacco risks at issue age 35. For issue age 65, the non-tobacco maximum factors are slightly higher than the tobacco maximum factors through duration 15. Thereafter, the non-tobacco and tobacco maximum factors are the same.
Chart 3
21
Chart 4
22
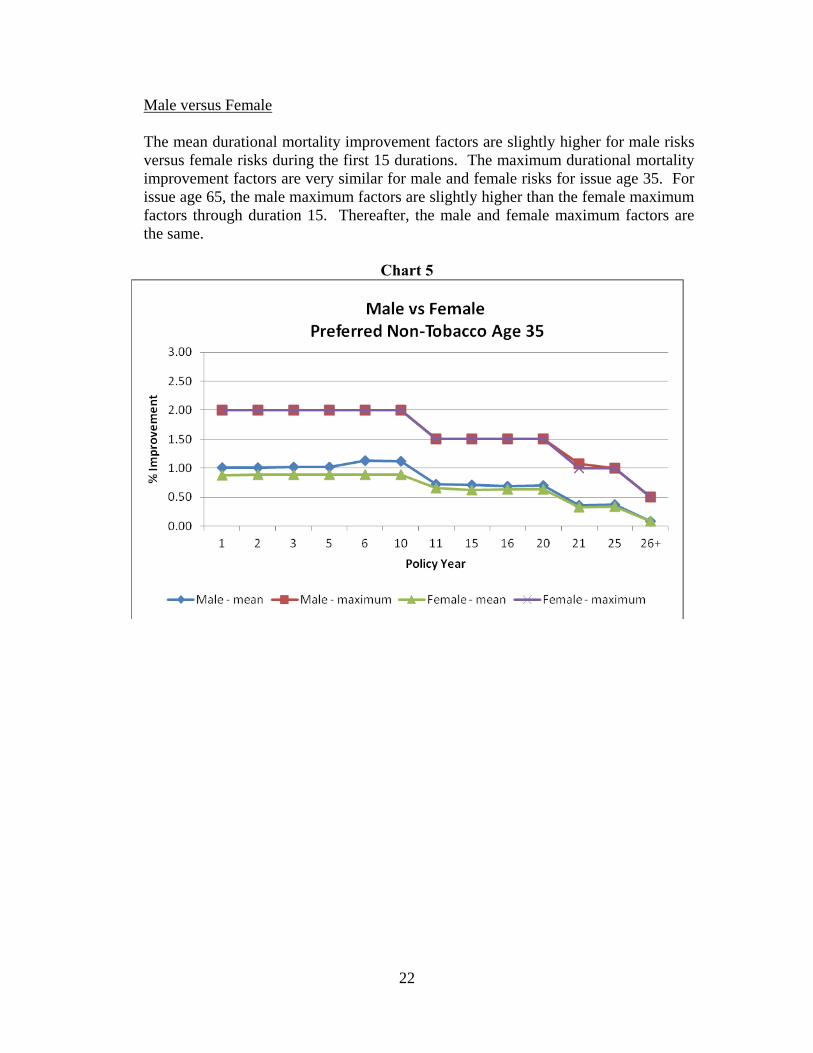
Male versus Female
The mean durational mortality improvement factors are slightly higher for male risks versus female risks during the first 15 durations. The maximum durational mortality improvement factors are very similar for male and female risks for issue age 35. For issue age 65, the male maximum factors are slightly higher than the female maximum factors through duration 15. Thereafter, the male and female maximum factors are the same.
Chart 5

23
Chart 6
24
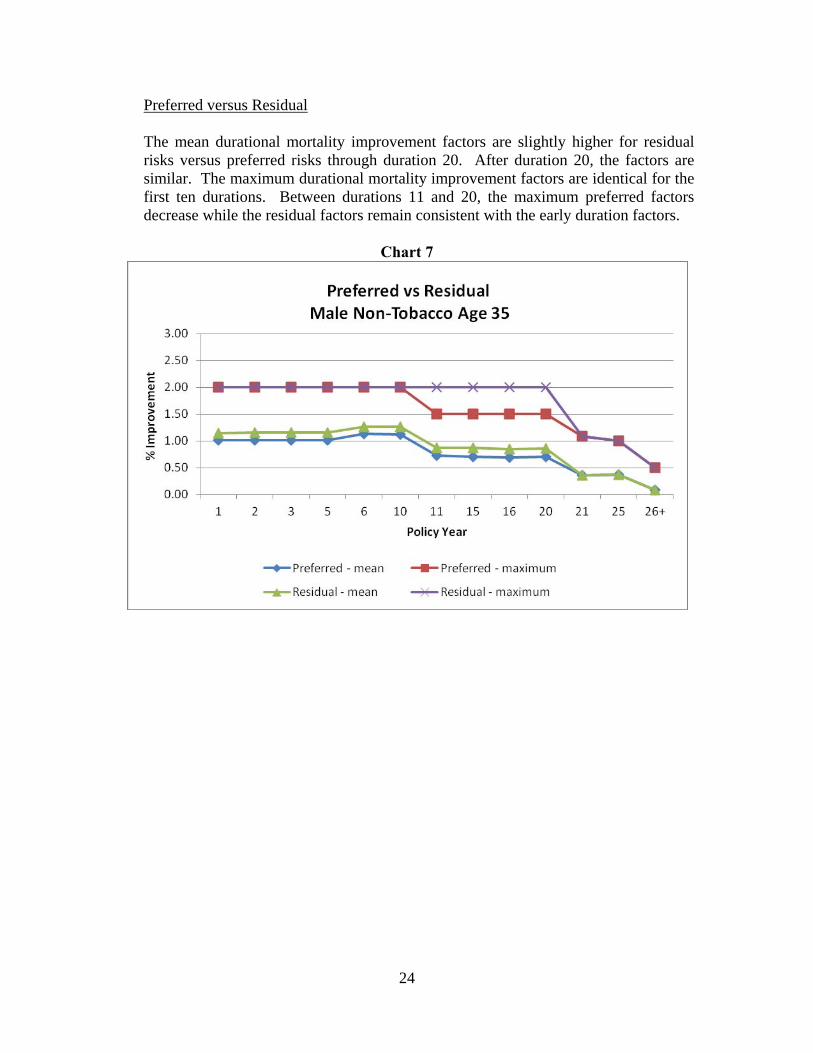
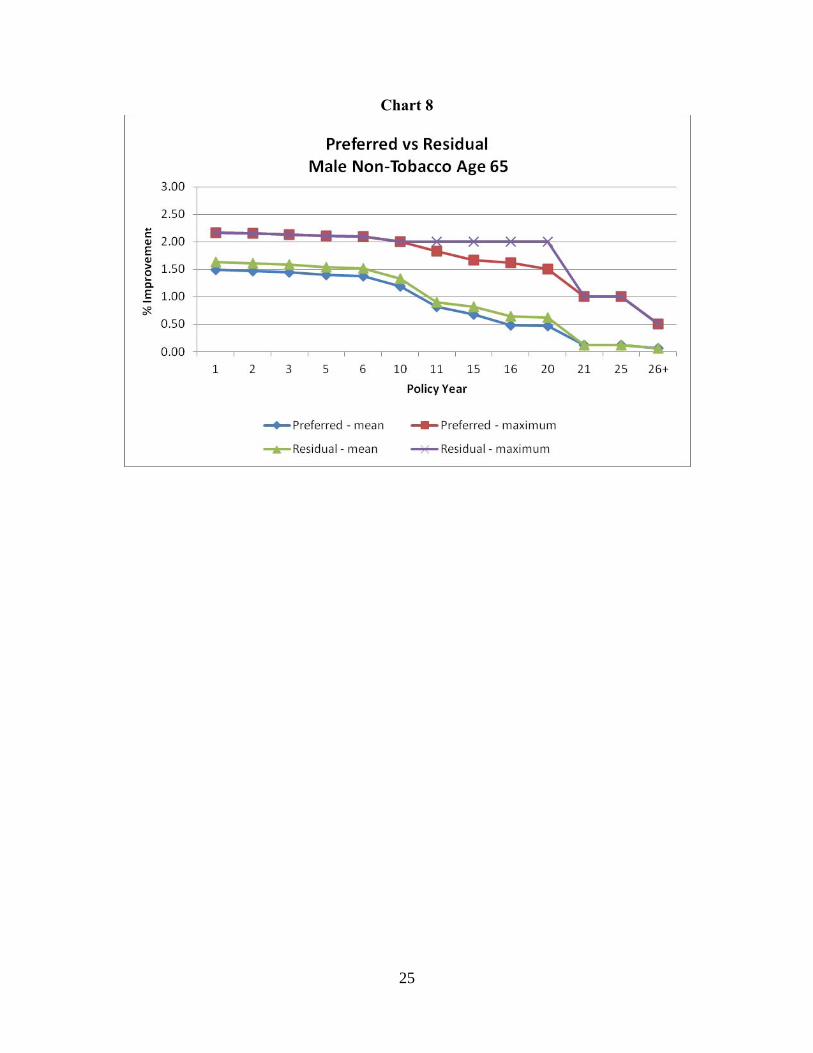
Preferred versus Residual
The mean durational mortality improvement factors are slightly higher for residual risks versus preferred risks through duration 20. After duration 20, the factors are similar. The maximum durational mortality improvement factors are identical for the first ten durations. Between durations 11 and 20, the maximum preferred factors decrease while the residual factors remain consistent with the early duration factors.
Chart 7
25
Chart 8
26
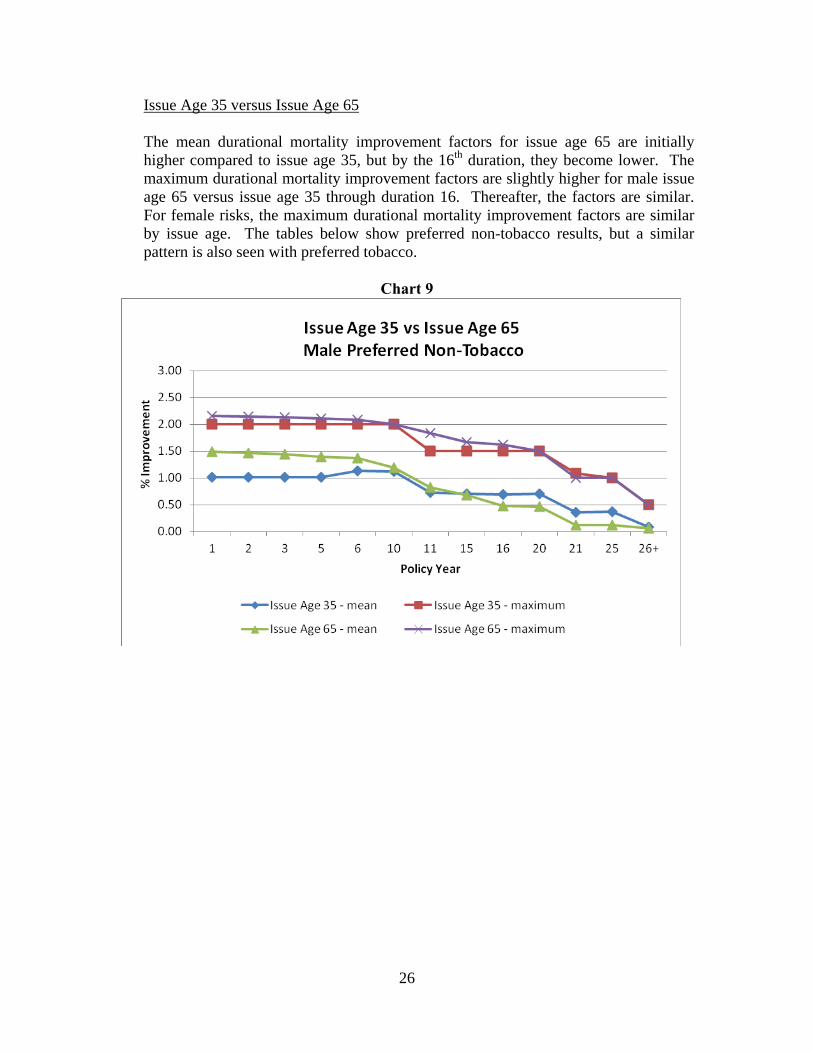
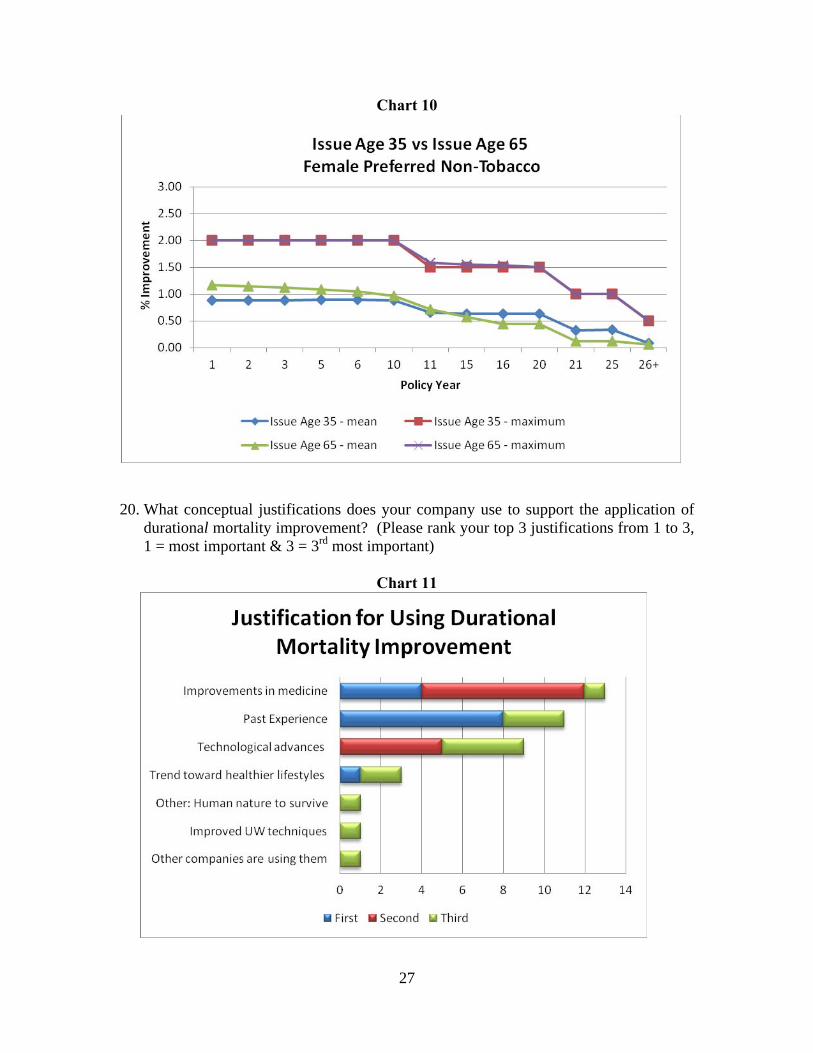
Issue Age 35 versus Issue Age 65
The mean durational mortality improvement factors for issue age 65 are initially higher compared to issue age 35, but by the 16th duration, they become lower. The maximum durational mortality improvement factors are slightly higher for male issue age 65 versus issue age 35 through duration 16. Thereafter, the factors are similar. For female risks, the maximum durational mortality improvement factors are similar by issue age. The tables below show preferred non-tobacco results, but a similar pattern is also seen with preferred tobacco.
Chart 9
27
Chart 10
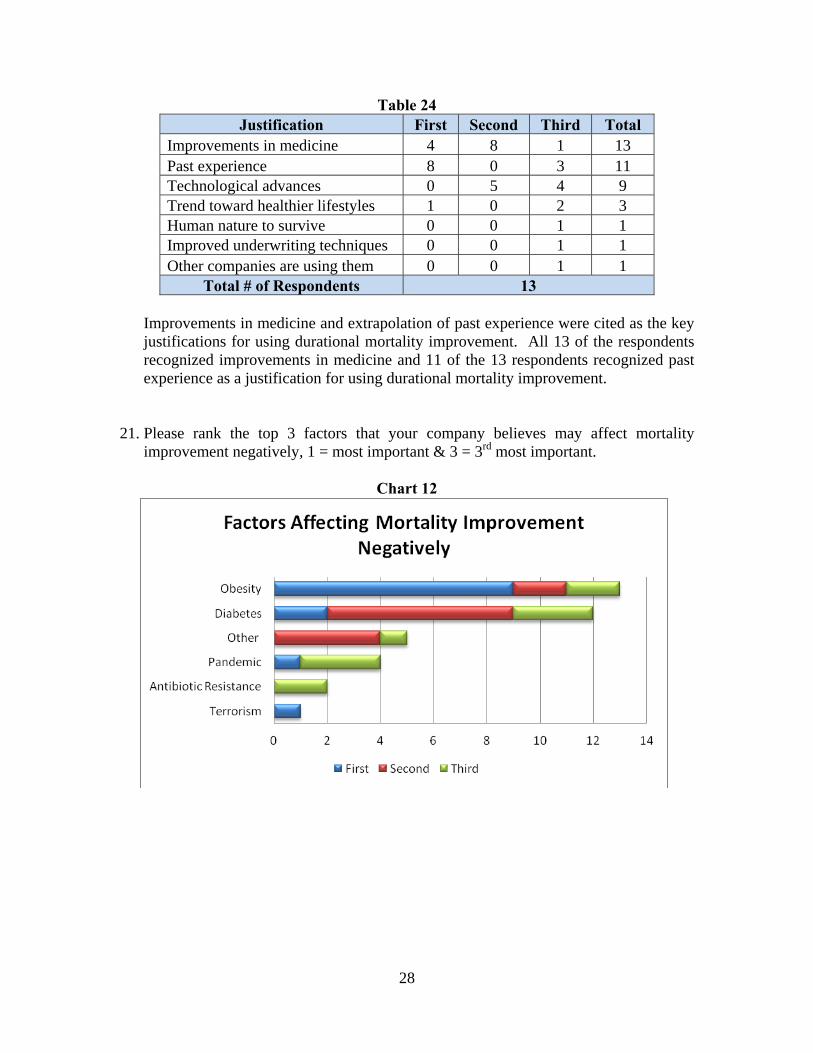
20. What conceptual justifications does your company use to support the application of
durational mortality improvement? (Please rank your top 3 justifications from 1 to 3, 1 = most important & 3 = 3rd most important)
Chart 11
28
Table 24 Justification First Second Third Total
Improvements in medicine 4 8 1 13 Past experience 8 0 3 11 Technological advances 0 5 4 9 Trend toward healthier lifestyles 1 0 2 3 Human nature to survive 0 0 1 1 Improved underwriting techniques 0 0 1 1 Other companies are using them 0 0 1 1
Total # of Respondents 13 Improvements in medicine and extrapolation of past experience were cited as the key justifications for using durational mortality improvement. All 13 of the respondents recognized improvements in medicine and 11 of the 13 respondents recognized past experience as a justification for using durational mortality improvement.
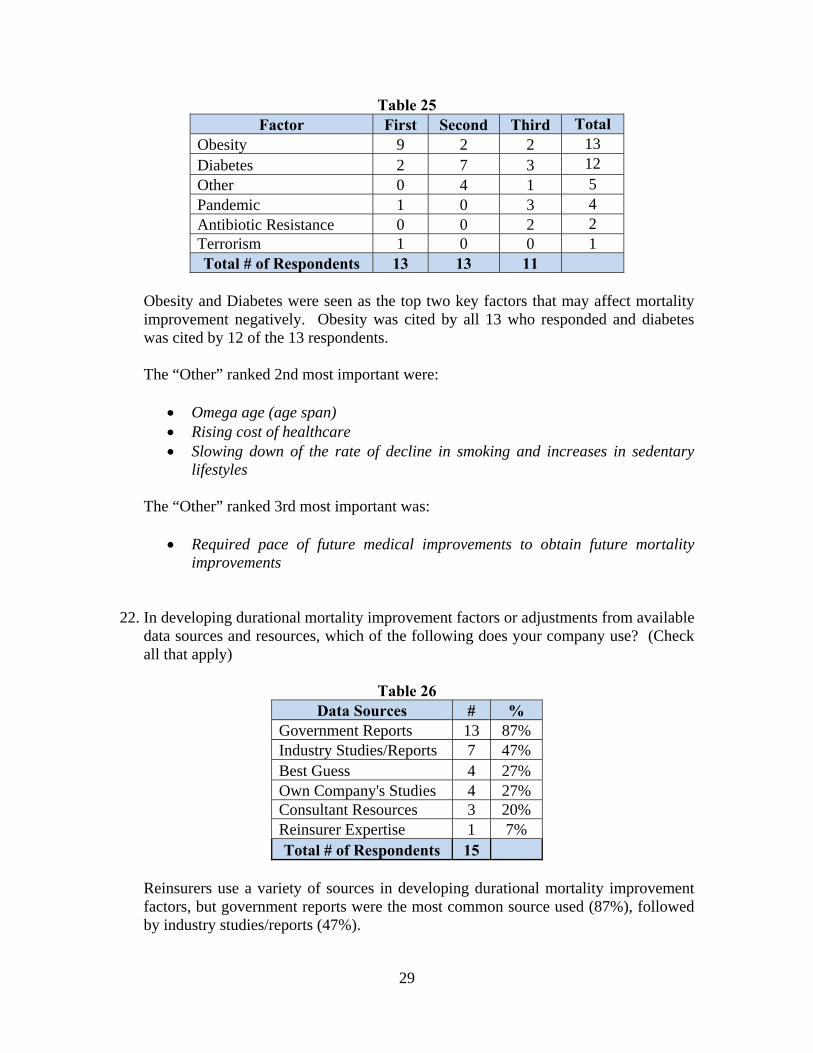
21. Please rank the top 3 factors that your company believes may affect mortality improvement negatively, 1 = most important & 3 = 3rd most important.
Chart 12
29
Table 25 Factor First Second Third Total
Obesity 9 2 2 13 Diabetes 2 7 3 12 Other 0 4 1 5 Pandemic 1 0 3 4 Antibiotic Resistance 0 0 2 2 Terrorism 1 0 0 1 Total # of Respondents 13 13 11
Obesity and Diabetes were seen as the top two key factors that may affect mortality improvement negatively. Obesity was cited by all 13 who responded and diabetes was cited by 12 of the 13 respondents.
The “Other” ranked 2nd most important were:
Omega age (age span) Rising cost of healthcare Slowing down of the rate of decline in smoking and increases in sedentary
lifestyles
The “Other” ranked 3rd most important was:
Required pace of future medical improvements to obtain future mortality improvements
22. In developing durational mortality improvement factors or adjustments from available data sources and resources, which of the following does your company use? (Check all that apply)
Table 26
Data Sources # % Government Reports 13 87% Industry Studies/Reports 7 47% Best Guess 4 27% Own Company's Studies 4 27% Consultant Resources 3 20% Reinsurer Expertise 1 7% Total # of Respondents 15
Reinsurers use a variety of sources in developing durational mortality improvement factors, but government reports were the most common source used (87%), followed by industry studies/reports (47%).

30
23. What methods does your company use to create durational mortality improvement factors? (Check all that apply)
Table 27 Methods # %
Regression based on historical experience 8 53% Flat percentage per year 5 33% Determined by outside source 0 0% Targeted longevity improvements by attained age over a period of years 0 0% Other 5 33%
Total # of Respondents 15 The results indicate respondents use various methods to create durational mortality improvement factors, but regression/historical experience was the most often cited method, with eight of the 15 respondents. Interestingly, flat percentage per year was selected by the majority of respondents (9 of 14) when creating generational mortality improvement factors, but only five of 15 respondents for durational mortality improvement factors. The five “Other” responses were:
Combination of Statistical model fit to historical data and adjustments based on professional judgment
Exponential grading Judgment Lee Carter Projection Paper from Canadian Institute of Actuaries

31
24. How often does your company update or review its durational mortality improvement factors and / or the mortality produced by application of such factors?
Table 28
Frequency of Update/Review # % At least annually 4 29% >1 year, but at least every 3 years 6 43% >3 years, but at least every 5 years 0 0% Less frequently than every 5 years 0 0% No set schedule. 4 29%
Total # of Respondents 14 * *Total does not add to 100% due to rounding.
Similar to generational mortality improvement, the majority of respondents (10 of 14) update or review their durational mortality improvement factors at least every three years and almost one third update or review at least annually.
25. Has your company validated or reviewed previous durational mortality improvement factors to see if the anticipated results have been realized?
Table 29
Validated/Reviewed # % Yes 6 43% No 8 57%
Total # of Respondents 14 100%
Slightly less than half of the respondents said they have validated or reviewed previous durational improvement factors to see if the anticipated results have been realized.
32
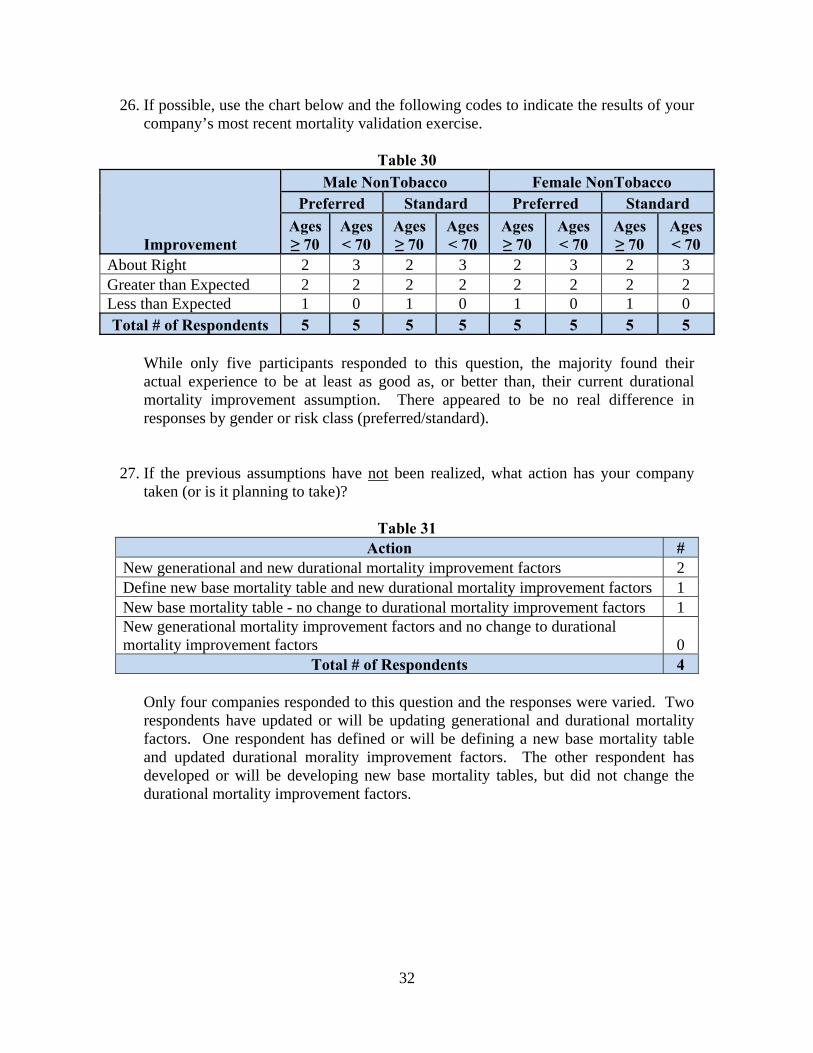
26. If possible, use the chart below and the following codes to indicate the results of your company’s most recent mortality validation exercise.
Table 30
Improvement
Male NonTobacco Female NonTobacco Preferred Standard Preferred Standard
Ages ≥ 70
Ages < 70
Ages ≥ 70
Ages < 70
Ages ≥ 70
Ages < 70
Ages ≥ 70
Ages < 70
About Right 2 3 2 3 2 3 2 3 Greater than Expected 2 2 2 2 2 2 2 2 Less than Expected 1 0 1 0 1 0 1 0 Total # of Respondents 5 5 5 5 5 5 5 5
While only five participants responded to this question, the majority found their actual experience to be at least as good as, or better than, their current durational mortality improvement assumption. There appeared to be no real difference in responses by gender or risk class (preferred/standard).
27. If the previous assumptions have not been realized, what action has your company taken (or is it planning to take)?
Table 31 Action #
New generational and new durational mortality improvement factors 2 Define new base mortality table and new durational mortality improvement factors 1 New base mortality table - no change to durational mortality improvement factors 1 New generational mortality improvement factors and no change to durational mortality improvement factors 0
Total # of Respondents 4
Only four companies responded to this question and the responses were varied. Two respondents have updated or will be updating generational and durational mortality factors. One respondent has defined or will be defining a new base mortality table and updated durational morality improvement factors. The other respondent has developed or will be developing new base mortality tables, but did not change the durational mortality improvement factors.

33
28. In addition to pricing, does your company also apply mortality improvement for the following applications? If yes, indicate whether the improvement rates are the same, higher or lower, than those used in pricing and comment as required.
Table 32
Application Yes - Same
Yes - Higher
Yes - Lower No N/A
Total # of Respondents
Planning/Forecasting 10 0 1 2 1 14 Capital Modeling 8 0 0 3 2 13 GAAP 7 0 1 3 3 14
Table 33
Application Yes - Same
Yes - Higher
Yes - Lower No N/A
Total # of Respondents
Planning/Forecasting* 71% 0% 7% 14% 7% 14 Capital Modeling 62% 0% 0% 23% 15% 13 GAAP* 50% 0% 7% 21% 21% 14
*Total does not add to 100% due to rounding.
Excluding “N/A” responses, the majority of respondents do apply the same mortality improvement factors for GAAP, capital modeling and planning/forecasting as they do for pricing; however, it should be noted there were a few respondents who do not apply any mortality improvement to these applications.
Additional comments received include:
GAAP and Capital Modeling include PADs for conservatism. Planning does not.
Valuation uses dynamic lapses rates that may be either higher or lower. Capital modeling includes PAD for conservatism.
29. Are there any other issues regarding the use of mortality improvement in life
insurance pricing you would have liked to have seen covered in this survey?
The two respondents who indicated they would have liked to have seen other issues regarding the use of mortality improvement in life insurance pricing suggested the following:
More exploration of whether companies uses statistical models (& what types) including stochastic components to derive improvement rates.
Would be interesting to get people's views on whether they thought improvement would continue or not. It will be interesting to see reasons people think it will or won't continue, but which do they think will "win" long term.

34
30. Why doesn’t your company use durational mortality improvement? (Check all that apply) Only one of the 16 responses did not assume durational mortality improvement. The reason given was “Not sufficiently credible.”

35
Section IV: Mortality Improvement Questions for Companies with Canadian Reporting Requirements who use Mortality Improvement The Canadian Institute of Actuaries is proposing modifying the valuation standard to allow for limited mortality improvement for life insurance liabilities and modify the existing projection scale for annuities. 31. Does your company plan to reflect the maximum rates allowed in its life insurance
valuation?
Table 34 Reflect Maximum Rates in Valuation #
Yes 1 No 1
Don't Know 3 Total # of Respondents 5
Of the five responses received, three did not know if their company planned to reflect the maximum rates allowed for life insurance valuation. The one “No” response indicated they will reflect partial improvement
32. Will your company’s pricing philosophy and practice change as a result of the new
standard?
Table 35 Will Pricing Philosophy and Practice Change #
Yes 1 No 2
Don't Know 2 Total # of Respondents 5
No explanation was provided from the one “Yes” response.

36
33. Please identify any concerns from either a valuation or pricing perspective resulting from the proposed professional changes.
Three of the five who responded to this section identified their concerns:
Our rates have been there for over 2 1/2 years. So far, I have not heard anybody say anything about changing them to a more updated table of mortality rates. I think that the mortality rates have been there since 1999 and no one has really said anything.
Potential disconnect between pricing & valuation. Too many to list here.

37
Appendix 1 - Durational Improvement Factor Results (Question 19) Preferred Non Tobacco Male Age 35
Policy Duration
1 2 3 5 6 10 11 15 16 20 21 25 26+ Median 1.00 1.00 1.00 1.00 1.00 1.00 0.60 0.66 0.68 0.75 0.00 0.00 0.00Mean 1.01 1.01 1.02 1.02 1.13 1.12 0.73 0.71 0.69 0.70 0.36 0.37 0.08Mode 1.50 1.00 1.00 1.00 2.00 2.00 1.50 #N/A 0.00 0.00 0.00 0.00 0.00Minimum 0.00 0.04 0.08 0.16 0.20 0.36 0.00 0.00 0.00 0.00 0.00 0.00 0.00Maximum 2.00 2.00 2.00 2.00 2.00 2.00 1.50 1.50 1.50 1.50 1.08 1.00 0.5025th Percentile 0.75 0.75 0.75 0.75 0.75 0.67 0.40 0.42 0.38 0.38 0.00 0.00 0.0075th Percentile 1.50 1.48 1.46 1.42 1.50 1.50 1.29 1.05 1.05 1.03 0.84 0.96 0.04
#N/A – could not be calculated Preferred Non Tobacco Male Age 65
Policy Duration
1 2 3 5 6 10 11 15 16 20 21 25 26+ Median 2.00 1.88 1.76 1.52 1.40 1.00 0.75 0.63 0.25 0.25 0.00 0.00 0.00Mean 1.49 1.47 1.44 1.40 1.37 1.19 0.82 0.68 0.48 0.47 0.13 0.13 0.06Mode 2.00 2.00 2.00 2.00 2.00 #N/A 0.00 1.00 0.00 0.00 0.00 0.00 0.00Minimum 0.50 0.50 0.50 0.50 0.50 0.50 0.00 0.00 0.00 0.00 0.00 0.00 0.00Maximum 2.16 2.15 2.13 2.11 2.09 2.00 1.83 1.67 1.62 1.50 1.00 1.00 0.5025th Percentile 1.00 1.00 1.00 0.98 0.96 0.78 0.50 0.30 0.00 0.00 0.00 0.00 0.0075th Percentile 2.00 2.00 2.00 2.00 2.00 1.50 1.29 1.00 0.81 0.81 0.00 0.00 0.00
#N/A – could not be calculated Residual Non Tobacco Male Age 35
Policy Duration
1 2 3 5 6 10 11 15 16 20 21 25 26+ Median 1.00 1.00 1.00 1.00 1.40 1.31 0.60 0.78 0.80 0.88 0.00 0.00 0.00Mean 1.15 1.15 1.15 1.16 1.27 1.26 0.87 0.87 0.85 0.86 0.36 0.37 0.08Mode 1.50 1.00 1.00 1.00 2.00 2.00 1.50 #N/A 0.00 0.00 0.00 0.00 0.00Minimum 0.00 0.04 0.08 0.16 0.20 0.36 0.00 0.00 0.00 0.00 0.00 0.00 0.00Maximum 2.00 2.00 2.00 2.00 2.00 2.00 2.00 2.00 2.00 2.00 1.08 1.00 0.5025th Percentile 0.85 0.85 0.85 0.83 0.82 0.67 0.40 0.42 0.38 0.38 0.00 0.00 0.0075th Percentile 1.50 1.50 1.50 1.50 2.00 2.00 1.50 1.28 1.27 1.20 0.84 0.96 0.04
#N/A – could not be calculated

38
Residual Non Tobacco Male Age 65
Policy Duration
1 2 3 5 6 10 11 15 16 20 21 25 26+ Median 2.00 1.93 1.86 1.71 1.64 1.36 0.81 0.75 0.25 0.25 0.00 0.00 0.00Mean 1.63 1.61 1.58 1.54 1.51 1.33 0.90 0.81 0.64 0.63 0.13 0.13 0.06Mode 2.00 2.00 2.00 2.00 2.00 2.00 0.00 0.00 0.00 0.00 0.00 0.00 0.00Minimum 0.50 0.50 0.50 0.50 0.50 0.50 0.00 0.00 0.00 0.00 0.00 0.00 0.00Maximum 2.16 2.15 2.13 2.11 2.09 2.00 2.00 2.00 2.00 2.00 1.00 1.00 0.5025th Percentile 1.00 1.00 1.00 1.00 1.00 0.93 0.19 0.25 0.00 0.00 0.00 0.00 0.0075th Percentile 2.00 2.00 2.00 2.00 2.00 1.87 1.50 1.17 1.16 1.13 0.00 0.00 0.00
Preferred Non Tobacco Female Age 35
Policy Duration
1 2 3 5 6 10 11 15 16 20 21 25 26+ Median 0.68 0.68 0.68 0.67 0.65 0.53 0.50 0.53 0.55 0.63 0.00 0.00 0.00Mean 0.88 0.88 0.89 0.89 0.89 0.88 0.66 0.63 0.63 0.64 0.33 0.34 0.08Mode 0.50 0.50 0.50 0.50 0.50 0.50 1.50 0.00 0.00 0.00 0.00 0.00 0.00Minimum 0.00 0.04 0.08 0.16 0.20 0.36 0.00 0.00 0.00 0.00 0.00 0.00 0.00Maximum 2.00 2.00 2.00 2.00 2.00 2.00 1.50 1.50 1.50 1.50 1.00 1.00 0.5025th Percentile 0.50 0.50 0.50 0.50 0.50 0.50 0.40 0.38 0.38 0.38 0.00 0.00 0.0075th Percentile 1.25 1.23 1.21 1.17 1.15 1.06 1.04 0.97 0.96 0.89 0.80 0.80 0.04
Preferred Non Tobacco Female Age 65
Policy Duration
1 2 3 5 6 10 11 15 16 20 21 25 26+ Median 1.00 1.00 1.00 1.00 1.00 0.93 0.56 0.50 0.25 0.25 0.00 0.00 0.00Mean 1.17 1.15 1.13 1.09 1.05 0.96 0.71 0.58 0.44 0.44 0.13 0.13 0.06Mode 0.50 0.50 0.50 0.50 0.50 0.50 0.00 0.00 0.00 0.00 0.00 0.00 0.00Minimum 0.50 0.50 0.50 0.50 0.50 0.50 0.00 0.00 0.00 0.00 0.00 0.00 0.00Maximum 2.00 2.00 2.00 2.00 2.00 2.00 1.59 1.55 1.54 1.50 1.00 1.00 0.5025th Percentile 0.50 0.50 0.50 0.50 0.50 0.50 0.50 0.25 0.00 0.00 0.00 0.00 0.0075th Percentile 1.70 1.69 1.68 1.52 1.40 1.02 0.96 0.81 0.63 0.63 0.00 0.00 0.00
39
Residual Non Tobacco Female Age 35
Policy Duration
1 2 3 5 6 10 11 15 16 20 21 25 26+ Median 1.00 1.00 1.00 1.00 1.00 1.00 0.50 0.76 0.77 0.80 0.00 0.00 0.00Mean 0.99 0.99 1.00 1.00 1.00 0.99 0.77 0.75 0.76 0.76 0.33 0.34 0.08Mode 1.50 1.50 1.50 1.50 1.50 1.50 1.50 1.50 1.50 1.50 0.00 0.00 0.00Minimum 0.00 0.04 0.08 0.16 0.20 0.36 0.00 0.00 0.00 0.00 0.00 0.00 0.00Maximum 2.00 2.00 2.00 2.00 2.00 2.00 1.50 1.50 1.50 1.50 1.00 1.00 0.5025th Percentile 0.50 0.50 0.50 0.50 0.50 0.50 0.40 0.38 0.38 0.38 0.00 0.00 0.0075th Percentile 1.50 1.50 1.50 1.50 1.50 1.50 1.50 1.13 1.13 1.13 0.80 0.80 0.04
Residual Non Tobacco Female Age 65
Policy Duration
1 2 3 5 6 10 11 15 16 20 21 25 26+ Median 1.50 1.45 1.39 1.29 1.23 1.00 0.81 0.63 0.25 0.25 0.00 0.00 0.00Mean 1.28 1.26 1.24 1.20 1.16 1.08 0.82 0.70 0.57 0.56 0.13 0.13 0.06Mode 0.50 0.50 0.50 0.50 0.50 0.50 0.00 0.00 0.00 0.00 0.00 0.00 0.00Minimum 0.50 0.50 0.50 0.50 0.50 0.50 0.00 0.00 0.00 0.00 0.00 0.00 0.00Maximum 2.00 2.00 2.00 2.00 2.00 2.00 1.59 1.55 1.54 1.50 1.00 1.00 0.5025th Percentile 0.80 0.80 0.80 0.79 0.65 0.63 0.50 0.25 0.00 0.00 0.00 0.00 0.0075th Percentile 1.70 1.69 1.68 1.52 1.50 1.50 1.50 1.13 1.13 1.13 0.00 0.00 0.00
Preferred Tobacco Male Age 35
Policy Duration
1 2 3 5 6 10 11 15 16 20 21 25 26+ Median 0.68 0.68 0.68 0.67 0.66 0.59 0.50 0.50 0.50 0.50 0.00 0.00 0.00Mean 0.79 0.80 0.80 0.81 0.82 0.82 0.63 0.58 0.59 0.61 0.26 0.28 0.11Mode 0.00 0.50 0.50 0.50 0.50 0.50 1.50 0.00 0.00 0.00 0.00 0.00 0.00Minimum 0.00 0.00 0.00 0.00 0.00 0.00 0.00 0.00 0.00 0.00 0.00 0.00 0.00Maximum 2.00 2.00 2.00 2.00 2.00 2.00 1.50 1.50 1.50 1.50 1.00 1.00 0.5025th Percentile 0.38 0.39 0.40 0.42 0.43 0.47 0.30 0.25 0.25 0.25 0.00 0.00 0.0075th Percentile 1.13 1.13 1.13 1.13 1.13 1.13 0.83 0.78 0.80 0.88 0.40 0.48 0.13
40
Preferred Tobacco Male Age 65
Policy Duration
1 2 3 5 6 10 11 15 16 20 21 25 26+ Median 1.00 1.00 1.00 0.99 0.98 0.86 0.60 0.50 0.50 0.50 0.00 0.00 0.00Mean 1.10 1.09 1.07 1.04 1.02 0.93 0.71 0.56 0.51 0.50 0.14 0.14 0.07Mode 0.50 0.50 0.50 0.50 0.50 0.50 0.00 0.00 0.00 0.00 0.00 0.00 0.00Minimum 0.00 0.00 0.00 0.00 0.00 0.00 0.00 0.00 0.00 0.00 0.00 0.00 0.00Maximum 2.00 2.00 2.00 2.00 2.00 2.00 1.69 1.60 1.58 1.50 1.00 1.00 0.5025th Percentile 0.50 0.50 0.50 0.50 0.50 0.50 0.38 0.17 0.00 0.00 0.00 0.00 0.0075th Percentile 1.87 1.84 1.78 1.59 1.50 1.18 0.98 0.75 0.75 0.75 0.00 0.00 0.00
Residual Tobacco Male Age 35
Policy Duration
1 2 3 5 6 10 11 15 16 20 21 25 26+ Median 0.93 0.93 0.93 0.92 0.91 0.84 0.55 0.56 0.60 0.75 0.00 0.00 0.00Mean 0.92 0.92 0.93 0.94 0.94 0.94 0.75 0.72 0.73 0.75 0.26 0.28 0.09Mode 1.50 1.50 1.50 1.50 1.50 1.50 1.50 1.50 1.50 1.50 0.00 0.00 0.00Minimum 0.00 0.00 0.00 0.00 0.00 0.00 0.00 0.00 0.00 0.00 0.00 0.00 0.00Maximum 2.00 2.00 2.00 2.00 2.00 2.00 1.50 1.50 1.50 1.50 1.00 1.00 0.5025th Percentile 0.38 0.39 0.40 0.42 0.43 0.47 0.30 0.25 0.25 0.25 0.00 0.00 0.0075th Percentile 1.50 1.50 1.50 1.50 1.50 1.50 1.50 1.25 1.25 1.25 0.40 0.48 0.08
Residual Tobacco Male Age 65
Policy Duration
1 2 3 5 6 10 11 15 16 20 21 25 26+ Median 1.50 1.50 1.50 1.50 1.40 0.93 0.81 0.50 0.50 0.50 0.00 0.00 0.00Mean 1.26 1.24 1.23 1.19 1.16 1.06 0.96 0.70 0.65 0.64 0.14 0.14 0.07Mode 2.00 #N/A #N/A #N/A #N/A #N/A 1.50 0.00 0.00 0.00 0.00 0.00 0.00Minimum 0.00 0.00 0.00 0.00 0.00 0.00 0.00 0.00 0.00 0.00 0.00 0.00 0.00Maximum 2.00 2.00 2.00 2.00 2.00 2.00 1.69 1.60 1.58 1.50 1.00 1.00 0.5025th Percentile 0.75 0.75 0.75 0.74 0.73 0.64 0.60 0.17 0.00 0.00 0.00 0.00 0.0075th Percentile 1.92 1.85 1.79 1.67 1.65 1.61 1.50 1.25 1.25 1.25 0.00 0.00 0.00
#N/A – could not be calculated

41
Preferred Tobacco Female Age 35
Policy Duration
1 2 3 5 6 10 11 15 16 20 21 25 26+ Median 0.50 0.50 0.50 0.50 0.50 0.50 0.50 0.50 0.50 0.50 0.00 0.00 0.00Mean 0.63 0.64 0.64 0.65 0.66 0.66 0.59 0.47 0.48 0.50 0.26 0.28 0.09Mode 0.00 0.50 0.50 0.50 0.50 0.50 0.50 0.00 0.00 0.75 0.00 0.00 0.00Minimum 0.00 0.00 0.00 0.00 0.00 0.00 0.00 0.00 0.00 0.00 0.00 0.00 0.00Maximum 2.00 2.00 2.00 2.00 2.00 2.00 1.50 1.00 1.00 1.00 1.00 1.00 0.5025th Percentile 0.25 0.27 0.29 0.33 0.35 0.43 0.44 0.25 0.25 0.25 0.00 0.00 0.0075th Percentile 0.72 0.72 0.72 0.71 0.70 0.64 0.63 0.66 0.68 0.75 0.40 0.48 0.08
Preferred Tobacco Female Age 65
Policy Duration
1 2 3 5 6 10 11 15 16 20 21 25 26+ Median 0.80 0.80 0.80 0.78 0.77 0.63 0.56 0.50 0.50 0.50 0.00 0.00 0.00Mean 0.95 0.93 0.91 0.88 0.86 0.77 0.68 0.44 0.40 0.39 0.14 0.14 0.07Mode 0.50 0.50 0.50 0.50 0.50 0.50 0.50 0.00 0.00 0.00 0.00 0.00 0.00Minimum 0.00 0.00 0.00 0.00 0.00 0.00 0.00 0.00 0.00 0.00 0.00 0.00 0.00Maximum 2.00 2.00 2.00 2.00 2.00 2.00 1.50 1.00 1.00 1.00 1.00 1.00 0.5025th Percentile 0.50 0.50 0.50 0.50 0.50 0.50 0.50 0.17 0.00 0.00 0.00 0.00 0.0075th Percentile 1.43 1.36 1.30 1.18 1.11 0.87 0.86 0.64 0.64 0.63 0.00 0.00 0.00
Residual Tobacco Female Age 35
Policy Duration
1 2 3 5 6 10 11 15 16 20 21 25 26+ Median 0.68 0.68 0.68 0.67 0.65 0.53 0.50 0.56 0.60 0.75 0.00 0.00 0.00Mean 0.70 0.71 0.72 0.73 0.73 0.73 0.66 0.54 0.55 0.57 0.26 0.28 0.09Mode 0.00 #N/A #N/A #N/A #N/A #N/A #N/A 0.00 0.00 0.75 0.00 0.00 0.00Minimum 0.00 0.00 0.00 0.00 0.00 0.00 0.00 0.00 0.00 0.00 0.00 0.00 0.00Maximum 2.00 2.00 2.00 2.00 2.00 2.00 1.50 1.00 1.00 1.00 1.00 1.00 0.5025th Percentile 0.25 0.27 0.29 0.33 0.35 0.43 0.44 0.25 0.25 0.25 0.00 0.00 0.0075th Percentile 0.88 0.88 0.88 0.88 0.88 0.88 0.88 0.88 0.88 0.88 0.40 0.48 0.08
#N/A – could not be calculated
42
Residual Tobacco Female Age 65
Policy Duration
1 2 3 5 6 10 11 15 16 20 21 25 26+ Median 0.85 0.84 0.84 0.83 0.82 0.80 0.80 0.50 0.50 0.50 0.00 0.00 0.00Mean 1.02 1.00 0.99 0.95 0.93 0.84 0.75 0.52 0.47 0.46 0.14 0.14 0.07Mode 2.00 #N/A #N/A #N/A #N/A #N/A #N/A 0.00 0.00 0.00 0.00 0.00 0.00Minimum 0.00 0.00 0.00 0.00 0.00 0.00 0.00 0.00 0.00 0.00 0.00 0.00 0.00Maximum 2.00 2.00 2.00 2.00 2.00 2.00 1.50 1.00 1.00 1.00 1.00 1.00 0.5025th Percentile 0.65 0.65 0.65 0.64 0.64 0.57 0.53 0.17 0.00 0.00 0.00 0.00 0.0075th Percentile 1.50 1.44 1.38 1.26 1.20 0.97 0.96 0.89 0.89 0.88 0.00 0.00 0.00
#N/A – could not be calculated

43
Appendix 2 - Comparison of Direct Writer and Reinsurer Results Both direct writers and reinsurers completed the survey, with the results analyzed separately. Many of the responses were similar among the two groups; however, there were a few areas where the reinsurers and direct writers varied in their approach. These areas are summarized below:
Reinsurers’ use of mortality improvement was similar to Canadian direct writers where the majority of companies use both generational and durational mortality improvement in the pricing of life insurance products. For US direct writers, the responses were split evenly between using and not using mortality improvement.
For both generational and durational mortality improvement, the basis most used by the reinsurers in setting mortality assumptions was population mortality studies, whereas direct writers more often used their own company or intercompany mortality studies.
While most direct writers indicated using a flat percentage per year to create both their generational and durational mortality improvement factors, most reinsurers used a flat percentage per year to create generational improvement factors. Regression based on historical experience was used by the majority of reinsurers to create their durational mortality improvement factors.
Most direct writers review and update both their generational and durational mortality improvement factors at least annually or on no set schedule. Most reinsurers indicated updating both their generational and durational mortality improvement factors between every one and three years.
Whereas both the reinsurers and direct writers were evenly split between having a maximum attained age at which to apply durational mortality improvement factors, the maximum attained age varied between reinsurers and direct writers. The maximum age for direct writers varied between ages 70 and 100, and for the reinsurers the range was between 89 and 120.

44
Companies were asked to comment on how their durational mortality improvement factors varied by risk class. For both the reinsurers and direct writers, durational mortality improvement factors were the same between non-tobacco and tobacco, older and younger attained ages, and preferred and standard risks. Sex was noted as having higher durational mortality improvement factors for males versus females among the US and reinsurer respondents. Canadian direct writers noted the factors between males and females as being the same.

45
Appendix 3 – List of Participating Companies Aurigen Reinsurance Company Berkshire Hathaway Life Re (US) * Berkshire Hathaway Life Re (Canada) * Generali USA Life Reassurance Company GenRe Hannover Life Re London Life Reinsurance Company M Financial Group Manulife Financial (Reins.) Munich Re Optimum Reinsurance Co (US) * Optimum Reassurance (Canada) * RMA SCOR Global Life US Reinsurance Company Swiss Re Life & Health N.A. (US) * Swiss Reinsurance Company Ltd. (Canada) * Transamerica Reinsurance (US) *Separate responses were provided for US and Canada.