Embed Size (px)
Citation preview


Report of the
Comptroller and Auditor General of India
on
Public Debt Management
Union Government
Ministry of Finance Report No. 16 of 2016
(Performance Audit)

Contents
Particulars Page No.
Preface
i
Executive Summary
iii
Chapter 1: Introduction
1
Chapter 2: Legal Framework
9
Chapter 3: Organizational Framework
15
Chapter 4: Debt Management Strategy
21
Chapter 5:Borrowing Activities
25
Chapter 6: Debt Information System, Debt Servicing and Debt Reporting
37
Chapter 7: Government Securities Market
43
Chapter 8: Conclusion and Recommendations
47
Annexures
49
List of Abbreviations
59
Glossary
61

i
Preface
his Report of the Comptroller and Auditor General of India has been
prepared for submission to the President of India under Article 151 of the
Constitution of India for being laid before the Parliament.
This report contains the result of the Performance Audit on ‘Public Debt
Management’ and covers the period from 2009-10 to 2014-15.
This report results from the scrutiny of the files and documents pertaining to Public
Debt Management in the Department of Economic Affairs and the Reserve Bank of
India.
T


Report No. 16 of 2016
iii
Executive Summary
1. Introduction
Public debt is the total financial obligations incurred by the entire public sector of a nation,
including guarantees and implicit debt. Public debt would include obligations evidenced by
a legal instrument issued by the Central, State, Municipal, or Local Government or
Enterprises owned or controlled by the Government; and other entities considered public or
quasi public. Public debt management is the process of establishing and executing a
strategy for managing public debt in order to raise the required amount of funding at the
desired risk and cost levels.
India, like most of the developing countries, seeks to grow its economy as also to expand
social services to its citizens. This raises large financing needs on the country resulting in
excess of expenditure over non–debt receipts, termed as fiscal deficit. The fiscal deficit is
sought to be plugged by borrowing, which adds to the country’s outstanding debt stock.
The shortfall is met either by internal or external borrowing contracted on the security of
the Consolidated Fund of India or by the use of surplus fund in the Public Account. In the
budget documents, internal debt and external debt together are referred to as ‘Public Debt’.
Internal debt refers to rupee–denominated debt, consisting of marketable securities (dated
securities, treasury bills) and non-marketable securities (14 days Intermediate Treasury
bills, compensation and other bonds, securities issued to international financial institution
etc.).
External debt refers to the debt raised by the Union Government from non-domestic
sources, namely, multilateral institutions like the International Bank for Reconstruction and
Development (IBRD), International Development Association (IDA), Asian Development
Bank (ADB) etc. In addition, external debt was also contracted from bilateral sources, i.e.,
directly from the foreign countries.
In India, the function of public debt management in respect of internal debt was performed
by Budget Division of the Department of Economic Affairs (DEA) of the Ministry of
Finance (MOF) along with the Internal Debt Management Department (IDMD) of Reserve
Bank of India (RBI). In respect of external debt (Multilateral and Bilateral), the various
divisions of the DEA like the Multilateral Relations (MR), Bilateral Cooperation (BC) and
Multilateral Institutions (MI) performed the function of debt management. They were also

Report No. 16 of 2016
iv
supported by the Controller of Aid, Accounts and Audit (CAAA). The Chief Controller of
Accounts, Ministry of Finance maintained accounts for both internal and external debt.
The performance audit on Public Debt Management was conducted as public debt
constituted a significant portion of the receipts of the Union Government. Further, such an
audit would help policymakers to understand the risks of public debt, make their operations
more effective, increase the efficiency of internal administrative processes and also enhance
public debt transparency and accountability. Moreover, the frequency and severity of debt
crises across the world and the consequent adverse impact on managing of public finances
reinforces the need for promoting responsible lending and borrowing behaviours.
The total outstanding public debt of India as on 31 March 2015 was ` 51,04,675 crore of
which ` 47,38,291 crore (92.82 per cent) was internal debt and ` 3,66,384 crore ( 7.18 per
cent) was external debt. The repayment of principal and the payment of interest of the
contracted debt is together termed as debt servicing. In 2014-15, 77 per cent of the long
term internal borrowings and 73 per cent of the external borrowings were utilized for debt
servicing implying that a larger percentage of debt was being used for debt servicing which
in turn meant lower percentage of debt taken was available for meeting developmental
expenditure to promote growth which is one of the reasons for contracting debt.
(Chapter 1)
2. Legal Framework
The legal framework provides strategic direction, defines and clarifies powers and supports
professionalism and operational focus in public debt management and promotes good
governance by establishing accountability for managing the government’s debt liabilities.
As per international best practices, the legal framework of public debt management should
provide for authorization by Parliament to the Executive and the debt management unit to
borrow, include the borrowing purposes and the debt management objectives, provide for
the formulation of debt management strategy and indicate the reporting requirements to
ensure accountability of the executive to the legislature.
The existing legal framework for the management of public debt in India is contained in
the Constitution of India and in various primary and secondary legislations like RBI
Act, 1934, Public Debt Act, 1944, FRBM Act, 2003, FRBM Rules, 2004, Government
Securities Act, 2006 etc. The existing legal framework does not define the term ‘Public
Debt’, does not indicate the objectives of public debt and the borrowing purposes and
also does not require the formulation of a debt management strategy.
(Para 2.3.1& 2.3.2)

Report No. 16 of 2016
v
As per Rule 3 (4) of FRBM Rules, 2004, no additional liabilities could have been assumed
in 2013-14 or thereafter. This provision was inconsistent with the target of 3 per cent of
GDP for fiscal deficit provided in Rule 3 (2) of FRBM Rules, 2004.
(Para 2.4)
3. Organizational Framework
A number of expert committees set up in India over the past two decades had recommended
the establishment of a separate Public Debt Management Agency (PDMA). Though a
PDMA was not set up, a separate Middle Office (MO) was established in September 2008.
No further progress has been made on the setting up of a separate PDMA till date.
The responsibilities of the MO, among other things, included formulation of comprehensive
risk management framework, formulation of a long term debt management strategy and
developing and maintaining a centralized database on Government liabilities. However,
these activities were not performed by the MO. Some of these functions were, however,
discharged by other agencies.
(Paras 3.2 & 3.4)
In respect of external debt (bilateral and multilateral), the MO functions, namely,
undertaking risk analysis and monitoring reports on portfolio-related risks, and assessing
the performance of debt managers against any strategic targets/benchmarks, were not being
performed by any entity.
(Para 3.3)
4. Debt Management Strategy
A debt management strategy is a plan that operationalizes the debt management objectives.
It lays out the desired composition of the public debt portfolio, which captures the
government’s preferences with regard to a cost-risk trade-off.
DEA brought out a Medium Term Debt Strategy (MTDS) for the first time in December
2015 which included risk analysis and stress testing but its scope was restricted to the
marketable debt of the Union Government only. Previously, some of the elements of debt
management strategy were discussed in the meetings of the Monitoring Group on Cash and
Debt Management (MGCDM) but MTDS had not been formulated.
(Para 4.2)
Report No. 16 of 2016
vi
5. Borrowing Activities
The borrowing activities envisage all the activities from the estimation of the required
borrowing to the actual borrowing of fund either from the domestic markets or from the
external markets.
The budget division, DEA, MOF is responsible for preparation of budget estimates (BE)
and revised estimates (RE) in respect of internal borrowings, external borrowings and other
receipts on the basis of inputs received from RBI, CAAA and other departments.
The borrowing calendar for market borrowings is prepared half–yearly on the basis of the
estimates of market borrowing, cash inflows, cash outflows and the likely funding-gap of
the Union Government. The borrowing calendar indicated the amount of securities to be
issued through weekly primary auctions during the ensuing half year and is issued with the
approval of the MGCDM.
During the period from 2009–10 to 2014–15, the variation between the actual external
borrowing and the revised estimates of external borrowing as per the budget ranged
between (-)33 per cent and 225 per cent.
(Para 5.3)
Primary auctions of government securities were conducted on the E–Kuber platform by
RBI. A system of underwriting for market lending operated in the government securities
markets in India through the mechanism of Primary Dealers (PDs). The Auction Committee
in the RBI decided the cut-off price/yield and the securities, if any, to be devolved upon the
underwriters.
There were no criteria for deciding particular issues wherein securities were to be devolved
on the underwriters. There were also no criteria for deciding the cut–off rate or the reasons
for deciding a particular cut-off rate. Subsequently RBI informed (May 2016) that a policy
on devolvement criteria had been prepared which inter alia incorporated the factors to be
considered for arriving at the devolvement decision.
(Para 5.2)
In respect of external borrowing, DEA is the nodal agency for posing projects to WB, ADB
and the IFAD. The proposals for external assistance to be posed to WB, ADB and IFAD
were decided by the Screening Committee in the DEA constituted in August 2009.
Report No. 16 of 2016
vii
‘Finance Plus’ criteria were instituted (September 2011) to maximize access and leverage
of Multilateral Financial Institutions’ (MFIs’)/Multilateral Development Banks’ (MDBs’)
knowledge base, international experience and familiarities with best practices making the
best use of limited available external resources. Since September 2011, a total of 82
proposals for obtaining external loan assistance were approved by the Screening
Committee. But in 60 of the approved proposals, the minutes of the Screening Committee
did not indicate whether knowledge transfer, technology transfer and best practices transfer
from international experience were considered.
(Para 5.4)
RBI is entrusted with the cash management of Government of India which they perform in
co-ordination with the Ministry of Finance, Government of India. Cash management mainly
entails cash flow forecasting, arranging temporary liquidity, maintaining target balance in
the Government account, investment of surplus balance over and above the target balance
in the market etc.
The mismatches between inflow and outflow in Government account are managed by cash
management instruments, viz. treasury bills and further fine tuned through availing Ways
and Means Advances/Overdraft and issuing Cash Management Bills (CMBs). Ways and
Means Advances (WMA) are the advances made by the RBI to the Government. Limits on
the WMA are fixed on a half yearly basis. Overdraft (OD) is similar to WMA and can be
resorted to for maximum 10 days at a stretch, when limit of WMA is crossed.
During the period from 2010 to 2015, in at least 40 weeks in each year, the variations
between the weekly projected cash balance and the actual cash balance were more than
` 10,000 crore. In many instances, the projection of the weekly cash balance was negative.
(Para 5.5.1)
Cash Management Bills were introduced in 2009 to meet temporary cash flow mismatches
of the Government. During August and September 2013, Cash Management Bills were
issued to the extent of ` 96,000 crore for meeting monetary policy objectives.
(Para 5.5.2.1)
6. Debt Information System, Debt Servicing and Debt Reporting
Debt management activities should be supported by an accurate and comprehensive
information system with proper safeguards. The information system should comprise of
components that capture, monitor, analyse and report debt information of a country. A
Public Debt Information System should support recording, reporting and analytical
functions.

Report No. 16 of 2016
viii
RBI uses E-Kuber for primary auctions of dated securities and treasury bills, debt service
payments and generating various reports for internal debt. In respect of external debt,
Integrated Computerised System (ICS) is used for maintaining various ledgers and registers
relating to each loan/grant, debt servicing and generating various reports. E-Kuber and ICS
did not have the provision for analytical functions.
(Para 6.1.1)
A centralized database on all internal and external liabilities of the government was not
available. The information in respect of internal debt and external debt was, however,
available in RBI and in the Office of the Controller of Aid, Audit and Accounts
respectively.
(Para 6.1.3)
Commitment charges on undrawn balance of external loans are paid on the amount of
principal rescheduled for drawal on later dates. During the period from 2009-10 to 2014-15,
commitment charges to the extent of ` 602.66 crore were paid.
(Para 6.2.1)
The figures of internal debt presented in different documents such as Status Paper and
Indian Public Finance Statistics published by Government of India did not agree with those
in the Finance Accounts of the Government of India.
(Para 6.3.2)
7. Government Securities Market
One of the objectives of Public Debt Management is to develop a liquid market.
Developing a liquid and vibrant secondary market for government securities and
broadening the investor base are the key factors to ensure that debt is raised in a cost
effective manner. Further, the government securities market (GSM) provides the
benchmark yield and imparts liquidity to other financial markets and is considered an
essential precursor, in particular, for development of the corporate debt market. Moreover,
government securities market acts as a channel for integration of various segments of the
domestic financial market and helps in establishing inter linkages between the domestic and
external financial markets.
Trade in dated Government securities in the secondary market was predominantly taking
place in a few securities with the top ten securities accounting for more than 90 per cent of
the trading volume of government securities.

Report No. 16 of 2016
ix
(Para 7.3)
A scheme of non-competitive bidding for allocation of upto 5 per cent of the notified
amount in the specified auctions of dated securities was introduced in January 2002 to
encourage small and medium investors to participate in the primary auction. However, the
total amount of bids received and accepted during 2009 to 2015 from small and medium
investors ranged from 0.30 per cent to 0.47 per cent of the notified amount.
(Para 7.4)
8 Recommendations
• Legal framework, consisting of both the primary as well as secondary legislation, may
include the definition of public debt, debt management objectives, borrowing purposes,
and requirement of debt management strategy. DEA may consider doing this in a
phased manner.
• Conditions of ‘Finance Plus’ criteria aimed at maximizing access and leverage of
Multilateral Financial Institutions’/Multilateral Development Banks’ knowledge base,
international experience and familiarity with best practices may be applied in deciding
on the projects for external assistance and the same should be properly documented.
• A centralized database of internal debt, external debt and other liabilities may be
developed.
• Steps may be taken to ensure that the public debt information systems used (E-Kuber
and ICS) support analytical functions.
• Mechanism may be developed to ensure consistency in the reporting of public debt by
RBI and DEA and amongst the various divisions of DEA.

Report No. 16 of 2016
1
Chapter 1
Introduction
1.1 Public Debt
Public debt occupies a centre stage in public financial management. Public debt is the total
financial obligations incurred by the entire public sector of a nation, including guarantees and
implicit debt. Public debt would include obligations evidenced by a legal instrument issued by
the Central, State, Municipal, or Local Government or Enterprises owned or controlled by the
Government; and other entities considered public or quasi public. The public debt portfolio is
often the largest financial portfolio in the country and can have a far-reaching impact on
financial stability.
Most governments have large financial needs as they seek to grow their economies and expand
social services in their countries. A country is required to borrow both for consumption as well
as investment to promote growth which would help in improving the living standards of its
population. In theory, public borrowing is an effective tool for generating economic growth by
expanding the production and consumption choices of current and future generations and fairly
distributing the debt burden between current and future generations of taxpayers. Without
public borrowing, Governments may have to reduce the number and amount of productive
investments or impose high taxes on current taxpayers or reduce current spending on services
to its citizens or choose a mix of these choices.
Public debt, while giving an opportunity to the country to fuel economic growth and ensure
inter–generational equity, also places onus on the country for being responsible in its use of the
borrowed funds. Borrowing for this purpose, when not justified by a national need, could be
inconsistent with sustainable economic policy.
1.2 Public Debt Management
Public debt management is the process of establishing and executing a strategy for managing
public debt in order to raise the required amount of funding at the desired risk and cost levels.
It should encompass the main financial obligations over which governments, central, regional
and local, exercise control. Public debt management is important for a number of reasons like:
• ensuring that the level and rate of growth of public debt is sustainable in a wide range
of circumstances;
Report No. 16 of 2016
2
• lowering public borrowing costs over the long term, thus reducing the impact of deficit
financing and contributing to debt and fiscal sustainability; and
• avoiding economic crisis because of poorly structured debt.
1.3 Public Debt of Union Government
India, like most of the developing countries, seeks to grow its economy and to expand social
services to its citizens. This raises large financing needs on the country resulting in excess of
expenditure over non-debt receipts, termed as fiscal deficit. The fiscal deficit is sought to be
plugged by borrowing, which adds to the country’s outstanding debt stock. In other words,
fiscal deficit can be seen as being indicative of the net incremental liabilities of the
Government or its additional borrowings to bridge the budgetary gap. The shortfall is met
either by internal or external borrowing contracted on the security of the Consolidated Fund of
India (CFI) or by the use of surplus fund in the Public Account. In the budget documents,
internal debt and external debt together are referred to as ‘Public Debt’.
Internal debt refers to rupee-denominated debt, consisting of marketable securities (dated
securities, treasury bills) and non-marketable securities (14 days Intermediate Treasury Bills,
compensation and other bonds, securities issued to international financial institutions etc.).
External debt refers to the debt raised by the Union Government from non-domestic sources,
namely, multilateral institutions like the International Bank for Reconstruction and
Development (IBRD), International Development Association (IDA), Asian Development
Bank (ADB) etc. or bilateral sources, i.e., directly from the foreign countries.
Liabilities in the Public Account (referred to as ‘other liabilities’) include National Small
Savings Fund (NSSF), Provident Funds, Reserve Funds and deposits and special bonds issued
to oil marketing companies, fertilizer companies and Food Corporation of India. ‘Other
liabilities’ are not included in the public debt.
Besides above direct liabilities, the Union Government provides guarantees for repayment of
borrowings and payment of interest thereon, repayment of share capital and payment of
minimum dividend, payment against agreements for supplies of materials and equipment on
credit basis, etc. on behalf of Government Companies/Corporations, Railways, Union
Territories, State Governments, Local Bodies, joint stock companies, co-operative institutions
etc. These guarantees constitute contingent liability of the CFI.
The details of the outstanding total liabilities of the Union Government at the end of each year
from 2011-12 to 2014-15 is presented in Table 1.1.

Report No. 16 of 2016
3
Table 1.1: Union Government Liabilities
( `̀̀̀ in crore)
Period
Gross
Domestic
Product
(GDP) at
current
prices
Internal
debt
External
debt (at
current
rate)
Public
debt
Other
liabilities
Total
liabilities (at
current rate)
(1) (2) (3) (4) (5=3+4) (6) (7=5+6)
2011-12 88,32,012@ 32,30,622
(36.58)
3,22,897
(3.66)
35,53,519
(40.24)
5,97,765
(6.77)
41,51,284
(47.00)
2012-13 99,88,540@ 37,64,566
(37.69)
3,32,004
(3.32)
40,96,570
(41.01)
6,10,016
(6.11)
47,06,586
(47.12)
2013-14 1,13,45,056@
42,40,767
(37.38)
3,74,483
(3.30)
46,15,250
(40.68)
6,44,060
(5.68)
52,59,310
(46.36)
2014-15 1,25,41,208$ 47,38,291
(37.78)
3,66,384
(2.92)
51,04,675
(40.70)
6,71,010
(5.35)
57,75,685
(46.05)
Note: Figures in parenthesis show percentage of Gross Domestic Product (GDP). GDP data is based on new series (Base year
2011-12). Data for the years 2009-10 and 2010-11 is not included due to change in base year of GDP to 2011-12.
@ Source: Central Statistical Office (CSO), Ministry of Statistics and Programme Implementation, Press Note
dated 30 January 2015
$ Source: Central Statistical Office (CSO), Ministry of Statistics and Programme Implementation, Press Note dated
29 May 2015
From Table 1.1, it can be seen that the outstanding total liabilities of the Union Government
had generally been around 46 per cent of the GDP of the country over the period from 2011-12
to 2014-15.
Report No. 16 of 2016
4
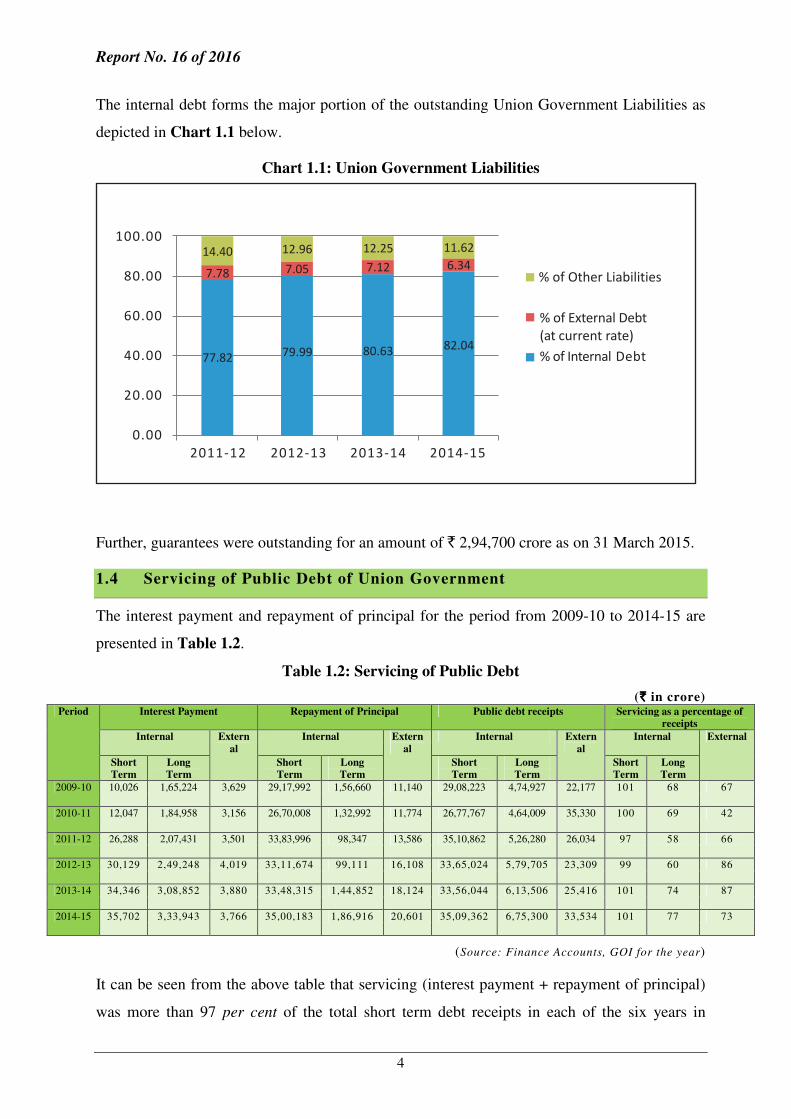
The internal debt forms the major portion of the outstanding Union Government Liabilities as
depicted in Chart 1.1 below.
Chart 1.1: Union Government Liabilities
Further, guarantees were outstanding for an amount of ` 2,94,700 crore as on 31 March 2015.
1.4 Servicing of Public Debt of Union Government
The interest payment and repayment of principal for the period from 2009-10 to 2014-15 are
presented in Table 1.2.
Table 1.2: Servicing of Public Debt
( `̀̀̀ in crore) Period Interest Payment Repayment of Principal Public debt receipts Servicing as a percentage of
receipts
Internal Extern
al
Internal Extern
al
Internal Extern
al
Internal External
Short
Term
Long
Term
Short
Term
Long
Term
Short
Term
Long
Term
Short
Term
Long
Term
2009-10 10,026 1,65,224 3,629 29,17,992 1,56,660 11,140 29,08,223 4,74,927 22,177 101 68 67
2010-11 12,047 1,84,958 3,156 26,70,008 1,32,992 11,774 26,77,767 4,64,009 35,330 100 69 42
2011-12 26,288 2,07,431 3,501 33,83,996 98,347 13,586 35,10,862 5,26,280 26,034 97 58 66
2012-13 30,129 2,49,248 4,019 33,11,674 99,111 16,108 33,65,024 5,79,705 23,309 99 60 86
2013-14 34,346 3,08,852 3,880 33,48,315 1,44,852 18,124 33,56,044 6,13,506 25,416 101 74 87
2014-15 35,702 3,33,943 3,766 35,00,183 1,86,916 20,601 35,09,362 6,75,300 33,534 101 77 73
(Source: Finance Accounts, GOI for the year)
It can be seen from the above table that servicing (interest payment + repayment of principal)
was more than 97 per cent of the total short term debt receipts in each of the six years in
Report No. 16 of 2016
5
respect of short term internal debt, which is understandable as short term debt is normally
repaid within a period of one year. In the case of long term internal debt, the corresponding
percentage ranged from 58 per cent to 77 per cent while in case of external debt, it ranged
from 42 per cent to 87 per cent over the period from 2009-10 to 2014-15. In 2014-15, 77 per
cent of the long term internal borrowings and 73 per cent of the external borrowing were
utilized for debt servicing implying that a larger percentage of debt was being used for debt
servicing which in turn meant lower percentage of debt taken was available for meeting
developmental expenditure to promote growth, which is one of the reasons for contracting
debt.
1.5 Rationale for Audit
As per Article 149 of the Constitution of India read with the provisions of the Comptroller and
Auditor General of India (Duties, Powers and Conditions of Service) Act, 1971, it is the duty
of the Comptroller and Auditor General of India to audit all receipts and expenditure of the
Union Government and State Governments. Public debt constitutes a significant portion of the
receipts of the Union Government. Further, audit of public debt would help in underlining the
significance and benefits of public debt management and also help policymakers to understand
the risks of public debt. It would make their operations more effective and increase the
efficiency of internal administrative processes. Such audit would also enhance public debt
transparency and accountability.
In the last few years, several countries across the world have faced public debt crisis. The
frequency and severity of debt crisis and the consequent adverse impact on managing of public
finances reinforces the need for promoting responsible lending and borrowing practices.
It is in this background that the topic of Public Debt Management was selected for
performance audit.
1.6 Audit Methodology
An introductory meeting was held with the Department of Economic Affairs (DEA), Ministry
of Finance (MOF) on 12 March 2014 and with the Reserve Bank of India (RBI) on 04 April
2014 to understand and assess the entire gamut of public debt management of the Union
Government. Performance audit on this topic commenced with an Entry Conference with RBI
on 16 July 2014 and with DEA on 05 August 2014 during which the audit methodology, scope,
objectives and criteria were discussed.

Report No. 16 of 2016
6
Audit was conducted in the offices of DEA and RBI. In order to assess the processes involved
in the public debt management, the audit procedure included inspection and examination of
records and documents as well as data analysis. Draft Performance Audit Report was issued to
DEA/RBI on 19 August 2015. On receipt of reply from RBI and clarifications from DEA,
another draft of the report was issued to DEA on 02 December 2015. An exit conference with
RBI was held on 06 November 2015 and with DEA on 04 April 2016. Responses of RBI and
DEA to the Draft Audit Report and views expressed by them during exit conference have been
duly considered and suitably incorporated in the report.
National Institute of Public Finance and Policy (NIPFP), a society engaged in research in
public economics and policies, provided consultancy in the conduct of this audit.
1.7 Audit Objectives
The Performance Audit on Public Debt Management was conducted in order to assess whether
the Government of India:
• had a clear and explicit legal as well as organizational framework for managing Public
Debt;
• had a debt management strategy to enable minimization of the risk and cost involved;
• had established an arrangement for effective execution of debt management activities and
adopted sound practices in debt servicing; and
• had set up effective information systems which enabled complete and accurate public debt
reporting system/debt database, to provide reliable financial information and to meet legal
requirements.
1.8 Audit Criteria
The audit objectives were benchmarked against audit criteria drawn from :
• Laws and regulations governing public debt activities viz.
o Fiscal Responsibilities and Budget Management (FRBM) Act, 2003
o Fiscal Responsibilities and Budget Management (FRBM) Rules, 2004
o Government Securities Act, 2006
o Government Securities Regulations, 2007
o Reserve Bank of India Act, 1934
• International practices
o Guidelines for Public Debt Management prepared by International Monetary Fund(IMF) and World Bank (WB)
Report No. 16 of 2016
7
o Manual of Effective Debt Management by Economic and Social Commission for Asia and the Pacific issued by United Nations
• Circulars/guidelines issued by Government of India (GOI)/RBI from time to time
• Quarterly/Annual Reports relating to Public Debt
• Status Paper on Government Debt issued by DEA
• Manuals of Internal Debt Management Department (IDMD) of RBI/Middle Office etc.
• Annual Financial Statements of the Government of India
1.9 Audit Scope
The performance audit covered internal and external debt of Union Government. The period of
audit coverage was for the five years from 2009-10 to 2013-14. However, facts and figures
were updated upto 31 March 2015.
1.10 Acknowledgement
We acknowledge the cooperation of DEA and RBI in facilitating the audit by providing
necessary records and information in connection with the conduct of this performance audit.
We also acknowledge the support and guidance provided by NIPFP.

Report No. 16 of 2016
9
Chapter 2
Legal Framework
2.1 Introduction
The legal framework provides strategic direction, defines and clarifies powers and supports
professionalism and operational focus in public debt management and also limits potential
abuses of power and promotes good governance by establishing accountability for managing
the government’s debt liabilities. A clear and explicit legal framework could contribute much
to achieve lower borrowing costs and prevent waste and inefficiency in public debt
management. The legal framework comprises both primary legislation (laws enacted with
approval of the legislature) and secondary or delegated legislation (rules, regulations, executive
orders etc.). As per international best practices, the legal framework of public debt
management should contain the following elements:
• Authorization by Parliament to the executive: The Parliament has ultimate power to
borrow on behalf of the government arising from its power to approve government tax and
expending measures. The Parliament should, therefore, authorize the executive to borrow.
• Authorization to the debt management unit: The legal framework should authorize the
debt management unit to borrow through regular issue of government securities.
• Borrowing purposes: The legal framework should clearly define the borrowing purposes.
• Debt management objectives: Having public debt objectives in legal framework allows a
country to formulate a debt management strategy to achieve the debt management
objectives.
• Debt management strategy: The legal framework should provide for preparation of debt
management strategy that is consistent with the debt management objectives.
• Debt reporting: There should be clear and explicit legal reporting requirements to hold
debt management unit/executive accountable to legislature.
2.2 Legal Framework in India
The legal framework for the management of public debt in India is contained in Article 292
of the Constitution of India which empowers the Union Government to borrow upon the
security of the CFI within such limits, if any, as may be fixed by Parliament by law, and in
different primary and secondary legislations as given below:

Report No. 16 of 2016
10
• The Fiscal Responsibility and Budget Management (FRBM) Act, 2003: The FRBM
Act, 2003 provided limits on the Central Government’s borrowings, debt and deficits,
greater transparency in fiscal operations of the Central Government and conducting fiscal
policy in a medium-term framework and of matters connected therewith or incidental
thereto.
• FRBM Rules, 2004: FRBM Rules, 2004 framed under FRBM Act, 2003 specified the
annual targets for reduction of fiscal and revenue deficits, annual targets for assuming
contingent liabilities in the form of guarantees and additional liabilities as a percentage of
GDP.
• RBI Act, 1934: Under Section 20 of the RBI Act, 1934, RBI was obliged to manage the
Central Government public debt.
• Public Debt Act, 1944 and Government Securities Act, 2006: The Public Debt Act is an
Act to consolidate the law relating to government securities and the management of the
public debt by RBI. With the enactment of the Government Securities Act, 2006, which
amends the law relating to Government securities and its management by RBI and matters
connected therewith, the Public Debt Act, 1944 ceased to apply to the government
securities.
2.3 Inadequacies in the Legal Framework
The existing legal framework in India covered some of the requirements of a good legal
framework. However, some aspects of an ideal legal framework for management of public debt
were not present in legislations governing public debt in India as discussed below.
2.3.1 Definition of Public Debt
Under the Indian budgetary classification; three sets of liabilities constituted Central
Government liabilities, namely, internal debt, external debt and other liabilities. In the budget
documents, internal debt and external debt were together termed as public debt. However, it
was observed in audit that the term ‘Public Debt’ had not been defined in the existing legal
framework.
RBI stated (July 2015) that though public debt had not been explicitly defined, all the liabilities
of government were listed and reported on a regular basis through Finance Accounts / Status
Paper of Government debt. In the Exit Conference, DEA stated that the term public debt had

Report No. 16 of 2016
11
been defined in the Indian Government Accounting Standard (IGAS) which could be adopted
after its notification.
DEA may consider adopting the definition as well as the components of public debt given in
the proposed IGAS.
2.3.2 Objectives, Purposes of Public Debt and Formulation of Debt Management
Strategy
As mentioned in the preceding paragraphs, the legal framework should ideally indicate the
public debt objectives, the borrowing purposes and should require the preparation of a debt
management strategy.
Audit observed that though the debt management objectives were mentioned in the Status
Paper prepared by the DEA, the existing legal framework did not indicate debt management
objectives explicitly. Further, while it can be construed from the Annual Financial Statement
passed by Parliament that borrowing was for financing the fiscal deficit, Audit observed that
borrowing purposes had not been mentioned in the existing legal framework of public debt
management in India. Moreover, the legal framework did not necessitate the formulation of a
debt management strategy.
RBI stated (July 2015) that the debt management objectives were implicit in FRBM Act and
Budgets and added (September 2015) that the overall objective of the Government debt
management policy was to meet Union Government’s financing need at the lowest possible
long term borrowing costs and also to keep the total debt within sustainable levels.
Additionally, it aimed at supporting development of a well-functioning and vibrant domestic
bond market. RBI stated (July 2015) that the main purpose of borrowing by the GOI was for
financing the fiscal deficit. RBI added that the mandate to manage public debt implicitly
imposed strategy formulation on the debt management agency. RBI further added that the
international sound practice clearly mentioned debt management objectives and the executive
in India had adopted those objectives.
DEA replied (September 2015) that borrowing was for the financing of fiscal deficit which has
Parliamentary approval. It was added that the purpose was dynamic and varied over time
depending on the priority of the nation and general socio-economic environment. It was opined
by DEA that such legal provisions might either create rigidities and/or require frequent legal
amendments.

Report No. 16 of 2016
12
In the Exit Conference, DEA stated that the inclusion of objectives of debt management,
borrowing purposes and the need for debt management strategy into the existing legal
framework such as Public Debt Act/Government Securities Act, etc. might not be desirable as
it could infuse elements of rigidity into debt management activities.
The reply of DEA should be viewed in light of the following:
• The FRBM Act, 2003 did not specify the objective of public debt management but
placed a ceiling on the Government’s borrowings while the budget shows the gap in
funding and requirement of debt. In no primary or secondary legislation were the
objectives of public debt management specified.
• It is to be noted that the FRBM Act, 2003 mandated submission of three reports to the
Parliament on an annual basis which inter alia contained information on debt
management activities. However, in the absence of stated objectives or requirement of a
strategy as indicated above, there was no evaluation of outcomes.
• While it is true that the borrowing purposes may be dynamic, the broad contours may
be prescribed in the legal framework.
• Though RBI stated that the mandate to manage public debt implicitly imposed strategy
formulation on the debt management agency, a debt management strategy had been
brought out only in December 2015 by DEA which covers the period from 2015 to
2018. Inclusion of the requirement to prepare a debt management strategy in the legal
framework would assure timely and regular preparation of the said strategy.
• The international best practices recommend that the legal framework should contain the
debt management objectives, borrowing purposes and formulation of debt management
strategy for effective debt management.
2.4 Inconsistency in the Provisions of FRBM Rules
Rule 3 (4) of FRBM Rules, 2004 framed under FRBM Act, 2003 provided:
“The Central Government shall not assume additional liabilities (including external debt at
current exchange rate) in excess of nine per cent of GDP for the financial year 2004-05 and in
each subsequent financial year, the limit of nine per cent of GDP shall be progressively
reduced by at least one percentage point of GDP.”
Rule 3 (2) of FRBM Rules, 2004 as amended by FRBM (Amendment) Rules, 2015 provided:

Report No. 16 of 2016
13
“The Central Government shall reduce the fiscal deficit by an amount equivalent to
0.4 per cent or more of the GDP at the end of each financial year beginning with the financial
year 2015-16, so that fiscal deficit is brought down to not more than 3 per cent to GDP at the
end of 31st day of March 2018.”
As per Rule 3 (4) above, it is clear that no additional liabilities could have been assumed in
2013-14 or thereafter which is inconsistent with the fiscal deficit target of 3 per cent of GDP as
per Rule 3 (2) above as amended.
In the Exit Conference, DEA noted the inconsistency between Rule 3(2) and Rule 3(4) of the
FRBM Rules for corrective action.
2.5 Management of External Debt
As per section 20 of the RBI Act, 1934, it is the obligation of RBI to undertake the
management of public debt. As stated above, the budget documents termed internal and
external debt together as public debt. However, it was observed that RBI was managing only
internal debt and DEA was managing external debt.
RBI, in their reply (July 2015), stated that Government of India (Allocation of Business) Rules
framed under the powers conferred by clause (3) of Article 77 of the Constitution of India;
allocated ‘management of external debt’ to DEA, Ministry of Finance (MOF); giving them
necessary legal authority to manage the debt. RBI, while stating that the MOF might be
managing the external debt due to sovereign – sovereign / multilateral relationship, added that
they managed the debt whenever it was issued in international capital markets like GBP1
denominated Indian Government bond in UK in 1935 and a Sterling loan in 1949.
DEA replied (September 2015) that considering more than 90 per cent financing of the fiscal
deficit was funded by domestic market borrowings which was being managed by RBI, as also
that external borrowing was largely concessional (and not market linked), it might be said that
legal provisions were being followed in spirit and to a substantial extent.
It is true that the Government of India (Allocation of Business) Rules provided sufficient legal
authority to DEA for management of external debt. However, it is pertinent to mention here
1 Great Britain Pound

Report No. 16 of 2016
14
that the requirement of RBI managing public debt is in the RBI Act, 1934. It is felt that these
two legislations need to be in consonance with each other.
Recommendation:
1. Legal framework, consisting of both the primary as well as secondary
legislation, may include the definition of public debt, debt management
objectives, borrowing purposes and requirement of debt management strategy.
DEA may consider doing this in a phased manner.
Report No. 16 of 2016
15
Chapter 3
Organizational Framework
3.1 Introduction
Organisational framework for debt management should establish clear roles and
responsibilities to ensure the effective execution of debt management activities, provide well
defined coordinating mechanism and establish a transparent and accountable system of checks
and balances. It should also enable debt managers to have the operational independence to
execute their objectives and strategies.
In order to increase efficiency, create adequate segregation of duties and achieve a basic level
of internal control, a Debt Management Office (DMO) is normally organized with front,
middle and back offices discharging distinct functions.
• The front office is typically responsible for executing transactions in financial markets,
including the management of auctions and other forms of borrowing, and all other funding
operations.
• The back office handles the settlement of transactions and the maintenance of the financial
records.
• The middle office usually undertakes risk analysis, monitors and reports on portfolio-
related risks and assesses the performance of debt managers against any strategic
targets/benchmarks.
In India, a number of entities are involved in public debt management operations with their
functions ranging from advisory to actual implementation to recording operations. Internal debt
is managed by the Budget Division of DEA, MOF along with the Internal Debt Management
Department (IDMD) of RBI while external debt is managed by various divisions of DEA like
Multilateral Relations (MR), Bilateral Cooperation (BC) and Multilateral Institutions (MI) and
Controller of Aid, Accounts and Audit (CAAA). Chief Controller of Accounts (CCA), MOF
maintains accounts for both internal and external debt.
Debt Management functions in respect of Public Debt Management of Union Government are
presented in Table 3.1 as below:

Report No. 16 of 2016
16
Table 3.1: Debt Management Functions of the Union Government
Front Office Middle Office Back Office
Internal Debt IDMD (RBI) IDMD (RBI), Middle Office (DEA), Budget Division (DEA)
IDMD (RBI),
CCA (MOF)
External Debt MI, MR and BC Divisions (DEA)
- CAAA (DEA), CCA (MOF)
3.2 Functioning of Middle Office
In India, though a DMO was not set up, as a first step the Middle Office (MO) was established
in September 2008. The responsibilities of MO, inter alia, included:
• formulation of comprehensive risk management framework;
• formulation of a long term debt management strategy; and
• developing and maintaining a centralized database on Government liabilities.
However, it was observed that these activities were not performed by the MO. Detailed
observations in this regard have been brought out in Chapter 4 and Chapter 6 of this Report.
In the Exit Conference, DEA stated that the MO could not function as a full-fledged MO
unless the statutory framework was appropriately amended to assign these functions to the
MO. It was added that apart from the creation of a centralized database, the other functions
were being performed by other agencies.
From the submission of DEA, it can be seen that the MO was not fully discharging the
functions assigned to it.
3.3 Middle Office Functions in respect of External Debt
Audit observed that in respect of external debt, the functions of MO were not being performed
by any entity.
DEA replied (September 2015) that performance evaluation and back testing against portfolio-
related benchmarks might not be meaningful as India’s external debt was largely multilateral
and on concessional terms. In the Exit Conference, it was stated that RBI were conducting a
cost-benefit analysis to ascertain the benefit or otherwise of contracting external loans as far as

Report No. 16 of 2016
17
market loans were concerned. It was also added that a strategic cap on the quantum of external
debt which could be contracted had been fixed.
Reply of DEA may be seen in the light of the fact that:
• Borrowings from IBRD and ADB which accounted for nearly 31 per cent of the total
external borrowing as on 31 March 2015 were not on concessional terms.
• The cost-benefit analysis conducted by RBI was to decide between market borrowing
within India or from abroad and was not in respect of bilateral and multilateral loans
which form the entirety of the external debt.
• The functions of the Middle Office also include risk analysis, essential for effective
debt management but the same were not being performed in respect of external debt. It
is to be noted that external debt is prone to exchange rate variations which pose a
serious risk and therefore, effective management of the same is of utmost importance.
3.4 Public Debt Management Agency (PDMA)
The issue of establishment of a separate PDMA in India has been considered by a number of
Committees like the Committee on Capital Account Convertibility (1997), the Working Group
on Separation of Debt Management from Monetary Management (1997), the Internal Expert
Group on the Need for a Middle Office for Public Debt Management (2001), the Committee on
Fuller Capital Account Convertibility (2006), High Level Committee on Financial Sector
Reforms (2008) and the Internal Working Group on Debt Management (2008) among others.
All the above Committees had suggested that there should be an independently functioning
office of public debt outside of RBI to enable more efficient debt management as well as
monetary management. Further, it was stated that internationally, there had been a strong
movement towards establishing separate debt management offices for selling bonds for the
government which was considered a best practice. Moreover, a separate debt management
agency would consolidate all debt management functions and be the catalyst for wider
institutional reform and transparency in public debt management.
The Finance Minister in his Budget Speech (2007-08) had proposed to set up an autonomous
DMO and, in the first phase a MO to facilitate the transition to a full-fledged DMO.
Accordingly, a MO was established in September 2008 in the MOF. The Financial Sector
Legislative Reforms Commission (FSLRC) in its Report (March 2013) recommended fast-
tracking of setting up of an independent PDMA.

Report No. 16 of 2016
18
It is pertinent to mention here that announcements on the establishment of a separate debt
management agency were made in the budget speeches of 2011-12, 2012-13 and 2014-15 also.
Taking forward the process for establishment of a separate DMO, the MOF set up a task force
(September 2014) with the objective of supporting the Ministry in preparatory work for
PDMA.
The Finance Minister in his budget speech (2015-16) observed that “one vital factor in
promoting investment in India, including in the infrastructure sector, is the deepening of the
Indian bond market, which we will have to bring at the same level as our world class equity
market. I intend to begin this process by setting up a Public Debt Management Agency
(PDMA) which will bring both India’s external borrowings and domestic debt under one
roof.”
The proposal for the setting up a separate public debt management agency had, however, been
shelved from the finance bill for the year with the following remarks of the Finance Minister
made in the Parliament (30 April 2015), “since, RBI has been handling Public Debt
Management, the Government in consultation with the RBI will prepare a detailed roadmap
separating the debt management and market infrastructure from RBI and having a unified
financial market..........it is being decided to delete the PDMA provisions from the finance bill
for the financial year”. He further added, “this Government is committed to unifying the
financial market both by making Government securities part of this market as well as creating
a proper bond currency market.”
From the above, it could be seen that even though a number of expert committees had
recommended the establishment of a separate public debt management agency over the past
two decades and the first step in the direction was taken seven years ago with the setting up of
a Middle Office, no further progress was made on the setting up of a separate public debt
management agency, except for setting up of a task force in September 2014.
RBI in their reply (September 2015), stated that DMO was only an agent of the treasury and
could not be independent while adding that multiplicity of arrangements existed around the
world regarding location of sovereign debt management functions. RBI further added that they
had been discharging their functions efficiently and effectively.
Referring to the statements made by the successive Finance Ministers in their budget speeches,
DEA replied (September 2015) that it was clear that the Government was ready with the draft
bill on PDMA with inputs from all stakeholders. DEA enumerated some measures taken for

Report No. 16 of 2016
19
setting up the PDMA like capacity building at MO, publications by MO for information
dissemination, setting up of task force for PDMA with a time schedule for implementation, etc.
In this regard, it is to be noted that while some measures had been taken for the setting up of a
PDMA, the task force for the setting up of an independent PDMA was established only in
September 2014, six years after the setting up of the MO and there was no clarity on the
proposed establishment of the PDMA despite several statements made by the Finance Minister
in Parliament.

Report No. 16 of 2016
21
Chapter 4
Debt Management Strategy
4.1 Introduction
A debt management strategy is a plan that operationalizes the debt management objectives. It
lays down the desired composition of the public debt portfolio, which captures the
government’s preferences with regard to a cost-risk trade-off. A debt management strategy has
a longer focus than a borrowing plan, and is essentially an iterative process to define the
government’s optimal funding sources, based on its risk tolerance, the stage of development of
domestic financial markets, the ability of the government and the private sector to obtain
external funding, and the country’s stage of economic development.
A public debt management strategy document contains description of the market risks being
managed, the future environment for debt management, including fiscal and debt projections. It
should also describe the analysis undertaken to support the recommended debt management
strategy and indicate the adopted strategy and its rationale, with specific targets and ranges for
key portfolio risk indicators and the financing programme over the projected horizon.
A risk management framework is developed to enable debt managers to identify and manage
the trade-offs between expected cost and risk in the government debt portfolio. To assess
risk, debt managers should regularly conduct stress tests of the debt portfolio on the basis of
the economic and financial shocks to which the government - and the country more generally -
are potentially exposed. The stress testing framework should consider the interrelations among
the variables that affect public debt dynamics and cover extreme scenarios to better assess the
costs and risks associated with the debt portfolio.
A debt management strategy is generally for a medium term, i.e., three to five years. Further, it
is seen that a medium term debt management strategy formulated for achieving the longer term
debt management objectives, should be reviewed periodically to assess the validity of the
assumptions in the light of changed circumstances. This is all the more important where the
debt is predominantly long term. It can be seen that nearly 70 per cent of the outstanding
public debt of India as on 31 March 2015 had residual maturity period of more than five years
extending upto 30 years as shown in Table 4.1 below pointing towards the criticality of
formulation of debt management strategy in India.

Report No. 16 of 2016
22
Table 4.1: Maturity Profile of Outstanding Dated Securities-Union Government
Residual Maturity Percentage of dated securities
Less than 1 year 3.5
1-5 Years 21.4
5-10 Years 31.4
10-20 Years 30.6
20 years and above 13.1
2
(Source: Quarterly Report on PDM, MO, DEA))
4.2 Formulation of Medium Term Debt Management Strategy and Risk
Management Framework
Audit observed that although some of the elements of a debt management strategy such as roll
over risk, projected cash flows and government market borrowing for six months, elongation
of maturity, issuance of debt instruments with variable coupons, revision in the upper limit of
maturity buckets and individual securities and usage of cash balances, were discussed in the six
monthly meetings of the Monitoring Group on Cash and Debt Management (MGCDM)2,
medium term debt strategy (MTDS) was not formulated till December 2015. Audit further
observed that some of the elements of debt management strategy, namely, description of the
future environment for debt management; specific targets and ranges for key risk indicators;
assessment and management of risks associated with foreign currency and policies related to
management of external debt vulnerabilities, were not discussed/analyzed in the meetings of
the MGCDM.
Audit observed that although refinance risk (roll over risk) and interest rate risk were discussed
in MGCDM meetings, Risk Management Framework was not formulated. Audit further
observed that the expected cost of debt was not being projected forward over the medium to
long term, exchange rate risk was not considered and stress tests were not being conducted.
It was stated in the Status Paper3 (December 2014) that ‘there is little consensus with regard to
a level of debt that may be considered unsustainable’. While it may be true that there is little
consensus even among international organizations on the acceptable levels of debt in the
country, it is felt that every country, including India, should work out the level and type of debt
2 MGCDM consisted of Secretary (DEA), Deputy Governor (RBI) and other Officers from DEA and RBI. 3 Status Paper presents an analysis of the Government’s debt position and is brought out by the DEA annually.

Report No. 16 of 2016
23
that is acceptable to them on the basis of analysis of the fiscal, economic, financial and other
parameters applicable to them and also work out indicative levels of debt and debt indicators,
so that the conclusion on the sustainability of the government debt may be verifiable.
In December 2015, DEA brought out a Debt Management Strategy for India for a period of
three years (2015-18). In the Debt Management Strategy document, issues related to raising
debt at low cost, risk mitigation and market development had been delved upon. The document
contained strategic benchmarks for certain items like share of short term debt, average maturity
of debt, issuance limits, indexed and floating debt and share of domestic to external debt. The
Debt Management Strategy also contained a Risk Management Framework presenting risk
analysis and stress testing. While this is a welcome step, the scope of the Debt Management
Strategy was restricted only to the marketable debt of Union Government.
In the Exit Conference, DEA stated that most of the external debt were concessional and were
backed by other considerations of bi/multi-lateral co-operation, agreements etc; it did not seem
appropriate to bracket them under the category of 'borrowing' and include them into debt
management strategy.
The reply of DEA needs to be seen in light of the fact that the borrowings from IBRD and
ADB which accounted for nearly 31 per cent of the total external borrowing as on 31 March
2015 were not on concessional terms. Further, external borrowing, whether concessional or
not, is subject to exchange rate risk which needs to be managed through a well-thought out
strategy.
Report No. 16 of 2016
25
Chapter 5
Borrowing Activities
5.1 Introduction
The borrowing activities envisage all the activities from the estimation of the required
borrowing to the actual borrowing of the funds either from the domestic markets or from the
external markets.
The Budget division, DEA, MOF was responsible for preparation of budget estimates (BE) and
revised estimates (RE) in respect of internal borrowings, external borrowings and other
receipts on the basis of inputs received from RBI, CAAA and other departments.
The borrowing calendar for market borrowings was prepared half-yearly on the basis of the
estimates of market borrowing, cash inflows, cash outflows and the likely funding gap of the
Union Government. The borrowing calendar indicated the amount of securities to be issued
through weekly primary auctions during the ensuing half year and was issued with the approval
of the MGCDM.
The information on each primary auction was posted on RBI website as a press release
indicating the details of auctions such as notified amount, date and timings for electronic
bidding, type of auction (multiple/uniform; yield based/price based), norms for non-
competitive bids, settlement date, when issued trading, etc.
Treasury bills, which were generally issued for 91 days, 182 days and 364 days, offered short
term investment opportunity to financial institutions, banks etc. The amount of weekly auction
of treasury bills was notified in indicative quarterly calendars.
Government borrowings from external sources were primarily from multilateral and bilateral
sources and were long-term in nature. The principal sources of multilateral external assistance
to India were the WB, the ADB, the International Fund for Agricultural Development (IFAD)
etc. Bilateral sources of external assistance included direct borrowing from foreign countries.
The external loans were contracted through negotiations with the concerned multilateral
agencies and/or the countries.
5.2 Devolvement of Union Government Dated Securities on Primary Dealers
Primary auctions of government securities were conducted on the E–Kuber platform by RBI.
Within ten minutes of the closure of the auction window, the result was processed and the
various reports giving details such as amount received under competitive /non-competitive
Report No. 16 of 2016
26
route, cut off yield/price, weighted average yield/price were generated and put up to the
Auction Committee for approval. The Auction Committee4 decided the cut-off price/yield.
Once the cut off was decided by the Auction Committee, the same was marked off in the E-
Kuber system and allotment was done by the system without any manual intervention. A
system of underwriting5 for market lending was also operating in the government securities
markets in India through the mechanism of Primary Dealers (PDs).
The underwriting commitment on dated securities of Union Government was divided into two
parts- (i) Minimum Underwriting Commitment (MUC) and (ii) Additional Competitive
Underwriting (ACU). The MUC amounted to 50 per cent of the notified amount of each issue.
This was distributed equally amongst all the PDs. The remaining portion of the notified
amount was underwritten through ACU auction. In the ACU auction, each PD was required to
bid for an amount at least equal to its share of MUC, but not exceeding 30 per cent of the
notified amount. Thus, there was 100 per cent underwriting of the government auction. The
PDs were also required to bid in the primary auctions of government securities for an amount
not less than its total underwriting obligation. Thus, in the existing arrangement, bid cover ratio
of primary auctions would not be less than one implying that there was no possibility of bonds
remaining unsubscribed. Hence, it appeared that the devolvement6 depended on the decision of
the Auction Committee and not on the amount remaining unsubscribed. A perusal of auction of
Union Government dated securities during 2009-10 to 2014-15 revealed that in 71 auctions, an
amount of ` 49,654.48 crore was devolved on underwriting PDs.
Audit observed that there were no criteria for devolvement of securities in a particular case. In
the absence of such criteria, Audit could not verify the necessity or otherwise of the
devolvement. There were also no criteria for deciding the cut–off rate or the reasons for
deciding a particular cut-off rate though various factors like market clearing rate, Fixed Income
Money Market and Derivatives Association of India (FIMMDA)7 previous day closing yield,
secondary market yield just before the auction and poll rate etc., were considered.
RBI in their reply stated (July 2015) that devolvement decision was taken after careful
consideration of market conditions, bidding pattern and cash/budget management needs when
the bidding in the auctions did not reflect the price of the security. RBI reiterated (September
4 Auction Committee consisted of Executive Director (ED) in charge of IDMD and Chief General Managers (CGMs) of
IDMD, Department of External Investments and Operations (DEIO), Financial Markets Operation Department (FMOD) and Monetary Policy Department (MPD)
5 Engaging to buy all the unsubscribed securities/ bonds in case of issue of securities/bonds
6 Devolvement is a process whereby if an investment issue is undersubscribed, an underwriter is required to subscribe to the
remaining securities / bonds. The outstanding unsubscribed amount devolves onto the underwriter. 7 For illiquid securities where there is no trading or volumes are very low, FIMMDA comes out with model price.

Report No. 16 of 2016
27
2015) their earlier reply and stated that they would further strengthen the documentation in
devolvement cases to ensure that appropriate detailed recording was done. It added that
general principles could be laid down for deciding on the devolvement of issues.
In the Exit Conference, RBI stated that a policy framework to indicate broad criteria for
devolvement was under finalization. Subsequently RBI informed (May 2016) that a policy on
devolvement criteria had been prepared which inter alia incorporated the factors to be
considered for arriving at the devolvement decision.
5.3 Variation between the Revised Estimate (RE) and Actuals with respect to
External Assistance
Audit observed that there were variations between RE and Actuals in respect of External
Assistance as mentioned in Table 5.1 below:
Table 5.1: Variation between RE & Actuals in respect of External Assistance
( `̀̀̀ in crore)
Year BE RE Actuals Variation between
RE and actuals (in
Percent)
2009-10 16,047 16,535 11,038 (-) 33 2010-11 22,464 22,264 23,556 6
2011-12 14,500 10,311 12,449 21 2012-13 10,148 2,214 7,201 225 2013-14 10,560 5,440 7,292 34
2014-15 5,734 9,705 12,933 33
(Source: Receipt Budgets and Finance Accounts of GOI)
From the above, it can be seen that the RE of external assistance varied from the actual
external assistance in the range of (-)33 per cent to 225 per cent. Thus, it appeared that the
system of preparation of BE and RE in respect of external debt was not robust.
5.4 Approval of External Assistance Proposals without considering
Knowledge Transfer, Technology Transfer and Best Practices Transfer
from International Experience
DEA was the nodal agency for posing projects to WB, ADB and the IFAD. No proposal for
external assistance was posed directly by any Central Ministry or State Government to the
multilateral/bilateral funding agency. A Screening Committee8 in DEA (constituted in August
2009) decided proposals to be posed to WB, ADB and IFAD.
8 Screening Committee consisted of Joint Secretary (MI), DEA and other Officers from DEA.

Report No. 16 of 2016
28
DEA vide its circular dated 01 September 2011 instituted a new set of principles and ‘Finance
Plus’ criteria to govern the selection of projects to be posed to the WB, ADB and the IFAD.
The goal of instituting the criteria was to maximize access and leverage of Multilateral
Financial Institutions’ (MFIs’)/Multilateral Development Banks’ (MDBs’) knowledge base,
international experience and familiarities with best practices making the best use of limited
available external resources.
The ‘Finance Plus’ criteria formed the main approach for accessing assistance from the WB,
ADB and IFAD. The criteria, inter alia, included that knowledge transfer, technology transfer
and best practices transfer from international experience should be envisaged with adequate
long term engagement for ensuring sustainability of the projects in the context of India. This
could be considered the crux of ‘Finance Plus’ criteria going a long way in realizing the goal of
instituting this criteria. The Screening Committee had, in one of its meetings (01 December
2011), also underscored the fact that external assistance should not be taken only for resources,
reiterating the spirit of the criteria cited above.
Scrutiny of minutes of the Screening Committee meetings held after the issue of the ‘Finance
Plus’ criteria, i.e., after 01 September 2011, provided to audit revealed that the Screening
Committee had deferred two9 proposals for loan assistance due to lack of knowledge transfer,
technology transfer and best practices transfer from international experience. However, the
minutes of the meetings of the Screening Committee did not indicate whether knowledge
transfer, technology transfer and best practices transfer from international experience were
considered while approving 60 projects (Annexure-I) out of a total of 82 approved projects
for external assistance.
DEA in their reply (April 2015) stated that Screening Committee examined the preliminary
proposal for financial assistance from multilateral agencies received from State Governments/
Central Ministries, in consultation with Central Line Ministries (in case of State projects) and
Planning Commission/NITI Aayog (in case of Central projects), and decided about their
suitability for external funding. It was added that during the meetings of the Screening
Committee, a preliminary presentation on Finance Plus elements was made that ultimately took
shape after the complete design of the project. In the Exit Conference, DEA accepted that in
some cases, the verification of these criteria was not documented but added that they were
considered in all cases.
9 Drinking Water Supply Scheme, Madhya Pradesh (Meeting dated 03 February 2013) and Rehabilitation and Upgradation to
two – lane, Uttarakhand (Meeting dated 22 August 2014)
Report No. 16 of 2016
29
Audit noticed that in 60 proposals/projects approved by the Screening Committee, the minutes
of the meetings of the Screening Committee did not indicate that knowledge transfer,
technology transfer and best practices transfer were considered. This was contrary to the
provisions of the circular cited above. Thus, in the absence of documentation, Audit could not
draw an assurance that the goal of instituting the criteria, to maximize access and leverage of
MFIs/MDBs knowledge base, international experience and familiarities with best practices had
been fulfilled.
5.5 Cash Management
Cash management mainly entails cash flow forecasting, arranging temporary liquidity,
maintaining target balance in the Government account, investment of surplus balance over and
above the target balance in the market etc. The market borrowing undertaken for budget
execution may contribute to large build up of surplus cash balance in the Government account
making it challenging for the cash management to deploy these surplus balances efficiently.
In India, RBI was entrusted with the cash management of Government of India under Sections
17, 20 and 21 of the RBI Act, 1934 which they performed in coordination with the Ministry of
Finance, Government of India.
The key features of the cash management operations were as under:
• There was treasury single account (TSA)10 with RBI and all the transactions (i.e.
receipts and payments) were routed through this account. GOI maintained minimum
balance of ` 100 crore on each reporting Friday and RBI’s annual closing day and ` 10
crore on all other days.
• RBI forecast the weekly inflows and outflows in GOI account based on past trends,
information given in the budget and any other information provided by the MOF, GOI
from time to time.
• The mismatches between inflows and outflow in TSA were rough tuned through
issuance of cash management instruments, viz., treasury bills and further fine tuned
through availing Ways and Means Advances (WMA)/ Overdraft (OD) and issuing cash
management bills (CMBs). WMA are the advances made by the RBI to the
10
A TSA (Treasury Single Account) is a unified structure of government bank accounts that gives a consolidated view of
government cash resources. Based on the principle of unity of cash and the unity of treasury, a TSA is a bank account or a
set of linked accounts through which the government transacts all its receipts and payments.

Report No. 16 of 2016
30
Government. Limits on the WMA are fixed on a half yearly basis. OD is similar to
WMA and can be resorted to for maximum 10 days at a stretch, when limit of WMA is
crossed. CMBs were non-standard, discounted instruments issued for maturities less
than 91 days. The half yearly limits of WMA for the period 2009-10 to 2014-15 are
mentioned in Table 5.2 below:
Table 5.2: WMA Limits of GOI
( `̀̀̀ in crore)
Year April-September October-March
2009-10 20,000 10,000
2010-11 30,000 10,000
2011-12 30,000 (45,000*) 10,000 (20,000**)
2012-13 50,000 (Q1)
45,000 (Q2)
20,000
2013-14 30,000 20,000
2014-15 35,000 20,000
* Raised from April 21 to June 30, 2011
** Raised for October-December 2011
(Source: Records of DEA & RBI)
• Surplus cash balances in GOI’s account were invested up to ` 50,000 crore in the
government securities through sale of securities to GOI from RBI’s investment account.
With effect from 16 December 2014, RBI had put in place a mechanism for investing
surplus cash balances (above precautionary balance of ` 20,000 crore) of the GOI in
variable rate repo instruments11. The end of day balance was placed in reverse repo
instruments 12 with RBI.
5.5.1 Deficiencies in Projected Cash Balances
Examination of Weekly Projected Cash Balance and Actual Cash Balance for the period 2010-
11 to 2014-15 revealed that:
(i) In at least 40 weeks in each year, the variations between the weekly projected cash
balances and the actual cash balance were more than ` 10,000 crore as reflected in
Table 5.3 below :
11
Repo instrument means an instrument for borrowing funds by selling securities with an agreement to repurchase the said securities on a mutually agreed future date at an agreed price which includes interest for the funds borrowed.
12 Reverse repo instrument means an instrument for lending funds by purchasing securities with an agreement to resell the said securities on a mutually agreed future date at an agreed price which includes interest for the funds lent.

Report No. 16 of 2016
31
Table 5.3: Number of Instances of Variations in Weekly Projected Cash Balance
and Actual Cash Balance
Year Variation of more than ` ` ` ` 10,000 crore
2010-11 47
2011-12 40
2012-13 49
2013-14 41
2014-15 41
(Source: Records of RBI)
(ii) As reflected in Table 5.4 below, the weekly projected cash balance was negative in
many instances:
Table 5.4: Instances of Weekly Negative Projected Cash Balance
Year Number of Instances
2010-11 16
2011-12 30
2012-13 26
2013-14 04
2014-15 19
(Source: Records of DEA/RBI)
From the above, it appears that the system of forecast of inflow and outflow in TSA of GOI
was not robust.
RBI replied (August 2015) that though their endeavour was to project cash balances with fair
degree of accuracy, there were occasions when the actual balances differed from projections.
RBI stated that the GOI’s cash balances were projected at least six months in advance and were
impacted by multiple factors including spending by GOI departments/units across the country,
spending by States (reflected by withdrawal from Intermediate Treasury Bills), etc. It was
added that RBI and GOI were continuously striving to improve the efficacy of the cash
forecasting. RBI further stated that issuance of dated securities and Treasury Bills were
generally evenly distributed across the weeks to enable successful auctions without distorting
the market and yield movements. It was further stated that issue of huge amount just to meet
the funding requirement may impact cost of issuances and hence, there might be instances

Report No. 16 of 2016
32
wherein cash balances could turn out to be negative and such mismatches in funding would be
met by WMA / OD and /or issuance of Cash Management Bills.
DEA replied (September 2015) that the purpose of forecasting GOI balances for the purpose of
Debt Management was not forecasting actual cash (as might be done for the purpose of cash
management in a commercial institution), but to ensure that GOI balances are between WMA
limits to a reasonable surplus, generally to prepare itself for bulky payments. It was added that
due to uncertainties involved in the forecasting and as market might not be able to fund a very
large requirement in a short period, it was prudent to allow negative GOI balances upto
permissible WMA limit.
The reply of RBI and DEA needs to be seen in the light of the fact that WMA/OD was for the
purpose of fine tuning the actual mismatches between the inflows and outflows and should not
be considered for forecasting cash balances. The purpose of the forecast was to ascertain the
possible position of cash so that appropriate steps could be taken to bridge the gap between
projected cash requirement and projected cash availability, if any. A wide variation between
the projected and the actual cash balance defeated the purpose of this projection.
In the Exit Conference, DEA stated that a Cash Coordination Committee had been set up to
strengthen cash flow forecasting and cash management.
5.5.2 Issuance of CMBs and Availing WMA/OD
As stated in the preceding paragraphs, the fine tuning of mismatches in TSA may be done
through CMBs/ WMA/ OD. The instances of fine tuning of the mismatches during the period
from 2009-2010 to 2014-2015 are presented in Table 5.5 below:
Table 5.5: Issuance of CMBs and Availing WMA/OD
Year CMBs (No. of
Instances)
WMA (No.
of days)
OD (No. of days)
2009-10 - 76 28
2010-11 2 (35 days, 28 days) 57 02
2011-12 14(35 -77 days) 263 74
2012-13 - 40 0
2013-14 13 (7-56 days) 42 9
2014-15 1(42 days) 74 25
(Source: Records of DEA and RBI)

Report No. 16 of 2016
33
5.5.2.1 Issuance of CMBs for Monetary Policy Objectives
CMBs were introduced in 2009 to meet temporary cash flow mismatches of the Government.
However, it was observed that during August and September 2013, CMBs worth ` 96,000
crore were issued to meet monetary policy objectives as shown in Table 5.6 given below:
Table 5.6: CMBs Issued for Monetary Policy Objectives
( `̀̀̀ in crore)
Sl. No. Date Amount of CMBs
issued for monetary
purpose
Discount
(Cost)
1 13 August 2013 11,000 119.49
2 14 August 2013 11,000 119.38
3 20 August 2013 11,000 100.91
4 21 August 2013 11,000 98.46
5 27 August 2013 11,000 167.64
6 28 August 2013 11,000 169.18
7 03 September 2013 11,000 166.65
8 04 September 2013 11,000 163.19
9 06 September 2013 8,000 87.71
Total 96,000 1192.61
(Source: Records of RBI)
In this regard, DEA had also communicated (14 August 2013) to RBI that use of debt
instruments for monetary policy objectives would interfere with the Government’s debt
strategy apart from fiscal implications. DEA advised that RBI may examine the option of using
non–debt instrument for the purpose of monetary policy. However, DEA approved issuance of
CMBs by RBI for monetary policy objectives.
RBI in their reply accepted (May 2015) the audit view with the remarks that the exchange rate
of the Indian Rupee (May 2013) had come under intense pressure, depreciated significantly
and was viewed by markets as the worst performing emerging market currency (with a

Report No. 16 of 2016
34
maximum depreciation of about 19 per cent during a short span of about three months between
22 May to 28 August 2013) warranting the issue of CMBs.
The above facts need to be seen in the light of:
• CMBs were to be issued to meet temporary cash flow mismatches.
• In such a scenario, even the monetary objectives may not be achieved as liquidity absorbed
through regular issuance of CMBs remained available with the GOI for spending as the
money impounded through CMBs got injected back into the system.
5.5.2.2 Issuance of CMBs on consecutive days
It was seen from the records that in anticipation of the government account not coming out of
overdraft within stipulated period of 10 consecutive working days, RBI had proposed
(2 November 2011) to the GOI to issue CMBs in two tranches, i.e., for ` 6,000 crore on
3 November 2011 and for ` 8,000 crore on 8 November 2011. RBI reassessed the position as
the Government had not issued the proposed first tranche on 3 November 2011 and proposed
that the Government may issue CMBs for ` 10,000 crore on 8 November 2011. However, it
was observed that the GOI decided to issue the CMBs on two consecutive days, i.e., 8 and 9
November 2011. RBI informed DEA vide their letter dated 25 November 2011 that in such an
environment, the cash management operation could have serious implications for the
remaining portion of market borrowing programme as well as the financial system including
primary dealers. Further, RBI had proposed (November 2011) that cash management
operations, especially issuance of CMBs, might be planned well in advance, preferably as soon
as WMA reaches 75 per cent of the limit.
RBI in their reply (May 2015) stated that it was suggested that the issuance of CMBs on
consecutive days should be avoided in the best interest of the market borrowing programme as
well as the stability of the financial system, as the market reads such move adversely.
However, RBI stated that the yields had not hardened very much in the subsequent days as
expected indicating that the yield had hardened by 20 basis points.
The reply of RBI should be viewed in light of the fact that RBI had informed the DEA (even
when RBI was aware that the yield had hardened by only 20 basis points) that the timing of
issuance of CMBs on two consecutive days, i.e., on 8 November 2011 and 9 November 2011,
when the Government had utilized OD for eight and nine working days had dampened the
market sentiment and pushed the yields upwards across the maturity in government securities
market.

Report No. 16 of 2016
35
RBI further furnished (April 2016) copies of correspondence with the DEA wherein it was
stated that they would endeavour to ensure that the GOI will not be availing OD. RBI had
again proposed that they will trigger issuance of CMBs as soon as WMA reaches 75 per cent
based on assessment of market conditions which indicates that the previous proposal of the
RBI has not yet been acted upon.
It is recommended that a decision on issue of CMBs as soon as WMA reaches 75 per cent be
taken expeditiously.
Recommendation:
2. Conditions of ‘Finance Plus’ criteria aimed at maximizing access and
leverage of Multilateral Financial Institutions’/Multilateral Development
Banks’ knowledge base, international experience and familiarities with
best practices may be applied in deciding on the projects for external
assistance and the same should be properly documented.

Report No. 16 of 2016
37
Chapter 6
Debt Information System, Debt Servicing and Debt Reporting
6.1 Debt Information System
Debt management activities should be supported by an accurate and comprehensive
information system with proper safeguards. The information system should comprise of
components that capture, monitor, analyse and report debt information of a country. The
system may be a combination of software, hardware, people that support data input,
processing, storage and report generation. While the importance of the system for effective
public debt management cannot be overemphasized, it should be ensured that the costs and
complexities of the system are appropriate to the needs of the organization. A Public Debt
Information System should support the following functions:
• Recording Function: To record debt and debt related information including basic details
and terms of contractual debt instruments such as loans and debt securities in addition to
actual transactions of disbursements and debt service and forecast for debt service
schedules.
• Reporting Function: To generate reports that meet internal and external reporting
requirements.
• Analytical Function: To obtain debt indicators and develop ‘what-if’ scenario analysis
resulting from hypothetical changes in financial variables, which linked with market
information and key macroeconomic information, assists in analysing the public debt
portfolio and the debt strategy.
In respect of internal debt, RBI used E-Kuber for primary auctions of dated securities and
treasury bills, debt service payments and generating various reports. In respect of external
debt, CAAA used Integrated Computerised System (ICS) for maintaining various ledgers and
registers relating to each loan/grant, debt servicing and generating various reports.
6.1.1 Analytical Functions
Audit observed that E-Kuber and ICS did not have the provision for analytical functions as
mentioned in previous paragraphs.
RBI replied (September 2015) that they were using Excel based tools for debt management
strategy and added that going forward, they would consider incorporating such analytical tools
in E-Kuber.

Report No. 16 of 2016
38
DEA replied (September 2015) that there existed no such software at their end. It was,
however, added that the relevant debt and cash related information was collated in spreadsheets
and maintained in W&M Section and MO.
In the Exit Conference, DEA stated that a system would be developed to support analytical
functions.
6.1.2 Deficient / Inaccurate report generation
The report generation in E-Kuber did not appear to be accurate as indicated by the following
instances:
• All the loans (dated securities and treasury bills) floated during the period 01 April 2009 to
31 March 2014 did not appear in the report generated from E-Kuber.
• The list of interest payment generated from E-Kuber did not indicate interest payment
during 01 April 2009 to 31 March 2014 in respect of all of the securities outstanding during
the aforesaid period.
• The list on redemptions generated from E-Kuber did not indicate all the loans that had
matured and been repaid during the period from 01 April 2009 to 31 March 2014.
In the absence of complete and correct lists, interest payments and redemptions made against
dated securities during the period 2009-10 to 2013-14 could not be verified.
In the Exit conference, RBI stated that all data was available as system of maintaining physical
registers also existed in parallel and there was no risk of data loss and accepted that there might
be issues with the report generation.
6.1.3 Centralised Database
It was observed that a centralized database of all internal and external liabilities of the
Government was not available. It was seen that this issue was considered over four years ago
when the Working Group on Debt Management (WG) had in its meeting suggested (December
2011) that steps be initiated to develop MO’s own database with the help of National
Informatics Centre (NIC). It was also suggested that the Commonwealth Secretariat’s Debt
Recording and Management System (CS-DRMS) be adopted as a temporary arrangement.
Audit observed that the requisite amount for conducting a System Requirement Study (SRS)
could not be released to NIC due to delayed processing of invoice. CS-DRMS had not been
adopted as a temporary measure in line with suggestion of the WG.

Report No. 16 of 2016
39
DEA in their reply (September 2015) stated that development of debt database was a desirable
outcome and not a necessity. DEA further stated that though adoption of the CS-DRMS would
have involved an expenditure of ` 1.92 lakh only, its implementation would require significant
human resources and also physical space. It was added that in the meanwhile, NIC initiated the
process and started working on the project in association with the MO and hence committing
MO’s limited human and physical resource to the temporary measure such as the CS-DRMS
was felt unfeasible.
In the Exit Conference, DEA agreed with the audit observation and stated that efforts would be
made to put in place a centralised database. Debt Servicing
6.2 Debt Servicing
Debt Servicing refers to payments made to creditor(s) towards interest and matured principal
amount. It usually includes service charges, commitment charges etc.
6.2.1 Payment of Commitment Charges
Commitment Charges on undrawn balance of external loans are paid on principal amount
rescheduled for drawal on later dates. During the period from 2009-10 to 2014-15,
commitment charges to the extent of ` 602.66 crore were paid. The year-wise total undrawn
balance (loans) from various sources and payment of commitment charges are shown in
Table 6.1.
Table 6.1: Undrawn Balance (Loans) and Payment of Commitment Charges
( `̀̀̀ in crore)
Year Undrawn Balance (loans) Commitment charges
2009-10 1,05,668 86.11
2010-11 1,10,872 112.57
2011-12 1,48,182 83.29
2012-13 1,89,197 92.95
2013-14 2,16,900 117.21
2014-15 2,10,099 110.53
Total 602.66
(Source: External Assistance (2013-14), CAAA, GOI)

Report No. 16 of 2016
40
The need for payment of commitment charges points towards inadequate planning of the
loans/credits without proper linkages with the requirement leading to avoidable payment of
commitment charges.
6.3 Debt Reporting
6.3.1 Delay in Publication of Status Paper
In the Union Budget for 2010-11, it was announced that a Status Paper would be brought out
giving detailed analysis of the Government’s debt situation. Consequently, DEA published the
Status Paper as indicated in the Table 6.2 below:
Table 6.2: Month of Publication of Status Paper
S. No. Year to which
pertaining
Month of publication
1 2009 – 10 November 2010
2 2010 – 11 March 2012 3 2011 – 12 Not published 4 2012 – 13 July 2013 5 2013 – 14 December 2014
6 2014 – 15 January 2016
The above table reveals that:
• Status Paper was not brought out for the year 2011–12.
• Four of the five editions of the Status Paper were published with a lag of more than six
months from the close of the financial year.
• One edition was brought out within four months of the close of the financial year.
In the Exit Conference, DEA stated that it was difficult to decide a precise date for the
publication of the Status Paper as it was dependent upon the availability of the Finance
Accounts and other State – wise statistics. It further added that it was their endeavour to bring
the Status Paper as quickly as possible after the required statistics become available. It was
added that Budget Division would explore to decide a timeline for publication of this
document to infuse elements of certainty and discipline.
Delay in publishing the status paper may impact the usefulness of the analysis of debt
presented in the Status Paper. The Government may decide to bring out the Status Paper at a
particular time every year or within a fixed time after receipt of all information.

Report No. 16 of 2016
41
6.3.2 Variations in Figures of Internal Debt in different Reports
The details of internal debt are shown in ‘Statement 14: Statement of debts and other interest
bearing obligations of Government’ of the Finance Accounts of GOI. The figures of internal
debt are also presented in other documents/publications like the Status Paper and the Indian
Public Finance Statistics (IPFS) published by the MOF and the Handbook of Statistics on the
Indian Economy brought out by the RBI. The figure of internal debt presented in these
publications is shown in Table 6.3 below:
Table 6.3: Internal Debt of Central Government
( `̀̀̀ in crore)
(Source: Status Paper, IPFS, RBI's Handbook and Finance Accounts, GoI for the year)
From the above, it can be seen that the figure of internal debt presented in the IPFS varied from
the figure of internal debt presented in the Finance Accounts in all the five years while the
figure in the Status Paper varied from the figure in the Finance Accounts in 2009-10. It was
further noted that the figures of outstanding debt which were presented in the IPFS and the
Status Paper, which are both published by the MOF, differed from each other in all the five
years.
Further, Audit observed that the figures of outstanding amounts against individual government
securities as on 31 March 2014 presented in the Status Paper did not match with the
corresponding figures in the Finance Accounts in respect of 19 outstanding securities as shown
in Annexure-II.
Year Finance
Accounts
Status Paper
January
2016
Budget
Division
IPFS, Economic
Division
Handbook of Statistics
on the Indian
Economy, RBI
2009-10 23,28,339 23,34,310 33,95,877 23,28,339
2010-11 26,67,115 26,67,115 37,81,135 26,67,115
2011-12 32,30,622 32,30,622 43,33,165 32,30,622
2012-13 37,64,566 37,64,566 48,72,409 37,64,566
2013-14 42,40,767 42,40,767
(Provisional)
53,83,827
(RE)
42,40,767

Report No. 16 of 2016
42
DEA in their reply (March 2016) stated that the data provided by the Budget Division and the
DMO was the right source of information and requested not to consider the figures given in the
IPFS of the Economic Division. In respect of the differences in the outstanding amounts
against individual outstanding securities, it was stated that they were either due to
typographical errors in the nomenclature of the stock or due to non–inclusion of the amount of
debt under the head conversion of bonds in marketable securities and that they were
compensatory errors.
Though the DEA accepted that the figures as shown in the IPFS did not match with their
figures and stated that the same should not be considered, it needs to be noted that the IPFS is
also brought out by the MOF and therefore it should be in consonance with the figures
presented in the other documents. Government needs to ensure that all reports published by
them are reconciled and reflect the accurate figures.
6.3.3 Publication of Security-wise Interest Payment
Audit observed that the amount of interest paid against each security during a year was not
reflected in any of the reports published by RBI/DEA. The depiction of this information would
make the reports more informative and transparent and might also be helpful in the verification
and accounting of the interest payment details at the government accounting units.
In the Exit Conference, DEA stated that they would explore the feasibility of compiling such
data and take necessary action accordingly.
Recommendations:
3. A centralized database of internal debt, external debt and other liabilities
may be developed.
4. Steps may be taken to ensure that the public debt information systems used
(E-Kuber and ICS) support analytical functions.
5. Mechanism may be developed to ensure consistency in the reporting of
public debt by RBI and DEA and amongst the various divisions of DEA.

Report No. 16 of 2016
43
Chapter 7
Government Securities Market
7.1 Introduction
One of the objectives of Public Debt Management is to develop a liquid market. Developing a
liquid and vibrant secondary market for government securities and broadening the investor
base are the key factors to ensure that debt is raised in a cost effective manner. Further, the
government securities market provides the benchmark yield and imparts liquidity to other
financial markets and is considered an essential precursor, in particular, for development of the
corporate debt market. Moreover, government securities market acts as a channel for
integration of various segments of the domestic financial market and helps in establishing inter
linkages between the domestic and external financial markets.
7.2 RBI Holding of Government Securities
In terms of the FRBM Act, 2003, RBI was not allowed to subscribe to the primary issuance of
the Government from April 2006 while they were allowed to buy and sell government
securities in the secondary market. In practice, RBI purchases and sells government securities
through Open Market Operations (OMOs) to infuse or absorb liquidity for monetary operations
and to adjust the monetary base and/or the interest rate in line with their targets. The OMOs
may also result in infusing liquidity to support the banking sector’s purchases of government
bonds. Audit observed that during the period 2009-10 to 2014-15, the holdings of Government
securities by Commercial Banks, Life Insurance Companies and RBI together ranged between
77.65 to 82.09 per cent of the outstanding dated securities as shown in the Table 7.1 below:
Table 7.1: Major Holders of Government Securities
(In per cent)
Category 2010
March
2011
March
2012
March
2013
March
2014
March
2015
March
Commercial Banks
(including Bank PDs)
47.25 47.03 46.11 43.86 44.46 43.30
Insurance companies 22.16 22.22 21.08 18.56 19.54 20.87 RBI 11.76 12.84 14.41 16.99 16.05 13.48
Total 81.17 82.09 81.6 79.41 80.05 77.65
(Source: Status Paper January 2016)

Report No. 16 of 2016
44
From the above, it can also be seen that RBI’s holding of Government securities had increased
from 11.76 per cent of dated securities in March 2010 to 16.99 per cent in March 2013 before
declining to 13.48 per cent in March 2015.
7.3 Concentrated Trading in a Few Securities
The total annual trading (outright) in government securities had increased from
` 24,80,850 crore to ` 91,49,608 crore over the period from 2009-10 to 2014-15 indicating
a 268.81 per cent increase. The details of the total dated government securities outstanding,
total quarterly trade in dated Government securities, trade in top three and 10 dated
Government securities has been presented in Annexure-III.
It was observed that though the trading volume of government securities had increased nearly
threefold, trade in government securities in the secondary market was predominantly taking
place in a few securities as can be seen from the Annexure-III. Thus, objective of developing
a deep and liquid market did not appear to have been fully achieved.
RBI in their reply stated (August 2015) that they were committed to development of the
government securities market and focused on market development along with cost
minimisation and risk mitigation while adding that Indian government securities market was
reasonably deep and liquid as evidenced by some measures of liquidity like average trading
volumes, turnover ratio, bid-ask spread, impact cost etc. RBI further enumerated the steps
taken by them for the development of the government securities markets in India and added
that they would continue efforts to further develop liquidity in government securities market.
7.4 Retail Participation in Government Securities Market
In order to encourage participation of medium and small investors in the primary market for
government securities, a scheme of non-competitive bidding for allocation of upto 5 per cent
of the notified amount in the specified auctions of dated securities at weighted average rate of
accepted bids was introduced in January 2002. The participation of retail investors in the
auction of dated securities during 2009-10 to 2014-15 is presented in Annexure-IV.
Audit observed that the total amount of bids received and accepted in respect of retail investors
during 2009-10 to 2014-15, ranged from 0.30 per cent to 0.47 per cent of the notified amount
as can be seen in Annexure-IV. From the above, it appeared that the steps taken by RBI and
the Government for improving retail participation in government securities market were not
producing the desired results.
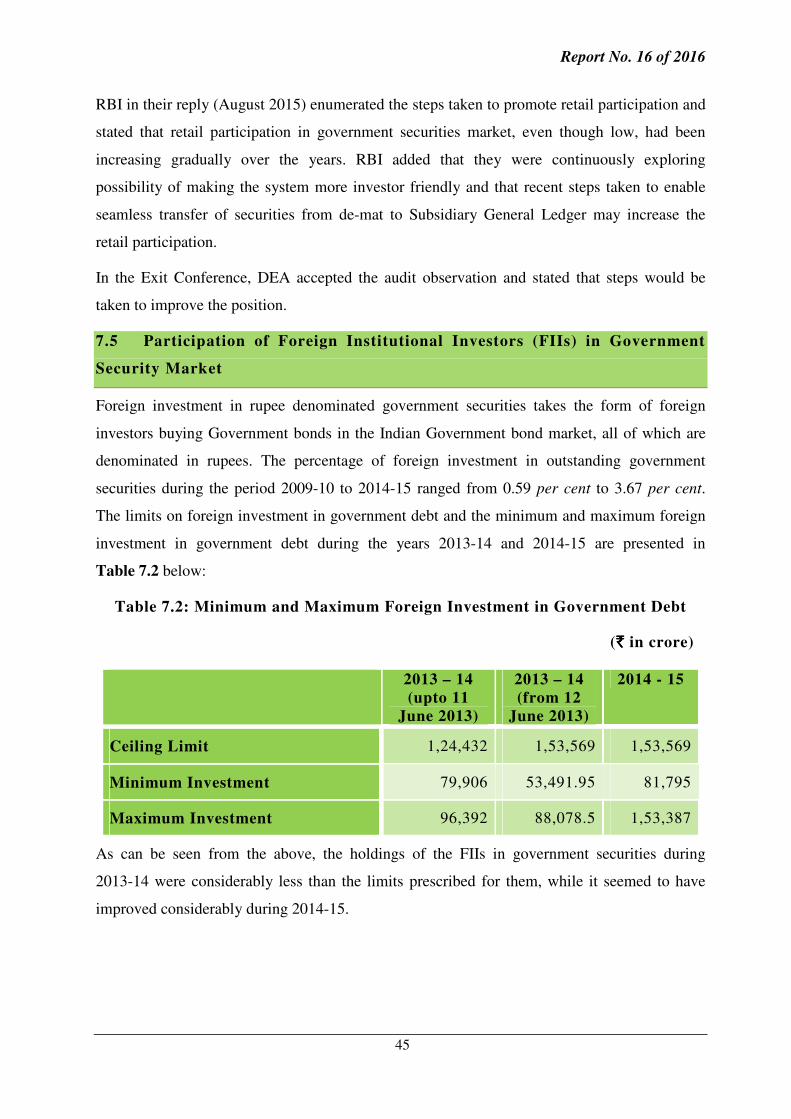
Report No. 16 of 2016
45
RBI in their reply (August 2015) enumerated the steps taken to promote retail participation and
stated that retail participation in government securities market, even though low, had been
increasing gradually over the years. RBI added that they were continuously exploring
possibility of making the system more investor friendly and that recent steps taken to enable
seamless transfer of securities from de-mat to Subsidiary General Ledger may increase the
retail participation.
In the Exit Conference, DEA accepted the audit observation and stated that steps would be
taken to improve the position.
7.5 Participation of Foreign Institutional Investors (FIIs) in Government
Security Market
Foreign investment in rupee denominated government securities takes the form of foreign
investors buying Government bonds in the Indian Government bond market, all of which are
denominated in rupees. The percentage of foreign investment in outstanding government
securities during the period 2009-10 to 2014-15 ranged from 0.59 per cent to 3.67 per cent.
The limits on foreign investment in government debt and the minimum and maximum foreign
investment in government debt during the years 2013-14 and 2014-15 are presented in
Table 7.2 below:
Table 7.2: Minimum and Maximum Foreign Investment in Government Debt
( `̀̀̀ in crore)
2013 – 14
(upto 11
June 2013)
2013 – 14
(from 12
June 2013)
2014 - 15
Ceiling Limit 1,24,432 1,53,569 1,53,569
Minimum Investment 79,906 53,491.95 81,795
Maximum Investment 96,392 88,078.5 1,53,387
As can be seen from the above, the holdings of the FIIs in government securities during
2013-14 were considerably less than the limits prescribed for them, while it seemed to have
improved considerably during 2014-15.

Report No. 16 of 2016
46
RBI in their reply stated (August 2015) that there was robust demand from FIIs for government
securities and the limits were fully utilized. RBI added that there was a demand from various
quarters to further open up the limits and that they had taken measures to improve the
participation of FIIs in government securities market.
RBI may continue to take steps to ensure that the participation of FIIs in the Indian
government securities market is maintained.

Report No. 16 of 2016
47
Chapter 8
Conclusion and Recommendations
8.1 Conclusion
Union Government’s public debt, consisting of internal and external debt, was managed by
various agencies with internal debt being managed by Budget Division of the DEA of the MOF
along with the IDMD of RBI and external debt being managed by MR, BC and MI divisions
of DEA and supported by the CAAA. The Performance Audit on Public Debt Management
showed that:
• The legal framework for debt management did not define the term public debt. The legal
framework did not indicate clearly debt management objectives and borrowing purposes;
and also did not provide for formulation of a debt management strategy.
• There were no objective criteria/guidelines for devolvement on PDs in auction of
securities. Subsequently RBI informed (May 2016) that a policy on devolvement criteria
had been prepared which inter alia incorporated the factors to be considered for arriving at
the devolvement decision.
• The minutes of the meetings of the Screening Committee did not indicate whether
knowledge transfer, technology transfer and best practices transfer from international
experience were considered while approving projects for external assistance in 60 of the 82
approved projects.
• CMBs, introduced to meet temporary cash flow mismatches of the Government, were
issued to meet monetary policy objectives.
• The public debt information systems used for internal debt (E-Kuber) and external debt
(ICS) did not have provisions for analytical functions.
• There was no centralized database of all internal and external liabilities of the Government.
Further, discrepancies were noticed in the internal debt figures published by various
divisions of DEA and RBI.
8.2 Recommendations
Based on the audit findings discussed in the foregoing chapters, the following
recommendations are made:
• Legal framework, consisting of both the primary as well as secondary legislation, may
include the definition of public debt, debt management objectives, borrowing purposes, and

Report No. 16 of 2016
48
requirement of debt management strategy. DEA may consider doing this in a phased
manner.
• Conditions of ‘Finance Plus’ criteria aimed at maximizing access and leverage of
Multilateral Financial Institutions’/Multilateral Development Banks’ knowledge base,
international experience and familiarity with best practices may be applied in deciding on
the projects for external assistance and the same should be properly documented.
• A centralized database of internal debt, external debt and other liabilities may be
developed.
• Steps may be taken to ensure that the public debt information systems used (E-Kuber and
ICS) support analytical functions.
• Mechanism may be developed to ensure consistency in the reporting of public debt by RBI
and DEA and amongst the various divisions of DEA.


Report No. 16 of 2016
49
Annexure-I
(Refer to para No. 5.4)
Projects/Proposals approved by the Screening Committee13
Sl.
No.
Proposal Date of approval Proposal posed by Funding
agency
Amount
1. Second Uttarakhand rural water supply and sanitation project II
27-02-15 Uttarakhand WB USD 120 million
2. Assam agriculture competitiveness project
27-02-15 Assam WB USD 200 million
3. Reconstruction and recovery from damages due to Hudhud
25-02-15 Andhra Pradesh WB USD 250 million
4. National cyclone risk mitigation project II
25-02-15 National Disaster Management Authority
WB USD 34.81 million
5. Renewable energy in agriculture sector
25-02-15 Punjab ADB USD 55 million
6. Solid waste management project in urban areas
25-02-15 Uttar Pradesh WB USD 85 million
7. Mukhyamantri Gram Sampark Yojana 20-11-14 Bihar WB USD 235 million
8. Six lane green field bridge over river Ganga
22-08-14 Bihar ADB USD 500 million
9. MP integrated urban water resource management program
22-08-14 Madhya Pradesh ADB USD 266 million
10. Special project on production and marketing with an emphasis on post harvest management practices of horticulture crops in HP
28-05-14 Himachal Pradesh WB USD 135 million
11. Nagaland multi sectoral heath initiative project
28-05-14 Nagaland WB USD 48 million
13 Where minutes did not indicate whether knowledge transfer, technology transfer and best practices transfer from international experience were considered.

Report No. 16 of 2016
50
Sl.
No.
Proposal Date of approval Proposal posed by Funding
agency
Amount
12. Additional financing for Andhra Pradesh under NCRMP
28-02-14 Andhra Pradesh WB USD 49 million
13. Second Punjab rural water supply and sanitation
28-02-14 Punjab WB USD 248 million
14. Additional financing of Phase II of Gram Swaraj- Karnataka Panchayat Strengthening Project
28-02-14 Karnataka WB USD 220 million
15. Odisha power sector emergency assistance
28-02-14 Odisha ADB USD 30 million
16. Higher education reforms in Madhya Pradesh
24-02-14 Madhya Pradesh WB USD 300 million
17. TN sustainable Urban Development Programme
24-02-14 Tamil Nadu WB USD 400 million
18. Strenghting of Lok Sewa Kendra 24-02-14 Madhya Pradesh WB ` 210 crore
19. Supporting additional skill acquisition programme
03-02-14 Kerala ADB USD 100 million
20. Urban Development Investment Programme Phase-III
17-01-14 Rajasthan ADB USD 250 million
21. Reconstruction of damaged houses 31-12-13 Odisha WB USD 153 million
22. National Cyclone Risk Mitigation Project
31-12-13 Odisha WB USD 55 million
23. Integrated Coastal Zone management Project (ICZMP), Odisha
31-12-13 Odisha WB USD 3 million
24. Rehabilitating damaged power sector infrastructure
31-12-13 Odisha ADB USD 70 million
25. Odisha Intergrated Agriculture and Water Management Project for Saline and River Embankments
31-12-13 Odisha ADB USD 35 million
26. Nagaland Multi Sectoral Health Initiative
29-11-13 Nagaland WB USD 48 million
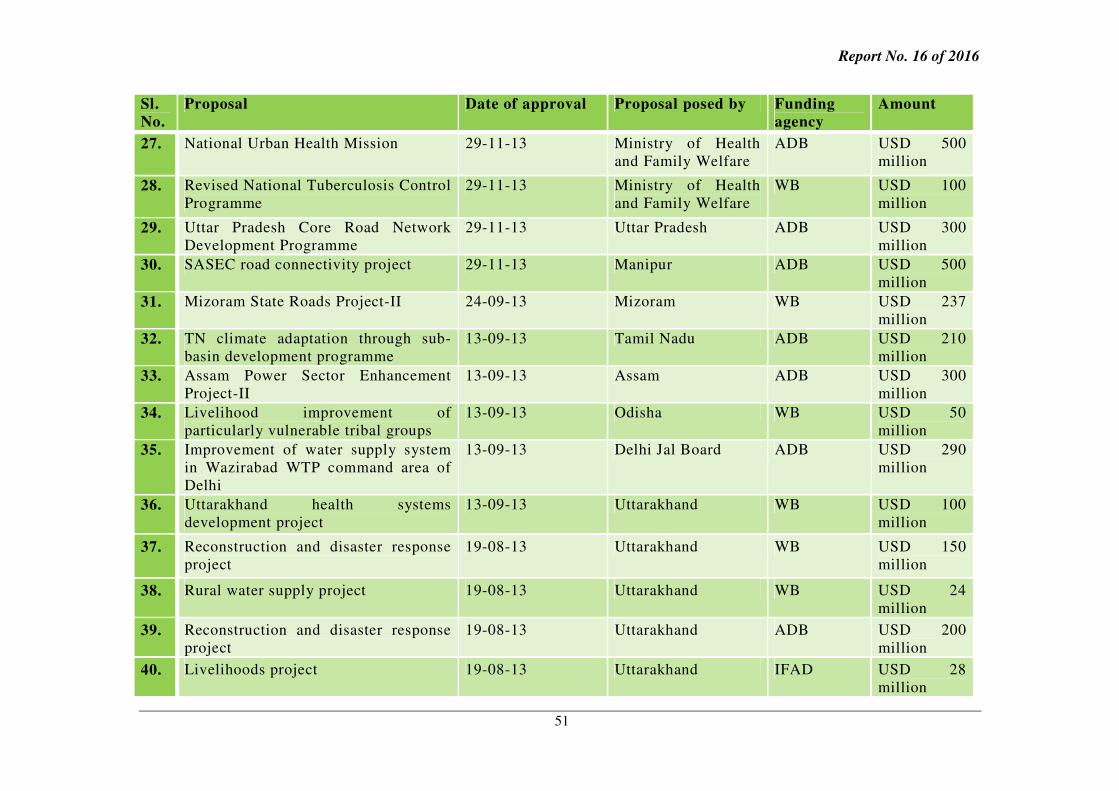
Report No. 16 of 2016
51
Sl.
No.
Proposal Date of approval Proposal posed by Funding
agency
Amount
27. National Urban Health Mission 29-11-13 Ministry of Health and Family Welfare
ADB USD 500 million
28. Revised National Tuberculosis Control Programme
29-11-13 Ministry of Health and Family Welfare
WB USD 100 million
29. Uttar Pradesh Core Road Network Development Programme
29-11-13 Uttar Pradesh ADB USD 300 million
30. SASEC road connectivity project 29-11-13 Manipur ADB USD 500 million
31. Mizoram State Roads Project-II 24-09-13 Mizoram WB USD 237 million
32. TN climate adaptation through sub-basin development programme
13-09-13 Tamil Nadu ADB USD 210 million
33. Assam Power Sector Enhancement Project-II
13-09-13 Assam ADB USD 300 million
34. Livelihood improvement of particularly vulnerable tribal groups
13-09-13 Odisha WB USD 50 million
35. Improvement of water supply system in Wazirabad WTP command area of Delhi
13-09-13 Delhi Jal Board ADB USD 290 million
36. Uttarakhand health systems development project
13-09-13 Uttarakhand WB USD 100 million
37. Reconstruction and disaster response project
19-08-13 Uttarakhand WB USD 150 million
38. Rural water supply project 19-08-13 Uttarakhand WB USD 24 million
39. Reconstruction and disaster response project
19-08-13 Uttarakhand ADB USD 200 million
40. Livelihoods project 19-08-13 Uttarakhand IFAD USD 28 million

Report No. 16 of 2016
52
Sl.
No.
Proposal Date of approval Proposal posed by Funding
agency
Amount
41. City cluster development around Bangalore
19-07-13 Karnataka ADB USD 300 million
42. National Cyclone Risk Mitigation Project II
19-07-13 National Disaster Management Authority
WB USD 250 million
43. Karnataka Integrated and Sustainable Water Resource Management Investment Programme- Urban Water Supply & Sanitation component
15-05-13 Karnataka ADB USD 150 million
44. Jaipur Rail Metro Corporation project 15-05-13 Rajasthan ADB USD 176 millon
45. Indian Renewable Energy Development Agency
15-05-13 Ministry of New and Renewable Energy
ADB USD 500 million
46. Project proposal for power transmission
15-05-13 Madhya Pradesh ADB USD 350 million
47. Livelihood improvement of vulnerable tribal group
15-05-13 Odisha IFAD USD 35 million
48. Ravine Reclamation UP Sodic Land Reclamation III
15-05-13 Uttar Pradesh WB USD 84 million
49. Tiranga Infrastructure Finance Facility 15-05-13 India Infrastructure Finance Company Limited
ADB USD 700 million
50. Punjab development finance programme
18-02-13 Punjab ADB USD 200 million
51. Second Kolkata Environment improvement project
18-02-13 West Bengal ADB USD 400 million
52. Meghalaya Integrated Rural Development Project
21-01-13 Meghalaya IFAD USD 45 Million
53. Karnataka state road improvement project (KSHIP-III)
21-12-12 Karnataka ADB USD 350 million

Report No. 16 of 2016
53
Sl.
No.
Proposal Date of approval Proposal posed by Funding
agency
Amount
54. Rapid response to the food price crisis and malnutrition in Karnataka
21-12-12 Karnataka WB USD 5 million
55. Chhattisgarh state road connectivity project
05-11-12 Chhattisgarh ADB USD 300 million
56. TN Roads II 31-08-12 Tamil Nadu WB USD 300 million
57. Watershed Management Project 27-07-12 Ministry of Rural Development
WB USD 245 million
58. Piped Water Supply 21-05-12 Ministry of Drinking Water and Sanitation
WB USD 500 million
59. AP Rural Inclusive Growth project 18-05-12 Andhra Pradesh WB USD 150 million
60. Strengthening of teacher training institutes for training of untrained teachers of Bihar using distance mode
18-05-12 Bihar WB ` 1280 crore
(Source: Screening Committee Minutes)

Report No. 16 of 2016
54
Annexure-II
(Refer to para No. 6.3.2)
Variation in Figures of Outstanding amount of Dated Securities as on 31 March 2014
( `̀̀̀ in crore)
Sl. No. Nomenclature Outstanding
amount as
per Status
Paper
December
2014
Outstanding
amount as
per Finance
Accounts
Difference
1. 7.56% GS 2014 40,845.08 15,845.08 25,000
2. 7.38% GS 2015 (Conv.) 57,386.74 54,386.73 3,000.01
3. 7.56% GS 2016 (Conv.) - 25,000 -25,000
4. 7.49% GS 2017(Conv.) 58,000 53,000 5,000
5. 6.25% GS 2018 (Conv.) 16,886.80 10,886.80 6,000
6. 5.69% GS 2018 (Conv.) 16,130 10,000 6,130
7. 6.50% GS 2019 - 4,000 - 4,000
8. 6.35% GS 2020 (Conv.) 61,000 56,000 5,000
9. 7.83% GS 2021 - 68,000 -68,000
10. 6.17% GS 2023 (Conv.) 14,000 6,000 8,000
11. 1.44 Inflation Index GS 2023
- 6,582.58 -6,582.58
12. 8.28% GS 2032 90,687.11 85,687.11 5,000
13. 8.32% GS 2032 62,434.05 67,434.05 -5,000
14. 8.30% GS 2040 72,000 - 72,000

Report No. 16 of 2016
55
Sl. No. Nomenclature Outstanding
amount as
per Status
Paper
December
2014
Outstanding
amount as
per Finance
Accounts
Difference
15. 6.30% GS 2040 - 72,000 -72,000
16. Inflation Indexed National Saving Securities – 2013
- 92 -92
17. 7.80% GS 2021 68,000 - 68,000
18. 5.87% GS 2022 (Conv.) 11,000 - 11,000
19. 5.97% GS 2025 (Conv.) 16,687.95 - 16,687.95
(Source: Status Paper 2014 and Finance Accounts, GoI)

Report No. 16 of 2016
56
Annexure -III
(Refer to para No. 7.3)
Trade in Dated Government Securities
( `̀̀̀ in crore)
Quarter Number of
dated
Government
securities
outstanding
Total amount
outstanding
against dated
Government
securities
Total trade
in dated
Government
securities
Total trade
in Top 10
traded dated
Government
securities
Percentage of
total trade in
top 10 traded
dated
Government
securities
against total
trade in dated
Government
securities
Total trade
in top 3
traded
dated
Government
securities
Percentage
of total
trade in top
3 against
total in
dated
Government
securities
Apr-Jun 2010* 96 19,41,595.40 8,95,231 8,22,630 91.89 6,58,018 73.50
Jul-Sep 2010 95 20,32,467.40 6,98,608 6,48,863 92.88 5,34,262 76.48
Oct-Dec 2010 94 21,29,843.00 5,14,299 4,77,444 92.83 3,32,976 64.74
Jan-Mar 2011 92 21,56,914.70 4,44,043 4,27,976 96.38 3,28,542 73.99
Apr-Jun 2011 92 22,63,441.70 5,09,795 4,92,163 96.54 4,24,671 83.30
Jul-Sep 2011 89 23,47,580.40 7,70,109 7,52,586 97.72 6,75,850 87.76
Oct-Dec 2011 91 24,62,333.50 8,19,819 7,94,562 96.92 6,16,644 75.22
Jan-Mar 2012 92 25,93,328.50 9,99,384 9,56,844 95.74 8,82,881 88.34
Apr-Jun 2012 90 27,05,754.30 11,50,531 11,20,254 97.37 9,83,930 85.52
Jul-Sep 2012 90 28,62,712.50 13,23,826 12,73,275 96.18 9,67,603 73.09
Oct-Dec 2012 91 30,12,712.50 11,65,239 11,21,349 96.23 7,90,520 67.84
Jan-Mar 2013 91 30,60,712.50 22,81,333 21,82,433 95.66 17,53,563 76.87

Report No. 16 of 2016
57
Quarter Number of
dated
Government
securities
outstanding
Total amount
outstanding
against dated
Government
securities
Total trade
in dated
Government
securities
Total trade
in Top 10
traded dated
Government
securities
Percentage of
total trade in
top 10 traded
dated
Government
securities
against total
trade in dated
Government
securities
Total trade
in top 3
traded
dated
Government
securities
Percentage
of total
trade in top
3 against
total in
dated
Government
securities
Apr-Jun 2013 92 31,98,961.20 36,32,422 34,67,288 95.45 26,91,049 74.08
Jul-Sep 2013 90 33,29,977.30 14,23,720 13,07,364 91.83 10,17,297 71.45
Oct-Dec 2013 92 34,95,277.00 13,12,755 12,41,440 94.57 8,96,836 68.32
Jan-Mar 2014 91 35,14,178.43 15,99,764 15,45,564 96.61 12,65,135 79.08
Apr-Jun 2014 89 36,37,065.40 23,67,773 22,84,644 96.49 18,03,718 76.18
Jul-Sep 2014 90 37,72,260.50 18,06,274 17,28,369 95.69 13,88,656 76.88
Oct-Dec 2014 89 38,69,869.61 26,90,532 24,93,679 92.68 20,32,631 75.55
Jan-Mar 2015 88 39,59,445.65 22,85,029 20,80,761 91.06 16,91,912 74.04
* Quarterly data is available in the quarterly reports from the year 2010-11. (Source: Quarterly Report on Public Debt Management)

Report No. 16 of 2016
58
Annexure-IV
(Refer to para No. 7.4)
Retail Participation in the Auction of Dated Government Securities
( `̀̀̀ in crore) Year Notified
Amount
Amount
Allocated for
retail
participation
(i.e. 5 percent
of notified
amount)
Non-competitive bids received Non-competitive bids accepted
Number Amount Percentage
of the
notified
amount
Percentage
against
amount
allocated
for retail
investors
Number Amount Percentage
of Notified
Amount
Percentage
against
amount
allocated
for retail
investors
(1) (2) (3) (4) (5) (6) (7) (8) (9) (10) (11)
((5)/
(2)*100)
(5)/(3)*100)
(9)/–(2)*100 (9)/–
(3)*100)
2009-10 4,18,000.00 20,900.00 504.00 1,241.00 0.30 5.94 504.00 1,241.00 0.30 5.94
2010-11 4,37,000.00 21,850.00 620.00 2,045.00 0.47 9.36 620.00 2,045.00 0.47 9.36
2011-12 5,10,000.00 25,500.00 714.00 1,703.00 0.33 6.68 714.00 1,698.00 0.33 6.66
2012-13 5,58,000.00 27,900.00 813.00 1,881.00 0.34 6.74 813.00 1,881.00 0.34 6.74
2013-14 5,63,500.00 28,175.00 898.00 1,738.00 0.31 6.17 898.00 1,738.00 0.31 6.17
2014-15 5,92,000.00 29,600.00 965.00 2,111.00 0.36 7.13 965.00 2,111.00 0.36 7.13
Total 30,78,500.00 1,53,925.00 4,514.00 10,719.00 0.35 6.96 4,514.00 10,714.00 0.35 6.96
(Source: RBI’s website)

Report No. 16 of 2016
59
List of Abbreviations
Sl. No. Term Description
1. ADB Asian Development Bank
2. BC Bilateral Cooperation
3. CAAA Controller of Aid, Accounts and Audit
4. CCA Chief Controller of Accounts
5. CS-DRMS Commonwealth Secretariat’s Debt Recording and
Management System
6. CFI Consolidated Fund of India
7. CGM Chief General Manager
8. CMB Cash Management Bill
9. CSO Central Statistical Office
10. DEA Department of Economic Affairs
11. DEIO Department of External Investments and Operations
12. DMO Debt Management Office
13. ED Executive Director
14. FIMMDA Fixed Income Money Market and Derivatives Association
of India
15. FMOD Financial Markets Operation Department
16. FSLRC Financial Sector Legislative Reforms Commission
17. GDP Gross Domestic Product
18. GOI Government of India
19. IBRD International Bank for Reconstruction and Development
20. ICS Integrated Computerised System
21. IDA International Development Association
22. IDMD Internal Debt Management Department
23. IFAD International Fund for Agricultural Development
24. IGAS Indian Government Accounting Standard
25. ITB Intermediate Treasury Bill
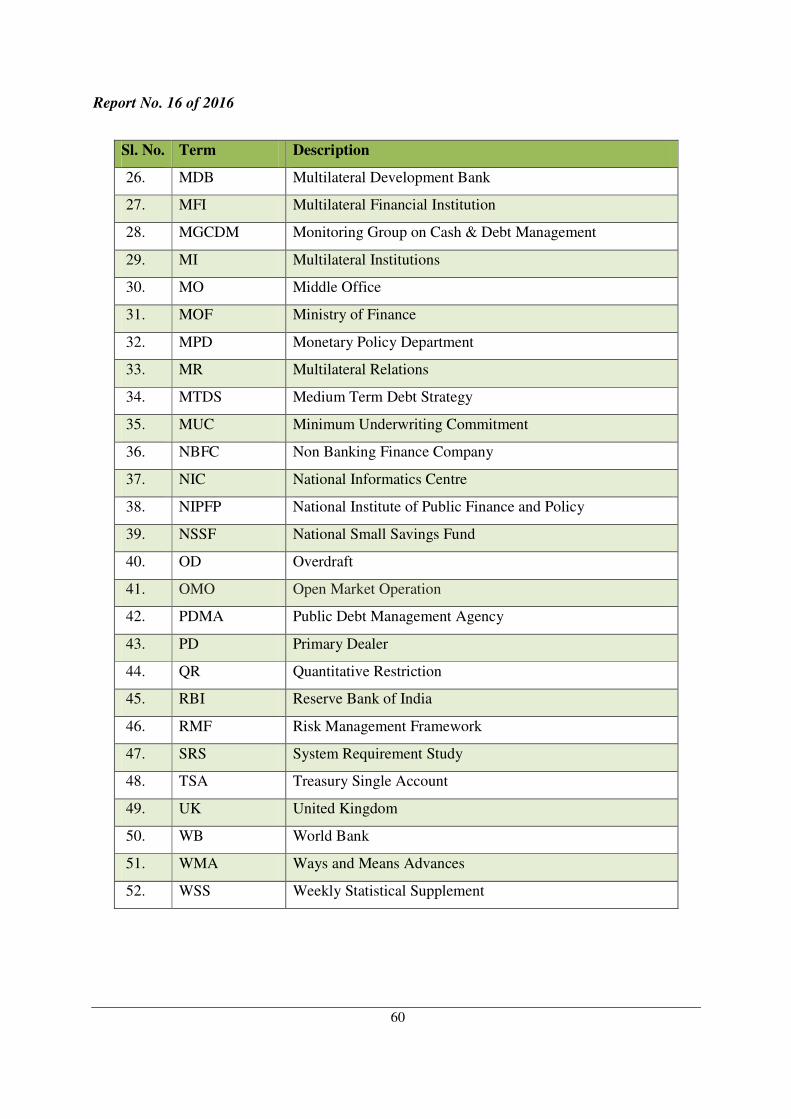
Report No. 16 of 2016
60
Sl. No. Term Description
26. MDB Multilateral Development Bank
27. MFI Multilateral Financial Institution
28. MGCDM Monitoring Group on Cash & Debt Management
29. MI Multilateral Institutions
30. MO Middle Office
31. MOF Ministry of Finance
32. MPD Monetary Policy Department
33. MR Multilateral Relations
34. MTDS Medium Term Debt Strategy
35. MUC Minimum Underwriting Commitment
36. NBFC Non Banking Finance Company
37. NIC National Informatics Centre
38. NIPFP National Institute of Public Finance and Policy
39. NSSF National Small Savings Fund
40. OD Overdraft
41. OMO Open Market Operation
42. PDMA Public Debt Management Agency
43. PD Primary Dealer
44. QR Quantitative Restriction
45. RBI Reserve Bank of India
46. RMF Risk Management Framework
47. SRS System Requirement Study
48. TSA Treasury Single Account
49. UK United Kingdom
50. WB World Bank
51. WMA Ways and Means Advances
52. WSS Weekly Statistical Supplement

Report No. 16 of 2016
61
Glossary
Sl. No. Term Description
1. Bid – Ask spread The difference between the offer price and the bid price.
2. Buyback of
Government Securities
Buyback of Government securities is a process whereby the
Government of India buys back their existing securities from the
holders.
3. Cash Management
Bills (CMBs)
The CMBs have the generic character of T-bills but are issued for
maturities less than 91 days. The tenure, notified amount and date
of issue of the CMBs depends upon the temporary cash
requirement of the Government. Investment in CMBs is also
reckoned as an eligible investment in Government securities by
banks for SLR purpose under Section 24 of the Banking
Regulation Act, 1949.
4. Competitive Bidding
Competitive bidding is a process in which an investor bids at a
specific price / yield and is allotted securities if the price / yield
quoted is within the cut-off price / yield.
5. Consolidated Fund of
India
The fund constituted under Article 266 (1) of the Constitution of
India into which all receipts, revenues and loans flow. It consists
of two main divisions, namely, Revenue Account (Revenue
Receipts and Revenue Expenditure) and Capital Account (Public
Debt and Loans, etc.).
6. Currency Risk
The risk of loss from an adverse movement in exchange rates
between the time of purchase and the time of sale of a currency
position / security.
7. Dated Government
Securities
Dated Government securities are long term securities and carry a
fixed or floating coupon (interest rate) which is paid on the face
value, payable at fixed time periods (usually half-yearly).
8. Debt Service Payments made to creditor(s) towards matured principal amount
and interest. It usually includes service charges, commitment
charges etc.
9. Devolvement Devolvement is a process whereby if an investment issue is
undersubscribed, an underwriter is required to subscribe to the
remaining securities / bonds. The outstanding unsubscribed
amount devolves onto the underwriter.

Report No. 16 of 2016
62
Sl. No. Term Description
10. FIMMDA
Fixed Income Money Market and Derivatives Association of
India (FIMMDA), a Company incorporated under section 25 of
the Companies Act, 1956, has members representing all major
institutional segments of the market. FIMMDA releases rates of
various Government securities that are used by market
participants for valuation purposes.
11. Fiscal Deficit It means the excess of total disbursements, from the Consolidated
Fund of India, excluding repayment of debt, over total receipts
into the Fund (excluding the debt receipts), during a financial
year.
12. Fixed Rate Bonds These are bonds on which the coupon rate is fixed for the entire
life of the bond
13. Floating Rate Bonds
Floating Rate Bonds are securities which do not have a fixed
coupon rate. The coupon is re-set at pre-announced intervals
(say, every six months or one year) by adding a spread over a
base rate.
14. Government Security
A Government security is a tradable instrument issued by the
Central Government or the State Governments. It acknowledges
the Government’s debt obligation.
15. Impact Cost Impact cost represents the cost of executing a transaction in a
given stock, for a specific predefined order size, at any given
point of time.
16. Indexed Bonds These are bonds, the principal and coupon of which is linked to
an accepted index of inflation with a view to protecting the
holder from inflation.
17. Interest Rate Risk
The risk faced by an entity holding a debt portfolio on account of
adverse movements in interest rates.
18. Market clearing rate Market clearing rate is the rate at which the quantity supplied
equals the quantity demanded.
19. Market Risk
Market risk is the exposure that arises as a consequence of
movement in market price of assets and positions which can be
traded in a defined market.
20. Maturity Buckets Maturity bucket denotes the period of residual maturity of a
security.
21. Maturity Date The date when the principal (face value) is paid back

Report No. 16 of 2016
63
Sl. No. Term Description
22. Monetary Policy The procedures by which Governments or the Central Banks try
to affect macroeconomic conditions by influencing the supply of
money.
23. Multiple/Uniform price
based auction
In a Uniform price auction, all the successful bidders are required
to pay for the allotted quantity of securities at the same rate, i.e.,
at the auction cut-off rate, irrespective of the rate quoted by them.
On the other hand, in a multiple price auction, the successful
bidders are required to pay for the allotted quantity of security at
the respective price/yield at which they have bid.
24. Multilateral and
Bilateral Debt
Multilateral debt is debt contracted from multilateral institutions
such as the International Development Association (IDA),
International Bank for Reconstruction and Development (IBRD),
Asian Development bank (ADB) etc. Bilateral debt is contracted
from sovereign countries.
25. Non-Competitive
Bidding
Non – competitive bidding is a process by which investors can
participate in the auction process without mentioning a specific
price / yield. Such bidders are allotted securities at the weighted
average price / yield of the auction
26. Open Market
Operations (OMOs)
OMOs are the market operations conducted by the Reserve Bank
of India by way of sale/ purchase of Government securities to/
from the market with an objective to adjust the rupee liquidity
conditions in the market on a durable basis.
27. Price based
auction/yield based
auction
A price based auction is conducted when GOI reissues securities
issued earlier. Bidders quote in terms of price per ` 100 of face
value of the security (e.g., ` 102.00, ` 101.00, ` 100.00, ` 99.00
etc. per ` 100) bids are arranged in decending order and the
successful bidders are those who have bid at or above the cut-off
price. A yield based auction is generally conducted when a new
government security is issued. Investors bid in yield terms up to
two decimal places (e.g., 8.19 percent, 8.20 percent, etc.). Bids
are arranged in ascending order and cut-off yield is arrived at the
yield corresponding to the notified amount of the auction. The
cut-off yield is taken as a coupon rate of security. Successful
bidders are those who have bid at or below the cut-off price.
28. Primary Dealers
Primary dealers are a group of highly qualified financial firms/
banks who are appointed to play the role of specialist
intermediaries in the government security market between the
issuer on the one hand and the market on the other to accomplish
the objective of meeting the government borrowing needs as
cheaply and efficiently as possible.

Report No. 16 of 2016
64
Sl. No. Term Description
29. Public Account All moneys other than those included in the Consolidated Fund,
received by or on behalf of Government of India, are credited to
the Public Account of India [Article 266 (2) of the Constitution
of India]. It includes transactions relating to ‘debt’ other than
those included in the Consolidated Fund of India. Public Account
transactions are not subject to vote/appropriation by Parliament
and the balances are carried forward.
30. Public Debt Office
(PDO)
Public Debt Office of the Reserve Bank of India acts as the
registry / depository of Government securities and deals with the
issue, interest payment and repayment of principal at maturity
31. Refinancing/Rollover
Risks
The risk associated with the redemption and renewal of
government debt.
32. Repo Repo is an instrument for borrowing funds by selling securities
with an agreement to repurchase the said securities on a mutually
agreed future date at an agreed price which includes interest for
the fund borrowed.
33. Reverse Repo
Reverse Repo is lending funds against purchasing securities with
an agreement to resell the said securities on a mutually agreed
future date at an agreed price which includes interest for the fund
lent.
34. Residual Maturity
The remaining period until maturity date of a security is its
residual maturity. For example, a security issued for an original
term to maturity of 10 years, after 2 years, will have a residual
maturity of 8 years.
35. Secondary Market
The market in which outstanding securities are traded. This
market is different from the primary or initial market where
securities are sold for the first time. Secondary market refers to
the buying and selling that goes on after the initial public sale of
the security.
36. Special Securities
These are Securities issued by the Government of India to entities
like Oil Marketing Companies, Fertilizer Companies, the Food
Corporation of India, etc. as compensation to these companies in
lieu of cash subsidies, with a spread of about 20-25 basis points
over the yield of the dated securities of comparable maturity.
37. Stress Test A method of risk analysis in which simulations are used to
estimate the impact of worst case situations.
Sl. No. Term Description
38. Target Balance The minimum balance which should be kept in the Government

Report No. 16 of 2016
65
account with the Central Bank on a given date.
39. Treasury Bills
(T-bills)
Treasury bills or T-bills are short term debt instruments issued by
the Government of India and are presently issued in three tenors,
namely, 91 day, 182 day and 364 day. Treasury bills are zero
coupon securities and pay no interest.
40. Treasury Single
Account (TSA)
TSA (Treasury Single Account) is a unified structure of
government bank accounts that gives a consolidated view of
government cash resources. Based on the principle of unity of
cash and the unity of treasury, a TSA is a bank account or a set of
linked accounts through which the government transacts all its
receipts and payments. The principle of unity follows from the
fungibility of all cash irrespective of its end use.
41. Underwriting The arrangement by which investment bankers undertake to
acquire any unsubscribed portion of a primary issuance of a
security.
42. Ways and Means
Advance (WMA)
Advances to the Government made by the central bank. These
are made when necessary, if Government expenditure runs in
advance of receipts from taxation plus receipts from borrowings.
43. Weighted Average
Price/ Yield
It is the weighted average mean of the price/yield where weight
being the amount used at that price/yield.
44. Yield The annual percentage rate of return earned on a security. Yield
is a function of a security’s purchase price and coupon interest
rate.