Embed Size (px)
Citation preview
1
Report of the Graduate Education Task Force (GETF) Executive Summary
Virginia Tech is a strong university with excellent opportunities for graduate education, and is among the leaders in land grant universities in the United States, with our crucial missions of teaching, scholarship, and outreach to our communities. Our trajectory has been upward, with our global university ranking recently rising substantially to the 201-250 band (from 251-300). Looking to the future, VT leadership has publicly announced strong ambitions, including our aspiration to be among the top 100 global universities. This ambition is not without relevant precedent; as noted elsewhere in the report, land grant universities from states with comparable populations and gross domestic products, like Purdue (88), Penn State (78), and Michigan State (84), are already among the top 100 global universities. There is, however, much work to be done for VT to perform in the area of graduate education at the levels of the land grant universities ahead of us in world rankings, and we have significant opportunity to improve upon the real, important, existing strengths in the quality of VT graduate education. VT lags its aspirational peers (throughout the report, we refer to the fourteen land grant universities that are ranked higher than VT in the global rankings, as well as nearby North Carolina St. U., as our “aspirational peers” in key performance criteria for graduate education). We have one of the smallest overall enrollments of the group, and we have full time graduate student enrollment that is only 55% of the average of those
aspirational peers (trailing that average by fully 4000 full time graduate students). Graduate enrollment per tenured and tenure track faculty member (TTF) lags the average of our aspirational peers by approximately 1.4 graduate students (3.2 per TTF for VT vs. 4.6 peer average). Effective mentoring of graduate students of course requires faculty mentors; yet, particularly in the science departments (defined broadly across several colleges), VT tends to trail most of our aspirational peers in both TTF faculty members and TTF faculty members normalized by total enrollment. External funding, so crucial to graduate education and research, and a very significant limiter on graduate enrollment, was fully 47% lower than the average of our aspirational peers (VT $297M, peer average $564M) in 2017. Since historically a significant proportion of VT external funding has come to the VT Transportation Institute, the Fralin Biomedical Research Institute, and the Biocomplexity Institute (the first two do not tend to fund many graduate students, and the research of the former Biocomplexity Institute has a decreased footprint), VT external funding for graduate education and research could actually be less than suggested by the 2017 numbers. Graduate enrollments at VT have declined in recent years, while graduate enrollments at our aspirational peer institutions have increased. It is equally worrying that both VT graduate applications and yield have declined, while those at our aspirational peers have increased. Some of the enrollment issues can be assigned to specific causes, and the vast majority of the decline has been in master’s programs. Declines in master’s of education program enrollments have continued over a long time span, believed to have been driven mostly by changes in teacher certification requirements. Declines in business master’s degrees may have resulted from discontinuation of the full time MBA program in Blacksburg. Yet at VT the level of PhD program enrollment has been stagnant as well, and some programs have experienced declines.
The GETF constructed hypotheses to explain these data, and considered approaches to improving enrollment in graduate education. Funding is essential to successful graduate programs. We noted that many other aspirational peers have far more robust programs to assist incoming and enrolled graduate students in crafting student-initiated funding proposals. In fact, in some respects the environment at VT not only fails to support such energetic students, but is punitive. Students who get a fellowship proposal funded, for example by the National Science Foundation, may receive a stipend that is lower than the VT average stipend for their program, and/or they may not receive funding for health insurance. We propose a mechanism herein that encourages and supports student-initiated funding proposals, and ensures that students who succeed will be advantaged, not disadvantaged. Currently, there are relatively few endowed graduate fellowships at VT. We contend that the level of bequest or giving to endow a graduate fellowship eternally is within the financial means of far more alumni and other potential VT supporters than, e.g., funding a building. We believe that graduate fellowship endowment targets should be set and potential donors approached such that we substantially grow the number of endowed graduate fellowships at VT. Many of our aspirational peers

2
provide a version of candidacy status for graduate students who have passed their preliminary exams, are now PhD candidates, and who are focusing on research. The funding that will be freed up by candidacy status will ease the financial burden on students, and make external funding go further in supporting VT graduate research. We propose herein a mechanism by which the resolution to create candidacy status at VT, passed by University Council, can be implemented in such a way as to provide these benefits and yet be less costly to the university.
In order to enhance the success rate of VT faculty in obtaining external funding, we surveyed faculty and office of sponsored programs (OSP) personnel at our aspirational peer universities to get a picture of how they are supported in creating research proposals. The survey reveals that VT faculty get a comparable amount of support to that available at our aspirational peers, but that there are best practices for support in crafting
proposals that the GETF hopes will be adopted at VT. These include more assistance in preparing forms for which the data can be extracted directly from OSP databases, further experimentation on placing some OSP personnel out in the colleges where they can interact more with proposal writers, and consideration of the possibility that OSP personnel in the colleges develop specific expertise and strong contacts with a funding agency of special pertinence to that college, acting as a conduit so that VT can extend its knowledge of upcoming opportunities, and even influence the nature of upcoming opportunities. To directly address the issue of recruiting success, the GETF recognizes the energy, expertise, and creativity of departments, and their essential role in the graduate recruiting process. We also recognize the value of a coordinating body; one which can create dashboards, university communications that are customizable to departments to keep up frequent contact with recruiting targets, help with constructing strategies tailored to characteristics of groups of similar departments, and bring together program and department recruiting experts to share and promulgate best practices. We recommend a hybrid model, which has also been called a
“central coordination, local deployment” model, to improve VT graduate recruiting. The Graduate School can play a strong role in this new model, and can also play a much stronger role in periodic program evaluation. A capable and neutral entity like the Graduate School can substantially improve graduate program assessment and review, promoting a culture of learning from one another, and constant improvement. We also note that the graduate student stipends that many of our programs offer fall well below those of our aspirational peers and that this likely has a negative impact on our ability to recruit top students. With regard to the quality of VT graduate education, our students tell us that they greatly appreciate the outstanding sense of community that is fostered here for graduate students; overall, they have many positive things to say about the quality of the VT graduate education experience. At the same time, there are areas for improvement as well. Quality and cost of housing for graduate students is a continuing issue; there may be opportunities for VT to work more closely with apartment owners and community leaders to raise expectations and improve availability. Mentorship is a crucial aspect of the interactions between faculty, particularly chairs of graduate committees, and graduate students. Most new faculty members have had no formal training in running a research group, supervising students, dealing with problems that arise, managing a research budget, and other aspects of successful mentorship. We propose herein that new VT TTF faculty
members should all participate in mentorship training, using effective and proven methodology. There are many other aspects of professional training that are highly beneficial to graduate students, preparing them to move on to virtually any imaginable career; effective oral and written communication, team leadership and working effectively on teams, basic statistics, and a number of other professional skills. The GETF recommends organization of VT professional training opportunities in a Graduate Certificate to increase awareness and ultimately achievement for our graduate students. Effective mentorship training for young faculty and professional development of our graduate students will thrust VT into a leadership position among land grant universities in these respects, and will make VT students exceptionally well-prepared for their professional careers. We give here abbreviated versions of the key GETF recommendations; all recommendations are elaborated within the appropriate, subsequent report section. We Recommend that VT:

3
1. Provide to graduate students resources to support enhanced numbers of student-initiated research
proposals.
2. Make a focused effort to solicit donations for endowed graduate fellowships.
3. Increase the number and scope of self-funded graduate programs.
4. Implement a modified version of the Candidacy Status resolution passed by the University Council in spring 2019.
5. Expand mentorship training to include all new assistant professors.
6. Implement 360 feedback for tenure-track faculty (TTF).
7. Implement a Professional Development Graduate Certificate.
8. Increase the minimum assistantship stipend rate to match the minimum rates of Virginia Tech’s aspirational peers..
9. Annually compare graduate stipend rates to our peers, and create incentives for colleges to maintain competitive rates.
10. Develop standard phrasing to properly convey intentions to employ graduate students for multiple years.
11. Enhance Office of Sponsored Programs support to faculty preparing research funding proposals.
12. Co-locate OSP staff in colleges and enhance agency-specific expertise and relationships.
13. Adopt a hybrid model where the Graduate School assists departments and programs to improve graduate recruiting.
14. Enhance the role of the Graduate School in graduate program review and evaluation for continuous improvement.

4
Introduction and Charge: On April 3, 2019, Executive Vice President and Provost Cyril Clarke and Vice President and Dean for Graduate Education Karen DePauw appointed a task force to examine graduate education at Virginia Tech (VT) and recommend ways to enhance the quality and impact of VT graduate education. The full charge memo is included as Appendix A of this report. A brief excerpt of the memo illustrates the charge to the group: “review
our research-based graduate education programs and draft recommendations for further enhancement.” Indeed, this has driven the work of the GETF. We list the membership of the GETF below (Table I1; original appointees, replacements for various reasons, and additions to the original membership to bring in needed expertise and perspective), and then we summarize our approach: Table I1. GETF Membership
Name Affiliation Role
Rajesh Bagchi Dept. Head, Marketing, Pamplin Coll. Bus. Member
Kevin Edgar Assoc. Dean, Grad School Chair
Dennis Dean Director, Fralin Life Sci. Inst. Member
Jeff Earley Assoc. V.P., Finance Member
Tom Ewing Assoc. Dean, CLAHS Member
Samantha Fried Pres., Grad. Student Assembly Member
Glenda Gillaspy Dept. Head, Biochemistry Member
Randy Heflin Assoc. Dean, Research, COS. Member
Eric Kaufman Faculty Senate Member
Kacy Lawrence Dir. of Assessment, Grad School Member
Margie Lee Dept. Head, Biomed. Sci. & Pathobiology, CVM Member
Theresa Meyer VP, Research Contributor
Nancy Ross Dept. of Geosciences, COS Member
Neil Sedlak Dir. Info. Tech., OVPRI Member
Brennan Shepard Dir. Financial Planning Member
Cortney Steele VT GRAte Fellow Member
Kenneth Wong Assoc. Dean, Grad School, Nat. Cap. Region Member
G. Don Taylor VP Research Contributor
Approach The charge was potentially very broad, so we agreed on a particular approach in consultation with the Provost and the VP and Dean for Graduate Education. Our approach was essentially two-fold: : 1) to review the university’s standings among national peers across several comparative criteria, and 2) to review the quality of the university’s graduate education as experienced and perceived by the university community. We considered global university rankings (focusing on the Times Higher Education (THE) World University rankings ((https://www.timeshighereducation.com/world-university-rankings)) as a primary source) as both an important indicator of performance for our research-based graduate education programs, and an important parameter to measure improvement. We recognize fully that other factors influence such rankings, but research and graduate education results are particularly valuable indicators due to their strong influence on these rankings which, in turn, impact decisions by prospective graduate students, funding agencies, donors, and many other influencers of graduate education success. We took an aspirational focus. We recognized land grant universities as peers, and we “looked up”; we compared our results, and the factors influencing those results, with the other members of the top 15 land grant universities as measured by THE World Rankings (Table I2). Many of the other top 15 universities (VT is ranked 15th as of early 2020) seem to be quite comparable to VT in terms of factors like state population, per capita income, and other economic measures (e.g. Purdue (88), Michigan State (84), and Penn State (78)), and the fact that those universities are significantly higher than VT in world rankings provided the impetus for hypotheses to answer the question “why?” A couple of top 15 land grants are very different from VT (201-250); Cornell (19) in New York, and U. California

5
Berkeley (13). Another campus of the University of California system, the U. California Davis (55) is much more like typical land grants, and thus a more instructive comparison to VT among California universities. We also chose to add North Carolina State (NCSU, 301-350) to the list of comparators, given the perceived similarities (geographic and otherwise) between VT and NCSU. Thus, much of the data that follows compares VT with these 16 universities (Table I2). Our second area of focus was on the quality of graduate education at VT, especially as experienced by graduate students themselves. It is important to understand, and potentially improve, the quality of the graduate student experience at VT. Such potential improvement can positively influence results of VT graduate education, help us recruit great graduate students in the future, enhance interdisciplinary collaboration, and help us to cultivate a culture of excellence at VT. The GETF generated hypotheses to attempt to explain why VT research-based graduate education programs are not more successful. It is important to understand that this approach does not presume that VT programs are not successful; rather, our perspective was that we aspire to be even more successful. We wished to identify the most significant impediments to future success, and the most fruitful actions we could take to ensure such success. We solicited hypotheses from the task force and from those with whom we communicated about our mission. We listed those hypotheses, and to the extent we could, we tested them with data (the complete list of major hypotheses is included as Appendix B at the end of this report). Thus, the report is organized around those hypotheses, describing the data collected related to each hypothesis, our conclusions with regard to whether the data confirmed or refuted the particular hypothesis, and GETF recommendations, if any, that resulted. In addition, we used many methods to gather fundamental data that both provide insights about whether these hypotheses are correct, and provide for a deeper understanding of where VT graduate education stands versus our aspirational competitive land grant universities. These data come from publicly available sources including the National Science Foundation and the Integrated Postsecondary Education Data System (IPEDS), from surveys carried out by the GETF, and from other sources. Table I2. Top Land Grant Universities and Some Characteristics
University 2020
Ranking*
Endowment
(M $)# Medical School?
2018 State Population
(M)**
2018 State GDP
(B $)## Per Capita State GDP
Full Time UG
Total GS
Full Time GS
U. California - Berkeley 13 4,271 Y 39.6 2998 75707 29351 11317 9601
Cornell U. (NY) 19 5,298 Y 19.5 1669 85590 14898 8109 8025
U. Illinois 48 1,659 Y 12.7 865 68110 32613 14261 10237
U. Wisconsin 51 3,102 Y 5.8 336 57931 28977 11619 9591
U. Cal. - Davis 55 1,108 Y 39.6 2998 75707 29284 7314 6763
Ohio St. U. 70 4,253 Y 11.7 676 57778 42003 13891 10054
Penn. St. U. 78 2,119 Y 12.8 783 61172 39785 6284 5551
U. Minnesota 79 3,494 Y 5.6 369 65893 29991 16415 9714
Michigan St. U. 84 3,075 Y 10.0 527 52700 35404 11203 8103
Purdue U. (IN) 88 2,424 Y 6.7 367 54776 30277 10567 6442
U. Maryland 91 519 Y 6.0 412 68667 27708 10653 8107
U. Arizona 104 843 Y 7.2 348 48333 29325 9650 7124
Rutgers U. 168 985 Y 8.9 622 69888 33677 13936 8517
U. of Florida 175 1,612 Y 21.3 1039 48779 31384 17422 12477

6
Texas A&M U. 178 10,908 Y 28.7 1802 62787 46724 14864 11799
Virginia Tech 201-250 996 Y 8.5 486 57176 26603 7247 4961
N. Carolina St. U. 301-350 1,122 N 10.4 564 54231 21384 10282 6031 *The World University Rankings, 2020 Edition; #Center for Measuring University Performance, 2017 Data. **US Census 2018 estimates; ##Federal Reserve Economic Data (FRED). Enrollment Data from IPEDS Fall 2017

7
Section 1. Enrollment Graduate Enrollment
Between Fall 2010 and Fall 2019, graduate enrollment at VT declined by 530 students (-7.6%). This
includes a decrease of 668 master’s students (-16.5%) which is slightly offset by an increase of 138 doctoral
students (+4.8%) over this period. Total doctoral enrollments have stayed relatively steady for the last decade,
after increasing significantly between 2000-2010. From 2017 to 2018, the Council of Graduate Schools (CGS)
Graduate Enrollment and Degrees Report found that overall enrollment in graduate education increased 1.5%
nationally1. In contrast, VT’s overall enrollment in this timeframe decreased 5.6% ( 8.8% decrease in Master’s
enrollment and a 1.5% decrease at the Doctoral level). Highest Research Doctoral institutions participating in
the survey saw an increase in enrollment of 1.9% and Public Highest Research Doctoral institutions saw an
increase of 1.3%1. The fact that VT’s master’s enrollment has decreased during the past decade is concerning,
given that many colleges have added new master’s programs and enrollments in programs like the Master of
Information Technology have doubled in the last decade. It is important to dig deeper into these numbers as
this pattern is driven by a small number of programs.
Figure 1.1 Trends in graduate enrollment
We analyzed the components of VT graduate enrollment carefully, and discovered that the master’s
decrease is weighted heavily across a few departments. The following table displays changes in Virginia
Tech’s graduate enrollment across colleges from Fall 2010 to Fall 2019, with the largest enrollment decreases
coming in the College of Liberal Arts and Human Sciences, the College of Architecture and Urban Studies, and
the Pamplin College of Business.
Figure 1.2 Changes in graduate enrollment
0
1000
2000
3000
4000
5000
6000
7000
8000
Fall 2010 Fall 2011 Fall 2012 Fall 2013 Fall 2014 Fall 2015 Fall 2016 Fall 2017 Fall 2018 Fall 2019
Trends in Graduate Enrollment
Doctoral Masters Total

8
Within the College of Liberal Arts & Human Sciences, master’s enrollment in the School of Education
has decreased by approximately 316 students (-55%) in the last decade, continuing a decline that began well
before 2010. Educational Leadership and Policy Studies (ELPS) master’s enrollment decreased by 45 students (-
46%), Career and Technical Education (CTE) decreased by 47 students (-80%) and Curriculum and Instruction
(EDCI) enrollment decreased by 183 students (59%). The Health and Physical Education master’s program,
which had enrolled 39 students in 2010, was phased out at the beginning of the decade as well. Nationally,
these programs have seen declines in enrollment, however not to the degree seen at VT. These changes can be
readily attributed to changes in Virginia teacher certification requirements, where a master’s degree is in many
cases no longer required for certification and advancement. This change is not one that VT can easily influence.
Additionally during this time, the Master’s in Higher Education and Student Affairs was added in 2015 and
peaked in enrollment a couple years after it began with ~36 students in Fall 2017. However, in 2018 and 2019
enrollments dropped, with only 20 students enrolled at the time of the Fall 2019 census. Overall doctoral
enrollment also decreased in the School of Education by 73 students (-21%) between Fall 2010 and Fall 2019
despite the addition of the Higher Education program. Similar to the master’s trend, most of this change is
attributed to the EDCI (-28%) and ELPS (-28%) programs.
In the College of Architecture and Urban Studies, the decrease in graduate enrollment between Fall
2010 and Fall 2019 is mainly attributed to a decline in master’s students in the School of Architecture and
Design (A+D) by 117 students (-50%), and the School of Public and International Affairs (SPIA) by 84 students
(-36%). The degree programs with the largest enrollment drops are the Master’s of Architecture (83 students,-
45%), Master’s in Urban and Regional Planning (48 students, -45%), the Master’s in Public and International
Affairs (38 students, -69%), and the Master’s of Landscape Architecture (34 students, -71%). Doctoral
enrollments in the college have remained relatively level over this period, with enrollment increases in the
Myers-Lawson School of Construction offsetting decreases in SPIA enrollments.
Additionally, the full-time master’s degree in Business Administration (MBA) was eliminated on the
Blacksburg campus by 2015. This decision was made in part because of the lack of proximity of Blacksburg to
major employers that would be key to a highly successful MBA program. This decision resulted in a decline in
master’s enrollment of approximately 100 students in the Pamplin College of Business.
52
-203
-91
123
57
-464
15
-14 -5
-500
-400
-300
-200
-100
0
100
200
Changes in college enrollment: 2010-2019 Agriculture & Life Sciences
Architecture & Urban Studies
Business
Engineering
Inter-College
Liberal Arts & Human Sciences
Natural Resources &Environment
Science
Veterinary Medicine

9
The above factors dominate the decline in graduate enrollment at VT in the last decade. While we can
assign the enrollment decline largely to a relatively small number of master’s programs and to specific causes,
this is not to say that we should be satisfied with the overall graduate enrollment situation; we should be
substantially growing Ph.D. enrollment, and we should be introducing other master’s programs (self-paying
and otherwise) that would balance or more than balance the losses noted above.
Virginia Tech Graduate Applications and New Enrollees Trends
The number of graduate applications received has decreased over the last decade by 24%, and by 25%
when looking over the last five years. A steady decline in applications began in 2013, with large drops
occurring in recent years: from Fall 2016 to 2017 (-681, -7%) then from Fall 2017 to 2018 (-1359, -14%), with the
decrease slowing from 2018 to 2019 (-190, -2%). Despite the significant reduction in applications, new
enrollment has not dropped nearly as much. This is in part due to the increased offer rate, with yield
decreasing only slightly.
In contrast, the CGS Graduate Enrollment and Degrees Report found that both graduate applications
and first-time graduate enrollments increased by about 2% from Fall 2017 to Fall 2018 for all responding
institutions1. For Highest Research Doctoral Universities1 the number of applications increased by 1.7% and
first-time enrollment by 0.6%1. During this same time period, applications to Virginia Tech decreased by 14%
and first-time enrollment decreased by 8%. Numbers for 2019 have not been released by CGS, but Virginia
Tech did slow down the application decline in 2019, with first-time enrollments increasing. For Fall 2018,
acceptance rates for Highest Research Doctoral Universities were 20.3% for Doctoral applications and 44.3%
for Master’s/Other1. At Virginia Tech the acceptance rate of doctoral students in Fall 2018 was about 36% and
for Master’s (not including non-degree) was around 49%.
Table 1.1. VT Graduate Applications by Fall Term
Fall
Term Applications Offers Enrolled
Offer
Rate Yield
2010 10327 3995 2265 39% 57%
2011 10577 3981 2287 38% 57%
2012 10762 3930 2239 37% 57%
2013 10653 3807 2122 36% 56%
2014 10476 3529 1975 34% 56%
2015 10135 4139 2306 41% 56%
2016 10092 4022 2204 40% 55%
2017 9411 3895 2050 41% 53%
2018 8051 3655 1891 45% 52%
2019 7860 3936 2006 50% 51%
Similar to enrollment trends, this decrease in applications is driven at the master’s level. From 2010 to
2019 master’s/non-degree (comparable to CGS categories above) applications decreased by 27% and doctoral
applications decreased by 18%. However, this decrease in doctoral applications is heavily skewed by a
decrease of 500 applications in the College of Engineering. Outside of the COE, there was only an 8.6%
1 Definition from Carnegie Classification System: R1: Doctoral Universities – Very high research activity. A University falls under the
Doctoral Universities category if they awarded at least 20 research doctorates or at least 30 professional practice doctorates across at least two programs. The level of research activity is assigned based on the following correlates of research activity: research & development (R&D) expenditures in science and engineering; R&D expenditures in non-S&E fields; S&E research staff (postdoctoral appointees and other non-faculty research staff with doctorates); doctoral conferrals in humanities, social science, STEM (science, technology, engineering, and mathematics) fields, and in other fields (e.g., business, education, public policy, social work).

10
decrease in doctoral applications. The College of Engineering has a much larger doctoral presence than other
colleges, receiving almost double the number of applications than the next largest college.
As shown in the figure below, the colleges with the biggest decreases in total applications were the
College of Engineering (-876, -17.9%) and the College of Architecture and Urban Studies (-472, -49.9%). The
decrease seen in CAUS is largely master’s students, while the decrease in COE is mostly doctoral students.
Additionally, the Pamplin College of Business saw a 40.8% decrease in applications which was driven at the
Master’s level (-266, -52.1%).
In the College of Engineering, the biggest decreases in doctoral applications were in the departments of
Electrical and Computer Engineering (ECE) (-232, -45%) and Mechanical Engineering (-106, -49%); these are
two of the largest departments in COE for graduate enrollment. Doctoral applications to ECE have been
decreasing since 2010. Electrical Engineering received half as many applications for Fall 2019 as it did for Fall
2010 (-219). Decreases in master’s applications to the COE are also mostly concentrated in ECE, with a decrease
of 376 applications (-38%) from Fall 2010 to Fall 2019.
A decrease in applications at the master’s level within PCOB was not unexpected, due to the
elimination of the full-time MBA. However, it must be noted that all PCOB graduate programs have seen a
decrease in master’s applications. For example, Accounting and Information Systems applications have
decreased over this period by 69 (44%).
Application trends in CAUS master’s programs mirror the enrollment trends we addressed earlier in
this section. SPIA saw a decrease of 143 applications (60%) from Fall 2010 to Fall 2019. In the School of
Architecture and Design, the Master’s of Architecture program saw a decrease of 276 applications (57%) and
Landscape Architecture saw a 54.7% decrease. Similar to PCOB, all programs saw a decline in applications.
Despite these decreases in applications, the number of new enrollees has changed to a much smaller
extent. From 2010 to 2019 new VT graduate enrollees only decreased by 259 students or about 11%. There was
a decrease in non-degree students accounting for 260 fewer students. The biggest loss in new enrollees was in
-83
-472
-283
-876
-313 -294
-47-93
-6
-1000
-900
-800
-700
-600
-500
-400
-300
-200
-100
0
100
Agriculture &Life Sciences
Architecture& UrbanStudies Business Engineering Inter-College
Liberal Arts &Human
Sciences
NaturalResources &Environment Science
VeterinaryMedicine
Change in College Applications: 2010-2019
Masters/Other Doctoral Total
Figure 1.3. Graduate applications over 2010-19

11
the College of Architecture and Urban Studies, with a loss of 103 new students (45%). The School of Education
saw a decrease in new enrollees of only 22%, while the number of applications decreased 35%. As seen in the
chart above, these results are being obtained while the offer rate is increasing. It must be noted that the
significant decrease in applications coupled with a smaller decrease in new enrollees leads to concerns about
potential declines in the average quality of admitted students.
Another important influence upon these numbers is the change in graduate applications from
international students. Over the decade from Fall 2010 to Fall 2019, international student applications declined
by 1,167 (21%). In contrast, new international student enrollments over this period increased 35%. However,
international applications peaked in Fall 2014, and new international enrollees peaked in Fall 2015.
Applications have decreased by about 30% since the peak in Fall 2014 and new enrollees have declined by 9%
since the peak in Fall 2015. A CGS report found that first time graduate enrollment for international students
decreased by 1.3% from Fall 2017 to Fall 2018 across all institution types2. It reported, however, that the five-
year and ten-year international enrollment trends were strong, with 2.3% and 4.9% increases respectively.
Engineering programs have seen some of the largest drops in applications and new enrollees. The CGS
report found the first-time enrollment of international students in engineering decreased by 8.3% from 2017 to
2018, with first-time enrollment decreasing 1.2% at the doctoral level and 5.7% at the master’s level2. At
Virginia Tech, we reported earlier that some engineering programs had seen some of the largest declines in
applications. As a whole, applications to the College of Engineering by international students decreased from
2017 to 2018 by 24%, with a decrease of 17% at the doctoral level and 27% as the Master’s level. In contrast,
new international enrollees to the COE enrollment increased 3%, including a 4% decline in doctoral enrollees
and an 8% increase in international master’s enrollees.
Peer Comparisons of Graduate Enrollments
The peer group chosen for enrollment comparison includes the top 14 United States land-grant
universities in the 2020 Times Higher Education (THE) World University Rankings, in addition to North
Carolina State University (added to this listing because of many similarities to VT as a land-grant institution in
a contiguous state). Several relevant observations are worth noting from these enrollment comparisons:
Graduate Enrollment (Full-time)
The average full-time graduate enrollment at peer universities was 8,755 in Fall 2018, compared to
4,792 full-time graduate students at VT
VT has the lowest full-time graduate enrollment among this peer set of universities
In the 5 years from Fall 2013 to Fall 2018:
o Average full-time graduate enrollment at peers grew 4.9%
o Full-time graduate enrollment at VT fell (by 2.5%)
Undergraduate Enrollment (Full-time)
The average full-time undergraduate enrollment at peer universities was 32,995 in Fall 2018, compared
to 27,180 full-time undergraduates at VT
In the 5 years from Fall 2013 to Fall 2018:
o Average full-time undergraduate enrollment at peers grew 7.9%
o Full-time undergraduate enrollment at VT grew 15.6%
Total Full-time Enrollment
The average total full-time enrollment in Fall 2018 was 41,750 at peer universities, compared to 31,972
at VT.

12
In the 5 years from Fall 2013 to Fall 2018:
o Average full-time enrollment at peers grew 7.3%
o Full-time enrollment at VT grew 12.5%.
Graduate Enrollment per Undergraduate Enrollment
The median number of full-time undergraduates per graduate at peer universities is 3.9
VT has 5.7 undergraduates per graduate student
Enrollment per Tenured and Tenure-Track (T-TT) Faculty Member
The average total full-time enrollment per tenured and tenure-track (T-TT) faculty member at peers is
23.5 in Fall 2018.
Virginia Tech enrolled 21.4 total full-time students per T-TT faculty member in Fall 2018.
The average full-time graduate student per T-TT faculty member at peers was 4.9 in Fall 2018.
VT enrolled 3.2 full-time graduate students per T-TT faculty member in Fall 2018.
In summary, the trend of full-time enrollment over the five-year period of Fall 2013 to Fall 2018
indicates that the average peer institution has grown by 7.3%. VT has grown overall enrollment more than
peers, growing by 12.5% over the same period. However, VT’s growth is due to undergraduate growth of
15.6%, as compared to just 7.9% undergraduate growth at peers. VT’s graduate enrollment has fallen 2.5% over
the five-year period while peers have grown graduate enrollment by 4.9%. As displayed in the chart below, VT
has the lowest graduate enrollment, the 2nd lowest overall enrollment, and the 2nd highest undergraduate to
graduate ratio.
Figure 1.4. Peer enrollment comparison
When comparing enrollment to the number of tenured and tenure-track (T-TT) faculty, data indicates
that VT has fewer total full-time students per faculty member than the average peer (21.4 at VT versus 23.5 at
peers on average in Fall 2018). VT faculty instruct about the same number of undergraduate students per T-TT
faculty member as the average aspirational peer (18.2 at Virginia Tech versus 18.5 at peers on average), while
mentoring the 2nd fewest graduate students per T-TT faculty member among the peers (3.2 at VT versus 4.9 at
peers on average).
Figure 1.5. Enrollment per TTF
0
1
2
3
4
5
6
7
8
0
10000
20000
30000
40000
50000
60000
70000
Land Grant Peer Enrollment ComparisonFall 2018
Undergraduate Graduate Undergraduate to Graduate Ratio

13
Recommendations
Funding greatly influences graduate enrollment. For most VT programs and departments, except those that
are designed to be self-funded, the number of graduate students taken into a program is limited by the funds
available to support those students. Such funding can come from grants from federal agencies, from graduate
assistantships, from traineeships, from industrial support, from student-initiated proposals, and from other
sources. We recommend actions to enhance funding of VT graduate education and provide support for those
recommendations in other sections. We can simply note here the gap between the most recent average
graduate enrollment of our aspirational peers and that of VT for the same time period, noted above;
approximately 4,000 graduate students. If we assume for the sake of an estimate that 58% of those would be
supported on something other than a GTA or self-support, as is the current percentage at VT (see Section 3),
and if we assume $30K to support a student, then VT would need to raise an additional $70M per year in
grants, endowed fellowships, student-initiated fellowships, and other sources to fund that many new graduate
students (or an additional $120M if we assume that 100% of the new students would be supported by other
than GTA or self-funding).
1) Develop a hybrid graduate school/department or program model for recruiting graduate students.
Background: Recruiting is one of the most important processes at VT. Done well, it brings us the
brightest, most highly motivated graduate students. Strong recruiting raises program capability and
stature, improves the quality of its scholarship, and strong students can be primary assets in recruiting
other strong students. Currently, recruiting is largely in the hands of departments and programs, for
the most part working in separate silos. We describe elsewhere the role of graduate stipends in
recruiting and retaining strong students, and the fact that some VT programs lag significantly in
average stipend. Yet recent scholarship that includes VT’s own David Knight3 points out that stipends
can be overrated as a mechanism for attracting the best graduate students; personal contact, sharing
information, conveying a sense that a recruit is wanted by the university and department, conveying a
sense of community, all can be just as important as the stipend level. For a strong university like VT
that is “in the picture” for a student because of its quality and reputation, the personal factors noted
above can make all the difference. We do not suggest that any central entity can or should take the
place of the department or program in recruiting. Yet a university entity like the Graduate School can
be a highly valuable partner. Supplying information and communications, customized to the
department, on a regular schedule and at critical times in the recruiting process to help build the bridge
to that recruit. Working with departments and programs to supply useful software and scheduling
0.05.0
10.015.020.025.030.035.0
Full-Time Enrollment per Tenured & Tenure-Track Faculty Member -Fall 2018
Undergrad per TTTF Graduate per TTTF

14
tools such that appropriate contact with the recruit is always maintained; convening program
representatives (e.g. graduate coordinators) to share best recruiting practices and ideas; this hybrid
approach can help bring the best graduate students to VT.
2) Initiate a periodic graduate program review process led by the Graduate School.
Background: As noted in the report, a number of graduate programs have experienced enrollment
issues in recent years, with some even being terminated. There is a need for a neutral, university level
process for evaluation of graduate programs, carried out at regular intervals, and based on tested and
effective methods4. Such a process will ensure that departments and programs evaluate their graduate
programs in depth and along with evaluators who have a broader perspective of VT graduate
programs, in order to maintain and indeed constantly improve the health of those programs. A
Graduate School-led approach will improve program evaluation and help to apply consistent
standards, as well as capture best practices, across all VT graduate programs.
3) Encourage academic departments to invest more in graduate recruitment and take full advantage of
the comparative capacity at Virginia Tech for mentoring graduate students.
Background: Clearly, from the data above, VT TTF members have capacity to mentor additional
graduate students, versus our aspirational peers. VT tenured and tenure track faculty members
mentor on average roughly 1.4 fewer graduate students than their counterparts at aspirational peer
universities. We know some of the reasons for this and describe them above; funding certainly has a
prominent place among the reasons. We describe elsewhere in the report a number of ways in which
we recommend that faculty and graduate students get additional support in order to enhance their
chances of getting increased financial support; increased OSP support, candidate status, increased
support for graduate student-initiated proposals, to name a few. With these new tools in hand, and
with the proper incentives, it is reasonable to expect that VT TTF will achieve their full capacity to
mentor graduate students. By so doing, we can help erase the gap between VT and our aspirational
peers with regard to enrolled graduate students.
References
1. Okahana, H., & Zhou, E. (2019). Graduate enrollment and degrees: 2008 to 2018. Washington, DC:
Council of Graduate Schools.
2. Zhou, E., Mitic, R., West, C., & Okahana, H. (2020). International Graduate Applications and
Enrollment: Fall 2019. Washington, DC: Council of Graduate Schools.
3. Bortz, W.E.W.; Knight, D.B.; Lyles, C.H.; Kinoshita, T.; Choe, N.H.; Denton, M.; Borrego, M. A
competitive system: graduate student recruitment in STEM and why money may not be the answer. J.
Higher Educ. 2020, DOI: 10:1080/00221546.2019.1706017.
4. Baker, M.J.; Carter, M.P.; Larick, D.K.; King, M.F. (2011). Assessment and Review of Graduate
Programs. Council of Graduate Schools, Washington, D.C. ISBN 10:1-933042-34-6.
Section 2. Comparisons of Numbers of Graduate Students and Faculty to Other Top Land Grants Times Higher Education World Rankings and Student Enrollment Compared to other top land grant universities, Virginia Tech has low numbers of Ph.D. students and faculty. This is especially true in the sciences (broadly defined), whereas the numbers in engineering are fairly healthy compared to those of peer universities. The small numbers of students and faculty likely also correlate strongly with perceived strengths of the graduate programs and universities, as evaluators (for the Times Higher Education Global Rankings and the U.S. News and World Report Graduate Program Rankings, for example) most likely consider only the total impact of all personnel when ranking a program and university and do not attempt to perform any normalization for size.

15
The National Science Foundation annually surveys U.S universities on numbers of graduate students and postdoctoral fellows. This data is available at https://www.nsf.gov/statistics/srvygradpostdoc/. The data are provided in terms of total numbers of individuals and are also separated into categories of science, engineering, and health. For graduate students, data are also separated into numbers of Master's and Ph.D. students. The survey defines "science" to include agricultural science, natural resources and conservation, biological and biomedical science, computer and information science, geoscience, mathematics and statistics, physical science, psychology, social science, and multidisciplinary science. It should also be noted that the survey excludes any disciplines that do not fall under this broad definition of science or in engineering and health. It therefore does not include areas such as humanities, architecture, and business. Table 2.1 shows the top U.S. land grant universities with their THE Global ranking and total numbers of graduate students within science, engineering, and health from 2017 NSF data. VT ranks in the bottom five in this measure, but it should also be noted that there is not a strong correlation of this metric with global rankings. Table 2.1. Top THE global land grant universities ranked by total number of graduate students in science, engineering, and health.
Land Grant University
No. of Graduate
Students
THE Global Rank
Texas A&M U. 8,045 178
U. Illinois, Urbana-Champaign 7,246 48
Purdue U. 6,659 88
U. California, Berkeley 6,494 13
U. Minnesota 6,022 79
North Carolina State U. 6,012 301-350
Pennsylvania State U. 5,951 78
U. Wisconsin-Madison 5,738 51
U. Maryland, College Park 5,614 91
U. Florida 5,598 175
Cornell U. 5,122 19
Ohio State U. 4,806 70
Virginia Tech 4,618 201-250
Rutgers, State U. New Jersey 4,181 168
U. California, Davis 4,140 55
U. Arizona 3,883 104
Michigan State U. 3,485 84
It is very instructive to separate this into the Master's and Ph.D. student components. Table 2.2 shows the same universities ranked by the total number of Master's students in science, engineering, and health. VT ranks near the middle in this metric, but there appears to be even less correlation between number of Master's students and global ranking. Table 2.3 shows the rankings by number of Ph.D. students in science, engineering, and health. In general, there is much stronger correlation of global ranking with number of Ph.D. students with the notable exception that Texas A&M still appears near the top of the list. But for the most part, the universities ranked in the top half of the global rankings are also in the top half of the number of Ph.D. students. Figure 2.1 shows a plot of the data from Table 2.3, along with a linear fit that shows the clear correlation of THE global ranking with number of PhD students. VT is indicated with the maroon star. It is notable that the number of VT science, engineering, and health PhD students deviates significantly in a negative fashion from the trend line. Since the global rankings have a strong component of research performance and reputation, this is not surprising as Ph.D. students are a major component of the research engine, while Master's students have proportionally less time to contribute to research.

16
Table 2.2. Top THE global land grant universities ranked by total number of Master's students in science, engineering, and health.
Land Grant Univ.
Master's Students
THE Global
Rank Texas A&M U. 3,942 178
U. Illinois, Urbana-Champaign 3,363 48
North Carolina State U. 3,182 301-350
Purdue U. 2,700 88
Pennsylvania State U. 2,660 78
U. Minnesota 2,593 79
U. Maryland, College Park 2,570 91
U. Florida 2,474 175
U. California, Berkeley 2,340 13
Virginia Tech 2,156 201-250
U. Arizona 1,935 104
Cornell U. 1,912 19
Rutgers, State U. New Jersey 1,900 168
U. Wisconsin-Madison 1,886 51
Ohio State U. 1,592 70
Michigan State U. 1,201 84
U. California, Davis 1,047 55
Table 2.3. Top THE global land grant universities ranked by total number of Ph.D. students in science, engineering, and health.
Land Grant Univ.
Ph.D. Students
THE Global
Rank U. California, Berkeley 4,154 13
Texas A&M U. 4,103 178
Purdue U. 3,959 88
U. Illinois, Urbana-Champaign 3,883 48
U. Wisconsin-Madison 3,852 51
U. Minnesota 3,429 79
Pennsylvania State U. 3,291 78
Ohio State U. 3,214 70
Cornell U. 3,210 19
U. Florida 3,124 175
U. California, Davis 3,093 55
U. Maryland, College Park 3,044 91
North Carolina State U. 2,830 301-350
Virginia Tech 2,462 201-250
Michigan State U. 2,284 84
Rutgers, State U. New Jersey 2,281 168
U. Arizona 1,948 104

17
Figure 2.1. THE global ranking versus total number of Ph.D. students in science, engineering, and health.
Additional insight is gained by separating out the numbers of Ph.D. students in science and engineering. Table 2.4 shows the global rankings vs. Ph.D. students in science; notably, VT is at the very bottom, and by quite a large margin, in this measure. The correlation of global ranking with number of Ph.D. students in science is quite strong. Figure 2.2 is a plot of this data along with the linear fit showing the correlation. VT is at the far left side of the chart with the smallest number of science Ph.Ds, and is only slightly below where the regression equation would have the university ranked based on enrollment. Table 2.5 shows the rankings vs. number of Ph.D. students in engineering. There is very little correlation of number of engineering Ph.D. students with global ranking (in fact, there is small inverse correlation), as evidenced by the appearance of Texas A&M, N.C. State, and VT in the top 5 in this metric, while being the bottom three in the global rankings of our aspirational peers (plus NCSU). Figure 2.3 shows the plot of this data and best fit with negative slope. Together, these latter two tables indicate that VT is much more heavily weighted towards Ph.D. students in engineering and away from Ph.D. students in science with respect to higher-ranked global land grant universities. Although not directly relevant to graduate education, it is also notable that the postdoctorate data (not shown here) shows that VT is the smallest by far of any of these universities at just 230 postdoctorates in science, engineering, and health with the next lowest of this peer set being Rutgers at 355, and the largest being U.C. Berkeley with 1146. Table 2.4. Top THE global land grant universities ranked by total number of Ph.D. students in science, broadly defined.
Land Grant Univ.
THE Global Rank
Ph.D. Students in
Science
U. California, Berkeley 13 3,063
U. Wisconsin-Madison 51 2,695
U. California, Davis 55 2,509
U. Illinois, Urbana-Champaign 48 2,476
Cornell U. 19 2,412
Texas A&M U. 178 2,405
U. Minnesota 79 2,346

18
Pennsylvania State U. 78 2,229
U. Florida 175 2,115
U. Maryland, College Park 91 2,033
Ohio State U. 70 1,999
Rutgers, State U. New Jersey 168 1,826
Purdue U. 88 1,816
Michigan State U. 84 1,787
North Carolina State U. 301-350 1,541
U. Arizona 104 1,465
Virginia Tech 201-250 1,271
Figure 2.2. THE Global ranking versus number of Ph.D. students in science.
Table 2.5. Top THE global land grant universities ranked by total number of Ph.D. students in engineering.
Land Grant Univ.
THE Global Rank
Ph.D. Students in Engineering
Purdue U. 88 1,913
Texas A&M U. 178 1,579
U. Illinois, Urbana-Champaign 48 1,310
North Carolina State U. 301-350 1,222
Virginia Tech 201-250 1,156
U. California, Berkeley 13 1,066
Ohio State U. 70 1,016
Pennsylvania State U. 78 984
U. Maryland, College Park 91 881
U. Wisconsin-Madison 51 853
U. Minnesota 79 852

19
Cornell U. 19 759
U. Florida 175 750
U. California, Davis 55 556
Michigan State U. 84 426
Rutgers, State U. New Jersey 168 419
U. Arizona 104 311

20
Figure 2.3. THE Global ranking versus number of Ph.D. students in engineering.
U.S. News and World Report Rankings and Tenure/Tenure-track Faculty As one measure of perceived quality, the U.S. News and World Report provides rankings of various individual graduate programs. These rankings of individual graduate programs are purely subjective, in that department chairs at peer programs are asked to rate each program on a scale of 1-5 and programs are then ranked on their average ratings. The rankings do have significance as they represent the quality as perceived by peers who engage in such activities as recommending graduate programs to undergraduate students who are considering graduate school, recommending programs to graduate students considering postdoctoral study, and reviewing grant proposals and journal manuscripts from our faculty. For the following, we examine the rankings of programs at our aspirational peer universities and for which U.S. News and World Report has graduate program rankings available. In order to examine whether these rankings correlate with the number of tenured and tenure track (T/TT) faculty members of each program, the number of faculty members was determined for each of the programs considered below by manually counting the number of faculty listed on each program's webpage that have titles that correspond to being a T/TT faculty member, during the Fall 2019 semester. U.S. News and World Report does not rank every program type annually, so the rankings listed below use data ranging from 2017 to 2019. The following tables also include the program T/TT faculty members as a percentage of the total T/TT faculty members at that university. This is done to account for the differences in total faculty size. The total numbers of T/TT faculty members at each university are from the Fall 2017 Integrated Postsecondary Education Data System (IPEDS) data. Chemistry is the largest doctoral program in the College of Science by enrollment. Figure 2.4 shows the relationship between U.S. News and World Report Rankings and the number of T/TT Chemistry faculty for the top global land grants, and Table 2.6 shows the corresponding data. While there is significant variance in the data, there is a clear correlation between chemistry T/TT faculty size and world ranking. VT is tied for second smallest in number of T/TT faculty members and fourth lowest when normalized for total faculty size. Even so, VT’s ranking is significantly lower than would be expected based on our Chemistry faculty size and the linear model.

21
Figure 2.4. Chemistry ranking versus number of tenured and tenure track faculty members.
Table 2.6. Chemistry graduate program ranking by U.S. News and World Report and number of tenured and tenure track faculty members, ordered by percentage of university total of T/TT faculty within that department.
Land Grant University % of Total Faculty
T/TT Faculty Chemistry Ranking
U. California, Berkeley 3.53 48 2
U. of Wisconsin 3.12 60 9
U. of Arizona 3.06 46 41
Purdue Univ. 2.90 49 24
Texas A&M 2.88 58 24
Pennsylvania St. Univ. 2.83 50 20
U. of Maryland 2.70 38 41
U. of California, Davis 2.65 40 32
Rutgers U. 2.40 43 67
Michigan St. Univ. 2.30 43 48
U. of Illinois 2.27 40 6
Cornell U. 2.15 30 9
Ohio St. Univ. 2.04 50 30
Virginia Tech 2.02 30 67
U. of Minnesota 1.98 43 24
North Carolina State U. 1.96 27 52
U. of Florida 1.67 41 41
Figure 2.5 and Table 2.7 below show the corresponding data for physics graduate programs. Ranking again correlates strongly with size. VT has the second smallest number of T/TT faculty members and the smallest when normalized to total faculty size. Once again, VT ranking for our faculty size falls far below the model line. For comparison, equivalent data are shown for Mechanical Engineering in Figure 2.6 and Table 2.8 and Electrical and Computer Engineering in Figure 2.7 and Table 2.9. These programs also show strong correlation of ranking with T/TT faculty size, and in this case the VT ranking for its faculty size falls close to the model line. However, Mechanical Engineering at VT is tied for the second largest in number of faculty

22
members and sole second for percentage of university faculty. Electrical Engineering at VT is third largest in faculty size and percentage. For the number of Electrical Engineering faculty, it should be noted that nearly all of the schools compared here have a Department of Electrical and Computer Engineering. It is the total number of T/TT faculty in these departments that is reported here.

23
Figure 2.5. Physics ranking versus number of T/TT faculty members.
Table 2.7. Physics graduate program ranking by U.S. News and World Report and number of tenured and tenure track faculty members, ordered by percentage of university total of T/TT faculty within that department.
Land Grant University Physics Ranking
T/TT Faculty % of Total Faculty
U. of Maryland 14 72 5.15
Michigan St. Univ. 28 87 4.94
U. of Minnesota 25 64 4.24
Texas A&M 47 67 3.73
U. of Illinois 9 64 3.63
U. California, Berkeley 3 64 3.33
Pennsylvania St. Univ. 25 49 3.31
Cornell U. 7 44 3.23
U. of Wisconsin 17 45 3.19
U. of Florida 37 47 3.13
U. of California, Davis 28 50 2.96
Purdue Univ. 37 55 2.94
Rutgers U. 28 69 2.81
Ohio St. Univ. 23 60 2.45
U. of Arizona 37 31 2.25
North Carolina State U. 52 41 1.89
Virginia Tech 61 35 1.74

24
Figure 2.6. Mechanical Engineering ranking versus number of T/TT faculty members.
Table 2.8. Mechanical Engineering graduate program ranking by U.S. News and World Report and number of tenured and tenure track faculty members, ordered by percentage of university total of T/TT faculty within that department.
Land Grant University Mechanical Engineering Ranking
T/TT Faculty % of Total Faculty
Purdue Univ. 8 82 4.85
Virginia Tech 23 62 4.18
North Carolina State U. 37 48 3.49
U. of Illinois 7 59 3.35
U. of Maryland 24 47 3.33
Texas A&M 17 62 3.08
U. California, Berkeley 3 41 3.01
Pennsylvania St. Univ. 14 51 2.89
Cornell U. 8 38 2.72
Michigan St. Univ. 47 45 2.41
Ohio St. Univ. 29 54 2.20
U. of Florida 29 50 2.04
U. of California, Davis 37 30 1.99
Rutgers U. 47 34 1.90
U. of Minnesota 24 41 1.89
U. of Arizona 52 28 1.86
U. of Wisconsin 17 34 1.77

25
Figure 2.7. Electrical Engineering ranking versus number of T/TT faculty members.
Table 2.9. Electrical Engineering graduate program ranking by U.S. News and World Report and number of tenured and tenure track faculty members, ordered by percentage of university total of T/TT faculty within that department.
Land Grant University
Electrical Engineering
Ranking
T/TT Faculty % of Total Faculty
Purdue Univ. 12 104 6.16
U. of Illinois 4 99 5.62
Virginia Tech 19 79 5.33
North Carolina State U. 35 63 4.58
U. California, Berkeley 2 61 4.48
U. of Maryland 16 61 4.33
Texas A&M 23 73 3.62
Michigan St. Univ. 45 63 3.37
Cornell U. 9 41 2.93
Pennsylvania St. Univ. 31 46 2.61
Ohio St. Univ. 30 59 2.40
U. of Wisconsin 16 46 2.39
U. of California, Davis 35 36 2.39
U. of Florida 31 58 2.37
U. of Minnesota 23 47 2.16
U. of Arizona 38 32 2.13
Rutgers U. 38 32 1.78
Data for Biological Sciences, Psychology, Computer Science, Sociology, and Computer Engineering are shown in Appendices 2A. In each case, the graduate program ranking correlates well with faculty size. VT is

26
second smallest in Biological Sciences faculty, tied for third smallest in Psychology faculty, near the middle in Computer Science faculty, tied for third largest in Sociology faculty, and third largest in Computer Engineering faculty. The number of Computer Engineering faculty is taken as the number of faculty in Departments of Electrical and Computer Engineering. For Biological Sciences, many universities separate out their program into multiple departments. The departments/programs included in counting the number of T/TT faculty are listed in Appendices 2A. For Sociology, it should also be noted that many universities also have separate departments/programs (criminology, women's and gender studies, Africana studies, and American Indian studies) that are all incorporated into Sociology at VT, and that the apparent large size of Sociology at VT relative to the comparison universities is likely an artifact of this. In summary, VT has a relatively small number of Ph.D. students compared to other top land grant universities. This is especially true in the sciences broadly defined (agricultural science, natural resources and conservation, biological and biomedical science, computer and information science, geoscience, mathematics and statistics, physical science, psychology, social science, and multidisciplinary science), where VT has the smallest number by a large margin. In contrast, the number of Ph.D. students in engineering at VT is quite healthy. The number of Ph.D. students at each university and, especially the number of Ph.D. students in science, correlates strongly with the THE global rankings. Similarly, VT has quite small numbers of T/TT faculty in the sciences relative to other top land grant universities while it has relatively large numbers of T/TT faculty in departments such as Mechanical Engineering and Electrical and Computing Engineering. The U.S. News and World Report graduate program rankings in each of these areas correlate well with the number of T/TT faculty in each discipline.

27
Appendix 2A. U.S. News and World Report Graduate Program Rankings and T/TT Data for Additional Programs
Figure 2A1. Biological Sciences ranking versus number of tenured and tenure track faculty members. Table 2A1. Biological Sciences graduate program ranking by U.S. News and World Report and number of tenured and tenure track faculty members, ordered by percentage of university total of T/TT faculty within that department.
Land Grant University Biological Sciences Ranking
T/TT Faculty % of Total Faculty
Cornell U. 10 110 7.87
U. California, Berkeley 1 95 6.98
Michigan St. Univ. 46 117 6.26
U. of California, Davis 18 89 5.90
Pennsylvania St. Univ. 46 100 5.67
U. of Minnesota 39 123 5.67
U. of Maryland 62 65 4.61
U. of Arizona 46 66 4.39
Purdue Univ. 62 63 3.73
Ohio St. Univ. 39 86 3.50
North Carolina State U. 85 46 3.35
Virginia Tech 73 48 3.24
U. of Florida 73 79 3.22
Rutgers U. 73 56 3.12
U. of Illinois 27 53 3.01
U. of Wisconsin 18 57 2.96
Texas A&M 62 53 2.63
Most of the comparison universities do not have a single biological sciences department, but break it up into multiple programs instead. The programs considered in each Biological Sciences total are listed below. U. California, Berkeley

28
Department of Integrative Biology Department of Molecular and Cell Biology - Division of Cell and Developmental Biology - Division of Genetics, Genomics and Development - Division of Immunology and Pathogenesis Cornell U. Department of Ecology & Evolutionary Biology Department of Molecular Biology & Genetics Department of Computational Biology Department of Microbiology School of Integrative Plant Science Plant Biology Section U. of Illinois Department of Evolution, Ecology, and Behavior in the School of Integrative Biology Department of Microbiology Department of Cell and Developmental Biology Department of Molecular and Integrative Physiology U. of Wisconsin Department of Integrative Biology Department of Cell and Regenerative Biology Department of Genetics U. of California, Davis Department of Evolution and Ecology Department of Microbiology and Molecular Genetics Department of Molecular and Cellular Biology Department of Plant Biology Ohio St. U. Department of Evolution, Ecology, and Organismal Biology Department of Microbiology Department of Molecular Genetics Pennsylvania St. U. Department of Biology Department of Microbiology and Immunology Department of Cellular and Molecular Physiology U. of Minnesota Department of Ecology, Evolution and Behavior Department of Genetics, Cell Biology and Development Department of Plant and Microbial Biology Michigan St. U. Department of Integrative Biology Department of Biochemistry and Molecular Biology* Department of Microbiology and Molecular Genetics Purdue U. Department of Biological Sciences

29
U. of Maryland Department of Biology Department of Cell Biology & Molecular Genetics U. of Arizona Department of Ecology and Evolutionary Biology Department of Molecular and Cellular Biology School of Animal and Comparative Biomedical Sciences (Microbiology) Rutgers U. Department of Ecology, Evolution, and Natural Resources Department of Biology Department of Biochemistry and Microbiology* U. of Florida Department of Biology Department of Microbiology & Cell Science Texas A&M Department of Biology Department of Microbiology, Virology, and Immunology Virginia Tech Department of Biological Sciences North Carolina State U. Department of Biological Sciences *Only half of the number of faculty were counted in Departments of Biochemistry and Microbiology as Biochemistry is a separate department at Virginia Tech but microbiology is included within Biological Sciences.

30
Figure 2A2. Psychology ranking versus number of tenured and tenure track faculty members. Table 2A2. Psychology graduate program ranking by U.S. News and World Report and number of tenured and tenure track faculty members, ordered by percentage of university total of T/TT faculty within that department.
Land Grant University Psychology Ranking T/TT Faculty % of Total Faculty
Michigan St. Univ. 45 69 3.69
U. of California, Davis 26 47 3.12
U. of Illinois 7 54 3.06
Pennsylvania St. Univ. 26 52 2.95
Purdue Univ. 39 46 2.72
U. California, Berkeley 1 37 2.72
U. of Arizona 45 37 2.46
U. of Maryland 39 32 2.27
Rutgers U. 53 40 2.23
North Carolina State U. 112 30 2.18
Virginia Tech 81 31 2.09
Ohio St. Univ. 24 51 2.08
U. of Minnesota 8 44 2.03
Texas A&M 66 40 1.99
U. of Wisconsin 13 33 1.72
Cornell U. 24 21 1.50
U. of Florida 39 31 1.26

31
Figure 2A3. Computer Science ranking versus number of tenured and tenure track faculty members. Table 2A3. Computer Science graduate program ranking by U.S. News and World Report and number of tenured and tenure track faculty members, ordered by percentage of university total of T/TT faculty within that department.
Land Grant University Computer Science Ranking
T/TT Faculty % of Total Faculty
Michigan St. Univ. 45 69 3.69
U. of California, Davis 26 47 3.12
U. of Illinois 7 54 3.06
Pennsylvania St. Univ. 26 52 2.95
Purdue Univ. 39 46 2.72
U. California, Berkeley 1 37 2.72
U. of Arizona 45 37 2.46
U. of Maryland 39 32 2.27
Rutgers U. 53 40 2.23
North Carolina State U. 112 30 2.18
Virginia Tech 81 31 2.09
Ohio St. Univ. 24 51 2.08
U. of Minnesota 8 44 2.03
Texas A&M 66 40 1.99
U. of Wisconsin 13 33 1.72
Cornell U. 24 21 1.50
U. of Florida 39 31 1.26

32
Figure 2A4. Sociology ranking versus number of tenured and tenure track faculty members. Table 2A4. Sociology graduate program ranking by U.S. News and World Report and number of tenured and tenure track faculty members, ordered by percentage of university total of T/TT faculty within that department.
Land Grant University Sociology Ranking T/TT Faculty % of Total Faculty
Pennsylvania St. Univ. 17 41 2.32
Virginia Tech 47 31* 2.09
North Carolina State U. 47 28 2.04
U. California, Berkeley 1 27 1.98
U. of Maryland 24 26 1.84
Rutgers U. 28 30 1.67
U. of Wisconsin 6 31 1.61
Ohio St. Univ. 17 37 1.51
Purdue Univ. 57 25 1.48
U. of California, Davis 30 22 1.46
U. of Minnesota 17 30 1.38
Michigan St. Univ. 42 25 1.34
Texas A&M 47 24 1.19
U. of Arizona 24 17 1.13
Cornell U. 17 14 1.00
U. of Florida 57 21 0.86
U. of Illinois 47 10 0.57
*The number of T/TT faculty in the Department of Sociology at VT likely appears large compared to peer programs because it includes programs such as criminology, women's and gender studies, Africana studies, and American Indian studies while most of the peer universities have separate departments for these programs.

33
Figure 2A5. Computer Engineering ranking versus number of tenured and tenure track faculty members. Table 5. Computer Engineering graduate program ranking by U.S. News and World Report and number of tenured and tenure track faculty members, ordered by percentage of university total of T/TT faculty within that department.
Land Grant University Computer Engineering Ranking
T/TT Faculty % of Total Faculty
Purdue Univ. 12 104 6.16
U. of Illinois 3 99 5.62
Virginia Tech 18 79 5.33
North Carolina State U. 28 63 4.58
U. of Maryland 16 61 4.33
Texas A&M 27 73 3.62
Cornell U. 9 41 2.93
Ohio St. Univ. 21 59 2.40
U. of Wisconsin 12 46 2.39
U. of California, Davis 34 36 2.39
U. of Florida 28 58 2.37
U. of Minnesota 21 47 2.16
U. of Arizona 45 32 2.13
Pennsylvania St. Univ. 21 36 2.04
Rutgers U. 34 32 1.78
It should be noted that nearly every comparison university has a Department of Electrical and Computer Engineering. Berkeley is an exception, having a Department of Electrical Engineering and Computer Science, and is thus not included in these data. Surprisingly, Michigan State is not included in the U.S. News and World Report rankings of Computer Engineering, so it is also omitted here. For all of the others, the same number of faculty is used for both the Electrical Engineering data and the Computer Engineering data, since most do not make any effort to identify faculty specifically with one or the other graduate program.

34
Section 3. Graduate Teaching and Research Assistantship Stipends
For prospective graduate students, the competitiveness of the financial aid package provided by offering institutions can be the deciding factor in selecting which institution to attend. In Academic Year 2016-2017, research assistantships (both institutionally and externally funded) and teaching assistantships were the primary funding mechanisms for nearly 72% of full-time doctoral students and approximately 28% of full-time master’s students at global land grant peer institutions. At Virginia Tech, those percentages were higher that same year, with nearly 89% of full-time doctoral students and 58% of full-time master’s students being primarily supported through assistantships. Given the significant role assistantships play in recruiting graduate students and in reducing graduate student debt, the GETF examined Virginia Tech’s use of graduate assistantships as a funding mechanism compared to our peers and the competitiveness of the university’s assistantship stipend rates. The following sources of information were used in this study:
1) The Graduate Students and Post-doctorates in Science and Engineering Survey, sponsored by the
National Science Foundation and the National Institutes of Health, provides information on sources of
funding and funding mechanisms supporting graduate students in all U.S. academic institutions
granting research-based graduate degrees in science, engineering, and selected health fields
(https://www.nsf.gov/statistics/srvygradpostdoc/);
2) The websites of select peer universities to compare graduate assistantship stipend ranges at an
institutional level;
3) The Oklahoma State University Survey of Graduate Assistant Stipends to benchmark Virginia Tech’s
graduate stipends at a discipline level; and,
4) A survey of departments in the College of Science to obtain additional discipline-level peer
comparisons of graduate assistantship stipend rates.
In addition to these sources of information, the GETF created a survey instrument that was sent directly to select departments at peer institutions to get information about graduate admissions and assistantship stipends. The response rate to questions involving graduate stipends was very low and did not yield useful information for this study.
Graduate Stipends as a Funding Mechanism at Selected Peer Institutions
Data related to funding mechanisms for graduate students comes from the Graduate Students and Post-doctorates in Science and Engineering Survey, and only reflects graduate enrollments in science, engineering, and selected health fields (See Appendix E for a full listing of included disciplines). The peer group chosen for comparison includes the other top 15 United States public land-grant universities in the 2020 Times Higher Education (THE) World University Rankings. North Carolina State University is also added to this peer list because of its similarities to Virginia Tech as a strong land-grant institution in a contiguous state. Appendix A provides detailed data from the survey for each of the selected institutions.
Primary Funding Mechanisms for Doctoral Students in Science, Engineering, and Health In NSF data for Academic Year 2016-17, teaching and research assistantships were the largest funding instruments for full-time doctoral students in science, engineering, and health at peer institutions, being the primary funding mechanism for 71.8% of this student population. Table 3.1 provides a breakdown of funding mechanisms by type and institution. It should be noted that the total number of doctoral students in the
reflected fields at Virginia Tech (2,148) is lower than that of all but two of the selected peer universities.

35
A higher proportion of full-time doctoral students was funded through teaching and research assistantships at VT (88.7%) than on average across our peers. The majority of the difference is accounted for by greater use of fellowships to support full-time doctoral students at peer institutions. Fellowships were the primary funding mechanism for 14.2% of full-time doctoral students at our peers, compared to only 2.4% at VT. As shown in Appendix A, institutionally-funded fellowships were the primary funding mechanism for 9.4% of doctoral students at our peers, compared to 4.8% supported primarily through externally-funded fellowships. Recommendations for how to increase the externally- and institutionally-funded graduate fellowships at Virginia Tech are described elsewhere in the GETF report (Sections 4-6).
Fewer full-time doctoral students at Virginia Tech (6.2%) were primarily funded through self-support than at peer institutions on average (8.9%). However, this peer average is skewed towards a higher percentage because of institutions like the University of Arizona and the University of Florida, where more than 20% of their full-time doctoral students were primarily self-supported.
Although it’s a very small percentage overall, many of our peers have training grants (i.e., traineeships) as a primary funding mechanism for some students. The University of Wisconsin leverages this funding instrument the most, with 6.9% of its full-time doctoral students being primarily supported through such grants. An example of this type of funding opportunity is the National Science Foundation Research Traineeship (NRT) program, “designed to encourage the development and implementation of bold, new, and potentially transformative models for science, technology, engineering and mathematics (STEM) graduate education training.” It’s worth noting that, despite the fact that VT has no traineeships reported as a primary funding mechanism in the Academic Year 2016-17 survey, NRT programs currently exist at VT. Therefore, either graduate funding from this program is not of the magnitude to be considered a primary funding mechanism for any of the university’s doctoral students, or VT reports this funding mechanism differently than do other selected peers.
Furthermore, a 2016 article in the Research Policy journal
(https://www.sciencedirect.com/science/article/pii/S004873331630035X) indicates that while an increase in focus on fellowships and traineeships for graduate students can increase enrollments, it may in their view lead to an undesirable tradeoff in the research-related outcomes. According to the paper’s abstract:
A National Institutes of Health (NIH) taskforce recently recommended decreasing the number of graduate students supported on research assistantships, and instead favoring traineeship and fellowship
Table 3.1. Full-time Doctoral Students by Count and Primary Funding Mechanism at Selected Institutions in AY2016-17.
Institution Count Research Teaching All
Michigan State University 2,211 51.0% 32.9% 83.9% 8.8% 1.6% 5.2% 0.6%
North Carolina State University 2,599 56.9% 27.2% 84.1% 9.4% 6.0% 0.4%
Ohio State University, The 3,170 39.8% 30.5% 70.3% 15.6% 2.1% 4.2% 7.9%
Pennsylvania State University, The 3,067 51.2% 28.2% 79.4% 8.7% 0.8% 10.9% 0.3%
Purdue University 3,185 57.7% 27.6% 85.3% 8.6% 0.6% 4.7% 0.7%
Rutgers, The State University of New Jersey 1,725 26.1% 38.7% 64.8% 15.0% 1.0% 15.4% 3.8%
Texas A&M University 3,655 43.6% 33.0% 76.6% 7.2% 0.5% 12.1% 3.6%
University of Arizona, The 1,654 26.5% 26.8% 53.4% 3.0% 3.0% 24.1% 16.6%
University of California, Berkeley 4,154 33.7% 26.5% 60.2% 33.2% 1.7% 4.8% 0.1%
University of California, Davis 3,063 29.8% 36.3% 66.1% 25.6% 5.8% 2.5%
University of Florida 3,118 39.3% 22.6% 61.9% 15.0% 0.4% 20.8% 1.9%
University of Illinois at Urbana-Champaign 3,809 42.5% 27.5% 70.0% 14.8% 0.1% 4.3% 10.9%
University of Maryland, College Park 2,854 39.0% 36.2% 75.2% 9.5% 0.9% 12.5% 1.9%
University of Minnesota 3,226 44.7% 29.6% 74.3% 15.3% 3.8% 5.3% 1.3%
University of Wisconsin-Madison 3,723 45.6% 23.8% 69.4% 10.9% 6.9% 8.5% 4.3%
Peer Average 3,014 42.4% 29.4% 71.8% 14.2% 1.6% 8.9% 3.5%
Virginia Polytechnic Institute and State University 2,148 53.4% 35.4% 88.7% 2.4% 6.2% 2.7%
Source: National Science Foundation, Survey of Graduate Students and Postdoctorates in Science and Engineering,
Academic Year 2017
Assistantships
Funding Mechanisms
Trainee-
ship
Self-
Support Other
Fellow-
ship

36
funding mechanisms. Using instrumental variables estimation with survey data collected from U.S. PhD-granting biomedical sciences departments and their newly-minted PhDs, we find that increases in these programs’ NIH-funded traineeships and fellowships do significantly increase programs’ total graduate enrollments, particularly of female students. However, PhDs who were funded primarily as research assistants are significantly more likely to take research-focused jobs in the U.S. scientific workforce after they graduate, as compared to PhDs who were primarily supported as trainees or fellows. The suggested policy changes thus may have unintended, negative consequences for scientific workforce participation.
This article points to the need for universities to remain cognizant of how research and non-research related academic experiences impact a student’s employment opportunities after graduation. The use of fellowships and traineeships as a funding mechanism to enhance graduate student support and increase enrollments should be balanced against ensuring that students’ experiences align with their employment expectations. As such, the Task Force recommends that the university examine opportunities for increasing each of these categories of funding as an approach for increasing total graduate student enrollment.
Primary Funding Mechanisms for Master’s Students in Science, Engineering, and Health
In Academic Year 2016-17, self-support was the primary funding mechanism for 59.2% of full-time master’s students at peer institutions, compared to 36.6% at VT (Table 3.2). Of the selected peers, only Michigan State had a smaller percentage of full-time master’s students than VT in this category. Table 3A4 in Appendix A shows that this peer difference in self-supporting master’s students exists across many disciplines at VT, where more institutional and extramural funds are being used to support this population of students. Teaching and research assistantships were the largest primary funding mechanism for 57.5% of full-time master’s students at VT, compared to 28.1% at our peers.
Institutionally funded teaching assistantships represented the next largest primary funding mechanism (after self-support, Table 3A2, Appendix A) for full-time master’s students at 25.2% of this population. Compared to our peers (13.2%, Table 3A2, Appendix A), VT is using a significantly higher percentage of its master’s students in the reported disciplines for teaching undergraduates. (It should be noted that several VT programs admit all graduate students at the master's level prior to progressing to doctoral status.) Finally, similar to the data on doctoral students, fellowships were also the primary funding mechanism for a higher percentage of full-time master’s students at our peers at 5.5%, compared to only 2.1% at VT.
Table 3.2. Full-time Master’s Students by Count and Primary Funding Mechanism at Selected Instititions.
Institution Count Research Teaching All
Michigan State University 626 29.4% 16.6% 46.0% 11.0% 3.8% 35.8% 3.4%
North Carolina State University 2,342 13.7% 7.3% 21.0% 2.7% 75.9% 0.3%
Ohio State University, The 1,289 17.4% 12.2% 29.6% 7.2% 4.4% 54.0% 4.8%
Pennsylvania State University, The 977 21.0% 9.8% 30.8% 1.0% 0.1% 67.5% 0.6%
Purdue University 1,379 29.1% 16.1% 45.2% 3.4% 48.4% 3.0%
Rutgers, The State University of New Jersey 785 5.7% 10.8% 16.6% 3.7% 0.1% 77.3% 2.3%
Texas A&M University 2,872 17.6% 12.1% 29.7% 2.7% 0.1% 58.7% 8.7%
University of Arizona, The 1,045 6.5% 7.4% 13.9% 0.3% 1.2% 61.0% 23.6%
University of California, Berkeley 1,635 7.0% 19.2% 26.2% 30.8% 41.5% 1.5%
University of California, Davis 1,016 11.8% 20.4% 32.2% 10.0% 40.4% 17.4%
University of Florida 2,474 9.6% 4.2% 13.8% 0.8% 70.4% 15.0%
University of Illinois at Urbana-Champaign 2,817 15.4% 15.9% 31.3% 4.9% 55.8% 8.0%
University of Maryland, College Park 1,698 9.5% 21.8% 31.3% 4.5% 0.1% 62.4% 1.8%
University of Minnesota 1,939 17.1% 11.6% 28.6% 2.0% 0.2% 65.1% 4.1%
University of Wisconsin-Madison 1,390 18.3% 20.1% 38.5% 4.8% 0.2% 50.9% 5.5%
Peer Average 1,619 14.8% 13.2% 28.1% 5.5% 0.4% 59.2% 6.7%
Virginia Polytechnic Institute and State University 1,212 32.3% 25.2% 57.5% 2.1% 36.6% 3.9%
Source: National Science Foundation, Survey of Graduate Students and Postdoctorates in Science and Engineering,
Academic Year 2017
Assistantships
Funding Mechanisms
Trainee-
ship
Self-
Support Other
Fellow-
ship

37
Graduate Teaching Assistants (GTAs) Given the greater emphasis VT appears to place on graduate teaching assistantships as a funding
mechanism in science, engineering, and selected health fields, it would be important to compare the number of GTAs at VT with the public land grant peer group. Since GTAs primarily support undergraduate instruction, it is appropriate to normalize the number of GTAs to the number of full-time undergraduates at each institution. IPEDS has a database that includes numbers of GTAs2, Graduate Research Assistants (GRAs)3, and Other Graduate Assistants4 reported by each university for the 2017-2018 academic year, as well as numbers of undergraduate students. The category Other Graduate Assistants likely refers primarily to the category referred to at VT as Graduate Assistants (GAs), who are institutionally-supported but carry out primarily non-instructional work. About half of the universities reported negligible numbers in the Other Graduate Student category, so it is likely that they incorporated their versions of GAs into their reported GTA number. For this reason, and because Other Graduate Assistants are almost certainly all institutionally-funded, we compare the numbers of full-time undergraduate students per combined number of GTAs and Other Graduate Assistants. These data are shown in Table 3.3.
The data show that VT is near the median compared to these peer global land grant universities with
regard to the number of GTAs plus GAs per given number of undergraduates. If anything, VT has a slightly lower proportion of (GTAs + GAs) to undergraduates than our aspirational peers as clearly indicated by comparison to the median (the mean is skewed a bit by the very high proportion of undergraduates to (GTAs + GAs) at Rutgers). Thus, VT appears to have a commensurate number of institutionally-funded graduate assistants but, as seen in Table 3A1 in the Appendix, appears to have a far smaller number of students on institutionally-funded fellowships (and, to a lesser degree, a higher percentage of institutionally-funded GRAs), which therefore makes the total number of institutionally-supported students lower than those of the peers.
2 Graduate assistants who primarily “assist faculty or other instructional staff in postsecondary institutions by performing instructional support activities, such as developing teaching materials, leading discussion groups, preparing and giving examinations, and grading examinations or papers” (IPEDS).
3 Graduate assistants who primarily perform non-teaching duties and “whose specific assignments customarily are made for the purpose of conducting research” (IPEDS).
4 All other graduate assistants who primarily perform non-teaching and non-research duties.
Table 3.3. Numbers of full-time undergraduate students and GTAs plus GAs at top public land grant universities from IPEDS 2017-2018 academic year data. University FT Undergraduates GTAs + GAs UG/(GTAs+GAs)
University of California-Berkeley 29,351 3,185 9.2
University of Minnesota-Twin Cities 29,991 3,244 9.2
University of Maryland-College Park 27,708 2,929 9.5
University of Illinois at Urbana-Champaign 32,613 3,044 10.7
University of California-Davis 29,284 2,620 11.2
University of Wisconsin-Madison 28,977 2,337 12.4
Purdue University-Main Campus 30,277 2,098 14.4
Pennsylvania State University-Main Campus 39,785 2,746 14.5
North Carolina State University at Raleigh 21,384 1,451 14.7
University of Arizona 29,325 1,866 15.7
Ohio State University-Main Campus 42,003 2,326 18.1
University of Florida 31,384 1,696 18.5
Texas A & M University-College Station 46,724 2,269 20.6
Michigan State University 35,404 1,340 26.4
Rutgers University-New Brunswick 33,677 906 37.2
Peer Median 30,277 2,326 14.5
Virginia Polytechnic Institute and State University 26,603 1,780 14.9
Source: Integrated Postsecondary Education Data System (IPEDS), Academic Year 2017-18

38
VT also has a lower number of externally supported graduate students. For example, considering the
externally-funded GRAs and fellowships for the averages of the peer institutions in Tables 3A1 and 3A2, the peer average is 808 external GRAs and 145 external fellowships for doctoral students and 128 external GRAs and 23 external fellowships for Master's students for a total of 1,104 externally-supported students in these categories. VT has 687 external GRAs and 30 external fellowships for doctoral students and 261 external GRAs and 12 external fellowship for master's students for a total of 990 externally supported students in these categories.
In summary, based on the above information, it is recommended that Virginia Tech: 1) evaluate the feasibility of increasing internally- and externally-funded fellowships, 2) investigate how peers are able to attract more full-time master’s students who are primarily self-supporting, and 3) consider whether traineeships should be more vigorously pursued as an appropriate graduate student funding mechanism. Specific recommendations related to these points can be found in Section 4.
Peer Comparison of Graduate Assistantship Stipend Ranges
There isn’t an available data source for comparing actual VT graduate assistantship stipend rates to those of the selected peers. While the Oklahoma State University’s Survey of Graduate Assistant Stipends provides discipline-level graduate stipend data across several institutions, the data are aggregated and individual institutions are not identified. In order to have the data filtered for specific, yet unidentified, institutions, there must be at least 10 institutions in the data set. Unfortunately, there are only two of the selected peers (Purdue University and North Carolina State University) among the 52 institutions submitting data for the survey. As a result, the next section of this report will review the Oklahoma State University’s Survey findings for all doctoral universities with the highest levels of research activity (or, Research 1 Institutions) in the data set. This section of the report will review graduate assistantship monthly stipend ranges at the previously selected peers, as reported on the peers’ websites, for comparison to VT’s monthly stipend rates.
Virginia Tech’s Monthly Stipend Ranges
In Academic Year 2019-20, university-approved stipend rates for full-time graduate assistants at VT ranged from $1,517 to $4,289 per month on a 50-step stipend scale (see Appendix D). The scale’s steps and step ranges are intended to give departments the flexibility to offer competitive salaries based on resource availability, the salary market, and graduate assistant qualifications. Stipends that are either lower than the approved minimum or higher than the approved maximum rate require approval by the Graduate School. The frequency of full-time equivalent stipends (i.e., based on 20 hours per week) for all teaching and research assistants at the university is shown on Figure 3.1, which shows that the rates paid to the largest grouping of graduate assistants (28.5%) were between $2,050 and $2,150 per month as of September 30, 2019.
Table 3.4 displays the differences in the assistantship counts and monthly stipend rates across VT senior management areas. Nearly 75% of VT graduate teaching assistants are employed by the Colleges of Engineering, Science, and Liberal Arts and Human Sciences. More than 67% of VT research assistants are in the Colleges of Engineering (55%) and of Agriculture and Life Sciences (12%). The College of Architecture and Urban Studies has the lowest average stipend rates for both teaching assistants and research assistants, at $1,822 and $1,959 per month respectively. The College of Business has the highest average stipend rate for teaching assistants at $2,385 per month and the College of Veterinary Medicine has the highest average stipend rate for research assistants at $2,479 per month. Overall, the average monthly stipend on September 30, 2019 was $2,092 for GTAs and $2,190 for GRAs.

39
Selected Peers Monthly Stipend Ranges Table 3.5 summarizes the Academic Year 2019-20
university-approved teaching assistantship stipend ranges reported on the websites of the selected peers, as detailed in Appendix 3B. Only 12 of the 15 selected peers are shown in this review. The three institutions excluded are Texas A&M University, the University of Arizona, and North Carolina State because their graduate assistantship stipend scales were not easily accessible through their websites. Stipend ranges collected from peer websites were all converted to monthly rates based on 50% full-time equivalent appointments (or, 20 h/week) and only reflect the rates for GTAs.
The minimum approved pay rates at the selected peers for Academic Year 2019-20 range from $1,705 per month (University of Minnesota, Twin Cities) to $2,857 per month (Rutgers University, New Brunswick). The median starting rate across all these institutions is $1,948 per month, which is significantly higher than the VT approved starting rate of $1,517 per month. It is also higher than the current pay for 483 of VT’s graduate assistants as shown in Figure 3.1, and the average pay rates for graduate assistants in the Colleges of Architecture and Urban Studies, and Natural Resources and Environment. Furthermore, the median of the minimum stipend values for GTAs at these peer universities is just $144 per month lower than the average VT GTA stipend, further indicating that VT stipends are significantly below those of these peers.
Many peer institutions didn’t report a maximum rate, making comparisons on the high end of the stipend scale difficult. Six of the 12 selected peers (i.e., Cal-Berkley, Penn State, U. of Minnesota, Purdue, Michigan State, and the U. of Florida) reported a maximum stipend rate, the highest being $3,778 per month at Purdue. The U. of California – Davis reported only one standard rate of $2,435 per month for teaching assistants. Only minimum rates were reported by the remaining institutions, with some indicating that there are other university stipend policies that may govern stipend amounts. Nevertheless, none of the institutions that reported a maximum stipend rate had a maximum rate as high as VT’s rate of $4,289 per month. Currently, 4.8% of VT’s graduate assistants (or, 150 students) earn more than the $3,116 per month peer median stipend cap. Therefore, the range
Table 3.5. 2019-20 Teaching Assistant Stipend Ranges
Institution Low High
Michigan State University 1,836$ 3,116$
Ohio State University 1,920 -
Pennsylvania State University 1,728 3,456
Purdue University 1,716 3,778
Rutgers University - New Brunswick 2,857 -
University of California - Berkeley 2,191 2,608
University of California - Davis 2,435 2,435
University of Florida 1,778 3,556
University of Illinois Urbana-Champaign 1,976 -
University of Maryland - College Park 1,978 -
University of Minnesota - Twin Cities 1,705 2,713
University of Wisconsin-Madison 2,222 -
Peer Median Starting Rate 1,948$ 3,116$
Virginia Tech 1,517$ 4,289$
Source: Institutions' web pages.
Monthly Stipend
Table 3.4. Graduate Teaching and Research Assistant Pay at Virginia Tech, by Senior Management Area
Count Minimum Maximum Average Count Minimum Maximum Average
Agriculture & Life Sciences 110 1,482$ 2,991$ 2,120$ 215 1,482$ 3,159$ 2,104$
Architecture & Urban Studies 124 1,689$ 2,082$ 1,822$ 20 1,857$ 2,197$ 1,959$
College of Business 55 1,517$ 4,055$ 2,385$ 4 1,517$ 3,511$ 2,126$
College of Engineering 489 1,517$ 3,230$ 2,098$ 945 1,517$ 4,289$ 2,183$
College of Science 448 1,517$ 3,333$ 2,038$ 131 1,778$ 2,484$ 2,082$
College of Veterinary Medicine 19 2,137$ 3,101$ 2,311$ 17 1,898$ 6,096$ 2,479$
Dean of Libraries 1 2,084$ 2,084$ 2,084$
Graduate School 48 2,029$ 2,805$ 2,322$ 116 1,889$ 2,600$ 2,299$
Liberal Arts and Human Sciences 225 1,689$ 3,471$ 2,217$ 21 1,626$ 2,377$ 2,178$
Natural Resources 40 1,778$ 2,969$ 1,919$ 62 593$ 4,289$ 2,079$
Vice President for Research 1 2,197$ 2,197$ 2,197$ 119 1,560$ 4,274$ 2,408$
Vice President-Info Technology 12 1,860$ 2,311$ 2,134$
Vice Pres-Outreach & Intrntl Affrs 5 2,000$ 2,000$ 2,000$
VP Health Sciences and Technology 70 1,517$ 2,369$ 2,326$
Grand Total 1,553 1,482$ 4,055$ 2,092$ 1,730 593$ 6,096$ 2,190$
Source: Banner Jobs_History table
Graduate Stipend Rates Converted to Full-Time GTA Appointments (20 hrs/wk), as of September 30, 2019
Monthly Pay Monthly Pay
Graduate Research AssistantsGraduate Teaching Assistants

40
of VT’s stipend scale provides the necessary flexibility for departments to offer salaries that can compete with the selected peers, provided the necessary resources are available.
However, it is worth noting that VT’s 50-step stipend scale has the highest number of steps by a wide margin than the stipend scales of the peer institutions reviewed in this report. The reason for the complexity of VT’s scale is unclear and it is recommended that it be re-examined.
Oklahoma State University’s Survey of Graduate Assistant Stipends - Academic Year 2018-19
The Survey of Graduate Assistant Stipends, administered annually by the Office of Institutional Research and Information Management at Oklahoma State, reports graduate stipends aggregated by academic discipline (i.e., CIP code), in addition to the amounts of tuition and fees waived for graduate assistants. For Academic Year 2018-19, 52 institutions participated in the survey, 36 of which had a Carnegie classification of doctoral university with the highest levels of research activity (“R1 Institution”) and only two of which are in the selected peer group – Purdue University and North Carolina State University. VT requested a special study that included only the 36 responding R1 institutions, listed on page 4 of Appendix C. VT stipend data for the 2018-19 academic year was compared at the CIP-code level to the aggregated results from the responding R1 institutions.
Graduate Teaching Assistants

41
The Academic Year 2018-19 data was examined separately for GTA and GRA appointments. Table 3.6 shows the GTA data at the highest level of academic disciplines (i.e., 2-digit CIP code level) for comparable disciplines at VT. VT had higher GTA stipends than the R1 peer average in half of the 22 comparable disciplines, with the greatest difference being in the rates paid to graduate students majoring in “Business, Management, Marketing and Related Support Services” fields. The average annual GTA stipend paid by VT in that discipline was $6,344 higher than the average at the 36 reporting R1 institutions. Across the 11 disciplines where VT’s GTA stipends were lower, “Mathematics and Statistics” had the greatest disparity with an annual average rate that was $2,273 lower than the reporting R1 institutions. Note that most instances where VT’s GTA stipends were lower than the reporting R1 institutions occurred in disciplines housed in two of the university’s nine degree-granting colleges – the College of Science and the College of Liberal Arts and Human Studies. More detailed data at the 4-digit CIP code level is provided in Appendix C.
Graduate Research Assistants
Table 3.7 shows GRA stipend data at the 2-digit CIP Code level. VT’s average annual GRA stipend was higher than those of reporting R1 institutions in only 5 of 17 disciplines, with the greatest difference being in the rates paid to graduate students in “Family and Consumer Sciences/Human Sciences” fields. Across the remaining 12 disciplines where VT’s GTA stipends were lower, “Biological and Biomedical Sciences” had the
Table 3.6. Comparing Virginia Tech’s Graduate Teaching Assistant Stipends to R1 Institutions responding to the 2018-19 Oklahoma State University Survey.
VT
Average Average Stipend
CIP Code Descriptions Count Stipend Count Stipend Difference
01 Agriculture, Agriculture Operations, And
Related Sciences.
49 18,253 437 16,703 1,550
03 Natural Resources And Conservation. 32 18,108 209 17,189 919
04 Architecture And Related Services. 116 15,682 475 11,994 3,688
09 Communication, Journalism, And Related
Programs.
13 15,480 1,023 16,874 (1,394)
11 Computer And Information Sciences And
Support Services.
82 18,409 1,180 16,424 1,985
13 Education. 32 16,681 1,300 16,145 536
14 Engineering. 401 18,096 4,067 17,168 928
16 Foreign Languages, Literatures, And Linguistics. 4 15,280 1,070 16,972 (1,692)
19 Family And Consumer Sciences/Human
Sciences.
47 17,324 497 16,263 1,061
23 English Language And Literature/Letters. 63 16,852 1,998 17,369 (517)
26 Biological And Biomedical Sciences. 86 18,771 2,237 20,022 (1,251)
27 Mathematics And Statistics. 82 17,717 2,279 19,990 (2,273)
30 Multi/Interdisciplinary Studies. 17 15,623 174 17,865 (2,242)
38 Philosophy And Religious Studies. 11 15,184 473 16,959 (1,775)
40 Physical Sciences. 188 17,705 4,160 19,478 (1,773)
42 Psychology. 36 17,782 1,388 17,598 184
44 Public Administration And Social Service
Professions.
10 17,921 221 17,091 830
45 Social Sciences. 117 17,155 2,700 17,271 (116)
50 Visual And Performing Arts. 10 14,819 2,323 15,167 (348)
51 Health Professions And Related Programs. 15 18,912 1,099 15,587 3,325
52 Business, Management, Marketing, And
Related Support Services.
71 21,171 1,474 14,827 6,344
54 History. (a) 14 15,551 789 17,042 (1,491)
99 All Other Programs 3 18,819
Notes
(a) Peer data for History (54) imputed from the 4-digit CIP code. The Oklahoma St. Survey report excluded this 2-digit CIP code.
Virginia Tech Peer
Graduate Teaching Assistants

42
greatest disparity followed closely by the “Physical Sciences” disciplines. More detailed data at the 4-digit CIP code level is provided in Appendix C.
Additional Departmental Stipend Comparison Data Several departments in the College of Science have obtained data that compare the stipends they offer to
those of peer universities. These are shown in Appendix 3C. For chemistry, Georgia Tech ran a survey in 2015 of stipends, fees, and net stipends that included 60 chemistry graduate programs. The average stipend of VT's Department of Chemistry ranked 51st of these 60 programs. In Physics, the American Institute of Physics operates the website https://www.gradschoolshopper.com/, which provides self-reported data from U.S. graduate programs to allow potential graduate students to contrast and compare. In 2018, the Department of Physics compared the stipend data from 58 programs. As shown in Appendix 3C, the VT stipend is the third lowest among these 58 programs. The table also includes information on fees at each university.
Our Department of Statistics used the website http://www.phdstipends.com/ to compare their 9-month stipend to those of universities with which they often compete. Their 9-month stipend of $16,600 is well below those of the peers, which are roughly in the $20,000 range. In Psychology, the Council of Graduate Departments of Psychology carried out a survey of graduate student support in 2018, the results of which are summarized in Appendix 3C. The $17,176 9-month stipend of the VT Department of Psychology is very similar to the $17,088 9-month average of peer stipends.
Table 3.7. Comparing Virginia Tech’s Graduate Research Assistant Stipends to R1 Institutions responding to the 2018-19 Oklahoma State University Survey.
VT
Average Average Stipend
CIP Code Descriptions Count Stipend Count Stipend Difference
01 Agriculture, Agriculture Operations, And
Related Sciences.
108 18,619 2,414 18,971 (352)
03 Natural Resources And Conservation. 71 18,667 780 18,103 564
04 Architecture And Related Services. 16 17,738 251 12,982 4,756
09 Communication, Journalism, And Related
Programs.
259 18,062
11 Computer And Information Sciences And
Support Services.
106 19,421 1,140 20,686 (1,265)
13 Education. 9 18,030 1,395 17,110 920
14 Engineering. 934 19,188 8,693 19,814 (626)
16 Foreign Languages, Literatures, And Linguistics. 131 21,447
19 Family And Consumer Sciences/Human
Sciences.
15 22,864 478 16,577 6,287
23 English Language And Literature/Letters. 1 17,721 210 19,154 (1,433)
26 Biological And Biomedical Sciences. 218 19,499 3,163 21,412 (1,913)
27 Mathematics And Statistics. 23 18,849 461 20,610 (1,761)
30 Multi/Interdisciplinary Studies. 3 21,030 245 22,742 (1,712)
38 Philosophy And Religious Studies. 43 18,570
40 Physical Sciences. 90 18,662 3,193 20,570 (1,908)
42 Psychology. 12 19,095 846 18,065 1,030
44 Public Administration And Social Service
Professions.
2 17,911 414 18,111 (200)
45 Social Sciences. 20 18,944 752 19,172 (228)
50 Visual And Performing Arts. 303 15,896
51 Health Professions And Related Programs. 25 20,361 1,805 20,642 (281)
52 Business, Management, Marketing, And
Related Support Services.
4 18,288 947 19,373 (1,085)
54 History. (a) 100 18,644
99 All Other Programs 22 20,508
Notes
(a) Peer data for History (54) imputed from the 4-digit CIP code. The Oklahoma St. Survey report excluded this 2-digit CIP code.
Graduate Research Assistants
Virginia Tech Peer

43
For comparison, the Oklahoma State data on R1 institutions (Appendix 3C) shows that the VT GRA and GTA stipends in these disciplines are less than those of the averages of R1 institutions in each case except for Psychology. The amounts by which the VT stipends are lower are $2,054 (GRA) and $1,293 (GTA) for Chemistry, $2,781 (GRA) and $2,973 (GTA) for Physics, $1,837 (GRA) and $2,509 (GTA) for Statistics. For Psychology, the VT GTA stipend is $85 higher and the GRA stipend is $359 higher than the Oklahoma State R1 averages, all of which align well with the data obtained by the departments. It is not difficult to imagine that such large disparities could be decisive in the minds of college seniors weighing different graduate school acceptance letters.
Multi-year Graduate Assistantship Commitments Prospective graduate students are in the process of deciding where to spend a considerable number of years of their lives, often leaving and/or deferring permanent employment to pursue their graduate study. Graduate assistantships (GA/GTA/GRAs) are a common source of income for graduate students during their course of study, especially those in doctoral programs. Though the pursuit of a graduate degree will likely span multiple years, at VT graduate assistants are offered employment contracts of just one year at most (some departments offer contracts by academic term). This has been brought to the attention of the task force by students as a frustration and a missed opportunity. Benchmarking with other R1 universities reveals that one-year graduate assistantship contracts are not just common, they are the standard. However, several peer institutions make an effort to communicate their intention to employ the graduate student for multiple years through their offer letters to prospective students. For example:
o University of Minnesota –Twin Cities: Offer letter includes “This is an annual appointment for the 20XX-XX Academic Year. This assistantship is renewable for up to XX years, subject to satisfactory academic progress toward your degree, your satisfactory performance of assistantship duties, and availability of departmental funding in future years.”
o University of Wisconsin –Madison: The department of Biochemistry states in their offer letter “Your appointment is dependent upon your maintaining full-time graduate student status and satisfactory academic progress toward your degree. You should be assured that as long as you are making satisfactory progress in the Program, your funding will be guaranteed.”
o Univ. of Virginia: The university’s graduate assistantship policy states “If a graduate student fulfills the terms and conditions of the initial appointment to a graduate assistantship, the student may be considered for reappointment in successive years up to the limit prescribed by the school or department; however, students who serve as graduate assistants have no expectation of reappointment unless provided for in writing by the department or school.”
Virginia Tech’s Graduate School encourages faculty and departments to make multiple-year commitments in the recruitment process, yet the use of this strategy is sporadic. Concerns over potential performance issues and funding uncertainty may be contributing factors, and at least one faculty member shared with the task force that their department held the perception that the university discourages them from making multi-year commitments. Communicating the intention of the university and hiring department to support a graduate student for the duration of their degree pursuit, subject to reasonable limits and the achievement of performance and funding expectations, can make Virginia Tech a more competitive recruiter of graduate students, while recognizing an existing practice. Therefore, the task force recommends that the university develop standard phrasing for use by departments to properly convey the intention to employ graduate students for multiple year periods, subject to reasonable constraints (academic progress, job performance, funding availability, need for position). If encouraged and communicated by the Provost and embedded in offer letter templates and/or

44
graduate contracts, this language can extend confidence to prospective graduate students that their commitment to Virginia Tech will be reciprocated.
Summary of Recommendations
Increase the minimum assistantship stipend rate to match the minimum rates of Virginia Tech’s aspirational peers (i.e., the top 14 United States land-grant universities in the 2020 Times Higher Education (THE) World University Rankings).
Annually compare graduate stipend rates to our peers at the discipline level, and create incentives for colleges to increase stipend rates, as appropriate, to be competitive (this could be incorporated into the dashboard used to measure department/program performance).
Graduate school should develop standard phrasing for use by departments to properly convey their intention to employ graduate students for multiple year periods, subject to reasonable constraints (academic progress, job performance, funding availability, need for position).
Appendix 3A. Primary Funding Mechanisms for Doctoral and Master’s Degree Students at Select Institutions
The following is based on data from the NSF Graduate Students and Post-doctorates in Science and Engineering Survey. The survey is an annual census of all U.S. academic institutions granting research-based master’s degrees or doctorates in science, engineering, and selected health fields as of fall of the survey year. Sponsored by the National Science Foundation and the National Institutes of Health, it collects the total number of graduate students, postdoctoral appointees, and doctorate-level non-faculty researchers by demographic and other characteristic such as source of financial support. Results are used to assess shifts in graduate enrollment and postdoc appointments and trends in financial support.
With the exception of North Carolina State University, the institutions selected for peer comparison are among the top 15 U.S. land-grant universities in the 2020 Times Higher Education World University Rankings. North Carolina State University is included as a local land-grant peer.
Table 3A1. Full-time Doctoral Students by Count and Funding Mechanism at Selected Instititions.
Institution Count Extramural Institutional Extramural Institutional
Michigan State University 2,211 32.4% 18.5% 32.9% 3.5% 5.2% 1.6% 5.2% 0.6%
North Carolina State University 2,599 33.5% 23.4% 27.2% 4.3% 5.2% 6.0% 0.4%
Ohio State University, The 3,170 29.3% 10.5% 30.5% 4.4% 11.2% 2.1% 4.2% 7.9%
Pennsylvania State University, The 3,067 30.0% 21.2% 28.2% 4.1% 4.6% 0.8% 10.9% 0.3%
Purdue University 3,185 33.9% 23.8% 27.6% 4.2% 4.4% 0.6% 4.7% 0.7%
Rutgers, The State University of New Jersey 1,725 16.1% 10.0% 38.7% 7.9% 7.1% 1.0% 15.4% 3.8%
Texas A&M University 3,655 24.7% 18.9% 33.0% 3.0% 4.2% 0.5% 12.1% 3.6%
University of Arizona, The 1,654 18.8% 7.7% 26.8% 3.0% 3.0% 24.1% 16.6%
University of California, Berkeley 4,154 25.0% 8.7% 26.5% 9.1% 24.0% 1.7% 4.8% 0.1%
University of California, Davis 3,063 17.1% 12.7% 36.3% 6.7% 18.9% 5.8% 2.5%
University of Florida 3,118 19.0% 20.4% 22.6% 5.3% 9.7% 0.4% 20.8% 1.9%
University of Illinois at Urbana-Champaign 3,809 25.7% 16.7% 27.5% 0.8% 13.9% 0.1% 4.3% 10.9%
University of Maryland, College Park 2,854 25.1% 14.0% 36.2% 3.2% 6.3% 0.9% 12.5% 1.9%
University of Minnesota 3,226 27.5% 17.2% 29.6% 4.3% 10.9% 3.8% 5.3% 1.3%
University of Wisconsin-Madison 3,723 36.5% 9.1% 23.8% 6.9% 4.0% 6.9% 8.5% 4.3%
Peer Average 3,014 26.8% 15.6% 29.4% 4.8% 9.4% 1.6% 8.9% 3.5%
Virginia Polytechnic Institute and State University 2,148 32.0% 21.4% 35.4% 1.4% 0.9% 6.2% 2.7%
Source: National Science Foundation, Survey of Graduate Students and Postdoctorates in Science and Engineering, Academic Year 2017
Funding Mechanism
Research Assistantship Teaching
Assistantship Traineeship
Self-
Support Other
Fellowship

45
Table 3A2. Full-time Master’s Students by Count and Funding Mechanism at Selected Instititions.
Institution Count Extramural Institutional Extramural Institutional
Michigan State University 626 15.0% 14.4% 16.6% 4.0% 7.0% 3.8% 35.8% 3.4%
North Carolina State University 2,342 7.5% 6.1% 7.3% 0.6% 2.1% 75.9% 0.3%
Ohio State University, The 1,289 10.6% 6.8% 12.2% 2.7% 4.5% 4.4% 54.0% 4.8%
Pennsylvania State University, The 977 12.4% 8.6% 9.8% 0.3% 0.7% 0.1% 67.5% 0.6%
Purdue University 1,379 15.8% 13.3% 16.1% 1.7% 1.7% 48.4% 3.0%
Rutgers, The State University of New Jersey 785 3.6% 2.2% 10.8% 0.8% 2.9% 0.1% 77.3% 2.3%
Texas A&M University 2,872 10.7% 7.0% 12.1% 1.1% 1.6% 0.1% 58.7% 8.7%
University of Arizona, The 1,045 4.6% 1.9% 7.4% 0.3% 1.2% 61.0% 23.6%
University of California, Berkeley 1,635 2.3% 4.8% 19.2% 7.3% 23.5% 41.5% 1.5%
University of California, Davis 1,016 3.9% 7.9% 20.4% 0.9% 9.2% 40.4% 17.4%
University of Florida 2,474 4.8% 4.8% 4.2% 0.4% 0.5% 70.4% 15.0%
University of Illinois at Urbana-Champaign 2,817 7.3% 8.0% 15.9% 0.4% 4.5% 55.8% 8.0%
University of Maryland, College Park 1,698 3.8% 5.7% 21.8% 0.5% 4.0% 0.1% 62.4% 1.8%
University of Minnesota 1,939 6.9% 10.2% 11.6% 2.0% 0.2% 65.1% 4.1%
University of Wisconsin-Madison 1,390 13.8% 4.5% 20.1% 2.4% 2.4% 0.2% 50.9% 5.5%
Peer Average 1,619 7.9% 6.9% 13.2% 1.4% 4.2% 0.4% 59.2% 6.7%
Virginia Polytechnic Institute and State University 1,212 21.5% 10.9% 25.2% 1.0% 1.1% 36.6% 3.9%
Source: National Science Foundation, Survey of Graduate Students and Postdoctorates in Science and Engineering, Academic Year 2017
Funding Mechanism
Research Assistantship Teaching
Assistantship Traineeship
Self-
Support Other
Fellowship

46
Table 3A3. Percent of Full-time Doctoral Students by Discipline and Source of Primary Funding.
Table 3A4. Percent of Full-time Master’s Students by Discipline and Source of Primary Funding.
Combined Virginia Combined Virginia Combined Virginia Combined Virginia
Peers Tech Peers Tech Diff. Peers Tech Diff. Peers Tech Diff.
Agricultural Science Fields 2,782 137 31% 33% 2% 59% 64% 5% 10% 3% -7%
Biological and Biomedical Science Fields 7,612 232 41% 34% -7% 54% 64% 10% 5% 3% -3%
Computer and Information Science Fields 2,278 143 42% 43% 2% 43% 46% 3% 15% 10% -5%
Engineering Fields 12,953 1,014 47% 43% -4% 43% 49% 6% 10% 8% -2%
Geoscience, Atmospheric and Ocean Science Fields 878 34 44% 35% -9% 48% 59% 10% 8% 6% -2%
Health Fields 1,840 33 27% 27% 0% 56% 67% 11% 17% 6% -11%
Mathematics and Statistics Fields 2,626 77 14% 14% 0% 82% 79% -3% 3% 6% 3%
Multidisciplinary and Interdisciplinary Studies 191 22 34% 5% -29% 54% 86% 32% 13% 9% -3%
Physical Science Fields 6,573 198 36% 23% -13% 60% 77% 17% 4% 1% -4%
Psychology Fields 2,104 59 21% 15% -6% 66% 85% 19% 13% -13%
Social Science Fields 5,376 199 11% 10% -1% 78% 83% 5% 11% 8% -4%
Grand Total 45,213 2,148 35% 34% -1% 56% 60% 4% 9% 6% -3%
Source: National Science Foundation, Survey of Graduate Students and Postdoctorates in Science and Engineering, Academic Year 2017
Headcounts Extramural Institutional Self
Graduate Percentages by Source of Primary Funding
Combined Virginia Combined Virginia Combined Virginia Combined Virginia
Peers Tech Peers Tech Diff. Peers Tech Diff. Peers Tech Diff.
Agricultural Science Fields 2,016 176 26% 36% 11% 49% 42% -7% 25% 22% -4%
Biological and Biomedical Science Fields 1,849 47 13% 28% 15% 33% 64% 31% 54% 9% -46%
Computer and Information Science Fields 3,449 88 5% 18% 14% 21% 40% 19% 74% 42% -32%
Engineering Fields 9,927 689 13% 23% 10% 25% 34% 9% 62% 43% -20%
Geoscience, Atmospheric and Ocean Science Fields 364 20 29% 25% -4% 49% 70% 21% 21% 5% -16%
Health Fields 2,598 47 12% 9% -4% 30% 17% -13% 58% 74% 16%
Mathematics and Statistics Fields 1,066 41 2% 10% 8% 22% 73% 51% 76% 17% -59%
Multidisciplinary and Interdisciplinary Studies 349 1 6% -6% 20% 100% 80% 74% -74%
Physical Science Fields 244 16 13% 13% -1% 43% 69% 26% 44% 19% -25%
Psychology Fields 282 - 13% n/a n/a 24% n/a n/a 63% n/a n/a
Social Science Fields 2,140 87 6% 10% 5% 39% 61% 22% 56% 29% -27%
Grand Total 24,284 1,212 12% 23% 11% 29% 41% 12% 59% 37% -23%
Source: National Science Foundation, Survey of Graduate Students and Postdoctorates in Science and Engineering, Academic Year 2017
Headcounts Extramural Institutional Self
Graduate Percentages by Source of Primary Funding

47
Appendix 3B. 2019-20 Graduate Teaching Assistantship Stipend Ranges Among Selected Universities Based on full-time appointments (or 20 h/week)
Monthly Stipend Comments
Websites Low High
Michigan State University
$1,836 $3,116 Paid out bi-weekly (11 periods in the Fall, 11 in the Spring)
https://hr.msu.edu/employment/graduate-assistants/stipend-ranges.html
Ohio State University
$1,920 - University only establishes a minimum rate; Appointing units determine stipend levels above the minimum within university stipend policies. Levels of responsibility, years of experience, progress toward a graduate degree, and performance as a GA are the most common factors used by appointing units to determine stipend levels.
https://gradsch.osu.edu/handbook/9-2-graduate-associates-terms-appointment-reappointment-or-termination#9-2-7
Pennsylvania State University
$1,728 $3,456 https://guru.psu.edu/resources/rates-and-schedules/stipends-for-graduate-assistants-19-20
Purdue University $1,716 $3,778 University establishes a minimum rate (p.38) and graduate stipends that exceed the full-time fiscal year rate of $68,000 ($34,000 at 0.50 FTE) are required to receive prior approval by the Graduate School (p.14-15). Over 60% of graduate students at Purdue are on assistantships
https://www.purdue.edu/gradschool/documents/gpo/graduate-student-employment-manual.pdf
Rutgers University - New Brunswick
$2,857 - All teaching assistants and graduate assistants holding standard (.33) 10- or 12-month appointments and many fellows, receive full remission of tuition during the Fall and Spring terms. Assistantship salaries, tuition, and health benefits vary from program to program.
https://uhr.rutgers.edu/policies-resources/salary-schedules/aaup-aft-faculty-salary-schedules/full-time-ta-and-ga-starting
University of California - Berkeley
$2,191 $2,608 https://hr.berkeley.edu/labor/contracts/BX/current-rates
University of California - Davis
$2,435 $2,435 University standard rate https://grad.ucdavis.edu/resources/student-employment/salary-scales
University of Florida
$1,778 $3,556 University establishes a minimum rate. Students paid more than double of Florida’s current minimum rate must submit the Pay Rate Justification Form.
https://hr.ufl.edu/manager-resources/recruitment-staffing/hiring-center/preparing-an-offer/requirements-for-an-appointment/#salaries
University of Illinois Urbana-Champaign
$1,976 - University only establishes a minimum rate https://humanresources.illinois.edu/assets/docs/AHR/Grad-Minimum-Salaries-2019-2020-for-website-posting.pdf
University of Maryland - College Park
$1,978 - The Graduate School sets a minimum stipend level for Step-I. Each unit is to ensure that its Step-I stipend level is equal to or higher than the minimum specified for 9-, 9.5-, and 12- month
https://gradschool.umd.edu/sites/gradschool.umd.edu/files/uploads/doc

48
assistantships. Teaching Assistants must be offered 9.5- or 12-month assistantships due to responsibilities after the last day of classes. Stipend levels have no caps at any step and must increase between steps. The appointment may be full-time (20 hours per week) or half-time (10 hours per week).
s/fy20_ga_fellow_stipend_memo_final.pdf
University of Minnesota - Twin Cities
$1,705 $2,713 https://humanresources.umn.edu/sites/humanresources.umn.edu/files/academic_salary_floors_fy20.pdf
University of Wisconsin-Madison
$2,222 - University establishes a minimum rate; a new policy allows graduate programs to adjust stipend amounts above the campus minimum to remain competitive in attracting top students. The Graduate School reviews, approves, and posts program rates annually.
https://grad.wisc.edu/wp-content/uploads/sites/329/2019/04/2019-20-program-approved-stipend-rate-by-college.pdf

49
Appendix 3C. Departmental Comparisons of Stipends by Some College of Science Programs
Chemistry Competitor Stipend Data – In 2015, Georgia Tech ran a comprehensive survey of graduate stipends and fees in chemistry. These results are summarized in Table C1. In 2015, Virginia Tech ranked 51st out of the 60 schools. Our Chair at the time, Jim Tanko, contacted Michigan State and found out that the number in Table C1 was only for the Academic Year which meant their actual stipend was $25215 (actually elevating them to 22nd place comparable to their Big 10 peers in the survey and dropping VT to 52nd place).
Table 3C1 - Graduate Stipends, Fees, and Net Stipends Prepared from a 2015 Salary Survey by Georgia Tech for Chemistry Programs
School Stipend
Fees Net School Stipend
Fees Net
1 Stanford 36192 3905 32287 31 Washington St. 24516 1092 23424
2 Boston U. 30750 0 30750 32 Duquesne 23175 0 23175
3 U. Chicago 30000 225 29775 33 Wake Forest 58364 35364 23000
4 Rosalind Franklin U.
29500 0 29500 34 Colorado S. Mines 23000 0 23000
5 U. Penn. 29000 0 29000 35 Loyola 23000 0 23000
6 Tufts U. 28500 0 28500 36 Portland State 24000 1284 22716
7 Montana State 28800 500 28300 37 Arizona State 23603 894 22709
8 Dartmouth 28200 0 28200 38 U. Cincinnati 23000 400 22600
9 Carnegie Mellon 28200 0 28200 39 Brigham Young 22000 0 22000
10 UC Davis
28000 0 28000 40 U. Maryland Baltimore 23166 1230 21936
11 UC Santa Barbara 28000 0 28000 41 Georgia Tech 25000 3419 21581
12 U. Idaho 28000 0 28000 42 U. Florida 23008 1876 21132
13 Duke 27583 0 27583 43 Drexel 46000 25000 21000
14 Brandeis 27500 27500 44 Miami (Ohio) 22453 1540 20913
15 USC 27336 0 27336 45 Rhode Island 22047 1148 20899
16 Lehigh 27334 0 27334 46 Nevada, Reno 22200 1693 20507
17 UC San Diego 27000 0 27000 47 SUNY Binghamton 21100 600 20500
18 Stony Brook 28000 1400 26600 48 U. Sciences 20500 0 20500
19 LSUHSC-Shreveport 26000 0 26000
49 U. Georgia 23000 2834 20166
20 Temple 26000 0 26000 50 Miss. State 22000 2000 20000
21 U. Rochester 26000 20 25980 51 Virginia Tech 22400 2400 20000
22 Colorado State 25000 0 25000 52 U. Calgary 25667 5717 19950
23 U. Nebraska 25000 0 25000 53 SUNY Oswego 20800 1000 19800
24 U. Mass. 25277 912 24365 54 U. New Hampshire 19700 0 19700
25 U. Oregon 24500 244 24256 55 South Dakota State 22925 3394 19531
26 U. Delaware 25000 792 24208 56 Clemson 22000 2897 19103
27 U. Wisconsin 25400 1300 24100 57 Villanova 18600 50 18550
28 TAMU 24000 0 24000 58 Michigan State 18537* 38 18499
29 UIUC 24831 1195 23636 59 West Virginia 20502 2304 18198
30 St. Louis U. 24000 450 23550 60 So. Miss. 19000 930 18070
*AY, actual stipend $25215 (for Michigan State)

50
Physics
School Average TA Stipend Amount (AY) Fees
Arizona State $15,631
SUNY Buffalo $16,500 $2337 per year
Virginia Tech $16,848 $2,024/year in-state comp fees; $2,629/year out-of-state and int'l
Montana State $17,200 $1000-$1800 per year
South Carolina $17,250 one-time international student fee of $750 and $80 matriculation fee
Oregon $18,203
New Hampshire $18,640 $2095 per year
Iowa State $18,900 $575 per semester
Oregon State $19,215 $1900 per year
Purdue $19,972
UVA $20,000 $50 per semester international student fee
Clemson $20,000 $1100 per semester
U of Denver $20,000 Student fees $10.65 per credit hour; health fee is paid for all grad assistants
Wisconsin-Madison $20,000 None
UC-Santa Cruz $20,051
Berkeley $20,650
UC-SB $20,653 $37.50 per quarter
UC-San Diego $20,653
U of Washington $20,655 $360 per quarter
Florida State $20,900 $6.50 per credit hour for transportation fee
Colorado-Boulder $21,451 $1762 per year
UT-Knoxville $21,500 Technology fee
UCF $22,307 $10 year for ID fee; int'l students pay $50 semester service fee
Indiana U $22,333 $1,148 per semester
U of Connecticut $22,910 $679 per semester
Stony Brook $23,000 $848 per semester
RPI $23,000 $1600 per year, plus insurance
UIUC $23,298 $3000 per year, but grad assistants get a partial waiver
NC State $23,532 $1300 per semester
Northeastern U $23,886 $300 per semester
West Virginia U $24,000 $650 per semester, plus an additional $300 for international students
Syracuse $24,250 $836 per year
UC-Davis $24,540 None

51
Penn State $24,577 Thesis or dissertation fee ($25 and $95, respectively)
U of Florida $25,000 Could not calculate, since fees were not listed separate from tuition
UNC-Chapel Hill $25,025 $984.51 per semester for all grad students
GA Tech $25,068 $1125 per semester
Case Western $25,276 $18 activity fee each semester; $276 for gym membership
Brown University $25,635 $60 activity fee; $64 recreation fee
Ohio State $25,728 less than $300 per semester
Rutgers $25,969 about $2000 per year
William and Mary $26,000 Paid by department
Maryland- Baltimore Co $26,000 $136 per credit hour
U Texas-Austin $27,000
Emory University $27,000 $414 per semester; $55 in summer for recreation fee
U of Rochester $27,744 $10 activity fee; $25 int'l student fee (per semester)
Pittsburgh $28,365 $425 per semester
Cornell $28,817 $84 per year activity fee
Carnegie Mellon $29,400 Paid by department ($852/year)
Vanderbilt $30,000 $457 per year activity fee; one time fee of $100 for transcripts
Notre Dame $30,000 $72 student union fee (TA parking is paid by the Graduate School)
Boston College $30,000
Harvard U $30,690 $25 per year student council fee
Duke $31,160 $589.22 per semester; $287.94 for summer health fee
Princeton $32,050 $1800 a year for student health plan
Northwestern $32,196 $40 per quarter for off-campus transportation and athletic center
Boston University $33,990 Fees covered by assistantship
MIT $39,156 $312 student life fee
Data from https://www.gradschoolshopper.com/gradschool/
Stipends are Academic Year amounts

52
Statistics
University 9-month Stipend
Virginia Tech $16,600
North Carolina State $18,750
Ohio State $20,290
Oklahoma State $20,560
Texas - Austin $20,655
Penn State $22,950
Rice U. $25,617
Data from www.phdstipends.com
Psychology Summary of Council of Graduate Departments of Psychology (COGDOP) Survey of
Graduate Funding Packages 29 responses collected
22 public schools, 7 private
Majority of programs were in the south (10) followed by the mid-west (9), east coast (5), mountain (3) and west coast (2).
Guaranteed funding:
84% of programs guaranteed funding for their PhD students. Of those programs, the majority (52%) guaranteed funding for 5 years, while 30% guaranteed funding for four years.
Only one program did not place an end date on their funding promise. How are students funded?
Majority of students are funded through RA or TA positions. A smaller portion are funded by internal grants. External grant funding is the least common method.
What’s included in a funding package?
100% of programs offer a tuition waiver/discount
All but one offer a stipend.
62% offer health insurance. 9-month stipends:
Graduate assistantships (teaching and research assistants) range from $10,800 to $24,957/9 months. Average stipend is $17,088.
Fellowships range from $15,528 to $27,000/9 months. Average fellowship stipend is $20,029. Summer funding:
The majority of programs (64%) do NOT guarantee summer funding.
Summer funding ranges from $1,800 to $6,500. Average summer funding stipend is $4,053. Compiled by Lindsey Jendraszak, [email protected], May 18th 2018

53
Section 4. Enhance support for student-initiated grant and fellowship applications University rankings are heavily influenced by student involvement in research, and external federal funding. While faculty-initiated federal grants and funded center grants should comprise a large portion of research funding, student-initiated grants can also contribute significantly to the overall funding portfolio. In addition, pursuing and acquiring grant funding provides valuable professional development for students as they develop a mentoring plan and a research project that can transition them to independence, enhancing their comprehension of the research enterprise. Most agencies and foundations that fund fellowships (for example, the NSF Graduate Research Fellowship program) require the student to describe available university resources, in addition to a strong research project. It is clear that Virginia Tech graduate students are currently at a disadvantage in this regard, as we are not broadly incentivizing these activities or providing the same support level as our peer institutions. In addition to federal agencies, fellowships are funded by private foundations, including Fulbright, American Council of Learned Societies, Spencer Foundation, Mellon Foundation, American Association of University Women, and others. Figure 4.1 below shows the rankings of our aspirational peer institutions, and the numbers of fellowships at each funded by specific federal agencies. Virginia Tech ranks near the bottom among aspirational peer land grant universities in number of externally-funded fellowships. Some universities have an expectation that students will pursue funding, and provide substantial support in the graduate office for these efforts. These resources include a mechanism to identify potential funding sources, fellowship and grant preparation assistance including writing templates, and proposal review. Although funding agencies consider graduate fellowship awards very prestigious, it is well known that some do not provide stipend and tuition support equal to the institution’s graduate funding. Awardees may actually receive less overall funding than their classmates, resulting in shortfalls in stipend, tuition, and/or fee funding. Therefore, most of our peers offer a mechanism to cover the shortfall. In addition, because these awards are prestigious, some institutions incentivize students to seek them out by providing additional support to awardees, such as travel or professional development dollars. Figure 4.1. Funded fellowships

54
Table 4.1 below illustrates the resources available to student applicants at peer institutions. A review of their websites suggests that nearly all of the universities with high levels of fellowship funding have extensive resources for student development. Most have websites with information about fellowship application resources, training exercises such as seminars and workshops for preparing applications, and staff dedicated to these activities. Furthermore, they have also developed mechanisms to incentivize students to pursue this type of funding by enhancing its value, such as including tuition waivers, reduced tuition via part-time registration, and/or fee support, especially for health insurance. We performed an email survey of peer institutions; responses are shown below. These data suggest that an expectation that each student will apply, and financial assistance for shortfalls may be the most important factors in a university’s success in acquiring external student-initiated funding. Table 4.1. Peer practices
Expectation that
students apply
Fellowship list
Fellowship preparation resources Financial assistance
Perks
Seminars/
workshops
Templates
Review mechanis
m
Resubmission
assistance
Tuition/
fees
Insurance
UC Berkeley
Yes Yes Yes No No No Yes Yes Yes
U Minn No Yes Yes Yes No No Yes Yes Yes Maryland
Yes Yes Yes No No No Yes Yes No
Purdue No Yes Yes No Yes Yes Yes No No Illinois No Yes Yes No Yes No No No No Cornell Yes Yes Yes Yes Yes No Yes Yes Yes
0
50
100
150
200
250
300
Funded fellowships by type (2017)
Dept of Agriculture Dept of Defense Dept of Energy Health & Human Servi.
NASA NIH NSF Other Fed. Sources

55
Penn St. No Yes Yes No Yes No Yes Yes No
While some individual VT graduate programs may offer incentives, VT does not broadly offer assistance for funding shortfalls for fellowship awardees, or any additional perks. In addition, VT does not offer application preparation assistance or resources to encourage students to pursue fellowships and grants. In some cases, we
actually provide negative incentives. For example, VT students awarded external fellowships do not receive the health insurance subsidy, nor are their mentors allowed to charge any portion of their health insurance costs to sponsored programs. With short notice, students find that they are required to self-fund health insurance premiums costing thousands of dollars. Virginia Tech Vignettes of fellowship success Students who are awarded external fellowships are among our top graduate students. Examples are given below. The faculty mentors of these students have received a combined career total of $72.1 million in external funding per OVPRI data available on the VT website.
Brantley Hall is currently a Merck Fellow of the Helen Hay Whitney Postdoctoral Foundation at the Broad Institute of Harvard and MIT as well as the Center for Computational and Integrative Biology at Massachusetts General Hospital and Harvard Medical School. Brantley studies why the gut microbiome is altered in IBD. While Brantley was a PhD student at Virginia Tech, he won a prestigious NSF graduate fellowship that supported his work in Jake Tu’s lab within Biochemistry. Brantley was first author on a paper published in Science in 2015, and was awarded the Outstanding Dissertation Award in “Science, Technology, Engineering and Mathematics” (March 2017), and the Outstanding Doctoral Student of Interdisciplinary
Programs (May 2016).
Tawni Paradise is a current Ph.D. candidate in Engineering Education working with Dr. Jacob Grohs. She is also pursuing an M.S. in Integrative STEM Education. Her research is focused on parents’ involvement in informal learning settings for students in K-12, with an emphasis on pre-kindergarten students. She received a Graduate Research Fellowship from the National Science Foundation in spring 2019.
Peter C. Fino is now an Assistant Professor at the University of Utah whose research focuses on improving mobility during daily life in people with neurological dysfunction, particularly those with brain injuries. Peter earned a PhD in Mechanical Engineering, working with Professor Maury Nussbaum. Peter’s graduate work was supported by an NSF graduate fellowship.

56
Tiairra Brown is pursuing a PhD in the Grado Department of Industrial and Systems Engineering (ISE) with Joseph Gabbard. She is a Gates Millenium Scholar and has been awarded an NSF graduate fellowship for her research on applying cognitive theory and gamification strategies to augmented reality learning environments.
Matthew Dewitt is currently a Research Scientist/Principal Investigator at Luna Innovations in Charlottesville working on developing new energy and materials-based solutions to biological and medical problems. Matthew received an NSF graduate fellowship and worked with Professors M. Nichole Rylander and Rafael Davalos on his PhD in Biomedical Engineering on nanoparticle transport.

57
Many universities provide detailed lists of fellowship opportunities for graduate students. As one example, snapshot of the UCLA site, which can be searched by non-UCLA persons, is shown below.
Recommendations We recommend that VT make available to accepted and enrolled graduate students the following Fellowship resources, which would likely be effective in increasing the number of student-initiated, funded proposals. We wish to emphasize that the added funding would benefit VT, but that the cultural change invoked by these new expectations would have even more beneficial impacts upon the quality of VT graduate education.
● User-friendly tool to search for fellowships, and list of currently available fellowships
● Fellowship preparation resources
o Seminars/webinars/workshops
o Templates for application preparation (facilities, mentoring plan, candidate description and goals)
o Review mechanism for feedback about draft proposal to student
o Assistance in resubmission
● Financial assistance
o Provide assistance to cover funding shortfalls for tuition and fees
o Reduce enrollment requirements or provide tuition waiver
o Health insurance
● Additional university perks for funded trainees could include:
o Travel awards
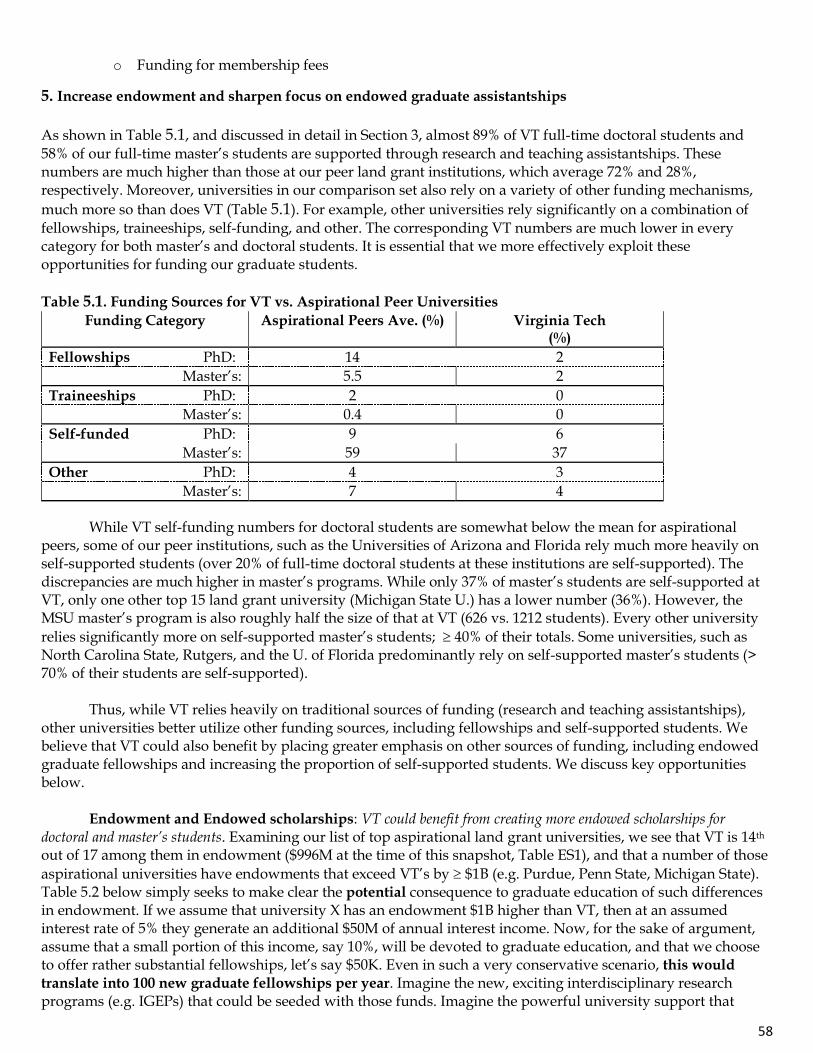
58
o Funding for membership fees
5. Increase endowment and sharpen focus on endowed graduate assistantships
As shown in Table 5.1, and discussed in detail in Section 3, almost 89% of VT full-time doctoral students and 58% of our full-time master’s students are supported through research and teaching assistantships. These numbers are much higher than those at our peer land grant institutions, which average 72% and 28%, respectively. Moreover, universities in our comparison set also rely on a variety of other funding mechanisms,
much more so than does VT (Table 5.1). For example, other universities rely significantly on a combination of fellowships, traineeships, self-funding, and other. The corresponding VT numbers are much lower in every category for both master’s and doctoral students. It is essential that we more effectively exploit these opportunities for funding our graduate students.
Table 5.1. Funding Sources for VT vs. Aspirational Peer Universities
Funding Category Aspirational Peers Ave. (%) Virginia Tech (%)
Fellowships PhD: 14 2
Master’s: 5.5 2
Traineeships PhD: 2 0
Master’s: 0.4 0
Self-funded PhD: 9 6
Master’s: 59 37
Other PhD: 4 3
Master’s: 7 4
While VT self-funding numbers for doctoral students are somewhat below the mean for aspirational peers, some of our peer institutions, such as the Universities of Arizona and Florida rely much more heavily on self-supported students (over 20% of full-time doctoral students at these institutions are self-supported). The discrepancies are much higher in master’s programs. While only 37% of master’s students are self-supported at VT, only one other top 15 land grant university (Michigan State U.) has a lower number (36%). However, the MSU master’s program is also roughly half the size of that at VT (626 vs. 1212 students). Every other university
relies significantly more on self-supported master’s students; 40% of their totals. Some universities, such as North Carolina State, Rutgers, and the U. of Florida predominantly rely on self-supported master’s students (> 70% of their students are self-supported). Thus, while VT relies heavily on traditional sources of funding (research and teaching assistantships), other universities better utilize other funding sources, including fellowships and self-supported students. We believe that VT could also benefit by placing greater emphasis on other sources of funding, including endowed graduate fellowships and increasing the proportion of self-supported students. We discuss key opportunities below.
Endowment and Endowed scholarships: VT could benefit from creating more endowed scholarships for doctoral and master’s students. Examining our list of top aspirational land grant universities, we see that VT is 14th out of 17 among them in endowment ($996M at the time of this snapshot, Table ES1), and that a number of those
aspirational universities have endowments that exceed VT’s by $1B (e.g. Purdue, Penn State, Michigan State). Table 5.2 below simply seeks to make clear the potential consequence to graduate education of such differences in endowment. If we assume that university X has an endowment $1B higher than VT, then at an assumed interest rate of 5% they generate an additional $50M of annual interest income. Now, for the sake of argument, assume that a small portion of this income, say 10%, will be devoted to graduate education, and that we choose to offer rather substantial fellowships, let’s say $50K. Even in such a very conservative scenario, this would
translate into 100 new graduate fellowships per year. Imagine the new, exciting interdisciplinary research programs (e.g. IGEPs) that could be seeded with those funds. Imagine the powerful university support that

59
could be thrown behind large center grant proposals, improving our chances of obtaining these major, prestigious grants. Another way to think about it is to consider the number of additional graduate fellowships we would like to have for such purposes; multiply by $50K and that gives you the portion of any increase in VT endowment that would be needed.
Table 5.2. Illustration of potential impact of endowment advantage upon graduate fellowships
Difference in endowment vs. VT: $1,000,000,000
Annual interest generated*: $50,000,000
Percentage allocated to graduate education: 10%
Amount allocated to graduate education: $5,000,000
Assumed cost of a graduate fellowship: $50,000
Increased number of grad fellowships available: 100
*Assumes 5% interest
These endowed scholarships could also be used to provide additional supplements to attract the best students to VT. The Via scholarships that the Departments of Electrical and Computer Engineering and Civil and Environmental Engineering offer are an excellent example of this (https://www.cee.vt.edu/via-endowment/). By collaborative effort of the advancement team, departments, and the graduate school, VT could make a concerted effort to increase the number of endowed scholarships. In addition to alumni with the means to make donations, we could reach out to companies who hire our students and encourage them to offer funds that could be used to attract some of the best students to VT. Firms could be afforded the opportunity to hire students who are given their named scholarships. VT could also organize thematic donation opportunities – by, e.g., the class of 1998.
A simple yet important way to look at the opportunity for VT, through the Advancement team, is as follows. If an alumnus or a person with other VT ties wishes to create a remembrance for a family member, they might choose to make a donation towards a named building for a long-term remembrance, perhaps for 100 years, at cost of perhaps $30-50M. It is likely that a relatively small set of individuals has the financial resources and VT ties to make such a donation. On the other hand, to endow that $50K annual fellowship cost, even assuming that we would ask the donor to fund the full cost, a donation of approximately $1M would be required. This donation would fund the named graduate fellowship permanently, and from interest only, if properly managed. Such an amount could be available to a far larger set of potential donors, and could provide opportunities for many more, e.g., alumni to get engaged and give back to VT.
There are already a number of valuable, competitive fellowship opportunities available at VT. Examples include ICTAS Doctoral Fellowships, which not only provide RA support and highly competitive stipends to graduate students for four years, but also create a community in which ICTAS Doctoral Fellows are celebrated, can easily make interdisciplinary connections, and gain networks and networking opportunities. The Graduate School provides a number of fellowship opportunities as well, for example the Cunningham Fellowships. These fellowships are prized by VT graduate students, deservedly so, and can be best employed as vehicles for attracting truly outstanding graduate students to VT, who might otherwise choose a more highly ranked university. In order to best leverage graduate student fellowship support, the GETF recommends two measures.
First, while fellowships like the Cunninghams and ICTAS Doctoral Fellowships are well known within VT, they are not well known outside of VT. In order to get maximum impact from these excellent fellowships, we need to advertise their valuable and prestigious nature outside of VT. We recommend that a centralized effort be made to make target undergraduates aware of these opportunities; perhaps led by the office of the VP for Research and Innovation or the Graduate School, and involving University Relations. Avenues for communication might include prestigious, general audience journals like Science and the Proceedings of the

60
National Academy of Science; social media; direct communications to top liberal arts colleges; and other appropriate outlets. We could envision a strong initial effort to raise awareness, followed by lower intensity follow-ups in subsequent years, and/or updates as new fellowship opportunities are created.
Second, many of the existing VT fellowships are not endowed, and many are not named. We recommend a strong effort to get these fellowships named, endowed, and increased in number. Instead of 8-10 “ICTAS Doctoral Fellowships” awarded each year, why not a collection of such fellowships with names of those whom donors would like to honor; the Schwartz ICTAS Doctoral Fellowship, the Ramirez ICTAS Doctoral Fellowship, the Jones ICTAS Doctoral Fellowship, etc. Donors could provide some percentage of the amount needed to fund an existing fellowship in perpetuity in exchange for naming rights, or they could provide enough to endow a new fellowship in exchange for naming rights and some other benefit (season tickets to Hokies basketball, for example!). Such measures promise to enlarge the number of available fellowships, reduce their expense to VT, and use them to their full potential to attract the very best graduate students to VT.
Self-funded and Other Programs: Another way to increase and diversify revenue sources is to offer more programs that attract self-funded students. Part-time programs: One possibility could be to offer more part-time programs tailored toward working professionals. The executive Ph.D. program offered by the Pamplin College of Business is an example of such a program (https://pamplin.vt.edu/academics/phd-programs/executive-phd.html). This program is designed for working professionals and takes about 4-5 years to complete. Students are self-funded. The program is flexible and is designed with the tight schedule of business executives in mind; classes are held on weekends and students primarily attend classes remotely (although some residency requirements also exist). Other colleges can explore the viability of offering similar doctoral programs.
Similar programs could also be offered at the master’s level. The Master of Information Technology (MIT) program jointly offered by the Pamplin College of Business and the College of Engineering is an example of such a program (https://vtmit.vt.edu/). This program is designed carefully to cater to working professionals, professionals who are busy, have little time, but need interdisciplinary knowledge. The MIT program is very flexible, is offered online, and gives professionals the kind of knowledge they need and when they need it. VT could also consider expanding other professional programs, such as the MBA programs offered by the Pamplin College of Business (https://mba.vt.edu/) in the National Capital Region, for example.
Masters programs generally tend to be more scalable and flexible relative to doctoral programs. It is easier to grow non-research master’s programs, they do not require the same amount of faculty involvement as do doctoral programs, and they could potentially rely on non-tenure track faculty. These programs can be good sources of revenue.
Certificates and badges: VT could explore the possibility of certificates and other kinds of creative programs that attract more self-funded students.
Full-time programs: VT could recruit more self- or industrially-funded students to our full-time doctoral and master’s programs. Accelerated programs will make such options more attractive to the tuition payers.
International programs: Given our aspiration to be a top-ranked Global land-grant University, VT could proactively engage with international universities to establish revenue generating graduate programs. One possibility could be to consider a hybrid model, comprising of a mix of online and in-class components, where the online courses are supplemented with in-class or in-university experiences. While the on-line component can help with costs and scaling up, the in-class components can help us give students the much-needed interaction with faculty and a University experience. However, any such program would need to distinguish itself from other online-only programs and would have to compete with other Universities vying for this marketplace. Therefore, the value proposition of this program needs to be carefully assessed. The program can be designed as a 2-year program where three semesters are online, and one semester is in-class. The in-class portion can be conducted at VT or at an international location with the help of one of our partners.
Types of Funding: In addition to traditional funding models (research and teaching assistantships), it may be important to find ways to generate other funding sources. Fellowships: It will be helpful to provide resources to those applying to our programs to help them apply for grants and fellowships, as recommended in Section 4. This service could be provided to all applying to VT

61
and it could also be extended to some of our best senior undergraduate students. This could be a way to encourage them to apply to our graduate programs. Other scholarships: It would be useful to maintain a list of current outside scholarships that may be available to our students, such as the one maintained by Rutgers University (https://financialaid.rutgers.edu/types-of-aid/scholarships/outside-scholarships/). We can advise and assist our deserving students to apply for these scholarships. Relationship with Financial Institutions: If VT decides to increase our proportion of self-funded students, then it may be useful to develop relationships with financial institutions who can make it easier for our students to get loans at attractive rates. Recommendations:
1) Make a strong and focused effort to solicit donations for endowed graduate fellowships at VT, thereby strongly and permanently enhancing the number of graduate students supported by such fellowships.
2) Increase the number and scope of self-funded graduate programs, thereby enhancing the number of graduate students, and funding for graduate programs.
3) Increase opportunities for career advancement and lifelong learning. This will ensure that VT remains engaged with students for a longer duration, which is also reciprocally likely to increase student engagement with VT and yield additional benefits (e.g., more giving).

62
6. Post-Comprehensive Candidacy Status Overview of Proposal Proposed by the Commission on Graduate and Professional Studies and Policies and passed by University Council in Spring 2019, this new status would convey full-time enrollment status to post-prelim doctoral candidates who are engaged in full-time research towards their dissertation while being enrolled for the equivalent of 3 credit hours per semester. This would reduce the tuition costs for eligible students, resulting in savings either to the student or the funding source of their tuition remission benefit (for those on assistantship). It should also be noted that reducing the tuition required of such students is aligned with the concept that they are less "consumers" of university resources (no coursework) and more "contributors" (research output) than students at an earlier stage of graduate study. This proposal would not impact master's students. Current Policy The Graduate Catalog, maintained by the Graduate School, states that “Students working on research/scholarly activity toward their thesis or dissertation should enroll in the number of credit hours that reflects the extent of a student’s study or research activity.”5 Students can currently enroll for a minimum of 3 credit hours and maintain continuous enrollment per Presidential Policy Memorandum 291.6 If a student has “fulfilled all requirements, including advisory committee review and agreement that the thesis or dissertation is ready for defense, and are registering only to take the final oral examination”, a student is eligible for a “Start of Semester Defense Exception”7 which bears a 1 credit hour load and tuition assessment.
While these enrollment options are currently available, fewer than 9 credit hours of enrollment per semester is considered part-time. Enrolling part-time may present challenges for some students, including:
Students on assistantship, who must be enrolled for at least 12 credit hours per University Policy 6210.8
International students on an F-1 student visa, who must maintain enrollment in a “full course of study”
per DHS guidelines.9
Students with federal loans in deferral for the duration of student’s full-time enrollment.
Students in these categories, while not required to enroll full-time to fulfill academic requirements, may find that full-time enrollment is required or preferable to fulfill external requirements and/or maintain financial benefits. The passed resolution deals with these issues and ensures equitable treatment of all post-prelim doctoral students by conveying full time status for eligible students while assessing three credit hours of tuition. Peer Findings Benchmarking the top 20 Land Grant institutions among the Times Higher Education (THE) World rankings found that just over half (11 of 20) publicize some type of enrollment status for students who are primarily engaged in research. All but one of those institutions require completion of the comprehensive exam. Of those 11 institutions, 5 require some level of research & dissertation credit completion in addition to the comprehensive exam and before eligibility for a reduced credit hour status, applied consistently across all post-preliminary exam doctoral students:
University of Wisconsin-Madison: Dissertator Status “is a unique fee status for students who have
completed all requirements for a doctoral degree except for the dissertation.” To be eligible for dissertator
fee status, a student must pass the preliminary examination and complete all program requirements
(major/minor) and any elective or certificate courses. A student may then enroll in exactly 3 credit hours
of research per semester until the degree is completed. No other coursework may be taken under this
status.
5 https://secure.graduateschool.vt.edu/graduate_catalog/policies.htm?policy=002d14432c654287012c6542e382008c 6 https://policies.vt.edu/assets/291-graduate-continuous-enrollment-.pdf 7 https://secure.graduateschool.vt.edu/graduate_catalog/policies.htm?policy=002d14432c654287012c6542e3720022 8 https://policies.vt.edu/6210.pdf 9 https://studyinthestates.dhs.gov/full-course-of-study

63
Ohio State University: “Candidacy should be reached after doctoral students have taken enough course
work to become proficient in the field of study, which is generally two to three years after starting the
doctoral program or one year after qualifying or preliminary exams.”
University of Arizona: Candidate must have “completed all coursework” and “completed 18 units of
dissertation (or equivalent)”.
University of Delaware: “completed registration in all required course credits needed for the degree
(including the registration of six credits of Master’s thesis or nine to twelve credits of dissertation)”.
University of Minnesota: “All Degree Program coursework is complete and grades are posted to the
transcript. Completed the 24 semester credits of xxxx 8888 doctoral thesis credits.”
North Carolina State University: (not among top 20 land grants, but included here as a peer) “Full Time:
These students will be full time if they take at least 9 hours per semester until the semester in which a
course load of less than 9 credit hours will reach an accumulated total equal to the minimum number of
hours required by their program. They should then register for that number of credits, but not less than
3. From that point on, they will continue to be considered full time until they complete their thesis or
dissertation, as long as they enroll for at least 3 credit hours.”
There are several common elements across these policies that could help frame a potential approach for Virginia Tech:
Successful completion of the preliminary examination.
Completion of all required coursework for the major/minor/concentration.
Full-time effort and focus on research and writing of dissertation.
A time limit for the status to encourage completion of the dissertation.
Application to the Graduate School, accompanied by the recommendation of the advisor that the student
is adequately prepared to undertake independent research and dissertation efforts.
Cost Analysis and Options Candidacy status will enhance the value of a graduate student to the primary investigator by reducing the cost of tuition remission. The grant funds freed up by Candidacy status can then be reinvested into tuition funding (for example, summer support for another student who is on a TA), or may be used to enhance research productivity of the faculty member, graduate student, and VT in other ways (i.e. purchasing needed equipment or services that accelerates the research). Such investment should enhance research results, enabling discoveries that may lead to successful external funding proposals. Candidacy status will also enhance equity for students across disciplines, between domestic and international students, and with regard to funding status. Two primary considerations that impact the cost of any such status are 1) the point in a student’s academic career that she/he becomes eligible for advanced status, and 2) the level of enrollment considered equivalent to full-time effort under the advanced status. Eligibility All examples found at peer institutions required, at a minimum, the completion of the preliminary exam. Most also required completion of all major, minor, and non-dissertation degree requirements. Some institutions further required the completion of a minimum number of research/dissertation credit hours (i.e. 18 credit hours after prelim). Credit Hour Load Advanced status is premised on the expectation that the student is conducting research and drafting a dissertation as part of a largely independent effort; therefore, institutions offering such a status have a lower

64
required credit hour requirement that maintains full-time status. Required credit hours vary. The following are some approaches to credit minimums:
Pennsylvania State University: 0 credit hours of Ph.D. Dissertation Course SUBJ601
University of Pittsburgh: 0 credit hours of FTDR3999 after completion of all credit requirements related to
the degree and minimum dissertation hours.
Michigan State University: 1 credit hours on “All But Dissertation” status.
Ohio State University: 3 credit hours after completion of doctoral candidacy examination
North Carolina State University – Raleigh: 3 credit hours minimum until completion of dissertation.
University of Maryland – College Park: 6 credit hours of 899-level dissertation course.
The passed VT Candidate Status resolution would allow graduate students to access this status in the semester following their preliminary examination passage, and would require the maintenance of 3 credit hours per semester until the dissertation is complete, with Candidacy status limited to no more than three years duration. As proposed, this would reduce annual tuition charges by an estimated $6.3 million, comprised of $0.8 million from tuition-paying students and $5.5 million from students on graduate assistantship. Institutional savings resulting from the reduced cost of graduate assistantship tuition remission is $5.5 million, comprised of $3.6 million in E&G and $1.9 million in Sponsored Programs. In summary, the university’s E&G budget is estimated to lose $2.7 million of tuition revenue, while the Research budget would save $1.9 million in tuition remission expenses. The out of pocket cost to VT would be a maximum, therefore, of approximately $800K annually. Table 6.1
As an alternative, Ohio State utilizes an approach that allows students to gain eligibility “generally two to three years after starting the doctoral program or one year after qualifying or preliminary exams”.10 This approach (which has a net cost of about $200k annually) furthers several Virginia Tech goals:
Provides academic department the opportunity to oversee start of student’s research endeavors
before student undertakes fully independent research,
Allows the student to continue pursuit of additional coursework, graduate certificates, etc. and
remain an active participant in graduate community,
Reduces the approximate annual cost of the Candidacy Status proposal as follows:
Table 6.2
10 https://gradsch.osu.edu/handbook/7-7-doctoral-candidacy
Original Proposal: Eligible next semester after prelim; 3SCH Min.
Research Budget
Foregone Tuition Remission Savings Remission Savings
Tuition-paying Students (800,341)
Graduate Assistants (5,511,844) 3,564,068 1,947,776
Subtotal (6,312,185) 3,564,068 1,947,776
Net Area Impact 1,947,776
E&G Budget
(2,748,117)

65
A third approach would allow the student to pursue the status in the term immediately after passing the preliminary exam, yet require enrollment of six credit hours per semester. Because the credit hour threshold is increased from the original proposal, this alternative also reduces the approximate annual cost of the Candidacy Status implementation (to about $330k) as follows: Table 6.3
Benefits/Commitments of Proposal The proposed policy has several potential direct and indirect benefits. 1) Ph.D. students who pay tuition (those not on assistantship) would benefit from an overall reduction in the
cost of their degree, as they would now be able to enroll a reduced credit hour load while still being
considered full-time.
2) Ph.D. students who are on assistantship (either E&G or Sponsor supported) would not experience a direct
benefit, as they do not fund the cost of their tuition. However, the fund source of their tuition remission
would experience savings.
3) The grant funds saved from reductions in GRA tuition due to candidate status will be redirected to other
beneficial purposes, advancing the success of graduate education at VT, including summer stipends,
materials and equipment essential to research, travel to conferences to gain experience in professional
communication and network with potential collaborators, and other useful purposes.
4) Reduction in time to degree. A two-year maximum eligibility for Candidacy Status will encourage shorter
time-to-degree while ensuring that students who do not complete their dissertation in a reasonable
timeframe must reengage with their advisor in a full-time capacity, further incentivizing completion.
Candidacy Status creates a powerful incentive to take one’s preliminary exam early, indeed by the end of the
second year, in order to achieve Candidacy Status as early as possible. In addition to reducing time to degree,
this will further enhance the quality of VT graduate education by highlighting cases where students have
not achieved enough to earn Ph.D. candidate status at a much earlier point in their academic careers,
permitting either earlier remedial action so that they do achieve Ph.D. candidate status on a second try, or
enabling them to choose at an earlier point in life to redirect their efforts towards a more suitable career goal.
Recommendation The Task Force recommends that Candidate Status be implemented for the aforementioned reasons. In a recent Graduate Student Forum, a current, very active and successful graduate student made the following suggestion; “I suggest that VT set goals that are aspirational; not settling for being equivalent to peer land grants, but
competing with the most excellent land grant universities”. As the committee charge instructs, this recommendation directly addresses a policy revision that will reduce the cost of graduate education with the goal of incentivizing enrollment. Recognizing that the implementation of such a policy has significant financial impact, and that the University Council approval included implementation contingent upon financial feasibility, we recommend that the university modify the original proposal to include a one-year period between passing the preliminary exam and becoming eligible for the Candidacy Status, and limiting the number of years a student can utilize Candidacy Status to two years (extensions due to extenuating circumstances may be approved by the Graduate School on a limited case-by-case basis). This approach addresses the needs of students and sponsors while mitigating the

66
negative financial impact, serving as a financial incentive to reaching the research phase of the doctoral pursuit. We feel that the goals listed above are very important, we strongly favor implementation of Candidacy Status, and we believe that the specific recommendation above is an attractive and workable way to implement such status. We also recognize that there are a number of ways to do so at costs reduced from that of the original proposal, some of which are illustrated by the examples above from our aspirational peers, and we would support different combinations of these example policy elements to achieve substantially the same goal. Reducing the cost of graduate study and of graduate assistantships will position Virginia Tech to be more competitive and more productive, raising the quality and output of our graduate education program.

67
7. External Research Funding and Support for those Preparing Research Proposals External Research Funding: External research funding directly impacts quality and size of VT graduate programs, and the university's overall reputational ranking (see full report Appendix F for factors considered and weights in THE rankings). For most graduate programs, the perceived quality relates to the research reputation of that program, as the bulk of the research is directly carried out by its graduate students. Increased funding enables researchers to carry out more research, and the amount of high-quality, impactful research should scale similarly. With respect to graduate program size, increased external funding allows for a larger number of students on graduate research assistantships (GRAs), which enables a graduate program to support a larger number of students overall. Furthermore, support by a GRA (as opposed to a GTA) generally allows the student to devote more time to their research project, which increases overall productivity as well as enabling students to complete their degrees in a shorter time. Both of these are factors that make a graduate program more attractive to a prospective student, and enable the university to be more selective in recruiting students. VT has a strong research funding profile, but has substantial room for improvement in comparison to other top land grant universities, especially with respect to external funding. The NSF publishes data on university expenditures each year in its Higher Education Research and Development (HERD) report. Table 7.1 shows total research expenditures for our aspirational peer land grant universities, taken from the 2018 HERD report. Only North Carolina State has lower total research expenditures, and is also ranked lower in THE Global University Rankings. Eleven of the higher-ranked universities have expenditures >$700M, compared to $532M for VT. The difference is exacerbated when only externally-supported research expenditures are considered. In this case, VT is the lowest of all of these peer universities at $312M. Ten of the comparison universities have external expenditures >$500M. THE Global Rankings are plotted against external research expenditures (Fig. 7.1) For universities with large, well-established medical schools, research expenditures associated with their medical schools can be a large fraction of the university's total expenditures. The final column of Table 7.1 shows the portion of the total research expenditures that are not associated with a medical school. In this case, VT fares a bit better, as five of the universities have lower non-medical school expenditures. However, it should be noted that this measure does include institutional expenditures, which are fairly large for VT compared to this set of universities. The HERD report does not provide information on the external and internal expenditures for the medical school and non-medical school expenditure categories. So VT's standing in the non-medical school expenditure category is likely boosted by its large internally-supported expenditures.
Table 7.1. Research Expenditures of Top Global Land Grant Universities from 2018 NSF HERD report.
Land Grant Univ. THE Global
Rank Total Res. Exp. ($M)
External Res. Exp. ($M)
Non-Medical School Exp. ($M)
U. of California, Berkeley 13 797 627 797
Cornell U. 19 1072 797 652
U. of Illinois 48 653 473 653
U. of Wisconsin 51 1206 808 788
U. of California, Davis 55 789 581 594
Ohio St. Univ. 70 875 746 512
Pennsylvania St. Univ. 78 908 712 804
U. of Minnesota 79 955 650 685
Michigan St. Univ. 84 715 427 634
Purdue Univ. 88 632 380 632
U. of Maryland 91 541 401 541
U. of Arizona 104 687 473 474
Rutgers U. 168 706 536 411
U. of Florida 175 865 641 479
Texas A&M 178 922 646 875
Virginia Tech 201-250 532 312 532

68
North Carolina State U. 301-350 510 389 510

69
Figure 7.1. THE Global Rankings vs. total external research expenditures (in this and all Figures in this section, VT data represented by red star).
Two methods to support increased external funding are discussed in this report. The first (discussed later in this section) is to provide further support mechanisms to faculty in the process of research proposal development, based on comparison to support provided by peer universities. The second approach (Section 4) is specifically targeted to graduate students as they prepare and submit proposals for external fellowships. While this approach is not as likely to result in large increases in VT's total research expenditures, it will have a targeted impact on increasing the quality and quantity of graduate students at VT, as well as their productivity and future success. Another mechanism for increased external research funding is to increase the number of tenured and tenure track faculty (T/TT), which VT is already doing through Destination Areas, Innovation Campus, and other initiatives. Additional approaches for increasing the T/TT faculty size will support increased VT research funding. Table 7.2 shows the number of T/TT faculty at the top land grant universities from IPEDS Fall 2017 data. While four of the peer universities have fewer T/TT faculty than VT, many of the other institutions benefit from having hundreds more T/TT faculty than VT. In addition to providing capability for increased research expenditures, a larger T/TT faculty will, in general, directly enable larger graduate programs and, as total research productivity is increased, higher perception of quality. It should be noted, however, that number of T/TT faculty alone does not correlate particularly well with THE Global Ranking. Table 7.2 also shows the external research expenditures (from Table 7.1) per tenured/tenure track faculty member. VT is the lowest in this group with Purdue and Michigan State only slightly higher.

70
Table 7.2. Number of Tenured, Tenure Track Faculty Members from IPEDS 2017 Data, External Research Expenditure per Tenured and Tenure Track Faculty Member, and THE Global Ranking.
Land Grant Univ.
THE Global Rank
Tenured and Tenure Track Faculty
Ext. Research Exp. per T/TT Faculty ($k)
U. of California, Berkeley 13 1361
461
Cornell U. 19 1398 570
U. of Illinois 48 1762 268
U. of Wisconsin 51 1924 419
U. of California, Davis 55 1508 385
Ohio St. Univ. 70 2455 303
Pennsylvania St. Univ. 78 1765 403
U. of Minnesota 79 2171 299
Michigan St. Univ. 84 1870 228
Purdue Univ. 88 1689 225
U. of Maryland 91 1410 284
U. of Arizona 104 1503 314
Rutgers U. 168 1794 298
U. of Florida 175 2451 261
Texas A&M 178 2015 320
Virginia Tech 201-250 1482 210
North Carolina State U. 301-350 1375 282
The NSF Survey of Graduate Students and Postdoctorates in Science and Engineering (https://www.nsf.gov/statistics/srvygradpostdoc/) provides data on the number of graduate students in science, engineering, and health that are supported externally, institutionally, and on their own at each university, which is shown along with the ratio of externally-supported students per T/T faculty member in Table 7.3. It should be noted that the number of students only includes science, engineering, and health disciplines while the T/TT faculty number is for the entire university. VT falls near the middle of the pack in number of externally-funded students per T/TT faculty member. Figure 7.2 shows the correlation between THE Global Ranking and number of externally-funded graduate students. There is, in general, a good correlation, but rankings for a few universities (including VT, North Carolina State, and Texas A&M) fall significantly below the trendline. This is true for most other correlations as well, suggesting that these universities seem to be systematically undervalued in the global rankings. Nonetheless, this correlation suggests that increasing the number of externally-funded students through working to increase external funding and the number of T/TT faculty would strengthen VT's graduate programs and increase its global ranking.
Table 7.3. Number of Externally-Funded Graduate Students in Science, Engineering and Health, Number of Tenured and Tenure Track Faculty Members, and Corresponding Ratio for Top Global Land Grant Universities.
Land Grant University Externally-Funded Graduate Students
Tenured and Tenure Track Faculty
Ext.-Funded Students per T/TT Faculty
U. California, Berkeley 1613 1361 1.19
U. of Wisconsin 2171 1924 1.13
Purdue Univ. 1398 1689 0.83
North Carolina State U. 1099 1375 0.80
Texas A&M 1599 2015 0.79
U. of Maryland 951 1410 0.67
U. of Illinois 1182 1762 0.67
Pennsylvania St. Univ. 1169 1765 0.66
U. of California, Davis 975 1508 0.65

71
Virginia Tech 958 1482 0.65
U. of Minnesota 1241 2171 0.57
Ohio St. Univ. 1369 2455 0.56
Michigan St. Univ. 832 1870 0.44
U. of Florida 998 2451 0.41
U. of Arizona 551 1503 0.37
Rutgers U. 505 1794 0.28
Figure 7.2. THE Global Rankings vs. number of externally-funded graduate students.
Support for Preparing Research Proposals Rationale and purpose - As described elsewhere in the report, rankings of our aspirational peer land grant universities (and perceived quality of graduate programs) correlate with success in garnering funds from external sources. University support, at various levels, is critically important to success in the intensely competitive funding climate. Therefore, the GETF deemed it worthwhile to explore various means by which our peer institutions support grant proposal preparation and other aspects of external funding. Our primary goal was to learn about best practices at other universities that could be applied productively at VT. Our approach was to design two survey vehicles with a mix of specific and open-ended questions about various mechanisms of proposal support. Survey questions were framed with input from GETF members and from the Virginia Tech Office of Sponsored Programs (OSP). One survey was addressed to the institutional director of the Office of Sponsored Programs, or the equivalent. The second survey was addressed to faculty in those institutions who were selected by members of the GETF. Both surveys are attached as Appendices 7A1 and 7A2. The topics probed by the two surveys were essentially identical, to provide different perspectives on the same topic. Summary of responses 14 surveys were sent OSP directors and nine were returned: Penn State University UC Davis University of Arizona* University of Maryland Rutgers University University of Minnesota

72
Texas A&M University* North Carolina State* Purdue University 23 faculty surveys were distributed and 10 faculty responded from: North Carolina State (3 responses)* Michigan St. U. (2 responses) Cornell U. Ohio St. Texas A&M* U. Arizona* U. of Florida *Institutions with responses from both OSP and faculty Unfortunately, none of the OSP directors responded to the last four questions, perhaps due to a glitch in the survey. All of the responses, verbatim, can be downloaded in two spreadsheets from https://drive.google.com/open?id=1ebwxg2RAZ9dBmLcb8sdpFQ4JfDi1oUdd. We summarize the observations deemed to be most pertinent, below:
1. Our peer institutions varied widely in services provided to faculty 2. Faculty indicated different levels of satisfaction with those services, ranging from “I feel fortunate for the
support we have” to “We are not a model anyone should follow.” 3. For the two institutions with multiple faculty respondents, awareness of services provided by each
institution seemed to vary within the institution. 4. For the three institutions with responses from directors and faculty, the faculty perceptions aligned
reasonably well with those of the OSP director. 5. Almost every institution makes an effort to inform faculty about funding opportunities, typically on a
weekly or monthly basis. Communications typically originate from OSP or college levels. Most institutions do not appear to target this information for expertise, and the majority do not assess the effectiveness of this service. However, one institution issues an annual survey and one uses Google analytics to track page accessions.
6. With regard to support for building and maintaining relationships with large government and industry sponsors, some institutions employ “federal relations staffs” and/or “corporate engagement centers”. However, this does not appear to be a very common practice. Purdue appears to be a model of best practices in “taking advantage of our Federal Relations staff to learn about upcoming appropriate opportunities or connect with government personnel to discuss opportunities”. On the industry side, Purdue is “Assisting in connecting potential industry sponsors to faculty with a particular expertise/research experience. Also, connecting faculty to potential industry sponsors”. Similarly, Cornell employs state and federal government liaisons as well as University, College and School/Department level business partnership liaisons. The government liaisons work with individual faculty on identifying funding sources and transmitting requests from federal or state government. The business partnership liaison interacts with faculty that are interested in specific business partnerships, and also with businesses that are interested in forming a partnership with Cornell. Cornell also engages undergraduate and graduate students, identifying internship opportunities and other educational opportunities.
7. Internal seed funding programs are common, often targeted, and typically competitive. 8. The majority of institutions offer support for preparation of large proposals, typically defined as $1-1.5
million and higher. The degrees and types of support appear to vary and appeared difficult to access from a couple of faculty perspectives.

73
9. Support for budget development and review is almost ubiquitous and generally effective, based on faculty responses.
10. Most institutions appear to offer at least some degree of support for “other forms”. Cornell appears to have a mechanism for tracking Current and Pending support and generating the necessary output, worthy of further exploration and perhaps adoption.
Overall, VT is positioned solidly within this group of aspirational peers, offering a number of laudable support mechanisms. We recommend the following to elevate VT to the upper echelon of this group: Recommendations
1. Make every effort to broadly publicize the resources that are already in place. We recognize that such efforts are already being made, but some repetition/redundancy is necessary to build full awareness of the valuable resources that are in place.
2. Conduct an annual survey to assess effectiveness of information provided via Recommendation 1. 3. Adopt mechanisms similar to those of Purdue and Cornell summarized in point 6 above. In particular,
there is great potential value in encouraging government relations staff to engage with funding agencies to identify funding opportunities as they are under development (in other words, well in advance of formal announcements) and to make every effort to embed VT faculty on committees from government granting agencies and other entities that conceive and design new funding opportunities. In this way, our faculty can shape such opportunities and can begin preparing proposals well in advance of the due dates.
4. Adopt the mechanism from Cornell summarized in point 10 above to allow assisted preparation of certain forms.
5. a) Consider locating some pre-award OSP staff in the colleges so they develop strong relationships with proposal submitters and thereby help improve proposal quality and success. We note that some colleges are already implementing this recommendation (e.g., CALS). b) Consider encouraging such co-located staff to develop agency-specific expertise and networking (regular contact, periodic meetings with key agency program managers, advance knowledge of upcoming large solicitations, beginning to develop relationships that will allow VT faculty to influence program manager choices about solicitations) that is well-suited to the college they support; e.g. NSF for COS, USDA for CALS, DOE for COE, EPA for CNRE.
6. Build additional grant support teams that function at a university-wide level, using the FAST team as a model.

74
Appendix 7A1. Sponsored Programs Survey - OSP Directors
Start of Block: Default Question Block
Q1 Thank you for your willingness to provide information about your institution's mechanisms for supporting faculty grant proposals. The goal of this survey is to understand how the Offices of Sponsored Programs (OSP) at our peer institutions support grant proposal preparation, assembly, and submission in order to learn best practices that could be recommended to Virginia Tech's OSP. In return, we would be happy to share our aggregated findings with you so that you will also understand how your institution compares to other universities.
Q2 As you answer the following questions, please consider the major sources of external funding sought at your institution.
Q3 How often does your institution inform faculty about funding opportunities?
o Never (or rarely)
o At least once per year
o At least quarterly
o Every month or so
o Every week or so
Display This Question:
If Does your institution actively provide information about funding opportunities? = Yes
Q4 To what degree is this information customized to faculty expertise and interests??
o There is no intentional targeting of the communication.
o The communication is targeted based on college or institute affiliation.
o The communication is targeted at a department or program level.
o To the degree possible, the communication is targeted based on individual faculty expertise.

75
Display This Question:
If Does your institution actively provide information about funding opportunities? = Yes
Q5 Where does the communication originate?
o Central Administrative Office (1)
o College (2)
o Department (3)
o Other (4) ________________________________________________
Display This Question:
If Does your institution actively provide information about funding opportunities? = Yes
Q6 How is feedback collected on the impact of this service?
________________________________________________________________
Q7 Does your institution provide support in building and maintaining relationships with large government and industry sponsors?
o Yes (1)
o No (2)
Display This Question:
If Does your institution provide support in building and maintaining relationships with large govern... = Yes
Q8 Please summarize the types of support that are provided to faculty. (If the information is available on a public website, feel free to provide a URL.)
________________________________________________________________
________________________________________________________________
________________________________________________________________
________________________________________________________________
________________________________________________________________

76
Q9 Describe the types of support that your institution provides to facilitate the initiation of large research programs, centers, or other infrastructure (e.g., seed funding, project management) that can be leveraged for success on large proposals.
________________________________________________________________
________________________________________________________________
________________________________________________________________
________________________________________________________________
________________________________________________________________
Q10 Discuss the resources at your institution provided to facilitate logistical aspects of large, complex proposals. Are there particular criteria for prioritizing requests for support of proposals?
________________________________________________________________
________________________________________________________________
________________________________________________________________
________________________________________________________________
________________________________________________________________
Q11 Discuss how your institution provides assistance in preparing budgets and entering the information in the relevant submission portal.
________________________________________________________________
________________________________________________________________
________________________________________________________________
________________________________________________________________
________________________________________________________________
Q12 Describe the assistance provided by your institution in filling out other forms (e.g., current and pending support) or preparation of other supporting material (e.g., templates for data management plans, mentoring plans)?
________________________________________________________________
________________________________________________________________

77
________________________________________________________________
________________________________________________________________
________________________________________________________________
Q13 Please share the most effective mechanisms of support that your institution provides for grant preparation and submission. (If the information is available on a public website, feel free to provide a URL.)
________________________________________________________________
________________________________________________________________
________________________________________________________________
________________________________________________________________
________________________________________________________________
Q14 Please discuss mechanisms of support that you would implement if resources were available.
________________________________________________________________
________________________________________________________________
________________________________________________________________
________________________________________________________________
________________________________________________________________
Q15 So that we can appropriately interpret your responses and provide a summary of our findings, please provide your contact information:
o Name (1) ________________________________________________
o Title (2) ________________________________________________
o E-mail address (3) ________________________________________________
May we contact you if we have brief follow-up questions? (Yes/No)
End of Block: Default Question Block
Appendix 7B2. Sponsored Programs Survey - Faculty

78
Start of Block: Default Question Block
Q1 Thank you for your willingness to provide information about your institution's mechanisms to support faculty grant proposals. The goal of this survey is to understand how the Offices of Sponsored Programs (OSP) at our peer institutions support grant proposal preparation, assemblage, and submission in order to learn best practices that could be recommended to Virginia Tech's OSP. In return, we would be happy to share our aggregated findings with you so that you will also understand how your institution compares to other universities.
Q2 Please identify a few examples of the major sources of external funding sought in your research program:
________________________________________________________________
Q3 Does your institution actively provide you with funding opportunities targeted to your expertise?
o Yes (1)
o No (2)
Display This Question:
If Does your institution actively provide you with funding opportunities targeted to your expertise? = Yes
Q5 Where does the communication originate from?
o Central Administrative Office (1)
o College (2)
o Department (3)
o Other (4) ________________________________________________
Display This Question:
If Does your institution actively provide you with funding opportunities targeted to your expertise? = Yes
Q6 How relevant and helpful is this service?
________________________________________________________________

79
Q7 Does your institution provide support in building and maintaining relationships with large government and industry sponsors?
o Yes (1)
o No (2)
Display This Question:
If Does your institution provide support in building and maintaining relationships with large govern... = Yes
Q8 Please summarize the types of support that are provided to faculty.
________________________________________________________________
________________________________________________________________
________________________________________________________________
________________________________________________________________
________________________________________________________________
Q9 Describe the types of support that your institution provides to facilitate the startup of large research programs, centers, or other infrastructure (e.g., seed funding, project management, etc.) that can be leveraged for success on large proposals.
________________________________________________________________
________________________________________________________________
________________________________________________________________
________________________________________________________________
________________________________________________________________
Q10 Discuss the resources at your institution to facilitate logistical aspects of large, complex proposals. Are there particular criteria for prioritizing requests for support of proposals?
________________________________________________________________
________________________________________________________________
________________________________________________________________
________________________________________________________________

80
________________________________________________________________
Q11 How does your institution assist you in budget preparation and entering budgets into the relevant submission portal?
________________________________________________________________
________________________________________________________________
________________________________________________________________
________________________________________________________________
________________________________________________________________
Q12 What assistance does your institution provide in filling out other forms (e.g., current and pending support, etc.) or preparation of other supporting material (e.g., templates for data management plans, mentoring plans, etc.)?
________________________________________________________________
________________________________________________________________
________________________________________________________________
________________________________________________________________
________________________________________________________________
Q13 Please share the most effective forms of support that your institution provides for grant proposal preparation and submission
________________________________________________________________
________________________________________________________________
________________________________________________________________
________________________________________________________________
________________________________________________________________

81
Q14 Please summarize support mechanisms that you wished existed at your institution.
________________________________________________________________
________________________________________________________________
________________________________________________________________
________________________________________________________________
________________________________________________________________
Q16 Please provide your contact information:
o Name (1) ________________________________________________
o Title (2) ________________________________________________
o E-mail Address (3) ________________________________________________
End of Block: Default Question Block

82
8. Enhancing the Quality of Graduate Education Much GETF work has focused on improving the outputs of VT graduate education, such as more students, more publications, more successful proposals, higher national rankings. All of these are appropriate goals. Another critical area of focus is simply the quality of graduate education at VT. For example, how well do we educate, support, reward, and involve our graduate students? How can we make the graduate education experience at VT more enjoyable, rewarding, interdisciplinary, enriching? Importantly, recent research reveals the importance of “considering students’ individual needs and decision factors1.” We took a number of approaches to address this aspect: discussions among the GETF, discussions with stakeholders, and most importantly a “forum-style” discussion with a group of VT graduate students who are deeply committed to the quality of the graduate education experience. We discuss this aspect of our report below in three sections:
1) Distinctive Aspects of Graduate Education at VT: GETF members and others felt that it was important to underline how much VT already does to enhance the quality of graduate education. This is an area of strength for VT, which of course does not preclude the possibility of improvement. We summarize below some perceived strengths of graduate education at VT.
2) Summary of Key Points from Graduate Student Forum: We summarize the key points brought up by VT graduate student leaders around the quality of VT graduate education. We wished to give a rich sense of the points most important to our students, beyond what could be captured in recommendations. (Full notes on the forum are attached as Appendix 8A.)
3) Recommendations: We outline our resulting recommendations for improving the quality of VT graduate education.
1. Distinctive Aspects of Graduate Education at VT Understanding that institutional context and culture uniquely influence the student experience2, we point out just a few illustrative examples of the distinctive, nationally- and internationally-admired aspects of graduate education at VT3. VT graduate education provides a consistent, high-profile emphasis on student success and well-being, based on a holistic perspective (e.g., academic respect, child care, diversity & inclusion4, community-building at various levels). This emphasis informs and incentivizes best mentoring practices and conveys to the students that they are integral, valued members of the VT community. The Preparing the Future Professoriate program adds value to any program of study and provides the participant with a distinctive credential. Over six hundred Future Professoriate Graduate Certificates have been earned, with another ~100 in progress. Nearly 1,500 students have taken the Preparing the Future Professoriate course, and a similar number have taken the Contemporary Pedagogy course. VT graduate education promotes other societal goals such as engaging citizens in scholarship, enhancing workforce diversity, and effectively enhancing the ability of scientists to communicate the value of their work5. GRAD courses have enabled and accelerated such progress. For example, just in the last 10 years, 170 students have taken Diversity for Global Society, while in the same period 339 students have taken the Communicating Science course. Every VT GTA has the opportunity to participate in a session on Oral Communication as part of the GTA Workshop, GRAD 5004 (ca. 800 graduate student participants/yr). The Citizen Scholar Engagement initiative has drawn 130 students who will head out into society trained in how to be engaged citizens. The Interdisciplinary Graduate Education Program (IGEP) is a model for effective promotion of interdisciplinary research. Whenever we describe it to colleagues at other institutions, they express their envy about the program. Multiple peer land-grant universities have invited those involved in graduate education at VT to visit and describe the workings of IGEPs. More recently, VT has initiated an Individualized Interdisciplinary Ph.D. (IPhD) program, enabling students to pursue interdisciplinary studies in a self-created curricular framework that transcends departmental or program boundaries, when the studies are so creative that the education and progress of the student is best served by the IPhD framework. In the first five years of the existence of IPhD, thirteen IPhD programs have been approved by the Commission of Graduate and Professional Studies and Policies, and recently the first IPhD student

83
graduated. IPhD is achieving its goal of improving the quality of VT graduate education; recently a student presenting his IPhD proposal remarked that the existence of IPhD at VT enabled him to do the interdisciplinary Ph.D. program that would have been very difficult to execute anywhere else, and he remarked that the availability of IPhD was the reason that this (extremely bright and creative) student came to VT.
2. Summary of Key Points from Graduate Student Forum Students provided input on key ways to improve the quality of graduate education at VT, as well as key areas of strength for VT.
A. Financial Issues: Students expressed concerns about the high cost of accommodations in Blacksburg, their need for financial literacy training, the burden of student loans, food security, and the quality of graduate housing.
B. Advising and Mentoring: The students highlighted such support as a key opportunity for improvement at VT, including: better ways for graduate students to give input and feedback on the quality of mentoring and advising, better professional learning for advisors, better guidance to help graduate students select and interact with advisors, and increased emphasis on quality advising and mentoring (e.g., better recognition for good mentoring and placing clear significance (e.g., in the promotion and tenure process) on either good or bad mentoring performance).
C. Student Success and Culture: The Graduate School’s work to create community among graduate students was highlighted as a Virginia Tech advantage. Opportunities for more attention include: mental health issues, follow-up on issues discussed with Graduate School staff, resources and information for entering graduate students, and better mechanisms for feedback from current and departing graduate students.
3. Recommendations Drawing upon insights from the hosted forum, as well as literature on factors supporting graduate student success6, we present the following recommendations.
1. We recommend that the COE mentorship program be expanded to include all new assistant professors at VT, thereby accelerating and directing their growth to be effective mentors for graduate students. Background: The College of Engineering (COE) has implemented the mentorship professional learning program developed at the Universities of Minnesota and Wisconsin7-9 by the Center for the Improvement of Mentored Experiences in Research (CIMER), and funded by both the NIH and the NSF. The first two years of the VT COE program included all assistant professors hired during that time; and COE has aspirations for expanding the program to all professors and even to graduate students (to teach them how to effectively interact with mentors and mentees) in future years. One GETF member participated in the first year of these mentoring sessions in COE and was impressed with the engagement of the young faculty members and the effectiveness of professional learning. Given the importance of mentorship of graduate students and effective running of a research group, as well as the paucity of such professional learning in a typical graduate school environment, training new VT faculty members to be better mentors can have a significant positive impact on the quality of graduate education.
2. We recommend implementation of 360 feedback for tenure-track faculty (TTF). Background: Recent research reveals that faculty advising plays a critical role (both positive and negative) in graduate student satisfaction and completion rates10. Currently TTF benefit from annual feedback from
department heads, and higher-level VT administrators benefit from 360 feedback as part of their five-year reviews. We suggest, as a mechanism for enhancing the quality of graduate education, that VT
consider implementing periodic 360 feedback for all TTF members to include feedback from their graduate students (as well as from faculty peers, department heads, and other appropriate administrators [e.g., an institute director for TTF who are strongly involved in that institute]). The frequency should be

84
high enough to give timely feedback but not so frequent as to be an unreasonable burden; perhaps every 3-5 years would be appropriate. Preservation of graduate student responder anonymity in small groups
is a critical consideration. One possible approach could be to create a VT survey instrument to be used by all, with the results going to department heads/chairs. Recipients would be instructed not to share
detailed results with the faculty member unless the group contained X graduate students (X could be 3-5, for example). Such feedback could be highly beneficial to the quality of mentorship, to graduate student progress, and to the quality of VT graduate education.
3. Implement a Professional Development Graduate Certificate. Background: When students engage in meaningful communities of practice, the experience aids in navigating the challenges of graduate education11. Professional skills (including oral and written communication, team leadership, statistical analysis skills, and effective team membership) are essential for nearly all professions that our graduates pursue. VT has many professional learning opportunities for graduate students to gain these skills. We propose creation of a graduate certificate to highlight the importance of these professional skills, provide a framework for adding coursework to enhance missing skills, and provide visible recognition to those students who attain these skills at VT.
Lastly, we would like to note that a great deal of additional data was collected by the Task Force on the full set of U.S. Land Grant universities. Those data are discussed in Appendix G.
References
1) Wall Bortz, W. E., Knight, D. B., Lyles, C. H., Kinoshita, T., Choe, N. H., Denton, M., & Borrego, M. A Competitive System: Graduate Student Recruitment in STEM and Why Money May Not be the Answer. The Journal of Higher Education, 2020, 1-26. https://doi.org/10.1080/00221546.2019.1706017
2) Gardner, S. K. (2010). Contrasting the socialization experiences of doctoral students in high-and low-completing departments: A qualitative analysis of disciplinary contexts at one institution. The Journal of Higher Education 2010, 81(1), 61-81. https://doi.org/10.1080/00221546.2010.11778970
3) Borrego, M.; DePauw, K.P. Interdisciplinary Graduate Education: Role of the Graduate School, CGS GradEdge, 2012, October, Volume 1, number 8
4) DePauw, K.P. What Works: Creating Diverse and Inclusive Graduate Campuses. Diverse Issues in Higher Education, 2019.
5) DePauw, K.P. Evolving landscape of global higher education: Challenges and opportunities from a graduate education perspective. In Major Challenges Facing Higher Education in the Arab World: Quality Assurance and Relevance. 2019, Springer. (125-132).
6) Gilmore, J. A., Wofford, A. M., & Maher, M. A. (2016). The flip side of the attrition coin: Faculty perceptions of factors supporting graduate student success. International Journal of Doctoral Studies, 2016, 11, 419-439. http://www.informingscience.org/Publications/3618
7) Rogers, J.; Sorkness, C.A.; Spencer, K.; Pfund, C. Increasing research mentor training among biomedical researchers at Clinical and Translational Science Award hubs: The impact of the facilitator training initiative J. Clin. Trans. Sci. 2018, 2, 118-123.
8) Pfund, C., Byars-Winston, A., Branchaw, J.L., Hurtado, S., and Eagan, M.K. Defining Attributes and Metrics of Effective Research Mentoring Relationships. AIDS and Behavior 2016 , 20, 238-248.
9) Butz, A.; Branchaw, J.; Pfund, C.; Byars-Winston, A.; Leverett, P. Promoting STEM trainee research self-efficacy: a mentor training intervention. Understanding Interventions 2018, 9, 3730.
10) Maher, M. A., Wofford, A. M., Roksa, J., & Feldon, D. F. (2018). Exploring early exits: Doctoral attrition in the biomedical sciences. Journal of College Student Retention: Research, Theory & Practice 2018, 1521025117736871. https://doi.org/10.1177%2F1521025117736871.
11) deChambeau, A. The practice of being a student: CoPs and graduate student success. In Jacquie McDonald & Aileen Cater-Steel (Eds.), Implementing Communities of Practice in Higher Education: Dreamers and Schemers 2017, (395-422). Singapore: Springer. https://doi.org/10.1007/978-981-10-2866-3_18

85

86
Appendix 8A. Detailed notes from graduate student forum, 1-15-20. Attending: Cortney Steele, Hypatia Alexandria, Cynthia Hampton, Maruf Hoque, Kirsten Davis, Angie Desoto, Martina Svyantek, Johnny C. Woods, Jr., Kacy Lawrence, Margie Lee, Kevin Edgar We asked the students two questions ahead of time in preparation for the open discussion. 1. What are the top three things that you would like to see improved in order to increase the quality of graduate
education at Virginia Tech? 2. What are the best aspects of graduate education at Virginia Tech, that we should make certain to preserve
and nurture as we go forward? The discussion was free form; student responses are grouped into a few topics on which most of the discussion
focused. D. Financial Issues: Subject of much focus. Consider cost of living in Blacksburg when setting stipend minima,
accommodations expensive in Blacksburg. There is a public servant loan forgiveness program, but graduate assistantships do not typically qualify (Required: full time employee of the university and at least 30 hours per week); how can we address (policy, legislation)? Develop financial literacy course for grad students that would help them work the system. Stipends are not considered when applying for home loans, some lenders may allow stipends if there is a multi-year contract (≥ 3 years). Need for bridge funding from graduate school between end of one funding source and start of another. Issues with accumulating burden of student loan interest. Several comments about how high VTs comprehensive fees are. Housing concerns and quality of housing (on a budget) are a concern especially to those graduate students with families. Issues of food security.
E. Advising and mentoring: Advising and mentoring should be prominent consideration in P&T process. Need a comment box or online equivalent that would enable collection of anonymous concerns about advisors and others. Better training in mentoring and coaching. Better consistency of quality info in dept handbooks, high importance for available resources to be shared in handbooks (accurate and updated). Advice on how to effectively pick advisor. List of neutral mediators from across university; faculty who are good at it and willing to advise students, e.g. from other departments. Make important advice available to students, e.g. in the form of short videos. Put a description of one and a link into every weekly grad school bulletin. Use data
analytics to identify and guide resources to key issues. Use SPOT evaluation of mentors or 360 feedback tools.
F. Culture: Concerns expressed about quality of life, culture, agency. Many properties available to grad students don’t meet minimum standards (mold etc.). Can VT work with Blacksburg city to address? Can VT help with discussions with landlords? Need more attention to mental health issues. Concern about whether follow-up to discussions with ombudsman, deans is adequate. Improve tracking, assessment. Staff-grad student interactions need to be considered in addition to GS-faculty interactions. A major plus was noted as the grad school’s ongoing efforts to create community.
G. Student success: Need a touch point for entering grad students, and a list of resources (from grad coordinator?). Do exit surveys of students who leave programs. Items for department/program dashboards; time to degree, attrition, number of students who switch labs. Use as early indicator of problem programs. Survey students for satisfaction; perhaps in third semester? GSA could take active role in educating new GS. Led to discussion of how time-consuming GSA service is; advisors often don’t support. Could GA slots be available for GSA leadership? This could lead to better faculty support, more competition for GSA slots.
H. Other comments: 1. Enhance contacts and interaction with industry. Make it part of the curriculum. 2. Create aspirational benchmarks beyond our normal list of competitor universities. 3. Important to improve professional development. Work-life balance GRAD course was very valuable.

87
4. Comments on grad student-initiated proposals; provide touch point for students at VT, create awareness of opportunities, encourage students to apply, provide for students to submit mini-proposal as part of admissions application.

88
Other Report Appendices
A. Graduate Education Task Force Charge Memo: April 3, 2019
Kevin Edgar, Associate Dean, Graduate School
Brennan Shepard, Director for Financial Planning
Jeff Earley, Associate Vice Provost for Finance
Rajesh Bagchi, Chair, Commission on Graduate Studies and Policies
Randy Heflin, Associate Dean for Research, COS
Nancy Ross, Professor of Geosciences
Tom Ewing, Associate Dean of Graduate Studies & Research, CLAHS
Margie Lee, Head, Biomedical Sciences and Pathobiology
Dennis Dean, Director of Fralin Life Science Institute
Eric Kaufman, Faculty Senate
Kenneth Wong, Associate Dean of the Graduate School & Northern Virginia Center Director
Samantha Fried, President of the Graduate Student Assembly
Glenda Gillaspy, Professor and Department Head, Biochemistry
Dear Colleagues:
As a Very High Research Activity (Carnegie classification) Land Grant university, it is imperative that Virginia Tech
maintain and advance development of its research-based graduate degree programs. Building on accomplishments achieved
at the department and college levels, the Graduate School has introduced a number of high-impact programs to enhance both
the disciplinary and professional education of graduate students. These include the Interdisciplinary Graduate Education
Programs (IGEPs) and the Transformative Graduate Education (TGE) initiative, which consists of a cluster of linked
programs designed to facilitate acquisition of disciplinary and interdisciplinary knowledge and support scholarly inquiry,
leadership development, and social responsibility.
While these and other programs have enriched the educational experience of graduate students, Virginia Tech is also
experiencing challenges related to declining applications for admission and decreased enrollment. Furthermore, it is unclear
whether individual graduate degree programs are achieving their potential for international recognition. As you know, the
university is in the process of drafting a new strategic plan to realize the vision of Beyond Boundaries. Scholarly excellence
and the close relationship between research and graduate education are anticipated to feature prominently in the plan.
To prepare graduate programs for full engagement with the new strategic plan, I am commissioning a task force to review
our research-based graduate education programs and draft recommendations for further enhancement. Please accept this
letter as your invitation to serve on this task force and to lend your expertise and experience to this important issue. Please
email Shannon Harvey ([email protected]) with your participation plans at your earliest convenience as she will be working
to schedule a meeting with this group in the next few weeks.
The task force will be charged to address the following:
•_ Conduct a comparative analysis (relative to peer land grant universities) of:
o Virginia Tech research-based graduate education programs, with particular attention to applications, admissions,
enrollment, and student success outcomes (retention, time to candidacy status, time to degree completion);
o the cost of research-based graduate education programs to students, Virginia Tech, and extramurally-funded grants
and contracts; and
o the national reputations of individual graduate degree programs.
• Recommend metrics and milestones that should be used to evaluate and track progress accomplished in graduate
program development.
• Consider and, if appropriate, recommend policy revisions and other actions that will reduce the cost of graduate
education and drive enrollment. Please note that one such action related to differential tuition for students with candidate
status has already received a supportive recommendation from University Council (Resolution CGSP 2018-19D).

89
• Consider and, if appropriate, recommend policy revisions that stipulate the importance of graduate student mentorship
for promotion and tenure.
• Consider and, if appropriate, recommend strategies to incentivize faculty and academic units to increase engagement in
graduate education.
• Recommend any other actions that have potential to advance both the size and quality of research-based graduate
education.
The task force will be chaired by Dr. Kevin Edgar. The timetable for submission of a report to my office and to Dr. Karen
DePauw, vice president and dean for graduate education, will be discussed during the initial charge meeting.
I look forward to working with you to accomplish this important task.
Sincerely,
Cyril R. Clarke
Executive Vice President and Provost
B. Hypotheses VT ranks approximately 225th on the world universities list. Among our aspirational peer land grant universities, Michigan State ranks 93rd, Penn State ranks 81st, Purdue ranks 64th, and University of California, Davis ranks 60th. In many cases VT trails significantly behind universities in states of similar or lower values of measures like population or gross domestic product, that one could readily imagine would influence funding available to support high quality graduate programs and education. We sought hypotheses that might help explain these apparent disparities. Hypotheses developed by the Graduate Education Task Force:
Hypothesis Relevant Data Developed Data Supports or Refutes?
Size matters – a larger UG population helps finances, a larger faculty population affords more “shots on goal” with regard to research grants
Undergraduate and graduate enrollment data
Weakly supports*
Stipend size matters – higher stipends help attract the best students
COS dept stipend size vs. other univ., survey data
Supports
VT has lost paying students over the last decade
Graduate enrollment data Supports loss of MS students
VT has lost students on assistantships over past decade
Graduate enrollment data Refutes
Fewer GS researchers per research dollar (inefficient)
Land grant univ. data (Excel spreadsheet)
Refutes
VT lags behind aspirational competitors in fellowships, self-supported students, traineeships
NSF data Supports
Excessive time to degree reduces ability to hire new GS
We did not see evidence that VT time to degree is excessive
Need to more effectively integrate biomedical research (Vet Med, Med School, MII, Infectious Disease biology, etc.)
Prior work by Dennis Dean TF We did not explore further; existing One Health initiative is a good model

90
Decline in master’s in education dominates losses in masters (paying masters at that) students; due to changes in certification requirements
Grad enrollment data Supports
We have not focused well; many small graduate programs with inadequate scale
We chose not to further explore
We do not distribute discretionary funding in the most effective way to get optimal programmatic results
We chose not to further explore
Our recruitment strategies are ineffectual
Application data Supports
Our endowment is too small; diminishing what could be an important source of investment in fellowships
Land grant univ. data Supports
VT faculty are not sufficiently successful in winning grant competitions
Land grant univ. data Supports
We do not provide sufficient support or encouragement to graduate students who would seek or are on graduate student-initiated grant proposals
Comparison with highly effective universities in this regard
Supports
*Note that this refers to correlation with total enrollment. Correlation with faculty size and graduate enrollment in many departments was quite strong (See Sections 1 & 2 of report).

91
C. Graduate Teaching and Research Assistant Annual Stipend Comparison by 4-Digit CIP Code
Virginia Tech rates converted to a full-time 9-month rate (20 hrs/wk), as of September 30, 2018 Peer average based on 36 R1 institutions responding to the 2018-19 Oklahoma State Graduate Assistant Stipend Survey
(See Page 4 of this Appendix)
Graduate Teaching Assistants Graduate Research Assistants
Virginia Tech Peer Virginia Tech Peer
Average
Average
Average
Average
CIP Code Descriptions Count
Stipend Count
Stipend Count
Stipend Count
Stipend
01.00
Agriculture, General. 1 18,054 3 17,319
01.01
Agricultural Business and Management.
1 17,595 105 17,362 32 18,667 454 19,000
01.06
Applied Horticulture and Horticultural Business Services.
2 10,980 6 15,191
01.08
Agricultural Public Services. 28 13,796 33 16,400
01.09
Animal Sciences. 31 18,532 98 15,525 27 19,243 583 17,098
01.10
Food Science and Technology. 7 16,813 37 18,270 6 17,400 354 19,106
01.11
Plant Sciences. 9 18,506 128 17,371 40 18,439 924 20,447
03.01
Natural Resources Conservation and Research.
95 16,962 286 18,025
03.02
Natural Resources Management and Policy.
28 17,143 109 17,224
03.03
Fishing and Fisheries Sciences and Management.
13 18,063 4 17,068 35 18,619 64 14,023
03.05
Forestry. 19 18,139 52 16,758 36 18,714 275 19,727
03.06
Wildlife and Wildlands Science and Management.
30 18,715 46 16,642
04.02
Architecture. 17 18,524 345 11,679 2 16,592 131 11,953
04.03
City/Urban, Community and Regional Planning.
15 14,978 62 14,232 4 17,213 81 13,669
04.04
Environmental Design. 5 17,095 14 14,895 10 18,177 5 15,580
04.06
Landscape Architecture. 79 15,124 42 10,842 32 15,171
05.01
Area Studies. 97 16,121 36 13,544
05.02
Ethnic, Cultural Minority, Gender, and Group Studies.
147 15,889 31 16,184
09.01
Communication and Media Studies.
13 15,480 638 17,760 81 18,635
09.04
Journalism. 224 16,413 161 17,529
09.07
Radio, Television, and Digital Communication.
80 15,005 8 26,217

92
09.09
Public Relations, Advertising, and Applied Communication.
81 13,014 9 15,181
11.01
Computer and Information Sciences, General.
82 18,409 417 19,805 106 19,421 386 19,870
11.04
Information Science/Studies. 54 15,961 6 17,000
11.07
Computer Science. 692 14,602 742 21,217
13.01
Education, General. 230 17,043 362 16,668
13.03
Curriculum and Instruction. 29 16,673 317 14,754 3 18,927 152 17,141
13.04
Educational Administration and Supervision.
1 18,558 208 16,035 2 18,558 380 16,279
13.05
Educational/Instructional Media Design.
11 21,046 12 25,049
13.06
Educational Assessment, Evaluation, and Research.
16 17,771 3 17,256 50 20,199
13.10
Special Education and Teaching.
34 16,258 48 19,453
13.11
Student Counseling and Personnel Services.
2 15,858 150 18,587 1 16,605 145 18,628
13.12
Teacher Education and Professional Development, Specific Levels and Methods.
39 16,002 25 19,995
13.13
Teacher Education and Professional Development, Specific Subject Areas.
236 16,103 100 18,084
14.01
Engineering, General. 141 16,809 249 20,011
14.02
Aerospace, Aeronautical and Astronautical Engineering.
34 18,123 163 16,941 68 18,531 316 18,851
Graduate Teaching Assistants Graduate Research Assistants
Virginia Tech Peer Virginia Tech Peer
Average
Average
Average
Average
CIP Code Descriptions Count
Stipend Count
Stipend Count
Stipend Count
Stipend
14.03
Agricultural Engineering. 11 19,433 47 17,496 16 19,311 318 18,656
14.05
Biomedical/Medical Engineering.
6 19,068 163 18,567 56 19,979 474 20,764
14.07
Chemical Engineering. 21 14,448 254 16,943 34 20,364 1,070 22,955
14.08
Civil Engineering. 80 18,392 510 15,845 128 19,038 1,165 18,802
14.09
Computer Engineering. 32 17,295 68 16,301 67 19,701 68 16,181
14.10
Electrical, Electronics and Communications Engineering.
60 17,235 997 17,862 204 19,224 1,845 19,468
14.11
Engineering Mechanics. 20 19,362 37 19,370
14.14
Environmental/Environmental Health Engineering.
7 18,054 27 16,904 10 18,545 37 17,810

93
14.18
Materials Engineering 22 17,942 82 17,549 32 19,532 421 20,752
14.19
Mechanical Engineering. 44 18,529 976 16,974 156 18,821 1,602 19,067
14.21
Mining and Mineral Engineering.
2 18,036 8 17,750 26 18,381 11 19,449
14.22
Naval Architecture and Marine Engineering.
1 18,558 2 18,702
14.23
Nuclear Engineering. 2 18,792 50 18,953 12 19,328 271 24,519
14.32
Polymer/Plastics Engineering.
6 18,221 30 19,433
14.33
Construction Engineering. 1 20,000 5 18,455
14.35
Industrial Engineering. 38 19,700 362 16,799 33 19,304 402 17,708
14.43
Biochemical Engineering. 4 22,734
14.99
Engineering, Other. 15 18,343 22 17,261 23 18,855 22 17,325
15.03
Electrical Engineering Technologies/Technicians.
23 16,405 21 16,384
16.01
Linguistic, Comparative, and Related Language Studies and Services.
4 15,280 650 16,292 33 20,396
16.05
Germanic Languages, Literatures, and Linguistics.
28 17,396 8 19,297
16.09
Romance Languages, Literatures, and Linguistics.
240 18,831 70 23,066
16.12
Classics and Classical Languages, Literatures, and Linguistics.
102 17,174 20 18,375
19.04
Family and Consumer Economics and Related Studies.
38 17,213 17 17,201
19.05
Foods, Nutrition, and Related Services.
22 18,910 107 15,059 11 24,709 155 16,940
19.07
Human Development, Family Studies, and Related Services.
25 15,929 230 16,522 4 17,332 238 16,213
23.01
English Language and Literature, General.
19 15,837 1,772 16,874 207 19,169
23.13
Rhetoric and Composition/Writing Studies.
44 17,290 222 21,385 1 17,721 3 18,157
24.01
Liberal Arts and Sciences, General Studies and Humanities.
84 14,723 41 16,062
26.01
Biology, General. 51 18,797 1,480 20,399 104 20,108 706 20,988
26.02
Biochemistry, Biophysics and Molecular Biology.
6 14,238 166 19,130 517 22,459
26.03
Botany/Plant Biology. 2 22,131 63 20,373 39 18,687 305 20,160
26.04
Cell/Cellular Biology and Anatomical Sciences.
4 40,000 82 24,591

94
26.05
Microbiological Sciences and Immunology.
88 18,807 272 21,791
26.07
Zoology/Animal Biology. 2 17,595 154 19,524 30 18,006 379 20,237
26.08
Genetics. 15 20,778 54 25,558
26.09
Physiology, Pathology and Related Sciences.
72 20,580
26.10
Pharmacology and Toxicology.
7 20,714 150 18,750
26.11
Biomathematics, Bioinformatics, and Computational Biology.
2 17,595 18 20,983 22 20,311 172 22,245
Graduate Teaching Assistants Graduate Research Assistants
Virginia Tech Peer Virginia Tech Peer
Average
Average
Average
Average
CIP Code Descriptions Count Stipend Count Stipend Count Stipend Count Stipend
26.13
Ecology, Evolution, Systematics, and Population Biology.
131 18,066 319 22,713
26.99
Biological and Biomedical Sciences, Other.
23 19,810 88 18,370 23 19,269 66 20,220
27.01
Mathematics. 47 17,501 1,796 19,929 9 18,365 211 21,058
27.05
Statistics. 35 18,007 448 20,516 14 19,140 113 20,977
30.12
Historic Preservation and Conservation.
4 15,912
30.15
Science, Technology and Society.
13 15,535 3 21,030
30.17
Behavioral Sciences. 13 14,956 7 21,344
30.19
Nutrition Sciences. 86 18,457 46 15,059
30.20
International/Global Studies. 2 13,500 3 13,500
30.99
Multi/Interdisciplinary Studies, Other.
44 16,175 47 19,253
31.03
Parks, Recreation and Leisure Facilities Management.
33 11,733 28 17,935
31.05
Health and Physical Education/Fitness.
479 16,437 152 17,461
38.01
Philosophy. 11 15,184 360 17,090 32 19,040
40.04
Atmospheric Sciences and Meteorology.
30 22,327 122 21,934
40.05
Chemistry. 88 18,492 2,227 19,785 44 19,042 1,329 21,096
40.06
Geological and Earth Sciences/Geosciences.
29 17,355 615 17,367 20 19,205 614 18,726
40.08
Physics. 71 16,871 1,226 19,844 26 17,600 922 20,381
40.10
Materials Sciences. 20 19,657 84 26,148

95
42.01
Psychology, General. 36 17,782 1,113 17,697 12 19,095 627 18,736
42.28
Clinical, Counseling and Applied Psychology.
231 17,684 218 16,187
43.01
Criminal Justice and Corrections.
63 15,126 76 19,061
43.03
Homeland Security. 6 21,572 9 27,087
44.04
Public Administration. 10 17,921 50 23,707 2 17,911 170 20,601
44.05
Public Policy Analysis. 50 14,586 56 17,173
44.07
Social Work. 120 15,371 177 15,905
45.02
Anthropology. 422 15,732 103 18,637
45.06
Economics. 31 18,231 640 18,663 1 20,878 128 19,568
45.07
Geography and Cartography. 15 16,198 353 17,025 8 20,355 145 20,100
45.10
Political Science and Government.
13 14,048 572 16,885 171 19,063
45.11
Sociology. 16 16,694 612 17,527 4 16,493 141 19,295
45.12
Urban Studies/Affairs. 17 17,377 7 18,458
45.99
Social Sciences, Other. 25 18,120 8 12,907 1 17,066
50.01
Visual and Performing Arts, General.
127 14,711 34 18,040
50.04
Design and Applied Arts. 69 16,272 16 17,023
50.05
Drama/Theatre Arts and Stagecraft.
10 14,819 267 14,835 74 16,328
50.06
Film/Video and Photographic Arts.
38 16,410 1 11,700
50.07
Fine and Studio Arts. 608 14,698 60 17,432
50.09
Music. 1,174 15,364 115 14,080
51.02
Communication Disorders Sciences and Services.
134 13,652 155 16,060
51.05
Advanced/Graduate Dentistry and Oral Sciences.
99 17,511 28 13,126
51.09
Allied Health Diagnostic, Intervention, and Treatment Professions.
3 16,009 17 19,278
51.11
Health/Medical Preparatory Programs.
12 12,664 1 18,670
51.12
Medicine. 6 15,962 328 25,737
51.20
Pharmacy, Pharmaceutical Sciences, and Administration.
206 15,316 325 20,603
51.22
Public Health. 5 17,969 201 14,562 4 17,784 383 18,168
Graduate Teaching Assistants Graduate Research Assistants

96
Virginia Tech Peer Virginia Tech Peer
Average
Average
Average
Average
CIP Code Descriptions Count
Stipend Count
Stipend Count
Stipend Count
Stipend
51.23
Rehabilitation and Therapeutic Professions.
62 19,322 66 25,102
51.24
Veterinary Medicine. 75 22,583 162 19,292
51.25
Veterinary Biomedical and Clinical Sciences.
10 19,383 6 20,244 21 20,851 117 27,166
51.38
Registered Nursing, Nursing Administration, Nursing Research and Clinical Nursing.
226 13,793 99 17,193
51.99
Health Professions and Related Clinical Sciences, Other.
4 18,032 16 16,964
52.01
Business/Commerce, General.
15 24,480 91 12,518 57 14,241
52.02
Business Administration, Management and Operations.
43 21,879 469 17,008 4 18,288 432 20,600
52.03
Accounting and Related Services.
7 14,430 297 12,923 103 17,911
52.08
Finance and Financial Management Services.
132 14,102 77 20,441
52.09
Hospitality Administration/Management.
1 13,149 53 14,936 26 15,213
52.10
Human Resources Management and Services.
26 16,588 15 15,583
52.12
Management Information Systems and Services.
61 15,759 55 21,650
52.13
Management Sciences and Quantitative Methods.
58 17,043 35 17,419
52.14
Marketing. 117 13,108 81 19,207
52.20
Construction Management. 5 16,202
54.01
History. 14 15,551 789 17,042 100 18,644
60.04
Medical Residency Programs - General Certificates.
1 19,226 124 21,490
99.00
All Other Programs 3 18,819 1,421 14,891 22 20,508 3,788 17,830
Reporting Peer Institutions (Total 36):
Arizona State University University of Delaware Auburn University (AL) University of Georgia Binghamton University (SUNY) University of Iowa Clemson University (SC) University of Louisville (KY) Florida State University University of Missouri at Columbia Kansas State University University of Nebraska at Lincoln Louisiana State University University of Nevada at Reno Mississippi State University University of New Mexico Montana State University University of North Carolina at Chapel Hill

97
North Carolina State University University of North Texas Oklahoma State University University of Oklahoma Oregon State University University of South Florida Purdue University (IN) University of Tennessee at Knoxville Texas A & M University University of Texas at Austin Texas Tech University University of Utah University of Alabama University of Wisconsin at Milwaukee University of Arkansas Washington State University University of Colorado at Denver Wayne State University (MI)

98
D. 2019-20 Full-Time Graduate Assistant Monthly Stipend Compensation Table
Step Rate Per Pay Period Monthly Rate 9 Month Total 12 Month Total
Step 1 $ 758.50 - $ 758.50 $ 1,517 - $ 1,517 $ 13,653 - $ 13,653 $ 18,204 - $ 18,204 Step 2 759.00 - 787.50 1,518 - 1,575 13,662 - 14,175 18,216 - 18,900 Step 3 788.00 - 815.50 1,576 - 1,631 14,184 - 14,679 18,912 - 19,572 Step 4 816.00 - 843.50 1,632 - 1,687 14,688 - 15,183 19,584 - 20,244 Step 5 844.50 - 871.50 1,689 - 1,743 15,201 - 15,687 20,268 - 20,916
Step 6 872.00 - 901.00 1,744 - 1,802 15,696 - 16,218 20,928 - 21,624 Step 7 901.50 - 928.50 1,803 - 1,857 16,227 - 16,713 21,636 - 22,284 Step 8 929.00 - 957.50 1,858 - 1,915 16,722 - 17,235 22,296 - 22,980 Step 9 958.50 - 985.00 1,917 - 1,970 17,253 - 17,730 23,004 - 23,640 Step 10 985.50 - 1,014.50 1,971 - 2,029 17,739 - 18,261 23,652 - 24,348
Step 11 1,015.00 - 1,041.00 2,030 - 2,082 18,270 - 18,738 24,360 - 24,984 Step 12 1,042.00 - 1,068.50 2,084 - 2,137 18,756 - 19,233 25,008 - 25,644 Step 13 1,070.00 - 1,098.50 2,140 - 2,197 19,260 - 19,773 25,680 - 26,364 Step 14 1,099.50 - 1,126.00 2,199 - 2,252 19,791 - 20,268 26,388 - 27,024 Step 15 1,127.00 - 1,155.00 2,254 - 2,310 20,286 - 20,790 27,048 - 27,720
Step 16 1,155.50 - 1,183.00 2,311 - 2,366 20,799 - 21,294 27,732 - 28,392 Step 17 1,183.50 - 1,211.00 2,367 - 2,422 21,303 - 21,798 28,404 - 29,064 Step 18 1,211.50 - 1,240.50 2,423 - 2,481 21,807 - 22,329 29,076 - 29,772 Step 19 1,241.00 - 1,268.50 2,482 - 2,537 22,338 - 22,833 29,784 - 30,444 Step 20 1,269.00 - 1,296.00 2,538 - 2,592 22,842 - 23,328 30,456 - 31,104
Step 21 1,297.00 - 1,325.00 2,594 - 2,650 23,346 - 23,850 31,128 - 31,800 Step 22 1,325.50 - 1,351.50 2,651 - 2,703 23,859 - 24,327 31,812 - 32,436 Step 23 1,352.00 - 1,380.50 2,704 - 2,761 24,336 - 24,849 32,448 - 33,132 Step 24 1,381.00 - 1,409.50 2,762 - 2,819 24,858 - 25,371 33,144 - 33,828 Step 25 1,410.00 - 1,437.50 2,820 - 2,875 25,380 - 25,875 33,840 - 34,500
Step 26 1,438.00 - 1,465.00 2,876 - 2,930 25,884 - 26,370 34,512 - 35,160 Step 27 1,465.50 - 1,495.50 2,931 - 2,991 26,379 - 26,919 35,172 - 35,892 Step 28 1,496.00 - 1,522.00 2,992 - 3,044 26,928 - 27,396 35,904 - 36,528 Step 29 1,523.00 - 1,550.50 3,046 - 3,101 27,414 - 27,909 36,552 - 37,212 Step 30 1,551.00 - 1,579.50 3,102 - 3,159 27,918 - 28,431 37,224 - 37,908
Step 31 1,580.00 - 1,606.50 3,160 - 3,213 28,440 - 28,917 37,920 - 38,556 Step 32 1,607.00 - 1,635.00 3,214 - 3,270 28,926 - 29,430 38,568 - 39,240 Step 33 1,636.00 - 1,663.50 3,272 - 3,327 29,448 - 29,943 39,264 - 39,924 Step 34 1,664.00 - 1,691.50 3,328 - 3,383 29,952 - 30,447 39,936 - 40,596 Step 35 1,692.00 - 1,719.50 3,384 - 3,439 30,456 - 30,951 40,608 - 41,268
Step 36 1,720.00 - 1,748.00 3,440 - 3,496 30,960 - 31,464* 41,280 - 41,952
Step 37 1,748.50 - 1,776.00 3,497 - 3,552 31,473 - 31,968 41,964 - 42,624 Step 38 1,776.50 - 1,804.50 3,553 - 3,609 31,977 - 32,481 42,636 - 43,308 Step 39 1,805.00 - 1,833.50 3,610 - 3,667 32,490 - 33,003 43,320 - 44,004 Step 40 1,834.00 - 1,860.50 3,668 - 3,721 33,012 - 33,489 44,016 - 44,652
Step 41 1,861.00 - 1,890.50 3,722 - 3,781 33,498 - 34,029 44,664 - 45,372 Step 42 1,891.50 - 1,918.00 3,783 - 3,836 34,047 - 34,524 45,396 - 46,032 Step 43 1,919.00 - 1,946.00 3,838 - 3,892 34,542 - 35,028 46,056 - 46,704 Step 44 1,946.50 - 1,975.00 3,893 - 3,950 35,037 - 35,550 46,716 - 47,400 Step 45 1,975.50 - 2,002.50 3,951 - 4,005 35,559 - 36,045 47,412 - 48,060
Step 46 2,003.00 - 2,032.00 4,006 - 4,064 36,054 - 36,576 48,072 - 48,768 Step 47 2,033.00 - 2,059.00 4,066 - 4,118 36,594 - 37,062 48,792 - 49,416 Step 48 2,059.50 - 2,088.50 4,119 - 4,177 37,071 - 37,593 49,428 - 50,124 Step 49 2,089.00 - 2,116.00 4,178 - 4,232 37,602 - 38,088 50,136 - 50,784 Step 50 2,116.50 - 2,144.50 4,233 - 4,289 38,097 - 38,601 50,796 - 51,468
Approved by BOV in April 2019 - Start Date Effective August 10, 2019
In-state tuition scholarship payment may be option if stipend exceeds 9-month total at Step 36 or more ($31,464)

99
E. Survey of Graduate Students and Postdoctorates in Science and Engineering (GSS) Fall 2017
GSS Code List Complete List of GSS Eligible Fields and Codes
Contents:
Agricultural Science Fields .............................................................................................................................................. 20
Natural Resources and Conservation ............................................................................................................................ 21
Biological and Biomedical Science Fields ...................................................................................................................... 21
Computer and Information Science Fields .................................................................................................................... 22
Geoscience, Atmospheric and Ocean Science Fields ................................................................................................... 23
Engineering Fields ............................................................................................................................................................ 23
Health Fields ...................................................................................................................................................................... 24
Mathematics and Statistics Fields ................................................................................................................................... 26
Physical Science Fields ..................................................................................................................................................... 26
Psychology Fields ............................................................................................................................................................. 27
Social Science Fields ......................................................................................................................................................... 27
Multidisciplinary and Interdisciplinary Studies .......................................................................................................... 29
Do not include certificate programs or units that only award professional degrees, such as AuD, DDS, DED, DN, DNP, DO, DPM, DPT, DScPT, JD, MLA, MD, ND, OD, OTD, PharmD, PsyD, or SLPD.
GSS Field Title GSS Code
CIP Program Title
Agricultural Science Fields
Agricultural Economics 901 Agricultural Economics Natural Resource Economics
Agricultural Sciences 501 Agricultural and Horticultural Plant Breeding
Agricultural Animal Breeding Agriculture, General Agriculture, Agriculture
Operations, and Related Sciences, Other
Agroecology and Sustainable Agriculture
Agronomy and Crop Science Animal Health Animal Nutrition Animal Sciences, General Animal Sciences, Other Dairy Science Food Science
Food Science and Technology, Other
Food Technology and Processing
Horticultural Science International Agriculture Livestock Management Ornamental Horticulture
Plant Protection and Integrated Pest Management
Plant Sciences, General Plant Sciences, Other Poultry Science Range Science and Management Soil Chemistry and Physics Soil Microbiology Soil Science and Agronomy Soil Sciences, Other
GSS Code GSS Field Title CIP Program Title
100
Natural Resources and Conservation
Environmental Science and
Studies 510 Environmental Science Environmental Studies
Forestry, Natural Resources and Conservation
511 Fishing and Fisheries Sciences and Management
Forest Management/Forest Resources Management
Forest Resources Production and Management
Forest Sciences and Biology Forestry, General Forestry, Other Land Use Planning and
Management/Development
Natural Resources and Conservation, Other
Natural Resources Conservation and Research, Other
Natural Resources Management and Policy
Natural Resources Management and Policy, Other
Natural Resources/Conservation, General
Urban Forestry Water, Wetlands, and
Marine Resources Management
Wildlife, Fish and Wildlands Science and Management
Wood Science and Wood Products/Pulp and Paper Technology
Biological and Biomedical Science Fields
Biochemistry 602 Biochemistry Biochemistry and Molecular Biology Molecular Biochemistry
Biochemistry, Biophysics and Molecular Biology, Other
Biology 603 Biology/Biological Sciences, General
Biomedical Sciences 623 Biomedical Sciences, General
Biostatistics and Bioinformatics
618 Bioinformatics Biometry/Biometrics Biostatistics
Computational Biology
Biomathematics, Bioinformatics and Computational Biology, Other
Biophysics 605 Biophysics Molecular Biophysics
Biotechnology 624 Biotechnology
Botany and Plant Biology 606 Botany/Plant Biology
Botany/Plant Biology, Other Plant Molecular Biology
Plant Physiology
Plant Pathology/Phytopathology
Cell, Cellular Biology and Anatomical Sciences
619 Anatomy Cell Biology and Anatomy Cell/Cellular and Molecular Biology Cell/Cellular Biology and Histology
Developmental Biology and Embryology
Cell/Cellular Biology and Anatomical Sciences, Other
Ecology and Population Biology
620 Aquatic Biology/Limnology Ecology Conservation Biology Ecology, Evolution, Systematics and
Population Biology, Other Ecology and Evolutionary Biology
Environmental Biology
Evolutionary Biology Population Biology Systematic
Biology/Biological Systematics
Epidemiology 621 Epidemiology
Genetics Biological and Biomedical S
610 cience
Animal Genetics
Genetics, General Genetics, Other Genome Sciences/Genomics Human/Medical Genetics
Fields continued next page
Microbial and Eukaryotic Genetics
Molecular Genetics Plant Genetics

GSS Code GSS Field Title CIP Program Title
101
Microbiological Sciences and Immunology
611 Immunology Medical Microbiology
and Bacteriology
Microbiological Sciences and Immunology, Other
Microbiology and Immunology
Microbiology, General
Mycology
Parasitology
Virology
Molecular Biology 622 Molecular Biology
Photobiology Radiation Biology/Radiobiology
Structural Biology
Neurobiology and Neuroscience
950 Neuroanatomy Neurobiology and Anatomy Neurobiology and Behavior
Neuroscience Neurobiology and Neurosciences,
Other
Nutrition Science 612 Nutrition Sciences
Pathology and Experimental
Pathology 613 Pathology/Experimental Pathology
Pharmacology and Toxicology
614 Environmental Toxicology Molecular Pharmacology Molecular Toxicology Neuropharmacology Pharmacology
Pharmacology and Toxicology
Pharmacology and Toxicology, Other
Toxicology
Physiology 615 Aerospace Physiology and Medicine Cardiovascular Science Cell Physiology Endocrinology Exercise Physiology Molecular Physiology Neurobiology and Neurophysiology
Oncology and Cancer Biology
Physiology, General
Physiology, Pathology, and Related Sciences, Other
Reproductive Biology
Vision Science/Physiological Optics
Zoology and Animal Biology 616 Animal Behavior and Ethology Animal Physiology Entomology
Wildlife Biology
Zoology/Animal Biology
Zoology/Animal Biology, Other
Biological and Biomedical Sciences, not elsewhere classified
617 Biological and Biomedical Sciences, Other
Molecular Medicine
Computer and Information Science Fields
Computer Science (exclude DCS)
410 Computer Science
Computer and Information Sciences, general (exclude DCS)
411 Artificial Intelligence Computer and Information Sciences,
General Computer and Information Sciences,
Other
Informatics
Information Technology
Computer and Information Sciences, not elsewhere
classified (exclude DCS)
412 Computer and Information Sciences and Support Services, Other
Computer and Information Systems Security/Information Assurance
Computer Graphics Computer Systems Analysis/Analyst Computer Systems Networking
and Telecommunications
Data Modeling/Warehousing and Database Administration
Information Science/Studies
Modeling, Virtual Environments and Simulation

GSS Code GSS Field Title CIP Program Title
102
Geoscience, Atmospheric and Ocean Science Fields
Atmospheric Sciences and
Meteorology 301 Atmospheric Chemistry
and Climatology
Atmospheric Physics and Dynamics Atmospheric Science and
Meteorology, General
Atmospheric Science and Meteorology, Other
Meteorology
Geological and Earth Sciences
302 Geochemistry
Geochemistry and Petrology
Geology/Earth Science, General
Geophysics and Seismology
Geological and Earth Sciences/Geosciences, Other
Hydrology and Water Resources Science
Paleontology
Ocean and Marine Sciences 303 Marine Biology and Biological Oceanography
Marine Sciences
Oceanography, Chemical and Physical
Geoscience, Atmospheric and Ocean Sciences, not elsewhere classified
304
Engineering Fields
Aerospace, Aeronautical, and Astronautical Engineering
101 Aerospace, Aeronautical, and Astronautical/Space Engineering
Agricultural Engineering 102 Agricultural Engineering
Biological and Biosystems Engineering
115 Biological/Biosystems Engineering
Bioengineering and Biomedical Engineering
103 Bioengineering and Biomedical Engineering
Biomedical Technology/ Technician (exclude Master’s)
Chemical Engineering 104 Biochemical Engineering Chemical and
Biomolecular Engineering
Chemical Engineering
Chemical Engineering, Other
Engineering Chemistry Paper Science and Engineering Polymer/Plastics Engineering
Civil Engineering 105 Architectural Engineering Civil Engineering, General Civil Engineering, Other Construction Engineering Environmental/Environmental
Health Engineering Geotechnical and Geoenvironmental
Engineering
Structural Engineering
Surveying Engineering
Transportation and Highway Engineering
Water Resources Engineering
Electrical, Electronics, and Communications Engineering
106 Computer Engineering, General Computer Engineering, Other Computer Hardware Engineering Computer Software Engineering Electrical Engineering and Electronics
Engineering
Electrical, Electronics and Communications Engineering, Other
Laser and Optical Engineering
Telecommunications Engineering
Engineering Mechanics, Physics, and Science
107 Engineering Mechanics Engineering Physics/Applied Physics
Engineering Science
Industrial and Manufacturing Engineering
108 Industrial Engineering Manufacturing Engineering
Operations Research Systems Engineering
Mechanical Engineering
Engineering Fields continued
109
on
Electromechanical Engineering Mechanical Engineering
next page
Mechatronics, Robotics, and Automation Engineering

GSS Code GSS Field Title CIP Program Title
103
Metallurgical and Materials Engineering
110 Ceramic Sciences and Engineering Materials Engineering Metallurgical Engineering
Textile Sciences and Engineering
Mining and Mineral Engineering
111 Geological/Geophysical Engineering Mining and Mineral Engineering
Nuclear Engineering 112 Nuclear Engineering
Petroleum Engineering 113 Petroleum Engineering
Engineering, not elsewhere classified
114 Engineering Design Engineering, General Engineering, Other Forest Engineering
Naval Architecture and Marine Engineering
Ocean Engineering
Nanotechnology 116 Nanotechnology
Health Fields
Anesthesiology (Postdocs and NFRs only)
701 Anesthesiology
Cardiology and Cardiovascular Disease(Postdocs and NFRs only)
702 Cardiology Cardiovascular Diseases
Pediatric Cardiology
Communication Disorders Sciences (exclude AuD and SLPD)
723 Audiology/Audiologist Audiology/Audiologist and
Speech- Language Pathology/Pathologist
Communication Sciences and Disorders, General
Communication Disorders Sciences and Services, Other
Speech-Language Pathology/ Pathologist
Dental Sciences (exclude DDS)
718 Advanced/Graduate Dentistry and Oral Sciences, Other
Dental Clinical Sciences, General
Dental Materials
Dental Public Health and Education
Endodontics/Endodontology
Oral Biology and Oral and Maxillofacial Pathology
Oral/Maxillofacial Surgery Orthodontics/Orthodontology Pediatric Dentistry/Pedodontics Periodontics/Periodontology Prosthodontics/Prosthodontology Endocrinology, Diabetes, and
Metabolism (Postdocs and NFRs only)
704 Endocrinology, Diabetes, and Metabolism
Pediatric Endocrinology
Gastroenterology (Postdocs and NFRs only)
705 Gastroenterology
Hematology (Postdocs and NFRs only)
706 Hematology Pediatric Hematology
Neurology (Postdocs and NFRs only)
707 Neurology Neurosurgery
Nursing Science (exclude ND and DNP)
719 Nursing Science
Nursing (exclude Master’s, ND, and DNP)
719 Nursing Administration Nurse Anesthetist Registered Nursing/Registered Nurse
Registered Nursing, Nursing Administration, Nursing Research, and Clinical Nursing, Other Obstetrics and Gynecology
(Postdocs and NFRs only)
Health Fields continued on n
708 ext pa
Gynecology ge
Obstetrics

GSS Code GSS Field Title CIP Program Title
104
Oncology and Cancer Research (Postdocs and NFRs only)
703 Cancer Research
Medical Oncology
Oncology Research
Pediatric Oncology
Ophthalmology (Postdocs and NFRs only)
709 Ophthalmology
Otorhinolaryngology (Postdocs and NFRs only)
710 Otorhinolaryngology
Pediatrics (Postdocs and NFRs only)
711 Pediatrics Prematurity and Newborn
Pharmaceutical Sciences (exclude PharmD)
720 Clinical and Industrial Drug Development
Industrial and Physical Pharmacy and Cosmetic Sciences
Medicinal and Pharmaceutical Chemistry
Natural Products Chemistry and Pharmacognosy
Pharmaceutical Sciences
Pharmaceutics and Drug Design
Pharmacoeconomics/ Pharmaceutical Economics
Pharmacy Administration and Pharmacy Policy and Regulatory Affairs (exclude Master’s)
Pharmacy, Pharmaceutical Sciences, and Administration, Other (exclude Master’s) Public Health 712 Community Health and
Preventive Medicine
Environmental Health Health/Medical Physics International Public
Health/ International Health
Maternal and Child Health
Occupational Health and Industrial Hygiene
Public Health Education and Promotion
Public Health, General Public Health, Other
Psychiatry (Postdocs and NFRs only)
713 Behavioral Medicine (clinical) Child Psychiatry
Pulmonary Disease (Postdocs and NFRs only)
714 Pulmonary Disease
Radiological Sciences (Postdocs and NFRs only)
715 Nuclear Radiology Radiation Oncology
Radiological Physics
Surgery (Postdocs and NFRs only)
716 Orthopedics/Orthopedic Surgery Surgery
Veterinary Biomedical and Clinical Sciences (exclude DVM)
Health Fields continued on n
721
ext pa
Comparative and Laboratory Animal Medicine
Large Animal/Food Animal and Equine Surgery and Medicine
Small/Companion Animal Surgery and Medicine
Veterinary Anatomy Veterinary Biomedical and
Clinical Sciences, Other Veterinary Sciences/Veterinary
and Clinical Sciences, General
ge
Veterinary Infectious Diseases
Veterinary Microbiology and Immunobiology
Veterinary Pathology and Pathobiology
Veterinary Physiology
Veterinary Preventive Medicine, Epidemiology, and Public Health
Veterinary Toxicology and Pharmacology

GSS Code GSS Field Title CIP Program Title
105
2017 GSS: Glossary
Clinical Medicine, not elsewhere classified (exclude DN, DO, DPM, MD and OD)
717 Aerospace Medicine Allergy and Immunology Medicine Clinical Laboratory Medicine Clinical/Medical Laboratory
Science and Allied Professions, Other (exclude Master’s)
Complementary and Alternative Medicine
Connective Tissue Diseases Critical Care Medicine Dermatology Diabetes Emergency Medicine Gene Therapy
HIV/AIDS Infectious Diseases Internal Medicine Liver Diseases Medical Scientist (exclude MD) Metabolic diseases Nephrology Occupational Medicine Palliative Care Physical Medicine and
Rehabilitation/Physiatry
Trauma Urology
Health-Related, not elsewhere classified (exclude DPT, DScPT, and OTD)
722 Bioethics/Medical Ethics Health Professions and Related
Clinical Sciences, Other (exclude Master’s)
Health Services/Allied Health/Health Sciences, General
Kinesiology and Exercise Science
Medical Informatics
Occupational Therapy/Therapist (exclude Master’s and OTD)
Physical Therapy/Therapist (exclude Master’s, DPT and DScPT)
Rehabilitation Science
Interdisciplinary Fields – see Multidisciplinary and Interdisciplinary Studies on page 10
Mathematics and Statistics Fields
Mathematics and Applied Mathematics
402 Algebra and Number Theory Analysis and Functional Analysis Applied Mathematics, General Applied Mathematics, Other Computational Mathematics Computational and
Applied Mathematics
Financial Mathematics
Geometry/Geometric Analysis
Mathematics, General
Mathematics, Other
Mathematical Biology
Topology and Foundations
Statistics 403 Mathematics and Statistics Mathematics and Statistics, Other Mathematical Statistics and
Probability
Statistics, General
Statistics, Other
Multidisciplinary Fields – see Multidisciplinary and Interdisciplinary Studies on page 10
Physical Science Fields
Astronomy and Astrophysics 201 Astronomy Astronomy and Astrophysics, Other Astrophysics
Planetary Astronomy and Science
Chemistry 202 Analytical Chemistry Chemical Physics Chemistry, General Chemistry, Other Environmental Chemistry Forensic Chemistry
Inorganic Chemistry
Organic Chemistry Physical Chemistry Polymer Chemistry Theoretical Chemistry
Materials Sciences
Physical Science Fields con
205
tinued
Materials Chemistry Materials Science
on next page
Materials Sciences, Other

GSS Code GSS Field Title CIP Program Title
106
2017 GSS: Glossary
Physics 203 Acoustics Atomic/Molecular Physics Condensed Matter and
Materials Physics Elementary Particle Physics Nuclear Physics Optics/Optical Sciences
Physics, General Physics, Other Plasma and High-
Temperature Physics Theoretical and
Mathematical Physics
Physical Sciences, not
elsewhere classified 204 Physical Sciences Physical Sciences, Other
Psychology Fields
Clinical Psychology (exclude PsyD)
803 Clinical Psychology Clinical Child Psychology
Counseling and Applied Psychology (exclude PsyD)
804 Applied Behavior Analysis Applied Psychology Clinical, Counseling and
Applied Psychology, Other
Community Psychology Counseling Psychology Educational Psychology Environmental Psychology Family Psychology
Forensic Psychology Geropsychology Industrial and
Organizational Psychology
Health/Medical Psychology Personality Psychology Psychology, Other School Psychology Social Psychology
Psychology, General (exclude PsyD)
801 Psychology, General
Research and Experimental Psychology (exclude PsyD)
805 Cognitive Psychology and Psycholinguistics
Comparative Psychology Developmental and Child Psychology Experimental Psychology Psychopharmacology
Physiological Psychology/ Psychobiology
Psychometrics and Quantitative Psychology
Research and Experimental Psychology, Other Social Science Fields
Anthropology 902 Anthropology Anthropology, Other Cultural Anthropology
Medical Anthropology
Physical and Biological Anthropology
Criminal Justice – Safety Studies
911 Criminal Justice/Safety Studies
Economics 903 Applied Economics Development Economics and
International Development Economics, General
Economics, Other
Econometrics and Quantitative Economics
International Economics
Geography and Cartography 904 Geographic Information Science and Cartography
Geography
Geography, Other
History and Philosophy of Science and Technology
905 History and Philosophy of Science and Technology
Human Development Social Science Fields continu
915 ed on
Adult Development and Aging Child Development
next page
Human Development and Family Studies, General

GSS Code GSS Field Title CIP Program Title
107
2017 GSS: Glossary
107
International Relations and National Security Studies
912 International Relations and Affairs International Relations and
National Security Studies, Other
National Security Policy Studies
Linguistics 906 Applied Linguistics Linguistics
Linguistics of ASL and Other Sign Languages
Political Science and Government
907 American Government and Politics (United States)
Canadian Government and Politics Political Economy
Political Science and Government, General
Political Science and Government, Other
Public Policy Analysis 914 Education Policy Analysis Health Policy Analysis International Policy Analysis
Public Policy Analysis, General Public Policy Analysis, Other
Sociology 908 Demography and Population Studies
Rural Sociology
Sociology Sociology and
Anthropology (combined program) Social Sciences, not
elsewhere classified 910 African Studies
African-American/Black Studies American Indian/Native
American Studies
American/United States Studies/Civilization
Archeology Area Studies, Other Asian Studies/Civilization Asian-American Studies Balkans Studies Baltic Studies Canadian Studies Caribbean Studies Chinese Studies Commonwealth Studies Criminology Deaf Studies Disability Studies East Asian Studies Ethnic, Cultural Minority, Gender,
and Group Studies, Other Ethnic Studies European Studies/Civilization Folklore Studies French Studies Gay/Lesbian Studies German Studies Hispanic-American, Puerto Rican,
and Mexican-American/ Chicano Studies
Irish Studies Italian Studies Japanese Studies Korean Studies Latin American and
Caribbean Studies Latin American Studies Near and Middle Eastern Studies Pacific Area/Pacific Rim Studies Polish Studies Regional Studies (US, Canadian,
Foreign)
Research Methodology and Quantitative Methods
Russian, Central European, East European and Eurasian Studies
Russian Studies Scandinavian Studies Slavic Studies Social Sciences, General Social Sciences, Other South Asian Studies Southeast Asian Studies Spanish and Iberian Studies Tibetan Studies Ukraine Studies Ural-Altaic and Central Asian Studies Urban Studies/Affairs Western European Studies Women's Studies

108
2017 GSS: Glossary
108
Multidisciplinary and Interdisciplinary Studies
Multidisciplinary and Interdisciplinary Studies (include only programs with a science, engineering or health field component)
980 Accounting and Computer Science (combined program)
Behavioral Sciences Biological and Physical Sciences Biopsychology Cognitive Science Computational Science Gerontology Holocaust and Related Studies Human Biology Human Computer Interaction
Intercultural/Multicultural and Diversity Studies
International/Global Studies Mathematics and Computer Science
(combined program) Natural Sciences Peace Studies and Conflict
Resolution Science, Technology and Society Systems Science and Theory

109
2017 GSS: Glossary
109
Appendix F. Components of Times Higher Education Survey Analysis of University Rankings*
Element Component Percentage (%)
Teaching (30%) (learning environment)
Reputation survey 15
Staff-to-student ratio 4.5
Doctorate-to-bachelors ratio 2.25
Doctorates awarded/academic staff ratio 6
Institutional income 2.25
Research (30%) (volume, income, reputation)
Reputational survey 18
Research income 6
Research productivity 6
Citations (30%) (research influence)
30
International Outlook (7.5%) (staff, students, research)
Proportion of international students 2.5
Proportion of international staff 2.5
International collaboration 2.5
Industry Income (2.5%) (knowledge transfer)
2.5
*https://www.timeshighereducation.com/world-university-rankings/world-university-rankings-2020-methodology

110
2017 GSS: Glossary
110
Appendix G. Additional U.S. Land Grant University Data Collected As part of its work, the Task Force collected a large amount of data on all of the land grant universities in the United States. These data include numbers of full-time undergraduate students, total graduate students, full-time graduate students, GRAs, GTAs, tenured and tenure track faculty, and external research expenditures as well as the ratios of undergraduates per GTA, external research expenditures per GRA, GRAs per GTA, GRAs per faculty, external research expenditures per faculty, and undergraduate students per faculty. Other than the external research expenditures (which come from the NSF HERD report for 2017 expenditures), all of the other data come from the IPEDS Fall 2017 database. At the time the data were collected, the 2020 World University Rankings had not been released. The Global Rankings in the spreadsheet and the tables below are the 2019 THE World University Rankings. The full spreadsheet with separate tabs that have the data sorted on many of these quantities is available at: https://graduateschool.vt.edu/about/numbers/Gtf.html In addition, some of the most relevant quantities are shown in the following tables below just for the set of aspirational land grant universities. Graduate Research Assistants (includes externally- and institutionally-funded)
Land Grant University THE Global Rank GRAs
Purdue U. 64 2856
U. of Wisconsin 43 2666
U. of Illinois 50 2583
U. of Minnesota 71 2316
U. of Florida 156 2205
Ohio St. U. 71 1903
North Carolina St. U. 251-300 1801
Michigan St. U. 93 1758
Virginia Tech 251-300 1638 U. California - Berkeley 15 1546
Texas A&M U. 171 1375
U. California - Davis 59 1289
U. of Maryland 82 1180
Cornell U. 19 1093
U. of Arizona 159 875
Pennsylvania St. U. 81 846
Rutgers U. 176 444

111
2017 GSS: Glossary
111
Graduate Teaching Assistants and Other Graduate Assistants (not GRAs)
Land Grant University THE Global Rank GTAs + GAs
U. of Minnesota 71 3244
U. California - Berkeley 15 3148
U. of Illinois 50 3044
U. California - Davis 59 2958
U. of Maryland 82 2929
Pennsylvania St. U. 81 2746
U. of Wisconsin 43 2337
Ohio St. U. 71 2326
Texas A&M U. 171 2269
Purdue U. 64 2098
U. of Arizona 159 1867
Virginia Tech 251-300 1780 U. of Florida 156 1696
Cornell U. 19 1486
North Carolina St. U. 251-300 1451
Michigan St. U. 93 1340
Rutgers U. 176 906
External Research Expenditures per GRA
Land Grant University THE Global Rank Res. Exp. ($M)
GRAs Res. Exp. / GRA ($)
Purdue U. 64 449.3 2856 157,318
Virginia Tech 251-300 296.6 1638 181,074
U. of Illinois 50 469.4 2583 181,727
North Carolina St. U. 251-300 380.4 1801 211,216
Michigan St. U. 93 437.6 1758 248,919
U. of Florida 156 579.9 2205 262,993
U. of Minnesota 71 621.2 2316 268,221
U. of Wisconsin 43 799 2666 299,700
U. of Maryland 82 412.6 1180 349,661
Ohio St. U. 71 737 1903 387,283
U. California – Berkeley 15 602.7 1546 389,845
U. California – Davis 59 541.2 1289 419,860
Texas A&M U. 171 640.7 1375 465,964
U. of Arizona 159 435 875 497,143
Cornell U. 19 723.6 1093 662,031
Pennsylvania St. U. 81 676.3 846 799,409
Rutgers U. 176 517.8 444 1,166,216

112
2017 GSS: Glossary
112
Graduate Research Assistants per Graduate Teaching Assistant
Land Grant University THE Global Rank GRAs GTAs GRA / GTA
Purdue U. 64 2856 2098 1.36
Michigan St. U. 93 1758 1340 1.31
U. of Florida 156 2205 1696 1.30
North Carolina St. U. 251-300 1801 1451 1.24
U. of Wisconsin 43 2666 2337 1.14 Virginia Tech 251-300 1638 1780 0.92 U. of Illinois 50 2583 3044 0.85
Ohio St. U. 71 1903 2326 0.82
Cornell U. 19 1093 1486 0.74
U.of Minnesota 71 2316 3244 0.71
Texas A&M U. 171 1375 2269 0.61
U. California - Berkeley 15 1546 3148 0.49
Rutgers U. 176 444 906 0.49
U. of Arizona 159 875 1867 0.47
U. California – Davis 59 1289 2958 0.44
U. of Maryland 82 1180 2929 0.40
Pennsylvania St. U. 81 846 2746 0.31
Graduate Research Assistants per Tenured and Tenure Track Faculty
Land Grant University THE Global Rank GRAs T/TT Fac. GRA per T/TT Fac.
Purdue U. 64 2856 1689 1.69
U. of Illinois 50 2583 1762 1.47
U. of Wisconsin 43 2666 1924 1.39
North Carolina St. U. 251-300 1801 1375 1.31
U. California - Berkeley 15 1546 1361 1.14 Virginia Tech 251-300 1638 1482 1.11
U. of Minnesota 71 2316 2171 1.07
Michigan St. U. 93 1758 1870 0.94
U. of Florida 156 2205 2451 0.90
U California - Davis 59 1289 1508 0.85
U. of Maryland 82 1180 1410 0.84
Cornell U. 19 1093 1398 0.78
Ohio St. U. 71 1903 2455 0.78
Texas A&M U. 171 1375 2015 0.68
U. of Arizona 159 875 1503 0.58
Pennsylvania St. U. 81 846 1765 0.48
Rutgers U. 176 444 1794 0.25

![Graduate School Task Force Stakeholder Presentation...stakeholders [e.g. faculty senate, council of deans, GOC Deans, URC Deans, graduate students, CPI, etc.] on the establishment](https://img.pdfslide.us/doc/110x75/5f30c04147fbe01b060051d8/graduate-school-task-force-stakeholder-presentation-stakeholders-eg-faculty.jpg)


![Federal Update [Presenter] [Conference] - Welcome | … · Tyrone Gadson Vonda Garcia Victoria Goeke Heather Hall Lewis ... • Task Force on Graduate-Specific Financial Aid Data](https://img.pdfslide.us/doc/110x75/5afa6af47f8b9aff288e7a81/federal-update-presenter-conference-welcome-gadson-vonda-garcia-victoria.jpg)