Embed Size (px)
Citation preview
REPORT OF THE
AUSTRALIAN ANDNEW ZEALANDNEONATAL NETWORK
ANZNN
Australian and N
ew Z
ealand Neonatal N
etwork 2010
report of the
AustrAliAn And new ZeAlAnd neonAtAl network
2010
sharon s.w. Chow
Anznn Executive:
kaye Bawden
roland Broadbent
david Cartwright
Jenny Corban
nick evans
ross haslam
kei lui
shelley reid
karen simmer
elizabeth sullivan
kenneth tan
william tarnow-Mordi
ANZNN

© Australian and New Zealand Neonatal Network 2013
This work is copyright. Apart from any use as permitted under the Copyright Act 1968, no part may be reproduced without prior written permission from the Australian and New Zealand Neonatal Network (ANZNN). Requests and enquiries concerning reproduction and rights should be directed to the Coordinator, Australian and New Zealand Neonatal Network at the Perinatal & Reproductive Epidemiology Research Unit, Level 2, McNevin Dickson Building, Gate 6, Avoca Street, Randwick Hospitals Campus, Randwick NSW 2031.
This publication is part of the Australian and New Zealand Neonatal Network annual reports series. A complete list of the ANZNN’s publications is available from the Network’s website <www.preru.unsw.edu.au/ANZNN>
ISBN: 978-0-9807290-3-0
Suggested citation:
Chow, S.S.W. 2013. Report of the Australian and New Zealand Neonatal Network 2010. Sydney: ANZNN.
Any enquiries about or comments on this publication should be directed to:
Coordinator Australian and New Zealand Neonatal Network Perinatal & Reproductive Epidemiology Research Unit Level 2, McNevin Dickson Building Gate 6, Avoca Street Randwick Hospitals Campus Randwick NSW 203
Phone: +612 9382 1047 Email: [email protected]
Published by the Australian and New Zealand Neonatal Network 2013 Designed and printed by Print Post Plus (P3)
Please note that there is the potential for minor revisions of data in this report. Please check the online version at <www.preru.unsw.edu.au/ANZNN> for any amendments.
iii
Contents
Acknowledgements ..................................................................................... v
Structure of this report ............................................................................. vi
Abbreviations ........................................................................................... vii
Participating units and supporting staff ..................................................... viii
1. Organisation of the ANZNN .................................................................... 1
History ....................................................................................................................... 1
Purpose of this report ................................................................................................. 1
Structure of the ANZNN ........................................................................................... 1
Registration criteria .................................................................................................... 2
Funding support ......................................................................................................... 3
Data set variables......................................................................................................... 3
2010 report of the Australian and New Zealand Neonatal Network .................. 4
Babies born in Australia, 2010 ..................................................................................... 5
Babies born in New Zealand, 2010 ............................................................................. 5
2. Babies registered to level III units, 2010 ..................................................... 6
3. Mothers of level III registrants, 2010 .........................................................10
Maternal age .............................................................................................................10
Previous antenatal history...........................................................................................10
Assisted conception ....................................................................................................10
Presenting antenatal problem ......................................................................................11
Antenatal corticosteroid use .......................................................................................12
Multiple births ...........................................................................................................13
Method of birth .........................................................................................................13
Place of birth .............................................................................................................14
Transport after birth to a level III NICU ....................................................................15
Breastfeeding at discharge ..........................................................................................15
4. Characteristics of level III registrants, 2010 ...............................................16
Baby gender...............................................................................................................16
Resuscitation in delivery suite ....................................................................................16
Apgar score at birth ...................................................................................................16
Admission temperature ..............................................................................................17
Indication for respiratory support ...............................................................................17
Exogenous surfactant .................................................................................................18
Type of assisted ventilation .........................................................................................19
iv
Ventilation in babies born at less than 32 weeks gestation ...........................................21
Ventilation in babies born at 32 to 36 weeks gestation ................................................21
Ventilation in babies born at term ..............................................................................21
Supplemental oxygen (O2) therapy .............................................................................21
Nasal high flow therapy .............................................................................................22
Chronic lung disease ..................................................................................................23
Pulmonary air leak .....................................................................................................23
Neonatal sepsis...........................................................................................................24
Retinopathy of prematurity .......................................................................................24
Intraventricular haemorrhage ....................................................................................26
Late cerebral ultrasound ............................................................................................27
Necrotising enterocolitis ............................................................................................28
Neonatal surgery .......................................................................................................28
Congenital anomalies .................................................................................................29
Transfer from level III NICUs to other units .............................................................29
Length of stay until discharge home ...........................................................................30
Survival of the ANZNN registrants ............................................................................31
5. Babies registered to level II units, 2010 .....................................................34
Overview ..................................................................................................................34
Maternal, pregnancy and birth characteristics..............................................................35
Characteristics of level II babies..................................................................................37
Eye examination ........................................................................................................38
Cerebral ultrasound....................................................................................................38
Other morbidities ......................................................................................................38
Level II transfers.........................................................................................................38
Survival .....................................................................................................................38
APPENDICES ..........................................................................................40
Appendix 1: Trends ....................................................................................40
Appendix 2: Data tables by birthweight, 2010 ...............................................49
Appendix 3: Methods used in this report ......................................................57
Derived data items: ....................................................................................................57
Appendix 4: Confidentiality guidelines .........................................................58
Principles of ownership and maintenance of data........................................................58
Conditions for data collection ....................................................................................58
Conditions for data security .......................................................................................59
Appendix 5: Minimum Data Set variables ....................................................60
Glossary ...................................................................................................73
List of Tables .............................................................................................76
List of Figures ...........................................................................................78
v
Acknowledgements
This is the fifteenth report of the Australian and New Zealand Neonatal Network (ANZNN) and the third report in the new format. The ANZNN has endeavoured to retain the information provided in previous reports to allow comparative reporting over time. Details of the current format can be found under ‘Structure of this report’.
The number of Australian level II units continues to increase with a total of eight units contributing data for this report, with more units joining ANZNN the number will continue to rise.
We would like to acknowledge all the units involved in the provision of data for this report. ANZNN appreciates the contribution of all participating units and we thank them for their ongoing support together with our data managers for their hard work and attention to detail.
The ANZNN greatly values the time, effort and expertise of the members of the ANZNN Advisory Committee and their conceptual, intellectual and financial contributions, all of which have helped make this network a respected and world-recognised organisation.
We thank the following members of the ANZNN Executive: Ross Haslam (Chairperson), Kaye Bawden, Roland Broadbent, David Cartwright, Jenny Corban, Brian Darlow, Nick Evans, Kei Lui, Shelley Reid, Karen Simmer, Elizabeth Sullivan, Kenneth Tan and William Tarnow-Mordi for their commitment and guidance for all the activities of the ANZNN. Particular thanks to the ANZNN Data Collection Operation Committee, namely Kei Lui (Chairperson), Jo Brooks, Ian Callander, David Cartwright, Deborah Donoghue, Lex Doyle, Lisa Hilder, Peter Marshall and Elizabeth Sullivan.
We thank QHealth (Australia) and Douglas Pharmaceuticals (New Zealand) for their ongoing support and for helping us to achieve our aims. We also thank the Leslie Stevens Fund for Newborn Care, Sydney Children’s Hospital Foundation for infrastructure support (2008 to 2010), as well as the Royal Hospital for Women Foundation for funding development of the data validation program. We acknowledge our colleagues from the Perinatal & Reproductive Epidemiology Research Unit for their continued technical support and encouragement.
vi
Structure of this report
Chapter 1: This chapter presents the structure and organisation of ANZNN together with some historical information related to its establishment. Also included is information on funding, selection criteria as well as a brief synopsis of level III registrants in Australia and New Zealand for 2010.
Chapter 2: ‘Babies registered to level III units, 2010’ provides information and characteristics on the ANZNN registrants in 2010 who are either born in a hospital with a level III unit or who are born elsewhere and then transferred to a level III unit within the first 28 days of life.
Chapter 3: ‘Mothers of level III registrants, 2010’ provides information on the mothers of level III registrants registered to the ANZNN in 2010.
Chapter 4: ‘Characteristics of level III registrants, 2010’ provides information about the babies admitted to a level III neonatal unit during 2010.
Chapter 5: ‘Babies registered to level II units, 2010’ provides information about babies registered to the level II special care baby units during 2010.
Appendices: Appendix 1 presents 10-year trends
Appendix 2 presents data tables by birthweight for 2010
Appendix 3 presents the methods employed for this report
Appendix 4 contains confidentiality guidelines, and conditions for data collection, use and security
Appendix 5 presents the Minimum Data Set for the ANZNN.
vii
Abbreviations
ABS Australian Bureau of Statistics
ANZNN Australian and New Zealand Neonatal Network
APH antepartum haemorrhage
CI confidence interval
CLD chronic lung disease
CPAP continuous positive airways pressure
CRIB Clinical Risk Index for Babies
ECMO extracorporeal membrane oxygenation
g gram
GIFT gamete intra-fallopian transfer
HFOV high frequency oscillatory ventilation
HMD hyaline membrane disease
ICD-10-AM The International Statistics Classification of Diseases and Related Health Problems,
Tenth Revision, Australian Modification
IPPV intermittent positive pressure ventilation
IQR interquartile range
IUGR intrauterine growth restriction
IVF in vitro fertilisation
IVH intraventricular haemorrhage
LOS length of stay
NEC necrotising enterocolitis
NHFT nasal high flow therapy
HFNC high flow nasal cannulae
NHMRC National Health and Medical Research Council
NICU neonatal intensive care unit
NO nitric oxide
O2 oxygen – normal air is 21% oxygen
PMA post menstrual age (completed weeks)
PPROM preterm pre-labour rupture of membranes
PRERU Perinatal & Reproductive Epidemiology Research Unit
PVL periventricular leukomalacia
RD respiratory distress
RDS respiratory distress syndrome
ROM rupture of membranes
ROP retinopathy of prematurity
UNSW University of New South Wales
WHO World Health Organization
viii
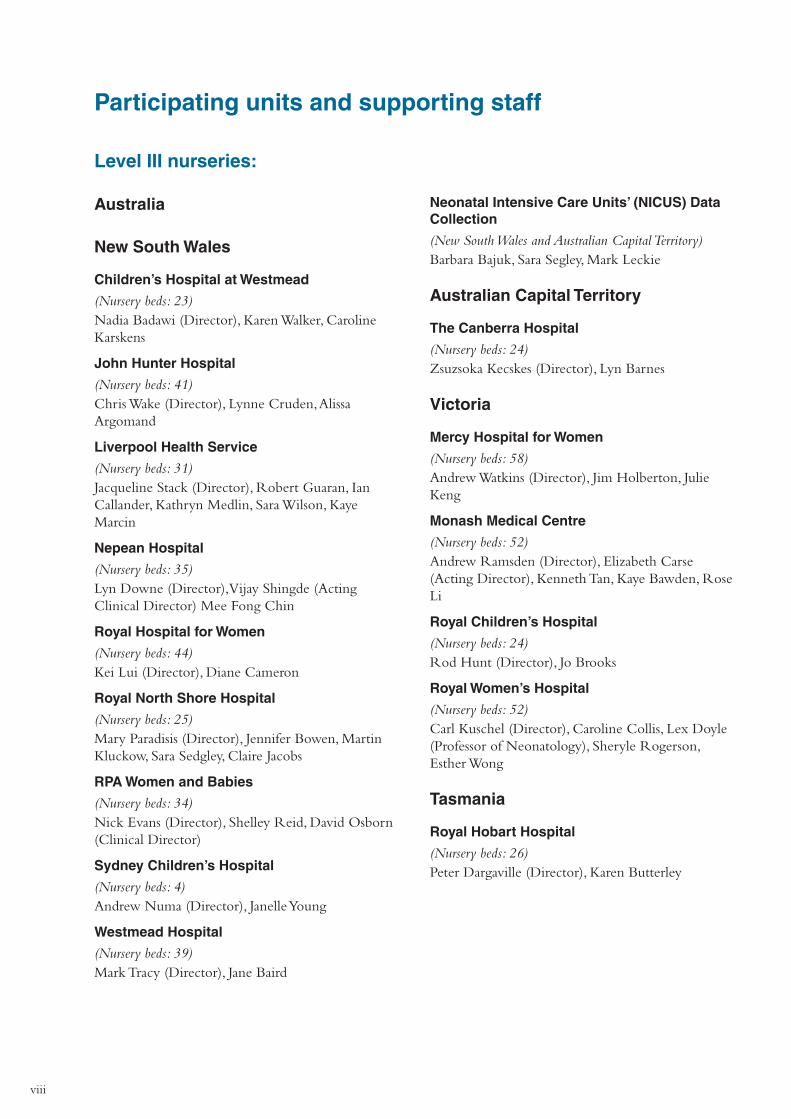
Participating units and supporting staff
Level III nurseries:
Australia
New South Wales
Children’s Hospital at Westmead
(Nursery beds: 23)Nadia Badawi (Director), Karen Walker, Caroline Karskens
John Hunter Hospital
(Nursery beds: 41) Chris Wake (Director), Lynne Cruden, Alissa Argomand
Liverpool Health Service
(Nursery beds: 31)Jacqueline Stack (Director), Robert Guaran, Ian Callander, Kathryn Medlin, Sara Wilson, Kaye Marcin
Nepean Hospital
(Nursery beds: 35)Lyn Downe (Director), Vijay Shingde (Acting Clinical Director) Mee Fong Chin
Royal Hospital for Women
(Nursery beds: 44)Kei Lui (Director), Diane Cameron
Royal North Shore Hospital
(Nursery beds: 25)Mary Paradisis (Director), Jennifer Bowen, Martin Kluckow, Sara Sedgley, Claire Jacobs
RPA Women and Babies
(Nursery beds: 34)Nick Evans (Director), Shelley Reid, David Osborn (Clinical Director)
Sydney Children’s Hospital
(Nursery beds: 4)Andrew Numa (Director), Janelle Young
Westmead Hospital
(Nursery beds: 39)Mark Tracy (Director), Jane Baird
Neonatal Intensive Care Units’ (NICUS) Data Collection
(New South Wales and Australian Capital Territory)Barbara Bajuk, Sara Segley, Mark Leckie
Australian Capital Territory
The Canberra Hospital
(Nursery beds: 24)Zsuzsoka Kecskes (Director), Lyn Barnes
Victoria
Mercy Hospital for Women
(Nursery beds: 58)Andrew Watkins (Director), Jim Holberton, Julie Keng
Monash Medical Centre
(Nursery beds: 52)Andrew Ramsden (Director), Elizabeth Carse (Acting Director), Kenneth Tan, Kaye Bawden, Rose Li
Royal Children’s Hospital
(Nursery beds: 24)Rod Hunt (Director), Jo Brooks
Royal Women’s Hospital
(Nursery beds: 52)Carl Kuschel (Director), Caroline Collis, Lex Doyle (Professor of Neonatology), Sheryle Rogerson, Esther Wong
Tasmania
Royal Hobart Hospital
(Nursery beds: 26)Peter Dargaville (Director), Karen Butterley
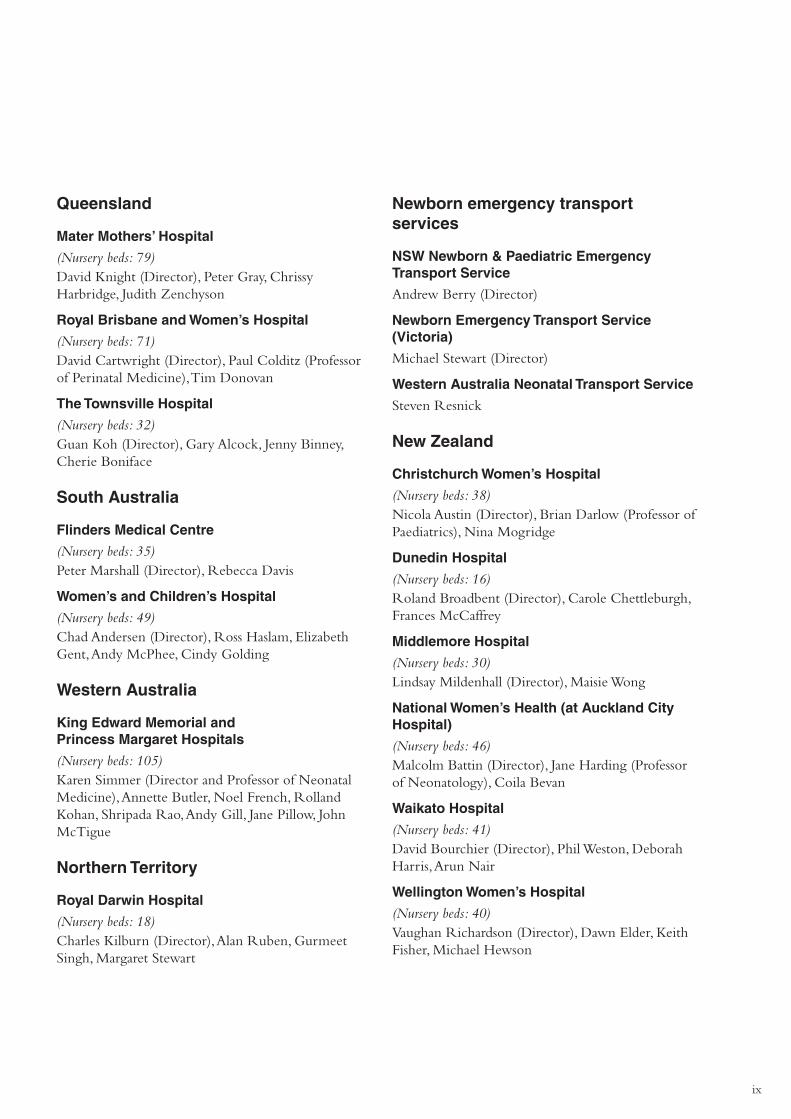
ix
Newborn emergency transport services
NSW Newborn & Paediatric Emergency Transport Service
Andrew Berry (Director)
Newborn Emergency Transport Service (Victoria)
Michael Stewart (Director)
Western Australia Neonatal Transport Service
Steven Resnick
New Zealand
Christchurch Women’s Hospital
(Nursery beds: 38)Nicola Austin (Director), Brian Darlow (Professor of Paediatrics), Nina Mogridge
Dunedin Hospital
(Nursery beds: 16)Roland Broadbent (Director), Carole Chettleburgh, Frances McCaffrey
Middlemore Hospital
(Nursery beds: 30)Lindsay Mildenhall (Director), Maisie Wong
National Women’s Health (at Auckland City Hospital)
(Nursery beds: 46)Malcolm Battin (Director), Jane Harding (Professor of Neonatology), Coila Bevan
Waikato Hospital
(Nursery beds: 41)David Bourchier (Director), Phil Weston, Deborah Harris, Arun Nair
Wellington Women’s Hospital
(Nursery beds: 40)Vaughan Richardson (Director), Dawn Elder, Keith Fisher, Michael Hewson
Queensland
Mater Mothers’ Hospital
(Nursery beds: 79)David Knight (Director), Peter Gray, Chrissy Harbridge, Judith Zenchyson
Royal Brisbane and Women’s Hospital
(Nursery beds: 71)David Cartwright (Director), Paul Colditz (Professor of Perinatal Medicine), Tim Donovan
The Townsville Hospital
(Nursery beds: 32)Guan Koh (Director), Gary Alcock, Jenny Binney, Cherie Boniface
South Australia
Flinders Medical Centre
(Nursery beds: 35)Peter Marshall (Director), Rebecca Davis
Women’s and Children’s Hospital
(Nursery beds: 49) Chad Andersen (Director), Ross Haslam, Elizabeth Gent, Andy McPhee, Cindy Golding
Western Australia
King Edward Memorial and Princess Margaret Hospitals
(Nursery beds: 105)Karen Simmer (Director and Professor of Neonatal Medicine), Annette Butler, Noel French, Rolland Kohan, Shripada Rao, Andy Gill, Jane Pillow, John McTigue
Northern Territory
Royal Darwin Hospital
(Nursery beds: 18)Charles Kilburn (Director), Alan Ruben, Gurmeet Singh, Margaret Stewart
x
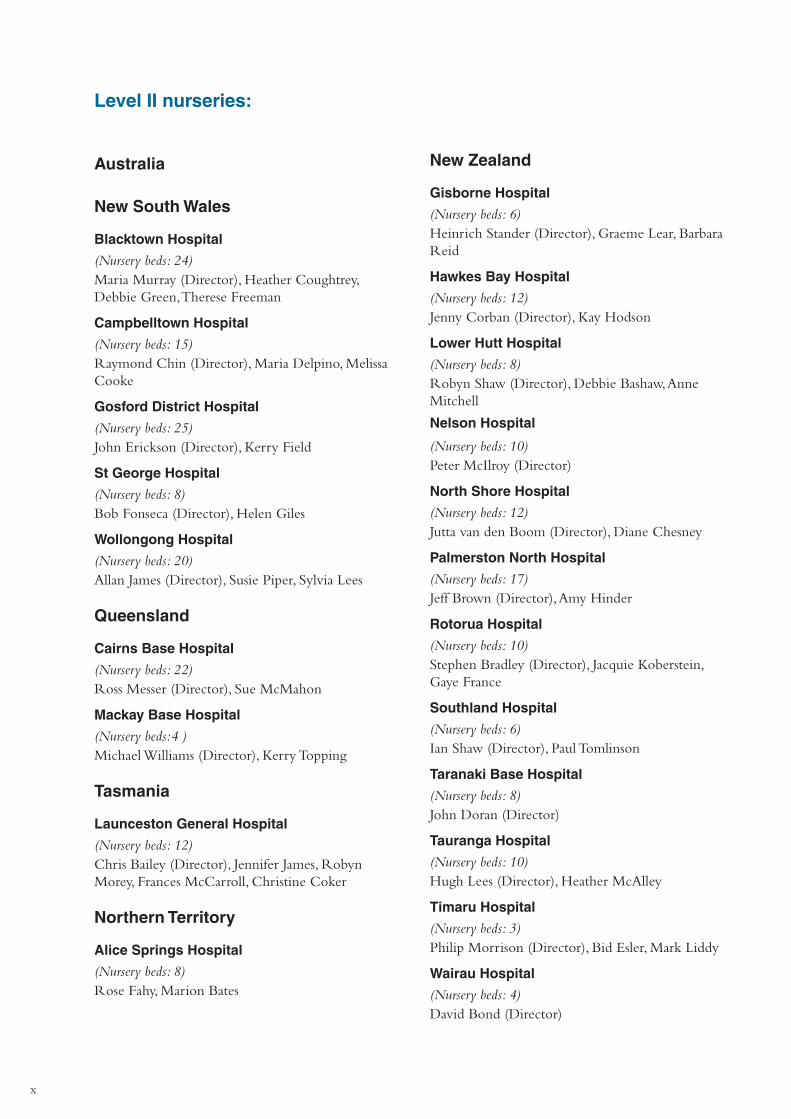
Level II nurseries:
Australia
New South Wales
Blacktown Hospital
(Nursery beds: 24)Maria Murray (Director), Heather Coughtrey, Debbie Green, Therese Freeman
Campbelltown Hospital
(Nursery beds: 15)Raymond Chin (Director), Maria Delpino, Melissa Cooke
Gosford District Hospital
(Nursery beds: 25)John Erickson (Director), Kerry Field
St George Hospital
(Nursery beds: 8)Bob Fonseca (Director), Helen Giles
Wollongong Hospital
(Nursery beds: 20)Allan James (Director), Susie Piper, Sylvia Lees
Queensland
Cairns Base Hospital
(Nursery beds: 22)Ross Messer (Director), Sue McMahon
Mackay Base Hospital
(Nursery beds:4 )Michael Williams (Director), Kerry Topping
Tasmania
Launceston General Hospital
(Nursery beds: 12)Chris Bailey (Director), Jennifer James, Robyn Morey, Frances McCarroll, Christine Coker
Northern Territory
Alice Springs Hospital
(Nursery beds: 8)Rose Fahy, Marion Bates
New Zealand
Gisborne Hospital
(Nursery beds: 6)Heinrich Stander (Director), Graeme Lear, Barbara Reid
Hawkes Bay Hospital
(Nursery beds: 12)Jenny Corban (Director), Kay Hodson
Lower Hutt Hospital
(Nursery beds: 8)Robyn Shaw (Director), Debbie Bashaw, Anne Mitchell
Nelson Hospital
(Nursery beds: 10)Peter McIlroy (Director)
North Shore Hospital
(Nursery beds: 12)Jutta van den Boom (Director), Diane Chesney
Palmerston North Hospital
(Nursery beds: 17)Jeff Brown (Director), Amy Hinder
Rotorua Hospital
(Nursery beds: 10)Stephen Bradley (Director), Jacquie Koberstein, Gaye France
Southland Hospital
(Nursery beds: 6)Ian Shaw (Director), Paul Tomlinson
Taranaki Base Hospital
(Nursery beds: 8)John Doran (Director)
Tauranga Hospital
(Nursery beds: 10)Hugh Lees (Director), Heather McAlley
Timaru Hospital
(Nursery beds: 3)Philip Morrison (Director), Bid Esler, Mark Liddy
Wairau Hospital
(Nursery beds: 4)David Bond (Director)
xi
Wanganui Hospital
(Nursery beds: 4)David Montgomery (Director), Barbara Hammond
Whakatane Hospital
(Nursery beds: 5)Chris Moyes (Director), Margret Norris, Lee Willetts
Whangarei Area Hospital
(Nursery beds: 8)Janine Whale (Director), Lynne Clarke
Waitakere Hospital
(Nursery beds: 12)Jutta van den Boom (Director), Janis Stockman
ANZNN Program and Secretariat
Perinatal & Reproductive Epidemiology Research Unit (PRERU)
Elizabeth Sullivan (Director), Sharon Chow, Vicki Gallimore, Sadia Hossain, Lisa Hilder

xii

1
1. Organisation of the ANZNN
History
A prospective audit commenced in 1994 with all level III units in Australia and New Zealand contributing data on babies from 1 January 1995. Level II units in New Zealand joined in 1998, followed by one level II unit in Tasmania, Australia in 1999. Level II units within Australia continue to join with a total of eight units contributing data in 2010.
Purpose of this report
The purpose of the Report of the Australian and New Zealand Neonatal Network is ‘to improve the care of high-risk newborn infants and their families in Australia and New Zealand through collaborative audit and research’.
This is achieved through:
�� providing a core data set that will:
�� provide information on neonatal outcomes, adjusted for case mix and disease severity, to participating neonatal units to assist with quality improvement
�� identify trends and variations in morbidity or mortality
�� assist with the identification of areas of priority for research
�� enhance the ability to carry out multicentre studies and randomised controlled trials through collaboration
�� monitoring the clinical indicators for perinatal care and improving clinical practice while maintaining national standards of evidence-based care
�� monitoring the use of new technologies, e.g. high flow/oxygen air usage by patient type and outcome
�� consistency in national data collections.
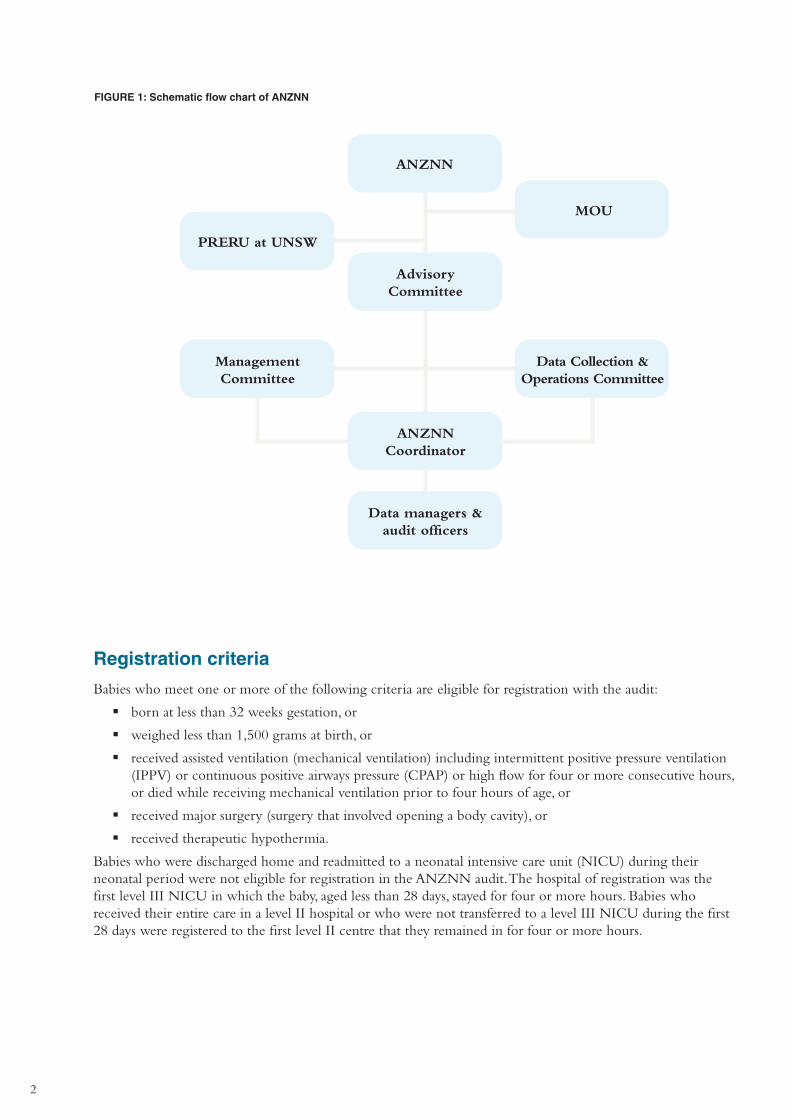
Structure of the ANZNN
The ANZNN is located in the Perinatal & Reproductive Epidemiology Research Unit (PRERU) within the University of New South Wales (UNSW). The arrangement is outlined in the memorandum of understanding (MOU) between ANZNN and UNSW.
The governance structure of the ANZNN (refer to Figure 1) consists of the Advisory Committee, the Data Collection and Operations Committee and the Management Committee. The Advisory Committee is the governing body of ANZNN and includes the directors (or their nominee) of each participating unit, the academic neonatologists and neonatal nurses in the region. The Director of PRERU, who is the data custodian for ANZNN, is also a member of the Advisory Committee. The purpose of the Advisory Committee is to monitor the progress of ANZNN, discuss current issues and agree on new variables for inclusion in the minimum data set and to approve the use of the data for research.
The Data Collection and Operations Committee coordinates the operations of the ANZNN data collection, monitors the workload and progress of the annual report and reports to both the Management Committee and Advisory Committee.
The Management Committee is an elected committee that has representation from directors, data managers and nurses from across the network and is concerned with the general functioning of the network, finance and decision-making.
The data managers and audit officers are responsible for the collection and submission of data for ANZNN. The ANZNN coordinator is the point of contact for ANZNN and liaises with ANZNN committees, PRERU, data managers and audit officers.
2
FIGURE 1: Schematic flow chart of ANZNN
ANZNN
Advisory Committee
ANZNN Coordinator
Data managers & audit officers
PRERU at UNSW
MOU
Management Committee
Data Collection & Operations Committee
Registration criteria
Babies who meet one or more of the following criteria are eligible for registration with the audit:
�� born at less than 32 weeks gestation, or
�� weighed less than 1,500 grams at birth, or
�� received assisted ventilation (mechanical ventilation) including intermittent positive pressure ventilation (IPPV) or continuous positive airways pressure (CPAP) or high flow for four or more consecutive hours, or died while receiving mechanical ventilation prior to four hours of age, or
�� received major surgery (surgery that involved opening a body cavity), or
�� received therapeutic hypothermia.
Babies who were discharged home and readmitted to a neonatal intensive care unit (NICU) during their neonatal period were not eligible for registration in the ANZNN audit. The hospital of registration was the first level III NICU in which the baby, aged less than 28 days, stayed for four or more hours. Babies who received their entire care in a level II hospital or who were not transferred to a level III NICU during the first 28 days were registered to the first level II centre that they remained in for four or more hours.

3
Funding support
Currently the major share of funding is from annual contributions received from level III units. The contribution was a voluntary and unanimous decision made by the unit directors. In return individual units receive a feedback report that enables them to benchmark their unit against the combined ANZNN data set.
QHealth (Australia) and Douglas Pharmaceuticals (New Zealand) make an annual contribution and the ANZNN thanks them for their generosity and support. The ANZNN also thanks the Leslie Stevens Fund for Newborn Care, Sydney Children’s Hospital Foundation for infrastructure support (2008 to 2010), as well as the Royal Hospital for Women Foundation for funding development of the data validation program.
Data set variables
The variables used for the 2010 audit are listed in Appendix 5 and are also available on the website <www.preru.unsw.edu.au/ANZNN>.
4
report of the
AustrAliAn And new ZeAlAnd neonAtAl network
2010
5
Babies born in Australia, 2010
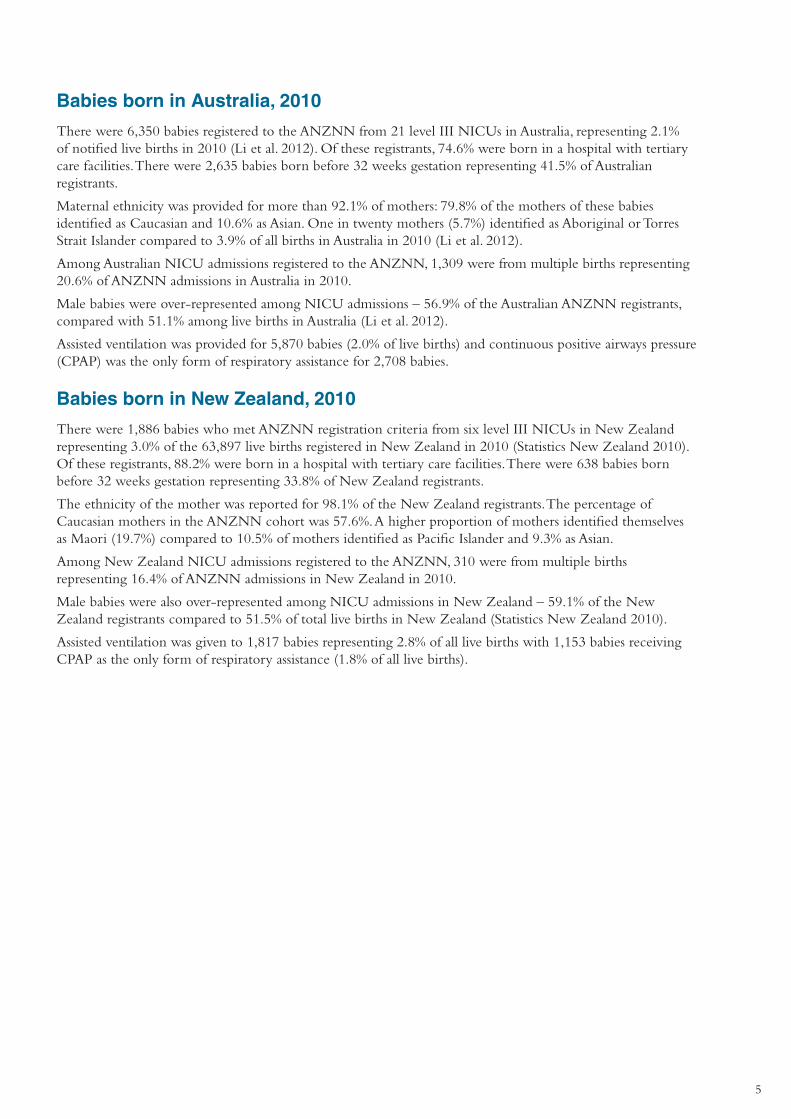
There were 6,350 babies registered to the ANZNN from 21 level III NICUs in Australia, representing 2.1% of notified live births in 2010 (Li et al. 2012). Of these registrants, 74.6% were born in a hospital with tertiary care facilities. There were 2,635 babies born before 32 weeks gestation representing 41.5% of Australian registrants.
Maternal ethnicity was provided for more than 92.1% of mothers: 79.8% of the mothers of these babies identified as Caucasian and 10.6% as Asian. One in twenty mothers (5.7%) identified as Aboriginal or Torres Strait Islander compared to 3.9% of all births in Australia in 2010 (Li et al. 2012).
Among Australian NICU admissions registered to the ANZNN, 1,309 were from multiple births representing 20.6% of ANZNN admissions in Australia in 2010.
Male babies were over-represented among NICU admissions – 56.9% of the Australian ANZNN registrants, compared with 51.1% among live births in Australia (Li et al. 2012).
Assisted ventilation was provided for 5,870 babies (2.0% of live births) and continuous positive airways pressure (CPAP) was the only form of respiratory assistance for 2,708 babies.
Babies born in New Zealand, 2010
There were 1,886 babies who met ANZNN registration criteria from six level III NICUs in New Zealand representing 3.0% of the 63,897 live births registered in New Zealand in 2010 (Statistics New Zealand 2010). Of these registrants, 88.2% were born in a hospital with tertiary care facilities. There were 638 babies born before 32 weeks gestation representing 33.8% of New Zealand registrants.
The ethnicity of the mother was reported for 98.1% of the New Zealand registrants. The percentage of Caucasian mothers in the ANZNN cohort was 57.6%. A higher proportion of mothers identified themselves as Maori (19.7%) compared to 10.5% of mothers identified as Pacific Islander and 9.3% as Asian.
Among New Zealand NICU admissions registered to the ANZNN, 310 were from multiple births representing 16.4% of ANZNN admissions in New Zealand in 2010.
Male babies were also over-represented among NICU admissions in New Zealand – 59.1% of the New Zealand registrants compared to 51.5% of total live births in New Zealand (Statistics New Zealand 2010).
Assisted ventilation was given to 1,817 babies representing 2.8% of all live births with 1,153 babies receiving CPAP as the only form of respiratory assistance (1.8% of all live births).
6
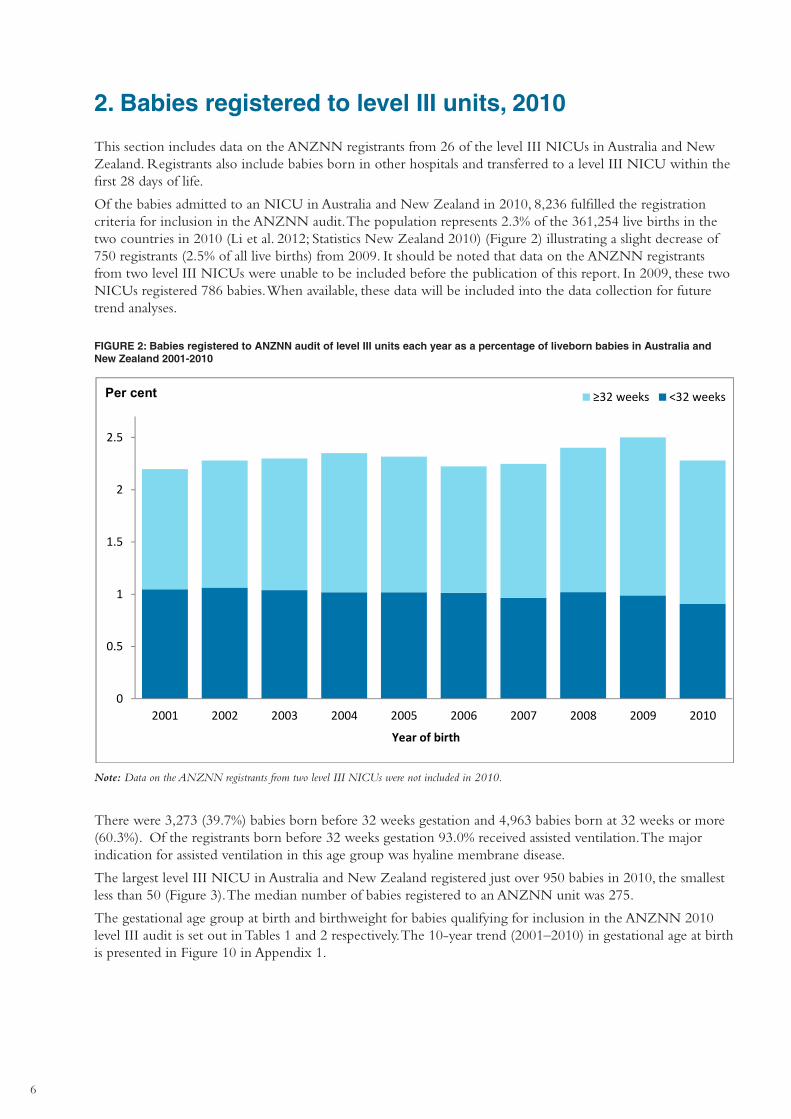
2. Babies registered to level III units, 2010
This section includes data on the ANZNN registrants from 26 of the level III NICUs in Australia and New Zealand. Registrants also include babies born in other hospitals and transferred to a level III NICU within the first 28 days of life.
Of the babies admitted to an NICU in Australia and New Zealand in 2010, 8,236 fulfilled the registration criteria for inclusion in the ANZNN audit. The population represents 2.3% of the 361,254 live births in the two countries in 2010 (Li et al. 2012; Statistics New Zealand 2010) (Figure 2) illustrating a slight decrease of 750 registrants (2.5% of all live births) from 2009. It should be noted that data on the ANZNN registrants from two level III NICUs were unable to be included before the publication of this report. In 2009, these two NICUs registered 786 babies. When available, these data will be included into the data collection for future trend analyses.
0
0.5
1
1.5
2
2.5
2001 2002 2003 2004 2005 2006 2007 2008 2009 2010
Year of birth
≥32 weeks <32 weeksPer cent
FIGURE 2: Babies registered to ANZNN audit of level III units each year as a percentage of liveborn babies in Australia and New Zealand 2001-2010
Note: Data on the ANZNN registrants from two level III NICUs were not included in 2010.
There were 3,273 (39.7%) babies born before 32 weeks gestation and 4,963 babies born at 32 weeks or more (60.3%). Of the registrants born before 32 weeks gestation 93.0% received assisted ventilation. The major indication for assisted ventilation in this age group was hyaline membrane disease.
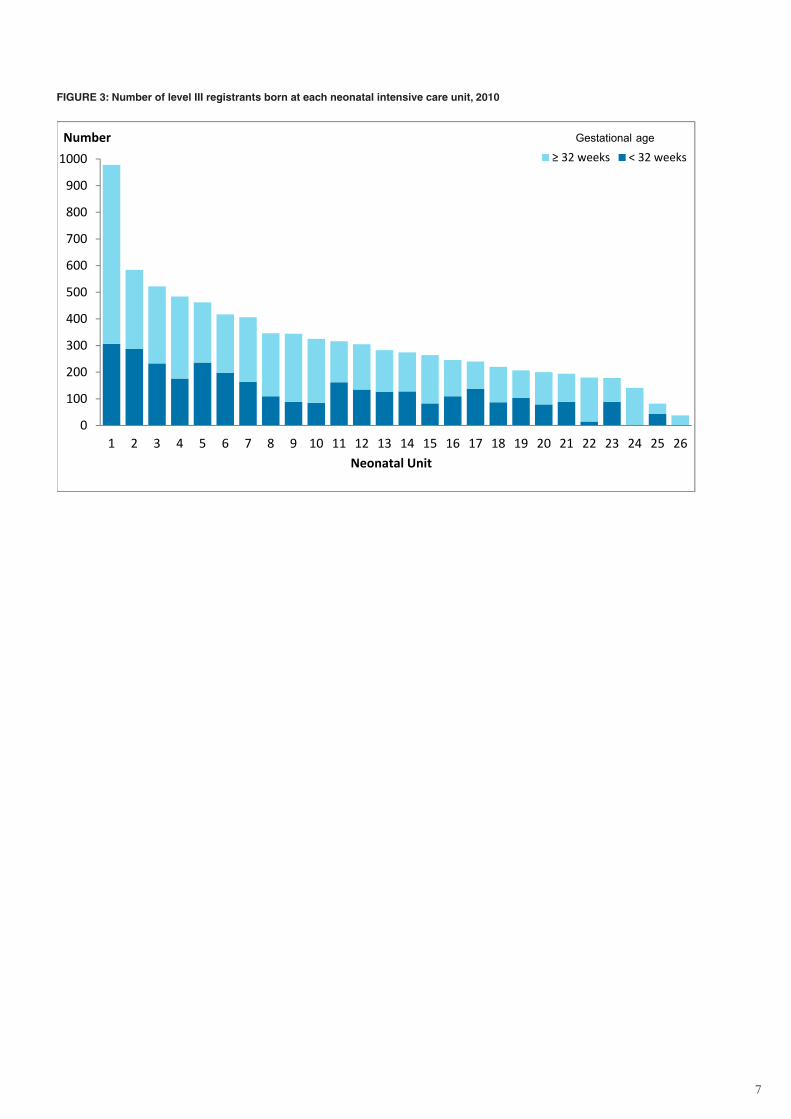
The largest level III NICU in Australia and New Zealand registered just over 950 babies in 2010, the smallest less than 50 (Figure 3). The median number of babies registered to an ANZNN unit was 275.
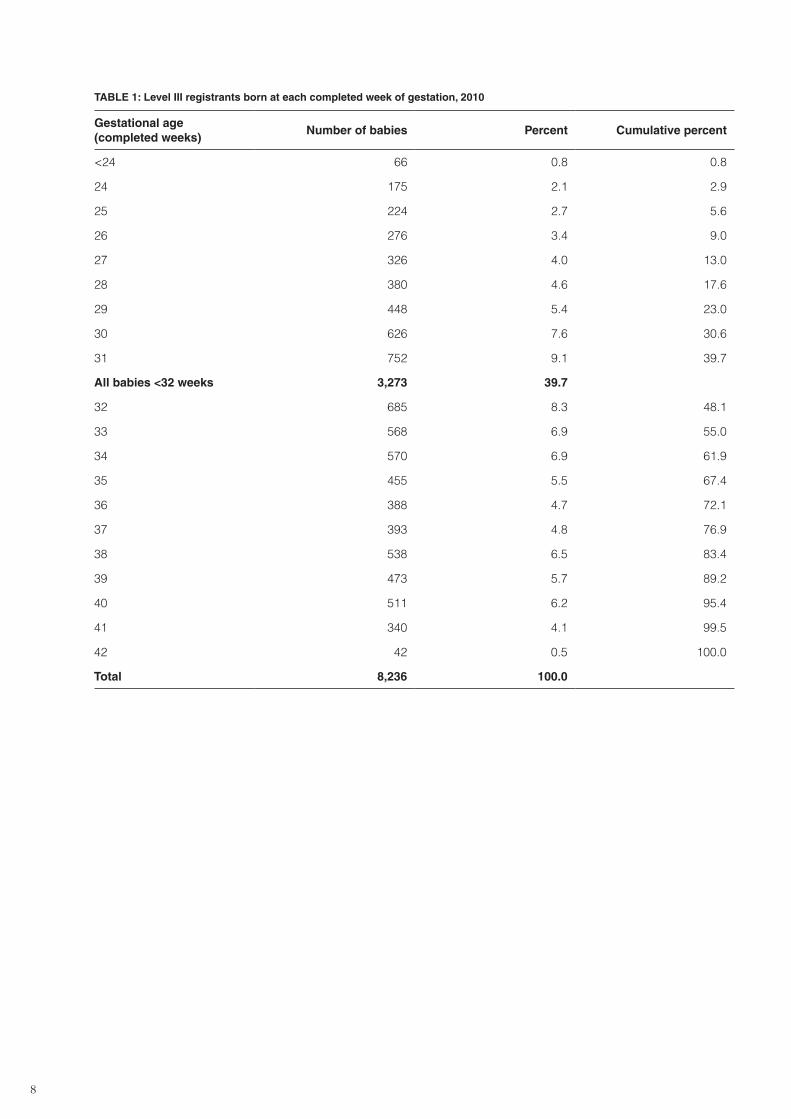
The gestational age group at birth and birthweight for babies qualifying for inclusion in the ANZNN 2010 level III audit is set out in Tables 1 and 2 respectively. The 10-year trend (2001–2010) in gestational age at birth is presented in Figure 10 in Appendix 1.
7
0
100
200
300
400
500
600
700
800
900
1000
1 2 3 4 5 6 7 8 9 10 11 12 13 14 15 16 17 18 19 20 21 22 23 24 25 26
Number
Neonatal Unit
≥ 32 weeks < 32 weeksGestational age
FIGURE 3: Number of level III registrants born at each neonatal intensive care unit, 2010
8
Table 1: level III registrants born at each completed week of gestation, 2010
Gestational age (completed weeks)
Number of babies Percent Cumulative percent
<24 66 0.8 0.8
24 175 2.1 2.9
25 224 2.7 5.6
26 276 3.4 9.0
27 326 4.0 13.0
28 380 4.6 17.6
29 448 5.4 23.0
30 626 7.6 30.6
31 752 9.1 39.7
all babies <32 weeks 3,273 39.7
32 685 8.3 48.1
33 568 6.9 55.0
34 570 6.9 61.9
35 455 5.5 67.4
36 388 4.7 72.1
37 393 4.8 76.9
38 538 6.5 83.4
39 473 5.7 89.2
40 511 6.2 95.4
41 340 4.1 99.5
42 42 0.5 100.0
Total 8,236 100.0
9
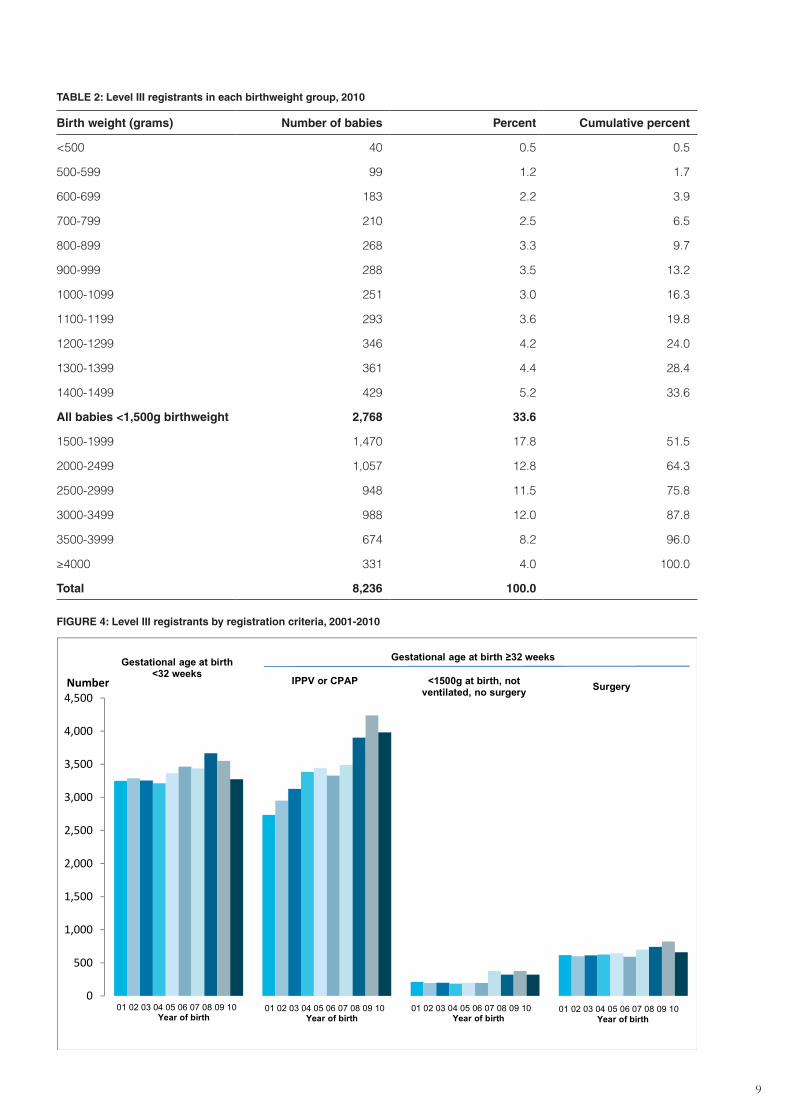
TABLE 2: Level III registrants in each birthweight group, 2010
Birth weight (grams) Number of babies Percent Cumulative percent
<500 40 0.5 0.5
500-599 99 1.2 1.7
600-699 183 2.2 3.9
700-799 210 2.5 6.5
800-899 268 3.3 9.7
900-999 288 3.5 13.2
1000-1099 251 3.0 16.3
1100-1199 293 3.6 19.8
1200-1299 346 4.2 24.0
1300-1399 361 4.4 28.4
1400-1499 429 5.2 33.6
All babies <1,500g birthweight 2,768 33.6
1500-1999 1,470 17.8 51.5
2000-2499 1,057 12.8 64.3
2500-2999 948 11.5 75.8
3000-3499 988 12.0 87.8
3500-3999 674 8.2 96.0
≥4000 331 4.0 100.0
Total 8,236 100.0
0
500
1,000
1,500
2,000
2,500
3,000
3,500
4,000
4,500Number
01 02 03 04 05 06 07 08 09 10Year of birth
Gestational age at birth <32 weeks
Gestational age at birth ≥32 weeks
IPPV or CPAP <1500g at birth, not ventilated, no surgery Surgery
01 02 03 04 05 06 07 08 09 10Year of birth
01 02 03 04 05 06 07 08 09 10Year of birth
01 02 03 04 05 06 07 08 09 10Year of birth
FIGURE 4: Level III registrants by registration criteria, 2001-2010
10
3. Mothers of level III registrants, 2010
Maternal age
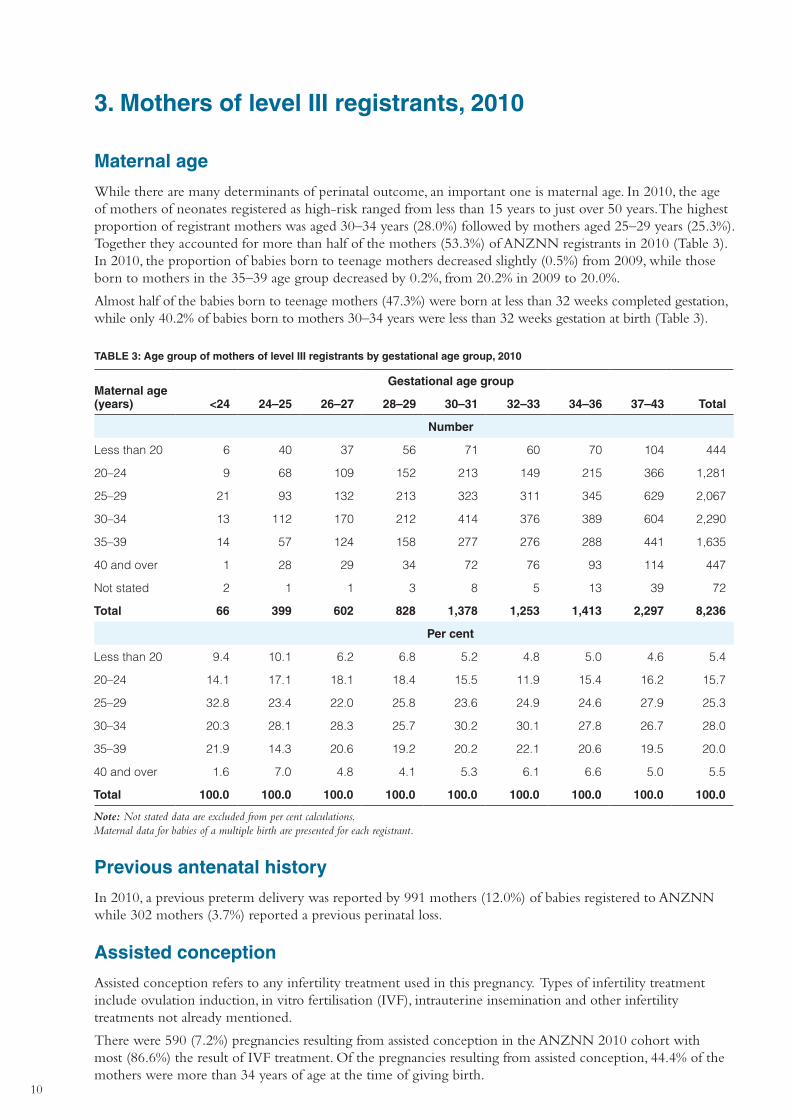
While there are many determinants of perinatal outcome, an important one is maternal age. In 2010, the age of mothers of neonates registered as high-risk ranged from less than 15 years to just over 50 years. The highest proportion of registrant mothers was aged 30–34 years (28.0%) followed by mothers aged 25–29 years (25.3%). Together they accounted for more than half of the mothers (53.3%) of ANZNN registrants in 2010 (Table 3). In 2010, the proportion of babies born to teenage mothers decreased slightly (0.5%) from 2009, while those born to mothers in the 35–39 age group decreased by 0.2%, from 20.2% in 2009 to 20.0%.
Almost half of the babies born to teenage mothers (47.3%) were born at less than 32 weeks completed gestation, while only 40.2% of babies born to mothers 30–34 years were less than 32 weeks gestation at birth (Table 3).
TABLE 3: Age group of mothers of level III registrants by gestational age group, 2010
Maternal age (years)
Gestational age group
<24 24–25 26–27 28–29 30–31 32–33 34–36 37–43 Total
Number
Less than 20 6 40 37 56 71 60 70 104 444
20–24 9 68 109 152 213 149 215 366 1,281
25–29 21 93 132 213 323 311 345 629 2,067
30–34 13 112 170 212 414 376 389 604 2,290
35–39 14 57 124 158 277 276 288 441 1,635
40 and over 1 28 29 34 72 76 93 114 447
Not stated 2 1 1 3 8 5 13 39 72
Total 66 399 602 828 1,378 1,253 1,413 2,297 8,236
Per cent
Less than 20 9.4 10.1 6.2 6.8 5.2 4.8 5.0 4.6 5.4
20–24 14.1 17.1 18.1 18.4 15.5 11.9 15.4 16.2 15.7
25–29 32.8 23.4 22.0 25.8 23.6 24.9 24.6 27.9 25.3
30–34 20.3 28.1 28.3 25.7 30.2 30.1 27.8 26.7 28.0
35–39 21.9 14.3 20.6 19.2 20.2 22.1 20.6 19.5 20.0
40 and over 1.6 7.0 4.8 4.1 5.3 6.1 6.6 5.0 5.5
Total 100.0 100.0 100.0 100.0 100.0 100.0 100.0 100.0 100.0
Note: Not stated data are excluded from per cent calculations. Maternal data for babies of a multiple birth are presented for each registrant.
Previous antenatal history
In 2010, a previous preterm delivery was reported by 991 mothers (12.0%) of babies registered to ANZNN while 302 mothers (3.7%) reported a previous perinatal loss.
Assisted conception
Assisted conception refers to any infertility treatment used in this pregnancy. Types of infertility treatment include ovulation induction, in vitro fertilisation (IVF), intrauterine insemination and other infertility treatments not already mentioned.
There were 590 (7.2%) pregnancies resulting from assisted conception in the ANZNN 2010 cohort with most (86.6%) the result of IVF treatment. Of the pregnancies resulting from assisted conception, 44.4% of the mothers were more than 34 years of age at the time of giving birth.
11
Presenting antenatal problem
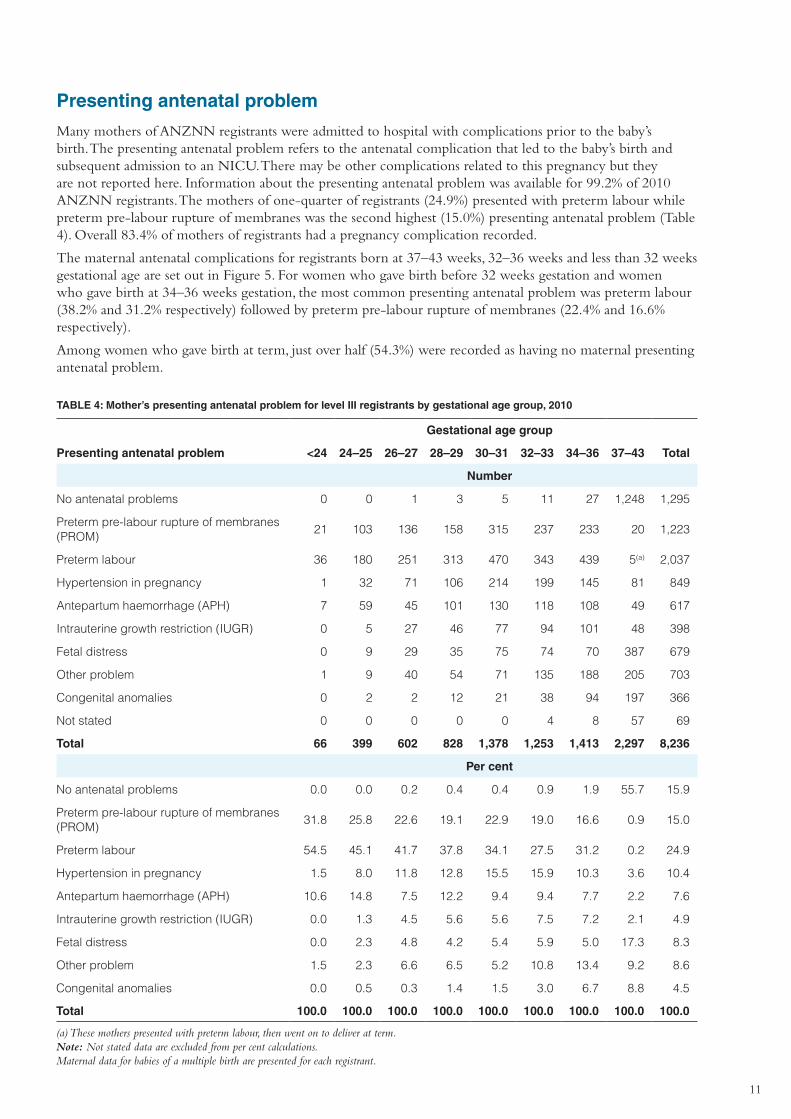
Many mothers of ANZNN registrants were admitted to hospital with complications prior to the baby’s birth. The presenting antenatal problem refers to the antenatal complication that led to the baby’s birth and subsequent admission to an NICU. There may be other complications related to this pregnancy but they are not reported here. Information about the presenting antenatal problem was available for 99.2% of 2010 ANZNN registrants. The mothers of one-quarter of registrants (24.9%) presented with preterm labour while preterm pre-labour rupture of membranes was the second highest (15.0%) presenting antenatal problem (Table 4). Overall 83.4% of mothers of registrants had a pregnancy complication recorded.
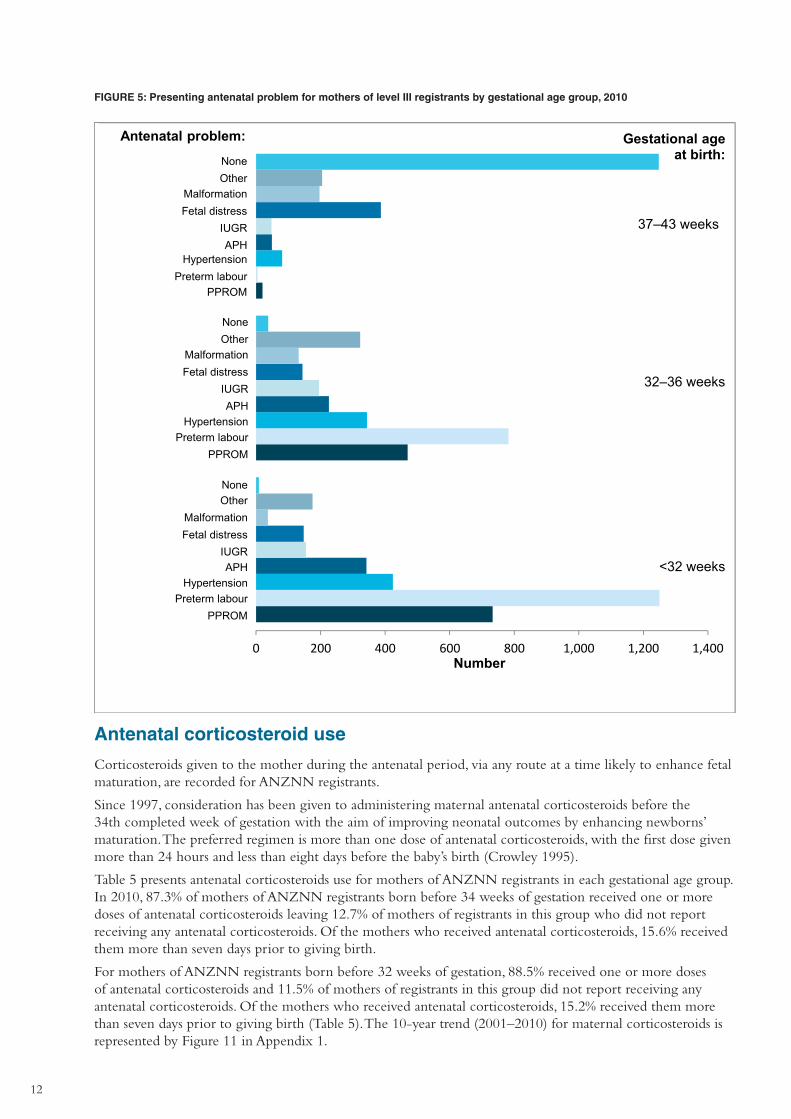
The maternal antenatal complications for registrants born at 37–43 weeks, 32–36 weeks and less than 32 weeks gestational age are set out in Figure 5. For women who gave birth before 32 weeks gestation and women who gave birth at 34–36 weeks gestation, the most common presenting antenatal problem was preterm labour (38.2% and 31.2% respectively) followed by preterm pre-labour rupture of membranes (22.4% and 16.6% respectively).
Among women who gave birth at term, just over half (54.3%) were recorded as having no maternal presenting antenatal problem.
TABLE 4: Mother’s presenting antenatal problem for level III registrants by gestational age group, 2010
Gestational age group
Presenting antenatal problem <24 24–25 26–27 28–29 30–31 32–33 34–36 37–43 Total
Number
No antenatal problems 0 0 1 3 5 11 27 1,248 1,295
Preterm pre-labour rupture of membranes (PROM)
21 103 136 158 315 237 233 20 1,223
Preterm labour 36 180 251 313 470 343 439 5(a) 2,037
Hypertension in pregnancy 1 32 71 106 214 199 145 81 849
Antepartum haemorrhage (APH) 7 59 45 101 130 118 108 49 617
Intrauterine growth restriction (IUGR) 0 5 27 46 77 94 101 48 398
Fetal distress 0 9 29 35 75 74 70 387 679
Other problem 1 9 40 54 71 135 188 205 703
Congenital anomalies 0 2 2 12 21 38 94 197 366
Not stated 0 0 0 0 0 4 8 57 69
Total 66 399 602 828 1,378 1,253 1,413 2,297 8,236
Per cent
No antenatal problems 0.0 0.0 0.2 0.4 0.4 0.9 1.9 55.7 15.9
Preterm pre-labour rupture of membranes (PROM)
31.8 25.8 22.6 19.1 22.9 19.0 16.6 0.9 15.0
Preterm labour 54.5 45.1 41.7 37.8 34.1 27.5 31.2 0.2 24.9
Hypertension in pregnancy 1.5 8.0 11.8 12.8 15.5 15.9 10.3 3.6 10.4
Antepartum haemorrhage (APH) 10.6 14.8 7.5 12.2 9.4 9.4 7.7 2.2 7.6
Intrauterine growth restriction (IUGR) 0.0 1.3 4.5 5.6 5.6 7.5 7.2 2.1 4.9
Fetal distress 0.0 2.3 4.8 4.2 5.4 5.9 5.0 17.3 8.3
Other problem 1.5 2.3 6.6 6.5 5.2 10.8 13.4 9.2 8.6
Congenital anomalies 0.0 0.5 0.3 1.4 1.5 3.0 6.7 8.8 4.5
Total 100.0 100.0 100.0 100.0 100.0 100.0 100.0 100.0 100.0
(a) These mothers presented with preterm labour, then went on to deliver at term. Note: Not stated data are excluded from per cent calculations. Maternal data for babies of a multiple birth are presented for each registrant.
12
FIGURE 5: Presenting antenatal problem for mothers of level III registrants by gestational age group, 2010
0 200 400 600 800 1,000 1,200 1,400
NoneOther
MalformationFetal distress
IUGRAPH
HypertensionPreterm labour
PPROM
NoneOther
MalformationFetal distress
IUGRAPH
HypertensionPreterm labour
PPROM
NoneOther
MalformationFetal distress
IUGRAPH
HypertensionPreterm labour
PPROM
37–43 weeks
32–36 weeks
<32 weeks
Gestational age at birth:
Antenatal problem:
Number
Antenatal corticosteroid use
Corticosteroids given to the mother during the antenatal period, via any route at a time likely to enhance fetal maturation, are recorded for ANZNN registrants.
Since 1997, consideration has been given to administering maternal antenatal corticosteroids before the 34th completed week of gestation with the aim of improving neonatal outcomes by enhancing newborns’ maturation. The preferred regimen is more than one dose of antenatal corticosteroids, with the first dose given more than 24 hours and less than eight days before the baby’s birth (Crowley 1995).
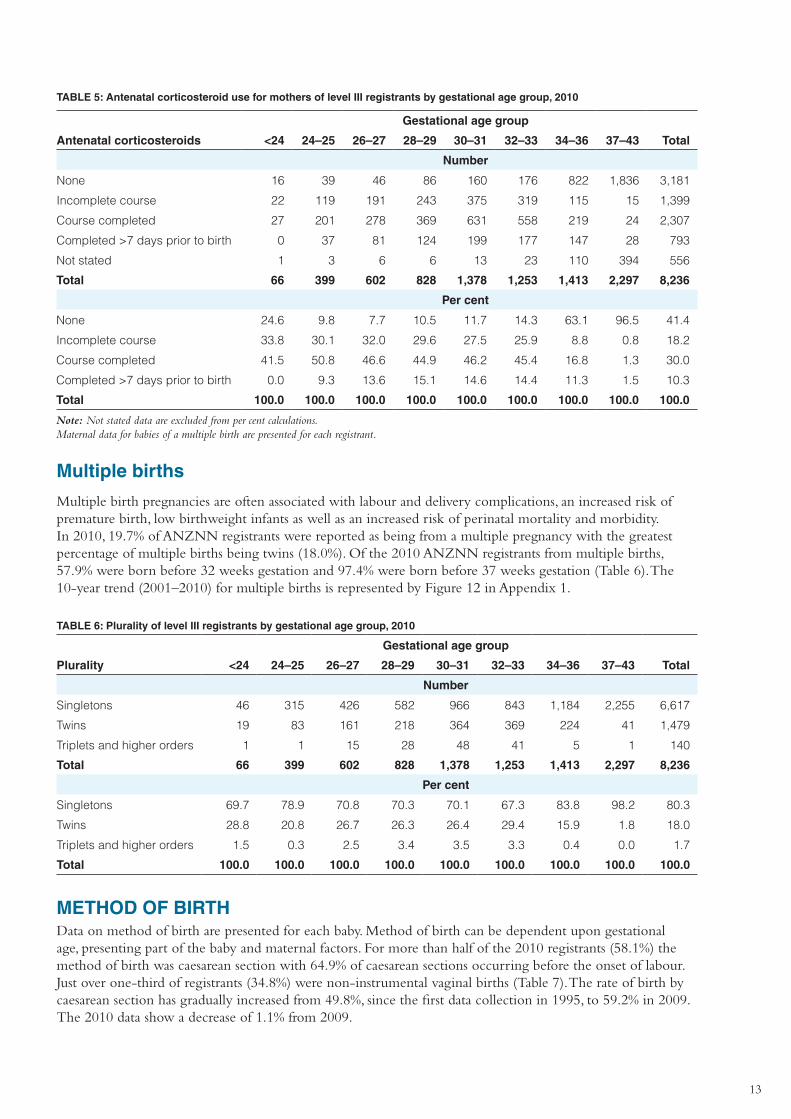
Table 5 presents antenatal corticosteroids use for mothers of ANZNN registrants in each gestational age group. In 2010, 87.3% of mothers of ANZNN registrants born before 34 weeks of gestation received one or more doses of antenatal corticosteroids leaving 12.7% of mothers of registrants in this group who did not report receiving any antenatal corticosteroids. Of the mothers who received antenatal corticosteroids, 15.6% received them more than seven days prior to giving birth.
For mothers of ANZNN registrants born before 32 weeks of gestation, 88.5% received one or more doses of antenatal corticosteroids and 11.5% of mothers of registrants in this group did not report receiving any antenatal corticosteroids. Of the mothers who received antenatal corticosteroids, 15.2% received them more than seven days prior to giving birth (Table 5). The 10-year trend (2001–2010) for maternal corticosteroids is represented by Figure 11 in Appendix 1.
13
TABLE 5: Antenatal corticosteroid use for mothers of level III registrants by gestational age group, 2010
Gestational age group
Antenatal corticosteroids <24 24–25 26–27 28–29 30–31 32–33 34–36 37–43 Total
Number
None 16 39 46 86 160 176 822 1,836 3,181
Incomplete course 22 119 191 243 375 319 115 15 1,399
Course completed 27 201 278 369 631 558 219 24 2,307
Completed >7 days prior to birth 0 37 81 124 199 177 147 28 793
Not stated 1 3 6 6 13 23 110 394 556
Total 66 399 602 828 1,378 1,253 1,413 2,297 8,236
Per cent
None 24.6 9.8 7.7 10.5 11.7 14.3 63.1 96.5 41.4
Incomplete course 33.8 30.1 32.0 29.6 27.5 25.9 8.8 0.8 18.2
Course completed 41.5 50.8 46.6 44.9 46.2 45.4 16.8 1.3 30.0
Completed >7 days prior to birth 0.0 9.3 13.6 15.1 14.6 14.4 11.3 1.5 10.3
Total 100.0 100.0 100.0 100.0 100.0 100.0 100.0 100.0 100.0
Note: Not stated data are excluded from per cent calculations. Maternal data for babies of a multiple birth are presented for each registrant.
Multiple births
Multiple birth pregnancies are often associated with labour and delivery complications, an increased risk of premature birth, low birthweight infants as well as an increased risk of perinatal mortality and morbidity. In 2010, 19.7% of ANZNN registrants were reported as being from a multiple pregnancy with the greatest percentage of multiple births being twins (18.0%). Of the 2010 ANZNN registrants from multiple births, 57.9% were born before 32 weeks gestation and 97.4% were born before 37 weeks gestation (Table 6). The 10-year trend (2001–2010) for multiple births is represented by Figure 12 in Appendix 1.
TABLE 6: Plurality of level III registrants by gestational age group, 2010
Gestational age group
Plurality <24 24–25 26–27 28–29 30–31 32–33 34–36 37–43 Total
Number
Singletons 46 315 426 582 966 843 1,184 2,255 6,617
Twins 19 83 161 218 364 369 224 41 1,479
Triplets and higher orders 1 1 15 28 48 41 5 1 140
Total 66 399 602 828 1,378 1,253 1,413 2,297 8,236
Per cent
Singletons 69.7 78.9 70.8 70.3 70.1 67.3 83.8 98.2 80.3
Twins 28.8 20.8 26.7 26.3 26.4 29.4 15.9 1.8 18.0
Triplets and higher orders 1.5 0.3 2.5 3.4 3.5 3.3 0.4 0.0 1.7
Total 100.0 100.0 100.0 100.0 100.0 100.0 100.0 100.0 100.0
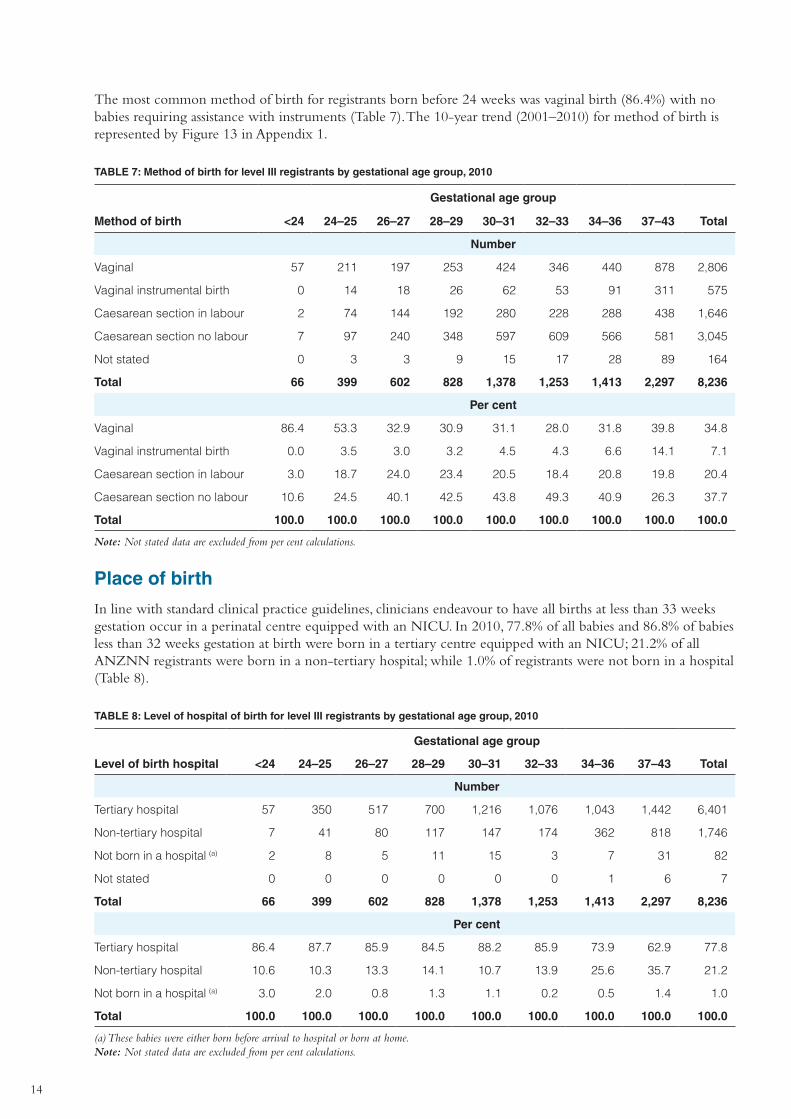
METHOD OF BIRTHData on method of birth are presented for each baby. Method of birth can be dependent upon gestational age, presenting part of the baby and maternal factors. For more than half of the 2010 registrants (58.1%) the method of birth was caesarean section with 64.9% of caesarean sections occurring before the onset of labour. Just over one-third of registrants (34.8%) were non-instrumental vaginal births (Table 7). The rate of birth by caesarean section has gradually increased from 49.8%, since the first data collection in 1995, to 59.2% in 2009. The 2010 data show a decrease of 1.1% from 2009.
14
The most common method of birth for registrants born before 24 weeks was vaginal birth (86.4%) with no babies requiring assistance with instruments (Table 7). The 10-year trend (2001–2010) for method of birth is represented by Figure 13 in Appendix 1.
TABLE 7: Method of birth for level III registrants by gestational age group, 2010
Gestational age group
Method of birth <24 24–25 26–27 28–29 30–31 32–33 34–36 37–43 Total
Number
Vaginal 57 211 197 253 424 346 440 878 2,806
Vaginal instrumental birth 0 14 18 26 62 53 91 311 575
Caesarean section in labour 2 74 144 192 280 228 288 438 1,646
Caesarean section no labour 7 97 240 348 597 609 566 581 3,045
Not stated 0 3 3 9 15 17 28 89 164
Total 66 399 602 828 1,378 1,253 1,413 2,297 8,236
Per cent
Vaginal 86.4 53.3 32.9 30.9 31.1 28.0 31.8 39.8 34.8
Vaginal instrumental birth 0.0 3.5 3.0 3.2 4.5 4.3 6.6 14.1 7.1
Caesarean section in labour 3.0 18.7 24.0 23.4 20.5 18.4 20.8 19.8 20.4
Caesarean section no labour 10.6 24.5 40.1 42.5 43.8 49.3 40.9 26.3 37.7
Total 100.0 100.0 100.0 100.0 100.0 100.0 100.0 100.0 100.0
Note: Not stated data are excluded from per cent calculations.
Place of birth
In line with standard clinical practice guidelines, clinicians endeavour to have all births at less than 33 weeks gestation occur in a perinatal centre equipped with an NICU. In 2010, 77.8% of all babies and 86.8% of babies less than 32 weeks gestation at birth were born in a tertiary centre equipped with an NICU; 21.2% of all ANZNN registrants were born in a non-tertiary hospital; while 1.0% of registrants were not born in a hospital (Table 8).
TABLE 8: Level of hospital of birth for level III registrants by gestational age group, 2010
Gestational age group
Level of birth hospital <24 24–25 26–27 28–29 30–31 32–33 34–36 37–43 Total
Number
Tertiary hospital 57 350 517 700 1,216 1,076 1,043 1,442 6,401
Non-tertiary hospital 7 41 80 117 147 174 362 818 1,746
Not born in a hospital (a) 2 8 5 11 15 3 7 31 82
Not stated 0 0 0 0 0 0 1 6 7
Total 66 399 602 828 1,378 1,253 1,413 2,297 8,236
Per cent
Tertiary hospital 86.4 87.7 85.9 84.5 88.2 85.9 73.9 62.9 77.8
Non-tertiary hospital 10.6 10.3 13.3 14.1 10.7 13.9 25.6 35.7 21.2
Not born in a hospital (a) 3.0 2.0 0.8 1.3 1.1 0.2 0.5 1.4 1.0
Total 100.0 100.0 100.0 100.0 100.0 100.0 100.0 100.0 100.0
(a) These babies were either born before arrival to hospital or born at home. Note: Not stated data are excluded from per cent calculations.
15
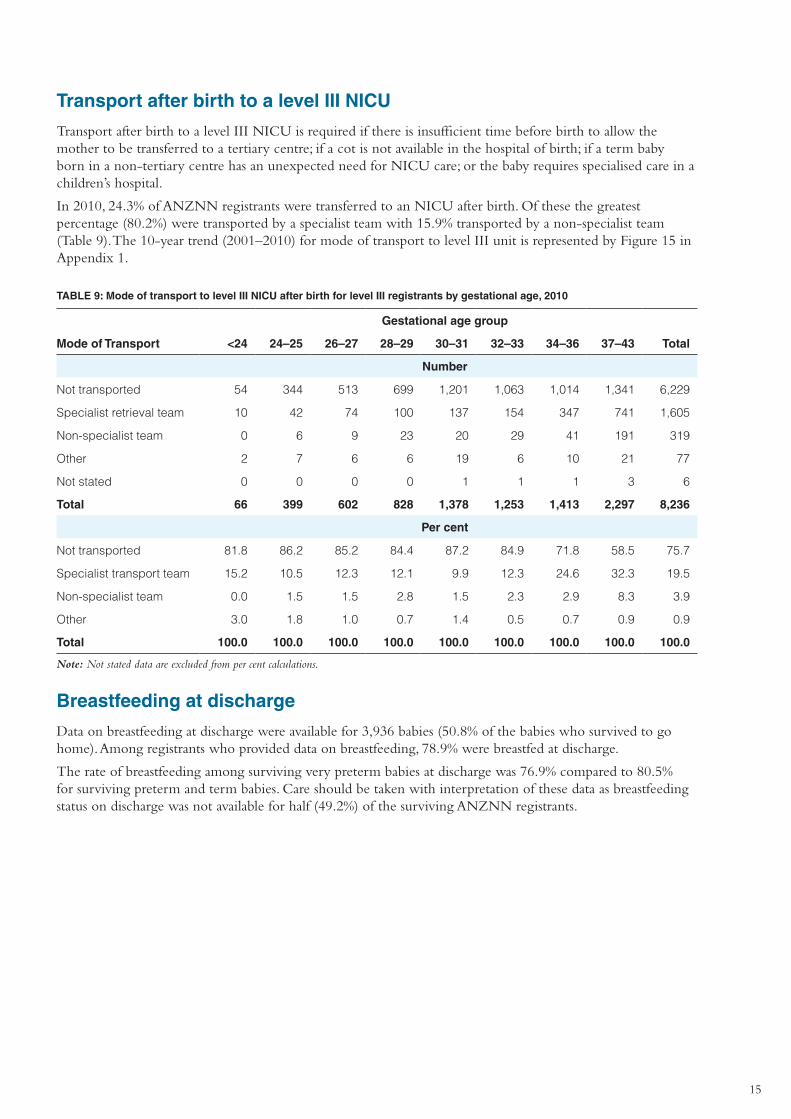
Transport after birth to a level III NICU
Transport after birth to a level III NICU is required if there is insufficient time before birth to allow the mother to be transferred to a tertiary centre; if a cot is not available in the hospital of birth; if a term baby born in a non-tertiary centre has an unexpected need for NICU care; or the baby requires specialised care in a children’s hospital.
In 2010, 24.3% of ANZNN registrants were transferred to an NICU after birth. Of these the greatest percentage (80.2%) were transported by a specialist team with 15.9% transported by a non-specialist team (Table 9). The 10-year trend (2001–2010) for mode of transport to level III unit is represented by Figure 15 in Appendix 1.
TABLE 9: Mode of transport to level III NICU after birth for level III registrants by gestational age, 2010
Gestational age group
Mode of Transport <24 24–25 26–27 28–29 30–31 32–33 34–36 37–43 Total
Number
Not transported 54 344 513 699 1,201 1,063 1,014 1,341 6,229
Specialist retrieval team 10 42 74 100 137 154 347 741 1,605
Non-specialist team 0 6 9 23 20 29 41 191 319
Other 2 7 6 6 19 6 10 21 77
Not stated 0 0 0 0 1 1 1 3 6
Total 66 399 602 828 1,378 1,253 1,413 2,297 8,236
Per cent
Not transported 81.8 86.2 85.2 84.4 87.2 84.9 71.8 58.5 75.7
Specialist transport team 15.2 10.5 12.3 12.1 9.9 12.3 24.6 32.3 19.5
Non-specialist team 0.0 1.5 1.5 2.8 1.5 2.3 2.9 8.3 3.9
Other 3.0 1.8 1.0 0.7 1.4 0.5 0.7 0.9 0.9
Total 100.0 100.0 100.0 100.0 100.0 100.0 100.0 100.0 100.0
Note: Not stated data are excluded from per cent calculations.
Breastfeeding at discharge
Data on breastfeeding at discharge were available for 3,936 babies (50.8% of the babies who survived to go home). Among registrants who provided data on breastfeeding, 78.9% were breastfed at discharge.
The rate of breastfeeding among surviving very preterm babies at discharge was 76.9% compared to 80.5% for surviving preterm and term babies. Care should be taken with interpretation of these data as breastfeeding status on discharge was not available for half (49.2%) of the surviving ANZNN registrants.
16
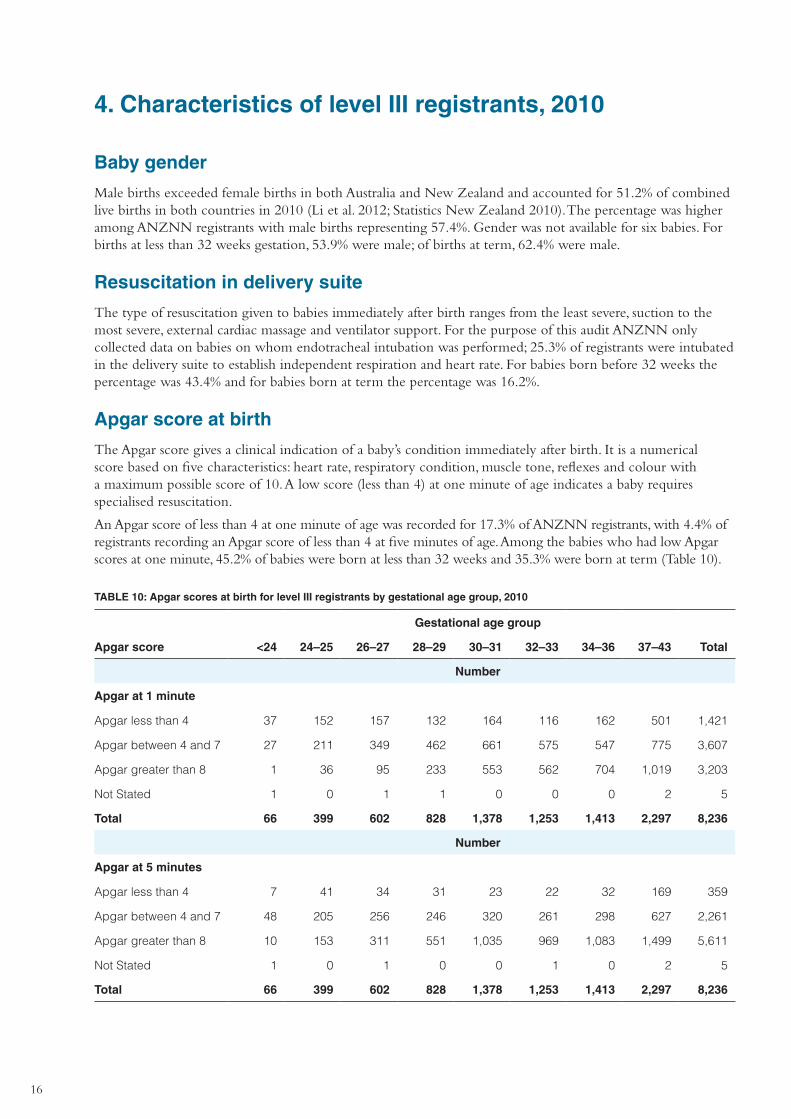
4. Characteristics of level III registrants, 2010
Baby gender
Male births exceeded female births in both Australia and New Zealand and accounted for 51.2% of combined live births in both countries in 2010 (Li et al. 2012; Statistics New Zealand 2010). The percentage was higher among ANZNN registrants with male births representing 57.4%. Gender was not available for six babies. For births at less than 32 weeks gestation, 53.9% were male; of births at term, 62.4% were male.
Resuscitation in delivery suite
The type of resuscitation given to babies immediately after birth ranges from the least severe, suction to the most severe, external cardiac massage and ventilator support. For the purpose of this audit ANZNN only collected data on babies on whom endotracheal intubation was performed; 25.3% of registrants were intubated in the delivery suite to establish independent respiration and heart rate. For babies born before 32 weeks the percentage was 43.4% and for babies born at term the percentage was 16.2%.
Apgar score at birth
The Apgar score gives a clinical indication of a baby’s condition immediately after birth. It is a numerical score based on five characteristics: heart rate, respiratory condition, muscle tone, reflexes and colour with a maximum possible score of 10. A low score (less than 4) at one minute of age indicates a baby requires specialised resuscitation.
An Apgar score of less than 4 at one minute of age was recorded for 17.3% of ANZNN registrants, with 4.4% of registrants recording an Apgar score of less than 4 at five minutes of age. Among the babies who had low Apgar scores at one minute, 45.2% of babies were born at less than 32 weeks and 35.3% were born at term (Table 10).
TABLE 10: Apgar scores at birth for level III registrants by gestational age group, 2010
Gestational age group
Apgar score <24 24–25 26–27 28–29 30–31 32–33 34–36 37–43 Total
Number
Apgar at 1 minute
Apgar less than 4 37 152 157 132 164 116 162 501 1,421
Apgar between 4 and 7 27 211 349 462 661 575 547 775 3,607
Apgar greater than 8 1 36 95 233 553 562 704 1,019 3,203
Not Stated 1 0 1 1 0 0 0 2 5
Total 66 399 602 828 1,378 1,253 1,413 2,297 8,236
Number
Apgar at 5 minutes
Apgar less than 4 7 41 34 31 23 22 32 169 359
Apgar between 4 and 7 48 205 256 246 320 261 298 627 2,261
Apgar greater than 8 10 153 311 551 1,035 969 1,083 1,499 5,611
Not Stated 1 0 1 0 0 1 0 2 5
Total 66 399 602 828 1,378 1,253 1,413 2,297 8,236
17
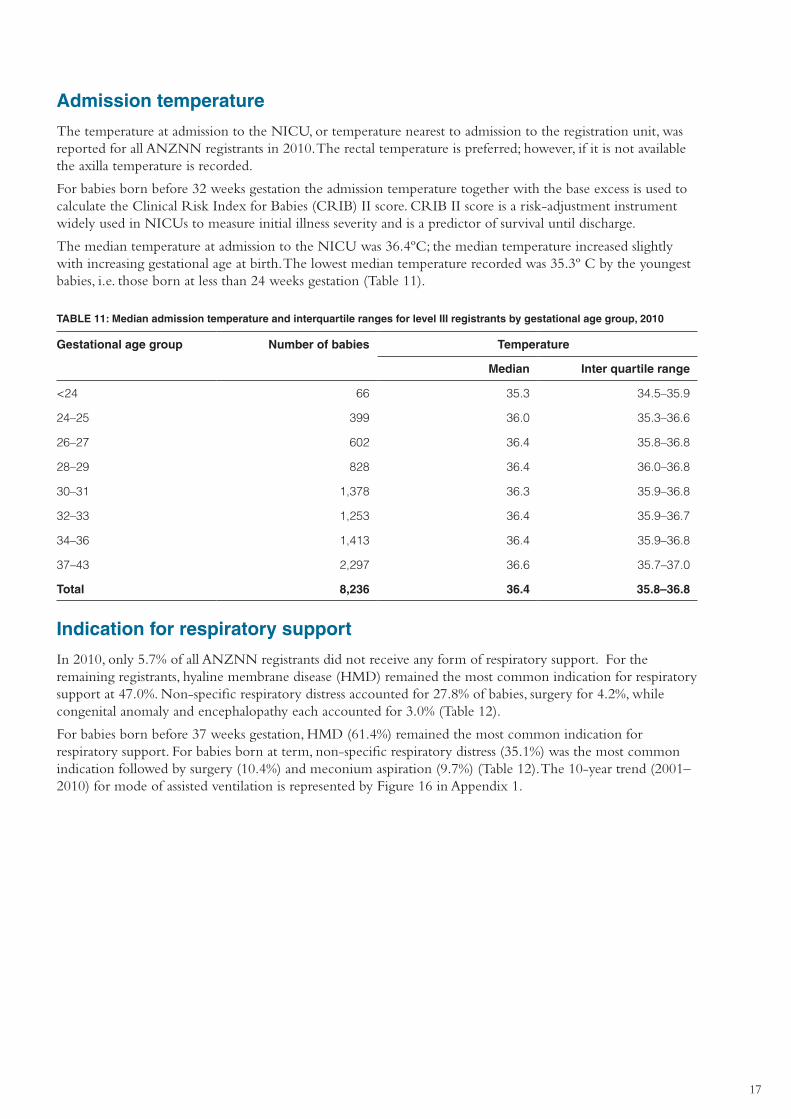
Admission temperature
The temperature at admission to the NICU, or temperature nearest to admission to the registration unit, was reported for all ANZNN registrants in 2010. The rectal temperature is preferred; however, if it is not available the axilla temperature is recorded.
For babies born before 32 weeks gestation the admission temperature together with the base excess is used to calculate the Clinical Risk Index for Babies (CRIB) II score. CRIB II score is a risk-adjustment instrument widely used in NICUs to measure initial illness severity and is a predictor of survival until discharge.
The median temperature at admission to the NICU was 36.4ºC; the median temperature increased slightly with increasing gestational age at birth. The lowest median temperature recorded was 35.3º C by the youngest babies, i.e. those born at less than 24 weeks gestation (Table 11).
TABLE 11: Median admission temperature and interquartile ranges for level III registrants by gestational age group, 2010
Gestational age group Number of babies Temperature
Median Inter quartile range
<24 66 35.3 34.5–35.9
24–25 399 36.0 35.3–36.6
26–27 602 36.4 35.8–36.8
28–29 828 36.4 36.0–36.8
30–31 1,378 36.3 35.9–36.8
32–33 1,253 36.4 35.9–36.7
34–36 1,413 36.4 35.9–36.8
37–43 2,297 36.6 35.7–37.0
Total 8,236 36.4 35.8–36.8
Indication for respiratory support
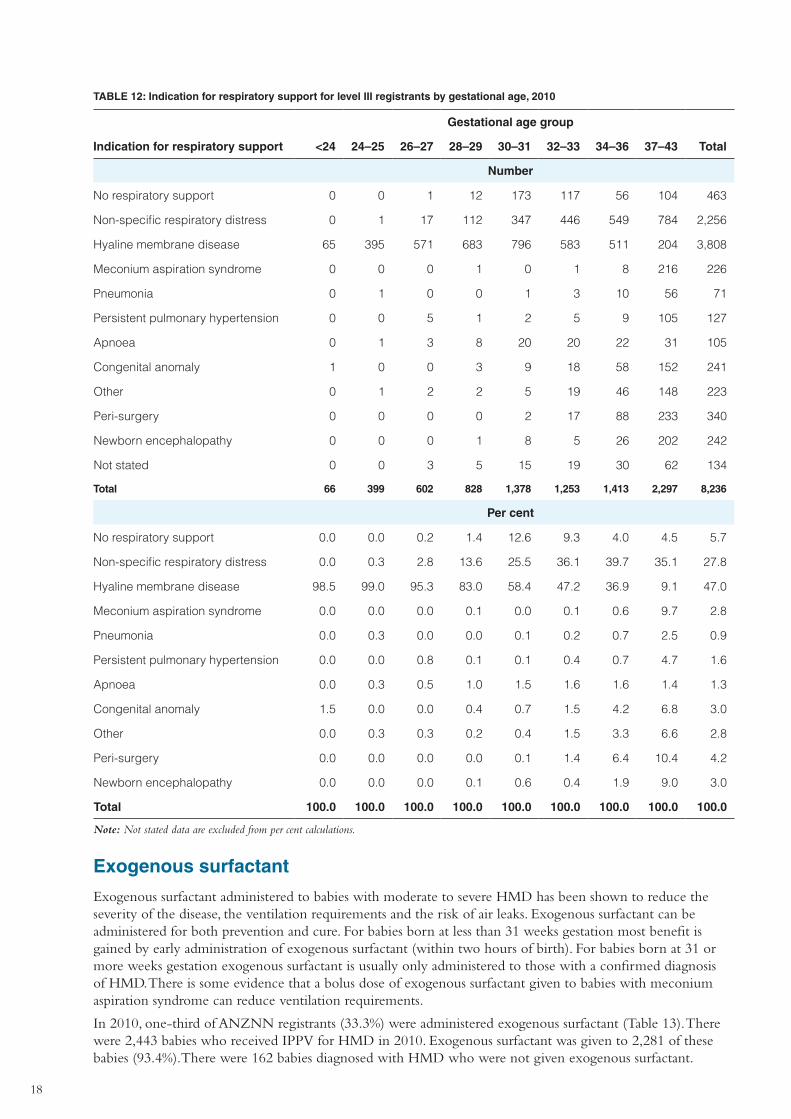
In 2010, only 5.7% of all ANZNN registrants did not receive any form of respiratory support. For the remaining registrants, hyaline membrane disease (HMD) remained the most common indication for respiratory support at 47.0%. Non-specific respiratory distress accounted for 27.8% of babies, surgery for 4.2%, while congenital anomaly and encephalopathy each accounted for 3.0% (Table 12).
For babies born before 37 weeks gestation, HMD (61.4%) remained the most common indication for respiratory support. For babies born at term, non-specific respiratory distress (35.1%) was the most common indication followed by surgery (10.4%) and meconium aspiration (9.7%) (Table 12). The 10-year trend (2001–2010) for mode of assisted ventilation is represented by Figure 16 in Appendix 1.
18
TABLE 12: Indication for respiratory support for level III registrants by gestational age, 2010
Gestational age group
Indication for respiratory support <24 24–25 26–27 28–29 30–31 32–33 34–36 37–43 Total
Number
No respiratory support 0 0 1 12 173 117 56 104 463
Non-specific respiratory distress 0 1 17 112 347 446 549 784 2,256
Hyaline membrane disease 65 395 571 683 796 583 511 204 3,808
Meconium aspiration syndrome 0 0 0 1 0 1 8 216 226
Pneumonia 0 1 0 0 1 3 10 56 71
Persistent pulmonary hypertension 0 0 5 1 2 5 9 105 127
Apnoea 0 1 3 8 20 20 22 31 105
Congenital anomaly 1 0 0 3 9 18 58 152 241
Other 0 1 2 2 5 19 46 148 223
Peri-surgery 0 0 0 0 2 17 88 233 340
Newborn encephalopathy 0 0 0 1 8 5 26 202 242
Not stated 0 0 3 5 15 19 30 62 134
Total 66 399 602 828 1,378 1,253 1,413 2,297 8,236
Per cent
No respiratory support 0.0 0.0 0.2 1.4 12.6 9.3 4.0 4.5 5.7
Non-specific respiratory distress 0.0 0.3 2.8 13.6 25.5 36.1 39.7 35.1 27.8
Hyaline membrane disease 98.5 99.0 95.3 83.0 58.4 47.2 36.9 9.1 47.0
Meconium aspiration syndrome 0.0 0.0 0.0 0.1 0.0 0.1 0.6 9.7 2.8
Pneumonia 0.0 0.3 0.0 0.0 0.1 0.2 0.7 2.5 0.9
Persistent pulmonary hypertension 0.0 0.0 0.8 0.1 0.1 0.4 0.7 4.7 1.6
Apnoea 0.0 0.3 0.5 1.0 1.5 1.6 1.6 1.4 1.3
Congenital anomaly 1.5 0.0 0.0 0.4 0.7 1.5 4.2 6.8 3.0
Other 0.0 0.3 0.3 0.2 0.4 1.5 3.3 6.6 2.8
Peri-surgery 0.0 0.0 0.0 0.0 0.1 1.4 6.4 10.4 4.2
Newborn encephalopathy 0.0 0.0 0.0 0.1 0.6 0.4 1.9 9.0 3.0
Total 100.0 100.0 100.0 100.0 100.0 100.0 100.0 100.0 100.0
Note: Not stated data are excluded from per cent calculations.
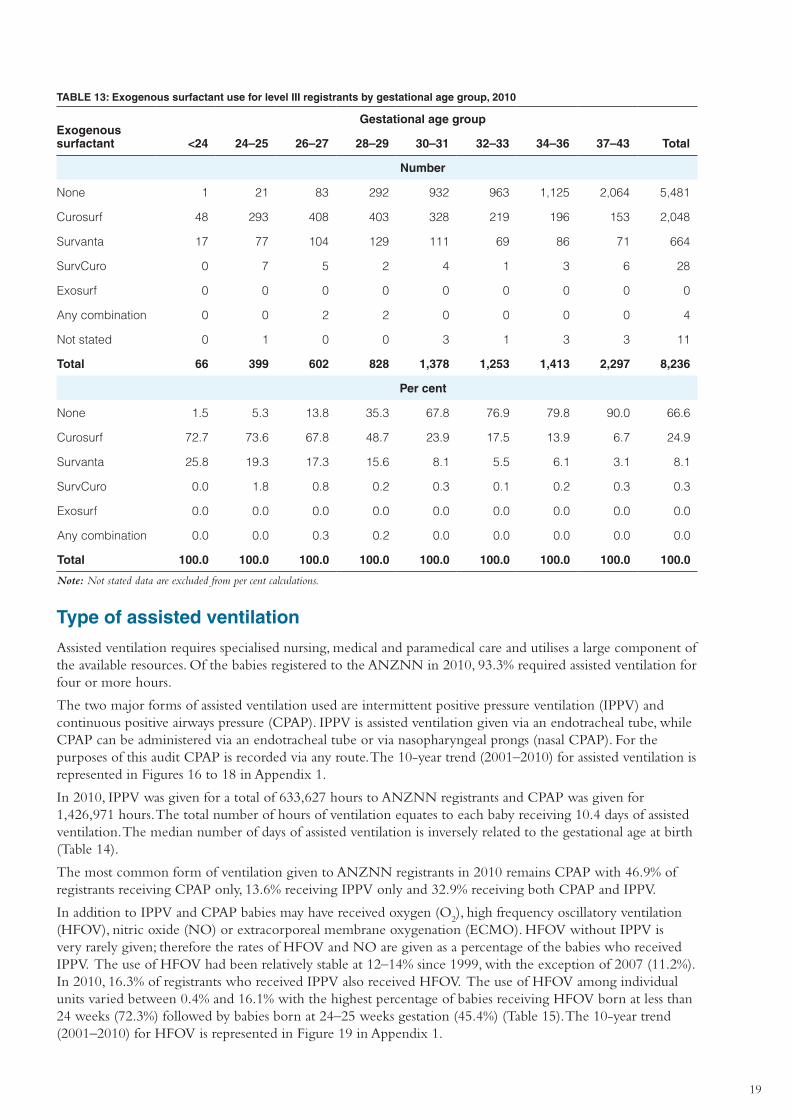
Exogenous surfactant
Exogenous surfactant administered to babies with moderate to severe HMD has been shown to reduce the severity of the disease, the ventilation requirements and the risk of air leaks. Exogenous surfactant can be administered for both prevention and cure. For babies born at less than 31 weeks gestation most benefit is gained by early administration of exogenous surfactant (within two hours of birth). For babies born at 31 or more weeks gestation exogenous surfactant is usually only administered to those with a confirmed diagnosis of HMD. There is some evidence that a bolus dose of exogenous surfactant given to babies with meconium aspiration syndrome can reduce ventilation requirements.
In 2010, one-third of ANZNN registrants (33.3%) were administered exogenous surfactant (Table 13). There were 2,443 babies who received IPPV for HMD in 2010. Exogenous surfactant was given to 2,281 of these babies (93.4%).There were 162 babies diagnosed with HMD who were not given exogenous surfactant.
19
TABLE 13: Exogenous surfactant use for level III registrants by gestational age group, 2010
Exogenous surfactant
Gestational age group
<24 24–25 26–27 28–29 30–31 32–33 34–36 37–43 Total
Number
None 1 21 83 292 932 963 1,125 2,064 5,481
Curosurf 48 293 408 403 328 219 196 153 2,048
Survanta 17 77 104 129 111 69 86 71 664
SurvCuro 0 7 5 2 4 1 3 6 28
Exosurf 0 0 0 0 0 0 0 0 0
Any combination 0 0 2 2 0 0 0 0 4
Not stated 0 1 0 0 3 1 3 3 11
Total 66 399 602 828 1,378 1,253 1,413 2,297 8,236
Per cent
None 1.5 5.3 13.8 35.3 67.8 76.9 79.8 90.0 66.6
Curosurf 72.7 73.6 67.8 48.7 23.9 17.5 13.9 6.7 24.9
Survanta 25.8 19.3 17.3 15.6 8.1 5.5 6.1 3.1 8.1
SurvCuro 0.0 1.8 0.8 0.2 0.3 0.1 0.2 0.3 0.3
Exosurf 0.0 0.0 0.0 0.0 0.0 0.0 0.0 0.0 0.0
Any combination 0.0 0.0 0.3 0.2 0.0 0.0 0.0 0.0 0.0
Total 100.0 100.0 100.0 100.0 100.0 100.0 100.0 100.0 100.0
Note: Not stated data are excluded from per cent calculations.
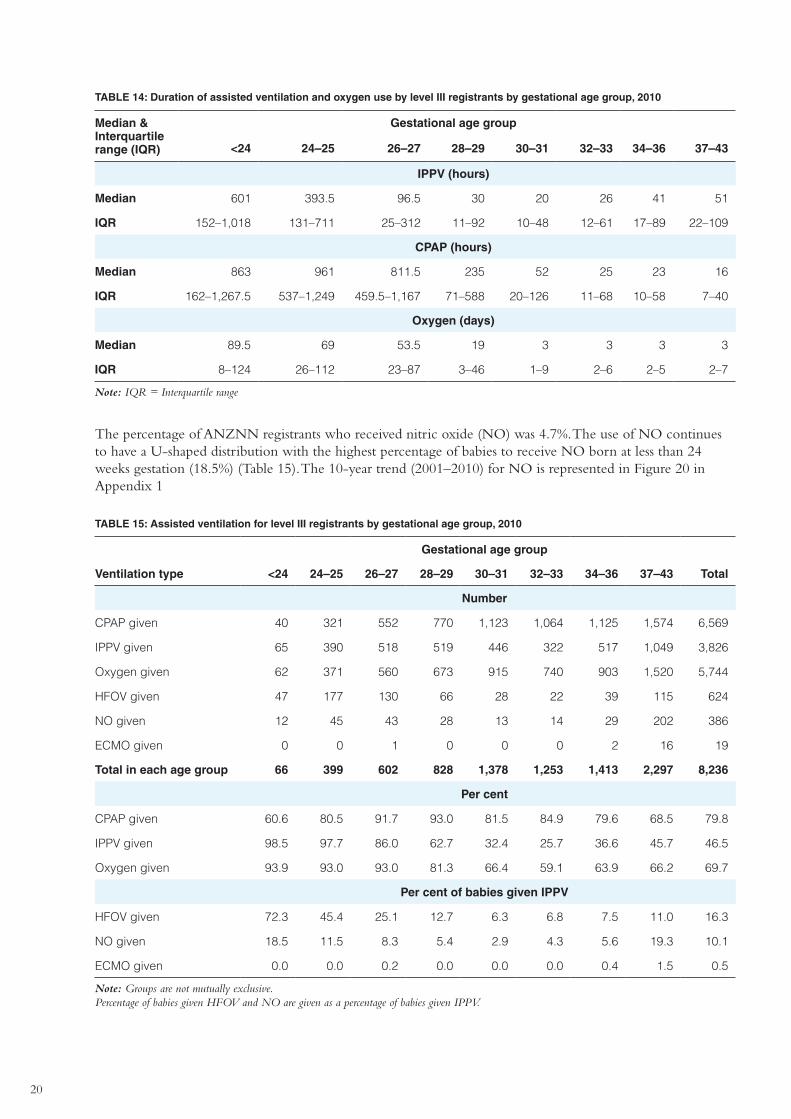
Type of assisted ventilation
Assisted ventilation requires specialised nursing, medical and paramedical care and utilises a large component of the available resources. Of the babies registered to the ANZNN in 2010, 93.3% required assisted ventilation for four or more hours.
The two major forms of assisted ventilation used are intermittent positive pressure ventilation (IPPV) and continuous positive airways pressure (CPAP). IPPV is assisted ventilation given via an endotracheal tube, while CPAP can be administered via an endotracheal tube or via nasopharyngeal prongs (nasal CPAP). For the purposes of this audit CPAP is recorded via any route. The 10-year trend (2001–2010) for assisted ventilation is represented in Figures 16 to 18 in Appendix 1.
In 2010, IPPV was given for a total of 633,627 hours to ANZNN registrants and CPAP was given for 1,426,971 hours. The total number of hours of ventilation equates to each baby receiving 10.4 days of assisted ventilation. The median number of days of assisted ventilation is inversely related to the gestational age at birth (Table 14).
The most common form of ventilation given to ANZNN registrants in 2010 remains CPAP with 46.9% of registrants receiving CPAP only, 13.6% receiving IPPV only and 32.9% receiving both CPAP and IPPV.
In addition to IPPV and CPAP babies may have received oxygen (O2), high frequency oscillatory ventilation
(HFOV), nitric oxide (NO) or extracorporeal membrane oxygenation (ECMO). HFOV without IPPV is very rarely given; therefore the rates of HFOV and NO are given as a percentage of the babies who received IPPV. The use of HFOV had been relatively stable at 12–14% since 1999, with the exception of 2007 (11.2%). In 2010, 16.3% of registrants who received IPPV also received HFOV. The use of HFOV among individual units varied between 0.4% and 16.1% with the highest percentage of babies receiving HFOV born at less than 24 weeks (72.3%) followed by babies born at 24–25 weeks gestation (45.4%) (Table 15). The 10-year trend (2001–2010) for HFOV is represented in Figure 19 in Appendix 1.
20
TABLE 14: Duration of assisted ventilation and oxygen use by level III registrants by gestational age group, 2010
Median & Interquartile range (IQR)
Gestational age group
<24 24–25 26–27 28–29 30–31 32–33 34–36 37–43
IPPV (hours)
Median 601 393.5 96.5 30 20 26 41 51
IQR 152–1,018 131–711 25–312 11–92 10–48 12–61 17–89 22–109
CPAP (hours)
Median 863 961 811.5 235 52 25 23 16
IQR 162–1,267.5 537–1,249 459.5–1,167 71–588 20–126 11–68 10–58 7–40
Oxygen (days)
Median 89.5 69 53.5 19 3 3 3 3
IQR 8–124 26–112 23–87 3–46 1–9 2–6 2–5 2–7
Note: IQR = Interquartile range
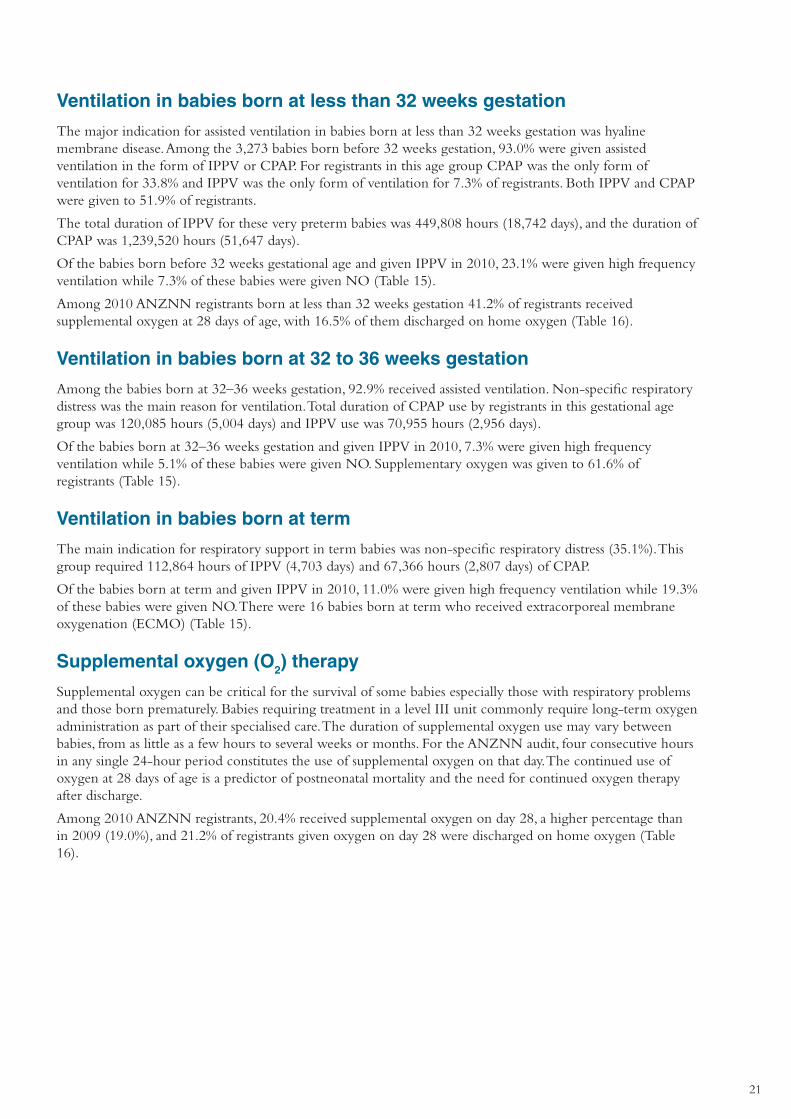
The percentage of ANZNN registrants who received nitric oxide (NO) was 4.7%. The use of NO continues to have a U-shaped distribution with the highest percentage of babies to receive NO born at less than 24 weeks gestation (18.5%) (Table 15). The 10-year trend (2001–2010) for NO is represented in Figure 20 in Appendix 1
TABLE 15: Assisted ventilation for level III registrants by gestational age group, 2010
Gestational age group
Ventilation type <24 24–25 26–27 28–29 30–31 32–33 34–36 37–43 Total
Number
CPAP given 40 321 552 770 1,123 1,064 1,125 1,574 6,569
IPPV given 65 390 518 519 446 322 517 1,049 3,826
Oxygen given 62 371 560 673 915 740 903 1,520 5,744
HFOV given 47 177 130 66 28 22 39 115 624
NO given 12 45 43 28 13 14 29 202 386
ECMO given 0 0 1 0 0 0 2 16 19
Total in each age group 66 399 602 828 1,378 1,253 1,413 2,297 8,236
Per cent
CPAP given 60.6 80.5 91.7 93.0 81.5 84.9 79.6 68.5 79.8
IPPV given 98.5 97.7 86.0 62.7 32.4 25.7 36.6 45.7 46.5
Oxygen given 93.9 93.0 93.0 81.3 66.4 59.1 63.9 66.2 69.7
Per cent of babies given IPPV
HFOV given 72.3 45.4 25.1 12.7 6.3 6.8 7.5 11.0 16.3
NO given 18.5 11.5 8.3 5.4 2.9 4.3 5.6 19.3 10.1
ECMO given 0.0 0.0 0.2 0.0 0.0 0.0 0.4 1.5 0.5
Note: Groups are not mutually exclusive. Percentage of babies given HFOV and NO are given as a percentage of babies given IPPV.
21
Ventilation in babies born at less than 32 weeks gestation
The major indication for assisted ventilation in babies born at less than 32 weeks gestation was hyaline membrane disease. Among the 3,273 babies born before 32 weeks gestation, 93.0% were given assisted ventilation in the form of IPPV or CPAP. For registrants in this age group CPAP was the only form of ventilation for 33.8% and IPPV was the only form of ventilation for 7.3% of registrants. Both IPPV and CPAP were given to 51.9% of registrants.
The total duration of IPPV for these very preterm babies was 449,808 hours (18,742 days), and the duration of CPAP was 1,239,520 hours (51,647 days).
Of the babies born before 32 weeks gestational age and given IPPV in 2010, 23.1% were given high frequency ventilation while 7.3% of these babies were given NO (Table 15).
Among 2010 ANZNN registrants born at less than 32 weeks gestation 41.2% of registrants received supplemental oxygen at 28 days of age, with 16.5% of them discharged on home oxygen (Table 16).
Ventilation in babies born at 32 to 36 weeks gestation
Among the babies born at 32–36 weeks gestation, 92.9% received assisted ventilation. Non-specific respiratory distress was the main reason for ventilation. Total duration of CPAP use by registrants in this gestational age group was 120,085 hours (5,004 days) and IPPV use was 70,955 hours (2,956 days).
Of the babies born at 32–36 weeks gestation and given IPPV in 2010, 7.3% were given high frequency ventilation while 5.1% of these babies were given NO. Supplementary oxygen was given to 61.6% of registrants (Table 15).
Ventilation in babies born at term
The main indication for respiratory support in term babies was non-specific respiratory distress (35.1%). This group required 112,864 hours of IPPV (4,703 days) and 67,366 hours (2,807 days) of CPAP.
Of the babies born at term and given IPPV in 2010, 11.0% were given high frequency ventilation while 19.3% of these babies were given NO. There were 16 babies born at term who received extracorporeal membrane oxygenation (ECMO) (Table 15).
Supplemental oxygen (O2) therapy
Supplemental oxygen can be critical for the survival of some babies especially those with respiratory problems and those born prematurely. Babies requiring treatment in a level III unit commonly require long-term oxygen administration as part of their specialised care. The duration of supplemental oxygen use may vary between babies, from as little as a few hours to several weeks or months. For the ANZNN audit, four consecutive hours in any single 24-hour period constitutes the use of supplemental oxygen on that day. The continued use of oxygen at 28 days of age is a predictor of postneonatal mortality and the need for continued oxygen therapy after discharge.
Among 2010 ANZNN registrants, 20.4% received supplemental oxygen on day 28, a higher percentage than in 2009 (19.0%), and 21.2% of registrants given oxygen on day 28 were discharged on home oxygen (Table 16).
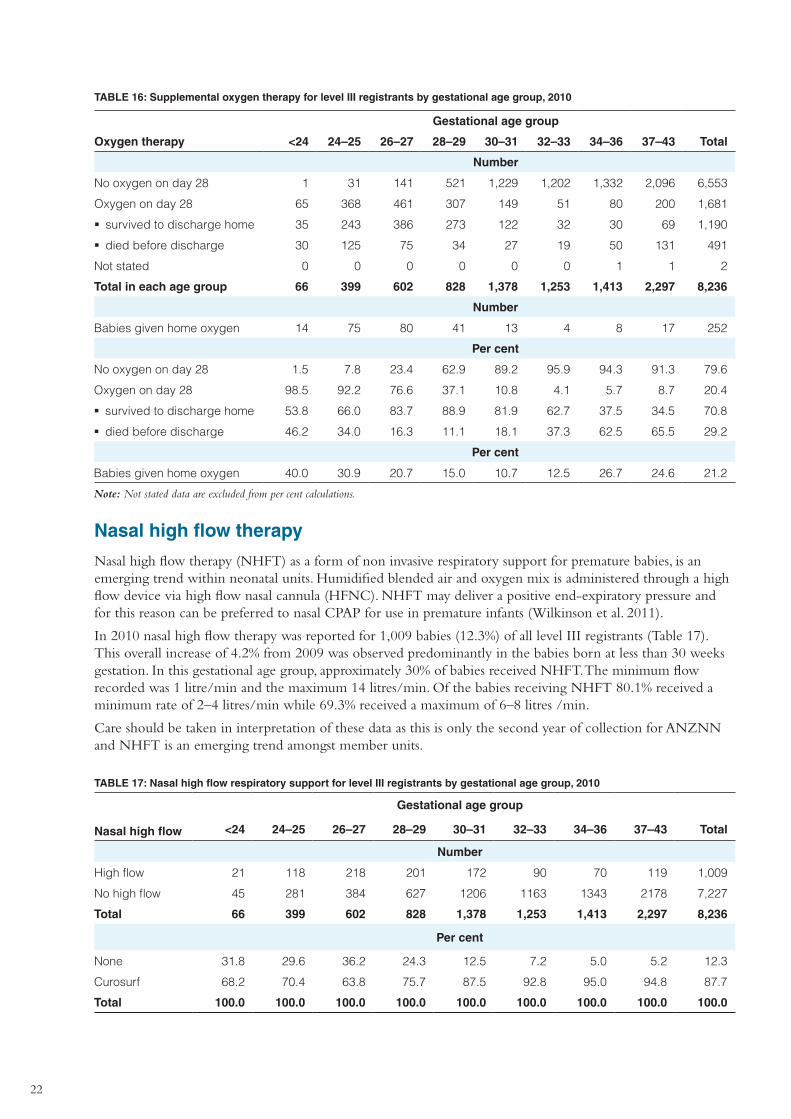
22
TABLE 16: Supplemental oxygen therapy for level III registrants by gestational age group, 2010
Gestational age group
Oxygen therapy <24 24–25 26–27 28–29 30–31 32–33 34–36 37–43 Total
Number
No oxygen on day 28 1 31 141 521 1,229 1,202 1,332 2,096 6,553
Oxygen on day 28 65 368 461 307 149 51 80 200 1,681
�� survived to discharge home 35 243 386 273 122 32 30 69 1,190
�� died before discharge 30 125 75 34 27 19 50 131 491
Not stated 0 0 0 0 0 0 1 1 2
Total in each age group 66 399 602 828 1,378 1,253 1,413 2,297 8,236
Number
Babies given home oxygen 14 75 80 41 13 4 8 17 252
Per cent
No oxygen on day 28 1.5 7.8 23.4 62.9 89.2 95.9 94.3 91.3 79.6
Oxygen on day 28 98.5 92.2 76.6 37.1 10.8 4.1 5.7 8.7 20.4
�� survived to discharge home 53.8 66.0 83.7 88.9 81.9 62.7 37.5 34.5 70.8
�� died before discharge 46.2 34.0 16.3 11.1 18.1 37.3 62.5 65.5 29.2
Per cent
Babies given home oxygen 40.0 30.9 20.7 15.0 10.7 12.5 26.7 24.6 21.2
Note: Not stated data are excluded from per cent calculations.
Nasal high flow therapy
Nasal high flow therapy (NHFT) as a form of non invasive respiratory support for premature babies, is an emerging trend within neonatal units. Humidified blended air and oxygen mix is administered through a high flow device via high flow nasal cannula (HFNC). NHFT may deliver a positive end-expiratory pressure and for this reason can be preferred to nasal CPAP for use in premature infants (Wilkinson et al. 2011).
In 2010 nasal high flow therapy was reported for 1,009 babies (12.3%) of all level III registrants (Table 17). This overall increase of 4.2% from 2009 was observed predominantly in the babies born at less than 30 weeks gestation. In this gestational age group, approximately 30% of babies received NHFT. The minimum flow recorded was 1 litre/min and the maximum 14 litres/min. Of the babies receiving NHFT 80.1% received a minimum rate of 2–4 litres/min while 69.3% received a maximum of 6–8 litres /min.
Care should be taken in interpretation of these data as this is only the second year of collection for ANZNN and NHFT is an emerging trend amongst member units.
TABLE 17: Nasal high flow respiratory support for level III registrants by gestational age group, 2010
Nasal high flow
Gestational age group
<24 24–25 26–27 28–29 30–31 32–33 34–36 37–43 Total
Number
High flow 21 118 218 201 172 90 70 119 1,009
No high flow 45 281 384 627 1206 1163 1343 2178 7,227
Total 66 399 602 828 1,378 1,253 1,413 2,297 8,236
Per cent
None 31.8 29.6 36.2 24.3 12.5 7.2 5.0 5.2 12.3
Curosurf 68.2 70.4 63.8 75.7 87.5 92.8 95.0 94.8 87.7
Total 100.0 100.0 100.0 100.0 100.0 100.0 100.0 100.0 100.0
23
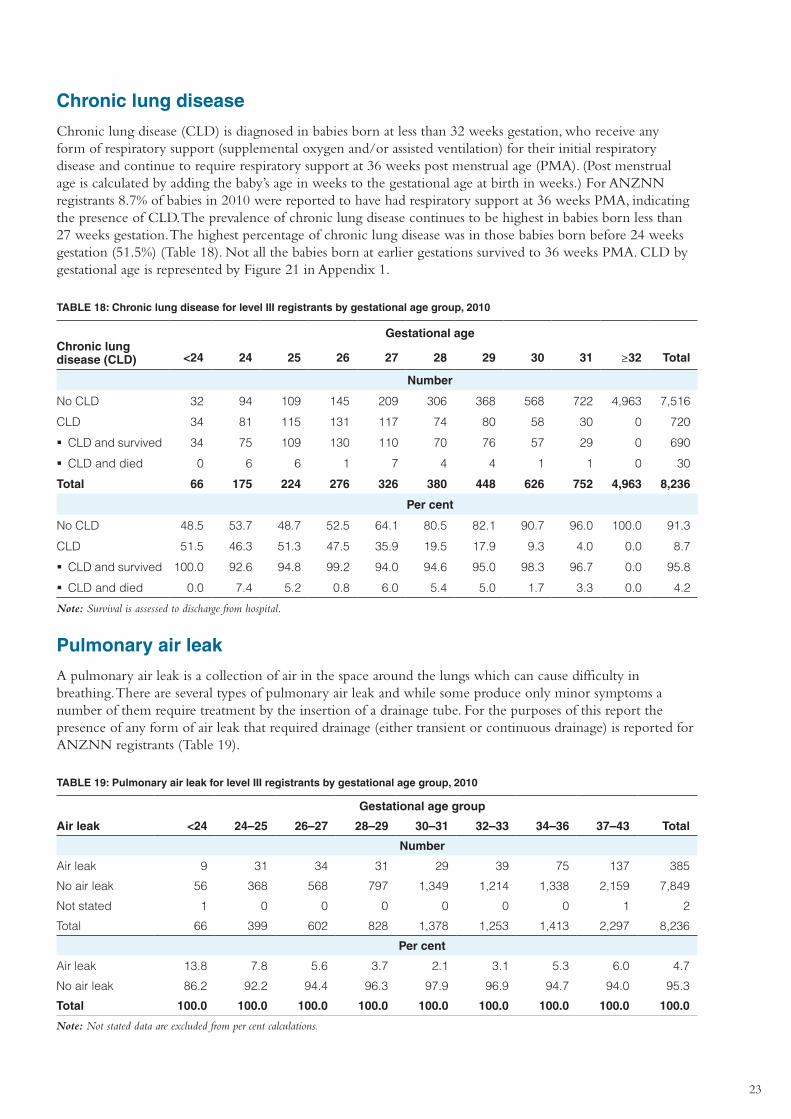
Chronic lung disease
Chronic lung disease (CLD) is diagnosed in babies born at less than 32 weeks gestation, who receive any form of respiratory support (supplemental oxygen and/or assisted ventilation) for their initial respiratory disease and continue to require respiratory support at 36 weeks post menstrual age (PMA). (Post menstrual age is calculated by adding the baby’s age in weeks to the gestational age at birth in weeks.) For ANZNN registrants 8.7% of babies in 2010 were reported to have had respiratory support at 36 weeks PMA, indicating the presence of CLD. The prevalence of chronic lung disease continues to be highest in babies born less than 27 weeks gestation. The highest percentage of chronic lung disease was in those babies born before 24 weeks gestation (51.5%) (Table 18). Not all the babies born at earlier gestations survived to 36 weeks PMA. CLD by gestational age is represented by Figure 21 in Appendix 1.
TABLE 18: Chronic lung disease for level III registrants by gestational age group, 2010
Chronic lung disease (CLD)
Gestational age
<24 24 25 26 27 28 29 30 31 ≥32 Total
Number
No CLD 32 94 109 145 209 306 368 568 722 4,963 7,516
CLD 34 81 115 131 117 74 80 58 30 0 720
�� CLD and survived 34 75 109 130 110 70 76 57 29 0 690
�� CLD and died 0 6 6 1 7 4 4 1 1 0 30
Total 66 175 224 276 326 380 448 626 752 4,963 8,236
Per cent
No CLD 48.5 53.7 48.7 52.5 64.1 80.5 82.1 90.7 96.0 100.0 91.3
CLD 51.5 46.3 51.3 47.5 35.9 19.5 17.9 9.3 4.0 0.0 8.7
�� CLD and survived 100.0 92.6 94.8 99.2 94.0 94.6 95.0 98.3 96.7 0.0 95.8
�� CLD and died 0.0 7.4 5.2 0.8 6.0 5.4 5.0 1.7 3.3 0.0 4.2
Note: Survival is assessed to discharge from hospital.
Pulmonary air leak
A pulmonary air leak is a collection of air in the space around the lungs which can cause difficulty in breathing. There are several types of pulmonary air leak and while some produce only minor symptoms a number of them require treatment by the insertion of a drainage tube. For the purposes of this report the presence of any form of air leak that required drainage (either transient or continuous drainage) is reported for ANZNN registrants (Table 19).
TABLE 19: Pulmonary air leak for level III registrants by gestational age group, 2010
Gestational age group
Air leak <24 24–25 26–27 28–29 30–31 32–33 34–36 37–43 Total
Number
Air leak 9 31 34 31 29 39 75 137 385
No air leak 56 368 568 797 1,349 1,214 1,338 2,159 7,849
Not stated 1 0 0 0 0 0 0 1 2
Total 66 399 602 828 1,378 1,253 1,413 2,297 8,236
Per cent
Air leak 13.8 7.8 5.6 3.7 2.1 3.1 5.3 6.0 4.7
No air leak 86.2 92.2 94.4 96.3 97.9 96.9 94.7 94.0 95.3
Total 100.0 100.0 100.0 100.0 100.0 100.0 100.0 100.0 100.0
Note: Not stated data are excluded from per cent calculations.
24
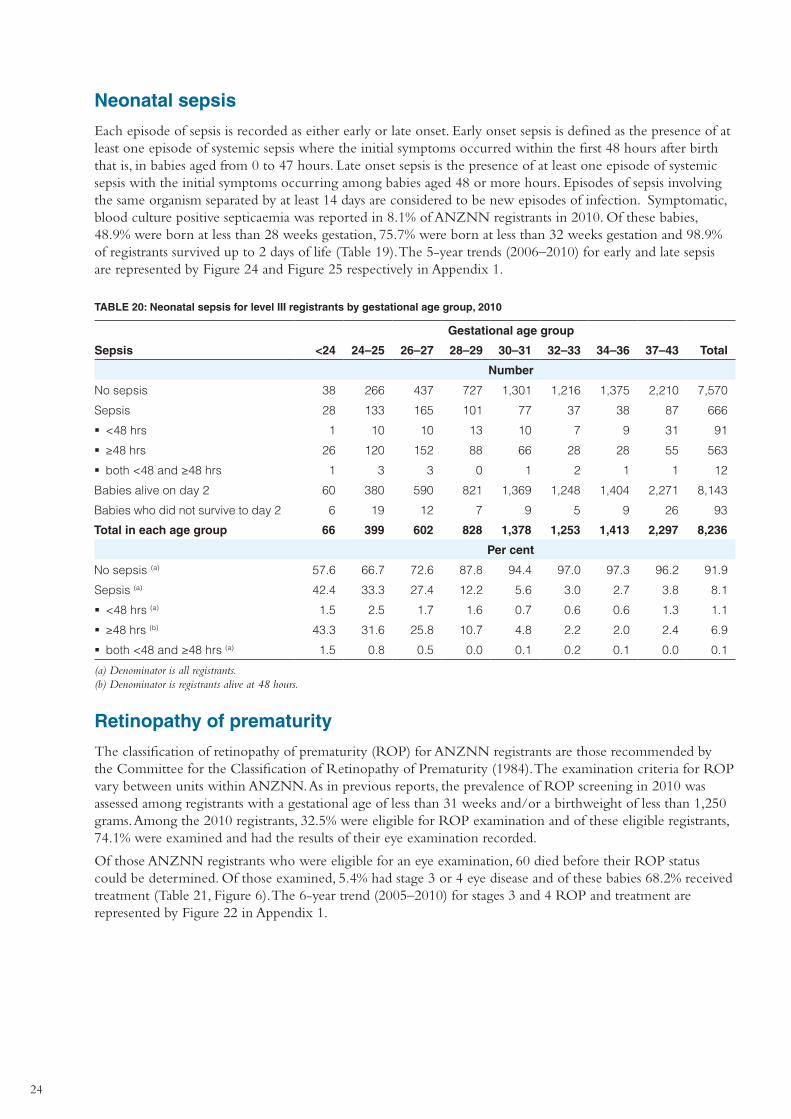
Neonatal sepsis
Each episode of sepsis is recorded as either early or late onset. Early onset sepsis is defined as the presence of at least one episode of systemic sepsis where the initial symptoms occurred within the first 48 hours after birth that is, in babies aged from 0 to 47 hours. Late onset sepsis is the presence of at least one episode of systemic sepsis with the initial symptoms occurring among babies aged 48 or more hours. Episodes of sepsis involving the same organism separated by at least 14 days are considered to be new episodes of infection. Symptomatic, blood culture positive septicaemia was reported in 8.1% of ANZNN registrants in 2010. Of these babies, 48.9% were born at less than 28 weeks gestation, 75.7% were born at less than 32 weeks gestation and 98.9% of registrants survived up to 2 days of life (Table 19). The 5-year trends (2006–2010) for early and late sepsis are represented by Figure 24 and Figure 25 respectively in Appendix 1.
TABLE 20: Neonatal sepsis for level III registrants by gestational age group, 2010
Gestational age group
Sepsis <24 24–25 26–27 28–29 30–31 32–33 34–36 37–43 Total
Number
No sepsis 38 266 437 727 1,301 1,216 1,375 2,210 7,570
Sepsis 28 133 165 101 77 37 38 87 666
�� <48 hrs 1 10 10 13 10 7 9 31 91
�� ≥48 hrs 26 120 152 88 66 28 28 55 563
�� both <48 and ≥48 hrs 1 3 3 0 1 2 1 1 12
Babies alive on day 2 60 380 590 821 1,369 1,248 1,404 2,271 8,143
Babies who did not survive to day 2 6 19 12 7 9 5 9 26 93
Total in each age group 66 399 602 828 1,378 1,253 1,413 2,297 8,236
Per cent
No sepsis (a) 57.6 66.7 72.6 87.8 94.4 97.0 97.3 96.2 91.9
Sepsis (a) 42.4 33.3 27.4 12.2 5.6 3.0 2.7 3.8 8.1
�� <48 hrs (a) 1.5 2.5 1.7 1.6 0.7 0.6 0.6 1.3 1.1
�� ≥48 hrs (b) 43.3 31.6 25.8 10.7 4.8 2.2 2.0 2.4 6.9
�� both <48 and ≥48 hrs (a) 1.5 0.8 0.5 0.0 0.1 0.2 0.1 0.0 0.1
(a) Denominator is all registrants. (b) Denominator is registrants alive at 48 hours.
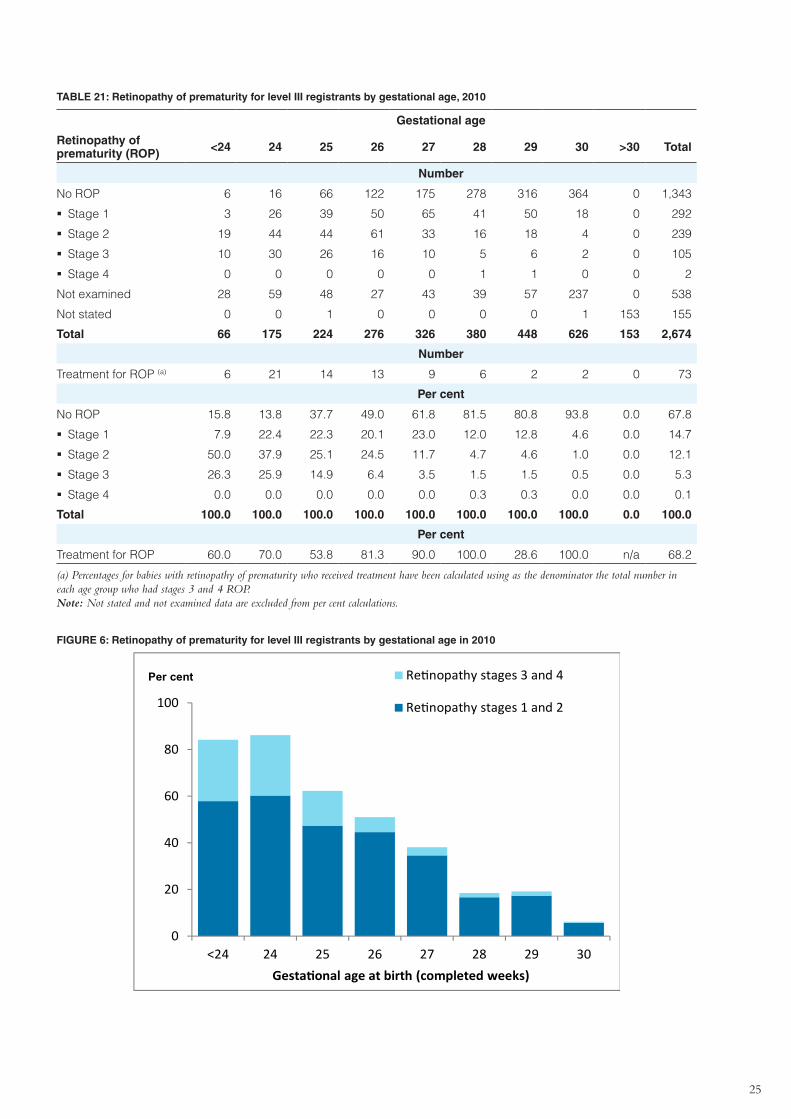
Retinopathy of prematurity
The classification of retinopathy of prematurity (ROP) for ANZNN registrants are those recommended by the Committee for the Classification of Retinopathy of Prematurity (1984). The examination criteria for ROP vary between units within ANZNN. As in previous reports, the prevalence of ROP screening in 2010 was assessed among registrants with a gestational age of less than 31 weeks and/or a birthweight of less than 1,250 grams. Among the 2010 registrants, 32.5% were eligible for ROP examination and of these eligible registrants, 74.1% were examined and had the results of their eye examination recorded.
Of those ANZNN registrants who were eligible for an eye examination, 60 died before their ROP status could be determined. Of those examined, 5.4% had stage 3 or 4 eye disease and of these babies 68.2% received treatment (Table 21, Figure 6). The 6-year trend (2005–2010) for stages 3 and 4 ROP and treatment are represented by Figure 22 in Appendix 1.
25
TABLE 21: Retinopathy of prematurity for level III registrants by gestational age, 2010
Gestational age
Retinopathy of prematurity (ROP) <24 24 25 26 27 28 29 30 >30 Total
Number
No ROP 6 16 66 122 175 278 316 364 0 1,343
�� Stage 1 3 26 39 50 65 41 50 18 0 292
�� Stage 2 19 44 44 61 33 16 18 4 0 239
�� Stage 3 10 30 26 16 10 5 6 2 0 105
�� Stage 4 0 0 0 0 0 1 1 0 0 2
Not examined 28 59 48 27 43 39 57 237 0 538
Not stated 0 0 1 0 0 0 0 1 153 155
Total 66 175 224 276 326 380 448 626 153 2,674
Number
Treatment for ROP (a) 6 21 14 13 9 6 2 2 0 73
Per cent
No ROP 15.8 13.8 37.7 49.0 61.8 81.5 80.8 93.8 0.0 67.8
�� Stage 1 7.9 22.4 22.3 20.1 23.0 12.0 12.8 4.6 0.0 14.7
�� Stage 2 50.0 37.9 25.1 24.5 11.7 4.7 4.6 1.0 0.0 12.1
�� Stage 3 26.3 25.9 14.9 6.4 3.5 1.5 1.5 0.5 0.0 5.3
�� Stage 4 0.0 0.0 0.0 0.0 0.0 0.3 0.3 0.0 0.0 0.1
Total 100.0 100.0 100.0 100.0 100.0 100.0 100.0 100.0 0.0 100.0
Per cent
Treatment for ROP 60.0 70.0 53.8 81.3 90.0 100.0 28.6 100.0 n/a 68.2
(a) Percentages for babies with retinopathy of prematurity who received treatment have been calculated using as the denominator the total number in each age group who had stages 3 and 4 ROP. Note: Not stated and not examined data are excluded from per cent calculations.
FIGURE 6: Retinopathy of prematurity for level III registrants by gestational age in 2010
0
20
40
60
80
100
<24 24 25 26 27 28 29 30Gestational age at birth (completed weeks)
Retinopathy stages 3 and 4
Retinopathy stages 1 and 2
Per cent
26
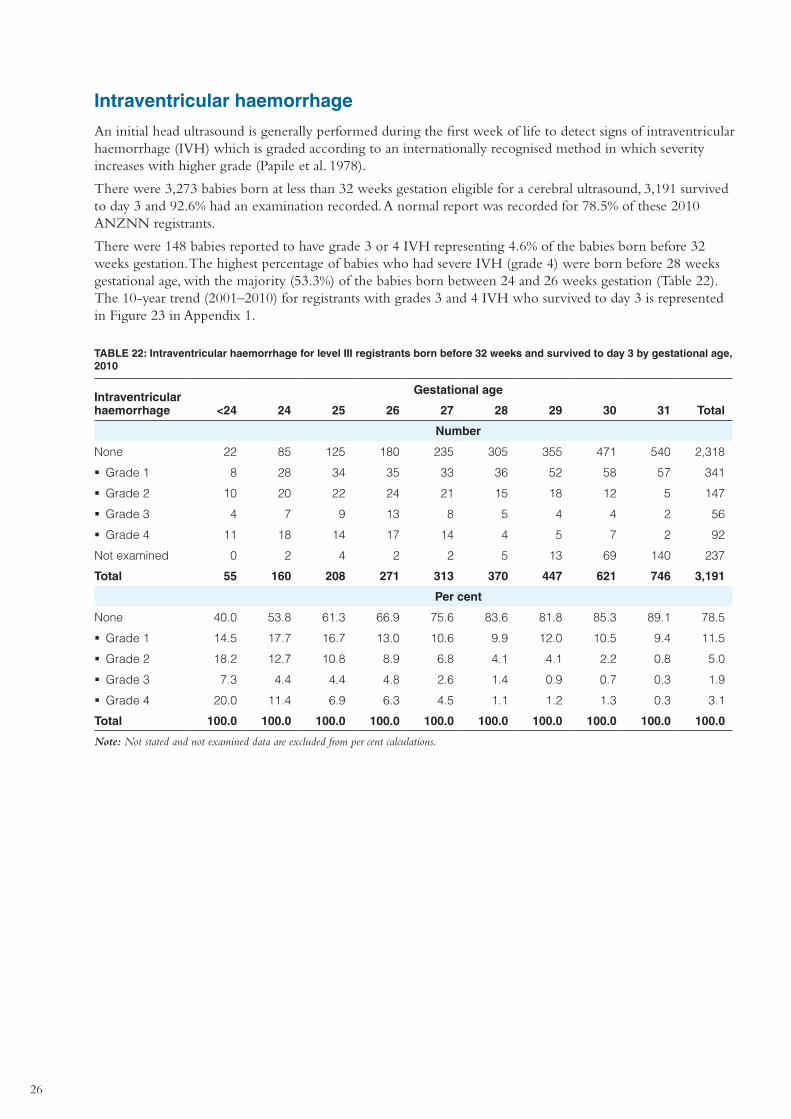
Intraventricular haemorrhage
An initial head ultrasound is generally performed during the first week of life to detect signs of intraventricular haemorrhage (IVH) which is graded according to an internationally recognised method in which severity increases with higher grade (Papile et al. 1978).
There were 3,273 babies born at less than 32 weeks gestation eligible for a cerebral ultrasound, 3,191 survived to day 3 and 92.6% had an examination recorded. A normal report was recorded for 78.5% of these 2010 ANZNN registrants.
There were 148 babies reported to have grade 3 or 4 IVH representing 4.6% of the babies born before 32 weeks gestation. The highest percentage of babies who had severe IVH (grade 4) were born before 28 weeks gestational age, with the majority (53.3%) of the babies born between 24 and 26 weeks gestation (Table 22). The 10-year trend (2001–2010) for registrants with grades 3 and 4 IVH who survived to day 3 is represented in Figure 23 in Appendix 1.
TABLE 22: Intraventricular haemorrhage for level III registrants born before 32 weeks and survived to day 3 by gestational age, 2010
Intraventricular haemorrhage
Gestational age
<24 24 25 26 27 28 29 30 31 Total
Number
None 22 85 125 180 235 305 355 471 540 2,318
�� Grade 1 8 28 34 35 33 36 52 58 57 341
�� Grade 2 10 20 22 24 21 15 18 12 5 147
�� Grade 3 4 7 9 13 8 5 4 4 2 56
�� Grade 4 11 18 14 17 14 4 5 7 2 92
Not examined 0 2 4 2 2 5 13 69 140 237
Total 55 160 208 271 313 370 447 621 746 3,191
Per cent
None 40.0 53.8 61.3 66.9 75.6 83.6 81.8 85.3 89.1 78.5
�� Grade 1 14.5 17.7 16.7 13.0 10.6 9.9 12.0 10.5 9.4 11.5
�� Grade 2 18.2 12.7 10.8 8.9 6.8 4.1 4.1 2.2 0.8 5.0
�� Grade 3 7.3 4.4 4.4 4.8 2.6 1.4 0.9 0.7 0.3 1.9
�� Grade 4 20.0 11.4 6.9 6.3 4.5 1.1 1.2 1.3 0.3 3.1
Total 100.0 100.0 100.0 100.0 100.0 100.0 100.0 100.0 100.0 100.0
Note: Not stated and not examined data are excluded from per cent calculations.
27
FIGURE 7: Intraventricular haemorrhage in level III registrants born at less than 32 weeks gestation and survived to day 3, by gestational age, 2010
0
10
20
30
40
50
60
70
<24 24 25 26 27 28 29 30 31
IVH grades 1 and 2
IVH grades 3 and 4
Per cent
Gestational age at birth (completed weeks)
Late cerebral ultrasound
Late cerebral ultrasound data are based on changes seen in brain tissue at the cerebral ultrasound scan nearest to six weeks of age. As noted above there were 3,273 babies born at less than 32 weeks gestation eligible for a cerebral ultrasound, 3,191 survived until day 3 and late ultrasound results were available for 2,483 of these babies. A normal report of no cysts was recorded for 96.8% of these registrants, 1.2% reported porencephalic cysts, 2.0% reported periventricular leukomalacia (PVL) and no reports of encephaloclastic porencephaly. Hydrocephalus was reported for 1.2% of these registrants in 2010 (Table 23).
TABLE 23: Late cerebral ultrasound results for level III registrants born before 32 weeks by gestational age, 2010
Gestational age
Cerebral ultrasound results <24 24 25 26 27 28 29 30 31 Total
Number
No cysts 52 128 183 242 277 330 367 430 395 2,404
Porencephalic cysts 3 3 2 1 3 4 4 3 6 29
Periventricular leukomalacia 1 7 3 10 3 4 8 9 5 50
Encephaloclastic porencephaly 0 0 0 0 0 0 0 0 0 0
Not stated 10 37 36 23 43 42 69 184 346 790
Total 66 175 224 276 326 380 448 626 752 3,273
Hydrocephalus 4 3 4 5 1 2 3 4 3 29
Per cent
No cysts 92.9 92.8 97.3 95.7 97.9 97.6 96.8 97.3 97.3 96.8
Porencephalic cysts 5.4 2.2 1.1 0.4 1.1 1.2 1.1 0.7 1.5 1.2
Periventricular leukomalacia 1.8 5.1 1.6 4.0 1.1 1.2 2.1 2.0 1.2 2.0
Encephaloclastic porencephaly 0.0 0.0 0.0 0.0 0.0 0.0 0.0 0.0 0.0 0.0
Total 100.0 100.0 100.0 100.0 100.0 100.0 100.0 100.0 100.0 100.0
Hydrocephalus 7.1 2.2 2.1 2.0 0.4 0.6 0.8 0.9 0.7 1.2Note: Not stated data are excluded from per cent calculations.
28
Necrotising enterocolitis
Necrotising enterocolitis (NEC) is a gastrointestinal disease affecting premature infants that can be life threatening and is a leading cause of mortality and morbidity among infants in NICUs. There is no definitive cause identified for NEC although infection, empirical use of antibiotics for more than five days and enteral feeding are thought to be involved. With an early diagnosis, NEC can be treated medically through cessation of feeds, use of parenteral nutrition and antibiotic treatment. If medical treatment is unsuccessful surgery may be required to remove the affected bowel.
For ANZNN registrants in 2010 the percentage of babies with confirmed NEC was 2.2%. Of these babies, 62.0% were born before 28 weeks gestation with 57.7% of them undergoing surgery, and 38.0% were born after 27 weeks gestation; surgery was required for 57.4% of them. In total 57 registrants died from NEC. The number of registrants with confirmed NEC is more than in 2009 (Table 24).
TABLE 24: Necrotising enterocolitis in level III registrants by year of birth, 2001–2010
Year of birth
Necrotising enterocolitis 2001 2002 2003 2004 2005 2006 2007 2008 2009 2010
Number
NEC at <28 weeks 78 75 78 85 85 95 80 118 97 111
�� No NEC at <28 weeks 952 1,042 943 941 951 944 1,005 1,052 1,032 952
�� Not stated 1 0 2 0 0 20 24 15 2 4
NEC at ≥28 weeks 57 65 77 63 50 72 50 74 50 68
�� No NEC at ≥28 weeks 5,718 5,861 6,091 6,316 6,560 6,428 6,773 7,339 7,801 7,093
�� Not stated 5 2 4 2 0 32 70 27 3 8
Total 6,811 7,045 7,195 7,407 7,646 7,591 8,002 8,628 8,986 8,236
Per cent
NEC <28 weeks 7.6 6.7 7.6 8.3 8.2 9.1 7.4 10.1 8.6 10.4
NEC ≥28 weeks 1.0 1.1 1.2 1.0 0.8 1.1 0.7 1.0 0.6 0.9
Note: Not stated data are excluded from per cent calculations.
Neonatal surgery
The information given in this report includes the registrant’s first admission to an NICU before their first discharge home after birth. Babies who were discharged home and re-admitted for surgery during the neonatal period are not included in this audit.
In 2010, there were 957 ANZNN registrants who had major surgery, of whom almost half (46.6%) were born at term. Of registrants born in a hospital, 72.4% were born in a hospital with tertiary care facilities. Of registrants who had major surgery, 68.3% also had a congenital anomaly present with 51.5% of these diagnosed during the antenatal period. 10.8% had surgery for proven NEC. The median length of stay (LOS) for survivors was 20 days (Table 25).
29
TABLE 25: Characteristics of level III registrants who underwent surgery by gestational age group, 2010
Gestational age group
Characteristics <24 24–25 26–27 28–29 30–31 32–33 34–36 37–43 Total
Number
Male 13 59 47 40 22 33 78 273 565
Female 6 34 35 23 18 22 81 173 392
Congenital anomaly present
2 12 17 23 15 44 141 400 654
Congenital anomaly diagnosed antenatally
0 2 4 6 8 26 97 194 337
Proven NEC 4 37 23 14 7 6 10 2 103
Hospital of birth
�� Tertiary 18 84 73 55 34 42 115 265 686
�� Non-tertiary 1 9 9 7 6 13 43 174 262
Median LOS for survivors (days)
132.5 126 115 87 69 43 36 21 20
Died before discharge home
2 20 17 8 7 5 13 19 91
Total in each age group 19 93 82 63 40 55 159 446 957
Per cent
Male 68.4 63.4 57.3 63.5 55.0 60.0 49.1 61.2 59.0
Female 31.6 36.6 42.7 36.5 45.0 40.0 50.9 38.8 41.0
Congenital anomaly present
10.5 12.9 20.7 36.5 37.5 80.0 88.7 89.7 68.3
Congenital anomaly diagnosed antenatally
0.0 2.2 4.9 9.5 20.0 47.3 61.0 43.5 35.2
Hospital of birth
�� Tertiary 94.7 90.3 89.0 87.3 85.0 76.4 72.3 59.4 71.7
�� Non-tertiary 5.3 9.7 11.0 11.1 15.0 23.6 27.0 39.0 27.4
Proven NEC 21.1 39.8 28.0 22.2 17.5 10.9 6.3 0.4 10.8
Died before discharge home
10.5 21.5 20.7 12.7 17.5 9.1 8.2 4.3 9.5
Total in each age group 100.0 100.0 100.0 100.0 100.0 100.0 100.0 100.0 100.0
Congenital anomalies
In 2010, 1,116 ANZNN registrants (13.6%) had one or more congenital anomalies. For registrants who had a congenital anomaly, 18.0% were born before 32 weeks gestation, 28.7% were born between 32 and 36 weeks gestation and more than half of registrants (53.3%) were born at term.
Over half of ANZNN registrants (53.0%) with congenital anomalies were diagnosed during the antenatal period with 8.8% of babies recorded as having a fatal congenital anomaly. A higher percentage of babies with congenital anomalies were male (58.2%).
Transfer from level III NICUs to other units
Once intensive care is no longer required babies are often transferred to a level II unit, sometimes referred to as a ‘special care baby unit’, either within the same hospital or to another hospital for convalescence before discharge home. In 2010, more than one-third of ANZNN registrants (37.0%) were transferred from a level III unit to a level II unit before discharge home. Almost half of the registrants (47.9%) transferred from level III to level II units were born at less than 32 weeks gestation compared to 14.9% born at term.
Some level III registrants required transfer to a specialist children’s hospital and in 2010 these accounted for 3.5% of transfers from level III units. Overall 56.1% of level III registrants were not transferred after registration (Table 26).
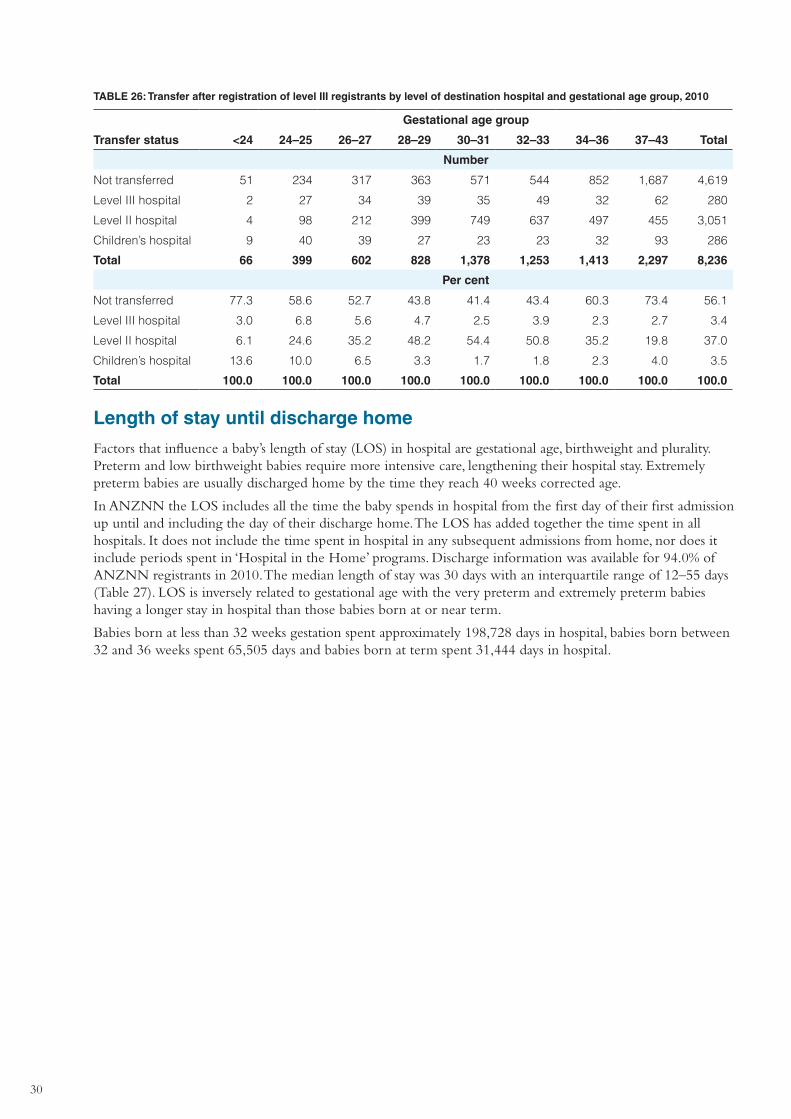
30
TABLE 26: Transfer after registration of level III registrants by level of destination hospital and gestational age group, 2010
Gestational age group
Transfer status <24 24–25 26–27 28–29 30–31 32–33 34–36 37–43 Total
Number
Not transferred 51 234 317 363 571 544 852 1,687 4,619
Level III hospital 2 27 34 39 35 49 32 62 280
Level II hospital 4 98 212 399 749 637 497 455 3,051
Children’s hospital 9 40 39 27 23 23 32 93 286
Total 66 399 602 828 1,378 1,253 1,413 2,297 8,236
Per cent
Not transferred 77.3 58.6 52.7 43.8 41.4 43.4 60.3 73.4 56.1
Level III hospital 3.0 6.8 5.6 4.7 2.5 3.9 2.3 2.7 3.4
Level II hospital 6.1 24.6 35.2 48.2 54.4 50.8 35.2 19.8 37.0
Children’s hospital 13.6 10.0 6.5 3.3 1.7 1.8 2.3 4.0 3.5
Total 100.0 100.0 100.0 100.0 100.0 100.0 100.0 100.0 100.0
Length of stay until discharge home
Factors that influence a baby’s length of stay (LOS) in hospital are gestational age, birthweight and plurality. Preterm and low birthweight babies require more intensive care, lengthening their hospital stay. Extremely preterm babies are usually discharged home by the time they reach 40 weeks corrected age.
In ANZNN the LOS includes all the time the baby spends in hospital from the first day of their first admission up until and including the day of their discharge home. The LOS has added together the time spent in all hospitals. It does not include the time spent in hospital in any subsequent admissions from home, nor does it include periods spent in ‘Hospital in the Home’ programs. Discharge information was available for 94.0% of ANZNN registrants in 2010. The median length of stay was 30 days with an interquartile range of 12–55 days (Table 27). LOS is inversely related to gestational age with the very preterm and extremely preterm babies having a longer stay in hospital than those babies born at or near term.
Babies born at less than 32 weeks gestation spent approximately 198,728 days in hospital, babies born between 32 and 36 weeks spent 65,505 days and babies born at term spent 31,444 days in hospital.
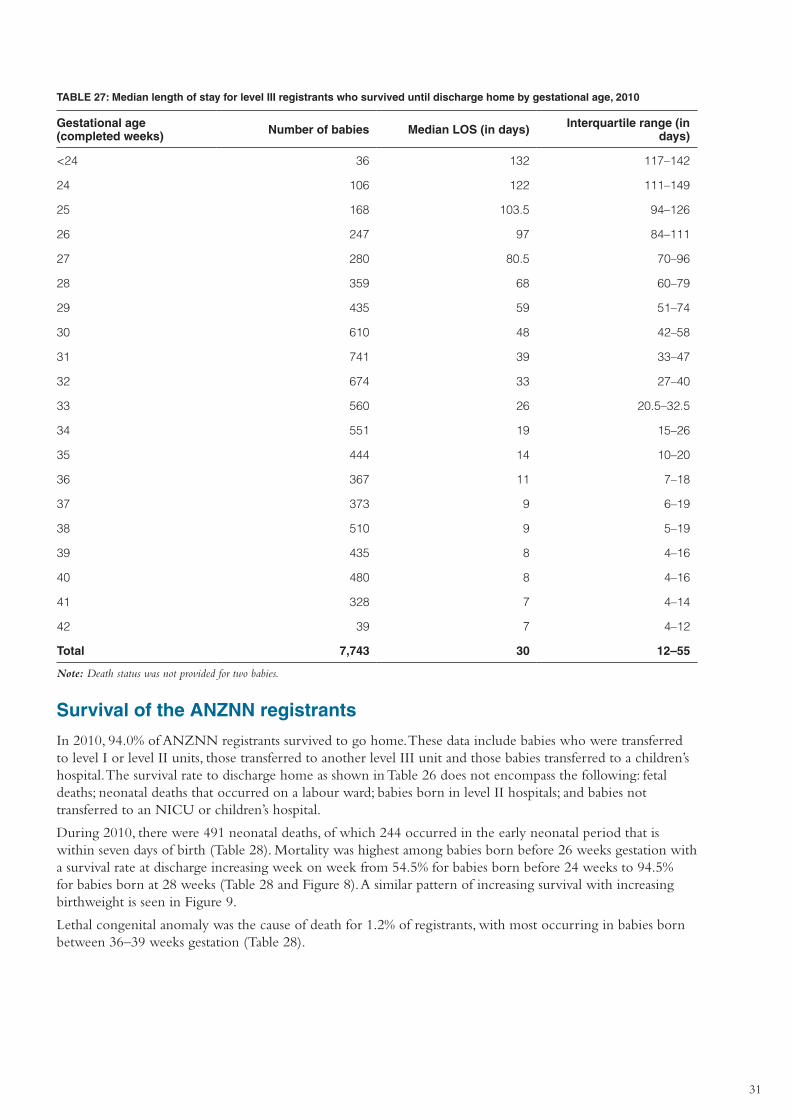
31
TABLE 27: Median length of stay for level III registrants who survived until discharge home by gestational age, 2010
Gestational age (completed weeks) Number of babies Median LOS (in days) Interquartile range (in
days)
<24 36 132 117–142
24 106 122 111–149
25 168 103.5 94–126
26 247 97 84–111
27 280 80.5 70–96
28 359 68 60–79
29 435 59 51–74
30 610 48 42–58
31 741 39 33–47
32 674 33 27–40
33 560 26 20.5–32.5
34 551 19 15–26
35 444 14 10–20
36 367 11 7–18
37 373 9 6–19
38 510 9 5–19
39 435 8 4–16
40 480 8 4–16
41 328 7 4–14
42 39 7 4–12
Total 7,743 30 12–55
Note: Death status was not provided for two babies.
Survival of the ANZNN registrants
In 2010, 94.0% of ANZNN registrants survived to go home. These data include babies who were transferred to level I or level II units, those transferred to another level III unit and those babies transferred to a children’s hospital. The survival rate to discharge home as shown in Table 26 does not encompass the following: fetal deaths; neonatal deaths that occurred on a labour ward; babies born in level II hospitals; and babies not transferred to an NICU or children’s hospital.
During 2010, there were 491 neonatal deaths, of which 244 occurred in the early neonatal period that is within seven days of birth (Table 28). Mortality was highest among babies born before 26 weeks gestation with a survival rate at discharge increasing week on week from 54.5% for babies born before 24 weeks to 94.5% for babies born at 28 weeks (Table 28 and Figure 8). A similar pattern of increasing survival with increasing birthweight is seen in Figure 9.
Lethal congenital anomaly was the cause of death for 1.2% of registrants, with most occurring in babies born between 36–39 weeks gestation (Table 28).
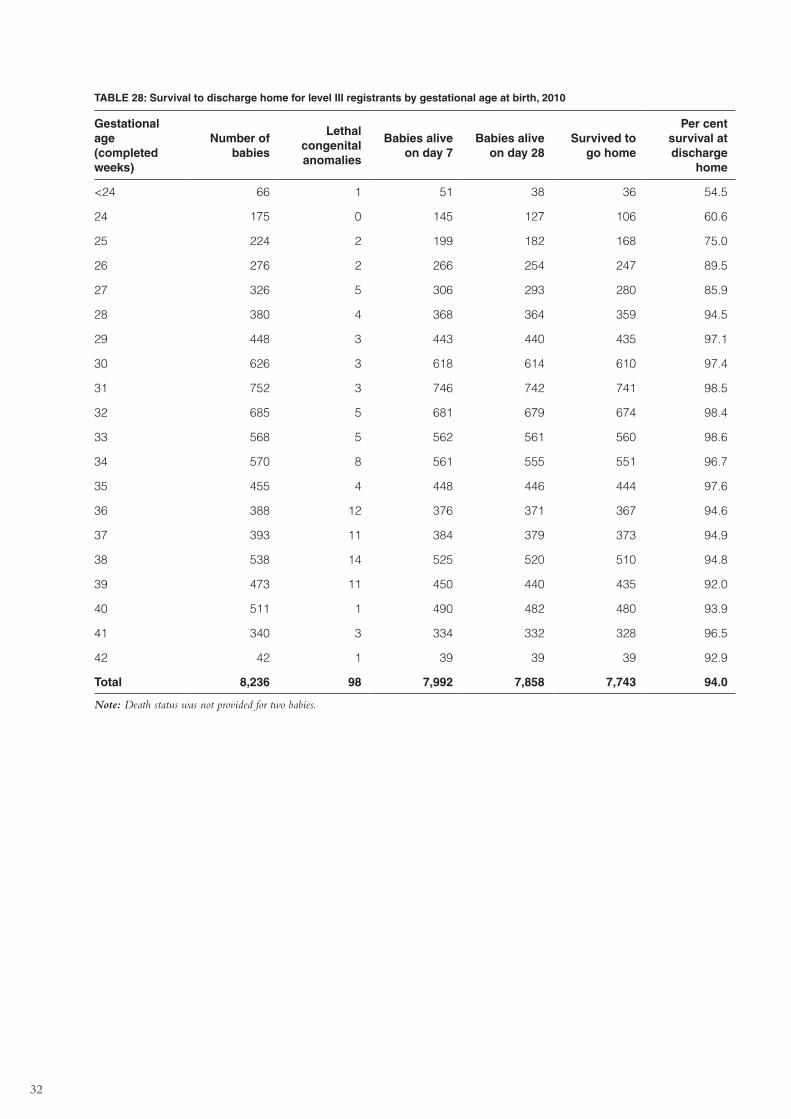
32
TABLE 28: Survival to discharge home for level III registrants by gestational age at birth, 2010
Gestational age (completed weeks)
Number of babies
Lethal congenital anomalies
Babies alive on day 7
Babies alive on day 28
Survived to go home
Per cent survival at discharge
home
<24 66 1 51 38 36 54.5
24 175 0 145 127 106 60.6
25 224 2 199 182 168 75.0
26 276 2 266 254 247 89.5
27 326 5 306 293 280 85.9
28 380 4 368 364 359 94.5
29 448 3 443 440 435 97.1
30 626 3 618 614 610 97.4
31 752 3 746 742 741 98.5
32 685 5 681 679 674 98.4
33 568 5 562 561 560 98.6
34 570 8 561 555 551 96.7
35 455 4 448 446 444 97.6
36 388 12 376 371 367 94.6
37 393 11 384 379 373 94.9
38 538 14 525 520 510 94.8
39 473 11 450 440 435 92.0
40 511 1 490 482 480 93.9
41 340 3 334 332 328 96.5
42 42 1 39 39 39 92.9
Total 8,236 98 7,992 7,858 7,743 94.0
Note: Death status was not provided for two babies.
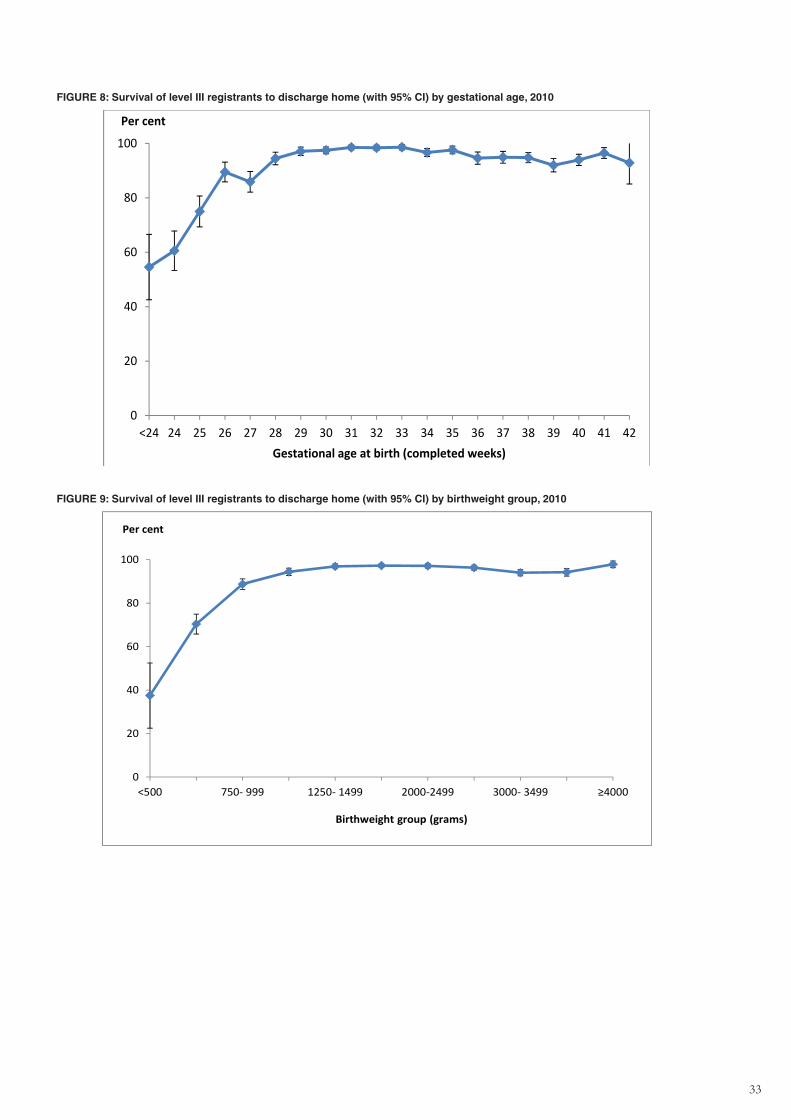
33
FIGURE 8: Survival of level III registrants to discharge home (with 95% CI) by gestational age, 2010
0
20
40
60
80
100
<24 24 25 26 27 28 29 30 31 32 33 34 35 36 37 38 39 40 41 42
Per cent
Gestational age at birth (completed weeks)
FIGURE 9: Survival of level III registrants to discharge home (with 95% CI) by birthweight group, 2010
0
20
40
60
80
100
<500 750‐ 999 1250‐ 1499 2000‐2499 3000‐ 3499 ≥4000
Per cent
Birthweight group (grams)
34
5. Babies registered to level II units, 2010
Overview
Nurseries with facilities to manage mild or moderately ill babies are known as ‘level II units’ or ‘special care baby units’. Individual nurseries may have varying levels of resources for giving special care. The ANZNN registration criteria for level II and level III units are the same. Babies born in a level II unit and transferred to a level III unit within 28 days of birth are registered to that level III unit. Babies are registered to a level II unit if their hospital stay was entirely within non-tertiary centre nurseries, or if they were transferred to a level III NICU after 28 days, or they were transferred to a level II nursery from a children’s hospital without first having been admitted to a level III unit.
There are 16 level II units in New Zealand and eight in Australia that are members of the ANZNN. Altogether, 20 level II units contributed data for this 2010 report.
In 2010, 778 babies fulfilled the ANZNN criteria for registration to a level II unit. Of those babies, 12.2% were born at less than 32 weeks gestation and 8.5% weighed less than 1,500 grams at birth (Table 29 and Table 30). The highest number of babies registered to a level II unit in 2010 was 93.
TABLE 29: Level II registrants born at each completed week of gestation, 2010
Gestational age group Number of babies Per cent Cumulative per cent
<28 8 1.0 1.0
28–29 25 3.2 4.2
30–31 62 8.0 12.2
All babies <32 weeks gestation 95 12.2
32–33 140 18.0 30.2
34–36 232 29.8 60.0
37–43 311 40.0 100.0
Total 778 100.0
Note: Gestational age groups below 28 weeks have been combined to maintain confidentiality of small numbers.
TABLE 30: Level II registrants by birthweight group, 2010
Birthweight group (grams) Number of babies Per cent Cumulative per cent
<1,000 8 1.0 1.0
1,000–1,099 5 0.6 1.7
1,100–1,199 6 0.8 2.4
1,200–1,299 8 1.0 3.5
1,300–1,399 17 2.2 5.7
1,400–1,499 22 2.8 8.5
All babies <1,500g birthweight 66 8.5
1,500–1,999 120 15.4 23.9
2,000–2,499 165 21.2 45.1
2,500–2,999 140 18.0 63.1
3,000–3,499 132 17.0 80.1
3,500–3,999 102 13.1 93.2
≥4,000 53 6.8 100.0
Total 778 100.0
Note: Birthweight groups below 1,000g have been combined to maintain confidentiality of small numbers. Birthweight was not provided for one baby.
35
More than half of the level II registrants, 496 babies (63.8%), were born to Caucasian mothers, 60.0% of whom were born preterm. The number of registrants born to Maori mothers was 127 (16.3%), and 82 (64.6%) were born preterm. There were 31 babies (4.0%) born to Pacific Islander mothers.
There were 467 male (60.0%) and 300 female (38.6%) registrants in the audit. No gender was recorded for 11 registrants (1.4%). Non-specific respiratory distress was the major reason for assisted ventilation for level II registrants.
Maternal, pregnancy and birth characteristics
Of the mothers of level II registrants, 26.9% did not present with any maternal complications. Among babies born before 37 weeks, 43.5% of mothers had presented with preterm labour (Table 31).
TABLE 31: Mothers of level II registrants presenting antenatal problem by gestational age group, 2010
Presenting antenatal problem
Gestational age group
<28 28–29 30–31 32–33 34–36 37–43 Total
Number
No antenatal problems 0 n.p. 0 n.p. 17 188 209
Preterm pre-labour rupture of membranes
0 n.p. 18 21 45 n.p. 90
Preterm labour n.p. 16 30 57 92 n.p. 207
Hypertension in pregnancy 0 n.p. n.p. 17 21 15 59
Antepartum haemorrhage 0 6 6 19 21 5 57
Intrauterine growth restriction 0 0 n.p. 10 n.p. 7 23
Fetal distress 0 0 0 5 14 61 80
Other problem 0 0 n.p. n.p. 16 18 43
Congenital anomalies n.p. 0 0 0 n.p. 7 8
Not stated 0 0 0 1 0 1 2
Total 8 25 62 140 232 311 778
Per cent
No antenatal problems 0.0 n.p. 0.0 n.p. 7.3 60.6 26.9
Preterm pre-labour rupture of membranes
0.0 n.p. 29.0 15.1 19.4 n.p. 11.6
Preterm labour n.p. 64.0 48.4 41.0 39.7 n.p. 26.7
Hypertension in pregnancy 0.0 n.p. n.p. 12.2 9.1 4.8 7.6
Antepartum haemorrhage 0.0 24.0 9.7 13.7 9.1 1.6 7.3
Intrauterine growth restriction 0.0 0.0 n.p. 7.2 n.p. 2.3 3.0
Fetal distress 0.0 0.0 0.0 3.6 6.0 19.7 10.3
Other problem 0.0 0.0 n.p. n.p. 6.9 5.8 5.5
Congenital anomalies n.p. 0.0 0.0 0.0 n.p. 2.3 1.0
Total 100.0 100.0 100.0 100.0 100.0 100.0 100.0
n.p. Data not published to maintain confidentiality of small numbers. Note: Not stated data are excluded from per cent calculations.
Previous preterm births were reported by 78 (10.0%) of the mothers of level II registrants and 25 mothers (3.2%) had had a previous perinatal death(s).
Most mothers (84.8%) of level II registrants had booked into a level II hospital for delivery. Of the level II registrants born before 34 weeks gestation, 56.2% of the mothers were given antenatal corticosteroids within seven days of the birth (Table 32).
36
TABLE 32: Antenatal corticosteroid use by mothers of level II registrants by gestational age group, 2010
Antenatal corticosteroids
Gestational age group
<28 28–29 30–31 32–33 34–36 37–43 Total
Number
None 5 7 16 36 184 298 546
Incomplete course n.p. n.p. 15 34 15 n.p. 75
Complete course n.p. 8 24 40 19 n.p. 93
Completed >7 days 0 n.p. 5 24 5 n.p. 36
Not stated 0 1 2 6 9 10 28
Total 8 25 62 140 232 311 778
Per cent
None 62.5 29.2 26.7 26.9 82.5 99.0 72.8
Incomplete course n.p. n.p. 25.0 25.4 6.7 n.p. 10.0
Complete course n.p. 33.3 40.0 29.9 8.5 n.p. 12.4
Completed >7 days 0.0 n.p. 8.3 17.9 2.2 n.p. 4.8
Total 100.0 100.0 100.0 100.0 100.0 100.0 100.0
n.p. Data not published to maintain confidentiality of small numbers. Note: Not stated data are excluded from per cent calculations.
Caesarean section was the most common method of birth for 53.7% of level II registrants, with half of these occurring before the onset of labour, followed by vaginal delivery (46.3%) (Table 33).
TABLE 33: Method of delivery for level II registrants by gestational age group, 2010
Method of delivery
Gestational age group
<28 28–29 30–31 32–33 34–36 37–43 Total
Number
Vaginal (a) 8 12 26 49 99 162 356
Caesarean (b) 0 13 36 90 131 143 413
Not stated 0 0 0 1 2 6 9
Total 8 25 62 140 232 311 778
Per cent
Vaginal 100.0 48.0 41.9 35.3 43.0 53.1 46.3
Caesarean 0.0 52.0 58.1 64.7 57.0 46.9 53.7
Total 100.0 100.0 100.0 100.0 100.0 100.0 100.0
(a) Vaginal and assisted births have been combined to maintain confidentiality of small numbers. (b) Caesarean section deliveries in labour and no labour have been combined to maintain confidentiality of small numbers. Note: Not stated data are excluded from per cent calculations.
37
Characteristics of level II babies
Among the 778 babies registered to level II units, 83 were from multiple births (10.7%). There were 467 male births and 11 babies whose gender was not recorded.
A low Apgar score of less than 4 at one minute of age was recorded for 14.5% of babies and 38.1% of them required endotracheal intubation in the labour ward to assist in their adaptation to extrauterine life.
Non-specific respiratory distress (50.4%) was the major reason for assisted ventilation for level II registrants, followed by hyaline membrane disease (29.7%) (Table 34).
For level II registrants, the median duration of assisted ventilation by IPPV was 20.5 hours and 17 hours by CPAP. The median duration of oxygen was 2 days (Table 35).
TABLE 34: Indication for respiratory support for level II registrants by gestational age group, 2010
Indication for respiratory support
Gestational age group
<28 28–29 30–31 32–33 34–36 37–43 Total
Number
No support 0 n.p. 18 n.p. 5 n.p. 44
Non specific distress 0 n.p. n.p. 51 132 192 384
Hyaline membrane disease 8 18 33 72 76 19 226
Meconium aspiration syndrome 0 0 0 0 0 48 48
Pneumonia 0 n.p. 0 n.p. 10 13 26
Persistent pulmonary hypertension 0 0 0 n.p. n.p. 7 9
Apnoea 0 0 n.p. 0 n.p. n.p. 7
Congenital anomaly 0 n.p. 0 0 0 n.p. 5
Other 0 0 0 0 0 8 8
Peri-surgery 0 0 0 0 0 0 0
Newborn encephalopathy 0 0 0 0 n.p. n.p. 5
Not stated 0 0 2 2 4 8 16
Total 8 25 62 140 232 311 778
Per cent
No support 0.0 n.p. 30.0 n.p. 2.2 n.p. 5.8
Non specific distress 0.0 n.p. n.p. 37.0 57.9 63.4 50.4
Hyaline membrane disease 100.0 72.0 55.0 52.2 33.3 6.3 29.7
Meconium aspiration syndrome 0.0 0.0 0.0 0.0 0.0 15.8 6.3
Pneumonia 0.0 n.p. 0.0 n.p. 4.4 4.3 3.4
Persistent pulmonary hypertension 0.0 0.0 0.0 n.p. n.p. 2.3 1.2
Apnoea 0.0 0.0 n.p. 0.0 n.p. n.p. 0.9
Congenital anomaly 0.0 n.p. 0.0 0.0 0.0 n.p. 0.7
Other 0.0 0.0 0.0 0.0 0.0 2.6 1.0
Peri-surgery 0.0 0.0 0.0 0.0 0.0 0.0 0.0
Newborn encephalopathy 0.0 0.0 0.0 0.0 n.p. n.p. 0.7
Total 100.0 100.0 100.0 100.0 100.0 100.0 100.0
n.p. Data not published to maintain confidentiality of small numbers. Note: Not stated data are excluded from per cent calculations.

38
TABLE 35: Duration of assisted ventilation and oxygen use by level II registrants by gestational age group, 2010
Median & Interquartile range (IQR)
Gestational age group
<28 28–29 30–31 32–33 34–36 37–43 Total
IPPV (hours)
Median 3.5 19 1 31 56.5 24 20.5
IQR 1.5–5 12–33 1–89 4–85 16–97.5 2–52 2–52
CPAP (hours)
Median 10 85 33 24 17 13.5 17
IQR 10–10 19.5–171.5 17–66 11.5–62 10–48 8–25 10–41
Oxygen (days)
Median 1 1 3 2 2 2 2
IQR 1–2 1–4 1–4.5 1–4 2–4 1–3 1–3
Note: IQR = Interquartile range.
Eye examination
Screening for retinopathy of prematurity (ROP) was reported for 28 of the 51 eligible babies born at less than 31 weeks gestational age and/or weighing less than 1,250 grams at birth. Most were reported as normal except for two babies who had stage 1 and 2 ROP, respectively.
Cerebral ultrasound
Of the 95 babies born at less than 32 weeks, 60 (63.2%) had a cerebral ultrasound in the first week after birth. Fifty-four of them were reported as normal, that is no intraventricular haemorrhage (IVH), four reported a grade 1 IVH, one reported a grade 2 IVH and one reported a grade 4 IVH. Most babies who did not have an early cerebral ultrasound reported at this time were born at 30 or 31 weeks gestation. A late cerebral ultrasound was reported for 40 babies, all of whom had normal reports.
Other morbidities
Septicaemia was proven in 30 babies, including 20 before day two, that is less than 48 hours. There were no cases of necrotising enterocolitis. Major congenital anomalies were reported for 29 babies, three required surgery, and two registrants died due to congenital anomalies.
Level II transfers
In total 55 level II registrants were transferred to other units, 24 were transferred to a level I or II unit, 23 were transferred to a level III unit and the remaining eight to a children’s hospital.
Survival
There were 759 level II registrants who survived to discharge home (97.6%). Twelve babies died within the first seven days of birth and a further seven babies died before discharge home. Two babies were reported to have had a lethal congenital anomaly (Table 36).
39
TABLE 36: Survival to discharge home for level II registrants by gestational age group, 2010
Gestational age group All babies
Lethal congenital anomalies
Babies alive on day 7
Babies alive on day 28
Survived to go home Per cent
<28 8 0 n.p. n.p. n.p. 12.5
28-29 25 n.p. n.p. n.p. n.p. 96.0
30-31 62 0 62 61 60 96.8
32-33 140 0 140 140 140 100.0
34-36 232 0 231 231 230 99.1
37-43 311 n.p. 307 306 304 97.7
All babies 778 2 766 764 759 97.6
n.p. Data not published to maintain confidentiality of small numbers. Note: Gestational age groups below 28 weeks have been combined to maintain confidentiality of small numbers. Death status was not provided for four babies.
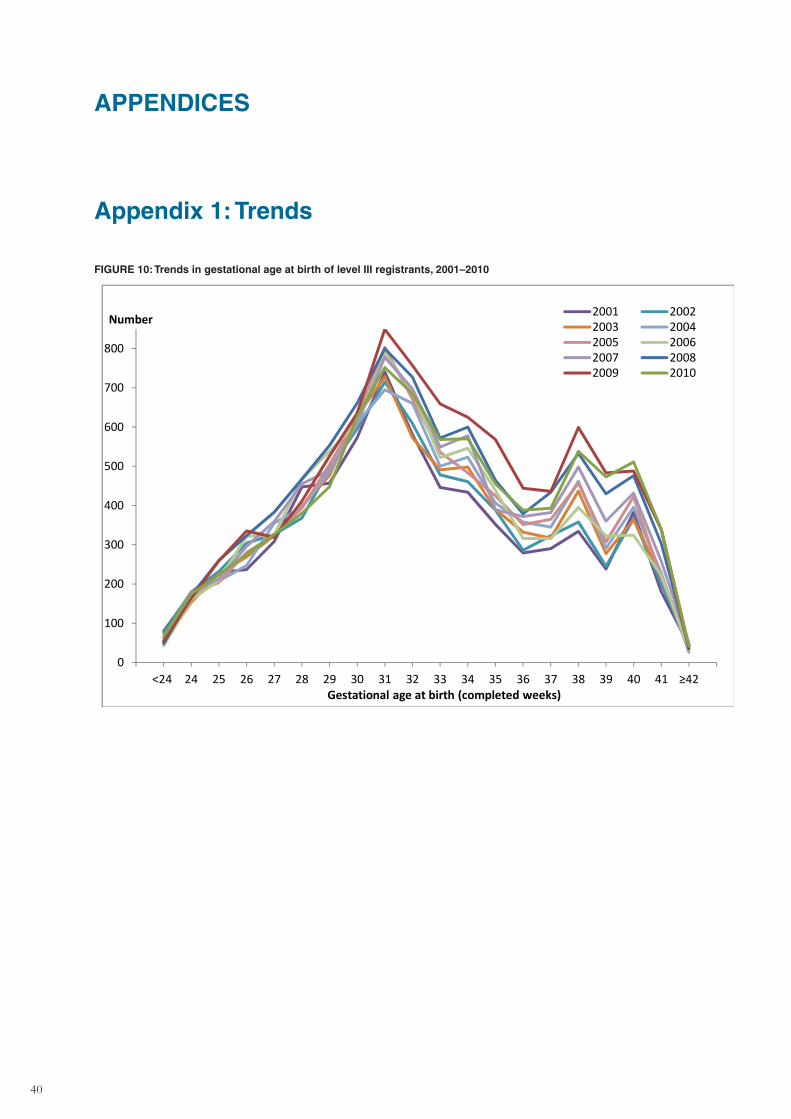
40
APPENDICES
Appendix 1: Trends
FIGURE 10: Trends in gestational age at birth of level III registrants, 2001–2010
0
100
200
300
400
500
600
700
800
<24 24 25 26 27 28 29 30 31 32 33 34 35 36 37 38 39 40 41 ≥42
Number
Gestational age at birth (completed weeks)
2001 20022003 20042005 20062007 20082009 2010
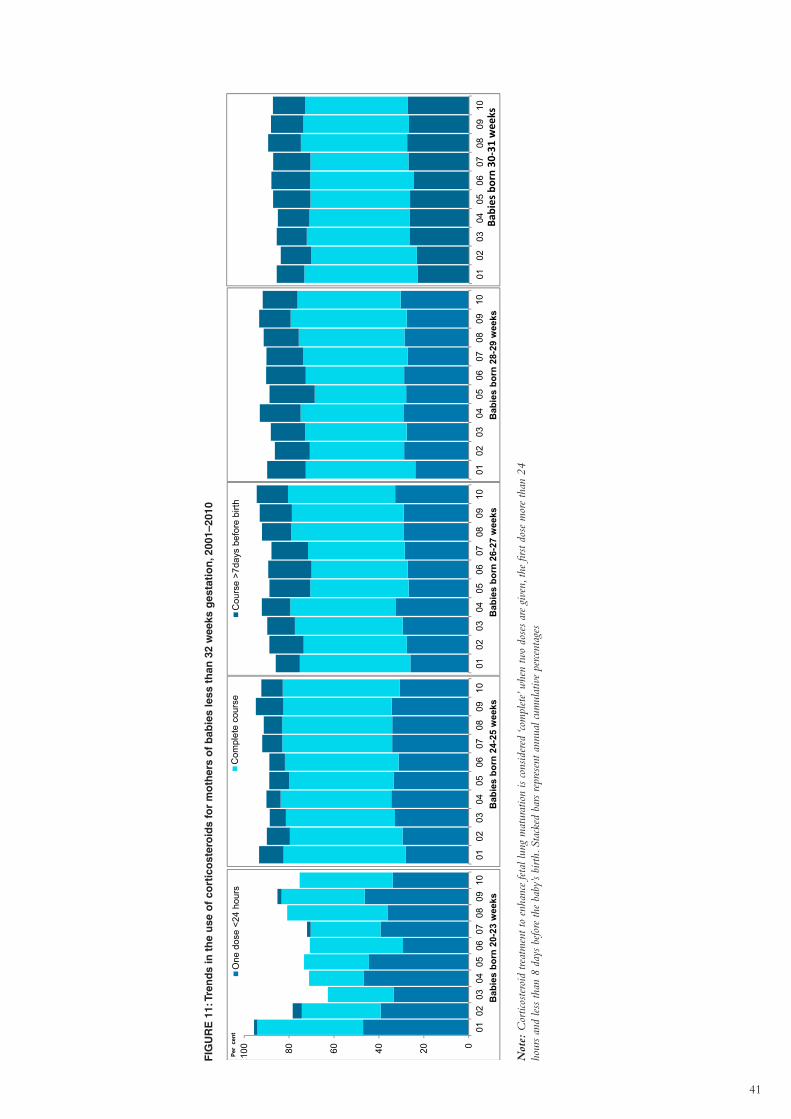
41
FIG
UR
E 1
1: T
ren
ds
in t
he
use
of
cort
ico
ster
oid
s fo
r m
oth
ers
of
bab
ies
less
th
an 3
2 w
eeks
ges
tati
on
, 200
1–20
10
0102
0304
0506
0708
0910
Bab
ies
born
24-
25 w
eeks
Com
plet
e co
urse
020406080100
0102
0304
0506
0708
0910
Per
cent
Bab
ies
born
20-
23 w
eeks
One
dos
e <2
4 ho
urs
0102
0304
0506
0708
0910
Bab
ies
born
26-
27 w
eeks
Cou
rse
>7da
ys b
efor
e bi
rth
0102
0304
0506
0708
0910
Bab
ies
born
28-
29 w
eeks
0102
0304
0506
0708
0910
Babies born 30
‐31 wee
ks
Not
e: C
ortic
oste
roid
trea
tmen
t to
enha
nce
feta
l lun
g m
atur
atio
n is
cons
ider
ed ‘c
ompl
ete’
whe
n tw
o do
ses
are
give
n, th
e fir
st do
se m
ore
than
24
hour
s an
d le
ss th
an 8
day
s be
fore
the
baby
’s bi
rth. S
tack
ed b
ars
repr
esen
t ann
ual c
umul
ativ
e pe
rcent
ages
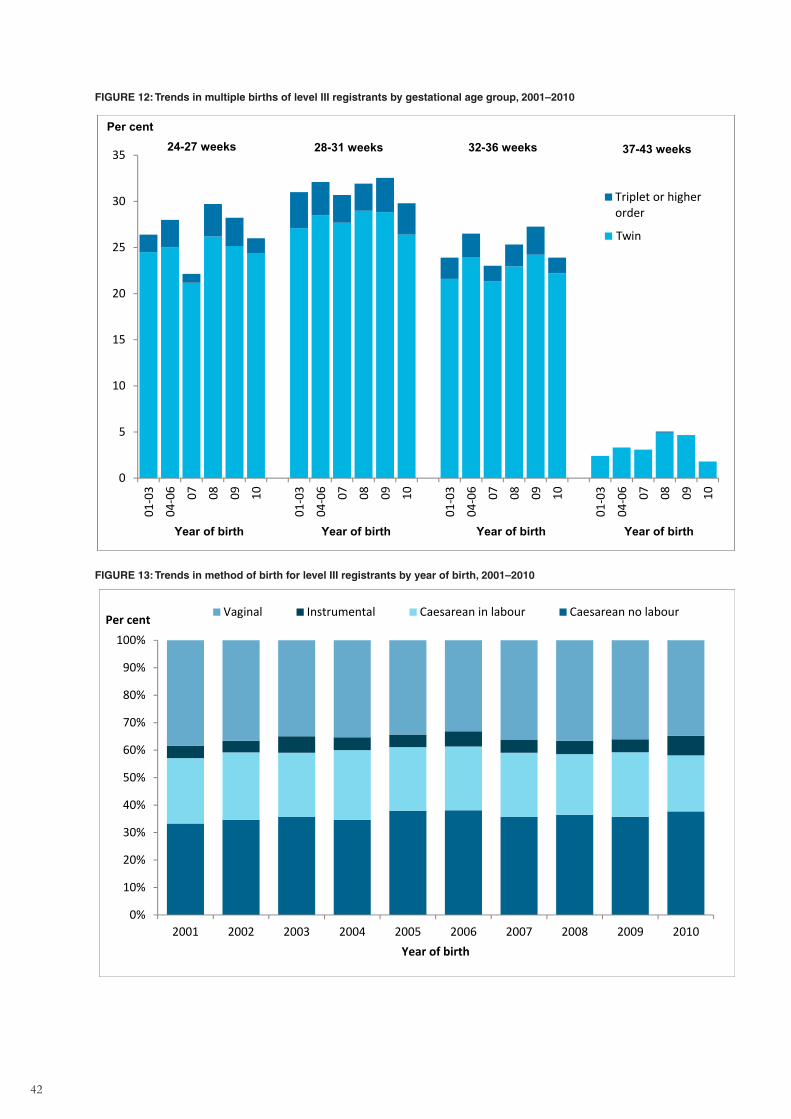
42
FIGURE 12: Trends in multiple births of level III registrants by gestational age group, 2001–2010
0
5
10
15
20
25
30
3501
-03
04-0
6 07 08 09 10
01-0
3
04-0
6 07 08 09 10
01-0
3
04-0
6 07 08 09 10
01-0
3
04-0
6 07 08 09 10
Triplet or higherorder
24-27 weeksPer cent
28-31 weeks 32-36 weeks 37-43 weeks
Year of birth Year of birth Year of birth Year of birth
Twin
FIGURE 13: Trends in method of birth for level III registrants by year of birth, 2001–2010
0%
10%
20%
30%
40%
50%
60%
70%
80%
90%
100%
2001 2002 2003 2004 2005 2006 2007 2008 2009 2010
Per cent
Year of birth
Vaginal Instrumental Caesarean in labour Caesarean no labour
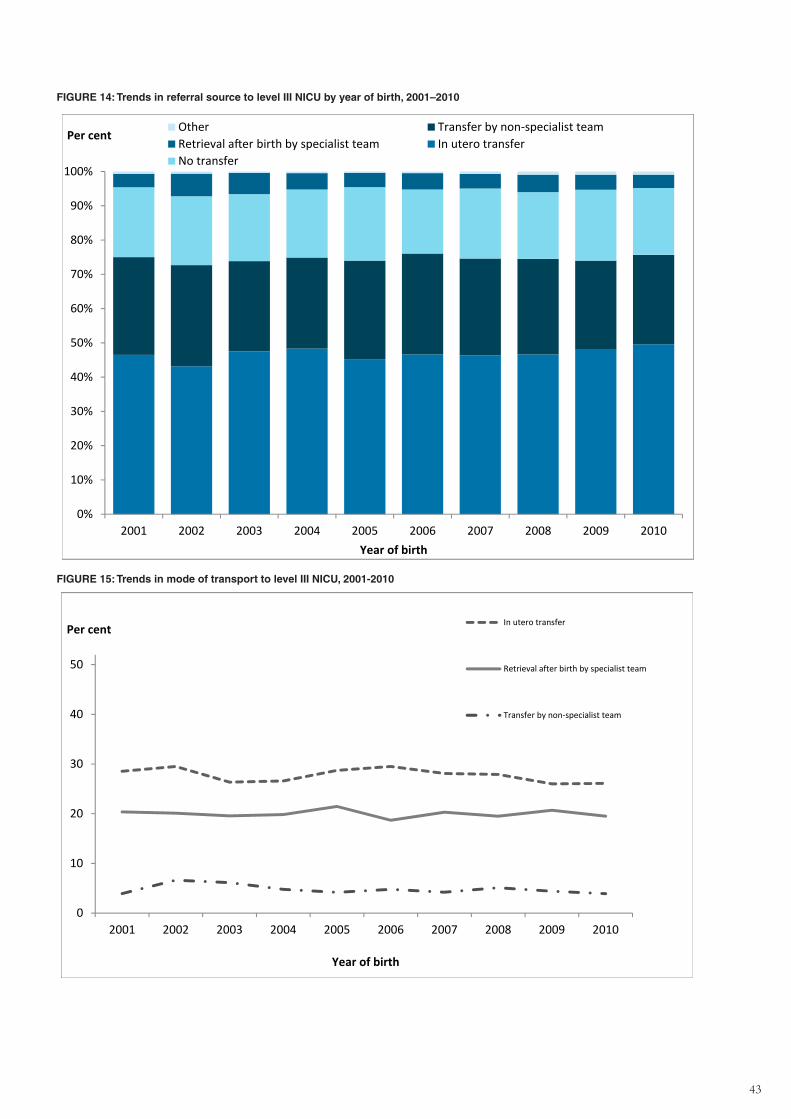
43
FIGURE 14: Trends in referral source to level III NICU by year of birth, 2001–2010
0%
10%
20%
30%
40%
50%
60%
70%
80%
90%
100%
2001 2002 2003 2004 2005 2006 2007 2008 2009 2010
Per cent
Year of birth
Other Transfer by non-specialist teamRetrieval after birth by specialist team In utero transferNo transfer
FIGURE 15: Trends in mode of transport to level III NICU, 2001-2010
0
10
20
30
40
50
2001 2002 2003 2004 2005 2006 2007 2008 2009 2010
Per cent
Year of birth
In utero transfer
Retrieval after birth by specialist team
Transfer by non‐specialist team
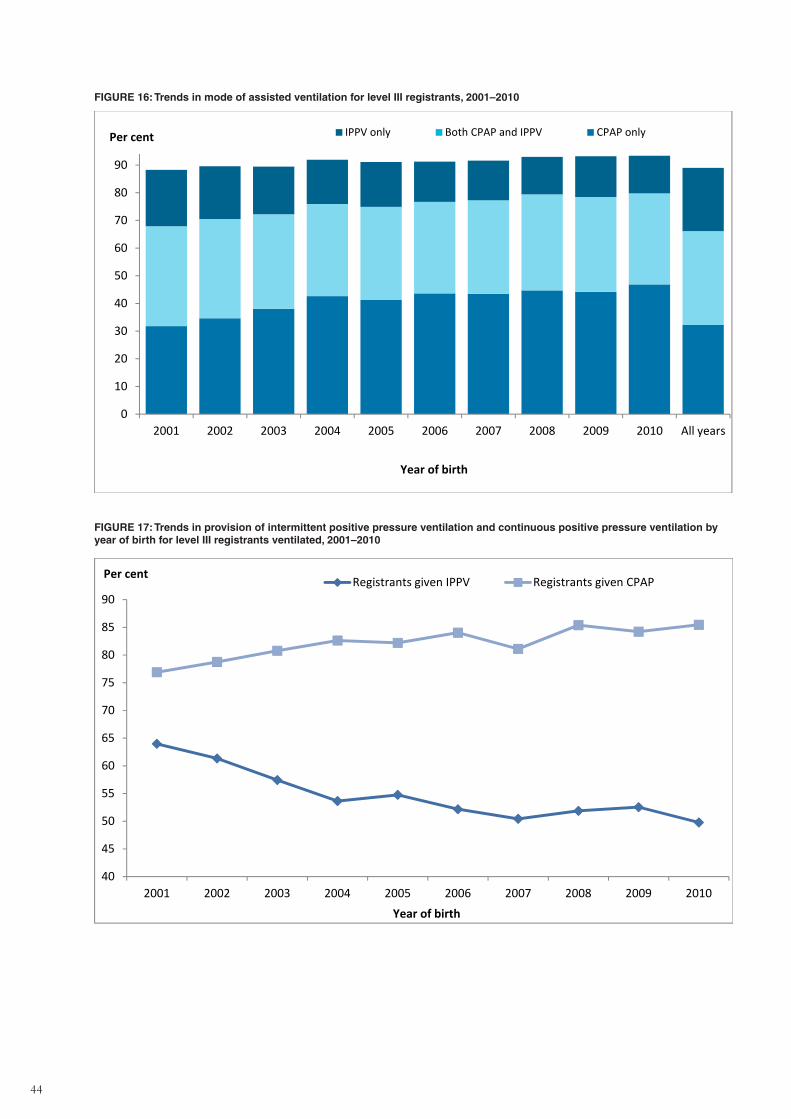
44
FIGURE 16: Trends in mode of assisted ventilation for level III registrants, 2001–2010
0
10
20
30
40
50
60
70
80
90
2001 2002 2003 2004 2005 2006 2007 2008 2009 2010 All years
Per cent
Year of birth
IPPV only Both CPAP and IPPV CPAP only
FIGURE 17: Trends in provision of intermittent positive pressure ventilation and continuous positive pressure ventilation by year of birth for level III registrants ventilated, 2001–2010
40
45
50
55
60
65
70
75
80
85
90
2001 2002 2003 2004 2005 2006 2007 2008 2009 2010
Per cent
Year of birth
Registrants given IPPV Registrants given CPAP
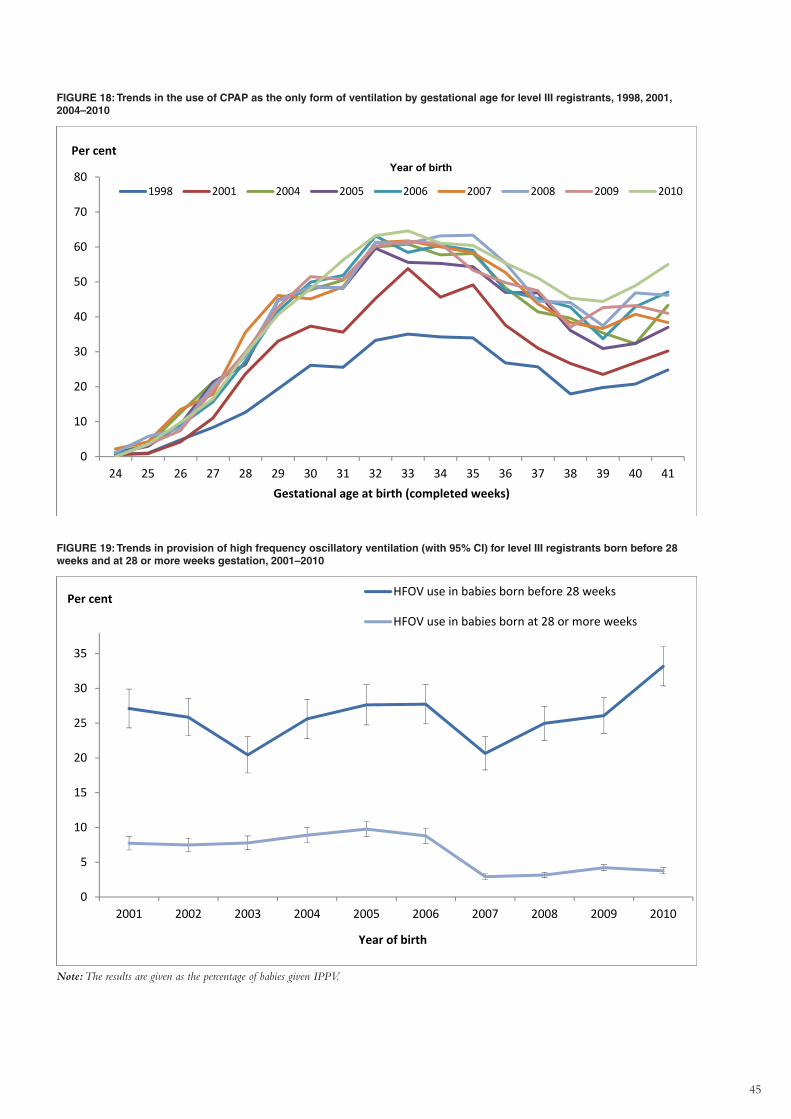
45
FIGURE 18: Trends in the use of CPAP as the only form of ventilation by gestational age for level III registrants, 1998, 2001, 2004–2010
0
10
20
30
40
50
60
70
80
24 25 26 27 28 29 30 31 32 33 34 35 36 37 38 39 40 41
Per cent
Gestational age at birth (completed weeks)
1998 2001 2004 2005 2006 2007 2008 2009 2010
Year of birth
FIGURE 19: Trends in provision of high frequency oscillatory ventilation (with 95% CI) for level III registrants born before 28 weeks and at 28 or more weeks gestation, 2001–2010
0
5
10
15
20
25
30
35
2001 2002 2003 2004 2005 2006 2007 2008 2009 2010
Year of birth
HFOV use in babies born before 28 weeks
HFOV use in babies born at 28 or more weeks
Per cent
Note: The results are given as the percentage of babies given IPPV.
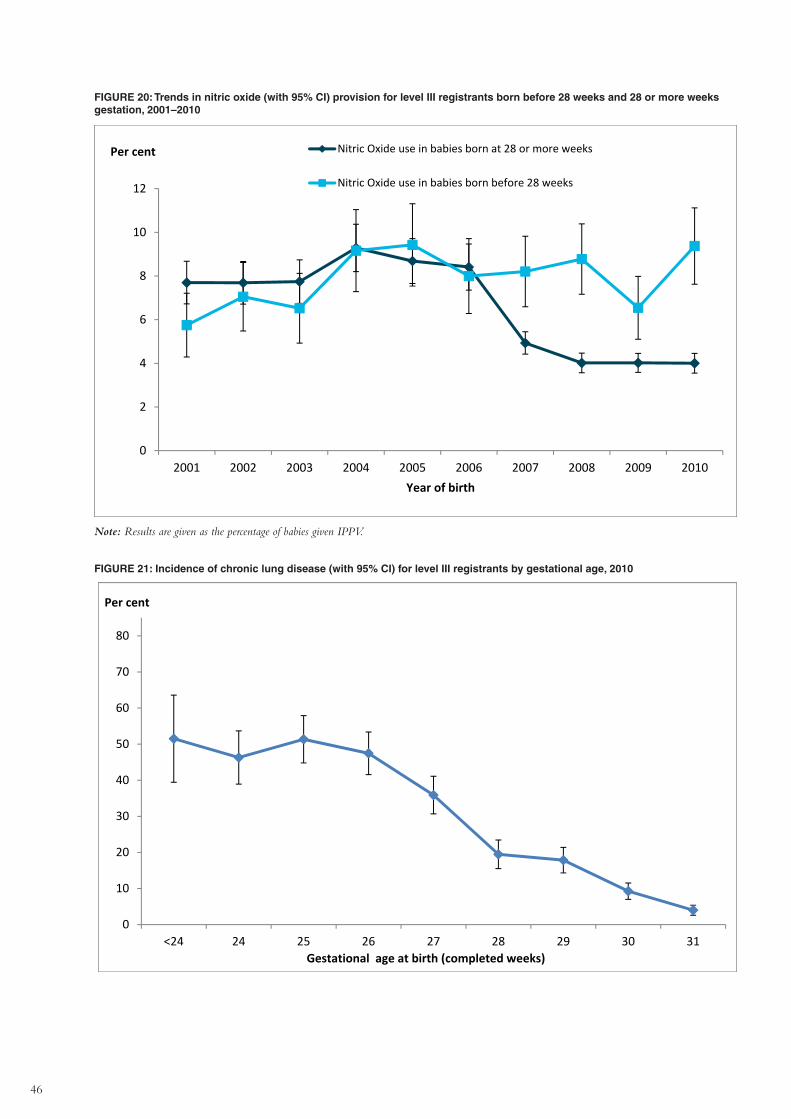
46
FIGURE 20: Trends in nitric oxide (with 95% CI) provision for level III registrants born before 28 weeks and 28 or more weeks gestation, 2001–2010
0
2
4
6
8
10
12
2001 2002 2003 2004 2005 2006 2007 2008 2009 2010Year of birth
Nitric Oxide use in babies born at 28 or more weeks
Nitric Oxide use in babies born before 28 weeks
Per cent
Note: Results are given as the percentage of babies given IPPV.
FIGURE 21: Incidence of chronic lung disease (with 95% CI) for level III registrants by gestational age, 2010
0
10
20
30
40
50
60
70
80
<24 24 25 26 27 28 29 30 31
Per cent
Gestational age at birth (completed weeks)
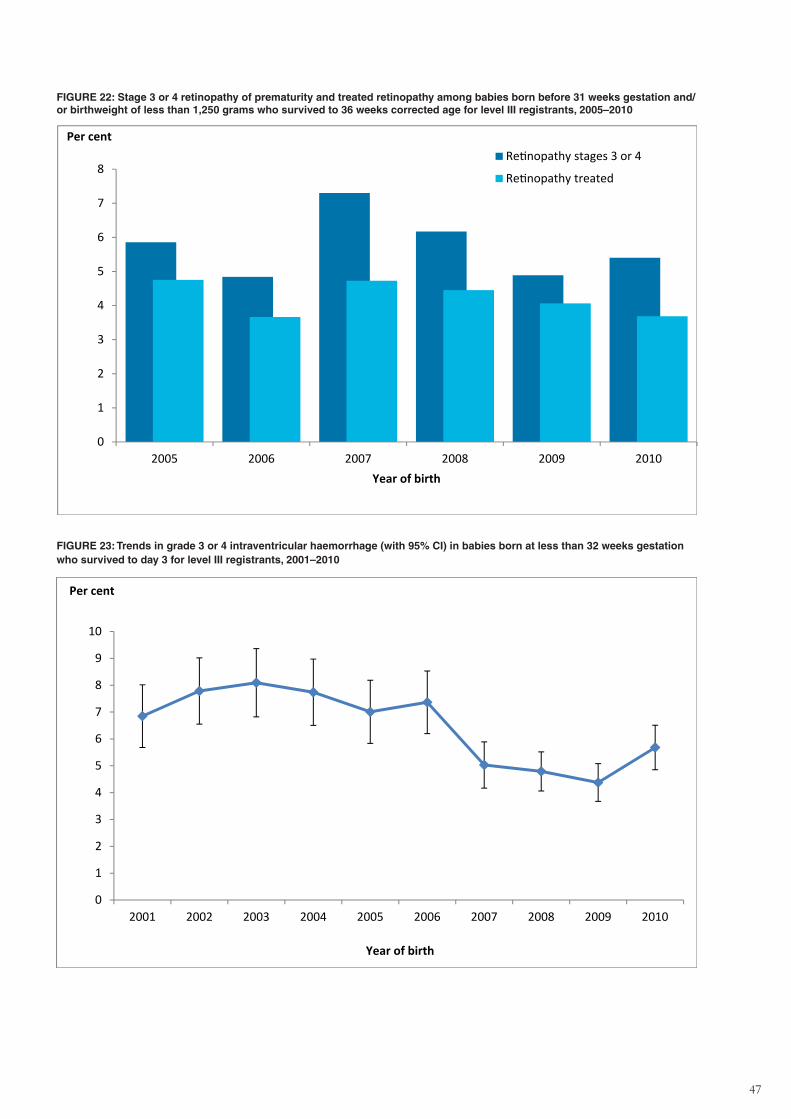
47
FIGURE 22: Stage 3 or 4 retinopathy of prematurity and treated retinopathy among babies born before 31 weeks gestation and/or birthweight of less than 1,250 grams who survived to 36 weeks corrected age for level III registrants, 2005–2010
0
1
2
3
4
5
6
7
8
2005 2006 2007 2008 2009 2010
Per cent
Year of birth
Retinopathy stages 3 or 4
Retinopathy treated
FIGURE 23: Trends in grade 3 or 4 intraventricular haemorrhage (with 95% CI) in babies born at less than 32 weeks gestation who survived to day 3 for level III registrants, 2001–2010
0
1
2
3
4
5
6
7
8
9
10
2001 2002 2003 2004 2005 2006 2007 2008 2009 2010
Per cent
Year of birth
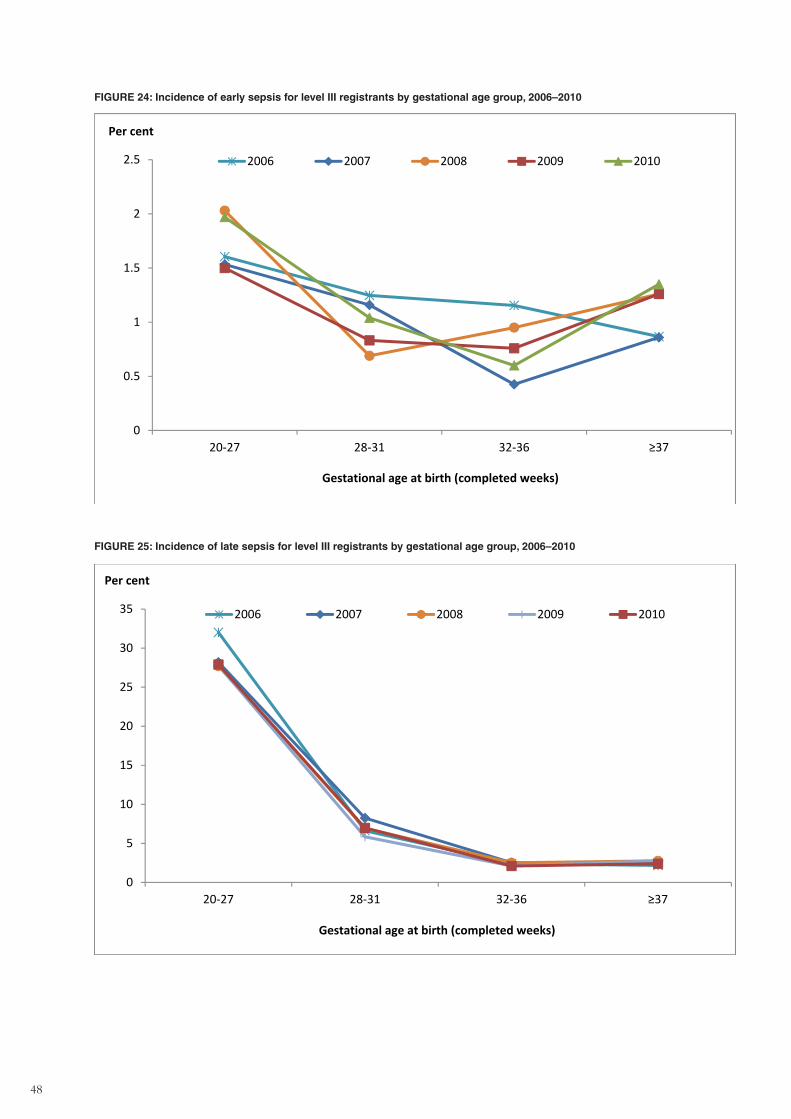
48
FIGURE 24: Incidence of early sepsis for level III registrants by gestational age group, 2006–2010
0
0.5
1
1.5
2
2.5
20‐27 28‐31 32‐36 ≥37
Per cent
Gestational age at birth (completed weeks)
2006 2007 2008 2009 2010
FIGURE 25: Incidence of late sepsis for level III registrants by gestational age group, 2006–2010
0
5
10
15
20
25
30
35
20‐27 28‐31 32‐36 ≥37
Per cent
Gestational age at birth (completed weeks)
2006 2007 2008 2009 2010
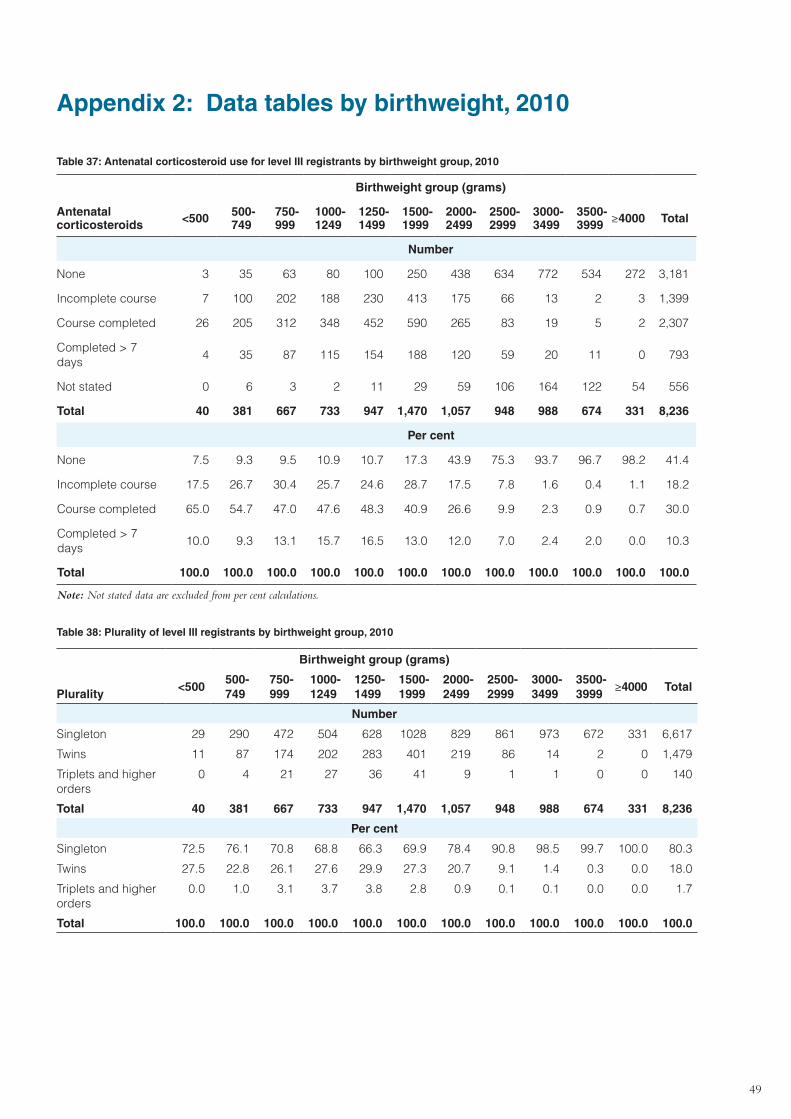
49
Appendix 2: Data tables by birthweight, 2010
Table 37: Antenatal corticosteroid use for level III registrants by birthweight group, 2010
Antenatal corticosteroids
Birthweight group (grams)
<500 500-749
750-999
1000-1249
1250-1499
1500-1999
2000-2499
2500-2999
3000-3499
3500-3999 ≥4000 Total
Number
None 3 35 63 80 100 250 438 634 772 534 272 3,181
Incomplete course 7 100 202 188 230 413 175 66 13 2 3 1,399
Course completed 26 205 312 348 452 590 265 83 19 5 2 2,307
Completed > 7 days
4 35 87 115 154 188 120 59 20 11 0 793
Not stated 0 6 3 2 11 29 59 106 164 122 54 556
Total 40 381 667 733 947 1,470 1,057 948 988 674 331 8,236
Per cent
None 7.5 9.3 9.5 10.9 10.7 17.3 43.9 75.3 93.7 96.7 98.2 41.4
Incomplete course 17.5 26.7 30.4 25.7 24.6 28.7 17.5 7.8 1.6 0.4 1.1 18.2
Course completed 65.0 54.7 47.0 47.6 48.3 40.9 26.6 9.9 2.3 0.9 0.7 30.0
Completed > 7 days
10.0 9.3 13.1 15.7 16.5 13.0 12.0 7.0 2.4 2.0 0.0 10.3
Total 100.0 100.0 100.0 100.0 100.0 100.0 100.0 100.0 100.0 100.0 100.0 100.0
Note: Not stated data are excluded from per cent calculations.
Table 38: Plurality of level III registrants by birthweight group, 2010
Birthweight group (grams)
Plurality
<500500-749
750-999
1000-1249
1250-1499
1500-1999
2000-2499
2500-2999
3000-3499
3500-3999
≥4000 Total
Number
Singleton 29 290 472 504 628 1028 829 861 973 672 331 6,617
Twins 11 87 174 202 283 401 219 86 14 2 0 1,479
Triplets and higher orders
0 4 21 27 36 41 9 1 1 0 0 140
Total 40 381 667 733 947 1,470 1,057 948 988 674 331 8,236
Per cent
Singleton 72.5 76.1 70.8 68.8 66.3 69.9 78.4 90.8 98.5 99.7 100.0 80.3
Twins 27.5 22.8 26.1 27.6 29.9 27.3 20.7 9.1 1.4 0.3 0.0 18.0
Triplets and higher orders
0.0 1.0 3.1 3.7 3.8 2.8 0.9 0.1 0.1 0.0 0.0 1.7
Total 100.0 100.0 100.0 100.0 100.0 100.0 100.0 100.0 100.0 100.0 100.0 100.0
50
Table 39: Method of delivery for level III registrants by birthweight group, 2010
Method of Delivery
Birthweight group (grams)
<500 500-749
750-999
1000-1249
1250-1499
1500-1999
2000-2499
2500-2999
3000-3499
3500-3999 ≥4000 Total
Number
Vaginal 5 172 208 212 265 480 379 322 357 279 127 2,806
Vaginal instrumental birth 1 3 21 18 31 75 75 88 114 102 47 575
Caesarean in labour 0 45 134 170 178 297 232 211 187 124 68 1,646
Caesarean no labour 33 158 297 331 454 604 355 299 293 144 77 3,045
Not stated 1 3 7 2 19 14 16 28 37 25 12 164
Total 40 381 667 733 947 1,470 1,057 948 988 674 331 8,236
Per cent
Vaginal 12.8 45.5 31.5 29.0 28.6 33.0 36.4 35.0 37.5 43.0 39.8 34.8
Vaginal instrumental birth 2.6 0.8 3.2 2.5 3.3 5.2 7.2 9.6 12.0 15.7 14.7 7.1
Caesarean in labour 0.0 11.9 20.3 23.3 19.2 20.4 22.3 22.9 19.7 19.1 21.3 20.4
Caesarean no labour 84.6 41.8 45.0 45.3 48.9 41.5 34.1 32.5 30.8 22.2 24.1 37.7
Total 100.0 100.0 100.0 100.0 100.0 100.0 100.0 100.0 100.0 100.0 100.0 100.0
Note: Not stated data are excluded from per cent calculations.
Table 40: Level of hospital of birth for level III registrants by birthweight group, 2010
Level of hospital
Birthweight group (grams)
<500 500-749
750-999
1000-1249
1250-1499
1500-1999
2000-2499
2500-2999
3000-3499
3500-3999 ≥4000 Total
Number
Tertiary 38 347 568 634 836 1,261 827 666 599 420 205 6,401
Non-tertiary 1 28 91 92 102 196 224 274 381 238 119 1,746
Born before arrival 1 6 8 7 9 13 5 6 7 13 7 82
Not stated 0 0 0 0 0 0 1 2 1 3 0 7
Total 40 381 667 733 947 1,470 1,057 948 988 674 331 8,236
Per cent
Tertiary 95.0 91.1 85.2 86.5 88.3 85.8 78.3 70.4 60.7 62.6 61.9 77.8
Non-tertiary 2.5 7.3 13.6 12.6 10.8 13.3 21.2 29.0 38.6 35.5 36.0 21.2
Born before arrival 2.5 1.6 1.2 1.0 1.0 0.9 0.5 0.6 0.7 1.9 2.1 1.0
Total 100.0 100.0 100.0 100.0 100.0 100.0 100.0 100.0 100.0 100.0 100.0 100.0
Note: Not stated data are excluded from per cent calculations.
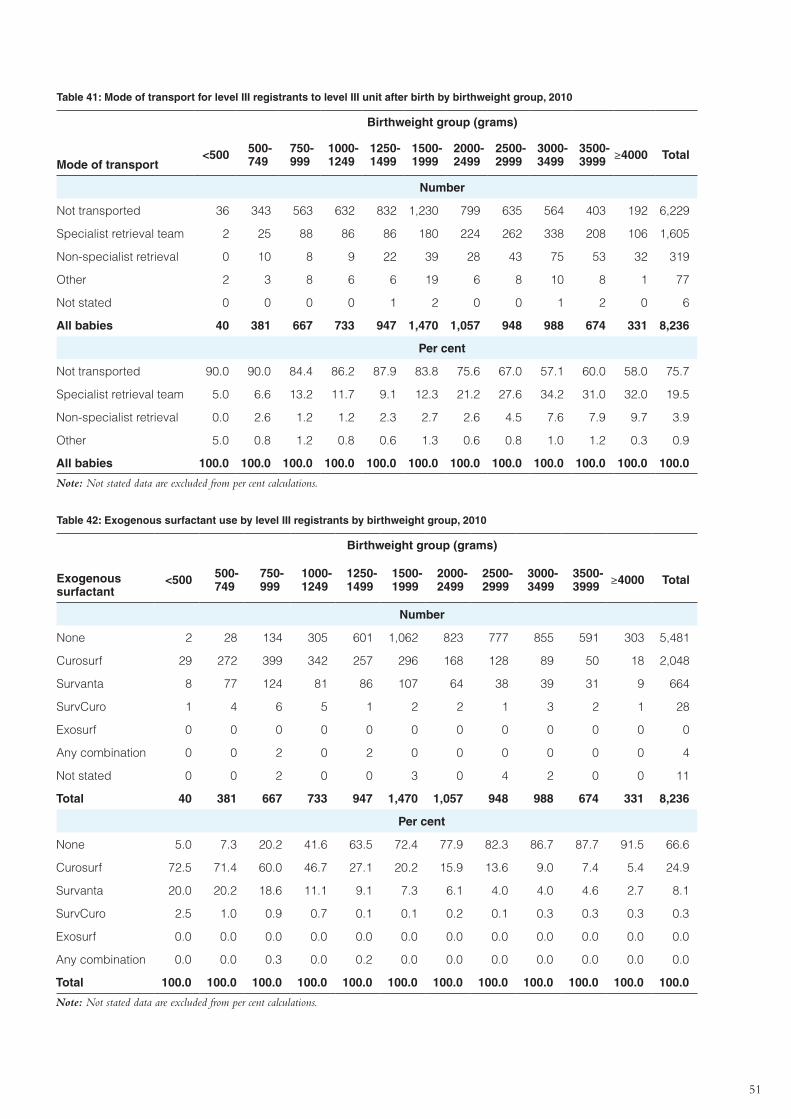
51
Table 41: Mode of transport for level III registrants to level III unit after birth by birthweight group, 2010
Mode of transport
Birthweight group (grams)
<500 500-749
750-999
1000-1249
1250-1499
1500-1999
2000-2499
2500-2999
3000-3499
3500-3999 ≥4000 Total
Number
Not transported 36 343 563 632 832 1,230 799 635 564 403 192 6,229
Specialist retrieval team 2 25 88 86 86 180 224 262 338 208 106 1,605
Non-specialist retrieval 0 10 8 9 22 39 28 43 75 53 32 319
Other 2 3 8 6 6 19 6 8 10 8 1 77
Not stated 0 0 0 0 1 2 0 0 1 2 0 6
All babies 40 381 667 733 947 1,470 1,057 948 988 674 331 8,236
Per cent
Not transported 90.0 90.0 84.4 86.2 87.9 83.8 75.6 67.0 57.1 60.0 58.0 75.7
Specialist retrieval team 5.0 6.6 13.2 11.7 9.1 12.3 21.2 27.6 34.2 31.0 32.0 19.5
Non-specialist retrieval 0.0 2.6 1.2 1.2 2.3 2.7 2.6 4.5 7.6 7.9 9.7 3.9
Other 5.0 0.8 1.2 0.8 0.6 1.3 0.6 0.8 1.0 1.2 0.3 0.9
All babies 100.0 100.0 100.0 100.0 100.0 100.0 100.0 100.0 100.0 100.0 100.0 100.0
Note: Not stated data are excluded from per cent calculations.
Table 42: Exogenous surfactant use by level III registrants by birthweight group, 2010
Exogenous surfactant
Birthweight group (grams)
<500 500-749
750-999
1000-1249
1250-1499
1500-1999
2000-2499
2500-2999
3000-3499
3500-3999 ≥4000 Total
Number
None 2 28 134 305 601 1,062 823 777 855 591 303 5,481
Curosurf 29 272 399 342 257 296 168 128 89 50 18 2,048
Survanta 8 77 124 81 86 107 64 38 39 31 9 664
SurvCuro 1 4 6 5 1 2 2 1 3 2 1 28
Exosurf 0 0 0 0 0 0 0 0 0 0 0 0
Any combination 0 0 2 0 2 0 0 0 0 0 0 4
Not stated 0 0 2 0 0 3 0 4 2 0 0 11
Total 40 381 667 733 947 1,470 1,057 948 988 674 331 8,236
Per cent
None 5.0 7.3 20.2 41.6 63.5 72.4 77.9 82.3 86.7 87.7 91.5 66.6
Curosurf 72.5 71.4 60.0 46.7 27.1 20.2 15.9 13.6 9.0 7.4 5.4 24.9
Survanta 20.0 20.2 18.6 11.1 9.1 7.3 6.1 4.0 4.0 4.6 2.7 8.1
SurvCuro 2.5 1.0 0.9 0.7 0.1 0.1 0.2 0.1 0.3 0.3 0.3 0.3
Exosurf 0.0 0.0 0.0 0.0 0.0 0.0 0.0 0.0 0.0 0.0 0.0 0.0
Any combination 0.0 0.0 0.3 0.0 0.2 0.0 0.0 0.0 0.0 0.0 0.0 0.0
Total 100.0 100.0 100.0 100.0 100.0 100.0 100.0 100.0 100.0 100.0 100.0 100.0
Note: Not stated data are excluded from per cent calculations.
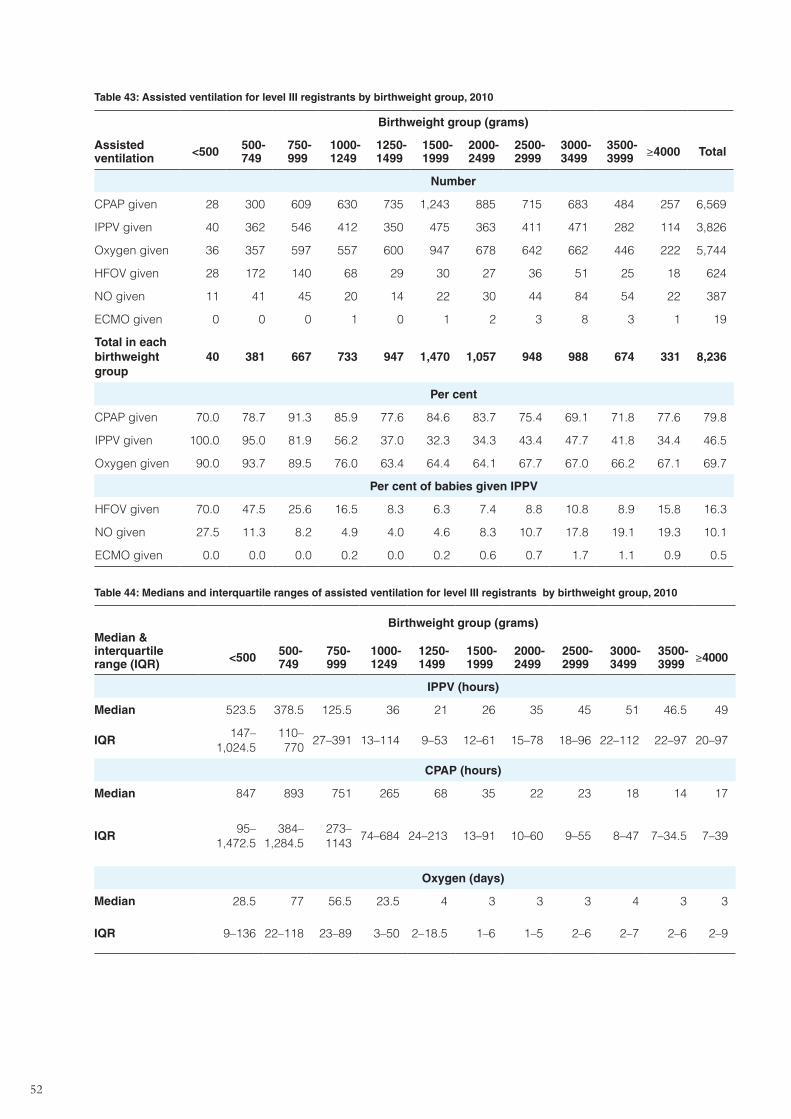
52
Table 43: Assisted ventilation for level III registrants by birthweight group, 2010
Assisted ventilation
Birthweight group (grams)
<500 500-749
750-999
1000-1249
1250-1499
1500-1999
2000-2499
2500-2999
3000-3499
3500-3999 ≥4000 Total
Number
CPAP given 28 300 609 630 735 1,243 885 715 683 484 257 6,569
IPPV given 40 362 546 412 350 475 363 411 471 282 114 3,826
Oxygen given 36 357 597 557 600 947 678 642 662 446 222 5,744
HFOV given 28 172 140 68 29 30 27 36 51 25 18 624
NO given 11 41 45 20 14 22 30 44 84 54 22 387
ECMO given 0 0 0 1 0 1 2 3 8 3 1 19
Total in each birthweight group
40 381 667 733 947 1,470 1,057 948 988 674 331 8,236
Per cent
CPAP given 70.0 78.7 91.3 85.9 77.6 84.6 83.7 75.4 69.1 71.8 77.6 79.8
IPPV given 100.0 95.0 81.9 56.2 37.0 32.3 34.3 43.4 47.7 41.8 34.4 46.5
Oxygen given 90.0 93.7 89.5 76.0 63.4 64.4 64.1 67.7 67.0 66.2 67.1 69.7
Per cent of babies given IPPV
HFOV given 70.0 47.5 25.6 16.5 8.3 6.3 7.4 8.8 10.8 8.9 15.8 16.3
NO given 27.5 11.3 8.2 4.9 4.0 4.6 8.3 10.7 17.8 19.1 19.3 10.1
ECMO given 0.0 0.0 0.0 0.2 0.0 0.2 0.6 0.7 1.7 1.1 0.9 0.5
Table 44: Medians and interquartile ranges of assisted ventilation for level III registrants by birthweight group, 2010
Median & interquartile range (IQR)
Birthweight group (grams)
<500 500-749
750-999
1000-1249
1250-1499
1500-1999
2000-2499
2500-2999
3000-3499
3500-3999 ≥4000
IPPV (hours)
Median 523.5 378.5 125.5 36 21 26 35 45 51 46.5 49
IQR147–
1,024.5110–770
27–391 13–114 9–53 12–61 15–78 18–96 22–112 22–97 20–97
CPAP (hours)
Median 847 893 751 265 68 35 22 23 18 14 17
IQR95–
1,472.5384–
1,284.5273–1143
74–684 24–213 13–91 10–60 9–55 8–47 7–34.5 7–39
Oxygen (days)
Median 28.5 77 56.5 23.5 4 3 3 3 4 3 3
IQR 9–136 22–118 23–89 3–50 2–18.5 1–6 1–5 2–6 2–7 2–6 2–9
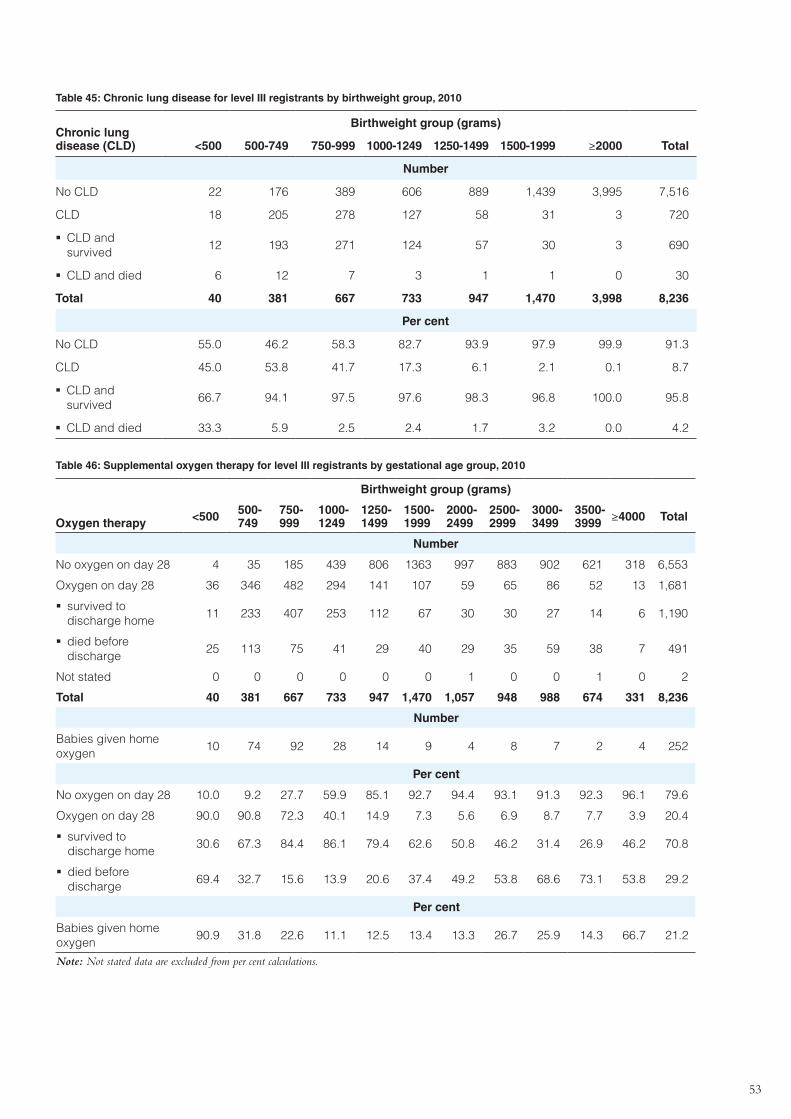
53
Table 45: Chronic lung disease for level III registrants by birthweight group, 2010
Chronic lung disease (CLD)
Birthweight group (grams)
<500 500-749 750-999 1000-1249 1250-1499 1500-1999 ≥2000 Total
Number
No CLD 22 176 389 606 889 1,439 3,995 7,516
CLD 18 205 278 127 58 31 3 720
�� CLD and survived
12 193 271 124 57 30 3 690
�� CLD and died 6 12 7 3 1 1 0 30
Total 40 381 667 733 947 1,470 3,998 8,236
Per cent
No CLD 55.0 46.2 58.3 82.7 93.9 97.9 99.9 91.3
CLD 45.0 53.8 41.7 17.3 6.1 2.1 0.1 8.7
�� CLD and survived
66.7 94.1 97.5 97.6 98.3 96.8 100.0 95.8
�� CLD and died 33.3 5.9 2.5 2.4 1.7 3.2 0.0 4.2
Table 46: Supplemental oxygen therapy for level III registrants by gestational age group, 2010
Oxygen therapy
Birthweight group (grams)
<500 500-749
750-999
1000-1249
1250-1499
1500-1999
2000-2499
2500-2999
3000-3499
3500-3999 ≥4000 Total
Number
No oxygen on day 28 4 35 185 439 806 1363 997 883 902 621 318 6,553
Oxygen on day 28 36 346 482 294 141 107 59 65 86 52 13 1,681
�� survived to discharge home
11 233 407 253 112 67 30 30 27 14 6 1,190
�� died before discharge
25 113 75 41 29 40 29 35 59 38 7 491
Not stated 0 0 0 0 0 0 1 0 0 1 0 2
Total 40 381 667 733 947 1,470 1,057 948 988 674 331 8,236
Number
Babies given home oxygen
10 74 92 28 14 9 4 8 7 2 4 252
Per cent
No oxygen on day 28 10.0 9.2 27.7 59.9 85.1 92.7 94.4 93.1 91.3 92.3 96.1 79.6
Oxygen on day 28 90.0 90.8 72.3 40.1 14.9 7.3 5.6 6.9 8.7 7.7 3.9 20.4
�� survived to discharge home
30.6 67.3 84.4 86.1 79.4 62.6 50.8 46.2 31.4 26.9 46.2 70.8
�� died before discharge
69.4 32.7 15.6 13.9 20.6 37.4 49.2 53.8 68.6 73.1 53.8 29.2
Per cent
Babies given home oxygen
90.9 31.8 22.6 11.1 12.5 13.4 13.3 26.7 25.9 14.3 66.7 21.2
Note: Not stated data are excluded from per cent calculations.
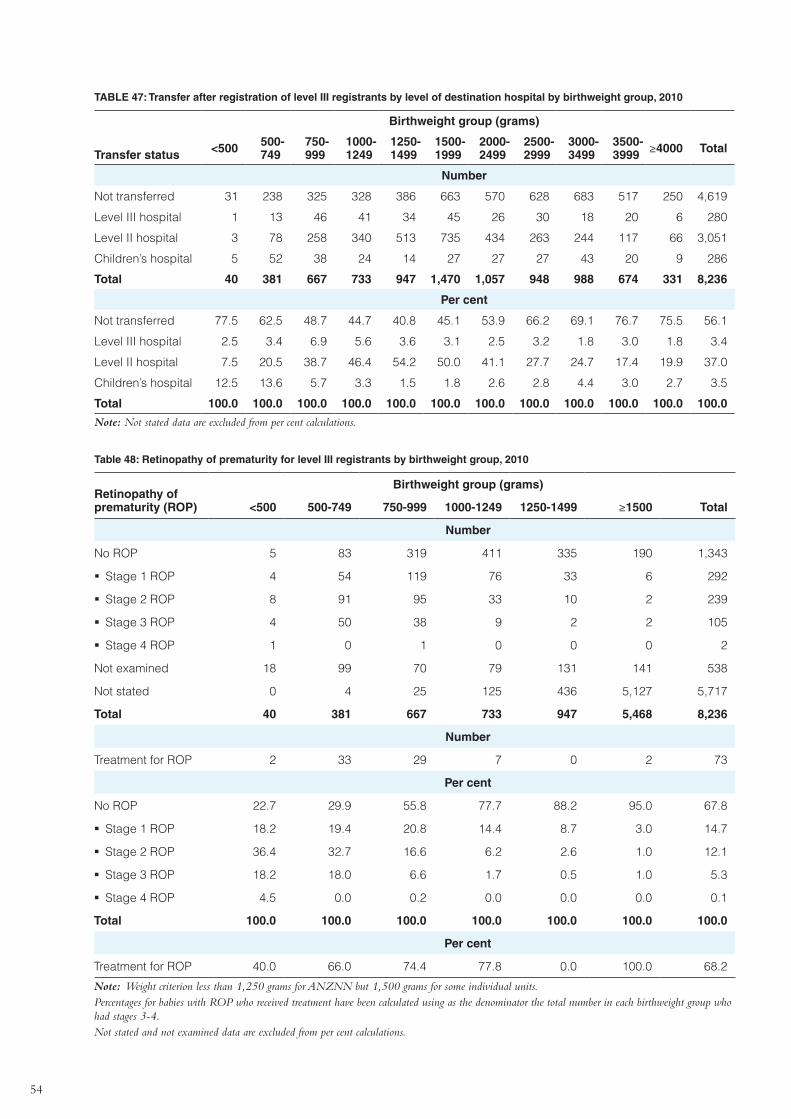
54
TABLE 47: Transfer after registration of level III registrants by level of destination hospital by birthweight group, 2010
Transfer status
Birthweight group (grams)
<500 500-749
750-999
1000-1249
1250-1499
1500-1999
2000-2499
2500-2999
3000-3499
3500-3999 ≥4000 Total
Number
Not transferred 31 238 325 328 386 663 570 628 683 517 250 4,619
Level III hospital 1 13 46 41 34 45 26 30 18 20 6 280
Level II hospital 3 78 258 340 513 735 434 263 244 117 66 3,051
Children’s hospital 5 52 38 24 14 27 27 27 43 20 9 286
Total 40 381 667 733 947 1,470 1,057 948 988 674 331 8,236
Per cent
Not transferred 77.5 62.5 48.7 44.7 40.8 45.1 53.9 66.2 69.1 76.7 75.5 56.1
Level III hospital 2.5 3.4 6.9 5.6 3.6 3.1 2.5 3.2 1.8 3.0 1.8 3.4
Level II hospital 7.5 20.5 38.7 46.4 54.2 50.0 41.1 27.7 24.7 17.4 19.9 37.0
Children’s hospital 12.5 13.6 5.7 3.3 1.5 1.8 2.6 2.8 4.4 3.0 2.7 3.5
Total 100.0 100.0 100.0 100.0 100.0 100.0 100.0 100.0 100.0 100.0 100.0 100.0
Note: Not stated data are excluded from per cent calculations.
Table 48: Retinopathy of prematurity for level III registrants by birthweight group, 2010
Retinopathy of prematurity (ROP)
Birthweight group (grams)
<500 500-749 750-999 1000-1249 1250-1499 ≥1500 Total
Number
No ROP 5 83 319 411 335 190 1,343
�� Stage 1 ROP 4 54 119 76 33 6 292
�� Stage 2 ROP 8 91 95 33 10 2 239
�� Stage 3 ROP 4 50 38 9 2 2 105
�� Stage 4 ROP 1 0 1 0 0 0 2
Not examined 18 99 70 79 131 141 538
Not stated 0 4 25 125 436 5,127 5,717
Total 40 381 667 733 947 5,468 8,236
Number
Treatment for ROP 2 33 29 7 0 2 73
Per cent
No ROP 22.7 29.9 55.8 77.7 88.2 95.0 67.8
�� Stage 1 ROP 18.2 19.4 20.8 14.4 8.7 3.0 14.7
�� Stage 2 ROP 36.4 32.7 16.6 6.2 2.6 1.0 12.1
�� Stage 3 ROP 18.2 18.0 6.6 1.7 0.5 1.0 5.3
�� Stage 4 ROP 4.5 0.0 0.2 0.0 0.0 0.0 0.1
Total 100.0 100.0 100.0 100.0 100.0 100.0 100.0
Per cent
Treatment for ROP 40.0 66.0 74.4 77.8 0.0 100.0 68.2
Note: Weight criterion less than 1,250 grams for ANZNN but 1,500 grams for some individual units. Percentages for babies with ROP who received treatment have been calculated using as the denominator the total number in each birthweight group who had stages 3-4. Not stated and not examined data are excluded from per cent calculations.
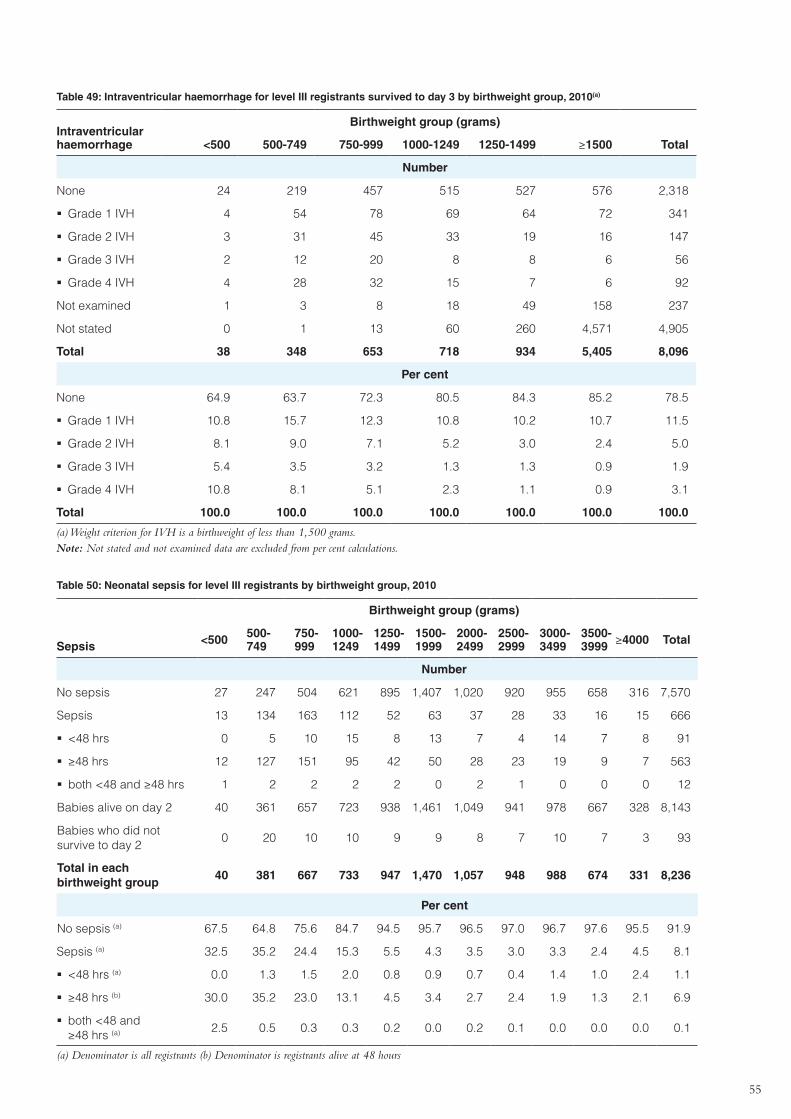
55
Table 49: Intraventricular haemorrhage for level III registrants survived to day 3 by birthweight group, 2010(a)
Intraventricular haemorrhage
Birthweight group (grams)
<500 500-749 750-999 1000-1249 1250-1499 ≥1500 Total
Number
None 24 219 457 515 527 576 2,318
�� Grade 1 IVH 4 54 78 69 64 72 341
�� Grade 2 IVH 3 31 45 33 19 16 147
�� Grade 3 IVH 2 12 20 8 8 6 56
�� Grade 4 IVH 4 28 32 15 7 6 92
Not examined 1 3 8 18 49 158 237
Not stated 0 1 13 60 260 4,571 4,905
Total 38 348 653 718 934 5,405 8,096
Per cent
None 64.9 63.7 72.3 80.5 84.3 85.2 78.5
�� Grade 1 IVH 10.8 15.7 12.3 10.8 10.2 10.7 11.5
�� Grade 2 IVH 8.1 9.0 7.1 5.2 3.0 2.4 5.0
�� Grade 3 IVH 5.4 3.5 3.2 1.3 1.3 0.9 1.9
�� Grade 4 IVH 10.8 8.1 5.1 2.3 1.1 0.9 3.1
Total 100.0 100.0 100.0 100.0 100.0 100.0 100.0
(a) Weight criterion for IVH is a birthweight of less than 1,500 grams.Note: Not stated and not examined data are excluded from per cent calculations.
Table 50: Neonatal sepsis for level III registrants by birthweight group, 2010
Sepsis
Birthweight group (grams)
<500 500-749
750-999
1000-1249
1250-1499
1500-1999
2000-2499
2500-2999
3000-3499
3500-3999 ≥4000 Total
Number
No sepsis 27 247 504 621 895 1,407 1,020 920 955 658 316 7,570
Sepsis 13 134 163 112 52 63 37 28 33 16 15 666
�� <48 hrs 0 5 10 15 8 13 7 4 14 7 8 91
�� ≥48 hrs 12 127 151 95 42 50 28 23 19 9 7 563
�� both <48 and ≥48 hrs 1 2 2 2 2 0 2 1 0 0 0 12
Babies alive on day 2 40 361 657 723 938 1,461 1,049 941 978 667 328 8,143
Babies who did not survive to day 2
0 20 10 10 9 9 8 7 10 7 3 93
Total in each birthweight group
40 381 667 733 947 1,470 1,057 948 988 674 331 8,236
Per cent
No sepsis (a) 67.5 64.8 75.6 84.7 94.5 95.7 96.5 97.0 96.7 97.6 95.5 91.9
Sepsis (a) 32.5 35.2 24.4 15.3 5.5 4.3 3.5 3.0 3.3 2.4 4.5 8.1
�� <48 hrs (a) 0.0 1.3 1.5 2.0 0.8 0.9 0.7 0.4 1.4 1.0 2.4 1.1
�� ≥48 hrs (b) 30.0 35.2 23.0 13.1 4.5 3.4 2.7 2.4 1.9 1.3 2.1 6.9
�� both <48 and ≥48 hrs (a) 2.5 0.5 0.3 0.3 0.2 0.0 0.2 0.1 0.0 0.0 0.0 0.1
(a) Denominator is all registrants (b) Denominator is registrants alive at 48 hours
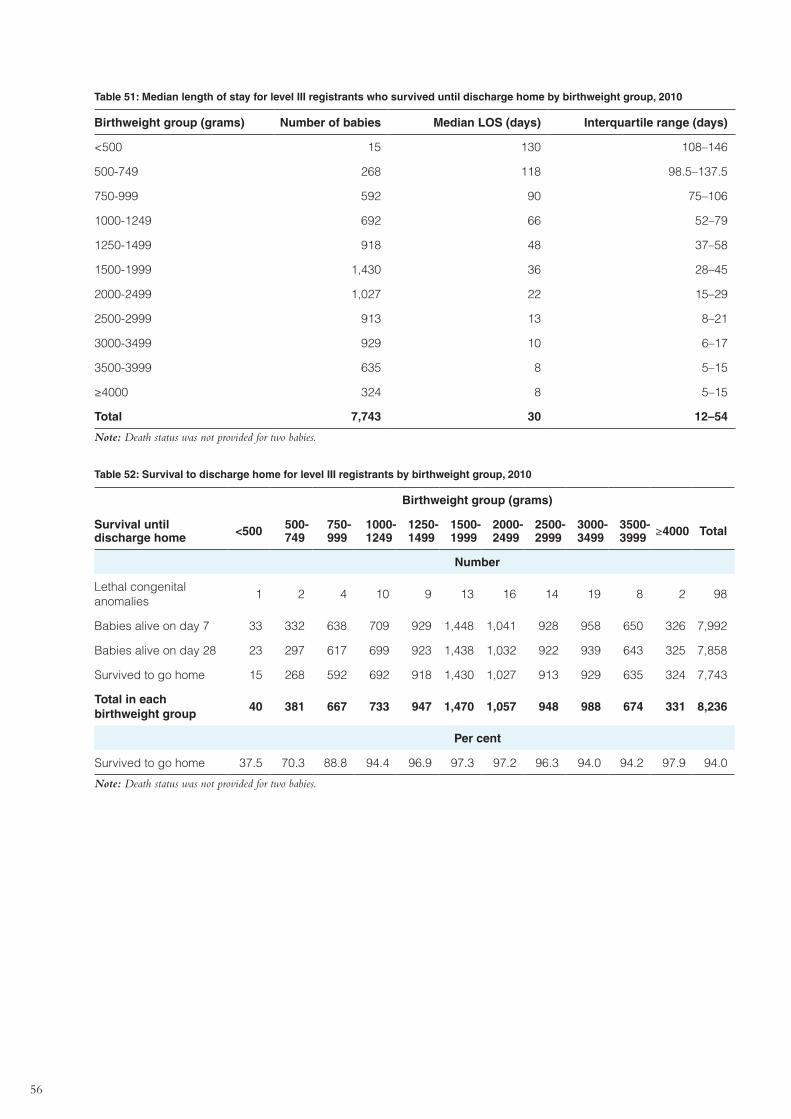
56
Table 51: Median length of stay for level III registrants who survived until discharge home by birthweight group, 2010
Birthweight group (grams) Number of babies Median LOS (days) Interquartile range (days)
<500 15 130 108–146
500-749 268 118 98.5–137.5
750-999 592 90 75–106
1000-1249 692 66 52–79
1250-1499 918 48 37–58
1500-1999 1,430 36 28–45
2000-2499 1,027 22 15–29
2500-2999 913 13 8–21
3000-3499 929 10 6–17
3500-3999 635 8 5–15
≥4000 324 8 5–15
Total 7,743 30 12–54
Note: Death status was not provided for two babies.
Table 52: Survival to discharge home for level III registrants by birthweight group, 2010
Survival until discharge home
Birthweight group (grams)
<500 500-749
750-999
1000-1249
1250-1499
1500-1999
2000-2499
2500-2999
3000-3499
3500-3999 ≥4000 Total
Number
Lethal congenital anomalies
1 2 4 10 9 13 16 14 19 8 2 98
Babies alive on day 7 33 332 638 709 929 1,448 1,041 928 958 650 326 7,992
Babies alive on day 28 23 297 617 699 923 1,438 1,032 922 939 643 325 7,858
Survived to go home 15 268 592 692 918 1,430 1,027 913 929 635 324 7,743
Total in each birthweight group
40 381 667 733 947 1,470 1,057 948 988 674 331 8,236
Per cent
Survived to go home 37.5 70.3 88.8 94.4 96.9 97.3 97.2 96.3 94.0 94.2 97.9 94.0
Note: Death status was not provided for two babies.
57
Appendix 3: Methods used in this report
The ANZNN data collection was moved to the Perinatal & Reproductive Epidemiology Research Unit, School of Women’s & Children’s Health, University of New South Wales in June 2008.
The historical ANZNN data were received as a Microsoft Access database. Updated data for the ANZNN audit of babies born in 2010 who qualified as high-risk neonates were requested from each participating unit in February 2012 with a deadline of April 2012. The data submitted were checked for consistency and completeness using a newly developed validation program, run sequentially on each batch of data entered. Exception reports were returned to units with details of missing and inconsistent data values in records identified as problematic. Most, but not all, units returned corrected records in time for the production of this report.
An extract from the database was made in August 2012. Apart from grouping, the data presented in the report reflect the database at that time with one exception: a series of derived data items were generated. These are listed below.
Derived data items:
Survival to day nThe number of days between the date of birth and the date of death was calculated and records flagged if this was less than n days.
Survival to 36 weeks post menstrual age
This item is for babies born at less than 36 weeks gestation only.
The day the baby reaches 36 weeks post menstrual age is considered to be the infant’s gestational age (completed weeks) plus chronological age in days. For example, a baby born at ‘28 weeks and four days’ gestation on 1 January is 36 weeks post menstrual age on 26 February.
Chronic lung disease (CLD)
This item is for babies born at less than 32 weeks gestation only.
The baby received any respiratory support (supplemental oxygen or intermittent positive pressure ventilation (IPPV) or continuous positive airways pressure (CPAP) for a chronic pulmonary disorder on the day the baby reached 36 weeks post menstrual age.
Date of final added respiratory support must be:
> Date of birth or {[(Hours of IPPV + Hours of CPAP)/168] + Gestational age} > 35.9 weeks
Length of stayThe total number of days a baby spent in hospital during their first admission from birth. The total may include stays in more than one hospital.
All data manipulations and analysis for the 2010 report were carried out using Statistical Analysis Systems (SAS) software, and tabulations and figures were produced using Microsoft Excel.
58
Appendix 4: Confidentiality guidelines
Confidentiality guidelines provide an unambiguous framework for the handling of data that met the strict criteria of governing bodies. Confidentiality guidelines for the collection, processing and analysis of data from the minimum data collection of ANZNN were devised and agreed to by the Advisory Committee at the ANZNN Advisory Committee Meeting, Auckland, New Zealand on 2 April 1995. The summary below incorporates modifications agreed in the Memorandum of Understanding (MOU) between ANZNN and the Perinatal & Reproductive Epidemiology Research Unit (PRERU), School of Women’s and Children’s Health, the University of New South Wales.
The purpose of these guidelines is to set out the principles under which the National Minimum Data Collection (NMDC) for neonatal intensive care units (NICUs) is formulated and the conditions that apply to the use of these data and release to parties internal and external to the ANZNN.
The essential purpose of the NMDC is to provide national unit record tabulations on babies meeting specified criteria who have been admitted to NICUs or affiliated nurseries in Australia and New Zealand. In general, this will be achieved through distribution of an annual report containing summary tables without identifying characteristics, either of a personal, institutional or state, territory or national nature. In certain other instances, data may be provided internally in the following manner:
�� as de-identified summary tables not provided in the annual report, but available upon request
�� as de-identified unit record data for analytical purposes as approved by the ANZNN
�� as NICU identifiable summary and/or unit record data for clinical audit purposes by the respective NICU providing the data. These guidelines will cover the collection and provision of data retrospectively from 1 January 1994.
Principles of ownership and maintenance of data
�� The Perinatal & Reproductive Epidemiology Research Unit (PRERU) agrees to house and maintain the ANZNN Data Collection through electronic data submission from neonatal intensive care units and special care nurseries during the period 1 January 2008 to 31 December 2012.
�� The ANZNN Data Collection will be housed at PRERU. It will be managed according to existing data security procedures as for other data collections at PRERU. The Data Custodian is the Director of PRERU.
The ANZNN Data Collection Operation Committee (“ANZNN DCOC”) was established in June 2008 to make decisions concerning the management, operation, data provision and reporting of the ANZNN Data Collection. The ANZNN DCOC is comprised of: three members appointed by the ANZNN Management Committee and the ANZNN Advisory Committee; two members appointed by the PRERU; and the Chairperson appointed by the ANZNN Management Committee. The operations and progress of ANZNN Data Collection will be reported quarterly by ANZNN DCOC to the ANZNN Management Committee.
PRERU will ensure that the data structure of the ANZNN Data Collection will remain the same as the existing data collection. Any modification to the data structure will be a joint decision between ANZNN Management Committee and PRERU. Issues such as data entry, collation, retrieval and analysis will be considered.
The ANZNN will be responsible for collection and maintenance of the data set and decision-making with respect to its use.
All queries related to the NMDC should be referred to the Data Custodian at PRERU who will address them personally or refer them to the appropriate source person.
Conditions for data collection
It is expected that all participating NICUs will collect the agreed-upon minimum set of data in a standardised format for eligible babies registered to the ANZNN audit in their unit. Data will be transferred securely to the ANZNN coordinator.

59
Conditions for data security
The electronic version of these data is maintained in a secure partition at the University of New South Wales. Access to the server is limited to authorised named staff and further protected by the use of a high-level password. Attempted security breaches are monitored and investigated. Hard copy patient identifiable data and electronic backup files are kept in secured and locked safe cabinets. Master lists of code material and source record identifiers are kept away from the database in a separate locked area. All rooms and offices used by the ANZNN are locked when not in use. Filing cabinets containing data are locked when not in use. Computerised data on the server are protected by high-level passwords known only to each person who has access to computerised data. Potentially identifiable data will not leave the site of the ANZNN. Security disposal of data is available through use of designated bags or a shredding machine and must be witnessed by at least two staff members. A destruction certificate stating the name of the data and the date on which they are destroyed is to be issued and retained in the records.
60
Appendix 5: Minimum Data Set variables
Registration hospital
Definition: The hospital of registration is the first level III NICU that the baby remained in for four or more hours during the first 28 days of life. Babies who received their entire care in a level II hospital, or who were not transferred to a level III NICU during the first 28 days are registered to the first level II centre that they remain in for four or more hours.
Coding: Numeric code representing registration hospital
Guide for use: If a baby dies within four hours, they are registered to the unit where they died.
Maternal age
Definition: Age in completed years of the woman giving birth on the date of the baby’s birth.
Coding: 2-digit number representing maternal age in completed years
Previous preterm birth
Definition: This mother has had a previous birth that was at less than 37 weeks gestation and more than 20 completed weeks, regardless of outcome.
Coding: 99: unknown.
0: no previous preterm birth.
-1: yes, there was a previous preterm birth.
Previous perinatal death
Definition: Mother has had a previous perinatal loss.
Coding: 99: unknown
0: no previous perinatal death.
-1: yes, has had a previous perinatal death.
Guide for use: A perinatal loss is when a baby with a birthweight of more than 400 grams or a gestational age of more than 20 completed weeks died during the first 28 days of life.
Assisted conception in this pregnancy
Definition: The type of infertility treatment used during conception or used to conceive this pregnancy.
Coding: 0: unknown.
1: none – no infertility treatment used for this pregnancy.
2: hyperovulation – any hormone therapy used to stimulate ovulation.
3: IVF / GIFT etc. – any method of in vitro fertilisation. Including in vitro fertilisation, gamete intrafallopian transfer, zygote intrafallopian transfer and IC sperm injection.
4: other – infertility treatment used that is not mentioned above, including artificial insemination
Guide for use: Disregard any treatment for any previous pregnancies.
61
Ethnicity of mother
Definition: Ethnic origin of the mother of baby, as identified by the mother.
Coding: 0: unknown.
1: Aboriginal or Torres Strait Islander – is a person of Aboriginal or Torres Strait Islander descent who identifies as an Aboriginal or Torres Strait Islander and is accepted as such by the community with which she is associated.
2: Asian – all whose ethnic background originates from countries of Asia, South East Asia and Indian subcontinent (eg. Fijian Indian).
3: Caucasian – all of Caucasoid heritage, including, European, Russian, Middle Eastern and Arabic.
4: Other – includes African Negroes, Inuit, American Blacks and Indians, Melanesian.
5: Pacific Islander – all from Pacific Islander background, including Samoan, Cook Islands Maori, Niuean, Tokelauan, and other Pacific Islands groups (eg. Hawaiian, Tahitian). Excludes Maori.
6: Maori – a person of New Zealand Maori descent who identifies as Maori.
Source of referral
Definition: Source of referral to registration unit.
Coding: 0: unknown.
1: booked at tertiary obstetric hospital – mother booked into a hospital with a NICU and was not transferred during the most recent admission.
2: in utero transfer from obstetric hospital – mother transferred during most recent admission, baby in utero.
3: ex utero retrieval – baby transferred from any hospital by a specialist retrieval team.
4: ex utero transfer – baby transferred from any hospital by non-specialist team, includes transport by ambulance.
5: other – born in transit or not booked.
6: booked at this level II unit – mother booked into this hospital, no NICU.
7: in utero transfer to this level II unit – mother transferred, baby in utero.
8: ex utero retrieval to this level II unit – baby ‘retrieved’ from any other hospital.
9: ex utero transfer to this level II unit.
Guide for use: Use most recent referral.
Presenting antenatal problem
Definition: The antenatal complication that the mother presented with in this pregnancy.
Coding: 0: unknown.
1: preterm pre-labour rupture of membranes – confirmed spontaneous rupture of membranes occurring prior to the onset of labour and before 37 weeks gestation.
2: preterm labour.
3: hypertension in pregnancy.
4: antepartum haemorrhage.
5: suspected intrauterine growth restriction.
6: fetal distress.
7: other.
8: none – no presenting problem. Born at term.
9: antenatal diagnosis of fetal malformation.
62
Other antenatal complications
Definition: Any other antenatal complication.
Coding: 99: unknown.
0: no other antenatal complication present.
-1: yes, other antenatal complication present.
Prolonged rupture of membranes (ROM)
Definition: Confirmed spontaneous ROM.
An obvious gush of clear amniotic fluid from vagina or if fluid available, by differentiation with urine or vaginal secretions, for more than 24 hours before birth.
Coding: 99: unknown.
0: no, membranes intact/ruptured for < 24 hrs.
-1: yes, membranes ruptured for > 24 hours.
Preterm labour
Definition: Regular painful contractions, leading to progressive effacement and dilatation of the cervix, eventually leading to the birth of the baby, and commencing before 37 weeks gestation.
Coding: 99: unknown.
0: no, labour did not commence before term.
-1: yes, labour commenced in preterm period.
Hypertension in pregnancy
Definition: A systolic blood pressure (BP) > 140 mmHg and/or diastolic BP > 90 mmHg, or a rise in systolic BP > 25 mmHg and/or a rise in diastolic BP > 15 mmHg from a reading before conception or in 1st trimester; confirmed by 2 readings 6 hours apart
Coding: 99: unknown.
0: no hypertension in pregnancy detected.
-1: yes, hypertension in pregnancy diagnosed.
Antepartum haemorrhage
Definition: Significant haemorrhage in the time from 20 weeks gestation to the end of second stage of labour (excludes a ‘show’).
Coding: 99: unknown.
0: no antepartum haemorrhage noted.
-1: yes, antepartum haemorrhage.
Suspected intrauterine growth restriction
Definition: A condition of the fetus in which it fails to reach its genetically predetermined full growth potential due to intrinsic or extrinsic factors based on more than one obstetric ultrasound.
Coding: 99: unknown.
0: no intrauterine growth restriction.
-1: yes, intrauterine growth restriction suspected.
63
Fetal distress
Definition: Any ‘distress’ of this fetus leading to intervention by the obstetric team.
Coding: 99: unknown.
0: no intervention necessary.
-1: yes, obstetric intervention required.
Antenatal diagnosis of fetal malformation
Definition: A fetal malformation is diagnosed prior to the baby’s birth, by any method.
Coding: 99: unknown.
0: no.
-1: yes, malformation detected prior to birth.
Guide for use: The diagnosis of the malformation may or may not be confirmed after birth.
Other antenatal complication
Definition: Complication, not specified.
Coding: 99: unknown.
0: no other significant antenatal complication.
-1: yes, other antenatal complication present.
Sex
Definition: The sex of the patient.
Coding: 0: unknown.
1: male.
2: female.
3: ambiguous or indeterminate.
Infant weight
Definition: The first weight of the baby after birth.
Coding: A 4-digit number representing birthweight in grams.
Guide for use: The weight is usually measured to the nearest five grams and is obtained within one hour of birth, or shortly after the infant has been admitted.
Gestational age
Definition: The estimated gestational age of the baby in completed weeks.
Coding: A 2-digit number representing the number of completed weeks of gestation.
Guide for use: Derived from a clinical assessment of the baby when accurate information is not stated.
Place of birth
Definition: Place of baby’s birth.
Coding: 0: unknown.
1: non-tertiary hospital – born in a hospital with no level III NICU.
2: tertiary hospital – born in a hospital with a level III NICU.

64
3: homebirth – planned.
4: born before arrival – unplanned birth at home, or in an ambulance, a car etc.
Presentation at birth
Definition: Presenting part of the fetus (at lower segment of the uterus) at birth.
Coding: 0: unknown.
1: cephalic – including face and brow.
2: breech – legs or feet were facing the cervix.
3: other – includes transverse.
Mode of birth
Definition: The method of complete expulsion or extraction from its mother of a product of conception.
Coding: 0: unknown.
1: vaginal – vaginal birth, includes breech.
2: instrument – vaginal birth using an instrument – forceps, rotations, vacuum extraction.
3: Caesarean section in labour – caesarean performed after the commencement of labour.
4: Caesarean section, no labour – caesarean section performed prior to labour commencing.
Antenatal corticosteroids
Definition: Corticosteroids given during the antenatal period via any route to the mother at a time likely to enhance fetal lung maturation.
Coding: 0: unknown.
1: none – steroids not given.
2: less than 24 hours – first dose given less than 24 hours prior to this baby’s birth.
3: complete – more than 1 dose of steroids given, and 1st dose at more than 24 hours and less than 8 days before birth.
4: given at more than 7 days before baby’s birth.
Guide for use: If two courses given, and one fulfils the ‘complete’ criteria, use ‘complete’. If the time of doses given is not available, but two doses are known to have been given appropriately, also use ‘complete’.
Plurality
Definition: The total number of births resulting from this pregnancy.
Coding: 0: singleton – only one baby born.
1. twins – two babies.
2. triplets – three babies.
3. quads – four babies.
4. more – quintuplets, sextuplets etc.
Guide for use: Determined by the number of live births or by the number of fetuses that remain in utero at 20 weeks gestation. If gestational age is unknown, only live births of any birthweight or gestation, or fetuses weighing ≥ 400 grams are taken into account. Fetuses aborted at < 20 weeks or fetuses compressed in the placenta at or more than 20 weeks are excluded.
65
Birth order
Definition: Order of each baby of a multiple birth.
Coding: Single-digit number representing birth order.
0: singleton.
1: first of a multiple birth.
2: second of a multiple birth.
3: third of a multiple birth etc.
4: other.
Date of birth
Definition: Date of birth of the patient.
Coding: DD / MM / YYYY
Admission date
Definition: The date on which an inpatient or same-day patient commences an episode of care.
Coding: DD / MM / YYYY
Apgar score (1 minute)
Definition: Numerical score to evaluate the baby’s condition at one minute after birth.
Coding: 2-digit number representing Apgar score.
Guide for use: The score is based on the five characteristics of heart rate, respiratory condition, muscle tone, reflexes and colour.
Apgar score (5 minute)
Definition: Numerical score to evaluate the baby’s condition at five minutes after birth.
Coding: 2 digit number.
Guide for use: As for Apgar score (1 minute).
Intubated at resuscitation
Definition: An active measure taken shortly after birth to establish independent respiration and heart rate, or to treat depressed respiratory effort by endotracheal intubation.
Coding: 99: unknown.
0: no, intubation was not necessary in labour ward.
-1: yes, intubation necessary in labour ward.
Guide for use: Does not include intubation for tracheal aspiration or intubation in the NICU after resuscitation is complete.
Congenital anomalies
Definition: Structural abnormalities (including deformations) present at birth and diagnosed prior to separation from care (discharge home).
Coding: 99: unknown.
0: no major congenital malformations noted.
-1: yes, major congenital malformation noted.
66
Specified congenital anomalies
Definition: Detail of the major congenital malformation.
Coding: Free text field representing congenital malformation coded by ICD-10-AM.
Temperature on admission
Definition: Temperature on admission to the NICU or closest to admission to registration unit. Use rectal temperature or, if not available, per axilla.
Coding: A 4-digit number representing temperature measured in degrees Celsius to 1 decimal place.
Guide for use: If the baby is transported by a specialist neonatal retrieval team, admission is considered to commence when the team arrive at the baby’s bedside. If the baby is more than 12 hours of age when NICU care started, or if an admission temperature is not recorded, use ‘0’ to denote missing.
Worst base excess
Definition: Worst base deficit recorded between admission to NICU and 12 hours after birth.
Coding: 3 digit numbered field representing base excess measured in mmol/l. May be negative.
Guide for use: Use ‘99’ to denote missing.
Main respiratory diagnosis
Definition: Main indication for respiratory support.
Coding: 0: unknown.
1: normal – no respiratory support.
2: non-specific – any non-specific respiratory distress (RD) in an infant requiring respiratory support (combines previous items transient tachypnoea of newborn and immature lung).
3: hyaline membrane disease – increasing RD or oxygen (O2) requirements, or the need for ventilator
support from the first six hours of life with a chest x-ray showing generalised reticulogranular pattern, plus or minus air bronchogram.
4: meconium aspiration – RD presenting from immediately after birth to 12 hours of age. Hypoxia, tachypnoea and gasping respirations are often signs of underlying asphyxia. Chest x-ray shows over-expansion of lungs with wide spread coarse, fluffy infiltrates.
5: pneumonia – RD with proven or suspected infection (toxic blood count), and chest x-ray showing persisting opacities.
6: persistent pulmonary hypertension – echocardiac (shunting) or clinical evidence – O2 need unexplained
by chest x-ray or loud P2, or differential pre /post ductal TCPO2.
8: apnoea – recurrent pauses in breathing for more than 20 seconds, or for less than 20 seconds associated with bradycardia or any desaturation requiring intervention.
9: congenital malformation – malformation is the primary reason for RD, e.g. diaphragmatic hernia (list malformation in appropriate field).
10: other – unspecified other RD.
11: peri surgical – no RD, support given for surgical intervention.
12: newborn encephalopathy – a syndrome of disturbed neurological function in an infant with difficulties initiating or maintaining respiration, depression of tone reflexes or consciousness and often with seizures.
Guide for use: For a diagnosis other than ‘normal’ the baby must receive respiratory support. If more than one diagnosis is possible, use the most serious condition.
67
Exogenous surfactant
Definition: Any treatment with exogenous surfactant.
Coding: 0: unknown.
1: none – no exogenous surfactant ever given.
2: Exosurf – any treatment using ‘Exosurf ’.
3: Survanta – any treatment using ‘Survanta’.
4: any combination – any combination of surfactant.
5: Curosurf– any treatment using ‘Curosurf ’.
6: Curosurf and Survanta.
Guide for use: Includes incomplete use.
Air leak requiring drainage
Definition: Any form of pulmonary air leak requiring drainage (transient or continuous).
Coding: 99: unknown.
0: no air leak requiring drainage present.
-1: yes, air leak requiring drainage.
Hours of intermittent positive pressure ventilation (IPPV)
Definition: Total number of hours of IPPV given via an endotracheal tube, at any rate.
Coding: 4- digit number – IPPV hours.
Guide for use: The hours of all forms of assisted ventilation via an endotracheal tube are summed. The usual rounding up applies.
Hours of continuous positive airways pressure (CPAP)
Definition: Total number of hours of CPAP via any route, and nasopharyngeal ventilation.
Coding: 4-digit number – CPAP hours
Guide for use: As for hours of IPPV.
High frequency oscillatory ventilation (HFOV)
Definition: Mechanical ventilation presented at high frequencies (small tidal volumes with frequencies > 4Hz) initiated for this baby.
Coding: 99: unknown.
0: no high frequency oscillatory ventilation initiated.
-1: yes, high frequency oscillatory ventilation was initiated.
Nitric oxide
Definition: Nitric oxide was used in any form or dose for respiratory support of the baby.
Coding: 99: unknown.
0: no, nitric oxide therapy never used.
-1: yes, nitric oxide therapy used.
68
Extracorporeal membrane oxygenation
Definition: An extracorporeal circuit was established to divert baby’s blood to a membrane lung for oxygenation, was initiated for this baby.
Coding: 99: unknown.
0: no ECMO initiated.
-1: yes, ECMO initiated.
Date of final added oxygen therapy
Definition: Date supplemental oxygen (O2) ceased appropriately.
Coding: DD / MM / YYYY
Guide for use: Four consecutive hours in any 24-hour period constitutes a ‘day’.
Nasal high flow therapy
Definition: Blended air and oxygen mix with a delivery flow of greater than 1 litre/min through any high flow device with humidification.
Coding: 99: unknown.
0: nasal high flow was never initiated.
-1: yes, nasal high flow was used for more than four hours.
Chronic lung disease
Definition: The baby received respiratory support (supplemental O2 or any form of assisted ventilation) for a
chronic pulmonary disorder at 36 weeks post menstrual age.
Coding: 99: unknown.
0: no chronic lung disease.
-1: yes, chronic lung disease.
Guide for use: Four consecutive hours in any one 24-hour period constitutes respiratory support on that day.
Home oxygen therapy
Definition: Supplemental oxygen therapy was used at home after discharge from hospital.
Coding: 99: unknown.
0: no supplemental oxygen used at home.
-1: yes, home oxygen therapy given.
Guide for use: Must have required supplemental oxygen in hospital.
Neonatal surgery
Definition: Did this baby have major surgery that involved opening a body cavity?
Coding: 99: unknown.
0: no.
-1: yes.
69
Proven necrotising enterocolitis (NEC)
Definition: Diagnosis of proven necrotising enterocolitis (NEC) is definite.
Coding: 99: unknown.
0: no necrotising enterocolitis proven.
-1: yes, necrotising enterocolitis proven.
Guide for use: Has at least four of the following symptoms:
1: At least one systemic sign: temperature instability, apnoea, bradycardia or lethargy; and one intestinal sign: a residual of more than 25% of the previous feed on 2 consecutive occasions, abdominal distension, vomiting or faecal blood.
2: Has profile consistent with definite NEC including at least one of the following: abdominal wall cellulitis and palpable abdominal mass, or pneumatosis intestinalis, or portal vein gas, or a persistent dilated loop on serial x-rays, or a surgical or post mortem diagnosis.
3: Plus the baby warranted treatment for NEC, which included nil by mouth and antibiotics.
Therapeutic hypothermia
Definition: Intentional cooling of an infant of any gestational age to a core temperature <35.0°C
Coding: 99: unknown.
0: no.
-1: yes.
Guide for use: Record if therapeutic hypothermia has occurred.
Early infection
Definition: An episode of systemic sepsis with initial symptoms occurring before 48 hours after birth.
Coding: 99: unknown.
0: no early infection noted.
-1: yes, early infection noted.
Guide for use: These conditions must apply:
Isolation of an organism from at least one blood culture and, after consideration of the clinical and laboratory evidence, a decision is made to give antibiotics with therapeutic intent against this organism. Mixed coagulase negative staphylococci or other skin flora – contaminant are not included.
Episodes of late-onset sepsis
Definition: At least one episode of systemic sepsis with initial symptoms from 48 hours after birth.
Coding: 2-digit field representing total episodes of late onset sepsis.
Guide for use: Isolation of organisms from one blood culture and, after considering clinical/ laboratory evidence, decision made to give antibiotics with therapeutic intent against this organism. The following must not apply: mixed coagulase negative staphylococci or other skin flora contaminant. Same blood organism isolated from blood during previous 14 days – repeat isolate.
Maximum grade of intraventricular haemorrhage
Definition: Worst level of IVH seen on either side by ultrasound or post mortem examination.
Coding: 0: none – ultrasound / post mortem shows no haemorrhage.
1: Grade 1 – subependymal germinal matrix haemorrhage.
2: Grade 2 – intraventricular haemorrhage with no ventricular distension.
70
3: Grade 3 – intraventricular haemorrhage with ventricle distended with blood.
4: Grade 4 – intraparenchymal haemorrhage.
5: Not examined- by ultrasound or by post mortem examination.
Date of late head ultrasound
Definition: Date of the cerebral ultrasound scan nearest to six weeks of age.
Coding: DD / MM / YYYY
Ventricle size
Definition: Size of ventricle at the ultrasound closest to six weeks of age (date above). Ventricular index (VI) is measured as the furthest lateral extent of each ventricle from the midline measured at the level of Foramen of Monro.
Coding: 0: unknown.
1: no dilatation – VI less than 97th centile.
2: dilatation – VI equal to 97th centile / 97th centile + 4mm.
3: hydrocephalus – VI greater than 97th centile + 4mm or hydrocephalus present requiring a shunt or drainage (permanent or transient).
Ventricular Index (VI)
Definition: Size of ventricle at the ultrasound closest to six weeks of age (date above).
Coding: 4-digit number representing VI in mm correct to one decimal place.
Guide for use: Record if ventricular dilatation is present, i.e. ‘dilatation’ or ‘hydrocephalus’.
Cerebral cystic formations
Definition: Changes in brain parenchyma seen at the scan closest to six weeks of age.
Coding: 0: unknown.
1: no cysts – none seen on ultrasound.
2: porencephalic cyst(s) – parenchymal lesions corresponding to grade 4 IVH.
3: periventricular leukomalacia (PVL) – ischaemic brain injury affecting periventricular white matter in the boundary zones supplied by terminal branches of both centripetal and centrifugal arteries.
4: encephaloclastic porencephaly – relatively late development on cerebral scan of extensive dense, cystic lesions involving the periphery of the brain (ANZNN 2009).
Baby meets local criteria for ROP exam
Definition: The baby meets the criteria for eye examination for ROP.
Coding: 99: unknown.
0: no.
-1: yes, did meet local criteria.
Retinopathy of prematurity (ROP)
Definition: Worst stage of ROP in either eye prior to going home.
Coding: 0: none seen – no changes seen.
1: stage I – demarcation line.
2: stage II – ridge.
71
3: stage III – ridge with extraretinal fibro-vascular proliferation.
4: stage IV – retinal detachment.
5: not examined – no eye examination.
Therapy for retinopathy of prematurity
Definition: Any therapy used to treat retinopathy of prematurity (ROP), i.e. laser or cryotherapy.
Coding: 99: unknown.
0: no therapy for ROP received.
-1: yes, therapy given for ROP.
Died
Definition: The death of this baby occurred prior to discharge from hospital.
Coding: 99: unknown.
0: no, survived to discharge to home.
-1: yes, died.
Date of death
Definition: Date of death of the baby.
Coding: DD / MM / YYYY
Guide for use: If baby is known to have died after discharge, record date here and ‘no’ to died.
Post mortem
Definition: Post mortem examination performed.
Coding: 99: unknown.
0: no post mortem performed.
-1: yes, a post mortem was performed.
Immediate cause of death
Definition: The cause of death as stated on the death certificate.
Coding: unspecified free text field
Guide for use: To be described in morbid anatomical terms.
Death due to congenital anomaly
Definition: The death of the infant directly attributed to the congenital anomaly.
Coding: 99: unknown.
0: no.
-1: yes.
Guide for use: Must be coded as ’yes‘ for major congenital anomaly and ’yes‘ for died.
72
Transferred to another hospital
Definition: The baby was transferred to another hospital nursery before going home.
Coding: 99: unknown.
0: no, never transferred.
-1: yes, transferred.
Date of transfer
Definition: Date on which a baby completes an episode of care after birth in the hospital of registration.
Coding: DD / MM / YYYY
Guide for use: Use the most significant date.
Discharge date
Definition: Date on which a patient completes an episode of care.
Coding: DD / MM / YYYY
Comment: All data collection ceases on this date.

73
Antepartum fetal death: fetal death occurring before the onset of labour.
Apgar score: numerical score used to indicate the baby’s condition at 1 minute and 5 minutes after birth. Between 0 and 2 points are given for each of five characteristics: heart rate, breathing, colour, muscle tone and reflex irritability, and the total score is between 0 and 10.
Baby’s length of stay: number of days between date of birth and date of separation from the hospital of birth (calculated by subtracting the date of birth from the date of separation).
Birth status: status of the baby immediately after birth.
Birthweight: the first weight of the baby (stillborn or liveborn) obtained after birth (usually measured to the nearest 5 grams and obtained within one hour of birth).
Caesarean section: operative birth by surgical incision through the abdominal wall and uterus.
Early neonatal death: death of a liveborn baby within seven days of birth.
Extremely low birthweight: birthweight of less than 1,000 grams.
Fetal death (stillbirth): death prior to the complete expulsion or extraction from its mother of a product of conception of 20 or more completed weeks of gestation or of 400 grams or more birthweight. The death is indicated by the fact that after such separation the fetus does not breathe or show any other evidence of life, such as beating of the heart, pulsation of the umbilical cord or definite movement of voluntary muscles.
Forceps: assisted birth using a metallic obstetric instrument.
Gestational age: the duration of pregnancy in completed weeks calculated from the date of the first day of a woman’s last menstrual period and her baby’s date of birth, or via ultrasound, or derived from clinical assessment during pregnancy or from examination of the baby after birth.
Hyaline membrane disease: a disorder of the respiratory system.
Instrumental delivery: vaginal delivery using forceps or vacuum extraction.
Intrapartum fetal death: fetal death occurring during labour.
Intrauterine growth restriction: a fetus whose estimated weight is below the 10th percentile for its gestational age.
Late neonatal death: death of a liveborn baby after seven completed days and before 28 completed days.
Live birth: the complete expulsion or extraction from its mother of a product of conception, irrespective of the duration of the pregnancy, which, after such separation, breathes or shows any other evidence of life, such as beating of the heart, pulsation of the umbilical cord, or definite movement of voluntary muscles, whether or not the umbilical cord has been cut or the placenta is attached; each product of such a birth is considered liveborn (WHO definition).
Low birthweight: birthweight of less than 2,500 grams.
Maternal age: mother’s age in completed years at the birth of her baby.
Mode of separation: status at separation of patient (discharge/transfer/death) and place to which patient is released (where applicable).
Neonatal care levels: Level I care is for normal healthy term babies, some of whom may need short-term observation during the first few hours of life.
Level II refers to a nursery that generally has babies born at 32–36 weeks gestation weighing around 1,500 to 2,500 grams at birth. It includes care for babies who require intravenous therapy or antibiotics, and/or those who are convalescing after intensive care, and/or those who need their heart rate or breathing monitored, and/or those who need short-term oxygen therapy.
Level III or intensive care refers to the care of newborn infants who require more specialised care and treatment. It includes most babies born at less than 32 weeks gestation or less than 1,500 grams birthweight, and others who may require such interventions as intravenous feeding, and/or surgery, and/or cardiorespiratory monitoring for management of apnoea or seizures, and/or require assisted ventilation, and/or supplemental oxygen over 40% or long-term oxygen.
Neonatal death: death of a liveborn baby within 28 days of birth.
Neonatal morbidity: any condition or disease of the baby diagnosed after birth and before separation from care.
Glossary
74
Perinatal death: a fetal or neonatal death of at least 20 weeks gestation or at least 400 grams birthweight.
Plurality: the number of births resulting from a pregnancy.
Post menstrual age (completed weeks): is calculated by taking the gestational age plus postnatal age – e.g. when a baby born at 25 weeks gestation is 15 weeks old, they are 40 weeks PMA (also known as term equivalent age).
Post neonatal death: death of a liveborn baby after 28 days and within one year of birth.
Post term birth: birth at 42 or more weeks of gestation.
Presentation at birth: presenting part of the fetus at birth.
Preterm birth: birth before 37 weeks of gestation.
Resuscitation of baby: active measures taken shortly after birth to assist the baby’s ventilation and heartbeat, or to treat depressed respiratory effort and to correct metabolic disturbances.
Retinopathy of prematurity (ROP): a disorder of the developing eye.
Sex ratio: number of male liveborn babies per 100 female liveborn babies.
Spontaneous vaginal: birth without intervention in which the baby’s head is the presenting part.
Stillbirth: see Fetal death (stillbirth).
Teenage mother: mother aged less than 20 years at the birth of her baby.
Vacuum extraction: assisted birth using a suction cap applied to the baby’s head.
Vaginal breech: vaginal birth in which the baby’s buttocks is the presenting part.
Very low birthweight: birthweight of less than 1,500 grams.
75
ANZNN (Australian and New Zealand Neonatal Network) 2012. Report of the Australian and New Zealand Neonatal Network 2008 and 2009. Sydney: ANZNN <www.preru.unsw.edu.au/ANZNN >. Crowley PA 1995. Antenatal corticosteroid therapy: a meta-analysis of the randomized trials, 1972 to 1994. American Journal of Obstetrics & Gynecology 173:322–35.
Finer NN & Barrington KJ 2000. Nitric oxide for respiratory failure in infants born at or near term (Cochrane Review). In: The Cochrane Library, Issue 1, 2003. Oxford: Update Software.
Li Z, Zeki R, Hilder L & Sullivan EA 2012. Australia’s mothers and babies 2010. Perinatal statistics series no. 27. Cat. no. PER 57. Canberra: AIHW National Perinatal Epidemiology and Statistics Unit <www.npsu.unsw.edu.au>.
Papile LA, Burstein J, Burstein R & Hoffler H 1978. Incidence and evolution of subependymal and intraventricular hemorrhage: a study of infants with birth weights less than 1500gm. Journal of Paediatrics 92(4):529–34.
Statistics New Zealand 2010. Demographic tables 2010. Wellington: Statistics New Zealand <www.stats.govt.nz>.
Wilkinson D, Andersen C, O’Donnell CP & De Paoli AG 2011. High flow nasal cannula for respiratory support in preterm infants. Cochrane Database Syst Rev 11(5).
References
76
List of Tables
Table 1: Level III registrants born at each completed week of gestation, 2010 ..................................................................... 8
Table 2: Level III registrants in each birthweight group, 2010... 9
Table 3: Age group of mothers of level III registrants by gestational age group, 2010..................................................10
Table 4: Mother’s presenting antenatal problem for level III registrants by gestational age group, 2010 .............................11
Table 5: Antenatal corticosteroid use for mothers of level III registrants by gestational age group, 2010 .............................13
Table 6: Plurality of level III registrants by gestational age group, 2010.........................................................................13
Table 7: Method of birth for level III registrants by gestational age group, 2010..................................................14
Table 8: Level of hospital of birth for level III registrants by gestational age group, 2010..................................................14
Table 9: Mode of transport to level III NICU after birth for level III registrants by gestational age, 2010 ..........................15
Table 10: Apgar scores at birth for level III registrants by gestational age group, 2010..................................................16
Table 11: Median admission temperature and interquartile ranges for level III registrants by gestational age group, 2010 .....17
Table 12: Indication for respiratory support for level III registrants by gestational age, 2010.......................................18
Table 13: Exogenous surfactant use for level III registrants by gestational age group, 2010..................................................19
Table 14: Duration of assisted ventilation and oxygen use by level III registrants by gestational age group, 2010 ................20
Table 15: Assisted ventilation for level III registrants by gestational age group, 2010..................................................20
Table 16: Supplemental oxygen therapy for level III registrants by gestational age group, 2010 .............................22
Table 17: Nasal high flow respiratory support for level III registrants by gestational age group, 2010 .............................22
Table 18: Chronic lung disease for level III registrants by gestational age group, 2010..................................................23
Table 19: Pulmonary air leak for level III registrants by gestational age group, 2010..................................................23
Table 20: Neonatal sepsis for level III registrants by gestational age group, 2010..................................................24
Table 21: Retinopathy of prematurity for level III registrants by gestational age, 2010 .......................................................25
Table 22: Intraventricular haemorrhage for level III registrants born before 32 weeks and survived to day 3 by gestational age, 2010 ...........................................................26
Table 23: Late cerebral ultrasound results for level III registrants born before 32 weeks by gestational age, 2010 ....27
Table 24: Necrotising enterocolitis in level III registrants by year of birth, 2001–2010 .....................................................28
Table 25: Characteristics of level III registrants who underwent surgery by gestational age group, 2010 ...............29
Table 26: Transfer after registration of level III registrants by level of destination hospital and gestational age group, 2010 .30
Table 27: Median length of stay for level III registrants who survived until discharge home by gestational age, 2010 ........31
Table 28: Survival to discharge home for level III registrants by gestational age at birth, 2010 ..........................................32
Table 29: Level II registrants born at each completed week of gestation, 2010 ....................................................................34
Table 30: Level II registrants by birthweight group, 2010 ..34
Table 31: Mothers of level II registrants presenting antenatal problem by gestational age group, 2010 ...............................35
Table 32: Antenatal corticosteroid use by mothers of level II registrants by gestational age group, 2010 .............................36
Table 33: Method of delivery for level II registrants by gestational age group, 2010..................................................36
Table 34: Indication for respiratory support for level II registrants by gestational age group, 2010 .............................37
Table 35: Duration of assisted ventilation and oxygen use by level II registrants by gestational age group, 2010 .................38
Table 36: Survival to discharge home for level II registrants by gestational age group, 2010 .............................................39
Table 37: Antenatal corticosteroid use for level III registrants by birthweight group, 2010 .................................................49
Table 38: Plurality of level III registrants by birthweight group, 2010.........................................................................49
Table 39: Method of delivery for level III registrants by birthweight group, 2010 ......................................................50
Table 40: Level of hospital of birth for level III registrants by birthweight group, 2010 ......................................................50
Table 41: Mode of transport for level III registrants to level III unit after birth by birthweight group, 2010 .....................51
Table 42: Exogenous surfactant use by level III registrants by birthweight group, 2010 ......................................................51
Table 43: Assisted ventilation for level III registrants by birthweight group, 2010 ......................................................52
Table 44: Medians and interquartile ranges of assisted ventilation for level III registrants by birthweight group, 2010 52
Table 45: Chronic lung disease for level III registrants by birthweight group, 2010 ......................................................53
Table 46: Supplemental oxygen therapy for level III registrants by gestational age group, 2010 .............................53

77
Table 47: Transfer after registration of level III registrants by level of destination hospital by birthweight group, 2010 .......54
Table 48: Retinopathy of prematurity for level III registrants by birthweight group, 2010 .................................................54
Table 49: Intraventricular haemorrhage for level III registrants survived to day 3 by birthweight group, 2010(a) ..55
Table 50: Neonatal sepsis for level III registrants by birthweight group, 2010 ......................................................55
Table 51: Median length of stay for level III registrants who survived until discharge home by birthweight group, 2010 ..56
Table 52: Survival to discharge home for level III registrants by birthweight group, 2010 .................................................56
78
List of Figures
Figure 1: Schematic flow chart of ANZNN........................ 2
Figure 2: Babies registered to ANZNN audit of level III units each year as a percentage of liveborn babies in Australia and New Zealand 2001-2010............................................... 6
Figure 3: Number of level III registrants born at each neonatal intensive care unit, 2010 ......................................... 7
Figure 4: Level III registrants by registration criteria, 2001-2010 .................................................................................... 9
Figure 5: Presenting antenatal problem for mothers of level III registrants by gestational age group, 2010 ........................12
Figure 6: Retinopathy of prematurity for level III registrants by gestational age in 2010 ...................................................25
Figure 7: Intraventricular haemorrhage in level III registrants born at less than 32 weeks gestation and survived to day 3, by gestational age, 2010 ...........................................................27
Figure 8: Survival of level III registrants to discharge home (with 95% CI) by gestational age, 2010 ................................33
Figure 9: Survival of level III registrants to discharge home (with 95% CI) by birthweight group, 2010 ..........................33
Figure 10: Trends in gestational age at birth of level III registrants, 2001–2010 .........................................................40
Figure 11: Trends in the use of corticosteroids for mothers of babies less than 32 weeks gestation, 2001–2010 ...................41
Figure 12: Trends in multiple births of level III registrants by gestational age group, 2001–2010 ........................................42
Figure 13: Trends in method of birth for level III registrants by year of birth, 2001–2010 ................................................42
Figure 14: Trends in referral source to level III NICU by year of birth, 2001–2010 ............................................................43
Figure 15: Trends in mode of transport to level III NICU, 2001-2010 ..........................................................................43
Figure 16: Trends in mode of assisted ventilation for level III registrants, 2001–2010 .........................................................44
Figure 17: Trends in provision of intermittent positive pressure ventilation and continuous positive pressure ventilation by year of birth for level III registrants ventilated, 2001–2010..........................................................................44
Figure 18: Trends in the use of CPAP as the only form of ventilation by gestational age for level III registrants, 1998, 2001, 2004–2010 ................................................................45
Figure 19: Trends in provision of high frequency oscillatory ventilation (with 95% CI) for level III registrants born before 28 weeks and at 28 or more weeks gestation, 2001–2010 .....45
Figure 20: Trends in nitric oxide (with 95% CI) provision for level III registrants born before 28 weeks and 28 or more weeks gestation, 2001–2010 ................................................46
Figure 21: Incidence of chronic lung disease (with 95% CI) for level III registrants by gestational age, 2010 ....................46
Figure 22: Stage 3 or 4 retinopathy of prematurity and treated retinopathy among babies born before 31 weeks gestation and/or birthweight of less than 1,250 grams who survived to 36 weeks corrected age for level III registrants, 2005–2010..........................................................................47
Figure 23: Trends in grade 3 or 4 intraventricular haemorrhage (with 95% CI) in babies born at less than 32 weeks gestation who survived to day 3 for level III registrants, 2001–2010..........................................................................47
Figure 24: Incidence of early sepsis for level III registrants by gestational age group, 2006–2010 ........................................48
Figure 25: Incidence of late sepsis for level III registrants by gestational age group, 2006–2010 ........................................48

REPORT OF THE
AUSTRALIAN ANDNEW ZEALANDNEONATAL NETWORK
ANZNN
Australian and N
ew Z
ealand Neonatal N
etwork 2010