Embed Size (px)
Citation preview

Report of the 26th ITTC
Seakeeping Committee
Presented by Paul Crossland
Brazil, September 2011

Membership • Paul Crossland (Chairman), QinetiQ,UK
• Dariusz Fathi (Secretary), Marintek, Norway
• Dan Hayden, Carderock Division, Naval Surface
Warfare Center, USA
• Greg Hermanski, Institute for Ocean Technology,
Canada
• Lex Keuning, Delft University of Technology, The
Netherlands
• Yonghwan Kim, Seoul National University, South
Korea
• Rumen Kishev, Bulgarian Ship Hydrodynamic
Centre, Bulgaria
• Koichiro Matsumoto, Universal Shipbuilding
Corporation, Japan
• Quanming Miao, China Ship Scientific Research
Center, China
Seakeeping Committee meeting at the V&V
workshop

Committee meetings • January 2009, Delft University of
Technology, The Netherlands
• October 2009, China Ship Scientific
Research Center, China
• May 2010, Institute for Ocean
Technology, Canada
• February 2011, QinetiQ Ltd, United
Kingdom
Additional meetings • October 2010 - V&V Workshop South
Korea
• November 2010 - Joint ISSC/ITTC
meeting, United Kingdom
Set up an e-room hosted by MARINTEK to
upload, store and download information

Presentation outline
• Recommendations of 25th ITTC
• Cooperation with ISSC
• Highlights
• State of the art review
• Verification and validation workshop
• Recommended procedures
• Recommendations for further work
• Discussion

Recommendations of 25th ITTC
1. State-of-the-art review
2. ITTC Recommended Procedures
– Review existing pertinent procedures
– Amend Procedure 7.5-02-07-02.1, “Seakeeping Experiments”
to bring uncertainty analysis into line with ISO GUM
– Assess whether Recommended Procedure 4.2.4-01,
“Standard Format for Exchange of Seakeeping Data on
Computer-Compatible Media” shall be retained.
– Develop a new procedure on the prediction of global wave
loads.
– Develop a new procedure for the prediction of power
increase in waves from model tests.

Recommendations of 25th ITTC
4. Organize a workshop on the verification and validation of
non-linear seakeeping codes. The results of the workshop
will be used to develop the procedure on validation and
verification of non-linear seakeeping computer codes.
5. Liaise with the ISSC and the Ocean Engineering Committee.

Cooperation with ISSC
• Importance of cooperation recognised by 25th ITTC
• Further cooperation mandated by ITTC and also by the
pertinent ISSC committees
• Joint meeting hosted by Lloyds Register in Portsmouth in
November 2010
• Attended by representatives from the ITTC SC and OEC and
ISSC Loads and Responses and Environment committees
• Possible level of cooperation
– Joint Project represents a high level of commitment
complicated by the one year phase difference of the two
committees
– Joint workshop seemed preferred level of cooperation

First Joint ISSC/ITTC International Workshop Uncertainty Modelling for Ships and Offshore Structures (UMSOS)
8th September 2012, Rostok, Germany
Organised by: ISSC / ITTC
In Association with: Lloyd’s Register Strategic Research and DNV Research & Innovation
Aim of understanding
uncertainty modelling
and its impact on:
• Model testing
• Full scale measurements
• Load prediction techniques
• Experimental validation techniques
• Utilization of satellite
measurements
• Extreme environmental
phenomena
• Risk assessment and mitigation
• Goal based standardisation

Highlights
• Procedures
– Developed two new procedures
– Major updates to two
– Minor corrections to one
– One withdrawn
• State of the art review with emphasis on sloshing,
hydroelasticity and added resistance
• Underpin a common approach to predicting added power
• Workshop on V&V of non-linear seakeeping codes

State of the art review
• New experimental facilities
• Experimental techniques
• Numerical methods (frequency and time domain)
• Rarely occurring events
• Sloshing
• Hydroelasticity (hull girder loads)
• Added resistance and power
• CFD applications

New experimental facilities
• Deepwater offshore basin in Shanghai
Jiao Tong University (50m long, 40m
wide, with a water depth of 10m and a
40m deep pit)
• Upgrade to the wavemaker at the
Bulgarian Ship Hydrodynamics Centre.
System has been developed based on AC
servomotors and ball-screw pairs.

New experimental facilities
• Ocean Basin at Harbin Engineering
University (50m long x 30m wide and
10m deep). Main carriage speed up to 3
m/s (with a sub-carriage capable of
2m/s).
• Sloshing Test Facility at Seoul National
University. 1.5 tonne and 5 tonne
capacity platforms in operation; a large
10 tonne platform is under construction
Experimental techniques - waves
• Generation of irregular waves using linear and second order
statistical models to fit the crests and heights of observed
waves, (Petrova and Guedes Soares, 2008).
• Development of a multi-peaked directional spectral approach
that allows the fitting of spectral models to measured or
Hindcast data, (Petrova and Guedes Soares, 2009)
• Development of a technique to generate design rogue wave
sequences in extreme seas, (Clauss, 2008). The method is
suited for investigating the mechanisms of specific extreme
events.

Experimental techniques – Model tests
• Investigation of structural loading in extreme
seas, (Roused et al, 2010). Investigated different
configurations in irregular, unidirectional and
bi-directional waves.
• Measurement of hull surface pressure in the
alternately wet and dry areas near the water line
and near the bow of a high speed vessel in
irregular head waves, (Chiu et al, 2009). The
model had a high deadrise angle so was
subjected to impacts and bow wave effects
• Experiments to evaluate the performance of a
submarine operating on surface with focus on
modelling the effect of free flow under the
casing on the roll response, (Hermanski and
Kim, 2010).

Experimental techniques – LNG tests
The greater demand for safety in LNG carrier
design results in the emergence of new
experimental facilities and R&D projects
investigating sloshing phenomena.
• Understanding the coupling effect of LNG
containers on ship motion
• Understanding of local behaviour of sloshing on
the LNG containment systems.
• Influence of fluid/gases to replicate full scale
behaviour
• Deriving full-scale design loads from model
experiments Model –scale tank test and
sloshing-motion coupling test
(Seoul National University)

Experimental techniques – Full scale trials Sea trials are considered to provide the most pertinent source of data;
though the uncertainty must be considered when examining the results.
• Derivation of methods for estimating the waves from vessel motion,
(Pascoal and Guedes Soares, 2009). Used motion sensor data as input
and provides an estimation of sea conditions and spectra.
• Lee et al, 2010, presented the results from a hull stress monitoring
system installed on a container ship. They recorded the hull girder loads
during a storm in the Mediterranean Sea.
• Methods developed to estimate waves and wave spectra from shipboard
radar, (Lyzenga and Nwogu, 2010)

Numerical techniques - Frequency domain
Less developments in frequency domain analysis. Advances
are quite targeted
• Fluid-structure interaction, e.g., establishing
correlation between modal accelerations on an
elastic segmented model to back estimate the
model loading, (Coppotelli et al, 2008)
• Coupled ship motion and sloshing, e.g.,
investigating the ship resonance as a result of
sloshing interaction.
• Multi-body, two ships in close proximity,
problems such as Underway Replenishment, (Li,
2009) studied two ship interaction in deep and
shallow water.
0
0.01
0.02
0.03
0.04
0.05
0.06
0.07
0.08
0.09
0.1
0 1 2 3 4 5
without sloshing
20%-20% filling
30%-30% filling
57.5%-43.3% filling
ω(L/g)1/2
Ro
ll(r
ad/m
)
Frequency-domain solution of
sloshing-motion coupling for a 285m
LNG-FPSO (Gou et al.)

Numerical techniques - Time domain Computational methodology for time-domain approaches
Numerical Method Advantage Disadvantage
CPU
capacity
and time
Impulse-Response-Function
approach
Easy to implement,
fast computation
require small computer memory
Need pre-computed
hydrodynamics coefficients
Limited applicability
Minimal
Strip/sectional-based
approach
2D BVP
Fast computation
require small computer memory
Limitation as 2D sectional
method
Poor accuracy in low frequency
Minimal
Transient wave Green
function approach
Radiation condition is
automatically satisfied.
Panel distribution on only body
surface
Hard to compute Green
function for non-zero speed
Limited application
Moderate
Rankine panel method
Good practicality
Easy extension to nonlinear
analysis
Good overall accuracy
Difficulty in 3D geometric
modelling and panel generation
Need a numerical method for
radiation condition
Moderate
CFD method solving field
equation(s)
Capability for violent ship motion
Can include viscous effects
Huge computational time and
effort
Poor accuracy in memory flow
Heavy
Hybrid method combing two
methods
Taking advantages of combined
method
No benefits in many
combinations
Additional effort for
combinations
(Varying)

Numerical techniques – Green water
Increasing use of CFD is these applications
• A combined/coupled approach with traditional
potential flow seakeeping analysis and CFD
methods.
– Grid methods such as Navier-Stokes for 3D
water-on-deck problems, (Colicchio et al,
2010), for example.
– Gridless methods such as Moving Particle
Semi-implicit (MPS) and Smooth Particle
Hydrodynamics (SPH) for impact pressures
and violent free-surface flows, (Lee et al,
2009) and (Le Touzé et al, 2010)

Numerical techniques – Slamming
Focus of slamming research is tailored toward practical
applications
• Slamming analysis is still largely empirically based
– Statistical properties of impact loads based on
Wagner theory, (Kapsenberg and Thornhill, 2010)
method of long term simulation to derive impact
loads
– Coupled time domain strip theory with the Wagner
formulation, (Hermundstad and Moan, 2009)
presented ship motion and slamming pressures of a
Ro-Ro ferry.
• Alternative approaches include CFD largely on simple
2D shapes, (Veen and Gourlay, 2009).
SPH simulation for wedge impact

Sloshing
Complex phenomena of fluid movement showing
strong non-linearity and apparent
randomness.
• The knowledge of the sloshing problem has
reached unprecedented levels:
– Significant numbers of papers
related to the effect of liquid
sloshing
– A number of papers related to the
coupling effects of sloshing
• Despite the numerical and experimental
modelling, there is no fully consistent
solution to determining full scale sloshing
loads

Numerical techniques – Sloshing
• Work summarised in Tables 3 and 4 of report
• Overview of sloshing problem, Gavory and de Seze (2009)
• Overview of coupled ship motion/sloshing problem Faltinsen
and Timokha (2009a)
• Impact loads are highly localised requiring simplified
hydrodynamic models to define the shape of the wave front
– Wagner-type impact
– Steep wave-type impact
– Bagnold-type impact
– Aerated fluid impact
• CFD methods (RANS, SPH, CIP, MPS et al) are used to
characterize the free surface and predict impact pressures

Numerical and experimental techniques – Sloshing
• Research on sloshing
– ExxonMobil covering development of sloshing related procedures
– GTT developed sloshing assessment procedure and developed
mathematical models
– Class Societies have developed procedures for predicting the
sloshing loads and to evaluate structural strength
– Joint Industry Project SLOSHEL aimed at collecting data from full-
scale experiments.
Experiment in
SLOSHEL JIP

Numerical and experimental techniques – Sloshing
• Three Sloshing Dynamics and Design Symposia (held in 2009~2011) as
a part of the ISOPE conference
– 1st included a comparative study on CFD
– 2nd included a comparative study investigating impulsive pressure
during the impact of a free-fall water column.
<SPH> <Exp.> <MPS> <VOF1> <Level Set> <CIP2>
Comparative study of sloshing simulation (ISOPE, 2009)

Hydroelasticity (hull girder loads)
Very large modern ships can be susceptible
to springing and slamming-induced
whipping - hydroelasticity represents an
area where there has been the most
significant activity related to the
development of time-domain seakeeping
analysis.
Stress response spectrum
measured on a real ship
(Vidic-Perunnovic, 2005)
There are two major contributions to loads:
one in the frequency range of the ocean
waves, and the other in the high frequency
range. The high-frequency response is due
to the hydroelastic effect of ship structure.

Hydroelasticity (hull girder loads)
Estimated fatigue damage per hour for the wave
frequency (WF) and the high frequency (HF)
contributions, Ito, Nielsen and Jensen (2010)
The potential for structural
damage due to springing and
whipping is significant in
large modern ships.
• The high-frequency (HF)
component contributes about
20~30% of the total amount of
estimated fatigue.
• Recent studies have predicted
over 50% increase in fatigue
damage.

Numerical techniques – Hydroelasticity coupled
analysis
• Required to solve the
seakeeping and structural
problem at the same time
– Frequency domain
approach with beam based
modal superposition
– 3D panel or CFD methods
with direct integration for
ship structure
Typical analysis methods for ship
springing
Numerical simulation of 2nd-order
springing (Kim et al., 2010)

Experimental techniques – Hydroelasticity
A hydro-structural model is made to be
geometrically similar, hydrodynamically
similar and structurally similar
• Two types of model elastic and
segmented
• Segmented is the most practicable
• Two types of segmented models
– Rigid segmented
– Elastic segmented
Elastic Segmented Model with Internal
Backspline Beam (Miyake, 2009).
Flexible Connections for Non-Backspline
Elastic Segmented Model (Drummen, 2007).

Experimental techniques – Hydroelasticity
• Hydroelastic models are very
expensive to build
• Experimental data not readily
shared
• Several European and Asian
Joint industry projects
• Is there the potential for ITTC
to engage with these partners?
WILS II JIP
(MOERI/KORDI, 2009-
2010).

Added resistance and power increase in waves
• Interim IMO guidelines for CO2 emissions, the Energy
Efficiency Design Index (EEDI)
• EEDI is CO2 emission divided by transported cargo weight and
velocity including speed loss at sea
• Includes fw which is a non-dimensional coefficient indicating the
decrease of speed in a representative sea condition, e.g. Beaufort
Scale 6.
• Emphasizes the need to provide reliable results of power increase
in waves
2 2CO from propulstion + CO from Auxiliaries - Efficient use of energy =
(DWT) (ship EE
speDI
ed)t wf f

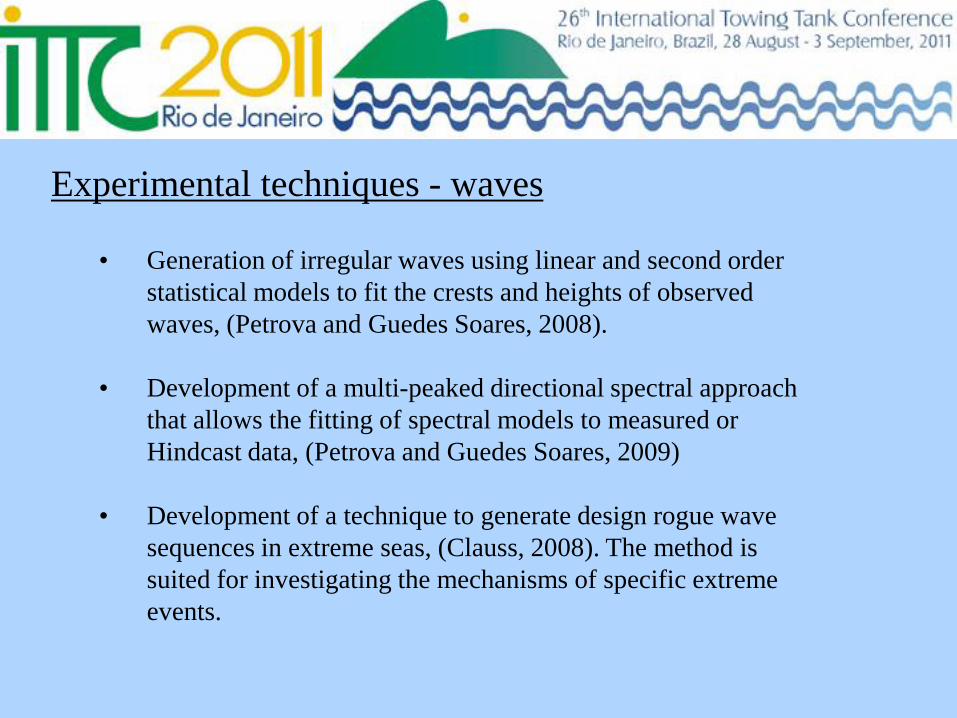
Added resistance and power increase in waves
• Four methods to predict increased powering in irregular waves
from model tests in regular waves were investigated by the 25th
ITTC SC
– Torque and Revolution Method (QNM)
– Thrust and Revolution Method (TNM)
– Resistance & Thrust Identify Method (RTIM)
– Direct Power Method (DPM)
• Recommendation was that DPM was unsuitable but 26th ITTC
SC required to investigate further
Added resistance and power increase in waves
0.00E+00
5.00E+03
1.00E+04
1.50E+04
2.00E+04
2.50E+04
3 4 5 6 7 8 9 10
Beaufort Scale
δPship (kW
)
DPM
Q NM
TNM
RTIM
Power increase in irregular
waves, Container ship (FULL)
0.00E+00
5.00E+03
1.00E+04
1.50E+04
2.00E+04
2.50E+04
3.00E+04
3.50E+04
4.00E+04
4.50E+04
3 4 5 6 7 8 9 10
Beaufort ScaleδPship (kW
)
D PM
Q NM
TNM
RTIM
Power increase in irregular
waves, VLCC (FULL)
• QNM, TNM and RTIM give
close agreement and so DPM
has been removed from the
procedure
• Further comparison between
QNM, TNM and RTIM is
difficult due to the absence of a
full set of data.

Added resistance and power increase in waves
• Full set of data required to
complete comparison
– Still water resistance
– Open water propeller tests
(TNM and RTIM)
– Tests in regular waves
– Tests in irregular waves
• Identified published papers
showing resistance increase,
propeller torque and RPM
increase
δRs/Hs2 (tonne/m2)
0.0
2.0
4.0
6.0
8.0
0.0 2.0 4.0 6.0 8.0
Predicted
Measured
①Takahashi
②Nakamura(RT)
③VLCC1
④VLCC2
Meas=Pred
Meas=1.1*Pred
Meas=0.9*Pred
δQ/Hs2 (tonne/m)
0.0
1.0
2.0
3.0
4.0
5.0
0.0 1.0 2.0 3.0 4.0 5.0
Predicted
Measured
②Nakamura(SPT)
Meas=Pred
Meas=1.1*Pred
Meas=1.7*Pred
δN/Hs2 (1/sec・m2)
0.0
0.1
0.2
0.3
0.4
0.5
0.0 0.1 0.2 0.3 0.4 0.5
Predicted
Measured
②Nakamura(SPT)
Meas=Pred
Meas=1.1*Pred
Meas=1.2*Pred
Torque
RPM
Resistance

Added resistance and power increase in waves
• Numerical techniques are developing
– Increase in run length (1.5 hours)
to obtain stable statistics for added
resistance
– Common approach is to use RTIM
to predict power increase
– Main focus on prediction of added
resistance

CFD applications
• CFD analysis
becoming popular in
a range of marine
applications
• Viscous effects are
mostly insignificant
• Primary difficulty in
the implementation
of the free surface
Overall status of the art of CFD schemes for
free surface flow: Field equation solvers

Cooperative Research Ships (CRS) Comparative study
• Comparison of CFD methods,
(Bunnik et al, 2010).
• Accurate computation of restoring
properties is important
Heave
Pitch

CFD summary
• CFD requires still significant CPU
time.
• Not practical for obtaining RAOs
for a range of speeds and headings
• CFD are still relatively poor at
predicting the far field radiated
wave.
• Very good at predicting local flow
phenomena.
• Focus of effort has been on extreme
non-linear problems where potential
theory is invalid
Seakeeping analysis using CIP
method (Hu et al., 2008, 2009)

Verification and validation workshop
• Seoul National University, 19th – 21st October 2010
• Jointly sponsored by
– Office of Naval Research
– Seoul National University
– Daewoo Shipbuilding and Marine
Engineering Co.
– Samsung Heavy Industries
• Two day conference and one day
workshop
• Aim to further develop the procedure on
V&V of non-linear seakeeping
computer codes.

Verification and validation definition
Verification of a computer code is the proof of its implementation.
Establish that the code written echoes the intended operations and
procedures. Its successful accomplishment means that the way the
code emulates the theory in itself is correct
Was the software built correctly?
Validation of a computer code is the proof of its applicability. To validate a
computer code one has to demonstrate that the mathematical model of the
verified computer code is an adequate representation of the physical reality.
Was it the right software?

Verification and validation workshop
• Twenty papers related to
– Developments in non-linear theories
– Wave loads and hydroelasticity
– Verification and validation activities
– Parametric and resonant rolling
– Navier Stokes formulations
– Applications in design
• Perception was that V&V activities are too expensive and in
some cases developers rely on their track record
• Key to V&V is that the process is streamline and targets key
issues throughout the development process

Liu et al Body non-linear
Bruzzone et al Body non-linear
Kim et al, Weak scatterer x
Qui et al Body non-linear
Miyake et al Non-linear strip x x
Wu et al Body non-linear
McTaggart Body non-linear
Walree and Carette Body non-linear
Grigoropoulos et alLinear, body non-linear, weak
scatterer x
Bulian et al Mathieu equation
Matusiak Body non-linear
Kim and KimMathieu equation, body non-
linear, weakly non-linear
Kim fully non-linear x x
Orihara fully non-linear
Wu et al fully non-linear
Kim et al Body non-linear x
Cho et al Weak scatterer
Comparative study
Exceedance
probabilities
Added
resistance
Motion responses/Hydrodynamic loading
Wave excitation
RAOsAuthor Method
Vertical plane
RAOs
Lateral plane
RAOs
Time
historiesHarmonics
Variation
with wave
steepness
Spectra
Key:
- Only motions,
x- Only loads,
- motions and
loads

Comparative study
Affiliation Methodology Linear/Nonlinear
Defence Research and Development Canada-Atlantic,
Canada BEM Linear
Harbin Engineering University, China BEM Nonlinear
Maritime & Ocean Engineering Research Institute,
Korea BEM, FEM Linear, Nonlinear
National Maritime Research Institute, Japan 2D-BEM Nonlinear
National Technical University of Athens, Greece BEM Linear, Nonlinear
Osaka University, Japan CIP(CFD) Nonlinear
Seoul National University, Korea BEM Linear, Nonlinear
University of Southampton, England BEM Linear

Methodology in ITTC SK Workshop in Seoul
7 8
0
2
4
6
8
10
Linear Nonlinear
Linear or Nonlinear
10
5
0
2
4
6
8
10
12
Time domain Frequency domain
Time domain or Frequency domain

6
4
1
2
0
2
4
6
8
RPM WGF CFD Strip
Theory
13
2
0
2
4
6
8
10
12
14
In-house Commercial
In-house or commercial program

14
1 0
4
8
12
16
BEM CIP/FDM
Numerical method
6
5
2
0
2
4
6
8
Rankine source 3D Green function 2D Green function
Green function type
Rankine 3D-Green 2D-Green

Comparative study
Body plan of the
S175 containership
Fn Heading
angle λ/L Motion Load
0.275 180 deg 0.2~2.4 Heave, pitch VSF, VBM
0.275 120 deg 0.2~2.4 Surge, sway, heave, roll,
pitch, yaw
VSF, VBM, HSF,
HBM
0.275 90 deg 0.2~2.4 Sway, heave, roll
0.275 0 deg 0.2~2.4 Heave, pitch VSF, VBM
Linear analysis
Fn Heading
angle λ/L kA Motion Load
0.20 180 deg
1.0 0.01,
0.04,
0.08,
0.12
Heave, pitch VBM(hogging),
VBM(sagging) 1.2
1.4
0.25 180 deg
1.0 0.01,
0.04,
0.08,
0.12
Heave, pitch VBM(hogging),
VBM(sagging) 1.2
1.4
0.275 180 deg
1.0 0.01,
0.04,
0.08,
0.12
Heave, pitch VBM(hogging),
VBM(sagging) 1.2
1.4
Non-linear analysis

Comparative study
/L
Su
rge
/A
0 0.5 1 1.5 2 2.50
0.1
0.2
0.3
0.4
/L
Sw
ay/A
0 0.5 1 1.5 2 2.50
0.2
0.4
0.6
0.8
/L
He
ave
/A
0 0.5 1 1.5 2 2.50
0.5
1
1.5
2
(a) Surge (b) Sway (c) Heave
/L
Ro
ll/k
A
0 0.5 1 1.5 2 2.50
1.5
3
4.5
6
7.5
/L
Pitch
/kA
0 0.5 1 1.5 2 2.50
0.2
0.4
0.6
0.8
1
/L
Ya
w/k
A
0 0.5 1 1.5 20
0.1
0.2
0.3
0.4
0.5
(d) Roll (e) Pitch (f) Yaw
Motion RAOs (120 degrees)

Comparative study
/L
VS
F/
gA
LB
0 0.5 1 1.5 2 2.50
0.015
0.03
0.045
0.06
/L
VB
M/
gA
L2B
0 0.5 1 1.5 2 2.50
0.01
0.02
0.03
0.04
(a) VSF at 1/4L from AP (b) VBM at 1/2L from AP
/L
HS
F/
gA
LB
0 0.5 1 1.5 2 2.50
0.03
0.06
0.09
0.12
0.15
/L
HB
M/
gA
L2B
0 0.5 1 1.5 2 2.50
0.01
0.02
0.03
0.04
(c) HSF at 1/4L from AP (d) HBM at 1/2L from AP
Structural load (120 degrees)
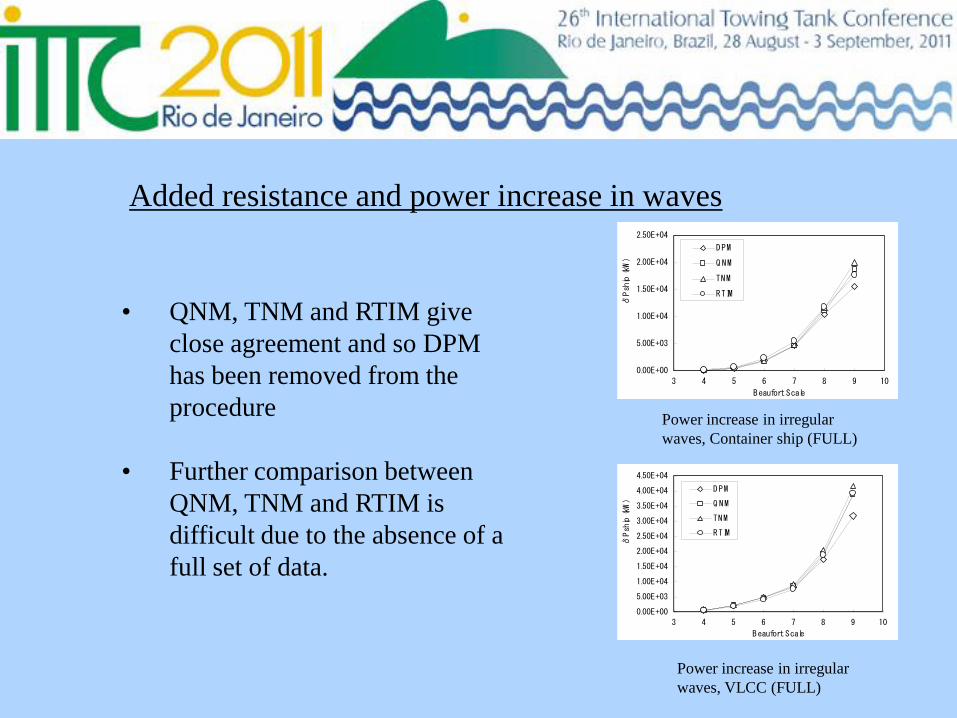
Comparative study
kA
He
ave
/A
0 0.05 0.1 0.150.4
0.8
1.2
1.6
2
kA
He
ave
/A0 0.05 0.1 0.15
0.4
0.8
1.2
1.6
2
kA
He
ave
/A
0 0.05 0.1 0.150.4
0.8
1.2
1.6
2
kA
Pitch
/kA
0 0.05 0.1 0.150.4
0.8
1.2
1.6
kA
Pitch
/kA
0 0.05 0.1 0.150.4
0.8
1.2
1.6
kA
Pitch
/kA
0 0.05 0.1 0.150.4
0.8
1.2
1.6
(a) λ/L=1.0 (b) λ/L=1.2 (c) λ/L=1.4
Heave (upper) and pitch (lower) motion responses (Fn=0.20, β=180°)

Most popular validation approaches
For motions:
• Vertical and lateral plane RAOs
• Harmonic analysis
• Variation of response with wave steepness
For loads:
• Vertical and lateral plane RAOs
• Variation of response with wave steepness
• Exceedance probabilities
Better outcome would have been achieved through
the use of a more modern dataset

Comments on Non-linear V&V
• Verification activities should be more explicitly demonstrated by
code developers than current practice
• Verification activities for CFD approaches should be based around
grid resolution studies targeted towards 2D problems with analytic
solutions
• Verification of CFD approaches for 3D problems is one of ensuring
boundary conditions are matched
• Validation of fully non-linear codes generally follow the process for
weakly non-linear.
• Requires greater definition such as sign convention for hogging and
sagging
• Validation of CFD approaches give rise to the opportunity to
compare with velocity data rather than pressure data

Recommended Procedures
ITTC Procedure 7.5-02-07-02.1, Seakeeping Experiments
• Minor editorial corrections
• ISO GUM approach to Uncertainty Analysis included as an
Appendix
• Both Type A and B uncertainties are identified and explained
• Introduced concept of standard, combined and expanded
uncertainties
• Explained by example

Recommended Procedures
ITTC Procedure 7.5-02-07-02.2, Predicting Power Increase in
Irregular Waves from Model Experiments in Regular
Waves
• The three methods for predicting power increase are described
• Data suggest RTIM is the best approach for predicting power
increase
• Insufficient consistent data across all the require tests to undertake
a full comparison

Recommended Procedures
ITTC Procedure 7.5-02-07-02.3, Experiments on Rarely
Occurring Events
• Only updated with minor editorial corrections
ITTC Procedure 4.2.4-01 Standard Format for Exchange of
Seakeeping Data on Computer-Compatible Media
• Recommended that procedure should be withdrawn
• The presentation of results and formatting of data is usually
covered by the particular procedure

Recommended Procedures
ITTC Procedure 7.5-02-07-02.5, Verification and Validation of
Linear and Weakly Non-Linear Seakeeping Computer
• Updated to include the V&V activities required for weakly non-
linear seakeeping analysis
• Focussing on weakly or weak-scatterer-based nonlinear time
domain analysis.
• Mandatory requirements are provided for the representation of the
input and output data.
• Recommend further update to include outcomes of V&V
workshop

Recommended Procedures
ITTC Procedure 7.5-02-07-02.6, Prediction of Global Wave
Loads
• New procedure to outline the methods by which measurements of
global wave loads can be made
• Expands the existing seakeeping procedure (7.5-02-07-02.1),
outlining the additional considerations required for the
measurement of global loads
• Describes the design of the experiment, the set-up of the model
and instrumentation, the test, and the analysis.

Recommendations for further work
• Participate in a joint ITTC/ISSC workshop on uncertainty
• Engaged, where practicable, JIPs on hydroelasticity
• Establish a numerical and experimental process for estimating fw
in the calculation of EEDI
• The current V&V procedure be extended to include the outcomes
of the seakeeping workshop, with the potential to address specific
aspects of global loads
• Investigate procedure for V&V of hydroelastic codes
• Review experimental procedures on sloshing currently under
development by the Class Societies.

Thank you
Any questions?


![Sloshing motion in excited tanks - context/Earthcontextearth.com/wp-content/uploads/2016/07/JCP04.pdf · Sloshing motion in excited tanks ... [35] modelled inviscid sloshing motion](https://img.pdfslide.us/doc/110x75/5a78985e7f8b9aa2448e4299/sloshing-motion-in-excited-tanks-context-motion-in-excited-tanks-35-modelled.jpg)