Embed Size (px)
Citation preview

i:>^i<. t / " / I I
Report of Results for Quarry-Rinker Springs April 2011 Storm Event Sampling
1.0 Introduction
The Quarry and Rinker Springs are associated with the Lemon Lane Landfill Superfund site. A Groundwater Investigation Plan (GWIP) for the Quarry and Rinker Springs area wais required by a Consent Decree Amendment (CDA) between CBS and the U.S. Environmental Protection Agency (U.S. EPA), the State of Indiana, the City of Bloomington and the County of Monroe (collectively called the CD Parties) for the Lemon Lane Landfill site (Reference 1). The CDA required the GWIP to:
"Complete an investigation of the effects of the effluent line change on flow and PCB concentrations discharged to the headwaters of Clear Creek from the Rinker Spring and Quarry Spring areas."
That GWIP (Reference 2) was submitted to the CD parties in February 2011. The goal of the GWIP as specified in Section 2.1.2 was to:
"...determine the levels of PCBs and flow rates In uncollected springs In the Quarry Springs area under various seasons and hydrologic conditions. This data will be used to evaluate the concentrations and estimate the total mass of PCBs discharged to the headwaters of Clear Creek for one annual hydrologic cycle."
Part of achieving the goal of the GWIP was to sample the Quarry and Rinker Springs during a storm event. This was specified in Section 2.2.1 of the GWIP as follows:
"Storm event samples will be taken at least once for a storm where ICS peak flow equals or exceeds 1,000 gpm based on sump-fill calculations during the one year of non-storm sampling. Samples will be taken once every four hours from before the main rain event begins until peak flow occurs at the Quarry Combined weir and then once every four hours until flow has receded to 20% of the peak flow as recorded at Quarry combined weir. Samples will be analyzed for:
• PCBs • TSS
Field parameters of flow, conductivity, and temperature will also be measured.
us EPA RECORDS CENTER REGION 5
1 - 424732

Springs to be storm sampled are:
Rinker Spring Quarry D Spring
• Quarry B Spring • Quarry Combined • Quarry A Spring (If It re-materlalizes post drought)"
A storm event meeting these requirements began on April 18, 2011, and sampling was conducted per the GWIP through April 21, 2011. This report gives the results of that sampling.
2.0 Storm Sampling Methodology
2.1 Station Location and Flow Measurement
2.1.1 Rinker Spring
Figure 1 shows the locations of the stations where samples were taken and flow measurements were made. Figure 2 is a photograph of the two 8 inch diameter PVC pipes that are identified as Rinker Spring. The description of the spring was given by Larry Rinker, current owner of the Kirkwood Mobile Home Park, on whose property the spring is located. According to Mr. Rinker, who purchased the mobile home park in March 1987, the mobile home park was constructed in 1968. Prior to the mobile home park, the area was known as the Patterson Hog Farm and a spring head was there that was used to water the livestock. In 1998, Mr. Rinker desired to expand the mobile home park and installed the two 8 inch PVC pipes 12-15 foot long and covered them with rip rap. He then filled the area in to accommodate additional trailers.
Figure 2 also shows the flexible 8 inch pipe CBS installed to convey the Rinker Spring discharge far enough downstream to elevate flow above the channel so flow measurements could be made by the timed filling of a calibrated container. Figure 3 shows the 6 inch diameter - 6 foot long level section of PVC pipe CBS installed with a sump in the middle for a data logger. This was an attempt to continuously log flow at Rinker Spring by the "California Pipe Method" described in the ISCO Open Channel Flow Measurement Handbook (Reference 3). Storm event samples were taken at the end of the pipe as shown in Figure 3 and flow measurements were also manually taken by timed filling of a calibrated container every time samples were taken.
Table 1 shows the measurements of depth of flow in the pipe and the calibrated flow measurements taken at Rinker Spring since the pipe was installed in February 2011. Figure 4 is a plot of the depth measurements vs. the flow for Rinker Spring. Although there is a general trend of increasing depth with Increasing flow, unfortunately, the correlation is too low and the scatter too great
-2

to give reliable flow measurements by this means. Therefore, all flow measurements reported for Rinker Spring are those performed by timing the filling of a calibrated container. It was not possible to accurately log the hourly flows using the aforementioned method.
2.1.2 Quarry D Spring
Quarry D Spring was discovered in September 2010 during the remediation of the Quarry Springs area. During the channel excavation, a previously unidentified spring orifice was discovered as shown on Figure 1. The water was issuing from a bedrock solution cavity and has since been designated as Quarry D Spring. The spring orifice was packed with gravel and a 4 inch PVC pipe was emJDanked in place so the water could be piped around the channel excavation as shown in Figure 5. The flexible 4 inch pipe was extended down the channel about 100 feet and elevated so that flow measurements could be made by timing the filling of a calibrated container. Figure 6 shows that flow measurement and sampling location for Quarry D Spring.
2.1.3 Quarry B Spring
The history of Quarry B Spring is given in the GWIP. For the purpose of post-remediation sampling, it was agreed that the locus of sampling would be the culvert on the east side of the road / former railroad right-of-way. Figure 7 shows the Quarry B sampling location. A combination V-notch and rectangular weir was Installed In December 2010 for measuring flow. A data logger was also installed in the weir pool to record hourly flow readings. Flows above 55 gpm (head = 0.3 feet) through the weir may be subject to submergence but no attempt was made to gauge that effect for Quarry B Spring.
2.1.4 Quarry-Combined Station
A combination V-notch and rectangular weir was installed in November 2010 for measuring the combined flows of the Quarry Springs area. Figure 8 shows the relation of the weir to the Illinois Central Spring Treatment Facility (ICSTF) effluent line discharge and Figure 9 shows the relation of the weir to Quarry B. Since the installation date, all samples for Quarry-Combined Station have been taken at the weir.
Due to the proximity of the weir to the effluent discharge and the low gradient along the reconstructed Quarry Springs channel, there is frequent submergence of the crest of the weir. CBS has included a data logger downstream of the crest to measure the depth of submergence as can be seen on Figure 9. The formula for correcting the flows for submergence is shown In Attachment 1 and was obtained from Bentley Systems, Inc. (Reference 4). Weir pool staff readings were taken when samples were taken during the storm event but the downstream crest submergence was not measured at those times.

Submergence correction was carried out on the datalogger-collected flow data only.
2.2 Storm Event Initiation and Sampling
Based on National Weather Service forecasts heavy rains were expected for the night of April 18* . A pre-storm sample for each station was taken beginning at 15:35 hours at the Quarry-Combined Station. Heavy thunderstorms began shortly after midnight on April 19^ and by 05:00 hours the NWS had recorded in excess of an inch of rain at the Monroe County Airport.
Field crews estimated that conditions would be met for the minimum criterion of storm sampling, i.e. that Illinois Central Spring flows would equal or exceed 1,000 gpm as measured by the sump fill calculations. Therefore, they began sampling at Quarry-Combined Station at 02:40 hrs. Figure 10 shows the corrected flow at the Quarry-Combined Station and the sampling points are noted on the hydrograph. Field crews knew that later in the morning of April 19 ^ the plant was pumping to the storage tanks indicating that Illinois Central Spring (ICS) flows had exceeded 1000 gpm and that sampling would be conducted at all stations every 4 hours thereafter. Figure 11 shows the ICS flow based on the sump-fill calculations. The first peak did indeed exceed 1,000 gpm, peaking at about 1,300 gpm sometime shortly after noon on April 19" .
The historic Quarry A Spring location was not noted as flowing at the time of the pre-storm sampling of April 18* . Surface water from the Swallowhole area was flowing through the culvert under the road and was recorded at 15:50 hours on April 18" as measured to be 23 gpm by timed bucket-filling. In response to the U.S. EPA comments on the GWIP, CBS took three samples of water coming from the Swallowhole area at the downstream end of the culvert under the road during the storm event sampling. Quarry A did not appear to flow during this storm event, although during the peak flow periods it was difficult for field observers to separate additional flows from the discharge coming through the culvert.
Flow had receded to 357 gpm by midnight April 20 * ' which is 53% of the peak flow at the Quarry-Combined Station. Sampling was to continue until flow had receded to 20% of the peak flow. However, additional thunderstorms occurred which caused flows to peak at 1,427 gpm by 03:00 on April 20 at the Quarry-Combined Station (Figure 10). Flow at ICS eventually peaked over 2,500 gpm by 08:00 on April 20** (Figure 11). Figure 11A shows the flow at Quarry-Combined and ICS with the rainfall distribution as recorded at the ICSTF. Discussions were held with U.S. EPA representatives on April 20' and it was determined that sampling for 24 hours after the second peak at Quarry-Combined Station would be sufficient to characterize storm event PCB discharge at the Quarry and Rinker Springs. Therefore, sampling was concluded by 03:00 hours on April 21, 2011.

All samples taken were immediately brought back to the PSARA office and
stored in a refrigerator at 40°F. Samples were labeled with a unique sample identifier and date and time of collection. Chain of custody forms were filled out and samples were packed in coolers on ice just prior to sample pick-up. Samples were delivered to Heritage Lab in Indianapolis by courier. Attachment 2 contains the field sample logs and Attachment 3 contains the certificates of analysis and the chain of custody forms.
3.0 Storm Sampling Results
3.1 Quarry Combined Springs
Table 2 shows the results of the storm sampling event. Figure 12 shows the plot of results for the Quarry Combined Station. The data logger flow corrected for downstream submergence is plotted along with the PCBs in ppb (pg/l) and conductivity in pS/cm. The TSS results in ppm (mg/l) are shown in parentheses next to the PCB result for the same time. The below-detection-limit PCB results are plotted as 0.1 ppb with 0.1 ppb as the abscissa.
All PCB concentration values during the storm event were less than the 0.3 ppb discharge limit. The two highest PCB values, 0.21 ppb on April 19* at 02:40 and 0.19 ppb on April 19* at 06:50 appear to be associated with the highest TSS values of 210 ppm and 130 ppm respectively. This seems to occur again during the second storm flow peak, although the PCB values are not as elevated. They appear as flow is peaking and conductivity is dropping which Implies the PCBs are related to residual entrained sediment being flushed by rainwater-diluted groundwater.
At the bottom of Table 2 are the results of three samples taken during the storm event of water from the Swallowhole area at the downstream end of the culvert under the road. All three samples are below the detection limit of 0.1 ppb for PCBs; so it does not appear that surface water from the Swallowhole area is a contributor to the PCBs at Quarry-Combined Station but rather is a diluting factor.
Temperature values seem to reflect diurnal variation and the fact a cold front followed the second rain peak.
3.2 Quarry B Spring
Figure 13 shows the plot of the results at Quarry B Spring. The flow is plotted from the hourly data logger data in gpm but is not corrected for downstream submergence. The average correction factor for Quarry-Combined Station was about 7%. PCBs are plotted in ppb and TSS values in ppm are noted in parentheses next to them. Conductivity is plotted as the value in pS/cm divided by 10.
5 -

Of the fourteen samples taken, three were above 0.3 ppb and one was reported at 0.3 ppb, the discharge limit. It should be noted from Table 2 that the highest value of 0.41 ppb taken on April 20 at 02:44 with a TSS of 38 ppm had a duplicate sample analyzed which was 0.29 ppb PCBs and 36 ppm TSS. Unlike Quarry Combined Station, the first PCB peak at Quarry B is not related to high TSS, low conductivity or the flow peak, but occurs on the receding limb of the hydrograph. If the 0.41 ppb is plotted, the second PCB peak is more like Quarry Combined with it occurring coincident with the flow peak, a higher TSS value, and the conductivity minimum implying a relation to residual entrained sediment being flushed by rainwater-diluted groundwater. However, if the duplicate is plotted, then the peak is displaced later than the flow peak which may mean the flow peak is dilution water perhaps related to surface runoff from the Westplex paved areas.
3.3 Quarry D Spring
Figure 14 is a plot of the results for Quarry D Spring. The flow plotted is the bucket-fill rate measured when the samples were taken. The PCB results are plotted in ppb with TSS in ppm next to them in parentheses. The PCB sample on April 20 at 18:38 was below the detection limit of 0.1 ppb and is plotted as 0.1 ppb. Conductivity is plotted as the value in pS/cm divided by 100.
All PCBs are below 0.3 ppb for the storm event. There is not much variance in either flow or PCBs for these storms. The two minor flow peaks coincide with conductivity lows and TSS highs, but not much effect on PCBs are discernable.
3.4 Rinker Spring
Figure 15 is a plot of the results for Rinker Spring. The flow plotted is the bucket-fill rate measured when the samples were taken. The PCB results are plotted in ppb with TSS in ppm next to them in parentheses. Conductivity is plotted as the value in pS/cm divided by 10.
All PCBs are below 0.3 ppb for the storm event except for the one on April 20 at 02:56. The two flow peaks coincide with conductivity lows and TSS highs, and in the case of the second flow peak there is an associated PCB peak.
It should be noted that storm event sampling had been performed during a November 15-16, 2005 storm where ICS peaked at 2,400 gpm. Rinker Spring PCBs ranged from 1.1 ppb to 1.9 ppb on a total rainfall event of 2.72 inches and a total of eleven samples. It would appear that PCB discharge at Rinker Spring during storm events has been diminished by the Swallowhole-Quarry Springs remediation.
6 -

REFERENCES
1. U.S. District Court 2009, "Agreed Amendment to the Consent Decree Providing for Remedial Actions at Neal's Landfill, Lemon Lane Landfill and Bennett's Dump and Addressing General Matters", United States District Court for the Southern District of Indiana, Indianapolis, Division, entered July 24, 2009.
2. CBS Corporation, "Lemon Lane Quarry and Rinker Springs Groundwater Investigation Plan for Operable Units 2&3, Bloomington QAPP Volume Lll, February 2011.
3. ISCO, Inc., "Open Channel Flow Measurement Handbook", Second Edition, Third Printing, 1988.
4. Bentley Systems, Inc. "Haestad Methods Solution Center", httD://docs.bentlev.com/en/HMFIowMaster/FlowMasterHelp-06-49.html. 2009.
- 7 -

Table 1 - Rinker Spring Flows vs. De
Date/Time 2/9/2011 10:47
2/15/2011 13:30 2/18/2011 13:30 2/21/2011 10:40 2/21/2011 15:56 2/22/2011 13:35 2/25/2011 13:25 3/1/2011 14:13 3/3/2011 13:30 3/7/2011 15:10 3/11/11 12:00
3/15/2011 15:30 3/24/2011 13:15 3/29/2011 13:30 4/1/2011 13:52 4/5/2011 12:00 4/7/2011 14:00
4/12/2011 10:40 4/15/2011 9:35 4/19/2011 7:09 4/20/2011 3:04 4/20/2011 6:51
4/20/2011 10:41 4/20/2011 14:49 4/20/2011 18:41
Rinker Sp. flow (gpm)
17 17.5 17 23 43 32 48 28.6 24 30 30 24.9 20 15 15 27.1 17.1 27.3 27 43
. 59 55.8 43.2 38.5 37.5
pth of Flow in Pipe measurement of 'd'
depth of f low in pipe
0.100 0.120 0.110 0.122 0.157 0.150 0.160 0.143 0.123 0.132 0.141 0.131 0.120 0.105 0.100 0.123 0.105 0.135 0.122 0.148 0.128 0.130 0.160 0.115 0.110

Table 2 - Quarry Springs & Rinker Spring Storm Event - April 18-21, 2011 PCB Results and Field Parameters
Station
Quarry Springs - Combined Quarrv Springs - Combined Quarry Springs - Combined Quany Springs - Combined Quarrv Springs - Combined Quarrv Springs - Combined Quanv Springs - Combined Quarrv Springs - Combined Quanv Springs - Combined Quarrv Springs - Combined Quanv Springs - Combined Quany Springs - Combined Quany Springs - Combined Quarrv Springs - Combined Quarrv Springs - Combined Quany Springs - Combined Quarrv B Spring Quarry B Spring Quanv B Spring Quanv B Spring Quanv B Spring Quany B Spring Quany B Spring Quarry B Spring Quarrv B Spring Quany B Spring Quarry B Spring Quany B Spring Quarry B Spring Quany B Spring Quanv B Spring Quanv D Sping Quarry D Sping Quanv D Sping Quarry D Sping Quarry D Sping Quany D Sping Quarry D Sping Quany D Sping Quany D Sping Quanv D Sping Quany D Sping Quanv D Sping Quany D Sping Quany D Sping Rinker Spring Rinker Spring Rinker Spring Rinker Spring Rinker Spring Rinker Spring Rinker Spring Rinker Spring Rinker Spring Rinker Spring Rinker Spring Rinker Spring Rinker Spring Rinker Spring Rinker Spring Rinker Spring Culvert from Swallowhole Area Culvert from Swallowhole Area Culvert from Swallowhole Area
Sample ID
LLl3474 LL13478 LLl3482 LLl3497 LL13502 LL13503" LLl3507 LLl3512 LLl3516 LLl3522 LLl 3527 LLl 3531 LLl 3532* LLl3536 LLl3541 LLl3545 LLl3475 LLl 3479 LLl3483 LLl3498 LLl3504 LLl3508 LLl3513 LL13517 LL13518' LL13523 LLl3528 LL13533 LL13537 LLl3542 LLl3546 LLl 3476 LLl3480 LLl 3484 LL13499 LLl3505 LLl3509 LLl3514 LLl3519 LLl3524 LL13529 LLl3534 LLl3538 LLl3543 LLl3547 LLl3477 LLl 3481 LLl3485 LLl3486' LLl 3500 LL13506 LLl3510 LL13515 LLl3520 LLl 3525 LLl 3530 LLl3535 LLl 3539 a i3544 LLl3548 LLl3549' LLl3501 LLl 3521 LLl3550
Collect Date-Time
4/18/11 15:35 4/19/11 2;40 4/19/11 6:50
4/19/11 10:47 4/19/11 14:46 4/19/11 14:46 4/19/11 18:51 4/19/11 22:40 4/20/112:35 4/20/116:33 4/20/11 10.30 4/20/11 14:34 4/20/11 14:34 4/20/11 18:30 4/20/1122:30 4/21/11 2:37 4/18/11 15:42 4/19/112:44 4/19/116:57 4/19/11 10:50 4/19/11 14:51 4/19/11 18:53 4/19/11 22:48 4/20/11 2:44 4/20/11 2:44 4/20/11 6 40 4/20/11 10:35 4/20/11 14:38 4/20/11 18:33 4/20/11 22:36 4/21/112:41 4/18/11 15:46 4/19/112:50 4/19/11 7:05 4/19/11 10:55 4/19/11 14:56 4/19/11 18:58 4/19/11 22:54 4/20/11 2:50 4/20/11 6:45 4/20/11 10:37 4/20/11 14:43 4/20/11 18:38 4/20/1122:41 4/21/11 2:47 4/18/11 15:50 4/19/112:55 4/19/117:09 4/19/11 7:14 4/19/11 11:00 4/19/11 15:00 4/19/11 19:02 4/19/11 23:00 4/20/112:56 4/20/11 6:51 4/20/11 10:41 4/20/11 14:49 4/20/11 18:41 4/20/11 22:50 4/21/11 2:54 4/21/11 2:54 4/19/11 11:05 4/20/11 3:04 4/21/11 3:01
PCB (ug/L)
L 0.11 0.21 0.19 0.11
<0.10 0.12 0.11 <0.10 0.12 0.14 <0.10 <0.10 <0.10 <0.10 <0.10 <0.10 0.17 0.24 0.25 0.30 035 029 0.25 0.41 0.29 0.32 0.29 0.28 0.26 0.22 0.22 0.13 0.14 0.14 0.15 0.19 0.18 0.17 0.18 0.18 0.16 0.14 <0.10 0.15 0.17 0.16 0.15 0.17 0.17 0.18 0,21 0.20 0.21 0.35 0.18 0.17 0.12 0.15 0.14 0.13 0.13
<0.10 <0.10 <0.10
Suspertded Solids (mg/L)
9 210 130 12 7 7 6 7
150 73 13 10 14 15 7 7 2
170 27 4 4 2 1
38 36 7 5 3 2 2 1
<1 <1 25 3 1
<1 <1 17 4 2 1
<1 <1 <1 <1 2 13 13 5 4 2 2 21 8 4 2 2 2 1 2 3 83 2
Conductivity (uS/cm)
643 502 386 451 473 473 486 501 352 397 442 466 466 479 503 509 668 553 392 578 615 632 631 402 402 572 610 626 644 651 651 664 652 487 527 570 589 601 458 493 544 572 602 610 616 699 694 537 537 573 619 625 623 438 516 594 611 610 612 622 622 385 305 441
Temperature (degC)
16.4 12.7 12.6 12.1 13.6 13.6 13.7 13.5 13.2 12.0 11.7 12.6 12.6 12.4 11.8 11.5 12.8 12.5 12.5 12.3 12.5 12.5 12.6 13.1 13.1 12.3 12.1 12.3 12.2 12.2 12.2 16.5 12.2 12.3 11.8 13.4 13.8 13.9 13.0 11.1 11.6 12.5 12.0 11.4 11.0 13.0 11.9 11.8 11.8 11.7 12.1 12.5 12.3 12.9 11.7 11.5 11.9 11.7 11.7 11.7 11.7 12.3 12.9 11.6
Flov* (gpm)
105° 162 628 408 487 487 415 369 1381 1270 993 723 723 759 663 563 29 35 128 76 70 55 51 229 229 1125 114 81 70 55 51 2.4 2.1 3.1 2.7 2.7 2.6 2.6 3.3 2.9 2.8 2.7 2.6 2.6 2.6 23 26 43 43 37 33 35 39 59 56 43 29 38 44 41 41 412 2000 632
Flow Estimation Method
V-notch Weir V-notch Weir V-notch Weir V-notch Weir V-notch Weir V-notch Weir V-notch Weir V-notch Weir V-notch Weir V-notch Weir V-notch Weir V-notch Weir V-notch Weir V-notch Weir V-notch Weir V-notch Weir V-notch Weir V-notch Weir V-notch Weir V-notch Weir V-notch Weir V-notch Weir V-notch Weir V-notch Weir V-notch Weir V-notch Weir V-notch Weir V-notch Weir V-notch Weir V-notch Weir V-notch Weir Bucket Rll Rate Bucket Fili Rate Bucket Fill Rate Bucket Rll Rate Bucket Rll Rate Bucket Ril Rate Bucket Fill Rate Bucket Rll Rate Bucket Rll Rate Bucket Rll Rate Bucket Rll Rate Bucket Fill Rate Bucket Rll Rate Bucket Rn Rate Bucket Rll Rate Bucket Rll Rate Bucket Rll Rate Bucket Rll Rate Bucket Rll Rate Bucket Rll Rate Bucket Fill Rate Bucket Fili Rate Bucket Ril Rate Bucket Rll Rate Bucket Fili Rate Bucket Fili Rate Bucket Fili Rate Bucket Rll Rate Bucket Rll Rate Bucket Fili Rate Bucket Rll Rate Visual estimate Bucket Rll Rate
BDL - Below Detection Limit (Detection Limit 0.10 ppb for all PCB Aroclors except PCB 1221, Detectkin LimK 0.20 ppb) ' Duplicate sample

Rgure 1 - Quarry Rinker Springs Area Flow Measurement and Sampling Locations

o ts
o u • • /
# '
/ ^ ^ ^ . '•
I ••-•i 'r ^,.
O)

Figure 3 - Rinker Spring Sample Station and "California Pipe" attachment with Data Logger

Figure 4 - Rinker Spring Calibrated Fiow IVIeasurements vs. Depth of Fiow in Pipe
0.110 0.120 0.130 0.140
depth of flow in pipe in feet
0.150 0.160 0.170

Figure 5 - Quarry D Orifice and Piping
;• ,W»» .^J,%:. ^ : ^ -
- ' • • - •
'HP
"" ' f * - ^ ^ '
r
*

uojieooi Bujiduies pue )U3Luajnsea|/y MO|J Q Ajieno - 9 ejnBij

Figure 7 - Quarry B Combination V-Notch and Rectangular Weir Sampling Location

m'^
X i - \ "'••• m ^
c 0 3 1 - ^
•n ( f i
c (D 00
3 I fl) r-
D ^ H l
0)
o fi)
( f i (D
fi> ^^ *3 • o o 3 or 3 0 fi.
(D
fi) 3 Q.
CO fi)
3 3 (fi CO # - • fi)
o 3
^ - i ^
73 2. fi)
O CO

Figure 9 - Quarry-Combined Weir and Data Loggers

Figure 10 - Corrected Flow at Quarry Combined Station for April 18-21 Storm
1600
4/17/11 4/18/11 4/18/11 4/19/11 4/19/11 4/20/11 4/20/11 4/21/11 4/21/11 4/22/11 4/22/11 4/23/11 12:00 0:00 12:00 0:00 12:00 0:00 12:00 0:00 12:00 0:00 12:00 0:00

Figure 11 -IC-SRS Flow for April 18-21 Storm Event
3000
2500
2000
£ a.
£ 1500
o
1000
500
second peak approximately 2500+ r t r \ r r \
first peak approximately 1300 gpm
mim 12:00
4/18/11 0:00
Ah^m 12:00
4/19/11 0:00
4/19/11 12:00
4/20/11 0:00
4/20/11 12:00
4/21/11 0:00
4/21/11 12:00
4/22/11 0:00
4/22/11 12:00
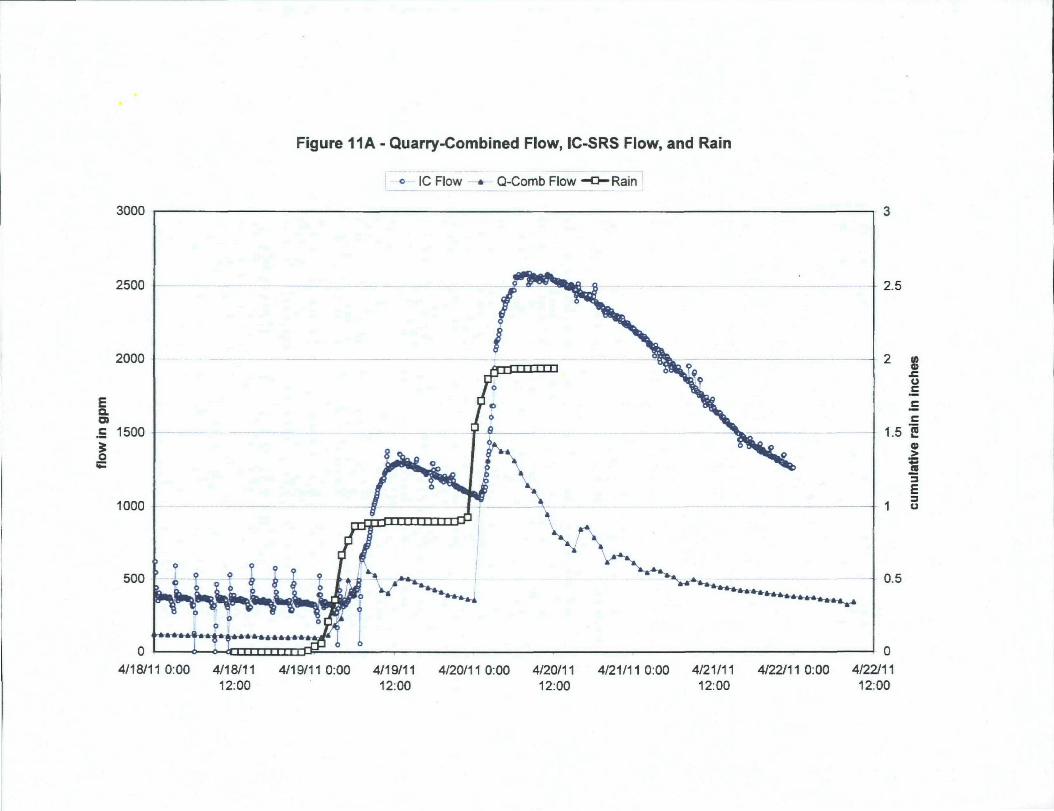
Figure 11A - Quarry-Combined Flow, IC-SRS Flow, and Rain
" O - IC Row - • Q-Comb Flow -Q-Rain
3000
2500
2000
E a o .£ 1500
o
1000
500
o
i i ! » - ^ i l l I I I
2.5
o c
1.5 2 « >
E 1 3
— 0.5
4/18/11 0:00 4/18/11 4/19/11 0:00 4/19/11 12:00 12:00
4/20/110:00 4/20/11 4/21/110:00 4/21/11 12:00 12:00
0 4/22/110:00 4/22/11
12:00

Figure 12 - Quarry Combined Flow, PCBs and Conductivity
'' - » Flow A- Cond • PCBs
E
3
c o u T> C ID
O)
i
1600
1400
1200
1000
110:00 4/18/11 4/19/110:00 4/19/11 4/20/110:00 4/20/11 4/21/110:00 4/21/11 4/22/110:00 4/22/11 12:00 12:00 12:00 12:00 12:00

Figure 13 - Quarry B Flow, PCBs and Conductivity
• Flow -A Cond. • PCBs l I
4/18/2011 4/18/2011 4/19/2011 4/19/2011 4/20/2011 4/20/2011 4/21/2011 4/21/2011 4/22/2011 4/22/2011 0:00 12:00 0:00 12:00 0:00 12:00 0:00 12:00 0:00 12:00

Figure 14 - Quarry D Flow, PCBs, and Conductivity
- • - F l o w - A Cond/100 • PCBs
6
E o
o o •o c CS
i
5 2
1
(«1) (25)
(<1)
i<r
PCBs<0.1
0.21
- 0.18
0.15
0.12 -a
a
0.09 CL
0.06
- 0.03
4/18/1112:00 4/19/110:00 4/19/1112:00 4/20/110:00 4/20/1112:00 4/21/110:00 4/21/1112:00

Figure 15 - Rinker Spring Flow, PCBs and Conductivity
Flow-A Cond/10 • PCBs
4/18/1112:00 4/19/110:00 4/19/1112:00 4/20/110:00 4/20/1112:00 4/21/110:00 4/21/1112:00

Attachment 1
Submerged Sharp-Crested Weir
Flow Correction Calculations
Bentley Systems, Inc. 2009

Submerged Sharp-Crested Weir ht^://docs.bentIey.com/en/HMFIowMaster/FlowMasterHelp-06-49.htr
Submerged Sharp-Crested Weir
_5L r^ T~
Figure 5-8: SubmergBd Sharp-Crested Weir
If the sharp-crested weir is submerged as illustrated in the figure above (with H2 > 0), then the flow Qi that would be obtained without submergence, using one of the equations above, is corrected as follows to obtain the flow Q over the weirl:
Q^Qi 1 -
-p.3SS
l ^ l >
(5.41)
Where Q Discharge over weir (m^/sec., ft^/sec.)
Q1 Discharge over weir opening that would be obtained without submergence at head Hi (m^/sec, ft^/sec.)
Hi Head above weir crest (m, ft)
H2 Downstream head above weir (m, ft)
Exponent in corresponding weir equation with no submergence (3/2 or 5/2 in cases above)
iBrater, Ernest F, and Horace \AAillams King. Handbook of Hydraulics, McGraw-l-ili Book Company, NewYork, 1976.
Copyright and Trademark Infomiation