Embed Size (px)
Citation preview

REPORT OF INDEPENDENT AUDITORS AND CONSOLIDATED FINANCIAL STATEMENTS
WITH SUPPLEMENTAL SCHEDULES
FOR
TRI-CITY HEALTHCARE DISTRICT
June 30, 2017 and 2016

Table of Contents PAGE Report of Independent Auditors 1–3 Management’s Discussion and Analysis 4–12 Consolidated Financial Statements Consolidated statements of net position 13–14 Consolidated statements of revenues, expenses, and changes in net position 15 Consolidated statements of cash flows 16–17 Notes to consolidated financial statements 18–34 Supplemental Schedules Consolidating statement of net position, June 30, 2017 35–36 Consolidating statement of revenues, expenses, and changes in net position, for the year ended June 30, 2017 37

1
REPORT OF INDEPENDENT AUDITORS The Board of Directors of Tri-City Healthcare District Report on the Financial Statements We have audited the accompanying consolidated financial statements of Tri-City Healthcare District (the District), which comprise the consolidated statements of net position as of June 30, 2017 and 2016, and the related consolidated statements of revenues, expenses, changes in net position, and cash flows for the years then ended, and the related notes to the financial statements. Management’s Responsibility for the Financial Statements Management is responsible for the preparation and fair presentation of these consolidated financial statements in accordance with accounting principles generally accepted in the United States of America; this includes the design, implementation, and maintenance of internal control relevant to the preparation and fair presentation of consolidated financial statements that are free from material misstatement, whether due to fraud or error. Auditor’s Responsibility Our responsibility is to express an opinion on these consolidated financial statements based on our audits. We conducted our audits in accordance with auditing standards generally accepted in the United States of America and the California Code of Regulations, Title 2, Section 1131.2, State Controller’s Minimum Audit Requirements for California Special Districts. Those standards require that we plan and perform the audits to obtain reasonable assurance about whether the consolidated financial statements are free from material misstatement. An audit involves performing procedures to obtain audit evidence about the amounts and disclosures in the consolidated financial statements. The procedures selected depend on the auditor’s judgment, including the assessment of the risks of material misstatement of the consolidated financial statements, whether due to fraud or error. In making those risk assessments, the auditor considers internal control relevant to the entity’s preparation and fair presentation of the consolidated financial statements in order to design audit procedures that are appropriate in the circumstances, but not for the purpose of expressing an opinion on the effectiveness of the entity’s internal control. Accordingly, we express no such opinion. An audit also includes evaluating the appropriateness of accounting policies used and the reasonableness of significant accounting estimates made by management, as well as evaluating the overall presentation of the consolidated financial statements. We believe that the audit evidence we have obtained is sufficient and appropriate to provide a basis for our audit opinion.
2
Opinion In our opinion, the consolidated financial statements referred to above present fairly, in all material respects, the financial position of Tri-City Healthcare District as of June 30, 2017 and 2016, and the results of its operations and its cash flows for the years then ended in accordance with accounting principles generally accepted in the United States of America. Other Matters Required Supplementary Information Accounting principles generally accepted in the United States of America require that management's discussion and analysis on pages 4 to 12 be presented to supplement the basic consolidated financial statements. Such information, although not part of the basic consolidated financial statements, is required by the Governmental Accounting Standards Board who considers it to be an essential part of financial reporting for placing the basic consolidated financial statements in an appropriate operational, economic, or historical context. We have applied certain limited procedures to the required supplementary information in accordance with auditing standards generally accepted in the United States of America, which consisted of inquiries of management about the methods of preparing the information and comparing the information for consistency with management's responses to our inquiries, the basic financial statements, and other knowledge we obtained during our audit of the basic financial statements. We do not express an opinion or provide any assurance on the information because the limited procedures do not provide us with sufficient evidence to express an opinion or provide any assurance. Other Information Our audit was conducted for the purpose of forming opinions on the consolidated financial statements that collectively comprise the District's basic financial statements. The consolidating statement of net position, June 30, 2017 and consolidating statement of revenues, expenses, and changes in net position for the year ended June 30, 2017 are presented for purposes of additional analysis and are not a required part of the basic financial statements.
3
The consolidating statement of net position, June 30, 2017 and consolidating statement of revenues, expenses, and changes in net position for the year ended June 30, 2017 are the responsibility of management and were derived from and relate directly to the underlying accounting and other records used to prepare the basic consolidated financial statements. Such information has been subjected to the auditing procedures applied in the audit of the basic consolidated financial statements and certain additional procedures, including comparing and reconciling such information directly to the underlying accounting and other records used to prepare the basic consolidated financial statements or to the basic financial statements themselves, and other additional procedures in accordance with auditing standards generally accepted in the United States of America and the California Code of Regulations, Title 2, Section 1131.2, State Controller’s Minimum Audit Requirements for California Special Districts. In our opinion, the consolidating statement of net position, June 30, 2017 and consolidating statement of revenues, expenses, and changes in net position for the year ended June 30, 2017 are fairly stated, in all material respects, in relation to the basic consolidated financial statements as a whole.
Los Angeles, California September 28, 2017

Tri-City Healthcare District Management’s Discussion and Analysis
As of and for the Years Ended June 30, 2017 and 2016
4
Overview The Tri-City Healthcare District (the “District”) is a public healthcare district and is a political subdivision of the State of California (the “State”) organized pursuant to Division 23 of the Health and Safety Code of the State of California. The District operates a 386-bed acute care hospital in northern San Diego County (the “County”). The “Tri-City” name represents the cities of Carlsbad, Oceanside, and Vista, the three cities which fall within its boundaries. The District was formed in 1957, and the hospital opened in 1961. This report contains the operating results of Tri-City Medical Center and the subsidiaries in which the District owns a controlling interest. Those entities include Tri-City Medical Center Ambulatory Surgery Center Operators, LLC (“Ambulatory Surgery Center Operators”), the Tri-City Medical Center Cardiovascular Health Institute, LLC (“Cardiovascular Institute”), the Tri-City Medical Center Orthopedic Institute, LLC (“Orthopedic Institute”), the Tri-City Medical Center Neuroscience Institute, LLC (“Neuro Institute”), the Tri-City Real Estate Holding and Management Company, LLC (“Real Estate Holding and Management Company”) and Tri-City Wellness, LLC (“Wellness Center”). Ambulatory Surgery Center Operators, the Cardiovascular Institute, the Orthopedic Institute, the Neuro Institute, the Real Estate Holding and Management Company and the Tri-City Wellness Center are component units that have been blended for presentation purposes. The District has determined blended presentation is appropriate for Ambulatory Surgery Center Operators as it appoints a voting majority of the governing body and its operations are an integral part of the District’s mission. The District has also determined blended presentation is appropriate for the Cardiovascular Institute, the Orthopedic Institute, and the Neuro Institute as the component units provide services almost entirely to the District. The District has determined blended presentation is appropriate for the Real Estate Holding and Management Company and the Tri-City Wellness Center as management of the District has operational responsibility. This section of the District’s annual financial report presents an analysis of the District’s financial performance for the years ended June 30, 2017 and 2016. All references to years refer to the fiscal year ended June 30, unless otherwise indicated. Please read this analysis in conjunction with the Report of Independent Auditors and the consolidated financial statements that follow this section. This annual financial report includes four items:
1. Report of Independent Auditors
2. Management’s Discussion and Analysis
3. Consolidated financial statements of the District, including notes that explain in more detail, some of the information in the consolidated financial statements.
4. Supplemental schedules

Tri-City Healthcare District Management’s Discussion and Analysis As of and for the Years Ended June 30, 2017 and 2016
5
Overview (continued) The District’s consolidated financial statements report information using accounting methods required by the Governmental Accounting Standards Board (“GASB”). These statements contain short-term and long-term financial information about its activities. In accordance with accounting principles generally accepted in the United States of America (also known as GAAP or generally accepted accounting principles) for governmental health care providers, the District’s consolidated statements of revenue, expenses, and changes in net position reflect that non-operating income (expenses) including interest expense, which for nongovernmental hospitals is typically grouped as an operating expense. While these GASB requirements make district hospitals conform to other governmental entities, such as cities and counties, they may be less comparable to nongovernment hospitals because of these GASB requirements. Executive Summary For the year ended June 30, 2017, the District reported consolidated excess revenue over expenses of approximately $1.9 million and net loss from operations of approximately $1.6 million. The 2017 excess of revenue over expenses by entity was as follows:
Tri-City Medical Center 326,450$ Ambulatory Surgery Center Operators 1,757,668 Real Estate Holding and Management Company 212,391 Tri-City Wellness Center (195,910) Cardiovascular Institute 175,840 Orthopedic Institute 116,942 Neuroscience Institute 111,712 Eliminations (624,677)
Total excess of revenue over expenses 1,880,416$
Contributing to the 2017 results were the following significant activities: • The District recorded revenue totaling approximately $11.7 million through the continuation of the
Intergovernmental Transfer (“IGT”) program. This program reimbursed the District for a portion of the difference between the cost of treating Medi-Cal patients and the amount reimbursed through a pre-existing Medi-Cal contract.
• The District participated in the Public Hospital Redesign and Incentives in Medi-Cal (PRIME) program in 2017. The PRIME program is a community centric population health, pay-for-performance, outcomes-based initiative. Performance baselines were established and target goals were set. The District is currently in the implementation and ongoing evaluation of quality improvement interventions phase of the program. The PRIME program contributed approximately $8.4 million to revenue in 2017.
• The Oncology infusion practice, acquired in April 2013 by the District (“OP Infusion Center”), contributed approximately $3.8 million to excess of revenues over expenses during 2017.

Tri-City Healthcare District Management’s Discussion and Analysis
As of and for the Years Ended June 30, 2017 and 2016
6
Executive Summary (continued) • The District’s strategic partnership in Ambulatory Surgery Center Operators resulted in an excess of
revenues over expenses of approximately $1.8 million in 2017. Because the District owns 60% of Ambulatory Surgery Center Operators and Ambulatory Surgery Center Operators owns 52.8% of North Coast Surgery Center Ltd., the District’s share of earnings was approximately $565 thousand.
• The increase in the District’s revenue related to prior years’ cost report settlements totaled
approximately $1.5 million. Cost reports typically are finalized several years beyond the close of each fiscal year, after review by the appropriate government agency, and after all appeal rights have been exhausted. Tentative settlements occur between the end of a fiscal year and finalization of the settlement process.
• In March 2017, the District completed a 25-year, $85.8 million mortgage financing insured by the United
States Department of Housing and Urban Development (HUD). This long-term, fixed-rate financing replaced the MidCap and Bank of the West term loans thereby releasing $51.0 million in cash previously held as collateral. In addition, the District was able to secure a more favorable interest rate through refinancing previous debt.
The District continued or started the following initiatives which are anticipated to provide future financial benefit: • In June 2016, the District entered into an agreement with the County of San Diego to open a Crisis
Stabilization Unit (“CSU”) which provides emergency psychiatric evaluation and crisis stabilization to adults on a 24-hour, 7-day per-week basis. Crisis stabilization includes crisis intervention, medication administration, consultation with significant others and outpatient providers, and linkage and/or referral to follow-up care and community resources. Not only does the CSU provide care for patients in an appropriate setting, but has also resulted in decreased Emergency Department wait times and additional Emergency Department bed availability for those in need of medical emergency services.
• In August 2016, the District and University of California San Diego Health (“UC San Diego Health”) solidified an exclusive affiliation agreement designed to enhance the delivery of high quality health care to patients in North San Diego County by leveraging the combined strengths of the District and UC San Diego Health to provide expanded access to locally provided healthcare services. Cardiothoracic surgery, mental health services physician coverage, neurosurgery, and intra-operative radiation therapy are a few of the collaborative efforts enhancing the health and wellness of the communities served by the District. Under the terms of a master agreement, UC San Diego Health and the District are collaborating to bring specialty care physicians to the District’s service area to supplement the needs of the existing medical staff, develop and market certain health care services, and clear a pathway to clinical integration for interested physicians and specialists.
• The District continued to recruit physicians to improve medical coverage for the communities it serves.
Specialties recruited include family medicine, urology, and oncology. Loans to physicians accrue interest during the draw period and during the forgiveness period. As of June 30, 2017, the physician loan balance was $4.9 million. Approximately $1.8 million was forgiven during 2017.

Tri-City Healthcare District Management’s Discussion and Analysis As of and for the Years Ended June 30, 2017 and 2016
7
Executive Summary (continued) • In response to the need for additional primary care physicians in its service area, the District opened
the Clancy Medical Group clinic in July 2016 and the Venus OB/GYN clinic in January 2017. The District owns and operates the clinics from which physicians provide professional services to the community.
Required Consolidated Financial Statements Consolidated Statement of Net Position – The consolidated statement of net position includes all of the District’s assets and liabilities and provides information about the nature and amounts of investments in resources (assets) and the obligations to the District’s creditors (liabilities), and net position – the difference between assets and liabilities – of the District, and the changes thereto. The statement of net position also provides the basis for evaluating the capital structure of the District and assessing the liquidity and financial flexibility of the District. Condensed Consolidated Statements of Net Position as of June 30, 2017 and 2016 (In Thousands)
2017 2016
Current assets 115,075$ 119,253$ Capital assets - net 103,650 108,307 Non-current assets 39,869 21,454
Total 258,593$ 249,014$
Current liabilities 67,817$ 117,444$ Long-term debt - net of current portion 88,091 29,464 Workers' compensation and comprehensive
liability - net of current portion 7,755 7,672
Total liabilities 163,662 154,580
Invested in capital assets - net of related debt 13,377 74,691 Restricted assets 7,966 1,432 Unrestricted 73,589 18,311
Total net position 94,931 94,434
Total 258,593$ 249,014$
LIABILITIES AND NET POSITION
ASSETS
Tri-City Healthcare District Management’s Discussion and Analysis
As of and for the Years Ended June 30, 2017 and 2016
8
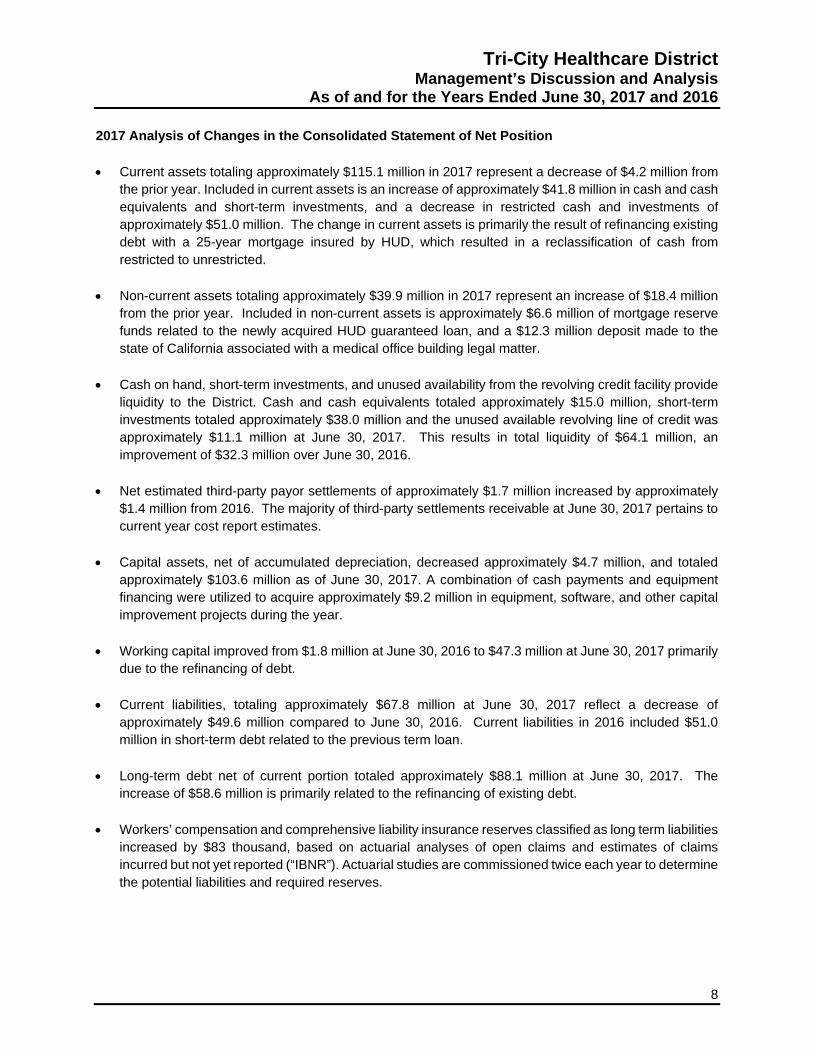
2017 Analysis of Changes in the Consolidated Statement of Net Position • Current assets totaling approximately $115.1 million in 2017 represent a decrease of $4.2 million from
the prior year. Included in current assets is an increase of approximately $41.8 million in cash and cash equivalents and short-term investments, and a decrease in restricted cash and investments of approximately $51.0 million. The change in current assets is primarily the result of refinancing existing debt with a 25-year mortgage insured by HUD, which resulted in a reclassification of cash from restricted to unrestricted.
• Non-current assets totaling approximately $39.9 million in 2017 represent an increase of $18.4 million
from the prior year. Included in non-current assets is approximately $6.6 million of mortgage reserve funds related to the newly acquired HUD guaranteed loan, and a $12.3 million deposit made to the state of California associated with a medical office building legal matter.
• Cash on hand, short-term investments, and unused availability from the revolving credit facility provide liquidity to the District. Cash and cash equivalents totaled approximately $15.0 million, short-term investments totaled approximately $38.0 million and the unused available revolving line of credit was approximately $11.1 million at June 30, 2017. This results in total liquidity of $64.1 million, an improvement of $32.3 million over June 30, 2016.
• Net estimated third-party payor settlements of approximately $1.7 million increased by approximately
$1.4 million from 2016. The majority of third-party settlements receivable at June 30, 2017 pertains to current year cost report estimates.
• Capital assets, net of accumulated depreciation, decreased approximately $4.7 million, and totaled
approximately $103.6 million as of June 30, 2017. A combination of cash payments and equipment financing were utilized to acquire approximately $9.2 million in equipment, software, and other capital improvement projects during the year.
• Working capital improved from $1.8 million at June 30, 2016 to $47.3 million at June 30, 2017 primarily
due to the refinancing of debt. • Current liabilities, totaling approximately $67.8 million at June 30, 2017 reflect a decrease of
approximately $49.6 million compared to June 30, 2016. Current liabilities in 2016 included $51.0 million in short-term debt related to the previous term loan.
• Long-term debt net of current portion totaled approximately $88.1 million at June 30, 2017. The
increase of $58.6 million is primarily related to the refinancing of existing debt.
• Workers’ compensation and comprehensive liability insurance reserves classified as long term liabilities increased by $83 thousand, based on actuarial analyses of open claims and estimates of claims incurred but not yet reported (“IBNR”). Actuarial studies are commissioned twice each year to determine the potential liabilities and required reserves.

Tri-City Healthcare District Management’s Discussion and Analysis As of and for the Years Ended June 30, 2017 and 2016
9
Condensed Consolidated Statements of Revenues, Expenses, and Changes in Net Position for the Years Ended June 30, 2017 and 2016 (In Thousands)
2017 2016
Operating revenue 340,112$ 334,596$ Operating expenses 341,682 340,625
Loss from operations (1,570) (6,029)
Non-operating revenue 3,450 4,336
Excess (deficiency) of revenue over expenses 1,880 (1,693)
Minority interest distributions - net (1,383) (1,601)
Change in net position 497 (3,294)
Beginning net position 94,434 97,728
Ending net position 94,931$ 94,434$
Average daily census 180 192 Emergency room visits 62,555 65,828
2017 Analysis of the Consolidated Statement of Revenues, Expenses and Changes in Net Position • Operating revenues increased by approximately $5.5 million in 2017 compared to 2016. This increase
is primarily due to receipts from the PRIME and IGT programs throughout the year, offset by a decrease in patient volume. PRIME is a community centric population health pay for performance outcomes based initiative. Focus on healthcare reform based programs along with increased acuity resulting in increased net revenue per day reimbursement more than offset a decrease in inpatient volume in 2017. Total average daily census was 180 for the current year compared to 192 in the prior year. Total hospital outpatient visits decreased by approximately 1.8% compared to 2016. Emergency treat and release visits decreased approximately 5.0%, while Outpatient Specialty Unit visits increased approximately 31.9% in 2017.
• Excess revenue over expenses (“EROE”) improved from a loss of $1.7 million in 2016 to a profit of
$1.9 million in 2017. EROE in 2017, exclusive of the current year one-time financing cost of $3.4 million, is $5.3 million.
• Earnings before interest, taxes, depreciation and amortization (“EBITDA”) improved from $12.8 million
in 2016 to $17.0 million in 2017. EBIDTA, exclusive of the current year one-time financing cost of $3.4 million, is $20.4 million.

Tri-City Healthcare District Management’s Discussion and Analysis
As of and for the Years Ended June 30, 2017 and 2016
10
2017 Analysis of the Consolidated Statement of Revenues, Expenses and Changes in Net Position (continued) • Operating expenses, which include patient care expenses and overhead and administrative expenses,
increased approximately $1.1 million. The largest single increase was experienced in salaries and related expenses. Although salaries and related expenses increased by approximately $1.9 million, salaries and related expenses as a percentage of total operating revenue remained constant at approximately 57% in both 2017 and 2016. Professional and medical fees expenses decreased by approximately $2.8 million as insurance recoveries for legal expenses were recognized in 2017.
• Non-operating income and expense is comprised of the District’s share of property tax revenue
collected by the County of San Diego, interest earned on invested monies, interest expense, and other non-operating items. Non-operating expenses include $3.4 million in closing costs related to the HUD financing. The resulting net non-operating revenue totaled approximately $3.5 million in 2017 compared to approximately $4.3 million in 2016.
Statement of Cash Flows – The Statement of Cash Flows reports cash receipts, cash payments, and net changes in cash resulting from operating, noncapital and capital financing, and investing activities.
2017 2016
Net cash provided by (used in)Operating activities 12,301$ 3,061$ Noncapital financing activities 6,019 6,299 Capital and related financing activities (21,121) (13,934) Investing activities 6,584 40
Net change in cash and cash equivalents 3,783 (4,534)
Cash and cash equivalents - Beginning of year 11,177 15,711
Cash and cash equivalents - End of year 14,960$ 11,177$
Cash flows arise from operating income adjusted for noncash expenditures such as depreciation expense and bad debt expense (“operating activities”), changes in investments and interest income received on investments (“investing activities”), purchase of new capital assets and payments of interest and principal on debt (“capital and related financing activities”), and county tax revenues (“noncapital financing activities”).

Tri-City Healthcare District Management’s Discussion and Analysis As of and for the Years Ended June 30, 2017 and 2016
11
2017 Analysis of the Consolidated Statement of Cash Flows Cash and cash equivalents totaled approximately $15.0 million at June 30, 2017, compared to approximately $11.2 million at June 30, 2016. Short- term investments totaled approximately $38.9 million at fiscal 2017-year end. The increase in short-term investments is primarily due to $51.0 million of restricted cash being released and reclassified to short-term investments as a result of the term loan refinancing in March 2017. Net cash provided by operating activities in 2017 was $12.3 million, an increase of approximately $9.2 million over the prior year. Cash provided by noncapital financing activities decreased by approximately $280 thousand and cash used in capital and related financing activities increased approximately $7.2 million from 2016. The $12.3 million deposit to the state of California associated with a medical office building legal matter contributed to the increase in cash used. Cash provided by investing activities increased approximately $6.5 million in 2017. Included in cash provided by investing activities is proceeds from restricted cash as a result of debt refinancing in March 2017. The District received approximately $1.3 million from the Foundation and Auxiliary during 2017. 2017 Capital Assets During 2017 the District invested approximately $9.2 million in new equipment and building improvements. Major acquisitions during 2017 included the da Vinci robotic surgical system, imaging equipment, several hospital remodel projects and a number of surgical equipment upgrades. Capital lease payments were made timely. More detailed information about the District’s debt is presented in Notes 7 and 8 to the consolidated financial statements. Economic Factors Over the next five years, the District will continue to face challenges in the evolving landscape of the healthcare industry. The industry is moving towards value-based care. As the industry migrates to a value-based system and new entrants force market innovation, the hospital‐focused inpatient utilization rates continue to decline in many areas of the country. Other drivers of lower hospital utilization include focus on decreasing readmission rates, transitioning patients to observation status and increased use of care management teams. Government payers have slowed on spending growth. On top of the 2% sequestration cuts that were put in place in 2013, Medicare is looking for additional ways to cut costs by focusing on quality-based reimbursement models which reward health care providers for their contributions to producing better health and penalizing providers who are not able to improve quality outcomes and reduce readmission rates. The Medicare value-based purchasing program includes measuring process-of-care measures, patient experience measures, patient outcome measures and efficiency measures. The District is working diligently to improve upon these quality metrics which in turn will reduce the risk of reimbursement cuts. On the State level, the Affordable Care Act (ACA) has significantly increased the coverage for the Medi-Cal population which in turn has reduced the amount of uncompensated/self‐pay care for hospitals across the state including the District. Greater use of Medi-Cal managed care is likely to continue with the goals of improved quality and increased savings through reduced use of hospital services.

Tri-City Healthcare District Management’s Discussion and Analysis
As of and for the Years Ended June 30, 2017 and 2016
12
Economic Factors (continued) Despite some of the challenges the hospital is facing from government payers, the District has been actively negotiating its insurance contracts to ensure that it maintains competitive reimbursement rates over the coming years. Furthermore, the District is actively engaged in service line analysis to identify opportunities for growth in profitable services, as well as evaluating unprofitable services for cost improvements, better process efficiencies, and/or elimination of services if need be. Finance Contact The District’s consolidated financial statements are designed to present users with a general overview of the District’s finances and to demonstrate the District’s accountability. If you have any questions about the report or need additional financial information, please contact the Chief Financial Officer, Tri-City Healthcare District, 4002 Vista Way, Oceanside, California 92056.

13 See accompanying notes.
Tri-City Healthcare District Consolidated Statements of Net Position
2017 2016
CURRENT ASSETSCash and cash equivalents 14,959,815$ 11,176,800$ Short-term investments 38,009,731 - Restricted cash and investments 332,000 51,366,000 Patient accounts receivable - net of estimated
uncollectible accounts of $19,182,808 and$18,474,430 in 2017 and 2016, respectively 44,016,641 42,396,754
Other receivables 4,777,119 2,647,024 Supplies inventory 8,590,391 8,479,210 Prepaid expenses and other assets 2,730,021 2,956,557 Estimated third-party payor settlements 1,658,990 230,191
Total current assets 115,074,708 119,252,536
NON-CURRENT INVESTMENTSBoard-designated 395,943 394,050
CAPITAL ASSETS - net 103,649,591 108,306,915
OTHER ASSETSNotes receivable 4,942,714 5,343,659 Restricted mortgage reserve fund 6,550,114 - Other 27,980,386 15,716,139
Total other assets 39,473,214 21,059,798
TOTAL 258,593,456$ 249,013,299$
ASSETS
JUNE 30,

See accompanying notes. 14
Tri-City Healthcare District
Consolidated Statements of Net Position (continued)
2017 2016
CURRENT LIABILITIESAccounts payable and accrued liabilities 41,580,578$ 37,033,841$ Accrued payroll and related expenses 18,079,312 19,824,036 Current maturities of long-term debt 4,146,391 4,151,552 Short-term debt 2,522,076 55,479,469 Other current liabilities 1,488,241 954,751
Total current liabilities 67,816,598 117,443,649
LONG-TERM DEBT - net of current portion 88,091,022 29,463,883
WORKERS' COMPENSATION AND COMPREHENSIVELIABILITY - net of current portion 7,754,520 7,671,667
Total liabilities 163,662,140 154,579,199
NET POSITIONInvested in capital assets - net of related debt 13,376,731 74,691,480 Restricted assets 7,965,983 1,432,253 Unrestricted 73,588,602 18,310,367
Total net position 94,931,316 94,434,100
TOTAL 258,593,456$ 249,013,299$
JUNE 30,
LIABILITIES AND NET POSITION
15 See accompanying notes.
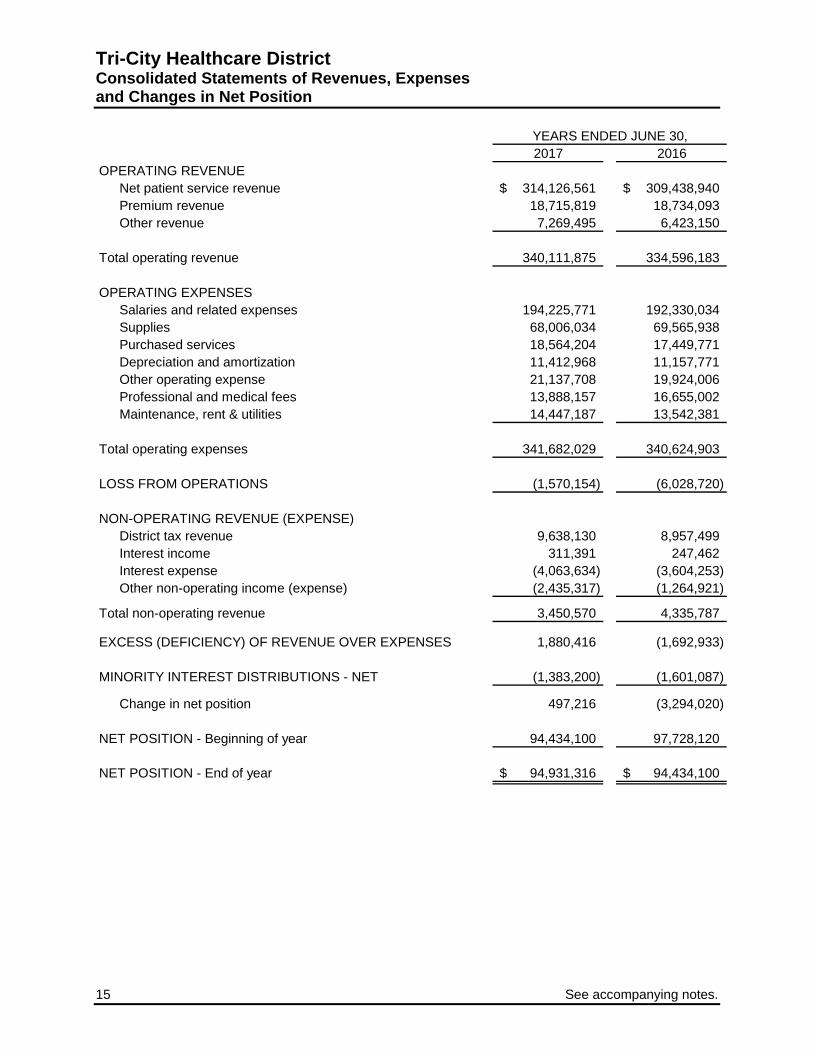
Tri-City Healthcare District Consolidated Statements of Revenues, Expenses and Changes in Net Position
2017 2016OPERATING REVENUE
Net patient service revenue 314,126,561$ 309,438,940$ Premium revenue 18,715,819 18,734,093 Other revenue 7,269,495 6,423,150
Total operating revenue 340,111,875 334,596,183
OPERATING EXPENSESSalaries and related expenses 194,225,771 192,330,034 Supplies 68,006,034 69,565,938 Purchased services 18,564,204 17,449,771 Depreciation and amortization 11,412,968 11,157,771 Other operating expense 21,137,708 19,924,006 Professional and medical fees 13,888,157 16,655,002 Maintenance, rent & utilities 14,447,187 13,542,381
Total operating expenses 341,682,029 340,624,903
LOSS FROM OPERATIONS (1,570,154) (6,028,720)
NON-OPERATING REVENUE (EXPENSE)District tax revenue 9,638,130 8,957,499 Interest income 311,391 247,462 Interest expense (4,063,634) (3,604,253) Other non-operating income (expense) (2,435,317) (1,264,921)
Total non-operating revenue 3,450,570 4,335,787
EXCESS (DEFICIENCY) OF REVENUE OVER EXPENSES 1,880,416 (1,692,933)
MINORITY INTEREST DISTRIBUTIONS - NET (1,383,200) (1,601,087)
Change in net position 497,216 (3,294,020)
NET POSITION - Beginning of year 94,434,100 97,728,120
NET POSITION - End of year 94,931,316$ 94,434,100$
YEARS ENDED JUNE 30,

See accompanying notes. 16
Tri-City Healthcare District Consolidated Statements of Cash Flows
2017 2016
CASH FLOWS FROM OPERATING ACTIVITIESReceipts from patients, insurers, and other payors 327,663,600$ 330,657,290$ Payments to vendors (130,098,606) (140,480,564) Payments for salaries, wages, and related benefits (195,970,495) (193,570,760) Other receipts (payments) 10,706,210 6,454,784
Net cash provided by operating activities 12,300,709 3,060,750
CASH FLOWS FROM NONCAPITAL FINANCING ACTIVITIESMinority interest distributions, net (1,383,200) (1,601,087) Receipt of District taxes 9,638,130 8,957,499 Other non-operating expense (2,235,725) (1,057,076)
Net cash provided by noncapital financing activities 6,019,205 6,299,336
CASH FLOWS FROM CAPITAL AND RELATEDFINANCING ACTIVITIESAcquisition and construction of capital assets (7,249,653) (5,880,765) Medical office building deposit (12,260,667) - Proceeds from revolving line of credit 348,250,484 327,286,467 Principal repayments on revolving line of credit (350,207,877) (328,237,431) Proceeds from debt 85,825,000 956,352 Principal repayments on debt (81,414,613) (4,454,385) Interest payments on debt (4,063,634) (3,604,253)
Net cash used in capital and related financing activities (21,120,960) (13,934,015)
CASH FLOWS FROM INVESTING ACTIVITIESPurchases of short-term investments (46,009,731) - Proceeds from sales of short-term investments 8,000,000 - Proceeds from restricted cash and investments 51,032,107 - Payments to mortgage reserve fund (6,550,114) - Interest on investments 111,799 39,617
Net cash provided by investing activities 6,584,061 39,617
NET CHANGE IN CASH AND CASH EQUIVALENTS 3,783,015 (4,534,312)
CASH AND CASH EQUIVALENTS - Beginning of year 11,176,800 15,711,112
CASH AND CASH EQUIVALENTS - End of year 14,959,815$ 11,176,800$
Capital assets financed with long-term debt and capital lease obligations 1,929,000$ 4,529,271$
YEARS ENDED JUNE 30,
NONCASH INVESTING, CAPITAL, AND FINANCING ACTIVITIES
17 See accompanying notes.
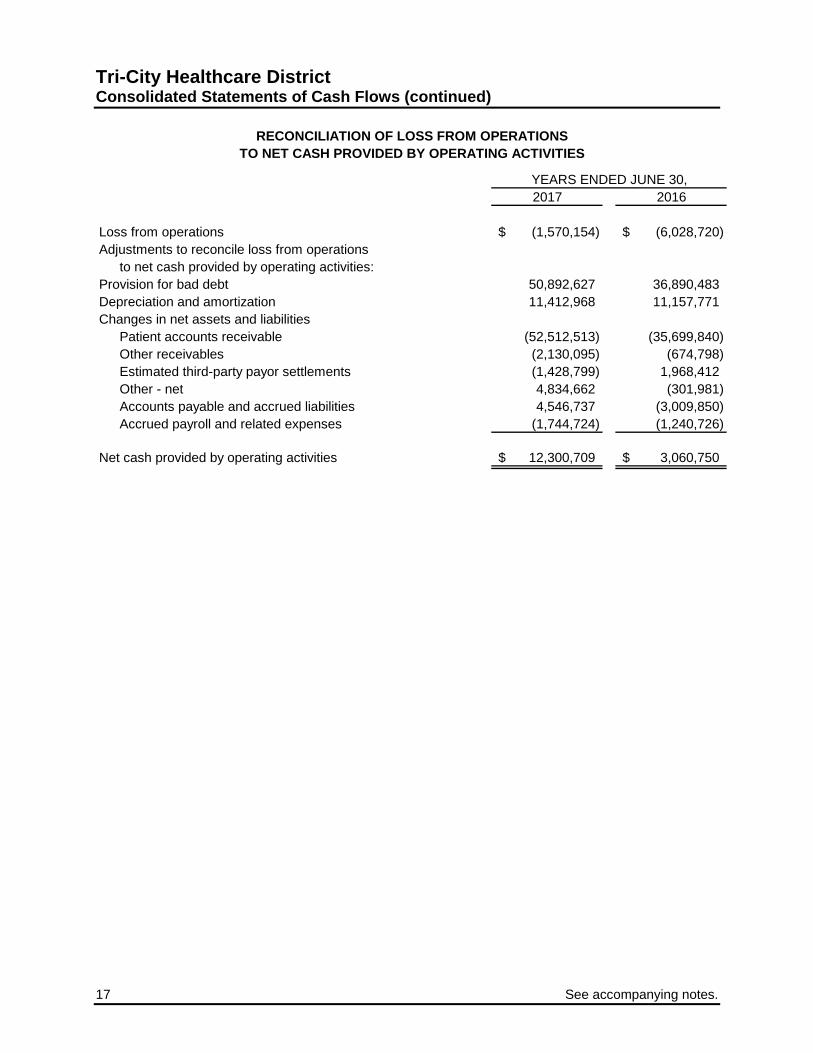
Tri-City Healthcare District Consolidated Statements of Cash Flows (continued)
2017 2016
Loss from operations (1,570,154)$ (6,028,720)$ Adjustments to reconcile loss from operations
to net cash provided by operating activities:Provision for bad debt 50,892,627 36,890,483 Depreciation and amortization 11,412,968 11,157,771 Changes in net assets and liabilities
Patient accounts receivable (52,512,513) (35,699,840) Other receivables (2,130,095) (674,798) Estimated third-party payor settlements (1,428,799) 1,968,412 Other - net 4,834,662 (301,981) Accounts payable and accrued liabilities 4,546,737 (3,009,850) Accrued payroll and related expenses (1,744,724) (1,240,726)
Net cash provided by operating activities 12,300,709$ 3,060,750$
YEARS ENDED JUNE 30,
RECONCILIATION OF LOSS FROM OPERATIONSTO NET CASH PROVIDED BY OPERATING ACTIVITIES
Tri-City Healthcare District
Notes to Consolidated Financial Statements
18
Note 1 – Organization Organization – Tri-City Healthcare District (the “District” or “TCMC”) is a political subdivision of the state of California organized as a special district. The District provides comprehensive medical services at its facility located in Oceanside, California. The consolidated financial statements of the District include the accounts of the District, Tri-City Medical Center ASC Operators, LLC (“ASCO”), North Coast Surgery Center Ltd. (“NCSC”), the Cardiovascular Health Institute, LLC (“CVI”), the Orthopedic Institute, LLC (“Ortho”), the Neuroscience Institute, LLC (“Neuro”), Tri-City Real Estate Holding and Management Co, LLC (“REHM”) and Tri-City Wellness, LLC (“Tri-City Wellness”). ASCO, NCSC, CVI, Ortho, Neuro, REHM and Tri-City Wellness are component units that have been blended for presentation purposes. The District owns a 60% interest in ASCO, which provides management services to NCSC. ASCO owns a 52.8% interest in NCSC. NCSC provides outpatient surgical services to the surrounding communities of Oceanside, California. The District has determined blended presentation is appropriate as it appoints a voting majority of ASCO’s governing body. The District owns 61.4% of CVI, 50% of Ortho and 68% of Neuro. These Institutes were established to align the goals of independent physician practices and specialty services with the goals of the hospital. Key goals are to improve quality outcome reporting and improve financial and operational performance of the respective service lines. The District has determined blended presentation is appropriate for CVI, Ortho, and Neuro as the component units provide services almost entirely to the District. The District owns 99% of REHM. The District has determined blended presentation is appropriate for REHM as management of the District has operational responsibility for REHM. The District owns 99.9% of Tri-City Wellness. The District has determined blended presentation is appropriate for Tri-City Wellness as management of the District has operational responsibility for Tri-City Wellness. All intercompany transactions have been eliminated in the District’s consolidated financial statements. Note 2 – Summary of Significant Accounting Policies Basis of presentation – The consolidated financial statements have been prepared in accordance with the applicable provisions of the American Institute of Certified Public Accountants’ Audit and Accounting Guide, Health Care Organizations, and pronouncements of the Governmental Accounting Standards Board (“GASB”) and the California Code of Regulations, Title 2, Section 1131, State Controller’s Minimum Audit Requirements and Reporting Guidelines for California Special Districts. The District uses proprietary (enterprise) fund accounting. Revenues and expenses are recognized on the accrual basis using the economic resources measurement focus. Accounting estimates – The preparation of consolidated financial statements in conformity with accounting principles generally accepted in the United States of America (“GAAP”) requires management to make estimates that affect the reported amounts of assets and liabilities and disclosure of contingent assets and liabilities at the date of the consolidated financial statements and the reported amounts of revenues and expenses during the reporting period. Actual results may differ from those estimates.

Tri-City Healthcare District Notes to Consolidated Financial Statements
19
Note 2 – Summary of Significant Accounting Policies (continued) Cash equivalents – For purposes of the consolidated financial statements, the District considers highly liquid debt instruments (excluding non-current cash and investments) purchased with a maturity of three months or less to be cash equivalents. Investments – Investments are primarily held in Local Agency Investment Fund (“LAIF”), a highly liquid fund. Deposits and withdrawals can be made daily upon demand without penalty. Investment income is reported in non-operating income (expense) in the consolidated statements of revenues, expenses, and changes in net position. Supplies inventory – Supplies inventory is reported at the lower of cost (first-in, first-out) or market value. Goodwill – Goodwill represents the excess of purchase price of an acquired business over the net tangible and identifiable intangible assets acquired and liabilities assumed in connection with the acquisition of the oncology infusion practice in 2013. At June 30, 2017 and 2016, goodwill associated with this transaction was approximately $4.6 million, which is included in other assets in the consolidated statements of net position. The District evaluates goodwill for impairment at least annually or whenever events or changes in circumstances require an interim impairment assessment. The District compares the fair value of each reporting unit to its carrying amount to determine if there is potential goodwill impairment. If the fair value of a reporting unit is less than its carrying value, an impairment loss is recorded to the extent that the fair value of the goodwill within the reporting unit is less than the carrying value of its goodwill. Management determined that there was no impairment of goodwill as of June 30, 2017 and 2016. Capital assets – Capital assets are recorded at cost. Depreciation is computed using the straight-line method over the estimated useful life of each class of depreciable asset (the shorter of the estimated useful life or the lease term for leasehold improvements) as follows:
Land improvements 15 yearsBuildings and building improvements 10-40 yearsLeasehold improvements 3-15 years
Capital assets are evaluated for impairment when events or changes in circumstances suggest that the service utility of the capital asset may have significantly and unexpectedly declined. Capital assets are considered impaired if both the decline in service utility of the capital asset is large in magnitude and the event or change in circumstance is outside the normal life cycle of the capital asset. Such events or changes in circumstances that may be indicative of impairment include evidence of physical damage, enactment or approval of laws or regulations or other changes in environmental factors, technological changes or evidence of obsolescence, changes in the manner or duration of use of a capital asset, and construction stoppage. The determination of the impairment loss is dependent upon the event or circumstance in which the impairment occurred. Impairment losses, if any, are recorded in the consolidated statements of revenues, expenses, and changes in net position. No impairment losses are recorded in the years ended June 30, 2017 and 2016.

Tri-City Healthcare District
Notes to Consolidated Financial Statements
20
Note 2 – Summary of Significant Accounting Policies (continued) Mortgage reserve fund – A mortgage reserve fund (“MRF”) related to the $85.8 million mortgage is required under the Hospital Regulatory Agreement between the District and HUD. The District makes deposits into the MRF trust account in accordance with the Mortgage Reserve Fund Agreement. Net position – Net position of the District is classified into three components. “Invested in capital assets – net of related debt” consists of capital assets, net of accumulated depreciation and is reduced by the balances of any outstanding borrowing used to finance the purchase or construction of those assets. “Restricted assets” net position represents the net position of ASCO, CVI, Ortho, Neuro, REHM and Tri-City Wellness not owned by the District in the amount of approximately $1.4 million at June 30, 2017 and 2016, as well as mortgage reserve fund deposits required under the Hospital Regulatory Agreement between the District and HUD in the amount of approximately $6.6 million at June 30, 2017. “Unrestricted” net position is the remaining net position that does not meet the definition of invested in capital assets – net of related debt or restricted assets. Grants and contributions – From time to time, the District receives grants and contributions from individuals or private organizations. Revenues from grants and contributions (including contributions of capital assets) are recognized when all eligibility requirements, including time requirements are met. Grants and contributions may be restricted for either specific operating purposes or for capital purposes. Amounts that are unrestricted or that are restricted to a specific operating purpose are reported as non-operating revenues. Amounts restricted to capital acquisitions are reported after non-operating revenues and expenses. Operating revenues and expenses – The District’s consolidated statements of revenues, expenses, and changes in net position distinguish between operating and non-operating revenues and expenses. Operating revenues result from exchange transactions associated with providing health care services – the District’s principal activity. Operating expenses include all expenses incurred to directly provide health care services. Non-operating income and expenses consist of those revenues and expenses that result from non-exchange transactions, such as District taxes, financing costs, interest expense, and investment income. Net patient service revenue – Net patient service revenue is reported at the estimated net realizable amounts from patients, third-party payers, and others for services rendered, including estimated retroactive adjustments under reimbursement agreements with third-party payers. Retroactive adjustments are accrued on an estimated basis in the period the related services are rendered and adjusted in future periods as final settlements are determined. The District estimates net collectible accounts receivable and the corresponding impact on net patient services revenue by applying historical collection realization percentages to outstanding gross accounts receivable by payor class. Normal estimation differences between subsequent cash collections on patient accounts receivable and net patient accounts receivable estimated in the prior year are reported as adjustments to net patient service revenue during the collection period.

Tri-City Healthcare District Notes to Consolidated Financial Statements
21
Note 2 – Summary of Significant Accounting Policies (continued) Premium revenue – The District has agreements with various health maintenance organizations (“HMOs”) to provide medical services to subscribing participants. Under these agreements, the District receives monthly capitation payments based on the number of each HMO’s participants, regardless of services actually performed by the District. The District recognizes premium revenue in the period the District is obligated to provide services, which is generally in the month capitation payments are received. In addition, the HMOs make fee-for-service payments to the District for certain covered services based upon discounted fee schedules. Under some of these agreements, the District also participates in shared-risk pools with medical groups, through which it could receive additional reimbursement or pay additional amounts to the medical groups. In conjunction with the risk pools, the District estimates incurred but not reported (“IBNR”) claims for medical services provided to patients at other facilities. See Note 13 – Commitments and Contingencies. IBNR liabilities of approximately $4.2 million and $1.5 million are included in accounts payable and accrued liabilities in the accompanying consolidated statements of net position as of June 30, 2017 and 2016, respectively. Property taxes – The District receives financial support from property taxes. These funds are used to support operations. Property taxes are levied annually by the County of San Diego (the “County”) on behalf of the District and are intended to finance the District’s activities. The County’s fiscal year is from July 1 through June 30. Amounts of tax levied are based on assessed property values as of the first day of January proceeding the fiscal year for which the taxes are levied. See Note 3 – Non-operating Revenue. Income taxes – The District is a governmental subdivision of the state of California and is exempt from federal income and state franchise taxes. Risk management – The District is exposed to various risks of loss from torts; theft of, damage to, and destruction of assets; business interruption; errors and omissions; employee injuries and illnesses; natural disasters; and employee health, dental, and accident benefits. Commercial insurance coverage is purchased for claims arising from such matters. The District is self-insured for a portion of its exposure to risk of loss from workers’’ compensation and malpractice claims. Annual estimated provisions are accrued based on actuarially determined amounts and includes an estimate of the ultimate costs for both reported claims and claims incurred but not yet reported. Compensated absences – The District’s benefits-eligible employees earn vacation leave at varying rates based upon qualifying-service hours. Employees may accumulate vacation leave up to a specified maximum. Accrued vacation leave is paid to the employee upon termination of employment or upon conversion to non-benefits-eligible status. The estimated amount of vacation leave payable to employees of approximately $8.8 million and $9.4 million as of June 30, 2017 and 2016, respectively, is reported as a current liability within accrued payroll and related expenses in the accompanying consolidated statements of net position. Sick time is also earned at a specific rate per qualified-service hour. However, no payment is made for accrued sick time when employment is terminated.

Tri-City Healthcare District
Notes to Consolidated Financial Statements
22
Note 3 – Patient Service Revenue, Third-Party Reimbursement Programs and Non-Operating Revenue The District renders services to patients under contractual arrangements with the Medicare and Medi-Cal programs and various HMOs and preferred provider organizations (“PPOs”). The Medicare program generally pays the District a prospectively determined rate per discharge for services rendered to Medicare inpatients. Additionally, Medicare reimburses the District for certain capital related costs and psychiatric services on the basis of costs incurred. The District is reimbursed for hospital inpatient services provided to Medi-Cal beneficiaries based upon Diagnosis Related Groups (“DRGs”), excluding rehabilitative services and behavioral health services. Rehabilitative services and behavioral health services are reimbursed on a per diem basis. Revenue from the Medicare and Medi-Cal programs accounted for approximately 66% and 65% of the District’s gross patient service revenue for the years ended June 30, 2017 and 2016, respectively. The District participates in the IGT program, which reimburses the District for a portion of the difference between the cost of treating Medi-Cal patients and the amount reimbursed through a pre-existing Medi-Cal contract. The District recognizes revenue from the IGT program when certainty of receiving the funds is assured. The District participates in PRIME, a pay-for-performance Medi-Cal program in which California’s public health care systems and District and Municipal Hospitals are using evidence-based quality improvement methods to achieve performance targets and improve health outcomes for patients. All funding for this program is contingent on meeting these targets and demonstrating continued improvement. The District is reimbursed for serving a disproportionate share of low income patients, reimbursable Medicare bad debt and certain other items at a tentative rate with final settlement determined after the District's submission of annual cost reports and audits thereof by State and Federal agencies and their intermediaries. Cost reports for the Medicare programs have been final settled for all years through 2013. Results of cost report settlements, as well as the District's estimates for settlements, of all fiscal years through 2017 are reflected in the accompanying consolidated financial statements. Estimated net third-party settlements consisted of a net receivable of approximately $1.7 million and $230 thousand as of June 30, 2017 and 2016, respectively. During years 2017 and 2016, the District settled various prior-year cost reports, appeal issues and adjusted prior-year settlement estimates. Prior year settlements and changes in estimates resulted in approximately $1.5 million and $2.8 million of additional net patient service revenue in the years ended June 30, 2017 and 2016, respectively, and are included in net patient service revenue in the accompanying consolidated statements of revenue, expenses, and changes in net position. The District has also entered into payment agreements with certain commercial insurance carriers, HMOs, and PPOs. The basis for payment to the District under these agreements includes prospectively determined rates per discharge, discounts from established charges, and prospectively determined daily rates.
Tri-City Healthcare District Notes to Consolidated Financial Statements
23
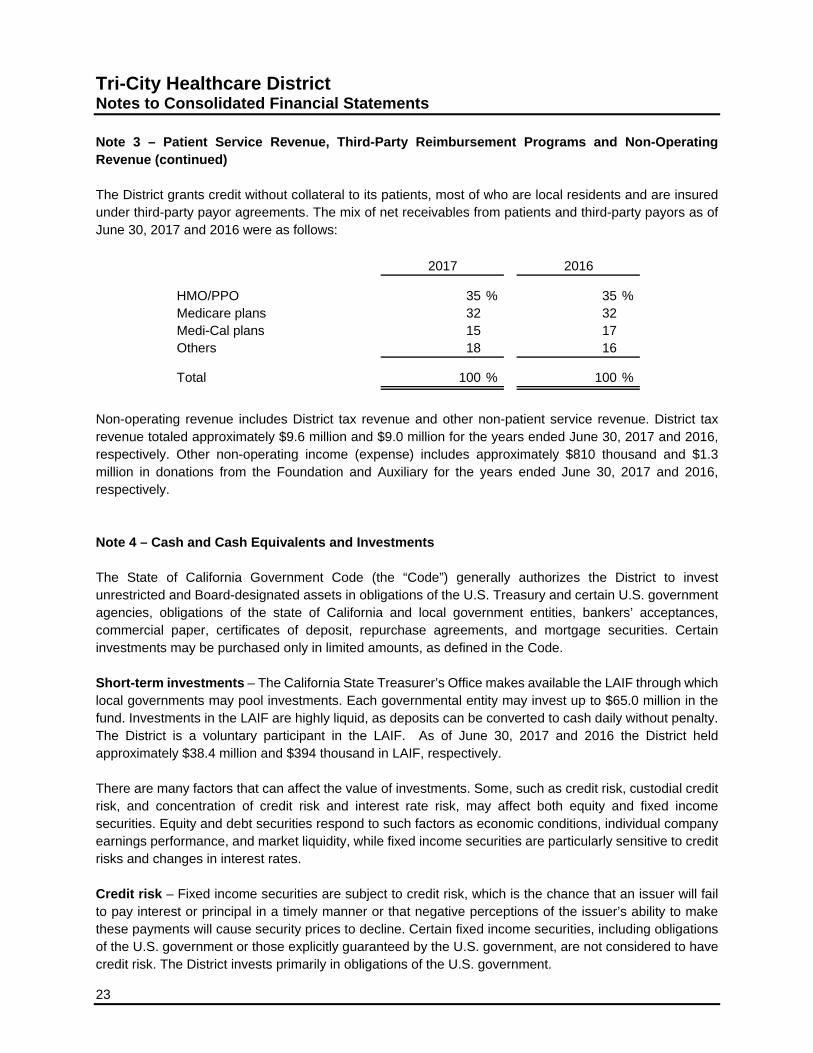
Note 3 – Patient Service Revenue, Third-Party Reimbursement Programs and Non-Operating Revenue (continued) The District grants credit without collateral to its patients, most of who are local residents and are insured under third-party payor agreements. The mix of net receivables from patients and third-party payors as of June 30, 2017 and 2016 were as follows:
HMO/PPO 35 % 35 %Medicare plans 32 32Medi-Cal plans 15 17Others 18 16
Total 100 % 100 %
20162017
Non-operating revenue includes District tax revenue and other non-patient service revenue. District tax revenue totaled approximately $9.6 million and $9.0 million for the years ended June 30, 2017 and 2016, respectively. Other non-operating income (expense) includes approximately $810 thousand and $1.3 million in donations from the Foundation and Auxiliary for the years ended June 30, 2017 and 2016, respectively. Note 4 – Cash and Cash Equivalents and Investments The State of California Government Code (the “Code”) generally authorizes the District to invest unrestricted and Board-designated assets in obligations of the U.S. Treasury and certain U.S. government agencies, obligations of the state of California and local government entities, bankers’ acceptances, commercial paper, certificates of deposit, repurchase agreements, and mortgage securities. Certain investments may be purchased only in limited amounts, as defined in the Code. Short-term investments – The California State Treasurer’s Office makes available the LAIF through which local governments may pool investments. Each governmental entity may invest up to $65.0 million in the fund. Investments in the LAIF are highly liquid, as deposits can be converted to cash daily without penalty. The District is a voluntary participant in the LAIF. As of June 30, 2017 and 2016 the District held approximately $38.4 million and $394 thousand in LAIF, respectively. There are many factors that can affect the value of investments. Some, such as credit risk, custodial credit risk, and concentration of credit risk and interest rate risk, may affect both equity and fixed income securities. Equity and debt securities respond to such factors as economic conditions, individual company earnings performance, and market liquidity, while fixed income securities are particularly sensitive to credit risks and changes in interest rates. Credit risk – Fixed income securities are subject to credit risk, which is the chance that an issuer will fail to pay interest or principal in a timely manner or that negative perceptions of the issuer’s ability to make these payments will cause security prices to decline. Certain fixed income securities, including obligations of the U.S. government or those explicitly guaranteed by the U.S. government, are not considered to have credit risk. The District invests primarily in obligations of the U.S. government.

Tri-City Healthcare District
Notes to Consolidated Financial Statements
24
Note 4 – Cash and Cash Equivalents and Investments (continued) Concentration of credit risk – Concentration of credit risk is the risk associated with a lack of diversification, such as having substantial investments in a few individual issuers, thereby exposing the District to greater risks resulting from adverse economic, political, regulatory, geographic, or credit developments. Investments issued or guaranteed by the U.S. government and investments in external investment pools, such as LAIF, are not considered subject to concentration of credit risk. In accordance with state law, no more than 5% of total investments may be invested in the securities of any one issuer, except obligations of the U.S. government, no more than 10% may be invested in any one mutual fund, and no more than 30% may be invested in bankers’ acceptances of any one commercial bank. The District’s investment in LAIF is not rated by a nationally recognized statistical rating organization since amounts invested in LAIF are protected by certain statutes. Custodial credit risk – deposits – Custodial credit risk is the risk that in the event of a bank failure, the District’s deposits may not be returned to it. The District does not have a policy for custodial credit risk. As of June 30, 2017 and 2016, the District’s bank balances totaled approximately $15.3 million and $62.5 million, respectively, and were not exposed to custodial credit risk, as the uninsured deposits are with financial institutions which are individually required by state law to have government deposits collateralized at a rate of 110% of the deposits. Such collateral is considered to be held in the District’s name. Custodial credit risk – investments – District policy requires that all investments be insured or registered, or be held by the District’s agent in the agent’s nominee name, with subsidiary records listing the District as the legal owner. For these reasons, the District is not exposed to custodial credit risk for its investments. The carrying amount of cash and investments are included in the following statements of net position captions at June 30:
2017 2016
Cash and cash equivalents 14,959,815$ 11,176,800$ Short-term investments 38,009,731 - Restricted cash and investments
Nonnegotiable certificates of deposit 332,000 51,366,000 Board-designated 395,943 394,050
Total 53,697,489$ 62,936,850$
Tri-City Healthcare District Notes to Consolidated Financial Statements
25
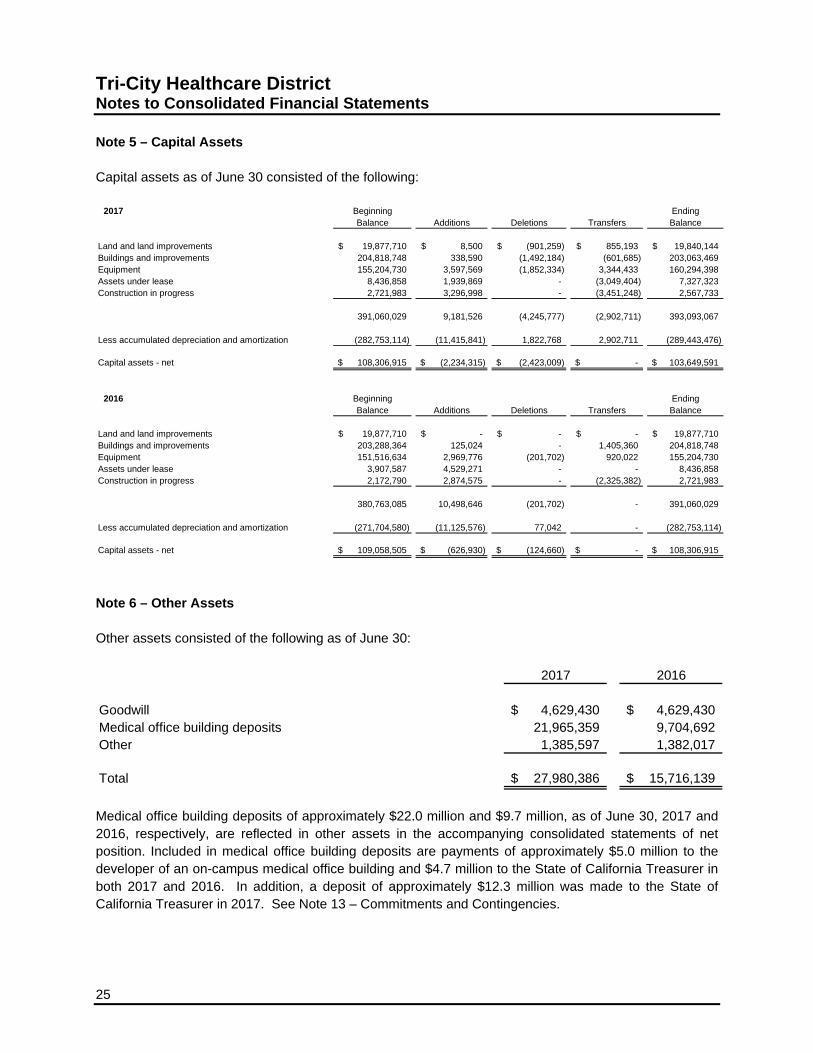
Note 5 – Capital Assets Capital assets as of June 30 consisted of the following:
2017 Beginning EndingBalance Additions Deletions Transfers Balance
Land and land improvements 19,877,710$ 8,500$ (901,259)$ 855,193$ 19,840,144$ Buildings and improvements 204,818,748 338,590 (1,492,184) (601,685) 203,063,469 Equipment 155,204,730 3,597,569 (1,852,334) 3,344,433 160,294,398 Assets under lease 8,436,858 1,939,869 - (3,049,404) 7,327,323 Construction in progress 2,721,983 3,296,998 - (3,451,248) 2,567,733
391,060,029 9,181,526 (4,245,777) (2,902,711) 393,093,067
Less accumulated depreciation and amortization (282,753,114) (11,415,841) 1,822,768 2,902,711 (289,443,476)
Capital assets - net 108,306,915$ (2,234,315)$ (2,423,009)$ -$ 103,649,591$
2016 Beginning EndingBalance Additions Deletions Transfers Balance
Land and land improvements 19,877,710$ -$ -$ -$ 19,877,710$ Buildings and improvements 203,288,364 125,024 - 1,405,360 204,818,748 Equipment 151,516,634 2,969,776 (201,702) 920,022 155,204,730 Assets under lease 3,907,587 4,529,271 - - 8,436,858 Construction in progress 2,172,790 2,874,575 - (2,325,382) 2,721,983
380,763,085 10,498,646 (201,702) - 391,060,029
Less accumulated depreciation and amortization (271,704,580) (11,125,576) 77,042 - (282,753,114)
Capital assets - net 109,058,505$ (626,930)$ (124,660)$ -$ 108,306,915$
Note 6 – Other Assets Other assets consisted of the following as of June 30:
2017 2016
Goodwill 4,629,430$ 4,629,430$ Medical office building deposits 21,965,359 9,704,692 Other 1,385,597 1,382,017
Total 27,980,386$ 15,716,139$
Medical office building deposits of approximately $22.0 million and $9.7 million, as of June 30, 2017 and 2016, respectively, are reflected in other assets in the accompanying consolidated statements of net position. Included in medical office building deposits are payments of approximately $5.0 million to the developer of an on-campus medical office building and $4.7 million to the State of California Treasurer in both 2017 and 2016. In addition, a deposit of approximately $12.3 million was made to the State of California Treasurer in 2017. See Note 13 – Commitments and Contingencies.
Tri-City Healthcare District
Notes to Consolidated Financial Statements
26
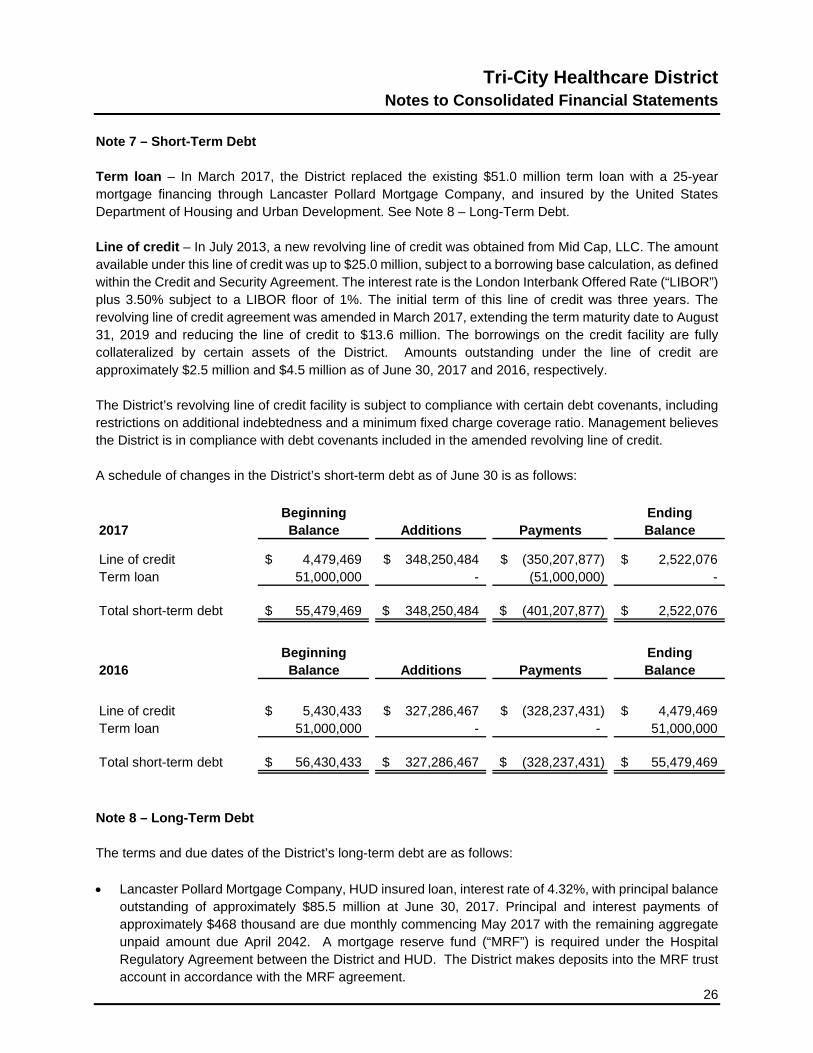
Note 7 – Short-Term Debt Term loan – In March 2017, the District replaced the existing $51.0 million term loan with a 25-year mortgage financing through Lancaster Pollard Mortgage Company, and insured by the United States Department of Housing and Urban Development. See Note 8 – Long-Term Debt. Line of credit – In July 2013, a new revolving line of credit was obtained from Mid Cap, LLC. The amount available under this line of credit was up to $25.0 million, subject to a borrowing base calculation, as defined within the Credit and Security Agreement. The interest rate is the London Interbank Offered Rate (“LIBOR”) plus 3.50% subject to a LIBOR floor of 1%. The initial term of this line of credit was three years. The revolving line of credit agreement was amended in March 2017, extending the term maturity date to August 31, 2019 and reducing the line of credit to $13.6 million. The borrowings on the credit facility are fully collateralized by certain assets of the District. Amounts outstanding under the line of credit are approximately $2.5 million and $4.5 million as of June 30, 2017 and 2016, respectively. The District’s revolving line of credit facility is subject to compliance with certain debt covenants, including restrictions on additional indebtedness and a minimum fixed charge coverage ratio. Management believes the District is in compliance with debt covenants included in the amended revolving line of credit. A schedule of changes in the District’s short-term debt as of June 30 is as follows:
Beginning Ending2017 Balance Additions Payments Balance
Line of credit 4,479,469$ 348,250,484$ (350,207,877)$ 2,522,076$ Term loan 51,000,000 - (51,000,000) -
Total short-term debt 55,479,469$ 348,250,484$ (401,207,877)$ 2,522,076$
Beginning Ending2016 Balance Additions Payments Balance
Line of credit 5,430,433$ 327,286,467$ (328,237,431)$ 4,479,469$ Term loan 51,000,000 - - 51,000,000
Total short-term debt 56,430,433$ 327,286,467$ (328,237,431)$ 55,479,469$
Note 8 – Long-Term Debt The terms and due dates of the District’s long-term debt are as follows:
• Lancaster Pollard Mortgage Company, HUD insured loan, interest rate of 4.32%, with principal balance
outstanding of approximately $85.5 million at June 30, 2017. Principal and interest payments of approximately $468 thousand are due monthly commencing May 2017 with the remaining aggregate unpaid amount due April 2042. A mortgage reserve fund (“MRF”) is required under the Hospital Regulatory Agreement between the District and HUD. The District makes deposits into the MRF trust account in accordance with the MRF agreement.

Tri-City Healthcare District Notes to Consolidated Financial Statements
27
Note 8 – Long-Term Debt (continued)
• Bank of the West note payable, interest rate of 2.91%, with principal balance outstanding of approximately $99 thousand and $294 thousand at June 30, 2017 and 2016, respectively. Principal and interest payments of approximately $17 thousand are due monthly commencing January 2013 with the remaining aggregate unpaid amount due December 2017. The note is collateralized by certain capital assets of the District.
• Bank of the West note payable, interest rate of 2.95%, with principal balance outstanding of
approximately $331 thousand and $682 thousand at June 30, 2017 and 2016, respectively. Principal and interest payments of approximately $30 thousand are due monthly commencing June 2015 with the remaining aggregate unpaid amount due May 2018. The note is collateralized by certain capital assets of the District.
• Bank of the West note payable, interest rate of 3.12%, with principal balance outstanding of
approximately $951 thousand and $1.4 million at June 30, 2017 and 2016, respectively. Principal and interest payments of approximately $39 thousand are due monthly commencing July 2016 with the remaining aggregate unpaid amount due June 2019. The note is collateralized by certain capital assets of the District.
• Various capital equipment leases with interest rates varying between 2.31% and 5.22%. Principal and
interest payments due monthly commencing various dates and expiring on various dates ranging from January 2019 through June 2022. Principal balances due totaled approximately $5.4 million and $4.5 million as of June 30, 2017 and 2016, respectively.
A schedule of changes in the District’s long-term debt (including current portion) as of June 30 is as follows:
Beginning Ending Due Within2017 Balance Additions Payments Balance 1 Year
Lancaster (HUD) mortgage debt -$ 85,825,000$ (319,268)$ 85,505,732$ 1,964,553$ Bank of the West notes payable 2,551,019 - (1,170,075) 1,380,944 878,962 REHM notes payable 1,320,833 - (1,320,833) - - Wellness Center term loan 25,228,895 - (25,228,896) - -
Total long-term debt 29,100,747 85,825,000 (28,039,072) 86,886,676 2,843,515
Capital lease obligations 4,514,688 1,929,000 (1,092,951) 5,350,737 1,302,876
Total long-term debt 33,615,435$ 87,754,000$ (29,132,023)$ 92,237,413$ 4,146,391$
Beginning Ending Due Within2016 Balance Additions Payments Balance 1 Year
Bank of the West notes payable 1,950,189$ 1,349,638$ (748,808)$ 2,551,019$ 1,206,924$ REHM notes payable 1,470,833 - (150,000) 1,320,833 1,320,833 Wellness Center term loan 25,705,440 - (476,545) 25,228,895 511,960 Promissory note payable (infusion) 1,027,775 - (1,027,775) - -
Total long-term debt 30,154,237 1,349,638 (2,403,128) 29,100,747 3,039,717
Capital lease obligations 1,424,780 4,132,130 (1,042,222) 4,514,688 1,111,835
Total long-term debt 31,579,017$ 5,481,768$ (3,445,350)$ 33,615,435$ 4,151,552$
Tri-City Healthcare District
Notes to Consolidated Financial Statements
28
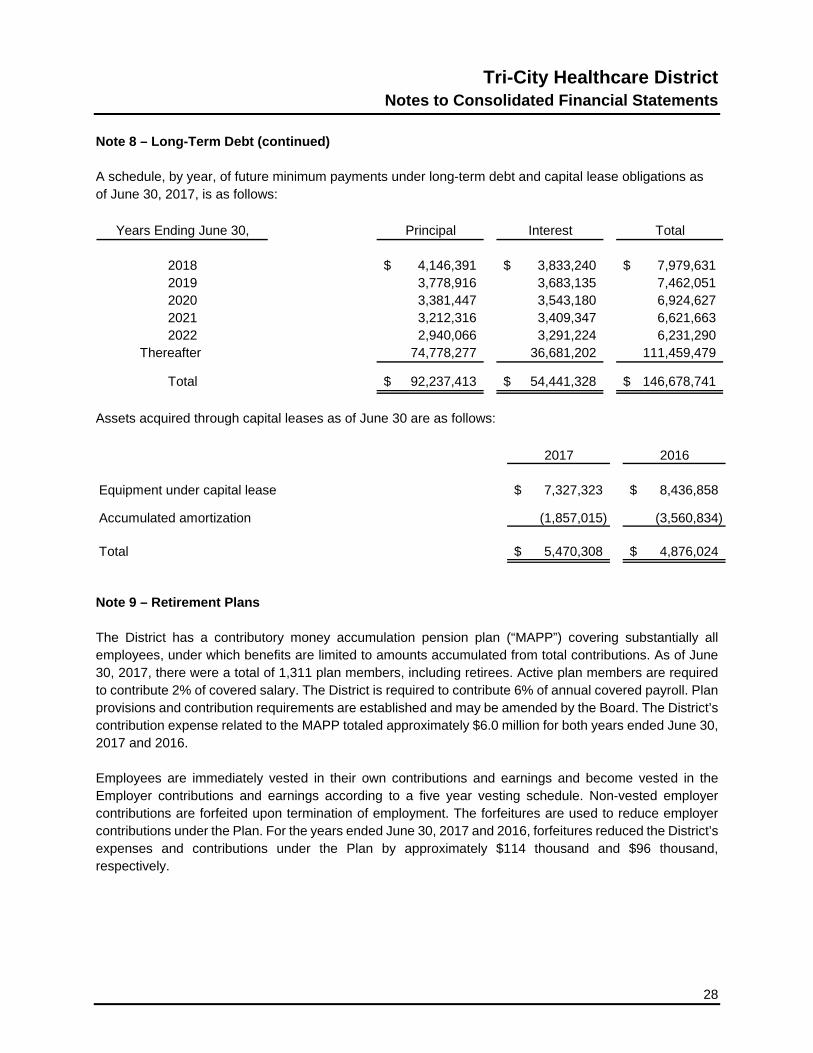
Note 8 – Long-Term Debt (continued) A schedule, by year, of future minimum payments under long-term debt and capital lease obligations as of June 30, 2017, is as follows:
Principal Interest Total
4,146,391$ 3,833,240$ 7,979,631$ 3,778,916 3,683,135 7,462,051 3,381,447 3,543,180 6,924,627 3,212,316 3,409,347 6,621,663 2,940,066 3,291,224 6,231,290
Thereafter 74,778,277 36,681,202 111,459,479
92,237,413$ 54,441,328$ 146,678,741$
2022
Total
Years Ending June 30,
2018201920202021
Assets acquired through capital leases as of June 30 are as follows:
2017 2016
Equipment under capital lease 7,327,323$ 8,436,858$
Accumulated amortization (1,857,015) (3,560,834)
Total 5,470,308$ 4,876,024$
Note 9 – Retirement Plans The District has a contributory money accumulation pension plan (“MAPP”) covering substantially all employees, under which benefits are limited to amounts accumulated from total contributions. As of June 30, 2017, there were a total of 1,311 plan members, including retirees. Active plan members are required to contribute 2% of covered salary. The District is required to contribute 6% of annual covered payroll. Plan provisions and contribution requirements are established and may be amended by the Board. The District’s contribution expense related to the MAPP totaled approximately $6.0 million for both years ended June 30, 2017 and 2016. Employees are immediately vested in their own contributions and earnings and become vested in the Employer contributions and earnings according to a five year vesting schedule. Non-vested employer contributions are forfeited upon termination of employment. The forfeitures are used to reduce employer contributions under the Plan. For the years ended June 30, 2017 and 2016, forfeitures reduced the District’s expenses and contributions under the Plan by approximately $114 thousand and $96 thousand, respectively.
Tri-City Healthcare District Notes to Consolidated Financial Statements
29
Note 9 – Retirement Plans (continued) Since 1983, the District has sponsored a retirement plan, the Tri-City Healthcare District National Security Retirement Program (“NSRP”), an alternative to the U.S. Social Security system. NSRP is administered by an insurance company and provides retirement and survivorship benefits. As a condition of participation, each employee makes contributions to NSRP. The District contributed 4.5% of each participating employee’s annual compensation up to approximately $85 thousand and $79 thousand for the years ended June 30, 2017 and 2016, respectively. The District’s contributions to NSRP totaled approximately $2.4 million and $2.6 million for the years ended June 30, 2017 and 2016, respectively. Effective January 1, 1992, the District provided its employees with the option of remaining in the NSRP program or transferring to the U.S. Social Security system. Statutes authorize NSRP to invest in group or individual insurance or annuity contracts or other funding vehicles as approved by the District’s Board. Contributions to NSRP are deposited in one or more investment options as elected by the individual participant or in the qualified default investment alternative if no election is made. The District also offers its employees a deferred compensation plan created in accordance with Internal Revenue Code Section 457. Employees who elect to participate in the plan make contributions through a reduction in salary. All employee contributions are invested by a funding agency selected by the District. The investments of the NSRP retirement plan and the Section 457 deferred compensation plan and earnings thereon are held by fiduciaries in trust for the benefit of the employees. The NSRP and the Section 457 deferred compensation plan assets are not subject to the claims of the District’s general creditors. Accordingly, the plans’ assets and the related liabilities are excluded from the accompanying consolidated statements of net position as of June 30, 2017 and 2016. The District maintains a tax-deferred capital accumulation account for certain management personnel under which the District has contributed funds to mutual fund investments as directed by the participants. The contributions vest over a period of no less than two years. As of June 30, 2017 and 2016, the balance of capital accumulation funds was approximately $334 thousand and $226 thousand, respectively, which is included in other long-term assets on the accompanying, consolidated statements of net position. The corresponding compensation liabilities of approximately $388 thousand and $226 thousand as of June 30, 2017 and 2016, respectively, are included in accrued payroll and related expenses on the accompanying consolidated statements of net position. The plan assets remain the property of the District until paid or made available to participants, subject only to claims of the District’s general creditors.

Tri-City Healthcare District
Notes to Consolidated Financial Statements
30
Note 10 – Operating Leases The District leases certain building space and equipment under non-cancelable operating leases expiring between August 2017 and October 2022. Operating lease expense for all operating leases totaled approximately $3.1 million and $3.2 million for the years ended June 30, 2017 and 2016, respectively. As of June 30, 2017, future minimum lease payments under non-cancelable operating leases are as follows:
3,183,224$ 2,152,697 1,292,119
591,931 345,313 86,879
7,652,163$
Thereafter
Total
Years Ending June 30,
20182019202020212022
Note 11 – Related Organizations Tri-City Hospital Foundation (the “Foundation”) and Tri-City Hospital Auxiliary (the “Auxiliary”) are California nonprofit corporations organized to benefit the District. Both the Foundation and the Auxiliary have bylaws that govern their separate activities, and the Board members and officers of each of the two organizations are selected solely by the members themselves. Donations to the District by the Foundation totaled approximately $1.2 million in both years ended June 30, 2017 and 2016. The Auxiliary donated $120 thousand and $36 thousand in the years ended June 30, 2017 and 2016, respectively. The District pays salaries and related costs for employees of the Foundation, provides facilities for the Auxiliary gift shop, and provides administrative office space to both organizations free of charge. Such costs totaled approximately $753 thousand and $726 thousand in the years ended June 30, 2017 and 2016, respectively.

Tri-City Healthcare District Notes to Consolidated Financial Statements
31
Note 11 – Related Organizations (continued) A summary of the organizations’ assets, liabilities and net assets (unaudited) as of June 30 is as follows:
2017 2016Tri-City Hospital Foundation
Assets 4,081,147$ 4,042,264$
Liabilities 102,535$ 211,650$
Net Assets 3,978,612$ 3,830,614$
Tri-City Hospital Auxiliary
Assets 505,515$ 568,585$
Liabilities 4,991$ 3,659$
Net Assets 500,524$ 564,926$
Note 12 – Partnerships During the year ended June 30, 2010, the District entered into a general partnership with Surgical Care Affiliates of Oceanside to form Tri-City Medical Center ASCO, LLC. The partnership acquired controlling interest in NCSC, a partnership between ASCO, and several limited partners, primarily physicians. The primary purpose of the District’s involvement in the venture is to relocate lower acuity out-patient surgeries to the surgery center in order to free up surgical suite time for surgeries requiring hospital surgical services. The financial results of ASCO have been consolidated into the District’s consolidated financial statements. Also during the year ended June 30, 2010, the District formed CVI, LLC. The purpose of CVI is to further the District’s mission and commitment to promote cardiovascular health and provide quality heart and vascular services for the residents of the District. The District and CVI entered into a co-management agreement under which CVI provides certain services to meet this mission. During the year ended June 30, 2011, the District formed Ortho, LLC. The purpose of Ortho is to further the District’s mission and commitment to promote orthopedic health and provide quality surgical, non-invasive and rehabilitation services for the residents of the District. The District and Ortho entered into a co-management agreement under which Ortho provides certain services to meet this mission. During the year ended June 30, 2012, the District formed Tri-City REHM, LLC. The purpose of the REHM is to facilitate the acquisition and use of real estate properties to promote the District’s mission. During the year ended June 30, 2015, the District formed Tri-City Wellness, LLC, a California Limited Liability Company to purchase the Wellness Center which the District had previously operated under a capital lease.

Tri-City Healthcare District
Notes to Consolidated Financial Statements
32
Note 12 – Partnerships (continued) During the year ended June 30, 2015, the District formed the Tri-City Medical Center Neuroscience Institute, LLC (“Neuro”), a California Limited Liability Company. The purpose of the Neuro Institute is to further the District’s mission and commitment to promote neuroscience health and provide quality neurological, neurosurgical and non-invasive services for the residents of the District. The District and the Neuro Institute, entered into a co-management agreement under which the Neuro Institute provides certain services to meet this mission. The portion of consolidated excess of revenues over expenses attributable to minority interests in these entities for both years ended June 30, 2017 and 2016 is approximately $1.4 million. Note 13 – Commitments and Contingencies Legal actions – The District is involved in various legal matters arising from time to time in the ordinary course of business. The District is exposed to various risks of loss from torts; theft of, damage to, and destruction of assets; business interruption; errors and omissions; natural disasters; and employee health and accident benefits. Commercial insurance coverage is purchased for claims arising from such matters. In April 2014, the District commenced eminent domain proceedings against the developer of an on- campus medical office building seeking to maintain a condemnation action under which it took possession of the medical office building. The developer filed a complaint against the District and District filed a cross complaint. In June 2016, the jury returned a verdict against the District awarding approximately $2.9 million in damages for breach of good faith and dealing under a related lease agreement. In addition, under the condemnation action, the jury determined the value of the ground lease to be $16.8 million. The District deposited $4.7 million in 2015 and an additional $12.3 million in 2017 related to the verdict (see Note 6) and has not recorded a liability regarding this legal matter as of June 30, 2017. The District has appealed the jury verdict and the ultimate financial impact remains uncertain. Seismic compliance – The California Office of Statewide Health Planning and Development (“OSHPD”) has revised its SB 1953 compliance standards by considering the HAZUS zones (FEMA Hazards – U.S.) in which each hospital is located. Under these revised HAZUS standards, it is expected that many acute care facilities throughout the state may be required to perform less seismic retrofit than originally expected, or none at all. Based on a waiver granted to the District by OSHPD during 2009, the District’s buildings are considered in compliance with all SB 1953 requirements to the year 2030. Self-insurance programs – The District is self-insured for unemployment benefits and dental PPO benefits.
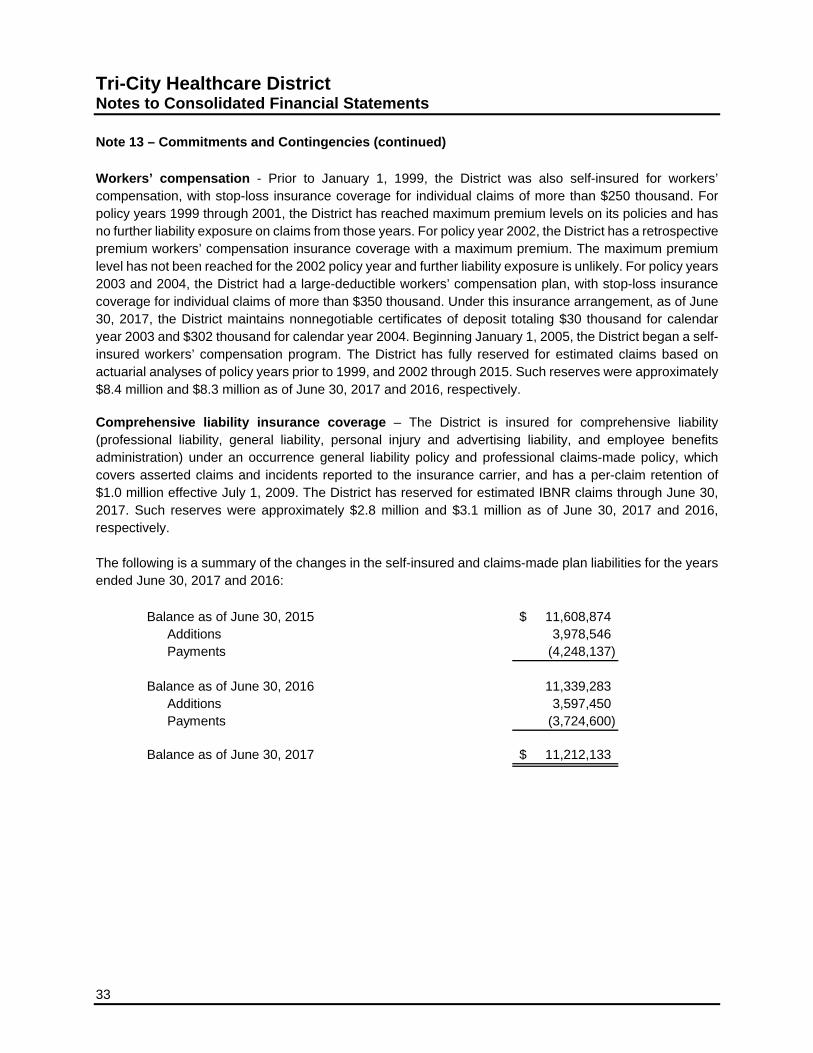
Tri-City Healthcare District Notes to Consolidated Financial Statements
33
Note 13 – Commitments and Contingencies (continued) Workers’ compensation - Prior to January 1, 1999, the District was also self-insured for workers’ compensation, with stop-loss insurance coverage for individual claims of more than $250 thousand. For policy years 1999 through 2001, the District has reached maximum premium levels on its policies and has no further liability exposure on claims from those years. For policy year 2002, the District has a retrospective premium workers’ compensation insurance coverage with a maximum premium. The maximum premium level has not been reached for the 2002 policy year and further liability exposure is unlikely. For policy years 2003 and 2004, the District had a large-deductible workers’ compensation plan, with stop-loss insurance coverage for individual claims of more than $350 thousand. Under this insurance arrangement, as of June 30, 2017, the District maintains nonnegotiable certificates of deposit totaling $30 thousand for calendar year 2003 and $302 thousand for calendar year 2004. Beginning January 1, 2005, the District began a self-insured workers’ compensation program. The District has fully reserved for estimated claims based on actuarial analyses of policy years prior to 1999, and 2002 through 2015. Such reserves were approximately $8.4 million and $8.3 million as of June 30, 2017 and 2016, respectively. Comprehensive liability insurance coverage – The District is insured for comprehensive liability (professional liability, general liability, personal injury and advertising liability, and employee benefits administration) under an occurrence general liability policy and professional claims-made policy, which covers asserted claims and incidents reported to the insurance carrier, and has a per-claim retention of $1.0 million effective July 1, 2009. The District has reserved for estimated IBNR claims through June 30, 2017. Such reserves were approximately $2.8 million and $3.1 million as of June 30, 2017 and 2016, respectively. The following is a summary of the changes in the self-insured and claims-made plan liabilities for the years ended June 30, 2017 and 2016:
Balance as of June 30, 2015 11,608,874$ Additions 3,978,546 Payments (4,248,137)
Balance as of June 30, 2016 11,339,283 Additions 3,597,450 Payments (3,724,600)
Balance as of June 30, 2017 11,212,133$

Tri-City Healthcare District
Notes to Consolidated Financial Statements
34
Note 13 – Commitments and Contingencies (continued) Medical services IBNR – The following is a summary of the changes in the medical services IBNR claims for the years ended June 30, 2017 and 2016:
Balance as of June 30, 2015 1,875,427$ Additions 6,470,756 Payments (6,847,994)
Balance as of June 30, 2016 1,498,189 Additions 9,675,689 Payments (6,954,425)
Balance as of June 30, 2017 4,219,453$
Physician loan agreements – Physician Recruitment Agreements are those under which the District has elected to loan practicing physicians up to a specified amount per month for a period of two or three years (the “loan distribution period”). At the end of the loan distribution period, each physician is obligated by a signed loan agreement to repay the outstanding loan balance. The loan can be repaid in cash or in-kind services. For repayment in-kind, the District forgives the loans monthly over the period defined in the loan agreement (up to 3 years), as long as the physician continues to practice in the defined service area. Loans to physicians accrue interest during the draw period and during the forgiveness period. The loan balances outstanding totaled approximately $4.9 million and $5.3 million as of June 30, 2017 and 2016, respectively. The balance is included in other long-term assets in the accompanying consolidated statements of net position. Note 14 – Subsequent Events Orthopedic Specialists of North County - In July 2017, the District entered into a multi-year arrangement including clinic operations and professional service agreements with Orthopedic Specialists of North County (“OSNC”). The District purchased the clinic operations for $6.0 million in July 2017. This partnership combines the strength of the two organizations to provide delivery of the most advanced, high quality orthopedic medical and surgical services, including joint replacement, spine care, sports medicine, cutting-edge non-operative therapy, and physical rehabilitation to the community. The associated transactions along with financial results will be reflected in the District’s consolidated financial statements.

Supplemental Schedules

See accompanying report of independent auditors. 35
Tri-City Healthcare District Consolidating Statement of Net Position
June 30, 2017
TCMC ASCO REHM WC CVI Ortho Neuro Eliminations Consolidated
CURRENT ASSETSCash and cash equivalents 12,511,674$ 303,149$ 543,088$ 1,368,283$ 115,240$ 70,152$ 48,229$ -$ 14,959,815$ Short-term investments 38,009,731 - - - - - - - 38,009,731 Restricted cash and investments 332,000 - - - - - - - 332,000 Patient accounts receivable - net of estimated
uncollectible accounts of $19,182,808 and$18,474,430 in 2017 and 2016, respectively 43,028,948 987,693 - - - - - - 44,016,641
Other receivables 4,767,259 - - - 285,825 147,283 132,000 (555,248) 4,777,119 Supplies inventory 8,589,454 937 - - - - - - 8,590,391 Prepaid expenses and other assets 2,593,468 115,980 - 20,573 - - - - 2,730,021 Estimated third-party payor settlements 1,658,990 - - - - - - - 1,658,990
Total current assets 111,491,524 1,407,759 543,088 1,388,856 401,065 217,435 180,229 (555,248) 115,074,708
NON-CURRENT INVESTMENTSBoard-designated 395,943 - - - - - - - 395,943
CAPITAL ASSETS - net 100,696,182 688,479 2,264,930 - - - - - 103,649,591
OTHER ASSETSNotes receivable 4,942,714 - - - - - - - 4,942,714 Restricted mortgage reserve fund 6,550,114 - - - - - - - 6,550,114 Other 30,527,572 - - - 100,789 40,213 46,267 (2,734,455) 27,980,386
Total other assets 42,020,400 - - - 100,789 40,213 46,267 (2,734,455) 39,473,214
TOTAL 254,604,049$ 2,096,238$ 2,808,018$ 1,388,856$ 501,854$ 257,648$ 226,496$ (3,289,703)$ 258,593,456$
ASSETS

36 See accompanying report of independent auditors.
Tri-City Healthcare District Consolidating Statement of Net Position (continued) June 30, 2017
TCMC ASCO REHM WC CVI Ortho Neuro Eliminations Consolidated
CURRENT LIABILITIESAccounts payable and accrued liabilities 41,710,375$ 238,913$ -$ 7,500$ 135,600$ 39,806$ 3,633$ (555,249)$ 41,580,578$ Accrued payroll and related expenses 17,858,343 220,969 - - - - - - 18,079,312 Current maturities of long-term debt 4,146,391 - - - - - - - 4,146,391 Short-term debt 2,522,076 - - - - - - - 2,522,076 Other current liabilities 1,410,215 78,026 - - - - - - 1,488,241
Total current liabilities 67,647,400 537,908 - 7,500 135,600 39,806 3,633 (555,249) 67,816,598
LONG-TERM DEBT - net of current position 88,091,022 - - - - - - - 88,091,022
WORKERS' COMPENSATION AND COMPREHENSIVE LIABILITY - net of current portion 7,754,520 - - - - - - - 7,754,520
Total liabilities 163,492,942 537,908 - 7,500 135,600 39,806 3,633 (555,249) 163,662,140
NET POSITIONInvested in capital assets - net of related debt 10,423,322 688,478 2,264,931 - - - - - 13,376,731 Restricted assets 6,550,114 1,064,651 28,080 1,381 141,520 108,921 71,316 - 7,965,983 Unrestricted 74,137,671 (194,799) 515,007 1,379,975 224,734 108,921 151,547 (2,734,454) 73,588,602
Total net position 91,111,107 1,558,330 2,808,018 1,381,356 366,254 217,842 222,863 (2,734,454) 94,931,316
TOTAL 254,604,049$ 2,096,238$ 2,808,018$ 1,388,856$ 501,854$ 257,648$ 226,496$ (3,289,703)$ 258,593,456$
LIABILITIES AND NET POSITION

See accompanying report of independent auditors. 37
Tri-City Healthcare District Consolidating Statement of Revenues, Expenses,
and Changes in Net Position For the Year Ended June 30, 2017
TCMC ASCO REHM WC CVI Ortho Neuro Eliminations Consolidated
OPERATING REVENUENet patient service revenue 304,524,497$ 9,602,064$ -$ -$ -$ -$ -$ -$ 314,126,561$ Premium revenue 18,715,819 - - - - - - - 18,715,819 Other revenue 7,797,817 102 121,537 2,067,578 294,210 217,902 205,764 (3,435,415) 7,269,495
Total operating revenue 331,038,133 9,602,166 121,537 2,067,578 294,210 217,902 205,764 (3,435,415) 340,111,875
OPERATING EXPENSESSalaries and related expenses 191,412,882 2,735,286 - - 20,505 36,592 20,506 - 194,225,771 Supplies 65,331,723 2,674,311 - - - - - - 68,006,034 Purchased services 18,581,115 701,199 - - 1,640 2,927 1,641 (724,318) 18,564,204 Depreciation and amortization 10,580,838 265,248 - 551,105 8,933 6,844 - - 11,412,968 Other operating expense 20,544,802 589,286 891 190 308 1,054 1,177 - 21,137,708 Professional and medical fees 13,632,067 43,835 - - 87,984 53,543 70,728 - 13,888,157 Maintenance, rent & utilities 15,189,725 840,070 - - - - - (1,582,608) 14,447,187
Total operating expenses 335,273,152 7,849,235 891 551,295 119,370 100,960 94,052 (2,306,926) 341,682,029
(LOSS) INCOME FROM OPERATIONS (4,235,019) 1,752,931 120,646 1,516,283 174,840 116,942 111,712 (1,128,489) (1,570,154)
NON-OPERATING REVENUE (EXPENSE)District tax revenue 9,638,130 - - - - - - - 9,638,130 Interest income 310,900 491 - - - - - - 311,391 Interest expense (2,861,157) (754) (22,180) (1,179,543) - - - - (4,063,634) Other non-operating income (expense) (2,526,404) 5,000 113,925 (532,650) 1,000 - - 503,812 (2,435,317)
Total non-operating revenue (expense) 4,561,469 4,737 91,745 (1,712,193) 1,000 - - 503,812 3,450,570
EXCESS OF REVENUE OVER EXPENSES 326,450 1,757,668 212,391 (195,910) 175,840 116,942 111,712 (624,677) 1,880,416
Minority interest distributions - net - (1,181,511) - - (104,115) (58,374) (39,200) - (1,383,200) Contributions (distributions) between
consolidating entities - (564,760) - (10,058,144) (90,850) (69,000) (83,300) 10,866,054 -
Change in net position 326,450 11,397 212,391 (10,254,054) (19,125) (10,432) (10,788) 10,241,377 497,216
NET POSITION - Beginning of year 90,784,657 1,546,933 2,595,627 11,635,410 385,379 228,274 233,651 (12,975,831) 94,434,100
NET POSITION - End of year 91,111,107$ 1,558,330$ 2,808,018$ 1,381,356$ 366,254$ 217,842$ 222,863$ (2,734,454)$ 94,931,316$