Embed Size (px)
Citation preview
FEI FILE NUMBER 03-12-1232-01 REPORT OF GROUND WATER SAMPLING AT THE THE MIDWAY GROCERY SITE 414A JARALES RD. JARALES, VALENCIA COUNTY, NEW MEXICO
PREPARED BY: STUART FAITH, P.E. FAITH ENGINEERING, INC. 5701 PIEDRA DR. NW ALBUQUERQUE, NM 87114 (505) 898-6140 • FAX (505) 508-5825
JANUARY 3, 2012 PREPARED FOR: MR. ARTHUR CORDOVA AND THE NEW MEXICO ENVIRONMENT DEPARTMENT PETROLEUM STORAGE TANK BUREAU

January 3, 2012 via e-mail and US Mail Ms. Dawn Bascomb New Mexico Environment Department Petroleum Storage Tank Bureau District 1 Office 5500 San Antonio NE Albuquerque, NM 87109 RE: Ground Water Sampling Report Midway Grocery, 414A Jarales Rd., Jarales, NM NMED Facility #: 53478 FEI Project #: 03-11-1232-01 Dear Ms. Bascomb: Please find included FEIʼs ground water monitoring report for the Midway Grocery site in Jarales, NM. This work was approved by NMED/PSTB on December 21, 2010 pursuant to FEIʼs work plan of December 16, 2010. The sampling described in this report was conducted December 16, 2011. Contaminants of concern (COC) have decreased in concentration in monitor wells MW-1, MW-5 and MW-7 from the last sampling conducted at the site in May 2011, and remain above standards in three (MW-1, MW-4, and MW-5) of the seven monitor wells. The on-site domestic well had no hydrocarbon or metal contaminants above standards. There has been no hydrocarbon vapor sample collected from the residence during the last quarter of monitoring conducted at the site. Vapor sampling canister replacement will be discontinued and the existing in-place canister returned to Air Toxics, LLC, as this represents the final quarterly activity under the currently approved work plan.. FEI will be accepting payment on an Assignment of Payment/Fixed Price basis. Because the summa canister was not put in place and exchanged, and no sample was collected this quarter, the claim amount will be $4,393.61. If you have any questions, please do not hesitate to call me at 898-6140. Respectfully submitted, FAITH ENGINEERING, INC.
Stuart E. Faith - President NM Professional Engineer No. 6396 cc: Mr. Arthur Cordova - Owner

i
Table of Contents
Form 1223 Cover Page ..................................................................................................................... 1
Statement of Familiarity ..................................................................................................................... 2
I. Introduction ............................................................................................................................. 3
A. Scope of work ................................................................................................................ 3
B. This quarter's highlights ................................................................................................. 4
II. Activities Performed During This Quarter ............................................................................... 4
A. Brief description of the remediation system and date installed ...................................... 4
B. Description of activities performed ................................................................................. 4
C. Monitoring activities performed ...................................................................................... 5
D. System performance and effectiveness ......................................................................... 5
E. Statement verifying containment of release ................................................................... 6
III. Summary and Conclusions ..................................................................................................... 6
A. Discussion of trends or changes .................................................................................... 6
B. Ongoing assessment of remediation system ................................................................. 6
C. Recommendations ......................................................................................................... 6
List of Figures
Figure 1 Site Map
Figure 2 Benzene Concentration Contour Map
Figure 2 Naphthalene Concentration Contour Map
Figure 4 Ground Water Elevation Map
List of Tables
Table 1 Summary of Ground Water Testing
Table 2 Well Elevation, Location, and Water Level Measurements
List of Appendices
Appendix 1 Field Sampling Procedures
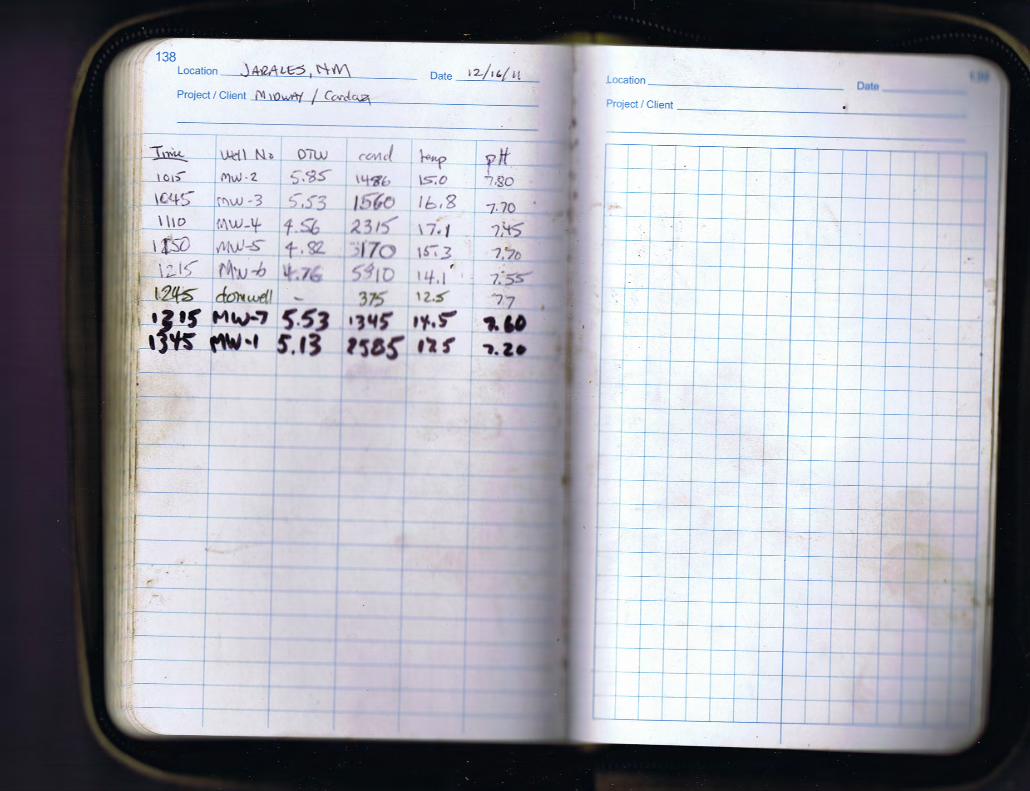
Appendix 2 Field Notes
Appendix 3 Laboratory Analyses
Form 1223 Site Name: Midway Grocery
PSTB Facility # 53478 Date: 1/3/12
Page 1
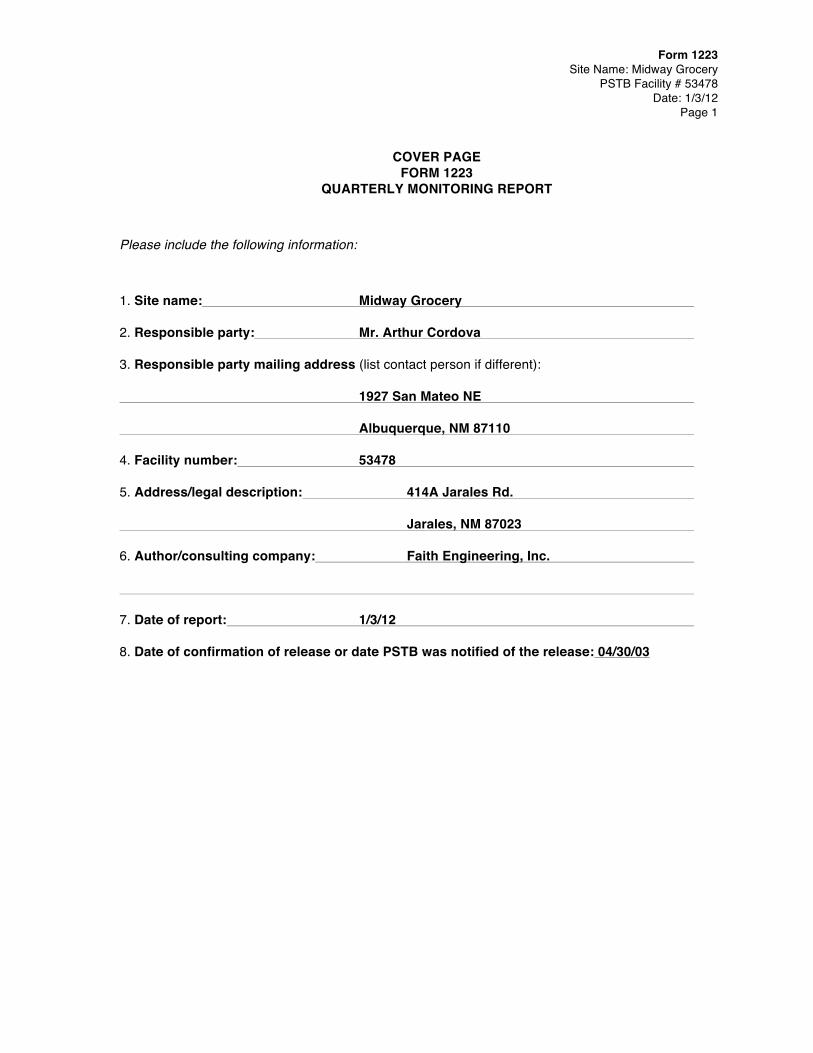
COVER PAGE
FORM 1223 QUARTERLY MONITORING REPORT
Please include the following information:
1. Site name: Midway Grocery
2. Responsible party: Mr. Arthur Cordova
3. Responsible party mailing address (list contact person if different):
1927 San Mateo NE
Albuquerque, NM 87110
4. Facility number: 53478
5. Address/legal description: 414A Jarales Rd.
Jarales, NM 87023
6. Author/consulting company: Faith Engineering, Inc.
7. Date of report: 1/3/12
8. Date of confirmation of release or date PSTB was notified of the release: 04/30/03

Form 1223 Site Name: Midway Grocery
PSTB Facility # 53478 Date: 1/3/12
Page 2
STATEMENT OF FAMILIARITY
I, the undersigned, am personally familiar with the information submitted in this report and the attached documents and attest that it is true and complete.
Signature:
Name: Stuart Faith
Affiliation: Faith Engineering, Inc.
Title: Professional Engineer
Certified Scientist #: 080
Date: 1/3/12

Form 1223 Site Name: Midway Grocery
PSTB Facility # 53478 Date: 1/3/12
Page 3
I. INTRODUCTION:
I. A. Scope of work
Midway Grocery (the Site) is located at 414A Jarales Rd. in north Jarales, NM. A release of unleaded
gas was documented by John Cherry (Fire Marshal) on 12/30/96. The location of the Site is shown on
Figures 1 through 4. Faith Engineering, Inc. (FEI) was retained by Mr. Arthur Cordova (ADC, Ltd.) to
provide a minimum site assessment of the property. Pursuant to New Mexico Petroleum Storage
Tank Regulations PSTR §1205 and §1206, FEI prepared a Work Plan, dated July 25, 2003, to
conduct a minimum site assessment of the contaminants from the previous tank hold and pump
island area pursuant to NMED/PSTBʼs letter of June 2, 2003. The work plan was subsequently
approved by NMED/USTB on October 1, 2003, and fieldwork was conducted on June 9, 10, 14 and
25, 2004. The MSA report was submitted to NMED PSTB on 6/30/04.
On August 9, 2004 a work plan for a Secondary Investigation was requested by NMED/PSTB. On
October 15, 2004, a work plan was submitted by FEI to conduct an off site subsurface geophysical
resistivity survey along with additional Direct Push Technology (DPT) drilling assessment and
supplemental monitoring well completion to assess the extent of soil and ground water contamination
at the site. That work plan was not approved by NMED/PSTB.
On February 8, 2006 NMED/PSTB requested a work plan to conduct four quarters of ground water
sampling. On February 21, 2006, FEI submitted a work plan for quarterly monitoring, which was
approved by NMED/PSTB on March 27, 2006. The final quarterly sampling report for that work plan
approval was submitted to NMED/PSTB on April 1, 2007.
Per NMED/PSTB request, on August 28, 2007, FEI submitted a new work plan for a single ground
water sampling event, site survey, and additional investigation by DPT. At the request of
NMED/PSTB, that work plan was revised on November 7, 2008 to clarify the DPT investigation.
NMED approved the work plan on March 31, 2009 and an amended approval on May 7, 2009.
However, NMED/PSTB only approved the ground water sampling, and did not approve the site survey
or DPT investigation. FEI submitted results of the single ground water sampling event on May 28,
2009.
Four quarters of ground water sampling and reporting were conducted in 2010 based on FEIʼs
September 4, 2009 work plan, which was approved by NMED/PSTB on February 9, 2010.
Form 1223 Site Name: Midway Grocery
PSTB Facility # 53478 Date: 1/3/12
Page 4
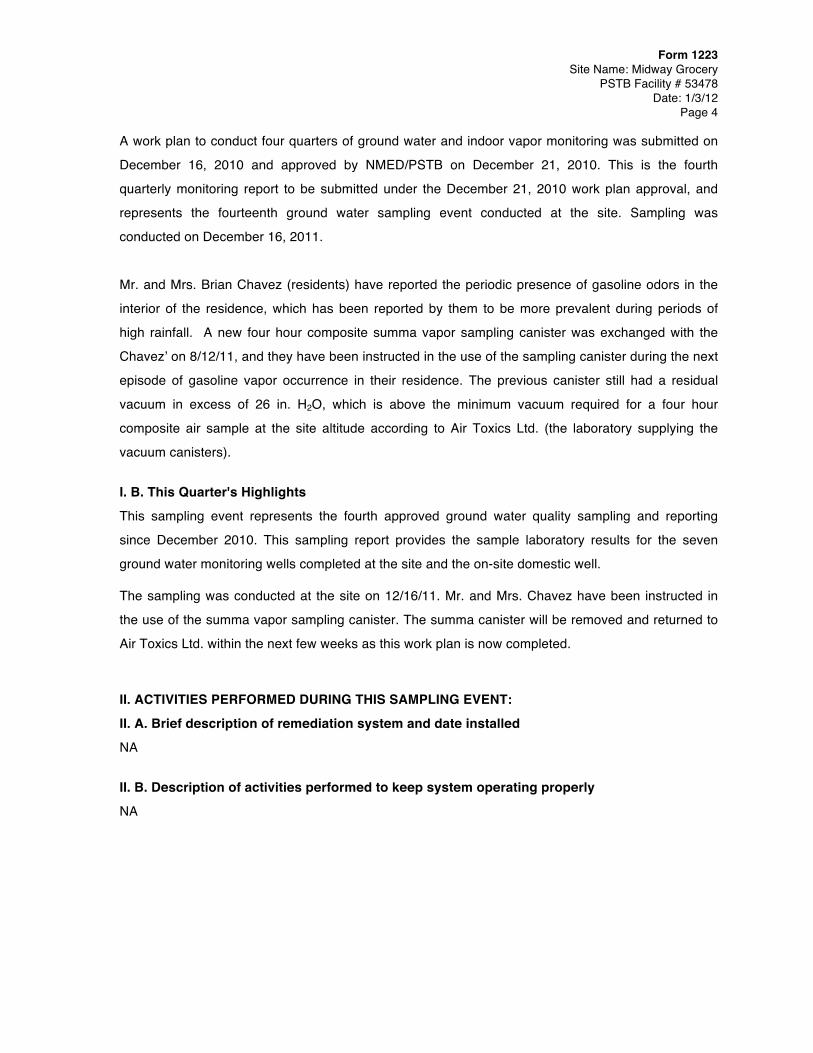
A work plan to conduct four quarters of ground water and indoor vapor monitoring was submitted on
December 16, 2010 and approved by NMED/PSTB on December 21, 2010. This is the fourth
quarterly monitoring report to be submitted under the December 21, 2010 work plan approval, and
represents the fourteenth ground water sampling event conducted at the site. Sampling was
conducted on December 16, 2011.
Mr. and Mrs. Brian Chavez (residents) have reported the periodic presence of gasoline odors in the
interior of the residence, which has been reported by them to be more prevalent during periods of
high rainfall. A new four hour composite summa vapor sampling canister was exchanged with the
Chavezʼ on 8/12/11, and they have been instructed in the use of the sampling canister during the next
episode of gasoline vapor occurrence in their residence. The previous canister still had a residual
vacuum in excess of 26 in. H2O, which is above the minimum vacuum required for a four hour
composite air sample at the site altitude according to Air Toxics Ltd. (the laboratory supplying the
vacuum canisters).
I. B. This Quarter's Highlights
This sampling event represents the fourth approved ground water quality sampling and reporting
since December 2010. This sampling report provides the sample laboratory results for the seven
ground water monitoring wells completed at the site and the on-site domestic well.
The sampling was conducted at the site on 12/16/11. Mr. and Mrs. Chavez have been instructed in
the use of the summa vapor sampling canister. The summa canister will be removed and returned to
Air Toxics Ltd. within the next few weeks as this work plan is now completed.
II. ACTIVITIES PERFORMED DURING THIS SAMPLING EVENT:
II. A. Brief description of remediation system and date installed
NA
II. B. Description of activities performed to keep system operating properly
NA

Form 1223 Site Name: Midway Grocery
PSTB Facility # 53478 Date: 1/3/12
Page 5
II. C. Monitoring activities performed
Ground water monitoring and sampling at the Site took place on December 16, 2011. All of the seven
monitoring wells and the domestic well at the site were sampled, and are shown on Figure 1. This
eventʼs monitoring and sampling included the following:
• Depth to ground water measurements in all monitor wells,
• Purging of all wells by a minimum of three wellbore volumes (5 - 10 gallons).
• Ground water sampling in monitoring wells MW-1, MW-2, MW-3, MW-4, MW-5, MW-
6, MW-7 and the domestic well (purged 80 gallons).
• Field measurement of temperature, pH, and conductivity.
• Laboratory analysis of ground water samples from all sampled wells for Benzene,
Toluene, Ethylbenzene, and total Xylenes (BTEX), Methyl-t-Butyl Ether (MTBE),
TMB, Ethylene Dibromide (EDB), Ethylene Dichloride (EDC), Naphthalene, and
selected mono-methyl naphthalenes, by an expanded EPA Method 8260B. Iron,
manganese and lead were analysed in the domestic well sample by EPA Method
200.7. Monitoring and sampling procedures are described in Appendix 1. The laboratory results of the
ground water analyses for the previous and current monitoring period are shown on Table 1. Figures
2 and 3 provide concentrations of the benzene and naphthalene for the seven monitor wells sampled.
Laboratory reports and the Chain of Custody Form are provided in Appendix 3.
Depth to ground water varied from 4.56 feet below ground surface (bgs) in MW-4 to 5.85 feet bgs in
MW-2. Current and historical ground water elevation data is summarized in Table 2. A map of the
ground water elevations and approximate ground water flow direction is shown on Figure 4. Ground
water elevations have decreased since the August 2011 sampling event by approximately 0.9 feet.
Field notes are presented in Appendix 2, which provide the field measured depth to water and other
field measured data.
II. D. System performance and effectiveness
NA

Form 1223 Site Name: Midway Grocery
PSTB Facility # 53478 Date: 1/3/12
Page 6
II. E. Statement verifying containment of release On-site containment of ground water contamination cannot be verified based on these and previous
ground water sampling events. Previous work plans that have been submitted by FEI for more
definitive investigation into the off site extent of soil and ground water contamination (geophysical
and/or DPT investigation), but have not been approved. Recently, NMED/PSTB has approved a work
plan to conduct a geoprobe survey east and south of the Midway Grocery business and residence,
which is currently scheduled to be conducted in the latter part of January 2012.
III. SUMMARY AND CONCLUSIONS:
III. A. Discussion of trends or changes noted in analytical results or site conditions
During this sampling event, benzene concentrations above the NMWQCC standard of 10 µg/l were
found in three of the seven monitoring wells that were sampled (MW-1, MW-4 and MW-5) with
decreases in all three of these monitor wells. MTBE was above standard in MW-4 and naphthalene
was above standard in MW-1, MW-4 and MW-5. There were no contaminants found in the domestic
well sample. The ground water flow direction has shifted from a more southwesterly direction since
the August 2011 event.
III. B. Ongoing assessment of the remediation system
NA
III. C. Recommendations
FEI recommends continued site monitoring and sampling after consideration of the results of the
currently approved geoprobe investigation. Consideration should be given to a site survey,
determining the extent of off site contamination, and for mitigating any future vapor occurrences in the
residence/ store building. The reported periodic vapor occurrences in the residence appear to have
decreased in frequency, and the residents should continue to report any additional vapor
accumulations to NMED/PSTB and FEI. FEI is planning to conduct a geoprobe survey at the site in
the latter part of January 2012.

Subject: Midway Grocery, 414A Jarales Rd., Jarales, NM •
File: 03-12-1232-01 Date: December 2011 Figure: By: SEF
N1"= 50'
5701 Piedra Dr, NWAlbuquerque, NM 87114(505) 898-6140 • Fax (505) [email protected]
Site Map
1
LEGENDMonitoring Wells
Domestic Well
2003 Soil Borings
MW-5
MW-6
MW-4MW-1
MW-3
MW-2
MW-7
Domestic Well
AST Shed
former dispenser island
abandoned (in-place) former UST
2 - 1000 gal USTs (removed)

Subject: Midway Grocery, 414A Jarales Rd., Jarales, NM •
File: 03-12-1232-01 Date: December 2011 Figure: By: SEF
N1"= 50'
5701 Piedra Dr, NWAlbuquerque, NM 87114(505) 898-6140 • Fax (505) [email protected]
Dissolved Benzene (ug/l)
2
LEGENDMonitoring Wells
Domestic Wellcontour interval = 500 ppb
2000
4700
< 1
110
710
1.5< 1
< 1
MW-5
MW-6
MW-4MW-1
MW-3
MW-2
MW-7
Domestic Well

Subject: Midway Grocery, 414A Jarales Rd., Jarales, NM •
File: 03-12-1232-01 Date: December 2011 Figure: By: SEF
N1"= 50'
5701 Piedra Dr, NWAlbuquerque, NM 87114(505) 898-6140 • Fax (505) [email protected]
Dissolved Naphthalene (ug/l)
3
LEGENDMonitoring Wells
Domestic Well
contour interval = 50 ppb
< 10
< 10
< 10
< 10
210
48
< 10
MW-5
MW-6
MW-4MW-1
MW-3
MW-2
MW-7
Domestic Well

Subject: Midway Grocery, 414A Jarales Rd., Jarales, NM •
File: 03-12-1232-01 Date: December 2011 Figure: By: SEF
N1"= 50'
5701 Piedra Dr, NWAlbuquerque, NM 87114(505) 898-6140 • Fax (505) [email protected]
Ground Water Elevation
4
LEGENDMonitoring Wells
Domestic Well
contour interval = 0.02 ft.
4784.32
4784.34
4784.32
4784.33
4784.19
4784.23
4784.27
MW-5
MW-6
MW-4MW-1
MW-3
MW-2
MW-7
Domestic Well

TABLE 1Midway Grocery
03-11-1232-01NMED FACILITY # 53478
RESULTS OF GROUND WATER TESTING
TABLE 1 Page 1 of 5
ORGANICS
LOCATION
DATE
SA
MPL
ED
BENZ
ENE
TOLU
ENE
ETHY
L BE
NZEN
E
TOTA
L XY
LENE
S
MTB
E
EDB
EDC
TMB
NAPH
THAL
ENE
IRO
N
MAN
GAN
ESE
LEAD
Tem
pera
ture
pH
Cond
uctiv
ity
Nitra
te
Alka
linity
Diss
olve
d O
xyge
n
UNITS µg/l µg/l µg/l µg/l µg/l µg/l µg/l µg/l µg/l (˚C) (µmhos/cm)(mg/l) (mg/l) (mg/l)STANDARDS 10 750 750 620 100 0.1 10 30 as CaCO3
MW-1 06/10/04 12000.0 3100.0 3100.0 14600.0 < 25 <0.01 < 25 2520.0 420.0 < 0.50 1.7 <0.025 21.0 7.33 3240 0.6 500 2.006/05/06 9600.0 1100.0 1700.0 7460.0 < 25 < 25 < 25 1750.0 <650 19.8 7.15 349909/12/06 8700.0 1300.0 2600.0 6800.0 < 10 < 10 220.0 2280.0 584.0 26.0 6.93 343612/12/06 6700.0 710.0 1800.0 4700.0 < 10 < 10 170.0 1590.0 686.0 18.0 6.98 314503/09/07 7000.0 160.0 1800.0 3529.0 < 20 < 20 160.0 2090.0 < 550 18.1 7.05 334005/14/09 11000.0 330.0 2100.0 5500.0 < 50 < 50 < 50 1650.0 360.0 16.0 7.10 352003/16/10 4700.0 58.0 410.0 470.0 < 10.0 < 10.0 < 10.0 204.0 62.0 17.2 7.00 310506/08/10 7700.0 250.0 1600.0 2400.0 < 10.0 < 10.0 < 10.0 844.0 270.0 18.0 7.25 325009/01/10 4500.0 57.0 650.0 720.0 < 10.0 < 10.0 < 10.0 280.0 120.0 17.0 6.98 315012/01/10 5700.0 89.0 1000.0 910.0 < 10.0 < 10.0 < 10.0 280.0 160.0 16.0 7.05 342002/15/11 5100.0 33.0 520.0 450.0 < 10.0 < 10.0 < 10.0 185.0 120.0 16.0 6.90 347505/05/11 8300.0 270.0 2300.0 2800.0 < 10.0 < 10.0 < 10.0 981.0 410.0 18.0 7.25 307508/12/11 8300.0 240.0 2400.0 2900.0 < 50.0 < 50.0 < 50.0 1369.0 390.0 23.3 7.10 318812/16/11 4700.0 < 50.0 1800.0 1700.0 < 50.0 < 50.0 < 50.0 1100.0 210.0 17.5 7.20 2585
MW-2 06/10/04 31.0 78.0 100.0 183.0 < 1.0 * < 1.0 246.0 15.0 0.2 3.9 <0.050 21.5 7.65 1373 0.2 260 5.506/05/06 < 1.0 < 1.0 1.0 <2.0 < 1.0 < 1.0 < 1.0 < 1.0 <13.0 21.7 7.10 183209/12/06 3.5 1.5 5.4 <2.0 < 1.0 < 1.0 < 1.0 < 2.0 <13.0 23.8 7.05 189612/12/06 7.1 2.8 5.4 <4.0 < 1.0 < 1.0 < 1.0 < 2.0 <13.0 15.0 7.19 197903/09/07 4.6 2.7 8.2 < 3.5 < 1.0 < 1.0 < 1.0 < 2.0 <13.0 12.3 7.34 19835/14/09. < 1.0 < 1.0 < 1.0 < 1.5 < 1.0 < 1.0 < 1.0 < 2.0 < 10.0 16.0 7.22 205003/16/10 < 1.0 < 1.0 < 1.0 < 1.5 < 1.0 < 1.0 < 1.0 < 2.0 < 10.0 17.5 7.70 331506/08/10 < 1.0 < 1.0 < 1.0 < 1.5 < 1.5 < 1.0 < 1.0 < 2.0 < 10.0 19.5 7.55 275009/01/10 < 1.0 < 1.0 < 1.0 < 1.5 < 1.0 < 1.0 < 1.0 < 2.0 < 10.0 19.0 7.33 260012/01/10 < 1.0 < 1.0 < 1.0 < 1.5 < 1.0 < 1.0 < 1.0 < 1.0 < 10.0 16.5 7.55 280002/15/11 < 1.0 < 1.0 < 1.0 < 1.5 < 1.0 < 1.0 < 1.0 < 1.0 < 10.0 16.0 7.22 275005/05/11 < 1.0 < 1.0 < 1.0 < 1.5 < 1.0 < 1.0 < 1.0 < 2.0 < 10.0 18.0 7.35 211008/12/11 < 1.0 < 1.0 3.0 < 1.5 < 1.0 < 1.0 < 1.0 < 2.0 < 10.0 24.2 7.40 181012/16/11 < 1.0 < 1.0 < 1.0 < 1.5 < 1.0 < 1.0 < 1.0 < 2.0 < 10.0 15.0 7.80 1486

TABLE 1Midway Grocery
03-11-1232-01NMED FACILITY # 53478
RESULTS OF GROUND WATER TESTING
TABLE 1 Page 2 of 5
LOCATION
DATE
SA
MPL
ED
BENZ
ENE
TOLU
ENE
ETHY
L BE
NZEN
E
TOTA
L XY
LENE
S
MTB
E
EDB
EDC
TMB
NAPH
THAL
ENE
IRO
N
MAN
GAN
ESE
LEAD
Tem
pera
ture
pH
Cond
uctiv
ity
Nitra
te
Alka
linity
Diss
olve
d O
xyge
n
UNITS µg/l µg/l µg/l µg/l µg/l µg/l µg/l µg/l µg/l (˚C) (µmhos/cm)(mg/l) (mg/l) (mg/l)STANDARDS 10 750 750 620 100 0.1 10 30 as CaCO3
MW-3 06/10/04 26.0 15.0 15.0 49.0 < 1.0 <0.01 < 1.0 13.7 3.0 0.1 3.3 <0.050 21.0 7.40 1651 0.4 275 7.006/05/06 < 1.0 < 1.0 < 1.0 <2.0 < 1.0 < 1.0 < 1.0 < 1.0 < 5.0 21.2 7.31 187509/12/06 3.6 2.1 6.5 2.8 < 1.0 < 1.0 < 1.0 < 2.0 <13.0 24.0 7.21 187312/12/06 5.2 2.4 4.8 <3.7 < 1.0 < 1.0 < 1.0 < 2.0 <13.0 17.1 7.30 178403/09/07 8.8 4.2 7.3 < 3.4 < 1.0 < 1.0 < 1.0 < 2.0 <13.0 14.7 7.27 17125/14/09. < 1.0 < 1.0 < 1.0 < 1.5 < 1.0 < 1.0 < 1.0 < 2.0 < 10.0 16.5 7.52 191003/16/10 < 1.0 < 1.0 < 1.0 < 1.5 < 1.0 < 1.0 < 1.0 < 2.0 < 10.0 17.0 7.80 278006/08/10 < 1.0 < 1.0 < 1.0 < 1.5 < 1.0 < 1.0 < 1.0 < 2.0 < 10.0 18.0 7.70 245009/01/10 < 1.0 < 1.0 < 1.0 < 1.5 < 1.0 < 1.0 < 1.0 < 2.0 < 10.0 18.0 7.55 235012/01/10 < 1.0 < 1.0 < 1.0 < 1.5 < 1.0 < 1.0 < 1.0 < 2.0 < 10.0 16.5 7.60 250002/15/11 < 1.0 < 1.0 < 1.0 < 1.5 < 1.0 < 1.0 < 1.0 < 2.0 < 10.0 16.0 7.50 255005/05/11 < 1.0 < 1.0 < 1.0 < 1.5 < 1.0 < 1.0 < 1.0 < 2.0 < 10.0 18.0 7.65 197508/12/11 < 1.0 < 1.0 1.6 < 1.5 < 1.0 < 1.0 < 1.0 < 2.0 < 10.0 24.0 7.40 178012/16/11 < 1.0 < 1.0 < 1.0 < 1.5 < 1.0 < 1.0 < 1.0 < 2.0 < 10.0 16.8 7.70 1560
MW-4 06/10/04 2800.0 160.0 750.0 868.0 440.0 * 68.0 350.0 170.0 < 0.5 1.6 <0.025 24.0 7.21 2100 0.4 525 3.506/05/06 1400.0 53.0 250.0 166.9 430.0 < 5.0 < 5.0 65.0 <133.0 21.6 7.24 393709/12/06 1800.0 29.0 98.0 50.5 510.0 < 1.0 34.0 12.5 80.0 25.5 6.99 391812/12/06 1100.0 17.0 110.0 41.1 640.0 < 1.0 29.0 14.9 97.0 16.5 7.04 364503/09/07 1400.0 28.0 150.0 < 60 620.0 < 10 36.0 < 20 < 166 16.5 7.07 381905/14/09 1800.0 35.0 270.0 83.0 340.0 < 5.0 < 5.0 24.0 99.0 17.0 7.20 365503/16/10 250.0 3.6 6.0 7.0 270.0 < 1.0 < 1.0 < 2.0 < 10.0 17.7 7.00 385006/08/10 2500.0 59.0 520.0 100.0 180.0 <10 <10 10.0 110.0 18.5 7.55 365009/01/10 190.0 2.5 8.3 7.4 240.0 < 1.0 < 1.0 < 2.0 2.6 18.0 7.10 355012/01/10 190.0 3.1 5.2 6.3 230.0 < 1.0 < 1.0 < 2.0 4.2 16.0 7.22 380002/15/11 130.0 2.2 3.4 6.3 260.0 < 1.0 < 1.0 < 2.0 < 10.0 16.0 7.10 374005/05/11 2600.0 54.0 570.0 55.0 150.0 < 10.0 < 10.0 < 20 110.0 17.5 7.45 298508/12/11 870.0 15.0 92.0 15.0 160.0 < 10.0 < 10.0 < 20 31.0 21.5 7.20 296712/16/11 110.0 < 10.0 < 10.0 < 15.0 160.0 < 10.0 < 10.0 < 20< 100.0 17.1 7.45 2315

TABLE 1Midway Grocery
03-11-1232-01NMED FACILITY # 53478
RESULTS OF GROUND WATER TESTING
TABLE 1 Page 3 of 5
LOCATION
DATE
SA
MPL
ED
BENZ
ENE
TOLU
ENE
ETHY
L BE
NZEN
E
TOTA
L XY
LENE
S
MTB
E
EDB
EDC
TMB
NAPH
THAL
ENE
IRO
N
MAN
GAN
ESE
LEAD
Tem
pera
ture
pH
Cond
uctiv
ity
Nitra
te
Alka
linity
Diss
olve
d O
xyge
n
UNITS µg/l µg/l µg/l µg/l µg/l µg/l µg/l µg/l µg/l (˚C) (µmhos/cm)(mg/l) (mg/l) (mg/l)STANDARDS 10 750 750 620 100 0.1 10 30 as CaCO3
MW-5 06/10/04 3000.0 6800.0 900.0 5300.0 < 10 <0.01 < 10 1260.0 230.0 <0.10 1.5 <0.050 22.0 7.48 1152 0.4 350 5.006/05/06 well not accessible due to parked trailer09/12/06 3000.0 2800.0 100.0 1970.0 13.0 < 1.0 66.0 157.0 41.5 25.6 7.37 464812/12/06 2800.0 2900.0 410.0 2700.0 4.0 < 1.0 170.0 570.0 197.0 15.0 7.24 448503/09/07 1400.0 1000.0 < 25 2700.0 < 25 < 25 120.0 630.0 < 400 12.6 7.73 406505/14/09 well inaccessible in livestock corral03/16/10 530.0 400.0 37.0 670.0 < 5.0 < 5.0 < 5.0 294.0 35.0 15.5 7.80 421506/08/10 980.0 1200.0 170.0 1300.0 < 50 < 50 < 50 490.0 < 500 16.5 7.50 415009/01/10 1900.0 2000.0 170.0 2000.0 < 50 < 50 < 50 610.0 < 500 17.2 7.35 390012/01/10 290.0 210.0 23.0 660.0 < 5.0 < 5.0 17.0 323.0 75.0 16.8 7.55 435002/15/11 140.0 68.0 14.0 200.0 < 5.0 < 5.0 9.5 156.0 20.0 16.2 7.40 440005/05/11 1300.0 1500.0 190.0 1300.0 < 1.0 < 1.0 16.0 500.0 135.0 17.8 7.50 405008/12/11 3200.0 4200.0 380.0 2600.0 < 10.0 < 10.0 25.0 660.0 174.0 22.0 7.60 393012/16/11 710.0 630.0 58.0 910.0 < 10.0 < 10.0 17.0 313.0 48.0 15.3 7.70 3170
MW-6 06/10/04 6.5 6.7 8.3 28.0 < 1.0 <0.01 < 1.0 12.0 < 3.0 <0.10 1.1 <0.050 22.5 7.69 2978 0.4 450 2.506/05/06 < 1.0 < 1.0 < 1.0 <2.0 < 1.0 < 1.0 < 1.0 < 1.0 <13.0 17.3 7.18 190209/12/06 210.0 130.0 17.0 60.0 8.4 < 1.0 10.0 11.4 <14.3 25.3 7.21 200512/12/06 490.0 330.0 45.0 152.0 6.5 < 1.0 19.0 22.0 19.3 15.6 7.15 161503/09/07 2.7 2.6 < 1.0 5.5 < 1.0 < 1.0 < 1.0 < 2.3 < 13 13.0 7.32 23155/14/09. well inaccessible in livestock corral03/16/10 < 1.0 < 1.0 < 1.0 < 1.5 < 1.0 < 1.0 < 1.0 < 2.0 < 10.0 16.0 7.30 221506/08/10 < 1.0 < 1.0 < 1.0 < 1.5 < 1.0 < 1.0 < 1.0 < 2.0 < 10.0 17.0 7.25 210009/01/10 < 1.0 < 1.0 < 1.0 < 1.5 < 1.0 < 1.0 < 1.0 < 2.0 < 10.0 16.0 7.10 202512/01/10 < 1.0 < 1.0 < 1.0 < 1.5 < 1.0 < 1.0 < 1.0 < 2.0 < 10.0 15.8 7.55 240002/15/11 < 1.0 < 1.0 < 1.0 < 1.5 < 1.0 < 1.0 < 1.0 < 2.0 < 10.0 16.0 7.45 233005/05/11 < 2.0 < 2.0 < 2.0 < 3.0 < 2.0 < 2.0 < 2.0 < 4.0 < 20.0 18.0 7.45 198008/12/11 3.0 9.7 1.2 9.2 < 1.0 < 1.0 < 1.0 2.0 < 10.0 21.0 7.40 205512/16/11 < 1.0 1.9 < 1.0 4.1 < 1.0 < 1.0 < 1.0 1.3 < 10.0 14.1 7.55 5810

TABLE 1Midway Grocery
03-11-1232-01NMED FACILITY # 53478
RESULTS OF GROUND WATER TESTING
TABLE 1 Page 4 of 5
LOCATION
DATE
SA
MPL
ED
BENZ
ENE
TOLU
ENE
ETHY
L BE
NZEN
E
TOTA
L XY
LENE
S
MTB
E
EDB
EDC
TMB
NAPH
THAL
ENE
IRO
N
MAN
GAN
ESE
LEAD
Tem
pera
ture
pH
Cond
uctiv
ity
Nitra
te
Alka
linity
Diss
olve
d O
xyge
n
UNITS µg/l µg/l µg/l µg/l µg/l µg/l µg/l µg/l µg/l (˚C) (µmhos/cm)(mg/l) (mg/l) (mg/l)STANDARDS 10 750 750 620 100 0.1 10 30 as CaCO3
MW-7 06/10/04 5.5 6.2 3.5 14.6 < 1.0 * < 1.0 2.4 < 3.0 <0.10 3.9 <0.050 20.5 7.43 1884 1.0 350 1.006/05/06 < 1.0 < 1.0 < 1.0 < 1.0 < 1.0 < 1.0 < 1.0 < 1.0 <13.0 19.2 7.23 177609/12/06 75.0 55.0 8.7 24.2 < 1.0 < 1.0 2.1 3.6 <13.0 23.5 7.07 182212/12/06 2.4 1.4 3.2 <2.0 < 1.0 < 1.0 < 1.0 < 2.0 <13.0 14.3 7.23 159503/09/07 5.6 3.3 6.6 < 3.9 < 1.0 < 1.0 < 1.0 < 2.0 <13.0 13.6 7.70 13555/14/09. 69.0 1.7 7.0 14.0 < 1.0 < 1.0 < 1.0 2.3 < 10.0 15.0 7.55 145003/16/10 120.0 4.1 14.0 16.0 < 1.0 < 1.0 < 1.0 4.3 < 10.0 17.0 7.80 310506/08/10 < 1.0 < 1.0 < 1.0 < 1.5 < 1.0 < 1.0 < 1.0 < 2.0 < 10.0 18.0 7.50 215009/01/10 60.0 < 1.0 7.1 6.9 < 1.0 < 1.0 < 1.0 1.6 < 10.0 18.0 7.45 185012/01/10 6.2 < 1.0 < 1.0 < 1.5 < 1.0 < 1.0 < 1.0 < 2.0 < 10.0 15.8 7.50 250002/15/11 1.8 < 1.0 < 1.0 < 1.5 < 1.0 < 1.0 < 1.0 < 2.0 < 10.0 16.0 7.40 215005/05/11 < 1.0 < 1.0 < 1.0 < 1.5 < 1.0 < 1.0 < 1.0 < 2.0 < 10.0 18.0 7.55 205008/12/11 3.9 < 1.0 1.6 < 1.5 < 1.0 < 1.0 < 1.0 < 2.0 < 10.0 22.0 7.45 167012/16/11 1.5 < 1.0 < 1.0 < 1.5 < 1.0 < 1.0 < 1.0 < 2.0 < 10.0 14.5 7.60 1345
domestic 06/10/04 < 1.0 < 1.0 < 1.0 <1.0 < 1.0 * < 1.0 <1.0 < 3.0 * * * * * * * * *5/14/09. < 1.0 < 1.0 < 1.0 < 1.5 < 1.0 < 1.0 < 1.0 < 2.0 < 10.0 15.0 7.6 1100.002/15/11 < 1.0 < 1.0 < 1.0 < 1.5 < 1.0 < 1.0 < 1.0 < 2.0 < 10.0 0.078 0.0025 <0.005 15.0 7.5 1200.005/05/11 < 1.0 < 1.0 < 1.0 < 1.5 < 1.0 < 1.0 < 1.0 < 2.0 < 10.0 0.065 0.0072 <0.005 15.0 7.5 1150.008/12/11 < 1.0 < 1.0 < 1.0 < 1.5 < 1.0 < 1.0 < 1.0 < 2.0 < 10.0 0.037 0.0039 <0.005 20.1 7.4 606.012/16/11 < 1.0 < 1.0 < 1.0 < 1.5 < 1.0 < 1.0 < 1.0 < 2.0 < 10.0 0.097 < 0.002 <0.005 14.5 7.7 1345.0

TABLE 1Midway Grocery
03-11-1232-01NMED FACILITY # 53478
RESULTS OF GROUND WATER TESTING
TABLE 1 Page 5 of 5
LOCATION
DATE
SA
MPL
ED
BENZ
ENE
TOLU
ENE
ETHY
L BE
NZEN
E
TOTA
L XY
LENE
S
MTB
E
EDB
EDC
TMB
NAPH
THAL
ENE
IRO
N
MAN
GAN
ESE
LEAD
Tem
pera
ture
pH
Cond
uctiv
ity
Nitra
te
Alka
linity
Diss
olve
d O
xyge
n
UNITS µg/l µg/l µg/l µg/l µg/l µg/l µg/l µg/l µg/l (˚C) (µmhos/cm)(mg/l) (mg/l) (mg/l)STANDARDS 10 750 750 620 100 0.1 10 30 as CaCO3
trip blank 06/10/04 < 1.0 < 1.0 < 1.0 <2.0 < 1.0 * < 1.0 <1.0 < 3.0 * * * * * * * * *06/05/06 < 1.0 < 1.0 < 1.0 < 1.0 < 1.0 < 1.0 < 1.0 < 1.0 < 5.009/11/06 < 1.0 < 1.0 < 1.0 < 1.0 < 1.0 < 1.0 < 1.0 < 1.0 < 5.012/12/06 < 1.0 < 1.0 < 1.0 < 1.0 < 1.0 < 1.0 < 1.0 < 2.0 < 13.003/09/07 < 1.0 < 1.0 < 1.0 < 2.0 < 1.0 < 1.0 < 1.0 < 2.0 < 13.05/14/09. < 1.0 < 1.0 < 1.0 < 1.5 < 1.0 < 1.0 < 1.0 < 2.0 < 10.003/16/10 < 1.0 < 1.0 < 1.0 < 1.5 < 1.0 < 1.0 < 1.0 < 2.0 < 10.006/08/10 < 1.0 < 1.0 < 1.0 < 1.5 < 1.0 < 1.0 < 1.0 < 2.0 < 10.009/01/10 < 1.0 < 1.0 < 1.0 < 1.5 < 1.0 < 1.0 < 1.0 < 2.0 < 10.012/01/10 < 1.0 < 1.0 < 1.0 < 1.5 < 1.0 < 1.0 < 1.0 < 2.0 < 10.005/05/11 < 1.0 < 1.0 < 1.0 < 1.5 < 1.0 < 1.0 < 1.0 < 2.0 < 10.008/12/11 < 1.0 < 1.0 < 1.0 < 1.5 < 1.0 < 1.0 < 1.0 < 2.0 < 10.012/16/11 < 1.0 < 1.0 < 1.0 < 1.5 < 1.0 < 1.0 < 1.0 < 2.0 < 10.0
* NOT ANALYSED
Data checked ______ / ______

TABLE 2MIDWAY GROCERY
03-11-1232-01NMED FACILITY #53478
WATER LEVEL MEASUREMENTS
TABLE 2 Page 1 of 3
WELL ELEVATION DATE STATIC WATER LEVEL (+) = RISINGNUMBER (feet above datum) Northing Easting (feet BG)* (feet AD)† (-) = FALLING
MW-1 4789.45 1,314,372.93 1,486,207.26 06/10/04 4.22 4785.2306/05/06 4.30 4785.15 -0.0809/12/06 4.75 4784.70 -0.4512/12/06 4.85 4784.60 -0.1003/09/07 5.29 4784.16 -0.4405/14/09 3.92 4785.53 1.3703/16/10 5.75 4783.70 -1.8306/08/10 4.35 4785.10 1.4009/01/10 5.17 4784.28 -0.8212/01/10 5.40 4784.05 -0.2302/15/11 5.97 4783.48 -0.5705/05/11 3.90 4785.55 2.0708/12/11 4.24 4785.21 -0.3412/16/11 5.13 4784.32 -0.89
MW-2 4790.19 1,314,457.16 1,486,180.26 06/10/04 4.95 4785.2406/05/06 4.75 4785.44 0.2009/12/06 5.48 4784.71 -0.7312/12/06 5.64 4784.55 -0.1603/09/07 6.00 4784.19 -0.3605/14/09 4.26 4785.93 1.7403/16/10 6.35 4783.84 -2.0906/08/10 5.05 4785.14 1.3009/01/10 5.76 4784.43 -0.7112/01/10 6.06 4784.13 -0.3002/15/11 6.64 4783.55 -0.5805/05/11 4.58 4785.61 2.0608/12/11 4.92 4785.27 -0.3412/16/11 5.85 4784.34 -0.93
MW-3 4789.85 1,314,405.17 1,486,248.60 06/10/04 4.58 4785.2706/05/06 4.41 4785.44 0.1709/12/06 4.89 4784.96 -0.4812/12/06 5.12 4784.73 -0.2303/09/07 5.64 4784.21 -0.5205/14/09 3.94 4785.91 1.7003/16/10 6.05 4783.80 -2.1106/08/10 4.64 4785.21 1.4109/01/10 5.42 4784.43 -0.7812/01/10 5.73 4784.12 -0.3102/15/11 6.32 4783.53 -0.5905/05/11 4.25 4785.60 2.0708/12/11 4.55 4785.30 -0.3012/16/11 5.53 4784.32 -0.98

TABLE 2MIDWAY GROCERY
03-11-1232-01NMED FACILITY #53478
WATER LEVEL MEASUREMENTS
TABLE 2 Page 2 of 3
WELL ELEVATION DATE STATIC WATER LEVEL (+) = RISINGNUMBER (feet above datum) Northing Easting (feet BG)* (feet AD)† (-) = FALLING
MW-4 4788.89 1,314,363.08 1,486,282.52 06/10/04 3.66 4785.2306/05/06 3.50 4785.39 0.1609/12/06 4.23 4784.66 -0.7312/12/06 4.42 4784.47 -0.1903/09/07 4.77 4784.12 -0.3505/14/09 3.05 4785.84 1.7203/16/10 5.14 4783.75 -2.0906/08/10 3.70 4785.19 1.4409/01/10 4.50 4784.39 -0.8012/01/10 4.80 4784.09 -0.3002/15/11 5.42 4783.47 -0.6205/05/11 3.28 4785.61 2.1408/12/11 3.64 4785.25 -0.3612/16/11 4.56 4784.33 -0.92
MW-5 06/10/04 3.90 4785.11well could not be accessed for sampling or survey 06/05/06
4789.01 1,314,323.23 1,486,216.50 09/12/06 4.35 4784.6612/12/06 4.5 4784.51 -0.1503/09/07 4.93 4784.08 -0.43
well could not be accessed for sampling or DTW measurement 05/14/0903/16/10 5.31 4783.7006/08/10 4.02 4784.99 1.2909/01/10 4.79 4784.22 -0.7712/01/10 5.05 4783.96 -0.2602/15/11 5.60 4783.41 -0.5505/05/11 3.48 4785.53 2.1208/12/11 3.80 4785.21 -0.3212/16/11 4.82 4784.19 -1.02
MW-6 4788.99 1,314,312.83 1,486,157.68 06/10/04 3.88 4785.1106/05/06 3.85 4785.14 0.0309/12/06 4.48 4784.51 -0.6312/12/06 4.56 4784.43 -0.0803/09/07 4.85 4784.14 -0.29
well could not be accessed for sampling or DTW measurement 05/14/0903/16/10 5.11 4783.8806/08/10 4.1 4784.89 1.0109/01/10 4.79 4784.20 -0.6912/01/10 4.97 4784.02 -0.1802/15/11 5.62 4783.37 -0.6505/05/11 3.50 4785.49 2.1208/12/11 3.86 4785.13 -0.3612/16/11 4.76 4784.23 -0.90

TABLE 2MIDWAY GROCERY
03-11-1232-01NMED FACILITY #53478
WATER LEVEL MEASUREMENTS
TABLE 2 Page 3 of 3
WELL ELEVATION DATE STATIC WATER LEVEL (+) = RISINGNUMBER (feet above datum) Northing Easting (feet BG)* (feet AD)† (-) = FALLING
MW-7 4789.80 1,314,403.35 1,486,128.29 06/10/04 4.64 4785.1606/05/06 4.51 4785.29 0.1309/12/06 5.20 4784.60 -0.6912/12/06 5.32 4784.48 -0.1203/09/07 5.65 4784.15 -0.3305/14/09 4.04 4785.76 1.2803/16/10 6.03 4783.77 -1.9906/08/10 4.74 4785.06 1.2909/01/10 5.50 4784.30 -0.7612/01/10 5.75 4784.05 -0.2502/15/11 6.31 4783.49 -0.5605/05/11 4.23 4785.57 2.0808/12/11 4.64 4785.16 -0.4112/16/11 5.53 4784.27 -0.89
* – Below Grade† – Above Datum (Datum = 0)
Data checked ______ / ______

APPENDIX 1
Field Sampling Procedures

Prior to any sampling, well development or purging, all monitor wells were sounded for depth to
ground water. FEI used an electronic sounder with an accuracy of ±0.01/foot. Ground water
elevations (from datum) were determined using survey data.
Prior to any sampling event, a minimum of three (3) well bore volumes were purged from each well
using a portable submersible pump, which was decontaminated between each well. Samples were
collected in HCl preserved VOAs and placed on ice in a container for delivery to Hall Laboratories, in
Albuquerque, New Mexico, for analyses. The ground water samples were analyzed for Benzene,
Toluene, Ethylbenzene, and total Xylenes (BTEX), Total Naphthalenes, Methyl-t-Butyl Ether (MTBE),
TMB, Ethylene Dibromide (EDB) and Ethylene Dichloride (EDC) by EPA Method 8260 with an
expanded Naphthalene range (PBMS).
The domestic well sample was collected after purging 80 gallons from the well. In addition to the
sample collected for the 8260B analyses described above, an additional sample aliquot for analyses
of iron, manganese and lead by EPA Method 200.7 was collected and preserved with HNO3 acid.

APPENDIX 2
Field Notes

APPENDIX 3
Analytical Laboratory Reports