Embed Size (px)
Citation preview
REPORT OF GEOTECHNICAL INVESTIGATION SEWER GROUP 806 BRIDGE CROSSING PROJECT
CITY OF SAN DIEGO
Submitted to:
MICHAEL BAKER INTERNATIONAL5050 Avenida Encinas, Suite 260
Carlsbad, CA 92008
Prepared By:
ALLIED GEOTECHNICAL ENGINEERS, INC.9500 Cuyamaca Street, Suite 102
Santee, California 92071-2685
AGE Project No. 185 GS-16-B
August 23, 2018(Revised October 23, 2018)
August 23, 2018(Revised October 23, 2018)
Mr. Bo Burick, P.E.Vice PresidentMichael Baker International5050 Avenida Encinas, Suite 260Carlsbad, CA 92008
Subject: REPORT OF GEOTECHNICAL INVESTIGATION SEWER GROUP 806 BRIDGE CROSSING PROJECTCITY OF SAN DIEGOAGE Project No. 185 GS-16-B
Dear Mr. Burick:
Allied Geotechnical Engineers, Inc. is pleased to submit the accompanying report to present thefindings, opinions, and recommendations of a geotechnical investigation that was performed to assistMichael Baker International with their design of the subject project.
We appreciate the opportunity to be of service on this project. If you have any questions regardingthe contents of this report or need further assistance, please feel free to contact our office.
Sincerely,
ALLIED GEOTECHNICAL ENGINEERS, INC.
Nicholas E. Barnes, P.G., C.E.G. Sani Sutanto, P.E.Senior Geologist Senior Engineer
NEB/SS/TJL:calDistr. (1 electronic) Addressee 05/31/2020 06/30/2020
AGE Project No. 185 GS-16-BAugust 23, 2018 (Revised October 23, 2018)Page i
REPORT OF GEOTECHNICAL INVESTIGATION SEWER GROUP 806 BRIDGE CROSSING PROJECT
CITY OF SAN DIEGO
TABLE OF CONTENTS
Page No.
1.0 INTRODUCTION. . . . . . . . . . . . . . . . . . . . . . . . . . . . . . . . . . . . . . . . . . . . . . . 1
2.0 SITE AND PROJECT DESCRIPTION.. . . . . . . . . . . . . . . . . . . . . . . . . . . . . . 2
3.0 OBJECTIVE AND SCOPE OF INVESTIGATION. . . . . . . . . . . . . . . . . . . . . 3 3.1 Information Review. . . . . . . . . . . . . . . . . . . . . . . . . . . . . . . . . . . . . . . . 3 3.2 Geotechnical Field Exploration. . . . . . . . . . . . . . . . . . . . . . . . . . . . . . . 3 3.3 Laboratory Testing. . . . . . . . . . . . . . . . . . . . . . . . . . . . . . . . . . . . . . . . . 4
4.0 GEOLOGIC CONDITIONS. . . . . . . . . . . . . . . . . . . . . . . . . . . . . . . . . . . . . . . 5 4.1 Geologic Setting and Site Physiography. . . . . . . . . . . . . . . . . . . . . . . . 5 4.2 Tectonic Setting. . . . . . . . . . . . . . . . . . . . . . . . . . . . . . . . . . . . . . . . . . . 5 4.3 Geologic Units. . . . . . . . . . . . . . . . . . . . . . . . . . . . . . . . . . . . . . . . . . . . 6
4.3.1 Fill Materials. . . . . . . . . . . . . . . . . . . . . . . . . . . . . . . . . 6 4.3.2 Young Colluvial Deposits. . . . . . . . . . . . . . . . . . . . . . . 6 4.3.3 Stadium Conglomerate.. . . . . . . . . . . . . . . . . . . . . . . . . 7
4.4 Groundwater. . . . . . . . . . . . . . . . . . . . . . . . . . . . . . . . . . . . . . . . . . . . . 8
Allied Geotechnical Engineers, Inc.
AGE Project No. 185 GS-16-BAugust 23, 2018 (Revised October 23, 2018)Page ii
TABLE OF CONTENTS(Continued)
Page No.
5.0 DISCUSSIONS, OPINIONS, AND RECOMMENDATIONS. . . . . . . . . . . . . 9 5.1 Potential Geologic Hazards. . . . . . . . . . . . . . . . . . . . . . . . . . . . . . . . . . 9
5.1.1 Faulting. . . . . . . . . . . . . . . . . . . . . . . . . . . . . . . . . . . . . 9 5.1.2 Fault Ground Rupture & Ground Lurching. . . . . . . . . 10 5.1.3 Soil Liquefaction. . . . . . . . . . . . . . . . . . . . . . . . . . . . . 10 5.1.4 Landslides. . . . . . . . . . . . . . . . . . . . . . . . . . . . . . . . . . 10 5.1.5 Lateral Spread Displacement. . . . . . . . . . . . . . . . . . . . 11 5.1.6 Differential Seismic-Induced Settlement. . . . . . . . . . . 11 5.1.7 Secondary Hazards.. . . . . . . . . . . . . . . . . . . . . . . . . . . 11
5.2 Soil Corrosivity. . . . . . . . . . . . . . . . . . . . . . . . . . . . . . . . . . . . . . . . . . 12 5.3 Expansive Soil. . . . . . . . . . . . . . . . . . . . . . . . . . . . . . . . . . . . . . . . . . . 13 5.4 Seismic Design Parameters. . . . . . . . . . . . . . . . . . . . . . . . . . . . . . . . . 13
5.4.1 Caltrans Seismic Design Parameters. . . . . . . . . . . . . . 13 5.4.2 California Building Code (CBC) 2016
Seismic Design Parameters. . . . . . . . . . . . . . . . . . . . . 17 5.5 Earthwork Operations. . . . . . . . . . . . . . . . . . . . . . . . . . . . . . . . . . . . . 19
5.5.1 Soil Excavation Characteristics. . . . . . . . . . . . . . . . . . 20 5.5.2 Placement and Compaction of Backfill. . . . . . . . . . . . 20
5.6 Bridge Foundation Recommendations.. . . . . . . . . . . . . . . . . . . . . . . . 21 5.7 Bridge Abutment Walls. . . . . . . . . . . . . . . . . . . . . . . . . . . . . . . . . . . . 25
Allied Geotechnical Engineers, Inc.
AGE Project No. 185 GS-16-BAugust 23, 2018 (Revised October 23, 2018)Page iii
TABLE OF CONTENTS(Continued)
Page No.
6.0 CONSTRUCTION-RELATED CONSIDERATIONS. . . . . . . . . . . . . . . . . . 27 6.1 Construction Dewatering. . . . . . . . . . . . . . . . . . . . . . . . . . . . . . . . . . . 27 6.2 Temporary Excavations. . . . . . . . . . . . . . . . . . . . . . . . . . . . . . . . . . . . 27 6.3 Temporary Shoring. . . . . . . . . . . . . . . . . . . . . . . . . . . . . . . . . . . . . . . 28 6.4 CIDH Piles Construction Considerations. . . . . . . . . . . . . . . . . . . . . . 29 6.5 Environmental Considerations.. . . . . . . . . . . . . . . . . . . . . . . . . . . . . . 30
7.0 GENERAL CONDITIONS. . . . . . . . . . . . . . . . . . . . . . . . . . . . . . . . . . . . . . . 32 7.1 Post-Investigation Services. . . . . . . . . . . . . . . . . . . . . . . . . . . . . . . . . 32 7.2 Uncertainties and Limitations. . . . . . . . . . . . . . . . . . . . . . . . . . . . . . . 32
8.0 REFERENCES. . . . . . . . . . . . . . . . . . . . . . . . . . . . . . . . . . . . . . . . . . . . . . . . 34
Figures
Figure 1 Location Map
Figure 2 Site Plan
Figure 3 Deterministic ARS
Figure 4 Probabilistic ARS
Figure 5 ARS Envelope Design Spectral Acceleration
Figure 6 LRFD Factored Axial Resistance 24-Inch Diameter CIDH Piles(Abutments 1 and 2)
Allied Geotechnical Engineers, Inc.
AGE Project No. 185 GS-16-BAugust 23, 2018 (Revised October 23, 2018)Page iv
TABLE OF CONTENTS(Continued)
Page No.
Tables
Table 1 Summary of Corrosivity Test Results. . . . . . . . . . . . . . . . . . . . . . . . . . . . . . . 12
Table 2 Summary of Fault Parameters. . . . . . . . . . . . . . . . . . . . . . . . . . . . . . . . . . . . . 15
Table 3 Summary of CBC 2016 Seismic Design Parameters (Site Class C). . . . . . . . 18
Table 4 General Foundation Information
Table 5 Preliminary Design Load
Table 6 CIDH Concrete Pile
Table 7 LPILE Soil Parameters
Table 8 LPILE Soil Profile at Abutments 1 and 2
Appendices
Appendix A Field Exploration Program
Appendix B Laboratory Testing
Allied Geotechnical Engineers, Inc.
SECTION ONE INTRODUCTION
1.0 INTRODUCTION
Allied Geotechnical Engineers, Inc. (AGE) is pleased to submit this report to present the findings,
opinions, and recommendations of a geotechnical investigation conducted to assist Michael Baker
International (MBI) with their design of the Sewer Group 806 Bridge Crossing Project for the City
of San Diego (City). The investigation was performed in conformance with AGE’s proposal dated
December 15, 2016 (Revised February 13, 2018), and the subconsultant agreement entered into by
and between MBI and AGE on June 5, 2017.
This report has been prepared for the exclusive use of MBI and its design team and the City in their
design of the project as described herein. The information presented in this report is not sufficient
for any other uses or the purposes of other parties.
AGE Project No. 185 GS-16-BAugust 23, 2018 (Revised October 23, 2018)Page 1 of 36 Allied Geotechnical Engineers, Inc.
SECTION TWO SITE AND PROJECTDESCRIPTION
2.0 SITE AND PROJECT DESCRIPTION
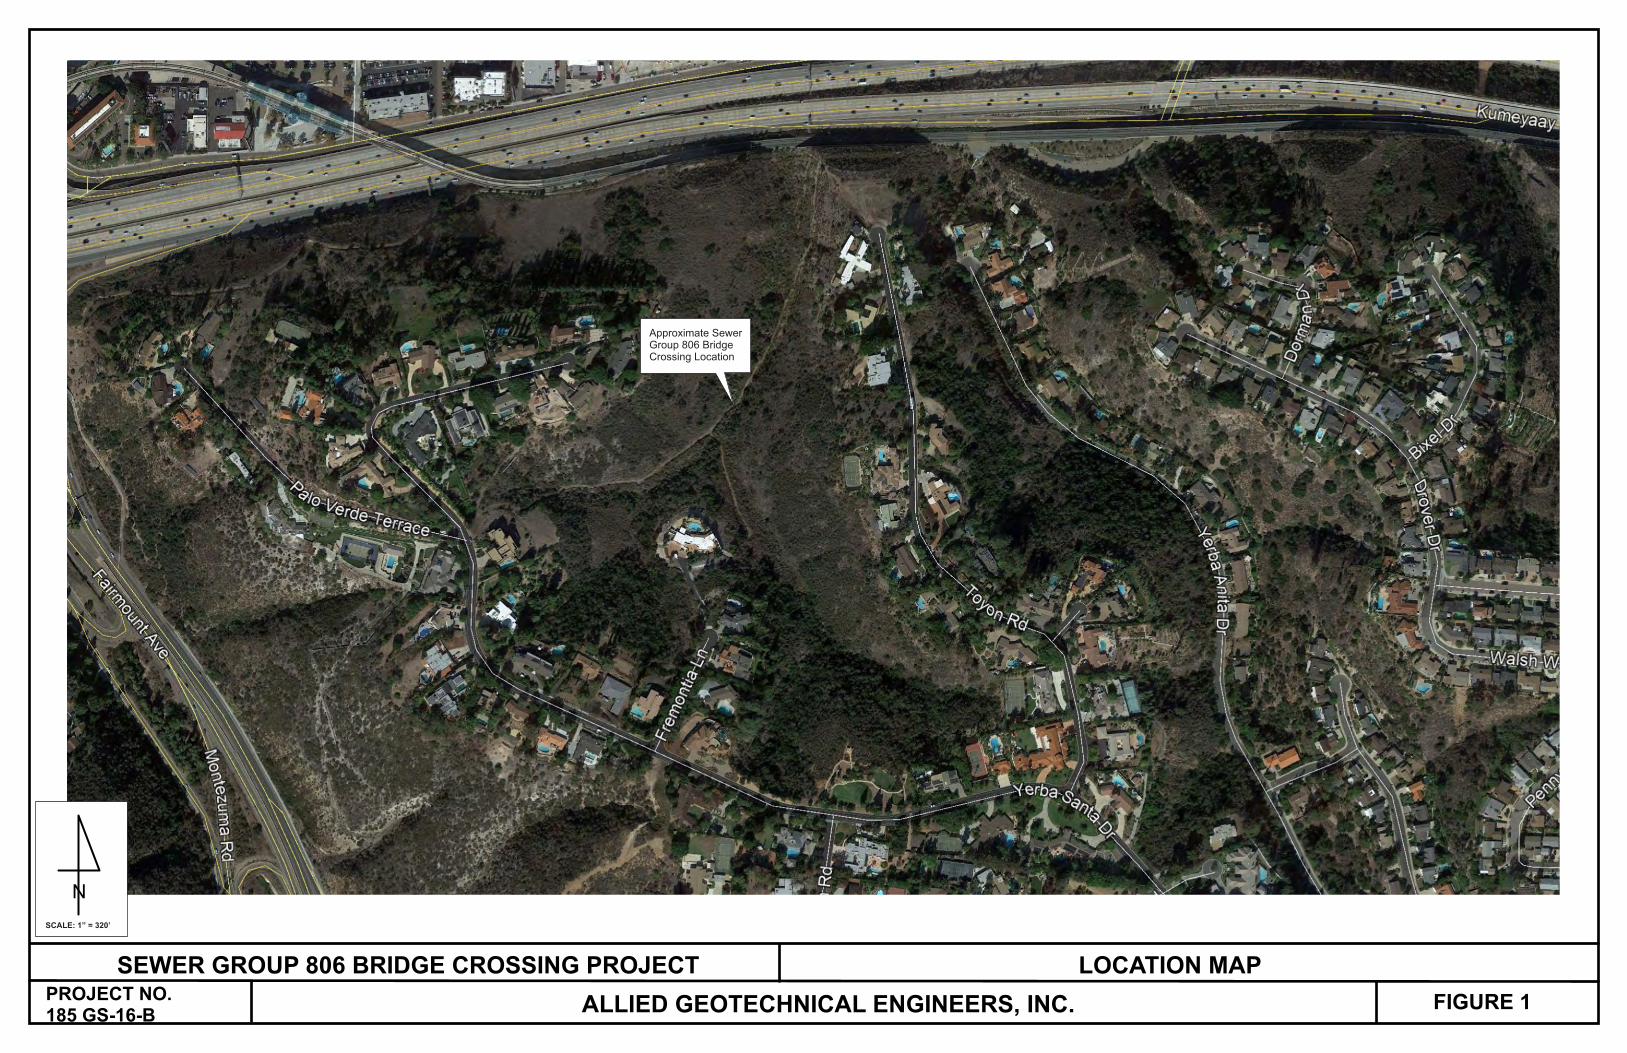
The project site is located in a northeast trending natural canyon in the gated Alvarado Estates
development in the communities of Talmadge and College Heights in the City of San Diego. The
approximate location of the project site is shown on the Location Map (Figure 1). Access to the
project site is via an existing sewer access road. The entrance to the road is located approximately
1,000 feet southwest of the project site at the intersection of Yerba Santa Drive and Palo Verde
Terrace. Nearby residential homesites are built along ridgelines overlooking the canyon, with the
canyon bottom and side walls left largely undisturbed as open space. The canyon walls are
moderately steep, with gradients of up to 3:1 (horizontal:vertical). The canyon is densely vegetated
with mostly chaparral vegetation. Site elevations vary from approximately 188 feet above mean sea
level (msl) to 194 feet msl. Nearby land uses include residential developments and open space.
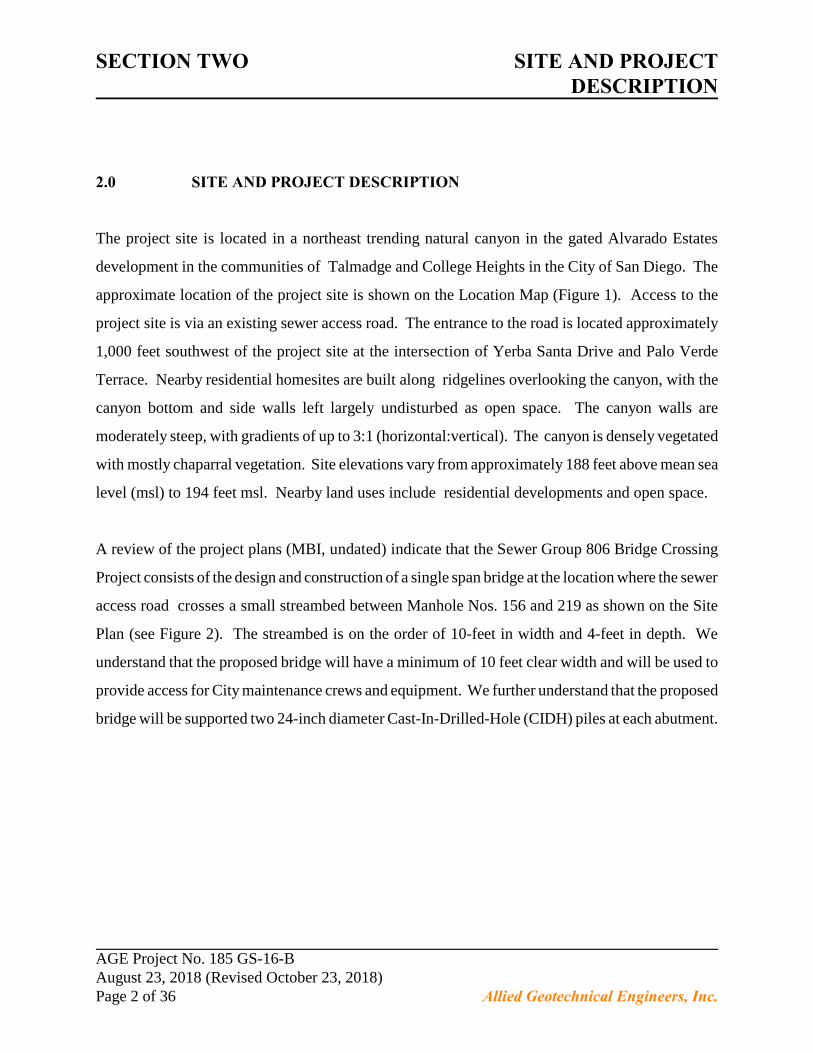
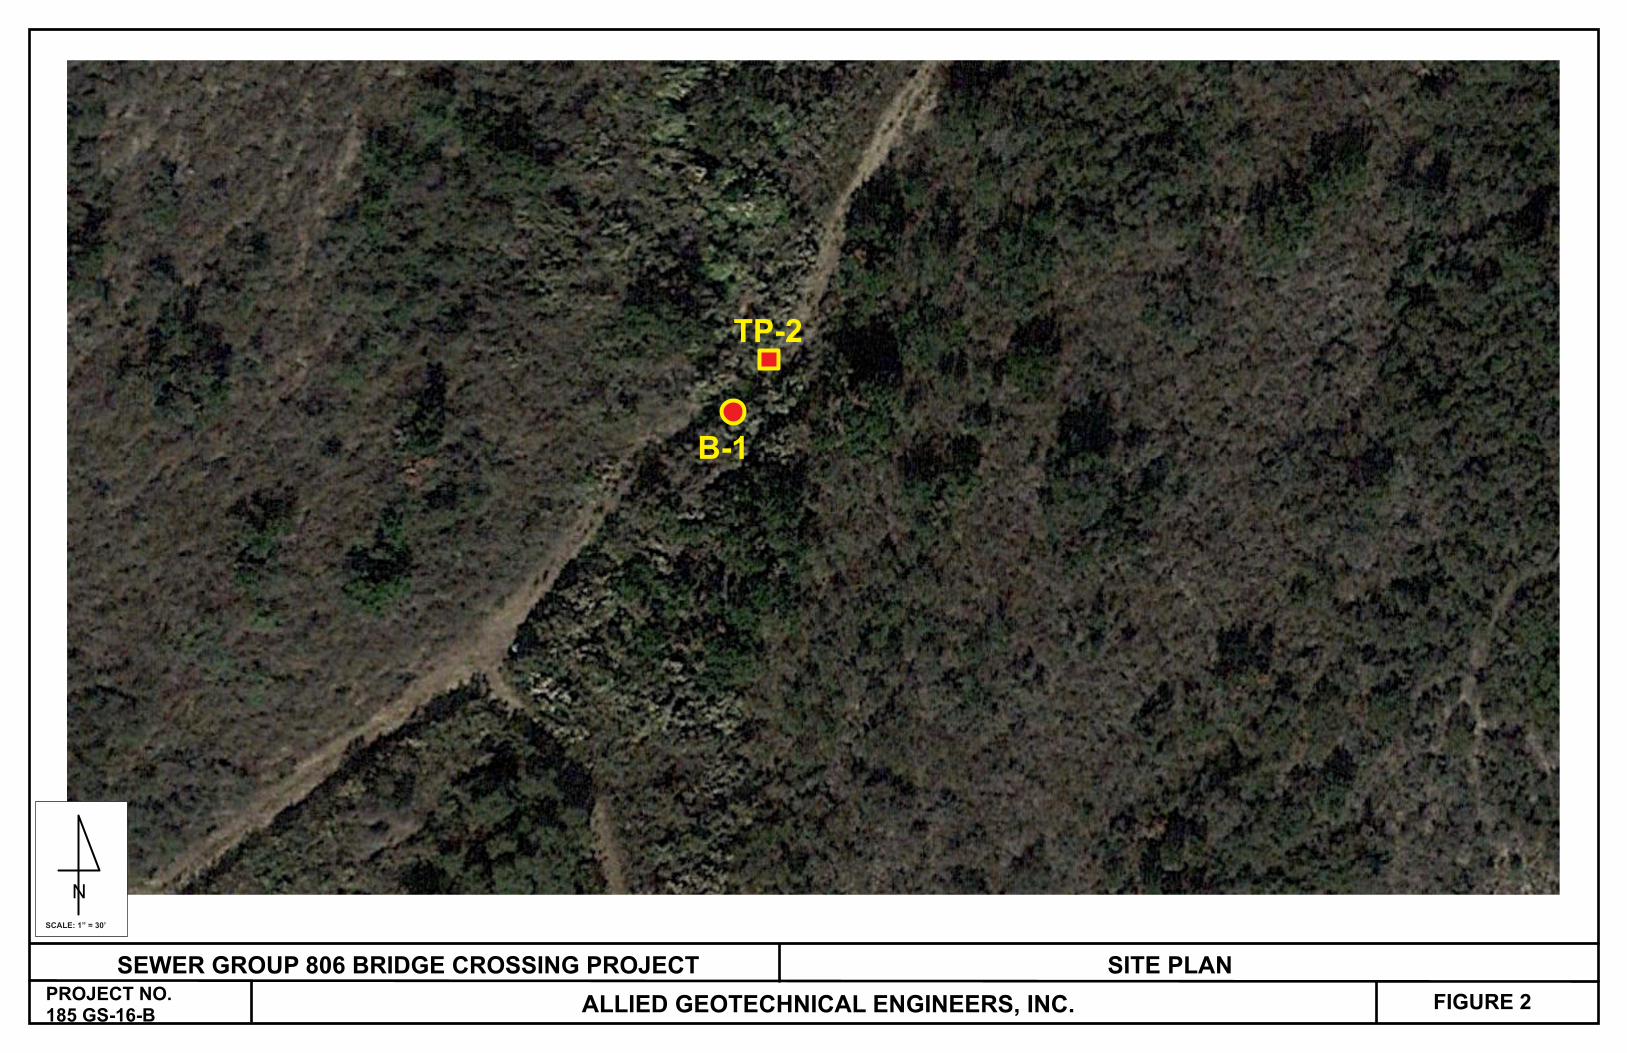
A review of the project plans (MBI, undated) indicate that the Sewer Group 806 Bridge Crossing
Project consists of the design and construction of a single span bridge at the location where the sewer
access road crosses a small streambed between Manhole Nos. 156 and 219 as shown on the Site
Plan (see Figure 2). The streambed is on the order of 10-feet in width and 4-feet in depth. We
understand that the proposed bridge will have a minimum of 10 feet clear width and will be used to
provide access for City maintenance crews and equipment. We further understand that the proposed
bridge will be supported two 24-inch diameter Cast-In-Drilled-Hole (CIDH) piles at each abutment.
AGE Project No. 185 GS-16-BAugust 23, 2018 (Revised October 23, 2018)Page 2 of 36 Allied Geotechnical Engineers, Inc.
SECTION THREE OBJECTIVE AND SCOPEOF INVESTIGATION
3.0 OBJECTIVE AND SCOPE OF INVESTIGATION
The objectives of this investigation were to characterize the subsurface conditions at the southwest
and northeast sides of the stream crossing and to develop geotechnical recommendations for use in
the design of the currently proposed project. The scope of our investigation included several tasks
which are described in more detail in the following sections.
3.1 Information Review
This task involved a review of readily available information pertaining to the proposed project,
including the preliminary project plans, as-built utility maps, topographic maps, published geologic
literature and maps, and AGE’s in-house references.
3.2 Geotechnical Field Exploration
The field exploration program for this project was performed on July 31, 2018. One (1) soil boring
and one (1) test pit were performed at the approximate locations shown on Figure 2. The soil boring
was advanced with an all-terrain drill rig to a depth of 28 feet below the existing ground surface
(bgs) and the test pit was excavated by manual labor to a depth of 5 feet bgs. A more detailed
description of the excavation and sampling activities, and logs of the soil boring and test pit are
presented in Appendix A.
AGE Project No. 185 GS-16-BAugust 23, 2018 (Revised October 23, 2018)Page 3 of 36 Allied Geotechnical Engineers, Inc.
SECTION THREE OBJECTIVE AND SCOPEOF INVESTIGATION
Prior to commencement of the field exploration activities, several site reconnaissance visits were
performed to observe existing conditions and to select suitable locations for the soil boring and test
pit. Subsequently, Underground Service Alert (USA) was contacted to coordinate clearance of the
proposed boring and test pit locations with respect to existing buried utilities. Our utility clearance
efforts revealed that the existing sewer pipeline is the only buried utility in the study area.
3.3 Laboratory Testing
Selected soil samples obtained from the soil boring and test pit were tested in the laboratory to verify
field classifications and evaluate certain engineering characteristics. The geotechnical laboratory
tests were performed in general conformance with the American Society for Testing and Materials
(ASTM) or other generally accepted testing procedures.
The laboratory tests included: in-place density and moisture content, maximum density and optimum
moisture content, sieve (wash) analysis, and shear strength. In addition, representative samples of
the onsite soil materials were collected and delivered to Clarkson Laboratories and Supply, Inc. for
chemical (analytical) testing to determine soil pH and resistivity, soluble sulfate and chloride
concentrations, and bicarbonate content. A brief description of the tests that were performed and the
final test results are presented in Appendix B.
AGE Project No. 185 GS-16-BAugust 23, 2018 (Revised October 23, 2018)Page 4 of 36 Allied Geotechnical Engineers, Inc.
SECTION FOUR GEOLOGIC CONDITIONS
4.0 GEOLOGIC CONDITIONS
4.1 Geologic Setting and Site Physiography
The project study area is located in a northeast trending canyon that drains to Alvarado Creek.
Mapped geologic units in the study area consist of nearly flat-lying to gently southwest dipping,
marine and non-marine sediments which range from Holocene to Eocene in age. Metavolcanic and
metasedimentary basement rocks of Jurassic/Cretaceous age are mapped northeast of the project
study area in Del Cerro and in Alvarado Creek near the SDSU campus (Kennedy and Tan, 2008).
The basement rocks are non-conformably overlain by the sedimentary deposits. Shallow man-made
fills are also present along the access road.
4.2 Tectonic Setting
Tectonically, the San Diego region is situated in a broad zone of northwest-trending, predominantly
right-slip faults that span the width of the Peninsular Ranges and extend offshore into the California
Continental Borderland Province west of California and northern Baja California. At the latitude
of San Diego, this zone extends from the San Clemente fault zone, located approximately 60 miles
to the west, and the San Andreas fault located about 95 miles to the east.
Major active regional faults of tectonic significance include the Coronado Bank, San Diego Trough,
San Clemente, and Newport Inglewood/Rose Canyon fault zones which are located offshore; the
faults in Baja California, including the San Miguel-Vallecitos and Agua Blanca fault zones; and the
faults located further to the east in Imperial Valley which include the Elsinore, San Jacinto and San
Andreas fault zones.
AGE Project No. 185 GS-16-BAugust 23, 2018 (Revised October 23, 2018)Page 5 of 36 Allied Geotechnical Engineers, Inc.

SECTION FOUR GEOLOGIC CONDITIONS
4.3 Geologic Units
Based on their origin and compositional characteristics, the soil types encountered in the soil boring
and test pit can be categorized into three geologic units which include (in order of increasing age)
fill materials; young colluvial deposits; and Stadium Conglomerate. A brief description of each unit
is presented below.
4.3.1 Fill Materials
Fill materials less than 1foot in thickness were encountered in the soil boring and test pit. The fill
materials generally consist of silty sands containing scattered to abundant sub-rounded gravel and
cobbles. The fill was in a dry condition, and is likely associated with construction of the sewer
access roadway. Documentation pertaining to the original placement of the fill materials is
unavailable.
4.3.2 Young Colluvial Deposits
Young colluvial deposits of Holocene to late Quaternary age were encountered to depths of up to
6-feet bgs in the soil boring and test pit. Although not mapped in the study area on the geologic map
prepared by Kennedy and Tan (2008), similar colluvial deposits are described as poorly consolidated
and poorly sorted sand and silt slopewash deposits. These deposits can generally be easily excavated
with conventional heavy duty construction equipment.
AGE Project No. 185 GS-16-BAugust 23, 2018 (Revised October 23, 2018)Page 6 of 36 Allied Geotechnical Engineers, Inc.
SECTION FOUR GEOLOGIC CONDITIONS
The young colluvial deposits encountered in the test excavations generally consist of brown to dark
brown silty sands and clayey sands with locally abundant sub-rounded gravel and cobbles up to 10"
in maximum dimension. The deposits were in a loose to medium dense condition, and damp to wet.
4.3.3 Stadium Conglomerate
The Eocene age Stadium Conglomerate was encountered below young colluvial deposits at the soil
boring and test pit, and extended to the maximum depths of exploration. The Stadium Conglomerate
consists of a massive cobble-conglomerate with a yellowish brown silty sand matrix that is locally
strongly cemented (Kennedy and Tan, 2008). The clasts are generally of rhyolite, dacite and
quartzite composition, and are typically well rounded, elongated and flattened. The conglomerate
is locally interbedded with lenses and layers of sandstone that is similar in composition to the matrix
(Kennedy and Tan, 2008). The combination of strong cementation and locally abundant gravels and
cobbles may pose difficult excavation conditions even for heavy duty construction equipment.
Stadium Conglomerate encountered in our soil boring and test pit consists of a dense to very dense
cobble-conglomerate with a pale yellow, medium-grained sandstone matrix in a damp to wet
condition.
AGE Project No. 185 GS-16-BAugust 23, 2018 (Revised October 23, 2018)Page 7 of 36 Allied Geotechnical Engineers, Inc.

SECTION FOUR GEOLOGIC CONDITIONS
4.4 Groundwater
At the time of our field investigation, groundwater was measured at a depth of 13 feet bgs in boring
B-1 approximately 1 hour after the completion of drilling. Groundwater encountered in the boring
appears to be a perched condition. Stadium Conglomerate encountered in the boring and test pit
generally possesses very low permeability characteristics.
The database available at the Geotracker website (www.Geotracker.com) includes an environmental
assessment report for Sullivan United, a storage and transfer company which formerly occupied a
building located at 4660 Alvarado Canyon Road. This site is located approximately 1,300 feet
northwest of the project study area north of the I-8 freeway and south of Alvarado Creek, at an
elevation of 115 feet msl. In a Case Closure Summary prepared by the County of San Diego DEH
(DEH, 2005) it was reported that the measured depth to groundwater varied from 27 feet to 63 feet
bgs in 12 monitoring wells on the site.
Based on a review of the available data, the depth (elevation) of the regional groundwater table in
the project study area is estimated to be well below the anticipated depths of excavation. However,
it is considered probable that perched water conditions may be encountered during construction,
especially during the rainy (wet) season.
AGE Project No. 185 GS-16-BAugust 23, 2018 (Revised October 23, 2018)Page 8 of 36 Allied Geotechnical Engineers, Inc.
SECTION FIVE DISCUSSIONS, OPINIONSAND RECOMMENDATIONS
5.0 DISCUSSIONS, OPINIONS AND RECOMMENDATIONS
5.1 Potential Geologic Hazards
The project study area is classified in the City of San Diego Seismic Safety Study (2008) as Hazard
Category 53, “Level or sloping terrain, unfavorable geologic structure, low to moderate risk”. The
classification is not expected to impact the proposed project. Based on the results of our study,
several potential geologic hazards in the project study area are more fully described herein.
5.1.1 Faulting
There are no known (mapped) active faults in the project study zone. For the purpose of this project
we consider the Rose Canyon fault zone (RCFZ) to represent the most significant seismic hazard.
The RCFZ is a complex set of anastomosing and en-echelon, predominantly strike slip faults that
extend from off the coast near Carlsbad to offshore south of downtown San Diego (Treiman, 1993).
Previous geologic investigations on the RCFZ in the Rose Creek area (Rockwell et. al., 1991) and
in downtown San Diego (Patterson et. al., 1986) found evidence of multiple Holocene earthquakes.
Based on these studies, several fault strands within the RCFZ have been classified as active faults,
and are included in Alquist-Priolo Special Studies Zones. In San Diego Bay, this fault zone is
believed to splay into multiple, subparallel strands; the most pronounced of which are the Silver
Strand, Spanish Bight and Coronado Bank faults. The project study area is not located within an
Alquist-Priolo Earthquake Study Zone.
AGE Project No. 185 GS-16-BAugust 23, 2018 (Revised October 23, 2018)Page 9 of 36 Allied Geotechnical Engineers, Inc.
SECTION FIVE DISCUSSIONS, OPINIONSAND RECOMMENDATIONS
5.1.2 Fault Ground Rupture & Ground Lurching
There are no known (mapped) active or potentially active faults crossing the project study area
(Kennedy, 1975; City of San Diego, 2008). Therefore, the potential for fault ground rupture and
ground lurching is considered insignificant.
5.1.3 Soil Liquefaction
Seismically-induced soil liquefaction is a phenomenon in which loose to medium dense, saturated
granular materials undergo matrix rearrangement, develop high pore water pressure, and lose shear
strength due to cyclic ground vibrations induced by earthquakes.
The findings of our investigation indicate that the project study area is underlain with dense to very
dense formational soils that are not considered to be liquefiable.
5.1.4 Landslides
A review of the published geologic maps indicate that there are no known (mapped) ancient
landslides in the project study area (Kennedy, 1975; Kennedy and Tan, 2008; City of San Diego,
2008). Furthermore, the underlying formational material is not considered to be susceptible to
landslide. Therefore, landsliding is not considered a significant risk.
AGE Project No. 185 GS-16-BAugust 23, 2018 (Revised October 23, 2018)Page 10 of 36 Allied Geotechnical Engineers, Inc.
SECTION FIVE DISCUSSIONS, OPINIONSAND RECOMMENDATIONS
5.1.5 Lateral Spread Displacement
The project study area is underlain by competent geologic units which are not considered susceptible
to seismic-induced lateral spreading.
5.1.6 Differential Seismic-Induced Settlement
Differential seismic settlement occurs when seismic shaking causes one type of soil to settle more
than another type. It may also occur within a soil deposit with largely homogeneous properties if the
seismic shaking is uneven due to variable geometry or thickness of the soil deposit. Based on the
results of our investigation, it is our opinion that there is a slight potential of differential settlement
in the young colluvial deposits.
5.1.7 Secondary Hazards
Given the elevation of the project study area and absence of large bodies of water, it is our opinion
that the potential of property damage from seismic-induced tsunamis and/or seiches is considered
remote. The project study area is not located within the 100- and 500-year flood zone (FEMA Flood
Insurance Rate Map, 2012). There is a potential of property damage due to flooding during strong
rainstorm events. A scour study was not performed for the proposed project.
AGE Project No. 185 GS-16-BAugust 23, 2018 (Revised October 23, 2018)Page 11 of 36 Allied Geotechnical Engineers, Inc.
SECTION FIVE DISCUSSIONS, OPINIONSAND RECOMMENDATIONS
5.2 Soil Corrosivity
In accordance with the City of San Diego Water Facility Design Guidelines, Book 2, Chapter 7, soil
is generally considered aggressive to concrete if its chloride concentration is greater than 300 parts
per million (ppm) or sulfate concentration is greater than 1,000 ppm, or if the pH is 5.5 or less.
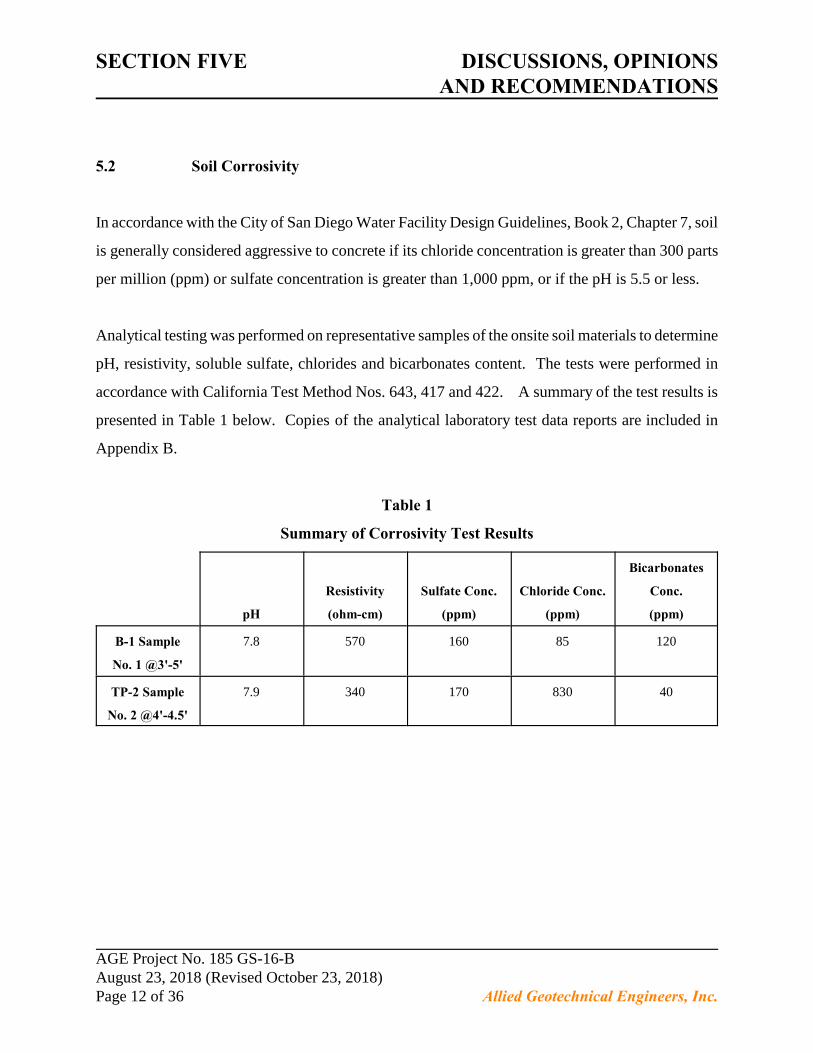
Analytical testing was performed on representative samples of the onsite soil materials to determine
pH, resistivity, soluble sulfate, chlorides and bicarbonates content. The tests were performed in
accordance with California Test Method Nos. 643, 417 and 422. A summary of the test results is
presented in Table 1 below. Copies of the analytical laboratory test data reports are included in
Appendix B.
Table 1
Summary of Corrosivity Test Results
pH
Resistivity
(ohm-cm)
Sulfate Conc.
(ppm)
Chloride Conc.
(ppm)
Bicarbonates
Conc.
(ppm)
B-1 Sample
No. 1 @3'-5'
7.8 570 160 85 120
TP-2 Sample
No. 2 @4'-4.5'
7.9 340 170 830 40
AGE Project No. 185 GS-16-BAugust 23, 2018 (Revised October 23, 2018)Page 12 of 36 Allied Geotechnical Engineers, Inc.
SECTION FIVE DISCUSSIONS, OPINIONSAND RECOMMENDATIONS
The test results indicate that the soils at the project site are considered aggressive to concrete.
Therefore, AGE recommends that Type V Portland Cement Concrete (high sulfate resistance) be
used for proposed facilities at the project site. It should be noted here that the most effective way
to prevent sulfate/chloride attack is to keep the sulfate/chloride ions from entering the concrete in
the first place. This can be done by using mix designs that give a low permeability (mainly by
keeping the water/cement ratio low) and, if practical, by placing moisture barriers between the
concrete and the soil.
AGE does not practice in the field of corrosion engineering. In the event that corrosion sensitive
facilities are planned, we recommend that a corrosion engineer be retained to perform the necessary
corrosion protection evaluation and design.
5.3 Expansive Soil
Based on visual observations and soil classifications, the on-site materials are considered non-
expansive or have a very low expansion potential.
5.4 Seismic Design Parameters
5.4.1 Caltrans Seismic Design Parameters
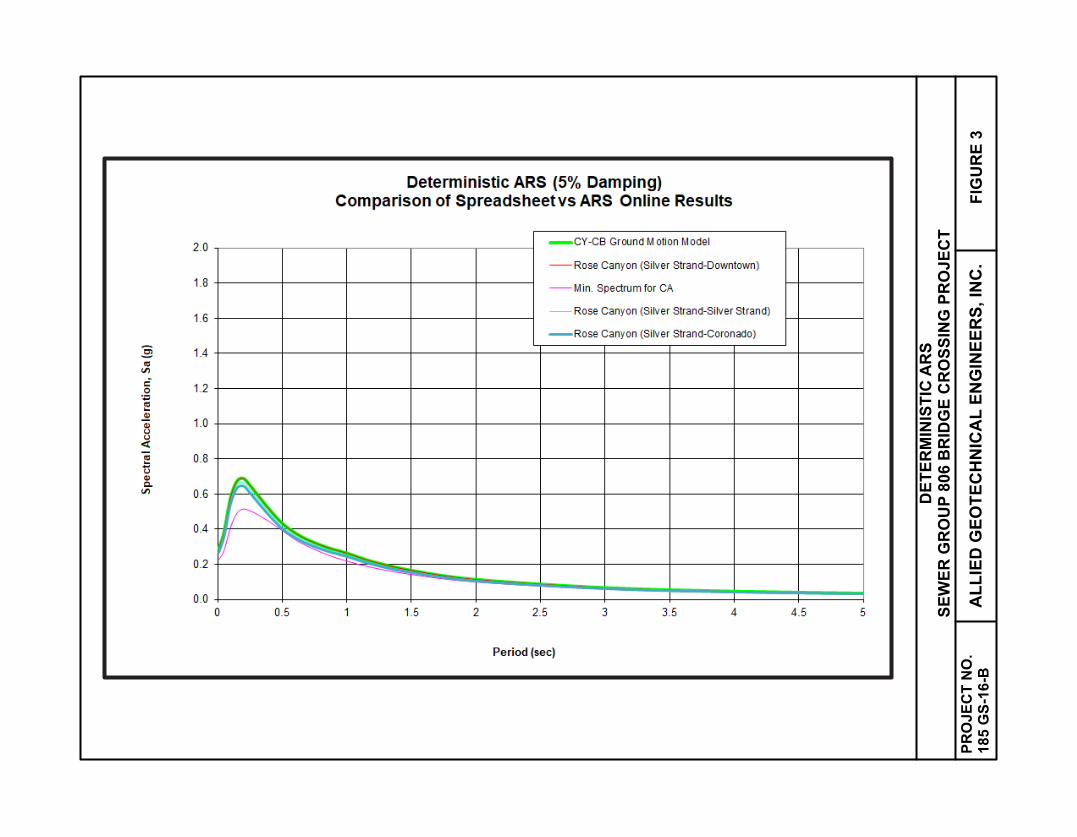
AGE has developed deterministic and probabilistic acceleration response spectra (ARS) curves for
the bridge based on the methodology presented in Caltrans “Methodology for Developing Design
AGE Project No. 185 GS-16-BAugust 23, 2018 (Revised October 23, 2018)Page 13 of 36 Allied Geotechnical Engineers, Inc.
SECTION FIVE DISCUSSIONS, OPINIONSAND RECOMMENDATIONS
Response Spectrum for Use in Seismic Design Recommendations” (November 2012). The curves
were developed using the current web-based Caltrans and United States Geological Survey (USGS)
software.
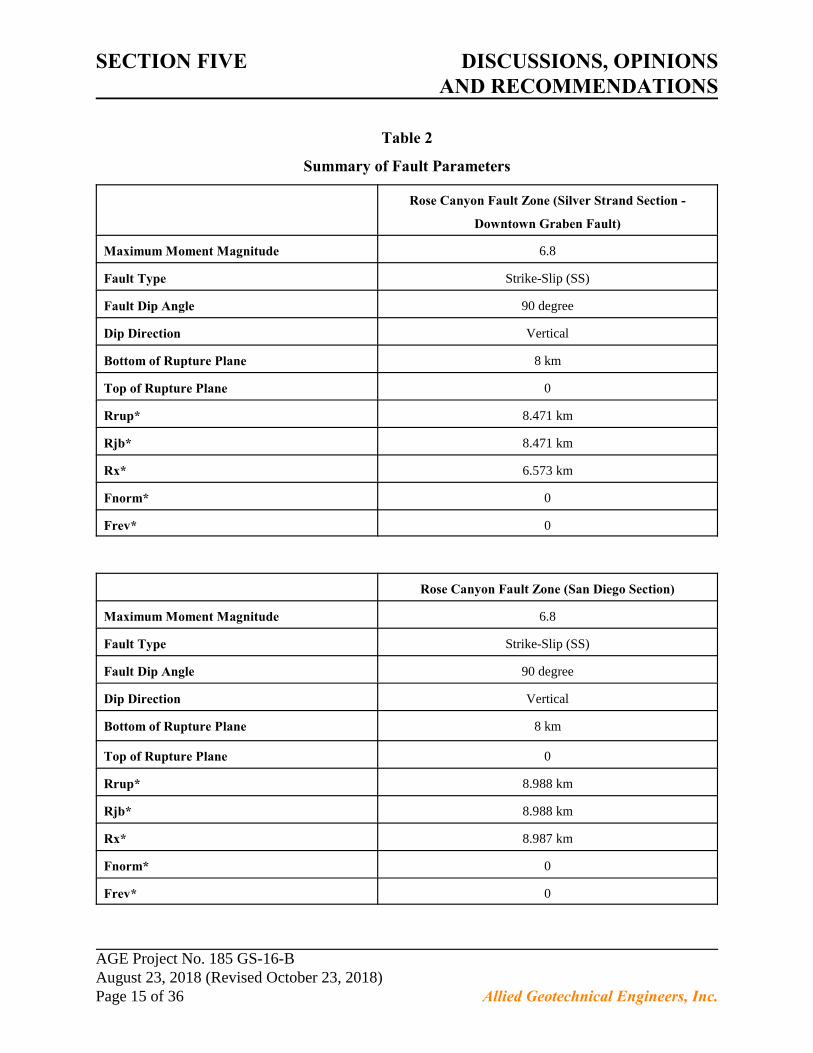
A summary of the three closest fault zones to the project site is presented in Table 2 on the next
page.
AGE Project No. 185 GS-16-BAugust 23, 2018 (Revised October 23, 2018)Page 14 of 36 Allied Geotechnical Engineers, Inc.
SECTION FIVE DISCUSSIONS, OPINIONSAND RECOMMENDATIONS
Table 2
Summary of Fault Parameters
Rose Canyon Fault Zone (Silver Strand Section -
Downtown Graben Fault)
Maximum Moment Magnitude 6.8
Fault Type Strike-Slip (SS)
Fault Dip Angle 90 degree
Dip Direction Vertical
Bottom of Rupture Plane 8 km
Top of Rupture Plane 0
Rrup* 8.471 km
Rjb* 8.471 km
Rx* 6.573 km
Fnorm* 0
Frev* 0
Rose Canyon Fault Zone (San Diego Section)
Maximum Moment Magnitude 6.8
Fault Type Strike-Slip (SS)
Fault Dip Angle 90 degree
Dip Direction Vertical
Bottom of Rupture Plane 8 km
Top of Rupture Plane 0
Rrup* 8.988 km
Rjb* 8.988 km
Rx* 8.987 km
Fnorm* 0
Frev* 0
AGE Project No. 185 GS-16-BAugust 23, 2018 (Revised October 23, 2018)Page 15 of 36 Allied Geotechnical Engineers, Inc.
SECTION FIVE DISCUSSIONS, OPINIONSAND RECOMMENDATIONS
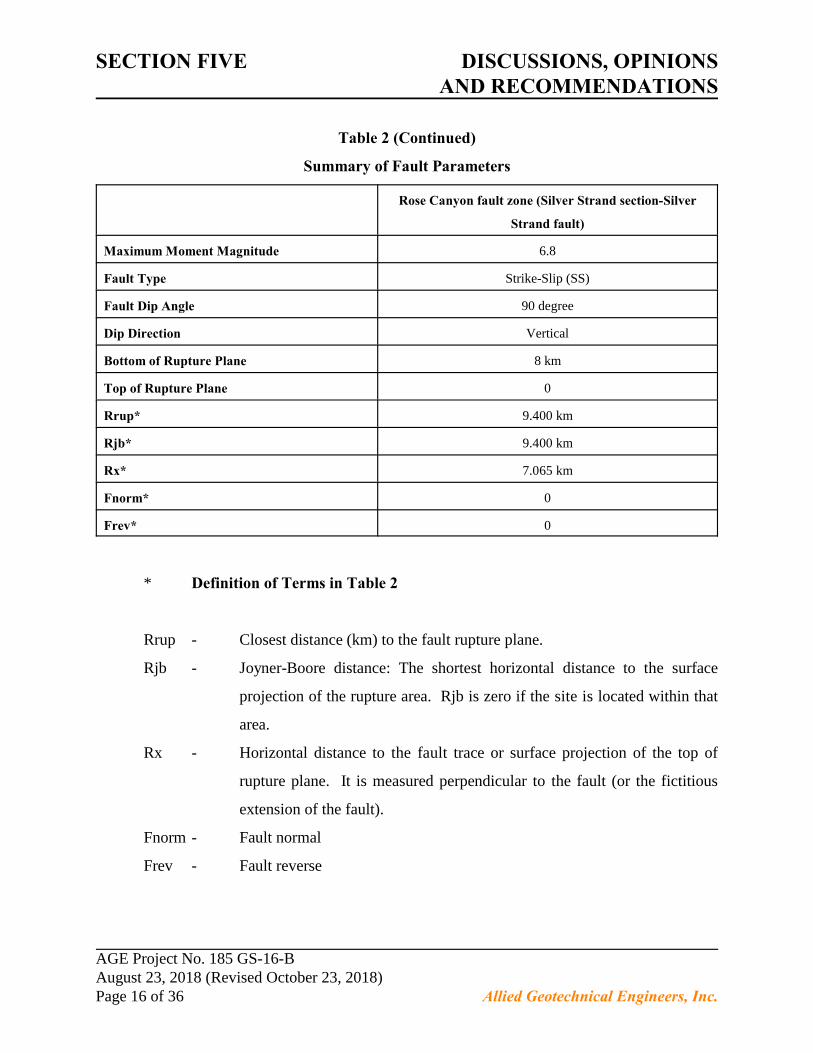
Table 2 (Continued)
Summary of Fault Parameters
Rose Canyon fault zone (Silver Strand section-Silver
Strand fault)
Maximum Moment Magnitude 6.8
Fault Type Strike-Slip (SS)
Fault Dip Angle 90 degree
Dip Direction Vertical
Bottom of Rupture Plane 8 km
Top of Rupture Plane 0
Rrup* 9.400 km
Rjb* 9.400 km
Rx* 7.065 km
Fnorm* 0
Frev* 0
* Definition of Terms in Table 2
Rrup - Closest distance (km) to the fault rupture plane.
Rjb - Joyner-Boore distance: The shortest horizontal distance to the surface
projection of the rupture area. Rjb is zero if the site is located within that
area.
Rx - Horizontal distance to the fault trace or surface projection of the top of
rupture plane. It is measured perpendicular to the fault (or the fictitious
extension of the fault).
Fnorm - Fault normal
Frev - Fault reverse
AGE Project No. 185 GS-16-BAugust 23, 2018 (Revised October 23, 2018)Page 16 of 36 Allied Geotechnical Engineers, Inc.
SECTION FIVE DISCUSSIONS, OPINIONSAND RECOMMENDATIONS
Based on the fault parameters, Maximum Magnitude (Mmax) earthquake for the site is equal to 6.8.
S30Based on the subsurface conditions observed in the boring and test pit, a V of 600 m/s was used
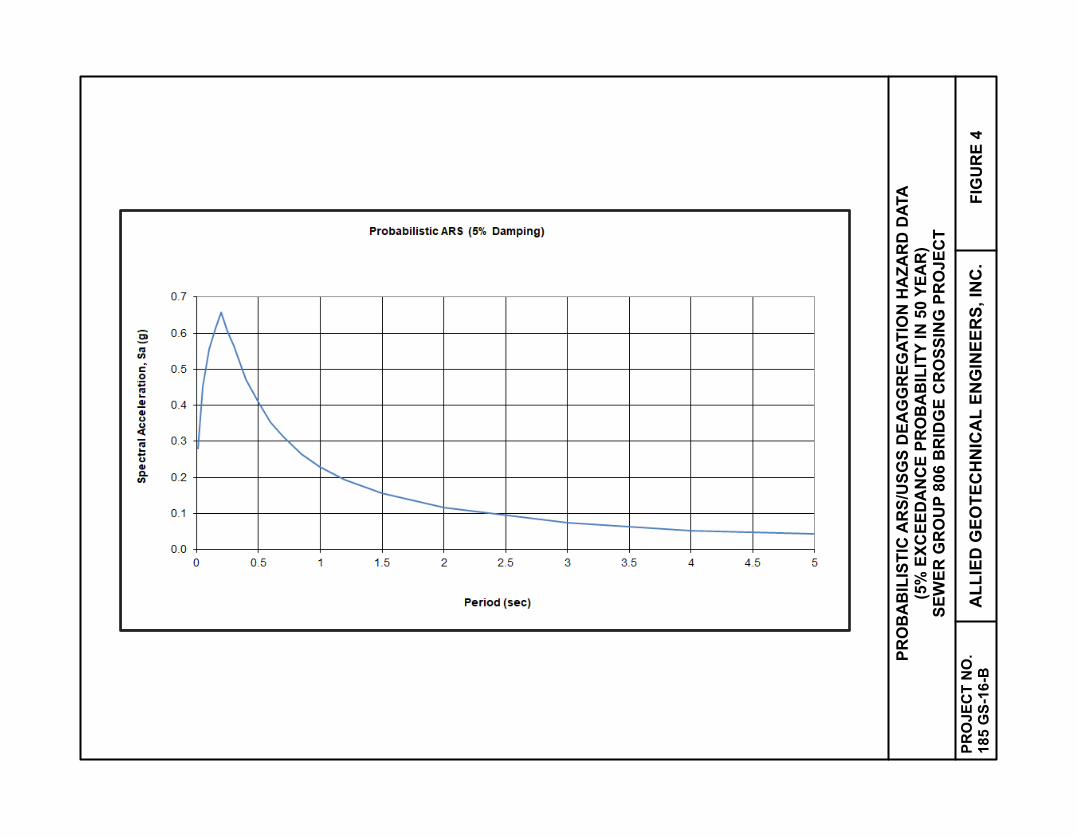
in the development of the ARS curves (Site Class C). The deterministic and probabilistic ARS
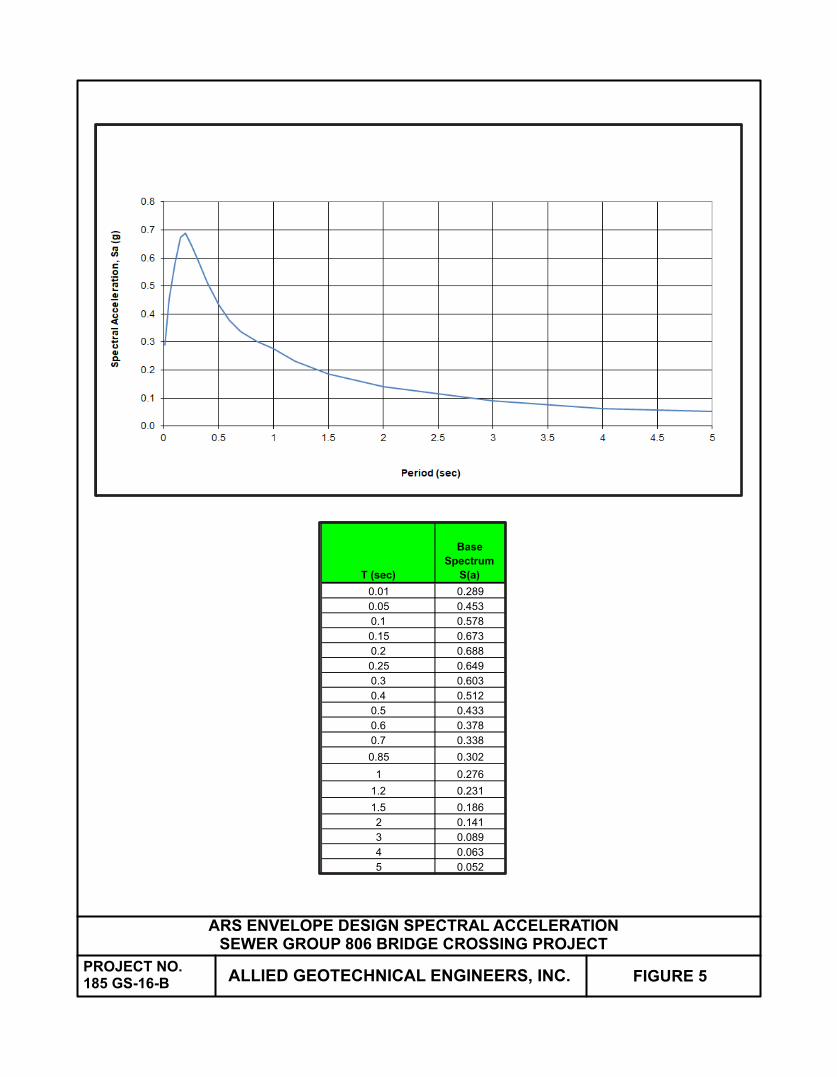
curves and curve coordinates that have been developed are shown on Figures 3 and 4. The design
response spectrum which is shown on Figure 5 is the upper envelope of the spectral values of the
deterministic response spectrum, probabilistic response spectrum and the minimum response
spectrum for the state of California. A maximum peak ground acceleration (PGA) of 0.289 g is
estimated for the bridge.
5.4.2 California Building Code (CBC) 2016 Seismic Design Parameters
For structural design in accordance with the CBC 2016 (ASCE 7-10 procedures), the United States
Geological Survey Design Maps (USGS, 2018) were used to calculate ground motion parameters
Rfor the project site. The Risk-Targeted Maximum Considered Earthquake (MCE ) ground motion
response acceleration is calculated based on the most severe earthquake effects considered by ASCE
7-10 determined for the orientation that resulted in the largest maximum response to the horizontal
ground motions and with adjustment to the targeted risk. The Maximum Considered Earthquake
GGeometric Mean (MCE ) is determined for the geometric peak ground acceleration and without
Gadjustment for the targeted risk. The MCE Peak Ground Acceleration (PGA) adjusted for site
Meffects (PGA ) should be used for design and evaluation of liquefaction, lateral spreading, seismic
settlements, and other soil related issues.
AGE Project No. 185 GS-16-BAugust 23, 2018 (Revised October 23, 2018)Page 17 of 36 Allied Geotechnical Engineers, Inc.
SECTION FIVE DISCUSSIONS, OPINIONSAND RECOMMENDATIONS
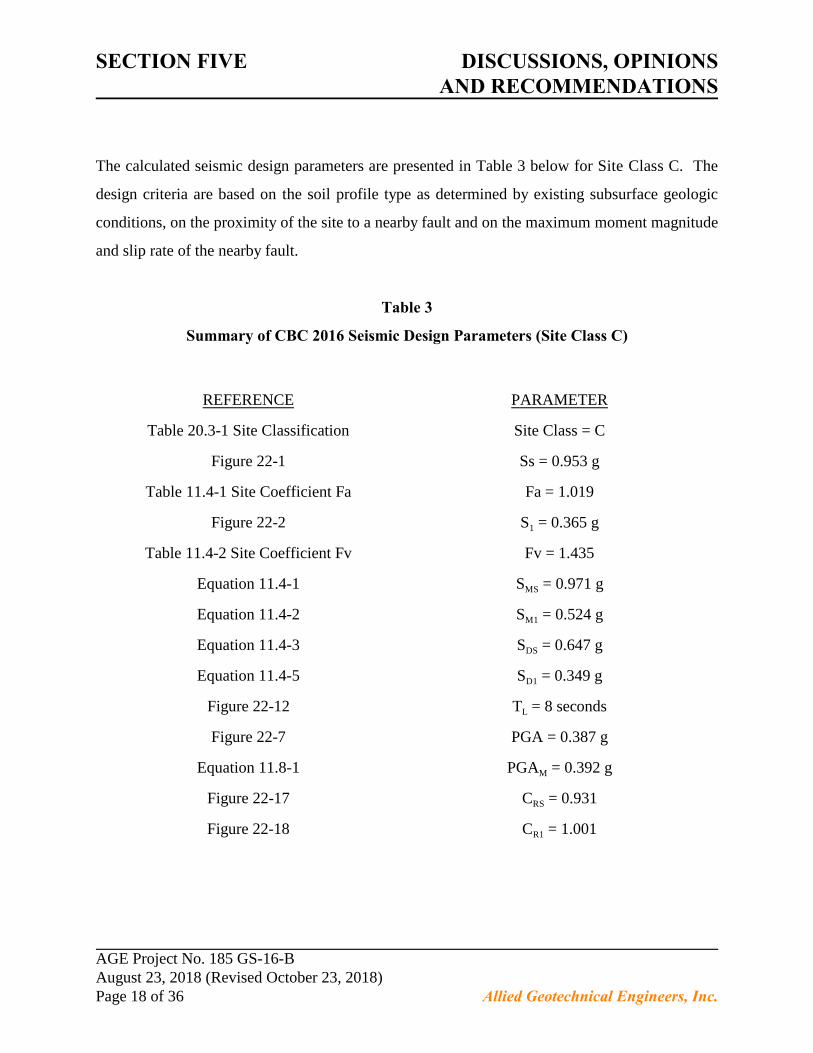
The calculated seismic design parameters are presented in Table 3 below for Site Class C. The
design criteria are based on the soil profile type as determined by existing subsurface geologic
conditions, on the proximity of the site to a nearby fault and on the maximum moment magnitude
and slip rate of the nearby fault.
Table 3
Summary of CBC 2016 Seismic Design Parameters (Site Class C)
REFERENCE PARAMETER
Table 20.3-1 Site Classification Site Class = C
Figure 22-1 Ss = 0.953 g
Table 11.4-1 Site Coefficient Fa Fa = 1.019
1Figure 22-2 S = 0.365 g
Table 11.4-2 Site Coefficient Fv Fv = 1.435
MSEquation 11.4-1 S = 0.971 g
M1Equation 11.4-2 S = 0.524 g
DSEquation 11.4-3 S = 0.647 g
D1Equation 11.4-5 S = 0.349 g
LFigure 22-12 T = 8 seconds
Figure 22-7 PGA = 0.387 g
MEquation 11.8-1 PGA = 0.392 g
RSFigure 22-17 C = 0.931
R1Figure 22-18 C = 1.001
AGE Project No. 185 GS-16-BAugust 23, 2018 (Revised October 23, 2018)Page 18 of 36 Allied Geotechnical Engineers, Inc.
SECTION FIVE DISCUSSIONS, OPINIONSAND RECOMMENDATIONS
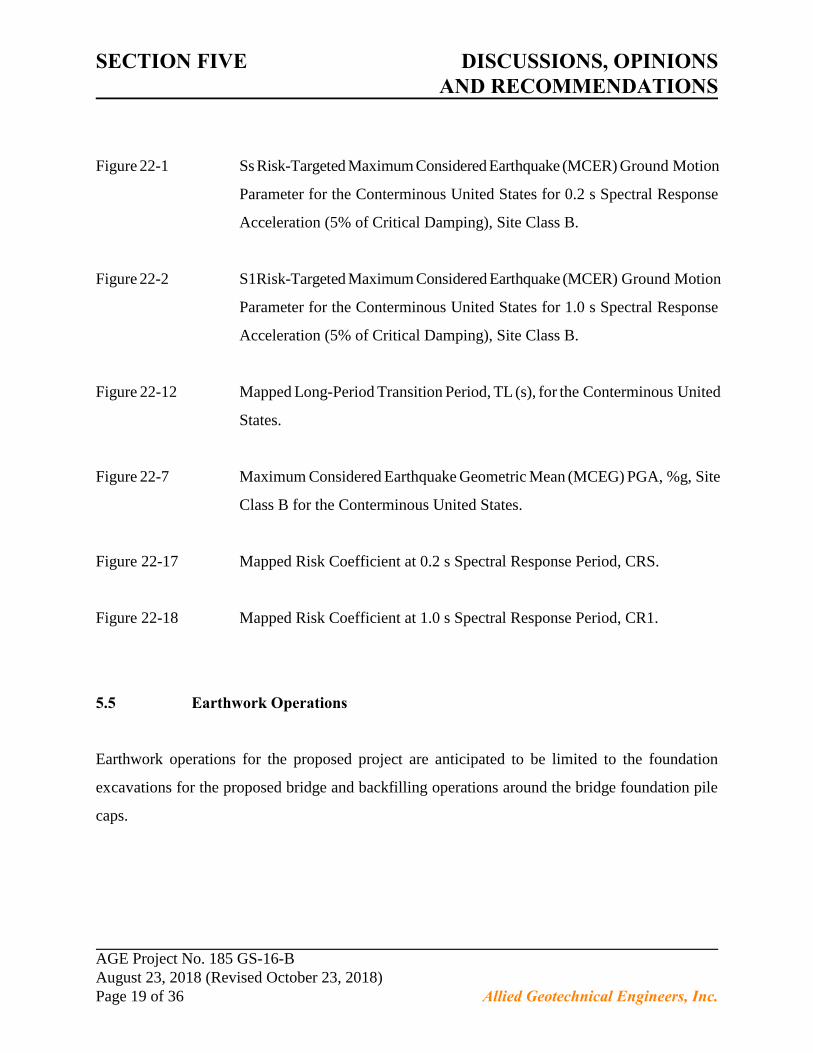
Figure 22-1 Ss Risk-Targeted Maximum Considered Earthquake (MCER) Ground Motion
Parameter for the Conterminous United States for 0.2 s Spectral Response
Acceleration (5% of Critical Damping), Site Class B.
Figure 22-2 S1Risk-Targeted Maximum Considered Earthquake (MCER) Ground Motion
Parameter for the Conterminous United States for 1.0 s Spectral Response
Acceleration (5% of Critical Damping), Site Class B.
Figure 22-12 Mapped Long-Period Transition Period, TL (s), for the Conterminous United
States.
Figure 22-7 Maximum Considered Earthquake Geometric Mean (MCEG) PGA, %g, Site
Class B for the Conterminous United States.
Figure 22-17 Mapped Risk Coefficient at 0.2 s Spectral Response Period, CRS.
Figure 22-18 Mapped Risk Coefficient at 1.0 s Spectral Response Period, CR1.
5.5 Earthwork Operations
Earthwork operations for the proposed project are anticipated to be limited to the foundation
excavations for the proposed bridge and backfilling operations around the bridge foundation pile
caps.
AGE Project No. 185 GS-16-BAugust 23, 2018 (Revised October 23, 2018)Page 19 of 36 Allied Geotechnical Engineers, Inc.
SECTION FIVE DISCUSSIONS, OPINIONSAND RECOMMENDATIONS
5.5.1 Soil and Excavation Characteristics
The majority of the on-site materials can be readily excavated with conventional heavy-duty
construction equipment. Difficult excavation conditions within the highly cemented and/or highly
conglomeratic Stadium Conglomerate may be anticipated, and may require the use of a rock breaker
and/or jackhammer.
Fill material should be free of biodegradable material, hazardous substance contamination, other
deleterious debris, and rocks or hard lumps greater than 6 inches. If the fill material contains rocks
4or hard lumps, at least 70 percent (by weight) of its particles shall pass a U.S. Standard / -inch sieve. 3
Fill material should consists of predominantly granular soil (less than 40 percent passing the U.S.
Standard #200 sieve) with Expansion Index of less than 30.
Soil materials generated from the young colluvial deposits and Stadium Conglomerate are likely to
contain abundant gravel and cobbles, and may require selective screening of oversize materials if
they are utilized as compacted fill. In lieu of screening, it may be more practical and economical for
the Contractor to use select import fill materials for backfill.
5.5.2 Placement and Compaction of Backfill
Prior to placement, all backfill materials should be moisture-conditioned, spread and placed in lifts
(layers) not-to-exceed 6 inches in loose (uncompacted) thickness, and uniformly compacted to at
least 90 percent relative compaction. During backfilling, the soil moisture content should be
maintained at or within 2 to 3 percent above the optimum moisture content of the backfill materials.
AGE Project No. 185 GS-16-BAugust 23, 2018 (Revised October 23, 2018)Page 20 of 36 Allied Geotechnical Engineers, Inc.
SECTION FIVE DISCUSSIONS, OPINIONSAND RECOMMENDATIONS
It is recommended that the upper 24 inches directly beneath slabs, pavement sections and the
underlying base materials be compacted to at least 95 percent relative compaction. The maximum
dry density and optimum moisture content of the backfill materials should be determined in the
laboratory in accordance with the ASTM D1557 testing procedures.
Small hand-operated compacting equipment should be used for compaction of the backfill materials
to an elevation of at least 4 feet above the top (crown) of pipes. Flooding or jetting should not be
used to densify the backfill. Appropriate compacting equipment should be used for compaction of
backfill materials placed adjacent to underground facilities, structures and walls such as not to
impose excessive loads on the facilities.
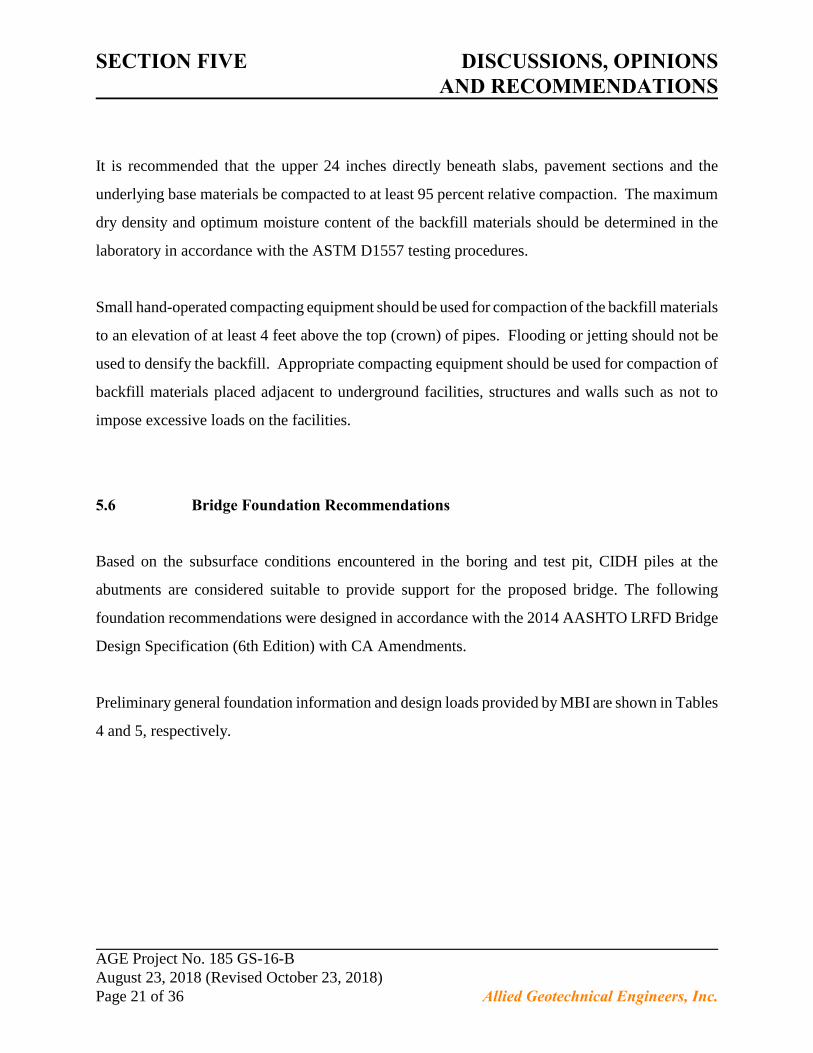
5.6 Bridge Foundation Recommendations
Based on the subsurface conditions encountered in the boring and test pit, CIDH piles at the
abutments are considered suitable to provide support for the proposed bridge. The following
foundation recommendations were designed in accordance with the 2014 AASHTO LRFD Bridge
Design Specification (6th Edition) with CA Amendments.
Preliminary general foundation information and design loads provided by MBI are shown in Tables
4 and 5, respectively.
AGE Project No. 185 GS-16-BAugust 23, 2018 (Revised October 23, 2018)Page 21 of 36 Allied Geotechnical Engineers, Inc.
SECTION FIVE DISCUSSIONS, OPINIONSAND RECOMMENDATIONS
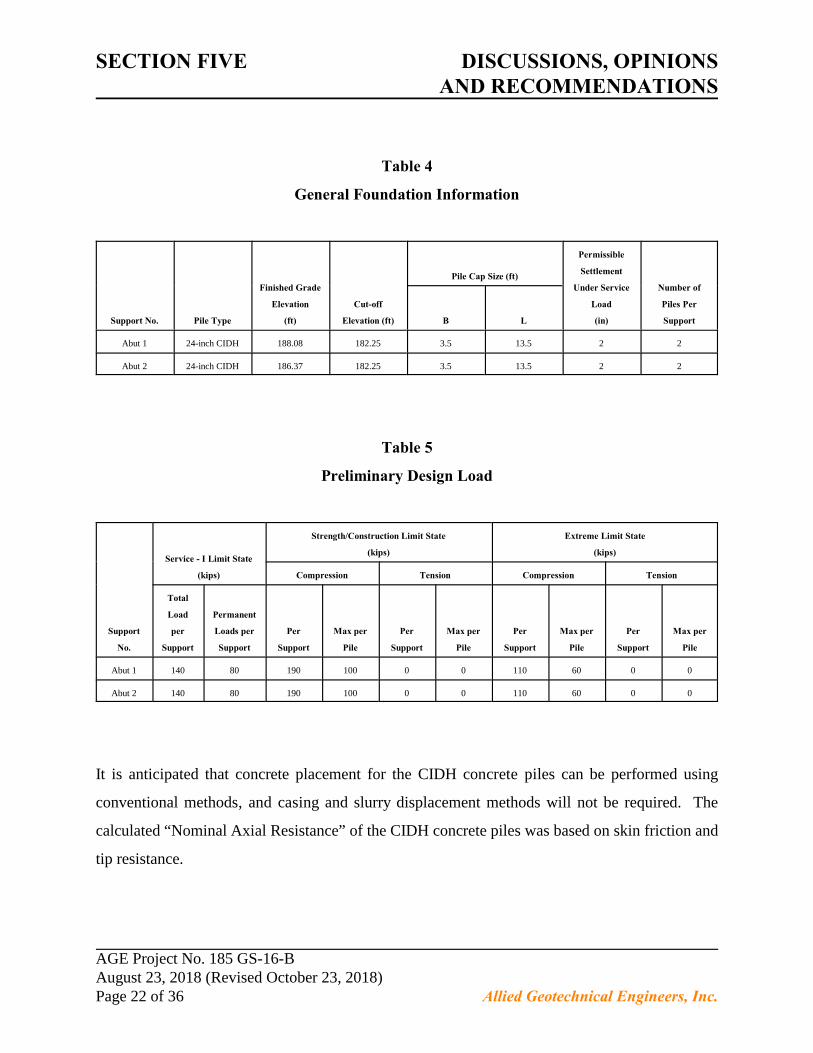
Table 4
General Foundation Information
Support No. Pile Type
Finished Grade
Elevation
(ft)
Cut-off
Elevation (ft)
Pile Cap Size (ft)
Permissible
Settlement
Under Service
Load
(in)
Number of
Piles Per
SupportB L
Abut 1 24-inch CIDH 188.08 182.25 3.5 13.5 2 2
Abut 2 24-inch CIDH 186.37 182.25 3.5 13.5 2 2
Table 5
Preliminary Design Load
Support
No.
Service - I Limit State
(kips)
Strength/Construction Limit State
(kips)
Extreme Limit State
(kips)
Compression Tension Compression Tension
Total
Load
per
Support
Permanent
Loads per
Support
Per
Support
Max per
Pile
Per
Support
Max per
Pile
Per
Support
Max per
Pile
Per
Support
Max per
Pile
Abut 1 140 80 190 100 0 0 110 60 0 0
Abut 2 140 80 190 100 0 0 110 60 0 0
It is anticipated that concrete placement for the CIDH concrete piles can be performed using
conventional methods, and casing and slurry displacement methods will not be required. The
calculated “Nominal Axial Resistance” of the CIDH concrete piles was based on skin friction and
tip resistance.
AGE Project No. 185 GS-16-BAugust 23, 2018 (Revised October 23, 2018)Page 22 of 36 Allied Geotechnical Engineers, Inc.
SECTION FIVE DISCUSSIONS, OPINIONSAND RECOMMENDATIONS
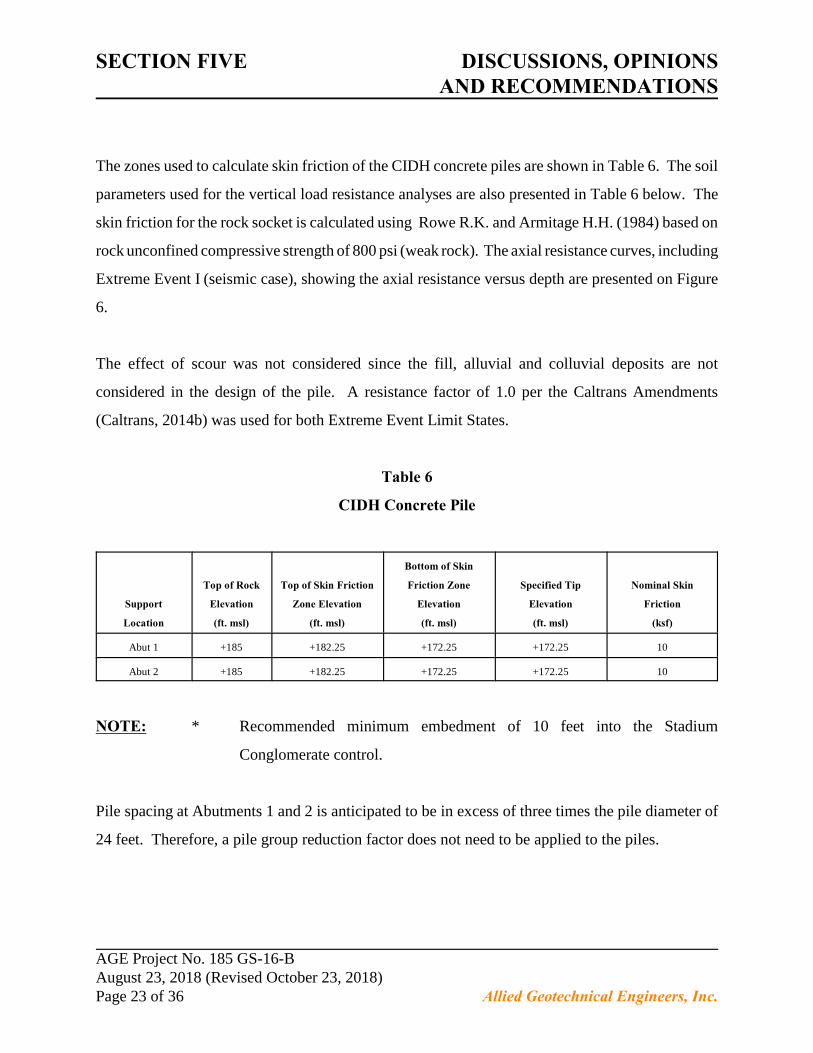
The zones used to calculate skin friction of the CIDH concrete piles are shown in Table 6. The soil
parameters used for the vertical load resistance analyses are also presented in Table 6 below. The
skin friction for the rock socket is calculated using Rowe R.K. and Armitage H.H. (1984) based on
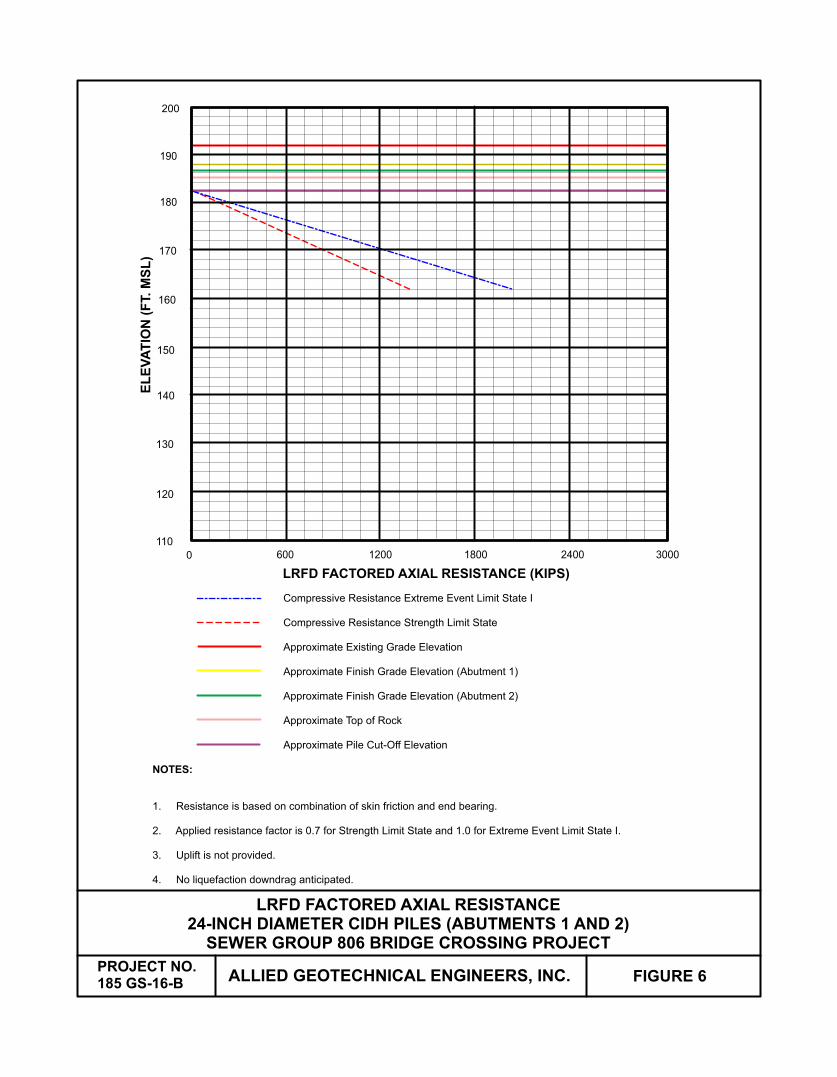
rock unconfined compressive strength of 800 psi (weak rock). The axial resistance curves, including
Extreme Event I (seismic case), showing the axial resistance versus depth are presented on Figure
6.
The effect of scour was not considered since the fill, alluvial and colluvial deposits are not
considered in the design of the pile. A resistance factor of 1.0 per the Caltrans Amendments
(Caltrans, 2014b) was used for both Extreme Event Limit States.
Table 6
CIDH Concrete Pile
Support
Location
Top of Rock
Elevation
(ft. msl)
Top of Skin Friction
Zone Elevation
(ft. msl)
Bottom of Skin
Friction Zone
Elevation
(ft. msl)
Specified Tip
Elevation
(ft. msl)
Nominal Skin
Friction
(ksf)
Abut 1 +185 +182.25 +172.25 +172.25 10
Abut 2 +185 +182.25 +172.25 +172.25 10
NOTE: * Recommended minimum embedment of 10 feet into the Stadium
Conglomerate control.
Pile spacing at Abutments 1 and 2 is anticipated to be in excess of three times the pile diameter of
24 feet. Therefore, a pile group reduction factor does not need to be applied to the piles.
AGE Project No. 185 GS-16-BAugust 23, 2018 (Revised October 23, 2018)Page 23 of 36 Allied Geotechnical Engineers, Inc.
SECTION FIVE DISCUSSIONS, OPINIONSAND RECOMMENDATIONS
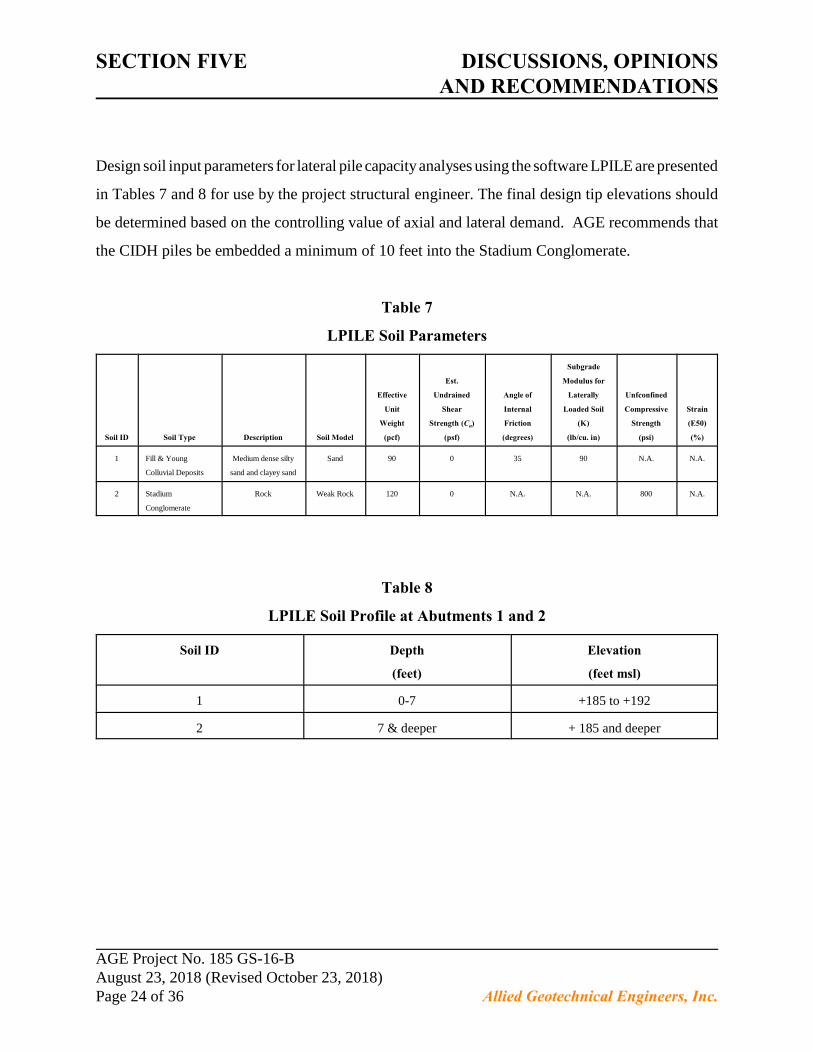
Design soil input parameters for lateral pile capacity analyses using the software LPILE are presented
in Tables 7 and 8 for use by the project structural engineer. The final design tip elevations should
be determined based on the controlling value of axial and lateral demand. AGE recommends that
the CIDH piles be embedded a minimum of 10 feet into the Stadium Conglomerate.
Table 7
LPILE Soil Parameters
Soil ID Soil Type Description Soil Model
Effective
Unit
Weight
(pcf)
Est.
Undrained
Shear
uStrength (C )
(psf)
Angle of
Internal
Friction
(degrees)
Subgrade
Modulus for
Laterally
Loaded Soil
(K)
(lb/cu. in)
Unfconfined
Compressive
Strength
(psi)
Strain
(E50)
(%)
1 Fill & Young
Colluvial Deposits
Medium dense silty
sand and clayey sand
Sand 90 0 35 90 N.A. N.A.
2 Stadium
Conglomerate
Rock Weak Rock 120 0 N.A. N.A. 800 N.A.
Table 8
LPILE Soil Profile at Abutments 1 and 2
Soil ID Depth
(feet)
Elevation
(feet msl)
1 0-7 +185 to +192
2 7 & deeper + 185 and deeper
AGE Project No. 185 GS-16-BAugust 23, 2018 (Revised October 23, 2018)Page 24 of 36 Allied Geotechnical Engineers, Inc.
SECTION FIVE DISCUSSIONS, OPINIONSAND RECOMMENDATIONS
Resistance to lateral loads may be developed by a combination of friction acting at the base of the
pile caps and passive earth pressure developed against the sides of the pile caps below grade.
Passive pressure and friction may be used in combination, without reduction, in determining the total
resistance to lateral loads.
An allowable passive earth resistance of 350 psf per foot of pile cap embedment below grade may
be used for the sides of foundations placed against the Stadium Conglomerate. The maximum
recommended allowable passive pressure is 3,500 psf. An allowable passive earth pressure of 250
psf per foot of pile cap embedment below grade may be used for the sides of foundations placed
against properly compacted filled ground and young colluvial deposits. The maximum
recommended allowable passive pressure is 2,500 psf. A coefficient of friction of 0.40 may be used
for foundations cast directly on the Stadium Conglomerate.
5.7 Bridge Abutment Walls
We recommend that bridge abutment walls be backfilled with soil materials which have less than
40 percent passing the standard #200 sieve and not less than 70 percent passing the U.S. standard
3/4-inch sieve, expansion index of less than 30 and minimum internal friction angle of 35 . Ino
addition, the backfill materials should not contain any organic debris, rocks or hard lumps greater
than 6 inches, or other deleterious materials. All backfill soils should be compacted to at least 90
percent of maximum dry density as determined in the laboratory by the ASTM D1557 testing
procedure.
AGE Project No. 185 GS-16-BAugust 23, 2018 (Revised October 23, 2018)Page 25 of 36 Allied Geotechnical Engineers, Inc.
SECTION FIVE DISCUSSIONS, OPINIONSAND RECOMMENDATIONS
For design of properly backfilled abutment walls, an active soil pressure equivalent to that generated
by a fluid weighing 35 and 61 pounds per cubic foot, for level and 2:1 (horizontal : vertical) sloped
backfill, respectively, may be used for design of the wall assuming that they are free to rotate at the
top at least 0.001H (where H is the height of the wall). An at-rest soil pressure equivalent to that
generated by a fluid weighing 60 pounds per cubic foot may be used for design of wall restrained at
the top. Traffic surcharge occurring within a horizontal distance equal to the wall height should be
added as lateral pressure equal to a uniformly distributed load of 75 psf along the entire face of the
wall.
Calculation for the Seismic Active Earth Pressure was performed in accordance with the procedure
outlined in Section 11.6.5.3 of the AASHTO LRFD Bridge Design Specifications 6 Edition (2012)th
husing the Mononobe-Okabe (M-O) Method. The Horizontal Acceleration Coefficient (K ) is
Mestimated to be 1/2 of PGA and equal to 0.196 (Site Class C), Vertical Acceleration Coefficient
v(K ) is assumed to be zero. The backfill material is assumed to have a unit weight of 110 pcf,
friction angle of 35 and cohesion value of 600 psf. The calculated Seismic Active Earth Pressureo
AECoefficient (K ) is equal to 0.10 for retaining structures up to 25 feet in height.
Based on the conditions described above, a triangular pressure distribution of 11 pcf (equivalent fluid
pressure) may be used for the Seismic Active Earth Pressure. This seismic earth pressures may be
assumed to act at 0.4H from the bottom of the wall and are applicable for both cantilever and braced
conditions. Forces resulting from wall inertia effects are expected to be relatively minor for
non-gravity walls and/or walls retaining less than 5 feet of backfill materials, and may be ignored
in estimating the seismic lateral earth pressure.
AGE Project No. 185 GS-16-BAugust 23, 2018 (Revised October 23, 2018)Page 26 of 36 Allied Geotechnical Engineers, Inc.
SECTION SIX CONSTRUCTION-RELATEDCONSIDERATIONS
6.0 CONSTRUCTION-RELATED CONSIDERATIONS
6.1 Construction Dewatering
The depth of the local groundwater table is expected to be below the anticipated depth of the
proposed excavations for this project. We therefore do not anticipate the need for dewatering of
excavations made during construction. The contractor should, however, anticipate the possible need
for sump pumps in the event that localized perched water conditions are encountered during
construction. The design, installation, and operation of any construction dewatering measures
necessary for the project shall be the sole responsibility of the contractor.
6.2 Temporary Excavations
Excavation and safety during construction are the sole responsibility of the contractor. Excavations
should be performed in accordance with applicable Local, State, and prevailing Federal and Cal
OSHA safety regulations to prevent excessive ground movement and failure. Unsupported
temporary excavations in the fill materials similar to those encountered in the boring and test pit may
be constructed at an inclination no steeper than 1.5 : 1 (horizontal to vertical), or flatter, up to a
maximum height of 15 feet. Unsupported temporary excavations in the formational materials similar
to those encountered in the boring and test pit may be constructed at an inclination no steeper than
3/4 : 1 (horizontal to vertical), or flatter, up to a maximum height of 15 feet. Temporary construction
slopes are considered to have a factor of safety against deep-seated failure in excess of 1.2 under
static conditions.
AGE Project No. 185 GS-16-BAugust 23, 2018 (Revised October 23, 2018)Page 27 of 36 Allied Geotechnical Engineers, Inc.
SECTION SIX CONSTRUCTION-RELATEDCONSIDERATIONS
Observations will need to be performed during site grading to check that no adverse conditions,
geologic features or discontinuities are exposed in the excavation which may necessitate shoring or
tie-backs. The contractor should exercise caution and provide adequate safety measures during
excavations to protect equipment and/or personnel working directly below any excavation. Adequate
safety measures include, but are not limited to, providing proper drainage control above and below
the excavation, and elimination of any surcharge within a lateral distance equal to the height of the
excavations.
6.3 Temporary Shoring
The contractor shall be responsible for the design and installation of temporary shoring for all
vertical excavations in excess of 4 feet in height. Design and installation of shoring should be in
accordance with the requirements specified by the State of California, Division of Occupational
Safety and Health, Department of Industrial Relations (CAL OSHA). Furthermore, it should be the
contractor's responsibility to provide adequate and safe support for all excavations and nearby
located improvements which could be damaged by earth movement.
Settlement of existing street improvements and/or utilties adjacent to the shoring may occur in
proportion to both the distance between shoring system and adjacent structures or utilities and the
amount of horizontal deflection of the shoring system. Vertical settlement will be maximum directly
adjacent to the shoring system, and decreases as the distance from the shoring increases. At a
distance equal to the height of the shoring, settlement is expected to be negligible. Maximum vertical
settlement is estimated to be on the order of 75 percent of the horizontal deflection of the shoring
system. It is recommended that shoring be designed to limit the maximum horizontal deflection to
1/2-inch or less where existing structures or utilities are to be protected.
AGE Project No. 185 GS-16-BAugust 23, 2018 (Revised October 23, 2018)Page 28 of 36 Allied Geotechnical Engineers, Inc.
SECTION SIX CONSTRUCTION-RELATEDCONSIDERATIONS
Temporary shoring should be designed to resist the pressure exerted by the retained soils and any
additional lateral forces due to loads placed near the top of the excavation. For design of braced
shorings supporting fill materials, the recommended lateral earth pressure should be 32H psf, where
H is equal to the height of the retained earth in feet. For braced shoring supporting formational
materials, the recommended lateral earth pressures may be reduced to 20H psf. Any surcharge loads
would impose uniform lateral pressure of 0.3q, where "q" equals the uniform surcharge pressure. The
surcharge pressure should be applied starting at a depth equal to the distance of the surcharge load
from the top of the excavation.
Resistance to lateral loads will be provided by passive soil resistance. The allowable passive pressure
for the fill materials and colluvial deposits may be assumed to be equivalent to a fluid weighing 250
pcf. Allowable lateral bearing pressure in fill material should not exceed 2,500 psf. Allowable
passive pressure for undisturbed formational materials may be assumed to be equivalent to a fluid
weighing 350 pcf, with maximum allowable lateral bearing pressure of 3,500 psf.
6.4 CIDH Piles Construction Considerations
It is anticipated that standard continuous flight rotary augers may be used for construction of the
proposed CIDH piles. The need for the use of drilling fluids and or slurry displacement method for
the installation of the proposed CIDH piles are not anticipated.
AGE Project No. 185 GS-16-BAugust 23, 2018 (Revised October 23, 2018)Page 29 of 36 Allied Geotechnical Engineers, Inc.
SECTION SIX CONSTRUCTION-RELATEDCONSIDERATIONS
Zones with abundant gravels and cobbles were encountered during the subsurface investigation. The
contractor should be prepared to use drilling buckets in the event that the augers are unable to extract
the cuttings from the drilled shafts. No boulders and/or hard rocks were encountered during the
subsurface investigation. Therefore, the need for rock coring is not anticipated on this project. Since
the gravels and cobbles are he use of temporary steel casings is not anticipated. In the event that
steel casings are required, the casings may be extracted from the shafts as the concrete is placed.
It is recommended that prior to placement of reinforcing steel, all footing shafts be downhole
inspected to confirm and verify the soil type at the bottom of the shafts and minimum depth
embedment into the Scripps Formation. Furthermore, prior to placement of concrete, it is
recommended that the shafts be cleaned of all loose materials with a cleanout bucket. Concrete
should be placed by using a tremie or pump pipe which can be adjusted to permit free discharge of
concrete and lowered rapidly, if needed, without excessive contact with the sides of the shaft.
6.5 Environmental Considerations
The scope of AGE’s investigation did not include the performance of a Phase I Environmental Site
Assessment (Phase I ESA) to evaluate the possible presence of soil and/or groundwater
contamination beneath the project site. During our subsurface investigation soil samples were field
screened for the presence of volatile organics using a RAE Systems MiniRAE 3000 organic vapor
meter (OVM). The field screening did not reveal elevated levels of volatile organics in the samples.
AGE Project No. 185 GS-16-BAugust 23, 2018 (Revised October 23, 2018)Page 30 of 36 Allied Geotechnical Engineers, Inc.
SECTION SIX CONSTRUCTION-RELATEDCONSIDERATIONS
In the event that hazardous or toxic materials are encountered during the construction phase, the
contractor should immediately notify the City and be prepared to handle and dispose of such
materials in accordance with current industry practices and applicable Local, State and Federal
regulations.
AGE Project No. 185 GS-16-BAugust 23, 2018 (Revised October 23, 2018)Page 31 of 36 Allied Geotechnical Engineers, Inc.
SECTION SEVEN GENERAL CONDITIONS
7.0 GENERAL CONDITIONS
7.1 Post-Investigation Services
Post-investigation geotechnical services are an important continuation of this investigation, and we
recommend that the City’s Construction Inspection Division performs the necessary geotechnical
observation and testing services during construction. In the event that the City is unable to perform
said services, it is recommended that our firm be retained to provide the services.
Sufficient and timely observation and testing should be performed during excavation, pipeline
installation, backfilling and other related earthwork operations. The purpose of the geotechnical
observation and testing is to correlate findings of this investigation with the actual subsurface
conditions encountered during construction and to provide supplemental recommendations, if
necessary.
7.2 Uncertainties and Limitations
The information presented in this report is intended for the sole use of MBI and other members of
the project design team and the City for project design purposes only and may not provide sufficient
data to prepare an accurate bid. The contractor should be required to perform an independent
evaluation of the subsurface conditions at the project site prior to submitting his/her bid.
AGE Project No. 185 GS-16-BAugust 23, 2018 (Revised October 23, 2018)Page 32 of 36 Allied Geotechnical Engineers, Inc.
SECTION SEVEN GENERAL CONDITIONS
AGE has observed and investigated the subsurface conditions only at selected locations at the project
site. The findings and recommendations presented in this report are based on the assumption that
the subsurface conditions beneath the remainder of the site do not deviate substantially from those
encountered in the exploratory soil boring and test pit. Consequently, modifications or changes to
the recommendations presented herein may be necessary based on the actual subsurface conditions
encountered during construction.
California, including San Diego County, is in an area of high seismic risk. It is generally considered
economically unfeasible to build a totally earthquake-resistant project and it is, therefore, possible
that a nearby large magnitude earthquake could cause damage at the project site.
Geotechnical engineering and geologic sciences are characterized by uncertainty. Professional
judgments and opinions presented in this report are based partly on our evaluation and analysis of
the technical data gathered during our present study, partly on our understanding of the scope of the
proposed project, and partly on our general experience in geotechnical engineering.
In the performance of our professional services, we have complied with that level of care and skill
ordinarily exercised by other members of the geotechnical engineering profession currently
practicing under similar circumstances in southern California. Our services consist of professional
consultation only, and no warranty of any kind whatsoever, expressed or implied, is made or
intended in connection with the work performed. Furthermore, our firm does not guarantee the
performance of the project in any respect.
AGE does not practice or consult in the field of safety engineering. The contractor will be
responsible for the health and safety of his/her personnel and all subcontractors at the construction
site. The contractor should notify the City if he or she considers any of the recommendations
presented in this report to be unsafe.
AGE Project No. 185 GS-16-BAugust 23, 2018 (Revised October 23, 2018)Page 33 of 36 Allied Geotechnical Engineers, Inc.
SECTION EIGHT REFERENCES
8.0 REFERENCES
City of San Diego, Public Works Department, “Standard Drawings for Public Work Construction”,
2012 Edition.
City of San Diego Seismic Safety Study, Geologic Hazards and Faults, Sheet No. 22, 2008
edition.
City of San Diego, “ Sewer Group 806 Pre Design Map”, dated August 11, 2015.
County of San Diego DEH, “Case Closure Summary, Unauthorized Release #H05236-001, Sullivan
United, 4660 Alvarado Canyon Road, San Diego, California, 92120", report dated December
7, 2005.
Department of Conservation, California Geological Survey Regulatory Hazard Zones Maps for
Earthquake Faults, Liquefaction and Landslide Zones, 2009.
Geotracker Data Base - (http://geotracker.waterboards.ca.gov).
International Conference of Building Officials, 1997, Maps of Known Active Fault Near Source
Zones in California and Adjacent Portions of Nevada.
Kennedy, M.P., 1975, Geology of the San Diego Metropolitan Area, California: California Division
of Mines & Geology, Bulletin 200.
AGE Project No. 185 GS-16-BAugust 23, 2018 (Revised October 23, 2018)Page 34 of 36 Allied Geotechnical Engineers, Inc.
SECTION TEN REFERENCES
Kennedy, M.P., et.al., 1975, Character and Recency of Faulting, San Diego Metropolitan Area,
California: California Division of Mines and Geology, Special Report 123.
Kennedy, M.P, and Tan, S.S, 2008, “Geologic Map of the San Diego 30' x 60' Quadrangle,
California”, Digital Preparation by U.S. Geological Survey.
Lindvall, S.C., and Rockwell, T.K., 1995, “Holocene Activity of the Rose Canyon fault zone in San
Diego, California” in Journal of Geophysical Research, v. 100, No. B12, pp. 24,121 -
124,132.
Marshall, M., 1989, "Detailed Gravity Studies and the Tectonics of the Rose Canyon--Point Loma--
La Nacion Fault System, San Diego, California" in Proceedings of Workshop on "The
Seismic Risk in the San Diego Region: Special Focus on the Rose Canyon Fault System"
(Glenn Roquemore, et.al, Editors).
Michael Baker Internation, “Plans for the Construction of San Diego Sewer Maintenance Bridge”,
plans, undated.
Patterson, R.H., D.L. Schug, and B.E. Ehleringer, 1986, "Evidence of Recent Faulting in Downtown
San Diego, California" in Geological Society of America, Abstracts With Programs, v. 18,
No. 2, p. 169.
Rockwell, T.K., et.al., 1991, "Minimum Holocene Slip Rate for the Rose Canyon Fault in SanDiego,
California" in Environmental Perils in the San Diego Region (P.L. Abbott and W.J. Elliott,
editors): San Diego Association of Geologists, pp. 37-46.
AGE Project No. 185 GS-16-BAugust 23, 2018 (Revised October 23, 2018)Page 35 of 36 Allied Geotechnical Engineers, Inc.
SECTION TEN REFERENCES
Treiman, J.A., 1993, “The Rose Canyon Fault Zone, Southern California”, California Division of
Mines and Geology Open File Report No. 93-02.
Standard Specifications for Public Works Construction ("Green Book"), including the Regional
Standards, 2010 Edition.
Aerial Photographs
U.S. Department of Agriculture black and white aerial photograph Nos. AXN-3M- 98 and 99 (dated
1953)
AGE Project No. 185 GS-16-BAugust 23, 2018 (Revised October 23, 2018)Page 36 of 36 Allied Geotechnical Engineers, Inc.
FIGURES
ALLIED GEOTECHNICAL ENGINEERS, INC.PROJECT NO.185 GS-16-B
FIGURE 1
SEWER GROUP 806 BRIDGE CROSSING PROJECT LOCATION MAP
N
SCALE: 1” = 320’
Approximate SewerGroup 806 BridgeCrossing Location
ALLIED GEOTECHNICAL ENGINEERS, INC.PROJECT NO.185 GS-16-B
FIGURE 2
SEWER GROUP 806 BRIDGE CROSSING PROJECT SITE PLAN
N
SCALE: 1” = 30’
TP-2
B-1
AL
LIE
D G
EO
TE
CH
NIC
AL
EN
GIN
EE
RS
, IN
C.
PR
OJE
CT
NO
.1
85 G
S-1
6-B
FIG
UR
E 3
DE
TE
RM
INIS
TIC
AR
SS
EW
ER
GR
OU
P 8
06 B
RID
GE
CR
OS
SIN
G P
RO
JE
CT
AL
LIE
D G
EO
TE
CH
NIC
AL
EN
GIN
EE
RS
, IN
C.
PR
OJE
CT
NO
.1
85 G
S-1
6-B
FIG
UR
E 4
PR
OB
AB
ILIS
TIC
AR
S/U
SG
S D
EA
GG
RE
GA
TIO
N H
AZ
AR
D D
ATA
(5%
EX
CE
ED
AN
CE
PR
OB
AB
ILIT
Y IN
50 Y
EA
R)
SE
WE
R G
RO
UP
806 B
RID
GE
CR
OS
SIN
G P
RO
JE
CT
ALLIED GEOTECHNICAL ENGINEERS, INC.PROJECT NO.185 GS-16-B FIGURE 5
ARS ENVELOPE DESIGN SPECTRAL ACCELERATIONSEWER GROUP 806 BRIDGE CROSSING PROJECT
T (sec)
Base
Spectrum
S(a)
0.01 0.289
0.05 0.453
0.1 0.578
0.15 0.673
0.2 0.688
0.25 0.649
0.3 0.603
0.4 0.512
0.5 0.433
0.6 0.378
0.7 0.338
0.85 0.302
1 0.276
1.2 0.231
1.5 0.186
2 0.141
3 0.089
4 0.063
5 0.052
ALLIED GEOTECHNICAL ENGINEERS, INC.PROJECT NO.185 GS-16-B FIGURE 6
LRFD FACTORED AXIAL RESISTANCE24-INCH DIAMETER CIDH PILES (ABUTMENTS 1 AND 2)
SEWER GROUP 806 BRIDGE CROSSING PROJECT
Compressive Resistance Extreme Event Limit State I
Compressive Resistance Strength Limit State
Approximate Existing Grade Elevation
Approximate Finish Grade Elevation (Abutment 1)
Approximate Finish Grade Elevation (Abutment 2)
Approximate Top of Rock
Approximate Pile Cut-Off Elevation
NOTES:
1. Resistance is based on combination of skin friction and end bearing.
2. Applied resistance factor is 0.7 for Strength Limit State and 1.0 for Extreme Event Limit State I.
3. Uplift is not provided.
4. No liquefaction downdrag anticipated.
200
190
180
170
160
150
140
130
120
110
EL
EV
AT
ION
(F
T. M
SL
)
600 1200 1800 2400 30000
LRFD FACTORED AXIAL RESISTANCE (KIPS)
APPENDIX A
FIELD EXPLORATION PROGRAM
Project No. 185 GS-16-BAppendix A, Sheet 1
APPENDIX A
FIELD EXPLORATION PROGRAM
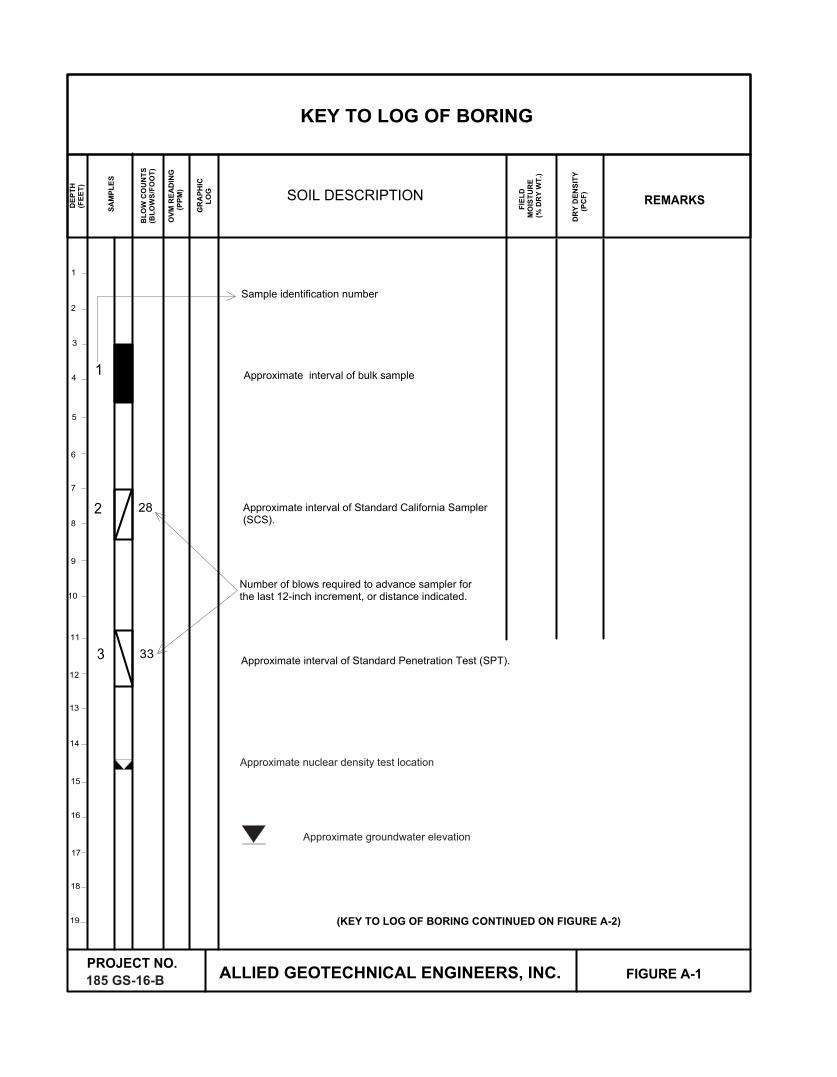
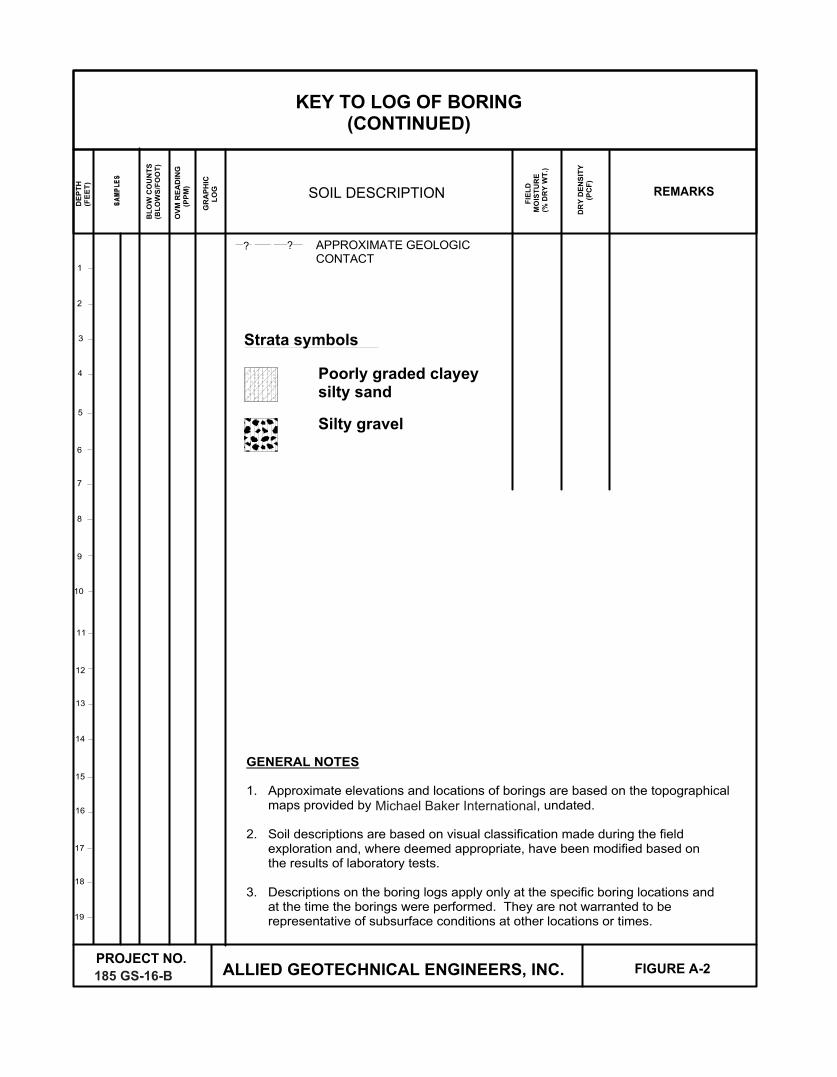
The field exploration program for this project was performed on July 31, 2018, and included theadvancement of one (1) soil boring and one (1) test pit at the approximate locations shown on theSite Plan (Figure 2). The soil boring was performed by Tri-County Drilling with a CME-75 all-terrain drill rig to a depth of 28 feet below the existing ground surface (bgs), and the test pit wasperformed by Mansolf Excavation using manual labor to a depth of 5 feet bgs. The soils encounteredin the soil boring and test pit were visually classified and logged by an experienced engineeringgeologist from AGE. A Key to Logs is presented on Figures A-1 and A-2, and logs of the boringand test pit are presented on Figures A-3 and A-4. The logs depict the various soil types encounteredand indicate the depths at which samples were obtained for laboratory testing and analysis.
Prior to commencement of the field exploration activities, several site visits were performed toobserve existing conditions and to select suitable locations for the soil boring and test pit.Subsequently, Underground Service Alert (USA) was contacted to coordinate clearance of theproposed test pit locations with respect to existing buried utilities.
During the excavation, moisture and density test readings were taken in the test pit using a nuclearsoil gauge (ASTM D6938-10). In addition, loose bulk samples were also collected. The sampleswere field screened for the presence of volatile organics using a RAE Systems MiniRAE 3000organic vapor meter (OVM). The OVM readings are indicated on the logs. During drilling, Standard Penetration Tests (SPT) were performed at selected depth intervals. TheSPT tests involve the use of a specially manufactured “split spoon” sampler which is driven into thesoils at the bottom of the borehole by dropping a 140-pound weight from a height of 30 inches. Thenumber of blows required to penetrate each 6-inch increment was counted and recorded on the fieldlogs, and have been used to evaluate the relative density and consistency of the materials. The blowcounts were subsequently corrected for soil type, hammer model, groundwater and surcharge. Thecorrected blow counts are shown on the boring logs.
Relatively undisturbed samples were obtained by driving a 3-inch (OD) diameter standard Californiasampler with a special cutting tip and inside lining of thin brass rings into the soils at the bottom ofthe borehole. The sampler is driven a distance of approximately 12 inches into the soil at the bottomof the borehole by dropping a 140-pound weight from a height of 30 inches. A 6-inch long sectionof soil sample that was retained in the brass rings was extracted from the sampling tube andtransported to our laboratory in close-fitting, waterproof containers. The samples were field screened for the presence of volatile organics using a RAE Systems MiniRAE 3000 organic vapor meter(OVM). The OVM readings are indicated on the logs. In addition, loose bulk samples were alsocollected.
ALLIED GEOTECHNICAL ENGINEERS, INC.
Project No. 185 GS-16-BAppendix A, Sheet 2
Upon completion of the drilling and sampling activities, boring B-1 was backfilled using bentonitegrout and bentonite chips to approximately 12 inches below the ground surface and capped withexcess soil cuttings. The test pit was backfilled with excess soil cuttings and compacted.
ALLIED GEOTECHNICAL ENGINEERS, INC.
185 GS-16-B
Approximate nuclear density test location
Approximate groundwater elevation
185 GS-16-B
Michael Baker International
Strata symbols
Poorly graded clayeysilty sand
Silty gravel
1
2
3
4
5
6
7
8
9
10
11
12
13
14
15
16
17
18
19
20
21
22
23
24
25
26
27
28
29
30
31
32
33
34
35
36
37
1
2
3
4
5
100+
100+
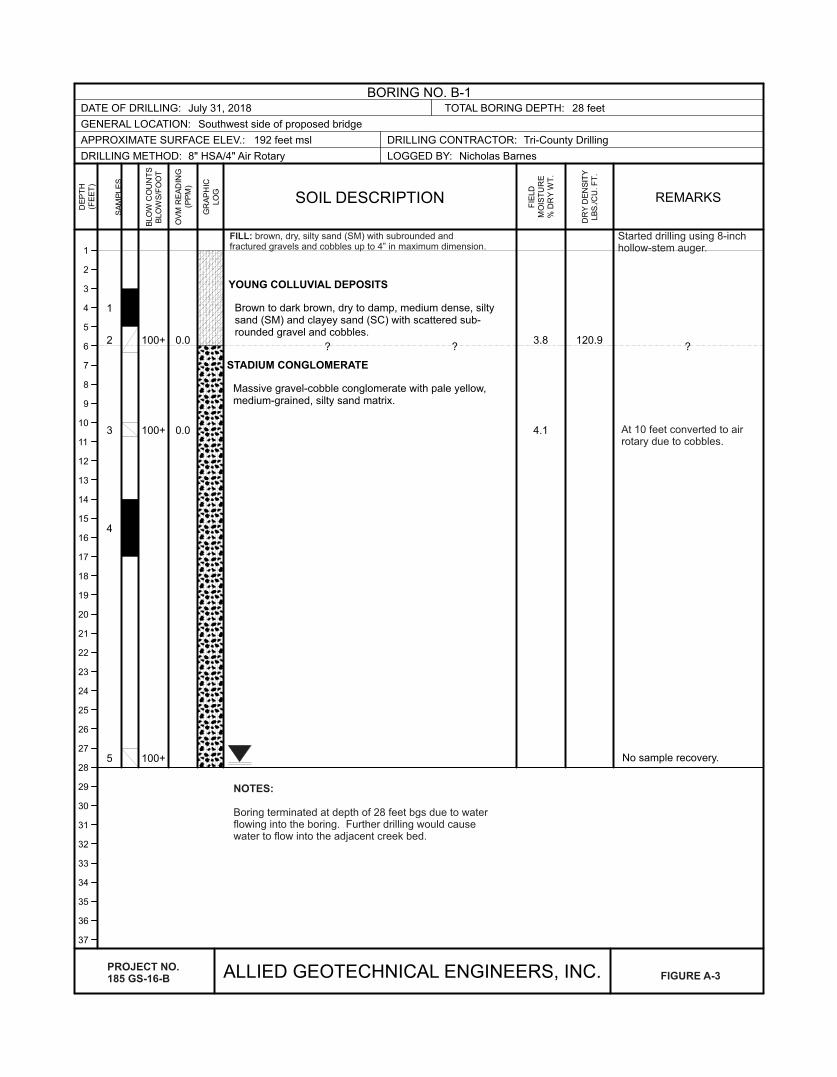
100+
0.0
0.0
YOUNG COLLUVIAL DEPOSITS
Brown to dark brown, dry to damp, medium dense, siltysand (SM) and clayey sand (SC) with scattered sub-rounded gravel and cobbles.
? ?
STADIUM CONGLOMERATE
Massive gravel-cobble conglomerate with pale yellow,medium-grained, silty sand matrix.
3.8
4.1
120.9 ?
No sample recovery.
BORING NO. B-1DATE OF DRILLING: July 31, 2018 TOTAL BORING DEPTH: 28 feet
GENERAL LOCATION: Southwest side of proposed bridge
APPROXIMATE SURFACE ELEV.: 192 feet msl DRILLING CONTRACTOR: Tri-County Drilling
DRILLING METHOD: 8" HSA/4" Air Rotary LOGGED BY: Nicholas Barnes
ALLIED GEOTECHNICAL ENGINEERS, INC.
DE
PT
H(F
EE
T)
SA
MP
LE
S
BLO
W C
OU
NT
SB
LO
WS
/FO
OT
OV
M R
EA
DIN
G(P
PM
)
GR
AP
HIC
LO
G
SOIL DESCRIPTION
FIE
LD
MO
IST
UR
E%
DR
Y W
T.
DR
Y D
EN
SIT
YLB
S./C
U. F
T.
REMARKS
NOTES:
Boring terminated at depth of 28 feet bgs due to waterflowing into the boring. Further drilling would causewater to flow into the adjacent creek bed.
PROJECT NO.185 GS-16-B FIGURE A-3
Started drilling using 8-inchhollow-stem auger.
At 10 feet converted to airrotary due to cobbles.
FILL: brown, dry, silty sand (SM) with subrounded andfractured gravels and cobbles up to 4” in maximum dimension.
1
2
3
4
5
6
7
8
9
10
11
12
13
14
15
16
17
18
19
20
21
22
23
24
25
26
27
28
29
30
31
32
33
34
35
36
37
123
4
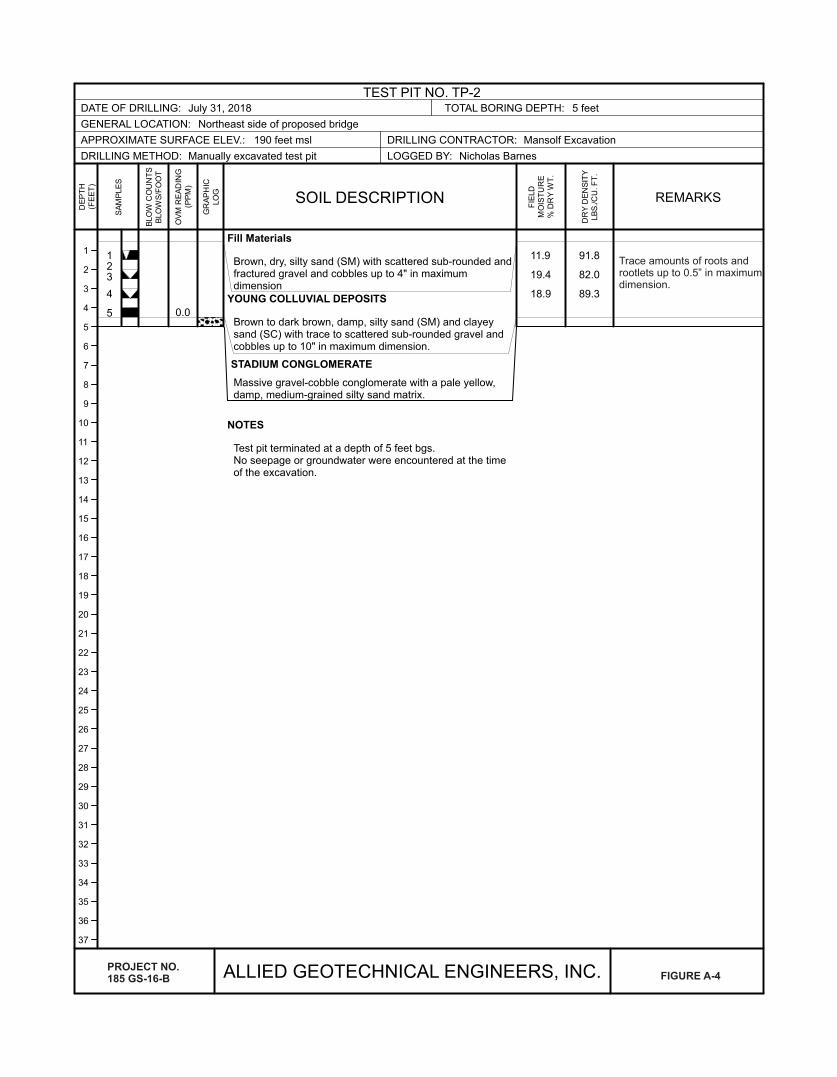
5 0.0
Fill Materials
Brown, dry, silty sand (SM) with scattered sub-rounded andfractured gravel and cobbles up to 4" in maximumdimension
YOUNG COLLUVIAL DEPOSITS
Brown to dark brown, damp, silty sand (SM) and clayeysand (SC) with trace to scattered sub-rounded gravel andcobbles up to 10" in maximum dimension.
STADIUM CONGLOMERATE
Massive gravel-cobble conglomerate with a pale yellow,damp, medium-grained silty sand matrix.
NOTES
Test pit terminated at a depth of 5 feet bgs.No seepage or groundwater were encountered at the timeof the excavation.
11.9
19.4
18.9
91.8
82.0
89.3
TEST PIT NO. TP-2DATE OF DRILLING: July 31, 2018 TOTAL BORING DEPTH: 5 feet
GENERAL LOCATION: Northeast side of proposed bridge
APPROXIMATE SURFACE ELEV.: 190 feet msl DRILLING CONTRACTOR: Mansolf Excavation
DRILLING METHOD: Manually excavated test pit LOGGED BY: Nicholas Barnes
ALLIED GEOTECHNICAL ENGINEERS, INC.
DE
PT
H(F
EE
T)
SA
MP
LE
S
BLO
W C
OU
NT
SB
LO
WS
/FO
OT
OV
M R
EA
DIN
G(P
PM
)
GR
AP
HIC
LO
G
SOIL DESCRIPTION
FIE
LD
MO
IST
UR
E%
DR
Y W
T.
DR
Y D
EN
SIT
YLB
S./C
U. F
T.
REMARKS
PROJECT NO.185 GS-16-B FIGURE A-4
Trace amounts of roots androotlets up to 0.5” in maximumdimension.
APPENDIX B
LABORATORY TESTING
Project No. 185 GS-16-BAppendix B, Sheet 1
APPENDIX B
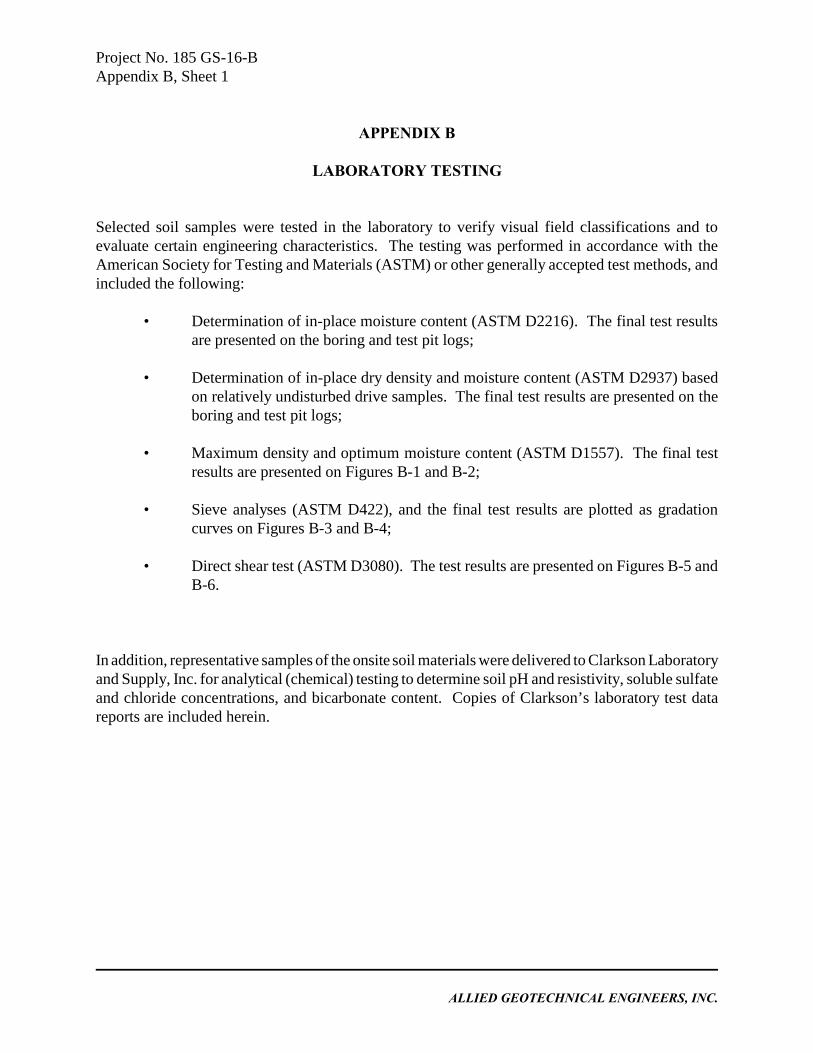
LABORATORY TESTING
Selected soil samples were tested in the laboratory to verify visual field classifications and toevaluate certain engineering characteristics. The testing was performed in accordance with theAmerican Society for Testing and Materials (ASTM) or other generally accepted test methods, andincluded the following:
• Determination of in-place moisture content (ASTM D2216). The final test resultsare presented on the boring and test pit logs;
• Determination of in-place dry density and moisture content (ASTM D2937) basedon relatively undisturbed drive samples. The final test results are presented on theboring and test pit logs;
• Maximum density and optimum moisture content (ASTM D1557). The final testresults are presented on Figures B-1 and B-2;
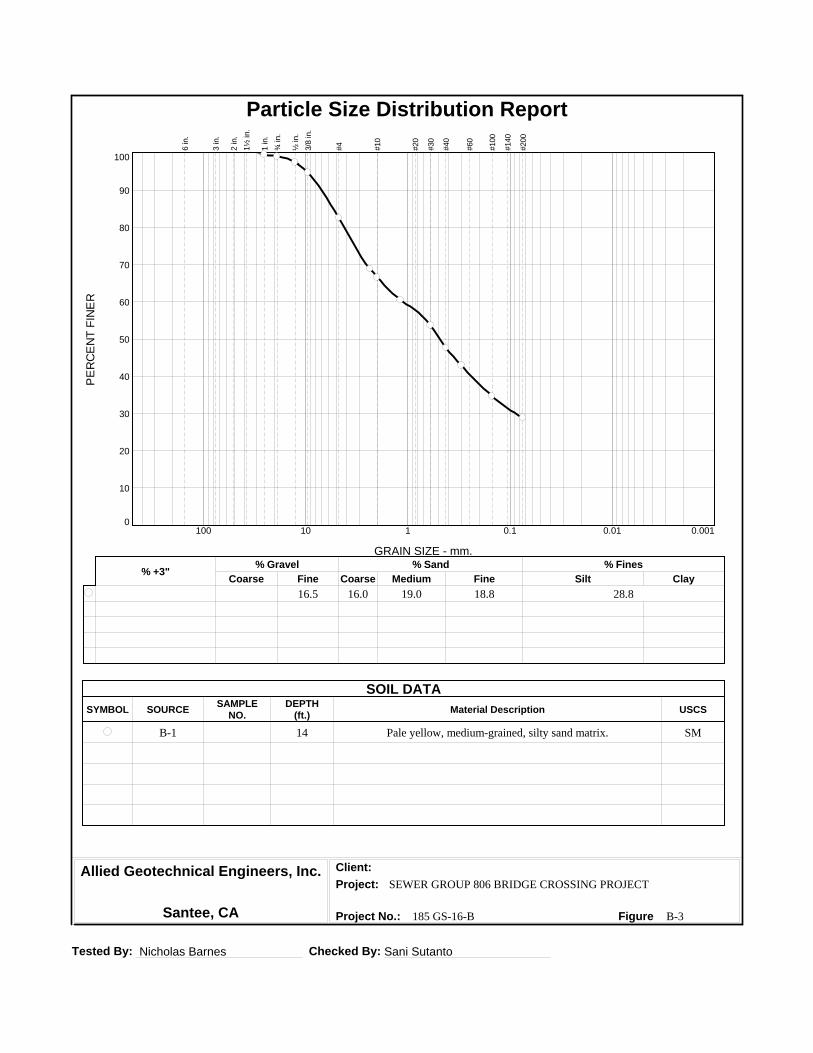
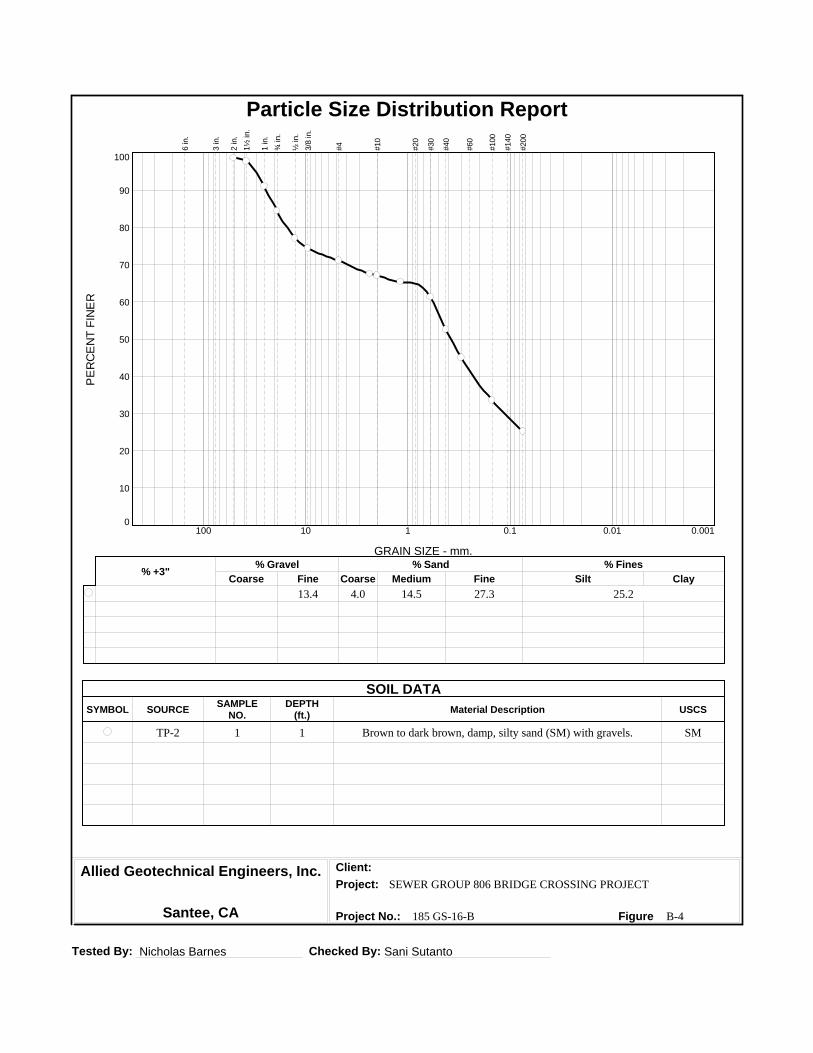
• Sieve analyses (ASTM D422), and the final test results are plotted as gradationcurves on Figures B-3 and B-4;
• Direct shear test (ASTM D3080). The test results are presented on Figures B-5 andB-6.
In addition, representative samples of the onsite soil materials were delivered to Clarkson Laboratoryand Supply, Inc. for analytical (chemical) testing to determine soil pH and resistivity, soluble sulfateand chloride concentrations, and bicarbonate content. Copies of Clarkson’s laboratory test datareports are included herein.
ALLIED GEOTECHNICAL ENGINEERS, INC.
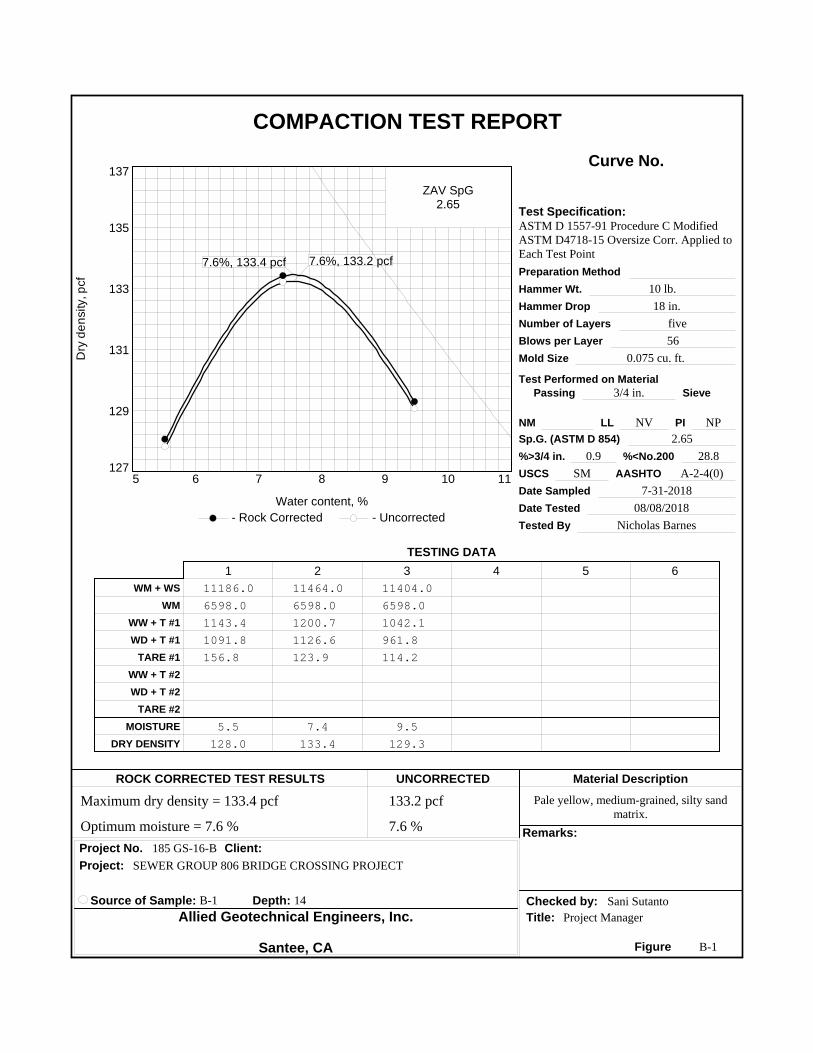
COMPACTION TEST REPORT
Dry
de
nsi
ty, p
cf
127
129
131
133
135
137
Water content, %
- Rock Corrected - Uncorrected
5 6 7 8 9 10 11
7.6%, 133.4 pcf 7.6%, 133.2 pcf
ZAV SpG2.65
1 2 3 4 5 6
Curve No.
Test Specification:
TESTING DATA
ROCK CORRECTED TEST RESULTS UNCORRECTED Material Description
Remarks:
Project No. Client:
Project:
Source of Sample: B-1 Depth: 14 Checked by:
Allied Geotechnical Engineers, Inc.
Santee, CA
Title:
Figure
ASTM D 1557-91 Procedure C ModifiedASTM D4718-15 Oversize Corr. Applied toEach Test Point
10 lb.
18 in.
five
56
0.075 cu. ft.
3/4 in.
NV NP
2.65
0.9 28.8
SM A-2-4(0)
7-31-2018
08/08/2018
Nicholas Barnes
Pale yellow, medium-grained, silty sandmatrix.
185 GS-16-B
Sani Sutanto
Project Manager
B-1
Preparation Method
Hammer Wt.
Hammer Drop
Number of Layers
Blows per Layer
Mold Size
Test Performed on Material
Passing Sieve
NM LL PI
Sp.G. (ASTM D 854)
%>3/4 in. %<No.200
USCS AASHTO
Date Sampled
Date Tested
Tested By
WM + WS
WM
WW + T #1
WD + T #1
TARE #1
WW + T #2
WD + T #2
TARE #2
MOISTURE
DRY DENSITY
11186.0 11464.0 11404.0
6598.0 6598.0 6598.0
1143.4 1200.7 1042.1
1091.8 1126.6 961.8
156.8 123.9 114.2
5.5 7.4 9.5
128.0 133.4 129.3
133.2 pcf Maximum dry density = 133.4 pcf
7.6 % Optimum moisture = 7.6 %
SEWER GROUP 806 BRIDGE CROSSING PROJECT
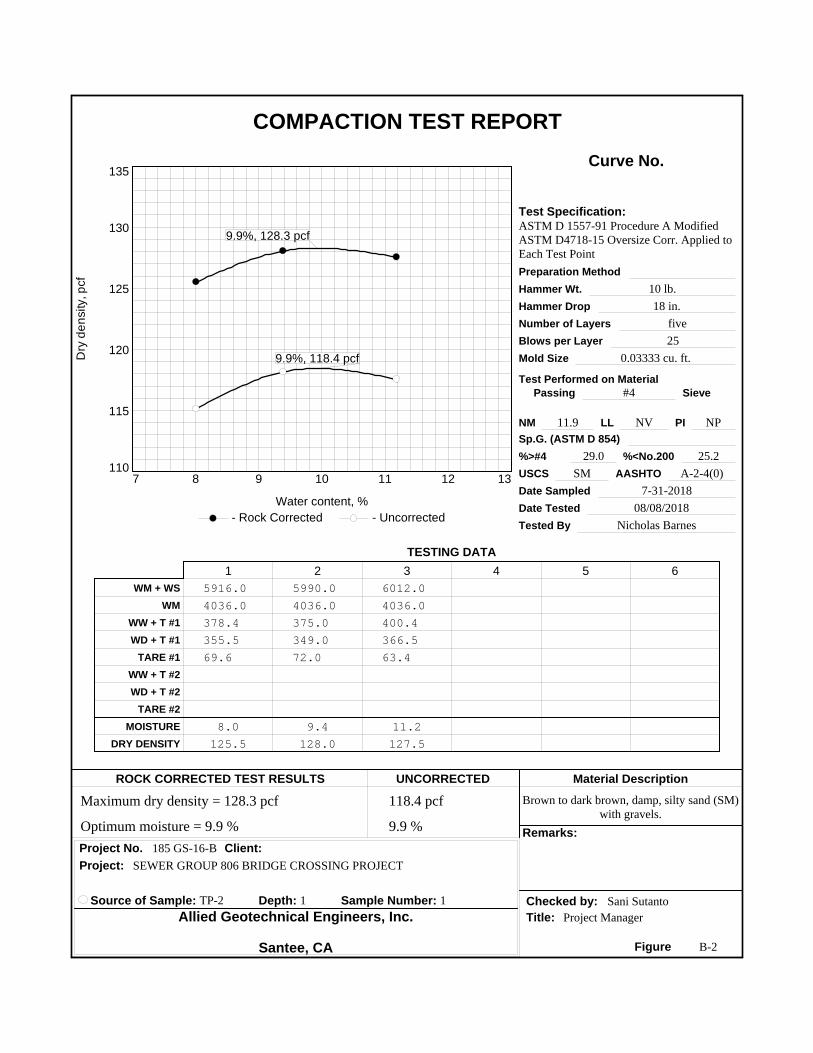
COMPACTION TEST REPORT
Dry
de
nsi
ty, p
cf
110
115
120
125
130
135
Water content, %
- Rock Corrected - Uncorrected
7 8 9 10 11 12 13
9.9%, 128.3 pcf
9.9%, 118.4 pcf
1 2 3 4 5 6
Curve No.
Test Specification:
TESTING DATA
ROCK CORRECTED TEST RESULTS UNCORRECTED Material Description
Remarks:
Project No. Client:
Project:
Source of Sample: TP-2 Depth: 1 Sample Number: 1 Checked by:
Allied Geotechnical Engineers, Inc.
Santee, CA
Title:
Figure
ASTM D 1557-91 Procedure A ModifiedASTM D4718-15 Oversize Corr. Applied toEach Test Point
10 lb.
18 in.
five
25
0.03333 cu. ft.
#4
11.9 NV NP
29.0 25.2
SM A-2-4(0)
7-31-2018
08/08/2018
Nicholas Barnes
Brown to dark brown, damp, silty sand (SM)with gravels.
185 GS-16-B
Sani Sutanto
Project Manager
B-2
Preparation Method
Hammer Wt.
Hammer Drop
Number of Layers
Blows per Layer
Mold Size
Test Performed on Material
Passing Sieve
NM LL PI
Sp.G. (ASTM D 854)
%>#4 %<No.200
USCS AASHTO
Date Sampled
Date Tested
Tested By
WM + WS
WM
WW + T #1
WD + T #1
TARE #1
WW + T #2
WD + T #2
TARE #2
MOISTURE
DRY DENSITY
5916.0 5990.0 6012.0
4036.0 4036.0 4036.0
378.4 375.0 400.4
355.5 349.0 366.5
69.6 72.0 63.4
8.0 9.4 11.2
125.5 128.0 127.5
118.4 pcf Maximum dry density = 128.3 pcf
9.9 % Optimum moisture = 9.9 %
SEWER GROUP 806 BRIDGE CROSSING PROJECT
Tested By: Nicholas Barnes Checked By: Sani Sutanto
Allied Geotechnical Engineers, Inc.
Santee, CA
Client:
Project:
Project No.: Figure
SEWER GROUP 806 BRIDGE CROSSING PROJECT
185 GS-16-B B-3
SYMBOL SOURCESAMPLE DEPTH
Material Description USCSNO. (ft.)
SOIL DATA
PE
RC
EN
T F
INE
R
0
10
20
30
40
50
60
70
80
90
100
GRAIN SIZE - mm.
0.0010.010.1110100
% +3"Coarse
% Gravel
Fine Coarse Medium
% Sand
Fine Silt
% Fines
Clay
16.5 16.0 19.0 18.8 28.8
6 in.
3 in.
2 in.
1½
in.
1 in.
¾ in.
½ in.
3/8
in.
#4
#10
#20
#30
#40
#60
#100
#140
#200
Particle Size Distribution Report
B-1 14 Pale yellow, medium-grained, silty sand matrix. SM
Tested By: Nicholas Barnes Checked By: Sani Sutanto
Allied Geotechnical Engineers, Inc.
Santee, CA
Client:
Project:
Project No.: Figure
SEWER GROUP 806 BRIDGE CROSSING PROJECT
185 GS-16-B B-4
SYMBOL SOURCESAMPLE DEPTH
Material Description USCSNO. (ft.)
SOIL DATA
PE
RC
EN
T F
INE
R
0
10
20
30
40
50
60
70
80
90
100
GRAIN SIZE - mm.
0.0010.010.1110100
% +3"Coarse
% Gravel
Fine Coarse Medium
% Sand
Fine Silt
% Fines
Clay
13.4 4.0 14.5 27.3 25.2
6 in.
3 in.
2 in.
1½
in.
1 in.
¾ in.
½ in.
3/8
in.
#4
#10
#20
#30
#40
#60
#100
#140
#200
Particle Size Distribution Report
TP-2 1 1 Brown to dark brown, damp, silty sand (SM) with gravels. SM
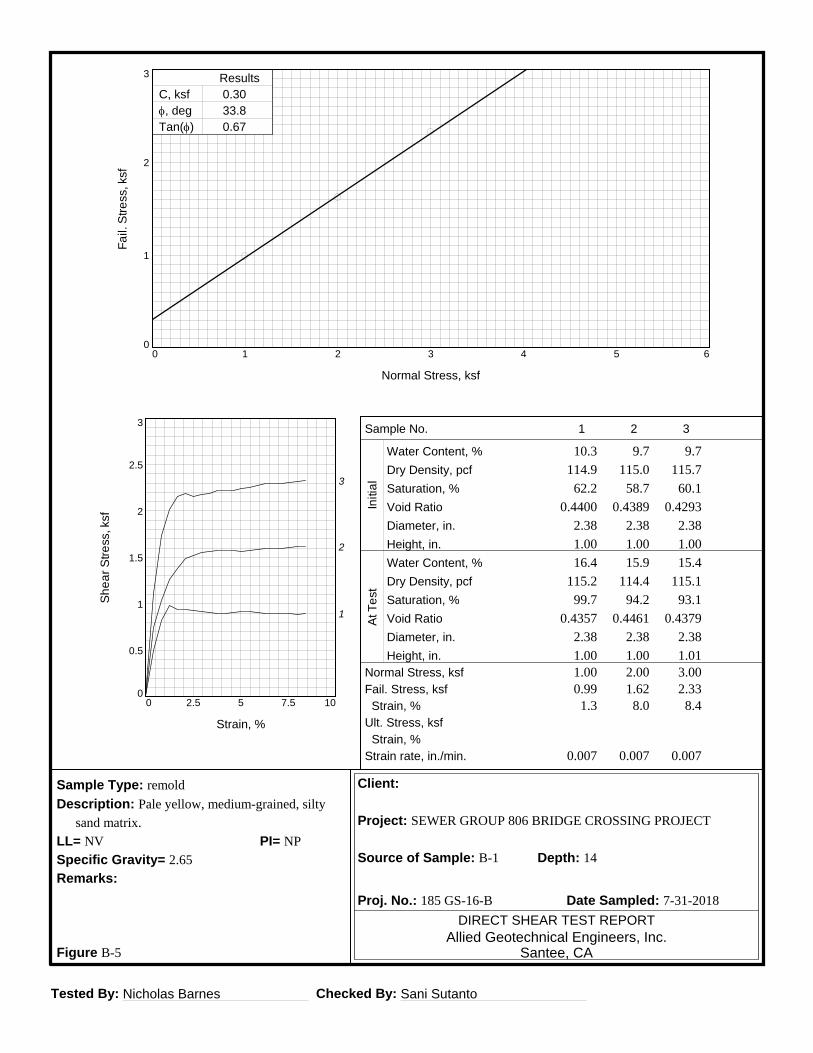
Tested By: Nicholas Barnes Checked By: Sani Sutanto
DIRECT SHEAR TEST REPORT
Allied Geotechnical Engineers, Inc.Santee, CA
Client:
Project: SEWER GROUP 806 BRIDGE CROSSING PROJECT
Source of Sample: B-1 Depth: 14
Proj. No.: 185 GS-16-B Date Sampled: 7-31-2018
Sample Type: remold
Description: Pale yellow, medium-grained, silty
sand matrix.
LL= NV PI= NP
Specific Gravity= 2.65
Remarks:
Figure B-5
Sample No.
Water Content, %
Dry Density, pcf
Saturation, %
Void Ratio
Diameter, in.
Height, in.
Water Content, %
Dry Density, pcf
Saturation, %
Void Ratio
Diameter, in.
Height, in.
Normal Stress, ksf
Fail. Stress, ksf
Strain, %
Ult. Stress, ksf
Strain, %
Strain rate, in./min.
Initi
al
At T
estSh
ea
r S
tre
ss, ks
f
0
0.5
1
1.5
2
2.5
3
Strain, %
0 2.5 5 7.5 10
1
2
3
Fa
il. S
tre
ss, ks
f
0
1
2
3
Normal Stress, ksf
0 1 2 3 4 5 6
C, ksf
f, deg
Tan(f)
Results
0.30
33.8
0.67
1
10.3
114.9
62.2
0.4400
2.38
1.00
16.4
115.2
99.7
0.4357
2.38
1.001.00
0.991.3
0.007
2
9.7
115.0
58.7
0.4389
2.38
1.00
15.9
114.4
94.2
0.4461
2.38
1.002.00
1.628.0
0.007
3
9.7
115.7
60.1
0.4293
2.38
1.00
15.4
115.1
93.1
0.4379
2.38
1.013.00
2.338.4
0.007
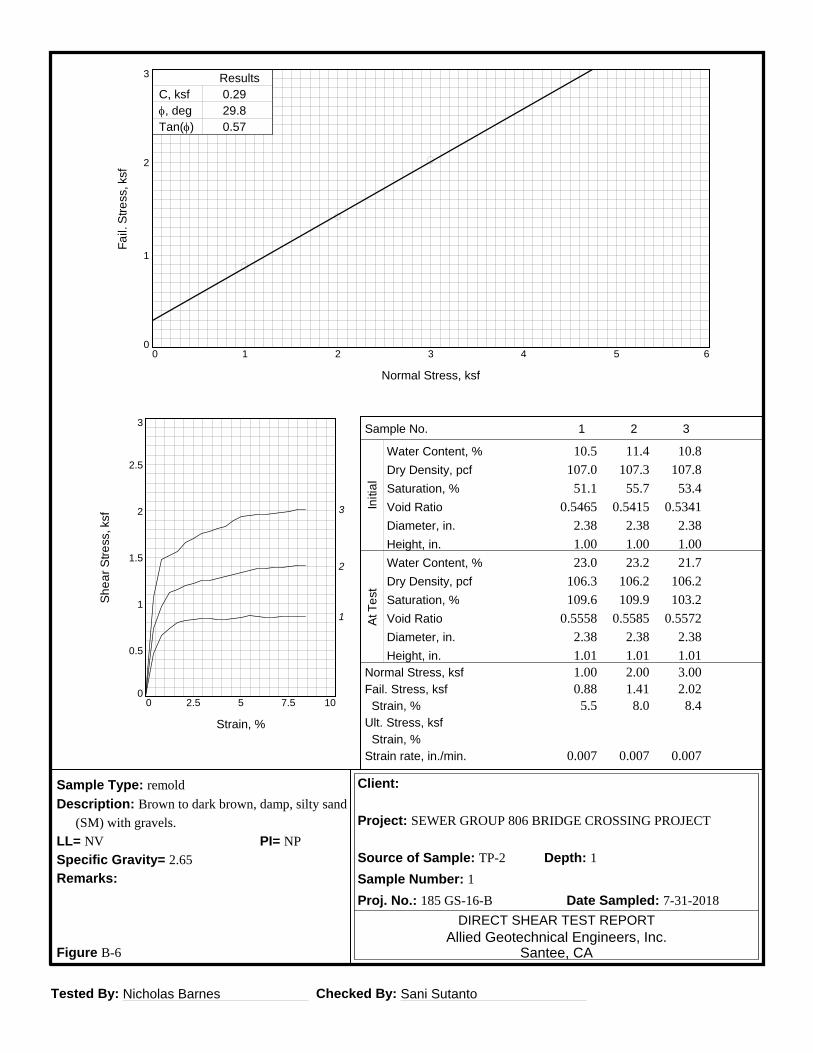
Tested By: Nicholas Barnes Checked By: Sani Sutanto
DIRECT SHEAR TEST REPORT
Allied Geotechnical Engineers, Inc.Santee, CA
Client:
Project: SEWER GROUP 806 BRIDGE CROSSING PROJECT
Source of Sample: TP-2 Depth: 1
Sample Number: 1
Proj. No.: 185 GS-16-B Date Sampled: 7-31-2018
Sample Type: remold
Description: Brown to dark brown, damp, silty sand
(SM) with gravels.
LL= NV PI= NP
Specific Gravity= 2.65
Remarks:
Figure B-6
Sample No.
Water Content, %
Dry Density, pcf
Saturation, %
Void Ratio
Diameter, in.
Height, in.
Water Content, %
Dry Density, pcf
Saturation, %
Void Ratio
Diameter, in.
Height, in.
Normal Stress, ksf
Fail. Stress, ksf
Strain, %
Ult. Stress, ksf
Strain, %
Strain rate, in./min.
Initi
al
At T
estSh
ea
r S
tre
ss, ks
f
0
0.5
1
1.5
2
2.5
3
Strain, %
0 2.5 5 7.5 10
1
2
3
Fa
il. S
tre
ss, ks
f
0
1
2
3
Normal Stress, ksf
0 1 2 3 4 5 6
C, ksf
f, deg
Tan(f)
Results
0.29
29.8
0.57
1
10.5
107.0
51.1
0.5465
2.38
1.00
23.0
106.3
109.6
0.5558
2.38
1.011.00
0.885.5
0.007
2
11.4
107.3
55.7
0.5415
2.38
1.00
23.2
106.2
109.9
0.5585
2.38
1.012.00
1.418.0
0.007
3
10.8
107.8
53.4
0.5341
2.38
1.00
21.7
106.2
103.2
0.5572
2.38
1.013.00
2.028.4
0.007
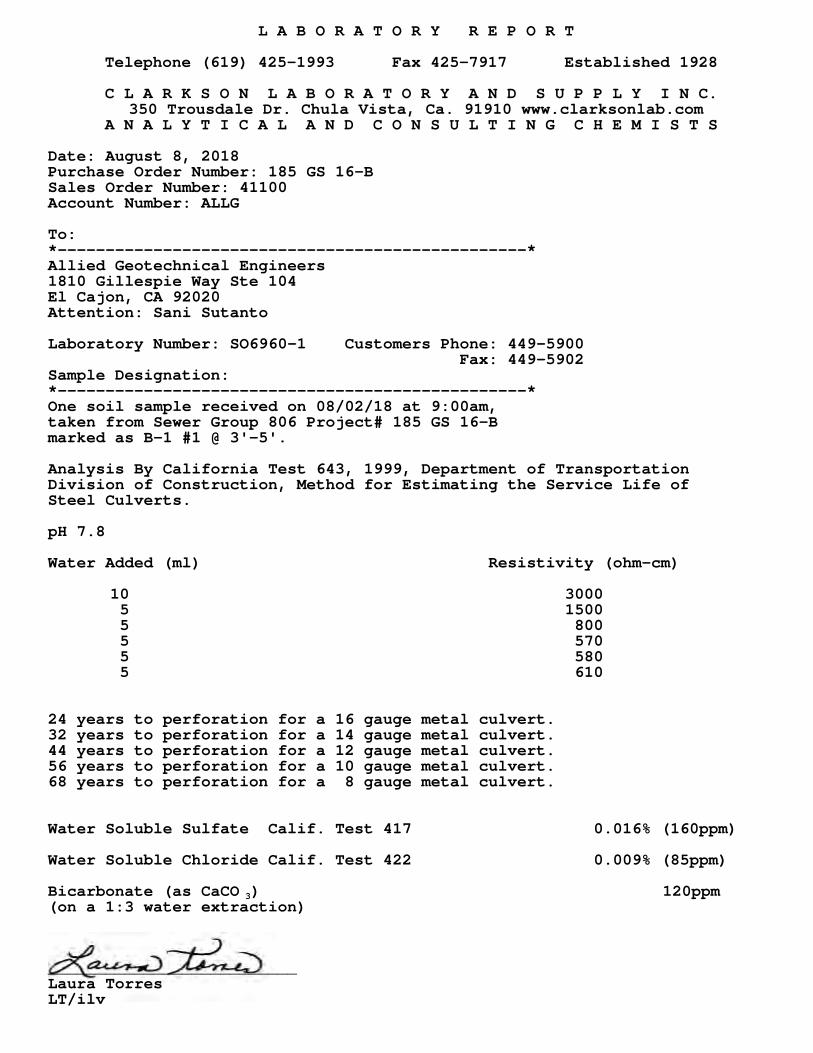
L A B O R A T O R Y R E P O R T
Telephone (619) 425-1993 Fax 425-7917 Established 1928
C L A R K S O N L A B O R A T O R Y A N D S U P P L Y I N C. 350 Trousdale Dr. Chula Vista, Ca. 91910 www.clarksonlab.com
A N A L Y T I C A L A N D C O N S U L T I N G C H E M I S T S
Date: August 8, 2018 Purchase Order Number: 185 GS 16-B Sales Order Number: 41100Account Number: ALLG
To: *-------------------------------------------------* Allied Geotechnical Engineers1810 Gillespie Way Ste 104El Cajon, CA 92020Attention: Sani Sutanto
Laboratory Number: SO6960-1 Customers Phone: 449-5900 Fax: 449-5902
Sample Designation: *-------------------------------------------------* One soil sample received on 08/02/18 at 9:00am,taken from Sewer Group 806 Project# 185 GS 16-Bmarked as B-1 #1 @ 3'-5'. Analysis By California Test 643, 1999, Department of TransportationDivision of Construction, Method for Estimating the Service Life ofSteel Culverts. pH 7.8
Water Added (ml) Resistivity (ohm-cm)
10 30005 15005 8005 5705 5805 610
24 years to perforation for a 16 gauge metal culvert.32 years to perforation for a 14 gauge metal culvert.44 years to perforation for a 12 gauge metal culvert.56 years to perforation for a 10 gauge metal culvert.68 years to perforation for a 8 gauge metal culvert.
Water Soluble Sulfate Calif. Test 417 0.016% (160ppm)
Water Soluble Chloride Calif. Test 422 0.009% (85ppm)
Bicarbonate (as CaCO 3) 120ppm(on a 1:3 water extraction)
__________________________Laura TorresLT/ilv
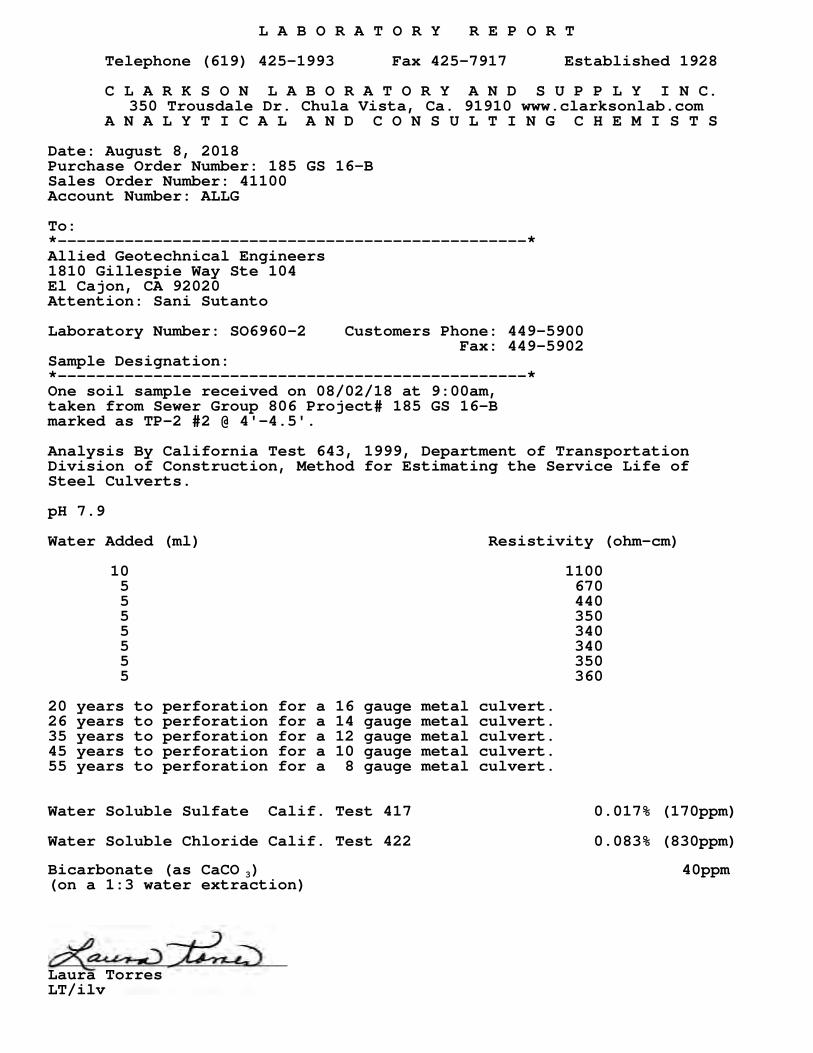
L A B O R A T O R Y R E P O R T
Telephone (619) 425-1993 Fax 425-7917 Established 1928
C L A R K S O N L A B O R A T O R Y A N D S U P P L Y I N C. 350 Trousdale Dr. Chula Vista, Ca. 91910 www.clarksonlab.com
A N A L Y T I C A L A N D C O N S U L T I N G C H E M I S T S
Date: August 8, 2018 Purchase Order Number: 185 GS 16-B Sales Order Number: 41100Account Number: ALLG
To: *-------------------------------------------------* Allied Geotechnical Engineers1810 Gillespie Way Ste 104El Cajon, CA 92020Attention: Sani Sutanto
Laboratory Number: SO6960-2 Customers Phone: 449-5900 Fax: 449-5902
Sample Designation: *-------------------------------------------------* One soil sample received on 08/02/18 at 9:00am, taken from Sewer Group 806 Project# 185 GS 16-Bmarked as TP-2 #2 @ 4'-4.5'. Analysis By California Test 643, 1999, Department of TransportationDivision of Construction, Method for Estimating the Service Life ofSteel Culverts. pH 7.9
Water Added (ml) Resistivity (ohm-cm)
10 11005 6705 4405 3505 3405 3405 3505 360
20 years to perforation for a 16 gauge metal culvert.26 years to perforation for a 14 gauge metal culvert.35 years to perforation for a 12 gauge metal culvert.45 years to perforation for a 10 gauge metal culvert.55 years to perforation for a 8 gauge metal culvert.
Water Soluble Sulfate Calif. Test 417 0.017% (170ppm)
Water Soluble Chloride Calif. Test 422 0.083% (830ppm)
Bicarbonate (as CaCO 3) 40ppm(on a 1:3 water extraction)
_________________________Laura TorresLT/ilv

![Sewer Processes and Design - SKYSCRAPERS · 2018-09-02 · SANITARY SEWER SYSTEM [Foul Sewer] I. Storm Sewer System STORM SEWER is designed to drain excess rainfall and groundwater](https://img.pdfslide.us/doc/110x75/5e9b180035942256b30ec806/sewer-processes-and-design-skyscrapers-2018-09-02-sanitary-sewer-system-foul.jpg)