Embed Size (px)
Citation preview

Attachment 4
NET-264-02 P, Revision 3, "Criticality Analysis of the Peach Bottom Spent Fuel Racks forGNF 2 Fuel with Boraflex Panel Degradation Projected to May 2010" (Non-Proprietary
Version)

Report No. NET-264-02 NPNon-Proprietary Information Submitted in
Accordance with 10 CFR 2.390
Criticality Analysis of the Peach Bottom
Spent Fuel Racks for GNF 2 Fuel with Boraflex Panel
Degradation Projected to May 2010 2
Prepared
for
Exelon NuclearUnder Purchase Order: 01003029
by:
Northeast Technology Corp.108 North Front Street
UPO Box 4178Kingston, New York 12402
Revision: Date: Prepared by: Reviewed By: Approved By: (QA)
Note: New revision signature sheet initiated due to the fact that Revision 2 of NET-264-02 included achange of title.

NET-264-02 NPNon-Proprietary Information Submitted in
Accordance with 10 CFR 2.390Table of Contents
1 .0 Intro d u ctio n ..................................................................................................... . . 1
2.0 Peach Bottom Unit 2 Spent Fuel Racks ........................................................... 32.1 Spent Fuel Rack Description ................................................................. 3
3.0 RACKLIFE Projections .................................................................................... 63.1 Model Overview and Assumptions ......................................................... 63.2 Projections through 2010 ................................. 7
4.0 The Reactivity Effects of Boraflex Degradation ............................................... 154 .1 Introd uctio n ....................................................................................... . . 15
4.1.1 Uniform Dissolution .................................................................. 154.1.2 Shrinkage, Including Gaps ......................................................... 154.1.3 Local Dissolution ...................................................................... 16
4.2 Methodology for Projecting Future Panel Conditions ........................... 164.3 Methodology for Assessing the Reactivity Effects of Boraflex
D eg rad atio n ...................................................................................... . . 204 .4 R e su lts .............................................................................................. . . 2 2
5.0 Results of the Criticality Analysis .................................................................... 275.1 Design Basis and Design Criteria ........................................................ 275.2 Analytical Methods and Assumptions ................................................. 285.3 Calculated Results ............................................................................. 31
5.3.1 Reference Eigenvalue Calculations ........................................... 315.3.2 CASMO-4 and KENO V.a Reactivity Calculations in Core and in
Rack Geometries ...................................................................... 355.3.3 Effect of Tolerances and Uncertainties ..................................... 365.3.4 Space Between Modules ........................................................... 395.3.5 Summary of Reactivity Calculations ......................................... 395.3.6 Abnormal/Accident Conditions .................................................. 39
6 .0 C o nclusio ns .................................................................................................. . . 4 2
ii

Figure 2-2:
Figure 3-1:
Figure 3-2:
Figure 3-3:
Figure 3-4:
Figure 3-5:
Figure 3-6:
Figure 4-1:
Figure 4-2:
Figure 5-1:
NET-264-02 NPNon-Proprietary Information Submitted in
Accordance with 10 CFR 2.390List of Figures
Peach Bottom Storage Cell Elements .................................................... 5
Occupied Cells in the Peach Bottom 2 Spent Fuel Storage Racks onFebruary 26 , 2006 ............................................................................... . . 9
Projected Occupied Cells in the Peach Bottom 2 Spent Fuel StorageR acks on M ay 1, 2010 ........................................................................ 10
Predicted Boron Carbide Loss through February 26, 2006 in the PeachBottom Spent Fuel Storage Racks ....................................................... 11
Panel Absorbed Dose through February 26, 2006 in the Peach BottomSpent Fuel Storage Racks .................................................................. 12
Predicted Boron Carbide Loss through May 1, 2010 in the Peach BottomSpent Fuel Storage Racks .................................................................. 13
Panel Absorbed Dose through May 1, 2010 in the Peach Bottom SpentFuel S torage R acks ........................................................................... . . 14
Typical Model of an Peach Bottom Unit 2 Boraflex Panel .................... 25
Sample Distribution of Panel Degradation Reactivity Effects ............... 26
Rack Reactivity versus Burnup for the GNF 2 Fuel Type in the PeachBottom Unit 2 Spent Fuel Storage Racks .......................................... 34
iii

NET-264-02 NPNon-Proprietary Information Submitted in
Accordance with 10 CFR 2.390List of Tables
Table 4-1: Conservative Reactivity Effects of Cracks Undetected by BADGER ....... 23
Table 4-2: Reactivity Effects of Uniform Boraflex Panel Thinning ........................ 23
Table 4-3: Reactivity Effects of Degraded Panels ................................................ 24
Table 5-1 GNF 2 Fuel Assembly Description Peach Bottom Nuclear GeneratingS ta tio n ................................................................................................ . . 3 3
Table 5-2 CASMO-4/KENO V.a Reactivity Comparison in Core Geometry: GNF 2Bundles @ [ ] w/o U-235 ([ ]% T.D.), Zero Burnup ......................... 35
Table 5-3 CASMO-4/KENO V.a Reactivity Comparison in Rack Geometry: GNF 2Bundles @ [ ] w/o U-235 ([ ]% T.D.), Zero Burnup ......................... 35
iv
NET-264-02 NPNon-Proprietary Information Submitted in
Accordance with 10 CFR 2.3901.0 Introduction
The Peach Bottom Unit 2 spent fuel pool was refitted with high density spent fuel
storage racks in 1986. These racks were fabricated by the Westinghouse Corporation
and utilize the neutron absorber material Boraflex for reactivity controld1' 21. Boraflex has
been observed to be subject to in-service degradation from the combined effects of
gamma radiation from spent fuel and long term exposure to the aqueous pool
environment.
To assure acceptable in service Boraflex performance Exelon Nuclear has initiated a
multi-prong surveillance program. This program includes monitoring pool reactive silica
levels, BADGER testing[3 ] and tracking the current and projected performance of each
panel of Boraflex in the Peach Bottom pools with RACKLIFE[4' 5]. To date three
BADGER test campaigns have been completed in the Unit 2 SFP (1996[6] 2002171and
2006[8]) and two campaigns have been completed in the Unit 3 SFP (2001191 and
2005110]). The Peach Bottom Unit 2 RACKLIFE model has been verified by the three
BADGER campaigns that also show the Unit 2 spent fuel racks are bounding with
respect to Boraflex degradation. This model has been used to predict the in-service
degradation of each Boraflex panel through May 1, 2010. 2
This report documents the application of an advanced methodology developed by
Northeast Technology Corp. for assessing the safe storage of GNF 2 fuel in the
Westinghouse spend fuel racks with degraded Boraflex[11 . This assessment is made
through May 2010 and utilized the results of the most recent Unit 2 BADGER test data 2
sets to establish distributions of local and global panel degradation at the time of the
testing. The RACKLIFE results are then used to track the progression of average panel
degradation and project the condition of the Boraflex in May 2010. A special algorithm, 2
developed by NETCO, is then applied to the BADGER data to project the local and
global panel degradation based on the RACKLIFE prediction of panel average boron
carbide loss.
1

NET-264-02 NPNon-Proprietary Information Submitted in
Accordance with 10 CFR 2.390The reactivity effects of local and global degradation in May 2010 have been converted 2
to an equivalent panel thinning using the KENO V.a code. The equivalent panel
thinning values so determined are then used in CASMO-4 models of the GNF 2 fuel
type in the Peach Bottom Unit 2 fuel racks. The GNF 2 fuel type was used as it is more
reactive than 7 x 7, 8 x 8, 9 x 9 and other 10 x 10 fuel designs of equivalent loadings
and is therefore bounding. This is due to the smaller rod diameter in the GNF 2 bundle
allowing for more rapid depletion of the gadolina. In this manner, it has been
demonstrated that GNF 2 fuel type (at [ ] percent theoretical density) with a
maximum average planar enrichment of up to [ ] w/o U-235 and a minimum of
I ] gadolinia rods each with a minimum Gd 2 0 3 loading of [ ] w/o can be I 3
safely stored (kerr<__ 0.95) in the Peach Bottom Boraflex racks through May 1,2010. 2
This methodology that was applied to the Peach Bottom Unit 2 racks has been used for
assessing Boraflex degradation at other LWRs. The methodology and results have
been placed under the review and scrutiny of the USNRC. The NRC has issued a
Safety Evaluation Report accepting the methodology on a plant specific basis[12 ].
2

NET-264-02 NPNon-Proprietary Information Submitted in
Accordance with 10 CFR 2.390
2.0 Peach Bottom Unit 2 Spent Fuel Racks
2.1 Spent Fuel Rack Description
The spent fuel racks at Peach Bottom are shown in Figure 2-1. The racks consist of 15
modules of varying size for a total capacity of 3814 storage cells. These racks utilize
Boraflex as a poison and contain the panels that were selected for BADGER testing[8 ].
In the design of the racks, one sheet of Boraflex is positioned between opposing faces
of the fuel assemblies. The individual storage cells are formed by creating a
checkerboard configuration of square tubes as shown in Figure 2-2. The basic structure
of this storage array is a square stainless steel tube [ ] inches thick with a
] inch inside dimension and 169 inches in length. Each structural tube has one
sheet of Boraflex [ ] inches long, [ ] inches wide, and [ ] inches thick (nominal)
positioned on each of the four outside faces. During manufacture, the Boraflex sheets
were first attached to [ I inches thick stainless steel wrapper plates using a Dow
silicone sealant that served as an adhesive. The wrapper plates were then tack welded
to the structural cell wall. Tack welds are located on approximately
[ ]-inch centers along the length of the wrapper plate.
To complete the rack module assembly, the structural tubes with Boraflex and stainless
steel cover plates are welded together at the corners and to a bottom base plate. In this
manner, every other storage location is formed by the structural tube and the resultant
locations are formed by the four adjacent faces of neighboring structural tubes. The base
plates of each module are fitted with leveling feet that rest on the pool floor.
3

NET-264-02 NPNon-Proprietary Information Submitted in
Accordance with 10 Cf R 2.390
North
r(-'1
2 3
11 12 4
14 13 5
7 68
-I
Figure 2-1: Peach Bottom Spent Fuel Pool(Note: Numerals are RACKLIFE module designations.)
4

NET-264-02 NPNon-Proprietary Information Submitted in
Accordance with 10 CFR 2.390
Figure 2-2: Peach Bottom Storage Cell Elements
5

NET-264-02 NPNon-Proprietary Information Submitted in
Accordance with 10 CFR 2.3903.0 RACKLIFE Projections
3.1 Model Overview and Assumptions
A RACKLIFE model of the Peach Bottom Unit 2 SFP was originally developed by
NETCO based on data provided by Exelon[61. The original model was updated by
Exelon to reflect subsequent fuel discharges into the spent fuel racks through February
2006. The projected dates and anticipated number of discharged assemblies forrefueling outages and dry cask storage loading campaigns beyond 2006 thru 2015 were
provided by Exelon[13 ]. In addition, pool history data (reactive silica concentration,
temperature and pH) for the Peach Bottom Unit 2 spent fuel pool were also provided.
Collectively, these data were used by NETCO to update the model and project the
extent of Boraflex dissolution biannually thru 2014.
This model was used to estimate the actual service history of each panel of Boraflex in
the Peach Bottom Unit 2 storage racks, including integrated gamma exposure and its
condition with respect to B4C loss. Information regarding the predicted state of the pool
and the condition of the Boraflex at a given time can be determined using the model.
Reactor Cycle Data
Cycle 16 ended in October 2006. All shutdowns were conservatively modeled as an
instantaneous shutdown from 100 percent of rated power. Peach Bottom Unit 2 operates
on a 2-year fuel cycle, and for modeling purposes it was assumed that the future refueling
outages would occur in October 2008, October 2010, and October 2012 and October
2014 per the schedule provided by Exelon[131. Future reactor shutdowns were also
modeled as instantaneous shutdown from 100 percent of rated power. This approach
provides a conservative estimate of the Boraflex gamma exposure to Boraflex panels.
Fuel Assembly Data
Review of the discharged bundles currently residing in the spent fuel pool indicated that,
prior to Cycle 13, all bundles were conservatively assigned a power sharing value of
1.0. Cycles 14 and 15 assembly data contain measured end-of-cycle assembly
average power sharing values. These measured values were used to determine
appropriate power sharing for future cycles. For Cycle 14, a weighted average end-of-
6

NET-264-02 NPNon-Proprietary Information Submitted in
Accordance with 10 CFR 2.390cycle power sharing of 0.74 was calculated, and for Cycle 15 the weighted average end-
of-cycle power sharing was 0.63. Thus, for future offloads, discharged assemblies were
conservatively assumed to have relative operating power sharing values of 0.8.
Pool History and Cleanup Data
Pool history data (temperature, pH and reactive silica concentration) were added to the
pool history file. In addition, letdowns to simulate mixing of the reactor cavity water withthe bulk spent fuel pool water were added to the cleanup system file to coincide with therefueling outages occurring in October of 2006, 2008, 2010 and 2012.
Assembly Shuffle and Dry Storaqe
Figure 3-1 shows the loading of the Peach Bottom 2 racks at the time of the test. As a
result of increased plant security concerns and to satisfy the thermal managementrequirements of Section 2.2.54 of Exelon Procedure NF-AA-310, Rev. 9 "Special
Nuclear Material and Core Component Movement", freshly discharged bundles mustcontain "cold" bundles on all four face adjacent cells. This requires some 1400 storage
locations to accommodate a discharge batch of 276 fuel assemblies.
A major goal is to preserve Module 1 for staging reload fresh fuel as this module has
seen the least severe service duty. Thus, Modules 3,4,5 and 12 were selected forplacement of freshly discharged bundles. Figure 3-2 shows the projected loading
pattern of the Peach Bottom Unit 2 spent fuel racks on May 1, 2010. 2
3.2 Projections through 2010 2
Using the input data and assumptions outlined in Section 3.1, the Peach Bottom
RACKLIFE model was updated and executed through ISFSI campaigns of 2012 and2014. This served to identify the cells with the greatest panel boron carbide loss and
absorbed dose. Figure 3-3 shows the percent boron carbide loss for the spent fuel
racks in February 2006 at the time of the last BADGER test. It can be seen that all of 2
the panels have at least [ ] loss while about half of the modules have panels with
more than [ ] percent loss. The peak loss ([ ]) occurs in Module 15. This 2
calculation used an escape coefficient of 1.0/day through February 2006 and 1 .25/day
7

NET-264-02 NPNon-Proprietary Information Submitted in
Accordance with 10 CFR 2.390
beyond. The RACKLIFE model was executed iteratively by varying the "escapecoefficient" until the predicted pool silica matched the measured pool silica. The escape
coefficient is the rate, in units of cavity volumes (the volume of fluid in the rack cavities
surrounding each Boraflex panel) per day, that are exchanged with the bulk poolvolume. An increase in the slope of the measured pool silica would indicate an
increase in the escape coefficient is necessary. The physical basis for this is that as theBoraflex dissolves, the clearances for flow increase, reducing the pressure drop and
increasing flow.
Figure 3-4 shows there is a fairly regionalized dose distribution throughout the pool. The
majority of high dose panels (greater than 1 x 10¹⁰ rads) are located in a central region of
the pool in front of the transfer canal. The panels with the highest dose are the south and
west panels in cell XX65 of Module 15 with an integrated exposure of 1.4 x 10¹⁰ Rads.
Prior to the End-of-Cycle 16 (EOC16), there were vacant areas in Modules 10 and 11
as well as individually scattered vacant cells in Modules 6,7,8,9,14 and 15. It was
decided that discharged bundles would reside in their "B.5.b" locations for 17 months
(from discharge until the subsequent ISFSI campaign) and then be moved to a vacant
module. For the 2006 offload, B.5.b cell locations were vacated and resident bundles
moved to Modules 10 and 11. In 2008, Module 11 was vacated and all bundles moved 2into dry storage casks. Bundles discharged in 2006 were subsequently moved to cellsin Module 11. In 2010, bundles in Module 10 were "moved into dry storage" and B.5.b
cell locations vacated with bundles discharged in 2008 relocated to module 10. Thesame process was repeated for the 2012 ISFSI campaign, with bundles in Modules 14,
15 and part of Module 9 being placed into dry storage.
Figure 3-5 shows the distribution of panel boron carbide loss for the Peach Bottom
spent fuel racks to May 1, 2010. The average panel boron carbide loss is [ ] percent 2
with a standard deviation (1a) of [ ] percent. The maximum panel loss is
percent to May 1,2010.
Figure 3-6 shows the distribution of panel absorbed dose (Rads) for the Peach Bottom
spent fuel racks to May 1, 2010. The average absorbed dose to all panels in the Peach 2Bottom spent fuel pool is 5.2 x 10⁹ Rads, while the maximum projected panel absorbed
dose is 1.5 x 10¹⁰ Rads.
8

NET-264-02 NPNon-Proprietary Information Submitted in
Accordance with 10 CFR 2.390
Figure 3-1: Occupied Cells in the Peach Bottom 2 Spent Fuel Storage Racks onFebruary 26, 2006.
9

NET-264-02 NPNon-Proprietary Information Submitted in
Accordance with 10 CFR 2.390
2
Figure 3-2: Projected Occupied Cells in the Peach Bottom 2 Spent Fuel StorageRacks on May 1, 2010.
10

NET-264-02 NPNon-Proprietary Information Submitted in
Accordance with 10 CFR 2.390
I
Figure 3-3: Predicted Boron Carbide Loss through February 26, 2006 in the PeachBottom Spent Fuel Storage Racks
Key:Red: > 18% lossYellow: > 12% lossGreen: > 6% loss
11

NET-264-02 NPNon-Proprietary Information Submitted in
Accordance with 10 CFR 2.390
Figure 3-4: Panel Absorbed Dose through February 26, 2006 in the Peach BottomSpent Fuel Storage Racks
Key:Red: > 1 x 10¹⁰ RadsYellow > 2 x 10⁹ RadsGreen >5x10⁸Rads
12

NET-264-02 NPNon-Proprietary Information Submitted in
Accordance with 10 CFR 2.390
2
Figure 3-5: Predicted Boron Carbide Loss through May 1, 2010 in the Peach BottomSpent Fuel Storage RacksKey:
Red: > 27% lossYellow: > 18% lossGreen: > 9% loss
13

NET-264-02 NPNon-Proprietary Information Submitted in
Accordance with 10 CFR 2.390
S -. I 2
Figure 3-6: Panel Absorbed Dose through May 1, 2010 in the Peach Bottom SpentFuel Storage Racks
Key:Red: > 1 x 10¹⁰ RadsYellow >2 x 10⁹ RadsGreen > 5 x 10⁸ Rads
14

NET-264-02 NPNon-Proprietary Information Submitted in
Accordance with 10 CFR 2.3904.0 The Reactivity Effects of Boraflex Degradation
4.1 Introduction
This section examines the reactivity effects of Boraflex panel degradation in the Peach
Bottom Unit 2 spent fuel racks. Boraflex panel degradation can be divided into three
modes, which are characterized by different degradation mechanisms, as described
below.
4.1.1 Uniform Dissolution
As described in Section 2.0, the Boraflex panels in the Peach Bottom Unit 2 spent fuel
racks are contained in a "panel cavity" created between the [ ] inch thick stainless
steel cell wall, and the [ ] inch thick stainless steel wrapper plate. The void volume
of this panel cavity is filled with water that generally surrounds the Boraflex panel. The
exchange of fluid between the bulk pool and the panel cavity (as measured by the"escape coefficient") results in a flow across the surfaces of the Boraflex panel as well
as local flow paths in between the tack welds long the wrapper plate. This can lead to a
relatively uniform dissolution of the amorphous silica from Boraflex panel surfaces along
with local scallop regions and consequent loss of absorber-
This mode of degradation increases the transmission of neutrons between assemblies
in the spent fuel racks by decreasing the amount of intervening absorber. However, the
remaining absorber still interposes between assemblies.
4.1.2 Shrinkage, Including Gaps
Radiation induces crosslinking of the polymer matrix of Boraflex. This causes the
material to shrink, reducing the volume of aBoraflex panel. While shrinkage reduces
the volume of an interposing panel, shrinkage does not reduce the mass of interposing
absorber, that is, the material undergoes densification as it shrinks.
15

NET-264-02 NPNon-Proprietary Information Submitted in
Accordance with 10 CFR 2.390
Width and end shrinkage can "uncover" the active fuel, allowing direct neutron transport
between assemblies without any intervening absorber. If a Boraflex panel is not allowed
to shrink uniformly (e.g., it is mechanically restrained), gaps will develop. This can lead
to direct neutron transport between the centers of assembly faces.
4.1.3 Local Dissolution
The dissolution described as mode 1, above, is generally uniform. However, local non-
uniformities in the panel, panel cavity, and cavity inlet/outlet geometry can accentuate
dissolution locally. For example, a gap in a panel locally increases the cavity volume,
which locally reduces the effects of wall friction on flow. This can increase local flow
rates causing accelerated dissolution. As another example, a bend, bow, or creases in
the stainless steel wrapper plates can provide the orifices, allowing increased flow into
or out of the panel cavity, thereby accelerating local degradation. These local effects
can exhibit a positive feedback; they accelerate the local dissolution of Boraflex, which
increases the local cavity volume. This in turn decreases wall friction losses, increasing
local flow rates, further accelerating local Boraflex dissolution.
As suggested in the discussion for each mode of dissolution, each mode will affect the
spent fuel pool reactivity differently. These synergistic reactivity effects may be strongly
non-linear. Criticality safety calculations using highly bounding assumptions, (e.g., very
large gaps all at the assembly mid-plane, complete dissolution of the Boraflex, etc.) lead
to reactivity increases far in excess of the actual reactivity state of the spent fuel pool.
On the other hand, the non-linear synergy necessitates a robust analysis of the
degradation, in order to conservatively take some credit for the Boraflex that remains in
the racks. This section of the report outlines a methodology for such a robust analysis.
4.2 Methodology for Projecting Future Panel Conditions
The results of the latest BADGER test campaign at Peach Bottom Unit 2 [8] were used to
characterize the state of the Peach Bottom Unit 2 spent fuel racks Boraflex panels at
16

NET-264-02 NPNon-Proprietary Information Submitted in
Accordance with 10 CFR 2.390the time of testing. The RACKLIFE projections (discussed in Section 3) were further
used to conservatively project the state of the panels to May 1, 2010. 2
Algorithms were developed for randomly sampling panel local degradation features
based on the BADGER data. The input to the algorithms are the panel absorbed dose
and B4C loss predicted by RACKLIFE. The algorithms are based on random sampling
from probability distributions of loss versus absorbed dose developed from the observed
BADGER data. The use of normal and uniform random numbers in the algorithms
account for the variance observed between RACKLIFE predictions and BADGER
observations and the random nature of local dissolution effects.
The Boraflex panel models developed represent degraded panels conservatively
projected to May 1,2010. They consist of an array of rectangular blocks: four blocks 2
across a panel to match the four detectors in BADGER, and each block two inches high
to match the two-inch "window" in front of the BADGER detectors. Away from local
areas of dissolution the blocks are as thick as a nominal panel of Boraflex. Each panel
of Boraflex in the Peach Bottom Unit 2 spent fuel racks that was measured by BADGER
was characterized using this system of blocks. Figure 4-1 is an example of a panel
model. In Figure 4-1, the column heading "Elev" refers to the axial elevation of each
block center. (The panel shown represents a [ ] inch panel; note that the panel is j 3
displayed top to bottom.) The columns are numbered to correspond to the four
BADGER detectors and represent an area of the panel 1.23 inches wide by 2 inches
high.
Integer values in Figure 4-1 represent an amount of gap in a block in thirds of an inch.
Thus the row of "2"s on a red background indicates a two-thirds inch gap at an elevation
of 43 inches. Cells in the panel model that are not colored are at a specified level of
uniform loss. The values on blue backgrounds represent areas of local dissolution,
quantified by the percent loss from the uniform loss condition. Some of the dissolution
occurs around the gap, some near the end of the panel, and some independent of any
other features of the panel. Dissolution that occurs around a feature is assumed to
17

NET-264-02 NPNon-Proprietary Information Submitted in
Accordance with 10 CFR 2.390extend into the feature. For example, the [ ]% loss measured by detector 2 (column 2)
at 131 inches is assumed to persist in the column 2 cell at 133 inches. In reality,
BADGER would detect the additional loss if it was there, but this accounts for any
uncertainty in an analyst's interpretation of how to allocate the loss. In the case of the
gap at 43 inches, a loss of [ ]% is assumed under detectors 3 and 4 since this is
(conservatively) the largest loss proximal to the gap.
In applying the panel models to the state of the Peach Bottom Unit 2 spent fuel racks in
2010, the degree of conservatism used is best illustrated by the following examples. 2
Example 1: Loss Equivalence
The BADGER campaign at Peach Bottom Unit 2 in February 2006 measured the state
of the Peach Bottom Unit 2 spent fuel rack Boraflex panels at that time. The RACKLIFE
code was used to identify which panels in the Peach Bottom SFRs had the highest
absorbed dose and/or the highest predicted B4C loss. Measurements were performed
on panels with a spectrum of dose and loss (in order to observe and quantify any trends
with dose and loss), but with a strong bias toward the "worst" panels. Therefore, the
panels that BADGER measured are typical of the worst panels in the pool. During the
BADGER campaign in February 2006, 38 panels exhibited a measurable loss of boron
carbide. The average loss from these 38 panels was[ ]%±-[ ]%.
On May 1, 2010, RACKLIFE predicts that the average loss for all panels in the racks is 2
]% ±[ ]%. These loses are comparable to what BADGER measured for the 2
panels that actually exhibited a loss. For example, in predicting the condition of a 20%
loss panel in 2010, it is reasonable to assume that the condition would be equivalent to 2
a 20% loss panel as measured by BADGER in 2006. If a 20% loss panel is not
available, then the next higher loss panel measured is conservatively used. In this
manner, projected panels in 2010 can be conservatively loss-equivalenced to panels 2
measured by BADGER in 2006.
18

NET-264-02 NPNon-Proprietary Information Submitted in
Accordance with 10 CFR 2.390
Example 2: Loss Extrapolation
On May 1, 2010, RACKLIFE predicts that the average loss in the racks is [ ] ±
]%, with a maximum loss of [ ]. The average loss measured by BADGER (for all 2 3
panels in 2006) was [ ]%. None of the panels exceeded the maximum loss predicted
by RACKLIFE. Of the three modes of degradation described in Section 4.1, the first
two, uniform dissolution and shrinkage, can be conservatively projected with a fair
degree of confidence and precision. The degradation mechanisms are well understood
and bounding models can be formulated. The third mode, local dissolution, however, is
random in nature and is not as amenable to prediction.
For example, consider a typical local dissolution feature: a "scallop" in the side of the
panel where higher levels of loss are observed. As illustrated below, suppose this takes
the form of two 2" high by 1.23" wide rectangular cells along the left edge of the panel
with 30% more loss than the uniform loss of the bulk panel. (The rectangular cells
bound the actual size and shape of the scallop.)
.30.0%30.0%
The question is, more specifically now, what will this local dissolution feature look like in
a panel that has undergone 1.5 times as much dissolution? Three distinct degradation
scenarios can be considered: 1) the scallop increases in size by a factor of 1.5 (to three
cells instead of two); 2) the scallop "deepens" by a factor of 1.5 (from 30% loss to 45%
loss); or 3) the scallop remains the same and another one-cell scallop with 30% loss
develops somewhere else on the panel. The truth is likely a randomly weighted mixture
of all three modes. To select a bounding degradation scenario is virtually impossible,
19

NET-264-02 NPNon-Proprietary Information Submitted in
Accordance with 10 CFR 2.390since the reactivity effects of each scenario will depend on the elevation of the scallop,
its proximity to other local dissolution features, gaps or end shrinkage. The
conservative approach used was to assume all three scenarios occur simultaneously on
a cell-by-cell basis. As a conservative upper-bound, the next highest (worse) local
dissolution pattern for the scallop was then selected.
Using the panel projections described above, the methodology described in section 4.3
was developed for simulating the reactivity effects of Boraflex panel degradation.
4.3 Methodology for Assessing the Reactivity Effects of Boraflex Degradation
The methodology described below was applied to the Peach Bottom Unit 2 spent fuel
racks. For clarity, the description below will generally refer to the racks generically.
The SCALE code package (described in Section 5.2) was used to calculate keff for the
racks. For the reactivity equivalence model, the Boraflex was assumed to be at its
nominal thickness and 10B loading. In addition, a conservatively bounding 4.1% width
shrinkage was also applied. This bounding shrinkage is based on both analytical and
experimental analyses[2] and has been confirmed by a large number of proprietary
laboratory studies and field observations. Recall from Section 4.1 that thickness
shrinkage is effectively offset by densification and so need not be accounted for. As
described in Section 4.1, the effects of axial shrinkage manifest themselves as both end
shrinkage and gapping. Measuring the amount of shrinkage-induced gapping is
complicated by the fact that local dissolution can increase the apparent size of a gap.
Further, BADGER may miss gaps that are less than 1/3 rd inch or smaller. To account
for the axial shrinkage with the possibility that some gaps may have been missed, it is
conservatively assumed that every panel has an undetected 4.1% axial shrinkage in the
form of 1/3 rd inch gaps uniformly distributed up the panel. The reactivity effect of this 2
assumption is shown in Table 4-1. These assumptions result in a higher than nominal
reactivity model, which conservatively increases the reactivity effects of Boraflex loss.
20

NET-264-02 NPNon-Proprietary Information Submitted in
Accordance with 10 CFR 2.390The Boraflex thickness in the base model was then uniformly decreased in 5%
increments to observe the reactivity effects of uniform dissolution. The results were
used to develop a relationship between uniform thinning and an increase in keff for
reactivity equivalencing between pure uniform thinning and the actual degraded
condition of the Boraflex. The results are shown in Table 4-2.
Next, a verified and validated Fortran program was used to modify the base case, so
that every panel in a given array of rack cells could be modeled independently. The
algorithms described in Section 4.2 were used to create panel models as described in
that section for each panel in the array. For this analysis, a [ ] array of cells was 3
modeled, thus, a total of [ ] panels are generated by the algorithm according 3
to the dose and loss predicted by RACKLIFE for each panel. These degraded models
of Boraflex panels are incorporated into a KENO model to simulate the conditions of the
module in 2010. This case is used to calculate a single estimate of the reactivity effect
of Boraflex panel degradation in the Peach Bottom Unit 2 spent fuel racks in 2010. 2
In executing the case, a total of 30 million neutrons were tracked over 3000
generations. Fifty generations were skipped to ensure convergence of the source
distribution. The large number of neutrons was used to ensure that there was adequate
sampling of all of the degradation features of all of the panels in the model. As per
standard practice, plots and statistics of the evolution of keff by generation were
inspected and calculated to provide confidence that no sampling instabilities were being
encountered.
As described in Section 4.2, the Boraflex panels generated for a model were based on a
sequence of random numbers, so that each panel model is a random model with an
expected value defined by the BADGER measurements plus a random variance.
Consequently, the single estimate case described above could be randomly higher or
lower than the actual condition of the panel being modeled. Therefore, a total of [ ] 3
independent and randomly distributed cases were created using the Fortran program.
These cases resulted in a distribution of calculated reactivity effects. The 95th percentile
21

NET-264-02 NPNon-Proprietary Information Submitted in
Accordance with 10 CFR 2.390of this reactivity effects distribution, at 95% confidence, can be used to bound the
reactivity effects of degraded Boraflex panels in the array of cells being considered.
Figure 4-2 shows one example of this distribution as points in a cumulative distribution
with the Monte Carlo statistical uncertainty, as shown by the error bars. The line in
Figure 4-2 is a cumulative normal distribution with a mean and variance from the [ ] 3
samples. In every distribution calculated, the data passed the Anderson-Darling and
Cramer-von Mises tests for normality; thus, one-sided normal distribution statistical
tolerance factors are valid for calculating bounding 9 5 th percentile eigenvalues at 95%
confidence. Figure 4-2 shows that[ ] samples are sufficient to bracket the 9 5 th 3
percentile and to look for any potential non-normal behavior in the tails. No non-normal
behavior was observed.
4.4 Results
Table 4-3 summarizes the reactivity effects in the Peach Bottom Unit 2 spent fuel racks.
The RACKLIFE predicted loss, as a uniform thinning loss, is shown in column 1. The
RACKLIFE code does not distinguish between uniform loss and local dissolution losses.
The reactivity effect in column 2 is the 95th percentile effect at 95% confidence and
includes the effects of uniform dissolution, local dissolution, and gaps.
Table 4-2 was used to interpolate the equivalent amount of uniform thinning loss that
will yield the same reactivity effect as the 95/95 effect above. The results are shown in
column 2. The value of [ ] for the equivalent loss in the racks is a conservative 23
over-estimate of the actual equivalent loss. Most of the panels measured by BADGER
in 2006 had very low losses compared to the losses predicted for the population of
panels. Thus, in equivalencing observed panel losses with predicted losses, a large
amount of conservatism was introduced for the low loss panels.
Column 4 shows the conservative amount of uniform thinning loss that will be assumed
in subsequent analyses. The many conservatisms used to arrive at these numbers
provides confidence that these losses will bound the state of the Peach Bottom Unit 2
spent fuel racks, on May 1, 2010. 1I2
22

NET-264-02 NPNon-Proprietary Information Submitted in
Accordance with 10 CFR 2.390
Table 4-1: Conservative Reactivity Effects of Cracks Undetected by BADGER
L I 2
Table 4-2: Reactivity Effects of Uniform Boraflex Panel Thinning
2
23

NET-264-02 NPNon-Proprietary Information Submitted in
Accordance with 10 CFR 2.390
Table 4-3: Reactivity Effects of Degraded Panels
1 This is the average ± 1 a loss predicted by RACKLIFE.
2 This is the 9 5 th percentile at 95% confidence reactivity effect of the degraded Boraflex
panels.
3 Based on Table 4-2, this amount of uniform thinning will result in the same reactivityeffect as shown in the previous column.
4 This is the conservatively higher amount of Boraflex loss (modeled as uniformthinning) that will be assumed in subsequent analyses.
2
24

NET-264-02 NPNon-Proprietary Information Submitted in
Accordance with 10 CFR 2.390
Figure 4-1: Typical Model of an Peach Bottom Unit 2 Boraflex Panel
25

NET-264-02 NPNon-Proprietary Information Submitted in
Accordance with 10 CFR 2.390
Figure 4-2: Sample Distribution of Panel Degradation Reactivity Effects
2
26

NET-264-02 NPNon-Proprietary Information Submitted in
Accordance with 10 CFR 2.3905.0 Results of the Criticality Analysis
The criticality analyses and evaluations described in this report demonstrate that the keff
of the Peach Bottom Unit 2 spent fuel racks is less than or equal to 0.95 when loadedwith the most reactive (GNF 2) fuel types under the most reactive conditions. Themaximum calculated reactivity (keff) when adjusted for computer code biases, fuel andrack manufacturing tolerances and methodology/calculational uncertainties (combinedusing the root-mean-square method) will be less than or equal to 0.95 with a 95%probability at a 95% confidence level.
5.1 Design Basis and Design Criteria
All analyses and evaluations have been conducted in accordance with the followingcodes, standards and regulations as they apply to spent fuel storage facilities:
" American Nuclear Society, American National Standard DesignRequirements for Light Water Reactor Spent Fuel Storage Facilities atNuclear Power Plants, ANSI/ANS-57.2-1983. October 7, 1983.
" Nuclear Regulatory Commission, Letter to All Power Reactor Licenseesfrom B. K. Grimes. OT Position for Review and Acceptance of Spent FuelStorage and Handling Applications. April 14, 1978, as amended by letterdated January 18, 1979.
" Nuclear Regulatory Commission, memorandum from Laurence Kopp toTimothy Collins. Guidance on the Regulatory Requirements for CriticalityAnalysis of Fuel Storage at Light-Water Reactor Power Plants. August 19,1998.
* USNRC Standard Review Plan, NUREG-0800, Section 9.1.1, New FuelStorage, and Section 9.1.2, Spent Fuel Storage.
* USNRC Regulatory Guide 1.13, Spent Fuel Storage Facility Design Basis,Rev. 2, March 2007. 1 2
* USNRC Regulatory Guide 3.41, Validation of Calculational Methods forNuclear Criticality Safety.
27
NET-264-02 NPNon-Proprietary Information Submitted in
Accordance with 10 CFR 2.390* General Design Criterion 62, Prevention of Criticality in Fuel Storage and
Handling.
* ANS/ANSI 8.12-1987, Nuclear Criticality Control and Safety of Plutonium -Uranium Fuel Mixtures Outside Reactor.
It is noted that the above USNRC and ANS documents refer to the requirement that themaximum effective neutron multiplication factor (keff) is to be less than or equal to 0.95.In demonstrating that this requirement is satisfied, the analyses herein of the reference(nominal dimensions) case fuel/rack configurations are based on an infinite repeatingarray in all directions. A bias (credit) for axial leakage is applied to the referencecalculation based on a model which is finite in the z-direction.
5.2 Analytical Methods and Assumptions
This analysis utilizes the stochastic three dimensional Monte Carlo code KENO V.a[14]
and the two dimensional deterministic code CASMO-4[15] to compute the reactivity
effects due to degraded Boraflex. The CASMO code yields a deterministic solution to
the neutron transport equation, which is useful for precisely computing reactivity
changes. The stochastic nature of the Monte Carlo solution in KENO means that
statistical tolerance factors at 95% probability with 95% confidence must be applied tothe solution. On the other hand, CASMO is limited to two-dimensional (axially uniform)
single cell (infinitely reflected) models, while KENO provides robust three-dimensional
modeling capability. Thus, KENO is used when axial effects are important (e.g., axially
distributed gaps), or when lateral non-uniformities are present (e.g., checkerboard
loading).
KENO V.a is a module in SCALE 5.0, a collection of computer codes and cross section
libraries used to perform criticality safety analyses for licensing evaluations. KENO
solves the three-dimensional Boltzmann transport equation for neutron-multiplying
systems. The collection also contains BONAMI-S to prepare problem specific master
cross section libraries and to make resonance self-shielding corrections for nuclideswith Bondarenko data. NITAWL-11 is used to prepare a working cross section library
with corrections for resonance self-shielding using the Nordheim integral treatment.
These modules are invoked automatically by using the CSAS25 analysis sequence in
SCALE 5.0.
28

NET-264-02 NPNon-Proprietary Information Submitted in
Accordance with 10 CFR 2.390
CASMO-4 is a two dimensional multigroup transport theory code for fuel assembly
burnup analysis in-core or in typical fuel storage racks. CASMO is a cell code in which
infinitely repeating arrays of fuel assemblies and/or fuel racks are modeled.
These codes have been verified and validated for use in spent fuel rack design
evaluations by using them to model a number of critical experiments[15-191 . The results
of this validation and verification are included in this report as Appendix A[201. The
calculated keff was compared to the critical condition (keff = 1.0) to determine the bias inthe calculated values.
In all SCALE/KENO calculations the 238 energy group ENDF/B-V criticality safety cross
section library[21] was used. The resulting bias in the SCALE codes was calculated to
be [ ]. In all CASMO calculations, the CASMO standard 70 energy
group cross section library was used. In all CASMO-4 calculations, the 70-energy 2
group neutron library[1 5] was used. The resulting bias in the CASMO-4 code wascalculated to be [ ]. The 95/95 statistical one-sided tolerance factor is /=
4.19.[22]
As noted above, all KENO results require that a one-sided 95% probability / 95%
confidence statistical tolerance factor be applied to the computed eigenvalue. In all
KENO runs, typically 3000 generations (after skipping 50 for source distribution
convergence) with between 2000 and 3,000 neutrons per generation were simulated for 2a total of between 6 million to 9 million neutrons tracked. This typically resulted in
statistical uncertainties in keff of G < 0.0003 (one standard deviation) and a 95/95
statistical tolerance factor K : 2.05[22].
The depletion characteristics of GNF 2 bundle (ko versus burnup) in both the coregeometry and fuel rack geometry have been assessed with CASMO-4 to determine theburnup resulting in peak bundle reactivity (k,). In these calculations the fuel bundle isdepleted at hot full power conditions in core geometry using CASMO-4. At specifiedburnup steps the bundle is brought to the cold zero power condition (no Xenon) andmodeled in the rack geometry. Subsequently, the bundle is subjected to additionalburnup in the hot full power condition in core geometry and the process repeated.
29

NET-264-02 NPNon-Proprietary Information Submitted in
Accordance with 10 CFR 2.390The design point for the Peach Bottom 2 fuel racks is taken at the burnup correspondingto peak reactivity of the Gd 20 3 bearing maximum reactivity bundle. A bias to accountfor depletion uncertainties is added to the k. at the point of peak reactivity to account foruncertainties in the depletion dependent cross sections.
To assure that the actual fuel/rack reactivity is always less than the calculated maximumreactivity, the following conservative assumptions have been applied to the analyses:
1. The fuel assembly design parameters for these analyses are based on themost reactive 10 x 10 fuel types.
2. The maximum fuel enrichment is [ ] w/o U235 with gadolinia and isassumed to be uniform throughout the bundle. The assumption of uniformenrichment results in a higher reactivity than would the distributedenrichment, which actually exists in the bundles.
3. The fuel bundle includes a coolant flow channel in the rack as thiscondition results in the highest reactivity.
4. The moderator is assumed to be demineralized water at full water density(1.0 gm/cm 3).
5. The array is infinite in lateral extent (x , y and z directions). A reactivitycredit for axial neutron leakage is subsequently applied to the referenceeigenvalue. Non-conservative, but appropriate.
6. All available storage locations are loaded with bundles of maximum
reactivity.
7. No credit is taken for neutron absorption in the fuel assembly grid spacers.
8. No credit is taken for any natural uranium or reduced enrichment axialblankets.
9. Boraflex is assumed to be uniformly at [ ]% nominal thickness (i.e., 2]% Uniform Thinning Loss). Tolerances were conservatively
evaluated at 35% uniform thinning.
Based on the analyses described subsequently the maximum keff of the fuel/rackconfiguration at a 95% probability with a 95% confidence level is calculated as:
30

NET-264-02 NPNon-Proprietary Information Submitted in
Accordance with 10 CFR 2.390
2keff =' kref + Akbias +IY Ak"
wherekref = Nominal keff adjusted for depletion effectsAkbias = Akmethod + Akself-shielding + Akundetected cracks + AkLeakage 2
+ Akgeometry
Tolerances and Uncertainties:
Ak1 = U0 2 enrichment toleranceAk2 = U0 2 pellet density toleranceAk 3 = Gd 20 3 loading toleranceAk4 = Rack cell pitch tolerance
Ak5 = Rack cell wall thickness toleranceAk 6 = Asymmetric assembly position toleranceAk7 = Boraflex panel width toleranceAk8 = Boraflex B-1 0 loading tolerance
Ak9 = Channel bulge effectAkio = Keno V.a Methodology bias uncertainty (95/95)Ak11 = Monte Carlo calculation uncertainty (95/95)Ak12 = Burnup uncertainty 2Ak13 - Pellet diameter toleranceAk, 4 = Clad thickness toleranceAk15 = CASMO Methodology bias uncertainty (95/95)
5.3 Calculated Results
5.3.1 Reference Eigenvalue Calculations
The fuel racks have been analyzed for GNF 2 fuel with a maximum average planarenrichment of [ ] w/o U-235 and a minimum of [ ] Gd 20 3 rods with a minimum loading 3
of [ ] w/o Gd 20 3. The fuel design parameters for the GNF 2 fuel assembly aresummarized in Table 5-1.
31

NET-264-02 NPNon-Proprietary Information Submitted in
Accordance with 10 CFR 2.390CASMO-4 was applied to compute the reactivity of the GNF 2 fuel type as a function ofburnup for bundles with [ ] gadolinia rods @ [ ] w/o gadolinia and for bundles withoutGd 20 3. Figure 5-1 contains a plot of rack k. versus burnup for the GNF 2 fuel bundle.As shown in this figure the GNF 2 fuel bundle with Gd 20 3 has a peak reactivity of k1, = 2[ ] which occurs at [ ] GWD/MTU.
This bias corrected peak reactivity, k1. = [ ], was calculated using CASMO. Assuch, the geometric limitations of this infinite array two-dimensional criticality code didnot permit explicit modeling of the asymmetries of the PB2 spent fuel racks. A KENOV.a model which mirrored the CASMO-4 geometry was created. The model is infinite inthe x,y,z directions with no gadolinia at a reactivity fresh fuel enrichment (REFFE) thathas been determined to be equivalent to the reactivity of the same bundle depleted byCASMO-4 up to the burn-up at peak reactivity. See Figure 5-1. Using this KENO V.amodel of the CASMO-4 geometry, KENO V.a was executed several times while iterating 2on U 23 5 enrichment to determine the REFFE that resulted in a kI, = [ ]. Thiscorresponds to an REFFE of [ ] weight percent U235 . To further illustrate the fidelitybetween CASMO and KENO V.a calculations, a zero burn-up comparison between theCASMO-4 and the KENO V.a models was performed. The difference in respective k1.values was determined to be negligible [ ], however, this is included as areactivity bias.
To quantify the geometric effects of the CASMO simplified geometry, a KENO V.a"exact geometry" model of the PB2 spent fuel rack was created. This model was usedto approximate the difference in ko. value so calculated with the k., value calculatedusing the "CASMO-4 geometry." The calculated difference was Ak = [ ]. Thisvalue of geometry bias was applied to the peak CASMO-4 calculated value of k,, todetermine the in-rack peak reactivity of k,1 = [ I.
32

NET-264-02 NPNon-Proprietary Information Submitted in
Accordance with 10 CFR 2.390
Table 5-1
GNF 2 Fuel Assembly Description
Peach Bottom Nuclear Generating Station
2
33

NET-264-02 NPNon-Proprietary Information Submitted in
Accordance with 10 CFR 2.390
2
Figure 5-1: Rack Reactivity versus Burnup for the GNF 2 Fuel Type in the PeachBottom Unit 2 Spent Fuel Storage Racks.
34

NET-264-02 NPNon-Proprietary Information Submitted in
Accordance with 10 CFR 2.390
5.3.2 CASMO-4 and KENO V.a Reactivity Calculations in Core and in Rack Geometries
As a check of the two independent methods used for these analyses, the reactivity ofthe GNF 2 fuel types in the standard core geometry at cold conditions (680 F) havebeen calculated with both KENO V.a and CASMO-4 at zero burnup. Table 5-2 containsthe core k- for the GNF 2 bundles with and without Gd 2 0 3 rods. The reported valuesinclude model biases, which have been determined via benchmark calculations. Thesebiases are [ I and [ ] for KENO V.a and CASMO-4, respectively. Table 2
5-3 contains a similar comparison of the Peach Bottom rack k. as calculated with KENOV.a and CASMO-4.
Table 5-2
CASMO-4/KENO V.a Reactivity Comparison in Core Geometry:
GNF 2 Bundles @ [ ] w/o U-235 ([ ]% T.D.), Zero Burnup
2
Table 5-3
CASMO-4/KENO V.a Reactivity Comparison in Rack Geometry:
GNF 2 Bundles @ [ ] w/o U-235 ([ ]% T.D.), Zero Burnup
2
In addition, the k.o at peak reactivity in the Standard Cold-Core Geometry (SCCG) ascalculated by CASMO-4 was [ ]. 2
The small differences in the eigenvalues are likely attributable to small differences incross sections. This comparison serves to confirm the calculational methods.
35
NET-264-02 NPNon-Proprietary Information Submitted in
Accordance with 10 CFR 2.390
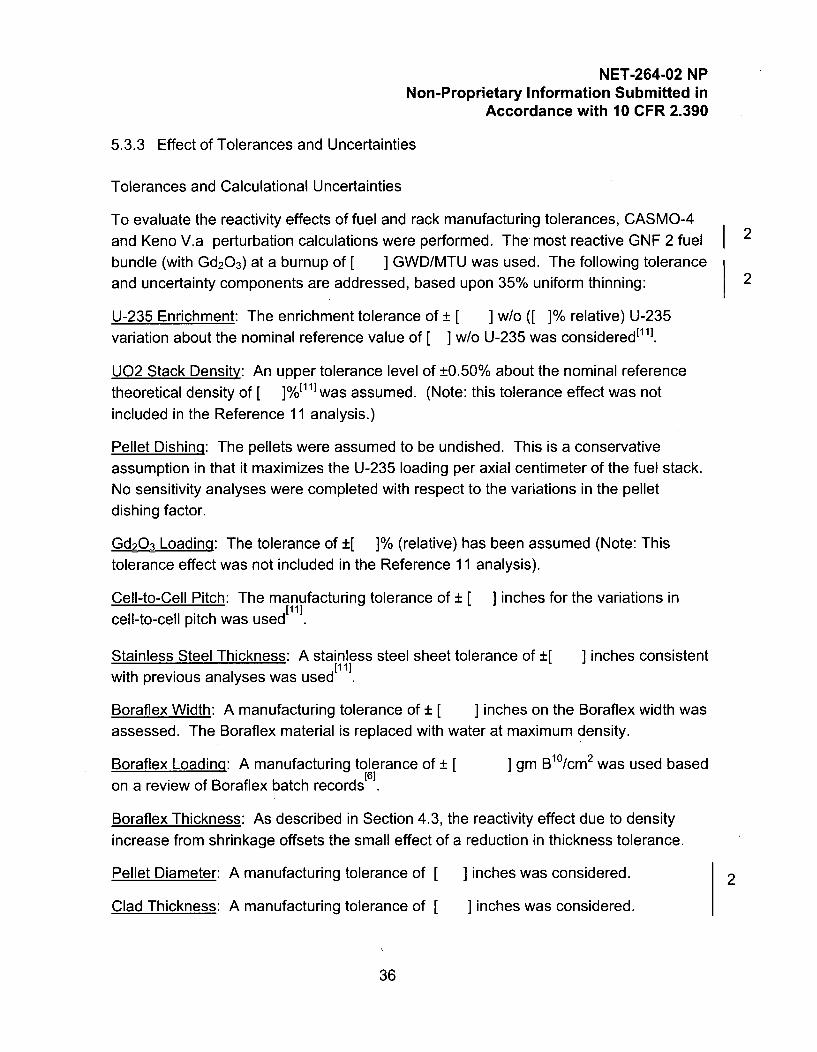
5.3.3 Effect of Tolerances and Uncertainties
Tolerances and Calculational Uncertainties
To evaluate the reactivity effects of fuel and rack manufacturing tolerances, CASMO-4
and Keno V.a perturbation calculations were performed. The most reactive GNF 2 fuel 2
bundle (with Gd 20 3) at a burnup of [ ] GWD/MTU was used. The following toleranceand uncertainty components are addressed, based upon 35% uniform thinning: 2
U-235 Enrichment: The enrichment tolerance of ± [ ] w/o ([ ]% relative) U-235variation about the nominal reference value of [ ] w/o U-235 was considered[11 ].
U02 Stack Density: An upper tolerance level of ±0.50% about the nominal referencetheoretical density of [ ]%[ll]was assumed. (Note: this tolerance effect was notincluded in the Reference 11 analysis.)
Pellet Dishing: The pellets were assumed to be undished. This is a conservativeassumption in that it maximizes the U-235 loading per axial centimeter of the fuel stack.No sensitivity analyses were completed with respect to the variations in the pelletdishing factor.
Gd2O3 Loading: The tolerance of +[ ]% (relative) has been assumed (Note: Thistolerance effect was not included in the Reference 11 analysis).
Cell-to-Cell Pitch: The manufacturing tolerance of ± [ ] inches for the variations incell-to-cell pitch was used
Stainless Steel Thickness: A stainless steel sheet tolerance of +[ ] inches consistentwith previous analyses was used
Boraflex Width: A manufacturing tolerance of ± [ ] inches on the Boraflex width wasassessed. The Boraflex material is replaced with water at maximum density.
Boraflex Loading: A manufacturing tolerance of ± [ ] gm B13/cm2 was used based[6]
on a review of Boraflex batch records
Boraflex Thickness: As described in Section 4.3, the reactivity effect due to densityincrease from shrinkage offsets the small effect of a reduction in thickness tolerance.
Pellet Diameter: A manufacturing tolerance of [ ] inches was considered. 2
Clad Thickness: A manufacturing tolerance of [ ] inches was considered.
36

NET-264-02 NPNon-Proprietary Information Submitted in
Accordance with 10 CFR 2.390
The reactivity effects of combined local dissolution, shrinkage induced gaps and uniformthinning are equivalent in reactivity to a uniform panel thinning of [ ]%. It was 2conservatively assumed that the panel thickness was at [ ]% of the nominalthickness ([ ]). This effect is modeled in the base eigenvalue (kref).
Assembly Location: The reference CASMO reactivity calculations are based on amodel with each bundle symmetrically positioned in each storage cell. The effect of fouradjacent assemblies with minimum separation distance has been considered and has asmall effect ([ ]) on reactivity.
Methodology Uncertainty: The 95% probability/95% KENO V.a confidence leveluncertainty of [ ] and the 95% probability/95% confidence level CASMO-4 2uncertainty of [ ] as determined from benchmark calculations (see Appendix A)have been applied. These uncertainties contain the one-sided tolerance factors asdiscussed in Section 5.2. The result of these analyses of the reactivity effect oftolerances is contained in Table 5-4.
Channel Bulge: The effect of channel bulge was analyzed to determine its impact orreactivity relative to the reference case model of an assembly with a channel at nominaldimensions. This perturbation yielded a small reactivity effect of [ ] due to channelbulge.
Monte Carlo Calculation Uncertainty: The calculation uncertainty (standard deviation) 2for a single calculation (typically <0.0003) with a one-sided tolerance factor of K = 1.7
for 3000 neutron generations.
Uncertainty Introduced by Depletion Calculations
Critical experiment data are generally not available for spent fuel and; accordingly,some judgment must be used to assess uncertainties introduced by the depletioncalculations. CASMO-4 and the 70 group cross section library used for these analyseshas been used extensively to generate bundle average cross sections for core followcalculations and reload fuel design in both BWRs and PWRs. Any significant error inthose depletion calculations would be detectable either by in-core instrumentationmeasurements of core power distributions or cycle energy output or both. Significantdeviations between the predicted and actual fuel cycle lengths and core powerdistributions using CASMO-4 generated cross sections are not observed.
37

NET-264-02 NPNon-Proprietary Information Submitted in
Accordance with 10 CFR 2.390For the purpose of assessing the effects of uncertainties introduced by depletioncalculations, it is useful to estimate the magnitude of depletion uncertainties in k,, andcompare this uncertainty with margins inherent in the present calculation. Reference 23 2suggests a reactivity uncertainty equivalent to 5 percent of the reactivity decrement tothe burnup of interest. For this analysis, in the absence of burnable absorbers, thereactivity decrement is [ ] Ak. The resulting burnup uncertainty would be I 3
[ ] Ak. For the limiting GNF 2 bundle at [ ] GWD/MTU, the uncertainty |3introduced by depletion is conservatively rounded up to [ ] in Ak and is included in 2Table 5-4.
Self-Shielding of Discrete Absorber Particle Size
The discrete absorber particle self-shielding bias accounts for the fact that Boraflex ismade from discrete boron carbide particles and thus is not a homogeneous distributionof absorber particles. The effect of discrete particle self shielding was based on atypical particle distribution size for boron carbide used in Boraflex. The analysisindicated that an equivalent homogenous density of [ ]% of the nominal B-1 0 densitywould yield a reactivity effect equivalent to an absorber panel containing discreteabsorber particles[25 ].
BADGER Measurement Bias
Review of the panel local dissolution effects from the Monte-Carlo analysis described inSection 4-2 indicated that each of the [ ] randomly generated panels included [ 1 3
inches of shrinkage. As a conservative bound, approximately [ ]" of total gap (or 2[ ] - 1/3rd inch cracks) corresponding to the maximum of 4.1% shrinkage (5.82") less3.35" could be manifested as undetected cracks or local dissolution. For this bias, itwas assumed that each panel contained [ ] cracks spaced axially on [ ]" centersalong the full length of the Boraflex panel. This is conservative in that gaps occur moreor less in a random pattern which results in a lower reactivity effect. The reactivity effect 2of possible undetected cracks being observed as local dissolution is [ ] asshown in Table 4-1. The reactivity effect is listed in Table 4-1 and is added directly tothe reference eigenvalue as listed in Table 5-4.
Leakage
38

NET-264-02 NPNon-Proprietary Information Submitted in
Accordance with 10 CFR 2.390The reactivity effect due to neutron leakage was analyzed by replacing the reflectedboundary condition of the reference model 2-D KENO V.a with a water albedo in the z-direction. The net reactivity effect (credit) is [
5.3.4 Space Between Modules
The reference CASMO calculations assume an infinitely repeating array of storage cellsin the x and y directions as shown in Figure 2-4. In the Peach Bottom Unit 2 pool theindividual storage cells are interconnected to form rack modules. One module typicallyconsists of an array of 19 x 20 cells. A KENO V.a model was developed to determinereactivity effect of gaps at the module-to-module interface. Effectively, this model is aninfinite array of 20 x 20 modules (modified in length for assembly drop analysis) eachseparated by 1.15 inch water gap in all directions. The result of this calculationindicates a net decrease in keff.
5.3.5 Summary of Reactivity Calculations
Table 5-4 contains a summary of the criticality analyses results for the Peach BottomUnit 2 spent fuel racks. The nominal reference case keff for the GNF 2 fuel at [ ] w/o 3containing gadolinia rods is [ ]. The results of tolerances and uncertaintieswhen combined in a root-mean-square sense are [ ]. At a 95% probability with a 295% confidence level the maximum keff of the Peach Bottom Unit 2 fuel racks loadedwith GNF 2 fuel including all bias, tolerances and uncertainties is [ ]. Thedifference between this value and the keff < 0.95 design limit represents marginthat is available to accommodate new fuel designs and to offset the effects of afuel assembly misload. The resulting margin is [ ] for GNF 2 fuel up to[ ] w1o U235 with gadolinia. The reactivity increase due to neutron spectral softening
as caused by reduced Boraflex thickness, has been determined and included in the95/95 maximum keff.
5.3.6 Abnormal/Accident Conditions
The following abnormal/accident conditions have been evaluated in order to determinethe corresponding effects on fuel pool criticality:
* Fuel Assembly Drop* Rack Lateral Movements
39

NET-264-02 NPNon-Proprietary Information Submitted in
Accordance with 10 CFR 2.390* Fuel Assembly Alongside Rack* Moderator Density and Temperature Variations
The drop of a fuel assembly with the assembly coming to rest in a horizontal position ontop of the fuel and rack module has been evaluated. The resulting change in reactivityis slightly negative, however within the statistical uncertainty of the calculation (1cy) it isnegligible.
Rack lateral motion can be postulated to occur during a seismic event. The racks havebeen analyzed at the minimum module-to-module spacing. Since all peripheral cellwalls contain Boraflex, racks in contact would have 2 panels of Boraflex betweenadjacent fuel bundles. Therefore, the limiting condition is the reference infinite arrayand there is no further increase in reactivity due to rack lateral movement during apostulated seismic event. Analysis of a 1.15-inch gap between modules resulted in alower keff relative to the infinite array.
The inadvertent positioning or the drop of a fuel assembly along side of a rack module
between the module and the pool wall has been evaluated. The maximum increase inreactivity due to a dropped bundle is [ ] and is well within the sub-criticalmargin to the keff < 0.95 limit for accident conditions as specified by ANSI/ANS-57.2-1983. 2
The effect of variations in moderator density and temperature on the reactivity of thePeach Bottom Unit 2 spent fuel storage racks have been analyzed. Loss of pool coolinghas been postulated and analyzed at [ ]IF and [ ]IF and results in a lower keffrelative to the reference case at maximum water density. Therefore, it is concluded thatunder worst-case accident conditions, the effective multiplication factor remains lessthan the keff •< 0.95 limit, which applies to accident conditions. 2
40

NET-264-02 NPNon-Proprietary Information Submitted in
Accordance with 10 CFR 2.390Table 5-4
Summary of Criticality Calculation Results(10x1O Fuel)
2
41

NET-264-02 NPNon-Proprietary Information Submitted in
Accordance with 10 CFR 2.3906.0 Conclusions
The Peach Bottom Unit 2 spent fuel racks have been analyzed GNF 2 fuel with uniforminitial enrichments of up to [ ] w/o U 2 3 5 at a stack density of [ ] percent theoreticaldensity. Maximum reactivity bundles with gadolinia for this fuel type have beenspecified requiring a minimum number of burnable poison rods per assembly and aminimum Gd 2 0 3 loading per rod. Analyses have demonstrated that the maximum keff of
the Peach Bottom Unit 2 spent fuel racks is less than 0.95 when loaded with maximumreactivity bundles of the GNF 2 fuel design and accounting for projected Boraflexdegradation through May 1, 2010. The analyses contained herein are subject to the 2restriction that discharged fuel is placed in a B.5.b configuration in Modules 3, 4, 5 and12 as described in Section 3.1 and as illustrated in Figure 3.2.
The maximum keff of the Peach Bottom Unit 2 spent fuel racks will not exceed the 0.95limit when loaded with GNF 2 fuel with a maximum bundle planer enrichment of [w/o U235 (at [ ] percent theoretical density) with a minimum of [ ] gadolina rods per
fuel assembly each containing a minimum loading of [ ] w/o Gd 20 3.
For the most reactive loading ([ ] w/o U235 with [ ] gadolinia rods per fuel assembly)
the margin to the keff -< 0.95 design limit is [ ]. When the worst case accident isimposed upon these conditions, keff remains below the accident condition regulatorylimit of_< 0.95. In all cases analyzed, conservative projections of Boraflex degradationthrough to May 1,2010 were assumed.
In order to insure that the projections of Boraflex degradation do not exceed [ ] 2 3(conservatively bounding), RACKLIFE projections should be verified with BADGERmeasurements.
Since 1996, BADGER testing has been conducted in the spent fuel pools of each unit at
Peach Bottom once every four years. Comparison of BADGER measurements with
RACKLIFE predictions has shown the RACKLIFE predictions to be conservative.
Accordingly, it is recommended that Exelon continue this practice.
42

NET-264-02 NPNon-Proprietary Information Submitted in
Accordance with 10 CFR 2.3907.0 References
1. "An Assessment of Boraflex Performance in Spent-Nuclear-Fuel StorageRacks," Northeast Technology Corp. for the Electric Power ResearchInstitute, NP-6159; December 1988.
2. "Boraflex Test Results and Evaluation", EPRI/TR-101986, prepared byNortheast Technology Corp. for the Electric Power Research Institute;February 1993.
3. "BADGER, a Probe for Non-destructive Testing of Residual Boron-10Absorber Density in Spent-fuel Storage Racks: Development andDemonstration", EPRI TR-107335. Electric Power Research Institute: PaloAlto, CA; October 1997.
4. "The Boraflex Rack Life Extension Computer Code -- RACKLIFE: Theory andNumerics." EPRI TR-107333. Electric Power Research Institute: Palo Alto,CA; September 1997.
5. "The Boraflex Rack Life Extension Computer Code -- RACKLIFE: Verificationand Validation." EPRI TR-109926. Electric Power Research Institute: PaloAlto, CA; March 1999.
6. "BADGER Demonstration at Peach Bottom Atomic Power Station Unit 2,"NET-092-05, Rev. 0., Northeast Technology Corp. for the Electric PowerResearch Institute; August 1996.
7. "BADGER Test Campaign at Peach Bottom Unit 2", NET-192-01, Rev. 0.,Northeast Technology Corp.: Kingston, NY; 22 May 2002.
8. "BADGER Test Campaign at Peach Bottom Unit 2", NET-264-01, Rev. 0.,Northeast Technology Corp.: Kingston, NY; 21 June 2006.
9. "BADGER Test Campaign at Peach Bottom Unit 3", NET-174-01, Rev. 0,Northeast Technology Corp.: Kingston, NY; 9 July 2001.
10. "BADGER Test Campaign at Peach Bottom Unit 3", NET-247-01, Rev. 0,Northeast Technology Corp.: Kingston, NY; 6 August 2005.
43

NET-264-02 NPNon-Proprietary Information Submitted in
Accordance with 10 CFR 2.390
11. "GNF2 Spent Fuel Rack Criticality Analysis for Peach Bottom Atomic PowerStation Units 2 and 3," 000-0035-7327-SFR, Rev. 0; Global Nuclear Fuel;June 2005.
12. Orechwa, Y and Golla, J., "Safety Evaluation by the Office of Nuclear ReactorRegulation Related to Amendment No. 227 to Facility Operating License No.DPR-26 Entergy Nuclear Operations Inc., Indian Point Nuclear GeneratingUnit No. 2 Docket No. 50 - 247," 5/29/2002.
13. Email from J. Holley [Exelon] to M. Harris [NETCO] dated 12 July 2006.
14. "SCALE-PC: Modular Code System for Performing Criticality Safety Analysesfor Licensing Evaluation, Version 5.0", Parts 1 through 3, RSIC ComputerCode Collection CCC-725. Oak Ridge National Laboratory: Oak Ridge,Tennessee; May 2004.
15. Rhodes, Joel and Malte Edenius. "CASMO-4: A Fuel Assembly BurnupProgram -- User's Manual", Version 2.05, Rev. 3. SSP-01/400. Studsvik ofAmerica: Newton, Massachusetts; July 2003.
16. Baldwin, M. N., G. S. Hoovler, R. L. Eng, and F. G. Welfare. "CriticalExperiments Supporting Close Proximity Water Storage of Power ReactorFuel," BAW-1484-7. Babcock & Wilcox: Lynchburg, Virginia; July 1979.
17. Mancioppi, S., and G. F. Gualdrini. "Standard Problem Exercise on CriticalityCodes for Spent LWR Fuel Transport Containers," CNEN-RT/FI(81)25.Comitato Nazionale Energia Nucleare: Rome; October 1981. Alternately,OECD Nuclear Energy Agency, Committee on the Safety of NuclearInstallations, CSNI-71; 1982.
18. Bierman, S. R., E. D. Clayton, and B. M. Durst. "Critical Separation BetweenSubcritical Clusters of 2.35 Wt% 2 3 5 U Enriched U0 2 Rods in Water with FixedNeutron Poisons", PNL-2438. Battelle Pacific Northwest Laboratories:Richland, Washington; October 1977.
19. Bierman, S. R., E. D. Clayton, and B. M. Durst. "Critical Separation BetweenSubcritical Clusters of 2.35 Wt% 2 3 5 U Enriched U0 2 Rods in Water with Fixed
44

NET-264-02 NPNon-Proprietary Information Submitted in
Accordance with 10 CFR 2.390Neutron Poisons", NUREG/CR-0073 RC. Battelle Pacific NorthwestLaboratories: Richland, Washington; May 1978.
20. "Benchmarking of Computer Codes for Calculating the Reactivity State ofSpent Fuel Storage Racks, Storage Casks and Transportation Casks," NET901-02-05, Rev. 0, Northeast Technology Corp., Kingston, NY; 29 October2004.
21. Jordan, W. C. "SCALE Cross Section Libraries", NUREG/CR-0200 Revision7, Volume 3, Section M4, Oak Ridge National Laboratory: Oak Ridge,Tennessee; Draft May 2004.
22. Natrella, Mary Gibbions, Experimental Statistics National Bureau ofStandards Handbook 91; 1 August 1963.
23. Memorandum from L. Kopp, SRE, to Timothy Collins, Chief, Reactors SystemBranch, Division of Systems Safety and Analysis, "Guidance on theRegulatory Requirements for Criticality Analysis of Fuel Storage at LightWater Reactor Power Plants", August 19, 1998.
24. Broadhead, B., "Feasibility Assessment of Burnup Credit in the CriticalityAnalysis of Shipping Casks with Boiling Water Reactor Spent Fuel"; ORNL,Nuclear Technology, 110, 1-20; April 1995.
25. Doub, W.B., "Particle Self-Shielding in Plates Loaded with Spherical PoisonParticles," Part B of Section 4.2, Naval Reactors Physics Handbook, Volume1: Selected Basic Techniques, Naval Reactors, Division of ReactorDevelopment, United States Atomic Energy Commission: Washington, D.C.;1964.
45

Appendix A NET-264-02 NPNon-Proprietary Information Submitted in
Accordance with 10 CFR 2.390
Appendix ANET-901-02-05, Rev 3,
"Benchmarking of Computer Codes forCalculating the Reactivity State of
Spent Fuel Storage Racks, Storage Casks andTransportation Casks"

Report No. 901-02-05 NP, Rev 3Non-Proprietary Information Submitted in
Accordance with 10 CFR 2.390
Benchmarking of Computer Codesfor
Calculating the Reactivity Stateof
Spent Fuel Storage Racks, Storage Casks and TransportationCasks
Northeast Technology Corp.
108 North Front StreetThird Floor
UPO Box 4178Kingston, New York
12402
Review/Approval Record
Rev. Date Prepared by: Reviewed/Approved by: Approved (QA) by:
Note: New Revision signature sheet initiated due to classification of Revision 3 of NET-901-02-05 as a NETCO ProprietaryDocument.

Report No. 901-02-05 NP, Rev 3Non-Proprietary Information Submitted in
Accordance with 10 CFR 2.390Table of Contents
Section Page
1.0 IN T R O D U C T IO N .................................................................................................. 1
2.0 BENCHMARKING - STANDARD PROBLEMS ANDCO NFIG URATIO N CO NTRO L .......................................................................... 3
2.12.22.3
SCALE-5 and MCNP5 Configuration Control ......................................... 3Sample Problems ................................................................................. 3CASMO-4 Configuration Control ........................................................... 4
3.0 BENCHMARK MODELING OF LWR CRITICAL EXPERIMENTS .................... 5
3.1 Benchmarking of SCALE-5 and MCNP5 ................................................ 53.2 Benchmarking of CASMO-4 ................................................................. 12
4.0 C O N C LU S IO N S ............................................................................................ 14
5 .0 R E F E R E N C E S ............................................................................................... 15
Report No. 901-02-05 NP, Rev 3Non-Proprietary Information Submitted in
Accordance with 10 CFR 2.390List of Tables
Table Page
Table 3-1: B&W and PNL Critical Experiment Design Parameters ............................. 8
Table 3-2: KENO V.a and MCNP5 Critical Experiment Results ................................. 9
Table 3-3: B&W Critical Experiments as CASMO Infinite Arrays - Results .............. 13
ii

Report No. 901-02-05 NP, Rev 3Non-Proprietary Information Submitted in
Accordance with 10 CFR 2.390List of Figures
Figure Page
Figure 3-1: Variation of Bias (keff -1) with Moderator-to-Fuel Ratio .......................... 10
Figure 3-2: Variation of Bias (keff -1) with Absorber Strength ................................. 11
iii

Report No. 901-02-05 NP, Rev 3Non-Proprietary Information Submitted in
Accordance with 10 CFR 2.3901.0 INTRODUCTION
This report documents the results of benchmark calculations of three computer codes
used to compute the reactivity state of nuclear fuel assemblies in close-packed arrays.
Such close-packed arrays include high density spent fuel storage racks, dry storage
casks and casks for transporting nuclear fuel. The three computer codes, which were
benchmarked and validated are:
* KENO V.a, which is a module of SCALE 511]
* MCNP5[21
* CASMO-4[31
Earlier versions of KENO and CASMO have been previously benchmarked and
validated by NETCO.[4'5 ] Most notably, the present version, which also includes MCNP,
incorporates the results of fifty-two critical experiments whereas earlier versions
incorporated thirteen critical experiments.
To benchmark and validate the codes for spent fuel racks and cask evaluations, KENO
and MCNP were used to simulate a series of critical experiments. The calculated
eigenvalues (keff) were then compared with the critical condition (keff = 1.0) to determine
the bias inherent in the calculated values. For the KENO V.a calculation, the 238
energy group ENDF/B-V cross-section library was used. For the MCNP5 calculations,
the continuous energy cross-section library based on ENDF/B-VI was used.
After determining the inherent biases associated with KENO V.a and MCNP5, both
KENO V.a and CASMO-4 (with its own 70 energy group cross-section library) were
used to model central arrays of select critical experiments. It is noted that CASMO-4
models an infinitely repeating array of fuel assemblies and is generally used to generate
cross-sections for core simulator models. As such, it does not lend itself directly to finite
arrays of fuel racks surrounded by a reflector, as is the case in the critical experiments
considered. Accordingly, the central fuel arrays of five critical experiments were
modeled as infinite arrays with both KENO V.a and CASMO-4. A comparison of the
1

Report No. 901-02-05 NP, Rev 3Non-Proprietary Information Submitted in
Accordance with 10 CFR 2.390KENO V.a and CASMO-4 eigenvalues provides a means to determine the CASMO-4
bias.
For the purposes of benchmarking, fifty-two critical experiments from the International
Handbook of Evaluated Criticality Safety Benchmark Experiments[6] were selected
because they closely represent typical fuel/rack geometries with neutron absorber
panels. The resulting models encompass the range of absorber strengths, moderator-
to-fuel ratios and fuel rod geometries representative of most fuel storage rack and fuel
cask configurations used today.
All work completed for the benchmarking calculations was carried out under NETCO's
Quality Assurance Program[7]. The methods employed have been patterned to comply
with industry accepted standards[8' 9'101 and with accepted industry criticalityreferences[11, 12, 13, 14, 15]
2

Report No. 901-02-05 NP, Rev 3Non-Proprietary Information Submitted in
Accordance with 10 CFR 2.3902.0 BENCHMARKING - STANDARD PROBLEMS AND CONFIGURATION
CONTROL
2.1 SCALE-5 and MCNP5 Configuration Control
The binary executable codes and associated batch files were provided by RSICC on
CD-ROM for use under the Windows operating system. In this form, the programs can
not be altered or modified. In addition to the binary executable codes, there are several
supporting files which contain cross- section sets, etc. Prior to executing either code
sequence, the user will verify the file names, creation dates, and sizes to insure that
they have not been changed.
2.2 Sample Problems
A suite of input files with their corresponding output files were provided with each code.
These were executed on NETCO's host computer via batch files provided by RSICC
and the resulting output files compared to those provided by RSICC on CD-ROM.
Except for the date and time of execution stamps, the respective output files were
identical. Each code uses a pseudo-random number generator that is initiated with a
default seed value. Since the default value was used in each case, the sequences of
random numbers were the same, leading to identical calculations. This verifies that the
as-received versions of both codes are identical to the versions documented in the
User's Manuals[1'2 ].
3
Report No. 901-02-05 NP, Rev 3Non-Proprietary Information Submitted in
Accordance with 10 CFR 2.390Examination of the sample input decks shows that the run modules in batch files
exercise all of the code options used by this benchmarking exercise. Before and after
each subsequent use of each code, one set of sample input modules are executed and
the output files compared to the sample output files to verify that no system degradation
has occurred.
2.3 CASMO-4 Configuration Control
The version of CASMO-4 used for these analyses was developed for a RISCC
workstation. Version 2.05 of CASMO-4 was used for this benchmarking work and
subsequent users of CASMO-4 for NETCO will verify that Version 2.05 is being used.
CASMO-4 and all versions are controlled by Studsvik of America under their Quality
Assurance Program[161 . If a different version of CASMO-4 is used by NETCO for any
subsequent analyses, the CASMO-4 analyses in Section 3.2 shall be repeated with the
version in use.
4

Report No. 901-02-05 NP, Rev 3Non-Proprietary Information Submitted in
Accordance with 10 CFR 2.3903.0 BENCHMARK MODELING OF LWR CRITICAL EXPERIMENTS
An index of input and output files for each experiment modeled is contained in the
calculation notebook for this project and represents a permanent record of all hand and
spreadsheet calculations performed during input preparation. All input parameters are
fully traceable to the appropriate source documents.
3.1 BENCHMARKING OF SCALE-5 and MCNP5
The selected critical experiments include fifty-two (52) water moderated LWR fuel rod
cores and close packed critical LWR fuel storage arrays. Of these, thirty-three were
conducted at the Critical Mass Laboratory at the Pacific Northwest Laboratories (PNL).
Twenty-one of the PNL critical experiments were either separated by water or stainless
steel (i.e., had no neutron absorber plates). The remaining twelve PNL criticals had
either borated stainless steel (of varying boron weight percents) or BORAL® absorber
plates separating the fuel rod arrays.
The remaining nineteen critical experiments were performed at the Babcock & Wilcox
(B&W) Lynchburg Research Center. These experiments involved 3X3 arrays of fuel
rods with a uranium enrichment of [ ] w/o. The 3X3 arrays are surrounded by borated
water. Four different loading configurations were used depending on the separation
spacing (number of pin pitches) between fuel assemblies. Some experiments (CoreXI)
merely used combinations of critical moderator height and soluble boron concentration.
In each MCNP5 model of the criticals, 6,000,000 neutrons in 3,000 generations were
tracked. In each KENO model of the criticals, at least 6,000,000 neutrons in at least
3,000 generations were tracked. The output files were always checked to insure that
the fission source distribution had converged. A summary of the distribution of keff over
all generations is automatically plotted in the output files and shows them to be
approximately normally distributed. Thus, normal one-sided tolerance limits with
appropriate 95% probability / 95% confidence factors (95/95) can be used. The
5

Report No. 901-02-05 NP, Rev 3Non-Proprietary Information Submitted in
Accordance with 10 CFR 2.390calculated results for each critical experiment are given in Table 3-2, including the
calculated keff, the one-standard-deviation statistical uncertainty of keff, denoted by cy,
and the bias with respect to the critical state keff = 1 .0.
The overall bias between the calculation eigenvalue and the experiments is calculated
as follows. First, the variance-weighted mean is calculated as
N N
km (il ( ik)l/1 (1/a2 (3-1)
where N = 52 (for the 19 B&W and 32 PNL criticals), ki is the SCALE-5 or MCNP5
calculated keff for critical i, and cai is the SCALE-5 or MCNP5 calculated standard
deviation of the distribution of keff for critical i. The standard deviation around km is given
by
[ N _k.)2 (3-2)ki=
The bias is calculated as km - 1, and has the same standard deviation as km. Based
upon the results shown in Table 3-2, it is recommended that the 238 energy group
ENDF/B-V library be used in all criticality analyses. For SCALE-5, the resulting mean
bias for this library is [ ]. For MCNP5, using the continuous energy
cross-section library based on ENDF/B-VI, the resulting variance weighted mean bias is
Correlations of bias with respect to moderator-to-fuel ratio (H / 235U) number density
ratio and absorber strength ('.th) were investigated and found to be not significant. The
coefficient of determination for bias versus moderator-to-fuel ratio for the 238 group
ENDF/B-V library was a negligible 10%, whereas for MCNP5 it was 6.4%, indicating
that the method bias is not strongly dependent on moderator-to-fuel ratio. In all cases,
the bias becomes less negative with decreasing moderator-to-fuel ratio (i.e., increasing
6

Report No. 901-02-05 NP, Rev 3Non-Proprietary Information Submitted in
Accordance with 10 CFR 2.390enrichment). The coefficient of determination for bias versus absorber strength for the
238 Group ENDF/B-V library was an insignificant 4.4%, while for MCNP5, it was 10.8%.
In all cases, the bias becomes less negative with increased absorber strength. These
results are illustrated in Figures 3-1 and 3-2, respectively.
7

Report No. 901-02-05 NP, Rev 3Non-Proprietary Information Submitted in
Accordance with 10 CFR 2.390
Table 3-1: B&W and PNL Critical Experiment Design Parameters

Report No. 901-02-05 NP, Rev 3Non-Proprietary Information Submitted in
Accordance with 10 CFR 2.390
Table 3-2 KENO V.a and MCNP5 Critical Experiment Results
9

Report No. 901-02-05 NP, Rev 3Non-Proprietary Information Submitted in
Accordance with 10 CFR 2.390
Figure 3-1: Variation of Bias (keff -1) with Moderator-to-Fuel Ratio
10

Report No. 901-02-05 NP, Rev 3Non-Proprietary Information Submitted in
Accordance with 10 CFR 2.390
Figure 3-2: Variation of Bias (keff-1) with Absorber Strength
11
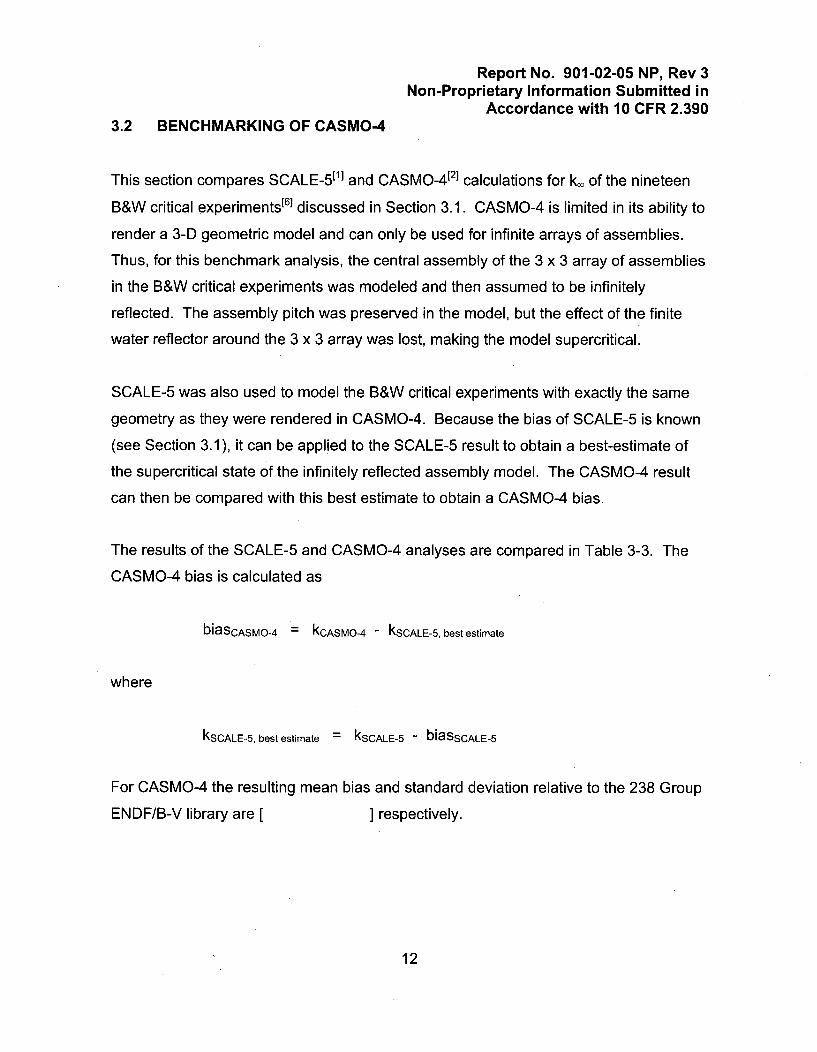
Report No. 901-02-05 NP, Rev 3Non-Proprietary Information Submitted in
Accordance with 10 CFR 2.3903.2 BENCHMARKING OF CASMO-4
This section compares SCALE-5 111 and CASMO-4[21 calculations for k', of the nineteen
B&W critical experiments161 discussed in Section 3.1. CASMO-4 is limited in its ability to
render a 3-D geometric model and can only be used for infinite arrays of assemblies.
Thus, for this benchmark analysis, the central assembly of the 3 x 3 array of assemblies
in the B&W critical experiments was modeled and then assumed to be infinitely
reflected. The assembly pitch was preserved in the model, but the effect of the finite
water reflector around the 3 x 3 array was lost, making the model supercritical.
SCALE-5 was also used to model the B&W critical experiments with exactly the same
geometry as they were rendered in CASMO-4. Because the bias of SCALE-5 is known
(see Section 3.1), it can be applied to the SCALE-5 result to obtain a best-estimate of
the supercritical state of the infinitely reflected assembly model. The CASMO-4 result
can then be compared with this best estimate to obtain a CASMO-4 bias.
The results of the SCALE-5 and CASMO-4 analyses are compared in Table 3-3. The
CASMO-4 bias is calculated as
biaSCASMO-4 = kCASMO-4 - kSCALE-5, best estimate
where
kSCALE-5, best estimate --- kSCALE-5 - biaSSCALE-5
For CASMO-4 the resulting mean bias and standard deviation relative to the 238 Group
ENDF/B-V library are [ ] respectively.
12

Report No. 901-02-05 NP, Rev 3Non-Proprietary Information Submitted in
Accordance with 10 CFR 2.390
Table 3-3: B&W Critical Experiments as CASMO Infinite Arrays - Results
13

Report No. 901-02-05 NP, Rev 3Non-Proprietary Information Submitted in
Accordance with 10 CFR 2.3904.0 CONCLUSIONS
SCALE-5 and MCNP5 have been benchmarked by modeling nineteen (19) Babcock
and Wilcox critical experiments and thirty-three (33) PNL critical experiments
representative of fuel storage rack and fuel cask geometries. At a 95% probability /
95% confidence level, the computed bias uncertainties for SCALE-5 and MCNP5 are
I ] and [ ], respectively.
CASMO-4 has also been benchmarked by modeling nineteen (19) Babcock and Wilcox
critical experiments as infinite arrays. Best estimates of the k,. for the exact same
geometry were calculated using SCALE-5 and applying the mean bias reported above.
The CASMO-4 bias with respect to these values was calculated to be [
] (1 sigma). At a 95% probability / 95% confidence level, the bias uncertainty
for CASMO-4 is [ ]. The comparison of SCALE-5 and CASMO-4 serves to
verify the results of each with respect to the other.
It is therefore concluded that these calculational methods have been adequately
benchmarked and validated. They may be used individually or in combination for the
criticality analysis of spent fuel storage racks, fuel casks and fuel casks in close
proximity to fuel storage racks, provided the appropriate biases are applied.
The SCALE-5 bias with respect to these critical experiments was calculated to be
I ]. The MCNP5 bias with respect to the critical experiments was calculated
to be [ I.
14

Report No. 901-02-05 NP, Rev 3Non-Proprietary Information Submitted in
Accordance with 10 CFR 2.3905.0 REFERENCES
1. "SCALE-PC: Modular Code System for Performing Standardized ComputerAnalyses for Licensing Evaluation for Workstations and Personal Computers,Version 5," Volumes 0 through 3, RSIC Computer Code Collection CCC-725.Oak Ridge National Laboratory: Oak Ridge, Tennessee; Draft May 2004.
2. "MCNP - A General Monte Carlo N-Particle Transport Code, Version 5",Volumes 1 - 3, RSICC Computer Code Collection CCC-710, X-5 Monte CarloTeam, Los Alamos National Laboratory, Los Alamos, NM, April 24, 2003.
3. Ekberg, Kim, Bengt H. Forssen and Dave Knott. "CASMO-4: A Fuel AssemblyBurnup Program - User's Manual," Version 1.10 STUDSVIK/SOA-95/1. Studsvikof America: Newton, Massachusetts; September 1995.
4. NETCO Report 901-02-03: "Benchmarking of the SCALE-PC Version 4.3Criticality and Safety Analysis Sequence Using the KENO V.a Monte Carlo Codeand of the Multigroup Two-Dimensional Transport Theory CASMO-4 Code",Northeast Technology Corporation: Kingston, New York; May 1995.
5. NETCO Report 901-02-04: "Benchmarking of the SCALE-PC Version 4.3Criticality and Safety Analysis Sequence Using the KENO5A Monte Carlo codeand of the Multigroup Two-Dimensional Transport Theory CASMO-4 Code",Northeast Technology Corporation: Kingston, New York; January 2000.
6. "International Handbook of Evaluated Criticality Safety Benchmark Experiments,"NEA/NSC/DOE (95)03, September 2008 Edition. Nuclear Energy Agency,September 2008.
7. "Quality Assurance Manual, Rev. 1, Northeast Technology Corp: Kingston, NY;10 August 2007.
8. "American National Standard for Nuclear Criticality Safety in Operations withFissionable Materials Outside Reactors," ANSI/ANS-8.1-1983, Revision ofANSI/N 16.1-1975. American Nuclear Society: La Grange Park, Illinois;Approved 7 October 1983.
15

Report No. 901-02-05 NP, Rev 3Non-Proprietary Information Submitted in
Accordance with 10 CFR 2.390
9. "Quality Assurance Requirements of Computer Software for Nuclear FacilityApplications," Part 2.7 of "Quality Assurance Requirements for Nuclear FacilityApplications," ASME NQA-2-1989, Revision of ANSI/ASME NQA-2-1986.American Society of Mechanical Engineers: New York; Issued 30 September1989.
10. Natrella, Mary Gibbons. Experimental Statistics, National Bureau of StandardsHandbook 91. U.S. Government Printing Office: Washington, D.C.; 1 Aug. 1963.
11. Cooney, B. F., T. R. Freeman, and M. H. Lipner. "Comparison of Experimentsand Calculations for LWR Storage Geometries." Transactions of the AmericanNuclear Society: Vol. 39, pp. 531-532; November 1981.
12. Westfall, R. M., and J. R. Knight. "SCALE System Cross Section Validation withShipping Cask Critical Experiments." Transactions of the American NuclearSociety: Vol. 33, pp. 368-370; 1979.
13. McCamis, R. H. "Validation of KENO V.a for Criticality Safety Calculations ofLow-Enriched Uranium-235 Systems," AECL-10146-1. Atomic Energy ofCanada Limited, Whiteshell Laboratories, Pinawa, Manitoba; February 1991.
14. Bierman, S. R., E. D. Clayton, and B. M. Durst. "Critical Separation BetweenSubcritical Clusters of 2.35 Wt% 2 3 5 U Enriched U0 2 Rods in Water with FixedNeutron Poisons," PNL-2438. Battelle Pacific Northwest Laboratories: Richland,Washington; October 1977.
15. Bierman, S. R., E. D. Clayton, and B. M. Durst. "Critical Separation BetweenSubcritical Clusters of 4.29 Wt% 2 3 5 U Enriched U0 2 Rods in Water with FixedNeutron Poisons," NUREG/CR-0073 RC. Battelle Pacific NorthwestLaboratories: Richland, Washington; May 1978.
16. "Quality Assurance Program", SOA/REV 2. Studsvik of America: Newton,Massachusetts; Approved 16 August 1991.
16

Attachment 6
Response to Request for Additional Information - Revision toTechnical Specification 4.3.1.1.a Concerning k-infinity, Revision 1
(Non-Proprietary Version)

Non-Proprietary Information Submittedin Accordance with 10 CFR 2.390
Attachment 6Response to Request for Additional Information - Revision to
Technical Specification 4.3.1.1 .a Concerning k-infinityRevision 1
Page 1
Questions 16 - 25:
These questions have been deleted from this response. The criticality analysis applicable toGlobal Nuclear Fuel (GNF) has been deleted from this License Amendment Request (LAR).Therefore, Questions 16 through 25 are no longer applicable. Question 16 through 25 have notbeen answered because NET-264-02 P, evaluates the effects ofBoraflex degradation and rack criticality in normal and off-normal conditions. The design basislattice has been evaluated using the GNF TGBLA06A methodology to establish the new coldincore k- criteria of 1.318. Accordingly, Enclosures 5 and 6 (GNF documents) of the LicenseAmendment Request (Letter from P. B. Cowan (Exelon Generation Company, LLC) to U. S.Nuclear Regulatory Commission, "License Amendment Request - Revision to TechnicalSpecification 4.3.1.1 .a Concerning k-infinity," dated June 25, 2008) are hereby withdrawn.
1. Question:
Proprietary and non-proprietary versions of technical report NET-264-02, "Criticality Analysis ofthe Peach Bottom Spent Fuel Racks for GNF-2 Fuel with Boraflex Panel degradation Projectedto May 2012," are included in the LAR. NET-264-02 contains estimates of Boraflex degradationusing testing conducted in accordance with EPRI (Electric Power Research Institute) TR-107335, "BADGER, a Probe for Non-destructive Testing of Residual Boron-10Absorber Densityin Spent-fuel Storage Racks: Development and Demonstration," and projections using EPRITR-107333, "The Boraflex Rack Life Extension Computer Code - RACKLIFE: Theory andNumerics: and EPRI TR-109926, "The Boraflex Rack Life Extension Computer Code -RACKLIFE: Verification and Validation." NET-264-02 also uses what is described as, "... anadvanced methodology..." and "...special algorithm...". in making the estimates. NET-264-02asserts that, "The NRC has issued a Safety Evaluation Report accepting the methodology on aplant specific basis." However, the NRC safety evaluation cited was not issued to PBAPS. Inaddition, there is no description of the "...advanced methodology..." or "...special algorithm..." inthe PBAPS SFP LAR or information that would allow the NRC to evaluate them ona plant-specific basis with regard to PBAPS. Please provide additional information that describes andjustifies the use of the "advanced methodology" and "special algorithm" at PBAPS.
Response:
As discussed in Section 3.0 of the LAR, the methodology is based upon the approval of similarmethodology for Indian Point. This methodology was cited as References 6 and 7 in the LAR.In the preparation of LARs that involve the application of methodologies, the standard andexpected practice is to identify similar methodologies that have been accepted by NRC for otherdockets, and apply these methodologies to the particular application. This practice provides aframework of predictability for Licensees in the preparation of LARs and reduces the time andcost in approving submittals. However, Exelon acknowledges NRC's concern that thereferenced safety evaluation cited was not issued to Peach Bottom Atomic Power Station(PBAPS). Per NRC's request, Exelon is providing additional information to allow NRC toconclude that the NETCO methodology is acceptable for use at PBAPS.

Non-Proprietary Information Submittedin Accordance with 10 CFR 2.390
Attachment 6Response to Request for Additional Information - Revision to
Technical Specification 4.3.1.1 .a Concerning k-infinityRevision 1
Page 2The "Advanced Methodology" and "Special Algorithm" refer to the Boraflex degradation featuresampling methodology developed by NETCO and documented in NET-264-03 P,Characterization of Boraflex Panel Degradation in the Peach Bottom Unit 2 Spent Fuel PoolProjected to May 2010".
2. Question:
The Boraflex degradation projected in NET-264-02 is based on an assumed future SFP loadingand the associated gamma dose to the Boraflex panels. However, there is no informationprovided for the NRC to assess the reasonableness of this assumption. Please provideadditional information that justifies the future SFP loading and associated gamma doseassumed in the LAR.
Response:
PBAPS is performing surveillances using RACKLIFE (as benchmarked with BADGER data) toensure that pool average Boraflex degradation does not exceed [ ] and the peak paneldegradation does not exceed [ ]%. Compliance with these criteria will ensure operation withinthe constraints of the analysis.
3. Question:
An "average panel boron carbide loss" is projected in NET-264-02 and converted into anestimated uniform Boraflex panel thinning for the entire SFP. However, Figure 3-5 indicatesthat a large number of storage cells will have a projected individual "panel boron carbide loss"
]. These storage cells are collocated, [] These localized circumstances are
not addressed. Please provide information that addresses the localized effects of collocatedstorage cells and the localized keff values relative to the estimated uniform Boraflex panelthinning for the entire SFP.
Response:
The Reference case KENO V.a models are high fidelity [ ] arrays generated by samplingpanels based on a distribution that reflects the projected boron carbide loss distribution in thePBAPS, Unit 2 spent fuel pool. These models are adjusted and verified to assure high losspanels are adequately sampled and preferentially placed adjacent to one another, such that theresulting boron carbide loss of the [ ] array bounds the worst rack modules in the spent fuelpool.
KENO V.a models of the limiting modules that contain arrays of cells with high loss panels[(> - %)] were also analyzed to verify that the reactivity effect of collocated panels did notexceed the reference case k.. Modules 7 (peripheral) and 12 (central) contain the largestarrays of high loss panels. These modules were modeled with 5x7 and 5x10 arrays of high losspanels [( %)] and surrounded by rows of cells conservatively assumed to be at the highestloss that bounded adjacent cells (i.e., the highest loss for a block of cells was assumed for all

Non-Proprietary Information Submittedin Accordance with 10 CFR 2.390
Attachment 6Response to Request for Additional Information - Revision to
Technical Specification 4.3.1.1 .a Concerning k-infinityRevision 1
Page 3.panels in that row). The models were infinite in the x, y and z directions using a periodicboundary condition in the x and y directions.
The KENO V.a calculations confirmed that the reference k. bounds the worst modulescontaining localized arrays of high loss panels. If an explicit model of the exact panel lossesbased on RACKLIFE projections to May 2010 were modeled, the reactivity effect would be evenmore negative due to conservatively neglecting lower loss panels that are present throughoutthe modules.
4. Question:
The Boraflex degradation projected in NET-264-02 is based on an end date of May 1, 2012.However, there is no proposed license condition that limits the licensee to that end date. Pleaseprovide a proposed license condition for the projected Boraflex degradation end date.
Response:
The analysis has been revised for an end date of May 2010. The date of the projection ismerely a reference point in RACKLIFE. The critical values to monitor are the pool averageboron carbide loss of [ ] for irradiated panels and peak panel loss of [ ]. Should thisboron carbide loss be approached, mitigation measures should be implemented.
Exelon hereby commits to resubmitting the analysis by December 31, 2009 incorporating a lessreactive fuel bundle, and including an alternative loading pattern, if the analysis warrants. (SeeAttachment 2 for a discussion of the conservative, peak reactivity fuel bundle used in this LAR.)This new submittal will provide ample margin until further corrective actions can be developedand implemented that will resolve the Boraflex degradation issue. Further discussion of thesecorrective actions and the overall spent fuel management plan are in Attachment 2.
5. Question:
A two dimensional deterministic code, CASMO-4, is utilized in NET-264-02 to compute thereactivity effects due to degraded Boraflex. CASMO-4 is a proprietary computer code createdby Studsvik. However, there is no generic Topical Report for CASMO-4, for either in-coreanalyses or in-rack analyses and the reference cited in NET-264-02 for CASMO-4 is not publiclyavailable. While the NRC has approved the use of CASMO-4 as an approved methodology forin-core analysis methodologies at several licensees, this does not appear to be the case forPBAPS. There is no information provided for the staff to review regarding justifying the use ofCASMO-4 specifically at PBAPS. Please provide information that justifies the use of CASMO-4at PBAPS.
Response:
As similarly noted in Response Number 1, Exelon acknowledges that the absence of a genericTopical Report and safety evaluation specifically citing PBAPS has raised NRC's concernsregarding the use of CASMO-4 in this analysis. Per NRC's request, Exelon is providing

Non-Proprietary Information Submittedin Accordance with 10 CFR 2.390
Attachment 6Response to Request for Additional Information - Revision to
Technical Specification 4.3.1.1 .a Concerning k-infinityRevision 1
Page 4additional information to allow NRC to conclude that the use of CASMO-4 is appropriate for thisanalysis.
NETCO has verified and validated CASMO-4 as documented in report NET-901-02-05 P,Revision 3, "Benchmarking of Computer Codes for Calculating the Reactivity State of SpentFuel Storage Racks, Storage Casks and Transportation Casks" (Attachment A to NET-264-02P). It should be noted that CASMO (due to its 2-D, infinitely reflected, rack modelcapabilities) has a limited number of critical experiments against which it can be validated. Forthe critical experiments evaluated, NETCO has determined the resulting CASMO-4 mean biasand standard deviation to be [ ] and [ ], respectively.
6. Question:
The [ ] in Table 5-4 is listed as
Pleaseprovide justification that clarifies the source of the [ ] listed in Table5.4.
Response:
The reference k-of [ ] (now [ ] based on [ ]% thinning) in Table 5.4 of NET-264-02 P, is the KENO V.a value at a Reactivity Equivalent Fresh Fuel Enrichment andcorrected for asymmetries in geometry modeling and cross-sections between CASMO-4 andKENO V.a. KENO V.a was executed by varying the U-235 enrichment to iteratively determinethe REFFE that produced a k- of [ I. The REFFE that produced the same peak k- was] w/o U-235.
CASMO-4 was used to determine the peak reactivity point during depletion. The peak k- (biascorrected) calculated by CASMO-4 was [ ]. Geometry limitations in CASMO-4 preventexplicit modeling of the rack layout of the PBAPS, Unit 2 spent fuel rack cells. Therefore, aKENO V.a model that mirrored the CASMO geometry was created to verify the fidelity of theCASMO model. The difference between the CASMO-4 and KENO V.a models was negligible[( )] and likely due to differences in cross sections confirming the fidelity of theCASMO model. An exact geometry model was subsequently created in KENO V.a to determinethe reactivity bias between the exact geometry and the CASMO-4 geometry. The difference inreactivity between the exact geometry and the CASMO-4 geometry as calculated with KENOV.a was [ ] Ak. This reactivity bias was applied to the k- at peak reactivity. This resultsin a peak k- of[
7. Question:
The information provided in the LAR and NET-264-02 is insufficient to evaluate the] listed in Table 5-4. Please provide additional information to support the use of

Non-Proprietary Information Submittedin Accordance with 10 CFR 2.390
Attachment 6Response to Request for Additional Information - Revision to
Technical Specification 4.3.1.1 .a Concerning k-infinityRevision 1
Page 5the [ ] listed in Table 5-4.
Response:
The base case KENO V.a was performed with infinite z boundary conditions. This case wascompared with the similar case with water albedo boundary conditions in the upper and loweraxial direction. The difference between these two values is [ ]Ak and represents thereactivity effect due to axial neutron leakage.
8. Question:
The information provided in the LAR and NET-264-02 is insufficient to evaluate the] listed in Table 5-4. Please provide
additional information to support the use of thelisted in Table 5-4.
Response:
The reactivity effects of tolerances were determined by varying the parameter of interest to theirupper and lower tolerance bounds and determining the worst case value in terms of reactivityrelative to the nominal dimension. The tolerance values for each parameter as outlined inSection 5.3.3 of NET-264-02 P, are listed in the table below:
9. Question:
The [ ] listed in Table 5-4 of NET-264-02 appears to be the
] Please provide additional information to support the selection of a 95/95 statistical tolerancevalue of 1.7 to the computed eigenvalues for KENO calculations as described on page 29 ofNET-264-02.

Non-Proprietary Information Submittedin Accordance with 10 CFR 2.390
Attachment 6Response to Request for Additional Information - Revision to
Technical Specification 4.3.1.1 .a Concerning k-infinityRevision 1
Page 6Response:,
Fifty-two critical experiments have been analyzed with SCALE 5.0 and MCNP5 ver. 1.4. Theresults are summarized in NET-901-02-05, Revision 3, "Benchmarking of Computer Codes forCalculating the Reactivity State of Spent Fuel Storage Racks, Storage Casks andTransportation Casks" (Attachment A to NET-264-02 P
Based upon 52 critical experiments, a one-sided (95/95) tolerance factor of 2.049 has beenapplied to the KENO V.a bias uncertainty.
10. Question:
NET-264-02 indicates the analysis is consistent with USNRC Regulatory Guide 1.13, "SpentFuel Storage Facility Design Basis," and ANSI/ANS-57-2-1983, "Design Requirements for LightWater Reactor Spent Fuel Storage Facilities at Nuclear Power Plants." Regulatory Guide 1.13does not address any criticality regulatory requirements such as Title 10 of the Code of FederalRegulations Part 50, Appendix A, General Design Criteria 62, "Prevention of criticality in fuelstorage and handling," within its scope. Therefore, Regulatory Guide 1.13 should not beconstrued as endorsing the criticality requirements of ANSI/ANS-57.2-1983. Provide ajustification for using the criticality requirements of ANSI/ANS-57.2-1983 as the methodology forthe criticality analysis in the PBAPS SFP criticality analysis. In addition, not all of the itemsrequired by ANSI/ANS-57.2-1983 paragraph 6.4.2 appear to have been addressed (i.e. therequirements of 6.4.2.2.2 and 6.4.2.2.5 do not appear to be fully addressed). Therefore, pleasealso provide additional information that addresses all items required by ANSI/ANS-57.2-1983paragraph 6.4.2.
Response:
The original Regulatory Guide 1.13, issued in December 1975 did not endorse the requirementsof ANSI/ANS-57.2-1983. However, Revision 2 to Regulatory Guide 1.13 in March 2007 (issuedas Draft Regulatory Guide DG-1 162 in October 2006) does endorse ANSI/ANS-57.2-1983,although the current status of this ANSI standard is indeterminate.
NET-264-02 P addresses the additional fuel rod tolerance uncertainties.
11. Question:
Appendix A of NET-264-02 documents benchmark calculations which determine computer codebiases and uncertainties for KENO V.a, MCNP5 and CASMO-4. KENO V.a and MCNP5 arebenchmarked to five criticality experiments which are common to other SFP criticality analysesand eight which are not. The vintage of the reference cited for the eight unfamiliar criticalityexperiments makes determining their validation difficult. Please provide additional informationthat supports the validation of the eight CSNI criticality experiments referred to in Section 4.0 ofAppendix A of NET-264-02.
Response:

Non-Proprietary Information Submittedin Accordance with 10 CFR 2.390
Attachment 6Response to Request for Additional Information - Revision to
Technical Specification 4.3.1.1 .a Concerning k-infinityRevision 1
Page 7
As noted in the response to Question Number 9, Revision 3 of NET-901-02-05 has beenprovided as Appendix A to NET-264-02 P. Table 3-1 of Appendix A contains the list of criticalexperiments used in benchmarking SCALE-5, MCNP5 and CASMO-4.
12. Question:
] presented in Appendix A of NET-264-02.
presented in Appendix A of NET-264-02.
Response:
The results of the 52 critical benchmark experiments passed the tests for normality using theAnderson-Darling, Cramer-Von Mises and Kolmogorov-Smirnoff Tests for normality. Table A-7of Experimental Statistics (Mary Gibbons Natrella, Experimental Statistics, National Bureau ofStandards Handbook 91, August 1, 1963) contains one-sided tolerance factors for normaldistributions for as few as 3 samples.
The 5 criticals employed in the CASMO-4 Benchmark were selected based on their beingrepresentative of typical fuel storage rack configurations similar to that at PBAPS.
13. Question:
Using the data provided in [ ] of Appendix A of NET-264-02 and thedescription of the treatment of the data, an NRC staff verification using a Microsoft Excelspreadsheet produces different results than those indicated
Pleaseprovide validation of the information indicated in ] of Appendix A of NET-264-02.
Response:
It was noted that while the values contained typographical errors, the bias reported was correct.The k values were corrected.
14. Question:

Non-Proprietary Information Submittedin Accordance with 10 CFR 2.390
Attachment 6Response to Request for Additional Information - Revision to
Technical Specification 4.3.1.1 .a Concerning k-infinityRevision 1
Page 8
Section 3.1 of Appendix A of NET-264-02 states the following: "For SCALE-5 the resultingmean bias for this library-is -0.00782 ± 0.00361. For MCNP5, using the continuous energycross-section library based on ENDF/B-VI, the resulting variance weighted mean bias is -0.00574 ± 0.00509." Section 4.0 of Appendix A states the following: "At a 95% probability/95%confidence level, the computed bias for SCALE-5 and MCNP5 are -0.01381 and -0.01460,respectively." The reason for the discrepancy between Section 3.1 and 4.0 of Appendix A ofNET-264-02 is not apparent. Please provide additional information clarifying the apparentdiscrepancy.
Response:
The 95% probability/95% confidence level uncertainty is derived by multiplying the appropriateone-sided tolerance factor to the standard deviation in the bias. Since the uncertainties in thebiases are statistical, they are treated in this manner and combined in the root-mean-squarecombination of tolerances and uncertainties in Table 5-4 of NET-264-02 P, for bothCASMO-4 and KENO V.a.
15. Question:
Potential abnormal conditions for the PBAPS SFP are evaluated in NET-264-02. Page 39 ofNET-264-02 concludes the following, "Therefore, it is concluded that under worst-case accidentconditions, the effective multiplication factor remains less than the keff < 0.98 limit, which appliesto accident conditions." However, the PBAPS Updated Final Safety Analysis Report (UFSAR),Section 10.3.3.1 states the following: "All arrangements of fuel in the spent fuel storage racksare maintained in a subcritical configuration having a keff < 0.95 for all conditions." The limit ofkeff < 0.95 is reiterated in Technical Specification 4.3.1 .b, which also references Section 10.3 ofthe PBAPS UFSAR. Therefore, the analysis criteria presented in NET-264-02 does not appearto apply the current licensing basis for the PBAPS SFP. Please provide an explanation for theuse of the ke, < 0.98 criteria as opposed to the current licensing basis criteria of keff < 0.95 for allconditions. In addition, confirm that the proposed change will result in the current licensingbasis being met for all conditions, including worst-case accident conditions. For example,adding the predicted keff value of [0.94881], reported in Section 5.3.5 of NET-264-02, with theAkeff value associated with a dropped bundle of [ ] (Section 5.3.6) results in a ke, of[ ]
Response:
The analysis has been performed for a nearer future date of May 2010 corresponding to alesser amount of boron carbide loss. The rack average boron carbide loss at that time is[ ]% with a maximum individual panel loss of [ ]%. The equivalent thinning amount used inthis analysis is [ ]%, which yields a kref of [ ] as shown in Table 5.4. When alluncertainties and biases are considered, the calculated keff is [ ]. Including the Akeffvalue associated with a dropped bundle of [ ], keff remains < 0.95 for all conditions.


![[ON TIME-CRITICALITY] TIME-CRITICALITY … · ["ON TIME-CRITICALITY"] TIME-CRITICALITY Time-critical signal processing in humans and machines ... - ancient Greek prosody based on](https://img.pdfslide.us/doc/110x75/5b914fb509d3f215288b5a2b/on-time-criticality-time-criticality-on-time-criticality-time-criticality.jpg)