Embed Size (px)
Citation preview
Report No. CG-D-1 7-88 MC FILE COPY
N CORROSIVE-WEAR OF BUOY CHAIN
0q RICHARD A. BROWN
ANDCRAIG A. KOHLERLj
U.S. COAST GUARD RESEARCH AND DEVELOPMENT CENTERAVERY POINT, GROTON, CONNECTICUT 06340-6096
bFINAL REPORTJANUARY 1988
This document is available to the U.S. public through theNational Technical Information Service, Springfield, Virginia 22161 DTIC
Prepared for: DEC 1 9 18
C-%
U.S. Department Of Transportation H
United States Coast GuardOffice of Engineering and DevelopmentWashington, DC 20593
DISTIUBUTION STATEMENT A
Approved for public reloazo;Dintribution Unlnmted I

NOTICE
This document is disseminated under the sponsorship of theDepartment of Transportation In the Interest of informationexchange. The United States Government assumes noliability for its contents or use thereof.
The United States Government does not endorse products ormanufacturers. Trade or manufacturers' names appear hereinsolely because they are considered essential to the object ofthis report.
The contents of this report reflect the views of the CoastGuard Research and Development Center, which isresponsible for the facts and accuracy of data presented.This report does not constitute a standard, specification, orregulation.
S AMUEL F. POWEL, IIITechnical DirectorU.S. Coast Guard Research and Development CenterAvery PGInt, Groton, Connecticut 06340-6096
IsCO
S, 4 ff 5 cO' J

Technical Report Dot lantation Page1. Report No. 2. Government Accession No. 3. Recipient's Catalog No.
CG-D-17-88
4. Title and Subtitle 5. Report DateJANUARY 1988
CORROSIVE-WEAR OF BUOY CHAIN 6. Performing Organization Code
8. Performing Organization Report No.7. Author(s)
RICHARD BROWN AND CRAIG A. KOHLER R&DC 02/88
9. Performing Organization Name and Address 10. Work Unit No. (TRAIS)U.S. Coast GuardResearch and Development Center 11. Contract cr Grant No.Avery PointGroton, Connecticut 06340-6096 13. Type of Report and Period Covered
12. Sponsoring Agency Name and AddressDepartment of Transportation FINALU.S. Coast GuardOffice of Engineering and Development 14. Sponsoring Agency CodeWashington, D.C. 20593-0001
15. Supplementary Notes
16. Abstract
Five alloy steel chains were exposed to a service environment as buoy chains todetermine the best candidate to replace the 1022 steel currently used. The bestcombination of resistance to material loss, strength and pitting corrosion resistance wasshown by the 4340 quenched and tempered steel. In the chafe section the 4340 steeldisplayed the best resistance to wear even th3ugh it was located in rocks and sand.The 1022 steel performed the best in terms of overall weight loss; however, the chainwas positioned on a sandy location and showed greater wear in the chafe section.These results suggsst that the 4340 steel may be an alterndtive to the 1022 steel inareas where the chnin moorings experience rapid corrosive wear. However, theavailability and welaability of the 4340 steel make it unsuitable as a buoy chain materialat the present time.
17. Key Words 18. Distribution Statement
CORROSION ABRASION Document is available to the U.S. public throughWEAR BUOY the National Technical Information Service,STEEL Springfield, Virginia 22161CHAIN
19. Security Classif. (of this report) 20. SECURITY CLASSIF. (of this page) 21. No. of Pages 22. PriceUNCLASSIFIED UNCLASSIFIEDII
Form DOT F 1700.7 (8/72) Reproduction of form and completed page Is authorized
±i.

(1) 0 N
E. E ~ 0
cz cn
0EL *~~~5,E ol0 0~ E ~0 ) 10 C))C C0. 0 1 E
u~ C~ t o , !
E6,v Ifl :N Iq qC :R l ' o' 0
o.) o 0 C 0 cm0 4 ' o1CO M 0
0 wl zo
0 wY 0->C 00 s C) 0r
00
E. :r E E
0 t 0 0Cu) U) '~ E E E~6 c a1 .
I.E uu. EE - E 0 79 a( Ca ,2Q OL
C) 1
C.)O2 z 610 ot0 1010 t 1 z I
111 111 !11 11110
Q) M E.:E r: 'EE 1 E' M0V010 V;C
C- E E ~ E 0 E3 1U)~~~~~~ ouxui 2 E~~~
o. LL 0 E E: EE>1 l 9~ .9 (D D a
() E0 :2 ( 00 i
0 Wm S2 w
Cn CO( q 0 I-CO 0 0q 101 10wqvq : 4"tqI %M
0 cy 0C 1 6 0 0 10 6 o6 j oi o ,O
0 Cl) C10 CM 0 M 10~C1 1 ~ ~ C
- CC)1* -% -.g4( ZC , -
_ C
> w v

TABLE OF CONTENTS
Pagle
INTRODUCTION ....................................... 1
OBJECTIVE ......... *..........*............*........... 3
MATERIALS ........ 9.o........*....................... 3
DESCRIPTION OF MOORING SYSTEM ....................... 9
PROCEDURE ............. . . .. . . ................. 9
RESULTS ............... .................*............ 13
DISCUSSION ..... ........................... ...... @*.. 23
CONCLUSIONS ....................... .. ................ 26
REFERENCES ................................ e.. ...... 28
LIST OF ILLUSTRATIONS
Figure Page
1 Location of Test Buoys (Block Island Sound:Chart No. 13215) ............................. 2
2 Quenched and Tempered Structure of 4140 Steel 6
3 Quenched and Tempered Structure of 4340 Steel 6
4 Quenched and Tempered Structure of 8740 Steel 7
5 Quenched and Tempered Structure of 8620 Steel 7
6 Ferrite and Pearlite Structure of 1022 Steel . 8
7 Buoy zind Mooring ............................. 10 GCW
8 Dimensions of Open Link U.S. Coast Guard Buoy C
Ch a in ..... ...... . 00.. .. *... ... * .... . 12 For
9 Chain Appearance After Two Years of Exposure, U [
1022 Steel ................................... 15 ['d C
10 Sandy Ocean Floor. Note Chain Motion Markings topin the Sand Indicating Lateral Motion ........ 16
11 Rocky Ocean Floor with Six to Twelve-inch on/Diameter Rocks ............... ............... 16 ity Code
t and/orULVt I I

LIST OF ILLUSTRATIONS (cont'd)
Figure Page
12 4340 Steel Chain with Shallow CorrosionAdjacent to the Weld Zone .................... 19
13 4140 Steel Chain with Shallow CorrosionAdjacent to the Weld ......................... 19
14 Weld Region of 1022 Steel Chain. Note SharplyDefined Corrosion at the Weld ................ 20
15 4340 Chain in Chafe Section with No Major Pits 20
16 1022 Chain in Chafe Section with Shallot;Elongated Pits ............................... 21
17 8620 Chain with Long Shallow Pits in Chafesection ...................................... 21
18 8740 Chain with Deep Pits .................... 22
19 4140 Chain with Deep Pits Connecting Together 22
20 Microstructure of Weld Zone in 4340 SteelShowing No Cracks After Two Years of Exposure 24
LIST OF TABLES
Table Page
1 Steel Composition ................................. 4
2 Chain Weight Data ............................. 14
3 Chain Link Diameter Data ...................... 17
vi

INTRODUCTION
This report summarizes the data collected over a two-year
period on five different alloy steel buoy chains. The chains
were field tested by employing them as mooring chains for
buoys placed one mile off the coast at Charlestown, RI, shown
in Figure 1. During the two-year period from August 1985 to
August 1987, quarterly inspections by divers ensured the
condition of the chains were adequate to continue the testing.
A previous program by the Canadian Coast Guard, Reference (1),
failed when buoys broke their mooring chain after six months.
The inspections were aimed at forewarning and avoidance of any
similar problem.
The two-year testing of the mooring chains reported in
this research followed to a great extent the guidelines
suggested in Reference (1):
"First of all the chain should have good corrosion
resistance and especially it should have good resistance
to pitting corrosion, because it is the deep pits which
shorten the life of a chain, not the overall weight loss.
Secondly, the chain should have good wear resistance.
This encompasses both resistance to inter-link wear and
barrel wear, i.e., abrasion of the sides of the chain
links against a rocky bottom or on a coarse sandy bottom."
1

~*%~ ~ ~ ~ o%~ 0% ,-N
C04%0
I, ..3 C
01 ow -
= .3 NLo
f4t 0 o
C$, P.%
0
10- 0
y3 L 0 %
1> CY 3 co
Ny 04 C3z 9%
0% .3 4
10
N C C )
CD C
r1 Ln 0,

The content of this report includes:
o The types of steels tested
o Precautions taken to ensure premature failure of
the chains
o Types of corrosion observed from tested chain
o Date on chain wear from the field tests
o Comparison with the laboratory data
OBJECTIVE
The main objective of the research was to determine
whether an improvement can be achieved in the service life of
chain moorings through the use of alloy steels. Laboratory
testing was conducted to simulate the mechanisms involved in
the corrosive-wear of steel chain so that the effects of the
steel's composition, hardness, and microstructure on their
degradation could be determined in a controlled environment.
Field testing of the different steel chains provided more
realistic data for comparing their performance.
MATERIALS
Five different steel alloy chains were employed as mooring
chains for the buoys. The composition of the steels are shown
in Table 1 along with their respective hardness values. The
3

'I 0
01
o; 0 0 0;
0 0:
-1 0cc N
v% i ILn in
CJL I 9 !0 0 0 0 0
C.*l I1 ? I Iw L n n In in 0n
0 0 0 0o
N 0 0 0 0
In n r.- In.t .r co

variations examined were basically chromium, nickel and
molybdenum contents. The 4340 steel has the largest total of
these alloying additions with the 8740, 8610 then 4140 steels
decreasing in their alloying additions. The conventional
steel chain used by the Coast Guard contain none of these
alloying additions. The purposes of the alloying additions
are:
o Improving the hardenability of the steel
o Strengthening of the steel by the presence of the
additions in the ferrite
o Enhancement of uniform corrosion protection by
modifying the surface layers of the steel
However, by increasing the alloy content and strength, the
stress corrosion cracking (SCC) resistance decreases. The
alloy steels therefore require a temper to approximately Rc30
or less to avoid premature failure in them by SCC in the
marine environment. As evident in Table 1, the alloy steels
in this research program were tempered to Rc30 or less to
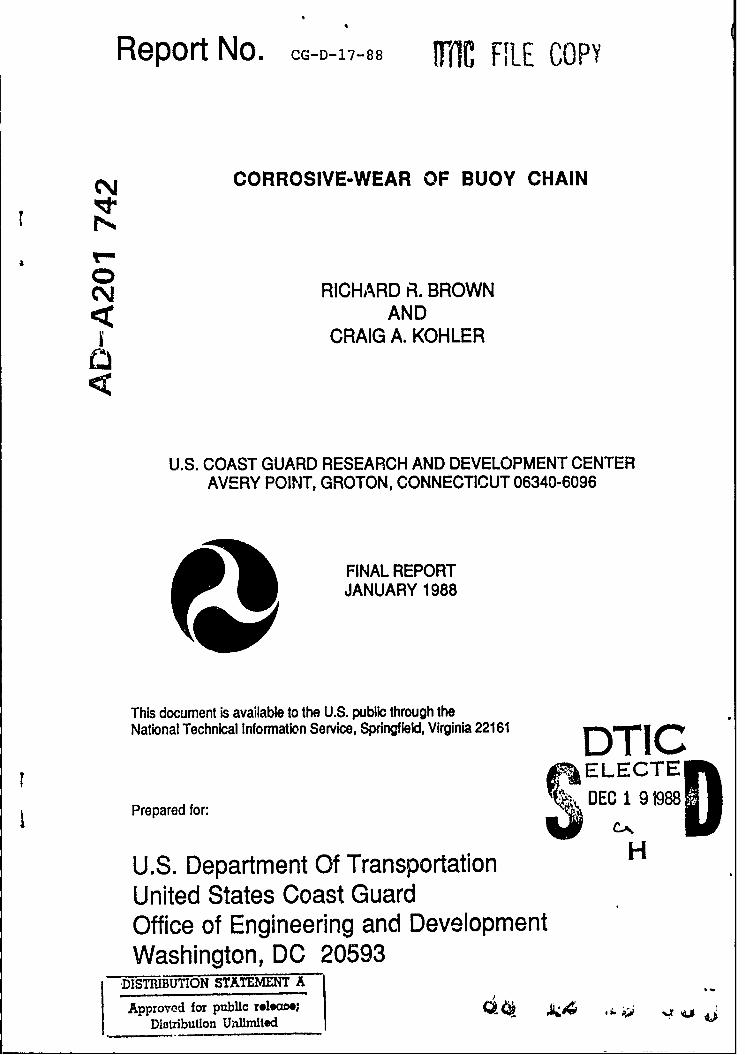
avoid SCC failure. In addition, tempering produces a
microstructure in the alloy steels of fine carbides in a
ductile body-centered cubic ferrite matrix. The
microstructures of the alloy steels are shown in Figures 2 to
5. In Figure 6 the 1022 steel microstructure of large ferrite
grains with fine areas of pearlite at the grain boundaries is
shown in contrast with the alloy structures.
5
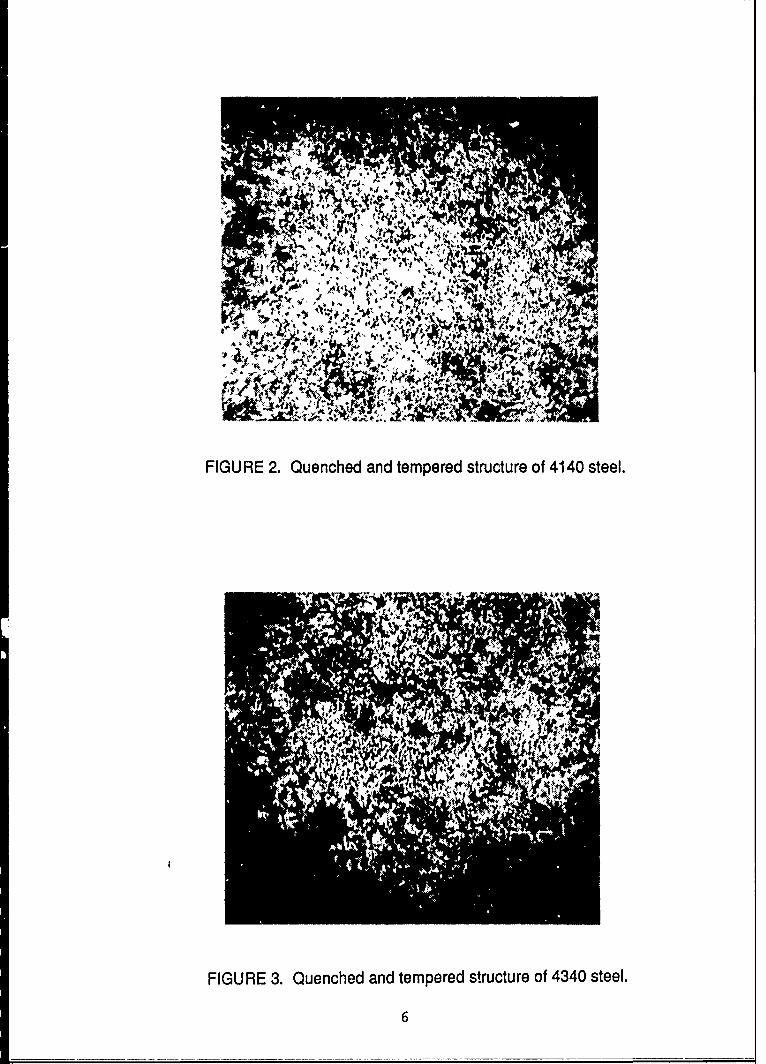
FIGURE 2. Quenched and tempered structure of 4140 steel.
' FIGURE 3. Quenched and tempered structure of 4340 steel.
74 6
|A
Vr

FIGURE 4. Quenched and tempered structure of 8740 steel.
FIGURE 5. Quenched and tempered structure of 8620 steel
7

FIGURE 6. Ferrite and pearlite structure of 1022 steel.
8

DESCRIPTION OF MOORING SYSTEM
The mooring system used for the field testing, shown in
Figure 7, consisted of the following components:
o Fourth class can buoy
o One shot (90 ft) of chain
o 2000 lb. concrete sinker
The buoys were constructed of sheetmetal filled with closed-
cell foam and weighed approximately 465 lbs.
The location of the buoys, shown in Figure 1, was selected
for several reasons. The most important of these is that the
buoys could be monitored at frequent intervals. Secondly, the
environment was semi-exposed. A wave height average of 24
feet and a current of less than one knot were observed.
Lastly, a water depth of 35 feet with a rough floor was
required.
PROCEDURE
The alloy steel chains were weighed initially with a
spring scale. The 1022 steel chain was weighed using a
calibrated load cell since the chain wasn't available to be
weighed with the others. Both instruments were accurate to
within one pound. Three readings were taken for each chain
and the average of these was used for the initial weights.
9

CC
C'4)
0
rn
0 '4CD
kN.0
0
0
0
w
U-
10

Link diameter measurements were obtained for all the
chains using a caliper micrometer. The accuracy of this
instrument was to within (.001 in). The measurements were
taken at two positions on the link, shown as dimensions "A"
and "H" in Figure 8. Measurements were acquired on ten links
at various locations along each chain and the averages were
calculated to yield the initial diameters for each position.
The mooring chains were placed in service on 29 August
1985. The moorings were inspected quarterly to ensure they
were in good condition and weren't wrapped around their
sinkers. The buoys were exposed to several severe storms
including Hurricane Gloria on 27 September 1985. One of the
buoys was reported sinking during the deployment period due to
a corroded plug. The buoy was repaired before it could sink
completely. An interim inspection was accomplished on 23
October 1986. The inspection consisted of pulling the chains
up to short stay which allowed for examination of the ends of
the chafe section and link diameter measurement at position
"A" with the caliper micrometer for some of the chains. In
addition, a diver obtained photographic dccumentation of the
bottom conditions. The buoys and chain moorings were removed
from service on 15 July 1987.
At the conclusion of the field testing the final weights
of all the chains were obtained using the calibrated load
cell. As with the initial weights, three readings were taken
11
cyW o o'm ZS
04 C.0
C), 0
_____Es §1_ _ __ _
C)I
(I) 0)Vi
LL 4-aL tb 0.
ClC
> C4
£00
£0
LLI01
CUL
'( E LA)j )C
122

for each chain and the average weight calculated. Although
each chain experienced some marine growth, this was assumed to
be equal for all chains and would not change the results
significantly.
Link diameter measurements were also collected at the same
positions on the links, "A" and "H" in Figure 8, using the
caliper micrometer. The measurements were obtained from the
links closest to the sinker, where high wear rates were
observed.
RESULTS
Initial weights of the chain prior to marine exposure are
shown in Table 2 along with the weights after two years of
exposure. The general condition of the chains during weighing
is shown in Figure 9. Also shown in Table 2 is the general
condition of the ocean floor surrounding the sinker. The two
ocean floor types, namely sandy and rocky, are shown in
Figures 10 and 11. The weight loss of chains was largely
influenced by the ocean floor rather than the chain type.
Both steels exposed to a sandy floor lost the least weight
while a rocky floor resulted in maximum weight loss. It was
unfortunate that the ocean floor varied so rapidly in such a
short distance.
All the link dia;,eter measurements recorded using the
caliper micrometer are listed in Table 3. The average initial
13

TABLE 2
CHAIN WEIGHT DATA
Steel Initial Weight Final Weight Change Floor
(lbs) (lbs) (lbs)
1022 410 371 -39 Sand
4140 413 376 -37 Sand
4340 409 363 -46 Sand+Rock
8740 407 356 -51 Rock
8620 406 353 -53 Sand
14

FIGURE 9. Chain appearance after two years of exposure, 1022 steel.
15

FIGURE 10. Sandy ocean floor. Note chain motion markingsin the sand indicating lateral motion.
FIGURE 11. Rocky ocean floor with six to twelve-inch diameter rocks.
16

TABLE 3
CHAIN LINK DIAMETER DATA
Initial Link Diameter Mid-term Link Final Link(in.) Diameter (in.) Diameter (in.) Material Loss
Stee._ l__ "Alal N "A" $O O $H2_1 (in.) .).
.776 .782 .740 .742 .701 .572 .444
.775 .780 .755 .730 .565 .444
1022 .775 .780 .731 .735 .575 .436
.776 .778 .730 .739 .530 .422*
.773 .772 .741 .744 .529 .432
AVE. = 0.777 AVE. s 9.739 AVE. = 0.554 AVE. z 0.435 0.304 41.1
.755 .755 .728 .726 .748 .552 .443
.752 .754 .731 .727 .744 .548 .437
4140 .749 .752 .726 .728 .697 .566 .443.752 .752 .721 .721 .685 .574 .451
.756 .758 .725 .721 .427*
AVE. 0.754 AVE. = 0.725 AVE. a 0.560 AVE. 0.440 0.285 39.3
.754 .751 .722 .736 .705 .542 .474
.756 .751 .729 .725 .665 .541 .487
4340 .752 .753 .730 .722 .657 .549 .497
.756 .758 .725 .722 .483*
.751 .752 .729 .727 .488
AVE. = 0.753 AVE. = 0.727 AVE. = 0.544 AVE. = 0.490 0.237 32.6
.754 .759 .726 .732 .654 .602 .559
.752 .757 .729 .726 .681 .620 .564
8740 .753 .750 .738 .727 .669 .612 .563
.751 .752 .731 .730 .546
.754 .756 .730 .727 .544
AVE. = 0.754 AVE. = 0.730 AVE. = 0.611 AVE. = 0.555 Data not valid
.767 .753 .723 .741 .697 .595 .437
.769 .750 .725 .724 .693 .585 .440
8620 .759 .752 .729 .743 .705 .594 ,434*
.764 .758 .738 .726 .590 .441
.760 .755 .727 .721 .573 .453
AVE. = 0.759 AVE. = 0.730 AVE. = 0.587 AVE. = 0.441 0.289 39.6
*Indicates smallest diameter Link
17

and average final link diameters at position "H" were used to
compute the loss in diameter of the chafe section for each
chain since the greatest wear occurred at this position. The
percentage losses were then calculated to allow for comparison
between the steels. An asterisk indicates the smallest link
measurement for each chain which indicates the so-called
"weakest link" where failure would most likely occur.
A visual examination of the chains was conducted to note
dny damage from corrosion or other processes not involved in
the wear action that may induce -chain failure. On the alloy
steel chains some accelerated corrosion was evident adjacent
to welds. A typical example is shown in Figures 12 and 13.
For the usual 1022 steel chain a much narrower attacked zone
was found, Figure 14. The narrow weld attack observed was
typical of the damage found on chains recovered from service.
It should be noted that the narrow attack region would
generally be more deleterious to stress corrosion cracking
(SCC) than the wider, shallower corrosion noted on some of the
alloy steel chains. Other features noted on the chain which
would be deleterious to the mechanical strength of the chain
were pits from localized corrosion on the chafe section of the
chain.
Figures 15 to 19 show pits on the chains in the order of
the best pitting resistance to the worst. In material terms
the best, most pit-resistant material was the 4340 steel while
the 1022, 8620, 8740 and 4140 were the decreasing order of pit
18
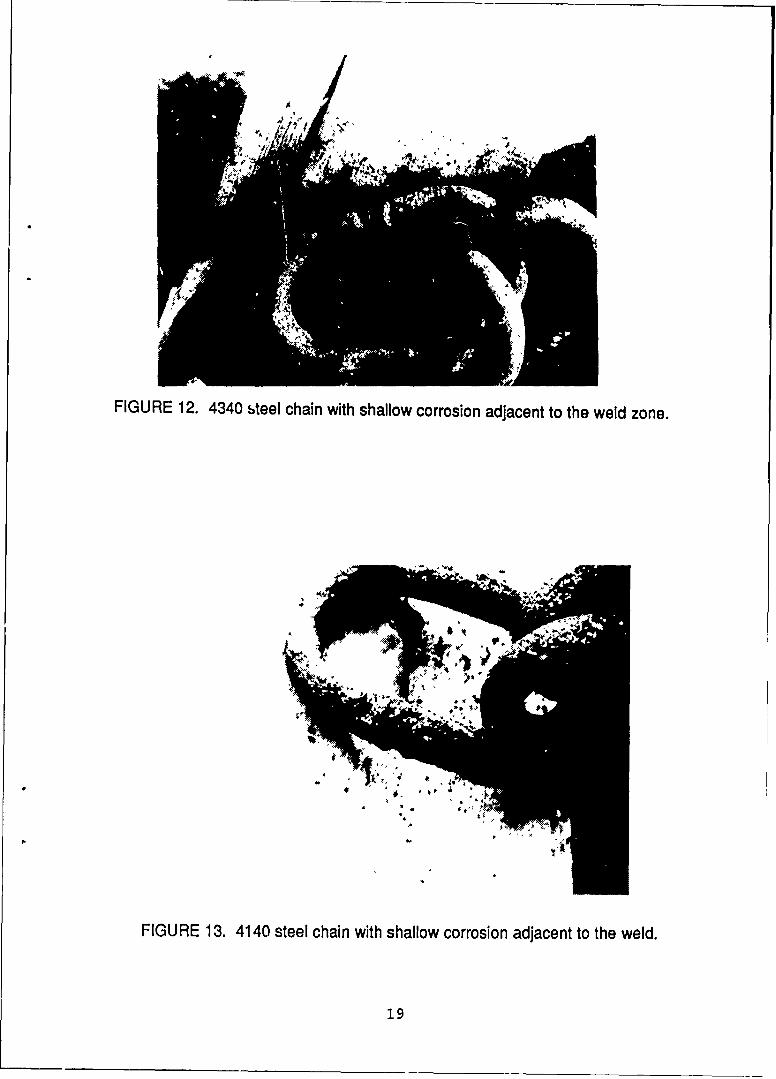
FIGURE 12. 4340 ,teel chain with shallow corrosion adjacent to the weld zone.
FIGURE 13. 4140 steel chain with shallow corrosion adjacent to the weld.
19

FIGURE 14. Weld region of 1022 steel chain. Note sharply definedcorrosion at the weld..
FIGURE 15. 4340 chain in chafe section with no major pits.
20

FIGURE 16. 1022 chain in chafe section with shallow elongated pits.
FIGURE 17. 8620 chain with long shallow pits in chafe section.
21

FIGURE 18. 8740 chain with deep pits.
FIGURE 19. 4140 chain with deep pits connecting together.
22

resistance. The 4340 steel chain, shown in Figure 15, shows
no evidence of pitting. The pitting resistance order is the
same reported previously from visual examination of chafe
section at quarterly periods and reported in the annual
report. The importance of these pits is that they are
nucleation sites for crack initiation under SCC and
effectively weaken the chain. Pit growth is highly
undesirable in that detection is difficult and may lead to a
premature failure of the mooring.
Microstructural examination of 4340 welds after exposure
indicated no cracking in the weld zone, Figure 20. The
tempered martensite structure of the 4340 was therefore
reasonably stable in the marine environment.
DISCUSSION
The data collection of the field testing consisted of
chain weight measurements, link diameter measurements,
microstructural examination, and visual observations. The
link diameter measurements were the most critical part of the
data in that they would determine which chain performed the
best, since it is reduction in link cross section which causes
failure of the mooring. However, these measurements have the
highest potential for error. An example of this is evident in
the final link diameter measurements of the 8740 steel chain.
The link diameter of this chain is approximately 0.1 inches
23

FIGURE 20. Microstructure of weld zone in 4340 steel showing no cracksafter two years of exposure.
24

larger than all the other chains; however, the weight loss of
the chain was one of the highest and the laboratory data
didn't predict the chain to perform well. A reasonable
explanation for this occurrence can be found in the diver
inspection reports. The chain was found to be tangled in
rocks in both June and October 1986. Estimating the chain to
have been tangled at least six months, the reduction in wear
would be accounted for by the lack of movement of the chafe
section. The remainder of the chain would still undergo wear
on the hard rocky bottom which would exp.ain the overall
weight loss. Therefore, the 8740 link diameter data is
considered to be invalid.
A more practical method for evaluating the performance of
the chains is to compare the smallest link diameter
measurements. Using the weakest link data, the 4340 steel
performed better than all the other steels though it was
located on a semi-rocky bottom. The typical buoy chain steel,
1022, exhibited the worst performanie.
A comparison of the 4140 steel chain with the 1022 steel
chain shows some unexpe,:ted results. Both chains were located
on the sandy ocean floor and from laboratory testing,
Reference 2, the 4140 steel should have greatly outperformed
the 1022 steel. However, there was little weight loss and
diameter loss difference between the two steels. One possible
explanation for this result is that interlink wear was a
25

primary mechanism of material loss. Link shape reflects the
increased material loss by the cu.rved chain portion having
considerably more material loss than the remainder of the
link. The 1022, 4140, and 8620 steels showed higher wear
measurements at position "H" than those at position "A" which
supports this theory. However, the 4340 steel showed minor
difference in wear at the two positions. Barrel wear would
account for the majority of the wear observed for this chain.
It appears that the interlink wear is a much more damaging
process than barrel wear. This conclusion is not only
supported by the data but observations as well. The reason
for the 1022 and 4140 steels having the same wear rate despite
hardness, compositional and microstructural differences is not
obvious. Clearly, the wear mechanisms for buoy chains on the
ocean floor are very complex.
CONCLUSIONS
As evidenced by the field testing performed in Reference 1
and in this study, obtaining highly accurate and reliable data
is difficult. The chain moorings must be exposed for long
periods of time to simulate actual service conditions. The
moorings may experience different conditions even though they
are positioned close together. However, by combining the
results of weight loss and link diameter measurements with
visual observations both during and after the testing, an
effective evaluation of chain mooring performance can be
achieved.
26

From the data collected in this study, the best material
choice to replace 1022 steel for buoy chain usage would be
4340 steel chain tempered to a hardness of Rc28. Previous
laboratory studies on corrosive-wear of steel in a marine
environment, Reference 2, indicated that 4340 steel would
probably be the material of choice. Over the two-year test
period the 4340 steel exhibited the least pitting of all the
chains. From a weight loss perspective other chain material
performed better. However, the weight loss was a function of
the ocean floor condition. For the rocky ocean floor, the
4340 steel lost less weight than the 8740. Laboratory data
supports the view that the 4340 will outperform 1022 steel
currently in use. This was supported by the link diameter
measurements in the chafe section where the 4340 steel
performed the best. The 4340 steel showed the best resistance
to interlink wear, which appears to account for the majority
of degradation in chain integrity. Additionally, the 4340
steel is of higher strength than the 1022 steel.
The difficulty with U.S. Coast Guard usage of the 4340
steel for buoy chain is availability. Presently, there are no
chain manufacturers in North America who produce this chain.
Foreign manufacturers could be an alternative; however,
rigorous inspection of the manufacturing process is required.
Stress corrosion cracking may occur, especially in sizes
greater than and including one inch diameter, if proper
27

welding and post heat treatment procedures are not applied.
Therefore, the cost and complexity of obtaininci this aiioy
steel chain make it unsuitable for buoy chain use at the
present time.
REFERENCES
1. Laing, A.K., Buhr, R.K., and Gertsman, S.L., Navigacional
Buoy Mooring Chains, Technical Report by the Canadia i
Dtipartment of Mines and Technical Surveys, 1965.
2. Kohler, C.A., May, D.A., Briggs, T.H., and Brown, R.R.,
Corrosive-Wear of Buoy Chain: Interim Report, U.S. Coast
Guard Report No. CG-D-21-86, July 1986.
28