Embed Size (px)
Citation preview

Report No. 7269-PH
Philippines:Energy Sector StudySeptember 15, 1988
Industry and EnErgy DivisionCountry Department IIAsia Region
FOR OFFICIAL USE ONLY
Document of the World Bank
This document has a restricted distribution and may be used by recipientsonly in the performance of their official duties. Its contents may not otherwisebe disclosed without World Bank authorization.
Pub
lic D
iscl
osur
e A
utho
rized
Pub
lic D
iscl
osur
e A
utho
rized
Pub
lic D
iscl
osur
e A
utho
rized
Pub
lic D
iscl
osur
e A
utho
rized

CURRENCY EQUIVALENTS
Currency Unit Philippine Peso (P)US$1.00 = P 21
WEIGHTS AND MEASURES
MMTOE = Million tons oil equivalentMMBOE = Million barrels oil equivalentBOPD = Barrels of oil per dayMW = Megawatt (1,000 kilowatts)lIWh = Terrawatt-hours (billion kilowatt-hours)kWh = Kilowatt-hours (1,000 watt-hours)kV = Kilovolt (1,000 volts)km = Kilometer (0.6214 mile)MWh = Megawatt hour (1,000 kilowatt-hours)
ABBREVIATIONS AND ACRONYMS
ADB - Asian Development BankBED - Bureau of Energy DevelopmentBEU - Bureau of Energy UtilizationEHV - Extra High VoltageERB - Energy Regulatory BoardHVDC - High Voltage Direct CurrentHVAC - High Voltage Alternate CurrentMERALCO - Manila Electric CompanyMOE - Ministry of EnergyNEA - National Electrification AdministrationNEDA - National Economic Development AuthorityNPC - National Power CorporationOEA - Office of Energy AffairsPCI - Philippine Geothermal Inc.PNOC - Philippine National Oil CompanyPNPC-EDC - PNOC-Energy Development CorporationPNOC-EDI - PNOC-Energy Drilling Inc.PNPP - Philippine Nuclear Power PlantSCC - Semirara Coal Corporation

FOR OFFICIAL USE ONLY
ENERGY SECTOR STUDY
Table of Contents
Page No.
Summary and Conclusionso................ e..... ..................... i
Part One: Energy Development Policy
I. AN OVz&¶IEW OF THE ENERGY SECTOR.......... .......... 1
A. The Macroeconomic Context ..................****.......... . IB. Energy Resources and Production...... . .... ....... 1
| ~~~~~C. Energy Demand .... .0....... . ....... 0........ .0-.000. .................. 3D. Institutional Framework ....... ..... . ............. .......o...o . 5
II. POWER SECTOR DEVELOPMENT PROGRAM ........... o ................ 7
A. Introduction..* .. 000 . 00000000..0-. 7B. Demand Forecast..o..r... ........ ... .. o.. .......... 7C. Present Generating l?acilities..*cit...ie.. ..... 9Do Least-Cost Expansion Plan..ooooo...o..o ... 10E. Sensitivity A sa l y s i s 15F. Other Giids 16Go Conclusionse.**..*.**oo*ea .. oo*oo* 17
III. COAL DEVELOPMENT AND UTILIZATION POLICY............... o.... 19
Ao Introduction ...... 19B. Coal Consumption* ...... .. .. .............. oooo.... 19C. Coal Productiono.. tu...oo.o n..... o.o ............... *oo. 20D. Major Policy Issues.**.e ..... s..ooo ........... oo.o.. 22E. Conclusions and Recommendations....................... 27
IV. GEOTHERMAL DEVELOPMENT AND UTILIZATION POLlCY... lCY......oo 29
Ao Intoutionuot i o n 29B. Organizational Structure. . o.o...... o.. . . o. ...... 29C. Assessment of Geothermal Resources.................... 30D. Cost of Geothermal Exploration and Development-om......nt 32E. The Tongonan Projecto.oj etoo.ovo. oo.. o.... ....... .... 34F. Major Issues in the Sectoroe ct.o.......o or.... o....or... 36G. Conclusions and Recommendations.m.....d t... o.....n.o.... 38
This document has a restricted distribution and may be used by recipients only in the performanceof their official duties. Its contents may not otherwise be disclosed without World Bank authorization.

Page No.
Part Two: Energy Pricing Policy
V. ENERGY PRICING .................. ................ ................... . 40
A. Introduction ... *.********* ............ *to ........... .* ........... 40B. Petroleum Product Prices. .. .......... t ............. . *... . 40C. Electricity Tariffs . ...................... .*. 42D. Steam Prices ....................... .... ... *.. .......... 46E. Coal Pricing Policy .. 48F. Recommendations ..................... ............. . 49
Part Three: Operational Issues
VI. TECHNICAL AND ECONOMIC ASPECTS OF POWER PLANTREHABILITATION ..................... **..* .................... #** .... 51
A. Introduction ....... .......... 51B. Technical Aspects of Plant Rehabilitation................ 51C. Economic Analysis of Plant Rehabilitation*................ 57D. Centralized Maintenance Capabilities&..................... 60E. Conclusions and Recommendations ............ .... .... 62
VII. TRANSMISSION AND DISTRIBUTION LOSSES ........................ 64
A. Introduction ... ................................... 64B. Technical Characterstics of the Distribution System ...... 64C. Technical Losses.*.*.**** ............... .... . . 67D. Non-Technical Losses* ....... * .... ...... **.s. 68E. Measures Taken by MERALCO.*.*. . .. ..... * . ..... ..... . 70"'. Conclusions ........ .0*0.... 000......................................... 71
VIII. FINANCIAL ISSUES FACING THE POWER SECTOR . .......... 73
A. Introduction ..... 000 ... . ........................ .................. 73B. Local Currency Funding Constraints .......... ............... 74C. Shortages of Equity Capital.o ..................... 79D. Government Support for Electricity Retailing Activities.. 82E. Conclusions.. ....... #0...... 0 ........ 84

ANNEXES
Annex 1.1 - Commercial Energy Balance, 1987
Annex 2.1 - NPC's June 1987 Generation Expansion ProgramAnnex 2.2 - Calculation of Levli-eO Generation CostsAnnex 2.3 - Underlying Assumptios. " the Least Cost Development ProgramAnnex 2.4 - Results of Least-Cost De.c_opment Plan
Annex 3.1 - Coal Consumption by End UseAnnex 3.2 - Coal Production and ImportsAnnex 3.3 - Historical and Projected Prices of CoalAnnex 3.4 - Environmeuntal Effects of Power and Coal Sector Development
Annex 4.1 - General Characteristics of Operating Geothermal Fields in thePhilippines
Annex 4.2 - Analysis of Geothermal Exploration ActivitiesAnnexi 4.3 - The Cost of Exploration and DevelopmentAnnex 4.4 - The Cost of a 110 MW Field: A Typical Case Versus Historical
CostsAnnex 4.5 - PNOC's Geothermal Development Module: Estimated ExpendituresAnnex 4.6 - Historical Costs of Geothermal Exploration and DevelopmentAnnex 4.7 - Estimated Cost of Geothermal Exploration and Development at
PinatuboAnnex 4.8 - Estimated Cost of Geothermal Exploration and Development at LaboAnnex 4.9 - Annual Operating and Maintenance Cost of the Bacon-Manito PlantAnnex 4.10 - Estimated Cost of Tongonan Development
Annex 6.1 - Summary of Technical Data fcr NPC Oil Fired Power PlantsAnnex 6.2 - Data and Assumptions underlying Economic Analysis of Plant
RehabilitationAnnex 6.3 - Partial Rehabilitation of Sucat Units 1 and 4Annex 6.4 - Cost Estimates for Partial Rehabilitation of Sucat Units 2 and 3Annex 6.5 - Cost Estimates for Full Rehabilitation of Sucat Units 2 and 3Annex 6.6 - Rehabilitation Program: Unit Outage ScheduleAnnex 6.7 - Cost Estimates for Restoration Program of Bataan Units 1 and 2Annex 6.8 - Cost Estimates for Restoration Program of Manila Units 1 and 2Annex 6.9 - List of Equipment for Fabrication ShopAnnex 6.10 - NPC Training Courses
Annex 7.1 - Estimation of Technical LossesAnnex 7.2 - Manila Electric Company: Yearly System Losses
Annex 8.1 - National Power Corporation: Key Financial IndicatorsAnnex 8.2 - Manila Electric Company: Key Financial Indicators

This report was prepared by an energy sector mission that visitedPhilippines from January 24 to February 19, 1988. The mission comprised:
1. Hossein Razavi, Senior Economist/Mission Leader2. Anil Malhotra, Senior Energy Specialist3. Jamil Sopher, Senior Financial Analyst4. Paul Dyson, Senior Mining Engineer5. Mihir Mitra, Power Engineer6. DeAnne Julius, Energy Pricing Specialist7. Mudasar Imran, Economist8. William Berge, Geothermal Specialist9. Richard Buckland, Coal Specialist10. M. Rozali, System Planning Engineer11. Alfred Banks, Power Plant Engineer12. Miguel Diaz, Power System Engineer
The mission gratefully acknowledges very effective cooperation fromthe Office of Energy Affairs (OEA), the National Economic DevelopmentAuthority (NEDA), the National Power Corporation (NPC), the PhilippineNational Oil Company (PNOC), the Manila Electric Company (IWEBALCO), theSemirara Coal Corporation (SCC) and the Energy Regulatory Board (ERB). Themission also acknowledges very beneficial discussions with the chairmen andcertain members of the House Committee on Energy, the Senate Committee onPublic Utilities and the Senate Committee on Natural Resources*

SUMMARY AND CONCLUSIONS
Background and Objective
1. Throughout the period following the oil crisis of the mid 1970s, theenergy policy of the Philippines has focused on developing indigenous energyresources and promoting more efficient energy usage. Indigenous energyresource development involved heavy government participation in developingoil, geothermal, coal and hydro resources. Energy demand management initiallyfocused on direct intervention, with fuel allocation and rationing schemesused during periods of tight supply. However, energy pricing was soon recog-nized as a more permanent and effective policy tool for managing demand. Theresults of steps taken to meet the above energy policy objectives have beenimpressive. Imported oil's share of total energy use has declined from 95% in1973 to 56% in 1986, and energy consumption patterns indicate improvingefficiency in energy use.
2. Despite the notable past success in resource development and demandmanagement, the sector now faces a number of issues with regard to its medium-and long-term development strategy and efficient utilization of availableresources:
(a) Previously, increases in electricity demand in Luzon were expectedto be met by generation from the 620 MW Philippine Nuclear PowerPlant (PNPP). However, the Government's decision in 1986 tomothball PNPP along with the "downgrading of generating capacity i.the Tiwi geothermal power plant and the relatively ;..-p increase inpower demand in 1987 have created a sudden need to re-examine andoptimize energy choices in order to meet the expected demandincreases;
(b) The recent collapse in international energy prices has introducedconsiderable uncertainty regarding the economics of domestic energyproduction. In particular, the development of domestic coal andcertain hydro resources may no longer be viable alternatives toenergy imports;
(c) Pricing of geothermal steam and domestic coal has been continuouslydisputed among the concerned entities and has created a bottleneckin planning by the agencies responsible for developing theseresources;
(d) The Government's decision to abolish the Ministry of Energy has ledto a lack of coordination of energy sector activities and, inparticular, a lack of clear direction for energy resource develop-ment; and
(e) Certain problems in the operational efficiency of the power sectorhave created considerable concern: electricity losses haveincreased from about 8Z in 1980 to more than 20% in 1987; rehabili-tation of oil-fired power plants needs to be decided urgently; andfinancial issues facing the power sector need to be resolved.

- ii -
3. The purpose of this study is to review: (a) the prospects fordevelopment of the country's indigenous energy resources, including hydropower, geothermal and coal resources; (b) the pricing of geothermal steam,coal, electricity and petroleum products; and (c) selective operational issuesin the power sector including power plant rehabilitation, transmission/distribution losses and financial issues facing the major entities in thesector. Based on this review, a short-, medium- and long-term strategy fornational energy development is suggested.
Energy Demand
4. Energy consumption in the Philippines fell from a peak of 9.2 mil-lion tons of oil equivalent (MMTOE) in 1Q79 to 7.1 MMTOE in 1985 in responseto a program of demand managemuent and a slowdown in economic activity. Withthe resumption of economic growth in 1987, chis trend has been reversed,resulting in total energy consumption of 9.6 MMTOE in 1987. Demand isexpected to continue growing over the next five years by an estimated 4.7%p.a. In 1987, the industrial sector accounted for 51% of tot l energy demand,followed by the transport sector with 32% of demand and resid..tial/commercialuses with 14%. Over 80% of total energy demand is met by petroleum productsand 15% is met by electricity, mainly for residential/commercial uses andindustry.
5. Electricity demand is forecast to grow at an annual average rate of5.4% over the period 1988-2000. This "base-case" forecast assumes a GDPgrowth rate of 5.8% in 1988-92. and 6.3% for 1993-2000. Despite theassumption of an increasing GDP grow'h rate, growth in power demand isexpected to be relatively stable due to declining trends in electricity/GDPelasticities. The mission developed also high and low growth scenarios. Thehigh-growth scenario is based on a GDP g.owth rate of 7.5% p.a., and indicatesa power demand growth of 6.5% p.a. The low growth scenario is based on a GDPgrowth rate of 5.2% p.a. and results in electricity consumption increasing at4.8% p.a.
Domestic Sources of Energy
6. The Philippines has only modest amounts of indigenuus energysources. Proven petroleum reserves are estimated at 4 million tons, naturalgas deposits are considered subcommercial, probable uranium v-serves are esti-mated at 1.2 MMTOE, and total potential coal resources are estimated at about1,500 million tons, with the largest proven deposits located on the smallisland of Semirara and in the Cagayan Valley of northern Luzon. Hydropowerresources, by contrast, are quite substantial, with a theoretical power poten-tial of over 10,000 MW. However, development of these resources is relativelycostly due to the distance of the better sites from the main transmissiongrid.
7. The country's main potential domestic energy resource is geothermalsteam. While the geothermal reserves have not been fully evaluated, theycould exceed 8,000 MW. Based on current information, there are about 4,431 MWof probable reserves, 1,640 MW of which nave been tested, but only 894 MW of

- iii -
capacity has been installed. About 3,000 MW of total pJotential reserves areon Luzon, but only 700 MW is being utilized. Most of the remaining geothermalresources are on the island of Leyte, which has potential geothermal resourcesestimated at about 2,000 MW, of which 400 MW is available from the Tongonanfield. Utilization of the Tongonan reserves would require the construction ofan overland/submarine transmission line from Tongonan to Luzon Island.Depending on whether this line is high voltage direct current (HVDC) or highvoltage alternate current (HVAC), the line would cost between US$210 millionand UJS$370 million. Further development of Tongonan reserves will require adetailed feasibility study to (a) determine the exact routing of the line;(b) estimate the impact of the line on the stability of the Luzon grid; and(c) decide whether HVDC or HVAC is technically appropriate.
Institutional Framework, Coordination and Planning
8. Policy formulation and planning of the energy sector are theresponsibilities of the Office of Energy Affairs (OEA), a new agencyestablished in mid-1987 to take over the functions formerly carried out by thenow abolished Ministry of Energy. OEA reports to the Office of thePresident. Other key sectoral institutions are: the Philippine National OilCompany (PNOC), responsible for developing indigenous hydrocarbon andgeothermal resources; the National Power Corporation (NPC), responsible forpower generation and transmission; the Manila Electric Company (MERALCO), aprivate company supplying electricity to the Metro Manila area; the state-owned Semirara Coal Corporation (SCC), the major coal producer; and theNational Electrification Administration (NEA), responsib e for rural electri-fication.
9. PNOC and NPC were att&ched to MOE prior to its abolition, anarrangement which allowed effective coordination of sector policies andprograms and contributed to the Philippines' rapid and successful drive todevelop domestic resources and curtail consumption. Currently, however, OEAis organizationally distinct from PNOC and NPC (which are also under theOffice of the President) and lacks the authority to carry out its coordinationand decision-making functions for the sector. As a result, sectoral policiesand investment programs lack cohesion and reflect inadequate long-rangeplanning. The lack of a strong central agency in the sector has also alloweddisagreements between PNOC and NPC over critical issues like steam pricing toremain unresolved for a relatively long period of time, with consequent anddeleterious effects on sector development.
10. To relieve this situation, it is recommended that an EnergyCoordination Council be set up in the Office of the President to be headed bythe Executive Secretary, with the Presidents of NPC, PNOC and SCC and theExecutive Director of the OEA as members. The OEA should then prepare a long-term plan for energy deNelopment for the country, in consultation with thethree major public sector energy agencies and under the overall framework ofthe economic plans prepared by the National Economic and Development Authority(NEDA). This plan should be formally ratified by the Energy CoordinationCouncil on ar annual basis. All investments in the energy sector whichrequire the commitment of government funds should be in consonarce with theenergy plan approved by the Energy Coordination Council. It would be the

- iv -
responsibility of OEA to ensure this through appropriate intercessions in thedeliberations of the Investment Coordinating Committee, the government agencyresponsible for investment fund appropriations.
Economics of Various Sources of Energy
11. The development of Philippine's indigenous energy resources isclosely intertwined with that of the power sector. Just as geothermal steam,domestic coal and hydropower represent a large energy source fcr power genera-tion; so the power sector represents the major consumer of these resourceswithout which none of them is likely to experience substantial development inthe future. Thus, the development strategy of indigenous sources of energyneeds to be studied within a consolidated framework using the netback value tothe p.wer sector as a benchmark to assess the economics of these resources.
12. The mission carried out a least-cost analysis of the power sectordevelopment program for the Luzon power grid in order to establish a frameworkfor comparison of the economics of various sources of energy. The results ofthis analysis indicate that the average incremental cost (in 1987 dollars) ofenergy generated from alternative sources of energy is as follows:
US /kwh
Luzon geothermal 2.90Tongonan geothermalwith HVAC 2.72with HVDC 3.08
Imported coal 3.46Domestic coal 4.50Heavy fuel oil 4.32
13. The dynamic analysis using the investment programming package, WASP,resulted in the same economic ranking as the above. Thus the economicsequence of utilizing various sources of energy would be:
(a) to develop Luzen geothermal resources as much and as rapidly aspossible;
(b) to utilize Tongonan geothermal after a detailed feasibility studyproving its technical viability with HVDC line or with HVAC line ata reduced cost;
(c) to fill the gap between the growth in electricity demand and theavailable geothermal resources with power plants using importedcoal; and
(d) to replace imported coal with domestic coal as and if the relativeeconomic merits of domestic coal improves due to an unexpectedincrease in international energy prices.
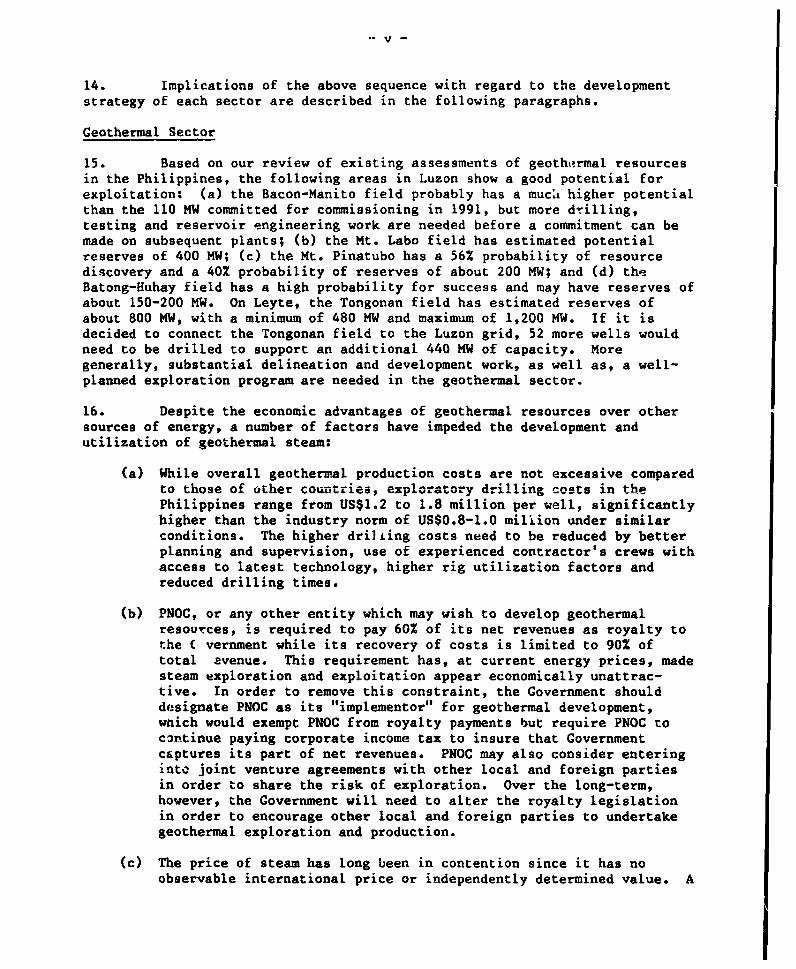
14. Implications of the above sequence with regard to the developmentstrategy of each sector are described in the following paragraphs.
Geothermal Sector
15. Based on our review of existing assessments of geothermal resourcesin the Philippines, the following areas in Luzon show a good potential forexploitation: (a) the Bacon-Manito field probably has a much higher potentialthan the 110 MW committed for commissioning in 1991, but more drilling,testing and reservoir engineering work are needed before a commitment can bemade on subsequent plants; (b) the Mt. Labo field has estimated potentialreserves of 400 MW; (c) the Mt. Pinatubo has a 56% probability of resourcediscovery and a 40% probability of reserves of about 200 MW; and (d) theBatong-Huhay field has a high probability for success and may have reserves ofabout 150-200 MW. On Leyte, the Tongonan field has estimated reserves ofabout 800 MW, with a minimum of 480 MW and maximum of 1,200 MW. If it isdecided to connect the Tongonan field to the Luzon grid, 52 more wells wouldneed to be drilled to support an additional 440 MW of capacity. Moregenerally, substantial delineation and development work, as well as, a well-planned exploration program are needed in the geothermal sector.
16. Despite the economic advantages of geothermal resources over othersources of energy, a number of factors have impeded the development andutilization of geothermal steam:
(a) While overall geothermal production costs are not excessive comparedto those of other countries, exploratory drilling costs in thePhilippines range from US$1.2 to 1.8 million per well, significantlyhigher than the industry norm of US$0.8-1.0 million under similarconditions. The higher drilling costs need to be reduced by betterplanning and supervision, use of experienced contractor's crews withaccess to latest technology, higher rig utilization factors andreduced drilling times.
(b) PNOC, or any other entity which may wish to develop geothermalresources, is required to pay 60% of its net revenues as royalty tothe C vernment while its recovery of costs is limited to 90% oftotal avenue. This requirement has, at current energy prices, madesteam exploration and exploitation appear economically unattrac-tive. In order to remove this constraint, the Government shoulddesignate PNOC as its "implementor" for geothermal development,wntich would exempt PNOC from royalty payments but require PNOC tocontinue paying corporate income tax to insure that Governmentcaptures its part of net revenues. PNOC may also consider enteringinto joint venture agreements with other local and foreign partiesin order to share the risk of exploration. Over the long-term,however, the Government will need to alter the royalty legislationin order to encourage other local and foreign parties to undertakegeothermal exploration and production.
(c) The price of steam has long been in contention since it has noobservable international price or independently determined value. A

- vi -
recent study has, however, proposed the principle of "avoided cost"to determine the price of steam in the Philippines and this has beenaccepted by both PNOC and NPC. In the case of a geothermal field onLuzon, th._ avoided cost is the break-even price of electricitygenerated from imported coal. This would enable NPC to generateelectricity from geothermal steam at the same cost as from a coal-powered plant, which is NPC's next best alternative. The missionhas estimated the avoided economic cost at USC2.4/kWh and theavoided f.nancial cost (after including duties on imported coal) atUS¢2.75/kWh. It is proposed that the steam price in Luzon be set atUSC2.7/kWh with the condition that PNOC absorb the exploration riskof resource development. This price would be appropriate for thenext four fields to be developed in Luzon and for the perceivedarrangement that two public entities (PNOC and NPC) produce and usethe geothermal steam. It is important to note that if a privatesector entity enters either or both of these activities, then aseparate pricing scheme would be needed to ensure that Gcvernmentwould capture the economic rent on geothermal resources.
(d) Coordination between PNOC as the geothermal producer and NPC as thesteam user needs to be improved and a mechanism established toassure the geothermal producer that the steam will be utilized whendeveloped and the power company that the steam will be availablewhen power plant construction is completed. Establishment of theproposed Energy Coordination Council (para. 10) would help resolvethis problem.
Coal Sector
17. Philippine coal resources, comprising thin seams of high qualitycoal and more accessible low quality coal, are considerably more expensive to
* mine than the resourc- q",ailable in the coal exporting countries, eveni allowing for the freight C differential. Domestic resources are currently
used to meet about half the 2._: million tons per annum of coal consumed by thecountry's power, cement and metal industries. There are two conflictingconsiderations in devising the future strategy for the coal sector. First,domestic coal is more expensive than imported coal. Thus, the mandated use ofdomestic coal imposes a significant burden on coal consumers in particular thepower and cement industry which may, in turn, hurt the internationalcompetitiveness of the industrial sector. Second, strategically, it is notunreasonable for the Philippines to have a domestic coal industry,particularly in view of fluctuating price of imported coal, lead time requiredfor mine development, and perhaps social considerations. The governmentstrategy should, therefore, allow for the financial survival of the existingcoal industry at its current stage of operation, but at the same time aim at(a) reducing the burden on coal users by narrowing the gap betweeninternational and domestic prices; and (b) preventing misallocation ofresources by limiting the expansion of the coal industry until and unlessinternational coal prices increase significantly.
18. In early 1988, the domestic price was about 15% above the purchasedprice (inclusive of duties) and 40% above the CIF price of imported coal. It

- vii -
is recommended that the domestic price of coal be maintained in nominalterms. Given the present projection of a relatively rapid increase in theinternational price of coal, the gap between the domestic and the import pricewill narrow substantially in the next few years. A fixed domestic price wouldresult in a parity with the purchased price of imported coal by 1990; there-after the duty on imported coal can be reduced gradually. The CIF price ofimported coal is expected to reach the level of domestic price by 1993-94.
19. With the above pricing policy, domestic coal will becomeeconomically cost effective within the next five years when the domestic pricewould give appropriate signals regarding economic viability of new investmentsin the sector. In the interim, however, the Government should limit theexpansion of the industry which might be triggered by the present prices.Candidates for major expansion in the coal industry are the Semirara andIsabela mines both of which are considered for supplying fuel to the powersector. NPC plans include a second 300 MW unit at Calaca, using Semirara coalas the fuel source, and a 300 MW mine mouth plant at Isabela in NorthernLuzon. With regard to Calaca, NPC's understanding was that the power plantshould be designed to use 100% Semirara coal and that the coal would beavailable by 1992 when the power plant will be commissioned. The missionreviewed the economic viability as well as the implementation constraints ofthe Calaca/Semirara development scheme. With the heat content of 7,200 BTU/lband the average cost of $40/ton, the cost of new coal on Semirara would bealmost twice the current CIF price of imported coal (on a BTU basis) and wouldstay 65% to 70% higher than the CIF price of $40/ton (12,000 BTU) projectedfor the early 1990s.
20. The mission reviewed the economic cost of the following alterna-tives: (a) to design Calaca II for imported coal and to use imported coal;(b) to design the plant for Semirara coal and to use Semirara coal; and (c) todesign the unit with the flexibility of using either imported or Semirara coalbut to use imported coal for the first five years (1992-1997) and Semiraracoal afterwards. The results indicate that the total discounted (investmentand fuel) cost of alternative (a) for a 300 MW power plant is US$568 millioncompared with a discounted cost of US$734 million for alternative (b), i.e.the additional cost to the country to use the Semirara coal is US$166 mil-lion. From this additional cost about US$22 million is due to the capitalcost differential of the power plant and about US$144 million to the coalprice differential. Alternative (c) reduces the additional cost imposed onthe economy from US$166 million to US$89 million. In view of the uncertaintyof international energy prices and the Government's desire to develop theindigenous resources, it is recommended that the Calaca plant be designed touse either domestic or imported coal, the premium paid for preserving thisflexibility being about US$20 million. NPC should use imported coal when thepower plant is commissioned in 1992 and switch to domestic coal in the late1990s if international coal prices increase beyond the current projections.On this basis, development of new Semirara deposits should be postponed untilthe late 1990s.
21. With regard to the proposed Isabela plant, analysis of this invest-ment scheme indicates that: (a) Isabela coal expansion is more costly thanthat of Semirara; (b) the Isabela plant would need a 400-km transmission line

- viii -
to connect with the main load center in southern Luzon, and (c) the Isabelaplant would have no flexibility to be able to use imported coal because of itsinland location. It is, therefore, recommended that the Isabela plant and itscorresponding transmission line be dropped from the NPC development plan.
22. By implementing the above pricing and investment policy, theGovernment would (a) allow the domestic coal industry to continue operatingexisting mines; (b) reduce the burden on coal consumers; and (c) provide aflexibility to expand the industry in the late 1990s if international pricesincrease substantially.
Power Sector
23. Based on current projections of power demand (base scenario,para. 5), the least-cost development program for the Luzon grid is as follows:
Year Plant Capacity (MW)
1989 Gas turbines 2001991 Bacon-Manito I geothermal 1101992 Bacon-Manito II geothermal 110
Calaca II coal 3001993 Luzon geothermal (Imported Coal*) 3301995 Tongonan geothermal I (Imported Coal*) 4501996 Kalayaan pumped storages 2 x 1501997 Tongonan geothermal II (Imported Coal*) 4501998 Imported Coal 3001999 Imported coal 2 x 3002000 Imported coal 2 x 3002001 Coal (imported/domestic) 2 x 300
* Fall back alternatives which need to be prepared for the eventthat geothermal resources cannot be committed on time.
24. This investment program is radically different from NPC's latestpublished investment program, which is heavily dependent on domestic coal andhydropower. Our least-cost analysis indicates that NPC should:
(a) defer its plans to construct the San Roque (390 MW), Casecnan (268MW) and Binongan (175 MW) hyrdo projects until and unless furtherstudies show substantial reduction in the estimated cost of theseplants; only installation of Kalayaan pump storage appearseconomical in conjunction with and complementary to the Tongonanplant;
(b) cancel its plan to construct the Isabela coal units (300 MW);
(c) cancel plans for construction of the Northern Luzon EHV (extra highvoltage) line which would have been needed in conjunction withIsabela and the hydro units;

- ix -
(d) change the design of Calaca II from dependence on domestic coal tothe use of either imported or domestic coal, but plan to useimported coal at least until the late 1990s;
(e) include the Tungonan geothermal project in its development plan; and
(f) continue to carry out preparation studies of plants using importedcoal to be implemented if (i) the demand grows faster than assumedhere, (ii) Luzon geothermal is not available in full capacity forcommissioning in 1993, or the Tongonan plant cannot be constructedfor commissioning in 1995.
25. It is very important to note that the main thrust of the least-costplan is the composition of the program based on the viability of thecandidates included in the program (Luzon geothermal, Tongonon geothermal andimported coal) and the non-viability of candidates excluded from the p-ogram(further domestic coal, and hydro power plants). The commissioning dates forthe included candidates can and should be adjusted based on growth in demandand practical constrainLs in implementation. In particular, the commissioningdates indicated in the program are based on full availability of Luzongeothermal resources. If PNOC cannot commit the timely availability of 330 MWfor commissioning in 1993, a 110 MW of Luzon geothermal should be constructedfor commissioning in 1993 and a 300 MW coal unit should bie built forcommissioning in 1994. As stated earlier, the development strategy for thepower sector should be (a) to commission Luzon geothermal plants as much andas early as possible (b) to develop Tongonan geothermal as soon as possibleafter the feasibility study is completed and (c) to supplement the gap betweenthe demand and geothermal supply, with thermal plants using imported coal. Inaddition, the short-term shortages in generating capacicy have to be met byinstalling gas turbines. The total capital cost of this investment programwill be US$337.3 million compared with US$3,373 million of the NPC'sdevelopment plan. Taking account of price escalations, the financingrequirements of the mission's proposed program will be about $4,700 million ofwhich US$2,980 million will be in foreign exchange. The mission carried out asensitivity analysis of the least-cost program with respect to assumptions onload growth, fuel prices and capital costs of various plants. This analysisindicates that the above least-cost sequence remains unchanged within areasonable range of variation in underlying assumptions (para. 2.20).However, it is noted that the least-cost development plan should becontinually updated as the underlying parameters change over time.
Key Issues In the Power Sector
26. Aside from the institutional and investment issues discussed above,several critical pricing, operational and financial issues in the sector needto be addressed and resolved for efficient development and operations of thepower sector.
27. Electricity Tariffs. Despite the prevailing perception, electricityprices in the Philippines are not excessively high ccmpared with average ratesin other ASEAN countries. However, the structure of tariffs is noteconomically efficient and leads to inefficient use of power and cross-subsidy

x
among various users. In particular, industrial customers are paying tariffshigher than cost of service in order to subsidize smaller users. The currenttariff structure should be revised to reflect the real cost of supplyingenergy and capacity to different consumers, perhaps even at different times ofday. This task should begin by NPC in cooperation with MERALCO so that long-run marginal cost (LRMC) pricing signals can be provided first to the indus-trial and other large electricity consumers in and around Manila. Over timethis may lead to a better dispersion of energy-intensive industry to otherareas and islands. In the meantime, it will provide a fair basis for chargingand a benchmark against which to measure the need for future tariff changes.
28. Our analysis indicates that a move towards LRMC pricing would notrequire a significant increase in average tariffs. Only after 1991 is a realincrease required. This provides ample time for a revenue-neutral restructur-ing of NPC's and MERALCO's tariffs and for implementation of a trial programof time-of-day metering. The mission's proposal for the capacity and energycharges of an LRMC-based tariff structure is presented in para. 5.12.Implementation of this proposal would reduce the cross-subsidy by .argeindustrial consumers of other customer groups and increase the economicefficiency of electricity use.
29. Power Plant Rehabilitation. Metro Manila has five major fuel oil-fired thermal plants: NPC's Malaya (600 MW), Sucat (850 MW), Manila (200 MW)and Bataan (225 MW) stations and MERALCO's Rockwell station (225 MW). Two ofthese plants (Sucat and Rockwell) are in very poor operating condition andwould need major repairs to remain in service. The Manila and Bataan.stationsare essentially at nameplate rating but need major overhaul work. Malaya hasrecently been rehabilitated and is operating at full capacity at an acceptableheat rate. Analysis carried out by the mission indicates that it is tech-nically feasible to rehabilitate all the derated units but it is noteconomically attractive to proceed with a full unit rehabilitation program inone step because: (a) the cost of full rehabilitation as presently estimatedis, for most of the units, excessively high; (b) the rehabilitated units wouldbe used at low plant factors after 1992-93 when base generation will shiftfrom oil to coal and geothermal energy; and (c) partially rehabilitating theunits to recover lost capacity will permit NPC to evaluate the full rehabili-tation program after the 1990-93 capacity shortage is over.
30. Considering the capacity requirements of the Luzon grid and the costof rehabilitating various plants, it is recommended that:
(a) the Rockwell power plant be retired in due course since its rehab-ilitation is not economically viable and its return to full loadingis likely to face serious environmental objections. The levelizedcost of operating a rehabilitated Rockwell plant is USC5.1/kWh,compared with USC4.8/kWh for a new oil-fired power station;
(b) an action program be prepared immediately for the partial rehabili-tation of Sucat units which, after a two-stage rehabilitation, wouldhave a lev.zlized cost of USC3.6 to USC3.8/kWh, which is the least-cost option compared to the alternatives af full rehabilitation orinstallation of new units;

- xi -
(c) the Bataan and Manila plants have been operating satisfactorily buttheir thermal efficiencies have deteriorated. Bataan unit 1 hassuffered a derating of 3-4 MW. After essential repairs, these unitscould operate at a levelized cost of USC3.1-3.3/kWh while withoutthe repairs the levelized cost would reach about USC4.0/kWh. It istherefore recommended that NPC allocate sufficient funds to purchasethe required spare parts and undertake essential repairs, and
(d) the two-stage rehabilitation of oil-fired power plants, particularlyof the Sucat un5ts, would provide NPC with an opportunity to savesubstantial resources by carrying out most of the rehabilitation in-house and to develop advanced maintenance capabilities through checlose involvement of its staff in all aspects of rehabilitation.However, to develop the capabilty for in-house rehabilitation, NPCwould need to: (i) establish fabrication shops to produce some ofthe spare parts which are presently bought at high prices from theoriginal manufacturers; (ii) augment NPC's central maintenancedepartment to perform the major portion of rehabilitation workscheduled over the next two to three years; and (iii) design acomprehensive training program coordinated with (i) and (ii).
31. MERALCO Transmission/Distribution Losses. In 1986, MERALCO hadsystem losses equivalent to about 21% of net generation. This level of lossesis extremely high and should, based on the technical characteristics of thesystem, be reduced to around 9%. MERALCO did, in fact, reduce its losses frommore than 20% in the 1950s to about 8%, which it maintained during the1970s.
32. Mission's analysis indicate that technical losses are about 9.5Znotably less than MERALCO's own estimate of 11%. Thus, there is only amoderate opportunity to reduce technical losses, a long-term target for theselosses would be about 8%. The first step towards reducing technical losseswould be to identify problem areas through improving the Transformer LoadMonitoring System; surveying serviced areas to establish priorities for systemrehabilitation; and updating computerized distribution records to include newload conditions.
33. Non-technical losses are primarily due to meter tampering by some ofthe large industrial and commercial consumers of electricity. Mission'sanalysis indicates that non-technical losses are about 11.5%, notably higherthan MERALCO's own estimate of 10%. To curb nontechnical losses, MERALCO hasbeen implementing an action program since 1985 which includes investigationand billing recourse, analysis of billing data, monitoring of consumers'monthly consumption and demands, enclosure of meters in steel boxes to preventreoccurance of tampering, advertisement, and elimination of interventions byMERALCO employees and others in the settlement of pilfered electricity ofrelatives and friends. This action program is satisfactory and a reversal intrends has already started. However, the long-term success of the loss reduc-tion program can be achieved only if appropriate legislation is passed toenable electricity distributers to prosecute pilferers more effectively andlevy heavy penalties on consumers involved in pilferage.

- xii -
34. Financial Issues. The power sector represents the largest share ofcapital expenditures in the country and, thus, requires a very effective meansof internal resource mobilization. Currently, the sector faces several struc-tural problems which have created financial constraints in optimizing invest-ment decisions and in allocating sufficient funds for maintenance of plant andequipment. The three major structural problems identified and recommendationsto address them are as follows:
(a) NPC. A chronic shortage of counterpairt funds has hampered NPC'sability to implement its projects in a least-cost manner by causingimplementation delays resulting in cost over-runs and by introducinga bias in favor of investments with large foreign exchange com-ponents which can be financed externally. During 1988-95, NPC'sinvestment requirements envision a local cost content that exceedsits capacity to generate cash from operations by P 26.4 billion; itsoverall financing gap is expected to be considerably larger as thecost and redemption requirements for local currency financing areadded to the investment shortfall. Thus, the overall financing gapis too large to be financed by the government through budgetaryallocations and the short term financing instruments that have beenused in the past are inadequate to meet the large projectedrequirements. In the short term, while its financing requirementsare modest and it is arranging to tap alternative domestic sourcesof long term funds, NPC should make the best use of instrumentsavailable internally through government, including: (a) maintainingits tariff at levels that enable it to realize the 10% maximum rateof return allowed under its statute; (b) auctioning five year bondsthrough the Government's securities auction facility; and(c) seeking some modest additional equity capital from thegovernment. For the medium to long term, NPC needs to cooperatewith financial institutions, institutional investors and privatesyndicates so that they can shoulder some of NPC's capitalrequirements either through the sale of long term financialinstruments or by independent investments in generation facilitiesthrough Build, Operate and Transfer schemes.
(b) MERALCO. Shortages of equity capital have engaged MERALCO to followa pattern of underinvestment in distribution facilities, preventingthe system from expanding in parallel with growth in demand.Because MERALCO tariffs are already set at levels yielding themaximum rates of return permitted under its charter, MERALCO too hasonly limited capacity to increase local currency generated fromoperations. It cannot obtain the credit it currently needs forinvestment without direct government financial support or, alterna-tively, government guarantees of its borrowings. MERAI.CCO plans toraise about P 1.6 billion in new equity capital during 1989-92.Still, its long-term financial health depends on the Government'sabolishing the current practice of allowing the financing of thetotal cost of public utility stock purchases by loans that depend onthe company's dividends for debt service, using the shares them-selves for collateral. Instead, the Government should require thatall purchases of shares in MERALCO and other providers of essential

- xiii -
services, even those transacted between principals, conform tomargin requirements similar to those of the Makati Stock Exchange,which currently requires a margin of at least 50%.
(c) Retailing Constraints. Weak commercial practices at the retaillevel have prevented both NPC and MERALCO from realizing their fullcapacity to generate cash from operations. In addition to theextremely high levels of nontechnical losses incurred by MERALCO,both NPC and MERALCO have experienced difficulty in collectingconsumer charges. When MERALCO and other electricity retailerscould not collect from government sector consurwers, they in turnwere not able to pay NPC. In 1987, the Governm'ent instituted pro-cedures to help the retailers collect the amounts due and encouragedNPC to use all available remedies to enforce its billings. Thesemeasures appear well conceived and comprehensive, but it is stilltoo early to judge their effectiveness.
National Energy Development Strategy
35. Based on the above analysis of sector development potential andoperational issues, the following strategy for energy development isrecommended.
36. In the short-run (1989-90), the power sector will face a shortage ofcapacity due to the rapid recovery of electricity demand, mothballing of thenuclear plant and the downgrading of the Tiwi geothermal plant. To forestallthis shortage, the following options are available to the economy: rehabili-tation of power plants at Sucat and Rockwell; reduction of transmission/distribution losses; management of power demand; and installation of gasturbines. Our analysis indicates that (a) rehabilitation of the Rockwellstation is not viable (para. 26); (b) rehabilitation of the Sucat station isadvisable with a phased program of works (para. 27); and (c) demand managementand loss reduction, though important from an efficiency point of view, willnot significantly affect the capacity requirements of the grid. Thus, themajor source of additional capacity in the short term has to be the installa-tion of gas turbines. Gas turbines are not necessarily wasteful investmentsbecause they can be relocated to serve other grids when they are not needed onLuzon and, as the system increasingly moves towards using coal and geothermalfor base-generation, gas turbines can provide complementary peaking capacity.
37. In the medium-term (1991-93), the new generating capacity should bebased on Luzon geothermal and imported coal. Commissioning of the Bacon-Manito I geothermal power plant is planned for 1991. The other three identi-fied geothermal sites on Luzon--Bacon-Manito II, Pinatubo, and Mt. Labo--havethe potential of supplying at least an additional 330 MW of power. However,assessment and delineation work on these sites needs to be accelerated. Aminimum of 9-12 geothermal wells should be drilled during the next 18-24months so that the steam fields at one or more of these sites can be committedfor development by the end of 1989. The least-cost development plan includesBacon-Manita II and at least one more site to be commissioned in 1992 and1993, respectively.
38. In the long-term (1994-2000) the options to increase generatingcapacity are Tongonan geothermal, imported coal, domestic coal, and, possibly,

- xiv -
further geothermal resources on Luzon. In view of the long lead timesinvolved in development and utilization of indigenous energy resources,several immediate actions are necessary if timely policy decisions are to bemade. In particular, (a) the feasibility study of the Tongonan project shouldbe commissioned immediately so that the results are available by the middle of1989 in order for NPC and the Government to decide between Tongonan and thefurther use of imported coal; (b) the program of geothermal exploration shouldbe corninued on Luzon with a minimum of three to five wells drilled per year;and (c) the Government should announce a policy that any geothermal steam thatcan be provided by a company, private or public, will be used in the powersector if it is available at a price lower than the power company's avoidedcost. However, the complementary component, as well as, the fall-backalternative to geothermal energy is imported coal. Thus, NPC should continueits preparation of coal power plants for implementation in the medium- and thelong-term.

I. AN OVERVIEW OF THE ENERGY SECTOR
A. The Macroeconomic Context
1.1 Most of the problems of the Philippines' energy sector today are abyproduct of the political and economic turbulance that the country hasexperienced since the beginning of the 1980s. This makes planning especiallydifficult. After growing faster than 6% per year during the last half of the1970s, GNP stagnated and then fell by more than 10% during 1984-85. It nowshown signs of recovering with an encouraging growth of 5.1% in 1987. Energydemand followed a similar pattern, but peaked in 1979, fell by nearly aquarter by 1985 and then recovered strongly to surpass its 1979 peak in 1987.
1.2 During the last half of the 1970s, investment averaged 30% of GNPand energy accounted for nearly half of total public sector investment. Underthe macroeconomic stabilization program of the mid 1980s, overall investmentwas cut back sharply to around 14% of GNP. This could not have been achievedwithout a significant cut in energy investment. In constant prices, the 1986level of energy sector investment was only 30% of its 1979 level. The declinehas been particularly pronounced in the geothermal subsector. In addition, amajor product of the earlier investment--the nuclear power plant--is notavailable for use following the Government's decision to mothball it.
1.3 The new legal and institutional structures being developed through-out the Government have had a major impact on the energy sector. The Ministryof Energy (MOE) has been abolished, and new people have been appointed to headthe major agencies involved in the sector. Legislative ccLmittees now take anactive interest in energy pricing and investment decisions. But the coordina-ting machinery is not yet in place to permit the input of all these bodies andstill enable prompt and lasting decisions to be made.
1.4 Thus the energy sector faces a number of challenges as thePhilippines emerges from its successful stabilization program and refocusesits efforts on economic recovery and growth. The remainder of this chapterprovides an overview of energy resources and production, demand patterns andgrowth, institutional developments and policy priorities. Subsequent chaptersdiscuss each of the energy sabsectors in greater detail.
B. Energy Resources and Production
1.5 Unlike many of its ASEAN neighbors, the Philippines is not wellendowed with indigenous energy that can be economically developed. After theenergy price increases of the early 1970s, a major effort was made to exploreand develop the available resources and, as a result, the country became aproducer of geothermal steam (1978) and oil (1979), in addition to coal andhydropower. However, proven oil reserves amount to only 4 million tons andproduction has been declining since 1983. Geothermal reserves are not yetfully evaluated, but could exceed 8,000 MW. Only 1,640 MW has been proven sofar. The total potential coal resource is estimated at about 1,500 milliontons but most of it is low grade and expensive to mine. Hydro resources arequite substantial, with a theoretical power potential in excess of 10,000

- 2 -
MW. However, the better sites are distant from the gria and thus expensive to
use. Non-conventional energy sources sucli as agricultural wastes and bio-
masses are plentiful, and the Philippines has beer in the forefront of inter-
national efforts to develop them. By 1926 non-conventional energy supplied
18.5% of the Philippines' total energy use.
1.6 Despite its relatively modest commercial energy endowment, the
Philippines has made great efforts to reduce dependence on imports. As shown
in Table 1.1, the country moved from a position of 6Z self-supply of commer-
cial energy in 1975 to over 30% by 1984. The mid-1980s was probably a turning
point for that ratio due to a combination of factors: (a) technical
constraints on expanding oil production, (b) economic constraints on expanding
coal and hydro based on the likelihood of continued weakness in imported coal
prices, and (c) a revival of energy demand growth. As discussed inChapter II, the only indigenous energy resource that merits significant new
investment is geothermal steam.
Table 1.1: ENERGY PRODUCTION('000 TOE)
Self-supplyCoal Oil Hydro Geothermal Total Ratio /a
1975 36 - 560 - 596 6
1980 23 490 877 517 1,861 15
1981 22 252 932 690 1,896 16
1982 102 483 939 881 2,406 20
1983 377 657 739 1,015 2,788 23
1984 571 524 1,314 1,128 3,537 32
1985 554 358 1,383 1,227 3,521 32
1986 593 423 1,498 1,140 3,654 33
1987 573 274 1,300 1,128 3,275 27
Z of total 17.5 8.4 39.7 34.4 100
Average Annual Growth Rates
1982-87 41.2 -10.7 6.7 5.1 6.4
/a Total indigenous production as a percent of commercial primary energy
requirements (i.e., including losses in transformation and distribution).

- 3 -
C. Energy Demand
1.7 During the 1970s the Philippines was one of the first oil-importingdeveloping countries to adopt a comprehensive program of energy conservationand demand management. Through both price increases and targetted energyaudits, a sustained effort was made to check the growth in consumption. Thesuccess of this effort is shown in Table 1.2. From a peak of 9.2 million TOEin 1979, commercial energy consumption fell to a trough of 7.1 million TOE in1985. At the same time, the proportion accounted for by oil was reduced from88% to 74%. With the resumption of economic growth in the Philippines in1986, these trends have been reversed.
1.8 Such a reversal does not indicate a relaxation of the conservationprogram; petroleum consumption remains heavily taxed and the energy auditprogram continues to expand to reach more industries. However, with inter-national energy prices below their levels of the late 1970s, and with theconsiderable progress already achieved in cutting excessive energy use, it isappropriate that energy demand management be redirected. The Office of EnergyAffairs (OEA) is well placed to undertake the coordination and strategicplanning roles which will be needed as sector objectives change to permitresumption of demand growth and increased imports where fc-eign sources areclearly cheaper than indigenous ones (para. 1.11).
Table 1.2: ENERGY CONSUMPTION /a('000 TOE)
Coal Oil Electricity Total Z Oil
1975 25 6,979 732 7,736 90
1979 66 8,130 1,052 9,248 881980 89 7,371 1,110 8,57Cj 861981 87 6,979 1,171 8,227 851982 91 6,869 1,263 8,223 841983 320 6,769 1,474 8,563 791984 390 5,465 1,470 7,325 751985 319 5,229 1,554 7,102 74
1986 305 5,860 1,366 7,530 781987 343 7,816 1,452 9,611 81
Average AnnualGrowth Rates
1982-87 30.4 2.6 2.8 3.2
1987-92 11.0 4.2 5.5 4.7
/a Net domestic consumption, after transformation and distribution losses.

- 4 -
1.9 Annex 1.1 presents the 1987 energy balance for the Philippines. Assummarized below in Table 1.3, it shows that the industrial sector accountsfor 51% of total energy demand, followed by transport with 32%. Electricityprovides over half the commercial energy used by the residential/commercialsector and llX of that used by industry. Over 80% of total energy demand ismet by petroleum products, of which the transport sector consumes only 40%.As economic growth is diversified away from heavy industry, it is likely thatthe share of energy used for transport and by the residential/commercialsectors will increase. Much of this increase can only be met by petroleumproducts. Thus, diversification away from oil in the power sector (seeChapter V) will be the only significant way to keep oil imports from growingrapidly.
Table 1.3: DISTRIBUTION OF ENERGY DEMAND, 1987('000 TOE)
Residential &commercial Industrial Transport Other Total Percent
Coal - 343 - - 343 3.6
Oil 604 4,022 3,030 160 7,816 81.3
Electricity 771 542 - 139 1,452 15.1
Total 1,375 4,907 3,030 299 9,611 100.0
Percent 14.3 51.1 31.5 3.1 100.0
D. Institutional Framework
1.10 There have been a number of major changes in the institutionalframework of the energy sector since it came into prominence in the mid-1970s. The basic organization of the sector was established by a PresidentialDecree in 1977 which created the Ministry of Energy (MOE) as the centralpolicy, planning and regulatory body for energy. The MOE had two major parts:a Bureau for Energy Development (BED) and a Bureau for Energy Utilization(BEU). In addition to the creation of the new Ministry, the responsibilitiesof the Philippine National Oil Company (PNOC) were extended to include thedevelopment of indigneous hydrocarbon and geothermal resources. The NationalPower Corporation (NPC), which is responsible for power generation and trans-mission, and the National Electricification Administration (NEA), which isresponsible for rural electricification, were also strengthened. PNOC and NFCwere attached to MOE for program and policy coordination which was handled byan internal committee chaired by the Minister of Energy. The Minister alsoserved as chairman of the boards of PNOC and NPC. This centralized structure

- 5 -
contributed to the Philippines' rapid and successful drive to develop indige-nous resources and to curtail consumption, yet it also suffered from a lack ofindependent oversight and accountability.
1.11 With the change in government in 1986, the MOE was abolished and itsfunctions were temporarily assumed by the Office of the President. The twomain bureaux of the MOE were placed under a Deputy Executive Secretary forEnergy in the President's Office pending the report of the President'sCommission on Government Reform. Through the issuance of Executive Order(E.O.) No. 193 in July 1987, the Office of Energy Affairs was mandated to takeover the bulk of the functions of the former MOE, but to be organizationallydistinct from PNOC and NPC and to remain under the Office of the President.In addition, the regulatory, environmental and watershed management functionsof MOE were reallocated, respectively, to the Energy Regulatory Board (E.O.172) and the Department of Environment and Natural Resources (E.O. 131).
1.12 This new organization of the sector is consistent with theGovernment's policy of decentralized decision-making and eventual privatiza-tion of the commercially viable public enterprises. However, there is a needfor closer coordination and a central focus for decision-making by those partsof the sector which represent natural monopolies and whose investments areinterdependent. In particular, the development policies for the geothermal,coal and power subsectors are largely interwined and none of the three canpursue an efficient strategy without close coordination with the other two.The OEA has a mandate to play this coordinating role but lacks the authorityto enforce its decisions.
1.13 An immediate action to relive the situation is to create acoordinated planning mechanism across the various sub-sectors. In the absenceof a separate department of energy, it is suggested that an EnergyCoordination Council be set up in the Office of the President to be headed bythe Executive Secretary, with the Presidents of NPC, PNOC and SCC and theExecutive Director of the OEA as members. The OEA should prepare a long-termplan for energy development for the country, in consultation with the threemajor public sector agencies involved and under the overall framework ofeconomic plans prepared by NEDA. This plan should be formally ratified by theEnergy Coordination Council on an annual basis. All investments in the energysector which require the commitment of government funds should be inconsonance with the energy plan approved by the Energy Coordination Council.It should be the responsibility of the OEA to ensure this through appropriateintercessions in the deliberations of the Investment Coordinating Committee(ICC). It should also be the responsibility of OEA to carry out studies ofvarious energy issues and ensure implementation of government policy regardinginvestment planning, pricing and operational performance of the energy sector.

- 6 -
II. THE POWER SECTOR DEVELOPMENT PROGRAP'
A. Introduction
2.1 The National Power Corporation (NPC) is responsible for the planningand operation of seven separate grids in the Philippines. These may be div-ided into three regions: the Luzon power grid (installed capacity 4,111 MW),five island grids in the Visayas islands (agaregate installed capacity 600MW), and the Mindanao grid (installed capacity 1,067 MW). Luzon is the mostimportant of these regions, accounting in 1986 for 114,756 CWh or 77% of totalelectricity generation, compared to Mindanao (3,040 GWh, 16%), and the Visayasgrids (collectively accounting for 1,467 GWh, or 8%).
2.2 The grids exhibit significantly different characteristics in theirgeneration plant mix; the Mindanao grid is heavily dependent (83%) on hydrocapacity. In the Visoyas, on the other hand, the individual grids on theislands of Leyte and Negros are similarly dependent (approximately 84%) ongeothermal capacity, with a mix of oil and coal plant in the remaininggrids. The Luzon power grid is the most diversified, with oil, coal,geothermal and hydro plant.
2.3 Because of its size and importance, the major issues for powerdevelopment arise in connection with the future development of the Luzon powergrid. Accordingly, the major part of this chapter focusses on the least-costdevelopment plan for Luzon, including an analysis of load forecasts, presentgenerating facilities, the least-cost expansion plan developed by the missionand sensitivity analysis.
B. Demand Forecasts
2.4 Growth of electricity sales for the Luzon power grid over the. period1971-80 averaged around 6.9% p.a., but dropped sharply in the first half ofthe 1980s, to an average growth rate of 1.7% p.a., and to negative grow-thrates in 1984 and 1985 (Table 2.1). The last two years, however, have wit-nessed a significant recovery, with a demand growth for sales of 2.4% in 1986,and over 10% in 1987. Energy sales in 1987 totalled 14,967 GWh, with a systempeak demand of 2,592 MW. Losses in generation and transmission are currentlyof the order of 9%, and the annual system load factor is around 70%.

Table 2.1: HISTORICAL ELECTRICITY DEMANDS
Sales Generation PeakGWh X p.a. GWh MW Load factor
1970 6,047 - 6,400 n.a. n.a.1971 6,688 10.60Z 7,569 n.a. n.a.1973 7,725 8.15% 8,227 1,335 70.35%1974 7,805 10.04% 8,262 1,379 68.39%1975 8,506 8.98Z 9,037 1,513 68.18%1976 9,200 8.16% 9,652 1,659 66.42%1977 9,813 6.66% 10,380 1,729 69.33%1978 10,749 9.54% 11,222 1,780 71.97%1979 11,645 8.34% 12,504 1,926 74.11%1980 12,163 4.45% 13,115 2,074 72.19%1981 12,690 4.33% 13,666 2,225 70.11%1982 13,125 3.43% 14,398 2,364 69.53%1983 13,907 5.96% 15,294 2,478 70.46%1984 13,243 -4.77% 14,655 2,374 70.47%1985 13,221 -0.17% 14,449 2,311 71.37%1986 13,542 2.43% 14,756 2,435 69.18%1987 14,967 10.52X n.a. 2,592 n.a.
2.5 NPC's load forecasts are based on analysis of sectoral demands usingdemographic and economic data. The latest (February 1988) forecast of elec-tricity generation for the Luzon power grid reflects the recent increase indemand, and is somewhat higher than the previous (September 1986) forecast.This forecast is based on GDP growth rates of 5.81 in 1988-92, and 6.3X for1993-2000 and is considered reasonable to be used as the normal scenario forleast-cost analysis. The mission developed also High and Low growthscenarios. The High-growth scenario is based on a GDP growth rate of 7.5%p.a. The Low-growth scenario is based on a GDP growth rate of 5.2% p.a. Theresultant demand projections are summarized in Table 2.2. Overall growthrates of electricity generation for the period 1987-2000 are 6.5% p.a. for thehigh growth scenario and 4.8% p.a. for the low growth scenario, compared to5.4% for the normal scenario. Under the normal scenario, electricity genera-tion in the year 2000 is predicted at 32,472 GWh, under the high scenario37,121 GWh (141 higher), and under the Low scenario 29,996 GWh (8% lower).

- 8 -
Table 2.2: SCENARIOS FOR GROWTH IN DEMAND(Average Growth Rate per Annum)
Period Base High Low
1987-90 6.15% 7.16% 6.09%1990-95 5.47% 6.92% 4.64%1995-2000 4.97% 5.76% 4.19%
1987-2000 5.44% 6.53% 4.8%
C. Present Generating Facilities
2.6 The current total installed capacity of the Luzon interconnectedsystem is around 4,111 MW, comprising 47% oil, 30% hydro, 16% geothermal, and7% coal fired capacity. For the oil-fired units, rehabilitation programs havebeen recently completed or are planned. In addition to NPC's units, a pro-posal is under consideration for rehabilitation of MERALCO's Rockwell powerstation, which has an installed capacity of five 25 MW and three 60 MWunits. Although the plant was retired in 1984, the 60 MW units were laterbrought back into limiLed service to augment supply to the Metro Manilaarea. The technical and economic assessment of this proposal is given inChapter VI. NPC's hydro capacity totals 1,226 MW, which includes a 300 MWpumped storage plant at Kalayaan. Seasonal variations in hydro flows restrictthe output of hydro stations significantly during the dry season. Geothermalplants are located at two sites in Luzon, Makiling-Banahaw and Tiwi, each ofwhich has six units of 55 MW nominally rated capacity. Owing to anticipatedreduction of steam output at Tiwi, a program has been drawn up to prematurelyretire two units at that site in 1988/89 and one more in 1992/93. NPC alsooperates a single 300 MW coal-fired unit at Calaca, which was commissioned in1984. This unit, though intended to burn local (Semirara) coal, cannot attainfull capacity with that coal, and currently operates on a blend of imported(Australian) and local coal. The 620 MW nuclear plant at Bataan reached anadvanced state of construction, but has for several years been mothballed. Itis not envisaged for the purposes of this study that this plant will be com-pleted and commissioned.
2.7 The major components of NPC's current generation expansion programare two 55 MW units at a new geothermal site at Bacon-Manito (1991), and a 300MW coal-fired unit as an expansion to Calaca (1992). In addition, at least200 MW of gas turbines are to be installed around 1989/90. This, togetherwith the rehabilitation program for Sucat Units 1 and 4 (recovering a total of120 MW), will add 730 MW of capacity through 1992. In view of the anticipatedrapid load growth up to the mid 1990s, however, some concern has beenexpressed as to the possibility of a capacity shortfall up to the date of com-missioning of the 300 MW coal unit in 1992. Consideration of the existing andcommitted plant complement in relation to the demand growth would seem to

- 9 -
indicate that there will be sufficient capacity over the period. This is con-tingent upon sufficient capacity being available from hydro during the dryseason (despite an installed conventional hydro capacity of 926 MW, NPCconsiders the guaranteed capacity during dry periods to be only about 200 MW).Furthermore, the Tiwi geothermal plant suffers from gradual derating inbetween scheduled outages owing to build-up of deposits, and this wouldfurther erode the capacity margins. Several measures can be contemplated toalleviate the shortfall, should it materialize. These include acceleratingthe current planting-up program, increasing the rated capacity of committedplant, introducing new plant such as additional geothermal and gas turbines,reducing losses, and demand management. Of these options, perhaps the mostrealistic at this point is the installation of additional gas turbines, asthese can be commissioned within a comparatively short lead time. Accord-ingly, should a continued high rate of demand growth increase the likelihoodof this capacity shortfall, or if the current expansion program is delayed,then the installation of additional gas turbines will be necessary in themedium term, and NPC should take appropriate steps to allow for this.
D. Least Cost Expansion Plan
2.8 NPC's current (June 1987) generation expansion plan for the Luzonpower grid is shown in Annex 2.1. Apart from the ongoing committed develop-ment program, post-1992 installations include further expansions to the geo-thermal complement (totalling 550 MW through the year 2000), a local coalplant (Isabela) of 300 MW in 1995, further hydro plants at San Roque,Casecnan, and Binongan (totalling 833 MW), and additional 300 MW coal units in1999 and 2000 (coal source not identified). The mission undertook an indepen-dent assessment of the least-cost development plan, based on the revised loadforecast and the latest available data on the capital and fuel costs ofvarious alternatives.
Options for Future Expansion
2.9 Apart from the two Luzon geothermal fields which are currently pro-ducing, further geothermal resources have been identified in Luzon with aproven reserve of around 530 MW, and a total probable reserve of over 1,300MW. The Tongonan geothermal fields in Leyte (Visayas) have a resource baseestimated at between 480-1,200 MW. The mission assessed the economic cost ofgeothermal steam (production cost for future wells plus an exploration riskpremium) to be USC1.63/kWh generated, while that of Tongonan was estimated atUS1.O07/kWh. Transmission from Leyte to Luzon, however, requires high-voltagelines and cables over a distance of around 480 km, including a submarineportion of around 25 km; this will substantially increase the delivered costsof power.
2.10 For indigenous coal, the source of particular interest for Luzonpower development is Semirara, a small island to the south, where the existingmine serves part of the needs of NPC's 300 MW coal station at Calaca, and canbe expanded to meet future local coal needs for power generation. With acalorific value of 7,200 BTU/lb, the economic delivered cost of futuresupplies of Semirara coal has been estimated at US$40/ton CIF or US$2.53/MBTU.The Isabela coal deposits in Luzon which feature in the June 1987 development

- 10 -
plan have been assessed to be uneconomic for the purposes of generation expan-sion in the foreseeable future (Chapter III). Imported coal is also an optionfor future thermal plant. This is currently available on the internationalmarket from Australia, China and other sources. Current prices of importedcoal are fairly low, of the order of US$30/ton for a calorific value of 12,000BTU/lb; they are, however, expected to increase in the future fromUS$1.21/MBTU in 1988 to around US$1.52/MBTU by 1992, and to escalate by 1%p.a. from 1995 onwards, reaching a level of US$1.59/MBTU by the year 2000.
2.11 Several hydro sites in Luzon have been identified by NPC as candi-dates for future system development, some of them being multi-purposeschemes. Feasibility or prefeasibility studies have been conducted for mostof these sites and provide sufficient data at the planning level for anassessment of the economics of this option. NPC's pumped storage plant atKalayaan, currently consisting of 2 x 150 MW pump-generators, can also beexpanded further to an additional 300 MW.
Levelized Generation Costs
2.12 The lifetime levelized generation costs (LGC) for the thermal andgeothermal base-load options, as estimated by the mission, are given inTable 2.3. Annex 2.2 details the methodology, data, and results of the LGCanalysis. The lowest-cost alternatives are Tongonan geothermal with HVACtransmission and Luzon geothermal--relative to the imported coal option, theLGCs for these candidates are 21Z and 16% cheaper, respectively. Othercandidates, in increasing order of cost, are Tongonan/HVDC (11% lower thanimported coal), oil (252 higher) and Semirara coal (30Z higher). Therefore,the most promising options for thermal and geothermal expansion are Luzon geo-thermal, Tongonan geothermal, and imported coal. Oil and domestic coal, onthe the other hand, are significantly more expensive and not competitive.
i

- 11 -
Table 2.3: LEVELIZED GENERATION COSTS
Plant Capacity LGC
ThermalImported coal 300 MW 3.46 cts/kWhSemirara coal 300 MW 4.50 cts/kWhFuel oil 300 MW 4.32 cts/kWh
GeothermalLuzon geothermal 55 MW 2.90 cts/kWhTongonan geothermal- HVAC transmission 450 MW 2.72 cts/kWh- HVDC transmission 450 MW 3.10 cts/kWh
HydroPantay 23 MW 7.09 cts/kWhSan Roque 390 MW 6.61 cts/kWhCasecnan 268 MW 5.54 cts/kWhAbra 174 MW 7.96 cts/kWhDiduyon 352 MW 5.83 cts/kWhBalogBalog 33 MW 9.74 cts/kWhAgos (Kaliwa) 140 MW 12.72 cts/kWhMatuno 180 MW 9.11 cts/kWhGened 600 MW 9.69 cts/kWh
2.13 As a comparison to the thermal and geothermal alternatives, theLGCs for hydro candidates are also summArized in Table 2.3. This shows thatcompared to the thermal and geothermal options, hydro candidates are notcompetitive-the lowest-cost (Casecnan) at 5.54 cts/kWh is 23X higher thaneven a domestic coal plant.
2.14 As the economic generation cost from Luzon geothermal issignificantly lower than that for imported coal, which is the next candidatefor development in lieu of geothermal, there is some latitude in price-settingfor geothermal steam. The break-even fuel price (i.e., the steam price whichyields the same cost per kWh generated as imported coal) is the "avoided cost"for the system. This was computed to be 2.40 cts/kWh in relation to the nextplanting-up, with imported coal priced at its economic cost (i.e., excludingduties and taxes). If imported coal is priced at financial cost, the break-even price for Luzon steam is 2.75 cts/kWh.
WASP Analysis
2.15 Based on the normal scenario of load growth (para. 2.5), and capitaland fuel costs of various candidate plants (Annex 2.3), a least-cost expansionplan was derived for the Luzon power grid over the period 1987-2001, using theWASP computer program. Details are given in Annex 2.4. The results (Table

- 12 -
2.4) confirm that Luzon geothermal and imported coal are clearly prioritycandidates--a total 495 MW Luzon geothermal capacity and 2,100 KW importedcoal capacity are in the least-cost plan over the period 1991-2001. Inaddition, the first stage of Tongonan geothermal (450 MW), with the assumptionof an HVAC line, is selected in 1995, followed by the second stage in 1997.Apart from these thermal/geothermal plants, the Kalayaan pumped storage plant(300 MW) features in the optimal solution from 1996. Local coal plant, gasturbines, and hydro candidates are not selected before 2000; this confirms theprevious LGC analysis. The capital cost of new capacity additions is $3,373million, and capital cost disbursements for this program reach a peak ataround $440 million in 1995/97. The objective function (total discountedoperation and capital cost, plus allowance for salvage value of new plant atthe planning horizon) amounts to $3,899 million over the fifteen-year period1987-2001. The underlying assumption regarding the interconnection from Leyteto Luzon is an HVAC line with the current estimated cost of $210 million. Incase the transmission requirement dictates an HVDC line, the strict least-costsolution would be to construct the Tongonan interlink in 1997-98. However,the additional cost of bringing the implementation forward to 1995-1998 wouldbe less than 1Z of the total discounted cost.
Table 2.4: LEAST-COST DEVELOPMENT PROGRAM
Year Plant Capacity (MW)
1989 Gas turbines 2001991 Bacon-Manito I geothermal 1101992 Bacon-Manito II geothermal 110
Calaca II coal 3001993 Luzon geothermal (Imported Coal*) 3301995 Tongonan geothermal I (Imported Coal*) 4501996 Kalayaan pumped storage 2 x 1501997 Tongonan geothermal II (Imported Coal*) 4501998 Imported Coal 3001999 Imported coal 2 x 3002000 Imported coal 2 x 3002001 Coal (imported/domestic) 2 x 300
* Fall back alternatives which need to be prepared for the eventthat geothermal resources cannot be committed on time.
2.16 In light of the above least-cost development plan, the followingrecommiendations can be made:
(a) In view of the important position of geothermal resources, effortsshould be made to prove and undertake necessary preparatory activi-ties for the timely exploitation of these indigenous resources bothin Luzon and in Leyte (Tongonan).

- 13 -
(b) NPC should take steps to prepare for a program of investment incoal-fired plant. Should the demand grow faster than assumed here,NPC would need to construct coal plants. In addition NPC may needto use imported coal as a fall-back alternative in case Luzongeothermal cannot be fully committed or the Tongonan plant does nctprove viable or if its implementation tak'i longer than expected.
(c) The viability of transmission of Tongonan geothermal power to Luzonneeds to be carefully studied to narrow down the alternatives avail-able (e.g. choice of DC or AC, routing), to establish reliableupdated cost estimates, to assess the impact of the interconnectionon the development of the existing transmission system, and toaddress operational aspects, including system reliability andsecurity.
(d) The identification of the expansion of Kalayaan pumped storage aspart of the optimal development sequence will necessitate anupdating study of this project so that it can proceed on schedulewhen required.
(e) Luzon transmission development as a whole will have to be assessedin light of the above development sequence. In particular, thecurrently planned transmission development north of Manila toaccommodate Isabela and the hydro plants should be deferred to alater stage.
It is very important to note that the main thrust of the least-cost plan isthe composition of the program based on the viability of the candidates in-cluded in the program (Luzon geothermal, Tongonon geothermal and importedcoal) and the non-viability of candidates excluded from the program (furtherdomestic coal, and hydro power plants). The commissioning dates for theincluded candidates can and should be adjusted based on growth in demand andpractical constraints in implementation. In particular, the commissioningdates indicated in the program are based on full availability of Luzon geo-thermal resources. If PNOC cannot commit the timely availability of 330 MWfor commissioning in 1993, a 110 MW of Luzon geothermal should be constructedfor commissioing in 1993 and 300 MW coal unit should be built for commission-ing in 1994. As stated earlier, the development strategy for the power sectorshould be (a) to commission Luzon geothermal plants as much and as early aspossible (b) to develop Tongonon geothermal as soon as possible after thefeasibility study is completed and (c) to supplement the gap between thedemand and geothermal supply, with thermal plants using import d coal. Inaddition, the short-term shortages in generating capacity have to be met byinstalling gas turbines. By implementing the above least-cost developmentplan, the share of oil in NPC's power generation will decline from 37% in 1987to 30% in 1995 and 11% in 2000. The share of geothermal power will changefrom 31% in 1987 to 43% in 2000. The share of coal will increase from 9Z in1987 to 27% in 1995 and 35% in 2000. However, almost all of the increase inthe share of coal will be based on imported coal. The total electricitysupply would be sufficient to meet the projected (base scenario) growth in thedei'and with a loss of load probability limited to three days a year. Figure2.1 shows the growth in demand ind the increments to the installed capacity.

- 14 -
Comparison with the June 1987 Development Program
2.17 The least-cost development program developed by the mission confirmsthe need to develop a significant capacity of Luzon geothermal plant over theplanning period, as proposed by NPC's June 1987 program. There are, however,significant differences between the two programs. While the June 1987 programproposes implementation of three hydro projects (San Roque, Casecnan andBinongan) with a total capacity of 833 MW, the least-cost program presentedhere does not include any of these projects. Also, the gas turbines in theJune 1987 program are only selected up to the 200 MW which is alreadycommitted to be installed prior to 1990.
2.18 Another major difference between the two expansion sequences relatesto the position of local coal, which is not selected in the least cost plan.Inste I, a major expansion sequence of imported coal units is indicated,culminating in a total of around 2,100 MW capacity by the year 2001.
2.19 Finally, the least-cost plan also includes Tongonan as a majorcandidate for future construction, totalling 900 MW by year 1998, togetherwith expansion of Kalayaan pumped storage (300 MW); these did not form part ofthe June 1987 program.
2.20 The total capital cost of this investment program will be US$3,373million compared with US$3,535 million of the NPC's development plan. Takingaccount of price scalation, the financing requirements of the mission'sproposed program will be about $4,700 million of which US$2,980 million willbe in foreign exchange.
Table 2.5: INVESTMENT AND OPERATING COST OF THE GENERATION EXPANSION PROGRAM(US$Nillion)
RequiredCapital Operating Total Total ForeignCost Cost Cost Financing Exchange
Mission's recommendedprogram 3,373 7,720 11,102 4,700 2,980
NPC's development plan 3,535 7,560 11,095 5,743 3,740
/a Includes the cost of EHV line to Northern Luzon.
E. Sensitivity Analysis
2.21 A series of additional studies were conducted to examine the effect ofvarying the following key assumptions on the above least-cost development plan:

- 14 a -
FRgur 2.1: Luzon Power GddPeak Demand veusus Installed and Derated Capacity
(MW)
*~ox
10000
o I 1. 1 I I I I ,,,,,,
1987 1989 1991 1993 1995 4997 1999 200)1
Wod1d Oalk-42998

- 15 -
(a) effect of high and low load growth scenarios on the generation expan-sion sequences;
(b) effect of changes in geothermal well development costs (steam price);
(c) effect of higher escalation rates for the projected coal price; offorcing local coal for the next addition to generating capacity(1992); of excluding imported coal as an option; and
(d) effect of forcing the sequence of development for Tongonan, or ofexcluding it entirely as an option for future generation.
2.22 Should demand growth be higher than currently anticipated, the onlyrealistic option available for system development in the near term would be theinstallation of gas turbines. An additional 150 MW of gas turbine capacity willbe required to be installed in 1991 under the High demand scenario. In themedium term the installation of Luzon geothermal plants is accelerated, andTongonan Stage I and Kalayaan pumped hydro are brought forward by one year. Inthe longer term, additional coal capacity is required, and San Roque hydro willneed to be commissioned in 2000. Under the Low scenario, on the other hand, theLuzon geothermal sequence is reduced by one unit, the imported coal requirementis reduced by two 300 MW units, and Tongonan Stage II is deferred by one year.
2.23 The preponderance of geothermal plant in the system generation mixmeans that overall system development and operational costs will be sensitive tothe actual costs of geothermal development. The sensitivity cases indicate thata variation of 25Z in geothermal well costs results in a 4.5% difference ($200million) in overall system development costs. In terms of the planting-upsequence, an increase in geothermal costs leads to a slight change in the Luzongeothermal planting-up sequence, and a one-year delay in Tongonan implementa-tion, but there is no change in the amount of imported coal capacity required,even if geothermal steam costs increase by up to 50%.
2.24 There is no substantive change in the overall installed capacity mixif higher escalation rates are applied to the price of imported coal, althoughthere is some rearrangement in the Luzon geothermal sequence and Tongonan isbrought forward by one or two years, depending on the escalation rate assumedfor imported coal. The effect on overall system costs is also small. Even withimported coal escalation of 3% p.a. in real terms from 1990 (compared to anassumed average rate of 1.55% p.a. in the base case) there is an increase ofless than 0.5% in the objective function. This would appear to be because sub-stantial imported coal capacity only materializes towards the middle of theplanning period.
2.25 Forcing local coal into the development sequence in 1992 results in anincrease in overall costs of arounA 2.5%. As with the base case, no other localcoal unit selections occur in the optimal solution. If imported coal isexcluded entirely as a candidate for system expansion, only then is there anysubstantial capacity selection of local coal units, but because of the highercosts of this option this leads to an overall penalty of around 4.2% or $164million relative to the base case.
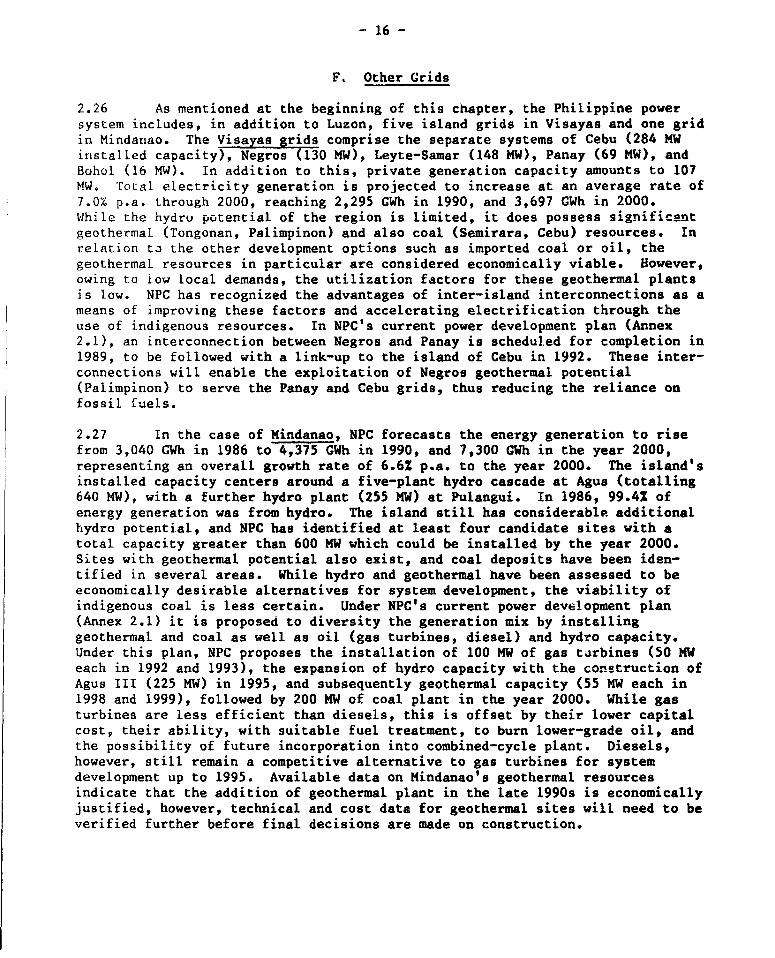
- 16 -
F. Other Grids
2.26 As mentioned at the beginning of this chiapter, the Philippine powersystem includes, in addition to Luzon, five island grids in Visayas and one gridin Mindanao. The Visayas grids comprise the separate systems of Cebu (284 MWinstalled capacity), Negros (130 MW), Leyte-Samar (148 MW), Panay (69 MW), andBohol (16 MW). In addition to this, private generation capacity amounts to 107MW. Total electricity generation is projected to increase at an average rate of7.0% p.a. through 2000, reaching 2,295 GWh in 1990, and 3,697 GWh in 2000.While the hydru potential of the region is limited, it does possess significantgeothermal (Tongonan, Palimpinon) and also coal (Semirara, Cebu) resources. Inrelation tJ the other development options such as imported coal or oil, thegeothermal resources in particular are considered economically viable. However,owing to iow local demands, the utilization factors for these geothermal plantsis low. NPC has recognized the advantages of inter-island interconnections as ameans of improving these factors and accelerating electrification through theuse of indigenous resources. In NPC's current power development plan (Annex2.1), an interconnection between Negros and Panay is scheduled for completion in1989, to be followed with a link-up to the island of Cebu in 1992. These inter-connections will enable the exploitation of Negros geothermal potential(Palimpinon) to serve the Panay and Cebu grids, thus reducing the reliance onfossil fuels.
2.27 In the case of Mindanao, NPC forecasts the energy generation to risefrom 3,040 GWh in 1986 to 4,375 GWh in 1990, and 7,300 GWh in the year 2000,representing an overall growth rate of 6.6% p.a. to the year 2000. The island'sinstalled capacity centers around a five-plant hydro cascade at Agus (totalling640 MW), with a further hydro plant (255 MW) at Pulangui. In 1986, 99.4% ofenergy generation was from hydro. The island still has considerable additionalhydro potential, and NPC has identified at least four candidate sites with atotal capacity greater than 600 MW which could be installed by the year 2000.Sites with geothermal potential also exist, and coal deposits have been iden-tified in several areas. While hydro and geothermal have been assessed to beeconomically desirable alternatives for system development, the viability ofindigenous coal is less certain. Under NPC's current power development plan(Annex 2.1) it is proposed to diversity the generation mix by installinggeothermal and coal as well as oil (gas turbines, diesel) and hydro capacity.Under this plan, NPC proposes the installation of 100 MW of gas turbines (50 MWeach in 1992 and 1993), the expansion of hydro capacity with the construction ofAgus III (225 MW) in 1995, and subsequently geothermal capacity (55 MW each in1998 and 1999), followed by 200 MW of coal plant in the year 2000. While gasturbines are less efficient than diesels, this is offset by their lower capitalcost, their ability, with suitable fuel treatment, to burn lower-grade oil, andthe possibility of future incorporation into combined-cycle plant. Diesels,however, still remain a competitive alternative to gas turbines for systemdevelopment up to 1995. Available data on Mindanao's geothermal resourcesindicate that the addition of geothermal plant in the late 1990s is economicallyjustified, however, technical and cost data for geothermal sites will need to beverified further before final decisions are made on construction.
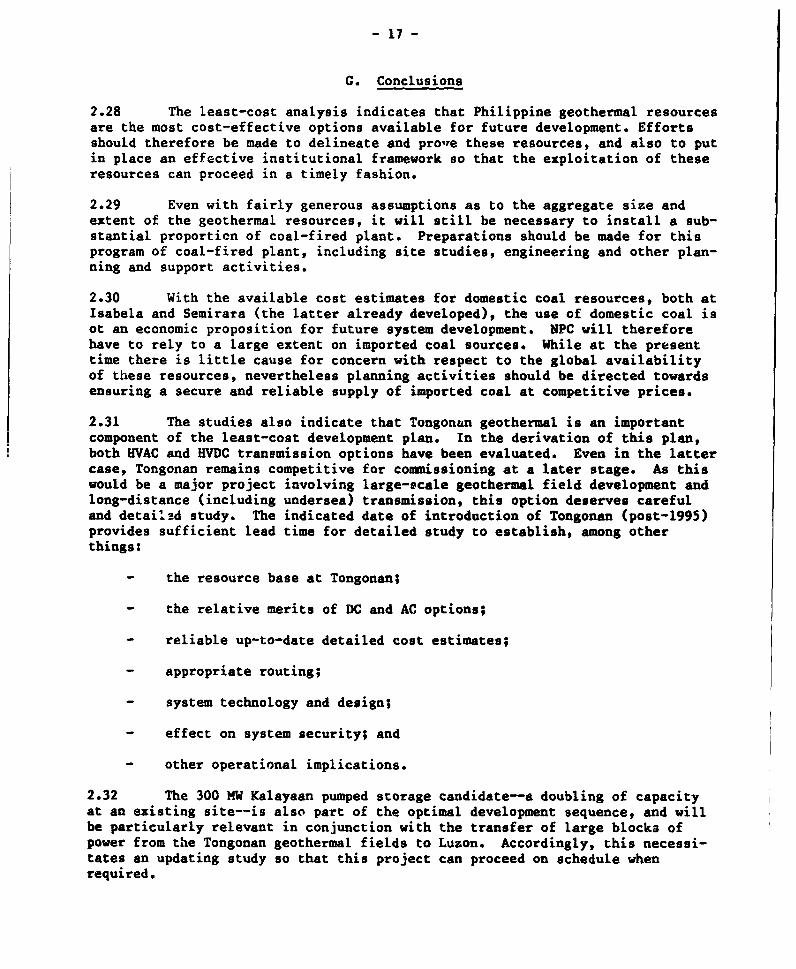
- 17 -
C. Conclusions
2.28 The least-cost analysis indicates that Philippine geothermal resourcesare the most cost-effective options available for future development. Effortsshould therefore be made to delineate and pro,re these resources, and also to putin place an effoctive institutional framework so that the exploitation of theseresources can proceed in a timely fashion.
2.29 Even with fairly generous assumptions as to the aggregate size andextent of the geothermal resources, it will still be necessary to install a sub-stantial proportion of coal-fired plant. Preparations should be made for thisprogram of coal-fired plant, including site studies, engineering and other plan-ning and support activities.
2.30 With the available cost estimates for domestic coal resources, both atIsabela and Semirara (the latter already developed), the use of domestic coal isot an economic proposition for future system development. NPC will thereforehave to rely to a large extent on imported coal sources. While at the presenttime there is little cause for concern with respect to the global availabilityof these resources, nevertheless planning activities should be directed towardsensuring a secure and reliable supply of imported coal at competitive prices.
2.31 The studies also indicate that Tongonan geothermal is an importantcomponent of the least-cost development plan. In the derivation of this plan,both HVAC and HVDC transmission options have been evaluated. Even in the lattercase, Tongonan remains competitive for commissioning at a later stage. As thiswould be a major project involving large-scale geothermal field development andlong-distance (including undersea) transmission, this option deserves carefuland detailad study. The indicated date of introduction of Tongonan (post-1995)provides sufficient lead time for detailed study to establish, among otherthings:
- the resource base at Tongonan;
- the relative merits of DC and AC options;
- reliable up-to-date detailed cost estimates;
- appropriate routing;
- system technology and design;
- effect on system security; and
- other operational implications.
2.32 The 300 KW Kalayaan pumped storage candidate-a doubling of capacityat an existing site--is also part of the optimal development sequence, and willbe particularly relevant in conjunction with the transfer of large blocks ofpower from the Tongonan geothermal fields to Luzon. Accordingly, this necessi-tates an updating study so that this project can proceed on schedule whenrequired.

- 18 -
2.33 Conventional hydro is generally not selected as part of the optimaldevelopment sequences unless constraints are placed on the availability or costof other expansion candidates. Nevertheless hydro represents a valuable indi-genous resource and may be required in case other options do not materialize asanticipated, or if the relative cost differential between hydro and otheroptions decreases in the future.
2.34 Oil-fired plant does not compete effectively with other options (apartfrom local coal), and it is not anticipated to be an important component of thegenerating mix in the future. However additional oil-fired gas turbines willbe necessary in the near-term future to accommotate shortfalls in generatingcapacity resulting from project delays or higher than expected demand growth.

- 19 -
III. COAL DEVELOPMENT AND UTILIZATION POLICY
A. Introduction
3.1 Coal is one of the major indigenous energy resources in thePhilippines and is found on all of the larger islands in the archipelago. Thetotal potential coal resources are estimated to be about 1500 million tons ofwhich the largest proven deposits are located on the small island of Semirara(35Z of the total reserves) and in the Cagayan Valley in Northern Luzon (22%of the total). The Semirara deposit is ranked from lignite to sub-bituminouswhereas the Cagayan Valley deposit is lignite. The Philippines' higherquality reserves are largely on Mindanao and Cebu and are being exploited byunderground methods while the Semirara deposit is being worked by open pitmethods. Both the low and higher quality coals are generally more expensiveto mine than resources of similar qualities in the major coal exportingcountries. The country imports higher grade coal to cover about 45% of itstotal coal requirements. This chapter reviews the consumption and productionof coal in the Philippines, then addresses the major policy issues regardingthe existing industry and the major investments planned for future expansionof the production capacity.
B. Coal Consumption
3.2 The consumption of coal in the Philippines increased substantiallyfrom about 300,000 tons/year prior to 1983 to over two million tons/year in1985; it declined below two million in 1986 but reached 2.1 million in 1987(Annex 3.1). The principal factors causing the increase in coal consumptionwere:
(a) the commissioning by NPC of the 50 and 55 MW coal-fired units atNaga in Cebu in 1982 and 1986;
(b) the commissioning by NPC of the 300 MW Calaca I coal-fired powerplant near Batangas south of Manila in late 1984;
(c) the mandated conversion of the cement industry, comprising 17 plantsthroughout the country, from oil to coal during 1983 and 1984; and
(d) the installation of a fluidized bed coal-fired power plant by AtlasMining in Cebu and the conversion from oil to coal-fired of thepower plant and ore driers by Lionoc Mining and IndustrialCorporation (NMIC) in 1983.
3.3 NPC is currently the largest consumer of coal using 1,042,000 tonsin 1987 which represents approximately 50% of the total coal use in thePhilippines. Coal use by the cement industry represents 35% of total consump-tion; coal use by the metals industries, which has declined significantly withthe closure of NMIC in early 1986, currently accounts for about 10% of totalconsumption. Thermal coal use over the last five years is given in Table 3.1.
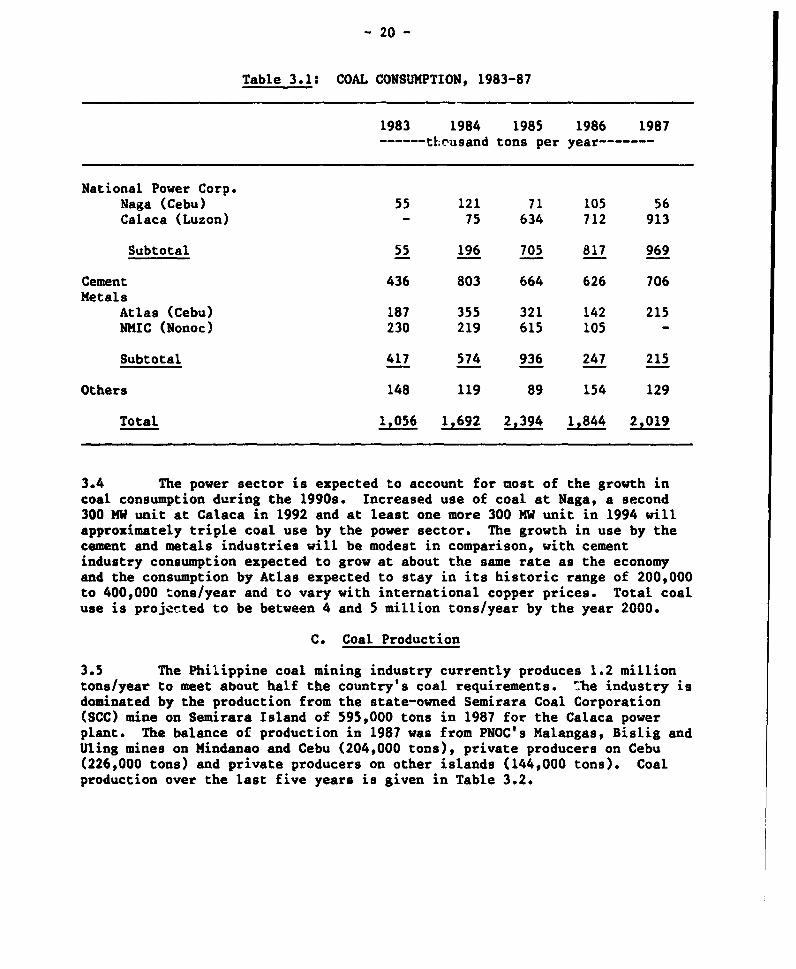
- 20 -
Table 3.1: COAL CONSUMPTION, 1983-87
1983 1984 1985 1986 1987…throusand tons per year-------
National Power Corp.Naga (Cebu) 55 121 71 105 56Calaca (Luzon) - 75 634 712 913
Subtotal 55 196 705 817 969
Cement 436 803 664 626 706Metals
Atlas (Cebu) 187 355 321 142 215NMIC (Nonoc) 230 219 615 105 -
Subtotal 417 574 936 247 215
Others 148 119 89 154 129
Total 1,056 12692 2,394 1,844 2,019
3.4 The power sector is expected to account for most of the growth incoal consumption during the 1990s. Increased use of coal at Naga, a second300 MW unit at Calaca in 1992 and at least one more 300 MW unit in 1994 willapproximately triple coal use by the power sector. The growth in use by thecement and metals industries will be modest in comparison, with cementindustry consumption expected to grow at about the same rate as the economyand the consumption by Atlas expected to stay in its historic range of 200,000to 400,000 tons/year and to vary with international copper prices. Total coaluse is projected to be between 4 and 5 million tons/year by the year 2000.
C. Coal Production
3.5 The Philippine coal mining industry currently produces 1.2 milliontons/year to meet about half the country's coal requirements. The industry isdominated by the production from the state-owned Semirara Coal Corporation(SCC) mine on Semirara Island of 595,000 tons in 1987 for the Calaca powerplant. The balance of production in 1987 was from PNOC's Malangas, Bislig andUting mines on Mindanao and Cebu (204,000 tons), private producers on Cebu(226,000 tons) and private producers on other islands (144,000 tons). Coalproduction over the last five years is given in Table 3.2.

- 21 -
Table 3.2: PHILIPINE COAL PRODUCTION, 1983-87
1983 1984 1985 1986 1987------thousand tons per year-------
Semirara (SCC) 32 55 568 592 605CebuPrivate 323 238 313 364 246PNOC-CC (Uling) 4 13 17 16 12
327 251 330 380 258
MindanaoPrivate 15 23 17 23 47PNOC/MCC (Malangas) 232 209 163 97 165PNOC (Bislig) 39 61 55 65 26
286 293 236 185 240
Other Islands (Private) 81 120 128 78 106
Total 1,020 1,216 1,261 1,235 1,209
3.6 Whereas production increased rapidly until 1983 to keep up with thegrowing demand for coal, it has remained essentially constant since then inspite of a doubling in coal demand. Some of the factors that have preventedthe domestic industry from expanding, and have resulted in almost half thePhilippine coal requirements being imported, are:
(a) declining international coal prices which, in spite of duties andtaxes of some 20% to 30% on imported coal, have made it moreeconomic for coal consumers to import than to use the relativelyhigh cost domestic coal;
(b) the mismatch between the design of the Calaca I coal handling equip-ment and boiler and the quai,ty of the Semirara coal which hasresulted in the need to import 40% to 50% of Calaca's coal require-ments to blend with Semirara coal;
(c) technical problems at both the Semirara mine and PNOC's largestunderground mine at Malangas which have prevented these mines frommeeting planned production levels; and
(d) the design of cement plants to burn the higher quality Mindanao andCebu coals which are now in limited supply.

- 22 -
D. Major Policy Issues
3.7 The policy issues currently facing the coal sector can be dividedinto two categories:
(a) whether the existing coal industry should continue operating themines which have already been developed; and
(b) whether to proceed with large investments in new coal mines to servemajor new power plants or to utilize imported coal.
Existing Coal Industry
3.8 Production frcm the Unong pit on Semirara I end started in 1983 andwas originally planned to supply about one million t. ear of run-of-minecoal to Calaca I and 300,000 tons/year to other consume such as Atlas.However, the Calaca coal handling equipment could not accommodate the highclay content in the run-of-mine coal and a selective mining method was adoptedto reduce the clay content. The selectively mined coal handled satisfactorilybut had a high sodium content which caused excessive fouling of the boiler. Ablend of 40-50% imported coal plus Semirara coal has been used to overcomethese coal quality problems at Calaca and thus only about half of the plannedlevel of output from Semirara has been required by NPC. In addition, produc-tion problems have been experienced at the mine which have also prevented thefull level of output being achieved.
3.9 In December 1987, NPC and SCC agreed to a revised contract in whichNPC would purchase 696,000 tons/year of selectively mined coal at a price ofP 750 per ton for 8,700 Btu/lb coal; this amounts to P 787 per ton deliveredto Calaca. The terms of the NPC/SCC contract ensure that SCC will receiveapproximately 1.5 times the duty free price of imported coal in the event ofincreases in the world price. The agreed quantity of 696,000 tons/year isgreater than SCC has produced in the past and greater than NPC has been ableto utilize at the Calaca power plant. SCC is currently receiving assistancefrom various sources aimed at optimizing the output over the remaining life ofthe Unong pit. Assuming the higher level of output is achieved, it isexpected to be absorbed by increasing the proportion of Semirara coal used atCalaca relative to imported coal and meeting part of the Naga power plant'srequirements with Semirara coal. The price of 750 pesos per ton should besufficient to cover the operating costs of the existing Semirara operation butis not sufficient to repay, or service, SCC's outstanding foreign debtincurred in the development of the mine. Operating at 696,000 tons/year theUnong pit is estimated to have a remaining life of about ten years. Theissues outstanding with respect to Semirara are not so much related to thepresent production of the Unong pit but rather to the potential expansion ofthe Semirara operations that are being considered to serve a second unit atCalaca, as discussed in para. 3.18.
3.10 The balance of the coal industry, which produces about half thetotal output, comprises PNOC's mines and the small private producers. During1987, PNOC sold its operating pits at Bislig in Eastern Mindanao and intendsto divest itself of its other mines. The private sector comprises the tradi-

- 23 -
tional mines on Cebu, currently operated by 18 companies, which have beenproducing between 200,000 and 350,000 tons/year over the past ten years andthe more recently developed mines on other .slands such as Batan, Masbate andPolillo. The level of output of the private producers is to a large extent afunction of the controls on imported coal and the available price for theirproduct. The control of coal imports and the setting of domestic prices forcoal in the Philippines has evolved throughout the 1980s in response tochanging international energy prices. In the early 1980s, when the interna-tional prices of both oil and coal were substantially higher than currentprices, the aim of the pricing policy was to protect consumers who hadrecently converted to coal and to provide a fair price to coal producers. Thesubstantial decline in the prices of international coal delivered to thePhilippines, from a high of US$60 to US$70/ton in 1981 to a low of US$26/tonin 1987, shifted the focus of policy to one of protecting the existing coalindustry and at, the same time, allowing consumers to take advantage of thelow international prices.
3.11 Coal imports are currently controlled by the requirement that coalconsumers meet set proportions of their needs, 50Z in 1987 and 55Z in 1988,with domestic coal. The percentage of domestic coal to be used is based onthe proportion of total consumption that can be met from Philippine mines asestimated by the Coal Council of Advisors (which includes coal producers andconsumers) and enforced by the Energy Regulatory Board. Coal prices in thePhilippines are affected by this required use of domestic coal and by:(a) the price of imported coal inclusive of duties and taxes which increasethe landed price by 20Z-30%; and (b) the price recently offered by NPC ofP 800 per ton for 8,500 Btu/lb coal (P 941/ton for 10,000 Btu/lb coal) to fuelthe Naga power plant. Prices for Philippine coal on Cebu and the duty freeprices for imported coal in 1981 and in 1986 to early 1988 are given inTable 3.3.
Table 3.3: PRICES FOR DOMESTIC AND IMPORTED COAL, 1981-88
Philippine Coal o2 Cebu Duty-Free Imported CoalP/ton US$/10 Btu US$/ton US$/10 Btu
1981 340 1.95 60 to 70 2.27 to 2.651986 740 to 930 1.64 to 2.08 31 to 40 1.17 to 1.511987 740 1.64 26 to 32 0.98 to 1.211988 (Jan. to May) 941 2.05 30 to 38 1.13 to 1.44
3.12 Both imported and domestically produced coal are subject to certaintaxes, duties and royalties. Imported coal is subject to a 20% duty, 0.1%Board of Energy fee and a specific tax that was 50 pesos per ton but was beenreduced to 10 pesos per ton with the imposition of the Value Added Tax (VAT)at the beginning of 1988. Although VAT applies to imported coal, consumerswill be able to deduct the VAT paid on coal from the VAT paid on their final

- 24 -
products with the net effect of not having to pay more for coal as a result ofVAT. The changes in the tax system in 1988, assuming no net increase due toVAT, reduce the total level of duty and taxes on imported coal from the 25-301range to the 20-25Z range (see Annex 3.3).
3.13 Domestically produced coal is subject to a royalty known as revenuesharing and the companies producing the coal are subject to income taxes.Revenue sharing for a Philippine-owned company with a mine developed since thelegislation was passed in 1976 is 301 of revenues minus costs (which cannotexceed 90% of revenue) and is 60% of revenues minus costs for foreign-ownedcompanies. Under current market conditions and ownership, most coal companiespay a minimum 31 for revenue sharing and in most cases low or no income taxes.However, under more normal profit margins the combined level of revenuesharing and income taxes could be 101 to 15% of revenues.
3.14 Prices for both domestically produced and imported coal haveincreased during the latter part of 1987 and early 1988. Prevailing coalprices in early 1988 as paid by consumers and excluding revenue sharing onPhilippine coal and duties and taxes on imported coal are given in Table 3.4.Since the beginning of 1988, duty-free prices of imported coal have increasedfrom about $30 to $38/ton.
Table 3.4: EFFECT OF TAXES AND DUTIES ON COAL PRICES
Philippine CoalCalaca Naga/Cebu Imported Coal
Heating Value (Btu/lb) 8,700 8,500 & 10,000 12,000Pricei to Coal Consumers- per ton P 787 P 800 & P 941 $38 to $48- per million Btu $2.00 $2.08 $1.44 to $1.80
Prices excluding revenuesharing on Philippinecoal, and duties andtaxes on imported coal- per ton P 763 P 777 & P 914 $30 to $38- per million Btu $1.94 $2.02 $1.13 to $1.44
3.15 The cost to Philippine coal consumers of paying the current domesticprices of US$2.00 to US$2.08 per million Btu for Philippine coal and US$1.80per million Btu for imported coal at the current price of $38.00/ton, ratherthan the duty-free price of US$1.44 per million Btu for imported coal, iscurrently about US$20 million per year. This additional cost to consumercomprises:
(a) US$15 million per year for using 1.2 million tons/year of Philippinecoal with a 40% price premium over duty-free imported coal. By pay-ing the higher price, coal consumers support a mining industry with
- 25 -
about 10,000 direct employees, provide considerable additionalemployment to shipping and support industries and provide revenue tothe government in the form of revenue sharing of $1.0 to $1.5 mil-lion plus corporate and personal income taxes generated by theindustry.
(b) US$5 million per year for the imported coal used, which has a pricepremium of 20% to 30Z which accrues as revenue to the Government inthe form of duties and taxes.
3.16 The small mining companies in the private sector base their deci-sions on whether to increase or decrease production at existing mines, or toinvest in new mines, on the prevailing domestic price. Domestic prices thatcontinue to be 40% above the duty-free price of imported coal will result inthe development of mines which are uneconomic from a national point of view.Annex 3.3 presents a forecast of international coal prices in constant 1987dollars and translates that forecast into future prices in pesos/ton for 8,500Btu/lb coal. Based on this price forecast and the domestic price of Y 800/tonfor 8,500 Btu/lb (P 941 for 10,000 Btu/lb coal) the differential between thedomestic price and the duty-free price of imported coal will decline from 40%in 1988 to ,bout 20% by 1990 which will be in line with the differentialresulting from the duties and taxes on imported coal. Thus, maintaining thedomestic price in nominal terms, i.e., not adjusting it for inflation, wouldlead to a parity between the financial price of imported coal and the domesticprice by 1991. Thereafter, the import duty could also be gradually reducedwhile the domestic price would approach, in real term, the CIF price ofimported coal.
Major Investments in New Mines to Serve the Power Sector
3.17 Major investments in new mines would primarily be aimed at sipplyingthe coal requirements of the power sector. NPC's recent plans for expandingthe Luzon system include a second 300 MW unit at CaLaca, with Semirara beingthe likely fuel source, and a 300 MW mine mouth plant at Isabela in theCagayan Valley in Northern Luzon. As outlined in para. 3.1, Semirara andCagayan Valley are the two largest coal deposits in the country and representalmost 60% of known reserves. The total coal requirements of these two newpower plants will be approximately two million tons per year and compare toexisting production in the Philippines, excluding the Semirara productiondedicated to Calaca I, of about 600,000 tons which is currently used by thecement and metals industries. The existing small mines could meet some ofthis future requirement of the power sector; however, the assessment ofwhether the greater part of this requirement should be met by domestic orimported coal requires a comparison of the cost of expanding production atSemirara and developing a new mine in the Cayagan Valley with the expectedfuture prices of imported coal.
3.18 Semirara Coal. The Unong pit currently being mined to serve part ofCalaca I is one of three deposits on Semirara Island. The other two deposits,Himalian and Panian, were assessed in 1987 in the "Fuel Specification and MinePlanning Study" for SCC by Monenco Consultants Limited. The principal objec-tive of this study was to assess the coal quality in these two deposits in

- 26 -
order to provide the design parameters for the Calaca II boiler. The studyalso presented preliminary cost estimates for developing each deposit to meetthe annual requirements of Calaca II and all, or part of, the requirements ofCalaca I after the Unong pit is exhausted in the late 1990s. Of the twodeposits, Himalian has the most complete set of data available and is the mostlikely to be developed first. Based on a projected output of 1.6 million tonsper year to serve all of Calaca II and part of Calaca I, the estimated capitalcost of developing the Himalian pit is $180 million, the estimated annualoperating and capital replacement costs are $35 million per year and the unitcost of mining, using a 12Z real interest rate, is $40/ton. The "as received"coal quality is estimated to a-erage 7,200 Btu/lb resulting in a coal cost of$2.50 per million Btu which is twice the current duty-free price of importedcoal and 651 above the forecast price for the early 1990s (Annex 3.3). It isestimated that about two thirds of the expenditures incurred in developing andoperating the mine will be for imported equipment and material and one thirdwill be for local labor and material. The labor force required to operate oneof the new pits would be approximately 1,300, the same as the present level ofemployment of Unong (see Annex 3.3 for employment in the mining industry inthe Philippines).
3.19 The economics of expanding Semirara to fuel Calaca II are examinedby comparing the following three options:
(a) designing Calaca II for imported coal and using imported coal;
(b) designing Calaca II for Semirara coal and using Semirara coal; and
(c) designing Calaca II with the flexibili.y of using either imported orSemirara coal but using imported coal for the first five years (1992- 1997) and Semirara coal thereafter.
The total discounted (investment and fuel) cost of the 300 MW power plantdesigned for, and using, imported coal is $568 million compared with a dis-counted cost of $734 million for a plant designed for, and using, domesticcoal, i.e. the country would pay $166 million additional cost to use theSemirara coal. Of this additional cost about $22 million is due to the capi-tal cost differential of the power plant and about $144 million is due to thecoal price differential. If the plant is designed to have the flexibility touse either imported or domestic coal, but to use only imported coal for thefirst five years, the additional cost imposed on the economy would be reducedfrom $166 million to $89 million. Based on the present outlook for interna-tional prices, the design for, and use of imported coal has the lowest eco-nomic cost. However, given the uncertainty in the international energy pricesand the desire to develop the indigenous resources, designing the plant toburn domestic or imported coal is considered to be the preferred approach.
3.20 Isabela Coal. The Isabela lignite property is located in CagayanValley in northern Luzon. The reserves within the Burnett and Hallamshire(B&H) concession were described in detail in a geological report in 1981 andmining costs were examined in the study, "Isabela Mining Project - AppraisalReport", which was completed in September 1987. Some of the pertinent aspectsof the Isabela lignite development relative to the Semirara expansion are:

- 27 -
Isabela Semirara
As-Received Heating Valueof the coal/lignite (Btu/lb) 4,000 7,000Strip Ratios 18:1 13 to 15:1Geology More complex at Semirara
3.21 Based on a review of the recently completed Isabela and Semirarareports, it is concluded that mining the Isabela lignite will be more expen-sive than the $2.50/million Btu estimated for expanding operations ofSemirara. In addition to being more expensive, the use of the Isabela ligniteto fuel a mine mouth power plant would have the following disadvantagescompared to a coastal power plant near the Manila load center:
(a) the cost of a 400 km transmission line south to Manila; and
(b) essentially no flexibility in terms of being able to use coal fromother sources to fuel the plant because of the inland location.
The high fuel cost, transmission penalty and lack of flexibility in fuelsourcing eliminate the Isabela development for the foreseeable future.
E. Conclusions and Recommendations
3.22 There are two conflicting considerations in devising the futurestrategy for the coal sector. First, domestic coal is more expensive thanimported coal. Thus, the mandated use of domestic coal imposes a significantburden on coal consumers in particular the power and cement industry whichmay, in turn, hurt the international competitiveness of the industrial sector.Second, strategically, it is not unreasonable for the Philippines to have adomestic coal industry, particularly in view of fluctuating price of impo. tedcoal, lead time required for mine development, and perhaps social considera-tions. The government strategy should, therefore, allow for the financialsurvival of the existing coal industry at its current stage of operation butat the same time aim at (a) reducing the burden on coal users by narrowing thegap between international and domestic prices and (b) preventing misallocationof resources by limiting the expansion of the coal industry umtil and unlessinternational coal prices increase significantly.
3.23 In early 1988, the domestic price was about 15% above the purchasdprice (inclusive of duties) and 40% above the CIF price of imported coal. Itis recommended that the domestic price of coal be maintained in nominalterms. Given the present projection of a relatively rapid increase in theinternational price of coal, the gap between the domestic and the import pricewill narrow substantially in the next few years. A fixed domestic price wouldresult in a parity with the purchased price of imported coal by 1991;thereafter the duty on imported coal can be reduced gradually. The CIF priceof imported coal is expected to reach the level of domestic price by 1993-94.
- 28 -
3.24 With the above pricing policy, domestic coal will becomeeconomically cost effective within the next five years when the domestic pricewould give appropriate signals regarding economic viability of new investmentsin the sector. In the interim, however, the Government should limit theexpansion of the industry which might be triggered by the present prices.Candidates for major expension in the coal industry are the Semirara andIsabela mines both of which are considered for supplying fuel to the powersector. The costs of expanding the Semirara mine and of developing a mine atIsabela are both estimated to be higher than the projected costs of importingcoal to fuel new power plants. The Isabela option has the additional costpenalty of a major transmission line and the disadvantage of being inland, andso limits options for supplying the mine mouth power plant from other sources.It is recommended that:
(a) in view of uncertain price of imported coal, the country keep itsoptions open by designing Calaca II to use either Semirara orimported coal; the premium paid for preserving this flexibility isabout US$20 million;
(b) NPC be prepared to use imported coal for at least the first fiveyears of the operation of Calaca II;
(c) the development of new deposits on Semirara be postponed for aboutfive years with a possible commencement of operations in the mid- tolate-1990s;
(a) given the three to five years lead time to develop a new pit atSemirara and the remaining life of about 10 years of the Uriong pit,feasibility studies be carried out to optimize mining layouts andcosting so that Semirara can react promptly when development iswarranted; and
(e) the construction of a new mine mouth power plant utilizing coal fromthe proposed Isabela mine and the associated EHV transmission linesouth to Manila be dropped froia NPC's expansion program.
By implementing the above pricing and investment policy, the Government would(a) allow the domestic coal industry to continue operating existing mines,(b) reduce the burden on coal consumers, and (c) provide a flexibility toexpand the industry in the late 1990s if international prices increasesubstantially.

- 29 -
IV. GEOTHERMAL DE'ELOPMENT AND UTILIZATION POLICY
A. Introduction
4.1 The Philippines' geothermal energy stems from the volcanic origin ofthe archipelago. Geothermal regions and springs are widespead and productionpotential is high. In January 1979, Union Oil's subsidiary, PhilippineGeothermal, Inc. (PCI), commissioned the country's first geothermal turbine, a55 MW unit at Tiwi, 200 miles southeast of Manila. Since then the Philippineshas continuously increased its productive capacity to become the world'ssecond largest producer of geothermal energy after the United States. In1987, domestic geothermal energy production generated more than 22% of thenation's electricity supply and geotherm-ial pow.r plant capacity constituted18Z of NPC's total installed capacity.
4.2 The Philippines has four commercially developed geothermal fieldssupplying the steam requirements of geothermal power plants with a combinedcapacity of 894 MW. Two of these fields--Tiwi and Makiling-Banahaw (Mak-Ban)--supply two generating plants, each with a rated capacity of 330 MW, in thecountry's largest grid in Luzon. The other two fields--Tongonan andPalimpinon--are being developed to supply two geothermal plants with acombined capacity of 234 MW in the Visayas. A fifth geothermal field isplanned to be developed in Bacon Manito (Bac-Man) straddling the Albay-Sorsogon boundary. This field is intended to support the new 110 MW Bacon-Manito plant in Luzon targeted for commissioning in 1991.
4.3 This chapter reviews the present assessments of geothermal resourcesand their cost of exploration and development. A separate section of thechapter is devoted to the discussion of the Tongonan project in view of thepressing need to determine the Government's policy on this project. Finally,the chapter will review the outstanding issues in geothermal development andpresent the mission's recommendations on pricing, government royalties andother pertinent matters.
B. Organizational Structure
4.4 PGI, a privately-owned company, is the major producer of geothermalsteam, accounting for over 80% of geothermal energy; the PNOC EnergyDevelopment Corporation (PNOC-EDC), a wholly-owned subsidiary of PNOC,produces the remaining 20%. PNOC-EDC conducts geothermal steam explorationand development operations and sells the steam it produces to NPC which isalso wholly-owned by the Government. There are a number of agencies--bothgovernment and private--which have played a significant role in geothermaldevelopment of the country:
(a) Philippines Institute of Technology carried out pioneering work inthe use of geothermal energy beginning in 1964 with financialassistance from the Philippine National Science and TechnologyAuthority.

- 30 -
(b) NPC is responsible for administering the exploration/development ofthe Tiwi and Mak-Ban fields through a service contract with PCI.NPC also buys the steam produced by PNOC-EDC in its Tongonan andPalimpinon fields.
(c) PGI entered into a service contract with NPC for the exploration andexploitation of geothermal resources. Under the contract, PCI(which essentially operates as NPC's contractor) is responsible forthe execution of services and technical assistance, and funds theoperating costs incurred in conducting exploration, exploitation andeffluent handling operations for the 1.urpose of producing geothermalenergy for electric power generation. PGI is entitled to recoverits operating costs and receives a service fee based on the sales ofpower produced from geothermal energy. Following the initialencouraging results at Tiwi, NPC-PGI entered into a second agreementfor the exploration and development of Mak-Ban in Laguna.
(d) Office of Energy Affairs (OEA) undertakes resource inventories inseveral known but unexplored thermal areas.
(e) Pilipinas Shell Petroleum Corporation (PSPC) entered into geothermalactivity in 1982 but reached only the planning stage and its planswere eventually shelved. In early 1982, several other foreign firmsshowed interest in participating in the search and development oflocal geothermal energy sources. These include Total Exploration ofFrance, Caltex Petroleum Corporation, and Occidental Geothermal,Inc. of the United States. In 1983, Total Exploration, PGI'spartner, pulled out of the Philippines as part of a worldwideretrenchment program. In 1982, the Government granted Caltex a non-exclusive permit to do a geophysical survey of the geothermalpotential of a 40,000 hectare area in Batong-Buhay, Pasil andKalinga-Apayao in 1982. The Batong-Buhay exploration continueduntil mid-1983, and in 1984 Caltex stopped its geothermal operationsreportedly because (a) it could not negotiate with the Governmentfor a more attractive steam price; and (b) economic difficulties didnot encourage capital investment in the project.
C. Assessment of Geothermal Resources
4.5 Based on an aq essments carried out over the last two decades, thePhilippines' potential _ geothermal reserves are estimated at 8,000 MW, of
1/ The term Installed Capacity refers to the number of megawatts or capacityin currently installed power plants, the term Proven Reserves is theadditional number of potential megawatts in the field that are eitherunder well head and not yet being produced or proven by reservoirtesting. Probable Reserves are also based on geologic and geophysicalinformation that give reasonable assurance that the fields will beextended beyond the presently tested wells. Potential Reserves aretested identified reserves plus unidentifed reserves likely to bediscovered by the year 2000.

- 31 -
which 4,431 KW are considered probable resources, about 1,640 MW are provenreserves and only 894 MW are being utilized. Distribution of these resourcesby field is given in Table 4.1.
Table 4.1: RESERVES OF GEOTHERMAL PROSPECTS
Field Name or Prospect Installed Proven Probable Potential(MW) (KW) (MW) (KW)
Luzon
Mak-Ban, Laguna 330 387 440 800Tiwi, Albay 330 330 250 250Bacon-Manito, Sorsogon 140 80 220Baton$-Buhay, Kal inga 150 350 350Mt. Pinatubo, Zambales 200 300Irosin-Bulusan, Sorsogon 30Mt. Labo, Camarines Norte 400 1,000Daklan, Benguet 50Buhi-Isarog, Camarines Sur 160Acupan-Itogon, Benguet 34
* ~~Mt. Natib, Bataan 160 160
* ~~Visayas
Tongonan, Leyte 115.5 400 800 1,200Palimpinon, Negros Oriental 118.5 224 283 372Biliran Island, Leyte 7.0 283 372Mambucal, Negros Occidental 1.0 1Baslay-Dauin, Negros Oriental 1.0 20 30Anahawan, Leyte 160 160Burauen, Leyte 330 330Bato-Lunas, Leyte 160 160Monte lago, Mindoro
Mindanao
Mt. Apo, Cotabato 160 160Malindong, Misamis Oriental 160 160Ammican,. No. Davao 1 916 30
Total 894 1,640 4,431 6,396
Undiscovered Reserves 1,000-2,000
Total Potential Approximately 8,000
4.6 Although the Philippines is the second largest producer ofgeothermal energy in the world, the potential of its geothermal resources hasbeen barely touched. Of the 25-30 known occurrences of geothermal in thePhilippines, very few have been fully explored. PNOC, for example, hasdrilled in eight areas, and the 150 wells drilled have proven reserves ofabout 685 MW. These represent a reserve of 32,050 MW-years, i.e., 1,000 MWf or 30 years. Overall, about 350 wells have been drilled countrywide, ofwhich more than 85% are appraisal or production wells.

- 32 -
4.7 Experience, worldwide shows that most geothermal fields are largerthan originally estimated. In the Philippines, for example, the Tongonan andPalimpinon fields are proving largev than originally thought and even theBacon-Manito field apparently has greater reserves in extended portions of thefield. Scientific assessments of the country's geothermal potential as wellas drilling throughout the islands indicate major potentials in the followingareas of Luzon:
(a) Bacon-Manito, Sorsogon. The Bacon-Manito field is located inSorsogon near Legazpi. The field lies along a volcanic belt oftertiary and quaternary volcanoes. The reservoir temperatures inthe field vary from 2700 C to 3250C with about 30% steam. There isevidently sufficient steam to supply one power plant at Bac-Man butmore drilling, testing, and reservoir engineering needs to becarried out before a commitment can be made for subsequent plants.However, experience in the Philippines suggests that the fieldprobably has a much higher potential than 110 MW.
(b) Mt. Labo, Camarines Norte. The Mt. Labo area is characterized bymany andesitic and dacite domes and a young andesitic volcaniccenter. Chemical geothermometers predict temperatures between 1800Cand 2500C and gas thermometers indicate temperatures higher than3000C degrees. There is a well defined resitivity low closure ofabout 20 to 30 km2. The area is estimated to have a potential of400 MW.
(c) Mt. Pinatubo Prospect. Mt. Pinatubo is a young perturbation of apre-existing older, much larger, deeper heat source. There is a 56Zprobability of a discovery and a 40Z probability of about 200 MW.The size of the anomaly would indicate a reservoir of up to 300 MW.
(d) Batong-Buhay Prospect This area is underlain by early tertiarymetabasalt, meta-andesite and metaconglomerate, which collectivelycomprise the basement complex. Geochemical thermometers indicate asubsurface temperature above 2200C, probably 265-2750 C and someevidence suggests temperatures of up to 300 C. This prospect has ahigh probability for success and could have reserves of 150-200 MW.
D. Cost of Geothermal Exploration and Development
4.8 Development costs of geothermal resources in the Philippines are notexcessive. Pipe for geothermal systems costs about the same as elsewhere,labor is less expensive in the Philippines but the work is usually in remoteareas, making it more expensive. Annexes 4.3 to 4.5 show the development costof a typical 110 MW geothermal field compared with the historical costs ofgeothermal sites in the Philippines and the average cost of the PNOCgeothermal development module. This information indicates that:
(a) the success ratio of exploration in the Philippines is estimated at482. This compares very favorably with industry norms of 15-20%;

- 33 -
(b) the cost of exploration is dependent on the area and the size ofeach prospect, and therefore varies from area to area. For thePhilippines, a reasonable range of costs would include US$400,000-US$800,000 per site for geology and geophysical survey expenses, andUS$1.0-1.5 per well for exploration costs; and
(c) the major element in the cost of exploration is the cost of drillingwells. The average cost per well in the Philippines range fromUS$1.2 to 1.8 million while the industry norms under similarconditions range from US$800,000 to US$1,000,000 per well. Sincethe cost of well drilling usually goes down as the producer movea upthe "learning curve," PNOC should attempt to reduce its drillingcost progressively to bring it in line with international industrynorms.
4.9 While the costs of geothermal development in the Philippines arewithin an acceptable range, they could be reduced as follows:
(a) Geoscientific studies need to be concentrated in areas with goodmarket potential, i.e. the Luzon grid. As phased or modulardevelopment of geothermal fields discovered on Luzon 'use up" thebest prospects and force a search for lesser prospects, the successratio will, over time decrease and the exploration costs increase.To compensate, at least partially, for the increasing cost, thepresent exploration techniques may need to be adjusted. Thegeochemical sampling, geophysical techniques, logging techniques,VES, etc., now being used for the rugged areas will undoubtedly haveto be changed as the situation changes and as new technologiEs arediscovered by the international industry.
(b) Since well drilling costs are 45-60% of total development costs, acontinuous effort should be made to utilize cost reducingtechnologies. In particular, developments in the internationalpetroleum industry drilling could provide improved technologiesapplicable to geothermal drilling.
(c) Services provided "in house," especially drilling services, aredifficult to maintain at an efficient level. When drilling is at anebb, neither crews nor rigs are maintained, and when drillingexpands, seasoned crews must be augmented by inexperienced personneland neither crews nor rigs are up to industry standards. Drillingservices then become inefficient. In contrast, contract servicecrews work on a variety of jobs, gaining experience and continuallyimproving their performance.
(d) Reducing drilling time and costs should be a continuing program. AtPNOC, future drilling costs are projected based on historicalcosts. This method of cost estimation does not encourage reductionsin cost as cost controls are primarily based on these projectedfigures. The prerequisites for an effective cost control arecareful planning, closely supervised drilling operations, and athorough post-completion analysis. Separate cost functions should

- 34 -
be developed for all past wells and appropriate candidates should beselected to establish cost targets for the future.
E. The Tongonan Project
4.10 The Tongonan geothermal field is located on the island of Leyte andlies along the Philippine Fault Zone. The field is 17 km northeast of OrmocCity. Tongonan is only one of several geothermal projects on Leyte, but it isthe only one that has been extensively drilled and developed. The others arestill in the exploration phase. Exploration began early at Tongonan and thefirst of several shallow temperature quadient levels were drilled in 1973.The first deep exploration rock was drilled in 1976, and in 1977 a three KWpilot plant went into production. The first major power plant began produc-tion in 1983 with a 112.5 MW plant. Drilling continued into the early 1980s,and there are currently proven reserves of 400 MW. Extensive geoscientificwork and testing has been carried out. In addition, two initial reservoirmodels established by well-tests are being confirmed as draw-down from thepower plant operations continue to reveal more information about thereservoir.
4.11 There have been 52 wells drilled in the field, 19 of which weredirectionally drilled. Some of these wells h9ve been exceptional, with singlewell production of 18 MW and others as hot as 3250C at 1,500 m. The deepestwell in the field is 2,795 m and the average depth is 2,133 m (1998 ft.).Estimates of capacity over field life vary from 465 to 866 MW for 25 years.The proven areas of the field may be 27 km2. If the field proves to be aslarge, it could contain reserves of over 1,200 rLW.
4.12 The Tongonan field has been divided into four sectors for develop-ment: (a) the Mahiao-Samaloran sector has 135 MW tested under the wellheadwhere the present power plant is installed; (b) the Malitbog sector has 104 MWin 13 production wells; (c) the Mahanagdong sector has four completed wells,three producers, and only 23 MW under the wellhead, so considerable drillingwill need to be done in this sector to prepare for production; and (d) theMahiao sector has 54 MW under nine wellheads, plus two reinjection wells.
4.13 The cost of bringing the Malitbog sector in production is estimatedat P 377.44 million of local and US$35.70 million of foreign expenditure.Commercial production would require eighc more production wells and seven morereinjection wells. This would cost about US$55 mill.on.
4.14 Plans for the Mahangdong and the Mahiao sectot.s indicate developmentof 165 MW in 1993 and 110 MW in 1994, respectively. The Mahanagdong sectorwill require 18 production wells and nine more reinjection wells. The Mahiaosector will require seven more production and three more reinjection wells.For the three sectors, the total new wells will be 52 which would thenincrease the number of wells from the present 30 to 82. Annex 2.10 show thecost estimates and a summary of available and additional well requirements.

- 35 -
4.15 Considerable testing and modeling of the Tongonan field have alreadybeen completed, the power plant is operating, and a program is in use to testthe models. Assuming open boundaries of the field, reservoir performance willdepend mostly on recharge which must be done by a careful managementstrategy. If the sites for reinjection are not carefully selected, some ofthe wells may be quenched. Recharge to the field is essential if productionis to exceed 100 MW for 25 years. This recharge may be natural or byreinjection, but reinjection planning should go hand-in-hand with productionplanning.
4.16 Some of the wells in the other sectors should probably be monitoredto ensure that there is no dangerous connection between sectors. Chemicalstudies should be done to ensure that there are no adverse affects on thereservoir. Along with the modeling and simulation of the reservoir, historymatching is being done with available production data to permit betterprediction of field performance. The reservoir studies and the estimates ofthe volume of reserves carried out by PNOC seem to have been well done. Theplanned development is based on the reserve estimates of three models. Thearea of the field is 22 k with a thickness of 2 km which gives a totalreservoir volume of 44 km with temperatures between 251C and 2610C and aporosity of about 8%. This gives a reserve estimate varying between 689 and1,213 MW. A more accurate estimate of the reserve should emerge as monitoringwork continues.
The Transmission Line from Leyte to Luzon
4.17 In order to utilize the full potential of the Tongonan energysource, much of the power needs to be transferred from Tongonan to the Luzongrid at Naga. The total length of transmission will be approximately 430 km,of which 23 km will be submarine cables. The issue at this stage is whether ahigh voltage direct current (HVDC) or a high voltage alternate current (HVAC)cable would suffice.
4.18 The preliminary study and cost estimates for HVAC versus HVDCtransmission indicate that HVAC transmission at 500 kV, inclusive of thesubmarine portion, is considerably cheaper. The cost of HVAC transmission isestimated at US$210 million against US$370 million for HVDC transmission. Adetailed feasibility study of the transmission system is however required,first to establish a feasible route based on logistic considerations and nextto exercise a choice between d.c. and a.c. transmission based on technicalconditions (the most important of which would be system stability andreliability) and cost.
4.19 Due to the substantial difference between the costs of a.c. and d.c.lines and the impact this would have on the economic ranking of the project,an engineering study should be carried out as soon as possible to review thetechnical and economic feasibility of the project including the transmissionline.

- 36 -
E. Major Issues in the Geothermal Sector
4.20 Capacity Utilization. Geothermal fields in the Philippines, parti-cularly those of PNOC, have a power potential from tested or producing wellsgreatly in excess of installed generation plant capacities. The Tongonanfield has an estimated 413 MW of well capacity and only a 115.5 MW generationplant, while the respective figures for the Palimpinon field are 246 MW and118.5 MW. Generation plant capacity utilization has also failed to meetexpectations. The Tongonan and Palimpinon plants operated at only 33% ofcapacity in 1986. Their contribution to the country's geothermal generationin 1986 was only 15% while their capacity comprised 26% of the total, as shownin Table 4.2. In contrast, NPC-PGI plants operated at 67% capacity in 1986.According to projections, the existing Tongonan and Palimpinon generatingplants will be underutilized until the end of the decade unless either demandpicks up in these areas or a means is found to transfer the power generated tosome other load centers.
Table 4.2: 1986 GEOTHERMAL CAPACITY AND GENERATION
Gross CapacitySteam Capacity Generation Utilization
Plant Suppliers MW % GWh Z Z
TiWi &Padk-pRar UPC -PrPT 660 74 3.900 85 67
Tongonan &Palimpinon PNOC-EDC 234 26 686 15 33
Total 894 100 4,586 100 58
4.21 Geothermal energy development has been exclusively related toelectric power supply, which has made PNOC vulnerable to variations inelectricity demand. PNOC plants have been built on the islands of Leyte andNegros, which are distant from major markets, apparently in expectation ofhigher local electricity demand growth than has actually been experienced.Low growth rates in power demand are attributed zo low operating levels,closure, or non-entry of industrial customers, and to lower than plannedelectricity demand for the local distribution utilities. The Leyte plant, forexample, was affected by the failure of the local copper smelting andfabrication industry. In the Negros grid, NPC lost its two main industrialcustomers--Basay Mining, which had its assets foreclosed and was shut downindefinitely and Sipalay copper mine (renamed Maricolum Mining) which has nowbeen revived due to a rescheduling of loans by Marubeni.
4.22 There are no grid inter-connections in the Philippines. This makesit difficult to distribute geothermally-generated electricity around thecountry. While submarine links have been proposed between Negros and Panay

- 37 -
and from Leyte via Samar to Luzon, these are not yet in place. The Negros-Panay interconnection is also uncertain at this time. Although the projectwas originally scheduled for 1988 and its funding was approved in principle bythe Asian Develoment Bank (ADB), the project is not included in NPC's list ofpriority projects for 1988-92. Thus, demand volumes from Panay are not expec-ted to be supplied from Palimpinon until at least the end of the decade, ifthen.
4.23 Steam pricing. With power generation the primary user of geothermalstedm, the issue of steam pricing is closely linked to the cost of alternativesources for power generation and NPC's financial standing, the cost ofdeveloping the steam supply and rate of return on PNOC's geothermal invest-ments (and that of potential foreign contractors) and Government's take ongeothermal steam. The major point of difficulty in reaching agreement on sucha steam price has been bridging the gap between: (a) the price PNOC or anyother contractor needs in order to earn the targeted return on its investmentunder the present royalty/tax structure on geothermal steam (para. 5.19) and(b) NPC's affordable price given the cost of its alternative fuels. Themission reviewed the latest developments, estimated the avoided cost ofgeothermal steam and proposed a steam price for the consideration of NPC, PNOCand the Government (para. 5.20).
4.24 Resource Mobilization Strategies. Fuel price increases have, in thepast, contributed significantly to the sector's resource mobilizationefforts. Until its dissolution in late 1984, Oil Industry Spocial Fund (OISF)received about 14% of these revenues for use largely in energy relatedprojects. Power generation and electrification have typically accounted forthe bulk (about 70-75Z) of the country's energy investment program, with thepublic sector providing over 901 of investment in the power sector. Theremaining 25-30% of the country's energy program has been directed towardenergy resource exploration and development (about 60-90%) and to a lesserextent downstream operations.
4.25 Funds for energy resource exploration and development acccounted forabout 70% of PNOC's appropriations from the OISF and covered about 60% ofPNOC's expenditures in the area during 1975-83. With the OISF's dissolutionand the Government's decision not to provide further equity for exploration,PNOC will need to rely increasingly on its own resources and foreignborrowings. Although its dependence on geothermal will gradually increase inthe future, PNOC's overall profitability at present is particularly sensitiveto its margins on petroleum products and volume of sales as this is still itsmain revenue-generating activity. The dissolution of the OISF, together withPNOC's coordination problems with NPC and the rather poor financialperformance of its geothermal investments to date, have led PNOC to reassessits longer-term role in exploration for geothermal, among other resources,vis-a-vis the private sector. As there is scope for both public and privateparticipation in such future ventures, PNOC might most effectively reduce itsrisk by entering into joint ventures with the private sector in the medium andlong term. In the short term, however, there seems to be little alternativeexcept for PNOC to continue its geothermal exploration and development effortsusing its internal funds and advance steam sale commitments from NPC.

- 38 -
4.26 Long-term Sector Needs. The issue of coordination of PNOC and NPCactivities is particularly important in geothermal deve'opment. Future explo-ration and development of geothermal energy in the Philippines is directlylinked to the development of the country's power supplv. Hence, carefulassessment of the appropriate staging for the introduction of further geother-mal capacity vis-a-vis existing oil-burning capacity and alternative resources(e.g., hydro and coal) into the Luzon and other power grids is essential.This assessment, moreover, needs to include potential as well as provengeothermal resources in order to help shape the country's geothermalexploration strategy. However, NPC and PNOC presently seem to be at a stand-off, whereby NPC is unwilling to include geothermal alternatives in itsplanning until the resources are proven and PNOC is unwilling to explore fornew geothermal resources until it is assured NPC is wiling to use them. Inan effort to alleviate this impasse, it has been sugg!-sted that PNOC and NPCinvestigate the possibility of drawing up an agreemen- whereby NPC wouldcommit to take geothermal (either as steam or power) into the grid on a base-load basis as long as the price is competitive with the next alternativesource of power and a sufficient lead time (perhaps 4-5 years) is given toincorporate these resources into its development program. The development ofsteam-fields could also be integrated with the geothermal power station sothat electric power is sold instead of sale of steam.
G. Conclusions and Recommendations
4.27 The total geothermal potential of the Philippines is estimated at8,000 MW, including 1,640 MW of proven reserves of which 894 KW representsinstalled capacity. The estimate for potential reserves is still a conserva-tive figure since undiscovered reserves are usually several times the provenreserves in a developing geothermal area.
4.28 The development policy of the geothermal sector should be coordi-nated with the power expansion plan and eventually with the developmentprogram of the entire energy sector. Along the lines suggested in this studyfor the energy development strategy (para. 1.15), geothermal resourcesrepresent the least-cost option and should be developed as rapidly aspossible. Translating this strategy into policy would suggest:
(a) the first order of priority is to develop geothermal resources onLuzon. In addition to Bacon-Manito I, which is scheduled forcommissioning in 1991, the other identified sites, Bacon-Manito II,Pinatubo, and Mt. Labo, have the potential of supplying at least 300MW of power. But the assessment and delineation work on these sitesneed to be considerably accelerated. A minimum of 9-12 geothermalwells should be drilled during the next 18-24 months so that thesteamfields at one or more of these sites can be committed fordevelopment before the middle or the end of 1989. This shouldpermit an addition of at least 220 ?W into the Luzon grid by 1993;

- 39 -
(b) the second priority would be the development of the Tongonan geo-thermal resource if the transmission system is found to be techni-cally viable. This development shou.d be in two phases in line withthe power demand growth. This will enable an addition of up to 900MW of power starting in 1995; and
(c) for the period beyond 1995, certain decisions in the resourceassessment area are critically needed in view of the long lead timesinvolved. With seven to ten years between initial exploration andcompletion of steamfield development for geothermal power, it is,recommended that the country continue a minimum program ofgeothermal exploration during the next few years of about three tofive exploration wells per year.
4.29 Finally, the implementation of the above strategy requires theresolution of a number of policy issues:
(a) A steam pricing contract should be signed between NPC and PNOC. Thecontract should include price escalation factors based on actualproduction costs and a cap equal to the avoided cost (para. 5.20).It should also contain provisions for the rigorous implementation of"take or pay" clauses.
(b) There is a need to re-examine the present royalty structure forgeothermal steamfield development so as to attract additionalcapital into the geothermal area (para. 5.22).
(c) In order to encourage investments in geothermal exploration anddevelopment, the Government may wish to state as its policy that anygeothermal steam that an be provided by a company, private orpublic, will be used in the power sector provided it is z-ailable ata price less than the power company's avoided cost and provided itis possible technically to hook this up in the existing grids.
(d) There is a need for closer coordination between the geothermalproducer and the power company. This problem would be solved byestablishment of the Energy Coordinating Committee (para. 1.19).

- 40 -
V. ENERGY PRICING
A. Introduction
5.1 Just as investments in the energy sector played a disproportionatelylarge role in the marcoeconomic and debt problems of the Philippines duringthe early 1980s, so energy pricing policies can make an important contributionto the Government's fiscal and budgetary objectives over the rest of thedecade. The shortage of public finance has been identified as the mainconstraint to economic recovery. Appropriate pricing policies can help torelax this constraint both directly--by taxing energy consumers whose demandis price inelastic and whose incomes are high--and indirectly by enabling theenergy enterprises to self-finance a larger share of their investment program.
5.2 This chapter reviews the current status of energy prices in each ofthe four main subsectors, both in terms of the relation to economic costs andin terms of their net impact on government resources. The final sectionsummarizes the changes that are recommended.
B. Petroleum Product Prices
5.3 As a net oil importer, the Philippines reacted to the energy priceshocks of the 1970s by rapidly increasing the domestic prices of petroleumproducts. This had the desired effect of restraining oil consumption, whileincreases in the tax rates kept total tax revenue roughly constant. When oilprices fell in the mid-1980s, domestic prices fell more slowly so that taxrevenues from oil consumption ballooned to 262 of total government revenues in1984. In line with the government policy of reducing taxes on raw materials,petroleum taxes were reduced and restructured in 1986 and 1987 (describedbelow). Even after these changes, and with other tax revenues starting torise in response to the tax reform package of 1986, oil consumption taxesstill accounted for an important 15% of total government revenue in 1987(Table 5.1).

- 41 -
Table 5.1: PETROLEUM PRODUCT TAXES AND CONSUMPTION
Oil Tax revenues % of Totalconsumption from oil Government(mil bbl) (bil P) revenues
1980 80.0 7.4 21
1981 75.2 6.5 22
1982 74.9 7.8 20
1983 74.8 8.8 19
1984 61.6 14.8 26
1985 55.1 15.1 22
1986 58.0 11.5 15
1987 66.7 11.7 15
5.4 Customs and ad valorem taxes are set by the legislature. The EnergyRegulatory Board (ERB, formerly he Board of Energy) is the government agencymandated to fix and regulate petroleum product prices. Based on the requestof oil companies as well as ERB's own information, the ERB decides on priceadjustments. Thus aichough the ERB holds extended public hearings on proposedchanges in oil prices, it is a quasi-judicial rather than a policy making bodyand its authority is correspondingly limited.
5.5 Since 1984 the structure of petroleum product taxation has graduallybeen simplified and rationalized with the abolition of "specific taxes" andspecial levies and the consolidation of all taxes into customs duties and advalorem taxes. Customs duties on crude oil (which is locally refined) andpetroleum products have been reduced from 22% in 1986 to 20X in May 1987, 15%in August 1987 and then to 10% following consumer protests. Ad valorem taxeswere also simplied in 1987 to two rates: 48% on gasoline, jet fuel andsolvents; and 24% on kerosene, diesel, LPG and asphalt. The ad valorem tax onfuel oil was abolished to prevent its pass-through into electricity tariffsand the prices of import-competing industrial products.
5.6 This new tax structure is a good compromise between fiscal, socialand efficiency objectives. Tax revenues are enhanced, and dead-weight lossesminimized, by a system of differential taxation based on the income and priceelasticity of the final consumer. This would suggest, for example, highertaxes on gasoline for private automobile use than on kerosene for cooking andlighting in rural areas. However, differential taxation of products which areclose substitutes--such as kerosene and diesel--is constrained on efficiency
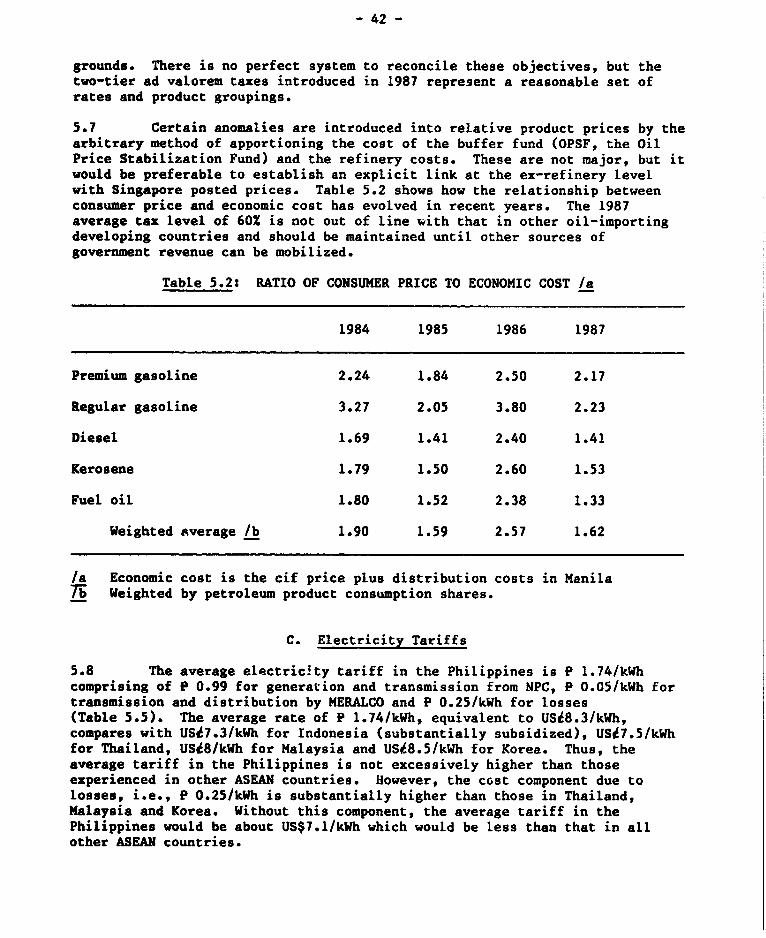
- 42 -
grounds. There is no perfect system to reconcile these objectives, but thetwo-tier ad valorem taxes introduced in 1987 represent a reasonable set ofrates and product groupings.
5.7 Certain anomalies are introduced into relative product prices by thearbitrary method of apportioning the cost of the buffer fund (OPSF, the OilPrice Stabilization Fund) and the refinery costs. These are not major, but itwould be preferable to establish an explicit link at the ex-refinery levelwith Singapore posted prices. Table 5.2 shows how the relationship betweenconsumer price and economic cost has evolved in recent years. The 1987average tax level of 60% is not out of line with that in other oil-importingdeveloping countries and should be maintained until other sources ofgovernment revenue can be mobilized.
Table 5.2: RATIO OF CONSUMER PRICE TO ECONOMIC COST /a
1984 1985 1986 1987
Premium gasoline 2.24 1.84 2.50 2.17
Regular gasoline 3.27 2.05 3.80 2.23
Diesel 1.69 1.41 2.40 1.41
Kerosene 1.79 1.50 2.60 1.53
Fuel oil 1.80 1.52 2.38 1.33
Weighted average /b 1.90 1.59 2.57 1.62
/a Economic cost is the cif price plus distribution costs in ManilaTh Weighted by petroleum product consumption shares.
C. Electricity Tariffs
5.8 The average electricity tariff in the Philippines is P 1.74/kWhcomprising of P 0.99 for generation and transmission from NPC, P 0.05/kWh fortransmission and distribution by MERALCO and P 0.25/kWh for losses(Table 5.5). The average rate of P 1.74/kWh, equivalent to USi8.3/kWh,compares with USV7.3/kWh for Indonesia (substantially subsidized), USi7.5/kWhfor Thailand, USi8/kWh for Malaysia and USi8.5/kWh for Korea. Thus, theaverage tariff in the Philippines is not excessively higher than thoseexperienced in other ASEAN countries. However, the cost component due tolosses, i.e., P 0.25/kWh is substantially higher than those in Thailand,Malaysia and Korea. Without this component, the average tariff in thePhilippines would be about US$7.1/kWh which would be less than that in allother ASEAN countries.

- 43 -
5.9 The electricity consumer in the Philippines is subject to frequent(sometimes monthly) changes in rates--both up and down--and a structure oftariffs that bears little relationship to the costs that his consumptionimposes on the system. The Metro Manila consumer pays close to the averageeconomic cost of supply today, although this cost will rise in real terms byabout 301 by 1992 when the first imported coal plant is needed. Thus theimmediate priority is to restructure electricity tariffs rather than to raisethem. The new structure may itself have an impact on demand--and thus thepace of new investment--and will enable the eventual tariff increases to befairly allocated across consumers.
5.10 In January 1987 the Philippine President and Cabinet directed NPC,NEDA and OEA to "define the structure of electricity tariffs, guided by theprinciple of pricing according to marginal cost and taking into account otherpolicy objectives of the government" and mandated several other importantimprovements in the system of small consumer subsidy, fiscal incentives tocooperatives and punitive rates for electricity pilferage. The agencies weregiven three months to develop a new tariff structure. NPC set to workupdating and revising estimates of LRMC produced in a 1985 consultant studywhich was rendered obsolete by the decision to mothball the nuclear plant.Unfortunately, the same decision meant that NPC's planning staff was also inthe process of developing a new system expansion plan. The tariff team usedthe latest available expansion plan, which showed Calaca II (based on localcoal) and Isabela as the marginal capacity investments. This resulted in veryhigh LRMCs for Luzon.
5.ii Based on the .ission's syetem planning exercise (Chapter II) arevised set of LRMCs was calculated for Luzon for generation and transmissiondown to the medium voltage level. During the period before 1991, incrementalcapacity is provided to the system through gas turbine plant. In 1991 themarginal plant becomes geothermal steam (Bac-Man I) and in 1992 it is importedcoal (Calaca II). For strict LRMCs all capacity costs are charged to the peakconsumer. Peak and off-peak energy costs reflect the differential betweendiesel oil (burned at the margin during peak periods) and heavy fuel oil (themarginal off-peak fuel). These remain the marginal fuels throughout theplanning horizon. All costs are in 1987 prices and the nil price is assumedconstant at $17/bbl CIF (see Table 5.3).
5.12 A comparison of these LRMCs with current tariffs is possible only byconsidering their net effect on sample classes of consumers. For NPC the mostimportant consumer is MERALCO, the distribution company for the Metro Manilaarea which supplies 77% of the electricity used in Luzon. Currently MERALCOpays a flat energy charge to NPC for all its electricity. Under an LRMCstructure, at least 40% of the revenue would be derived from capacity chargeswhile unit energy charges would drop significantly. This would reduce thecross-subsidy by the large industrial consumers of other customer groups andincrease the economic efficiency of electricity use.

- 44 -
Table 5.3: LONG-RUN MARGINAL COSTS FOR LUZON
1988-90 1991 1992-95
Capacity costs ($/kW/yr)
at generation 72 137 175at EHV 86 151 189at VHV 104 170 208at HV 115 185 225at MV 128 202 245
Energy costs (c/kWh) Peak Off-peak
at generation 4.7 2.5at EHV 4.7 2.5at VHV 4.8 2.5at HV 5.0 2.6at MV 5.3 2.8
5.13 The total revenue impact of LRMC-based tariffs for MERALCO is shownin Table 5.4, based on 1986 sales and assuming an average energy chargecomposed of 15% peak/85Z off-peak generation. The total revenue from LRMC-based tariffs during the period until geothermal generation becomes themarginal capacity addition is within 10 of the current average tariff (andthus within the margin of error around the estimates). Only after 1990 is areal increase in average tariff levels necessary to reflect increases inLRMC. This provides ample time for a revenue-neutral restructuring of tariffsto take place between NPC ard MERALCO (to be passed onto Meralco's largeconsumers) and for a trial program of time-of-day metering to be implemented.Because of the predominance of large electricity consumers in the Manila area,and the importance of MERALCO's demand growth to NPC's system planning andinvestment program, the priority should be given to implementing LRMC pricingbetween NPC and MERALCO.
Table 5.4: REVENUE IMPLICATIONS OF LRMC TARIFFS FOR MERALCO
1986 sales basis Revenues Difference(MW) (GWH) ($ mil) (c/kWh) (X)
Current tariff 728 4,212 476 4.8 01988-90 LRMC 728 4,212 451 4.6 -5.41991 LRMC 728 4,212 565 5.7 +18.71992-95 LRMC 728 4,212 632 6.4 +32.7

- 45 -
5.14 The change to an LRMC based tariff structure with both capacity andenergy charges should be accompanied by a change in the tariff adjustmentsystem. While the petroleum product consumer has been protected from pricefluctuations through the establishment of a special buffer fund (see above),the electricity consumer has had every movement of fuel prices or exchangerates pasqed through to him. Not only does this create cnnfusion, but thefuel adjustment formula is flawed and behaves perversely when both the priceand the quantity of oil used in generation decline. In addition, through theforeign exchange adjustment NPC is protected from exchange risk andconsequently has little incentive to seek the most economical source ofinvestment funds. A better system would be to review the full tariffstructure, say, every three years and to make interim adjustments every 6months to take account of changes in fuel prices, exchange rates and domesticinflation. These changes should be discussed with OEA and MERALCO prior toimplementation and subject to ERB review if OEA believes them to beunjustified.
5.15 On MERALCO's side the priority is reducing distribution systemlosses (see Chapter VII). A moderate reduction is possible in the technicallosses, perhaps from the 1987 level of 9.5X to 8Z by the early 1990s. The bigreduction is expected to come in nontechnical losses (theft), from its 1987level of 11.2% to 2% by 1990 and 1% by 1992. Achieving these targets couldmean that the full 33X increase in LRMC expected by 1992 could be accommodatedby only a 7% real increase in average consumer tariffs, as shown in Table 5.5which is based on these assumptions.
5.16 Compared to the petroleum sector, tax revenues from electricity areinsignificant. NPC pays import tax on the coal and fuel oil that it uses(which is included in the petroleum tax revenue shown in Table 5.1), but isexempt from income tax on its profits. Until 1986 NPC was a net recipient ofgovernment equity, with a total injection of P 1.9 billion in the three years1984-86.
Table 5.5: BREAKDOWN OF ELECTRICITY TARIFF(P /kWh)
1987 1992
Generation and transmission (from NPC) 0.99 1.31 /aDistribution costs 0.50 0.50 ThTechnical losses 0.05 0.04Nontechnical losses 0.20 0.02
Price to consumer 1.74 1.87
/a Equal to the LRMC for HERALCO of US$0.0594 from Table 5.4.Th Assumed to remain constant in real terms due to the need to rehabilitate
much of the distribution system to contain losses. No further expansionof the MERALCO franchise area is assumed.

- 46 -
5.17 As a private company, MERALCO is treated differently. It pays realestate taxes, a franchise tax (2Z of gross revenues) and a 35% income tax.During the three years 1984-86, these taxes amounted to a total of P 844 mil-lion. Thus Meralco's tax contributions to the government budget representednearly 45Z of the government's contribution to NPC during that period. Thisdisparity of tax treatment between electricity generation (MPC) and distribu-tion (MERALCO) must be kept in mind whenever there is a possibility of compe-tition between the two. For example, in serving large industrial consumersthe government should ensure that NPC does not derive an unfair advantagebecause of its status as a public monopoly which is exempt from most taxes.
D. Steam Prices
5.18 As noted in Chapter IV, the Philippines' geothermal resources areamong the largest in the world, they are the least cost option for futurepower generation (Chapter II) and yet they are underexplored and under-developed. This paradoxical situation is largely the result of a stalemateover steam pricing. As described in more detail in Report No. 6999-PH(January 27, 1988) the attempt to treat steam like petroleum in terms ofroyalty arrangements and contractors' obligations has effectively put toogreat a risk on the developer and thereby stifled development.
5.19 There are two aspects to the problem. First, unlike oil, steam hasno observable international price or independently determined value. It hasfew uses other than pow*er generation, NPC is the only certain power sectorpurchaser and thus it is only worth what NPC is willing to pay for it.Further, NPC's reputation as a buyer has been tarnished by its failure tohonor previous take-or-pay clauses for steam when the demand for electricityfell below its expectations. Second, even if a price were agreed, the steamdeveloper is currently subject to a 60X royalty on net income which is farsteeper than the corporate profit tax (35%) and provides insufficientfinancial reward given the current prices of alternative imported energysources.
5.20 The recent completion of a consultant study on the basis for steampricing has advanced the debate considerably. The study showed that under thedemand/supply conditions for steam prevailing in the Philippines (i.e., largenontradable and depletable steam resources, but substituting at the margin fortradable fuel--mostLy coal--in power generation), the economic value of steamis the "avoided cost" of the next best alternative in power generation. BothNPC and PNOC have accepted this principle, which prosides the key to the firstproblem noted above. According to the mission's system planning analysis forLuzon, the avoided economic cost for steam is US¢2.4/kWh. This is the break-even price of electricity generated from imported coal excluding all taxes,etc. and using a real discount rate of 12%. The avoided financial cost(including import and other taxes paid by NPC for coal) is US02.75/kWh.

- 47 -
5.21 To address the second problem noted above, the reference price mustbe compared with the cost of steam exploration and development to see howlarge a tax wedge can be accommodated while still preserving the contractor'sincentive to explore and develop steam. The mission assessed the productioncost of future geothermal wells in Luzon to be of the order of 1.5 cents/kWh,to which an exploration risk premium of up to 0.5 cents/kWh is added, yieldingan economic cost in the range 1.5 to 2A0 cents/kWh. This is well below theavoided economic cost, as borne out in the power system planning exercise.However, for Bacon-Manito I PNOC estimates that a 12% real return on allinvestment (including sunk costs, which have been excluded from the derivationof the economic cost) would require a minimum price of 2.52 cents/kWh. Thisis because heavy drilling costs were incurred as far back as 1983/84 with, asyet, no return. The figure would still exclude taxes and royalties.
5.22 Taking into account the naturally heavy up-front costs involved inexploring for and developing a new indigenous resource, the mission recommendsthat:
(a) the price of steam in Luzon be set at US¢2.7/kWh. This price wouldbe appropriate for the next four fields in Luzon and for the per-ceived arrangement that two public entities (PNOC and NP0. produceand use the geothermal steam. It is important to note that if aprivate sector entity enters either or both of these activities,then a separate pricing scheme would be needed to ensure thatGovernment would capture the economic rent on geothermal resources;
(h) PNOC absorb the cogt and risk of exploration. either on its own orthrough joint ventures with other local or foreign partners.
(c) PNOC be designated as the "implementor" for geothermal developmentwhich would exempt it from royalty payment; and
(d) PNOC continue to be subject to the 35% corporate income tax.
This set of price/tax arrangements, coupled with the institutional changesrecommended in Chapter 1 for unified sector planning and approval for newinvestments in power, steam and coal. should enable the immediate Luzondevelopment to go ahead. Over the long-term, however, the Government willneed to alter the royalty legislation in order to encourage other local andforeign parties to undertake geothermal exploration and production.
5.23 The proposed arrangements imply a loss of royalty revenue by thegovernment, but this is a purely hypothetical loss. Steam development in thePhilippines is at such an early stage that tax holidays protect its revenuesand, in any case, a significant positive cash-flow is not expected until about1994. Exploration is currently being financed by PNOC out of earnings on itsother operations, with no net equity from the government budget.

- 48 -
E. Coal Pricing
5.24 International coal prices reversed their rise of the late 1970s withan even sharper fall during the 1980s. In response to the earlier price rise,the Philippines increased its coal production by about fivefold so that it nowsupplies half of domestic demand. However, with the recent fall in prices,the cost of locally mined coal is 30-80% higher than the price of importedcoal (see Table 5.6). The roller-coaster behavior of world prices, coupledwith the long lead time for new investment and the recent period of governmentencouragement for mine expansion in the private sector, provide a difficultbackground for coal pricing policy in the Philippines.
Table 5.6: AVERAGE DOMESTIC AND INTERNATIONAL COAL PRICES($/ton of 12,000 BTU/lb coal equivalent)
Domestic price CIF price Ratio
1981 72.5 71.4 1.021982 66.0 50.5 1.311983 54.0 39.8 1.361984 64.8 42.9 1.511985 57.8 41.4 1.401986 43.3 36.9 1.171987 42.7 32.5 1.31
5.25 To balance the interest:s of coal producers and users, as well as thelong and short-term objectives of the government with respect to coaldevelopment, a system of industry self-regulation has evolved. Its core isthe Coal Council of Advisors which includes representatives from the majorconsumers, producers and the OEA. Each year the OEA makes an estimate ofindustry supply and demand to determine the percentage of demand that can bemet by domestic production (55% in 1988). Each consumer is then required topurchase at least that percentage of his requirements locally, and evidence ofcontracts with local producers is required before the Council will approveimport licenses.
5.26 Domestic coal prices are supported both by the system of allocationdescribed above and by tariffs and taxes on imported coal which, in December1987, added about 30% to the cif price. However, domestic prices vary widely,with the Semirara price (agreed separately between NPC and the Semerara CoalCompany) about 40% higher than its cif equivalent.
5.27 While this system provides a flexible mechanism to reconcile theinterests of producers, consumers and the government, it also disguises thereal cost to the economy of supporting the domestic coal industry and carries

- 49 -
the risk of encouraging uneconomic investment (see Chapter III). Sinceinternational coal prices are expected to rise, thereby narrowing the gapbetween domestic and import prices, the mission recommends that the presentdomestic coal price be maintained in nominal terms (i.e., not adjusted forinflation) in order to allow the private mines to plan on the basis of anorderly transition to lower levels of subsidy.
5.28 Tax revenue from the coal sector must be set in the perspective ofgovernme.lt contributions to the investment of Semirara Coal Corporation. In1987 taxes on imported coal amounted to about $5 million and taxes on localcoal production (3% bed share) added another $1 million. If the expansion ofSemirara were to go ahead, its capital cost alone would be $180 million.
F. Recommendations
5.29 There are no subsidized energy prices in the Philippines. Exceptfor electricity, prices across the sector reflect a strategy of discouragingconsumption and encouraging indigenous production in an environment of highworld prices. This strategy was successful in reducing oil consumption,building a local coal industry and stimulating geothermal steam exploration--until world prices began to fall in the early 1980s. In today's environmentof lower ard uncertain world prices, and a continued shortage of governmentbudgetary resources, certain changes in the pricing strategy should beconsidered.
5.30 The first priority is to agree upon price and tax policy forgeothermal steam on Luzon. The analytical work has been completed and thepricing principle agreed, so the final contract negotiation and a decision bygovernment on the royalty status of PNOC development is all that remains.Agreement is urgent if geothermal development is to proceed.
5.31 The second priority is to restructure electricity tariffs to reflectthe real cost of supplying energy and capacity to different consumers, perhapseven at different times of the day. This task should begin in cooperationwith MERALCO so that LRMC pricing signals can be provided first to theindustrial and other large electricity consumers in and around Manila. Overtime this may lead to a better dispersion of energ,-intensive industry toother areas and islands. In the meantime it will provide a fair basis forcharging and a benchmark against which to measure the need for future tariffchanges.
5.32 In the coal subsector, international price declines have resulted ina very high level of protection for domestic producers. However, many ofthese are in the private sector and were encouraged to develop theiroperations by government as part of its efforts to promote indigenous energyproduction. We therefore, recommended that current prices be held stable innominal terms so that the level of protection is gradually reduced ifinternational coal prices rise as expected.

- 50 -
VI. TECHNICAL AND ECONOMIC ASPECTS OF POWER PLANT REHABILITATION
A. Introduction
6.1 A prolonged period of budget constraints has caused several of theNPC plants to suffer derating, as well as loss of operating efficiency. Giventhe magnitude of sectoral investment as a component of the Public InvestmentProgram, efficient utilization of power sector assets is critically importantas it helps defer investment in new generating capacity.
6.2 The scope for rehabilitation of the existing power plants isindicated by the following table which compares the rated and currentcapacities of Metro Manila's fuel-oil-fired thermal plants.
Table 6.1: OIL-FIRED POWER PLANTS
MW RatingPlant No. of Units Rated Current
Sucat 4 850 650Malaya 2 650 650Manila 2 200 200Bataan 2 225 221Rockwell 6 255 90 /a
/a Environmental constraints in the areapermit only one unit operating at a time at30 MW only.
6.3 In this chapter are described the technical aspects ofrehabilitation, the results of economic analysis, and the institutionalrequirements for training and maintenance.
B. Technical Aspects of Plant Rehabilitation
Rehabilitation of Rockwell Units
6.4 Present Condition of Units. This plant is owned and operated byMERALCO, and is the oldest major fuel oil fired plant in the Luzon grid. Onlythree of the eight units (Units 6, 7 and 8) are in operable condition at halfcapacity (30 MW), but only one unit can be operated at any time under normalcircumstances. However, two units can be operated in an absolute emergency upto a maximum generation level of 60 MW. Units 3, 4 and 5 are still listed atsystem capacity although they have not operated for several years. This onlyserves to inflate the capacity figure, while, in effect, the units may not beavailable for service at all. Units 1 and 2 are considered inoperable.Installation dates and ages of the units are as follows:

- 51 -
Unit 3 - 1953 (35 years)Unit 4 - 1955 (33 years)Unit 5 - 1958 (30 years)Unit 6 - 1960 (28 years)Unit 7 - 1961 (27 years)Unit 8 - 1963 (25 years)
6.5 MERALCO's Plan for Rockwell Rehabilitation. Based on a studyrecently completed to establish the feasibility of reactivating the Rockwellplant, the following plan has been suggested with respect to the individualgenerating units:
(a) Units 6, 7 and 8 be rehabilitated to restore full capability;
(b) Units 3, 4 and 5 be converted to combined cycle operation byinstalling new gas turbines and waste heat boilers; and
(c) Units 1 and 2 remain out of service.
6.6 Cost Estimates. The engineering cost estimates and recoveredcapacity projections for these programs are as follows:
Units 6, 7 and 8
Base cost estimate US$47,548,200 Capacity 180 MWWith potential additionalrepairs US$65,066,700 Capacity 180 MW
Units 3, 4 and 5
Base estimate US$129,812,300 Capacity 270 MWWith potential additionalrepairs US$139,441,900 Capacity 270 MW
6.7 Factors Affecting Rockwell Rehabilitation. As the estimate reflectsa cost higher than that for a new plant, it is concluded that rehabilitationof the Rockwell power station is not economically viable (para. 6.33).Moreover, its return to full service is likely to face serious environmentalobjections. If the oil-fired plant runs at full capacity, it is judged thatthe environmental impact of emitting as much as four to eight times the SOXdischarge presentiy being placed in the atmosphere by the plant would beunacceptable.
6.8 Despite the near-term need for capacity, NPC's generation expansionplan will reduce the importance of fuel oil as the prime thermal energy sourceby the mid to late 1990's as new hydro, geothermal and coal units are added tothe system. The thermal efficiencies of Units 6, 7 and 8, compared with theefficiencies of other NPC rehabilitated units, would place these units in thecategory of the highest-cost fuel oil fired units in the Luzon grid, hence at

- 52 -
the bottom of the operating sequence as cycling units, i.e., the last to startin service and the first to be removed from service. As these units will beused at very low plant factors after 1992-93, the rehabilitation plan is ofquestionable merit.
6.9 For Units 3, 4 and 5, the reliability and merit of operating gasturbines on heavy fuel oil, especially with the limited quality of heavy oilavailable to MERALCO or NPC, is a highly contentious option. The quality ofthe heavy fuel oil burned in combined cycle units must be closely monitoredand the vanadium, sodium and potassium contents held to rigid limits.Compared to other heavy oil fired gas turbine units throughout the world, the150 ppm sodium/vanadium content measures as a high contaminant raw fuel feedfor which a very elaborate oil treating system will be required. (One exampleof a successfully converted gas turbine unit is in Taiwan but in that case theraw heavy fuel oil feed contains a 5.2 ppm vanadium/sodium content as comparedto the 150 ppm vanadium/sodium content in the NPC fuel oil). Additionally,the turbines must be taken out of service frequently to wash off the depositsfrom the buckets. The delivery of fuel oil to the Rockwell station is fromthe local Philippines refineries via an existing pipeline from the NPC oildistribution system. There is little possibility that high grade heavy fueloil will be made available exclusively at the Rockwell station. Finally, 195MW of new generating capacity coupled to 3 x 25 MW of 30 to 35 year oldturbine generating units, cannot be expected to provide reliable service in acombined cycle mode.
Rehabilitation of Sucat Units
6.10 Present Condition of Sucat Units 1 and 4. Units 1 and 4 are bothoperating at reduced operating pressure and capacity. Unit 1 is derated from150 MW to 100 MW and Unit 4 from 300 MW to 230 MW. Present thermalefficiencies are given as 29.2Z on Unit 1 and 29.02 on Unit 4 as compared tothe design efficiencies of 37.12 and 38.52 respectively. The units arederated because the boiler tubes have been rendered metallurgicaly weak due tocorrosion caused by poor quality of boiler water. In order to minimizefailure rates, NPC has been operating the Sucat units at reduced pressures.Returning these units to full rating would mainly require replacement of theaffected boiler tubes and repair of water treatment equipment in conjunctionwith repair or upgrading of instruments and controls, the turbine generatorunits, air preheaters, fuel oil burners, and the cooling water cycle.Restoration of the units to operate at rated pressure and temperature wouldnot only permit operation at design load, but would also increase unitefficiency and reiiability.
6.11 Present Condition of Sucat Units 2 and 3. These identical unitsrated at 200 MW each, a-e also operating at reduced pressure (2,300 psi) andtemperature (950°F) and at a reduced load of 160 MW for the same reasans asunits 1 and 4. This condition has also materially contributed to the presentunusually low efficiency which is recorded as averaging 30.6% on Unit 2 and26.9X on Unit 3 as compared to the design efficiency of 36.2Z (9,420 Btu/kWh).
6.12 Other systems and equipment have also deteriorated due to lack ofspares. The common plant systems which require rehabilitation are presentlyincluded as part of the rehabilitation of Units 1 and 4.

- 53 -
6.13 Partial versus Full Rehabilitaticn. Rehabilitation of the Sucatunits can be performed in two stages. The first stage would comprise partialrehabilitation to restore the units to full capacity mostly by reinstating theboiler pressure parts and the turbine. Partial rehabilitation, in addition torestoring capacity, will significantly improve unit reliability and heat rateover its present values as the penalties associated with generationconstraints are reduced. The second stage, or full rehabilitation, will yieldfurther recovery of heat rate and extend the life of the unit by severaladditional years. The majority of this work will relate to the auxiliarysystems, some of which have built in redundancy (e.g. pumps) which can berepaired with the unit in service. In a resource-constrained environment,partial rehabilitation may be an option to enable NPC to meet the short-termdemand while leaving the balance of the rehabilitation program for a moreopportune time.
6.14 Cost Estimates for Sucat Units 1 and 4. The estimated costs of theessential repairs and the expected heat rates are:
Unit 1 Units 4$ million Btu/kWh $ million Btu/kWh
Current heat rate - 11,688 - 11,769
Partial rehab: Stage I 17.2 10,000 49.8 10,300Stage II 27.7 9,400 31.3 9,600Spares 1.0 1.0
Full rehabilitation 45.9 9,400 82.1 9,600
6.15 Cost Estimates for Sucat Units 2 and 3. The estimated costs of theessential repairs and the expected heat rates are:
Unit 2 Units 3$ million Btu/kWh $ million Btu/kWh
Current heat rate 11,154 12,688
Partial rehab: Stage I 7.6 10,300 7.4 10,300Stage II 17.2 /a 9,600 15.8 9,600Spares 5.0 -
Full rehabilitation 29.8 9,600 23.2 9,600
/a Due to lack of a definitive stage II work scope, this figure is taken asthe difference between the full and partial rehabilitation costs

- 54 -
6.16 Scheme of Rehabilitation. The present NPC rehabilitation programcalls for the full restoration of all four units at this plant. However, thecurrent schedule is to complete Unit 1 work in August 1989 and Unit 4 work inApril 1989. The subsequent rehabilitation of Units 2 and 3 is not planneduntil after restoration of Units 1 and 4 is complete.
6.17 The rehabilitation of Units 1 and 4 would permit NPC to implementthe capacity recovery program. The retubing and upgrading of Unit 1 has beencompleted. The outage also permitted inspection and some essential repairs tothe turbine generator.
6.18 Based upon a review of the units' conditions, and their thermalperformance, a list of tasks has been compiled which, when completed, shouldreturn the units to full capacity and to an acceptable thermal efficiency(estimated at 33.1Z). The repairs to recover the majority of the design heatrate would be the balance of the work listed in Annex 6.5.
Rehabilitation of Bataan Units
6.19 Present Conditions of Units. The two Bataan units are the newestfuel oil fired units in the NPC system. The boilers are outdoor drum designinstallations and are fired with high viscosity oil (asphaltic quality heavyoil) supplied by the refinery adjacent to the station at a cost of$3.25/MMBTU. Design thermal efficiencies are 37.0Z for Unit 1 and 38.7X forUnit 2.
6.20 Both units are operating very reliably with good availabilityconsidering the fuel being burned. While Unit 2 operates at rated capacity,Unit 1 has operated at a 3-4 KW derated output since its early operation dueto suspected air preheater seal leakages, limitations in the forced draft fancombustion air flow and, currently, burner nozzle problems. This problemshould get resolved with the completion of the current overhauling program.The thermal efficiencies are 33.3% on Unit 1 and 33.9% on Unit 2.Improvements should conceivably upgrade Unit 1 to 36% and Unit 2 to 37%.
6.21 The plant in general is experiencing seawater corrosion in thecooling water system which should be arrested before it becomes a severehindrance to continued plant reliability. Embedded items also are beingattacked by seawater, which should be checked.

- 55 -
6.22 With Unit 1 restored to full capacity, the thermal performance isexpected to improve as follows:
Design heat rate: Unit 1 8,690 BTU/kWhUnit 2 8,520 BTU/kWh
Present heat rate: Unit 1 10,256 BTU/kWhUnit 2 10,071 BTU/kWh
Rehabilitated heat rate Unit 1 9,500 BTU/kWhUnit 2 9,225 BTU/kWh
6.23 Cost Estimates. The estimated costs of the restoration are as follows:
Unit 1 $0.980 million$1.324 million with spares
Unit 2 $1.797 million$0.632 million with spares
Comon auxiliaries $0.923 million$1.247 million with spares
Rehabilitation of Manila Units
6.24 Present Condition of Units. The two Manila units commissioned inthe mid-60s, are each rated at 100 MW. The boilers are heavy fuel oil fireddrum units operating at design pressure (1,800 psi) and temperature (1,000°F).Although these units operate continually at rated pressure ard temperature andat full capacity, the thermal efficiencies have fallen off with time.Presently, Unit 1 is operating at 33.82 efficiency and Unit 2 at 33.7Z havingbeen overhauled in 1987 and 1986 respectively.
6.25 While the need for turbine spare parts is being addressed,purchasing additional parts for other equipment will become more difficult inthe coming years due to obsolescence, since these units are nearly 25 yearsold. If the Manila units are to remain in service for the next ten to twelveyears, they will need to be improved. The boiler casings and insulation areboth in need of upgrading for health and economic reasons. Furtherimprovement in efficiency can be achieved with a major upgrading of the feeloil burners to improve combustion. Added improvements will also be realizedby overhauling the soot blowers to improve boiler heat transfer. Heat rateimprovements are estimated as follows:

- 56 -
Design heat rate: 8,909 Btu/kWh
Present heat rate: Unit 1 10,088 Btu/kWhUnit 2 10,116 Btu/kWh
Rehabilitated heat rate: (both units) 9,200 Btu/kWh
6.26 Cost Estimates. The estimated cost of the restoration work is$6,000,000 including US$1,600,000 for spare parts.
C. Economic Analysis of Plant Rehabilitation
6.27 The approach taken here in analyzing the economic viability ofrehabilitation options for the Luzon power grid is to consider the costs ofthe expected utilization of the plant over an extended period (25 years) andcomparing the net discounted costb of operation of the various rehabilitationproposals against (a) the option of not rehabilitating the plant, and (b) theoption of installing a new unit.
6.28 For each plant, a reference capacity is defined (the capacity of therehabilitated plant). Where there is a shortfall in capacity relative to thisreference capacity, replacement capacity will be required, and this is valuedat the system's long run capacity cost (LRCC). Where there is a shortfall ingeneration (energy), the replacement generation is valued at the system's longrun energy cost (LREC).
6.29 Table 6.2 summarizes the results of economic analysis. The mainconclusions of economic analysis for each plant are summarized in thefollowing paragraphs.
6.30 Rockwell Plant. The economic analysis considered two options forUnits 6, 7 and 8--rehabilitation at US$47.55 million, and rehabilitation withadditional repairs/spares at US$65.07 million. Both these options are cheaperthan the "no rehabilitation" option. However, compared to the "new unit"option, neither of the rehabilitation alternatives is viable, being 6.0X and11.3% higher than the "new unit" option. Units 3, 4 and 5 have not operatedfor many years, but the program envisages extensive rehabilitation of theunits as well as conversion to combined cycle operation. The cost of thismodification is more than that of a new unit. Units 1 and 2 are conpideredinoperable. Based on the above, the mission recommends that the RockwellPower Plant be retired from service.

- 57 -
Table 6.2: RESULTS OF THE ECONOMIC ANALYSIS OF REHABILITATION
Plant NPV DIFF DIFF LevelizedUS$M US$M Z cost C/kWh Description
RockwellCa-s-eT I 393.00 56.75 16.88% 5.65 No rehabilitationCase II 356.30 20.05 5.96% 5.12 Rehab w/o additional repairsCase III 374.32 38.07 .11.32% 5.38 Rehab with additional repairsCase IV 336.25 .00 .00% 4.83 New unit
Sucat 1Case I 292.77 77.10 35.75% 5.05 No rehabilitationCase II 215.67 .00 .00% 3.72 Two-stage rehabilitationCase III 224.26 8.59 3.98% 3.87 Full rehabilitationCase IV 280.21 64.54 29.92% 4.83 New unit
Sucat 2Cas-e I 385.46 106.57 38.21% 4.98 No rehabilitationCase II 278.90 .00 .00% 3.61 Two-stage rehabilitationCase III 288.73 9.84 3.53% 3.73 Single-stage rehabilitationCase IV 373.61 94.72 33.96% 4.83 New unit
Sucat 3Case I 399.00 121.02 43.54% 5.16 No rehabilitationCase II 277.97 .00 .00% 3.59 Two-stage rehabilitationCase III 287.67 9.70 3.49Z 3.72 Single-stage rehabilitationCase IV 373.61 95.64 34.41Z 4.83 New unit
Sucat 4Case I 583.96 135.87 30.32% 5.03 No rehabilitationCase II 448.08 .00 .00% 3.86 Two-stage rehabilitationCase III 481.02 32.94 7.35% 4.15 Full rehabilitationCase IV 561.36 113.27 25.28% 4.84 New unit
Bataan 1Mase I 115.98 25.80 28.61% 4.00 No rehabilitationCase II 90.18 .00 .00% 3.11 RehabilitationCase III 91.00 .82 .90% 3.14 Rehabilitation, with sparesCase IV 133.16 42.97 47.65% 4.59 New unit
Bataan 2Case I 192.65 9.56 5.22% 3.32 No rehabilitationCase II 183.10 .00 .00% 3.16 RehabilitationCase III 184.13 1.04 .57% 3.17 Rehabilitation, with sparesCape IV 266.31 83.21 45.45% 4.59 New unit
Manila 1 & 2Case I 326.15 71.19 27.92% 4.22 No rehabilitationCase II 254.96 .00 .00% 3.30 RehabilitationCase III 255.41 .45 .18% 3.30 Rehabilitation, with sparesCase IV 374.24 119.27 46.78% 4.84 New Unit
- 58 -
6.31 Sucat Plant. The cost of full rehabilitation of Sucat Unit 4 hasbeen estimated at US$82.1 million and of Unit 1 at US$45.9 million. Acondensed program of rehabilitation to recover lost capacity is estimated tocost US$49.8 million for Unit 4 and US$18.2 million for Unit ln plus US$4.9million for civil works and rehabilitation of common facilities which NPCplans to do themrelves. This will enable NPC to rehabilitate units 2 and 3 aswell in almost the same time frame, thus permitting restoration of full plantcapacity by mid 1990. For Sucat 1, partial rehabilitation and fullrehabilitation are compared against the "no rehabilitation" and "new unit"options. Both are viable, the cheaper being partial rehabilitation (NPV =US$216 million), with full rehabilitation 4.0% more expensive, and a new unit29.9% more expensive. For Sucat 4, again both partial and full rehabilitationoptions are viable, the lowest cost being partial rehabilitation (NPV = US$448million), with full rehabilitation 7.4% or $33 million more expensive, and anew unit 25.3% or US$113 million more expensive. Based on the economicanalysis and the capacity shortages forecast for the early 1990s, it isrecommended that the rehabilitation work on Sucat Units 1 through 4 beimplemented in two stages:
(a) Stage I to recover the full capacity of each of these units with thework completed in 1989. Annex 6.3 lists the work items included inStage I with their estim'ated costs.
(b) Stage II to recover the maximum practical heat rate performance.Annex 6.6 plots the suggested rehabilitation schedule options toimplement the optimum rehaibilitation program.
6.32 A review of this program nay be initiated by NPC with theircontractor to revise and reschedule the rehabilitation of Sucat Units 1 and4. Units 2 and 3 rehabilitation should be coordinated with the implementationof the Stage I works on Units 1 and 4. Annex 6.4 lists the work itemsincluded for partial rehabilitation of these units while Annex 6.5 includes awork list for their full rehabilitation. In both cases the partial and fullrehabilitation options are economical.y viable, being cheaper than either the"no rehabilitation" or "onew unit" options. In both cases two-stagerehabilitation is cheaper. In the case of Sucat 2, the NPV is US$279 million,with single-stage full rehabilitation 3.5% more expensive, while with Sucat 3,the two-stage rehabili-ation hap in NPV of US$278 million, with fullrehabilitation also 3.5% more expensive. It is recommended, therefore, thatSucat units 2 and 3 be rehabilitated in two stages.
6.33 Bataan Plant. Both units at this plant are operating reliably; how-ever, Bataan Unit 1 has suffered a derating or 3-4 MW due to limited avail-ability of totl air for combustion. This problem is to be corrected duringthe 1988 schet led overhaul of the unit. Bataan Unit 2 is currently operatingat rated outpuL. The economic assessment indicates that rehabilitation isviable for both Bataan 1 and 2. In the case of Bataan 1, the costs of "norehabilitation" are US$26 million (28.6%) more expensive, and the "new unit"option is US$43 million (47.1%) more expensive. In the case of Bataan 2, norehabilitation is US$9.6 million or 5.2% more expensive, while a new unit isUS$83 million or 45.5% more expensive. It is recommended that funds(US$5 million) are made available for this plant to make essential repairs and

- 59 -
to purchase adequate spare parts for both units to continue in reliableservice. Annex 6.7 lists the tasks and cost estimates to upgrade the Bataanunits together with an allocation for spare parts.
6.34 Manila Plant. This plant has been operating satisfactorily at ratedoutput although the thermal efficiency has been deteriorating with time. Thepresent average heat rate is 10,102 Btu/kWh and can be substantially improvedby appropriate rehabilitation programs. These mainly comprise upgrading thefuel oil burners, eliminating boiler casing leaks, overhauling the boilersuperheater and reheater sections and rehabilitating two feed water heaters.The economic analysis indicates that rehabilitation of Manila Units 1 and 2 iseconomically viable with an NPV of US$255 million, no rehabilitation being27.9% or US$71 million more expensive, and the "new unit" option 46.8% orUS$119 million more expensive. Based on the above, it is recommended thatfunds (US$6 million) be made available for these units in order to improveefficiency as well as reliability. Annex 6.8 lists the suggested work thatshould be undertaken to rehabilitate the Manila plant.
D. Centralized Maintenance Capabilities
6.35 The Metro Manila Regional Center (MMRC) is one of three NPC regionalcenters on the island of Luzon. Other islands in the NPC service area arestructured in a similar manner. Each region has a Central MaintenanceDivision (CMD), which is responsibile for maintaining the system in itsarea. The MMRC maintenance division is responsible for planning andimplementing maintenance of the four major fuel oil fired generating plants atSucat, Malaya, Manila and Bataan.
6.36 The CMD has an authorized staff of 185:
Department Supervision and Engineers 45Support Services 18Maintenance supervisors and foremen 9Crafts: welders 17
mechanics 66electricians 10technicians (testers, lab, etc) 9
Vacancies 11
Total 185
6.37 A small fabrication/repair shop is located at the Sucat plant whichis used to repair and fabricate miscellaneous tools, small parts and otherdevices.
Maintenance Division Expansion Plan
6.38 A 1985 study on the expansion of the Maintenance Division outlined aprogram to upgrade the NPC maintenance system. The cost of implementing thislarge and ambitious program plus the logistics involved in implementing the

- 60 -
program all at once were not judged to be feasible at the time and the planwas placed on hold. It appears, however, that a more practical approach wouldbe to implement the proposed program in stages. Initially the reorganizationof the MMRC maintenance division could be authorized as a pilot program. Uponthe successful completion of the MMRC program, the CMD organization could beexpanded as proposed in the 1985 study, with the assistance of a major utilitywith well-developed maintenance and construction project skills.
6.39 The services of a major utility with large maintenance andconstruction type project skills is proposed because we believe that a sisterutility would be much more qualified to provide assistance to NPC than anoutside consultant providing the same service as an intermediary. Some ofthese large utilities design, build and maintain their own power stationswithout outside assistance.
6.40 The services from a sister utility could include an in-depth reviewof NPC skills and qualifications, existing shop facilities, and long-termdevelopment needs. The utility would then submit a report on their findings,including a suggested program with costs and schedules to reorganize theCMD. An estimate of necessary assistance in project implementation anddevelopment of NPC engineers, project support staff and craftsmen should alsoincluded in their terms of reference.
6.41 It is also recommended that the NPC craft, technical and projectstaff be fully committed to the rehabilitation of the Sucat units. This wouldprovide an excellent opportunity for NPC to raise the standard of localPhilippine expertise for the execution of tasks previously performed byexpatriate firms.
Fabrication Shop
6.42 NPC also intends to expand the existing Sucat fabrication/repairshop facilities and develop the in-house capability to fabricate and repairsome of the components which are now beilLg procured from abroad. NPC ispresently negotiating the purchase of property next to the Sucat station forthis purpose. The new shop could produce air heater elements and seals, pumpand valve parts, burner nozzles, dampers, expansion joints, pipe hangers,orifices, cable trays, tanks, and similar components. In addition, repair efthese components would also be performed in the shop.
6.43 Machinery for the facility is expected to be funded under the ADB'sThird Power Loan. The bid proposals for rehabilitation of the Sucat 1 and 4units also contain funds for the supply of shop equipment. Equipment,machinery and devices from the PNPP nuclear plant and the existing CMDfacility are also being reassigned to the new fabrication shop facility.Annex 6.9 lists the additional machinery required to outfit the new shop whichis estimated to cost approximately US$650,000.

- 61 -
Institutional Development
6.44 To successfully implement the CMD expansion program and participatein the Sucat rehabilitation program, it is necessary to develop the requiredexpertise. A comprehensive skill program should therefore, be devised forproject services staff, engineers and craftsmen. The existing NPC HumanResources Group, with its training facilities, should be used to launch thisprogram. Annex 6.10 describes the NPC training programs already available.Furthermore emphasis on the development program should include:
(a) For engineers: the most recent techniques in maintenance planningprocedures, the latest repair methods, proper task organization,estimating time and material quantities, costs and other relatedtechnical duties;
(b) For project support staff: planning, schedu'ing, monitor andreporting on the development and implementation of major repair/maintenance projects;
(c) For trades and craftsmen: the intricate and complex tasks requiredfor maintenance of generating plants; and
(d) For transmission and distribution personnel: qualifying personnelto work on hot line systems, proper safety and first aid procedures,as well as preventive maintenance techniques.
6.45 Simultaneously, further development of plant operators should alsobe considered by NPC. The use of simulators to guide the operators in themost efficient operating procedures and techniques would reduce operatingcosts and forced outages. This is especially true in the case of MMRC fueloil fired units which would see cycling service by the mid 1990s. The use ofsimulators would be a valuable tool in developing operators for this complexoperating service, especially on the once-through units, and in conditioningthem to handle plant emergencies as they occur. The simulator would als, beuseful in preparing personnel for the operation of the new coal fired units.A simulator would cost approximately US$1,OOO,OOO. The total skills develop-ment program, inclusive of the simulator, is estimated to cost $1,700,000.
E. Conclusions and Recommendations
6.46 In summary, the mission's estimates of the levelized cost (USUkWh)of energy from each unit, before and after rehabilitation, are:
Rockwell Sucat 1 Sucat 2 Sucat 3 Sucat 4
No rehabilitation 5.65 5.05 4.98 5.16 5.03Full rehabilitation 5.38 3.87 3.73 3.72 4.15Two-stage rehabilitation - 3.72 3.61 3.59 3.86New oil-fired unit 4.83 4.83 4.83 4.83 4.83

- 62 -
In view of the above, the following conclusions are drawn:
(a) rehabilitation of the Rockwell plant is not economically viable andany substantial increase in the generation level of this station islikely to attract serious environmental objections;
(b) the most economical course for rehabilitating the Sucat units is tocarry out the rehabilitation work on all four units in two stages:(i) stage 1 to recover the full capacity by mid-1990 with increasedreliability and operating efficiency and (ii) stage 2 to furtherrecover heat rate. This would permit utilization of the capacityduring the cr-tical period of 1990-92 and provide an opportunity forNPC to save resources; and
(c) in order for NPC to actAeve further self-sufficiency in performingmaintenance on its generating units, it should enhance its centra-lized maintenance organization with a cadre of skilled engineers,technicians, electricians, mechanics, machinists, welders, riggers,and other support personnel. NPC should also further develop itsshop facilities for fabrication and machining of power plantcomponents. The estimated cost of all these improvements at anominal level of about US$2.5 million is well worth the futurebenefits to NPC.

- 63 -
VII. TRANSMISSION AND DISTRIBUTXON LOSSES
A. Introduction
7.1 System losses of major utilities in the Philippines were 3.5%of net generation for NPC, 23.7% for NEA and about 20.9% for MERALCO. Thisstudy focussed on MERALCO's losses. The losses, which were in the order of20X in the early 1950s, had been reduced to about 8% by the late 1960s andsustained at that level until 1980. Since then, however, the level of losseshas increased sharply, creating considerable concern and forcing MERALCO toembark on a loss reduction program. This chapter reviews the technicalcharacteristics of MERALCO's system and evaluates the effectiveness of variousmethods of reducing pow2r losses.
B. Technical ;haracteristics of the Distribution System
7.2 MERALCO supplies electricity to an area of 8,813 square km with apopulation of 11 million. It currently has some 1.6 million customers in 9cities and 102 municipalities in Luzon. MERALCO's peak demand of 1,923 MW in1987 is 75% of peak production of the Luzon grid and its energy consumption of11,366 GWh represents 77% of NPC's Luzon grid sales and 59% of thePhilippines' total energy consumption. As mandated by Presidential Decree No.40, MERALCO sold its power plants to rhe government in 1978-79, with theexception of the Rockwell plant at Makati, Metro Manila.
7.3 The main characteristics of the power system are presented inTable 7.1.

- 64 -
Table 7.1: MANILA ELECTRIC COMPANY, SYSTEM CHARACTERISTICS, 1987
General
Frequency 60 HzPeak Demand 1,923 MWUnits purchased 11,106,440 MWhUnits generated 260,249 KWhTotal energy 11,366,689 MWh
Subtransmission
Voltage 115.0 kVLines overhead 381.3 km
Power transformersVoltage 230 kV/115 kVNumber 2Capacity 600 MVA
Voltage 115/34.5 kV, 115/34.5/13.8 kV, 115/13.8 kVNumber 33Capacity 2,990.66 MVA
Primary Distribution
Voltage 34.5 kV 13.8 kV and belowLinesOverhead /a 4,008 km 3,150 km
Substation iransformerVoltage 69 kV,34.5 kV, 13.8 kV, 13.2 kV,
8.3 Kv, 6.2 kV, 4.8 kV, 2.4 kVNumber 96Capacity 969.7 MVA
Distribution transformersVoltage 34.5 kV 13.8 kV and belowNumber 33,696 22,359Capacity 3,530 MVA 1,277 MVA
Sales
Consumers (Number) (MWh)Residential 1,528,695 3,044,870Commercial 159,407 2,931,761Industrial 3,972 2,768,587Others 3,174 82,612
Total sales 1,695,248 8,827,830
MERALCO own use 39,297 KWh
Total System Losses 2,360,773 MWh
As a percentage of total purchased and generated 20.77%
/a The total length of 13.8 kV also includes 13.2, 8.3, 6.24, 4.8 and 2.4 kVl ines.

- 65 -
7.4 Subtransmission. MERALCO's subtransmission system consistsof twenty eight 115 kV circuits of overhead lines with a total length of381.3m. These lines interconnect the five major supply points: Binan, Sucat,Manila, Dolores and Balintawak and the two minor delivery points of Malaya andBotocan.
7.5 Primary Distribution. Primary distribution is at 34.5 Y/20 kV, 13.8kV. 13.2 Y/7.6 kV , 8.3 Y/4.8kV, 6.24 Y/3.6 kV, 4.8 kV and 2.4 kV. The 34.5kV consists of approximately 4,008.4 km of overhead lines (three phase andsingle phase). The 13.8 kV and below network consist of 3,150.3 km ofoverhead and a limited number of underground lines. The present policy is togradually replace the distribution at 13.8 kV and below with 34.5 kV.Distribution construction practices are based on American standards, which usesingle-phase networks and transformers.
7.6 There are around 56,328 distribution transformers for a totalinstalled capacity of 4,807 MVA. The ratio of peak demand to installedcapacity is 2.5, and considered adequate. The conductors used fordistribution are large enough to supply future loads and to maintain a lowlevel of technical losses. For the main lines, 795 ACSR conductors are usedand for the branches, 3/0 ACSR conductors.
7.7 Secondary Distribution. The secondary distribution is 460, 230,230/115 and 216 volts (secondary. network). The conductors used are reportedto be larger than required; 336.4 MCM conductors are used for the main linesand 3/0 Al conductors for the principal branches. This is the main reason whythe secondary losses are not very high. The system appears to be in goodcondition with the exception of some depressed areas and the "new" areas,where the lines are undersized and in poor condition.

- 66 -
Table 7.2: DISTRIBUTION OF MERALCO'S POWER SYSTEM LOSSES in 1987
Total purchased and generated (MWh) 11,366,689Total sales and own use iMWh) 9,005,916Total losses (MWh) 2,360,773Peak demand (MW) 1,923------------------------------------------------------------------ __---------_
PercentTechnical Losses MWh loss
Subtransmission System:230 kV transformers 13,835 0.12115 kV lines 66,806 0.59Transformers 53,179 0.47
Total Subtransmissicn 133,819 1.18
Distribution System:Primary:34.5 kV lines 116,996 1.03
Transformers 176,172 1.5513.8 kV lines 59,955 0.53Transformers 76,767 0.68Capacitors 444 0.00Regulators 7,481 0.07
Total primarydistribution 437,815 3.85
Secondary:Lines 488,768 4.30Meters 23,327 0.21
Total secondarydistribution 512,094 4.51
TGXAL TECHNICAL LOSSES 1,083,729 9.53
TOTAL NON-TECHNICAL LOSSES 1,277,044 11.23
TOTAL SYSTEM LOSSES 2,360,773 20.77
C. Technical Losses
7.8 The sharp increase in power system losses is mostly due to non-technical factors. However, a systematic approach towards analyzing losseswould comprise first estimating the technical losses at the each segment ofthe distribution system. Table 7.2 contains a breakdown of the technicallosses.
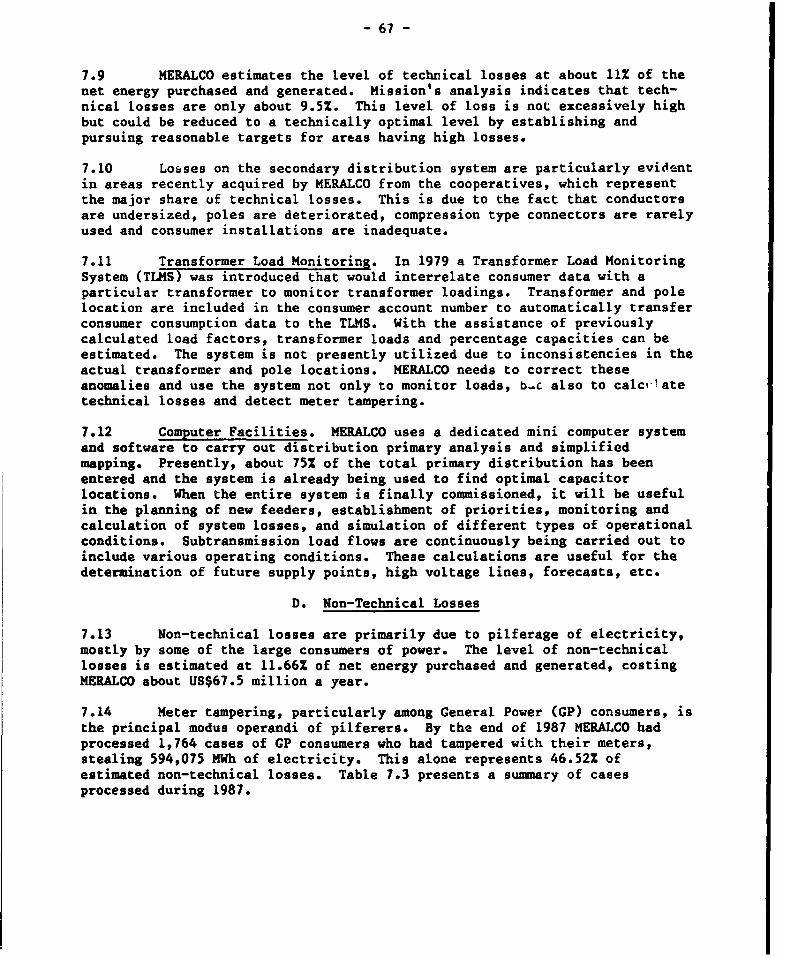
- 67 -
7.9 MERALCO estimates the level of technical losses at about 11% of thenet energy purchased and generated. Mission's analysis indicates that tech-nical losses are only about 9.5Z. This level of loss is not excessively highbut could be reduced to a technically optimal level by establishing andpursuing reasonable targets for areas having high losses.
7.10 Losses on the secondary distribution system are particularly evidentin areas recently acquired by MERALCO from the cooperatives, which representthe major share of technical losses. This is due to the fact that conductorsare undersized, poles are deteriorated, compression type connectors are rarelyused and consumer installations are inadequate.
7.11 Transformer Load Monitoring. In 1979 a Transformer Load MonitoringSystem (TLMS) was introduced that would interrelate consumer data with aparticular transformer to monitor transformer loadings. Transformer and polelocation are included in the consumer account number to automatically transferconsumer consumption data to the TLMS. With the assistance of previouslycalculated load factors, transformer loads and percentage capacities can beestimated. The system is not presently utilized due to inconsistencies in theactual transformer and pole locations. MERALCO needs to correct theseanomalies and use the system not only to monitor loads, b-c also to calcvlatetechnical losses and detect meter tampering.
7.12 Computer Facilities. MERALCO uses a dedicated mini computer systemand software to carry out distribution primary analysis and simplifiedmapping. Presently, about 75% of the total primary distribution has beenentered and the system is already being used to find optimal capacitorlocations. When the entire system is finally commissioned, it will be usefulin the planning of new feeders, establishment of priorities, monitoring andcalculation of system losses, and simulation of different types of operationalconditions. Subtransmission load flows are continuously being carried out toinclude various operating conditions. These calculations are useful for thedetermination of future supply points, high voltage lines, forecasts, etc.
D. Non-Technical Losses
7.13 Non-technical losses are primarily due to pilferage of electricity,mostly by some of the large consumers of power. The level of non-technicallosses is estimated at 11.66% of net energy purchased and generated, costingMERALCO about US$67.5 million a year.
7.14 Meter tampering, particularly among General Power (GP) consumers, isthe principal modus operandi of pilferers. By the end of 1987 MERALCO hadprocessed 1,764 cases of GP consumers who had tampered with their meters,stealing 594,075 MWh of electricity. This alone represents 46.52% ofestimated non-technical losses. Table 7.3 presents a summary of casesprocessed during 1987.

- 68 -
Table 7.3: VIOLATION OF CONTRACT CASES BY GENERAL POWER CONSUMERS IN 1987
Cases Cases EstimatedMonth received processed kWh loss Amount
TOTAL 1986 793 668 72,053,927 P 162,668,684
January 15 109 26,680,461 57,592,828February 76 10 457,564 877,479March 93 72 6,468,850 13,280,436April 85 93 12,599,934 26,037,822May 70 128 30,495,650 58,872,440June 56 65 55,126,200 101,239,589July 121 79 6,323,418 12,519,369August 172 140 34,961,447 73,089,470September 123 141 26,234,504 54,866,499October 106 136 72,055,244 141,158,296November 107 62 236,148,986 274,597,965December 50 61 14,469,622 29,033,647
Total 1987 1,074 1,096 522,021,880 P 843,163,840
Total 86 + 87 1,867 1,764 594,075,807 P 1,005,834,524
Percent of Non-Technical Losses 46.52%
Estimated Non-Technical Losses 1,277,044,000 kWh
Present level of system losses 2,360,773,000 kWhPercent loss (X) 20.77%Level of system losses after indictment 1,766,697,193Percent loss (Z) 15.5%
7.15 Billing. Billing errors and failures to bill represent a minorportion of the non-technical losses, but should not be neglected. For 1987, atotal of 1,095 errors were detected and corrected with an estimated kWh valueof 876,000. The number of failures to bill at the end of 1987 was 19,000,which represents a reduction of 36% from the 30,000 reporced at the beginningof the year. Efforts should continue to further reinforce this area with aview to reducing billing errors.
7.16 Meter Division. The Meter Division appears to be well staffed andendowed with proper equipment. In 1987, it tested 3,696 three-phase metersand 50,127 single-phase meters, of which 53% and 60%, respectively, had beentampered with, usually through altered disk assembly, misaligned dial pointersand altered potential links (three phase only).

- 69 -
7.17 Inspection Division. The Inspection Division was completelyreorganized in 1986 and placed under the Office of the President for speedieraction and access to logistic support. In 1987, it inspected 12,670 GPservices and 713,724 residential, commercial and other services. The majorproblems faced by the inspectors in the course of their duties are: (a)delayed access to the customer premises so that evidence of tampering can beremoved; (b) unauthorized enclosure of meters or obstacles placed to preventaccess to the meters; and (c) the use of sophisticated tampering devices thatare difficult to detect.
7.18 Meter Reading. A totally computerized system is used for meterreading. On-site meter reading is done with hand-held computers, which verifyif the readings are compatible with previous month's readings and indicateactual monthly consumption. A notice of meter reading and kWh consumption isprepared by hand, at the time of reading, by the meter readers. PortaIrinters are presently being considered to automatically produce on-sitebilling. At the end of the day, the computer data are loaded into the maincomputer system for the consumer consumption calculation and the next day'sreading cycle. Built into the computers are a number of codes that identifythe most common irregularities found in consumer installations, which permitthe preparation of a list of customers for investigation.
7.19 Meter readers serving GP consumers are rotated. The complexity ofstreet and meter locations are given as the main reason for not rotating theother meter readers. The number of errors and meters not read during a trialperiod proved the inconveniences of the rotation. Additional duties of themeter readers include the off-cycle reading and verification of around 3,000GP consumers per month. This measure is directed at detecting illegalinstallations, and facilitated monitoring of consumers by the Intensive CareProject based on reoccurrence, consumption and electrical use.
E. Loss-Reduction Measures Taken by MERALCO
7.20 Task Force. In 1987 a task force comprising high ranking MERALCOofficials was formed to introduce new policies and procedures to reduce powersystem losses and to monitor progress of loss reduction programs. The taskforce has concentrated mainly on reducing and controlling non-technicallosses. It meets at least once a week to discuss specific loss reductionprograms, results of action already taken and future plans. Appropriate divi-sion heads are usually invited to the meetings to present their ideas,problems and suggestions to the task force.
7.21 Amnesty Program. An amnesty program was introduced in 1986soliciting consumers to voluntarily come forward to report illegal services ortampered meters. In return, charges were not to be pressed against them. Themajority of the reported cases were from consumers who wanted to be assuredthat their meters were registering properly. An estimated 36Z of the total31,000 customers, who availed themselves of the program, were found to havetampered meters. This represented a total of 48,980 MWh of energy orP 32.8 million (US$1.6 million).

- 70 -
7.22 Billing Analysis Staff. In early 1987 a Special Billing AnalysisStaff section (SBAS) was created to specifically monitor General Power (GP)consumers accounts. During the first year of operation the SBAS unitforwarded 3,067 requests for inspection and 529 for meter testing. However,for various reasons only 57% were inspected, of which 16% were found to havetampered meters. The metering division tested 43Z of the meter testingrequests, finding 1% of the meters tampered with. Up to the end of 1987, SBASprocessed 1,867 or 23% of all GP consumers.
7.23 Intensive Care Project. The Intensive Care Project (ICP) wasintroduced in April 1987, to:
(a) detect and/or deter probable pilferage of energy through theanalysis of billing records, analysis of circuit loss, off-cyclemeter readings, systematic inspection of metering installation andmeterirg protection devices; and
(b) identify GP consumers whose meters should be enclosed by metalcovers in order to prevent tampering.
Initially, 500 GP accounts were included in the ICP, but in light of programfindings, this was increased to 2,800 by the end of the year.
F. Conclusions
7.24 Mission's analysis indicates that (a) MERALCO's technical losses arelower than what was believed to be the case at the start of the study;(b) non-technical factors such as meter tampering by some large consumers makeup the major component of electricity losses; and (c) MERALCO's program toreduce these losses is appropriate; however, its success is limited by (i) theabsence of strong legislation to permit apprehension and prosecution ofconsumers found stealing electricity; (ii) indiscriminate court orders toreconnect derelict industrial consumers, citing as justification the loss ofjobs the cut-off would entail; (iii) intervention of influential people infavor of the offending consumers; and (iv) leaving the onus of proof on thecompany responsible to prove meter tampering, with complex legal requirements.
7.25 In the area of technical losses, some moderate improvements can beachieved. The first step in improving the system is to define specificproblem areas. To determine the high-loss areas MERALCO would need to:
(a) improve the TLMS to determine secondary losses and monitortransformer loading.. The circuits identified with high lossesshould be modelled to develop an optimal system or systems;
(b) survey new areas to establish priorities for the preparation ofdistribution rehabilitation programs;
(c) update computerized distribution records to include new loadconditions and optimize capacitor bank locations;

- 71 -
(d) simulate future load growths and their effects on the system foroptimal development planning;
(e) replace .:ransformers reaching their economic capacity in order toreduce transformer losses. In many cases it is economical toreplace a transformer loaded above 75% of its capacity, with one ofhigher capacity, using state-of-the-art technology. The changeoverpoint is conditional upon utility energy and demand costs;
(f) pursue the current plan to convert part of the 13.8 kV and 6.25 kVsystems to 34.5 kV; and
(g) install a Supervisory Control and Data Acquisition System (SCADA) toimprove the monitoring of circuits and power transformer loads andto assist in load transfers. This system wouid also provide a morereliable distribution network and avoid prolonged blackouts.
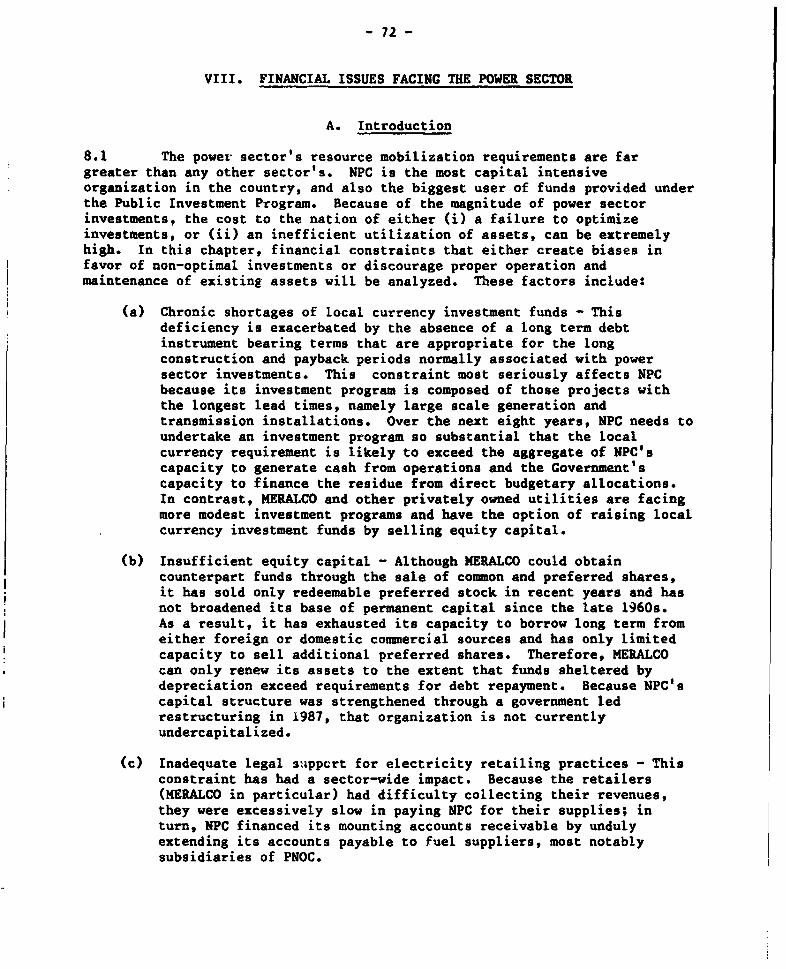
- 72 -
VIII. FINANCIAL ISSUES FACING THE POWER SECTOR
A. Introduction
8.1 The power sector's resource mobilization requirements are fargreater than any other sector's. NPC is the most capital intensiveorganization in the country, and also the biggest user of funds provided underthe Public Investment Program. Because of the magnitude of power sectorinvestments, the cost to the nation of either (i) a failure to optimizeinvestments, or (ii) an inefficient utilization of assets, can be extremelyhigh. In this chapter, financial constraints that either create biases infavor of non-optimal investments or discourage proper operation andmaintenance of existing assets will be analyzed. These factors include:
(a) Chronic shortages of local currency investment funds - Thisdeficiency is exacerbated by the absence of a long term debtinstrument bearing terms that are appropriate for the longconstruction and payback periods normally associated with powersector investments. This constraint most seriously affects NPCbecause its investment program is composed of those projects withthe longest lead times, namely large scale generation andtransmission installations. Over the next eight years, NPC needs toundertake an investment program so substantial that the localcurrency requirement is likely to exceed the aggregate of NPC'scapacity to generate cash from operations and the Government'scapacity to finance the residue from direct budgetary allocations.In contrast, MERALCO and other privately owned utilities are facingmore modest investment programs and have the option of raising localcurrency investment funds by selling equity capital.
(b) Insufficient equity capital - Although MERALCO could obtaincounterpart funds through the sale of common and preferred shares,it has sold only redeemable preferred stock in recent years and hasnot broadened its base of permanent capital since the late 1960s.As a result, it has exhausted its capacity to borrow long term fromeither foreign or domestic commercial sources and has only limitedcapacity to sell additional preferred shares. Therefore, MERALCOcan only renew its assets to the extent that funds sheltered bydepreciation exceed requirements for debt repayment. Because NPC'scapital structure was strengthened through a government ledrestructuring in 1987, that organization is not currentlyundercapitalized.
(c) Inadequate legal suippcrt for electricity retailing practices - Thisconstraint has had a sector-wide impact. Because the retailers(MERALCO in particular) had difficulty collecting their revenues,they were excessively slow in paying UPC for their supplies; inturn, NPC financed its mounting accounts receivable by undulyextending its accounts payable to fuel suppliers, most notablysubsidiaries of PNOC.

- 73 -
B. Local Currency Funding Constraints
8.2 NPC's Past and Present Local Currency Constraints. Since the mid1970's, NPCT efforts to implement ambitious investment programs have beenhampered by its inability to raise counterpart funds. At that time, NPC wouldraise commercial borrowings, development assistance or supplier credits fromabroad to meet its foreign currency requirements. In turn, its local cur-encyinvestment requirements were met either from internal cash generation or withfunds that the Government normally provided as fresh equity investments.However, as NPC's requirements for local currency increased, the politicaldifficulties associated with raising the tariff inhibited increasing internalcash generation, and the Government's widespread commitments to invest inother sectors inhibited its capacity to provide NPC with satisfactory amountsof additional equity.
8.3 NPC was then committed to implement an ambitious investment programthat had the 620 MW Philippine Nuclear Power Plant (PNPP) as its cornerstone.Its constraint in raising counterpart funds caused some lengthy project imple-mentation delays; in turn, those delays gave rise to some important costoverruns. During the 1980s, counterpart funding constraints may well havebiased NPC to choose investments with a high foreign content that could befinanced externally, in lieu of alternatives with a higher local content.During 1980-86, foreign currency expenditures accounted for about 70% of NPC'sinvestments; in contrast, in connection with the appraisal of the SeventhPower Project (Loan 1460-PH), the Bank had projected in 1977 that NPC'sinvestment program for the period ending in 1983 should have a foreign contentof only 55%, and is now projecting that the foreign content of NPC'sinvestments through 1995 should also be about 55%.
8.4 After 1983, in the face of increasingly difficult national economicconditions, NPC was asked to reduce its investment program substantially.From 1984-86, NPC's investment expenditure was confined to what was requiredfor completing projects already under implementation. Because the Governmentcould make available only nominal infusions of equity, NPC was permitted toraise its tariff to enable realizing the maximum rate of return allowed underits charter, namely 10% on its revalued "rate base" (with the "rate base"defined to include a small increment of working capital). Despite the addedcapability for internal cash generation, NPC needed yearly infusions ofadditional equity ranging between P 400-900 million to meet its counterpartfunding requirement in 1984-86.
8.5 In 1987, recognizing that NPC was facing large requirements for newinvestments as a result of the decision to mothball PNPP, the Government tookinitiative to restructure NPC by relieving it of respoasibility for the assetsand liabilities pertaining to PNPP and by directing it to reschedule thearrears of i*s largest creditors. This restructuring has returned NPC tofinancial strength. It's capital structure (net of transactiorns related toPNPP) is sound, its revenues yielded a healthy 8% rate of return on revaluedassets, and it had a substantial reserve of cash or equivalents from whichmost of its local currency investment requirements for 1988 would be met.

- 74 -
8.6 Projected Counterpart Funding Constraints. The economic recoverybegun in 1986 has brought about a growth in demand for electricity that hasexceeded NPC's previous expectations; at the same time, the decision tomothball PNPP denies NPC the additional capacity needed to meet projectedincreases in demand. As a result, NPC faces a period of ambitious investment,at least through 1995. The investment program envisioned is likely to have asignificant local content; NPC projects that about 45% of its investmentrequirement for the period will involve local currency expenditures. NPCcontinues to have a policy of maintaining its tariff at levels that willenable realization of the 10% maximum allowable rate of return on revaluedassets; however, even if the tariff were maintained at maximum levels, NPCwould still realize a gap between its local currency investment requirementand the amounts of local currency that can be raised through internal cashgeneration. Moreover, during the summer of 1987, NPC received clear signalsthat it would encounter serious consumer resistance to tariff increases. Thegap is so large that it exceeds the Government's capacity to meet it throughdirect budgetary allocation. Even if the Government had the capacity tocreate an instrument appropriate for financing NPC's investments, use of theGovernment's securities auction facility for this purpose would prevent theGovernment from raising similar amounts of funds for alternative purposes. Tomeet the requirements of its investment program, NPC will need to makeeffective use of all domestic sources of long term funds, especially thosethat can be mobilized through the capital markets. In this regard, it willneed to coordinate with financial institutions and institutional investors tocreate financial instruments that are appropriate to its investmentrequirements and can attract a following in the capital markets. To theextent that NPC uses financial instruments to raise counterpart funds, theamount needing to be financed would be increased by the cost of money and theinstruments' terms of redemption. Alternatively, NPC should exploreapproaches of reducin; its own investment requirements by encouraging invest-ment by private parties in Build, Operate and Transfer (BOT) schemes todevelop generating and some limited transmission facilities. These approachesneed to be pursued carefully to ensure (ngruence between the interest of theinvesting parties and the national interest.
8.7 To appreciate the urgency with which NPC must reduce its dependenceon the Government for bridging its local currency investment finance shortage,the extent of the gap as well as its sensitivity to variations in cost andredemption of money must be evaluated. In this regard, projections wereprepared for the period 1988-1995 comparing six scenarios for meeting thatportion of NPC's local currency investment requirements with different finan-cial instruments. For each scenario, identical assumptions about investmentlevels and demand were used. Electricity rates were assumed to move fromexisting levels (that are expected to yield rates of return of about 7% onrevalued assets in 1987-88) back to maximum pricing by 1990. No provision wasmade for subjecting NPC to income tax. Presumably, if NPC were permitted tokeep its tariff at a level that would enable realizing a 10% rate of return,it could increase rates to levels that would enable covering the income taxliability from consumer charges. This would have the effect of raising NPC'stariff by 7Z-1O% over projected levels throughout the projection period. Withthe additional retailer mark up, the ultimate consumer would be paying about15 centavos/kWh over the levels assumed through 1995. Since the consumers'

- 75 -
manifestation of their resistance inter alia to higher electric charges lastsummer, the environment appears not to be conduc.ve to adding a substantialnew constituent to NPC's tariff. Because the instrument used to finance thegap in investment would not have a major impact on the rate base, the tariffassumed was nearly the same for each scenario. Thus, the cost and redemptionfeatures associated with the instrument chosen to finance the gap was the onlyvariable between scenarios. The results of this analysis are given in Annex8.1. They indicate that NPC will need to raise about P 26.4 billion over andabove cash generated from operations to fund the uncovered portion of itsprojected P 139 billion investment program for 1988-95; the local component ofthat program is projected at about P 63 billion.
8.8 Because the Government has advised NPC that it prefers not toprovide new equity capital, NPC would need to finance the bulk of the gapdomestic sources of borrowings. NPC's investments involve long paybackperiods that only begin after completion of construction; on that basis, NPCshould ideally finance its investments with borrowings maturing in twelve ormore years. However, in the past, NPC has only been enabled to float threeyear bonds through the Government auction; it has been trying to persuade theGovernment to authorize it to float securities of five years maturity forfuture issues. In the past, the private capital markets have not been tappedbecause they have hardly offered better alternatives. They did not offermaturities of twelve or more years; and for maturities of five to seven years,underwriters have sought (i) variable interest at a substantial spread abovethe Government bond rate, and (ii) recourse. Even on fixed rate three yearbonds, the private underwriters were offering interest rates that were 5%higher than NPC realized by floating ito own bonds at the Governmentauction. Making assumptions about interest and repayment that were inreasonable conformity with the terms of the three year bonds that were issuedthrough the Government's auction facility in 1987, NPC's resource mobilizationrequirement for the period 1989-95 was computed as P 26.4 billion using equityto provide the local currency investment requirements; P 38.2 billion usingtwelve year bonds; P 43.5 billion using five year bonds; P 53.3 billion usingthree year bonds; P 41.6 billion using five year bonds supplemented withP 5 billion of equity in 1992-94; and P 34.7 billion using equal amounts ofnotional five year bonds and equity. These results are summarized inTable 8.1, below:

- 76 -
Table 8.1: SUMMARY OF LOCAL FINANCING REQUIREMENTS 1988-1995
Financial year ended December 31 1988 1989 1990 1991 1992 1993 1994 1995 1988-95
Annual Investment Program (P Bn) 9.0 12.0 10.6 15.9 20.9 28.3 25.7 16.5 138.9
Case 1Peso Gap Met With EquitySelf financing ratio (Z) 25.1 19.4 39.3 34.9 36.9 25.6 34.3 72.4 36.0Additional Financing Needs(P Bln) 0.0 1.0 1.7 4.0 4.5 8.5 6.7 0.0 26.4
Case 2Peso Cap Met With 12-year BondsSelf financing ratio (%) 25.1 19.4 37.8 32.1 31.4 18.5 19.4 37.0 27.6Additional financing needs(P Bin) 0.0 1.0 1.8 4.4 5.5 10.4 10.2 4.8 38.2
Case 3Peso Cap Met With 5-year BondsSelf financing ratio (Z) 25.1 19.4 38.0 32.5 30.5 16.1 12.2 18.4 24.0Additional financing needs(P Bln) 0.0 1.0 1.8 4.3 5.7 11.0 11.9 7.6 43.5
Case 4Peso Gap Met With 3=year BondsSelf financing ratio (x) 25.1 19.4 38.1 30.5 26.1 9.9 1.2 -10.1 17.5Additional financing needs
(P Bln) 0.0 1.0 1.8 4.7 6.6 12.7 14.6 11.9 53.3
Case 5Peso Gap Met With 5-year Bondsand P 5 Billion EquitySelf financing ratio (X) 25.1 19.4 38.0 32.5 30.5 16.8 14.2 26.6 25.4Additional financing needs(P Bln) 0.0 1.0 1.8 4.3 5.7 10.8 11.5 6.4 41.6
Case 6Peso Cap Met With 5-year Bondsand Equity EquallySelf financing ratio (2) 25.1 19.4 38.6 33.7 33.7 20.9 23.3 45.4 30.0Additional financing needs(P Bln) 0.0 1.0 1.7 4.2 5.1 9.8 9.3 3.6 34.7

- 77 -
8.9 As the analysis indicates, the cost and redemption of funds addssubstantially to NPC's resource mobilization requirement. Of the factors, theadditional cash needed to meet redemption requirements is greater than theincrement needed to cover the cost of money. This conclusion is supported bya comparison of the various cases. Using longer term securities implies alower overall tinancing requirement. Moreover, as shown by a comparison ofcases 2 and 6, the consistent use of non-repayable equity in combination witha five year instrument lowers the overall financing requirement even more thanthe regular use of twelve year bonds. A comparison of cases 3, 5 and 6indicates that the use of equity has greaLer advantages in years subsequent tothe financing, when NPC would be facing repayment obligations for thealternative instrument. Finally, a comparison of cases 1 and 4 shows that NPCcould meet its local currency funding requirements for investments in 1995entirely from internal cash generation; however, in that very year, it faces amajor local currency shortfall associated with the cost and terms ofredemption of money raised to meet shortages incurred in previous years.
8.10 Since completion of the field work for this study, the Philippineeconomy has grown faster than anticipated and growth in electricity demand hasalso exceeded expectations. As a result, NPC has increased its demandforecast and is attempting to accelerate implementation of its investmentprogram. This will only exacerbate the year by year local currency shortfallsdeveloped for each scenario. Thus, the urgency of developing an appropriatelong-term financial instrument for use by the power sector has become evenmore acute. In this regard, in the past, the Government seems to have had agreater appreciation for the financial and other constraints that NPC wasfacing because its Board had included one or more Cabinet members and at leastone Undersecretary (or Deputy Minister) of Finance. For the foreseeabiefuture, NPC would benefit greatly from the inclusion on its Board of one ormore Cabinet officers and at least one senior official from the Department ofFinance.
8.11 Thus, the extent to which financing assets writh long constructionperiods and even longer payback periods using short term financial instru-ments imposes a resource mobilization burden on the economy is clear evidenceof why the shorter term instruments that have been used in the past areinadequate for the future. Government alone cannot provide the answers tothis problem. With the cost of financing added to the P 26.4 billion (ormore) of investment requirements that cannot be covered from tariff revenues,the aggregate amount of local currency that needs to be mobilized most likelyexceeds the Government's capacity to provide financing, either using budgetaryallocations or the securities auction window. Approaches are needed so thatinvestments generated through the domestic financial markets and throughprivate investment in BOT schemes can supplant investments that had previouslybeen provided by NPC with financial assistance from the Government.
8.12 For the short term, when its requirements are expected to be modestand while it is developing with the financial institutions its approaches totapping other sources of long term domestic funding, NPC needs to make optimaluse of instruments available through the Government for raising localcurrency:

- 78 -
(a) NPC should maintain its rates at levels that enable it to realizethe 10% maximum allowable rate of return on revalued assets.
(b) The Government should give NPC support similar to that given to LandBank by establishing and assisting in the floatation of a debtinstrument with longer term maturities. These maturities should beof at least five years, and preferably of 10-12 years.
(c) The Government should consider equity investments in NPC. Alreadyin 1988, the Government has made available about P 1.0 billion inequity. Some equity investments are justified on the basis thattheir negligible cost and non-redeema&ility substantially lowerslocal currency response mobilization requirements in future years;moreover, they continue to strengthen NPC's capital structure sothat it will present attractive investment poatential within thecapital markets.
These recommendations, which can be implemented without major changes in theexisting policy framework, can be helpful in reducing the local currencyshortfall in the short term.
8.13 For the medium to long term, NPC needs to develop devices so thatboth the domestic financial markets and the private sector can shoulder someof NPC's capital requirements, either through (i) the sale to financialinstitutions of specially designed long term financial instruments, or(ii) independent investment by private parties in generation and some limitedtransmission facilities through BOT schemes:
(a) special long term debt instruments -- Given NPC's repeated need forlong term funds to finance generically similar investments and itsrelative corporate and financial strength, it could cooperate withfinancial institutions, insurance companies and pension funds, inthe creation of a pool of funds that would be earmarked forfinancing generation and transmission facilities. In turn, thatpool would be used to buy NPC issues of either non-redeemablepreferred stock or twelve year bonds. Because the financialinstitutions have shown an aversion to the exchange and inflationaryrisks inherent in long term investment securities, the Governmentshould provide incentives to investors in the pool, in recognitionthat investments financed from the pool would correspondingly reducethe resources that would otherwise have to be made available fromthe Government through budget allocations or from the Government'ssecurities auction window; and
(b) Private sector investments in generation -- NPC has been examiningseriously reducing its own investment requirements by enablingprivate investments in BOT schemes. Usually, such schemes wouldappose the interests of the Government, NPC and the investor. TheGovernment could consider providing incentives for investment in BOTschemes that are consistent with the national interest; once again,investment financed through BOT schemes would use private sources ofcapital to replace resources that otherwise would have to be metfrom public sources.

- 79 -
C. Shortages of Equity Capital
8.14 MERALCO's Past and Present Financial Condition - MERALCO has facedserious cash constraints throughout the 1980s. Its financial problems beganin the mid-1970s when its current owner, the MERALCO Foundation, purchasedsoe sizable blocks of stock from other shareholders and financed thesepurchases with borrowings, the repayment of which was to be met fromdividends. While these transactions did not infuse any new equity capitalinto the company, they did result in increasing the pressure on the company topay dividends. At the same time, margins declined because growth in salesrevenue was lower than expected; thus dividends were paid, on occasion in lieuof making necessary investments. The company's increasing undercdpitalizationled to constraints in raising long term credit; in turn, these constraints ledto further underinvestment, which prevented MERALCO's system from expanding inparallel with demand growth and caused the quality of its service todecline.
8.15 By the early 1980s, following the second oil price increase,PERALCO's financial difficulties were so severe that it had stopped payingdividends and was restricting investments to levels that could largely befinanced from internal cash generation. Then, in 1983-84, the Governmentpressed MERALCO into absorbing the businesses of several failing ctioperativesalong the fringes of its franchise area. As a result, MERALCO needed to raisesubstantial investment finance just when it was unable to borrow, either onits own credit or with Government guarantees, or raise sufficient amounts ofequity capital in depressed domestic capital markets. To solve this problem,the company chose to increase its short-term borrowings from a group offoreign commercial banks. In turn, this increased MERALCO's short-term cashrequirements to precarious levels. During 1986, these loans were restructuredinto one term loan for US$ 148 million, owed to a group of foreign banks ledby the Bank of Montreal, with the first of 17 unequal quarterly repaymentshaving been due in December 1987.
8.16 MERALCO's charter allows the company to set rates at levels thatyield a maximum rate of return of 12% on revalued net fixed assets. In 1985-87, MERALCO realized rates of return on revalued assets averaging 9%.MERALCO's average revenue of about 8.2 USC per kWh is higher than many otherutilities in the region; however, this level of revenues includes generousblocks being supplied to residential and small commercial consumers at highlysubsidized rates. As a result, poorer consumers receive large amounts ofelectricity at rates that are being cross-subsidized by industrial and majorco_mercial consumers. The Government has asked MERALCO to reduce the amountof power being subsidized to levels consistent with what has been evaluatedas a minimum requirement; because corresponding reductions would be passed tothe higher paying consumers, this move to reduce subsidies will be implementedin a revenue neutral manner.
8.17 Currently, MERALCO can only invest in amounts comparable to cashprovided by depreciation. Because MERALCO has already been setting prices toyield the maximum allowable rate of return, it cannot project substantialincreases in funds provided for investment from operations. While local banks
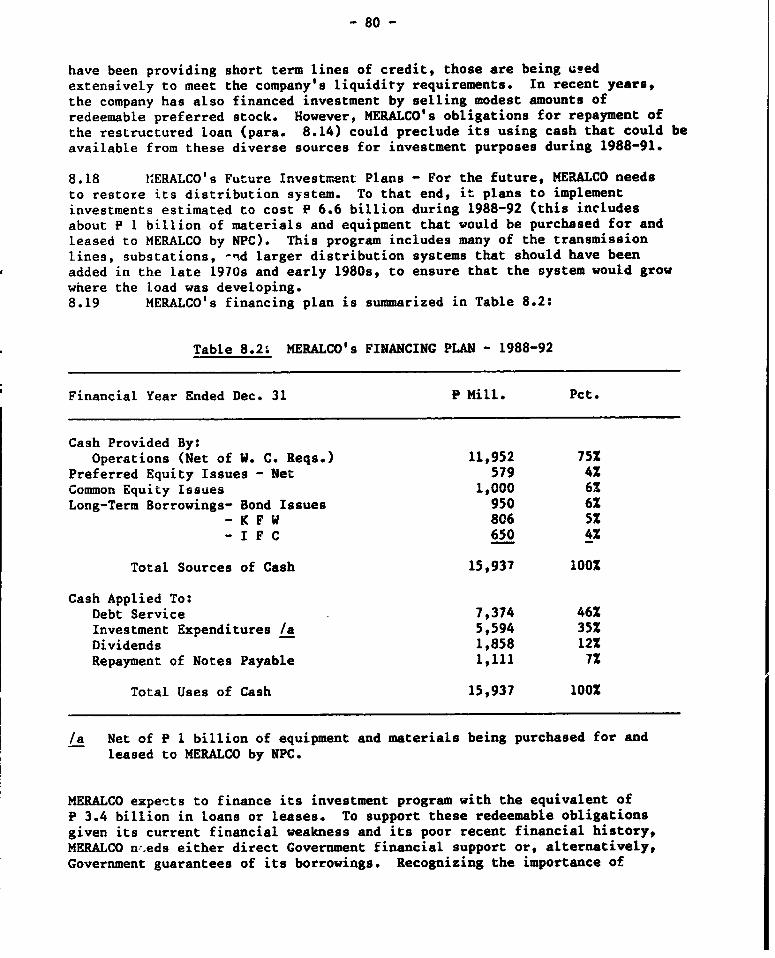
- 80 -
have been providing short term lines of credit, those are being usedextensively to meet the company's liquidity requirements. In recent years,the company has also financed investment by selling modest amounts ofredeemable preferred stock. However, MERALCO's obligations for repayment ofthe restructured loan (para. 8.14) could preclude its using cash that could beavailable from these diverse sources for investment purposes during 1988-91.
8.18 tIERALCO's Future Investment Plans - For the future, MERALCO needsto restore its distribution system. To that end, it plans to implementinvestments estimated to cost P 6.6 billion during 1988-92 (this includesabout P 1 billion of materials and equipment that would be purchased for andleased to MERALCO by NPC). This program includes many of the transmissionlines, substations, -nd larger distribution systems that should have beenadded in the late 1970s and early 1980s, to ensure that the system would growwhere the load was developing.8.19 MERALCO's financing plan is summarized in Table 8.2:
Table 8.2: MERALCO's FINANCING PLAN - 1988-92
Financial Year Ended Dec. 31 P Mill. Pct.
Cash Provided By:Operations (Net of W. C. Reqs.) 11,952 75%
Preferred Equity Issues - Net 579 4%Common Equity Issues 1,000 6ZLong-Term Borrowings- Bond Issues 950 6%
- K F W 806 5%- I F C 650 4%
Total Sources of Cash 15,937 100%
Cash Applied To:Debt Service 7,374 46%Investment Expenditures /a 5,594 35%Dividends 1,858 12%Repayment of Notes Payable 1,111 7%
Total Uses of Cash 15,937 100%
/a Net of P 1 billion of equipment and materials being purchased for andleased to MERALCO by NPC.
MERALCO expects to finance its investment program with the equivalent ofP 3.4 billion in loans or leases. To support these redeemable obligationsgiven its current financial weakness and its poor recent financial history,MERALCO n .eds either direct Government financial support or, alternatively,Government guarantees of its borrowings. Recognizing the importance of

- 81 -
electricity supply in Metro Manila, the Government has indicated a willingnessto provide guarantees so that MERALCO could finance the upgrading of itssystem of substations with a loan from the Kreditanstalt fur Wiederaufrau,channeled to MERALCO through the Development Bank of the Philippines.Moreover, the government has been discussing a program to finance theupgrading of its transmission l:nes, some distribution systems, and thepurchase of modern system management and maintenance equipment with a WorldBank loan, channeled to MERALCO through NPC.
8.20 However, MERALCO must earn that support by taking steps to ensureits long term commercial viability. Central to this effort, MERALCO will beexpected to increase its permanent capital by selling substantial new equity,and thereby develop for itself the capacity to borrow as much as it would needto finance satisfactory levels of future investment. To satisfy thiscondition, MERALCO has indicated that it will use its best efforts to raiseabout P 1.6 billion in new equity capital during 1989-92. If these effortssucceed, MERALCO will become a conservatively capitalized company, capable ofborrowing substantially on the strength of its own credit-worthiness.Annex 8.2 shows that projections for MERALCO for the period 1987-95, based onthe financing plan given in Table 8.2, support the conclusion that theintended recapitalization will restore MERALCO's financial health.
8.21 In providing MERALCO with che needed loan guarantees, theGovernment is enabling the electricity distribution system of Metro Manila tobe rebuilt. To ensure that the guarantees are aiso used to assist inrestoring MERALCO's financial health, the Government will need to monitorclosely and enforce implementation of MERALCO's program to raise new equitycapital. Moreover, MERALCO will rneed to corntinue its policy of setting itstariff to yield the maximum rate of return authorized by its charter. How-ever, these measures by themselves will not prevent a repetition of theinappropriate dividend practices that originally caused MERALCO's financialproblems. Several measures that are either currently available or beingdeveloped reduce the risk of a reversion to these past detrimentalpractices. The trust indenture that MERALCO uses as security for itsborrowings contains a clause that prevents the company from declaringdividends on common stock in amounts that exceed the company's earnings forthe previous year. Moreover, the Government's current plan for privatizingMERALCO envisions dispersing MERALCO's existing shares so that no singlefamily or interest group could acquire more than lOX of the company. With'idespread ownership, the company's dividend policy should not be subject toabuse by special interests.
8.22 The Government should be equally concerned that when shares in aprovider of es3ential services are permitted to be transacted on a self-liquidating basis, the interest of shareholders can conflict with the com-pany's obligations to its consumers. The company's recent history hasdemonstrated that this practice puts intense pressure on the company to paydividends, without regard for its investment needs. The Government shoulddevelop a regulation proscribing shares in public utilities from beingtransacted with credit that depends entirely on dividends for debt service andon the shares themselves for collateral; rather, buyers of public utilityshares should be required to meet a margin requirement of at least 50S. This

- 82 -
measure, which is consistent with the regulations of the Makati Stock Exchangepertaining to the purchase of stock in companies with a hi_tory of payingdividends, should be applied to transactions of all public utility stock,whether they involve registered shares traded on an exchange or over thecounter, or unregistered shares transacted between principals or throughprivate placements.
D. Government Support for 1'e--ricity Retailing Activities
8.23 Non-technical Losses and CollecL.in of Consumer Charges - MERALCO'scommercial practices (particularly those pertaining to detection andprevention of non-technical losses, and billing and collection of consumercharges) are described in detail elsewhere in this study (Chapter VII). Thefollowing section will present briefly the sector-wide financial impact ofweak commercial practices at the retail level together with an analysis ofstructural factors that deter effective remedial action by the retailers.
8.24 System Losses. In MERALCO's case, the financial impact of havinghigh non-technical losses has so far been minor. The tariff includes aprovision that enables the utility to recover automatically through anadjustment to energy rates much of the cost associated with units of electricenergy that have been purchased trom NPC but not sold to consumers. Conse-quently, if system losses are high in a given month, the rate charged theconsumer the next month is increased so that the consumer will reimburse toMERALCO the cost (though not the foregone profitability) of the lost energy.Effectively, this provision negates any incentive MERALCO might otherwise haveto address losses. However, the impact of this provision on NPC, and in turnthe Public Investment Program, is substantial; NPC could reduce its investmentin new generating facilities in correspondence with the extent to whichdistributors curb system losses by (i) investing in system upgrades thatreduce technical losses, or (ii) undertaking effective measures to detect andprevent or receive revenues for non-technical losses. As investments toreduce distribution losses are normally less costly than correspondinginvestments to increase generation and transmission, loss reduction measureswould generally be beneficial to the economy.
8.25 MERALCO has already been advised that, in conjunction with tariffreform aimed at reducing the extent of subsidized blocks of consumption, theutility will in the future only be able to recover the cost associated withsystem losses that do not exceed a specified target level (in MERALCO's case,15Z). While this measure gives the utility a financial incentive to curblosses, it does little to address the main constraints that would frustrateany system loss reduction program, including:
(a) Legal procedures that have hampered the prosecution of casesinvolving theft of energy. The existing laws covering energypilferage has some inherent weaknesses. Like other classes oftheft, pilferage of energy is considered only a misdemeanor; assuch, the corresponding penalty is relatively light and does notserve as a deterrent. Also, trial courts have tended to be lenientwith defendants in energy pilferage cases.

- 83 -
(b) Known difficulties that inhibit utilities from prosecutingsuccessfully cases of energy pilferage appear to have encouragedpilferers. Because utilities are held to rigid standards of proofin energy pilferage cases, and because they have experiencedsubstant:al difficulty in obtaining testimony from witnesses incases involving third parties, pilfere.rs tend not to be deterred bythe threat of punishment in the event they are apprehended.
(c) Organized theft often involving utility employees is difficult todetect because the employees involved will usually alter data thatwould reveal the crime. In some instances, utilities have detectedorganized theft; however, such cases are difficult to prosecute,given the rigid standard of proof to which utilities are held.
8.26 The Government needs to provide better legal support for theretailing activities of utilities. Under the existing system, consumers whopay their electric bills subsidize pilferers of electricity; moreover, theeconomy bears the cost of investment in the increment of plant that feeds non-technical losses. So that the threat of punishment acts to deter energytheft, the Government needs to relax the standard of proof required inpilferage cases and provide that convicted pilferers receive penalties thatare comparable to those levied in countries, such as Singapore or Japan, whereutilities can exercise tight control over distribution losses. Since the mainfield mission for this study, MERALCO has assisted in developing a bill forintroduction in Congress that would facilitate the prosecution of pilferers,by making circumstantial evidence admissible and by reducing the standard ofproof. The bill also proposes to increase the penalties for convictedpilferers. The Government needs to mobilize the maximum support for this billin order to enhance its czw.ices of passage.
8.27 Collection of Consumer Charges - Since the mid 1970s, NPC has haddifficulty collecting its outstanding bills from Rural ElectrificationCooperatives. In the early 1980s, MERALCO also fell behind in its payments toNPC. These trends were exacerbated by the economic recession of 1983-86, whenmany large commercial and industrial consumers and Government agencies werenot sufficiently liquid to remit payment for electricity to their suppliers;in turn, stretched for cash, MERALCO and the Cooperatives fell evcn furtherbehind in remitting payments to NPC. In turn, NPC financed the cash short-fall resulting from this difficulty in collecting its charges by developingsimilar arrears with regard to its payments for fuel. By the end of 1986, NPChad nearly P 5 billion in accounts receivable (representing about 3.5 monthssales); of that amount, about P 1.7 billion repreaented arrears fromMERALCO. At the same time, NPC was carrying about P 7.2 billion in accountspayable; of that amount, nearly P 4.5 billion represented arrears owing toPNOC. Also at year end 1986, MERALCO's accounts receivable reached P 2.3billion; most of its arrears were from national or local Government sectorconsumers.

- 84 -
8.28 In 1987, the Government took several steps to break this viciouscircle of non-payment between energy sector corporations. In relieving NPC ofthe assets and liabilities related to investments in PNPP, the Governmentassumed responsibility to settle most of NPC's obligations to PNOC. TheGovernment agreed to use a clearinghouse approach whereby electricityretailers could transfer to NPC verifiable receivables from nationalGovernment consumers; in turn, NPC could collect the amounts due directly fromthe Treasury. The Government invited NPC and MERALCO to restructure MERALCO'sarrears with a blend of front end payments and negotiable six year bonds thatwere drawn against the trust indenture that MERALCO uses in lieu of a mort-gage. In effect, NPC is capable of foreclosing on MERALCO's assets shouldMERALCO once again become seriously delinquent in its payments to NPC.Finally, NPC was authorized and encouraged to implement a policy ofdisconnecting delinquent Cooperatives.
8.29 The Government's strategy for addressing the collections problem,as evidenced by the combined measures described above, is realistic andappropriate. The Government is assisting the retailers by ensuring that thoseof their larger consumers, who depend on the Government for financing, paytheir electric bills on time. With this assistance, the Government's strategypresumes that the retailers will be able to remit payment to NPC. on time;therefore, NPC is being given the authority to collect its dues and also beingencouraged to pay its own obligations on time. The Government needs tomonitor closely realization of these combined measures and ensure that theyare implemented vigorously; by encouraging disciplined financial managementamong the full range of power sector institutions, the Government is alsoencouraging NPC, MERALCO and the other retailers to realize the full potentialof their capacity to generate casa from operations.
E. Conclusions
8.30 Because power represents the most capital intensive sector, afailure to optimize investments or the inefficient utilization of assets canbe eutremely costly to the economy. Several structural "roblems have createdfinancial constraints, which can result in non-optimal investments or inviteinadequate operation and maintenance of plant and equipment. In this chapter,an analysis of three structural problems .tas led to the followingrecommendations:
(a) Local Currency Investment Funding Constraints - Because NPC isdevising its tariff to yield the maximum rates of return permittedunder its charter, it has only limited capacity to increase localcurrency generated from operations. However, its overall localcurrency investment requirements for the period 1988-1995 exceedsubstantially its capacity to generate funds through operations andthe government's capacity to finance the residue through budgetallocations. If redeemable financial instruments are used to raiseneeded additional increments of local currency, still greateramounts would need to be raised to take account of the cost of moneyand annual redemption obligations. NPC should consider enteringinto arrangements with financial institutions and institutionalinvestors to raise more permanent or long capital from domestic

- 85 -
sources of long term funds. To assist NPC in identifying localcurrency loans with maturities appropriate for the long constructionand payback periods related to investments in generation andtransmission ficilities, the Government could consider providinginstitutional investors with incentives to invest in speciallydesigned longer term securities. Alternatively, NPC might considerreducing its own investment requirements by developing arrangementsfor independent private investments in generation facilities throughBOT schemes.
(b) Equity Capital Constraints - Because H4ERALCO is devising its tariffto yield the maximum rates of return permitted under its charter, ittoo has only limited capacity to increase local currency generatedfrom operations. It cannot obtain the credit it currently needs forinvestment without direct Government finanzial support or,alternatively Government guarantees of its borrowings. MERALCOplans to raise about P 1.6 billion in new equity capital during1989-92. Still, MERALCO's long term financial health depends on theGovernment proscribing future transactions of the company's stockthat are financed entirely with loans which depend on the company'sdividends for debt service and the shares themselves for collateral;rather, the Government should require that all purchases of sharesin provid-rs of essential services, even those transacted betweenprincipals, conform to margin requirements similar to those of thekakati Stock Exchange.
(c) Retailing Constraints - Neither NPC nor MERALCO have been realizingtheir full capacity to generate cash from operations. The MERALCOsystem has been plagued with extremely high levels of non-technicallosses as a result of the company's inatility to prosecutesuccessfully identified pilferers of energy. So that the threat ofpunishment acts to deter energy theft, the Government needs to relaxthe standard of proof required in pilferage cases and provide thatconvicted pilferers receive penalties that are comparable to thoselevied in countries, such as Singapore or Japan, where utilities canexercise tight control over distribution losses. Since thecoLpletion of the field work for this study, MERAT .CO has assisted inthe development of a bill for introduction in Congress that wouldfacilitate the prosecution of and increase penalties for pilferersof electricity. The Government should support this bill stronglyand assist its passage to the degree possible. Both NPC and HERALCOhave experienced difficulty collecting consumer charges. MERALCOcould not collect from Government sector consumers and, in turn,could not pay NPC. In 1987, the Government instituted procedures tohelp the retailers realize their dues and encouraged NPC to use allavailable remedies to enforce its billings. These measures arewell conceived and comprehensive; their effectiveness can only bejudged after some running time.

PHILIPPINES
ENERGY SECTOR STUDY
Commercial Energy Balance, 1987
Crude Totaloil and Elec- commer-
Crude Petroleum petroleum Natural Hydro- Geo- tri- cialCoal oil products products gas power thermal city energy
Indigenous production,flare and loss 573 274 - 274 - 1,300 1,128 - 3,275
Import 388 8,219 1,306 9,525 - - - - 9,913Export - - (277) (277) - - - - (277)Bunker - - (422) (422) - - - - (422)Stock change 22 (262) 19 (243) - - - - (222) X
Primary energy dept. 982 8,231 626 8,857 - 1,300 1,128 - 12,268 0
Statistical differenceOil refinery - (8,231) 7,870 (360) - - - - (OM0)Power generationfuel consumed 639 - (681) (681) (1,300) (1,128) - - (3,749)Power generated 266 - 844 844 - 449 390 1,949 1,949
Trans. distr. Loss -Energy sector ownuse & loss - - - - - - - (90)
Net supply available 343 - 7,816 7,816 - - - (1,452) 9,611
Net domestic consumption 343 - 7,816 7,816 - - - 1,452 9,611Residential & rommerce - - 604 604 - - - 771 1,375Industry 34. - 4,022 4,022 - - - 54z 4,9079Transport - - 3,030 3,030 - - - - 3,030Others - - - - - - - 139 139Nonenergy use - - 160 160 - - - - 160

ANNEX 2.1- 87 -
PHILIPPINES
ENERGY SECTOR REVIEW
NPC's June 1987 Generation Expansion Plan
Luzon Visayas MindananYear Plant MW Plant MW Plant MW
1987 Rehab Malaya 1 300.0 - -
1988 Rockwell 180.0 Bohol diesel II-2 3.4 Agus I 80.0Leyte-Samar I/C - DLPCO diesels 46.0
1989 Gas turbine A 150.0 Janopol hydro 5.0 -Rehab Sucat 1 150.0 Negros-Panay I/C -
1990 Gas turbine B 200.0Rehab Sucat 4 300.0
1991 Back-Man geo 1 110.0 -
1992 Calaca coal II 300.0 Cebu-Negros-Panay I/C - Gas turbine 50.0retire Rockwell -180.0
1993 Pantay hydro 23.0 Palimpinon geo 4 37.5 Gas turbine 50.0Bac-Man geo II 110.0Pinatubo geo 110.0
1994 Labo geo 110.0 Palimpinon geo 5 37.5 Diesel 19.3Irosin geo 110.0 Bohol diesel 5.5
1995 Isabela coal 300.0 - Agus III 225.0
1996 San Roque hydro 390.0 - -
1997 Casecnan hydro 268.0 Power barge #4 32.0 Diesel 19.3Bohol diesel 5.5 Power barge #4 out -32.0
1998 Binongan hydro 175.0 Palimpinon geo 6 37.5 Geothermal 55.0Geothermal 110.0
1999 Coal A 300.0 Jalaur hydro 24.0 Geothermal 55.0Bohol diesel 5.5
2000 Coal B 300.0 - Coal 200.0

ANNEX 2.2- 88- Table 1
PHILIPPINES
ENERGY SECTOR REVIEW
LGCs for Hydra Candidates
Levelized generation cost (LGC) for hydro computed on the basis of:
Discount rate 12.00% p.a.Plant life 50 yearsFixed O&M $0.46/kW/yr
Installed Annual Capacity Construc- Capital P.V. Lev. gen.Site capacity energy factor tion time cost factor cost
(MW) (GWh) (%) (years) ($/kW) (M) (cts/kWh)
Pantay 23 153 75.94 6.00 2,872.50 36.24 7.09
San Roque 390 1,214 35.53 7.00 1,187.20 43.70 6.61
Casecaan 268 1,379 58.74 5.00 1,829.70 29.23 5.54
Abra 174 718 47.11 6.00 2,000.50 36.24 7.96
Diduyon 352 957 31.04 5.00 1,015.80 ̂ 9.23 5.83
BalogBalog 33 99 34.07 6.00 1,769.10 36.24 9.74
Agos (Kaliwa) 140 623 50.77 6.00 3,444.40 36.24 12.72
Matuno 180 528 33.49 5.00 1,715.00 29.23 9.11
Gened 600 1,632 31.05 8.00 1,441.10 51.66 9.69

ANNEX 2.2- 89 - Ta=le 2
PHILIPPINES
ENERGY SECTOR REVIEW
LGCs for Thermal/Geothermal Candidates
Discount rate 12% p.a.
Case Description
1 Imported coal plant2 Semirara coal plant3 Luzon geothermal4 Tongonan geothermal, generation only4A Tongonan geothermal with HVDC stage I4B Tongonan geothermal with HVDC stage II4C Tongonan geothermal with HVDC both stages4D Tongonan geothermal with HVAC stage I4E Tongonan geothermal with HVAC stage II4F Tongonan geothermal with HVAC both stages5 Oil
Con- Rela-struc- tive
Capa- Capital tion P.V. Mainte- Lev. gen. toCase city cost time factor -eat rate FOR nance Fixed O&M cost ease 1
(MW) ($/kW) (yrs) (M) (kcal/kWh) (2) (days/yr) ($/kW/mo) (cts/kWh) (2)
* 1 300 750.00 4.50 25.89 2,.3.J 9.0 56 1.25 3.46 100
2 300 800.00 4.50 25.89 2,390 9.0 56 1.33 4.50 130
3 55 579.90 4.00 22.64 4,031 4.0 35 0.63 2.90 84
4 450 540.39 4.00 22.64 4,031 4.0 35 0.63 2.26 65
4A 450 1,095.95 .0 22.64 4,031 4.0 35 0.63 3.37 97
4B 450 80i.06 4.00 22.64 4,031 4.0 35 0.63 2.79 81
4C 450 951.50 4.00 22.64 4,031 4.0 35 0.63 3.08 89
4D 450 962.61 4.00 22.64 4,031 4.0 35 0.63 3.10 90
4E 450 584.83 4.00 22.64 4,031 4.0 35 0.63 2.35 68
4F 450 773.72 4.00 22.64 4,031 4.0 35 0.63 2.72 79
5 300 625.00 4.00 22.64 2,390 7.0 40 1.04 4.32 125

ANNEX 2.3
90 - Table I
PHILIPPINES
ENERGY SECTOR REVIEW
Generation Expansion Candidates
Gas turbine GTSO 50 MW UnlimitedLuzon geothermal LGEO 55 MW 10 unitsLeyte geothermal TGEO 450 MW Per stage, 2 stagesImported coal ICOL 300 MW UnlimitedLocal coal LCOL 300 MW Unlimited
Kalayaan PS 3 and 4 PSTR 300 MW Modelled as one unit
Luzon hydro candidates VHYD (Pantay is committed)
Capa- Foreign Construc- P.V. factor P.V. of capital costName city cost tion time (@ 12% p.a.) Total Local Foreign
(MW) $/kW Z local (years) (Z ) - ($/kW)
ThermalGT50 50 300.0 19.6 2.5 13.50 340.5 66.8 273.7LGEO 55 579.9 35.8 4.0 22.64 711.2 254.3 456.9TGEO 450 951.5 25.0 4.0 22.64 1,166.9 291.7 875.2ICOL 300 774.9 13.7 4.5 25.89 975.5 134.0 841.5LCOL 300 824.9 13.7 4.5 25.89 1,038.5 142.7 895.8
HydroPantay 23 2,827.5 7.2 6.0 36.24 3,913.4 281.3 3,632.1San Roque 390 1,187.2 40.5 7.0 43.70 1,706.1 691.2 1,014.9Casecnan 268 1,829.7 41.4 5.0 29.23 2,364.5 979.3 1,385.3Abra 175 2,000.5 47.1 6.0 36.24 2,725.5 1,282.8 1,442.7Diduyon 352 935.0 42.9 5.0 29.23 1,208.3 517.8 690.5BalogBalog 33 1,769.1 39.7 6.0 36.24 2,410.2 956.2 1,454.1Agos Kaliwa 140 3,444.4 10.6 6.0 36.24 4,692.6 495.8 4,196.8Matuno 180 1,715.0 28.7 5.0 29.23 2,216.3 636.8 1,579.5Gened 600 1,441.1 42.0 8.0 51.66 2,185.6 918.3 1,267.3
Pumped StoragePSTR 300 525.3 30.6 2.0 10.63 581.2 178.0 403.2

ANNEX 2.3- 91 - Table 2
PHILIPPINES
ENERGY SECTOR REVIEW
Fuel Prices($/MM BTf)
Heavy Diesel ImportedYear fuel oil % p.a. oil % p.a. coal % p.a,
1987 2.43 - 3.16 - 1.21 -1988 2.16 -11.10 2.81 -11.10 1.21 0.001989 2.13 -1.56 2.76 -1.56 1.29 6.251990 2.30 8.19 2.99 8.19 1.36 5.88
1991 2.42 5.05 3.14 5.05 1.44 5.561992 2.54 5.05 3.30 5.05 1.52 5.261993 2.67 5.05 3.47 5.05 1.52 0.001994 2.80 5.05 3.64 5.05 1.52 0.001995 2.94 5.05 3.82 5.05 1.52 0.00
1996 3.03 3.12 3.94 3.12 1.53 1.001997 3.13 3.12 4.07 3.12 1.55 1.001998 3.23 3.12 4.19 3.12 1.56 1.001999 3.33 3.12 4.32 3.12 1.58 1.002000 3.43 3.12 4.46 3.12 1.59 1.00
2001 3.46 1.00 4.50 1.00 1.61 1.00
Luzon geotheinal $1.02/MM BtuTongonan geothermal $0.67/MM BtuSemirara coal $2.53/MM Btu

ANNEX 2.4
- 92 -
PHILIPPINES
ENERGY SECTOR STUDY
Results of Least-Cost Developmnt Plan(Costs in US$ million)
Year GT50 LGEO TGEO LCOL ICOL N600 VMYD PSTR C.COST M.COST Total
1987 0 0 J 0 0 0 0 0 7.7 315.079 322.779
1988 0 0 0 0 0 0 0 0 41.5 321.770 363.270
1989 0 0 0 0 0 0 0 0 134.0 358.939 492.939
1990 0 0 0 0 0 0 0 0 210.6 397.049 60/.649
1991 0 2 0 0 0 0 0 0 176.3 432.124 608.424
1992 0 4 0 0 1 0 0 0 163.2 459.474 622.674
1993 0 10 0 0 1 0 0 0 250.7 492.806 743.506
1994 0 10 0 0 1 0 0 0 291.6 540.197 831.797
1995 0 10 1 0 1 0 0 0 447.8 556.251 1.004.051
1996 0 10 1 0 1 0 0 1 395.0 596.505 992.305
1997 0 10 1 0 1 0 0 1 441.2 608.204 1,049.404
1998 0 10 2 0 2 0 0 1 440.1 625.394 1,065.494
1999 0 10 2 0 4 0 0 1 295.9 650.620 946.528
2000 0 10 2 0 6 0 0 1 77.3 668.053 745.353
2001 0 10 2 0 8 0 0 1 0.0 706.174 706.174
Total 3,373.700 7,728.647 11,102.347
Net present value 1,450.868 3,480.473 4,931.342
Objective function 3,899.438
Notes: Normal demand scenario; Tongonan HVAC line.

93 - ANNFX 3.1
PHILIPPINES -
ENERGY SECTOR STUDY
Coal Consuuption by End-Uae (1977-87)('000 tona)
1977/a 1978 1979 1980 1981 1982 1983 1984 1985 1986 1987
Power Plant.
National Power Corp.Naga (Cebu) - - - - - 18.4 54.7 121.0 66.2 105.3 44.8
Calaca - - - - - - - 75.0 651.0 737.5 996.8
Atlas Nining (Cebu) 56.3 47.4 39.9 26.8 13.0 8.3 186.4 354.6 324.9 141.1 207.4
Visayan Elect. Co. (Cebu) 22.4 25.3 33.0 53.4 50.0 34.0 26.3 33.0 7.7 6.0 1.5
Universal Cement (Cebu) 21.2 17.7 16.4 14.9 21.9 41.9 52.7 - - - -
LuDo and LuYu (Cebu) - 3.0 5.9 9.1 7.3 60.2 66.5 47.3 48.5 73.3 43.5
MMIC - - - - - - - 219.0 361.6 62.0 -Semirara Coal Corp. - - - - - - - - - 43.4 44.5
Subtotal 99.9 93.4 95.2 103.8 92.2 162.8 386.6 849.9 1.459.9 1,168.8 1,338.5
Ceaent Plants
Universal (Cebu) 85.0 70.6 64.5 84.8 61.8 54.5 61.7 22.6 15.7 - -
Pacific (Surigao Del Norte) 31.6 44.2 32.4 32.5 35.7 49.2 48.8 56.4 38.3 36.0 29.4
Bacuotan (La Union) 18.3 31.8 11.6 15.3 29.7 24.9 19.4 58.1 34.2 53.6 72.9
Apo (Cebu) 10.9 17.9 17.2 23.3 16.2 16.7 29.0 25.3 34.4 27.4 39.0
Floro (Iligan City) - - - - - 16.7 25.5 47.2 48.9 17.4 16.5
Iligan (lligan City) - - - - - 10.5 43.5 50.9 49.0 48.5 58.6
Northern (Rizal) - - - - - - 42.2 80.8 49.9 59.2 71.9
Island (Rizal) - - - - - - 94.2 70.0 91.8 35.9 11.0
Continental (Bulacan) - - - - - - 14.6 31.2 25.0 29.3 12.1
Bacnotan (Davao) - - - - - - 18.0 56.5 68.7 77.9 89.3
Republic (tulacan) - - - - - - 6.6 41.1 45.9 59.2 71.9
Midland (Rhzal) - - - - - - 13.9 57.8 - - -
Hi (Rhzal) - - - - - - 11.6 14.0 40.4 47.2 65.6
Central (Rlzal) - - - - - - 1.9 60.0 42.4 24.6 35.9
Filipines - - - - - - - 74.8 31.2 - 9.2
Fortune - - - - - - - - - 50.0 56.9
R1zal - - - - - - - - - 58.7 82.0
Subtotal 145.8 164.5 125.7 155.9 143.4 172.5 430.9 802.9 677.6 625.3 737.5
Other Industrial
Biophil (food processing-Leyte) - 1.3 12.0 23.7 35.2 16.2 5.1 10.9 - - -
MaIC (nickel) - - - - - - 230.4 - 252.4 43.1 -
Philphos - - - - - - - - 24.2 26.2 12.1
Asian Alcohol - - - - - - - - - - 44.1
Pasar - - - - - - - - - 5.7 5.8
Other - - 0.2 7.3 3.9 3.2 - - - - -
Subtotal - 1.3 12.2 31.0 39.1 19.4 235.5 10.9 276.6 75.0 62.0
Nonanergy
Maria Chrietna Chemical Ind. 13.8 6.0 4.5 4.4 0.4 - - - - - -
Electro-Alloys - - - 3.2 3.0 0.8 1.2 - - - -
Subtotal 13.8 6.0 4.5 7.6 3.3 0.8 1.2 - - - -
Total Steam Coal 259.5 265.2 237.6 298.3 278.0 353.9 1,054.2 1,663.8 2,414.1 1,868.8 2,138.1
Metallurgical coal /b 150.0 162.0 180.0 191.7 220.7 240.0 200.0 n/a n/a n/a n/a
/a No data available prior to 1977.
/b Philippines Sinter Corp. (imported).

PHILIPPINES
ENERGY SECTOR STUDY
Coal Production and Imports (1977-87)('000 tons)
Production 1977 1978 1979 1930 1981 1982 1983 1984 1985 1986 1987
Semirara (SCC) - - 5.3 32.7 13.2 90.8 325.7 551.9 568.0 592.4 595.2
CebuPrivate 137.8 217.4 198.4 201.0 216.6 248.6 323.1 237.9 312.9 364.3 225.9PNOC-CC - 0.5 13.7 15.4 8.2 12.1 3.6 13.3 16.6 15.9 12.5
Subtotal 237.8 217.9 212.0 216.4 224.8 260.6 326.7 251.2 329.5 380.2 238.4
MindanaoPrivate 11.0 6.3 5.8 25.6 15.8 16.0 15.0 23.4 17.6 23.2 45.1 >PNOC/MCC(Zamboanga) - - 8.0 25.8 44.3 100.4 232.0 209.3 163.3 97.6 165.4PNOC (Bislig) - - - 1.0 5.6 32.0 38.9 60.6 55.8 64.6 26.0
Subtotal 11.0 6.3 13.8 52.3 65.8 148.4 285.9 293.2 236.4 185.4 236.5
OtherBatan Island 26.5 17.3 19.1 11.8 8.0 39.6 34.0 100.0 100.7 52.6 54.7Masbate - - - - 1.2 5.0 19.0 10.6 12.3 11.7 14.2Polillo Island 9.3 13.0 13.0 14.3 17.1 12.7 11.8 9.6 14.0 11.4 12.4Other Islands - - - 1.2 0.7 0.8 16.4 0.7 - 1.9 17.8
Subtotal 35.8 30.3 32.1 27.3 27.0 58.1 81.2 120.2 127.7 77.5 99.1
Total Production 284.6 254.5 263.2 328.8 330.7 558.0 1,019.6 1,216.4 1,261.2 1,235.5 1,169.2
Imports 11.9 20.0 - - 25.0 141.2 202.0 513.1 1,240.0 957.6 615.0

ANNEX 3.3- 95 - Table 1
rHILIPPINES
ENERGY SECTOR STUDY
Historical and Projected Prices of Coal
Historic Import Coal Prices (PNOC) /a
FOB CIFAustralia Freight Philippines Unit cost
Year ---- (US$Jton) -- ------ (US$/MM Btu)
1981 /b 50.00 20.00 60.00 to 2.27 to70.00 2.65
1982 42.00 to 6.00 to 50.00 1.8944.00 8.00
1983 31.00 to 7.50 to 39.00 to 1.47 to32.00 10.50 42.00 1.59
1985 33.00 to 7.00 41.00 to 1.55 to36.00 9.50 43.50 1.64
1986 Jan to June 30.00 to 6.00 to 36.00 to 1.36 to33.00 7.00 40.00 1.51
July to Dec. 25.50 5.50 31.00 1.17
1987 20.00 to 6.00 to 26.00 to 0.98 to24.00 8.00 32.00 1.21
1988 Jan-May 22.00 to 8.00 30.00 to 1.13 to24.00 38.00 1.44
/a The upper end of the 1988 price range (38/ton) is based on informationreceived from NPC during May 1988.
/b The 1981 shipment was delivered to Naga and the high freight ratereflects the higher cost per ton of the smaller ship size required forthat dock. A CIF coal price of $60 to $70 per ton is shown to reflectthe range if a more typical freight rate of $10/ton had been incurred,and the actual price paid based on the smaller ship.
Source: PNOC (and NPC for 1988), typical prices for 12,000 Btu/lb coal.

-96 - ANNEX 3.3Table 2
PHILIPPINES
ENERGY SECTOR STUDY
Historical and Projected Prices of Coal
Historic Domestic Coal Prices(on the Pier in Cebu for 10,000 Btu/lb coal)
Coal prices Exchange rate(Pesos (Pesos Unit cost
Year per ton) per dollar) (US$/MM Btu)
1981 340 7.9 1.95
1982 438 8.5 2.34
1983 438 11.1 1.79
1984 579 to 930 16.7 1.57 to 2.53
1985 930 18.6 2.27
1986 Jan to Jun 837 to 930 20.3 1.87 to 2.08Jul to Dec 740 20.5 1.64
1987 740 20.5 1.64
1988Jan to May 941 20.8 2.05
Note: The P 941 in 1988 for 10,000 Btu/lb coal corresponds to NPC's price ofP 800 for 8,500 Btu/lb coal offered to suppliers at the beginning of1988 for coal to be used in the Naga power plant in Cebu. The contractprice between NPC and Semirara Coal Corporation (SCC) for coal to fuelCalaca I on Luzon is P 750/ton at Semirara and P 787/ton delivered toCalaca.

ANNEX 3.397 Table 3
PHILIPPINES
ENERGY SECTOR STUDY
Historical and Projected Prices of Coal
International Forecast of Coal Prices(US$/ton for 12,000 Btu/lb coal)
World Bank /a Forecast Forecast /cforecast (constant (constant
(current price 1987 prices 1987 pricesFOB east GNP /b FOB east FOB
Year coast US) deflator coast US) Australia)
1987 37 100 37
1990 42 117.4 35.8 30.8
1995 53 149.8 35.4 30.4
2000 72 196.0 36.7 31.7
/a World Bank September 2, 1987 Commodity Forecast Price.
/b World Bank December 16, 1987 US GNP Deflator Forecast, adjusted to 1987 -100.
/c Based on a long-term differential of $5.00/ton between FOB prices on eastcoast US and FOB prices in Australia.

ANNEX 3.3- 98 - Table 4
PHILIPPINES
ENERGY SECTOR STUDY
Historical and Projected Prices of Coal
Forecast of CIF Prices of Imported Coal for the Philippines(Constant 1987 US$ for 12,000 Btu lb coal)
Freight /bFOB price Australia to CIr price Philippines
Year Australia Philippines $/ton $/MM Btu
1988 30 8 38 1.44
1990 30 10 40 1.51
1992 30 to 40 1.51
1995 30 10 40 1.51
1996 onwards CIF price is forecast to increase at 1.0% p.a. in real terms /c
/a FOB price is forecast to increase gradually from the currently depressedlevels in 1987 end early 1988 to a level in line with the World Bankforecast by 1992.
/b Freight rates, which were depressed through the mid-1980s, but havestarted to recover, are forecast to reach $10/ton by 1992.
/c Real increases of 1% p.a. are forecast after 1995 as new investment isrequired in coal-producing countries to meet growing demand.

ANNEX 3.3- 99 - Table 5
PHILIPPINES
ENERGY SECTOR STUDY
Historical and Projected Prices of Coal
Prices of Imported and Domestic Coal in 1988-92
Forecast prices of Linorted coalP/mt for 8.500 Etuf lb Current priceWithout With of domestic coal
$/ot for 12,000 Btu/lb duties & duties 6 (P/mt forConstant 1987 $ Current $ /a taxes /b taxes /c 8,500 Btu/lb)
(1) (2) (3) (4) (5)
1988 36.20 38.00 552 669 800
3989 39 43.00 624 756 800
1990 40 46.30 672 813 800
1991 40 48.62 706 854 800
1992 40 51.05 741 896 800
/a Based on price escalation of 52 per year. [The 1988 value in column (1) is based onthe actual $38.00 price in 1988 deflated to 1987 $1.
/b Converted to pesos using P 20.5 - US$1.00 and ratio of heating values.
/c Includes specific tax of 10 pesos per ton for 12,000 Btu/lb coal plus 20% for customduties.

-100 - ANNEX 3.3
PHILIPPINES
ENERGY SECTOR-STUDY
Ristorical and Projected Prices of Coal
Coal Taxes. Duties and Royalties
Imported Coal. The taxes and duties on imported coal changed as of thebeginning of 1988. At the end of 1987 taxes and duties comprised:
- customs duty of 202;- Board of Energy fee of 0.12; and- specific tax of 50 pesos/ton.
At the beginning of 1988 the 102 value added tax (VAT) was applied to importedcoal and the specific tax was reduced from 50 pesos to 10 pesos. However,consumers such as cement companies will be able to deduct the VAT paid on coalfrom the VAT paid on their final product, and thus will not pay more forimported coal because of VAT. NPC will probably not be requried to pay VAT oncoal imports. The taxes and duties on imported coal at the end of 1987 and atthe beginning of 1988 with and without VAT are presented below:
19881987 With VAT Without VAT
(Pesos per ton)
Landed CIP price /a 656 656 656Custous duty (201) 131 131 131Specific tax 50 10 10Board of energy fee (0.1X) 1 1 1
Total 838 798 798
Value added tax (102) nil 80 nil
Total 838 878 798
Taxes and duties as percentof CIF price 282 342 222
/a Based on a CIF price of $32.00/ton and P 20.5 per US dollar.
Domestic Coal. Philippine mining companies pay income taxes and revenuesharing which is a form of royalty. The revenue sharing for a Philippineowned company with a mine developed since the legislation was passed in 1976is 302 of revenues minus costs (which cannot exceed 902 of revenues). Undercurrent market conditions, most coal companies would be paying the minimum 32of revenues and in most cases, low or no income taxes. Revenue sharing from1983 to 1986 has been:
Year In P Million
1983 12.4571984 24.0101985 31.1901986 20.010
Total 87.667
Source: Philcoal.

ANNME 3. 3- 101 - Table 7
PHILIPPINES
ENERGY SECTOR STUDY
Historical and Projected Prices of Coal
Mining Employment by Area
Cebu 5,559 6,350 7,186 6,096 2,585batan 217 254 412 474 500Masbate 468 498 401 353 327Zauboanga 1,414 1,699 1,673 1,402 1,368Surigao del Sur 800 969 979 780 485Samar 381 - - - -
Quezon 141 96 138 146 159Sodirara 704 1,664 1,109 1,067 1,315Miudoro - 64 32 46 -
Total 9,724 10,994 11,930 10,364 6,739
Source: Philcoal.

- 102 - ANNEX 3.4Page 1
PHILIPPINES
ENERGY SECTOR STUDY
Environmental Effects of Power and Coal Sector Developments
1. The coal-fired power plants that are planned and the potentialexpansion of the Semirara mine as the fuel source will impact on theenvironment as will the continued operation of the existing oil-fired pl-ntsand the geothermal plants identified in the least cost expansion plan. Theuse of coal for power generation impacts on the air, land and wacer. Thecoal-fired plants, as costed for use in developing the least cost expar.sionsequence, include precipitators to remove 99.5% of particulates and thefacilities needed for ash handling and disposal, but do not include flue gastreatment equipment to reduce SO2 and NOX emissions. The coals considered foruse in new power plants have the following sulphur contents and heatingvalues:
Coal Sulphur content Heating value
Semirara 0.5% 7,200 Btu/lbImported <1.0% 12,000 Btu/lb
2. The SO2 emiscions per kilowatt-hour of energy from the plantsburning these coals will be about half of those from the existing oil-firedplants in the Philippines which are using oil with sulphur contents of about3X. NO and particulate emissions will tend to be slightly higher in a coal-fired plant relative to an oil-fired plant. Also, a coal-fired plant willrequire about 50% more land than an oil-fired plant excluding the areas forash disposal, will have a greater visibility because of its comparativelylarger size and will have the potential for more run off effluent from coalpiles and ash handling facilities.
3. Both oil and coal fired thermal plants need relatively smallquantities of fresh make up water but large volumes of cooling water. Asingle 300 MW unit will use about 6 cu.ft./second of cooling water and raisethe temperature of the water some 8 to 10°C. The water will frequently bechlorinated to minimize biological fouling of the condenser tubes. All of thenew thermal plants being considered will be located on the coast and will haveonce through cooling. The water intakes will have the potential of entraininglarval invertebrates and fish fry in large quantities which will usually bekilled due to pressure and temperature change, physical battering or chlorinepoisoning. Similarly, the warmer discharga water can have a detrimentaleffect on all levels of the food web, except possibly certain algae such asbluegreens which often thrive in thermally enhanced waters. Theseenvironmental effects can be minimized through screened intakes designed tominimize water velocities and, in areas where there is insufficient tidal

ANNEX 3.4-103 - Page 2
action to disperse the heated discharge water, a series of nozzles along thedischarge pipe to ensure rapid dispersion of the heated water and return toambient water temperature.
4. The extension of the mining operationis on Semirara Island, locatedsouth of Mindoro Island and measuring 6 by 15 em, will have detrimentalenvironmental effects unless care is taken with the disposal of overburden, soas not to smother surrounding coral with sedimen.., and a reclamation programis implemented. The transportation of the Semirara coal by barges to theCalac... power plant, or the importation of coal by ships to Calaca or otherpower stations, poses a relatively minor threat to the environment. Coalunloading can result in fugitive dust but the impact can be minimized throughthe design of the delivery system.
5. The environmental impact of geothermal power plants is less thanthose of both oil and coal-fired plants because of the absence of a boiler andits emissions in the form of SO , NO, and particulates. Some sulphur andother gases are released from tfe steam in the geotbermal operation but thequantities are very small relative to those from oii and coal-fired boilers.

PHILIPPINES
ENERGY SECTOR STUDY
General Characteristics of Operating Geothermal Fields in the Philippines
Tiwi Mak-Ban Tongonan Palimpinon Bac-Mangeothermal field geothermal field geothermal field geothermal field geothermal field
Location Albay Laguna Leyte Negros Oriental Albay
Proponents NPC-PGI NPC-PGI PNOC-EDC PNOC-EDC PNOC-EDC
Arrangemen. service Service contract Contract with PCI -with PGI
Financial assistance - OECF of Japan OECF of Japan WB loan expected -
Technical assistance - From New Zealand From New Zealand Government -Government Government
No. of wells 112 87 52 56 26
Estlmated total 350 MW 355 MW 413 MW 246 MW 74 MWwell capacity
Estimated field not available 15,000 NW yrs. 12,000 to 9,750 NW yrs. 2,350 topotential available 7,300 MW yrs.
Status For further For further For further For further Under developmentdevelopment development development development
User NPC NPC NPC NPC (NPC to set up110 MW powerplant in 1987-90)
Installed capacityyear of operation: Unit 1&2-110 MW/1979 Pilot-3.0 MW/1979 Pilot-3.0 MW/1980 Pilot-3.0 HW/1980
Unit 364-110 MW/1980 Unit 364-110 MW/1980 Tongonan 1-112.5 HW/ Pilot-3.0 MW/1982Unit 5&6-110 MW/1982 Unit 516-110 MW/1984 1983 Pal 1-112.5 HW/1982Total - 330 MW Total - 330 KW Total - 115.5 MW Total - 118.5 MW

ANNEX 4.2- 105-
PHILIPPINES
ENERGY SECTOR STUDY
Analysis of Geothermal Exploration Activities
Dry(20 kg/s
Field Wells drilled Successes or/untested)
Tongonan 16 10 6
Palimpinon 13 9 4
Other Southern Negros 10 4 6
Bacon-Manito 10 5 5
Biliran 3 2 1
Daklan 5 0 5
Mambucal 2 0 2
Davao (Manat-Amacan) 4 0 4
Total 63 30 33
Success Ratio: 47.62%
Source: Tolentino & Buning, 1985.
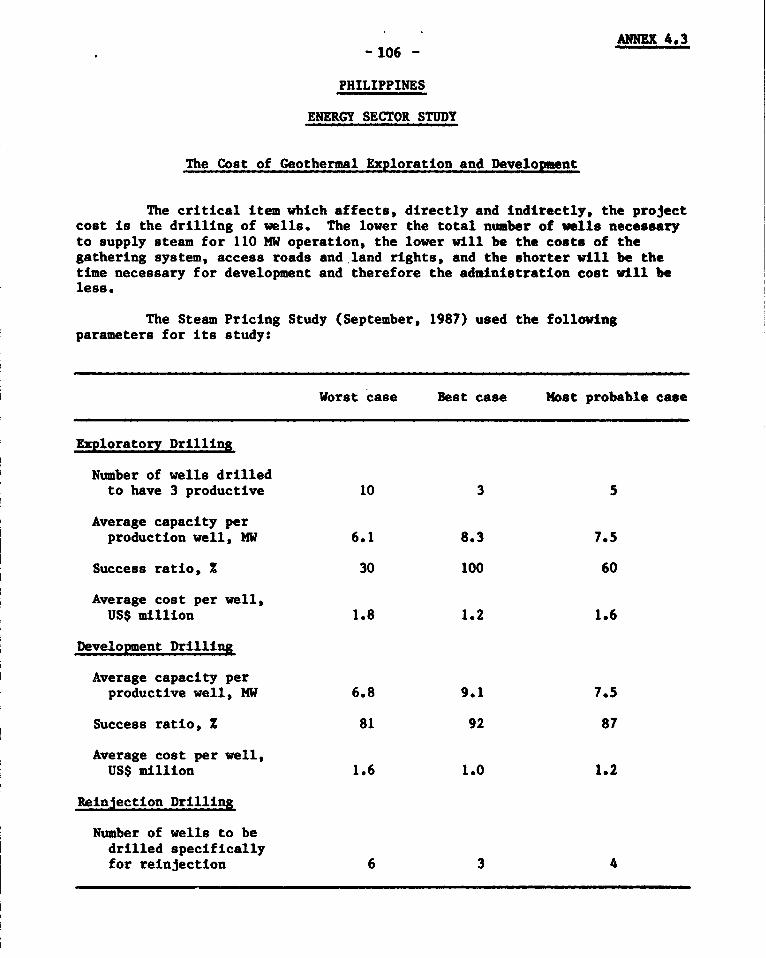
ANNEX 4.3-106-
PHILIPPINES
ENERGY SECTOR STUDY
The Cost of Geothermal ELxloration and DeveloL ent
The critical item which affects, directly and indirectly, the projectcost is the drilling of wells. The lower the total number of wells necessaryto supply steam for 110 MW operation, the lower will be the costs of thegathering system, access roads and land rights, and the shorter will be thetime necessary for development and therefore the administration cost will beless.
The Steam Pricing Study (September, 1987) used the followingparameters for its study:
Worst case Best case Most probable case
Exploratory Drilling
Number of wells drilledto have 3 productive 10 3 5
Average capacity perproduction well, MW 6.1 8.3 7.5
Success ratio, x 30 100 60
Average cost per well,US$ million 1.8 1.2 1.6
Development Drilling
Average capacity perproductive well, MW 6.8 9.1 7.5
Success ratio, x 81 92 87
Average cost per well,US$ million 1.6 1.0 1.2
Reinjection Drilling
Number of wells to bedrilled specificallyfor reinjection 6 3 4

PHILIPPINES
ENERGY SECTOR STUDY
The Cost of a 110 MW Field: A Typical Case Versus Historical Costs(US$ '000)
Worst Most prob- Best Theoretical, based on actual costcase able case case Tiwi Mak-Ban Tongonan Palimpinon Bac-Man
Investment Cost
Exploration 2.0 2.0 2.0 2.0 2.0 3.0 1.0 1.0Exploration drilling 18.0 8.0 3.6 11.0 7.0 5.4 9.6 12.0Development drilling 38.4 23.8 15.0 15.0 21.0 22.8 50.4 30.0Gathering system 36.0 16.0 7.5 18.0 12.0 21.0 18.0 18.0Access roads 7.0 3.0 1.1 3.0 2.0 2.8 3.0 5.0 1Engineering & administration 18.0 15.0 9.0 12.0 10.0 12.0 14.0 16.0 o
Total 119.4 67.0 38.2 61.0 54.0 67.0 96.0 82.0 1
Early Operating Cost
Wells work-over 0.4 0.4 0.4 0.5 0.2 0.4 0.4 0.4Drilling of replacement wells 2.0 1.0 0.5 2.0 0.5 0.6 0.8 1.0System's O&M 1.6 1.1 0.6 1.2 0.8 1.2 2.0 1.1Administration 1.0 1.0 1.0 3.0 3.0 0.6 1.0 1.0
Total 5.0 3.5 2.5 6.7 4.5 2.8 4.2 3.5
Source: Geothermal Steam Pricing Study, September 1987.
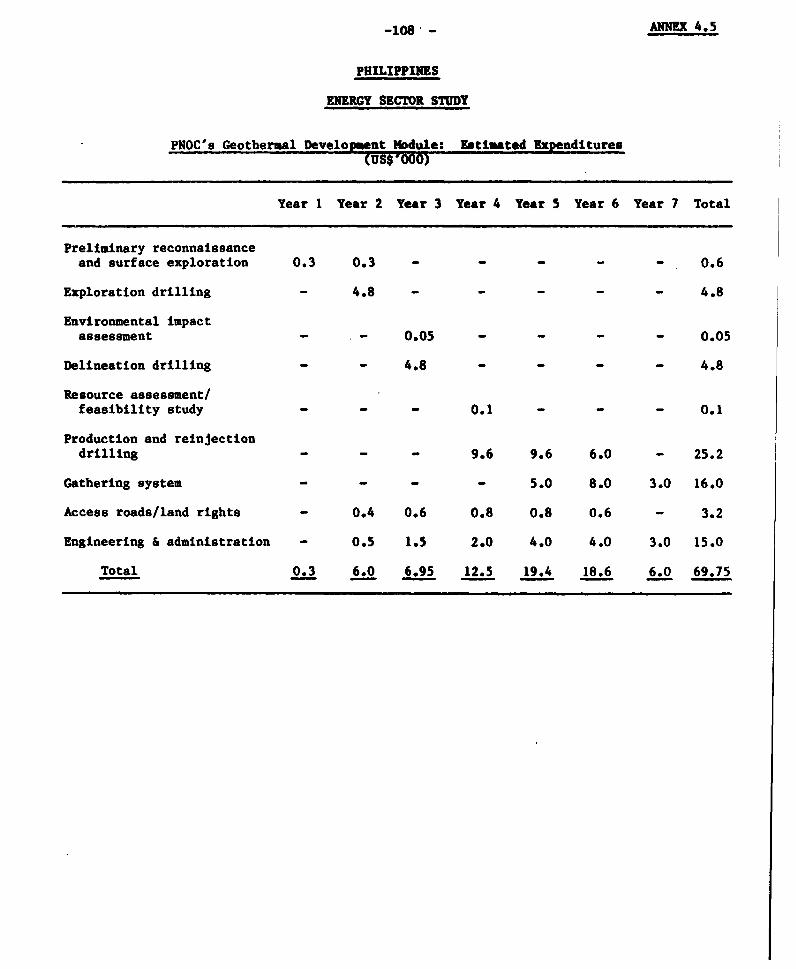
-108. - ANNEX 4.5
PHILIPPINES
ENERGY SECTOR STUDY
- PNOC's Geothermal Development Module: Eatimated Expenditures(US$'000)
Year 1 Year 2 Year 3 Year 4 Year 5 Year 6 Year 7 Total
Preliminary reconnaissanceand surface exploration 0.3 0.3 - - - - - 0.6
Exploration drilling - 4.8 - - - - - 4.8
Environmental impactassessment - - 0.05 - - - - 0.05
Delineation drilling - - 4.8 - - - - 4.8
Resource assessment/feasibility study - - - 0.1 - - - 0.1
Production and reinjectiondrilling - - - 9.6 9.6 6.0 - 25.2
Gathering system - - - - 5.0 8.0 3.0 16.0
Access roads/land rights - 0.4 0.6 0.8 0.8 0.6 - 3.2
Engineering & administration - O.S 1.5 2.0 4.0 4.0 3.0 15.0
Total 0.3 6.0 6.95 12.5 19.4 18.6 6.0 69.75

- 109 - ANNEX 4.6
PHILIPPINES
ENUGY SECTOR STUDY
Historical Costa of Geothernal ftlorstton and Development am of End 1986
Addinis- Engineertngtration and Geo- Well Collection& others maintenance scientific Drilling development system Total
Leyte
Tongonan 1 31,520.0 21,450.0 1,850.0 81,020.0 12,450.0 172,430.0 320,720.0Tongonan II, others 56,132.0 54,977.8 10,155.7 323,508.9 46,233.4 10,828.8 501,837.2
Subtotal 87,652.6 76.427.8 12,005.7 404,528.9 58,683.4 183,258.8 822.557.2
So. Ne'8ro
Palhinpinon I 83,910.0 30,890.0 4,060.0 522,480.0 17,410.0 157,345.0 816,095.0Palhinpinon 11, others 30,457.2 27,903.1 5,342.5 324,991.2 17,281.1 - 405,975.1
Subtotal 114,367.2 58.793.1 9,402.5 847,471.2 34.691.1 157,345.0 1,222.070.1
Z c-NIn 43,266.0 70,719.0 7,729.0 425,799.0 24,319.0 7,058.4 578,890.4
Other AreasLuzon: Batangas - - 1.1 - - - 1.1
Benguet 1,850.4 546.4 194.1 (365.7) /a 84.8 - 2,310.0Mt. Lobo - - 137.1 - - - 137.1Sorsogon - - 663.7 - - - 663.7Zambales - - 1,055.2 - - - 1,055.2
Viscyas: Biliran 1,869.9 6,655.6 596.3 35,083.9 677.4 - 41,883.1Burauen 570.5 1,933.7 727.0 - - - 3,231.2No. Negros - - 118.7 2.9 0.5 - 122.1
Mindanao: Davao 2,864.8 4,591.6 183.7 23,586.7 442.8 - 31,669.6lalingasag - - 0.2 - - - 0.2Mt. Apo - - 1,532.0 - - - 1,532.0Mt. Malindang - - 64.3 - - - 64.3Surigao - - 3.9 - - - 3.9
Head Office 251,500.0 - - - - - 2,515,000.0
Total 503,941.4 219.667.2 34,414.5 1.736.106.9 118,899.0 3,475,662.2 2.960,691.2
/a Net of P 24,8)5.5 million joint BED/JICA grant.

PRILIPPINES
ENERGY SECTOR SYUDY
Estimated Cost of Geothermal Exploration and Development at Pinatubo
Findigg costistorical costs 1981 1982 1983 1984 1985 1986 1987 1988 1989 Subtotal 1989 1990 1991 1992 1993 Total
eneral/administration 0.00 0.00 0.01 0.00 0.00 0.01 0.34 0.81 0.53 1.70 0.80 1.34 1.33 1.33 0.00 6.50eology/geoscientific 0.00 0.03 0.04 0.00 0.01 0.01 0.00 0.06 0.02 0.18 0.04 0.06 0.06 0.06 0.00 0.40teld development 0.00 0.00 0.00 0.00 0.00 0.00 0.72 0.39 0.20 0.13 0.31 0.48 0.48 0.49 0.00 30.07ell irilling 0.00 0.00 0.00 0.00 0.00 0.00 0.01 4.75 3.17 7.93 4.75 7.92 7.92 7.92 0.00 36.44ell development 0.00 0.00 0.00 0.00 0.00 0.00 0.00 0.00 0.15 0.09 0.24 0.14 0.29 0.30 0.00 1.27echnical assistance 0.00 0.00 0.00 0.00 0.00 0.00 0.00 0.07 0.07 0.14 0.10 0.14 0.10 0.10 0.00 0.58team gathering system 0.00 0.00 0.00 0.00 0.00 0.00 0.00 0.00 0.00 0.00 0.00 0.63 11.22 4.59 0.00 16.44ffice facilittes 0.00 0.00 0.00 0.00 0.00 0.00 0.00 0.00 0.00 0.00 0.00 0.00 0.00 1.35 0.00 1.35
Total 0.00 0.03 0.05 0.00 0.02 0.01 10.07 6.24 40.09 11.50 6.13 10.86 21.41 16.14 0.00 66.05
schange rate P/$ 7.8996 8.5369 11.1335 16.7214 18.6583 20.5000 20.5000 25.0000 20.5000 - 20.5000 20.5000 20.5000 20.5000 20.5000 -
nflator to 1987 1.0751 1.0907 1.1199 1.1405 1.1256 1.0500 1.000 1.000 1.000 - 1.0000 1.0000 1.0000 1.0000 1.0000 -
>tal at 1987 prices 0.00 0.03 0.06 0.00 0.02 0.01 1.07 6.24 4.09 11.52 6.13 10.86 21.41 16.14 0.00 66.06
rmber of wells - - - - - - - 3 2 5 3 5 5 5 - 23
0
Ii

PHILIPPINES
E?ERCY SECTOR STUD!
Estimated Coast of Geothermal Exploration and Development at Labo(US1 milion)
Filndin costHistorical costs 1985 1986 1987 1988 1989 Subtotal 1989 1990 1991 1992 1993 1994 Total
General/administraticn 0.00 0.00 0.01 0.57 0.82 1.40 0.27 1.32 1.32 1.33 0.58 0.00 6.23Geology/geoscientiftc 0.00 0.01 0.03 0.06 0.05 0.14 0.02 0.06 0.06 0.06 0.06 0.00 0.40Field development 0.00 0.00 0.00 0.37 0.42 0.78 0.14 0.48 0.48 0.48 0.32 0.00 2.68Well drilling 0.0o, 0.00 0.00 3.17 4.75 7.92 1.58 7.92 7.92 7.92 3.17 0.00 36.44Well development 0.00 0.00 0.00 0.13 0.16 0.28 0.05 0.23 0.23 0.30 0.25 0.00 1.35Techntcal assistance 0.00 0.00 0.00 0.07 0.08 0.15 0.03 0.10 0.10 0.10 0.10 0.00 0.57Steam gathering system 0.00 0.00 0.00 0.00 0.00 0.00 0.00 0.00 0.63 11.22 4.59 0.00 16.44Offile facilities 0.00 0.00 0.00 0.00 0.00 0.00 0.00 0.00 0.00 0.00 1.35 0.00 1.35
Total 0.00 0.01 0.05 4.37 6.27 10.69 2.09 10.11 10.74 21.41 10.43 0.00 65.46
Exchange rate P/$ 18.6583 20.5000 20.5000 20.5000 20.5000 - 20.5000 20.5000 20.5000 20.5000 20.5000 20.5000 -
Inflator to 1987 1.1256 1.0500 1.0000 1.0000 1.0000 - 1.0000 1.0000 1.0000 1.0000 1.0000 1.0000 -
Total at 1987 prices 0.00 0.01 0.05 4.37 6.27 10.69 2.09 10.11 10.74 21.41 10.43 0.00 65.47
Number of wells - - - 2 3 5 1 5 5 5 2 - 23

PHILIPPINES
ENERGY SECTOR STUDY
Annual Operating and Maintenance Cost of the Bacon-Manito Plant
Well replacement Addi- GeneralRein- Work- Civil SGS main- Well tional & admin-
Year Production Jection over works tenance hookup pipeline subtotal istration Total
1 665.56 - 305.35 27.79 217.33 19.87 11.49 1,247.39 124.74 1,372.132 665.56 - 305.35 27.79 217.33 19.87 11.49 1,247.39 124.74 1,372.133 665.56 - 305.35 27.79 217.33 19.87 11.49 1,247.39 124.74 1,372.134 665.56 - 305.35 27.79 217.33 19.87 11.49 1,247.39 124.74 1,372.135 665.56 - 305.35 27.79 217.33 19.87 11.49 1,247.39 124.74 1,372.136 1,331.12 332.78 305.35 69.47 348.85 45.41 34.36 2,467.44 246.74 2,714.197 1,331.12 332.78 305.35 69.47 348.85 45.41 34.36 2,467.44 246.74 2,714.198 1,331.12 332.78 305.35 69.47 348.85 45.41 34.36 2,467.44 246.74 2,714.199 1,331.12 332.78 305.35 69.47 348.85 45.41 34.36 2,467.44 246.74 2,714.1910 1,331.12 332.78 305.35 69.47 348.85 45.41 34.36 2,467.44 246.74 2,714.19 .
11 1,996.68 665.56 305.35 111.15 809.19 70.94 6.89 3,965.77 396.58 4,362.35 ~12 1,996.68 665.56 305.35 111.15 809.19 70.94 6.89 3,965.77 396.58 4,362.3513 1,996.68 665.56 305.35 111.15 809.19 70.94 6.89 3,965.77 396.58 4,362.3514 1,996.68 665.56 305.35 111.15 809.19 70.94 6.89 3,965.77 396.58 4,362.3515 1,996.68 665.56 305.35 111.15 809.19 70.94 6.89 3,965.77 396.58 4,362.3516 2,329.46 332.78 305.35 111.15 482.12 75.22 6.89 3,642.97 364.30 4,007.2717 2,329.46 332.78 305.35 111.15 482.12 75.22 6.89 3,642.97 364.30 4,007.2718 2,329.46 332.78 305.35 111.15 482.12 75.22 6.89 3,642.97 364.30 4,007.2719 2,329.46 332.78 305.35 111.15 482.12 75.22 6.89 3,642.97 364.30 4,007.2720 2,329.46 332.78 305.35 111.15 482.12 75.22 6.89 3,642.97 364.30 4,007.2721 332.78 - 305.35 13.89 480.86 9.94 11.49 1,154.31 115.43 1,269.7422 332.78 - 305.35 13.89 480.86 9.94 11.49 1,154.31 115.43 1,269.7423 332.78 - 305.35 13.89 480.86 9.94 11.49 1,154.31 115.43 1,269.7424 332.78 - 305.35 13.89 480.86 9.94 11.49 1,154.31 115.43 1,269.7425 332.78 - 305.35 13.89 480.86 9.94 11.49 1,154.31 115.43 1,269.74
Totals 33,278.07 6,699.61 7,633.78 1,667.23 11,691.75 1,106.91 356.06 62,389.42 6,238.94 68,628.36 o

PUILIPPINS
M 1 SECTOR STUDY
Entimted Coat of Tongoann Development (I4iitboa Sector)
Standards 19U8 1989 190 1991 1992 1993 1994 99S TotalP H $-11 P1 $1 P 11 $ t PIt $3n P H $M PF 1 $ P p 5 H $HPM SN PM t PH 1 $ 3
1. Well Drillina (R5/7/9-8500*) 14,348.3 794.2 0.00 0.00 86.09 4.77 14.35 0.79 43.04 2.38 71.74 3.97 0.00 0.00 0.00 0.00 0.00 0.00 215.22 11.91
11. neld Dewlomnent
General expense 3,608.9/yr - 1.20 - 1.20 - 1.20 - 1.20 - 1.20 - 0.00 - 0.00 - 0.00 - 6.01 -Plan/bed survey 242.6/yr - 0.08 - 0.08 - 0.08 - 0.08 - 0.08 - 0.00 - 0.00 - 0.00 - 0.40 -Rad/site maintenance 26.3/km - 0.14 - 0.22 - 0.23 - 0.27 - 0.33 - 0.00 - 0.00 - 0.00 - 1.18 - IEquipment maintenance 3,591.0/yr - 1.20 - 1.20 - 1.20 - 1.20 - 1.20 - 0.00 - 0.00 - 0.00 - 5.99 - PSite preparation 451.5/cell - 0.00 - 2.71 - 0.45 - 1.35 - 2.26 - 0.00 - 0.00 - 0.00 - 6.77 - 1-
Subtotal - - 2.62 0.00 9.56 0.00 3.85 0.00 6.18 0.00 8.53 0.00 0.00 0.00 0.00 0.00 0.00 0.00 30.74 0.00
111. Geologicel 6 Geoccientitfic
General expenae 1,740.9/yr - 0.58 - 0.58 - 0.58 - 0.58 - 0.58 - 0.00 - 0.00 - 0.00 - 2.90 -Well logging 16.9!uIll - 0.00 - 0.10 - 0.02 - 0.05 - 0.08 - 0.00 - 0.00 - 0.00 - 0.25 -Geochemistry 518.7/yr - 0.17 - 0.17 - 0.1' - 0.17 - 0.17 - 0.00 - 0.00 - 0.00 - 0.86 -Other research 87.Z/yr - 0.03 - 0.03 - 0.03 - 0.03 - 0.03 - 0.00 - 0.00 - 0.00 - 0.15 -
Subtotal - - 0.78 0.00 0.88 0.00 0.80 0.00 0.83 0.00 0.87 0.00 0.00 0.00 0.00 0.00 0.00 0.00 4.16 0.00
IV. Well Development
Ceneral expense 911.4/yr - 0.30 - 0.30 - 0.30 - 0.30 - 0.30 - 0.00 - 0.00 - 0.00 - 1.52 -Planning 13579.2/yr - 0.00 - 0.53 - 0.53 - 0.53 - 0.53 - 0.00 - 0.00 - 0.00 - 2.11 -Well testing 560.7 + 363.3/well - 0.19 - 2.37 - 0.55 - 1.28 - 2.00 - 0.00 - 0.00 - 0.00 - 6.38 -Well maintenance 854.7 + 21.0/well - 0.62 - 0.75 - 0.77 - 0.83 - 0.94 - 0.00 - 0.00 - 0.00 - 3.90 -
Subtotal - - 3.11 0.00 3.94 0.00 2.15 0.00 2.94 0.00 3.77 0.00 0.00 0.00 0.00 0.00 0.00 0.00 13.91 0.00 |.
V. Technical Assistance/Traininx - - 0.00 0.00 0.34 0.08 0.68 0.17 0.67 0.16 0.67 0.16 0.00 0.00 0.00 0.00 0.00 0.00 2.35 0.57 D
TOTAL (I to V) - - 4.51 0.00 100.83 4.85 21.83 0.96 53.66 2.55 85.58 4.13 0.00 0.00 0.00 0.00 0.00 0.00 266.39 12.49
VI. C 6 A (152 of above TOTAL) - - 0.68 - 30.68 - 6.36 - 16.22 - 26.11 - 0.00 - 0.00 - 0.00 - 80.04 -
Vll. Steam Gathertnt System - - 0.00 0.00 0.00 0.00 13.72 0.22 11.89 15.90 4.90 6.59 0.00 0.00 0.00 0.00 0.00 0.00 30.51 22.71
VIII. Office Facilities - - 0.00 0.00 0.00 0.00 0.00 0.00 0.00 0.00 0.50 0.00 0.00 0.00 0.00 0.00 0.00 0.00 0.50 0.00
TOTAL (I to VIII) - - 5.19 0.00 131.50 4.85 41.90 1.18 81.77 18.45 117.08 10.72 0.00 0.00 0.00 0.00 0.00 0.00 377.44 35.20

PHILIPPINES
ENERCY SECr0F STUDY
Estimted Cost of Tongonen Development (Mahana gdong Sector)
Standards 1988 1989 1990 1991 1992 1993 1994 1995 Totalj tt tt II tt S tt P It $ It1 p mi S 1 P tt S tt P tt S tt P S t1Pt15t P S 11 Ptl St
T. Well Dril2inr (RS5/4/9-8500 ) 14,348.3 794.2 0.00 0.00 43.04 2.38 86.09 4.77 100.44 5.56 157.83 8.74 0.00 0.00 0.00 n.00 0.00 0.00 387.40 2i.44
It. Field Development
General expense 3,608.9/yr - 1.20 - 1.20 - 1.20 - 1.20 - 1.20 - 0.00 - 0.00 - 0. - 6.01Plan/bed survey 242.6/yr - 0.08 - 0.08 - 0.08 - 0.08 - 0.08 - 0.00 - 0.00 - 0.00 - 0.40Road/site maintenance 26.3/ko - 0.36 - 0.40 - 0.48 - 0.57 - 0.71 - 0.00 - 0.00 - 0.00 - 2.52 -Equipment maintenance 3,591.0/yr - 1.20 - 1.20 - 1.20 - 1.20 - 1.20 - 0.00 - 0.00 - 0.00 - 5.99Stte preparation 451.5/cell - 0.00 - 1.35 - 2.71 - 3.16 - 4.97 - 0.00 - 0.00 - 0.00 - 12.19Ioad construction 1,385.0/ke - 0.00 - 2.08 - 4.15 - 4.85 - 7.62 - 0.00 - 0.00 - 0.00 - 18.70
Subtotal - - 2.84 0.00 6.31 0.00 9.82 0.00 2t.06 0.00 25.76 0.00 0.00 0.00 0.00 0.00 0.00 0.00 45.61 0.00 I
111. CeolotcaeL O Geoctentiftc
Genersl expense 1,740.9/yr - 0.5S - 0.38 - 0.58 - 0.58 - 0.58 - 0.00 - 0.00 - o.oo - 2.90 -Well togning 16.8/wel - 0.00 - 0.05 - 0.10 - 0.12 - 0.18 - 0.00 - 0.00 - 0.00 - 0.45 - tGeochmistry 518.7/yr - 0.17 - 0.17 - 0.17 - 0.17 - 0.17 - 0.00 - 0.00 - 0.00 - 0.86 -Other research 87.2/yr - 0.03 - 0.03 - 0.03 - 0.03 - 0.03 - 0.00 - 0.00 - 0.00 - 0.15 -
Subtotal - - 0.76 0.00 0.83 0.00 0.U8 0.00 0.90 0.00 0.97 0.00 0.00 0.00 0.00 0.00 o.o0 0.00 4.36 0.no
IV. Well Developmnt
General expense 911.4/yr - 0.30 - 0.30 - 0.30 - 0.30 - 0.30 - 0.00 - 0.00 - 0.0o - 1.S2 -Planning 1,579.2tyL - 0.00 - 0.53 - 0.53 - 0.53 - 0.53 - 0.00 - 0.00 - 0.00 - 2.11Well testing 360.7 + 363.3/vell - 0.19 - 1.28 - 2.37 - 2.37 - 4.18 - 0.00 - n.0n - 0.00 - 6.'8 -Well mintenance 854.7 + 21.0/well - 0.35 - 0.41 - 0.54 - 0.68 - 0.91 - 0.00 - 00 - 0.00 - 3.90 -
Subtotal _ 0.84 0.00 2.52 0.00 3.73 0.00 4.24 _.( ! 5.93 0.00 0.00 0.00 0.00 0.00 0.o0 0 .o 1 7.26 0.o
V. Technical Asutstance/Tratnlns - - 0.00 0.00 0.34 0.08 0.68 0.17 0.67 0.16 0.67 0.16 0.00 0.00 0.00 0.00 0.00 0.00 2.35 0.57
TOTAL (I to V) - - 4.46 0.00 33.05 2.47 101.21 4.93 117.3' 5.72 181.17 8.90 0.00 0.00 0.00 0.00 0.00 0.00 457.19 22.02
VI. C & A (152 of abovo TOTAL) - - 0.67 - 15.87 - 31.01 - 35.96 - 55.74 - 0.00 - 0.00 - 0.00 - 139.25
Vil. Steam Cathering System - - 0.00 0.00 0.00 0.00 13.72 0.22 11.89 15.90 4.90 6.59 0.00 0.00 0.00 0.00 0.00 n.00 30.51 22.71
VIII. Office Factlitien - - 0.00 0.00 0.00 0.00 0.00 0.00 0.00 0.00 0.s0 0.00 0.00 0.00 0.00 O.00) 0.00 n.o0 0.50 0.01 )
TOTAL (I to Vill) - - 5.13 0.00 68.92 2.47 145.94 5.15 165.16 21.62 242.32 15.49 0.00 0.00 0.00 0.0o 0.0') 0.00 627.46 44.73 .4 .c
tt;

PHIILIPPIIIIU
mUNO SECTOR STUDY
Eatlsted Coet of Toasonan Developient (Nsbi.o Sector)
Standrds 198 1989 1990 1991 1992 1993 1994 1995 TotalPH SN PH 11N -H SN P1 tS 1 1 SN X - 6tii P N$ P SN PH $ N PH SN$ H i N
1. Wall Drillina (18/4/9-8500') 15,300.1 881.5 0.00 0.00 44.90 2.64 30.60 1.76 30.60 1.76 15.30 0.68 76.50 4.41 0.00 0.00 0.00 0.00 198.90 11.46
It. Paeld DeveloLuent
CGeral expemse 3.608.9/yr - 1.20 - 1.20 - 1.20 - 1.20 - 1.20 - 1.20 - 0.00 - 0.00 - 7.22 -Plan/bed survey 242.6/yr - 0.06 - 0.08 - 0.08 - 0.08 - 0.08 - 0.08 - 0.00 - 0.00 - 0.49 -
nad/alt. mintennee 26.3/ba - 0.18 - 0.22 - 0.25 - 0.28 - 0.29 - 0.35 - 0.00 - 0.00 - 1.58 -
qulp_snt mintenance 3,591.0/yr - 1.20 - 1.20 - 1.20 - 1.20 - 1.20 - 1.20 - 0.00 - 0.00 - 7.18 -
Site preparation 451.5/coll - 0. - - 1.35 - 0.90 - 0.90 - 0.45 - 2.26 - 0.00 - 0.00 - 5.37 -
lad construction 1.385.0/h - 0.00 - 2.08 - 1.38 - 1.38 - 0.69 - 3.46 - 0.00 - 0.00 - 9.00 -
Subtotal 2.66 0.0 6.14 0.00 5.02 0.00 5.04 0.00 3.91 0.00 8.56 0.00 0.00 0.00 0.00 0.00 31.33 0.00
IlI. Geoloulcal 6 osocientfl e
Genral sxppose 1,740.9/yr - 0.58 - 0.58 - 0.56 - 0.54 - 0.58 - 0.00 - 0.00 - 0.00 - 3.48 -
Well logina 16.8/u11 - 0.00 - 0.05 - 0.03 - 0.03 - 0.02 - 0.06 - 0.00 - 0.00 - 0.22 -
Coachenmstry 518.7/yr - 0.17 - 0.17 - 0.17 - 0.17 - 0.17 - 0.17 - 0.00 0.00 - 1.04 -
Other remrch 87.2/yr - 0.03 - 0.03 - 0.03 - 0.03 - 0.03 - 0.03 - 0.00 - 0.00 - 0.17
Subtotal - 0.78 0.00 0.83 0.00 0.82 0.00 0.82 0.00 0.80 0.00 0.87 0.00 0.00 0.00 0.00 0.00 4.91 0.00
IV. Well Develoomnt
General e*nse 911.4/yr - 0.30 - 0.30 - 0.30 - 0.30 - 0.30 - 0.30 - 0.00 - 0.00 - 1.62 -Plenning 1.579.2/yr - 0.00 - 0.53 - 0.53 - 0.53 - 0.53 - 0.53 - 0.00 - 0.00 - 2.63 -Well testinS 560.7 + 363.3/ll - 0.19 - 1.28 - 0.91 - 0.91 - 0.55 - 2.00 - 0.00 - 0.00 - 5.84 -Well maintenance 854.7 + 21.0/well - 0.47 - 0.54 - 0.5# - 0.62 - 0.64 - 0.75 - 0.00 - 0.00 - 3.60 - , .
Subtotal - 0.96 0.00 2.64 0.00 2.32 0.00 2.36 0.00 2.02 0.00 3.58 0.00 0.00 0.00 0.00 0.00 13.90 0.00 O
V. Technical Assistance/Training - - 0.00 0.00 0.34 0.08 0.68 0.17 0.34 0.08 0.50 0.12 0.50 0.12 0.00 0.00 0.00 0.00 2.36 0.58
TOTAL (I to V) - - 4.41 0.00 55.85 2.73 39.44 1.93 39.16 1.85 22.54 1.00 90.00 4.53 0.00 0.00 0.00 0.00 251.40 12.04
VI. C & A (152 of above TOTAL) - - 0.66 - 17.13 - 12.11 - 11.80 - 6.60 - 28.04 - 0.00 - 0.00 - 76.34 -
Vil. Steam Gathering System - - 0.00 0.00 0.00 0.00 0.00 0.22 9.15 0.15 7.93 10.60 3.26 4.39 0.00 0.00 0.00 0.00 20.34 15.14
VIII. Office Facilities - - 0.00 0.00 0.00 0.00 0.00 0.00 0.00 0.00 0.50 0.00 0.00 0.00 0.00 0.00 0.00 0.00 0.50 0.00
TOTAL (I to VIII) - - 5.07 0.00 72.98 2.73 51.54 1.93 60.11 2.00 27.07 11.60 121.81 8.92 0.00 0.00 0.00 0.00 348.59 27.18

PHILIPPINES
EIERCY SECTOR STUDY
Su_mnr of Technical Dnta for NW Fuel Oil-Fred Therml Power Plants
Design dataDepend- Year of co_r- Turbine Generator
Rated able missioning Dolear Rated Throttle Throttle Raeoutput output a A TIC man- final Steam output aten steem epacity Power Voltage Hydrogn
Plant new (NW) (NV) ufacturer /a S/S press temperature Steam flow (NW) pressure temperature (kVA) factor (V) pressure
Ibermal
AMC alay& No. lIb 300 300 flU-WVU 1975 2,770 PSIG 1,005/1,0050
F 2,028,507 lbe/hr 300 2,700 PSIG I.000/1,000°F NC 370,000 0.9 21,000 45 PSIG P
No. 2 350 350 HUW-R 1979 173.8 lt/cm2
C 541/5410
C MC 1,205,423 kg/hr 350 169 k&/cu2
G 538/5380C NCR 438,000 0.9 21,000 45 PSIG os
IHC Sucat No. I 150 100 RUW-CE 1966 NM 1,850 PSlC 1,005/1,005°F NCR 1,065,000 lbs/hr IS0 1,e00 PSIG 1,0001.00F 188,000 0.9 18.000 30 PSIC
No. 2/b 200 160 0UW-KDU 1970 2,770 PSIG I,OOS/1,005°F MCR 1,675,485 lbs/hr 200 2,700 PSIC 1,000/1,000°F 245,000 0.9 14,400 45 PSIC
No. 3/b 200 160 RUW-KWU 1971 2,770 PSIC 1,005/1,005OF NICR 1,675,485 lbs/hr 200 2,700 PSIG 1,000/1,1O0°F 245 000 0.9 14,400 45 PSIC
No. 41b 300 230 1U3W-RU 1972 2,770 PSIC 1,005/1,005F NCR 2,274,227 lbu/hr 300 2,700 PSIC 1,000/1,000OF 370,000 0.9 21,000 45 PSIC
lltlC Nanila No. I 100 100 0U1W-H 1965 1.850 PSIC 1,00S/1,0050
F 720,000 lbs/hr 100 1,800 PSIC 1,000/1,000oF 128,000 0.85 13,800 30 PSIC
No. 2 100 100 RB10-3 1966 1,850 PSIC 1,OOS/1,005°F 720,000 lbs/hr 100 1,800 PSIC 1,000/1,000°F 120,000 0.85 13,800 30 PSIG
Mac Bataan No. 1 75 72 N-IIR 1972 147 kS/cm2C 5410C 240 tons/hr 75 127 kg/c-
2C 5380C 93,750 0.8 13,800 2 k/.02C
No. 2 IS0 ISO NHN-FUJI 1977 165 kg/cu2G 540°C 490 tons/hr 150 141 kg/c.2C 5380C 187.000 0.8 13,800 2 ka/cm2
C
/a 0UW - 0ttechi, Babcock * Wilcox; KWU - Kraft Works Union; CE - General Electric; N - Hitachi; 1t - Mitsubishi; NHI - NItsublhi Heavy Industries; and FUJI - Fuji Electric. .
/b These units hav. "once -hrough" design boilers which do not use boiler drums.

- 117 - ANNEX 6.2Page 1
PHILIPPINES
ENERGY SECTOR STUDY
Assumptions Underlying Economic Analysis and Rehabilitation
1. All costs are denominated in 1987 US dollars. The Long Run CapacityCost (LRCC) is based on the following additions to the Luzon power grid:
1988/89 4 x 50 MW gas turbines1991 2 x 55 MW Bac-Man I geothermal1992 1 x 300 MW Calaca II coal
The total discounted capacity cost of this program in replacement generationis 94.47 $/kI/year.
2. During the period under consideration, the principal marginal energygeneration will be from mix of existing oil-fired steam plant (801) and gasturbines buring dierel (20%). The cost of this generation is used as the LongRun Energy Cost and computed assuming an average heat rate ot 10,500 Btu/kWhfor steam plant, 13,000 Btu/kWh for a gas turbine plant. The marginal energycost is 2.80 cents/kWh.
3. All the units under consideration for rehabilitation are mature oil-fired plants. Accordingly, it is not expected that these plants will berequired for lengthy base-load duty, and their utilization factors will reduceover plant lifetime. The utilization factors are assumed to fall with age ofplant as follows:
Years 1-5 60%Years 6-10 50%Years 11-15 401Years 16-20 301Years 21-25 25%
Fuel costs are based on the following crude oil prices:
1987 17.31988 15.41989 15.141990 16.381995 20.962000 24.44
4. Beyond 2000, oil is assumed to escalate at 11 p.a. in real terms.LRECs are assumed to escalate at the same rate as oil. Cost of fuel oil isassumed to be 85Z of crude, and cost of diesel is assumed to be 130% of crude.

_ 118 _
ANNEX 6.3Table 1
PHILIPPINES
ENERGY SECTOR STUDY
Sucat Unit 1: Essential Repairs
Task Cost EstimateUS$1,000's
Instrument repairs and overhaul 2,000Boiler water wall tubes 700Superheater tube repairs 325Reheater tube repairs 200Burner system overhaul 75Casing leaks, expan. jt., insulation 300Air htr. overhaul 1,200Fuel oil system upgrading 30Startup system overhaul 100Turbine generator essential repairs 2,250Pipe and valve repairs 150FW cycle repairs 75CW cycle repairs 100Electrical repair work 75Chemical cleaning boiler 50Misc. related repairs 1,570
Subtotal 9,200
Field services 10% 930Engineering services 7% 720
Subtotal 10,850
Contingencies 20Z 2,150
Grand Total 13,000

- 119 -
ANNEX 6.3Table 2
PHILIPPINES
ENERGY SECTOR STUDY
Sucat Unit 4: Essential Repairs
Task Cost EstimateUS$'000
Instrument repairs and overhaul 1,300Boiler water wall tubes 700Superheater tube repairs 1,500Reheater tube repairs 1,600Burner system overhaul 125Casing leaks, expan. jt., insulation 300Air htr. overhaul 1,000Fuel oil system upgrading 60Startup system overhaul 200Turbine generator essential repairs 2,500Pipe and valve repairs 200FW cycle repairs 300CW cycle repairs 200Electrical repair work 105Chemical cleaning boiler 50Stack repairs 175Water treating system overhaul 300
Subtotal 10,610
Field services 102 1,060Engineering services 7% 830
Subtotal 12,500
Contingencies 20X 2,500
Grand Total 15,000

ANNEX 6.4.- 120-
PHILIPPINES
ENERGY SECTOR STUDY
Cost Estimate for Partial Rehabilitation of Sucat Unit 2(US$S000)
Task Cost/a
Replace horizontal reheater tubes 575Waterwall tubes (including burner area) 685Secondary superheater panels 572Replacement pendant reheater bottom loops 143Air preheater rehabilitation 400Overhaul FD fans 86Boiler casing, ducts, expansion joint repairs 500Replacement of station drain valves 75FO burner and supply system overhaul 480No. 3 LP heater replacement 70Reblade BFP turbine /b 250Turbine generator overhaul includingLP turbine reblading (partial) 315Miscellaneous 1,000
Instrumentation essential rehabilitation 300Miscellaneous pipe and valve repairs 76
Subtotal 5,526
Engineering (7%) 392Field services (10%) 552Contingencies (20%) 1,105
Subtotal 7,575
Spare parts 5,000
Total 12,575
/a These figures include 20% local labor costs.
/b Units 2 and 3 have common standby motor-operated BFP requiring overhaul.The Unit and standby pumps together can maintain full load while BFPturbine is being rebladed. Expedite standby pump repairs.

- 121 - ANNEX 6.5
PHILIPPINES
ENERGY SECTOR STUDY
Cost Estimate for Partial Rehabilitation of Sucat Unit 3(US$o000)
Task Cost/a
Replace horizontal reheater tubes 575Waterwall tubes (including burner area) 685Secondary superheater panels 572Replacement pendant reheater bottom loops 143Steam coil air heater system repairs 75Overhaul FD fans 90Boiler casing, ducts, expansion joint repairs 500Replacement of station drain valves 75FO burner and supply system overhaul 500Turbine generator overhaul includingMiscellaneous 250HP turbine stop valve repairs 125Turbine impulse blade installation 30Reblading of HP, IP, LP stages /b 1,000
Instrument essential rehabilitation 715Miscellaneous pipe and valve repairs 80
Subtotal 5,415
Engineering (7%) 380Field services (10%) 542Contingencies (20%) 1,083
Total 7,420
/a These figures include 20% local labor costs.
/b LC 88158F issued for HP turbine blades - delivery scheduled 10/88.

- 122 -
PHILIPPINESANNEX 6.6
ENERGY SECTOR STUDY
Cost Estimate for Full Rehabilitation of Sucat Units 2 and 3
Cost US21,000'sTask Unit 2 Unit Total
Instruments & controls 2,000 2,000 4,000Water wall boiler tubes 700 700 1,400Superheater tubes 1,000 1,000 2,000Safety valve rehab. 1,000 /a 500 1,500Casing, ducts & insulation 25 25 50Expan. joint repairs/repla e 400 400 800FO burner system rehab. 500 500 1,000FO heater system overhaul 750 750 1,500Soot blower overhaul 100 100 200Air heater seals/baskets etc. 325 325 650Stm. coil air htr. overhaul 1,000 1,000/b 2,000FD fan overhaul (axial) 700 700 1,400Valves & piping upgrading 18 17 25Building vent fans 150 150 300Turbine overhaul program 118 117 235
nozzle block 5,800 5,800 11,600turbine rotor repair /aturbine casing insertturbine blade replacement /a /ajacking oil pump replacementmisc. repairs
BFP turbine rehabilitation 250a 250CU pump gear box repair 35 65 100Condenser retubing work 400 400 800Deaerator unit repair 75 75 150FW heater upgrading program 400 400 800Cathodic protection repairs 6 6 12Auto Boiler Control (optional) 500 500 1,000Startup system rebuild 350 350 700Condensate polisher rehab. 400 400 800Demineralizer repairs 150 150 300Switch gear overhaul 535 535
Subtotal 17,687 16,630 34,317
Engineering Services 7% 2,400Field Services 10% 3,413Contingency 20% 7,87C
Subtotal 48,000
Spare Parts 5,000
Grand Total 53,000
/a Some material on order or already on site.75 Material on site.

ANNEX 6.7- 123-
PHILIPPINES
ENERGY SECTOR STUDY
Cost Estimates for Restoration of Bataan Units 1 and 2(US$`000)
Cost /aTask Unit I Unit 2 Common Total
Air preheater overhaul -/b 650 - 650FO burner overhaul 65 75 - 140Auxiliary transformer upgrade - - 75 75Uninterrupted power supply 50 - - 50Automatic voltage control 85 100 - 185Cathodic protection system overhaul 90 150 - 240Circulating water system rehabilitation /c 50 60 - 110Air blast breaker repairs 55 65 - 120HP heater replacement 150 - - 150Buried potable water system upgrade - - 80 80Water treating basin upgrade /c - - 100 100Boiler water sampling system replacement - - 150 150Boiler feed pumps overhaul 50 50 - 100Control air dryer replacement - - 50 50Instrument and controls - misc. upgraeing 100 125 - 225Transportatioi: Dump trucks, bus, flatbedtruck, pickup truck - - 200 200
Subtotal 695 1,275 855 2,625
Engineering (7%) 190Field services (10%) 270Contingencies (20%) 615
Subtotal upgrade 3,700
Spare parts allotment /d 1,300
Total 5,000
/a Costs include 20% local labor.7T Unit 1 completed.7W All local costs.7dT Includes boiler and condenser tubes, turbine blades, generator

- 124 - ANNEX 6.8
PHILIPPINES
ENERGY SECTOR STUDY
Cost Estimate for Restoration of Manila Units 1 and 2(US$0ooo)
Task Cost/a
Boiler tubes, supports and spacers 409
FO burning equipment (steam atomization) 1,225
FD fan upgrading 277
Air preheater repairs 226
Boiler casing, ducts and expansion joint repairs 365
Boiler blowdown tank repairs 11
HP heaters tube bundle replacement (No. 6) 409
LP heaters tube bundle replacement (No. 3) 186
Water treating plant repairs 7
Station and control air compressor upgrades 250
Plant communication system 51
Subtotal 3,416
Engineering (7%) 239
Contingencies (20X) 731
Subtotal 4,386
Spare parts 1,614
Total 6,000
/a Includes 20X local labor costs.

- 125 - ANNEX 6.9
PHILIPPINES
ENERGY SECTOR STUDY
List of Equipment for Fabrication Shop
Machine name Quantity
Overhead travelling machine 1Lay-out machine 1Surface plate 8Box surface plate 4Angle plate 2Pipe threading maohine 1Radial drilling machine (small) 1Veretical lathe (small) 1Horizontal boring and milling machine (table) 1Horizontal boring and milling machine (floor) 1Roller stand (small) 2Roller stand (large) 2Rotary table 2Turning roll 2Dynamic balancing machine (large) 1"%ynamic balancing machine (small) 1Static balancing stand 1Field balancer 1Air grinder 3Carbide tool bit grinder 1Electric bench grinder 1Boom truck with basket 1Forklift IPortable steam washer 1Engine driven sump pump 4Hydraulic pump 1Hydraulic jack 6

-126 ANNEX 6.10Page 1
PHILIPPINES
ENERGY SECTOR STUDY
NPC Training Courses
Program title Course description and objectives
Mechanical Maintenance This course emphasizes the importance of properCourse (25-day lecture repair and preventive maintenance, inspectionseries; 45 days of prac- procedures of plant equipment.tice)
It also hopes to develop skills in machine-shoppractices, rigging, welding and proper use oftools and equipment.
Basic Welding Course This skills course focuses on techniques for(one-month course) better weld quality, i.e., the elimination of
warping, distortion, embrittlement and otherdiscontinuities/damage of base metals.
By the end of the course, participants will beable to:- perform welding jobs satisfying required star-dards of each of the following:- oxyacetylene welding;- manual-arc welding;- tungsten and inert gas welding; and- others
- perform welding on high-pressure pipelines- perform rebabitting, brazing and hard surfac-ing powers, among others.
Instrumentation and Con- The course focuses on the basic principles andtrol Course (one-month the development of corresponding skills in han-course) dling thermal power plant instrumentation and
control systems.
Upon completion of the course, participants willbe able to effectively maintain the various in-struments and control system of thermal powerplants, specifically troubleshooting, repair andcalibration.

ANNEX 6.10-127 - Page 2
Program title Course description and objectives
Bailey Network 90 Course The program introduces a new concept in power(three-week course) plant operations, the Automatic Boiler Control
System. Starting from a basic understanding ofthe network and progressing into the module in-terconnections and actual applications, the pro-gram will enable the participants to:- acquire fundamental k:owledge about the systemand how it applies to Sucat 4; and
- develop the skills that will enable them tooperate the system with minimum supervision.
Water Treatment and Fuel Starting from an introductory concept on waterOil Analysis Course chemistry and gradually progressing to water and(one-month course) fuel oil tests and treatment through actual lab-
oratory work, the program aims to broaden under-standing of water and fuel oil with emphasis onthe development of the following skills:- performing standard laboratory tests for waterand fuel oil;
- operating chemical process equipment effi-ciently and safely; and
- proper water conditioning of boiler watersystem.
Electrical Maintenance This training course focuses on electrical fun-Course (21-day series) damentals, principles of operation and construc-
tion of related equipment and instruments lead-ing to the development of skills in the field ofelectrical repair, operations and maintenance.
By the end of the course, participants areexpected to perform electrical maintenance worksafely, effectively and with minimal or nosupervision at all.
Basic Lineman Course This skills course focuses on the proper han-(two-month course) dling and use of lineman tools/equipment neces-
sary in developing the ability to do basic re-pair and maintenance of line works. After theprogram, participants will be able to:- climb/descend poles properly and safely;- erect poles properly and safely;- apply first aid; and- repair/maintain line works based on specifica-tions.

- 128 ~~~~~ANNEX 6.10- 128- FPage 3
Program title Course description and objectives
Hotline Maintenance This course deals with hotline tools and equip-Course (one-month ment, identification/familiarization, uses, carecourse) and methods/techniques involved, for skill
development.
Upon completion of the course, participants areexpected to do repair work safely and effective-ly on maintained transmission lines withoutshutdown and/or power interruption.
Substation Operations This course focuses on the substation system de-and Maintenance Course sign, testing and commissioning and highlighting(for engineers and non- common problems/troubles experienced in substa-engineers) (one-month tion operations and maintenance.course)
By the end of the program, participants shouldhave broadened their knowledge on and acquiredskills in substation works that will eventuallylead them to work on their own initiative orwith minimal supervision.

- 129 - ~~~~ANNEX 7.1
-129 - Page 1
PHILIPPINES
ENERGY SECTOR STUDY
Estimation of Technical Losses
1. The estimation of technical losses wal done using specializedengineering software for distribution analysis.-/ Technical losses aredivided into two main categories: (a) no load and (b) load losses. No loadlosses are those attributable to the electrical equipment components that arenot independent of loads. Their contribution to technical losses can behigh. No load losses are found mainly on transformer cores, meters, voltagecoils and capacitors. Load losses are a function of the electricity currentflowing through the conductors. Load losses on meters are due to currentcoils and are minimal, but should also be taken into account.
Subtransmission
2. Peak losses were determined from MERALCO's load flow calculationstaking into consideration the dry and wet seasons. Annral energy losses wereestablished using the calculated system loss factor. The 230 kV powertransformer losses were calculated using the current flows through the unitsand transformer characteristics.
3. The 115 kV transformer losses were calculated by MERALCO's technicalgroup using readings from the 115 kV metering system. Adjustments were madeto take into account any metering inaccuracies.
Primary Distribution
4. Loss calculations were carried out on 254 distribution feeders (34.5and 13.8 kV) representing 73% of the total primary distribution system. Theloss analysis consisted of preparing a simplified computer model using feedercharacteristics to calculate sectional feeder losses, voltage drops, powerfactors, etc.
5. The losses obtained from the sample calculations are then related tothe total feeder demand using the ratio square of the losses over the peakdemand. A diversity factor of 1.2 was used to relate the feeders demand tothe system peak demand. Peak loads of individual feeders were considered.
Secondary Distribution
6. The number of extensions of secondary circuits makes it verydifficult to estimate losses directly. To provide an idea of the level of
1/ CADPAD under license of Westinghouse Inc.

130 ~~~~~~ANNEX 7.1- 130- Page 2
losses two samples were taken to prepare a computer model. Unfortunately, thecases studied did not provide a good representation of the secondary systemand a mix of the calculations carried out by the technical service group,comparison with other Ltilities, own judgement and computer calculations, wereused for the determination of the secondary losses. More work will have to beperformed by MERALCO to properly calculate those losses.
Peak Demand
7. The 1987 system peak was used for all the calculations. Feederdemands reported at the substation were used and related to the system peakdemand. Peak demand was estimated for the level, i.e., subtransmission,primary distribution and secondary distribution. For the calculation oftransformer load, losses and average peak demand was used by the technicalgroup. Those are the same figures used in this report.
Power Factor
8. Power factor was reported to be between 90-95% at peak and henceused for all calculations.
Load Factor and Loss Factor
9. The riported system load factor is 75%. This is an excellent loadfactor. However, to calculate technical losses different load factors foreach component were estimated. Loss factors were calculated using thefollowing formulas:
For lines:Loss Factor = 0.3 (load factor) + 0.7 (load factor)2;
For transformers:Loss Factor = 0.15 (load factor) + 0.85 (load factor)2.
The .oad factor and loss factor used for the calculation of losses are:
Load factor Loss factorSystem (Z) (Z)
Subtransmission 75 62Power transformers 75 59Primary distribution 65 49Distribution transformers 65 46Secondary 48 30

- 131- A'NEX 7.2
MANILA ELECTRIC COMPANYYEARLY SYSTEM LOSS
24 -
22-
20 -
18-
16-
14
.C A
4-- _ _ __ _ _
2- 10- ---r--- T-r-T,,-I,- ---- ,- rm t-rr-T-T mTTF1950 1955 1960 1965 1970 1975 1980 195 1987
YEAR

'IILIPPINES
EIERP6 SECTOR STUIT
CASE I Cationl P ower toreration: Ovn Finacial ihcatouPESO SAP IlET 31H EQ1UIY ------- ---- --
Financial Year Enmt DedWr 51 1994 ISIIS 199 1987 2m S19S9 1° I991 19°2 1°S1 19S4 1995- fictuall- ------------------------------ Projections--------------- ---------------
, ::tt,.3.:.3 ::::. :3::.tn tflEtlf:: .:g1:ns:nnn:s n ...: : if lfste : : st:.f.llStuCt flX:tfXtflSUtt S Sl5lS ::l:lSfltt :S SttOS flf *l=ltflt
POIIER SILDIlkhl 17 006 17 140 17 144 o 399 'o 50 22 531 235734 25 036 2 44 2S Ot 29 607 1 1 1140ERA9E REVEIIUK (tvs./tib tl.54 104.95 sl.s 94.51 91.77 9).75 14.00 111.73 114.54 121.45 127.77 li.20
OPER}1111S REVEIE tP llnl It 590 17 "I 1 ,514 lo. 19 I 914 21 BVI 25 855 27 5S2 29 59 35 02 6,749 40 589 q t
aIIEW lNEISEtTR "mm (p "ni 9,3101 7,383 0 104 35,2 9 00 it1970 1051 15,926 20 5 23,3 25,740 16,434 131,914LCKI FINKINC REUIED821 (P NMI 514 400 99 0 0 1,02 1,070 3,990 4,45 6,52 4,700 0 20,350RATE 3BAE, StILE AVE. IP hll 30,803 45,702 56,742 03,33 00,101 72,320 77,014 7S,499 344 02 92,012 ",051 113,607 U SS
P31603 RM1IOS: :2.33:.
RATE OF RET.-RIVAL. ASSTES 10? n et 9? n 32 101 101 101 101 102 lo0 lotSELF FIWINI RATIO 191 5it 17n 9 25t In 3n 53n 202 3t2 72? 3DEBT SERVICE C AVERKE 1.3 1.7 1.3 1.7 1.4 1.3 1.5 1.7 2.0 1.7 1.9 2.2 1.7EltKDEII PLUS EQUITY 71M m 72t 0? 5 03 00 57 542 51 417 45t 551
PESO WAP NET NITH 12-YE9II 1 0DB Key Finotaial inicators
Financial YTer Entdam etbr 31 1994 S195 1996 IT97 1999 1999 1 I99 92 M1 1994 1995---- Ikteul ---- -- - --------- …Projetion ----------------
PMuIRSOLeu Ri 127010 17140 '7645 18 359 20950 " 531 23754 25 03 26444 23 060 294.07 31 164AVE9S REVIRE ICtn./tik el.54 a 109.5 S4.54 94.50 95.77 Sl 75 204.00 111.73 11I.50 121.45 127.72 13i.20
PER3IIIC REVERSE IP lb) 14,s3 17,99 bI 514 19 24 19,914 2i,B91 25,933 271592 29 596 33,024 3U 4 40,5 Oq4ratNET O1311I136 IOCO IF lnl 3,056 3,92 4,306 4,914 5,047 3, 17 0 270 3,45 9,240 9,5 1 ,36 l I5MET IKREI IP hbi 1,009 1,094 715 ,041 2,032 h,34 2,669 3,12 ,9 3,939 3,315 3,5---33.NO1W31 IVESTIIENT PR0311 IP rl 9,609 71353 6,104 55313 9,000 11 970 20,581 15,924 20,375 2B,332 25,740 10 434 13,914 LOCAL FINICINS REWUIRED IP lnl 514 400 9S5 0 0 'i,OI 1,921 4,400 5 515 10 37B 10,200 4,313 36,154RAlE Mm51,11LE AVE. IP lb) 30,803 45,702 56742 43,313 06,11 71,320 77,014 79,499 64,01 92,022 9351 113,467
P326031RATIOS: SO - - -RATE OF RET.-REVL. 4SSEIS 101 9n 9t 9 92 et 101 t0t 10? 101 107 10? lo2SELF FI1ICiN6 RATIO 19m 5U? 1171 en 25? 192 332 ; it 3 1 In 37 2nKEBT SERVICE COERAE 1.3 1.7 1.3 2.7 1.4 1.3 l.4. 2.7 2.5 2.4 1.4 2.5KESTIKEUT PLUS EQUITY 711 721 721 00? 5162 42 033 I4.l 02 03 03 42 3U2
CASE 3PESO 6AP SET WITH 5-9AR WIIDM Key Fiancial Inficators
Financial Year Ended Dcnber V 1994 1995 199t 1997 1999 1989 29 19SI I9S2 I91 1S 195- --- A -lkt,alal--i------ ---------------------------------- Projectioris-----------------------------------
POWER SOLDO IvO 17 006 17 140 17 445 1 359 20 950 22 531 23 754 25 036 24 449 2040 294 07 31 194AVE911R REVENUE ':.- 1kihl 67.54 204.15 9.54 94.50 d9.77 9.75 204.OO 111.713 11t.5 121.45 12).72 135 20 D
OFERATIN6 REVENIUE(P hlni 14 390 17 991 26,524 o 9269 19 914 21,991 25 033 27,592 it9 59t 33 024 3t 749 40,539 A teNET 99131239INCO IPm hib 3,050 3,90 4,3046 4,914 5,947 5,790 7,762 7,95 9,459 9,240 9,545 21,3966SET 221011 (P h I 2,069 20 75 1, a 2 2,032 1,343 2,990 3,472 4.250 4,194 3,545 4,352 0AIWAL INESTIEUT PRu6RaH IP Hn 9,509 7,383 6204 5,533 9 ,00 1,970 10,5B2 25,926 20,B75 2BJ32 25,740 26,494 138,924LOC. FINWIC1NS REQUIRED IP ; 524 400 995 0 0 1,029 1,0OO 4349 5,10 11,041 11 46 7,69 4 9RATE SE51, SUILE AVE. IP %i 30,903 45,702 50,742 43,313 66,1I 72,320 77,B14 79,499 S4 hI 92,4l2 99,451 213,56766 th 2:03"0 77614 7, 84,, 92,12 ".51 11 867AverapoPR1603 RATIOS: 2....
AtE OF RiREVT . ASETS lOt 9? et Bt In 5t 102 10? 101 20? 101 101 20?SELF FIRIICIUB RATiO I2 50? 1in 9m 251 291 381 33? 30 262 121 1B2 241DEIT SERVICE COVEASE 2.3 2.7 1.3 1.7 1.4 2.3 2.5 1.6 2.7 2.4 1.2 1.2 1.4
ITIEBIT PLUS EI1 712 722 72 46 ? 65 42 632 1 th2 43? 63 2 42? 431mn.::::eswr:t33333d332f3S3 tczefe n CnntSSwUftSnflUtfltttflUtflflflttflUflZtfltttttttt*fltflfltttttttttfltt :te:e ret:etrf=l::,et::t:::::ees=me--

CASE 4 National Pour Corpwratius Ke Financial IndicatorsPESODP lET IITN 3-YEAR i ---- --- --- -- - ----- ------ - --Finafncial Yea Ended kcir 31 1914 155 14 IS7 1999 9m 14S0 191 IS2 1443 1444 145-------- tktut) --------- ---- -------------------- -------- frjKtion--------------------------------
PMIIERU lNkl) 17 006 17 140 17645 ,1359 20 50 22 531 23 754 25 036 26448 2R060 29607 31 14AVE111E REYENUE (Chs./t.IWl l.54 104.95 91.94 SS.50 95.77 9.75 1O4.00 111.73 115.56 121.45 W1.72 135.20OPERAIIS REVEUI (P Ihl 14,390 17,991 16,514 19,26i 19,914 21,E91 25,933 27,517 29,596 33,024 36, 40,3N Ir 1 ttNET OPERATING ISCE IP 11l 3,056 3,S02 4,306 4,9 547 5,796 7,762 7,50 ,4 9,260 9,3 I5 11,33415IT INCICE (P bIl 1,69 I ,096 715 1,040 2,032 1,343 2,S00 3,501 4,326 4,3 4,100 4,7hL. INVESTMENT P IP oIbl 4,96 7,363 6,104 5,539 ,006 11,970 10,31 15,426 20,075 23,332 25,740 U, 135,S14LOCI FINANC REQUIRED (P Me) 514 400 49 0 1,019 I,79 4,66 6,564 12,713 14,04 11,93 53,23RITE ASE, SIIE AVE. IP re) 30,103 45,702 56,742 63,31 66,161 72,320 77,614 79, 4 4,601 9,612 9,651 113,367PRI3W RATIOS:
RATE OF RET.-IEVAL. SSETS 10? 9? ? et 9? 9 10? 10? 101 10? 101 101 101SELF FIRNINS RATIO 1i9 562 17n s 251 in 33? S30 26? 101 IT -IN InKEIT SOEINE CWEIIIIE 1.3 1.7 1.3 1.7 1.4 1.3 1.5 1.5 1.6 1.2 1.1 1.0 1.3EITIDENT PLUS EQUITY 71? 72? 72? 661 65? 6t 631 621 62? 63 63 61 6DSfhSSCSShSD hlS BIDDDS DnflZSnfugfhgnfllfllfnflSSflllD DOtfltAAA5llUffSfllllfSf -I AfOA AAnflI
CASE 5PESO GAP MET PITH 5-YEAR IS
I P5-lILLION EGUITY by Finncial lndicators
Financial Yer Endd December 31 1914 915 16 117 199 1919 19 1991 I992 1991 1944 15----- likteaUll--------__________----------Proectons---------…
PIUEI 500 l&WI 17 006 17 140 17 645 13 359 20 50 22 531 23 754 25 036 26 44 2 060 29 607 31 14AVERSE REVEUE (Ctn.tkUhI 31.54 IOS.E5 91.94 S4.50 S5.77 S1.75 IO0.00 11.7n 115.56 121.45 127.72 135.20OPRiMTlS REVEIUE (P Na) 14,3" 17,941 16,514 11,261 19,914 21,991 25,933 27,512 29,596 33,024 36,749 40,51 BrteNET WERATIHB IICOIE (P lnl 3,056 3,02 4,306 4, 5,947 5,796 7,762 7,S50 3,459 9,2U0 9,5 11,336 1-195 NET INCIWIE (P rhl 1,064 1,096 715 1,04U 2,032 1,343 2, 3,O 4,250 4,339 4,324 5,06 mus,:A1151 IINSET)ERT P0M1M (P Na) 9,lO9 7,393 6,104 5,531 9,006 I'l,9 10,to1 15,926 20,75 23,332 25,74 1U,44 139,14LOCAL FINNCE IEWIRED IP Nn) 514 400 SY5 0 0 1, 100 ,34 5,703 10,4% 11,477 ,426 41,U20RATE MM51, SIWLE AVE. IP Na) 30,r03 45,702 56,742 63,313 66 ,161 7,320 ,6 79, 4,601 n2,612 99,51 113,36A7
PSIIM RATIOS: -RTE OF REI.-M. ASSETS 10t 9n s2 3 it to0 10? 10 10? 10? 10 10nSELF FINANCING RTIO Inm 56? 17 9n 25 In M? 3M 30 in 14? 27 25?MET SERVICE COEM 1.3 1.7 1.3 1.7 1.4 1.3 1.5 1.6 1.7 1.4 1.3 1.3 1.4KEOTIKT PUSIS 71E72? 72?t m 66 65m 64 63? 62? 61? kit * 0? 3N i2OGO5 3SS35"AS*=AtS _ _ __AAAs2suz,,ssu,,Rs,u,2u,Sg3SSSS,,u3S-A Asss,2u_O-s
CASE 6PESO SW IET NITH 5-EAS NOI
AND5 EMIT? O0ALLY kby Fianaial Indicatos
Finncial Year Enred hreeWr 31 1994 1l9 I19 197 ISII 19 9 Iffl ISl I92 I13 14 I95 so'------- Ikbnl-------~ ------------- Prolections-----------------… -OQ i
PoER SOLD (UVtuH 17 006 17 10 17 645 18354 2050 22531 23 754 25 03 243 23 060 29 607 31 34AVERAGE RE9EIIUE (l"v.lk) 91.54 104.95 9.94 I.so 95.7 97.75 IS.OO Ill." 215.56 121.45 121.72 135.20OPERTIN REVEll (P lb) 14,390 17,9"I 16,514 19,261 19,914 21,8991 25,933 27,582 29,54 33,024 36,749 40,319 Amat" 'NET OPERATING INEIE (P nll 3,056 3,02 4,306 4,914 5,947 5, 796 7,762 7,950 9,459 9,260 9,865 11,336 S 19-15.NET INCOKI P ((oP I'm ,06 75 ,4 2,032 1,343 2,956 3,655 4,717 5,0 5, 315 6,45ssAIL IVESTIEIT PR3SRIII (P ln) 9,608 7,39 6,204 5,538 S,006 12 470 10,591 15 S26 20,675 21,332 25,740 l64U4 13,914LOClt FINANCE RESUIRED IP 361 514 400 995 0 0 2,01 1,734 4,170 5,075 9,779 9,323 3,643 34,742RATE BASE, SIIIPLE AVE. (P Rn) 30,803 45,702 56,742 63,313 66,161 72,320 77,614 79,49S 84,602 92,612 96,651 11,6u7PRIWRY RATIOS:
RATE OF RET.-REVAL. ASSETS 10? 9? el et 9n M 10? 20? 10 10? 10? 10? 10DSELF FIUICING RATIO 19? 56? 217? 39 25? 19? 3M 34? 34? 21? 23? 45? 30?DEKl SERVICE COVERAGE 1.3 1.7 1.3 1.7 1.4 1.3 1.5 1.6 1.9 1.6 2.5 1.6 1.5IESTIDEST PLUS EMUITY 71T 72 72? 66? 65? 64? 6 m 5 57t 55? 53t s
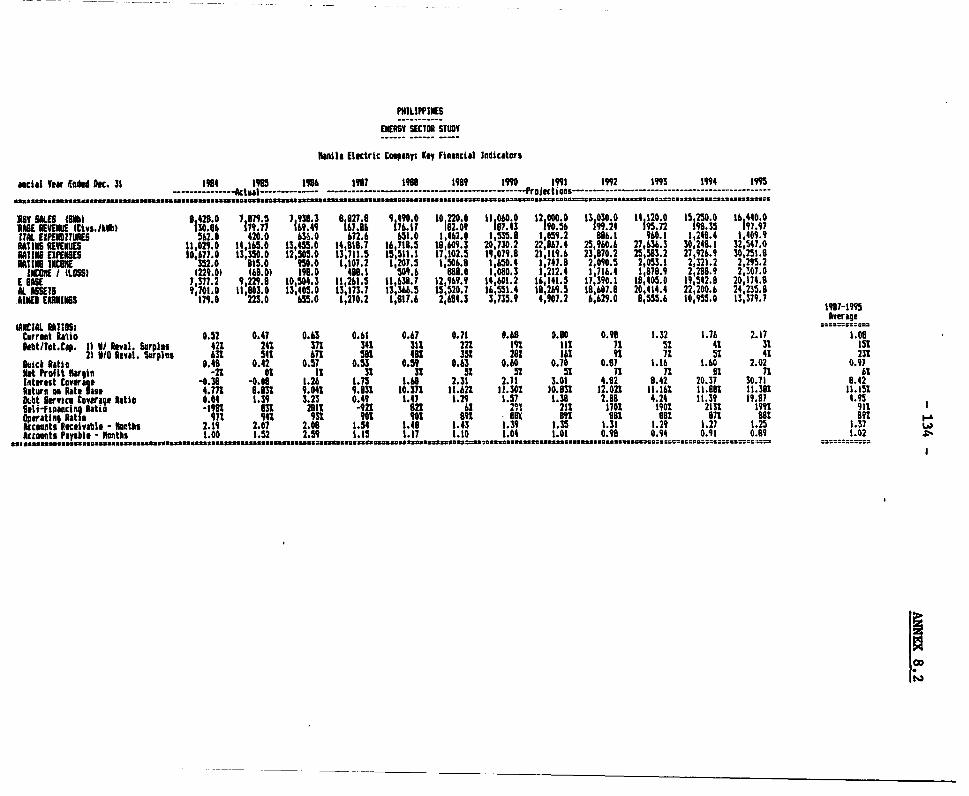
PHIILIPPINES
EIERSY SECTOR STUDY
Nlanila Elettric Cou,ay: Key Fianciail Indicaturs
social Vear Ended Dec. 31 1986 1915 1986 1997 1961 19'9 1910 1911 192 11 1`914 191-ti- --- -k_tual ----- … - - -- - - - - - -- - - -- - -- - -- -…--- Projection…s------- ------------------ ------------
O-"s IES (i)1421.0 18179.5 79383 89027 94900 10 220.0 De3060.0 12 000.0 D 03003 1I4120 0 15 250.0 164400RASE REVENUE lCtvs.IkSb) 130.86 179.77 169.49 1&i.si 116.17 682.09 187.43 190.56 19.2 195.7,2 191.35 191.971T1 EIPKTIMES 562.0 420.0 636.0 72.6 651 .0 1,462.0 1 .2 8.1 960.1 124.4 1,409.9RATIlS RE'JENIIE 11,029.0 14,165.0 13,455.0 14,818.7 16,718.5 18,609.3 20,302 22,867.4 25,960.6 27,636.3 30,248.1 32,547.0RATIO LElNSES 10,677.0 13,350.0 12,505.0 13,711.5 15,511.1 17,102.5 19019.9 21,319.6 23,810.2 25,583.2 21,926.9 30,251.8RAT!. lUCIllE 352.0 815.0 505.0 1,107.2 1,207.5 1,506.9 1,650.4 1,747.8 2,090.5 2,053.1 2,321.2 2,295.2
INCU! I (LASS 1229.0) (68.01 198.0 499.1 509.6 9881.0 1,010.3 1,212.4 1,116.4 1,978.9 2,288.9 2,307.0E AlRSET 7,377.2 9,229.9 10,504.3 11,261.5 11,638.7 12,969.9 14601.2 16,141.5 17,390.1 19, 405. 0 19,542.8 20,174.9
AL ASSETS ~~~~~9,701.0 11,803.0 13,405.0 131,173.7 13,366.5 15,520.7 16551.4 18,269.5 181,601.8 20,414.4 22,200.6 24,235.8RAifle EARNIIIS 179.0 223.0 65.0 1,270.2 1,817.6 2,684.3 3,735.9 4,907.2 6,629.0 8,555.6 10,955.0 13,379.7 1917-1995
1ANCIAL 3A*7S1Dbz-cCurrent Wain, 0.52 0.47 0.63 0.6 0.67 0.71 0.68 0.90 0.91 1.32 1.76 2.17 1.09IebttTot.Cap. 1VI) NJRval. SurTplus 421 241 371 342 312 22? 191 III 71 St 41 31 152
2) Vic Roiva. Surplus 632 541 671 591 461 352 281 161 9n 71 51 41 231huick Ratio 0.48 0.42 0.57 0.53 0.59 0.63 0.60 0.70 0.87 1.16 1.60 2.02 0.97Not Profit Ilarin -21 01 It 32 St 51 52 52 71 fl 8 7n 61lInterest Cowr~ -0.39 -0.09 1.26 1.7 1.68 2.31 2.71 3.01 4.92 9.42 20.37 30.71 9.42Returni an Rate lacle 4.772 8.931 9.041 9.9131 10.37 11.621 11.301 10.931 12.021 11.161t 11.881 11.381 II. 151,kebt Service Coverage Ratio 0.04 1.39 3.23 0.49 1.47 1.29 1.51 1.39 2.89 4.24 11.39 19.91 4.95seli-hnoandlng Ratio -1991 932 281! -921 922 a3 lii 211 1701 1901 2131 1991 911 Operating Ratio 972 942 931 901 l0t 891 881 991 991 981 971 got 892IRcmoute Receivable - bauths 2.19 2.07 2.08 1.54 1.48 1.43 1.39 1.35 1.3! 1.21 1.21 1.25 1.37 Acconts Payable - Nonths 1.00 1.52 2.59 1.15 1.17 1.10 1.04 1.01 0.91 0.9 0.9! 0.89 1.02
sea ~ ~ ~ ~ ~ ~ ~ ~ ~ ~ ~ ~ ~ ~ ~ ~ ~ ~ ~ ~ ~~ ~~~~~~~~~~~~~~~~=.Z-m .. *-=...