Embed Size (px)
Citation preview
REPORT No. 712
PROPELLER ANALYSIS FROM EXPERIMENTAL DATA
By GEORGE TV.STICKKEand JOHN L.CEImER
SUMMARY
The operation of the propeller i$ analyzed by the useof the diNribulion of force8 along the Tadim, combinedwith theoretical equations. The data were obtained inthe NAL?A .20-joot m“nd tunnel on a .&footdiameter,two-bladepropeller, operating in.jront offour body dapw,ranp”ngfrom a snm[l shajt to suppoti the propeller to aconceptional NACA cowling. A method of estimatingthz m-al and tlw rotational energy in the uzzke as a frac-tional part oj the prope~er power is gi.ren.. A knowledgeof thetotal thrustand torqueis neces8aryforth estirnatjon.
The loss of eficiency due to the rotational celocitg isaluxqp small jor a propeller of optimum design., beingonly oj the order of 1 percen~jor a low-solidity propl[er.The loss of ejiciency jrom this source may become quitelarge, however,at high blade-angleseti”ngsjor a propellerwith improper load clistm”h.tion. Counterrofuting pro-pellers are shown to be attraciilyejrom coni%%atiorw ojaerodynamic ej%ie ncy only wh.+mpropel[er8 ~f high~olidity are wed. If high-solidity propellers “are selectedbecause oj “limitatiorw on propeller diati-ukr, it mag beu8eful to resoti ti count+v-rotaiingpr0pelier8 to eii.ininafeth4 effect oj the engine tarqiu on tlwflying characteristicsoj thQairplane, but only a small gain in propeller efi-ciency is normally to be expected.
The acerage angle of hukt in the.propeller slipstream‘is shown to be a function oj the torqw coejicient Q. andchurtaare ~“cen to h.dp estimate the angle. The increasein toi!ulpreseure along the radius behind the propeller isgn”uena8 a -function oj the power coejim”ent1f~ jor visein estimating the m.ui[ablepressure that may be obtainedfor air intakes behind the propeller. The effect oj thepropeller-body shape upon the thrust and the torque dis-tribution of fhe prope[[er is shown.
INTRODUCTION
The t.heoreticaI analysis of propeller operation hasbeen investigated and the results’ of the investigationare summarized in reference 1. Many experimentalstudies of the operation of the entire propeller have akcbeen made. In an attempt to combine the results ofthe investigations with those from theoretical anaIyaes,it is necessary to how not only the totfd forces on the
propeller but also the distribution of these forces alongthe radius. A method of obtaining the distribution ofthese forces from measurements in the wake of thepropeller is givem in reference 2.
In the present paper the distribution of thrust andtorque along the radius is used to compare the actualperformance of a.propeller with the calculated perform-ance. The energy losses in the wake of the yropelleras obtained from &perimeni%d measurements are dis-cussed. A method of determining these 10SW fromthe total thrust and torque of the complete propelleris given; the method permits an analysis of the effectsof propelIer solidity on the axial tmd the rotationallosses of the propeller to be made from ~.he total thrustand torque. The report, presents data that show howand why the propeller eficiency is affected by the body -shape. The data used in the analysis were obtfiinedin the NACA 20-focJt tunnel on a 4-foot+cIiameter, two-hlacle propeller operating in front of four body shapes,ranging from a small shtif t to support the propeller toR conventional hTACA cwvling.
,-SYMBOLS .
UOTc.CQc,
1’
q.
sT,
reIocity of air strewn”-relopity in plane of p.y3pelJer (propeller
removed)veIocity increase due to propellermass. density of airdyna’mic pressure of aii stream (1/2pV)revolutions per seconddiameter of propelIeradvance-diameter. ratio (V/nD)input power to propellerinput torque to propellerth.rwt of propeller (crankshaft tension)useful work per unit timepower coefficient (P/pn3D’)torque coefficient (Q/Pn’P)thrust coeftlcient (T/pn’P)true propeller efficiency,..
(n’ (?, vapparent propeller efllciency ~ =~PX~
)disk area of propeller -thrust disk-loading coefficient (T/@)
147
.-
148 REPORT NO. 712-NATIONAL ADVI130RY433biMImEE FOR AERoNAmICf3
P, power disk-loading coefficient (P/@’T~Q. torque coef%cient (Q/pVW)
differential pressure in yaw-head tubes due totwist of propeller slipstream
total pressure behind propeller pkme withpropeller operating
total pressure behind propelIer plane withpropeIler removed
increase in total pressure due to propeller
(~T–HTJ
. .
radius to any blade elementradius to tip of propeller= r/Rgeometric pitchpropelIer bIade-angle setting at 0,75 f?calibration constant for each yawmeter
‘c’ differential thrust coafiicient (rHx/2prFD9x
differential torque coefficient (uKH#/8pn’D9
~a,...erenMctir(r,+Jy)y)[a’ rotational in terference factor ‘~
2 1dx#J3?(l+a)”E; axial energy per unit time ir-slipstream –E, rotational energy per unit time in slipstream
* angle of twist in the propeller slipstream
$2 angular velocity of propeIler (2Tn)
DERIVATION OF FORMULAS
The differential thrust and torque coefficients maybe computed as follows (see referance 2):
dcr THXz=-
dCa rKHv%x-w
From the values of dC#ix, thefactor a may be computed:
dCr~=rfl(l+a)a
(1)
(2)
axial interfermoe
dCr, . ... . .. . .
–1+ l+4d~&a= .,,
2 ‘“ ““-”- (3)
From the values of dCG/dxand of a., the vaIuc of therotational interference factor a’ may bc ccmputwl:
‘Co=tid(l +a)a’X2
=dCaa’ Z #J&?l+a) - ““’““““-”” ‘4)
The values of the axial and the rotational intcrfermcofactors obtained from these formulas are the averagevalues. The flow at the propeller being continuous,this average value cIoseIy approximates the true value.
The amount of total pressure added by the propellerto the slipstream in terms of the dynamic prcssum ofthe air stream may ba obtained directly from equation(1)
~._2pn’D’ dC,n-xx
.—-
.“. . . . . r.
,. (5)== .+
From the force measurements, the- vaIue of theapparent propeller efficiency is
If the velocity in the propeller plane with the pro-peIIer removed U. is equaI to V at all radii, then thevalue of ~= obtained by means of equation (6) is thetrue propeIh3r efficiency. If U. is different from 17, thetrue propelIer efficiency may be computed from ~= bythe use of the curves of the thrust distribution and thevelocity distribution with the propeller removed,according to the following relation:
(7)
The energy imparted to the propeller slipstream pcrunit time may be computed from the curves of thrustand torque distribution and the interference velocities.The energy Iost per unit time in axial vcIocity may bowritten
JE.= J aT7dT=pngD41” ‘ ‘c dx,Ux (8)
If E=”is divided by the power input to tic propeller,the fractional part of power lost in a.tiaI energy isobtained:
E._pn’D4T” ~ dC,dz= ~ lUdC,sP-–T ~a-Z- JCP 1] xdx “)

PROPELLER MfMYSLS FROM EXPERIMENTAL DATA 149
The energy lost per unit time in rotational velocitymay be written
E,= J a’Q.dQ=2rpn3D5J‘,dG&oadx(10)
The fractional part of the power Iost in rotationalenergy may then be written
(11)
(ha)
The fractional part of the power unaccounted forfrom the foregoing analysis may be computed as follows:
) (12)Remainder $=1–(q+~+~
This remainder of tho power consists of the errorsin calculation of energy in axial and rotational velocitiescaused by the nonuniform character of the -wake and ofthe energy represented in the profle drag of the blades,which is in t-he form of random velocities and of heat.
Mounted on floalhgframe
! II Mom ted k fixedfrme
l-vFmuu L-T@starrangement0[ free+.ir bOdY.
The amgle of twist in the propeller’ slipstream im-mediatdy behind the propeIIer may be ocrnputed fromthe axial and the tmgular velociti~:
From equations (4) and (13)
dCo4=
tan *== J%?(l+a)2
(13)
(14)
But
CQp=aTherefore
4dQCdi
‘m *= ~(l+a)%?(15)
Equation (15) expresses the relationship between thetorque coefficient 0. and” the angle-of tm-ist in the mo-peII& slipstream, v%ch will be &ed later.
The tests
FIGTXM2.—Free-airbody.
APPARATUS AND TESTS
were conducted in the NACA 20-foothmnel described in reference 3. Four body shapesmere tested: a free-air body, a propeller-hub body, abody of revolution, and a body of revolution with anNACA cowling.
Figure 1 is a he drawing of the fre~air body; aphotograph of it is shown in figure 2, The propeller-Dub body (fig. 3) consists of the propeller-shaft housing,which is 9.6 inches in diameter; a spinner band whichturns with the propeller and which is mounted on aEoating frame; and a spinner mounted on the &edframe. Figure 4 shows the body of revolution thathouses the motor and the propeffer shaft. Figure 5hews the body of revolution with an NACA cowling,the mwrinmm diameter of which is 20 inches, A modelof .a J-5 engine, composed of dummy wooden cylinders,was mounted inside the cowling. The body of revo-lution with the ocwling will hereinafter be referred toas the “NACA cowling.” The propeller, which hadtwo blades, was a 4-foot model of Bureau of Aeronauticsdrawing No. 4412. The blade-form curves of the pro-peller are given in figure 6.
430M4’-42-11

150 REPoRT NO. 71%NATIONAL ADVISORY CO.M?dITTE!EFOR AERONAUTICS
Simultaneous measurements were made. of the totalthrust and torque and of the difTerent.ial thrust andtorque along the radius. The method of measuring thedifferential thrust and torque from measureme.nta inthe propcller wake was t.hc same as us~d in reference Z.
FIGUEE3.–fi~peJ.Ieranb tidy.
The position of the tubes was such that yaw-head andtotal-head readings were observed at 22.2, 33.3, 44.4,55.6, 66,7, 77.8, and 88.9 percent of ““ “ ‘“from the center of the crmk.shaft.
RESULTS
The basic results of the force
Ule prOpfYlei” r&3dlUS
tests are given infigures 7 to 10. The efficiency envelopes for ~he four
1..>.
.“
,L . ...
i
FIGVRE4.—Eiodyof revolution.
body shapes are compared in figure 11. The efficiencyobtained with the propeller-hub body is about 6 per-cent greater than that with the free-air body and thisincrease k due to the elimination of the drag of thepropeller hub and the inner portion of the blade shanksby covering them. The spinner covered two-tenths ofthe propeller blade; the shaft housing had the same
diameter as the spinner but was mounted on the fixwlframe. In the case of a propeller mounted on a longshaft ahead of a body, the cliffwince Wween the drug
FIOmE 5.–Body of revolution; NACA eowlfng.
of the propeller hub and th[l spinner would be rua]izcdin the propellm eff,cicncy.
The efficiency obtained with either thr body of revo-lution or the NACA cowling is not t.hc true, but the
bz.08
.07
.06
.05
.04
.03
.02
.0[
or/R
F[QUEEIl.-Propeller blade-form mIIves. Q dtrmeter; R, rridbMto the tip, r, swtion radlrrs; b, satfon ohord n. cation f,hkknesa;p, geometrfc pitch; p, bhdear3gIeof 0.76R.
apparent, prope~er efficiency. The prop~llcr outputused to compute the apparent efficiency was T1’,whereas? the thrust was obtained in a region of velocityU. and the useful work per unit time was UOZ’, Thechange from apparent efficiency to true efficiency will bediscussed later.
,,-..
. .+. .,-
. ..—.-;,
..,”. .
._:-
. .
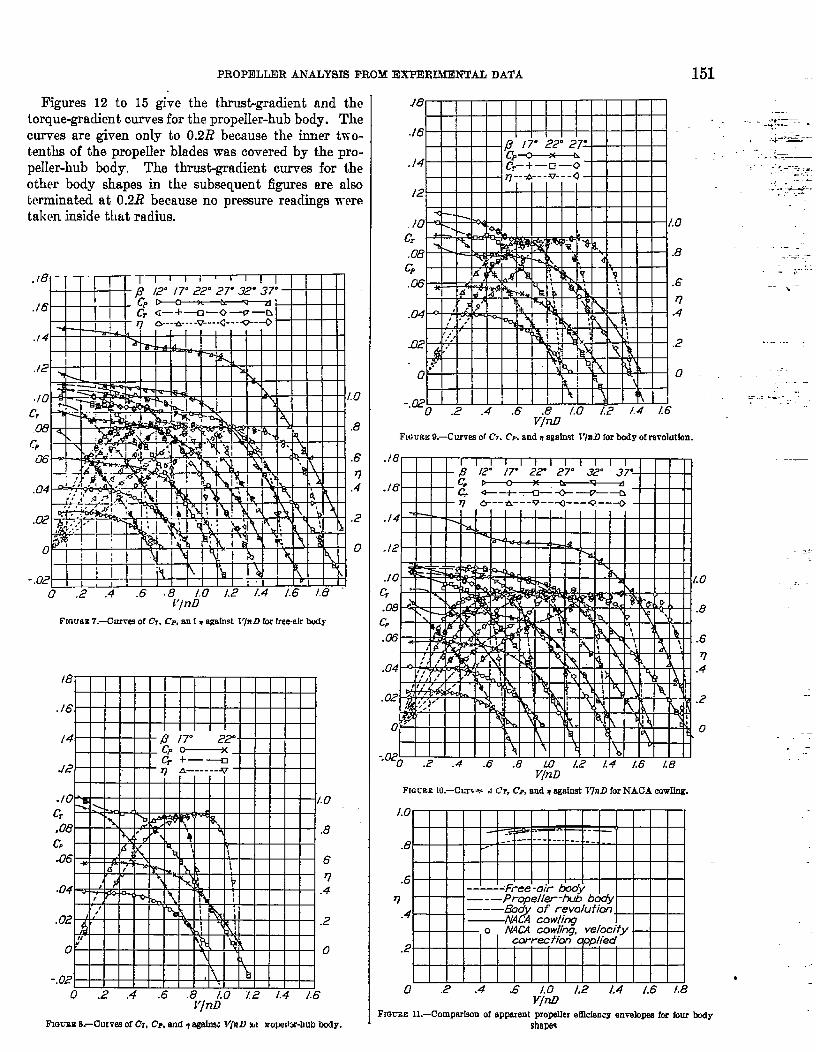
PROPELLER ANALYSIS FROM EXPERIMENTAL DATA 151
Figures 12 to 15 give the thrust-gradient and thetorque-gradient curves for the propeIIer-hub body. Thecurves are given only to 0.2R because the her two-tenths of the propeIler blades was covered by the pro-peIIer-hub body. The thrust-gradient curves for theother body shapes in the subsequent figures are alsotmminated at 0.2R because no pressure readings weretaken inside tht radius.
.18
/6
14
[2
ro 1.0
c,
m .8
Cp
06 .6
v.04 .4
.02 .2
0 0
l-i,,,
i-.021
i~;i~ ‘~i~~I ! R.wl I yI I , I I t I I I I t I
u .2 .4 .6 .8 /.0 /.2 1,4 /.6 1.8F/rtD
FIGuae 7.—Curwe of Cr. Cp, ani a egahwt J’/nD for fredr Iwdy
t8
./6
/4
./2
./0 /.0C,,08 .8Cp.06 6
v.04 .4
.02 .2
0 0
-.020 .2 .4 .6 .% LO /.2 1.4 /.6
V/nilFmL%E &–CuIvaq of CZ, CA and qagfdrw v/RIJ M w.@2x-htltl bcdy.
J8
./6
./4
/2
10 f.o
c,
.Gz7 .8
Cp
.06 .6
I/.04 .4
-02 .2
0 0
-.020 .2 ,4 .6.8 /.0 /.2 1.4 IX
P-pmFIuuriri!J–Cnrws or C,. C’P. and n&wimt Tr/rrDfor body of rwolutkm.
q’ O---*---V–--Q---Q---O I I I I
./4 I I I I I [ I I I II I I I
.—. . .
.-.“..-.,.
\-
...-
, , I ,Y , I \ 1 1 \ 1 1 1-. t 1 \l
-.020‘.J’.J’-JI)JIJI)21,
1 1I
I bl I I I II1.4 1.6 L8
V~nDFIGURE10.–Cur\ + A Cr, 12P,andqagafnstT7i7DforNACA cwhg.
1.0
.8
.6
n.4
.2
0 .2 .4 .6 1.0 1,2 1.4 1.6 1.8V/no
FIWEE 11.–Comparieon of ap~ent pro@Ier efficiency ermebpes fm four Mysham
.
,.:.
--
.-
.

152 REPORT NO. 71*NATIONAL ADVISORY COMMITTEE FOR AERONAUTICS
CTdz
-.
,2 .3 .4 .5 .6 .7 .8 .9 LO” ‘“x
FIGURE12.-C!urw9 for dCrfdz agrdmt r for pro@Ier-lmb lmdy. 8, IT’.
.f8
.16
./4
~/2
.10
.08
-.02V,’? /’f i I I /1 1,.
I Iw
-, -i’ I I I I 1. p I-,
I I I I 1 1 1.-m h Y I I I
\ / y/
-.U$2 .3 -4‘ ‘ I I I I 1 J.5. .6.7 ”.8 .9.(0
x
FIOUIUI14.-Curven for dCr/& aga.imstskmpropekbub body. A 22°.
.0/6—“ -\ 1 I 1
V/nil .1/ ‘
I I 1/2.014
.018
.Rd+++tH—I 1/
)fl%H+’wI-l
.(2/0 1/A
%1dz
x
FIWEE 13.-Curws for dC@ againstr for pmpdler-bub body. j%1P.
.036
.Qw
,028
.oi4
:a?o
.0/6
.orz
.004H+’Z
1 I - t. i I It I .-. .---. —..—-—-
—L ~,C .d .-r .d .6 .7 .8 .S [0
xFIGUEE15.—Curvm for dC~& e.gafnstr for ptipelfer-lurb body. E,W.
. ...
.
.—. .—.
PROPELLER ANALYSIS FROM EXPERM~M DATA 153
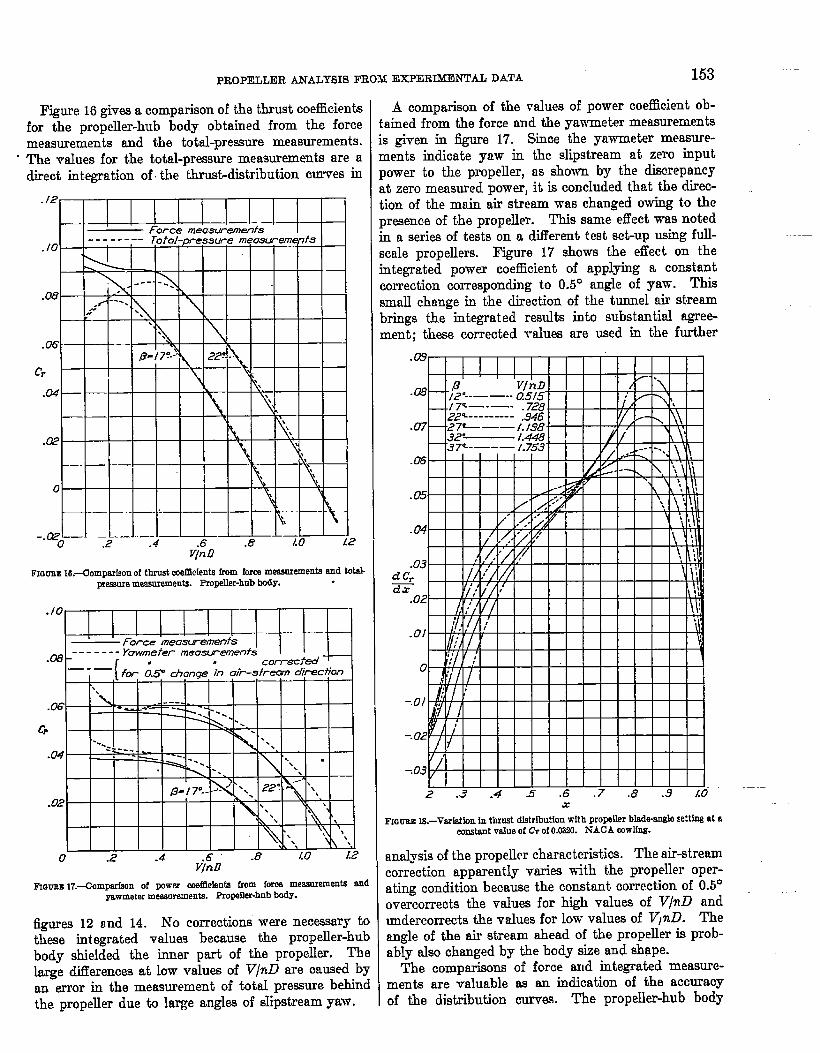
Figure 16 gives a comparison of the thrust coefficientsfor the propeller-hub body obtained from the forcemeasurements and the total-pressure measurements.
“ The values for the total-pressure measurements are adirect integration of. the thrust-distribution curves in
. 12—
.10 —
.08 —
.06
c,
.04 —
—
.02 —
o —
-.a2oy—
——Force meo-m--fs
-------- Tofai-pessure measwemepfs
..f’ ‘.—
I/3-t7?-5\
—
—\
K Y
t-1-lfl+t-t-k.;lj!d.2 .4 .6 .8 . .i2
V~nD
Fmrrm 16.-Oomporkon of thrust oxftictente from force mmeuremeti and totrJ-
Wessuremeasx.ramenk Prordkr-hnb WY. “
.10 —
..—bFwce measwemenfs
.08-------- YOwmefer mea-efmnfs
[
“ .—-— correcfdfm 09 change in uir-streum direcfihn
‘.
.06----
. L..-— —--— ‘ - -.
Cp‘.+.
--
.04
.02
\. . ~
h,
* . .
0 .2 .4 .6 .8 Lo L2VjnD
FrGWEE17.-Comparf9on of powrr coefo.etenti from form measurements audyuwmeter m=rements. PrmMler-hnb lxulY.
figures 12 and 14. No corrections ware neces.wuy tothwe integrated values because the propeller-hubbody shielded the inner part of the propeller. Thelarge dithences at low values of V/nD are cmsed byrm error in the measurement of total pressure behindthe propeller due to large angles of Slipstream yaw.
A comparison of the values of power coefficient ob-ained from the force rmd the yawmeter measurementss given in figure 17. Since the yaw-meter measure-ments indicate yaw in the slipstream ai zero inputlower to the propeller, as shown by the discrepancyLt zero measured power, it is concIuded that the direc-,ion of the main air stream was changed owing to the]rwence of the propeller. This same effect was notedn a series of tests on a dif7erent test set-up using full-lcale propellers. Figure 17 shows the eflect on thentegrated power coefficient of applying a constant:orrection caresponding to 0.5° angle of yaw. This~malI change in the direction of the tunnel air streamwings the integrated results into substantial agree-nent; these corrected mlues are used in the further
.03d c=x
o
-.0/
-.02
-.03
2 .3 .4 S .6 .7 .8 .3 iO-.x
FIQUEEIS.-Variation in thrust dfstribntion wfth propeller blade-anslesettiru at aUX!St8ntvnhle OfC%OfO.OML A“ACAMWM.
analysis of the propelkr characteriatim. The air-strea
correction apparently varies with the propeller oper-ating condition because the constant correction of 0.5°overcorrects the values for high values of V/nD andundercorrects the values for low values of VlnD. Theangle of the air stream ahead of the propeller is prob-ably also changed by the body size and shape.
The comparisons of force and integrated measure-ments are valuable as an indication of the accuraqof tie distribution CUIWM. The propeller-hub body
.—.—
154 REPORT h’O.712-NATIONAl ADVISORY “mLMM.I’ITEEFOR AERONAUTICS :
/.fw
..%
.60
;.70
,60
,,50
.2 .3 .4 .5 .6 .7 .8 .9 16”x
FIGURE19.—Veklty dktribut!on In Dfeneof prefxJler (jmopellerremoved). V, !33miles per hour.
furnishes the best opportunity to detemaine this accu-racy, no corrections being necessary to put the inte-grated and the measured results on an equal basis
because of the hub @ag. The fact that tJIC intcgratc~
power coefficients need a correction to bring tlwm intoagreement with the measured power coef%eicnts indi-catw. that the integrated power measurements arcquantita.tively inaccurate. Inasmuch as a const.ttn tcorrection to the angle of yaw of the tunnel air strctimbrings the results into substtintial agrgemmt, the dis-. ____tribution of t.ho torque along the blade is believed to INIsufficiently accurate for use in further analysis.
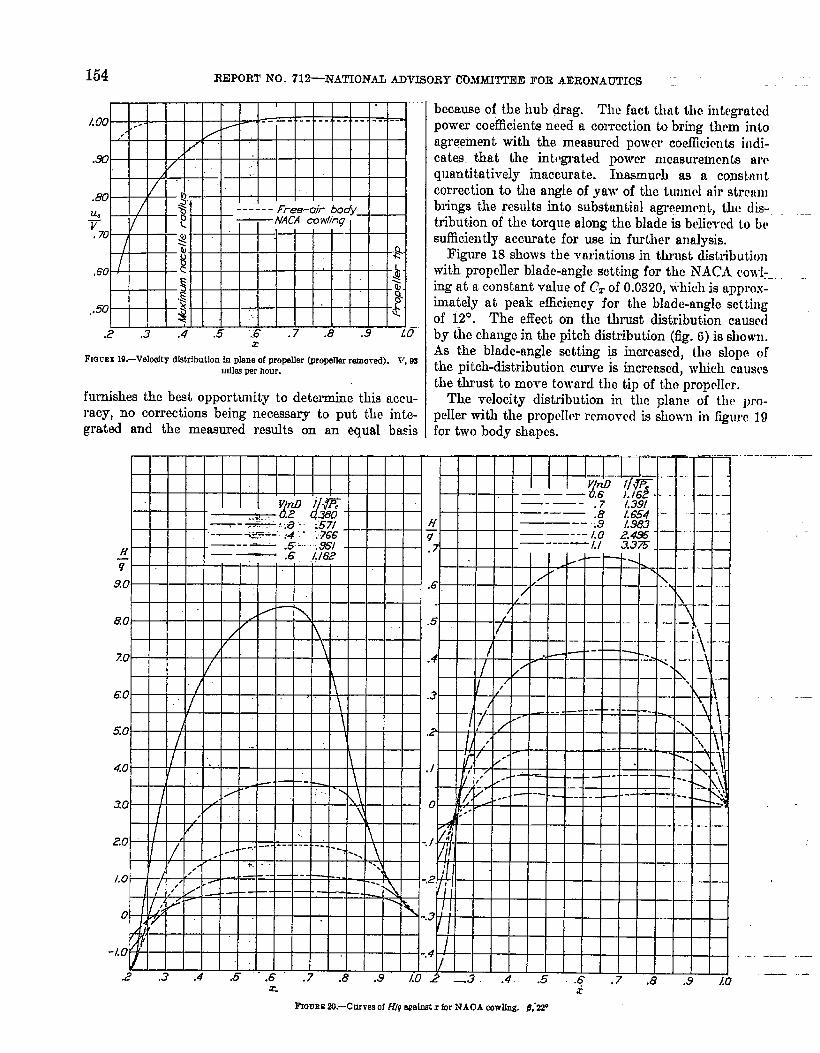
Figure 18 shows the variations in thrust distributionwith propeller blade-angle setting for the NACA cowl:..ing at a constant value of CT of 0,0320, tihich is approx-imately ab peak efficiency for the blade-angle settingof 12°. The effect on the thrust distribution causedby the change in the pitch distribution (fig. 6) is show]).As the blade-angle setting is increased, the slope ofthe pitch-distribution curve is increased, which cuuwsthe tluwst to move toward the tip of the propeller.
The velocity distribution in the plane of thr pro-peIIer with the propd[rr rrmovcd is shown in figure 19for two body shapes.
z. x
-.
——. -
———..—
—. -
FIGUREW.–Curves of HIqefminetz for NACA wwllng. 19,-2P

PROPELLER ANALYSIS FROM EXPERIMEN!IM DATA 155
DISCUSSION
TOTALPRESSUREDUE TO THE PROPELLER
The effect of the propeIIer slipstream on the bodybehind the propeller may be studied by determining g theincrease in total pressure due to the propeller. Thisincrease in pressure divided by the dynamic pressureof the undisturbed air stream may be computeddirectly from the thrushdistribution curves and equa-tion (5). Figure 20 shows the distribution of H/q aIongthe radius for the 22° blado-angIe setting with the NTACAcowling. The magnitude of H/q will remain essentiallythe same for equal values of l/$Z regardless of blade-angle setting; the ma.xinmm value, however, will shifttoward the tip as the blade-angle setting is increased.For optimum design the shift will be sma~er than isshown for this test propeller. The values of V/n~ meshown on the curves for comparative purjoses, but itmust be kept in mind that the curves of H/g againstl’/nll can be used for only the blade-mgle setting given.
The magnitude of the increase in total pressure in theregion in front of the body permits a rough approxi-mation of the increase in body drag due to the propellerslipstream, provided that the type of flow over thebody is not critically affected by the slipstream. If theslipstream changes the flow over the body, ”the changein drag cannot be predicted.
The curves of H/qare usefti in indicating the increasein total pressure that cm be obtained in a scoop orother air intake located behind the propeller.
Because of the increase in totaI pressure that can beobtained behind good propeller blade sections, the cool-ing of engines should be taken into acount in the designof the inner sections, especially -when the engines aremounted in open-nose cowlings.
PROPELLEREFFICIENCYINTHE EECION OF REDUCED VELOCITY
Computation of the true propeller efficiency fromthe apparent propeller efficiency for the hTACA cowl-ing ,can be made by the use of thrustdistributioncurves (fig. 19), equation (7), and uo/~ data. Figure21 illustrates the rwdts of calculation for blade-anglesettings of 17° and 37° at 0.75R for the peak-efficiencypoints. The ratio of the mess under the curves givesthe factor by which the apparent propdler efficiencymust be multiplied to give the true prcpelIer efficiency.The correction amounts to approximately 2 percentfor the 17° blade-angle setting but disappears for the37° blade-angle setting because of the shift of thethrust distribution from the low-velocity region to thehigh-velocity region near the tip. The results of thiscorrection to the peak efficiencies of the two blade-angle settings are shown as points in figure 11.
The disappearance of this correction is particularityapplicable to the test conditions and should not beapplied as a function of blade-angle setting for otherconditions.
VELOCITYINCREASEDUE TO THE PROPELLER
In order to study the inflow velocity ahead of thepropeller, surv~ mewements -were made with andwithout the propeller operating. Figure 22 shows theresults of these measurements for two body shapeswith the propelIer operating near peak efficiency at ablade-angle setting of 22° at 0.75R. For the NACAcowling, the maximum inflow velocity at the centerline of the propeller is 7 percent of the free-streamvelocity and is ordy 2 percent at a distance one-thirdof the propeller diameter ahead of the propeller. Thesecurves also show how the NACA cowling increases the
.18
./6
./4
x
FIGURE!21.-Exe.mpleIIIumnting the methorlof determinh trrrepropelIerefScfencYin presenceof body. NACA eowhg.
tingle of attack of the propeller sections by decreasingthe axiaI velocity over these inner sections.
ANGLEOFTWISTIN THESIJPSTEEAM
A knowledge of the magnitude of the angle of twist* in the propeller slipstream is helpful in the inter-pretation of the action of airplane parts, such as intakescoops and wing ~ets. The angle of twist immedigtt,ybehind the prcpeIIer plane maybe calculated from equa-tion (14). This angle of twist will vary with the dis-tance from the prcpelIel piano. Two separate effectsthat change the angle of twist are: The convwaion ofstatic pressure into dynamic pressure incrmses theaxial component of tho velrIcit y, which reduces the angleof twist, and the contraction of the dipstream combinedwith the change of the cross section of the afterbody in
. .

156 REPORT NO. 712-NAmoNAL ADVISORYCOhIhImEE FOR AERONAUTICS
the slipstream changm tho radius of the streamlinesand, consequently, changes the angular velocity of theslipstream. The effect of speeding up the &al velocityamounts to only a small change in the angle of twist,If the propeller is operating in front of a blunt body likean NACA cowling, the angle of ttit in the slipstreamclose to the surface is leas than that calculated tiedi-ately behind the propeller. This difference in the angleof twist is due to the acceleration of the air going overthe cowling and to the increase in the radius of thestreamlines, which decrease the angular velocity of theair.
Figure 23 shows the change, at various operatingconditions, of the angle of twist with x in the propellerslipstream immediately behind the propeller computedfor two blade-angle settings. Equation (15) gives theangle of twist in the propeller slipstream as a functionof the torque coefficimt Q.. h e9timate of the angleof twist in the slipstream for any propeller-body com-bination may be obtained by computing Qc for thepropeller operating condition desired and by using figure23 to estimate the angle. It must be kept in mind,however, that the dmtribution of twist along the radiusvaries with pitch distribution, body shape, and opmat-ing condition; consequently, an exact value of the angleof twist for other propeller-body combinations cannotbe obtained from figure 23.
For the 22° blade-angle setting, the maximum propel-ler efficiency ~ccurs at v/?zD=O.803 or a value of
T
I/J& of 10. It may be seen from figure 23 (b) thatthe angle of twist for this operating condition is lessthan ~-o. This angle of twist is representative of thevalue obtained with a propeller operating in thecruising or the high-speed condition of flight.
DISPOSITIONOF PROPELLERPOWER
The-disposition of the power input to the prcpcHorwith the propeller-hub body is given for the 17° blado-“knglesetting in figure 24 (a) and for the 22° blade-anglesetting in figure 24 (b). The percentage of power be-tween the propeller-efficiency curve and unity representsthe losses of the propeller. The thrust-distribution andthe torque-distribution curves in conjunction withequations (9) and (11) permit the calculation of theenergy going into the propeller slipstream in the formof axial and rotational velocity. Equation (9) miy berewritten as
It may be seen that EJP, to the firstorder, is pro-portional to the product of q and a.
Equation (3) may be rewritten in the form
“4
~ ““–1+ 1+5- . .(’f=— —-..-. .-—
~
\
d.~ I I I I 1 1 1 1 I 1 11, 1
-i
-------- .. --., -- 1 1 I 1 1 1
@ , 1 1 I 1 1 1 1 1 + 1 1.—. — - 1 1YI O ‘-.2 :?J o -2 -,1” 0 .1
-----.------------- AWV
.—. .-.
—
I I x----— Free-air boaj~NAcA cowling
~. . .&-------FIomE 22,-FcacHcmaIirwreaw In velocity due to pmpe.l]er. J?,‘i&; V/nD,0395.
-- ,.. . . . ..-.

PROPELLER A_NALYSISFROM EXPERIMENTAL DATA 157
1.0
.9
.8
.7
.6
q .5
.4
.3
.2
.1
0 L2 1.4 L6 L8 20 22. .?!4 26 /2 14 1.6 L8 20 22 2.4 26 28rfn
(s)6,1P. (b)B,!2?.FIOU&E2L-13kpmIthm of propeller bput power. Propeller-hub body.
+--i--t+tttttt
12
8
4! J--J Iw I I I
+f7nI .-. I
f.. u I/ /
om ~ (a)
8 I
I I I 1 I 11/7/-) I I I
\ Ii -0 I I I - .980 < (b)
2 .3 .4 .5 .6 .7 .8 .9x (a)/?,1P.
(b) 8,22°.FrGUBE23.-CurVES ot nn@eof twist in the shpstream. Propeller-hub body.
.024
.020
.0J6
RY .012N
.008
.004
0 .004 .008 .of2 .W6 .G20 .G24 .028~~J
FIOUBE2&–Expe.rimental come sbowing rektbnslrip of EJP ta Qf,l.
which shows that a is a direct function of dT= or thatEs/P is a function of T. and ~, if changes in the dia-tribut.ion of thrust are neglected.
From equation (ha) it is seen that the fractionalpart of the power going into rotational velocity in thewake is proportional to al.
Equation (4) may be written in the form
.
dGQ 2a?=7F7?S72?(l+a)
-.
158 REPORT NO. 7ltiNATIONAL ADVISORY COMMITTEE FOR AERONAUTICS
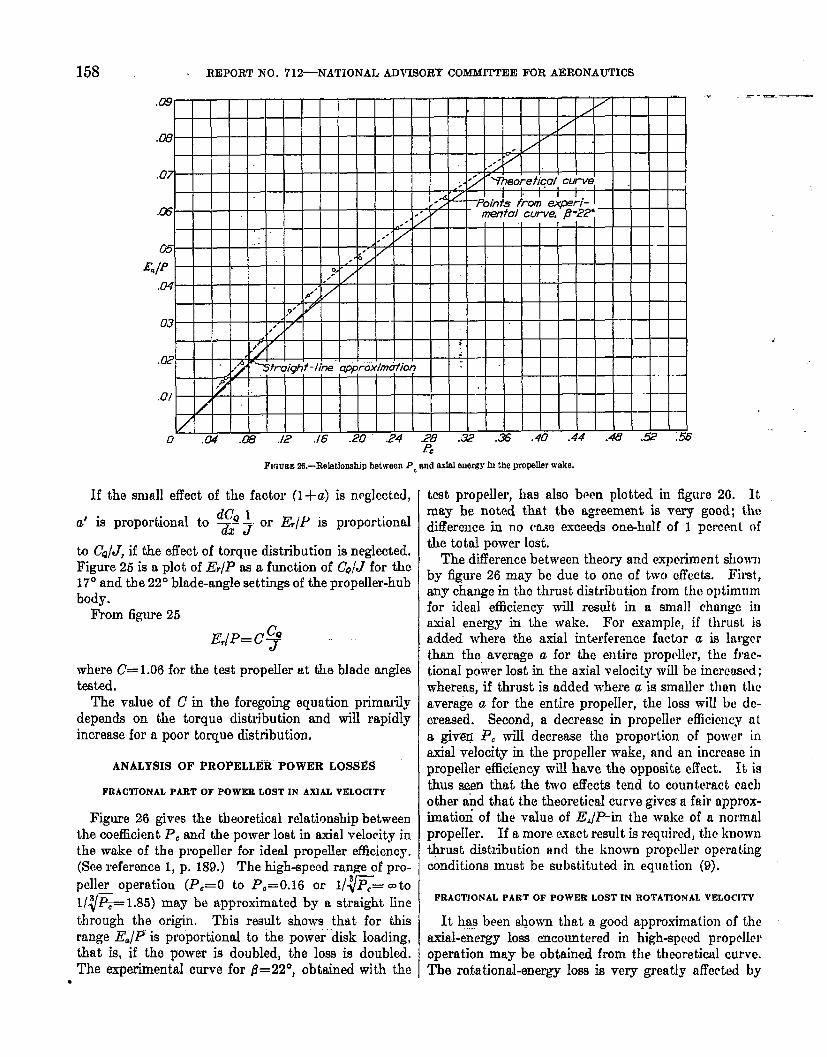
.
E.
P=FIGURE2&—Rdationship between PC and IUIBIenergy III the pro@ler wake.
If the small effect of the factor (1 +a) is neglcctcd,
d(7Q Ia’ is proportional to TX- ~ or &/l’ is pmportiomd
to CQ/J,if the affect of torque distribution is neglected.Figure 25 is a plot of lG/Fas a function of Co/J for the17° and the 22° blade-angle settings of the propeller-hubbody.
l?rom figure 25CQ
E,[P=CZ
where C= 1.06 for the test propelIer at the blade anglestested.
The value of C in the foregoing equation primarilydepends on the torque distribution and will rapidlyincrease for a poor torque dktribution.
ANALYSIS OF PROPELLER POWER LOS5E~
FRACTIONALPART OF POWER LOSTINAXIALVELOCITY
Figure 26 gives the theoretical relationship betweenthe coefficient P, and tbe power lost in axial velocity inthe wake of the propeller for ideal propeller efficiency.(See reference 1, p. 189.) Tbe high-spmd range of pro-
peller opemtiou (PC=O to PO=0.16 or l/~~= ~to
l/.@~l .85) may be approximated by a straight line
through the origin. This result shows that for thisrange E./P”is proportional G the power disk loading,that is, if tho power is doubled, the low is doubled.The experimental curve for 19=22”, obtained with the
..f >-- . . . .
test propeller, has also bmn plotted in figure 26. Itmay be noted that the agmeme,nt is very good; h:ditTe.rence in no rme exceeds one-half of 1 percent ofthe total power lost.
T&.difference between theory and experiment shownby &we 26 may bc due to one of two effects. Flrsttany change in tho thrust distribution from thu optimumfor ideal efficiency will result in a small chtmgc inaxial energy iri the wake. For ~~ample, if thrust isadded where the axial interference factor a is largerthan the average a for the entire propeller, the frac-tional power lost in the axifil velocity will be increased;whereas, if thrust is added where a is smaller than thea-retie a for the entire propeller, the loss will bc de-creased. Second, a decrease in propellcr efiicicncy ata givm FC wiLI decrease the proportion of power inaxial velocity in the propeller wake, and an increase inpropeller efficiency will have the opposite effect, It isthus seen that the two e.fTccts tend to counteract eachother aid that the theoretical curve gives a fair approx-imation of the value of EJl%n the wake of a normalpropeller. If a more e.~act result is required, t.hc knownt$rust distribution and the known propeller operatingconditions must be substituted in equation (9}.
FACTIONAL PART OF POWER LOSTINROTATIONALVELOCITY
It @ been ~own that a good approximation of theaxial-energy loss encountered in high-speed propelleroperation may be obtained from the theoretical curve.The rotational-energy loss is very greatly affected by

PROPELLER ANALYSIS FROM EXPERIMFNPAL DATA 159
changes in the distribution of propeller loading, how-ever, and no theoretical. estimate can be made of thisenergy loss from the total power of the propeIler with-out a knowledge of the torque distribution.
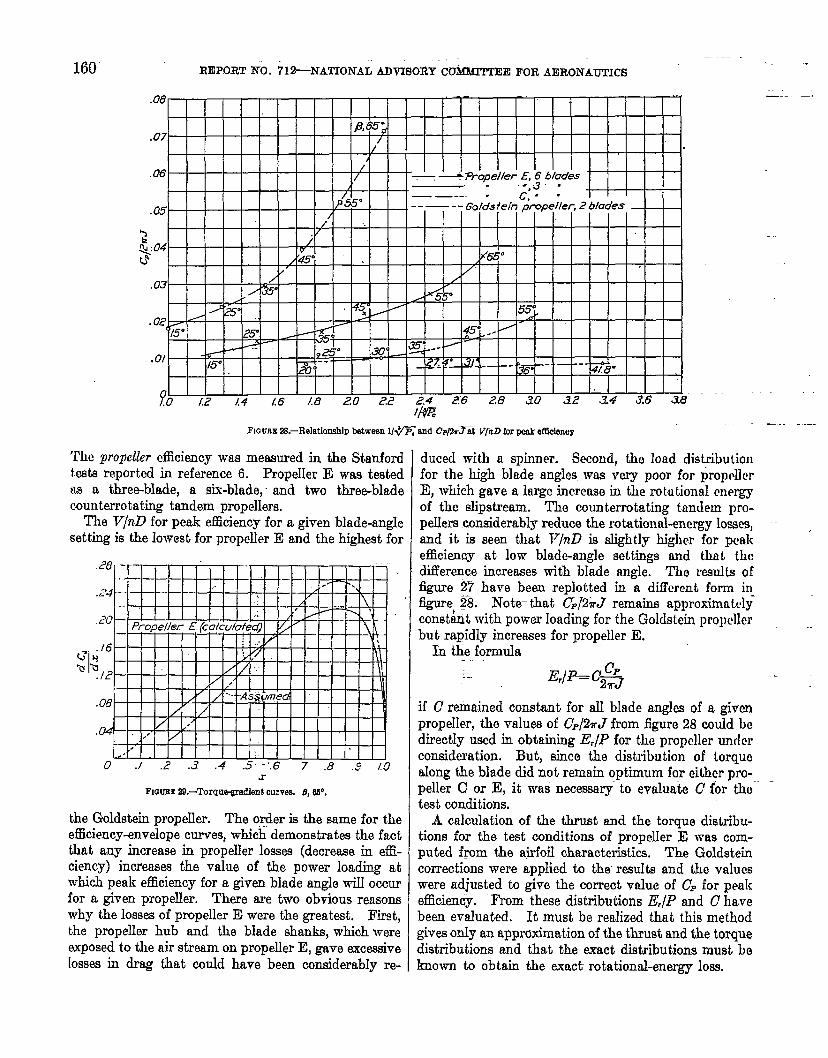
The total torque at peak efficiency for three types ofpropeller is given in @ure 27, which is a plot of C= atlx/n~ for peak efficiency and the peak-efficiency en-velopes ~gainst V/nD. One of these, the two-bladeGoldstein propeller (reference 4} was specially designedto corrwpond to the “minimum energy loss” conditionof Betz, for a certain relation between blade angle and-working condition. The hub and t-he inner portionof the propeller were covered to a radius of 0.27R by a
long cylindrical body -with a streamline nose and tailthat was supported free of the propeller. The pro-peller ticiency was measured. The results for pro-peller C on nose 4 were taken from reference 5.Nose 4 @ended through the propelIer disk in the formof a large spinner and covered the radius to approxi-mately 0.25R. Propeller C is Bureau of Aeronauticsdrawing No. 5868-91 is 10 feet in diameter, and hasthee blades. The propulsir~ ef&cicmcy was obtaineclfrom tests in reference 5 and is plotted in figure 27.Propeller E (reference 0) was a 3-footdiameter modelof standard Navy plan form. NTOspinner was used,the propeller being entirely exposed on a long shaft.
/.6
K
/!4
[3
/.2
/./
/.0
.9
v
.8
f>
.7
.6’
5
.4
.3
.2
./
13’ #o!’!’,!!’!-
I +--1+E+H+=E’iT
1 I I I I I I
1 I , , b 1 I I 1 I , I
.4 .b .b- f.u 12 1.4 1.6 ‘“[8 2.2 2.4 2.6 2.8 3.0 3.2 3.4 3.6V?;
.,. .
:.
-,=
FIGURE27.-EfZctenoy-curve envelopm and Yaks of CP at Vln D M peak efdciency.
160—
REPQRT NO. 71%NATIONAL ADVISO~Y”CC&lTTTE E FOR AERONAUTICS
FKJuBii28.-Relat&nahlp ke$ween11~ and C’i+!k%it V[RD for p@ WwIenuy
The propeller efficiency was measured in the Stanfordtests reported in reference 6. PropeIIer E was &M
us ci three-blade, a six-blade, - and two threebladeccnmterrotating tandem propellers.
The V/n.Dfor peak efficiency for a given blade-anglesetting is the lowest for propeller E and the highest for
.28
“4.&
,.20
- .16;2
./2
.08
.04
0 ./ .2 .3 .4 .5-’.6 7 .8 ,2 /0x
Ftmnm 28.-Torqu~adiant curves. & 65”,
the Goldstein propeller. The order is the same for theefficiency-enveIope curves, which demonstrates the factthat any increase in propeller losses (decrease in effi-ciency) increasw the value of the power loading atwhich peak efficiency for a given blade angle fl occurfor a given propeller. There are two obvious reasonswhy the 10SSSSof propeller E were the greatest, First,the propeller hub and the blade shanks, which wereexposed to the air stream on propeller E, gave excessive[osses in drag that could have been considerably re-
—--— .
—..
duced with a spinner. Second, the load distributionfor the high blade angles. was very poor for propdlerE, which gave a large increaso in the rot.utional energyof the slipstream. The counterrotating tandem pro-pelkrs considerably reduce the rotational-energy losses, --and it is seen that V/nil is slightly higher for peakefficiency at low blade-angle settings and thut thedifteregce increases with blade angle. The results offigure 2? have been replotted in a different form inmfigure 28, Nota- that CP/2irJ remains approximntdyconstkt with power loading for the Goldstein prop&rbut rapidly increases for propeller E.
k the. formula-..— CD
E,/P=CGJ
if C remained constant for aII blade angles of a givenpropeller, the values of C=/27J from figure 28 could bedirectly used in obtaining E,/~ for the propeller underconsideration. But, since the distribution of torquealong the blade did not remain optimum for either pro- _peller C or E, it was neceesa~” to evaluate C for tlmtest conditions.
A calculation of the thrust and the torque distribut-ions for the test conditions of propeIIer E was com-puted f~m the airfoiI characteristics. The Goldsteincorrections were applied to the results and tho valueswere ndjusted to give the correct value of Cp for peakefficiency. From these distributions E,/P and C havebeen evaluated, It must be realized that this methodgives only an approximation of the thrust and the torquedistributions and that the exact distributions must beknown to obtain the exact rotational-energy loss.
PROPELLER ANfiYSIS FROM EXPE-NTAL DATA 161
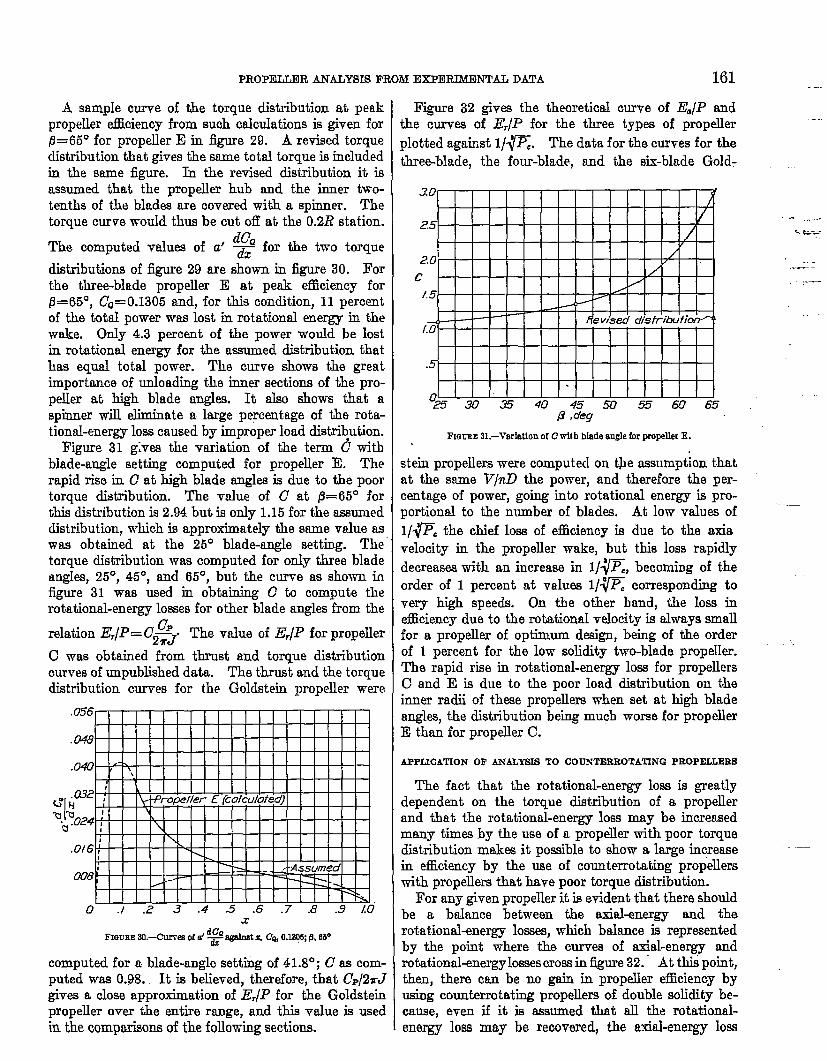
A sample curve of the torque distribution at peakpropeller efllciency from such calculations is given for13=65° for propeller E in figure 29. A retied torquedistribution that gives the same totaI torque is includedin the same figure. h the revised distribution it isassumed that the propeller hub and the inner two-tenths of the blades are covered with a spinner. Thetorque curve would thus be cut off at the 0.2R station.
The computed values of a’ ~ for the two torque
distributions of &e 29 me shown in figure 30. Forthe three-blade propeller E at peak efficiency forP=65”, cQ=0.1305 and, for this condition, 11 percentof the toted power was lost in rotational energy in thewake. Only 4.3 percent of the power would be lostin rotational energy for the assumed distribution thathas equal total power. The curve shows the greatimportmce of urdoading the inner sections of the pro-pek at high blade angles. It also shows that aspinner will eliminate a large percentage of the rota-tional-energy loss caused by improper load distri~ution.
Figure 31 gives the variation of the term C withblade-angle setting computed for propeller E. Therapid rise in C at high blade angles is due to the poortorque distribution. The value of C at 13=65° forthis distribution is 2.94 but is only 1.15 for the assumeddistribution, which is approximately the same value aswas obtained at the 25° blade-angle setting. The”torque distribution was computed for only three bladeangka, 25°, 45°, and 65°, but the curve as shown hfigure 31 was used in obtain& C! to compute therotational-energy losses for other blade angles from the
Cprelation E,/P= C2;-. The value of E,/P for propeller
C -was obtained from thrust and torque distributioncurves of unpublished data. The thrust and the torquedistribution curves for the Goldstein propelIer were
o .1 .2 3 .4 -5 .6 .7 .8 .9 [0”z
dc~-~= Q, m% ~-ah”FIQUIZESfJ.-Curres of d ~
computed for a blade-angle setting of 4 1.8°; C as com-puted was 0.98. It is believed, thmfore, that CF/2TJgives a close approximation of E,/P for the GoIdsteinpropeller over the entire range, and this value is usedin the comparisons of the following sections.
F~ure 32 gives the theoretical curve of E=/P andthe curves of E,/P for the three types of propeller
plotted agab,st l/~c. The data for the curves for the
three-blade, the four-blade, and the ti-blade Gold-
...——
~ ,deg
Fmmm 81.–VarlatIon of Cwitb bfade angle for propsller E.
stein propellem were computed on t$e assumption thatat the same V/nD the power, and therefore the per-centage of power, going into rotational energy is pro-portional to the number of bladw. At low values of
l/~C the chief lose of efficiency is due to the axia
velocity in the propeller wake, but this loss rapidly
decreas= with an increase in l/~c, becoming of the
order of 1 percent at vahma II= corresponding to
very high speeds. On the other band, the loss inefficiency due to the rotdiomd velocity is always smallfor a propeller of optimum ddgn, being of the orderof 1 percent for the low solidity two-blade propeller. ““The rapid rise in rotational-energy loss for propellersC and E is due to the poor load distribution on theinner radii of these propellem when set at high bladeangles, the distribution being much worse for propellerE than for propeller C.
APPLICA’llONOF ANALYSISTO COUNTEEROTATINGPEOPELLEllS
The fact that the rotational-energy 10* is greatlydependent on the torque distribution of a propellerand that the rotationrd-energy loss may be increasedmany times by the use of a propeller with poor torquedistribution makes it possible to show a large inqease ----in efficiency by the use of countarotating propellerswith propellers that have poor torque distribution.
For any given propeller it is evident that there shouldbe a baIance between the axial~nergy and therotationakmergy losses, which balance is representedby the point where the curves of @al-energy androtational-energy bases cross in @me 32. At this point,then, there can be no gain in propeller eftlciency byusing counterrotating propellem of double solidity be-cause, even if it k assumed that all the rotational-energy loss may be recuvered, the axial-energy low
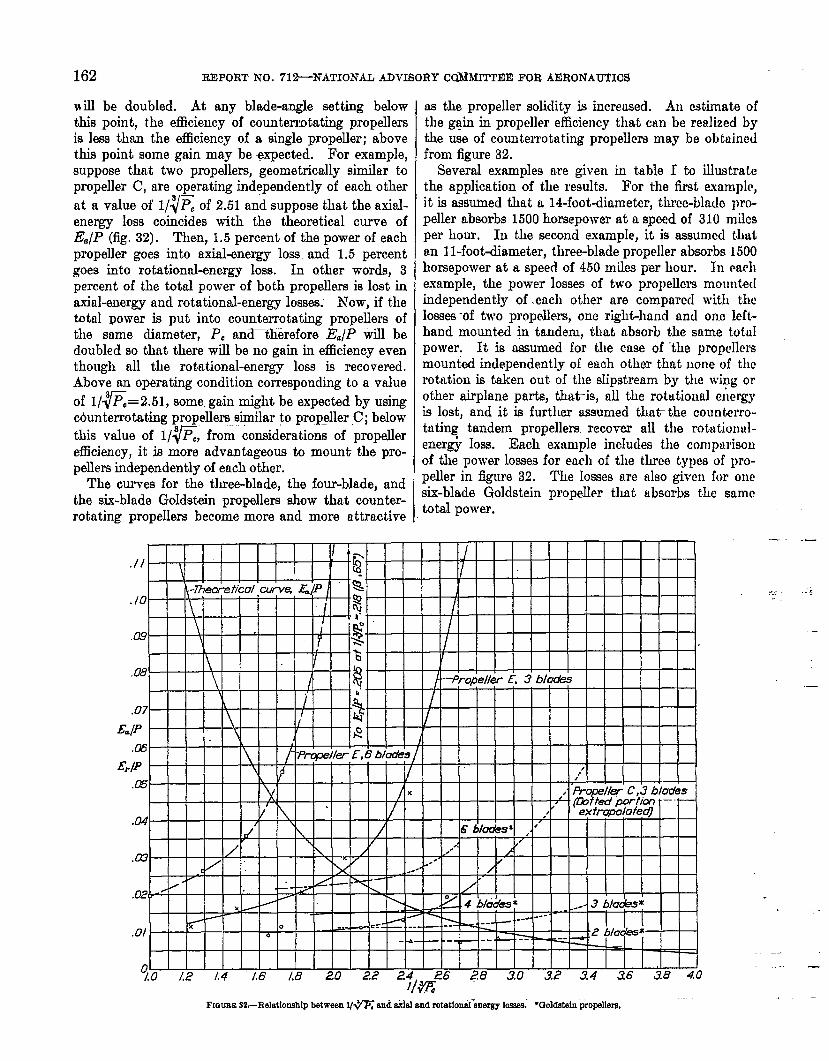
162 REPORT NO. 71*NATIONAL ADVISORY C~MITTEE FOR AERONAUTICS
will be doubled. At any blade-angle sett~~ belowthis point, the efficiency of countermtating propellersis less than the efficiency of a single propeIler; abovethis point some gain may be expected. For example,suppose that two propellem, geometrically similar topropeller C, are operating independently of each other
at a value ot’ l/$E of 2.51 an-d suppose that the axial-energy 10SS coincides with the theoretical curve ofEC/P(fig, 32). Then, 1.5 percent of the power of eachpropeller goes into axial-energy loss and 1.5 percentgoes into rotation&energy loss. In other words, 3percent of the total power of both propellers is Iost inaxial-energy and rotational-energy losses. Now, if thetotal power is put into counterrotating propellers ofthe same diameter, P. and tlerefore Es/P will bedoubled so that there will be no gain in efficiency eventhough all the rotational-ene~ loss is recovered.Above an operating condition corresponding to a valueof l/~= 2.51, some, gain might be expected by usingcdunterrotating propellers similar to propgller C; below
this value of l/~, from considerations of propellerefficiency, it is more advantageous to mount the pro-pellers independently of each other.
The curves for the three-blade, the four-blade, andthe six-blade Goldstein propellers ahow that counter-rotating propellers become more and more attmctive
as the propeller solidity is increused. An estimate ofthe ggin in propeller efficiency that can be realized bythe use of counterrottiting propellcm may be ot.)tuincdfrom figure 32.
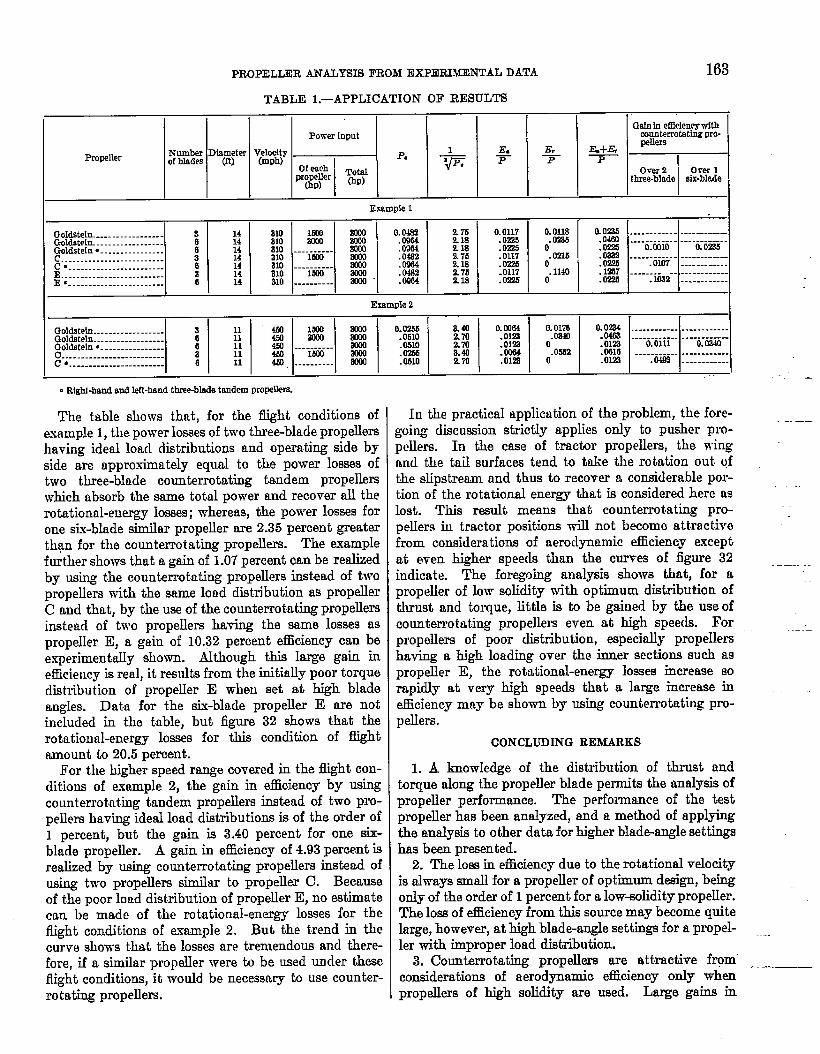
Several examples nre given in ta.ble I to illustratethe application of the results. For the first example,it is assumed that a 14-foot-diumet+r, three-blmde pro-peller absorbs 1500 horsepower at u speed of 310 milesper hour. In the second example, it is aesumcd thutan 1l-foot-diameter, three-blade propeller absorbs 1500horsepower at a speed of 45o miles per hour. In em-hexample, the power losses of two propellers mountedindependently of. each other are compared with thelosses ‘of two propellers, one right-hand and onc left.-hand mounted @ taudemj that absorb the same totalpower. It is assumed for the case of “the propellcmmount&d independently of each other tht-tt none of therotation is taken out of the slipstream by the wing orother airplane parts, that-is, all the rottitional el\ergyis lost, and it is further assumed that the countmro-ttiting tandem propellera recover all the rcttitiontil-ener~ 10SS. Each example inchdes the cmupurieonof the power losses for each of the three typca of pro-peller in figure 32. The losses are also given for onesix-blade Goldstein prope~er that absorbs the sametotal power.
.02~q- 1 I I 1. I t VI I I I t I I I I t I I4--77
I I -A! I f t10/1 . ~., 1, .L -. .,... i+’ }4 mutes= .-.+ J Dtuc=s”
T. I : 77%+---4<= ‘-------
“-.01.:-— ...-—- -- ---
--. ---- ---
70 /.2 /,4I t , , , 1
1.6 /.8 2!0 22 24 26 ~8 .30 .32 .34 .36 38 40l/~
-ttmtntnFIGURESZ.-RelatiomhIp bdwem I/w and add snd rotatIon&merg’y lma ‘Ooldskln propdlm.
:._.:. .
.
.-
...:
—
—
PROPELIJZR ANALYSIS FROM EXPERIMENTAL DATA 163
TABLE 1.—APPLICATION OF RESULTS
--!.Power Input
+
Gednin efflcleneywffhmunkmoteting pro-
Nrmk Dlrm&ter Ve;ehy E, _&+Er@lerS
Propeller of bladesP=
Of eoch -k + 7 p
‘%? %$
over2 Orer 1three-blade six-blade
I
Example 1
OoIdsteln.. . . . . . . . . . . . . . . . . 3 14 WI 0.0482 276 0.0117 O::mOO1dstein.. . . . . . . . . . . . . ---- 6 14 810
0.0Z5 .. . . . . . . . ..- .-..–----–M m .0i164 2.18 .0225
C+oldstein~. . . . . . . . . . . . . . . . 14.0K+3 ...-6-mi6. - .-..i-tii-.
.0964 =2.18 .OzzS o .02Hc . . . . . . . . . . . . . . . . . . . . . . . . . . : 14 .Om ‘a.75 .0117 .0Z16c ●. . . . . . . . . . . . . . . . . . . . . . . . 6 14
.0382 ._:----- --.--..-.-–.0M4 2.18 .0226 0 .0a26
E...........---------------8 14 m.0107 ............
.04s2 X76 .0117 .1140E *--. -..--. . . . . . . . . . . . . . . . 6
. ln7 .-..-... -- ------------14 Slo ---------- amo” .0064 l.ls .0z26 0 .0225 .ma ------------
ExampIe 2
r 1 1 1Goltiteh ------------------ 3Gol&teln ------------------ 6Ooldstein ●. . . . . . ------0-------------------------- :c ●.----------------------- 6
~ “~ ~::1 ~1 ‘~ *!O~ ~: ~~ ‘:~~’ ==:1
. Rlgbl-hend 8ndleft-hand three-bbbdetrmdempm@m.
1 , , I I ._
The table shows that, for the flight conditions ofexmnrde 1, the Power losses of ho thee-bladewope~~rshaving ideal l~acl distributions and operating side byside are approximately equal to the power losses oftwo three-blade counterrotating tandem propellerswhich absorb the same total power and recover all therotationrd-euergy losses; whereas, the power 10SSCSforone six-blade similar propeller are 2.35 percent greaterthan for the counterrot sting propellers. The axamplefurther shows that a gain of 1.07 percent can be realizedby using the counterrotating propellers instead of twopropellem with the same load distribution as propellerC and that, by the use of the counterrotating propellersinstead of two prope~ers having the same 10SSW aspropeller E, a gain of 10.32 percent efficiency can beexperimentally shown. Nthough this Iarge gain inefllciency is real, it results from the initially poor torquedistribution of propeller E when set at high bladeangles. Data for the six-blade propelIer E are notincluded in the table, but 6gure 32 aho ws that therotational-energy losses for this condition of flightamount to 20.5 percent.
For the higher speed range covered in the fliiht con-ditions of ~xample 2, the gain in efficiency by usingcount errotat.ing tandem propellem instead of two pro-pellers having ideal load distributions is of the order ofI percent, but the gafi k 3.40 percent for one six-blade propeller. A gain in eftlciency of 4.93 percent isrealized by using counterrotating propellem instead ofua&c two propellers similar to propeller C. Becauseof the poor load distribution of propeller E, no estimatecan be made of the rotational-energy losses for tbeflight conditions of emrnple 2. But the trend h thecurve shows that the losses are tremendous and there-fore, if a similar propelIer were to be used under theseflight conditions, it would be necessary to use counter-
rotating propellers.
III the practical applictition of the problem, the fore-going discumion strictly applies only to pusher pro-pellers. In the case of tractm propellem, the wingand the tail surfaces tend to take the rotation out’ vfthe slipstream and thus to recover a considerable por-tion of the rotational energy that is considered here aslost. This result means that counterrotating pro-pellers in tractor positions will not becomo attractivefrom considerations of aerod~mnic efhiency e..ceptat even higher speeds than the curves of figure 32indicate. The foregoing analysis shows that, for apropeller of low- solidity with optimum distribution ofthrust and torque, little is to be gained by the use ofcounterrotutiug propellers even at high speeds. ForpropelIera of poor distribution, especially propellershaving a high loading over the inner sections such aspropeller E, the rotdionrd-energy losses increase sorapidly at very high speeds that a large increase ins.lliciency may be shown by using counterrotat,ing pro-pellers.
CONCLUDING REM.4RKS
1. A IinowIedge of the distribution of thrust andtorque along the propeller blade permits the analysis ofpropeller performance. The performance of the testpropeller has been analyzed, and a method of applyingthe analysis to other data for higher b~ade-angle settingshas been presented.
2. The 10SSin efficiency due to the rotational velocityis always small for a propeller of optimum design, beingonIy of the order of 1 percent for a low-solidity propeller.The loss of ticiency from this source may become quitelarge, however, at high blade-angle settings for a propel-ler with improper load distribution.
3. Counterrotating propellem are attractive from”considerations of aerodynamic efEciency only whmpropellers of high adidity are used. Large gains in
-——..-

164
propeller efficiency
REPORT NO. 71%NATIONAL ADVISORY COMMI’fTEE FOR AERONAUTICS
with counterrotating propellers maybe expectid only ~ propellers of poor tofi~e &Aributio~are used.
4. If high-solidity propellers are selected because oflimitatio~.on propeller diameter, it may be useful toresort to counterrotating propellera to eliminate theeffect of the engine torque on the flying characteristicsof the airplane. Only a small direct gain in propel.Ierefficiency is normally to be expected.
5. The effects of body ahape on the thrust and thetorque distributions of the propeller are shown.
6. The average angle of twist in the propeller slip-stream is shown to be a unique function of the torquecoe.flicient Q, and charta are given to help estimate theangle.
7. The increase in total pressure along the radiusbehind the propeller is given as a function of the powercoefficient 1f=. It is of use k“”estimatin~”the av~able
I LANGfi-Y NIEMORIAL AERONAUTICAL LABORATORY,
NAfiONAL ADVISORY COMMITTEE FOR AERONA~ICS,
LANGLEY FIELD, ~TA,, July 19, 1940.
REFERENCES
1. Glauert, H.: AirpIane Propellers. Vol. IV, div. L of Aero-dynamic Theory, W. F. Durand, cd., Julius Springer (Be.c-lin), 1035,pp. 169-360.
2. Stickle, George W.: Measurement of the Difhmcntial andTotal Thrust and Torque of Six Full-scale Adjusta&-Pitch Propellers. Rep. No. 421, NACA, 1932.
3. Weick, Fred E,, and Wood, Donald H.: The Twenty-FootPropeller Research Tunnel of the National Advisory Comm-ittee for Aeronautics. Rep. No. 300, NACA, 1928.
4. Lockj C. N. H., and Batmnan, H.: Wind Tunnel Teets ofHigh Pitch Airscrews. Part IL Variations of Blade Widthand Blade Section. R. & M. No. 1729, British A. R. C.,193~.
5. Stiok]e, George W., Crigler, John L., and Nkiman, Irven:Effect of Body Nose Shape on the Propulsive EEiciencyof a Propeller. Rep. No. 725, NACA, 1941.
pressure that’c& be obtained for air hk~es betid tie I 6. Lesley, E, P.: Tandem Air Propellers-II. T, N. (No. 822),.-
propeller. I NACA, 1941.