Embed Size (px)
Citation preview
Report No. 5563-SYR
SyriaRecent Economic Developmentsand ProspectsMay1986
Country Program Departrent 11Europe, Middle East and North Africa Region
FOR OFFICIAL USE ONLY
* ~~~~~~~ .. 3'
Documentof die World Bank
This document has a restricted dLsrinbuton and may be used by recipientsonly in the performiance of their official duties. Its contents may not othrwisebe disdosed without Wbrld Bank authorization
Pub
lic D
iscl
osur
e A
utho
rized
Pub
lic D
iscl
osur
e A
utho
rized
Pub
lic D
iscl
osur
e A
utho
rized
Pub
lic D
iscl
osur
e A
utho
rized
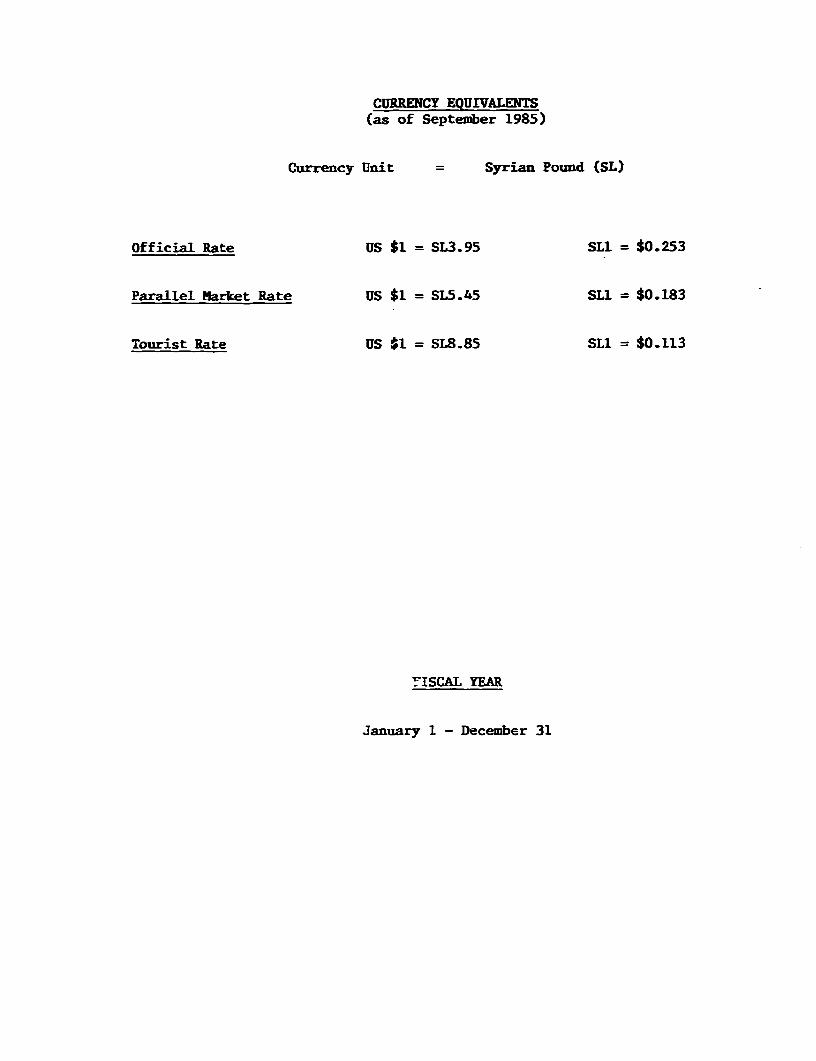
CURRENCY EQUIVALENTS(as of September 1985)
Currency Unit = Syrian Pound (SL)
Official Rate US $1 = SL3.95 SL1 = $0.253
Parallel Market Rate US $1 = SL5.45 SLI = $0.183
Tourist Rate US $1 = SL8.85 SL = $0.113
v'ISCAL YEAR
January 1 - December 31
FOR OFFMAL USE ONLY
This report was prepared by an ecouomic mission which visited Syria duringOctober 16-31, 1984. It was updated following a short visit of the MissionChief in September 1985 during which the draft report was discussed with theGovernment. The mission consisted of the following:
Mr. Edmond Asfour (Mission Chief)
Delbert Fitchett (Agricultural Economist)Dale Gray (Energy Economist)Ivan Christin (Public Finance Specialist, Consultant)Tarek Khahil (Debt Specialist)
ITh document has a restied ditibution and way be used by reipients only in the performanceof their official dutis Its contents my not olbhewise be dickosd without Wodd Bank authorintion.
Abstract
The report studies the adjustment of the Syrian economy to a set ofunfavorable exogeneous and domestic developments in the first half of the1980's. These include declining external grants, disappearance of the net oilsurplus, and the continued rise in public consumption.
The net effect of these developments was a virtual stagnation of thegross domestic product (following a period of fast growth in the 1970's),increasing budget and balance of payments imbalances, rekindling of inflationand overvaluation of the Syrian pound. The report reviews the problems facedby the Government, its reaction to them, and the policy it followed in orderto stabilize the economy. The report examines the areas where the imbalancesare still important and reconnends possible actions to be undertaken. Amongthe most important issues are: (a) the rate of exchange which is presentlysplit into four different rates each pertaining to a different set oftransactions; (b) the level of Government subsidies which, in presentcircumstances of greater budget str;-gencies, has acquired an addedimportance, and related to the previous point, (c) the maintenance of fixedprices, below the market level, for a number of goods which are not all staplecoamodities. The report focuses in particular on the balance of paymentswhich at present seems to represent the main constraint for the resumption ofa policy of fast growth. In that context an expansion of merchandise exportsand workers' remittances and the rationalization of domestic prices of importsare of particular significance, and the report assesses the prospects for sucha development by analyzing the likely effects of the exchange rate adjustmentand the recent decline in the world price of oil.
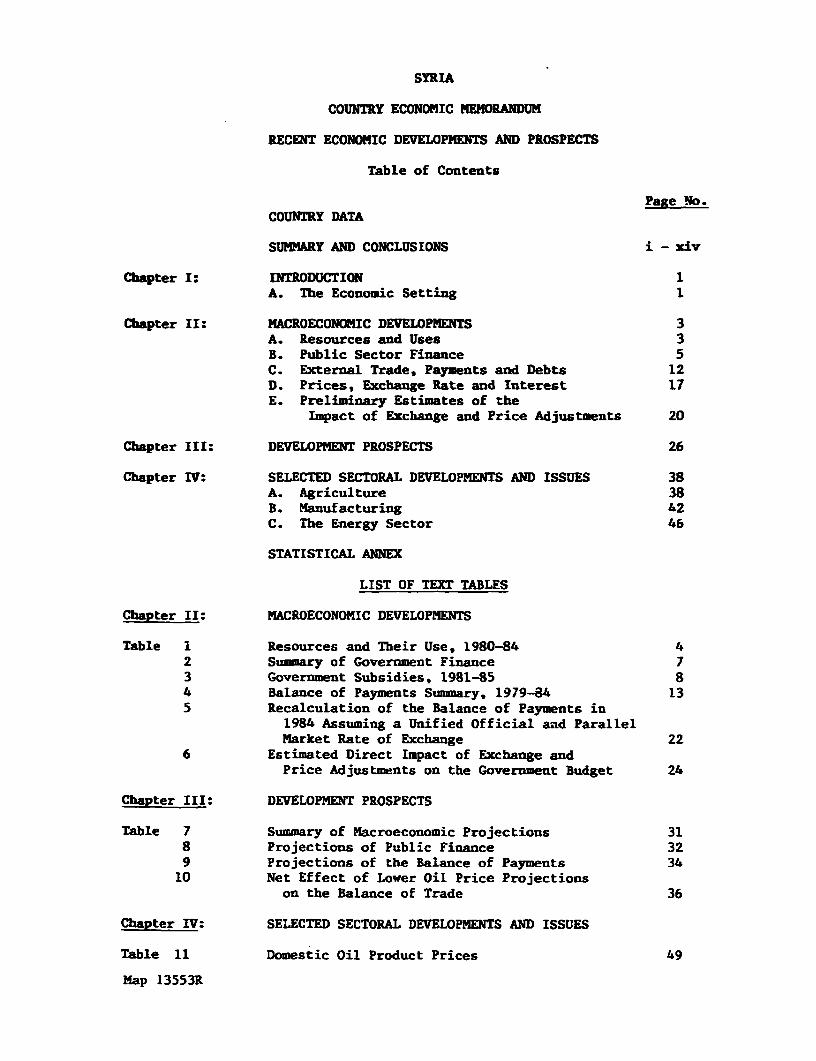
SYRIA
COUNTRY ECONOMIC MEMORANDUM
RECENT ECONOMIC DEVELOPMENTS AND PROSPECTS
Table of Contents
Page No.COUNTRY DATA
SUMMARY AND CONCLUSIONS i - xiv
Chapter I: INTRODUCTION 1A. The Economic Setting I
Chapter II: MACROECONOMIC DEVELOPMENTS 3A. Resources and Uses 3B. Public Sector Finance 5C. External Trade, Payments and Debts 12D. Prices, Exchange Rate and Interest 17E. Preliminary Estimates of the
Impact of Exchange and Price Adjustments 20
Chapter III: DEVELOPMENT PROSPECTS 26
Chapter IV: SELECTED SECTORAL DEVELOPMENTS AND ISSUES 38A. Agriculture 38B. Manufacturing 42C. The Energy Sector 46
STATISTICAL ANNEX
LIST OF TEXT TABLES
Chapter II: MACROECONOMIC DEVELOPMENTS
Table 1 Resources and Their Use, 1980-84 42 Summary of Government Finance 73 Government Subsidies, 1981-85 84 Balance of Payments Summary, 1979-84 135 Recalculation of the Balance of Payments in
1984 Assuming a Unified Official aad ParallelMarket Rate of Exchange 22
6 Estimated Direct Impact of Exchange andPrice Adjustnents on the Government Budget 24
Chapter III: DEVELOPMENT PROSPECTS
Table 7 Summary of Macroeconomic Projections 318 Projections of Public Finance 329 Projections of the Balance of Payments 34
10 Net Effect of Lower Oil Price Projectionson the Balance of Trade 36
Chapter IV: SELECTED SECTORAL DEVELOPMENTS AND ISSUES
Table 11 Domestic Oil Product Prices 49
Map 13553R
snu - a am
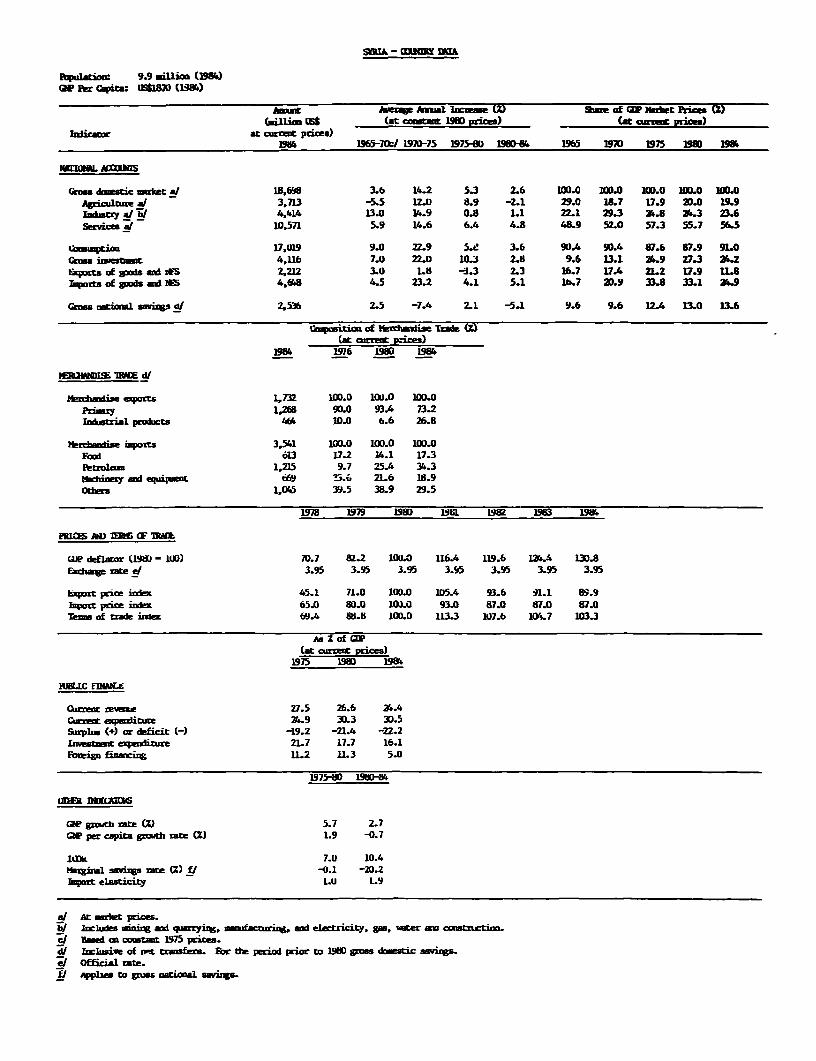
FuLatioa 9.9 nifim (1984)GM Per Capita: US170 (1984)
AMMM havget Aum. I_(-ne ne 1 98e of Q l ftPni (2)(ouilima uNs (at cootat 1980 prices) (at cawre pricE.)
hrdicatr at airlfe pre.s)1984 1965-7/ 1970-75 1975-80 1980-64 1965 1970 1975 1980 1964
NlilfL AN15E
caeom a m#t A! 18,69B 3.6 14.2 5.3 2.6 100.0 IOD.O 110.0 100.0 100.0hgriAae a/ 3,713 -5.5 12.0 .9 -2.1 29.0 18.7 17.9 2D.0 19.9Imiucy /i 4,414 13.0 14.9 0.8 LI 22.1 29.3 .8 34.3 23.6Services A/ 10.571 5.9 14.6 6.4 4.8 48.9 52.0 57.3 55.7 56.5
i x-Wti- 17,U19 9.0 2Z.9 5.8! 3.6 90.4 90.4 87.6 87.9 91.0GM"a itnemir 4.116 7.0 22.0 10.3 2.8 9.6 13.1 2349 27.3 21..2Eaportg of gXds agd iS 2,212 3.0 LB -3.3 2.3 16.7 17.4 21.2 12.9 U.8lqorts of wfds td a's 4,6.W 4.5 23.2 4.1 5.1 1HO 2D.9 33.8 33.1 24.9
Gr im il sainp a/ 2,536 2.5 -7.4 2.1 -5.1 9.6 9.6 12.4 13.0 13.6
CRMsition of tkdmu1iae Trode (2)(at armnt xices)
1984 1976 19l0 194
1ERU M MIE d/
Mkusafiie eqxmta 1,732 110.0 10..0 110.0Prim 1,268 90.0 93.4 73.2c&strial products 464 10.0 6.6 26.8
1ehdia e isports 3,541 100.0 I0D.O ICO.OFoof 613 17.2 14.1 17.3Betraldm 1,215 9.7 25.4 34.3Mdinery and equipL 66q9 ; 21.6 18.9Otts 1,05 39.5 38.9 29.5
1978 1979 10W 198L 18 19B 1 964
PRICS AND 1i CF 2WE
UW deflaror (1980 - 1W) 70.7 8.2 100.0 116.4 119.6 1264 13D.8E¢mpse rae e/ 3.95 3.95 3.95 3.95 3.95 3.95 3.95
o-rt pric in 45.1 71.0 10D.0 105.4 93.6 i1.1 89.9Tlair price ine 65.0 80.0 101.0 93.0 87.0 87.0 87.0T=ms of rzade izex A.4 W6.8 100.0 113.3 107.6 10.7 103.3
An 2 of 1t(at ot prices)
1975 19 1984
RliMIC F-ml
Qerret e2m 27.5 26.6 34.4Gwrnt ezxiit.r 24.9 3D.3 30.5
s5plz Co) deficit (-) -19.2 -21.4 -22.2Imenit exqnditure 217 17.7 16.1Foxeigm fining 11.2 11.3 5.0
1975-O0 198W-4
0D6ER nD871
GM gputb vte (2) 5.7 2.7Cw per capita gceth rate () 1.9 -0.7
1ak 7.0 10.4targi savi%s rate (Z) f/ -0.1 -20.2Iniort elaticity Lu 1.9
at Atr uket prices.ii/ h 1cudes -ing ad qarryirng, mfaawiz, ad eletricity, gs, water am comstructio.Bnlde a c IYt 1975 pries.
dl }lusive of opt ats.fer. For da pnrod pio to 1980 W=s dstic sangs.;' Official rae.
fl ppli to pse -- a- w-ings.
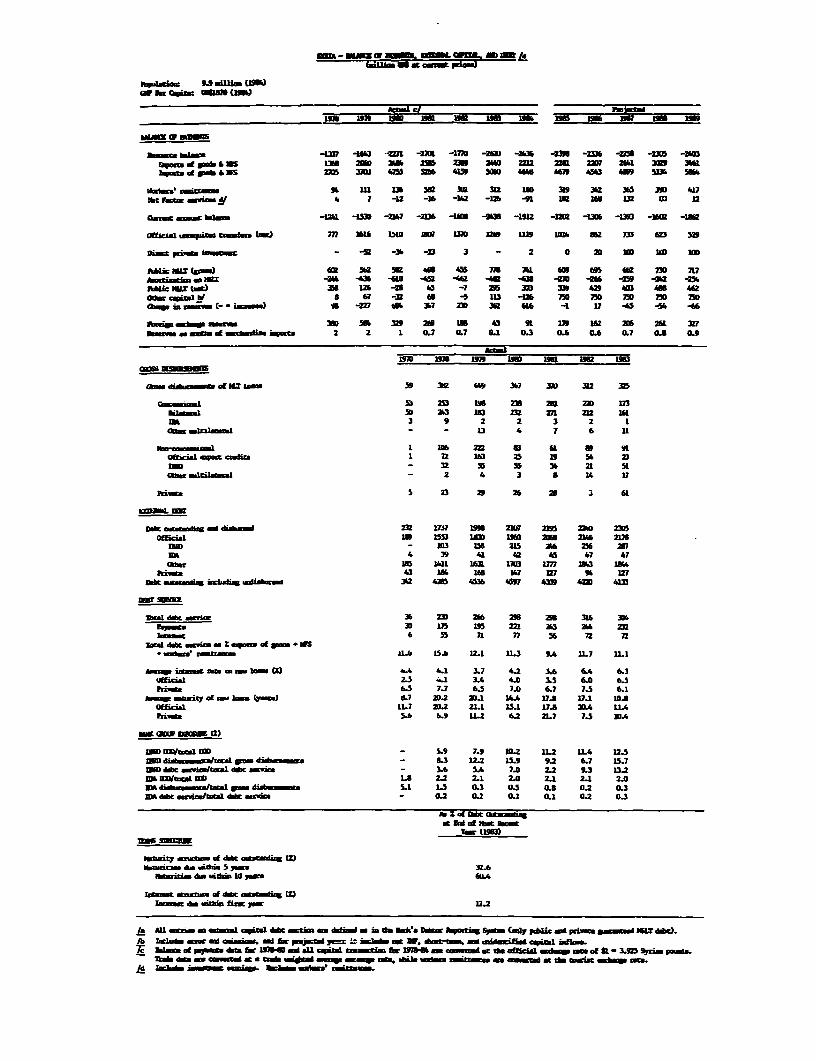
MIA - m w . - 7
ats~~~~~~~~~~~~Wk e a
-~~~~ C/ -83 DIrapastim m 91 MW 16 1ff MU MOiMU 16 51(MO19
Ba.nme ba a -17 -1613 --Ml -M1 -1770 -2J2 -M -M -136 - -23 -am
- *t Eo S D32 21O 5 22U 233 211 212 Z5 22D7 2 31 :1 311of ap. l 21 0 3XU 1 475 23 435 SIlle 9 69 4n 'S 5. I 5
' x % 111 t 3'. 51 23 312 1U0 319 312 AS 397 4.17kF yrac rwiosdl I 7 -2 -16 -LA2 -I2 91 lf Ift 132 0 12
wm m b-me -UIM 1D W- -213 -195 -" -112 -123 -13 -I3 -10Z -18-2
Ornfia_ quu.sa x.rs m 1611 135 N 13n 2m no9 w ' mu m an 33
U i iU e - 1 -331 -23 3 - 2 0 21 llD 11 100
Ihic 31 (mE am %12 W Im 453 731 741 6s lBS 012 730 n7_zrciamti 1g x -20 -4 -610 -w -42 -. -43 -M -M -059 -312 -72
;clh DMc(w) 13 121 -2J 45 -7 295 313 313 42 am A 42wdor c*tnl 6 67 -3 6 -5 113 -1n 73 750 D5 D 5 750Om in X C- - iszmm I -2 am 31.7 MD 367 61 -1 17 - -54 46
routap *_ld 38D 551 329 211 U 43 91 i9 162 36 211 327__a - f _mmiin iStB 2 2 L Q.7 0.7 L1 0.3 0.6 Ca 0.7 o.a 0.9
-- minmsim~~~~~~~~~~~~IOBm M nwi imiCFOM~~~~~~~~~B lSI D 1 t1I^ZD
VAwp diab co IZ - 59 32 4 9 7 310 312 in
Qxmmmuava D5 2S3 I3v Z1 231 21D 13Em_ i xi 2 I3 n 23 27 212 11
53 3 9 2 2 3 2 1cam-lt_1 - - 13 4 7 6 11
_ Ss1 mmLaml I Y6 212 U 61 *9 'aftida1.suanic 1 12 163 75 19 54 23mU - 3Z 55 53 31 21 51Otg ziJa m - 2 4 3 8 UI 17
ki_t"Ce5 23 2D 9 21 25 ; 1
D-eb a _t j dial,_d 2} 17J 1m 21D 2195 2 1 2375oeial 13 Lin Dm I60 D 25 21W6 2178
DM - 133 Ls6 2135 IS 76 217ML 4 39 41 '2 43 47 47
C15. 09 Wl1 1631 143 D777 13.3 73.'hi. 43 1If 16 V7 127 9 127
.m- w imbudismdisbwm 352 M 431 4597 4339 47 433
dml 46sc i 3b D 3D 236 29 as 31s 3011 S 3D 175 175 221 A3 21' 273
.cumaK 6 S 5 1 77 56 72 72
* so * imm. 15.6 12I 11.3 9.4 11.7 1LI
_R i C Um - m .O 4.1 3.7 4.2 3. 6.4 6.3Ufficial 2.5 4.1 3.1 4.0 3.5 L0 6.5hri_.t 6.5 7.7 6.5 7.0 6.7 7.5 6.1_O _aqtY Of 3s VWWJ d.7 2e.2 1D.1 2. 1 7.8 17.1 10.8Official IL7 2.2 2LI Oa1 17VA 2L4 IL4p,js 53. b.9 1.2 6.2 2L7 7.5 BL4
IM MDI-I COD - 5.9 7.9 10.2 IL2 L4 12.5nMD di/bEc?ocU pws di*m .s - .3 12.2 15.9 9.2 6.7 15.7OM dc t db e - 3.' 5.4 7.0 2.2 9.3 13.2ML Usam 1u LA 2.2 2.1 2.0 2.1 2.1 2.0MA diIa/sZatal gm di*qwu_t 3.1 15 0.3 0.5 ELI 0.2 0.3m3 debtg /iafftal d*t* macm - 0.2 0.2 0.1 0.1 0.2 03
at ral of Ibac bcwt
mo.ii isa .. tidai S Y 3.6
Ibum bmZ.m of da~m 10 m 51dL4
ammmc an m~alu brm yw 12.2
/a AU cno an mm1m aqizl dA OCtdM MO dif4W 80 3m Ia 3.iea Dmr Amtf (iCody public ad wI sgmem MU 35
ad O 1 od for-'-3m m W. - - ifid cpi-I imfim.=~1sc P-, dil fo 1976306a all cq.i3I tmmintks fag 29M141. cowmmmi st do official ogN mof &1 - 3.973 Sy.m p..
.4 1=3mn * mnssmaw.6 &Cltfi MA M MW
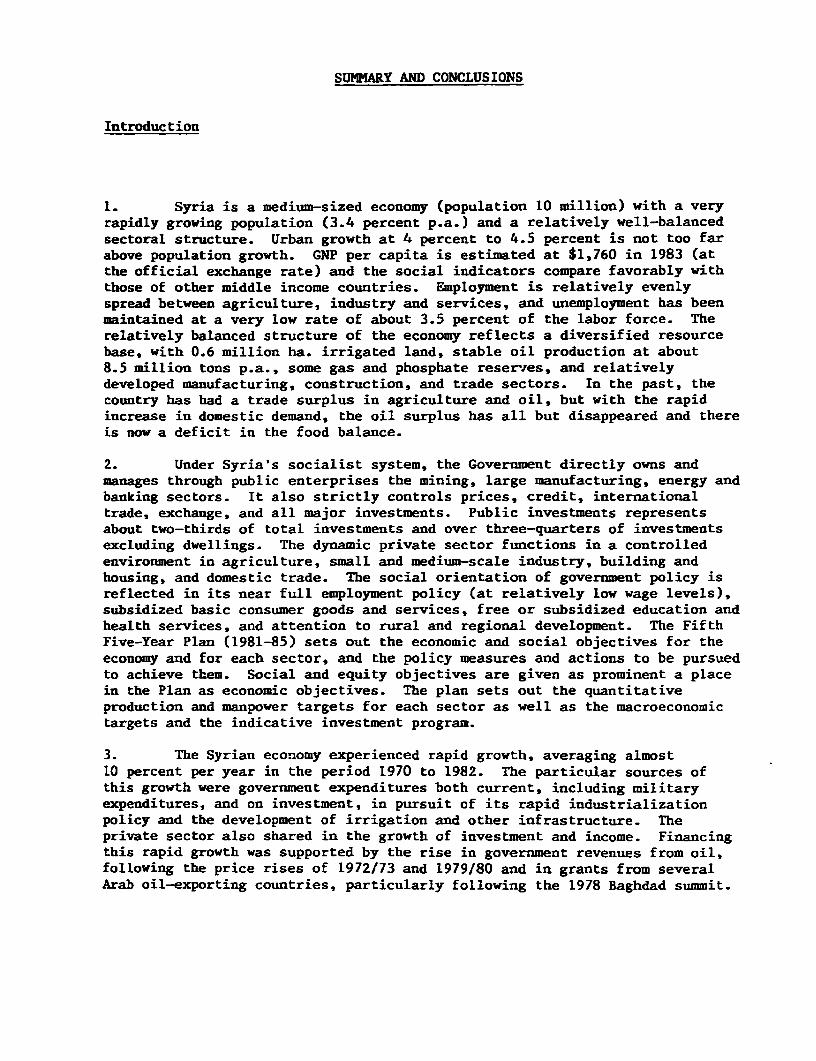
SUMMARY AND CONCLUSIONS
Introduction
1. Syria is a medium-sized economy (population 10 million) with a veryrapidly growing population (3.4 percent p.a.) and a relatively well-balancedsectoral structure. Urban growth at 4 percent to 4.5 percent is not too farabove population growth. GNP per capita is estimated at $1,760 in 1983 (atthe official exchange rate) and the social indicators compare favorably withthose of other middle income countries. Employment is relatively evenlyspread between agriculture, industry and services, and unemployment has beenmaintained at a very low rate of about 3.5 percent of the labor force. Therelatively balanced structure of the economy reflects a diversified resourcebase, with 0.6 million ha. irrigated land, stable oil production at about8.5 million tons p.a., some gas and phosphate reserves, and relativelydeveloped manufacturing, construction, and trade sectors. In the past, thecountry has had a trade surplus in agriculture and oil, but with the rapidincrease in domestic demand, the oil surplus has all but disappeared and thereis now a deficit in the food balance.
2. Under Syria's socialist system, the Government directly owns andmanages through public enterprises the mining, large manufacturing, energy andbanking sectors. It also strictly controls prices, credit, internationaltrade, exchange, and all major investments. Public investments representsabout two-thirds of total investments and over three-quarters of investmentsexcluding dwellings. The dynamic private sector functions in a controlledenvironment in agriculture, small and medium-scale industry, building andhousing, and domestic trade. The social orientation of government policy isreflected in its near full employment policy (at relatively low wage levels),subsidized basic consumer goods and services, free or subsidized education andhealth services, and attention to rural and regional development. The FifthFive-Year Plan (1981-85) sets out the economic and social objectives for theeconomy and for each sector, and the policy measures and actions to be pursuedto achieve them. Social and equity objectives are given as prominent a placein the Plan as economic objectives. The plan sets out the quantitativeproduction and manpower targets for each sector as well as the macroeconomictargets and the indicative investment program.
3. The Syrian economy experienced rapid growth, averaging almost10 percent per year in the period 1970 to 1982. The particular sources ofthis growth were government expenditures both current, including militaryexpenditures, and on investment, in pursuit of its rapid industrializationpolicy and the development of irrigation and other infrastructure. Theprivate sector also shared in the growth of investment and income. Financingthis rapid growth was supported by the rise in government revenues from oil,following the price rises of 1972/73 and 1979/80 and in grants from severalArab oil-exporting countries, particularly following the 1978 Baghdad summit.
- ii -
Signs of overheating of the economy appeared in the latter part of the period,as a substantial jump was recorded in the budget deficit and in that of theexternal current account, and inflationary pressures increased.
4. Following the very rapid growth in the twelve-year period 1970-1982,GDP growth slumped down to 3.2 percent in 1982, stopped in 1983 and dropped byan estimated 2 percent in 1984. This compares with the Fifth Plan (1981-85)objective of 7.2 percent p.a growth. The slowdown in 1982 and reversal in1983-84 were mainly due to poor agricultural crops and related drop in trade,transport and other non-government services, combined with stagnation inpetroleum and mining, and a fall in value added in manufacturing andutilities. This occurred despite a substantial growth in production in theselatter sectors, reflecting the high level of subsidies and price distortion.The major growth sectors were government services, which continued to grow(though at a decelerating rate), and construction by the private sector in1982 and 1984.
5. In addition to the slowdown in output in 1982 to 1984, totalavailable resources have been constrained by a substantial decline in netimports of goods and services, which dropped from 16.6 percent of GDP in 1981to 10.6 percent in 1982, 13.7 percent in 1983 and 11.4 percent in 1984 (incurrent prices). The result of the constraint in total available resourceswas a slight reduction in the share of private consumption, a correspondingrise in that of public consumption, to about 20 percent of GDP, while that ofinvestment remained stable at about 21 percent of GDP at current prices.Gross domestic savings improved somewhat but remained quite low at 12 percentof GDP in 1982 and 1984, and lOZ in 1983. National savings, however,including net factor income and transfers, were much higher, representing18 percent to 20 percent of GNP, thanks to workers' remittances andparticularly to the large level of external grants.
6. A major factor behind the overall resource constraint and thebudgetary constraint in 1982 to 1984 has been the drop in the level ofexternal grants to the public sector. These grants dropped from $1.8 billion(10.4 percent of GNP) in 1981 to $1.3 billion (6.7 percent of GNP) in 1983 and$1.2 billion (6.2 percent of GNP) in 1984. Together with public demand risingat a faster rate than domestic revenues and GDP in 1982 to 1984, this createda large overall budgetary deficit of about 9 percent of GDP in 1982-83 andalmost 16 percent in 1984. The budgetary gap was financed very largely byborrowing from the Central Bank, leading to a rapid increase in money supplyand increased inflationary pressures. The retail price index, despite strictcontrol of many elements, rose by over 14 percent in 1982, 6 percent in 1983,and 9 percent in 1984. It rose further in 1985.
Public Sector Finance
7. A balance in current domestic revenues and expenditures and largeoverall budget deficits (including investment expenditure) have been aconstant feature of Syrian public finance until 1984. The overall deficitexcluding grants was about 16 percent of GDP in 1981 to 1983. Includinggrants, the overall deficit as a share of GDP was over 9 percent in 1982 and
- iii -
1983 and almost 16 percent in 1984, due to a large drop in revenues. Thelarge structural deficits in Syrian public finance are the result ofpersistently high levels of expenditures on investment, defence expendituresand subsidies on the one hand, combined with low taxes, low public enterpriseprofits (apart from oil) and declining external grants on the other. Overall,public expenditures as a share of GDP were at roughly the same level in 1984as in 1980. On the revenue side, tax revenues rose significantly *n realterms in 1980-84 (raising their share from 10 to 12 percent of GDP), whilenon-tax revenues (representing mainly the current surpluses of the oilindustry and financial public enterprises) fluctuated between 15 percent to17 percent of GDP in 1980 to 1983 but dropped sharply to 12.4 percent in1984. The share of external grants in total revenues including grantsdeclined continuously from 41 percent in 1979 to 21 percent in 1983 and 1984.The ratio of external grants to defence expenditures also dropped from over100 percent in 1979 to two-thirds in 1980-81 and one-half in 1982-83.
8. On average, one half of the overall budget deficit in 1980-83 hasbeen financed by external grants from neighboring oil exporting countries(mainly Saudi Arabia, but also Kuwait, UAE, Qatar, Libya and Iran). Thisratio dropped to less than 30 percent in 1984. The balance was financed verylargely by domestic borrowing, and to a much lesser extent (except in 1981) bynet borrowing from external sources. External borrowing increased in 1984,with disbursements estimated at $406 million (compared with $325 million in1983).
9. In attempting to contain the persistently large overall deficitssince 1980, the Government has taken a series of measures to increase revenuesand contain the rise in expenditures. Tax Revenues increased at an average of20 percent p.a. compared with 18.5 percent p.a. growth of nominal GDP,implying a tax buoyancy of 1.08 during 1980-83. The rise in tax revenues wasparticularly notable in 1982 and 1983 and continued in 1984. This was theresult mainly of a rise in the profit tax payment by public enterprises andparticularly by the oil sector and also of measures taken by the government toimprove tax administration and collection efforts. The tax base was enlargedparticularly through discontinuing exemption of public enterprises from theprofit tax, starting February 1982; unpaid taxes after that date areconsidered loans bearing low interest. Also, starting August 1984, arrearsdue to the government by public enterprises (estimated at over SL5.6 billion),were to be settled by 1986 according to agreed payments plans; this isexpected to add SL 1 billion to 1984 revenues and 3.5 billion in 1985.
10. Non-tax revenues have increased more rapidly than tax revenues, theirgrowth averaging 26 percent p.a. during 1980-83. The bulk of these revenuesrepresented the "surpluses" of public enterprises, which include both theirnet profits as well as their liquidity surpluses (representing depreciationallowance and provisions not allocated). Most of these surpluses weretransferred by the petroleum sector enterprises and the banking and financialenterprises. The main measures taken by the Government to achieve this resultwere the 1982 price adjustment of petroleum products, cement (as well asunrationed rice and sugar) and the efficiency drive that the ministries incharge have undertaken to raise production (to reach a target of at least85 percent capacity utilization) and to reduce costs.
- iv -
11. The financial surpluses of the public enterprises as a group weresufficient to finance the bulk of their investments: 98 percent in 1981,78 percent in 1982 and 97 percent in 1983. This however disguises the factthat the surplus of the oil sector has in effect financed the investment ofother sectors. Nevertheless a good part of investments by individual publicenterprises were financed directly out of their gross profits after tax. Theself-financing ratio outside the oil sector rose from 17 percent in 1981 to27 percent in 1982 and 24 percent in 1983.
12. Current expenditures have been difficult to contain despitesubstantial efforts made by the government since 1980, when currentexpenditures had jumped up by 70 percent. In 1980 to 1983 their growth rateslowed down to an average 11.8 percent p.a. in nominal terms and their levelwas about the same in real terms. A major action to achieve this was thefreezing since 1981 of the scales of government salaries and wages and thoseof public enterprise in nominal terms, while the cost of living has risen by40 percent between 1980 and 84. Nevertheless, the total government wage billcontinued to increase as employment grew in defence and the administration(which incidentally helped to maintain full employment in this period). Inaddition, the government considerably slowed down expenditures on social andeconomic services after 1981 and planned for reductions in their nominal levelin the 1984 budget. Finally, price and other subsidies, including productionsubsidies of public enterprises, which had reached the high level ofSL 4.5 billion (equivalent to 6.8 percent of GDP) in 1981 were reducedconsiderably in nominal terms in 1982 and 1983 (to 5.4 percent and 5.8 percentof GDP) and were planned to be reduced further in the 1984 budget. (Not allsubsidies appear in the budget; a substantial part is borne by theStabilization Fund, which subsidizes prices of essential consumer goods andcovers its subsidy by surcharges levied on other goods).
13. The principal measures taken to reduce subsidies in this period werethe sharp increases in prices of petroleum products in August 1981 and inJuly 1982, which together with the decline in international prices reduced theprice subsidy on oil products accounts from SL 2.5 billion in 1980 toSL 0.8 billion in 1983. The remaining fuel subsidy applies mainly to butanegas which is sold to households at 50 percent of production cost. Cementprices were also raised to cover costs. Price subsidies on consumer productswere contained by raising the prices of better quality bread and unrationedrice, although subsidies remain on bread, sugar, rice and vegetable oil. Amajor remaining subsidy is that on electricity, where tariffs, unchanged since1981 cover only about two-thirds of electricity's operating costs. In early1985 the government raised tariffs on larger household and commercialconsumers, which is expected to raise revenues by 7 percent. Larger priceincreases are needed in all categories to slow consumption and cover costs.So-called economic subsidies to agricultural producers, and to certainindustries, such as fertilizers and paper, also remain a heavy burden on thegovernment and public enterprise accounts.
14. Capital expenditures by the public sector have risen at 5Z and 7Zcurrent prices in 1983 and 1984, or less than the rate of inflation, as partof the effort to contain the growth of total expenditures. It is expectedthat they will remain at approximately the same level in 1985. Substantial
expenditures were made on large infrastructural and industrial projects underthe previous plan. The public investment policy followed under the currentFive-Year Plan (1981-85) has been to focus on completion of ongoing projectsand not to start new large projects. Among the large completed projects inthis period are the fertilizer complex and paper pulp plants and a textileplant, the Banias oil refinery, a large cement plant and two large electricpower plants. Large ongoing projects include a barrage on El Kebir River, theHoas-eama water and sewerage project, Latakia-Tartous and Deir Ezzor-Abukemalrailways, Tishrin University and several highways.
15. It is clear that the prospects of reducing the budgetary deficit in1985 and beyond in the face of uncertain levels of grants will depend upon thereinforcement of the revenue raising fiscal policy of 1984 and on furthercontainment of current expenditures. The government is clearly awar', of theissue, as witnessed by the measures it has taken in the last few years toraise revenues and reduce subsidies, and the efforts deployed to improve theefficiency and profitability of the economic public enterprises. Given acontinued freeze of public salary scales, and continued economLes in spendingon administrative materials and social and economic services, the only largeexpenditure categories that remain are subsidies and defence expenditures(debt servicing is considered inflexible). Defence expenditures lie outsidethe scope of an economic analysis, although there is a link between theirvolume and the volume of external aid extended by neighboring Arab countriesin support of Syria's defence expenditures. As noted earlier, the ratiobetween the two has shifted considerably, with an increasing share of thedefence burden being carried by domestic resources.
16. Subsidies are the largest single category of expenditure (besidesdefense) which weigh on the budget. On their own they were equivalent toalmost two-thirds of the deficit including grants in 1981-83. Their reductioncould therefore make a substantial contribution towards bridging the budgetarygap. Price adjustments of various consumer prices have been periodicallymade, but the length of the intervening periods points to the well knowndifficulties and pressures against making such adjustments as well as to theinherent weakness of the adjustment process which aims at most at catching upwith the inflated prices of inputs. If subsidies for production purposes areto be reduced there needs to be a less inflexible and preferably a continuousand automatic process by which product prices adjust to changes in inputprices. Within the existing system, the effect of inflation on the size ofsubsidies can be reduced if prices of subsidized products are reviewedfrequently (say every 3-6 months) and adjusted automatically to the extentthat prices of inputs had risen. In addition, a program for the gradualreduction of the ratios between the cost of inputs and the price of outputneeds to be prepared and implemented. Such a reform, if applied particularlyto pricing of electrictity and butagaz, and to the production of fertilizers,would have a considerable impact in reducing total subsidies and hence thebudget deficit.
17. On the revenue side, the relatively low ratio of taxes to GDP of10-12 percent in 1980-84 point clearly to a considerable potential for raisingrevenues through reviewing tax rates, enlarging the tax base and improving
- vi -
collection. Direct taxes are particularly low on all sources of income andwealth, except for the profit tax which is largely paid by the publicenterprises. The planned introduction of a consolidated tax system, togetherwith better assessment and collection could improve tax revenues from theprivate sector. The main indirect taxes and dues which derive from importscannot be expected to rise considerably under the present exchange and pricesystems, due to the rigidity of the latter and the need to contain the rise inimports. A less rigid exchange and price system (without full tariffcompensation) combined with gradual liberalization of imports would result ina substantial rise in this source of revenue.
18. Increasing non-tax revenues and specifically the surpluses of publicenterprises is potentially the most important instrument, next to reducingcurrent expenditures, for correcting the budgetary situation. While thegovernment has made extensive efforts to raise their efficiency (throughmonthly and quarterly review of performance, worker incentive schemes, rewardsfor good management and penalties for failure etc.), the objective and focusof these efforts has been the achievement of physical production targets andnot financial performance. The latter is closely linked to the price systemas noted earlier (and in certain cases to inappropriate technology). A reformof the price system which reduces rigidities and produces small but frequentadjustments of price of inputs and outputs would not only reduce subsidies butalso supply a relatively objective measure of the efficiency of enterprises.
Prices, exchange and interest rates
19. On the price policy followed in Syria, the Five-Year Plan documentstates that "prices of domestic products and imported goods are determined onan economic basis (real cost), but that a final consumer price for all basiccommodities is determined on both social and economic considerations." Theseobjectives are of a general nature and leave a wide scope for interpretationor definition of specific policies. In the past year, as the resource andexchange constraints became tighter, a greater emphasis has been put by policymakers on real cost pricing and on compensating subsidized essentialcommodities with higher prices on other commodities. The pace of priceadjustments, however, has been slow and its impact on subsidies has beenmodest.
20. It would be desirable to reduce the inflexibility or "stickiness" ofprices of basic consumer goods and inputs through frequent small adjustments.This would seem a desirable objective as a means of reducing the budget andbalance of payments deficits and avoiding the effects of substantial andpainful price changes at long intervals with potentially wide repercussions onreal incomes and the allignment of relative prices. Flexible priceadjustments should also be feasible within the existing framework ofadministered pricing systems.
21. An appropriate price policy in Syria is clearly not only of directrelevance to narrowing the budgetary deficit, but it is also relevant tonarrowing the current account deficit of the balance of payments through itseffect on shifting demand for available tradeable resources from domesticconsumption to exports. In particular, restraining the rapidly growing demand
- vii -
for energy (oil products and electricity) at a rate far above the rate ofgrowth of GDP (9.4 percent p.a. for oil products and 15 percent forelectricity compared with 4.3 percent p.a. for GDP during 1980-83) can beachieved by raising the prices of energy products in relation to that of otherdomestic goods and services. Such restraint in domestic demand for energywould translate into increased net exports of oil and oil products. Inaddition to relative price, the level of oil prices, while generally aboveinternational prices at the official rate of exchange ($1 = SL 3.95), would beconsiderably below international prices if calculated at the parallel marketrate ($1 = 5.45) 1/. Similarly, the price of imported raw material or otherimports used by domestic industry and agriculture are understated at theofficial exchange rate and hence tend to lead to understating the relativeprice of domestic products in which they are used.
22. Concerning the exchange rate, the Plan's policy to set it so as toencourage exports and transfers has been partly successful following theintroduction of a fixed parallel market rate for private transactions and atourist rate for transfers and tourism. It has been less successful inpromoting exports of goods, except for textiles, or in rationalizing domesticprices. The use of several rates makes the objective of rationalizingdomestic prices on a real cost basis extremely difficult to determine or toimplement. In an economy as open as that of Syria, maintenance of a low rateof exchange for a substantial part of external transactions encourages theexcessive use of imports at that rate and tends to result in windfall profitsto some importers as well as to encourage illegal imports by those who cannotobtain licenses. To reduce the distortion in domestic relative pric-s arisingfrom the use of several exchange rates, it is desirable to seriously considerintegrating the official exchange rate with the parallel market rate at adepreciated level as a first step. The budgetary implications of such a stepwould have to be considered. Secondly, as in the case of domestic pricedetermination and for the same reasons, it would be desirable to introduceflexible and frequent reviews of the unified rate to reflect changing economicconditions and to bring about a closer balance between the availablity anddemand for foreign exchange.
23. Interest rates are generally low in Syria compared with internationallevels or with the domestic inflation rate. They had been adjusted upwards inFebruary 1981, but remain negative in real terms (i.e. as adjusted forinflation) with the highest lending rate being 9 percent p.a. and the lowest2 percent. Private current account deposits carry 4 percent interest andpublic deposits 2 percent, but advance import deposits carry no interest.Time deposits of 6-12 months earn 7 and 8 percent respectively and interest oninvestment bonds is used by the government to finance public enterpriseinvestments Interest on other loans vary by sector and are lowest inagriculture and highest in real estate and range from 2-9 percent. Inindustry, interest ranges from 5.5-9 percent. While the higher interest ratesoutside agriculture and for the private sect-or are not too far below recentinflation rates, they would seem to be too low in agriculture and real estateand generally low for the public sector (except for investment loans, whichare not always serviced). As in the case of price administration it wouldseem desirable to adjust the rates more frequently, and to reduce
L1 In September 1985 the Government announced a 38 percent increase in pricesof gasoline and 50 percent in those of diesel and kerosene.
- viii -
the gaps between preferential and nonpreferential rates. Real estate loansand commercial loans are prime candidates for allignment to a positive reallevel, given the strong demand and high return on these activities. It mayalso be useful to consider increasing mobilization of private savings by thegovernment through raising term deposit rates and issuing tax free treasurybearer bonds with an appropriate rate of interest, while removing the ceilingon the lending rate.
Trade and BaLance of Payments
24. Syria's overall balance of payments has turned from an overallsurplus of $220 million in 1979 to an overall deficit of $690 million in 1980.In the following three years, the overall deficit was reduced but still rangedbetween $230-370 million per year, with corresponding reductions in officialexchange reserves and an increase in net external liabilities. In 1984, theoverall deficit rose to about $600 million. Net foreign borrowing contributedlittle foreign exchange receipts until 1983 and 1984, when it reached over$300 million per year. The main sources of foreign exchange were exports ofoil, remittances of Syrian workers and entrepreneurs from neighboring oilexporting countries and official transfers from these countries in support ofSyria's defence expenditures. The main payments were for imports of capitalgoods and foodstuffs, as well as for crude oil refined in Syria.
25. The development of Syria's balance of payments in recent years hasbeen determined only partly by the industrial and trade policies Syria hasfollowed, and mainly by external economic and political developments which arenot under its control. The external developments find their origin in therapid rise in oil prices in 1979-81, followed by their continued erosionthrough 1985, and in the military tensions in the region which necessitatedlarge military expenditures abroad. The fluctuations in oil prices affectednot only Syria's revenues from its oil exports - by far the largest componentof total exports - but also the volume of remittances (private transfers)which Syrian workers and entrepreneurs could send from the oil exportingcountries, and the level of the substantial grants (official transfers) whichSyria received from the Gulf countries. Grants declined from their high of$1.8 billion in 1981 to $1.3 billion in 1983 and $1.2 billion in 1984(converted at the official exchange rate). Similarly, remittances of Syrianworkers and entrepreneurs dropped 20 percent between 1981 and 1983 and by afurther 30 percent in 1984. The continued weakness of oil prices (and rapidrise in domestic demand) does not presage well for the recovery of either netoil exports or revenues from external grants.
26. Oil exports declined gradually from $1.6 billion in 1981 to$1.3 billion in 1983, and $1.2 billion in 1984, as world prices declined andvolume continued to stagnate at about 8.5 millions tons. Oil imports alsosoared in value in 1979-81 both because of rising world prices and of rapidlyrising imports of light crude (which is mixed with heavy Syrian crude oil fordomestic refining; surplus refined products are exported). Oil importsstabilized after 1981 at about 6.5 million tons and their value eased asinternational prices dropped. As a result, the oil trade balance turned from
- ix -
a positive $600 million in 1980 to -440 million in 1983 and -$250 million in1984. In volume, the net trade balance in oil and oil products has alsodropped, from net exports of 3.4 million tons in 1980 to 0.9 million tons in1983 and only 0.1 million tons in 1984. The greater decline in value reflectsthe increasing share of higher priced imported light crude and exports oflower quality crude and fuel oil.
27. The rapid growth of imports during 1978-81 (at an average 27 percentp.a. in current dollars) was largely due to the growth of imports of oil andof capital goods. Since then, and through 1984, imports declinedsubstantially. This was the result of several factors, including, inparticular, the decline in oil prices, a slowdown in investments; greater useof domestic inputs in investments, the increasingly strict control of importof consumer goods and drawdown of stocks. Thus, excluding oil, importsdropped by 24 percent in current terms in 1982, and, following a rise in 1983,dropped in 1984 to the level of 1982.
Trade Policy
28. Syria's trade policy has emphasized import substitution through heavyindustrial investment and through agricultural incentives for such importedproducts as sugar and cereals. It also aimed at changing the structure ofexports in favor of semi-finished and manufactured goods rather than rawmaterials. Exporting was considered secondary to satisfying domestic needs,and export promotion was limited to tourism and other services (through apreferential exchange rate) and to "non-essential" commodities includingtextiles. The Fifth Plan put a slightly greater emphasis on exports. ltsquantitative targets for 1981-85 were 3.4 percent average annual growth forimports of goods and services and 6.5 percent for exports of goods andservices.
29. Under the strictly controlled trade and exchange system, the currentvalue of imports was in fact stabilized (except in 1981). Exports, however,declined in current terms but the structure changed as planned, with oilproducts rising rapidly up until 1982 and other manufactured products growing,particularly textiles which grew at 34 percent p.a. in current terms during1980-83. The decline in the overall value of exports was partly the result ofweak prices of oil and phosphates, but also of the lack of growth ofproduction in these sectors and in cotton, and, in the case of oil, of therapid growth of domestic demand for oil products. The closeness of the linkbetween the prospect for total exports and the investment policy in industryand agriculture, and with price policy in energy, is obvious. The incentiveand pricing system for the growing exports of manufactured products and foragricultural exports including cotton are also important subjects in anyfuture policy review which aims at promoting exports and redressing thecurrent account balance.
Capital Flows and External Debt
30. Net capital flow to Syria has been modest since 1978. Net directinvestment, mainly by foreign oil companies has been generally negative. Netshort-term flow of capital has averaged under $50 million per year up to 1983

but became negative in 1984. Net long-term public capital inflow, as recordedin the balance cf payments, showed a substantial decline and a negative netoutflow in 1982. In 1983 and 1984, however, receipts from long-term publiccapital jumped to $800 million per year while repayments remained at the 1982level, thus resulting in a net inflow of over $300 million per year. Thecapital flows recorded in the balance of payments include, however, receiptsand repayments in kind with the Eastern Bloc countries which offsettransactions in the trade and services but which are not included in the cashtransactions of the external public debt.
31. The overall balance of payments deficit has resulted in a small dropin gross foreign exchange and gold reserves but a substantial increase in netexternal liabilities. Gross reserves fell from $826 million at the end of1979 to $477 million at the end of 1983 and $463 million at the end of 1984,equivalent to 5 weeks of imports of goods and services. Net foreign assets of$274 million in 1979 turned into net liabilities of to $1.4 billion in 1983and $2.1 billion at end 1984.
32. Syria's disbursed and outstanding public debt (excluding defensedebt) amounted to $2,305 million at the end of 1983, equivalent to less than12 percent of GDP. Undisbursed commitments were $1,635 million. Of theoutstanding debt at the end of 1983, 75.7 percent was owed to bilateralcreditors, 18.8 percent to multilateral creditors, 5.5 percent to suppliersfinancial institutions. The largest multilateral creditors are the World Bankand the Arab Fund for Economic and Social Development. Bilateral creditorsinclude mainly Eastern bloc countries (39 percent of total debt), OECDcountries (19 percent), Arab countries and their bilateral agencies(16 percent) and Iran (4 percent). Debt (including undisbursed) owed to theWorld Bank reached $422 million (10.7 percent of the total), of which$287 million were outstanding. Debt owed to IDA, all disbursed, was another$47 million (2.0 percent of total).
33. Concessional financing played a dominant role in Syria's externaldebt with 77 percent of debt being on concessional terms. Debt serviceremained stable during 1978-83, and was $304.4 million in 1983, of which$231.7 million in amortization and $72.7 million in interest payments. Thisrepresented 12.0 percent of exports of goods and services. As a percentage ofgoods, services and official transfers, the debt service represented only8 percent in 1983.
Policy Issues for Medium-Term Prospects
34. As stated earlier, Syria has made impressive progress in the pastdecade in raising its gross domestic product, expanding its economic andsocial infrastructure and ensuring the basic needs and employmentopportunities to the bulk of the population. In these achievements, Syria hasbeen the beneficiary of a diversified and moderately rich resource base, adynamic labor force, the substantial rise in the international prices of itsmain export, oil, in the early and late 1970's, and the considerable financialassistance of Arab oil exporting capital surplus countries. It also profitedfrom the enormous opportunities for employment, trade and construction in theoil countries.
- xi -
35. Syria starts the second half of the 1980's with these substantialeconomic assets, but with a net oil surplus that has disappeared and with adecline in external financial assistance, along with the opportunities foremployment and exports in the oil countries. The shift in the high rate ofgrowth and in financial ease coincided with the falling of international oilprices starting in 1981, and has continued since. The persistent pressure ofhigh demand on declining resources in the last few years has inevitablyresulted in financial imbalances, both external and internal, suppressedinflationary pressures, and a growing need for quicker and more flexibleadjustments to a rapidly changing situation. More radical adjustment measureswould be needed to correct the imblances and protect the economy against theeffects of further possible reduction in external grants.
36. In the domestic budget, a reduction of subsidies, particularly onelectricity and fertilizers would seem essential; subsequent frequentadjustment to price changes would be required. Investment expenditures wouldhave to be compressed and the profitability of public enterprises and theirtransfers to the budget has to be improved further.
37. To raise the low level of savings and restrain the less productiveinvestments, somewhat higher interest rates are needed, particularly ondeposits and on medium and long-term credits in agriculture and construction.Higher deposit rates, if combined with an appropriate exchange rate, shouldattract a greater volume of transfers from Syrians abroad. In the area ofprivate consumption, a liberalization of the price system for all but rationedbasic goods would be a more effective means of restraining consumption,stimulating production of better quality goods in high demand and improvingthe profitability of public enterprises. Prices of inputs produced by publicenterprises would also need to be liberalized. A general and gradualrelaxation of price rigidities would ease the adjustment process and wouldprobably release the dynamic energies of private enterprise both in hedomestic and export markets.
38. To correct the imbalance in the external accounts and guard against apossible future drop in external grants, an appropriate rate of exchange isneeded to promote exports and restrain imports. Such an adjustment shouldalign import prices more closely with domestic prices of substitutes; itwould also reduce windfall profits or illegal imports and encourage legalrecording of exchange transfers from immigrant workers. In this area, theunification of the official and parallel market rates at a depreciated levelshould be seriously considered, to be followed shortly by several upwardadjustments leading to the unification of all rates at a realistic level. Therecent deterioration in the balance of payments situation suggests the need toaccelerate the unification of the rates. Flexible adjustment thereaftershould take account of the balance of payments situation and of domestic pricechange- relative to international prices. Export promotion could also includeincentives to private exporters, e.g., through an exchange retention scheme,export credit facility, technical support and market intelligence services,etc.
39. Besides the exchan-e rate adjustment and export promotion policies, aset of policies needs to be devised to restrain domestic demand for exportablegoods and to support the increase of production for export, including, in
- xii -
particular, investment policies in oil and agriculture. These policies in theoil sector would include adjustment of oil product prices along with theexchange rate to maintain their relationship to international prices so as torestrain domestic consumption and shift part of that demand to exports,greater investment in oil exploratisd and the rapid exploitation of gasresources that would substitute for exportable oil. Adjustment of electricitytariffs would also restrain domestic demand for oil products and raise theirnet exports. In agriculture a lot depends on Syria's success in exploitingthe large potential in irrigated agriculture in the northeast and theimprovement of agricultural productivity so as to increase exports as well asfeed the rapidly expanding population and restrain the growth of the foodimport bill (agriculture has been given higher share since 1983 in the publicinvestment program). Given the overall financial constraint, such policieswould require a shift in public investments from social and economicinfrastructure and industry to quickly productive investments in the oil, gasand agricultural sectors.
40. The economic prospects in the medium and long term will depend partlyon the actual price, demand management and investment policies that will befollowed, particularly in relation to the exchange rate, electricity tariffs,food prices, and investments in agriculture and oil and gas sectors. Theappropriate mix of policies should result in raising the productivity of thepublic enterprise sector as well as in stimulating private investment andoutput for export. However, future prospects will also depend on severalother important factors all of which are not subject to economic policyadjustments. First is Syria's ability to adjust current expenditureseffectively to the changing level of external grants. Second is the extent ofthe recently discovered gas and oil reserves and the speed of theirexploitation. Third is the extent to which external borrowing and directinvestment will make up for the shortfall in national savings in financing theminimum investment level.
The Medium-Term Projections
41. The medium-term projections assume the effective and earlyimplementation of the macroeconomic policies outlined earlier and whichrequire substantial corrective action on prices exchange rate and publicexpenditure. On these assumptions, it would be possible for the Syrianeconomy to continue to grow at 4.1 percent p.a. in the period 1983-88 and at5.0 percent beyond 1988, while correcting the financial imbalances in themedium term. The main sources of GDP growth would have to come fromagriculture, oil, manufacturing industry and non-government services. Thekeys to achieving this rate of growth is the expansion of agricultural and oilproduction and the improvement of the productivity of the manufacturingsector. Government services (current expenditures) are assumed to grow at2 percent p.a. only compared to 4 percent in the past. Based on the latestestimates of the recent finds of oil and gas, the oil and gas sector wouldgrow at 8 percent p.a. in 1983-88 and 7.2 percent p.a. thereafter. Theprojected growth of value added in the electricity and chemical sectors arereflected in the reduction of subsidies and corresponding rise in net indirecttaxes.
- xiii -
42. With net external resources falling rapidly at 4 percent p.a. in1983-88, total available resources would grow at about 3.5 percent p.a. in theperiod. This, together with the modest drop in investment, would allowconsumption to grow at 2 percent in the oublic sector and 4.7 percent in theprivate sector. This compares with a nrAtural population growth of 3.9 percentp.a. In the period following 1988, thie higher GDP growth rate would allow aresumption of investment growth at 5 percent p.a. as well as 5 percent annualgrowth in private consumption.
43. Public finance projections show that the overall budget deficitexcl-ading grants would be reduced from 17 percent of GDP in 1983 to2.7 percent in 1988, and including grants, from -9 percent to 0.5 percent. Inabsolute terms this means a reduction of the deficit from SL 6.4 billion in1983 to a small surplus of SL 0.4 billion in 1988 (in constant prices) and agrowing surplus after 1990, which would finance part of investments. Thisimprovement in public savings would be achieved despite the assumed decline ingrants from SL 5.8 billion in 1983 to SL 2.9 billion in 1988, and further toSL 1.5 billion by 1992. The main measures that are assumed to achieve thisobjective are the rise in taxation at 1.1 times the rate of growth of GDP andthe rise of revenues from public enterprises at 0.8 times the rate of growthof industry. On the expenditure side the main measure would be to limitcurrent expenditure growth at 2 percent p.a. in real terms, and the reductionof subsidies on basic foods, electricity and production of public enterprisesto 40 percent of their level by 1988 and their elimination by 1992.
45. In the projection of external accounts it is assumed that exports aresupported by the necessary production policies in agriculture and in oil andgas, and by price policy and export incentives as outlined earlier and thatthey would therefore grow at about 6.4 percent p.a. in volume in 1983-88 and5.2 percent p.a. in 1988-92. With fuel imports that cannot be compressed itwould be necessary to restrain the growth of food and intermediate imports, ifthe trade deficit is to be reduced and the growth of external debt containedwithin acceptable limits. This is more so, given the assumption on stableremittances in real terms and declining grants. The restraint of importswould require both the raising of the price of imports (through the exchangerate adjustment) as well as appropriate policies to raise domestic output ofsuch imports.
46. With these assumptions, tie deficit on goods and non factor serviceswould be reduced from $2.6 bill.:: in 1983 to $2.2 billion in 1988 but wouldrise to $2.6 billion in 1992 (in current dollars). Transfers and worker'sremittance would bring down the current account balance to be financed to$1.6 billion in 1988. However, rising interest payments on external debt anddeclining transfer would lead to a deficit of $2.7 billion in 1992.
46. To finance the deficit it is assumed that Syria would obtain newmedium and Long term commitments of $600 million a year (in real terms) onterms somewhat harder than in the past. This would seem feasible on the basisof past comnitments. Receipts from existing and new commitments and othercapital receipts would cover the bulk of the deficit up to 1988 leaving
- xiv -
$220 million to be financed from an increase in short-term credits andcommercial loans. However, even with the stringent import assumptions, theincreasing current account gap would lead to a rapid rise after 1988 in shortterm and commercial debt and in interest payments on that debt. This wouldtest Syria's ability to borrow large amounts on commercial terms and would notbe sustainable in the long run. The debt service ratio (as a percentage ofexports of goods and non factor services) would rise from 12.5 percent in 1983to 17 percent in 1988 and accelerate to 22 percent by 1992.
47. The projected acceleration of the debt service in the long run andits sensitivity to the growth rates of oil and gas production and consumptionand to raising output of agricultural tradeables point to the importance ofmaking the necessary adjustments in the sectoral investment pattern as soon aspossible to increase the production of these traded good:. 1
L also points tothe need of continued review of exchange, trade and price policies in the nextfew years so as to orient the economy more towards exports and restrainingdomestic demand for tradeable goods and services. This would seem necessaryif the external deficit and debt are to be kept at manageable levels in thelong run.
48. The recent sharp drop in world oil prices, if sustained in the nextfew years, would have a substantial negative impact on the balance ofpayments, gross national income and external debt situation. Assuminginternational oil prices average $15 per bbl in 1986 and would remain belowthat level in real terms until 1990, rising rapidly thereafter, then theprojected accounts as compared with the basic case would show littledeterioration in the balance of trade in the near future (because of theapproximate balance in the oil trade) but a growing loss estimated at$70 million in 1988 rising to $280 million in 1992 (as net exports increase).The overall deterioration in the terms of trade would represent a loss of 1 to1.4 percent of GDP in the years 1988-92. The deterioration in t-he balance ofpayments would create larger external financing requirements, which would pushthe debt service ratio to 20 percent in 1988 and over 30 percent in 1992. Ifthe drop in international prices of oil is not allowed to affect domesticprices and if the assumed rise in domestic prices of petroleum products andenergy prices is implemented as projected in the basic case then the reductionin the cost of oil imports (as compared with 1984) would mean a gain to thebudget and a corresponding reduction of its deficit of SL 2.5 - 3 billion peryear in 1988-92. The analysis clearly indicates the need for even greaterefforts than assumed in the base case to increase net exports of oil andraising domestic energy prices in order to reduce the budget deficit andprevent a deterioration in creditworthiness.
CHAPTER I - INTRODUCTION
A. The Economic Setting
1.1 Syria can be described as a medium-sized economy (population10 million) with a very rapidly growing population (3.4 percent p.a.) and arelatively well-balanced sectoral structure. Urban growth at 4 percent to4.5% is not too far above population growth. GNP per capita is estimated at$1,760 in 1983 (at the official exchange rate) and the social indicatorscompare favorably with those of other middle income countries. Employment isrelatively evenly spread (32:29:39) between agriculture, industry andservices, and unemployment has been maintained at a very low rate of about3.5 percent of the labor force. Output, however, is less evenly distributed,with agriculture accounting for 20 percent of total GDP, industry (includingmining and petroleum, manufacturing, construction and utilities) for24 percent and services for 56 percent. Government and trade account for thebulk of employment and output in the services sector.
1.2 The relatively balanced structure of the economy reflects adiversified resource base, with 5.6 million ha. of cultivatable land of which0.6 million ha. irrigated, stable oil production at about 8.5 million tonsp.a., some gas and phosphate reserves, relatively developed manufacturing,construction, and trade sectors, and a dynamic labor force and privateentrepreneurship. In the past, the country has had a trade surplus inagriculture and oil, but with the rapid increase in demand, the oil surplushas all but disappeared and there is now a substantial deficit in the foodbalance covered by imports (mainly cereals and sugar). Large transfers fromthe oil exporting countries of the gulf (in the form of grants and workers'remittances) have enabled Syria to finance a large current trade deficit andto maintain civilian external debt at a modest level.
1.3 Other structural characteristics of the Syrian economy derive fromits centrally planned socialist system, its social orientation and its highdefense requirements. Military expenditures, although alleviatedsubstantially (over 40 percent) by corresponding external grants, havemaintained a heavy pressure on public finance. Under Syria's socialistsystem, the Government directly owns and manages the mining, largemanufacturing, energy and banking sectors, strictly controls prices, credit,international trade, exchange and all major investments. Public investmentsrepresents about two-thirds of total investments and over three-quarters ofinvestments excluding dwellings. The system, however, has allowed a privatesector to function in a controlled environment in agriculture, small andmedium-scale industry, building and housing, and domestic trade. The privatesector is quite dynamic in industry, construction and trade and has developeda prospering market which complements or parallels and competes with that ofthe public enterprises in these sectors. The social orientation of governmentpolicy is reflected in its near full employment policy (at relatively low wagelevels), subsidized basic consumer goods and services, free or subsidededucation and health services, and attention to rural and regional development.
1.4 Institutionally, the economic activities of the Government areexercised through several thousand establishments of varying sizes found inall sectors. Apart from the large number in the utilities, trade and services

- 2 -
sectors some 900 establishments grouped under general organizations and a fewother entities form the core of the economic and public enterprises sector.Among the most important of these are the Central Bank of Syria and the sixbanks, the Syrian Petroleum Company, the two oil refineries, the SyrianAirlines, the Euphrates Dam Authority and several large trading,manufacturing, construction and distribution general organizations as well assome agricultural enterprises. The Ministries in charge of public enterprisesand the general organizations are expected to ensure that they achieve thequantitative production targets set by the Fifth Five-Year Plan (1981-85), andthat they show an operating profit except in specific cases which aresubsidized for social reasons. Their salaries and wages follow a nationalscale but with some bonuses. Prices of products are determined essentially onthe basis of cost plus a fixed profit margin (except in the subsidizedproducts).
1.5 The Fifth Five-Year Plan (1981-85) sets out the quantitativeproduction and manpower targets as well as the macroeconomic targets and theindicative investment program. It also sets out the economic and socialobjectives for the economy and for each sector, and the general policymeasures and actions to be pursued to achieve them. Social and equityobjectives are given as prominent a place in the Plan as economic objectives.Social objectives include reduction of illiteracy, full employment, ensuringbasic food necessities and adequate housing, income distribution, ruraldevelopment and regional balance. The economic objectives include a high rateof growth of productivity and production, raising the savings rate, reducingthe overall budget deficit and promoting exports. Sectoral objectives includereaching a positive agricultural balance, higher exploitation of mining andoil resources, energy conservation and increasing the efficiency of workersand institutions.
1.6 Social development and demographic growth in Syria have been quiteimpressive, as reflected in the Table of Social Indicators, and comparefavorably at present with those in other middle income countries. Nutritionallevels are substantially above the average. Mortality has declined by almosttwo-thirds over the past twenty years and life expectancy at birth (65 yearsfor males and 69 years for females) is above average for middle incomecountries and the highest in the region. With a stable and very high crudebirthrate (46 per thousand) and a very low death rate (7 per thousand) Syriahas one of the highest natural growth rates in the world (3.9 percent p.a.).The labor force has grown at an increasing rate and is projected to grow at4.4 percent in the next decaoe. The population pressure has been relieved inthe past decade by the rapid growth of employment in construction and in thepublic sector and by emigration to the booming oil-exporting countries in theGulf.
- 3 -
CHAPTER II - MACROECONOMIC DEVELOPMENTS
2.1 Syria's economy grew rapidly in the 1970's. The growth rate of GDPin real terms averaged almost 10 percent from 1970 to 1979, compared with4.9 percent during 1963 to 1970. All sectors shared in the rapid growth rate,with construction (17 percent p.a.) and Government (15 percent p.a.) being theleading sectors. Both public and private sector investments grew rapidly,rising in total from 13 percent of GDP in 1970 to 26 percent in 1979 (atcurrent prices). Development efforts were accelerated following the 1973October war, with emphasis on industrialization, irrigation and transport.The unsettled security conditions in the region led to a substantial rise indefence expenditures. Financing the rapid growth of public expenditures oninvestment and government services after 1973 was made possible by thesubstantial rise in government revenues from oil following the rise in oilprices in 1972/73 and in the grants from Arab oil-exporting countries,particularly following the Baghdad 1978 summit conference. In addition, theeconomic boom in the Gulf countries themselves led to a rise in private incometransfers of Syrian workers and entrepreneurs working there. Thecorresponding foreign exchange revenues have enabled Syria to cover the largerpart of its current account deficits, maintain a low level of debt and add toits current reserves. The very rapid growth of the 1970's continued into 1980and 1981, when GDP grew at 8 percent and 10 percent respectively, sustained bya new jump in oil prices, expanding government expenditures and a high levelof external grants. There were signs of overheating in the economy as thebudget and external deficit jumped up and inflationary pressures increased.
A. Resources and Uses
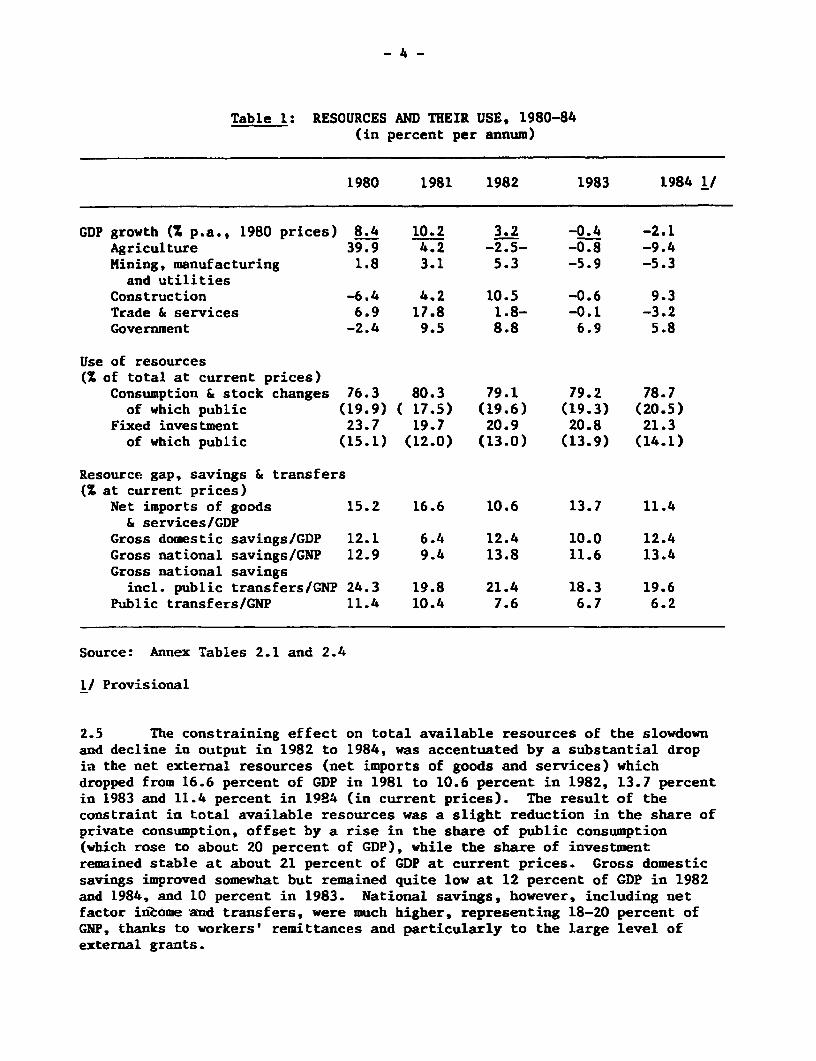
2.2 Following this very rapid growth over a period of twelve years, GDPgrowth slumped down to 3.2 percent in 1982, stopped in 1983 (-0.4 percent) anddropped by an estimated 2 percent in 1984 (Table 1). This compares with theFifth Plan (1981-85) objective of 7.2 percent average growth per year.
2.3 The slowdown in 1982 was mainly due to a 2.5 percent drop in valueadded by agriculture (due to a one-third drop in the value of cereals outputcaused by poor rainfall, which was not fully offset by substantial rises inlivestock, cotton and fruits), and to a related slowdown in trade andservices. Growth was maintained in 1982 thanks mainly to the industrialsector, with construcion growing at over 10 percent and mining andmanufacturing at over 5 percent.
2.4 The long-term growth trend was reversed in 1983 and 1984. Allsectors showed a decline in value added in 1983 except for governmentservices, which offset most of the declines. In 1984 a very poor harvest anda 5 percent decline in industry was only partly offset by a revival in theconstruction sector and by the continued growth in government. The decline invalue added in industry, despite a 5-6 percent annual overall growth inindustrial production and of 8-9 percent in manufacturing production(Table 8.1) is a major indicator of the large subsidies and price distortionsin the sector. The growth outlook for 1985 is likely to improve somewhatthanks to good agricultural crops, which should revive trade and services, andto continued growth in construction.
- 4 -
Table 1: RESOURCES AND THEIR USE, 1980-84(in percent per annum)
1980 1981 1982 1983 1984 l/
GDP growth (X p.a., 1980 prices) 8.4 10.2 3.2 -0.4 -2.1Agriculture 39.9 4.2 -2.5- -0.8 -9.4Mining, manufacturing 1.8 3.1 5.3 -5.9 -5.3and utilities
Construction -6.4 4.2 10.5 -0.6 9.3Trade & services 6.9 17.8 1.8- -0.1 -3.2Government -2.4 9.5 8.8 6.9 5.8
Use of resources(S of total at current prices)
Consumption & stock changes 76.3 80.3 79.1 79.2 78.7of which public (19.9) ( 17.5) (19.6) (19.3) (20.5)
Fixed investment 23.7 19.7 20.9 20.8 21.3of which public (15.1) (12.0) (13.0) (13.9) (14.1)
Resource gap, savings & transfers(X at current prices)
Net imports of goods 15.2 16.6 10.6 13.7 11.4& services/GDP
Gross domestic savings/GDP 12.1 6.4 12.4 10.0 12.4Gross national savings/GNP 12.9 9.4 13.8 11.6 13.4Gross national savingsincl. public transfers/GNP 24.3 19.8 21.4 18.3 19.6
Public transfers/GNP 11.4 10.4 7.6 6.7 6.2
Source: Annex Tables 2.1 and 2.4
1/ Provisional
2.5 The constraining effect on total available resources of the slowdownand decline in output in 1982 to 1984, was accentuated by a substantial dropin the net external resources (net imports of goods and services) whichdropped from 16.6 percent of GDP in 1981 to 10.6 percent in 1982, 13.7 percentin 1983 and 11.4 percent in 1984 (in current prices). The result of theconstraint in total available resources was a slight reduction in the share ofprivate consumption, offset by a rise in the share of public consumption(which rose to about 20 percent of GDP), while the share of investmentremained stable at about 21 percent of GDP at current prices. Gross domesticsavings improved somewhat but remained quite low at 12 percent of GDP in 1982and 1984, and 10 percent in 1983. National savings, however, including netfactor in-ome -and transfers, were much higher, representing 18-20 percent ofGNP, thanks to workers' remittances and particularly to the large level ofexternal grants.
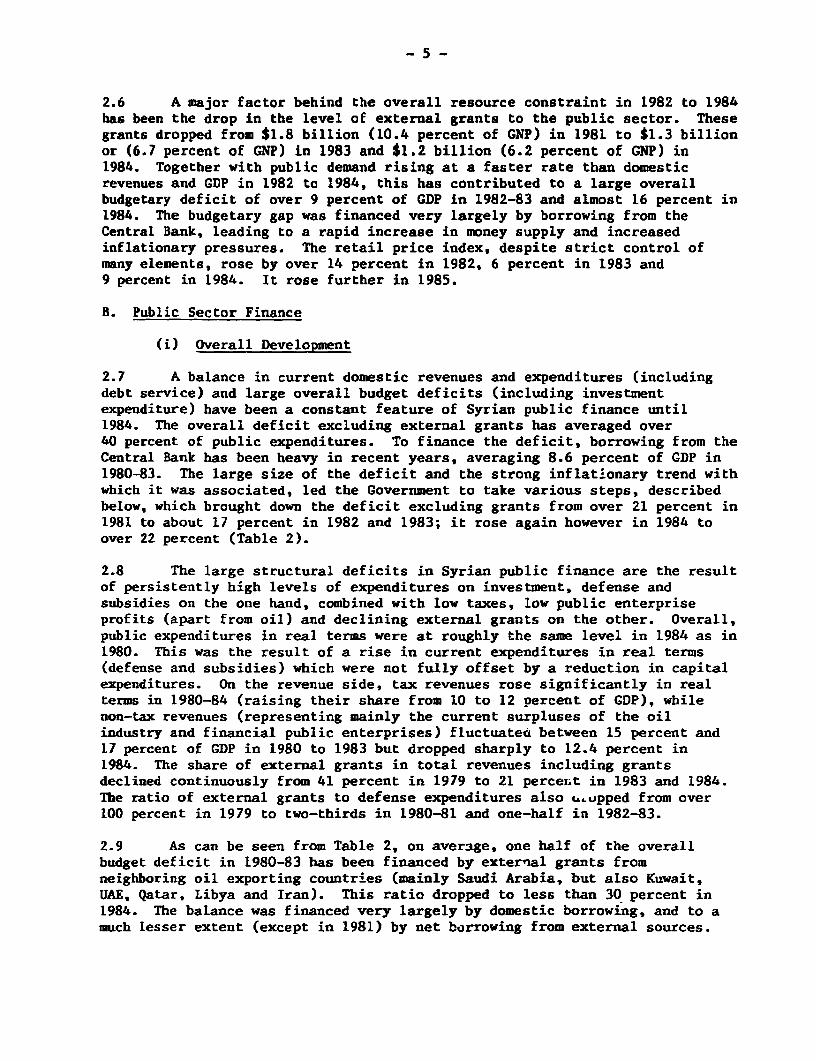
2.6 A major factor behind the overall resource constraint in 1982 to 1984has been the drop in the level of external grants to the public sector. Thesegrants dropped from $1.8 billion (10.4 percent of GNP) in 1981 to $1.3 billionor (6.7 percent of GNP) in 1983 and $1.2 billion (6.2 percent of GNP) in1984. Together with public demand rising at a faster rate than domesticrevenues and GDP in 1982 to 1984, this has contributed to a large overallbudgetary deficit of over 9 percent of GDP in 1982-83 and almost 16 percent in1984. The budgetary gap was financed very largely by borrowing from theCentral Bank, leading to a rapid increase in money supply and increasedinflationary pressures. The retail price index, despite strict control ofmany elements, rose by over 14 percent in 1982, 6 percent in 1983 and9 percent in 1984. It rose further in 1985.
B. Public Sector Finance
(i) Overall Development
2.7 A balance in current domestic revenues and expenditures (includingdebt service) and large overall budget deficits (including investmentexpenditure) have been a constant feature of Syrian public finance until1984. The overall deficit excluding external grants has averaged over40 percent of public expenditures. To finance the deficit, borrowing from theCentral Bank has been heavy in recent years, averaging 8.6 percent of GDP in1980-83. The large size of the deficit and the strong inflationary trend withwhich it was associated, led the Government to take various steps, describedbelow, which brought down the deficit excluding grants from over 21 percent in1981 to about 17 percent in 1982 and 1983; it rose again however in 1984 toover 22 percent (Table 2).
2.8 The large structural deficits in Syrian public finance are the resultof persistently high levels of expenditures on investment, defense andsubsidies on the one hand, combined with low taxes, low public enterpriseprofits (apart from oil) and declining external grants on the other. Overall,public expenditures in real terms were at roughly the same level in 1984 as in1980. This was the result of a rise in current expenditures in real terms(defense and subsidies) which were not fully offset by a reduction in capitalexpenditures. On the revenue side, tax revenues rose significantly in realterms in 1980-84 (raising their share from 10 to 12 percent of GDP), whilenon-tax revenues (representing mainly the current surpluses of the oilindustry and financial public enterprises) fluctuateci between 15 percent and17 percent of GDP in 1980 to 1983 but dropped sharply to 12.4 percent in1984. The share of external grants in total revenues including grantsdeclined continuously from 41 percent in 1979 to 21 percen.t in 1983 and 1984.The ratio of external grants to defense expenditures also u,upped from over100 percent in 1979 to two-thirds in 1980-81 and one-half in 1982-83.
2.9 As can be seen from Table 2, on average, one half of the overallbudget deficit in 1980-83 has been financed by external grants fromneighboring oil exporting countries (mainly Saudi Arabia, but also Kuwait,UAE, Qatar, Libya and Iran). This ratio dropped to less than 30 percent in1984. The balance was financed very largely by domestic borrowing, and to amuch lesser extent (except in 1981) by net borrowing from external sources.
- 6 -
2.10 In attempting to contain the persistently large overall deficitssince 1980, the Government has taken a series of measures to increase revenuesand contain the rise in expenditures. These are described below.
(ii) Revenues
2.11 Tax Revenues increased at an average of 13.6 percent p.a. comparedwith 9.7 percent p.a. growth of nominal GDP, implying a tax buoyancy of 1.40during 1980-84. The rise in tax revenues was particularly notable in1981-1982 but slowed down sharply in 1983 and 1984 (see Table 5.2). This wasthe result mainly of a rise in the profit tax payment by public enterprisesand particularly by the oil sector (see Table 5.3) and also of measures takenby the Government to improve tax administration and collection efforts,improve tax administration and arrears collection, widen the tax base andincrease a few taxes and surcharges. A scheme of prepayment of duties onimported cars and trucks was introduced in 1982 and 1983 and stricter controlof illegal imports and of import duty collection were exercised in 1984. Thetax base was enlarged particularly through discontinuing exemption of publicenterprises from the profit tax, starting February 1982. New taxes and raisesin tax rates were very few and included raising stamp duties in 1981 anddoubling (from 15 percent to 30 percent) the surcharges for the war effort onall taxes and duties except on income tax on wages and salaries.
2.13 Non-tax revenues have increased more rapidly than tax revenues, theirgrowth averaging 26 percent p.a. during 1980-83, but declined sharply by25 percent in 1984. The bulk of these revenues (94 percent in 1983)represented the "surpluses"' of public enterprises, which include both theirnet profits (68 percent of total) as well as their liquidity surpluses(representing depreciation allowance and provisions not allocated). Most ofthese surpluses were transferred by the petroleum sector enterprises(53 percent of total in 1983) and the banking and financial enterprises(17 percent of total in 1983) (see Table 5.4). The main measures taken by thegovernment to achieve this result were the 1982 price adjustment of petroleumproducts, cement (as well as unrationed rice and sugar) and the efficiencydrive that the ministries in charge have undertaken to raise producLion (toreach a target of at least 85 percent capacity utilization) and to reducecosts. 1/ In addition, starting August 1984, arrears due to the Gcvernment bypublic enterprises (estimated at over SL 5.6 billion), were to be settled by1986 according to agreed payments plans; this is expected to add SL I billionto 1984 revenues and 3.5 billion in 1985.
2.14 The financial surpluses of the public enterprises as a group weresufficient to finance the bulk of public investments: 98 percent in 1981,78 percent in 1982 and 97 percent in 1983. This however hides the fact that
1/ The rise in total surpluses however, should not be taken to reflect theimprovement in the efficiency of public enterprises because of the impactof administered prices of their inputs and outputs on theirprofitability. Excluding the petroleum and financial sector enterprises,for example, the surpluses of all other enterprises in 1983 were the samein nominal terms as in 1982, while the latter were 56 percent above 1981.The rise in the surpluses of banking and financial enterprises isattributable in part to the Government's introduction in April 1981 ofnon-interest bearing import deposits and of evaluation of some imports atthe parallel market exchange rate. It is also noted that the surplus ofthe petroleum sector enterprises rose in 1983 compared with 1981 despitethe decline in export prices of oil.
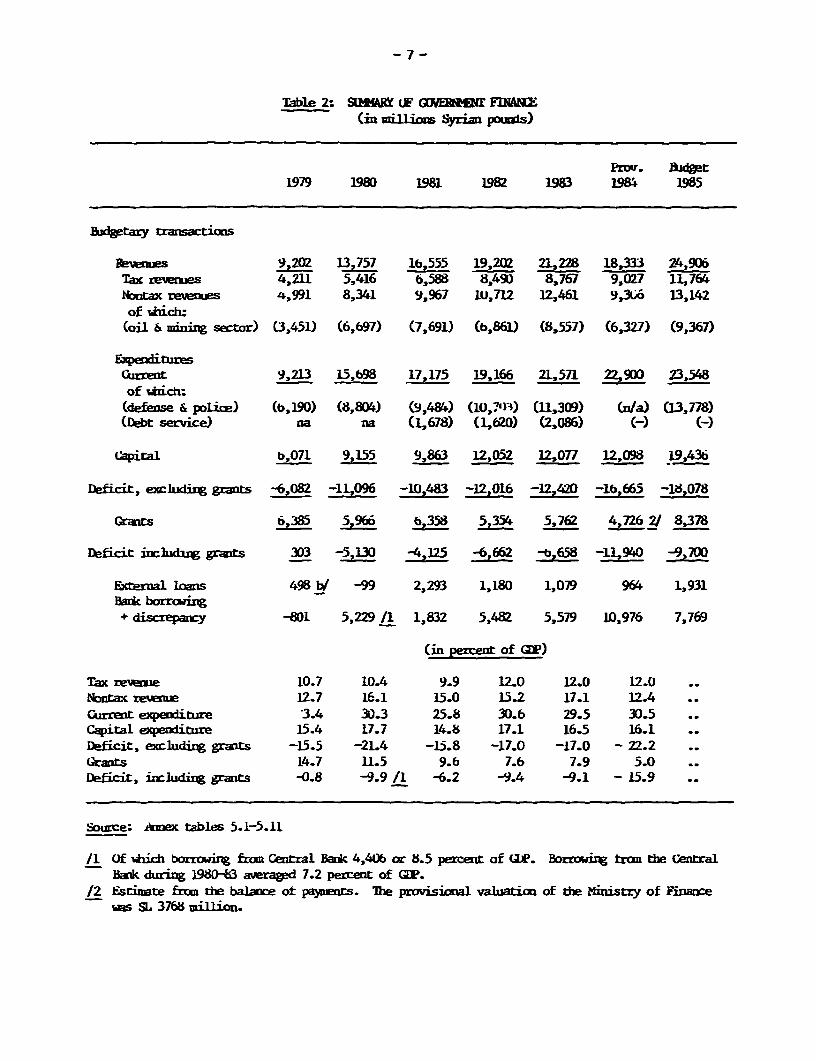
Table 2: SUMMABY iF GOYEREZ4th FINARNE(in millions Syrian potils)
Ptov. Bia0et1979 1980 1981 198Z 1983 198f 1985
hxwary Lansactloas
9,202 13,757 1,555 19,202 21,228 18,333 24,906Tax revemues 4,211 5,416 6,588 8,490 8,767 9,027 11,764NIotax revenues 4,991 8,341 9,967 IU,712 12,461 9,3X6 13,142of vhich:
(oil & mining sector) (3,451) (6,697) (7,691) (b,861) (8.557) (6,327) (9,367)
EipwdituresCurreat 9,213 15,698 17,175 19,166 21,571 22,900 23,548of which:
(defEnse & police) (b,190) (8,804) (9,484) (10,7')3) (11,309) (W/a) (13,778)(Debt service) na na (1,678) (1,620) (2,086) (-) C-)
Capiral b,071 9,155 9,863 12,052 12,077 12,098 19,436
Deficit, exchudinWg grants -6,082 -1,096 -10,483 - 12,016 -12,42D0 -lb,665 -18,078
(ranrs 6,385 5,966 b,35 5,354 5,762 4,7262/ 8,378
Deficit jinludang grants 303 -5,130 -4,125 -6,662 -b,658 -11,940 -9,700
External loans 498 b/ -99 2,293 1,180 1,079 964 1,931Bank borrmaing
+ disrepanczy -801 5,229 /1 1,832 5,482 5,579 10,976 7,769
(in percent of GDP)
Tax revenue 10.7 10.4 9.9 12.0 12.0 12.0Nontax reverne 12.7 16.1 15.0 15.2 17.1 12.4Current expenditure 3.4 30.3 25.8 30.6 29.5 30.5Capital expenditure 15.4 17.7 14.8 17.1 16.5 16.1Deficit, excluding grants -15.5 -21.4 -15.8 -17.0 -17.0 - 22.2Grants 14.7 11.5 9.6 7.6 7.9 5.0Deficit, including grants -0.8 -9.9 /1 -6.2 -9.4 -9.1 - 15.9
Source: AXnex tables 5.1-5.11
/1 Of btiich borrowing fron Central Bank 4,40b or 8.5 percent of UR. Borrowing tram the CentralBank during 1980-83 averaged 7.2 percent of CUP.
/2 Estinate frLm the balance ot payments. The provisional valuation of the Ministry of FioanceIra SL 3768 milion.
the surplus of the oil sector has in effect financed the investment of othersectors. Nevertheless a good part of investments by individual publicenterprises were financed directly out of their gross profits after tax. Theself-financing ratio rose from 17 percent in 1981 to 27 percent in 1982 and24 percent in 1983 (see Table 5.4).
(iii) Current Expenditures
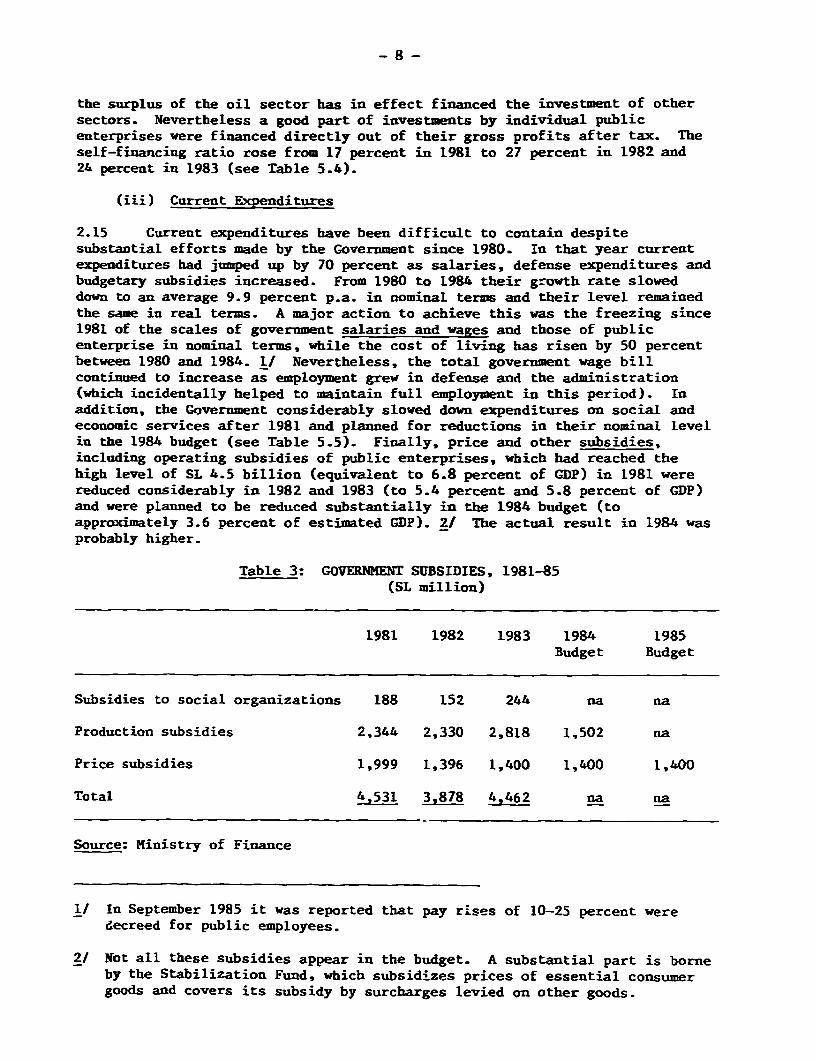
2.15 Current expenditures have been difficult to contain despitesubstantial efforts made by the Government since 1980. In that year currentexpenditures had jumped up by 70 percent as salaries, defense expenditures andbudgetary subsidies increased. From 1980 to 1984 their growth rate sloweddown to an average 9.9 percent p.a. in nominal terms and their level remainedthe same in real terms. A major action to achieve this was the freezing since1981 of the scales of government salaries and wages and those of publicenterprise in nominal terms, while the cost of living has risen by 50 percentbetween 1980 and 1984. I/ Nevertheless, the total government wage billcontinued to increase as employment grew in defense and the administration(which incidentally helped to maintain full employment in this period). Inaddition, the Government considerably slowed down expenditures on social andeconomic services after 1981 and planned for reductions in their nominal levelin the 1984 budget (see Table 5.5). Finally, price and other subsidies,including operating subsidies of public enterprises, which had reached thehigh level of SL 4.5 billion (equivalent to 6.8 percent of GDP) in 1981 werereduced considerably in 1982 and 1983 (to 5.4 percent and 5.8 percent of GDP)and were planned to be reduced substantially in the 1984 budget (toapproximately 3.6 percent of estimated GDP). 21 The actual result in 1984 wasprobably higher.
Table 3: GOVERNMENT SUBSIDIES, 1981-85(SL million)
1981 1982 1983 1984 1985Budget Budget
Subsidies to social organizations 188 152 244 na na
Production subsidies 2,344 2,330 2,818 1,502 na
Price subsidies 1,999 1,396 1,400 1,400 1,400
Total 4,531 3,878 4,462 na na
Source: Ministry of Finance
1/ In September 1985 it was reported that pay rises of 10-25 percent weredecreed for public employees.
2/ Not all these subsidies appear in the budget. A substantial part is borneby the Stabilization Fund, which subsidizes prices of essential consumergoods and covers its subsidy by surcharges levied on other goods.
-9-
2.16 The principal measures taken to reduce subsidies in this period werethe sharp increases in prices of petroleum products in August 1981 and inJuly 1982, which together with the decline in international prices reduced theprice subsidy on oil products accounts from SL 2.5 biLlion in 1980 toSL 0.8 billion in 1983. The remaining subsidy applies mainly to butane gaswhich is sold to households at 50 percent of production cost. Cement priceswere also raised to cover costs. Price subsidies on consumer products werecontained by raising the prices of better quality bread and unrationed rice,although subsidies remain on bread, sugar, rice and vegetable oil. A majorremaining subsidy is that on electricity. where tariffs. unchanged since 1981,have not enabled the industry to cover operating costs. Value added has beennegative since then. The Government decided in early 1985 to raise tariffs tolarger household and commercial consumers, which should help to reduce theoperating deficit modestly.
2.17 Total price subsidies have been maintained at their nominal levelsince 1982. However, so-called economic (or production) subsidies toagricultural producers, electricity and certain industries have remained aheavy burden on government and public enterprise accounts. In addition toelectricty, the high production cost of fertilizers - although prices offertilizers to agriculture are comparable to international prices - haveresulted in a large and increasing fertilizer production subsidy. 1/ Othereconomic subsidies cover the operating losses of a recently completed paperplant and other smaller operations.
(iv) Capital Expenditures
2.18 Capital expenditures by the public sector have risen at 5 percent and7 percent in current prices in 1983 and 1984, or less than the rate ofinflation, as part of the effort to contain the growth of totalexpenditures. 2/ It is expected that they remained at approximately the samelevel in 1985. Following substantial expenditures on large infrastructuraland industrial projects under the previous plan, 3/ particularly in 1980, thepublic investment policy followed untder the current Five-Year Plan (1981-85)has been to focus on completion of ongoing projects and not to start new largeprojects. Among the large completed projects in this period are thefertilizer complex and paper pulp plants and a textile plant, the Banias oilrefinery, a large cement plant and two large electric power plants. Largeongoing projects include a barrage on El Kebir River, the Homs-Hama water andsewerage project Latakia-Tartous and Deir Ezzor-Abukemal railways, TishrinUniversity and several highways.
1/ The industry has been established recently and uses expensive importednaphtha as feedstock. At the same time the subsidized product is sold atless than the cost of the naphtha. Plans are under way to replace thenaphtha with domestically produced gas at a fraction of the cost.
2/ The national accounts (Table 2.4) which are estimated on a slightlydifferent basis (mainly excluding land value), indicate a substantiallylower figure for 1982. This would imply a small increase in currentprices in investment expenditures in 1982 but a large increase in 1983.
3/ Such large projects included The Euphrates dam, oil exploration,construction of oil refineries in Hors and Banias, electric power stationsin Banias, a fertilizers complex in Homs, cement plants, a paper pulpplant in Aleppo and several large housing projects.
- 10 -
(v) Reducing the Budget Deficit
2.19 It is clear from the above brief analysis that the prospects ofreducing the budgetary deficit in 1986 and beyond will depend on the one handupon the reinforcement of the revenue raising fiscal policy of 1984 and onfurther containment of current expenditures. This latter would requirecontinued restraint on salary and other administrative expenditures. It wouldalso require a review of the other major categories of expenditures, namelyinvestment, subsidies and defense. The economic, social and political aspectsof these categories of expenditures are evident. However, whatever choicesare made concerning the level of these categories of expenditures, a parallelreview of methods of raising the productivity of the given level of investmentexpenditures would be desirable to ensure the continued growth of the economyat a rate higher than that of the population.
2.20 The level of grants in aid, which has been gradually eroding incurrent terms since 1979, would seem subject to greater uncertainty in thefuture, in view of the developments in oil prices and the consequent adverseeffects on the financial position of the donors. Narrowing the largebudgetary gap, including grants (i.e. 9 percent of GDP in 1980-83 and16 percent in 1984), 1/ as quickly as possible would seem a primary objectiveif the economy is to be prepared to meet possible continued drop in externalgrants_ The alternative would be increased and possibly uncontrollableinflationary pressures and/or unplanned and substantial reductions inessential capital expenditures, with consequent reductions in the growth rateand rise in social pressures.
2.21 The Government is clearly aware of the issue, as witnessed by themeasures it has taken in the last few years to raise revenues and reducesubsidies, the reinforcing policies embodied in its 1985 budget and theefforts deployed to improve the efficiency and profitability of the economicpublic enterprises. Given a continued freeze of public salary scales andcontinued economies in spending on administrative materials and social andeconomic services, the only large expenditure categories that remain aresubsidies and defense expenditures (debt servicing is considered inflexible).Defense expenditures lie outside the scope of an economic analysis, althoughthere is a link between their volume and the volume of external aid extendedby neighboring Arab countries in support of Syria's defense efforts. As notedearlier, the ratio between the two has shifted considerably, with anincreasing share of the defense burden being carried by domestic resources.
2.22 Subsidies are the largest single category of expenditure (besidesdefence) which weigh on the budget. On their own they were estimated at justunder 6 percent of GDP in 1983, equivalent to almost two-thirds of the deficitincluding grants. Their reducton could therefore make a substantialcontribution towards bridging the budgetary gap. Both subsidies to consumersand farmers as well as subsidies to cover operational deficits of publicenterprises are primarily a functon of the prices charged to the users inrelation to the price of the major inputs. As noted earlier, priceadjustments of various consumer prices have been periodically made, but thelength of the intervening periods points to the well known difficulties andpressures against making such adjustments as well as to the inherent weakness
I/ Of which borrowing from the Central Bank averaged 7.2 percent of GDP in1980-1983.
- 11 -
of the adjustment process which aims at most at catching up with the inflatedprices of inputs. If producer subsidies are to be reduced there needs to be aless inflexible and preferably a continuous and automatic process by whichproduct prices adjust to changes in input prices. Within the existing system,the effect of inflation on the size of subsidies can be reduced if prices ofsubsidized products are reviewed frequently (say every 3-6 months) andadjusted automatically to the extent that prices of inputs had risen. Inaddition, a program for the gradual reduction of the ratios between the costof inputs and the price of output needs to be prepared and implemented. Sucha reform, if applied particularly to pricing of electrictity, fertilizers andbutagaz would have a considerable impact in reducing total subsidies and hencethe budget deficit.
2.23 On the revenue side, the relatively low ratio of taxes to GDP of10-12 percent in 1980-84 and the low tax elasticity (less than 1) pointclearly to a considerable potential for raising revenues through reviewing taxrates, enlarging the tax base and improving collection. Direct taxes areparticularly low on all sources of income and wealth, except for the profittax which is largely paid by the public enterprises. The planned introductionof a consolidated income tax system, 1/ together with better assessment andcollection could improve tax revenues from the private sector. Improvement inthe public sector depends essentially on petroleum product pricing (whichaffect the profitability of the oil sector) and on improvement in theefficiency and financial performance of the other public enterprises discussedabove. The main indirect taxes and duties which derive from imports cannot beexpected to rise considerably under the present exchange and price systems,due to the rigidity of the latter and the need to contain the rise inimports. A less rigid exchange and price system (without full tariffcompensation) combined with gradual liberalization of imports would result ina substantial rise in this source of revenue. Part of the increase could comefrom a drop in illegal imports as their profitablility decreases.
2.24 Increasing non-tax revenues and specifically the surpluses of publicenterprises is potentially the most important instrument, next to reducingcurrent expenditures, for correcting the budgetary situation. While theGovernment has made extensive efforts to raise their efficiency (throughmonthly and quarterly review of performance, worker incentive schemes, rewardsfor good management and penalties for failure etc.), the objective and focusof these efforts has been the achievement of physical production targets andnot financial performance. The latter is closely linked to the price systemas noted earlier (and in certain cases to the technology utilized). A reformof the price system which reduces rigidities and produces small but frequentadjustments of price of inputs and outputs would not only reduce subsidies butalso supply a relative objective measure of the efficiency of enterprises.
1/ The draft law would consolidate incomes from all sources and would includea tax on agricultural incomes, previously exempt, and remove exemptions onnonbusiness capital gains. The draft law would also lover tax rates andraise exemption levels on lower income tranches for social purposes andimprove collection.
- 12 -
C. External Trade, Payments and Debt
(i) Overall Developments
2.25 Syria's overall balance of payments has turned from an overallsurplus of $220 million in 1979 to an overall deficit of $690 million in1980. 1/ In the following three years, the overall deficit was reduced butstill ranged between $230-370 million per year (Table 4), which resulted inroughly corresponding reductions in official exchange reserves and an increasein net external liabilities (Tables 6.2). In 1984, the overall deficit roseto about $600 million. Net foreign borroving contributed little to foreignemchange receipts until 1983 and 1984, when it reached over $300 million peryear. The main sources of foreign exchange were exports of oil, remittancesof Syrian workers and entrepreneurs from neighboring oil exporting countriesand-official transfers from these countries in suppport of Syria's defenseeffort. The main payments were for imports of capital goods and foodstuffs aswell as for crude oil refined in Syria.
2.26 The development of Syria's balance of payments in recent years hasbeen determined only partly by the industrial and trade policies Syria hasfollowed, and mainly by external economic and political developments which arenot under its control. The external developments find their origin in therapid rise in oil prices in 1979-81, followed by their continued erosionthrough 1985, and in the military tensions in the region which necessitatedlarge defense expenditures abroad. The fluctuations in oil prices affectednot only Syria's revenues from its oil exports - by far the largest componentot total exports - but also the volume of remittances (private transfers)which Syrian workers and entrepreneurs could send from the oil exportingcountries and the level of the substantial grants (official transfers) whichSyria received from the Gulf countries. Grants declined from their high of$1.8 billion in 1981 to $1.3 billion in 1983 and $1.2 billion in 1984(converted at the official exchange rate). Net oil exports fell from about$600 million in 1980 to -$40 million in 1983 and -$250 million in 1984. Thecontinued weakness of oil prices (and rapid rise in domestic demand) does notpresage well for the recovery of either net oil exports or revenues fromexternal grants. Remittances of Syrian workers and entrepreneurs (whichdropped 20 percent between 1981 and 1983 and by a further 30 percent in 1984)may decrease further as demand for services and investments are reduced in theoil exporting countries themselves.
2.27 Syria's outstanding debt (excluding military debt) remains modest at$2.3 billion or 12 percent of GDP, and debt service at $304 million represents12 percent of exports of goods and services. External debt and debt servicecan be expected to rise in the medium term, during the period of adjustment tolower external transfers.
1/ There are three exchange rates applied in Syria. The official exchangerate of $1 = 3.95 applies to all public transactions, with a fewexceptions (including exports of textiles and agricultural products whichare at the parallel rate). The parallel market rate of $1 = 5.45 appliesto private sector trade transactions. The tourist exchange rate whichapplies to private transfers and tourist expeditions has risen severalsteps to $1 = SL8.0 in December 1984 and a reported SL 11.0 inSeptember 1985. The weighted average exchange rates used by the CentralBank of Syria to estimate the balance of payments are for the US$, in1979-80: SL 3.952; 1981: SL 4.173; 1982 SL 4.228; 1983 SL 4.206.
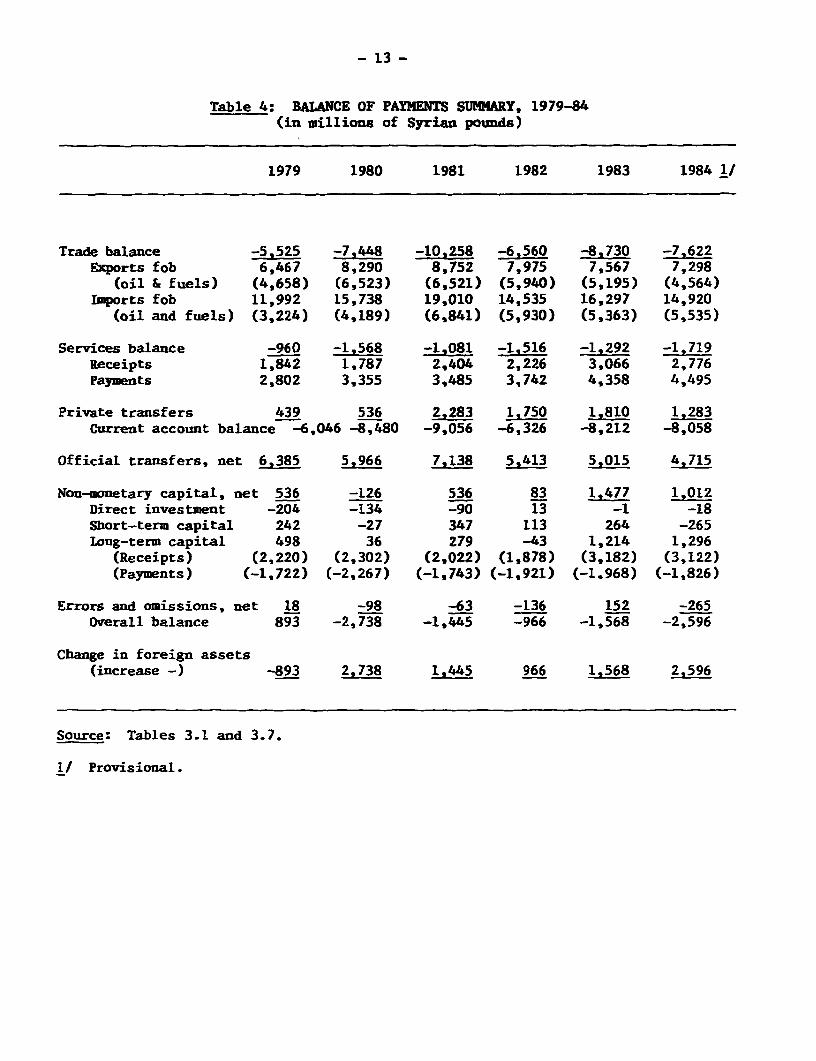
- 13 -
Table 4: BALANCE OF PAYMENTS SUMMARY, 1979-84(in millions of Syrian pounds)
1979 1980 1981 1982 1983 1984 1/
Trade balance -5,525 -7,448 -10.258 -6,560 -8,730 -7,622Exports fob 6,467 8,290 8,752 7,975 7,567 7,298
(oil & fuels) (4,658) (6,523) (6.521) (5,940) (5,195) (4,564)Imports fob 11,992 15,738 19,010 14,535 16,297 14,920
(oil and fuels) (3,224) (4,189) (6,841) (5,930) (5,363) (5,535)
Services balance -960 -1.568 -1.081 -1,516 -1,292 -1,719Receipts 1,842 1,787 2,404 2,226 3,066 2,776Payments 2,802 3,355 3,485 3,742 4,358 4,495
Private transfers 439 536 2.283 1,750 1.810 1,283Current account balance -6,046 -8,480 -9,056 -6,326 -8,212 -8,058
Official transfers, net 6,385 5,966 7,138 5.413 5,015 4,715
Non-monetary capital, net 536 -126 536 83 1,477 1,012Direct investment -204 -134 -90 13 -1 -18Short-term capital 242 -27 347 113 264 -265Long-term capital 498 36 279 -43 1,214 1,296
(Receipts) (2,220) (2,302) (2,022) (1,878) (3,182) (3,122)(Payments) (-1,722) (-2,267) (-1,743) (-1,921) (-1.968) (-1,826)
Errors and omissions, net 18 -98 -63 -136 152 -265Overall balance 893 -2,738 -1,445 -966 -1,568 -2,596
Change in foreign assets(increase -) -893 2,738 1,445 966 1,568 2,596
Source: Tables 3.1 and 3.7.
1/ Provisional.
- 14 -
The Current Account
2.28 From 1978 to 1981 both exports and imports doubled in value to $2.1and $4.6 billion respectively, and the trade deficit rose from $1.1 to$2.5 billion. I/ This large deficit was reduced sharply to $1.6 billion in1982 but rose again to $2.1 billion in 1983. The evolution of total trade inthis period was dominated by the developments of trade in oil and oilproducts. Oil exports represented 74 percent of total exports in 1979-83 andoil imports 34 percent of total imports.
2.29 Oil exports, 2/ after growing rapidly to a peak of $1.6 billion in1981 as prices soared while volume stagnated, declined gradually to$1.2 billion in 1984, as world prices declined and volume continued tostagnate at about 8.5 million tons (see Table 3.7). Oil imports also soaredin value in 1979-81 both because of rising world prices and of rapidly risingimports of light crude which is mixed with heavy Syrian crude oil for domesticrefining (surplus refined products are exported). Oil imports stabilizedafter 1981 at about 6.5 million tons and their value eased as internationalprices dropped. As a result, the oil trade balance turned from a positive$600 million in 1980 to -$80 million in 1981 and -$40 million in 1983 and-$250 million in 1984. In volume, the net trade balance in oil and oilproducts has also dropped, from net exports of 3.4 million tons in 1980 to0.9 million tons in 1983 and only 0.1 million tons in 1984. The greaterdecline in value reflects the increasing share of higher priced imported lightcrude and exports of lower quality crude and fuel oil. 3/
2.30 Syria's other main exports include cotton, phosphates, agriculturalproducts and textiles (Table 3.4). Exports of all these commodities havestagnated or declined in current dollar terms in 1978-83, except for textilesvhich nave shown a healthy growth rate of about 24 percent p.a. in thisperiod. 41 In 1984 a decline in textile exports was offset by a rise inexport of raw cotton.
2.31 The rapid growth of imports during 1978-81 (at an average 27 percentp.a. in current dollars) was largely due to the growth of oil imports, asnoted earlier, and of imports of capital goods (Table 3.6). Since then, andthrough 1984, imports declined substantially, particularly in 1982 and 1984.This was the result of several factors, including, in particular, the declinein oil prices combined with stable volume of imports; the decline in imports
1/ Values in SL are converted at the weighted average exchange rates.
2/ Values in SL are converted at the official exchange rate.
3/ These estimates are based on customs figures and evaluations.Other calculations (Table 8.3) based on detailed trade output andconsumption figures show the same trend but a still positivebalance in value in 1983 and a slightly larger balance involume. In 1983 the average export price fob of Syrian crude perton was about 8 percent below that of imported crude cif.
4/ Over o0 percent of textile exports and agricultural exports havebeen valued at the parallel market rate which is 38 percent abovethe official rate since April 1981. The private sector accountsfor the larger part of these exports.
- 15 -
of capital goods associated with a slowdown in investments; greater use ofdomestic inputs in investments; and the increasingly strict control of importof consumer goods and drawdown of stocks. Thus, excluding oil, importsdropped by 24 percent in current terms in 1982, and, following a rise in 1983,dropped in 1984 to the level of 1982. The drop in imports of all categoriesexcept cereals and oil was particularly noticeable in 1984 (Table 3.5).
2.32 The services account of the balance of payments (Table 3.1) shows nosignificant improvement in recent years. The large items are freight andtransport which continued to grow up to 1983 with the growth in the volume oftrade (particularly oil). Recorded receipts from tourism, which hasbenefitted from a promotional exchange rate (rising from SL 5.8 to SL 8 perUS$ between 1982 and 1984) have risen rapidly, but have been largely offset byexpenditures of Syrians abroad. Interest and dividend receipts have declinedrapidly with the decline in foreign assets while interest payments onshort-term credits and long-term loans have risen to an annual level of about$150 miilion in the last three years.
(ii) Trade Policy
2.33 Syria's trade policy, in aiming at reducing the current accountdeficit, has emphasized import substitution through heavy industrialinvestment and through agricultural incentives for such imported products assugar and cereals. It also aimed at changing the structure of exports infavor of semi-finished and manufactured goods rather than raw materials (e.g.exporting refined oil and textiles rather than crude oil or cotton);exporting was cousidered secondary to satisfying domestic needs, and exportpromotion was limited to tourism and other services (through a preferentialexchange rate) and to "non-essential" commodities including textiles. TheFifth Plan put a slightly greater emphasis on exports. Its quantitativetargets for 1981-85 were 3.4 percent average annual growth for imPorts ofgoods and services and 6.5 percent for exports of goods and services.
2.34 Under the strictly controlled trade and exchange system, the currentvalue of imports was in fact stabilized (except in 1981), but the basicstructure did not change during 1980-84 (see Tables 3.3 and 3.5). Exports,however, declined in current terms but the structure changed as planned, withexports of refined oil products rising rapidly until 1982 (Table 3.7) andexports of other manufactured products growing, particularly textiles whichgrew at 34 percent p.a. in current terms during 1980-83 (see Tables 3.7 and3.4). The decline in the overall value of exports was partly the result ofweak prices of major export co,modities - oil and phosphates - but also of thelack of growth of production in these sectors and in cotton (except in 1984),and, in the case of oil, of the rapid growth of domestic demand for oilproducts (averaging 9.4 percent p.a. during 1980-83). The closeness of thelink between the prospect for total exports and the investment policy inindustry and agriculture, and with price policy in energy, is obvious. Theincentive and pricing system for the growing exports of manufactured productsand for agricultural exports including cotton are also important subjects inany future policy review which aims at promoting exports and redressing thecurrent account balance.
2.35 The pressure on the balance of payments has so far been met bysubstantial cuts in imports, drawdown on exchange reserves and an increase innet external liabilities. The continuation of a downward trend in thetransfers and grants from oil exporting countries would necessititate agreater emphasis than in the past on stimulating exports of goods and
- 16 -
services. A policy shift towards export promotion and growth would have to besupported by appropriate adjustments in investment and sectoral policies (inindustry, agriculture energy, and mining) which aims at stimulating productionfor exports. It will also require a review of the exchange rate policy thatwould increase the profitability of exports, as well as the adoption ofdomestic price policies that restrain domestic demand for exportable products,particularly oil.
(iii) Capital Flows and External Debt
2.36 As mentioned earlier, net capital flow to Syria has been modest after1978. Net direct investment, mainly by foreign oil companies has beengenerally negative. Net short-term inflow of capital has averaged under $50million per year in 1981-83 but was negative in 1984. Net long-term publiccapital inflow, as recorded in the balance of payments (Table 3.1), shows asubstantial decline and a negative net outflow in 1982; receipts declined from$600 million in 1978 to $475 million in 1982, while repayments rose from$250 million to $485 million. In 1983 and 1984, however, receipts fromlong-term public capital jumped to $800 million per year while repaymentsremained at the 1982 level, thus resulting in a net inflow of over$300 million per year.
2.37 The capital flows recorded in the balance of payments include,however, receipts and repayments in kind with the Eastern Bloc countries whichoffset transactions in the trade and services but which are not included inthe cash transactions of the external public debt.
2.38 The overall balance of payments deficit has resulted in a small dropin gross foreign exchange and gold reserves but a substantial increase in netexternal liabilities. Gross reserves fell from $826 million at the end of1979 to $477 million at the end of 1983 and $463 million at the end of 1984,equivalent to 5 weeks of imports of goods and services. Net foreignliabilities turned from -$274 million (net assets) to $1.4 billion in 1983 and$2.1 billion at the end of 1984 (Table 6.2).
2.39 Syria's disbursed and outstanding public debt (excluding militarydebt) amounted to $2,305 million at the end of 1983, equivalent to less than12 percent of GDP. Undisbursed commitments were $1,635 million. Of theoutstanding debt at the end of 1983, 75.7 percent was owed to bilateralcreditors, 18.8 percent to multilateral creditors, 4.9 percent to suppliersand only 0.6 percent to financial institutions (Table 4.1). The largestmultilateral creditors are the World Bank and the Arab Fund for Economic andSocial Development. Bilateral creditors include mainly Eastern Bloccountries (39 percent of total debt), OECD countries (19 percent), Arabcountries and their bilateral agencies (16 percent) and Iran (4 percent).Debt (including undisbursed) owed to the World Bank reached $422 million(10.7 percent of the total), of which $287 million were outstanding(12.5 percent of total outstanding). Debt owed to IDA, all disbursed, wasanother $47 milli-on (20 percent of total).
2.40 Concessional financing played a dominant role in Syria's externaldebt with 77 percent of debt being on concessional terms. The grant elementwas 36 percent to 41 percent during 1979-81. The average terms were quitesoft in 1979-81, with the average interest ranging from 3.6 percent to4.2 percent, maturity 17-22 years with over 5 years grace. In 1982 and 1983,terms of new commitments hardened somewhat, reflecting the rise in
- 17 -
international interest rates, but average interest remained at slightly over6 percent and although maturity remained at about 20 years on the average,grace periods were shortened to 2-4 years.
2.41 Debt service remained stable during 1978-83, and was $304.4 millionin 1983, of which $231.7 million in amortization and $72.7 million ininterest payments (Table 4.2) This represented 12.0 percent of exports ofgoods and services. The debt service ratio varied little from the previousfour years. As a percentage of goods, services and official transfers, thedebt service represented only 8 percent in 1983.
2.42 Projected disbursements on existing commitments is expected to beabout $406 to $450 million in 1984-86, while service payments are projected torise gradually to $370 million by 1986, resulting in net transfers of lessthan $100 million per year. New commitments recovered sharply since 1982,mainly from the Eastern Bloc, and reached $443 million in 1983. Newcommitments in 1984 included a reported oil facility by Iran of $993 millionof which $493 million would be repaid in $20 million monthly installmentsbeginning May 1985 and the balance in quarterly installments over three yearsbeginning May 1989.
D. Prices, Exchange Rate and Interest
2.43 Domestic financing of the budget deficit largely by borrowing fromthe Central Bank has resulted in a rapid expansion in the money supply and asubstantial rise in prices, despite a strict price control system. Moneysupply increased by 20 percent p.a. during 1980-83 as compared with13.7 percent p.a. growth in total available resources at current prices and6.9 percent at constant prices. While the growth of money supply slowed downto 16 percent in 1981 it rose at 20 percent in 1982 and surged at the rate of26 percent in 1983. The source of the growth of money supply was the rapidincrease in net domestic credits (24.6 percent p.a.) and particularly inclaims on the government and on public enterprises, which together accountedfor about 90 percent of the credit expansion. The rapid growth of netdomestic credits was offset only partially by the growth in domesticliabilities (including import deposits) or by the continuous reduction in netforeign assets, which changed from a positive level of L 1.1 billion at theend of 1979 to net liabilities of SL 1.6 billion in 1980, and SL 5.4 billionat the end of 1983 (see Table 6.1).
(i) Price Policy
2.44 The rapid increase of liquidity at a substantially faster rater ratethan the growth of total available resources was reflected in a rise in pricesand the building up of excess liquidity balances.
2.45 The new wholesale price index rose at an average 11.1 percent p.a. in1980-83 while that of retail prices rose at 12.9 percent p.a. (Tables 9.2 and9.3). The retail price index would have been substantially higher if oldhouse rents were not fixed or if prices of such goods as rationed bread, rice,sugar, coffee, tea and electricity were not fixed.
2.46 On the price policy followed in Syria, the Five-Year Plan documentstates that "prices of domestic products and imported goods are determined onan economic basis (real cost), but that a final consumer price for all basiccommodities is determined on both social and economic considerations."
- 18 -
Subsidies should be directed to reach categories of citizens to which suchsupport is intended with the aim of reducing the deficit resulting fromsupport to prices of essential commodities". Thus the policy is "to usepricing as an economic incentive and instrument to increasing production and ajust distribution of income." The direct link between the index of retailprices and "minimal increases" of wages and salaries is recognized. On theexchange rate, the policy is to set it so as to encourage exports andtransfers from Syrians working abroad. These objectives are of a generalnature and leave a wide scope for interpretation or the definition of specificpolicies. In the past year, as the resource and exchange constraints becametighter, a greater emphasis has been put by policy makers on real cost pricingand on compensating subsidized essential commodities with higher prices onother commodities. The pace of price adjustments, however, has been slow andits impact on subsidies has been modest.
2.47 As discussed earlier, it would be desirable to reduce theinflexibility or "stickiness" of prices of basic consumer goods and inputsthrough frequent small adjustments. This would seem a desirable objective asa means of reducing the budget and balance of payments deficits and avoidingthe effects of substantial and painful price changes at long intervals withpotentially wide repercussions on real incomes and the allignment of relativeprices. Flexible price adjustments should also be feasible within theexisting framework of administered pricing systems.
2.48 In addition, it would be desirable to review the usefulness of apervasive price control system (based on an estimated cost plus profit margin)whose main benefit is to protect against excessive profits or consumerexploitation, but which in practice tends to delay price adjustments and isoften circumvented by changes in the quality of products or by the growth ofparallel markets. Such a review should look for means of allowing prices toreflect more sensitively differences in quality and preserving consumerprotection against excessive profits through wider competition (in whichpublic sales outlets may play a part). The review could also draw a programfor progressively reducing the list of goods and services which would remainsubject to price control, limiting it as a first step to basic consumer goodsand main industrial inputs.
2.49 An appropriate price policy in Syria is clearly not only of directrelevance to narrowing the budgetary deficit, but it is also relevant tonarroving the current account deficit of the balance of payments through itseffect on shifting demand for available tradeable resources between domesticconsumption and exports. In particular, restraining the rapidly Frowingdemand for energy (oil products and electricity) at a rate far above the rateof growth of GDP (9.4 percent p.a. for oil products and 15 percent forelectricity compared with 4.3 percent p.a. during 1980-83) can be achieved byraising the prices of energy products in relation to that of other domesticgoods and services. Such restraint in domestic demand for energy wouldtranslate into increased net exports of oil and oil products. In addition torelative price, the level of oil prices, while generally above internationalprices at the official rate of exchange ($1 = SL3.95), would be considerablybelow international prices if calculated at the parallel market rate
- 19 -
($1-5.45). V Similarly, the price of imported raw material or other importsused by domestic industry and agriculture are understated at the officialexchange rate and hence tend to lead to understating the relative price ofdomestic products in which they are used.
(ii) ExchanRe Rate Policy
2.50 Concerning the exchange rate, the Plan's policy to set it so as toencourage exports and transfers has been partly successful following theintroduction of a fixed parallel market rate for private transactions and atourist rate for transfers and tourism. It has been less successful inpromoting exports of goods, except for textiles, or in rationalizing domesticprices. The use of three rates makes the objective of rationalizing domesticprices on a real cost basis extremely difficult to determine or to implement.In an economy as open as that of Syria, maintenance of a low rate of exchangefor a substantial part of external transactions encourages the excessive useof imports at that rate and tends to result in windfall profits to someimporters as well as to encourage illegal imports by those who cannot obtainlicenses. To reduce the distortion in domestic relative prices arising fromthe use of several exchange rates, it is desirable to seriously considerintegrating the official exchange rate with the parallel market rate at adepreciated level as a first step, and to make several upward adjustmentsthereafter leading to the unification of all rates at a realistic level. Therecent deterioration in the balance of payments situation suggests the need toaccelerate the unification of the rates. The budgetary implications of such astep would have to be carefully considered. Secondly, as in the case ofdomestic price determination and for the same reasons, it would be desirableto introduce flexible and frequent reviews of the unified rate to reflectchanging economic conditions and to bring about a closer balance between theavailablity and demand for foreign exchange.
(iii) Interest Rates
2.51 Interest rates are generally low in Syria compared with internationallevels or with the domestic inflation rate. The retail price index rose byover 14 peicent in 1982, slowed down to 6 percent in 1983, but rose by9 percent in 1984 and accellerated in 1985. Interest rates had been adjustedupwards in February 1981, but remain negative in real terms (i.e. as adjustedfor inflation) with the highest lending rate being 9 percent p.a. and thelowest 2 percent. Private current account deposits carry 4 percent interestand public deposits 2 percent, but advance impo-t deposits carry no interest.Time deposits of 6-12 months earn 7 and 8 percett respectively and interest oninvestment bonds is 9 percent (see Table 6.6). Investment bonds rre theinstrument used to finance public enterprise investments from the budget (i.e.excluding self financing) at the same rate, but it seems that most publicenterprises are in arrears in payment of this interest charge. It._erest onother loans vary by sector and are lowest in agriculture and highest in realestate. The range is now from 4-6 percent in public and cooperativeagriculture to 5.5-7.5 percent for private farmers (with loans for fruitplantations and electric transformers free of interest). In real estate thevare 7 percent for cooperatives and 9 percent for contractors and individuals.In industry, interest ranges from 5.5-7 percent for the public sector,5.25-8 percent for cooperatives and 7.5-9 percent for the private sector.
1/ In September 1985, the Government announced a 38 percent increase inprices of gasoline and 50 percent in those of diesel and kerosene.Consumer prices for liquid gas were raised by 70 percent.
- 20 -
2.52 While the higher interest rates outside agriculture are not too farbelow recent inflation rates, they would seem to be too low in agriculture andreal estate and generally low for the public sector (except for investmentloans, which are not always serviced). As in the case of price administrationit would seem desirable to adjust the rates more frequently, and to reduce thegaps between preferential and nonpreferential rates. Real estate loans andcommercial loans are prime candidates for allignment to a positive real level,given the strong demand and high return on these activities. It may also beuseful to consider increasing mobilization of private savings by thegovernment through raising term deposit rates and issuing tax free treasurybearer bonds with an appropriate rate of interest, while removing the ceilingon the lending rate, starting with credit to the private sector.
E. Preliminary Estimates of the Impact of Exchange and Price Adjustments
2.53 Adjusting price, exchange and interest rate policies along the linesdescribed in the Report will have a significant net positive impact on themobilization and allocation of resources, particularly by the public sector,and also on external creditworthiness. It will at the same time involveadjustments in the level and distribution of private incomes and consumption.Obviously, a detailed analysis and quantified estimates of these effects onthe specific sectors and income groups is beyond the purview of this reportand would require a more systematic and extensive effort. A modest attempt ismade in the following paragraphs to estimate roughly the expected impact ofexchange and price policies on three main areas: the balance of payments,government budget, and income levels. The macroeconomic framework andprojections underlying these rough estimates are described in Chapter III(Development Prospects), and the assumed objectives are outlined inparas. 3.12 to 3.18.
(i) Impact on the Balance of Payments
2.54 The overall projected effects of the package of policies on thebalance of payments are summarized in Table 9 in Chapter III on DevelopmentProspects. Ihe main policies concerned are the exchange rate adjustment anddomestic price adjustment of energy and food products.
2.55 The adjustment of the exchange rate on the balance of payments can beexpected to increase the volume of exports of agricultural products andmanufactures while restraining imports of goods and services that are atpresent allowed at the official rate. The major part of exports (60 percent)and a good part of imports (24 percent) represent trade in oil which is notaffected directly by the exchange rate. Apart from Government imports, mostother trade takes place at the parallel rate. An exchange adjustment wouldtherefore have a direct impact on the balance of trade in the othercommodities only after further adjustment of the unified offical and parallelmarket rate. However, the indirect effect of the exchange rate unification,which would raise the domestic price of traded oil, would be important if thatrise is accompanied by corresponding adjustments of domestic prices of fuelsand electricity in domestic c.Arrency; this would restrain domestic demand forthese products and release oil and oil products for exports (or reduction ofimports). This effect and the assumptions underlying its estimation arestated in para. 3.15 of the report. The result, compared with a situationwhere no price adjustment is made, would be an estimated net increase in oilexports of 400 thousand tons of oil valued at $70 million in 1988 rising to900 thousand tons valued at $200 million in 1992 (in current prices).
- 21 -
2.56 For traded products other than oil the effect on exports of exchangerate adjustments that follow the rate unification will depend mainly on twofactors: the price elasticity of demand for exports of manufactures,particularly of textiles, and the volume of agricultural products availablefor exports, particularly cotton and pulses (but also livestock, fruits andvegetables, etc.). There is no data on price elasticities for Syrian exportsbut it can be supposed (based on the experience of other Mediterraneancountries which similarly export textiles and agricultural products to theEEC) that an annual 6 percent growth in volume is feasible with littleadjustment and that it could rise to 10 percent or more assuming tangibleexchange rate adjustment and some liberalization of export and exchangecontrols. On the import side, the main impact would be expected to arise fromthe fact that the higher domestic prices of imported cereals, animal feed andother foodstuffs would stimulate domestic production, substitute for importedfoodstuffs, and stabilize the level of such imports which otherwise couldcontinue to grow at the past rate of over 15 percent p.a. or over $100 millionper year.
2.57 The effects of exchange rate adjustments on services and transfer inthe balance of payments are largely of an accounting nature, i.e. in terms ofdomestic currency. These are important for the budget (see (ii) below) butthey would affect exchange receipts and payments to a smaller extent. Thus,payments for government services would increase in Syrian pounds, whilereceipts from the same sources would increase, with a probable small net lossin exchange terms. The more important private transfers of Syrian workerswould not be affected since they are already being converted at the touristrate. The even larger official transfers are recorded at the official rate,so their conversion at the parallel or higher rate would increase their valuein Syrian pounds substantially, but should not affect their volume. The samecan be said of net capital inflows. The direct accounting impact in Syrianpounds of the unification of the offical and parallel market rate isillustrated in Table 5, estimated for the year 1984. The illustrationindicates that assuming no change in demand for foreign exchange arising fromthe unification of the two rates there would have been a net increase inreceipts of SL 2.3 billion which would have almost covered the recordeddeficits of SL 2.6 billion at the existing rates. This of course does nottake account of the changes in receipts and payments that would be stimulatedby the unification and subsequent adjustment of the rates.
2.58 The base case projections in Table 10, which assume only aunification of the official and parallel rates, indicate a reduction in thecurrent account and transfers balance in current terms from $1.4 billion in1984 to about $1 billion by 1988. The fact that almost half of this deficitwould have to be financed by increasing short term liabilities is a clearindication that further exchange adjustments, following the unification of theofficial and parallel rates, would be necessary so as to stimulate non-oilexports further.
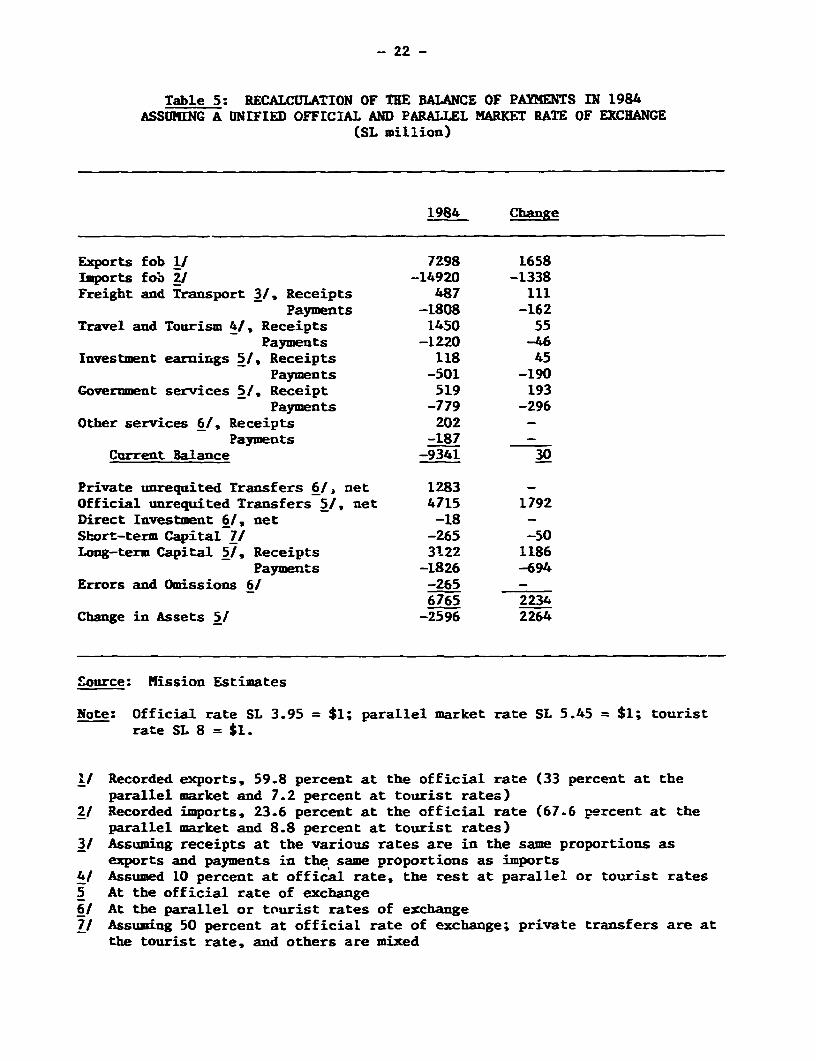
- 22 -
Table 5: RECALCULATION OF THE BALANCE OF PAYMENTS IN 1984ASSUMING A UNIFIED OFFICIAL AND PARALLEL MARKET RATE OF EXCHANGE
(SL million)
1984 Change
Exports fob 1/ 7298 1658Imports fob 2/ -14920 -1338Freight and Transport 3/, Receipts 487 111
Payments -1808 -162Travel and Tourism 4/, Receipts 1450 55
Payments -1220 -46Investment earnings 51, Receipts 118 45
Payments -501 -190Government services 5/, Receipt 519 193
Payments -779 -296Other services 61, Receipts 202 -
Payments -187 _
Current Balance -9341 30
Private unrequited Transfers 61, net 1283 -Official unrequited Transfers 5/, net 4715 1792Direct Investment 6/, net -18 -Short-term Capital 71 -265 -50Long-term Capital 5/, Receipts 3122 1186
Payments -1826 -694Errors and Omissions 61 -265 -
6765 2234Change in Assets 5/ -2596 2264
Source: Mission Estimates
Note: Official rate SL 3.95 = $1; parallel market rate SL 5.45 = $1; touristrate SL 8 = $1.
I/ Recorded exports, 59.8 percent at the official rate (33 percent at theparallel market and 7.2 percent at tourist rates)
2/ Recorded imports, 23.6 percent at the official rate (67.6 percent at theparallel market and 8.8 percent at tourist rates)
31 Assuming receipts at the various rates are in the same proportions asexports and payments in the same proportions as imports
4/ Assumed 10 percent at offical rate, the rest at parallel or tourist rates5 At the official rate of exchange6/ At the parallel or tourist rates of exchange7/ Assuming 50 percent at official rate of exchange; private transfers are at
the tourist rate, and others are mixed
- 23 -
(ii) Impact on the Budget
2.59 The impact on the budget of the price and exchange adjustments aresubstantial. This is illustrated in Table 6, which estimates that the directimpact in 1984 could have been a reduction in the overall deficitSL 3.2 billion or by half. The projections for 1988 are shown in Table 9 inChapter III.
2.60 As seen from the discussions of the effects on the balance ofpayments, budgetary receipts in Syrian pounds would rise substantially as aresult of converting official transfers and net long term capital inflows atthe parallel or higher rates. These two items alone would have increasedrevenues by SL 2.3 billion in 1984. A further increase of revenues would havecome from higher customs receipts on imports valued at tLe official rate(assuming no compensating reduction in the rates) which is estimated at aboutSL 0.5 billion. Increased budget expenditures, on the other hand, wouldresult from the rise in government expenditures abroad in terms of Syrianpounds (SL 0.3 billion gross).
2.61 The rise in the SL value of exports and imports of the public sector(mainly oil, but also textiles and imported machiaery and equipment) would bereflected in the increase both in the gross receipts and in the cost of inputsand investment goods in the public sector. Assuming that trade of the publicsector at the offical exchange rate is wholly undertaken by public enterprisesand that the rise in domestic prices of imported inputs and investment goodsare passed on to them and reflected in an equivalent rise in the price oftheir products, than the net gain would have been about SLO.3 billion in 1984,which would represent a rise in the "surpluses" of the public enterprises.The small amount reflects the fact that the net balance in oil, the majorpublic export, has become negative, with gains from exports offset by losseson imports. As net exports of oil increase in the future, this surplus couldgrow significantly, by perhaps SL 2 billion by 1988.
2.62 Budgetary revenues and expenditures will also be affected by theadjustment of prices over and above those resulting from the exchange rateadjustment. In particular, the gradual adjustment of electricity prices andwater rates, as well as of subsidized food and fertilizers, would be expectedto reduce production subsidies to half their level in 1988 and theirsubsequent elimination implies a reduction of about SL 0.5 billion per year inconstant prices.
2.63 The exchange adjustments and price rises will indirectly affectbudget expenditures in an important area, in that it will increase pressuresto raise wages and salaries of public sector employees to compensate, in part,for inflation. (The rise in the public wage bill will also be independentlyaffected by the recruitment of additional staff and workers). The rate offuture inflation cannot be projected with any degree of confidence, and thecompensation for it, because of its social implications, is to a great extenta political decision. It is assumed in the projections that currentexpenditures would rise at 2 percent p.a. in real terms in the period 1983 to1988. Ttis would combine the effects of a 6 percent p.a. increase inexpenditures on salaries (including both increase in number of employees andof higher real salaries, and on services and materials), offset by a13 percent p.a. reduction of subsidies to half their level by 1998. Assuming,for example, that employment increases by 4 percent p.a. and subsidies are
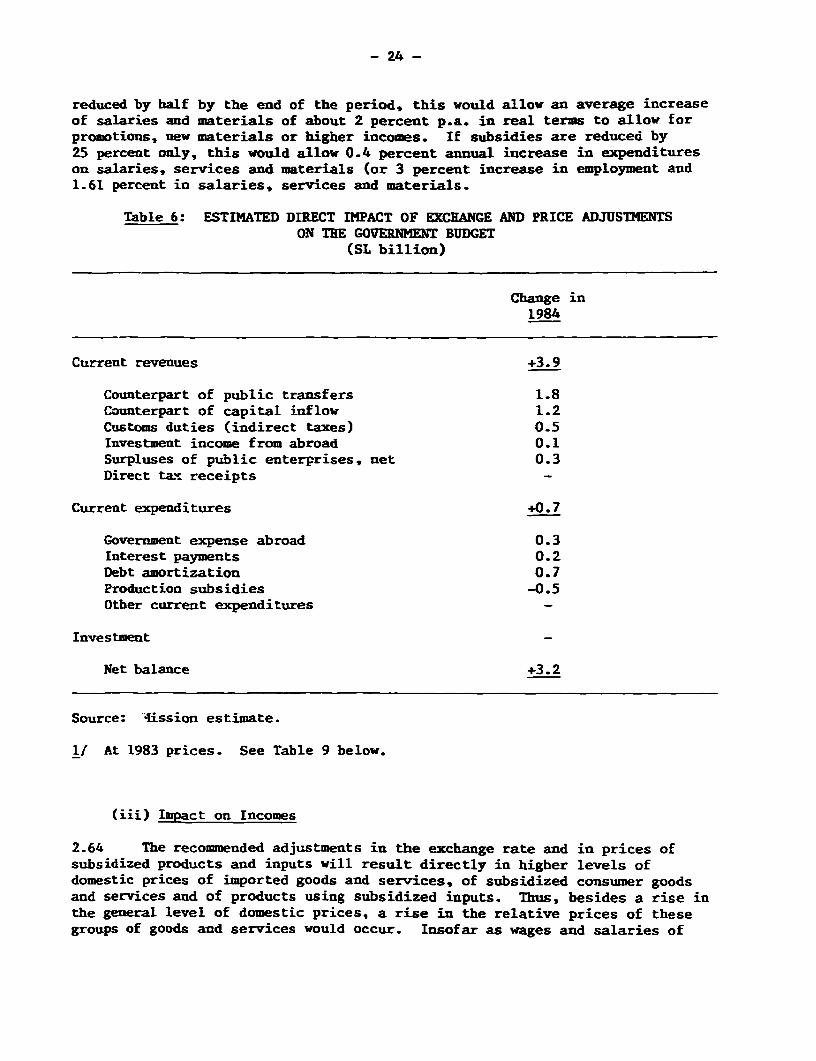
- 24 -
reduced by half by the end of the period, this would allow an average increaseof salaries and materials of about 2 percent p.a. in real terms to allow forpromotions, new materials or higher incomes. If subsidies are reduced by25 percent only, this would allow 0.4 percent annual increase in expenditureson salaries, services and materials (or 3 percent increase in employment and1.61 percent in salaries, services and materials.
Table 6: ESTIMATED DIRECT IMPACT OF EXCHANGE AND PRICE ADJUSTMENTSON THE GOVERMENT BUDGET
(SL billion)
Change in1984
Current revenues +3.9
Counterpart of public transfers 1.8Counterpart of capital inflow 1.2Customs duties (indirect taxes) 0.5Investment income from abroad 0.1Surpluses of public enterprises, net 0.3Direct tax receipts -
Current expenditures +0.7
Government expense abroad 0.3Interest payments 0.2Debt amortization 0.7Production subsidies -0.5Other current expenditures
Investment
Net balance +3.2
Source: -lission estimate.
1/ At 1983 prices. See Table 9 below.
(iii) Impact on Incomes
2.64 The recommended adjustments in the exchange rate and in prices ofsubsidized products and inputs will result directly in higher levels ofdomestic prices of imported goods and services, of subsidized consumer goodsand services and of products using subsidized inputs. Thus, besides a rise inthe general level of domestic prices, a rise in the relative prices of thesegroups of goods and services would occur. Insofar as wages and salaries of
- 25 -
various groups rise less than the rise in the weighted prices of consumergoods and services, there would be a deterioration in the standard of livingof those groups. Hence the need for a preferred gradual reduction in thesubsidies of basic consumer goods and services which is orchestrated withappropriate upward adjustments (smaller in real terms) in wages and salariesoE the lower fixed income groups that would soften the impact on thesegroups. The current system of protecting low income groups from priceadjustments through rationing of basic subsidized consumer products or fixinglower water and electricity rates for small consumers, while serving the samepurpose from a social point of view, does not effectively limit the subsidiesto the target groups and encourages the uneconomical use of the subsidizedproducts, because of their low relative price, by those who can afford it.
2.65 With inflation continuing, it has also encouraged the emergence oftwo overlapping but distinguishable groups - one with low fixed wages andsalaries which depends on low-priced subsidized products; and a second withflexible salaries and incomes which bids up the prices of non-subsidizedproducts while profiting from those subsidies. As inflation progresses, theincome gap between the two groups would widen, and the price distortionsbetween the two markets would increase, unless direct taxes on incomes andindirect taxes on consumer goods other than essentials are increased. Atransition period where a safety net to protect the lowest income groups e.g.through subsidized rationed food and free social services would seem necessary.
2.66 The macroeconomic projections summarized in Table 7 in Chapter IIIindicate that, with the restricitons on Government current and investmentsexpenditures, it would be possible for overall private consumption to grow at4.8 percent p.a. for 1983-88, which would represent about 1 percent p.a. percapita in real terms.
- 26 -
CHAPTER III - DEVELOPMENT PROSPECTS
(i) The Policy Framework
3.1 The analysis of past performance in Chapter II shows that Syria hasmade considerable progress in the past decade in raising its gross domesticproduct, expanding its economic and sccial infrastructure and ensuring thebasic needs and employment opportunities to the bulk of the population. Thisis the more impressive when considered in the context of a very rapidly andstill accelerating population growth (3.4 percent p.a.), heavy defenceexpenditures (15 percent of GDP). relatively low external indebtedness(12 percent of GDP) and moderate inflation (8 percent p.a. on average). Inthese achievements, Syria has been the beneficiary of a diversified andmoderately rich resource base, a dynamic labor force, the substantial rise inthe internatLonal prices of its main export, oil, in the early and late 1970s,and the considerable financial assistance of Arab oil exporting capitalsurplus countries. It also profited from the enormous opportunities foremployment, trade and construction in the oil countries.
3.2 Syria starts the second half of the 1980's with the substantialeconomic assets listed above, but with a net oil surplus that has disappearedand with a decline in external financial assistance, along with theopportunities for growth of employment in and exports to the oil countries.The shift in the high rate of growth and in financial ease coincided with thefalling of international oil prices starting in 1981, and has continuedsince. Official transfers steadily declined from 11.5 percent of GDP in 1980to 7.9 percent in 1983 and 5 percent in 1984. On the other hand, investmentand defense expenditures remained at relatively high levels (21 percent and15 percent of GDP in 1980 and 1983). Coupled with drought-affectedagriculture and stagnant oil output, the GDP growth rate has declined to lessthan that of the population after 1981 and has been negative in 1983 and1984. The persistent pressure of high demand on declining resources in thelast few years has inevitably resulted in financial imbalances, both externaland internal, suppressed inflationary pressures, and a growing need forquicker and more flexible adjustments to a rapidly changing situation.
3.3 The Government has succeeded in the last few years in a holdingoperation through a policy of containing the growth of public investment andmilitary expenditures, modestly raising tax revenue and income of publicenterprises, and drastically reducing imports. On the other hand, its effortshave been less evident in restraining private consumption or reducing publiccurrent expenditures. Subsidies on basic consumer goods, electricity, LPG andfertilizers etc. represent about 6 percent of GDP or two-thirds of the overallpublic finance deficit in 1981-83.
3.4 On the external side, the main instruments of containing the currentaccount deficit have been greater restriction on imports, coupled withincentives for import substitution and limited export promotion measures.
3.5 While these measures have succeeded in preventing a widening of thebalance of payments and budgetary gaps in the short term, they cannot bythemselves correct the structural imbalances, particularly if the decliningtrend in external grants continues, and if oil and agricultural production do
- 27 -
not recover rapidly, and oil prices continue their decline in real terms.More radical adjustment measures would be needed to correct the imbalances andprotect the economy against a steep reduction in external grants.
3.6 In the domestic budget, a reduction of subsidies, particularly onelectricity and fertilizers would seem essential; subsequent frequentadjustment to price changes would be required. Investment expenditures wouldhave to be compressed and the profitability of public enterprises and theirtransfers :o the budget has to be improved further.
3.7 To encourage savings and restrain the less productive investments,somewhat higher interest rates are needed, particularly on deposits and onmedium and long-term credits in agriculture and construction. Higher depositrates, if combined with an appropriate exchange rate, should attract a greatervolume of transfers from Syrians abroad. In the area of private consumption,a liberalization of the price system for all but rationed basic goods would bea more effective means of restraining consumption, stimulating production ofbetter quality goods in high demand and improving the profitability of publicenterprises. Prices of inputs produced by public enterprises would also needto be liberalized. A general and gradual relaxation of price rigidities wouldease the adjustment process and would probably release the dynamic energies ofprivate enterprise both in he domestic and export markets.
3.8 To correct the imbalance in the external accounts and guard against apossible future drop in external grants, an appropriate rate of exchange isueeded to promote exports and restrain imports. Such an adjustment shouldalign import prices more closely with domestic prices of substitutes; it wouldalso reduce windfall profits or illegal imports and encourage legal recordingof exchange transfers from immigrant workers. A first step in this area couldbe the unification of the official and parallel market rates and flexibleadjustmenL thereafter to take account of domestic price changes relative tointernational prices. The medium-term objective would be to unify all rates.Export promotion could also include incentives to private exporters, e.g.through an exchange retention scheme, export credit facility, technicalsupport and market intelligence services, etc.
3.9 Besides the exchange rate adjustment and export promotion policies, aset of policies needs to be devised to restrain domestic demand for exportablegoods and to support the increase of production for export, including, inparticular, investment policies in oil and agriculture. These policies in theoil sector would include adjustment of oil product prices along with theexchange rate to maintain their relationship to international prices so as torestrain domestic consumption and shift part of that demand to exports,greater investment in oil exploration and the rapid exploitation of gasresources that would substitute for exportable oil. Adjustment of electricitytariffs would also restrain domestic demand for oil products and raise theirnet exports. In agriculture a lot depends on Syria's success in exploitingthe large potential in irrigated agriculture in the northeast and theimprovement of agricultural productivity so as to increase exports as well asfeed the rapidly expanding population and restrain the growth of the foodimport bill (agriculture has been given higher priority since 1983 in thepublic investment program). Given the overall financial constraint, suchpolicies would require a shift in public investments from social and economicinfrastructure and industry to quickly productive investments in the oil, gasand agricultural sectors.
- 28 -
3.10 The economic prospects in the medium and long term will depend partlyon the actual price, demand management and investment policies that will befollowed, particularly in relation to the exchange rate, electricity tariffs,food prices, and investments in agriculture and oil sectors. The appropriatemix of policies should result in raising the productivity of the publicenterprise sector as well as in stimulating private investment and output forexport. However, future prospects will also depend on several other importantfactors all of which are not subject to economic policy adjustments. First isSyria's ability to adjust current expenditures effectively to the changinglevel of external grants. Second is the extent of the recently discovered gasand oil reserves and the speed of their exploitation. Third is the extent towhich external borrowing and direct investment will make up for the short fallin national savings in financing the minimum investment level.
(ii) The Main Assumptions
3.11 In making projections of Syria's likely economic development in themedium term (1983-1992), and in light of the above analysis of the policyframework and the main exogenous factors, several key assumptions have to bemade about the following issues. These are: (i) the extent to which therequired policy adjustments are ,nade in the areas of restraining consumptiondemand both in the public and private sectors through an appropriate price andwage policy; (ii) the effectiveness of the investment policy in reallocatingresources to the oil, gas and agriculture and in increasing the efficiency ofinvestments; (iii) the extent to which policy adjustments are made in theexchange rate and export promotion; (iv) the future level of external grantsand workers' remittances; and (v) the extent to which exploitation of new oiland gas discoveries can exceed the natural decline in the production ofexisting wells.
3.12 The base case makes favorable assumptions as to the likely policyadjustments and to the efforts that are made in adjusting prices and reducingsubsidies, on containing other current expenditures, on compressing andredirecting the volume of investment towards the more productive sectors andon implementing export promotion policies. The financial objective of thesepolicies would be to reduce the overall budget deficit, including declininggrants, frcm 9.0 percent of GDP in 1983 to an approximate balance by 1990 andto produce a growing surplus thereafter to finance part of investments. Themajor objective in the external accounts would be to reduce the resource gapfrom 15 percent to about 10 percent in 1988 and to 7 percent in 1992, in theface of declining transfers and rapidly rising interest payments on debt. Themain assumptions are a strict containment of the growth of imports, throughsubstitution of food imports, containment of imports of capital goods througha lower investment level and lower import content, and a major effort toincrease exports of oil by strongly restraining domestic demand, increasingoutput of oil and gas, and through substitution of oil with gas.
3.13 On output, the base case assumes a 5 percent annual real growth invalue added in agriculture (except in the bumper year 1985 and in 1986). Inmining, growth of output will depend on the definite results of the oil andgas discoveries and on investment policy in the sector (as well as oninternational prices of oil). It is projected that output from old wellswould be stable at 8.0 million tons through the projection period, and that
- 29 -
production from new wells would rise to 2 million tons in 1987, 3-4 milliontons in 1988-90 and 5.0 million in 1992. Gas production on the other hand isassumed to grow from 0.2 million ton oil equivalent (MTOE) in 1986 to 1.5 MTOEin 1988 and 3.5 MTOE in 1992. 1/ In construction, the growth rate is assumedto follow that of investment. In manufacturing, (including oil refining)value added will depend on the success of the current drive to improve theefficiency of the public enterprises and the package of policies affecting theprivate sector. The real growth rate is assumed to be 6 percent p.a.Services other than government can be expected to follow the average growthrates of GDP at factor cost. Value added by kovernment services follow thatof the assumed growth in current expenditure i.e., a 2 percent annual realgrowth rate.
3.14 Investment expenditures would have to be reduced somewhat in the basecase from their present level in real terms through 1988 if the twinobjectives of reducing the budget deficit and the current account deficit ofthe balance of payments are to be achieved. Thus fixed investment as a shareof GDP is assumed to drop from 23.4 percent in 1983 and 23.8 percent in 1984to 18 percent in 1988. After 1988, they are assumed to rise at the same rateas GDP. To reduce the overall budgetary deficit, it is also assumed that theshare of public sector investment would decline gradually in real terms from16 percent of GDP in 1983-84 to 11 percent in 1992.
3.15 Concerning the projections of exports and imports of oil, gas and oilproducts, the main assumptions in the base case are the following. Given theassumed oil and gas production levels and a stable level of imports, exportswill depend essentially on domestic consumption of oil products and demand ofoil for electricity production. Domestic consumption of oil products isprojected on the basis of an average income elasticity of 1.2 with referenceto GDP for oil products (80 percent of oil product consumption) and anelasticity coefficient of 1.5 for electricity (20 percent of oil productconsumption). The effect of price adjustments are calculated on the basis ofprice elasticity coefficients of -0.2 for electricity and for other oilproducts. It is also assumed that domestic prices of oil would rise by25 percent (to match prices at the parallel market rate) over the two yearperiod 1986-87 and that prices of electricity would rise in real terms by20 percent p.a. over five years (to cover fully its operating costs).
3.16 For exports other than oil, much will depend on agriculturalperformance and the policies concerning the private sector. In the basic casethe growth of agricultural exports and manufactured exports are assumed to be6 percent p.a. after 1984, i.e., higher than agricultural and industrialgrowth, and equal to that of manufacturing.
1/ See Bank Report 5822. These projections may be optimistic and assumeintensive efforts in exploitation of gas and in petroleum recovery andexploration starting in 1986.
I
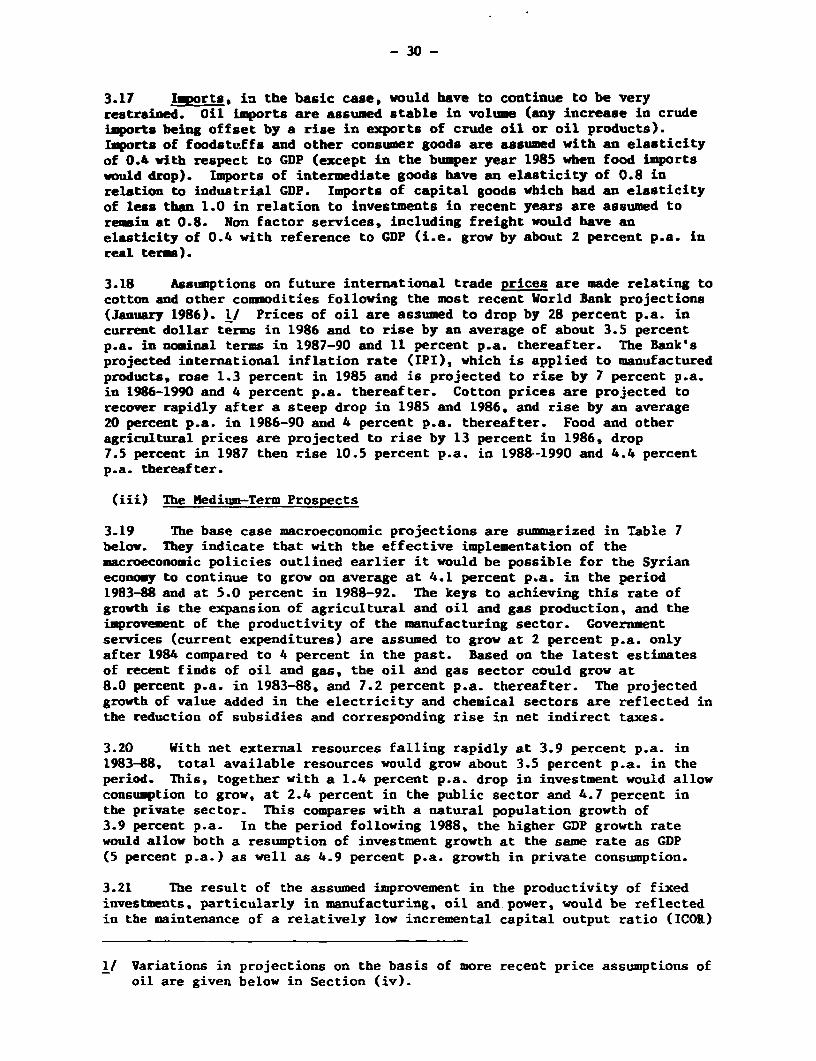
- 30 -
3.17 Imports, in tbe basic case, would have to continue to be veryrestrained. Oil imports are assumed stable in volume (any increase in crudeimports being offset by a rise in exports of crude oil or oil products).Imports of foodstuffs and other consumer goods are assumed with an elasticityof 0.4 with respect to GDP (except in the bumper year 1985 when food importswould drop). Imports of intermediate goods have an elasticity of 0.8 inrelation to industrial GDP. Imports of capital goods which had an elasticityof less than 1.0 in relation to investments in recent years are assumed toreiain at 0.8. Non factor services, including freight would have anelasticity of 0.4 with reference to CDP (i.e. grow by about 2 percent p.a. inreal terms).
3.18 Assumptions on future international trade prices are made relating tocotton and other commodities following the most recent World Bank projections(January 1986). I/ Prices of oil are assumed to drop by 28 percent p.a. incurrent dollar terms in 1986 and to rise by an average of about 3.5 percentp.a. in nominal terms in 1987-90 and 11 percent p.a. thereafter. The Bank'sprojected international inflation rate (IPI), which is applied to manufacturedproducts, rose 1.3 percent in 1985 and is projected to rise by 7 percent p.a.in 1986-1990 and 4 percent p.a. thereafter. Cotton prices are projected torecover rapidly after a steep drop in 1985 and 1986, and rise by an average20 percent p.a. in 1986-90 and 4 percent p.a. thereafter. Food and otheragricultural prices are projected to rise by 13 percent in 1986, drop7.5 percent in 1987 then rise 10.5 percent p.a. in 1988-1990 and 4.4 percentp.a. thereafter.
(iii) The Medium-Term Prospects
3.19 The base case macroeconomic projections are suammarized in Table 7below. They indicate that with the effective implementation of themacroeconomic policies outlined earlier it would be possible for the Syrianeconomy to continue to grow on average at 4.1 percent p.a. in the period1983-88 and at 5.0 percent in 1988-92. The keys to achieving this rate ofgrowth is the expansion of agricultural and oil and gas production, and theimprovement of the productivity of the manufacturing sector. Governmentservices (current expenditures) are assumed to grow at 2 percent p.a. onlyafter 1984 compared to 4 percent in the past. Based on the latest estimatesof recent finds of oil and gas, the oil and gas sector could grow at8.0 percent p.a. in 1983-88, and 7.2 percent p.a. thereafter. The projectedgrowth of value added in the electricity and chemical sectors are reflected inthe reduction of subsidies and corresponding rise in net indirect taxes.
3.20 With net external resources falling rapidly at 3.9 percent p.a. in1983-88, total available resources would grow about 3.5 percent p.a. in theperiod. This, together with a 1.4 percent p.a. drop in investment would allowconsumption to grow, at 2.4 percent in the public sector and 4.7 percent inthe private sector. This compares with a natural population growth of3.9 percent p.a. In the period following 1988, the higher GDP growth ratewould allow both a resumption of investment growth at the same rate as GDP(5 percent p.a.) as well as 4.9 percent p.a. growth in private consumption.
3.21 The result of the assumed improvement in the productivity of fixedinvestments, particularly in manufacturing, oil and power, would be reflectedin the maintenance of a relatively low incremental capital output ratio (ICOR)
11 Variations in projections on the basis of more recent price assumptions ofoil are given below in Section (iv).
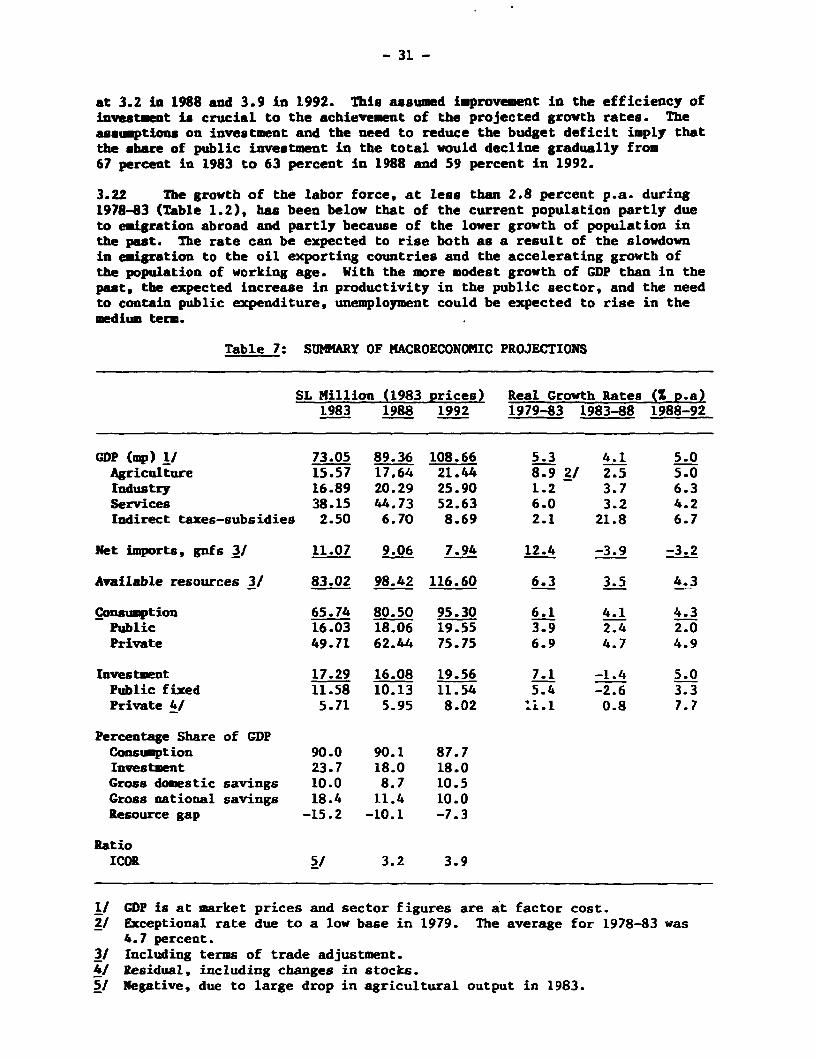
- 31 -
at 3.2 li 1988 and 3.9 ln 1992. This assumed improvement in the efficiency ofinvestment is crucial to the achievement of the projected growth rates. Theassumptions on investment and the need to reduce the budget deficit imply thatthe share of public investment in the total would decline gradually from67 percent in 1983 to 63 percent in 1988 and 59 percent in 1992.
3.22 The growth of the labor force, at less than 2.8 percent p.a. during1978-83 (Table 1.2), has been below that of the current population partly dueto emigration abroad and partly because of the lower growth of population inthe past. The rate can be expected to rise both as a result of the slowdownin emigration to the oil exporting countries and the accelerating growth ofthe population of working age. With the more modest growth of GDP than in thepast, the expected increase in productlvity in the public sector, and the needto contain public expenditure, unemployment could be expected to rise in themedium term.
Table 7: SUMMARY OF MACROECONOMIC PROJECTIONS
SL Million (1983 prices) Real Growth Rates (S p.a)1983 1988 1992 1979-83 1983-88 1988-92
GDP (mp) 1I 73.05 89.36 108.66 5.3 4.1 5.0Agriculture 15.57 17.64 21.44 8.9 2/ 2.5 5.0Industry 16.89 20.29 25.90 1.2 3.7 6.3Services 38.15 44.73 52.63 6.0 3.2 4.2Indirect taxes-subsidies 2.50 6.70 8.69 2.1 21.8 6.7
Net imports, gnfs 3/ 11.07 9.06 7.94 12.4 -3.9 -3.2
Available resources 3/ 83.02 98.42 116.60 6.3 3.5 4.3
consumption 65.74 80.50 95.30 6.1 4.1 4.3Public 16.03 18.06 19.55 3.9 2.4 2.0Private 49.71 62.44 75.75 6.9 4.7 4.9
Investment 17.29 16.08 19.56 7.1 -1.4 5.0Public fixed 11.58 10.13 11.54 5.4 -2.6 3.3Private 4/ 5.71 5.95 8.02 'i.1 0.8 7.7
Percentage Share of GDPConsumption 90.0 90.1 87.7Investment 23.7 18.0 18.0Gross domestic savings 10.0 8.7 10.5Gross national savings 18.4 11.4 10.0Resource gap -15.2 -10.1 -7.3
RatioICOR 5/ 3.2 3.9
1/ GDP is at market prices and sector figures are at factor cost.2/ Exceptional rate due to a low base in 1979. The average for 1978-83 was
4.7 percent.3/ Including terms of trade adjustment.4/ Residual, including changes in stocks.51 Negative, due to large drop in agricultural output in 1983.
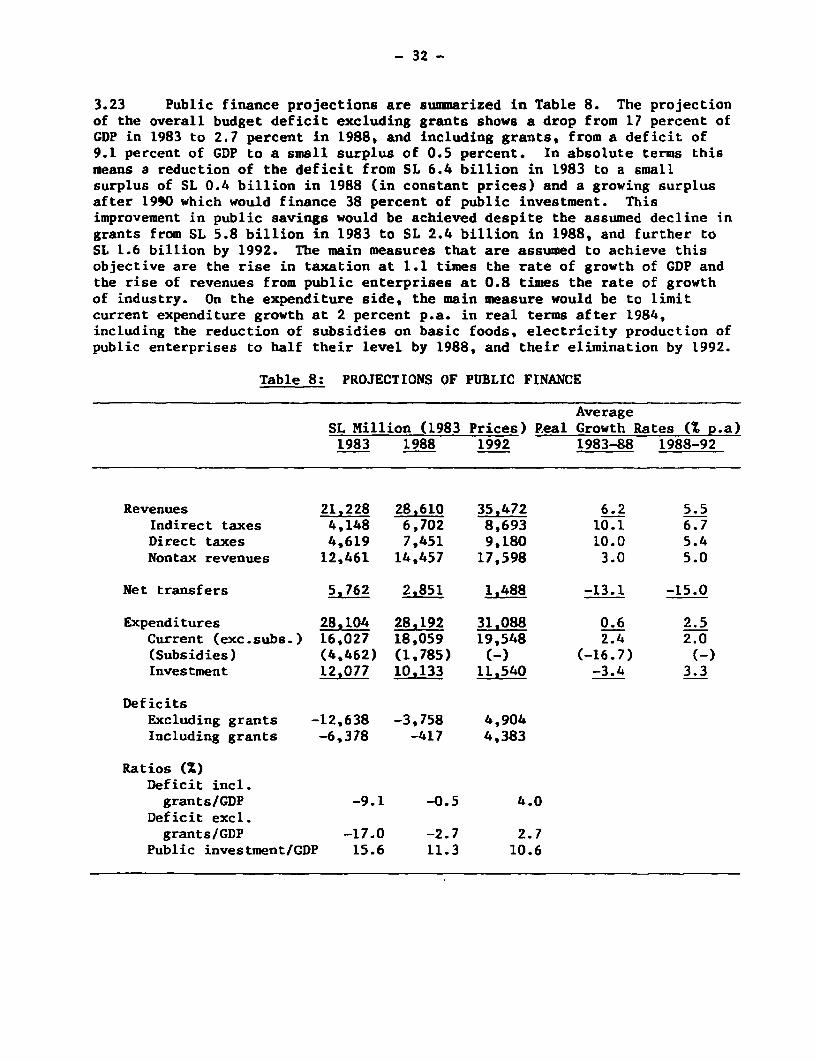
- 32 -
3.23 Public finance projections are summarized in Table 8. The projectionof the overall budget deficit excluding grants shows a drop from 17 percent ofGDP in 1983 to 2.7 percent in 1988, and including grants, from a deficit of9.1 percent of GDP to a small surplus of 0.5 percent. In absolute terms thismeans a reduction of the deficit from SL 6.4 billion in 1983 to a smallsurplus of SL 0.4 billion in 1988 (in constant prices) and a growing surplusafter 1990 which would finance 38 percent of public investment. Thisimprovement in public savings would be achieved despite the assumed decline ingrants from SL 5.8 billion in 1983 to SL 2.4 billion in 1988, and further toSL 1.6 billion by 1992. The main measures that are assumed to achieve thisobjective are the rise in taxation at 1.1 times the rate of growth of GDP andthe rise of revenues from public enterprises at 0.8 times the rate of growthof industry. On the expenditure side, the main measure would be to limitcurrent expenditure growth at 2 percent p.a. in real terms after 1984,including the reduction of subsidies on basic foods, electricity production ofpublic enterprises to half their level by 1988, and their elimination by 1992.
Table 8: PROJECTIONS OF PUBLIC FINANCE
AverageSL Million (1983 Prices) Real Growth Rates (2 p.a)1983 1988 1992 1983-88 1988-92
Revenues 21.228 28,610 35,472 6.2 5.5Indirect taxes 4,148 6,702 8,693 10.1 6.7Direct taxes 4,619 7,451 9,180 10.0 5.4Nontax revenues 12,461 14,457 17,598 3.0 5.0
Net transfers 52762 2.851 1.488 -13.1 -15.0
Expenditures 282104 28,192 31,088 0.6 2.5Current (exc.subs.) 16,027 18,059 19,548 2.4 2.0(Subsidies) (4,462) (1,785) (-) (-16.7) (-)Investment 12,077 10.133 11,540 -3.4 3.3
DeficitsExcluding grants -12,638 -3,758 4,904Including grants -6,378 -417 4,383
Ratios (x)Deficit incl.grants/GDP -9.1 -0.5 4.0
Deficit excl.grants/GDP -17.0 -2.7 2.7
Public investment/GDP 15.6 11.3 10.6
- 33 -
3.24 The projections of the external accounts are presented in Table 9.tt is assumed that exports are supported by the necessary production policiesin agriculture, and in oil and gas, and by price policy and export incentivesas outlined earlier. Exports would grow at about 6.4 percent p.a. in volumein 1983-88 and 5.2 percent p.a. in 1988-92, thank; to the rapid export growthof oil, agricultural products, textiles, and miscellaneous manufactures. Withfuel imports that cannot be compressed it would be necessary to restrain thegrowth of food and intermediate imports, if the trade deficit is to be reducedand the growth of external debt contained within acceptable limits. This ismore so, given the assumption on stable remittances in real terms anddeclining grants (at 15 percent p.a. in real terms after 1985) and in theelasticity of imports detailed earlier.
3.25 With these assumptions, the deficit on gouds and non factor serviceswould be reduced from $2.6 billion in 1983 to $2.2 billion in 1988 but wouldrise back to $2.6 billion in L992 (in current dollars). Transfers andworker's remittance would bring down the current account balance to$1.6 billion in 1988. However, the stagnation of workers' remittances andrise in interest rate payments on both long-term debt and short-term debt,would lead to the growth of the current account deficit and transfers to$2.7 billion by 1992 (all in current dollars). The current deficit wouldcontinue to grow in current terms after 1992 and would become unsustainable inthe long run unless new resources become available or further tradeadjustments are made.
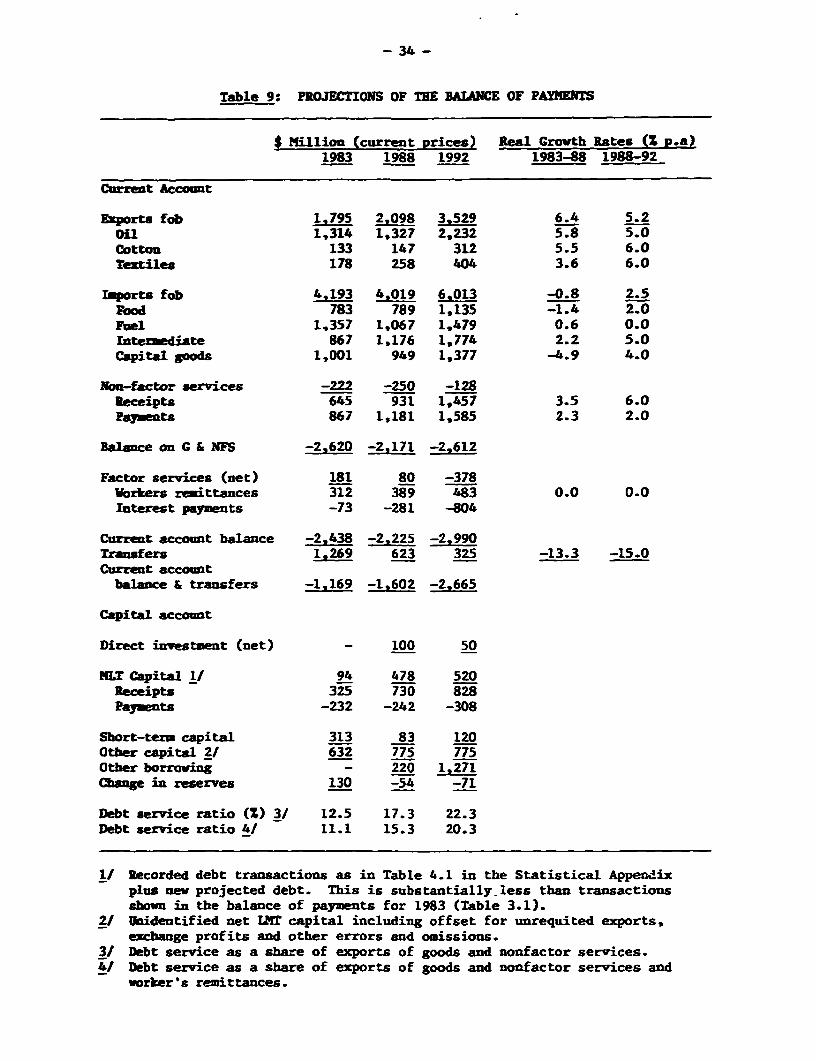
- 34-
Table 9: PROJECTIONS OF TEE BALANCE OF PAThENTS
$ Million (current prices) Real Growth Rates (Z v.a)1983 1988 1992 1983-88 1988-92
Current Account
Ezports fob 1.795 2,098 3.529 6.4 5.2Oil 1,314 1,327 2,232 5.8 5.0Cotton 133 147 312 5.5 6.0Teztiles 178 258 404 3.6 6.0
Imports fob 4.193 4.019 6.013 -0.8 2.5Food 783 789 1.135 -1.4 2.0Fuel 1,357 1,067 1.479 0.6 0.0Intermediate 867 1.176 1,774 2.2 5.0Capital goods 1,001 949 1,377 -4.9 4.0
Non-factor services -222 -250 -128Receipts 645 931 1,457 3.5 6.0Payments 867 1,181 1,585 2.3 2.0
Balance on G & NFS -2.620 -2.171 -2.612
Factor services (net) 181 80 -378Workers remittances 312 389 483 0.0 0.0Interest payments -73 -281 -804
Current account balance -2.438 -2.225 -2.990Transfers 1.269 623 325 -13.3 -15.0Current account
balance & transfers -1.169 -1,602 -2.665
Capital account
Direct investment (net) - 100 50
MLT Capital 1/ 94 478 520Receipts 325 730 828Payments -232 -242 -308
Short-term capital 313 83 120Otber capital 2/ 632 775 775Other borrowing - 220 1.271Change in reserves 130 -54 -71
Debt service ratio (S) 3/ 12.5 17.3 22.3Debt service ratio 4/ 11.1 15.3 20.3
1/ Recorded debt transactions as in Table 4.1 in the Statistical Appendixplus new projected debt. This is substantially. less than transactionsshown in the balance of payments for 1983 (Table 3.1).
2/ Unidentified net LMT capital including offset for unrequited exports,exchange profits and other errors and omissions.
3/ Debt service as a share of exports of goods and nonfactor services.4. Debt service as a share of exports of goods and nonfactor services and
worker' a remittances.
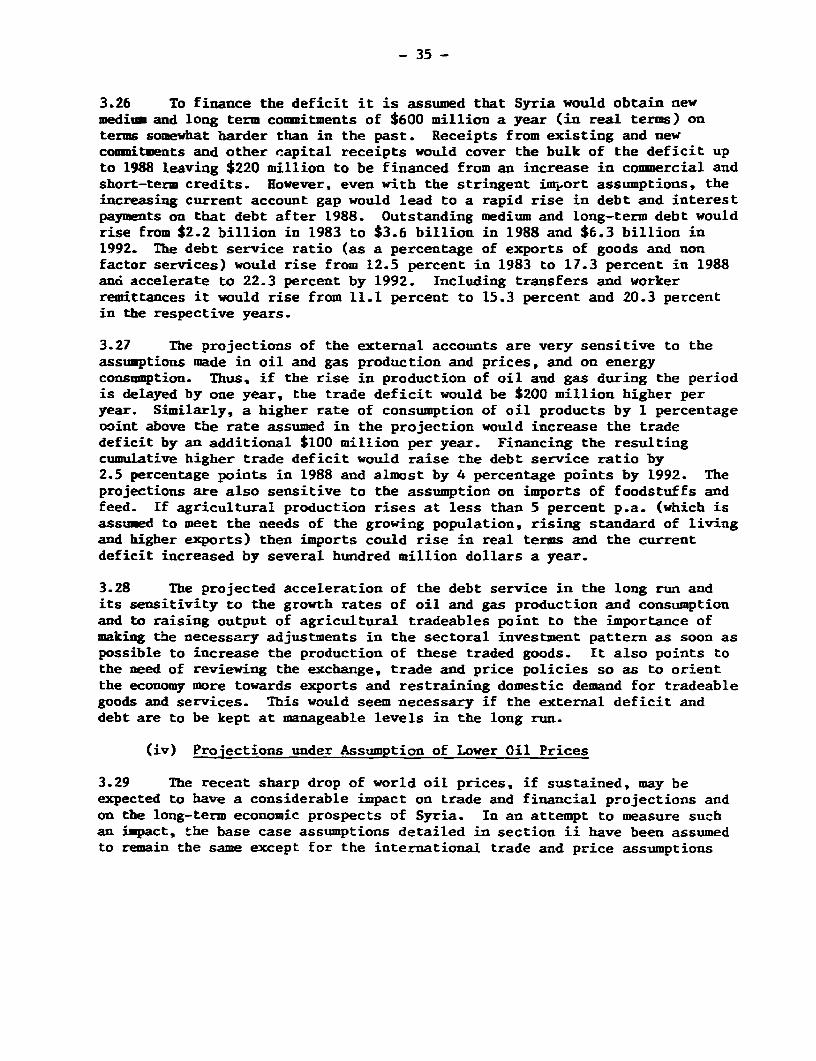
- 35 -
3.26 To finance the deficit it is assumed that Syria would obtain newmedium and long term commitments of $600 million a year (in real terms) onterms somewhat harder than in the past. Receipts from existing and newcommitments and other capital receipts would cover the bulk of the deficit upto 1988 leaving $220 million to be financed from an increase in commercial andshort-term credits. However, even with the stringent imjrort assumptions, theincreasing current account gap would lead to a rapid rise in debt and interestpayments on that debt after 1988. Outstanding medium and long-term debt wouldrise from $2.2 billion in 1983 to $3.6 billion in 1988 and $6.3 billion in1992. The debt service ratio (as a percentage of exports of goods and nonfactor services) would rise from 12.5 percent in 1983 to 17.3 percent in 1988and accelerate to 22.3 percent by 1992. Including transfers and workerremittances it would rise from 11.1 percent to 15.3 percent and 20.3 percentin the respective years.
3.27 The projections of the external accounts are very sensitive to theassumptions made in oil and gas production and prices, and on energyconsumption. Thus, if the rise in production of oil and gas during the periodis delayed by one year, the trade deficit would be $200 million higher peryear. Similarly, a higher rate of consumption of oil products by 1 percentageooint above the rate assumed in the projection would increase the tradedeficit by an additional $100 million per year. Financing the resultingcumulative higher trade deficit would raise the debt service ratio by2.5 percentage points in 1988 and almost by 4 percentage points by 1992. Theprojections are also sensitive to the assumption on imports of foodstuffs andfeed. If agricultural production rises at less than 5 percent p.a. (which isassumed to meet the needs of the growing population, rising standard of livingand higher exports) then imports could rise in real terms and the currentdeficit increased by several hundred million dollars a year.
3.28 The projected acceleration of the debt service in the long run andits sensitivity to the growth rates of oil and gas production and consumptionand to raising output of agricultural tradeables point to the importance ofmaking the necessary adjustments in the sectoral investment pattern as soon aspossible to increase the production of these traded goods. It also points tothe need of reviewing the exchange, trade and price policies so as to orientthe economy more towards exports and restraining domestic demand for tradeablegoods and services. This would seem necessary if the external deficit anddebt are to be kept at manageable levels in the long run.
(iv) Projections under Assumption of Lower Oil Prices
3.29 The recent sharp drop of world oil prices, if sustained, may beexpected to have a considerable impact on trade and financial projections andon the long-term economic prospects of Syria. In an attempt to measure suchan impact, the base case assumptions detailed in section ii have been assumedto remain the same except for the international trade and price assumptions
- 36 -
given in para 3.18. The exception is an assumed drop of oil prices to $15 in1986 followed by a 2 percent annual drop in real terms up to 1990 and a riseof 9.6 percent p.a. after 1990. 1/
3.30 It may be assumed that in the short term, a further drop in theinternational price of oil by $5 per barrel would not have a significantimpact on Syria's trade balance. Since the balance of trade in oil has beenslightly negative since 1983 and would be close to a balance in 1986-87, thedrop in the value of oil exports would be largely offset in this period by thedrop in the value of oil imports. In the long term however, as the volume ofnet oil exports increase, the value of net exports would rise less thanprojected in the base case. Thus, comparison of the base case and low-oilprice projections show a relatively small net difference up to 1987 but a netloss of $69 million in 1988 rising to $277 million in 1992.
Table 10: NET EFFECT OF LOWER OIL PRICE PROJECTIONS ON THE BALANCE OF TRADE($ mill)
Base Case Lower Oil Prices Net DifferenceImports Exports Net Import Export Net
($ million) ($ million)
1983 1357 1314 -43 1357 1314 -431984 1374 1119 -255 1371 1117 -2551985 1334 1101 -233 1337 1104 -233 -1986 961 884 -77 722 664 -58 191987 1054 1160 106 770 848 78 -281988 1067 1327 260 785 976 191 -691990 1200 1696 496 816 1153 337 -1591992 1641 2454 813 1051 1587 536 -277
11 The new price assumptions of oil prices in current USS per bbl (based onBank projections of January 1986 but with a $5 per bbl. less for oil) arethe following:
Base Case New
1983 29.1 29.11984 28.5 28.51985 27.8 27.81986 20.0 15.01987 22.0 17.01988 22.3 17.31990 23.0 18.01992 24.7 19.7
- 37 -
3.31 The effect on the balance of payments, in contrast with the balanceof trade, could well be different, however, because the bulk of oil importshave been purchased on credit (and partly received as a grant). Thus, to theextent that such credit arrangment continues in the next few years, the levelof such credit would be lower but Syria would suffer a substantial drop inexchange receipts from exports. The gross loss of receipts from exports ascompared with the base case could rise from $220 million in 1986 to$350 millie- in 1988 and over $870 million in 1992. The last figure wouldrepresent about 22 percent of exports projected in the base case at the higheroil prices.
3.32 As compared with the base case, the lower oil prices would createlarger financing requirements and a more rapidly growing debt. The debtservice ratio would reach 20.4 percent as early as 1988 (compared with17.3 percent in the base case) and rise to 30.8 percent in 1992 (as comparedwith 22.3 percent in the base case). The above figures emphasize theimportance of increasing net exports of oil (through higher production, gassubstitution and restraining demand) as compared with the base case to avoidan undue deterioration of creditworthiness.
3.33 The direct effect of the drop in oil prices on gross national incomecomes from the deterioration in the terms of trade. The projections on thebasis of lower oil as compared with the base case indicate a deterioration inthe terms of trade of SL 0.5 billion in 1986 rising to SL 0.8 billion in 1988and SL 1.5 in 1992. This loss would represent roughly 0.9 to 1.4 percent ofGDP in latter years. The indirect effects of the drop in oil prices aredifficult to estimate but focus on the future volume of external grants and ofreceipts from workers' remittances and other factor incomes. A drop inrevenues and economic activities in the oil exporting capital surpluscountries can be expected to affect such flows to Syria negatively, althoughmuch depends on the political developments in the region.
3.34 The direct impact of the drop in oil prices is essentially on thebalance of payments. The changes affecting the budget accounts and those ofthe public sector (particularly the Syrian Petroleum Company and Electricityproduction) are complex and would largely depend on how the international oilprices are allowed to affect domestic prices of oil products. If the drop ininternational prices is not offset by a devaluation of the exchange rateapplying to oil exports, that would mean a corresponding drop in the revenuesin Syrian pounds of the Syrian Petroleum Company from its oil exports. If thesame price is passed on to other public enterprises (particularly electricityproduction), then their costs would be reduced correspondingly; there would beno effect on total profits of the public sector as a whole or on its transferto the budget. The cost of imported oil on the other hand would be reduced,and if the reduction is not passed to the consumers it would result in acorresponding rise in the profit of the SPC and its transfers to the budget.This profit is quite substantial, rising from about SL 2.2 billion in 1986 toSL 2.5 billion in 1988 and over SL 3 billion in 1990 and 1992 (as comparedwith 1984). This would make a significant contribution to the reduction ofthe huge budgetary deficit which reached SL 12 billion in 1984. Theseprojections assume that consumer prices (of refined products, electricity,etc.) are not allowed to fall below their assumed levels in the basic caseprojections (see para. 3.23). It is therefore important that the projectedrise in domestic prices of products and electricity take place, or evenaccellerated, to help narrow the wide budgetary gap and cushion the negativeeffect on the balance of payments.
- 38 -
CHAPTER IV - SELECTED SECTORAL DEVELOPMENTS AND ISSUES
A. Agriculture
(i) Background
4.1 The cropped area in Syria has averaged about 3.9 millionhectares - of which 580 thousand hectares are irrigated - and has onlymarginally increased in recent years. Over the last decade, the irrigatedcropped area has risen to about 17 percent of the total, mainly because of agreater cropping intensity. Agricultural output fluctuates considerably,owing to the erratic timing and magnitude of annual precipitation.Vegetables, cotton and sugarbeet are the principal irrigated crops, whilecereals (mainly wheat) and fruits (including olives) are the principal rainfedcrops 11 (Table 7.1). The main irrigated cereal, wheat, represents only aboutone-fourth to one-fifth of total wheat output in recent years. Livestock(mainly sheep) accounts for about one-third of the value of output. Extensivesheep grazing is carried out on marginal rainfed pastureland and steppe, insome cases supplemented by crop wastes in cultivated areas andgovernment-supplied rations. Agricultural products (primarily cotton) aresecond only to petroleum as foreign exchange earners. Intersectoral linkagesare strong, as about one-half of the gross output and employment in themanufacturing sector, excluding petroleum refining, is in food, beverage andtextile activities. While the Government has made appreciable efforts toredress the imbalance in economic and social conditions between the rural andurban areas, the former continues to have lower income levels and more limitedaccess to social services.
4.2 There are about 485,400 holders (including about 40,000 livestockholders), primarily privately owned except for a few state farms establishedsince the 1958 agrarian reform. Some 408,000 farmers have joined 3,903cooperatives, 81 percent of which are multipurpose cooperatives in whichproduction activities are individually organized on private holdings. Membersof cooperatives cultivated 1.4 million hectares (largely on an individualbasis) in 1983 and farmers not members of cooperatives cultivated 2.6 millionhectares. State farms cropped only 0.04 million hectares. The Government'sprogress in implementing the 1958 Agrarian Reform Law is evidenced by the factthat, by 1970, 96 percent of all farms (including non-irrigated lands) wereless than 25 ha and accounted for 59 percent of the land in farms (and most ofthe irrigated area). Only 1 percent of the farms were over 100 ha (averaging222 ha) and accounted for 8 percent of the area. At present, a variety oftenancy arrangements exist and are subject to government regulation. Aproblem faced by the sector is the heavy incidence of very small andfragmented holdings; in 1970, 15 percent of the farms were less than 2 ha insize and were often made up of several non-contiguous parcels. This problemmerits government attention, because of its impact on farm productivity andsince fragmented holdings are often associated with low income.
4.3 Although the proportion of the labor force engaged in agriculture hascontinued a secular trend downward, from almost 50 percent in the early 1970sto only about 30 percent in the early 1980s, it continues to be a major sourceof employment. It appears from available data that the size of the
I/ The main irrigated cereal, wheat, represents only about one-fourth toone-fifth of total wheat output in recent years.
- 39 -
agricultural labor force has stabilized, although the national labor force hasgrown by about 3 percent p.a. since 1970 (Table 2.1). Out migration fromfarms was to both urban areas and neighboring countries where employmentopportunities were rapidly expanding. There was also an increase in temporary(seasonal) employment in urban areas during slack periods in the agriculturalcycle. Concurrently, there was an expansion in labor intensive crops,especially under irrigation. As a result of these forces, rural labor marketshave come under increasing pressure and there appear to have been noticeableincreases in rural wages. Finally, in recent years the economy has witnessedits formerly positive trade balance in food and agricultural raw materialserode and finally turn seriously negative, led by the rapid rise in the valueof imports of foodgrains and animal feedstuffs.
(ii) Investment and Output
4.4 During the Fourth Five-Year Plan (1976-80) about 7 percent of thepublic sector investment budget was allocated to the agricultural sector(excluding spending on the Euphrates Dam), and actual expenditures were onlyabout 5Z of total actual investment. The impact of investments has beenmarginal, especially as they were heavily weighted towards large-scale,capital-intensive, long-gestation irrigation projects (e.g., in the EuphratesBasin). The Fifth Five-Year Plan (1981-85), by comparison, allocatesSL 15,500 million (19 percent) of the public investment program to theagricultural sector. Of this total 67 percent is specifically assigned tofurther development in the irrigation and reclamation projects. The Plan'starget is that by 1985 irrigatiot. infrastructure would be completed on 201,000hectares in the Euphrates Basin and drainage services on another 125,000hectares, while 50,000 hectares would be actually brought into cultivation.It appears, however, that these undartakings continue to be plagued by costoverruns and that execution is falling behind the initial expectations. It isalso desirable to shift more investment resources towards maintenance andrehabilitation of existing irrigation projects.
4.5 As a result of relatively very rapid growth of GDP, the relativeshare of agriculture in GDP has declined in recent years to an average ofabout 20 percent, from 30 percent in the 1960's. During the first half of the1970's, the index of agricultural production rose rapidly, at 8.9 percentp.a., and continued to grow at 7.7 percent p.a. during 1976-80, boosted by thebumper crop in 1980 (livestock output grew at 10 percent p.a. while cropoutput rose by 6.8 percent p.a.). Output performance during 1981-83 has sofar been very disappointing due to poor climactic conditions. The averageannual increase has been at 2.9 percent p.a., but this disaggregates into only0.3 percent p.a. for crops and 9.1 percent p.a. for livestock products(Table 7.2). Output growth of vegetables and industrial crops (cotton andsugarbeets) suffered less than cereals as they are cultivated mostly in theirrigated areas (Table 7.1). 1/ With the continued advances in both yieldsand cropping intensities in irrigated areas, these now account for well overhalf the value of all crop output.
1/ While droughts principally depress crop output on rainfed lands, theyalso reduce surface water supplies and increase the costs of groundwaterutilizations in irrigated areas, thus tending to limit their output aswell. The costs of livestock production are also affected as diminishedfodder supplies have to be supplemented by imported feedstuffs(principally for poultry).
- 40 -
4.6 The Plan document highlighted the need for more intensivecultivation, the use of price policy to provide production incentives, and anexpanded use of fertilizers, pesticides and improved seeds. Improved rainfallthrough the Spring of 1985 could result in a bumper crop and repeat the 1980experience, boosting average output growth near the Plan target of 7.8 percentp.a. The recent results for cotton, dairy products and some vegetables havealready surpassed the Plan target, and output of sugar beet and pulses haverisen considerably but, together with cereals, seem to be lagging behind theambitious Plan targets.
(iii) Pricing Policy
4.7 The Government, through public sector processing/exportingenterprises, is the sole purchaser of cotton, tobacco and sugarbeets. It alsopurchases varying amounts (typically less than a third) of the output ofwheat, maize, barley, lentils and peanuts, as well as smaller quantities offruits and vegetables. Of the major products - wheat, cotton, sugarbeets,maize and barley - only the official procurement price of barley has failedto more than double in the last seven years (Table 7.3). For the majorinternatiov^lly traded crops, except cotton, the domestic procurement price ishigh relative to international prices (converted at the parallel market ratebeginning 1981), particularly for maize and sugar beets (Table 7.4). TheGovernment has established these prices on the basis of production coststudies and as an instrument to encourage farmers to expand output of thecrops in question.
4.8 One may ask, however, in view of the declining world prices, if insome cases prices have become so high, e.g., wheat, maize and sugarbeet, asto: (a) encourage high cost marginal producers; (b) provide excessivefinancial rents to relatively efficient producers; and (c) divert resourcesfrom production of other profitable but unsupported crops. Moreover, giventhe Government's long-standing commitment to maintaining low prices on basicfoodstuffs, these high output prices result in very large subsidies in thefood processing and distribution systems. Thus, while farmers were beingofficially paid on average SL 1230 per ton for soft wheat and flour wasimported by the Government at about SL 1070 per ton, flour was being solddomestically at SL 142.5 a ton to state bakeries to prepare a popularly pricedbread (or the equivalent of 13 percent of the cost of imported flour). Otherflour sold to consumers is roughly equal to the cost of imported flour. Inthe case of sugar, the retail price for the monthly 1.5 kg per capita sugarration is less than one-third the raw material cost of sugarbeets, and theunrationed price is barely equal to raw material costs.
(iv) Farm Credit and Input Supply
4.9 The principal institutional source of agricultural credit is theAgricultural Cooperative Bank (ACB), which has 62 branches throughout thecountry. The ACB is also the main vendor of farm inputs. Lending by the ACBhas expanded rapidly in recent years to SL 876.5 million in 1983. Outstandingcredit reached SL 1075 million at the end of the year (Table 6.5). Tofacilitate continued expansion, the Government increased the ACB's capital toSL 250 million in 1983 and a further increase may be authorized in 1985.
- 41 -
Deposits are principally those of farm cooperatives and public enterprises.Lending interest rates at present range from 4 percent p.a. for the publicsector to 4 percent to 6 percent p.a. for loans to cooperatives and5.5 percent to 7.5 percent to private individuals 1/ (Table 6.6). Overall,just under three-quarters of credits are for short-term loans and less than10 percent for long-term, with the remainder for medium-term loans. In 1982close to half of the lending was for cotton and cereals; machinery andequipment loans were about 13 percent of the total. As deposit interest ratesrange from 4 percent p.a. for sight accounts up to 8 percent p.a. for termdeposits of not less than 12 months (except for public sector deposits whichare paid a flat 2 percent p.a.), it appears that the operating margin of theACB is relatively thin. In all cases the deposit and lending rates are wellbelow the rate of inflation, which induces an erosion of the institution's networth in real terms, transferring the institution's assets to the most favoredborrowers.
4.10 The ACB is responsible for selling farm inputs in the rural areas, inpart on credit to farmers who have been granted a crop license by the localagent of the Ministry of Agriculture and Agrarian Reform (MAAR); quantitiesare supplied according Lo standard predetermined needs. Additional inputs --to the extent they are stocked by the ACB and the farmer has a croppinglicense - are sold for cash. Farm prices of fertilizers are substantiallybelow domestic production costs but slightly above internatinal f.o.b.prices. 2/
(v) Production Planning
4.11 According to Law 14 of 1975, an annual national agriculturalproduction plan, determining both cropping patterns and inputs, isadministered by the MAAR. National targets are disaggregated on provincialand district level and form the basis for licensing farmers to producecereals, cotton, vegetables, tobacco, sugarbeets and any other commodity forwhich a farmer wishes to obtain a crop production loan or inputs from theACB. Penalties for noncompliance with crop plans include the possibility offines and crop confiscation. However, in view of the heavy administrativeburden put on MAAR field staff to annually distribute licenses and verify thepatterns of input use, variations from licensed cropping patterns, andespecially diversion of inputs from one crop to another or even into asecondary market are reported.
1/ Except loans for fruit tree plantations which are interest free for boththe public and private sectors, and loans for the construction ofelectrical transporting units which are interest free for three years.
2/ In 1984 the domestic fertilizer price of triple superphosphate wasSL 1000/ton and that of urea SL 950/ton. At the parallel market rate thiswould be $183 and $174 respectively, this compares with internationalfertilizer prices f.o.b. (i.e. excluding freight and handling) of $135 and$176 respectively.
- 42 -
4.12 To encourage Syrian farmers to progressively move into the productionof high value, specialized crops and crops in high demand domestically and forexport, greater flexibility in the planning system would be desirable byincreasing the role of relative prices in determining the cropping pattern andthe use of inputs. Concerning inputs, a first step might be to separate theinput provision function from the lending operations of the ACB and introducecommercially-oriented agencies to be responsible for input sales. Governmentpolicy is to encourage the use of inputs, particularly fertilizers andselected seeds so as to increase production. While this may be justified inareas where farmers have not yet become familiar with their use, prices ofinputs need to be gradually raised in other areas for a limited period, so asto reduce subsidies and ensure that they are used appropriately and where theyyield the highest return. Over the medium term, responsibilities fordistribution of inputs could probably be shared by private trade, permittingqualified government staff to better concentrate on their farm lending andextension duties.
(vi) Agricultural Exports
4.13 Syria's natural resource base and proximity to prosperous Gulfmarkets provide important opportunities for continued expansion of fresh andprocessed agricultural exports. This growth will, however, depend onsustained efforts to establish and maintain a reputation as a reliable,relatively low cost supplier of a consigtently high quality product. Theenforcement of grades and standards for produce for the export market and thequick local dissemination of market intelligence represent an importantsupport the Government would provide to producers and traders. On the otherhand, time-consuming procedures for private traders to obtain export licenseswould discourage taking timely advantage of opportunities which might open upand should be relaxed. Export opportunities could include deciduous fruits,grapes, pistachio nuts, canned fruits, vegetables and juices, etc. Furtherincentives which the Government could consider include, e.g., access to theparallel exchange market for conversion of foreign currency earnings arisingfrom agricultural exports, retention of part of foreign currency earnings byexperters for their own uses (rather than compulsory surrender), etc.
B. Manufacturing
(i) Recent Developments
4.14 During 1980-83, output of the manufacturing sector has grown atalmost 15 percent p.a., compared with 8 percent p.a. achieved during 1975-80(Table 8.1). The large chemicals subsector -- dominated by petroleumrefining -- grew at the same average rate. The most important growth was inthe food and chemicals subsectors, including oil refining, while textilesproduction grew more moderately. The principal individual manufacturedproducts showing rapid growth in ouput in recent years include preservedfoods, bugar, carpets, hides, fertilizers, detergents, metal cables, cement,glass, household durables and electric transformers (see Table 8.2). Thegrowth of output may slow down in the next few years, as completions of newplants taper off and if foreign exchange constraints limit the supply ofimported raw materials and intermediate goods.
- 43 -
4.15 In 1983, manufacturing value-added (including petroleum refining)represented 8 percent of GDP. In that same year, 308,400 persons or13 percent of the labor force were employed in the sector, a figure which grewat an average rate of 2.7 percent p.a. during 1978-83. Comparing the growthrates of employment and output in recent years indcates that productivity perworker has risen considerably.
4.16 The manufacturing sector comprises slightly over 100 publicenterprises employing about 96,000 persons in 1983 and a very large number -almost 55,000 - of mainly very small private firms employing about 146,000persons in that year. The Government's policy has been to reserve for itselfcertain basic or strategic manufacturing activities, e.g., cereals milling,sugar refining, petroleum refining, cement production, and to permit theprivate sector to enter into other lines of manufacturing activity. In someindustries, particularly the large textile subsector, both private and publicfirms operate.
4.17 About two-thirds of public sector manufacturing employment is inenterprises under the control of the Ministry of Industry. The oil refineriesare controlled by the Ministry of Petroleum and Natural Resources, cottonginning and tobacco trade by the Ministry of Economy and Foreign Trade, andcereals milling and state bakeries by the Ministry of Supply and ForeignTrade. The manufacturing enterprises in the Ministry of Industry are gatheredinto General Organizations (G.O.s) according to their line of production.These G.O.s are the principal agency of control of the firms, reviewing andapproving plans for output, operating budgets, investment, and employment, aswell as assisting in the procurement of inputs and products sales (to theextent that trading matters are not handled by General Organizations locatedin other Ministries).
4.18 The evolution of output and employment in the various subsectors,divided between the public and the private sectors in 1979-83 is shown inTable 8.3. Almost three-quarters of the expansion of manufacturing employmentbetween 1980 and 1983 was in public sector enterprises, mainly food productsand textiles. There were also large increases in private sector employment infood products, wood and furniture, non-metallic and metallic products, whilethe number employed in what was formerly the principal subsector - textiles-- fell by about 50 percent. Measured in current prices, the share of theprivate sector in total manufacturing output fell marginally from 38 percentin 1980 to 34 percent in 1983. However, if one excludes the value ofpetroleum refining, the private sector share of gross output is about 50Z,approximately the same as in 1980.
4.19 In 1983, average output per worker in the public sector was aboutthree times that of the private sector (Table 8.3), but value added per workerwas higher in the private sector by about 17 percent (Table 8.4). Value addedper worker varies considerably between subsectors. Thus, while it is muchhigher in the public sector chemicals (including petroleum refining), cement,and metal products industries, it is 67 percent higher in the private sectorin all the other industries combined. This asymmetry may be explained in partby the intensive use of capital in the chemical and metal public enterprises,contrasted with the labor intensive small industry in the private sector.Value added in some public sector industries is diminished also by subsidizedprices of output (e.g., food and fertilizers) or by high cost of inputs(fertilizer, paper).
- 44 -
(ii) Public Sector Investment
4.20 A number of large investments in the chemical, oil refining andcement industries were initiated in the Fourth Plan (1975-80) but productiononly started in the Fifth Plan period (1981-85). During the present Plan, themanufacturing sector has been allocated SL 10.8 billion, or 13 percent of thetotal public investment program. About one-quarter of this investment will bein chemical industries (SL 1.3 billion for the refineries) and a like amountin foodstuff industries. Of the total public sector investment program abouttwo-thirds are identified for specific projects or programs. Almostuniversally, these are for completing projects carried over from the previousplan period or for modernization and upgrading of existing plants. Perhapsthe largest expansion activity which cannot be so classified is theSL 1,072 million allocated to construct additional automated public sectorbakeries, which are being manufactured domestically.
4.21 During the first three years of the present Plan, realized investmentexpenditures by public sector manufacturing enterprises have reachedSL 3.5 billion, 74 percent of the amounts authorized (Table 8.5). Thiscompares with an estimated SL 2.7 billion investment in privatemanufacturing. Public investments have mostly been carried out by GeneralOrganizations under the Ministry of Industry and have been in the chemical,sugar and cement industries. These first two General Organizations alsoexhibit relatively high rates of budget utilization within that Ministry, aresult which is probably related to the large share of set-up and trial-runexpenditures in the total for these two G.O.s. Overall, 28 percent of theMinistry's investment expenditures were in this category and are additionalevidence of the concentration on bringing into production new facilitiescarried over from the previous Plan period. Also substantial investments weremade in bakeries and cereals processing and milling by the Ministry of Supplyand Internal Trade.
(iii) Selected Issues
4.22 The State Planning commissioned a comprehensive study of themanufacturing sector which is to be completed in early 1985. It should shedlight on the detailed structure and issues facing the manufacturing industryin Syria and could form a basis for reviewing industrial policies with the aimof raising productivity and efficiency, as well as output. The followingobservations should therefore be considered preliminary until a review of thestudy can be made.
4.23 Salaries, Wages and Incentives. Employees in public sectormanufacturing enterprises fall generally under the same salary and benefitprovisions as all public sector employees. Pay is according to jobclassification, with definite rules for pay raises and advancement accordingto time in grade. As public sector salary scales have been frozen since thepast general increase in 1980, the salary scales in public manufacturingenterprises have gotten increasingly out of line with both private sectorrenumeration and general living costs. Turnover of qualified staff continuesto be a serious problem and is often attributed to this. However, earnings inpublic sector manufacturing enterprises have improved to some extent as thepractice of introducing productivity bonuses and incentive schemes becameuniversal in the early 1980's; average remuneration in public sector
- 45 -
manufacturing industries rose 44 percent between 1980 and 1983, slightly morethan in the private sector. Nevertheless, substantial disparities arereported to still exist between the public and private sectors, while withinthe public sector certain lines of activity, e.g., construction enterprises,provide more generous pay and allowances to professional staff and qualifiedworkers. While the aforementioned productivity bonus schemes appear to havebeen widely and successfully implemented in public sector manufacturingenterprises and have helped in attaining or exceeding the target of 85 percentcapacity utilization set by the Plan in several industries, achieving andmaintaining adequate levels of product quality appear to continue to be aproblem. In part this may be due to the overly quantitative orientation ofthe criteria applied to award performance bonuses, as well as the lack ofeffective sanctions (e.g., suspension or dismissal) for consistentlysubstandard performance. Excessive job turnover and inadequate workertraining programs may also be contributing factors.
4.24 Domestic Sales and Exports. Responsibility for the domestic orexport sales of public enterprise manufacturing output is often placed in aseparate section of the firm's General Organization even in a wholly separateMinistry. (Procurement of raw materials and spare parts, especially fromabroad, is typically carried out by a separate general organization). Thisisolation of producing enterprises from the markets of their product or inputsmay affect the maintenance of product quality, and the timely adaptation ofproduct lines to changing market conditions, or the timely supply of theappropriate inputs at least cost. While it may not be inappropriate tomaintain such institutional arrangements for standardized, widely-traded goodssuch as cement or refined sugar, its application or generalization to lessstandardized or special order items seems inappropriate. In these morespecialized product lines a firm or small association of firms might considerrecruiting a qualified specialist sales staff, with an adequate budget todevelop a keen market intelligence capability, especially in the export field,where quick response and adaptability to market demands are an importantelement of success.
4.25 In 1983, of total exports of SL 7,547 million, manufactured goodsrepresented SL 3,045 million or 40 percent - a relatively impressive share.However, when refined petroleum product exports of SL 1,064 million areexcluded, this share falls to 26 percent. In 1983 these manufactured exportsrepresented only 10Z of the total value of manufacturing sector output (again,excluding petroleum refin4in.) Of these manufactured goods exports,64 percent (SL 1,268 million) were by the public sector and 36 percent(SL 714 million) by the private sector. In both instances about threequarters of the exports were from the textiles subsector. Sectors whereadditional or new possibilities for export could arise are processedfoodstuffs and cement. In view of the relatively buoyant domestic markets inrecent years, the degree of protection afforded local manufactures in the formof quantitative restrictions and tariffs and the relatively low exchange rateapplied to exports, firms may not have been greatly interested in aggressivelypursuing prospective exports. While the total manufactured exports so far maybe relatively small, they do suggest latent possibilities which could beexploited.
- 46 -
4.26 The structure of tariffs on imported goods is generally progressive,according to the degree of processing; for most raw materials and capitalgoods these are about I percent, while for finished goodz (especially thoseclassified as consumer luxuries), rates may reach caveral hundred percent.Surcharges for special purposes are also usually applied. On the other hand,basic foodstuffs, fertilizers and medicines may be admitted duty-free. Animportant complement to the tariff system as an instrument of protectionpolicy is the application of quota and import licensing regulations,especially for goods produced in the country and/or at times of foreignexchange stringency. Furthermore, the extent to which various differentexchange rates are applicable for both imports and exports depends on both thetype of product and whether the public or private sector is undertaking theoperation. This trade policy system has developed over the years on apiecemeal basis and it would appear appropriate to undertake a carefulreassessment of its impact on the structure, growth and efficiency ofmanufacturing output and trade. At the same time, the effects on exports ofcurrent policies as regards applicable exchange rates, tax rebates, etc.,deserve a careful assessment and review.
C. The Energy Sector
4.27 Syria's main energy resources are oil, natural gas and hydropower.Other utilized resources (estimated at less than 5 percent of consumption)include fuelwood, charcoal, solar and wind energy. Potential additionalresources include oil shale and geothermal energy. By tar the most importantenergy source at present is oil (production 8.5 million tons/year) part ofwhich is exported and part of which is refined together with imported lighteroil in the two refineries (which produce about 9.3 million tons of petroleumproducts per year). Hydroelectricity (from the Euphrates and other rivers)represented about 30 percent in 1983 and 28 percent in 1984 of totalelectricity generated. The net trade balance in oil and oil products whichhas been substantially positive in the late 1970's has become slightlynegative due to declining production of oil and rapidly rising demand forpetroleum products and electricity.
(i) Oil Resources
4.28 The Syrian economy has relied heavily on oil export earnings forfinancing imports and investment. Export earnings from this source, despite adecline in volume since 1976, have accounted for three-fourths of totalmerchandise exports and have been equivalent to about 39 percent of importsand over 40 percent of g:oss investment during the period 1979-83. As of1984, while Syria was still a net exporter of oil and oil products in quantityterms, its exports and imports of oil in value terms have become roughlybalanced (see Table 3.7). This is because Syria imports high quality oil andproducts but exports low quality oil (at about 8 percent lower price thanimported oil) and fuel oil. Gross exports of oil and oil products in 1983reached $1315 million, while imports were $1357 million. A small net surplusappeared in the first half of 1984.
4.29 Syria's known oil resources are located in seven major fields in thenortheastern part of the country. Proven oil reserves as of the beginning of1984 were 1.49 billion bbls (about 207 million metric tons). This crude hashigh viscosity and is high in sulfur. Oil production reached a peak of10.04 million tons in 1976, which declined at over 4 percent per year to
- 47 -
8.32 million tons in 1980 and remained at approximately that level through1983 (Table 8.6). The slow decline of oil production has been arrested in1980-1984 by the acceleration of drilling of production wells (up to 101 wellsin 1983 compared to 37 in 1980), with consequent rapid rise in the marginalcost of oil production. This production strategy has reportedly caused sometechnical problems, and it is expected that the current level of productioncan be held only until 1986. After 1986, production from old fields could bemaintained at near present levels with additional technical inputs andconcerted effort to increase oil recovery. How much new production there willbe from the new Pecten-Shell discovery should be known more accurately in thecourse of 1985, when more delineation drilling is completed. Preliminaryestimates of future output from this field range from 3 to 6 million tons peryear, and possibly more. An estimate of total oil production (from old fieldsand aew discoveries) adopted in this report is 11.5 million tons by 1990 and13.5 million tons by 1992.
4.30 Hydrocarbon exploration is carried out by both the Syrian PetroleumCompany (SPC) and by foreign contractors (Marathon and Pecten-Shell). The SPChas 18 rigs: 10 for exploration wells and 8 for production wells. In 1983the SPC drilled 28 exploratory wells, with a total of about 50,000 meters.The cost of drilling is about US $1,000/ meter, so this is an annualexpenditure of US $50 million per year. Foreign companies have drilled fewerwells but the cost is higher, US $2,000-4,000 per meter. Pecten-Shelldiscovered what appears to be a commercial oil field in mid-1984 as mentionedearlier. Production from this new discovery is not expected to begin before1986. Based on a 1984 consultant evaluation, SPC's exploration program wouldseem low when compared with exploration in other onshore basins with similarhydrocarbon potential. Indeed, overall exploration expenditures in Syriawould appear to be low considering the hydrocarbon potential of the region.
(ii) Gas Resources and Utilization
4.31 Proved reserves of gas in Syria as of 1982 were 36.2 billion cubicmeters, and probable reserves are 60-85 billion cubic meters. Most of the gasis sour, i.e. has a high sulfur content. The only gas currently consumed isassociated gas being used to generate electricity in the northeast oilfields. This Suwaidiyah associated gas plant is planning to process0.24 billion cubic meters of gas in the northeast. The reserve figures havebeen increased in 1984 but are not available yet. Most of the probablereserves are expected by experts to be reclassified as proved after moredrilling. In addition to these measured gas reserves, Marathon Oil hasrecently discovered a gas field and the new Pecten-Shell discovery containssome associated gas. There are also potentially large gas reserves in thePalmyra basin. Some of the gas at Jibesse is currently planned to be used forfertilizer production, but there is an urgent need to evaluate gas reservesand utilization strategy to establish priorities among gas use for variousindustrial demands, electric power or other developments. Bulgarian and otherEastern bloc countries are assisting on gas development and have begun a gasstudy in 1984.
4.32 The major gas project, which is in the construction phase, is toproduce gas from the Jibesse non-associated gas field and pipe it to Homs toreplace high cost naphtha in the fertilizer plant. The planned rate ofproduction of gas for the Homs fertilizer plant is 0.40 billion cubic metersper year beginning in 1986. Production from Jibesse could possibly go up to
- 48-
bet-een 0.55 and 0.73 billion cubic meters per year with additionalcompressors. The reserve-to-production ratio is thus 62 years (using theproved reserve figure) and 185 years when probable reserves are added. Thereis no decision on how to price the gas, but it would be desirable to price itnear the opportunity cost. e.g. in electricity generation or cement (i.e.,close to the price of gas oil or fuel oil) in order to reflect its value andto create financial surplus for further gas development.
4.33 The Jibesse gas processing plant has an investment cost of$95 *illion. operating cost of $2 million per year, and pipeline investmentcost of about $45 million. The missions's estimates of gas cost delivered toKoms is lower than the cost of gas oil, fuel oil and naptha.
4.34 In addition to these plans, it is likely that an accelerated programof gas developmnet (including the Palmyra basin gas) could lead to substantialbenefits. For every 0.1 billion cubic meters of gas consumed, there will be asavings of about 83,000 tons of oil. The electricity sector consumed338,000 tons of gas oil and 1070,000 tons of fuel oil in 1983, while thecement industry consumed about 500.000 tons of fuel oil. If one-half of theoil now consumed in both the electricity sector and cement sector could besubstituted for additional gas (i.e., I billion cubic meters per year aboveplanned production of 0.4 billion), the financial savings from the additionalgas for Syria would be about $100 million per year. These large potentialsavings indicate that accelerated gas development and a detailed study of gasutilization options should be a high investment priority for the government.Preliminary estimates are that gas production could increase from 0.16 billioncubic meters (bcm) currently to 0.9 bcm (0.8 million ton of oil equivalent) by1990 and about 3 billion (2.5 million TOE) by 1995. An accelerated gasdevelopment program could raise production to 1.5 bcm in 1990 and 5 bcm in1995. Additional gas could be used as a substitute for gas oil and fuel oilcurrently used in electricity and industry near Homs, as well as future powergeneration in Damascus and elsewhere. These options will be evaluated inrelation to all other gas utilization options by the Energy Assessmentmission.
(iii) Energy Demand
4.35 The growth of energy demand, particularly for electricity, has beenvery rapid. The consumption of petroleum products has grown at an averageannual rate of 9 percent from 1980-1984 to a level of 6.5 million metrictons. About 3' percent of the oil product consumption is fuel oil and43 percent is diesel (Table 8.7). Much of the recent increase in consumptionof oil products is due to rapidly increasing fuel oil use for electric powerand for industry. Due to the rapidly rising consumption of oil, the Ministryof Petroleum has initiated a program to conduct energy audits in somefactories (there are about 100 large factories in Syria). There is also needto evaluate options for reducing diesel consumption in transport, powergeneration and, particularly, in households where it is used for space andwater heating.
4.36 Electric power consumption and generation has increased at 17 percentper year on the average during 1979-83 (Table 8.2). Total electricitygenerated in 1983 was 7117 Gwh, of which 30 percent-is hydropower and 70t oilfired. Hydroelectricity generation has declined considerably since 1979.Thermal power capacity jumped up by almost 23 percent and production by61 percent between 1981 and 1983 as the 330 MW Banias plant was completed.Consumption ef electricity for lighting has increased 15 percent per year from1977-82, while consuaption of electricity for electromotive power increased
- 49 -
16 percent per year over the same period. Losses have increased from about15 percent in the early 1970's to over 30 percent in 1982 due to poor*anagement and then declined to 28 percent in 1983. But losses are reportedto have declined somewhat in 1984 due to closer monitoring of corcumption andsales. Peak load has grown from 435 MW in 1973 to 1280 MS in 1983, or at11.4 percent per year. A recent analysis by the Ministry of Electricity offuture electricity demand projects peak load to continue to grow at13.5 percent p.a. from 1983 to 1993 and for electricity generation to increaseat 14.7 percent p.a. A study of future electricity growth vill be completedunder the Energy Assessment. Preliminary estimates are that growth ofconsumption will be substantially lower depending on the future income growthrate and the rise effected in the real prices of electricity.
4.37 For future planning of the energy sector, an integrated framework ofdemand forecasting is needed by the Ministry of Petroleum and by the Ministryof Electricity. This framework should allow analysis of how various alternatescenarios of economic growth, price policies and investrient plans are likelyto affect consumption.
(iv) Energy Pricing
4.38 Electricity tariffs declined in nominal terms every year from 1975 to1979. Average tariff levels were increased 46 percent in 1980 and 24 percentin 1981 to 54.8 mills/kWh. The tariff levels have fallen considerably in realterms (over 40 percent since 1975), encouraging rapid increases inconsumption. Current tariff levels cover less than two-thirds of operatingcosts and no capital costs are recovered. Prices and long run marginal costcalculations (LRMC) by the Ministry of Electricity are shown in Table 8.9.Minizmm tariff increases of 75 percent would be needed to cover operationalcosts and debt service. rn early 1985. the Government raised tariffs onlarger households and commercial consumers, which is expected to raiserevenues by 7 percent. Larger price increases are needed in all categories toslow the rapid rate of consumpt'on and encourage efficient use of resources.
4.39 The price level of most petroleum products in 1984 was generally inline with c.i.f. border prices if converted at the official exchange rate. Itis higher for gasoline products. If the parallel market rate is used forconversion, prices of kerosene and gas oil would fa:l bel-w the internationallevel by approximately 20 percent. 1/
Table 11: DOMESTIC OIL PRODUCT PRICES(As a percent of cif prices in 1984)
Regular gasoline 215SPremium gasoline 200ZKerosene 107SGas oil 106SFuel oilType 1 (low sulfur) 135XType 2 (medium sulfur) 1221Type 3 (high sulfur) 105l
LPG 651
l/ Prices were reportedly raised in September 1985 for gasoline (30 percent),kerosene and gas oil (50 percent) and LPG (70 percent).
- 50 -
4.40 In 1984 LPG (Liquid Petroleum Gas), which is used mainly forhousebold cooking, was sold at about 916 SL per ton, an estimated 50 percentof ex-refinery cost. Consumption of LPG is rising at about 15 percent peryear, and the rapid growth in consumption is leading to increased imports.The rapid growth in LnG is due to a substitution of LPG for kerosene as theprices of LPG have been below kerosene since 1980. Official wholesale pricesof LPG are 11 SL per bottle, and while retail prices are supposed to be 15 SLper bottle, with the actual sales price reported near 20 SL per bottle. Aslight rise in the LPG price would not affect consumers but shift more revenuetowards the government and away from retail distributors. A careful study andanalysis of LPG and other petroleum products pricing policies and theireffects on consumption have been examined in another report. 11 Totalgovernment subsidy on oil products in 1983 amounted to about SL 800 million($200 million).
(v) investment
4.41 Total investment in the energy sector has been substantial in recentyears, despite the financial constraints. Public investment in the oil andgas sector has tripled duri5ng 1981-1983, rising from about SL 0.5 billion toSL 1.6 billion ($400 million). Investment in ,he refining and distributionsector has slowed down after the completion of the Banias refinery in 1980.but still continues at the rate of SL 0.7 billion per year. Investment inelectricity has been particularly heavy in recent years, with the constructionof the Bania& power plant (330 MW) and has been at the rate of aboutSL 1.2 billion per year. Thus, public investment in the energy sector as awhole was on the order of SL 3.5 billion (about $900 million) or theequivalent of about 30 percent of total public investment in that year. Theimportance of greater investments in oil exploration and gas development inthe future at a time of increasing financial constraints, points to the needto review sectoral investment priorities and promote foreign directinvestments and joint ventures in the oil and gas sector in addition toexternal borrowing.
(vi) Defining Strategy
4.42 Syria has expanded its refining capacity in order to reduce itsdependence on imports of certain products. The Homs refinery, completed in1959 and expanded in 1974-78, has an Annual capacity of 5.2 million tons, andthe recently completed Banias refinery has a capacity of 6 million tons.Total capacity is thus 11.2 million tons. The Banias refinery was initiallydesigned to handle a mix of 80 percent of higher quality imported crude and201 of Syrian crude. However, the design was subsequently changed in order toinrease the share of the Syrian crude in the mix from 20 percent to50 percent. The Banias refinery came into full operation in 1981 and has beenoperating at close to full capacity since the first half of 1982.
4.43 In 1983, refinery demand for crude oil reached 5.3 million tons,about 83 percent higher than the 1979 level. To ensure supply of the propermix for refinery usage. 5.8 million tons of crude oil were imported from theIslamic Republic of Iran, thus enabling Syria to export its excess supply ofheavier oil. While refining output remained largely unchanged at about9.0 million tons during the 1981-84 period, domestic consumpiton of refinedproducts gradually increased to 6.5 million tons estimated for 1984(Tables 8.6 and 8.7).
11 Syria: Issues and Options in the Energy Sector (No. 5822-SYR).
- 51 -
4.44 Currently LPG and diesel are imported while fuel oil and naphtha areexported. Projections of the Syrian refined products balance show that thecurrent deficits of LPG (75 thousand tons) and diesel (383 thousand tons) areexnected to increase by 1990. However, consideration of building a thirdrefinery can very well be postponed for several years. Existing capacity willprobably be able to meet demand by 1990 for oil products except for somediesel and LPG. In addition, an accelerated program of gas development wouldinrease LPG production, as well as substitute for substantial amount of fueloil and some gas oil. Thirdly, it is acknowledged that refining smalladditional amounts could be done more cheaply outside Syria, e.g. in Italywhere refinery utilization is only 43 percent of capacity. Given the heavyinvestment and the financial constraints, a careful independent analysis ofrefining strategy should precede any major investment decision. Importantoptions to study are ways to minimize the cost of product and increase outputsupply through refinery modifications (upgrading), removal of bottlenecksand/or arrangements for more product imports from other surplus refineries inthe region. Flexible refinery strategies need to be studied in the context ofalternative crude price to product price ratios, and in light of the massiveincrease in the regional refining market and the world-wide surplus inrefining capacity. 1/ These options will be evaluated by the EnergyAssessment mission.
(vii) Other Energy Sources
4.45 Syria enjoys a very high solar insolation which averages about 5.87kwh/m2/day (2,145 kwh/m2/year); however, solar energy has not been adequatelyutilized although isolated and experimental installations exist. Thereappears to be a wide scope for using solar energy, especially for use inhouseholds for space and water heating, which would slow down the high ratesof diesel and electricity consumption in the domestic sector.
4.46 Already 2,000 wind towers exist in the Kalamoun area (north ofDamascus), and the general impression is that the scope for utilizing windenergy is excellent. These possibilities should be investigated and analyzedto see how development of this resource can be accelerated, again in anattempt to conserve electricity or diesel.
4.47 Although the use of kerosene and LPG has penetrated deep into therural areas, there is still a small segment of the population that usesfuelwood and charcoal. In rural areas, sticks and twigs are collected freelyand no estimates are readily available on the extent of this consumption.
1/ OAPEC refining capacity is expected to rise from 170 million tons ofcapacity in 1983 to 278 million tons in 1990. There will be an expectedsurplus in 1990 of diesel for export in OAPEC of 24.3 million tons (upfrom 3.2 million tons in 1980), if refineries are used at fullthroughput. OAPEC fuel oil surpluses are expected to be 50 percent higherthan 1980 but LPG supplies may be tight. This increase in product exportscomes at a time when there is a worldwide surplus in refinery capacity.In these conditions little economic benefit can be expected from addingnew capacity.
- 52 -
4.48 There are extensive shale oil resources in Syria. Oil productionfrom shale is considered a high cost option and of low priority. Options fordirect burning of shale rock in electric power need to be studied, although itis doubtful that costs would be lower than other fuels such as gas. There aresome geothermal prospects in the Safa Hills, 60 miles southeast of Damascus,and some other low temperature locations. The potential for utilization ofthese alternative energy sources will be investigated by the Energy Assessmentmission.
- 53 -
Page 1 of 2
STATISTICAL ANNEX
Table No. Title
1.1 Population1.2 Labor Force by Sector of Economic Activity
2.1 Gross Domestic Product by Industrial Origin,At Constant (1980) Market Prices, 1979-84
2.2 Gross Domestic Product by Industrial Origin,At Current Market Prices, 1979-84
2.3 Resources and Their Uses at Constant(1980) Prices, 1979-84
2.4 Resources and Their Uses at CurrentPrices, 1979-84
2.5 Gross Fixed Capital Formation by Type ofAssets and Source, 1978-84
2.6 Gross Fixed Capital Formation by Sector,1978-84
3.1 The Balance of Payments, 1978-843.2 Exports by SITC Sections, 1978-843*3 Imports by SITC Sections, 1978-843.4 Commodity Composition of Exports, 1978-843.5 Commodity Composition of Imports, 1978-843.6 Imports According to End-Use, 1978-843.7 Trade in Oil and Oil Products, 1978-84
4.1 External Public Debt OutstandingIncluding Undisbursed as of 12/31/83
4.2 Service Payments, Commitments,Disbursements and Outstanding Amountsof External Public Debt
5.1 Public Sector Finances, 1981-855.2 Budgetary Revenues, 1979-855.3 Composition of Tax Revenues, 1979-855.4 Surpluses of Public Enterprises Transferred
to the Budget, 1979-855.5 Budgetary Expenditures, 1979-855.6 Public Sector Allocations and Actual Investments
Under the Fifth Five-Year Plan, 1981-85
- 54 -
Page 2 of 2
STATISTICAL ANNEXContinued
Table No. Title
6.1 Monetary Survey, 1979-846.2 Foreign Assets and Liabilities, 1979-846.3 Balance Sheet of the Central Bank, 1979-846.4 Consolidated Balance Sheet of the Commercial
Bank and the Specialized Banks, 1979-846.5 Commercial Bank's and Specialized Banks' Credit
by Sector, 1979-846.6 Interest Rate Structure
7.1 Major Crop Production, Cropped Area and Yields, 1978-857.2 Indices of Agricultural Production, 1978-847.3 Official Procurement Prices of Selected Crops, 1979-857.4 Official Procurement Price and International Prices
of Selected Crops, 197&-84
8.1 Index Numbers of Industrial Production, 1978-848.2 Production of Main Manufacturing Industries aad
Electricity, 1979-848.3 Output and Employment in the Manufacturing Sector,
1979-838.4 Manufacturing Sector Employment and Value Added, 19838.5 Investment Expenditures of Public Sector Manufacturing
Organizations, 1981-838.6 Production of Crude Oil and Products in Syria, 1980-838.7 Consuzmpcion of Petroleum Products in Syria, 1975-848.8 Prices of Petroleum Products8.9 Electricity Prices in 19848.10 Building Construction, 1978-84
9.1 Implicit Deflators of GDP, By Sector, 1979-849.2 Wholesale Price Indices, 1980-849.3 Retail Price in Damascus, 1978-84
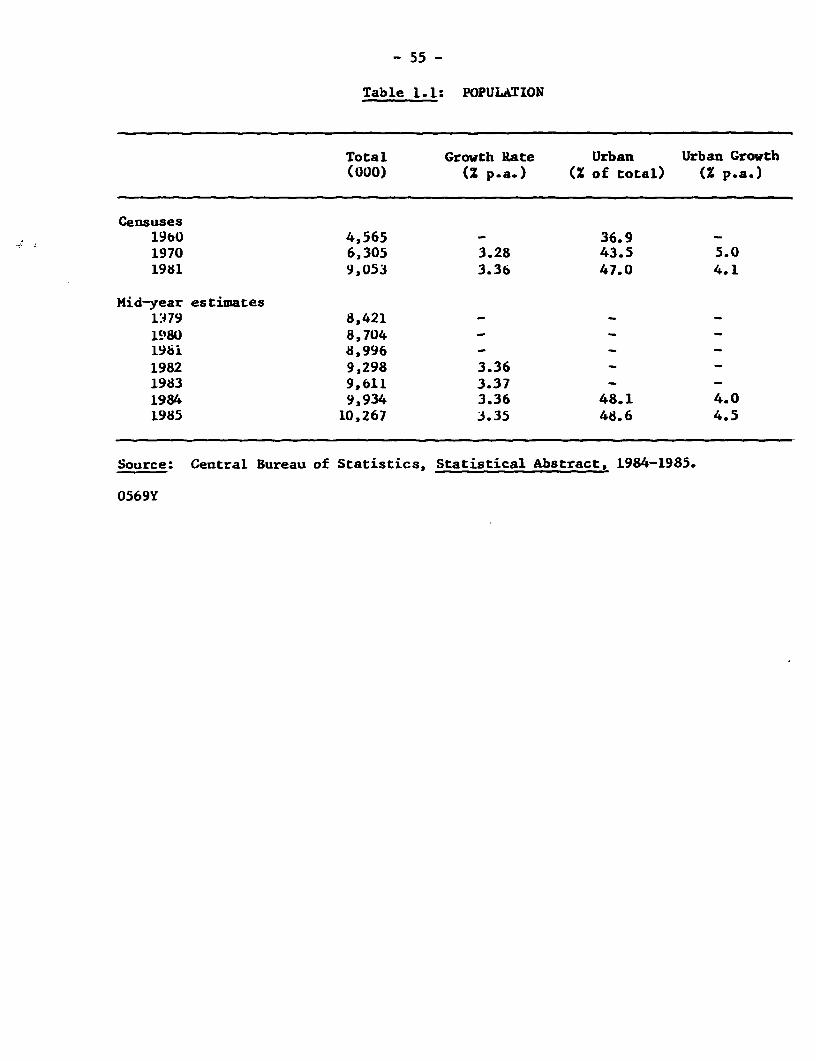
- 55 -
Table 1.1: POPULATION
Total Growth Rate Urban Urban Growth(O0O) (Z p.a.) (Z of total) (Z p.a.)
Censuses1960 4,565 - 36.9 -1970 6,305 3.28 43.5 5.01981 9,053 3.36 47.0 4.1
Mid-year estimates1.179 8,421 - - -1980 8,704198i 8,996 -1982 9,298 3.361983 9,bll 3.37 - -1984 9,934 3.36 48.1 4.01985 10,267 3.35 48.6 4.5
Source: Central Bureau of Statistics, Statistical Abstract, 1984-1985.
0569Y
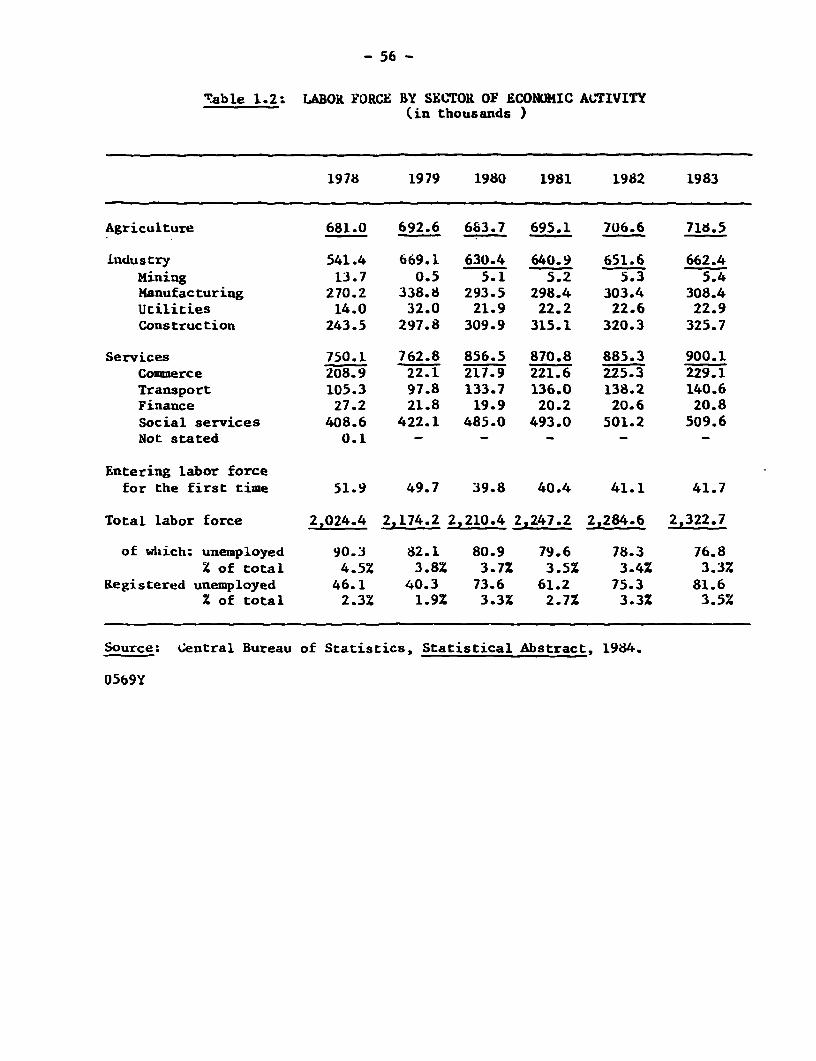
- 56 -
Table 1.2: LABOR FORCE BY SECTOR OF ECONOMIC ACTIVITY(in thousands )
1978 1979 1980 1981 1982 1983
Agriculture 681.0 692.6 683.7 695.1 706.6 718.5
Industry 541.4 669.1 630.4 640.9 651.6 662.4Mining 13.7 0.5 5.1 5.2 5.3 5.4Manufacturing 270.2 338.8 293.5 298.4 303.4 308.4Utilities 14.0 32.0 21.9 22.2 22.6 22.9Construction 243.5 297.8 309.9 315.1 320.3 325.7
Services 750.1 762.8 856.5 870.8 885.3 900.1Commerce 208.9 22.1 217.9 221.6 225.3 229.1Transport 105.3 97.8 133.7 136.0 138.2 140.6Finance 27.2 21.8 19.9 20.2 20.6 20.8Social services 408.6 422.1 485.0 493.0 501.2 509.6Not stated 0.1 - - - -
Entering labor forcefor the first time 51.9 49.7 39.8 40.4 41.1 41.7
Total labor force 2,024.4 2,174.2 2,210.4 2,247.2 2,284.6 2,322.7
of wlhich: unemployed 90.3 82.1 80.9 79.6 78.3 76.8% of total 4.5% 3.8% 3.72 3.5Z 3.4X 3.3%
Registered unemployed 46.1 40.3 73.6 61.2 75.3 81.61 of total 2.3% 1.9% 3.3% 2.7Z 3.3Z 3.5%
Source: Central Bureau of Statistics, Statistical Abstract, 1984.
05b9Y
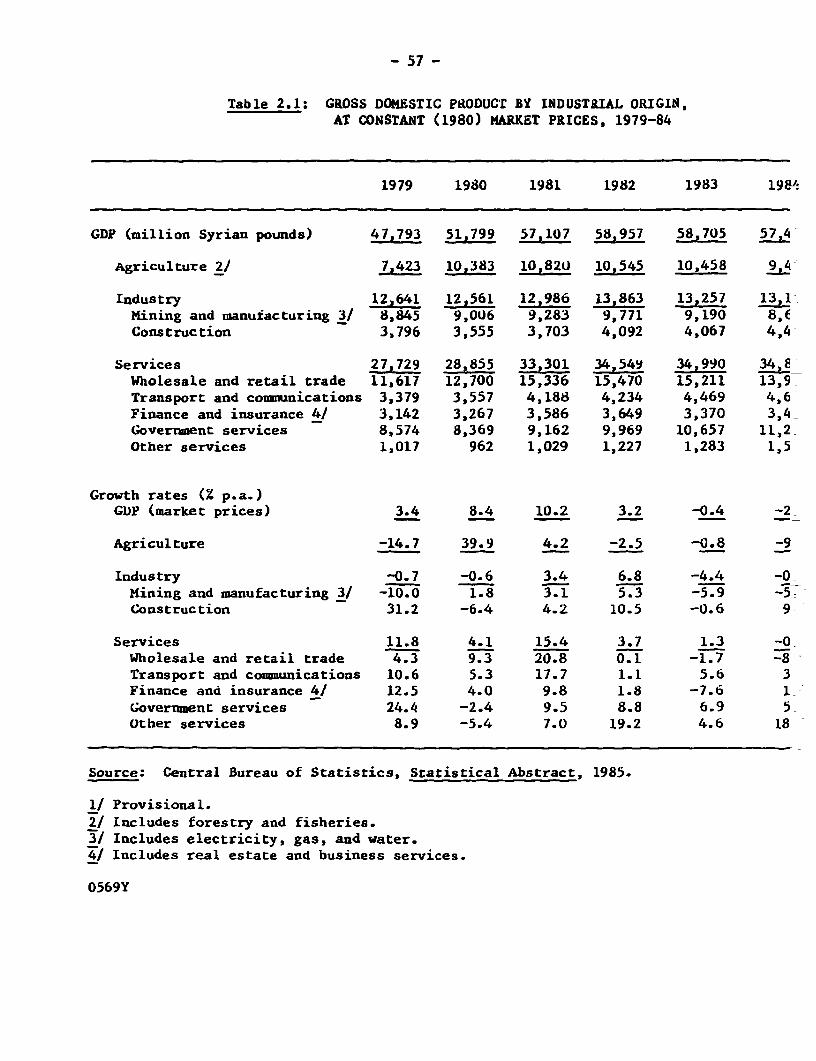
- 57 -
Table 2.1: GROSS DOMESTIC PRODUCT BY INDUSTRIAL ORIGIN,AT CONSTANT (1980) MARKET PRICES, 1979-84
1979 1980 1981 1982 1983 198^
GDP (million Syrian pounds) 47,793 51,799 57,107 58,957 58,705 57,4
Agriculture 2/ 7,423 10,383 10 820 10,545 10,458 9,4
Industry 12,641 12,561 12,986 13,863 13,257 13,1Mining and manufacturing 3/ 8,845 9,006 9,283 9,771 9,190 8 EConstruction 3,796 3,555 3,703 4,092 4,067 4,4
Services 27.729 28,855 33,301 34,50 34,990 3478Wholesale and retail trade 11,617 12,700 15,336 15,470 15,211 13,9Transport and communications 3,379 3,557 4,188 4,234 4,469 4,6Finance and insurance 41 3,142 3,267 3,586 3,649 3,370 3,44_Government services 8,574 8,369 9,162 9,969 10,657 11,2Other services 1,017 962 1,029 1,227 1,283 1,5X_
Growth rates (Z p.a.)GDP (market prices) 3.4 8.4 10.2 3.2 -0.4 2-
Agriculture -14.7 39.9 4.2 -2.5 -0.8 -9
Industry -0.7 -0.6 3.4 6.8 -4.4 -0Mining and manufacturing 3/ -10.0 1.8 3.1 5.3 -5.9 -53-Construction 31.2 -6.4 4.2 10.5 -0.6 9
Services 11.8 4.1 15.4 3.7 1.3 -0Wholesale and retail trade 4.3 9.3 20.8 0.1 -1.7 -8>Transport and communications 10.6 5.3 17.7 1.1 5.6 3Finance and insurance 4/ 12.5 4.0 9.8 1.8 -7.6 1Government services 24.4 -2.4 9.5 8.8 6.9 5other services 8.9 -5.4 7.0 19.2 4.6 18
Source: Central Bureau of Statistics, Statistical Abstract, 1985.
1/ Provisional.
2/ Includes forestry and fisheries.3/ Includes electricity, gas, and water.41 Includes real estate and business services.
0569Y
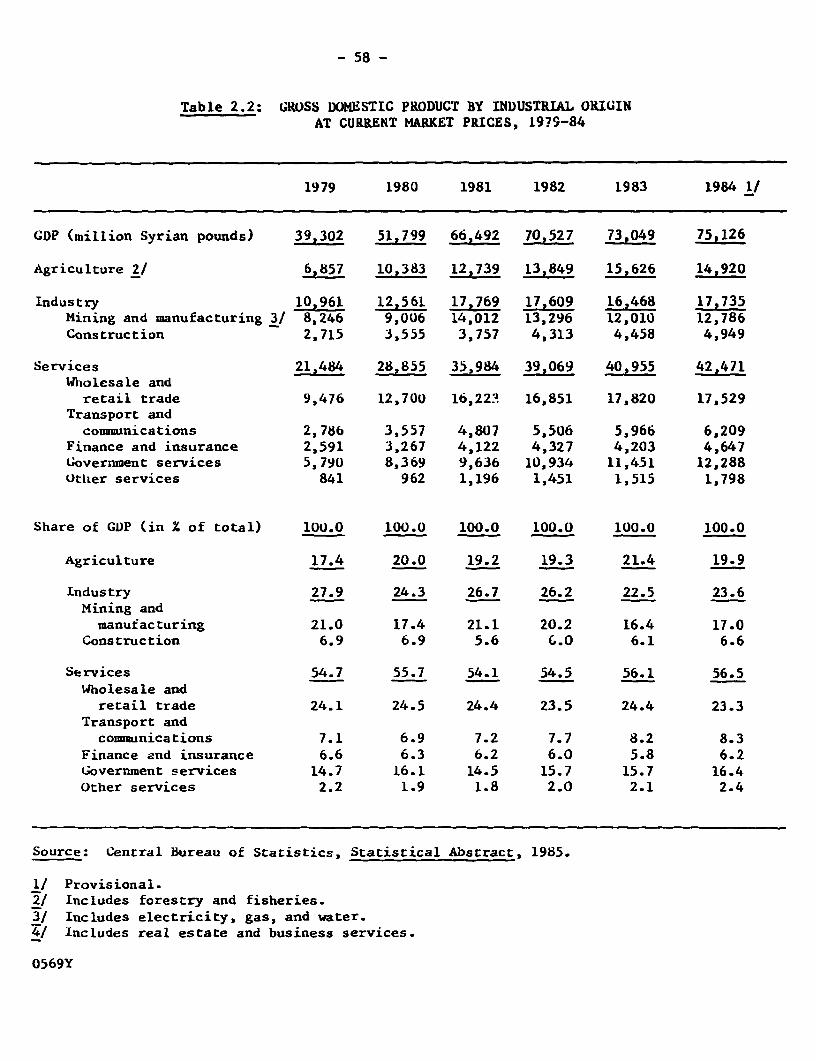
- 58 -
Table 2.2: GROSS DOMESTIC PRODUCT BY INDUSTRIAL ORII;INAT CURRENT MARKET PRICES, 1979-84
1979 1980 1981 1982 1983 1984 1/
GOP (million Syrian pounds) 39,302 51,799 66,492 70,527 73,049 75,126
Agriculture 2/ 6,857 10,383 12,739 13,849 15,626 14,920
Industry 10X961 12,561 17,769 17,609 16,468 17,735Mining and manufacturing 3/ 8,246 9,006 14,012 13,296 12,010 12,786Construction 2,715 3,555 3,757 4,313 4,458 4,949
Services 21,484 28,855 35,984 39,069 40,955 42,471Wholesale andretail trade 9,476 12,700 16,222t 16,851 17,820 17,529
Transport andcommunications 2,786 3,557 4,807 5,506 5,966 6,209
Finance and insurance 2,591 3,267 4,122 4,327 4,203 4,647Government services 5,790 8,369 9,636 10,934 11,451 12,288Utlher services 841 962 1,196 1,451 1,515 1,798
Share of GDP (in Z of total) 100.0 100.0 100.0 100.0 100.0 100.0
Agriculture 17.4 20.0 19.2 19.3 21.4 19.9
Industry 27.9 24.3 26.7 26.2 22.5 23.6Mining andmanufacturing 21.0 17.4 21.1 20.2 16.4 17.0
Construction 6.9 6.9 5.6 G.O 6.1 6.6
Services 54.7 55.7 54.1 54.5 56.1 56.5Wholesale andretail trade 24.1 24.5 24.4 23.5 24.4 23.3
Transport andcommunications 7.1 6.9 7.2 7.7 8.2 8.3
Finance and insurance 6.6 6.3 6.2 6.0 5.8 6.2Government services 14.7 16.1 14.5 15.7 15.7 16.4Other services 2.2 1.9 1.8 2.0 2.1 2.4
Source: Central Bureau of Statistics, Statistical Abstract, 1985.
1/ Provisional.2/ Includes forestry and fisheries.31 Includes electricity, gas, and water.4/ Includes real estate and business services.
0569Y
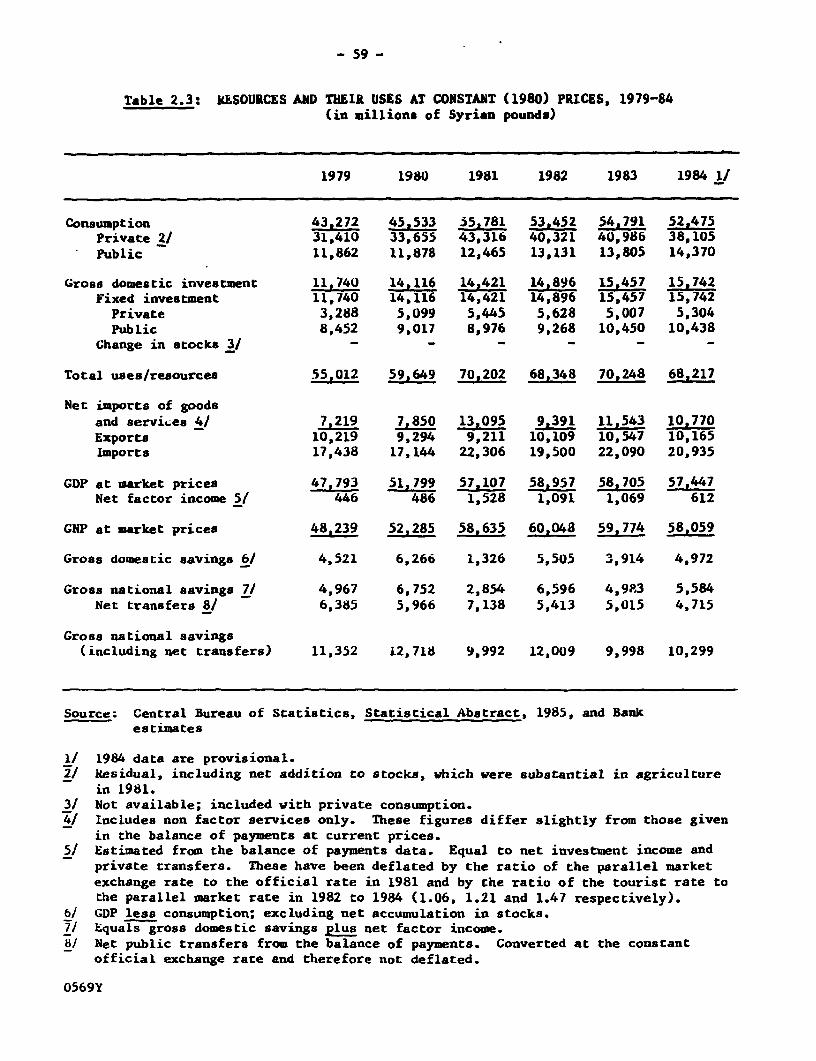
- 59 -
Table 2.3: MLSOURCES AND THEIR USES AT CONSTANT (1980) PRICES, 1979-84(in millions of Syrian pounds)
1979 1980 1981 1982 1983 1984 1/
Consumption 43j272 45,533 55.781 53,452 54,791 52,475Private 2/ 31,410 33,655 43,316 40,321 40,986 38,105Public 11,862 11,878 12,465 13,131 13,805 14,370
Gross domestic investment 11,740 14,116 14,421 14,896 15 457 15,742Fixed investment 11,740 14,116 14,421 14,896 15,457 15,742Private 3,288 5,099 5,445 5,628 5,007 5,304Public 8,452 9,017 8,976 9,268 10,450 10,438
Change in stocks 3/ - - - - - -
Total uses/resources 55,012 59,649 70,202 68,348 70,248 68,217
Net imports of goodsand servi.ea 4/ 7,219 7,850 13,095 9.391 11,543 10,770Exports 10,219 9,294 9,211 10,109 10,547 10,165Imports 17,438 17,144 22,306 19,500 22,090 20,935
GDP at market prices 47,793 51,799 57,107 58,957 58,705 57,447Net factor income 5/ 446 486 1,528 1,091 1,069 612
GNP at market prices 482239 52,285 58,635 60,048 59,774 58,059
Gross domestic savings 6/ 4,521 6,266 1,326 5,505 3,914 4,972
Gross national savings 71 4,967 6,752 2,854 6,596 4,9Y3 5,584Net transfers 8/ 6,385 5,966 7,138 5,413 5,015 4,715
Gross national savings(including net transfers) 11,352 12,718 9,992 12,009 9,998 10,299
Source; Central Bureau of Statistics, Statistical Abstract, 1985, and Bankestimates
1/ 1984 data are provisional.2/ Residual, including net addition to stocks, which were substantial in agriculture
in 1981.31 Not available; included with private consumption.4/ Includes non factor services only. These figures differ slightly from those given
in the balance of payments at current prices.5/ Estimated from the balance of payments data. Equal to net investment income and
private transfers. These have been deflated by the ratio of the parallel marketexchange rate to the official rate in 1981 and by the ratio of the tourist rate tothe parallel market rate in 1982 to 1984 (1.06, 1.21 and 1.47 respectively).
b/ GDP less consumption; excluding net accumulation in stocks.7/ Equals gross domestic savings plus net factor income.8/ Net public transfers from the balance of payments. Converted at the constant
official exchange rate and therefore not deflated.
0569Y
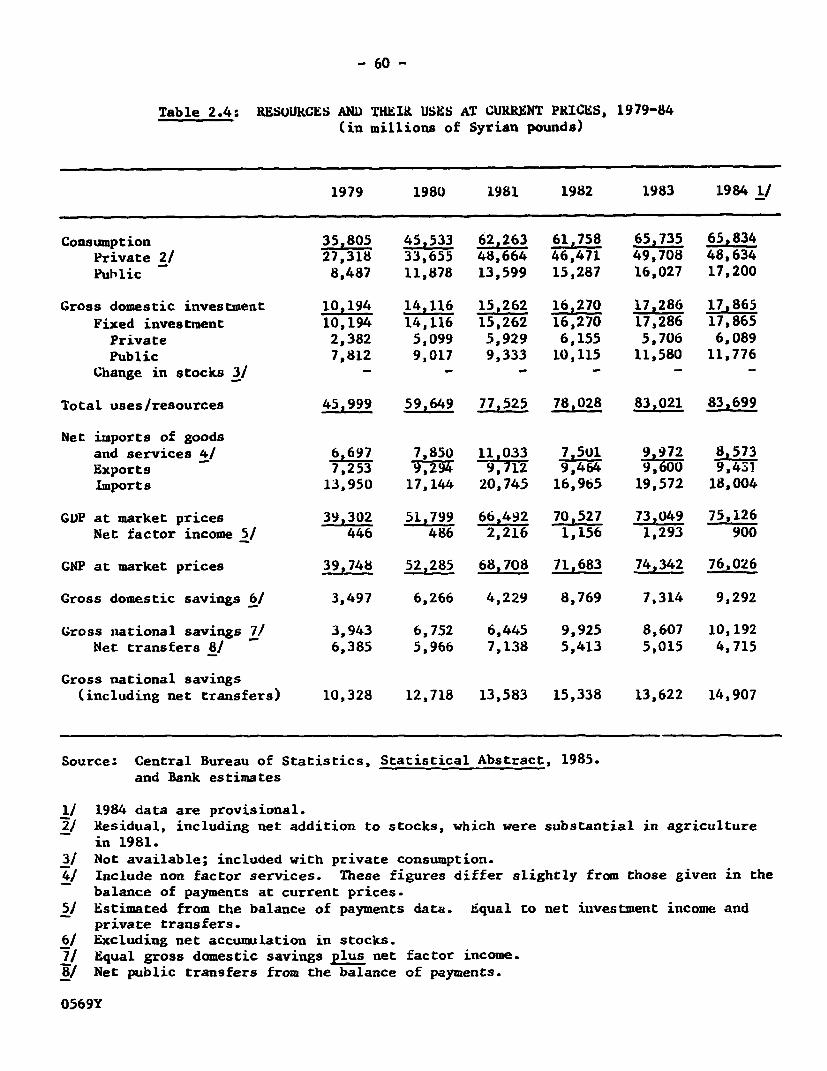
- 60 -
Table 2.4; RESUURCES AND THEIR USES AT CURRENT PRICES, 1979-84(in millions of Syrian pounds)
1979 1980 1981 1982 1983 1984 11
Consumption 35,805 45,533 62,263 61,758 65,735 65,834Private 2/ 27,318 33,655 48,664 46,471 49,708 48,634Public 8,487 11,878 13,599 15,287 16,027 17,200
Gross domestic investment 10,194 14,116 15,262 16,270 17,286 17,865Fixed investment 10,194 14,116 15,262 16,270 17,286 17,865Private 2,382 5,099 5,929 6,155 5,706 6,089Public 7,812 9,017 9,333 10,115 11,580 11,776
Change in stocks 3/ - - - - - -
Total uses/resources 45,999 59,649 77,525 78,028 83,021 83,699
Net imports of goodsand services 4/ 6,697 7,850 11 033 7,501 9 972 8,573Exports 7,253 9,294 9,71-2 9,464 9,600 9,431Imports 13,950 17,144 20,745 16,965 19,572 18,004
GOP at market prices 39,302 51,799 66,492 70,527 73,049 75,126Net factor income 5/ 446 486 2,216 1,156 1,293 900
GNP at market prices 39,748 52,285 68,708 71,683 74,342 76,026
Gross domestic savings 6/ 3,497 6,266 4,229 8,769 7,314 9,292
Gross national savings 7/ 3,943 6,752 6,445 9,925 8,607 10,192Net transfers 8/ 6,385 5,966 7,138 5,413 5,015 4,715
Gross national savings(including net transfers) 10,328 12,718 13,583 15,338 13,622 14,907
Source: Central Bureau of Statistics, Statistical Abstract, 1985.and Bank estimates
1/ 1984 data are provisional.2/ Residual, including net addition to stocks, which were substantial in agriculture
in 1981.3/ Not available; included with private consumption.41 Include non factor services. These figures differ slightly from those given in the
balance of payments at current prices.5/ Estimated from the balance of payments data. Equal to net inLvestment income and
private transfers.6/ Excluding net accumulation in stocks.7/ Equal gross domestic savings plus net factor income.8/ Net public transfers from the balance of payments.
0569Y
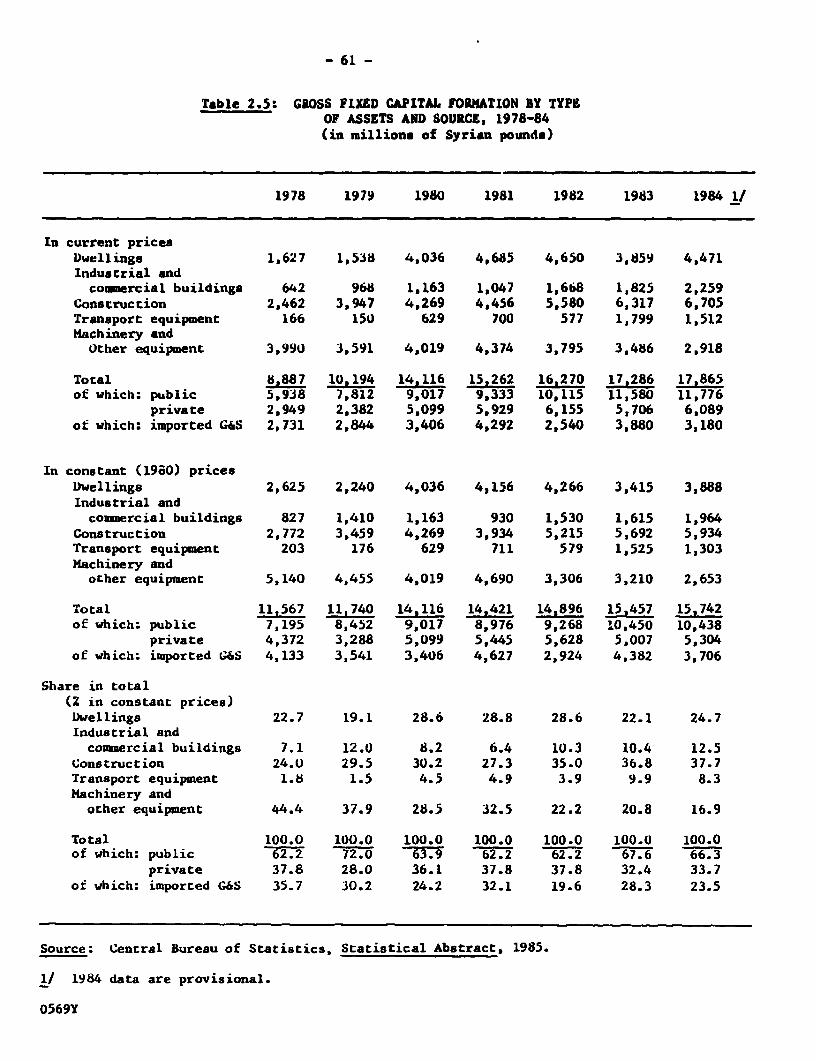
- 61 -
Table 2.5: GROSS FIXED CAPITAL FORMATION BY TYPEOF ASSETS AND SOURCE, 1978-84(in millions of Syrian pounds)
1978 1979 1980 1981 1982 1983 1984 I/
In current pricesDwellings 1,627 1,538 4,036 4,685 4,650 3,859 4,471Industrial andcomiercial buildings 642 968 1,163 1,047 1,668 1,825 2,259
Construction 2,462 3,947 4,269 4,456 5,580 6,317 6,705Transport equipment 166 150 629 700 577 1,799 1,512Machinery andOther equipment 3,990 3,591 4,019 4,374 3,795 3,486 2,918
Total 8,887 10,194 14,116 15,262 16,270 17,286 17,865of which: public 5,938 7,812 9,017 9,333 10,115 11,580 11,776
private 2,949 2,382 5,099 5,929 6,155 5,706 6,089of which: imported G&S 2,731 2,844 3,406 4,292 2,540 3,880 3,180
In constant (1980) pricesDwellings 2,625 2,240 4,036 4,156 4,266 3,415 3,888Industrial andcommercial buildings 827 1,410 1,163 930 1,530 1,615 1,964
Construction 2,772 3,459 4,269 3,934 5,215 5,692 5,934Transport equipment 203 176 629 711 579 1,525 1,303Machinery andother equipment 5,140 4,455 4,019 4,690 3,306 3,210 2,653
Total 11,567 11,740 14,116 14,421 14,896 15,457 15,742of which: public 7,195 8,452 9,017 8,976 9,268 10,450 10,438
private 4,372 3,288 5,099 5,445 5,628 5,007 5,304of which: imported G&S 4,133 3,541 3,406 4,627 2,924 4,382 3,706
Share in total(Z in constant prices)Dwellings 22.7 19.1 28.6 28.8 28.6 22.1 24.7Industrial andcomnercial buildings 7.1 12.0 8.2 6.4 10.3 10.4 12.5
Construction 24.0 29.5 30.2 27.3 35.0 36.8 37.7Transport equipment 1.8 1.5 4.5 4.9 3.9 9.9 8.3Machinery andother equipment 44.4 37.9 28.5 32.5 22.2 20.8 16.9
Total 100.0 100.0 100.0 100.0 100.0 100.0 100.0of which: public 62.2 72.0 63.9 62.2 62.2 67.6 66.3
private 37.8 28.0 36.1 37.8 37.8 32.4 33.7of which: imported G&S 35.7 30.2 24.2 32.1 19.6 28.3 23.5
Source: Central Bureau of Statistics, Statistical Abstract, 1985.
1/ 1984 data are provisional.
0569Y
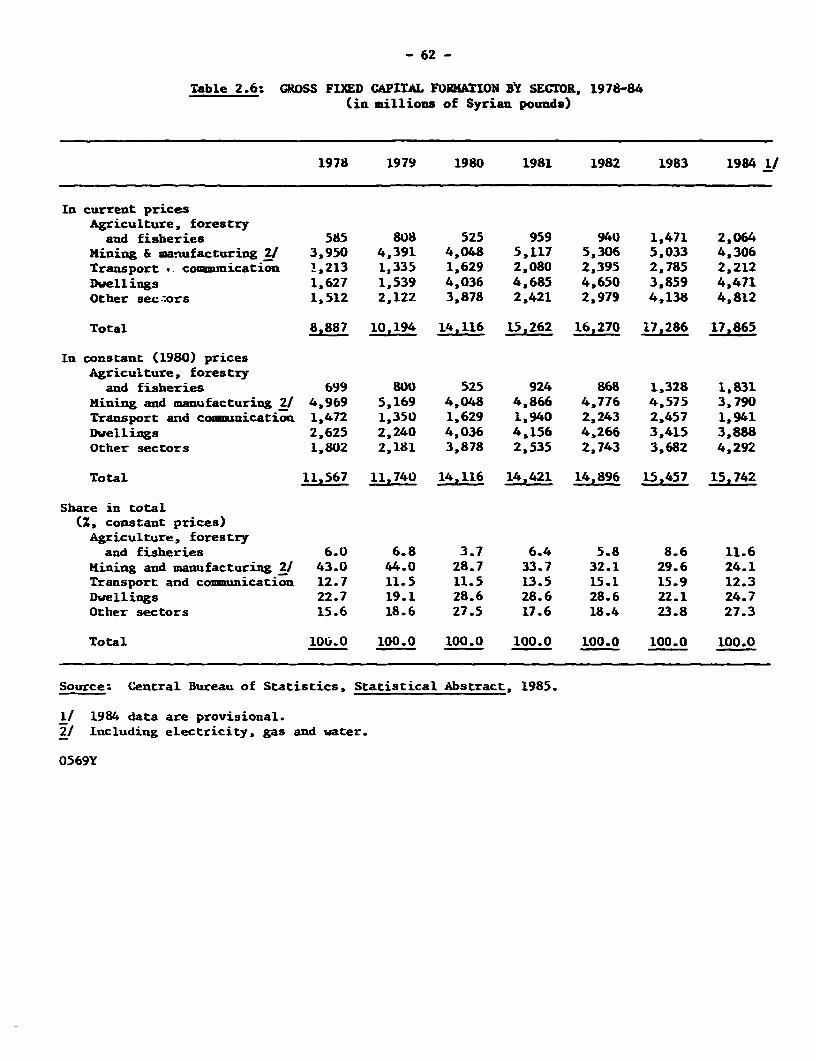
- 62 -
Table 2.6: GROSS FIXED CAPITAL FORMATION BY SECTOR, 1978-84(in millions of Syrian pounds)
1978 1979 1980 1981 1982 1983 1984 1/
In current pricesAgriculture, forestryand fisheries 585 808 525 959 940 1,471 2,064
Mining & manufacturing 2/ 3,950 4,391 4,048 5,117 5,306 5,033 4,306Transport . coumunication 1,213 1,335 1,629 2,080 2,395 2,785 2,212Dwellings 1,627 1,539 4,036 4,685 4,650 3,859 4,471Other sec ors 1,512 2,122 3,878 2,421 2,979 4,138 4,812
Total 8,887 10,194 14,116 15,262 16,270 17,286 17,865
In constant (1980) pricesAgriculture, forestry
and fisheries 699 800 525 924 868 1,328 1,831Mining and manufacturing 2/ 4.969 5,169 4,048 4,866 4,776 4,575 3,790Transport and communication 1,472 1,350 1,629 1,940 2,243 2,457 1,941Dwellings 2,625 2,240 4,036 4,156 4,266 3,415 3,888Other sectors 1,802 2,181 3,878 2,535 2,743 3,682 4,292
Total 11,567 11,740 14,116 14,421 14,896 15,457 15,742
Share in total:, constant prices)Agriculture, forestryand fisheries 6.0 6.8 3.7 6.4 5.8 8.6 11.6
Mining and manufacturing 2/ 43.0 44.0 28.7 33.7 32.1 29.6 24.1Transport and communication 12.7 11.5 11.5 13.5 15.1 15.9 12.3Dwellings 22.7 19.1 28.6 28.6 28.6 22.1 24.7Other sectors 15.6 18.6 27.5 17.6 18.4 23.8 27.3
Total 100.0 100.0 100.0 100.0 100.0 100.0 100.0
Source: Central Bureau of Statistics, Statistical Abstract, 1985.
1/ 1984 data are provisional.2/ Including electricity, gas and water.
0569Y
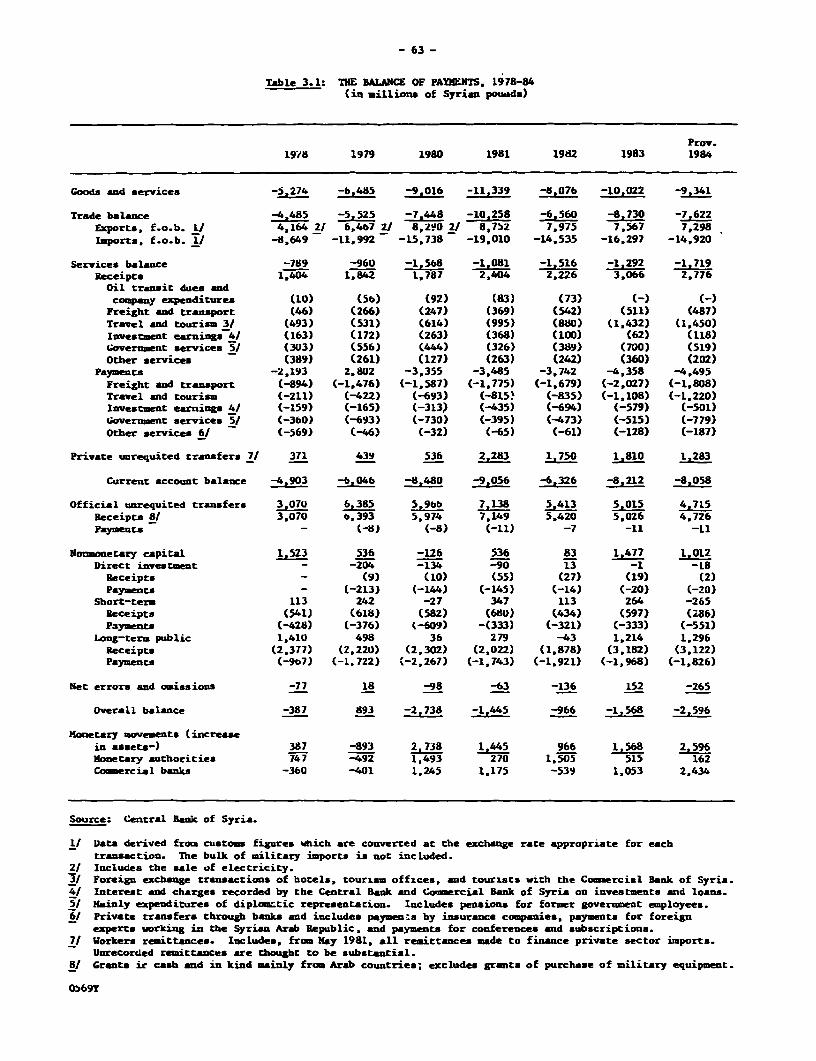
- 63-
Table 3.1: THE BALANCE OF PAYM¢NTS, 1978-84(in millions of Syrian pouads)
Prov.1918 1979 1980 1981 1982 1983 1984
Goods and services -5,274 -b,485 -9,016 -11,339 -6,07b -10,022 -9,341
Trade blance -4,485 -5,525 -7,448 -10,258 -6,560 -8.730 -7,622Exports, f.o.b. 1/ 4,164 21 6,467 Z/ 8,290 2/ 8,752 7,975 7,567 7,298Imports. f.o.b. 1/ -8,649 -11,992 -15,738 -19,010 -14,535 -16.297 -14,920
Services balance -789 -960 -1,568 -1,081 -1,516 -1,292 -1,719Receipts 1,404 1,842 1,787 2,404 2,226 3,066 2,776Oil transiC dues andcompany expenditures (10) (56) (92) (83) (73) (-3 1-)Freight and transport (46) (266) (247) (369) (542) (511) (487)Travel and tourism 3/ (493) (531) (614) (995) (880) (1,432) (1,450)Investment earnings 4/ (163) (172) (263) (368) (100) (62) (118)Government services 5/ (303) (556) (444) (326) (389) (700) (519)Other services (389) (261) (127) (263) (242) (360) (202)
Payments -2,193 2.802 -3,355 -3,485 -3,742 -4.358 -4,495Freight and transport (-894) (-1.476) (-1.587) (-1,775) (-1.679) (-2,027) (-1,808)Travel and tourism (-211) (-422) (-693) (-8S5W (-835) (-1,108) (-1,220)Investment earnings 4/ (-159) (-165) (-313) (-435) (-694) (-579) (-501)Government services 5/ (-360) (-693) (-730) (-395) (-473) (-515) (-779)Other services 6/ (-569) (-46) (-32) (-65) (-61) (-128) (-187)
Private unrequited transfers 7/ 371 439 536 283 1,750 1810 1.283
Current account balance -4,903 -6.046 -8,480 -9,056 -6,326 -8,212 -8,058
Official unrequited transfers 3 6.385 5.9,o 7,138 5,4L 3 5,015 4,715Receipts 8/ 3,070 b.393 5,974 7,149 5,420 5,026 4,726Payments - (-8) (-8) (-11) -7 -11 -11
Nonoonetary capital 1.523 536 -126 536 83 1.477 1,012Direct investment - -204 -134 -90 13 -1 -18Receipts - (9) (10) (55) (27) (19) (2)Payments - (-213) (-144) (-145) (-14) (-20) (-20)
Short-term 113 242 -27 347 113 264 -265Receipts (541) (618) (582) (680) (434) (597) (286)Pazyents (-428) (-376) (-W09) -(333) (-321) (-333) (-551)
Long-tern public 1,410 498 36 279 -43 1,214 1,296Receipts (2,377) (2.220) (2,302) (2.022) (1.878) (3,182) (3.122)Paynents (-907) (-1.722) (-2,267) (-1,743) (-1.921) (-1.968) (-1.826)
Net errors and omissions -77 18 -98 -63 -136 152 -265
Overall balance -387 893 -2,738 -1,445 -966 -1,568 -2,596
Monetary movements (increasein assets-) 387 -893 2,738 1,445 966 1,568 2.596Monetary authorities WU -492 1,493 270 1,505 515 162Commercial banks -360 -401 1,245 1,175 -539 1,053 2,434
Source: Central Bank of Syria.
1/ Data derived from customs figures which are converted at the exchange rate appropriate for eachtransaction. The bulk of military imports is not incLuded.
2/ Includes the sale of electricity.I/ Foreign exchange transactions of hotels, tourism offices, and tourxsts vith the Commercial Bank of Syria.4/ Interest and charges recorded by the Central Bank and Commercial Bank of Syria on investments and loans.51 Mainly expenditures of diplomatic representation. Includes pensions for former governmuent employees.6/ Private transfers through banks and includes paymen:s by insurance companies, payments for foreign
experts working in the Syrian Arab Republic *and payments for conferences and subscriptions.7/ Workers remittances. lncludes, from May 1981, all remittances made to finance private sector imports.
Unrecorded remittances are thought to be substantial.8/ Grants ir cash and in kind minly from Arab countries; excludes grants of purchase of military equipment.
0569Y
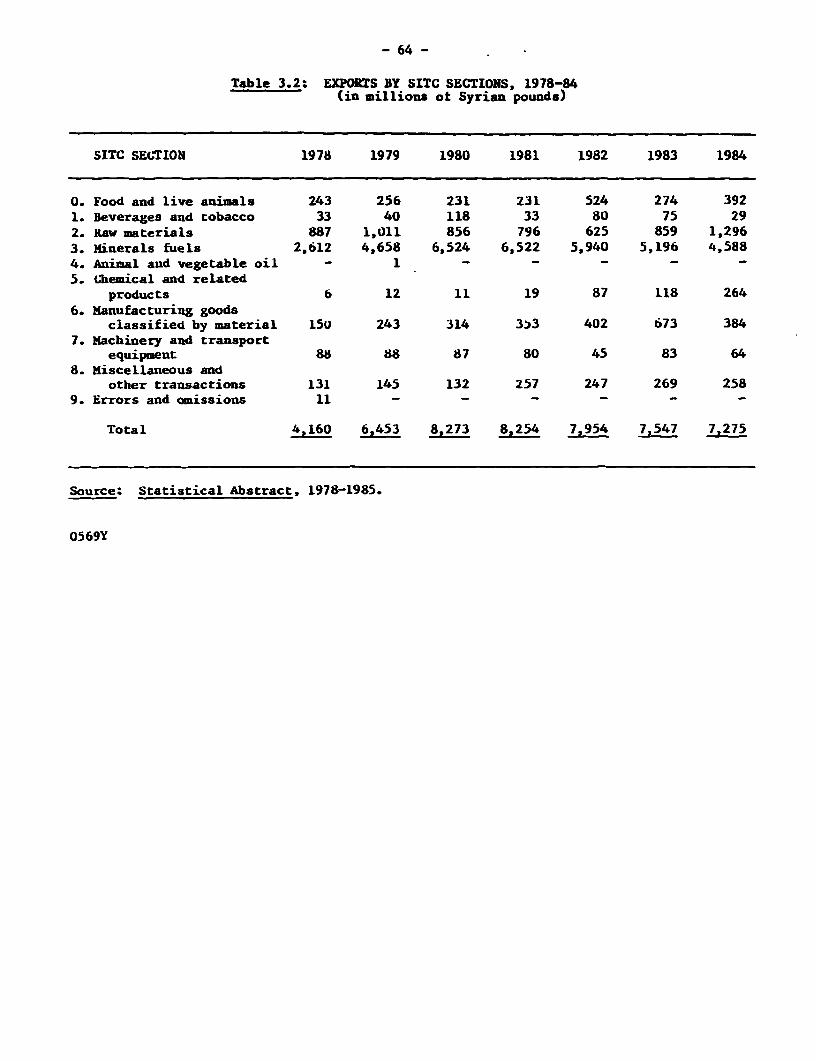
- 64 -
Table 3.2: EXPORTS BY SITC SECTIONS, 1978-84(in millions ot Syrian pounds)
SITC SECTION 1978 1979 1980 1981 1982 1983 1984
0. Food and live animals 243 256 231 231 524 274 3921. Beverages and tobacco 33 40 118 33 80 75 292. Maw materials 887 1,011 856 796 625 859 1,2963. Minerals fuels 2,612 4,658 6,524 6,522 5,940 5,196 4,5884. Animal and vegetable oil - 1 - - - - -5. Chemical and related
products 6 12 11 19 87 118 2646. Manufacturing goods
classified by material l5o 243 314 3>3 402 673 3847. Machinery and transport
equipment 88 88 87 80 45 83 648. Miscellaneous and
other transactions 131 145 132 257 247 269 2589. Errors and omissions 11 - - - - - -
Total 4,160 6,453 8,273 8,254 7,954 7,547 7.275
Source: Statistical Abstract, 1978-1985.
0569Y
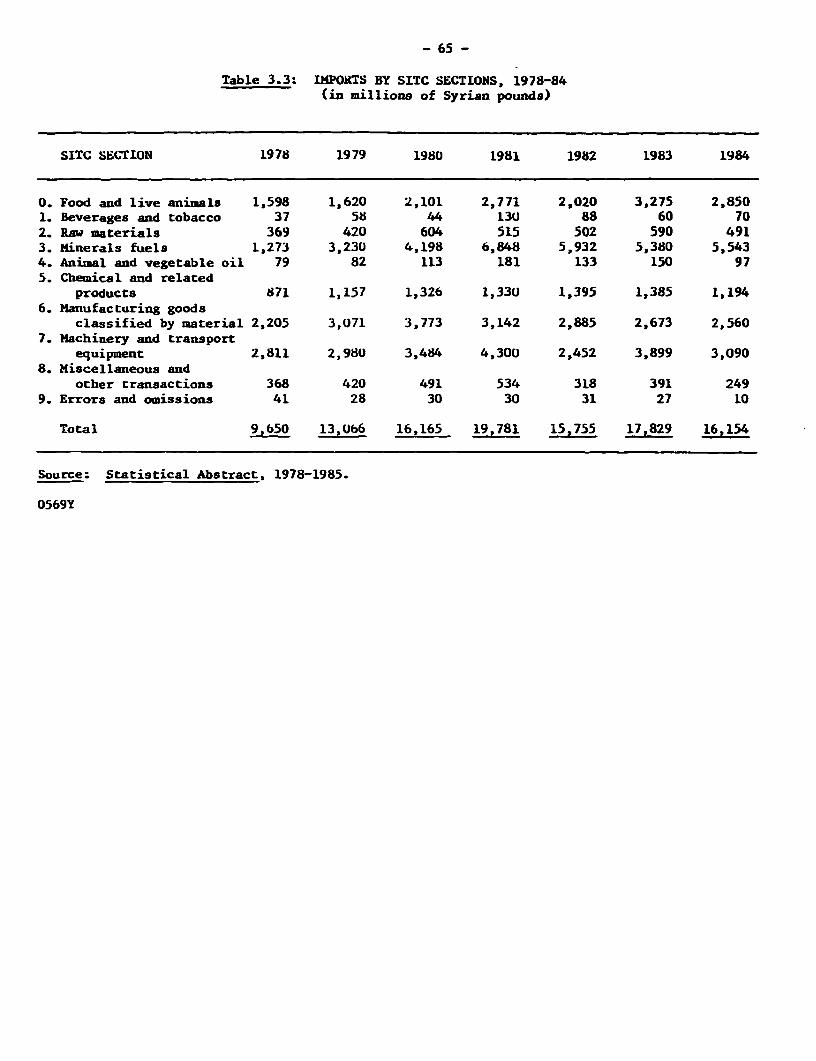
- 65 -
Table 3.3: IMPORTS BY SITC SECTIONS, 1978-84(in millions of Syrian pounds)
SITC SECTION 1978 1979 1980 1981 1982 1983 1984
0. Food and live animals 1,598 1,620 2,101 2,771 2,020 3,275 2,8501. Beverages and tobacco 37 58 44 130 88 60 702. Raw materials 369 420 604 515 502 590 4913. Minerals fuels 1,273 3,230 4,198 6,848 5,932 5,380 5,5434. Animal and vegetable oil 79 82 113 181 133 150 975. Chemical and related
products 871 1,157 1,326 1,330 1,395 1,385 1,1946. Manufacturing goods
classified by material 2,205 3,071 3,773 3,142 2,885 2,673 2,5607. Machinery and transport
equipment 2,811 2,980 3,484 4,300 2,452 3,899 3,0908. Miscellaneous and
other transactions 368 420 491 534 318 391 2499. Errors and omissions 41 28 30 30 31 27 10
Total 9,650 13,0b6 16,165 19,781 15,755 17,829 16,154
Source: Statistical Abstract, 1978-1985.
0569Y
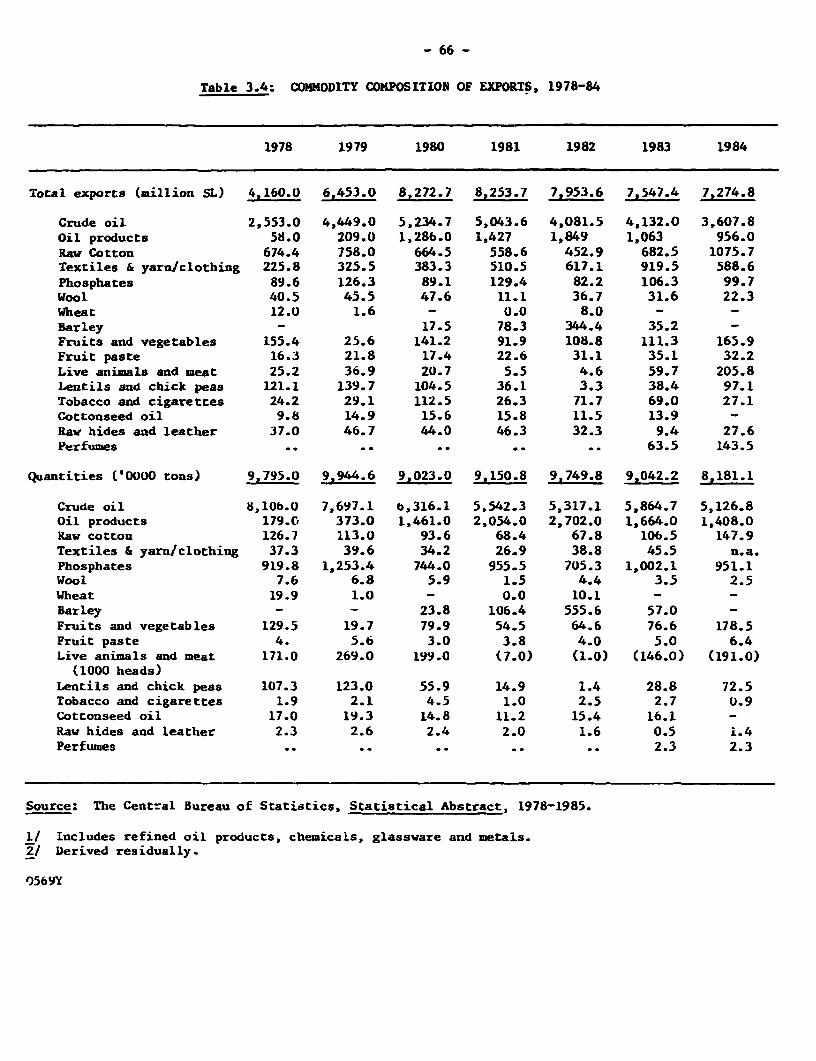
- 66 -
Table 3.4: COMMODITY COHPOSITION OF EXPORTS, 1978-84
1978 1979 1980 1981 1982 1983 1984
Total exports (million SL) 4,160.0 6,453.0 8,272.7 8,253.7 7,953.6 7,547.4 7,274.8
Crude oil 2,553.0 4,449.0 5,234.7 5,043.6 4,081.5 4,132.0 3,607.8Oil products 58.0 209.0 1,286.0 1,427 1,849 1,063 956.0Raw Cotton 674.4 758.0 664.5 558.6 452.9 682.5 1075.7Textiles & yarn/clothing 225.8 325.5 383.3 510.5 617.1 919.5 588.6Phosphates 89.6 126.3 89.1 129.4 82.2 106.3 99.7Wool 40.5 45.5 47.6 11.1 36.7 31.6 22.3Wheat 12.0 1.6 - 0.0 8.0 - -Barley - 17.5 78.3 344.4 35.2 -Fruits and vegetables 155.4 25.6 141.2 91.9 108.8 111.3 165.9Fruit paste 16.3 21.8 17.4 22.6 31.1 35.1 32.2Live animals and meat 25.2 36.9 20.7 5.5 4.6 59.7 205.8Lentils and chick peas 121.1 139.7 104.5 36.1 3.3 38.4 97.1Tobacco and cigarettes 24.2 29.1 112.5 26.3 71.7 69.0 27.1Cottonseed oil 9.8 14.9 15.6 15.8 11.5 13.9 -Raw hides and leather 37.0 46.7 44.0 46.3 32.3 9.4 27.6Perfumes .. .. .. .. .. 63.5 143.5
Quantities ('0000 tons) 9,795.0 9,944.6 9,023.0 9,150.8 9,749.8 9,042.2 8,181.1
Crude oil 8,lOb.0 7,697.1 b,316.1 5,542.3 5,317.1 5,864.7 5,126.8Oil products 179.0 373.0 1,461.0 2,054.0 2,702.0 1,664.0 1,408.0Raw cotton 126.7 113.0 93.6 68.4 67.8 106.5 147.9Textiles & yarn/clothing 37.3 39.6 34.2 26.9 38.8 45.5 n.a.Phosphates 919.8 1,253.4 744.0 955.5 705.3 1,002.1 951.1Wool 7.6 6.8 5.9 1.5 4.4 3.5 2.5Wheat 19.9 1.0 - 0.0 10.1 - -Barley - - 23.8 106.4 555.6 57.0 -Fruits and vegetables 129.5 19.7 79.9 54.5 64.6 76.6 178.5Fruit paste 4. 5.6 3.0 3.8 4.0 5.0 6.4Live animals and meat 171.0 269.0 199.0 (7.0) (1.0) (146.0) (191.0)
(1000 heads)Lentils and chick peas 107.3 123.0 55.9 14.9 1.4 28.8 72.5Tobacco and cigarettes 1.9 2.1 4.5 1.0 2.5 2.7 U.9Cottonseed oil 17.0 19.3 14.8 11.2 15.4 16.1 -
Raw hides and leather 2.3 2.6 2.4 2.0 1.6 0.5 i.4Perfumes .. .. .. .. .. 2.3 2.3
Source: The Central Bureau of Statistics, Statistical Abstract, 1978-1985.
1/ Includes refined oil products, chemicals, glassware and metals.2/ Derived residually.
0569Y
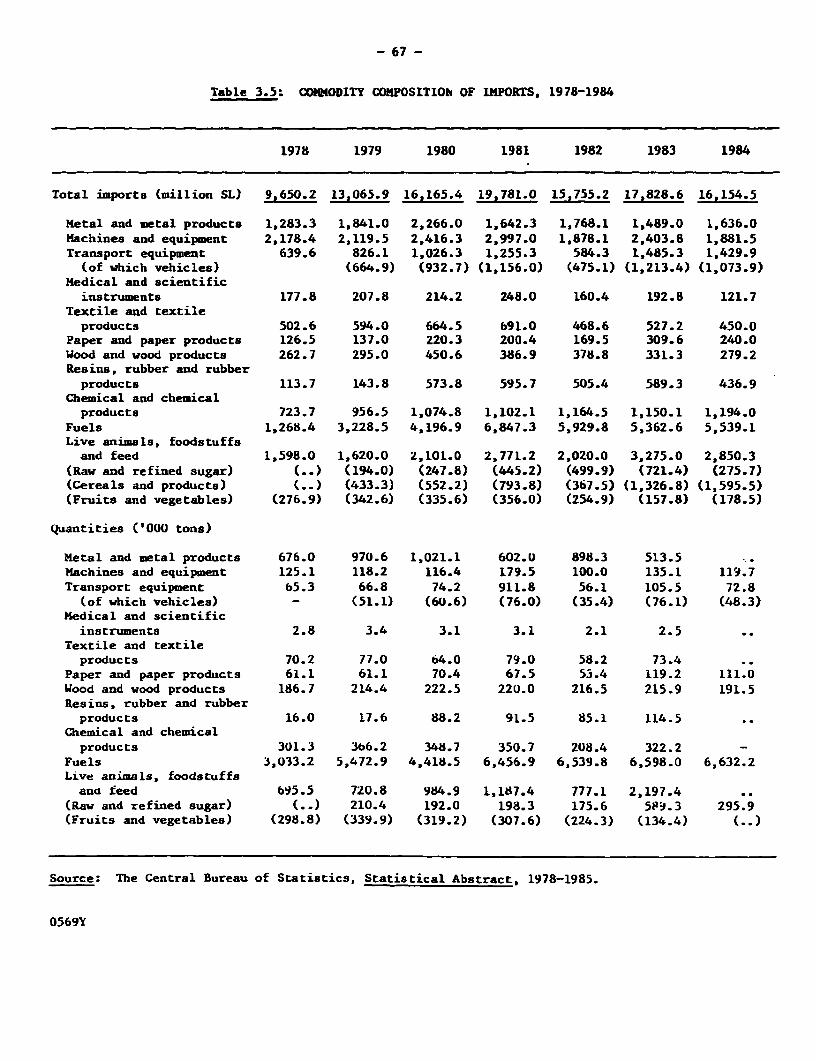
- 67 -
Table 3.5: CONMODITY COMPOSITIOb OF IMPORTS, 1978-1984
1978 1979 1980 1981 1982 1983 1984
Total imports (million SL) 9,650.2 13,065.9 16,165.4 19,781.0 15,755.2 17,828.6 16,154.5
Metal and metal products 1,283.3 1,841.0 2,266.0 1,642.3 1,768.1 1,489.0 1,636.0Machines and equipment 2,178.4 2,119.5 2,416.3 2,997.0 1,878.1 2,403.8 1,881.5Transport equipment 639.6 826.1 1,026.3 1,255.3 584.3 1,485.3 1,429.9(of which vehicles) (664.9) (932.7) (1,156.0) (475.1) (1,213.4) (1,073.9)
Medical and scientificinstruments 177.8 207.8 214.2 248.0 160.4 192.8 121.7
Textile and textileproducts 502.6 594.0 664.5 691.0 468.6 527.2 450.0
Paper and paper products 126.5 137.0 220.3 200.4 169.5 309.6 240.0Wood and wood products 262.7 295.0 450.6 386.9 378.8 331.3 279.2Resins, rubber and rubber
products 113.7 143.8 573.8 595.7 505.4 589.3 436.9Chemical and chemical
products 723.7 956.5 1,074.8 1,102.1 1,164.5 1,150.1 1,194.0Fuels 1,268.4 3,228.5 4,196.9 6,847.3 5,929.8 5,362.6 5,539.1Live animals, foodstuffsand feed 1,598.0 1,620.0 2,101.0 2,771.2 2,020.0 3,275.0 2,850.3
(Raw and refined sugar) ( .) (194.0) (247.8) (445.2) (499.9) (721.4) (275.7)(Cereals and products) (..) (433.3) (552.2) (793.8) (367.5) (1,326.8) (1,595.5)(Fruits and vegetables) (276.9) (342.6) (335.6) (356.0) (254.9) (157.8) (178.5)
Quantities ('000 tons)
Metal and metal products 676.0 970.6 1,021.1 602.0 898.3 513.5Machines and equipment 125.1 118.2 116.4 179.5 100.0 135.1 119.7Transport equipment 65.3 66.8 74.2 911.8 56.1 105.5 72.8(of which vehicles) - (51.1) (60.6) (76.0) (35.4) (76.1) (48.3)
Medical and scientificinstruments 2.8 3.4 3.1 3.1 2.1 2.5
Textile and textileproducts 70.2 77.0 64.0 79.0 58.2 73.4
Paper and paper products 61.1 61.1 70.4 67.5 53.4 119.2 111.0Wood and wood products 186.7 214.4 222.5 220.0 216.5 215.9 191.5Resins, rubber and rubberproducts 16.0 17.6 88.2 91.5 85.1 114.5
Chemical and chemicalproducts 301.3 366.2 348.7 350.7 208.4 322.2 -
Fuels 3,033.2 5,472.9 4,418.5 6,456.9 6,539.8 6,598.0 6,632.2Live animals, foodstuffsana feed 695.5 720.8 984.9 1,187.4 777.1 2,197.4
(Raw and refined sugar) ( .) 210.4 192.0 198.3 175.6 58..3 295.9(Fruits and vegetables) (298.8) (339.9) (319.2) (307.6) (224.3) (134.4) (.)
Source: The Central Bureau of Statistics, Statistical Abstract, 1978-1985.
0569Y
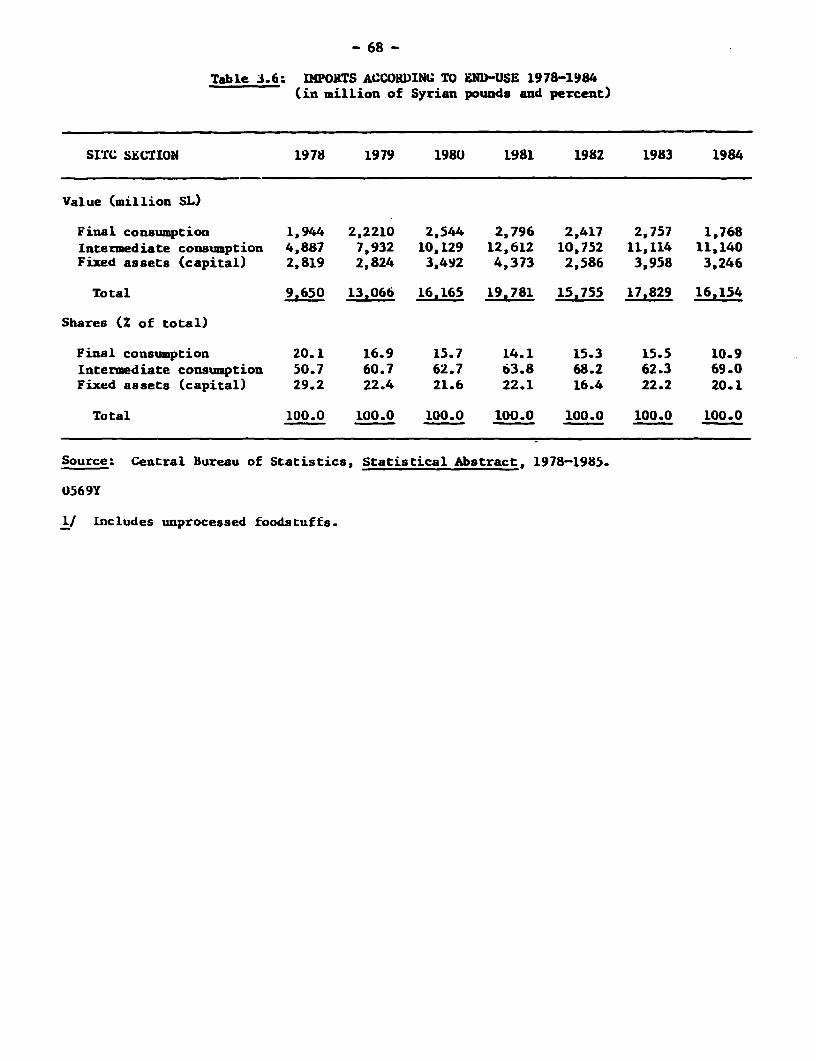
- 68 -
Table 3.6: IMPORTS ACCORDING TO END-USE 1978-1984(in million of Syrian pounds and percent)
SIrC SECTION 1978 1979 1980 1981 1982 1983 1984
Value (million SL)
Final consumption 1,944 2,2210 2,544 2,796 2,417 2,757 1,768Intermediate consumption 4,887 7,932 10,129 12,612 10,752 11,114 11,140Fixed assets (capital) 2,819 2,824 3,492 4,373 2,586 3,958 3,246
Total 9,650 13,066 16,165 19,781 15,755 17,829 16,154
Shares (X of total)
Final consumption 20.1 16.9 15.7 14.1 15.3 15.5 10.9Intermediate consumption 50.7 60.7 62.7 63.8 68.2 62.3 69.0Fixed assets (capital) 29.2 22.4 21.6 22.1 16.4 22.2 20.1
Total 100.0 100.0 100.0 100.0 100.0 100.0 100.0
Source: Central Bureau of Statistics, Statistical Abstract, 1978-1985.
0569Y
I/ Includes unprocessed foodstuffs.
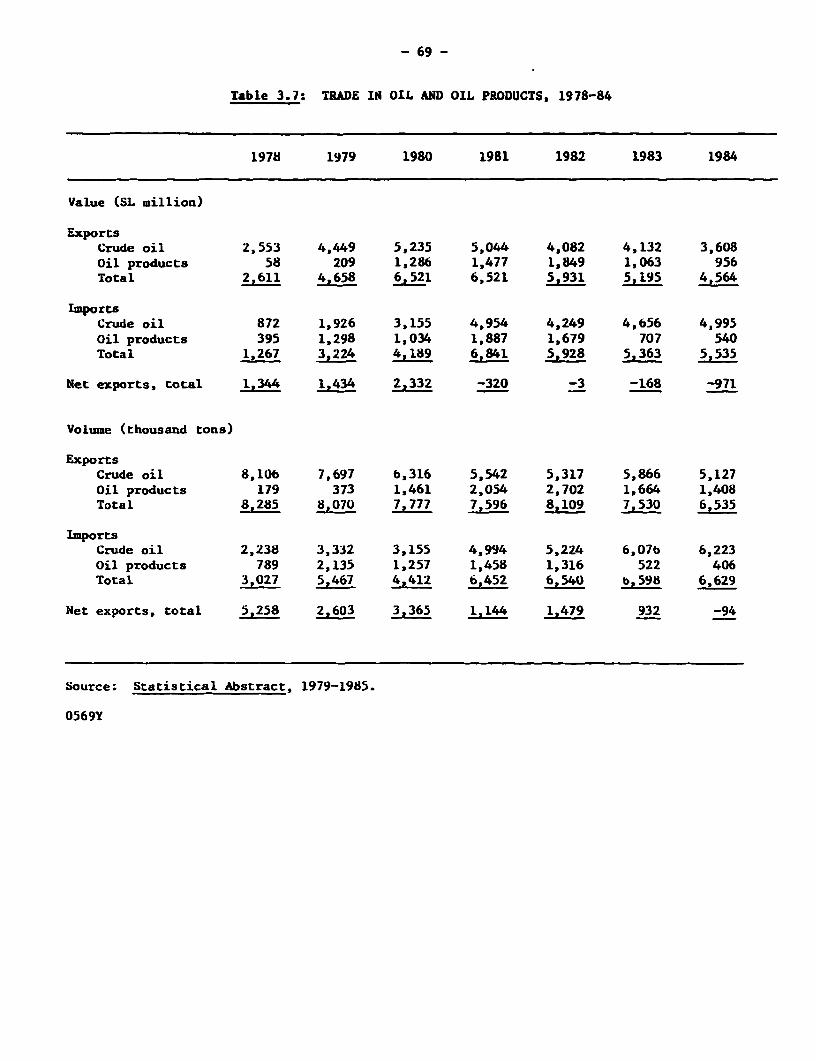
- 69 -
Table 3.7: TRADE IN OIL AND OIL PRODUCTS, 1978-84
1978 1979 1980 1981 1982 1983 1984
Value (SL million)
ExportsCrude oil 2,553 4,449 5,235 5,044 4,082 4,132 3,608Oil products 58 209 1,286 1,477 1,849 1,063 956Total 2,611 4,658 6,521 6,521 5.931 5,195 4,564
ImportsCrude oil 872 1,926 3,155 4,954 4,249 4,656 4,995Oil products 395 1,298 1,034 1,887 1,679 707 540Total 1,267 3,224 4,189 6,841 5,928 5,363 5,535
Net exports, total 1,344 1,434 2,332 -320 -3 -168 -971
Volume (thousand tons)
ExportsCrude oil 8,106 7,697 6,316 5,542 5,317 5,866 5,127Oil products 179 373 1,461 2,054 2,702 1,664 1,408Total 8.285 8,070 7,777 7,596 8,109 7,530 6,535
ImportsCrude oil 2,238 3,332 3,155 4,994 5,224 6,076 6,223Oil products 789 2,135 1,257 1,458 1,316 522 406Total .!027 5,467 4,412 6,452 6,540 b,598 6,629
Net exports, total 5,258 2,603 3.365 1,144 1,479 932 -94
Source: Statistical Abstract, 1979-1985.
0569Y
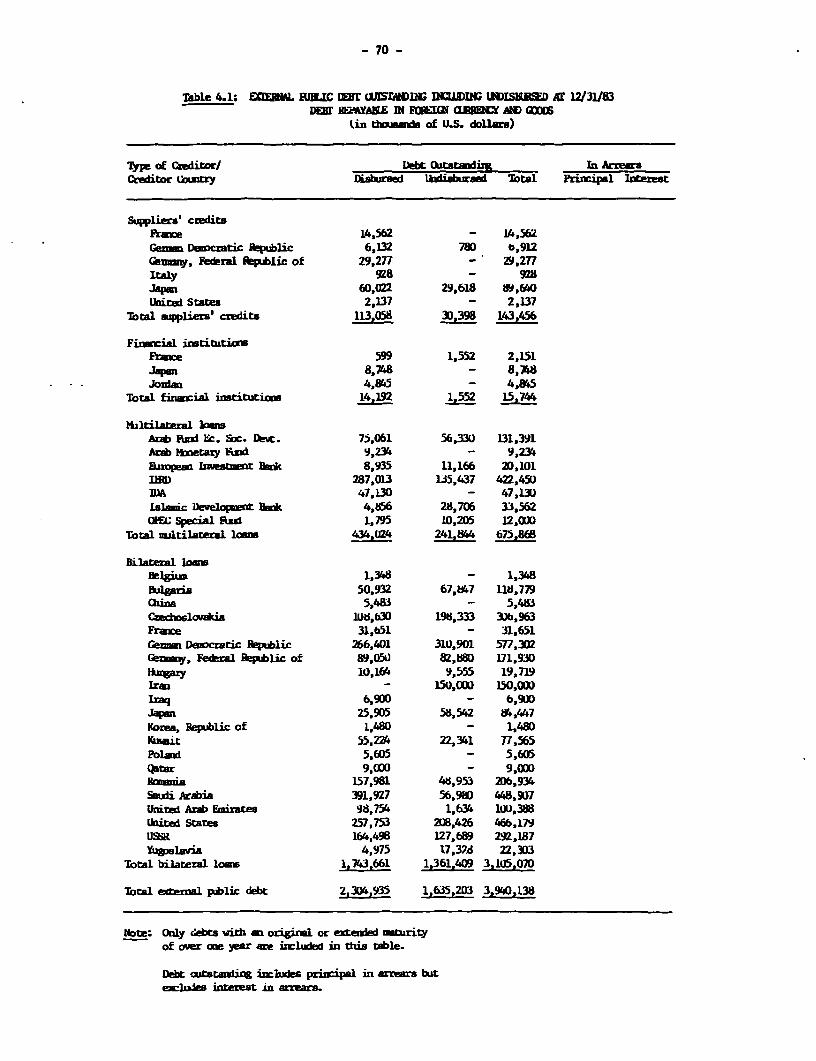
- 70 -
Table 4.1: EXIERIML JEJUBC IEr W1115DDL; DUC INt IUISIMD A 12/31183DEBTr M1AhEBN OE ll1 aRENCY AN ODE
(in tbouurla of U.S. dollas)
Type Of cedi±ori Dlebt Cltstmdiig In ArrewsCreditor Iaatry Disbursaed lIxiahwad Total Priiuipal interest
Suppliers' craditsFrame 14,562 - 14,562Genmm Dancrtic RPgublic 6,132 780 t,912Cev=W, Fedral Republic of 29,277 - 29,277Italy 928 - 928Jap 60,022 29,618 89,640tUited States 2,137 - 2,137
Total ppliers' credits 113,058 3D,398 143,456
Finacrial ilstituotiLFrance 599 1,552 2,151Japan 8,748 - 8,7.8Jordnm 4,845 - 4,845
Total financial institutiona 14,192 1.552 15,744
ibltilateral lonsArab Fund 1c. Soc. Devt. 75,061 56,330 131,391Arab mmetaxy Fund 9,2341 - 9,234Eurpean Inweszernt Bank 8,935 11,166 20,101IND 287,013 135,437 422,450IDA 47,30 - 47,13Ulalsnic Developinert Benk 4,f56 28,706 33,562(OEM Special Eaud 1,795 10,205 12,000
Total ultilateral loom 434,024 241,844 o75,868
Bilateral loanBelgiun 1,3b8 - 1,348Bulgaria 50,932 67,547 118,779hirna 5,483 - 5,4H3
Czedoslovikia 11)8630 19M,333 3Ub,963Franoe 31,651 - 31,651Gezman Devncraric Republic 266,401 310,901 577,302Gemwn, Federal Pepublic of 89,050 82,880 171.930HWga 10,164 9,555 19,719fra - 150,oO W50,00
Ixaq 6,900 - 6,900Japan 25,905 58,542 84i,447Korea, Bepublic of 1,480 - 1,480Kuwait 55,224 22,341 77,565Polard 5,605 - 5,605Qatar 9,000 - 9,000Mulia 157,981 46,953 20b,934Smdi Arabia 391,927 56,980 448,907Unitid Anb Emixates 98,754 1,634 1W,388Unitei States 257,753 208,426 466,179USSR 164,498 127,689 292,187YiMpa1avia 4,975 17,324 22,303
Total bilatera loos 1,743,661 1,361,409 3,105.070
Total enal public debt 2,304,935 1,635,203 3,910,138
Ntte: Only debts with am origiral or exded uturityof auer oe year are iJuded in this table.
Debt outs-Wing imch principal in arrears butexcluh inteest in arrears.
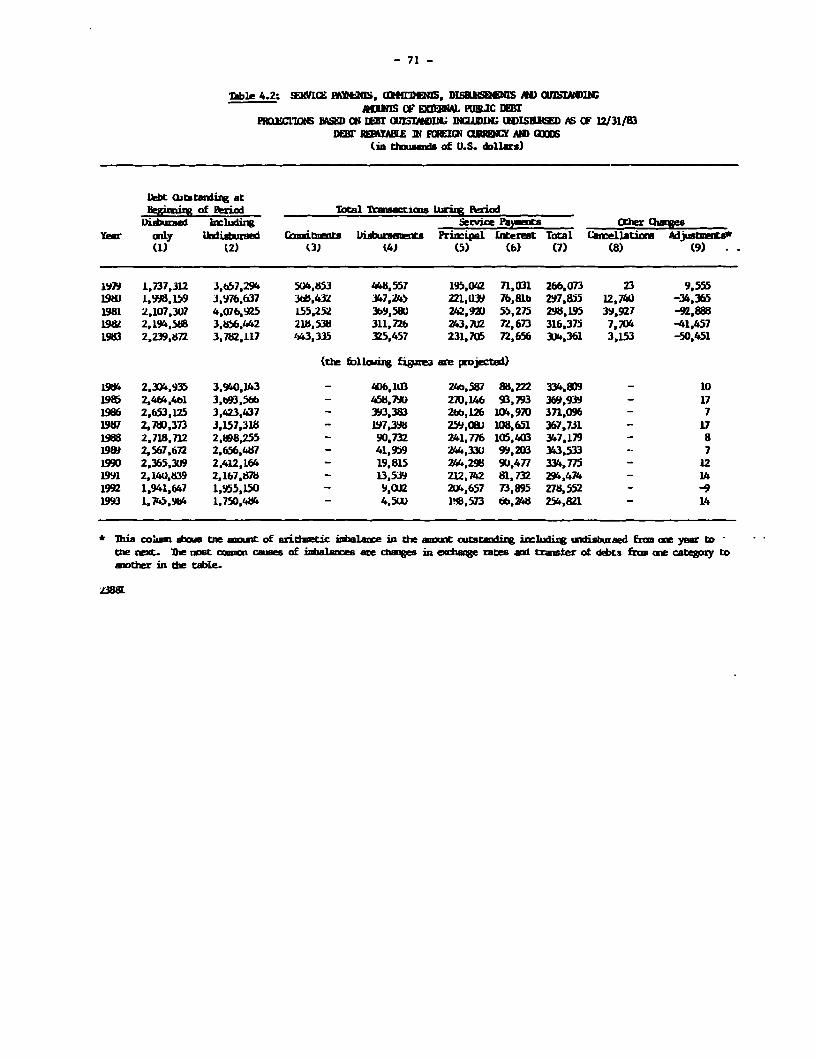
- 71 -
Toble 4.2: SaE MIYllS, M*rDIM, DISW.103 AID wIbAUI)Actrm cO EKiiwL MuIC DM
PKhCM MM Ctl1 SS IONlD LlIII D IKDLE; IWLISaIO AS CF /31/83nEEr REEBAE IN POEIG taMCr AND200
(in t houaaa of U.S. dollars)
Debt 0itstadirg atBeeqmizu of Period Total lrmactims Ia-rig kiriod
Diomed 1zI1Udix Seevce Pa^ts Cer OmesYear ady Ukdixaused Camsibunts DidAxewuts Prin:ipl Lnterat Total Calelatim Adjusnmts*
(1) (2) (3) (4) t5) (6) (7) (8) (9)
1979 1,737,312 3,057,294 5(1,853 448,557 195,042 71,031 266,073 23 9,55519W 1,998,159 3,976,637 3jb.43XL 347,245 221.039 76,81b 297,855 12,740 -34,3651981 2,107,307 4,076,915 t55,252 3b9,58U 242,9ZU 55,275 298,195 39,927 -9,888198t 2,194,58a 3,856,442 21b,538 311,72b Z43,7U2 7Z,673 316,375 7,704 -41,457L983 2,239,872 3,782,117 £243,335 325,457 231,705 72,656 3U4,361 3,153 -50,451
(thk fblkai*g fi3a are pajected)
19M4 2,304,935 3,940,143 - 406,10B 240,587 85,222 334,809 - 101985 2,464,4bl 3,93,5bb - 458,79U 270,1A6 93,793 369,939 - 171986 2.653,125 3,423,437 - 393,383 2b,126 l14,970 371,096 - 71987 2,780,373 3,157,318 - 197,395 259,08) 108,651 367,731 - 171988 2,718,712 2.808,255 - 90.732 241,776 105,403 347,179 - 8198S 2,567,672 2,656,487 - 41,959 244,33(3 99,203 343,533 -- 71990 2,365,3U9 2.412,164 - 19,815 2.4,29H 911,477 334,775 - 121991 2,14U,839 2,167,878 - 13,539 212,742 81,732 294,474 - 141992 1,941,647 1,955,1S0 - 9,0U2 2[A,657 T3,895 278,552 - -91993 1,745,9b4 1,750,484 - 4,5W 14B,573 6b,ZW 254,821 - 14
Mhis co:am aim tne mat of arit.let: iIbalane 2n the amm=t cutsr- includizc undisbuaed from ae year toOch t. 'De nst comin cz of izibalan:es are changs in ewEalge mts and trmster at ddbts from ane catezy toaxther in the table.
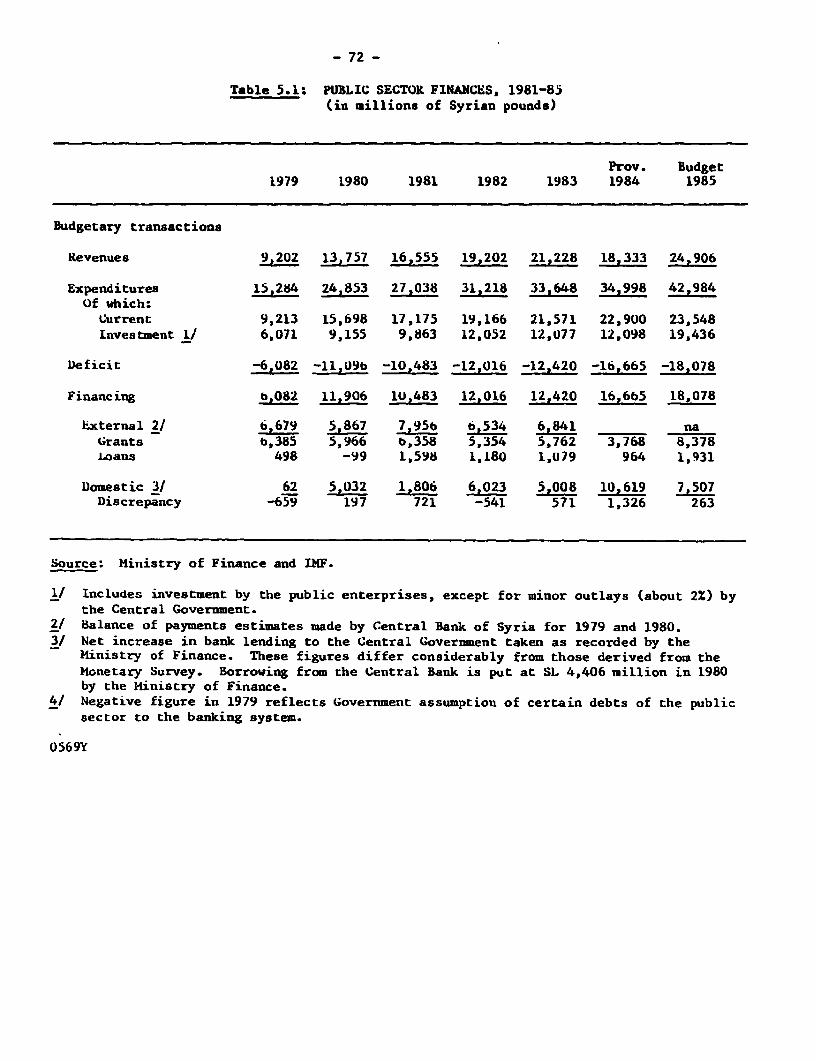
- 72 -
Table 5.1: PUBLIC SECTOR FINANCES, 1981-85(in millions of Syrian pounds)
Prov. Budget1979 1980 1981 1982 1983 1984 1985
Budgetary transactions
Revenues 20 13,757 16,555 19,202 21,228 18,333 24,906
Expenditures 15,284 24,853 27,038 31,218 33,648 34,998 42,984Of which:Current 9,213 15,698 17,175 19,166 21,571 22,900 23,548Investment 1/ 6,071 9,155 9,863 12,052 12,077 12,098 19,436
Deficit -6.082 -1l109b -10,483 -12,016 -12,420 -16,665 -18,078
Financing b 11,906 1U,483 12,016 12,420 16,665 18,078
kxternal 2/ b,679 5,867 7,95b 6,534 6,841 naGrants b,385 5,966 b,358 5,354 5,762 3,768 8,378Loans 498 -99 1,598 1,180 1,079 964 1,931
Domestic 31 62 5,032 1,806 6,023 5,008 10,619 7,507Discrepancy -659 197 721 -541 571 1,326 263
Source: Ministry of Finance and IMF.
1/ Includes investment by the public enterprises, except for minor outlays (about 2%) bythe Central Government.
2/ Balance of payments estimates made by Central Bank of Syria for 1979 and 1980.3/ Net increase in bank lending to the Central Government taken as recorded by the
Ministry of Finance. These figures differ considerably from those derived from theMonetary Survey. Borrowing from the Central Bank is put at SL 4,406 million in 1980by the Ministry of Finance.
4/ Negative figure in 1979 reflects Government assumption of certain debts of the publicsector to the banking system.
0569Y
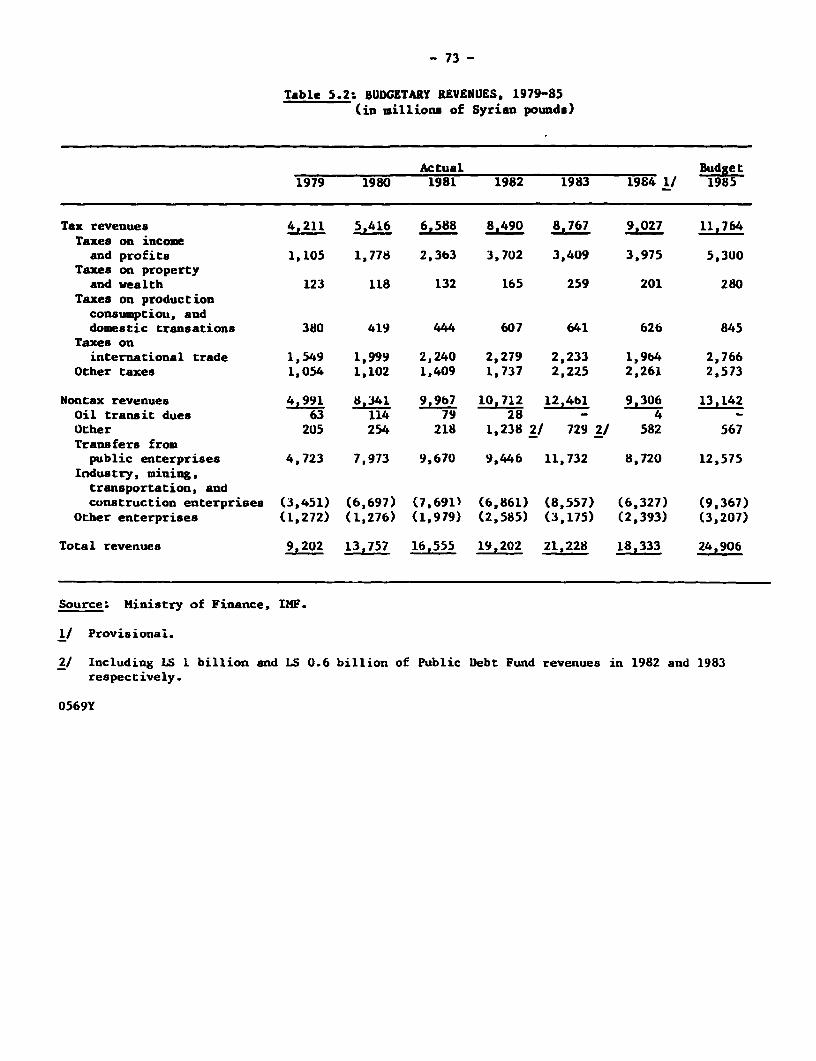
- 73 -
Table 5.2: BUDGETARY REVENUES, 1979-85(in millions of Syrian pounds)
Actual Budget1979 1980 1981 1982 1983 1984 1/ 1985
Tax revenues 4,211 5,416 6,588 8,490 8.767 9 027 11,764Taxes on incomeand profits 1,105 1,778 2,363 3,702 3,409 3,975 5,3U0
Taxes on propertyand wealth 123 118 132 165 259 201 280
Taxes on productionconsumption, anddomestic transations 380 419 444 607 641 626 845
Taxes oninternational trade 1,549 1,999 2,240 2,279 2,233 1,964 2,766
Other taxes 1,054 1,102 1,409 1,737 2,225 2,261 2,573
Nontax revenues 4,991 8,341 9,9b7 10,712 12,4bl 9,306 13,142Oil transit dues 63 114 79 28 - 4 -Other 205 254 218 1,238 2/ 729 2/ 582 567Transfers frompublic enterprises 4,723 7,973 9,670 9,446 11,732 8,720 12,575
Industry, mining,transportation, andconstruction enterprises (3,451) (6,697) (7,691) (6,861) (8,557) (6,327) (9,367)
Other enterprises (1,272) (1,276) (1,979) (2,585) (3,175) (2,393) (3,207)
Total revenues 9,202 13,757 16,555 19,202 21,228 18,333 24,906
Source: Hinistry of Finance, IMF.
1/ Provisional.
2/ Including IS 1 billion and LS 0.6 billion of Public Debt Fund revenues in 1982 and 1983respectively.
0569Y
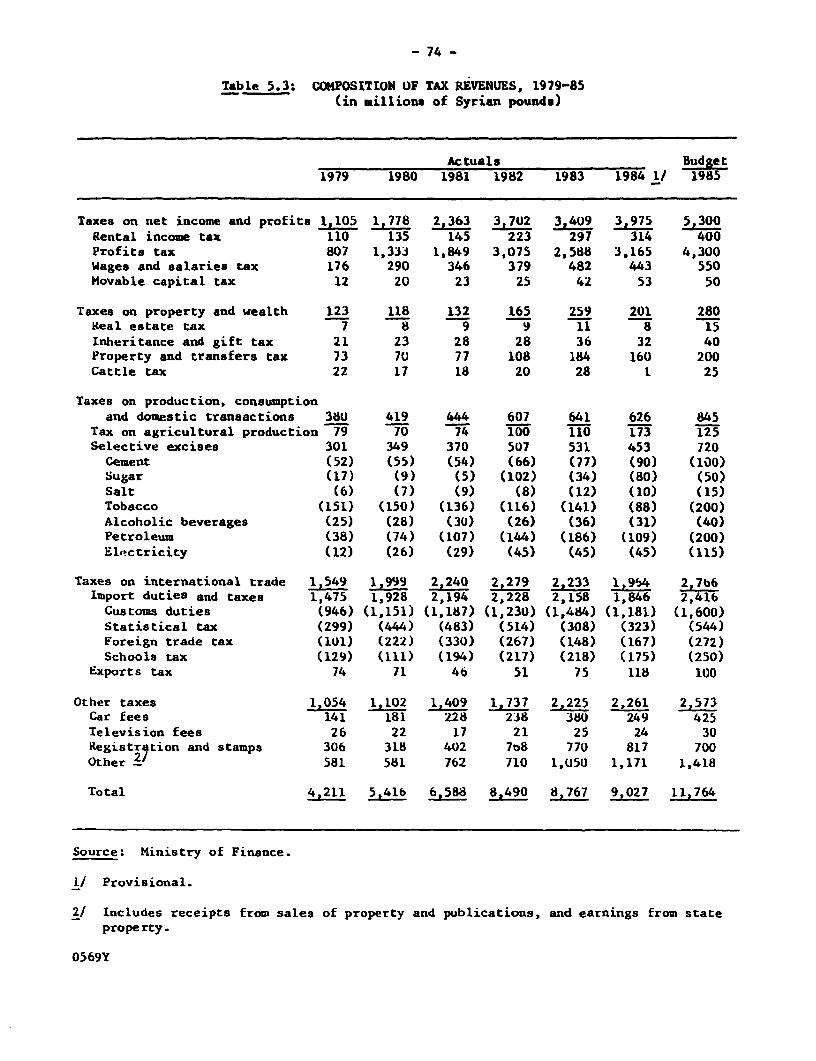
- 74 -
Table 5.3: COMPOSITION OF TAX REVEfNUES, 1979-85(in millions of Syrian pounds)
Actuals Budget1979 1980 1981 1982 1983 1984 1/ 1985
Taxes on net income and profits 1,105 1,778 2,363 3,702 3,409 3,975 5,300Rental income tax 110 135 145 223 297 314 400Profits tax 807 1,333 1,849 3,075 2,588 3,165 4,300Wages and salaries tax 176 290 346 379 482 443 550Movable capital tax 12 20 23 25 42 53 50
Taxes on property and wealth 123 118 132 165 259 201 280Keal estate tax 7 8 9 9 11 8 15Inheritance and gift tax 21 23 28 28 36 32 40Property and transfers tax 73 70 77 108 184 160 200Cattle tax 22 17 18 20 28 1 25
Taxes on production, consumptionand domestic transactions 380 419 444 607 641 626 845
Tax on agricultural production 79 70 74 100 110 173 125Selective excises 301 349 370 507 531 453 720Cement (52) (55) (54) (66) (77) (90) (100)Sugar (17) (9) (5) (102) (34) (80) (50)Salt (6) (7) (9) (8) (12) (10) (15)Tobacco (151) (150) (136) (116) (141) (88) (200)Alcoholic beverages (25) (28) (30) (26) (36) (31) (40)Petroleum (38) (74) (107) (144) (186) (109) (200)Electricity (12) (26) (29) (45) (45) (45) (115)
Taxes on international trade 1,549 1,999 2,240 2,279 2,233 1,964 2,7b6Import duties and taxes 1,475 1,928 2,194 2,228 2,158 1,846 2,416Customs duties (946) (1,151) (1,187) (1,230) (1,484) (1,181) (1,600)Statistical tax (299) (444) (483) (514) (308) (323) (544)Foreign trade tax (lU) (222) (330) (267) (148) (167) (272)Schools tax (129) (111) (194) (217) (218) (175) (250)
Exports tax 74 71 46 51 75 118 100
Other taxes 1,054 1,102 1,409 1,737 2,225 2,261 2,573Car fees 141 181 228 238 380 249 425Television fees 26 22 17 21 25 24 30Registration and stamps 306 318 402 708 770 817 700Other 2 581 581 762 710 1,050 1,171 1,418
Total 4,211 5,41b 6,588 8,490 8,767 9,027 11,764
Source: Ministry of Finance.
1/ Provisional.
2/ Includes receipts from sales of property and publications, and earnings from stateproperty.
0569Y
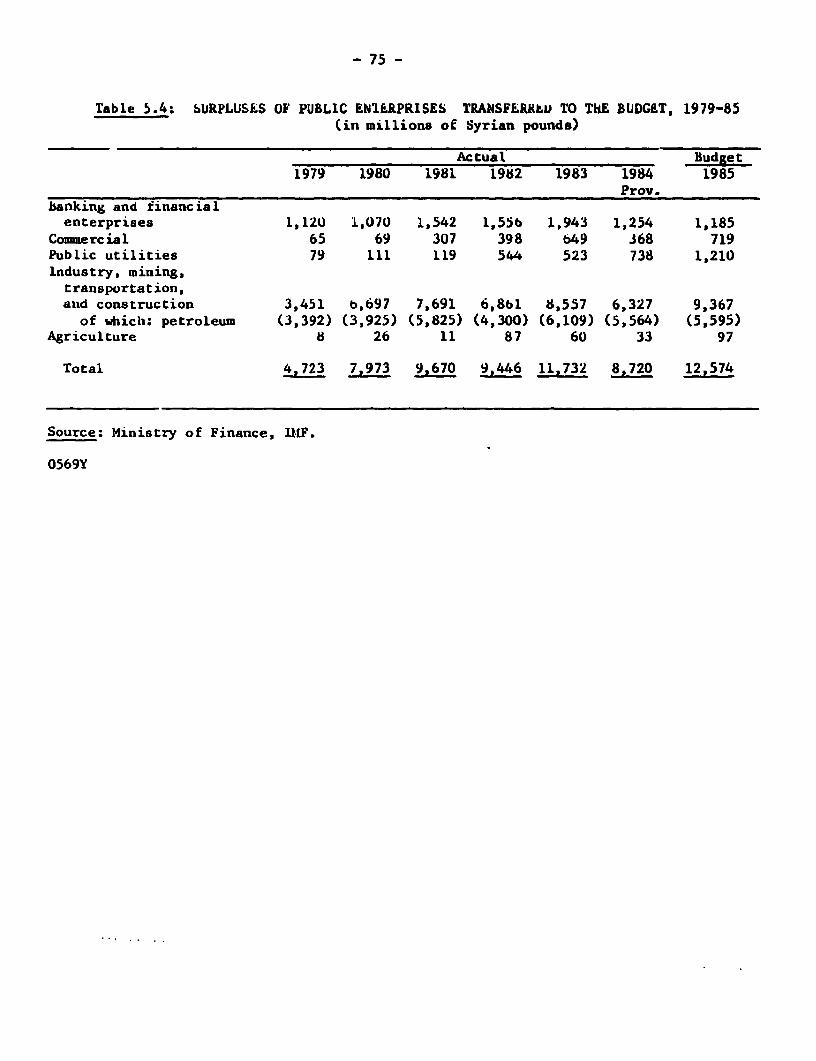
- 75 -
Table 5.4: bURPLUSES OF PUBLIC ENI1RPRISES TRANSFLRKkLI TO ThE BUDGET, 1979-85(in millions of Syrian pounds)
Actual Budget1979 1980 1981 1982 1983 1984 1985
Prov.banking and financialenterprises 1,120 1,070 1,542 1,55b 1,943 1,254 1,185
Commercial 65 69 307 398 b49 368 719Public utilities 79 111 119 544 523 738 1,210Industry, mining,transportation,and construction 3,451 b,697 7,691 6,8bl 8,557 6,327 9,367of which: petroleum (3,392) (3,925) (5,825) (4,300) (6,109) (5,564) (5,595)
Agriculture 8 26 11 87 60 33 97
Total 4,723 7,973 9,670 9,446 11,732 8,720 12,574
Source: Ministry of Finance, U.IF.
0569Y
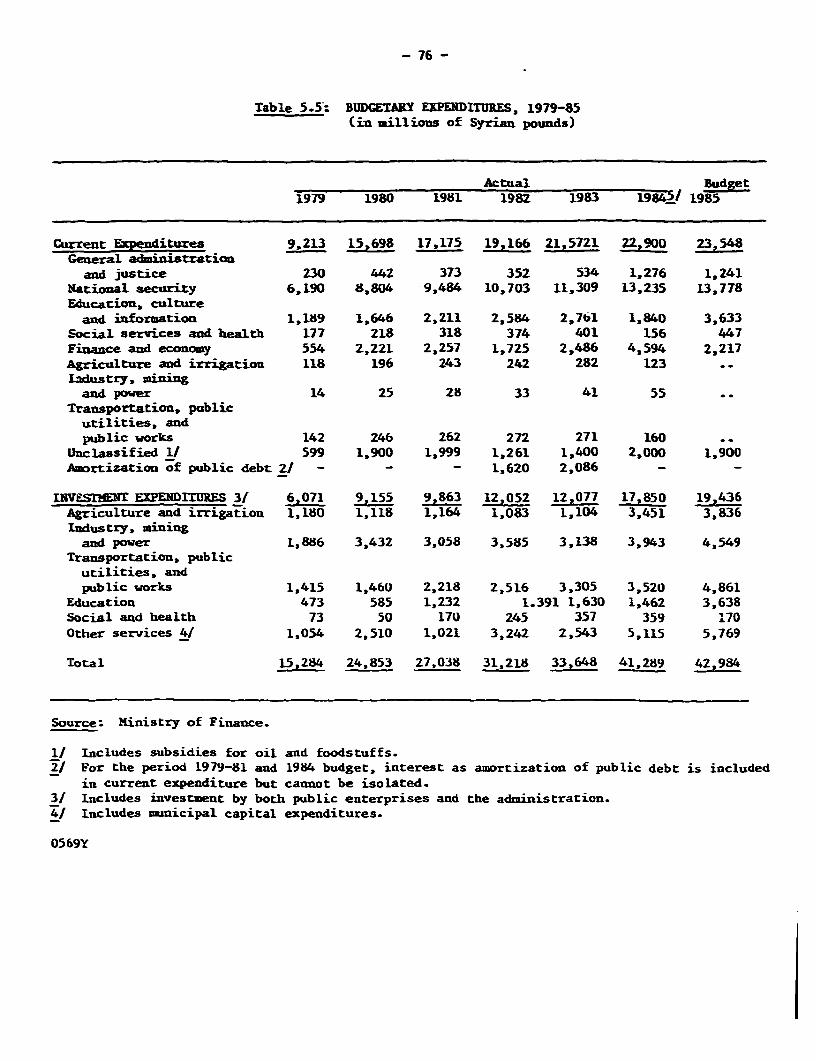
- 76 -
Table 5.5: BUDGETARY EXPENDITURES, 1979-85(in millions of Syrian pounds)
Actual Budget1979 1980 1981 1982 1983 IgaZ65 1985
Current Expenditures 9,213 15,698 17,175 19,166 21,5721 22,900 23,548General administration
and justice 230 442 373 352 534 1,276 1,241National security 6,190 8)804 -9,484 10,703 11,309 13,235 13,778Edaucation, cultureand information 1,189 1,646 2,211 2,584 2,761 1,840 3,633
cocial services and health 177 218 318 374 401 156 447Finan e and economy 554 2,221 2,257 1,7Z5 2,486 4,594 2,217Agriculture and irrigation 118 196 243 242 282 123 ..
L.-ustry veminingand power 14 25 28 33 41 55
Transportation, publicutilities, andpublic works 142 246 262 272 271 160 --
Unclassified 1J 599 1,900 1,999 1,261 1,400 2,000 1,900Amortization of public debt 2/ - - - 1.620 2,086 - -
INVESTi T EXPENDITURES 31 6,071 9,155 9,863 12,052 12,077 17,850 19,436Agriculture and irrigation 1,180 1,118 1,164 1,083 1,104 3,451 3,836Industry, miningand power 1,886 3,432 3,058 3,585 3,138 3,943 4,549
Transportation, publicutilities, andpublic works 1,415 1,460 2,218 2,516 3,305 3,520 4,861
Education 473 585 1,232 1.391 1,630 1,462 3,638Social and health 73 50 170 245 357 359 170
Other services 41 1,054 2,510 1,021 3,242 2,543 5,115 5,769
Total 15,284 24,853 27,038 31,218 33,648 41,289 42,984
Source: Ministry of Finance.
1/ Includes subsidies for oil and foodstuffs.Z/ For the period 1979-81 and 1984 budget, interest as amortization of public debt is included
in current expenditure but cannot be isolated.3/ Includes investment by both public enterprises and the administration.4/ Includes municipal capital expenditures.
0569Y
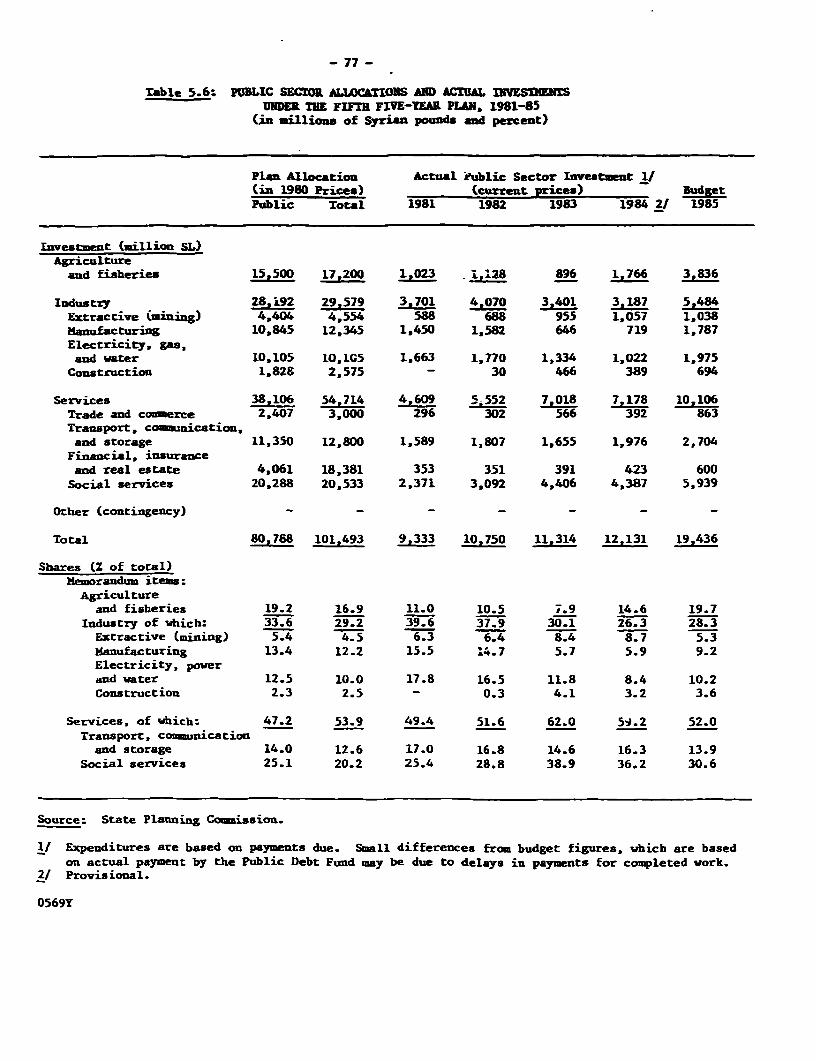
- 77 -
Tmble 5.6: PUBLIC SECOR ALLOCAITDONS AND ACTUAL INVESIMENTSUNDER THE FIFTR FIE-TEAl PLAN, 1981-85
(in millions of Syrian pounds and percent)
Plan Allocation Actual Public Sector Investment 1/(in 1980 Prices) (current prices) BudgetPublic Total 1981 1982 1983 1984 2/ 1985
lnvestment (million SL)Agriculture
and fisheries 15,500 17,200 1.023 i,.28 896 1,766 3,836
Industry 28,192 29,579 3.701 4.070 3.401 3,187 5,484Extractive (miuing) 4.404 4,554 588 688 955 1,057 1,038Mnufacturing 10,845 12,345 1,450 1,582 646 719 1,787Electricity, gas,and water 10,105 l0.lG5 1,663 1,770 1,334 1,022 1,975
Construction 1,828 2,575 - 30 466 389 694
Services 38,106 54.714 4,609 5.5 7,018 7.178 10,106Trade and comerce 2,407 3,000 296 302 566 392 863Transport, comaLnication,and storage 11,350 12,800 1,589 1,807 1,655 1,976 2,704Financial, insuranceand real estate 4,061 18,381 353 351 391 423 600Social services 20,288 20,533 2.371 3,092 4,406 4,387 5,939
Other (contingency) - - - - - - -
Total 80.788 101,493 9,333 10,750 11,314 12,131 19,436
Shares (Z of total)memorandum items:
Agricultureand fisheries 19.2 16.9 11.0 10.5 7.9 14.6 19.7
Industry of which: 33.6 29.2 39.6 37.9 30.1 26.3 28.3Extractive (mining) 5.4 4.5 6.3 6.4 8.4 8.7 5.3Manufacturing 13.4 12.2 15.5 14.7 5.7 5.9 9.2Electricity, powerand water 12.5 10.0 17.8 16.5 11.8 8.4 10.2Construction 2.3 2.5 - 0.3 4.1 3.2 3.6
Services, of which: 47.2 53.9 49.4 51.6 62.0 59.2 52.0Transport, comeunication
and storage 14.0 12.6 17.0 16.8 14.6 16.3 13.9Social services 25.1 20.2 25.4 28.8 38.9 36.2 30.6
Source: State Planning Comcission.
11 Expenditures are based on payments due. Small differences from budget figures, which are based
on actual payment by the Public Debt Fund may be due to delays in payments for completed work.2/ Provisional.
0569Y
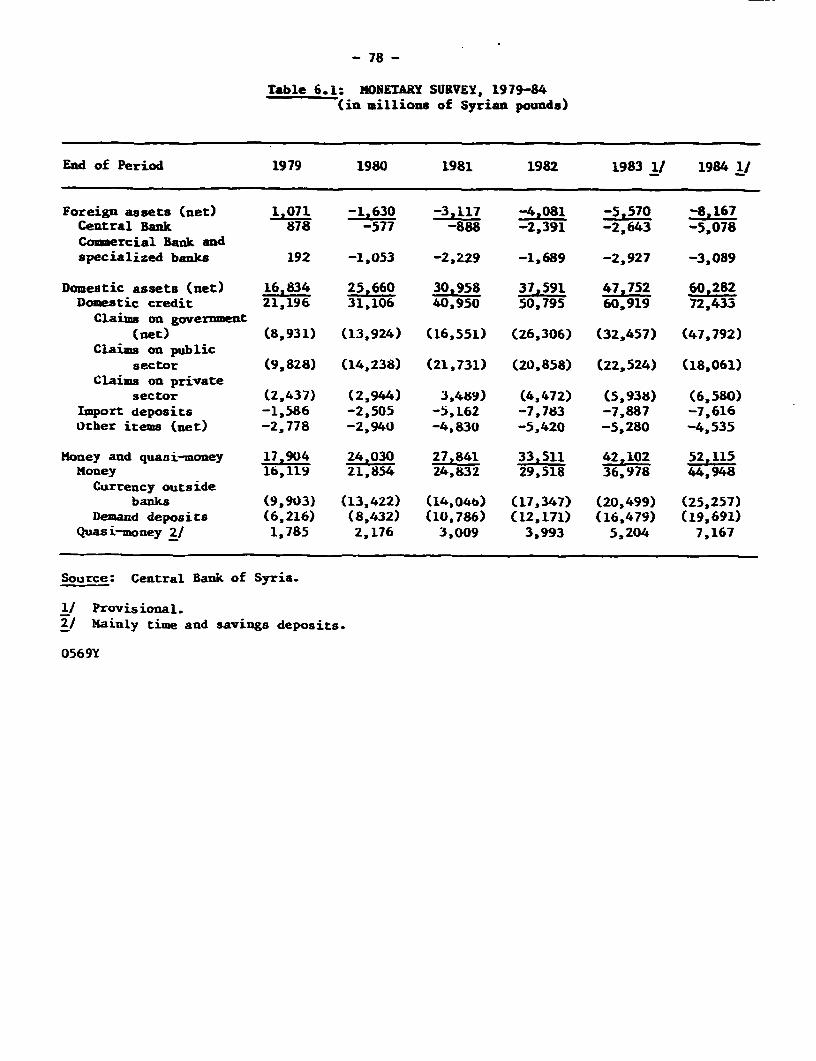
- 78 -
Table 6.1: MONETARY SURVEY, 1979-84(in millions of Syrian pounds)
End of Period 1979 1980 1981 1982 1983 1/ 1984 11
Foreign assets (net) 1,071 -1,630 -3,117 -4,081 -5,570 -8,167Central Bank 878 -577 -888 -2,391 -2,643 -5,078Commercial Bank andspecialized banks 192 -1,053 -2,229 -1,689 -2,927 -3,089
Domestic assets (net) 16,834 25,660 30,958 37,591 47,752 60,282Domestic credit 21,196 31,106 40,950 50,795 60,919 72,433
Claims on government(net) (8,931) (13,924) (16,551) (26,306) (32,457) (47,792)
Claims on publicsector (9,828) (14,238) (21,731) (20.858) (22,524) (18,061)
Claims on privatesector (2,437) (2,944) 3,489) (4,472) (5,938) (6,580)
Import deposits -1,586 -2,505 -5.162 -7,783 -7,887 -7,616other items (net) -2,778 -2,940 -4,830 -5,420 -5,280 -4,535
Money and quasi-money 17,904 24,030 27,841 33,511 42,102 52,115Money lb,119 21,854 24,832 29,518 36,978 44,948Currency outside
banks (9.903) (13,422) (14,04b) (17,347) (20,499) (25,257)Demand deposics (6,216) (8,432) (10,786) (12,171) (16,479) (19,691)
Quasi-money 2/ 1,785 2,176 3,009 3,993 5,204 7,167
Source: Central Bank of Syria.
_/ Provisional.2/ Mainly time and savings deposits.
0569Y
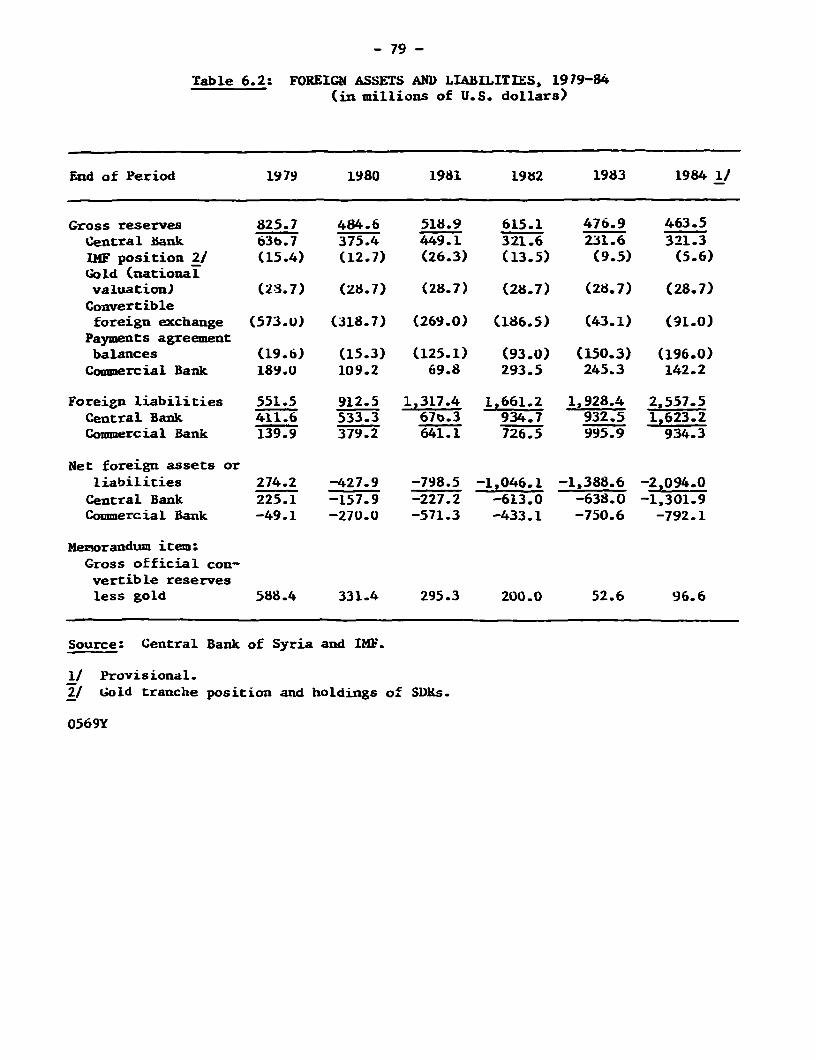
- 79 -
Table 6.2: FOREIGN ASSETS AND LIABILITIES, 1979-84(in millions of U.S. dollars)
End of Period 1979 1980 1981 1982 1983 1984 1/
Gross reserves 825.7 484.6 518.9 615.1 476.9 463.5Central bank 63b.7 375.4 449.L 321.6 231.6 321.3WF position 2/ (15.4) (12.7) (26.3) (13.5) (9.5) (5.6)
Gold (nationalvaluation) (28.7) (28.7) (28.7) (28.7) (28.7) (28.7)Convertibleforeign exchange (573.U) (318.7) (269.0) (186.5) (43.1) (91.0)
Payments agreementbalances (19.6) (15.3) (125.1) (93.0) (150.3) (196.0)Commercial Bank 189.0 109.2 69.8 293.5 245.3 142.2
Foreign liabilities 551.5 912.5 1,317.4 1,661.2 1,928.4 2,557.5Central Bank 411.6 533.3 67f.3 934.7 932.5 1,623.2Commercial Bank 139.9 379.2 641.1 726.5 995.9 934.3
Net foreign assets orliabilities 274.2 -427.9 -798.5 -1,046.1 -1,388.6 -2,094.0Central Bank 225.1 -157.9 -227.2 -613.0 -638.0 -1,301.9Commercial Bank -49.1 -270.0 -571.3 -433.1 -750.6 -792.1
Menorandum item:Gross official con-
vertible reservesless gold 588.4 331.4 295.3 200.0 52.6 96.6
Source: Central Bank of Syria and IMF.
1/ Provisional.2/ Gold tranche position and holdings of SDRs.
0569Y
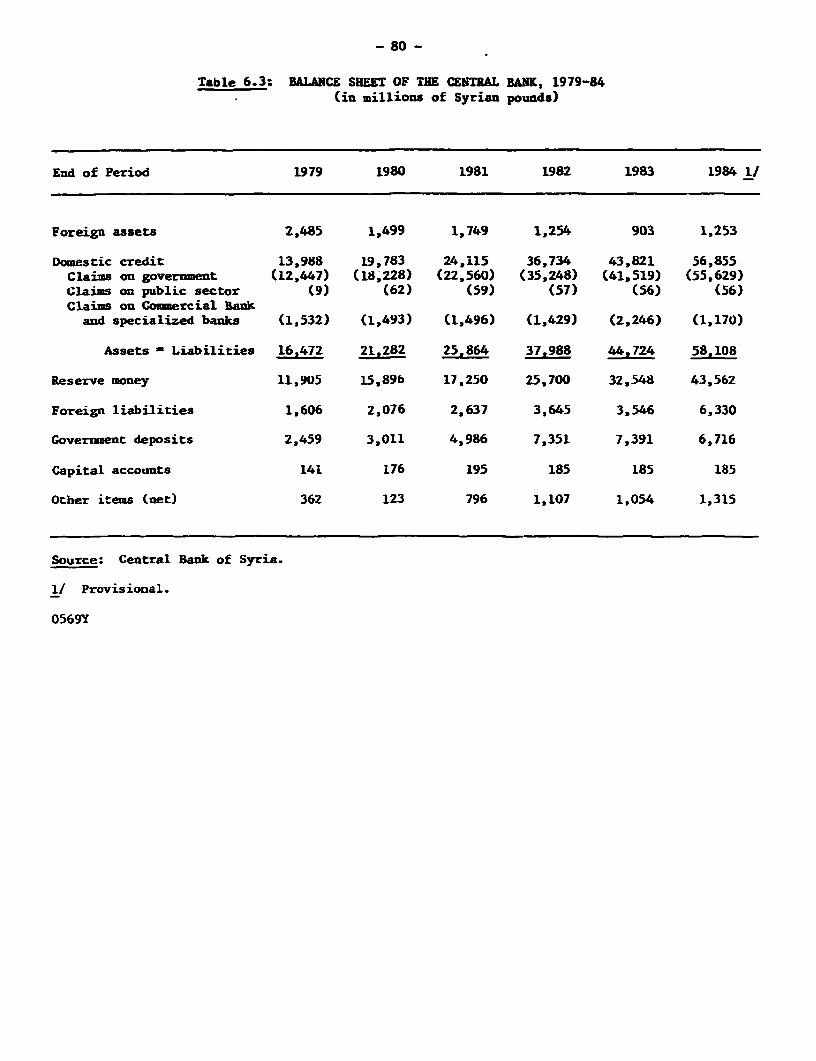
- 80 -
Table 6.3: BALANCE SHEET OF THE CENITRAL BANK, 1979-84(in millions of Syrian pounds)
End of Period 1979 1980 1981 1982 1983 1984 1/
Foreign assets 2,485 1,499 1,749 1,254 903 1,253
Domestic credit 13,988 19,783 24,115 36,734 43,821 56,855Claims on government (12,447) (18,228) (22,560) (35,248) (41,519) (55,629)Claims on public sector (9) (62) (59) (57) (56) (56)Claims on Comercial Bankand specialized banks (1.532) (1,493) (1,496) (1,429) (2,246) (1,170)
Assets - Liabilities 16,472 21,282 25,864 37,988 44,724 58,108
Reserve money 11,905 15,89b 17.250 25,700 32,548 43,562
Foreign liabilities 1,606 2,076 2,637 3,645 3.546 6,330
Government deposits 2,459 3,011 4,986 7,351 7,391 6,716
Capital accounts 141 176 195 185 185 185
Other items (net) 362 123 796 1,107 1,054 1,315
Source: Central Bank of Syria.
1/ Provisional.
0569Y
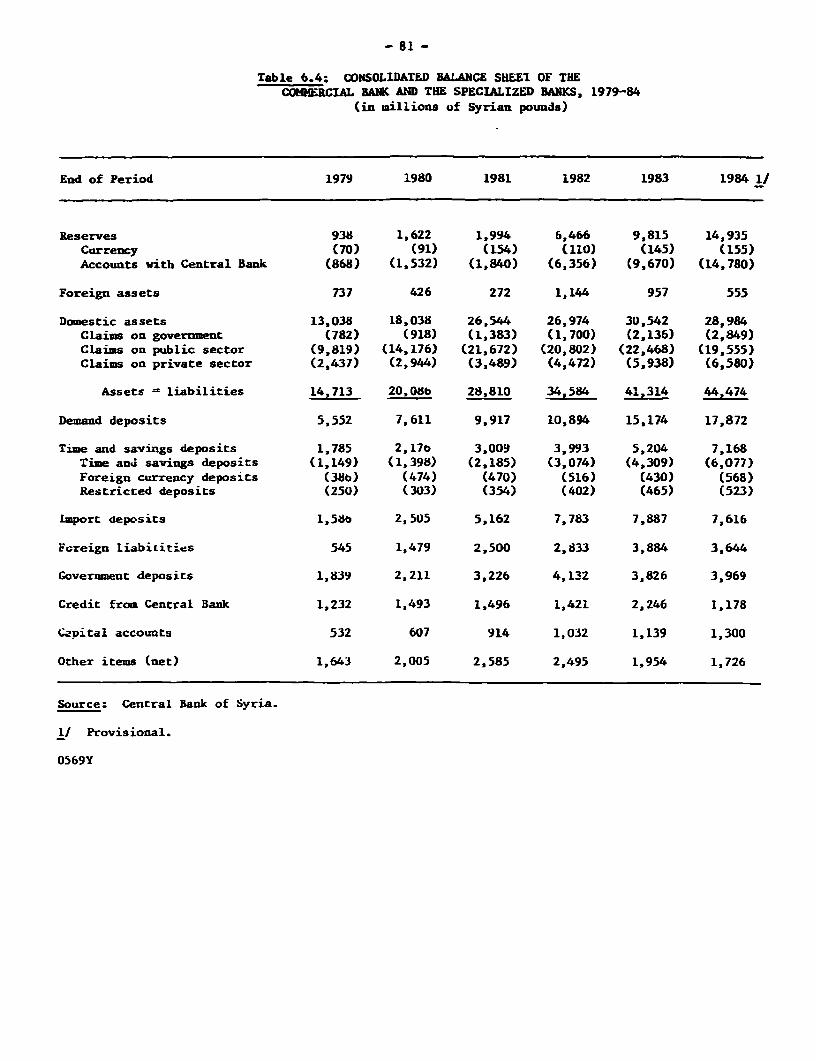
- 81 -
Table 6.4: CONSOLIDATED BALANCE SHEEl OF THECOlHERCIAL BANK AND THE SPECIALIZED BANXS, 1979-84
(in millions of Syrian pounds)
End of Period 1979 1980 1981 1982 1983 1984 1/
Reserves 938 1,622 1,994 6,466 9,815 14,935Currency (70) (91) (154) (110) (145) (155)Accounts with Central Bank (868) (1,532) (1,840) (6,356) (9,670) (14,780)
Foreign assets 737 426 272 1,144 957 555
Domestic assets 13,038 18,038 26,544 26,974 30,542 28,984Claims on government (782) (918) (1,383) (1,700) (2,136) (2,849)Claims on public sector (9,819) (14,176) (21,672) (20,802) (22,468) (19,555)Claims on private sector (2,437) (2,944) (3,489) (4,472) (5,938) (6,580)
Assets = liabilities 14,713 20,08b 28,810 34,584 41,314 44,474
Demand deposits 5,552 7,611 9,917 10,894 15,174 17,872
Time and savings deposits 1,785 2,17t 3,009 3,993 5,204 7,168Time an. savings deposits (1,149) (1,398) (2,185) (3,074) (4,309) (6,077)Foreign currency deposits 380t) (474) (470) (516) (430) (568)Restricted deposits (250) (303) (354) (402) (465) (523)
Import deposits 1,58b 2,505 5,162 7,783 7,887 7,616
Foreign IiabiLiti,es 545 1,479 2,500 2,833 3,884 3,644
Government deposits 1,839 2,211 3,226 4,132 3,826 3,969
Credit from Central Bank 1,232 1,493 1,496 1,421 2,246 1,178
Qvital accounts 532 607 914 1,032 1,139 1,300
Other items (net) 1,643 2,005 2,585 2,495 1,954 1,726
Source: Central Bank of Syria.
1/ Provisional.
0569Y
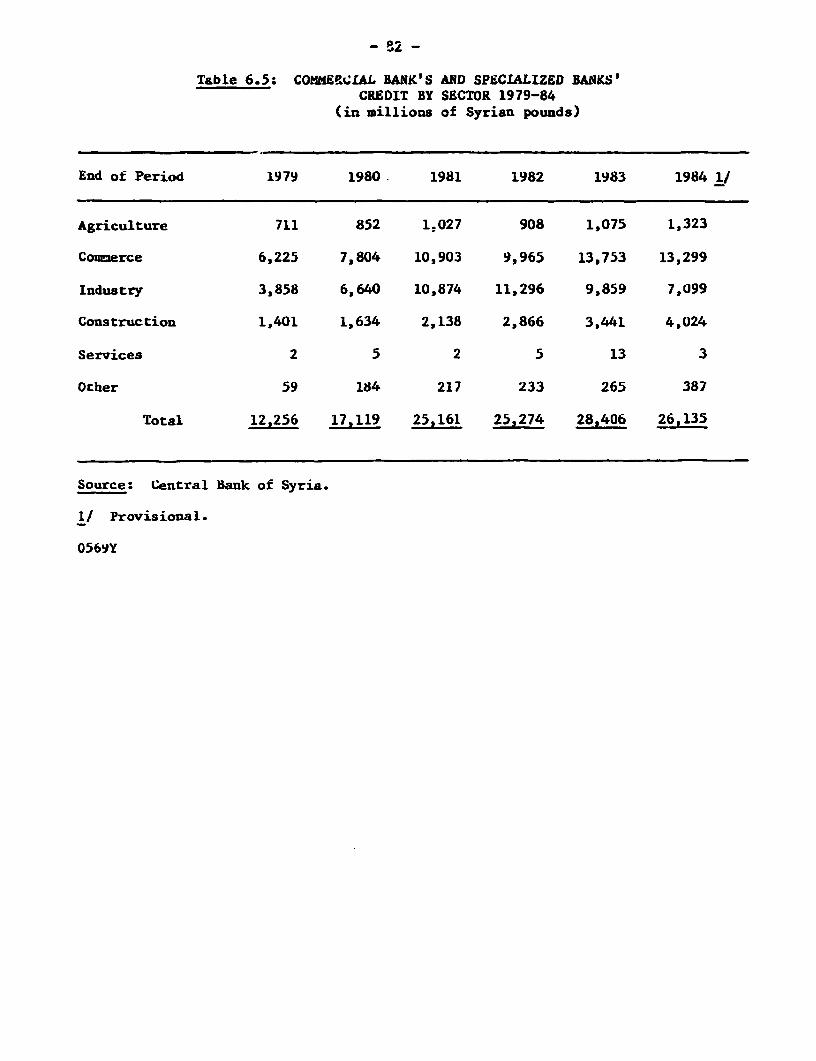
- P2 -
Table 6.5: COMNEP-LAL BANK'S AND SPECLALIZED BANKS'CREDIT BY SECTOR 1979-84
(in millions of Syrian pounds)
End of Period 1979 1980. 1981 1982 1983 1984 1/
Agriculture 711 852 1:027 908 1,075 1,323
Commerce 6,225 7,804 10,903 9,965 13,753 13,299
Industry 3,858 6,640 10,874 11,296 9,859 7,099
Construction 1,401 1,634 2,138 2,866 3,441 4,024
Services 2 5 2 5 13 3
Other 59 184 217 233 265 387
Total 12,256 17,119 25,161 25,274 28,406 26,135
Source: Central Bank of Syria.
1/ Provisional.
0569Y
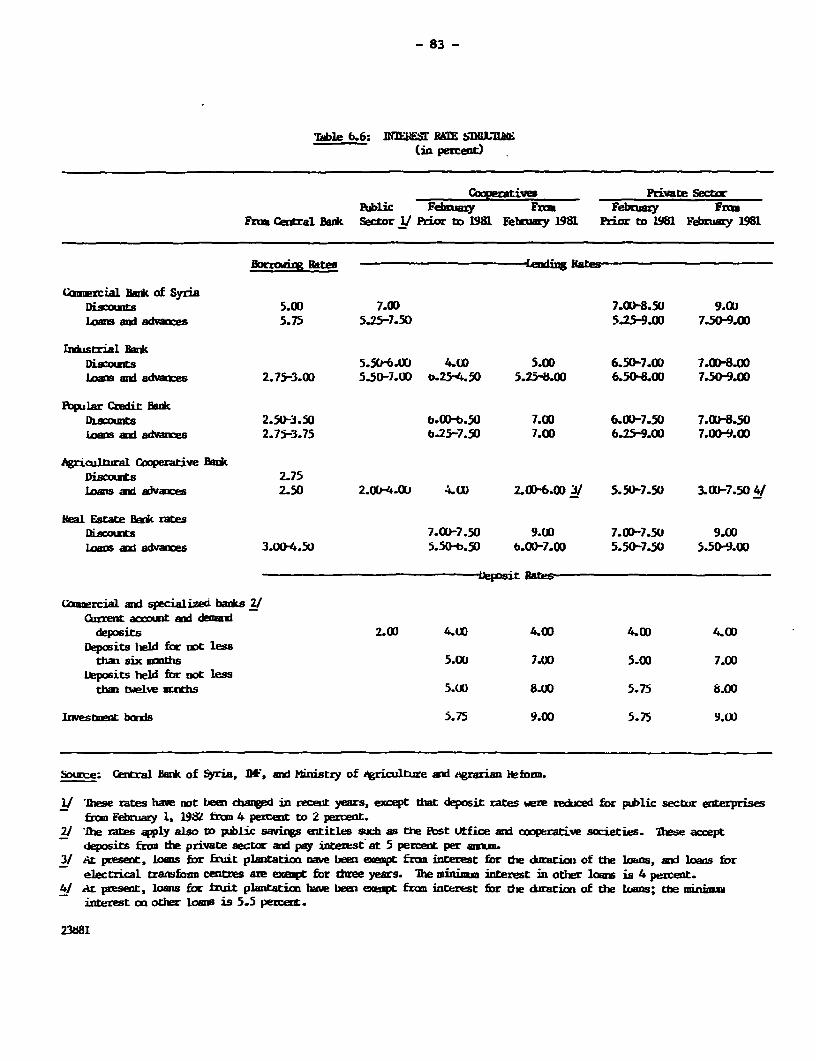
- 83 -
Table 6.6: INMEsr BE 5DMLLA(ia percent)
Cooperatives Private SectorPublic Februay From Febary Frma
Fun Cmara BErk 9ror I/ Prior to 1981 Febuary 1981 Pior to 81 Februy 1981
Bo,xvig Rates ren Kitgs
o.n:rcial Bark of SyriaDiscomts 5.00 7.00 7.00-8.50 9.0ULoans ans advaos 5.75 5.25-7.50 5.25-9.00 7.50-9.00
LUbjstr2al BancDiscourts 5.50-6.00 4.UO 5.00 6.50-7.o0 7.0D-8.00lAn and advances 2.75-3.0O 5.50-7.aO t.254.50 5.25'8.00 6.504.00 7.50-9.00
Popular Credit HankDiaounts 2.50-3.50 b.O0b.50 7.W 6.00-7.50 7.01)8.50ans ani advazEes 2.75-3.75 b.25-7.50 7.00 6.25-9.00 7.00-9.00
Agrioltural CoperatiLve BaRkDiscounts 2.75loans and Ivanes 2.50 2.W-4.0Li 4.W 2.0D-6.00 3/ 5.50-7.50 3.O-7.504/
Real Estate Beak ratesDiscounts 7.OD-7.50 9.00 7.OD-7.50 9.00lam an advaoes 3.004.50) 5.50-4,.50 6.00-7.W 5.50-7.50 5.50-9.0U
oepositR
Commercial ard specializai bar 2/Oarrent aco=mt and deaid
deposits 2.00 4.00 4.00 4.00 4.ODDeposits held for not less
that six mondts 5.00 7.U0 5.00 7.00Deposits held for not less
tham twelve urcnths 5.u0 8.00 5.75 s.00
Invesbw!nt barxs 5.75 9.00 5.75 9.00
Source: Central Bank of Syria, D*', aed 2inistry of igriculture ard i%rra 1ionnm.
1/ 'lhese rates have not been chardd in renet years, except that deposit rates we redwed for piblic sector enterprisesfrn February 1, 19& fra 4 peat to 2 percent.
2/ Ihe rates aqply also tD public saving entitles swLh as the Past Utfice an cooperative societies. These acceptdeposits fran the private sector and pay inten:st at 5 perent per a
3/ at present, Loans for frtit plartaticn na ve bew ampt fmn intrest f&r he duraticu of the loans, and loaw forelectrical transf centres are exipc fDr thre years. lhe _minima initrest in other loam is 4 percent.
4/ Ar present, loas for bruit pltation haen been eampt fran interest for the diratin of the I1iars; tne _interest an other loas is 5.5 percet.
2388I
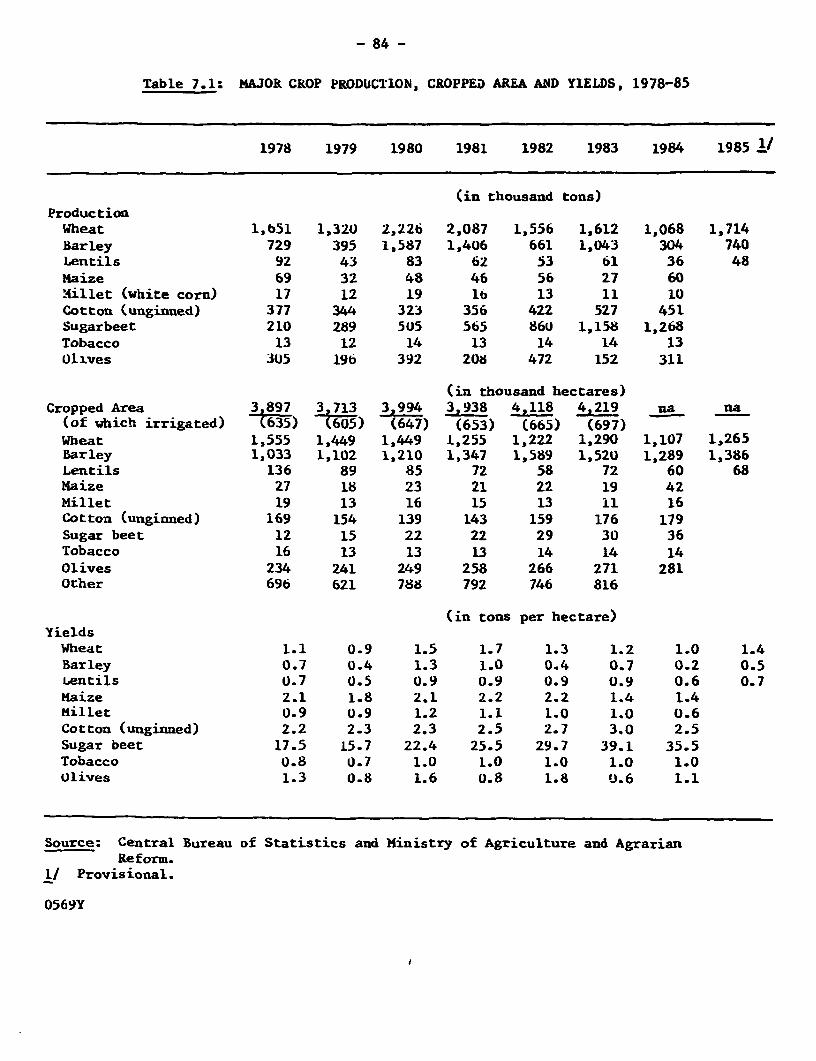
- 84 -
Table 7.1: MAJOR CROP PRODUCTION, CROPPED AREA AND YlELDS, 1978-85
1978 1979 1980 1981 1982 1983 1984 1985 11
(in thousand tons)ProductionWheat 1,b51 1,320 2,226 2,087 1,556 1,612 1,068 1,714Barley 729 395 1,587 1,406 661 1,043 304 740Lentils 92 43 83 62 53 61 36 48Maize 69 32 48 46 56 27 60'illet (white corn) 17 12 19 lb 13 11 10Cotton (unginned) 377 344 323 356 422 527 451Sugarbeet 210 289 505 565 860 1,158 1,268Tobacco 13 12 14 13 14 14 13Olives 305 196 392 208 472 152 311
(in thousand hectares)Cropped Area 3 897 3 713 3,994 3,938 4,118 4,219 ua na(of which irrigated) (635) (605) (647) (653) (665) (697) -
Wheat 1,555 1,449 1,449 1,255 1,222 1,290 1,107 1,265Barley 1,033 1,102 1,210 1,347 1,589 1,520 1,289 1,386Lentils 136 89 85 72 58 72 60 68Maize 27 18 23 21 22 19 42Millet 19 13 16 15 13 11 16Cotton (unginned) 169 154 139 143 159 176 179Sugar beet 12 15 22 22 29 30 36Tobacco 16 13 13 13 14 14 14Olives 234 241 249 258 266 271 281Other 696 621 788 792 746 816
(in tons per hectare)YieldsWheat 1.1 0.9 1.5 1.7 1.3 1.2 1.0 1.4Barley 0.7 0.4 1.3 1.0 0.4 0.7 0.2 0.5Lentils 0.7 0.5 0.9 0.9 0.9 0.9 0.6 0.7Maize 2.1 1.8 2.1 2.2 2.2 1.4 1.4Millet 0.9 0.9 1.2 1.1 1.0 1.0 0.6Cotton (unginned) 2.2 2.3 2.3 2.5 2.7 3.0 2.5Sugar beet 17.5 15.7 22.4 25.5 29.7 39.1 35.5Tobacco 0.8 0.7 1.0 1.0 1.0 1.0 1.0Olives 1.3 0.8 1.6 0.8 1.8 r.6 1.1
Source: Central Bureau of Statistics and Ministry of Agriculture and AgrarianReform.
11 Provisional.
0569Y
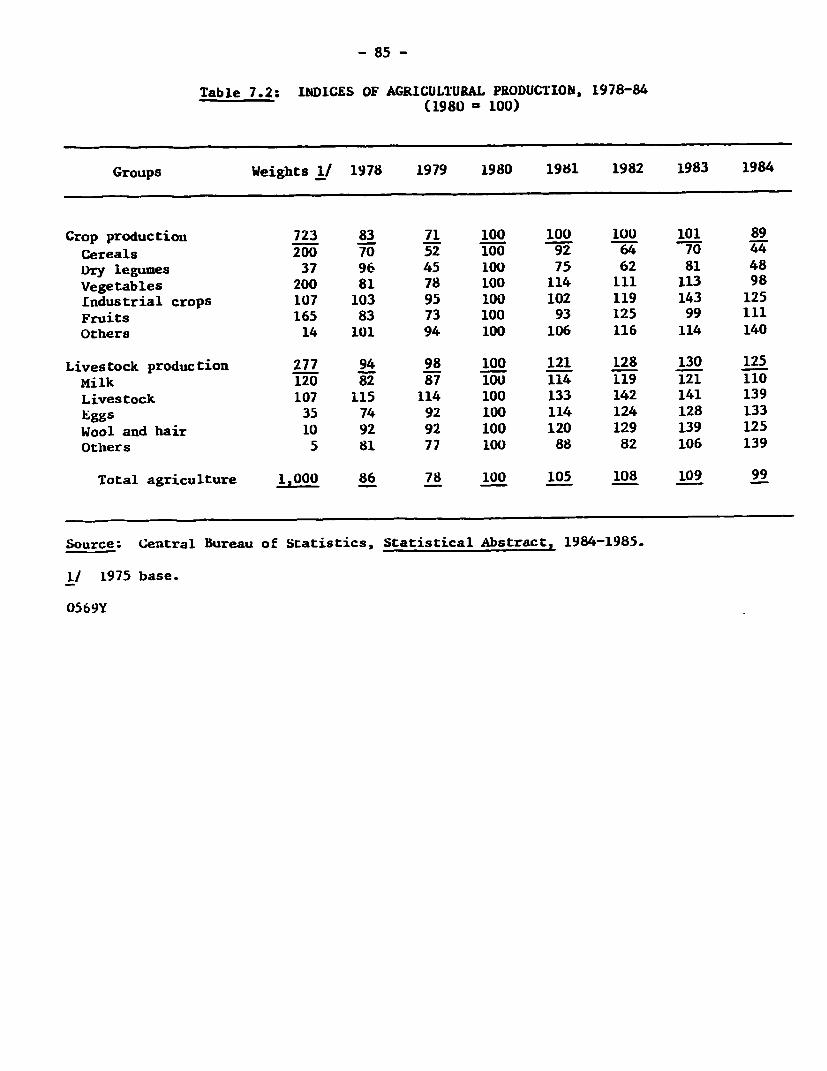
- 85 -
Table 7.2: IMDIC(ES OF AGRICULTURAL PRODUCTION, 1978-84(1980 = 100)
Groups Weights 1/ 1978 1979 1980 1981 1982 1983 1984
Crop productiou 723 83 71 100 100 lUO 101 89Cereals 200 70 52 100 92 64 70 44Dry legumes 37 96 45 100 75 62 81 48Vegetables 200 81 78 100 114 111 113 98Industrial crops 107 103 95 100 102 119 143 125Fruits 165 83 73 100 93 125 99 111Others 14 101 94 100 106 116 114 140
Livestock production 277 94 98 100 121 128 130 125Milk 120 82 87 100 114 119 121 110Livestock 107 115 114 100 133 142 141 139Eggs 35 74 92 100 114 124 128 133Wool and hair 10 92 92 100 120 129 139 125Others 5 81 77 100 88 82 106 139
Total agriculture 1,000 86 78 100 105 108 109 99
Source: Central Bureau of Statistics, Statistical Abstract, 1984-1985.
I/ 1975 base.
0569Y
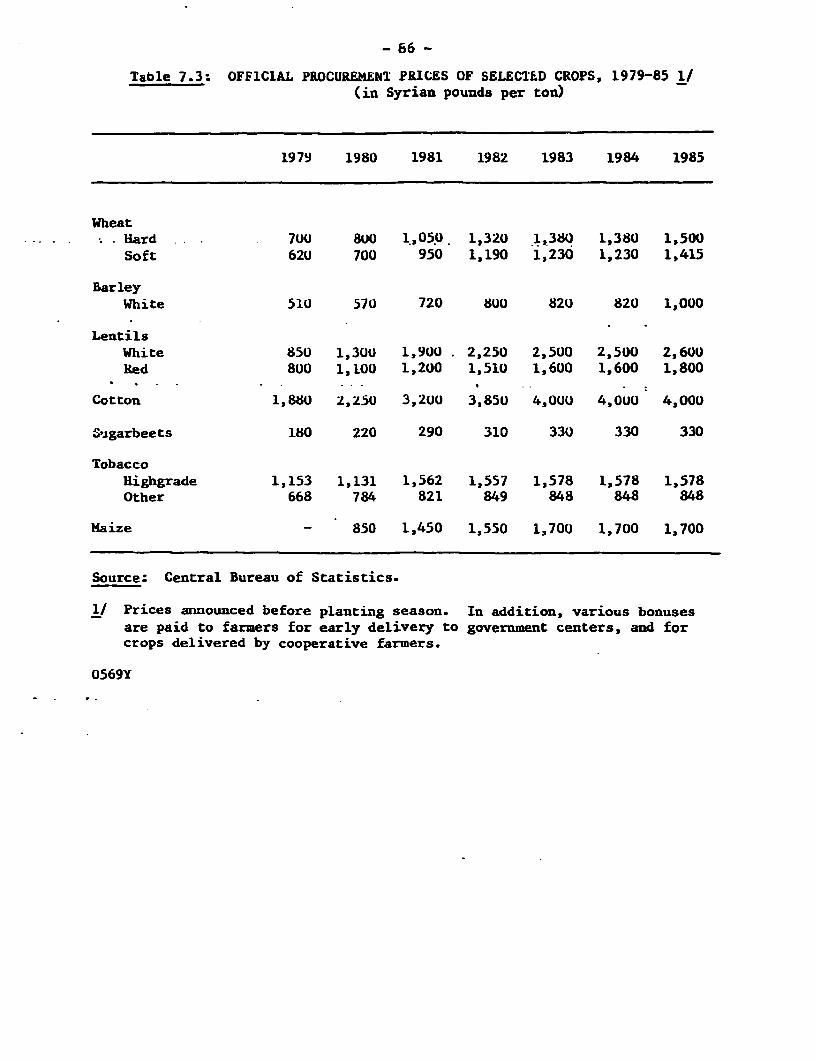
- 86 -
Table 7.3: OFFIC1AL PROCUREMENT PRICES OF SELECTED CROPS, 1979-85 1/(in Syrian pounds per ton)
1979 1980 1981 1982 1983 1984 1985
WheatHard 700W 8U0 ,05.0 1,320 1,380 1,380 1,500Soft 620 700 950 1,190 1,230 1,230 1,415
BarleyWhite 510 570 720 800 820 820 1,000
LentilsWhite 850 1,300 1,900 2,250 2,500 2,500 2,600Red 8U0 1,100 1,200 1,510 1,600 1,600 1,800
Cotton 1,880 2,250 3,200 3,850 4,000 4,0UO 4,000
Suigarbeets 180 220 290 310 330 330 330
Tobacco
Highgrade 1,153 1,131 1,562 1,557 1,578 1,578 1,578Other 668 784 821 849 848 848 848
Maize - 850 1,450 1,550 1,700 1,700 1,700
Source: Central Bureau of Statistics.
1/ Prices announced before planting season. In addition, various bonusesare paid to farmers for early delivery to government centers, and forcrops delivered by cooperative farmers.
0569Y
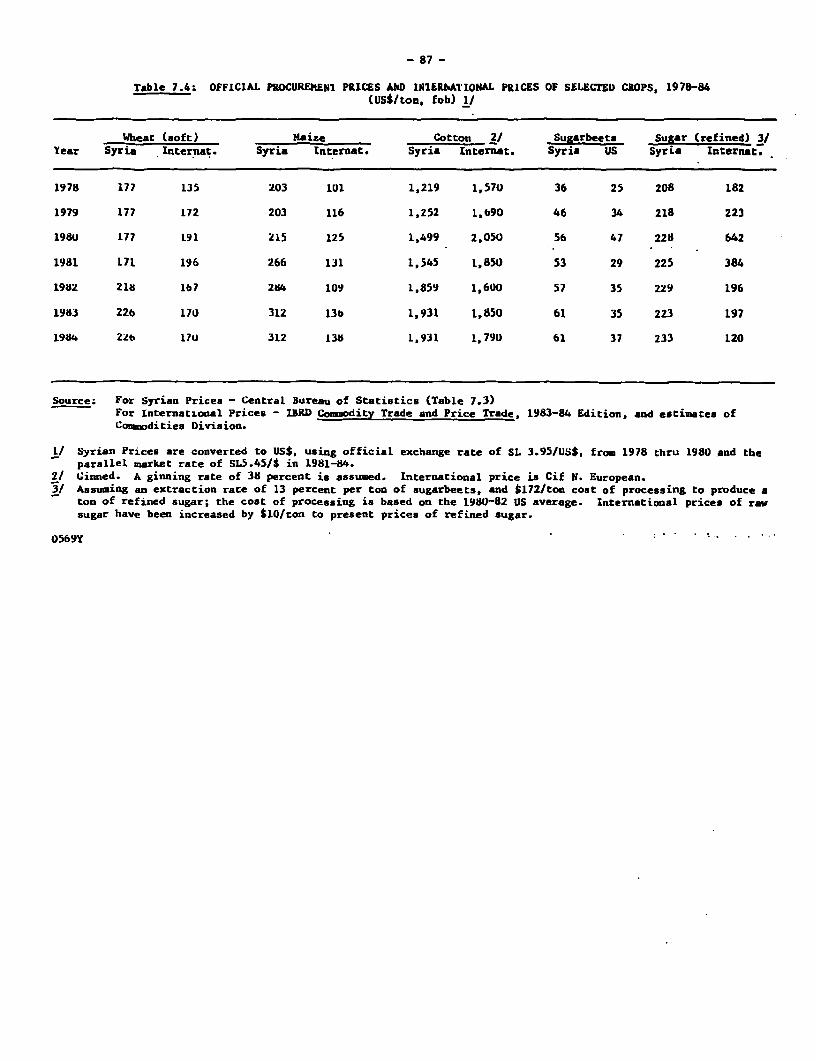
- 87 -
Table 7.4. OFFICIAL PROCUREIENI PRICES AhD INILRfATIONAL PRICES OF SELECTED CROPS, 1978-84(USS/ton, fob) 11
Wheat (soft) Maize Cotton 2/ Sugarbeets Sugar (refined) 3/Year Syria Internat. Syria Internat. Syria Incernat. Syria US Syria Internat.
1978 177 135 203 101 1,219 1,570 36 25 208 182
1979 177 172 203 116 1,252 1,b90 46 34 218 223
1980 177 191 215 125 1,499 2,050 56 47 228 642
1981 171 196 266 131 1,545 1,850 53 29 225 384
1982 218 167 284 109 1,859 1,600 57 35 229 196
1983 226 170 312 13o 1,931 1,850 61 35 223 197
1984 22t 17U 312 138 1,931 1,790 61 37 233 120
Source. For Syrian Prices - Central Bureau of Statistics (Table 7.3)For International Prices - IBRD Cosodity Trade and Price Trade, 1983-84 Edition, and estimates ofConjwdities Division.
Li Syrian Prices are converted to US$, using official exchange rate of SL 3.95/USS, from 1978 thru 1980 and theparallel market rate of SL5.45/t in 1981-84.
2/ Ginned. A ginning rate of 38 percent ia assumed. International price is Cif N. European.3/ Assuming an extraction rate of 13 percent per ton of sugarbeets, and $172/ton cost of processing to produce a
ton of refined sugar; the cost of processing is based on the 1980-82 US average. International prices of rawsugar have been increased by $lo/ton to present prices of refined sugar.
0569Y
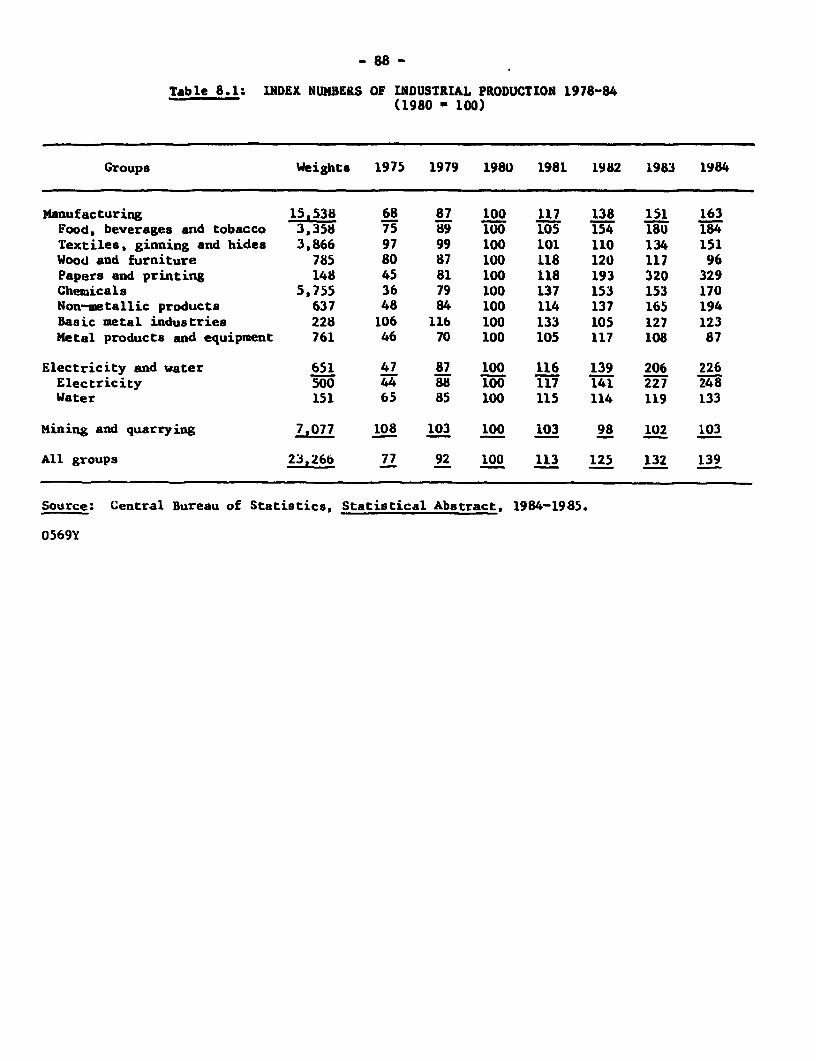
- 88 -
Table 8.1: INDEX NUMBERS OF INDUSTRIAL PRODUCTION 1978-84(1980 - 100)
Groups Weights 1975 1979 1980 1981 1982 1983 1984
Manufacturing 15,538 68 87 100 117 138 151 163Food, beverages and tobacco 3,358 75 89 100 105 154 180 184Textiles, ginning and hides 3,866 97 99 100 101 110 134 151Wood and furniture 785 80 87 100 118 120 117 96Papers and printing 148 45 81 100 118 193 320 329Chemicals 5,755 36 79 100 137 153 153 170Non-metallic products 637 48 84 100 114 137 165 194Basic metal industries 228 106 llb 100 133 105 127 123Metal products and equipment 761 46 70 100 105 117 108 87
Electricity and water 651 47 87 100 116 139 206 226Electricity 500 44 88 100 117 141 227 248Water 151 65 85 100 115 114 119 133
Mining and quarrying 7,077 108 103 100 103 98 102 103
All groups 23,266 77 92 100 113 125 132 139
Source: Central Bureau of Statistics, Statistical Abstract, 1984-1985.
0569Y
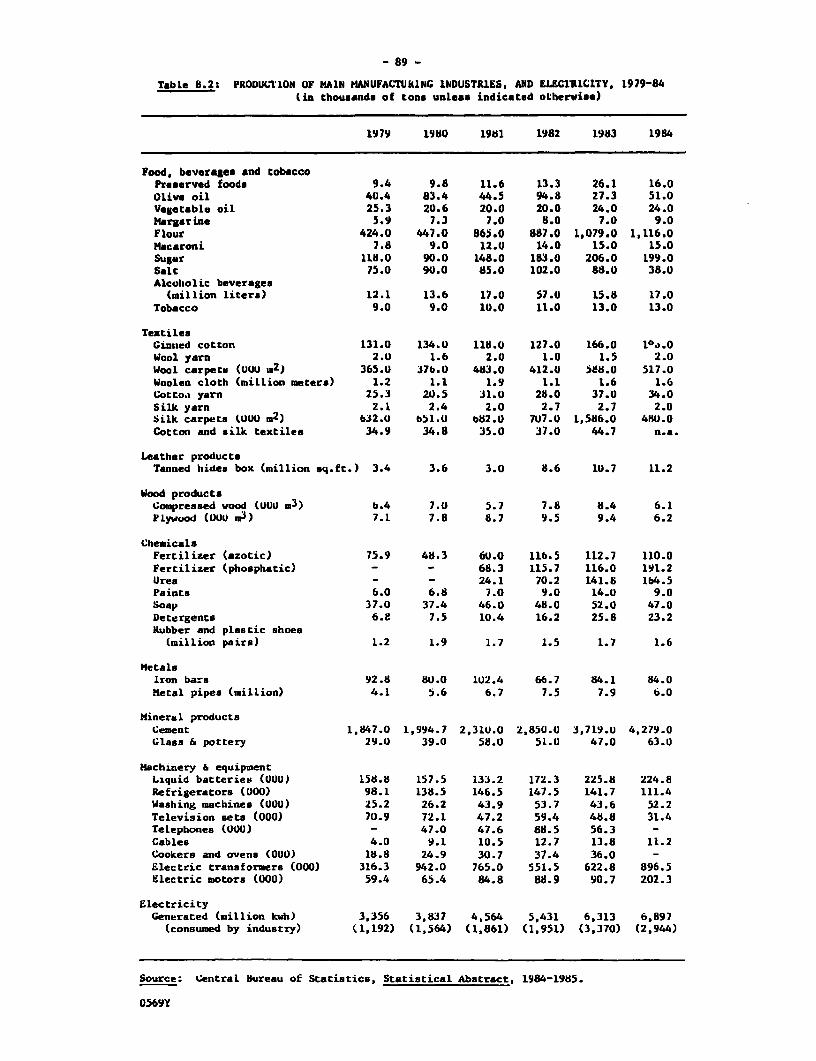
- 89 -
Table 8.2: PRODUCTION OF MAlN MANUFACTIURING INDUSTRIES, AMD ELECTRICITY, 1979-84(in thousands of tons unless indicated otherwise)
1979 1980 1981 1982 1983 1984
Food, beverages and tobaccoPreserved foods 9.4 9.8 11.6 13.3 26.1 16.0Olive oil 40.4 83.4 44.5 94.8 27.3 51.0Vegetable oil 25.3 20.6 20.0 20.0 24.0 24.0Margarine 5.9 7.3 7.0 8.0 7.0 9.0Flour 424.0 447.0 865.0 887.0 1,079.0 1,116.0Macaroni 7.8 9.0 12.0 14.0 15.0 15.0Sugar 118.0 90.0 148.0 183.0 206.0 199.0Salt 75.0 90.0 85.0 102.0 88.0 38.0Alcobolic beverages
(million liters) 12.1 13.6 17.0 57.0 15.8 17.0Tobacco 9.0 9.0 10.0 11.0 13.0 13.0
TextilesGinned cotton 131.0 134.0 118.0 127.0 166.0 100.0Wool yarn 2.0 1.6 2.0 1.0 1.5 2.0Wool carpets (UOU n2) 365.0 37b.0 483.0 412.0 5!88.0 517.0Woolen cloth (million meters) 1.2 1.1 1.9 1.1 1.6 1.6Cotto.a yarn 25.3 20.5 31.0 28.0 37.0 34.0Silk yarn 2.1 2.4 2.0 2.7 2.7 2.0Silk carpets (0OU m 2) 632.0 651.0 Off2.0 707.0 1,586.0 4AU.0Cotton and silk textiles 34.9 34.8 35.0 37.0 44.7 n.a.
Leather productsTanned hides box (million sq.ft.) 3.4 3.6 3.0 8.6 1U.7 11.2
Wood productsCompressed wood (UU0 m3) b.4 7.U 5.7 7.8 8.4 6.1Plywood (000 m3 ) 7.1 7.8 8.7 9.5 9.4 6.2
ChemicalsFertilizer (azotic) 75.9 48.3 60.0 116.5 112.7 110.0Fertilizer (phosphatic) - - 68.3 115.7 116.0 191.2Urea - - 24.1 70.2 141.S lb4.5Paints 6.0 6.8 7.0 9.0 14.0 9.0Soap 37.0 37.4 46.0 48.0 52.0 47.0Detergents 6.8 7.5 10.4 16.2 25.8 23.2Rubber and plastic shoes
(million pairs) 1.2 1.9 1.7 1.5 1.7 1.6
MetalsIron bars 92.8 80.0 102.4 66.7 84.1 84.0Metal pipes (million) 4.1 5.6 6.7 7.5 7.9 6.0
Mineral productsCement 1,847.0 1,994.7 2,310.0 2,850.U 3,719.U 4,279.0Glass & pottery 29.0 39.0 58.0 51.a 47.0 63.U
Machinery & equipmentLiquid batteries (000) 158.8 157.5 133.2 172.3 225.8 224.8Refrigerators (000) 98.1 138.5 146.5 147.5 141.7 111.4Washing macihines (000) 25.2 26.2 43.9 53.7 43.6 52.2Television sets (000) 70.9 72.1 47.2 59.4 48.8 31.4Telephones (000) - 47.0 47.6 88.5 56.3 -Cables 4.0 9.1 10.5 12.7 13.8 11.2Cookers and ovens (000) 18.8 24.9 30.7 37.4 36.0 -Electric transformers (000) 316.3 942.0 765.0 551.5 622.8 896.5Electric motors (000) 59.4 65.4 84.8 88.9 90.7 202.3
ElectricityGenerated (million kwh) 3,356 3,837 4,564 5,431 6,313 6,897
(consumed by industry) (1,192) (1,564) (1,861) (1,951) (3,370) (2,944)
Source: Central Bureau of Statistics, Statistical Abstract, 1984-1985.
0569Y
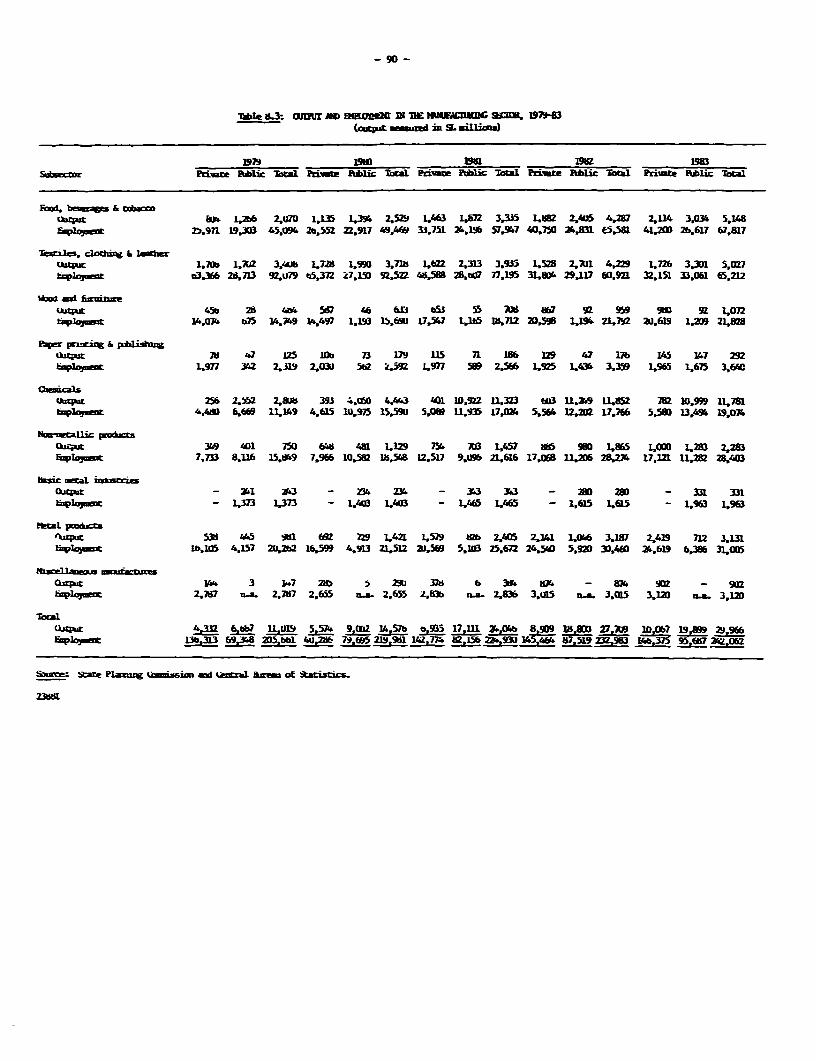
- 90 -
Mible &3. OUnUlr AI JMOO N 'DE PPFCU SW= 1971Fll- (sM.ep.t _tsed in5L milli
1979 ISQ "a 2a 08Prvt abcTtl Pdiaf Pabic E; -W privat -A)i Prim euLs Tana Privt PubLicoa
FoA bevzls &wrp~~~~~8 &P .2bb 2.7 . 1_1 . tS L.463 L.b 3-U L.W 2, 4.287 2.L4 3s0r S.4
EIJK 25.9n 19.303 4509. 2b.55t 2Z.917 49,Ui9 33.75L X. M 57.7 0.75 X.831 6& 41,2 2.617 67,87
Texls 1- Cloti4 1 t4kt. 1.70D L,X2 3.4 1,72 490 3.71 LbU 2313 3.935 L.SN 2701 4.29 .726 3.M 5.027
t:ploye n3.366 28B.713 9WU79 t6,32 27,IM 925 4Sff 28.0 77.U5 3L.W 29.WI W.92 32.L5 33.06 6521
Wodadhsmw
U.Cp 45~~ib 29 X4b 56 46 66 5 55 7*1 OV 92 95 gm 9L17topki- 14.074 o75 14.749 14.497 IIW 15.6 LUS% L.165 M71 204 lL9f 2792 20,6W19 JW
P-V eC- & bsuq.puc 78 47 IZ5 ub 73 17 IL 71 b 12 47 17 145 147 29hwici- 1.977 362 2.319 2.03U W6 925 1,977 589 2.566 1.925 14346 3.359 1.96 1.675 3.64
chmcl
ck.CP.t~~~~zi 2.56 252 2,& 39 4O 4.43 40 10.9U2 1323 W3 U.X9 Ud5 78 1.999 U,78wljt 4.4dO 6.669 11.49 4.61 K.975 15.5 5.OW Ll.! 17.O 5.564 1= 17.766 55 13.494 19.07*
No;ecaic p&tsl- NO9 41 750 648 4M 1.2 7% Rs 1,57 M6 L9S L.6 IM 423 223BPO-kay 7.733 S.Ufi 15.849 7.9E6 10.5 b,SW 12,57 9.L M,616 17,08JM V .m n .2z 21.S ^Z
B:asi 5 ir'ufre
n'.c. - 3r1 263 - a4& 236 - 3t4 363 - 2ao 2 - 3A 33: ,,yum - u73 1.373 - 14W9 1.43 - 1.46 L."6 - 1,615 LG15 - 1.9S3 L.9E3
.M1m pmw
' S31 $ 445 91s16 7f29 1 421 L.579 t2b .45 2.141 LO 3.187 2.419 712 3.13;wlIyct I b.105 4,157 2U,2b2 W-M 4,93 ZL.51 2.569 5.1 25,672 26.5 5,92 D40 X .619 6,M6 31.oo
e,.., k4 4 3 IP7 2th 29u 376 b 3w W4 - 4 - 902ECioy- 2.tW na. 2.787 2,655 a 2,%5 Z.3b n. 7, 3.uJ5 a..3.M5 3,1M 3.120
TOCNss,2.. s4 3Z6.b 11 U19 5,574 9,a Ob57 ,93 1,7,11b 8.0 Z 7.U9 9 06 989 29 966
FAIJn c Lb3 69%S8 205,bbl 4U,286 79.e95 219.% 4, 774 W.1 Ob.9 1R g75982Z3 1'b,375 '956W7 2-4,s202
so:ze Xcare Ps;lam tammmad X=enlsma cot *Ast2rr
237
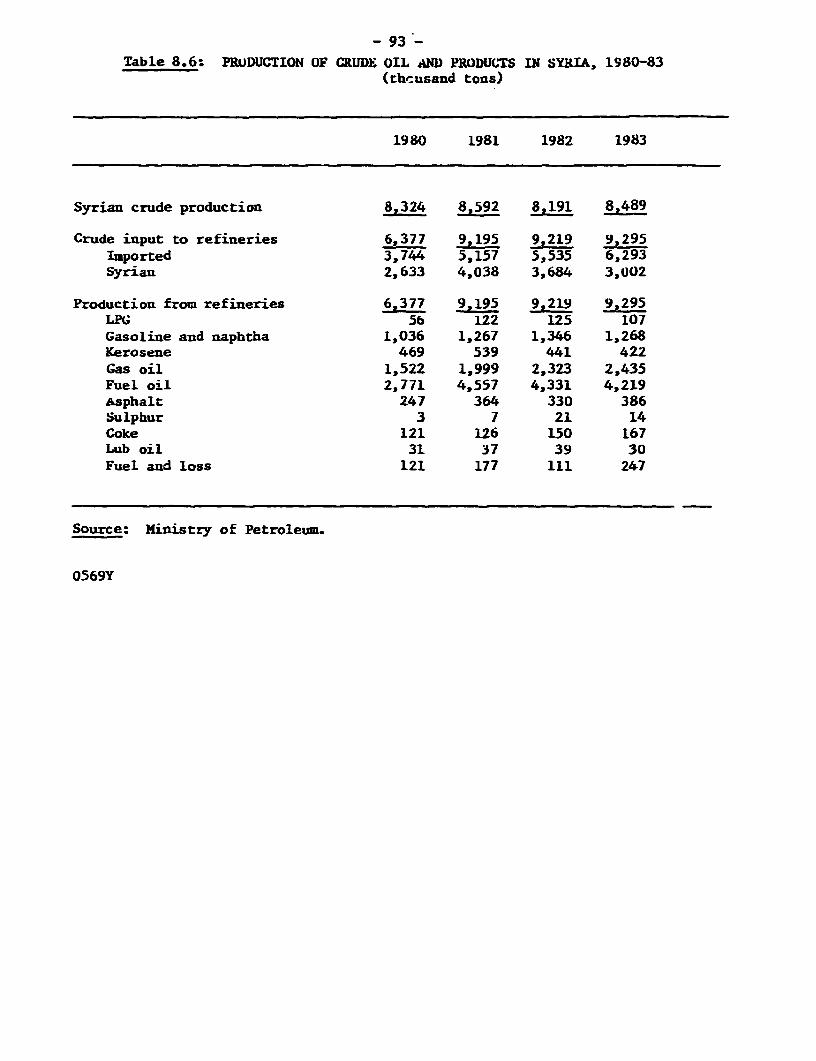
- 93-
Table 8.6: PRUDUCTION OF CRUDE OIL AND PRODUCTS IN SYRIA, 1980-83(th'usand tons)
1980 1981 1982 1983
Syrian crude production 8,324 8,592 8,191 8,489
Crude input to refineries 6,377 9,195 9,219 9,295Imported 3,744 5,157 5,535 6,293Syrian 2,633 4,038 3,684 3,002
Production from refineries 6,377 9,195 9,219 9,295LPG 56 122 125 107Gasoline and naphtha 1,036 1,267 1,346 1,268Kerosene 469 539 441 422Gas oil 1,522 1,999 2,323 2,435Fuel oil 2,771 4,557 4,331 4,219Asphalt 247 364 330 386Sulphur 3 7 21 14Coke 121 126 150 167Lub oil 31 37 39 30Fuel and loss 121 177 111 247
Source: Ministry of Petroleum.
0569Y
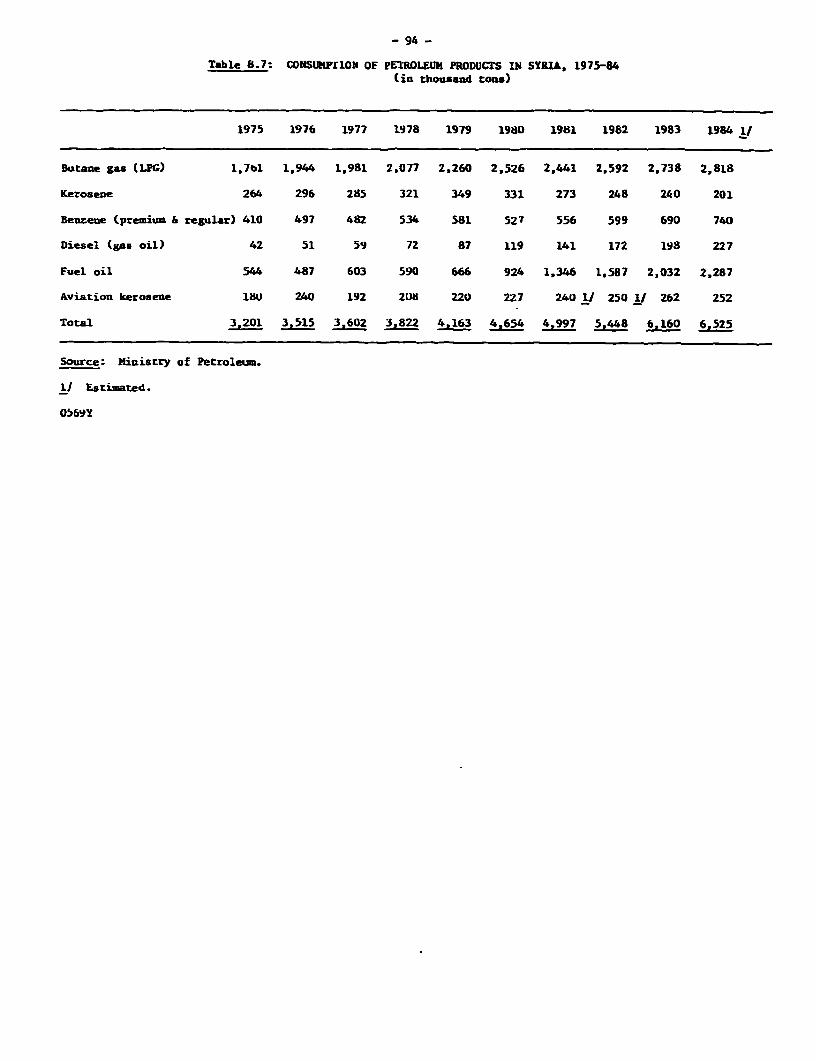
- 94 -
Table 8.7: CONSUNWrlOIN OF PETROLEUM PRODUCTS IN SYRIA, 1975-84(in thousand tons)
1975 1976 1977 1978 1979 1980 1981 1982 1983 1984 I/
Butane gas (LPG) 1,761 1,944 1,981 2.077 2,260 2,526 2,441 2.592 2,738 2,818
Kerosene 264 296 285 321 349 331 273 248 240 201
Benzene (premium & regular) 410 497 482 534 581 527 556 599 690 740
Diesel (gas oil) 42 51 59 72 87 119 141 172 198 227
Fuel oil 544 487 603 590 666 924 1.346 1,587 2,032 2,287
Aviation kerosene 1W 240 192 208 220 227 240 1, 250 1/ 2b2 252
Total 3,201 3,515 3,602 3.822 4.163 4,654 4,997 5,448 6.160 6,525
Source: Ministry of Petroleum.
11 Estimated.
0569Y
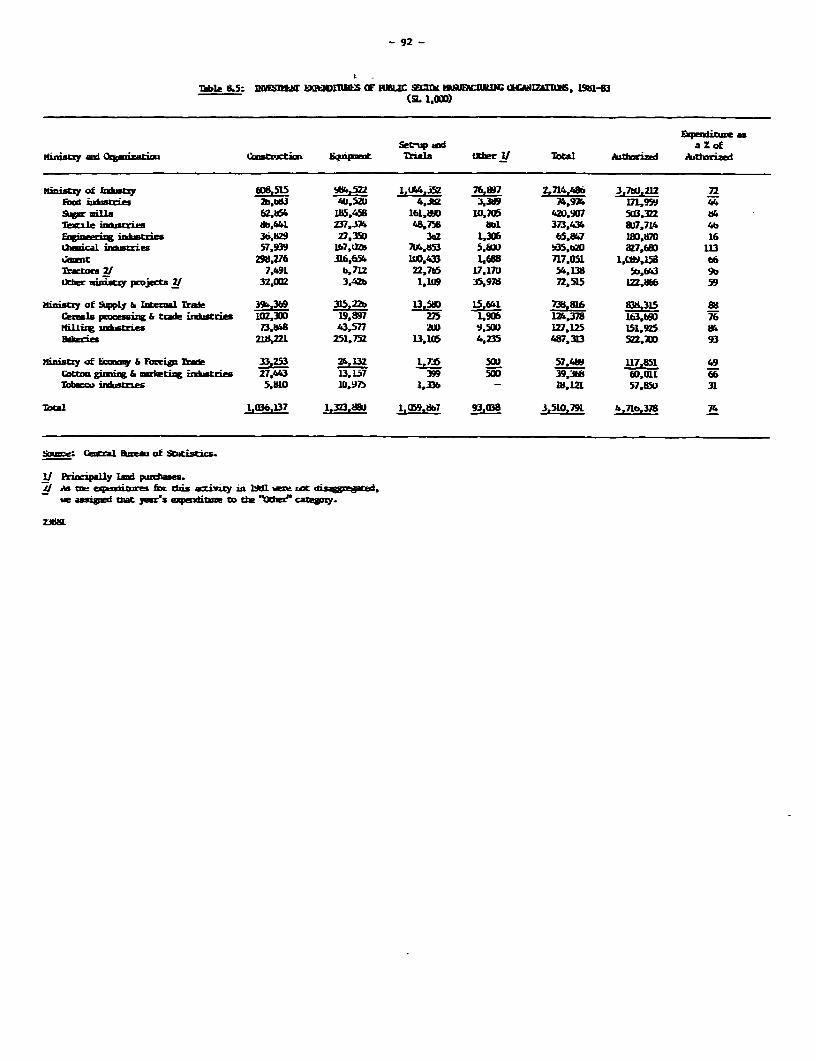
- 92 -
ibl e.: h.M tlll WEXRAM3 OF REI SU& MWMi)k GhIZA3tE, 1951-83(SL 1,000)
SecWp I a Z ofinis-7 -d OgAzatiotsfm i.m Wa1Mt C riala Iti3r I/ Total Atomized A riaed
oinistz Of hastzy 608,515 95,-522 1,U.4.352 76_837 2,714.486 3,7tO, 72Food ir a 2b.bS3 40,520 4,JI 3,39 74,974 171,5 44SWr uills 62,b% 185,458 161.W110 10,705 420,907 503,322 wiexle i -uxwa 8b,441 27,J74 48,758 4bl 373,43. OU7,714 4b
Enginarixz i*AhstXics 36,829 27.350 3ta 1,306 65,87 18.870 16Lbabcal 57,939 Ib7,U 7W4.853 5.80 !'35,bM a27,60b 113coagmt 298,276 316,654 1 ,433 1L688 717.051 1,tW5 661TraWr 2/ 7,491 b,71Z 22,7bS 17.17U 54,138 5b.13 9ttkhr inmtzy p.jects 32.COM 3,42b 1,109 35,97d 72.515 1866 59
HinisCy of SW1y & bT 1 Tiae 3%,369 315,b 13,58D 561 3,16 ,315 8sc*zms ing & bade irth ies m300 19,897 275 1,9016 12,378 163.690 76KiLLixg uxb5res 73,586 43,577 ;li 9,500) 127,125 151,925 84Bdv!ries 218.221 251,752 13,105 4,235 487,313 522.,X 93
ainistcy aof 1cmca & FoeeMp M 33,Z53 2,I2 5 500 57.48 U7,851 49(Ettz gimmd & _tis inrg ;r ff ri Z7,443 13,157 399 0,3b 60,01 6
imhIes 5.810 10,975 1,33b - ,121 57,85U 31
Tota 1,M6.137 1,323.88U 1,C59,8b7 93.M8 3,510,791 4.,71,378 74
_, : Cnal &bzeal of Statistics.
If Prtipei1y mu pubhaies.A s M!Op eailizss foe hs ativity in 1981 i.m zWt duagp¶ebated.we assig--d tht y expend ium t ch- -btkmez" cazegoy.
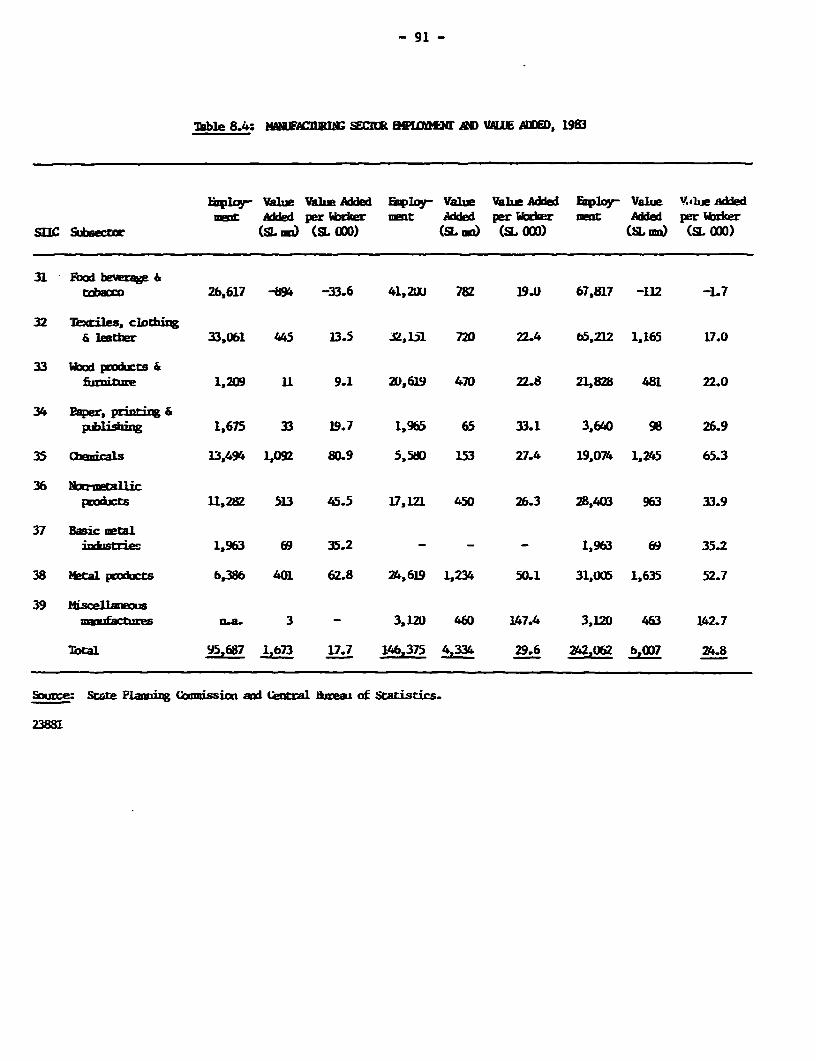
- 91 -
Mible 8.4: MMIACDRItI I 3ISWfl*21 AM VAW2 AIWD, 1983
ipkia- Valb Vahlt Added ploy- Valz Vah Added Employ- Value v,.e Addedtamw Aided per W=ker .t Added per Woer nmt Added per 1ker
srYc Sm6e (SL W) (L 000) (Sl M) (S. 000) (SL i (SL 0lO)
31 Food bev etdac 26,617 -494 -33.6 41, 20U 782 19.0 67,817 -112 -1.7
32 Textiles, cloctirg6 leather 33,061 445 13.5 2,1il 720 22.4 65,212 1,165 17.0
33 Wod pLIoduts &fu=riture 1,209 11 9.1 2D,619 470 22.8 21,828 481 22.0
34 Par, pCintiig Spublihsbi 1,675 33 19.7 1,9b5 65 33.1 3,640 98 26.9
35 Cheuicals 13,494 1,092 80.9 5.580 153 27.4 19,074 1,245 65.3
products 11,282 513 45.5 17,121 450 26.3 28,403 963 33.9
37 Basic metalinduscrdec 1,963 69 35.2 - - - 1,963 69 35.2
38 Metal products b,386 401 62.8 24,619 1,234 50.1 31,005 1,635 52.7
39 Hiscellaeom
aumifactures n.a. 3 - 3.12U 460 147.4 3,120 463 142.7
Total 95,687 1.673 17.7 146,375 4,334 29.6 242,062 b,007 24.8
Soure: Se P1aug r<ccssici ani uentral meaw of Sratisri.
23881
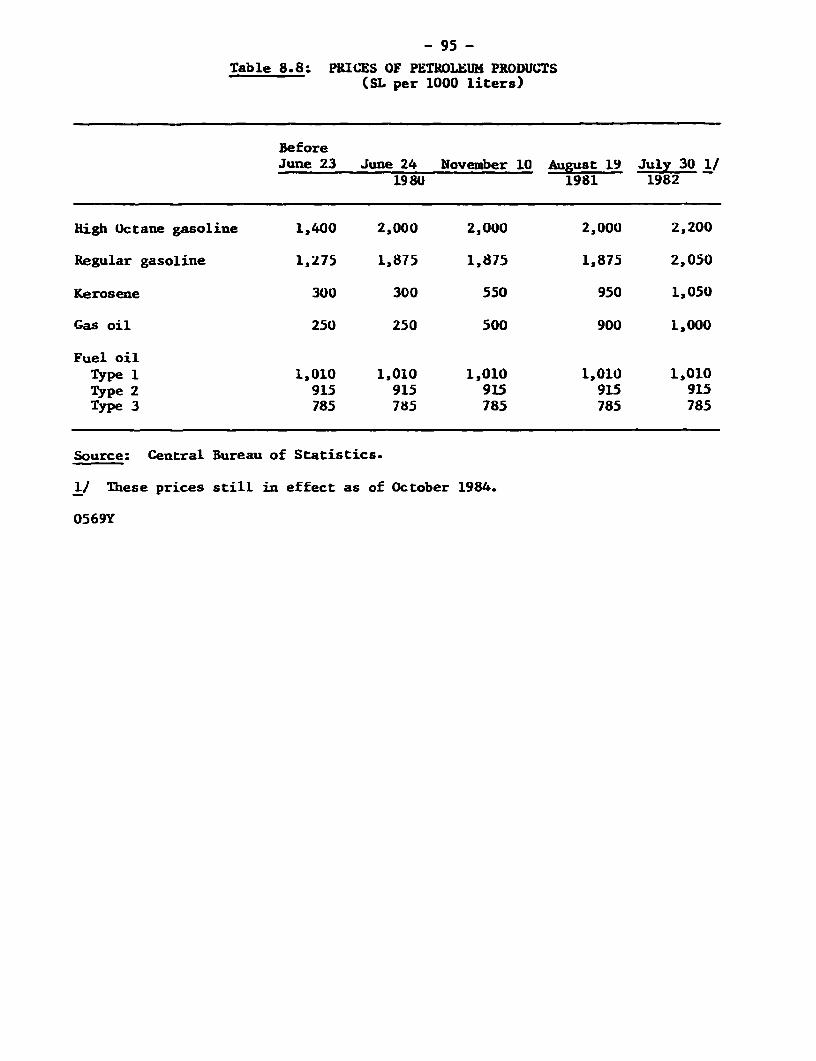
- 95 -
Table 8.8: PRICES OF PETROLEUM PRODUCTS(SL per 1000 liters)
BeforeJune 23 June 24 November 10 August 19 July 30 1/
1980 1981 1982
High Octane gasoline 1,400 2,000 2,000 2,000 2,200
Regular gasoline 1,275 1,875 1,875 1,875 2,050
Kerosene 300 300 550 950 1,050
Gas oil 250 250 500 900 1,000
Fuel oilType 1 1,010 1,010 1,010 1,010 1,010Type 2 915 915 915 915 915Type 3 785 785 785 785 785
Source: Central Bureau of Statistics.
1/ These prices still in effect as of October 1984.
0569Y
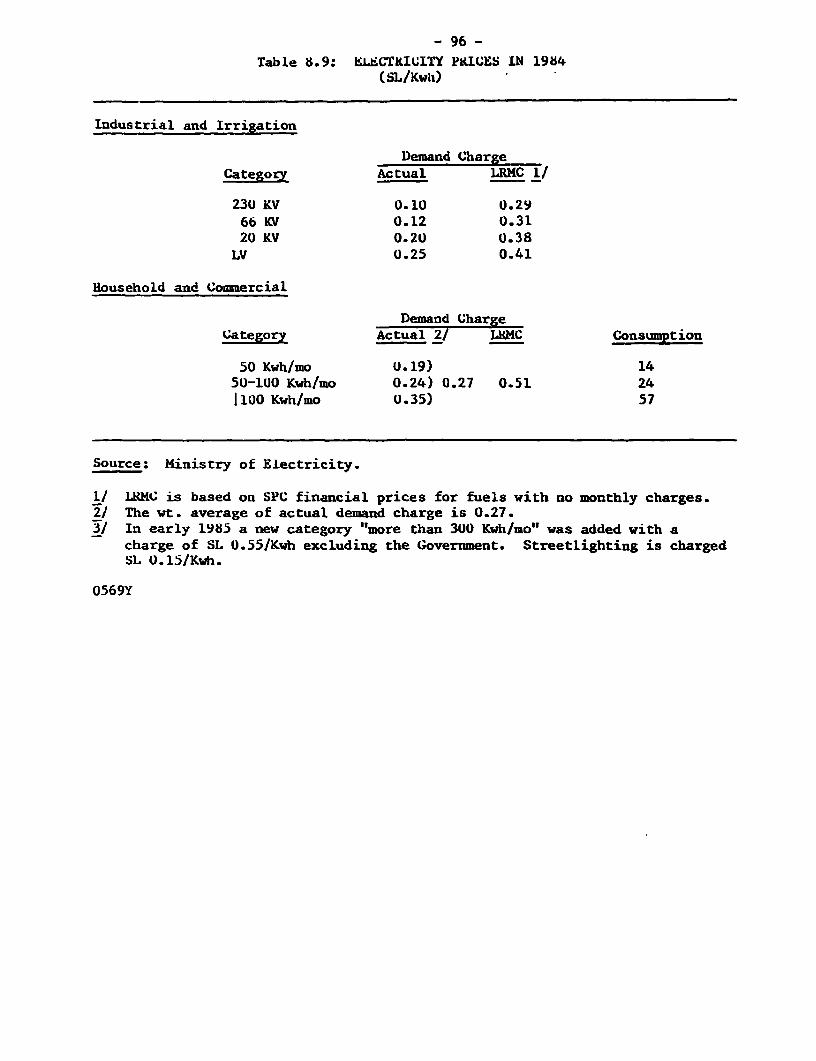
- 96 -
Table 8.9: ELECTRICITY PYICES IN 1984(SL/Kwvh)
Industrial and Irrigation
Demand ChargeCategory Actual LRMC 1/
230 KV 0.10 0.2966 KV 0.12 0.3120 KV 0.20 0.38
LV 0.25 0.41
Household and Commercial
Demand ChargeCategory Actual 2/ LTMC Consumption
50 Kwh/mo U.19) 1450-100 Kwh/mo 0.24) 0.27 0.51 241100 Kwh/mo U.35) 57
Source: Ministry of Electricity.
1/ LRMC is based on SPC financial prices for fuels with no monthly charges.2/ The wt. average of actual demand charge is 0.27.1 In early 1985 a new category "more than 300 Kwh/mo" was added with a
charge of SL 0.55/Kwh excluding the Government. Streetlighting is chargedSL 0.15/Kwh.
0569Y
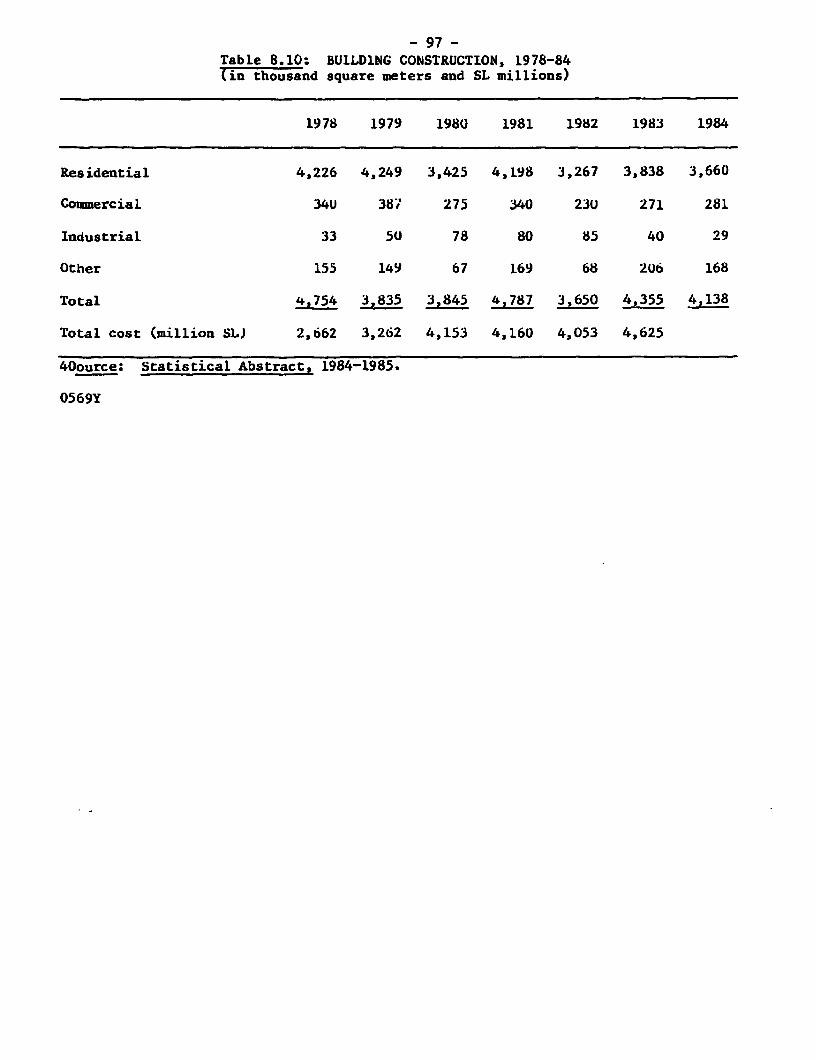
- 97 -Table 8.10: BUILDlNG CONSTRUCTION, 1978-84(in thousand square meters and SL millions)
1978 1979 1980 1981 1982 1983 1984
Residential 4,226 4,249 3,425 4,198 3,267 3,838 3,660
CommerciaL 34U 38; 275 340 230 271 281
Industrial 33 50 78 80 85 40 29
Other 155 149 67 169 68 206 168
Total 4,754 3,835 3,845 4,787 3,650 4,355 4,138
Total cost (million SL) 2,662 3,262 4,153 4,160 4,053 4,625
40ource: Statistical Abstract, 1984-1985.
0569Y
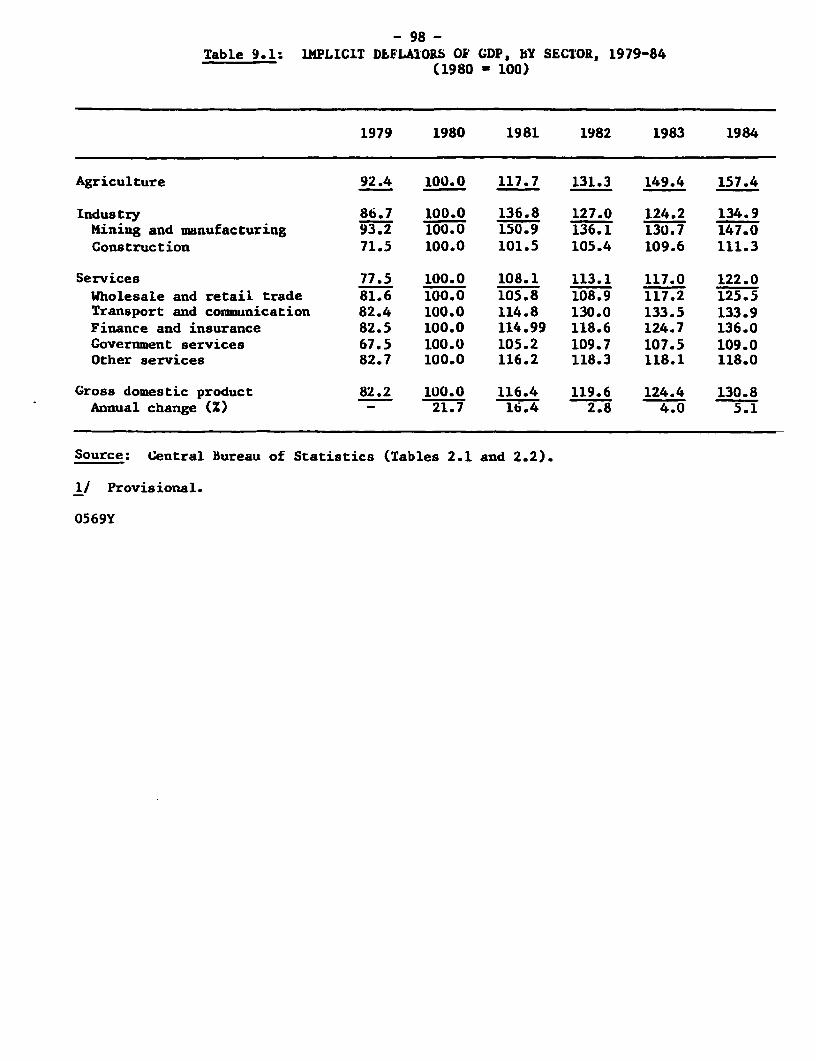
- 98 -Table 9.lM lMPLIClT DEFLATORS OF GDP, BY SECTOR, 1979-84
(1980 - 100)
1979 1980 1981 1982 1983 1984
Agriculture 92.4 100.0 117.7 131.3 149.4 157.4
Industry 86.7 100.0 136.8 127.0 124.2 134.9Mining and manufacturing 93.2 100.0 150.9 136.1 130.7 147.0Construction 71.5 100.0 101.5 105.4 109.6 111.3
Services 77.5 100.0 108.1 113.1 117.0 122.0Wholesale and retail trade 81.6 100.0 105.8 108.9 117.2 125.5Transport and communication 82.4 100.0 114.8 130.0 133.5 133.9Finance and insurance 82.5 100.0 114.99 118.6 124.7 136.0Government services 67.5 100.0 105.2 109.7 107.5 109.0Other services 82.7 100.0 116.2 118.3 118.1 118.0
Gross domestic product 82.2 100.0 116.4 119.6 124.4 130.8Annual change (Z) - 21.7 16.4 2.8 4.0 5.1
Source: Central Bureau of Statistics (Tables 2.1 and 2.2).
I/ Provisional.
0569Y
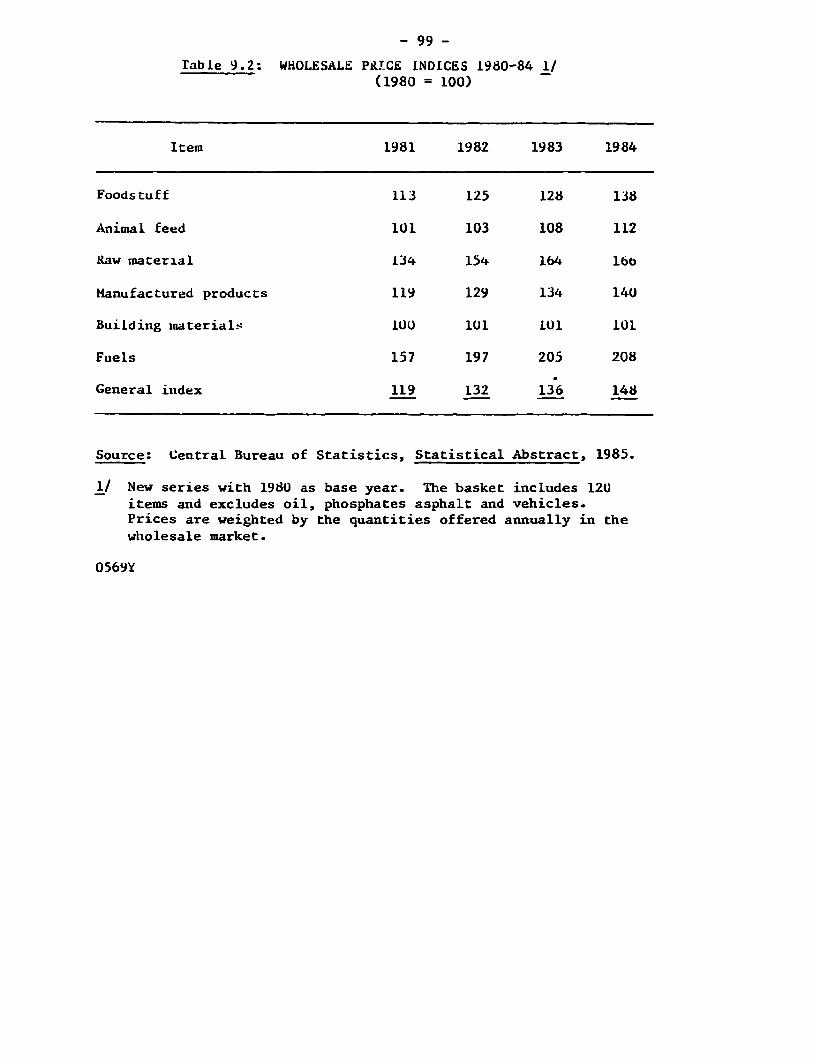
- 99 -
Table 9.2: WHOLESALE PLICE INDICES 1980-84 1/(1980 = 100)
Item 1981 1982 1983 1984
Foodstuff 113 125 128 138
Animal feed 101 103 108 112
Raw material 134 154 164 16b
Manufactured products 119 129 134 140
Building materials 100 101 101 101
Fuels 157 197 205 208
General index 119 132 136 148
Source: Central Bureau of Statistics, Statistical Abstract, 1985.
1/ New series with 1980 as base year. The basket includes 120items and excludes oil, phosphates asphalt and vehicles.Prices are weighted by the quantities offered annually in thewholesale market.
0569Y
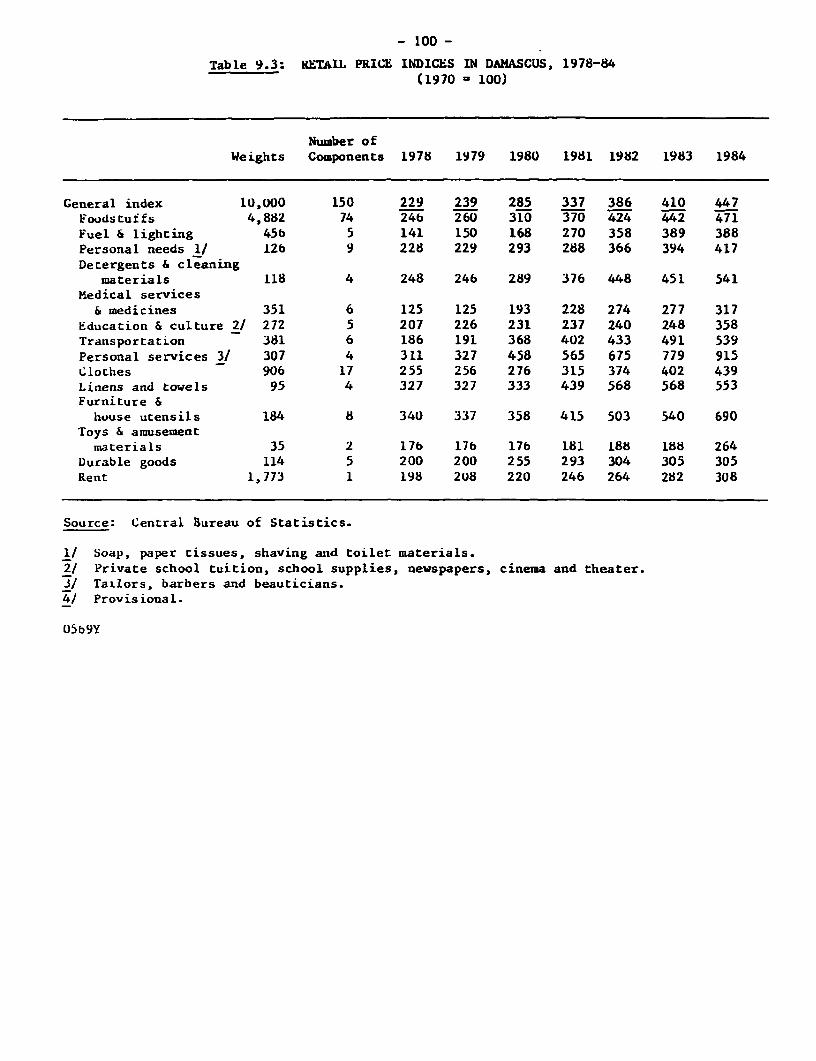
- 100 -
Table 9.3: RETAIL PRICE INDICES IN DAMASCUS, 1978-84(1970 - 100)
Number ofWeights Components 1978 1979 1980 1981 1982 1983 1984
General index l0,U00 150 229 239 285 337 386 410 447Foodsturfs 4,882 74 246 260 310 370 424 442 471Fuel & lighting 456 5 141 150 168 270 358 389 388Personal needs 1/ 126 9 228 229 293 288 366 394 417Detergents & cleaning
materials 118 4 248 24b 289 376 448 451 541
Medical services& medicines 351 6 125 125 193 228 274 277 317
Education & culture 2/ 272 5 207 226 231 237 240 248 358Transportation 381 6 186 191 368 402 433 491 539Personal services 3/ 307 4 311 327 458 565 675 779 915Clothes 906 17 255 256 276 315 374 402 439Linens and towels 95 4 327 327 333 439 568 568 553Furniture &
house utensils 184 8 340 337 358 415 503 540 690Toys & amusement
materials 35 2 176 176 176 181 188 188 264Durable goods 114 5 200 200 255 293 304 305 305
Rent 1,773 1 198 2U8 220 246 264 282 308
Source: Central Bureau of Statistics.
1/ Soap, paper tissues, shaving and toilet materials.2/ Private school tuition, school supplies, newspapers, cinema and theater.J Tailors, barbers and beauticians.4/ Provisional.
O b 9Y
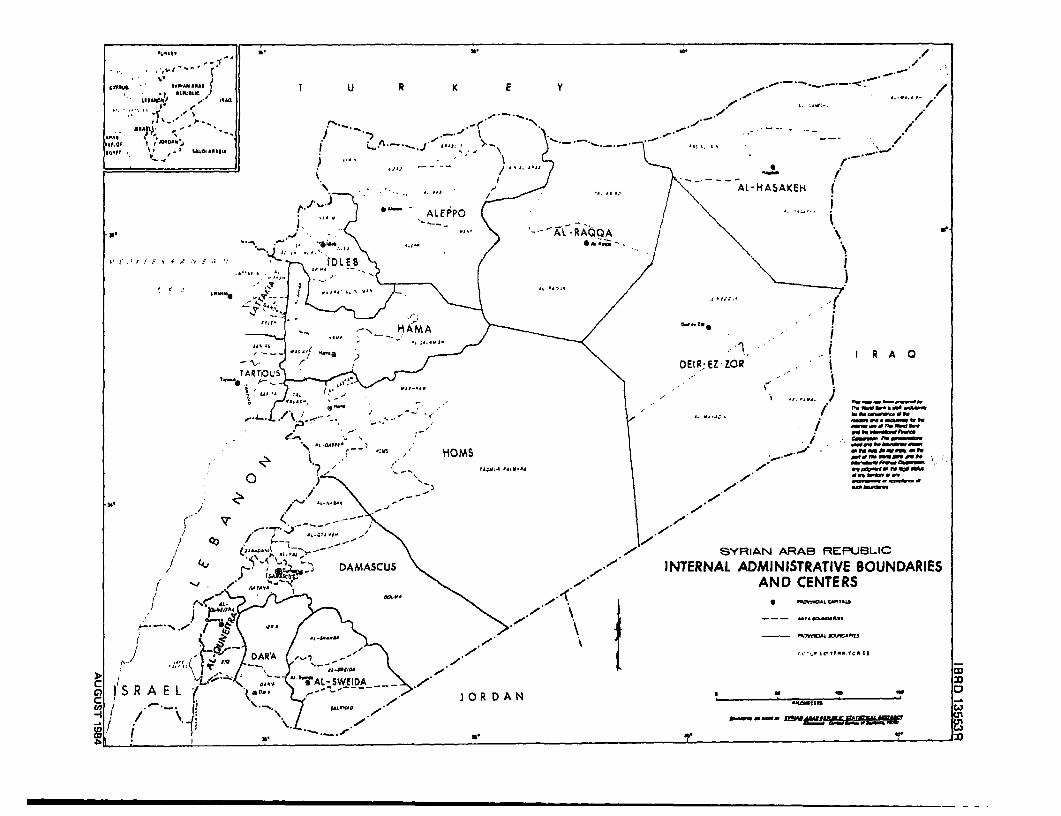
t^^ , sI tr.s e .Sv ~ ~T U R K E Y , ~ *
L E 8G
= ~~HAMA ~ ~ <
r ._ _ _ S ''/ j \ i . ! I~~~~~~~~~~~~~ R A O_ x f ' / \ ~~~~~~~~~~ ~ ~ ~~~OEIR EZ- ZOR
; g¢46AR., . , , t ' | *!. f J j _I., Vs
x t r~~ Riq ' HOMSI,,,_ -- _
(;">'>'1 *^-,^,.7---- \ ~~~~~SYRIAN ARAB REPlUELIC/ i J29>) ~~~~DAMASCUS < /INTERNAL ADMINISTRATIVE BOUNDARIES
K , ,, ,^,z- \ v ~~~~~~~~~~~~~~~~~~AND CENTERS
>) 1/S R A E L i z ^; L WIA_ 5/S_ ,,t
8' i/ 06 R1 D A.r N" C )~w=