Embed Size (px)
Citation preview
Document of
The World Bank
FOR OFFICL& USE ONLY
Report No: 28943-BR
PROJECT APPRAISAL DOCUMENT
ONA
PROPOSED PURCHASE OF EMISSIONS REDUCTIONS
BY THE NETHERLANDS CLEAN DEVELOPMENT MECHANISM FACILITY
IN THE AMOUNT OF EURO 8.5 MILLION
FROM THE
NOVA GERAR ECO-ENERGIA LTDA.
(FEDERATIVE REPUBLIC OF BRAZIL)
FOR THE
NOVA GERAR LANDFILL RIO DE JANEIRO
IN THE METROPOLITAN AREA OF RIO DE JANEIRO
MAY 7, 2004
Finance, Private Sector and Infrastructure UnitBrazil Country Management UnitLatin America and the Caribbean Region
This document has a restricted distribution and may be used by recipients only in the performance of theirofficial duties. Its contents may not be otherwise disclosed without World Bank authorization.
Pub
lic D
iscl
osur
e A
utho
rized
Pub
lic D
iscl
osur
e A
utho
rized
Pub
lic D
iscl
osur
e A
utho
rized
Pub
lic D
iscl
osur
e A
utho
rized
Pub
lic D
iscl
osur
e A
utho
rized
Pub
lic D
iscl
osur
e A
utho
rized
Pub
lic D
iscl
osur
e A
utho
rized
Pub
lic D
iscl
osur
e A
utho
rized
CURRENCY EQUIVALENTS
Currency Unit - Real (R$)
EXCHANGE RATE
December 31, 2001 - R$ 2.65= US$ I
December 31, 2002 - R$ 3.52= US$ I
December 31, 2003 - R$ 2.90= US$ I
WEIGHTS AND MEASURES
Metric System
FISCAL YEAR: 04
Vice President: David de Ferranti
Country Manager/Director: Vinod ThomasSector Manager/Director: Susan Goldmark
Task Team Leader/Task Manager: Werner Kornexl
ii
FOR OFFICIAL USE ONLY
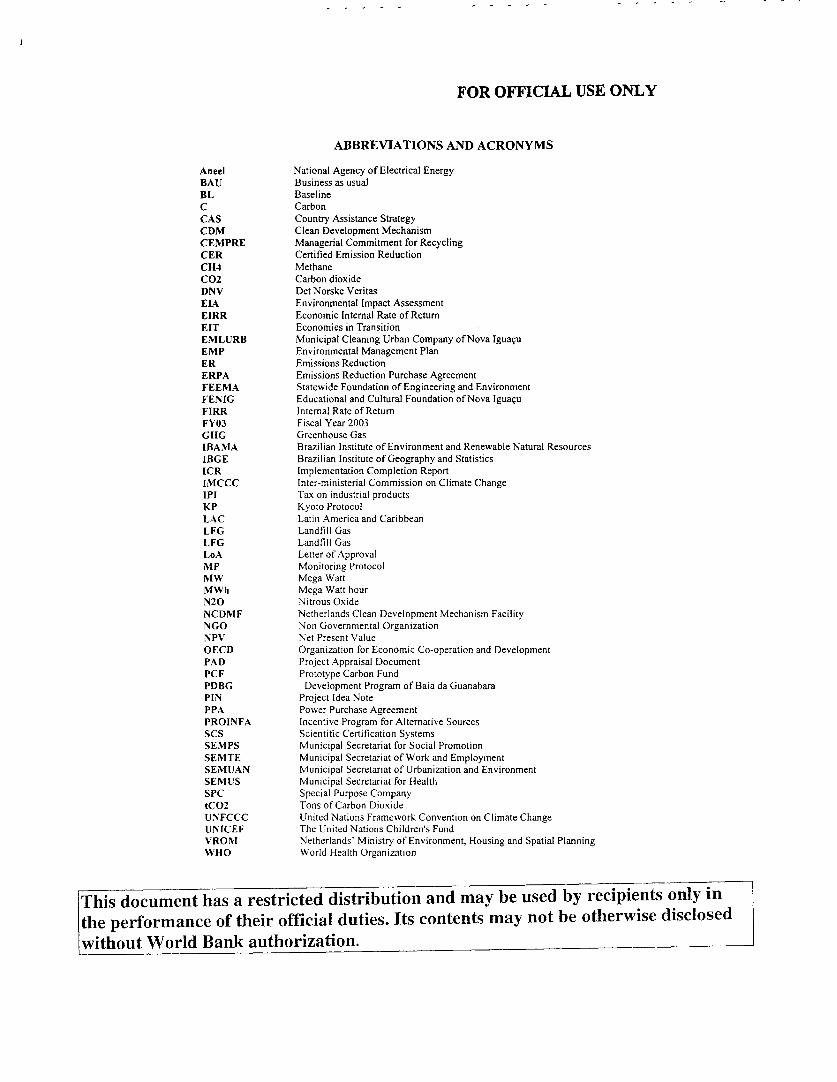
ABBREVIATIONS AND ACRONYMS
Aneel National Agency of Electrical EnergyBAU Business as usualBL BaselineC CarbonCAS Country Assistance StrategyCDM Clean Development MechanismCEMPRE Managerial Commitment for RecyclingCER Certified Emission ReductionCH4 MethaneC02 Carbon dioxideDNV Det Norske VeritasEIA Environmental Impact AssessmentEIRR Economic Internal Rate of RetumEIT Economies in TransitionEMLURB Municipal Cleaning Urban Company of Nova Igua,uEMP Environmental Management PlanER Emissions ReductionERPA Emissions Reduction Purchase AgreementFEEMA Statewide Foundation of Engineering and EnvironmentFENIG Educational and Cultural Foundation of Nova lgua,uFIRR Internal Rate of RetumFY03 Fiscal Year 2003GHG Greenhouse GasIBAMA Brazilian Institute of Environment and Renewable Natural ResourcesIBGE Brazilian Institute of Geography and StatisticsICR Implementation Completion ReportIMCCC Inter-ministerial Commission on Climate ChangeIPI Tax on industrial productsKP Kyoto ProtocolLAC Latin America and CaribbeanLFG Landfill GasLFG Landfill GasLoA Letter of ApprovalMP Monitoring ProtocolMW Mega WattMWh Mega Watt hourN20 Nitrous OxideNCDMF Netherlands Clean Development Mechanism FacilityNGO Non Governmental OrganizationNPV Net Present ValueOECD Organization for Economic Co-operation and DevelopmentPAD Project Appraisal DocumentPCF Prototype Carbon FundPDBG Development Program of Baia da GuanabaraPIN Project Idea NotePPA Power Purchase AgreementPROINFA Incentive Program for Alternative SourcesSCS Scientific Certification SystemsSEMPS Municipal Secretariat for Social PromotionSEMTE Municipal Secretariat of Work and EmploymentSEMUAN Municipal Secretariat of Urbanization and EnvironmentSEMUS Municipal Secretariat for HealthSPC Special Purpose CompanytCO2 Tons of Carbon DioxideUNFCCC United Nations Framework Convention on Climate ChangeUNICEF The United Nations Children's FundVROM Netherlands' Ministry of Environment, Housing and Spatial PlanningWHO World Health Organization
This document has a restricted distribution and may be used by recipients only inthe performance of their official duties. Its contents may not be otherwise disclosedwithout World Bank authorization.

I
Brazil
Nova Gerar Landfill Rio De Janeiro
Table of Contents
A. PROJECT DEVELOPMENT OBJECTIVE .............................................................. 2
1. PROJECT DEVELOPMENT OBJECTIVE ............................................................. 22. KEY PERFORMANCE INDICATORS ............................................................. 3
B. STRATEGIC CONTEXT .............................................................. 5
1. SECTOR-RELATED COUNTRY ASSISTANCE STRATEGY (CAS) GOAL SUPPORTED BY THEPROJECT ............................................................ 52. MAIN SECTOR ISSUES AND GOVERNMENT STRATEGY: ......................................................... 53. SECTOR ISSUES TO BE ADDRESSED BY THE PROJECT AND STRATEGIC CHOICES .............. 8
C. PROJECT DESCRIPTION SUMMARY ............................................................. 9
1. PROJECT COMPONENTS ............................................................. 92. INSTITUTIONAL AND IMPLEMENTATION ARRANGEMENTS .................................................... 123. BENEFITS AND TARGET POPULATION ............................................................ 20
D. PROJECT RATIONALE ............................................................ 22
1. PROJECT ALTERNATIVES CONSIDERED AND REASONS FOR REJECTION ............ ............... 223. LESSONS LEARNED AND REFLECTED IN THE PROJECT DESIGN ..................... ..................... 264. INDICATIONS OF BORROWER COMMITMENT AND OWNERSHIP ............................................ 265. VALUE ADDED OF THE BANK AND GLOBAL SUPPORT IN THIS PROJECT ............ ............... 26
E. SUMMARY PROJECT ANALYSIS ............................................................ 27
1. ECONOMIC ............................................................ 272. FINANCIAL ............................................................ 283. TECHNICAL ............................................................ 314. INSTITUTIONAL ............................................................ 355. ENVIRONMENTAL ............................................................ 356. SOCIAL ............................................................ 397. SAFEGUARD POLICIES ............................................................ 41
F. SUSTAINABILITY AND RISKS ............................................................ 41
1. SUSTAINABILITY ............................................................ 412. CRITICAL RISKS ............................................................ 423. POSSIBLE CONTROVERSIAL ASPECTS ..................... ....................................... 43
G. MAIN ERPA CONDITIONS ............................................................ 43
1. EFFECTIVENESS CONDITION ............................................................ 432. OTHER ............................................................ 43
H. READINESS FOR IMPLEMENTATION ............................................................ 44
I. COMPLIANCE WITH BANK POLICIES ............................................................ 44
ANNEX 1: PROJECT DESIGN SUMMARY ............................................................ 45
ANNEX 2: ESTIMATED PROJECT COSTS ............................................................ 47
iv
ANNEX 3: ENVIRONMENTAL AND SOCIAL ASSESSMENT .......................................... 48
ANNEX 4: PROJECT PROCESSING SCHEDULE ........................................................ 57
ANNEX 5: FINANCIAL ANALYSIS ........................................................ 58
ANNEX 6: ECONOMIC ANALYSIS OF THE NOVAGERAR PROJECT .......................... 70
ANNEX 7: LANDFILL GAS ASSESSMENT ........................................................ 71
ANNEX 8: THE LANDFILL GAS COLLECTION SYSTEM .................................................. 77
ANNEX 9: RISK ANALYSIS ........................................................ 84
ANNEX 10: STATUS OF BANK GROUP OPERATIONS ................................................... 88
ANNEX 11: STATEMENT OF IFC HELD AND DISBURSED PORTFOLIO .................... 90
ANNEX 12: BRAZIL AT A GLANCE ........................................................ 93
v
Netherlands Clean Development FundBRAZILIAN LANDFILL GAS TO ENERGY GENERATION PROJECT
PROJECT APPRAISAL DOCUMENT
Latin American and Caribbean Regional Office
Date: May 7, 2004 Team Leader: Werner L. Komexl
Sector Manager/Director: Vinod Thomas Sector: Power (50%), Solid waste
Country Manager/Director: Vinod Thomas management (50%)
Project ID: P079182 Theme(s): Climate change (P), Other urbandevelopment (S)
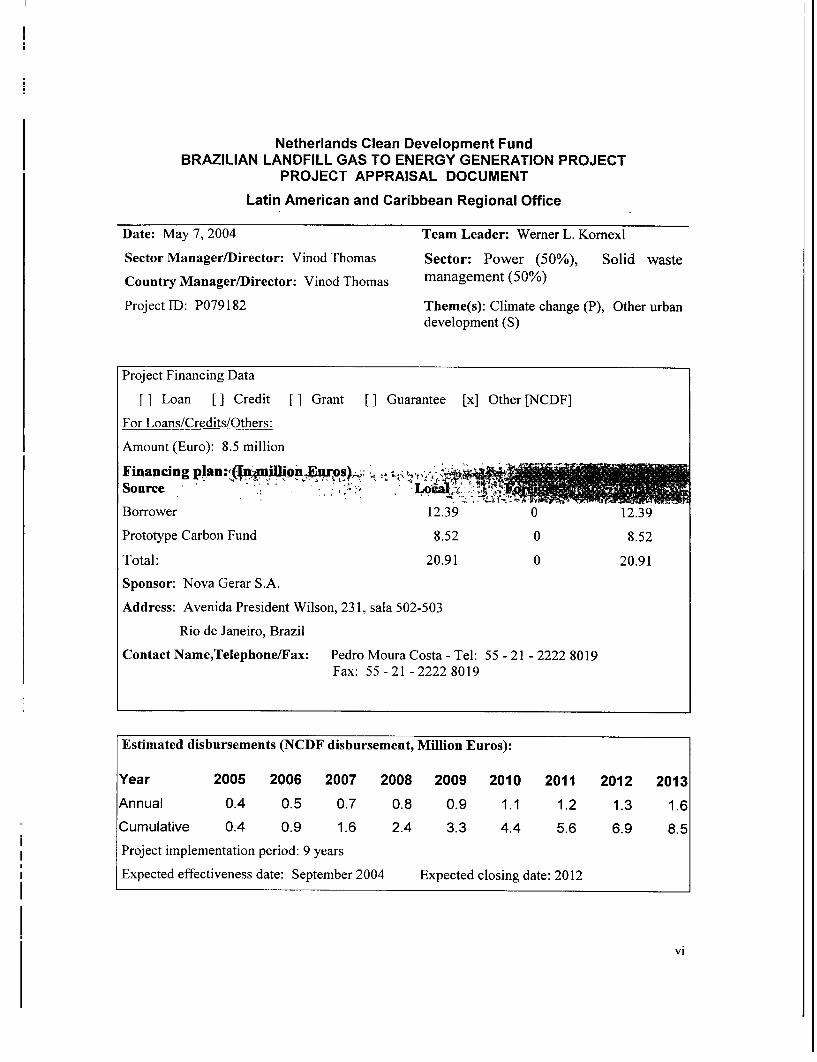
Project Financing Data
[ ] Loan [ ] Credit [] Grant [] Guarantee [x] Other [NCDF]
For Loans/Credits/Others:
Amount (Euro): 8.5 million
Financing pl.an, n.Ezp4:!- Source
Borrower 12.39 0 12.39
Prototype Carbon Fund 8.52 0 8.52
Total: 20.91 0 20.91
Sponsor: Nova Gerar S.A.
Address: Avenida President Wilson, 231, sala 502-503
Rio de Janeiro, Brazil
Contact Name,Telephone/Fax: Pedro Moura Costa - Tel: 55 - 21 - 2222 8019Fax: 55 - 21 - 2222 8019
Estimated disbursements (NCDF disbursement, Million Euros):
Year 2005 2006 2007 2008 2009 2010 2011 2012 2013
Annual 0.4 0.5 0.7 0.8 0.9 1.1 1.2 1.3 1.6
Cumulative 0.4 0.9 1.6 2.4 3.3 4.4 5.6 6.9 8.5
Project implementation period: 9 years
Expected effectiveness date: September 2004 Expected closing date: 2012
vi
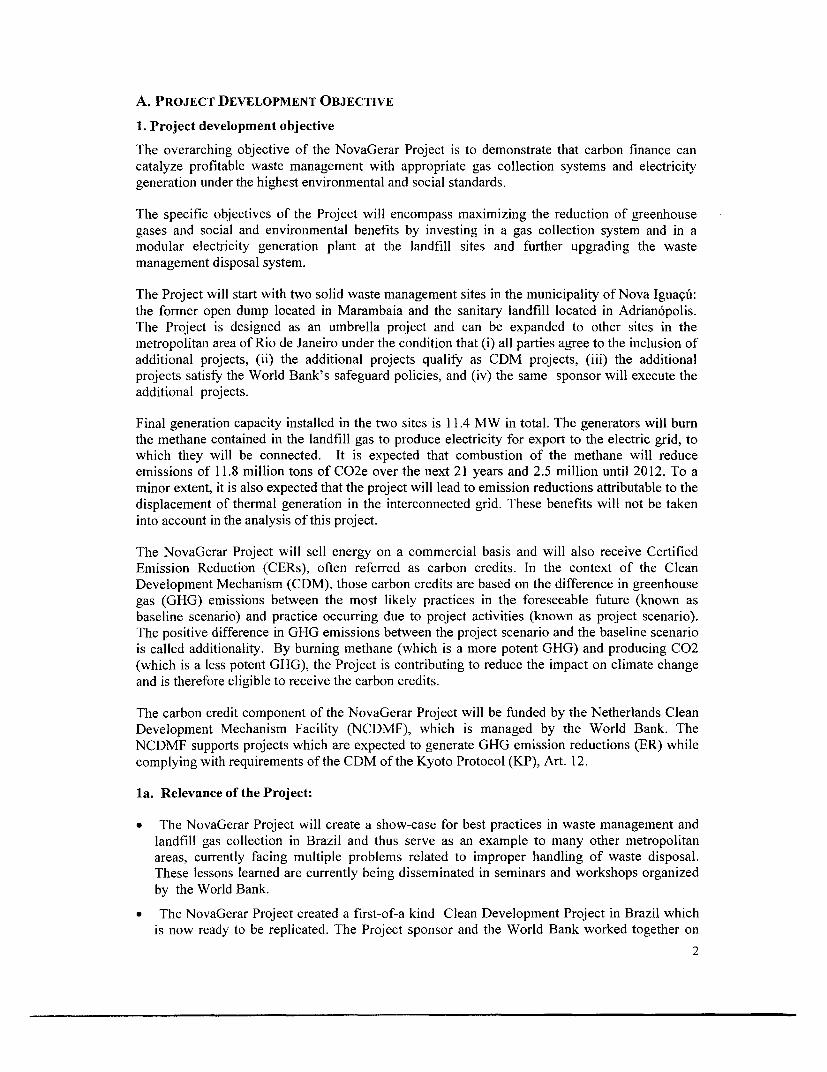
A. PROJECT DEVELOPMENT OBJECTIVE
1. Project development objective
The overarching objective of the NovaGerar Project is to demonstrate that carbon finance can
catalyze profitable waste management with appropriate gas collection systems and electricity
generation under the highest environmental and social standards.
The specific objectives of the Project will encompass maximizing the reduction of greenhouse
gases and social and environmental benefits by investing in a gas collection system and in amodular electricity generation plant at the landfill sites and further upgrading the waste
management disposal system.
The Project will start with two solid waste management sites in the municipality of Nova Igua9c:
the former open dump located in Marambaia and the sanitary landfill located in Adrian6polis.The Project is designed as an umbrella project and can be expanded to other sites in the
metropolitan area of Rio de Janeiro under the condition that (i) all parties agree to the inclusion of
additional projects, (ii) the additional projects qualify as CDM projects, (iii) the additionalprojects satisfy the World Bank's safeguard policies, and (iv) the same sponsor will execute the
additional projects.
Final generation capacity installed in the two sites is 11.4 MW in total. The generators will bum
the methane contained in the landfill gas to produce electricity for export to the electric grid, towhich they will be connected. It is expected that combustion of the methane will reduce
emissions of 11.8 million tons of C02e over the next 21 years and 2.5 million until 2012. To aminor extent, it is also expected that the project will lead to emission reductions attributable to the
displacement of thermal generation in the interconnected grid. These benefits will not be taken
into account in the analysis of this project.
The NovaGerar Project will sell energy on a commercial basis and will also receive Certified
Emission Reduction (CERs), often referred as carbon credits. In the context of the CleanDevelopment Mechanism (CDM), those carbon credits are based on the difference in greenhouse
gas (GHG) emissions between the most likely practices in the foreseeable future (known asbaseline scenario) and practice occurring due to project activities (known as project scenario).
The positive difference in GHG emissions between the project scenario and the baseline scenario
is called additionality. By burning methane (which is a more potent GHG) and producing C02
(which is a less potent GHG), the Project is contributing to reduce the impact on climate change
and is therefore eligible to receive the carbon credits.
The carbon credit component of the NovaGerar Project will be funded by the Netherlands Clean
Development Mechanism Facility (NCDMF), which is managed by the World Bank. The
NCDMF supports projects which are expected to generate GHG emission reductions (ER) while
complying with requirements of the CDM of the Kyoto Protocol (KP), Art. 12.
la. Relevance of the Project:
* The NovaGerar Project will create a show-case for best practices in waste management andlandfill gas collection in Brazil and thus serve as an example to many other metropolitanareas, currently facing multiple problems related to improper handling of waste disposal.These lessons learned are currently being disseminated in seminars and workshops organized
by the World Bank.
* The NovaGerar Project created a first-of-a kind Clean Development Project in Brazil which
is now ready to be replicated. The Project sponsor and the World Bank worked together on
2
setting up and having approved a specific baseline methodology for CDM projects that is nowavailable to the public. Furthermore, the Project documents relevant to the Kyoto Protocolframework, such as the Project Design Document, the Monitoring Protocol and the BaselineStudy serve as a model for other municipalities.
* The NovaGerar Project was also the first project presented to the National DesignatedAuthority and could help stimulate the national debate on CDM and on the creation ofnational procedures for project approvals.
* By virtue of its umbrella concept, the Project can be easily expanded to other open dumpsites in the metropolitan area of Rio de Janeiro.
* The Project also represents a model for a Public Private Partnership, as it associates themunicipality of Nova Iguacu and its waste management company, EMLURB to the privatecompany S.A. Paulista. Further partners are the state environmental agency FEEMA, thefederal environmental agency IBAMA, the Ministry of the Environment, and the GeneralAttorney Office (Ministerio Publico).
2. Key performance indicators
2.a. The NovaGerar Project has two key performance indicators and corresponding goals:
* Maximize generation of C02 ER - project is expected to generate at least 11.8 million t ofC02e in ER over 21 years, which may be achieved by an adequate gas collection system andburning of the generated methane;
* Maximize generation of MWh to be injected into the interconnected grid and minimizeflaring - the Project is expected to operate at baseload capacity, burning all available methaneproduced and 90% plant availability, for a total plant capacity of 11.4 MW, out of which 7.6MW by 2012, to be installed according to gas availability and to a pre-agreed installationschedule.
The probability of reaching the second objective (power generation) will depend on the projectsponsor's ability to negotiate a PPA with a unit price of US$ $48/MWh, which is the thresholdprice agreed by NovaGerar and it's leasing partner EnerG for installation of the engines. Thefinancial analysis demonstrates that $51/MWh reflects the break-even point and that the lossbetween the threshold price and breakeven price will be covered by the revenues from theEmission Reductions. The Emission Reductions Purchase Agreement foresees an implementationschedule for the energy generation component, and includes a default in the case ofnoncompliance. The project sponsor is only obliged to implement energy generator, if a long-term PPA with a feasible price is negotiated. Otherwise, a fine will have to be paid, that equalsthe revenues the project sponsor would get from ERs when replacing C02 by generatingrenewable energy. As this fine is very low, it would not jeopardize the project and hence thegeneration of emission reductions.
The probability for being able to negotiate a long-term PPA under the required conditions, isrelatively high, due to Eletrobras' recent launch of it's renewable energy program "Proinfa" thatwould fulfill the contractual conditions indicated. But even if energy will not be generated (onlymethane gas flared), the project is still as being a contribution to sustainable development, due toits environmental and social excellence in the waste management sector and due to it's learning,demonstration and replication effect, and because the global benefits related to climate changewill be guaranteed by only flaring methane (the Brazilian grid is dominated by hydropower withvery little fossil fuel content).
3
2.b. A separate Monitoring Protocol (MP) includes the following additional indicators
* Measurement of flow of landfill gas to the combustion engines and flares, and gross
electricity produced;
* Calculation of ER based on the above;
* Sustainable Development Indicators such as:
o job creation (during construction and operation);
o integration of former scavengers;
o ground water quality;
o native forest restoration (30 ha restored and 10 enriched);
o biodiversity (bird population);
o workers health care; and
o working conditions certification.
Payments by NCDF for ER achieved during the project cycle, are to be made in accordance to the
Emissions Reduction Purchase Agreement (ERPA). Such payments typically follow annual
certification of ER.
2a. Quality Assurance Mechanisms
A specialized World Bank team will supervise the Project activities through twice a year field
visits to verify progress on i) project implementation, including the outcomes of environmental
and social due diligence, and ii) achievement of the development indicators. Additionally, CDM
projects foresee a number of quality assurance mechanisms during the preparation and
implementation of the project, as indicated below. As the Project sponsor is paid only after
verification of annual performance, the sponsor has a genuine interest in complying with the
ERPA.
* The Kyoto Protocol CDM project cycle requires independent validation of a detailed Project
Design Document, including the Baseline Study and the Monitoring Protocol. This validation
process guarantees that the documentation and the project are prepared in compliance with
the CDM. The validation is important for assuring the quality of the project and gives
comfort to the parties involved that the CERs to be created throughout the project
implementation phase are valid under the Kyoto Protocol and will represent a carbon asset.
The Validator guarantees the correctness of all data presented . The project was already
validated by Det Norske Veritias (DNV), one of the leading validation companies for CDM
projects worldwide.
* The Project documentation is made available for public opinion for one month before the
Emissions Reduction Purchase Agreement is signed. This provides another important control
mechanism for CDM projects.
* The Host Country provides a Letter of Approval (LoA) after the validation process has been
concluded. The LoA will guarantee that the project is in compliance with the Host Country's
strategy and sustainable development policies.
* During the implementation process, the ER achieved by the Project will be verified by an
external consultant on an annual basis. The CER will only be emitted if the project sponsor's
activities are in compliance with the MP and the ERPA.4
* The annual verification reports are made available to the World Bank and only after thereceipt of the verification report, the payment to the Project sponsor will be effected
B. STRATEGIC CONTEXT
1. Sector-related Country Assistance Strategy (CAS) goal supported by the project
Link to the CAS Document or Pro2ress Report
CAS document number: 27043-BR Date of latest CAS: November 10, 2003
The Project would address the sustainability and competitiveness objectives outlined in the CAS,specifically regarding the issues of reducing poverty and achieving a higher quality of life in ruralareas and urban centers. The basic strategy in the CAS related to this project is to encourageenvironmental protection with actions to (a) strengthen private sector involvement by contractingout delivery of special services to private sector, local communities and NGOs; (b) promotelaws, regulations and policies for tradable pollution and conservation permits; (c) improve urbanservices and develop and implement strategies to improve sewage collection, solid wastemanagement, air pollution in the biggest metropolitan areas, and water pollution in rivers, lakesand ocean beaches in and around major cities; and (d) improve activities related to energyefficiency and use of renewable energy.
The importance of the World Bank's carbon finance instruments is highlighted in the CAS toassist Brazil to develop its world-scale carbon trading market by further project development,capacity building, and replication of best practices.
la. Global Operational strategy/Program objective addressed by the project
In addition to the CAS issues, the NovaGerar project supports the global objectives of the WorldBank Carbon Finance operations for:
1. Achieving High-Quality ERs
The NCDF supports funding of projects that produce high quality greenhouse gas ER whichcould be registered with the United Nations Framework Convention on Climate Change(UNFCCC) for the purposes of the KP.
2. Generating Knowledge to support carbon market development through learning-by-doing:
By transacting the business of reducing greenhouse gas emissions, the NCDF is developing anincreased knowledge base of business processes and sound practices to facilitate investments inGHG ER and inform the ongoing UNFCCC negotiations on project-based CDM.
2. Main sector issues and Government strategy:
The NovaGerar Project attempts to seize an opportunity created by a novel Carbon Market. It alsoaddresses issues in two main sectors:
. Waste management & the environment
* Power generation
The strategic significance of the Carbon Market for Brazil and each one of those sector issues willbe discussed separately.
5
2a. The Carbon Market
The CDM, as defined in the Kyoto Protocol, represents the first global environmental tradingscheme. Brazil's private sector is prepared for taking advantage for this market, which isestimated to generate several billion dollars per year to development countries. This is the reasonwhy several market analysts evaluate that Brazil will be able to take a significant share of thismarket.
Although the Kyoto Protocol has not entered into force yet, significant market transactions arealready under way. But even without the Kyoto Protocol entering into force, it is expected that themarket will accept the CDM as a project based emission reduction mechanism for countries andcompanies that have voluntarily adopted a policy to reduce GHG emissions. More importantly, itis expected that the credits generated by the CDM can be used by European companies coveredby the European Emissions Trading Scheme. Several countries have already set up funds thatwill purchase Emissions Reductions through the CDM and the Chicago Climate Exchange hasexpressly permitted trading of CDM projects from Brazil. It is expected that the carbon market ishere to stay, although it is yet too early to estimate the exact overall volume of carbon credits tobe traded.
The host countries in the developing world obtain a form of economic rent through the carbonfinance flow, without having an emission reduction objective such as OECD countries and EIT.
The Latin America region, and Brazil in particular, has been among the most aggressive inpursuing the CDM opportunity. Private sector and civil society see carbon finance as a suitableinstrument to help attract foreign investment flows and technology transfer. Brazil was an earlyadvocate of including the CDM within the Kyoto Protocol structure, and is basing a significantpart of its national sustainable development strategy on the country's ability to attract externalfinancing through the provision of global environmental services for biodiversity protection andclimate change mitigation. Currently, there is a carbon finance projects in the Bank's Brazilportfolio: the Plantar Project in Minas Gerais, which replaces coal/coke with sustainablyproduced charcoal for the pig iron sector. Under development is a number of landfill projects, aswell as cogeneration projects that aim to use wood residues and bagasse to generate power,andreforestation and afforestation projects. Further potential has been identified in the iron and steel,forestry, waste management, sugar cane, petrochemical, renewable energy (mainly wind energy)and transport sectors.
2b. Waste Management & the Environment
The CAS states that improvements in environmental management are ongoing. However, theimprovement of environmental problems and waste management in particular still represents ahuge challenge.
According to the latest survey published by IBGE in 2000 (National Sanitation Research 2000),47,1% of all waste collected in Brazil is dumped in sanitary landfills, 22,3 % in controlledlandfills and 30,5% in open dumps (lix6es). That would mean that more than 69% of all thecollected household waste is disposed of in a sanitary or controlled landfill. But if this analysis isbased on the number of municipalities, the result is much less positive: 63,6% of the total of5.507 municipalities informed that their waste was disposed of in open dumps and only 32,2%declare that operate adequate final disposal sites (Sanitary and controlled landfills). According tothe same survey, Brazil maintains 817 sanitary landfills, compared to a total number of 3,834open dumps. According to parallel surveys in some States, the amount of open dumps might beeven higher. According to UNICEF (1999), more than 43,000 children live in and from garbage,most of them in the Northeast of Brazil.
Within the last 10 years, collected waste increased from 100 thousand tons to 154 thousand, anincrease of 54%. In the same period, the population increased by only 15,6% (IBGE, 2000).
6
These numbers clearly indicate that waste management solutions will become increasinglyimportant in the near future.
In Brazil, as well as in other developing countries, municipalities invest first in waste collectionand then in waste disposal. Nearly all municipalities collect their waste in a way or another, butonly 8,2% have a selective collection system (IBGE 2000). The economic burden of wastedisposal is not necessarily on the construction of waste disposal sites, but on their maintenance. Itis thus essential to have an appropriate cost recovery system. But more than half of allmunicipalities in Brazil do not charge for their collection and disposal services. And most ofthose that recover costs, do not charge sufficiently. About 90% of cost recovery systems arelinked to the property tax. Only recently, the private sector has started to get more interested inlong-term concessions, which will probably help introduce best practices in major cities. While inmany cases private concessionaires would not be able to generate profits with the low tipping feespaid by municipalities for their solid waste, additional high-priced businesses such as recycling,hospital waste and special waste from private suppliers can turn these waste disposal operationsvery attractive financially.
Waste avoidance and recycling are other important activities to mitigate the waste problem andin turn they create job and income opportunities. According to the Association CEMPRE(Compromisso Empresarial para a Reciclagem), recycling activities generated roughly US$ Ibiin 2002. IBGE indicates that more than 200,000 people in Brazil live from recycling and wastecollection in general but more than half of them are not organized and are working underdangerous conditions. This number is being challenged by several waste collection associationsfor being too low.
At the federal level, responsibility is shared between three Ministries (Health, Environment andCities). Coordination among them is still required. Recently the Forum de Lixo e Cidadania(Trash and Citizenship Forum) was created to coordinate the agenda between the Ministries andrelevant governmental and non-governmental organizations. There is no specific federallegislation in place.
At a state level, the situation varies a lot. Only 8 states have a specific solid waste legislation (CE,GO, MS, PE, PR, RS, BA and MT). Other 14 are currently preparing their legislation, includingthe state of Rio de Janeiro while 7 have not started with this process.
Although, a significant increase of funds were made available by the Federal Government to thesolid waste management sector, especially to the eradication of open dumps (in January 2004,two major public banks, Caixa Econ6mica Federal and BNDES, have made available more thanUS$lbi to sanitation and solid waste management) the resources are still insignificant comparedto the huge requirements.
The Ministry of Cities has indicated that the priority for investments should consider the (i)reduction of open dumps by 50% within 5 years; (ii) unification and coordination of existingfinancing lines and programs; (iii) capacity building with focus on the elaboration of integratedsolid waste management plans for municipalities and states, as well as on research and support toNGOs and other technical assistance programs; and (iv) promotion of programs with social-economic objectives linked to waste collection, such as creation and enhancement of solid wastecollection cooperatives, recycling programs, selective collection programs, capacity buildingprograms, etc.
In the case of the metropolitan area of Rio de Janeiro, that generates more than 14,000 tons ofsolid waste per day, the situation is more than precarious. Current waste disposal sites that receive90% of the municipal waste of the region will close down and have to be replaced, which willprobably create a disposal bottleneck very shortly.
7
A special program (Programa de Despolui,ao da Baia da Guanabara - PDBG) aims to address theissue of the pollution of the Guanabara Bay which surrounds the Rio de Janeiro metropolitanarea. The municipality of Nova Iguacu receives about R$3.7 million from this program through apartnership with IBAMA, the Federal Government environmental agency, established in the year2000. These funds come from a penalty imposed by the Brazilian Justice Ministry onPETROBRAS for a large oil leak from one of its cargo-ships in that region. As per the terms ofthe concession for its new landfill, the municipality agreed to transfer that amount to the newconcessionaire to help defray investment (R$1 million) and operational (R$2.7 million in twentymonthly quotas) costs.
Furthermore, the State of Rio de Janeiro created a program called "Pr6-Lixo" which aims topromote sustainable waste management practices by investing in waste disposal sites, recyclingfacilities, and environmental education in the "Baixada Fluminense", which comprises severalpoor municipalities in the Rio de Janeiro metropolitan area.
At the municipal level, the Project is part of a large program managed by the Municipality ofNova Iguacu, focusing on the collection of urban waste in the city. A selective waste collectionsystem was initiated with community support, which covers 450 collection sites within the city ofNova Igua9c. The second phase of this program is based on the construction of a state-of-the-artWaste Treatment Plant, of which Adrian6polis and the revamped Marambaia landfills are acentral component, together with units to treat hospital and construction waste, as well as awastewater treatment plant.
2c. Power Generation
The Government of Brazil (GOB) has been fostering the expansion of generation capacity and thediversification of energy sources. After the rationing crisis in 2001-2002, it became conspicuousthat the electric sector in Brazil could not rely solely on large hydro-based generation plants,which will make power supply vulnerable in years of low rainfall.
In addition to the reliability aspects, Brazil wants to diversify its energy matrix by introducingrenewable sources of energy. Law 10.438, enacted in early 2002, established a special program,named PROINFA (Programa de Incentivo a Fontes Alternativas) to provide specific incentives torenewable sources of power generation, such as wind, solar and biomass. ELETROBRAS willact as a single buyer, and will contract up to 3,300 MW until 2006. From those, 1,100 MW areearmarked for initiatives like co-generation and power produced in landfills. The governmentexpects to have the first call for bids in the month of February 2004. The price to be paid for thisenergy is still under discussion. Currently, there is a public hearing, where both government andpotential investors are trying to agree on a price, differentiated by each source, which issatisfactory for both parties.
3. Sector issues to be addressed by the project and strategic choices
The NovaGerar Project is aligned both with the Waste Management & Environment and with thePower Generation sectors' objectives, as described in the previous section.
In terms of Waste Disposal & the Environment, the NovaGerar Project will be an enabler to theconsolidation of Adrian6polis, sanitary landfill both in terms of waste management and in termsof methane collection and its use to produce electricity. Therefore, the Project expects todemonstrate that carbon finance can catalyze environmentally sustainable, profitable wastemanagement with appropriate gas collection systems under strict environmental standards. TheNovaGerar Project, in conjunction with the Adrian6polis landfill initiative, will help establish areal scale model for a new paradigm of waste management and gas utilization. It will help buildcapacity in the private sector and governmental institutions. Adrian6polis is the first landfill thatreceived an environmental license in the State of Rio de Janeiro and could set new benchmarksfor the waste management sector in the State.
8
In terms of Power Generation, the NovaGerar Project is aligned with GOB intention to diversifysources of power generation, fostering non-conventional, renewable sources of energy. Theproximity to the load centers is also a positive aspect of landfill gas power generation, as itcontributes to alleviate existing constraints in the transmission, particularly in the metropolitanarea of Rio de Janeiro. Finally, a carbon credit finance mechanism will provide badly neededforeign currency revenues, which are required to finance a large percentage of the hard-currencydenominated investment or leasing costs. The great majority of the power projects underconstruction in Brazil have their revenues denominated in local currency, while a significantportion of their costs is indexed to the US$ (e.g. financing, and in some cases fuel). So far, noadequate hedge mechanism has been found for the exchange risk faced by those projects. This hasbeen a significant factor which has inhibited the expansion of the power system in Brazil. In thatsense, the NovaGerar project is unique, and opens up a wide range of possibilities for the powergeneration business. The Project will involve the use of a new financial source (CleanDevelopment Mechanism) for the funding of power sector, in particular for renewable generation.
C. PROJECT DESCRIPTION SUMMARY
1. Project components
The Project components include investments in a gas collection system and in modular electricitygeneration plants at the former open dump in Marambaia and a new sanitary landfill inAdrian6polis.
The understanding of the Project components can be enhanced by looking first at the landfilloperations. Although the Project has not directly invested in the construction and operation ofthe landfill, the World Bank analyzed the design and operational practices related to the wastemanagement and will monitor them very closely during the project cycle. The Adrian6polislandfill is divided in four sections, for which the operator has received an operationalenvironmental license for one section only. If the operator does not receive a renewal of thisoperational license or is unable to obtain licenses for the other sections, the Project targets foremission reduction will not be achieved and the contract between the Bank and the projectsponsor (ERPA) will enter into default.
The NovaGerar Project can be seen in association with a large program of rationalization of urbanwaste collection and management, initiated by the Municipality of Nova Igua,u, a city of 800,000inhabitants with more than 600 industries and 2,400 commercial establishments. When theprogram was initiated, the situation was critical. Some 100,000 t of waste were found in over1,200 sites within the city. In a few months, the program managed to raise the waste collectionrate to 90% of waste generated in the city. A selective waste collection was initiated withcommunity support, which covers 450 collection sites. The program also included anenvironmental education project. The second phase of the program focuses on adequate wastetreatment in Adrian6polis, which started to receive solid waste on February 2003. At the sametime, Marambaia, which is adjacent to Adrian6polis, was deactivated
Marambaia covers an area of 20 ha and has been in operation since May 1987. It received anaverage of 450 tons of waste per day from the Municipality Nova Igua,u, leading to anaccumulation of some 250,000 t of waste. It operated without an environmental license.Marambaia was poorly managed and the environmental damage it caused is conspicuous. Theenterprise which operated the illegal dumpsite until recently, was ordered by the GeneralAttomey Office (MinisterioPziblico) to close the dumpsite. In practice, this order only came intoeffect when Adrian6polis provided a feasible alternative to the municipality. A plan to implementappropriate measures to minimize environmental impacts was designed and fully executed byPaulista S.A., a partner in Nova Gerar and owner of the Adrian6polis landfill, which took over
9

Marambaia in 2003 to carry out a proper closure of the dump site. This executive plan includedthe re-shaping of the external parts of the dump site, the construction of a leachate collectionsystem, closure and re-forestation of the site.
Differently from Marambaia, the design and executive plan for the construction of theAdrian6polis landfill measures up to the quality and environmental standards as applied inEurope. Licensing for Adrian6polis was granted by FEEMA, the state Environmental authority,and authorized a maximum waste disposal of 200,000 m2. The ultimate receiving capacity of thelandfill is expected to be some 4,000 - 5,000 t/day. For the Project projections, it is envisaged thatAdrian6polis will be able to capture around 2,000 t/day from Nova Iguacu and othermunicipalities. This scenario is very likely to happen due to the precarious waste disposalsituation in and around Rio de Janeiro, where most of the current sites will have to be closed by2005 and only a few alternatives can be practically considered.
The main Project components for both the Marambaia and Adrian6polis sites include:
* Gas collection system
* Flares
* Power generators
The gas collection system will use state-of-the-art technology. The landfill uses cells coated withan impermeable high-density polyethylene membrane; water residues will be channeled andtreated in a waste water treatment plant. Landfill gas will be collected and channeled to the powergeneration units; excess gas will be flared. Vertical wells will be used to extract gas, and theirspacing is optimized, aiming at maximizing gas collection and minimizing costs. Gas headers willbe designed as a looping system in order to allow for partial or total loss of header function in onedirection without losing gas system functionality. Condensate extraction and storage systems willbe designed at strategic low points throughout the gas system. Efforts will be made to minimizecondensate handling..
The flares, to be installed in parallel with the generator sets, will be 2000 m3/hour ModularGround Gas Flares. The flares employ a biogas technology design and will be skid or base framemounted ground flares. Ground flare stacks enable higher burning temperature to ensure lowemissions, in accordance with current best practice guidelines in the UK. The burner unit is fullyadjustable to enable high temperature flaring of the landfill gas, which will vary in both qualityand quantity from site to site, and over time. The unit is comprised of multiple stainless steelburner nozzles mounted onto a pedestal which supports the flare stack and houses the primaryand secondary air supply ductwork. Manual and actuated louvers are provided to control the airsupply and manual valves in the pipe work to control the gas supply.
10

-4 -
Fig. 1.: Gas collection system and flare, leachate collection and treatment systems
In terms of power generatrs British landfill-gas-to-power company EnerG has recommended theuse of modular engines, such as the Caterpillar G 351I6TA LE spark ignition engines. A modularreciprocating engine facility requires considerably less initial capital expenditure, but does incurhigher maintenance costs. Given the inherent uncertainty of gas supply, the smaller modularreciprocating engine generators units offer a significant advantage to adapt the equipment to thesite-specific gas volumes. This flexibility enables a small pilot plant to be established at arelatively low cost. As gas volume decreases over time, the modules can be relocated to othersites. Each generating set is rated 0.95 MW.
The generation installation schedule for each of the sites during the ERPA period is indicated in
Fig. 2. It is phased to provide a gradually increasing production capability.
In Marambaia, the installation will be carried out as a single deployment of one 0.95 MWgeneration set. Methane gas will be captured by drilling 21 gas domes or gas collection drains tobe used for the generation of energy. Because of Marambaia's character as an original open dumpsite, monitoring activities will be implemented to carefully observe groundwater quality, finalcovering and stability of the topsoil and operators' health and safety. As the amount of gas in thissite decreases, the engine will be transferred to Adrian6polis.
______ N of generab __ N' gPWTiWs TOTALYU Maim,j3b1j N1V1Yr4F Adnan6oIis MWWYwa
2005 1 7,184 1 7,884 15,768
2006 I 7.884 2 1 5,768 23.631
2007 I 7,884 3 23,652 31,536.
2001 I 7,884 4 31.536 39,4202009 I 7,884 5' 39,420) 47,304
2010 I 7.884 6. 47,304 55~3. 2011 0.7* 55.I1A9 55i I 9
2Q12 0 _ _ _ _ _ _8 63.072 _ _ _ _ _ _
Fig. 2: Installation Schedule of Generators in Marambaia and Adrian6polis
In termsof powe generatrs, Briish landill-gasto-powercompanyEnerG ha recommnded th
2. Institutional and implementation arrangements
2a. The Project Sponsor
NovaGerar Eco-Energia Ltda. (NovaGerar) is a Special Purpose Company (SPC) representing a50-50 joint venture between EcoSecurities Brasil Ltda (EcoSecurities) and S.A. Paulista deConstrucoes e Comercio (S.A. Paulista). Ecosecurities is an environmental finance companywhich specializes in the GHG mitigation business; its parent company has headquarters in theUK. Ecosecurities' contribution to the project was initially the preparation of the CDM-relevantdocuments, such as the Project Idea Note and the Project Concept Note. Furthermore,Ecosecurities decisively contributed to the elaboration of the Monitoring Protocol, the BaselineStudy and the Project Design Document (in close cooperation with the World Bank).Additionally, it led the technical feasibility study for gas collection and power generation.
NovaGerar Eco-Energia Ltda. (NovaGerar) is a Special Purpose Company (SPC) representing a50-50 joint venture between EcoSecurities Brasil Ltda (EcoSecurities) and S.A. Paulista deConstru,6es e Comercio (S.A. Paulista). Ecosecurities is an environmental finance companywhich specializes in GHG mitigation issues; its mother company has offices in the UK, USA, theNetherlands and Australia.
S.A. Paulista is a Brazilian civil engineering and construction firm based in the city of Sao Paulo,with branches in several other Brazilian states and counties. S.A. Paulista's core business is intraditional heavy construction sectors such as highways, railways, airports, ports, industries andsanitation. In the area of waste management, S.A. Paulista manages the largest domestic wastetransfer station in South America (Transbordo Ponte Pequena), responsible for 60% of alldomestic waste from Sao Paulo, a city with a population of more than 10 million people and isoperating the Gramacho landfill in Rio de Janeiro, the largest landfill in Latin America receiving7,000 tons of waste/day.
S.A. Paulista is in charge of landfill operations, while NovaGerar will explore all businessesrelated to the use of the GHG and hold all the assets related to gas collection and powergeneration. It is therefore the legal contractual partner of the NCDMF. Through an agreementwith S.A. Paulista, NovaGerar will have access and full priority to all the gas produced byMarambaia and Adrian6polis, at no cost.
In 2001, S.A. Paulista was granted a 20-year concession license by the Empresa Municipal deLimpeza Urbana of Nova Iguacu-EMLURB (the municipal-government owned companyresponsible for waste collection and disposal) to manage the Marambaia and the Adrian6polislandfills. This was the result of a competitive and transparent bidding process.
The clean up of the Marambaia dump is part of a contractual obligation between S.A Paulista andEMLURB S.A.. Following protracted negotiations with the owner of the Marambaia dump site,in April 2003 S.A. Paulista rented the dump site for 20 years with rights to exploit the landfillgas.
All licenses required by environmental control agencies have been issued, including theinstallation license for the power generation plants by FEEMA in March 2003. For the futurepower generation, NovaGerar will have to obtain an authorization from ANEEL, the nationalregulatory agency for electricity, to operate as an independent power producer.
NovaGerar will sign an agreement with EnerG for leasing and operation of the gas collectiondevices and the power plants. Section 2.4 provides the key features of these arrangements.
Funding for the Project will come in its majority from two major sources. First, EnerG willfacilitate the deployment of the energy generation equipment, which accounts for a significantpart of the Project investments, through a leasing arrangement. Second, a long-term ERPA will
12
provide the carbon credits through the NCDMF, which can also be used as financial guaranteesfor the leasing contract between NovaGerar and EnerG.
2b. The Netherlands Carbon Development Mechanism Fund - NCDMF
The NCDMF was established in May 2002 between the IBRD and the State of the Netherlands asa facility to purchase GHG ER credits. The agreement, signed with the Netherlands' Ministry ofEnvironment, Housing and Spatial Planning (VROM), supports projects in developing countriesin exchange for ER credits under the CDM established by the Kyoto Protocol.
NCDF purchases high quality GHG ER which could be registered with the UNFCCC for thepurposes of the Kyoto Protocol. NCDF enters into Emissions Reduction Purchase Agreements(ERPA) with "project sponsors", defining the quantity, price and other delivery conditions of ERto be purchased by NCDF, including the monitoring and verification protocols to enablequantification, verification and certification of ER actually achieved. To increase the likelihoodthat the ER will be recognized by the Parties to the UJNFCCC, independent experts from theengineering and economic consulting industry and the global certification and audit industryprovide baseline validation and verification/certification services for ER transactions that respondto UJNFCCC rules as they develop.
The NCDF has a target of placing up to 70 million Euros in projects over the first two years of itsagreement, leading to emission reductions of approximately 16 million metric tons of C02equivalent. equivalent until the end of 2012. Over the next two years, the NCDF will enter intopurchase agreements to purchase ER credits from renewable energy, energy efficiency, and fuelswitching CDM project activities.
Despite not being directly related to NovaGerar, another important source of funding for theoverall venture under which the Project is framed, will come from the Brazilian FederalGovernment. IBAMA has agreed with the Nova Iguacu City Govemment to contribute R$ Imillion to S.A. Paulista to the financing of the Adrian6polis landfill (see B2.a).
NCDF retains services of internationally-recognized, fully independent third parties to verify andcertify the actual ER produced. The NCDF will only disburse against delivery of verified andcertified ER. In the event that the project sponsor fails to deliver the quantity of ER for any givencalendar year as set forth in the ERPA, remedies against the project sponsor will apply as agreedin the ERPA.
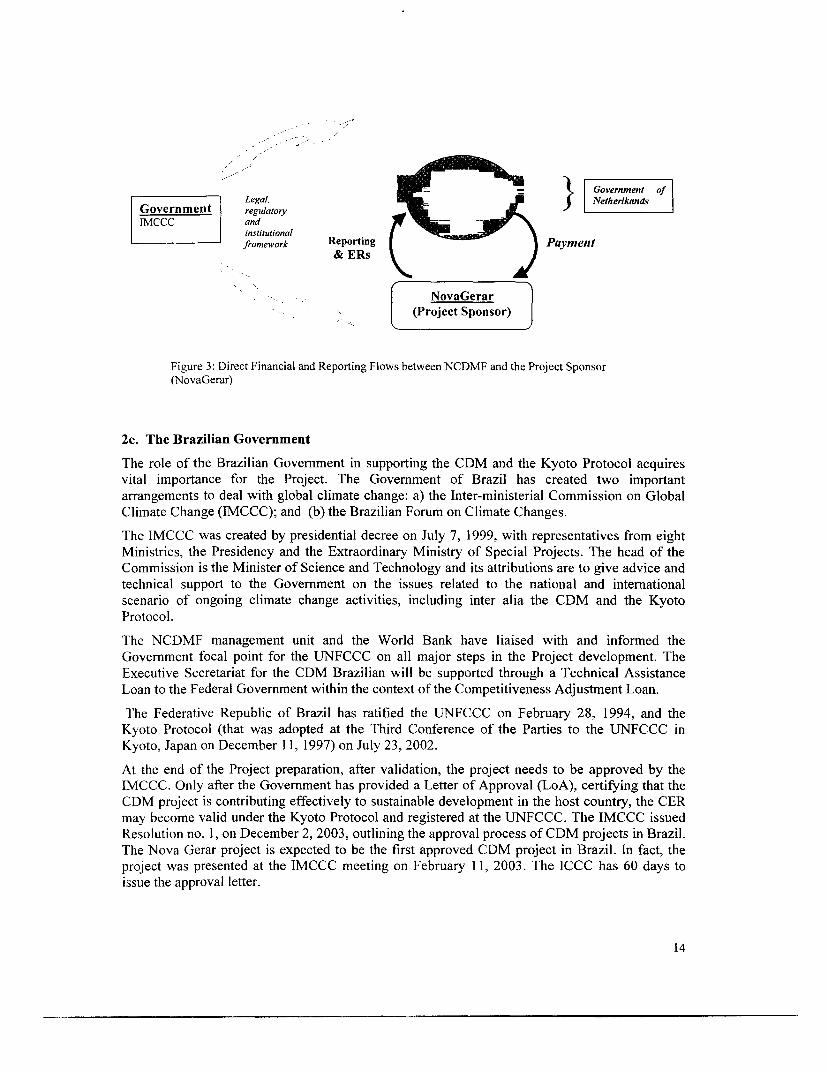
The ER reporting and financial flows between NovaGerar and NCDMF/The World Bank areshown in Figure 3:
13
/
/~~~~~
Government of
Goverment Legal, NetherikandsGoernment regulatory jA
IMCCC andinstitutional .framework Reporting Payment
& ERs
NovaGerar- -. \ t (Project Sponsor)
Figure 3: Direct Financial and Reporting Flows between NCDMF and the Project Sponsor(NovaGerar)
2c. The Brazilian Government
The role of the Brazilian Government in supporting the CDM and the Kyoto Protocol acquires
vital importance for the Project. The Government of Brazil has created two important
arrangements to deal with global climate change: a) the Inter-ministerial Commission on Global
Climate Change (IMCCC); and (b) the Brazilian Forum on Climate Changes.
The IMCCC was created by presidential decree on July 7, 1999, with representatives from eight
Ministries, the Presidency and the Extraordinary Ministry of Special Projects. The head of the
Commission is the Minister of Science and Technology and its attributions are to give advice and
technical support to the Government on the issues related to the national and international
scenario of ongoing climate change activities, including inter alia the CDM and the Kyoto
Protocol.
The NCDMF management unit and the World Bank have liaised with and informed the
Government focal point for the UNFCCC on all major steps in the Project development. The
Executive Secretariat for the CDM Brazilian will be supported through a Technical Assistance
Loan to the Federal Government within the context of the Competitiveness Adjustment Loan.
The Federative Republic of Brazil has ratified the UNFCCC on February 28, 1994, and the
Kyoto Protocol (that was adopted at the Third Conference of the Parties to the UNFCCC in
Kyoto, Japan on December 11, 1997) on July 23, 2002.
At the end of the Project preparation, after validation, the project needs to be approved by the
IMCCC. Only after the Government has provided a Letter of Approval (LoA), certifying that the
CDM project is contributing effectively to sustainable development in the host country, the CER
may become valid under the Kyoto Protocol and registered at the UNFCCC. The IMCCC issued
Resolution no. 1, on December 2, 2003, outlining the approval process of CDM projects in Brazil.
The Nova Gerar project is expected to be the first approved CDM project in Brazil. In fact, the
project was presented at the IMCCC meeting on February 11, 2003. The ICCC has 60 days to
issue the approval letter.
14
2d. Deal Structure
2d.1 Main actors and arrangements
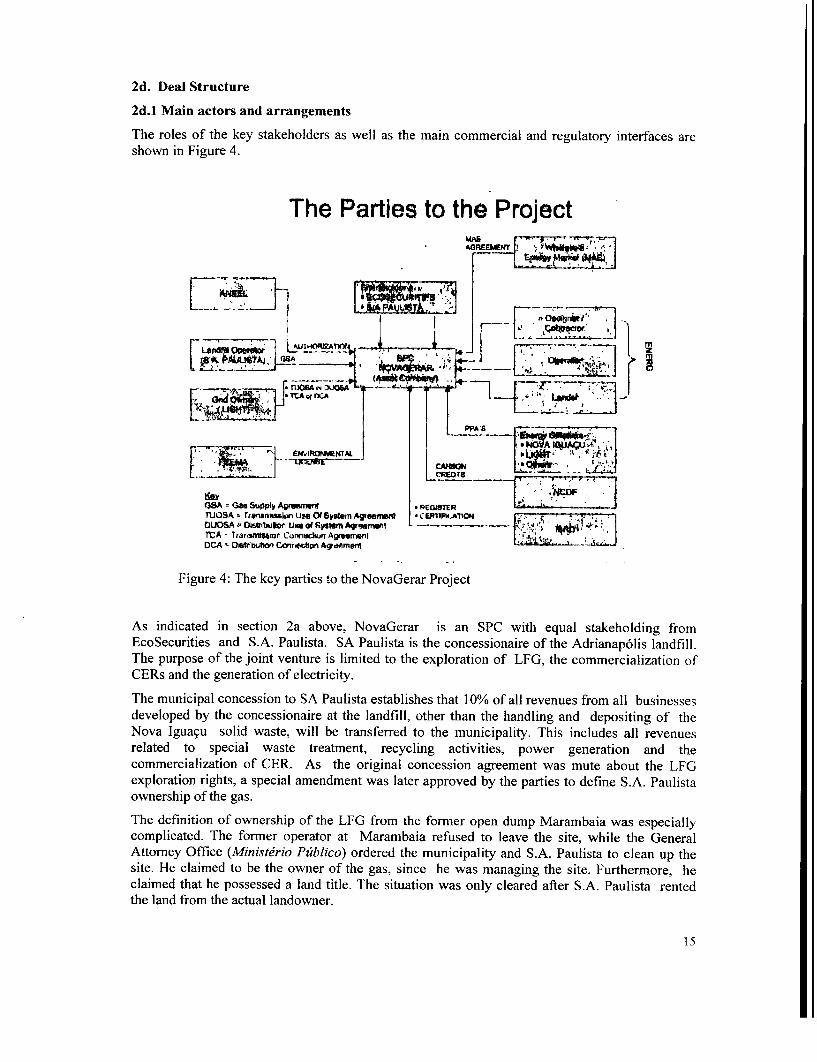
The roles of the key stakeholders as well as the main commercial and regulatory interfaces areshown in Figure 4.
The Parties to the ProjectMAe r'1T' j-V
AGREEEH wa'-
Len.." ~ ~ ~ ~ ~ _ 0EMf __ - i
! 11G R . w 7 y~~~~~~~P' L~~~~~~TAor MA
G3SA Gas SupplIy * Pg8PGTERTUOSA a Trrnsbnmk-i, Use OF System Agbesnw? * ElmFIKtATION .DLJOSA aDtinbub Use d System A.riW1t .-i io<i- iTCA - Trarsriwsnir Connacb Agrwemeril . aDCA I Dstrbuibt Cor'ectlan Acy&AmeM , _:_
Figure 4: The key parties to the NovaGerar Project
As indicated in section 2a above, NovaGerar is an SPC with equal stakeholding fromEcoSecurities and S.A. Paulista. SA Paulista is the concessionaire of the Adrianap6lis landfill.The purpose of the joint venture is limited to the exploration of LFG, the commercialization ofCERs and the generation of electricity.
The municipal concession to SA Paulista establishes that 10% of all revenues from all businessesdeveloped by the concessionaire at the landfill, other than the handling and depositing of theNova Igua,u solid waste, will be transferred to the municipality. This includes all revenuesrelated to special waste treatment, recycling activities, power generation and thecommercialization of CER. As the original concession agreement was mute about the LFGexploration rights, a special amendment was later approved by the parties to define S.A. Paulistaownership of the gas.
The definition of ownership of the LFG from the former open dump Marambaia was especiallycomplicated. The former operator at Marambaia refused to leave the site, while the GeneralAttomey Office (Minist&rio Pzublico) ordered the municipality and S.A. Paulista to clean up thesite. He claimed to be the owner of the gas, since he was managing the site. Furthermore, heclaimed that he possessed a land title. The situation was only cleared after S.A. Paulista rentedthe land from the actual landowner.
15
According to final negotiations, NovaGerar will sign agreements with two EnerG subsidiaries for
leasing and operation of the gas collection devices and the power plants. Biogas Technology
Limited will be responsible to design, supply, install and commission the equipments for the gas
collection system, gas transmission system and flaring, and then operate such systems. Natural
Power Limited will designe supply, install and commission the power generation plants in the
sites of Marambaia and Adrianopolis, and then operate them. The contracts will have the same
duration as the ERPA agreement with the World Bank (i.e. December 2012). A scrow account
will receive the payments for the carbon credits, which will first satisfy the NovaGerar
obligations to EnerG. The remainder will be transferred to NovaGerar.
The leasing and administration contracts will include a fixed payment and a variable payment
based on output. Main features of these contracts are given below under item 2d.3. In summary,
NovaGerar will be paying EnerG about US$ 36 per MWh of electricity output sold from the sites,
plus 25% of the project gross margin (EBITDA). This overall price is considered high, but may
be deemed acceptable considering the complex scope of responsibilities assumed by EnerG.
Most of the business risks are being shared between the Companies, since (i) the payments related
to the electricity production are linked to the electricity sale and the sum of the payments cannot
exceed the annual net revenues of the project; and (ii) for the flaring activity, the payments
include a share in the carbon revenues and business profitability.
The advantages of a leasing contract with EnerG are (i) a technology transfer to Brazil from a
very experienced LFG operator which reduces the performance risk substantially, (ii) a low risk
operation for Nova Gerar and its leasing partner, EnerG, due to payments in hard currency
guaranteed by the ERPA, (iii) the assurance of a prompt start of activities, once the ERPA is
signed, and iv) NovaGerar, being a low capital and debt-averse SPC is not required to deploy
financial resources for up-front investment.
The commercial arrangements for the sale of the energy produced by NovaGerar have not beenfinalized. Currently, NovaGerar is analyzing several options, including purchase power
agreements with LIGHT (the local distribution company), and sale of part of the energy to Nova
Igua,u to satisfy the municipality own needs. One of the most promising options as an off-taker
of NovaGerar's power output is ELETROBRAS, which has the legal responsibility of
establishing long term PPAs with renewable-based generators under the PROINFA. Althoughthe final conditions and guidelines are not clear yet, it is expected that ELETROBRAS will enter
into long term obligations (20 years) with three clusters of renewable sources of energy, including
wind, small hydro and biogas. The energy price will be established in advance. Producers will
compete based on location, technical capability, limits by state, availability of supply for each
source of energy, and other factors.
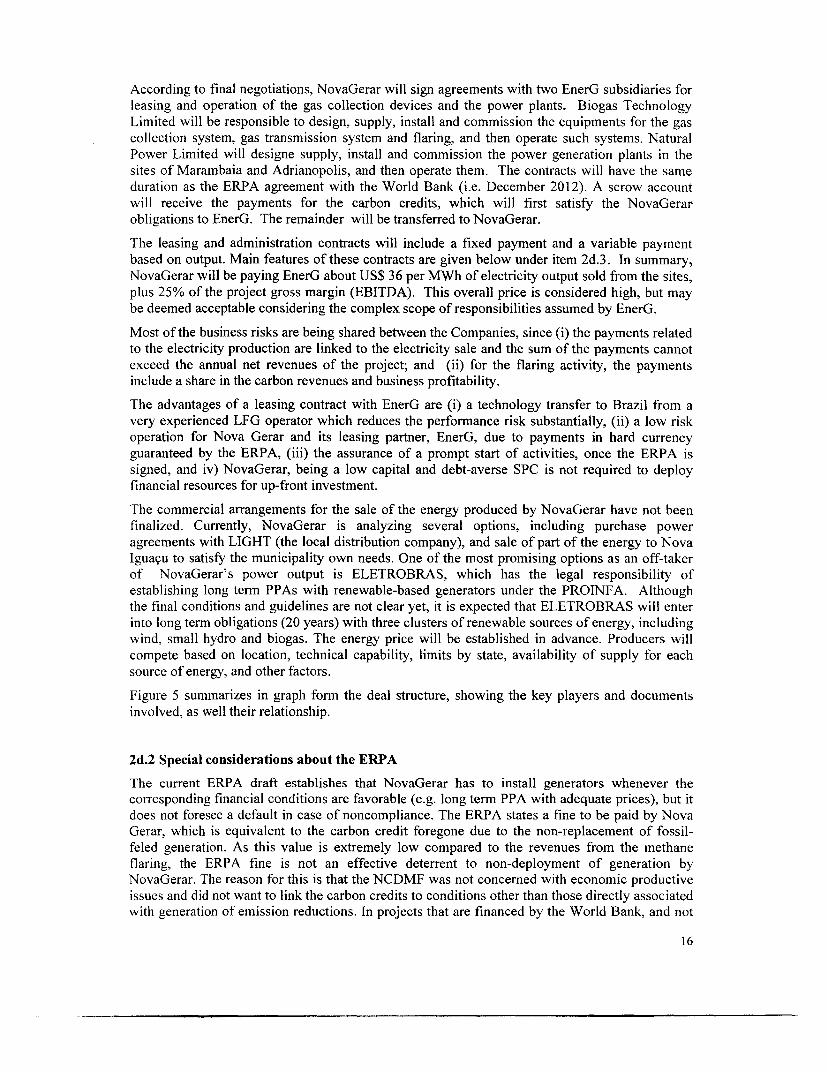
Figure 5 summarizes in graph form the deal structure, showing the key players and documents
involved, as well their relationship.
2d.2 Special considerations about the ERPA
The current ERPA draft establishes that NovaGerar has to install generators whenever the
corresponding financial conditions are favorable (e.g. long term PPA with adequate prices), but it
does not foresee a default in case of noncompliance. The ERPA states a fine to be paid by Nova
Gerar, which is equivalent to the carbon credit foregone due to the non-replacement of fossil-
feled generation. As this value is extremely low compared to the revenues from the methane
flaring, the ERPA fine is not an effective deterrent to non-deployment of generation by
NovaGerar. The reason for this is that the NCDMF was not concerned with economic productive
issues and did not want to link the carbon credits to conditions other than those directly associated
with generation of emission reductions. In projects that are financed by the World Bank, and not
16
intermediated for a Carbon Purchaser, more effective conditions would have been chosen toenforce energy generation.
The ERPA is deemed as the financial guarantee for the leasing contract between EnerG andNovaGerar, whose signature for this reason is only contemplated after the ERPA signature.Therefore, the Project activities can only be implemented after the ERPA signature as well and nocertified ERs will be generatated before that.
; z , l- I . -- , d I ];H
Figure 5: Contractual Structure for the NovaGerar Project
2.d.3 Main aspects of the contrats between NovaGerar and EnerG
For the gas and flaring systems, EnerG will charge NovaGerar a fixed sum of £4,250 per monthcommencing in 2005, plus a percentage share of the gross Emission Reductions income dueunder the World Bank contract, according to the schedule in the table below. Amounts areexclusive of relevant taxes payable (i.e. the above amounts will be paid grossed up to addallowance for all applicable taxes).
1 7
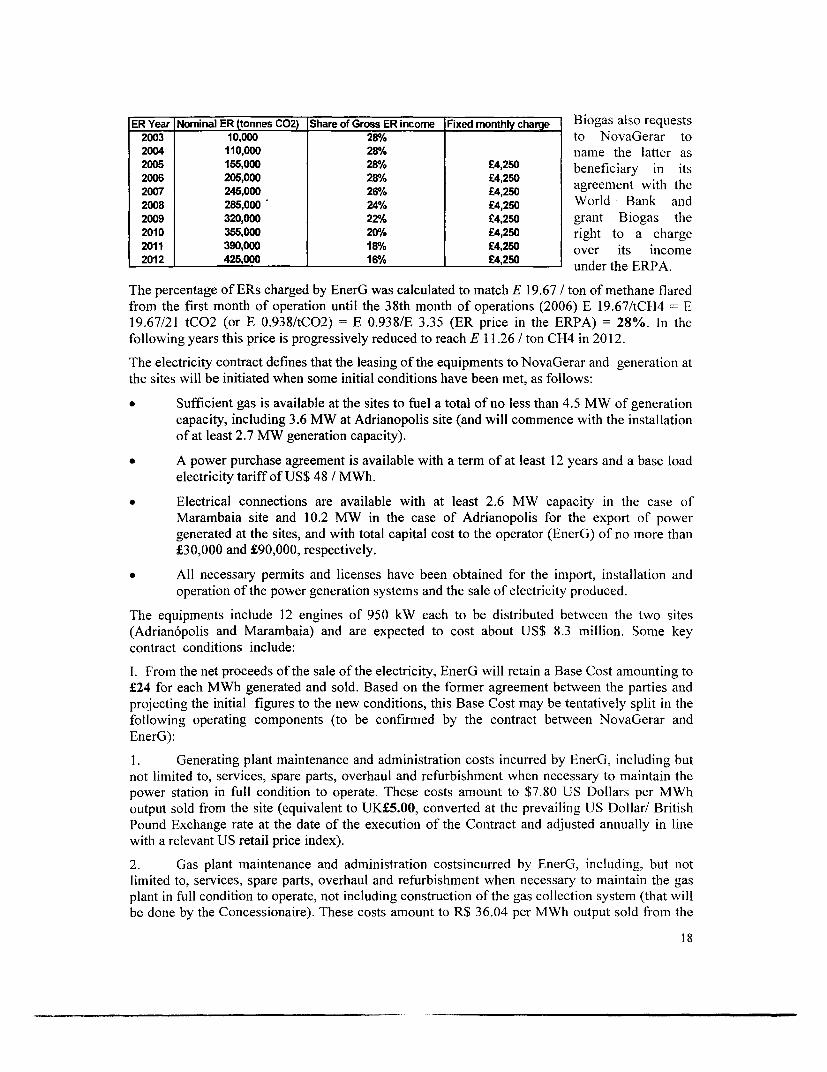
ER Year Nominal ER (tonnes C02) Share of Gross ER income Fixed monthly charge Biogas also requests
2003 10,000 28%0y to NovaGerar to2004 110,000 28% name the latter as2006 166,000 28% £4,260 beneficiary in its
2006 205,000 28% £4250 agreement with the2007 245,000 26% £4,260
2008 285,000 24% £4,250 World Bank and
2009 320,000 22%/o £4,250 grant Biogas the
2010 355,000 20°/o £4,250 right to a charge
2011 390,000 18%/0 £4,250 over its income
2012 425,000 160/0 £4,250 under the ERPA.
The percentage of ERs charged by EnerG was calculated to match E 19.67 / ton of methane flared
from the first month of operation until the 38th month of operations (2006) E 19.67/tCH4 = E
19.67/21 tCO2 (or E 0.938/tCO2) = E 0.938/E 3.35 (ER price in the ERPA) = 28%. In the
following years this price is progressively reduced to reach E 1 1.26 / ton CH4 in 2012.
The electricity contract defines that the leasing of the equipments to NovaGerar and generation at
the sites will be initiated when some initial conditions have been met, as follows:
* Sufficient gas is available at the sites to fuel a total of no less than 4.5 MW of generation
capacity, including 3.6 MW at Adrianopolis site (and will commence with the installation
of at least 2.7 MW generation capacity).
* A power purchase agreement is available with a term of at least 12 years and a base load
electricity tariff of US$ 48 / MWh.
* Electrical connections are available with at least 2.6 MW capacity in the case of
Marambaia site and 10.2 MW in the case of Adrianopolis for the export of power
generated at the sites, and with total capital cost to the operator (EnerG) of no more than
£30,000 and £90,000, respectively.
* All necessary permits and licenses have been obtained for the import, installation and
operation of the power generation systems and the sale of electricity produced.
The equipments include 12 engines of 950 kW each to be distributed between the two sites
(Adrian6polis and Marambaia) and are expected to cost about US$ 8.3 million. Some key
contract conditions include:
I. From the net proceeds of the sale of the electricity, EnerG will retain a Base Cost amounting to
£24 for each MWh generated and sold. Based on the former agreement between the parties and
projecting the initial figures to the new conditions, this Base Cost may be tentatively split in the
following operating components (to be confirmed by the contract between NovaGerar and
EnerG):
1. Generating plant maintenance and administration costs incurred by EnerG, including but
not limited to, services, spare parts, overhaul and refurbishment when necessary to maintain the
power station in full condition to operate. These costs amount to $7.80 US Dollars per MWh
output sold from the site (equivalent to UK£5.00, converted at the prevailing US Dollar/ British
Pound Exchange rate at the date of the execution of the Contract and adjusted annually in line
with a relevant US retail price index).
2. Gas plant maintenance and administration costsincurred by EnerG, including, but not
limited to, services, spare parts, overhaul and refurbishment when necessary to maintain the gas
plant in full condition to operate, not including construction of the gas collection system (that will
be done by the Concessionaire). These costs amount to R$ 36.04 per MWh output sold from the
18
sites (equivalent to UK£7.00 GPB, converted at the prevailing rate of exchange rate at the date ofthe execution of the Contract and adjusted annually in line with a relevant Brazilian retail priceindex.).
3. Capital recovery cost incurred by EnerG in equipment, construction and connection ofthe power plants and gas collection systems (if any) to be recovered in 15 years from the start ofoperation of each engine, set at UK£12.00 per MWh output sold from the sites. These costs arebased on the taxes being limited to:
a) Import Tax = 3%
b) IPI- Tax on industrial products = 5%
c) ICMS- VAT = 18%
d) FRMM = 0,25% on freight
e) Warehouse= 1% of CIF value for 10 days
f) Other= 1,5%
Note: a), b), and c) apply in cascade.
These costs will be adjusted annually in line with the relevant UK retail price index until it hasbeen agreed by both parties that full capacity has been installed on the site. Also, the above ratewill also be adjusted to take account of any variation in the tax rates listed above or the inclusionor removal of any new duties.
II. In addition to the above-mentioned base cost, the EnerG will also charge 25% of the P&LNet Income from the sale of electricity after deduction of any direct cost of selling / exploring theelectricity (e.g. network connection or use of system charges, etc.) and EnerG base cost.
Other relevant agreements include:
j * NovaGerar will name EnerG as one of beneficiaries in the ERPA for directly receivingpayments in UK£ related to Capital Recovery.
l * These payments should not exceed the combined amount raised through the sale ofCarbon Credits and the Net Revenue from electricity sales in a given year.
2e. Process for Inclusion of Additional Projects
The Umbrella Project is set up to facilitate the inclusion of other projects in addition toNovaGerar centered around Adrian6polis. With the approval of the Umbrella Project, it isexpected that initially two additional projects will be processed. Additional projects can beadded to the Umbrella as they are submitted and processed by December 31, 2005. All additionalprojects have to be located in the Rio de Janeiro metropolitan area and executed by the sameproject sponsor. They do not need to be financed by the same CF instrument, being open forother CF instruments managed by the World Bank. The process and further criteria for inclusionof additional projects are as follows:
Project selection criteria
Consistent with the project selection criteria and project cycle for the World Bank Carbon Funds,additional projects have to meet the following requisites:
19
The additional project clearly passes the additionality test as provided for by the Baseline
Methodology developed for the NovaGerar Project and subsequently approved by the
CDM executive board for use in similar projects (identification number AM0003;
All World Bank Group Safeguards Policies (on Environmental Assessment, Natural
Habitats, Involuntary Resettlement, etc.) have to be complied with;
Subprojects should have undergone an appropriate bidding procedure or any other
applicable due process required by Brazilian law, that sets up the project sponsor as the
concessionaire of the landfill and the owner of the LFG to be explored, and
documentation to this effect is provided to the World Bank;
Under this special arrangement, in addition to the project selection and portfolio criteria specified
in the relevant carbon fund's instrument, preference will be given to projects where:
Required licenses, concessions, permits, etc, have been obtained;
Clear and measurable environmental and social benefits can be created in addition to the
Emission Reductions;
Power Purchase Agreement (PPA) is in place based on generation of electricity using the
LFG;
Debt, leasing and/or equity finance for the additional project will be in place such that
financial closure can be attained by the time the ERPA is negotiated.
An Environmental Impact Assessment (EIA) has been prepared and approved by
FEEMA and by The World Bank; and
An operational license has been emitted by FEEMA to operate the landfill and the gas
collection.
Due diligence and appraisal
A Project Concept Note (PCN) will be prepared for each additional project and submitted to the
World Bank's Carbon Fund Unit and to the relevant sector leader and task manager for review
and subsequent required approval and clearances as per the relevant Carbon Fund's Instrument
and by the Project Concept Note meeting. Upon approval and clearance, funds will be authorized
to undertake standard World Bank technical, economic, financial, legal and environmental/social
due diligence on each additional project. In addition, a Project Design Document and a
Monitoring Protocol will be prepared for each additional project. Based on the results of the due
diligence and the above documents, the Carbon Fund Manager may agree with the regional Task
Team Leader on the inclusion of an additional project in the Umbrella Project. The Task Team
Leader will then send a memo to the Country Director, describing the additional project and
recommending its inclusion in the Umbrella. Once the Country Director approves and the
additional project has been independently validated to meet all UNFCCC criteria, it can be
included in the Umbrella Project as an annex to the Project Appraisal Document.
3. Benefits and target population
The main social and environmental impacts of this project will be a positive effect on health and
amenity in the areas where the dumpsites are located. Contaminated leachate and surface run-off
from landfills can affect down-gradient ground and surface water quality, thus adversely
20
affecting the local environment. The uncontrolled release of landfill gas can also impactnegatively on the health of the local environment and the local population and lead to risks ofexplosions in the local surroundings. By properly managing the Marambaia and Adrian6polissites, the environmental health risks and the potential for explosions is greatly reduced. TheProject will also have a small, but positive impact on employment in the local area as a number ofstaff will need to be recruited to manage the landfill gas sites.
Economic benefits include the project acting as a clean technology demonstration project,encouraging less dependency on grid-supplied electricity and better management of landfillsthroughout Brazil, which could be replicated across LAC. The nature of the model - landfill gasto power generation - is of enormous significance to the Brazilian waste management sector,municipalities, public banks and relevant federal and state programs..
The NovaGerar Project will also play an important demonstration effect, illustrating the use of anew financial mechanism for funding of the renewable energy sector i.e. the CDM, as it is one ofthe first CDM projects in Brazil and the first CDM project presented to the IMCCC.
A more detailed description of the NovaGerar Project benefits, classified into environmental,socio-economic and economic, is shown as follows.
Environmental Benefits:
Regarding the current precarious waste management situation in Brazil, the Project will generatemany additional environmental benefits:
* By collecting and combusting landfill gas, the project sanitary landfills will reduce bothglobal and local environmental effects of uncontrolled releases.
* Through appropriate and/or improved management of the sites, landfill gas will becaptured and combusted, removing the risks of toxic effects on the local community andlocal environment.
* Although the majority of landfill gas emissions are quickly diluted by the atmosphere, inconfined spaces there is a risk of asphyxiation and/or toxic effects if landfill gas ispresent at high concentrations. Landfill gas also contains over 150 trace components thatcan cause other local and global environmental effects such as odor nuisances,stratospheric ozone layer depletion, and ground-level ozone creation.
* In most cases the waste disposal situation is also precarious. Leachate is directly goinginto the groundwater and small rivers heading to the Guanabara Bay. By providingappropriate management on the site, these potential problems can be avoided.
* Other potential hazards and amenity impacts minimized by appropriate management ofthe landfill sites include the risks of fire or explosions, landfill gas migration, dust, odor,pests, vermin, unsightliness and litter, each of which may occur on-site or off-site.
* Appropriate management of the landfill sites will also decrease the risk of landslide onthe sites, thus reducing risks to employees and surrounding population.
* Where landfill gas utilization schemes, such as the NovaGerar Project, are developed incountries like Brazil, there is also an opportunity to promote best practices to improvelandfill management standards, and contribute towards global sustainable development.
21
Social Benefits:
* The project will have a positive impact on amenity and the communities in the local area.
Contaminated leachate and surface run-off from landfills can affect down-gradient
ground and surface water quality, and have secondary impacts on the local environment
and health of the local population. The uncontrolled release of landfill gas can also lead
to risks of explosions in the local surroundings. By managing the Marambaia and
Adrian6polis landfill sites properly, the health risks and the potential for explosions is
greatly reduced.
* The project will also have a small, but positive impact on employment in the local area as
a number of staff will need to be recruited to manage the landfill gas sites. As a condition
to the license granted by the Municipality of Nova Igua,u, the project will donate 10% of
the electricity generated on-site to this city, to provide equivalent lighting for local
schools, hospitals and other public buildings.
* The project aims to promote capacity building seminars demonstrating best practices in
waste management and contract - so far illegal workers - legally.
General Economic Benefits:
* CDM attracts additional foreign investment into the country, with a positive effect on
Brazil's balance of payment.
* The multiplier effect of this investment is likely to bring additional benefits such as
increased employment opportunities, in the area where the project is located.
* The Project will create a sustainable revenue stream of hard currency revenues, therefore
mitigating the exchange risk (the fact that a significant part of the costs are in US$, while
most revenues are in local currency), currently one of the major roadblocks for power
system expansion in Brazil.
* The Project increases diversity and security of electricity supply, one of the clear
objectives of the Government as spelled out by Law 10,428/2002.
* The Project will act as a clean technology demonstration project, encouraging less
dependency on grid-supplied electricity and better management of landfills throughout
Brazil which could be replicated across the region. The CDM demonstrates that carbon
finance can turn a financially unattractive or marginally attractive activity into a
profitable operation.
* The Project will play an important demonstration effect, illustrating the use of a new
financial mechanism for funding of the renewable energy sector, namely the CDM.
In terms of target population, the Project will have a positive impact on a local basis, as far as
environment and quality of life are concerned. It will also marginally benefit the entire population
of the country, as it provides additional capacity to be made available to the power grid.
D. PROJECT RATIONALE
1. Project alternatives considered and reasons for rejection
DI. Basis for project selection for carbon finance in Brazil
22
Waste Management Projects in Brazil: The World Bank Carbon Finance unit intends topromote a series of waste management projects in major Brazilian cities, with the objective to theeradication of open dumps and create additional social, environmental and economic benefitsThe overall strategic objective in all those projects is to improve the waste management practices,reduce the GHG emissions and use methane gas for energy generation. Several projects are beingscreened for further operations. The decision on how many waste management projects will beincluded in the carbon finance program will not only depend on the technical quality of theproposal (baseline, environmental and technical soundness) but also on the availability ofinvestment capital provided by the investors and on environmental and social additionalities.In January, 2004, a LFG collection to power generation project was launched in Bandeirantes,Sao Paulo, one of the biggest n Brazil. A generation capacity of 22MW was installed by apublic/private joint venture sharing investment costs and revenues. Power is purchased by aprivate bank, Unibanco, to a price above the market level and receives in return. It is expectedthat this undertaking will apply for qualification as a CDM project in the near future.Another example is the landfill in the city of Salvador, based on a long term concession to theFrench private company VEGA. The landfill was originally financed by a loan from the WorldBank. The VEGA landfill started to receive waste in 2001. A CDM project was prepared and alsoapproved by the methpanel. The objective of the project is in principle similar to NovaGerar'sbut it is not yet certain whether it will generate electricity, due to the uncertainties about thePROINFA.
There are roughly more than 100 potential waste management sites with potential to receivecarbon finance, more than half of these sites include open dumps. In order to qualify for thecarbon market, a minimum of landfill gas has to be available or has to be generated, which willeffectively rule out municipalities of less than 200,000 inhabitants. Another condition is a clearinstitutional setting on operational responsibilities and ownership of waste and gas. Initially, theNovaGerar Project based on the Adrian6polis & Marambaia complex was found to be at anadvanced stage of development and meet the basic criteria set forth by the Kyoto Protocol.According to these criteria, technical qualifications and investors' willingness to develop areimportant determinants for eligibility.
NCDMF elijibilitv criteria: The Project was also selected on the basis of NCDF's eligibilitycriteria. The NCDF funds projects in the framework of Article 12 (CDM) of the Kyoto Protocol.As per the terms of the Agreement, NCDMF projects should be located in Non-Annex I Countries(Annex I countries are listed in the UN Climate Convention) which have (i) signed and ratified,accepted, approved or acceded to the Kyoto Protocol, or (ii) signed the Kyoto Protocol anddemonstrated a clear interest in becoming a party thereto in due time, for example those that havealready started or are on the verge of starting their national ratification, acceptance or approvalprocess or (iii) already started or are at the verge of starting the national accession process. Brazilmeets the criteria under (i) as it is a non-Annex I Country as per the UN Climate Convention andlhas ratified the Kyoto Protocol.
Cost-effectiveness and sustainability play a major role in selection and approval of NCDFprojects. Projects are drawn from a broad range of technologies and processes in energy, industry,and transport, which provide various vehicles for generating ER, which contribute to sustainabledevelopment and achieve transfer of cleaner and more efficient technology to Host Countries.VROM ranks technologies in the following descending order: (i) renewable energy technology,such as geothermal, wind, solar, and small-scale hydro-power; (ii) clean, sustainably-grownbiomass (no waste); (iii) energy efficiency improvement; (iv) fossil fuel switch and methanerecovery; and (v) sequestration.
Additionalitv The most important Kyoto Protocol requirement for CDM projects is that"reductions in emissions are additional to any that would occur in the absence of the certified
23
project activity." This environmental additionality of the project is assessed against a baseline,
which describes what would happen without the proposed project.
The landfill gas projects are based on the collection and utilization of landfill gas, which is
currently released in an uncontrolled manner. This will lead to reductions of landfill gases rich in
methane, a highly potent GHG, and potential reductions of GHG emissions associated with the
use of fossil fuels used for generation of electricity. The collection and reduction of landfill gases
would not occur without the Project involvement.
The NovaGerar Project for use of landfill gas clearly exceeds the requirements of Brazilian
regulations, since it ensures that landfills are managed according to the latest environmental
standards, and aiming at collecting the highest amount of landfill gases. This represents an
unprecedented investment in this type of activity in Brazil. Currently, there is neither policy nor
regulatory framework in Brazil determining that a certain quantity of methane should be flared or
combusted and used for power generation. National and State regulations will be checked
periodically, as part of the Monitoring Plan for the Project, to guarantee that the Project maintains
the additionality as required by the Kyoto Protocol.
In the case of power generation, it demonstrates that the current situation for small scale power
producer is very risky due to low energy sales prices to be achieved in the market. This would
prevent private investors to go ahead with using methane gas for energy generation, since it is not
the most economic way to produce energy. In parallel to the risks related to power sales, there are
further entrepreneurial risks, such as the uncertainty of the amount of landfill gas available over
the years and the performance of the plant. Given that there is not a single landfill site in Brazil
generating electricity, this is seen as 'unproven' technology by local investors.
The additional value derived from the sale of carbon credits appears to increase the Project's
financial returns to a level sufficient to justify the inherent risks associated with long-term
investment decisions and capital allocation for landfill gas collection systems and electricity
generation equipment.
The NovaGerar baseline study confirmed the eligibility and viability of the proposed project.
Particularly, the study (i) confirmed the environmental additionality of the project, and (ii)
estimated the quantity of ER that the project is expected to generate by reducing methane
emissions and fossil fuel replacement on the energy market.
The baseline approach adopted for the NovaGerar project is, in accordance with the CDM rules,
the scenario that represents "emissions from a technology that represents an economically
attractive course of action, taking into account barriers to investment". The NovaGerar Project
circumstances permit the use of a simplified financial analysis to determine the baseline scenario.
The proposed project involves a significant investment in power generation that must compete
with other such investments. It is therefore appropriate to assume that the decision between
alternative baseline scenarios is based on an investment return assessment. The methodology
involves an analysis of the economic attractiveness of the project alternative without the revenue
from carbon credits using an IRR calculation and comparison of the results with a reasonable
expected return on investment in Brazil. The results show that the project is not an economically
attractive course of action. The only other plausible scenario is continued non-utilization of
landfill gas. This scenario is determined as the baseline scenario based on an analysis of current
practices and current and foreseeable regulations in the waste management sector.
D.2 Identify comparable CDM/JI projects financed by the World Bank Carbon Finance
instruments or others / Lessons learned and reflected in proposed project design
Waste management projects considered by the World Bank Carbon Finance unit include projects
in Argentina, Bolivia, India, Mexico, and South Africa under different stages of development.24
(i) While it is not related to waste management, it is relevant to mention the Plantar project, thefirst Brazilian CDM project signed by the PCF (September 5, 2002). Plantar aims to replace cokeby charcoal from renewable and certified sources in the pig iron sector. The project also involvesa forestry component (21,000 ha of certified Eucalyptus plantations and 487 ha of cerradoforests) and a component which aims to reduce methane during the carbonization process ofcharcoal. The project is one of the most complex and first of-a-kind projects with several lessonslearned on how to manage finance risks related to a CDM project, adopt CDM related projectmethodology, improve stakeholder consultation processes and conduct projects under changingrules related to the Kyoto Protocol.
(ii) The first waste management project in operation supported by the World Bank Carbon Fundsis located in Monterrey, Mexico. The Simeprodeso landfill was established on a greenfield sitewith a total landfill area of 212 ha. Since operation began in September , 1990, the landfill hasbeen taking mostly non-hazardous domestic and commercial waste as well as some non-hazardous hospital and industrial waste. This landfill currently receives 750 trucks daily,corresponding to approximately 4,500 tons of municipal solid waste. In 2003, the total wastedisposed reached 1.6 million tons. The 44 ha cell, from which the biogas is collected, was filledwith 7.7 million tons of waste between 1991 and 1999, at which time it was filled and cappedwith clay. The landfill continues to accept waste and is expanding to fill other cells in the 212 hasite. The ultimate installed generation capacity on the site is & MW, and the plant is currentlygenerating energy.
(iii) A landfill gas to energy project in Latvia in the city of Liepaja has been fully negotiated andwill start operations shortly. The monitoring methodology used in the Latvia Liepaja project isdirectly replicated in the NovaGerar Monitoring Plan.
(iv) A landfill CDM project, currently being developed in Durban, South Africa, involves thecollection of LFG and the generation of power in three landfills within the urban area of the city.The design and baseline are very similar to the NovaGerar project. In comparison to theBrazilian project, the Durban project receives not only credits for the destruction of methane butalso for the replacement of C02 by the generation of power, due to South Africa's high relianceon coal generation. The Durban project has not been yet approved, due to the pending disclosureof the Environmental and Social Assessment. The main project landfill -Bisassar Road- is thebiggest in Africa and has communities living in its immediate surroundings. It is expected thatthe CDM project will essentially mitigate the main cause for dissatisfaction of the neighbors(odor) by collecting and destroying the LFG. In the Durban case, the Prototype Carbon Fundintends to set up a separate community fund, created with a contribution of US$ 0.30 per ton ofC02e out of the CER sold by the project, to finance small scale community projects in theneighborhood.
25
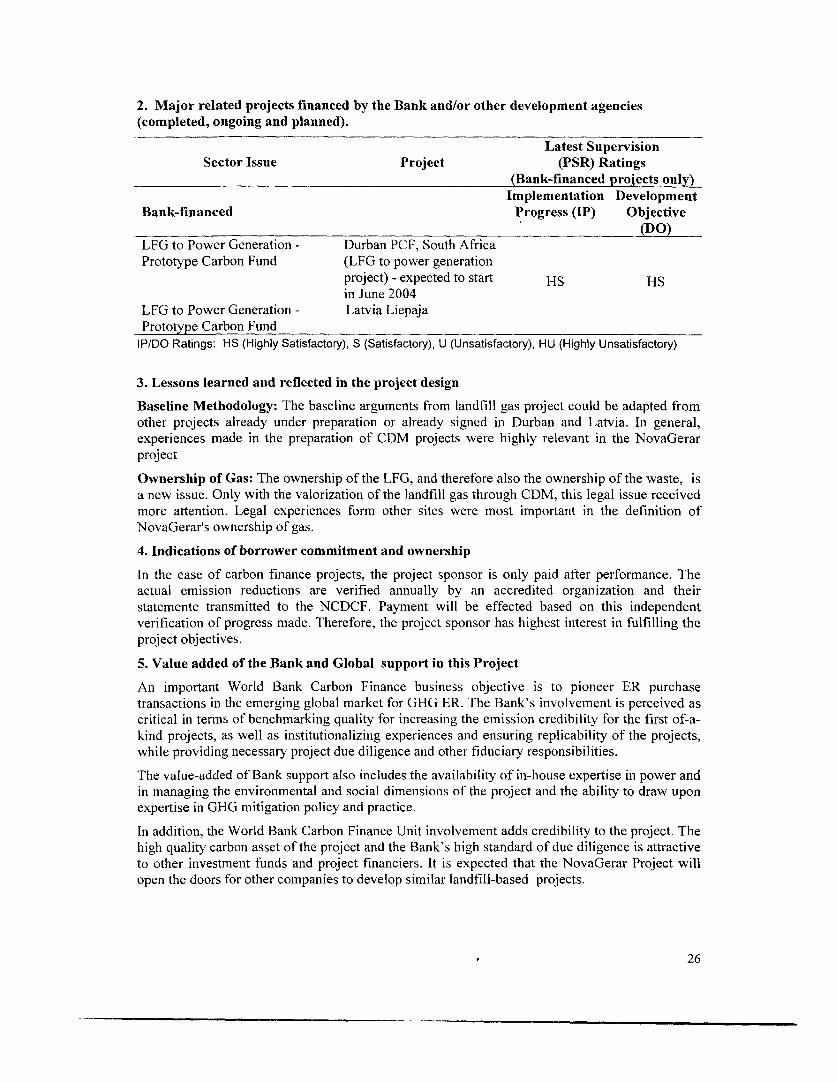
2. Major related projects financed by the Bank and/or other development agencies
(completed, ongoing and planned).
Latest Supervision
Sector Issue Project (PSR) Ratings(Bank-financed projects only)
Implementation Development
Bank-financed Progress (IP) Objective(DO)
LFG to Power Generation - Durban PCF, South Africa
Prototype Carbon Fund (LFG to power generationproject) - expected to start HS HS
in June 2004
LFG to Power Generation - Latvia Liepaja
Prototype Carbon Fund
P/DO Ratings: HS (Highly Satisfactory), S (Satisfactory), U (Unsatisfactory), HU (Highly Unsatisfactory)
3. Lessons learned and reflected in the project design
Baseline Methodology: The baseline arguments from landfill gas project could be adapted from
other projects already under preparation or already signed in Durban and Latvia. In general,
experiences made in the preparation of CDM projects were highly relevant in the NovaGerar
project
Ownership of Gas: The ownership of the LFG, and therefore also the ownership of the waste, is
a new issue. Only with the valorization of the landfill gas through CDM, this legal issue received
more attention. Legal experiences form other sites were most important in the definition of
NovaGerar's ownership of gas.
4. Indications of borrower commitment and ownership
In the case of carbon finance projects, the project sponsor is only paid after performance. The
actual emission reductions are verified annually by an accredited organization and their
statemente transmitted to the NCDCF. Payment will be effected based on this independent
verification of progress made. Therefore, the project sponsor has highest interest in fulfilling the
project objectives.
5. Value added of the Bank and Global support in this Project
An important World Bank Carbon Finance business objective is to pioneer ER purchase
transactions in the emerging global market for GHG ER. The Bank's involvement is perceived as
critical in terms of benchmarking quality for increasing the emission credibility for the first of-a-
kind projects, as well as institutionalizing experiences and ensuring replicability of the projects,
while providing necessary project due diligence and other fiduciary responsibilities.
The value-added of Bank support also includes the availability of in-house expertise in power and
in managing the environmental and social dimensions of the project and the ability to draw upon
expertise in GHG mitigation policy and practice.
In addition, the World Bank Carbon Finance Unit involvement adds credibility to the project. The
high quality carbon asset of the project and the Bank's high standard of due diligence is attractive
to other investment funds and project financiers. It is expected that the NovaGerar Project will
open the doors for other companies to develop similar landfill-based projects.
26
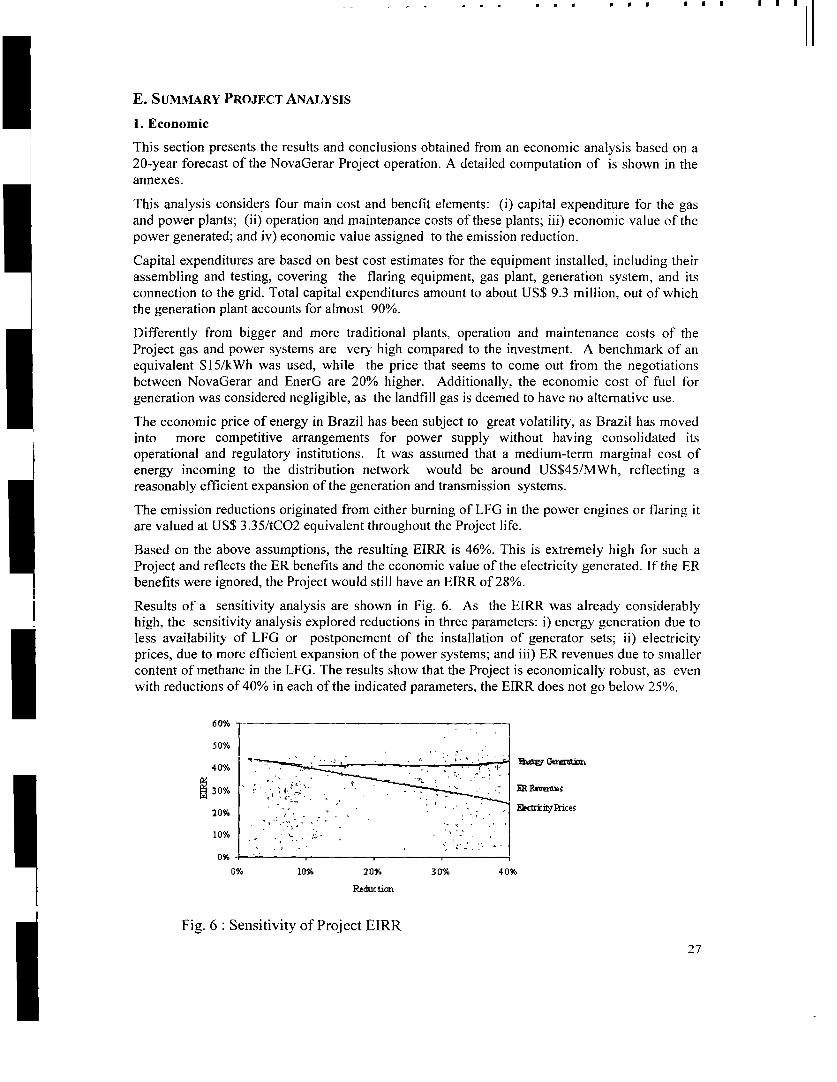
E. SUMMARY PROJECT ANALYSIS
1. Economic
This section presents the results and conclusions obtained from an economic analysis based on a20-year forecast of the NovaGerar Project operation. A detailed computation of is shown in theannexes.
This analysis considers four main cost and benefit elements: (i) capital expenditure for the gasand power plants; (ii) operation and maintenance costs of these plants; iii) economic value of thepower generated; and iv) economic value assigned to the emission reduction.Capital expenditures are based on best cost estimates for the equipment installed, including theirassembling and testing, covering the flaring equipment, gas plant, generation system, and itsconnection to the grid. Total capital expenditures amount to about US$ 9.3 million, out of whichthe generation plant accounts for almost 90%.
Differently from bigger and more traditional plants, operation and maintenance costs of theProject gas and power systems are very high compared to the investment. A benchmark of anequivalent $15/kWh was used, while the price that seems to come out from the negotiationsbetween NovaGerar and EnerG are 20% higher. Additionally, the economic cost of fuel forgeneration was considered negligible, as the landfill gas is deemed to have no alternative use.The economic price of energy in Brazil has been subject to great volatility, as Brazil has movedinto more competitive arrangements for power supply without having consolidated itsoperational and regulatory institutions. It was assumed that a medium-term marginal cost ofenergy incoming to the distribution network would be around US$45/MWh, reflecting areasonably efficient expansion of the generation and transmission systems.The emission reductions originated from either burning of LFG in the power engines or flaring itare valued at US$ 3.35/tCO2 equivalent throughout the Project life.Based on the above assumptions, the resulting EIRR is 46%. This is extremely high for such aProject and reflects the ER benefits and the economic value of the electricity generated. If the ERbenefits were ignored, the Project would still have an EIRR of 28%.Results of a sensitivity analysis are shown in Fig. 6. As the EIRR was already considerablyhigh, the sensitivity analysis explored reductions in three parameters: i) energy generation due toless availability of LFG or postponement of the installation of generator sets; ii) electricityprices, due to more efficient expansion of the power systems; and iii) ER revenues due to smallercontent of methane in the LFG. The results show that the Project is economically robust, as evenwith reductions of 40% in each of the indicated parameters, the EIRR does not go below 25%.
60% T
50%
40% ,
30% g 30% ' ~~~~~~ ' ' ' ~~~~ EZecm]iyvrices
_ o~~~~~~~2%10%
0%
0% 10% 20% 30% 4 0%Peeautio
Fig. 6: Sensitivity of Project EIRR
27
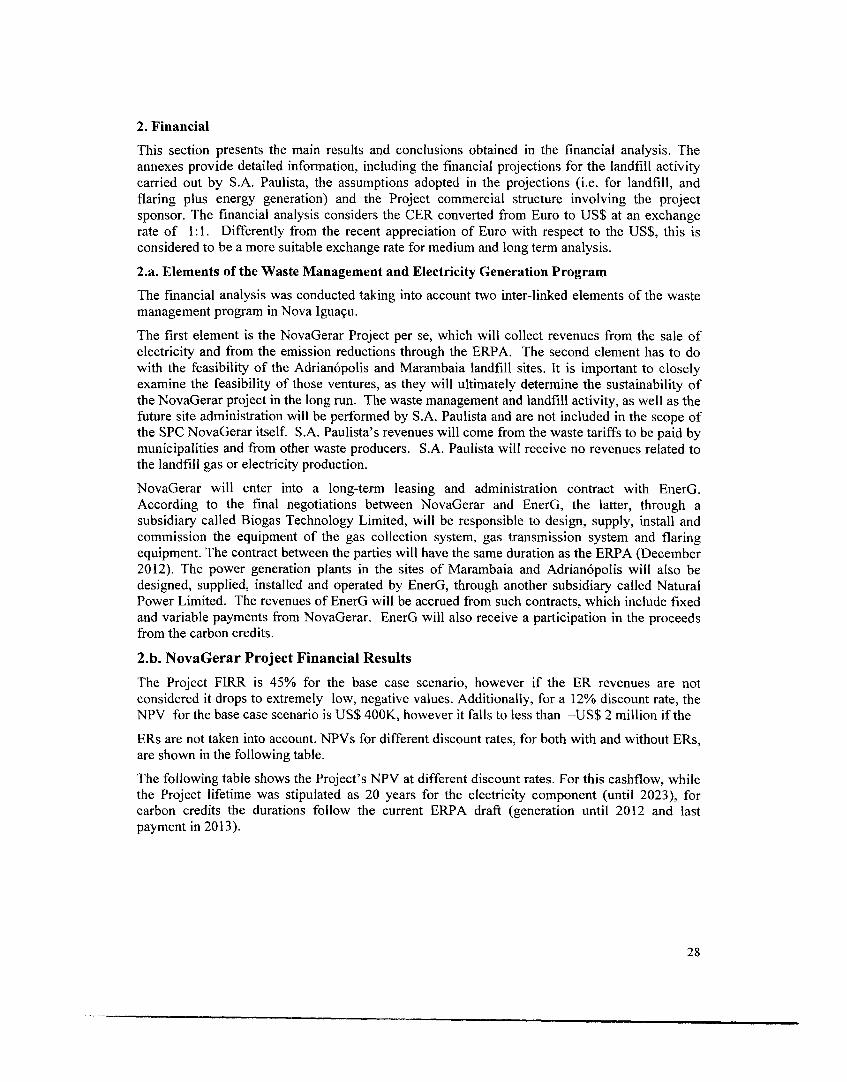
2. Financial
This section presents the main results and conclusions obtained in the financial analysis. The
annexes provide detailed information, including the financial projections for the landfill activity
carried out by S.A. Paulista, the assumptions adopted in the projections (i.e. for landfill, and
flaring plus energy generation) and the Project commercial structure involving the project
sponsor. The financial analysis considers the CER converted from Euro to US$ at an exchange
rate of 1:1. Differently from the recent appreciation of Euro with respect to the US$, this is
considered to be a more suitable exchange rate for medium and long term analysis.
2.a. Elements of the Waste Management and Electricity Generation Program
The financial analysis was conducted taking into account two inter-linked elements of the waste
management program in Nova Igua9u.
The first element is the NovaGerar Project per se, which will collect revenues from the sale of
electricity and from the emission reductions through the ERPA. The second element has to do
with the feasibility of the Adrian6polis and Marambaia landfill sites. It is important to closely
examine the feasibility of those ventures, as they will ultimately determine the sustainability of
the NovaGerar project in the long run. The waste management and landfill activity, as well as the
future site administration will be performed by S.A. Paulista and are not included in the scope of
the SPC NovaGerar itself. S.A. Paulista's revenues will come from the waste tariffs to be paid by
municipalities and from other waste producers. S.A. Paulista will receive no revenues related to
the landfill gas or electricity production.
NovaGerar will enter into a long-term leasing and administration contract with EnerG.
According to the final negotiations between NovaGerar and EnerG, the latter, through a
subsidiary called Biogas Technology Limited, will be responsible to design, supply, install and
commission the equipment of the gas collection system, gas transmission system and flaring
equipment. The contract between the parties will have the same duration as the ERPA (December
2012). The power generation plants in the sites of Marambaia and Adrian6polis will also be
designed, supplied, installed and operated by EnerG, through another subsidiary called Natural
Power Limited. The revenues of EnerG will be accrued from such contracts, which include fixed
and variable payments from NovaGerar. EnerG will also receive a participation in the proceeds
from the carbon credits.
2.b. NovaGerar Project Financial Results
The Project FIRR is 45% for the base case scenario, however if the ER revenues are not
considered it drops to extremely low, negative values. Additionally, for a 12% discount rate, the
NPV for the base case scenario is US$ 400K, however it falls to less than -US$ 2 million if the
ERs are not taken into account. NPVs for different discount rates, for both with and without ERs,
are shown in the following table.
The following table shows the Project's NPV at different discount rates. For this cashflow, while
the Project lifetime was stipulated as 20 years for the electricity component (until 2023), for
carbon credits the durations follow the current ERPA draft (generation until 2012 and last
payment in 2013).
28
The same Table 2 also __ ____ __shows that even | RR -- * % 002 ccvering electiitylos 1assuming the 7000% 10Q0% ielectricity tariff at o 00US$ 48/MWh, 3 60.00% - iM 90.0%requested by EnerG in > 50.00% -0.0%
70.0%order to start installing . 60X0% -.the engines the 0 000%
0~ ~ ~ ~ ~~~~~~~~~~~~00electricity component 3o *.%. 400systematically 2000%/ 300%produces yearly _ 0 . .. . . 20.0%losses. The following iu 10.00% -graph illustrates the s2 0.00% - 0.0%impact of carboncredits on the Project.Even considering a Ž _ _ _
favorable electricity tariff of US$ 48/MWh, it would be necessary to resort to 22% of the ERrevenues to avert losses in the energy generation. The significant amount of ER revenues until2013 not only offsets the financial losses due to the electricity production, but also lead toconsiderable profits, thus assuring a sizable FIRR for the whole Project during its entire lifetime.Alternatively, with no ER revenues, a tariff increase to US$ 51 /MWh would be required to enablethe generation component to breakeven.
Main results from the sensitivity analysis are described below and portrayed in the annexes.
As expected, the Project feasibility is extremely dependent on the amount of ERs, which in turnare a direct consequence of the incremental landfill gas production. Therefore, in order to have asafety cushion on evaluating that feasibility, the ERs are estimated very conservatively. Thisnotwithstanding, reducing the ER payments by only 10% causes a drop in the FIRR from 45% to35% and in the NPV of some 40% to a level of US$ 240K.
The generation output goes in opposite direction to the FIRR. For instance, a reduction of theelectricity output by 50%, increases the FIRR further to 57%, and correspondingly the NPV toover US$ 560K. If however the generation installation and output are kept as in the base casescenario, a 16% tariff reduction to US$ 40/MWh would cause the FIRR to of the tariff to.
Finally, keeping the same amount of engines and assuring the same electricity generation, furtherreductions in the energy tariffs would materially jeopardize the project, who would keep the samelevel of obligations with EnerG, and need more ERs to subsidize the electricity losses. Byreducing the energy tariffs to US$ 40 / MWh (i.e. about 16% reduction over the US$ 48 / MWhin the base scenario), the Project FIRR to become negative and the NPV fall to less than -US$ 1.5million.
2.c Conclusions
* The overall financial evaluation of the Project is deemed positive
* The profitability of the land filling activity and the healthy situation of S.A. Paulistaguarantee the continuity of the gas supply for the methane flaring and electricity generation.
* The administration of the flaring and energy systems is being done by an experiencedinternational company (EnerG). The risk and profit sharing taken by this company results in ahigher commitment to the success of the Project. Even at an extreme scenario, the projectprofitability clause of step in rights provided by NovaGerar in case of commercial default,assures the continuity of the project and the generation of ERs.
29
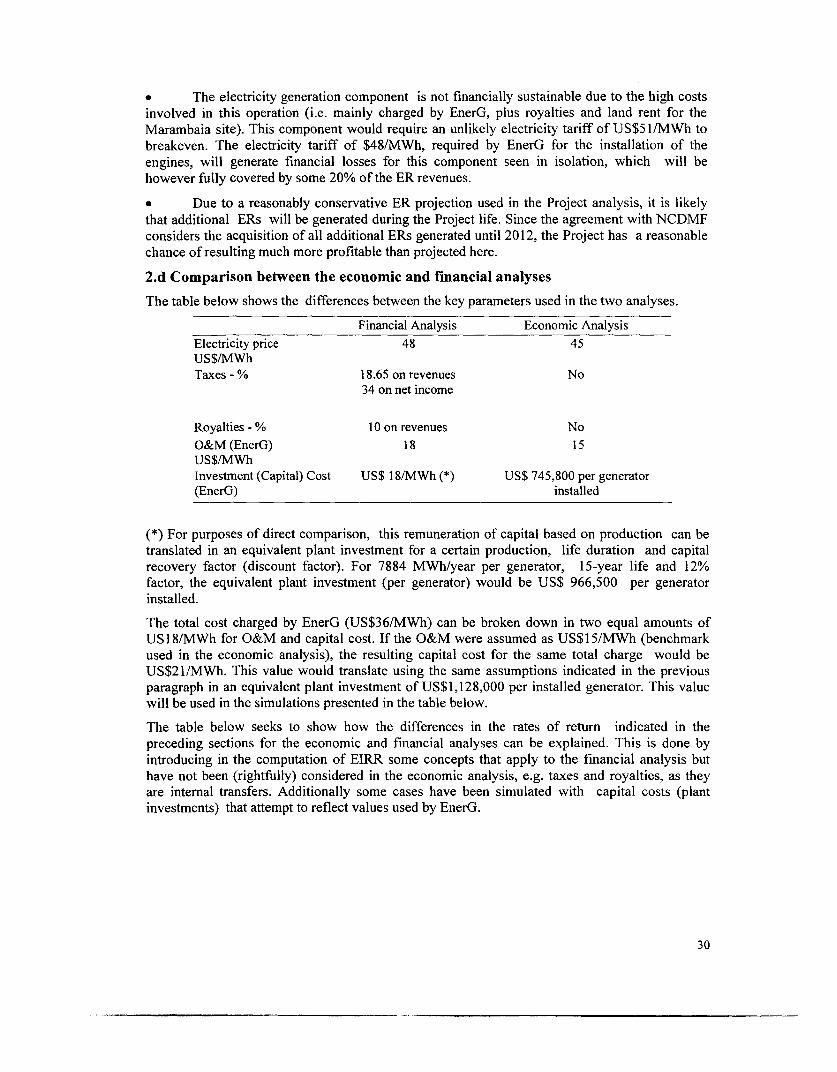
* The electricity generation component is not financially sustainable due to the high costs
involved in this operation (i.e. mainly charged by EnerG, plus royalties and land rent for the
Marambaia site). This component would require an unlikely electricity tariff of US$51/MWh to
breakeven. The electricity tariff of $48/MWh, required by EnerG for the installation of the
engines, will generate financial losses for this component seen in isolation, which will be
however fully covered by some 20% of the ER revenues.
* Due to a reasonably conservative ER projection used in the Project analysis, it is likely
that additional ERs will be generated during the Project life. Since the agreement with NCDMF
considers the acquisition of all additional ERs generated until 2012, the Project has a reasonable
chance of resulting much more profitable than projected here.
2.d Comparison between the economic and financial analyses
The table below shows the differences between the key parameters used in the two analyses.
Financial Analysis Economic Analysis
Electricity price 48 45
US$/MWhTaxes - % 18.65 on revenues No
34 on net income
Royalties - % 10 on revenues No
O&M (EnerG) 18 15
US$/MWhInvestment (Capital) Cost US$ 18/MWh (*) US$ 745,800 per generator
(EnerG) installed
(*) For purposes of direct comparison, this remuneration of capital based on production can be
translated in an equivalent plant investment for a certain production, life duration and capital
recovery factor (discount factor). For 7884 MWh/year per generator, 15-year life and 12%
factor, the equivalent plant investment (per generator) would be US$ 966,500 per generator
installed.
The total cost charged by EnerG (US$36/MWh) can be broken down in two equal amounts of
US 1 8/MWh for O&M and capital cost. If the O&M were assumed as US$15/MWh (benchmark
used in the economic analysis), the resulting capital cost for the same total charge would be
US$21/MWh. This value would translate using the same assumptions indicated in the previous
paragraph in an equivalent plant investment of US$1,128,000 per installed generator. This value
will be used in the simulations presented in the table below.
The table below seeks to show how the differences in the rates of return indicated in the
preceding sections for the economic and financial analyses can be explained. This is done by
introducing in the computation of EIRR some concepts that apply to the financial analysis but
have not been (rightfully) considered in the economic analysis, e.g. taxes and royalties, as they
are internal transfers. Additionally some cases have been simulated with capital costs (plant
investments) that attempt to reflect values used by EnerG.
30
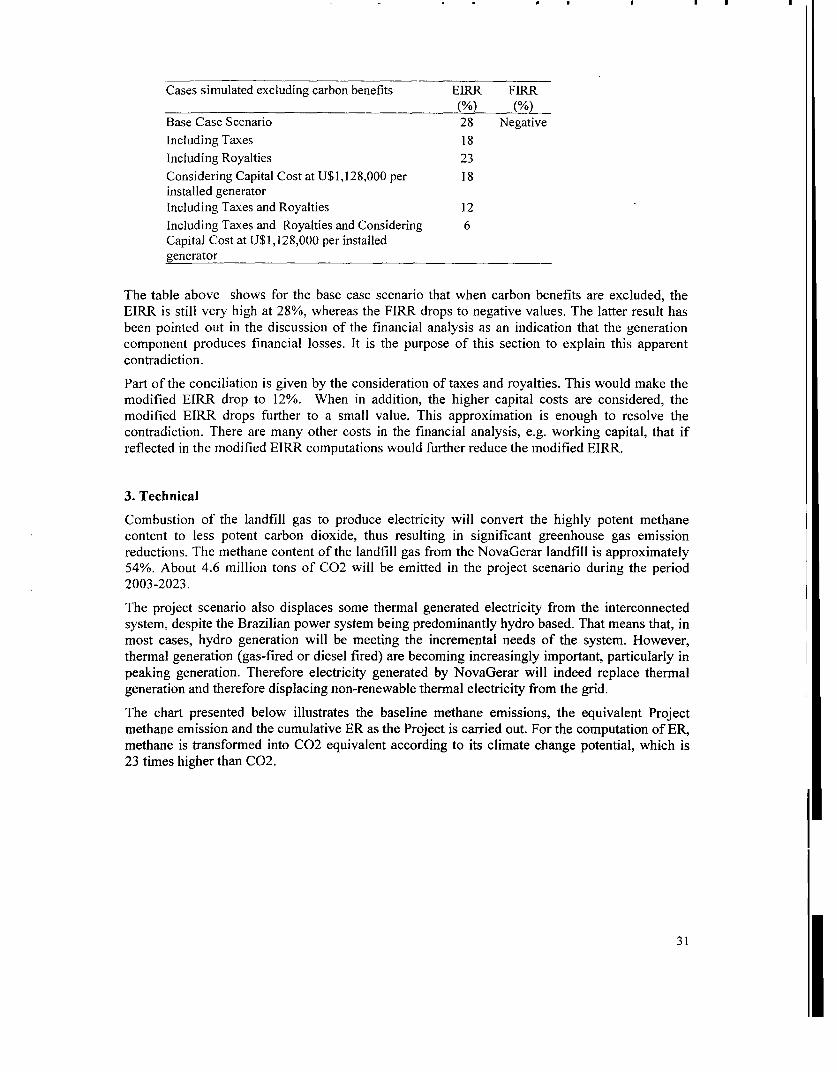
Cases simulated excluding carbon benefits EIRR FIRR
(%) (%)Base Case Scenario 28 NegativeIncluding Taxes 18Including Royalties 23Considering Capital Cost at U$1,128,000 per 18installed generatorIncluding Taxes and Royalties 12Including Taxes and Royalties and Considering 6Capital Cost at U$1,128,000 per installedgenerator
The table above shows for the base case scenario that when carbon benefits are excluded, theEIRR is still very high at 28%, whereas the FIRR drops to negative values. The latter result hasbeen pointed out in the discussion of the financial analysis as an indication that the generationcomponent produces financial losses. It is the purpose of this section to explain this apparentcontradiction.
Part of the conciliation is given by the consideration of taxes and royalties. This would make themodified EIRR drop to 12%. When in addition, the higher capital costs are considered, themodified EIRR drops further to a small value. This approximation is enough to resolve thecontradiction. There are many other costs in the financial analysis, e.g. working capital, that ifreflected in the modified EIRR computations would further reduce the modified EIRR.
3. Technical
Combustion of the landfill gas to produce electricity will convert the highly potent methanecontent to less potent carbon dioxide, thus resulting in significant greenhouse gas emissionreductions. The methane content of the landfill gas from the NovaGerar landfill is approximately54%. About 4.6 million tons of C02 will be emitted in the project scenario during the period2003-2023.
The project scenario also displaces some thermal generated electricity from the interconnectedsystem, despite the Brazilian power system being predominantly hydro based. That means that, inmost cases, hydro generation will be meeting the incremental needs of the system. However,thermal generation (gas-fired or diesel fired) are becoming increasingly important, particularly inpeaking generation. Therefore electricity generated by NovaGerar will indeed replace thermalgeneration and therefore displacing non-renewable thermal electricity from the grid.
The chart presented below illustrates the baseline methane emissions, the equivalent Projectmethane emission and the cumulative ER as the Project is carried out. For the computation of ER,methane is transformed into C02 equivalent according to its climate change potential, which is23 times higher than C02.
31
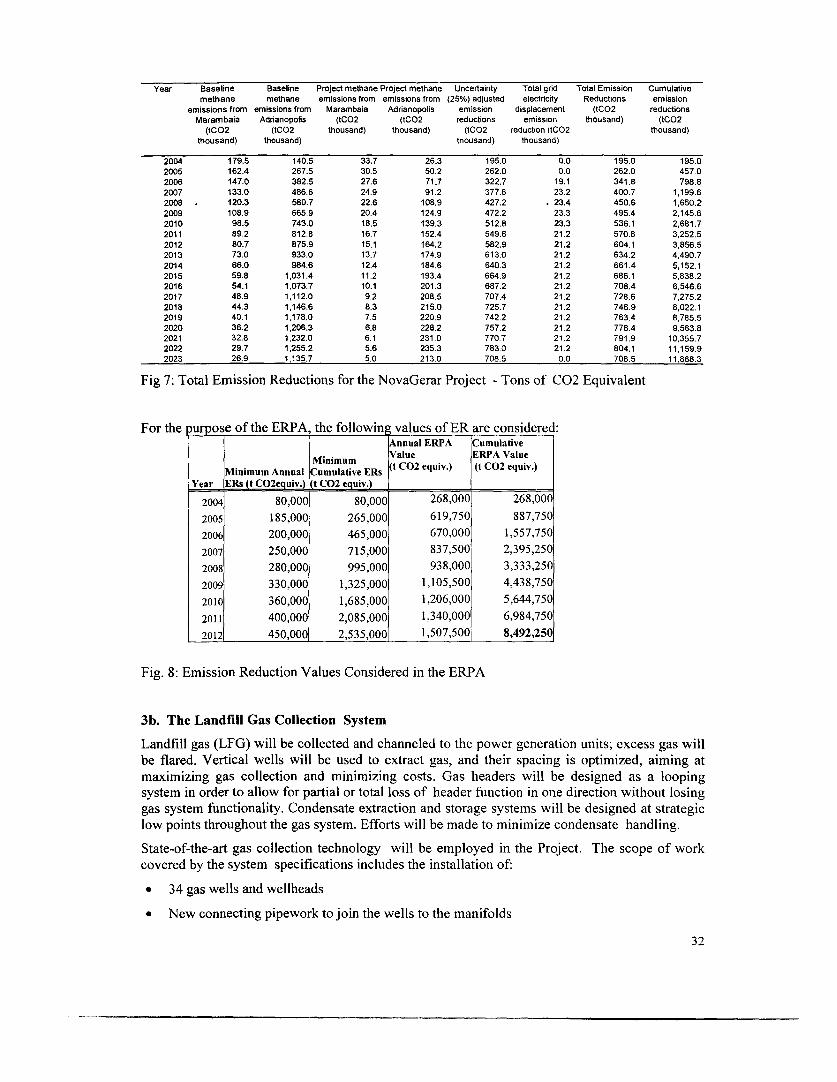
Year Baseline Baseline Project methane Project methane Uncertainty Total grid Total Emission Cumulative
methane methane emissions from emissions from (25%) adjusted electricity Reductions emission
emissions from emissions from Marambaia Adrianopolis emission displacement (tCO2 reductions
Marambaia Adrianopolis (tCO2 (tCO2 reductions emission thousand) (tCO2
(tC02 (tCO2 thousand) thousand) (tCO2 reduction (tCO2 thousand)
thousand) thousand) thousand) thousand)
2004 179.5 140.5 33.7 26.3 195.0 0.0 195.0 195.0
2005 162.4 267.5 30.5 50.2 262.0 0.0 262.0 457.0
2006 147.0 382.5 27.6 71.7 322.7 19.1 341.8 798.8
2007 133.0 486.6 24.9 91.2 377.6 23.2 400.7 1,199.6
2008 120.3 580.7 22.6 108.9 427.2 . 23.4 450.6 1,650.2
2009 108.9 665.9 20.4 124.9 472.2 23.3 495.4 2,145.6
2010 98.5 743.0 18.5 139.3 512.8 23.3 536.1 2,681.7
2011 89.2 812.8 16.7 152.4 549.6 21.2 570.8 3,252.5
2012 80.7 875.9 15.1 164.2 582.9 21.2 604.1 3,856.5
2013 73.0 933.0 13.7 174.9 613.0 21.2 634.2 4,490.7
2014 66.0 984.6 12.4 184.6 640.3 21.2 661.4 5,152.1
2015 59.8 1,031.4 11.2 193.4 664.9 21.2 686.1 5,838.2
2016 54.1 1,073.7 10.1 201.3 687.2 21.2 708.4 6,546.6
2017 48.9 1,112.0 9.2 208.5 707.4 21.2 728.6 7,275.2
2018 44.3 1,146.6 8.3 215.0 725.7 21.2 746.9 8,022.1
2019 40.1 1,178.0 7.5 220.9 742.2 21.2 763.4 8,785.5
2020 36.2 1,206.3 6.8 226.2 757.2 21.2 778.4 9,563.8
2021 32.8 1,232.0 6.1 231.0 770.7 21.2 791.9 10,355.7
2022 29.7 1,255.2 5.6 235.3 783.0 21.2 804.1 11,159.9
2023 26.9 1,135.7 5.0 213.0 708.5 0.0 708.5 11,868.3
Fig 7: Total Emission Reductions for the NovaGerar Project - Tons of C02 Equivalent
For the purpose of the ERPA, the followin values of ER are considered:Annual ERPA Cumulative
Minimum Value ERPA Value
Minimum Annual Cumulative ERs (t C02 equiv.) (t C02 equiv.)
Year ERs (t C02equiv.) t C02 equiv.)
2004 80,000 80,000 268,000 268,000
2005 185,000 265,000 619,750 887,750
2006 200,000 465,000 670,000 1,557,750
2007 250,000 715,000 837,500 2,395,250
2008 280,000 995,000 938,000 3,333,250
2009 330,000 1,325,000 1,105,500 4,438,750
2010 360,000 1,685,000 1,206,000 5,644,750
2011 400,000 2,085,000 1,340,000 6,984,750
2012 450,000 2,535,000 1,507,500 8,492,250
Fig. 8: Emission Reduction Values Considered in the ERPA
3b. The Landfill Gas Collection System
Landfill gas (LFG) will be collected and channeled to the power generation units; excess gas will
be flared. Vertical wells will be used to extract gas, and their spacing is optimized, aiming at
maximizing gas collection and minimizing costs. Gas headers will be designed as a looping
system in order to allow for partial or total loss of header function in one direction without losing
gas system functionality. Condensate extraction and storage systems will be designed at strategic
low points throughout the gas system. Efforts will be made to minimize condensate handling.
State-of-the-art gas collection technology will be employed in the Project. The scope of work
covered by the system specifications includes the installation of:
* 34 gas wells and wellheads
* New connecting pipework to join the wells to the manifolds
32
* 4 manifolds
* Gas main to connect the manifolds to the flare
* 4 pumped knockout pots
* Pneumatic condensate pumping system, comprising pneumatic pumps, air line, dischargelines and compressor.
* Condensate pumping system, comprising pneumatic pumps, air line, discharge lines andcompressor
* Secure housing for compressor and refrigerator unit.
* Ground flare and flare compound
In Marambaia, a total of 34 vertical wells will be installed, in addition to those already necessaryfor and planned in the closure process of the dump. The destruction and utilization of methanefor power generation is expected to end in 2011 in Marambaia .
In Adrian6polis, the landfill is divided in four sections. The first landfill section started receivingwaste in February 2003. According to the executive plan the life time of this section is expectedto be 5 years. After this period, waste will be deposited in the next section. Vertical wells areconstructed already during the filling of the sections, as planned in the executive plans andexpanded according to the height of the waste levels. It was estimated that enough gas would beaccumulated to start extraction and flaring after 200 operational days.
The sections are divided in three sub-sections. After one year, the first subsection will be closedand waste will go the next subsection. When the first subsection is closed, gas extraction canbegin. The distance between the wells will depend on the shape, volume, quality and height, andwill be determined by cost-benefit evaluations.
The flares, to be installed in parallel with the generator sets (or even before, according to thefeasibility of power generation) will be 2000 m3/hour Modular Ground Gas Flares. The flaresemploy a biogas technology design and will be skid or base frame mounted ground flares. Theburner unit is fully adjustable to enable high temperature flaring of the landfill gas, which willvary in both quality and quantity from site to site, and over time. The unit is comprised ofmultiple stainless steel burner nozzles mounted onto a pedestal which supports the flare stack andhouses the primary and secondary air supply ductwork. Manual and actuated louvers are providedto control the air supply and manual valves in the pipe work to control the gas supply.
3c. Power generation
In addition to the benefits derived from ER by burning methane in its power plants, the Projectalso displaces grid electricity from the Southeastern Brazilian grid. Given the uncertainty aboutthe evolution of the Brazilian generation system, these benefits cannot be predicted with a highdegree of confidence. This notwithstanding, and to have an order of magnitude estimate, it isconsidered that over the Project period of 21 years, such electricity replacement would yield ERof approximately 400,000 tCO2. This compares with nearly 12 million tCO2 from ER generatedby burning the methane in Marambaia and Adrian6polis.
The Project will be connected to the grid, but because of its size, (< 50MW) it will likely be self-dispatched by NovaGerar. Physical interconnection to the grid will be discussed with ONS andLight, in terms of cost-effectiveness.
British specialist landfill gas to energy company EnerG, the partner of NovaGerar for the energycomponent, has recommended the use of modular engines. A modular reciprocating enginefacility requires considerably less initial capital expenditure, but does incur higher maintenance
33
costs. Given the inherent uncertainty of gas supply, the smaller modular reciprocating engine
generator units may offer a significant advantage to adapt the equipment to the site-specific gas
volumes. This is because it allows for a small pilot plant to be established at a relatively low cost
and then, if economics and gas volumes support it, a plant expansion can be accomplished with
minimal difficulty. Furthermore, as the gas volumes decrease over time, the modules can be
relocated to other sites.
The overall capacity installed will be 12MW with a maximum energy output of 65,000
MWh/year. Power generation in Marambaia can start from the first year on, because methane gas
is already available for power generation (estimated between 13,000 - 6,000 MWh/year output,
decreasing over seven years). It is expected that Adrian6polis will be able to start generating
energy from the second year on with an electricity output of 25,445MWh/year rising over the
years to 63,613 MWh/year.
3d. Landfill operation
The Marambaia site covers 200,000 m2 and has been operated by a company, other than Paulista
S.A., since 1986. It ceased operation in August 2002. Over 2 million tons of waste are already
deposited in the site, but no waste management, gas collection or wastewater treatment system
were installed by the previous operator. Paulista S.A. will rehabilitate the site, while the
NovaGerar project will install a landfill gas collection system and a drainage system to collect
and treat effluents.
The Adrian6polis site has replaced Marambaia. It occupies an area of 1,200,000 m2, and
commenced operation in February 2003. It is anticipated that it will receive an average of 2,000
tons of municipal waste per day for at least 20 years. This figure may rise to 3,000 to 4,000 tons
per day, but in the interest of conservatism a figure of 2,000 tons per day has been used in the
analyses related to the CDM project. This landfill is being managed according to the latest
technology, which has been sought from specialist American and European waste management
companies, with additional advice provided by EnerG. The bottom of the landfill will be coated
with an impermeable high-density polyethylene membrane and the water residues will be
channeled and treated in a wastewater treatment plant. Landfill gas will be collected by a gas
collection system, and channeled to the electricity generation units. Excess gas will be flared. The
project has already secured all the necessary environmental permits required by the Brazilian law.
Capture and combustion of the landfill gas will effectively result in the avoidance of
approximately 11.6 million tons of C02 emissions over 21 yeas.
The Adrian6polis design comprises all necessary elements for a well managed and protected
landfill and include:
* bottom liner for underground protection;
* compartmentalization of disposed refuse with covering of completed sections;
* construction of leachate drains;
* vertical domes for biogas collection;
* water drains in slopes;
* final covering;
* leachate collection basin;
* monitoring plan.
34
4. Institutional
S.A. Paulista, a Brazilian civil engineering and construction firm, has a 20-year concession fromthe Municipality of Nova Iguacu for the operation of Marambaia and Adrian6polis landfills. Thiscompany and Ecosecurities, an environmental finance company, created a 50-50 joint ventureunder the name of NovaGerar to explore businesses related to the use of the GHG, specially forpower generation. NovaGerar, which is the Project sponsor, has full access to gas produced bythese landfills, whose ownership rights were awarded to Paulista S.A. by the Municipality.
The Municipality of Nova Iguacu receives 10% of all revenues generated by the businessesdeveloped by the Project and the landfills, other than those related to Paulista's handling anddepositing of the Nova Iguacu solid waste.
NovaGerar will sign an agreement with EnerG, a power generation company from UK thatprovides clean energy initiatives, for leasing and operation of the power plants. Therefore, bothS.A. Paulista and Ecosecurities will avoid using their own resources to fund NovaGerar'sinvestment requirements.
The NCDMF, a fund created by the State of the Netherlands, will purchase GHG ER fromNovaGerar. For this purpose, NovaGerar will sign an ERPA with the World Bank, which acts asthe Trustee for the NCDMF, which will permit disbursement against verified and certified ERgenerated by the Project. After the Project's validation by the World Bank and NCDMF, theBrazilian government must provide a Letter of Approval, certifying that the CDM projectcontributes to sustainable development in the country, so that the project will be valid under theKyoto protocol.
4.1 Executing Agencies
NovaGerar, a Special Purpose Company, composed of S.A Paulista and Ecosecurities
4.2 Project Management
NovaGerar
4.3 Procurement Issues
N/A
4.4 Financial Management Issues
N/A
5. Environmental
5.1 Summarize significant environmental issues and objectives and identify keystakeholders. If the issues are still to be determined, describe current or planned efforts todo so.
The primary focus of the Project is the efficient collection of biogas and power generation usingmethane. The Project is expected to (i) reduce methane, a greenhouse gas, by generation ofelectricity from landfill gas, and to (ii) improve the management of municipal waste in themunicipality and is expected to have significant positive benefits notably the protection of theenvironment and human beings through the mitigation of potential risks associated with improperwaste disposal.
The municipality of Nova Iguacu located in the Baixada Fluminense, is one of the most highlypopulated areas in Brazil, with a population of approximately 3 million people. Continuedpopulation growth as a result of migration, has contributed to social tension in the area, and
35
significant environmental degradation from sustained, inappropriate municipal solid waste
disposal practices in the area. Of particular relevance is the significant environmental degradation
of the Guanabara Bay (Baia de Guanabara) over several years. Solid waste disposal in the area
has been largely by uncontrolled, open dumping at the Marambaia dumpsite which received
approximately 600tonnes waste/day over the past 15 years, until its closure in January 2003.
Leachate from the site pollutes the local soil and the adjacent river (Rio Igua,u) which empties
into the Guanabara bay.
To address the problem of inadequate solid waste disposal, the municipality in cooperation with
the Ministry of the Environment, FEEMA and IBAMA (state and federal environmental agencies
respectively) promoted the decommissioning of the Marambaia dumpsite and the construction ofan engineered sanitary landfill at Adrian6polis. The site of the proposed Adrian6polis landfill is
located in the Vila da Cava district, about 1Okm from the city's urban center. A total area of 20ha
of land has been assigned for the construction of the landfill and the energy component. The
areas to be filled are spread out over four main areas in the site and can receive up to 4000-5000
tonnes of waste/day at full capacity. The vegetation in the site and its immediate vicinity is
secondary forest with low biodiversity value. The underlying soil on the site is clayey soil of low
permeability. The site is located within a lOkm radius of the Federal Biological Reserve of
Tingua. Both the Marambaia and Adrian6polis sites have roads leading to them, as such there is
no need for construction of access roads that may interrupt the activities of residents of the nearby
community.
Potential adverse impacts from the energy generation component are noise from the operation of
generators, generation of waste residues (lubricant oils, spent coolant liquid, condensates),
accidents (fires, gas leakages), electric discharges along transmission lines. Although a decision
is yet to be made as to the mode of transmission of energy that will be generated from
Adrian6polis and Marambaia, no resettlement is envisaged as a result of installation of
transmission lines. In the case of Adrian6polis landfill, the site shares a border with a FURNAS
500 kV power substation, and as such any environmental impacts associated with the installation
of the lines are expected to be minor. In the case of the Marambaia site, there is some 600-800
meters between the power substation and the point of connection at Marambaia. In order to
ensure that adequate measures are taken to safeguard people and the environment, the client will
submit any plans, work programs and environmental assessments to the Bank for approval prior
to implementation.
The main impacts associated with the construction of the Adrian6polis landfill have been
identified in a report of study of altematives Estudo Ambiental de Alternativas Locacionais
carried out under the project by the municipal entity responsible for waste management,
EMLURB. Project impacts are associated with construction activities at the sites of the
Adrian6polis sanitary landfill and the Marambaia dump. Main impacts during the construction
phase include (i) loss of vegetation and fauna from clearing of secondary forests for site
preparation; (ii) reduced replenishment of the underlying aquifer; and (iii) other potential impacts
such as construction nuisance including disposal of construction waste, noise, increased traffic,
dust, impacts on other road users. Potential impacts during operations include increased traffic,
odor, noise, litter, visual impacts, health and safety of workers on the site (dealing with healthcare
and municipal waste, operation of sensitive and/or heavy equipment), disposal of solid and liquid
waste streams generated on site. All these impacts are being addressed through environmental
guidelines and targeted mitigation activities.
With respect to the Marambaia dumpsite closure, the environmental impacts are expected to be
largely positive given the deplorable conditions - presence of disease causing vectors, visual
impact, soil and water contamination by leachate, associated with the practice of uncontrolled
open dumping and exposure to risks thereof by scavengers.
36
As with all landfill construction and dump closure projects, potential impacts after site closure
include: (i) fires; (ii) methane migration from the site which if not adequately mitigated could
have severe consequences. Both possibilities are being avoided to the extent possible through
proper planning and targeted mitigation measures.
5.2 What are the main features of the EMP and are they adequate?
Determine whether an environmental management plan (EMP) will be required and its overall
scope, relationship to the legal documents, and implementation responsibilities. For Category B
projects for IDA funding, determine whether a separate EA report is required. What institutional
arrangements are proposed for developing and handling the EMP.
The EA reports incorporate EMPs for the Adrian6polis landfill site, the Marambaia dumpsite
closure and the energy component at both sites. The EA reports identify the responsible entities
for the various mitigation measures. Some of the key features of the EMP are described briefly
below:
Engineering Design
To mitigate the negative environmental impacts of inadequate solid waste disposal, the
engineering designs for the dumpsite closure and construction of the Adrianopolis landfill have
been carried out according to intemationally accepted standards to ensure adequate provision for
waste disposal and protection of the environment. The construction at Marambaia will feature:
(i) Re-shaping of the extemal parts of the landfill to improve slopes and create terraces,
(ii) Construction of a leachate collection and recirculation system,
(iii) Construction of gas collection and flaring system,
(iv) Low-permeability engineered final cover,
(v) Surface runoff drainage,
(vi) Monitoring provision for gas, groundwater, leachate.
The construction of the Adrian6polis landfill features:
(i) Low-permeability basal liner, using high density polyethylene PEAD
(ii) Compartmentalization of disposed refuse with covering of completed sections,
(iii) Leachate collection and treatment system
(iv) Gas collection system,
(v) Surface runoff drainage,
(vi) Low-permeability engineered final cover,
(vii) Monitoring plan
Vegetation Enrichment Plan
To address the loss of vegetation as a result of clearing for construction purposes, the project
sponsor has prepared a vegetation enrichment plan which will involve the reforestation with
native species, of areas cleared during construction activities; restoration of 30ha of degraded
land in the Federal Biological Reserve of Tingua; and planting of a green belt to reduce any
visual impacts of the landfill. A similar vegetation enrichment plan will be embarked upon at the
Marambaia site. At Adrianopolis landfill, the reforestation will also serve to improve water
37
retention around the water spring area. No use of pesticides is envisaged for reforestationactivities. Control of ants (formigas cortadeiras) will be carried out by (i) mechanical methodsinvolving excavation until nests of fungus housing the queen are encountered, for small areas; (ii)cultural methods that involve use of plant species such as Sesamum indicum, Ruta spp andVandalia spp., that possess pest control properties.
Energy generation component
The mitigation plan for the energy generation components will feature measures to address the
following:
(i) Waste management including waste from equipment packaging, waste oils, lubricants,spent coolant, gas condensate
(ii) Noise reduction from the engines
(iii) Safety and security controls to reduce risk of accidents
(iv) Worker protection and safety
(v) Equipment maintenance plan
(vi) Monitoring plan including measurements and documentation of emissions includingmethane; oily wastes, liquid wastes, leaks, accidents
Environmental education program
An auditorium with classrooms will be constructed on-site for the purpose of providing educationby way of lectures and classes to members of the community on environmental protection andmanagement as well as training to site workers.
5.3 For Category A and B projects, timeline and status of EA
Date of receipt of final draft: April 6, 2003
5.4 How have stakeholders benn consulted at the stage of (a) environmental screening and(b) draft EA report on environmental impacts and proposed environment managementplan? Describe mechanisms of consultations that were used and which groups wereconsulted.
How will stakeholders be consulted at the stage of (a) environmental screening and (b) draft EAreport on the environmental impacts and proposed EMP?
Public consultation with stakeholders was conducted in three distinct stages: (i) Prior to theissuance of environmental licences, stakeholder consultation was conducted by the municipalityand the landfill operator, which culminated in an official public hearing in June 2001. Theconcerns of the stakeholders are recorded in the official minutes of the hearing (Ata de AudienciaPzuhlica) kept by FEEMA; (ii) An opinion survey on the remediation of the dumpsite andimplementation of the Adrian6polis landfill with energy generation; and (iii) Interviews andspecific questionnaires for the scavengers (catadores).
Key stakeholders in the consultation process include:
* Municipalities and local institutions (Nova Iguagu and Rio de Janeiro)
* Local NGOs and community groups
* Climate change communities (NGOs, Government institutions)
* Catadores at the Marambaia dumpsite
38
It is important to note that in response to stakeholder concerns the project sponsors among other
actions, agreed to remediate and close the highly polluting Marambaia dumpsite.
A detailed study of alternative locations, Estudo Ambiental de Alternativas Locacionais wascarried out by the municipality prior to selection of the Adrian6polis landfill site. This study was
submitted to IBAMA, the Federal Environmental Agency, in order to obtain an environmental
license because the site is located in the vicinity (under lOkm) of the Federal Biological Reserve
of Tingua. The selection of the site was made according to the following criteria: (i) availabilityof sufficient space to locate the project; (ii) existence of adequate roads; (iii) proximity to points
of waste generation; (iv) distance from areas of dense population; (v) compatibility with
municipal urban legislation and environmental legislation; and (vi) appropriate physical and
geographic characteristics for the undertaking.
5.5 What mechanisms have been established to monitor and evaluate the impact of theproject on the environment? Do the indicators reflect the objectives and results of theEMP?
The project will monitor and measure the following project impacts on the environment
consistent with the EMPs:
* Monitoring of groundwater quality in the Marambaia and Adrian6polis sites
* Restoration with native species of 30ha of land with vegetation; and enrichment of 1Oha
of land with native species to form green belt.
* Monitoring of bird population in Adrian6polis
* Monitoring of air emissions from energy generation component
* Monitoring of emission reductions to achieve 120,700 tons of methane reduction by2012.
6. Social
6.1 Summarize key social issues relevant to the project objectives, and specify the project'ssocial development outcomes.
Summarize key social issues arising out of project objectives, and the project's planned social
development outcomes. If the issues are still to be determined, describe current or planned efforts
to do so.
The main social issue arising out of the project development objectives results from prohibition of
scavengers at the dumpsite and the cessation of scavenging activities. A Social Plan, was
developed by the municipality in November 2002, to address the compensation of scavengersdisplaced from their activities at Marambaia dumpsite and is summarized in a report with the
environmental assessment. Some of the elements of this plan include:
* Registration of families for inclusion in Federal government records. This registration
was completed in February 2003.
* Individual service to obtain access to community resources such as documentation,photos, legal services and so on.
* Assisting catadores in entering the job market, by building capacity through literacycourses.
39
* Creation of 30 job vacancies for scavengers in companies linked to the municipaladministration
* Establishment of waste recovery units that will be operated by a cooperative of catadoresthat will be created. The units will be located in two or three areas of the municipality andwill receive waste destined for Adrian6polis landfill.
* Provision of food baskets by the municipality, to all the catadores until they areestablished in the job market.
6.2 Participatory Approach: How will key stakeholders participate in the project?
The Social Plan embodies an intersectoral approach for the proposed social interventions andidentifies responsibilities and actions of different stakeholders including the Secretariat for SocialPromotion (SEMPS), Municipal Secretariat for Health (SEMUS), Foundation of Education ofNova Iguacu (FENIG), Municipal Secretariat of Work and Employment (SEMTE), MunicipalSecretariat of Urbanization and Environment (SEMUAM) and Municipal Schools near the region.
6.3 How does the project involve consultations or collaboration with NGOs or other civilsociety organizations?
Public consultation was conducted with stakeholders including NGOs and community groups. inthree distinct stages, as described in section 5. It is important to note that in response tostakeholder concerns the project sponsors among other actions, agreed to remediate and close thehighly polluting Marambaia dumpsite.
6.4 What institutional arrangements are planned to ensure the project achieves its socialdevelopment outcomes?
The project sponsor is Nova Gerar, a 50:50 joint venture between EcoSecurities, anenvironmental finance company and SA Paulista, a Brazilian civil engineering and constructionfirm. SA Paulista was granted a 20 year concessional licence by the Empresa Municipal deLimpeza Urbana (EMLURB - Municipal Waste Collection company linked to the municipality ofNova Iguacu) to manage the Marambaia and Adrian6polis sites. As part of this concessionalagreement, S.A. Paulista is responsible for operating the new landfill, and decommissioning andrehabilitating the dumpsite. As mentioned above, responsibilities for the proposed socialinterventions have been detailed in the Social Plan.
6.5 How will the project monitor performance in terms of social development outcomes?
Benchmarks to monitor and measure project performance in terms of social developmentoutcomes include:
* Creation of 200 jobs during the construction phase. Job vacancies for 10 scavengers willbe created in the office of the landfill operator, S.A. Paulista.
* Creation of 70 jobs during project operation including 10 jobs for former scavengers atthe Adrian6polis and Marambaia sites.
* Improvements in health conditions of former scavengers
Does this project include any Community-Driven Development component? No
40
7. Safeguard Policies
7.1 Do any of the following safeguard policies apply to the project? Yes
Policy Applicability
Environmental Assessment (OP 4.01, BP 4.01, GP 4.01) Yes
Natural Habitats (OP 4.04, BP 4.04, GP 4.04) No
Forestry (OP 4.36, GP 4.36) No
Pest Management (OP 4.09) No
Cultural Property (OPN 11.03) No
Indigenous Peoples (OD 4.20) No
Involuntary Resettlement (OP/BP 4.12) No
Safety of Dams (OP 4.37, BP 4.37) No
Projects in International Waters (OP 7.50, BP 7.50, GP 7.50) No
Projects in Disputed Areas (OP 7.60, BP 7.60, GP 7.60)* No
7.2 Describe provisions made by the project to ensure compliance with applicable safeguardpolicies.The Project has taken measures to comply with OP4.01 on Environmental Assessment. TheProject has carried out an Environmental Assessment including an analysis of alternatives. TheEA identifies potential environmental impacts of the Project and details measures to mitigatethem. The EA has been publicly consulted with stakeholders and disclosed in-country and in theInfoshop in Washington.
F. SUSTAINABILITY AND RISKS
1. Sustainability
The Project is expected to be sustainable. In its Carbon Finance operations, one of the Bank'smain concerns is that the Project be technically and financially sound, and therefore be able togenerate environmentally credible GHG ER. Both, the landfill operation and the gas collectionand power generation are deemed financially feasible and are expected to be sustainable until theclosing date of the Project, 2012. The Project has satisfactorily complied with the Bank'sSafeguard Policy and it expected to continue doing so. It is deemed that in Brazil the stability ofthe regulatory and policy environment, the solidity of the Project sponsor, and the capacity of theGovernment to play its role in adding value to the emissions reductions achieved by the Projectthrough ratifying and following its obligations under the UNFCCC and its Protocols, enhance thesustainability prospects.
la. Replicability:
According to the National Statistic Office, IBGE, there is an overall replication potential of above100 municipalities in over 150 landfills. According to the total waste amount available andgenerated, methane production and transformed in Emission Reductions, the overall potential inBrazilian Landfills would be almost I billion tons of C02 of Emission Reductions.
41
2. Critical Risks
The Project risks and the corresponding mitigation measures are provided in the annexes. Nounusual or high-risk issues have been identified.
Most of the risks identified during the early preparation phase of the Project were fully addressed.At appraisal, there is no remaining risk that could seriously jeopardize the Project activities.Regarding the risk assurance for carbon finance projects, the NCDF only pays for the CERs aftersatisfactory performance has been validated.
For the technical implementation of the project, there are some remaining risks:
i) Availability of waste/gas for the project. The availability of gas for fully achieving the ultimateProject target will depend on the issuance of an operational license for the expansion ofAdrian6polis. This process is already under way and it is expected that the operational licensewill be issued for all three remaining areas in Adrian6polis. The high technical standards for thesefollow the same level of the existing, licensed area in Adrian6polis, which is the only sanitarylandfill in the state of Rio de Janeiro.
ii) Commercial arrangements for the sale of electricity. The electric sector in Brazil is currentlyfacing an energy supply glut, after almost a year of an imposed 20% rationing across the board.Those up and downs in energy availability are intrinsic to a predominantly hydro system likeBrazil. Furthermore, demand has declined, partly because of the economic crisis, but mainlybecause customers learned how to use energy rationally, as a positive spillover of the energycrisis. Due to those factors, energy prices in the wholesale market (MAE), particularly in theSouthern Region, have been at very low levels. There are no buyers at this moment willing toacquire energy under long term contracts at prices that make NovaGerar an attractive venture.However, it is probable that in 2-3 years there will be a market for long term energy contractsreaching the US$ 35-40/MWh plateau. This limits NovaGerar options for selling energy at theoutset, and may reduce its profitability in the first years of operation. Other possibilities beingexplored include sale under the PROINFA arrangement. There will be a call for bids in February2004, for energy delivery in late 2006. NovaGerar would certainly qualify to bid. Prices will beset by the government, and will be significantly higher than the long term marginal cost ofexpansion. This is a deliberate intention to diversify the energy balance. ELETROBRAS has thelegal obligation to sign 20 year PPAs. There are a few risks associated with PROINFA. First,despite the government intention to have the first call for bids soon, there may be delays in theprocurement and contracting process. The second risk has to do with the total amount of energyto be offered in the biogas category and the process by which the plants will be selected. Third,there is a risk that the government may force producers to share part of their ER revenues withELETROBRAS. Nothing has been regulated on this matter, but MME is internally consideringthis possibility.
iii) Issuance of the Government's Letter of Approval (LOA). At appraisal, the Government hasnot yet issued the LOA for the Project, which is necessary for trading the CERs. The Project isalready in the agenda for a forthcoming IMCCC meeting, and the expectation is that the Projectwill be approved.
iv) Eligibility of Emission Reductions. Since the baseline and monitoring methodology used wereapproved by the CDM methodology panel, the eligibility of ERs from the project baselineappears to be less of a risk. The ERs have been examined in detail in a formal baseline studyprepared for the NovaGerar Project and the validation will be formally completed shortly.
42
3. Possible Controversial Aspects
No controversial Aspects were identified
G. MAIN ERPA CONDITIONS
1. Effectiveness Condition
1.1. Signature of a contract between NovaGerar and EnerG for the deployment and operation ofthe power generation plant.
1.2. Issuance of a Letter of Approval through the GOB, satisfactory to the Bank.
2. Other
Disbursement Condition:
Approval of the ERPA conditions by the NCDMF
43
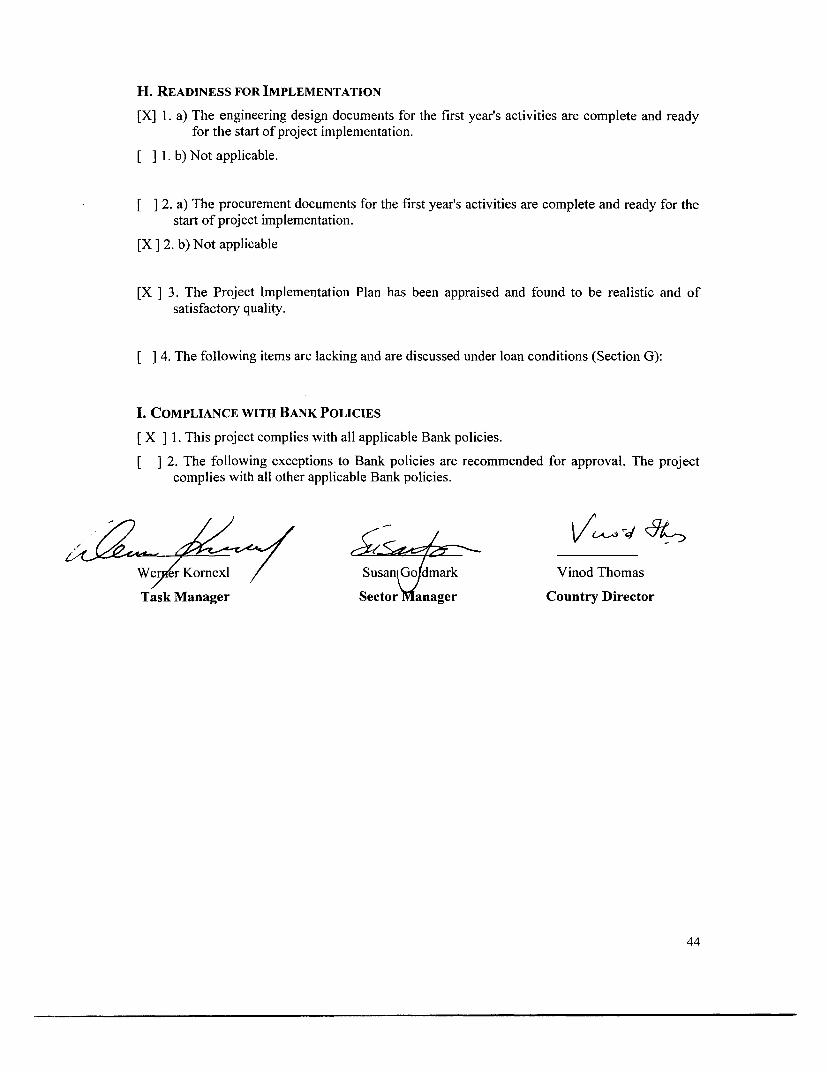
H. READINESS FOR IMPLEMENTATION
[X] 1. a) The engineering design documents for the first year's activities are complete and ready
for the start of project implementation.
[ ]1. b) Not applicable.
] 2. a) The procurement documents for the first year's activities are complete and ready for the
start of project implementation.
[X] 2. b) Not applicable
[X ] 3. The Project Implementation Plan has been appraised and found to be realistic and of
satisfactory quality.
[ ] 4. The following items are lacking and are discussed under loan conditions (Section G):
I. COMPLIANCE WITH BANK POLICIES
[X 31. This project complies with all applicable Bank policies.
[ ] 2. The following exceptions to Bank policies are recommended for approval. The project
complies with all other applicable Bank policies.
We r Korexl Susan dmark Vinod Thomas
Task Manager Sector anager Country Director
44
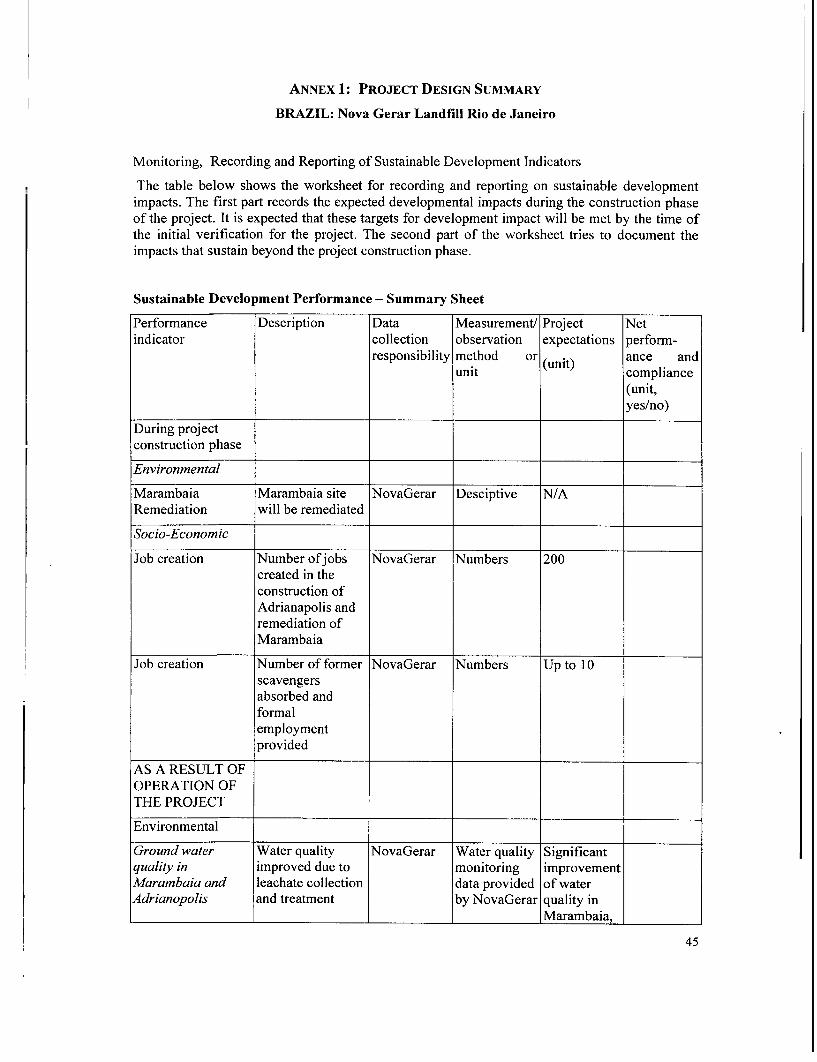
ANNEX 1: PROJECT DESIGN SUMMARY
BRAZIL: Nova Gerar Landfill Rio de Janeiro
Monitoring, Recording and Reporting of Sustainable Development Indicators
The table below shows the worksheet for recording and reporting on sustainable developmentimpacts. The first part records the expected developmental impacts during the construction phaseof the project. It is expected that these targets for development impact will be met by the time ofthe initial verification for the project. The second part of the worksheet tries to document theimpacts that sustain beyond the project construction phase.
Sustainable Development Performance - Summary Sheet
Performance Description Data Measurement/ Project Netindicator collection observation expectations perform-
responsibility method or (unit) ance andunit (unit)icompliance
(unit,yes/no)
During projectconstruction phase
Environmental
Marambaia Marambaia site NovaGerar Desciptive N/ARemediation will be remediated
Socio-Economic
Job creation Number ofjobs NovaGerar Numbers 200created in theconstruction ofAdrianapolis andremediation ofMarambaia
Job creation Number of former NovaGerar Numbers Up to 10scavengersabsorbed andformalemploymentprovided
AS A RESULT OFOPERATION OFTHE PROJECT
Environmental
Ground water Water quality NovaGerar Water quality Significantquality in improved due to monitoring improvementMarambaia and leachate collection data provided of waterAdrianopolis and treatment by NovaGerar quality in
Marambaia,
45
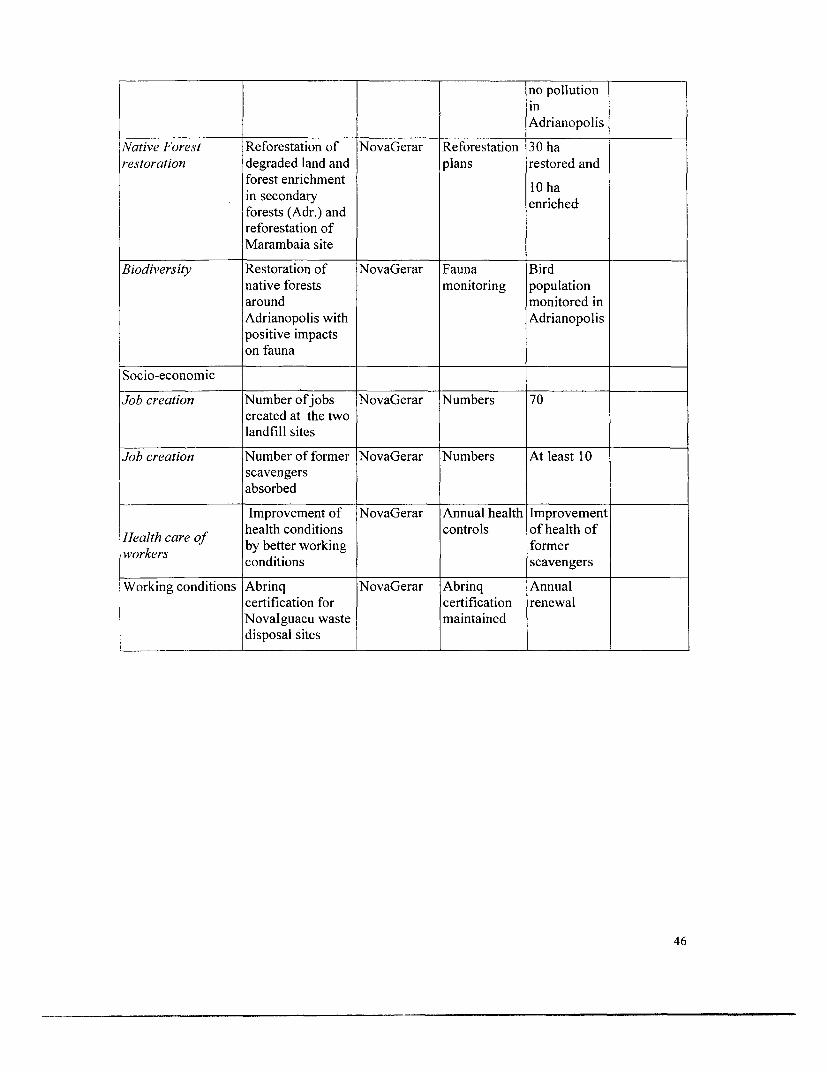
no pollutioninAdrianopolis
Native Forest Reforestation of NovaGerar Reforestation 30 ha
restoration degraded land and plans restored and
forest enrichment 10 hain secondaryforests (Adr.) and enrichedreforestation ofMarambaia site
Biodiversity Restoration of NovaGerar Fauna Birdnative forests monitoring populationaround monitored inAdrianopolis with Adrianopolispositive impactson fauna
Socio-economic
Job creation Number ofjobs NovaGerar Numbers 70created at the twolandfill sites
Job creation Number of former NovaGerar Numbers At least 10scavengersabsorbed
Improvement of NovaGerar Annual health Improvement
Health care of health conditions controls of health ofworkers by better working former
conditions scavengers
Working conditions Abrinq NovaGerar Abrinq Annualcertification for certification renewalNovalguacu waste maintaineddisposal sites
46
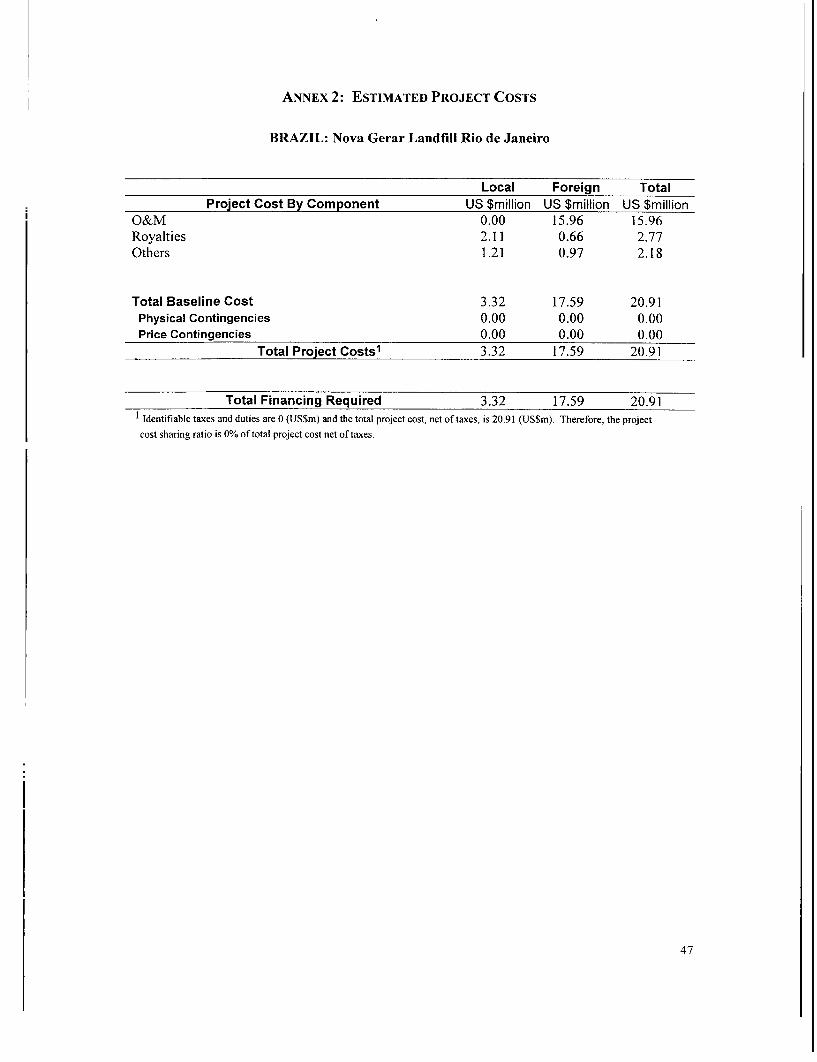
ANNEX 2: ESTIMATED PROJECT COSTS
BRAZIL: Nova Gerar Landfill Rio de Janeiro
Local Foreign TotalProject Cost By Component US $million US $million US $million
O&M 0.00 15.96 15.96Royalties 2.11 0.66 2.77Others 1.21 0.97 2.18
Total Baseline Cost 3.32 17.59 20.91Physical Contingencies 0.00 0.00 0.00Price Contingencies 0.00 0.00 0.00
Total Project Costs1 3.32 17.59 20.91
Total Financing Required 3.32 17.59 20.91Identifiable taxes and duties are 0 (US$m) and the total project cost, net of taxes, is 20.91 (US$m). Therefore, the project
cost sharing ratio is 0% of total project cost net of taxes.
47
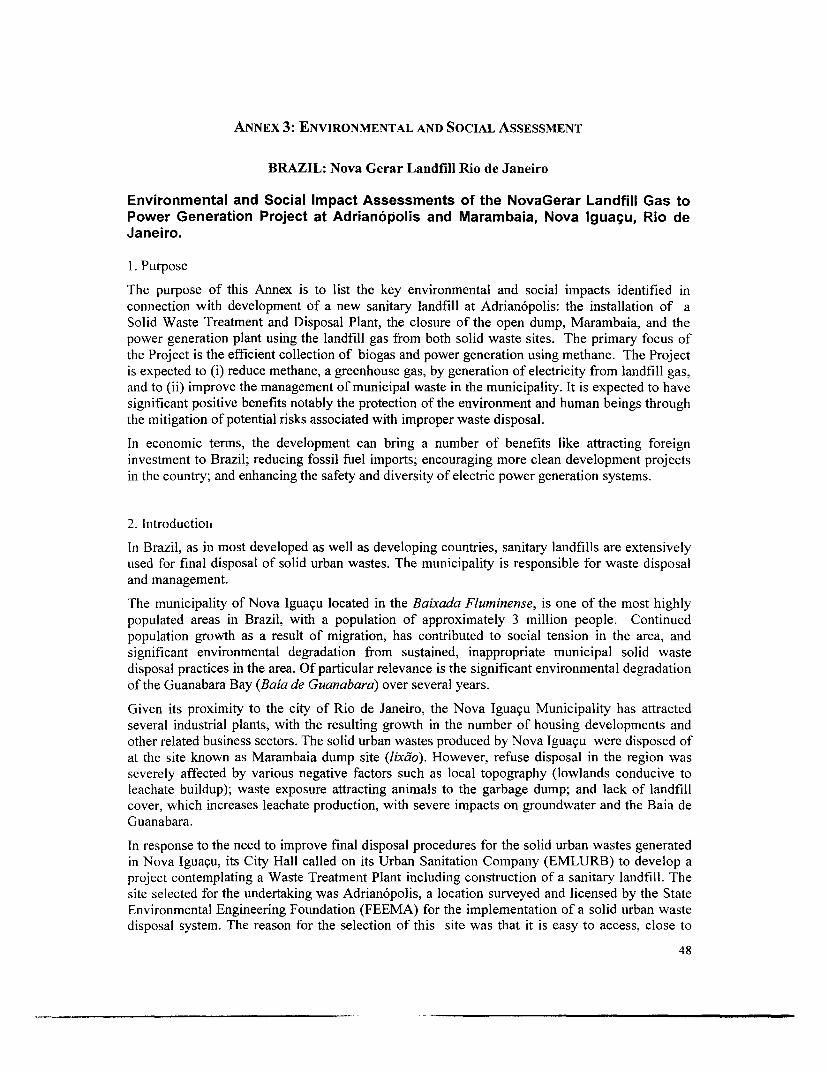
ANNEX 3: ENVIRONMENTAL AND SOCIAL ASSESSMENT
BRAZIL: Nova Gerar Landfill Rio de Janeiro
Environmental and Social Impact Assessments of the NovaGerar Landfill Gas to
Power Generation Project at Adrian6polis and Marambaia, Nova Iguagu, Rio deJaneiro.
1. Purpose
The purpose of this Annex is to list the key environmental and social impacts identified in
connection with development of a new sanitary landfill at Adrian6polis: the installation of a
Solid Waste Treatment and Disposal Plant, the closure of the open dump, Marambaia, and the
power generation plant using the landfill gas from both solid waste sites. The primary focus of
the Project is the efficient collection of biogas and power generation using methane. The Project
is expected to (i) reduce methane, a greenhouse gas, by generation of electricity from landfill gas,
and to (ii) improve the management of municipal waste in the municipality. It is expected to have
significant positive benefits notably the protection of the environment and human beings through
the mitigation of potential risks associated with improper waste disposal.
In economic terms, the development can bring a number of benefits like attracting foreign
investment to Brazil; reducing fossil fuel imports; encouraging more clean development projects
in the country; and enhancing the safety and diversity of electric power generation systems.
2. Introduction
In Brazil, as in most developed as well as developing countries, sanitary landfills are extensively
used for final disposal of solid urban wastes. The municipality is responsible for waste disposal
and management.
The municipality of Nova Igua,u located in the Baixada Fluminense, is one of the most highly
populated areas in Brazil, with a population of approximately 3 million people. Continued
population growth as a result of migration, has contributed to social tension in the area, and
significant environmental degradation from sustained, inappropriate municipal solid waste
disposal practices in the area. Of particular relevance is the significant environmental degradation
of the Guanabara Bay (Baia de Guanabara) over several years.
Given its proximity to the city of Rio de Janeiro, the Nova Igua,u Municipality has attracted
several industrial plants, with the resulting growth in the number of housing developments and
other related business sectors. The solid urban wastes produced by Nova Iguacu were disposed of
at the site known as Marambaia dump site (lixdo). However, refuse disposal in the region was
severely affected by various negative factors such as local topography (lowlands conducive to
leachate buildup); waste exposure attracting animals to the garbage dump; and lack of landfill
cover, which increases leachate production, with severe impacts on groundwater and the Baia de
Guanabara.
In response to the need to improve final disposal procedures for the solid urban wastes generated
in Nova Igua,u, its City Hall called on its Urban Sanitation Company (EMLURB) to develop a
project contemplating a Waste Treatment Plant including construction of a sanitary landfill. The
site selected for the undertaking was Adrian6polis, a location surveyed and licensed by the State
Environmental Engineering Foundation (FEEMA) for the implementation of a solid urban waste
disposal system. The reason for the selection of this site was that it is easy to access, close to
48
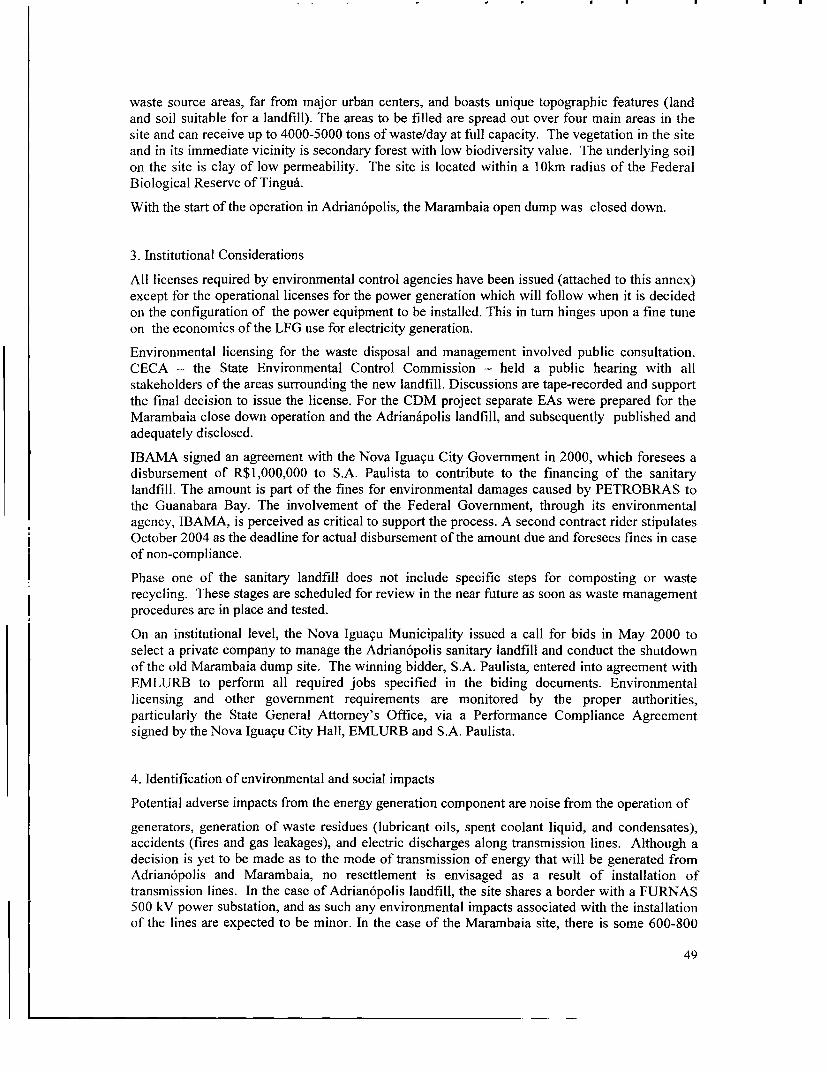
waste source areas, far from major urban centers, and boasts unique topographic features (landand soil suitable for a landfill). The areas to be filled are spread out over four main areas in thesite and can receive up to 4000-5000 tons of waste/day at full capacity. The vegetation in the siteand in its immediate vicinity is secondary forest with low biodiversity value. The underlying soilon the site is clay of low permeability. The site is located within a 10km radius of the FederalBiological Reserve of Tingua.
With the start of the operation in Adrian6polis, the Marambaia open dump was closed down.
3. Institutional Considerations
All licenses required by environmental control agencies have been issued (attached to this annex)except for the operational licenses for the power generation which will follow when it is decidedon the configuration of the power equipment to be installed. This in turn hinges upon a fine tuneon the economics of the LFG use for electricity generation.
Environmental licensing for the waste disposal and management involved public consultation.CECA - the State Environmental Control Commission - held a public hearing with allstakeholders of the areas surrounding the new landfill. Discussions are tape-recorded and supportthe final decision to issue the license. For the CDM project separate EAs were prepared for theMarambaia close down operation and the Adrianapolis landfill, and subsequently published andadequately disclosed.
IBAMA signed an agreement with the Nova Igua,u City Government in 2000, which foresees adisbursement of R$1,000,000 to S.A. Paulista to contribute to the financing of the sanitarylandfill. The amount is part of the fines for environmental damages caused by PETROBRAS tothe Guanabara Bay. The involvement of the Federal Government, through its environmentalagency, IBAMA, is perceived as critical to support the process. A second contract rider stipulatesOctober 2004 as the deadline for actual disbursement of the amount due and foresees fines in caseof non-compliance.
Phase one of the sanitary landfill does not include specific steps for composting or wasterecycling. These stages are scheduled for review in the near future as soon as waste managementprocedures are in place and tested.
On an institutional level, the Nova Iguacu Municipality issued a call for bids in May 2000 toselect a private company to manage the Adrian6polis sanitary landfill and conduct the shutdownof the old Marambaia dump site. The winning bidder, S.A. Paulista, entered into agreement withEMLURB to perform all required jobs specified in the biding documents. Environmentallicensing and other government requirements are monitored by the proper authorities,particularly the State General Attorney's Office, via a Performance Compliance Agreementsigned by the Nova Iguacu City Hall, EMLURB and S.A. Paulista.
4. Identification of environmental and social impacts
Potential adverse impacts from the energy generation component are noise from the operation of
generators, generation of waste residues (lubricant oils, spent coolant liquid, and condensates),accidents (fires and gas leakages), and electric discharges along transmission lines. Although adecision is yet to be made as to the mode of transmission of energy that will be generated fromAdrian6polis and Marambaia, no resettlement is envisaged as a result of installation oftransmission lines. In the case of Adrian6polis landfill, the site shares a border with a FURNAS500 kV power substation, and as such any environmental impacts associated with the installationof the lines are expected to be minor. In the case of the Marambaia site, there is some 600-800
49
meters between the power substation and the point of connection at Marambaia. In order to
ensure that adequate measures are taken to safeguard people and the environment, the client will
submit any plans, work programs and environmental assessments to the Bank for approval prior
to implementation.
The lower flow rate, i.e., reduced replenishment of the water spring area is another negative
impact of the Adrianapolis waste site. Mitigation is achieved by planting a forest tract around the
spring with native tree species to improve water retention for the spring, and by adding the
drainage system.
The following section contains a summary of other impacts.
a) Adrian6polis landfill:
General Technical Aspects:
The site selected for the landfill covers a total of 20 hectares of land and consists of a valley
surrounded by hills approximately 90 meters high covered by secondary vegetation and showing
varying rates of rehabilitation along its different slopes. The area abuts the Adrian6polis Road on
its northeastern side. There are two water springs, one surfacing on the northern slope and the
other on the western valley wall, the latter drained by pipes since the site was originally filled in
1994.
The Adrian6polis landfill was newly constructed and started operation in February 2003. The
underground is basically rocky with clay formations on top. The projected area of the landfill
amounts to 120,000 m2. Future extension of the landfill is possible up to 60 hectares. The
maximum height of the refuse body will be approximately 63 meters. However, for the extension
of the landfill, IBAMA will have to issue a separate approval, because the landfill is near a
federal environmental conservation unit.
The original executive plan, prepared by S.A.Paulista, indicates that the waste disposal rate will
be some 1,000 tons/day with maximum of 1,500 tons/day. At present date, contracts up to 1,200
tons/day have been negotiated. The receiving capacity of the landfill is about 4,000 - 5,000
tons/day. The envisaged period of operation was calculated at 5.1 years with a total volume of
refuse disposed amounting to 1,588,600 m3. The Plan also indicates a specific weight of the
waste equalling tol.3 ton/m3, however an independent consultant estimates this value at 1.0
ton/m3, resulting in a total mass of 1,588,600 tons instead of 1,845,000 tons as projected
The actual breakdown of solid wastes currently disposed of at the Marambaia garbage dump is
not available because no formal survey has been performed to date. In the absence of more
accurate data, the utility is working on the basis of the following figures recorded in the Greater
Rio de Janeiro area:
Type of waste Percentage of total (base year:1998)
Paper and cardboard 18.8
Rags and leather 3.0
Plastics 22.9
Glass 1.5
Metal and tin 3.0
Organic matter 69.5
Note: data required to calculate potential biogas generation are available in the engineering design documentation.
50
The Executive Plan for the construction of the Adrian6polis landfill measures up to the qualityand environmental standards as applied in Europe:
- bottom liner for underground protection;
- compartmentalization of disposed refuse with covering of completed sections;
- construction of leachate drains;
- vertical domes for biogas collection;
- water drains in slopes;
- final covering and afforestation with native species;
- leachate collection basin;
- monitoring plan.
The main impacts associated with the construction of the Adrian6polis landfill have beenidentified in a report of study of alternatives Estudo Ambiental de Alternativas Locacionaiscarried out under the project by the municipal entity responsible for waste management,EMLURB and in a separate EA for the purpose of the CDM project. Project impacts areassociated with construction activities at the sites of the Adrian6polis sanitary landfill and theMarambaia dump. Main impacts during the construction phase include: i) loss of vegetation andfauna from clearing of secondary forests for site preparation; ii) reduced replenishment of theunderlying aquifer; and(iii) other potential impacts such as construction nuisance includingdisposal of construction waste, noise, increased traffic, dust, impacts on other road users.Potential impacts during operations include increased traffic, odor, noise, litter, visual impacts,health and safety of workers on the site (dealing with healthcare and municipal waste, operationof sensitive and/or heavy equipment), disposal of solid and liquid waste streams generated on site.All these impacts are being addressed through environmental guidelines and targeted mitigationactivities.
The impacts noted on wildlife and plants are closely interrelated. The landfill lies in a valley andwas cleared on a permanent basis. IBAMA has issued the Vegetation Removal Permit No.046/02, authorizing the clearing of 15 ha, of which 1.57 ha were set aside as a permanentlypreserved area. The total estimated volume of biomass - secondary vegetation - to be removed is84.6 m3. The native fauna will be resettled to the surrounding vegetation.
To address the loss of vegetation as a result of clearing for construction purposes, the projectsponsor has prepared a vegetation enrichment plan which will involve the reforestation withnative species of areas cleared during construction activities; restoration of 30 ha of degradedland in the Federal Biological Reserve of Tingua, and planting of a green belt to reduce any visualimpacts of the landfill. A similar vegetation enrichment plan will be embarked upon at theMarambaia site. At the Adrian6polis landfill, the reforestation will also serve to improve waterretention around the water spring area. No use of pesticides is envisaged for reforestationactivities. Control of ants (formigas cortadeiras) will be carried out by: i) mechanical methodsinvolving excavation until nests of fungus housing the queen are encountered, for small areas,and ii) cultural methods that involve use of plant species such as Sesamum indicum, Ruta spp andVandalia spp., that possess pest control properties.
The plan also requires soil waterproofing, which will reduce the aquifer replenishment rate andaffect flow rate volumes. To lessen this impact, native species will be planted around the springheadwaters to help improve water retention about the spring. Drainpipes will be built also tochannel the water for use by the development.
51
With respect to the Marambaia dumpsite closure, the environmental impacts are expected to be
largely positive given its deplorable conditions - presence of disease-causing vectors, visual
impact, soil and water contamination by leachate, associated with the practice of uncontrolled
open dumping and exposure by scavengers to risks thereof.
As with all landfill construction and dump closure projects, potential impacts after site closure
include: i) fires; and ii) methane migration from the site which if not adequately mitigated could
have severe consequences. Both possibilities are being avoided to the extent possible through
proper planning and targeted mitigation measures.
Some other potential hazards minimized by this project include the risk of explosion or fire, gas
leaks, dust and bad odors typically associated with open-air dumps and controlled landfills.
Engineering Design of the landfill operations
To mitigate the negative environmental impacts of inadequate solid waste disposal, the
engineering designs for the dumpsite closure and construction of the Adrianopolis landfill have
been carried out according to intemationally accepted standards to ensure adequate provision for
waste disposal and protection of the environment.
The intervention at Marambaia features:
(i) Re-shaping of the external parts of the landfill to improve slopes and create terraces,
(ii) Construction of a leachate collection and recirculation system,
iii) Construction of gas collection and flaring system,
iv) Low-permeability engineered final cover,
v) Surface runoff drainage,
vi) Monitoring provision for gas, groundwater, leachate.
The construction of the Adrian6polis landfill features:
(i) Low-permeability basal liner,
(ii) Compartmentalization of disposed refuse with covering of completed sections,
(iii) Leachate collection and treatment system
(iv) Gas collection system,
(v) Surface runoff drainage,
(vi) Low-permeability engineered final cover,
(vii) Monitoring plan
Energy generation component
The mitigation plan for the energy generation components features measures to address the
following:
(i) Waste management including waste from equipment packaging, waste oils, lubricants,
spent coolant, gas condensate
(ii) Noise reduction from the engines
52
(iii) Safety and security controls to reduce risk of accidents
(iv) Worker protection and safety
(v) Equipment maintenance plan
(vi) Monitoring plan including measurements and documentation of emissions includingmethane; oily wastes, liquid wastes, leaks, accidents
Public Consultation:
Public consultation with stakeholders was conducted in three distinct stages: (i) Prior to theissuance of environmental licences, stakeholder consultation was conducted by the municipalityand the landfill operator, which culminated in an official public hearing in June 2001. Theconcerns of the stakeholders are recorded in the official minutes of the hearing (Ata de AudinciaPuiblica) kept by FEEMA; (ii) An opinion survey on the remediation of the dumpsite andimplementation of the Adrian6polis landfill with energy generation; and (iii) Interviews andspecific questionnaires for the catadores.
Key stakeholders in the consultation process include:
* Municipalities and local institutions (Nova Iguacu and Rio de Janeiro)
* Local NGOs and community groups
* Climate change communities (NGOs, Government institutions)
* Catadores at the Marambaia dumpsite
It is important to note that in response to stakeholder concerns the project sponsors among otheractions, agreed to remediate and close the highly polluting Marambaia dumpsite.
Social Impacts
Since this is a large-scale project, its announcement initially drew a negative response among thelocal population and some NGOs. Arguments against it have been both political and technical innature, chiefly because there is no similar undertaking for waste disposal in the state. AnEnvironmental Education Program will be offered to overcome the problem. The program willcover approximately 12 municipalities and includes courses and lectures on environmentaleducation held in an Environmental Education Hall seating 50 people to be built at the NovaIguacu Treatment Station premises. The hall will be equipped with audiovisual aids and a libraryand will also be used to train company employees in occupational safety and environmentalissues.
An auditorium with classrooms was constructed on-site for the purpose of providing education byway of lectures and classes to members of the community on environmental protection andmanagement as well as training to site workers.
The main social issue arising out of the project development objectives results from prohibition ofscavengers at the dumpsite and the cessation of scavenging activities. A Social Plan wasdeveloped by the municipality in November 2002 to address the compensation of scavengersdisplaced from their activities at Marambaia dumpsite and is summarized in a report with theenvironmental assessment. Some of the elements of this plan include:
53
Registration of families for inclusion in Federal govemment records. This registration
was completed in February 2003.
* Individual service to obtain access to community resources such as documentation,
photos, legal services and so on.
Assisting catadores in entering the job market, by building capacity through literacy
courses.
Creation of 30 job vacancies for scavengers in companies linked to the municipal
administration
* Establishment of waste recovery units that will be operated by a cooperative of catadores
that will be created. The units will be located in two or three areas of the municipality and
will receive waste destined for Adrian6polis landfill.
* Provision of food baskets by the municipality, to all the catadores until they are
established in the job market.
The Social Plan embodies an intersectoral approach for the proposed social interventions and
identifies responsibilities and actions of different stakeholders including the Secretariat for Social
Promotion (SEMPS), Municipal Secretariat for Health (SEMUS), Foundation of Education of
Nova Iguacu (FENIG), Municipal Secretariat of Work and Employment (SEMTE), Municipal
Secretariat of Urbanization and Environment (SEMUAM) and Municipal Schools near the region.
Transportation of materials for disposal is a key activity under this type of development. Waste
must be collected at source for disposal on the landfill. All wastes will be collected by compactor
trucks from households and removed to the Solid Waste Treatment and Disposal Plant. Though
such trucks already drive around the city, they pose an additional risk of accidents both in public
thoroughfares and within the plant premises. Another negative impact is deterioration of street
and road surfaces due to the truck flow. Both impacts already exist. The only difference will be
an increase in traffic as service coverage expands.
5. Reclamation Plan for the Marambaia Garbage Dump
The Marambaia landfill is an existing site located at Vila de Cava and in operation since May
1987. It consists of 6 sub-areas covering a total area of 200.000 m2. Some 136,000 tonnes of
waste was disposed over the 14 years of operation (1987-2001), which equals to some 450
tonnes/day at 300 operational days/year (table 1).
The current waste disposal procedure in Marambaia is technically, socially and environmentally
inadequate. It allows the spread of disease-carrying vectors among the population and cause
discomfort due to noxious odors, visual impact, soil and groundwater pollution by leachate. The
new undertaking will eliminate these problems.
In addition, the gateway into the new landfill will have a Medical Waste Treatment and
Disinfecting System prior to final disposal at the sanitary landfill, thus reducing the hazard of
infecting the people via medical and hospital waste contamination.
The closure of the site was thought to be in October 2002 but it was delayed due to the delay in
the construction of Adrianopolis (started to receive waste February, 2003).
54

Table 1: Overview of disposed wastes at Marambaia landfill
Section no. Area (m2) Thickness (m) Volume (m3) Weight (1) Weight (2)(tonnes) (tonnes)
1 26.800 35,0 938.000 1.219.400 938.0002 12.940 16,0 207.040 269.152 207.0403 20.220 20,0 404.400 525.720 404.4004 7.210 14,5 104.545 135.909 104.5455 8.410 21,7 182.497 237.246 182.4976 4.240 18,4 78.016 101.421 78.016Total 1.914.498 2.488.847 1.914.498NB. data as per April 2001
(1) according to S.A.Paulista
(2) according to BGP expert's estimate
The site was in highly precarious and improper condition. The leachate ran off and polluted thelocal soil and occasionally neighboring areas as well, depending on the volume of waste dumped.Today, the leachate recycling system was installed
Already before the construction of Adrianopolis, some actions have been initiated to shut downthe Marambaia garbage dump and reclaim the environment around Vila de Cava. Such actionswere part of the plan submitted by S.A. Paulista to EMLURB, and included certain key measurescontemplated in the development.
The entire disposal site now received a sanitary cap to avoid open air exposure of refuse andprotect the area. Properly compacted soil is provided for that purpose. The required material isharvested either from surrounding soil beds or outside the perimeter. The soil used must beclayey, spread in 20-cm layers and then compacted to build a soil cap at least 60 cm thick.The garbage dump geometry had to be redesigned to include slopes consistent with the geometricshape of a sanitary landfill to ensure embankment stability vis-a-vis potential refuse landslides.To solve the leachate problem, a percolate and gas collection and drainage system was built withgravel drains, in line with local conditions. The gases generated by the landfills will be burned toensure air polluting emissions control.
Surface protection is being provided by the grass planted along all slopes and by a tree barrier toisolate the site of a new rainwater drainage system. The surface drainage system will trap run-offcaused by rain at the garbage dump site and carry it effectively to discharge points, thus avoidingthe risk of erosion and flooding and preventing seepage of the run-off into the landfillembankment.
Based on the results of emergency actions performed and on the preliminary findings of previoussurveys, additional interventions are scheduled as part of the overall project to be implemented byS.A. Paulista.
The planned interventions include building gas wells in the upper layer, where the solid wastecover is already quite advanced, for relief of the landfill embankment gases.Drainage pipelines will be available to recirculate the leachate that now runs directly into a pondlocated at the eastern end of the garbage dump where it abuts on a neighboring ranch. The drain
55
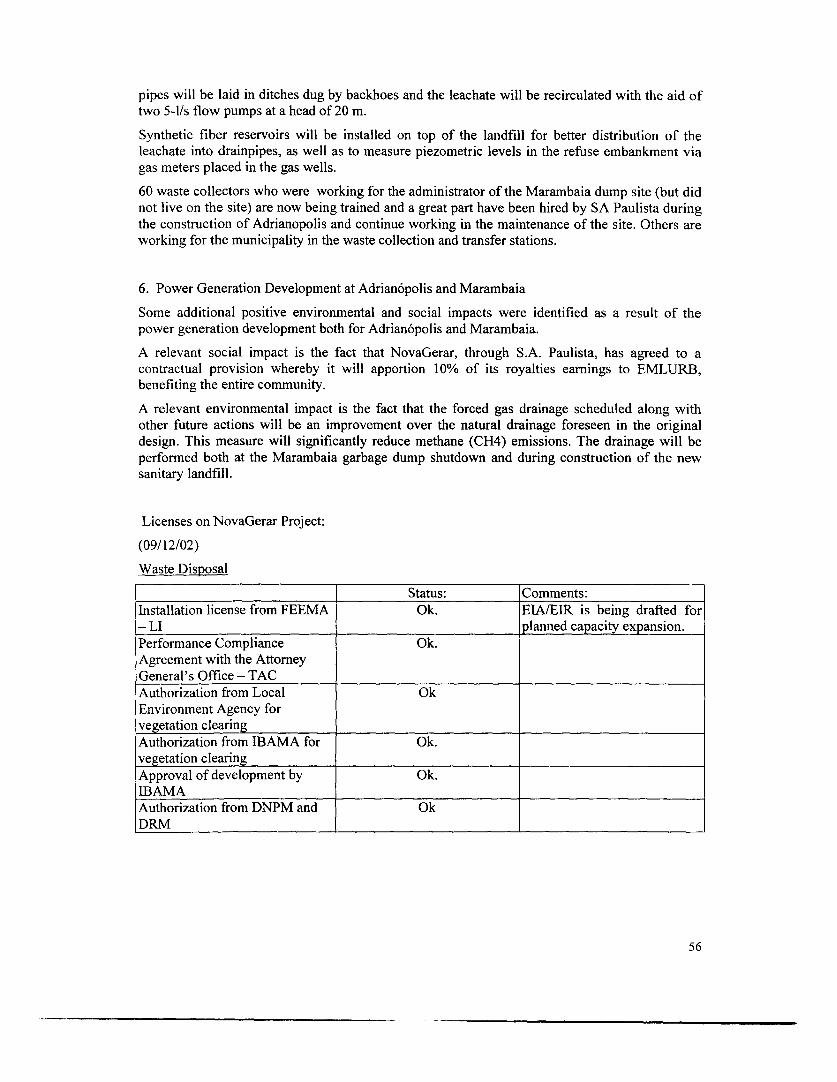
pipes will be laid in ditches dug by backhoes and the leachate will be recirculated with the aid of
two 5-1/s flow pumps at a head of 20 m.
Synthetic fiber reservoirs will be installed on top of the landfill for better distribution of the
leachate into drainpipes, as well as to measure piezometric levels in the refuse embankment via
gas meters placed in the gas wells.
60 waste collectors who were working for the administrator of the Marambaia dump site (but did
not live on the site) are now being trained and a great part have been hired by SA Paulista during
the construction of Adrianopolis and continue working in the maintenance of the site. Others are
working for the municipality in the waste collection and transfer stations.
6. Power Generation Development at Adrian6polis and Marambaia
Some additional positive environmental and social impacts were identified as a result of the
power generation development both for Adrian6polis and Marambaia.
A relevant social impact is the fact that NovaGerar, through S.A. Paulista, has agreed to a
contractual provision whereby it will apportion 10% of its royalties earnings to EMLURB,
benefiting the entire community.
A relevant environmental impact is the fact that the forced gas drainage scheduled along with
other future actions will be an improvement over the natural drainage foreseen in the original
design. This measure will significantly reduce methane (CH4) emissions. The drainage will be
performed both at the Marambaia garbage dump shutdown and during construction of the new
sanitary landfill.
Licenses on NovaGerar Project:
(09/12/02)
Waste Disposal
Status: Comments:
Installation license from FEEMA Ok. EWVEIR is being drafted for
- LI planned capacity expansion.
Performance Compliance Ok.
Agreement with the Attorney
General's Office - TACAuthorization from Local Ok
Environment Agency forvegetation clearingAuthorization from IBAMA for Ok.
vegetation clearingApproval of development by Ok.
IBAMAAuthorization from DNPM and Ok
DRM
56
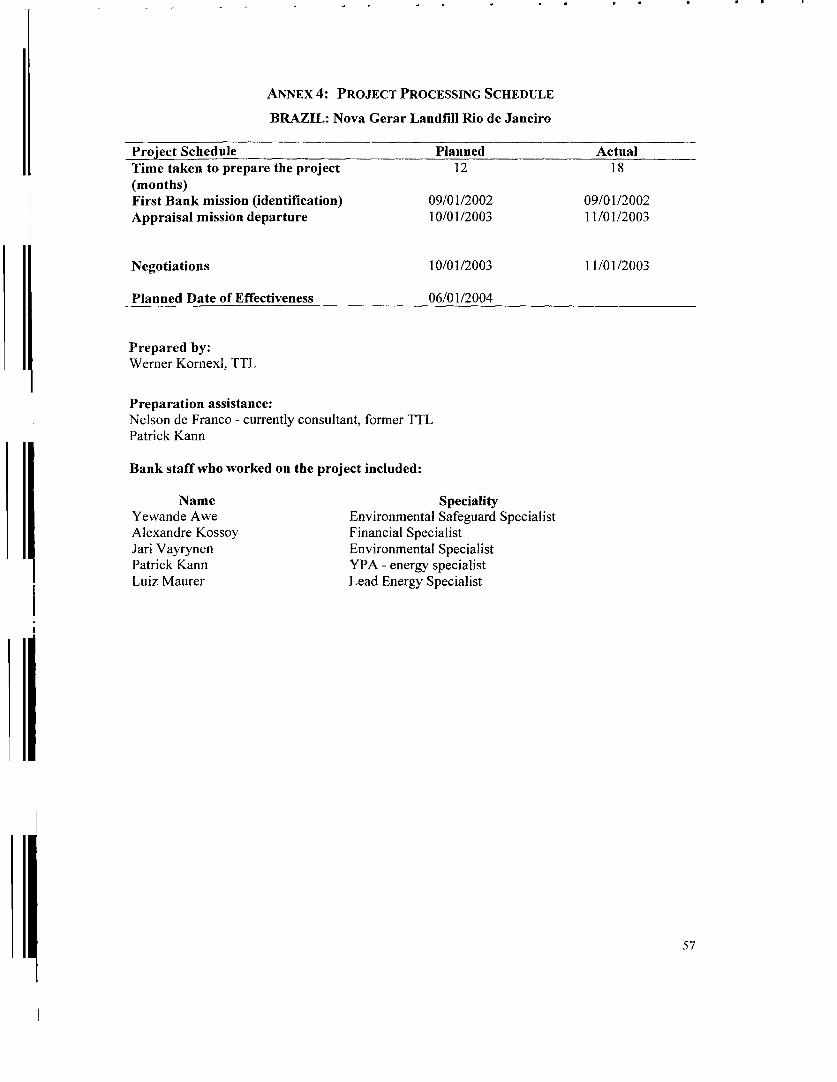
ANNEX 4: PROJECT PROCESSING SCHEDULE
BRAZIL: Nova Gerar Landfill Rio de Janeiro
Project Schedule Planned ActualTime taken to prepare the project 12 18(months)First Bank mission (identification) 09/01/2002 09/01/2002Appraisal mission departure 10/01/2003 11/01/2003
Negotiations 10/01/2003 11/01/2003
Planned Date of Effectiveness 06/01/2004
Prepared by:Werner Kornexl, TTL
Preparation assistance:Nelson de Franco - currently consultant, forner TTLPatrick Kann
Bank staff who worked on the project included:
Name SpecialityYewande Awe Environmental Safeguard SpecialistAlexandre Kossoy Financial SpecialistJari Vayrynen Environmental SpecialistPatrick Kann YPA - energy specialistLuiz Maurer Lead Energy Specialist
57
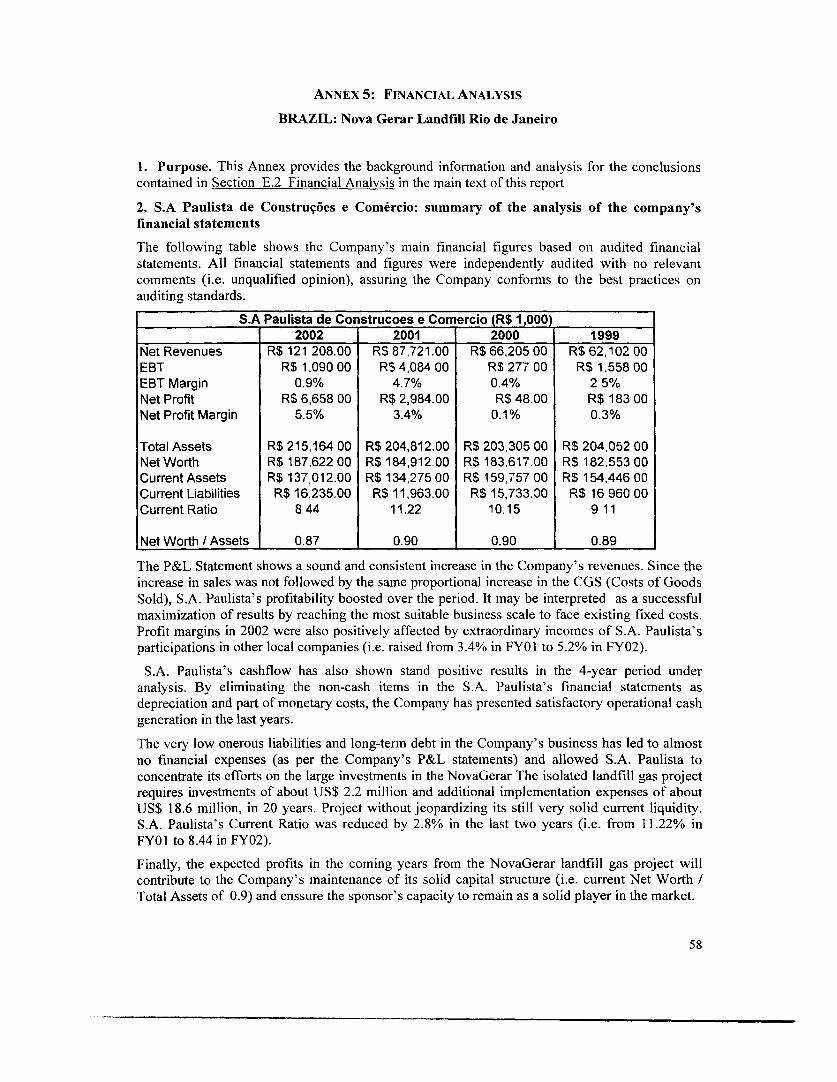
ANNEX 5: FINANCIAL ANALYSIS
BRAZIL: Nova Gerar Landfill Rio de Janeiro
1. Purpose. This Annex provides the background information and analysis for the conclusions
contained in Section E.2 Financial Analysis in the main text of this report
2. S.A Paulista de Construq6es e Comercio: summary of the analysis of the company's
financial statements
The following table shows the Company's main financial figures based on audited financial
statements. All financial statements and figures were independently audited with no relevant
comments (i.e. unqualified opinion), assuring the Company conforms to the best practices on
auditing standards.
S.A Paulista de Construcoes e Com ercio (R$ 1,000)
2002 2001 2000 1999
Net Revenues R$ 121 208.00 R$ 87.721.00 R$ 66.205 00 R$ 62,102 00
EBT R$ 1,090 00 R$ 4,084 00 R$ 277 00 R$ 1,558 00
EBT Margin 0.9% 4.7% 0.4% 2 5%
Net Profit R$ 6,658 00 R$ 2,984.00 R$ 48.00 R$ 183 00
Net Profit Margin 5.5% 3.4% 0.1% 0.3%
Total Assets R$ 215,164 00 R$ 204,812.00 R$ 203.305 00 R$ 204.052 00
Net Worth R$ 187,622 00 R$ 184,912.00 R$ 183,617.00 R$ 182,553 00
Current Assets R$ 137,012.00 R$ 134,275 00 R$ 159,757 00 R$ 154,446 00
Current Liabilities R$ 16,235.00 R$ 11,963.00 R$ 15,733.30 R$ 16 960 00
Current Ratio 8 44 11.22 10.15 911
Net Worth / Assets 0.87 0.90 0.90 0.89
The P&L Statement shows a sound and consistent increase in the Company's revenues. Since the
increase in sales was not followed by the same proportional increase in the CGS (Costs of Goods
Sold), S.A. Paulista's profitability boosted over the period. It may be interpreted as a successful
maximization of results by reaching the most suitable business scale to face existing fixed costs.
Profit margins in 2002 were also positively affected by extraordinary incomes of S.A. Paulista's
participations in other local companies (i.e. raised from 3.4% in FYOI to 5.2% in FY02).
S.A. Paulista's cashflow has also shown stand positive results in the 4-year period under
analysis. By eliminating the non-cash items in the S.A. Paulista's financial statements as
depreciation and part of monetary costs, the Company has presented satisfactory operational cash
generation in the last years.
The very low onerous liabilities and long-term debt in the Company's business has led to almost
no financial expenses (as per the Company's P&L statements) and allowed S.A. Paulista to
concentrate its efforts on the large investments in the NovaGerar The isolated landfill gas project
requires investments of about US$ 2.2 million and additional implementation expenses of about
US$ 18.6 million, in 20 years. Project without jeopardizing its still very solid current liquidity.
S.A. Paulista's Current Ratio was reduced by 2.8% in the last two years (i.e. from 11.22% in
FY01 to 8.44 in FY02).
Finally, the expected profits in the coming years from the NovaGerar landfill gas project will
contribute to the Company's maintenance of its solid capital structure (i.e. current Net Worth /
Total Assets of 0.9) and enssure the sponsor's capacity to remain as a solid player in the market.
58
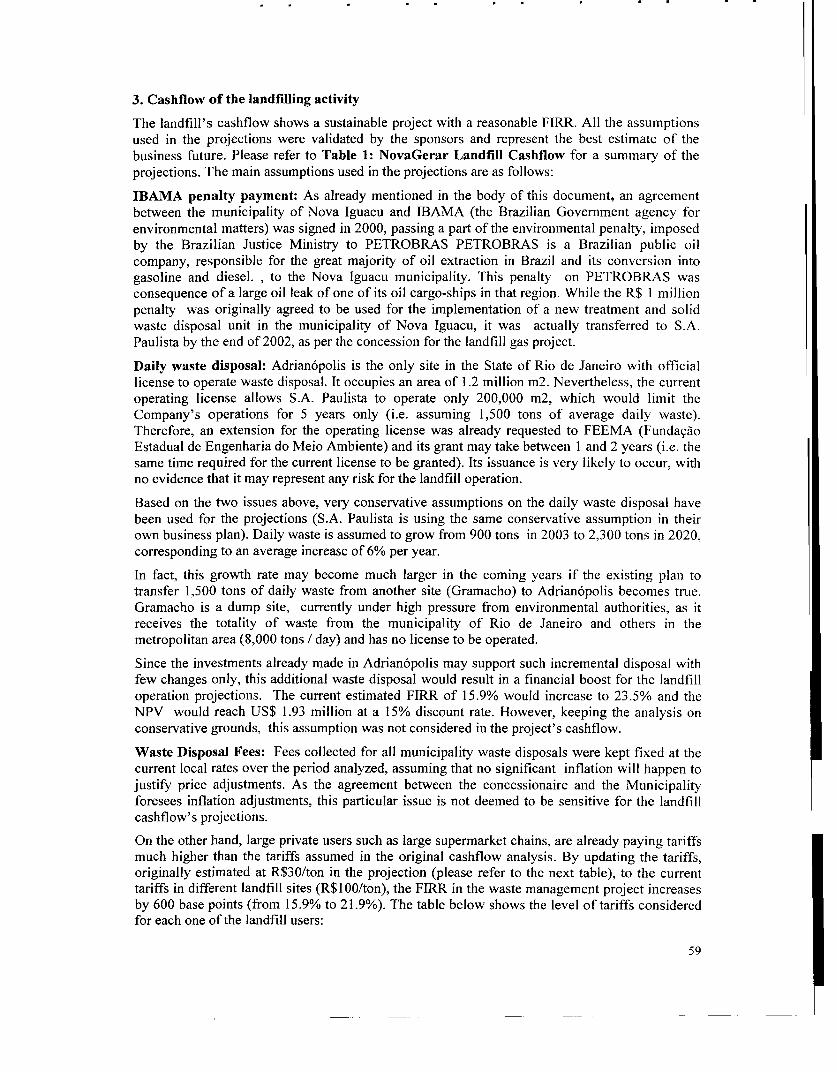
3. Cashflow of the landfilling activity
The landfill's cashflow shows a sustainable project with a reasonable FIRR. All the assumptionsused in the projections were validated by the sponsors and represent the best estimate of thebusiness future. Please refer to Table 1: NovaGerar Landfill Cashflow for a summary of theprojections. The main assumptions used in the projections are as follows:
IBAMA penalty payment: As already mentioned in the body of this document, an agreementbetween the municipality of Nova Iguacu and IBAMA (the Brazilian Government agency forenvironmental matters) was signed in 2000, passing a part of the environmental penalty, imposedby the Brazilian Justice Ministry to PETROBRAS PETROBRAS is a Brazilian public oilcompany, responsible for the great majority of oil extraction in Brazil and its conversion intogasoline and diesel. , to the Nova Iguacu municipality. This penalty on PETROBRAS wasconsequence of a large oil leak of one of its oil cargo-ships in that region. While the R$ I millionpenalty was originally agreed to be used for the implementation of a new treatment and solidwaste disposal unit in the municipality of Nova Iguacu, it was actually transferred to S.A.Paulista by the end of 2002, as per the concession for the landfill gas project.
Daily waste disposal: Adrian6polis is the only site in the State of Rio de Janeiro with officiallicense to operate waste disposal. It occupies an area of 1.2 million m2. Nevertheless, the currentoperating license allows S.A. Paulista to operate only 200,000 m2, which would limit theCompany's operations for 5 years only (i.e. assuming 1,500 tons of average daily waste).Therefore, an extension for the operating license was already requested to FEEMA (FundacaoEstadual de Engenharia do Meio Ambiente) and its grant may take between 1 and 2 years (i.e. thesame time required for the current license to be granted). Its issuance is very likely to occur, withno evidence that it may represent any risk for the landfill operation.
Based on the two issues above, very conservative assumptions on the daily waste disposal havebeen used for the projections (S.A. Paulista is using the same conservative assumption in theirown business plan). Daily waste is assumed to grow from 900 tons in 2003 to 2,300 tons in 2020,corresponding to an average increase of 6% per year.
In fact, this growth rate may become much larger in the coming years if the existing plan totransfer 1,500 tons of daily waste from another site (Gramacho) to Adrian6polis becomes true.Gramacho is a dump site, currently under high pressure from environmental authorities, as itreceives the totality of waste from the municipality of Rio de Janeiro and others in themetropolitan area (8,000 tons / day) and has no license to be operated.
Since the investments already made in Adrian6polis may support such incremental disposal withfew changes only, this additional waste disposal would result in a financial boost for the landfilloperation projections. The current estimated FIRR of 15.9% would increase to 23.5% and theNPV would reach US$ 1.93 million at a 15% discount rate. However, keeping the analysis onconservative grounds, this assumption was not considered in the project's cashflow.
Waste Disposal Fees: Fees collected for all municipality waste disposals were kept fixed at thecurrent local rates over the period analyzed, assuming that no significant inflation will happen tojustify price adjustments. As the agreement between the concessionaire and the Municipalityforesees inflation adjustments, this particular issue is not deemed to be sensitive for the landfillcashflow's projections.
On the other hand, large private users such as large supermarket chains, are already paying tariffsmuch higher than the tariffs assumed in the original cashflow analysis. By updating the tariffs,originally estimated at R$30/ton in the projection (please refer to the next table), to the currenttariffs in different landfill sites (R$100/ton), the FIRR in the waste management project increasesby 600 base points (from 15.9% to 21.9%). The table below shows the level of tariffs consideredfor each one of the landfill users:
59
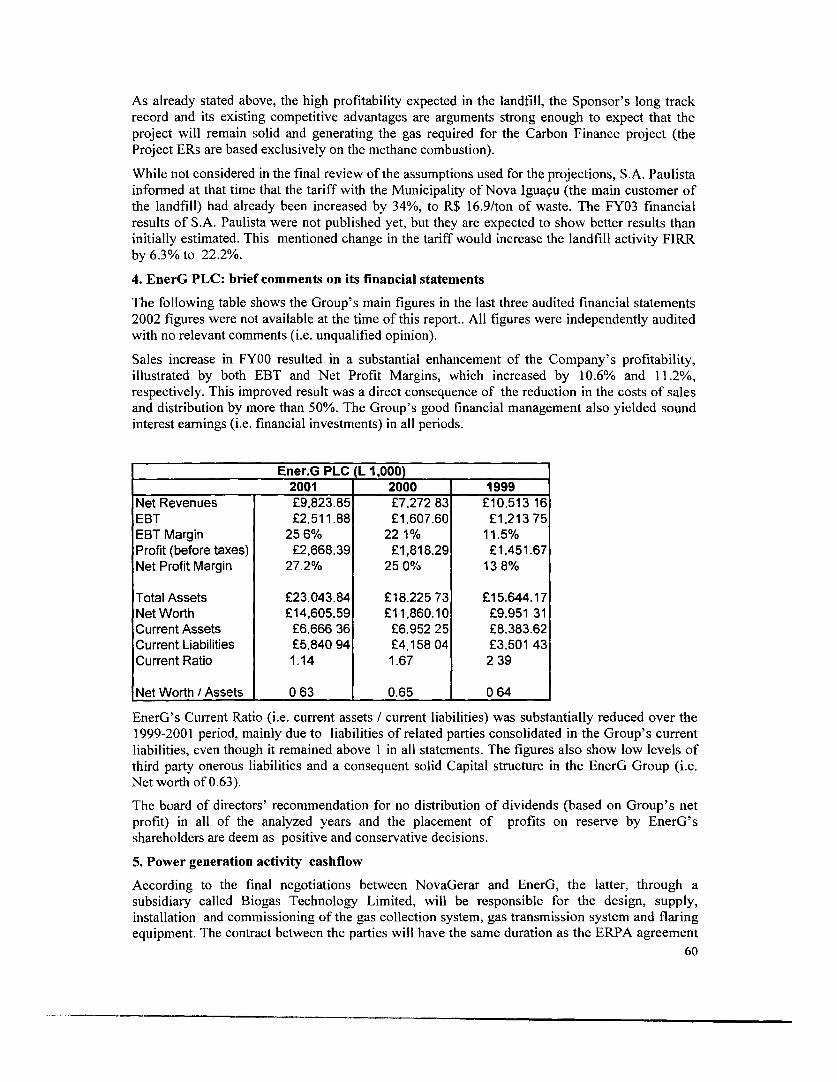
As already stated above, the high profitability expected in the landfill, the Sponsor's long track
record and its existing competitive advantages are arguments strong enough to expect that the
project will remain solid and generating the gas required for the Carbon Finance project (the
Project ERs are based exclusively on the methane combustion).
While not considered in the final review of the assumptions used for the projections, S.A. Paulista
informed at that time that the tariff with the Municipality of Nova Igua,u (the main customer of
the landfill) had already been increased by 34%, to R$ 16.9/ton of waste. The FY03 financial
results of S.A. Paulista were not published yet, but they are expected to show better results than
initially estimated. This mentioned change in the tariff would increase the landfill activity FIRR
by 6.3% to 22.2%.
4. EnerG PLC: brief comments on its financial statements
The following table shows the Group's main figures in the last three audited financial statements
2002 figures were not available at the time of this report.. All figures were independently audited
with no relevant comments (i.e. unqualified opinion).
Sales increase in FY00 resulted in a substantial enhancement of the Company's profitability,
illustrated by both EBT and Net Profit Margins, which increased by 10.6% and 11.2%,
respectively. This improved result was a direct consequence of the reduction in the costs of sales
and distribution by more than 50%. The Group's good financial management also yielded sound
interest earnings (i.e. financial investments) in all periods.
Ener.G PLC (L 1,000)2001 2000 1999
Net Revenues £9,823.85 £7.272 83 £10.513 16
EBT £2,511.88 £1,607.60 £1.213 75
EBT Margin 256% 22 1% 11.5%
Profit (before taxes) £2,668.39 £1,818.29 £1,451.67
Net Profit Margin 27.2% 25 0% 13 8%
Total Assets £23.043.84 £18,225 73 £15,644.17
Net Worth £14,605.59 £11,860.10 £9,951 31
Current Assets £6,666 36 £6,952 25 £8,383.62
Current Liabilities £5,840 94 £4,158 04 £3,501 43
Current Ratio 1.14 1.67 2 39
Net Worth I Assets 0 63 0.65 0 64
EnerG's Current Ratio (i.e. current assets / current liabilities) was substantially reduced over the
1999-2001 period, mainly due to liabilities of related parties consolidated in the Group's current
liabilities, even though it remained above I in all statements. The figures also show low levels of
third party onerous liabilities and a consequent solid Capital structure in the EnerG Group (i.e.
Net worth of 0.63).
The board of directors' recommendation for no distribution of dividends (based on Group's net
profit) in all of the analyzed years and the placement of profits on reserve by EnerG's
shareholders are deem as positive and conservative decisions.
5. Power generation activity cashflow
According to the final negotiations between NovaGerar and EnerG, the latter, through a
subsidiary called Biogas Technology Limited, will be responsible for the design, supply,
installation and commissioning of the gas collection system, gas transmission system and flaring
equipment. The contract between the parties will have the same duration as the ERPA agreement60
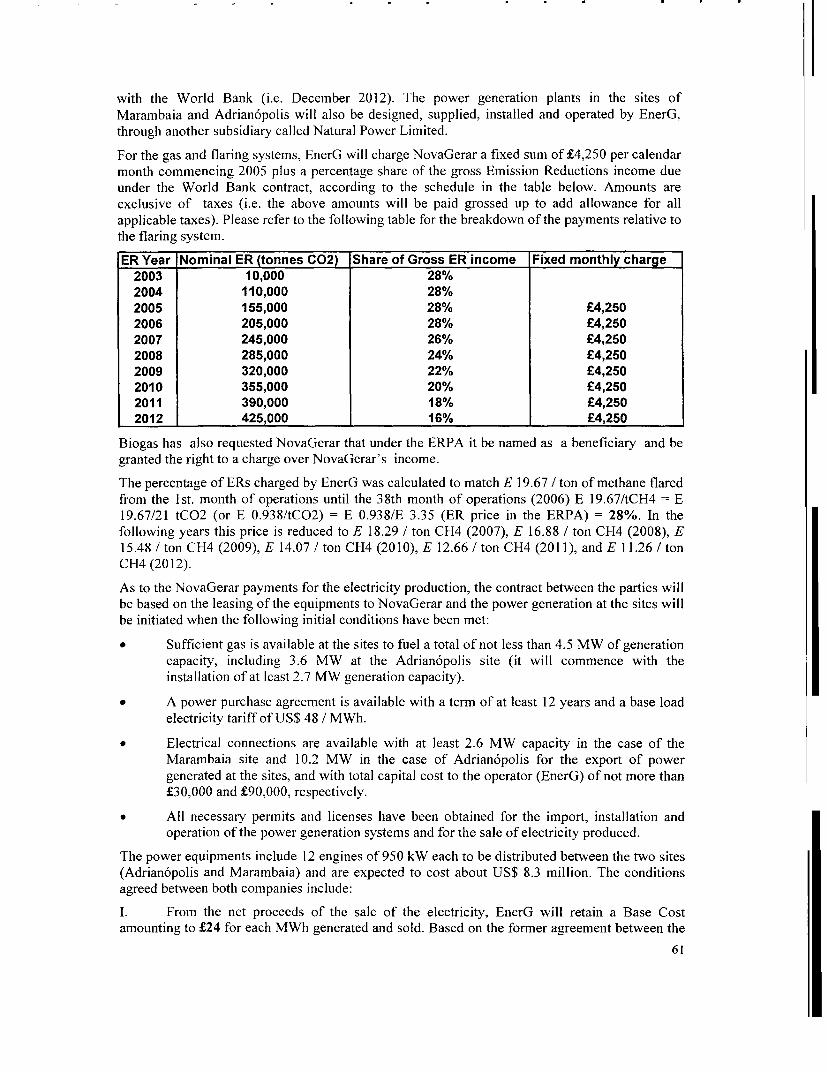
with the World Bank (i.e. December 2012). The power generation plants in the sites ofMarambaia and Adrian6polis will also be designed, supplied, installed and operated by EnerG,through another subsidiary called Natural Power Limited.
For the gas and flaring systems, EnerG will charge NovaGerar a fixed sum of £4,250 per calendarmonth commencing 2005 plus a percentage share of the gross Emission Reductions income dueunder the World Bank contract, according to the schedule in the table below. Amounts areexclusive of taxes (i.e. the above amounts will be paid grossed up to add allowance for allapplicable taxes). Please refer to the following table for the breakdown of the payments relative tothe flaring system.
ER Year Nominal ER (tonnes C02) Share of Gross ER income Fixed monthly charge2003 10,000 28%2004 110,000 28%2005 155,000 28% £4,2502006 205,000 28% £4,2502007 245,000 26% £4,2502008 285,000 24% £4,2502009 320,000 22% £4,2502010 355,000 20% £4,2502011 390,000 18% £4,2502012 425,000 16% £4,250
Biogas has also requested NovaGerar that under the ERPA it be named as a beneficiary and begranted the right to a charge over NovaGerar's income.
The percentage of ERs charged by EnerG was calculated to match E 19.67 / ton of methane flaredfrom the 1st. month of operations until the 38th month of operations (2006) E 19.67/tCH4 = E19.67/21 tCO2 (or E 0.938/tCO2) = E 0.938/E 3.35 (ER price in the ERPA) = 28%. In thefollowing years this price is reduced to E 18.29 / ton CH4 (2007), E 16.88 / ton CH4 (2008), E15.48 / ton CH4 (2009), E 14.07 / ton CH4 (2010), E 12.66 / ton CH4 (2011), and E 11.26 / tonCH4 (2012).
As to the NovaGerar payments for the electricity production, the contract between the parties willbe based on the leasing of the equipments to NovaGerar and the power generation at the sites willbe initiated when the following initial conditions have been met:
* Sufficient gas is available at the sites to fuel a total of not less than 4.5 MW of generationcapacity, including 3.6 MW at the Adrian6polis site (it will commence with theinstallation of at least 2.7 MW generation capacity).
* A power purchase agreement is available with a term of at least 12 years and a base loadelectricity tariff of US$ 48 / MWh.
* Electrical connections are available with at least 2.6 MW capacity in the case of theMarambaia site and 10.2 MW in the case of Adrian6polis for the export of powergenerated at the sites, and with total capital cost to the operator (EnerG) of not more than£30,000 and £90,000, respectively.
* All necessary permits and licenses have been obtained for the import, installation andoperation of the power generation systems and for the sale of electricity produced.
The power equipments include 12 engines of 950 kW each to be distributed between the two sites(Adrian6polis and Marambaia) and are expected to cost about US$ 8.3 million. The conditionsagreed between both companies include:
I. From the net proceeds of the sale of the electricity, EnerG will retain a Base Costamounting to £24 for each MWh generated and sold. Based on the former agreement between the
61
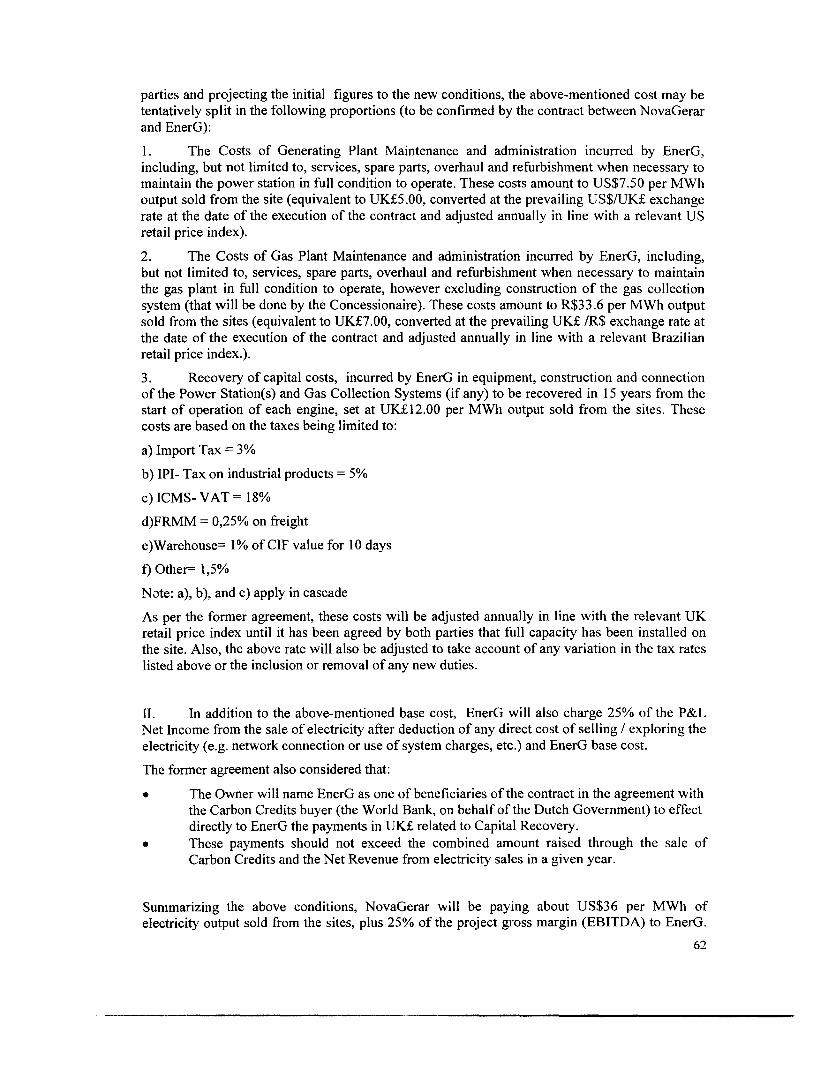
parties and projecting the initial figures to the new conditions, the above-mentioned cost may be
tentatively split in the following proportions (to be confirmed by the contract between NovaGerar
and EnerG):
1. The Costs of Generating Plant Maintenance and administration incurred by EnerG,
including, but not limited to, services, spare parts, overhaul and refurbishment when necessary to
maintain the power station in full condition to operate. These costs amount to US$7.50 per MWh
output sold from the site (equivalent to UK£5.00, converted at the prevailing US$/UK£ exchange
rate at the date of the execution of the contract and adjusted annually in line with a relevant US
retail price index).
2. The Costs of Gas Plant Maintenance and administration incurred by EnerG, including,
but not limited to, services, spare parts, overhaul and refurbishment when necessary to maintain
the gas plant in full condition to operate, however excluding construction of the gas collection
system (that will be done by the Concessionaire). These costs amount to R$33.6 per MWh output
sold from the sites (equivalent to UK£7.00, converted at the prevailing UK£ /R$ exchange rate at
the date of the execution of the contract and adjusted annually in line with a relevant Brazilian
retail price index.).
3. Recovery of capital costs, incurred by EnerG in equipment, construction and connection
of the Power Station(s) and Gas Collection Systems (if any) to be recovered in 15 years from the
start of operation of each engine, set at UK£12.00 per MWh output sold from the sites. These
costs are based on the taxes being limited to:
a) Import Tax = 3%
b) IPI- Tax on industrial products = 5%
c) ICMS- VAT = 18%
d)FRMM = 0,25% on freight
e)Warehouse= 1% of CIF value for 10 days
f) Other= 1,5%
Note: a), b), and c) apply in cascade
As per the former agreement, these costs will be adjusted annually in line with the relevant UK
retail price index until it has been agreed by both parties that full capacity has been installed on
the site. Also, the above rate will also be adjusted to take account of any variation in the tax rates
listed above or the inclusion or removal of any new duties.
II. In addition to the above-mentioned base cost, EnerG will also charge 25% of the P&L
Net Income from the sale of electricity after deduction of any direct cost of selling / exploring the
electricity (e.g. network connection or use of system charges, etc.) and EnerG base cost.
The former agreement also considered that:
* The Owner will name EnerG as one of beneficiaries of the contract in the agreement with
the Carbon Credits buyer (the World Bank, on behalf of the Dutch Government) to effect
directly to EnerG the payments in UK£ related to Capital Recovery.
* These payments should not exceed the combined amount raised through the sale of
Carbon Credits and the Net Revenue from electricity sales in a given year.
Summarizing the above conditions, NovaGerar will be paying about US$36 per MWh of
electricity output sold from the sites, plus 25% of the project gross margin (EBITDA) to EnerG.
62
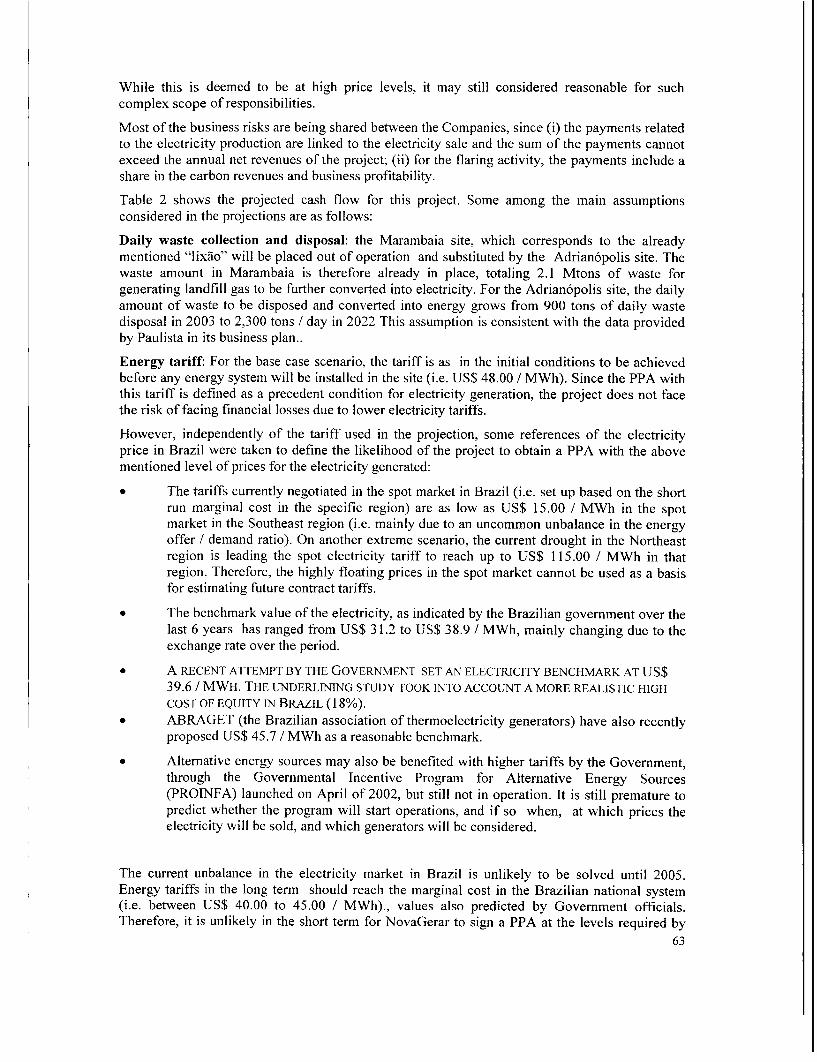
While this is deemed to be at high price levels, it may still considered reasonable for suchcomplex scope of responsibilities.
Most of the business risks are being shared between the Companies, since (i) the payments relatedto the electricity production are linked to the electricity sale and the sum of the payments cannotexceed the annual net revenues of the project; (ii) for the flaring activity, the payments include ashare in the carbon revenues and business profitability.
Table 2 shows the projected cash flow for this project. Some among the main assumptionsconsidered in the projections are as follows:
Daily waste collection and disposal: the Marambaia site, which corresponds to the alreadymentioned "lixao" will be placed out of operation and substituted by the Adrian6polis site. Thewaste amount in Marambaia is therefore already in place, totaling 2.1 Mtons of waste forgenerating landfill gas to be further converted into electricity. For the Adrian6polis site, the dailyamount of waste to be disposed and converted into energy grows from 900 tons of daily wastedisposal in 2003 to 2,300 tons / day in 2022 This assumption is consistent with the data providedby Paulista in its business plan..
Energy tariff: For the base case scenario, the tariff is as in the initial conditions to be achievedbefore any energy system will be installed in the site (i.e. US$ 48.00 / MWh). Since the PPA withthis tariff is defined as a precedent condition for electricity generation, the project does not facethe risk of facing financial losses due to lower electricity tariffs.
However, independently of the tariff used in the projection, some references of the electricityprice in Brazil were taken to define the likelihood of the project to obtain a PPA with the abovementioned level of prices for the electricity generated:
* The tariffs currently negotiated in the spot market in Brazil (i.e. set up based on the shortrun marginal cost in the specific region) are as low as US$ 15.00 / MWh in the spotmarket in the Southeast region (i.e. mainly due to an uncommon unbalance in the energyoffer / demand ratio). On another extreme scenario, the current drought in the Northeastregion is leading the spot electricity tariff to reach up to US$ 115.00 / MWh in thatregion. Therefore, the highly floating prices in the spot market cannot be used as a basisfor estimating future contract tariffs.
* The benchmark value of the electricity, as indicated by the Brazilian government over thelast 6 years has ranged from US$ 31.2 to US$ 38.9 / MWh, mainly changing due to theexchange rate over the period.
* A RECENT ATTEMPT BY THE GOVERNMENTI SET AN ELECTRICITY BENCHMARK AT US$
39.6 / MWH. THE UNDERLINING STUDY TOOK INTO ACCOUNT A MORE REALISTIC HIGHCOST OF EQUITY IN BRAZIL (18%).
* ABRAGET (the Brazilian association of thermoelectricity generators) have also recentlyproposed US$ 45.7 / MWh as a reasonable benchmark.
* Alternative energy sources may also be benefited with higher tariffs by the Government,through the Governmental Incentive Program for Alternative Energy Sources(PROINFA) launched on April of 2002, but still not in operation. It is still premature topredict whether the program will start operations, and if so when, at which prices theelectricity will be sold, and which generators will be considered.
The current unbalance in the electricity market in Brazil is unlikely to be solved until 2005.Energy tariffs in the long term should reach the marginal cost in the Brazilian national system(i.e. between US$ 40.00 to 45.00 / MWh)., values also predicted by Government officials.Therefore, it is unlikely in the short term for NovaGerar to sign a PPA at the levels required by
63
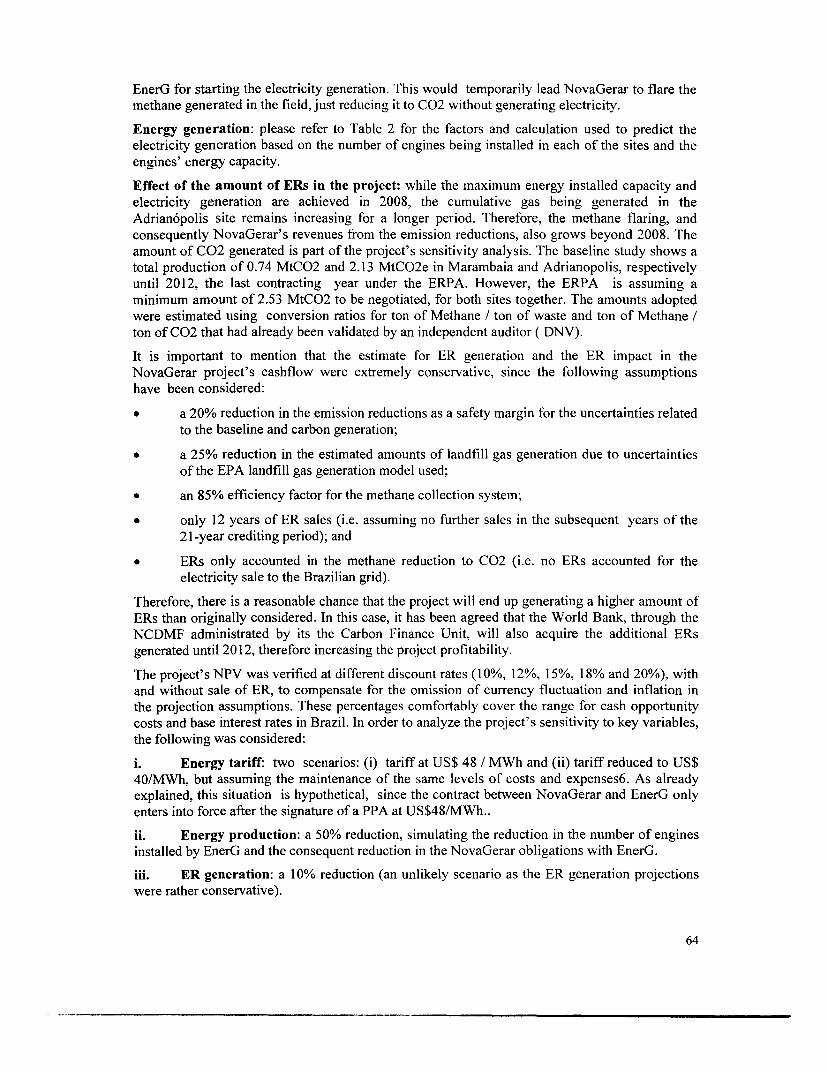
EnerG for starting the electricity generation. This would temporarily lead NovaGerar to flare the
methane generated in the field, just reducing it to C02 without generating electricity.
Energy generation: please refer to Table 2 for the factors and calculation used to predict the
electricity generation based on the number of engines being installed in each of the sites and the
engines' energy capacity.
Effect of the amount of ERs in the project: while the maximum energy installed capacity and
electricity generation are achieved in 2008, the cumulative gas being generated in the
Adrian6polis site remains increasing for a longer period. Therefore, the methane flaring, and
consequently NovaGerar's revenues from the emission reductions, also grows beyond 2008. The
amount of C02 generated is part of the project's sensitivity analysis. The baseline study shows a
total production of 0.74 MtCO2 and 2.13 MtCO2e in Marambaia and Adrianopolis, respectively
until 2012, the last contracting year under the ERPA. However, the ERPA is assuming a
minimum amount of 2.53 MtCO2 to be negotiated, for both sites together. The amounts adopted
were estimated using conversion ratios for ton of Methane / ton of waste and ton of Methane /
ton of C02 that had already been validated by an independent auditor ( DNV).
It is important to mention that the estimate for ER generation and the ER impact in the
NovaGerar project's cashflow were extremely conservative, since the following assumptions
have been considered:
* a 20% reduction in the emission reductions as a safety margin for the uncertainties related
to the baseline and carbon generation;
* a 25% reduction in the estimated amounts of landfill gas generation due to uncertainties
of the EPA landfill gas generation model used;
* an 85% efficiency factor for the methane collection system;
* only 12 years of ER sales (i.e. assuming no further sales in the subsequent years of the
21-year crediting period); and
* ERs only accounted in the methane reduction to C02 (i.e. no ERs accounted for the
electricity sale to the Brazilian grid).
Therefore, there is a reasonable chance that the project will end up generating a higher amount of
ERs than originally considered. In this case, it has been agreed that the World Bank, through the
NCDMF administrated by its the Carbon Finance Unit, will also acquire the additional ERs
generated until 2012, therefore increasing the project profitability.
The project's NPV was verified at different discount rates (10%, 12%, 15%, 18% and 20%), with
and without sale of ER, to compensate for the omission of currency fluctuation and inflation in
the projection assumptions. These percentages comfortably cover the range for cash opportunity
costs and base interest rates in Brazil. In order to analyze the project's sensitivity to key variables,
the following was considered:
i. Energy tariff: two scenarios: (i) tariff at US$ 48 / MWh and (ii) tariff reduced to US$
40/MWh, but assuming the maintenance of the same levels of costs and expenses6. As already
explained, this situation is hypothetical, since the contract between NovaGerar and EnerG only
enters into force after the signature of a PPA at US$48/MWh..
ii. Energy production: a 50% reduction, simulating the reduction in the number of engines
installed by EnerG and the consequent reduction in the NovaGerar obligations with EnerG.
iii. ER generation: a 10% reduction (an unlikely scenario as the ER generation projections
were rather conservative).
64
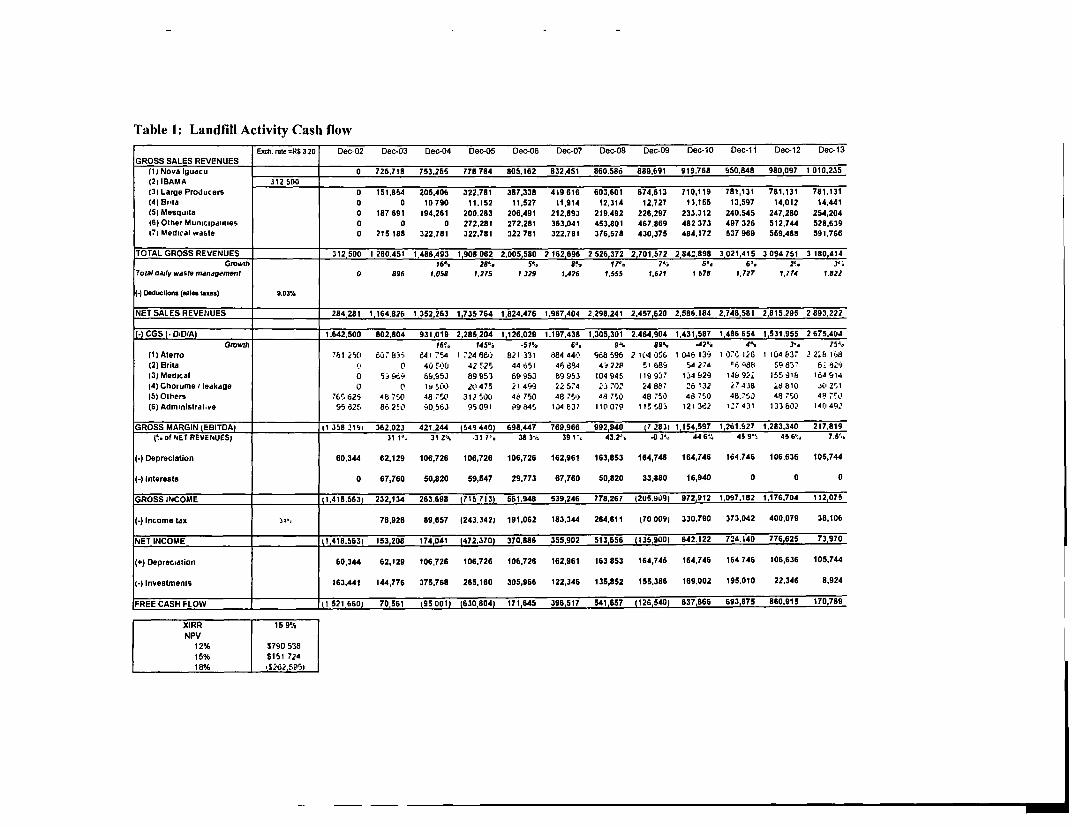
Table 1: Landfill Activity Cash flowExch. rate =R$ 3.20 Dec-02 Dec-03 Dec-04 Dec-05 Dec-06 Dec-07 Dec-08 Dec-09 Dec-10 Dec-1i Dec-12 Dec-13GROSS SALES REVENUES
(I Nova lguacu 0 725,718 753.255 778 784 805.162 832,451 860.586 889.691 919,768 950.848 980,097 1010.235(21 IBAMA 312 500t3t Large Producers 0 151.854 205.406 322,781 387,338 419 616 603.601 674,613 710,119 781,131 781.131 781.131(4) BrIa 0 0 10790 11.152 11,527 11,914 12,314 12.727 13.155 13.597 14,012 14.441(Si Mesquina 0 187 691 194.261 200.283 206.491 212.893 219.492 226,297 233.312 240.545 247,280 254,204t6) Other Municipalities 0 0 0 272,281 272.281 363.041 453.801 467,869 482 373 497 326 512.744 528.639t7t Medical wasle 0 215 188 322.781 322.781 322 781 322.781 376,578 430,375 484,172 537 969 559.488 591,766
TOTAL GROSS REVENUES 312,500 1 280.451 1,486,493 1,908 062 2.005,580 2162,696 2526,372 2,101,572 2,842.898 3,021,415 3094,751 3 180,414Gro*ih 16% 28s. 5%. E'% 17'. 74. 5. 6'. 2%. 3%?oial aaily waste mandgemenr 0 89( 1.058 1.275 1329 1.426 1.555 1,621 1678 1.727 1,774 1.822
(-) Deducions (sales taxes) 9.03%
NET SALES REVENUES 284,281 1,164.826 1,352,263 1,735 764 1,824,476 1,967,404 2,298,241 2.457,620 2,586.184 2,748,581 2,815.295 2 893.222
I-)CGS (. DiD/A) 1.642.500 802,804 931.019 2,285,204 1,126,029 1.197.438 1,305,301 2.464,904 1,431,587 1,486 654 1,531,955 2675.404Growth l6 145%b -515 68. 9%. 89%. 4Pi 4% 3'. 75.(1) Alerro 781 25CI 60. 86 641 75A 1 724 66') 821 j331 84 440 668 596 2 10450S6 1 046 139 1 07e 126 1 104 837 2 2.8 168
(2) Brita 0 L 40 500 42 525 44 651 46 884 4d 228 S" 68i 54 274?a dc8 5 837 62926t3( Medical 0 5J6 69.953 as 993 69 953 89 953 104 945 119 937 134 929 149 92 15 918 164 914(4) Chorume I leakage 0 0 18500 20475 21 493 22574 23 702 24887 26 132 2 7438 d6810 302 31(5) Olhers 765 625 48 750 48 750 312 500 46 750 48 75. 48 750 48 750 48 750 48.7S0 48 750 48 7o(6) Adminislral-ve 95625 8e2W0 90.5e3 95091 99645 104 837 1100,9 115583 121 362 127 431 133 802 t4 '490
GROSS MARGIN (EBITDA) 1 358 219i 362,023 421.244 (549 440) 698,447 769.966 992,940 (7 2831 1,154,597 1,261.927 1.283.340 217.819%orfNET REVENUES) 31 1. 31 2'& 31 7-. 3834 39 1". 43.2% 4-34. 446,: 45 9% 4566% 7.5%,
(-) Depreciation 60.344 62,129 106,726 106,726 106,726 162,961 163,853 164,746 164,746 164.746 106.636 105,744
(-) Interests 0 67,760 50,820 59,547 29,773 67,760 50,820 33,880 16,940 0 0 0
GROSS INCOME t1.418.563I 232,134 263.698 (715 713) 561,948 539,246 778,267 (205.909) 972,912 1,097,182 1,176.704 112,075
(-) Income tax 3- 78,926 89,657 (243.342) 191.062 183.34 264,611 (70 0091 330.790 373.042 400,079 38.106
NET INCOME t1,418.5631 153,208 174,041 (472.310) 370.886 355,902 513,656 (135,900) 642.122 724.140 776,625 73,970
(4) Depreciation 60,344 62,129 106,726 106,726 106,726 162,961 163 853 164,746 164,746 164 746 106,636 105,744
(I) InvesLmenls 163,441 144,776 375,768 265.160 305,966 122,346 135,852 155.386 169.002 195.010 22,346 8,924
FREE CASH FLOW III 521,660) 70,561 (95 001) (630,804) 171,645 396,517 541,657 (126,540) 637,866 693,875 860,915 170,789
XIRR 15 9%NPV
12% 1790 53815% $151 72418% i,5262.5951
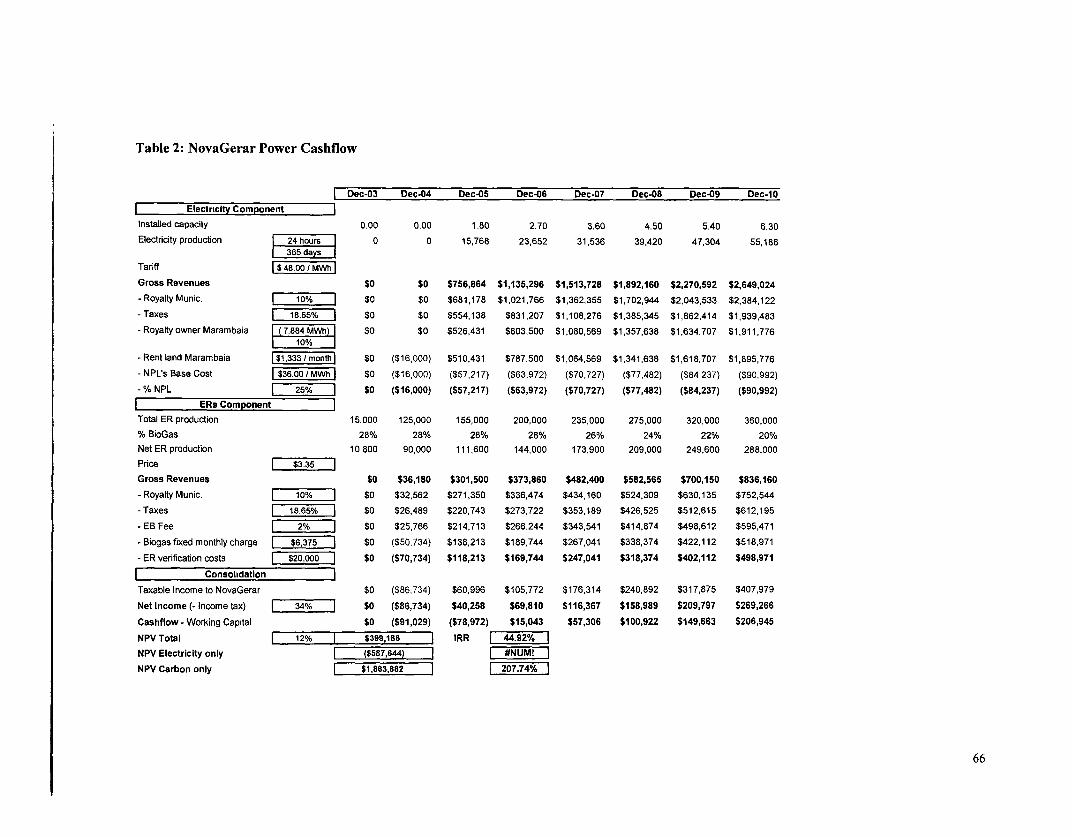
Table 2: NovaGerar Power Cashflow
I Dec-03 Dec404 Dec405 Dec-06 Dec-07 Dec408 Dec409 Dec-10
Electricity Component |
Installed capacity 0.00 0.00 1.80 2.70 3.60 4.50 5.40 6.30
Electrcity production 24 hours 0 0 15,768 23,652 31,536 39,420 47,304 55,188
365 days
Tariff $ 48.00 / MWMh
Gross Revenues $0 $0 $756,864 $1,135,296 $1,513,728 $1,892,160 $2,270,592 $2,649,024
-Royalty Munic. 10% 1 $0 $0 $681,178 $1,021,766 $1,362,355 $1,702,944 $2,043,533 $2,384,122
-Taxes 18.65% $0 $0 $554,138 $831,207 $1,108,276 $1,385,345 $1,662,414 $1,939,483
-Royalty owner Marambaia 7884MWh $0 $0 $526,431 $803,500 $1,080,569 $1,357,638 $1,634,707 $1,911,776
10% 1
-RentlandMarambaia $1,333/month $0 ($16,000) $510,431 $787,500 $1,064,569 $1,341,638 $1,618,707 $1,895,776
-NPL's Base Cost $36.00/MWhj $0 ($16,000) ($57,217) ($63,972) ($70,727) ($77,482) ($84,237) ($90,992)
- % NPL 25% $0 ($16,000) ($57,217) ($63,972) ($70,727) ($77,482) ($84,237) ($90,992)
ERs Component
Total ER production 15,000 125,000 155,000 200,000 235,000 275,000 320,000 360,000
% BioGas 28% 28% 28% 28% 26% 24% 22% 20%
Net ER production 10,800 90,000 111,600 144,000 173,900 209,000 249,600 288,000
Price $3.35 ]
Gross Revenues $0 $36,180 $301,500 $373,860 $482,400 $582,565 $700,150 $836,160
- Royalty Munic. 10% $0 $32,562 $271,350 $336,474 $434,160 $524,309 $630,135 $752,544
- Taxes 18.65% $0 $26,489 $220,743 $273,722 $353,189 $426,525 $512,615 $612,195
- EB Fee 2% $0 $25,766 $214,713 $266,244 $343,541 $414,874 $498,612 $595,471
-Biogas fixed monthly charge $6,375 $0 ($50,734) $138,213 $189,744 $267,041 $338,374 $422,112 $518,971
- ER verification costs $20,000 $0 ($70,734) $118,213 $169,744 $247,041 $318,374 $402,112 $498,971
Consolidation
Taxable Income to NovaGerar $0 ($86,734) $60,996 $105,772 $176,314 $240,892 $317,875 $407,979
Net Income (- Income tax) 34% $0 ($86,734) $40,258 $69,810 $116,367 $158,989 $209,797 $269,266
Cashflow - Working Capital $0 ($91,029) ($78,972) $15,043 $57,306 $100,922 $149,663 $206,945
NPV Total 12% $399,186 IRR 44.92%
NPV Electricity only ($587,644) #NUMi
NPV Carbon only $1,863,882 207.74%
66
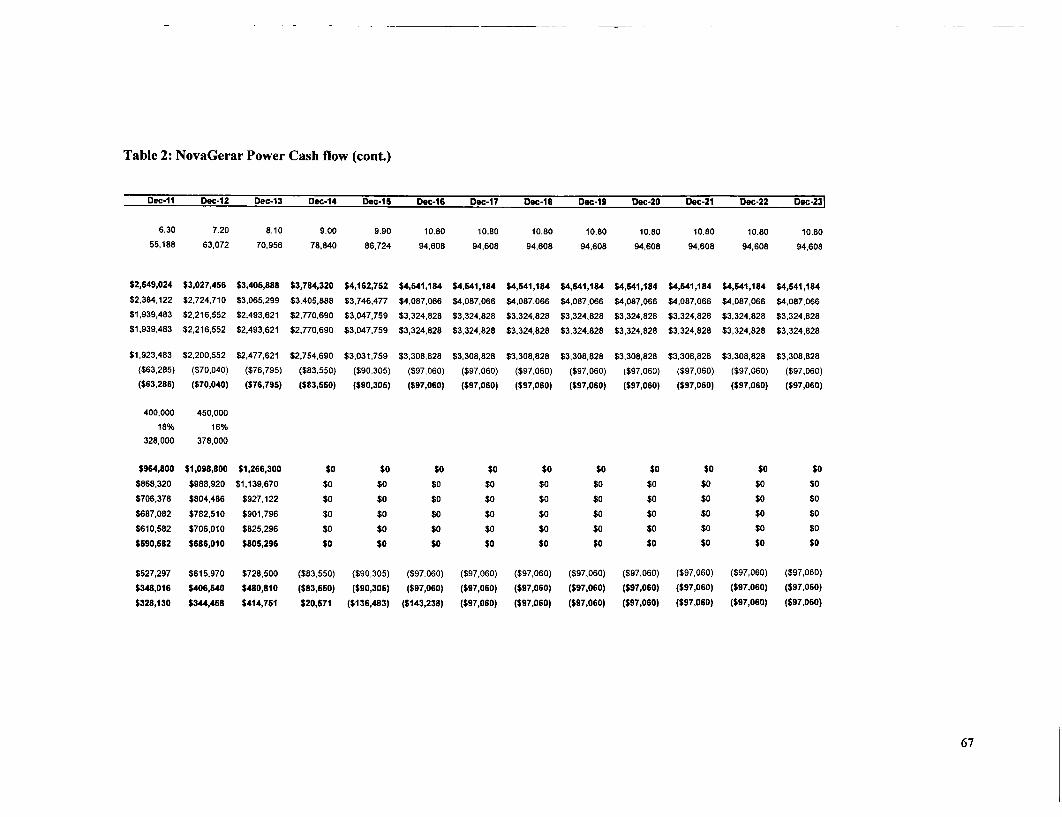
Table 2: NovaGerar Power Cash flow (cont.)
Dec-1l Dec-12 Dec-13 Dec-14 Dec-16 Dec-16 Dec-17 Dec-18 Dec-19 Dec-20 Dec-21 Dec-22 Dec-23
6.30 7.20 8.10 9.00 9.90 10.80 10.80 10.80 10.80 10.80 10.80 10.80 10.8055,188 63,072 70,956 78,840 86,724 94,608 94,608 94,608 94,608 94,608 94,608 94,608 94,608
$2,649,024 $3,027,456 $3,405,888 $3,784,320 $4,162,752 $4,641,184 $4,641,184 $4,641,184 $4,641,184 $4,541,184 $4,541,184 $4,641,184 $4,541,184$2,384,122 $2,724,710 $3,065.299 $3,405,888 $3,746,477 $4,087,066 $4,087,066 $4,087,066 $4,087,066 $4,087,066 $4,087,066 $4,087,066 $4,087,066$1,939,483 $2,216,552 $2,493,621 $2,770,690 $3,047,759 $3,324,828 $3,324,828 $3,324,828 $3,324,828 $3,324,828 $3,324,828 $3,324,828 $3,324,828$1,939,483 $2,216,552 $2,493,621 $2,770,690 $3,047,759 $3,324,828 $3,324,828 $3,324,828 $3,324,828 $3,324,828 $3,324,828 $3,324,828 $3,324,828
$1,923,483 $2,200,552 $2,477,621 $2,754,690 $3,031,759 $3,308,828 $3,308,828 $3,308,828 $3,308,828 $3,308,828 $3,308,828 $3,308,828 $3,308,828($63,285) ($70,040) ($76,795) ($83,550) ($90,305) ($97,060) ($97,060) ($97,060) ($97,060) ($97,060) ($97,060) ($97,060) ($97,060)($63,285) ($70,040) ($76,798) ($83,550) ($90,305) ($97,060) ($97,060) ($97,060) ($97,060) ($97,060) ($97,060) ($97,060) ($97,060)
400,000 450,00018% 16%
328,000 378,000
$964,800 $1,098,800 $1,266,300 $0 $0 $0 $0 $0 $0 S0 $0 $0 $0$868,320 $988,920 $1,139,670 $0 $0 $0 $0 $0 $0 $0 $0 $0 $0
$706,378 $804,486 $927,122 $0 $0 $0 $0 $0 $0 $0 $0 $0 $0
$687,082 $782,510 $901,796 $0 $0 $0 $0 $0 $0 $0 $0 $0 $0$610,582 $706,010 $825,296 $0 $0 $0 $0 $0 $0 $0 $0 $0 $0
$590,582 $686,010 $805,296 $0 $0 $0 $0 $0 $0 $0 $0 $0 $0
$527,297 $615,970 $728,500 ($83,550) ($90,305) ($97,060) ($97,060) ($97,060) ($97,060) ($97,060) ($97,060) ($97,060) ($97,060)$348,016 $406,640 $480,810 ($83,550) (S90,305) ($97,060) ($97,060) ($97,060) ($97,060) ($97,060) ($97,060) ($97,060) ($97,060)$328,130 $344,468 $414,751 $20,571 ($136,483) ($143,238) ($97,060) ($97,060) ($97,060) ($97,060) ($97,060) ($97,060) ($97,060)
67
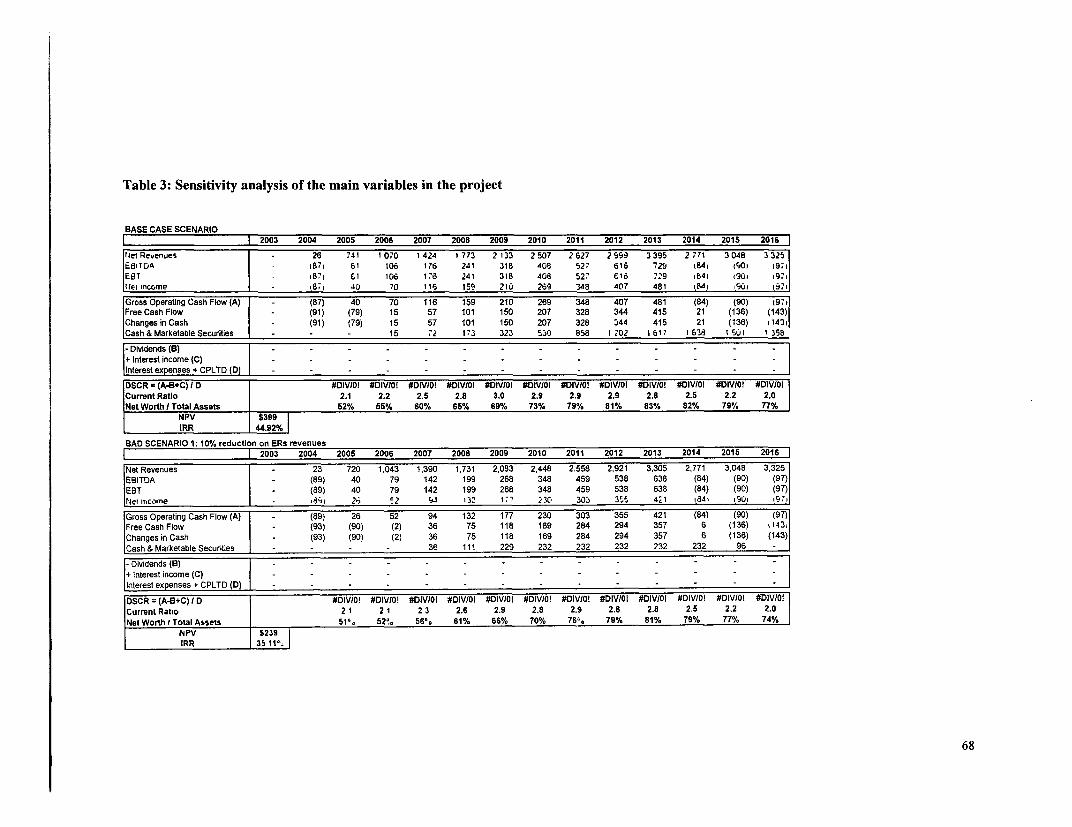
Table 3: Sensitivity analysis of the main variables in the project
BASE CASE SCENARIOB 2003 2004 2005 2006 2007 2008 2009 2010 2011 2012 2013 2014 2015 2016
Jet Re.enues - 26 741 1070 1424 1773 2133 2507 2627 2999 3395 2771 30048 33251
ESiTDA 187,1 61 106 176 241 318 408 527 616 729 M84i t90, 1971
EST i87i 61 106 176 241 318 408 527 616 729 1841 1901 i97i
Niel ncome - i87i 40 70 116 159 21u 269 348 407 481 841 901 19.
Gross Operating Cash Flow (A) (87) 40 70 116 159 210 269 348 407 481 (84) (90) ig;
FreeCashFlow - (91) (79) 15 57 101 150 207 328 344 415 21 (136) (143)
Changes in Cash - (91) (79) 15 57 101 150 207 328 344 415 21 (136) 1 14311
Cash&MarketableSecurities - - - 15 .i 173 323 530 858 I 202 I 617 I 638 I 501 1 358
Dividends (B) 1+ Interest income (C) )+ Interest expenses +CPLTD(D) |
DSCR * (A-B+C) I D #DIVIO0 #DiVIO! #DIVI0! #DiVIOI #DIV10I #DIVIO/ #DIVIO! #DIVIO #DIVIOI #DIV/0I #DIVIO! #DIV/Of1
Current Ratio 2.1 2.2 2.5 2.8 3.0 2.9 2.9 2.9 2.8 2.5 2.2 2.0
Net Worth I Total Assets 52% 55% 60% 65% 69% 73% 79% 81% 83% 82% 79% 77%
NPV $399IRR 44.92%
BAD SCENARIO 1: 10% reduction on ERs revenuesI______________________* 1 2003 2004 2005 2006 2007 2008 2009 2010 2011 2012 2013 2014 2015 2016
Net Revenues - 23 720 1,043 1,390 1,731 2,083 2,448 2,558 2,921 3,305 2,771 3,046 3,325
EBITDA (89) 40 79 142 199 268 348 459 538 638 (84) (90) (97)
EBT - (89) 40 79 142 199 268 348 459 538 638 (84) (90) (97)
Ne ,Income * ,d8 26 2 91 I'32 17? i30 303 355 421 841 190I ,9
Gross Operating Cash Flow (A) (89) 26 52 94 132 177 230 303 355 421 (84) (90) (97)
Free Cash Flow (93) (90) (2) 36 75 118 169 284 294 357 6 (136) ,143,
Changes in Cash (93) (90) (2) 36 75 118 169 284 294 357 6 (136) (143)
Cash & Marketable Securities - - - - 36 111 229 232 232 232 232 232 96 -
- Dividends (B) 1+ Interest income (C) j-Interest expenses + CPLTD (D) |
DSCR =(A-B+C) I 1 #DIV/0! #DIVtOI #DIV/OI #DIV/01 #DIV/0I #DIVIO! #DIVIO! #DIVW0I #DIVIO! #DIV101 #DIV/01 #DIV/O!
Current Ratio 2 1 2 1 2 3 2.6 2.9 2.8 2.9 2.8 2.8 2.5 2.2 2.0
Nel Worth ITotal Assets | 51 % 52a. 56%. 61% 66% 70% 76%. 79% 81% 79% 77% 74%
NPV | S239IRR 35 11i.
68
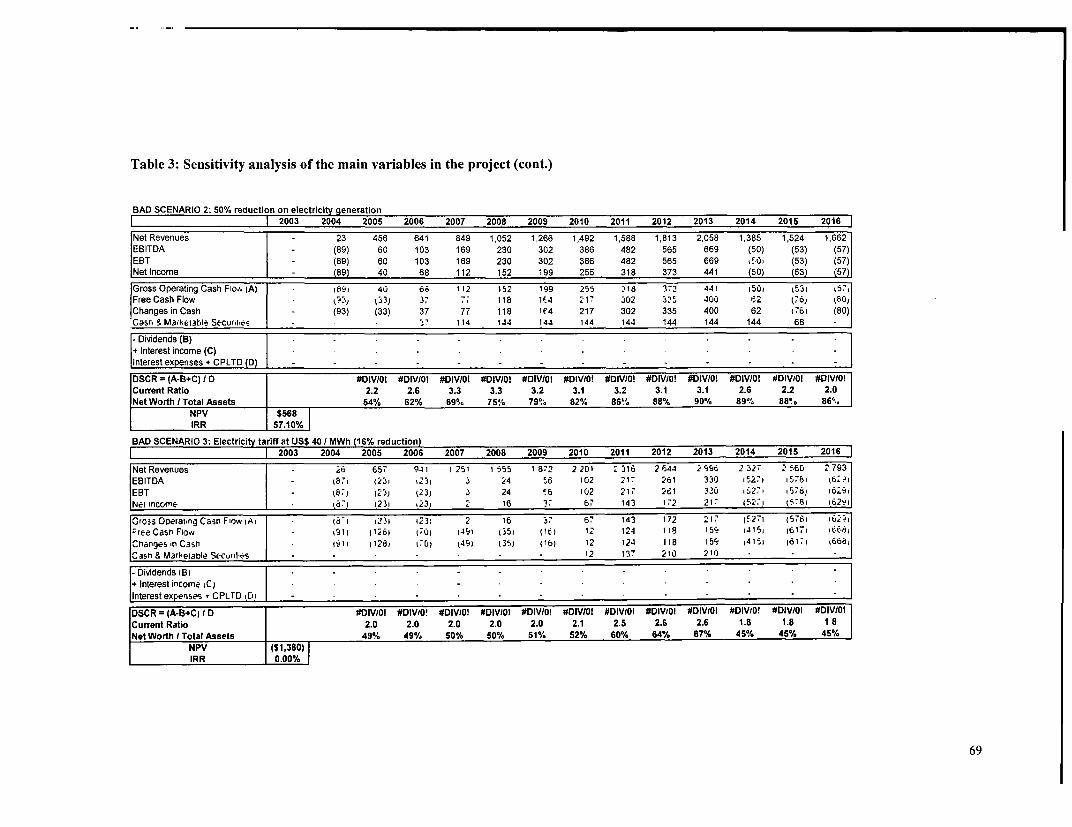
Table 3: Sensitivity analysis of the main variables in the project (cont.)
BAD SCENARIO 2: 50% reduction on electricity generation| 2003 2004 2005 2006 2007 2008 2009 2010 2011 2012 2013 2014 2015 2016
Net Revenues - 23 456 641 849 1,052 1,266 1,492 1,588 1,813 2,058 1,385 1,524 1,662
EBITDA (89) 60 103 169 230 302 386 482 565 669 (50) (53) (57)
EBT (89) 60 103 169 230 302 386 482 565 669 ,'0G (53) (57)
Net Income - (89) 40 68 112 152 199 255 318 373 441 (50) (53) (57)
GrossOperatingCashFioeilA) 180 40 64 112 152 199 256 318 373 441 1501 k531 657,
FreeCashFlow I93. . 33) 3. 77 118 lf4 217 302 3?5 400 62 .76J t80)
|Changes in Cash - (93) (33) 37 77 118 1C4 217 302 335 400 62 I761 (80)
Casr S Make13tl,e Securl. - 37 114 1J4 144 144 141 144 144 144 68 -
-Dividends (B) I . . . ..
Interest expenses + CPLTD (D)
DSCR = (A-B+C) / D #DIVI0! #DIV/0i #DIV/OI O DIV/0! #DIVI0! #DIVI/0! #DIVW0! #DIV/OI #DIV/O! #DIVIG DIVD0! #DIV/O!
Current Ratio 2.2 2.6 3.3 3.3 3.2 3.1 3.2 3.1 3.1 2.6 2.2 2.0
Net Worth I Total Assets 54% 62% 69% 751% 79°. 82% 86%. 88% 90% 89% 88°. 86%U
NPV $668IRR 57.10%
BAD SCENARIO 3: Electricity tariff at US$ 40/ MWh (16% reduction)I ______________________1 2003 2004 2005 2006 2007 2008 2009 2010 2011 2012 2013 2014 2015 2016
NetRevenues - 26 657 941 125' 1655 1872 2201 2316 2644 2996 232, 2e60 2793EBITDA - t'i 23; I2i'J 3 24 56 102 217 261 330) 52.1 1576, tt,'
EBT - t8J t23) ( 23J 3 24 ¶6 102 217, 261 33U0 ,27. 15781 ,6.9,
Net income . 7; ! 23; t23! 2 16 37 6' 143 172 21 7 527 ! 57'8! i62'9,
Gross OPeFat.ng Cas' Filvl Ai -I 1231 1231 2 16 37 6' 143 172 217 t5271 15781 i62'i
IreeCasn Flow 911 1128, 1701 4J91 t351 116 12 124 118 159 1:151 16171 1664,j
Changes,nCash IYII 1128 I G) tj9; 131) N16) 12 124 118 159 4 16 16171 1668,
C35ah & Marle3Dtle SecuriI, . . . . . . 12 137 210 210
-Dividends iBi+ Interest income ;ClInterest expenses * CPLTD iD |
DSCR = (A-B+Cj I D #DIVI0l #DIVIO! #DIVIOI #DIVIO! #DIVIOI #DIV/OI #DIVIOf #DIV#01 #DIVIOI #DIViO! #DIVI0I #DIV/0!
Cuffent Ratio 2.0 2.0 2.0 2.0 2.0 2.1 2.5 2.6 2.6 1.8 1.8 1 8
Net Worth I Total Assets 49% 49% 50% 50% 51% 52% 60% 64% 67% 45% 45% 45%
NPV (S 1,380)IRR 0.00%
69
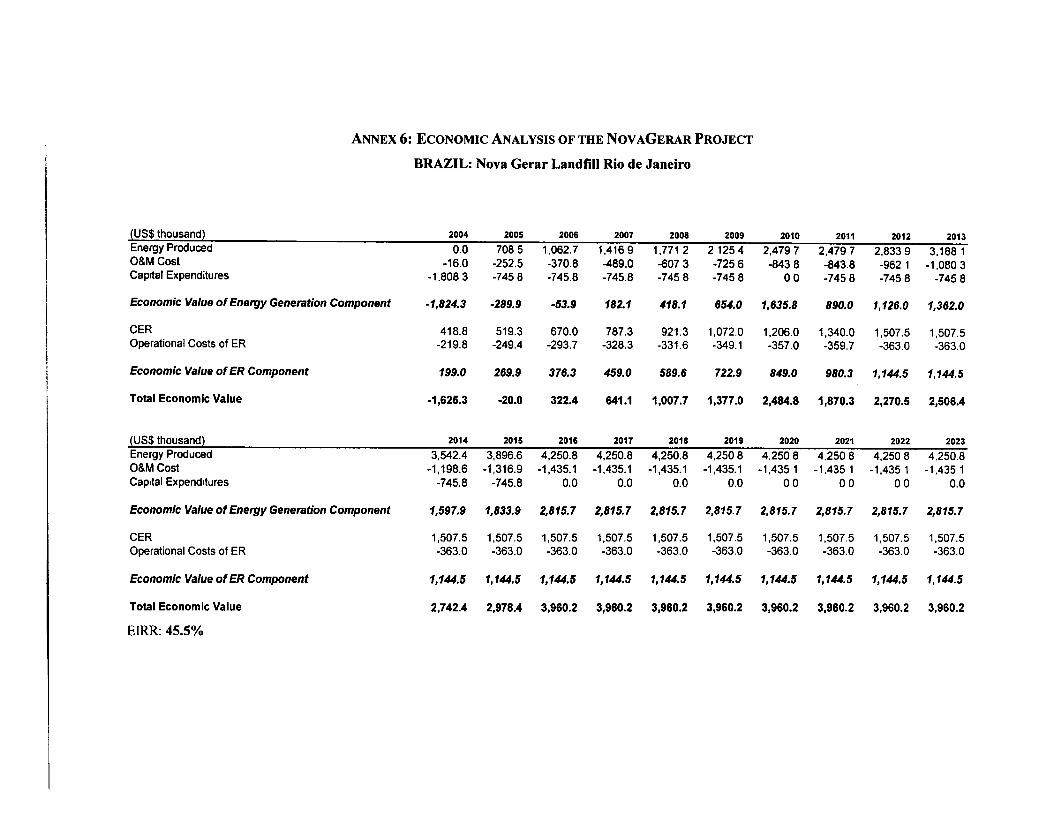
ANNEX 6: ECONOMIC ANALYSIS OF THE NOVAGERAR PROJECT
BRAZIL: Nova Gerar Landfill Rio de Janeiro
(US$ thousand) 2004 2005 2006 2007 2008 2009 2010 2011 2012 2013Energy Produced 0.0 708 5 1.062.7 1.4169 1,771 2 2 1254 2,479 7 2,479 7 2.833 9 3.188 1O&M Cost -16.0 -252.5 -370.8 -489.0 -607 3 -725 6 -843 8 -843.8 -9621 -1.080 3Captal Expenditures -1.808 3 -745 8 -745.8 -745.8 -745 8 -745 8 0 0 -745 8 -745 8 -745 8
Economic Value of Energy Generation Component -1,824.3 -289.9 -53.9 182.1 418.1 654.0 1,635.8 890.0 1,126.0 1,362,0
CER 418.8 519.3 670.0 787.3 921.3 1,072.0 1,206.0 1,340.0 1,507.5 1,507.5Operational Costs of ER -219.8 -249.4 -293.7 -328.3 -331.6 -349.1 -357.0 -359.7 -363.0 -363.0
Economic Value of ER Component 199.0 269.9 376.3 459.0 589.6 722.9 849.0 980.3 1,144.5 1,144.5
Total Economic Value -1,625.3 -20.0 322.4 641.1 1,007.7 1,377.0 2,484.8 1,870.3 2,270.5 2,506.4
(US$ thousand) 2014 2015 2016 2017 2018 2019 2020 2021 2022 2023Energy Produced 3,542.4 3,896.6 4,250.8 4,250.8 4,250.8 4,250 8 4.250 8 4.250 8 4,250 8 4250.8O&M Cost -1,198.6 -1,316.9 -1,435.1 -1,435.1 -1,435.1 -1,435.1 -1,435 1 -1.435 1 -1.435 1 -1,435 1Capital Expenditures -745.8 -745.8 0.0 0.0 0.0 0.0 0 0 0 0 0 0 0.0
Economic Value of Energy Generation Component 1,597.9 1,833.9 2,815.7 2,815.7 2,815.7 2,815.7 2,815.7 2,815.7 2,815.7 2,815.7
CER 1,507.5 1,507.5 1,507.5 1,507.5 1,507.5 1,507.5 1,507.5 1,507.5 1,507.5 1,507.5Operational Costs of ER -363.0 -363.0 -363.0 -363.0 -363.0 -363.0 -363.0 -363.0 -363.0 -363.0
Economic Value of ER Component 1,144.5 1,144.5 1,144.5 1,144.5 1,144.5 1,144.5 1,144.5 1,144.5 1,144.5 1,144.5
Total Economic Value 2,742.4 2,978.4 3,960.2 3,960.2 3,960.2 3,960.2 3,960.2 3,960.2 3,960.2 3,960.2
EIRR: 45.5%
ANNEX 7: LANDFILL GAS ASSESSMENT
BRAZIL: Nova Gerar Landfill Rio de Janeiro
1. Purpose:
This Annex presents the calculation of methane recovery potential at Marambaia and Adrian6polis, basedon the baseline study prepared for the Nova Gerar Project.
2. Gas Calculation Assumptions:
The US EPA first order decay model equation from the US EPA manual 'Turning a Liability into anAsset: A Landfill Gas to Energy Handbook for Landfill Owners and Operators' (December 1994), asdescribed in Section II, is as follows:
LFG=2LoR(e-kc-e-kt)
Where
LFG = total landfill gas generated in current year (cf)
Lo = theoretical potential amount of landfill gas generated (cf/lb)
R = waste disposal rate (lb/year)
t = time since landfill opened (years)
c = time since landfill closed (years)
k= rate of landfill gas generation (1/year)
The inputs used were:
Waste disposal rate (R): The waste placement volumes are based on historical waste disposal tonnagefrom contracts with various municipalities through 6 months of 2000. Future waste volumes are based oncurrent waste receipts and contracts which are in place for future waste streams. The fact that wastedisposal at Marambaia ceased in late 2002, and disposal would commence in early 2003 at Adrianopolis,has also been taken into account. These data forms the foundation of the gas volume projection and issubject to change over the active lifetime of the landfill as refuse acceptance volumes vary. This impliesthat the gas volume projection will vary accordingly. Therefore, even though gas volumes may fluctuateover a period of time because of varying disposal rates, the ultimate total volume of gas projected for thesite will remain constant. The values used for R are shown in Table 1.
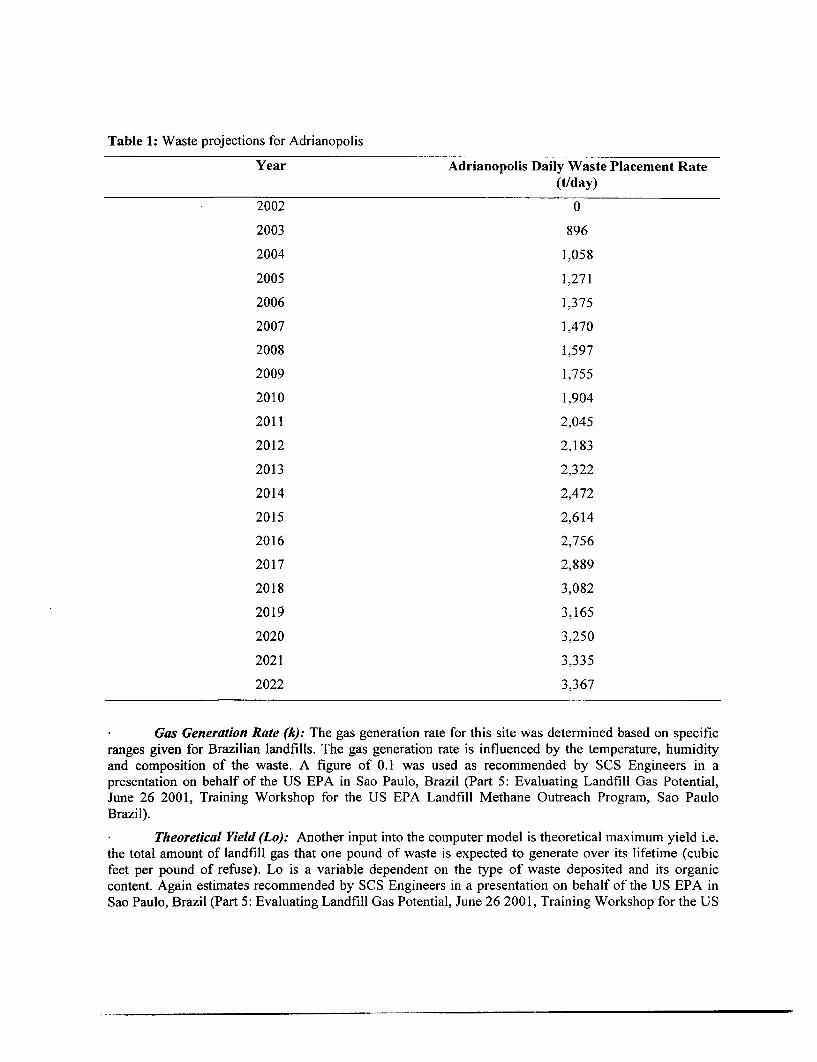
Table 1: Waste projections for Adrianopolis
Year Adrianopolis Daily Waste Placement Rate(t/day)
2002 0
2003 896
2004 1,058
2005 1,271
2006 1,375
2007 1,470
2008 1,597
2009 1,755
2010 1,904
2011 2,045
2012 2,183
2013 2,322
2014 2,472
2015 2,614
2016 2,756
2017 2,889
2018 3,082
2019 3,165
2020 3,250
2021 3,335
2022 3,367
Gas Generation Rate (k): The gas generation rate for this site was determined based on specificranges given for Brazilian landfills. The gas generation rate is influenced by the temperature, humidityand composition of the waste. A figure of 0.1 was used as recommended by SCS Engineers in apresentation on behalf of the US EPA in Sao Paulo, Brazil (Part 5: Evaluating Landfill Gas Potential,June 26 2001, Training Workshop for the US EPA Landfill Methane Outreach Program, Sao PauloBrazil).
Theoretical Yield (Lo): Another input into the computer model is theoretical maximum yield i.e.the total amount of landfill gas that one pound of waste is expected to generate over its lifetime (cubicfeet per pound of refuse). Lo is a variable dependent on the type of waste deposited and its organiccontent. Again estimates recommended by SCS Engineers in a presentation on behalf of the US EPA inSao Paulo, Brazil (Part 5: Evaluating Landfill Gas Potential, June 26 2001, Training Workshop for the US
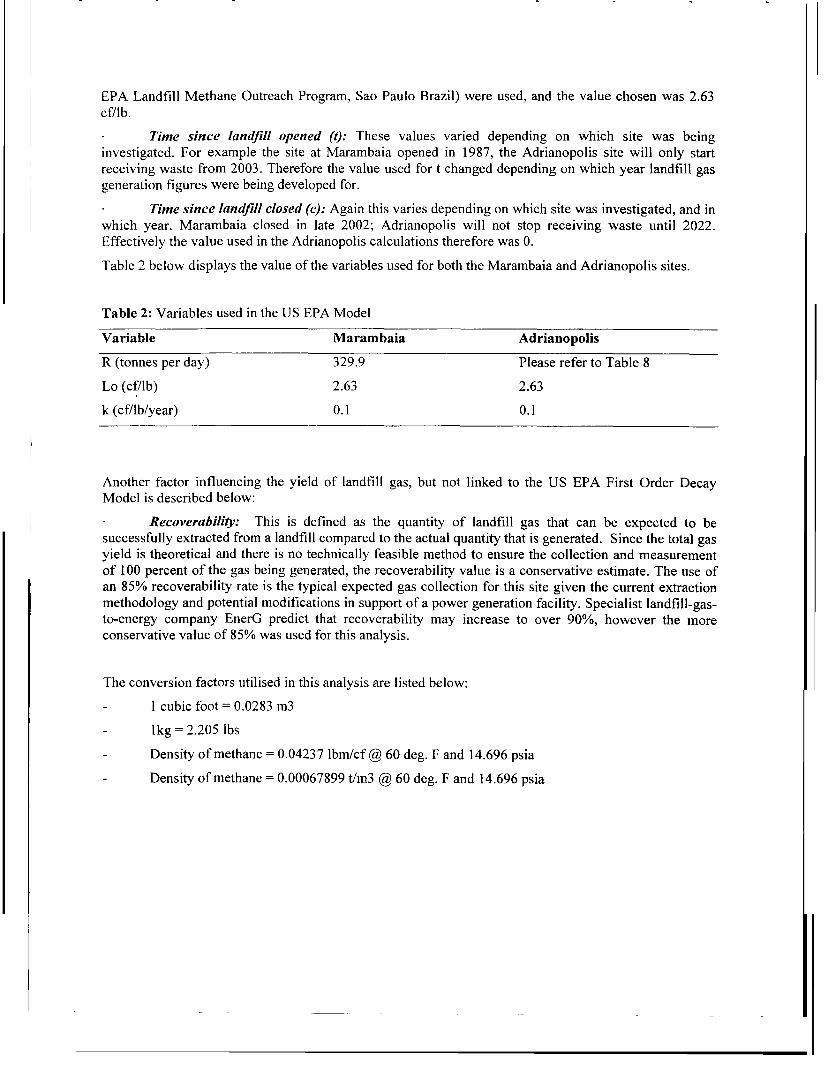
EPA Landfill Methane Outreach Program, Sao Paulo Brazil) were used, and the value chosen was 2.63
cf/lb.
Time since landfill opened (t): These values varied depending on which site was beinginvestigated. For example the site at Marambaia opened in 1987, the Adrianopolis site will only start
receiving waste from 2003. Therefore the value used for t changed depending on which year landfill gas
generation figures were being developed for.
Time since landfill closed (c): Again this varies depending on which site was investigated, and inwhich year. Marambaia closed in late 2002; Adrianopolis will not stop receiving waste until 2022.
Effectively the value used in the Adrianopolis calculations therefore was 0.
Table 2 below displays the value of the variables used for both the Marambaia and Adrianopolis sites.
Table 2: Variables used in the US EPA Model
Variable Marambaia Adrianopolis
R (tonnes per day) 329.9 Please refer to Table 8
Lo (cf/lb) 2.63 2.63
k (cf/lb/year) 0.1 0.1
Another factor influencing the yield of landfill gas, but not linked to the US EPA First Order DecayModel is described below:
* Recoverability: This is defined as the quantity of landfill gas that can be expected to besuccessfully extracted from a landfill compared to the actual quantity that is generated. Since the total gas
yield is theoretical and there is no technically feasible method to ensure the collection and measurementof 100 percent of the gas being generated, the recoverability value is a conservative estimate. The use of
an 85% recoverability rate is the typical expected gas collection for this site given the current extraction
methodology and potential modifications in support of a power generation facility. Specialist landfill-gas-to-energy company EnerG predict that recoverability may increase to over 90%, however the moreconservative value of 85% was used for this analysis.
The conversion factors utilised in this analysis are listed below:
- I cubic foot= 0.0283 m3
- Ikg= 2.205 lbs
- Density of methane = 0.04237 lbm/cf @ 60 deg. F and 14.696 psia
- Density of methane = 0.00067899 t/m3 @ 60 deg. F and 14.696 psia
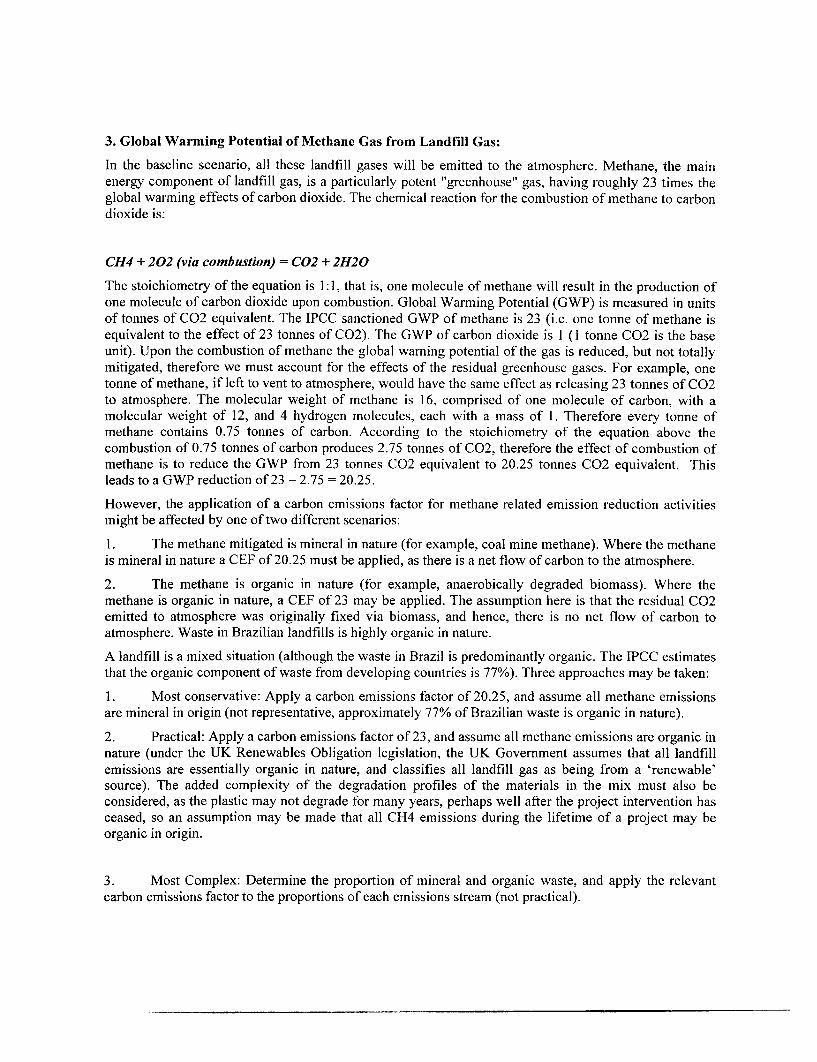
3. Global Warming Potential of Methane Gas from Landfill Gas:
In the baseline scenario, all these landfill gases will be emitted to the atmosphere. Methane, the mainenergy component of landfill gas, is a particularly potent "greenhouse" gas, having roughly 23 times theglobal warming effects of carbon dioxide. The chemical reaction for the combustion of methane to carbondioxide is:
CH4 + 202 (via combustion) = C02 + 2H20
The stoichiometry of the equation is 1:1, that is, one molecule of methane will result in the production ofone molecule of carbon dioxide upon combustion. Global Warming Potential (GWP) is measured in unitsof tonnes of C02 equivalent. The IPCC sanctioned GWP of methane is 23 (i.e. one tonne of methane isequivalent to the effect of 23 tonnes of C02). The GWP of carbon dioxide is I (I tonne C02 is the baseunit). Upon the combustion of methane the global warning potential of the gas is reduced, but not totallymitigated, therefore we must account for the effects of the residual greenhouse gases. For example, onetonne of methane, if left to vent to atmosphere, would have the same effect as releasing 23 tonnes of C02to atmosphere. The molecular weight of methane is 16, comprised of one molecule of carbon, with amolecular weight of 12, and 4 hydrogen molecules, each with a mass of 1. Therefore every tonne ofmethane contains 0.75 tonnes of carbon. According to the stoichiometry of the equation above thecombustion of 0.75 tonnes of carbon produces 2.75 tonnes of C02, therefore the effect of combustion ofmethane is to reduce the GWP from 23 tonnes C02 equivalent to 20.25 tonnes C02 equivalent. Thisleads to a GWP reduction of 23 - 2.75 = 20.25.
However, the application of a carbon emissions factor for methane related emission reduction activitiesmight be affected by one of two different scenarios:
1. The methane mitigated is mineral in nature (for example, coal mine methane). Where the methaneis mineral in nature a CEF of 20.25 must be applied, as there is a net flow of carbon to the atmosphere.
2. The methane is organic in nature (for example, anaerobically degraded biomass). Where themethane is organic in nature, a CEF of 23 may be applied. The assumption here is that the residual C02emitted to atmosphere was originally fixed via biomass, and hence, there is no net flow of carbon toatmosphere. Waste in Brazilian landfills is highly organic in nature.
A landfill is a mixed situation (although the waste in Brazil is predominantly organic. The IPCC estimatesthat the organic component of waste from developing countries is 77%). Three approaches may be taken:
1. Most conservative: Apply a carbon emissions factor of 20.25, and assume all methane emissionsare mineral in origin (not representative, approximately 77% of Brazilian waste is organic in nature).
2. Practical: Apply a carbon emissions factor of 23, and assume all methane emissions are organic innature (under the UK Renewables Obligation legislation, the UK Government assumes that all landfillemissions are essentially organic in nature, and classifies all landfill gas as being from a 'renewable'source). The added complexity of the degradation profiles of the materials in the mix must also beconsidered, as the plastic may not degrade for many years, perhaps well after the project intervention hasceased, so an assumption may be made that all CH4 emissions during the lifetime of a project may beorganic in origin.
3. Most Complex: Determine the proportion of mineral and organic waste, and apply the relevantcarbon emissions factor to the proportions of each emissions stream (not practical).
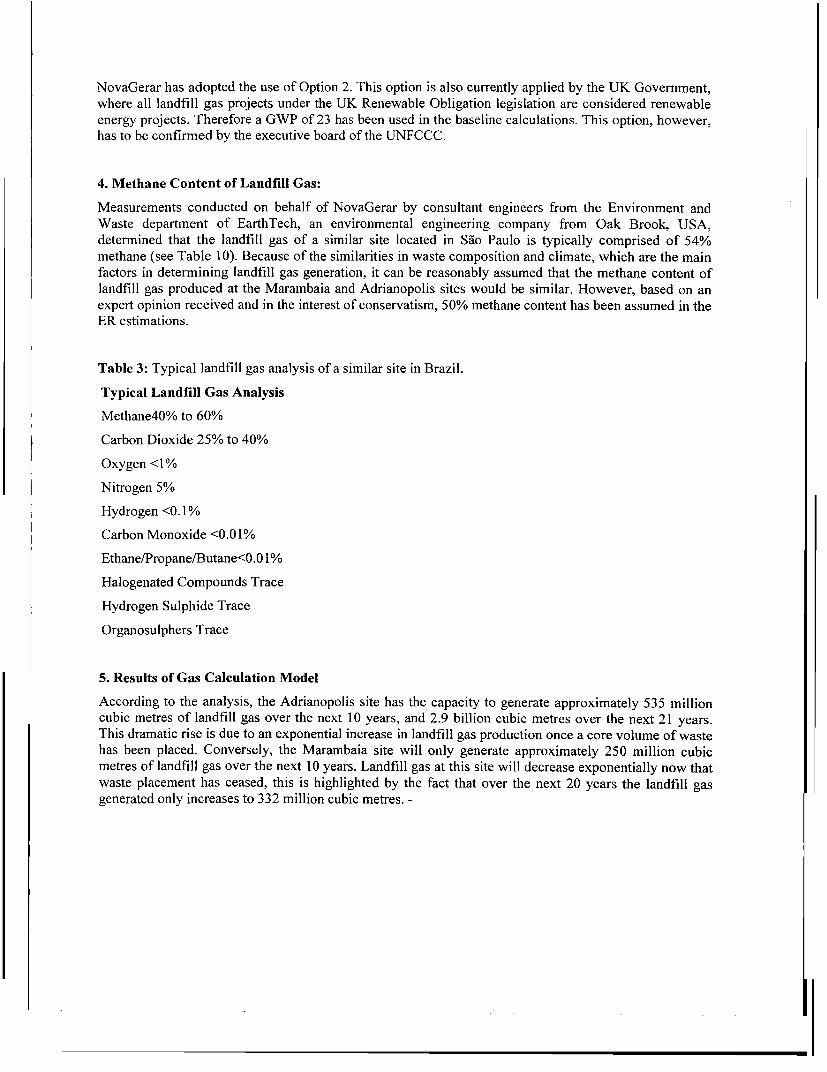
NovaGerar has adopted the use of Option 2. This option is also currently applied by the UK Government,where all landfill gas projects under the UK Renewable Obligation legislation are considered renewable
energy projects. Therefore a GWP of 23 has been used in the baseline calculations. This option, however,
has to be confirmed by the executive board of the UNFCCC.
4. Methane Content of Landfill Gas:
Measurements conducted on behalf of NovaGerar by consultant engineers from the Environment andWaste department of EarthTech, an environmental engineering company from Oak Brook, USA,
determined that the landfill gas of a similar site located in Sao Paulo is typically comprised of 54%
methane (see Table 10). Because of the similarities in waste composition and climate, which are the main
factors in determining landfill gas generation, it can be reasonably assumed that the methane content oflandfill gas produced at the Marambaia and Adrianopolis sites would be similar. However, based on an
expert opinion received and in the interest of conservatism, 50% methane content has been assumed in the
ER estimations.
Table 3: Typical landfill gas analysis of a similar site in Brazil.
Typical Landfill Gas Analysis
Methane4O% to 60%
Carbon Dioxide 25% to 40%
Oxygen <1%
Nitrogen 5%
Hydrogen <0. 1%
Carbon Monoxide <0.01%
Ethane/Propane/Butane<0.0 1 %
Halogenated Compounds Trace
Hydrogen Sulphide Trace
Organosulphers Trace
5. Results of Gas Calculation Model
According to the analysis, the Adrianopolis site has the capacity to generate approximately 535 millioncubic metres of landfill gas over the next 10 years, and 2.9 billion cubic metres over the next 21 years.
This dramatic rise is due to an exponential increase in landfill gas production once a core volume of wastehas been placed. Conversely, the Marambaia site will only generate approximately 250 million cubic
metres of landfill gas over the next 10 years. Landfill gas at this site will decrease exponentially now that
waste placement has ceased, this is highlighted by the fact that over the next 20 years the landfill gasgenerated only increases to 332 million cubic metres. -
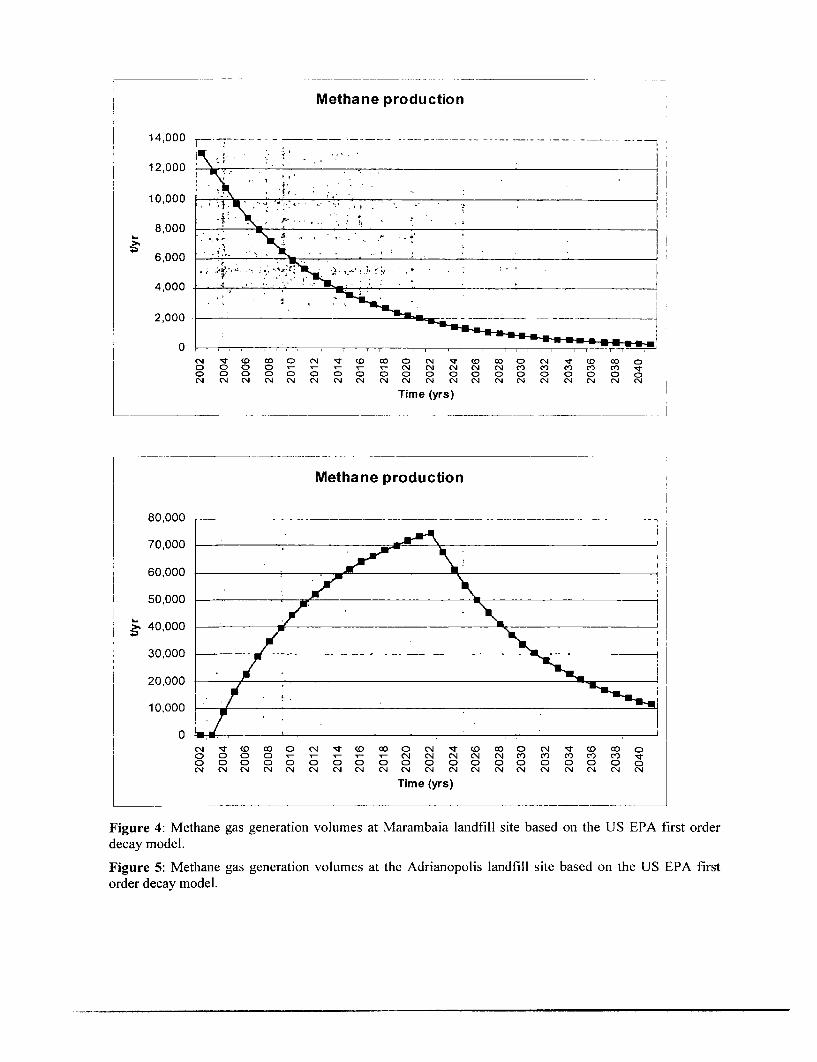
Methane production
14,000
12,000 ___.*-
10,000
8,000
4,000 -- -
,- ,, .';
2,000 _ _-_-__ _
0N t (O 0D 0 N st (0 C0 0 N t C 1D0 0 N t (0 C0 0O 0 0 0 N N N N N CO CO CO CO ) C -
O 0 0 0 O 0 0 0 0O C0 0 0 O 0D 0 0 ON N N N N N N N N NN N N N N N N N N N N
Time (yrs)
Methane production
80,000 ------- -- - - - _ _ -_ __ -70,000
60,000
50,000 - :__-
40,000 ------ _30,000 --------
20,000
10,000
0 .'N T (o 0 o N a N 0 C 0 N IT co C 0O 0 0 0 O- O O O O N N N N N ) ) ) ) o 0000 0 0 0 0 0 0 0 0 0 0 0 0 0 0) 0N (N N N N N N N N N N N N CN N N N 0N
Time (yrs)
Figure 4: Methane gas generation volumes at Marambaia landfill site based on the US EPA first orderdecay model.
Figure 5: Methane gas generation volumes at the Adrianopolis landfill site based on the US EPA firstorder decay model.
ANNEX 8: THE LANDFILL GAS COLLECTION SYSTEM
BRAZIL: Nova Gerar Landfill Rio de Janeiro
1. Installation of LFG collection system in Marambaia
This specification describes the installation of a gas collection system that will enhance the control of
landfill gas migration and provide further gas for prospective power generation at Marambaia Landfill
Site. Marambaia
Scope of Work
The scope of work covered by this specification is as follows:
* The installation of 34 gas wells and wellheads
* The installation of new connecting pipework to join the wells to the manifolds
* The installation of 4 manifolds
* The installation of a gas main to connect the manifolds to the flare
* The installation of 4 pumped knockout pots
* The installation of a pneumatic condensate pumping system, comprising pneumatic pumps, air
line, discharge lines and compressor.
* Supply and install secure housing for compressor and refrigerator unit.
Supply and installation of a ground flare and flare compound
All work will be carried out under the contract to be signed between Nova Gerar and EnerG and will be
carried out in accordance with the Construction Quality Assurance Plan by EnerG
Design and Standardisation
The Collections system will be designed to a high standard and to facilitate inspection, cleaning and
repair to ensure continuity of satisfactory operation under all working conditions for a period of at least
fifteen years.
During the excavation of any part of the site any vertical soil structures will be observed and separate
materials as these are removed accordingly. Excavations are planned to be back filled in layers to match
the original vertical structure. No excavations will be left un-attended and all areas will be made secure at
the end of each working day. Marker tape will be installed 300mm above the crown of all buried
pipework.
All reasonable precautions will be taken to prevent
The silting or erosion of the banks of rivers, streams, waterways and the like
Adverse effects of the chemical or visual quality of all surface water bodies
Injury or death to plant or animal life
Interference with the supply or abstraction of underground water resources
Adverse effects on the quality of groundwater
Uncontrolled releases of landfill gas to air causing odour or hazard
Risk of accumulations of gas in voids or structures likely to come into contact with a source ofignition.
Health and Safety
It will be ensured that proper safety controls and responsibilities are in place prior to commencing workon the Site. All workers employed by the Contractor will receive proper training In particular followingspecific safety requirements will be monitored: -
(i) High visibility coats or jackets should be worn at all times within the Site.
(ii) Proper protective clothing should be worn including boots with steel toe caps and mid soles and hardhats.
(iii) Eating, drinking and smoking are not permitted on Site outside of any Site cabin or in the changing orwashing area.
(iv) Hands and face should be washed thoroughly before eating and drinking.
(v) All persons employed by the Contractor will sign in and out of the Site daily.
Precautions are being taken for:
(i) The explosive and flammable dangers of landfill gas particularly in confined spaces.
(ii) The danger of asphyxiation through reduced oxygen levels and high carbon dioxide levels in confinedspaces. Personnel must not enter confined spaces.
(iii) The dangers of excavations or trenches in excess of 1.5 metres depth. Deep excavations in soil will beproperly shored.
2. Gas Collection System
Gas Wells
Thirty four vertical gas wells will be installed across the Site at typically 40 metre intervals. The Siteshows the proposed layout of the gas wells. The location of each gas well will be marked out usingsurveying techniques, either XYZ information or a digital copy of the location plan can be obtained fromthe Engineer.
The drilling and installation of the new gas extraction wells (GEWs) will be in accordance with the SiteInvestigation Steering Group, Guidelines for the safe Investigation of drilling of Landfills andcontaminated land.
The wells will be designed and installed in accordance with the following requirements:-
1. All GEWs will be drilled to a minimum diameter of 300mm, using appropriate drilling techniquefor drilling in landfill. This could be continuous flight auger, shell and auger, barrel augering or similarapproved.
2. Each GEW will be drilled to a depth agreed with the clients' representative, typically to finish atleast 4m above the base liner of the landfill.
3. GEWs will be lined with a 90mm diameter (minimum) High Density Polyethylene (HDPE)slotted pipe of 10 bar rating and supplied in standard 3 m lengths, with threaded male / female ends toform flush joints. The top three metre sections will be supplied plain (un-perforated) for capping
purposes. The slotted liner will have 3mm horizontal slots to yield a minimum 15-20% surface areaexposed for ingress.
4. The bottom section of slotted liner installed will be fitted with a protective end cap.
5. The annulus between the liner and waste will be backfilled with a single sized coarse washednon-calcareous gravel pack of approximately a 10-20mm diameter. Care will be taken during installationto ensure "bridging" of the gravel does not occur between the liner and the waste. Gravel will also beplaced in the bottom of the borehole (approx 300-500mm) to protect the bottom cap before the liner isinstalled.
6. The top of the well will be sealed with at least 2.5m of soaked bentonite to prevent air and wateringress. The bentonite seal must coincide fully with the landfill cap and extend at least 1 metre below, toensure the caps integrity due to future settlement of the site. The bentonite will be in a granular form andposes a swelling volume of 200-300%. The bentonite seal will be installed using the following method: Adry bag of bentonite will be placed to form a dry layer on top of the gravel pack. The gas well annuluswill then be gradually filled with water from a bowser and the remaining bentonite emptied into thisstanding water until the annulus is full. The use of bentonite pellets is not acceptable.
7. Drilling logs will be kept for each GEW and copies will be supplied for record purposes.
8. The drilling operation will be carried out by competent persons and in a safe manner.
9. The use of water or air-flushing techniques will not be used.
10. Drilling Logs are required for all wells including aborted wells.
Table A - Estimated Drilling Depths
BH Ref Drilling BH Ref Drilling BH Ref DrillingNumber Depth Number Depth Number Depth
(m) (m) (m)I TBC 14 TBC 26 TBC
2 TBC 15 TBC 27 TBC
3 TBC 16 TBC 28 TBC
4 TBC 17 TBC 29 TBC
5 TBC 18 TBC 30 TBC
6 TBC 19 TBC 31 TBC
7 TBC 20 TBC 32 TBC
8 TBC 21 TBC 33 TBC
9 TBC 21A TBC
10 TBC 22 TBC
11 TBC 23 TBC
12 TBC 24 TBC
13 TBC 25 TBC
The site is fully restored therefore, in all areas the gas wells will be installed as follows:
* All well heads are to be buried lm below ground level or at the top of the cap, which ever comes
first.
Plain well casing from ground level to 3m below ground level.
Perforated well casing from 3m below ground to the depth required.
Gravel pack from 2.5m below ground level to well base
Bentonite seal from ground level to 2.5m below ground level.
Gas Wellheads
Connection to the 34 gas wells will be made in solid MDPE pipe including a 90x63 reducer as shown in
Figure 3. The wellheads will be buried with pipe laid and the excavation back filled to ensure a fall is
maintained to the manifold.
Connecting Pipework
The connecting pipework will be constructed from 63mm black MDPE to SDR 11 and joined using
electrofusion or fully automatic butt welding techniques. The pipe layout will be as shown in the Site
plan attached (Figure 1). All lines will be buried lm below ground level or on top of the cap which ever
comes first. Nominal pipe lengths are estimated to be 2,600m of 63mm pipe to connect the gas wells to
their specific manifold. Pipes will be installed in shared trenches where appropriate to reduce cost.
All connecting pipework will be laid to maximise the fall to the manifolds. Ideally falls should be 1:25 or
greater. Where this is not achievable, connecting pipeline routes will be agreed on Site with the Engineer.
The Contractor will be required to survey proposed connecting pipeline routes to determine levels and
falls.
Connecting pipework will connect each well individually to a control and isolating valve on one of the
four new manifolds as described below and shown on the layout plan, figure 1.
Manifolds
Manifolds will be fabricated from 315mm diameter black MDPE to SDR 17.6 with a single 160mm
valved outlet for connection to the gas main and a 160mm blank/drainage flange complete with 2" BSP
socket for connection to an automatic drain Fig. 3. The manifold will include a number (described below)
2"BSP x 63mm compression Plasson valve inlets for each gas well connecting pipe. Three of the four
manifolds will have inlets on both sides of the manifold barrel as described as follows.
Manifold Ml - will have 15 valved inlets - 12 on one side and 3 on the opposite side
Manifold M2 - will have 11 valved inlets - 8 on one side and 3 on the opposite side
* Manifold M3 - will have 12 valved inlets - 9 on one side and 3 on the opposite side
Manifold M4 - will have 5 valved inlets - 5 all on one side
The manifolds will be laid to fall towards the drainage outlet as shown in Figure 4 to facilitate drainage ofcondensate. Isolating and control valves will be provided for each incoming gas line. The seal will bemanufactured from nitrile rubber or other material resistant to landfill gases and condensate.
Tefen gas sample points will be provided immediately upstream of each isolating and control valve. Thedust cap on the Tefen will be attached by a non-perishable line, of a type and quality agreed by theEngineer, to the base of the Tefen. In addition, each incoming line will be marked with a non-perishabletag indicating to which gas well the line is connected e.g. MI-I refers to Manifold 1 / well 1.
The outlet of the manifold will comprise a single 160mm MDPE pipe of SDR 17.6 and be fitted with a6"butterfly valve for isolation and control as specified above. Tefen gas sample points will be providedimmediately upstream and downstream of the manifold isolating and control valve. The dust cap on theTefen will be attached by a non-perishable line, of a type and quality agreed by the Engineer, to the baseof the Tefen.
The Manifold will be factory tested to 1 bar gauge and supplied to Site with a pressure test certificate.
Each manifold will sit on a base of 100mm well graded stone compacted on Terram or approved similarseparation membrane. .
Automatic Drainage Points
Automatic dewatering points are designed to automatically return all condensate back to the landfill mass,via a liquid seal.
To work efficiently they must be installed in dry waste in either excavated pits or within a dedicated borehole.
They incorporate the following features:
- Be fully accessible for priming, pumping out, cleaning, monitoring etc. via a gas tight screw top.
- Typically be offset from the manifold to mitigate the effects of local subsidence.
- Access points for condensate level measurements.
- Installed in lightweight lockable chambers.
- Low maintenance.
The dewatering points will meet the following requirements:
- Manufactured from Black MDPE 6 bar pipe (min) and fittings
- Pipe jointing will be by butt-fusion, electro-fusion or compression fittings. The number of jointswill be kept to a minimum.
- Unless specified otherwise the standard dewatering leg proposed is designed to cater for amaximum suction of-150mbar.
Gas Main
The gas mains will be constructed from 250mm and 160mm black MDPE pipe to SDR 17.6 and joinedusing electrofusion or fully automatic butt welding techniques. Only moulded fittings will be used,fabricated fittings will not be accepted.
The Contractor will survey the proposed gas main routes, mark out the proposed routes and check thefalls. The results of the survey and the proposed routes will be verified by the Engineer and the Contractorbefore installation.
The final location and levels of the gas pipes will be surveyed by the Contractor at intervals of at least
every 20 metres with the results included in the as built drawings.
One road crossing is required and this will consist of an appropriately sized steel sleeve protected with
lean mix concrete. It should be sized to not only accommodate the gas main but also the airmain and
condensate discharge lines for possible future use.
Pumped Knockout Pots
Four pumped condensate knockout pots will be included in the new gas main.
The pumped condensate knockout pots will aid the removal of liquid by altering the gas stream's velocity.
The condensate knockout pot will be fabricated from MDPE/HDPE and constructed as shown in Figure 5.
The pot will consist of an internal and external chamber (Figure 5). The internal chamber will be
fabricated from 315mm SDR 17.6 MDPE and the external chamber from 500mm SDR 17.6 MDPE. The
315mm section will be brought through the top of the external chamber and finish at the appropriate levelin a blank flange. The top blanking flange will also include monitoring facilities that will comprise of an
isolation valve for atmospheric balancing, pipe glands for the pneumatic pump and a 1" BSP dipping
point with a threaded cap, which must be removable by hand.
During commissioning, but after pressure testing the 1" BSP dipping point will be opened to allow the
internal chamber pressure to equalise with the barometric pressure. The base of the internal chamber will
rest on the flat cap end of the external chamber and will have a spacer around the outside diameter of the
pipe to support it within the external chamber. All joints on the inner chamber of the knockout pot will be
internally debeaded.
Condensate will drain into the external chamber because of the falls on either side of the pot and by virtue
of a decrease in velocity through the pot. The condensate will be removed by means of a compressed air
pump.
The pot will be installed by excavation. Care will be taken to avoid over excavation. The hole will be
backfilled with the excavated materials placed in layers of no more than 300 mm and compacted.
Compressed Air Pumping System
A compressed air pumping system will be installed to supply the all new knockout pots on site. This will
consist of a compressor, compressed air driven pumps, a compressed air line and a condensate drainage
line.
Pneumatic Pump
A short compressed air pump or suitable alternative such as a 'Bio-Pump' will be used to pump
condensate from the knockout pot. The specific pump type is to be agreed with the Engineer prior to
purchase. The pump will be installed in the internal chamber after the pressure test of the gas main is
successful and after the pot has been primed to at least the level indicated by the equilibrium level. Glandswill be fitted to the access flange of the knockout pots to allow any supply or return lines to pass to the
pump from external connections. The glands will be of a type approved by the Engineer.
Compressed Air Line
A compressed air line will be constructed from 63mm black MDPE to SDR 11. All pipework will bejoined using electrofusion or fully automatic butt welding techniques.
At the knockout pot, the air line will terminate with an isolation valve, pressure regulator, counter autodrain all housed in an appropriate housing. This will be supported on a galvanised steel or MDPE plateattached to the external side of the access flange of the knockout pot. The support plate will not hinderremoval of the access flange or contents of the knockout pots.
The complete system will be pressure tested upon commissioning. Compressed air lines will be pressuretested to 10 bar gauge for a period of one hour. The pressure tests will be witnessed and approved by theEngineer.
Condensate Drainage Line
A condensate discharge line will be constructed from 63mm blue MDPE to SDR 11. All buried pipeworkwill be joined using electrofusion or fully automatic butt welding techniques. Surface laid pipework maybe joined using suitable compression type mechanical fittings but not push fit fittings.The condensate discharge line will run from the pumped condensate knockout pot to a suitable disposalpoint such as leachate lagoon. This will be decided upon on site to by the Engineer. The condensate lineswill be buried for their full length. At the knockout pot the lines will be fitted with a non return valve andan isolation valve and be secured to the plate attached to the knockout pot. Nominal total pipe lengths areestimated to be 500m.
Compressor
The compressor will be capable of generating 18 Nm3/hr (10 cfm) FAD of compressed air flow and apressure of up to 7-10 bar gauge. The compressor should be of an industrial duty standard preferably ascrew type. A refrigeration dryer unit will be installed to take the dew point of the compressed air to twodegrees Celsius. The compressor will be fitted with a receiver with a volume of at least 250 litrescapacity and be fitted with an automatic drain.
The compressor and dryer will be powered by electricity from the flare distribution panel and will includethe controls necessary to permit continuous automatic operation. The compressor will have an appropriatestarter and automatically restart after a power failure. The compressor will be located in the proposed gascompound.
When operating under full load conditions the compressor and dryer should not emit noise exceeding 70dBA at one metre. The compressor will be housed in a suitable secure weather and dust proof housingwhich will be suitably ventilated to prevent overheating.
The proposed design is to be approved by the Engineer.
Removal of Redundant Gas Vents
Typically any redundant gas vents etc will be removed by excavating to IM below ground level, cuttingand sealing the vent, then back filling with clay or bentonite compacted at 300mm levels.
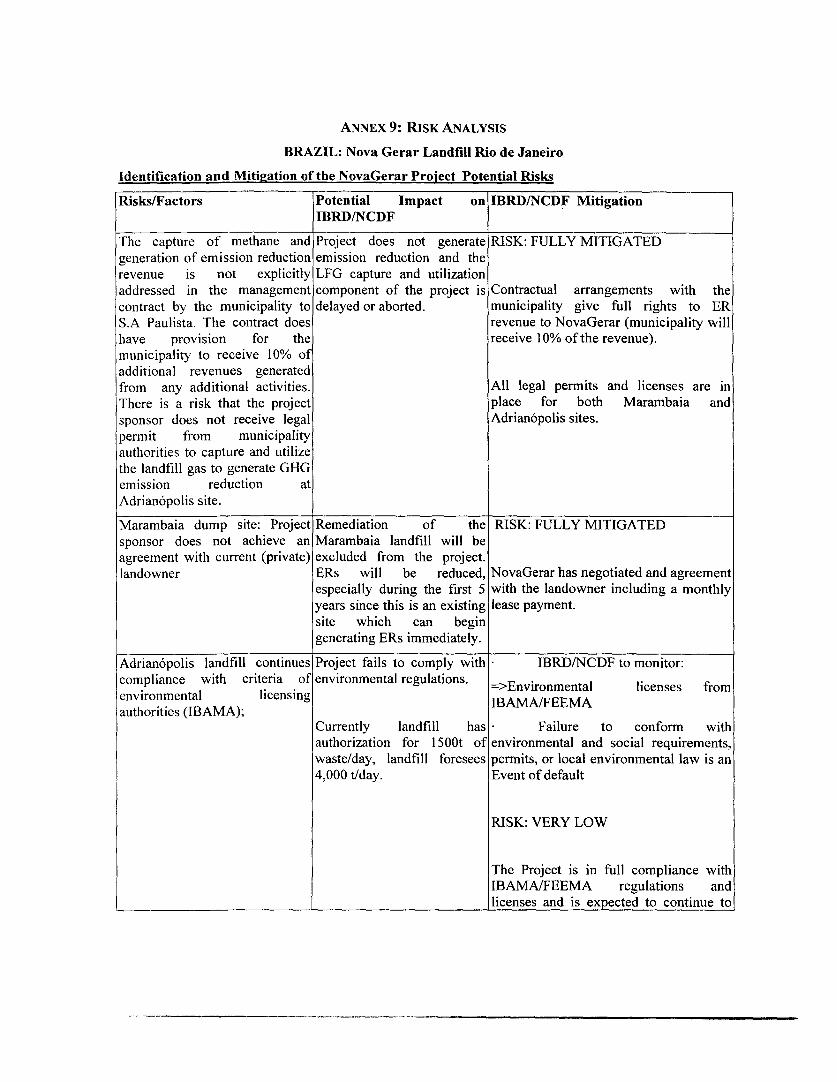
ANNEX 9: RISK ANALYSIS
BRAZIL: Nova Gerar Landfill Rio de Janeiro
Identification and Mitigation of the NovaGerar Proiect Potential Risks
Risks/Factors Potential Impact on IBRD/NCDF MitigationIBRD/NCDF
The capture of methane and Project does not generate RISK: FULLY MITIGATED
generation of emission reduction emission reduction and the
revenue is not explicitly LFG capture and utilization
addressed in the management component of the project is Contractual arrangements with the
contract by the municipality to delayed or aborted. municipality give full rights to ER
S.A Paulista. The contract does revenue to NovaGerar (municipality will
have provision for the receive 10% of the revenue).
municipality to receive 10% of
additional revenues generatedfrom any additional activities. All legal permits and licenses are in
There is a risk that the project place for both Marambaia and
sponsor does not receive legal Adrian6polis sites.
permit from municipalityauthorities to capture and utilizethe landfill gas to generate GHGemission reduction at
Adrian6polis site.
Marambaia dump site: Project Remediation of the RISK: FULLY MITIGATED
sponsor does not achieve an Marambaia landfill will be
agreement with current (private) excluded from the project.
landowner ERs will be reduced, NovaGerar has negotiated and agreement
especially during the first 5 with the landowner including a monthly
years since this is an existing lease payment.
site which can begingenerating ERs immediately.
Adrian6polis landfill continues Project fails to comply with IBRD/NCDF to monitor:
compliance with criteria of environmental regulations. ->Environmental licenses from
environmental licensing IBAMA/FEEMA
authorities (IBAMA);Currently landfill has Failure to conform with
authorization for 1 500t of environmental and social requirements,
waste/day, landfill foresees permits, or local environmental law is an
4,000 t/day. Event of default
RISK: VERY LOW
The Project is in full compliance with
IBAMA/FEEMA regulations andlicenses and is expected to continue to
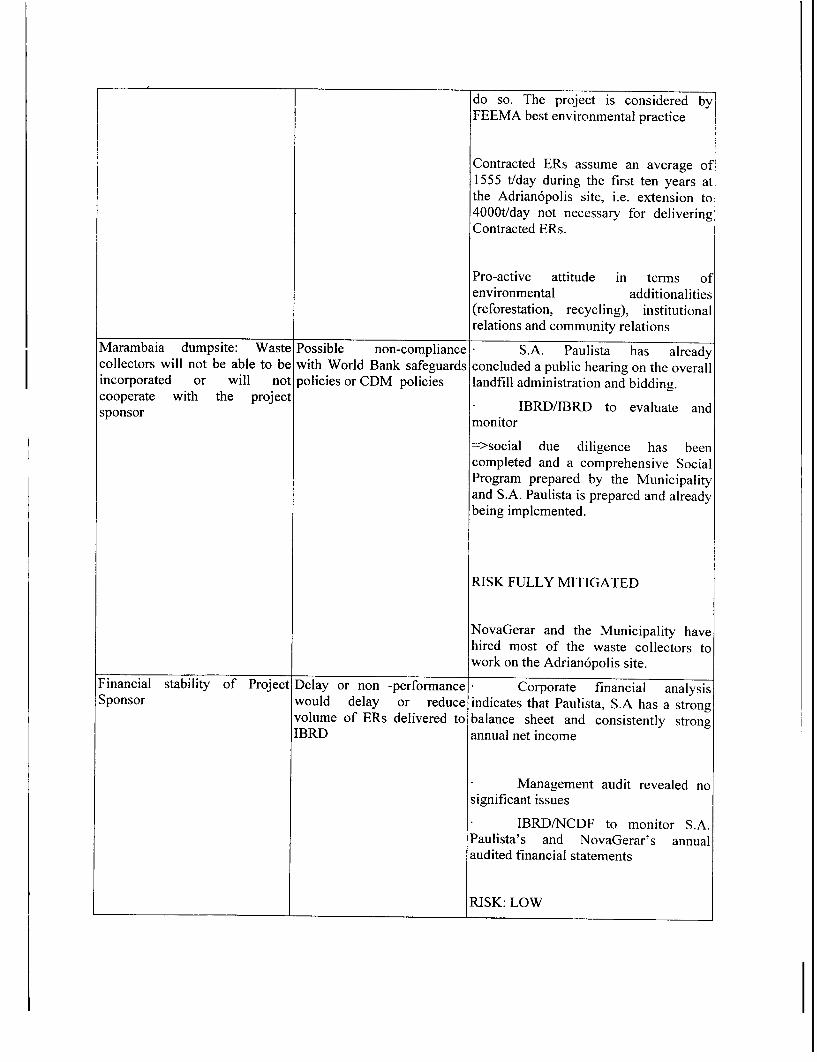
do so. The project is considered byFEEMA best environmental practice
Contracted ERs assume an average of1555 t/day during the first ten years atthe Adrian6polis site, i.e. extension to4000t/day not necessary for deliveringContracted ERs.
Pro-active attitude in terms ofenvironmental additionalities(reforestation, recycling), institutionalrelations and community relations
Marambaia dumpsite: Waste Possible non-compliance S.A. Paulista has alreadycollectors will not be able to be with World Bank safeguards concluded a public hearing on the overallincorporated or will not policies or CDM policies landfill administration and bidding.cooperate with the project IBRD/IBRD to evaluate andsponsor monitor
=>social due diligence has beencompleted and a comprehensive SocialProgram prepared by the Municipalityand S.A. Paulista is prepared and alreadybeing implemented.
RISK FULLY MITIGATED
NovaGerar and the Municipality havehired most of the waste collectors towork on the Adrian6polis site.
Financial stability of Project Delay or non -performance Corporate financial analysisSponsor would delay or reduce indicates that Paulista, S.A has a strong
volume of ERs delivered to balance sheet and consistently strongIBRD annual net income
Management audit revealed nosignificant issues
IBRD/NCDF to monitor S.A.Paulista's and NovaGerar's annualaudited financial statements
RISK: LOW
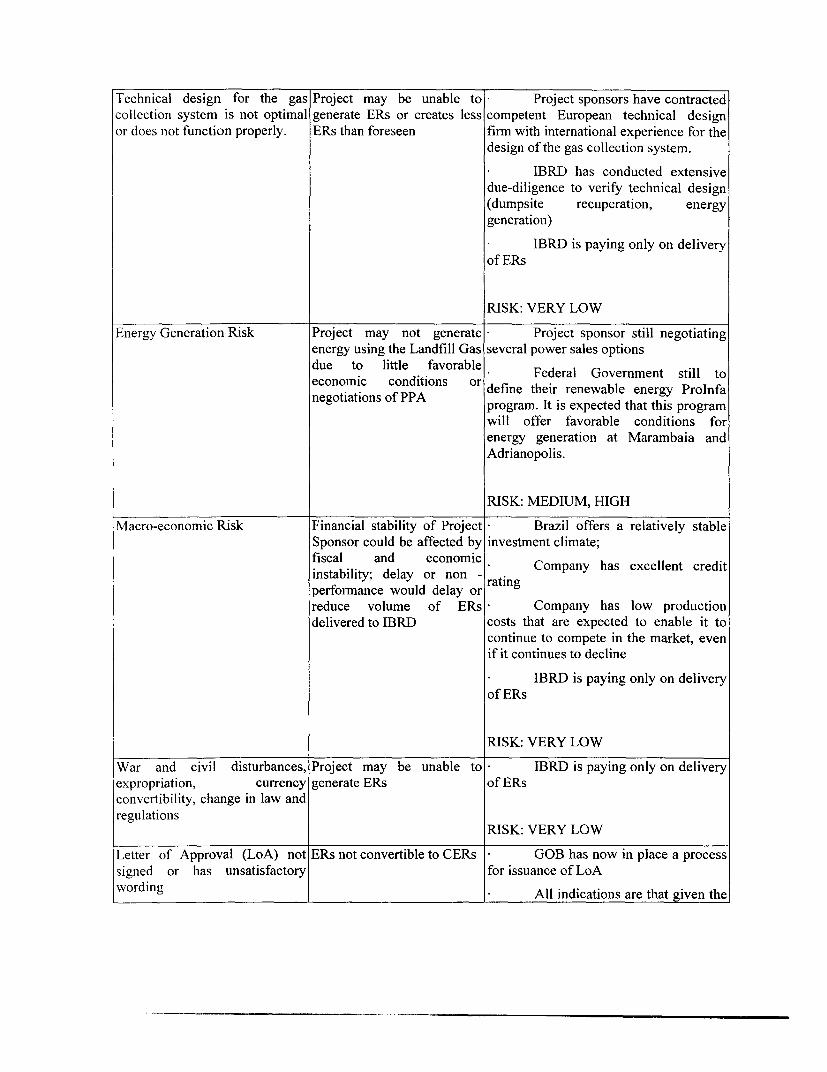
Technical design for the gas Project may be unable to Project sponsors have contracted
collection system is not optimal generate ERs or creates less competent European technical design
or does not function properly. ERs than foreseen firm with international experience for the
design of the gas collection system.
IBRD has conducted extensivedue-diligence to verify technical design(dumpsite recuperation, energygeneration)
IBRD is paying only on deliveryof ERs
RISK: VERY LOW
Energy Generation Risk Project may not generate Project sponsor still negotiating
energy using the Landfill Gas several power sales options
due to little favorable Federal Government still toeconomic conditions or define their renewable energy Prolnfa
negotiations of PPA program. It is expected that this programwill offer favorable conditions forenergy generation at Marambaia andAdrianopolis.
RISK: MEDIUM, HIGH
Macro-economic Risk Financial stability of Project Brazil offers a relatively stableSponsor could be affected by investment climate;fiscal and economic Company has excellent credit
instability; delay or non - ratinperformance would delay or greduce volume of ERs Company has low production
delivered to IBRD costs that are expected to enable it tocontinue to compete in the market, evenif it continues to decline
IBRD is paying only on deliveryof ERs
RISK: VERY LOW
War and civil disturbances, Project may be unable to IBRD is paying only on delivery
expropriation, currency generate ERs of ERs
convertibility, change in law andregulations
RISK: VERY LOW
Letter of Approval (LoA) not ERs not convertible to CERs GOB has now in place a process
signed or has unsatisfactory for issuance of LoA
wording All indications are that given the
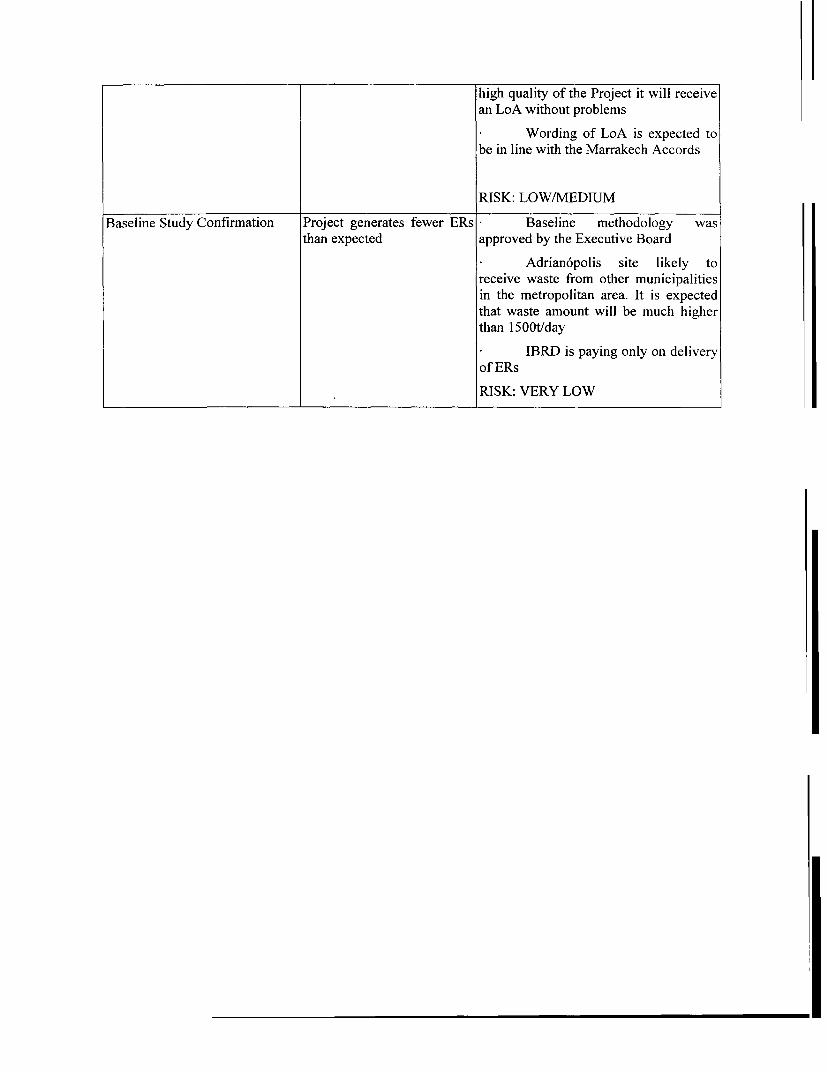
high quality of the Project it will receivean LoA without problems
Wording of LoA is expected tobe in line with the Marrakech Accords
RISK: LOW/MEDIUM
Baseline Study Confirmation Project generates fewer ERs Baseline methodology wasthan expected approved by the Executive Board
Adrian6polis site likely toreceive waste from other municipalitiesin the metropolitan area. It is expectedthat waste amount will be much higherthan 15OOt/day
IBRD is paying only on deliveryof ERs
RISK: VERY LOW
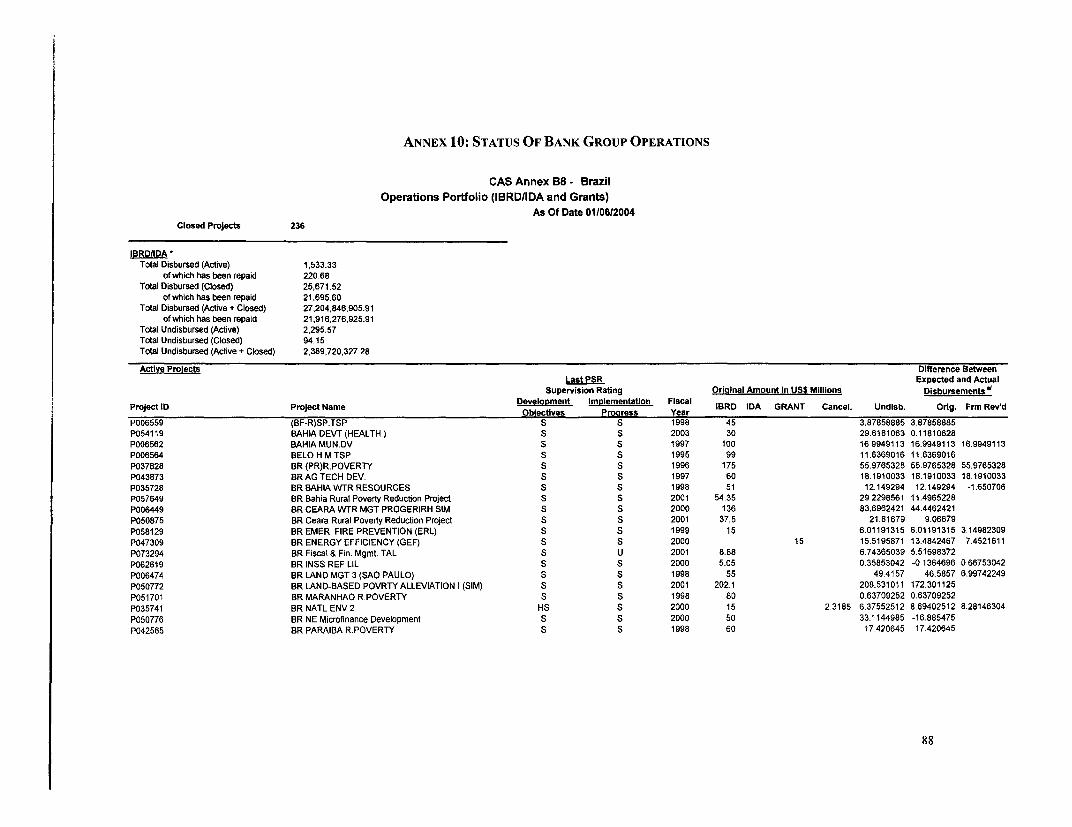
ANNEX 10: STATUS OF BANK GROUP OPERATIONS
CAS Annex B8 - BrazilOperations Portfolio (IBRD/IDA and Grants)
As Of Date 0110612004
Closed Projects 236
IBRDIIDA ITotal Disbursed (Active) 1,533.33
of which has been repaid 220.68Total Disbursed (Closed) 25,671.52
of which has been repaid 21,695.60Total Disbursed (Active + Closed) 27,204,846,905.91
of which has been repaid 21,916,276,925.91Total Undisbursed (Active) 2,295.57Total Undisbursed (Closed) 94.15Total Undisbursed (Active + Closed) 2,389,720,327.28
Active Proiects Difference Between
Last PSR Expected and ActualSupervision Rating Oriqinal Amount In US$ Millions Disbursements
Project ID Project Name DeveloDment Implementation Fiscal IBRD IDA GRANT Cancel. Undisb. Orig. Frm Rev'dObiectives Procaress Year
P006559 (BF-R)SP.TSP S S 1998 45 3.87858885 3,87858885
P054119 BAHIA DEVT (HEALTH) S S 2003 30 29.6181063 0.11810628
P006562 BAHIAMUN.DV S S 1997 100 169949113 16.9949113 16.9949113
P006564 BELO H M.TSP S S 1995 99 11.6369016 11.6369016
P037828 BR (PR)R.POVERTY S S 1996 175 55.9765328 55.9765328 55.9765328
P043873 BR AG TECH DEV. S S 1997 60 18.1910033 18.1910033 18.1910033
P035728 BR BAHIA WTR RESOURCES S S 1998 51 12.149294 12.149294 -1.650706
P057649 BR Bahia Rural Poverty Reducton Project S S 2001 54.35 29 2298561 11.4965228
P006449 BR CEARA WTR MGT PROGERIRH SIM S S 2000 136 83,6962421 44.4462421
P050875 BR Ceara Rural Poverty Reduction Project S S 2001 37.5 21.81679 9.06679
P058129 BR EMER. FIRE PREVENTION (ERL) S S 1999 15 6.01191315 6.01191315 3.14982309
P047309 BR ENERGY EFFICIENCY (GEF) S S 2000 15 15.5195871 13.4842467 7.4521611
P073294 BR Fiscal & Fin. Mgmt. TAL S U 2001 8.88 6.74365039 5.51698372
P062619 BR INSS REF LIL S S 2000 5.05 0.35853042 -0 1364696 0.66753042
P006474 BR LAND MGT 3 (SAO PAULO) S S 1998 55 49.4157 46.5857 6.99742249
P050772 BR LAND-BASED POVRTY ALLEVIATION I (SIM) S S 2001 202.1 208.531011 172.301125
P051701 BR MARANHAO R.POVERTY S S 1998 80 0.63709252 0.63709252
P035741 BR NATL ENV 2 HS S 2000 15 2.3185 6.37552512 8.69402512 8,28146304
P050776 BR NE Microfinance Development S S 2000 50 33.1144985 -16.885475
P042565 BR PARAIBA R.POVERTY S S 1998 60 17.420645 17.420645
88
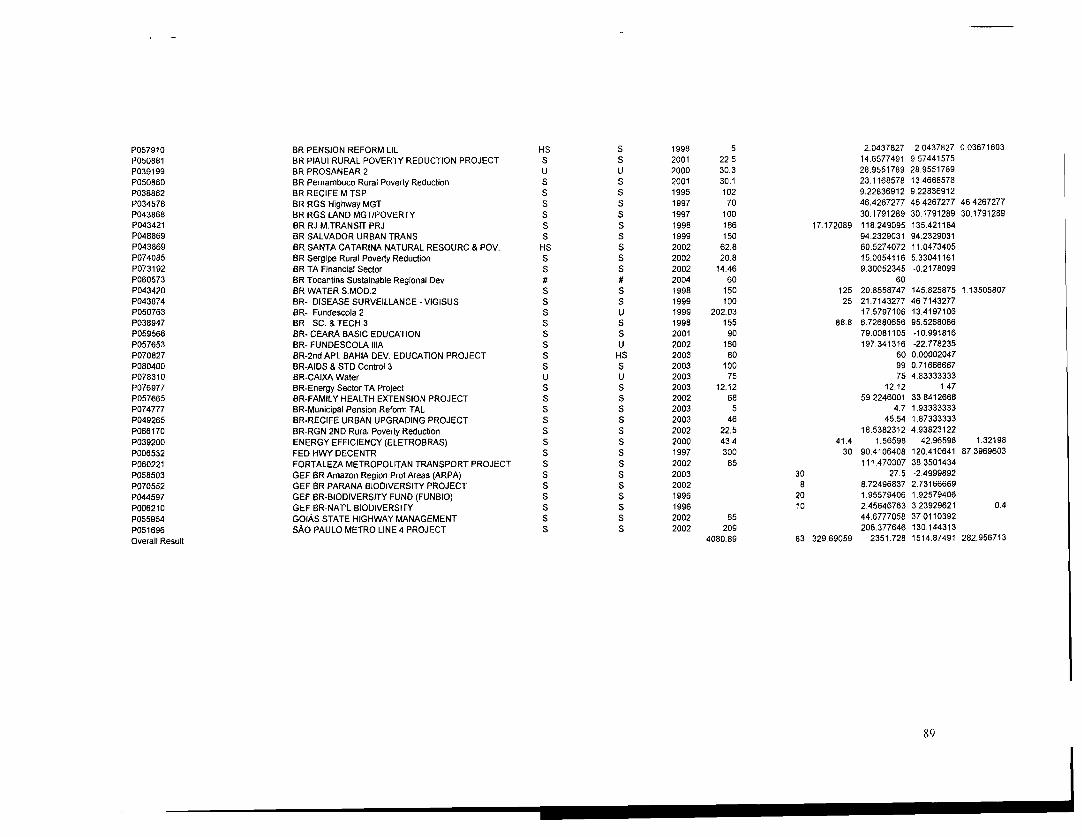
P057910 BR PENSION REFORM LIL HS S 1998 5 2.0437827 2 0437827 0.03671603P050881 BR PIAUI RURAL POVERTY REDUCTION PROJECT S S 2001 22.5 14.6577491 9 57441575P039199 BR PROSANEAR 2 U U 2000 30.3 28.9551789 28.9551789P050880 BR Pernambuco Rural Poverty Reduction S S 2001 30.1 23.1168578 13.4668578P038882 BR RECIFE M.TSP S S 1995 102 9.22836912 9.22836912P034578 BR RGS Highway MGT S S 1997 70 46.4267277 464267277 464267277P043868 BR RGS LAND MGT/POVERTY S S 1997 100 30.1791289 30.1791289 30.1791289P043421 BR RJ M.TRANSIT PRJ S S 1998 186 17.172089 118.249095 135.421184P048869 BR SALVADOR URBAN TRANS S S 1999 150 94.2329031 94.2329031P043869 BR SANTA CATARINA NATURAL RESOURC & POV. HS S 2002 62.8 60.5274072 11.0473405P074085 BR Sergipe Rural Poverty Reduction S S 2002 20.8 15.0054116 5.33041161P073192 BR TA Financial Sector S S 2002 14.46 9.30052345 -0.2178099P060573 BR Tocantins Sustainable Regional Dev 2004 60 60P043420 BR WATER S.MOD.2 S S 1998 150 125 20.8558747 145.825875 1.13505807P043874 BR- DISEASE SURVEILLANCE - VIGISUS S S 1999 100 25 21.7143277 46 7143277P050763 BR- Fundescola 2 S U 1999 202.03 17.5797106 13.4197106P038947 BR- SC. & TECH 3 S S 1998 155 88.8 6.72680656 95.5268066P059566 BR- CEARA BASIC EDUCATION S S 2001 90 79.0081105 -10.991816P057653 BR- FUNDESCOLA IIIA S U 2002 160 197.341316 -22.778235P070827 BR-2nd APL BAHIA DEV. EDUCATION PROJECT S HS 2003 60 60 0.00002047P080400 BR-AIDS & STD Control 3 S S 2003 100 99 0.71666667P078310 BR-CAIXA Water U U 2003 75 75 4.83333333P076977 BR-Energy SectorTA Project S S 2003 12.12 12.12 1.47P057665 BR-FAMILY HEALTH EXTENSION PROJECT S S 2002 68 59.2246001 33.6412668P074777 BR-Municipal Pension Reform TAL S S 2003 5 4.7 1.93333333P049265 BR-RECIFE URBAN UPGRADING PROJECT S S 2003 46 45.54 1.87333333P066170 BR-RGN 2ND Rural Poverty Reduction S S 2002 22.5 18.5382312 4.93823122P039200 ENERGY EFFICIENCY (ELETROBRAS) S S 2000 43.4 41.4 1.56598 42.96598 1.32198P006532 FED HWY DECENTR S S 1997 300 30 90.4106408 120.410641 87.3969603P060221 FORTALEZA METROPOLITAN TRANSPORT PROJECT S S 2002 85 111.470307 38.3501434P058503 GEF BR Amazon Region Prot Areas (ARPA) S S 2003 30 27.5 -2.4999892P070552 GEF BR PARANA BIODIVERSITY PROJECT S S 2002 8 8.72496837 2.73166669P044597 GEF BR-BIODIVERSITY FUND (FUNBIO) S S 1996 20 1.95579406 1.92579406P006210 GEF BR-NAT'L BIODIVERSITY s s 1996 10 2.45646763 3 23929621 0.4P055954 GOIAS STATE HIGHWAY MANAGEMENT S S 2002 65 44.6777058 37.0110392P051696 sAo PAULO METRO LINE 4 PROJECT S 5 2002 209 206.377646 130.144313Overall Result 4080.89 83 329.69059 2351.728 1514.87491 282,956713
89
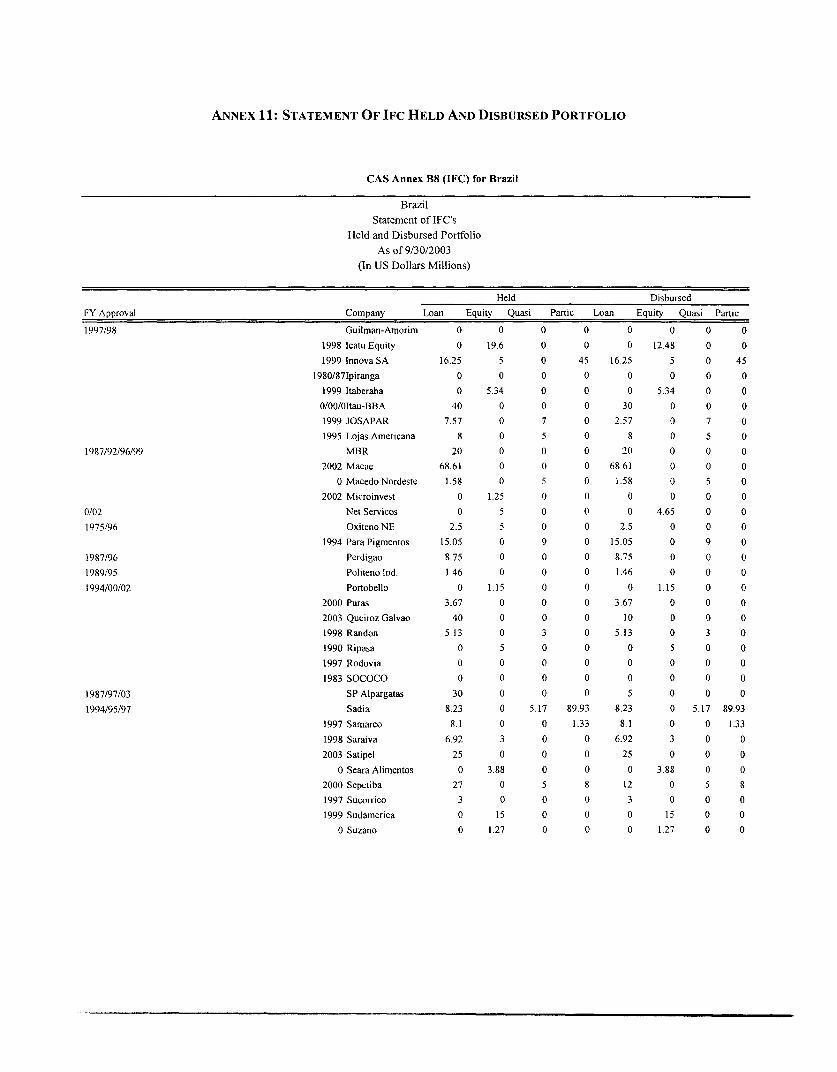
ANNEX 11: STATEMENT OF IFC HELD AND DISBURSED PORTFOLIO
CAS Annex B8 (IFC) for Brazil
Brazil
Statement of IFC's
Held and Disbursed Portfolio
As of 9/30/2003
(In US Dollars Millions)
Held Disbursed
FY Approval Company Loan Equity Quasi Partic Loan Equity Quasi Partic
1997/98 Guilman-Amorim 0 0 0 0 0 0 0 0
1998 Icatu Equity 0 19.6 0 0 0 12.48 0 0
1999 Innova SA 16.25 5 0 45 16.25 5 0 45
1980/871piranga 0 0 0 0 0 0 0 0
1999 Itaberaba 0 5.34 0 0 0 5.34 0 0
0/00/01tau-BBA 40 0 0 0 30 0 0 0
1999 JOSAPAR 7.57 0 7 0 2.57 0 7 0
1995 LojasAmericana 8 0 5 0 8 0 5 0
1987/92/96/99 MBR 20 0 0 0 20 0 0 0
2002 Macae 68.61 0 0 0 68 61 0 0 0
0 Macedo Nordeste 1.58 0 5 0 1.58 0 5 0
2002 Microinvest 0 1.25 0 0 0 0 0 0
0/02 Net Servicos 0 5 0 0 0 4.65 0 0
1975/96 Oxiteno NE 2.5 5 0 0 2.5 0 0 0
1994 Para Pigmentos 15.05 0 9 0 15.05 0 9 0
1987/96 Perdigao 8.75 0 0 0 8.75 0 0 0
1989/95 Politeno Ind. 1.46 0 0 0 1.46 0 0 0
1994/00/02 Portobello 0 1.15 0 0 0 1.15 0 0
2000 Puras 3.67 0 0 0 3.67 0 0 0
2003 Queiroz Galvao 40 0 0 0 10 0 0 0
1998 Randon 5.13 0 3 0 5.13 0 3 0
1990 Ripasa 0 5 0 0 0 5 0 0
1997 Rodovia 0 0 0 0 0 0 0 0
1983 SOCOCO 0 0 0 0 0 0 0 0
1987/97/03 SP Alpargatas 30 0 0 0 5 0 0 0
1994/95/97 Sadia 8.23 0 5.17 89.93 8.23 0 5.17 89.93
1997 Samarco 8.1 0 0 1.33 8.1 0 0 1.33
1998 Saraiva 6.92 3 0 0 6.92 3 0 0
2003 Satipel 25 0 0 0 25 0 0 0
0 Seara Alimentos 0 3.88 0 0 0 3.88 0 0
2000 Sepetiba 27 0 5 8 12 0 5 8
1997 Sucorrico 3 0 0 0 3 0 0 0
1999 Sudamerica 0 15 0 0 0 15 0 0
0 Suzano 0 1.27 0 0 0 1.27 0 0
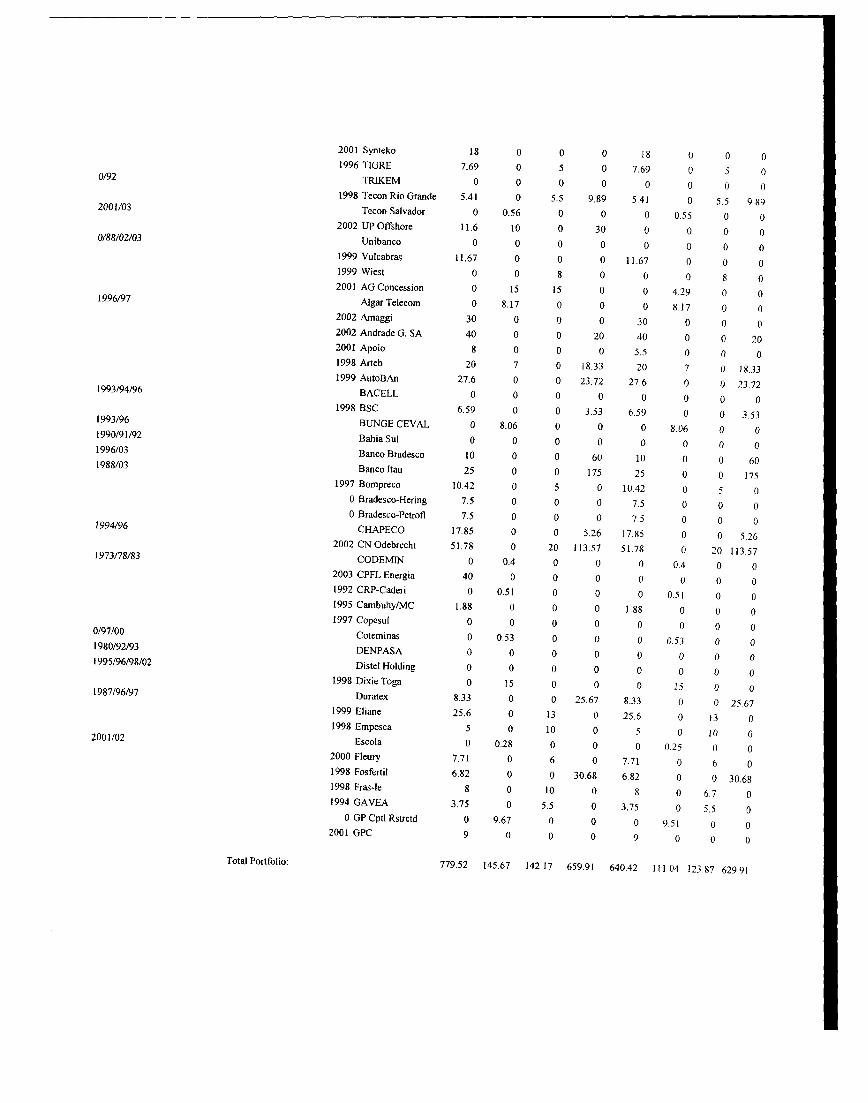
2001 Synteko 18 0 0 0 18 0 0 01996 TIGRE 7.69 0 5 0 7.69 0 5 00/92 TRIKEM 0 0 0 0 0 0 0 01998 Tecon Rio Grande 5.41 0 5.5 9.89 5.41 0 5.5 9 892001/03 Tecon Salvador 0 0.56 0 0 0 0.55 0 02002 UPOffshore 11.6 10 0 30 0 0 0 00/88/02/03 Unibanco 0 0 0 0 0 0 0 01999 Vulcabras 11.67 0 0 0 11.67 0 0 01999 Wiest 0 0 8 0 0 0 8 02001 AG Concession 0 15 15 0 0 4.29 0 01996/97 Algar Telecom 0 8.17 0 0 0 8.17 0 02002 Amaggi 30 0 0 0 30 0 0 02002 Andrade G. SA 40 0 0 20 40 0 0 202001 Apolo 8 0 0 0 5,5 0 0 01998 Arteb 20 7 0 18.33 20 7 0 18.331999 AutoBAn 27.6 0 0 23.72 27.6 0 0 23.721993/94/96 BACELL 0 0 0 0 0 0 0 01998 BSC 6.59 0 0 3.53 6.59 0 0 3.531993/96 BUNGE CEVAL 0 8.06 0 0 0 8.06 0 01990/91/92 Bahia Sul 0 0 0 0 0 0 0 01996/03 Banco Bradesco 10 0 0 60 10 0 0 601988/03 Banco Itau 25 0 0 175 25 0 0 1751997 Bompreco 10.42 0 5 0 10.42 0 5 0
0 Bradesco-Hering 7.5 0 0 0 7.5 0 0 00 Bradesco-Petrofl 7.5 0 0 0 7.5 0 0 01994/96 CHAPECO 17.85 0 0 5.26 17.85 0 0 5.26
2002 CNOdebrecht 51.78 0 20 113.57 51.78 0 20 113.571973/78/83 CODEMIN 0 0.4 0 0 0 0.4 0 02003 CPFL Energia 40 0 0 0 0 0 0 01992 CRP-Caderi 0 0.51 0 0 0 0.51 0 01995 Cambuhy/MC 1.88 0 0 0 1.88 0 0 01997 Copesul 0 0 0 0 0 0 0 00/97/00 Coteminas 0 0.53 0 0 0 0.53 0 01980/92/93 DENPASA 0 0 0 0 0 0 0 01995/96/98/02 Distel Holding 0 0 0 0 0 0 0 01998 Dixie Toga 0 15 0 0 0 15 0 01987/96/97 Duratex 8.33 0 0 25.67 8.33 0 0 25.671999 Eliane 25.6 0 13 0 25.6 0 13 019 98 Empesca 5 0 10 0 5 0 10 02001/02 Escola 0 0.28 0 0 0 0.25 0 02000 Fleury 7.71 0 6 0 7.71 0 6 01998 Fosfertil 6.82 0 0 30.68 6.82 0 0 30.681998 Fras-le 8 0 10 0 8 0 6.7 01994 GAVEA 3.75 0 5.5 0 3,75 0 5.5 0
0 GP Cptl Rstrctd 0 9.67 0 0 0 9.51 0 02001 GPC 9 0 0 0 9 0 0 0
Total Portfolio: 779.52 145.67 142.17 659.91 640.42 III 04 123.87 62991
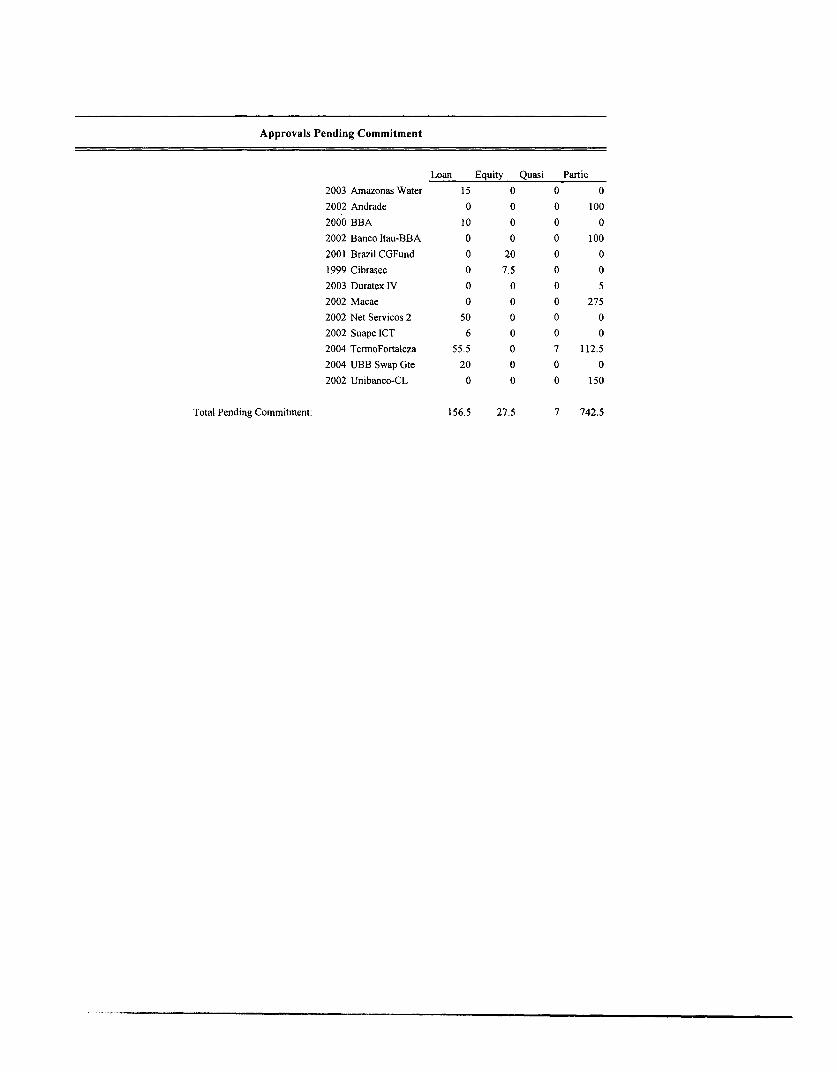
Approvals Pending Commitment
Loan Equity Quasi Partic
2003 Amazonas Water 15 0 0 0
2002 Andrade 0 0 0 100
2000 BBA 10 0 0 0
2002 Banco ltau-BBA 0 0 0 100
2001 Brazil CGFund 0 20 0 0
1999 Cibrasec 0 7.5 0 0
2003 Duratex IV 0 0 0 5
2002 Macae 0 0 0 275
2002 Net Servicos 2 50 0 0 0
2002 Suape ICT 6 0 0 0
2004 TermoFortaleza 55.5 0 7 112.5
2004 UBB Swap Gte 20 0 0 0
2002 Unibanco-CL 0 0 0 150
Total Pending Commitment: 156.5 27.5 7 742.5
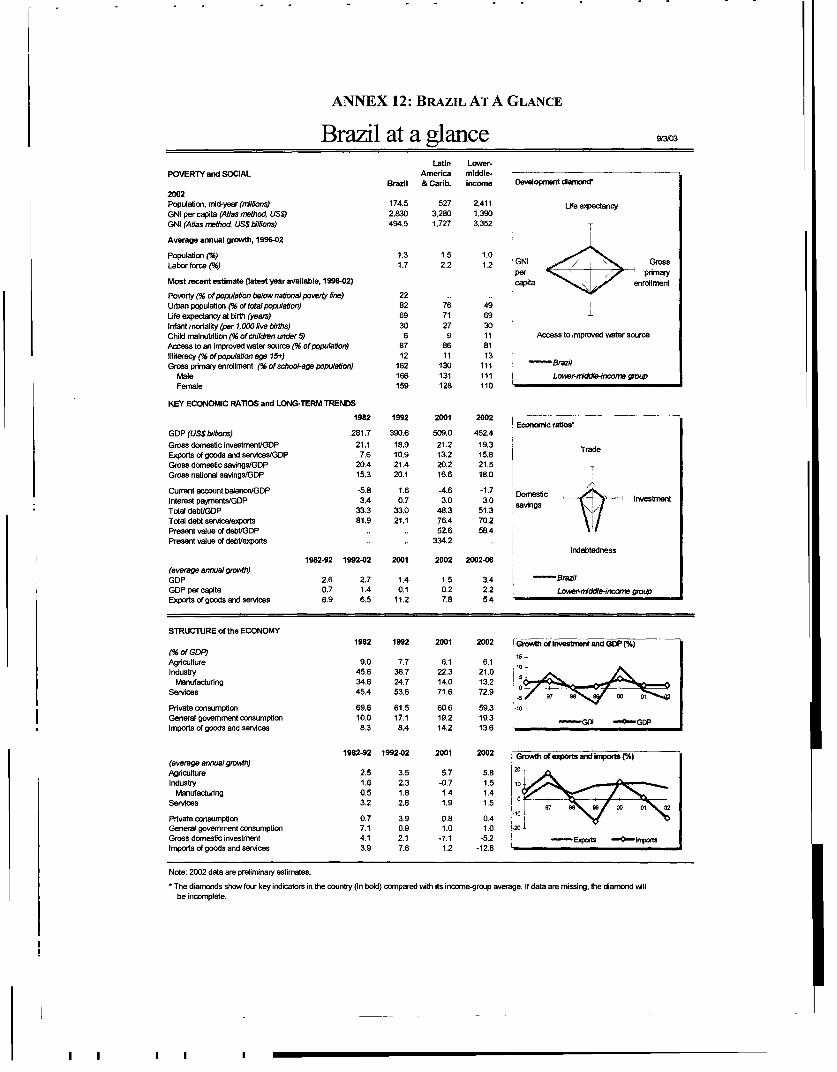
ANNEX 12: BRAZIL AT A GLANCE
Brazil at a glance 93/03
Latin Lower-POVERTY and SOCIAL America middle-
Brazil & Carib. income Develomentd ciamnd-2002Population, mid-year (nilions) 174.5 527 2,411 Life expectancyGNI per capita (Atlas nethod, USS) 2,830 3,280 1,390GNM (Atlas method, USS bmiions) 494.5 1,727 3,352 TAverage annual growth, 1996-02
Population (96) 1.3 1.5 1.0 1Labor force (I) 1.7 2.2 1.2 GI p primaryMost recent estimate (latest year available, 1996802) capita erriertPoverty (% of populadlon below nabnal poverty line) 22Urban population (X of total population) 82 76 49 IUfe expectancy at birth (years) 69 71 69Infant mortality (per 1,000 live births) 30 27 30Child malnutrition (X of childlen under5) 6 9 11 Access to improved water sourceAccess to an improved water source (96 of population) 87 86 81Illiteracy (% ofpopulation age 15+) 12 11 13Gross primary enrollment (96 ofschool-age population) 162 130 111 i 0-Bazi
Male 166 131 111 I Lower-middle-income groFemale 159 128 110
KEY ECONOMIC RATIOS and LONG-TERM TRENDS
1982 1992 2001 2002 EEconomic ratos,GDP (USS billions) 281.7 390.6 509.0 452.4 1Gross domestic investment/GOP 21.1 18.9 21.2 19.3 TradeExports of goods and services/GDP 7.6 10.9 13.2 15.8 TGross domestc savings/GDP 20.4 21.4 20.2 21.5 IGross national savings/GDP 15.3 20.1 16.6 18.0
Current account balance/GDP -5.8 1.6 -4.6 -1.7 |Does ticInterest payments/GDP 3.4 0.7 3.0 3.0 s g InvestmentTotat debVGDP 33.3 33.0 48.3 51.3 savingsTotal debt servicetexports 81.9 21.1 76.4 70.2Present value of debtVGDP .. .. 52.6 58.4Present vatue cf debVexports .. ,. 334.2 .. Ide8tedness
1982-92 1992-02 2001 2002 2002-06(average annual growh)GDP 2.6 2.7 1.4 1.5 3,4 BraziGDP per capita 0.7 1.4 0.1 0.2 2.2 I oer-miqde-incane g,opExports of goods and services 6.9 6.5 11.2 7.8 5.4
STRUCTURE of the ECONOMY1982 1992 2001 2002 Growth of inrestment and GOP (%)
(9 of GDP 9Agriculture 9.0 7.7 226.1 6.0 1 eIndustry 45.6 38.7 22.3 21.0
Manufacturng 34.6 24.7 14.0 13.2 |Services 45.4 53.6 71.6 72.9 ya
Prvate consumption 69.6 61.5 60.6 59.3 -10General govemment consumption 10.0 17.1 19.2 193 |_ D t-GDPImportsofgoodsandservices 8.3 8.4 14.2 13.6
1982-92 1992402 2001 2002 Growthofexportsandimports(%)(avarage anua growth)Agriculture 2.5 3.5 5.7 5.8 2TIndustry 1.6 2.3 -0.7 1.5 10
Manufactunng 0.5 1.8 1.4 1.4Services 3.2 2.8 1.9 1.5 0
Private consumption 0.7 3.9 0.8 0.4General govemment consumption 7.1 0.9 1.0 1.0 -201Gross domestc investment 4.1 2.1 -1.1 -5.2 |E- otImports of goods and services 3.9 7.6 1.2 -12.8
Note: 2002 data are preliminary estimates.
The diamonds show four key indicators in the country (in bold) compared with its income-group average. If data are missing, the diamond willbe incDmplate.
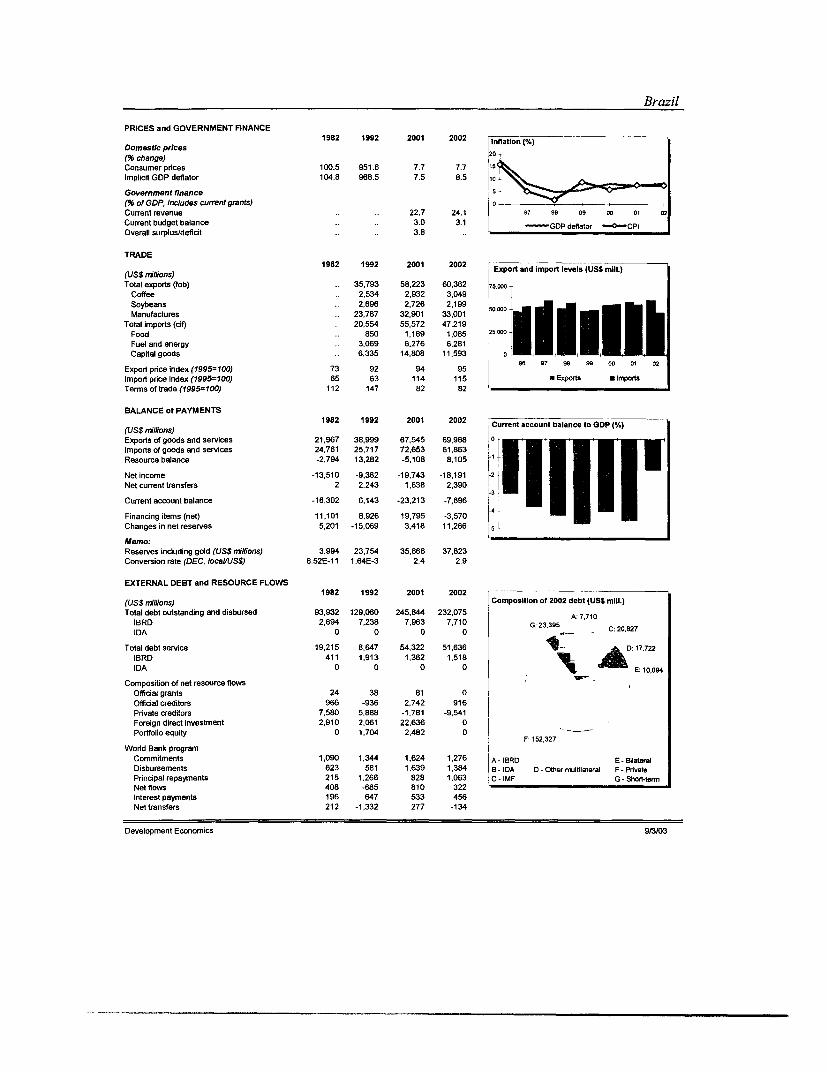
Brazil
PRICES and GOVERNMENT FINANCE1982 1992 2001 2002 Inflaton (%)
Domestic prices 20
(% change)Consumer prices 100.5 951.6 7.7 7.7 is,
Implicit GDP deflator 104.8 968.5 7.5 8.5 1>
Government finance s j(% of GDP, includes current grants) oCurrent revenue .. .. 22.7 24.1 97 9a 99 00 01
Current budget balance .. .. 3.0 3.1 -G OP deflator CPIOverall surplus/deficit .. .. 3.8
TRADE
(US$ n-a/lions) 1982 1992 2001 2002 Export and import levels (USS mill.)
Total exporls (fob) .. 35,793 58,223 60,362 75,000Coffee .. 2,534 2,932 3,049Soybeans .. 2,896 2,728 2,199 900
Manufactures 23,787 32,901 33,001 TTotal imports (cit) . 20,554 55,572 47,219
Food .. 850 1,169 1,085 25,000Fuel and energy .. 3,069 6,276 6.281Capital goods . 6,335 14,808 11,593
Export price index (1995=100) 73 92 94 95Importpriceindex(1995=100) 65 63 114 115 MExports mImports
TemTsoftrade(1995=100) 112 147 82 82
BALANCE of PAYMENTS1982 1992 2001 2002 Current account balance to GDP C%)
(USS milb/ons)Exports of goods and services 21,967 38,999 67,545 69,968 0
Imports of goods and services 24,761 25,717 72,653 61,863 UResource balance -2,794 13,282 -5,108 8,105 - *-
Net income -13,510 -9,382 -19,743 -18,191 -2 -Net current transfers 2 2,243 1,638 2,390 1-3
Current account balance -16,302 6,143 -23.213 -7,696 -4
Financing items (net) 11,101 8,926 19,795 -3,570Changes in net reserves 5,201 -15,069 3,418 11,266 5
Memo:Reserves including gold (US$ rnillions) 3,994 23,754 35,866 37,823Conversion rate (DEC, localWUSS) 6.52E-1 1 1.64E-3 2.4 2.9
EXTERNAL DEBT and RESOURCE FLOWS1982 1992 2001 2002
(USS nillions) I Composition of 2002 debt (USS mill.)
Total debt outstanding and disbursed 93,932 129,060 245,844 232,075 A: 7,710
IBRD 2,694 7,238 7.963 7,710 G: 23,395 c: 20.827
IDA 0 0 0 0 c2,2
Total debt service 19,215 8,647 54,322 51,636 D: 17.722
IBRD 411 1,913 1,362 1,518 I
IDA 0 0 0 0 E E: 10.094
Composition of net resource flowsOfficial grants 24 38 81 0Official creditors 966 -936 2,742 916Private creditors 7,580 5,888 -1,781 -9,541Foreign direct investment 2,910 2,061 22,636 0 |Portfolio equity 0 1,704 2,482 0
F' 152.327
Worid Bank programCommitments 1,090 1,344 1,624 1,276 A - IBRO E -Bilateral
Disbursements 623 581 1,639 1,384 -BIDA 0 - Other multilateral F - Private
Prncipalrepayrments 215 1,266 828 1,063 C- IMF G-SShort-termNetflows 408 -685 810 322Interest payments 196 647 533 456Net transfers 212 -1,332 277 -134
Development Economics 9/3/03