Embed Size (px)
Citation preview
Report No. 14062-BA
MyanmarPolicies for Sustaining Economic ReformOctober 16, 1995
Country Operations DivisionCountry Department IEast Asia ancl Pacific Region
Document of the World Bank
Pub
lic D
iscl
osur
e A
utho
rized
Pub
lic D
iscl
osur
e A
utho
rized
Pub
lic D
iscl
osur
e A
utho
rized
Pub
lic D
iscl
osur
e A
utho
rized
CURRENCY EQUIVALENTS (Official Exchange Rate)
Currency Unit = Kyat
End-March 1995 - US$1.0 = Kvat 5.520Kyat I.0 US$ 0 181
Averagc 1994 - US$1.0 = Kyat 5.975Kvat 1.0 US$ 0. 167
Average 1993 - US$1.0 = Kyat 6.157Kvat 1.0 = US$ 0.162
GLOSSARY OF ABBREVIATIONS
CBM Central Bank of MvanmarFDI Foreign Direct InvestmentFECs Foreign Exchangc CertificatesFY Fiscal Ycar; in Mvanmar. runs from April I to March 3 1GNFS Goods and Non-Factor ServicesGOM Government of MvanmarHYVs High-vielding varieties
iV Joint ventureMAPT Mvanmar Agricultural Produce TradingMARDB Mvanmar Agricultural and Rural Development BankMEB Myanma Economic BankMEPE Myanmnar Electric Power EnterpriseMFR Ministrv of Finance and RevenueMFTB Mvanmar Foreign Trade BankMIC Mvanmar Investment CommissionM'FNPED Ministry of National Planning and Economic DevelopmentMOA Ministry of AgricultureMOI Ministry of IndustrvMOLF Ministrv of Livestock and FishericsMPPE Mvanmar Petroleum Product EnterpriseMTE IMvanma Timber EnterpriseNEER Nomilal Effective Exchange RateREER Real Effective Exchange RateSDR Special Drawing RightSE Statc EnterpriseSEE State Economic EnterpriseSFA State Fund AccountSLORC State Law and Order Restoration CouncilTVEs Tow-n and Village EnterprisesUNDP Ulnited Nations Development ProgramVAT Value Added TaxYCDC Yangon City Development Committee
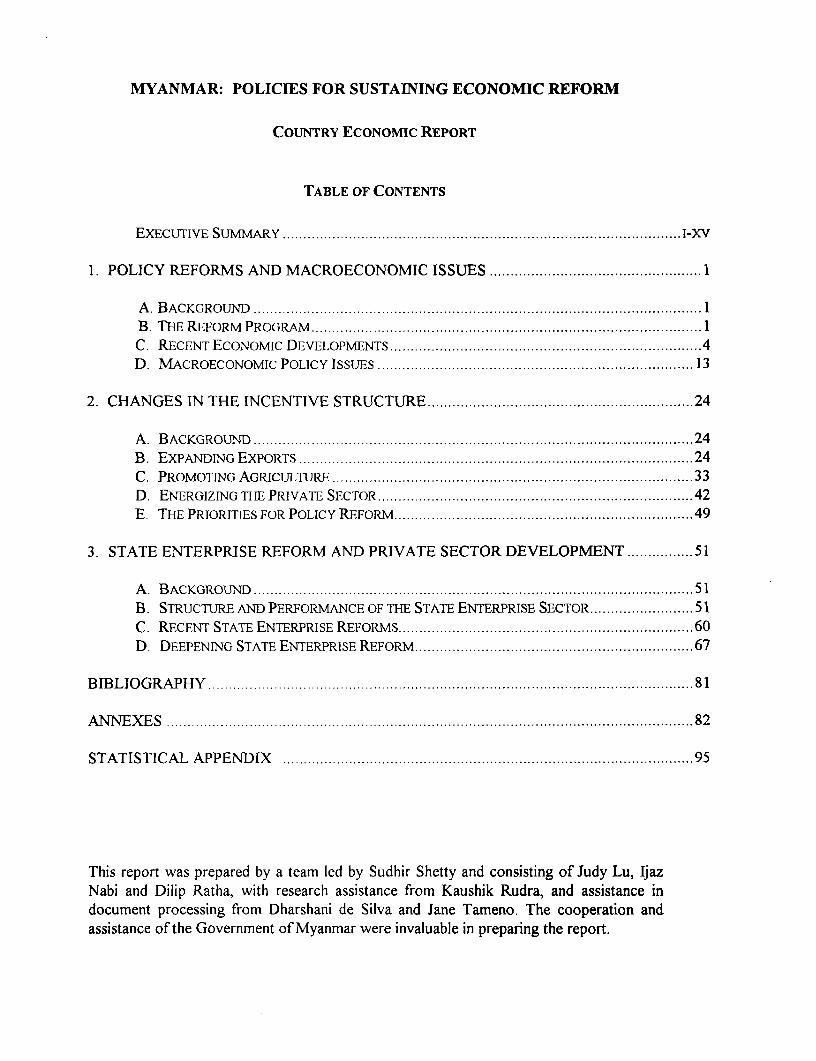
MYANMAR: POLICIES FOR SUSTAINING ECONOMIC REFORM
COUNTRY ECONOMIC REPORT
TABLE OF CONTENTS
EXECUTIVE SUMMARY ......................................... I-XV
1. POLICY REFORMS AND MACROECONOMIC ISSUES ................................................ 1
A. BACKGROUND ........................................................................... 1..............1B. THE REFORM PROGRAM .............. 1C. REcENT EcoNoMIc DEVELOPMENTS .4D. MACROECONOMIC POLICY ISSUES ..... ..................... 1..................... 13
2. CHANGES IN THE INCENTIVE STRUCTURE .......... 24
A. BACKGROUND .......... 24B. ExPANDING EXPORTS .......... 24C. PROMOTING AGRICULTURE ........... 33D. ENERGIZING TI-E PRIVATE SECTOR .......... 42E. THE PRIORITIES FOR POLICY REFORM .......... 49
3. STATE ENTERPRISE REFORM AND PRIVATE SECTOR DEVELOPMENT .51
A. BACKGROUND .... 51B. STRUCTURE AND PERFORMANCE OF THE STATE ENTERPRISE SECTOR .51C. RECENT STATE ENTERPRISE REFORMS .60D. DEEPENING STATE ENTERPRISE REFORM .67
BIBLIOGRAPHY .81
ANNEXES .................................................................................................... 82
STATISTICAL APPENDIX .95
This report was prepared by a team led by Sudhir Shetty and consisting of Judy Lu, IjazNabi and Dilip Ratha, with research assistance from Kaushik Rudra, and assistance indocument processing from Dharshani de Silva and Jane Tameno. The cooperation andassistance of the Government of Myanmar were invaluable in preparing the report.
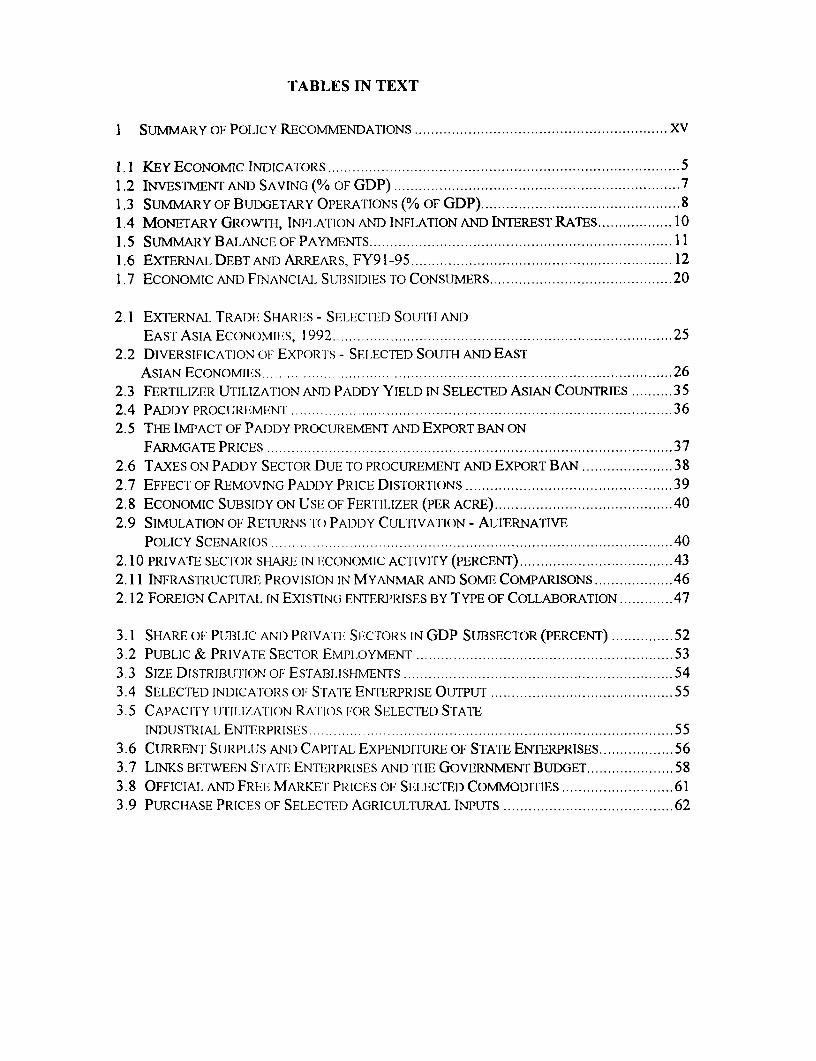
TABLES IN TEXT
I SUMMARY OF POLICY RECOMMENDATIONS ............................................................ XV
1.1 KEY EcoNoMic INDICATORS ............................................................ 51.2 INVESTMENT AND SAVING (% OF GDP) ............................................................ 71.3 SUMMARY OF BUDGETARY OPERATIONS (% OF GDP) ................................................ 8
1.4 MONETARY GROWVTH, INFLATION AND INFLATION AND INTEREST RATES .................. 101.5 SUmmARY BALANCE OF PAYMENTS .............................. .............................. 11.6 EXTERNAL DEBT AND ARREARS, FY91-95 ............................................................ 12
1.7 ECONOMIC AND FINANCIAL SUT3SIDIES TO CONSUMERS ............................................ 20
2.1 EXTERNAI. TRADE SHARES - SELECTED SOUTH ANDEAST ASIA ECONOMIES, 1992 ............................................................ 25
2.2 DIVERSIFICATION Ol EXPIORTI S - SEI.ECTED SOUTH AND EASTASIAN ECONOMIES ............................................................ 26
2.3 FERTILIZER UTILIZATION AND PADDY YIELD IN SELECTED ASIAN COUNTRIES .......... 352.4 PADDY PROCURFMENT ............................................................ 36
2.5 THE IMPACT OF PADDY PROCUREMENT AND EXPORT BAN ON
FARM GATE PRICES ............................................................ 37
2.6 TAXES ON PADDY SECTIOR DUE TO PROCUREMENT AND EXPORT BAN ...................... 38
2.7 EFFECT OF REMOVING PADDY PRICE DISTORTIONS .................................................. 39
2.8 ECONOMIC SUBSIDY ON USE OF FERTILIZER (PER ACRE) ........................................... 40
2.9 SIMULATION OF RETURNS TO PADDY CULTIVATION - ALTERNATIVE
POLICY SCENARIOS ............................................................ 40
2.10 PRIVATE SECTOR SHARE IN ECONOMIC ACTIVITY (PERCENT) . . 43
2.11 INFRASTRUCTURE PROVISION IN MYANMAR AND SOME COMPARISONS .. 46
2.12 FOREIGN CAPITAL IN EXISTING ENTERPRISES BY TYPE OF COLLABORATION .. ........... 47
3.1 SHARE OF PUBLIC AND PRIVATE SECTORS IN GDP SUBSECTOR (PERCENT) ........ ....... 52
3.2 PUBLIC & PRIVATE SECTOR EMPL.OYMENT ............................................................ 53
3.3 SIZE DISTRIBUTION OF ESTAI3I.ISHMENTS ............................................................ 54
3.4 SELECTED INDICAI ORS OF STA1TE ENTERPRISE OUTPUT .................... ........................ 55
3.5 CAPACITY lJTIILIZA I1ION RATIOS FOR SELECTED STATE
INDUSTRIAL ENTERPRISES ............................................................ 55
3.6 CURRENT SURPLUS AND CAPI'TAL EXPEiNDITURE OF STATE ENTERPRISES .................. 56
3.7 LINKS BETWEEN S1TATE ENTEIRPRISES AND THE GOVERNMENT BUDGET ..................... 58
3.8 OFFICIAL AND FREE MARKET PRICES OF SELECTED COMMODITIES ........................... 61
3.9 PURCIHASE PRICES OF SELECTED AGRICULTURAL INPUTS ......................................... 62
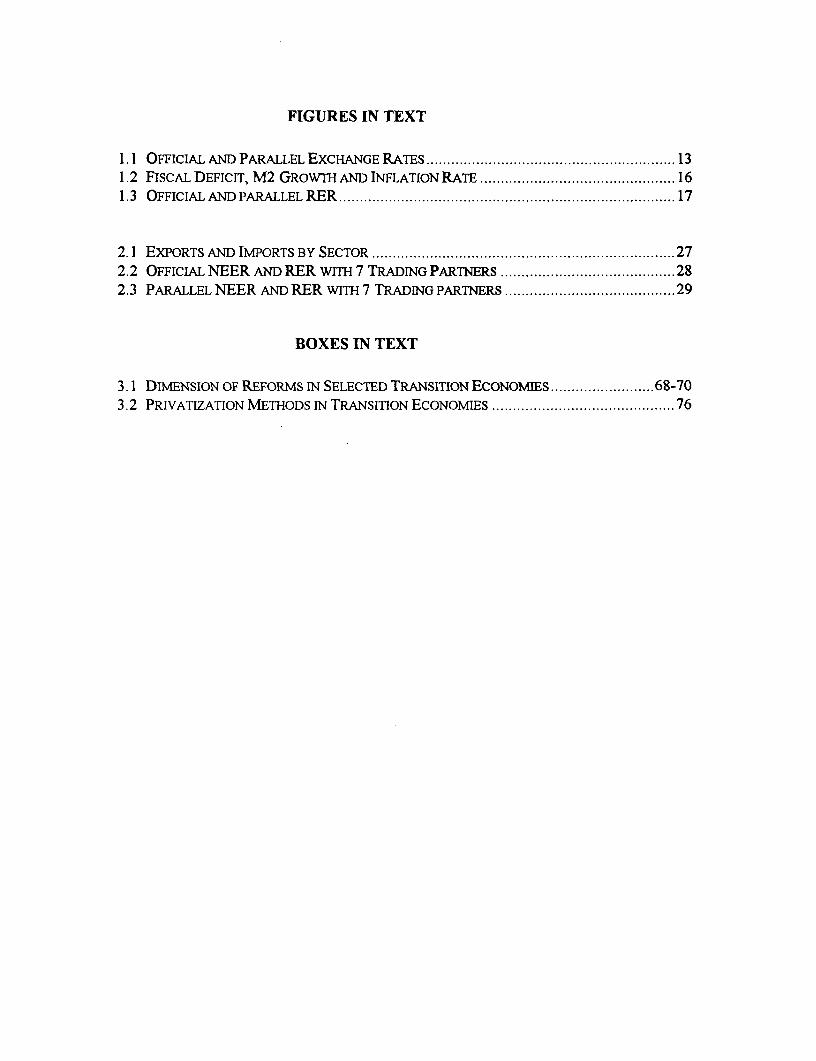
FIGURES IN TEXT
1.1 OFFICIAL AND PARALLEL EXCHANGE RATES ................................................. 131.2 FISCAL DEFICIT, M2 GROWTH AND INFLATION RATE ............................................... 161.3 OFFICIAL AND PARALLEL RER ................................................ 17
2.1 EXPORTS AND IMPORTS BY SECTOR ................................................. 272.2 OFFICIAL NEER AND RER WITH 7 TRADING PARTNERS .......................................... 282.3 PARALLEL NEER AND RER WITH 7 TRADING PARTNERS ......................................... 29
BOXES IN TEXT
3.1 DIMENSION OF REFORMS IN SELECTED TRANSITION ECONOMIES ............. ............ 68-703.2 PRIVATIZATION METHODS IN TRANSITION ECONOMIES ............................................ 76

EXECUTIVE SUMMARY
A. INTRODUCTION
1. A significant program of economic reforms has been instituted in Myanmar since the StateLaw and Order Restoration Council (SLORC) assumed power in late-1988. This shift in economicpolicies followed almost a quarter century of economic decline during which the prevalent developmentparadigm was termed "the Burmese way of socialism". Under that model, economic development was to beachieved through rapid industrialization and self sufficiency, and led by the State Enterprise (SE) sector.Economic performance under that policy regime was poor. During 1962-77, real GDP growvth barely keptup with population expansion and, as a result, living standards stagnated. Investment levels remained low,agricultural output grew slowly, and the economy grew more inward looking. The initial attempts ateconomic reform in the mid-1970s succeeded at first but could not be sustained due to macroeconomic andstructural factors, which were reflected in widening budget and current account deficits, rising inflation,and stagnant agricultural output and exports. Faced with these serious external and internal imbalances inthe early-1980s, the Government's stabilization attempts relied on tightening import controls, cutting publicinvestment, and demonetization but were ineffective in reversing the economic decline.
2. Following the anti-government demonstrations of 1988, the SLORC assumed power andannounced that many key aspects of the earlier model would be abandoned in its economic reform program.With over seven years having elapsed since those reforms were initiated, it is an opportune time to takestock. Specifically, this report examines the impacts of the policy changes, with a view to identifying theareas in which progress has been made, as well as the gaps that still remain in the program. This analysiswould then underpin the report's recommendations concerning areas in which additional reforms arerequired and how these measures should be phased. 1
B. POLICY REFORMS AND RECENT ECONOMIC PERFORMANCE
3-. In the early-1980s, the pace of GDP growth slowed while external and internal imbalancesworsened. As a share of GDP, the budget deficit in FY82-86 averaged over 8% while the current accountdeficit rose to over three-quarters of export earnings, and was financed primarily through external public-sector borrowings.2 These imbalances forced the Government to attempt actions aimed at stabilizing theeconomy. However, these measures consisted mainly of quantitative restraints on investment and imports.In this sense, they were focused on the symptoms of the problems rather than at addressing their underlyingcauses, which included the overvaluation of the Kyat, the continued bias against agriculture, the restrictionson private sector activity, and the inefficiency of the large state enterprise sector, particularly in industry.Without effective stabilization and adjustment efforts, the economic situation deteriorated sharply by themid-1980s, with inflation worsening as well. Two rounds of demonetization were instituted in 1985 and1987 to curb inflation, during each of which over half the currency in circulation was declared worthless.
' In keeping with this focus on the key macroeconomic and sectoral policy issues, this report does notdirectly deal with the important issue of designing strategies for poverty reduction. However, since sustainedgrowth is a necessary condition for success in reducing poverty, the recommendations here set the stage for moredetailed follow-up work, which would be undertaken when feasible.
2 The Government of Myanmar (GOM) fiscal year FY) runs from April 1 to March 31. The shorthand FY95,as used in this report, refers to the fiscal year ending March 31, 1995, i.e., 1994/95.
ii
However, these efforts did not succeed either, and during FY87-89, annual inflation averaged almost 20percent (compared to about 4% in FY82-86). Moreover, both the budget deficit and the current accountgap widened, while export earnings fell sharply.
The Reform Proeram
4. It was in this context that the SLORC initiated its so-called "Open-Door" program ofeconomic reforms in late-1988. These reforms aimed at expanding the role of the private sector, reducingthe scope and extent of government intervention, and promoting integration with the world economy, andbuilt on the liberalization of agricultural pricing and marketing in 1987. In this manner, the reform programwas intended to transform the economy from one organized along socialist lines and dominated by the statesector to a market-oriented system. The initial measures focused on liberalizing regulations and enactingfiscal incentives for foreign investment. The reforms have since been broadened to include policies aimedat controlling public expenditures and monetary expansion; licensing private banks, extending investmentincentives to local investors, and allowing the retention and trading of foreign exchange by privateexporters. In many respects, therefore, the economic environment in Myanmar today differs from thatbefore 1988.
5. Agricultural sector policies. The major reform in agricultural policies occurred in 1987with the abolition of the system of forced government procurement of major crops and the liberalization ofdomestic marketing and processing. Although these steps were accompanied by the imposition of a higherland tax and a tax on grain trading, those taxes were soon rescinded. Moreover, formal governmentcontrols on farmers' cropping patterns were also eliminated in 1988. However, the government continues toprocure albeit on a smaller scale than before, accounting in FY95 for about 11% of the total crop.3 Pricesof some agricultural inputs supplied by the government, including fertilizers and mechanization services,have also been raised. Finally, extensive leasing of fallow land for cultivation and livestock breeding byprivate farmers has been undertaken since 1991.
6. Industrial sector policies. With the shift away from the "Burmese way of socialism" in1988, the restrictions on private sector involvement in the industrial sector have been reducedprogressively. Private firms are now allowed to operate in all industrial subsectors other than thosespecified as activities reserved for the state sector (such as teak extraction, mining of gems, oil and gasextraction, and power generation).4 With the acknowledgment of the expanded role of the private sector,the commercial tax was introduced in 1990 to replace the previous commodity and services tax, whichapplied only to SEs and cooperatives. The commercial tax, by contrast, applies to the sales (domestic andimported) of all enterprises, private and public. With the enactment of the Foreign Investment Law in late-1988, foreign investors in Myanmar are now allowed to establish wholly-owned enterprises or enter intojoint ventures with Myanma citizens in almost all subsectors. Even in subsectors reserved for stateenterprises (SEs), foreign investment has been approved in several cases, particularly in mining andfisheries. A range of tax benefits and streamlined licensing procedures are also provided to foreigninvestors under the law (with additional exemptions for export-oriented enterprises) as are guaranteesagainst nationalization and for the repatriation of capital and the foreign exchange component of profits. In1994, most of these tax benefits available to foreign investors were also extended to local investors. Pricing
3 Although these sales are termed voluntary, this procurement occurs at below-market prices. Themagnitude of such implicit taxation of paddy farmers is evaluated in Chapter 2.
4 Even these restrictions can be relaxed on a case-by-case basis, as noted below with respect to foreigninvestment.
iii
policies have also been liberalized with the removal of most formal price controls (except on energyproducts).
7. State enterprise reformns. State enterprises have been granted greater operational autonomy,in areas such as pricing, input procurement, and production. Regarding production, the enterprises canchoose also whether to enter into agreements with private domestic or foreign investors whereby theyproduce on a consignment basis, lease their facilities to these investors, or enter into joint ventures withthese firms. The goal of privatizing SEs in a more systematic manner has recently been announcedalthough detailed implementation procedures are yet to be developed. In 1989, the outstanding credit toSEs was converted into non-interest bearing government equity, and since then, all financing to SEs isprovided from the budget.
8. Trade and foreign exchange policies. At the core of the Government's "open door" policyin 1988 was the expansion of the role of the private sector in extemal trade. Border trade, which occursacross Myanmar's land borders and was previously illegal, was normalized (i.e. licenses or permits arerequired from the authorities). However, private sector exports of some commodities such as rice, teak andminerals continue to be prohibited. Foreign exchange control procedures have also been reformed. Since1988, retention of foreign exchange earnings by exporters has been permitted, initially for 60 percent ofexport proceeds, and since 1989 for the entire proceeds. Moreover, these retained earnings can bedeposited in foreign exchange accounts at the Myanmar Foreign Trade Bank (MFTB), and transfers arepernitted between these accounts.' In 1993, Foreign Exchange Certificates (FECs) were introduced by theCentral Bank with an FEC equivalent to US$1. Residents can now acquire and trade FECs, and use themto open foreign exchange accounts.
9. Financial policies. Several banking laws were enacted in 1990 including the Central BankLaw, which empowers the Central Bank of Myanmar (CBM) to supervise and regulate the financialsystem, including the conduct of monetary policy, and the Financial Institutions Law, which provides theframework for the establishment and operation of a range of institutions including commercial banks,finance companies, and development banks. In an important break with the past, private domestic bankscan also now be established. As of end-July 1995, 15 private banks were in operation, of which, 4 had alsobeen granted licenses to transact in foreign exchange, and although foreign banks cannot operate yet, 28have been licensed to establish representative offices.
5 Since these transactions are not officially recognized by the authorities, the exchange rates at whichtransfers occur are not recorded.
iv
Recent Economic Performance6
10. Growth trends. GDP growth has rebounded since FY90, averaging about 4.2% in FY90-94 and rising to 6.8% in FY95, in contrast with the average decline of over 5% during FY86-88. Butgrowth has been highly variable from year to year, and slower than in the early-1980s. This recent growthhas extended to all sectors of the economy, although it has been most rapid in the primary sectors,particularly agriculture and forestry. Within the industrial sector, mining and construction have grownfastest, reflecting in part their response to the incentives now provided to foreign investment in theseactivities. Manufacturing growth has resumed but has remained variable due to its links to agriculturalperformance.
11. Investment and saving. Investment recovered during FY90-95, reflecting the increase inprivate investment that followed the implementation of tax incentives and liberalization measures, whichmore than made up for the continued fall in public investment. Savings have also recovered since FY90,reflecting the reduction in the dissaving of the public sector. However, despite this recovery, theconsequent narrowing of the saving-investment gap relative to the early-1980s has been achieved entirelydue to the fall in investment. The domestic saving rate now is actually lower than in the early-1980s, whilegross investment has fallen to about 12% of GDP.
12. Fiscal trends. The composition of public sector revenues changed little during FY91-95,but the share of revenues to GDP continued to decline, and in FY95, was slightly over 7% compared toabout 19% during the early-1980s. Tax revenues, which account for almost 60% of revenues, showed thesame declining trend. Efforts to control expenditures in FY91 -95 have been more successful, and the cutshave been deepest in capital expenditures of SEs. The only expenditure category that has been protectedfrom cuts has been defense which now accounts for over a third of total public expenditures. Reflecting theefforts at expenditure control, the fiscal deficit fell to 6% of GDP during FY90-94, from an average of over10% in FY87-89. However, this improvement was reversed in FY95 when the deficit rose to 6.3% ofGDP. The deficit has been financed by borrowing from the domestic banking system, and increasingly,since FY89, by the accrual of arrears on external debt.
13. Monetary growth and inflation. As the fiscal deficit fell in FY91-94, monetary growthslowed, particularly in FY94. However, with the widening of the fiscal deficit in FY95, monetaryexpansion accelerated once again. The private sector's share in domestic credit has grown but remainssmall -- about 14% in FY95. All interest rates -- deposit and lending -- are still controlled, and despite asmall increase in some rates in 1992 and again in early-1995, these remain highly negative in real terms.Although measures were implemented to promote financial savings, its share in GDP has stagnated. At theconsumer level (in Yangon), average annual inflation in FY95 fell to 22%. But, a clear downward trend isnot yet apparent, and the average annual inflation rate during FY91-95 was much higher than in the early-1980s.
14. External trends. During FY91 -95, the deficit on the current account improved, due mostlyto higher remittances from Myanma citizens abroad, and increases in receipts from travel, owing to theremoval of restrictions on tourism and the incentives provided to foreign investment in tourism. However,
6 The economic trends summarized here rely on official data from GOM sources, and should beinterpreted with caution because they are based on the official exchange rate. Since the economic distortions thatarise from the overvalued exchange rate are pervasive, a systematic attempt at adjusting the official data is beyondthe scope of this report. However, apart from this problem, the quality and coverage of economic statistics appearno worse than in other low-income countries in East Asia.
v
despite more rapid export growth, the trade balance has improved little. Moreover, the direction of exportsand their concentration among primary products have remained almost unchanged. But the composition ofimports shifted sharply towards consumer goods (mainly food and durables), which now account for over40% of all imports. The current account gap has been financed increasingly by accumulating arrears,which have doubled since FY91, to almost $1.5 billion. With the suspension of foreign aid since FY90,there have been substantial outflows of medium- and long-term capital since FY91. However, attracted bythe changes in the foreign investment laws and tax incentives, foreign direct investment has averaged about$190 million annually in FY91-95. It has been concentrated in the oil and gas, mining, and hotels andtourism sectors. Finally, although the official exchange rate remains fixed at its 1977 level (vis-a-vis theSDR), a variety of arrangements have been instituted since 1988 to allow private sector transactions tooccur at a far more depreciated parallel-market exchange rate.
C. EVALUATION OF REFORMS
15. The GOM's economic reform program is distinguished from the development strategyfollowed for the quarter century since 1962 ty three clear features. The schemes to compensate for theovervaluation of the Kyat, such as foreign exchange retention, and the incentives provided to foreigninvestment aim at encouraging exports and integrating the Myanma economy with the rest of the world.The liberalization of agricultural pricing and marketing is intended to reduce the bias against agriculturalproduction and allow farmers greater freedom of choice. And, removing restrictions on private-sectorinvolvement in economic activity and encouraging the growth of private businesses are directed atfacilitating the transition to a market-oriented economy. Along with these structural reforms, there havealso been attempts at addressing the internal and external imbalances that afflicted the economy in the late-1980s.
Macroeconomic Stabilization
16. Stabilization has not vet been achieved. When economic reforms were initiated in the late-1980s, severe macroeconomic problems characterized the Myanma economy, largely due to unsustainablylarge fiscal deficits. The situation has undoubtedly eased in some respects. The current account deficit hasbeen reduced (as a share of exports), and consumer price inflation (year-on-year) has fallen. Theseimprovements reflect the fall in the fiscal deficit from 13.7% of GDP in FY89 to 6.5% in FY95.
17. But despite this improvement, macroeconomic stability remains elusive, as indicated bycontinued internal and external imbalances. Inflation remains high and variable. The reduction in the fiscaldeficit has been achieved entirely by cutting expenditures (current and capital) rather than by broadeningthe revenue base or improving the performance of SEs. In particular, the continued erosion of the revenuebase can be seen by noting that the average ratio of government revenues in FY91-95 was half that in theearly-1980s, with the contraction covering all components of revenue. And, the slowing of monetarygrowth until FY94 was accomplished mainly by limiting growth of credit to the private and cooperativesectors rather than by reducing the expansion of public-sector credit.
18. The current account gap also remains unsustainably large, as is evident from the continuedbuild-up of extemal arrears. The main policy response to this external imbalance has been to allow theprivate sector's extemal transactions to be conducted at an exchange rate lower than the highly-overvaluedofficial rate. By allowing the full retention of foreign exchange eamings by private exporters, and thetrading of foreign exchange by domestic residents through foreign exchange accounts and FECs, there hasbeen a de facto legalization of the parallel foreign exchange market with the goal of engineering a de facto
vi
devaluation. These measures have not restored external balance mainly because the official nominalexchange rate remains highly overvalued. And since the official rate still applies to all public-sectorimports, a complex exchange rate system now exists, which segments the market for foreign exchangebetween the private and public sectors. The continued discrimination against the tradeables sectors(exports and import-substitutes) can be noted from the trends in the real exchange rate (RER) even aftertaking account of the parallel-market rate. A weighted-average RER (that uses the relative trade shares ofthe private and public sector) has appreciated by more than two-thirds even since 1989, implying that thebias against tradeables has worsened to this extent.
19. Why macroeconomic stability is essential. Hence, macroeconomic stabilization measuresare still needed urgently. Without them, the reforms in sectoral policies that have been implemented,important as they are, will not be enough to bring forth a sustained growth response. The recent experienceof the successful economies of East Asia illustrates clearly the importance of restoring and maintainingmacroeconomic stability for sustained export-led growth. The key to doing this in most of these economieswas the control of fiscal deficits to levels that could be financed without need for excessive monetaryexpansion. The need to establish a stable macroeconomic framework along with the implementation ofsectoral policy reforms is borne out also in the economies that are currently making the transition fromcentral planning. The dividends from pursuing aggressive macroeconomic stabilization early in the reformprocess are evident, for instance, from the recent experience of Viet Nam and Laos. Viet Nam's ambitiouseconomic reform program, for instance, was initiated in 1989. It included stabilization measures such asunification and devaluation of the exchange rate (by over 70 percent in 1989), increases in deposit andlending interest rates to positive real levels, and reductions in fiscal expenditures through the streamliningof the military and the public sector. The resulting macroeconomic stability has contributed to higherinvestment and growth.
The Incentive Structure
20. To achieve its goals, the reform program has attempted to alter the structure of incentivesin the Myanma economy. The need for greater integration with the world economy through trade andinvestment links is explicitly acknowledged, with the main impetus for growth coming from exports ratherthan from import substitution. Hence, private exporters are now allowed to retain foreign exchangeearnings from exports, while fiscal incentives are offered to foreign investors and to activities that generateforeign exchange. The importance of encouraging agricultural production, particularly paddy, has alsobeen noted by eliminating the forced procurement of crops at below-market prices and government controlover cropping decisions. Finally, the stringent restrictions on private-sector participation in economicactivity have been reduced, and a range of fiscal incentives extended to domestic private businesses.Despite the many legislative measures that have been implemented, however, the earlier biases have not yetbeen redressed in all areas, and the picture that emerges is one of patchy reform rather than of coordinatedsystemic change.
21. The exchange rate system. The overvaluation of the official exchange rate has continuedto erode the profitability of exports. Adjusting for Myanmar's higher inflation relative to its regionaltrading partners, the profitability of exporting at the official rate has fallen to less than a seventh of its1985 level. To address this deterioration, private exporters are allowed to retain all the foreign exchangefrom exports, and to maintain foreign exchange-denominated deposits. Hence, all private-sector externaltrade is now conducted through the parallel market in foreign exchange. By expanding the scope of thismarket, it is hoped that the profitability of export production would be enhanced. However, estimates ofthe RER using the parallel rate shows that export profitability (vis-a-vis Myanrar's regional tradingpartners) has still declined to less than half its level a decade ago. The efforts to improve export
vii
profitability by expanding the scope of the parallel market are also problematic because they exclude theexternal transactions of the public sector, including SEs. Moreover, it raises transactions costs and risksfor private exporters who must deal with a multiplicity of parallel-market exchange rates in an unofficialand unregulated market.
22. Other barriers to exports. The economic reforms have eliminated restrictions on privatesector exports, with paddy, rice, teak, most minerals and pearls being the main exceptions. The mostserious restraint is the continued ban on paddy and rice exports. This policy not only constitutes acontinued bias against paddy farmers (see next para.); it also discriminates against the export product withthe greatest potential. A recent export tax of 5% imposed on private and joint-venture exporters is anotherpolicy that worsens the anti-export bias. The segmentation of the foreign exchange market also remains aserious problem because private firms, including potential exporters, can import inputs only if theygenerate their own foreign exchange earnings or can find another private exporter. This system, with itsattendant risks and transactions costs, restricts the access of potential exporters to imported inputs. Andthe costs of imports are raised even further by the requirement that all private-sector imports include aspecified proportion of officially-designated priority goods. Finally, despite recent efforts at improvingcustoms procedures, the quality of the infrastructure needed for external trade, including cargo handling,ports and warehousing facilities is poor while procedures are still cumbersome and private exportersreceive little government support. Trade finance is also impossible to obtain due to the segmentation of theforeign exchange market.
23. Implicit taxation of paddy production. Since paddy is dominant in the agricultural sector,changes in the incentives for paddy production largely determine the sectoral incentives. While theliberalization of agricultural pricing and marketing in 1987-88 raised prices to paddy farmers, their implicittaxation through the structure of output and input prices, and export restrictions continues. The mainpolicies by which these implicit taxes are levied are the paddy procurement system and the ban on private-sector paddy exports. About 11% of paddy production is procured by the government at below-marketprices, thereby reducing farmgate prices by about 8%. However, paddy farmers are taxed even morebecause of the ban on private-sector exports of paddy and rice. Since the intemational price of rice ishigher than domestic prices, this government monopoly means that the price received by paddy farmers isabout a third lower than if they could export freely.
24. These implicit taxes mean that paddy farmers suffer large losses in income, which weremore than double Myanmar's total tax collections in FY95. These distortions imply even larger medium-term losses because they discourage farmers from expanding output. The estimates presented in Chapter 2point to increased yields per acre of about 10%, and higher farm output (in value terms) of over 35%, if theexport ban were eliminated. A common justification for such implicit taxes is that many paddy farmersreceive implicit subsidies on their fertilizer use. However, even taking account of these subsidies, paddyfarmers' returns/acre would increase by 50 to 100% (even without taking account of the yield increase) ifcrop procurement and the export ban were eliminated in tandem with removal of the fertilizer subsidy.
25. Land tenure and cropping choice. Despite the reforms, the government still exercisessubstantial control ovcr the choices of farmers, especially on land designated for paddy, through theiraccess to credit, irrigation, and fertilizer. Meanwhile, continued subsidies and other distortions (such as theexchange rate) mean that private-sector involvement in provision of inputs has not grown. Therefore,shortages of these inputs continue to constrain production. The ambiguity of land tenure also constrainsagricultural productivity. The inability to trade or lease paddy land means that much of the cultivated landmay not be operated efficiently or is left fallow. And, unclear use rights to land mean that farmers have
viii
little incentive to undertake investments such as erosion control, which yield returns only over the longterm.
26. Private-sector access to credit. The availability of credit to domestic private businesseshas improved since 1990 with the enactment of the Financial Institutions Law. The private sector's share intotal domestic credit has now risen to about 14%, still far lower than its share of GDP or manufacturingvalue added. Moreover, continued large fiscal deficits mean that the credit demands of the public sectorstill crowd out private sector access. As the private sector grows, and its credit needs expand, its demandscannot be met unless the fiscal deficit can be controlled. Moreover, SEs are still treated differently fromprivate businesses in that they are financed directly from the government budget. Those with operatingdeficits receive interest-free credit, which provides them a significant subsidy, and further impairs theability of private businesses to compete effectively with them.
27. Access to infrastructure and public services. Apart from the inadequacies of Myanrar'sphysical infrastructure, private businesses have only limited access to these facilities and services comparedto SEs and government departments. It appears to take private entrepreneurs considerably longer than SEsto obtain power, water and telephone connections, or to have goods cleared through the port and stored inwarehouses. Apart from the advantages of incumbency enjoyed by SEs, the lack of formal interactionbetween representatives of the domestic private sector (such as the Myanma Chamber of Commerce) andkey policvmakers is a contributing factor. And, the fuzziness of land ownership and use rights even inurban areas makes it difficult for private firms to acquire land and get access to public services. Theserelative advantages enjoyed by SEs in their access to infrastructure and public services can be seen also inthe preference that foreign investors have shown to enter into partnerships with SEs rather than withdomestic private firms. As of March 1995, less than 30% of FDI inflows that took the form of jointventures was with the domestic private sector.7
28. Access to imports. Private businesses import inputs and machinery at the parallel marketrate, while SEs do so at the official rate. In this sense, SEs get their imports at heavily-subsidized prices.But, given the extreme shortages of foreign exchange in the Myanma economy, the access of all businessesto imported inputs is impaired. The import requests of SEs are tightly controlled by the Ministry ofFinance. However, those SEs that do receive permission to import raw materials and intermediates,obviously receive large scarcity rents on their imports. These subsidies to SEs also reduce the priceincentives for expanded private participation in legitimate businesses. SEs, which use cost-plus pricing, settheir prices at levels at which domestic manufacturing is unprofitable. Hence, private businesses areencouraged to concentrate in the trading and services sectors or to engage in unregistered (and small-scale)manufacturing.
State Enterprise Reform
29. Since state ownership was among the main tenets of the "Burmese way of socialism", theSE sector played a central role in Myanmar's development strategy until the Government's economicreforms were initiated in the late-1980s. Its significance was greatest in sectors such as manufacturing,mining, communications, infrastructure, financial services, and trade, which were considered to be mostcritical to the emergence of a modem, industrialized economy. Given this starting point, the GOM hasrecognized the need to implement reforms aimed at rationalizing the role of SEs in the economy.
7 This share excludes joint ventures with quasi-official entities such as Myanma Economic Holdings andYangon City Development Committee.
ix
30. These reforms since 1989 have involved actions in several areas. A system of dual pricinghas been adopted for outputs, which allows SEs to make sales at free-market prices once their procurementtargets (of government sales at controlled prices) are met. For most crops used as industrial raw materials,official prices are now higher than that offered by private traders. SEs have been granted limited autonomyin decisions regarding contract and consignment production and marketing and distribution. Another focusof the reform efforts has been to transfer ownership and management of SEs to the private sector, foreignand domestic. While there has been little privatization, progress in expanding private-sector involvementhas occurred through the establishment of new joint ventures (JVs) and production-sharing arrangementsbetween SEs and private investors, and through leasing the facilities of SEs to private entrepreneurs. Mostcollaborations involve SEs with foreign investors from the United States and several East Asian countries,notably Singapore, Thailand, and Hong Kong. The bulk of these have been in oil and gas extraction, hotelsand tourism, fisheries, and garments. Foreign investors have contributed capital, foreign exchange,management skills and access to new technology, while the SEs have offered access to natural resources,prime locations, and infrastructural advantages. The leasing of SE facilities has been the usual form ofcollaboration with local entrepreneurs, especially in the industrial sector. A high-level PrivatizationCommission was created earlier this year to oversee the detailed design and implementation of aprivatization program. Of the 51 small establishments that were designated as initial candidates forprivatization, 6 have been privatized using a tendering process.
31. While these reforms are noteworthy because they recognize the seriousness of the problemsfacing SEs, they do not go far enough in addressing the underlying policy distortions that constrain SEperformance. For example, the impact of pricing and marketing reform has been limited because a largepart of production is still subject to government procurement or inter-enterprise transfers, whose prices arestill controlled. And, the complex pattern of cross-subsidies that arises from the dual pricing system andthe overvalued exchange rate mean that the financial profitability of enterprises does not accurately reflecttheir economic viability. Similarly, the changes designed to enhance the autonomy of SEs do not go farenough, and in some respects, have actually had the opposite effect. Even where SEs have been grantedgreater flexibility, decisions are still centralized within the parent Ministries. And the allocation ofinvestment funds and foreign exchange is actually more centralized than before 1989. The lack of progressin reforming the investment allocation system and exchange rate mechanism along with the maintenance ofthe procurement system means that SE managers still cannot be held accountable for the performance oftheir enterprises. So, the reforms have not changed SE behavior towards greater fiscal responsibility. Theapproach taken to privatization also has serious problems. It is not based on a clear delineation of thefuture roles of the private and public sectors. It risks diluting the full benefits of privatization because it isdifficult for potential foreign investors to formn a clear sense of which enterprises will be sold, and whichenterprises would be retained within the public sector.
32. In strengthening the program for SE reform in Myanmar, it is useful to look at the experiencesof other transition economies. One important lesson is that successful programs combine changes inmacroeconomic and pricing policies with targeted reforms. Macroeconomic and pricing reforms arenecessary preconditions because they alter the environment in which SEs operate. All transition economieshave implemented price liberalization and macroeconomic stabilization, although the pace of those effortshas ranged from rapid in Vietnam and the Czech Republic to gradual in China. Targeted reforms, such asprivatization and restructuring, must also be based on a clear definition of the role and objectives of the SEsector. Hence, in all transition countries, except China, there has been rapid growth in the private sector,and even in China, it has translated into an expansion of the non-state sector, owned and controlled by localgovernments. Finally, all these reform programs have emphasized financial accountability. They haveattempted, with varying success, to impose financial discipline (hard budget constraints) on the remainingSEs by cutting subsidies and liquidating loss-making enterprises.
x
D. THE REFORM AGENDA
33. This assessment of the scope and impact of the GOM's reform program points to the areasin which it needs to be deepened if sustained and balanced economic growth is to result. More needs to bedone to achieve macroeconomic stabilization by reducing the fiscal and external imbalances to sustainablelevels. The biases against exports and the continued transfers from the agricultural sector need to bereversed. And the role of SEs in the economy needs to be rationalized while the remaining biases againstthe domestic private sector are eliminated. This reform agenda is summarized in Table 1, which alsoshows the goals and proposed phasing of various measures.
Restorine Macroeconomic Stability
34. Why adiustin, the exchange rate is critical. The essential step in restoring macroeconomicstability is a nominal adjustment of the exchange rate so as to unify it with the parallel rate. Doing thiswould help restore external and internal balance. By removing the tax on the tradeables sector due toovervaluation, it would encourage the production of exports and import substitutes. Hence, export growthwould accelerate, especially of non-traditional products, while the strong pent-up demand for importswould fall. External balance would, therefore, improve.
35. Adjusting the official exchange rate would also help address the current fiscal difficultiesbecause the recent efforts to compensate for overvaluation have perversely contributed to the narrowing ofthe revenue base. Import-related revenues such as customs duties and commercial taxes would rise sinceimports would be valued at a higher, more realistic exchange rate. Estimates in Chapter I indicate that thecorresponding revenue increase (excluding the impact on external debt service) would exceed K50 billioneven if import tariff rates were reduced substantially in conjunction with a devaluation. Adjusting theexchange rate would also eliminate the complex set of cross-subsidies in the economy, which currentlydeprive many SEs and government agencies of revenues. The largest of these impacts would be theeconomic subsidies that currently accrue 1O those with access to electricity, petroleum products, andfertilizers at official prices. The resulting revenue increase (with full pass through to consumers) isestimated at over K30 billion (roughly equivalent to current government revenues). Finally, an exchangerate adjustment would make it easier to improve tax compliance. At present, the unofficial economyoutside the tax net has grown with the increased importance of the parallel foreign exchange market, whichhas blurred the line between legal and illegal economic activities.
36. If this nominal exchange rate adjustment is to help restore extemal balance, it musttranslate into a substantial real depreciation of the Kyat, which would require the maintenance of tightfiscal and monetary policies. To reduce credit demand, interest rates should also be raised to positive reallevels. This step would ensure that the allocation of credit to the private sector is done on an economicbasis, while an important source of subsidies to the SE sector is eliminated. Tightening the fiscal andmonetary stance would also help deal with the fear of policymakers that a nominal devaluation wouldworsen inflation. And, the positive fiscal impacts of a devaluation should allow the authorities to tightenmacroeconomic policies sufficiently to dampen inflationary pressures. Moreover, such apprehensions areexaggerated since for much of the population, a significant portion of the price adjustment has alreadytaken place through the parallel market. The other fear concems the increase in the Kyat equivalent ofexternal debt service. However, this increase is largely notional, since the real value of debt service inforeign exchange terms is obviously unchanged. And, because substantial arrears are already beingaccumulated, the situation can improve only with an increase in export eamings and the negotiation of debtrescheduling, both of which are more likely with a large devaluation.
xi
37. The continued unwillingness to adjust the exchange rate also stems from the fear thatinfluential groups in the population would lose as a result. The main losers would be those who haveaccess to official imports either directly or indirectly through the resulting cross-subsidies. Those withdirect access to cheap imports include many SEs, which receive underpriced inputs while exporting little, aswell as groups in the population (mainly government officials and military personnel) who receive theseproducts through government shops and rations. The indirect beneficiaries include consumers of petroleumproducts and electric power at official prices. While difficult to estimate precisely what part of thepopulation currently benefits from these subsidies, it is likely to be only a small fraction, which is alreadybetter-off than the bulk of the population. Part of the impact of higher prices on groups such as civilservants, whose real incomes have been eroded over the past decade, could be offset with higher wages.And, in cases where subsidies are thought necessary, these should be provided directly and targeted muchmore narrowly than is possible, as at present, through the overvalued exchange rate.
38. Against the short-term losses of these groups should be weighed the gains to the economyfrom reforming the exchange rate system. Adjusting the exchange rate would encourage the production ofexports and import-substitutes and employment in these activities would expand. It would also send astrong signal to foreign investors about the coherence of the ongoing economic reform efforts, and therebyhelp boost foreign investment flows, particularly into export sectors. By helping to reduce the fiscal deficitand better allocating credit demand, inflationary pressures could be better controlled. And by contributingto export growth while controlling import growth, it would reduce the need to accumulate further externalarrears. By restoring the Myanma economy to a path of sustainable medium-term growth, these reforms,thus, have the potential to benefit far more people than those who would lose from its immediate impacts.
39. Too little attention has likewise been focused on the economic costs of continued inaction,particularly on the exchange rate. Without an exchange rate adjustment, both inflation and the ability toservice external debt are likely to worsen. Inflationary pressures will continue unabated because, as arguedbefore, no sustained improvement in the fiscal situation is possible without a broadening of the revenuebase. The longer an exchange rate adjustment is postponed, the more the ability to raise revenues willdiminish. The financial and operational condition of many SEs will also continue to worsen as they bearthe burdens of the economic subsidies that are provided to a few consumers through the overvalued Kyat,which will increase the fiscal burden of the SE sector. Finally, the current account balance will worsenfurther without the elimination of the bias against tradeables due to overvaluation. Hence, external arrearswill continue to increase.
40. The obvious conclusion from this counterfactual is that an eventual adjustment of theexchange rate is inevitable. Postponing that adjustment is likely only to delay the resumption of sustainedgrowth of the Myanma economy, and, therefore, would impose large economic costs in terms of foregoneoutput. A less costly alternative would be to acknowledge the pressing need to restore macroeconomicstability, and assign the central role in this strategy to an adjustment of the nominal exchange rate. Thepolicy discussion could then shift, more fruitfully, to the questions of how such an adjustment would beaccomplished and, as important, of how consistent fiscal and monetary policies could be pursued so thatthis nominal adjustment translates into a real depreciation.
Reorientin! Incentives
41. Expanding exports. If the incentives for export production are to be improved, the mainaction required is an adjustment of the official exchange rate to a level closer to the parallel market rate.Despite the de facto devaluation of the Kyat with the recognition of the parallel market, the absoluteprofitability of export production has declined since 1989. Adjusting the official rate would also mean that
xii
private exporters would not face the risks and costs of transacting on the parallel market, while themanagers of SEs would be encouraged to expand their exports. Apart from removing the export ban onpaddy and rice (as discussed below), the requirement that private importers be required to importgovernment-specified priority goods should also be eliminated.
42. Promoting agriculture. The key policy distortions that need to be eliminated are the ban onexports of paddy and rice, and the paddy procurement system. By reducing farmgate prices by about athird, such implicit taxation reduces farm incomes to the tune of over K46 billion. It also lowers paddyproduction by reducing its profitability. Thus, removing the export ban would not only encourage ruralgrowth by increasing farm incomes; it would also result in additional production of about 1.9 million tonsof paddy annually, much of which would be exported. Although the procurement system benefits urbanconsumers by providing them subsidized rice, it is highly regressive since the paddy farmers who are beingtaxed are poorer than the consumers who benefit. If targeted subsidies to rice consumers are considereddesirable, other taxes to finance these would be less costly than an export ban. Action is also required toclarify the legal basis for private ownership and leasing of agricultural land, as well as to end governmentcontrol over cropping choice and access to complementary inputs. Adjusting the official exchange ratewould also encourage private-sector involvement in provision of fertilizers and seeds.
43. Reducing biases against private businesses. The ability of most private businesses toexpand further and develop into potential exporters as well as credible competitors to SEs in domesticmarkets is compromised by the discrimination they still face. Therefore, steps must be taken to reduce thefavored access of SEs. Specifically, the interest rate subsidies on borrowing and the exchange ratesubsidies on imports that SEs enjoy (constrained as both are) should be eliminated by adjusting both"prices". The preferential access of SEs to such services as transportation, telecommunication, and electricpower should be reduced with systematic government efforts to expand private-sector access to these. Itwould also be helpful in dealing with many of these constraints if the GOM formalized and broadened itsdialogue with representatives of the domestic private sector. Private sector access to credit can beexpanded if public-sector credit demand can be further reduced while positive real interest rates are used toallocate credit.
Reformine the SE Sector
44. A reform strategy. An effective SE reform strategy in Myanmar would require actions inthe following areas: (i) macroeconomic and sectoral policy reform; (ii) clarification of the role andobjectives of the SE sector, which would enable a classification of enterprises into those that would beretained by the state in the medium term, and those that could be divested immediately; (iii) measures toprivatize management or ownership of SEs, including actions with regard to labor retrenchment; (iv) stepsfor restructuring those SEs that are to be retained, including ways of improving their operational andfinancial performance; and, (v) actions aimed at supporting the development of strong domestic privateenterprises.
45. Macroeconomic and sectoral policy reform. If the reform of SEs is to succeed, theadjustment of the exchange rate and interest rates to realistic levels, and price liberalization must be amongthe highest priorities. Macroeconomic reforms would allow the true picture regarding the financial andeconomic viability of enterprises to emerge. Similarly, until the prices at which SEs can purchase inputsand sell their outputs are liberalized, it is difficult to determine their economic viability. The other risk withattempting to divest SEs in such a controlled policy environment is that it may be necessary to offeroffsetting subsidies and other fiscal benefits as sweeteners to attract potential buyers. The fiscal anddistortionary effects of such incentives would reduce the gains from SE reform, and reform will be slow
xiii
and costly. In contrast, there is no better way to encourage confidence among foreign investors than byeliminating overvaluation and enhancing convertibility of the Kyat.
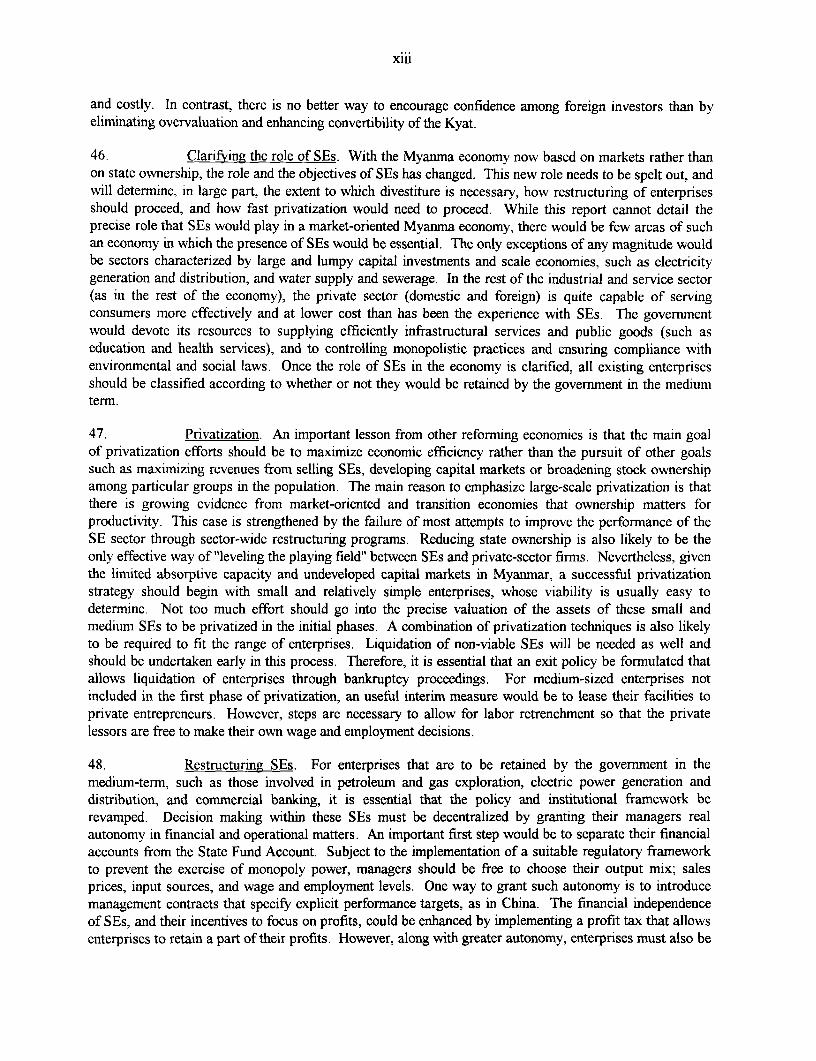
46. Clarifying the role of SEs. With the Myanma economy now based on markets rather thanon state ownership, the role and the objectives of SEs has changed. This new role needs to be spelt out, andwill determine, in large part, the extent to which divestiture is necessary, how restructuring of enterprisesshould proceed, and how fast privatization would need to proceed. While this report cannot detail theprecise role that SEs would play in a market-oriented Myanma economy, there would be few areas of suchan economy in which the presence of SEs would be essential. The only exceptions of any magnitude wouldbe sectors characterized by large and lumpy capital investments and scale economies, such as electricitygeneration and distribution, and water supply and sewerage. In the rest of the industrial and service sector(as in the rest of the economy), the private sector (domestic and foreign) is quite capable of servingconsumers more effectively and at lower cost than has been the experience with SEs. The governmentwould devote its resources to supplying efficiently infrastructural services and public goods (such aseducation and health services), and to controlling monopolistic practices and ensuring compliance withenvironmental and social laws. Once the role of SEs in the economy is clarified, all existing enterprisesshould be classified according to whether or not they would be retained by the government in the mediumterm.
47. Privatization. An important lesson from other reforming economies is that the main goalof privatization efforts should be to maximize economic efficiency rather than the pursuit of other goalssuch as maximizing revenues from selling SEs, developing capital markets or broadening stock ownershipamong particular groups in the population. The main reason to emphasize large-scale privatization is thatthere is growing evidence from market-oriented and transition economies that ownership matters forproductivity. This case is strengthened by the failure of most attempts to improve the performance of theSE sector through sector-wide restructuring programs. Reducing state ownership is also likely to be theonly effective way of "leveling the playing field" between SEs and private-sector firms. Nevertheless, giventhe limited absorptive capacity and undeveloped capital markets in Myanmar, a successful privatizationstrategy should begin with small and relatively simple enterprises, whose viability is usually easy todetermine. Not too much effort should go into the precise valuation of the assets of these small andmedium SEs to be privatized in the initial phases. A combination of privatization techniques is also likelyto be required to fit the range of enterprises. Liquidation of non-viable SEs will be needed as well andshould be undertaken early in this process. Therefore, it is essential that an exit policy be formulated thatallows liquidation of enterprises through bankruptcy proceedings. For medium-sized enterprises notincluded in the first phase of privatization, an useful interim measure would be to lease their facilities toprivate entrepreneurs. However, steps are necessary to allow for labor retrenchment so that the privatelessors are free to make their own wage and employment decisions.
48. Restructuring SEs. For enterprises that are to be retained by the government in themedium-term, such as those involved in petroleum and gas exploration, electric power generation anddistribution, and commercial banking, it is essential that the policy and institutional framework berevamped. Decision making within these SEs must be decentralized by granting their managers realautonomy in financial and operational matters. An important first step would be to separate their financialaccounts from the State Fund Account. Subject to the implementation of a suitable regulatory frameworkto prevent the exercise of monopoly power, managers should be free to choose their output mix; salesprices, input sources, and wage and employment levels. One way to grant such autonomy is to introducemanagement contracts that specify explicit performance targets, as in China. The financial independenceof SEs, and their incentives to focus on profits, could be enhanced by implementing a profit tax that allowsenterprises to retain a part of their profits. However, along with greater autonomy, enterprises must also be
xiv
held accountable for their performance. This would require the imposition of a hard budget constraint,which in the Myanma context would require eliminating the implicit and explicit subsidies currentlyenjoyed by SEs on imports, credit and energy inputs. To ensure that SEs cannot escape hard budgetconstraints by defaulting on payments to other enterprises or on loans, it is essential also that bankruptcybe made a credible threat by implementing the necessary laws.
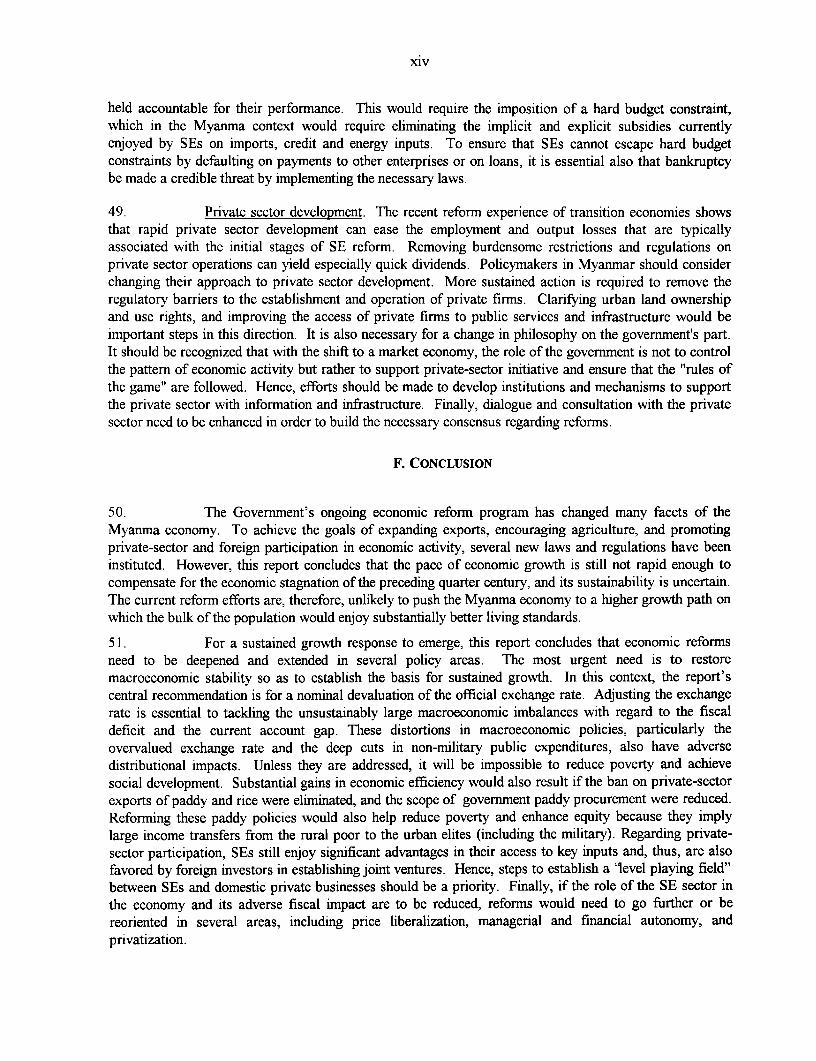
49. Private sector development. The recent reform experience of transition economies showsthat rapid private sector development can ease the employment and output losses that are typicallyassociated with the initial stages of SE reform. Removing burdensome restrictions and regulations onprivate sector operations can yield especially quick dividends. Policymakers in Myanmar should considerchanging their approach to private sector development. More sustained action is required to remove theregulatory barriers to the establishment and operation of private firms. Clarifying urban land ownershipand use rights, and improving the access of private firms to public services and infrastructure would beimportant steps in this direction. It is also necessary for a change in philosophy on the government's part.It should be recognized that with the shift to a market economy, the role of the government is not to controlthe pattern of economic activity but rather to support private-sector initiative and ensure that the "rules ofthe game" are followed. Hence, efforts should be made to develop institutions and mechanisms to supportthe private sector with information and infrastructure. Finally, dialogue and consultation with the privatesector need to be enhanced in order to build the necessary consensus regarding reforms.
F. CONCLUSION
50. The Government's ongoing economic reform program has changed many facets of theMyanma economy. To achieve the goals of expanding exports, encouraging agriculture, and promotingprivate-sector and foreign participation in economic activity, several new laws and regulations have beeninstituted. However, this report concludes that the pace of economic growth is still not rapid enough tocompensate for the economic stagnation of the preceding quarter century, and its sustainability is uncertain.The current reform efforts are, therefore, unlikely to push the Myanma economy to a higher growth path onwhich the bulk of the population would enjoy substantially better living standards.
51. For a sustained growth response to emerge, this report concludes that economic reformsneed to be deepened and extended in several policy areas. The most urgent need is to restoremacroeconomic stability so as to establish the basis for sustained growth. In this context, the report'scentral recommendation is for a nominal devaluation of the official exchange rate. Adjusting the exchangerate is essential to tackling the unsustainably large macroeconomic imbalances with regard to the fiscaldeficit and the current account gap. These distortions in macroeconomic policies, particularly theovervalued exchange rate and the deep cuts in non-military public expenditures, also have adversedistributional impacts. Unless they are addressed, it will be impossible to reduce poverty and achievesocial development. Substantial gains in economic efficiency would also result if the ban on private-sectorexports of paddy and rice were eliminated, and the scope of government paddy procurement were reduced.Reforming these paddy policies would also help reduce poverty and enhance equity because they implylarge income transfers from the rural poor to the urban elites (including the military). Regarding private-sector participation, SEs still enjoy significant advantages in their access to key inputs and, thus, are alsofavored by foreign investors in establishing joint ventures. Hence, steps to establish a 'level playing field"between SEs and domestic private businesses should be a priority. Finally, if the role of the SE sector inthe economy and its adverse fiscal impact are to be reduced, reforms would need to go further or bereoriented in several areas, including price liberalization, managerial and financial autonomy, andprivatization.
xv
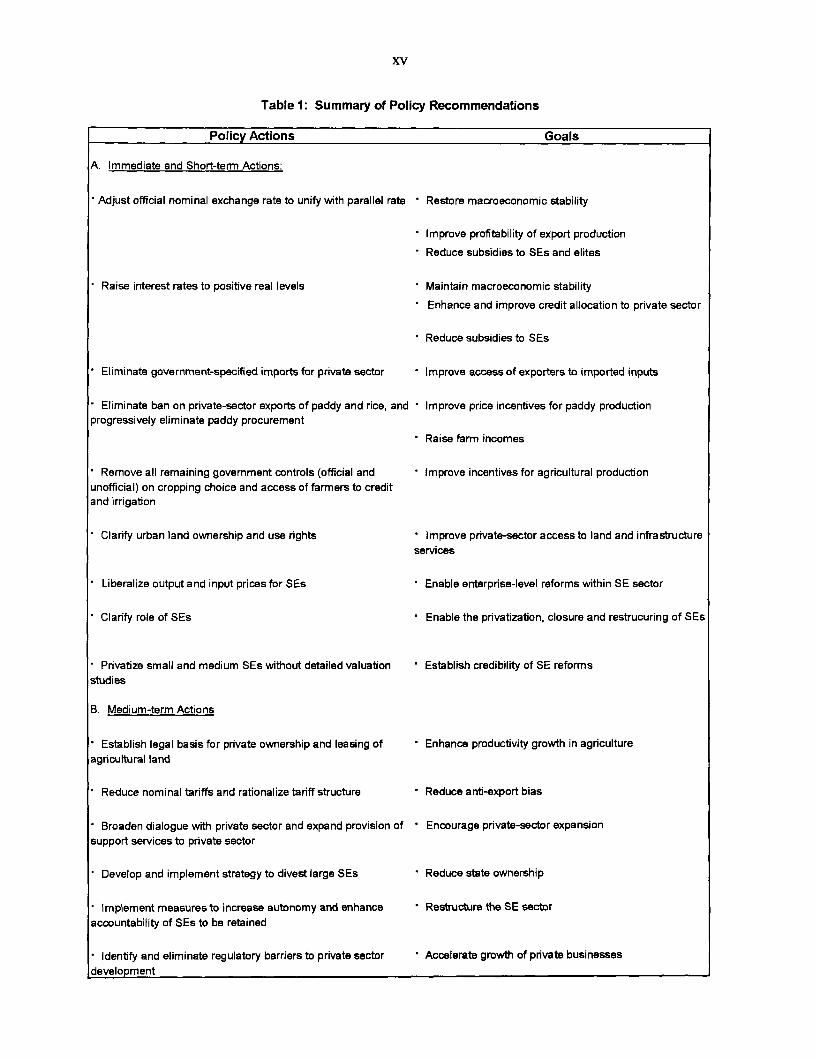
Table 1: Summary of Policy Recommendations
Policy Actions Goals
A. Immediate and Short-term Actions:
Adjust official nominal exchange rate to unify with parallel rate Restore macroeconomic stability
Improve profitability of export production
Reduce subsidies to SEs and elites
Raise interest rates to positive real levels Maintain macroeconomic stability
Enhance and improve credit allocation to private sector
Reduce subsidies to SEs
Eliminate government-specified imports for private sector Improve access of exporters to imported inputs
Eliminate ban on private-sector exports of paddy and rice, and Improve price incenbves for paddy productionprogressively eliminate paddy procurement
Raise farm incomes
Remove all remaining government controls (official and Improve incentives for agricultural productionunofficial) on cropping choice and access of farmers to creditand irrigation
Clarify urban land ownership and use rights Improve private-sector access to land and infrastructureservices
Liberalize output and input prices for SEs Enable enterprise-level reforms within SE sector
Clarify role of SEs Enable the privatization, closure and restrucuring of SEs
Privatize small and medium SEs without detailed valuation Establish credibility of SE reformsstudies
B. Medium-term Actions
* Establish legal basis for private ownership and leasing of Enhance productivity growth in agricultureagricultural land
* Reduce nominal tariffs and rationalize tariff structure Reduce anti-export bias
* Broaden dialogue with private sector and expand provision of Encourage private-sector expansionsupport services to private sector
* Develop and implement strategy to divest large SEs Reduce state ownership
* Implement measures to increase autonomy and enhance Restructure the SE sectoraccountability of SEs to be retained
* Identify and eliminate regulatory barriers to private sector Accelerate growth of pnvate businessesdevelopment

1. POLICY REFORMS AND MACROECONOMIC ISSUES
A. BACKGROUND
1.1 A significant program of economic reforms has been instituted in Myanmar since the StateLaw and Order Restoration Council (SLORC) assumed power in late-1988. Since this report aims to takestock of these reforms, the next two sections of this Chapter set the stage by summarizing the key featuresof the Government's reform program, and reviewing recent macroeconomic developments. The rest of theChapter then evaluates the progress made in restoring macroeconomic stability.
1.2 The shift in the GOM's policy stance came at the end of almost a quarter century ofeconomic decline, which had accelerated during the 1980s. Since the military takeover in 1962, Myanmarhad followed a development paradigm that emphasized state ownership and autarky, and was termed "theBurmese way of socialism". In this model, economic development was to be achieved through rapidindustrialization and self sufficiency, and was to be led by the State Enterprise (SE) sector. Hence, therewere large-scale nationalizations of enterprises in manufacturing, trade and finance so that the stateexercised a virtual monopoly over most organized economic activity outside the agricultural sector. Andwhile agricultural land continued to be operated largely by private farmers, the state owned all land andexercised significant control over output pricing and marketing, input supply, and cropping choice.
1.3 Economic performance under this policy regime was dismal. During 1962-77, real GDPgrowth barely kept up with population expansion and, as a result, living standards stagnated. Investmentlevels remained low, and with discrimination against the agricultural sector, agricultural output grewslowly despite the country's potential. With the emphasis on import substitution, the outward orientation ofthe economy decreased with exports falling during the early-1970s. These problems led to the firstattempts at economic reform in the mid-1970s. Although those reforms produced encouraging resultsinitially -- agricultural output and GDP growth increased, export growth resumed, and the tax baseexpanded during 1977-82 -- those improvements could not be sustained. The problems were bothmacroeconomic and structural. The exchange rate became progressively more overvalued, the fiscal deficitwidened, and the role of the private sector remained tightly circumscribed. With widening external andinternal imbalances in the early-1980s, the Government attempted to stabilize the economy by tighteningimport controls and cutting public investment. Growth slowed as a result even as inflation rose sharplywith the increased monetization of the fiscal deficit. To control inflation, two rounds of demonetizationwere instituted -- in 1985 and 1987. These economic difficulties were followed by the anti-governmentdemonstrations of 1988, and the subsequent takeover by the SLORC.
B. THE REFORM PROGRAM
1.4 The genesis of the current economic reforms was the announcement by SLORC in late-1988 of its intention to abandon the economic policies of its predecessors by liberalizing the economy,encouraging private participation, and promoting integration with the world economy. These reforms wereto build on the liberalization of agricultural pricing and marketing policies, which had been instituted in1987. The initial policy changes that were launched as part of the so-called "Open-Door" program after theSLORC took power in 1988 focused on liberalizing foreign investment regulations, including openingsectors such as timber extraction and mining, and enacting fiscal incentives. These measures have sincebeen broadened to include such measures as: controlling public expenditures; slowing monetary expansion;
-2-
licensing private banks; extending investment incentives to local investors; and allowing the retention offoreign exchange by private exporters and the use of foreign exchange deposits by residents.
1.5 Agricultural sector policies. The major reform in agricultural policies occurred in 1987with the abolition of the system of forced government procurement of major crops and the liberalization ofdomestic marketing and processing. Initially, controls on internal trade in industrial crops were retained,but these have since been liberalized as well. The abolition of forced procurement was accompanied by theimposition of a higher land tax and a tax on grain trading, but these taxes were soon rescinded. Moreover,formal government controls on farmers' cropping patterns were also eliminated in 1988. Despite thesechanges, informal controls on cropping choice on designated paddy lands appear to continue. And, thegovernment continues to procure albeit on a smaller scale than before, accounting in FY95 for about 11%of the total crop.' Prices of some agricultural inputs supplied by the government, including fertilizers andmechanization services, have also been raised. Finally, extensive leasing of fallow land for cultivation orlivestock breeding by private farmers has been undertaken since 1991.
1.6 Industrial sector policies. With the shift away from the "Burmese way of socialism" in1988, the restrictions on private sector involvement in the industrial sector have been reducedprogressively. The Private Industrial Enterprise Law was enacted in 1990 to govern establishment andoperation of private enterprises in the industrial sector. Its provisions allow private firms to operate in allindustrial subsectors other than those specified in the State-owned Economic Enterprises Law as activitiesreserved for the state sector (such as teak extraction, mining of gems, oil and gas extraction, and powergeneration).2
1.7 A key aspect of the Government's "open door policy" was the enactment of the ForeignInvestment Law in late-1988. This law allows foreign investors in Myanmar to establish wholly-ownedenterprises or enter into joint ventures with Myanma citizens. Foreign investment is allowed in almost allsubsectors other than those reserved for the state sector. However, in practice, participation even in thesereserved sectors, particularly mining and fisheries, has been approved in several cases. In the miningsector, a new law has been enacted that allows private sector participation in joint ventures. A range of taxbenefits and streamlined licensing procedures are also provided to foreign investors under the law (withadditional exemptions for export-oriented enterprises) as are guarantees against nationalization and for therepatriation of capital and the foreign exchange component of profits. In 1994, most of these tax benefitsavailable to foreign investors were also extended to local investors through the Myanmar CitizensInvestment Law.
1.8 Changes have also been made in pricing policies with the removal of most formal pricecontrols (except on energy products). State enterprises (SEs) have been granted more operationalautonomy, in areas such as pricing, input procurement, and production. Specifically, on production, theenterprises can choose also whether to enter into agreements with private domestic or foreign investorswhereby they produce on a consignment basis, lease their facilities to these investors, or enter into jointventures with these firms. The goal of privatizing SEs in a more systematic manner has recently beenannounced although detailed implementation procedures are yet to be developed. In 1989, the outstanding
I Although these sales are termed voluntary, this procurement occurs at below-market prices, and themagnitude of such implicit taxation of paddy farmers is evaluated in Chapter 2.
2 Even these restrictions can be relaxed on a case-by-case basis, as noted below with respect to foreigninvestment.
- 3 -
credit to SEs was converted into non-interest bearing government equity, and since then, all financing toSEs (including working capital credit) is provided from the budget.
1.9 Trade and foreign exchange policies. Changes in many of these policies formed the core ofthe announcement of the Government's "open door" policy in 1988. In particular, the role of the privatesector in external trade was expanded sharply. Border trade (which occurs across Myanmar's land borders,and was previously illegal) was normalized (i.e. licenses or permits are required from the authorities), andcountertrade measures such as import first and consignment imports were introduced for SEs3. Althoughthe role of the private sector in external trade has been broadened substantially, private sector exports ofsome commodities such as rice, teak and minerals continue to be prohibited.
1.10 Foreign exchange control procedures have also been reformed. Since 1988, retention offoreign exchange earnings by exporters has been permitted, initially for 60% of export proceeds, and since1989 for the entire proceeds. Moreover, these retained earnings can be deposited in foreign exchangeaccounts at the Myanmar Foreign Trade Bank (MFTB), and transfers are pernitted between theseaccounts.4 In 1993, Foreign Exchange Certificates (FECs) were introduced by the Central Bank with anFEC equivalent to US$1. Residents can now acquire and trade FECs, and use them to open foreignexchange accounts, although a service charge of 10% applies to these transactions.
1.11 Financial policies. Several banking laws were enacted in 1990 including the Central Bankof Myanmar Law, the Financial Institutions Law, and the Myanmar Agricultural and Rural DevelopmentBank Law. The Central Bank Law empowers the CBM to supervise and regulate the financial system,including the conduct of monetary policy. The Financial Institutions Law provides the framework for theestablishment and operation of a range of institutions including commercial banks, finance companies, anddevelopment banks. In an important break with the past, private domestic banks can now be established.As of end-July 1995, 15 private banks were in operation, of which, 4 had also been granted licenses totransact in foreign exchange, and although foreign banks cannot operate yet, 28 had been given licenses toopen representative offices. The other recent innovation in financial policies was the first public issue in1993 of Treasury bonds in maturities of 5 and 7 years.
1.12 Tax policies. The main recent change in this area was the enactment of the CommercialTax Law in 1990. The commercial tax has a broader base than the previous commodity and services tax,which applied only to SEs and cooperatives. The commercial tax, by contrast, applies to the sales(domestic and imported) of all enterprises, private and public. It also has provisions for duty drawbacks aswith a VAT, although these provisions appear not to be used widely in practice. With the enactment of theForeign Investment and Myanmar Citizens' Laws, a large number of tax exemptions are now granted toforeign and local investors. Specifically, foreign investors are exempt from corporate income taxes for atleast three years with additional three-year exemptions (beyond the initial three-year period) possible forexport-oriented production, customs duty and commercial taxes on imports of capital goods and
3 Under these schemes. SEs are allowed to sell imported goods in the domestic market. For consignmentimports, such sales are made in foreign exchange, which proceeds are then paid to the foreign supplier. Under theimport first scheme, the sales of imports is made either for foreign exchange or Kyats. The Kyat proceeds are thenused to procure goods for export. which are then used to pay the supplier of the original imports.
4 Since these transactions are not officially recognized by the authorities, the exchange rates at which transfersoccur are not recorded.
- 4 -
intermediates; and commercial taxes on exports. Local investors are provided similar exemptions forexport-oriented enterprises.
Summary Assessment
1.13 The GOM's economic reforms are aimed at transforming the economy from one organizedalong socialist lines and dominated by the state sector to a market-oriented system. Specifically, thereforms aim at increasing the outward orientation of the economy and its integration with the worldeconomy, at expanding the role of the private sector, and at reducing the scope and extent of governmentintervention.
1.14 A number of new laws have been enacted and regulations instituted since 1988 to help inachieving these goals. Particularly noteworthy are the laws that eliminate the restrictions on private sectorparticipation in industry and finance, encourage foreign investment, liberalize agricultural production,processing, pricing, and marketing, and allow retention and trading of foreign exchange by privateexporters. Despite these changes, however, there are still constraints to the expansion of external trade,private sector participation, and the agricultural sector, and the reduction in the role of state enterprises ineconomic activity. Before these constraints are examined in greater detail in the rest of this Report, recenteconomic developments are reviewed, and the macroeconomic situation is assessed.
C. RECENT ECONOMIC DEVELOPMENTS
.15 This section reviews macroeconomic and sectoral developments in the period since 1989 asbackground to the policy discussion in the remainder of the report. Therefore, the trends in the mainaggregates during this period of economic reform are summarized5. Also, these developments in theMyanma economy are contrasted with those during the mid-1980s so as to provide a more realisticperspective on the impacts of the reform program.
Output and Demand Developments
1.16 GDP growth and sectoral shares. GDP growth has rebounded since FY90, following theeconomic collapse of FY87-89. Growth has averaged about 4.2% in FY90-94 and rose to 6.8% in FY95,compared to an average decline of 5.5% during FY87-89 (Table 1.1). However, even during this recentperiod, growth has been highly variable, rising to over 9% in FY93 but also declining slightly in FY92,reflecting poor agricultural performance owing to bad weather. Also, the average growth rate since FY90has still been no higher than in the first half of the 1980s. Coupled with the sharp output drop in the late1980s, real GDP in FY95, therefore, was only about 10% higher than in FY86, which is particularlydisturbing since the population has grown by almost 20% since then.
5 The discussion of these trends is based on the official data, and their interpretation is problematic, since theyare based on the official exchange rate. Given the highly overvalued exchange rate, adjusting the data for this andother distortions is not attempted here. Apart from these problems, the quality and coverage of economic statisticsin Myanmar appears to be comparable or better than other low-income countries in East Asia.
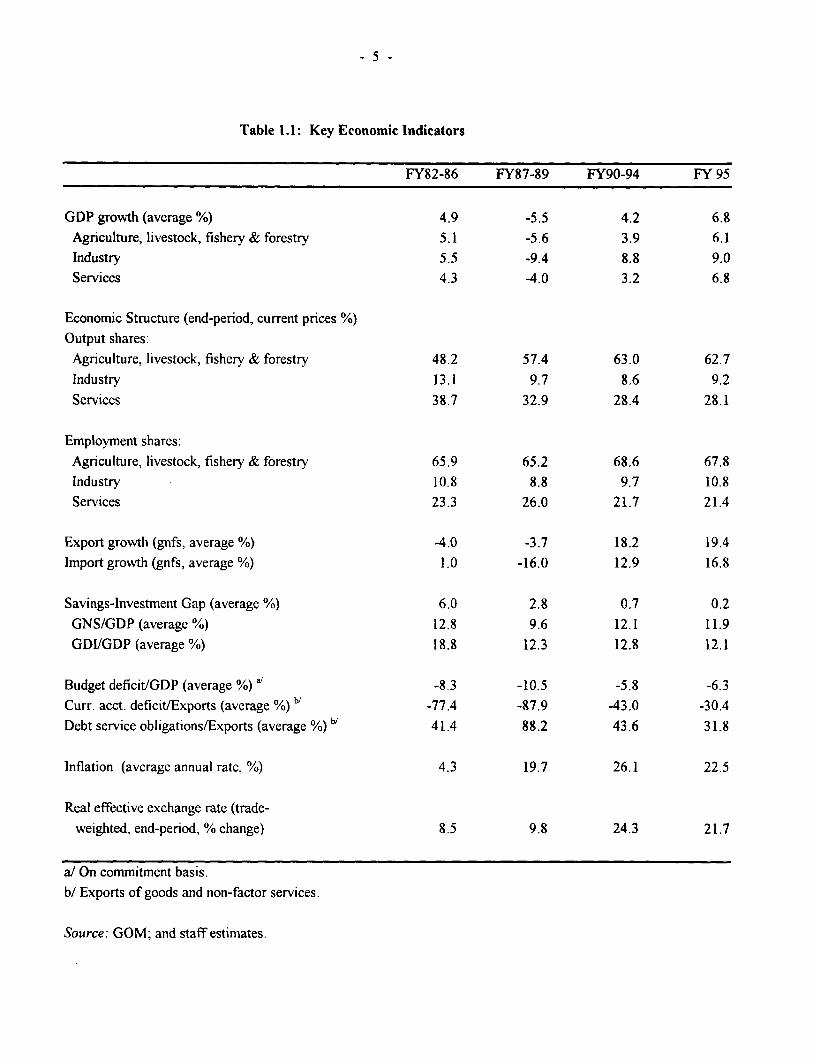
- 5 -
Table 1.1: Key Economic Indicators
FY82-86 FY87-89 FY90-94 FY 95
GDP growth (average %) 4.9 -5.5 4.2 6.8Agriculture, livestock, fishery & forestry 5.1 -5.6 3.9 6.1Industry 5.5 -9.4 8.8 9.0Services 4.3 -4.0 3.2 6.8
Economic Structure (end-period, current prices %)Output shares:Agriculture, livestock, fishery & forestry 48.2 57.4 63.0 62.7Industry 13.1 9.7 8.6 9.2Services 38.7 32.9 28.4 28.1
Employment shares:Agriculture, livestock, fishery & forestry 65.9 65.2 68.6 67.8Industry 10.8 8.8 9.7 10.8Services 23.3 26.0 21.7 21.4
Export growth (gnfs, average %) -4.0 -3.7 18.2 19.4Import growth (gnfs, average %) 1.0 -16.0 12.9 16.8
Savings-Investment Gap (average %) 6.0 2.8 0.7 0.2GNS/GDP (average %) 12.8 9.6 12.1 11.9GDI/GDP (average %) 18.8 12.3 12.8 12.1
Budget deficit/GDP (average %) a/ -8.3 -10.5 -5.8 -6.3Curr. acct. deficit/Exports (average %) b/ -77.4 -87.9 -43.0 -30.4Debt service obligations/Exports (average %) b/ 41.4 88.2 43.6 31.8
Inflation (average annual rate, %) 4.3 19.7 26.1 22.5
Real effective exchange rate (trade-weighted, end-period, % change) 8.5 9.8 24.3 21.7
a/ On commitment basis.
b/ Exports of goods and non-factor services.
Source: GOM; and staff estimates.
- 6 -
1.17 The agricultural, fisheries and forestry sector continues to be dominant in the Myanmaeconomy, and now accounts for over 63% of GDP and about 68% of employment (Table 1.1). Further,both shares have riseh since the mid-1980s, reflecting its smaller decline during FY86-88 and its morerapid expansion than the services sector since FY90 (Table 1.1). Part of this sectoral growth has comefrom the expansion in forestry due especially to increased timber extraction in FY90 and FY91. Whileagricultural output has grown, reflecting in part a response to the liberalization measures, the production ofmany crops has only just retumed to the levels of the mid-1980s. For instance, production of the maincrop, paddy, only reached its peak of the mid-1980s in FY93. Hence, per capita agricultural output todayis still below mid-1980 levels.
1.18 The recovery has also extended to the industrial and services sectors. The most rapidgrowth has been in subsectors such as mining and construction, in part because they were dislocated moreduring FY87-89, but also reflecting the response to the incentives now provided to foreign investment inmineral exploration and extraction, and tourism. The recovery in manufacturing activity has been morevariable than in the other industrial subsectors because it still remains closely linked to agriculturalperformance.
1.19 Investment and Saving. Investment recovered during FY90-95 from its collapse (of almosta third) in FY89. This growth mainly reflects the increases in private investment, particularly in FY91 andFY92, which followed the implementation of investment incentives and liberalization measures. Incontrast, the level of public investment has continued to fall in real terms. Savings have also recoveredsince FY90, reflecting primarily a reduction in the dissaving of the public sector. However, despite thisrecovery and the consequent narrowing of the saving-investment gap in FY90-95, the picture is less brightwhen the early-1980s are used as the benchmark. The smaller saving-investment gap relative to FY82-86has been achieved entirely due to the fall in investment (Table 1.1). The average domestic saving rate isactually lower in FY90-95 than in the mid-1980s, while gross investment has fallen to about 12% of GDP,which is obviously inadequate for a country with Myanmar's needs for infrastructure and capital
t6equipment
6 The reasons for the lowv private saving rate (apart from low incomes) are not well understood.
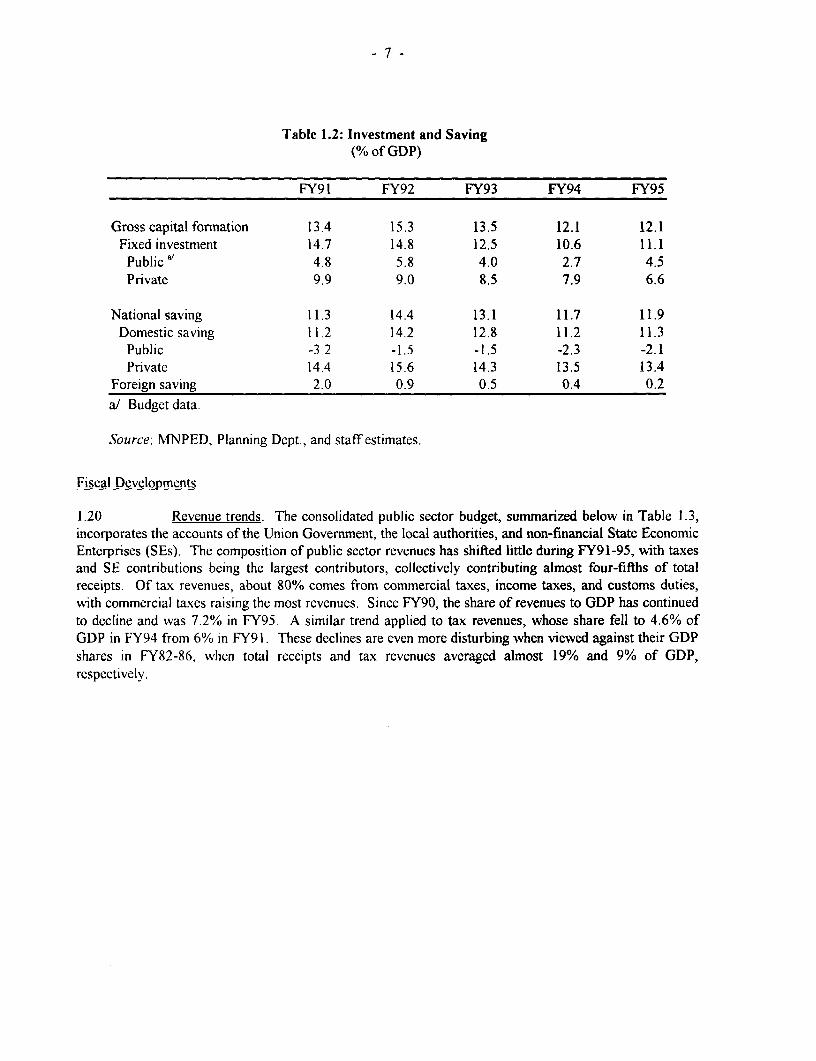
Table 1.2: Investment and Saving(% of GDP)
FY91 FY92 FY93 FY94 FY95
Gross capital fonnation 13.4 15.3 13.5 12.1 12.1Fixed investment 14.7 14.8 12.5 10.6 11.1
Public i 4.8 5.8 4.0 2.7 4.5Private 9.9 9.0 8.5 7.9 6.6
National saving 11.3 14.4 13.1 11.7 11.9Domestic saving 11.2 14.2 12.8 11.2 11.3
Public -3.2 -1.5 -1.5 -2.3 -2.1Private 14.4 15.6 14.3 13.5 13.4
Foreign saving 2.0 0.9 0.5 0.4 0.2a/ Budget data.
Source: MNPED, Planning Dept., and staff estimates.
Fiscal Developments
1.20 Revenue trends. The consolidated public sector budget, summarized below in Table 1.3,incorporates the accounts of the Union Government, the local authorities, and non-financial State EconomicEnterprises (SEs). The composition of public sector revenues has shifted little during FY91-95, with taxesand SE contributions being the largest contributors, collectively contributing almost four-fifths of totalreceipts. Of tax revenues, about 80% comes from commercial taxes, income taxes, and customs duties,with commercial taxes raising the most revenues. Since FY90, the share of revenues to GDP has continuedto decline and was 7.2% in FY95. A similar trend applied to tax revenues, whose share fell to 4.6% ofGDP in FY94 from 6% in FY91. These declines are even more disturbing when viewed against their GDPshares in FY82-86, when total receipts and tax revenues averaged almost 19% and 9% of GDP,respectively.
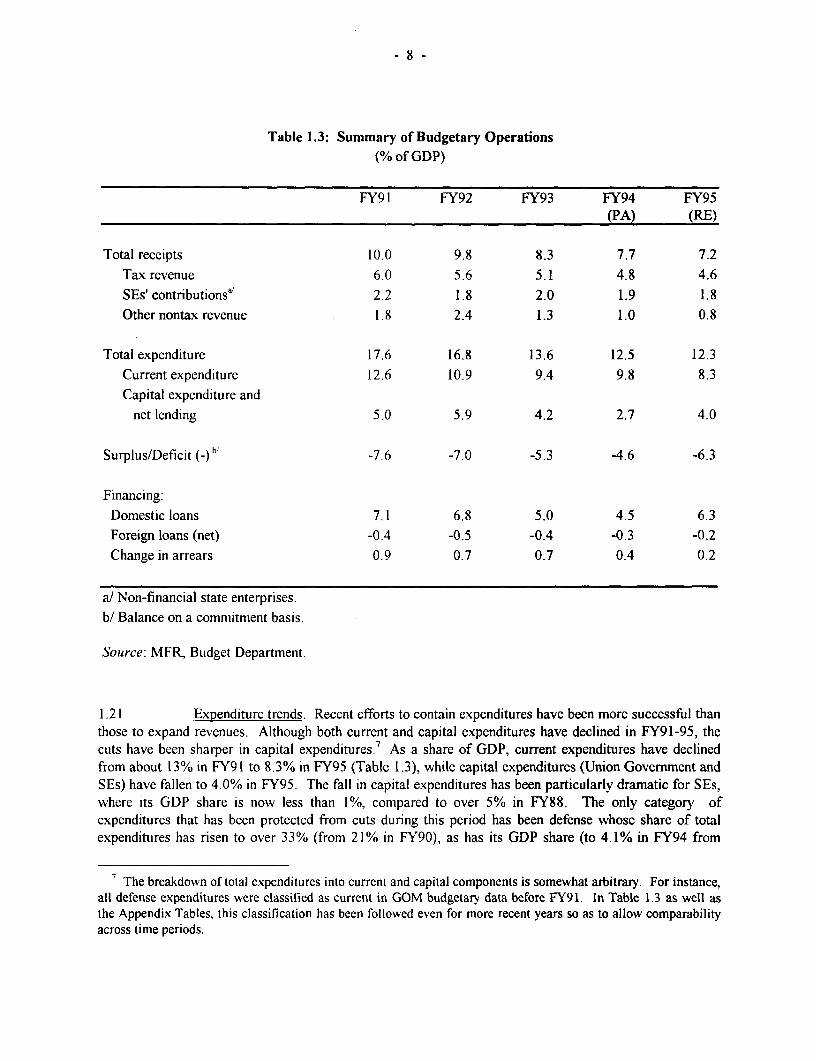
-8-
Table 1.3: Summary of Budgetary Operations(% of GDP)
FY91 FY92 FY93 FY94 FY95(PA) (RE)
Total receipts 10.0 9.8 8.3 7.7 7.2Tax revenue 6.0 5.6 5.1 4.8 4.6SEs' contributionsa/ 2.2 1.8 2.0 1.9 1.8Other nontax revenue 1.8 2.4 1.3 1.0 0.8
Total expenditure 17.6 16.8 13.6 12.5 12.3Current expenditure 12.6 10.9 9.4 9.8 8.3Capital expenditure and
net lending 5.0 5.9 4.2 2.7 4.0
Surplus/Deficit (_) b/ -7.6 -7.0 -5.3 -4.6 -6.3
Financing:Domestic loans 7.1 6.8 5.0 4.5 6.3Foreign loans (net) -0.4 -0.5 -0.4 -0.3 -0.2Change in arrears 0.9 0.7 0.7 0.4 0.2
a/ Non-financial state enterprises.b/ Balance on a commitment basis.
Source: MFR, Budget Department.
1.21 Expenditure trends. Recent efforts to contain expenditures have been more successful thanthose to expand revenues. Although both current and capital expenditures have declined in FY91-95, thecuts have been sharper in capital expenditures.7 As a share of GDP, current expenditures have declinedfrom about 13% in FY91 to 8.3% in FY95 (Table 1.3), while capital expenditures (Union Government andSEs) have fallen to 4.0% in FY95. The fall in capital expenditures has been particularly dramatic for SEs,where its GDP share is now less than 1%, compared to over 5% in FY88. The only category ofexpenditures that has been protected from cuts during this period has been defense whose share of totalexpenditures has risen to over 33% (from 21% in FY90), as has its GDP share (to 4.1% in FY94 from
7The breakdown of total expenditures into current and capital components is somewhat arbitrary. For instance,all defense expenditures were classified as current in GOM budgetary data before FY91. In Table 1.3 as well asthe Appendix Tables, this classification has been followed even for more recent years so as to allow comparabilityacross time periods.
- 9 -
3.5% in FY90). Even public sector wage expenditures (excluding the military) have fallen during FY91-95from about 46% of total expenditures to less than 37%.
1.22 The fiscal deficit. Reducing the fiscal deficit has been an important policy goal.Reflecting these efforts, the consolidated fiscal deficit averaged about 6% of GDP during FY91-95, fallingfrom an average of 10.5% in FY87-89. However, the improvement that had occurred since FY91 wasreversed in FY95 when the deficit increased to 6.3%. As the revenue and expenditure trends indicate, theproblem is that the initial improvement reflected a larger than proportionate reduction in expenditures,especially capital spending. Rather than expanding, the revenue base has shrunk further, and these trendspoint to the problems (evident in FY95) in sustaining the smaller deficits. Over the period, the deficit hasbeen financed by borrowing from the domestic banking system, and increasingly, since FY89, by theaccrual of arrears on external debt (para. 1.28). These trends also contrast with the 1980s when foreignloans were used to finance a significant part of the deficit; in FY91-95, net foreign loans averaged outflowsof about 0.4% of GDP.
Monetary Trends and Inflation
1.23 Monetary growth. Since almost the entire fiscal deficit is financed by recourse toborrowing from the Central Bank, the decline in the fiscal deficit during FY91-94 was accompanied by agradual slowing of monetary growth. The tightening of monetary policy was evident particularly in FY94when total liquidity (M2) grew (on a year-to-year basis) by about 20%, compared to average annualgrowth of over 36% during FY90-93. However, the widening of the fiscal deficit in FY95 meant a reversalof this trend with an acceleration of monetary growth. While the volume of private sector credit (excludingcooperatives) has risen rapidly in conjunction with the economic liberalization, its share in domestic creditremains small (14% at end-FY95 -- Table 1.4).
1.24 Interest rates. All interest rates -- deposit and lending -- are still controlled, and despite asmall increase in some rates in 1992, these remain highly negative in real terms (Table 1.4). Hence, despiteseveral measures to promote financial savings, including increases in the number of bank branches throughthe new Rural Savings Mobilization Scheme, the sale of Treasury bonds to the public, and the licensing ofprivate banks, the ratio of financial savings to GDP (measured as M2/GDP) has stagnated. With interestrates controlled in this manner, credit allocation decisions depend little on the levels of interest rates.
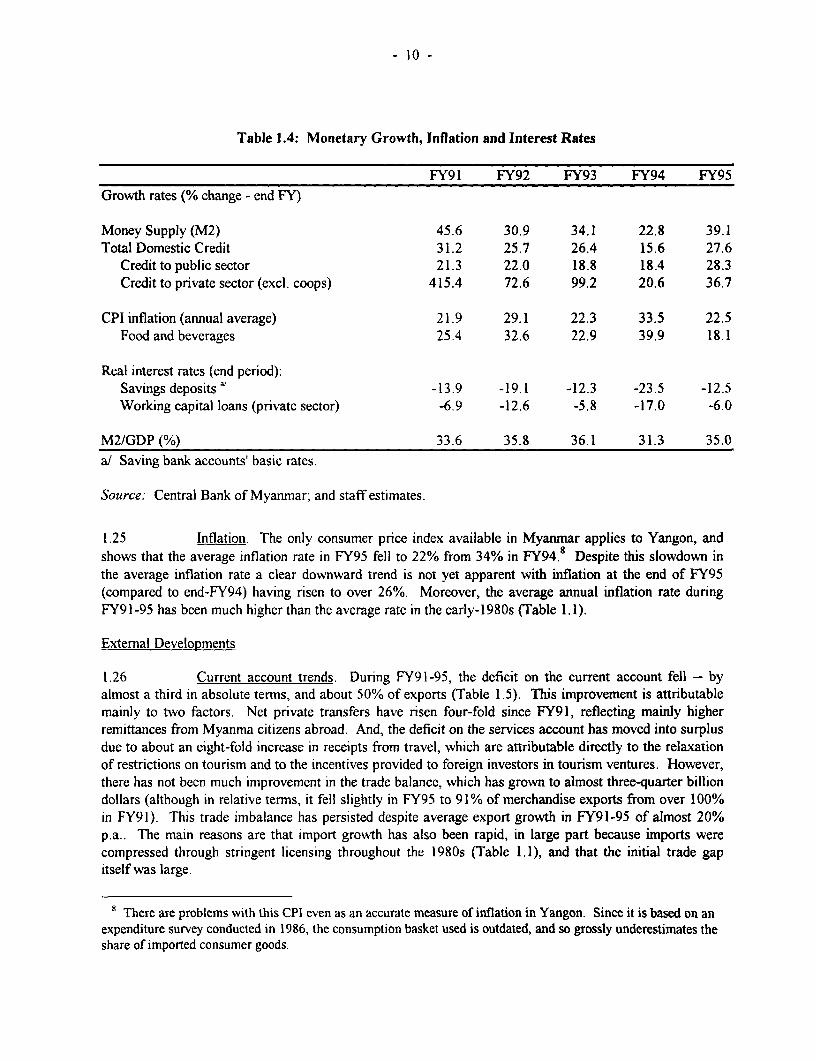
- 10 -
Table 1.4: Monetary Growth, Inflation and Interest Rates
FY91 FY92 FY93 FY94 FY95Growth rates (% change - end FY)
Money Supply (M2) 45.6 30.9 34.1 22.8 39.1Total Domestic Credit 31.2 25.7 26.4 15.6 27.6
Credit to public sector 21.3 22.0 18.8 18.4 28.3Credit to private sector (excl. coops) 415.4 72.6 99.2 20.6 36.7
CPI inflation (annual average) 21.9 29.1 22.3 33.5 22.5Food and beverages 25.4 32.6 22.9 39.9 18.1
Real interest rates (end period):Savings deposits a' -13.9 -19.1 -12.3 -23.5 -12.5Working capital loans (private sector) -6.9 -12.6 -5.8 -17.0 -6.0
M2/GDP (%) 33.6 35.8 36.1 31.3 35.0a/ Saving bank accounts' basic rates.
Source. Central Bank of Myanmar; and staff estimates.
1.25 Inflation. The only consumer price index available in Myanmar applies to Yangon, andshows that the average inflation rate in FY95 fell to 22% from 34% in FY94.8 Despite this slowdown inthe average inflation rate a clear downward trend is not yet apparent with inflation at the end of FY95(compared to end-FY94) having risen to over 26%. Moreover, the average annual inflation rate duringFY91 -95 has been much higher than the average rate in the early-1980s (Table 1.1).
External Developments
1.26 Current account trends. During FY91-95, the deficit on the current account fell -- byalmost a third in absolute terms, and about 50% of exports (Table 1.5). This improvement is attributablemainly to two factors. Net private transfers have risen four-fold since FY91, reflecting mainly higherremittances from Myanma citizens abroad. And, the deficit on the services account has moved into surplusdue to about an eight-fold increase in receipts from travel, which are attributable directly to the relaxationof restrictions on tourism and to the incentives provided to foreign investors in tourism ventures. However,there has not been much improvement in the trade balance, which has grown to almost three-quarter billiondollars (although in relative terms, it fell slightly in FY95 to 91% of merchandise exports from over 100%in FY91). This trade imbalance has persisted despite average export growth in FY91-95 of almost 20%p.a.. The main reasons are that import growth has also been rapid, in large part because imports werecompressed through stringent licensing throughout the 1980s (Table 1.1), and that the initial trade gapitself was large.
8 There are problems with this CPI even as an accurate measure of inflation in Yangon. Since it is based on anexpenditure survey conducted in 1986, the consumption basket used is outdated, and so grossly underestimates theshare of imported consumer goods.
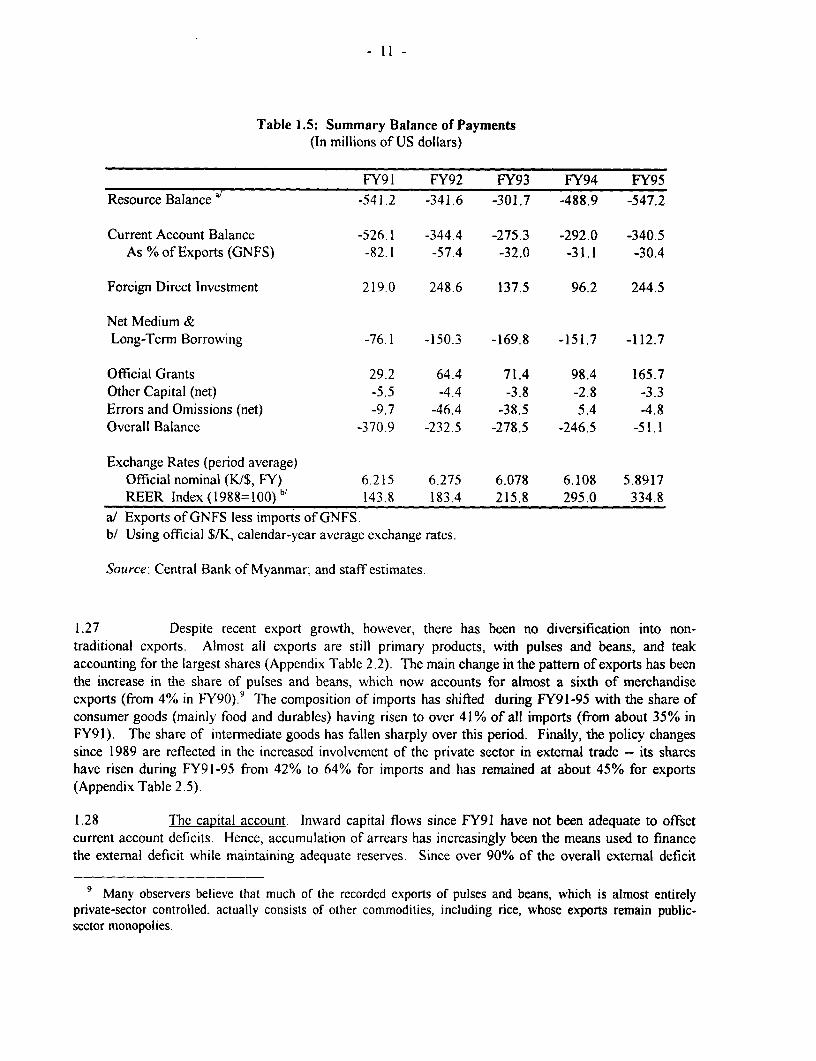
- l1l -
Table 1.5: Summary Balance of Payments(In millions of US dollars)
FY91 FY92 FY93 FY94 FY95Resource Balance -541.2 -341.6 -301.7 -488.9 -547.2
Current Account Balance -526.1 -344.4 -275.3 -292.0 -340.5As % of Exports (GNFS) -82.1 -57.4 -32.0 -31.1 -30.4
Foreign Direct Investment 219.0 248.6 137.5 96.2 244.5
Net Medium &Long-Term Borrowing -76.1 -150.3 -169.8 -151.7 -112.7
Official Grants 29.2 64.4 71.4 98.4 165.7Other Capital (net) -5.5 -4.4 -3.8 -2.8 -3.3Errors and Omissions (net) -9.7 -46.4 -38.5 5.4 4.8Overall Balance -370.9 -232.5 -278.5 -246.5 -51.1
Exchange Rates (period average)Official nominal (KI$, FY) 6.215 6.275 6.078 6.108 5.8917REER Index(1988=100)b' 143.8 183.4 215.8 295.0 334.8
a! Exports of GNFS less imports of GNFS.b/ Using official $/K, calendar-year average exchange rates.
Source: Central Bank of Myanmar; and staff estimates.
1.27 Despite recent export growth, however, there has been no diversification into non-traditional exports. Almost all exports are still primary products, with pulses and beans, and teakaccounting for the largest shares (Appendix Table 2.2). The main change in the pattern of exports has beenthe increase in the share of pulses and beans, which now accounts for almost a sixth of merchandiseexports (from 4% in FY90).9 The composition of imports has shifted during FY91-95 with the share ofconsumer goods (mainly food and durables) having risen to over 41% of all imports (from about 35% inFY91). The share of intermediate goods has fallen sharply over this period. Finally, the policy changessince 1989 are reflected in the increased involvement of the private sector in extemal trade -- its shareshave risen during FY91-95 from 42% to 64% for imports and has remained at about 45% for exports(Appendix Table 2.5).
1.28 The capital account. Inward capital flows since FY91 have not been adequate to offsetcurrent account deficits. Hence, accumulation of arrears has increasingly been the means used to financethe extemal deficit while maintaining adequate reserves. Since over 90% of the overall extemal deficit
9 Many observers believe that much of the recorded exports of pulses and beans, which is almost entirelyprivate-sector controlled. actually consists of other commodities, including rice, whose exports remain public-sector monopolies.
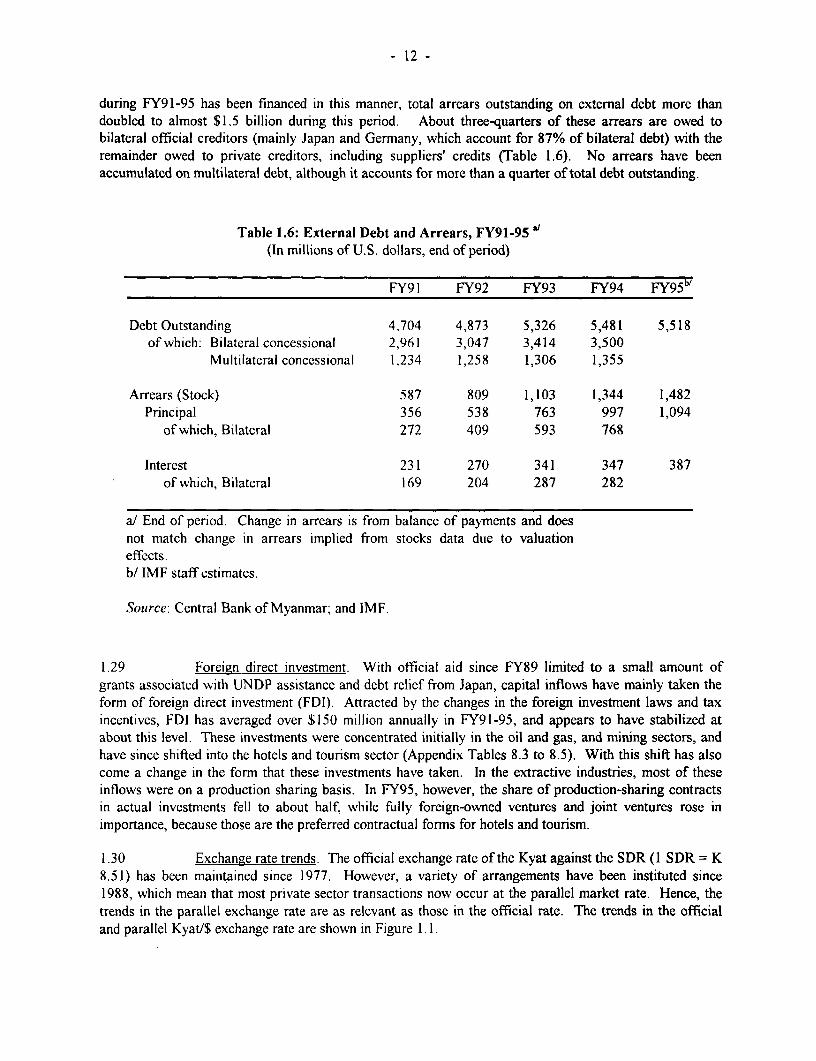
- 12 -
during FY91-95 has been financed in this manner, total arrears outstanding on external debt more thandoubled to almost $1.5 billion during this period. About three-quarters of these arrears are owed tobilateral official creditors (mainly Japan and Germany, which account for 87% of bilateral debt) with theremainder owed to private creditors, including suppliers' credits (Table 1.6). No arrears have beenaccumulated on multilateral debt, although it accounts for more than a quarter of total debt outstanding.
Table 1.6: External Debt and Arrears, FY91-95S(In millions of U.S. dollars, end of period)
FY91 FY92 FY93 FY94 FY95b/
Debt Outstanding 4,704 4,873 5,326 5,481 5,518of which: Bilateral concessional 2,961 3,047 3,414 3,500
Multilateral concessional 1.234 1,258 1,306 1,355
Arrears (Stock) 587 809 1,103 1,344 1,482Principal 356 538 763 997 1,094
of which, Bilateral 272 409 593 768
Interest 231 270 341 347 387of which, Bilateral 169 204 287 282
a/ End of period. Change in arrears is from balance of payments and doesnot match change in arrears implied from stocks data due to valuationeffects.b/ IMF staff estimates.
Source: Central Bank of Myanmar; and IMF.
1.29 Foreign direct investment. With official aid since FY89 limited to a small amount ofgrants associated with UNDP assistance and debt relief from Japan, capital inflows have mainly taken theform of foreign direct investment (FDI). Attracted by the changes in the foreign investment laws and taxincentives, FDI has averaged over $150 million annually in FY91-95, and appears to have stabilized atabout this level. These investments were concentrated initially in the oil and gas, and mining sectors, andhave since shifted into the hotels and tourism sector (Appendix Tables 8.3 to 8.5). With this shift has alsocome a change in the form that these investments have taken. In the extractive industries, most of theseinflows were on a production sharing basis. In FY95, however, the share of production-sharing contractsin actual investments fell to about half, while fully foreign-owned ventures and joint ventures rose inimportance, because those are the preferred contractual forms for hotels and tourism.
1.30 Exchange rate trends. The official exchange rate of the Kyat against the SDR (1 SDR = K8.51) has been maintained since 1977. However, a variety of arrangements have been instituted since1988, which mean that most private sector transactions now occur at the parallel market rate. Hence, thetrends in the parallel exchange rate are as relevant as those in the official rate. The trends in the officialand parallel Kyat/$ exchange rate are shown in Figure 1.1.
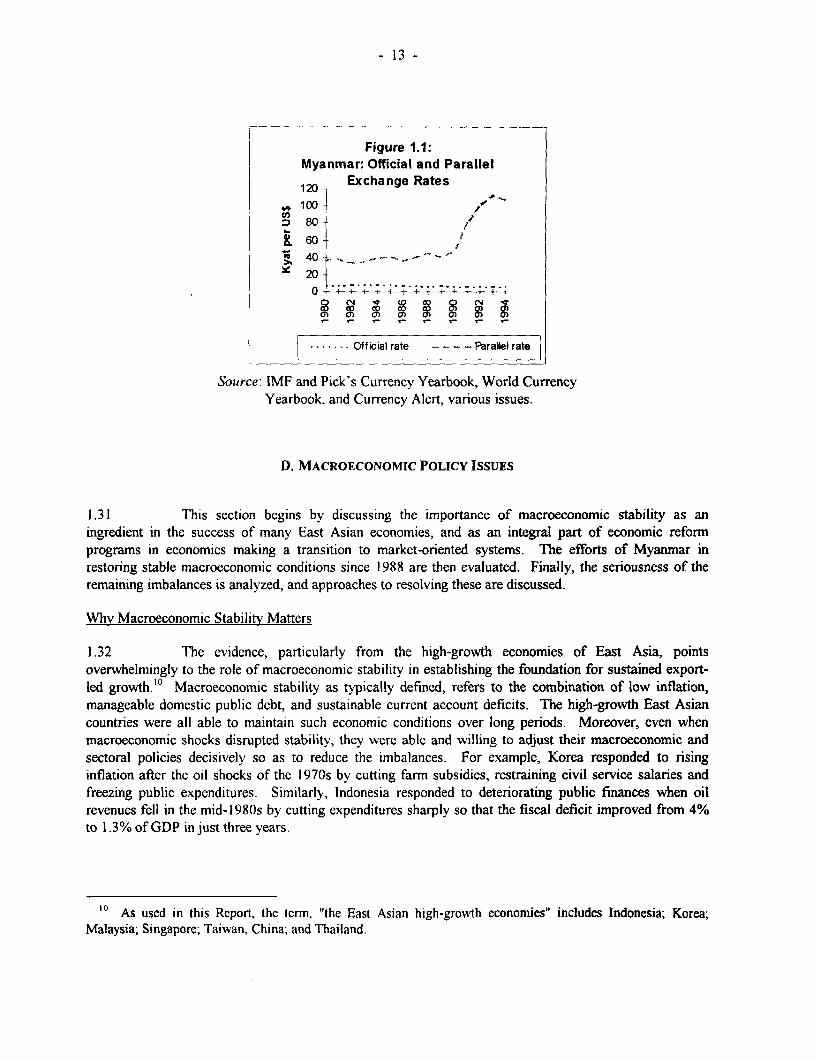
- 13 -
Figure 1.1:Myanmar: Official and Parallel
20 Exchange Rates
,* 100 /80 -
K 60- )*, 40 -
20
a) 0) @ § 9
- - Official rate -- -- Parallel rate
Source: IMF and Pick's Currency Yearbook, World CurrencyYearbook, and Currency Alert, various issues.
D. MACROECONOMIC POLICY ISSUES
1.31 This section begins by discussing the importance of macroeconomic stability as aningredient in the success of many East Asian economies, and as an integral part of economic reformprograms in economies making a transition to market-oriented systems. The efforts of Myanmar inrestoring stable macroeconomic conditions since 1988 are then evaluated. Finally, the seriousness of the
remaining imbalances is analyzed, and approaches to resolving these are discussed.
Why Macroeconomic Stability Matters
1.32 The evidence, particularly from the high-growth economies of East Asia, pointsoverwhelmingly to the role of macroeconomic stability in establishing the foundation for sustained export-led growth.'° Macroeconomic stability as typically defined, refers to the combination of low inflation,manageable domestic public debt, and sustainable current account deficits. The high-growth East Asiancountries were all able to maintain such economic conditions over long periods. Moreover, even whenmacroeconomic shocks disrupted stability, they were able and willing to adjust their macroeconomic andsectoral policies decisively so as to reduce the imbalances. For example, Korea responded to risinginflation after the oil shocks of the 1970s by cutting farm subsidies, restraining civil service salaries andfreezing public expenditures. Similarly, Indonesia responded to deteriorating public finances when oilrevenues fell in the mid- I 980s by cutting expenditures sharply so that the fiscal deficit improved from 4%to 1.3% of GDP in just three years.
'0 As used in this Report. the lerm. "the East Asian high-growth economies" includes Indonesia; Korea;Malaysia; Singapore; Taiwan, China; and Thailand.
- 14 -
1.33 Experience also shows that the main policy that allowed macroeconomic stability to bemaintained in these successful economies was the control of fiscal deficits so that they could be financedwithout resorting to excessive monetary expansion. Where fiscal deficits were modest, they could befinanced without adopting an expansionary monetary stance or building up high domestic and foreign debt.Inflation, therefore, was maintained at relatively low levels in these countries, and real appreciations of theexchange rate were avoided. Hence, these countries were largely able to avoid significant externalimbalances. Inflation in the high-growth East Asian economies during 1961-91 averaged 7.5% annually,and none had average inflation rates higher than 13%. "
1.34 Conversely, where chronic macroeconomic imbalances occurred, as in many LatinAmerican and African economies in the 1980s, large and unsustainable fiscal deficits were the principalcontributing factor. As governments relied more on money creation to finance their deficits, inflationincreased. This usually coincided with or followed the buildup of large and unserviceable domestic andforeign debt. And with higher inflation, and a reluctance to undertake nominal devaluations, real exchangerates appreciated. Hence, current account balances deteriorated, making the external debt situation evenmore untenable. Thus, Latin American economies, which averaged almost 200% inflation annually during1961-91, were not surprisingly those affected most severely by the debt crisis of the mid-1980s.
1.35 This cross-country evidence on the importance of macroeconomic stability for long-termgrowth is unambiguous, and has a clear theoretical rationale. There are at least three reasons whysustained economic growth requires macroeconomic stability. First, relative prices, which guide resourceallocation, are clearer when inflation is low and stable. This is true especially of the two most importanteconomy-wide prices -- the exchange rate and interest rates. In turn, this clarity of price signals reducesuncertainty and fosters private investment. The second reason is that macroeconomic stability, particularlylow inflation, contributes to higher public sector saving by broadening the tax base and increasing taxcollections (the so-called Tanzi effect). High public saving supports growth by providing domesticresources for investment. Finally, stable macroeconomic conditions allow economies to be more outwardoriented. Since the real exchange rate is not overly appreciated, import liberalization is more feasible, anddoes not result in large current account deficits. This openness, in tum, promotes growth by increasingefficiency and allowing technology transfer.
1.36 This dependence of sustained growth on macroeconomic stability is of particular relevanceto countries like Myanmar that are in the midst of transforming their economies from state control tomarket orientation. An important question in designing such reform programs concerns the extent to whichefforts to establish a stable macroeconomic framework should precede sectoral policy reforms. As noted,there are compelling reasons to focus on restoring macroeconomic stability at the outset of the reformeffort.
1.37 A particularly instructive example in this regard is Viet Nam's experience with economicreforms since 1989.12 Faced with stagnant GDP growth in the 1980s and the imminent end to large aidflows from the former Soviet Union, Vietnam initiated an ambitious reform program ("doi moi" orrenovation) in 1989. It included wide-ranging reforms of the agricultural sector, such as liberalization ofpricing and marketing and abolition of collective farming, decontrol of non-agricultural prices, and removal
" See, World Bank (1993), Chapter 3.
12 For details on the phasing and impacts of Vietnam's reform program, particularly its macroeconomic aspects,see Dollar (I994).
- 15 -
of trade restrictions on most products, including rice exports. Most striking, however, were the changes inpolicy aimed at restoring macroeconomic stability, which were made at the outset of the reform programitself. These steps included unification and devaluation of the exchange rate (by over 70% in 1989),increases in deposit and lending interest rates to positive real levels, and reductions in public expendituresthrough the streamlining of the military (over half a million soldiers were demobilized) and the public sector(by cutting budgetary subsidies to state enterprises, which resulted in layoffs of 800,000 employees in1989-91).
1.38 The impact on Viet Nam's macroeconomic balances was inimediate and positive, with thefiscal deficit falling from over 11 % of GDP in 1989 to less than 4% in 1992. Consumer price inflation felldramatically from over 70% in 1990 and 1991 to 17% in 1992, and about 5% in 1993. Thismacroeconomic stability has paved the way for growth to accelerate, with GDP growth averaging over 8%p.a. during 1992-94, compared to about 5% p.a. in 1986-88. Moreover, gross fixed investmnent has risenfrom about 11% to over 19% of GDP during 1990-93.
The Need for Continued Stabilization
1.39 The preceding discussion raises the question of how far Myanmar has progressed instabilizing macroeconomic conditions. The macroeconomic situation has undoubtedly improved in somerespects compared to the late-1980s. The current account deficit fell, as a share of exports (GNFS), fromabout 67% in FY89 to 30% in FY95. And, consumer price inflation (year-on-year) has fallen during theperiod from 34% to about 26%. These improvements stem from the tightening of fiscal and monetarypolicies. The fiscal deficit has shrunk from 13.7% of GDP in FY89 to 6.3% in FY95.
1.40 However, despite these improvements, macroeconomic stability remains elusive as can beseen from the indicators of both internal and cxternal balance. Inflation remains high and variable. In thelast five years, for instance, the inflation rate (year-on-year as well as the average annual rate) hasfluctuated between 18% and 35%. While the fiscal deficit has fallen since FY89, this reduction wasachieved entirely by cutting expenditures (current and capital) rather than by broadening the revenue baseor improving the performance of SEs. Moreover, the deficit rose in FY95. And, the slowing of monetarygrowth until FY94 was accomplished mainly by limiting growth of credit to the private and cooperativesectors rather than by reducing the monetization of the fiscal deficit.
1.41 The persistence of external imbalances can be seen from the current account deficit, whichhas also been large and variable. During FY90-94, the current account gap averaged 43% of total exportreceipts (GNFS), rising as high as I 10% in FY91. Despite a further improvement in FY95, itsunsustainability is clear from the continued build-up of external arrears. In FY94, for instance, almost40% of the current account deficit was financed by accumulating arrears. Another sign that the externaldeficit is even more serious than is indicated by its recent improvement is its persistence despite the exportrecovery during FY90-95 (Table 1. 1) because import growth during this period has also been rapid.
1.42 This analysis shows that macroeconomic stabilization measures are still needed urgently inMyanmar if the current policy reforms are to be successful in restoring medium-term growth. Despitehealthy GDP growth in the last two years, real GDP in FY95 was only about 10% larger than in FY86 --an annual growth rate of only about 1.1 %, far below the population growth rate. For Myanmar to realizeits potential, and to reverse the long period of economic stagnation, growth rates have to rise substantially.For this to occur, sustained macroeconomic stabilization, similar to that implemented by Vietnam in thelate-1980s, is essential. Without macroeconomic stability, the reforms in sectoral policies that have been
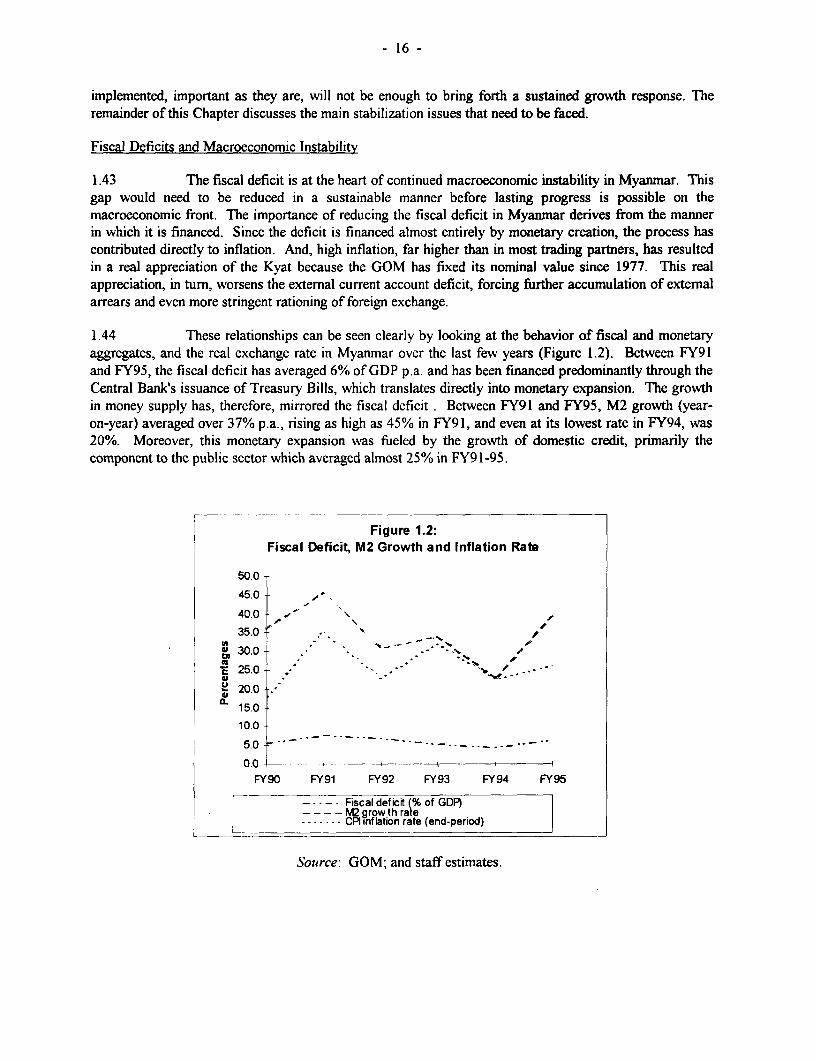
- 16 -
implemented, important as they are, will not be enough to bring forth a sustained growth response. Theremainder of this Chapter discusses the main stabilization issues that need to be faced.
Fiscal Deficits and Macroeconomic Instability
1.43 The fiscal deficit is at the heart of continued macroeconomic instability in Myanmar. Thisgap would need to be reduced in a sustainable manner before lasting progress is possible on themacroeconomic front. The importance of reducing the fiscal deficit in Myanmar derives from the mannerin which it is financed. Since the deficit is financed almost entirely by monetary creation, the process hascontributed directly to inflation. And, high inflation, far higher than in most trading partners, has resultedin a real appreciation of the Kyat because the GOM has fixed its nominal value since 1977. This realappreciation, in tum, worsens the external current account deficit, forcing further accumulation of extemalarrears and even more stringent rationing of foreign exchange.
1.44 These relationships can be seen clearly by looking at the behavior of fiscal and monetaryaggregates, and the real exchange rate in Myanmar over the last few years (Figure 1.2). Between FY91and FY95, the fiscal deficit has averaged 6% of GDP p.a. and has been financed predominantly through theCentral Bank's issuance of Treasury Bills, which translates directly into monetary expansion. The growthin money supply has, therefore, mirrored the fiscal deficit . Between FY91 and FY95, M2 growth (year-on-year) averaged over 37% p.a., rising as high as 45% in FY91, and even at its lowest rate in FY94, was20%. Moreover, this monetary expansion was fueled by the growth of domestic credit, primarily thecomponent to the public sector which averaged almost 25% in FY9 1-95.
Figure 1.2:Fiscal Deficit, M2 Growth and Inflation Rate
50.045.01-40.0 -v
35.0+
30.0 - ___ -25.0- . . -- - -
@ 20.0 .-ffi 150-10.015.0
10.00.0 - - ---.------ .
FY90 FY91 FY92 FY93 FY94 FY95
r. . -. Fiscal deficft (% of GDP)- - ~goth rat
. .... -nflation rate (end-period)
Source: GOM; and staff estimates.
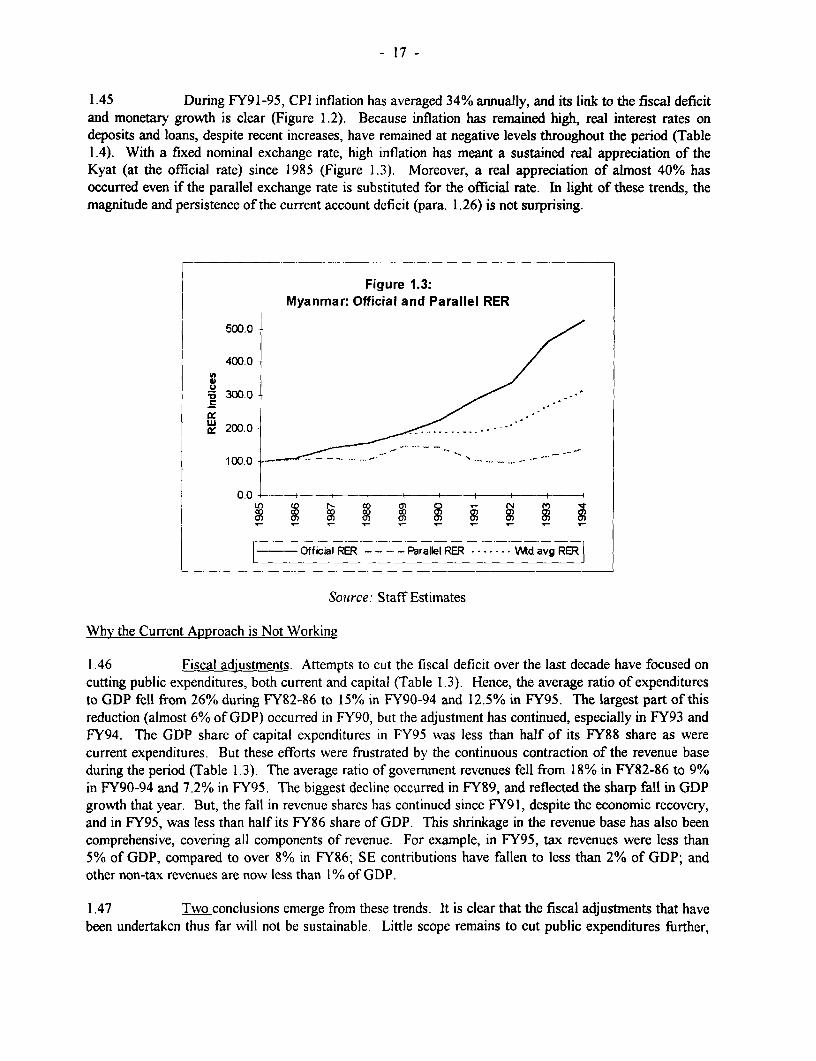
- 17 -
1.45 During FY91-95, CPI inflation has averaged 34% annually, and its link to the fiscal deficitand monetary growth is clear (Figure 1.2). Because inflation has remained high, real interest rates ondeposits and loans, despite recent increases, have remained at negative levels throughout the period (Table1.4). With a fixed nominal exchange rate, high inflation has meant a sustained real appreciation of theKyat (at the official rate) since 1985 (Figure 1.3). Moreover, a real appreciation of almost 40% hasoccurred even if the parallel exchange rate is substituted for the official rate. In light of these trends, themagnitude and persistence of the current account deficit (para. 1.26) is not surprising.
Figure 1.3:Myanmar: Official and Parallel RER
500.0
400.0 -/
VI I
LUlX 300.0 -.
200.0
0.0 -IfTh100. D 0 0 OD 0 , a
Off iciaI RER - - Parallel RER -. *.. Md avg RER
Source: Staff Estimates
Why the Current Approach is Not Working
1.46 Fiscal adjustments. Attempts to cut the fiscal deficit over the last decade have focused oncutting public expenditures, both current and capital (Table 1.3). Hence, the average ratio of expendituresto GDP fell from 26% during FY82-86 to 15% in FY90-94 and 12.5% in FY95. The largest part of thisreduction (almost 6% of GDP) occurred in FY90, but the adjustment has continued, especially in FY93 andFY94. The GDP share of capital expenditures in FY95 was less than half of its FY88 share as werecurrent expenditures. But these efforts were frustrated by the continuous contraction of the revenue baseduring the period (Table 1.3). The average ratio of government revenues fell from 18% in FY82-86 to 9%in FY90-94 and 7.2% in FY95. The biggest decline occurred in FY89, and reflected the sharp fall in GDPgrowth that year. But, the fall in revenue shares has continued since FY91, despite the economic recovery,and in FY95, was less than half its FY86 share of GDP. This shrinkage in the revenue base has also beencomprehensive, covering all components of revenue. For example, in FY95, tax revenues were less than5% of GDP, compared to over 8% in FY86; SE contributions have fallen to less than 2% of GDP; andother non-tax revenues are now less than I% of GDP.
1.47 Two conclusions emerge from these trends. It is clear that the fiscal adjustments that havebeen undertaken thus far will not be sustainable. Little scope remains to cut public expenditures further,
- 18 -
especially since infrastructural inadequacies mean that even lower capital expenditures will only hurt theprospects for medium-term growth. And, it is obvious that no long-term improvement in the fiscal position,and hence in the macroeconomic situation is possible without measures to expand the revenue base. Beforeexamining ways to expand the revenue base, recent trends in the current account deficit are delineated.
1.48 Exchange rate management and external trade policies. Apart from administrativemeasures aimed at reducing public-sector imports, the GOM's policy response to continued externalimbalance has been in three main areas. First, measures have been implemented so that the private sector'sexternal transactions are undertaken at an exchange rate lower than the highly-overvalued official rate.These policies have included permitting the full retention of foreign exchange earnings by private exporters,the trading of foreign exchange by domestic residents through foreign exchange accounts and FECs.Hence, there has been a de facto legalization of the parallel foreign exchange market, and by allowing thisrate to be market determined, the aim was to allow a de facto devaluation. The second set of actions hasaimed at encouraging exports by liberalizing the environment for foreign investment. Hence, attractiveincentives are now offered to foreign investment that is export-oriented or generates foreign exchange (as intourism) -- both for joint ventures and fully foreign-owned enterprises. Finally, measures have beeninstituted that attempt to link the availability of imports by SEs to export production. The import first andconsignment import schemes are examples of such schemes (see footnote 3). Encouraging SE exports wasalso the aim of creating foreign exchange revolving funds for eight ministries in late-1992. These fundssupplement the annual foreign exchange allocations, and are intended to be used to finance essentialimports, which could then be used to increase export production.
1.49 Although these measures were intended to reduce the external deficit, their positive impactis difficult to discern.3 The primary reason, of course, is that the official nominal exchange rate remains atits highly overvalued level, and this rate still applies to all public-sector imports. At this rate, which isabout one-twentieth that in the parallel market, excess demand for imports is substantial. Moreover, themain effect of the complex exchange rate system in place has been to segment the market for foreignexchange between the private sector and public sector (which includes the SEs). Private exporters, who areallowed to retain most of their export receipts, are the main source of foreign exchange for private sectorimports. Hence, the external account of the private sector is roughly in balance. However, the excessdemand for public sector imports is balanced only by the administrative allocation of foreign exchange bythe Ministry of Finance.
1.50 The trends in the REER illustrate this continued discrimination against the tradeablessectors. As Figure 1.3 shows, the REER (evaluated at the parallel rate) at end-1994 had appreciated about40% since 1985. But since all public-sector transactions are still conducted at the official rate, the realexchange rate is not determined by the parallel rate alone. A weighted-average REER (with the relativetrade shares of the private and public sector as the weights) is also shown in Figure 1.3. By this measure,the bias against tradeables has increased, not only since 1985 by more than three-fold, but also since 1989,by over two-thirds. Thus, the current approach of allowing a backdoor devaluation in the unofficial foreignexchange market has done little to restore external balance.
The Role of the Exchange Rate in Restoring Macroeconomic Stability
1.51 Adjusting the official exchange rate by unifying it with the parallel rate is the first andmost essential step in addressing external and internal imbalances that still afflict the Myanma economy.
13 The microeconomic effects of these measures is dealt with in Chapter 2. This discussion focuses on theirimpacts on external balance.
- 19 -
The link between the overvaluation of the Kyat and the external imbalances in the economy isstraightforward. Overvaluation imposes a large tax on the tradeables sector (production of exports andimport substitutes) while favoring the non-tradeables sector. As shown in Figure 1.3, the magnitude of thistax has been reduced somewhat but not eliminated by the authorities' efforts to push all private-sectorexternal transactions to the de facto legal parallel market. The impact of this bias against tradeablesproduction is evident in the lack of growth in exports other than traditional primary products that stillaccount for almost all exports. It has also stunted the growth of import substituting activities, which is onereason that there remains such strong pent-up demand for imports, especially consumer-goods imports.Annual merchandise import growth (in value terms) has averaged about 25% during FY90-95, andconsumer-goods imports account for over a third of all imports.
1.52 The manner in which the exchange rate distortion has contributed to the internalimbalances in the Myanma economy is as straightforward as well as more subtle. As was noted, the keyfactor at the center of the current fiscal difficulties is the narrowness of the revenue base. Theovervaluation of the Kyat, and the subsequent efforts to compensate for it, has contributed to this problemin three ways. First, revenues from imports in the form of customs duties and commercial taxes have beenreduced compared to the situation if the exchange rate were at a realistic level. Overvaluation has meantthat the Kyat value of imports (on which basis, customs duties and commercial taxes are assessed) isunderstated by a factor of about twenty, thus depriving the government of revenues of this order. Takingaccount of this degree of overvaluation, the effective average nominal import tariff in Myanma is less than3% with obvious implications for government revenues.
1.53 The second reason that overvaluation has shrunk the revenue base is that more and moreeconomic activity has been effectively pushed into the parallel economy, where it is outside the tax net. Asthe official exchange rate has become more overvalued, it no longer signals the true price of foreignexchange, a better approximation of which is the parallel rate. Hence, a growing portion of the economy,particularly the emerging private sector, now uses the parallel rate in its transactions. But with the use ofthese multiple exchange rates and the complex transactions system of which they are part, tax evasion hasbecome much easier because the valuation of imports is almost entirely discretionary. Moreover, byofficially sanctioning, and even encouraging, the segmentation of the foreign exchange market, the GOMhas spurred the expansion of the parallel economy. This unofficial recognition of the parallel market inforeign exchange has meant that the line between legal and illegal economic activities in Myanmar isincreasingly blurred. In this situation, the ability of the tax authorities to collect taxes and customs dutiesis limited. Despite a series of well-publicized tax amnesties in recent years, tax compliance thus remains amajor problem area.
1.54 Finally, the overvalued exchange rate deprives many SEs and government agencies ofrevenues because it is used to maintain a complex and intricate set of cross-subsidies in the economy.Through their access to imported products (inputs or consumer goods) at the official exchange rate, variousgroups in the population (including many SEs) are provided large economic subsidies. An example is theeconomic subsidy provided to farmers who receive imported urea at prices that reflect the official exchangerate. Similarly, while petroleum products and electric power are provided at prices that do not requirefinancial subsidies (and hence have no direct budgetary impact), their pricing reflects large economicsubsidies. In this situation, relative prices in the official market are meaningless, and because of extremeshortages at the subsidized prices, active black markets have developed. For instance, gasoline is rationedstringently for most of the population at the official price of K25/lmperial gallon. However, much of thedemand for gasoline is met through the parallel market where the price in Yangon, for instance, is aboutK200AImperial gallon. These subsidies are estimated in Table 1.7, and include those for rice, which are
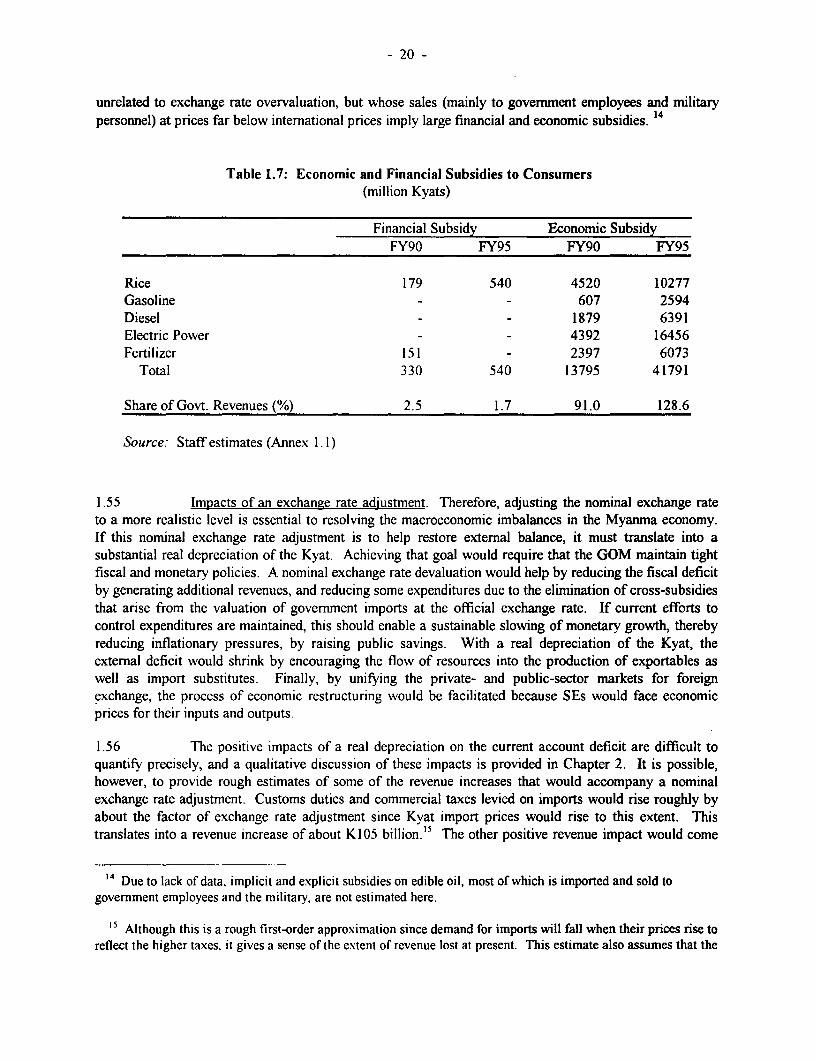
- 20 -
unrelated to exchange rate overvaluation, but whose sales (mainly to government employees and mnilitarypersonnel) at prices far below international prices imply large financial and economic subsidies. 14
Table 1.7: Economic and Financial Subsidies to Consumers(million Kyats)
Financial Subsidy Economic SubsidyFY90 FY95 FY90 FY95
Rice 179 540 4520 10277Gasoline - - 607 2594Diesel - - 1879 6391Electric Power - - 4392 16456Fertilizer 151 - 2397 6073
Total 330 540 13795 41791
Share of Govt. Revenues(%) 2.5 1.7 91.0 128.6
Source: Staff estimates (Annex 1. 1)
1.55 Impacts of an exchange rate adjustment. Therefore, adjusting the nominal exchange rateto a more realistic level is essential to resolving the macroeconomic imbalances in the Myanma economy.If this nominal exchange rate adjustment is to help restore external balance, it must translate into asubstantial real depreciation of the Kyat. Achieving that goal would require that the GOM maintain tightfiscal and monetary policies. A nominal exchange rate devaluation would help by reducing the fiscal deficitby generating additional revenues, and reducing some expenditures due to the elimination of cross-subsidiesthat arise from the valuation of government imports at the official exchange rate. If current efforts tocontrol expenditures are maintained, this should enable a sustainable slowing of monetary growth, therebyreducing inflationary pressures, by raising public savings. With a real depreciation of the Kyat, theexternal deficit would shrink by encouraging the flow of resources into the production of exportables aswell as import substitutes. Finally, by unifying the private- and public-sector markets for foreignexchange, the process of economic restructuring would be facilitated because SEs would face economicprices for their inputs and outputs.
1.56 The positive impacts of a real depreciation on the current account deficit are difficult toquantify precisely, and a qualitative discussion of these impacts is provided in Chapter 2. It is possible,however, to provide rough estimates of some of the revenue increases that would accompany a nominalexchange rate adjustment. Customs duties and commercial taxes levied on imports would rise roughly byabout the factor of exchange rate adjustment since Kyat import prices would rise to this extent. Thistranslates into a revenue increase of about K105 billion."5 The other positive revenue impact would come
1' Due to lack of data, implicit and explicit subsidies on edible oil, most of which is imported and sold togovernment employees and the military, are not estimated here.
1' Although this is a rough first-order approximation since demand for imports will fall when their prices rise toreflect the higher taxes. it gives a sense of the extent of revenue lost at present. This estimate also assumes that the
- 21 -
from eliminating the large economic subsidies that are provided to users of electricity, petroleum products,and fertilizers. These impacts are estimated in Annex 1.1, and in FY94 amounted to K16.5 billion onelectric power, K9 billion on diesel and gasoline and K6. 1 billion on fertilizers. In sum, these economicsubsidies (K31.5.6b) were almost as large as government revenues in FY95. Obviously, governmentexpenditures made in foreign exchange would also rise following such an adjustment. Apart from theincrease in external debt service (para. 1.63), the net would be zero since the consolidated public sector hasbalanced foreign exchange flows (in cash terms).
Maintaining Tight Fiscal and Monetary Policies
1.57 To control inflationary pressures following an exchange rate adjustrnent, it is essential thatfiscal control be maintained, and that monetary growth be slowed. In reducing the fiscal deficit, there is notmuch scope for increasing revenues beyond those associated with the exchange rate adjustment. The mainreason is that the volume of financial subsidies, which are being provided through the budget are alreadyquite small in relation to the deficit (Table 1.7). The key, therefore, is to adjust the exchange rate so as tobe able to capture the economic subsidies associated with overvaluation. It will also be necessary tocontinue to control expenditures tightly. Again, since little scope exists to cut capital expenditures further,the emphasis should be on finding ways to cut defense expenditure, which is the only category that has beenprotected since the reform program began. Financing the deficit that remains in a non-inflationary mannerdepends crucially on the availability of external financing.
1.58 Cutting the fiscal deficit would also allow a slowdown in the growth of public-sectorcredit, which would facilitate the tightening of monetary conditions. Along with this tightening, it isessential that interest rates be raised to positive real levels. This step would ensure that the allocation ofcredit to the private sector is done on an economic basis rather than being rationed, as it is at present. Thisoutcome would become increasingly important in the future as the role of the private sector in the Myanmaeconomy and its share in domestic credit grow. Positive real interest rates would also help increasefinancial savings, thereby helping to finance the large investment needs of the economy. Finally, asexplained in Chapter 3, eliminating the subsidies that flow to SEs through negative real interest rates is acritical part of successful SE reforms.
1.59 The fiscal deficit and SE finances. The direct impact of the poor financial performance ofSEs on the fiscal deficit is limited."6 In fact, the GOM's presentation of the fiscal relationship shows that inrecent years, the SE sector has been a net contributor to government revenues since its current surplus,which is computed after contributions to the government, has been larger than its capital expenditures.
1.60 However, (as detailed in Chapter 3), this accounting is incomplete mainly because it leavesout the many economic subsidies that flow to SEs through the exchange rate and the interest rate, and othercross-subsidies through controlled input and output prices. Since the importance of controlled prices hasprobably diminished with the reforms since 1989, the main economic subsidies that remain are those
current tariff structure is maintained and that a third of current commercial tax revenues are related to imports.Since these assumptions imply a high average nominal tariff of about 52% (see Chapter 2), a more realisticscenario would combine an exchange rate adjustment with a decrease in tariff rates. However, even if effectivetariffs were to rise to about 12% (compared to the current 2.5%), tariff revenues would rise by about K16 billion,and commercial tax receipts would increase by over K35 billion.
16 The relationship between the Government budget and SE finances is analyzed in greater detail in Chapter 3(see paras. 3.15 to 3.18).
- 22 -
provided through the underpricing of energy, imported inputs and capital. The precise impact of thesecross-subsidies on individual SEs is difficult to evaluate. However, in aggregate, they weaken thegovernment budget because they deprive it of the potential revenue that could be generated if the prices ofthese inputs were increased to their economic levels.
1.61 But, while removing these subsidies by adjusting the prices of these inputs will increasepublic saving somewhat by reducing the fiscal deficit, their impact will be muted unless the process of SEreform itself is deepened. For example, raising prices of petroleum products will improve the finances ofthe SEs that import and distribute these, and contribute to higher public saving. However, it will also leadto a significant deterioration in the finances of most other SEs, which account for more than half the totalconsumption of these products. Unless steps are taken to ensure that those losses are not automaticallytransferred to the government budget, as they would at present, the net positive fiscal impact would bemuch reduced. Hence, any serious attempt at reducing the drain of SEs on the government budget wouldhave to combine the removal of subsidies (by adjusting the exchange rate and interest rates) with SEreforms that enhance financial discipline by ensuring that enterprises face hard budget constraints.
1.62 Impacts on inflation and debt service. These arguments in favor of a large adjustment inthe nominal value of the Kyat are well understood by most policymakers in Myanrar. Their reluctance totake this step, despite the willingness to pursue reforms in other areas, has stemmed mainly from the fear oftwo sets of adverse economic repercussions. Thefirst has been that a large devaluation would worseninflationary pressures. By raising prices of imported inputs and consumer goods, especially for SEs, adevaluation would lead to an inflationarv spiral that would lower living standards, and could threatenpolitical stability. This argument exaggerates the potential price impacts of a devaluation. The mainreason is that, for the bulk of the population, a significant portion of the price adjustment to a Kyatdevaluation has already taken place. Since almost all of the private sector's purchases of imported goodsare made at the unofficial exchange rate, it is that value of the Kyat rather than the official rate, which hasbeen relevant to their consumption for the last two or three years. The other reason to doubt that a largedevaluation would seriously worsen inflationary pressures is because of its positive fiscal impacts, bothdirectly as well as through SE finances (para. 1.60). The resultant fall in the fiscal deficit should allow theauthorities to tighten monetary policy further, and consequently dampen inflationary pressures.
1.63 The second negative impact feared by policymakers is that on external debt. Obviously, adevaluation (especially of the order necessary) will increase the Kyat equivalent of external debt servicepayments substantially, and to this extent, increase the fiscal burden substantially. A rough estimate of thisincrease due to the first-round effect of unifying the official and parallel rates (at about KI 10/$) is about K.37.1 billion. However, this impact, although huge, should not be used to postpone action on the exchangerate because the increase is largely notional. Despite the increase in Kyat terms, the foreign exchange valueof debt service, which is its real value, is obviously unchanged. Moreover, as Table 1.6 showed,substantial arrears are already being accumulated, even with the overvalued Kyat, demonstrating that thesituation is unsustainable unless export earnings can be increased and repayment terms modified onoutstanding bilateral debt. These events are far more likely with a large devaluation than if the currentsituation is allowed to persist.
1.64 Winners and losers. Continued unwillingness to adjust the exchange rate also stems fromthe fear that some groups in the population would lose as a result. Any package of reforms involveswinners and losers. What is relevant, however, is the extent to which the gains outweigh the losses. And, ifmacroeconomic stabilization measures are implemented forcefully, the potential gains in terms of economicgrowth and efficiency would be vastly greater than the losses.
- 23 -
1.65 The main losers from adjustment of the exchange rate would be those who have access toofficial imports, either directly or indirectly through the resulting cross-subsidies. Those with direct accessto cheap imports include many SEs, which receive underpriced inputs while exporting little, as well assections of the population who (mainly government officials and military personnel) receive these productsthrough government shops and rations. The indirect beneficiaries include consumers of petroleum productsand electric power at official prices. While difficult to estimate precisely what part of the populationreceives these subsidies, it is unlikely to be a large proportion given that three-quarters of Myanmar'spopulation is still rural. Similarly, those who gain the most from interest rate subsidies are SEs andconsumers of their products.
1.66 Against the short-term losses of these groups should be weighed the gains to the economyfrom reforming the exchange rate and interest rate systems. Unifying the exchange rate system wouldencourage the production of exports and import-substitutes and employment in these activities wouldexpand. It would also send a strong signal to foreign investors about the coherence of the ongoingeconomic reform efforts, and thereby help boost foreign investment flows, particularly into export sectors.By helping to reduce the fiscal deficit and better allocating credit demand, inflationary pressures could bebetter controlled. And by contributing to export growth while controlling import growth, it would reducethe need to accumulate further external arrears. By helping to restore the Myanma economy to a path ofsustainable medium-term growth. these reforms, thus, have the potential to benefit far more people thanthose who would lose from its immediate impacts.
The Costs of Inaction
1.67 While the adverse economic and political effects of macroeconomic reforms have beenemphasized, too little attention has been focused on the economic costs of continued inaction, particularlyon the exchange rate. Without an exchange rate adjustment, both inflation and the ability to serviceexternal debt are likely to worsen. Inflationary pressures will continue unabated because, as argued before,no sustained improvement in the fiscal situation is possible without a broadening of the revenue base. Thelonger an exchange rate adjustment is postponed, the more the ability to raise revenues will diminish. Thefinancial and operational condition of many SEs will also continue to worsen as they bear the burdens ofthe economic subsidies that are provided to a few consumers through the overvalued Kyat. Finally, thecurrent account balance will continue to worsen without the elimination of the bias against tradeables dueto overvaluation. Hence, external arrears will continue to increase.
1.68 The obvious conclusion from this counterfactual is that an eventual adjustment of theexchange rate is inevitable. Postponing that adjustment is likely only to delay the resumption of sustainedgrowth of the Myanma economy, and, therefore, would impose large economic costs in terms of foregoneoutput. A less costly alternative would be to acknowledge the pressing need to restore macroeconomicstability, and assign the central role in this strategy to an adjustment of the nominal exchange rate and theinterest rate. The policy discussion could then shift, more fruitfully, to the questions of how suchadjustments would be accomplished and, as important, of how consistent fiscal and monetary policies couldbe pursued so that this nominal exchange rate adjustment translates into a real depreciation.
- 24 -
2. CHANGES IN THIE INCENTIVE STRUCTURE
A. BACKGROUND
2.1 The GOM's reform program has three clear features that distinguish it from thedevelopment strategy that was followed between 1962 and 1987. First, it aims to integrate the Myanmaeconomy with the rest of the world through trade and investment links. This contrasts with the autarky thatwas emphasized in the previous period. Second, it seeks to recognize the importance of the agriculturalsector in accelerating medium-term growth. Hence, the earlier biases against agricultural production infavor of the industrial sector are to be reduced. Finally, the role of the private sector in development wouldbe emphasized. The many restrictions on private-sector involvement in economic activity are to beremoved, and the role of the State Enterprises (SEs) in the economy is to be rationalized.
2.2 The aim of this Chapter is to assess the extent to which the recent reforms have altered thestructure of incentives in these directions. The next section examines recent changes in the outwardorientation of the Myanma economy. The focus is particularly on whether the reforms have reversed theprevious bias against tradeables (exports and import-substitutes) through the overvaluation of the exchangerate. Section C analyzes the effects of the reforms in pricing and marketing on the agricultural sector. Theemphasis is on assessing the effective taxation of paddy production, which is the most important part ofMyanma's agricultural sector. The final Section examines how far the biases against the private sector,both domestic and foreign, have been removed. Particular attention is paid to whether the domestic privatesector continue to have less-favored access to key inputs and services compared to SEs.
B. EXPANDING EXPORTS
2.3 A key feature of the shift towards a market-oriented economy in Myaunar has been theacknowledgment of the need for greater integration with the world economy. Specifically, the main impetusfor growth would come from the expansion of exports rather than, as in the past, from the pursuit of apolicy aimed at import substitution and autarky. One aspect of these reforms intended to increase theopenness of the Myanma economy has been the liberalization of the foreign investment regime (para. 1.29).These measures were among the first to be implemented as part of the GOM's "Open Door" economicreform program, and are discussed further in Section D of this Chapter, which deals with the role of theprivate sector. This section focuses mainly on the policy issues raised by the second set of reforms thathave aimed at encouraging exports. These measures include allowing exporters to retain their foreignexchange earnings, and to trade these through foreign exchange accounts.
Structure of External Trade and Recent Export Performance
2.4 Trade orientation. Despite the recent reforms, Myanmar remains an extremely closedeconomy. The shares of imports and exports to GDP in 1994 were each between 2% and 3%. The lack ofoutward orientation of the Myanma economy is in stark contrast to its neighbors, not only in East Asia butalso in South Asia, which until recently have themselves not been exemplars of openness (Table 2.1).Moreover, there has been little increase in these trade shares since 1990 or even as far back to 1984.
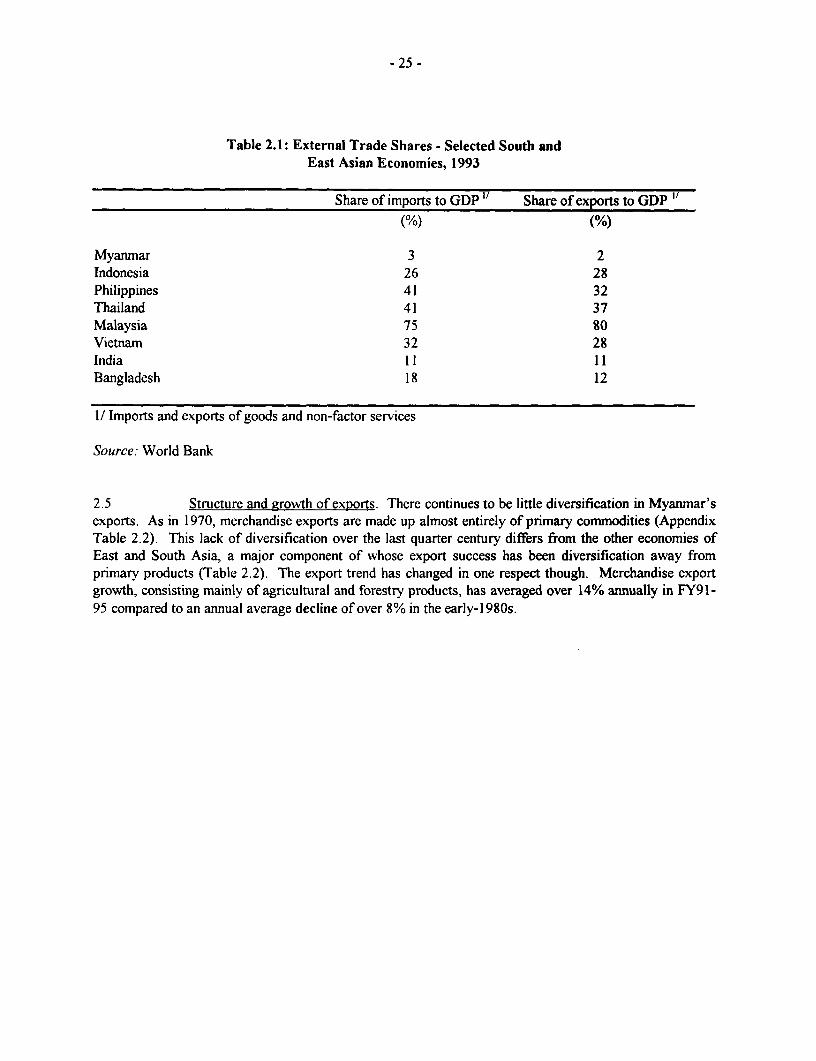
- 25 -
Table 2.1: External Trade Shares - Selected South andEast Asian Economies, 1993
Share of imports to GDP" Share of exports to GDP "
(%) (%)
Myanmar 3 2Indonesia 26 28Philippines 41 32Thailand 41 37Malaysia 75 80Vietnam 32 28India 11 11Bangladesh 18 12
1/ Imports and exports of goods and non-factor services
Source: World Bank
2.5 Structure and growth of exports. There continues to be little diversification in Myanmar'sexports. As in 1970, merchandise exports are made up almost entirely of primary commodities (AppendixTable 2.2). This lack of diversification over the last quarter century differs from the other economies ofEast and South Asia, a major component of whose export success has been diversification away fromprimary products (Table 2.2). The export trend has changed in one respect though. Merchandise exportgrowth, consisting mainly of agricultural and forestry products, has averaged over 14% annually in FY91-95 compared to an annual average decline of over 8% in the early-1980s.
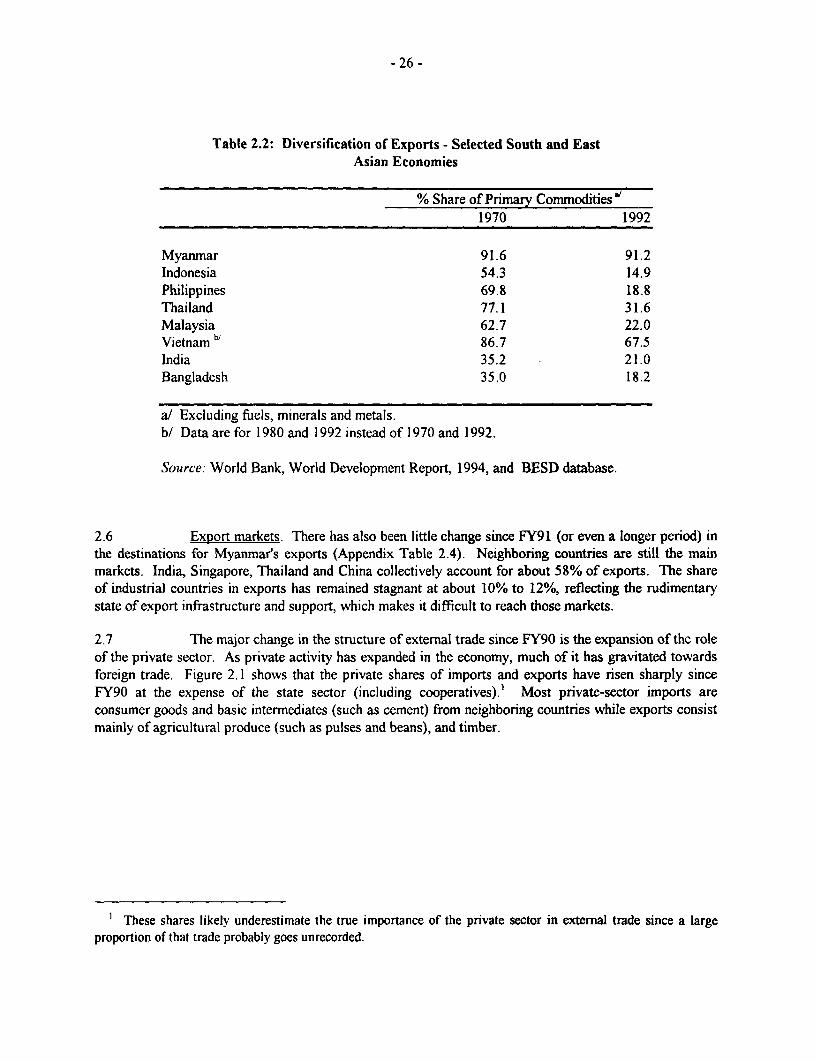
- 26 -
Table 2.2: Diversification of Exports - Selected South and EastAsian Economies
% Share of Primary Commodities "'1970 1992
Myanmar 91.6 91.2Indonesia 54.3 14.9Philippines 69.8 18.8Thailand 77.1 31.6Malaysia 62.7 22.0Vietnam b' 86.7 67.5India 35.2 21.0Bangladesh 35.0 18.2
a/ Excluding fuels, minerals and metals.b/ Data are for 1980 and 1992 instead of 1970 and 1992.
Source: World Bank, World Development Report, 1994, and BESD database.
2.6 Export markets. There has also been little change since FY91 (or even a longer period) inthe destinations for Myanmar's exports (Appendix Table 2.4). Neighboring countries are still the mainmarkets. India, Singapore, Thailand and China collectively account for about 58% of exports. The shareof industrial countries in exports has remained stagnant at about 10% to 12%, reflecting the rudimentarystate of export infrastructure and support, which makes it difficult to reach those markets.
2.7 The major change in the structure of external trade since FY90 is the expansion of the roleof the private sector. As private activity has expanded in the economy, much of it has gravitated towardsforeign trade. Figure 2.1 shows that the private shares of imports and exports have risen sharply sinceFY90 at the expense of the state sector (including cooperatives).) Most private-sector imports areconsumer goods and basic intermediates (such as cement) from neighboring countries while exports consistmainly of agricultural produce (such as pulses and beans), and timber.
l These shares likely underestimate the true importance of the private sector in external trade since a largeproportion of that trade probably goes unrecorded.
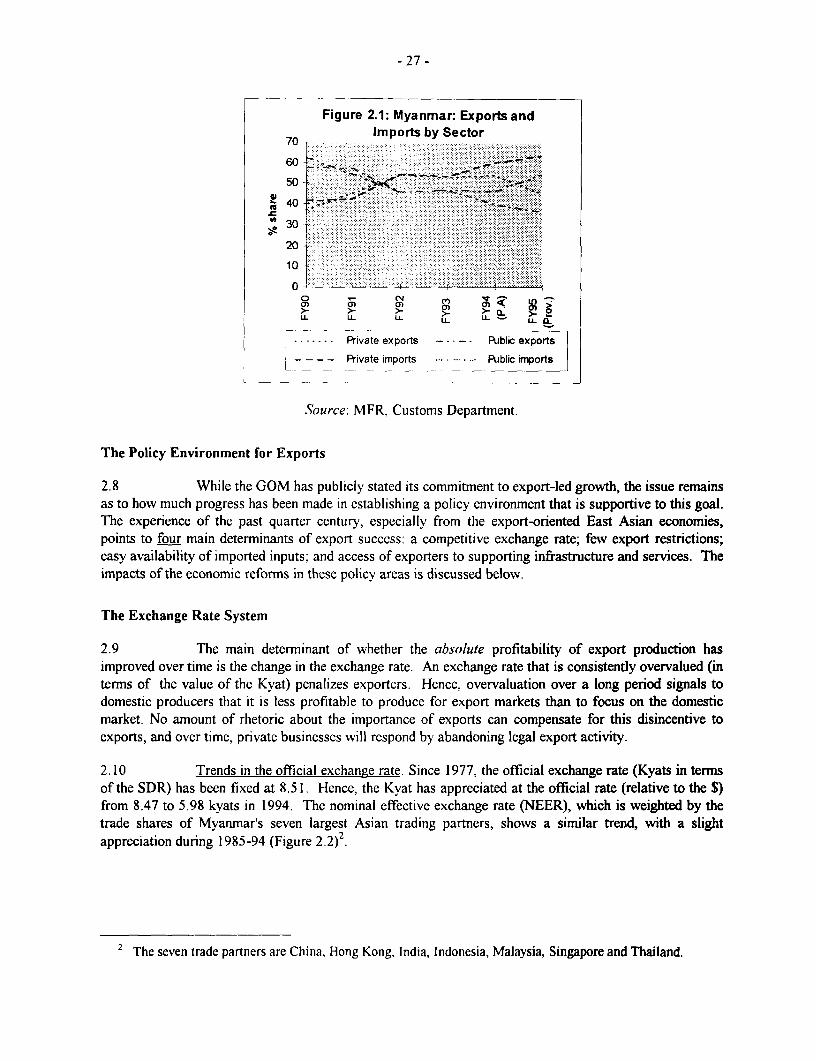
- 27 -
Figure 2.1: Myanmar: Exports andImports by Sector
60 S .. : ..- -.--..-..... - --
X . --.. --. ,-,... '.. - ,-, --::."- ;"'-'.,,..-'.,...-.....40 ..... .
0 - : 1 : . . . . . .;. .... . : : :.:.:.:.:. :....::-::::'::::' '
>~~~~~~~~~~~~~~~~~~ . ... . . ... ....p_~~~. . . . . . . . . . . . . . . . . . _
20
0 IN m ;
LL LL LL LL - LL. O
------ -Private exports -- - - Public exports: --- - Private imports Public irports
Source: MFR, Customs Department.
The Policy Environment for Exports
2.8 While the GOM has publicly stated its commitment to export-led growth, the issue remainsas to how much progress has been made in establishing a policy environment that is supportive to this goal.The experience of the past quarter century, especially from the export-oriented East Asian economies,points to four main determinants of export success: a competitive exchange rate; few export restrictions;easy availability of imported inputs; and access of exporters to supporting infrastructure and services. Theimpacts of the economic reforms in these policy areas is discussed below.
The Exchange Rate System
2.9 The main determinant of whether the absolute profitability of export production hasimproved over time is the change in the exchange rate. An exchange rate that is consistently overvalued (interms of the value of the Kyat) penalizes exporters. Hence. overvaluation over a long period signals todomestic producers that it is less profitable to produce for export markets than to focus on the domesticmarket. No amount of rhetoric about the importance of exports can compensate for this disincentive toexports, and over time, private businesses will respond by abandoning legal export activity.
2.10 Trends in the official exchange rate. Since 1977, the official exchange rate (Kyats in ternsof the SDR) has been fixed at 8.51. Hence, the Kyat has appreciated at the official rate (relative to the $)from 8.47 to 5.98 kyats in 1994. The nominal effective exchange rate (NEER), which is weighted by thetrade shares of Myanmar's seven largest Asian trading partners, shows a similar trend, with a slightappreciation during 1985-94 (Figure 2.2)2.
2 The seven trade partners are China. Hong Kong. India, Indonesia, Malaysia, Singapore and Thailand.
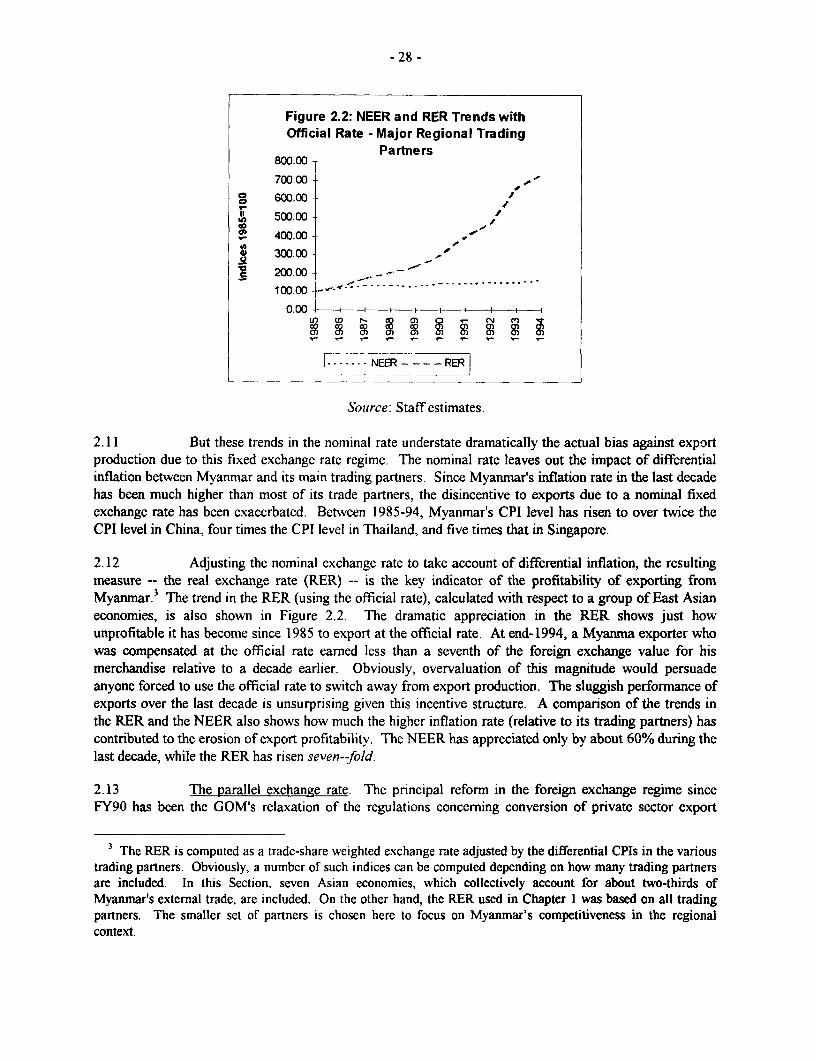
- 28 -
Figure 2.2: NEER and RER Trends withOfficial Rate - Major Regional Trading
Partners800.00
700.00 - -
° 600.00 r
II' 500.00 /
400.00
* 300.00 -
X 200.00 -.
100.00
0.001 I I I I 1 I
rf _ __ _ _ __
__ E NEER---- ~ RERt
Source: Staff estimates.
2.11 But these trends in the nominal rate understate dramatically the actual bias against exportproduction due to this fixed exchange rate regime. The nominal rate leaves out the impact of differentialinflation between Myanmar and its main trading partners. Since Myanmar's inflation rate in the last decadehas been much higher than most of its trade partners, the disincentive to exports due to a nominal fixedexchange rate has been exacerbated. Between 1985-94, Myanmar's CPI level has risen to over twice theCPI level in China, four times the CPI level in Thailand, and five times that in Singapore.
2.12 Adjusting the nominal exchange rate to take account of differential inflation, the resultingmeasure -- the real exchange rate (RER) -- is the key indicator of the profitability of exporting fromMyanmar.3 The trend in the RER (using the official rate), calculated with respect to a group of East Asianeconomies, is also shown in Figure 2.2. The dramatic appreciation in the RER shows just howunprofitable it has become since 1985 to export at the official rate. At end-1994, a Myanma exporter whowas compensated at the official rate earned less than a seventh of the foreign exchange value for hismerchandise relative to a decade earlier. Obviously, overvaluation of this magnitude would persuadeanyone forced to use the official rate to switch away from export production. The sluggish performance ofexports over the last decade is unsurprising given this incentive structure. A comparison of the trends inthe RER and the NEER also shows how much the higher inflation rate (relative to its trading partners) hascontributed to the erosion of export profitability. The NEER has appreciated only by about 60% during thelast decade, while the RER has risen seven--fold.
2.13 The parallel exchange rate. The principal reform in the foreign exchange regime sinceFY90 has been the GOM's relaxation of the regulations concerning conversion of private sector export
3 The RER is computed as a trade-share weighted exchange rate adjusted by the differential CPIs in the varioustrading partners. Obviously, a number of such indices can be computed depending on how many trading partnersare included. In this Section, seven Asian economies, which collectively account for about two-thirds ofMyanmar's external trade, are included. On the other hand, the RER used in Chapter 1 was based on all tradingpartners. The smaller set of partners is chosen here to focus on Myanmar's competitiveness in the regionalcontext.
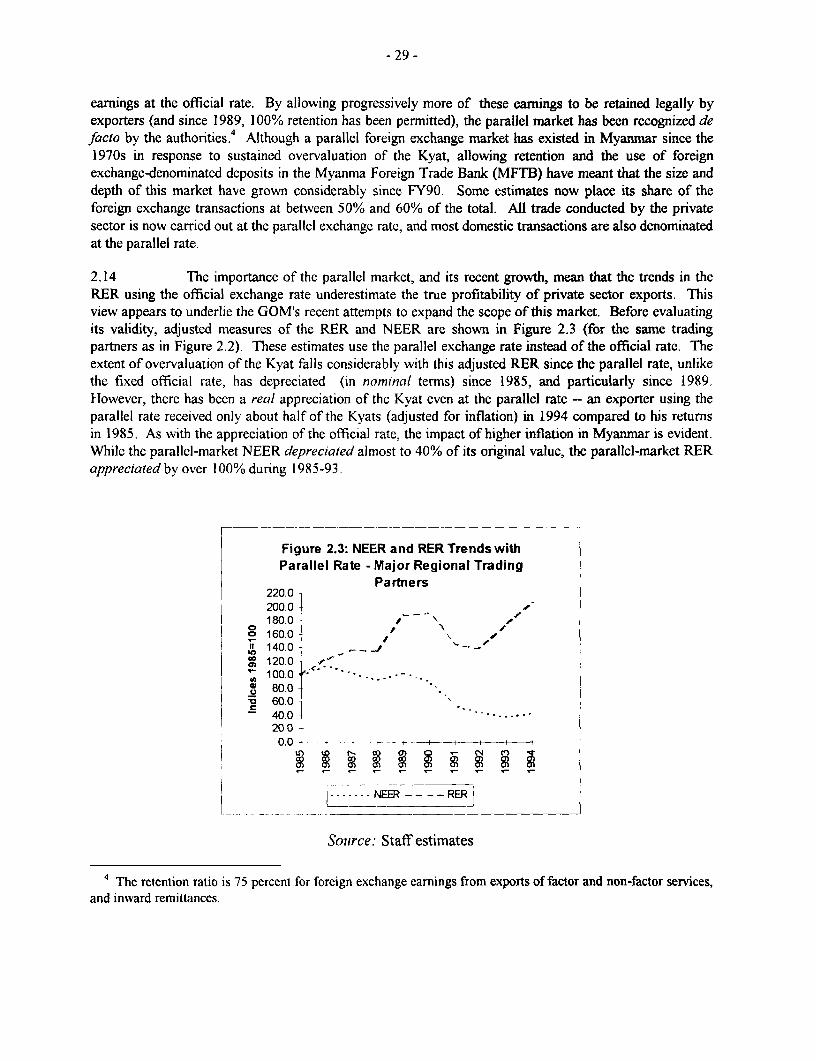
- 29 -
earnings at the official rate. By allowing progressively more of these earnings to be retained legally byexporters (and since 1989, 100% retention has been permitted), the parallel market has been recognized de
facto by the authorities.4 Although a parallel foreign exchange market has existed in Myanmar since the1970s in response to sustained overvaluation of the Kyat, allowing retention and the use of foreignexchange-denominated deposits in the Myanma Foreign Trade Bank (MFTB) have meant that the size anddepth of this market have grown considerably since FY90. Some estimates now place its share of theforeign exchange transactions at between 50% and 60% of the total. All trade conducted by the privatesector is now carried out at the parallel exchange rate, and most domestic transactions are also denominatedat the parallel rate.
2.14 The importance of the parallel market, and its recent growth, mean that the trends in theRER using the official exchange rate underestimate the true profitability of private sector exports. Thisview appears to underlie the GOM's recent attempts to expand the scope of this market. Before evaluatingits validity, adjusted measures of the RER and NEER are shown in Figure 2.3 (for the same tradingpartners as in Figure 2.2). These estimates use the parallel exchange rate instead of the official rate. Theextent of overvaluation of the Kyat falls considerably with this adjusted RER since the parallel rate, unlikethe fixed official rate, has depreciated (in nominal tenns) since 1985, and particularly since 1989.However, there has been a real appreciation of the Kyat even at the parallel rate -- an exporter using theparallel rate received only about half of the Kyats (adjusted for inflation) in 1994 compared to his returnsin 1985. As with the appreciation of the official rate, the impact of higher inflation in Myanmar is evident.While the parallel-market NEER depreciated almost to 40% of its original value, the parallel-market RERappreciated by over 100% during 1985-93.
Figure 2.3: NEER and RER Trends withParallel Rate - Major Regional Trading
Partners220.0200.0 -180.0 --
I 160.0 or XI I 140.0 .X
| 120.0100.080.0
n 60.040.0 .........20.0
0.0 + i
6 In eU D t- CD a) oo co coXa)c 10q
j <.~~~~NER----NEER
So?urce: Staff estimates
4 The retention ratio is 75 perceni for foreign exchange earnings from exports of factor and non-factor services,and inward remittances.
- 30 -
2.15 Hence, the Kyat has appreciated in real terms even when the parallel- market exchangerate is used. Although the extent of appreciation is lower than when the official rate is used, theprofitability of private-sector exports has still not recovered to its level of a decade ago. There are twoother problems with the GOM's efforts to improve export profitability by expanding the scope of theparallel market. First, while private-sector trade is conducted at the parallel exchange rate, the officialexchange rate is still used in valuing almost all the external transactions of the public sector -- both SEsand administrative departments. There has been no change in this system, and its means that the exports ofthe SE sector are undervalued substantially. Hence, even if SE managers were to become more profit-oriented, there would still be little incentive for them to make efforts to expand exports.
2.16 The second problem with this segmented exchange rate system from the perspective of theincentives for export is that it increases transactions costs for exporters. Since the parallel market is notrecognized officially, a multiplicity of parallel market exchange rates exists at any time.5 Moreover, itsunofficial status also means that it is unregulated, and therefore, transactions are risky and must be basedon personal links rather than the arms-length relationships that exist in more organized markets. Theserisks are heightened in the context of Myanmar, where memories of two rounds of large-scale
6demonetization in the 1980s remain vivid . For these reasons, allowing exporters to transact on anunofficial parallel market will not be enough to meet the authorities' goal of improving export profitability.W.hile access to the parallel market does reduce the tax on exports due to the overvaluation of the Kyat, thecomplexity and costs of conducting external trade in this way are so high as to make a substantialexpansion of private-sector exports impossible.
2.17 The GOM has attempted to reduce some of these costs of transacting in the parallelmarket. It has created tradeable Foreign Exchange Certificates (FECs), each of which is equivalent to adollar, and has allowed foreign exchange-denominated accounts in MFTB. However, the restrictionsplaced on these transactions has reduced their efficacy in easing external trade. Foreign exchange accountsmay only be opened by Myanma citizens with FECs or with foreign currency accompanied by a Customs'export declaration. Hence, those who engage in border trade (and, therefore, lack the necessary Customs'declaration) must first acquire FECs in return for their foreign exchange in order to open these accounts,which are then subject to a 10% tax. While this tax exists ostensibly to discourage the conversion offoreign exchange proceeds from smuggling, it reduces the attractiveness of these accounts for manypotential private exporters.
Export Restrictions and Taxes
2.18 With the economic reforms, quantitative restrictions on private sector exports have beeneliminated in most areas, the notable exceptions being paddy, rice, teak, most minerals and pearls. Themost serious restraint is the continued ban on paddy and rice exports. The full impact of this prohibition on
5 For instance, a quasi-official publication aimed at foreign investors in Myanmar reported that in July-1994,parallel foreign exchange market rates were as follows, in Kyats (K): 1 FEC = K105.00; $1 (cash) = K110.00; forunofficial inward remittances ("Handis"), $1 = K115: in pricing imported durables, $1 = K120; for dollarsavailable to import goods, $1 = K 135.
6 During each of these rounds of demonetization. in 1985 and 1987, about half the currency in circulation wasdeclared worthless.
- 31 -
the paddy sector is dealt with below in the next section on agricultural incentives. However, the continuedmaintenance of this ban is incompatible with the movement towards free trade. By allowing rice exportsonly by government agencies, the price that farmers receive for paddy is, on average, a sixth lower than itsexport parity price, which is the price that the government agencies receive on rice exports. Hence, this banallows the government, in effect, to tax paddy farmers to this extent (para. 2.42). This policy not onlyconstitutes a continued bias against paddy farmers, it also discriminates against the sector of the economywith the greatest potential to expand exports in the short and medium term. The success of Viet Nam inexpanding rice exports when it eliminated the export ban is instructive in this regard.
2.19 In December 1994, the commercial tax was amended to include a tax of 5% on the exportearnings of all private-sector businesses (including joint ventures), which is payable in foreign currency.Despite its relatively low rate, this tax only worsens the anti-export bias already implied by the exchangerate system.
Access to Imported Inputs
2.20 Evidence from countries that have successfully expanded exports indicates that ensuringaccess to imported inputs at world prices is just as important in encouraging exports as maintaining acompetitive exchange rate. Obviously, imported inputs are cheap in Kyat terms when valued at the officialexchange rate. However, the large excess demand for imports that arises in this context (without anadjustment of the official rate) can onlv be maintained by rationing the availability of foreign exchange.Since the economic reforms began, this rationing has operated by segmenting the foreign exchange market.The private sector has been allowed full retention of its export earnings but has no access to any of theforeign exchange available to the GOM.7 Hence, all private firms, including potential exporters, canimport inputs only if they can generate their ow-n foreign exchange earnings or can locate another privateexporter. While transfers from foreign exchange accounts are pernitted, these can only be made intoexisting accounts, not into new accounts -- a restriction that in practice reduces their usefulness.
2.21 The risks and transactions costs due to this segmentation have already been noted (para2.17). Obviously, trade financing is not available in this context, while the access of potential exporters toimported inputs remains limited even through the parallel market. And the situation is exacerbated by theimport licensing restrictions that remain. Even though private importers are not allocated any foreignexchange by the GOM, they are still required to import a proportion of items considered priority goods bythe GOM (as specified on Schedule A of the regulation, including fertilizers, cooking oil, livestock andmachinery), along with their own imports of non-prioritv items (specified in Schedule B) or other goods("neutral items').8 Although these imports from Schedule A can then be sold by the private importer at anyprice (ostensibly including the parallel market), this requirement effectively increases import costs evenfurther. Since importers are forced to source items about which they likely have little information, loss ofspecialization results, and importers cannot focus on locating the cheapest sources and most profitable mix
' The main official sources of foreign exchange are: the proceeds from exports by SEs, signature bonuses frommineral concessions, the 25% of foreign exchange service income and remittances that must be converted, and10% of overseas Myanma workers' earnings.
8 For items on Schedule B, importers must import goods on Schedule A of the same value. For "neutralitems", importers must import goods on Schedule A worth 50% of the value of the desired "neutral item" imports.
- 32 -
of their imports. The net result is that imported inputs for potential exporters are even more scarce andcostly.
2.22 The overvalued exchange rate not only limits access to imported inputs; it alsodiscriminates against the domestic production of many import substitutes. By keeping Kyat prices ofimports low, overvaluation makes it unprofitable for domestic producers to enter into import-substitutingactivities. This effect on incentives over the long period that the Kyat has been overvalued is the mainreason that import substitution industries have barely developed in Myanmar despite consistently high tariffprotection (para 2.23). While imports are obviously not freely available at their low official-market prices,the incentives for producing import substitutes are still determined in part by those prices. And theexistence of large scarcity rents associated with the resale of these imports means that it has been far moreprofitable to trade in these imports rather than attempt to produce them domestically.
2.23 In many countries making the transition to export-led growth, high and uneven tariffsconstitute a major constraint on exporters' access to imported inputs at world prices. The misalignment ofthe exchange rate, and its attendant implications on the availability of imports, means that the tariffstructure is a second-order problem for Myanmar at present. Since the assessable value of all imports(including private-sector imports) is calculated at the official exchange rate, it is so low, when evaluated ata realistic exchange rate, that the effective duty rate is much lower than the statutory rate. The trade-weighted average tariff rate in FY94 was about 52%.9 However, recognizing that all import values areunderstated about twenty-fold, the average effective tariff is about 2.5% -- easily among the lowest in thedeveloping world.
2.24 However, the reform of import tariffs should be a priority once the misalignment of theexchange rate has been corrected. The current structure is excessively complex with 23 duty bands, whichgo as high as 500%, in addition to a number of specific duties. Also, the current average tariff is too high,compared for instance to Myanmar's neighbors. For instance, the highest nominal tariff in Vietnam is200%, while the average unweighted tariff is about 12%, while the trade-weighted average tariff in China is32%. '° When a realistic exchange rate policy is adopted, the current high and variable tariffs would protectproduction for the domestic market from imports. Hence, they would impart an anti-export bias to thestructure of incentives and discourage exports by making it relatively more profitable to produce for thedomestic market. The other lesson from neighboring economies in export promotion is to combine tariffreform with implementation of schemes that provide drawbacks and rebates of import duties on importedinputs used by exporters and this too should be a priority once an exchange rate adjustment has beenaccomplished.
Support Services for Exporters
2.25 The final set of determinants of the efficacy of export promotion efforts is the quality ofsupport that exporters receive in such areas as information, finance, and transportation. There have beenefforts recently to address the problems faced by private exporters in some of these areas. For instance, theCustoms Department has sought to facilitate private-sector exports by: reducing the necessary
9 This computation is based on import data for FY94, which were provided by the Customs Department.
'0 Average tariffs are much lower in other East Asian countries, ranging in the early-1990s from less than 10%(unweighted average) in Malaysia to 28% (trade-weighted average) in Thailand. See, World Bank, (1994), fordetails.
- 33 -
documentation; allowing the use of provisional assessment and deferred control, which permits largeimporters to clear imports on the basis of their declared valuation; and, increasing its staff and upgradingtheir skills.
2.26 Despite these efforts, much more is required if the enabling environment in Myanmar is toimprove sufficiently to enable rapid export growth. The adequacy and quality of the infrastructure neededfor external trade are key problems. For instance, there are no bonded areas for exports that wouldfacilitate the clearance of exports, while pre-inspection of cargo is possible only for public sector exports.Yangon port, which is the country's principal port, is congested and with little mechanization, has littlecapability to handle container cargo. Moreover, since preference is given to public-sector shipments, longwaiting periods are common for private importers and exporters.
2.27 The segmentation of the foreign exchange market that has resulted from the misalignmentof the exchange rate and the scarcity of foreign exchange have also meant that trade finance is almostimpossible to obtain. MFTB, which is government-owned, essentially operates only as a foreign exchangeclearing house for the private sector. It provides exporters such services as opening letters of credit,negotiating export bills and arranging transfers, but does not provide trade finance. While four of therecently-opened private banks have been licensed to deal in foreign exchange, they do not currently financeexternal trade due to the lack of foreign exchange.
C. PROMOTING AGRICULTURE
2.28 In the past eight years, the system of socialist agricultural policies that had existed since1962 has been dismantled progressively. The forced procurement of output of many crops (includingpaddy, maize, pulses and oilseeds) by the government was discontinued in 1987, and private trading ofthese was permitted. In 1988, government control over cropping decisions was relaxed substantially, andexcept on paddy land (see para.2.54), farmers are now free to make their own cropping decisions. Exceptfor rice and some industrial crops, private exports of agricultural produce has also been permitted since1988. Finally, private sector provision of agricultural inputs is also now allowed.
2.29 These reforms have altered substantially the policy context in which the agricultural sectoroperates. The degree of government control over cropping, pricing and marketing decisions of farmers hasdiminished. Private marketing of agricultural produce is now well-developed in domestic markets, as wellas for exports of crops such as pulses and oilseeds. This section evaluates whether the bias against theagricultural sector that had existed under the previous policy regime has been eliminated due to thesereforms.
Structure and Recent Performance of the Agricultural Sector
2.30 The share of the agricultural sector in GDP has increased during FY91-95 and is nowalmost 55% (Appendix Table 1. 1). This increase reflects the more rapid recovery in agricultural outputsince the GOM initiated its reform measures. The importance of the agricultural sector is also evident inthat it provides employment to almost two-thirds of the work-force (Appendix Table 10.1).
2.31 Of Myanmar's total land area, about 13% was cultivated in FY94 -- an increase of about10% since FY89. Despite this increase in sown area, a substantial amount of land that is classifiedofficially as either fallow (2% of total land in FY95) or as wasteland suitable for cultivation (12% inFY95) still remain uncultivated. These areas provide one indicator of the substantial untapped potential foragricultural expansion in Myanmar. Cultivation is carried out predominantly by small farms. In terms of
- 34 -
the number of farms, almost 87% are less than 10 acres, and these account for about 59% of the totalcultivated area. Farms over 50 acres are less than I % of the total number and cultivate about 2% of totalland.
2.32 The major crop is paddy, which in FY95 was cultivated on about 15.3 million acres,representing an increase of over a quarter compared to FY85 and FY90. The other main trend duringFY91-95 was the doubling in the area under cultivation of pulses, which have now displaced sesame as thesecond-most widely cultivated crop (Appendix Table 9.1). However, in terms of the areas cultivated forthe four most important crops (sesame and groundnuts are the others), only paddy and pulses have morethan recovered to their FY85 levels. Similarly, for the two main industrial crops -- cotton and sugarcane --the areas cultivated in FY95 were still far below their FY85 levels. Hence, much of the expansion incultivated area since FY91, other than for paddy and pulses, has served only to regain the ground lostduring FY85-89.
2.33 These trends are mirrored in the crop production and yield data. Until FY93, paddyproduction remained below its FY85 level, and by FY95, it was about 32% higher. The production ofpulses rose spectacularly, by more than 130%, during FY85-95, after falling in the late-1980s. However,output levels of all other major crops, including groundnuts, cotton, and sugarcane are still below theirFY85 levels, despite recent increases. Moreover, yields of all crops including paddy have remainedstagnant (Appendix Table 9.2).
2.34 This brief overview of the Myanma agricultural sector illustrates its recent recovery buthighlights even more starkly its unfulfilled potential. With its rich physical endowments, considerablescope still exists for a substantial expansion in agricultural output. Soils are generally fertile, rainfall in themain paddy-growing regions is plentiful, cropping intensities are low, and the supply of cultivable land isfar from exhausted. The comparisons of yields and fertilizer utilization in Table 2.3 illustrate this potentialfor paddy. Even with the lowest intensity of fertilizer use in this group, Myanmnar's paddy yields are higherthan in Thailand, Bangladesh, and India, and not much lower than in Sri Lanka and Viet Nam. Its inabilityto exploit this agricultural potential since the 1960s reflects mainly inappropriate policies, in output pricingand marketing, input supply and land tenure.
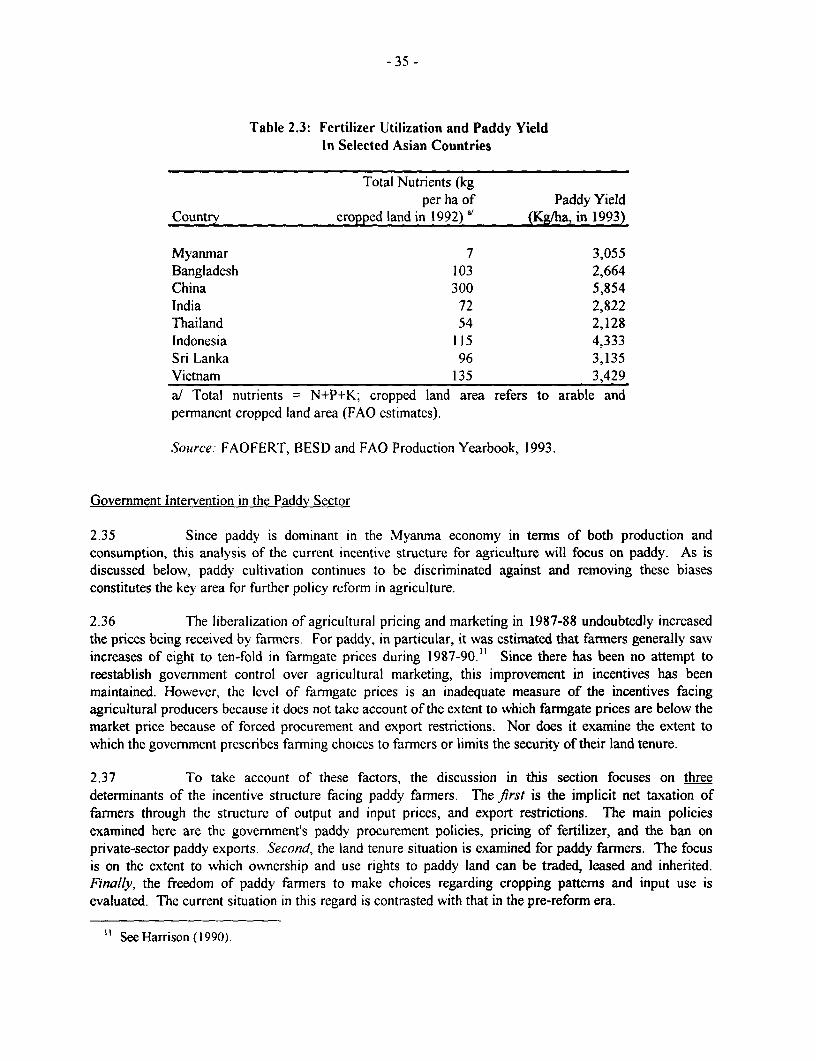
- 35 -
Table 2.3: Fertilizer Utilization and Paddy YieldIn Selected Asian Countries
Total Nutrients (kgper ha of Paddy Yield
Country cropped land in 1992) a/ (Kg/ha, in 1993)
Myanmar 7 3,055Bangladesh 103 2,664China 300 5,854India 72 2,822Thailand 54 2,128Indonesia 115 4,333Sri Lanka 96 3,135Vietnam 135 3,429a/ Total nutrients N+P+K; cropped land area refers to arable andpermanent cropped land area (FAO estimates).
Source: FAOFERT, BESD and FAO Production Yearbook, 1993.
Government Intervention in the Paddy Sector
2.35 Since paddy is dominant in the Myanma economy in terms of both production andconsumption, this analysis of the current incentive structure for agriculture will focus on paddy. As isdiscussed below, paddy cultivation continues to be discriminated against and removing these biasesconstitutes the key area for further policy reform in agriculture.
2.36 The liberalization of agricultural pricing and marketing in 1987-88 undoubtedly increasedthe prices being received by farmers. For paddy, in particular, it was estimated that farmers generally sawvincreases of eight to ten-fold in farrngate prices during 1987-90." Since there has been no attempt toreestablish government control over agricultural marketing, this improvement in incentives has beenmaintained. However, the level of farmgate prices is an inadequate measure of the incentives facingagricultural producers because it does not take account of the extent to which farmgate prices are below themarket price because of forced procurement and export restrictions. Nor does it examine the extent towhich the government prescribes farmning choices to farmers or limits the security of their land tenure.
2.37 To take account of these factors, the discussion in this section focuses on threedeterminants of the incentive structure facing paddy farmers. The first is the implicit net taxation offarmers through the structure of output and input prices, and export restrictions. The main policiesexamined here are the government's paddy procurement policies, pricing of fertilizer, and the ban onprivate-sector paddy exports. Second, the land tenure situation is examined for paddy farmers. The focusis on the extent to which ownership and use rights to paddy land can be traded, leased and inherited.Finally, the freedom of paddy farmers to make choices regarding cropping patterns and input use isevaluated. The current situation in this regard is contrasted with that in the pre-reform era.
" See Harrison (1990).
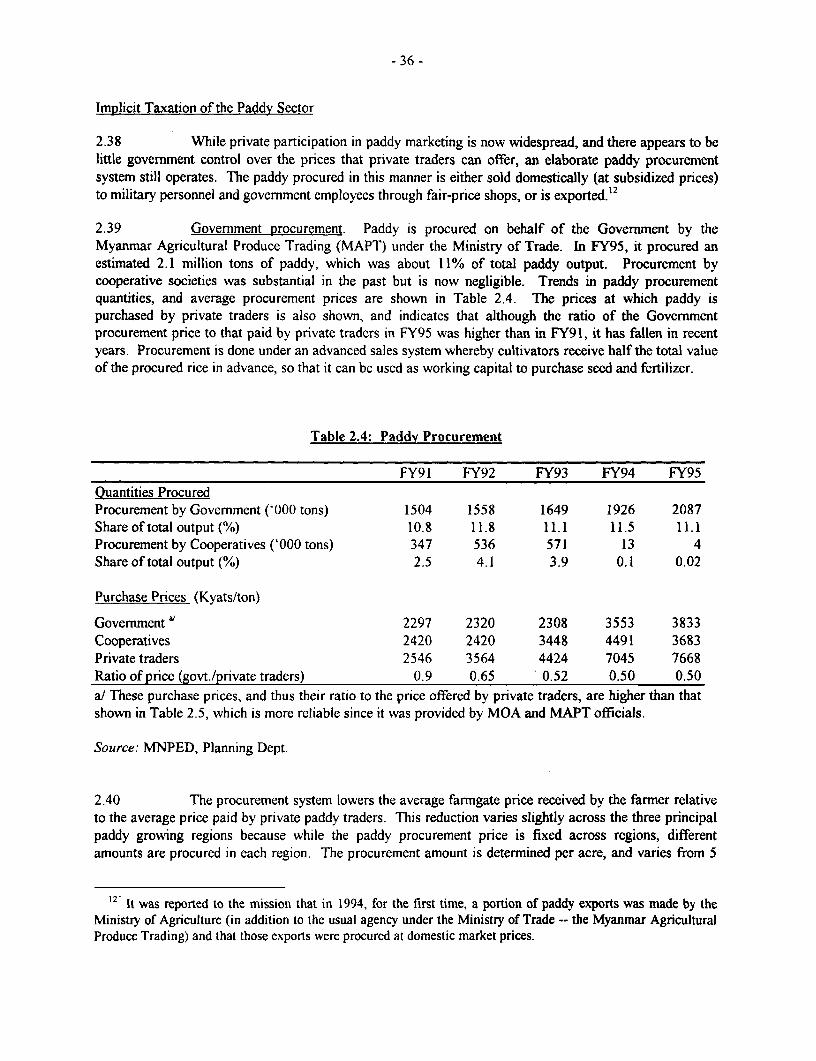
- 36 -
Implicit Taxation of the Paddy Sector
2.38 While private participation in paddy marketing is now widespread, and there appears to belittle government control over the prices that private traders can offer, an elaborate paddy procurementsystem still operates. The paddy procured in this manner is either sold domestically (at subsidized prices)to military personnel and govemment employees through fair-price shops, or is exported.'2
2.39 Govemment procurement. Paddy is procured on behalf of the Government by theMyanmar Agricultural Produce Trading (MAPT) under the Ministry of Trade. In FY95, it procured anestimated 2.1 million tons of paddy, which was about 11% of total paddy output. Procurement bycooperative societies was substantial in the past but is now negligible. Trends in paddy procurementquantities, and average procurement prices are shown in Table 2.4. The prices at which paddy ispurchased by private traders is also shown, and indicates that although the ratio of the Governmentprocurement price to that paid by private traders in FY95 was higher than in FY91, it has fallen in recentyears. Procurement is done under an advanced sales system whereby cultivators receive half the total valueof the procured rice in advance, so that it can be used as working capital to purchase seed and fertilizer.
Table 2.4: Paddy Procurement
FY91 FY92 FY93 FY94 FY95Quantities ProcuredProcurement by Govemment ('000 tons) 1504 1558 1649 1926 2087Shareoftotaloutput(%) 10.8 11.8 11.1 11.5 11.1Procurement by Cooperatives ('000 tons) 347 536 571 13 4Share of total output (%) 2.5 4.1 3.9 0.1 0.02
Purchase Prices (Kyats/ton)
Government a/ 2297 2320 2308 3553 3833Cooperatives 2420 2420 3448 4491 3683Private traders 2546 3564 4424 7045 7668Ratio of price (govt./private traders) 0.9 0.65 0.52 0.50 0.50a/ These purchase prices, and thus their ratio to the price offered by private traders, are higher than thatshown in Table 2.5, which is more reliable since it was provided by MOA and MAPT officials.
Source: MNPED, Planning Dept.
2.40 The procurement system lowers the average farmgate price received by the farmer relativeto the average price paid by private paddy traders. This reduction varies slightly across the three principalpaddy growing regions because while the paddy procurement price is fixed across regions, differentamounts are procured in each region. The procurement amount is determined per acre, and varies from 5
12 It was reported to the mission that in 1994, for the first time, a portion of paddy exports was made by theMinistry of Agriculture (in addition to the usual agency under the Ministry of Trade -- the Myanmar AgriculturalProduce Trading) and that those exports were procured at domestic market prices.
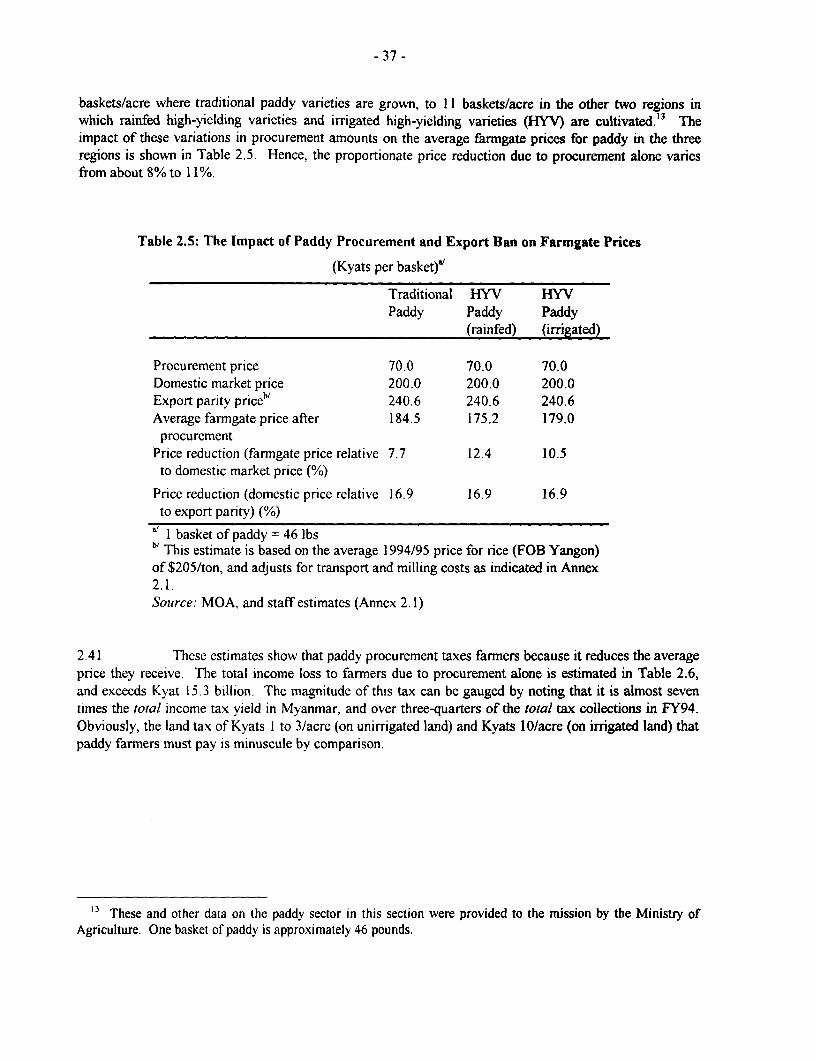
- 37 -
baskets/acre where traditional paddy varieties are grown, to 1 I baskets/acre in the other two regions inwhich rainfed high-yielding varieties and irrigated high-yielding varieties (HYV) are cultivated.'3 Theimpact of these variations in procurement amounts on the average farmgate prices for paddy in the threeregions is shown in Table 2.5. Hence, the proportionate price reduction due to procurement alone variesfrom about 8% to 11%.
Table 2.5: The Impact of Paddy Procurement and Export Ban on Farmgate Prices
(Kyats per basket)"'
Traditional HYV HYVPaddy Paddy Paddy
(rainfed) (irrigated)
Procurement price 70.0 70.0 70.0Domestic market price 200.0 200.0 200.0Export parity priceb/ 240.6 240.6 240.6Average farmgate price after 184.5 175.2 179.0
procurementPrice reduction (farmgate price relative 7.7 12.4 10.5
to domestic market price (%)
Price reduction (domestic price relative 16.9 16.9 16.9to export parity) (%)
1I basket of paddy = 46 lbsbt This estimate is based on the average 1994/95 price for rice (FOB Yangon)of $205/ton, and adjusts for transport and milling costs as indicated in Annex2.1.Souirce: MOA, and staff estimates (Annex 2.1)
2.41 These estimates show that paddy procurement taxes farmners because it reduces the averageprice they receive. The total income loss to farmers due to procurement alone is estimated in Table 2.6,and exceeds Kyat 15.3 billion. The magnitude of this tax can be gauged by noting that it is almost seventimes the total income tax yield in Myanmar, and over three-quarters of the total tax collections in FY94.Obviously, the land tax of Kyats I to 3/acre (on unirrigated land) and Kyats 10/acre (on irrigated land) thatpaddy farmers must pay is minuscule by comparison.
13 These and other data on the paddy sector in this section were provided to the mission by the Ministry ofAgriculture. One basket of paddy is approximately 46 pounds.
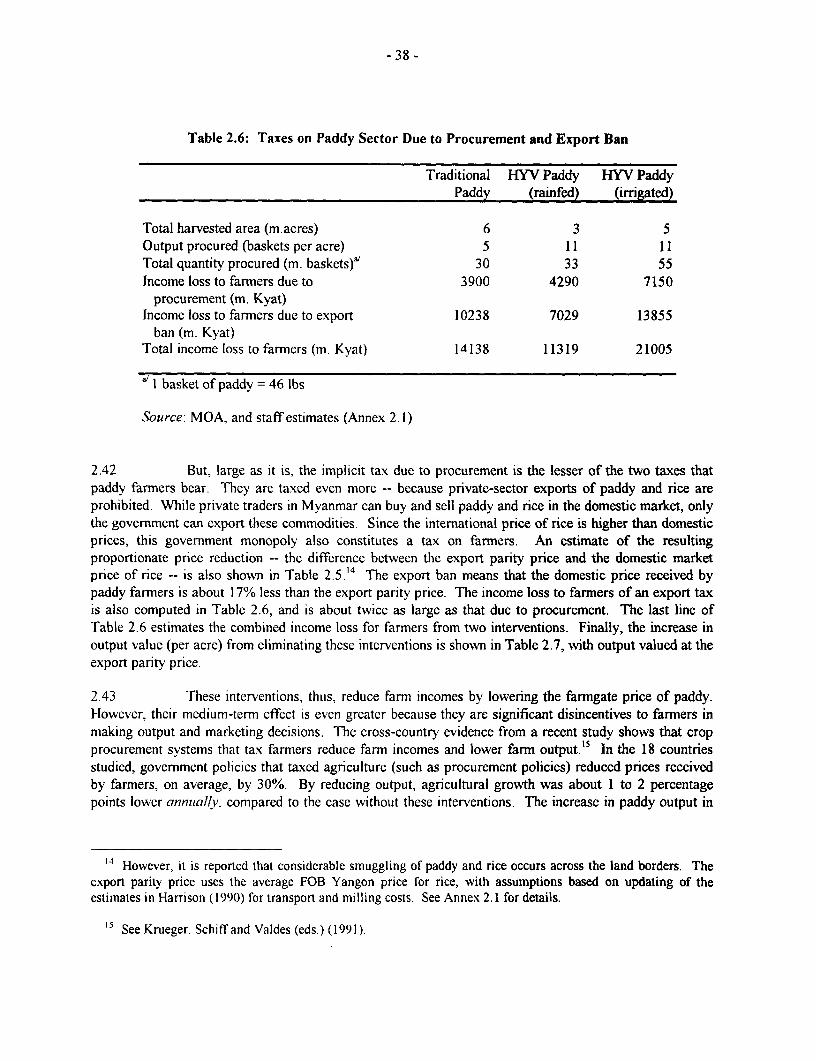
- 38 -
Table 2.6: Taxes on Paddy Sector Due to Procurement and Export Ban
Traditional HYV Paddy HYV PaddyPaddy (rainfed) (irrigated)
Total harvested area (m.acres) 6 3 5Output procured (baskets per acre) 5 11 11Total quantity procured (m. baskets)a' 30 33 55Income loss to farmers due to 3900 4290 7150
procurement (m. Kyat)Income loss to farmers due to export 10238 7029 13855
ban (m. Kyat)Total income loss to farmers (m. Kyat) 14138 11319 21005
a/ I basket of paddy = 46 lbs
Source: MOA. and staff estimates (Annex 2.1)
2.42 But, large as it is, the implicit tax due to procurement is the lesser of the two taxes thatpaddy farmers bear. They are taxed even more -- because private-sector exports of paddy and rice areprohibited. While private traders in Myanmar can buy and sell paddy and rice in the domestic market, onlythe government can export these commodities. Since the international price of rice is higher than domesticprices, this government monopoly also constitutes a tax on farmers. An estimate of the resultingproportionate price reduction -- the difference between the export parity price and the domestic marketprice of rice -- is also shown in Table 2.5.'4 The export ban means that the domestic price received bypaddy farmers is about 17% less than the export parity price. The income loss to farners of an export taxis also computed in Table 2.6, and is about twice as large as that due to procurement. The last line ofTable 2.6 estimates the combined income loss for farmers from two interventions. Finally, the increase inoutput value (per acre) from eliminating these interventions is shown in Table 2.7, with output valued at theexport parity price.
2.43 These interventions, thus, reduce farm incomes by lowering the farngate price of paddy.However, their medium-term effect is even greater because they are significant disincentives to farmers inmaking output and marketing decisions. The cross-country evidence from a recent study shows that cropprocurement systems that tax farmers reduce farmn incomes and lower farm output.'5 In the 18 countriesstudied, government policies that taxed agriculture (such as procurement policies) reduced prices receivedby farmers, on average, by 30%. By reducing output, agricultural growth was about 1 to 2 percentagepoints lower anntallv. compared to the case without these interventions. The increase in paddy output in
14 However, it is reported that considerable smuggling of paddy and rice occurs across the land borders. Theexport parity price uses the average FOB Yangon price for rice, with assumptions based on updating of theestimates in Harrison (1990) for transport and milling costs. See Annex 2.1 for details.
1 See Krueger. Schiff and Valdes (eds.) (1991).
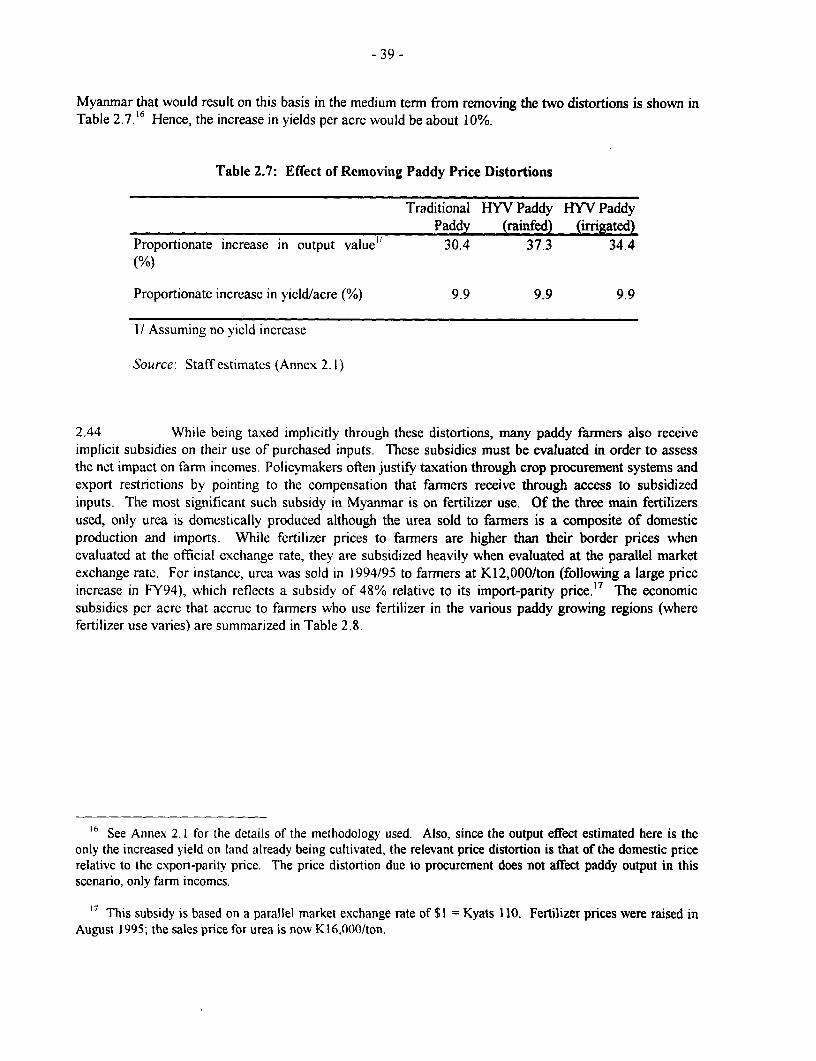
- 39 -
Myanrar that would result on this basis in the medium terrn from removing the two distortions is shown inTable 2.7. 16 Hence, the increase in yields per acre would be about 10%.
Table 2.7: Effect of Removing Paddy Price Distortions
Traditional HYV Paddy HYV PaddyPaddy (rainfed) (irrigated)
Proportionate increase in output value" 30.4 37.3 34.4(%)
Proportionate increase in yield/acre (%) 9.9 9.9 9.9
1/ Assuming no yield increase
Source: Staff estimates (Annex 2. 1)
2.44 While being taxed implicitly through these distortions, many paddy farmers also receiveimplicit subsidies on their use of purchased inputs. These subsidies must be evaluated in order to assessthe net impact on farm incomes. Policvmakers often justifv taxation through crop procurement systems andexport restrictions by pointing to the compensation that farmers receive through access to subsidizedinputs. The most significant such subsidy in Myanmar is on fertilizer use. Of the three main fertilizersused, only urea is domestically produced although the urea sold to farmers is a composite of domesticproduction and imports. While fertilizer prices to farmners are higher than their border prices whenevaluated at the official exchange rate, they are subsidized heavily when evaluated at the parallel marketexchange rate. For instance, urea was sold in 1994/95 to farmers at K12,000/ton (following a large priceincrease in FY94), which reflects a subsidy of 48% relative to its import-parity price.'7 The economicsubsidies per acre that accrue to farmers who use fertilizer in the various paddy growing regions (wherefertilizer use varies) are summarized in Table 2.8.
16 See Annex 2.1 for the details of the methodology used. Also, since the output effect estimated here is theonly the increased yield on land already being cultivated, the relevant price distortion is that of the domestic pricerelative to the export-parity price. The price distortion due to procurement does not affect paddy output in thisscenario, only fann incomes.
'' This subsidy is based on a parallel market exchange rate of $1 = Kyats 110. Fertilizer prices were raised inAugust 1995; the sales price for urea is now K 16,000/ton.
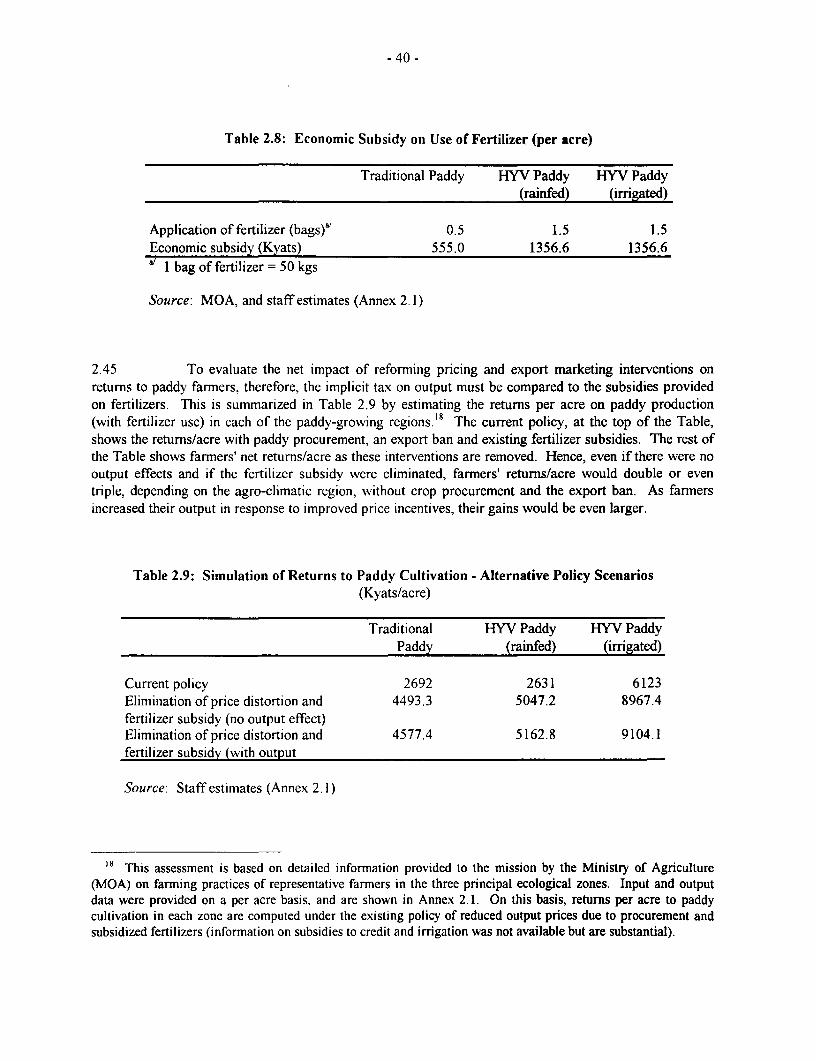
- 40 -
Table 2.8: Economic Subsidy on Use of Fertilizer (per acre)
Traditional Paddy HYV Paddy HYV Paddy(rainfed) (irrigated)
Application of fertilizer (bags)a' 0.5 1.5 1.5Economic subsidy (Kyats) 555.0 1356.6 1356.6a' 1 bag of fertilizer = 50 kgs
Source: MOA, and staff estimates (Annex 2.1)
2.45 To evaluate the net impact of reforming pricing and export marketing interventions onreturns to paddy farmners, therefore, the implicit tax on output must be compared to the subsidies providedon fertilizers. This is summarized in Table 2.9 by estimating the returns per acre on paddy production(with fertilizer use) in each of the paddy-growing regions." The current policy, at the top of the Table,shows the returns/acre with paddy procurement, an export ban and existing fertilizer subsidies. The rest ofthe Table shows farmers' net returns/acre as these interventions are removed. Hence, even if there were nooutput effects and if the fertilizer subsidy were eliminated, farmers' returns/acre would double or eventriple, depending on the agro-climatic region, without crop procurement and the export ban. As farmersincreased their output in response to improved price incentives, their gains would be even larger.
Table 2.9: Simulation of Returns to Paddy Cultivation - Alternative Policy Scenarios(Kyats/acre)
Traditional HYV Paddy HYV PaddyPaddy (rainfed) (irrigated)
Current policy 2692 2631 6123Elimination of price distortion and 4493.3 5047.2 8967.4fertilizer subsidy (no output effect)Elimination of price distortion and 4577.4 5162.8 9104.1fertilizer subsidy (with output
Source: Staff estimates (Annex 2. 1)
)8 This assessment is based on detailed information provided to the mission by the Ministry of Agriculture(MOA) on farming practices of representative farrners in the three principal ecological zones. Input and outputdata were provided on a per acre basis, and are shown in Annex 2.1. On this basis, returns per acre to paddycultivation in each zone are computed under the existing policy of reduced output prices due to procurement andsubsidized fertilizers (information on subsidies to credit and irrigation was not available but are substantial).
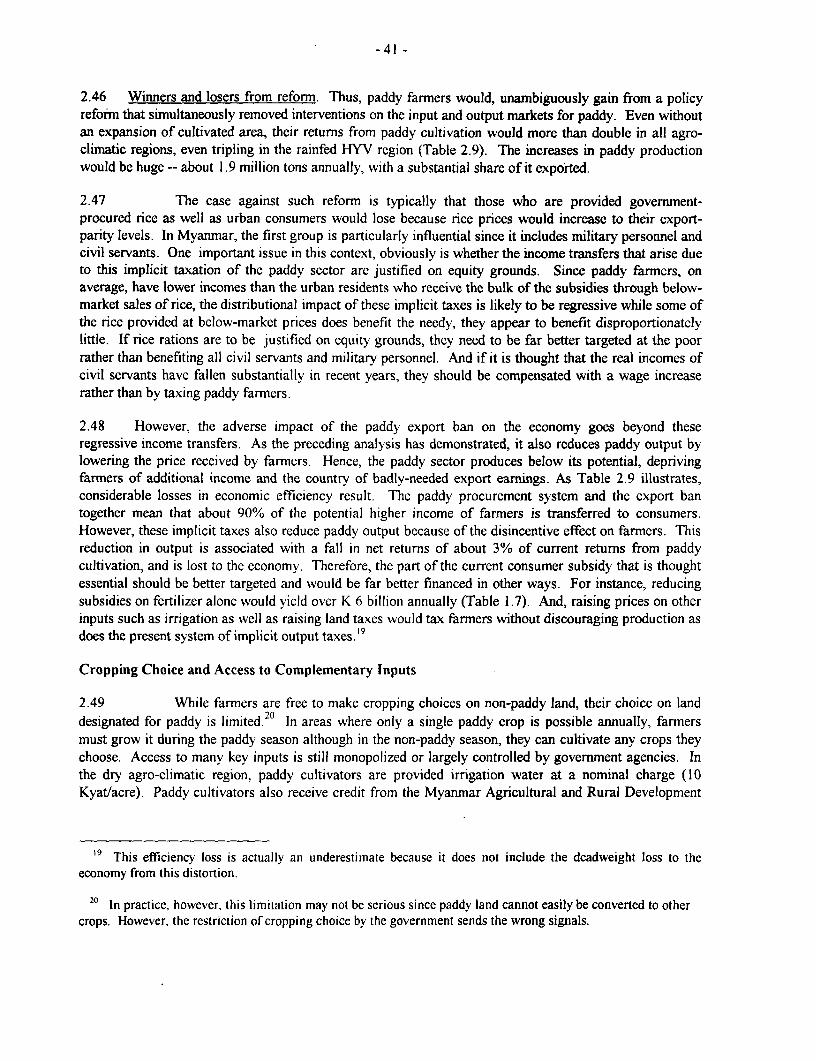
- 41 -
2.46 Winners and losers from reform. Thus, paddy farmers would, unambiguously gain from a policyreform that simultaneously removed interventions on the input and output markets for paddy. Even withoutan expansion of cultivated area, their returns from paddy cultivation would more than double in all agro-climatic regions, even tripling in the rainfed HYV region (Table 2.9). The increases in paddy productionwould be huge -- about 1.9 million tons annually, with a substantial share of it exported.
2.47 The case against such reform is typically that those who are provided government-procured rice as well as urban consumers would lose because rice prices would increase to their export-parity levels. In Myanmar, the first group is particularly influential since it includes military personnel andcivil servants. One important issue in this context, obviously is whether the income transfers that arise dueto this implicit taxation of the paddy sector are justified on equity grounds. Since paddy farmers, onaverage, have lower incomes than the urban residents who receive the bulk of the subsidies through below-market sales of rice, the distributional impact of these implicit taxes is likely to be regressive while some ofthe rice provided at below-market prices does benefit the needy, they appear to benefit disproportionatelylittle. If rice rations are to be justified on equity grounds, they need to be far better targeted at the poorrather than benefiting all civil servants and military personnel. And if it is thought that the real incomes ofcivil servants have fallen substantially in recent years, they should be compensated with a wage increaserather than by taxing paddy farmers.
2.48 However, the adverse impact of the paddy export ban on the economy goes beyond theseregressive income transfers. As the preceding analysis has demonstrated, it also reduces paddy output bylowering the price received by farmers. Hence, the paddy sector produces below its potential, deprivingfarmers of additional income and the country of badly-needed export earnings. As Table 2.9 illustrates,considerable losses in economic efficiency result. The paddy procurement system and the export bantogether mean that about 90% of the potential higher income of farmers is transferred to consumers.However, these implicit taxes also reduce paddy output because of the disincentive effect on farmers. Thisreduction in output is associated with a fall in net returns of about 3% of current returns from paddycultivation, and is lost to the economy. Therefore, the part of the current consumer subsidy that is thoughtessential should be better targeted and would be far better financed in other ways. For instance, reducingsubsidies on fertilizer alone would yield over K 6 billion annually (Table 1.7). And, raising prices on otherinputs such as irrigation as well as raising land taxes would tax farmers without discouraging production asdoes the present system of implicit output taxes.'9
Cropping Choice and Access to Complementary Inputs
2.49 While farmers are free to make cropping choices on non-paddy land, their choice on landdesignated for paddy is limited.20 In areas where only a single paddy crop is possible annually, farmersmust grow it during the paddy season although in the non-paddy season, they can cultivate any crops theychoose. Access to many key inputs is still monopolized or largely controlled by government agencies. Inthe dry agro-climatic region, paddy cultivators are provided irrigation water at a nominal charge (10Kyat/acre). Paddy cultivators also receive credit from the Myanmar Agricultural and Rural Development
'9 This efficiency loss is actually an underestimate because it does not include the deadweight loss to theeconomy from this distortion.
20 In practice, however, this limitation may not be scrious since paddy land cannot easily be converted to othercrops. However, the restriction of cropping choice by the government sends the wrong signals.
- 42 -
Bank (MARDB) at the rate of Kyats 1000/paddy acre (for high yield paddy) and Kyat 700/acre (for otherpaddy) or at an annual nominal interest rate of 18%.
2.50 There are two key problems with the present situation as it affects the incentives offarmers. First, the government still exercises substantial control over the decisions of farmers. For creditand fertilizer, this control is applied either directly through the provision of these inputs throughgovernment agencies. In other instances, the control is indirect, as with the pressure from the quasi-officialvillage committees or access to irrigation water in dry areas to ensure that paddy is grown on the designatedland. Similarly, no collateral is required on MARDB loans, but the endorsement of the village committee isrequired. In this sense, therefore, the autonomy of farmers in making cropping decisions is still impingedupon.
2.51 The second problem is that continued subsidies and other distortions have prevented theexpansion of private-sector involvement in provision of inputs. Therefore, shortages of these inputscontinue to constrain production. Large official subsidies on fertilizers and seeds mean that it is notprofitable for the private sector to consider supplying these on a sustained basis. And, the lack of clearland rights as well as the provision of subsidized agricultural credit mean that private banks have littleinterest to diversify into such lending.
Landownership and Use Rights
2.52 All agricultural land in Myanmar is owned by the state but cannot be confiscated by thegovernment. Cultivators have use rights on land, which can be passed on to their sons for cultivation. Ifland is not cultivated by these successors, it reverts back to the state through the village committees. Inaddition, all land on which paddy can be grown is officially designated as paddy land (about half the totalcultivated area). On paddy land, use rights cannot be rented or sold. Use rights to land not designated forpaddy, which includes land used for plantations, orchards and non-paddy crops, can be traded or rented.
2.53 Such ambiguity of land tenure has two adverse effects on agricultural productivity thatneed to be addressed in the medium term. First, the inability to trade or lease paddy land means that muchof the cultivated land may not be operated efficiently. Since transfers of use rights are difficult, if notimpossible, land is either allowed to be fallow or is operated by farmers who lack the skills, motivation oraccess to complementary inputs. This constraint is an important reason that a large amount of good-qualityland remains uncultivated.
2.54 The second adverse impact on productivity is because unclear use rights to land reduce theincentive of farmers to undertake long-term investments such as erosion control. Since it is difficult forfarmers to determine whether they will be able to get the returns from such long-lived investments, mostwill opt not to make them. Evidence from Thailand, for instance, strongly supports this link between moresecure land tenure and investments in land improvements.2'
D. ENERGIZING THE PRIVATE SECTOR
2.55 The private sector in Myanmar is beginning to coalesce following the "Open Door"economic policies initiated by the GOM in 1988. In the quarter century that preceded these reforms, therole of the private sector outside agriculture was tightly controlled. In 1962, all medium and large-scale
21 See Feder et.al. (1988).
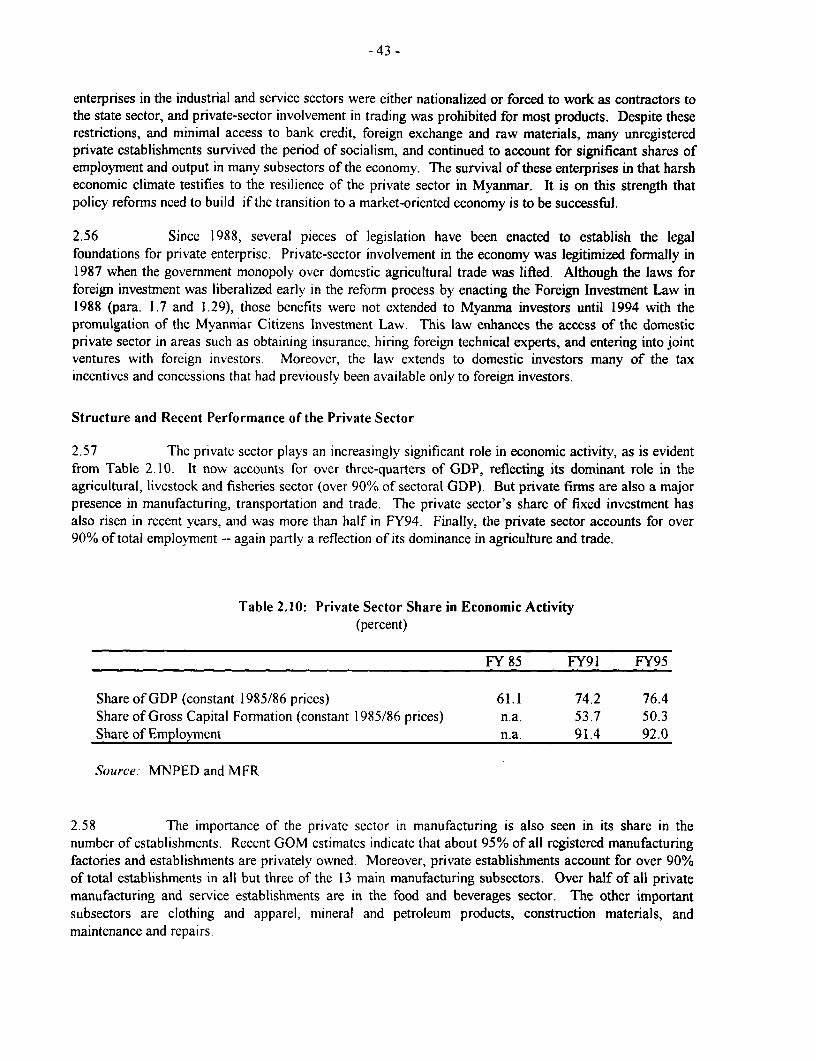
- 43 -
enterprises in the industrial and service sectors were either nationalized or forced to work as contractors tothe state sector, and private-sector involvement in trading was prohibited for most products. Despite theserestrictions, and minimal access to bank credit, foreign exchange and raw materials, many unregisteredprivate establishments survived the period of socialism, and continued to account for significant shares ofemployment and output in many subsectors of the economy. The survival of these enterprises in that harsheconomic climate testifies to the resilience of the private sector in Myanmar. It is on this strength thatpolicy reforms need to build if the transition to a market-oriented economy is to be successful.
2.56 Since 1988, several pieces of legislation have been enacted to establish the legalfoundations for private enterprise. Private-sector involvement in the economy was legitimized forrnally in1987 when the government monopoly over domestic agricultural trade was lifted. Although the laws forforeign investment was liberalized early in the reform process by enacting the Foreign Investment Law in1988 (para. 1.7 and 1.29), those benefits were not extended to Myanma investors until 1994 with thepromulgation of the Myanmar Citizens Investment Law. This law enhances the access of the domesticprivate sector in areas such as obtaining insurance, hiring foreign technical experts, and entering into jointventures with foreign investors. Moreover, the lawv extends to domestic investors many of the taxincentives and concessions that had previouslv been available only to foreign investors.
Structure and Recent Performance of the Private Sector
2.57 The private sector plays an increasingly significant role in economic activity, as is evidentfrom Table 2.10. It now accounts for over three-quarters of GDP, reflecting its dominant role in theagricultural, livestock and fisheries sector (over 90% of sectoral GDP). But private firms are also a majorpresence in manufacturing, transportation and trade. The private sector's share of fixed investment hasalso risen in recent years, and was more than half in FY94. Finally, the private sector accounts for over90% of total employment -- again partly a reflection of its dominance in agriculture and trade.
Table 2.10: Private Sector Share in Economic Activity(percent)
FY 85 FY91 FY95
Share of GDP (constant 1985/86 prices) 61.1 74.2 76.4Share of Gross Capital Formation (constant 1985/86 prices) n.a. 53.7 50.3Share of Employment n.a. 91.4 92.0
Source MNPED and MFR
2.58 The importance of the private sector in manufacturing is also seen in its share in thenumber of establishments. Recent GOM estimates indicate that about 95% of all registered manufacturingfactories and establishments are privately owvned. Moreover, private establishments account for over 90%of total establishments in all but three of the 13 main manufacturing subsectors. Over half of all privatemanufacturing and service establishments are in the food and beverages sector. The other importantsubsectors are clothing and apparel, mineral and petroleum products, construction materials, andmaintenance and repairs.
- 44 -
2.59 Despite their dominant share, almost all private establishments are small, employing lessthan 10 workers. In FY95, only 81 private establishments (of about 45,000) employed between 51-100workers and another 43 employed over 100 workers. Hence, private establishments accounted only for aquarter of those that employed between 51 -100 workers, and less than a tenth of all establishments withover 100 workers.
2.60 The good news, therefore, is that a vibrant domestic private sector still exists in Myanmar.However, decades of control and discrimination have meant that it is made up of a large number of verysmall firms. Moreover, the continued dominance of the state sector in many activities has meant that it isnot easy for private firms to expand. Finally, by virtue of their size and lack of experience, the privatesector remains relatively unsophisticated, especially in comparison to private businesses in most other Eastand South Asian countries.
2.61 Foreiign direct investment. With the enactment of the Foreign Investment Law in 1988, theMyanma economy has been opened to foreign investment. Total foreign direct investment (FDI) flowsduring FY90-95 have totaled $871.5 million (see Appendix Tables 8.3 to 8.5 for details). These FDI flowshave come from industrial countries as well as several East Asian countries. The largest sources of FDIduring FY91 -95 have been the United States (31 %), the Netherlands (1 1%), Korea (11%), Japan (9%), andFrance (9%) with smaller shares from the United Kingdom, Thailand, and Singapore.2 2 The significance ofthese FDI flows can be seen by noting that, even at the overvalued official exchange rate, they account foralmost 3% of gross investment during the period. Since all FDI flows are in foreign exchange, their trueimportance is several times larger.
2.62 The bulk of these FDI flows have gone into natural-resource sectors, which is notsurprising in light of Myanmar's untapped natural wealth. About 85% of FDI has been in oil and gasexploration, and mining. The other significant sector into which FDI has flowed is hotels (10%),responding again to untapped potential and the GOM's desire to expand tourism. Manufacturing activitieshave received only about 5.5% of total FDI during FY91-95.
Policy Issues in Leveling the Playing Field for Private Enterprises
2.63 Since private enterprises remain small and their capabilities relatively weak, significantpolicy efforts will have to be directed towards strengthening them if the private sector is to be capable oftaking the lead in economic activity. An important aspect will be to strengthen institutions that providesupport and promotional services to private enterprises as well as to reform regulatory requirements.Those issues will be analyzed in the next Chapter in evaluating the relative roles of the public and privatesector. This Section focuses on assessing another key determinant of private sector development -- theextent to which domestic private enterprises operate on a "level playing field" with State Enterprises (SEs).Specifically, the focus is on the relative access of private enterprises and SEs to three sets of critical inputs-- credit, infrastructure and public services, and imports.
22 These shares refer to actual foreign investment rather than foreign investment approvals that signal onlyintentions to invest. Although actual investments from Singapore and Thailand have become more important inthe last two years, FDI from the industrial countries remains significant.
- 45 -
Access to Credit
2.64 The availability of credit, both for working capital needs and for investment, is obviouslycritical to the operation of the private sector. Until the role of the private sector was legitimized, its accessto credit was constrained severely. In FY91, for instance, credit to the private sector (excluding co-operatives) was less than 2% of total domestic credit. The few loans that were made to the private sectorconsisted mainly of personal and professional loans to individuals.
2.65 This situation began to improve in 1990 with the enactment of the Financial InstitutionsLaw. The private sector's share in total domestic credit has risen continuously since FY90, and was about14% in FY95. Similarly, the Myanma Economic Bank, the state-owned (and dominant) commercial banknow makes almost 40% of its total loans in FY95 to the private sector. The private sector's access to long-term credit to undertake capital investment, however, remains severely constrained. The current practiceamong commercial banks of rolling over loans to extend the term is both costly and time consuming.Outside the banking sector, the capital market is virtually non-existent. And the informal capital marketoffers only limited opportunities -- interest rates range between 3 to 5% per month and only short-termloans are made.
2.66 The Financial Institutions Law has also permitted the operation of domestically-ownedprivate banks. Before 1962. Myanmar had 14 foreign and 10 domestic private banks, and these accountedfor two-thirds of all deposits before they were nationalized. Since 1990, 15 private banks have beenestablished and are currently in operation, and they now account for 7% of total deposits. Four of thesebanks are permitted to transact in foreign exchange, including the maintenance of foreign exchangedeposits. The operation of private banks also helps improve the access of private businesses to credit sincethese banks are more likely to be run along commercial lines. However, domestic private banks still face aserious handicap because, unlike the state-owned banks, they must pay a 15% withholding tax on theirsavings deposits.
2.67 Despite these improvements, the availability of credit to private businesses is still squeezedby the efforts of the Central Bank to control the expansion of credit, which have been made more difficult
&23by the recent increase in the fiscal deficit. While private-sector credit (other than cooperatives) hasexpanded very rapidly since FY90 (and more rapidly than public-sector credit), that pace reflects mainlythe small base on which those increases occurred. And, the rate of increase slowed substantially in FY95(to about 37% from 73% in FY92 and almost 100% in FY93). These trends show that as the private sectorexpands, and its need for credit grows, these demands are unlikely to be met while curbing monetarygrowth satisfactorily unless the public sector's credit demands (primarily to finance the fiscal deficit) arereduced.
2.68 Apart from this general sense in which private sector credit demand is being crowded outby the needs of the public sector, there is another sense in which SEs are treated differently from privatebusinesses. As discussed in greater detail in the next Chapter, since 1989, the working capital andinvestment needs of SEs are now financed directly from the government budget. Given the GOM's fiscaldifficulties, the capital budgets of SEs are scrutinized closely. Nevertheless, those that run operatingdeficits receive interest-free credit. This system provides a significant subsidy (see Table 3.7 forestimates), and further impairs the ability of private businesses to compete effectively with the SE sector.
23 CBM officials explained that credit expansion was controlled not with quantitative credit ceilings but ratherby using other monetary policy tools such as reserve requirements and liquidity ratios.
- 46 -
Access to Infrastructure and Public Services
2.69 Poor physical infrastructure. Adequate infrastructure, and equitable access to it, areessential to private-sector development. Years of neglect, lack of investment, and mismanagement havemeant that Myanmar's infrastructure facilities are grossly inadequate to meet the needs of a modemindustrial economy. Scarcity of power and energy supplies, poor transport networks and antiquatedteleconmmunications facilities characterize the present situation. The comparisons of some indicators ofinfrastructure capacity illustrate just how far Myanmar must go to catch up with its neighbors in thisregard (Table 2.11).
Table 2.11: Infrastructure Provision in Selected Asian Countries
TelephoneElectricity Paved roads main lines
Energy use production per million per thousandper capita per capita persons persons
1992 1992 1992 1992(kgoe) (kwh.) (kms.) (number)
Myanmar 42 61 210 2Bangladesh 59 79 59 2China 600 647 749 10Indonesia 303 233 160 8Thailand 614 1000 841 31Viet Nam 100 139 187 2
Note: Data for Viet Nam on energy use per capita is for 1990; for China on paved roads is for1990.
Source: MNPED; World Bank, World Development Report. 1995
2.70 Unequal access. But even more problematic from the perspective of private businesses isthat they have limited access to the little infrastructure that does exist compared to SEs and governmentdepartments. Systematic evidence on these problems is difficult to obtain but the Myanmar Chamber ofCommerce, which is the oniv organization that represents domestic private businesses, provided someexamples.24 These cases serve to indicate the dimensions of the problems faced. It usually takes privateentrepreneurs a year or longer to obtain a telephone connection; to get a new water connection for anindustrial site is near-impossible; while a new electricity connection is both difficult and expensive tosecure. Similarly, SEs and government departments can get goods cleared through the port without delaysand have access to warehousing facilities, unlike private businesses.
24 During the mission in November 1994, a short questionnaire was designed (Annex 2.2), with the goal ofdetermining the severity of some of these and other constraints on private sector activity. Although the Chamberof Commerce agreed to distribute the survey to a sample of its members, only one response was communicated tothe mission through the GOM. However, follow-up discussions with representatives of the Chamber of Commercein August 1995 indicated little improvement had occurred in private-sector access to these services.
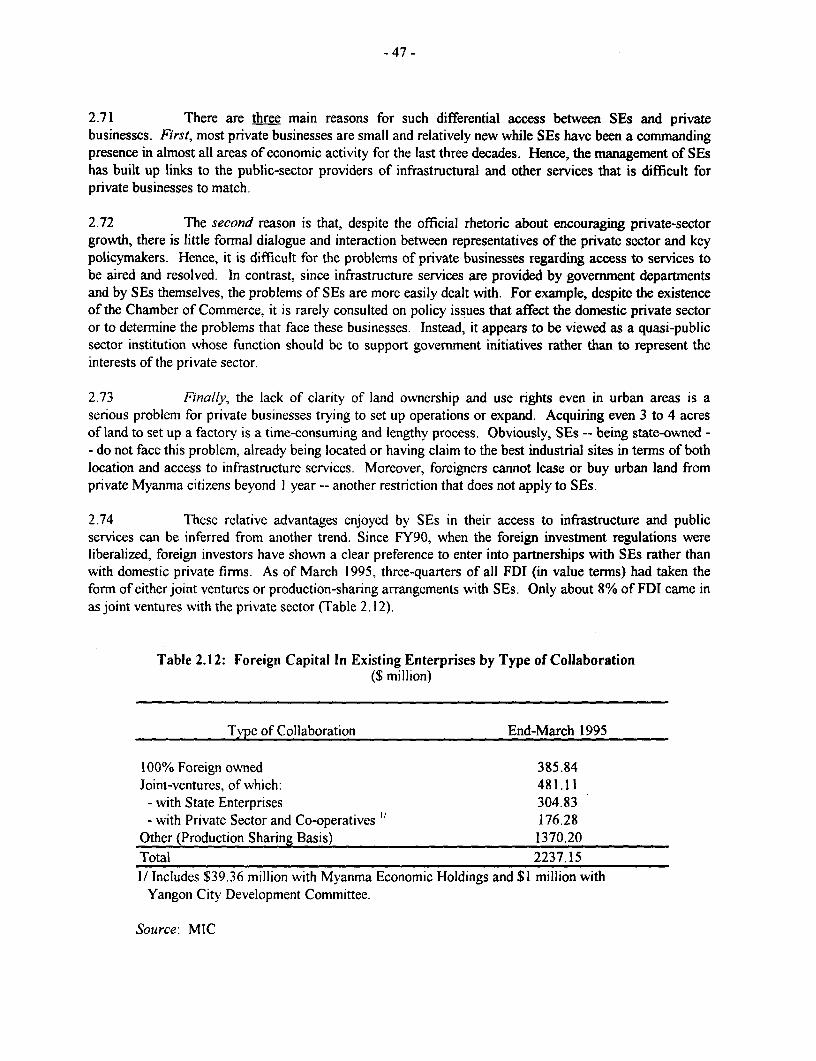
- 47 -
2.71 There are three main reasons for such differential access between SEs and privatebusinesses. First, most private businesses are small and relatively new while SEs have been a commandingpresence in almost all areas of economic activity for the last three decades. Hence, the management of SEshas built up links to the public-sector providers of infrastructural and other services that is difficult forprivate businesses to match.
2.72 The second reason is that, despite the official rhetoric about encouraging private-sectorgrowth, there is little formal dialogue and interaction between representatives of the private sector and keypolicymakers. Hence, it is difficult for the problems of private businesses regarding access to services tobe aired and resolved. In contrast, since infrastructure services are provided by government departmentsand by SEs themselves, the problems of SEs are more easily dealt with. For example, despite the existenceof the Chamber of Commerce, it is rarely consulted on policy issues that affect the domestic private sectoror to determine the problems that face these businesses. Instead, it appears to be viewed as a quasi-publicsector institution whose function should be to support government initiatives rather than to represent theinterests of the private sector.
2.73 Finally, the lack of clarity of land ownership and use rights even in urban areas is aserious problem for private businesses trying to set up operations or expand. Acquiring even 3 to 4 acresof land to set up a factorv is a time-consuming and lengthv process. Obviously, SEs -- being state-owned -- do not face this problem, already being located or having claim to the best industrial sites in terms of bothlocation and access to infrastructure services. Moreover, foreigners cannot lease or buy urban land fromprivate Myanma citizens beyond 1 year -- another restriction that does not apply to SEs.
2.74 These relative advantages enjoyed by SEs in their access to infrastructure and publicservices can be inferred from another trend. Since FY90, when the foreign investment regulations wereliberalized, foreign investors have shown a clear preference to enter into partnerships with SEs rather thanwith domestic private firms. As of March 1995. three-quarters of all FDI (in value terns) had taken theforn of either joint ventures or production-sharing arrangements with SEs. Only about 8% of FDI came inas joint ventures with the private sector (Table 2.12).
Table 2.12: Foreign Capital In Existing Enterprises by Type of Collaboration($ million)
Type of Collaboration End-March 1995
100% Foreign owned 385.84Joint-ventures, of which: 481.11
- with State Enterprises 304.83- with Private Sector and Co-operatives 176.28
Other (Production Sharing Basis) 1370.20Total 2237.15I/ Includes $39.36 million with Myanma Economic Holdings and $1 million with
Yangon City Development Committee.
Source: MIC
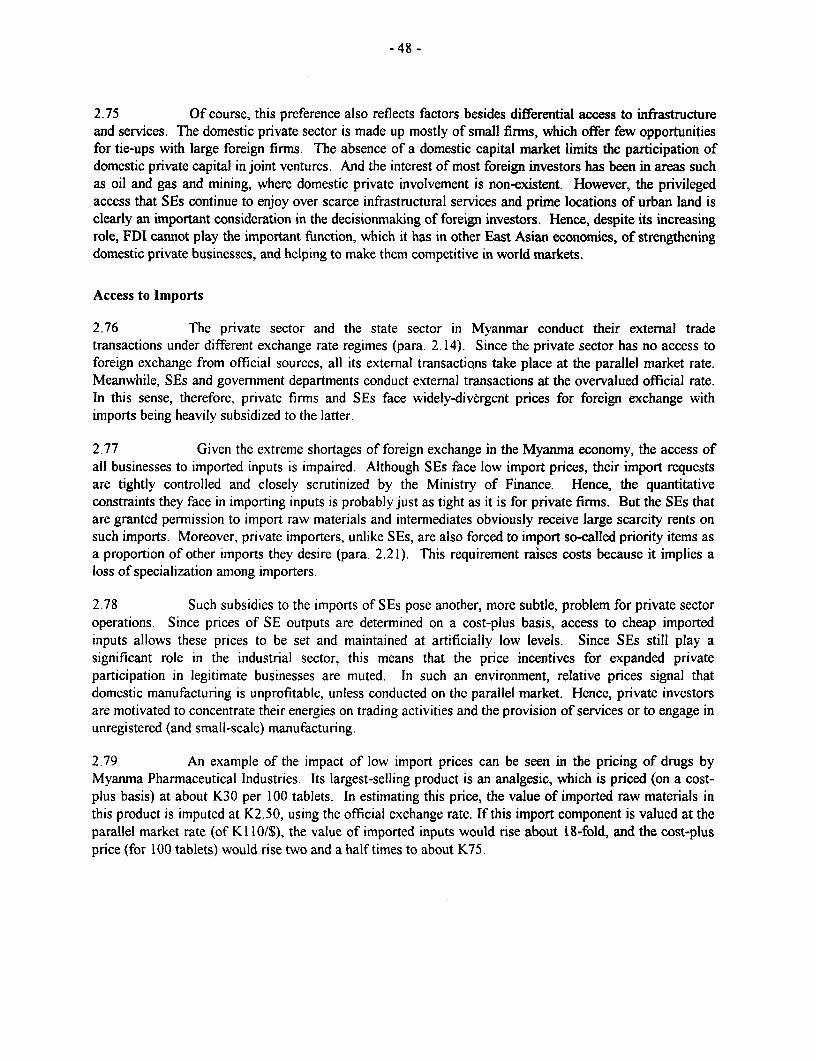
- 48 -
2.75 Of course, this preference also reflects factors besides differential access to infrastructureand services. The domestic private sector is made up mostly of small firms, which offer few opportunitiesfor tie-ups with large foreign firms. The absence of a domestic capital market limits the participation ofdomestic private capital in joint ventures. And the interest of most foreign investors has been in areas suchas oil and gas and mining, where domestic private involvement is non-existent. However, the privilegedaccess that SEs continue to enjoy over scarce infrastructural services and prime locations of urban land isclearly an important consideration in the decisionmaking of foreign investors. Hence, despite its increasingrole, FDI cannot play the important function, which it has in other East Asian economies, of strengtheningdomestic private businesses, and helping to make them competitive in world markets.
Access to Imports
2.76 The private sector and the state sector in Myanmar conduct their extemal tradetransactions under different exchange rate regimes (para. 2.14). Since the private sector has no access toforeign exchange from official sources, all its external transactions take place at the parallel market rate.Meanwhile, SEs and government departments conduct external transactions at the overvalued official rate.In this sense, therefore, private firms and SEs face widely-divergent prices for foreign exchange withimports being heavily subsidized to the latter.
2.77 Given the extreme shortages of foreign exchange in the Myanma economy, the access ofall businesses to imported inputs is impaired. Although SEs face low import prices, their import requestsare tightly controlled and closely scrutinized by the Ministry of Finance. Hence, the quantitativeconstraints they face in importing inputs is probably just as tight as it is for private firms. But the SEs thatare granted permission to import raw materials and intermediates obviously receive large scarcity rents onsuch imports. Moreover, private importers, unlike SEs, are also forced to import so-called priority items asa proportion of other imports they desire (para. 2.21). This requirement raises costs because it implies aloss of specialization among importers.
2.78 Such subsidies to the imports of SEs pose another, more subtle, problem for private sectoroperations. Since prices of SE outputs are determined on a cost-plus basis, access to cheap importedinputs allows these prices to be set and maintained at artificially low levels. Since SEs still play asignificant role in the industrial sector, this means that the price incentives for expanded privateparticipation in legitimate businesses are muted. In such an environment, relative prices signal thatdomestic manufacturing is unprofitable, unless conducted on the parallel market. Hence, private investorsare motivated to concentrate their energies on trading activities and the provision of services or to engage inunregistered (and small-scale) manufacturing.
2.79 An example of the impact of low import prices can be seen in the pricing of drugs byMyanma Pharmaceutical Industries. Its largest-selling product is an analgesic, which is priced (on a cost-plus basis) at about K30 per 100 tablets. In estimating this price, the value of imported raw materials inthis product is imputed at K2.50. using the official exchange rate. If this import component is valued at theparallel market rate (of K 101$), the value of imported inputs would rise about 18-fold, and the cost-plusprice (for 100 tablets) would rise two and a half times to about K75.
- 49 -
E. THE PRIORITIES FOR POLICY REFORM
2.80 This analysis shows that, although progress has been made in improving incentives in thedesired directions, there are still three main areas remain where more needs to be done. Aggressivelyremoving these remaining distortions in incentives is essential if a sufficiently strong supply response is toemerge through export growth, agricultural expansion, and a dynamic private sector.
Exchange Rate and Trade Policies
2.81 In addition to the macroeconomic case for adjusting the nominal exchange rate to a morerealistic level, the analysis here demonstrates the need for such an adjustment if the incentives for exportproduction are to be improved. Despite the de facto devaluation of the Kyat that has been achievedthrough the recognition of the parallel market, the real effective exchange rate has still appreciated, therebyreducing the absolute profitability of export production. Moreover, the segmentation of the official andparallel foreign exchange markets raises transactions costs for potential private-sector exporters because ofthe risks inherent in parallel-market transactions and the multiplicity of exchange rates. Finally, allexternal transactions of SEs are still conducted at the official rate, which means that their managers havelittle incentive to expand exports. Adjusting the exchange rate would also assist in raising agriculturaloutput by improving the incentives for private-sector involvement in providing agricultural inputs such asfertilizer and pesticide. Overvaluation currently means that it is uneconomic for the private sector tocompete directly with public-sector imports of these inputs.
2.82 The main trade restriction that should be eliminated is the ban on exports of paddy andrice. This ban implies that the price received by paddy farmers is about a third lower than that dictated byinternational prices. Such implicit taxation reduces farm incomes to the tune of over K45 billion. It alsolowers paddy production by reducing its profitability. Thus, removing the export ban would not onlyencourage rural growth by increasing farm incomes; it would also result in additional production of about1.9 million tons of paddy annually. If targeted subsidies to rice consumers are considered desirable, thesehigher incomes and output would allow their provision in a less costly way than by prohibiting paddyexports. The other restriction on external trade that should be removed is the requirement that privateimporters blend priority items specified by the GOM (in Schedule A) with their own imports. Thisspecification unnecessarily imposes costs on importers without addressing the underlying reasons forshortages of some imported raw materials and intermediates. Eliminating it would help enhance thetransparency of trade policies.
Land Ownership and Tenure
2.83 The lack of clear tenurial rights creates problems both in agriculture as well as for theexpansion of private-sector activity in trade and industry. In agriculture, the uncertainty about inter-generational transfers reduces the incentives for land improvement, while the lack of a rental and salemarket mean that substantial areas either remain fallow or are operated inefficiently. Inability to use landas collateral to get long-term credit, and lack of access to suitable industrial sites constitute majorimpediments to private-sector growth.
2.84 Hence, immediate steps are necessary to establish the legal basis for private ownership andrental of land both in rural and urban areas. With the acknowledgment that Myanmar is now a market-oriented economy must come the recognition that this is incompatible with state ownership of all land.Further, this recognition will have to go beyond the current implicit tolerance of land transfers and rentals
- 50 -
between private individuals in some sectors. Rather, in order to be transparent and reduce uncertainty, theclarification of land rights should take the form of well-defined private ownership and use rights.
Paddy Procurement
2.85 Apart from removing the export ban, the other key reform that would improve theincentives for paddy production is the elimination of the paddy procurement system. Although the share ofprocurement has fallen since FY90, this system still reduces the price received by paddy farmers by about10%, thus reducing farm incomes. Moreover, the system is regressive since subsidized rice benefits mostlyurban consumers who are better off than the paddy farmers being taxed.
Supporting the Private Sector
2.86 The removal of many of the restrictions on private-sector activity has helped encourage thegrowth of private businesses outside agriculture. However, most of these enterprises remain small, andtheir ability to expand further and develop into potential exporters as well as credible competitors to SEs indomestic markets is compromised by the many biases that still exist. Specifically, their access to credit iscrowded out by the demands of the fiscal deficit, SEs continue to enjoy favored access to infrastructure andpublic services, and there are few support services aimed at potential exporters.
2.87 The priority for reform in this area is to take steps to reduce the favored access that SEsstill enjoy relative to private firms. Specifically, the interest rate subsidies on borrowing and the exchangerate subsidies on imports that SEs enjoy (constrained as both are) should be eliminated by adjusting both"prices" appropriately. The advantages that flow to SEs in their access to such services as transportation,telecommunication, and electric power should be reduced with systematic government efforts to expandprivate-sector access to these. Ensuring better access to transport and storage facilities for exporters is ofparticular importance. To better deal with many of these constraints, it is also necessary for the GOM tobroaden the dialogue with representatives of the domestic private sector. Private sector access to credit canbe expanded if public-sector credit demand can be further reduced while positive real interest rates are usedto allocate credit. Finally, if the exchange rate is adjusted, financial institutions would be more willing andable to provide trade finance to private exporters.
- 51 -
3. STATE ENTERPRISE REFORM AND PRIVATE SECTOR DEVELOPMENT
A. BACKGROUND
3.1 An important goal of the Government's reform program has been to improve theperformance of the State Enterprise (SE) sector while supporting the development of the private sector. ThisChapter examines the effectiveness of the measures intended to meet this objective. The next section providesthe backdrop to the policy discussions by presenting various facets of the role of SEs in the Myanma economy.Their structure and sectoral contribution are assessed, various indicators of their recent performance arepresented, and the links of the SE sector to the government budget are delineated. On this basis, the extent towhich SEs contribute to the Government's fiscal problems is evaluated, and the constraints to improved SEperformance are discussed. The recent reforms aimed at improving SE performance are summarized in SectionC, and their effectiveness is evaluated. Particular attention is focused on the effect of these reforms on theoperational and financial autonomy of SEs, as well as their operation along commercial lines. The last sectiondescribes the elements of a strategy to deepen SE reform and strengthen the private sector in Myanmar. Theproposed approach builds on the recent experience in Myanmar as well as on the lessons from similar reformefforts in other economies that are making the transition to a market, including China, Vietnam, and thecountries of Eastern and Central Europe.
3.2 The SE sector played a central role in Myanmar's development strategy until theGovernment's reform program was initiated in the late- 1 980s. State ownership was one of the main tenets ofthe "Burmese way of socialism". In practice, the coverage of the public sector was not uniform. Rather, itssignificance was greatest in sectors such as manufacturing, mining, commumcations, financial services,transport infrastructure, and trade that were thought to be most critical to the emergence of a modem,industrialized economy. Given this starting point, a comprehensive program of transition to a market economymust include a major component targeted at rationalizing the role of SEs and removing the barriers that stillrestrain private sector activity. As this Chapter documents, the GOM has taken some steps in this regard,which indicate its commitment to reducing the role of SEs in economic activity and expanding the scope of theprivate sector, domestic and foreign. Despite the progress that has been made, implementing these reformsinvolves difficult choices, and much remains to be done. Yet, if Myanmar's transition to a market economy isto be successful, the role and functioning of the SE sector must be reoriented and the scope for private sectorinvolvement expanded.
B. STRUCTURE AND PERFORMANCE OF THE STATE ENTERPRISE SECTOR
Role of State Enterprises in the Economy
3.3 The public sector. The pervasive control of the public sector in critical sectors of theeconomy is clearly seen from its share of the sector in GDP by industry of origin (Table 3.1).1 While thepublic sector contributes about 22% of GDP, its role is largest in the services sector, where it accounts forover half of value added. It also still plays an important role in some parts of the industrial sector and in trade.
I As with all data involving sectoral breakdowns of GDP, these shares should be interpreted with caution.
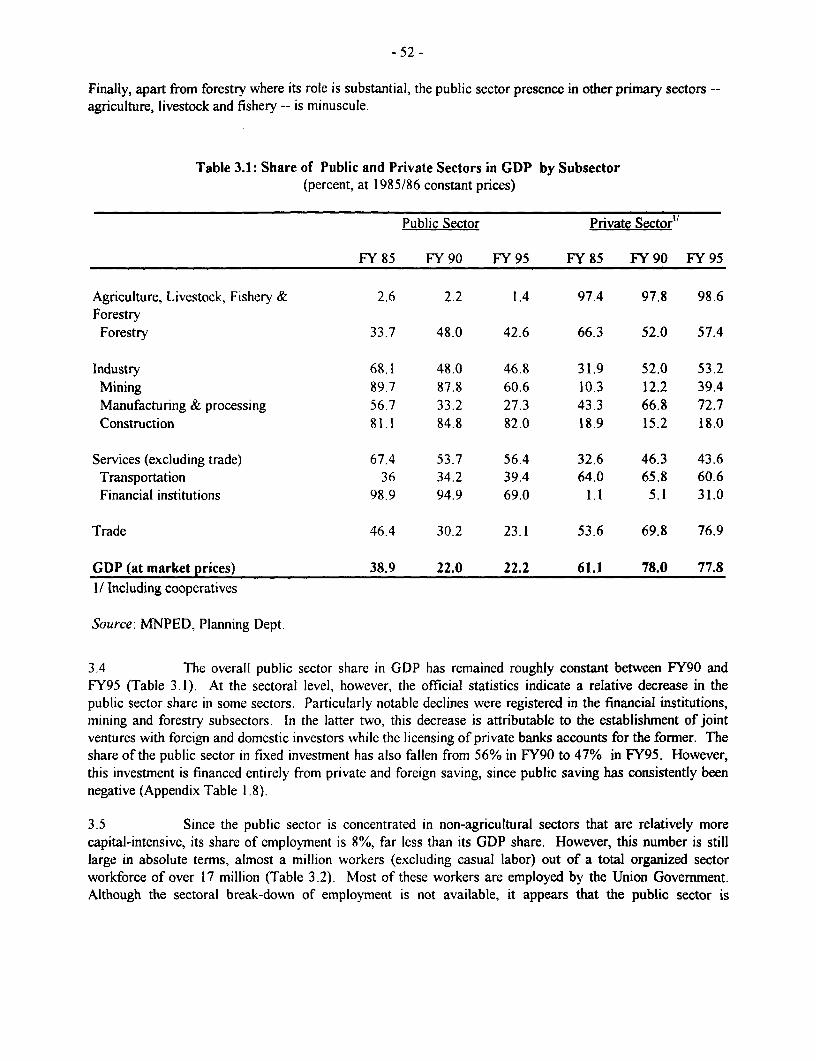
- 52 -
Finally, apart from forestry where its role is substantial, the public sector presence in other primary sectors --agriculture, livestock and fishery -- is minuscule.
Table 3.1: Share of Public and Private Sectors in GDP by Subsector(percent, at 1985/86 constant prices)
Public Sector Private Sector"
FY 85 FY 90 FY 95 FY 85 FY 90 FY 95
Agriculture, Livestock, Fishery & 2.6 2.2 1.4 97.4 97.8 98.6Forestry
Forestry 33.7 48.0 42.6 66.3 52.0 57.4
Industry 68.1 48.0 46.8 31.9 52.0 53.2Mining 89.7 87.8 60.6 10.3 12.2 39.4Manufacturing & processing 56.7 33.2 27.3 43.3 66.8 72.7Construction 81.1 84.8 82.0 18.9 15.2 18.0
Services (excluding trade) 67.4 53.7 56.4 32.6 46.3 43.6Transportation 36 34.2 39.4 64.0 65.8 60.6Financial institutions 98.9 94.9 69.0 1.1 5.1 31.0
Trade 46.4 30.2 23.1 53.6 69.8 76.9
GDP (at market prices) 38.9 22.0 22.2 61.1 78.0 77.81/ Including cooperatives
Source: MNPED. Planning Dept.
3.4 The overall public sector share in GDP has remained roughly constant between FY90 andFY95 (Table 3.1). At the sectoral level, however, the official statistics indicate a relative decrease in thepublic sector share in some sectors. Particularly notable declines were registered in the financial institutions,mining and forestry subsectors. In the latter two, this decrease is attributable to the establishment of jointventures with foreign and domestic investors while the licensing of private banks accounts for the former. Theshare of the public sector in fixed investment has also fallen from 56% in FY90 to 47% in FY95. However,this investment is financed entirely from private and foreign saving, since public saving has consistently beennegative (Appendix Table 1.8).
3.5 Since the public sector is concentrated in non-agricultural sectors that are relatively morecapital-intensive, its share of employment is 8%, far less than its GDP share. However, this number is stilllarge in absolute terms, almost a million workers (excluding casual labor) out of a total organized sectorworkforce of over 17 million (Table 3.2). Most of these workers are employed by the Union Government.Although the sectoral break-down of employment is not available, it appears that the public sector is
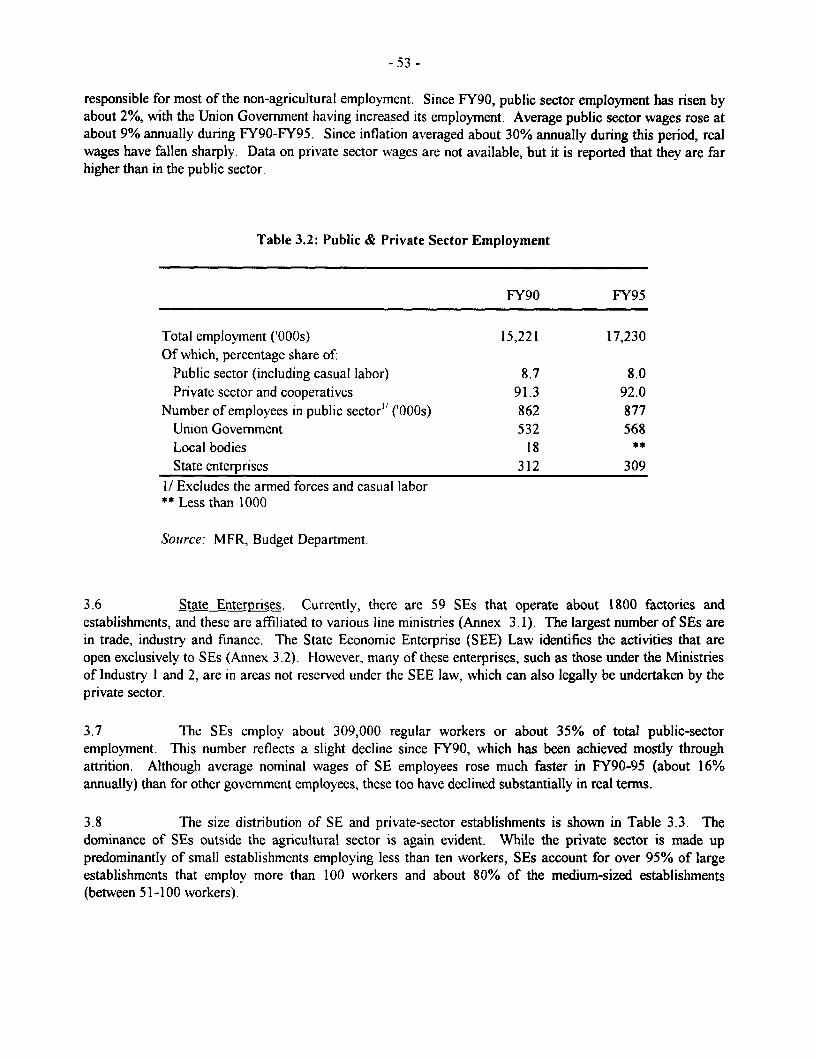
- 53 -
responsible for most of the non-agricultural employment. Since FY90, public sector employment has risen byabout 2%, with the Union Government having increased its employment. Average public sector wages rose atabout 9% annually during FY90-FY95. Since inflation averaged about 30% annually during this period, realwages have fallen sharply. Data on private sector wages are not available, but it is reported that they are farhigher than in the public sector.
Table 3.2: Public & Private Sector Employment
FY90 FY95
Total employment ('OOOs) 15.221 17,230Of which, percentage share of
Public sector (including casual labor) 8.7 8.0Private sector and cooperatives 91.3 92.0
Number of employees in public sector" ('OOOs) 862 877Union Government 532 568Local bodies 18 **
State enterprises 312 309I/ Excludes the armed forces and casual labor** Less than 1000
Source: MFR, Budget Department.
3.6 State Enterprises. Currently, there are 59 SEs that operate about 1800 factories andestablishments, and these are affiliated to various line ministries (Annex 3.1). The largest number of SEs arein trade, industry and finance. The State Economic Enterprise (SEE) Law identifies the activities that areopen exclusively to SEs (Annex 3.2). However, many of these enterprises, such as those under the Ministriesof Industry 1 and 2, are in areas not reserved under the SEE law, which can also legally be undertaken by theprivate sector.
3.7 The SEs employ about 309,000 regular workers or about 35% of total public-sectoremployment. This number reflects a slight decline since FY90, which has been achieved mostly throughattrition. Although average nominal wages of SE employees rose much faster in FY90-95 (about 16%annually) than for other govemment employees, these too have declined substantially in real terms.
3.8 The size distribution of SE and private-sector establishments is shown in Table 3.3. Thedominance of SEs outside the agricultural sector is again evident. While the private sector is made uppredominantly of small establishments employing less than ten workers, SEs account for over 95% of largeestablishments that employ more than 100 workers and about 80% of the medium-sized establishments(between 51-100 workers).
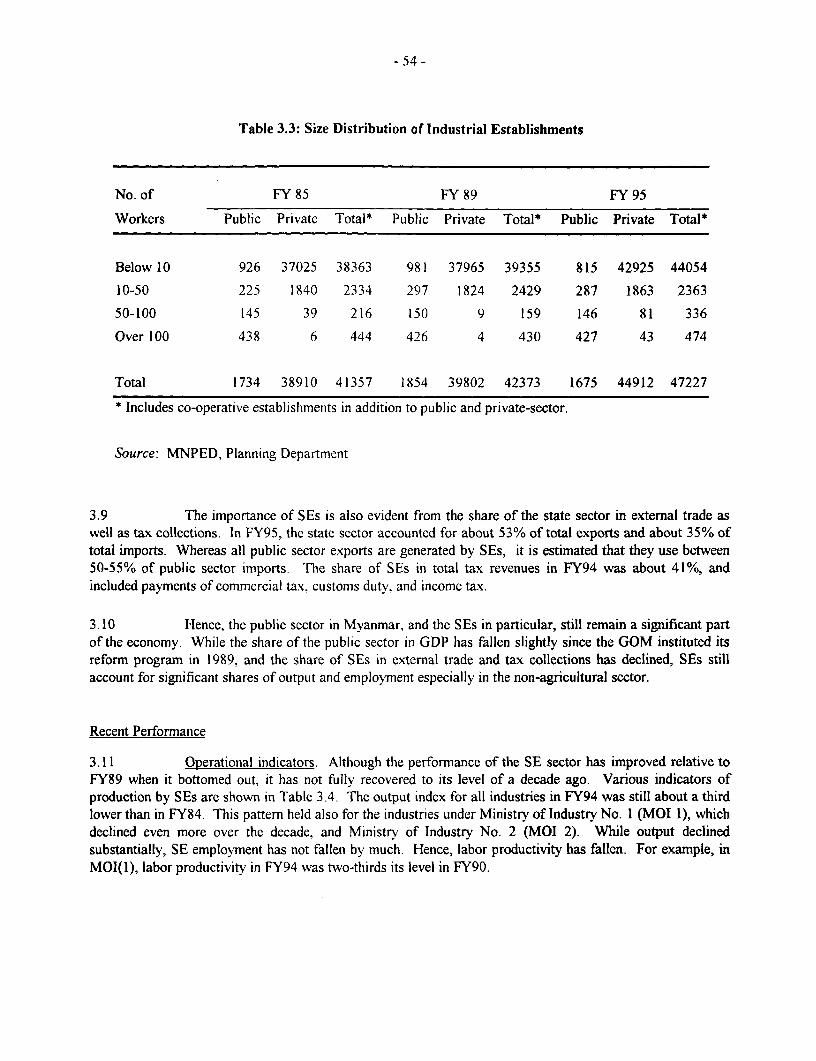
- 54 -
Table 3.3: Size Distribution of Industrial Establishments
No.of FY85 FY89 FY95
Workers Public Private Total* Public Private Total* Public Private Total*
Below 10 926 37025 38363 981 37965 39355 815 42925 44054
10-50 225 1840 2334 297 1824 2429 287 1863 2363
50-100 145 39 216 150 9 159 146 81 336
Over 100 438 6 444 426 4 430 427 43 474
Total 1734 38910 41357 1854 39802 42373 1675 44912 47227
* Includes co-operative establishments in addition to public and private-sector.
Source: MNPED, Planning Department
3.9 The importance of SEs is also evident from the share of the state sector in external trade aswell as tax collections. In FY95, the state sector accounted for about 53% of total exports and about 35% oftotal imports. Whereas all public sector exports are generated by SEs, it is estimated that they use between50-55% of public sector imports. The share of SEs in total tax revenues in FY94 was about 41%, andincluded payments of commercial tax, customs duty, and income tax.
3.10 Hence, the public sector in Myanmar, and the SEs in particular, still remain a significant partof the economy. While the share of the public sector in GDP has fallen slightly since the GOM instituted itsreform program in 1989, and the share of SEs in external trade and tax collections has declined, SEs stillaccount for significant shares of output and employment especially in the non-agricultural sector.
Recent Performance
3.11 Operational indicators. Although the performance of the SE sector has improved relative toFY89 when it bottomed out, it has not fully recovered to its level of a decade ago. Various indicators ofproduction by SEs are shown in Table 3.4. The output index for all industries in FY94 was still about a thirdlower than in FY84. This pattern held also for the industries under Ministry of Industry No. I (MOI 1), whichdeclined even more over the decade, and Ministry of Industry No. 2 (MOI 2). While output declinedsubstantially, SE employment has not fallen by much. Hence, labor productivity has fallen. For example, inMOI(1), labor productivity in FY94 was two-thirds its level in FY90.
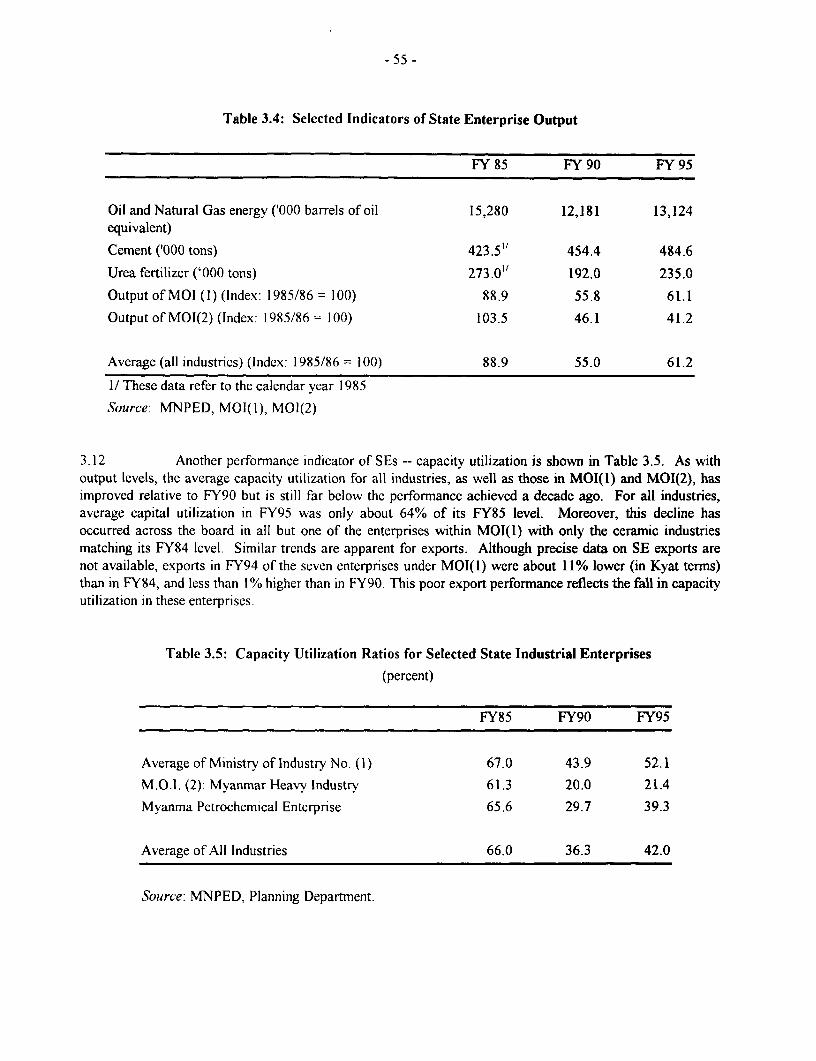
- 55 -
Table 3.4: Selected Indicators of State Enterprise Output
FY 85 FY 90 FY 95
Oil and Natural Gas energy ('000 barrels of oil 15,280 12,181 13,124equivalent)
Cement ('000 tons) 423.5" 454.4 484.6
Urea fertilizer ('000 tons) 273.0" 192.0 235.0
Output of MOI (1) (Index: 1985/86 I100) 88.9 55.8 61.1
Output of MOI(2) (index: 1985/86= 100) 103.5 46.1 41.2
Average (all industries) (Index: 1985/86 = 100) 88.9 55.0 61.2
1/ These data refer to the calendar year 1985
Source: MNPED, MOI(I), MO1(2)
3.12 Another performance indicator of SEs -- capacity utilization is shown in Table 3.5. As withoutput levels, the average capacity utilization for all industries, as well as those in MOI(1) and MOI(2), hasimproved relative to FY90 but is still far below the performance achieved a decade ago. For all industries,average capital utilization in FY95 was only about 64% of its FY85 level. Moreover, this decline hasoccurred across the board in all but one of the enterprises within MOI(1) with only the ceramnic industriesmatching its FY84 level. Similar trends are apparent for exports. Although precise data on SE exports arenot available, exports in FY94 of the seven enterprises under MOI(I) were about 11% lower (in Kyat terms)than in FY84, and less than I% higher than in FY90. This poor export performance reflects the fall in capacityutilization in these enterprises.
Table 3.5: Capacity Utilization Ratios for Selected State Industrial Enterprises
(percent)
FY85 FY90 FY95
Average of Ministry of Industry No. (1) 67.0 43.9 52.1
M.O.I. (2): Myanmar Heavy Industry 61.3 20.0 21.4
Myanma Petrochemical Enterprise 65.6 29.7 39.3
Average of All Industries 66.0 36.3 42.0
Source: NMNPED, Planning Department.
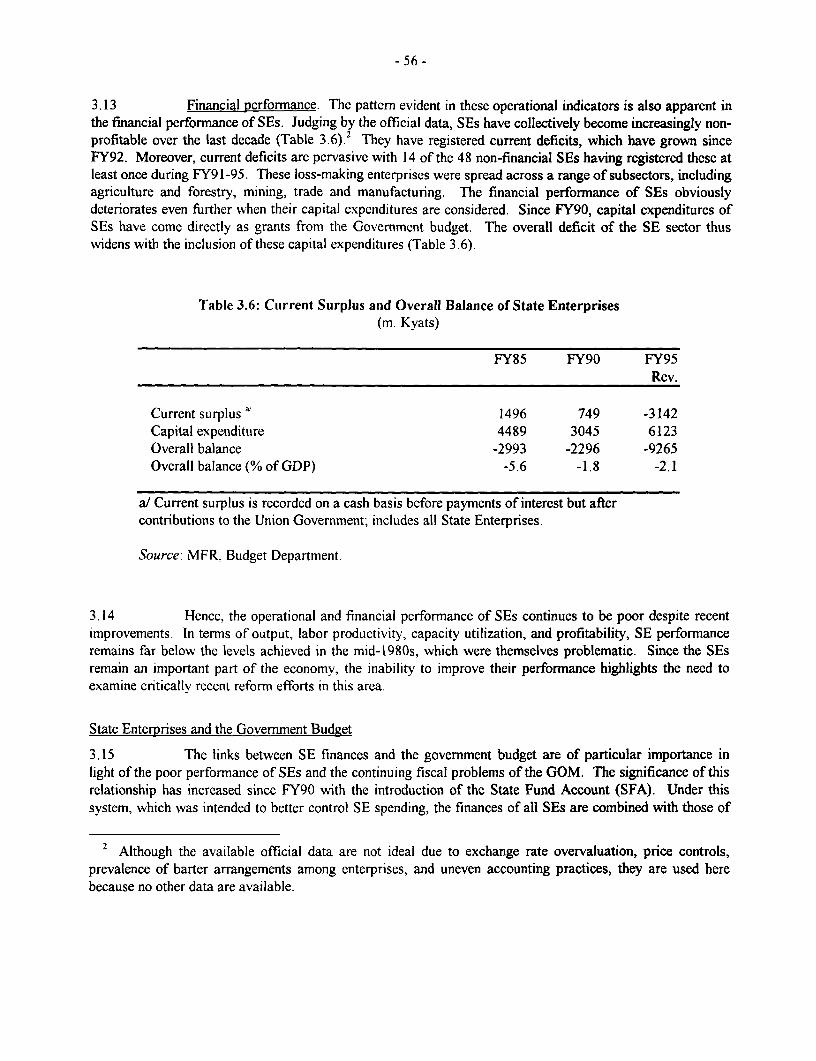
- 56 -
3.13 Financial performance. The pattern evident in these operational indicators is also apparent inthe financial performance of SEs. Judging by the official data, SEs have collectively become increasingly non-profitable over the last decade (Table 3.6).2 They have registered current deficits, which have grown sinceFY92. Moreover, current deficits are pervasive with 14 of the 48 non-financial SEs having registered these atleast once during FY91-95. These loss-making enterprises were spread across a range of subsectors, includingagriculture and forestry, mining, trade and manufacturing. The financial performance of SEs obviouslydeteriorates even further when their capital expenditures are considered. Since FY90, capital expenditures ofSEs have come directly as grants from the Government budget. The overall deficit of the SE sector thuswidens with the inclusion of these capital expenditures (Table 3.6).
Table 3.6: Current Surplus and Overall Balance of State Enterprises(m. Kyats)
FY85 FY90 FY95Rev.
Current surplus a/ 1496 749 -3142Capital expenditure 4489 3045 6123Overall balance -2993 -2296 -9265Overall balance (% of GDP) -5.6 -1.8 -2.1
a/ Current surplus is recorded on a cash basis before payments of interest but aftercontributions to the Union Government; includes all State Enterprises.
Source: MFR. Budget Department.
3.14 Hence, the operational and financial performance of SEs continues to be poor despite recentimprovements. In terms of output, labor productivity, capacity utilization, and profitability, SE performanceremains far below the levels achieved in the mid-1980s, which were themselves problematic. Since the SEsremain an important part of the economy, the inability to improve their performance highlights the need toexamine critically recent reform efforts in this area.
State Enterprises and the Government Budget
3.15 The links between SE finances and the government budget are of particular importance inlight of the poor performance of SEs and the continuing fiscal problems of the GOM. The significance of thisrelationship has increased since FY90 with the introduction of the State Fund Account (SFA). Under thissystem, which was intended to better control SE spending, the finances of all SEs are combined with those of
2 Although the available official data are not ideal due to exchange rate overvaluation, price controls,prevalence of barter arrangements among enterprises, and uneven accounting practices, they are used herebecause no other data are available.
- 57 -
administrative departments into a combined pool called the SFA. Since all revenues flow into this pool and allexpenditures must be made from it, this system has meant that control over SE finances effectively has beentransferred from the enterprises to the Union Government. Since they are owned by the government, they areobliged to surrender any surplus they generate, initially as a "contribution" that is budgeted at the start of eachfiscal year and as the residual surplus if any remains at the end of the year. Similarly, SEs also receive adirect subsidy from the budget to the extent they accrue a current deficit at the end of the year. Finally, likeadministrative departments, their capital expenditures are made directly from the government budget. Apartfrom the link through the SFA, SEs contribute indirectly to government revenues through payments ofcommercial and income taxes and customs duties.
3.16 It is contended that the SE sector now constitutes a smaller drain on fiscal resources. Thisconclusion is based on the narrow estimate of the financial linkage between SEs and the consolidated publicsector budget, which is shown at the top of Table 3.7 as the net contribution to the government. Contributionsby SEs have grown since FY9 l. while the share of SE expenditure has remained stable. However, even bythis measure, SEs were net contributors to the budget only in FY92 and FY93. In the last two fiscal years,SEs' net contributions to the budget have been negative. Another point worth noting is that SEs' contributionsto the Government are unrelated to their current surplus or deficit. Their contributions were positive andrising even during FY92-94 when the current deficit of the SE sector was increasing (Table 3.7).
3.17 This narrow measure of SEs' net contributions also needs to be adjusted in two ways if it is toaccurately reflect the interactions between the SE sector and the budget. First, the tax payments of SEs in theform of commercial taxes, income taxes and custom duties need to be added to their direct contributions.These payments are shown in the bottom half of Table 3.7, and are almost as large as their directcontributions.3 The second adjustment necessary is to reflect the fiscal impacts of the benefits that SEsreceive from the government in the form of subsidized inputs (including capital). The most significant of theseimplicit subsidies is estimated in Table 3.7, and arise from subsidized access of SEs to electricity, andpetroleum products.4
3 The commercial tax and incomc tax paid by SEEs is assumed to be equal to that of the state sector.SEEs' payment of custom duties are estimated by multiplying total custom duties by first the state sector shareand then the share of SEEs in state sector imports. For details, see Annex 3.3.
4 Official prices of petroleum products remained constant for five years until they were increased inNovember 1994. Even then the revised prices fail to reflect the parallel market price. For example, gasolinesells at about Kyat 200/gallon in the parallel market, but the official price is only Kyat 25/gallon. Similarly,electricity is sold to private users at 6 times the price charged to public-sector users including the SEs. Itshould be noted, however, that these estimates do not take account of the implicit taxes on SEs through theirsales of output at below-market prices because these are difficult to estimate. While including those transferswould obviously improve the financial picture of SEs, they would likely be offset by other subsidies to SEs,which are also not estimated here, including their access to subsidized imports (other than petroleum products)and free land.
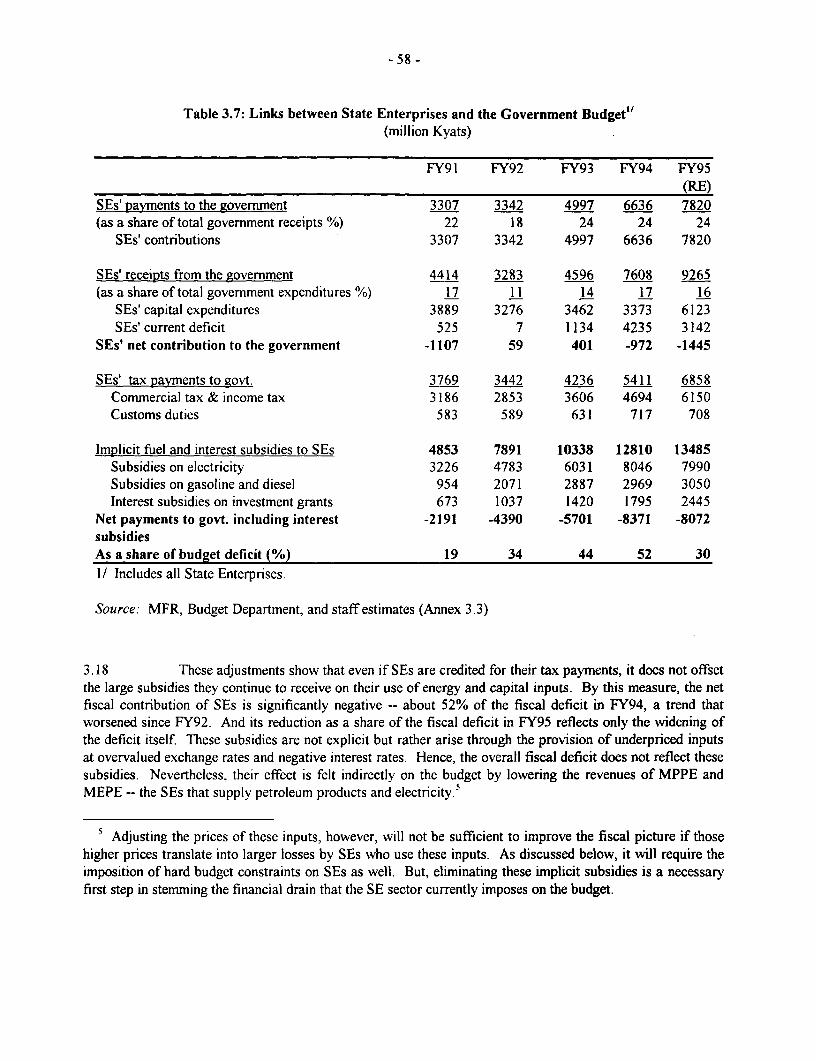
- 58 -
Table 3.7: Links between State Enterprises and the Government Budget"'(million Kyats)
FY91 FY92 FY93 FY94 FY95(RE)
SEs' payments to the government 3307 3342 4997 6636 7820(as a share of total government receipts %) 22 18 24 24 24
SEs'contributions 3307 3342 4997 6636 7820
SEs' receipts from the government 4414 3283 4596 7608 9265(as a share of total government expenditures %) 17 11 14 17 16
SEs' capital expenditures 3889 3276 3462 3373 6123SEs' current deficit 525 7 1134 4235 3142
SEs' net contribution to the government -1107 59 401 -972 -1445
SEs' tax payments to govt. 3769 3442 4236 5411 6858Commercial tax & income tax 3186 2853 3606 4694 6150Customs duties 583 589 631 717 708
Implicit fuel and interest subsidies to SEs 4853 7891 10338 12810 13485Subsidies on electricitv 3226 4783 6031 8046 7990Subsidies on gasoline and diesel 954 2071 2887 2969 3050Interest subsidies on investment grants 673 1037 1420 1795 2445
Net payments to govt. including interest -2191 -4390 -5701 -8371 -8072subsidiesAs a share of budget deficit (%) 19 34 44 52 30I/ Includes all State Enterprises.
Source: MFR, Budget Department, and staff estimates (Annex 3.3)
3.18 These adjustments show that even if SEs are credited for their tax payments, it does not offsetthe large subsidies they continue to receive on their use of energy and capital inputs. By this measure, the netfiscal contribution of SEs is significantly negative -- about 52% of the fiscal deficit in FY94, a trend thatworsened since FY92. And its reduction as a share of the fiscal deficit in FY95 reflects only the widening ofthe deficit itself. These subsidies are not explicit but rather arise through the provision of underpriced inputsat overvalued exchange rates and negative interest rates. Hence, the overall fiscal deficit does not reflect thesesubsidies. Nevertheless, their effect is felt indirectly on the budget by lowering the revenues of MPPE andMEPE -- the SEs that supply petroleum products and electricity.5
5 Adjusting the prices of these inputs, however, will not be sufficient to improve the fiscal picture if thosehigher prices translate into larger losses by SEs who use these inputs. As discussed below, it will require theimposition of hard budget constraints on SEs as well. But, eliminating these implicit subsidies is a necessaryfirst step in stemming the financial drain that the SE sector currently imposes on the budget.
- 59 -
Have State Enterprises Performed Better in the Reform Period?
3.19 A judgment on whether the performance of SEs has improved depends on the time period thatis considered. On some operational and financial indicators, SE performance in FY95 was better than inFY91 soon after the GOM instituted its reforms. However, that comparison is misleading because the period1988-90 was especially difficult for the Myanma economy, and economic recovery began only in FY90.Hence, it is unsurprising that the situation today is not as bleak as in FY91. A more meaningful comparisonwould contrast the current situation of SEs with their performance a decade ago. When that benchmark isused, the real magnitude of the problems facing the SE sector becomes apparent. On every availableperformance measure, the SE sector, in general, as well as specific enterprises are doing much worse todaythan a decade ago. Their poor performance is especially striking given the context of overall economicrecovery.
3.20 The one area which is often pointed to as a sign of improving SE performance - their positivecontribution to the government budget -- is also misleading, as illustrated in Table 3.7. While the SE sectormakes a positive financial contribution to the budget, a more complete accounting of the links between thebudget and SE finances shows that these financial transfers are dwarfed once the capital outlays of SEs aretaken into account along with the implicit subsidies that flow to some SEs through the underpricing of energyinputs and capital. For the Government's fiscal position to improve significantly, these subsidies would needto be reduced without the budget having to absorb any resulting SE losses. Before examining the refonns thatare still required in order to make that 'possible, the constraints that limit SE performance are noted.
3.21 Constraints on SE performance. From interviews with SE managers, three main factorsappear to account for the continued poor performance of SEs in Myanmar. First, almost all enterprises sufferfrom shortages of capital and foreign exchange. The adverse effects of these shortages are compounded by asecond factor, which is the inability of SE managers to operate along strictly commercial lines. Managershave little autonomy in their decision making, into which non-commercial considerations constantly intrude.Finally, with the liberalization of private-sector activity and foreign exchange retention (and despite theremaining biases against the private sector), many SEs now face greater competition from domesticmanufactures and imports.
3.22 The most important implications of these constraints on SE performance is that it limits theirability to import key inputs, including spare parts, and new capital equipment to replace their outdatedmachinery. The centralization of all capital budgeting and import decisions makes it even more difficult tomake these choices in a timely manner. Hence, it is increasingly difficult for SEs to improve capacityutilization or to compete effectively with private producers or imports. Their lack of operational and financialautonomy means that SE managers have little incentive to control costs or look for innovative ways ofimproving performance. Whilc many SE managers continue to make such efforts, their perseverance in theface of stifling constraints and distorted incentives will not suffice. For sustained improvement, action isneeded in several interrelated policy areas.
3.23 Policy reform is essential because without it the current constraints on SE performance willremain. For instance, while access to capital and imported inputs are obviously major factors in low capacityutilization in most SEs, merely increasing the availability of credit and foreign exchange without changing theincentive structure facing SE managers will do little to help improve the functioning of SEs over the mediumterm. The needed policy reforms cover three main areas. First, the prices that face SE managers must be setat more realistic levels so that they reflect market conditions. In particular, a more realistic exchange rate and
- 60 -
interest rate must be used in valuing, respectively, the external trade and investment of SEs, while their salesprices, even to other SEs should be liberalized.
3.24 Second, measures must be taken to enhance the financial and operational autonomy of SEmanagers. They should be allowed much greater latitude in making production, pricing, sales, recruitment,and investment choices along commercial lines. In return, SEs should face hard budget constraints that meanthat their deficits would not automatically be covered from the government budget. The final policy area thatneeds attention is strategic, involving the need for the GOM to decide on the relative role of the private andpublic sectors in the economy. This delineation needs to go beyond the view that the private sector isimportant to medium-term development, by spelling out the sectors in which the continued presence for SEs isforeseen along with a rationale for this role. Before fleshing out the details of proposed reforms in each ofthese policy areas, the next Section examines the effectiveness of current reform efforts in addressing the mainconstraints on SE performance.
C. RECENT STATE ENTERPRISE REFORMS
3.25 The efforts by the GOM since 1989 to reform the SE sector have involved actions on twomain fronts. Measures have been undertaken to restructure enterprises by liberalizing the price-settingmechanism, increasing the autonomy of SE managers on operational and financial matters, and attempting toincrease fiscal discipline among SEs. These actions have been accompanied by efforts, which haveaccelerated recently, to sell or lease some enterprises or facilities to private entrepreneurs. This sectiondescribes these reforms along with an assessment of their efficacy in addressing the policy issues notedpreviously.
Pricing Reform
3.26 Output prices. Since FY90, there have been changes in the system for pricing SE output aswell as the prices at which agro-industrial enterprises procure their agricultural raw materials. Before 1989,prices for SEs' outputs (to consumers as well as to other SEs) were strictly controlled at levels that weretypically unrelated to production costs. This has now been replaced with a system of dual pricing. The ex-factory prices for output sold to the Government (to satisfy compulsory procurement targets) or to other SEsare still set on a cost-plus basis, and can be increased only if shown to be justified on the basis of costincreases. There is no evidence that there is any greater flexibility in granting price adjustments on such sales.Once the procurement targets are met, sales can be made at free-market prices either explicitly, or implicitlyby making sales in foreign exchange. As Table 3.Y, shows for some industrial products, these prices are muchhigher than official prices. The gap between the free-market and official prices for gasoline and otherpetroleum products is also about eight-fold. For instance, MPPE is allowed to make about 10% of its gasolineand diesel sales (in volume terms) in foreign exchange at "mixed prices" that are a composite of foreignexchange (dollars) and Kyat, and are close to the free-market price 6
6 The "mixed price" for gasoline is ($1.32 + KIO.5) per gallon (Imperial), which works out to K156/gallon,if the dollar is evaluated at the parallel exchange rate (Kl 10/$). This price compares to the official price ofK25/gallon, and a free-market price of K200/gallon. Similarly, for diesel, the mixed price is ($1.12+K5.8) pergallon (Imperial) or about K129/gallon at the parallel exchange rate. The official price of diesel isK20/gallon, and the free-market price is about K 1 60/gallon.
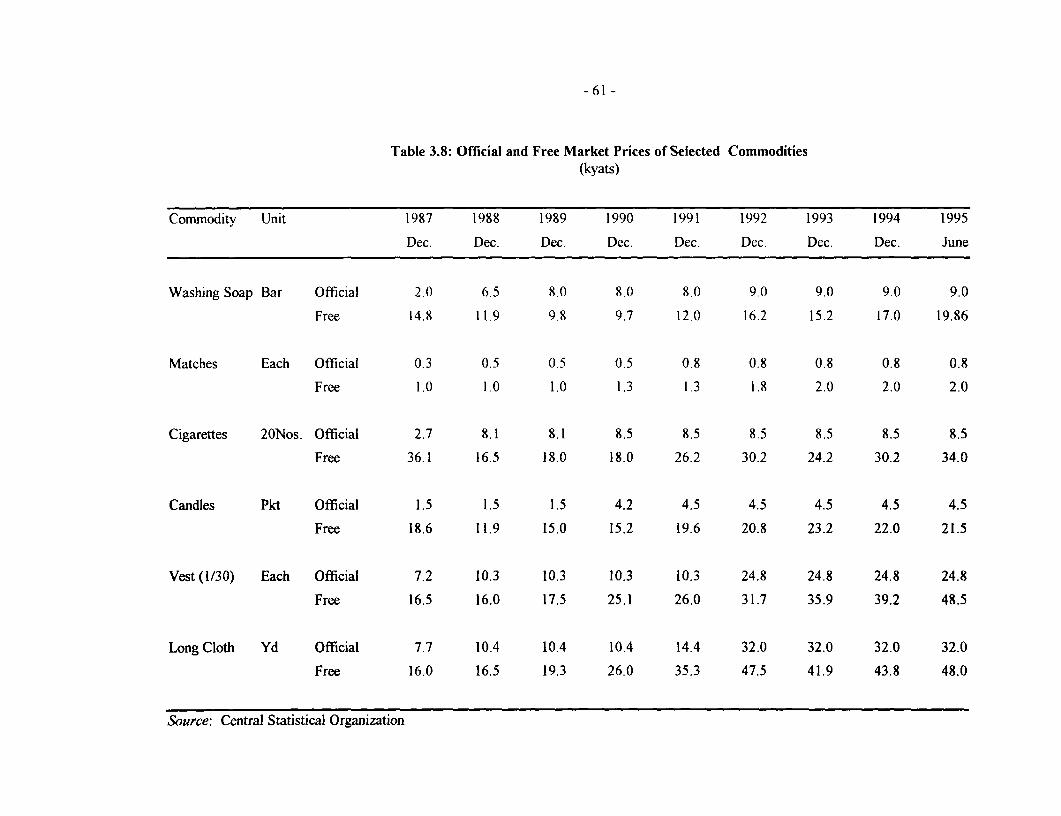
- 61 -
Table 3.8: Official and Free Market Prices of Selected Commodities(kyats)
Commodity Unit 1987 1988 1989 1990 1991 1992 1993 1994 1995
Dec. Dec. Dec. Dec. Dec. Dec. Dec. Dec. June
Washing Soap Bar Official 2.0 6.5 8.0 8.0 8.0 9.0 9.0 9.0 9.0
Free 14.8 11.9 9.8 9.7 12.0 16.2 15.2 17.0 19.86
Matches Each Official 0.3 0.5 0.5 0.5 0.8 0.8 0.8 0.8 0.8
Free 1.0 1.0 1.0 1.3 1.3 1.8 2.0 2.0 2.0
Cigarettes 2ONos. Official 2.7 8.1 8.1 8.5 8.5 8.5 8.5 8.5 8.5
Free 36.1 16.5 18.0 18.0 26.2 30.2 24.2 30.2 34.0
Candles Pkt Official 1.5 1.5 1.5 4.2 4.5 4.5 4.5 4.5 4.5
Free 18.6 11.9 15.0 15.2 19.6 20.8 23.2 22.0 21.5
Vest (1/30) Each Official 7.2 10.3 10.3 10.3 10.3 24.8 24.8 24.8 24.8
Free 16.5 16.0 17.5 25.1 26.0 31.7 35.9 39.2 48.5
Long Cloth Yd Official 7.7 10.4 10.4 10.4 14.4 32.0 32.0 32.0 32.0
Free 16.0 16.5 19.3 26.0 35.3 47.5 41.9 43.8 48.0
Source: Central Statistical Organization
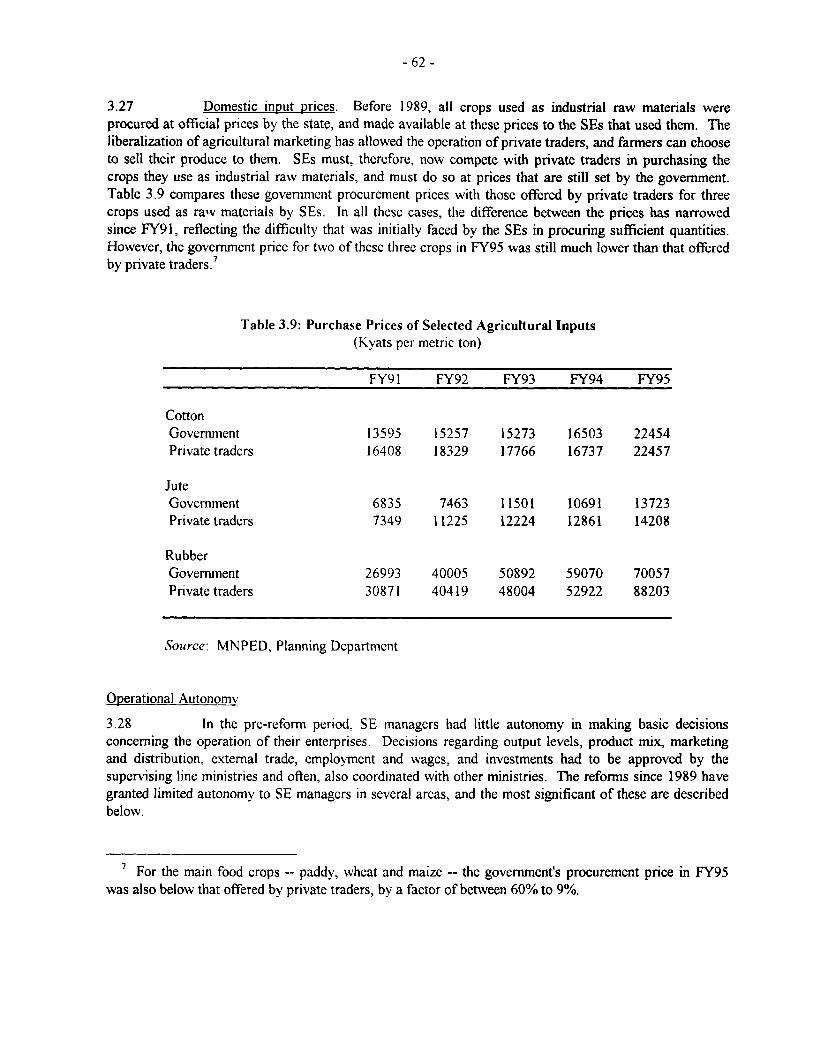
- 62 -
3.27 Domestic input prices. Before 1989, all crops used as industrial raw materials wereprocured at official prices by the state, and made available at these prices to the SEs that used them. Theliberalization of agricultural marketing has allowed the operation of private traders, and farners can chooseto sell their produce to them. SEs must, therefore, now compete with private traders in purchasing thecrops they use as industrial raw materials, and must do so at prices that are still set by the government.Table 3.9 compares these government procurement prices with those offered by private traders for threecrops used as raw materials by SEs. In all these cases, the difference between the prices has narrowedsince FY91, reflecting the difficulty that was initially faced by the SEs in procuring sufficient quantities.However, the government price for two of these three crops in FY95 was still much lower than that offered
7by private traders.
Table 3.9: Purchase Prices of Selected Agricultural Inputs(Kyats per metric ton)
FY91 FY92 FY93 FY94 FY95
CottonGovernment 13595 15257 15273 16503 22454Private traders 16408 18329 17766 16737 22457
JuteGovernment 6835 7463 11501 10691 13723Private traders 7349 11225 12224 12861 14208
RubberGovernment 26993 40005 50892 59070 70057Private traders 30871 40419 48004 52922 88203
Source: MNPED, Planning Department
Operational Autonomv
3.28 In the pre-reform period. SE managers had little autonomy in making basic decisionsconcerning the operation of their enterprises. Decisions regarding output levels, product mix, marketingand distribution, external trade, employment and wages, and investments had to be approved by thesupervising line ministries and often, also coordinated with other ministries. The reforms since 1989 havegranted limited autonomy to SE managers in several areas, and the most significant of these are describedbelow.
7 For the main food crops -- paddy, wheat and maize -- the government's procurement price in FY95was also below that offered by private traders, by a factor of between 60% to 9%.
- 63 -
3.29 Production. SEs are now allowed to use their facilities and equipment to or production onconsignment basis for foreign or local entrepreneurs who furnish the raw materials. This method hasgrown in popularity, particularly with industrial SEs, because it has allowed them to obtain critical inputs(especially imports) and increase capacity utilization. For instance, during FY95, 27 factories under MOI(1) producing textiles and pharmaceuticals, operated under consignment basis. Eight of these werenegotiated with foreign companies while the rest involved collaborations with local businessmen. The totalvalue of output produced under such arrangements was K816 million in FY95. Since the commissions toSEs from these contracts are negotiated individually, consignment production also allows SE managers tocircumvent the price controls that would otherwise apply to a portion of their output. Despite the increasedflexibility due to this possibility, decisions concerning consignment production cannot be made byindividual SE managers but rather must be referred to senior officials in the parent ministries. Apart fromconsignment production, SEs can also enter into joint ventures with foreign firms, establishing either newcompanies or converting existing factories. Under MOI(I) 10 such JVs have been established with theshare of the SE varying from 45% to 65% of the equity, with this contribution taking the form of land andbuildings.
3.30 Marketing and distribution. SE managers are now allowed to sell output at free-marketprices once their enterprises' procurement targets have been met. In practice, however, low capacityutilization in most SEs means that their output levels are below the procurement targets or only slightlyabove them. Hence, little is sold at free-market prices, and managers do not actually have much discretionas to the distribution of output. For instance, Myanma General and Maintenance Industries (under MOI(I)) sold almost 78% of its FY95 output to government departments at controlled prices. Collectively, forthe enterprises under MOI (1), the average share of output (in terms of value) sold to governmentdepartments was 46% in FY90 and, although declining, was still 40% in FY95. Moreover, all six of theenterprises under MOT (1) sold more than a sixth of the value of their output to government departmentswith three of the six enterprises selling over half their output in this manner.8 Another 14% of MOI(l)output value was accounted for bv inter-factory transactions, also at controlled prices.
3.31 Foreign exchange transactions. In 1993, a revolving fund of almost $60 million wasestablished for the use of SEs under 8 ministries (MOI (1) and (2), Forestry, Hotels and Tourism,Livestock and Fisheries, Trade, Agriculture and Energy). This fund was intended as seed money to helpthe SEs generate additional foreign exchange. The foreign exchange earned by Ministries by using theseallocations do not need to be surrendered, unlike other foreign exchange earnings. Moreover, whether ornot the initial foreign exchange allocation is repaid is according to the discretion of the individualMinistries. While this allocation has enhanced the flexibility of SEs in making foreign exchange decisionsit also means that Ministries and SEs would use it for more profitable activities while using centrally-allocated foreign exchange for less profitable ventures. The foreign exchange earnings from the otherschemes that have been instituted since 1990 to encourage SEs to expand exports (para. 1.48) are treatedlike all other revenues of SEs, and are monitored and controlled centrally by the Ministry of Finance.
8 Since the prices on such sales are far lower than the free-market prices, the share of output (inphysical terms) sold to government departments is even higher than is shown here. Also, these sharesexclude sales to the government employees' cooperative and to the armed forces, which are also made atcontrolled prices. Such sales are particularly significant for Myanmar Pharmaceutical Industries, andcollectively account for over 11% of the value of MOI(l) sales.
- 64 -
3.32 Employment and wages. There has been little progress in expanding the role of enterprisesin making decisions regarding employment and wage decisions. While employment in some SEs has fallen,these decreases have been the result of a centrally-mandated decision to reduce the workforce throughattrition. For instance, the workforce employed by the enterprises of MOI (1) fell about 10% during FY90-94. The reforms have not included any schemes to link performance and pay. A bonus system formanagers that had been in place since the mid-1970s was discontinued in 1989 when salaries for allgovernment personnel were raised.
Financial Autonomy
3.33 Until 1989, SEs were financed under a working capital system. Each SE was allocatedseed money from the government budget, and could then borrow the rest of its capital requirements fromthe Myanmar Economic Bank at nominal interest rates of between 5 and 8% p.a., depending on whether thefinancing was sought for investment or for working capital needs. In response to the rising debt burdens ofSEs, the GOM decided at the start of FY90 to convert their debt to government equity. Simultaneously, anew system of financial management was established with the aim of exercising tighter control over SEfinances. The finances of SEs were integrated with those of the administrative departments to form acentralized pool called the State Fund Account (SFA).9
3.34 The creation of the SFA has meant that SEs have little or no control any longer over theirfinances. Enterprises must deposit their receipts into the SFA (typically maintained by the MEB) and, likeadministrative departments, all their expenditures on current and capital accounts must be approved by theBudget Department. While the evaluation process for current expenditures is not very stringent, that forcapital expenditures is a cumbersome process involving several ministries. SEs also can no longer borrowfrom commercial banks. Within the SFA, although separate accounts are maintained for each SEE formonitoring purposes, various pooling arrangements have been introduced since 1992 to allow transfer offunds from cash-surplus SEs to other enterprises.
Fiscal Discipline
3.35 A major goal of pooling SE finances into the SFA was to instill greater discipline into thefinancial practices of these enterprises. While the SFA has increased scrutiny of expenditures, there is noevidence that the fiscal discipline imposed on unprofitable SEs has been strengthened. In fact, it appears tohave had the opposite result. Since enterprises are now funded directly from the budget, these funds are notallocated according to any clear-cut criteria related to performance or need. For instance, Myanma TimberEnterprise (MTE), which is among the largest exporters in the economy, accounting for about a sixth oftotal exports in FY95, was able to import goods worth only about $4.5 million compared to its exportearnings of over $150 million. Yet its managers consider lack of foreign exchange the main constraint inimproving its capacity utilization, which languishes at about 60%. Moreover, the financial performance ofindividual SE is even less transparent than before because the SFA allows for funds to flow from cash-surplus to deficit enterprises.
9 The balance sheet of the SFA is maintained by the Central Bank. SEs account for between 60-70% ofexpenditures from the SFA.
- 65 -
Ownership and Management
3.36 Transferring the ownership and management of SEs to the private sector, foreign anddomestic, has been viewed as an integral part of the GOM's efforts to reform the SE sector. Until 1995,privatization of functioning enterprises was limited to restoring small factories and establishments to theiroriginal owners from whom these were confiscated in the 1960s. Much of the progress in expandingprivate-sector involvement has come through the establishment of new joint ventures (JVs) and production-sharing arrangements between SEs and private investors, and through leasing the facilities of SEs to privateentrepreneurs. In 1995, six establishments operated by SEs -- 4 cinemas and 2 workshops under MOI(2) --were privatized (para. 3.39).
3.37 The main catalyst to establishing joint ventures and production-sharing contracts has beenthe enactment of the Foreign Investment Law in late-1988. This legislation opened up much of theMyanma economy to foreign investors. operating either as wholly-owned foreign companies or jointly withdomestic firms, and offered significant fiscal incentives. Given the lack of information and uncertaintyabout the economy, manv investors have chosen to enter into JVs with already-established SEs. Theforeign investors have contributed capital, foreign exchange, management skills and access to newtechnology, while the SEs have offered access to natural resources, prime locations, and infrastructuraladvantages.
3.38 Another form of private participation has been through the leasing of SE facilities to localentrepreneurs. Such leases are usually concluded on the basis of competitive bidding. Among theenterprises within MOI (1), for instance, 15 mills and factories have been leased out, and generated K43million in FY94 in annual rental fees. Hence, almost 30% of the output of the Myanna PharmaceuticalIndustries under MOI (1) is currently being produced by private entrepreneurs leasing its facilities.
3.39 In January 1995, the GOM announced the creation of a high-level PrivatizationCommission to oversee the detailed design and implementation of the program to privatize SEs. TheCommission is being assisted by an Evaluation and Assessment Committee which will select the SEs to beprivatized and conduct valuation of the assets of these SEs (especially land). The details of the methods ofprivatization are still being worked out but the Commission has identified 51 establishments to beprivatized initially. Many of these are small establishments and workshops, but their composition shows aninclination to privatize commercial operations of SEs in areas where the private sector is already active.'°Of the 51 establishments that have been identified, 6 had been privatized by August 1995, using a tenderingprocess. It is anticipated that 20 more of these establishments would be privatized by end-1995.
Evaluation of SE Reforms
3.40 Although the reforms described above have altered many features of the operatingenvironment for SEs, they have not effectively addressed the underlying policy distortions that haveconstrained the performance of SEs. This conclusion is not meant to dismiss the significance of many of
'° Of the 51 establishments to be privatized, 18 factories and workshops are operated by SEs underMOI (1), 4 factories and workshops are under MOI (2), 4 factories are under the Ministry of LivestockBreeding and Fisheries (MOLF); 4 mills are under SEs of the Ministry of Trade; and 21 cinemas areoperated by the Ministry of Information.

- 66 -
the actions that the GOM has taken, but rather to indicate that a long road lies ahead if SE reform inMyanmar is to be effective.
3.41 An example of the limitations of the current reforms is provided by the changes in pricingand marketing. The ability to sell a portion of their output in the free market has certainly improved thefinancial prospects for many SEs. However, as the data from the enterprises operated by MOI (1) show,the real impact of this step has been limited because a large share of production is still subject togovernment procurement or inter-enterprise transfers. The continued lack of adjustment of the officialexchange rate, which is used in valuing all external trade transactions of SEs, also means that the ex-factory prices used as a basis for cost-plus pricing bear no relation to economic costs. Hence, manyenterprises are still penalized by the complex pattern of cross-subsidies that arise from this system of pricedetermination and marketing. Moreover, the financial profitability of enterprises in this situation providesno guidance as to their economic viability. For instance, the implicit subsidies on energy use and capitalinvestment, which arise from the overvalued exchange rate and zero interest rate on borrowing, areexcluded from the cost structures of enterprises.
3.42 Similarly, the changes designed to enhance the autonomy of SEs do not go far enough, andin some respects, have actually had the opposite effect. SEs do have more flexibility now in entering intotransactions with private entrepreneurs to produce on consignment basis or even to lease their facilities tothem. However, even these decisions are not left to SE managers but are centralized within the parentMinistries. And the allocation of investment funds and foreign exchange is actually more centralized nowunder the SFA than before 1989. All decisions on these matters are now made outside the enterprises onthe basis of requests from the enterprises, which in aggregate are typically about 50% higher than theavailable amount." In sum, the operational and financial autonomy.of SE managers has shrunk, withcontrol and oversight actually having become more centralized in their parent ministries.
3.43 The lack of progress in reforming the investment allocation system and exchange ratemechanism combined with the maintenance of the procurement system has meant that the informationalcontent of prices, costs, and profits is as negligible today as it was before the reforms. Hence, it is stillimpossible to hold SE managers accountable for the performance of their enterprises. Not only is their rolein making decisions limited; there are no clear indicators of good or bad performance in a situation whereall prices are badly distorted. The obvious implication in this situation is that there are few incentives forSE managers to exercise fiscal discipline. And because the closure of loss-making enterprises has beenruled out, managers of SEs that make large losses can always blame the pricing and distribution system fortheir predicament, while knowing that the losses will be covered by the government budget. And, byassigning no value to foreign exchange and investment funds, the SFA worsens these managerial incentivesto squander resources. Therefore, the reforms have not succeeded in making SE behavior more fiscallyresponsible.
3.44 As with price reform and autonomy, the progress that has been made toward privatization,while noteworthy when compared to the period before 1 989, masks serious problems in the approach that isbeing followed. As explained in greater detail in the following section, an important element of successful
" For instance, all SE investment proposals are scrutinized by two inter-ministerial committees -- theConstruction Coordination Committee chaired by the Minister of Construction, and the Equipment ControlCommittee, chaired by the Ministers of Industry (1) and (2).
- 67 -
privatization strategies in other formerly-socialist countries has been a clear definition of the future roles ofthe private and public sectors. This delineation serves as a blueprint based upon which the detailed designof the privatization exercise as well as other private sector development efforts can be formulated. TheGOM's willingness to establish institutional mechanisms to help in privatization as well as to identifypossible candidates is a good beginning. But, what is still missing is a detailed statement regarding theareas in which a continued SE role is envisaged. Hence, the rationale for the choice of the 51 enterprises tobe privatized initially is unclear. Consequently, it is difficult for potential private investors to have a clearidea as to what else will be sold and when. The risk of this approach is, therefore, that it will result in apiecemeal transfonnation of the economy, in which the full benefits of privatization and the development ofa vibrant private sector are not realized.
D. DEEPENING STATE ENTERPRISE REFORM
3.45 The preceding discussion shows the gaps in the current efforts to reform SEs in Myanmar.In determining how to strengthen this program, it is important to first establish why the delineation of aclearer strategy is required in this area. An important lesson from efforts elsewhere to reform SEs is thatsuccessful programs includes several elements. On the one hand, macroeconomic and pricing policies needto be altered if these communicate the wrong signals to enterprises. Such changes in the enablingenvironment in which SEs operate are critical preconditions to undertaking more targeted SE reform.Those targeted policies, on the other hand, must be based on a clear definition of the role and objectives ofthe SE sector. Such an assessment at the very outsct of the reform effort allows clearer choices to be madeas to which enterprises are to be retained in the public sector, and how the rest are to be divested orliquidated. In that context, decisions concerning privatization and the restructuring of enterprises can thenbe made more rationally.
3.46 These aspects of SE reform are well-illustrated by the experience of other transitionaleconomies in Eastern Europe and East Asia. The key elements of these recent reforms are summarized inBox 3.1 for several of these countries, and contrasted with the Myanmar experience. These experiencesshow interesting similarities as well as differences in approach. While the transition strategies followed bythese countries vary widely in terms of speed and sequencing, they share three common features. All thereforms aimed at price liberalization and macroeconomic stabilization, although the pace of those effortswas rapid in Vietnam and the forner Czechoslovakia but more gradual (and almost stop-go) in China.And, all of them emphasized efforts to encourage the establishment and expansion of new, non-state sectorfirms. In all countries, except China, this meant rapid growth in the private sector, and even in China, ittranslated into an expansion of the non-state sector, owned and controlled by local governments. Finally,all these reform programs emphasized financial accountability. They have attempted, with varying success,to impose financial discipline (hard budget constraints) on the remaining SEs by cutting subsidies andliquidating loss-making enterprises.
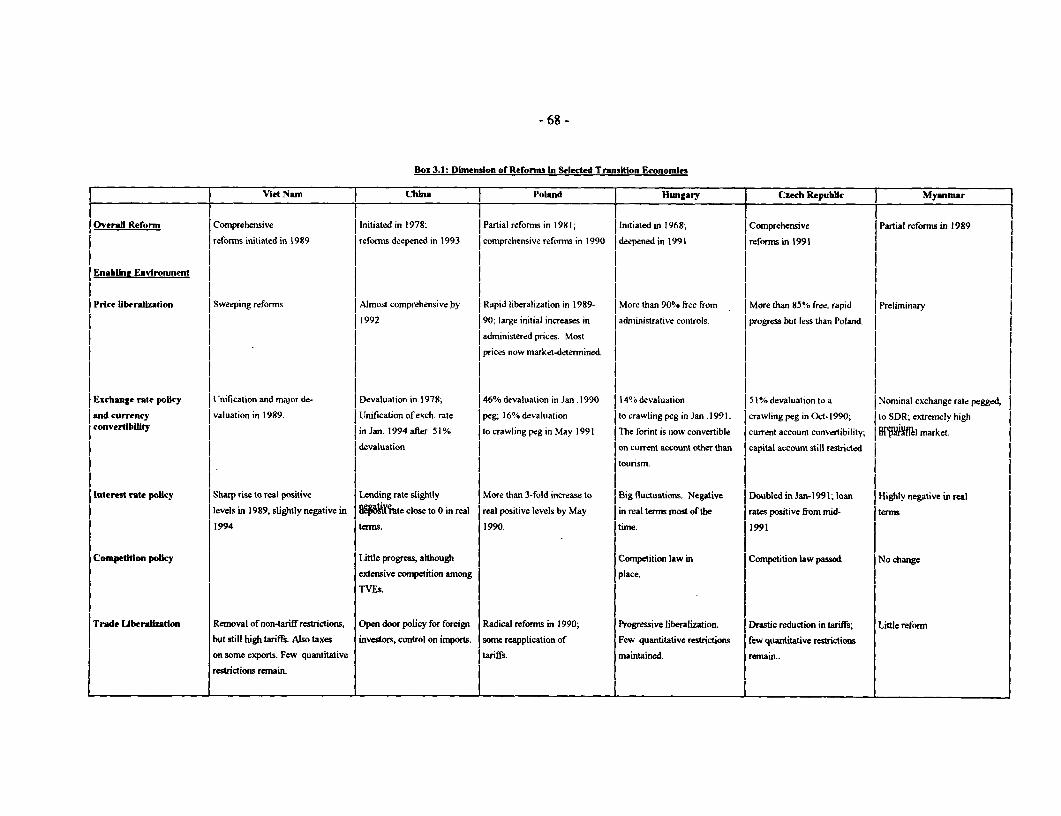
- 68 -
Box 3.1: Dimension of Reforms In Selected Transition Economies
Viet Nam | China Poland Hungary Czech Republic Myanar
Overanfl Reform |Comprehensive |Initiated in 197S| Partial reforms in 198 1; (Initiated in 1968; |Comprehensive |Partial reforms in 1989
reforms initiated in 1989 |reforms deepened in 1993 |comprehensive reforms in 1990 |deepened in 1991 reforms in 1991
|Enabline Environment |
Price lIberalization Sweeping reforms Almost comprehensive by |Rapid liberalization in 1989- More than 90% free from More than 85% free. rapid Preliminary
l1992 |90; large initial increases in administrative controls. |progress but less than Poland.
administered prices. Most
I prices now market-determined. |
|Exchange rate policy Unification and major de- Devaluation in 1978; 46% devaluation in Jan. 1990 14% devaluation 51 % devaluation to a Nominal exchange rate pegged,
and currency |valuation in 1989. (Unification ofexch. rate (peg; 16% devaluation |to crawling peg in Jan. i991. |crawling peg in Oct-l 990; |to SDR; extremely high
convertlbitlty | in Jan. 1994 afler 51% |to crawling peg in May 1991 |The forint is now convertible |current account convertibility; |R?aNlI market.
devaluation | |on current account other than |capital account still restricted
(tourism.
|Interest rate policy |Sharp rise to real positive (Lending rate slightly (More than 3-fold increase to Big fluctuations. Negative |Doubled in Jan- I 99 1; loan |Highly negative in real
levels in 1989, slightly negative in | 8*Yte close to 0 in real |real positive levels by May | in real terms most of the rates positive from mid- (terms
1994 terms. 1990. time. 1991
Competiton poltcy Little progress, although Competition law in Competition law passed. No change
extensive competition among place.
TVEs.
Trade Uberaliztion Removal of non-tariff restrictions, Open door policy for foreign Radical reforms in 1990; Progressive liberalization. Drastic reduction in tariffs; Little reform
but still high tariffs. Also taxes investors, control on imports. some reapplication of Few quantitative restrictions few quantitative restrictions
on some cxports. Fcw quantitative tariffs. maintained remain..
restrictions remain. a
I I I~~~~~~~~~
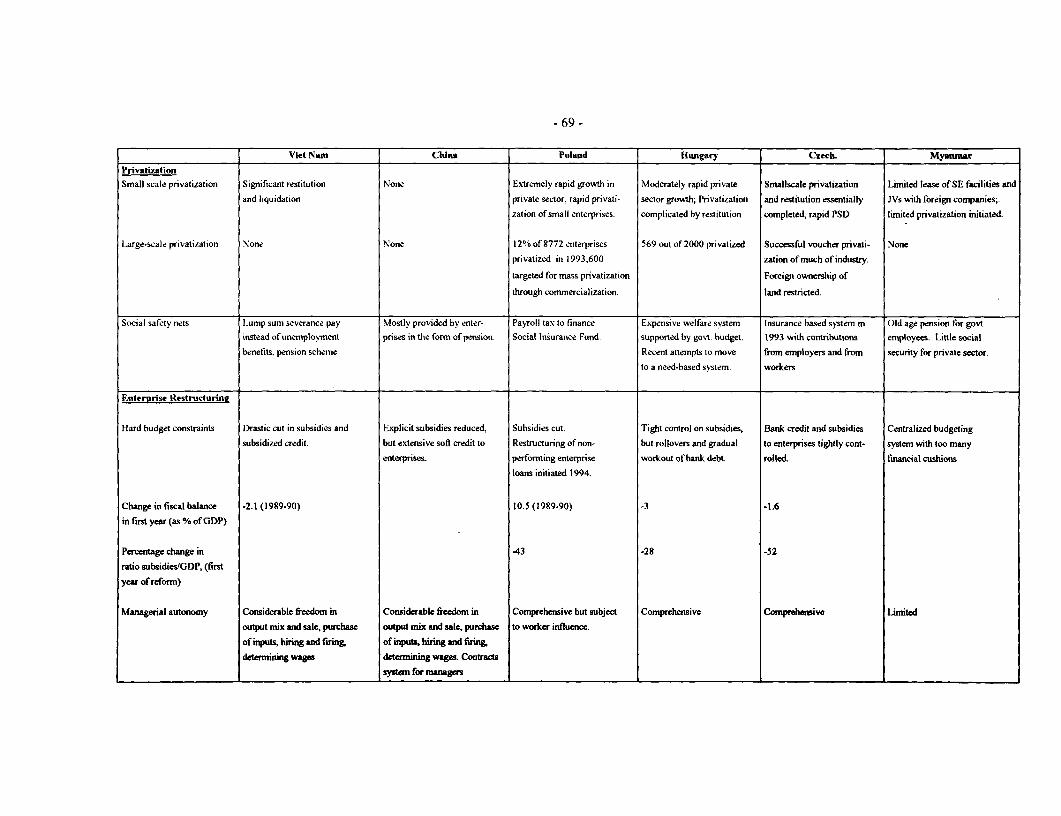
- 69 -
Viet Nan China Poland Hungary Czech. Mya r
Privatization
Small scale privatization Significant restitution None Extremely rapid growth in Moderately rapid private Smallscale privatization Limited lease of SE facilities and
and liquidation private sector; rapid privati- sector growth; Privatization and restitution essentially JVs with foreign companies;.
zation of small enterprises. complicated by restitution completed, rapid PSD limited privatization initiated.
Large-scale pnvatization None None 12% of 8772 etiterpises 569 out of 2000 privatized Successful voucher privati- None
privatized in 1993;600 zation of much of industry.
targeted for mass privatization Foreign ownership of
through commercialization. land restricted.
Social safety nets Lump sum severance pay Mostly provided by enter- Payroll tax to finance Expensive welfare system Insurance based system in Old age pension for govt
instead of tnemployment prises in the fomi of pension. Social Insurance Fhnd. supported by govt. budget. 1993 with contributions employees. Little social
benefits. pension scheme Recent attempts so move from employers and from security for private sector.
to a need-based system. workers
Enterprise Restructurint
Hard budget constraints Drastic cut in subsidies and Explicit subsidies reduced, Subsidies cut. Tight control on subsidies, Bank credit and subsidies Centralized budgeting
subsidized credit. but extensive soft credit to Restructuring of non- but rollovers and gradual to enterprises tightly cont- system with too many
enterprises. performing enterprise workout of bank debt. rolled. financial cushions
loans initiated 1994.
Change in fiscal balance -2.1 (1989-90) 10.5 (1989-90) -3 -1.6
in furst year (as % of ODP)
Percentage change in 43 -28 -52
ratio subsidies/GDP, (first
year of reform)
Managerial autonomy Considerable freedom in Considerable freedom in Comprehensive but subject Comprehensive Comnprehertsive Limited
output mix and sale, purchase output mix and sale, purchase to worker influence.
of inputs, hiring and faring, of inuta hiring d firing.
determining wages detemining w-ag Conracts
systan for managers
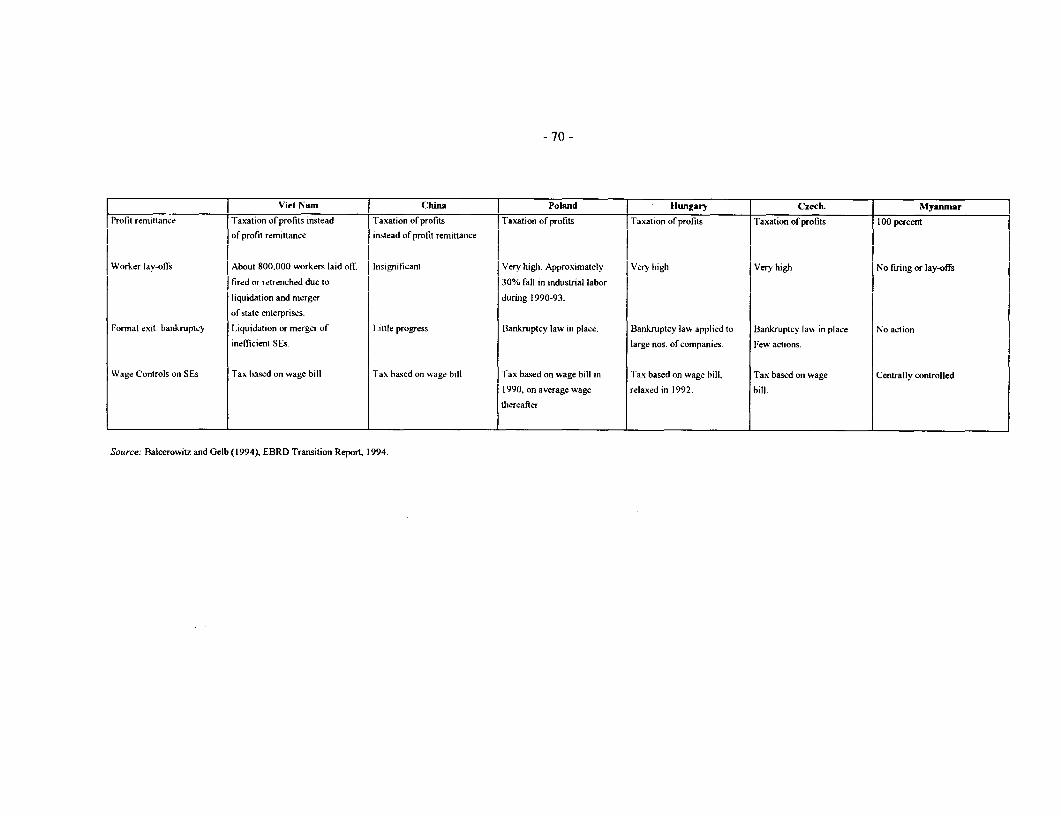
- 70 -
Viet Namn ChiUa ! Poland i Hungary 1 Czech. Myanmar
Profit remittance rTaxation of profits instead Taxati oaxation of profits Taxation of profits Taxation of profits 1100 percentof profit remittance jinstead ofprofit remitnance e l
Worker lav-offs About 800.000 workers laid off. j isignificant Very high. Approximately Very high Very high No firing or lay-offs
fired or retrenched due to 30% fall in industrial labor
liquidation and merger during 1990-93.
of state enterprises.
Formal exit: bankruptcy Liquidation or merger of Little progress Bankruptcy law in place. Bankruptcy law applied to Bankruptcy law. in place No action
inefficient SEs. large nos. of companies. Few actions.
Wage Controls on SEs Tax hased on wage bill Tax based on wage bill Tax based on wage bill in Tax based on wage bill, Tax based on wage Centrally controlled
1990, on average wage relaxed in 1992. bill.
thereafter
Souirce: Balcerowitz and Gelb (1994), EBRD Transition Report, 1994.
- 71 -
3.47 These similarities are especially pertinent in the context of Myannar's current SEreforms. As has already been shown earlier in this report, macroeconomic stability has not been restored.The key "prices" in the economy -- the exchange rate and the interest rate -- are still badly distorted withserious impacts on the operating environment of SEs and their finances. Moreover, the links between theSE sector and the government are still very strong, in financial and operational terms. The reforms to datehave done little to enable SEs develop a more "arm's length" relationship with the government. And,finally, the current approach appears to stress selective privatization as a solution to the problems of the SEsector with little attention to the other elements of SE reform. In this sense, the approach thus far is adhoc, and would be more effective if greater attention were focused on fleshing out a more completeapproach, and on phasing different measures.
Elements of an SE Reform Strategv
3.48 An effective SE reform strategy in the Myanma context would require actions in thefollowing areas: (i) reforms of macroeconomic and sectoral policies to help define the environment in whichSEs operate; (ii) clarification of the role and objectives of the SE sector, which would enable aclassification of enterprises into those that would be retained by the state in the medium term, and thosethat could be divested immediately; (iii) measures to privatize management or ownership of SEs, includingactions with regard to labor retrenchment; (iv) steps for restructuring those SEs that are to be retained,including ways of improving their operational and financial performance; and (v) actions aimed atsupporting the development of strong domestic private enterprises that can replace SEs and ease thetransition. In the rest of this section, recommendations in these areas are fleshed out along with the recentexperiences of other countries that are restructuring their state-owned enterprises.
Macroeconomic and Sectoral Policy Reform
3.49 The importance of stabilizing the macroeconomy and of restoring prices to their functionas signals of scarcity to the success of SE reform is clear both from theory and cross-country experience.Macroeconomic reformns -- in particular, the adjustment of the exchange rate and interest rates to realisticlevels -- would allow the true picture regarding the financial and economic viability of enterprises toemerge. Without such adjustment, the financial statements of SEs are unreliable because the key prices inthe economy are wrong, and because many are recipients of large implicit subsidies through theunderpricing of foreign exchange and capital. Similarly, until the prices at which SEs can purchase inputsand sell their outputs are liberalized. it is difficult to determine their economic viability. The other risk withattempting to divest SEs in such a controlled policy environment is that it may be necessary to offeroffsetting subsidies and other fiscal benefits sweeteners to attract potential buyers. The fiscal anddistortionary effects of such incentives would reduce the gains from SE reform. In contrast, there is nobetter way to encourage confidence among foreign investors than by eliminating overvaluation andenhancing convertibility of the currency.
3.50 The recent experience of successful reform in transitional economies supports this view.Most of them began their reforms with highiv-overvalued exchange rates, negative interest rates, andcontrolled prices. Almost all devalued their currencies substantially at the outset (Box 3.1). Poland andthe former Czechoslovakia, for instance, devalued by almost 50% in 1990 before switching to a crawling-peg system of exchange rate determination. Similarly, Viet Nam's devaluation of almost 70% in 1989almost completely eliminated the parallel-market premium. And, although China only unified its exchangerates in early-1994, its official nominal exchange rate had been devalued by over 500% since 1978, thereby
- 72 -
greatly reducing its overvaluation. The pattern is similar with interest rate liberalization. Poland, theformer Czechoslovakia and Viet Nam all raised their interest rates sharply to positive real levels in 1989and 1990. Even in China, interest rates have been only slightly negative in real termis. Finally, priceliberalization has been undertaken extensively in all these economies including Viet Nam and China.
3.51 The lessons for Myanmar are straightforward. If the reform of SEs is to succeed,complementary changes in macroeconomic and sectoral policies must be among the highest priorities. Evenapart from the stabilization case for an adjustment of the official exchange rate and the restoration ofinterest rates to positive real levels, the ultimate success of SE reforms depends on those actions. Thisassertion is not to imply that no progress can be made on restructuring SEs in the absence ofmacroeconomic and pricing reform. Rather, the risk of such incomplete reform would be that whateverprogress is made will be slow and costly. In privatizing SEs, for instance, it is possible that buyers (likelyforeign firms) can be found for the most attractive divestiture candidates. But, with the large distortionsthat remain at the macroeconomic and microeconomic level, these potential purchasers will face muchuncertainty about future profits and costs. Therefore, they will seek guarantees and subsidies, open andhidden, to assure them of acceptable returns. If such protections are widely granted, as they will have tobe, it will mean that the inefficiency of the SE sector would only have been replaced by that of protectedprivate enterprises.
3.52 The main adverse consequence from such reforms that is feared by policymakers inMyanmar is rising inflation. Undoubtedly, adjusting administered prices, including interest rates and theexchange rate, will result in a one-time increase in the price level. However, experience from otherreforming economies indicates that, with proper macroeconomic management and sustained reforms,inflationary pressures can be controlled. For instance, a tight fiscal and monetary stance brought theinflation rate in Viet Nam down from almost 400% in end-1988 to 35% in end-1989. Similarly, inCzechoslovakia, the inflation rate was reduced to less than 20% within the first year of reforms. And, thesituation may be even more favorable for Myanmar on several counts. The public sector is a much smallerpart of the economy, in terms of output and employment, than was the case in China and in EasternEurope, and no larger than in Viet Nam. And, much of the price adjustment has already occurred inMyanmar through the parallel exchange rate market (para. 1.62). On both counts, therefore, the direct andindirect impacts, such as a wage-price spiral and cost-push effects, of price liberalization would bedampened.
Clarification of the Role of SEs
3.53 With the reforms since 1989, the Myanma economy is now based on markets rather thanon state ownership. This shift in paradigm obviously means the role and the objectives of SEs has changed.The restructuring of SEs would be facilitated if their new role in a market-oriented economy is spelt out.Specifically, the goals of SEs in this changed economic environment need to be clarified before specificdetails of their restructuring can be worked out. Those goals will deternine, in large part, the extent towhich divestiture is necessary, how restructuring of enterprises should proceed, and how fast privatizationwould need to proceed.
3.54 While this report cannot detail the precise role that SEs would play in a market-orientedMyanma economy, a general observation is relevant. Judging by the GOM's statements, it is fullycommitted to the transformation of the economy into one that is led by the private sector and is integratedwith the world economy. Given that vision, the role of the SE sector would be relatively minor. It is
- 73 -
difficult to think of many areas of the economy in which SEs would be required. The only possibleexceptions of many magnitude would be sectors in which large and lumpy capital investments and scaleeconomies, such as electricity generation and distribution, and water supply and sewerage.12 In the rest ofthe industrial and service sector (as in the rest of the economy), the private sector (domestic and foreign) isquite capable of serving consumers more effectively and at lower cost than has been the experience withSEs. This is not to imply that the government would play no role in economic activity. Rather it woulddevote its resources to supplying efficiently the infrastructural services and public goods (such as educationand health services) for which it would still be responsible. And, it would be referee for economic activityensuring that businesses do not behave as monopolists, and that environmental and social laws are obeyed.
3.55 Policymakers in Myanmar have to decide whether this division of labor between theprivate and public sectors, is one with which they are comfortable. While this vision rests on theexperience of many countries, industrial and developing, its promise in terms of efficiency does not meanthat the transition from the current situation will be smooth or easy. As with any other wrenching change,there will be losers just as there will be winners. But as economic reformers in many other transitionaleconomies have decided, the potential gains far outweigh the losses. In Eastern Europe and Viet Nam, forinstance, economic reformers decided early in the reform process that the ultimate goal of their economicrestructuring was a predominantly private-market economy. In that context, substantial privatization ofSEs and private-sector development measures were obviously emphasized. China, on the other hand,decided to maintain its state ownership of SEs. Therefore, its reforms have been aimed at creating"socialist market" that mimics competitive conditions without privatization.
3.56 Once the role of SEs in the economy and their goals are clarified, the next step for SEreform is to classify all existing enterprises on the basis of whether or not they should be retained by thegovernment in the medium term. Of those that are to be divested, their viability in a reformed policyenvironment will need to be assessed so as to decide on how best to divest them. These are tasks that theGOM needs to begin immediately, using the newly-created institutions it has established to assist inprivatization. While precise decisions regarding the viability of many enterprises (and the value of theirassets) may be difficult at the outset due to the distortions that currently exist, the cases at either extremewill be relatively easy to identify, i.e., those are clearly viable, and those that are obviously uneconomic.
Privatization
3.57 An important lesson from other reforming countries is that privatization efforts should beaimed primarily at maximizing economic benefits. After all, enhancing economic efficiency is the mainreason for wanting to reform the economy in general, and to restructure the SE sector in particular.Accepting this goal means that the design and phasing of privatization efforts should not be dictated byother objectives such as generating the most money from sales of SEs or developing capital markets orbroadening stock ownership among the population or in particular groups of the population. Hence, SEassets should not be disposed of on terms that impose costs on other parts of the economy. Specifically, it
12 Even in these sectors, it is possible to have efficient service provision by regulated private firms.Many countries, industrial and developing (including several in East Asia), have moved to this model or arein the process of moving towards it by privatizing or corporatizing their public utilities.
- 74 -
is critical that some purchasers not be given special privileges, such as fiscal incentives or importprotection, on the grounds that their acquisition of the enterprises would help attain non-economic goals.
3.58 Without a detailed analysis of the businesses in which individual enterprises are involvedand of their economic viability, which is beyond the scope of this report, precisely which enterprises wouldbe retained in the public sector cannot be identified. However, it is probable that, if the test of economicefficiency is applied, the public sector would eventually divest itself of most existing SEs. There are nocompelling reasons for public-sector involvement in (and, in several cases, monopoly over) such areas astextiles, pharmaceuticals and machine tools production, or in operating departnent stores, and breedinglivestock.
3.59 Why privatize rather than restructure first. There are several reasons to emphasize large-scale privatization in attempting to improve the performance of the SE sector. First, there is growingevidence from a number of economies, both market-oriented and transitional, to support the contention thanownership matters. For example, although profits continued to decline in most Polish firms in 1992, thesmallest declines occurred in firms that had been privatized through sales, auctions or public offerings.Employment losses were also the smallest in genuinely privatized firms while they were the highest incommercialized SEs. And, even partial privatization has led to considerable restructuring withinenterprises. In China, although SEs have improved their performance due to restructuring, the annualproductivity growth recorded by the non-state town and village enterprises (TVEs) during 1980-92 wasmore than twice as rapid.3 Even stronger support emerges from a recent study that evaluates twelve casesof privatization in Chile, Malaysia, Mexico, and the U.K.. It concludes that in eleven of these enterprises,domestic welfare improved substantially, mainly because of increased investment and productivity gains inthe privatized firms.14
3.60 The case for privatizing ownership quickly to enhance economic efficiency is strengthenedby two other factors. First, evidence from a range of countries (mixed economies and transitionaleconomies) shows that attempts to improve the performance of the SE sector through sector-widerestructuring programs have succeeded rarely. In part, this reflects the detailed information needed todesign and implement such programs, which is typically not available in transition economies. Also, it isprobable that "insiders" who have the best information on the enterprises would adversely influence theimplementation of restructuring. In Hungary and China, for example, managers and workers of SEs beingrestructured have claimed disproportionate amounts in wage payments, thereby reducing the fundsavailable for investment.
3.61 Experience shows that the other problem in restructuring extensively before privatization isthe difficulty of imposing hard budget constraints on large numbers of SEs during this process. In Chinaand Poland, this has led to the need for frequent bail-outs, and associated fiscal difficulties. Finally, thewill to persevere with these enterprise-level reforms usually falters once the immediate crisis in SE finances
13 The evidence for Poland is from a survey of 55 privatized finns conducted in mid-1992. For details,see Dabrowski, J., et. al. (1992). For China, see Jefferson and Rawski (1994).
14 For a summary of these results, see Kikeri (et.al.), (1992).
- 75 -
has passed. For example, in China, a restructuring program for SEs improved performance of someenterprises, but about a third of all SEs still make losses, accounting for a sixth of public expenditures.
3.62 The second factor that argues in favor of less state ownership is that this approach istypically the only practical way of "leveling the playing field" between SEs and private-sector firns. AsChapter 2 documented, a major constraint to private-sector activity outside agriculture and trade inMyanmar is the continued bias against private firms and in favor of SEs in allocating credit and imports,and in access to infrastructure. While some steps can be taken in reducing these advantages, experienceshows that these biases are difficult to uproot in economies like Myanmar where the private sector has longbeen assigned a peripheral role and SEs have been dominant. In this situation, the only effective way ofimproving private-sector access is by reducing the direct involvement of the public sector in economicactivity.
3.63 Privatization in Myanmar. The design of a successful privatization strategy must takeaccount of the initial conditions of the country as well of the SE sector. Several aspects of the currentsituation in Myanmar are particularly relevant because they limit what is possible. The most importantconstraints are limited absorptive capacity and undeveloped capital markets. Due to low savings rates, anda weak domestic private sector, there is unlikely to be much demand among local investors for theenterprises being privatized. The absence of a stock market means that the sale of SEs through publicissues of shares is not possible. Moreover, the financial condition of many of the enterprises is weak andthe existing cross-subsidies and controls make it difficult to evaluate their true financial condition. Andmost SEs, even in manufacturing, are effectively shielded from competition. For economic efficiency, theirdivestiture must be accompanied by measure to promote competition. However, given its directinvolvement in economic activity, the GOM currently lacks the capacity to design and implement suchregulatory policies effectively.
3.64 These initial conditions have four main implications for the pace and sequencing, and formof privatization efforts in Myanmar. First, privatization should begin with small and relatively simpleenterprises. In these cases, their viability is usually easy to ascertain. Their capitalization would be suchthat buyers can be identified quickly. And, if mistakes are made in the privatization transaction, the overalleconomic impacts are likely to be limited. This approach was followed, for example in Viet Nam, whichrapidly privatized (or restored to the former owners) large numbers of small enterprises. To accelerate thisprocess for small firms, the managers and workers of the enterprises could be allowed to initiate theliquidation process as is being proposed in Poland.
3.65 Second, care should be taken that too much effort does not go into the precise valuation ofassets for the small and medium SEs that would be privatized in the initial phases of privatization.'5 Inpart, this conclusion stems from the difficulty of such a valuation exercise in Myanmar because prices aredistorted so badly. Further, for the types and sizes of enterprises that would be covered initially, even ifthere is systematic undervaluation of SE assets in these sales (and there is no reason to believe there shouldbe), it would probably be more than offset by the gains from initiating and completing the process quickly.The emphasis should be on transferring these assets rapidly out of the state sector and into private hands.If too much time and effort are spent on valuation, the costs can be excessive, both of the valuation exerciseitself and from the continued SE losses that will affect the government budget.
15 Part of the current delays in quickly disposing of even the 51 establishments identified for privatization inMyanmar appears to stem from the process of valuing their assets, especially land.
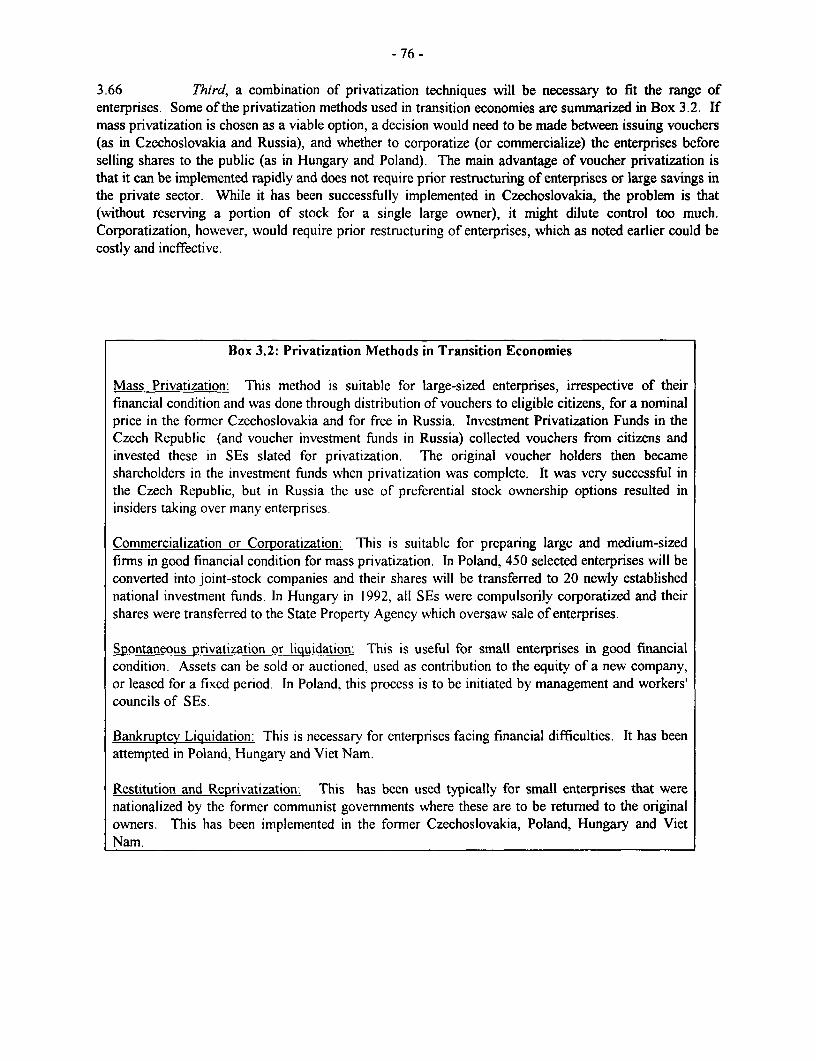
- 76 -
3.66 Third, a combination of privatization techniques will be necessary to fit the range ofenterprises. Some of the privatization methods used in transition economies are summarized in Box 3.2. Ifmass privatization is chosen as a viable option, a decision would need to be made between issuing vouchers(as in Czechoslovakia and Russia), and whether to corporatize (or commercialize) the enterprises beforeselling shares to the public (as in Hungary and Poland). The main advantage of voucher privatization isthat it can be implemented rapidly and does not require prior restructuring of enterprises or large savings inthe private sector. While it has been successfully implemented in Czechoslovakia, the problem is that(without reserving a portion of stock for a single large owner), it might dilute control too much.Corporatization, however, would require prior restructuring of enterprises, which as noted earlier could becostly and ineffective.
Box 3.2: Privatization Methods in Transition Economies
Mass Privatization: This method is suitable for large-sized enterprises, irrespective of theirfinancial condition and was done through distribution of vouchers to eligible citizens, for a nominalprice in the former Czechoslovakia and for free in Russia. Investment Privatization Funds in theCzech Republic (and voucher investment funds in Russia) collected vouchers from citizens andinvested these in SEs slated for privatization. The original voucher holders then becameshareholders in the investment funds when privatization was complete. It was very successful inthe Czech Republic, but in Russia the use of preferential stock ownership options resulted ininsiders taking over many enterprises.
Commercialization or Corporatization: This is suitable for preparing large and medium-sizedfirms in good financial condition for mass privatization. In Poland, 450 selected enterprises will beconverted into joint-stock companies and their shares will be transferred to 20 newly establishednational investment funds. In Hungary in 1992, all SEs were compulsorily corporatized and theirshares were transferred to the State Property Agency which oversaw sale of enterprises.
Spontaneous privatization or liquidation: This is useful for small enterprises in good financialcondition. Assets can be sold or auctioned, used as contribution to the equity of a new company,or leased for a fixed period. In Poland, this process is to be initiated by management and workers'councils of SEs.
Bankruptcy Liquidation: This is necessary for enterprises facing financial difficulties. It has beenattempted in Poland, Hlungarv and Viet Nam.
Restitution and Reprivatization: This has been used typically for small enterprises that werenationalized by the former communist governments where these are to be returned to the originalowners. This has been implemented in the former Czechoslovakia, Poland, Hungary and VietNam.
- 77 -
3.67 Finally, the essential role of liquidating non-viable SEs early in this process needs to berecognized by policymakers. It is obviously easier to privatize profit-making enterprises, and tempting topostpone action on those suffering losses. Given the poor financial and operational health of many SEs inMyanmar, the latter will find it difficult to compete effectively with domestic and import competition in aliberalized and unsubsidized environment. And the obsolescence of their capital equipment and excessemployment mean that they will not be attractive candidates for acquisition by private entrepreneurs.Unless arrangements are made to liquidate these enterprises quickly, they will drain the budget even more.And the entire SE reform process would be threatened if this fiscal impact is dealt with by reintroducingsubsidies to rescue these enterprises. Therefore, it is essential to formulate an exit policy and allowliquidation of enterprises through bankruptcy proceedings.
3.68 Also, for medium-sized enterprises that are not included in the first phase of privatization,an useful interim measure would be to lease their facilities to private entrepreneurs. Such leases arealready being used for some factories by some enterprises of MOI (1) and MOLF, and their applicationcould be broadened. The investors who lease the SEs would then be granted complete operational andfinancial autonomy in return for the payment of a fixed fee, which could be renegotiated periodically.Again, labor retrenchment is an issue that would need to be worked out because the lessors of the facilitiesshould be free to make their own wage and employment decisions.
3.69 An important policy issue that would need to be dealt with if liquidations of enterprises areto be politically feasible is the design of measures to provide severance payments to workers who lose jobs.The problem may be more manageable in Myanmar compared to many other transition economies becauseoverstaffing in SEs appears not to be as serious. And, as the experience of Viet Nam shows, a significantshare of workers laid off by the liquidation of SEs (almost 800,000 in Viet Nam) would find alternativeemployment quickly if private-sector growth accelerates. Currently, since no labor retrenchment hasoccurred, no severance pay scheme exist. Although many transition economies have financedunemployment benefits by taxing wages, it would be better if Myanmar followed the lead of Viet Nam,where lump-sum severance payments are made to workers who are laid off due to liquidation of SEs.
3.70 In sum, therefore, a well-designed privatization program offers Myanmar the opportunityto enhance efficiency in its industrial and service sectors. It is important, however, that this program notplace too many constraints on potential buyers either in terms of their qualifications or future operation ofthe enterprise. And, it is essential that the pace and composition reflect the realities of the Myanmaeconomy and of the financial and operational health of the enterprises being privatized. Finally, it needs tobe recognized explicitly by policymakers that privatization is only one way of encouraging the involvementof private firms. Experience from Eastern Europe and China has shown that far more important, in somerespects, are actions aimed at making it easier for the private sector to establish and operate newbusinesses, and steps that promote competition within the economy. These measures are discussed in theconcluding section of this Chapter.
Restructuring SEs
3.71 Not all SEs in Myanmar can or should be divested by the government in the short andmedium-term -- several large enterprises such as those involved in petroleum and gas exploration, electricpower generation and distribution, and commercial banking will be retained. To manage these enterprisesbetter, it is important that the policy and institutional framework within which they operate be revamped.Two elements of reform are key -- autonomy and accountability.
- 78 -
3.72 Managerial and financial autonomy. Decentralizing decision making within the SEs to beretained by granting real autonomy in financial and operational matters to managers is essential forimproving SE performance. Managers should be free to choose their output mix, make choices regardingoutputs and inputs and decide on hiring and firing workers. Without being able to make such basicdecisions, SEs will find it hard to survive without continued government support. An essential preconditionfor increasing the financial autonomy of SEs is that the centralized budget system based on the SFA mustbe replaced by a system of separate accounts for each enterprise.
3.73 One way to grant managers greater autonomy is to introduce management contracts thatspecify explicit performance targets. In China, this system contributed greatly to the improvedperformance of the SE sector in the 1980s. Another reform, which would enhance the financialindependence of SEs, would be to implement a profit tax for SEs. Such a tax wouli- allow SEs to retain apart of their profits rather than having to remit all their profits to the budget, as with the current system.This step, which has also been implemented in China, would provide SE managers an incentive to increaseprofits by improving efficiency as well as providing them retained earnings with which to financeinvestment. Unlike the situation in which capital expenditures are allocated from the budget, this wouldensure that only well-performing firms have access to investment funds.
3.74 Financial discipline. However, granting SEs greater autonomy without making them moreaccountable for their performance would be disastrous. The most important mechanism by which suchdiscipline would be enhanced is the imposition of a hard budget constraint. The first step would be toeliminate the implicit and explicit subsidies currently enjoyed by SEs. In Myanmar, this would meanadjusting the exchange rate so that SE imports are not underpriced, increasing interest rates on SE loans topositive real levels, raising the prices of energy to SEs to the same levels as for private firms, and reducingthe exemptions that most SEs currently enjoy on import tariffs and commercial taxes. Elimninating financialand economic subsidies was among the first reforms introduced in the successful transition economies ofEastern Europe.
3.75 However, input subsidies are only one aspect of soft budgets for SEs. Enterprises canalso avoid attempts to impose financial discipline by defaulting on loans and interest payments to thebanking sector. This has been a major problem in Poland and China where a large portion of bank debt isconcentrated in loss-making, inefficient enterprises. Similarly, SEs can default on payments to otherenterprises. Such inter-enterprise arrears have been particularly severe in Russia and Romania. To ensurethat SEs cannot escape hard budget constraints through defaults, it is essential that bankruptcy is made acredible threat to their managements. While implementation has proven difficult in practice, manytransition economies have enacted bankruptcv lawvs for SEs, and this step should receive priority inMyanmar.
Private Sector Development
3.76 Among the lessons from the reform experience of transition economies is the importance ofmeasures to support the growth and expansion of the private sector. Rapid private sector development canease the employment and output losses that are typically associated with the initial stages of SE reform.Moreover, removing burdensome restrictions and regulations on private sector operations can yield quickand dramatic dividends. For example, many countries in Eastern and Central Europe lifted their onerouscontrols over the establishment, expansion and operation of private firms at the outset of their reforms.The response was immediate: in 1990, over half a million private single proprietorships were registered in
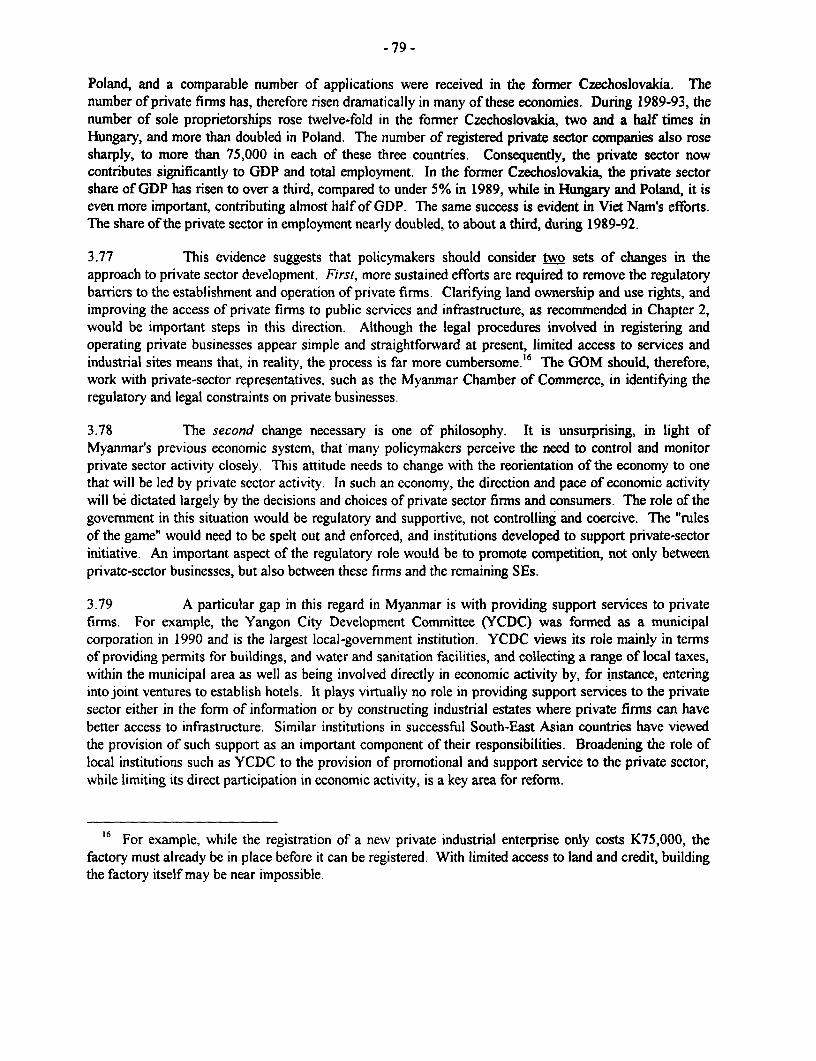
- 79 -
Poland, and a comparable number of applications were received in the former Czechoslovakia. Thenumber of private firms has, therefore risen dramatically in many of these economies. During 1989-93, thenumber of sole proprietorships rose twelve-fold in the former Czechoslovakia, two and a half times inHungary, and more than doubled in Poland. The number of registered private sector companies also rosesharply, to more than 75,000 in each of these three countries. Consequently, the private sector nowcontributes significantly to GDP and total employment. In the former Czechoslovakia, the private sectorshare of GDP has risen to over a third, compared to under 5% in 1989, while in Hungary and Poland, it iseven more important, contributing almost half of GDP. The same success is evident in Viet Nam's efforts.The share of the private sector in employment nearly doubled, to about a third, during 1989-92.
3.77 This evidence suggests that policymakers should consider two sets of changes in theapproach to private sector development. First, more sustained efforts are required to remove the regulatorybarriers to the establishment and operation of private firms. Clarifying land ownership and use rights, andimproving the access of private firms to public services and infrastructure, as recommended in Chapter 2,would be important steps in this direction. Although the legal procedures involved in registering andoperating private businesses appear simple and straightforward at present, limited access to services andindustrial sites means that, in reality, the process is far more cumbersome.16 The GOM should, therefore,work with private-sector representatives, such as the Myanmar Chamber of Commerce, in identifying theregulatory and legal constraints on private businesses.
3.78 The second change necessary is one of philosophy. It is unsurprising, in light ofMyanmar's previous economic system, that many policymakers perceive the need to control and monitorprivate sector activity closely. This attitude needs to change with the reorientation of the economy to onethat will be led by private sector activity. In such an economy, the direction and pace of economic activitywill be dictated largely by the decisions and choices of private sector firms and consumers. The role of thegovermnent in this situation would be regulatory and supportive, not controlling and coercive. The "rulesof the game" would need to be spelt out and enforced, and institutions developed to support private-sectorinitiative. An important aspect of the regulatory role would be to promote competition, not only betweenprivate-sector businesses, but also between these firms and the remaining SEs.
3.79 A particular gap in this regard in Myanmar is with providing support services to privatefinrms. For example, the Yangon City Development Committee (YCDC) was formed as a municipalcorporation in 1990 and is the largest local-government institution. YCDC views its role mainly in termsof providing permits for buildings, and water and sanitation facilities, and collecting a range of local taxes,within the municipal area as well as being involved directly in economic activity by, for instance, enteringinto joint ventures to establish hotels. It plays virtually no role in providing support services to the privatesector either in the form of information or by constructing industrial estates where private firms can havebetter access to infrastructure. Similar institutions in successful South-East Asian countries have viewedthe provision of such support as an important component of their responsibilities. Broadening the role oflocal institutions such as YCDC to the provision of promotional and support service to the private sector,while limiting its direct participation in economic activity, is a key area for reform.
16 For example, while the registration of a new private industrial enterprise only costs K75,000, thefactory must already be in place before it can be registered. With limited access to land and credit, buildingthe factory itself may be near impossible.
- 80 -
3.80 The other aspect that needs improvement to help private sector development efforts is theGOM's interaction with the private sector. As noted in Chapter 2, the lack of dialogue at presentcontributes to the persistence of many of the problems faced by private firms. It is, therefore, essential thatmechanisms be established through which a dialogue concerning policy and institutional reforms can beconducted with representatives of the private sector, domestic and foreign. Such consultation has been animportant ingredient in the economic success of such countries as Korea, Thailand, and Indonesia, becauseit helps build the consensus necessary to formulate and implement a medium-term development strategy.
- 81 -
BIBLIOGRAPHY
Balcerowicz, H. and A. Gelb., "Policy Lessons from Early Reformers," paper prepared for the Sixth AnnualWorld Bank Conference on Development Economics, 1994.
Dawbrowski, J., M. Federowicz, and J. Szomburg, "Privatization of the Polish State Owned Enterprises," TheGdansk Institute for Market Economies, 1992.
Dollar, D., "Macroeconomic Management and the Transition to the Market in Vietnam," Journal of ComparativeEconomics, Vol.18, pp.357-375, 1994.
European Bank for Reconstruction and Development (EBRD), Transition Report: Economic Transition inEastem and the Former Soviet Union, 1994.
Feder, G., T. Onchan, Y. Chalamwong, and C. Hongladarom, Land Policies and Farm Productivity in Thailand,1988.
Harrison, P.M., "Myanmar: A Review of the Agricultural Sector," Background paper prepared for the WorldBank Country Economic Memorandum, June 1990.
Jefferson, G., and T. Rawski, "Enterprise Reforms in Chinese Industry," Journal of Economic Perspectives, Vol.8, pp. 47-70, 1994.
Kikeri, S., J. Nellis, and M. Shirley, Privatization: The Lessons of Experience, World Bank, 1992.
Krueger, A.O., M. Schiff, and A. Valdes (eds.), The Political Economy of Agricultural Pricing Policy, WorldBank, 1991.
UNDP, Report MYA/86/012, pp. 29-32, 1992.
World Bank, The East Asian Miracle: Economic Growth and Public Policy, 1993.
East Asia's Trade and Investment, 1994.
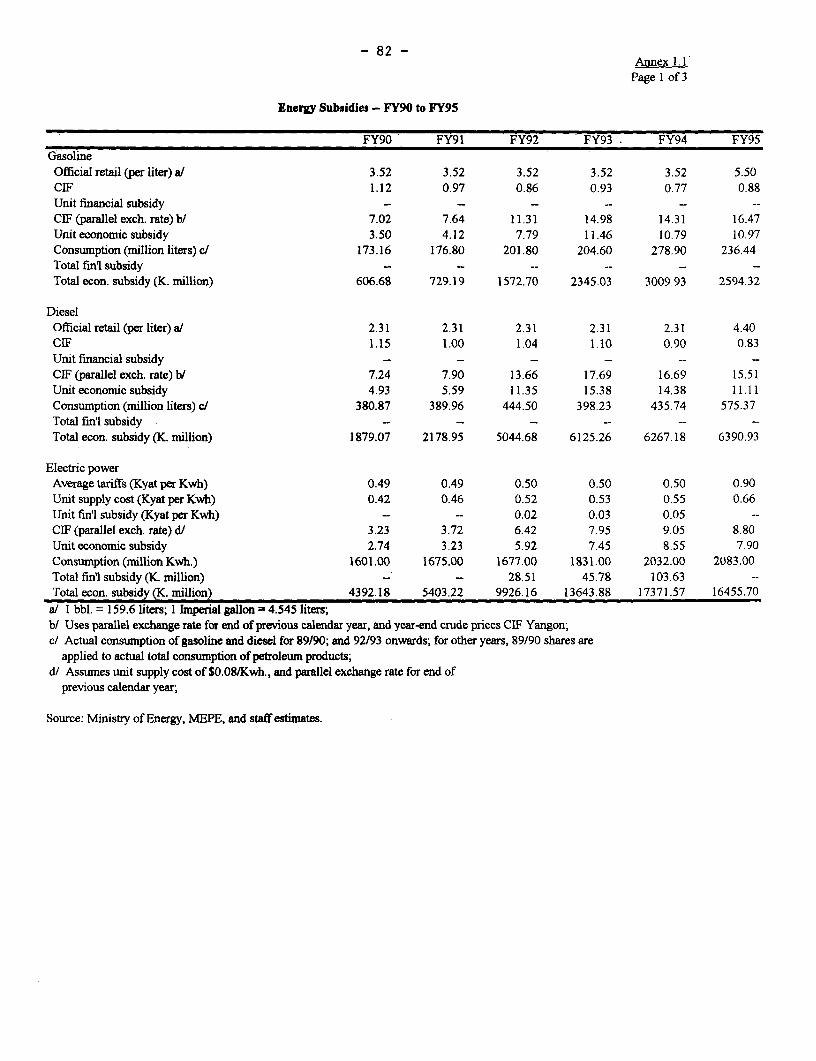
- 82 -Annex 1. I
Page I of 3
Energy Subsidies - FY90 to FY95
FY90 FY91 FY92 FY93 . FY94 FY95GasolineOfficial retail (per liter) a/ 3.52 3.52 3.52 3.52 3.52 5.50CIF 1.12 0.97 0.86 0.93 0.77 0.88Unit financial subsidy - - -- -- - --CIF(parallelexch.rate)b/ 7.02 7.64 11.31 14.98 14.31 16.47Unit economic subsidy 3.50 4.12 7.79 11.46 10.79 10.97Consumption(millionliters)c/ 173.16 176.80 201.80 204.60 278.90 236.44Total finl subsidy - -- -- -- - -Total econ. subsidy (K. million) 606.68 729.19 1572.70 2345.03 3009.93 2594.32
DieselOfficialretail (per liter) a/ 2.31 2.31 2.31 2.31 2.31 4.40CIF 1.15 1.00 1.04 1.10 0.90 0.83Unit financial subsidy -- - -- - -- --CIF (parallel exch. rate) b/ 7.24 7.90 13.66 17.69 16.69 15.51Unit economic subsidy 4.93 5.59 11.35 15.38 14.38 11.11Consumption (million liters) c/ 380.87 389.96 444.50 398.23 435.74 575.37Total fin'l subsidy -- - - -- --Total econ. subsidy (K. million) 1879.07 2178.95 5044.68 6125.26 6267.18 6390.93
Electric powerAverage tariffs (Kyat per Kwh) 0.49 0.49 0.50 0.50 0.50 0.90Unit supply cost (Kyat per Kwh) 0.42 0.46 0.52 0.53 0.55 0.66Unit fin'l subsidy (Kyat per Kwh) - - 0.02 0.03 0.05 --CIF (parallel exch. rate) d/ 3.23 3.72 6.42 7.95 9.05 8.80Unit economic subsidy 2.74 3.23 5.92 7.45 8.55 7.90Consumption (million Kwh.) 1601.00 1675.00 1677.00 1831.00 2032.00 2083.00Total fin'l subsidy (K. million) - - 28.51 45.78 103.63 --Total econ. subsidy (K. million) 4392.18 5403.22 9926.16 13643.88 17371.57 16455.70
a/ I bbl. = 159.6 liters; I Imperial gallon = 4.545 liters;b/ Uses parallel exchange rate for end of previous calendar year, and year-end crude prices CIF Yangon;c/ Actual consumption of gasoline and diesel for 89/90; and 92/93 onwards; for other years, 89/90 shares are
applied to actual total consumption of petroleum products;d/ Assumes unit supply cost of S0.08/Kwh., and parallel exchange rate for end of
previous calendar year;
Source: Ministry of Energy, MEPE, and staff estimates.
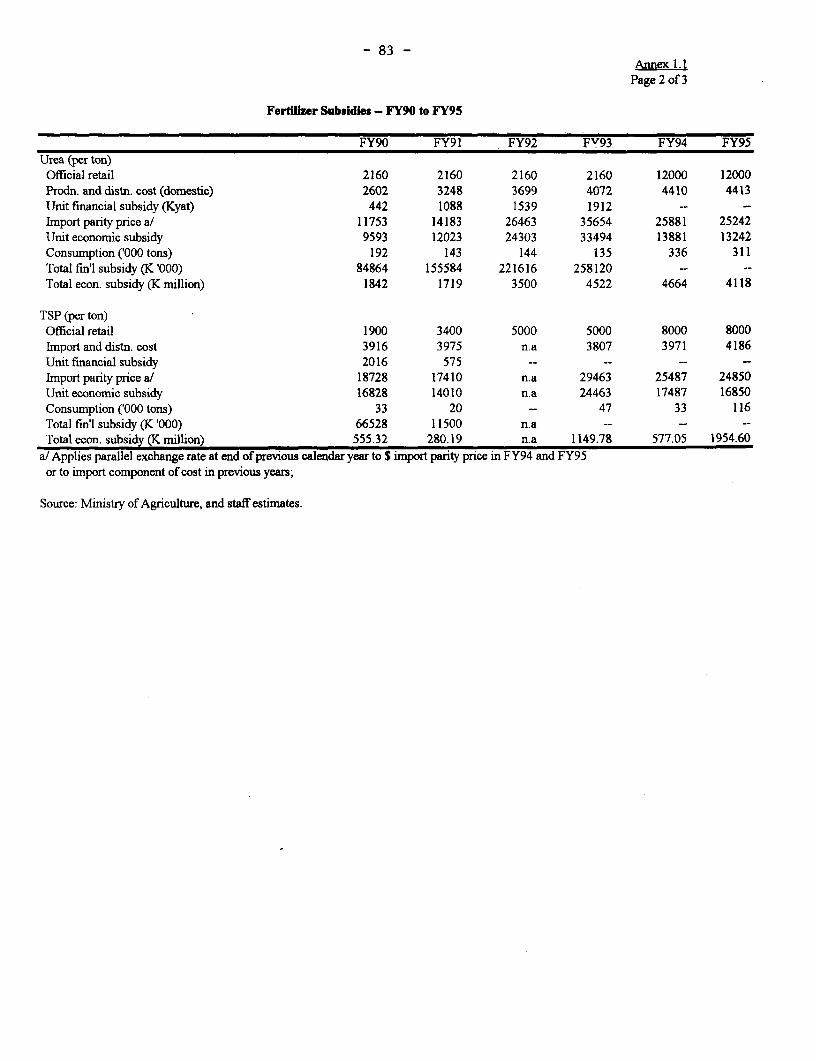
- 83 -Annex 1. I
Page 2 of 3
Fertilizer Subsidies - FY90 to FY95
FY90 FY91 FY92 Fv93 FY94 FY95Urea (per ton)Official retail 2160 2160 2160 2160 12000 12000Prodn. and distn. cost (domestic) 2602 3248 3699 4072 4410 4413Unit financial subsidy (Kyat) 442 1088 1539 1912 -- -Import parity price a/ 11753 14183 26463 35654 25881 25242Unit economic subsidy 9593 12023 24303 33494 13881 13242Consumption ('000 tons) 192 143 144 135 336 311Total fin'l subsidy (K'000) 84864 155584 221616 258120 -- --Totalecon. subsidy(Kmillion) 1842 1719 3500 4522 4664 4118
TSP (per ton)Official retail 1900 3400 5000 5000 8000 8000Import and distn. cost 3916 3975 n.a 3807 3971 4186Unit financial subsidy 2016 575 -- -- -- --Import parity price a/ 18728 17410 n.a 29463 25487 24850Unit economic subsidy 16828 14010 n.a 24463 17487 16850Consumption ('000 tons) 33 20 -- 47 33 116Total fin'l subsidy (K '000) 66528 11500 n.a -- -- --Total econ. subsidy (K million) 555.32 280.19 n.a 1149.78 577.05 1954.60
a/ Applies parallel exchange rate at end of previous calendar year to S import parity price in FY94 and FY95or to import component of cost in previous years;
Source: Ministry of Agriculture, and staff estimates.
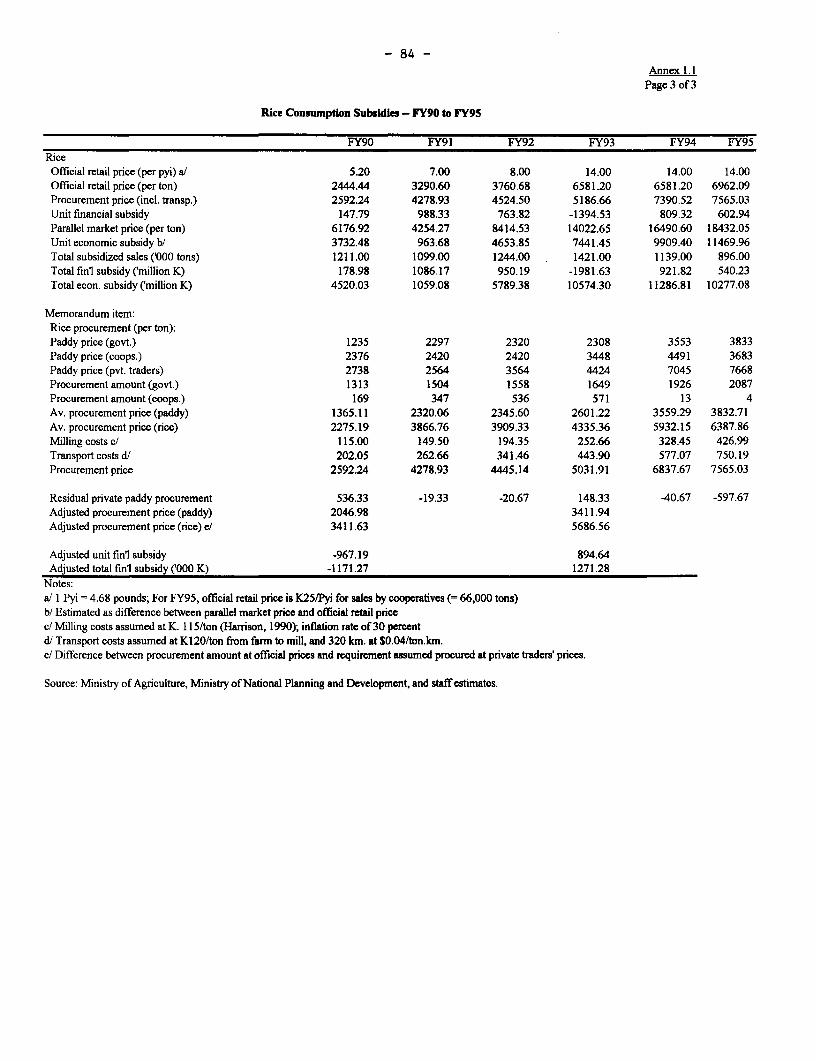
- 84 -
Annex 1. IPage 3 of 3
Rice Consumption Subsidies - FY90 to FY95
FY90 FY91 FY92 FY93 FY94 FY95RiceOfficial retail price (per pyi) a/ 5.20 7.00 8.00 14.00 14.00 14.00Official retail price (per ton) 2444.44 3290.60 3760.68 6581.20 6581.20 6962.09Procurement price (incl. transp.) 2592.24 4278.93 4524.50 5186.66 7390.52 7565.03Unit financial subsidy 147.79 988.33 763.82 -1394.53 809.32 602.94Parallel market price (per ton) 6176.92 4254.27 8414.53 14022.65 16490.60 18432.05Unit economic subsidy b/ 3732.48 963.68 4653.85 7441.45 9909.40 11469.96Total subsidized sales ('000 tons) 1211.00 1099.00 1244.00 1421.00 1139.00 896.00Total fin'l subsidy (million K) 178.98 1086.17 950.19 -1981.63 921.82 540.23Total econ. subsidy ('million K) 4520.03 1059.08 5789.38 10574.30 11286.81 10277.08
Memorandum item:Rice procurement (per ton):Paddy price (govt.) 1235 2297 2320 2308 3553 3833Paddy price (coops.) 2376 2420 2420 3448 4491 3683Paddy price (pvt. traders) 2738 2564 3564 4424 7045 7668Procurement amount (govt.) 1313 1504 1558 1649 1926 2087Procurement amount (coops.) 169 347 536 571 13 4Av. procurement price (paddy) 1365.11 2320.06 2345.60 2601.22 3559.29 3832.71Av. procurement price (rice) 2275.19 3866.76 3909.33 4335.36 5932.15 6387.86Milling costs c/ 115.00 149.50 194.35 252.66 328.45 426.99Transport costs d/ 202.05 262.66 341.46 443.90 577.07 750.19Procurement price 2592.24 4278.93 4445.14 5031.91 6837.67 7565.03
Residual private paddy procurement 536.33 -19.33 -20.67 148.33 -40.67 -597.67Adjusted procurement price (paddy) 2046.98 3411.94Adjusted procurement price (rice) e/ 3411.63 5686.56
Adjusted unit fin'l subsidy -967.19 894.64Adjusted total fin'l subsidy ('000 K) -1171.27 1271.28
Notes:a/ I Pyi = 4.68 pounds; For FY95, official retail price is K25/Pyi for sales by cooperatives (= 66,000 tons)b/ Estimated as difference between parallel market price and official retail pricec/ Milling costs assumed at K. 115/ton (Harrison, 1990); inflation rate of 30 percentd/ Transport costs assumed at K120/ton from farm to mill, and 320 km. at $0.04/ton.km.e/ Difference between procurement amount at official prices and requirement assumed procured at private traders' prices.
Source: Ministry of Agriculture, Ministry of National Planning and Development, and staff estimates.
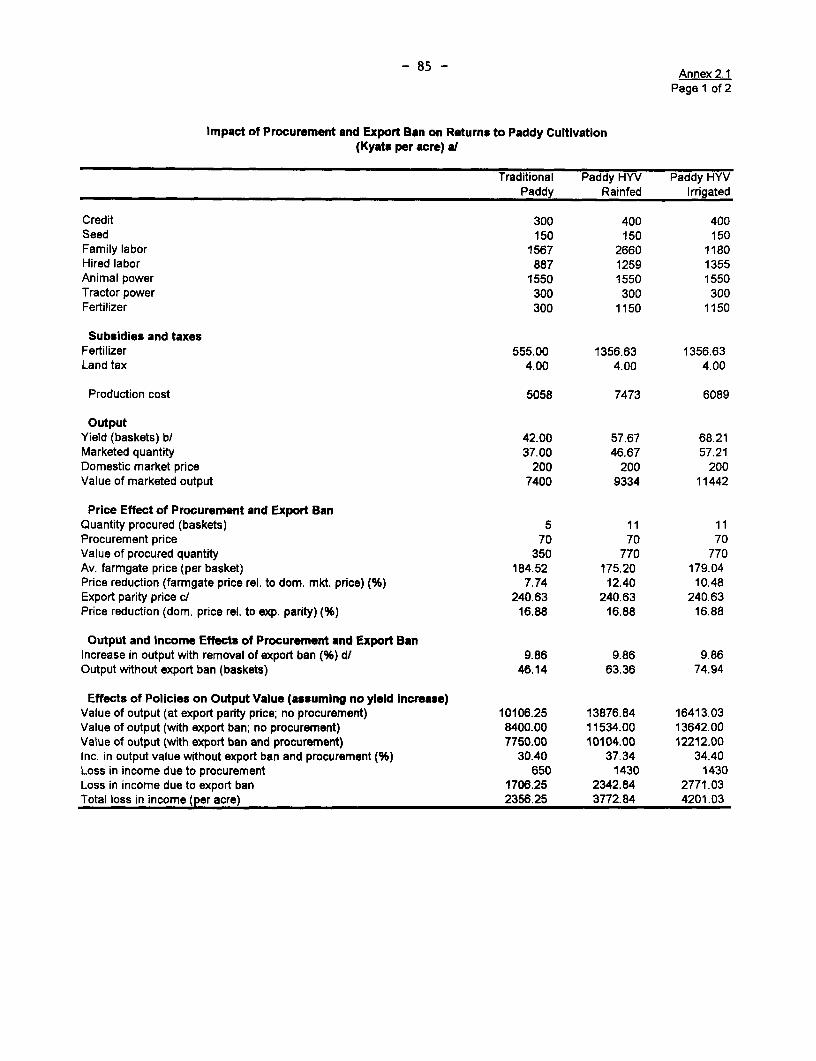
- 85 - Annex 2.1
Page 1 of 2
Impact of Procurement and Export Ban on Returns to Paddy Cultivation(Kyats per acre) a/
Traditional Paddy HYV Paddy HYVPaddy Rainfed Irrigated
Credit 300 400 400Seed 150 150 150Family labor 1567 2660 1180Hired labor 887 1259 1355Animal power 1550 1550 1550Tractor power 300 300 300Fertilizer 300 1150 1150
Subsidies and taxesFertilizer 555.00 1356.63 1356.63Land tax 4.00 4.00 4.00
Production cost 5058 7473 6089
OutputYield (baskets) b/ 42.00 57.67 68.21Marketed quantity 37.00 46.67 57.21Domestic market price 200 200 200Value of marketed output 7400 9334 11442
Price Effect of Procurement and Export BanQuantity procured (baskets) 5 11 11Procurement price 70 70 70Value of procured quantity 350 770 770Av. farmgate price (per basket) 184.52 175.20 179.04Price reduction (farmgate price rel. to dom. mkt. price) (%) 7.74 12.40 10.48Export parity price c/ 240.63 240.63 240.63Price reduction (dom. price rel. to exp. parity) (%) 16.88 16.88 16.88
Output and Income Effects of Procurement and Export BanIncrease in output with removal of export ban (%) d/ 9.86 9.86 9.86Output without export ban (baskets) 46.14 63.36 74.94
Effects of Policies on Output Value (assuming no yield Increase)Value of output (at export parity price; no procurement) 10106.25 13876.84 16413.03Value of output (with export ban; no procurement) 8400.00 11534.00 13642.00Value of output (with export ban and procurement) 7750.00 10104.00 12212.00Inc. in output value without export ban and procurement (%) 30.40 37.34 34.40Loss in income due to procurement 650 1430 1430Loss in income due to export ban 1706.25 2342.84 2771.03Total loss in income (per acre) 2356.25 3772.84 4201.03
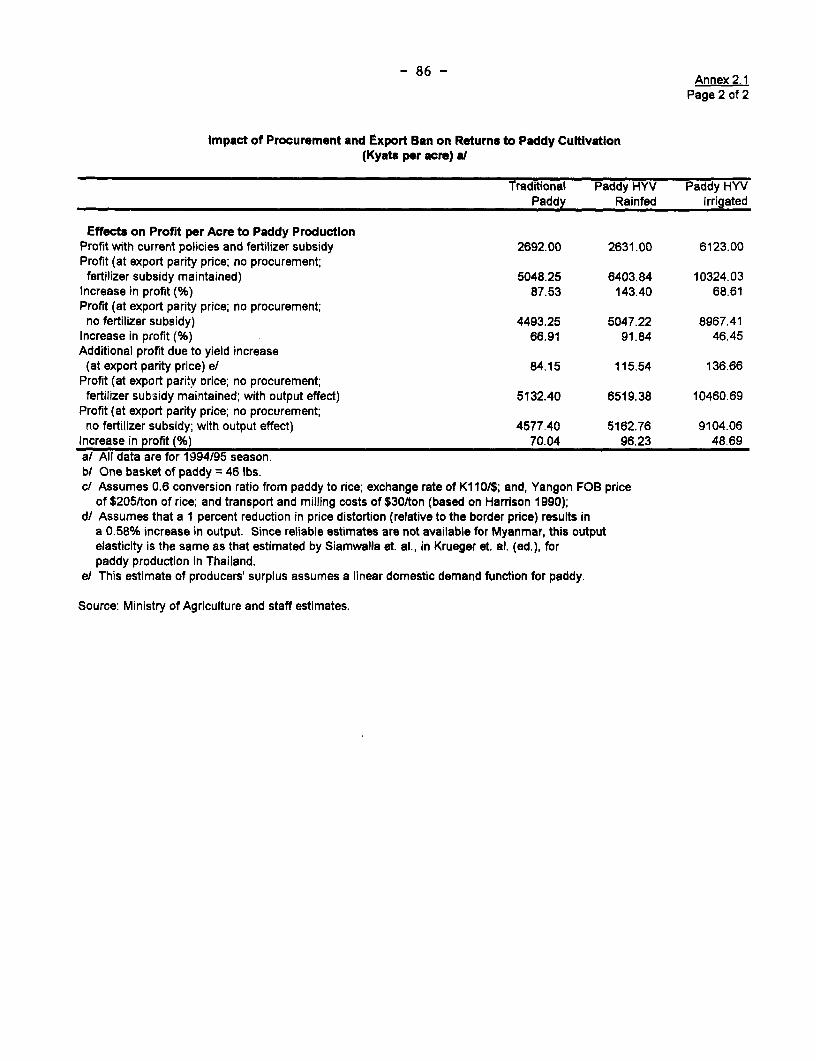
- 86 - Annex 2.1
Page 2 of 2
Impact of Procurement and Export Ban on Returns to Paddy Cultivation(Kyats per acre) a/
Traditional Paddy HYV Paddy HYVPaddy Rainfed Irrigated
Effects on Profit per Acre to Paddy ProductionProfit with current policies and fertilizer subsidy 2692.00 2631.00 6123.00Profit (at export parity price; no procurement;fertilizer subsidy maintained) 5048.25 6403.84 10324.03
Increase in profit (%) 87.53 143.40 68.61Profit (at export parity price; no procurement;
no fertilizer subsidy) 4493.25 5047.22 8967.41Increase in profit (%) 66.91 91.84 46.45Additional profit due to yield increase(at export parity price) e/ 84.15 115.54 136.66
Profit (at export parity orice; no procurement;fertilizer subsidy maintained; with output effect) 5132.40 6519.38 10460.69
Profit (at export parity price; no procurement;no fertilizer subsidy; with output effect) 4577.40 5162.76 9104.06
Increase in profit (%) 70.04 96.23 48.69a/ All data are for 1994/95 season.b/ One basket of paddy = 46 lbs.c/ Assumes 0.6 conversion ratio from paddy to rice; exchange rate of K110/$; and, Yangon FOB price
of $205/ton of rice; and transport and milling costs of $30/ton (based on Harrison 1990);d/ Assumes that a 1 percent reduction in price distortion (relative to the border price) results in
a 0.58% increase in output. Since reliable estimates are not available for Myanmar, this outputelasticity is the same as that estimated by Siamwalla et. al., in Krueger et. al. (ed.), forpaddy production in Thailand.
e/ This estimate of producers' surplus assumes a linear domestic demand function for paddy.
Source: Ministry of Agriculture and staff estimates.
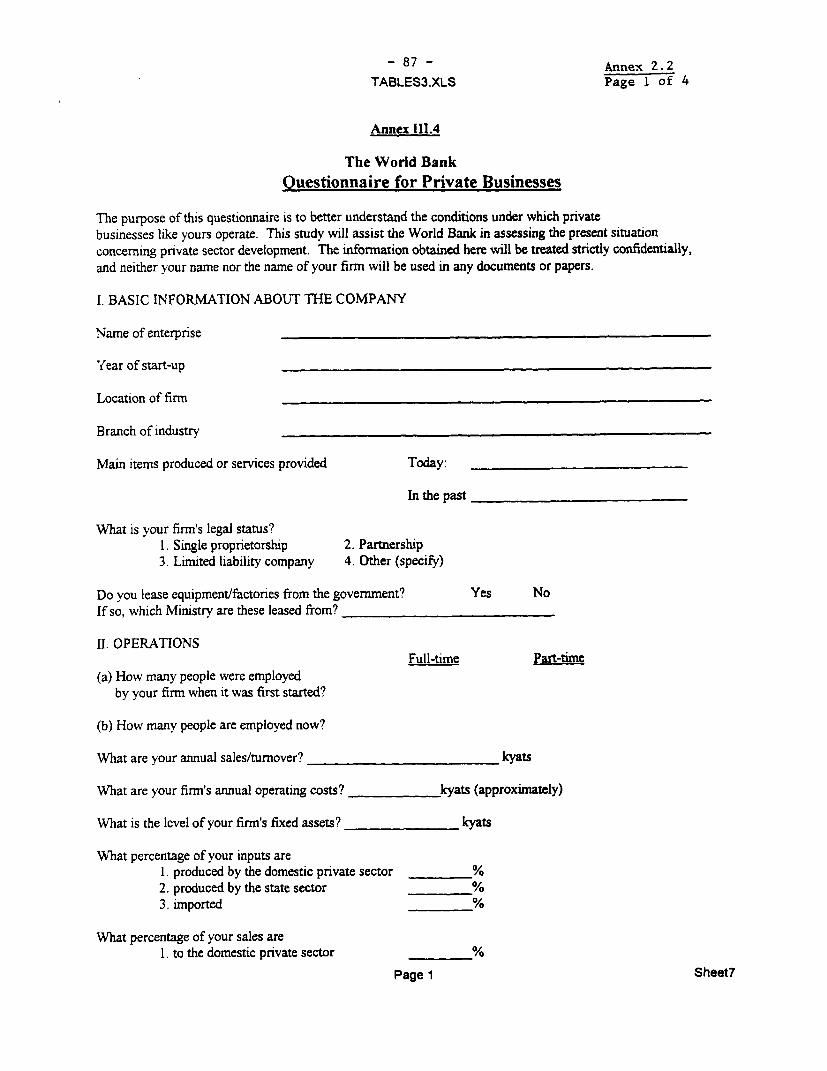
- 87 - Annex 2.2TABLES3.XLS Page 1 of 4
Annex 111.4
The World Bank
Ouestionnaire for Private Businesses
The purpose of this questionnaire is to better understand the conditions under which privatebusinesses like yours operate. This study will assist the World Bank in assessing the present situationconcerning private sector development. The information obtained here w%ill be treated strictly confidentially,and neither your name nor the name of your firm will be used in any documents or papers.
1. BASIC INFORMATION ABOUT THE COMPANY
Name of enterprise
Year of start-up
Location of firm
Branch of industry
Main items produced or services provided Today:
In the past
What is your firm's legal status?1. Single proprietorship 2. Partnership3. Limited liability company 4. Other (specify)
Do you lease equipment/factories from the government? Yes NoIf so, which Ministry are these leased from?
11. OPERATIONSFull-time Part-time
(a) How many people were employedby your firm when it was first started?
(b) How many people are employed now?
What are your annual sales/turnover? kyats
What are your firm's annual operating costs? _ kyats (approximately)
What is the level of your firm's fixed assets? kyats
What percentage of your inputs are1. produced by the domestic private sector %2. produced by the state sector %3. imported %
What percentage of your sales are1. to the domestic private sector %
Page 1 Sheet7
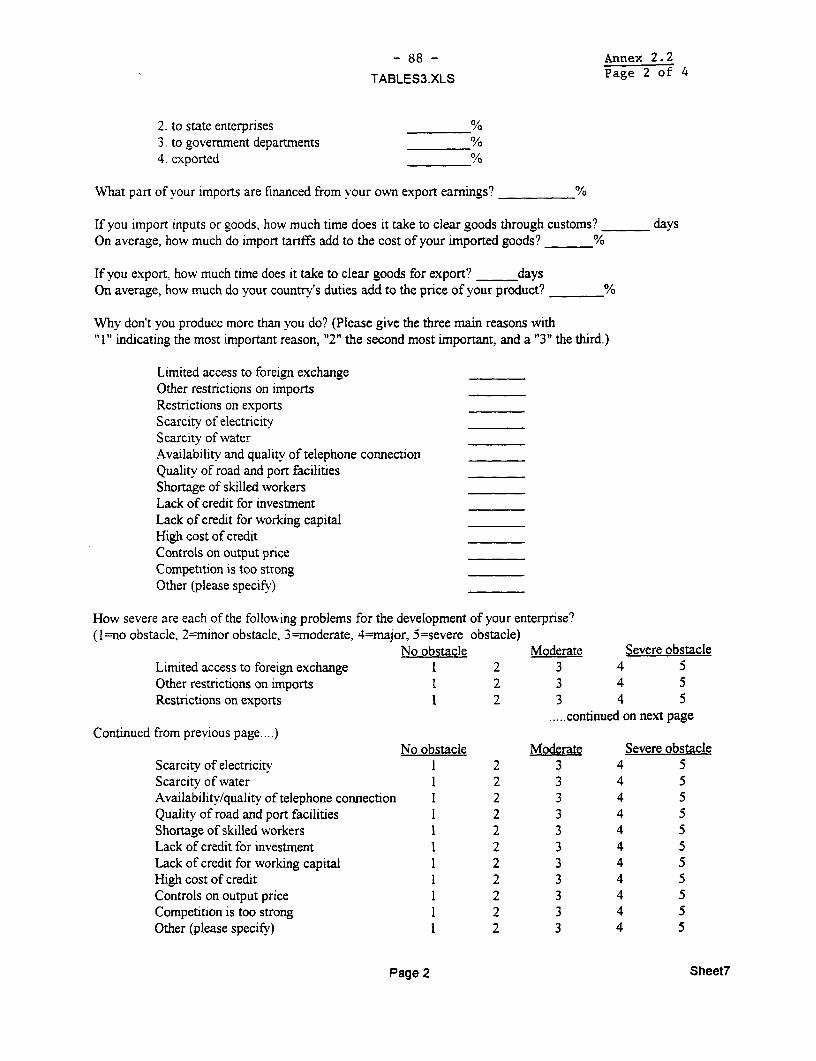
- 88 - Annex 2.2
TABLES3.XLS Page 2 of 4
2. to state enterprises %3. to government departments %4. exported %
What part of your imports are financed from vour oNvn export earnings? %
If you import inputs or goods, how much time does it take to clear goods through customs? daysOn average, how much do import tariffs add to the cost of your imported goods? %
If you export, how much time does it take to clear goods for export? _ _daysOn average, how much do your country's duties add to the price of your product? %
Why don't you produce more than you do? (Please give the three main reasons with"I," indicating the most important reason, "2" the second most important, and a `3" the third.)
Limited access to foreign exchange
Other restrictions on importsRestrictions on exportsScarcity of electricitvScarcity of waterAvailability and quality of telephone connectionQuality of road and port facilitiesShortage of skilled workersLack of credit for investment
Lack of credit for working capitalHigh cost of creditControls on output price
Competition is too strongOther (please specifv)
How severe are each of the following problems for the development of your enterprise?(I=no obstacle, 2=minor obstacle, 3=moderate. 4=major, 5=severe obstacle)
No obstacle Moderate Severe obstacleLimited access to foreign exchange 1 2 3 4 5Other restrictions on imports 1 2 3 4 5Restrictions on exports 1 2 3 4 5
..... continued on next pageContinued from previous page....)
No obstacle Moderate Severe obstacleScarcity of electricitv 1 2 3 4 5Scarcity of water 1 2 3 4 5Availability/quality of telephone connection 1 2 3 4 5Quality of road and port facilities 1 2 3 4 5Shortage of skilled workers 1 2 3 4 5Lack of credit for investment 1 2 3 4 5Lack of credit for working capital 1 2 3 4 5High cost of credit 1 2 3 4 5Controls on output price 1 2 3 4 5Competition is too strong 1 2 3 4 5Other (please specify) 1 2 3 4 5
Page 2 Sheet7
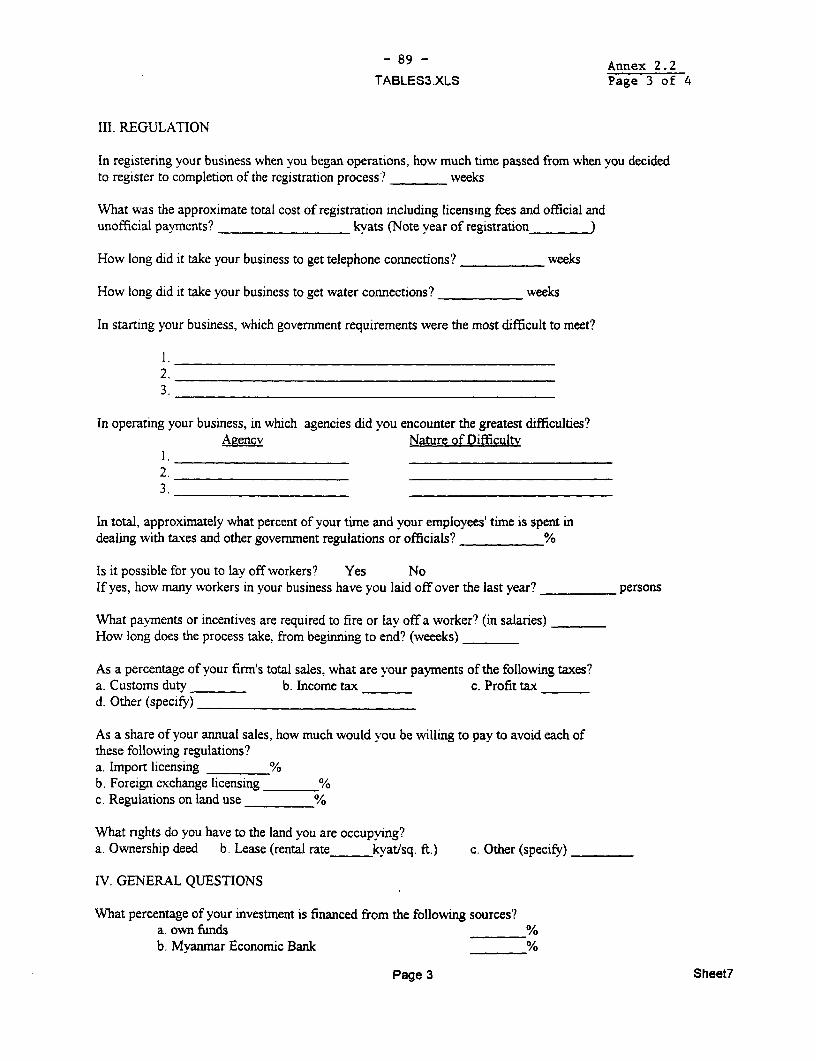
- 89 - Annex 2.2
TABLES3.XLS Page 3 of 4
III. REGULATION
In registering your business when you began operations. how much time passed from when you decidedto register to completion of the registration process? weeks
What was the approximate total cost of registration including licensing fees and official andunofficial payments? kvats (Note vear of registration)
How long did it take your business to get telephone connections? weeks
How long did it take your business to get water connections? weeks
In starting your business, which government requirements were the most difficult to meet?
I1.
2.3.
In operating your business, in which agencies did vou encounter the greatest difficulties?ALgencv Nature of Difficultv
2.__ _
3.
In total, approximately what percent of your time and vour emplovees' timne is spent indaealing with taxes and other governunent regulations or officials? %
Is it possible for you to lay off workers? Yes NoIf yes, how many workers in your business have vou lad off over the last year? persons
What pavments or incentives are required to fire or lav off a worker? (in salaries)H ow long does the process take. from beginning to end? (weeeks)
As a percentage of your firmn's total sales. what are * our payrnents of the following taxes?a. Customs duty b. Income tax c. Profit taxd. Other (specify)
As a share of your annual sales, how much would y,ou be willing to pay to avoid each ofthese following regulations?a. Import licensing %b. Foreign exchange licensing %c. Regulations on land use %
What rights do you have to the land you are occupving?a. Ownership deed b. Lease (rental rate kvatlsq. ft.) c. Other (specify)
IV. GENERAL QUESTIONS
What percentage of your investment is financed from the following sources?a. own funds %b. Myanmar Economic Bank %
Page 3 Sheet7
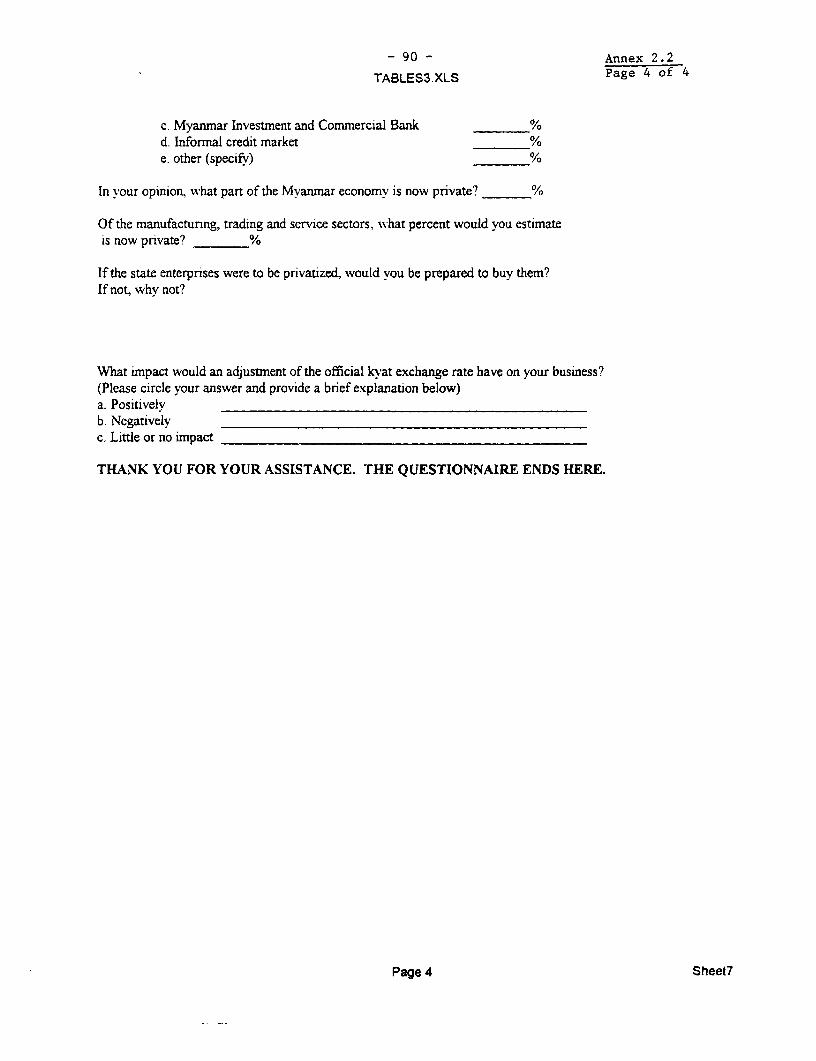
- 90 - Annex 2.2
TABLES3.XLS Page 4 of 4
c. Myanmar Investment and Commercial Bank %d. Informal credit market %e. other (specifv) %
In y our opinion, what part of the Mvanmar economv is now private? %
Of the manufactunng, trading and service sectors. what percent would you estimateis now pnrvate? %
If the state enterprises were to be privatized, would vou be prepared to buy them?If not, why not?
What impact would an adjustment of the official kyat exchange rate have on your business?(Please circle your answer and provide a brief explanation below)a. Positivelyb. Negativelvc. Little or no impact
THANK YOU FOR YOUR ASSISTANCE. THE QUESTIONNAIRE ENDS HERE.
Page 4 Sheet7
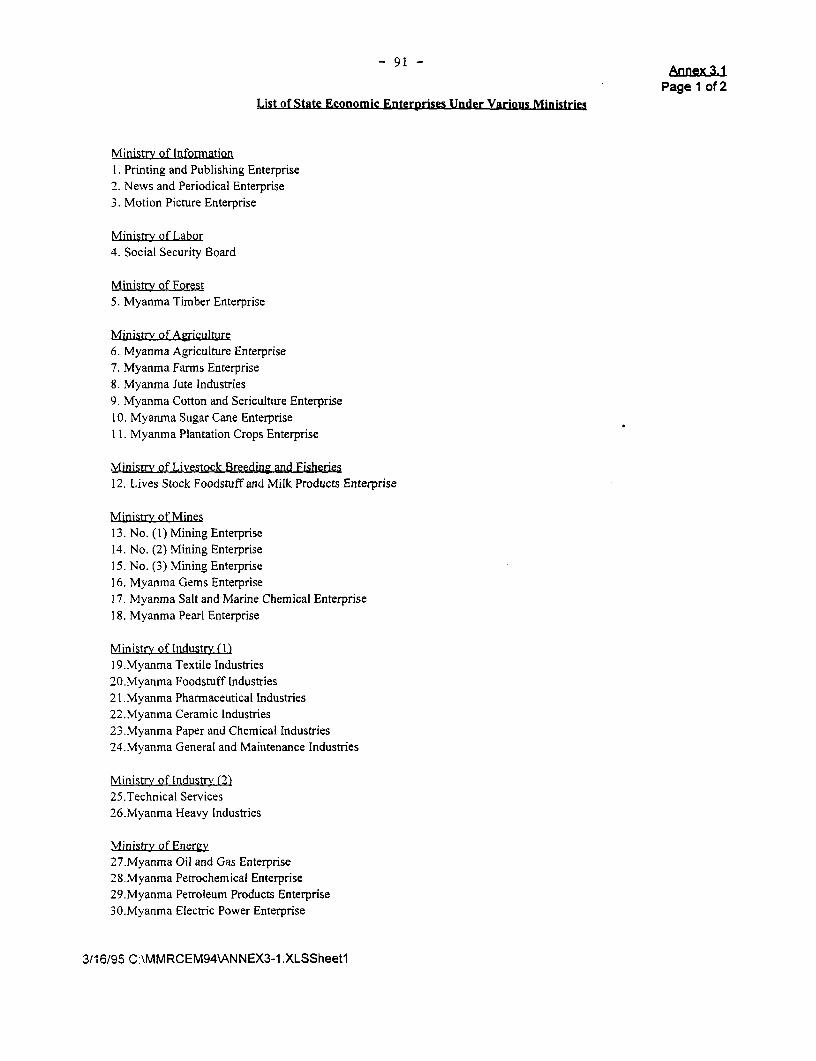
-91- Annex 3.1
Page 1 of 2List of State Economic Enterprises Under Various Ministries
Ministry of Information1. Printing and Publishing Enterprise2. News and Periodical Enterprise3. Motion Picture Enterprise
Ministry of Labor4. Social Security Board
Ministrv of Forest5. Myanma Timber Enterprise
Ministry of Agriculture6. Myanma Agriculture Enterprise7. Myanma Farms Enterprise8. Myanma Jute Industries9. Myanma Cotton and Sericulture Enterprise10. Myanma Sugar Cane Enterprise11. Myanna Plantation Crops Enterprise
Ministry of Livestock Breeding and Fisheries12. Lives Stock Foodstuff and Milk Products Enterprise
Ministry of Mines13. No. (I) Mining Enterprise14. No. (2) Mining Enterprise15. No. (3) Mining Enterprise16. Myanma Gems Enterprise17. Myanma Salt and Marine Chemical Enterprise18. Myanma Pearl Enterprise
Ministry of Industry (1)19.Myanma Textile Industries20.Myanma Foodstuff Industries21. Myanma Pharmaceutical Industries22.Myanma Ceramic Industries23.Myanma Paper and Chemical Industries24.Myanma General and Maintenance Industries
Ministry of Industrv (2)25.Technical Services26.Myanma Heavy industries
Ministry of Energy27.Myanma Oil and Gas Enterprise28.Myanma Petrochemical Enterprise29.Myanma Petroleum Products Enterprise30.Myanma Electric Power Enterprise
3/16/95 C:\MMRCEM94\ANNEX3-1.XLSSheet1

- 92 -
Annex 3.1Page 2 of 2
Ministry of Construction31.Public Works
Ministr, of Transport32.lnland Water Transport33.Myanma Five Star Line34.Myanma Ports Authority35.Myanma Shipyards36.Myanma Airways
Ministry of Railways37.Myanma Railways38.Road Transport
Ministrv of Communications, Post and Telegraphs39.Myanma Posts and Telecommunications
Ministry of Trade40.My inma Agricultural Produce Trading41.General Merchandise Trading42.Myanma Department Stores43.Stationery, Printing and Photographic Store Trading44.Medicines and Medical Equipment Trading45.Vehicles, Machinery and Equipment Trading46.Construccion and Electrical Stores Trading47.Inspeccion and Agency Services48.Myanma Export and Import Services
Ministry of Hotel and Tourism Services49.Myanma Hotel and Tourism Services50.Restaurant and Beverage Enterprise
Ministrv of Co-operatives51 .Co-operative Export Import Enterprise
Ministrv of Planning & Finance52.Central Bank of Myanmar53.Myanma Economic Bank54.Myanma Investment and Commercial Bank55.Myanma Foreign Trade Bank56.Myanma Agricultural and Rural Development Bank57.Myanma Small Loan58.Myanma Insurance59.Security Printing Works
Source: Budget Department.
3/16/95 C:\MMRCEM94\ANNEX3-1.XLSSheet1
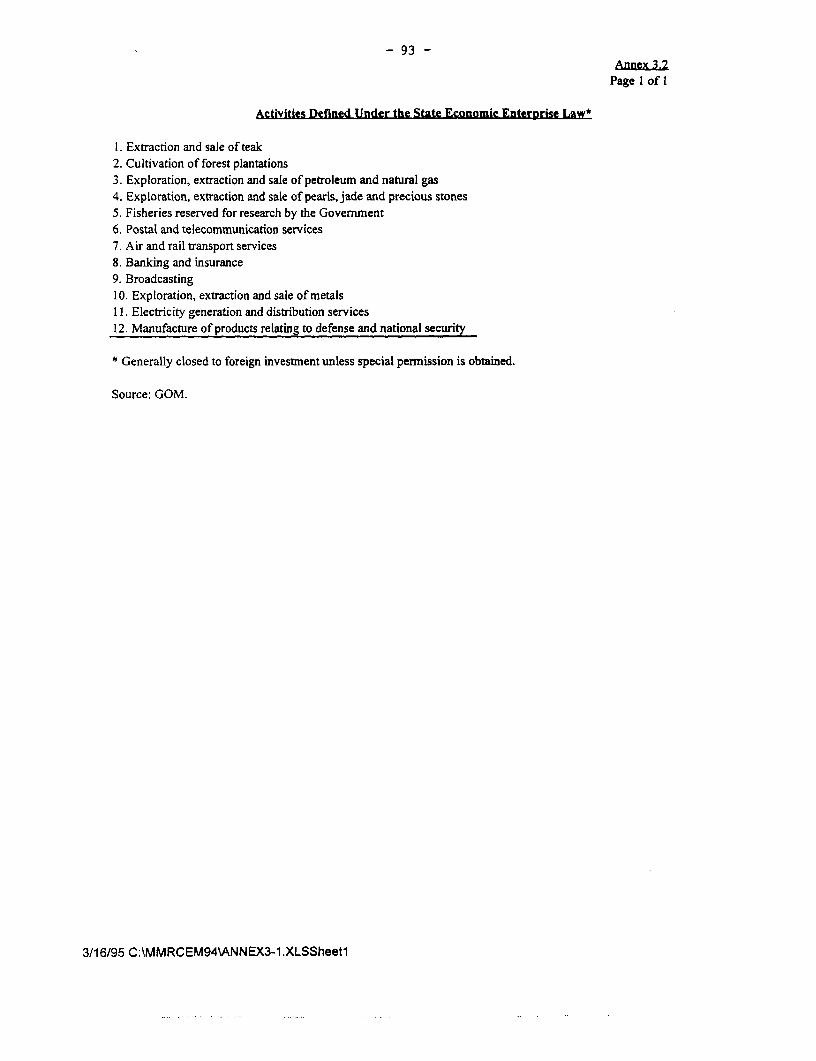
- 93 -Annex 3.2
Page I of I
Activities Defined Under the State Economic Enterprise Law*
I. Extraction and sale of teak2. Cultivation of forest plantations3. Exploration, extraction and sale of petroleum and natural gas4. Exploration, extraction and sale of pearls, jade and precious stones5. Fisheries reserved for research by the Government6. Postal and telecommunication services7. Air and rail transport services8. Banking and insurance9. Broadcasting10. Exploration, extraction and sale of metals11. Electricity generation and distribution services12. Manufacture of products relating to defense and national security
* Generally closed to foreign investment unless special permission is obtained.
Source: GOM.
3/16/95 C:\MMRCEM94\ANNEX3-1.XLSSheetI
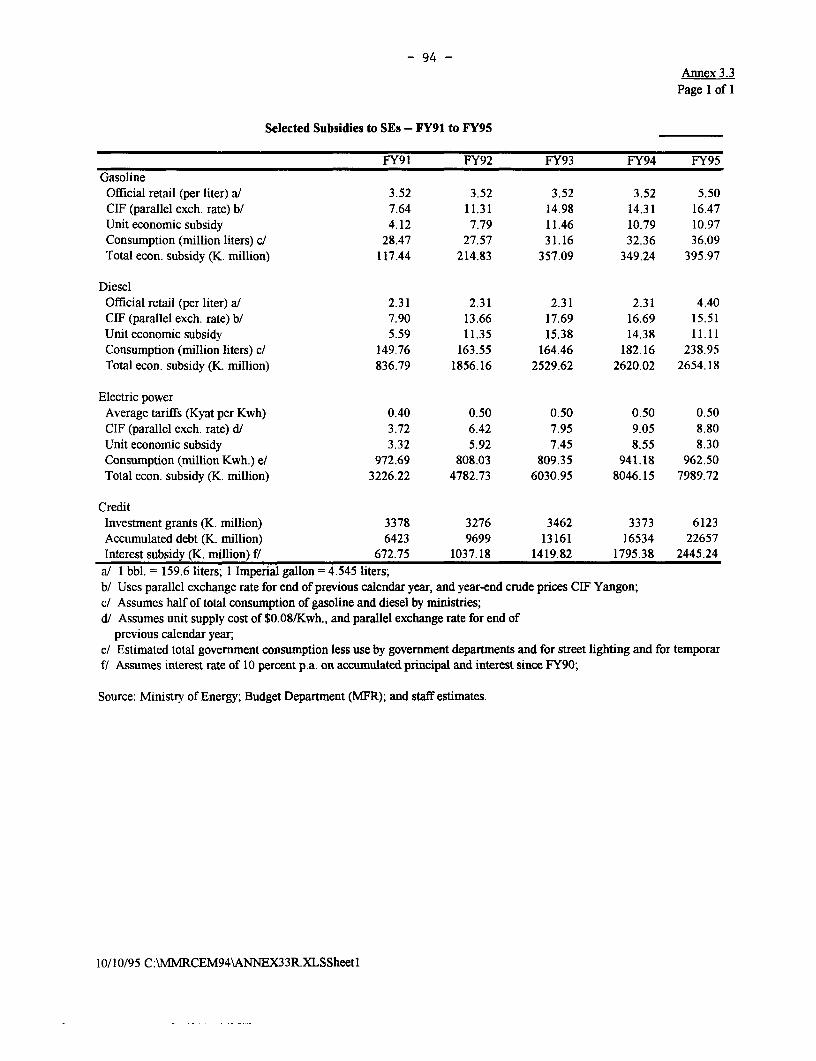
- 94 -Annex 3.3
Page I of I
Selected Subsidies to SEs - FY91 to FY95
FY91 FY92 FY93 FY94 FY95GasolineOfficial retail (per liter) a! 3.52 3.52 3.52 3.52 5.50CIF(parallelexch. rate)b/ 7.64 11.31 14.98 14.31 16.47Unit economic subsidy 4.12 7.79 11.46 10.79 10.97Consumption (million liters) c/ 28.47 27.57 31.16 32.36 36.09Total econ. subsidy (K. million) 117.44 214.83 357.09 349.24 395.97
DieselOfficial retail (per liter) a/ 2.31 2.31 2.31 2.31 4.40CIF (parallel exch. rate) b/ 7.90 13.66 17.69 16.69 15.51Uniteconomicsubsidy 5.59 11.35 15.38 14.38 11.11Consumption (million liters) c/ 149.76 163.55 164.46 182.16 238.95Total econ. subsidy (K. million) 836.79 1856.16 2529.62 2620.02 2654.18
Electric powerAverage tariffs (Kyat per Kwh) 0.40 0.50 0.50 0.50 0.50CIF (parallel exch. rate) d/ 3.72 6.42 7.95 9.05 8.80Unit economic subsidy 3.32 5.92 7.45 8.55 8.30Consumption (million Kwh.) e/ 972.69 808.03 809.35 941.18 962.50Total econ. subsidy (K. million) 3226.22 4782.73 6030.95 8046.15 7989.72
CreditInvestment grants (K. million) 3378 3276 3462 3373 6123Accumulated debt (K. million) 6423 9699 13161 16534 22657Interest subsidy (K. million) f/ 672.75 1037.18 1419.82 1795.38 2445.24
a! 1 bbl. = 159.6 liters; 1 Imperial gallon = 4.545 liters;b/ Uses parallel exchange rate for end of previous calendar year, and year-end crude prices CIF Yangon;c/ Assumes half of total consumption of gasoline and diesel by ministries;d/ Assumes unit supply cost of $0.08/Kwh., and parallel exchange rate for end of
previous calendar year;e/ Estimated total government consumption less use by government departments and for street lighting and for temporarf/ Assumes interest rate of 10 percent p.a. on accumulated principal and interest since FY90;
Source: Ministry of Energy; Budget Department (MFR); and staff estimates.
10/10/95 C:\MMRCEM94\ANNEX33R.XLSSheetl
- 95 -
STATISTICAL APPENDIX
APPENDIX TABLES
1. National Accounts
1.1 GDP By Industrial Origin at Current Market Prices1.2 GDP By Industrial Origin at Constant 1985/86 Prices1.3 Deflators by Industrial Origin (1985/86=100)1.4 GDP By Expenditure Category at Current Market Prices1.5 GDP By Expenditure Category at Constant 1985/86 Prices1.6 GDP Deflators by Expenditure Category (1985/86=100)1.7 Allocation of Public Capital Expenditure1.8 Investment and Saving
2. Balance of Payments
2.1 Balance of Payments2.2 Merchandise Exports2.3 Imports by Major Categories2.4 Direction of Trade2.5 Exports and Imports by Sector2.6 International Reserves2.7 Services Account
3. External Debt
3.1 External Medium- and Long-Term Public Debt and Debt Service Payments3.2 Medium and Long-Term External Public Debt by Creditors as of March 31, 19943.3 External Debt and Arrears
4. Public Finance
4.1 Summary of Consolidated Non-financial Public Sector Operations4.2 Government Current Revenue4.3 Union Government Current Expenditure4.4 Union Government Capital Expenditure
5. Money and Credit
5.1 Monetary Survey5.2 Selected Interest Rates
- 96 -
6. Industry
6.1 Capacity Utilization Ratios, and Output and Capacity Indices for Selected Industrial Enterprises6.2 Production, Trade, and Consumption of Oil and Natural Gas6.3 Generation and Consumption of Electricity
7. Prices
7.1 Yangon Consumer Price Index7.2 Official and Free Market Prices of Selected Goods
8. State Owned and Private Entervrises
8.1 Budget of the State Economic Enterprises8.2 Sectoral Breakdown of SEEs' Current Surplus and Capital Expenditure8.3 Approved and Actual Foreign Direct Investment Inflows8.4 Foreign Direct Investment by Country8.5 Foreign Direct Investment by Industry
9. Azriculture and Forestry
9.1 Sown Area for Major Crops9.2 Output and Yield of Major Crops9.3 Production and Utilization of Teak and Hardwood
10. Population. Employment and Waaes in the Public Sector
10.1 Employment and Population10.2 Employment and Wages in the Public Sector
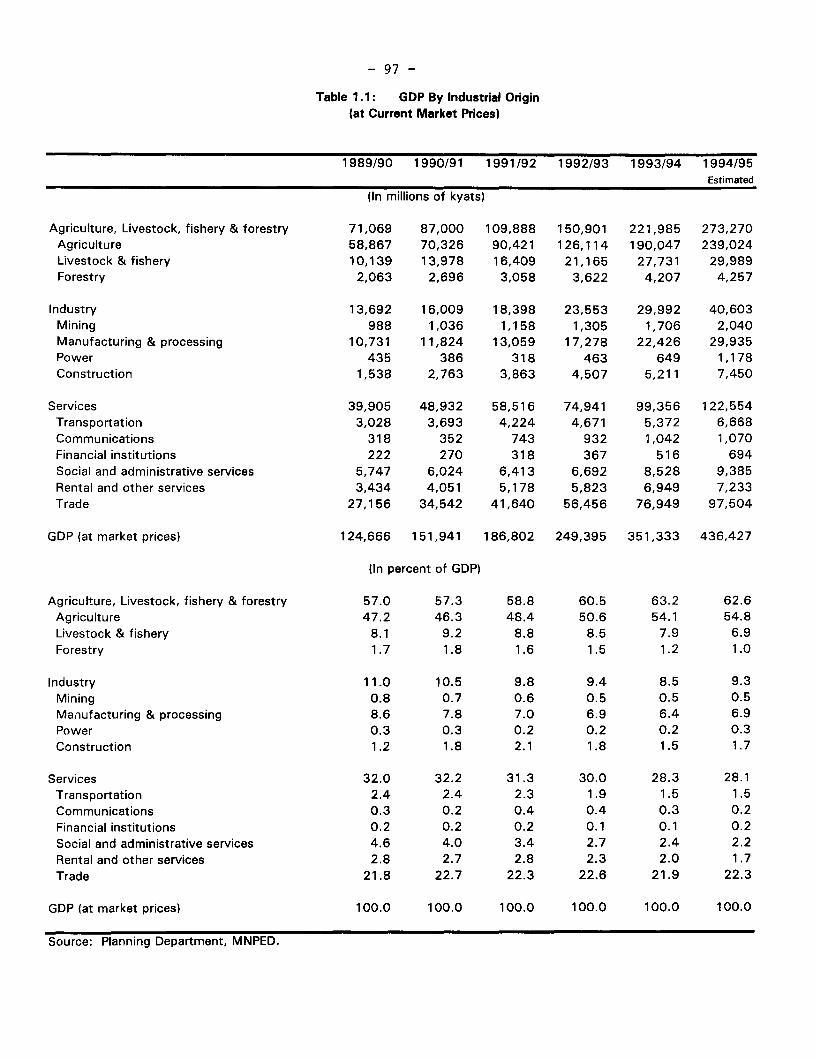
- 97 -
Table 1.1: GDP By Industrial Origin(at Current Market Prices)
1989/90 1990/91 1991/92 1992/93 1993/94 1994/95Estimated
(In millions of kyats)
Agriculture, Livestock, fishery & forestry 71,069 87,000 109,888 150,901 221,985 273,270Agriculture 58,867 70,326 90,421 126,114 190,047 239,024Livestock & fishery 10,139 13,978 16,409 21,165 27,731 29,989Forestry 2,063 2,696 3,058 3,622 4,207 4,257
Industry 13,692 16,009 18,398 23,553 29,992 40,603Mining 988 1,036 1,158 1,305 1,706 2,040Manufacturing & processing 10,731 11,824 13,059 17,278 22,426 29,935Power 435 386 318 463 649 1,178Construction 1,538 2,763 3,863 4,507 5,211 7,450
Services 39,905 48,932 58,516 74,941 99,356 122,554Transportation 3,028 3,693 4,224 4,671 5,372 6,668Communications 318 352 743 932 1,042 1,070Financial institutions 222 270 318 367 516 694Social and administrative services 5,747 6,024 6,413 6,692 8,528 9,385Rental and other services 3,434 4,051 5,178 5,823 6,949 7,233Trade 27,156 34,542 41,640 56,456 76,949 97,504
GDP (at market prices) 124,666 151,941 186,802 249,395 351,333 436,427
(In percent of GDP)
Agriculture, Livestock, fishery & forestry 57.0 57.3 58.8 60.5 63.2 62.6Agriculture 47.2 46.3 48.4 50.6 54.1 54.8Livestock & fishery 8.1 9.2 8.8 8.5 7.9 6.9Forestry 1.7 1.8 1.6 1.5 1.2 1.0
Industry 11.0 10.5 9.8 9.4 8.5 9.3Mining 0.8 0.7 0.6 0.5 0.5 0.5Manufacturing & processing 8.6 7.8 7.0 6.9 6.4 6.9Power 0.3 0.3 0.2 0.2 0.2 0.3Construction 1.2 1.8 2.1 1.8 1.5 1.7
Services 32.0 32.2 31.3 30.0 28.3 28.1Transportation 2.4 2.4 2.3 1.9 1.5 1.5Communications 0.3 0.2 0.4 0.4 0.3 0.2Financial institutions 0.2 0.2 0.2 0.1 0.1 0.2Social and administrative services 4.6 4.0 3.4 2.7 2.4 2.2Rental and other services 2.8 2.7 2.8 2.3 2.0 1.7Trade 21.8 22.7 22.3 22.6 21.9 22.3
GDP (at market prices) 100.0 100.0 100.0 100.0 100.0 100.0
Source: Planning Department, MNPED.
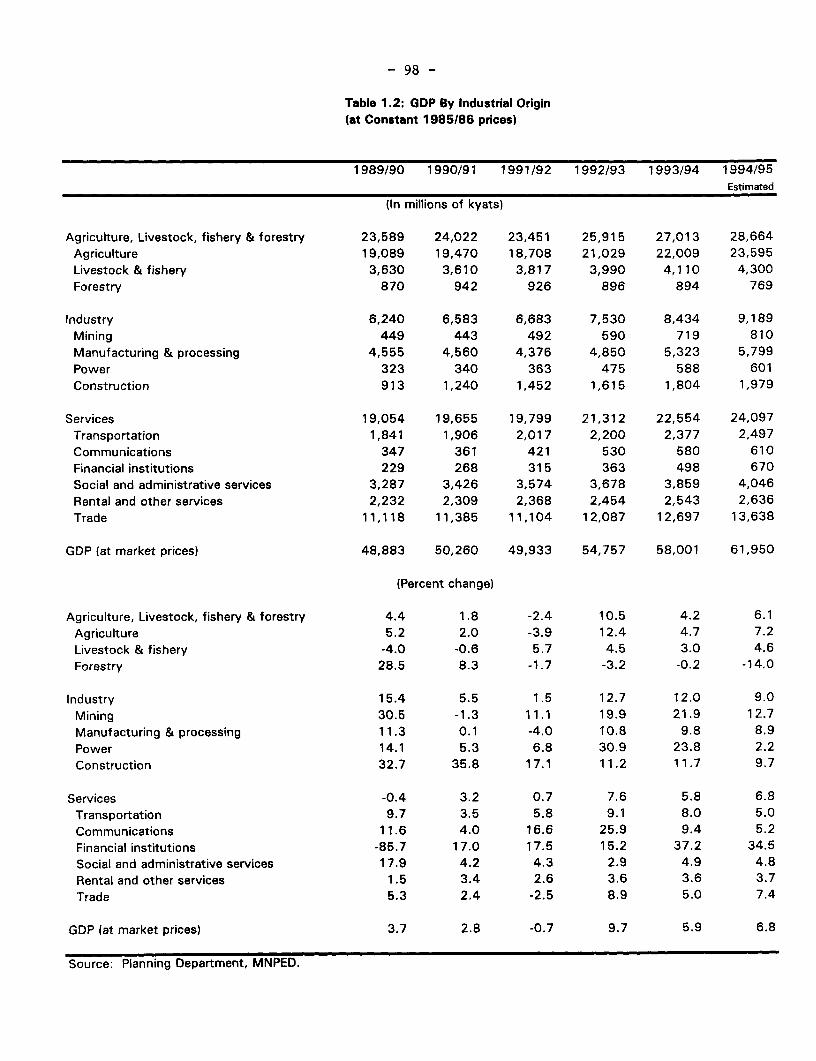
- 98 -
Table 1.2: GDP By Industrial Origin(at Constant 1985/86 prices)
1989/90 1990/91 1991/92 1992/93 1993/94 1994/95Estimated
(In millions of kyats)
Agriculture, Livestock, fishery & forestry 23,589 24,022 23,451 25,915 27,013 28,664Agriculture 19,089 19,470 18,708 21,029 22,009 23,595Livestock & fishery 3,630 3,610 3,817 3,990 4,110 4,300Forestry 870 942 926 896 894 769
Industry 6,240 6,583 6,683 7,530 8,434 9,189Mining 449 443 492 590 719 810Manufacturing & processing 4,555 4,560 4,376 4,850 5,323 5,799Power 323 340 363 475 588 601Construction 913 1,240 1,452 1,615 1,804 1,979
Services 19,054 19,655 19,799 21,312 22,554 24,097Transportation 1,841 1,906 2,017 2,200 2,377 2,497Communications 347 361 421 530 580 610Financial institutions 229 268 315 363 498 670Social and administrative services 3,287 3,426 3,574 3,678 3,859 4,046Rental and other services 2,232 2,309 2,368 2,454 2,543 2,636Trade 11,118 11,385 11,104 12,087 12,697 13,638
GDP (at market prices) 48,883 50,260 49,933 54,757 58,001 61,950
(Percent change)
Agriculture, Livestock, fishery & forestry 4.4 1.8 -2.4 10.5 4.2 6.1Agriculture 5.2 2.0 -3.9 12.4 4.7 7.2Livestock & fishery -4.0 -0.6 5.7 4.5 3.0 4.6Forestry 28.5 8.3 -1.7 -3.2 -0.2 -14.0
Industry 15.4 5.5 1.5 12.7 12.0 9.0Mining 30.5 -1.3 11.1 19.9 21.9 12.7Manufacturing & processing 11.3 0.1 -4.0 10.8 9.8 8.9Power 14.1 5.3 6.8 30.9 23.8 2.2Construction 32.7 35.8 17.1 11.2 11.7 9.7
Services -0.4 3.2 0.7 7.6 5.8 6.8Transportation 9.7 3.5 5.8 9.1 8.0 5.0Communications 11.6 4.0 16.6 25.9 9.4 5.2Financial institutions -85.7 17.0 17.5 15.2 37.2 34.5Social and administrative services 17.9 4.2 4.3 2.9 4.9 4.8Rental and other services 1.5 3.4 2.6 3.6 3.6 3.7Trade 5.3 2.4 -2.5 8.9 5.0 7.4
GDP (at market prices) 3.7 2.8 -0.7 9.7 5.9 6.8
Source: Planning Department, MNPED.
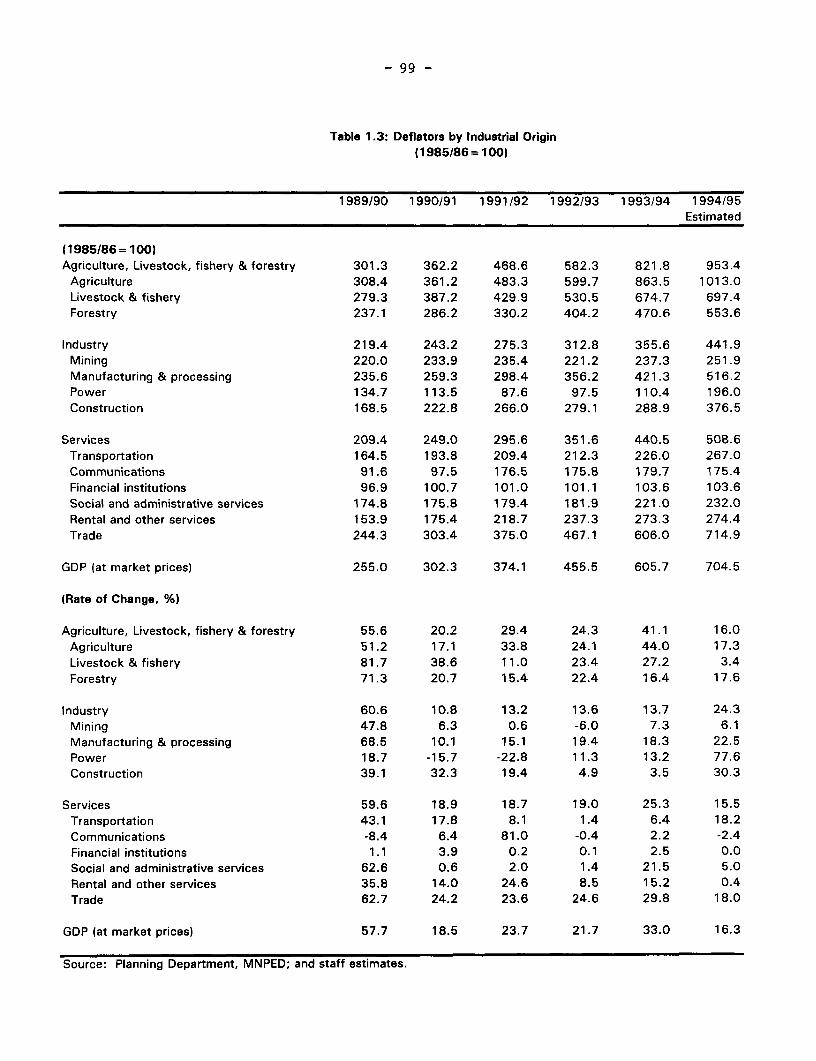
- 99 -
Table 1.3: Deflators by Industrial Origin(1985/86 =100)
1989/90 1990/91 1991/92 1992/93 1993/94 1994/95Estimated
(1985/86= 100)Agriculture, Livestock, fishery & forestry 301.3 362.2 468.6 582.3 821.8 953.4
Agriculture 308.4 361.2 483.3 599.7 863.5 1013.0Livestock & fishery 279.3 387.2 429.9 530.5 674.7 697.4Forestry 237.1 286.2 330.2 404.2 470.6 553.6
Industry 219.4 243.2 275.3 312.8 355.6 441.9Mining 220.0 233.9 235.4 221.2 237.3 251.9Manufacturing & processing 235.6 259.3 298.4 356.2 421.3 516.2Power 134.7 113.5 87.6 97.5 110.4 196.0Construction 168.5 222.8 266.0 279.1 288.9 376.5
Services 209.4 249.0 295.6 351.6 440.5 508.6Transportation 164.5 193.8 209.4 212.3 226.0 267.0Communications 91.6 97.5 176.5 175.8 179.7 175.4Financial institutions 96.9 100.7 101.0 101.1 103.6 103.6Social and administrative services 174.8 175.8 179.4 181.9 221.0 232.0Rental and other services 153.9 175.4 218.7 237.3 273.3 274.4Trade 244.3 303.4 375.0 467.1 606.0 714.9
GDP (at market prices) 255.0 302.3 374.1 455.5 605.7 704.5
(Rate of Change, %)
Agriculture, Livestock, fishery & forestry 55.6 20.2 29.4 24.3 41.1 16.0Agriculture 51.2 17.1 33.8 24.1 44.0 17.3Livestock & fishery 81.7 38.6 11.0 23.4 27.2 3.4Forestry 71.3 20.7 15.4 22.4 16.4 17.6
Industry 60.6 10.8 13.2 13.6 13.7 24.3Mining 47.8 6.3 0.6 -6.0 7.3 6.1Manufacturing & processing 68.5 10.1 15.1 19.4 18.3 22.5Power 18.7 -15.7 -22.8 11.3 13.2 77.6Construction 39.1 32.3 19.4 4.9 3.5 30.3
Services 59.6 18.9 18.7 19.0 25.3 15.5Transportation 43.1 17.8 8.1 1.4 6.4 18.2Communications -8.4 6.4 81.0 -0.4 2.2 -2.4Financial institutions 1.1 3.9 0.2 0.1 2.5 0.0Social and administrative services 62.6 0.6 2.0 1.4 21.5 5.0Rental and other services 35.8 14.0 24.6 8.5 15.2 0.4Trade 62.7 24.2 23.6 24.6 29.8 18.0
GDP (at market prices) 57.7 18.5 23.7 21.7 33.0 16.3
Source: Planning Department, MNPED; and staff estimates.
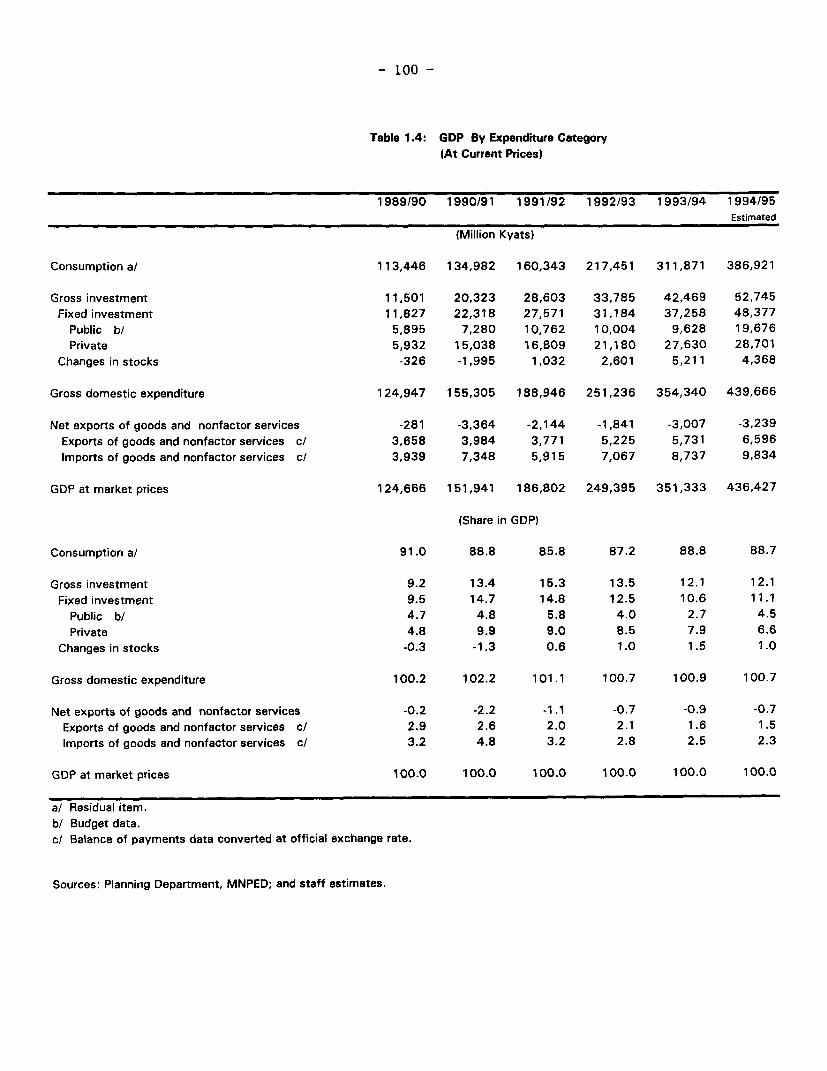
- 100 -
Table 1.4: GDP By Expenditure Category(At Current Prices)
1989/90 1990/91 1991/92 1992/93 1993/94 1994/95Estimated
(Million Kyats)
Consumption a/ 113,446 134,982 160,343 217,451 311,871 386,921
Gross investment 11,501 20,323 28,603 33,785 42,469 52,745Fixed investment 11,827 22,318 27,571 31,184 37,258 48,377
Public b/ 5,895 7,280 10,762 10,004 9,628 19,676Private 5,932 15,038 16,809 21,180 27,630 28,701
Changes in stocks -326 -1,995 1,032 2,601 5,211 4,368
Gross domestic expenditure 124,947 155,305 188,946 251,236 354,340 439,666
Net exports of goods and nonfactor services -281 -3,364 -2,144 -1,841 -3,007 -3,239Exports of goods and nonfactor services c/ 3,658 3,984 3,771 5,225 5,731 6,596Imports of goods and nonfactor services c/ 3,939 7,348 5,915 7,067 8,737 9,834
GDP at market prices 124,666 151,941 186,802 249,395 351,333 436,427
(Share in GDP)
Consumption a/ 91.0 88.8 85.8 87.2 88.8 88.7
Gross investment 9.2 13.4 15.3 13.5 12.1 12.1Fixed investment 9.5 14.7 14.8 12.5 10.6 11.1
Public b/ 4.7 4.8 5.8 4.0 2.7 4.5Private 4.8 9.9 9.0 8.5 7.9 6.6
Changes in stocks -0.3 -1.3 0.6 1.0 1.5 1.0
Gross domestic expenditure 100.2 102.2 101.1 100.7 100.9 100.7
Net exports of goods and nonfactor services -0.2 -2.2 -1.1 -0.7 -0.9 -0.7Exports of goods and nonfactor services c/ 2.9 2.6 2.0 2.1 1.6 1.5Imports of goods and nonfactor services c/ 3.2 4.8 3.2 2.8 2.5 2.3
GDP at market prices 100.0 100.0 100.0 100.0 100.0 100.0
a/ Residual item.b/ Budget data.c/ Balance of payments data converted at official exchange rate.
Sources: Planning Department, MNPED; and staff estimates.
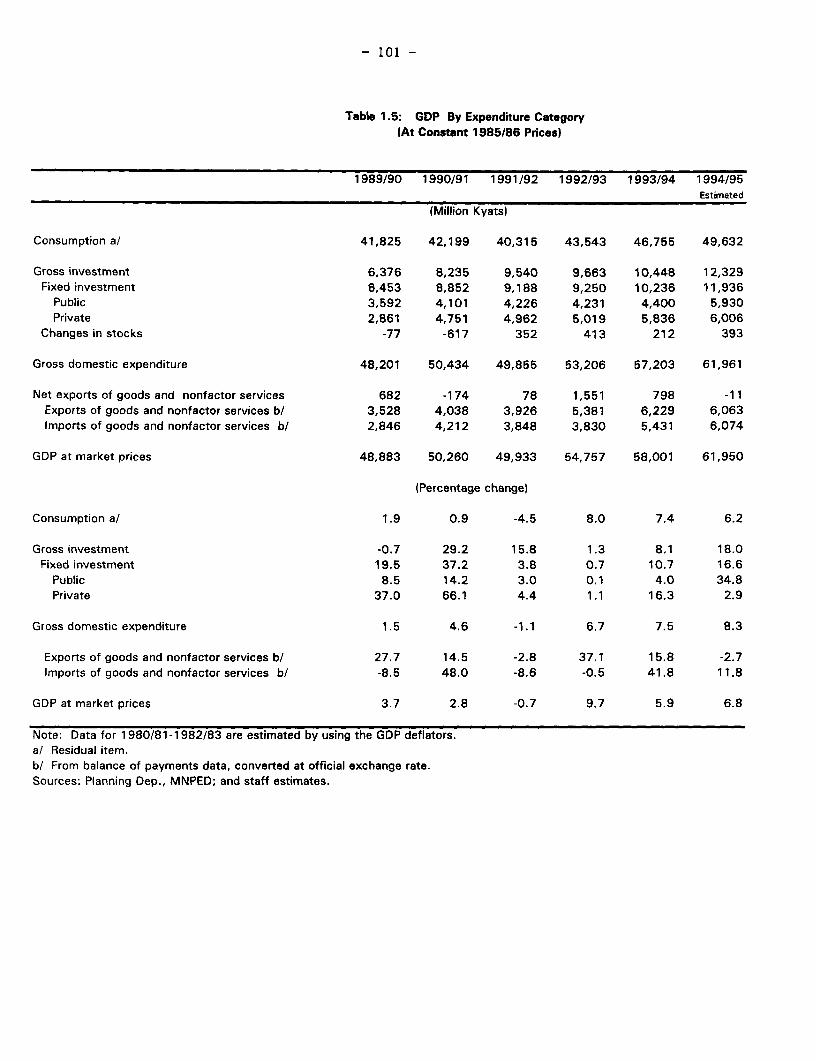
- 101 -
Table 1.5: GDP By Expenditure Category(At Constant 1985/86 Prices)
1989/90 1990/91 1991/92 1992/93 1993/94 1994/95Estimated
(Million Kyats)
Consumption a/ 41,825 42,199 40,315 43,543 46,755 49,632
Gross investment 6,376 8,235 9,540 9,663 10,448 12,329Fixed investment 6,453 8,852 9,188 9,250 10,236 11,936
Public 3,592 4,101 4,226 4,231 4,400 5,930Private 2,861 4,751 4,962 5,019 5,836 6,006
Changes in stocks -77 -617 352 413 212 393
Gross domestic expenditure 48,201 50,434 49,855 53,206 57,203 61,961
Net exports of goods and nonfactor services 682 -174 78 1,551 798 -11Exports of goods and nonfactor services bl 3,528 4,038 3,926 5,381 6,229 6,063Imports of goods and nonfactor services b/ 2,846 4,212 3,848 3,830 5,431 6,074
GDP at market prices 48,883 50,260 49,933 54,757 58,001 61,950
(Percentage change)
Consumption a/ 1.9 0.9 -4.5 8.0 7.4 6.2
Gross investment -0.7 29.2 15.8 1.3 8.1 18.0Fixed investment 19.5 37.2 3.8 0.7 10.7 16.6
Public 8.5 14.2 3.0 0.1 4.0 34.8Private 37.0 66.1 4.4 1.1 16.3 2.9
Gross domestic expenditure 1.5 4.6 -1.1 6.7 7.5 8.3
Exports of goods and nonfactor services b/ 27.7 14.5 -2.8 37.1 15.8 -2.7Imports of goods and nonfactor services b/ -8.5 48.0 -8.6 -0.5 41.8 11.8
GDP at market prices 3.7 2.8 -0.7 9.7 5.9 6.8
Note: Data for 1980/81-1982/83 are estimated by using the GDP deflators.a! Residual item.b/ From balance of payments data, converted at official exchange rate.Sources: Planning Dep., MNPED; and staff estimates.
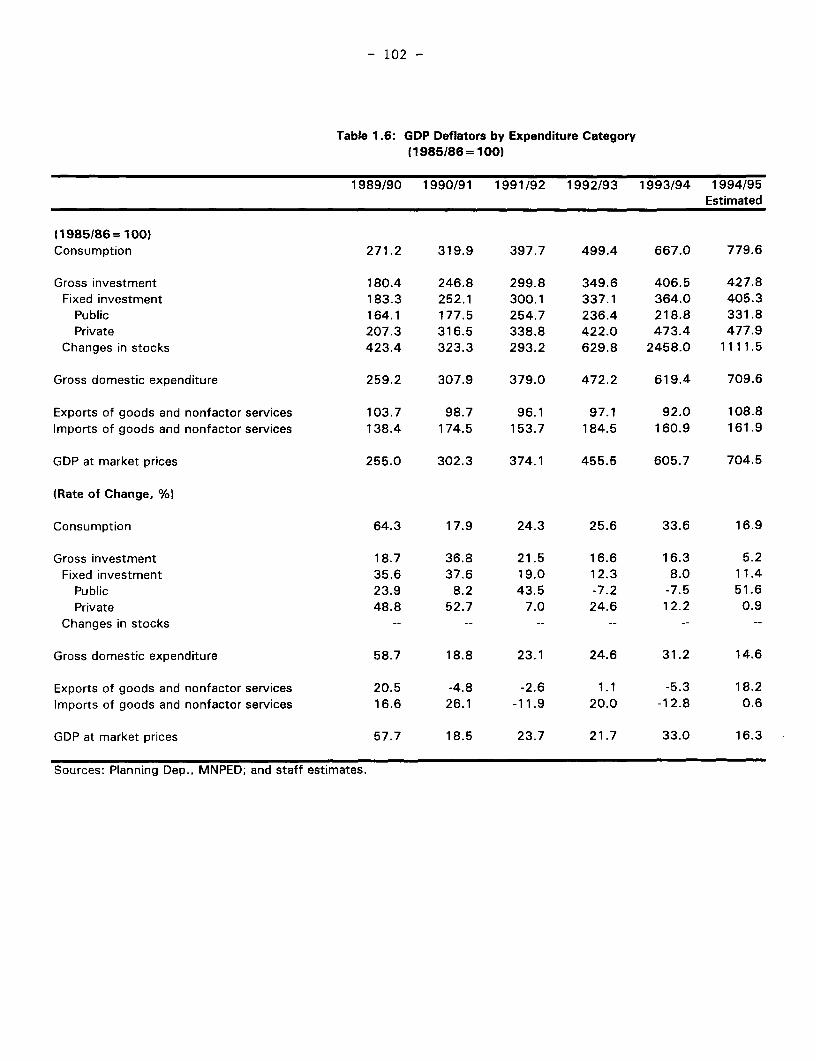
- 102 -
Table 1.6: GDP Deflators by Expenditure Category(1985/86 = 100)
1989/90 1990/91 1991/92 1992/93 1993/94 1994/95Estimated
(1985/86 = 100)Consumption 271.2 319.9 397.7 499.4 667.0 779.6
Gross investment 180.4 246.8 299.8 349.6 406.5 427.8Fixed investment 183.3 252.1 300.1 337.1 364.0 405.3
Public 164.1 177.5 254.7 236.4 218.8 331.8Private 207.3 316.5 338.8 422.0 473.4 477.9
Changes in stocks 423.4 323.3 293.2 629.8 2458.0 1111.5
Gross domestic expenditure 259.2 307.9 379.0 472.2 619.4 709.6
Exports of goods and nonfactor services 103.7 98.7 96.1 97.1 92.0 108.8Imports of goods and nonfactor services 138.4 174.5 153.7 184.5 160.9 161.9
GDP at market prices 255.0 302.3 374.1 455.5 605.7 704.5
(Rate of Change, %l
Consumption 64.3 17.9 24.3 25.6 33.6 16.9
Gross investment 18.7 36.8 21.5 16.6 16.3 5.2Fixed investment 35.6 37.6 19.0 12.3 8.0 11.4
Public 23.9 8.2 43.5 -7.2 -7.5 51.6Private 48.8 52.7 7.0 24.6 12.2 0.9
Changes in stocks
Gross domestic expenditure 58.7 18.8 23.1 24.6 31.2 14.6
Exports of goods and nonfactor services 20.5 -4.8 -2.6 1.1 -5.3 18.2Imports of goods and nonfactor services 16.6 26.1 -11.9 20.0 -12.8 0.6
GDP at market prices 57.7 18.5 23.7 21.7 33.0 16.3
Sources: Planning Dep., MNPED; and staff estimates.
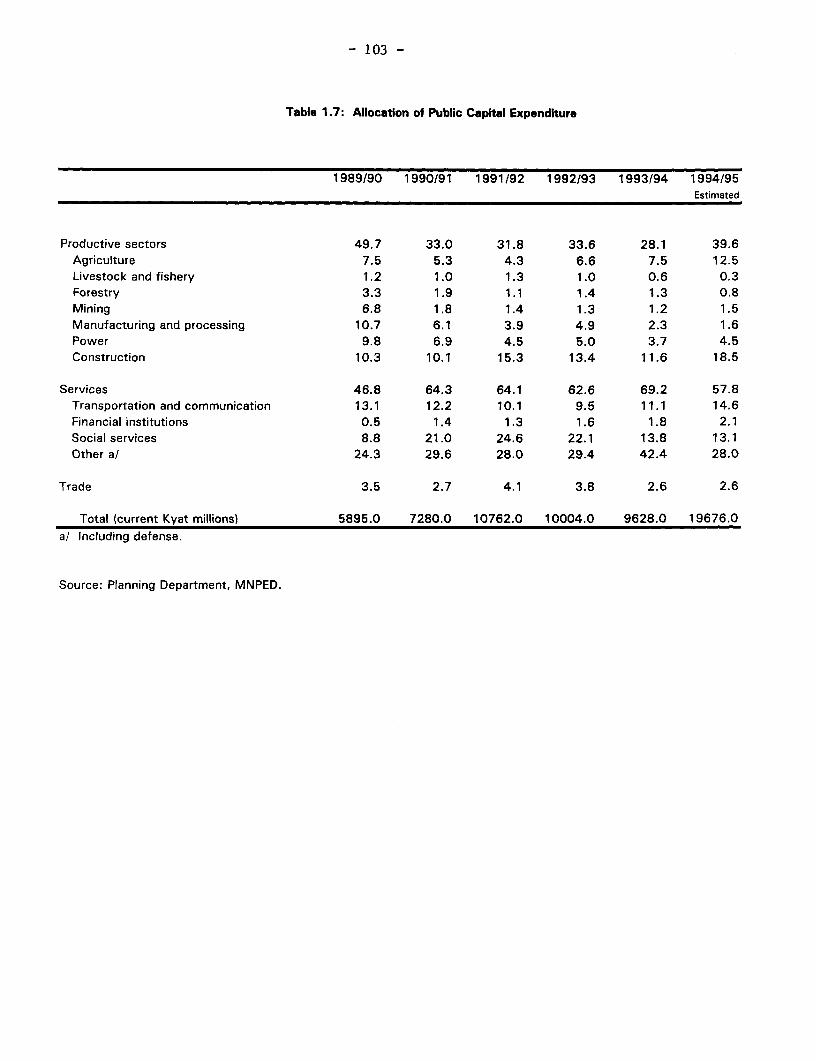
- 103 -
Table 1.7: Allocation of Public Capital Expenditure
1989/90 1990/91 1991/92 1992/93 1993/94 1994/95Estimated
Productive sectors 49.7 33.0 31.8 33.6 28.1 39.6Agriculture 7.5 5.3 4.3 6.6 7.5 12.5Livestock and fishery 1.2 1.0 1.3 1.0 0.6 0.3Forestry 3.3 1.9 1.1 1.4 1.3 0.8Mining 6.8 1.8 1.4 1.3 1.2 1.5Manufacturing and processing 10.7 6.1 3.9 4.9 2.3 1.6Power 9.8 6.9 4.5 5.0 3.7 4.5Construction 10.3 10.1 15.3 13.4 11.6 18.5
Services 46.8 64.3 64.1 62.6 69.2 57.8Transportation and communication 13.1 12.2 10.1 9.5 11.1 14.6Financial institutions 0.5 1.4 1.3 1.6 1.8 2.1Social services 8.8 21.0 24.6 22.1 13.8 13.1Other a/ 24.3 29.6 28.0 29.4 42.4 28.0
Trade 3.5 2.7 4.1 3.8 2.6 2.6
Total (current Kyat millions) 5895.0 7280.0 10762.0 10004.0 9628.0 19676.0a/ Including defense.
Source: Planning Department, MNPED.
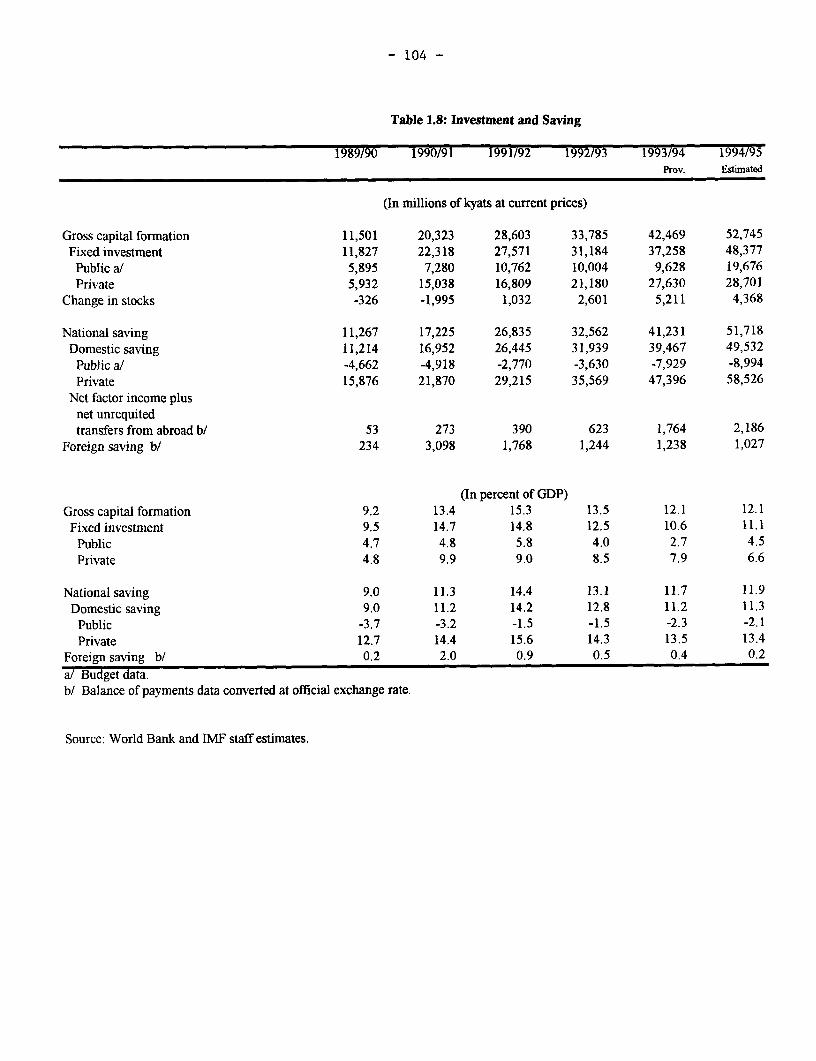
- 104 -
Table 1.8: Investment and Saving
1989/90 1990/91 1991/92 1992/93 1993/94 1994/95Prov. Estimated
(In millions of kyats at current prices)
Gross capital formation 11,501 20,323 28,603 33,785 42,469 52,745Fixed investment 11,827 22,318 27,571 31,184 37,258 48,377Public a/ 5,895 7,280 10,762 10,004 9,628 19,676Private 5,932 15,038 16,809 21,180 27,630 28,701
Change in stocks -326 -1,995 1,032 2,601 5,211 4,368
National saving 11,267 17,225 26,835 32,562 41,231 51,718Domestic saving 11,214 16,952 26,445 31,939 39,467 49,532
Public a/ -4,662 -4,918 -2,770 -3,630 -7,929 -8,994Private 15,876 21,870 29,215 35,569 47,396 58,526
Net factor income plusnet unrequitedtransfers from abroad b/ 53 273 390 623 1,764 2,186
Foreign saving b/ 234 3,098 1,768 1,244 1,238 1,027
(In percent of GDP)Gross capital formation 9.2 13.4 15.3 13.5 12.1 12.1Fixed investment 9.5 14.7 14.8 12.5 10.6 11.1Public 4.7 4.8 5.8 4.0 2.7 4.5Private 4.8 9.9 9.0 8.5 7.9 6.6
National saving 9.0 11.3 14.4 13.1 11.7 11.9Domestic saving 9.0 11.2 14.2 12.8 11.2 11.3Public -3.7 -3.2 -1.5 -1.5 -2.3 -2.1Private 12.7 14.4 15.6 14.3 13.5 13.4
Foreign saving b/ 0.2 2.0 0.9 0.5 0.4 0.2
a! Budget data.b/ Balance of payments data converted at official exchange rate.
Source: World Bank and IMF staff estimates.
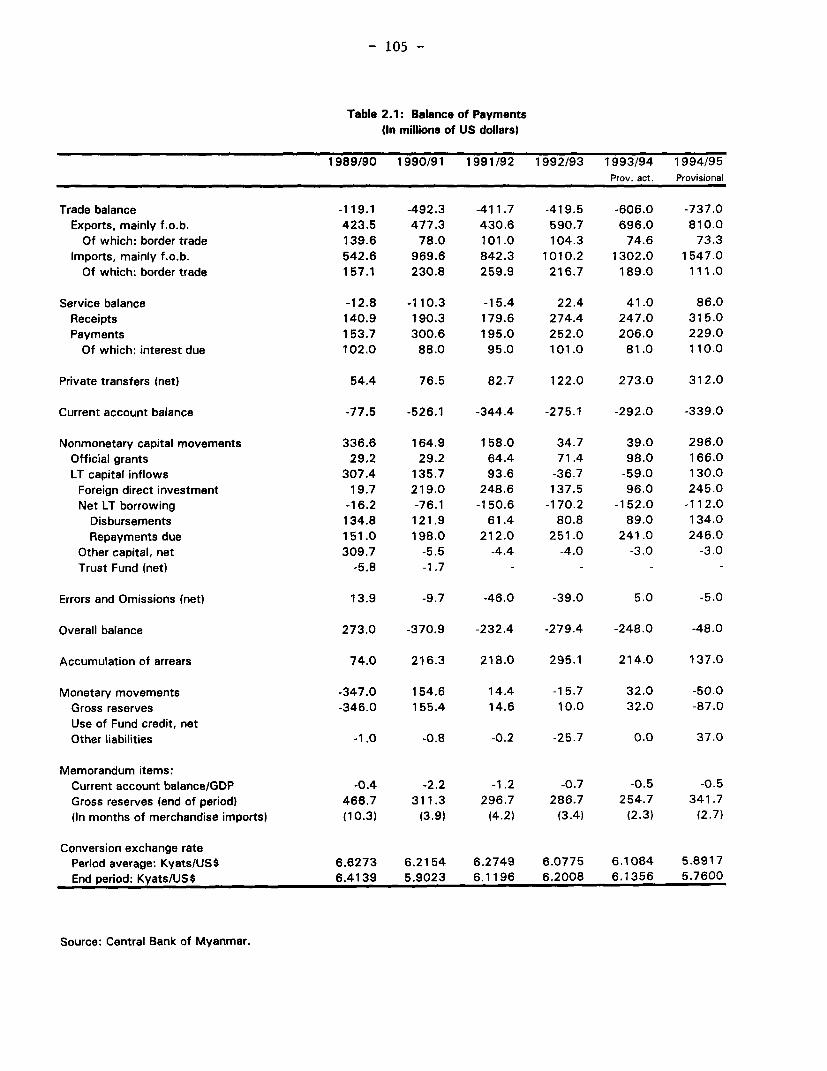
- 105 -
Table 2.1: Balance of Paymentsfin millions of US dollars)
1989/90 1990/91 1991/92 1992/93 1993/94 1994/95Provy act. Provisional
Trade balance -119.1 -492.3 -411.7 -419.5 -606.0 -737.0Exports, mainly f.o.b. 423.5 477.3 430.6 590.7 696.0 810.0
Of which: border trade 139.6 78.0 101.0 104.3 74.6 73.3Imports, mainly f.o.b. 542.6 969.6 842.3 1010.2 1302.0 1547.0
Of which: border trade 157.1 230.8 259.9 216.7 189.0 111.0
Service balance -12.8 -110.3 -15.4 22.4 41.0 86.0Receipts 140.9 190.3 179.6 274.4 247.0 315.0Payments 153.7 300.6 195.0 252.0 206.0 229.0
Of which: interest due 102.0 88.0 95.0 101.0 81.0 110.0
Private transfers (net) 54.4 76.5 82.7 122.0 273.0 312.0
Current account balance -77.5 -526.1 -344.4 -275.1 -292.0 -339.0
Nonmonetary capital movements 336.6 164.9 158.0 34.7 39.0 296.0Official grants 29.2 29.2 64.4 71.4 98.0 166.0LT capital inflows 307.4 135.7 93.6 -36.7 -59.0 130.0
Foreign direct investment 19.7 219.0 248.6 137.5 96.0 245.0Net LT borrowing -16.2 -76.1 -150.6 -170.2 -152.0 -112.0
Disbursements 134.8 121.9 61.4 80.8 89.0 134.0Repayments due 151.0 198.0 212.0 251.0 241.0 246.0
Other capital, net 309.7 -5.5 -4.4 -4.0 -3.0 -3.0Trust Fund (net) -5.8 -1.7 - - - -
Errors and Omissions (net) 13.9 -9.7 -46.0 -39.0 5.0 -5.0
Overall balance 273.0 -370.9 -232.4 -279.4 -248.0 -48.0
Accumulation of arrears 74.0 216.3 218.0 295.1 214.0 137.0
Monetary movements -347.0 154.6 14.4 -1 5.7 32.0 -50.0Gross reserves -346.0 155.4 14.6 10.0 32.0 -87.0Use of Fund credit, netOther liabilities -1.0 -0.8 -0.2 -25.7 0.0 37.0
Memorandum items:Current account balance/GDP -0.4 -2.2 -1.2 -0.7 -0.5 -0.5Gross reserves (end of period) 466.7 311.3 296.7 286.7 254.7 341.7(In months of merchandise imports) (10.3) (3.9) (4.2) (3.4) (2.3) (2.7)
Conversion exchange ratePeriod average: Kyats/US$ 6.6273 6.2154 6.2749 6.0775 6.1084 5.8917End period: Kyats/US$ 6.4139 5.9023 6.1196 6.2008 6.1356 5.7600
Source: Central Bank of Myanmar.
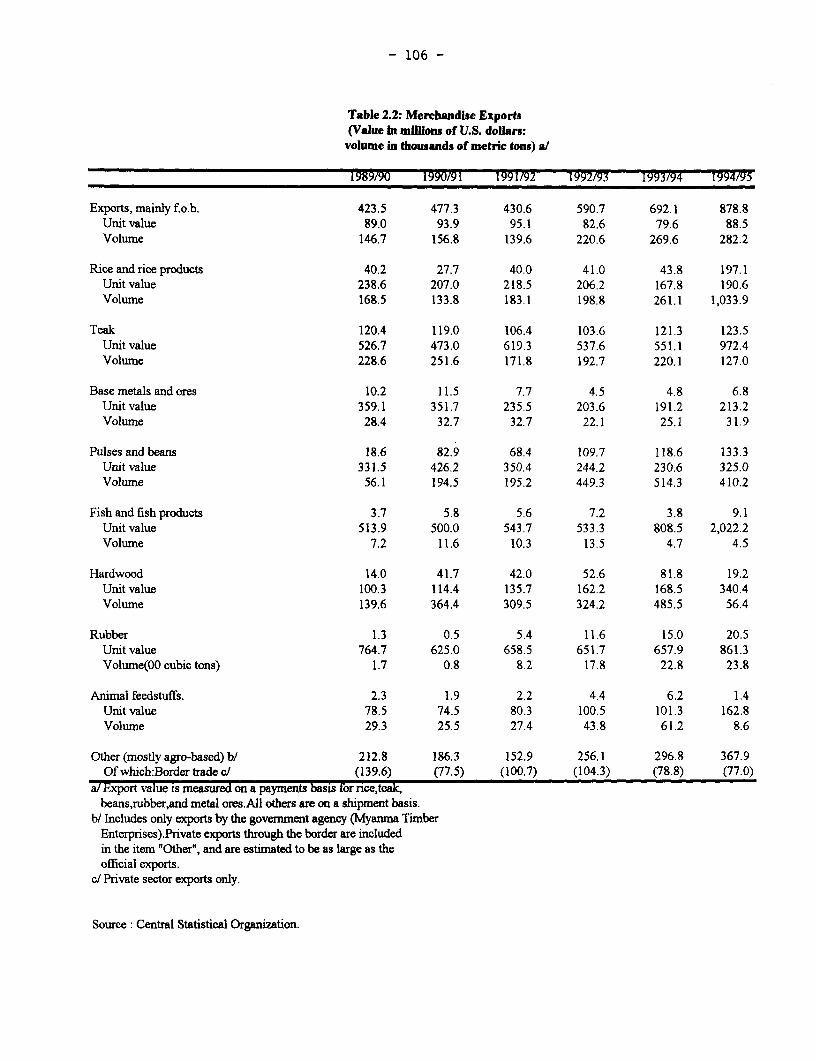
- 106 -
Table 2.2: Merchandise Exports(Value in millions of U.S. dollars:
volume in thousands of metric tons) al
1989/90 1990/91 1991/92 1992/93 1993/94 1994/95
Exports, mainly f.o.b. 423.5 477.3 430.6 590.7 692.1 878.8Unit value 89.0 93.9 95.1 82.6 79.6 88.5Volume 146.7 156.8 139.6 220.6 269.6 282.2
Rice and rice products 40.2 27.7 40.0 41.0 43.8 197.1Unit value 238.6 207.0 218.5 206.2 167.8 190.6Volume 168.5 133.8 183.1 198.8 261.1 1,033.9
Teak 120.4 119.0 106.4 103.6 121.3 123.5Unit value 526.7 473.0 619.3 537.6 551.1 972.4Volume 228.6 251.6 171.8 192.7 220.1 127.0
Basemetalsandores 10.2 11.5 7.7 4.5 4.8 6.8Unit value 359.1 351.7 235.5 203.6 191.2 213.2Volume 28.4 32.7 32.7 22.1 25.1 31.9
Pulses and beans 18.6 82.9 68.4 109.7 118.6 133.3Unit value 331.5 426.2 350.4 244.2 230.6 325.0Volume 56.1 194.5 195.2 449.3 514.3 410.2
Fishandfishproducts 3.7 5.8 5.6 7.2 3.8 9.1Unit value 513.9 500.0 543.7 533.3 808.5 2,022.2Volume 7.2 11.6 10.3 13.5 4.7 4.5
Hardwood 14.0 41.7 42.0 52.6 81.8 19.2Unit value 100.3 114.4 135.7 162.2 168.5 340.4Volume 139.6 364.4 309.5 324.2 485.5 56.4
Rubber 1.3 0.5 5.4 11.6 15.0 20.5Unit value 764.7 625.0 658.5 651.7 657.9 861.3Volume(00 cubic tons) 1.7 0.8 8.2 17.8 22.8 23.8
Animal feedstuffs. 2.3 1.9 2.2 4.4 6.2 1.4Unit value 78.5 74.5 80.3 100.5 101.3 162.8Volume 29.3 25.5 27.4 43.8 61.2 8.6
Other (mostly agro-based) b/ 212.8 186.3 152.9 256.1 296.8 367.9Ofwhich:Bordertradec/ (139.6) (77.5) (100.7) (104.3) (78.8) (77.0)
a/ Export value is measured on a payments basis for rice,teak,beans,rubber,and metal ores.AII others are on a shipment basis.
b/ Includes only exports by the government agency (Myanma TimberEnterprises).Private exports through the border are includedin the item 'Other', and are estimated to be as large as theofficial exports.
c/ Private sector exports only.
Source: Central Statistical Organization.
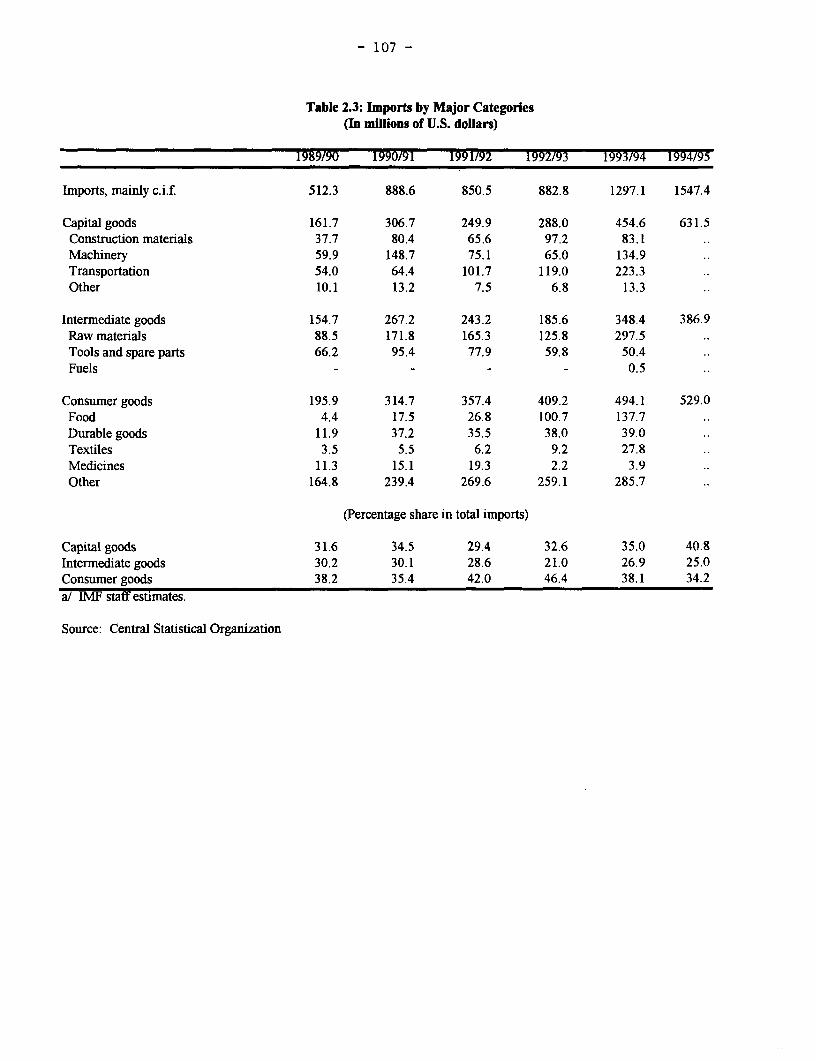
- 107 -
Table 2.3: Imports by Major Categories(In millions of U.S. dollars)
1989/90 1990/91 1991/92 1992/93 1993/94 1994/95
Imports, mainly c.i.f. 512.3 888.6 850.5 882.8 1297.1 1547.4
Capital goods 161.7 306.7 249.9 288.0 454.6 631.5Construction materials 37.7 80.4 65.6 97.2 83.1Machinery 59.9 148.7 75.1 65.0 134.9Transportation 54.0 64.4 101.7 119.0 223.3Other 10.1 13.2 7.5 6.8 13.3
Intermediate goods 154.7 267.2 243.2 185.6 348.4 386.9Raw materials 88.5 171.8 165.3 125.8 297.5Tools and spare parts 66.2 95.4 77.9 59.8 50.4Fuels - - - 0.5
Consumer goods 195.9 314.7 357.4 409.2 494.1 529.0Food 4.4 17.5 26.8 100.7 137.7Durable goods 11.9 37.2 35.5 38.0 39.0Textiles 3.5 5.5 6.2 9.2 27.8Medicines 11.3 15.1 19.3 2.2 3.9Other 164.8 239.4 269.6 259.1 285.7
(Percentage share in total imports)
Capital goods 31.6 34.5 29.4 32.6 35.0 40.8Intermediate goods 30.2 30.1 28.6 21.0 26.9 25.0Consumer goods 38.2 35.4 42.0 46.4 38.1 34.2a/ IMF staff estimates.
Source: Central Statistical Organization
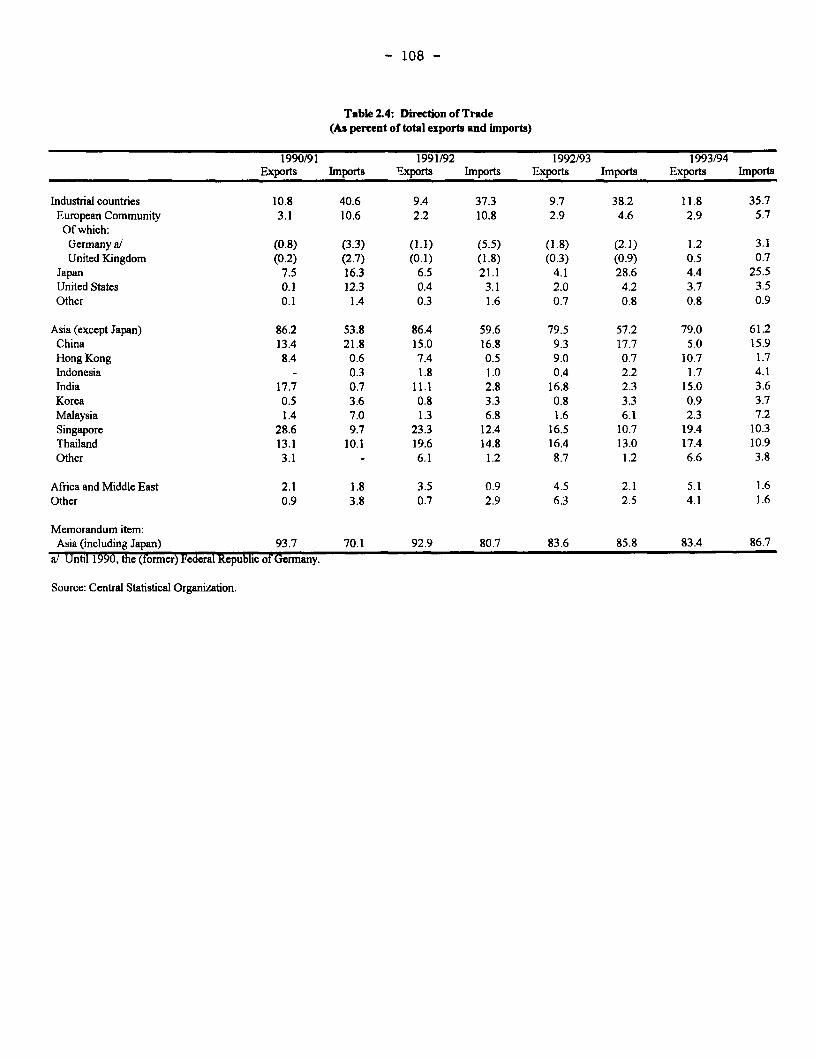
- 108 -
Table 2.4: Direction of Trade(As percent of total exports and imports)
1990/91 1991/92 1992/93 1993/94Exports Imports Exports Imports Exports Imports Exports Imports
Industrial countries 10.8 40.6 9.4 37.3 9.7 38.2 11.8 35.7European Community 3.1 10.6 2.2 10.8 2.9 4.6 2.9 5.7Of which:
Germanya/ (0.8) (3.3) (1. 1) (5.5) (].8) (2.1) 1.2 3.1United Kingdom (0.2) (2.7) (0.1) (1.8) (0.3) (0.9) 0.5 0.7
Japan 7.5 16.3 6.5 21.1 4.1 28.6 4.4 25.5United States 0.1 12.3 0.4 3.1 2.0 4.2 3.7 3.5Other 0.1 1.4 0.3 1.6 0.7 0.8 0.8 0.9
Asia (except Japan) 86.2 53.8 86.4 59.6 79.5 57.2 79.0 61.2China 13.4 21.8 15.0 16.8 9.3 17.7 5.0 15.9Hong Kong 8.4 0.6 7.4 0.5 9.0 0.7 10.7 1.7Indonesia - 0.3 1.8 1.0 0.4 2.2 1.7 4.1India 17.7 0.7 11.1 2.8 16.8 2.3 15.0 3.6Korea 0.5 3.6 0.8 3.3 0.8 3.3 0.9 3.7Malaysia 1.4 7.0 1.3 6.8 1.6 6.1 2.3 7.2Singapore 28.6 9.7 23.3 12.4 16.5 10.7 19.4 10.3Thailand 13.1 10.1 19.6 14.8 16.4 13.0 17.4 10.9Other 3.1 - 6.1 1.2 8.7 1.2 6.6 3.8
Africa and Middle East 2.1 1.8 3.5 0.9 4.5 2.1 5.1 1.6Other 0.9 3.8 0.7 2.9 6.3 2.5 4.1 1.6
Memorandum item:Asia (including Japan) 93.7 70.1 92.9 80.7 83.6 85.8 83.4 86.7
a/ Until 1990, the (former) Federal Republic of Germany.
Source: Central Statistical Organization.
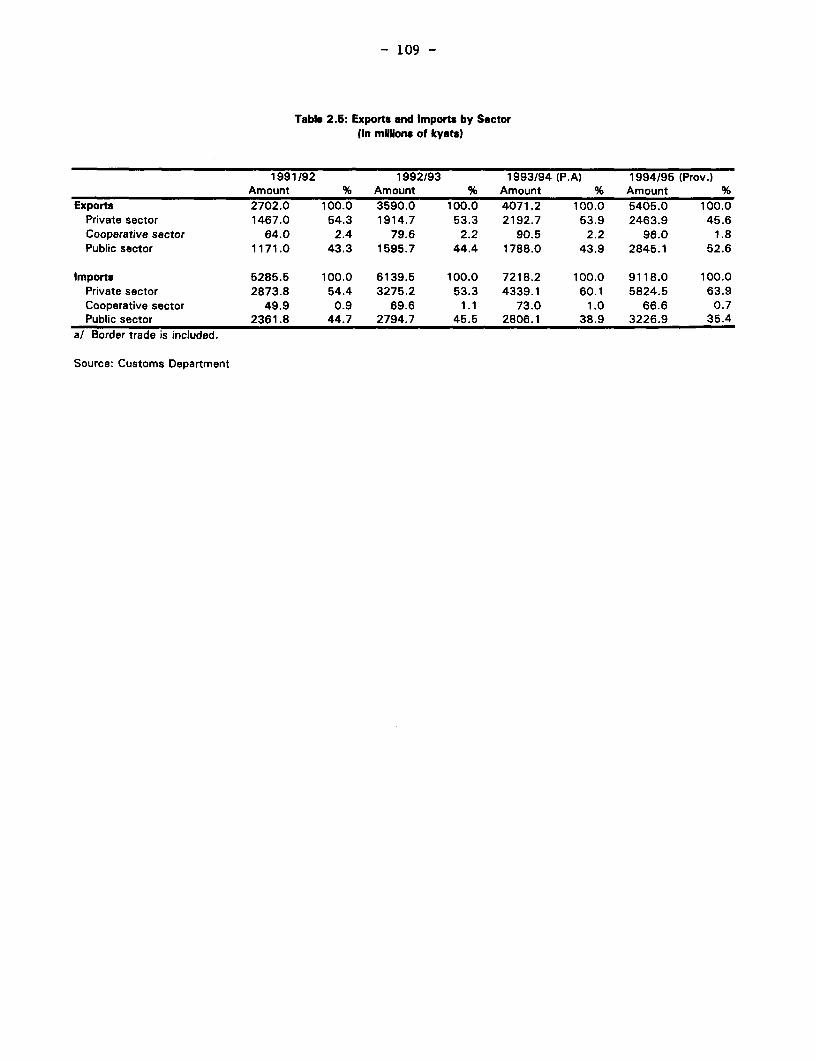
- 109 -
Table 2.5: Exports and Imports by Sector(In millons of kyats)
1991/92 1992/93 1993/94 (P.A) 1994/95 (Prov.)Amount % Amount % Amount % Amount %
Exports 2702.0 100.0 3590.0 100.0 4071.2 100.0 5405.0 100.0Private sector 1467.0 54.3 1914.7 53.3 2192.7 53.9 2463.9 45.6Cooperative sector 64.0 2.4 79.6 2.2 90.5 2.2 96.0 1.8Public sector 1171.0 43.3 1595.7 44.4 1788.0 43.9 2845.1 52.6
Imports 5285.5 100.0 6139.5 100.0 7218.2 100.0 9118.0 100.0Private sector 2873.8 54.4 3275.2 53.3 4339.1 60.1 5824.5 63.9Cooperative sector 49.9 0.9 69.6 1.1 73.0 1.0 66.6 0.7Public sector 2361.8 44.7 2794.7 45.5 2806.1 38.9 3226.9 35.4
a/ Border trade is included.
Source: Customs Department
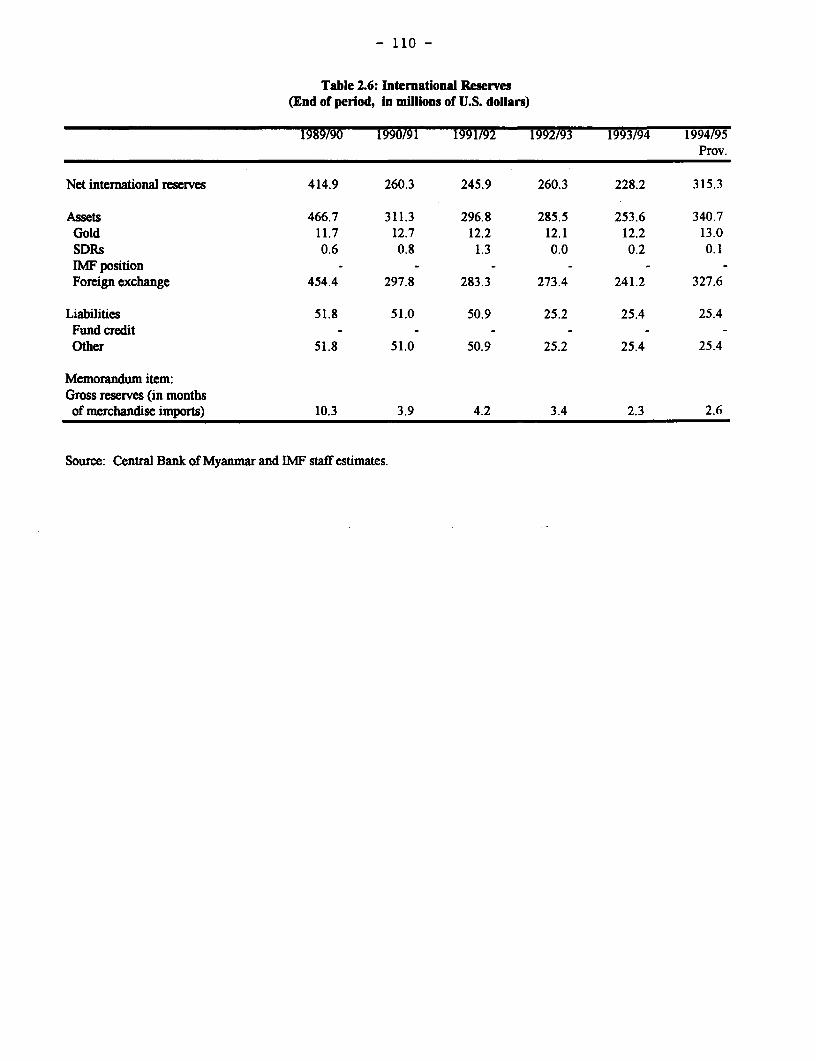
- 110 -
Table 2.6: International Reserves(End of period, in millions of U.S. dollars)
1989/90 1990/91 1991/92 1992/93 1993/94 1994/95Prov.
Net international reserves 414.9 260.3 245.9 260.3 228.2 315.3
Assets 466.7 311.3 296.8 285.5 253.6 340.7Gold 11.7 12.7 12.2 12.1 12.2 13.0SDRs 0.6 0.8 1.3 0.0 0.2 0.1IMF positionForeign exchange 454.4 297.8 283.3 273.4 241.2 327.6
Liabilities 51.8 51.0 50.9 25.2 25.4 25.4Fund creditOther 51.8 51.0 50.9 25.2 25.4 25.4
Memorandum item:Gross reserves (in monthsof merchandise imports) 10.3 3.9 4.2 3.4 2.3 2.6
Source: Central Bank of Myanmar and IMF staff estimates.
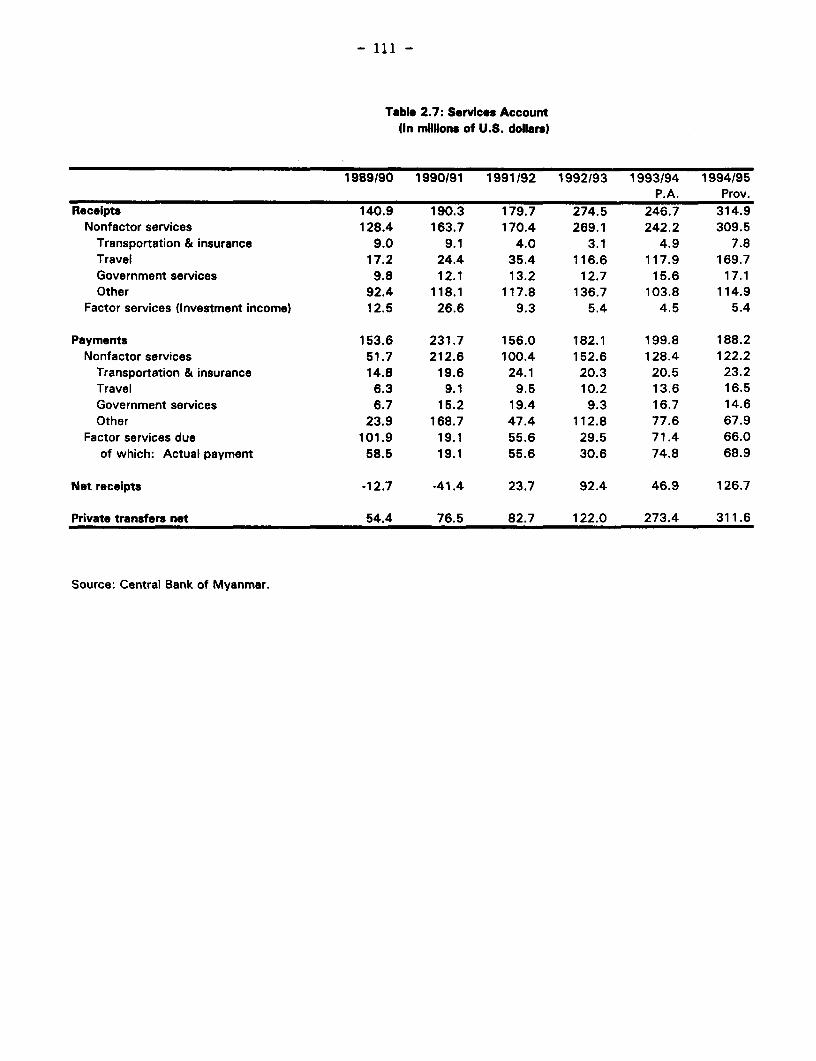
- 111 -
Table 2.7: Services Account(In mllons of U.S. dollars)
1989190 1990/91 1991/92 1992/93 1993/94 1994/95P.A. Prov.
Receipts 140.9 190.3 179.7 274.5 246.7 314.9Nonfactor services 128.4 163.7 170.4 269.1 242.2 309.5
Transportation & insurance 9.0 9.1 4.0 3.1 4.9 7.8Travel 17.2 24.4 35.4 116.6 117.9 169.7Government services 9.8 12.1 13.2 12.7 15.6 17.1Other 92.4 118.1 117.8 136.7 103.8 114.9
Factor services (Investment income) 12.5 26.6 9.3 5.4 4.5 5.4
Payments 153.6 231.7 156.0 182.1 199.8 188.2Nonfactor services 51.7 212.6 100.4 152.6 128.4 122.2
Transportation & insurance 14.8 19.6 24.1 20.3 20.5 23.2Travel 6.3 9.1 9.5 10.2 13.6 16.5Government services 6.7 15.2 19.4 9.3 16.7 14.6Other 23.9 168.7 47.4 112.8 77.6 67.9
Factor services due 101.9 19.1 55.6 29.5 71.4 66.0of which: Actual payment 58.5 19.1 55.6 30.6 74.8 68.9
Net receipts -12.7 -41.4 23.7 92.4 46.9 126.7
Private transfers net 54.4 76.5 82.7 122.0 273.4 311.6
Source: Central Bank of Myanmar.
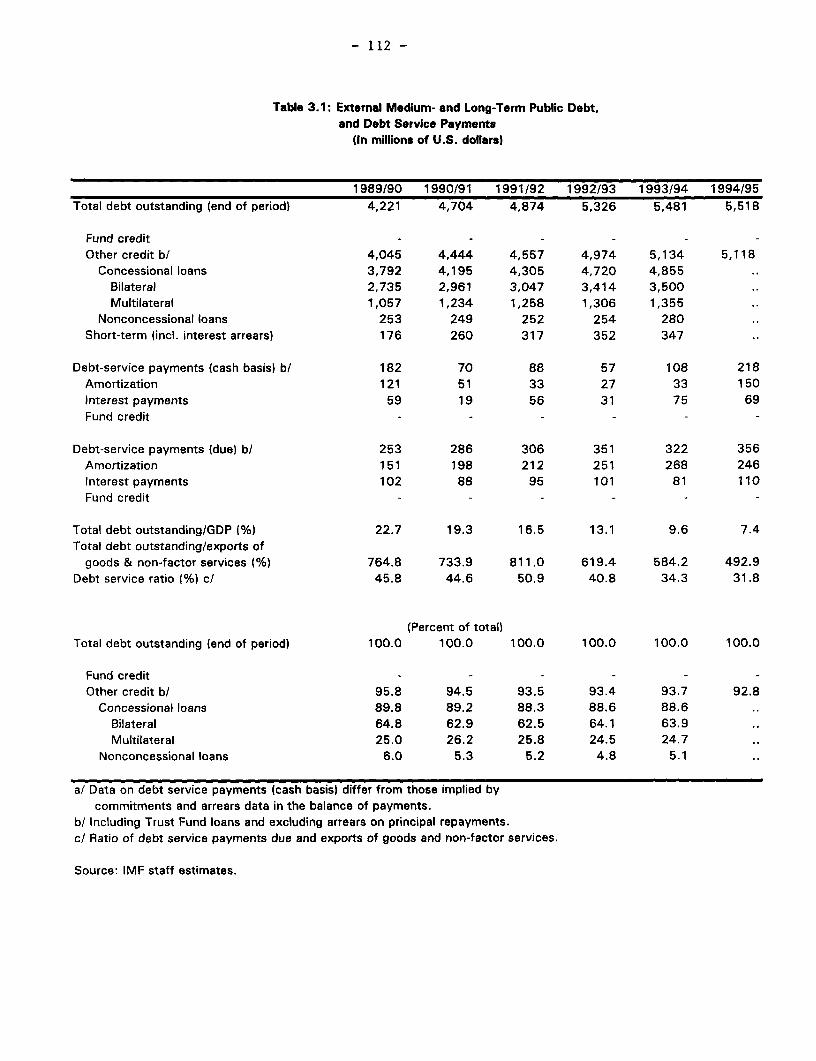
- 112 -
Table 3.1: External Medium- and Long-Term Public Debt,and Debt Service Payments
(In millions of U.S. dollars)
1989/90 1990/91 1991/92 1992/93 1993/94 1994/95Total debt outstanding (end of period) 4,221 4,704 4,874 5,326 5,481 5,518
Fund creditOther credit b/ 4,045 4,444 4,557 4,974 5,134 5,118
Concessional loans 3,792 4,195 4,305 4,720 4,855Bilateral 2,735 2,961 3,047 3,414 3,500Multilateral 1,057 1,234 1,258 1,306 1,355
Nonconcessional loans 253 249 252 254 280Short-term (incl. interest arrears) 176 260 317 352 347
Debt-service payments (cash basis) b/ 182 70 88 57 108 218Amortization 121 51 33 27 33 150Interest payments 59 19 56 31 75 69Fund credit - - - - - -
Debt-service payments (due) b/ 253 286 306 351 322 356Amortization 151 198 212 251 268 246Interest payments 102 88 95 101 81 110Fund credit
Total debt outstanding/GDP (%) 22.7 19.3 16.5 13.1 9.6 7.4Total debt outstanding/exports of
goods & non-factor services (%) 764.8 733.9 811.0 619.4 584.2 492.9Debt service ratio 1%) c/ 45.8 44.6 50.9 40.8 34.3 31.8
(Percent of total)Total debt outstanding (end of period) 100.0 100.0 100.0 100.0 100.0 100.0
Fund creditOther credit b/ 95.8 94.5 93.5 93.4 93.7 92.8
Concessional loans 89.8 89.2 88.3 88.6 88.6Bilateral 64.8 62.9 62.5 64.1 63.9Multilateral 25.0 26.2 25.8 24.5 24.7
Nonconcessional loans 6.0 5.3 5.2 4.8 5.1
a/ Data on debt service payments (cash basis) differ from those implied bycommitments and arrears data in the balance of payments.
b/ Including Trust Fund loans and excluding arrears on principal repayments.c/ Ratio of debt service payments due and exports of goods and non-factor services.
Source: IMF staff estimates.
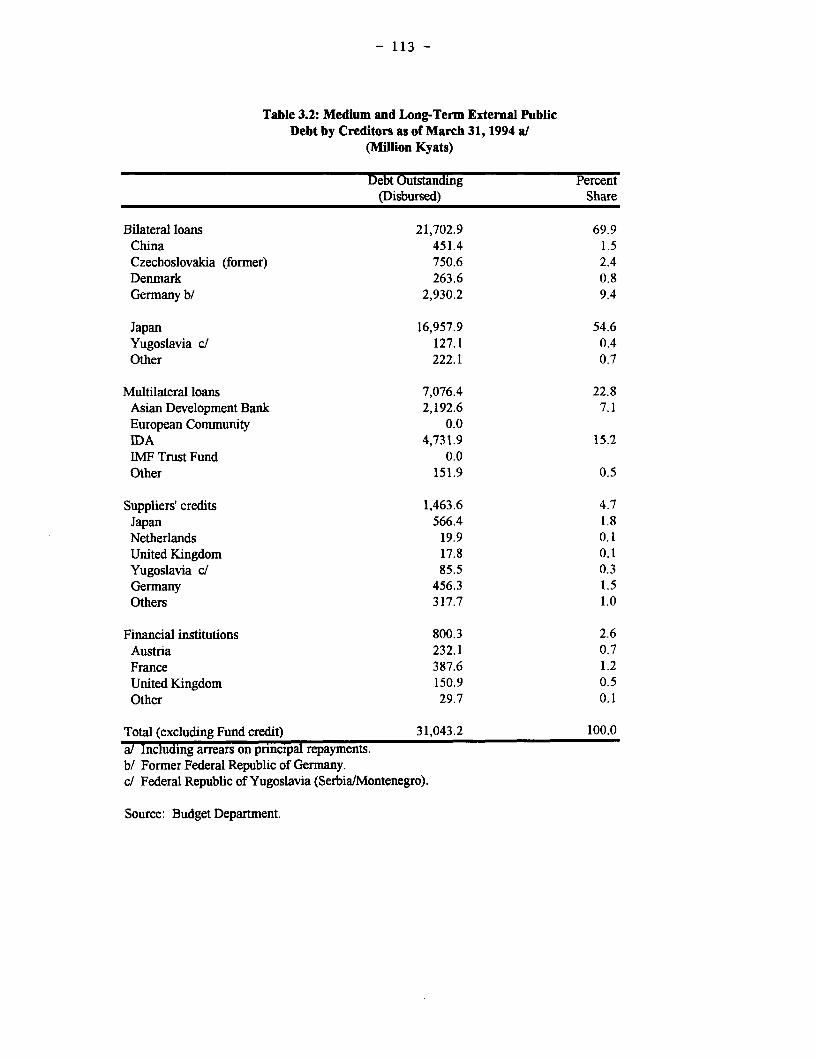
- 113 -
Table 3.2: Medium and Long-Term External PublicDebt by Creditors as of March 31, 1994 a!
(Million Kyats)
Debt Outstanding Percent(Disbursed) Share
Bilateral loans 21,702.9 69.9China 451.4 1.5Czechoslovakia (former) 750.6 2.4Denmark 263.6 0.8Germany b/ 2,930.2 9.4
Japan 16,957.9 54.6Yugoslavia c/ 127.1 0.4Other 222.1 0.7
Multilateral loans 7,076.4 22.8Asian Development Bank 2,192.6 7.1European Community 0.0IDA 4,731.9 15.2IMF Trust Fund 0.0Other 151.9 0.5
Suppliers' credits 1,463.6 4.7Japan 566.4 1.8Netherlands 19.9 0.1Urnited Kingdom 17.8 0.1Yugoslavia c/ 85.5 0.3Germany 456.3 1.5Others 317.7 1.0
Financial institutions 800.3 2.6Austria 232.1 0.7France 387.6 1.2United Kingdom 150.9 0.5Other 29.7 0.1
Total (excluding Fund credit) 31,043.2 100.0a! Including arrears on principal repayments.b/ Former Federal Republic of Germany.c/ Federal Republic of Yugoslavia (Serbia/Montenegro).
Source: Budget Department.
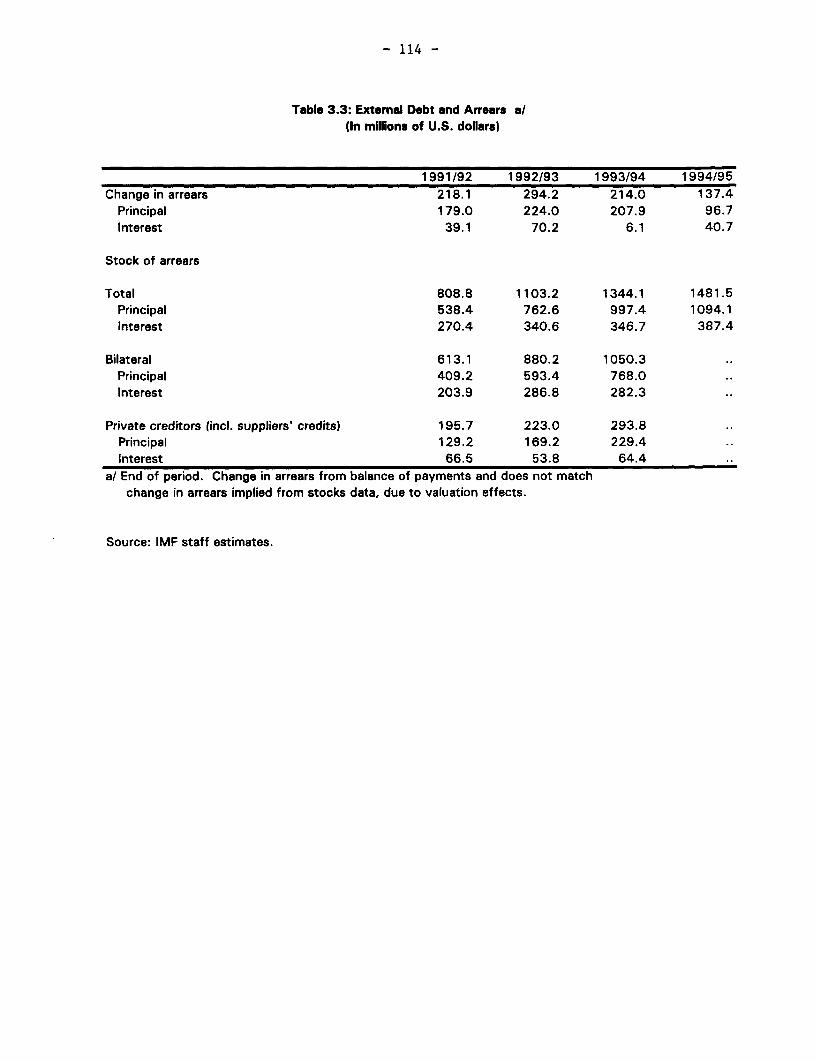
- 114 -
Table 3.3: External Debt and Arrears a/(In millions of U.S. dollars)
1991/92 1992/93 1993/94 1994/95Change in arrears 218.1 294.2 214.0 137.4
Principal 179.0 224.0 207.9 96.7Interest 39.1 70.2 6.1 40.7
Stock of arrears
Total 808.8 1103.2 1344.1 1481.5Principal 538.4 762.6 997.4 1094.1Interest 270.4 340.6 346.7 387.4
Bilateral 613.1 880.2 1050.3Principal 409.2 593.4 768.0Interest 203.9 286.8 282.3
Private creditors (incl. suppliers' credits) 195.7 223.0 293.8Principal 129.2 169.2 229.4Interest 66.5 53.8 64.4
a/ End of period. Change in arrears from balance of payments and does not matchchange in arrears implied from stocks data, due to valuation effects.
Source: IMF staff estimates.
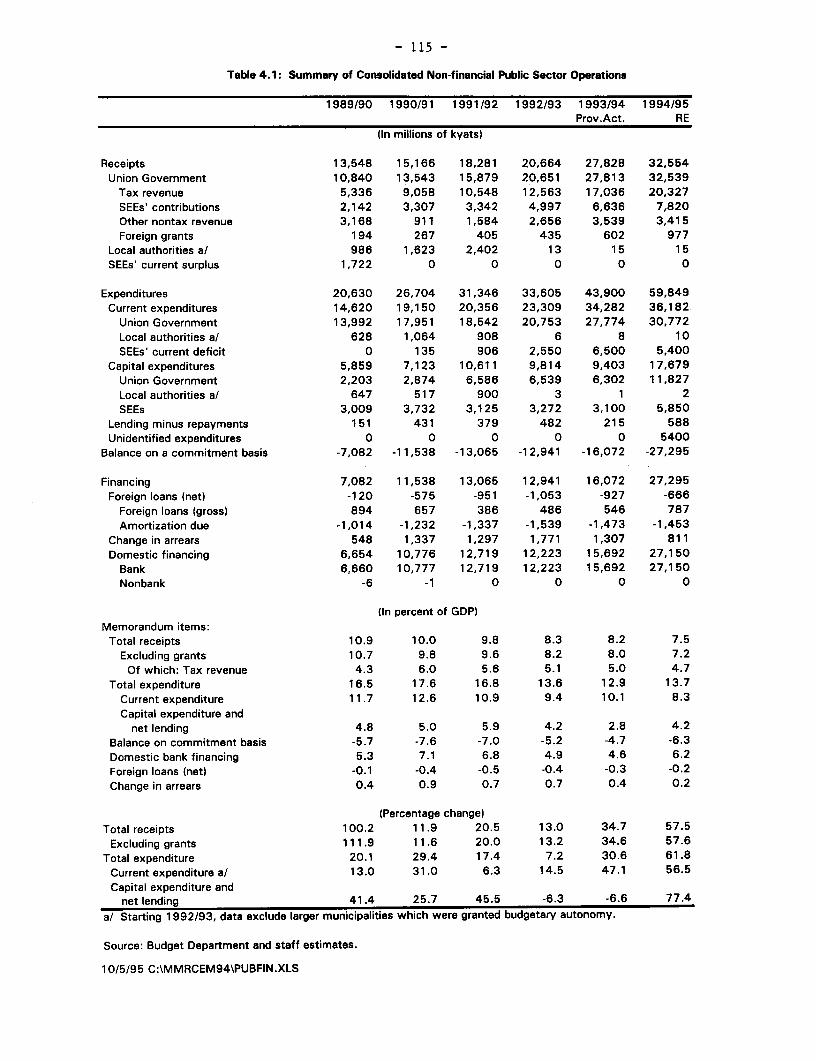
- 115 -
Table 4.1: Summary of Consolidated Non-financial Public Sector Operations
1989/90 1990/91 1991/92 1992/93 1993/94 1994/95Prov.Act. RE
(In millions of kyats)
Receipts 13,548 15,166 18,281 20,664 27,828 32,554Union Government 10,840 13,543 15,879 20,651 27,813 32,539
Tax revenue 5,336 9,058 10,548 12,563 17,036 20,327SEEs' contributions 2,142 3,307 3,342 4,997 6,636 7,820Other nontax revenue 3,168 911 1,584 2,656 3,539 3,415Foreign grants 194 267 405 435 602 977
Local authorities a/ 986 1,623 2,402 13 15 15SEEs' current surplus 1,722 0 0 0 0 0
Expenditures 20,630 26,704 31,346 33,605 43,900 59,849Current expenditures 14,620 19,150 20,356 23,309 34,282 36,182
Union Government 13,992 17,951 18,542 20,753 27,774 30,772Local authorities a/ 628 1,064 908 6 8 10SEEs' current deficit 0 135 906 2,550 6,500 5,400
Capital expenditures 5,859 7,123 10,611 9,814 9,403 17,679Union Government 2,203 2,874 6,586 6,539 6,302 11,827Local authorities a/ 647 517 900 3 1 2SEEs 3,009 3,732 3,125 3,272 3,100 5,850
Lending minus repayments 151 431 379 482 215 588Unidentified expenditures 0 0 0 0 0 5400
Balance on a commitment basis -7,082 -11,538 -13,065 -12,941 -16,072 -27,295
Financing 7,082 11,538 13,065 12,941 16,072 27,295Foreign loans (net) -120 -575 -951 -1,053 -927 -666
Foreign loans (gross) 894 657 386 486 546 787Amortization due -1,014 -1,232 -1,337 -1,539 -1,473 -1,453
Change in arrears 548 1,337 1,297 1,771 1,307 811Domesticfinancing 6,654 10,776 12,719 12,223 15,692 27,150
Bank 6,660 10,777 12,719 12,223 15,692 27,150Nonbank -6 -1 0 0 0 0
(In percent of GDP)Memorandum items:Total receipts 10.9 10.0 9.8 8.3 8.2 7.5
Excluding grants 10.7 9.8 9.6 8.2 8.0 7.2Of which: Tax revenue 4.3 6.0 5.6 5.1 5.0 4.7
Total expenditure 16.5 17.6 16.8 13.6 12.9 13.7Current expenditure 11.7 12.6 10.9 9.4 10.1 8.3Capital expenditure and
net lending 4.8 5.0 5.9 4.2 2.8 4.2Balance on commitment basis -5.7 -7.6 -7.0 -5.2 -4.7 -6.3Domestic bank financing 5.3 7.1 6.8 4.9 4.6 6.2Foreign loans (net) -0.1 -0.4 -0.5 -0.4 -0.3 -0.2Change in arrears 0.4 0.9 0.7 0.7 0.4 0.2
(Percentage change)Total receipts 100.2 11.9 20.5 13.0 34.7 57.5
Excluding grants 111.9 11.6 20.0 13.2 34.6 57.6Total expenditure 20.1 29.4 17.4 7.2 30.6 61.8
Current expenditure a/ 13.0 31.0 6.3 14.5 47.1 56.5Capital expenditure and
net lending 41.4 25.7 45.5 -6.3 -6.6 77.4a/ Starting 1 992/93, data exclude larger municipalities which were granted budgetary autonomy.
Source: Budget Department and staff estimates.
10/5/95 C:\MMRCEM94\PUBFIN.XLS
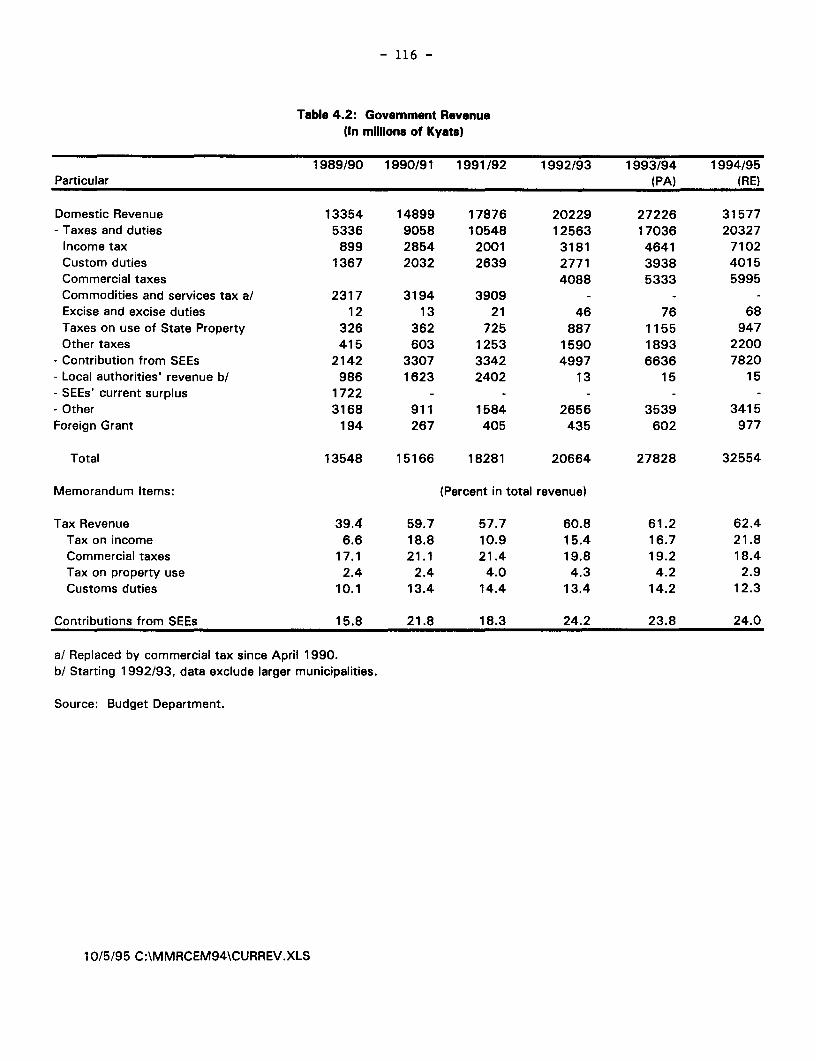
- 116 -
Table 4.2: Government Revenue(In millions of Kyats)
1989/90 1990/91 1991/92 1992/93 1993/94 1994/95Particular (PA) (RE)
Domestic Revenue 13354 14899 17876 20229 27226 31577- Taxes and duties 5336 9058 10548 12563 17036 20327
Income tax 899 2854 2001 3181 4641 7102Custom duties 1367 2032 2639 2771 3938 4015Commercial taxes 4088 5333 5995Commodities and services tax a/ 2317 3194 3909 - - -Excise and excise duties 12 13 21 46 76 68Taxes on use of State Property 326 362 725 887 1155 947Other taxes 415 603 1253 1590 1893 2200
- Contribution from SEEs 2142 3307 3342 4997 6636 7820- Local authorities' revenue b/ 986 1623 2402 13 15 15- SEEs' current surplus 1722 - - - - -- Other 3168 911 1584 2656 3539 3415Foreign Grant 194 267 405 435 602 977
Total 13548 15166 18281 20664 27828 32554
Memorandum Items: (Percent in total revenue)
Tax Revenue 39.4 59.7 57.7 60.8 61.2 62.4Tax on income 6.6 18.8 10.9 15.4 16.7 21.8Commercial taxes 17.1 21.1 21.4 19.8 19.2 18.4Tax on property use 2.4 2.4 4.0 4.3 4.2 2.9Customs duties 10.1 13.4 14.4 13.4 14.2 12.3
Contributions from SEEs 15.8 21.8 18.3 24.2 23.8 24.0
a/ Replaced by commercial tax since April 1990.b/ Starting 1992/93, data exclude larger municipalities.
Source: Budget Department.
10/5/95 C:\MMRCEM94\CURREV.XLS
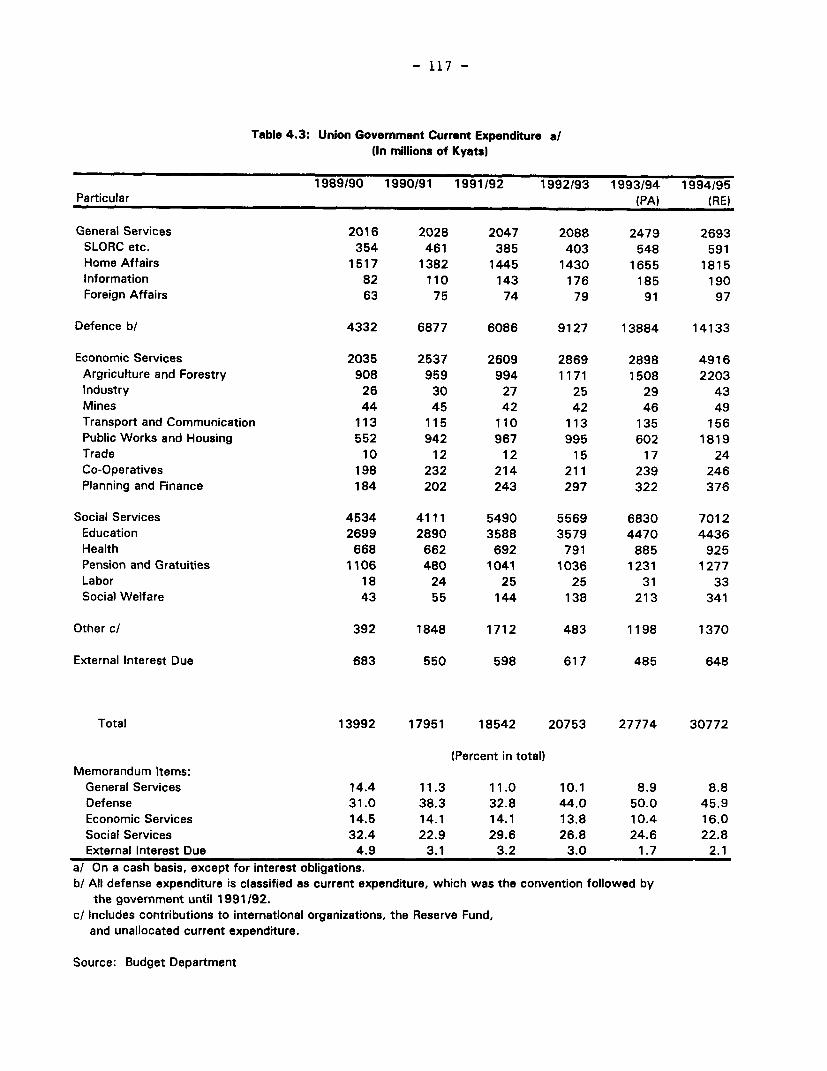
- 117 -
Table 4.3: Union Government Current Expenditure a/(In millions of Kyats)
1989/90 1990/91 1991/92 1992/93 1993/94 1994/95Particular (PA) (RE)
General Services 2016 2028 2047 2088 2479 2693SLORC etc. 354 461 385 403 548 591Home Affairs 1517 1382 1445 1430 1655 1815Information 82 110 143 176 185 190Foreign Affairs 63 75 74 79 91 97
Defence b/ 4332 6877 6086 9127 13884 14133
Economic Services 2035 2537 2609 2869 2898 4916Argriculture and Forestry 908 959 994 1171 1508 2203Industry 26 30 27 25 29 43Mines 44 45 42 42 46 49Transport and Communication 113 115 110 113 135 156Public Works and Housing 552 942 967 995 602 1819Trade 10 12 12 15 17 24Co-Operatives 198 232 214 211 239 246Planning and Finance 184 202 243 297 322 376
Social Services 4534 4111 5490 5569 6830 7012Education 2699 2890 3588 3579 4470 4436Health 668 662 692 791 885 925Pension and Gratuities 1106 480 1041 1036 1231 1277Labor 18 24 25 25 31 33Social Welfare 43 55 144 138 213 341
Other c/ 392 1848 1712 483 1198 1370
External Interest Due 683 550 598 617 485 648
Total 13992 17951 18542 20753 27774 30772
(Percent in total)Memorandum Items:
General Services 14.4 11.3 11.0 10.1 8.9 8.8Defense 31.0 38.3 32.8 44.0 50.0 45.9Economic Services 14.5 14.1 14.1 13.8 10.4 16.0Social Services 32.4 22.9 29.6 26.8 24.6 22.8External Interest Due 4.9 3.1 3.2 3.0 1.7 2.1
a/ On a cash basis, except for interest obligations.b/ All defense expenditure is classified as current expenditure, which was the convention followed by
the government until 1991/92.c/ Includes contributions to international organizations, the Reserve Fund,
and unallocated current expenditure.
Source: Budget Department
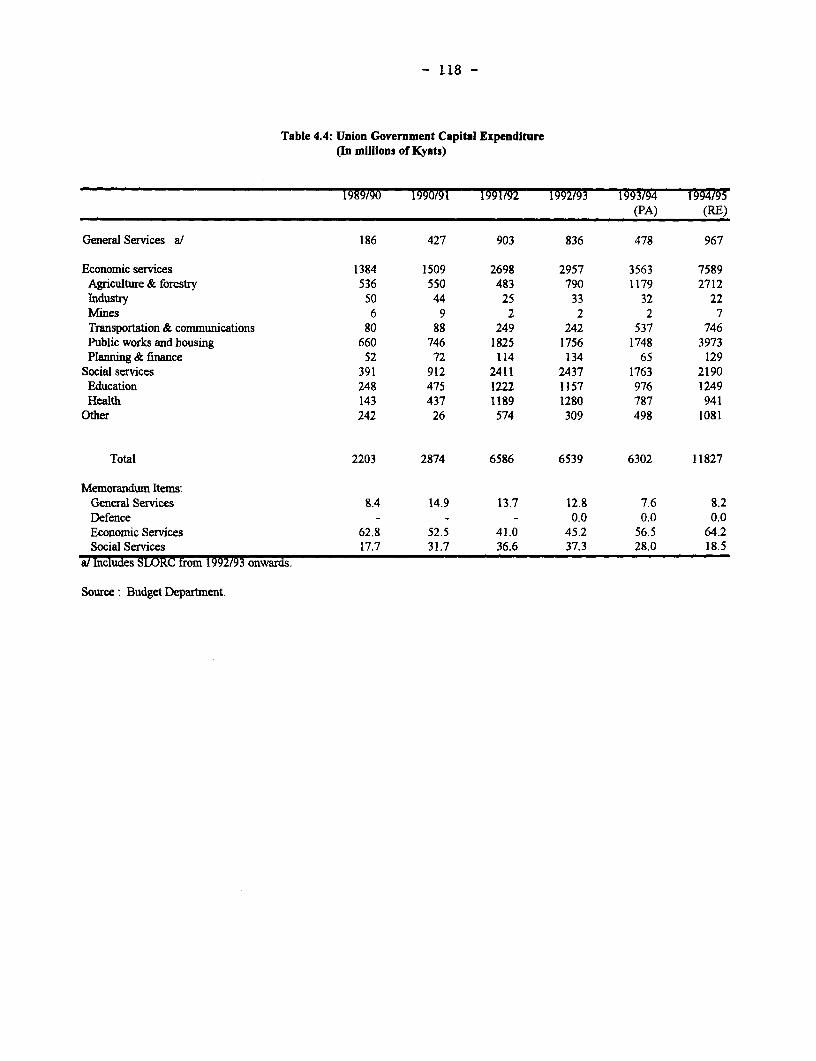
- 118 -
Table 4.4: Union Government Capital Expenditure(In millions of Kyats)
1989/90 1990/91 1991/92 1992/93 1993/94 1994/95(PA) (RE)
General Services a/ 186 427 903 836 478 967
Economic services 1384 1509 2698 2957 3563 7589Agriculture & forestry 536 550 483 790 1179 2712Industry 50 44 25 33 32 22Mines 6 9 2 2 2 7Transportation & communications 80 88 249 242 537 746Public works and housing 660 746 1825 1756 1748 3973Planning & finance 52 72 114 134 65 129
Social services 391 912 2411 2437 1763 2190Education 248 475 1222 1157 976 1249Health 143 437 1189 1280 787 941
Other 242 26 574 309 498 1081
Total 2203 2874 6586 6539 6302 11827
Memorandum Items:General Services 8.4 14.9 13.7 12.8 7.6 8.2Defence - - 0.0 0.0 0.0Economic Services 62.8 52.5 41.0 45.2 56.5 64.2Social Services 17.7 31.7 36.6 37.3 28.0 18.5
a/Includes SLORC from 1992/93 onwards.
Source: Budget Department.
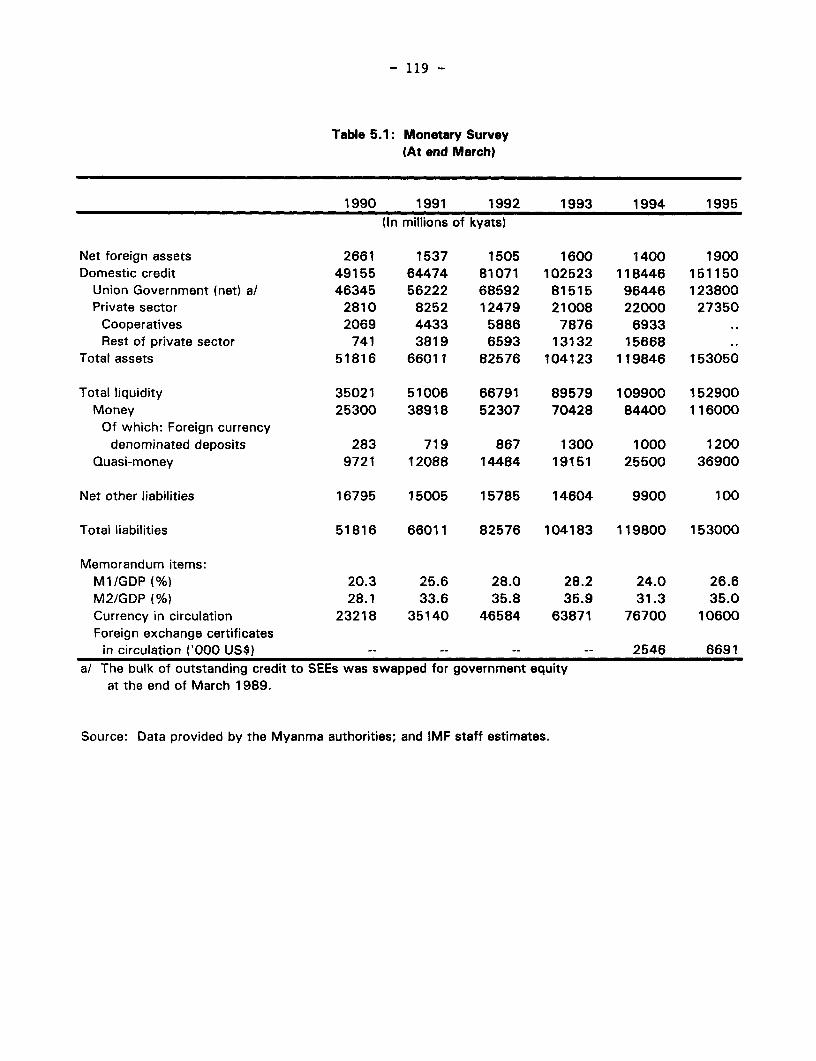
- 119 -
Table 5.1: Monetary Survey(At end March)
1990 1991 1992 1993 1994 1995(In millions of kyats)
Net foreign assets 2661 1537 1505 1600 1400 1900Domestic credit 49155 64474 81071 102523 118446 151150
Union Government (net) a/ 46345 56222 68592 81515 96446 123800Private sector 2810 8252 12479 21008 22000 27350
Cooperatives 2069 4433 5886 7876 6933Rest of private sector 741 3819 6593 13132 15668
Total assets 51816 66011 82576 104123 119846 153050
Total liquidity 35021 51006 66791 89579 109900 152900Money 25300 38918 52307 70428 84400 116000
Of which: Foreign currencydenominated deposits 283 719 867 1300 1000 1200
Quasi-money 9721 12088 14484 19151 25500 36900
Net other liabilities 16795 15005 15785 14604 9900 100
Total liabilities 51816 66011 82576 104183 119800 153000
Memorandum items:M1/GDP (%) 20.3 25.6 28.0 28.2 24.0 26.6M2/GDP (%) 28.1 33.6 35.8 35.9 31.3 35.0Currency in circulation 23218 35140 46584 63871 76700 10600Foreign exchange certificates
in circulation ('000 US$) -- -- -- -- 2546 6691a/ The bulk of outstanding credit to SEEs was swapped for government equity
at the end of March 1989.
Source: Data provided by the Myanma authorities; and IMF staff estimates.
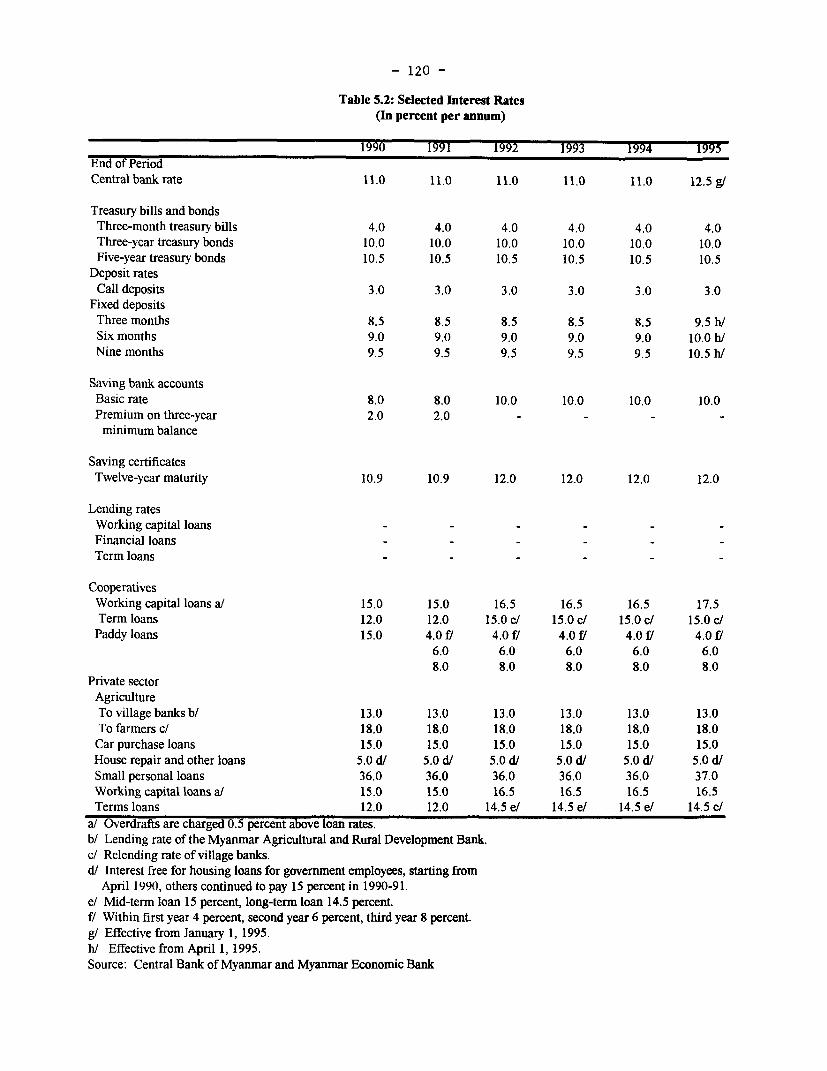
- 120 -
Table 5.2: Selected Interest Rates(In percent per annum)
1990 1991 1992 1993 1994 1995End of PeriodCentralbankrate 11.0 11.0 11.0 11.0 11.0 12.5g/
Treasury bills and bondsThree-month treasury bills 4.0 4.0 4.0 4.0 4.0 4.0Three-year treasury bonds 10.0 10.0 10.0 10.0 10.0 10.0Five-year treasury bonds 10.5 10.5 10.5 10.5 10.5 10.5
Deposit ratesCall deposits 3.0 3.0 3.0 3.0 3.0 3.0
Fixed depositsThree months 8.5 8.5 8.5 8.5 8.5 9.5 h/Six months 9.0 9.0 9.0 9.0 9.0 10.0 h/Nine months 9.5 9.5 9.5 9.5 9.5 10.5 h/
Saving bank accountsBasic rate 8.0 8.0 10.0 10.0 10.0 10.0Premium on three-year 2.0 2.0
minimum balance
Saving certificatesTwelve-year maturity 10.9 10.9 12.0 12.0 12.0 12.0
Lending ratesWorking capital loansFinancial loansTerm loans
CooperativesWorking capital loans a/ 15.0 15.0 16.5 16.5 16.5 17.5Term loans 12.0 12.0 15.0 e/ 15.0 e/ 15.0 e/ 15.0 e/
Paddy loans 15.0 4.0 f/ 4.0 f 4.0 f/ 4.0 f 4.0 fl6.0 6.0 6.0 6.0 6.08.0 8.0 8.0 8.0 8.0
Private sectorAgricultureTo village banks b/ 13.0 13.0 13.0 13.0 13.0 13.0To farmers c/ 18.0 18.0 18.0 18.0 18.0 18.0Car purchase loans 15.0 15.0 15.0 15.0 15.0 15.0House repair and other loans 5.0 d/ 5.0 d/ 5.0 d/ 5.0 d/ 5.0 d/ 5.0 d/Small personal loans 36.0 36.0 36.0 36.0 36.0 37.0Working capital loans a/ 15.0 15.0 16.5 16.5 16.5 16.5Terms loans 12.0 12.0 14.5 e/ 14.5 e/ 14.5 e/ 14.5 e/
a/ Overdrafts are charged 0.5 percent above loan rates.b/ Lending rate of the Myanmar Agricultural and Rural Development Bank.c/ Relending rate of village banks.d/ Interest free for housing loans for government employees, starting from
April 1990, others continued to pay 15 percent in 1990-9 1.e/ Mid-term loan 15 percent, long-term loan 14.5 percent.f/ Within first year 4 percent, second year 6 percent, third year 8 percent.g/ Effective from January 1, 1995.h/ Effective from April 1, 1995.Source: Central Bank of Myanmar and Myanmar Economic Bank
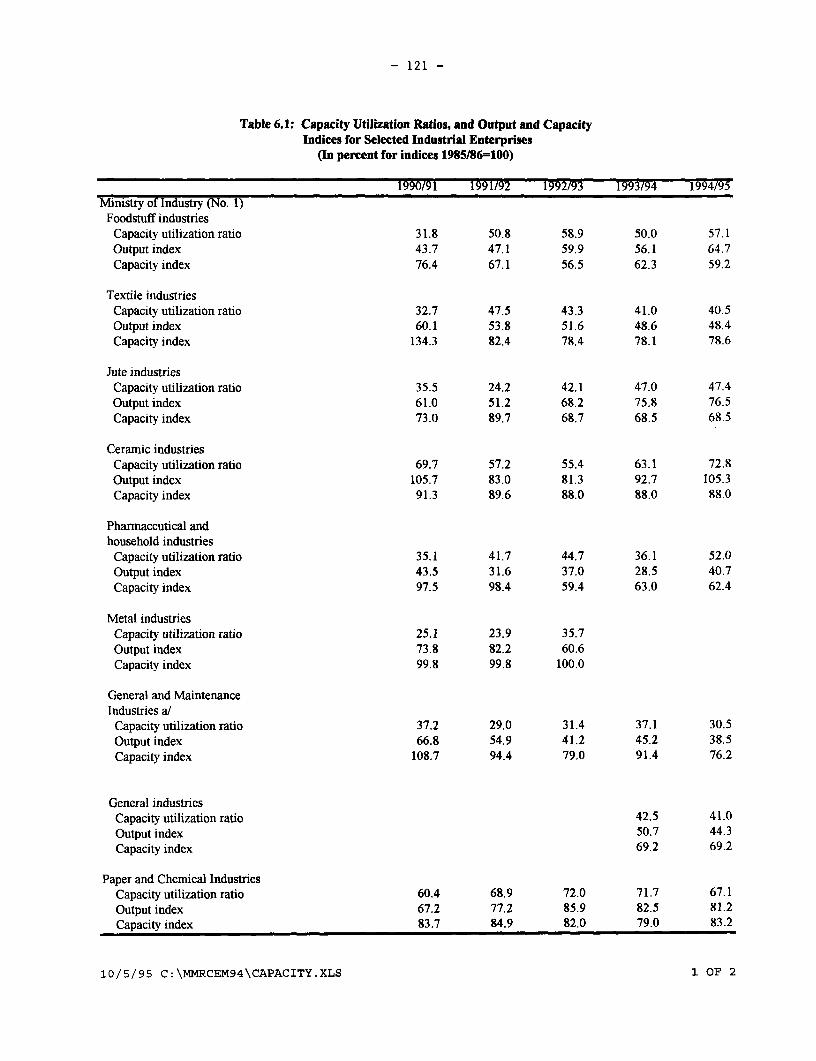
- 121 -
Table 6.1: Capacity Utilization Ratios, and Output and CapacityIndices for Selected Industrial Enterprises
(In percent for indices 1985/86=100)
1990/91 1991/92 1992/93 1993/94 1994/95Ministry of Industry (No. 1)Foodstuff industries
Capacity utilization ratio 31.8 50.8 58.9 50.0 57.1Output index 43.7 47.1 59.9 56.1 64.7Capacity index 76.4 67.1 56.5 62.3 59.2
Textile industriesCapacity utilization ratio 32.7 47.5 43.3 41.0 40.5Output index 60.1 53.8 51.6 48.6 48.4Capacity index 134.3 82.4 78.4 78.1 78.6
Jute industriesCapacity utilization ratio 35.5 24.2 42.1 47.0 47.4Output index 61.0 51.2 68.2 75.8 76.5Capacity index 73.0 89.7 68.7 68.5 68.5
Ceramic industriesCapacity utilization ratio 69.7 57.2 55.4 63.1 72.8Output index 105.7 83.0 81.3 92.7 105.3Capacity index 91.3 89.6 88.0 88.0 88.0
Pharnaccutical andhousehold industriesCapacity utilization ratio 35.1 41.7 44.7 36.1 52.0Output index 43.5 31.6 37.0 28.5 40.7Capacity index 97.5 98.4 59.4 63.0 62.4
Metal industriesCapacity utilization ratio 25.1 23.9 35.7Output index 73.8 82.2 60.6Capacity index 99.8 99.8 100.0
General and MaintenanceIndustries a/Capacity utilization ratio 37.2 29.0 31.4 37.1 30.5Output index 66.8 54.9 41.2 45.2 38.5Capacity index 108.7 94.4 79.0 91.4 76.2
General industriesCapacity utilization ratio 42.5 41.0Output index 50.7 44.3Capacity index 69.2 69.2
Paper and Chemical IndustriesCapacity utilization ratio 60.4 68.9 72.0 71.7 67.1Output index 67.2 77.2 85.9 82.5 81.2Capacity index 83.7 84.9 82.0 79.0 83.2
10/5/95 C: \MMRCEM94\CAPACITY.XLS 1 OF 2
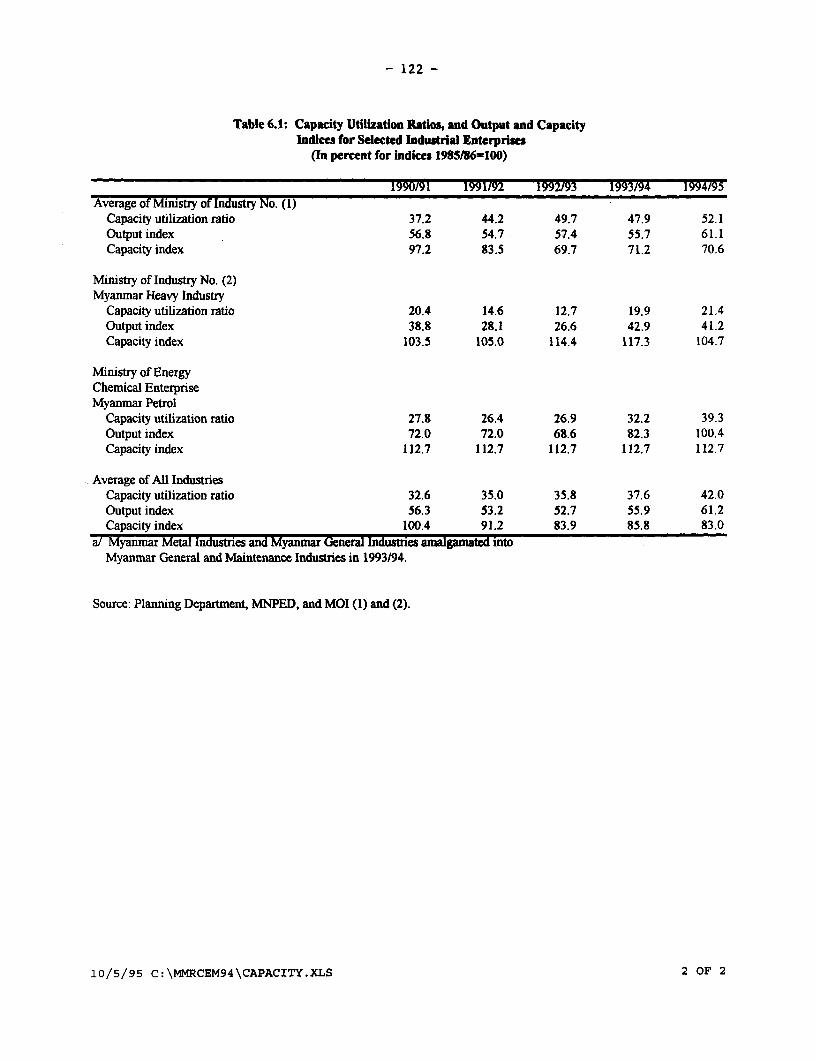
- 122 -
Table 6.1: Capacity Utilization Ratios, and Output and CapacityIndices for Selected Industrial Enterprises
(In percent for indices 1985186=100)
1990/91 1991/92 1992/93 1993/94 1994/95Average of Ministry of Industry No. (1)
Capacity utilization ratio 37.2 44.2 49.7 47.9 52.1Output index 56.8 54.7 57.4 55.7 61.1Capacity index 97.2 83.5 69.7 71.2 70.6
Ministiy of Industry No. (2)Myanmar Heavy Industry
Capacity utilization ratio 20.4 14.6 12.7 19.9 21.4Output index 38.8 28.1 26.6 42.9 41.2Capacity index 103.5 105.0 114.4 117.3 104.7
Ministry of EnergyChemical EnterpriseMyanmar Petrol
Capacity utilization ratio 27.8 26.4 26.9 32.2 39.3Output index 72.0 72.0 68.6 82.3 100.4Capacity index 112.7 112.7 112.7 112.7 112.7
Average of All IndustriesCapacity utilization ratio 32.6 35.0 35.8 37.6 42.0Output index 56.3 53.2 52.7 55.9 61.2Capacity index 100.4 91.2 83.9 85.8 83.0
a/ Myanmar Metal Industries and Myanmar General Industries aialganated intoMyanmar General and Maintenance Industries in 1993/94.
Source: Planning Department, MNPED, and MOI (1) and (2).
10/5/95 C:\MMRCEM94\CAPACITY.XLS 2 OF 2
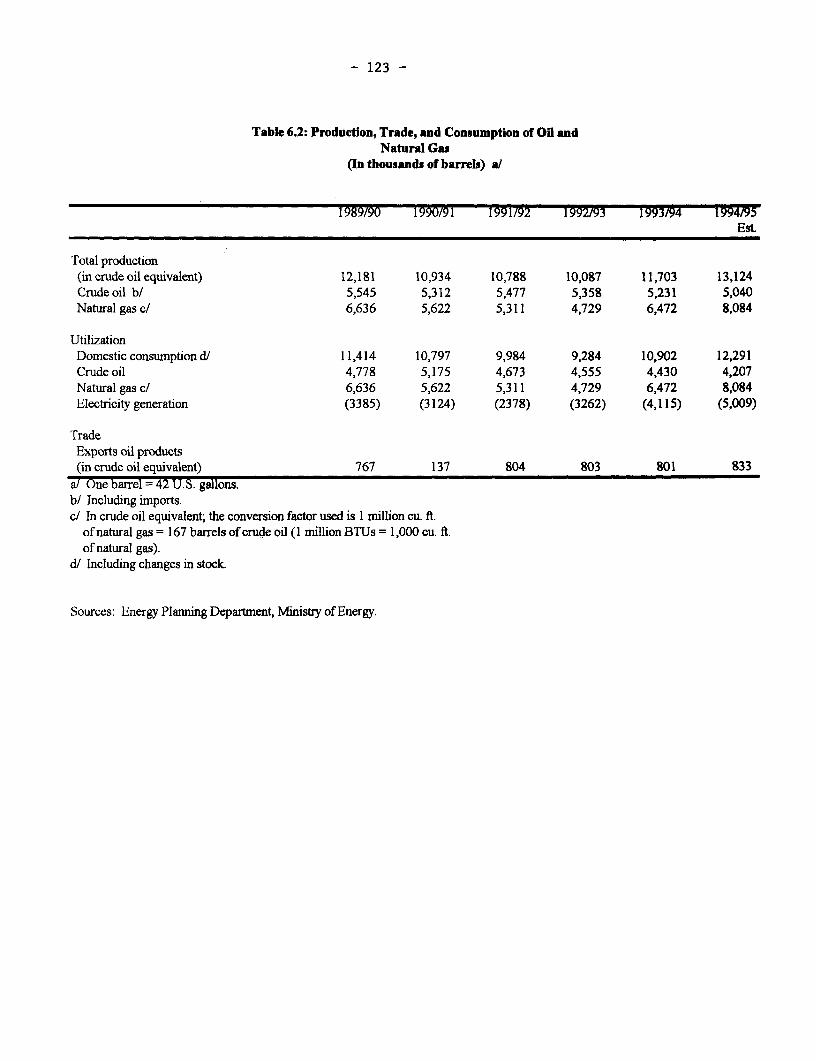
- 123 -
Table 6.2: Production, Trade, and Consumption of Oil andNatural Gas
(In thousands of barrels) a/
1989/90 1990/91 1991/92 1992/93 1993/94 1994/95EsL
Total production(incrudeoilequivalent) 12,181 10,934 10,788 10,087 11,703 13,124Crude oil b/ 5,545 5,312 5,477 5,358 5,231 5,040Natural gas c/ 6,636 5,622 5,311 4,729 6,472 8,084
UtilizationDomestic consumption d/ 11,414 10,797 9,984 9,284 10,902 12,291Crude oil 4,778 5,175 4,673 4,555 4,430 4,207Natural gas c/ 6,636 5,622 5,311 4,729 6,472 8,084Electricity generation (3385) (3124) (2378) (3262) (4,115) (5,009)
TradeExports oil products(in crude oil equivalent) 767 137 804 803 801 833
a/ One barrel = 42 U.S. gallons.b/ Including imports.c/ In crude oil equivalent; the conversion factor used is I million cu. ft.
of natural gas = 167 barrels of crude oil (I million BTUs = 1,000 cu. ft.of natural gas).
d/ Including changes in stock.
Sources: Energy Planning Department, Ministry of Energy.
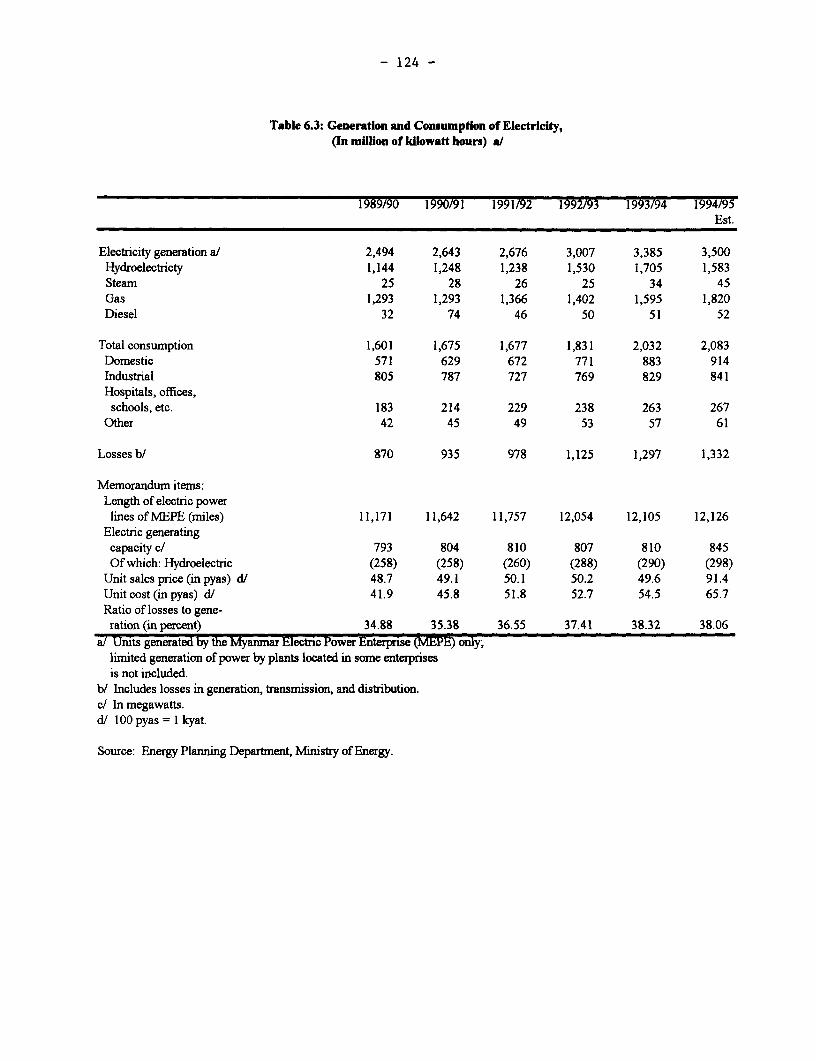
- 124 -
Table 6.3: Generation and Consumption of Electricity,(In million of kilowatt hours) a/
1989/90 1990/91 1991/92 1992/93 1993/94 1994/95Est.
Electricity generation a/ 2,494 2,643 2,676 3,007 3,385 3,500Hydroelectricty 1,144 1,248 1,238 1,530 1,705 1,583Steam 25 28 26 25 34 45Gas 1,293 1,293 1,366 1,402 1,595 1,820Diesel 32 74 46 50 51 52
Total consumption 1,601 1,675 1,677 1,831 2,032 2,083Domestic 571 629 672 771 883 914Industrial 805 787 727 769 829 841Hospitals, offices,schools, etc. 183 214 229 238 263 267
Other 42 45 49 53 57 61
Losses b/ 870 935 978 1,125 1,297 1,332
Memorandum items:Length of electric powerIines of MEPE (miles) 11,171 11,642 11,757 12,054 12,105 12,126
Electric generatingcapacity c/ 793 804 810 807 810 845Of which: Hydroelectric (258) (258) (260) (288) (290) (298)
Unit sales price (in pyas) d/ 48.7 49.1 50.1 50.2 49.6 91.4Unit cost (in pyas) d/ 41.9 45.8 51.8 52.7 54.5 65.7Ratio of losses to gene-ration (in percent) 34.88 35.38 36.55 37.41 38.32 38.06
a/ Units generated by the Myannar Electric Power Enterprise (MEPE) only;limited generation of power by plants located in some enterprisesis not included.
b/ Includes losses in generation, transmission, and distribution.c/ In megawatts.d/ 100 pyas = I kyat.
Source: Energy Planning Department, Ministry of Energy.
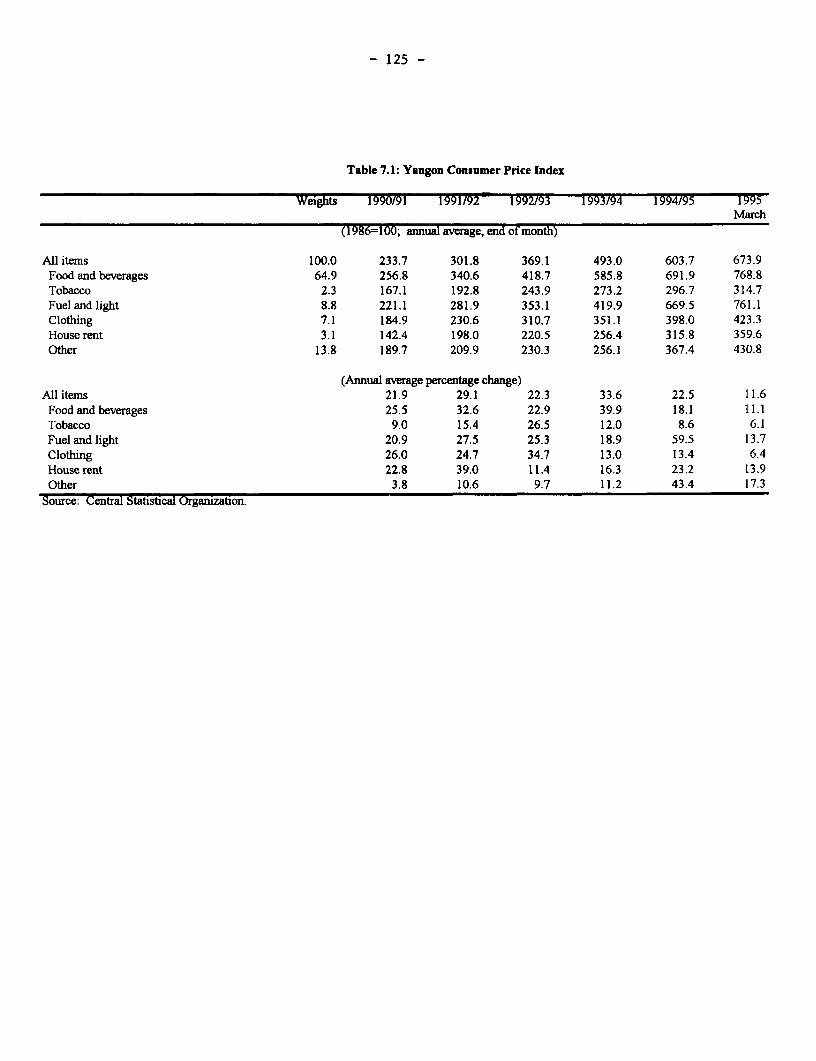
- 125 -
Table 7.1: Yangon Consumer Price Index
Weights 1990/91 1991/92 1992/93 1993/94 1994/95 1995March
(1986=100; annual average, end of month)
All items 100.0 233.7 301.8 369.1 493.0 603.7 673.9Food and beverages 64.9 256.8 340.6 418.7 585.8 691.9 768.8Tobacco 2.3 167.1 192.8 243.9 273.2 296.7 314.7Fuel and light 8.8 221.1 281.9 353.1 419.9 669.5 761.1Clothing 7.1 184.9 230.6 310.7 351.1 398.0 423.3House rent 3.1 142.4 198.0 220.5 256.4 315.8 359.6Other 13.8 189.7 209.9 230.3 256.1 367.4 430.8
(Annual average percentage change)All itemns 21.9 29.1 22.3 33.6 22.5 11.6Food and beverages 25.5 32.6 22.9 39.9 18.1 11.1Tobacco 9.0 15.4 26.5 12.0 8.6 6.1Fuel and light 20.9 27.5 25.3 18.9 59.5 13.7Clothing 26.0 24.7 34.7 13.0 13.4 6.4House rent 22.8 39.0 11.4 16.3 23.2 13.9Other 3.8 10.6 9.7 11.2 43.4 17.3
Source: Central Statistical Organization.
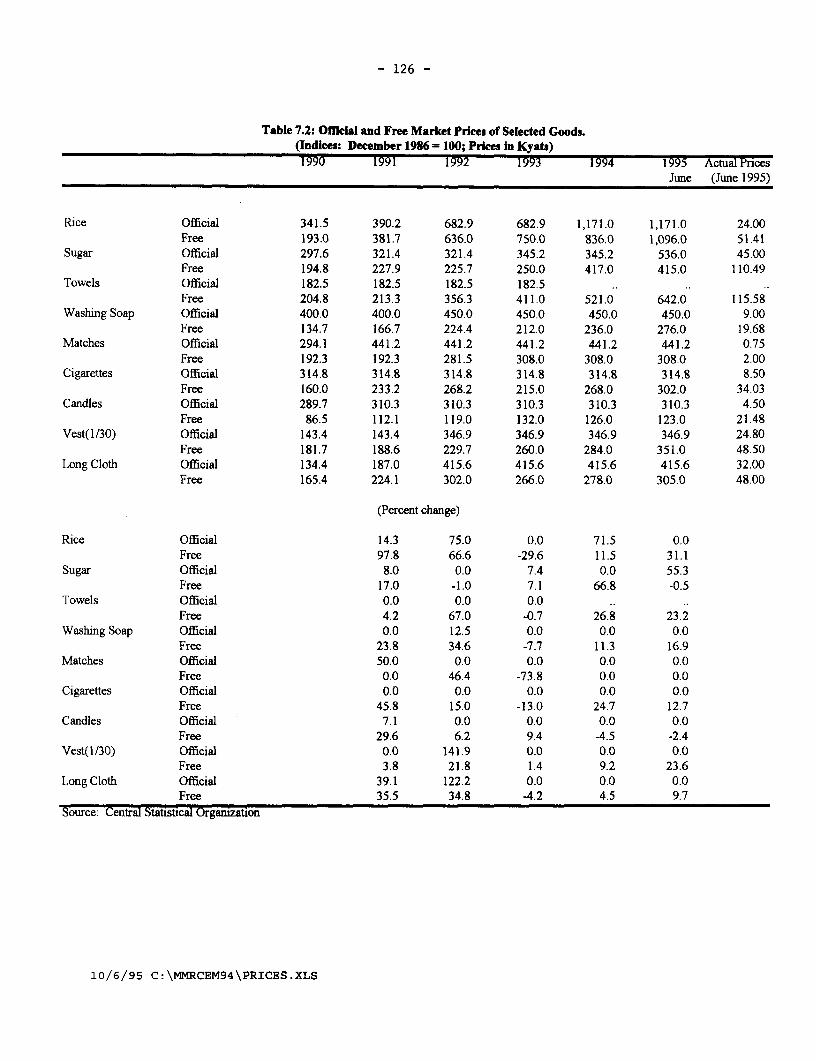
- 126 -
Table 7.2: Offrcial and Free Market Prices of Selected Goods.(Indices: December 1986= 100; Prices in Kyats)1990 1991 1992 1993 1994 1995 Actual Pnces
June (June 1995)
Rice Official 341.5 390.2 682.9 682.9 1,171.0 1,171.0 24.00Free 193.0 381.7 636.0 750.0 836.0 1,096.0 51.41
Sugar Official 297.6 321.4 321.4 345.2 345.2 536.0 45.00Free 194.8 227.9 225.7 250.0 417.0 415.0 110.49
Towels Official 182.5 182.5 182.5 182.5Free 204.8 213.3 356.3 411.0 521.0 642.0 115.58
Washing Soap Official 400.0 400.0 450.0 450.0 450.0 450.0 9.00Free 134.7 166.7 224.4 212.0 236.0 276.0 19.68
Matches Official 294.1 441.2 441.2 441.2 441.2 441.2 0.75Free 192.3 192.3 281.5 308.0 308.0 308.0 2.00
Cigarettes Official 314.8 314.8 314.8 314.8 314.8 314.8 8.50Free 160.0 233.2 268.2 215.0 268.0 302.0 34.03
Candles Official 289.7 310.3 310.3 310.3 310.3 310.3 4.50Free 86.5 112.1 119.0 132.0 126.0 123.0 21.48
Vest(1/30) Official 143.4 143.4 346.9 346.9 346.9 346.9 24.80Free 181.7 188.6 229.7 260.0 284.0 351.0 48.50
Long Cloth Official 134.4 187.0 415.6 415.6 415.6 415.6 32.00Free 165.4 224.1 302.0 266.0 278.0 305.0 48.00
(Percent change)
Rice Official 14.3 75.0 0.0 71.5 0.0Free 97.8 66.6 -29.6 11.5 31.1
Sugar Official 8.0 0.0 7.4 0.0 55.3Free 17.0 -1.0 7.1 66.8 -0.5
Towels Official 0.0 0.0 0.0Free 4.2 67.0 -0.7 26.8 23.2
Washing Soap Official 0.0 12.5 0.0 0.0 0.0Free 23.8 34.6 -7.7 11.3 16.9
Matches Official 50.0 0.0 0.0 0.0 0.0Free 0.0 46.4 -73.8 0.0 0.0
Cigarettes Official 0.0 0.0 0.0 0.0 0.0Free 45.8 15.0 -13.0 24.7 12.7
Candles Official 7.1 0.0 0.0 0.0 0.0Free 29.6 6.2 9.4 -4.5 -2.4
Vest(1/30) Official 0.0 141.9 0.0 0.0 0.0Free 3.8 21.8 1.4 9.2 23.6
Long Cloth Official 39.1 122.2 0.0 0.0 0.0Free 35.5 34.8 -4.2 4.5 9.7
Source: Central Statistical Organization
10/6/95 C:\MMRCEM94\PRICES.XLS
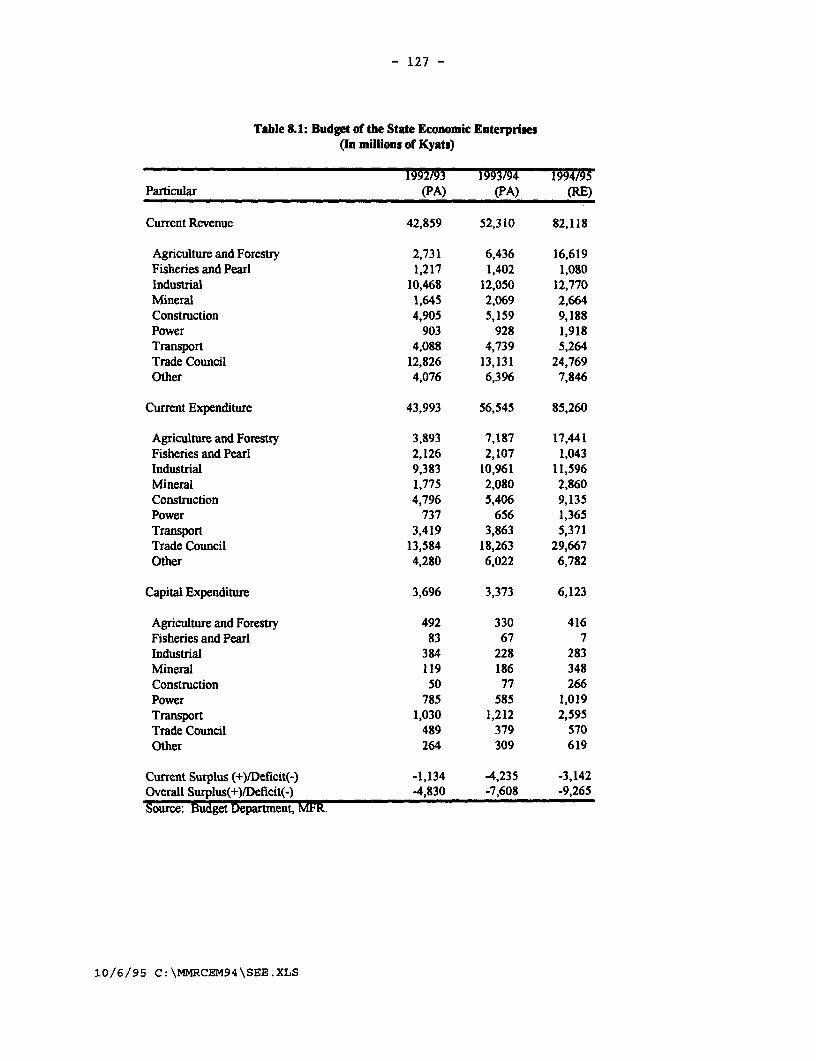
- 127 -
Table 8.1: Budget of the State Economic Enterprises(In millions of Kyats)
1992/93 1993/94 1994/95Particular (PA) (PA) (RE)
CurrentRevenue 42,859 52,310 82,118
Agriculture and Forestry 2,731 6,436 16,619Fisheries and Pearl 1,217 1,402 1,080Industrial 10,468 12,050 12,770Mineral 1,645 2,069 2,664Construction 4,905 5,159 9,188Power 903 928 1,918Transport 4,088 4,739 5,264Trade Council 12,826 13,131 24,769Other 4,076 6,396 7,846
Current Expenditure 43,993 56,545 85,260
Agriculture and Forestry 3,893 7,187 17,441Fisheries and Pearl 2,126 2,107 1,043Industrial 9,383 10,961 11,596Mineral 1,775 2,080 2,860Construction 4,796 5,406 9,135Power 737 656 1,365Transport 3,419 3,863 5,371Trade Council 13,584 18,263 29,667Other 4,280 6,022 6,782
Capital Expenditure 3,696 3,373 6,123
Agriculture and Forestry 492 330 416Fisheries and Pearl 83 67 7Industrial 384 228 283Mineral 119 186 348Construction 50 77 266Power 785 585 1,019Transport 1,030 1,212 2,595Trade Council 489 379 570Other 264 309 619
Current Surplus (+)/Deficit(-) -1,134 -4,235 -3,142Overall Surplus(+)lDeficit(-) -4,830 -7,608 -9,265Source: Budget Department, MFR.
10/6/95 C: \MMRCEM94\SEE.XLS
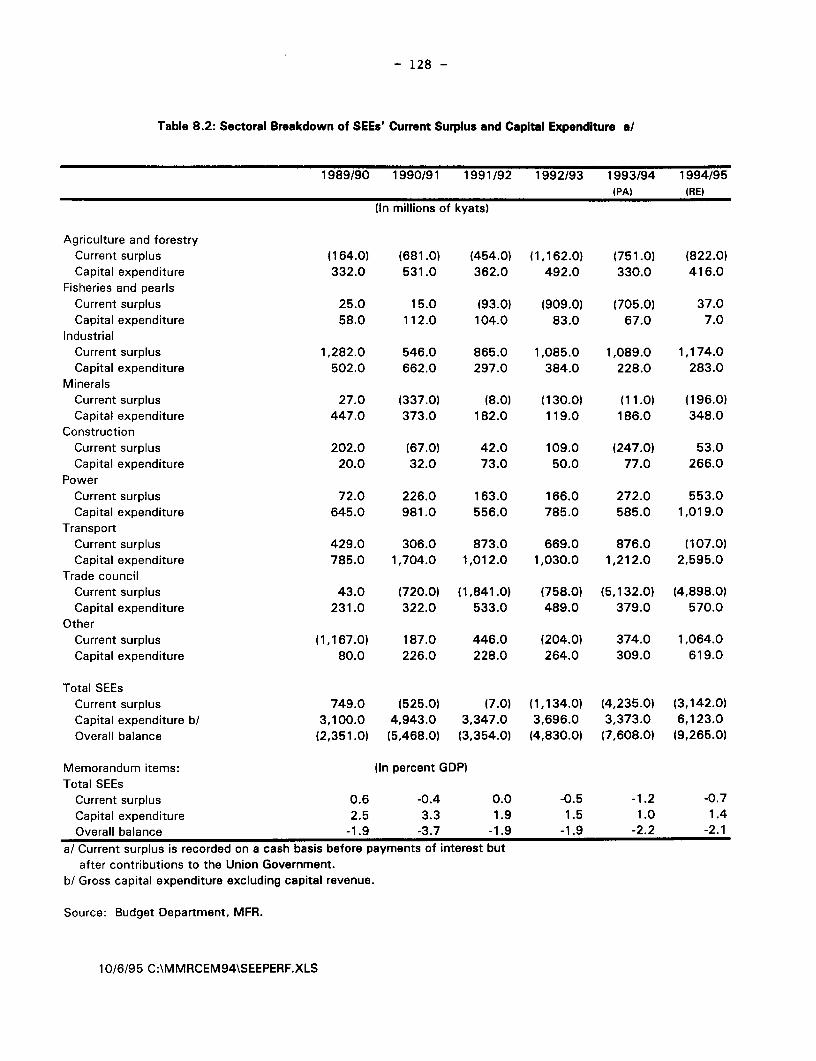
- 128 -
Table 8.2: Sectoral Breakdown of SEEs' Current Surplus and Capital Expenditure a/
1989/90 1990/91 1991/92 1992/93 1993/94 1994/95IPA) (RE)
(In millions of kyats)
Agriculture and forestryCurrent surplus (164.0) (681.0) (454.0) (1,162.0) (751.0) (822.0)Capital expenditure 332.0 531.0 362.0 492.0 330.0 416.0
Fisheries and pearlsCurrent surplus 25.0 1 5.0 (93.0) (909.0) (705.0) 37.0Capital expenditure 58.0 112.0 104.0 83.0 67.0 7.0
IndustrialCurrent surplus 1,282.0 546.0 865.0 1,085.0 1,089.0 1,174.0Capital expenditure 502.0 662.0 297.0 384.0 228.0 283.0
MineralsCurrent surplus 27.0 (337.0) (8.0) (130.0) (11.0) (196.0)Capital expenditure 447.0 373.0 182.0 119.0 186.0 348.0
ConstructionCurrent surplus 202.0 (67.0) 42.0 109.0 (247.0) 53.0Capital expenditure 20.0 32.0 73.0 50.0 77.0 266.0
PowerCurrent surplus 72.0 226.0 163.0 166.0 272.0 553.0Capital expenditure 645.0 981.0 556.0 785.0 585.0 1,019.0
TransportCurrent surplus 429.0 306.0 873.0 669.0 876.0 (107.0)Capital expenditure 785.0 1,704.0 1,012.0 1,030.0 1,212.0 2,595.0
Trade councilCurrent surplus 43.0 (720.0) (1,841.0) (758.0) (5,132.0) (4,898.0)Capital expenditure 231.0 322.0 533.0 489.0 379.0 570.0
OtherCurrent surplus (1,167.0) 187.0 446.0 (204.0) 374.0 1,064.0Capital expenditure 80.0 226.0 228.0 264.0 309.0 619.0
Total SEEsCurrent surplus 749.0 (525.0) (7.0) (1,134.0) (4,235.0) (3,142.0)Capital expenditure b/ 3,100.0 4,943.0 3,347.0 3,696.0 3,373.0 6,123.0Overall balance (2,351.0) (5,468.0) (3,354.0) (4,830.0) (7,608.0) (9,265.0)
Memorandum items: (In percent GDP)Total SEEs
Current surplus 0.6 -0.4 0.0 -0.5 -1.2 -0.7Capital expenditure 2.5 3.3 1.9 1.5 1.0 1.4Overall balance -1.9 -3.7 -1.9 -1.9 -2.2 -2.1
a/ Current surplus is recorded on a cash basis before payments of interest butafter contributions to the Union Government.
b/ Gross capital expenditure excluding capital revenue.
Source: Budget Department, MFR.
10/6/95 C:\MMRCEM94\SEEPERF.XLS
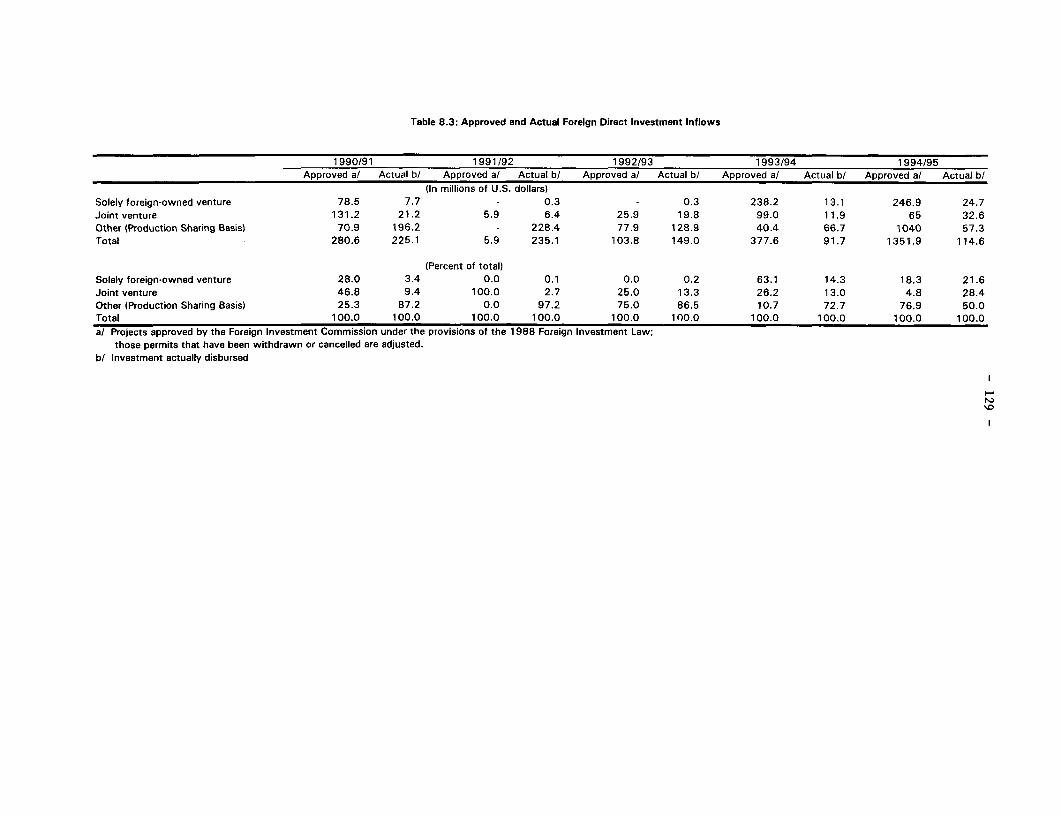
Table 8.3: Approved and Actual Foreign Direct Investment Inflows
1990/91 1991/92 1992/93 1993/94 1994/95Approved a/ Actual b/ Approved a/ Actual b/ Approved a/ Actual b/ Approved a/ Actual b/ Approved a/ Actual b/
(In millions of U.S. dollars)Solely foreign-owned venture 78.5 7.7 - 0.3 - 0.3 238.2 13.1 246.9 24.7Joint venture 131.2 21.2 5.9 6.4 25.9 19.8 99.0 11.9 65 32.6Other (Production Sharing Basis) 70.9 196.2 - 228.4 77.9 128.9 40.4 66.7 1040 57.3Total 280.6 225.1 5.9 235.1 103.8 149.0 377.6 91.7 1351.9 114.6
(Percent of total)Solely foreign-owned venture 28.0 3.4 0.0 0.1 0.0 0.2 63.1 14.3 18.3 21.6Joint venture 46.8 9.4 100.0 2.7 25.0 13.3 26.2 13.0 4.8 28.4Other (Production Sharing Basis) 25.3 87.2 0.0 97.2 75.0 86.5 10.7 72.7 76.9 50.0Total 100.0 100.0 100.0 100.0 100.0 100.0 100.0 100.0 100.0 100.0a/ Projects approved by the Foreign Investment Commission under the provisions of the 1988 Foreign Investment Law;
those permits that have been withdrawn or cancelled are adjusted.b/ Investment actually disbursed
r'.
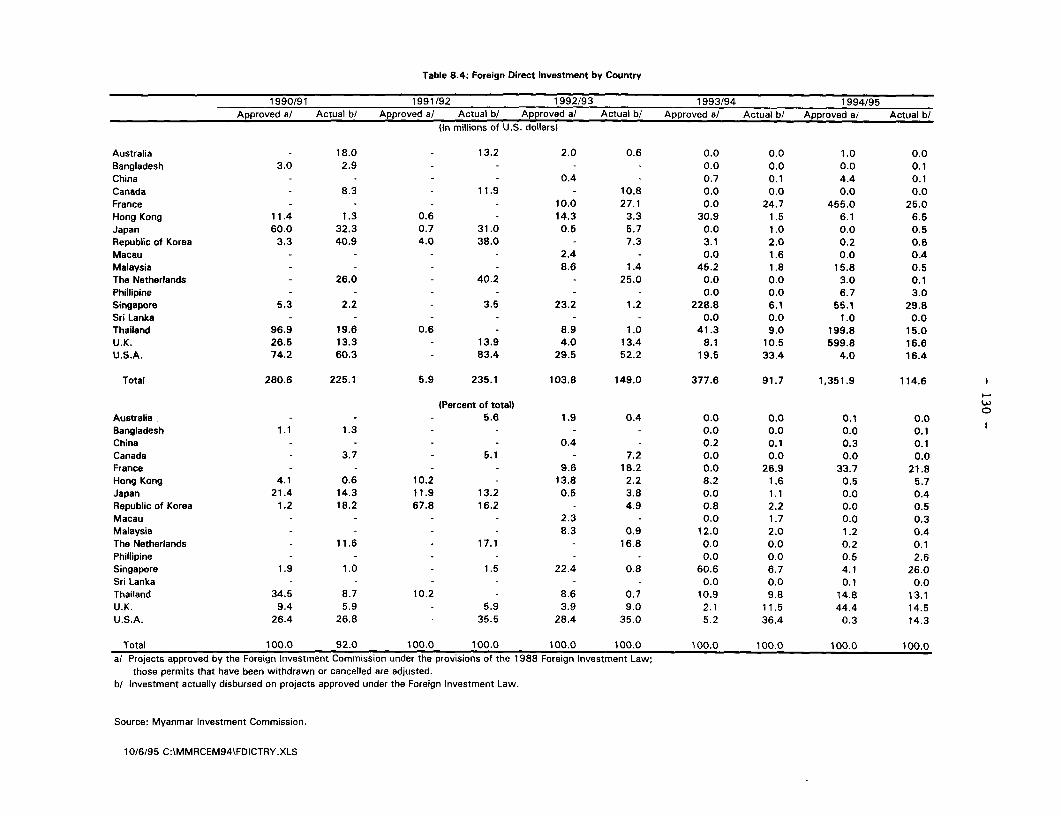
Table 8.4: Foreign Direct Investment by Country
1990/91 1991/92 1992/93 1993/94 1994/95Approved a/ Actual b/ Approved a/ Actual b/ Approved al Actual b/ Approved a/ Actual b/ Approved ai Actual b/
(In millions of U.S. dollars)
Australia - 18.0 - 13.2 2.0 0.6 0.0 0.0 1.0 0.0Bangladesh 3.0 2.9 - - - - 0.0 0.0 0.0 0.1China - - - - 0.4 - 0.7 0.1 4.4 0.1Canada - 8.3 - 11.9 - 10.8 0.0 0.0 0.0 0.0France - - - - 10.0 27.1 0.0 24.7 455.0 25.0Hong Kong 11.4 1.3 0.6 - 14.3 3.3 30.9 1.5 6.1 6.5Japan 60.0 32.3 0.7 31.0 0.5 5.7 0.0 1.0 0.0 0.5Republic of Korea 3.3 40.9 4.0 38.0 - 7.3 3.1 2.0 0.2 0.6Macau - - - - 2.4 - 0.0 1.6 0.0 0.4Malaysia - - - - 8.6 1.4 45.2 1.8 1 5.8 0.5The Netherlands - 26.0 - 40.2 - 25.0 0.0 0.0 3.0 0.1Phillipine - - - - - - 0.0 0.0 6.7 3.0Singapore 5.3 2.2 - 3.5 23.2 1.2 228.8 6.1 55.1 29.8Sri Lanka - - - - - - 0.0 0.0 1.0 0.0Thailand 96.9 19.6 0.6 - 8.9 1.0 41.3 9.0 199.8 15.0U.K. 26.5 13.3 - 13.9 4.0 13.4 8.1 10.5 599.8 16.6U.S.A. 74.2 60.3 - 83.4 29.5 52.2 19.5 33.4 4.0 16.4
Total 280.6 225.1 5.9 235.1 103.8 149.0 377.6 91.7 1,351.9 114.6
(Percent of total)Australia - - - 5.6 1.9 0.4 0.0 0.0 0.1 0.0Bangladesh 1.1 1.3 - - - - 0.0 0.0 0.0 0.1China - - - - 0.4 - 0.2 0.1 0.3 0.1Canada - 3.7 - 5.1 - 7.2 0.0 0.0 0.0 0.0France - - - - 9.6 18.2 0.0 26.9 33.7 21.8Hong Kong 4.1 0.6 10.2 - 13.8 2.2 8.2 1.6 0.5 5.7Japan 21.4 14.3 11.9 13.2 0.5 3.8 0.0 1.1 0.0 0.4Republic of Korea 1.2 18.2 67.8 16.2 - 4.9 0.8 2.2 0.0 0.5Macau - - - - 2.3 0.0 1.7 0.0 0.3Malaysia - - - - 8.3 0.9 12.0 2.0 1.2 0.4The Netherlands - 11.6 - 17.1 - 16.8 0.0 0.0 0.2 0.1Phillipine - - - - 0.0 0.0 0.5 2.6Singapore 1.9 1.0 - 1.5 22.4 0.8 60.6 6.7 4.1 26.0Sri Lanka - - - - - . 0.0 0.0 0.1 0.0Thailand 34.5 8.7 10.2 - 8.6 0.7 10.9 9.8 14.8 13.1U.K. 9.4 5.9 - 5.9 3.9 9.0 2.1 11.5 44.4 14.5U.S.A. 26.4 26.8 - 35.5 28.4 35.0 5.2 36.4 0.3 14.3
Total 100.0 92.0 100.0 100.0 100.0 100.0 100.0 100.0 100.0 100.0a/ Projects approved by the Foreign Investment Commission under the provisions of the 1988 Foreign Investment Law;
those permits that have been withdrawn or cancelled are adjusted.b/ Investment actually disbursed on projects approved under the Foreign Investment Law.
Source: Myanmar Investment Commission.
10/6/95 C:\MMRCEM94\FDICTRY.XLS
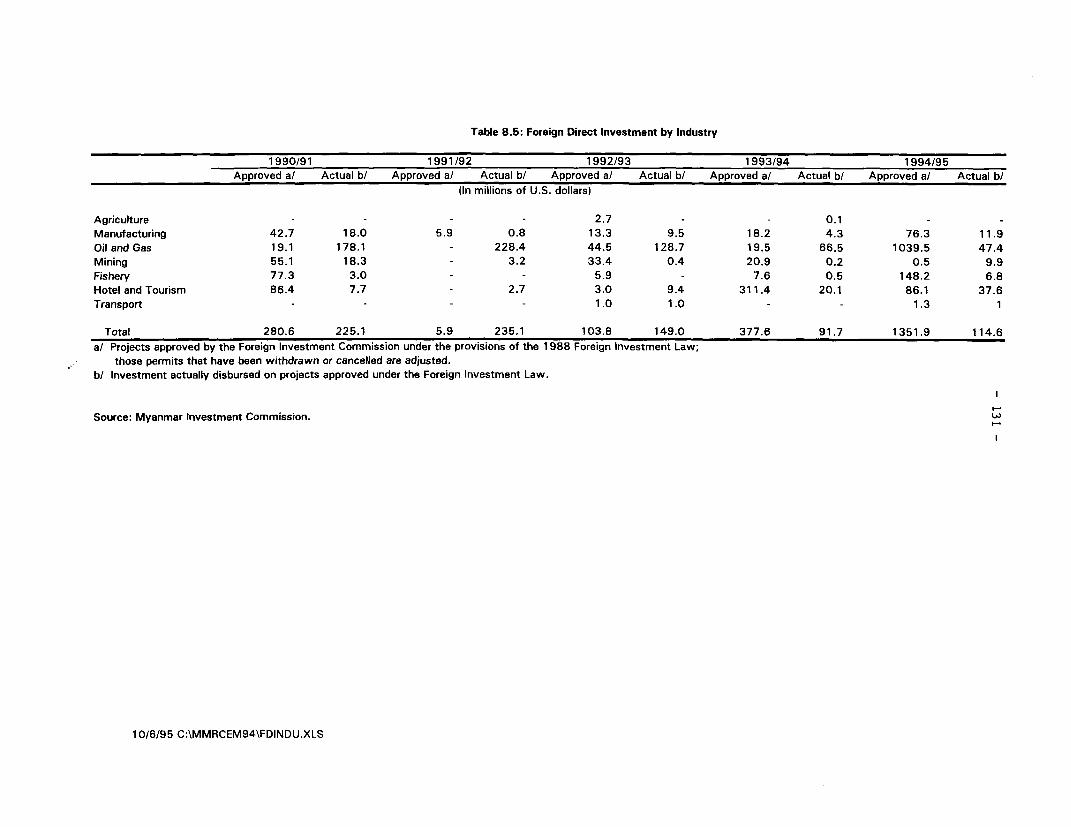
Table 8.5: Foreign Direct Investment by Industry
1990/91 1991/92 1992/93 1993/94 1994/95Approved a/ Actual b/ Approved a/ Actual b/ Approved a/ Actual b/ Approved a/ Actual b/ Approved a/ Actual b/
fIn millions of U.S. dollars)
Agriculture - - - - 2.7 - - 0.1 -
Manufacturing 42.7 18.0 5.9 0.8 13.3 9.5 18.2 4.3 76.3 11.9
Oil and Gas 19.1 178.1 - 228.4 44.5 128.7 19.5 66.5 1039.5 47.4
Mining 55.1 18.3 3.2 33.4 0.4 20.9 0.2 0.5 9.9
Fishery 77.3 3.0 - - 5.9 - 7.6 0.5 148.2 6.8
Hotel and Tourism 86.4 7.7 - 2.7 3.0 9.4 311.4 20.1 86.1 37.6
Transport - - - - 1.0 1.0 - - 1.3 1
Total 280.6 225.1 5.9 235.1 103.8 149.0 377.6 91.7 1351.9 114.6
a/ Projects approved by the Foreign Investment Commission under the provisions of the 1 988 Foreign Investment Law;those permits that have been withdrawn or cancelled are adjusted.
b/ Investment actually disbursed on projects approved under the Foreign Investment Law.
Source: Myanmar Investment Commission. W
10/6/95 C:\MMRCEM94\FDINDU.XLS
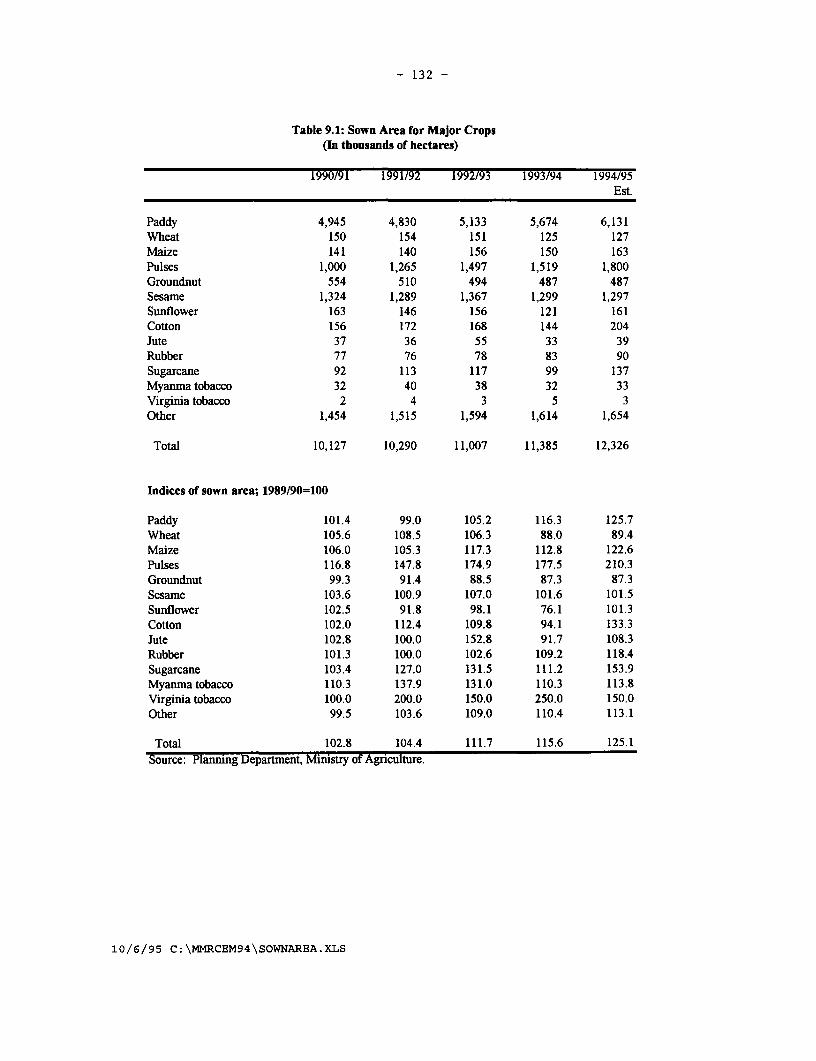
- 132 -
Table 9.1: Sown Area for Major Crops(In thousands of hectares)
1990/91 1991/92 1992/93 1993/94 1994/95Est.
Paddy 4,945 4,830 5,133 5,674 6,131Wheat 150 154 151 125 127Maize 141 140 156 150 163Pulses 1,000 1,265 1,497 1,519 1,800Groundnut 554 510 494 487 487Sesame 1,324 1,289 1,367 1,299 1,297Sunflower 163 146 156 121 161Cotton 156 172 168 144 204Jute 37 36 55 33 39Rubber 77 76 78 83 90Sugarcane 92 113 117 99 137Myanma tobacco 32 40 38 32 33Virginia tobacco 2 4 3 5 3Other 1,454 1,515 1,594 1,614 1,654
Total 10,127 10,290 11,007 11,385 12,326
Indices of sown area; 1989/90=100
Paddy 101.4 99.0 105.2 116.3 125.7Wheat 105.6 108.5 106.3 88.0 89.4Maize 106.0 105.3 117.3 112.8 122.6Pulses 116.8 147.8 174.9 177.5 210.3Groundnut 99.3 91.4 88.5 87.3 87.3Sesame 103.6 100.9 107.0 101.6 101.5Sunflower 102.5 91.8 98.1 76.1 101.3Cotton 102.0 112.4 109.8 94.1 133.3Jute 102.8 100.0 152.8 91.7 108.3Rubber 101.3 100.0 102.6 109.2 118.4Sugarcane 103.4 127.0 131.5 111.2 153.9Myamma tobacco 110.3 137.9 131.0 110.3 113.8Virginia tobacco 100.0 200.0 150.0 250.0 150.0Other 99.5 103.6 109.0 110.4 113.1
Total 102.8 104.4 111.7 115.6 125.1Source: Planning Department, Ministry of Agriculture.
10/6/95 C:\MMRCEM94\SOWNAREA.XLS
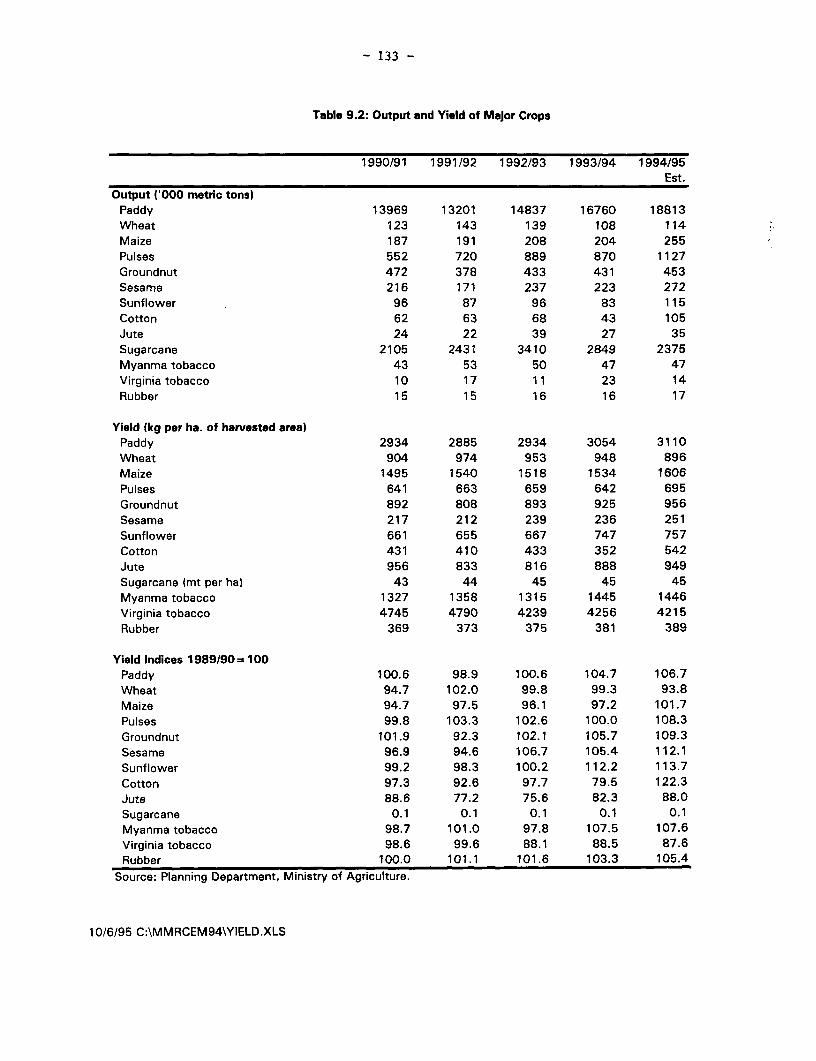
- 133 -
Table 9.2: Output and Yield of Major Crops
1990/91 1991/92 1992/93 1993/94 1994/95Est.
Output '000 metric tons)Paddy 13969 13201 14837 16760 18813Wheat 123 143 139 108 114Maize 187 191 208 204 255Pulses 552 720 889 870 1127Groundnut 472 378 433 431 453Sesame 216 171 237 223 272Sunflower 96 87 96 83 115Cotton 62 63 68 43 105Jute 24 22 39 27 35Sugarcane 2105 2431 3410 2849 2375Myanma tobacco 43 53 50 47 47Virginia tobacco 10 17 11 23 14Rubber 15 15 16 16 17
Yield (kg per ha. of harvested area)Paddy 2934 2885 2934 3054 3110Wheat 904 974 953 948 896Maize 1495 1540 1518 1534 1606Pulses 641 663 659 642 695Groundnut 892 808 893 925 956Sesame 217 212 239 236 251Sunflower 661 655 667 747 757Cotton 431 410 433 352 542Jute 956 833 816 888 949Sugarcane (mt per ha) 43 44 45 45 45Myanma tobacco 1327 1358 1315 1445 1446Virginia tobacco 4745 4790 4239 4256 4215Rubber 369 373 375 381 389
Yield Indices 1989/90 100
Paddy 100.6 98.9 100.6 104.7 106.7Wheat 94.7 102.0 99.8 99.3 93.8Maize 94.7 97.5 96.1 97.2 101.7Pulses 99.8 103.3 102.6 100.0 108.3Groundnut 101.9 92.3 102.1 105.7 109.3Sesame 96.9 94.6 106.7 105.4 112.1Sunflower 99.2 98.3 100.2 112.2 113.7Cotton 97.3 92.6 97.7 79.5 122.3Jute 88.6 77.2 75.6 82.3 88.0Sugarcane 0.1 0.1 0.1 0.1 0.1Myanma tobacco 98.7 101.0 97.8 107.5 107.6Virginia tobacco 98.6 99.6 88.1 88.5 87.6Rubber 100.0 101.1 101.6 103.3 105.4
Source: Planning Department, Ministry of Agriculture.
10/6/95 C:\MMRCEM94\YIELD.XLS
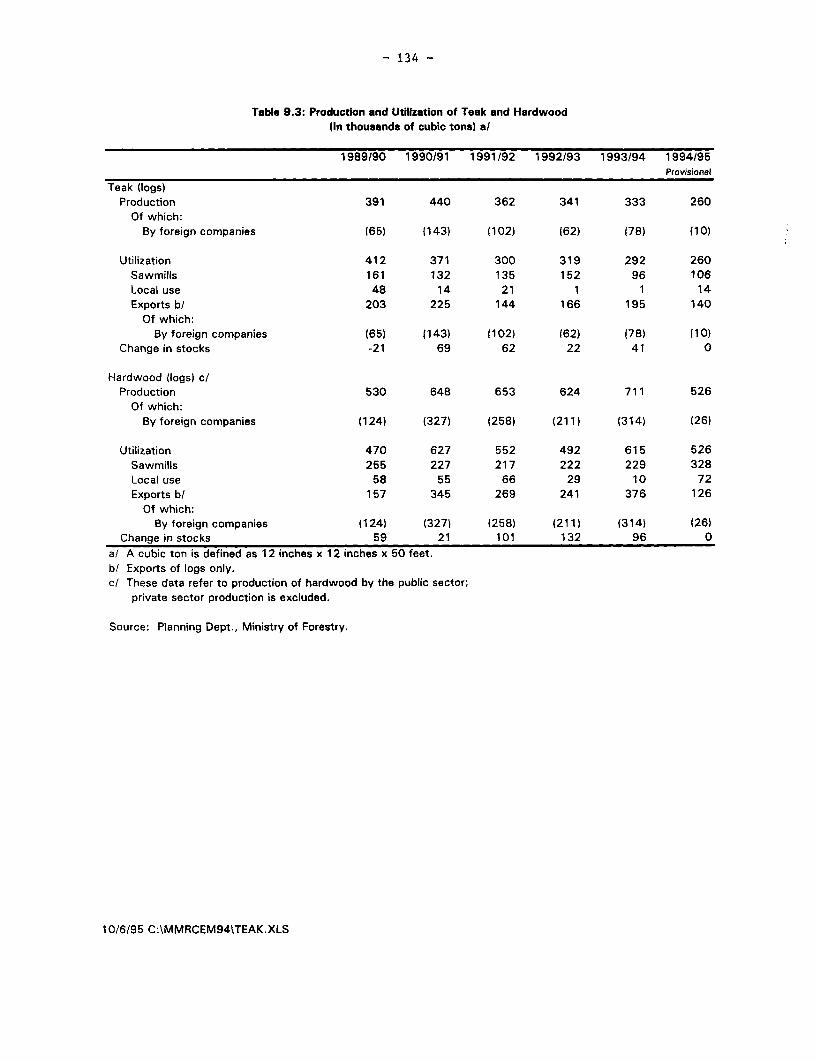
- 134 -
Table 9.3: Production and Utilization of Teak and Hardwood(In thousands of cubic tons) a/
1989/90 1990/91 1991/92 1992/93 1993/94 1994/95Provisional
Teak (logs)Production 391 440 362 341 333 260
Of which:By foreign companies 165) (143) 1102) (62) i78) (10)
Utilization 412 371 300 319 292 260Sawmills 161 132 135 152 96 106Local use 48 14 21 1 1 14Exports b/ 203 225 144 166 195 140
Of which:By foreign companies (65) (143) (102) (62) (78) (10)
Change in stocks -21 69 62 22 41 0
Hardwood (logs) c/Production 530 648 653 624 711 526
Of which:By foreign companies (124) (327) (258) (211) (314) (26)
Utilization 470 627 552 492 615 526Sawmills 255 227 217 222 229 328Local use 58 55 66 29 10 72Exports b/ 157 345 269 241 376 126
Of which:By foreign companies (124) (327) (258) (211) (314) (26)
Change in stocks 59 21 101 132 96 0
a/ A cubic ton is defined as 12 inches x 12 inches x 50 feet.b/ Exports of logs only.c/ These data refer to production of hardwood by the public sector;
private sector production is excluded.
Source: Planning Dept., Ministry of Forestry.
10/6/95 C:\MMRCEM94\TEAK.XLS
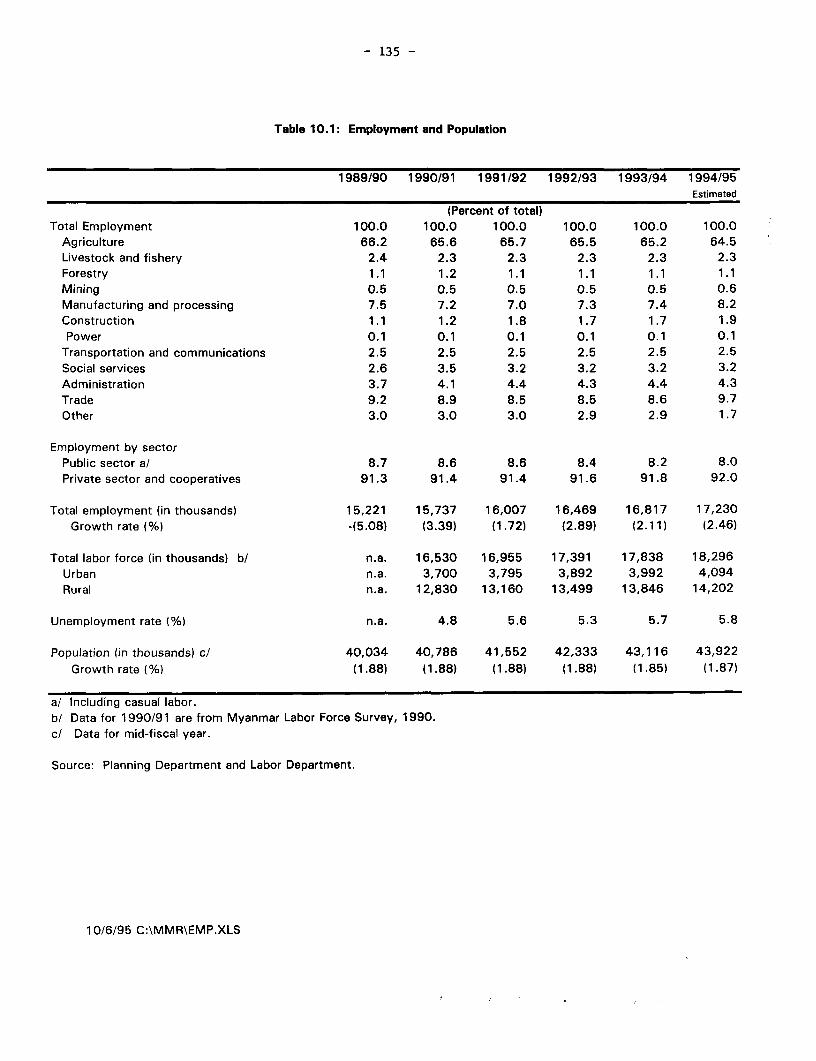
- 135 -
Table 10.1: Employment and Population
1989/90 1990/91 1991/92 1992/93 1993/94 1994/95Estimated
(Percent of total)Total Employment 100.0 100.0 100.0 100.0 100.0 100.0
Agriculture 66.2 65.6 65.7 65.5 65.2 64.5Livestock and fishery 2.4 2.3 2.3 2.3 2.3 2.3Forestry 1.1 1.2 1.1 1.1 1.1 1.1Mining 0.5 0.5 0.5 0.5 0.5 0.6Manufacturing and processing 7.5 7.2 7.0 7.3 7.4 8.2Construction 1.1 1.2 1.8 1.7 1.7 1.9Power 0.1 0.1 0.1 0.1 0.1 0.1
Transportation and communications 2.5 2.5 2.5 2.5 2.5 2.5Social services 2.6 3.5 3.2 3.2 3.2 3.2Administration 3.7 4.1 4.4 4.3 4.4 4.3Trade 9.2 8.9 8.5 8.5 8.6 9.7Other 3.0 3.0 3.0 2.9 2.9 1.7
Employment by sectorPublic sector a/ 8.7 8.6 8.6 8.4 8.2 8.0Private sector and cooperatives 91.3 91.4 91.4 91.6 91.8 92.0
Total employment (in thousands) 15,221 15,737 16,007 16,469 16,817 17,230Growth rate (%) -(5.08) (3.39) (1.72) (2.89) (2.11) (2.46)
Total labor force (in thousands) b/ n.a. 16,530 16,955 17,391 17,838 18,296Urban n.a. 3,700 3,795 3,892 3,992 4,094Rural n.a. 12,830 13,160 13,499 13,846 14,202
Unemployment rate (%) n.a. 4.8 5.6 5.3 5.7 5.8
Population (in thousands) c/ 40,034 40,786 41,552 42,333 43,116 43,922Growth rate (%) (1.88) (1.88) (1.88) (1.88) (1.85) (1.87)
a/ Including casual labor.b/ Data for 1990/91 are from Myanmar Labor Force Survey, 1990.c/ Data for mid-fiscal year.
Source: Planning Department and Labor Department.
10/6/95 C:\MMR\EMP.XLS
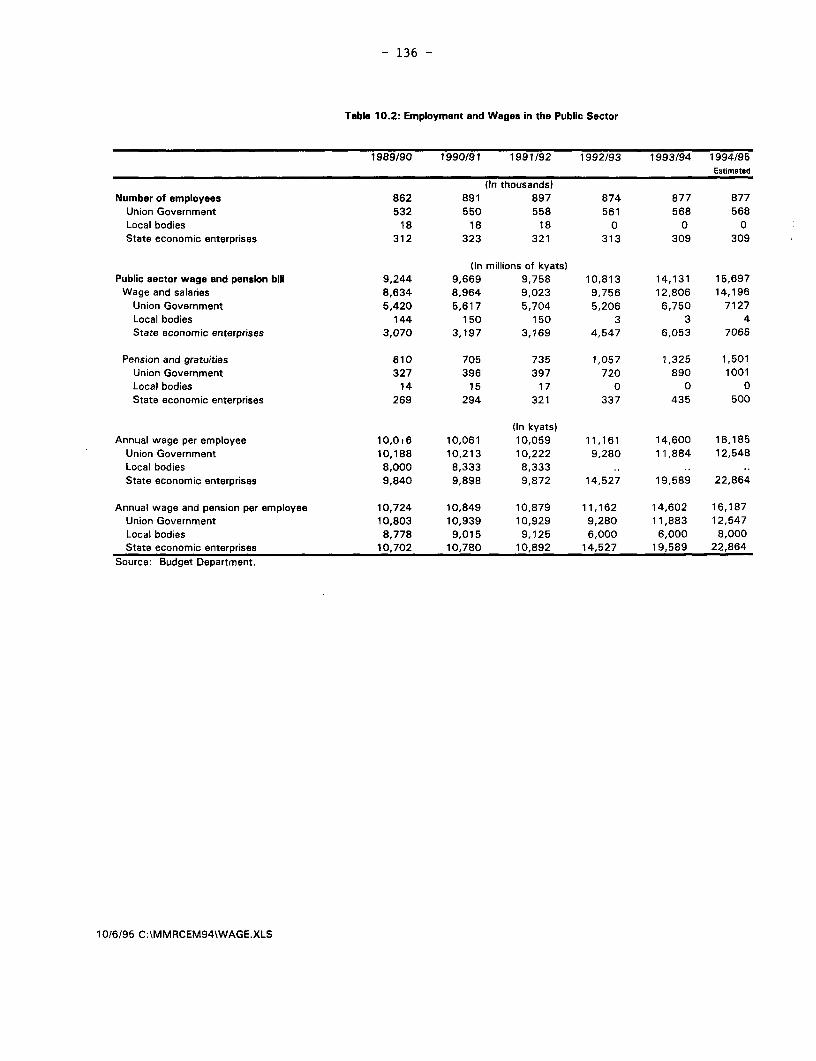
- 136 -
Table 10.2: Employment and Wages in the Public Sector
1989/90 1990/91 1991/92 1992/93 1993/94 1994/95Estimated
(In thousands)Number of employees 862 891 897 874 877 877
Union Government 532 550 558 561 568 568Local bodies 18 18 18 0 0 0State economic enterprises 312 323 321 313 309 309
(In millions of kyats)Public sector wage and pension bill 9,244 9,669 9,758 10,813 14,131 15,697
Wage and salaries 8,634 8,964 9,023 9,756 12,806 14,196Union Government 5,420 5,617 5,704 5,206 6,750 7127Local bodies 144 150 150 3 3 4State economic enterprises 3,070 3,197 3,169 4,547 6,053 7065
Pension and gratuities 610 705 735 1,057 1,325 1,501Union Government 327 396 397 720 890 1001Local bodies 14 15 17 0 0 0State economic enterprises 269 294 321 337 435 500
(In kyats)Annual wage per employee 10,016 10,061 10,059 11,161 14,600 16,185
Union Government 10,188 10,213 10,222 9,280 11,884 12,548Local bodies 8,000 8,333 8,333 ..
State economic enterprises 9,840 9,898 9,872 14,527 19,589 22,864
Annual wage and pension per employee 10,724 10,849 10,879 11,162 14,602 16,187Union Government 10,803 10,939 10,929 9,280 11,883 12,547Local bodies 8,778 9,015 9,125 6,000 6,000 8,000State economic enterprises 10,702 10,780 10,892 14,527 19,589 22,864
Source: Budget Department.
10/6/95 C:\MMRCEM94\WAGE.XLS

NOTES


MAP SECTION

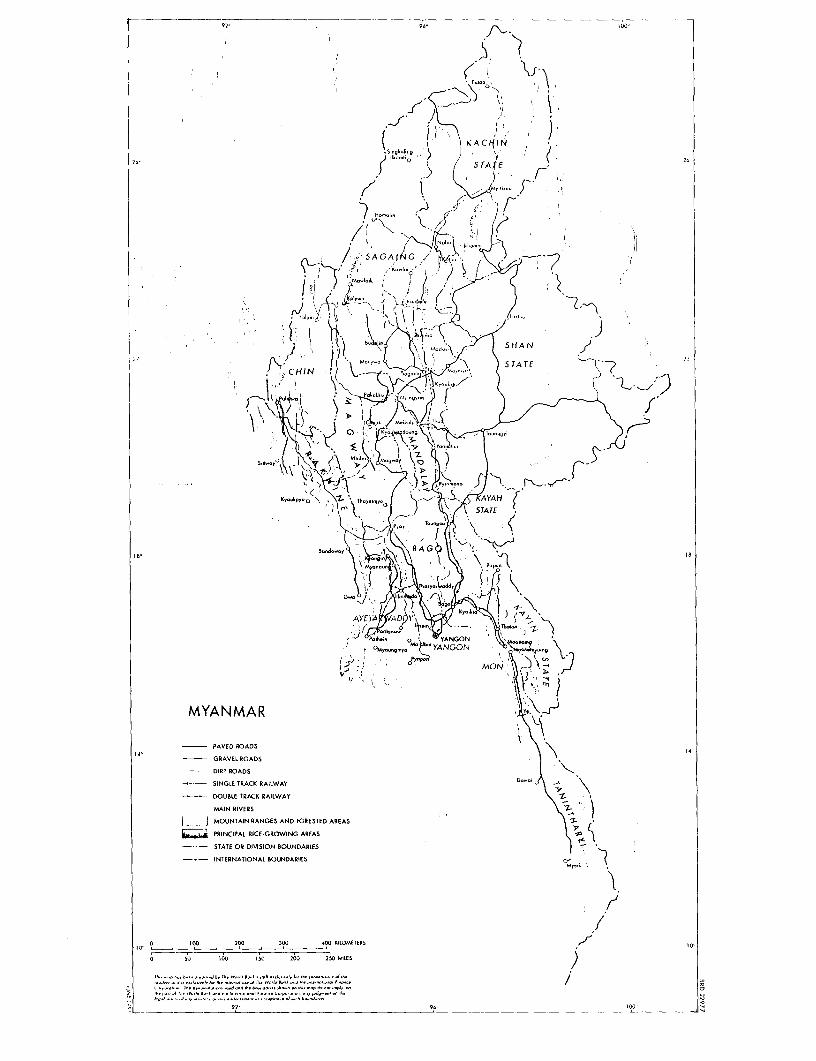
96- L0r ~~ ~ ~~~~92 ~ 00 00
2~~~~~~~~~~~~~~~~~~~~2
2.' 85mgLol r TE )
Or Hkni,0
~~~{f S F4/Fo 2
jo!~ ~ ) I-'{j ,
/5SAAt'0 <A
'i. T ½-1
J¾. ~ ~ oo~.n'~ THAN
CHIN !A
C l Sia t\TNT.6*? JC) i ~
SondLpw o loy 'BAG
M~~~o~MO
MYANMAR O
PAVED ROADS
GRAVEL ROADS
-- DIRT ROADS
SINGLE TRACK RAILWAY D-
DOUBLE TRACK RAILWAY
MAIN RIVERS
- - MOUNTAIN RANGES AND FORESTED AREAS
e~., PRINCIPAL RICE-GROWING AREAS
-. - - STATE OR DIVISION BOUNDARIES
--- INTERNAIIONAL BOUNDARIES
o 'IO 200 300 400 KILOMETERS 0
0 50 160 150 200 250 MILES
~~~~~~~~~~~~.IId \.X u 1 ... . ....................... 6, a . ele vsh.be
- - 92' 900 1-O __________9


At~~~~~~~~~~~~ ~~~~~~T