Embed Size (px)
Citation preview

i
Report No: 105753-PH.
Republic of the Philippines
PFM Strategy Implementation Support
Public Financial Management and Accountability Assessment
June 2016
GGO14
EAST ASIA AND PACIFIC
A project of the World Bank, with the support of the Australian Government through the
Australia-World Bank Philippines Development Trust Fund, Asian Development Bank
and International Monetary Fund

2016 Philippines PEFA Assessment 30 June 2016
The GoP and Development Partners ii
Standard Disclaimer:
This volume is a product of the staff of the International Bank for Reconstruction and Development/ The World
Bank. The findings, interpretations, and conclusions expressed in this paper do not necessarily reflect the views of
the Executive Directors of The World Bank or the governments they represent. The World Bank does not guarantee
the accuracy of the data included in this work. The boundaries, colors, denominations, and other information shown
on any map in this work do not imply any judgment on the part of The World Bank concerning the legal status of
any territory or the endorsement or acceptance of such boundaries.
Copyright Statement:
The material in this publication is copyrighted. Copying and/or transmitting portions or all of this work without
permission may be a violation of applicable law. The International Bank for Reconstruction and Development/ The
World Bank encourages dissemination of its work and will normally grant permission to reproduce portions of the
work promptly.
For permission to photocopy or reprint any part of this work, please send a request with complete information to the
Copyright Clearance Center, Inc., 222 Rosewood Drive, Danvers, MA 01923, USA, telephone 978-750-8400, fax
978-750-4470, http://www.copyright.com/.
All other queries on rights and licenses, including subsidiary rights, should be addressed to the Office of the
Publisher, The World Bank, 1818 H Street NW, Washington, DC 20433, USA, fax 202-522-2422, e-mail
FISCAL YEAR

2016 Philippines PEFA Assessment 30 June 2016
The GoP and Development Partners iii
January 1 - December 31
CURRENCY EQUIVALENTS
Currency unit = Philippine Peso (PhP)
USD 1 = PhP 47.06 (as of June 28, 2016)
Acronyms and Abbreviations
AAR Annual Audit Report
ADB Asian Development Bank
AFR Annual Financial Report
APCPI Agency Procurement Compliance and Performance Indicator
ARAAOD Annual Report on Appropriations, Allotment, Obligations and Disbursements
ARMM Autonomous Region in Muslim Mindanao
BED Budget Execution Document
BESF Budget of Expenditures and Sources of Financing
BIR Bureau of Internal Revenue
BLGF Bureau of Local Government Finance
BoC Bureau of Customs
BOT Build-operate-transfer
BSP Bangko Sentral ng Pilipinas
BTr Bureau of the Treasury
CIIP Comprehensive and Integrated Infrastructure Program
CoA Commission on Audit
COFOG Classification of the Functions of Government
COMELEC Commission on Elections
CPI Consumer Price Index
CSO Civil Society Organization
DAR Department of Agrarian Reform
DBCC Development Budget Coordinating Committee
DBM Department of Budget and Management
DENR Department of Environment and Natural Resources
DepEd Department of Education
DFA Department of Foreign Affairs
DFAT Department of Foreign Affairs and Trade (Australia)
DILG Department of the Interior and Local Government
DND Department of National Defense
DoA Department of Agriculture
DoF Department of Finance
DoH Department of Health
DoJ Department of Justice
DOLE Department of Labor and Employment
DOST Department of Science and Technology
DOTC Department of Transportation and Communications
DPWH Department of Public Works and Highways
DSWD Department of Social Welfare and Development
eFPS Electronic Filing and Payment System
eLAMS Electronic Letter of Authority Monitoring System
eMDS Electronic Modified Disbursement System
eNGAS Electronic New Government Accounting System

2016 Philippines PEFA Assessment 30 June 2016
The GoP and Development Partners iv
EO Executive Order
GAA General Appropriations Act
GAM Government Accounting Manual
GCG Governance Commission for GOCCs
GDP Gross Domestic Product
GFS Government Finance Statistics
GGAC Good Governance and Anti-Corruption (Cabinet Cluster)
GIFMIS Government Integrated Financial Management Information System
GMIS Government Manpower Information System
GNI Gross National Income
GOCC Government-owned or controlled corporation
GPPB Government Procurement Policy Board
GPRA Government Procurement Reform Act
ICC Investment Coordination Committee
IMF International Monetary Fund
INTOSAI International Organization of Supreme Audit Institutions
IPSAS International Public Sector Accounting Standards
ISSAI International Standards of Supreme Audit Institutions
IT Information Technology
LBM Local Budget Memorandum
LGU Local Government Unit
LIBOR London Interbank Offered Rate
MDS Modified Disbursement System
MFO Major Final Output
MTEF Medium-term expenditure framework
MTFF Medium-term fiscal framework
NEDA National Economic and Development Authority
NEP National Expenditure Program
NGA National government agency
NGAS New Government Accounting System
NGICS National Guidelines on Internal Control Systems
ODA Official development assistance
OSBPS Online Submission of Budget Proposal System
PAP Program, activity, and project
PDAF Priority Development Assistance Fund
PEFA Public Expenditure and Financial Accountability
PFM Public Financial Management
PGIAM Philippine Government Internal Audit Manual
PhilGEPS Philippine Government Electronic Procurement System
PI Performance indicator
PPP Public–private partnership
PPSAS Philippine Public Sector Accounting Standard
PPSSA Philippine Public Sector Standard on Auditing
RA Republic Act
RATE Run-After-Tax-Evaders
RATS Run-After-The-Smugglers
RMO Revenue Memorandum Order
TESDA Technical Education and Skills Development Authority
TSA Treasury Single Account
UACS Unified Accounts Code Structure

2016 Philippines PEFA Assessment 30 June 2016
The GoP and Development Partners v

2016 Philippines PEFA Assessment 30 June 2016
The GoP and Development Partners vi
Contents
Acronyms and Abbreviations ................................................................................................................... iii
Acknowledgments ....................................................................................................................................... x
Executive Summary .................................................................................................................................. xii
Chapter 1. Introduction .............................................................................................................................. 1
1.1 Rationale for and Purpose of the Assessment ................................................................................ 1 1.2 Assessment Management and Quality Assurance .......................................................................... 1 1.3 Assessment Methodology, Coverage, and Scheduling ................................................................... 2
Chapter 2. Country Background Information ......................................................................................... 4
2.1 Country Economic Situation .......................................................................................................... 4 2.2 Fiscal and Budgetary Trends .......................................................................................................... 5 2.3 Legal and regulatory arrangements for PFM .................................................................................. 9 2.4 Institutional arrangements for PFM.............................................................................................. 14
Chapter 3. Assessment of PFM Systems, Processes and Institutions ................................................... 18
Pillar I. Budget Reliability ....................................................................................................................... 18
PI-1 Aggregate expenditure outturn ................................................................................................... 18 PI-2 Expenditure composition outturn ............................................................................................... 19 PI-3 Revenue outturn.......................................................................................................................... 22
Pillar II. Transparency of Public Finances ............................................................................................. 23
PI-4 Budget classification .................................................................................................................. 23 PI-5 Budget documentation ................................................................................................................ 24 PI-6 Central government operations outside financial reports ........................................................... 28 PI-7 Transfers to subnational governments ........................................................................................ 29 PI-8 Performance information for service delivery ............................................................................ 31 PI-9 Public access to fiscal information ............................................................................................. 33
Pillar III. Management of Assets and Liabilities.................................................................................... 35
PI-10 Fiscal risk reporting .................................................................................................................. 35 PI-11 Public investment management ................................................................................................ 38 PI-12 Public asset management .......................................................................................................... 42 PI-13 Debt management ..................................................................................................................... 44
Pillar IV. Policy-Based Fiscal Strategy and Budgeting ......................................................................... 46
PI-14 Macroeconomic and fiscal forecasting ..................................................................................... 46 PI-15 Fiscal strategy ........................................................................................................................... 48 PI-16 Medium-term perspective in expenditure budgeting ................................................................ 49 PI-17 Budget preparation process ...................................................................................................... 52 PI-18 Legislative scrutiny of budgets ................................................................................................. 56
Pillar V. Predictability and Control in Budget Execution ..................................................................... 59
PI-19 Revenue administration ............................................................................................................ 59 PI-20 Accounting for revenue ............................................................................................................ 63 PI-21 Predictability of in-year resource allocation ............................................................................. 64
2016 Philippines PEFA Assessment 30 June 2016
The GoP and Development Partners vii
PI-22 Expenditure arrears ................................................................................................................... 67 PI-23 Payroll controls ......................................................................................................................... 69 PI-24 Procurement .............................................................................................................................. 71 PI-25 Internal controls on non-salary expenditure ............................................................................. 73 PI-26 Internal audit ............................................................................................................................. 75
Pillar VI. Accounting and Reporting ...................................................................................................... 77
PI-27 Financial data integrity ............................................................................................................. 77 PI-28 In-year budget reports............................................................................................................... 81 PI-29 Annual financial reports ........................................................................................................... 84
Pillar VII. External Scrutiny and Audit ................................................................................................. 87
PI-30 External audit............................................................................................................................ 87 PI-31 Legislative scrutiny of audit reports ......................................................................................... 91
Chapter 4. Conclusions of the Analysis of PFM Systems ...................................................................... 93
4.1 Integrated assessment of PFM performance ................................................................................. 93 4.2 Effectiveness of the internal control framework .......................................................................... 97 4.3 PFM strengths and weaknesses .................................................................................................. 100 4.4 Performance changes since the 2010 assessment ....................................................................... 103
Chapter 5. Government PFM Reform Process .................................................................................... 106
5.1 Approach to PFM reforms .......................................................................................................... 106 5.2 Recent and on-going reform actions........................................................................................... 107 5.3 Institutional Considerations ........................................................................................................ 113
Annex 1: Performance Indicator Summary ......................................................................................... 116
Annex 2: Summary of Observations on the Internal Control Framework ....................................... 122
Annex 3A. PEFA Assessment Management Organization .................................................................. 128
Annex 3B: Persons Consulted ................................................................................................................ 130
Annex 3C: Sources of information ........................................................................................................ 131
Annex 4: Data for PI‐1, PI‐2 and PI-3................................................................................................... 135
Annex 5: Summary Assessment based on Old Methodology .............................................................. 141
Endnotes: ................................................................................................................................................ 153

2016 Philippines PEFA Assessment 30 June 2016
The GoP and Development Partners viii
Figures and Tables
Figure 0.1 PEFA Rating Summary ........................................................................................................ xiv
Figure 5.1. The Updated PFM Roadmap Summary (2015-2016) ...................................................... 107
Table 0.1: Distribution of PEFA assessment 2016 Ratings by Indicator ............................................ xiv
Table 0.2: Distribution of PEFA assessment 2016 Ratings by Dimensions ......................................... xv
Table 0.3: Distribution of Ratings by Indicator (old methodology) ................................................... xvii
Table 0.4: Distribution of Ratings by Dimensions (old methodology) ............................................... xvii
Table 0.5: PEFA Assessment Summary of Scores 2016 ........................................................................ xx
Table 2.1: Selected economic indicators ................................................................................................... 5
Table 2.2: National Government Aggregate Fiscal Data ......................................................................... 6
Table 2.3: National Government expenditures, obligation basis, by sector........................................... 6
Table 2.4: National Government Expenditures, obligation basis, by sector .......................................... 7
Table 2.5: National Government expenditures, obligation basis, by expense class .............................. 8
Table 2.6: National Government expenditures, obligation basis, by expense class .............................. 9
Table 2.7: Legislative and Regulatory Framework for PFM ................................................................ 12
Table 2.8: Structure of the Public Sector ................................................................................................ 15
Table 2.9: Financial Structure of the National Government – Budget estimates ............................... 16
Table 2.10: Financial Structure of the National Government – Actual expenditures ........................ 16
Table 3.1: Calculation of Variance .......................................................................................................... 19
Table 3.2: Calculation of Variances by Administrative Unit ................................................................ 20
Table 3.3: Calculation of Variance by Economic Classification ........................................................... 21
Table 3.4: Calculation of Contingency Share ......................................................................................... 21
Table 3.5: Budget obligations incurred for contingency reserves ........................................................ 22
Table 3.6: Actual revenue compared to originally approved budget ................................................... 23
Table 3.7: Summary of information included in budget documentation ............................................. 26
Table 3.8: Public access to key fiscal information .................................................................................. 33
Table 3.9: Number of Auditees and Financial Statements Submitted, 2012 ....................................... 37
Table 3.10: Number of Auditees and Financial Statements Submitted, 2013 ..................................... 37
Table 3.11: Number of Barangays with Financial Statements, 2011-2013 .......................................... 37
Table 3.12: Major Investment Projects ................................................................................................... 39
Table 3.13: National Government Fiscal Position .................................................................................. 47
Table 3.14: Variance between budget proposals and ceilings based on projected estimates ............. 51

2016 Philippines PEFA Assessment 30 June 2016
The GoP and Development Partners ix
Table 3.15: Activity Deadlines for 2016 Budget Process ....................................................................... 53
Table 3.16: Submission and Approval Dates of Budget Bills ................................................................ 58
Table 3.17: National Government Revenues .......................................................................................... 60
Table 3.18: Collectible Tax Arrears as of Year-End ............................................................................. 63
Table 3.19: Audit observations on Accounts payable as of December 31, 2014 .................................. 67
Table 3.20: Audit observations on Accounts payable as of December 31, 2013 .................................. 68
Table 3.21: Tally of Audit Opinions ........................................................................................................ 79
Table 3.22: CoA Audit Opinions rendered to Selected Departments and Agencies ........................... 79
Table 3.23: Budget Execution Documents and Budget and Financial Accountability Reports ......... 82
Table 3.24: Status of Implementation of 2013 Audit Recommendations ............................................. 89
Table A4.1: Data for PI-1 and PI-2, 2012 ............................................................................................. 135
Table A4.2: Data for PI-1 and PI-2, 2013 ............................................................................................. 136
Table A4.3: Data for PI-1 and PI-2, 2014 ............................................................................................. 137
Table A4.4: Results Matrix for PI-1 and PI-2 ...................................................................................... 138
Table A4.5: Data for PI-2.2, 2012 .......................................................................................................... 138
Table A4.6: Data for PI-2.2, 2013 .......................................................................................................... 138
Table A4.7: Data for PI-2.2, 2014 .......................................................................................................... 139
Table A4.8: Results Matrix for PI-2.2 ................................................................................................... 139
Table A4.9: Data for PI-3, 2012 ............................................................................................................. 139
Table A4.10: Data for PI-3, 2013 ........................................................................................................... 140
Table A4.11: Data for PI-3, 2014 ........................................................................................................... 140
Table A4.12: Results Matrix for PI-3 .................................................................................................... 140
Table A5.2: Distribution of Ratings by Indicator – Old Methodology .............................................. 142
Table A5.3: Distribution of Ratings by Dimensions – Old Methodology ........................................... 142
Table A5.4: Description of Assessed Scores – Old Methodology…………………………………… 141

2016 Philippines PEFA Assessment 30 June 2016
The GoP and Development Partners x
Acknowledgments
The 2015 Public Expenditure and Financial Accountability (PEFA) assessment was carried
out by the World Bank in collaboration with the Government of the Philippines. The Asian
Development Bank (ADB), the Australian Department for Foreign Affairs and Trade (DFAT),
and the International Monetary Fund (IMF) provided peer review.
The Government managed the process through a high-level Steering Committee under the
leadership of the Department of Budget and Management (DBM) and with representation from
the Commission on Audit (CoA), Department of Finance (DoF), Bureau of the Treasury (BTr),
National Economic and Development Authority (NEDA), and Governance Commission for
Government-Owned or Controlled Corporations (GCG).
The PEFA assessment team acknowledges and appreciates the excellent cooperation
extended by Government counterparts who facilitated the entire process and enabled a timely
completion of the assessment.
The World Bank cross-sectoral task team who contributed to this PEFA assessment report
comprised Robert R. Taliercio (Assessment Manager, Practice Manager), Saeeda Sabah
Rashid (co-Task Team Leader, Sr. Public Sector Specialist), Pazhayannur K. Subramanian
(co-Task Team Leader, Lead Financial Management Specialist), Rogier Van den Brink (Lead
Economist and Program Leader), Bonnie Ann Sirois (Senior Financial Management Specialist),
Kai-Alexander Kaiser (Senior Economist), Karl Kendrick Tiu Chua (Senior Country
Economist), Cecilia D. Vales (Lead Procurement Specialist), Justine Espina Letargo
(Communications Officer), Tomas A. Sta. Maria, Jr. (Financial Management Specialist), Aisha
Lanette De Guzman (Financial Management Specialist), and Maria Liennefer Rey Penaroyo
(Financial Management Analyst). The team was supported by Peter Jensen and Michael Jacobs
(International Consultants), and Mark Robis and Olidan Ceasar Galvez (National Consultants).
Maria Consuelo Sy (Program Assistant) provided administrative and logistical support.
Internal World Bank peer reviewers were Andrew James Mackie (Senior Financial
Management Specialist) and Ivor Beazley (Senior Public Sector Specialist). External peer
reviewers from the PEFA Secretariat were Helena Grandão Ramos (Senior PFM Specialist);
from ADB, Warren Turner (Senior Public Management Specialist); from IMF, Sandeep
Saxena (Senior Economist); and from DFAT, Daniel Featherston (Economic Counselor).

2016 Philippines PEFA Assessment 30 June 2016
The GoP and Development Partners xi
PEFA assessment report of the Republic of the Philippines, May 2016
The quality assurance process followed in the production of this report satisfies all
the requirements of the PEFA Secretariat and hence receives the ‘PEFA
CHECK’.
PEFA Secretariat,
June 2, 2016

2016 Philippines PEFA Assessment 30 June 2016
The GoP and Development Partners xii
Executive Summary
1. This Public Expenditure and Financial Accountability (PEFA) performance assessment
report evaluates the seven core pillars of the public financial management (PFM) system of the
Government of the Philippines (Government) as set out in the summary assessment below. It
evaluates how effectively the PFM system achieves the desirable budget outcomes of aggregate
fiscal discipline, strategic allocation of resources, and efficient service delivery. The assessment
was conducted through consultations between departmental staff and a World Bank cross-
sectoral team, and was managed by a high-level Government steering committee. Where there
are PFM weaknesses, the report provides information on areas that reform activity should
address more strongly. Table 05, at end of the Executive Summary, gives the performance
indicator scores. A more comprehensive table showing the scores with accompanying
explanation is in Annex 1 of the report.
2. A similar assessment was conducted in 2007 but published with some delay in 2010; and
this most recent assessment, begun in mid-2015, is used to compare progress over the past eight
years. The recent assessment uses an upgraded 2016 PEFA framework that includes four new
indicators on management of assets and liabilities, refines some of the previous indicators, and
introduces a stronger focus on internal financial controls.
3. The main report is structured as follows: Chapter 1 is an introduction explaining the
context, purpose and process of preparing the report, specifying the institutional coverage;
Chapter 2 provides an overview of relevant country-related information that provides the
context underpinning the indicator results and the overall PFM performance; Chapter 3 provides
the detailed assessment of performance in terms of the seven pillars of the PFM system. It
provides analysis and measurement of results in terms of the 31 performance indicators (PIs) of
PFM performance; Chapter 4 includes an integrated crosscutting analysis on performance of the
PFM systems and how it impacts on the Government’s ability to deliver on the intended fiscal
and budgetary outcomes, and to identify the most important systems weaknesses in that respect;
Chapter 5 provides an overview of government initiatives to improve PFM performance
summarizing the approach to PFM reform, including the institutional factors that are likely to
impact the planning and implementation of reforms. Annexes 1-4 provide supporting data and
information to the assessment; and Annex 5 provides scores assessed using the 2005/2011 PEFA
assessment framework for direct comparison with the previous PEFA assessment baseline
scores.
Assessment Coverage and Timing
4. The assessment covers general central government PFM practices used by institutions
with budget allocations from the central government. For local government and government
companies, the assessment covers fiscal risk oversight practices, but not the detailed PFM
practices that are in place in the local government units and the government companies. Public-
private partnership arrangements and Social Security Funds are covered only to the extent that
allocations are made in the central government budget. These are considered extra-budgetary
units. Data gathering for the assessment, primarily took place from July to November 2015, but
data through April 30, 2016 was considered. Completed fiscal years are 2012, 2013, and 2014,

2016 Philippines PEFA Assessment 30 June 2016
The GoP and Development Partners xiii
the latest three years for which audited reports are available. The last completed fiscal year is
2015, and the latest budget submitted to legislature and enacted is for the fiscal year 2016.
Summary Assessment of PFM Performance
5. The PEFA Framework enables the Government of the Philippines to examine, both at the
broad and detailed levels, how each area of its PFM system is performing and how performance
has changed since the 2010 assessment. The first and most important step is to look at the results
at the broad level of the PFM pillars of the budget cycle. This enables the Government to see
where reform efforts have not yet enabled the PFM system to reach a satisfactory level.
6. The PEFA assesses 94 PFM dimensions that make up 31 performance indicators (PIs),
which in turn make up the 7 PFM pillars. Each dimension and performance indicator is assigned
a rating of “A” to “D” as per highly structured objective criteria set down in the PEFA
Framework (Figure 0.1). Table 0.1 compares the numbers of performance indicators in each
pillar that rated reasonably well (A or B) with the numbers that did not (C or D). Table 0.2
shows the equivalent results at the lower level of PFM dimensions for each of the pillars. The
tables show that 3 of the 7 PFM pillars (transparency, policy-based budgeting, and asset and
liability management) are strong and have improved since the 2010 assessment; 1 pillar
(predictability and control in budget execution) is evenly balanced; and the remaining 3 (budget
reliability, accounting and reporting, and external scrutiny) are weak. These results show that
good performance at the beginning of the budget cycle in policy-based budgeting and
transparency are not yet put into effect by the downstream accounting and external scrutiny
elements of the budget cycle with a consequential poor performance in budget reliability. This
deficiency has substantial effects on budget outcomes considering that budget reliability is a
central factor to ensuring fiscal discipline in allocating budget resources to deliver intended
services. The lack of capacity of the accounting system to assist budget managers with timely
information is a primary cause of the relatively poorer downstream results. This area needs
urgent attention. Continued development of a comprehensive, integrated accounting and
financial information system can provide tools for monitoring and analysis that would allow
timely decision-making to enhance efficiency in budget execution and effectiveness in service
delivery. A substantial investment of resources, skills, and authority is required to achieve such
outcomes. An effective PFM system needs the defining authority of a comprehensive PFM law
to ensure that all staff engaged in financial activities understand and adhere properly to the
financial regulations and procedures. Only at that time will the Government be able to deliver the
budget as intended.
7. With regard to the design of reform actions, it is creditable that compared with 2010
assessment, there are more areas rated as good (“A”) or satisfactory (“B”). At the sub-indicator
level (dimensions), the improvement is even more marked (Tables 0.2 and 0.4). Performance can
be improved by focusing reform efforts on clearly identified parts of the PFM systems and
processes that do not meet the necessary requirements for an open and orderly PFM system. The
PEFA assessment provides a solid foundation for designing new and evaluating ongoing
reforms. In summary, the assessment found the following main concerns that need to be
addressed to improve the delivery of budget outcomes:

2016 Philippines PEFA Assessment 30 June 2016
The GoP and Development Partners xiv
Fiscal discipline – Failings and delays in reconciliations with budget execution and
accounting systems are inadequate to monitor and facilitate budget delivery.
Resource allocation – An FMIS is still in development and procurement lacks an
independent complaints mechanism while budget allocations steadily increased with
limited absorptive capacity in executing departments.
Service delivery – Inadequacies in internal control exist while financial reporting and
oversight is insufficient to provide assurance on service delivery as envisioned in the
budget.
Figure 0.1 PEFA Rating Summary
Table 0.1: Distribution of PEFA assessment 2016 Ratings by Indicator
Core Pillars of PFM Performance Ratings
Total indicators A / B C / D
I. Budget reliability 1 2 3
II. Transparency of public finances 5 1 6
III. Management of assets and liabilities 3 1 4
IV. Policy-based fiscal strategy and budgeting 5 - 5
V. Predictability and control in budget execution 5 3 8
VI. Accounting and reporting - 3 3
VII. External scrutiny and audit - 2 2
Total 19 12 31

2016 Philippines PEFA Assessment 30 June 2016
The GoP and Development Partners xv
Table 0.2: Distribution of PEFA assessment 2016 Ratings by Dimension
Core Pillars of PFM Performance Ratings Total
dimensions A / B C / D
I. Budget reliability 2 4 6
II. Transparency of public finances 9 3 12
III. Management of assets and liabilities 8 5 13
IV. Policy-based fiscal strategy and budgeting 16 1 17
V. Predictability and control in budget execution 23 5 28
VI. Accounting and reporting 4 6 10
VII. External scrutiny and audit 2 6 8
Total 64 30 94
Major Strengths and Weaknesses in Achieving Budget Outcomes
8. This section considers the results for each pillar, examining the main strengths and
weaknesses, and assessing how performance, in particular processes and systems, affect other
public financial management (PFM) processes as well as the budget outcomes. It is necessary to
assess why a poor score justifies reform effort in terms of its likely effect on budget outcomes.
9. Budget reliability (PI-1-3). While the assessment framework specification for comparing
budgeted expenditure with expenditure outturn data could not be calculated as such due to the
non-availability of consolidated, comparable numbers for actual disbursements, the comparison
was made with obligations incurred. As a proxy for expenditure, obligations would always be in
excess, but the budget reliability still comes out as poor for both revenue and expenditure
outturns. This lack of credibility in the budget can lead to shortfalls in the funding of priority
expenditures. For the outturn by allotment class, the variance ranged from 14 percent in 2012 to
25 percent in 2014 with capital outlays showing the greatest gap in expenditures. Aggregate
revenue outturn performed well, but aggregate expenditure outturn did not, with obligations
falling short of appropriations by 13 percent in 2012 to 28 percent in 2014, thereby affecting
fiscal discipline. Improving budget outcomes would require an emphasis on both revenue and
expenditure. This depends on prompt and focused financial reporting processes so that budget
managers can respond to variations as they arise. The effect on desired budget outcomes is
potentially substantial as the Government has strong intentions to secure social service
expenditure priorities and deliver these services in the most efficient manner. A well-performing
information system within a strong regulatory framework could help achieve this objective.
10. Transparency of public finances (PI-4-9). This area performs very well. The budget
preparation and budget management processes rate highly in public policy and transparency.
There is room for greater accord with Government Finance Statistics (GFS) classifications in
accounting processes to give better information that will assist with budget monitoring; and there
is need to improve data on financial assets. Timeliness of Annual Financial Reports for extra-
budgetary agencies needs to improve to meet statutory requirements.

2016 Philippines PEFA Assessment 30 June 2016
The GoP and Development Partners xvi
11. Management of assets and liabilities (PI-10-13). Results for this pillar are mixed. Some
annual audited reports for government-owned or -controlled corporations (GOCCs) and local
government units (LGUs) were not issued within 9 months risking the adequacy of the timeliness
of fiscal risk monitoring. Management of public investments rated well with strong institutional
arrangements, an important area for public financial management. Management of public assets
was less effective with need for better accounting systems for financial and non-financial assets
to deal with audit reports of discrepancies leading to qualified audit opinions. Debt management
is an extremely important function for fiscal discipline and generally rates well, but the medium-
term debt management strategy needs to be published to provide transparency.
12. Policy-based fiscal strategy and budgeting (PI-14-18). This pillar rates well with all
areas displaying satisfactory or good performance, which reflects the many efforts made in the
recent years to improve the budget formulation process.
13. Predictability and control in budget execution (PI-19-26). Results here are mixed with
weaknesses undermining performance in other pillars. The performance indicators focus on the
internal control framework. The Government has an extensive formal structure for internal
control and internal audit with its Administrative Code and rules for the implementation of
internal control and internal audit. However, the de jure and de facto performance can diverge;
internal audit programs can be delayed, similarly as the implementation of management actions,
to address concerns raised by the auditors. External audit observations and audit qualifications
were too numerous to be fully satisfied with the implementation of these controls, thus risking
budget outcomes. Internal control of payroll and the conduct of payroll audits were assessed as
sufficiently effective as were arrangements for expenditure commitment control. However lack
of automation limits the overview to enable effective monitoring of continuing appropriations
and commitments brought forward from previous years. Audit reports from the Commission on
Audit (CoA) are routinely qualified, and even adverse opinions and disclaimers are issued.
Concerns raised include compliance with internal controls and largely the integrity of financial
information presented. Procurement processes rated well apart from the need to introduce an
independent complaints mechanism, leaving concerns about transparency, fairness, and fiscal
discipline. Also, a significant proportion of procurements did not use competitive processes,
again leaving similar concerns. Other areas that need rectification are improving the
effectiveness of internal audit through better resourcing and an independent reporting
mechanism; inclusion of accounts for foreign-funded projects in the treasury single account
(TSA) system to consolidate cash balances for effective fiscal management; and an efficient
regular process for capturing and aging arrears in both revenues and expenditures to mitigate
risks to fiscal discipline.
14. Accounting and reporting (PI-27-29). Systems and processes covered under this pillar
form the primary source of information for decision-making by management. These did not rate
well. Both financial data integrity processes and in-year budget reporting require substantial
improvement. Some basic processes such as reconciliation of bank accounts, and cash advances
were not handled well. Most financial reporting is compiled through spreadsheets without the
necessary controls that would ensure data integrity. Most departmental annual accounts are given
qualified audit opinions leaving the Government with no assurance as to the reliability of its
annual accounts. Timely submission of in-year budget reports is a challenge among several line

2016 Philippines PEFA Assessment 30 June 2016
The GoP and Development Partners xvii
departments and agencies. Most reports are prepared manually and, as of February 29, 2016, less
than 20 percent of reports for the second, third, or fourth quarter had been received. The need
for a comprehensive accounting system is apparent if budget outcomes are to be assured. With
the pace of development of technology in recent years, it is common for governments to rely on
comprehensive accounting systems to monitor and achieve stated intentions for fiscal discipline,
optimum resource allocation, and service delivery. The electronic New Government Accounting
System (eNGAS), with its computerized accounting solutions, has been rolled out to many
agencies, but not all, and is undergoing development and further updating. A whole of
government audit opinion is not currently issued by the Commission on Audit; but with qualified
opinions on the majority of the individual agency financial statements, it may not be possible to
ascertain the integrity and completeness of the overall financial data for the Government. This is
a continuing significant defect in the annual financial accountability framework.
15. External scrutiny and audit (PI-30-31). This pillar is incomplete; despite a strong
external audit performance, there is the lack of a complete revenue audit. Absence of a formal
scrutiny process at the legislature leaves the oversight function in the budget cycle incomplete.
Main Performance Changes since 2010 PEFA Assessment
16. Tables 0.3 and 0.4 compare the changes in performance ratings (by indicators and
dimensions, respectively) from the 2010 PEFA assessment with those in 2016.
Table 0.3: Distribution of Ratings by Indicator (old methodology)
Core Pillars of PFM Performance
2010 Ratings 2016 Ratings Total
indicators A / B C / D A / B C / D
Credibility of the budget 1 3 1 3 4
Comprehensiveness and transparency 3 3 5 1 6
Policy-based budgeting 1 1 2 - 2
Predictability and control in budget execution 2 7 6 3 9
Accounting, recording and reporting - 4 1 3 4
External scrutiny and audit 1 2 2 1 3
Total 8 20 17 11 28
Table 0.4: Distribution of Ratings by Dimensions (old methodology)
Core Pillars of PFM Performance
2010 Ratings 2016 Ratings Total
indicators A / B C / D A / B C / D
Credibility of the budget 1 4 2 4/a 5
Comprehensiveness and transparency 6 4 9 1 10
Policy-based budgeting 2 5 7 - 7
Predictability and control in budget execution 10 18 19 9 28
Accounting, recording and reporting 2 7 4 5 9
External scrutiny and audit 5 5 6 4 10
Total 26 43 47 23 69 /a
Indicator was revised in 2011 to add a dimension.

2016 Philippines PEFA Assessment 30 June 2016
The GoP and Development Partners xviii
17. It is clear that the Government of the Philippines has improved its PFM performance in
some areas but not in the most crucial areas of budget credibility and accounting, recording, and
reporting. Annex 5 contains a table showing the current PI ratings and explanations along with
the 2010 report ratings for comparison. The previous assessment resulted in a number of
recommendations. The following list gives those recommended areas in need of change and the
current position in relation to their most relevant desired budget outcome parameter:
Fiscal discipline
Proliferation of banking arrangements with limited central control/oversight – now
resolved through the treasury single account.
Absence of a central fiscal authority with government-wide responsibility for financial
risk management – now resolved through effective fiscal risk management.
Lack of codification of financial management rules – now resolved through
comprehensive manuals.
Ineffective external audit – now resolved with well performing Commission on Audit.
The issue of unreconciled bank accounts is a continuing problem for departments and
agencies – not yet resolved, needing a comprehensive accounting system.
Resource allocation
Ineffective control in procurement process – now resolved through formal procurement
arrangements.
Lack of monitoring/control of budgetary realignments and use of savings – now resolved
through improved budget management.
Fragmented financial management information system with limited capability to track
transactions and reconcile the individual systems – partly resolved through IT
improvements but still in need of major revamp.
Many inventory and asset management systems are presently manual systems, subject to
the usual weakness of any manual record-keeping system – not fully resolved needing a
comprehensive accounting system.
Service delivery
Persistence of high-risk transactions – not fully resolved with continuing internal control
deficiencies. Limited use of risk-based audit – now resolved through more modern CoA-audit
methods. Generally weak capacity of Internal Audit Units – now partly resolved through more
resources in Internal Audit Service but more central monitoring could be considered. Apart from the absence or the limited development of a management information system,
the extensive reliance on hard-copy memos appears to slow down internal
communications – not fully resolved without a comprehensive management information
system.
Sanctions for financial mismanagement are rarely applied, partly because of the inexact
assignments of accountabilities; the apparent lack of concern over compliance with rules
means that the government is not in a position to identify systemic weaknesses in the
existing internal control and financial accountability regime and take corrective measures

2016 Philippines PEFA Assessment 30 June 2016
The GoP and Development Partners xix
– not fully resolved with a need to consider modernized financial management
legislation.
On-Going and Planned PFM Reform Agenda
18. The Philippines Government is implementing its Philippine PFM Reform Roadmap:
Towards Improved Accountability and Transparency, 2011–2015. Also the Good Governance
and Anti-Corruption Cabinet Cluster Action Plan 2013-2016 includes several PFM-related
activities. The comprehensive PFM reform agenda aims to clarify, simplify, improve, and
harmonize the financial management processes and information systems of the Philippines’ civil
service. The PFM program is the main vehicle for consideration when evaluating the results of
this PEFA assessment.
19. A PFM Program Steering Committee provides strategic oversight to program planning
and implementation and decides funding priorities year to year. The National Economic and
Development Authority plays an important advisory role to the program. The PFM program has
ongoing improvement activities in the following areas relevant to the findings of this assessment:
automating financial management processes in large spending agencies; introducing
a government integrated financial management information system (GIFMIS); supporting
departments to improve their internal controls, risk management, and internal audit functions;
and pilot-testing a PFM competency framework.
20. The PEFA results show that the reform program to date has had success in strengthening
the capacity of central agencies such as the Department of Budget and Management (DBM) in
budget development and transparency, but this has not been matched by reform improvements in
the capacity of line agencies to provide accurate and timely reporting. It is clear from the results
of this PEFA assessment that the reforms associated with technology need substantial increases
in scope to enable line agencies to manage financial transactions in accord with regulations and
budget intentions and to obtain real-time financial reporting to maintain budget execution in line
with service delivery requirements. The improved accounting systems must enable agencies to
produce annual accounts that are timely and free from audit qualifications. The performance of
eNGAS and current IT development plans need to be reviewed against international practices
and in relation with the PEFA results and revised as necessary to provide the PFM information
and management systems needed.
2016 Philippines PEFA Assessment 30 June 2016
The GoP and Development Partners xx
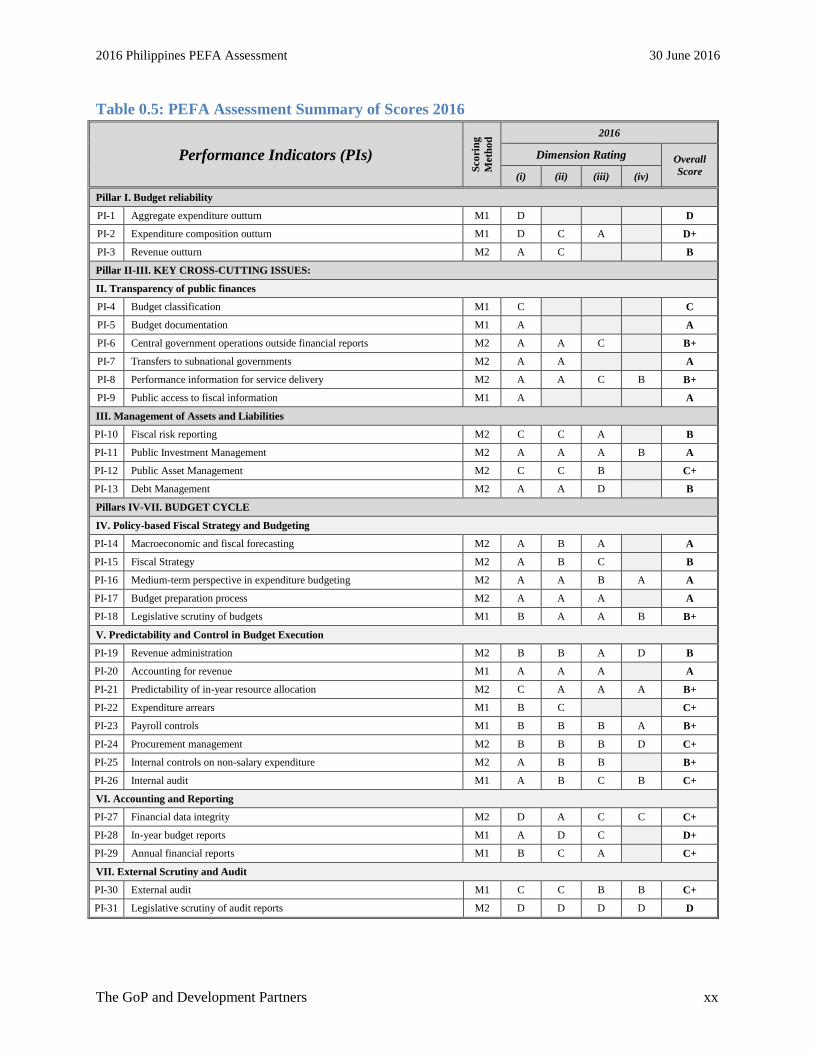
Table 0.5: PEFA Assessment Summary of Scores 2016
Performance Indicators (PIs)
Sco
rin
g
Meth
od
2016
Dimension Rating Overall
Score (i) (ii) (iii) (iv)
Pillar I. Budget reliability
PI-1 Aggregate expenditure outturn M1 D D
PI-2 Expenditure composition outturn M1 D C A D+
PI-3 Revenue outturn M2 A C B
Pillar II-III. KEY CROSS-CUTTING ISSUES:
II. Transparency of public finances
PI-4 Budget classification M1 C C
PI-5 Budget documentation M1 A A
PI-6 Central government operations outside financial reports M2 A A C B+
PI-7 Transfers to subnational governments M2 A A A
PI-8 Performance information for service delivery M2 A A C B B+
PI-9 Public access to fiscal information M1 A A
III. Management of Assets and Liabilities
PI-10 Fiscal risk reporting M2 C C A B
PI-11 Public Investment Management M2 A A A B A
PI-12 Public Asset Management M2 C C B C+
PI-13 Debt Management M2 A A D B
Pillars IV-VII. BUDGET CYCLE
IV. Policy-based Fiscal Strategy and Budgeting
PI-14 Macroeconomic and fiscal forecasting M2 A B A A
PI-15 Fiscal Strategy M2 A B C B
PI-16 Medium-term perspective in expenditure budgeting M2 A A B A A
PI-17 Budget preparation process M2 A A A A
PI-18 Legislative scrutiny of budgets M1 B A A B B+
V. Predictability and Control in Budget Execution
PI-19 Revenue administration M2 B B A D B
PI-20 Accounting for revenue M1 A A A A
PI-21 Predictability of in-year resource allocation M2 C A A A B+
PI-22 Expenditure arrears M1 B C C+
PI-23 Payroll controls M1 B B B A B+
PI-24 Procurement management M2 B B B D C+
PI-25 Internal controls on non-salary expenditure M2 A B B B+
PI-26 Internal audit M1 A B C B C+
VI. Accounting and Reporting
PI-27 Financial data integrity M2 D A C C C+
PI-28 In-year budget reports M1 A D C D+
PI-29 Annual financial reports M1 B C A C+
VII. External Scrutiny and Audit
PI-30 External audit M1 C C B B C+
PI-31 Legislative scrutiny of audit reports M2 D D D D D

1
Chapter 1. Introduction
1.1. Chapter 1 outlines the context and purpose of the public financial management (PFM)
assessment, the process by which the assessment report was prepared, and the methodology used
in undertaking the assessment.
1.1 Rationale for and Purpose of the Assessment
1.2. The previous Public Expenditure and Financial Accountability (PEFA) assessment for the
Government of the Philippines (Government) was undertaken during 2007 (based on data
covering the period 2004-2006 and the PFM status as of mid-2007), and published with some
delay in May 2010.1 The assessment showed that while some specific elements of the
Government’s PFM were relatively well functioning, overall it was weak with shortcomings in
all six PFM (PEFA-rated) areas. However, improving the functioning of the PFM system has
been an integral part of reform measures under the administration of President Benigno S.
Aquino, and several concrete initiatives have been undertaken since mid-2010.
1.3. The PEFA is carried out as an objective, indicator-led assessment of the national
PFM system in a concise and standardized manner. Its intention is to establish the current
status of PFM performance that correlates with an updated understanding of the overall fiduciary
environment, identifies the developments that have taken place since 2010, and provides a
credible basis for the preparation of a medium-term PFM reform strategy (spanning a three- to
five-year horizon). These will inform the plans of development partners that are supporting PFM
reform initiatives, including Australia’s Department of Foreign Affairs and Trade (DFAT) and
the World Bank.
1.4. By applying the 2016 PEFA Performance Management Framework, the work will
help to provide a baseline for future assessments of PFM performance. This can take into
account remaining weaknesses as well as new gaps identified so as to establish new control
mechanisms.
1.2 Assessment Management and Quality Assurance
1.5. The World Bank and Australia’s DFAT initiated the PEFA process in collaboration with
the Government of the Philippines. The assessment was financially supported by DFAT, and the
World Bank organized the technical team. The Government through the PFM Committee under
the DBM leadership provided high-level coordination of assessment inputs, reviewed and
approved the Concept Note, appraised the draft report as well as the action plan and medium-
term strategy, and cleared the report for publication.
1.6. The management and quality assurance arrangements and participating individuals
are presented in Annex 3A. As exemplified in this PEFA organizational arrangement, a cross-

2016 Philippines PEFA Assessment 30 June 2016
The GoP and Development Partners 2
sectoral team from the World Bank carried out the assessment. The reviewers of the Concept
Note and the Assessment Report, both draft and final, comprised a diverse group of experts and
PFM professional from development agencies.
1.3 Assessment Methodology, Coverage, and Scheduling
1.7. The institutional coverage of the assessment encompasses the budgetary central
government. This includes all Government departments, national government agencies (NGAs),
autonomous agencies, and de-concentrated entities. However, at the level of institutional entities,
the focus is on PFM practices as evidence of Government performance rather than a review of
specific entities. The coverage also includes the budgetary support to government-owned or -
controlled corporations (GOCCs), which are included in the Government’s annual expenditure
program. Similar approach was taken for Social Security funds. Contingent liabilities related to
Public-private partnership (PPP) projects were included in fiscal risk management and the PPP
projects are extra-budgetary activities. The Government’s fiscal risk oversight of GOCCs is also
covered, but not the GOCCs’ PFM performance. Local government units, which comprise
provinces, cities, municipalities and barangays, are not covered in this assessment. The
assessment includes an overall review of inter-governmental relationships, including LGU
reporting and Government monitoring.
1.8. The assessment team carried out extensive data collection and consulted with a
range of stakeholders, including Government officials and development partner
representatives. The list of persons consulted is presented in Annex 3B, and main information
sources are provided in Annex 3C. Sources are provided for all data tables, figures, and boxes;
and specific references are provided in the main text, especially in Chapter 3.
1.9. The data cut-off (snapshot) date of the assessment was April 30, 2016. Data gathering
for the assessment, primarily took place from July to November 2015, but data through April 30,
2016 was considered. Completed fiscal years are 2012, 2013, and 2014, the latest three years for
which audited reports are available. The last completed fiscal year is 2015, and the latest budget
submitted to legislature and enacted is for the calendar year 2016. The analyses of the
performance indicators in Chapter 3 are based on the latest data available in each case. The
coverage has been clearly indicated under each PI description.
1.10. The assessment was conducted in order of the following stages and schedule:
a) Briefing to the DBM Executive Committee March 9, 2015
b) Issuance of letters requesting nomination of focal persons March 24, 2015
c) Concept note review by circulation March 31, 2015
d) Formal launch workshop May 13, 2015
e) Data gathering July to November, 2015
Pending the release of the revised Performance Measurement Framework by the PEFA
Secretariat on February 1, 2016, the assessment came to a temporary pause. Once the new

2016 Philippines PEFA Assessment 30 June 2016
The GoP and Development Partners 3
framework was released, the draft report was revised to align it with the new guidance and the
assessment resumed:
f) Draft report submitted to Steering Committee March 1, 2016
g) Stakeholders’ validation workshops April 6-18, 2016
h) Receipt of written comments from Government April 28, 2016
i) Presentation to Steering Committee May 12, 2016
j) Presentation to Development Partners May 13, 2016
k) Final report for clearance to publish May 26, 2016
l) Revised final draft report to PEFA Secretariat May 30, 2016
m) Issuance of PEFA CHECK by PEFA Secretariat June 2, 2016
n) Clearance to publish issued by PFM Committee June 15, 2016
o) Receipt of final comments from Government June 21, 2016
p) Publishing and dissemination of reports June 30, 2016
4
Chapter 2. Country Background Information
2.1. In order to place the PFM performance measurement in a wider context, Chapter 2
provides information about core characteristics of the Government’s PFM system. This covers
country economic, budgetary and fiscal trends, structure of the public sector, legal and
institutional framework for PFM, and the Government’s internal control framework.
2.1 Country Economic Situation
2.2. The Philippines is one of the most dynamic economies in the East Asia region, with
increasingly sound macroeconomic fundamentals and a competitive, globally recognized
workforce. In 2015, economic growth was recorded at 5.9 percent, which represents a slight
deceleration from 6.2 percent the previous year. Nonetheless, the country is still one of the
leading performers among major economies in the region.
2.3. On the demand side, the strong performance of private domestic demand supported
by decade-low inflation and robust, although slowing, remittances drove GDP growth. Government consumption and capital formation were also stronger than the previous year at 9.4
percent and 13.6 percent respectively, as public spending picked up in the last three quarters.
However, a contraction in net exports adversely affected growth. On the supply side, agriculture
growth continued to disappoint as El Niño intensified. Manufacturing also decelerated, driven by
slower growth in food and beverage subsectors weaker exports. As in previous years, the
services sector drove growth, accelerating to 6.7 percent in 2015.
2.4. Sustained growth in 2015 led to significant improvements in unemployment and, to
some extent, job creation; but the quality of growth remains a problem. In January 2016, the
unemployment rate fell to 5.8 percent, the second lowest in a decade. However, the
underemployment rate rose by 2 percentage points to 19.7 percent. In addition, weak agricultural
output led to a reduction of 935,000 jobs in agriculture, bringing net job creation to 752,000
between January 2015 and January 2016.
2.5. The domestic financial market experienced sharp volatilities, yet fundamentals
remain sound. The stock index, responding largely to uncertainties in China’s financial market,
declined significantly by 12.5 percent from its end-2015 levels and 25 percent from its peak in
April 2015, bringing the stock index to its lowest level in almost two years. However, in early
2016, the stock market recovered strongly. Despite the volatility, the domestic financial market
remains resilient and underlying fundamentals continue to be sound. The combination of low
levels of non-performing loans and higher capital adequacy ratio provides the necessary cushion
for the domestic financial sector. In addition, several prudential measures are in place to mitigate
risks. Likewise, monetary policy remains supportive with room to respond to higher global
interest rates. Finally, the peso remains flexible and is in line with market fundamentals, offering
a cushion to large capital outflows.
2.6. Consumer price index (CPI) inflation continued to decelerate, averaging 1.4 percent
in 2015, the lowest inflation rate in a decade. This was below the 2 to 4 percent target of the

2016 Philippines PEFA Assessment 30 June 2016
The GoP and Development Partners 5
Bangko Sentral ng Pilipinas (BSP). Several supply-side factors explain the slower rate of
inflation.
2.7. Lower inflation was driven by the deceleration of food inflation, as timely importation of
rice kept food supply sufficient despite lower agriculture output, partly as a result of El Niño. In
addition, low oil prices also contributed to lower inflation given its direct pass through on
electricity, transportation, and manufactured goods prices. On the other hand, core inflation,
which excludes certain food and energy items to better capture underlying price volatilities, was
higher at 2.0 percent. This suggests that low inflation is largely driven by volatile goods and is
transitory in nature, and hence is not indicative of the economy slowing. Table 2.1 shows
selected economic indicators over the past three years.
Table 2.1: Selected economic indicators
2013 2014 2015
GDP (current values, PHP billions) 11,538 12,645 13,307
GDP per capita (current values, PHP thousands) 117.5 126.6 131.0
Real GDP growth (%) 7.1 6.2 5.9
CPI (annual average change, (%) 3.0 4.1 1.4
National government debt (% of GDP) 49.2 45.4 44.8
External terms of trade (annual % change)
Exports of goods and services 1.5 10.4 -3.8
Imports of goods and services -2.0 11.9 -0.1
Current account balance (% of GDP) 4.2 3.8 2.9
External debt (% of GDP) 28.9 27.3 26.5
Gross official reserves (months of imports) 11.5 9.9 10.1
Source: PSA, BSP, and BTr
2.2 Fiscal and Budgetary Trends
2.8. Higher revenues and weak spending have led to a growing fiscal space despite
unprecedented increases in the budget in recent years. In 2015, despite some revenue reducing
measures,1 tax effort was sustained at 13.6 percent in part due to strong private sector growth,
ramp-up of excise tax rates and less leakages from sin tax, and improved tax administration.
However, government spending decreased from 17.3 percent of GDP in 2013 to 16.8 percent of
GDP in 2015. For instance, during the same period, while the budget increased by more than 30
percent, government expenditures only increased by 11.6 percent in nominal terms. Key numbers
from the Government’s aggregate fiscal data are shown in Table 2.2.
2.9. Increases in the budget were rightly targeted toward priority areas. The budget for
education, health, and social protection grew by almost three times between 2010 and 2016. As a
result, the Philippines today has a world-class conditional cash transfer program. The public
education system provides 13 years of free schooling, and universal healthcare coverage is close
to being achieved. The spending reforms were made possible by the above-mentioned improved
revenue effort, which created significant fiscal space of more than 1 percent of GDP, lower
1 For instance, a proposal increasing the non-taxable ceiling on bonuses from PHP 30,000 to 82,000 was signed into
law in the first quarter of 2015.

2016 Philippines PEFA Assessment 30 June 2016
The GoP and Development Partners 6
interest payments as a percentage of GDP, and improved transparency and accountability of
public spending. Table 2.3 shows the Government’s actual budget allocation by functions.
Table 2.2: National Government Aggregate Fiscal Data
% of GDP
Actual Programmed
2013 2014 2015 2015
Total revenues 14.9 15.1 15.8 17.1
Own revenues 14.9 15.1 15.8 17.1
Tax revenues 13.4 13.6 13.6 16.0
Non-tax revenues 1.5 1.5 1.7 1.1
Other revenues - - 0.5 -
Grants - - - -
Total expenditure 17.3 16.0 16.7 19.6
Non-interest expenditure 14.5 13.5 14.4 16.8
Interest expenditure 2.8 2.5 2.3 2.8
Government balance (including
grants) -2.4 -0.9 -0.9 -2.5
Primary balance 0.5 1.9 1.4 0.5
Net financing 2.8 1.4 0.7 0.7
External -0.7 0.1 0.5 0.5
Domestic 3.5 1.3 0.2 0.2
Source: BTr and DBM.
Table 2.3: National Government expenditures, obligation basis, by sector
Nominal (in Php millions)
2013 2014 2015*
Economic Services 516,710 492,502 706,991
Agriculture, Agrarian Reform, and Natural Resources 119,687 108,089 138,257
Trade and Industry 6,546 5,741 5,971
Tourism 5,214 3,656 4,631
Power and Energy 29,829 18,394 9,476
Water Resource Development and Flood Control 27,074 25,556 39,756
Communications, Roads, and Other Transportation 207,351 202,164 340,158
Other Economic Services 15,203 9,361 32,291
Subsidy to Local Government Units 105,806 119,541 136,451
Social Services 712,112 764,590 952,741
Education, Culture, and Manpower Development 327,036 325,801 453,013
Health 56,857 84,986 96,258
Social Security, Welfare, and Employment 177,347 199,073 246,738
Land Distribution (CARP) 5,000 - 100
Housing and Community Development 32,196 26,691 10,349
Other Social Services 1,824 1,667 2,035
Subsidy to Local Government Units 111,852 126,372 144,248

2016 Philippines PEFA Assessment 30 June 2016
The GoP and Development Partners 7
Defense 87,833 87,195 115,785
Domestic Security 87,833 87,195 115,785
General Public Services 341,661 340,195 431,120
General Administration 132,537 119,164 153,402
Public Order and Safety 115,055 121,968 143,035
Other General Public Services 9,424 3,430 25,522
Subsidy to Local Government Units 84,645 95,633 109,161
Net Lending 16,626 13,395 26,500
Debt Service 323,434 321,185 372,863
Interest Payments 323,434 321,185 372,863
Total expenditure 1,998,376 2,019,062 2,606,000
Source: DBM Fiscal Statistics Handbook
Notes: *denotes programmed expenditures.
2.10. Despite the government’s target of achieving infrastructure spending of 5 percent of
GDP by 2016, this area lags far behind the progress achieved in human capital investment. In 2015, infrastructure spending was programmed at 4.8 percent of GDP from 3.5 percent in
2013, although actual spending may be much lower.2 According to the Government, the
relatively slow growth of infrastructure spending is partly the result of structural weaknesses
within key departments and agencies, including (i) poor planning; (ii) weak program and project
design; and (iii) procurement difficulties such as frequent bid failures, weak capacity to procure,
right-of-way issues, difficulties in securing permits, and coordination problems. Weak spending
also points to an improving debt profile as evidenced by declining government debt and
corresponding interest payments although at the same time it indicates missed opportunities for
translating revenue growth into severely needed investments.
Table 2.4: National Government Expenditures, obligation basis, by sector
% of GDP
2013 2014 2015*
Economic Services 4.5 3.9 5.3
Agriculture, Agrarian Reform, and Natural Resources 1.0 0.9 1.0
Trade and Industry 0.1 0.0 0.0
Tourism 0.0 0.0 0.0
Power and Energy 0.3 0.1 0.1
Water Resource Development and Flood Control 0.2 0.2 0.3
Communications, Roads, and Other Transportation 1.8 1.6 2.6
Other Economic Services 0.1 0.1 0.2
Subsidy to Local Government Units 0.9 0.9 1.0
Social Services 6.2 6.1 7.2
Education, Culture, and Manpower Development 2.8 2.6 3.4
2 Actual data on infrastructure spending for 2015 has yet to be released.

2016 Philippines PEFA Assessment 30 June 2016
The GoP and Development Partners 8
Health 0.5 0.7 0.7
Social Security, Welfare, and Employment 1.5 1.7 1.9
Land Distribution (CARP) 0.0 0.0 0.0
Housing and Community Development 0.3 0.2 0.1
Other Social Services 0.0 0.0 0.0
Subsidy to Local Government Units 1.0 1.0 1.1
Defense 0.8 0.7 0.9
Domestic Security 0.8 0.7 0.9
General Public Services 3.0 2.7 3.2
General Administration 1.1 0.9 1.2
Public Order and Safety 1.0 1.0 1.1
Other General Public Services 0.1 0.0 0.2
Subsidy to Local Government Units 0.7 0.8 0.8
Net Lending 0.1 0.1 0.2
Debt Service 2.8 2.5 2.8
Interest Payments 2.8 2.5 2.8
Total expenditure 17.4 16.0 19.6
Source: DBM Fiscal Statistics Handbook
Notes: *denotes programmed expenditures. Numbers may not add up due to rounding
Table 2.5: National Government expenditures, obligation basis, by expense class
Nominal (in Php millions)
2013 2014 2015*
Current expenditures (CE)
1,531,784
1,623,586
1,911,440
Personal Services (PS)
611,752
635,598
745,965
Maintenance and Other Operating Expenses (MOOE)
299,995
314,912
463,325
Subsidies
54,760
77,407
15,719
Allotment to LGUs
241,843
273,236
311,888
Interest payments
323,434
321,185
372,863
Other CE -
1,248
1,680
Capital Outlay (CO)
449,966
382,081
668,060
Infrastructure spending
404,084
350,727
641,790
Other CO
45,882
31,354
26,270
Net lending
16,626
13,395
26,500

2016 Philippines PEFA Assessment 30 June 2016
The GoP and Development Partners 9
Net lending
16,626
13,395
26,500
Total expenditure
1,998,376
2,019,062
2,606,000
Source: DBM Fiscal Statistics Handbook
Notes: *denotes programmed expenditures. Numbers may not add up due to rounding.
Table 2.6: National Government expenditures, obligation basis, by expense class
% of GDP
2013 2014 2015*
Current expenditures (CE) 13.4 12.8 14.4
Personal Services (PS) 5.3 5.0 5.6
Maintenance and Other Operating Expenses (MOOE) 2.6 2.5 3.5
Subsidies 0.5 0.6 0.1
Allotment to LGUs 2.2 2.2 2.3
Interest payments 2.8 2.5 2.8
Other CE - - -
Capital Outlay (CO) 3.9 3.0 5.0
Infrastructure spending 3.5 2.8 4.8
Other CO 0.4 0.2 0.2
Net lending 0.1 0.1 0.2
Net lending 0.1 0.1 0.2
Total expenditure 17.4 16.0 19.6
Source: DBM Fiscal Statistics Handbook
Notes: *denotes programmed expenditures. Numbers may not add up due to rounding.
2.3 Legal and regulatory arrangements for PFM
2.11. Under its 1987 Constitution, the Republic of the Philippines has provincial and municipal
local governments with local revenue collection and spending autonomy as well as autonomous
regions, all under the general supervision of the President. The Constitution provides a strong
statutory basis for PFM and the economic management of the country. Various sections of
Article II, Declaration of Principles and State Policies, establish requirements that the PFM
system must meet. Section 9 provides that the state shall promote a just and dynamic social order
that will ensure the prosperity and independence of the nation and free the people from poverty
through policies that provide adequate social services; and promote full employment, a rising
standard of living, and an improved quality of life for all. Section 25 provides that the state shall
ensure the autonomy of local governments. Section 27 provides that the state shall maintain
honesty and integrity in the public service and take positive and effective measures against graft
and corruption. Section 28 covers taxation, including that Congress is to evolve a progressive
taxation system. Article VI sets out the legislative arrangements for the Congress; it includes
sections for appropriation and revenue bills, preparation and management of the budget,
disbursement of discretionary funds, and taxation. Article VII vests executive power in the
President; it includes sections on public debt, and the submission to the Congress within 30 days
from the opening of every regular session, as the basis of the general appropriations bill, a budget
of expenditures and sources of financing, including receipts from existing and proposed revenue

2016 Philippines PEFA Assessment 30 June 2016
The GoP and Development Partners 10
measures. Article IX establishes constitutional commissions, including establishing the
Commission on Audit with the dual roles of keeping the general accounts of the Government,
and of auditing those accounts as well as providing the President and the Congress with an
annual report on the financial condition and operation of the Government and its agencies, and
recommendations for measures to improve effectiveness and efficiency. Article XI establishes a
strong basis for internal control over PFM through its provisions on the accountability of public
officers and includes establishing anti-graft and ombudsman bodies. Article XII covering the
national economy includes arrangements for a planning body and a central bank, and for
establishing government companies. The National Economic and Development Authority
(NEDA) is the country’s premier social and economic development planning and policy
coordinating body. It is chaired by the President and supported by seven cabinet-level
interagency committees dealing with functional areas.
2.12. The Constitution’s budgetary provisions provide some detailed prescriptions of
relevance to PFM. Article VI Section 25 provides that the Congress may not increase the
appropriations recommended by the President for the operation of the Government as specified
in the budget; that budget provisions must relate to particular appropriations; and that the form,
content, and manner of preparation of the budget shall be prescribed by law. Other provisions
cover special appropriations for specific purposes and carry over of previous year’s
appropriations in case Congress is unable to pass the budget on time. Article VI Section 29
provides that no money shall be paid out of the Treasury except in pursuance of an appropriation
made by law and that money collected on any tax levied for a special purpose shall be treated as
a special fund and paid out for such purpose only.
2.13. The administrative arrangements for the legislative and regulatory framework for
PFM established by the Constitution are given effect at a general level the Administrative
Code of 1987. This act incorporates in a unified document the major structural, functional, and
procedural principles and rules of governance desired by the Government of the Philippines. The
Code includes separate sections covering finance, budget and management, local government,
and the Commission on Audit, which includes accounting as well as audit. A Department of
Finance is primarily responsible for the sound and efficient management of the financial
resources of the Government, its subdivisions, agencies, and instrumentalities. The national
budget is formulated within the context of a regionalized governmental structure and within the
totality of revenues and other receipts, expenditures, and borrowings of all levels of government
and of government corporations. The Code includes skeleton provisions covering budget policy,
preparation, authorization, execution, and accountability. It also includes some detailed
provisions relating to various forms of expenditure and contracting. The President submits a
budget covering estimated receipts and estimated expenditures to the Congress. All
appropriations, revenue or tariff bills (bills authorizing increase of the public debt) shall originate
exclusively in the House of Representatives, but the Senate may propose or concur with
amendments. The decentralized local government structure is guaranteed it’s just share in
national taxes and wide latitude for resources generation. The annual budget preparation process
is organized based on a circular issued each year by DBM, which also issues circulars on budget
execution and reporting guidance: the Budget Execution Documents (BEDs) and the Budget and
Financial Accountability Reports. At the operational level the Administrative Code provides for

2016 Philippines PEFA Assessment 30 June 2016
The GoP and Development Partners 11
planning services in each department to provide the department with economical, efficient, and
effective services relating to planning, programming, and project development.
2.14. The Administrative Code’s chapter on the Commission on Audit provides support
for internal control and accounting. All government resources are managed, expended, or
utilized in accordance with law and regulations and safeguarded against loss or wastage through
illegal or improper disposition to ensure efficiency, economy, and effectiveness in the operations
of government. The responsibility to take care that this policy is faithfully adhered to rests
directly with the chief or head of the government agency concerned. Accounting provisions state
that all moneys and property officially received by a public officer must be accounted for as
government funds and government property, revenue funds shall not be paid out except in
pursuance of an appropriation law or other specific statutory authority, and every officer whose
duties permit or require the possession or custody of government funds shall be held
accountable. Government auditing is defined as the analytical and systematic examination and
verification of financial transactions, operations, accounts, and reports of any government agency
for the purpose of determining their accuracy, integrity, and authenticity; and satisfying the
requirements of law, rules, and regulations.
2.15. There are sets of laws, presidential orders, and agency circulars and memoranda
that provide the detailed rules and regulations for the administration of these
arrangements in the Administrative Code. The DBM issued Circular No. 2008-8 on the
National Guidelines on Internal Control Systems (NGICS)2 and Circular 2011-5 on the
Philippine Government Internal Audit Manual. They are applicable to all departments,
government companies and local government units. These regulations contain substantial
arrangements for the internal control systems that are required by the Constitution. The DBM is
mandated to promulgate the necessary rules, regulations or circulars for the strengthening of
internal control systems of government agencies concerned3. In the development and
implementation of policies, plans and programs as regards strengthening of internal control
systems and internal audit in government, the DBM is coordinating with the Office of the
President-Internal Audit Office, COA and other departments/agencies concerned. The Office of
the President-Internal Audit Office has a coordinating role and, in concert with DBM and the
Commission on Audit, has the responsibility for regularly reviewing the manuals to ensure that
they are updated, relevant, and attuned to the developments in the bureaucracy and best
international practices such as those of INTOSAI. Since 1978 the Government of the Philippines
has required that agency heads have responsibility to install, implement, and monitor a sound
system of internal control. The Internal Audit Service is required to operate in all government
agencies and is regulated by the DBM.
2.16. The NGICS contains the fundamental principles, policies, and standards to guide
each government agency in developing its detailed and comprehensive system of internal
controls. Agency characteristics such as mandate, functions, nature of activities, operating
environment, human resource profile, size and organizational structure are to be considered in
developing or improving the individual controls. A strong and responsive internal control system
is an essential component of an organization’s internal and external processes, and can
3 Administrative Order No. 119, s. 1989; Memorandum Order No. 277, s. 1990

2016 Philippines PEFA Assessment 30 June 2016
The GoP and Development Partners 12
significantly enhance the integrity of operations and improve organizational outcomes and
results. Fiscal transparency is supported by Article II Section 28 of the Constitution that states
“Subject to reasonable conditions prescribed by law, the State adopts and implements a policy of
full public disclosure of all its transactions involving public interest”.
2.17. There is no separate law for accounting. Provisions for accounting are instead
promulgated by the Commission on Audit with Circular No. 2001-004 that prescribes the New
Government Accounting System (NGAS) for all national government agencies.3 The NGAS
Manual is based on CoA Circular No. 2002-002. With the adoption of the Philippine Public
Sector Accounting Standards (PPSAS) effective January 1, 2014,
CoA revised the NGAS Manual and prescribed the Government Accounting Manual for National
Government Agencies to be used effective January 1, 2016 through COA Circular No. 2015-007.
The Co A annually issues a number of circulars that provide further guidance on specific
accounting aspects. This includes Circular No. 2013-1 on the Unified Accounts Code Structure
(UACS), which was issued jointly with the DBM and the Department of Finance (DoF).
2.18. The legislative and regulatory PFM framework is fragmented with many elements
having extensive provisions. An overview regarding the legislative and regulatory PFM
framework is provided in Table 2.5.
Table 2.7: Legislative and Regulatory Framework for PFM
Constitution Laws Rules and
Regulations4
Planning
Article XII, Section 9
and 10
Book II, Section 29. EO292
Book IV Chapter 3 Section 12 EO2925
Executive Order 230
Memorandum Order
No. 222
Budgeting
Article VII, Section 22
Article VI, Section 25,
paras 1 and 7
Article VI, Section 27,
para 2
Book VI, Chapter 2, Sections 4-8. EO292
Book VI, Chapter 3. EO292
Book VI, Chapter 4. EO292
-
DBM annual circulars
Inter-
governmental
fiscal relations
Article X Sections 6 and
7
Book II, Chapter 4, Section 36. EO292
RA 7160 (Local Government Code), Title
III
Revenue functions Article VI, Section 28,
paras 1 and 2 Book VI, Chapter 3, Section 20. EO292
Budget execution - Book VI, Chapter 5. EO292
Accounting Article IX, Part D,
Section 2 (2)
Book V, Subtitle B, Chapter 6-8.
PD 1445 (Government Auditing Code of
the Philippines), Sections 25, 33, 63, 86,
109-122
CoA Circulars No.
2001-004 and 2002-
002 (NGAS), and
2015-007
(Government
4 Several circulars, memorandum orders and other issuances have been issued over the years and this column only
includes the main documents. 5 Administrative Code of 1987 issued as Executive Order 292.

2016 Philippines PEFA Assessment 30 June 2016
The GoP and Development Partners 13
Constitution Laws Rules and
Regulations4
Accounting Manual
for National
Government
Agencies)
COA Resolution No.
2014-003 (PPSAS
Adoption)
Joint Circular No.
2013-1 (UACS)
Internal control Article IX, Part D,
Section 2 (1)
Book V, Subtitle B, Chapter 4. EO292.
PD 1445 (Government Auditing Code of
the Philippines), Sections 123 and 124.
Administrative Order
No. 119 dated March
29, 1989
Memorandum Order
No. 277 dated January
19, 1990
DBM Circular No.
2008-8 (NGICS)
Internal audit - Book IV, Chapter 2, section 8. EO292
RA 3456 as amended by RA 4177
DBM Circular No.
2011-5 (PGIAM)
Budget reporting
and monitoring
(accountability)
Article IX, Part D,
Section 4
Book VI, Chapter 6, Section 52-57.
EO292
DBM Circular No.
2012-543
CoA-DBM Joint
Circular No. 2014-1
Procurement - RA 9184 (GPRA)
Revised
Implementing rules
and regulations
Debt management - - /a
Asset
management - -
/b
Treasury functions
Article VI, Section 28,
para 1
Article VI, Section 29,
para 1
Book IV, Title II, Chapter 4, Section 29,
EO 292
Performance
monitoring -
Book VI, Chapter 2, Section 9. EO292
Book VI, Chapter 6, Section 51. EO292
External audit Article IX, Part D Book V, Subtitle B, Chapter 6. EO292
PD 1445 – State Audit Code
/a Debt management is stated as a task of the Bureau of the Treasury (BTr), but is not otherwise specified.
/b A requirement to review and appraise asset management systems is stated for two departments (Agrarian Reform, and
Public Works and Highways), but not across national government agencies or as an oversight function.
2.19. In 2015, two bills were separately submitted to the House of Representatives and the
Senate, respectively, to enforce greater accountability in PFM by strengthening
Congressional power of the purse, instituting an integrated PFM system, and increasing
budget transparency and participation. These bills (HB 6117 submitted September 8, 2015;

2016 Philippines PEFA Assessment 30 June 2016
The GoP and Development Partners 14
and SB 2719 submitted on April 14, 2015) were intended to fill the deficiency of a PFM
Framework Law and seek to institutionalize the various budget cycle reforms introduced in
recent years, harmonize and standardize the current mix of laws and regulations, and address the
budget weaknesses identified by the Supreme Court in its July 2014 ruling on the Disbursement
Acceleration Program. The law also included provisions to establish the Office of the
Comptroller General in DBM and the position of Comptroller in each national government
agencies. Still under deliberation since 2009, a Freedom of Information Bill would give
substance to the public information prescriptions of the Constitution when issued into law.
2.4 Institutional arrangements for PFM
2.20. Executive Order No. 55 signed by President Benigno S. Aquino on September 6, 2011,
established a PFM Committee composed of the Commission on Audit, Department of Budget
and Management, Department of Finance, and Bureau of Treasury and authorized it to oversee
the implementation of the Philippine PFM Reform Roadmap: Towards Improved Accountability
and Transparency (2011-2016) especially the integration and automation of government
financial systems. The roles played by these key Government agencies in PFM are described as
follows:
Department of Budget and Management. The main DBM functions include budget policy,
preparing the annual national budget and medium-term expenditure plan, administering and
controlling budget execution through the national accounting system, exercising the authority
to release allotments and cash allocations to spending units through Notice of Cash
allocation, overseeing the government compensation and position classification plan, and
monitoring of LGU and GOCC physical and financial operations. The Department also
promulgates rules, regulations, and circulars for strengthening the internal control systems of
government and the organization of the Internal Audit Service. The Government
Procurement Policy Board (GPPB) Technical Support Office is an attached agency under the
Department.
Department of Finance. The Department of Finance is in charge of the Government’s fiscal
policies, oversees the Bureau of Internal Revenues (BIR) and Bureau of Customs (BoC), and
manages cash resources and public debt through the Bureau of Treasury (BTr). With the
Department of Budget and Management, the Bureau of Treasury coordinates the allowable
cash disbursements to national government agencies for budget execution. Also, the DoF
Corporate Affairs Group supervises selected GOCCs and oversees fiscal and financial affairs
of local government units through the Bureau of Local Government Finance (BLGF).
Commission on Audit. The Commission on Audit is a constitutional body charged with the
external audit of all state entities’ accounts and with promulgating accounting and auditing
rules and regulations. It keeps the general accounts of the Government and submits an
Annual Financial Report to the President and Congress.4
National Economic and Development Authority. The Authority formulates the medium-
term Philippine Development Plan and Public Investment Programs and related annual plans

2016 Philippines PEFA Assessment 30 June 2016
The GoP and Development Partners 15
and programs, and coordinates programming of official development assistance. The NEDA
Board, which is chaired by the President and has most secretaries as members, approves
projects costing more than Php 1 billion (about US$ 21.4 million) except if ICC approval is
otherwise required by law e.g. projects requiring National Government borrowing or
guarantee etc. Seven inter-agency committees assist the NEDA Board: development budget
coordination, infrastructure, investment coordination, social development, tariffs, regional
development, and national land use.
2.21. The institutional set-up for PFM has two unusual attributes. First, the dual external
auditing and accounting roles of the Commission on Audit are considered conflicting under
international standards; the preferred arrangement is for an audit to be independent of any
administrative role in government. Second, the division of tasks between the Department of
Budget and Management and Department of Finance is also overlapping; in many jurisdictions,
though not all, fiscal, budgetary, cash, and debt management tasks are placed within the same
entity. With the current institutional framework involving more than one oversight agency in
different aspects of the PFM cycle, close coordination is a necessity and an obvious challenge.
Key Features of the PFM system
2.22. As previously described, the Government’s PFM system is characterized by tasks being
distributed among several oversight agencies in a manner that is somewhat unusual by
international standards. At the same time, the legislative and regulatory framework is fragmented
with many legislative and regulatory sources. Together this makes governance in the PFM sector
challenging. Other characteristics of the PFM system include the relatively strong executive
control over the budget, which includes both discretionary powers (the right to veto line items),
to disburse appropriated funds and reallocate unspent balances as “savings”,5 and the use of
substantial discretionary funds (17 percent of the 2015 budget) in the form of Special Purpose
Funds.6
The highly decentralized nature of government administration through local government
units and the substantial assets held through GOCCs are shown in Tables 2.6, 2.7, and 2.8.
Table 2.8: Structure of the Public Sector
2014
(Number of entities and financial turnover)
Government Sub-Sector Social
Security
Funds
Public Corporation Sub-Sector
Budgetary
units
Extra-
budgetary
units
Non-financial public
corporations/a
Financial public
corporations
Government 1 95 3 639 21
Provinces 81 - - - -
Cities 144 - - - -
Municipalities 1,490 - - - -
Barangays 42,029 - - - -
Sources: PSA, CoA, DBM, and DoF.

2016 Philippines PEFA Assessment 30 June 2016
The GoP and Development Partners 16
/a Includes 14 major non-financial government corporations and 464 water districts.
Table 2.9: Financial Structure of the National Government – Budget estimates
2014
(PhP millions)
Budgetary Units
Budgetary
units
Social
Security
Funds
Total
aggregated Budgetary
operations
Extra-
budgetary
operations
Revenue 2,018,050/a 72,364 - 474,252
Expenditure 3,077,574/b 38,301 - 284,781
Transfers to/from other
Government entities or
LGUs 328,527
/c - - -
Liabilities/e 6,322,072
/d - - 55,543
Financial assets/e 3,095,642 - - 996,995
Non-financial assets/e 1,178,964 - - 484,754
Sources: BTr, CoA, DBM /a
2014 BESF Table C.1 /b GAA 2014 /c 2014 BESF Table B.26 (ALGU, Capital Transfers to LGUs, and Equity) /d 2014 BESF Table D.3 /e Denotes 2014 data (latest available)
Table 2.10: Financial Structure of the National Government – Actual expenditures
2014
(PhP millions)
Budgetary units
Budgetary
units
Social
security
funds
Total
aggregated Budgetary
operations
Extra-
budgetary
operations
Revenue 1,908,527/a 57,961 - 474,252
Expenditure 2,227,532/b 44,831 - 284,781
Transfers to/from other
Government entities or
LGUs 429,190
/c - - -
Liabilities/e 5,735,242
/d - - 55,543
Financial assets/e 3,095,642 - - 996,995
Non-financial assets/e 1,178,964 - - 484,754
Sources: BTr, CoA, DBM, DOF. /a 2016 BESF Table C.1
/b Annual Financial Report 2014
/c 2016 BESF Table B.26 (ALGU, Subsidy, Capital Transfers to LGUs, and Equity)

2016 Philippines PEFA Assessment 30 June 2016
The GoP and Development Partners 17
/d BTr Data for 2014 National Government Debt
/e Denotes 2014 data (latest available)

2016 Philippines PEFA Assessment 30 June 2016
The GoP and Development Partners 18
Chapter 3. Assessment of PFM Systems, Processes and Institutions
3.1. Chapter 3 provides an assessment of the key elements of the PFM system as captured by
the 31 performance indicators (PIs) and, where applicable, reports on progress made in
improving these. The PFM performance for each of the performance indicators was assessed and
assigned ratings of “A” to “D” as per the scoring criteria for each indicator that must be met in
entirety. The scores may be broadly interpreted as follows:
A Represents performance that meets good international practice; the criteria for the
indicator are met in a complete, orderly, accurate, timely, and coordinated way.
B Typically represents a level of performance ranging from good to medium by
international standards.
C Represents a level of performance ranging from medium to poor.
D Indicates either that a process or procedure does not exist at all, or that it is not
functioning effectively.
Pillar I. Budget Reliability
PI-1 Aggregate expenditure outturn
3.2. Implementing the budget as approved is an important aspect of the government’s ability
to deliver public services as expressed in budgetary policy documents. This indicator assesses the
difference between the actual expenditure in terms of major aggregate against the originally
budgeted expenditure. This measure reflects the government’s ability to maintain fiscal
discipline while adhering to the parameters set in the approved budget.
Indicator / Dimension Score Brief Explanation
PI-1 Aggregate expenditure
outturn D
The obligations incurred exceeded the
range of 85% to 115% of the original
budget in two of the last three fiscal years
(2012 to 2014).
3.3. This indicator assesses the credibility of the budget by calculating the level of aggregate
expenditure achieved as compared to the original budget appropriation for the last three
completed fiscal years for which audited information is available (2012-2014). The data and
resulting overall variances (in absolute terms) are used to ascertain the score achieved are shown
in Table 3.1. Detailed data tables are provided in Annex 4. Considering the variances the score
for PI-1 is assessed as “D” since the variance exceeded the range of 85 percent to 115 percent of
the aggregate budget in two of the three fiscal years considered.

2016 Philippines PEFA Assessment 30 June 2016
The GoP and Development Partners 19
Table 3.1: Calculation of Variance
Fiscal Year
Total budget
appropriation (PhP billion)
Total obligations
incurred (PhP billion)
Outturn as a %age
of appropriation
2012 2,529.56 2,196.11 86.82
2013 2,818.39 2,228.80 79.08
2014 3,077.57 2,227.53 72.38
Source: CoA Annual Financial Reports. Includes contingency, interest and debt principal amortization.
3.4. In the 2010 assessment, this indicator could not be rated due to challenges in ascertaining
comparable numbers. A major source of complication in that assessment period (2004, 2005, and
2006) was the non-enactment of budgets before the start of the fiscal year leading to the
inclusion of amounts as “re-enacted budget” in the “original” budget number.7
PI-2 Expenditure composition outturn
3.5. Where the sub–aggregate composition of expenditure varies considerably from the
original budget, it is unlikely that the budget will be a useful statement of policy intent. This
indicator hence measures the extent to which reallocations between the main budget categories
during execution have contributed toward the variance in expenditure composition. See Box 3.1
for a brief discussion about unique features of budget and expenditure data.
Box 3.1 Unique features of budget and expenditure data The first two performance indicators (P-1 and P-2) require that the budget documents report the total amount
budgeted by the government as well as the individual appropriation to each agency, and that the information is
comparable to the actual expenditure. In the Philippine budget setting, this simple comparison is hampered
largely by the sporadic use of technology across several decentralized accounting processes. Since the 2014
budget, a Unified Account Coding Structure (UACS) was adopted for budget formulation, execution, and
reporting. The roll-out of this structure to cover all transactions is still underway. In addition, there are
continuing appropriations which should be separately identified both in the appropriations as well as the
expenses. A major cause of these limitations is the absence of an integrated financial management information
system, which would greatly facilitate the preparation of financial reports enabling a direct comparison of the
budget with accomplishment.
The original budget documents published by the Department of Budget and Management on its website are the
National Expenditures Program (NEP), the consolidated budget proposals of the agencies; the Budget of
Expenditures and Sources of Financing, including the underlying macroeconomic assumptions, fiscal position
and detailed description of fund sources and expenditures; and the General Appropriations Act, the final
approved budget for the year. The Department of Budget and Management reports on budget execution;
however, the data does not include actual disbursements made. The Annual Financial Report prepared by the
Commission of Audit presents the total approved budget, total released allotments, obligations incurred, and the
unused balance of appropriations. The Annual Financial Report also provides consolidated information about
the results of operations, cash flows, and financial condition. This Report however, does not follow the structure
of any of the three DBM reports described above; thus the information in the reports by these two oversight
agencies is difficult to compare. For the purposes of the assessment of the first two indicators, the numbers for
appropriations and obligations are drawn from the Annual Financial Report.

2016 Philippines PEFA Assessment 30 June 2016
The GoP and Development Partners 20
Indicator / Dimension Score Brief Explanation
PI-2 Expenditure composition
outturn D+ Overall rating based on M1 methodology.
2.1 Expenditure composition outturn
by function D The functional composition variances (in
absolute terms) exceeded 15% in two of
the last three years.
2.2 Expenditure composition outturn
by economic type C The economic composition variances (in
absolute terms) were less than 15% in
two of the last three years.
2.3 Expenditure from contingency
reserves A The average of the actual expenditure
charged to the contingency vote in the
last three years was less than 3% of the
original budget appropriation.
Dimension 2.1 Expenditure composition outturn by function
3.6. This dimension measures the variance between the original, approved budget and end-of-
year outturn in expenditure composition by program, administrative, or functional classification
during the last three years. Contingency items and interest on debt is excluded. It reflects the
government’s ability to pursue its policy objectives as intended and stated in the budget. As per
Table 3.2, the variance in expenditure composition exceeded 15 percent in 2013 and 2014. The
score for Dimension 2.1 is hence assessed at “D”. Detailed data tables are provided in Annex 4.
Table 3.2: Calculation of Variances by Administrative Unit
Year
(PhP billions)
Total budget
appropriation
Total
obligations
incurred
Absolute deviation Composition
Variance
2012 1,814.02 1,483.03 184.22 12.42%
2013 2,021.36 1,662.44 272.53 16.39%
2014 2,233.59 1,644.30 359.01 21.83%
Note: Adjusted budget = Budget allotment x Total obligation / Total budget. Absolute deviation = Total obligation – Adjusted
budget. Composition variance = Total absolute deviation / Total adjusted budget.
Source: CoA Annual Financial Report.
Dimension 2.2 Expenditure composition outturn by economic type
3.7. This indicator measures the difference between the original, approved budget and end-of-
year outturn in expenditure composition by economic classification during the last three years,
including interest on debt but excluding contingency items. The composition of the budget by
economic classification is important for showing the balance between different categories of
inputs.
3.8. The computation is based on the total aggregate appropriation by allotment class to
departments and agencies. The allotment classifications are maintenance and other operating

2016 Philippines PEFA Assessment 30 June 2016
The GoP and Development Partners 21
expenses, capital outlays, personnel services, and financial expenses. The results are shown in
the Table 3.3 with detailed data tables provided in Annex 4. The variance is within 15 percent in
2012 and 2013. The score for Dimension 2.2 is assessed as “C”.
Table 3.3: Calculation of Variance by Economic Classification
Year
(PhP billions)
Total budget
appropriation
Total
obligations
incurred
Absolute
deviation Composition
Variance
2012 2,121.82 1,790.88 252.98 14.13%
2013 2,355.26 1,984.98 292.84 14.75%
2014 2,586.25 1,964.71 498.92 25.39%
Note: Adjusted budget = Budget allotment x Total obligation / Total budget. Absolute deviation = Total obligation – Adjusted
budget. Composition variance = Total absolute deviation / Total adjusted budget.
Source: CoA Annual Financial Report.
Dimension 2.3 Expenditure from contingency reserves
3.9. This indicator recognizes that while it is prudent to include an amount to allow for
unforeseen events in the form of a contingency, this amount should not be so large however as to
undermine the credibility of the budget. Table 3.4 summarizes the calculations for the years 2012
to 2014 with detailed data tables provided in Annex 4. The share is calculated using the total
budget appropriation including contingency, interest and debt principal amortization.
Table 3.4: Calculation of Contingency Share
Fiscal Year
(PhP billions) Contingency share
(%) Total budget
appropriation
Total contingency
obligations incurred
2012 2,529.56 6.93. 0.27
2013 2,818.39 9.33 0.33
2014 3,077.57 41.32 1.34
Average contingency share 0.65
Source: CoA Annual Financial Reports and DBM Budget Technical Bureau.
.
3.10. In the Philippines, contingency reserves are composed of a Calamity Fund, later renamed
as the National Disaster Risk Reduction and Management Fund, special fund allocations for local
government units from shares in national taxes, and the President’s Contingency Fund.
3.11. The contingency share average for 2012 to 2014 is 0.65 percent, which merits an “A”
score for Dimension 2.3.

2016 Philippines PEFA Assessment 30 June 2016
The GoP and Development Partners 22
Table 3.5: Budget obligations incurred for contingency reserves
Name of fund (PhP millions)
2012 2013 2014
National Disaster Risk Reduction and Management
Fund / Calamity Fund 3,960.17 7,676.70 41,063.82
Transfers to LGUs 2,966.18 1,649.03 258.13
Total 6,926.35 9,325.73 41,321.95
Source: DBM Budget Technical Bureau.
PI-3 Revenue outturn
3.12. Accurate revenue forecasts are a key input to the preparation of a credible budget.
Revenues allow the government to finance expenditures and deliver services to its citizens.
Optimistic revenue forecasts can lead to unjustifiably large expenditure allocations that will
eventually require either an in-year and potentially disruptive reduction in spending or an
unplanned increase in borrowing to sustain the spending level.
Indicator / Dimension Score Brief Explanation
PI-3 Revenue outturn B Overall rating based on M2 methodology.
3.1 Aggregate revenue outturn A The revenue variances were between
97% and 106% for the years 2012 and
2013. 3.2 Revenue composition outturn C The composition variances (in absolute
terms) were less than 15% in the last
three years (2012, 2013, and 2014).
3.13. Data on revenue estimates in the original approved budget and actual domestic revenue
collection based on tax and non-tax recurrent revenues is based on the information presented in
the Budget of Expenditures and Sources of Financing (BESF). There are only two major revenue
contributors, the Bureau of Internal Revenue (BIR) and Bureau of Customs (BoC).
3.14. The Department of Finance, Bureau of Treasury, Bureau of Internal Revenue, and Bureau
of Customs assist the Development Budget Coordination Committee (DBCC) in determining the
sources of financing.8 The DBCC establishes the projected revenues to be generated for the
budget year based on macroeconomic assumptions and parameters as well as borrowing (if
needed).
Dimension 3.1 Aggregate revenue outturn
3.15. The overall variances were 98.40 percent, 98.30 percent, and 94.60 percent for 2012,
2013, and 2014, respectively. Detailed data tables are provided in Annex 4. This qualifies
Dimension 3.1 for a rating of “A”.
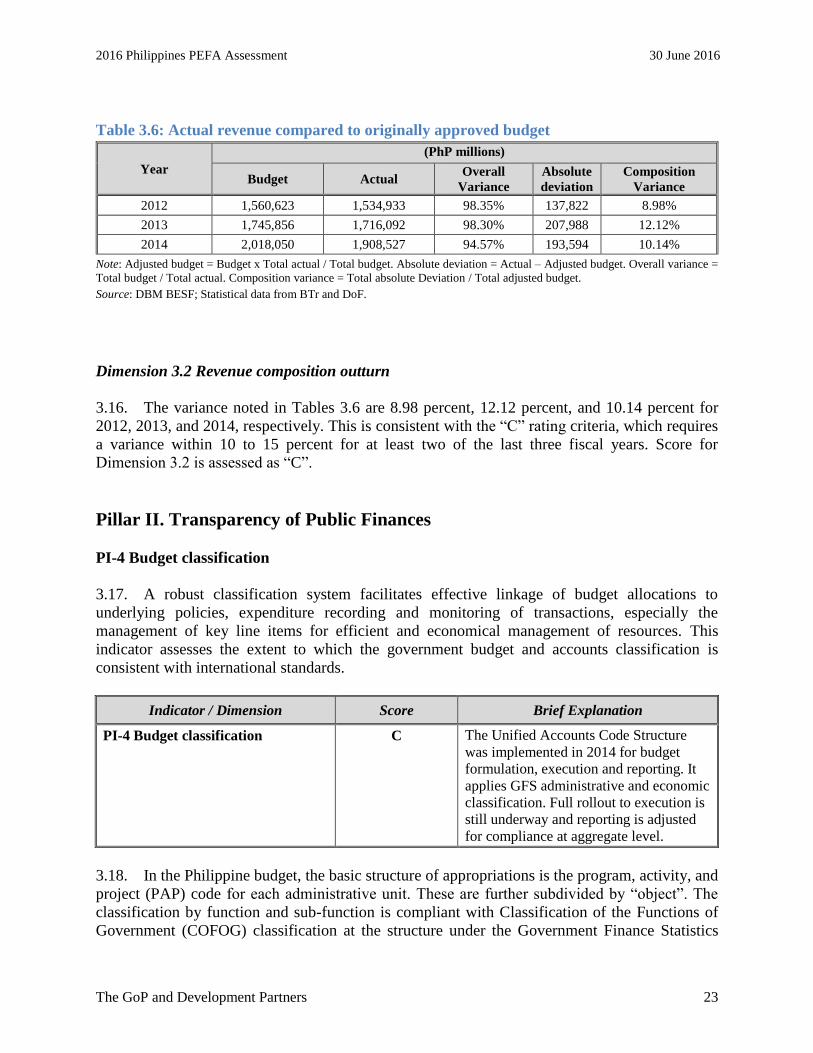
2016 Philippines PEFA Assessment 30 June 2016
The GoP and Development Partners 23
Table 3.6: Actual revenue compared to originally approved budget
Year
(PhP millions)
Budget Actual Overall
Variance
Absolute
deviation
Composition
Variance
2012 1,560,623 1,534,933 98.35% 137,822 8.98%
2013 1,745,856 1,716,092 98.30% 207,988 12.12%
2014 2,018,050 1,908,527 94.57% 193,594 10.14%
Note: Adjusted budget = Budget x Total actual / Total budget. Absolute deviation = Actual – Adjusted budget. Overall variance =
Total budget / Total actual. Composition variance = Total absolute Deviation / Total adjusted budget.
Source: DBM BESF; Statistical data from BTr and DoF.
Dimension 3.2 Revenue composition outturn
3.16. The variance noted in Tables 3.6 are 8.98 percent, 12.12 percent, and 10.14 percent for
2012, 2013, and 2014, respectively. This is consistent with the “C” rating criteria, which requires
a variance within 10 to 15 percent for at least two of the last three fiscal years. Score for
Dimension 3.2 is assessed as “C”.
Pillar II. Transparency of Public Finances
PI-4 Budget classification
3.17. A robust classification system facilitates effective linkage of budget allocations to
underlying policies, expenditure recording and monitoring of transactions, especially the
management of key line items for efficient and economical management of resources. This
indicator assesses the extent to which the government budget and accounts classification is
consistent with international standards.
Indicator / Dimension Score Brief Explanation
PI-4 Budget classification C The Unified Accounts Code Structure
was implemented in 2014 for budget
formulation, execution and reporting. It
applies GFS administrative and economic
classification. Full rollout to execution is
still underway and reporting is adjusted
for compliance at aggregate level.
3.18. In the Philippine budget, the basic structure of appropriations is the program, activity, and
project (PAP) code for each administrative unit. These are further subdivided by “object”. The
classification by function and sub-function is compliant with Classification of the Functions of
Government (COFOG) classification at the structure under the Government Finance Statistics

2016 Philippines PEFA Assessment 30 June 2016
The GoP and Development Partners 24
(GFS) Manual 2001. At its most aggregated form, it lumps together, under the broad
maintenance and other operating expenses, a range of various expenditures such as subsidies,
current transfers, interest payments, and other operating expenses. The Unified Accounts Code
Structure (UACS) addresses the disaggregated presentation of the different types of expenditures
mentioned. It identifies the following three key elements: source of funding, level of
organization it belongs to, and location area of the activity undertaken. The object codes are
largely aligned with the GFS Manual 2001.
3.19. The UACS has officially been issued for use in the budget formulation, execution, and
reporting.9 It was used in the preparation of the 2014, 2015, and 2016 budget proposal. As for
execution and reporting, the review noted compliance in the available 2014 CoA annual audited
reports, otherwise the agency’s non-compliance is tagged as a finding [e.g., National Youth
Commission under the Department of Social Welfare and Development (DSWD)]. Regarding the
use of the Unified Accounts Code Structure in reporting, the following was observed: (a) the
BESF and General Appropriations Act (GAA) report on details of budget execution on
obligation basis; (b) CoA reports reflect the actual payments and disbursements as per
transaction and organize the annual report on allotment, obligations, and disbursements via
responsibility centers; and (c) at the agency level every transaction is to be recorded through
eNGAS, which generates the Journal Entry Voucher while every transaction requiring the
utilization of allotments is recorded and monitored through eBudget System, which generates the
Obligation Request and Status showing the UACS codes. However UACS procedures are fully
available only in version 2 of eNGAS and eBudget, which have only been partially rolled out. At
the time of assessment, no department had fully rolled out version 2 except CoA. Fields for
location code are not available in this version either, but remaining 45 digits can be entered at
transaction level.
3.20. The UACS Manual indicated that the GFS coding is not generally shown to be part of the
Unified Accounts Code Structure; nevertheless, GFS-compliant data can be obtained from the
reference table inside the system mapping the GFS function from the MFO/PAP codes, including
GFS economic classification coding from the object codes for non-financial assets, financial
assets, liabilities, revenues, and expenses. A separate exercise to map PAP codes with COFOG
was undertaken for the 2016 budget proposal, but it is yet to be rolled out for reporting. Score for
PI-4 is assessed at “C”. In the absence of an integrated financial management information
system, it is difficult to apply the full 54 digit UACS codes at the transaction level.
PI-5 Budget documentation
3.21. The indicator assesses the comprehensiveness of the information included in the annual
budget documentation as submitted to the legislature for scrutiny and approval.10
Indicator / Dimension Score Brief Explanation
PI-5 Budget documentation A
The 2016 budget documentation fulfills
10 of 12 information benchmarks,
including all the basic elements.
2016 Philippines PEFA Assessment 30 June 2016
The GoP and Development Partners 25
3.22. The Department of Budget and Management issues the Budget Call for the preparation of
departments and agencies to submit their budget proposals. The Department reviews the
proposals and prepares a consolidated budget proposal for scrutiny and approval of the President
and the Cabinet.
3.23. The President is mandated to submit to Congress the National Expenditure Program
(NEP), Budget of Expenditures and Sources of Financing, and President’s Budget Message.11
The Budget of Expenditures and Sources of Financing reflects the annual budget and the
estimates and sources of financing.12
3.24. The Government publishes several annual budget documents, which include:
National Expenditure Program provides the prior year’s outturn, revised budget for the
current year, and proposed budget for the next year on an obligation basis for the details
of the budget of each department and agency, by program, activity or project. It also
includes the agency’s mandates, strategies and performance targets.
Budget of Expenditure and Sources of Financing provides the underlying
macroeconomic assumptions and fiscal and financial projections for the national
government, local government, and corporate sectors, and details of national expenditures
and revenues on a functional basis and per organizational entity (prior year, adjusted
budget for the current year, and budget year on an obligation basis).
President’s Budget Message provides a preview of the National Expenditure Program
including the principles, policies and priorities of the proposed National Budget.
Budget priorities framework outlines the key programs, projects and activities based on
the national development plan to be supported by the National Budget.
Staffing Summary provides detailed reporting on the number and cost of permanent
positions by agency, including unfilled positions.
People’s Budget provides informational material in an easily understandable format
about the Philippine budget, its process, principles, priority expenditures and the public
expenditure reforms embodied in the National Budget.
General Appropriations Act is the legislative authorization containing the new annual
appropriations authorized by Congress in specific amounts for the implementation of
programs and activities of departments and offices of government for a given year which
comes into effect when the President approves and signs the General Appropriations Bill.
3.25. The comprehensiveness of the information included in the 2015/2016 budget documents
vis-à-vis the elements considered is shown in table 3.13. The table shows that the 2015/2016
budget documents fulfill 10 of 12 information benchmarks including the first 4 basic elements.
The scores for PI-5 is thus assigned as “A”.

2016 Philippines PEFA Assessment 30 June 2016
The GoP and Development Partners 26
Table 3.7: Summary of information included in budget documentation
Elements of Annual Budget
Documentation
Criteria
met Comments
1. Forecast of the fiscal deficit or
surplus, defined according to GFS
or other internationally
recognized standard./a
Yes The past year, current year and forecast for the budget
year of the fiscal position is reported in the BESF and
available in DBM website./b
The Government calculates
the deficit as revenues (tax, non-tax, and privatization)
minus disbursements (current operating expenditures,
including interest payments, and capital outlays) and the
forecast includes a three-year projection.
2. Previous year’s budget outturn
presented in the same format as
the budget proposal.
Yes The previous year’s outturn is reported in the BESF
available in DBM website./c
The presentation in the NEP
and BESF is consistent with the budget proposal.
3. Current year’s budget (either
revised budget or estimated
outturn) presented in the same
format as the budget proposal.
Yes The current year’s budget presentations of NEP and
BESF in DBM website/d
are in the same format as the
budget proposal; however, the financial data is updated to
reflect the adjusted expenditure level.
4. Aggregate budget data for both
revenue and expenditure
according to the main heads of the
classification used, including data
for current and previous year, in
addition to the detailed
breakdown of revenue and
expenditure estimates.
Yes The aggregate revenue data is presented by source/e and
collecting department/f is reported in the BESF in DBM
website, while the expenditure programs are presented by
object,/g by sector,
/h and by recipient unit.
/i
5. Deficit financing, describing
anticipated composition.
Yes The Government summarizes the net domestic and
foreign borrowing and the detailed government-financing
requirement in the DBM website/j under the heading of
National Government Financing.
6. Macro-economic assumptions,
including at least estimates of
GDP growth, inflation, interest
rates, and exchange rate.
Yes The macro-economic assumptions/k
as well as budget
sensitivity to key macroeconomic variables/l are also
included in BESF available in DBM website.
7. Debt stock, including details at
least for the beginning of the
current year, presented as per
GFS or other comparable
standard.
Yes The data of debt stock of the national government is
reported in the BESF presented in DBM website./m
The
information shown is the beginning outstanding debt of
the national government plus the additional borrowings
for the year and the principal payments.
8. Financial assets, including
details at least for the beginning
of the current year as per GFS or
other comparable standard.
No There is no summary data of the aggregate national
government financial assets./n
The information noted is
per department as presented in their respective Annual
Financial Report.

2016 Philippines PEFA Assessment 30 June 2016
The GoP and Development Partners 27
Elements of Annual Budget
Documentation
Criteria
met Comments
9. Summary information of fiscal
risks, including contingent
liabilities/n
such as guarantees and
contingent obligations, embedded
in structure financing instruments
such as public-private
partnerships.
No Fiscal risks of the government are presented in the fiscal
risks statement published by the DBCC/o
but there are
gaps in the presentation of contingent liabilities (PI-10.3).
Information on domestic and foreign debt service for
regular liabilities assumed by the national government,
and the sinking fund provision for the retirement of
domestic debt are separately disclosed in the BESF
published on DBM website.
10. Explanation of budget
implications of new policy
initiatives and major new public
investments, with estimates of the
budgetary impact of all major
revenue policy changes and/or
some major changes to
expenditure programs.
Yes The impact of major changes in the expenditure program
is noted such as the discontinuance of PDAF and DAP,
significant changes in agency performance outputs and
the new revenue reforms/initiatives. In 2014, the fiscal
risks statement/p
(table 4) disclosed the forgone revenues
from different tax measures and practices. Similar
disclosure was noted in Fiscal Risks Statement 2015-
2016.
11. Documentation on the
medium-term fiscal forecasts.
Yes Medium-term fiscal information are published in DBM
website as approved by Development Budget
Coordination Committee as part of the BESF.
12. Quantification of tax
expenditures.
Yes The quantification of tax expenditures is available in
DBM website.
/a Fiscal deficit is understood as the primary deficit (difference between current government spending on goods and services
and total current revenue) plus debt service payments. /b BESF Table A.2 /c BESF Table B.1 /d BESF Table B.1 /e BESF Table C.1 /f BESF Table C.2 /g BESF Table B.1 /h BESF Table B.8 /i BESF Table B.10 /j BESF Table D.1 /k BESF Table A.1.The macro-economic parameters includes budget assumptions about nominal GNI, real GNI growth,
nominal GDP and real GDP growth as well as projections for inflation rate, population, unemployment rate, 364-day
Treasury Bill rate, PhP/US$ exchange rate, LIBOR, Dubai crude oil price, exports and import of goods levels and growth
rates, current account balance level and % of GDP, and gross international reserves (year-end) level and equivalent
importations income per month. /l BESF Table A. 6 Budget Sensitivity to Key Macro-Economic Variables which includes estimated effects of changes in
exchange rate, Treasury Bill rate, LIBOR, inflation rate, real GDP growth rate, and import growth rate on revenues,
disbursements and budget balance. /m
BESF Table D.3 /n Article VI Section 29 (1) states that no money shall be paid out of the Treasury except in pursuance of an appropriation
made by law. /o
The observation is consistent to the response in the International Budget Partnership Survey question no. 039. /p http://www.dbm.gov.ph/?page_id=9010 .
2016 Philippines PEFA Assessment 30 June 2016
The GoP and Development Partners 28
PI-6 Central government operations outside financial reports
3.26. Ex post financial reports available to the government should cover all budgetary and
extra-budgetary activities of central government to allow a complete picture of revenue and
expenditures.
Indicator / Dimension Score Brief Explanation
PI-6 Central government
operations outside financial reports
B+ Overall rating based on M2 methodology.
6.1 Expenditure outside financial
reports
A Expenditure outside government financial
reports is less than 1% of total
expenditures.
6.2 Revenue outside financial reports A Revenues outside government financial
reports are less than 1% of total revenues.
6.3 Financial reports of extra-
budgetary units C Detailed financial reports of the majority
of extra-budgetary units are submitted
within nine months of the end of the
fiscal year.
Dimension 6.1 Expenditure outside financial reports
Dimension 6.2 Revenue outside financial reports
3.27. The Administrative Code instituted through Executive Order (EO) 292, provides that all
income and revenue of the government must accrue to the General Fund deposited in the
National Treasury under the “one-fund” concept.13
Because of the imposition of this restriction,
the amount of unreported revenue and expenditure that is outside the budget framework is small
and would not exceed 1 percent of total expenditure. An example of unreported revenue is the
income derived from the sale of bidding documents, which are generated to recoup the
administrative cost (i.e., printing expenses), and the excess is usually provided as an allowance to
the technical evaluation committee.
3.28. According to interviews in the department and bureaus, all activities and operations are
subjected to accounting and auditing rules and regulations. The recorded transactions are
reported and disclosed in the annual audited report in line with the transparency and
accountability thrust of the government. For the national government agencies, it is required that
they display prescribed set of information under the Transparency Seal on their websites as
mandated by Department of Budget and Management, while local government units follow the
Seal of Good Housekeeping managed by the Department of Interior and Local Government
(DILG).
3.29. All information, activities, and operations of departments and agencies are disclosed in
their annual audit reports. Audited financial statements are consolidated by the Commission on
Audit through the Annual Financial Report per Constitutional requirement (addressed in PI-
29.1). The Commission on Audit consolidates the report to three categories by national
government agencies, local government units, and GOCCs. In cases of special projects such as

2016 Philippines PEFA Assessment 30 June 2016
The GoP and Development Partners 29
grant and foreign funding, a separate annual audit is required and the aggregate amount of such
special projects is presented in a separate table in the BESF. This information is aggregated in
the Government’s Annual Financial Report. The annual audited reports of official development
assistance (ODA) programs and project activities are also consolidated by the Commission on
Audit pursuant to the ODA Law.14
Both dimensions are thus assessed at “A”.
Dimension 6.3 Financial reports of extra-budgetary units
3.30. Regarding the year-end Annual Financial Report, Section 41 (1) of Presidential Decree
1445 specifically states that the deadline for its submission to the President and Congress is the
last day of September of each year (i.e., nine months after year-end). The Commission on Audit
consolidates the report by national government agencies and GOCCs, including the extra-
budgetary units. As of this assessment date, the 2014 Annual Financial Reports were posted on
the CoA website in October and November 2015.
3.31. While all transactions are reported by the respective departments and GOCCs, the
timeliness of submission of the Annual Financial Reports varies. A majority of the financial
reports by the extra-budgetary units were submitted within nine months of the fiscal year-end.
Dimension 6.3 is rated “C”.
PI-7 Transfers to subnational governments
3.32. While the assessment is focused on the national government, it is recognized that
subnational governments also have wide-ranging expenditure responsibilities. This indicator
assesses the transparency and timeliness of transfers to local government units. In the
Philippines, local government units consist of provinces, cities, municipalities, and barangays.
As of December 31, 2015, the total number is 81 provinces, 145 cities, 1,489 municipalities, and
42,036 barangays.
Indicator / Dimension Score Brief Explanation
PI-7 Transfers to subnational
governments A Overall rating based on M2 methodology.
7.1 System for allocating transfers A All transfers to the LGUs are based on
clearly defined set of rules and
procedures.
7.2 Timeliness of information on
transfers A Information on transfers is provided by
DBM early in the budget cycle.
Dimension 7.1 System for allocating transfers
3.33. National government transfers to local government units are of three types: (a) formula-
based block grants (i.e., internal revenue allotment, which is the principal source of

2016 Philippines PEFA Assessment 30 June 2016
The GoP and Development Partners 30
intergovernmental fiscal transfers in the Philippines; (b) origin-based share of national
government revenues; and (c) ad hoc categorical grants.
3.34. Under the Local Government Code, the aggregate internal revenue allotment of local
government units is set at 40 percent of the actual internal revenue tax collections of the national
government three years prior to the current year. The aggregate internal revenue allotment is then
divided among different local government levels as follows: 23 percent to provinces, 23 percent
to cities, 34 percent to municipalities, and 20 percent to barangays. The internal revenue
allotment share of each tier is then apportioned to individual local government units based on
population (50 percent), land area (25 percent), and equal sharing (25 percent) of the 40 percent
of BIR revenue collections of the third quarter of the fiscal year preceding the current year. In
accordance with a DBM local budget memorandum, the internal revenue allotment shares for
FY2015 amount to PhP 389.860 billion while the LGU financial subsidy (also known as Local
Government Support Fund), as per the 2015 Governance Appropriations Act, has a total
appropriation of PhP 3.129 billion. This total appropriation is comprised of PhP 200 million
financial assistance to support various priority projects, PhP 2,828 million for bottom-up
budgeting projects and PhP 100 million to cover any deficiency in the internal revenue allotment
shares of local government units. In aggregate, internal revenue allotment is by far the dominant
source of inter-governmental transfers.
3.35. In addition to the internal revenue allotment, local government units are also entitled to
shares (a) in utilization and development of natural wealth, (b) from gross income earned by all
businesses and enterprises within the economic zone areas, (c) in value added taxes, (d) in
tobacco excise taxes, (e) in proceeds of fire code fees, and (f) from Executive Order No. 115, on
claim of Barangay officials from death benefits fund. These transfers are governed by a relevant
set of rules, including the respective fund release procedures. Since all transfers to the local
government units are governed by clear rules, the score for Dimension 7.1 is assessed at “A”.
Dimension 7.2 Timeliness of information on transfers
3.36. The Department of Budget and Management issues a Local Budget Memorandum (LBM)
as guidance to prepare local budgets and to inform the local government units of their internal
revenue allotment level for the budget year. The allotment is based on BIR certification on the
computation of the local unit’s respective share from the actual collection of national internal
revenue taxes pursuant to the implementing rules and regulations of the Local Government
Code.15
For 2015, LBM No. 68 was issued on July 1, 2014,16
and for 2016, LBM No. 70 was
released on June 15, 2015.17
This is six months before the start of the fiscal year. The score for
Dimension 7.2 is assessed at “A”.
3.37. The Department of Budget and Management also issues guidance for the release and
utilization of funds chargeable against the yearly Local Government Support Fund through the
Local Budget Circular (2014 and 2015)18
and the utilization of LGU shares on the collection of
tobacco and cigarette excise taxes through the Local Budget Memorandum,19
which also
provides any specific requirements that need to be met for release of certain funds.

2016 Philippines PEFA Assessment 30 June 2016
The GoP and Development Partners 31
PI-8 Performance information for service delivery
3.38. This indicator examines the service delivery performance information in the executive’s
budget proposal or its supporting documentation in year-end reports. It determines whether
performance audits or evaluations are carried out. It also assesses the extent to which information
on resources received by service delivery units is collected and recorded.
Indicator / Dimension Score Brief Explanation
PI-8 Performance information for
service delivery
B+ Overall rating based on M2 methodology.
8.1 Performance plans for service
delivery
A Performance information, both financial
and non-financial, is presented in the
budget documentation.
8.2 Performance achieved for service
delivery
A Performance results for most departments
are annually published through report
cards on respective websites and in the
agency annual audit reports.
8.3 Resources received by service
delivery units
C PETS led by the Bank in 2015 for DepEd
has captured the information on resources
received by schools.
8.4 Performance evaluation for
service delivery
B Evaluations of service delivery have been
carried out and published for the majority
of the departments.
Dimension 8.1 Performance plans for service delivery
3.39. In 2014, the Department of Budget and Management introduced performance-informed
budgeting through National Budget Memorandum No. 117 and the National Budget Circular No.
552 for guidance on the shift to the outcome-based, performance-informed budget. This required
government agencies to strengthen the link between planning and budgeting to simplify the
presentation of the budget. Performance-informed budgeting is an approach that uses
performance information to assist in deciding where the funds will go. Performance information,
both financial and non-financial, is presented in the appropriations document, which provides the
context for the programs, activities, and projects pursued by the different agencies of
government. The same practice was continued for 2015 and 2016 budgets.
3.40. The General Appropriations Act presents non-financial performance information together
with the allocated resources for the different programs, activities, and projects. This information
was used by the Department of Budget and Management to evaluate department and agency
proposals during the budget preparation process. Instead of being immediately confronted with a
long list of line items, programs, activities, and projects are grouped according to the major final
outputs that departments and agencies seek to achieve. In this way the budget that goes into a
particular program, activity, or project is linked directly to the final output it intended to achieve.
3.41. Performance information, both financial and non-financial information, are presented in
the published appropriations document, the General Appropriations Act for all departments and

2016 Philippines PEFA Assessment 30 June 2016
The GoP and Development Partners 32
agencies. This includes objectives, indicators, and outputs. Hence, the rating for Dimension 8.1
is assessed as “A”.
Dimension 8.2 Performance achieved for service delivery
3.42. The results of each agency’s performance are generated through the results-based
performance management system (RBPMS) and published under the Development Academy of
the Philippines website.20
Results of the priority programs are rated through the Priority Program
Accountability Report Card while the results of the major final output (MFO) is rated through
the MFO Accountability Report Card. Performance results are also published on the agency’s
website under transparency seal and in annual audit reports, particularly in the executive
summary.
3.43. Comparison with targets is available, and information on outputs is routinely published
for most departments in their audit reports. Based on the assessment, the rating for Dimension
8.2 is considered as “A”.
Dimension 8.3 Resources received by service delivery units
3.44. Once the budget is approved, the Department of Budget and Management releases the
funds. The actual flow of funds to the service delivery unit varies per agency and nature of the
programs. Records are maintained at various levels, which allow this process to be documented,
but lack of integrated systems and automation limits the ability to monitor at a central level.
3.45. Delays in receipt of intended resources by service delivery units is not uncommon and is
a fact noted in CoA audit reports. This is further exacerbated by the often incomplete and
unreliable records in the field offices. The lack of an integrated computerized system contributes
to the difficulty in consolidating and reporting information in a timely manner. Reconciliations
between the records of the recipient unit and the downloading entity are often delayed.
3.46. The Department of Education maintains an electronic basic education information
system, which provides a database of physical resources at the school level. This is annually
updated through a school census verified by divisional offices. Financial information is not
included. In 2015, the World Bank conducted a public expenditure tracking survey (PETS),
which collected data on resources received by schools. The DepEd, like all departments, is
required to submit a consolidated Statement of Appropriations, Allotments, Obligations,
Disbursements, and Balances (SAAODB) on a quarterly basis to the DB M. This report reflects
information on resources received by the frontline service delivery units whether sub-allotted by
the Central Office or directly released by DBM. Consolidation of information is however a
challenge due to the absence of an integrated financial management information system, which
would facilitate the consolidation of data from Budget and Accounting Units. As a result
submissions are often delayed considerably. The rating is assessed as “C” based on the conduct
of PETS for Department of Education, the largest service delivery departments.
Dimension 8.4 Performance evaluation for service delivery

2016 Philippines PEFA Assessment 30 June 2016
The GoP and Development Partners 33
3.47. The Department of Budget and Management annually commissions program evaluations
conducted either by DBM or through third party institutions such as the Philippine Institute for
Development Studies. The reports of these studies are available at the DBM website21
or at
SocioEconomic Research Portal for the Philippines.22
The Commission on Audit, through its
Special Audits Office, also conducts performance audits. Performance or value-for-money audits
are classified as government-wide, sector-wide, or agency-wide. Reports are published on the
CoA website.
3.48. The value-for-money audit is conducted to review management efficiency and ascertain
the agency’s effectiveness in achievement of desired results. In the years since 2012 to 2015,
program evaluations and performance audits have been conducted for departments representing a
majority of the budget appropriations. The rating for Dimension 8.4 is thus assessed as “B”.
PI-9 Public access to fiscal information
3.49. Transparency in government depends on comprehensiveness of fiscal information
available to the public. The quality of information and the means by which this is made available
to the public is as important as the extent of information coverage.
Indicator / Dimension Score Brief Explanation
PI-9 Public access to fiscal
information A
The Government makes available to the
public all of the 5 basic elements and all
additional elements of information.
3.50. Table 3.14 discusses the elements determining public access to key fiscal information.
Table 3.8: Public access to key fiscal information
Elements of information Criteria
met Availability and means
BASIC ELEMENTS
1. Annual Executive Budget proposal
documentation: A complete set of executive
budget proposal documents (as per PI-5) is
available to the public within one week of the
executive’s submission to the legislature.
Yes
Budget documents (NEP and BESF) are
published by DBM on its website within a week
after submission to Congress.
2. Enacted Budget: The annual budget law
approved by the legislature is publicized
within two weeks of passage of the law.
Yes After approval, the GAA is usually published by
DBM on its website within two weeks.
3. In-year budget execution reports: The
reports are routinely made available to the
public within one month of issuance as
assessed in PI-27
Yes
The in-year reports are listed in PI-27. Timeliness
of issue is delayed but these are published within
one month of issuance on DBM website.

2016 Philippines PEFA Assessment 30 June 2016
The GoP and Development Partners 34
Elements of information Criteria
met Availability and means
4. Annual budget execution report: The report
is made available to the public within six
months of the year-end.
Yes
The cumulative budget execution report for
December 2015 was available on the DBM
website as of February 20, 2016. Detailed year-
end report of the DBCC on the 2014 budget
utilization was issued October 31, 2015 i.e. ten
months after year-end.
5. Audited Annual Financial Report,
incorporating or accompanied by the external
auditor’s report: The reports are made
available to the public within twelve months
of the year-end.
Yes
Most annual audited reports of NGAs, LGUs and
GOCCs are published on Commission on Audit’s
website within twelve months of the year-end.
ADDITIONAL ELEMENTS
6. Pre-Budget Statement: The broad
parameters for the executive budget proposal
regarding expenditure, planned revenue and
debt is made available to the public at least
four months before the start of the fiscal year.
Yes
Pre-budget documents (Budget call and Budget
Fora for the budget preparation) are published by
DBM on its website at the start of the budgeting
process which is usually twelve months before the
start of the next fiscal year. Budget proposal is
submitted five months before the start of the fiscal
year and a separate pre-budget statement is not
issued.
7. Other external audit reports: All non-
confidential reports on National Government
consolidated operations are made available to
the public within six months of submission. Yes
All CoA audit reports are published on its
website within a few days of submission.
8. Summary of the Budget Proposal: A clear,
simple summary of the Executive's Budget
Proposal or the Enacted Budget accessible to
the non-budget experts, and where appropriate
translated into the most commonly spoken
language, is publicly available within two
weeks of the Executive Budget Proposal being
submitted to the legislature and within one
month of the budget's approval.
Yes
People’s Proposed Budget is published by DBM
on its website. The 2014 People’s Budget was
published late but performance for 2015 and 2016
has been timely. For 2015 it was published in
April (before submission) within the required
time period, while for 2016, the publication was
in August but still within two weeks of the
submission of Budget proposal to the legislative
branch.
9. Macroeconomic forecasts: as assessed in
PI-14.1 are available within one week of
endorsement.
Yes
Macro-economic forecasts are included in the
budget memo released by DBM and posted on
DBM website or announced through the media
within one week.
3.51. The Philippine Government discloses its fiscal information through various agencies’
websites. The DBM website (www.dbm.gov.ph) contains all budget documents, including the
BESF, National Expenditure Program, and General Appropriations Act. It also contains all
budget circulars and memoranda issued. The DoF website (www.dof.gov.ph) and the BTr
website (www.treasury.gov.ph) both contain statistical data on the national government’s fiscal

2016 Philippines PEFA Assessment 30 June 2016
The GoP and Development Partners 35
position with a breakdown of revenues and expenditure on a cash flow basis. The level of
government debt is also disclosed on these websites.
3.52. Audit reports of all government agencies and its instrumentalities, including selected
GOCCs and local government units, are posted on the CoA website (www.coa.gov.ph). As for
the year-end Annual Financial Report, Section 41 (1) of Presidential Decree 1445 specifically
states that the deadline for its submission to the President and Congress should be not later than
the last day of September of each year (i.e. within nine months of year-end). For FY2014, only
the publication of the Annual Audit Reports of DFA, DOLE, TESDA, and DOTC, exceeded the
prescribed 12-month period of publication but all other Annual Audit Reports were published
within the 12-month period. The CoA consolidates the reports along three categories of national
government agencies, local government units, and GOCCs. Considering that all five required
basic elements are met as well as the additional elements, the score for PI-9 is assessed at “A”.
Pillar III. Management of Assets and Liabilities
PI-10 Fiscal risk reporting
3.53. The indicator measures the extent to which fiscal risks to the national government are
reported. Fiscal risks could arise from adverse macroeconomic situations, financial positions or
subnational governments or public corporations and contingent liabilities from government
programs and activities.
Indicator / Dimension Score Brief Explanation
PI-10 Fiscal risk reporting B Overall rating based on M2 methodology.
10.1 Monitoring of public
corporations C Annual audit reports for most GOCCs are
issued and published by CoA within nine
months of the year-end.
10.2 Monitoring of subnational
governments C Annual audited reports of majority LGUs are
issued and published by CoA within nine
months of the year-end.
10.3 Contingent liabilities and other
fiscal risks
A Fiscal Risk Statement issued by DBM
presents the country’s exposure to major
fiscal risks, including significant contingent
liabilities. While annual reports were issued
for 2013 and 2014, a combined report was
issued for 2015 and 2016.
Dimension 10.1 Monitoring of public corporations
3.54. Public corporations exist in the Philippines in the form of GOCCs, which carry out
commercial and non-commercial activities.23
The GOCCs both receive subsidies and pay
dividends to the national government. According to the Constitution, GOCCs “may be created or
established by special charters in the interest of the common good and subject to the test of
economic viability” (Article XII, Section 16).
2016 Philippines PEFA Assessment 30 June 2016
The GoP and Development Partners 36
3.55. The Philippine Government provides budgetary support to GOCCs particularly to those
implementing priority programs. The total budgetary support to GOCCs in 2015 and 2016
amounts to PhP 90.33 billion and PhP 153.62 billion, respectively.24
3.56. The Governance Commission for GOCC (GCG) provides oversight to GOCCs. The GCG
was established in 2011 and is attached to the Office of the President. According to Republic Act
No. 10149, the GCG acts as a “central advisory, monitoring, and oversight body with authority
to formulate, implement and coordinate policies” (Chapter 2, Section 5). The GCG’s focus on
ensuring commercial viability has resulted in the number of GOCCs being reduced from 157 to
116 in 2014.25
The GCG collects information on GOCCs’ financial performance on a quarterly
basis and publishes an annual report with consolidated information, while a condensed version is
included in the Government-wide Fiscal Risks Statement. The GCG conducts annual
performance-setting reviews with GOCCs, using a balance scorecard approach. Targets for the
next year are monitored through quarterly reports.
3.57. The Department of Finance complements the oversight role of the GCG by monitoring
the contribution to the public sector fiscal balance and other financial indicators of the 14 major
non-financial government corporations, three governmental financial institutions, and three
social security institutions.26
3.58. The Commission on Audit issues annual audit reports for GOCCs and publishes these on
its website. The 2014 CoA Annual Financial Report disclosed that combined total GOCC assets
amount to PhP10.59 trillion. The top-20 GOCCs ranked by total assets already account for PhP
9.81 trillion or 92.66 percent of the total combined assets. Using the top-20 GOCC rankings by
total assets and total liabilities, some of these reports for 2014 were issued within six months,
while most were issued within nine months. The score for Dimension 10.1 is thus assessed at
“C”.
Dimension 10.2 Monitoring of subnational governments
3.59. The individual LGU fiscal data as well as consolidated fiscal data of all provinces, cities,
and municipalities categorized by region have been published on the BLGF website since 2010.
The BLGF also publishes the Local Government Financial Performance Monitoring System. The
BLGF’s local government financial performance monitoring systems measure several indicators
regarding the financial health of local government units. Information is aggregated for inclusion
into the Fiscal Risk Statement.
3.60. Local government units are allowed to borrow when funding capital investment up to a
maximum amount where debt service costs account for 20 percent of regular income (Article 324
of the Local Government Code 1991). Before they are able to borrow, local government units are
required to obtain ex ante approval that their plans are within this prudent cap. In practice,
overall levels of LGU debt are low, averaging 1.4 percent of the total outstanding loans and
investments from 2002-2009,27
and most local government units borrow significantly below their
potential maximum entitlement.

2016 Philippines PEFA Assessment 30 June 2016
The GoP and Development Partners 37
3.61. The local government units are audited by the Commission on Audit annually per Section
41 (1) of Presidential Decree 1445. However, the Annual Financial Report disclosed that the
barangays are audited on a cyclical basis and only about 33 percent of the consolidated financial
statements were audited. Per internal revenue allotment allocation, 20 percent of the total budget
allocation to local government units goes to the barangays, thus the consolidated LGU report
only accounts to around 87 percent audited financial information.
3.62. Tables 3.15 and 3.16 summarize the number of auditees and respective number of
financial statement submissions for 2012 and 2013, respectively.
Table 3.9: Number of Auditees and Financial Statements Submitted, 2012
Provinces Cities Municipalities Barangays
Total number of auditees 80 143 1,491 42,028
Total number of financial
statement submitted 80 143 1,462 29,673
Percentage of financial statement
submission 100 100 98 71
Average % of financial statement
submission 92
Source: CoA 2012 Annual Financial Report for LGUs.
Table 3.10: Number of Auditees and Financial Statements Submitted, 2013
Provinces Cities Municipalities Barangays
Total number of auditees 81 144 1,490 42,028
Total number of financial
statement submitted 79 144 1,446 29,947
Percentage of financial statement
submission 98 100 97 71
Average % of financial statement
submission 92
Source: CoA 2013 Annual Financial Report for LGUs.
3.63. The Annual Financial Report for local government units also includes information on the
summary of barangays, which submitted their financial statements to the Commission on Audit.
A summary is presented in Table 3.17.
Table 3.11: Number of Barangays with Financial Statements, 2011-2013
Year Number of barangays with
financial statement Total number of barangays % of submission
2011 29,069 42,026 69.17
2012 29,673 42,028 70.60
2013 29,947 42,028 71.25
Source: CoA Annual Financial Reports for LGUs.
3.64. As an alternative source of LGU fiscal data, BESF includes a section on LGU statement
of receipts and expenditures for the previous, current, and next fiscal years. Given the time lag in

2016 Philippines PEFA Assessment 30 June 2016
The GoP and Development Partners 38
fiscal data collection by the Bureau of Local Government Finance, the previous year’s data
reported in BESF are not final figures (as compared to CoA Annual Financial Report). The
expenditures are reported by sector, but only at a high level of aggregation.
3.65. The Commission on Audit issues annual audit reports for the local government units and
publishes these on its website. A majority and not most of the audit reports for 2014 were issued
within nine months, and the score for Dimension 10.2 is thus assessed at “C”.
Dimension 10.3 Contingent liabilities and other fiscal risks
3.66. The Government’s Development Budget Coordination Committee has since 2012
published a Fiscal Risk Statement to provide a comprehensive view of the country’s exposure to
fiscal risks emanating from fiscal projections and turnouts, public debt, and contingent liabilities
associated with the financial sector, GOCCs, public-private partnerships, local government units,
and natural disasters.28
The report also includes reforms and risk mitigation efforts. It covers
sensitivity analysis on the impact of changes in key macro-economic variables to the fiscal
position and also assesses fiscal risks in other sectors and areas, including the financial sector,
contingent liabilities associated with public-private partnerships, local government units, and
GOCCs.
3.67. The Fiscal Risk Statement provides a clear overview regarding significant risks. The
Fiscal Risks Statements from 2013 to 2016 clearly meet requirements of quantification and
consolidation for all “significant” explicit contingent liabilities and other fiscal risks and report
publication;29
thus, the score for Dimension 10.3 is assessed at “A”.
PI-11 Public investment management
3.68. Public investments are viewed as a key prerequisite to achieve and sustain economic
growth, achieve strategic policy objectives, and address national service delivery needs. This
indicator assesses economic appraisal, selection, costing, and monitoring of public investment
projects by the government with an emphasis on the most significant projects.
Indicator / Dimension Score Brief explanation
PI-11 Public investment
management A Overall rating based on M2 methodology.
11.1 Economic analysis of investment
proposals A List of projects approved by the NEDA
Board; ICC is posted in NEDA website.
ICC reviews all major capital projects
that are above PhP 1 billion. The review
includes evaluation of technical,
financial, economic, environmental,
institutional, social, and sensitivity
analysis./a
11.2 Investment project selection A NEDA published the Public Investment
Program and Comprehensive and
Integrated Infrastructure Program (CIIP)

2016 Philippines PEFA Assessment 30 June 2016
The GoP and Development Partners 39
Indicator / Dimension Score Brief explanation
list and applies standard criteria for
prioritization.
11.3 Investment project costing A NEDA guidelines require all investment
capital and recurrent costs to be
identified.
11.4 Investment project monitoring B The Budget Call for 2016 introduced a
results-based M&E system. Projects are
monitored by the implementing agencies
and the implementation status is
published quarterly as prescribed by the
transparency seal provision. a/ The DBCC and DBM review investment proposals based on cost, (i.e., the DBCC-SC-PPA for those costing PhP 300
million or more, and the DBM for those costing below PhP 300 million).
3.69. The indicator spans all types of PFM systems, including those with separate recurrent and
capital budget management processes and institutions. Moreover, the term “major investment
project” includes investments implemented through structured financing instruments such as
public-private partnerships.
Dimension 11.1 Economic analysis of investment proposals
3.70. Major investment projects as of December 2015 are shown in Table 3.12.
Table 3.12: Major Investment Projects
Project title Estimated cost (PhP billion) Implementation period
1 LRT Line 1 South Extension
Project
64.92 3rd
Qtr 2015 - 1st Qtr 2019
construction period
2 MRT Line 7 Project 62.70 4 years with 25-years concession
period
3 North-South Railway Project
(NSRP) - South Line
170.699 2016-2019 construction period
4 Iloilo, Bacolod, and Davao Airport
Development, Operations and
Maintenance Projects
91.23
Iloilo (30.40); Bacolod (20.26)
Davao (40.57)
30 years (2016-2045)
5 LRT Line 6 Project 64.71 Over a concession period of 30
years and design and construction
period of 5 years
6 LRT Line 4 Project 50.15 (original proposal); 42.89
(the reserve price basis following
the LRT Line 6 costing per km)
Over a concession period of 34
years, including design and
construction period of 4 years
7 Laguna Lakeshore Expressway
Dike Project
122.81 Over a concession period of 37
years (7 for design and 30 for
operations and maintenance)
8 North-South Commuter Railway
(NSCR) Project, Phase 1
105.31 2015-2021

2016 Philippines PEFA Assessment 30 June 2016
The GoP and Development Partners 40
Project title Estimated cost (PhP billion) Implementation period
9 Regional Prison Facilities Project 50.204 20 years exclusive of a three year
construction period.
Source: NEDA.
3.71. Review of project investments starts when the implementing government agency or local
government unit submits the project proposal30
to the Investment Coordination Committee
(ICC).31
The scope of ICC review covers major capital projects costing PhP 1 billion and above
per project,32
as well as projects covered by the Build-Operate-Transfer (BOT) Law,33
projects
that require national government borrowing or guarantee covered by the Foreign Borrowings Act
(Republic Act No. 4860) and the Official Development Assistance Act (Republic Act No. 8182),
and joint venture projects as provided in Section 7.2b of the Revised Guidelines and Procedures
for Entering into Joint Venture Agreements Between Government and Private Entities.34
The
NEDA Secretariat serves as Secretariat to the ICC Technical Board and Cabinet Committee. As
such, it provides technical staff support to ICC in evaluating projects in terms of their economic,
financial, technical, social, environmental, and institutional viability, among others.35
For PPP
projects, the PPP Center, which acts as the ICC Secretariat, is responsible for the initial project
review and project circulation to the ICC Technical Working Group36
for appraisal and
evaluation. The NEDA Secretariat as part of the ICC Technical Working Group undertakes the
assessment of the socio-economic aspects of the project as well as appraises each project in
terms of its alignment and contribution to the Philippine Development Plan and compliance with
existing laws, rules, and regulations. The ICC evaluation includes the project’s financial,
economic, technical, environmental, institutional, social, and sensitivity analysis.37
The list of
NEDA Board-confirmed and ICC-approved projects is posted in NEDA website.38
The score for
Dimension 11.1 is assessed at “A”.
Dimension 11.2 Investment project selection
3.72. Per ICC Guidelines, projects lined up for ICC discussions should be drawn primarily
from the Public Investment Program of the proponent government unit in order of their relative
priority, target commencement schedule, and complementation with other priority projects. First,
priority will be given to projects whose implementation is targeted for the first and second years
of the Public Investment Program and whose loan negotiations are forthcoming. The concerned
proponent agencies will ensure ICC clears, as necessary, those projects under the Public
Investment Program that are scheduled for implementation in the current year.
3.73. The ICC Secretariat ensures the completeness of submission of ICC requisite documents
that form the basis of project evaluation. The proponent agency is required to submit to the ICC
Secretariat with copies to DBM, DoF, and those pertinent documents and information on the
project to facilitate simultaneous evaluation of financing terms and external financing
requirements by oversight agencies. Proponent should secure a DBM certification of the
availability of budget cover for new requests related to ongoing projects before submitting such
for ICC action.
2016 Philippines PEFA Assessment 30 June 2016
The GoP and Development Partners 41
3.74. Projects under build-operate-transfer and its variant schemes should adhere to the ICC
review and approval process provided in RA 7718, the Philippine BOT Law, and its
implementing rules and regulations.
3.75. The ICC approval should be secured before the program appraisal by foreign funding
agencies and prior to the issuance of approval-in-principle by the Monetary Board as well as
negotiation of loan terms and project documents. The projects approved by the ICC are elevated
to the NEDA Board for confirmation as may be required under existing rules and regulations.
The ICC-approved cost and other NEDA Board conditions on projects will be reflected in the
NEDA Board resolutions which serve as the basis for loan negotiations, the compliance of which
will be monitored and reported. Considering the procedures in place for the selection of projects,
the score for Dimension 11.2 is assessed as “A”.
Dimension 11.3 Investment project costing
3.76. The Department of Budget and Management issues the budget priorities framework,
which takes into account the program priorities of the current administration and level of
investment consistent with growth targets. This framework includes the prioritized infrastructure
projects comprising of the Public Investment Program and the Comprehensive and Integrated
Infrastructure Program (CIIP). The Public Investment Program consists of priority programs and
projects across all sectors that are expected to contribute toward achievement of the country’s
development objectives stated in the Philippine Development Plan as well as the outcomes
indicated in the Results Matrices. The CIIP, on the other hand, comprises the infrastructure
projects funded by the Government through different sources. The main objective of CIIP is to
provide the entire view of Philippine investment in public infrastructure ranging from start to
completion (including the projects’ maintenance costs). The CIIP is updated39
annually to reflect
revision40
in the investment requirement of the ongoing infrastructure projects. The updated CIIP
includes both ongoing and proposed public infrastructure projects of all government agencies,
including public infrastructure projects of the national government agencies, GOCCs, and those
national government-supported LGU projects as well as those projects that are implemented
through public-private partnerships, joint venture agreements, and/or those which are financed
by the private sector.
3.77. The IMF’s Philippine Fiscal Transparency evaluation also reported that the budget details
each investment and provides information on the annual spending for each project.41
The
responsibility of accounting for the recurrent cost on the general operations as well as the
maintenance and operating cost resides with the respective implementing agencies and are
considered in their annual budget expenditures. The Budget Call for 2016, introduced a results-
based monitoring and evaluation (M&E) where it requires that each new program and project
proposed for funding will be supported not only by project profile but also complemented with a
credible M&E plan and robust baseline information for approval.42
The memorandum also
indicated that to complement the program, the ICC and the different clusters have also began to
require member agencies and corporations to develop rolling pipeline investment programs such
as the three-year rolling infrastructure program and the pipeline of public-private partnership
projects. Considering the procedures in place for comprehensive costing of projects, the score for
Dimension 11.3 is assessed at “A”.

2016 Philippines PEFA Assessment 30 June 2016
The GoP and Development Partners 42
Dimension 11.4 Investment project monitoring
3.78. Executive Order No. 93, amending EO No. 376 (series of 1989) also known as
“establishing the regional project monitoring and evaluation system and for other purposes”,
provides a scheme for monitoring and evaluating projects at the national, regional,
provincial/city, and municipal level. The main objective of regional project M&E system is to
expedite implementation of the project and devolve project facilitation and monitoring and
evaluation to the regional and sub-regional levels. The regional project M&E system was
established to ensure continuous monitoring of funds earmarked for each activity,43
and
prescribed reports are to be accomplished by the monitoring units. Under NEDA, Regional
Project Monitoring Committees44
also prepare quarterly and annual accomplishment reports on
the physical and financial status of ongoing government programs and projects. In addition, an
annual Official Development Assistance Portfolio Review Report is submitted by NEDA to the
Congress by June 30, and also published on the NEDA website. The PPP Center also monitors
the implementation of PPP projects as mandated under Section 14.1 of the BOT Law
Implementing Rules and Regulations; and the PPP governing board has approved a policy
circular on PPP monitoring framework and protocols.
3.79. The transparency seal45
also requires each agency to disclose the status of implementation
and program/project evaluation and/or assessment reports on quarterly basis as well as the major
programs/project categorized in accordance with the five key results areas as required in EO No.
43, series 2011.46
Agencies are also mandated by the National Economic and Development
Authority to update information in CIIP. Compliance with these requirements is generally done
but with delays. The score for Dimension 11.4 is assessed at “B” as monitoring for major
projects exists, standard rules are in place, and information on implementation is at least
published annually.
PI-12 Public asset management
3.80. This indicator assesses the management and monitoring of government assets and the
transparency of asset disposal.
Indicator / Dimension Score Brief Explanation
PI-12 Public asset management C+ Overall rating based on M2 methodology.
12.1 Financial asset monitoring C Reports in varying frequencies and
registers are prepared for monitoring
purposes. However, CoA audit reports
include substantial observations pointing
to absence of up to date and complete
financial asset registers.
12.2 Non-financial asset monitoring C Fixed asset registers exist but
comprehensive management and
statistical reports are not published
annually.
2016 Philippines PEFA Assessment 30 June 2016
The GoP and Development Partners 43
Indicator / Dimension Score Brief Explanation
12.3 Transparency of asset disposal B The procedures for competitive and
transparent sale, transfer or disposal of
assets and usage rights are established in
legislation and generally respected. This
information is included in financial
statements but not reported to legislature.
Dimension 12.1 Financial asset monitoring
3.81. Financial assets can be diverse, including cash, securities, loans and receivables owned
by the government; and foreign reserves and long-term funds such as sovereign wealth funds and
equity in state-owned and private sector institutions. The Treasury acts as principal custodian of
the financial assets of the national government. Categories of assets held and their value is
disclosed in the Annual Financial Report.
3.82. For monitoring the stock and performance of the financial assets, several reports in
varying frequency are prepared and appropriate subsidiary ledgers kept. However, the
Commission on Audit has consistently raised substantive audit findings and observations that
indicate ineffective monitoring schemes resulting in a qualified audit opinion. For example, these
observations include discrepancies in the balances, dormant accounts, non-recognition of interest
income, and investments without stock certificates casting doubts on their existence. In addition,
the Commission on Audit commented that subsidiary ledgers for investments stated in foreign
currencies were not maintained.
3.83. While records are maintained, these are not considered up to date or complete in view of
the audit observations in this regard; and the score for Dimension 12.1 is assessed as “C”.
Dimension 12.2 Non-financial asset monitoring
3.84. All economic assets other than financial assets are classified as non-financial assets. Non-
financial assets may come to existence as outputs from production, be naturally occurring, or be
constructs of society. Most non-financial assets provide benefits either through their use in the
production of goods or services or in the form of property income.
3.85. Each agency manages their respective non-financial assets, which are carried separately
in the agency books. The Commission on Audit consolidated the available information and
showed in its 2013 Annual Financial Report the corresponding balances of the different non-
financial assets maintained by the various agencies. However, given that the underlying
information were not adjusted and that several audit observations were raised, the accuracy and
validity of these balances are doubtful.
3.86. The New Government Accounting System prescribes agencies to maintain different
subsidiary ledgers and registries to record and track their respective non-financial assets.
Subsidiary ledgers are books of final entry containing the details or breakdown of the balance of
the controlling account appearing in the general ledger. These subsidiary ledgers are the

2016 Philippines PEFA Assessment 30 June 2016
The GoP and Development Partners 44
Property, Plant and Equipment Ledger Card, Supplies Ledger Card; and Construction in Progress
Ledger Card. In addition, three registries must be maintained: Registry of Public
Infrastructures,47 Registry of Reforestation Projects,48 and Registry of Public Infrastructures-
Summary.49
3.87. The New Government Accounting System further prescribes that a physical count of
supplies and property, plant, and equipment be conducted. However, based on CoA observations,
physical count is not consistently performed. Fixed asset registers thus exist but information on
usage and age is not substantially complete. Wherever fully implemented, useful life of property,
plant and equipment is tracked in eNGAS. Score for Dimension 12.2 is assessed at “C”.
Dimension 12.3 Transparency of asset disposal
3.88. In accordance with EO No. 285, dated July 25, 1987, responsibility for disposal of
supplies, equipment, and materials, which are obsolete, forfeited, abandoned, and surplus to their
needs, was transferred to the different line departments and agencies subject to guidelines
developed by DBM’s Systems and Procedures Bureau and existing laws. A Manual of the
Disposal of Government Property was developed and issued through National Budget Circular
No. 425, dated January 28, 1992. The Manual was prepared taking into consideration existing
laws and policies governing disposal, guidelines issued by the defunct Supplies Coordination
Council, and pertinent rules and regulations of the Commission on Audit.
3.89. The CoA rules and regulations are outlined in Section 79 of Presidential Decree 1445,
which relates to destruction or sale of unserviceable property. There were no noted CoA audit
findings referring to non-compliance with the prescribed rules and regulations relating to sale,
transfer, and disposal of non-financial assets.
3.90. The required procedures are established in legislation, which does not include
requirement for information to be submitted to the legislature, and no major observations on non-
compliance are included in the audit reports. The score for Dimension 12.3 is assessed at “B”.
PI-13 Debt management
3.91. This indicator assesses the management of domestic and foreign debt and guarantees. It
seeks to identify whether satisfactory management practices, records, and controls are in place to
ensure efficient and effective arrangements.
Indicator / Dimension Score Brief Explanation
PI-13 Debt management B Overall rating based on M2 methodology.
13.1 Recording and reporting of debt
and guarantees A
Detailed debt data (domestic and foreign)
is published on the BTr website. The data
is updated monthly and presented two
months from the reference period.

2016 Philippines PEFA Assessment 30 June 2016
The GoP and Development Partners 45
13.2 Approval of debt and guarantees A
Legislation provides clear authorization
to DoF to review, approve and manage
debt. Ceilings are prescribed in law.
Debts are also contracted following the
fiscal target and the prescribed law.
13.3 Debt management strategy D Medium-term debt strategy in the form of
strategic guidelines is in place, however
this document is not publicly available.
Dimension 13.1 Recording and reporting of debt and guarantees
3.92. The Department of Finance, through the Fiscal Planning and Policy Office and the
Treasury, collects and compiles fiscal data for the public sector. Outstanding public sector debt50
and the national government outstanding debt stock and other debt-related reports and tables are
published by Finance and Treasury Departments.
3.93. The BTr website discloses the national government debt report on a monthly and annual
basis.51
The reports posted include the debt stock,52
debt indicators, and interest type of the
outstanding debt. The major component of the national government debt is government
securities.
3.94. The DBCC mid-year reports also present information about the national government
financing operations. The presented data includes actual debt stock as compared to the
programmed debt service, debt ratios (i.e., as a percentage of GDP), interest rate mix, interest
payments, debt average maturity, and debt cost and risk considerations. The information is
reconciled with creditors on a monthly basis. As the management reports are produced monthly,
the score for Dimension 13.1 is assessed at “A”.
Dimension 13.2 Approval of debt and guarantees
3.95. In the Philippines, the Department of Finance is mandated53
to review, approve, and
manage both domestic and foreign public sector debt. Under DoF supervision, the Bureau of the
Treasury assists in the formulation of policies on borrowing, control, and servicing of public debt
(foreign or domestic), issuance of government securities for the account of the national
government as authorized by the President, administer the Securities Stabilization Fund to
promote private investment in government securities, certify allowable debt and guarantee,54
and
prepare and submit reports55
to the DoF.
3.96. Public debts are contracted by the national government, GOCCs, government financial
institutions, or local government units as debtors. The LGU debts under the Local Government
Code are recorded in their respective books of accounts. Contracted foreign loans are managed
by the DoF, through the Municipal Development Fund Office. For GOCCs, the proceeds of the
loans are booked in the GOCC book of accounts, those guaranteed GOCC loans are disclosed in
the BTr notes to financial statement. For national government debt, the loan proceeds are booked
by the BTr National Government Debt Accounting Division.

2016 Philippines PEFA Assessment 30 June 2016
The GoP and Development Partners 46
3.97. Since the 2010 PEFA assessment, there is minimal change in the system for contracting
loans56
and issuance of guarantees except for the creation of the Debt and Risk Management
Division under the BTr in 2010.57
The Debt and Risk Management Division serves as a middle
office responsible for policy institutionalization and debt strategy formulation to manage public
sector debt and to monitor, report, and ensure compliance with debt management policies.
Ceilings for foreign borrowings and guarantees are provided in Republic Act (RA) 4860. Since
all criteria are fulfilled, the score for Dimension 13.2 is assessed at “A”.
Dimension 13.3 Debt management strategy
3.98. While a medium-term debt strategy in the form of strategic guideline is already in place
and has been disclosed to investors, credit rating agencies, and within the Cabinet, it is not a
published document. The result of the Debt and Risk Management Division’s analysis revealed
that the national government debt remains broadly sustainable. In addition, the national
government debt is generally resilient even under severe interest rate shock.
3.99. The national government budget financing program and outstanding debt are part of the
information presented by the Development Budget Coordination Committee to the President and
the Cabinet for approval. The national budget financing program and outstanding debt is
presented under BESF Table D.58
A debt management strategy document is not published. The
information in budget documentation for national government borrowing covers a three-year
horizon. The score for Dimension 13.3 is assessed as “D”.
Pillar IV. Policy-Based Fiscal Strategy and Budgeting
PI-14 Macroeconomic and fiscal forecasting
3.100. A credible fiscal strategy should support the achievement of the Government’s fiscal
policy objectives. This indicator measures the ability of a country to develop robust
macroeconomic and fiscal forecasts, which are crucial to developing a sustainable fiscal strategy
and ensuring greater predictability of budget allocations. It also assesses the Government’s
capacity to estimate the fiscal impact of potential changes in economic circumstances.
Indicator / Dimension Score Brief Explanation
PI-14 Macroeconomic and fiscal
forecasting
A Overall rating based on M2 methodology.
14.1 Macroeconomic forecasts A Macroeconomic projections are prepared
and used in the annual budget
preparation. The forecast covers the
budget year and the two following fiscal
years. Forecasts are updated in the DBCC
mid-year report.

2016 Philippines PEFA Assessment 30 June 2016
The GoP and Development Partners 47
Indicator / Dimension Score Brief Explanation
14.2 Fiscal forecasts B The forecasts of the main fiscal indicators
are presented in the BESF covering the
proposed budget year and the two
succeeding years.
14.3 Macro-fiscal sensitivity analysis A Forecasts of the budget sensitivity
analysis and debt sustainability are
published.
Dimension 14.1 Macroeconomic forecasts
3.101. Every year, the Department of Budget and Management issues a budget call and budget
priorities framework through the National Budget Memorandum to guide all
departments/agencies in their budget preparation. A DBM-prepared and DBCC-approved three-
year fiscal position and macro-economic assumptions are presented in the Memorandum. The
three-year projection only started with the 2015 budget preparation and was continued for the
2016 budget process with inputs from NEDA and Bangko Sentral ng Pilipinas.
3.102. This macroeconomic forecast together with fiscal performance is updated by the
Development Budget Coordination Committee in its mid-year report published on the DBM
website, thus Dimension 14.1 scores “A” under the assessment framework.
Dimension 14.2 Fiscal forecasts
3.103. The BESF presents the three-year projection of the main fiscal indicators,59
including
revenues that are generated based on the underlying macro-economic assumptions60
and budget
sensitivity to key macro-economic variables,61
the aggregate expenditures, and the budget
balance that in this case is a deficit. The budget technical notes and the People’s Budget
Proposals62
explain the estimates as well as the underlying macro-economic assumptions.
3.104. Forecast of the main fiscal indicators as presented in BESF covers the fiscal year and the
two subsequent years, thus this qualifies Dimension 14.2 for a rating of “B” under the
assessment framework.
Dimension 14.3 Macro-fiscal sensitivity analysis
3.105. The information in the BESF includes all the major economic aggregates, aggregate case
scenarios (both high and low), and the risk to fiscal variables in the form of a sensitivity analysis.
The budget sensitivity to key macroeconomic variables is shown in BESF Table A.6. While the
debt sustainability analysis is available in the published Fiscal Risks Statements, Dimension 14.3
qualifies for an “A” score.
Table 3.13: National Government Fiscal Position

2016 Philippines PEFA Assessment 30 June 2016
The GoP and Development Partners 48
Particulars 2014 2013 2012
Revenue (PhP millions) 1,908,527 1,716,093 1,534,932
Expenditures (PhP millions) 1,981,619 1,880,155 1,777,759
Deficit (PhP millions) 73,092 164,062 242,827
Nominal GDP (PhP millions) 12,642,736 11,548,191 10,564,886
Deficit (% of GDP) 0.6 1.4 2.3
Source: BTr.
PI-15 Fiscal strategy
3.106. This indicator provides an analysis of the capacity to develop and implement a clear
fiscal strategy. It also measures the ability to develop and assess the fiscal impact of revenue and
expenditure policy proposals that support the achievement of the Government’s fiscal goals. The
revenue budgeting process is not free of political interferences; thus having transparent and
formalized processes in place is essential to ensure accountability for the revenue collection
function.
Indicator / Dimension Score Brief Explanation
PI-15 Fiscal strategy B Overall rating based on M2 methodology.
15.1 Fiscal impact of policy proposals A Impact of proposed tax policy changes to
major sources of revenue as well as major
investments and programs on the government
fiscal program are estimated for three years.
President’s Budget Message also discusses
budget execution and the fiscal policy benefits.
These documents are submitted to the
legislature.
15.2 Fiscal strategy adoption B A fiscal strategy including mostly quantitative
fiscal objectives is prepared for up to six years
and the technical notes provide the narrative
for these targets. These documents are
submitted to Congress and published in the last
two budget years.
15.3 Reporting on fiscal outcomes C DBCC publishes a mid-year and year-end
report on Government’s progress of its fiscal
strategy but these are not submitted to the
legislature.
Dimension 15.1 Fiscal impact of policy proposals

2016 Philippines PEFA Assessment 30 June 2016
The GoP and Development Partners 49
3.107. In the Fiscal Risks Statement, the quantification of the national government revenue
fiscal program, as illustrated in Table 3.19, reflects the impact of the recent and proposed tax
policy changes to major sources of revenue. The BESF presents the three-year projection of
revenues, which are generated based on the underlying macro-economic assumptions (defined in
BESF Table A.1) and budget sensitivity to key macro-economic variables (shown in BESF Table
A.6). The budget technical notes and the People’s Budget Proposals63
explain the estimates, and
the details of the different programs and sectors to be funded under the budget as well as the
underlying macro-economic assumptions. The President’s Budget Message discusses plans on
how the budget will be spent and the gains of the fiscal policy. This document is included in the
proposed budget document to the legislature.
3.108. As previously discussed in PI-3, the Development Budget Coordination Committee
assesses the reliability of the revenue estimates using the macro-economic assumptions and
sensitivity of key fiscal variables to these assumptions (i.e., risk analysis). This forecast as
presented in the BESF covers the fiscal year and the two subsequent years. Similarly the impact
of major new investments and other expenditure policy decisions is estimated for the fiscal year
and two subsequent years. This qualifies Dimension 15.1 for a rating of “A” under the
assessment framework.
Dimension 15.2 Fiscal strategy adoption
3.109. The budget priorities framework presents the Government’s fiscal strategy. The
presentation of the three-year fiscal position only started in 2014 to prepare for the 2015 budget.
The budget submission to the legislature is comprehensive, based on the set quantitative targets
of the fiscal objectives and the key variables such as the revenue, expenditure, deficit, and debt.
The fiscal objectives are largely quantitative and cover a period of up to six years. The technical
notes for the 2016 proposed budget supplement the presented quantitative budget information.
Rating for Dimension 15.2 is assessed as “B”.
Dimension 15.3 Reporting on fiscal outcomes
3.110. The mid-year and year-end DBCC reports provide a substantive discussion on progress
achieved in comparison to the budget estimates and provides updates on programs and activities
for revenues, expenditures, financing, and debt. These reports examine the year-to-date
performance relative to macroeconomic and fiscal objective targets initially adopted. While the
reports are published on the DBM website, these are not formally submitted to the legislature.
Under the assessment framework, this qualifies Dimension 15.3 for a “C” rating.
PI-16 Medium-term perspective in expenditure budgeting
3.111. Expenditure policy decisions have multi-year implications and should be aligned with the
availability of resources in the medium-term perspective. The resulting medium-term
expenditure estimates should be reconciled with fiscal aggregates determined through a fiscal
strategy. This indicator examines the extent to which expenditure budgets are developed for the
medium term within explicit medium-term budget expenditure ceilings.

2016 Philippines PEFA Assessment 30 June 2016
The GoP and Development Partners 50
Indicator / Dimension Score Brief Explanation
PI-16 Medium-term perspective in
expenditure budgeting
A Overall rating based on M2 methodology.
16.1 Medium-term expenditure
estimates
A Government prepares a three year rolling
budget allocated by administrative,
economic and program classification.
16.2 Medium-term expenditure
ceilings
A Budget ceilings based on the agencies’
forward estimates are reviewed and
discussed by Cabinet. These are issued as
part of the pre-budget statement.
16.3 Alignment of strategic plans and
medium-term budgeting
B Majority of agencies align their activities
to the priority program of the
Government. The three-year plans
include cost information.
16.4 Consistency of budgets with
previous year’s estimates
A Deviation from the previous forecasted
budget is minimal and any changes are
explained in the People’s Budget.
Dimension 16.1 Medium-term expenditure estimates
3.112. The budget preparation guideline prescribes key programs and mandates all departments
and agencies to identify programs, activities, and projects in support of the five key results
areas64
of the President’s Social Contract with the Filipino People65
and to the goals and
objectives set under the Philippine Development Plan 2011-2016. This program budgeting66
sets
the need to prioritize those identified programs67
as well as the related cost (recurrent and
investment)68
to attain the desired outcomes for the 2014-2016 period in line with the Philippine
Development Plan.
3.113. The budget preparation continues to use the medium-term expenditure framework
(MTEF),69
which was noted in the 2010 assessment. Under MTEF, each agency and department
prepares a three-year rolling budget. The MTEF ensures that the next year’s budget takes into
account the decisions from the previous year and provides agencies with a three-year baseline
budget that is considered and decided in a consultative manner.
3.114. The NEP provides detailed information by operating departments and by program,
activities, and projects, while BESF shows the aggregate information by operating department by
object and the detailed expenditure programs by sectors. The score for Dimension 16.1 is
assessed at “A”.
Dimension 16.2 Medium-term expenditure ceilings
3.115. The Department of Budget and Management provides the hard budget ceiling that is
derived from the forward estimates of each department/agency for the budget year. Keeping in
line with the fiscal program and expenditure framework for each department/agency the budget
proposals are prepared in accordance with these indicative budgets ceiling. As a consequence,

2016 Philippines PEFA Assessment 30 June 2016
The GoP and Development Partners 51
there is limited deviation from the prescribed budget ceiling. In 2016 budget preparation, the
forward estimates (hard budget ceilings) were formulated, reviewed through technical hearings
with the agencies and approved by the DBM prior to issuance to agencies.
3.116. The budget ceiling for the ongoing projects of line agencies were part of the Budget
Priorities Framework issued through National Budget Memorandum 124, dated March 30, 2015.
This framework is part of the budget call issued through National Budget Memorandum 123 in
January 28, 2015, which serves as a guide to line agencies for their whole budget preparation
process. The score for Dimension 16.2 is thus assessed as “A”.
Dimension 16.3 Alignment of strategic plans and medium-term budgets
3.117. The budget guideline requires output targets, strategies, and indicative
participation/contribution of each agency to the specific component programs, activities, and
projects, and includes key annual targets and funding needs. For the 2014 budget, the
Department of Budget and Management issued guidance to all departments and agencies in
focusing their budget proposals on specific objectives and programs to continue the program
budgeting approach started in 2013. The Department presented the sector budget using the
COFOG concentrating on five vital sectors: social protection, health, education, economic
affairs, and housing and community amenities.
3.118. For both the 2015 and 2016 budgets, 64 percent of the budget was allocated to social
services and economic services to address the sector strategies initiated in 2014. The Department
of Education received the highest share to invest in improving school completion and student
achievement rates and to help the Basic Education Reform Program. The Departments of Health
and Social Welfare and Development were strongly supported to strengthen health services to
the most vulnerable, including the elderly and the youth, through social protection packages.
3.119. Budgeting is conducted using the program (activities and projects) classification,
specifically aligned with the government’s priorities; and the plans include costing information
for most of the ministries. The score for Dimension 16.2 is assessed at “B”.
Dimension 16.4 Consistency of budgets with previous year’s estimates
3.120. Per 2016 budget call,70
the 2015-2016 budget amounts for the existing or ongoing
projects are based on program plans/profiles. The budget level is adjusted considering the latest
actual obligations and payments of agencies for 2014. Thus, the budget level for 2015-2018
represents the forecasts of the likely obligations/contracting and payment requirements of the
agencies for each program, activity, and project. Table 3.20 highlights the minimal difference
between proposals and ceilings.
Table 3.14: Variance between budget proposals and ceilings based on projected estimates
Economic classification 2013 (PhP billions) 2014 (PhP billions) 2015 (PhP billions)
Proposed Adjusted Proposed Adjusted Proposed Adjusted

2016 Philippines PEFA Assessment 30 June 2016
The GoP and Development Partners 52
Economic classification 2013 (PhP billions) 2014 (PhP billions) 2015 (PhP billions)
Proposed Adjusted Proposed Adjusted Proposed Adjusted
Agriculture and agrarian
reform 109.28 111.14 116.58 112.09 109.27 114.46
Infrastructure 197.57 203.77 253.13 260.53 339.44 340.16
Education, culture and
human resource development 329.40 330.18 389.52 383.08 450.21 453.01
Social security, welfare and
employment 169.28 169.46 214.92 218.01 261.37 246.74
Public order and safety 124.39 124.28 134.53 134.40 141.89 143.04
Total 929.92 938.83 1,108.68 1,108.11 1,302.18 1,297.41
Variance 0.96% (0.05%) (0.37%)
Source: BESF.
3.121. As noted in Table 3.20, deviation from the proposed budget is minimal due to continued
use of MTEF. The mid-year report discloses that in 2014 the national budget tightly linked
performance targets to the budget allocations, and in 2015 the national budget affirms the
Administration’s promise that each peso spent must result in direct and measurable results for the
people to ensure agencies deliver their commitments in exchange. The highlight of all changes to
budgets at the sectors level is available in the proposed People’s Budget (i.e. in the budget
documents). Score for Dimension 16.4 is assessed at “A”.
PI-17 Budget preparation process
3.122. A well-planned, well-executed budgeting process is vital for ensuring that the budget – as
a policy statement that applies relative spending levels for a variety of programs and activities –
reflects the intended fiscal and sector policies of the government.
Indicator / Dimension Score Brief Explanation
PI-17 Budget preparation process A Overall rating based on M2 methodology.
17.1 Budget calendar. A A clear annual budget calendar exists,
which allows national government
agencies more than 10 weeks to complete
their detailed estimates.
17.2 Guidance on budget preparation A The National Budget Memoranda for
budget preparation are clear and
comprehensive. They include the
approved “hard” budget ceilings per
department and agency.
17.3 Budget submission to the
legislature A The President has in each of the last three
years submitted the budget proposal to
Congress more than five months before
the start of the fiscal year.

2016 Philippines PEFA Assessment 30 June 2016
The GoP and Development Partners 53
Dimension 17.1 Budget calendar
3.123. The 2016 annual budget process started with Department of Budget and Management
issuing a National Budget Memorandum (January 28, 2015) with the 2016 Budget Call to all
entities covered by the Government budget. The purpose of this issuance is to introduce the two-
tier budgeting approach,71
communicate the overall macroeconomic and fiscal policy framework
and priority thrusts for the coming budget year; prescribe the guidelines and procedures in the
preparation of the agency budget; and set the schedule of budget preparation activities. The
detailed guidelines, budget preparation forms, and a budget preparation calendar are also
included. Another National Budget Memorandum on budget priorities framework followed for
the 2016 preparation of agency budget proposals under Tier 2 of the two-tier budgeting
approach.72
All documents are posted on the DBM website.73
3.124. The 2016 budget calendar clearly specifies the planned dates for various preparation
activities. The planned and actual dates for the 2016 budget process are shown in Table 3.21.
Table 3.15: Activity Deadlines for 2016 Budget Process
Activity Planned date in 2015 Actual date in 2015

2016 Philippines PEFA Assessment 30 June 2016
The GoP and Development Partners 54
Activity Planned date in 2015 Actual date in 2015
1. Issuance of Budget Call. January 28 January 28
2. Budget Forum:
i. DBM officials and staff.
ii. National government agencies.
iii. Corporate Budget Forum.
February 10
February 11-17
February 18
February 10
February 11-17
February 18
3. DBM-RO/Agency-RO Budget Forum on the 2016
National Budget. February 12 February 12
4. Consultations on agencies’ on-going programs and
projects with:
i. Regional Development Councils.
ii. Civil Society Organizations.
iii. Other stakeholders under Bottom-Up
Budgeting.
January to February January to February
February 24
5. Submission of B.P. Form No. 201 A, B, C – Past
year’s actual obligation and current year
appropriation (through OSBP)
February February to May 5
6. Formulation of Forward Estimates (Hard Budget
Ceiling) January to February January to February 20
7 Technical Budget hearings with Agencies (Forward
Estimates) February 9-27
February 17 to
March 10
8 Updating of GMIS February 21 to
March 7
9 DBM Budget Review March 2-6 March 9-19
10 Sending of confirmation letters to agencies. March 9-10 March 23-26
11 Issuance of Ceiling and Budget Priorities
Framework March 20 March 30
12 Budget Forum
a. National Government Agencies
Batch 1
Batch 2
b. Corporate Budget Forum
March 23
March 24
March 25
April 13-17
13 RDC consultation/dialogue with selected agency
central offices March 26 to April 1 March 30 to April 1
14 Encoding in OSBPS of 2016 Budget Proposals
(New Spending Proposals) and Details of Forward
Estimates (Hard Budget Ceiling)
April 2-27 April 13 to May 15
15 Deadline of Submission (thru OSBPS) of 2016
Budget Proposals (New Spending Proposals and
Hard Budget Ceiling)
April 27 June 1
16 Technical Budget Hearing on New Spending
Proposals May 4-22 May 18 to June 9
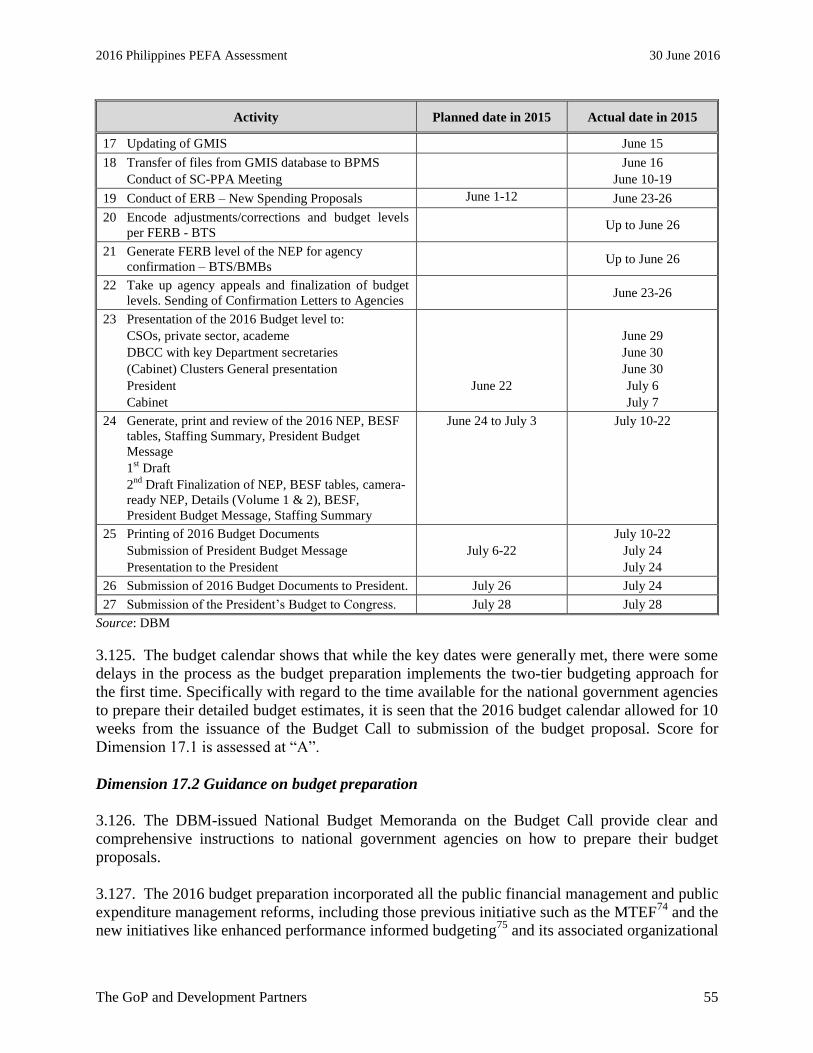
2016 Philippines PEFA Assessment 30 June 2016
The GoP and Development Partners 55
Activity Planned date in 2015 Actual date in 2015
17 Updating of GMIS June 15
18 Transfer of files from GMIS database to BPMS
Conduct of SC-PPA Meeting
June 16
June 10-19
19 Conduct of ERB – New Spending Proposals June 1-12 June 23-26
20 Encode adjustments/corrections and budget levels
per FERB - BTS Up to June 26
21 Generate FERB level of the NEP for agency
confirmation – BTS/BMBs Up to June 26
22 Take up agency appeals and finalization of budget
levels. Sending of Confirmation Letters to Agencies June 23-26
23 Presentation of the 2016 Budget level to:
CSOs, private sector, academe
DBCC with key Department secretaries
(Cabinet) Clusters General presentation
President
Cabinet
June 22
June 29
June 30
June 30
July 6
July 7
24 Generate, print and review of the 2016 NEP, BESF
tables, Staffing Summary, President Budget
Message
1st Draft
2nd
Draft Finalization of NEP, BESF tables, camera-
ready NEP, Details (Volume 1 & 2), BESF,
President Budget Message, Staffing Summary
June 24 to July 3 July 10-22
25 Printing of 2016 Budget Documents
Submission of President Budget Message
Presentation to the President
July 6-22
July 10-22
July 24
July 24
26 Submission of 2016 Budget Documents to President. July 26 July 24
27 Submission of the President’s Budget to Congress. July 28 July 28
Source: DBM
3.125. The budget calendar shows that while the key dates were generally met, there were some
delays in the process as the budget preparation implements the two-tier budgeting approach for
the first time. Specifically with regard to the time available for the national government agencies
to prepare their detailed budget estimates, it is seen that the 2016 budget calendar allowed for 10
weeks from the issuance of the Budget Call to submission of the budget proposal. Score for
Dimension 17.1 is assessed at “A”.
Dimension 17.2 Guidance on budget preparation
3.126. The DBM-issued National Budget Memoranda on the Budget Call provide clear and
comprehensive instructions to national government agencies on how to prepare their budget
proposals.
3.127. The 2016 budget preparation incorporated all the public financial management and public
expenditure management reforms, including those previous initiative such as the MTEF74
and the
new initiatives like enhanced performance informed budgeting75
and its associated organizational

2016 Philippines PEFA Assessment 30 June 2016
The GoP and Development Partners 56
performance indicator framework, zero-based budgeting,76
program budgeting,77
and bottom-up
budgeting (formerly known as grassroots participatory budgeting).78
The two-tier budgeting
approach79
was introduced to supplement the MTEF. These new processes are still in an early
stage of development and are yet to be fully institutionalized.
3.128. Prior to 2016, the National Budget Memorandum on the budget priorities framework
includes indicative budget ceilings per department and agency, but the Cabinet has not approved
either the budget priorities framework or the ceilings prior to their issuance. In the 2016 budget
preparation, the forward estimates (hard budget ceilings) were formulated, reviewed, and
approved by the DBM Executive Review Board separately from the rest of the agency proposals
on new and expanded programs, thereby simplifying the review of agency proposals. Score for
Dimension 17.2 is assessed at “A”.
Dimension 17.3 Budget submission to the legislature
3.129. The annual budget is presented to Congress in July, and detailed discussions occur from
then onwards. Since 2012, the Executive has consistently submitted the budget proposal to the
House of Representatives at the end of July, usually a day after the President delivers his State of
the Nation Address allowing Congress sufficient time to review and scrutinize it. Since the
budget proposal has consistently been submitted five months before the start of the fiscal year for
the last three years, the score for Dimension 17.3 is assessed at “A”.
PI-18 Legislative scrutiny of budgets
3.130. The power to give the government authority to spend rests with the legislature and is
exercised through the passing of the General Appropriations Act. If the legislature does not
rigorously examine and debate the law, the power is not being effectively exercised and will
undermine the accountability of the government to the electorate. This indicator considers the
extent to which the legislature scrutinizes, debates, and approves the annual budget.
Indicator / Dimension Score Brief Explanation
PI-18 Legislative scrutiny of
budgets
B+ Overall rating based on M1 methodology.
18.1 Scope of budget scrutiny. B The Legislature scrutinizes the budget
proposal submitted which includes
fiscal policies, aggregates and detailed
estimates for revenue and expenditure.
MTFF and priorities are not included in
the budget document.
18.2 Legislative procedures for
budget scrutiny.
A Both Houses of Congress have
established, comprehensive procedures
that are respected.

2016 Philippines PEFA Assessment 30 June 2016
The GoP and Development Partners 57
Indicator / Dimension Score Brief Explanation
18.3 Timing of budget approval. A In each of the last three years, the
Bicameral Conference Committee
composed of representatives from both
Houses of Congress approved the GAA
before the start of the fiscal year.
18.4 Rules for budget adjustments by
the executive.
B Expansion of the total expenditure is not
allowed but under EO 292, the
President is authorized to reallocate
among approved items of the budget to
utilize savings and cover deficits in any
line item.
Dimension 18.1 Scope of budget scrutiny
3.131. The Senate Finance Committee and the House (of Representatives) Appropriations
Committee and their corresponding sub-committees review the budget proposal submitted by the
Executive. The BESF includes an MTEF, but not a medium-term fiscal framework (MTFF).
Budget priorities framework is published at the start of the budget process on the DBM website
but is not subject to legislative review, which is limited to the documents submitted. However it
is used for reference regarding priority programs, strategies and approach in formulation of the
budget. Departments are required to appear before the committees to defend their budget
proposal. Score for Dimension 18.1 is assessed as “B”.
Dimension 18.2 Legislative procedures for budget scrutiny
3.132. Both the House of Representatives and the Senate have well established and respected
procedures for review of the budget law. The House of Representatives through the
Appropriations Committee with its sub-committees, after receiving the budget proposal from the
Executive, usually spends one month to review and conduct budget hearings before a General
Appropriations Bill is endorsed for plenary deliberation until its approval. The Senate conducts
simultaneous budget hearings but will only act on the approved the House of Representatives
version. After the Senate approval, a Bicameral Conference Committee reconciles the difference
between the House of Representatives and Senate versions. A Bicameral Conference Committee
report is then ratified by both Houses. The enrolled copy of the general appropriations bill is
finalized, printed, and sent to the President for signature.
3.133. To aid legislators during budget hearings, particularly in the House of Representatives,
the Congressional Policy and Budget Research Department in August 2013 issued “A
Legislator’s Guide in Analyzing the National Budget” that contains the framework and guide
questions for budget analysis. Agency Budget Notes containing pertinent information about the
department or agency under review are prepared and distributed by the Congressional Policy and
Budget Research Department. In addition, the Congressional District Representatives usually
meet with their constituents to gather relevant information for budget deliberation.

2016 Philippines PEFA Assessment 30 June 2016
The GoP and Development Partners 58
3.134. The procedures remain firmly established, comprehensive, and respected. The score for
Dimension 18.2 is assessed at “A”.
Dimension 18.3 Timing of budget approval
3.135. As shown in Table 3.22, the House of Representatives in the past three years has
approved the budget proposal in October followed by Senate’s approval in November. After
which the Bicameral Conference Committee has approved the budget well in time for the
President to complete the process before the start of the fiscal year. Score for Dimension 18.3 is
thus assessed at “A”.
Table 3.16: Submission and Approval Dates of Budget Bills
Fiscal
Year
Budget
proposal
House
approval
Senate
approval
Bicameral
approval
President’s
approval Republic Act
2012 July 26, 2011 Oct.12, 2011 Nov. 22, 2011 Nov. 29, 2011 Dec. 15, 2011 RA 10155
2013 July 24, 2012 Oct. 15, 2012 Nov. 28, 2012 Dec. 5, 2012 Dec. 19, 2012 RA 10352
2014 July 23, 2013 Oct. 22, 2013 Nov. 26, 2013 Senate:
Dec. 11, 2013
House:
Dec. 16, 2013
Dec. 20, 2013 RA 10633
2015 July 30, 2014 Oct. 29, 2014 Nov. 26, 2014 Senate:
Dec. 11, 2014
House:
Dec. 15, 2014
Dec. 23, 2014 RA 10651
2016 July 28, 2015 Oct. 09, 2015 Nov. 26, 2015 Senate:
Dec. 14, 2015
House:
Dec. 16, 2015
Dec. 22, 2015 RA 10717
Source: House Committee on Appropriations and www.senate.gov.ph.
3.136. At the time of the 2010 PEFA assessment, there was a trend for budgets not to be passed
by Congress prior to the start of the fiscal year. This however has not been a feature in recent
years with the budget passing on time in each of the last three years. This partly reflects efforts
of the Government of the Philippines to bring forward the budget preparation timetable to ensure
that both houses of Congress have adequate time for full consideration of their proposal.
Dimension 18.4 Rules for budget adjustments by the executive
3.137. The Administrative Code [Section 1 (6) of Book VI] authorizes the President to augment
any item in the General Appropriations Act from savings in other items. This is further supported
by Section 39, which states that any savings in the regular appropriations authorized in the
General Appropriations Act for programs and projects of any department, office, or agency may,
with the approval of the President, be used to cover a deficit in any other item of the regular
appropriations. These provisions give the President the flexibility to reallocate budgets within the
Executive as long as total appropriations do not exceed the levels prescribed in the General
Appropriations Act. In addition, the Executive determines the final utilization of any lump sum
appropriations as allocation to various line departments. The Executive is required to seek
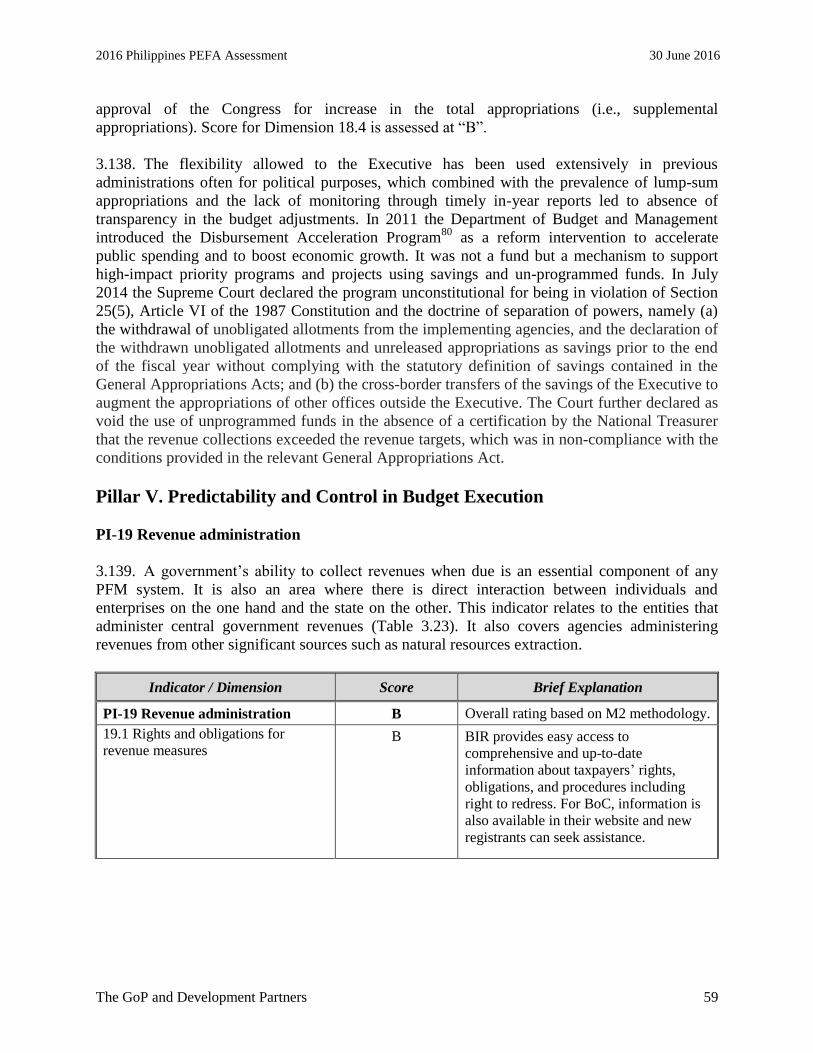
2016 Philippines PEFA Assessment 30 June 2016
The GoP and Development Partners 59
approval of the Congress for increase in the total appropriations (i.e., supplemental
appropriations). Score for Dimension 18.4 is assessed at “B”.
3.138. The flexibility allowed to the Executive has been used extensively in previous
administrations often for political purposes, which combined with the prevalence of lump-sum
appropriations and the lack of monitoring through timely in-year reports led to absence of
transparency in the budget adjustments. In 2011 the Department of Budget and Management
introduced the Disbursement Acceleration Program80
as a reform intervention to accelerate
public spending and to boost economic growth. It was not a fund but a mechanism to support
high-impact priority programs and projects using savings and un-programmed funds. In July
2014 the Supreme Court declared the program unconstitutional for being in violation of Section
25(5), Article VI of the 1987 Constitution and the doctrine of separation of powers, namely (a)
the withdrawal of unobligated allotments from the implementing agencies, and the declaration of
the withdrawn unobligated allotments and unreleased appropriations as savings prior to the end
of the fiscal year without complying with the statutory definition of savings contained in the
General Appropriations Acts; and (b) the cross-border transfers of the savings of the Executive to
augment the appropriations of other offices outside the Executive. The Court further declared as
void the use of unprogrammed funds in the absence of a certification by the National Treasurer
that the revenue collections exceeded the revenue targets, which was in non-compliance with the
conditions provided in the relevant General Appropriations Act.
Pillar V. Predictability and Control in Budget Execution
PI-19 Revenue administration
3.139. A government’s ability to collect revenues when due is an essential component of any
PFM system. It is also an area where there is direct interaction between individuals and
enterprises on the one hand and the state on the other. This indicator relates to the entities that
administer central government revenues (Table 3.23). It also covers agencies administering
revenues from other significant sources such as natural resources extraction.
Indicator / Dimension Score Brief Explanation
PI-19 Revenue administration B Overall rating based on M2 methodology.
19.1 Rights and obligations for
revenue measures B BIR provides easy access to
comprehensive and up-to-date
information about taxpayers’ rights,
obligations, and procedures including
right to redress. For BoC, information is
also available in their website and new
registrants can seek assistance.

2016 Philippines PEFA Assessment 30 June 2016
The GoP and Development Partners 60
Indicator / Dimension Score Brief Explanation
19.2 Revenue risk management B BIR has created a comprehensive end-to-
end compliance improvement strategy for
its risk management. The DoF Fiscal
Intelligence Unit has expanded the
previous post-entry audit scope of the
BoC Post-Entry Audit Group.
19.3 Revenue audit and investigation A BIR sets its policies and guidelines for its
annual audit and the investigation and
prosecution of cases under the Run-After-
Tax-Evaders (RATE) program. For BoC,
it is Run-After-The-Smugglers (RATS)
and creation of DoF Fiscal Intelligence
Unit to eliminate smuggling. Target
outputs are exceeded.
19.4 Revenue arrears monitoring D In 2014, the stock of revenue arrears is
less than 10% of the total revenue
collection and those arrears older than 12
months are more than 75% of the total
revenue arrears.
Table 3.17: National Government Revenues
2012 2013 2014
(PhP
millions) %
(PhP
millions) %
(PhP
millions) %
BIR 1,057,916 68.92 1,216,661 70.90 1,334,762 69.94
BoC 289,866 18.88 304,925 17.77 369,277 19.35
Other offices 13,291 0.87 14,112 0.82 14,947 0.78
Total tax revenue 1,361,073 88.67 1,535,698 89.49 1,718,986 90.07
Non-tax revenue 173,760 11.32 180,074 10.49 189,308 9.92
Grants 99 0.01 321 0.02 233 0.01
Total revenue 1,534,932 100.00 1,716,093 100.00 1,908,527 100.00
Source: BTr.
Dimension 19.1 Rights and obligations for revenue measures
3.140. Transparency of taxpayer obligations and liabilities aids not only the tax administrators
who collect taxes but also taxpayers willing to comply with their tax obligations. Actual and
potential taxpayers can easily access Internet-based information on taxation laws, regulations,
and procedures, including the taxpayers’ right to redress.81
The information is updated and
amended through revenue issuances of regulations, memorandum circulars, and memorandum
orders. The BIR website also provides a basic eight-page guide on business taxpayer obligations
and liabilities for professionals. The Bureau of Internal Revenue also created the Register, File

2016 Philippines PEFA Assessment 30 June 2016
The GoP and Development Partners 61
and Pay website to disseminate information to the taxpayer to comply with his obligation of
“paying right taxes”.82
In addition, the Bureau of Internal Revenue has recently launched the
Electronic Filing and Payment System (eFPS) to facilitate online filing and payment.
3.141. Customs information is available on the Internet though these documentation
requirements are not user-friendly to new registrants. According to interviews, a new registrant
may seek advice from the importation business community group about all documentary
requirements. Since BIR, as the major revenue collector, provides easy access to updated and
comprehensive information, the score for Dimension 19.1 is assessed at “B”.
Dimension 19.2 Revenue risk management
3.142. The Bureau of Internal Revenue created the Compliance Improvement Strategy Council
with a mandate for principal decision-making in risk management. Its main role is to identify
compliance risks (e.g., registration, filing and reporting, underreporting and payment), including
new and emerging risks; to prioritize significant risks for ensuring effective mitigation of
significant risks; and escalate any significant unmitigated risk to the appropriate forum/business
owner in case there is a broader impact to the Bureau. The creation of the Compliance
Improvement Strategy Council is to provide a comprehensive end-to-end compliance
improvement strategy for taxpayers to effectively manage the risks.
3.143. As for the Bureau of Customs, President Aquino issued EO No. 155 toward the end of
2013, which effectively dissolved the BoC Post-Entry Audit Group and transferred its post-entry
audit functions to the DOF Fiscal Intelligence Unit, in an effort to institute reforms. The
Department of Finance issued several department orders to implement EO No. 155. The issued
departmental orders include the prescription of new general post-entry audit guidelines and
procedures to be adopted by the Fiscal Intelligence Unit and audit selection through a computer-
aided risk management system.83
Departmental Order No. 11-2014 introduced many changes
designed to strengthen post-entry audits such as the coverage84
and retains provision for Customs
Administrative Order on the list of records to be kept by importers, mode of selection of
importers to be audited, as well as the imposable penalties for deficiency customs duties and
taxes.
3.144. Considering the processes in place for both Bureau of Internal Revenue and Bureau of
Customs, the score for Dimension 19.2 is assessed at “B”.
Dimension 19.3 Revenue audit and investigation
3.145. The BIR National Office sets the annual audit program and coverage through Revenue
Memorandum Order (RMO)85
to guide all its revenue officers in the respective revenue
jurisdictions in their conduct of audit/investigation. The Bureau of Internal Revenue performs its
audits in a decentralized manner whereby regional directors have been given complete authority
over the conduct of audits in their jurisdictions and the responsibility of audit and investigation is
with the assigned revenue officers.
2016 Philippines PEFA Assessment 30 June 2016
The GoP and Development Partners 62
3.146. The identified risks, based on the investigation report of the revenue officers, are
escalated to the appropriate management (Regional District Officers or the National Office) to
check if the risk has a broader BIR implication or will generate maximum effect to the taxpayers
by prosecuting high-profile tax evaders. For identified tax evasion and fraud cases, the National
Office through the Commissioner of Internal Revenue refers these cases to the Department of
Justice for preliminary investigation.
3.147. The RMO 24-2008 prescribes the policies and guidelines for development, investigation,
and prosecution of cases under the Run After Tax Evaders (RATE) Program. It mandates the
Bureau of Internal Revenue to investigate criminal violations of the National Internal Revenue
Code of 1997 and assist in the prosecution of criminal cases that will generate the maximum
deterrent effect, enhance voluntary compliance, and promote public confidence in the tax system
in the Philippines. Audits and fraud investigations are being undertaken and outputs of the
Electronic Letter of Authority Monitoring System (eLAMS)86
are disclosed in the annual
report.87
The key performance indicators are monitored and evaluated quarterly. For 2014 the
target of at least 36 cases filed was exceeded as the Bureau accomplished a total of 123 RATE
cases filed with the Department of Justice with estimated tax liabilities amounting to PhP 20.44
billion.
3.148. The BoC Run-After-The-Smugglers (RATS) Program focuses on monitoring, profiling,
case building, and prosecution of smugglers.88
It is designed not only to collect taxes but also to
ensure that importers comply with existing laws and regulations on tariff and customs that
complement the post-audit power under RA No. 9135, Tariff and Customs Code of the
Philippines.89
Milestones and key performance indicators are published. The guideline for Post-
Entry Audit under the Fiscal Intelligence Unit was also issued through the Customs Circular.90
With the yearly target to file 24 cases, the target outputs were exceeded for 2013 (43 cases filed)
and 2014 (35 cases filed). Score for Dimension 19.3 is assessed at “A”. The assessment of this
dimension took into consideration that the combined revenue collection by BIR and BOC is 89
percent of the total revenue, and they both exceeded their target output.
Dimension 19.4 Revenue arrears monitoring
3.149. The substantial increase of tax arrears in 2013 was attributable to the improved recording
and monitoring process of the revenue arrears as prescribed by BIR’s internal memorandum.91
For proper guidance, the Bureau issued a memorandum for policies, guidelines, and procedures
in the periodic cleanup of accounts receivable or revenue arrear92
and its amendments.93
This is
also supplemented by the BIR reform for Arrears Management94
and the implementation of
Accounts Receivable Management System95
to enable the establishment of accurate Accounts
Receivable/Delinquent Accounts database across all BIR offices.
3.150. The percentages of the total stock of arrears against the total revenue were 4 percent, 6
percent, and 6 percent for 2012, 2013, and 2014, respectively (Table 3.18). The score for the
percentage of the total stock arrears in relation to the total 2014 revenue may have qualified for
an “A” rating; however, the criteria must also satisfy the requirement on revenue arrears older
than 12 months. In 2014, the BIR data on those revenue arrears older than 12 months was 89

2016 Philippines PEFA Assessment 30 June 2016
The GoP and Development Partners 63
percent of the total revenue arrears for the year. Thus, Dimension 19.4 is assessed as “D” under
the assessment framework.
Table 3.18: Collectible Tax Arrears as of Year-End
Taxable
year No. of
dockets
No. of
cases
Collectible
arrears
older than
12 months
(PhP billion)
Total
collectible tax
arrears
(PhP billion)
% of tax
arrears
older than
12 months
relative to
total
arrears
Total
revenue
(PhP
billion)
% of
tax
arrears
relative
to total
revenue
2012 38,457 54,020 36.91 61.64 60 1,534.932 4
2013 42,664 64,244 88.15 107.61 82 1,716.093 6
2014 41,988 66,560 108.49 121.88 89 1,908.527 6
Source: BIR.
PI-20 Accounting for revenue
3.151. This indicator assesses procedures for recording and reporting revenue collections,
consolidating revenue collected, and reconciling tax revenue accounts. It covers both tax and
non-tax revenue collected by the central government.
Indicator / Dimension Score Brief Explanation
PI-20 Accounting for revenue A Overall rating based on M1 methodology.
20.1 Information on revenue
collection A Monthly submission by the revenue
generating agencies is consolidated and
published by BTr covering all revenue.
20.2 Transfer of revenue collections A The BIR and BoC comply with the use of
TSA System.
20.3 Revenue accounts reconciliation A The reconciliation with the BTr of the
BIR and BoC collections is done
monthly.
Dimension 20.1 Information on revenue collections
3.152. The Department of Finance receives information by each revenue type from the revenue-
generating agencies. This is consolidated monthly to keep track of the national government’s
fiscal condition. The monthly consolidated revenue report96
is posted on the BTr website within
two months of reference period. Score for Dimension 20.1 is assessed at “A” since the published
data includes all the national government revenue.
Dimension 20.2 Transfer of revenue collections

2016 Philippines PEFA Assessment 30 June 2016
The GoP and Development Partners 64
3.153. The taxpayers and importers settle their tax dues and custom duties directly to the
accounts controlled by the Treasury through authorized commercial depositary bank and
authorized government depositary bank. To show compliance with TSA implementation, a
memorandum of agreement among the signing bank, Bureau of the Treasury, and Bureaus of
Internal Revenue and Customs covers remittances and reports of collection by the banks. Per the
memorandum, the signing bank will remit all collections to the account of the BTr with Bangko
Sentral ng Pilipinas not later than 10:00 AM of the succeeding banking day counted from date of
collection; and the signing bank will submit to BTr a collection report comprising all BIR/BoC
collection not later than 2:00 PM of the succeeding banking day counted from date of collection.
Score for Dimension 20.2 is thus assessed at “A”.
Dimension 20.3 Revenue accounts reconciliation
3.154. The revenues collected by Bureau of Internal Revenue and Bureau of Customs amount to
around 89 percent of the total revenue. This revenue data97
is reconciled with the Bureau of the
Treasury and Bangko Sentral ng Pilipinas on a monthly basis. Reconciliations are done every
month from the 5th
to 15th
to reconcile the collections/receipts of the Bureau of the previous
month with the transfers to the BTr account. Annual reconciliation for both bureaus is done
before the end of the fiscal period as it customarily accounts for discrepancies and collection
adjustments. Reconciliation of collections is also performed with the assessments and if
applicable the arrears (opening and closing) in both Bureau of Internal Revenue and Bureau of
Customs. Score for Dimension 20.3 is assessed at “A”.
PI-21 Predictability of in-year resource allocation
3.155. This indicator assesses the extent to which the central Ministry of Finance is able to
forecast cash commitments and requirements and to provide reliable information on the
availability of funds to budgetary units for service delivery.
Indicator / Dimension Score Brief Explanation
PI-21 Predictability of in-year
resource allocation
B+ Overall rating based on M2 methodology.
21.1 Consolidation of cash balances. C TSA is in place for revenue collected by
BIR and BoC and is being rolled out for
expenditure through eMDS. Accounts for
foreign-funded projects and those trust
accounts with legal basis remain outside
the TSA.
21.2 Cash forecasting and monitoring. A Cash flow committee prepares a cash
flow forecast and updates it twice a
month for actual flows and changes in
forecast.

2016 Philippines PEFA Assessment 30 June 2016
The GoP and Development Partners 65
Indicator / Dimension Score Brief Explanation
21.3 Information on commitment
ceilings.
A Since 2014, the GAA stands as the
government’s primary budget release
document. Notices of cash allocation are
issued for a semester and agencies are
able to plan and commit for a six-month
horizon.
21.4 Significance of in-year budget
adjustments.
A Any realignment requires a request by the
concerned department or agency and
should be approved by DBM.
Adjustments involve the management of
the department or agency.
Dimension 21.1 Consolidation of cash balances
3.156. In accordance with EO No. 55 (2011), the Bureau of the Treasury operates a treasury
single account to receive remittance of collections of internal revenue taxes and customs duties
from BIR- and BoC-authorized agent banks as well as other collections of national government
agencies from authorized government depository banks. The treasury single account, maintained
at Bangko Sentral ng Pilipinas, aligns the government policy of greater financial management
and control of its cash resources and allows the unification of the structure of government bank
accounts to enable consolidation and optimum utilization of government cash resources.
3.157. Spending agencies process payments through the Modified Disbursement System
(MDS)98 and as part of TSA implementation, Department of Budget and Management and
Department of Finance, through Joint Administrative Order No. 2015-1 dated March 12, 2015,
prescribe the adoption of the electronic MDS (eMDS). With the implementation of the eMDS,
the government agency shall no longer submit the hardcopy of the documents as previously
required in the MDS. In addition, the required MDS reports will be immediately available to the
Bureau of the Treasury and concerned government agencies. The BTr replenishes the MDS
account with government servicing banks with funds equivalent to the amount of negotiated
checks presented to the government servicing banks by implementing agencies.
3.158. Special accounts of ODA funds and those trust accounts with legal basis that are
maintained by the ministries, departments, and agencies implementing the projects are currently
not covered in the treasury single account and hence are not included in the consolidated cash
balances. All other balances are with the BTr and are consolidated. Score for Dimension 21.1 is
assessed at “C”.
Dimension 21.2 Cash forecasting and monitoring
3.159. The Bureau of the Treasury and Department of Budget and Management are both
involved in the government’s cash management function. The Department of Budget and
Management manages allotments and cash releases to spending agencies through the issuance of
Notices of Cash Allocation. The BTr, on the other hand, manages the government bank accounts.

2016 Philippines PEFA Assessment 30 June 2016
The GoP and Development Partners 66
The DBCC Cash Programming and Monitoring Committee regularly meets to assess the fiscal
performance of the national government and to recommend to the Development Budget
Coordination Committee the annual and quarterly cash budget programs of the government.
These cash budget programs are closely monitored and updated from time to time to take into
account significant fiscal developments and status of resources and expenditures. A Cash Flow
Committee also monitors the cash flows prepared by Asset Management Service (AMS). This
Committee meets twice a month before the conduct of bills and bonds options and reports the
forecast on the level and direction of the yield rates for government securities to guide the
Auction Committee composed of the Bureau of the Treasury, Department of Finance, and
Bangko Sentral ng Pilipinas. The AMS updates the cash forecast daily based on actual flows,
internal estimates and any adjustments or changes in forecast. Score for Dimension 21.1 is thus
assessed at “A”.
Dimension 21.3 Information on commitment ceilings
3.160. In 2014 and 2015, the General Appropriations Act stands as the government’s primary
budget release document. This means that all the disaggregated budget items in the General
Appropriations Act are already considered released to their respective agencies, with the
exception of lump-sum funds that have yet to be itemized and therefore require prior approval
before release through issuance of the Special Allotment Release Order. Departments and
agencies no longer need to secure the Special Allotment Release Orders to obligate funds (i.e.,
for initiating the procurement process and entering into contracts). Instead, an agency can begin
obligating funds as soon as the General Appropriations Act is enacted.
3.161. For multi-year programs, activities, and projects that take more than one year to
complete, a Multi-Year Obligational Authority must be requested from Department of Budget
and Management prior to entering into contracts to cover the total project costs.
3.162. For budget year 2014 and 2015,99 disbursement authorities such as Notice of Cash
Allocation are released by Department of Budget and Management on the basis of the Budget
Execution Documents, particularly the Monthly Disbursement Program, prepared and submitted
by the agency to Department of Budget and Management. The Notice of Cash Allocation acts as
a second level of control as recipients of allotments incur obligations but cannot make payments
until they receive Notice of Cash Allocations, which are treated as authorizations to issue checks.
An initial comprehensive Notice of Cash Allocation is issued directly to the operating units
covering the first semester requirements (i.e., January to June), chargeable against the current
year budget. Succeeding comprehensive Notices of Cash Allocations are issued to cover the 2nd
semester regular requirements, subject to the submission of Budget and Financial Accountability
Reports as at end of June and consistent with DBCC-approved Monthly Disbursement Program.
In 2014 and 2015, this did not disrupt the operations of agencies and the receipt of Notice of
Cash Allocations has been predictable allowing advance planning of expenditures for a horizon
of six months. Score for Dimension 21.3 is thus assessed as “A”.
Dimension 21.4 Significance of in-year budget adjustments

2016 Philippines PEFA Assessment 30 June 2016
The GoP and Development Partners 67
3.163. In 2015, the Department of Budget and Management issued National Budget Circular No.
559 dated June 26, 2015, to provide guidelines in the realignment of funds under the FY2015
General Appropriations Act in which it states that realignment covers change in (a) object of
expenditure within an allotment class; (b) implementing or operating units; (c) project
modifications as authorized in the pertinent special provisions of certain agencies in the General
Appropriations Act; or (d) one allotment class to another. Since any realignment requires a
request by the concerned department or agency and should be approved by Department of
Budget and Management, the score for Dimension 21.4 is assessed at “A”.
PI-22 Expenditure arrears
3.164. This indicator measures the extent to which there is a stock of arrears, and the extent to
which a systemic problem in this regard is being addressed and brought under control.
Indicator / Dimension Score Brief Explanation
PI-22 Expenditure arrears C+ Overall rating based on M1 methodology.
22.1 Stock of expenditure arrears B The stock of expenditures arrears is no
more than 6% of the total obligations
incurred for the past three years.
22.2 Expenditure arrears monitoring C CoA requirement for the submission of
year-end reports includes the aging of
expenditure arrears
Dimension 22.1 Stock of expenditure arrears
3.165. The balance sheet for government in the annual financial report prepared by the
Commission on Audit shows accounts payable of PhP 101.68 billion, PhP 119.61 billion, and
PhP 107.91 billion that were due to external suppliers in the 2014, 2013 and 2012 accounts,
respectively. These payables pertain to accounts that have been outstanding for over two years
with no actual claims, administrative or judicial, being filed against them or are not covered by
contracts which, under Section 98 of Presidential Decree 1445 or the Government Auditing Code
of the Philippines, should be reversed. True arrears may in fact be only a part of this total
amount. The Tables 3.19 and 3.20 show the decreasing trend of overstated and understated
accounts payable findings drawn from the CoA financial audit reports.
3.166. The stock of payables in 2012 is 5 percent of the total obligations incurred, 5.4 percent of
the total obligations incurred in 2013 and 4.59 percent of the total obligations incurred in 2014.
The score for Dimension 22.1 is assessed at “B”.
Table 3.19: Audit observations on Accounts payable as of December 31, 2014
Department Overstatement and (Understatement)
(PhP millions)
Dangerous Drugs Board (4.170)
Design Center of the Philippines 0.214

2016 Philippines PEFA Assessment 30 June 2016
The GoP and Development Partners 68
Department Overstatement and (Understatement)
(PhP millions)
Laguna State Polytechnic University 4.220
Philippine Army 23.828
Philippine Air Force (1.458)
National Parks Development Committee 7.254
Intramuros Administration (2.040)
Philippine Trade Training Center (2.682)
Total 25.166
Source: CoA 2014 Annual Financial Report for National Government, Volume I.
Table 3.20: Audit observations on Accounts payable as of December 31, 2013
Department Overstatement (and Understatement)
(PhP millions)
Department of Transportation and Communication 22.786
Bureau of Internal Revenue 162.453
Department of Education (514.890)
Department of Energy 914.835
Department of Environment and Natural Resources 67.424
Department of Social Welfare and Development (562.397)
Metro Manila Development Authority 1,524.175
National Youth Commission (1.408)
National Water Resources Board 0.301
Kalinga-Apayao State College 12.101
Philippine Merchant Marine Academy 1.100
Jose Rizal Memorial State University– Dipolog (0.215)
Jose Rizal Memorial State University – Tampilisan (0.228)
Total 1,626.037
Source: CoA 2013 Annual Financial Report for National Government, Volume I-B.
3.167. These accounts payable figures may be materially overstated. Interviews with DBM
officials reveal that a large portion of these accounts payable were due to the recording of
obligations as accounts payable using the definition of obligations under the old government
accounting system. Under the old system, an obligation referred to contracts entered into whether
or not goods or services were delivered. This definition of obligation was tightened with the
introduction of the New Government Accounting System in January 2002. The new system
defines obligations as “commitment by a government agency arising from an act of a duly
authorized official which binds the government to the immediate or eventual payment of a sum
of money in view of the delivery of goods or services”.
Dimension 22.2 Expenditure arrears monitoring
3.168. More reliable data on the stock of arrears is included in the budget proposal submissions
by line departments to the Department of Budget and Management, but that data is not collated
and analyzed. According to the Department of Budget and Management, a computerized system

2016 Philippines PEFA Assessment 30 June 2016
The GoP and Development Partners 69
to monitor outstanding claims and their settlement has been developed. Its full utilization should
facilitate improved management of accounts payable.
3.169. The CoA Accounting Circular Letter 2007-001 for NGAs includes requirement for aging
reports as part of the submission of year-end financial reports. Sample of aging reports of
expenditure arrears for FY2015 submitted by various departments were provided for verification.
The score for Dimension 22.2 is assessed as “C”.
PI-23 Payroll controls
3.170. This indicator is concerned with payroll for public servants only: how it is managed, how
changes are handled, and how consistency with personnel records management is achieved.
Wages for casual labor and discretionary allowances that do not form part of the payroll system
are included in the assessment of non-salary internal controls in PI-25.
Indicator / Dimension Score Brief explanation
PI-23 Payroll controls B+ Overall rating based on M1 methodology.
23.1 Integration of payroll and
personnel records B DBM maintains central-level GMIS used for
budgeting; departments maintain personnel
records and payroll data. Controls exist over
hiring and promotion to ensure compliance with
approved positions. Reconciliation of payroll with
personnel records is conducted monthly.
23.2 Management of payroll changes B Personnel record and payroll are updated upon
receipt of the required documentation within the
month and in the case of DepEd, within a quarter.
Retroactive adjustments are few.
23.3 Internal control of payroll B Control exists on the authority and basis for the
changes to personnel records and payroll.
23.4 Payroll audit A While payroll audits are performed by CoA as
part of their regular annual audit of the agency’s
financial statements, the installation of biometric
attendance systems in all national government
offices has minimized the risk of ghost workers.
Dimension 23.1 Integration of payroll and personnel records
3.171. The DBM-based Organization, Position Classification and Compensation Bureau
maintains the Government Manpower Information System (GMIS). This database includes the
total number of authorized positions for each organizational unit and the aggregate actual salaries
of permanent positions, which are comprised of the actual salaries of the filled positions and the
authorized salaries of the unfilled positions. The GMIS generates the list of filled and unfilled

2016 Philippines PEFA Assessment 30 June 2016
The GoP and Development Partners 70
positions as well as basic information, including the salary grade of personnel. The Bureau
utilizes this information for budgeting.
3.172. Each line department and agency maintains their respective personnel records and payroll
data either manually or in a computerized system. For instance, The Department of Education,
having the largest human resource complement of 761,647 positions (711,472 filled and 50,175
unfilled as of February 29, 2016), adopts a decentralized system where regional offices as well as
those secondary schools with fiscal autonomy manage their own records and data through a
Regional Payroll Service Unit database.
3.173. Personnel records and payroll data are updated by the respective line agencies on receipt
of required documentation in compliance with CoA guidance on documentary requirements.100
Personal benefits include salary increases; step increment; incentives; other benefits and claims;
and other forms of compensation, including payment for retirement gratuities, separation pay,
and terminal leave benefit.
3.174. The list of approved positions is consulted prior to approval of staff promotion and
hiring. The payroll data is validated with the personnel records on monthly basis as verified in
Departments of Education, Trade and Industry, Social Welfare and Development, and
Environment and Natural Resources. Score for Dimension 23.1 is assessed at “B”.
Dimension 23.2 Management of payroll changes
3.175. The authorized payroll staff in each line department record changes in payroll only after
receiving required documentation to support salary differentials due to promotion and/or step
increment, with changes made in the month these actions are received. Delays in receipt of the
necessary documents leads to retroactive adjustments in a few cases. Tax adjustments are made
annually at the end of the fiscal period.
3.176. While payroll processing as such is decentralized in the Department of Education, delays
still occur in updating changes in personnel records and payroll data, but these are made within a
quarter. The CoA audit reports regularly identify instances of delays in updating the personnel
records and timely changes to payroll data in this Department. The status of implementation of
prior year’s audit recommendation included in the annual audit report for calendar year 2014
reported these observations as only partially implemented. Score for Dimension 23.2 is assessed
at “B”.
Dimension 23.3 Internal control of payroll
3.177. Each line department and agency maintains their respective personnel records and
processes payroll separately. Only authorized staff is allowed to make changes with an available
audit trail. Timekeeping is facilitated through use of either Bundy clocks or biometrics, which
becomes the input for payroll processing.
3.178. Payroll controls for preparation, validation, calculation, and segregation between the
preparation and payment functions were found to be in place when reviewing sample

2016 Philippines PEFA Assessment 30 June 2016
The GoP and Development Partners 71
departments. Payrolls are prepared by the personnel service department based on the validated
daily time records. Approved prepared payroll is then presented to the accounting department for
budget verification and validation of payroll data and its calculation and computation of
deductions. Verified payroll information are processed and forwarded to the bank for payment
3.179. The CoA audit reports note some instances of errors in the payroll data update; but
despite weaknesses in implementation of some controls, the overall level of compliance for
payroll is considered sufficient for ensuring integrity of the payroll data. Score for Dimension
23.3 is assessed at “B”.
Dimension 23.4 Payroll audit
3.180. Biometric attendance systems have been installed in all national government offices
thereby minimizing the risk of existence of ghost employees. This was verified in the sample
departments visited as well as through certifications from several departments and validations by
assigned auditors. The Commission on Audit includes, as part of their regular annual audit of an
agency’s financial statements, procedures to attest management’s assertion on the accuracy and
validity of the payroll accounts, including controls in place to prevent ghost workers. Score for
Dimension 23.4 is assessed as “A”.
PI-24 Procurement
3.181. Significant public spending takes place through the public procurement system. This
indicator examines key aspects of procurement management. It focuses on transparency of
arrangements, emphasis on open and competitive procedures, monitoring of procurement results,
and access to appeal and redress arrangements. The scope of the indicator covers the entire
central government and all procurement of goods, services, and civil works whether classified as
recurrent or capital investment expenditure (e.g., including civil works and major equipment
investments).
Indicator / Dimension Score Brief Explanation
PI-24 Procurement C+ Overall rating based on M2 methodology.
24.1 Procurement monitoring B The procurement monitoring system of 15 national
government agencies maintains data for contracts on what
has been procured, value of procurement and who has been
awarded contracts. The data are accurate and complete for
most (about 80% by value) of the contracts procured using
different methods for goods, services and works.
24.2 Procurement methods B The total value of contracts awarded through competitive
methods in 2014 was PhP 35.4 billion for central
government agencies and PhP 26.2 billion or 74% was done
through competitive bidding.

2016 Philippines PEFA Assessment 30 June 2016
The GoP and Development Partners 72
24.3 Public access to
procurement information B 5 of the 6 key procurement information elements are
complete and reliable for national government agencies
representing 75% of procurement operations (by value) and
are made available to the public in a timely manner through
appropriate means.
24.4 Procurement complaints
management D There is no independent administrative procurement
complaints system provided for under GPRA.
Dimension 24.1 Procurement monitoring
3.182. The PEFA assessment covered 15 national government agencies that awarded contracts
in 2014 in the amount of PhP 35.4 billion, comprising goods, works, and services using different
procurement methods. The records for these contracts are maintained for each step of the process
from pre-procurement conference; advertisement; bid submission; bid evaluation; notice to the
awardee; and contract preparation, finalization, and signing.
3.183. Documents are filed and maintained by the Procurement Unit of each national
government agency. Relevant data are captured in a procurement monitoring report that is
periodically submitted, together with the approved procurement plan to the Government
Procurement Policy Board, as mandated by the implementing rules and regulations of the
Government Procurement Reform Act (GPRA).
3.184. The GPPB-issued Agency Procurement Compliance and Performance Indicator (APCPI)
system is the standard for monitoring and the annual performance measurement of procuring
entities’ procurement systems (GPPB Resolution No. 2012-026, July 2012). The APCPI system
has been rolled out to 18 national government agencies and some GOCCs and local government
units. The Philippine Government Electronic Procurement System (PhilGEPS) publishes
invitation to bids and contract awards of all procuring entities. The score for Dimension 24.1 is
assessed at “B”.
Dimension 24.2 Procurement methods
3.185. This dimension analyzes the percentage of total value of contracts awarded with and
without competition. A good procurement system uses competitive method as the default mode.
In 2014, the 15 national government agencies awarded contracts worth PhP 35.4 billion using
different procurement methods. Out of this amount, PhP 26.2 billion (or 74 percent of the total
value of contracts) was procured through competitive method. Score for Dimension 24.2 is thus
assessed as “B”.
Dimension 24.3 Public access to procurement information
3.186. At least five of the six key procurement information elements are complete and reliable
for national government agencies representing most (75 percent or better) of procurement
operations (by value) and made available to the public through appropriate means. The

2016 Philippines PEFA Assessment 30 June 2016
The GoP and Development Partners 73
Philippine public procurement system makes available to the public (a) the legal and regulatory
framework as published on GPPB website (www.gppb.gov.ph); (b) the government procurement
plans in each NGA website; (c) the bidding opportunities in PhilGEPS (www.philgeps.gov.ph);
(d) contract awards with purpose, contractor, and value in PhilGEPS on each NGA website; and
(e) data on resolution of complaints in GPPB website. It is not publishing yet the data on annual
procurement statistics. Score for Dimension 24.3 is assessed at “B”.
Dimension 24.4 Procurement complaints management
3.187. While the Government Procurement Reform Act provides a protest mechanism, there is
no provision for an independent administrative procurement complaints body. Moreover, the
protest mechanism requires payment of fees that may discourage aggrieved parties. Scores for
Dimension 24.4 is assessed at “D”.
PI-25 Internal controls on non-salary expenditure
3.188. This indicator measures the effectiveness of general internal controls for non-salary
expenditures. Specific expenditure controls on public service salaries are considered in PI-23.
Indicator / Dimension Score Brief explanation
PI-25 Internal controls on non-
salary expenditure
B+ Overall rating based on M2 methodology.
25.1 Segregation of duties A Segregation of duties is prescribed throughout the
process.
25.2 Effectiveness of expenditure
commitment controls
B Controls exist for limiting commitments to budget
allocations and cash allocations. Effectiveness is
limited by continuing appropriations and weak
systems for recording and reporting commitments
and expenditures by year of budget allocation.
25.3 Compliance with payment
rules and procedures
B CoA audit reports raise observations on instances
of non-compliance and most departments are
issued a modified opinion. However, most
payments comply with regular payment procedures
and the instances of non-compliance are not the
main reason for qualified opinions in a majority of
cases.
Dimension 25.1 Segregation of duties
3.189. The NGICS provides that key duties and responsibilities need to be divided or segregated
among different people to reduce the risk of error or fraud. This includes separating the
assignment of responsibilities for processing, reviewing, recording, custody, and
approval/authorization of certain transactions. The organization of national government agencies
ensures that duties are delegated and any conflicting responsibilities are segregated. The
Accounting Division in charge of the recording and keeping the books is usually under the
Financial Management Service, separate from the Administrative Service that normally handles

2016 Philippines PEFA Assessment 30 June 2016
The GoP and Development Partners 74
the cashiering function. Procurement is also a separate function that works alongside the Bids
and Awards Committee.
3.190. The implementation of reforms in budgeting, cash/treasury management, accounting
(e.g., adoption of Philippine Public Sector Accounting Standards or PPSAS and the revised chart
of accounts), and auditing necessitated the updating of rules, regulations, guidelines, and
manuals. Hence, the Commission on Audit developed and prescribed the Government
Accounting Manual for National Government Agencies through CoA Circular No. 2015-007
dated October 22, 2015. The Manual, which took effect on January 1, 2016, replaces the NGAS
Manual, which is no longer in harmony with existing financial management processes. The
Government Accounting Manual for NGAs presents the basic accounting policies and principles
in accordance with the PPSAS adopted through CoA Resolution No. 2014-003, dated January
24, 2014; other pertinent laws, rules, and regulations; the revised chart of accounts prescribed
under CoA Circular No. 2013-002, dated January 30, 2013, as amended; accounting procedures,
books, registries, records, forms, reports, and financial statements; and illustrative accounting
entries. Delineation of responsibilities over government transactions and the detailed activities to
be performed by each area of responsibility are detailed in Volume I of both the NGAS Manual
and Government Account Manual for NGAs. Score for Dimension 25.1 is thus assessed as “A”.
Dimension 25.2 Effectiveness of expenditure commitment controls
3.191. Procedures for incurring expenditure commitments consist of a series of prior approvals
and clearances from the Department of Budget and Management. In 2014, the Department of
Budget and Management initiated the use of the General Appropriations Act as a release
document, which means that the budgets – except for those included in the negative list – are
considered released when the General Appropriations Act is enacted. Disbursement authorities
(i.e., notice of cash allocation, non-cash availment authority, and cash disbursement ceiling) are
still issued, as the case may be, to settle the obligations of agencies. The scheme intends to speed
up budgetary releases as agencies can immediately initiate procurement processes. The Special
Allotment Release Order is applicable to those in the negative list only.
3.192. There are controls in place to ensure that expenditures are within the allotments, and
allotments are within the appropriations. For instance, budget divisions/units are required to
approve obligation requests, maintain registries, and submit financial accountability reports to
track releases of allotments, commitments, and obligations. No contract involving the
expenditure of public funds by any government agency shall be entered into or authorized unless
the concerned agency accounting official has certified that duly appropriated funds are available
to cover the proposed contract for the current fiscal year. Thus the score for Dimension 25.2 is
assessed at “B”.
Dimension 25.3 Compliance with payment rules and procedures
3.193. Both the NGAS Manual, Volume 1, and Government Accounting Manual for NGAs
outline procedures for disbursement, either by cash or by check. The payment process includes
sufficiently strong internal controls. The CoA audit reports raise observations on instances of
non-compliance and most audit opinions are modified (i.e., qualified or adverse). However, most

2016 Philippines PEFA Assessment 30 June 2016
The GoP and Development Partners 75
payments comply with regular payment procedures, and in a majority of cases the instances of
non-compliance are not the main causes of the qualified opinions. The score for Dimension 25.3
is assessed at “B”.
PI-26 Internal audit
3.194. This indicator assesses the standards and procedures applied in internal audit.
Indicator / Dimension Score Brief Explanation
PI-26 Internal audit C+ Overall rating based on M1 methodology.
26.1 Coverage of internal audit A Internal Audit Service or Internal Audit Unit has been
established in all national government agencies
covering revenue and expenditure.
26.2 Nature of audits and
standards applied
B Under the Philippine Government Internal Audit
Manual, the internal audit function conducts
compliance, operations, and management audit.
However, quality assurance process is not yet in place.
26.3 Implementation of internal
audits and reporting
C Audit programs are largely completed, but with delays.
The report is submitted to the Secretary of the
department but not to DBM or CoA.
26.4 Response to internal audits B In every internal audit report issued, Internal Audit
Service and Internal Audit Unit provide
recommendations that are presented to the head of the
audited unit. Management response is solicited to
indicate corresponding action plan, and a formal
response is received in most instances within 12
months.
Dimension 26.1 Coverage of internal audit
3.195. The institutionalization of the internal audit function is based on Philippine laws and
statutes, the most recent of which is the DBM Circular Letter No. 2008-05 dated April 14, 2008,
which provides guidelines in the organization of the Internal Audit Service or Internal Audit
Unit, clarifying its functions and specifying the rank and salary grade of the head of the Internal
Audit Service and Units. The head of the Internal Audit Service or Internal Audit Unit reports
directly to the head of the agency or the secretary.
3.196. The Internal Audit Service or Internal Audit Unit have been formally established in all
national government agencies. Since internal audit is operational for all central government
entities, the score for Dimension 26.1 is assessed as “A”.
Dimension 26.2 Nature of audits and standards applied
3.197. In accordance with the Administrative Code of 1987, and as emphasized in the NGICS,
the functions of the Internal Audit Service or Internal Audit Unit include the following:

2016 Philippines PEFA Assessment 30 June 2016
The GoP and Development Partners 76
Advise the Department Secretary and Head of Agency, or the governing body through the
Audit Committee in the case of GOCCs and government financial institutions, on all
matters relating to management control and operations audits;
Conduct with department, agency, GOCC, and government financial institutions the
management and operations audits of functions, programs, projects, activities with
outputs, and determine the degree of compliance with their mandate, policies,
government regulations, established objectives systems and procedures /processes and
contractual obligations;
Review and appraise systems and procedures, organizational structures, asset
management practices, financial and management records, reports and performance
standards of the department proper, bureaus and regional offices;
Analyze and evaluate management deficiencies and assist top management by
recommending realistic courses of action; and
Perform such other related duties and responsibilities as may be assigned or delegated by
the secretary or the governing board or as may be required by law.
3.198. Through Circular Letter No. 2011-5, dated May 19, 2011, the Department of Budget and
Management issued the Philippine Government Internal Audit Manual, which contains
guidelines that outline basic concepts and principles of internal audit; policies and standards that
will guide government agencies in organizing, managing, and conducting an effective internal
audit; and practices that provide user-friendly tools, techniques, and approaches in appraising the
internal control systems against strategic objectives and in conducting management and
operations audits.
3.199. According to the Philippine Government Internal Audit Manual, the Internal Audit
Service or Internal Audit Unit performs three types of audit: compliance, management, and
operations. In most agencies, it is organized to have two divisions – management audit and
operations audit. Annual audit programs are prepared and recommendations for improvement in
internal controls are provided. Formal quality assurance function within Internal Audit Units is
not currently in place. Score for Dimension 26.2 is assessed at “B”.
Dimension 26.3 Implementation of internal audits and reporting
3.197. Each agency’s Internal Audit Service or Internal Audit Unit prepares and executes an
annual audit program. The assessment considered a sample of large agencies, including DPWH,
DSWD, DepEd, DoA, and DoF.
3.198. Audit programs are usually completed, but there are delays in completion often attributed
to shortage of staff. Most units are able to complete and submit reports, but not as per planned
timelines. These reports are submitted to the secretary of the department. Reports are not
submitted to the Department of Budget and Management or Commission on Audit and a central
(i.e., single) database of the reports is currently not present. Data on performance of the units i.e.
full completion of approved audit plan, was consolidated by the Department of Budget and
Management. This showed that majority of the audit plans are completed but delays are

2016 Philippines PEFA Assessment 30 June 2016
The GoP and Development Partners 77
common. Score for Dimension 26.3 is assessed at “C” due to delays and limited distribution of
reports.
Dimension 26.4 Response to internal audits
3.200. In every final internal audit report issued, Internal Audit Service or Internal Audit Units
provide recommendations that are presented to the head of the audited unit and the department
secretary. Management response is solicited to indicate the corresponding action plan that will be
undertaken.
3.201. The DPWH Internal Audit Service has developed a system in the conduct of audit follow-
up that is being used to determine the degree of compliance of the audited unit to the
recommendations. In DOTC, a clear process with timelines is prescribed for management
response on the recommendations. The head of the audited unit submits a signed, written
response within twelve months. Similar processes are in place in other departments. Score for
Dimension 26.4 is assessed at “B”.
Pillar VI. Accounting and Reporting
PI-27 Financial data integrity
3.202. This indicator assesses the extent to which treasury bank accounts, suspense accounts,
and advance accounts are regularly reconciled and how the processes in place support the
integrity of financial data.
Indicator / Dimension Score Brief explanation
PI-27 Financial data integrity C+ Overall rating based on M2 methodology.
27.1 Bank account reconciliation D While monthly Bank Reconciliation Statements are
prescribed per law, issues of non-preparation / delayed
submission and/or non-recording of reconciling items
are substantial as per CoA audit reports which cite
unreliable cash balances.
27.2 Suspense accounts A The revised chart of accounts does not provide for any
suspense account.
27.3 Advance accounts C Advances are reconciled in that break-up of
outstanding amounts is available. Despite repeated
efforts, significant advances remain outstanding long
after the prescribed periods for settlement.
27.4 Financial data integrity
processes
C While access to records is restricted, often without
audit trail, the quality and reliability of financial
reporting process is low due to use of spreadsheet that
lacks controls for assuring financial data integrity.
Dimension 27.1 Bank account reconciliation

2016 Philippines PEFA Assessment 30 June 2016
The GoP and Development Partners 78
3.203. Timely comparison between all government bank account transaction data and
government cashbooks should be undertaken on a regular basis, the results reported, and actions
taken to reconcile any differences. Such reconciliation is fundamental to the integrity of the
accounting records and financial statements.
3.204. Monthly bank reconciliation is required under Section 74 of Presidential Decree 1445 as
well as CoA Circular No. 92-125A, dated March 4, 1992. Several agencies are preparing the
bank reconciliations but with delays. CoA’s 2013 audit of Bureau of the Treasury reported
unreliable cash balance resulting from unreconciled cash sub-accounts and non-confirmation by
banks of the balance. Common Audit Observations and Recommendations from the annual audit
reports for national government agencies for 2013 included the following issues related to bank
reconciliations: (a) non-preparation; (b) delayed submission; and (c) non-recording of the
reconciling items. Deficiencies are considered substantial. The score for Dimension 27.1 is
assessed at “D”.
Dimension 27.2 Suspense accounts
3.205. Suspense accounts refer to unclassified debits and credits awaiting proper identification
for classification. The revised chart of accounts does not provide for any suspense account. There
is no need for reconciliation because the revised chart of accounts does provide for recording of
any suspense account. Score for Dimension 27.2 is assessed at “A”.
Dimension 27.3 Advance accounts
3.206. Under existing regulations, cash advances must be liquidated within the prescribed
periods depending upon the nature and purpose of the advance (e.g., for salaries and wages);
petty and field operating expenses; and local and foreign travel. Included among operating
expenses are cash advances for the payment of honoraria and similar payments to officials and
employees; operating expenditures for special projects and activities like anniversary
celebrations; and special purpose and time-bound activity like cultural and athletic activities.
These must be liquidated within 20 days from accomplishment of the purpose.
3.207. The Commission on Audit, through Circular No. 2012-004, dated November 28, 2012,
demanded for immediate liquidation and settlement of all outstanding cash advances as of
December 31, 2011. Despite such demand, the audit of national government agencies revealed
that there remained significant balances of unliquidated cash advances. Listing of these advances
is available with concerned agencies.
3.208. Based on CoA Annual Financial Report for 2014, only PhP 13.49 billion out of the total
cash advance of PhP 31.43 billion granted during FY2014 or 43 percent had been liquidated;
therefore, the unliquidated balance at year-end totaled PhP 17.94 billion or 57 percent. Further,
out of the PhP 35.29 billion cash advance granted in prior years, only PhP 6.90 billion or 20
percent had been liquidated in FY2014. Therefore, there had been an unliquidated balance from
prior years totaling PhP 28.38 billion or 80 percent of the outstanding balance. While cash
advances were not liquidated within the prescribed period, a reconciliation of these accounts is

2016 Philippines PEFA Assessment 30 June 2016
The GoP and Development Partners 79
prepared annually with full details, within two months of the end of the fiscal year. The score for
Dimension 27.3 is thus assessed at “C”.
Dimension 27.4 Financial data integrity processes
3.209. The eNGAS, a CoA-crafted computerized system, was rolled out to national government
agencies in 2003. It specifically addresses the computerization of the government’s accounting
system and automatic generation of required financial statements and reports. Embedded in
eNGAS are access controls and an audit trail. The Commission on Audit commenced the rollout
for eNGAS, Version 1.2.0, in 2003, with CoA Central Office as the pilot agency. The
Commission, in an effort to resolve implementation issues/concerns in the system reported by
users, came up with version 1.2.2 of the eNGAS. Thus, through CoA Resolution No. 2010-010,
dated November 15, 2010, the Commission on Audit resumed the rollout of eNGAS. As of
November 2012, eNGAS was rolled out in 406 agencies, of which 206 are DPWH (central,
regional, and district) offices. However, the system rolled out to 389 offices was version 1.2.1.
Only 17 offices received version 1.2.2. The eNGAS version 1.2.1 includes some features for
consolidation but these could not be operationalized. Consolidation of data at regional and then
central offices, essential for submitting required financial reports for departments or agencies, is
done on spreadsheets. Additionally, the agencies lacking eNGAS are using manual record-
keeping with appropriate segregation of duties and restrictions but still resort to spreadsheet for
preparing financial reports. As reported by CoA, an enhanced version of eNGAS (v 2.0.0) was
implemented starting September 2014. As of December 31, 2015, training has been provided to
210 offices of national government agencies.
3.210. Audit opinions from the Commission on Audit are seldom unqualified as shown in
Tables 3.27 and 3.28. As indicated in the audit reports, reasons for modified opinions are due to
misstatements/inaccuracies in the financial statements. The score for Dimension 27.4 is assessed
at “C” because, although access to basic records is restricted, changes in spreadsheets used for
consolidating financial reports are without an audit trail and quality of data in financial reports
may not be considered reliable.
Table 3.21: Tally of Audit Opinions
Type of Audit Opinion 2014 2013 2012 2011
Unqualified 2 3 2 2
Qualified 19 17 15 18
Adverse 4 8 12 7
Disclaimer - 1 - 2
No annual audit report, only ML 4 - - -
TOTAL 29 29 29 29
Source: CoA
Note: Data as of February 24, 2016
Table 3.22: CoA Audit Opinions rendered to Selected Departments and Agencies
Agency 2014 Issue date 2013 Issue date 2012 Issue date 2011 Issue date

2016 Philippines PEFA Assessment 30 June 2016
The GoP and Development Partners 80
Agency 2014 Issue date 2013 Issue date 2012 Issue date 2011 Issue date
1 Department of
Agrarian Reform Q Oct 30, 2015 A Oct 28, 2014 A
Aug 29,
2013 A Nov 13, 2012
2 Department of
Agriculture A July 6, 2015 A Oct 20, 2014 A
Sep 18,
2013 A Nov 14, 2012
3
Department of
Budget and
Management
Q Aug 28, 2015 Q Jun 30, 2014 Q Jun 25,
2013 Q May 30, 2012
4 Department of
Education Q Jun 15, 2015 Q Oct 15, 2014 Q Jul 31, 2013 Q Jun 30, 2012
5 Department of
Energy Q Oct 30, 2015 Q Sep 10, 2014 Q
Feb 28,
2013 Q Feb 28, 2012
6
Department of
Environment and
Natural Resources
Q Jun 4, 2015 A Jun 30, 2014 A May 31,
2013 A Jun 11, 2012
7 Department of
Finance Q Jun 16, 2015 UQ
Apr 15,
2014 Q
Mar 22,
2013 Q Apr 20, 2012
8 Department of
Foreign Affairs Q Jul 30, 2015 Q
Aug 22,
2014 Q
Jun 17,
2013 Q May 31, 2012
9 Department of
Health Q Apr 10, 2015 Q Oct 3, 2014 Q Jul 31, 2013 Q May 31, 2012
10 Department of
Justice A Jun 29, 2015 A Jun 30, 2014 A
Jun 20,
2013 Q Feb 28, 2012
11
Department of
Interior and Local
Government
Q Jun 11, 2015 Q Jul 31, 2014 A Jun 30,
2013 Q Jun 1, 2012
12 Department of Labor
and Employment Q Jun 29, 2015 Q Jul 7, 2014 Q Aug 8, 2013 Q Jun 29, 2012
13 Department of
National Defense No AAR; only ML Q
May 30,
2014 A
Apr 30,
2013 Q Apr 30, 2012
14
Department of Public
Works and
Highways
A Nov 5, 2015 Q Apr 10,
2014 A
Nov 25,
2013 A Oct 29, 2012
15
Department of
Science and
Technology
Q Jun 30, 2015 Q Nov 27,
2014 Q
Jun 17,
2013 Q May 10, 2012
16
Department of Social
Welfare and
Development
Q Jun 30, 2015 Q Sept 4, 2014 Q May 31,
2013 Q Jun 30, 2012
17 Department of
Tourism Q Jun 30, 2015 Q
Apr 10,
2015 Q Jul 26, 2013 Q Oct 29, 2012
18 Department of Trade
and Industry Q Aug 28, 2015 A Sep 5, 2014 A Jul 10, 2013 A Jul 31, 2012
19
Department of
Transportation and
Communication
Q Oct 30, 2015 Q Mar 30,
2015 A Not dated A Nov 16, 2012
20
Metropolitan Manila
Development
Authority
Q July 16, 2015 Q Oct 22, 2014 Q Aug 15,
2013 A Feb 28, 2012
21
National Economic
Development
Authority
Q May 29, 2015 Q May 16,
2014 Q
Jun 15,
2013 Q May 14, 2012
22 Philippine National
Police A Jun 30, 2015 A
May 26,
2014 A
Apr 30,
2013 Q Aug 15, 2012
23 BIR - National
Government Books No AAR; only ML D
Apr 30,
2014 Q
Jun 15,
2013 Q Jul 6, 2012
24 BIR - Regular
Agency Books No AAR; only ML A
Apr 30,
2014 A
Jun 15,
2013 D Jul 6, 2012

2016 Philippines PEFA Assessment 30 June 2016
The GoP and Development Partners 81
Agency 2014 Issue date 2013 Issue date 2012 Issue date 2011 Issue date
25 Bureau of Customs No AAR; only ML A May 2, 2014 A May 23,
2013 D Apr 30, 2012
26 Office of the
President Q Apr 30, 2015 Q Jul 15, 2014 Q Not dated Q Apr 20, 2012
27 Office of the Vice-
President Q
Jun 16, 2015 UQ
Mar 30,
2014 UQ Mar 1, 2013 UQ Feb 24, 2012
28 House of
Representatives UQ Apr 24, 2015 UQ
May 30,
2014 UQ
Apr 30,
2013 Q Apr 23, 2012
29 Senate of the
Philippines UQ May 18, 2015 Q May 5, 2014 Q
May 21,
2013 UQ May 15, 2012
Note: Q: Qualified opinion, UQ: Unqualified opinion, A: Adverse opinion, D: Disclaimer of opinion, No AAR: No Annual Audit
Report, only Management Letter issued.
PI-28 In-year budget reports
3.211. This indicator assesses the comprehensiveness, accuracy and timeliness of information on
budget execution. In-year budget reports must be consistent with budget coverage and
classifications to allow monitoring of budget performance and, if necessary, timely use of
corrective measures.
Indicator / Dimension Score Brief Explanation
PI-28 In-year budget reports D+ Overall rating based on M1 methodology.
28.1 Coverage and
comparability of reports
A Several reports on budget execution and accountability
are required to be submitted by the departments and
agencies to both CoA and DBM. Formats of these
reports comprehensively cover expenditures and
comparison with budget estimates.
28.2 Timing of in-year budget
reports
D Timely submission remains to be a challenge among a
number of line departments and agencies. As of
February 29, 2016, less than 20% of reports for second,
third or fourth quarter were received.
28.3 Accuracy of in-year
budget reports
C The reports are prepared manually using spreadsheet.
Although there is some level of data extraction from
systems such as eBudget and eNGAS, not all agencies
and departments have fully rolled out these systems.
Despite limitations, these are used by DBM for
planning and monitoring.
Dimension 28.1 Coverage and comparability of reports
3.212. Several reports, as enumerated in Table 3.29, are required to be submitted by the line
departments and agencies to both Commission on Audit and Department of Budget and
Management. The Department of Budget and Management requires submission of various

2016 Philippines PEFA Assessment 30 June 2016
The GoP and Development Partners 82
Budget Execution Documents and Budget and Financial Accountability Reports on a monthly,
quarterly, and annual basis. The DBM/CoA-issued Joint Circular No. 2014-1 dated July 2, 2014,
provides guidelines prescribing the use of modified formats of Budget and Financial
Accountability Reports. The scope and timing of submission of these reports are indicated in the
Joint Circular and in Sections 31 and 32, Chapter 3, Volume I of the Government Accounting
Manual for NGAs. Considering the scope and coverage of these reports, the score for Dimension
28.1 is assessed at “A”.
3.213. On the basis of the submissions of Budget and Financial Accountability Reports by line
departments and agencies, the CoA-prepared 2014 Annual Report on Appropriations,
Allotments, Obligations and Disbursements (ARAAOD), provides financial information on how
the national budget was allocated to the different government departments and agencies by
region, by province, and by cities; and on how these funds were expended by the agencies. Data
on appropriations, allotments, obligations incurred, and disbursements made were presented by
department/agency and by province/city.
Table 3.23: Budget Execution Documents and Budget and Financial Accountability
Reports
Report ID Title Description
Within 30 days after the end of each quarter
BAR No. 1 Quarterly Physical Report of
Operations (QPRO)
QPRO shall reflect the department’s/agency’s actual
physical accomplishments as of a given quarter in terms of
the performance indicated its physical plan (BED No. 2)
FAR No. 1 Statement of Appropriations,
Allotments, Obligations,
Disbursements and Balances
(SAAODB)
SAAODB shall reflect the authorized appropriations and
adjustments; total allotments received, including transfers/
adjustments, total obligations, total disbursements and the
balances of unreleased appropriations; unobligated
allotments; and unpaid obligations of a department/office/
agency by fund cluster and by allotment class. It shall
likewise be presented by (a) fund authorization; (b) major
final output; (c) program, activity, and project (PAP); and
(d) major programs/projects (identified by KRA).
FAR No. 1-A Summary of Appropriations,
Allotments, Obligations,
Disbursements and Balances by
Object of Expenditures
(SAAODBOE)
SAAODBOE shall be prepared by fund cluster and shall
reflect the summary of appropriations, allotments,
obligations, disbursements, and balances detailed by object
of expenditures consistent with the Revised Chart of
Accounts per CoA Circular No, 2013-002, dated January 30,
2013, and the conversion from the Philippine Government
Chart of Accounts to the Revised Chart of Accounts,
additional accounts/revised description/title of accounts per
CoA Circular No 2014-003, dated April 15, 2014.
FAR No. 1-B List of Allotments and Sub-
allotments (LASA)
LASA shall reflect allotments released by DBM and the
sub-allotments issued by the agency central/regional office,
their corresponding numbers, date of issuance, and amounts
by allotment class and by fund cluster. The total allotments
per LASA should be equal to the total allotments appearing
in SAAODB (FAR No. 1).

2016 Philippines PEFA Assessment 30 June 2016
The GoP and Development Partners 83
Report ID Title Description
FAR No. 2 Statement of Approved Budget,
Utilizations, Disbursements and
Balances (SABUDB) (for Off-
Budget Fund)
SABUDB shall reflect the approved budget, utilizations,
disbursements, and balances of the agency authorized by
law to use their income such as state universities and
colleges, and approved by the Board of Trustee/Regents,
and shall be prepared by fund cluster.
BFAR No. 2-A Summary of Approved Budget,
Utilizations, Disbursements and
Balances by Object of
Expenditures (SABUDBOE)
(for Off-Budget Fund)
SABUDBOE shall reflect the details of the approved
budget, utilizations, disbursements, and balances of the
agency authorized by law to use their income presented by
object of expenditures consistent with the CoA Revised
Chart of Accounts, and shall be prepared by fund cluster.
FAR No. 5 Quarterly Report of Revenue
and Other Receipts (QRROR)
QRROR shall reflect the report on actual revenue and other
receipts of the agency/operating units for the current year
presented by quarter, and by specific sources consistent
with the CoA Revised Chart of Accounts.
On or before 30th day following the end of the year
FAR No. 3 Aging of Due and Demandable
Obligations (ADDO)
ADDO shall be prepared by the fund cluster and shall
reflect the balance of unpaid obligations as indicated in the
Obligation Request and the aging of due and demandable
obligations as of year-end.
BED No. 4 List of Not Yet Due and
Demandable Obligations
This report shall reflect the level of obligations/
expenditures charged against prior year’s budget, for which
goods/services/projects are not yet delivered/rendered/
completed and accepted as of the preceding year.
On or before 30th day of the following month covered by the report
FAR No. 4 Monthly Report of
Disbursements
This report shall reflect the total disbursements made by
department, office, or agency and the operating unit by
Fund Cluster from the following disbursement authorities:
a) Notice of Cash Allocation;
b) Notice of cash allocation for the BTr-issued Working
Fund as an advance funding from loan/grants proceeds
in favor of an agency;
c) Tax remittance advice issued;
d) Cash disbursement ceiling issued by departments with
foreign-based agencies or units;
e) Non-cash availment authority;
f) Others, e.g. Customs, Duties and Taxes, BTr
Documentary Stamps.
On or before February 15 of every year
BED No. 1 Physical and Financial Plan
(PFP)
PFP shall reflect the overall physical (targeted outputs) and
financial (estimated obligations/expenditures) plan of the
agency with their approved budget level for the year,
broken down by quarters.
BED No. 2 Monthly Cash Program This report shall reflect the monthly disbursement
requirements of the agency, which is the basis for issuance
of notice of cash allocation, cash disbursement ceiling, and
other disbursement authorities.
BED No. 3 Estimate of Monthly Income This report shall reflect estimated income for the year by
source, as contained under the Budget Expenditures and
Sources of financing of the given year.
Dimension 28.2 Timing of in-year budget reports

2016 Philippines PEFA Assessment 30 June 2016
The GoP and Development Partners 84
3.214. Line departments and agencies submit their reports through Online Submission of Budget
Proposal System, which is then consolidated in the Unified Reporting System being managed by
the DBM Information and Communications Technology and System Service. Monthly in-year
reports such as the Report on Utilization of Cash Allocation and Status of Allotment Releases
and the quarterly Statement of Allotment, Obligation, and Balances are published on the DBM
website (www.dbm.gov.ph).
3.215. Timely submission remains a challenge. The status on submissions of Budget and
Financial Accountability Reports generated from the DBM Unified Reporting System, as of
February 29, 2016, for 2015 budget execution showed that less than 20 percent of line
departments and agencies had submitted their reports for all the quarter ends. The report
indicated non-submission or delay in compliance. The Commission on Audit also noted the same
observations in most of departments’ annual audit reports for calendar year 2014. Extensive
delays in the submission undermine relevance of the information. Score for Dimension 28.2 is
assessed at “D”.
Dimension 28.3 Accuracy of in-year budget reports
3.216. The budget execution and accountability reports are prepared manually using
spreadsheet. Although there is some level of data extraction from systems such as eBudget
System and eNGAS, not all agencies and departments have fully rolled out these systems.
Reliability of the information may be questionable considering the lack of appropriate control
mechanisms to ensure accuracy and validity of financial data. As such, consolidation is entirely
manual with supervisory review and authorization that does not fully mitigate the inherent risk of
errors and omissions.
3.217. Despite the limitations in accuracy and completeness of the reports, different operation
bureaus in Department of Budget and Management use these reports for planning and
monitoring. Score for Dimension 28.3 is assessed at “C”.
PI-29 Annual financial reports
3.218. This indicator assesses the extent to which annual financial statements are complete,
timely, and consistent with generally accepted accounting principles and standards. This is
crucial for accountability and transparency in the public financial management system.
Indicator / Dimension Score Brief explanation
PI-29 Annual financial reports C+ Overall rating based on M1 methodology.
29.1 Completeness of Annual
Financial Reports
B The Annual Financial Report includes information on
revenue, expenditure, financial assets, financial
liabilities, guarantees and long-term obligations.
Comparison of budget with outturn is provided in
ARAOD introduced in 1997 and enhanced to ARAAOD
in 2014.

2016 Philippines PEFA Assessment 30 June 2016
The GoP and Development Partners 85
Indicator / Dimension Score Brief explanation
29.2 Submission of reports for
external audit
C Financial statements of major spending agencies included
in the report are submitted for audit within nine months
of end of the fiscal year.
29.3 Accounting standards A In 2014, CoA adopted 25 PPSAS based on IPSAS. In the
previous years, NGAS was applied. The 2014 audited
financial statements of national government agencies
included disclosure on compliance with PPSAS in the
notes to financial statements.
Dimension 29.1 Completeness of annual financial reports
3.219. The Philippine Constitution (Section 4, Article IX-D) mandates the Commission on Audit
to submit to the President and Congress the Annual Financial Report of the Government. Further,
Section 41 of Presidential Decree No. 1445 of the Government Auditing Code of the Philippines,
requires that an annual report on the financial condition and results of operations of all agencies
of the government, which shall include recommendations of measures necessary to improve their
efficiency and effectiveness, will be submitted not later than September 30 of each year.
3.220. The Annual Financial Report is prepared to provide information on the total approved
budget, total released allotments, obligations incurred, and the unused balance of the
appropriations. It also provides vital information about the financial condition, cash inflows and
outflows, and the results of operations of national government agencies. Among the financial
information in the Annual Financial Report prior to FY2014 are as follows:
a) Condensed Balance Sheet;
b) Condensed Statement of Income and Expenses;
c) Condensed Statement of Government Equity;
d) Condensed Statement of Cash Flows;
e) Notes to Financial Statements;
f) Financial Analyses of Balance Sheet Assets, Liabilities and Equity;
g) Financial Analyses of Statement of Income and Expenses;
h) Financial Analyses of Cash Flows;
i) National Government Debt; and
j) Significant and Common Audit Observation and Recommendations.
3.221. With the adoption of 25 PPSAS through CoA Resolution No. 2014-003, dated January
24, 2014, the Commission on Audit renamed and reformatted the four financial statements
prescribed under the NGAS and required two more financial statements to be submitted by
government agencies. The Annual Financial Report for National Government Agencies for 2014
includes the following financial information:
a) Statement of Financial Position, showing current and non-current assets and liabilities;
b) Statement of Financial Performance;
c) Statement of Cash Flows;

2016 Philippines PEFA Assessment 30 June 2016
The GoP and Development Partners 86
d) Statement of Changes in Net Assets/Equity;
e) Statement of Comparison of Budget and Actual Amounts;
f) Notes to Financial Statements;
g) National Government Debt;
h) Significant and Common Audit Observations and Recommendations; and
i) Summary of Audit Opinions.
3.222. The Bureau of the Treasury maintains the national government books. The financial data
is taken from payment and collection reports from the authorized government depository banks
and authorized agent banks. Under the NGAS, national government agencies maintained two
sets of books (regular agency and national government books) and submitted two sets of
financial statements, which were prepared by agency accountants in accordance with existing
rules and regulations. Since UACS adoption in 2014, national government agencies maintain
books of accounts by fund cluster. There are seven fund clusters provided in the UACS Manual.
The financial data for the Annual Financial Report is taken from audited financial statements; the
agency accountants prepare the reports in accordance with existing rules and regulations.
3.223. Misstatements identified during audit are discussed with management during audit exit
conferences, usually through an Audit Observations Memorandum (AOM). Ideally, agency
accountants adjust their books of accounts based on audit recommendations and submit adjusted
financial statements. However, misstatements might be adjusted in the ensuing year particularly
in cases when there is no time, due to submission deadlines of audit reports, to make adjustments
and submit the adjusted financial statements to auditors. Misstatements that remained
unadjusted are considered by the auditors in rendering opinion, other than unqualified opinion,
on the fairness of the presentation of the financial statements. Many of these errors in the
individual financial statements are material, resulting in qualified opinions and using them
without the appropriate rectification leads to inaccurate reporting in the Annual Financial Report.
Furthermore, the inter-agency balances are not adjusted, and thus the data is simply compiled
rather than consolidated. The Commission on Audit does not provide an overall audit opinion on
the Annual Financial Report. Due to the qualified opinions on the majority of individual agency
financial statements, integrity and completeness of overall financial data may not be ascertained.
Nevertheless, the Commission mentioned that previous experiences disclosed no material
discrepancies that may adversely affect the integrity of the overall financial data.
3.224. Starting 2014, the Annual Financial Report includes a statement comparing the
obligations with the original budget. However, pursuant to RA No. 7226 dated March 12, 1992,
the Commission on Audit prepares a separate report named Annual Report on Allotments,
Obligations and Disbursements (ARAOD). In 2014, the Commission prepared Annual Report on
Appropriations, Allotments, Obligations and Disbursements (ARAAOD) in compliance with RA
7226 and Special Provision No. 6 on the Commission on Audit in the General Appropriations
Act of 2014. The Budget and Financial Accountability Reports form the basis of this report as
submitted to the Commission on Audit and Department of Budget and Management as outlined
in the DBM/CoA Joint Circular No. 2014-1, dated July 2, 2014. The 2014 ARAAOD was
submitted to the President, Senate, and House of Representatives on April 30, 2015.

2016 Philippines PEFA Assessment 30 June 2016
The GoP and Development Partners 87
3.225. Considering the information contained in the Annual Financial Report and ARAAOD
introduced in 2014, the score for Dimension 29.1 is assessed at “B”.
Dimension 29.2 Submission of reports for external audit
3.226. The annual financial statements of different departments and agencies are submitted to
the Commission on Audit after close of the fiscal year. Based on records given by the
Commission on some selected departments and agencies for 2014, the earliest agency to submit
was the Philippine Racing Commission on January 14, 2015, while the last financial statements
received were from the Construction Industry Authority of the Philippines on March 28, 2016.
Submission of the financial statement of the major spending agencies fell within nine months of
the end of the fiscal year. Score for Dimension 29.2 is assessed at “C”.
Dimension 29.3 Accounting standards
3.227. In CoA Resolution No. 2014-003, dated January 24, 2014, the Philippine Public Sector
Accounting Standards were adopted shifting from the previously issued State Accounting
Standards. The PPSAS are broadly consistent with the International Public Sector Accounting
Standards (IPSAS) and are set by the Commission on Audit through its Public Sector Accounting
Standards Board to harmonize the existing public sector accounting standards to the prevailing
international standards. As part of PPSAS, the Commission issued Philippine Application
Guidance where international standards are not applicable under the Philippine regulatory or
legislative environment. Out of 32 IPSAS contained in the 2012 Edition of the Handbook of
International Public Sector Accounting Pronouncements, 28 were found applicable in the
Philippine setting, and 25 had already been implemented in 2014. The remaining 3 in the 2012
Handbook, as well as IPSAS in the 2015 Handbook, are being evaluated for possible
implementation in 2017. Chart of accounts and the NGAS Manual were also revised in line with
the change in accounting standards.
3.228. The CoA-issued audit reports include information on the basis of preparation of the
financial statements. The disclosure on compliance to PPSAS and the revised chart of accounts is
also included in the Notes to Financial Statements of the audited financial statements for
CY2014. As indicated in the audit reports, reasons for modified opinions are due to
misstatements/inaccuracies in the financial statements and not due to major departure in the
prescribed accounting standards. Score for Dimension 29.3 is assessed at “A” since most IPSAS
have been adopted and applied.
Pillar VII. External Scrutiny and Audit
PI-30 External audit
3.229. This indicator examines the characteristics of external audit.
Indicator / Dimension Score Brief Explanation
PI-30 External audit C+ Overall rating based on M1 methodology.

2016 Philippines PEFA Assessment 30 June 2016
The GoP and Development Partners 88
Indicator / Dimension Score Brief Explanation
30.1 Audit coverage and
standards
C PPSSA, based on ISSAI, were adopted on January 29,
2013 and are applied for all audits. In 2011, a risk-based
audit methodology was adopted. The scope of the audit
covers the entire government but verification of
revenues collected by BIR is not conducted pending
approved guidelines in audit of tax assessment.
30.2 Submission of audit reports
to the legislature
C Audit reports are submitted to the head of the concerned
department within 9 months of receipt of the financial
reports for audit.
30.3 External audit follow-up B A formal response on recommendations is provided by
management of audited entity, and action is taken on a
majority of the recommendations.
30.4 Supreme Audit Institution
(SAI) Independence
B CoA’s independence regarding appointment/ removal of
the Head is laid down in the Constitution and is free
from Executive’s interference from the planning of audit
engagement, arrangement for publicizing reports, and
approval and execution of budget. While there is
unrestricted access to information for expenditure, scope
of audit for revenue collected by BIR (70% of revenues)
is limited.
Dimension 30.1 Audit coverage and standards
3.230. The Commission on Audit performs financial and compliance audits of all national
government agencies, local government units, and GOCCs. It also carries out value-for-money
(performance audit), fraud and other special audits.
3.231. The audit is conducted according to Philippine Public Sector Standards on Auditing
(PPSSA), which were adopted through CoA Resolutions No. 2013-007, 2014-011, and 2016-
010, dated January 29, 2013, May 7, 2014 and May 10, 2016, respectively, to align with
international standards. In 2011, the Commission on Audit shifted from the risk-based audit
approach to the integrated results and risk-based audit methodology and formulated the Forensic
Audit Manual; with this approach the Commission would be able to integrate its different types
of audits into a holistic audit methodology that would take into consideration the projected and
actual outputs and outcomes of programs, activities, and projects of government agencies. The
Commission on Audit developed the Integrated Results and Risk-Based Audit Software, a
computer-based tool that state auditors employ in conducting their audit. Training on this tool
started in 2014 and is ongoing.
3.232. Scope of the audit covers the entire government expenditures. Executive Order 38, issued
in 1998, requires the Department of Finance and Bureau of Internal Revenue to adopt certain
measures and audit procedures in coordination with the Commission on Audit to facilitate the
conduct of audit of assessments, revenues, and receipts.101
Pending issuance of the required
guidelines for implementation of this Executive Order, the revenue audit is limited to verification

2016 Philippines PEFA Assessment 30 June 2016
The GoP and Development Partners 89
of the collection and receipts, including remittances. The scope of audit conducted for the Bureau
of Internal Revenue is therefore limited. Score for Dimension 30.1 is assessed at “C”.
Dimension 30.2 Submission of audit reports to legislature
3.233. The Commission on Audit submits the audit report to the secretary of the department or
head of agency that is being audited. A copy is also submitted to the Speaker of the House of
Representatives and Chair of the Senate. This is usually done within 9 months after the
Commission on Audit receives its financial reports for audit. The score for Dimension 30.2 is
assessed at “C”.
3.234. There is no legal requirement for submission of audit reports by Commission on Audit to
the legislature. Both the 1987 Philippine Constitution and Presidential Decree 1445 require the
Commission on Audit to only submit the Annual Financial Report, which does not include an
audit opinion.
Dimension 30.3 External audit follow-up
3.235. The CoA audit observations and recommendations are presented to the management of
the audited entity through Audit Observations Memorandum and an exit conference; a
management response is solicited for inclusion in the CoA report. Responses are received in a
timely manner to allow inclusion in the issued report. An agency action plan is also submitted,
which becomes the basis for follow-up and monitoring. During the course of the current year’s
audit, status of implementation of prior year’s recommendations is assessed. This report is also
made part of the current year’s audit report. Based on CoA’s tally of the status of implementation
of 2013 audit recommendations, most recommendations have been fully or partially
implemented as summarized in Table 3.30. The score for Dimension 30.3 is assessed as “B”.
Table 3.24: Status of Implementation of 2013 Audit Recommendations
Agency No. fully
implemented
No. partially
implemented
No. not
implemented
Without
status report Total
Department of Agrarian Reform 10 32 78 - 120
Department of Agriculture 62 79 53 - 194
Department of Budget and Management 8 19 5 - 32
Department of Education - 32 - - 32
Department of Energy 10 16 11 - 37
Department of Environment and Natural
Resources 24 86 10 24 144
Department of Foreign Affairs 10 14 31 - 55
Department of Finance 6 6 2 - 14
Department of Health 29 52 13 10 104
Department of Justice 5 13 2 - 20
Department of Interior and Local Government 2 13 2 - 17
Department of Labor and Employment 2 23 3 - 28
Department of National Defense 1 9 2 - 12
Department of Public Works and Highways 2 35 4 - 41

2016 Philippines PEFA Assessment 30 June 2016
The GoP and Development Partners 90
Agency No. fully
implemented
No. partially
implemented
No. not
implemented
Without
status report Total
Department of Science and Technology 53 83 28 - 164
Department of Social Welfare and
Development 32 52 5 - 89
Department of Trade and Industry 28 38 13 - 79
Department of Transportation and
Communications 12 19 2 - 33
Department of Tourism 4 18 1 - 23
Metropolitan Manila Development Authority 30 22 8 - 60
National Economic Development Authority - 9 1 - 10
Philippine National Police 4 21 4 - 29
BIR-National Government Books 34 31 6 14 85
BIR-Regular Agency Books 21 45 8 - 74
Bureau of Customs 3 124 72 - 199
Office of the President 7 6 9 - 22
Office of the Vice-President 2 1 3 - 6
House of Representatives 3 - 1 - 4
Senate of the Philippines 1 5 - - 6
TOTAL 405 903 377 48 1,733
23% 52% 22% 3% 100%
Source: 2014 CoA Annual Audit Reports; CoA Website (http://www.coa.gov.ph/index.php/national-government-agencies/2014).
Dimension 30.4 Supreme Audit Institution Independence
3.236. The Commission on Audit has at its head a chairperson and two commissioners (together
known as the Commission Proper). Each of these members of the Commission Proper is
appointed by the President and subject to confirmation by the Commission on Appointments,
which is composed of Members of Congress. Members of the Commission Proper each serve
one, seven-year term; and cases requiring removal from office must be made by impeachment.
Budget for the Commission on Audit is included in the General Appropriations Act, which
undergoes legislative scrutiny. Budget execution is subject to the routine discipline of accounting
and internal control rules. There have not been any recent instances of restrictions placed on CoA
budget or funds flow. As provided in Article IX-A, Section 5 of the 1987 Philippine
Constitution, CoA, being a constitutional commission, enjoys fiscal autonomy; thus, its approved
annual appropriations shall be automatically and regularly released.
3.237. Independence is composed of two main important aspects: independence in fact (real
independence) and independence in appearance (perceived independence). An auditor’s
objectivity must be beyond question. In this regard, there is a perceived conflict of interest in the
function of the Commission on Audit being the auditor and accountant at the same time due to its
Constitutional mandate (Article IX-D, of the 1987 Philippine Constitution) which provides that:
The Commission on Audit shall have the power, authority and duty to examine, audit, and settle all
accounts pertaining to the revenue and receipts of, and expenditures or uses of funds and property,
owned or held in trust by, or pertaining to, the Government, or any of its subdivisions, agencies, or
instrumentalities, including government-owned or controlled corporations with original charters,

2016 Philippines PEFA Assessment 30 June 2016
The GoP and Development Partners 91
and on a post-audit basis: (a) constitutional bodies, commissions and offices that have been granted
fiscal autonomy under this Constitution; (b) autonomous state colleges and universities; (c) other
government-owned or controlled corporations and their subsidiaries; and (d) such non-
governmental entities receiving subsidy or equity, directly or indirectly, from or through the
Government, which are required by law or the granting institution to submit to such audit as a
condition of subsidy or equity. However, where the internal control system of the audited agencies
is inadequate, the Commission may adopt such measures, including temporary or special pre-audit,
as are necessary and appropriate to correct the deficiencies. It shall keep the general accounts of the
Government and, for such period as may be provided by law, preserve the vouchers and other
supporting papers pertaining thereto. [Section 2 (1)]
No law shall be passed exempting any entity of the Government or its subsidiaries in any guise
whatever; or any investment of public funds, from the jurisdiction of the Commission on Audit.
(Section 3)
3.238. The Commission on Audit’s independence regarding appointment and removal of the
head is laid down in the Constitution. It is free from Executive interference from the planning of
audit engagement, arrangement for publicizing reports, and approval and execution of budget. It
has unrestricted access to information related to expenditures; but as mentioned in PI-30.1, there
is a scope limitation for the BIR-collected revenue considering that the audit does not include the
assessments of all national revenue taxes, fees and charges of the Bureau of Internal Revenue.
Several efforts have been made by the Commission on Audit to address the limitation in revenue
audit, but these have yet to come to fruition. Minimal CoA staff are involved in preparing the
Annual Financial Report, which is a compilation of the financial statements prepared by the
departments. The score for Dimension 30.4 is assessed at “B”.
PI-31 Legislative scrutiny of audit reports
3.239. This indicator focuses on legislative scrutiny of the audited financial reports of the
national government, including institutional units, to the extent that either (a) they are required
by law to submit audit reports to the legislature or (b) their parent or controlling unit must
answer questions and take action on their behalf.
Indicator / Dimension Score Brief explanation
PI-31 Legislative scrutiny of audit
reports
D Overall rating based on M2 methodology.
31.1 Timing of audit report scrutiny D There is no formal scrutiny of audit
reports by the legislature.
31.2 Hearings on audit findings D Not applicable considering PI-31.1.
Observations from latest available audit
reports are considered during review of
budget proposals and legislative
inquiries; there are no formal hearings for
review of audit reports by the legislature.
31.3 Recommendations on audit by
the legislature
D There is no such process in place.
31.4 Transparency of legislative
scrutiny of audit reports
D Since legislative scrutiny of audit reports
does not occur, there is no hearing or

2016 Philippines PEFA Assessment 30 June 2016
The GoP and Development Partners 92
report to be made available to public.
Dimension 31.1 Timing of audit report scrutiny
3.240. As indicated in PI-30.2, the Commission on Audit transmits a copy of the audit reports
issued to departments and agencies and to both houses of Congress. There is no designated
Committee in the form of a public accounts committee, which is specifically tasked to examine
all these audit reports and question the audited entities regarding observations and issues raised
therein. Score for Dimension 31.1 is assessed at “D”.
Dimension 31.2 Hearings on audit findings
3.241. The legislature does not conduct periodic committee hearings with CoA representatives
to explain observations and findings nor the auditee department to seek their explanation and
plans of action. The Commission on Audit is often invited to attend the budget hearings and
other special investigations on an ad hoc basis where the latest available audit report is used as a
resource. There is no regular process in place to systematically receive and scrutinize, audit
reports. In the absence of a legal requirement, Dimension 31.2 is assessed at “D”.
Dimension 31.3 Recommendations on audit by the legislature
3.242. Since there is no formal review hearing for audit reports by either house of Congress,
there are no recommended actions requiring follow-up for recommendation. Dimension 31.3 is
assessed at “D”.
Dimension 31.4 Transparency of the legislative scrutiny of audit reports
3.243. Based on there being no committee hearing or committee report on scrutiny of audit
reports, the issue of transparency of such function does not arise. Dimension 31.4 is assessed at
“D”.
2016 Philippines PEFA Assessment 30 June 2016
The GoP and Development Partners 93
Chapter 4. Conclusions of the Analysis of PFM Systems
4.1. Chapter 4 provides an integrated analysis on the basis of the information presented in the
preceding Chapters 2 and 3 and states overall conclusions on the performance of PFM systems.
In particular, the analysis assesses how the performance of PFM systems may impact the
Government’s ability to deliver intended fiscal and budgetary outcomes. The most important
systemic weaknesses are identified in that respect.
4.1 Integrated assessment of PFM performance
4.2. This section shows the implications of the assessment for the seven pillars of PFM
performance: budget reliability, transparency of public finances, management of assets and
liabilities, policy-based fiscal strategy and budgeting, predictability and control in budget
execution, accounting and reporting, and external scrutiny and audit.
4.3. Pillar I, Budget reliability. The extent to which the government budget is realistic and
implemented as intended is measured by comparing actual revenue and expenditure with the
original budget. At the overall-level aggregate revenue prediction proved to be reliable, but not
for the individual taxes. There was substantial under-performance in collections for taxes on
goods and services and taxes for income, profit, and capital gains. Unreliable revenue estimating
has substantial effects for the Government’s ability to deliver services and the indicator analysis
showed that higher than budgeted collections for taxes on exports, and other non-tax proceeds,
including remittances, provided balance for the revenue budget. This performance does not
provide stability for confident revenue prediction and the revenue prediction processes in the
Bureau of Internal Revenue and the Bureau of Customs merit further development.
4.4. Budget reliability at the overall level between budget allotments and obligations incurred
was reasonable although the difference between allotments and obligations incurred increased
through 2012, 2013, and 2014. For the Government’s ability to pursue its policy objectives, as
intended by the budget allotments for departments and agencies, performance was also less
reasonable with expenditure outturn by function and by economic type varying substantially
from budget. Using continuing appropriations that are difficult to identify separately in the
accounting system reduces the clarity of the budget because the expenditures remaining are not
disaggregated between those covered by the current year appropriations and those incurred
against continuing appropriations from previous years. The present degree of budget reliability
does not provide the Government with a budget that is reliable enough to provide fiscal
discipline and for agencies to plan the effective provision of services. The budget preparation
arrangements need to be reviewed against best practices for budget clarity.
4.5. Pillar II, Transparency. Information on public financial management is comprehensive,
consistent, and accessible to users. This is achieved through comprehensive budget
classification; transparency of all government revenue and expenditure, including
intergovernmental transfers; publication of information on service delivery performance; and
ready public access to fiscal and budget documentation. Transparency helps operations to take
place within the government fiscal policy framework under adequate budget management and
reporting arrangements. The Unified Accounts Code Structure initiated in 2014 is a major step
2016 Philippines PEFA Assessment 30 June 2016
The GoP and Development Partners 94
toward a classification system to track transactions through the budget cycle according to
administrative, economic, and program categories as per GFS/COFOG standards. Currently,
reporting by agencies is not yet fully compliant with the new system. The documentation
provided to the legislature with the budget is sufficiently comprehensive to rate reasonably well
on the PEFA indicator, but more information on fiscal risks and the budget implications of new
policy initiatives and major new public investments will provide capacity for better fiscal
discipline.
4.6. Any failures in reporting of government activities detract from efficient allocation of
resources and fiscal discipline. The Government performs well on PFM indicators covering the
extent to which government revenue and expenditure are reported outside central government
financial reports and on the indicators covering transfers to subnational governments. The
Government assures full reporting through Administrative Code Executive Order 292, which
provides that all income and revenues of the government must accrue to the General Fund under
the “one-fund” concept. The transactions are reported and disclosed in the annual audited reports
of the national government agencies. Resources that are transferred to local government units are
allocated according to clearly defined rules managed by the Department of Budget and
Management. The year-end Annual Financial Report prepared by the Commission on Audit for
submission to the President and the Congress consolidates the revenue and expenditure fiscal
data.
4.7. Effective budget execution requires that the Government receive comprehensive and
accurate information on service delivery as per the intentions of the budget. The PEFA
performance indicator examines the extent to which information on resources received by service
delivery units is collected, recorded, and reported in year-end reports. The indicator also looks
for verification through performance audits or evaluations. This indicator focuses on the
availability, coverage, and timeliness of performance information on the delivery of public
services and on the extent to which such information is likely to promote improvements in the
effectiveness and operational efficiency of those services. It is also important for the legislature,
government officials, and the general public to know whether budget resources reach service
delivery units as planned. There are substantial difficulties for agencies in achieving good results
in this area because of manual reporting processes. Performance results are intended to be shown
in the agency annual audit reports; but of the main service delivery functions, only Education
presents performance results that are comparable to the targets. Delays in receipt of intended
resources by service delivery units is not uncommon and is a fact noted in CoA audit reports.
This is further exacerbated by the often incomplete and unreliable records in the field offices.
The lack of an integrated computerized system contributes to the difficulty in consolidating and
reporting information in a timely manner. Reconciliations between the records of the recipient
unit and the downloading entity are often delayed. These deficiencies constitute a major
continuing PFM impediment and can only be addressed through developing a comprehensive,
distributed, integrated accounting and performance information system. Such an investment
would provide substantial returns in improvements in fiscal discipline and efficient service
delivery against government intentions for its programs. The need for a government integrated
financial management information system (GIFMIS) has been under consideration by the
Government since 2009 and a PFM Committee is continuing the process. A project was awarded
in November 2015 for a Budget and Treasury Management System as a scaled-down version of

2016 Philippines PEFA Assessment 30 June 2016
The GoP and Development Partners 95
the eventual GIFMIS. It would be appropriate for continuing appraisals of the development of
these systems to consider how the initial system and its extensions may rectify the deficiencies
noted in this report.
4.8. Fiscal transparency also depends on whether information on government fiscal plans,
positions, and performance is easily accessible to the general public. The Government makes
available to the public all the five basic elements and additional four elements of information
required by the PEFA indicator, but the desired timeframes for in-year and annual budget
execution reports are not met. Accurate, comprehensive, in-year budget execution reports should
routinely be made available to the public within one month of their issuance. Greater
transparency on budget execution would be assisted by development of a more comprehensive
accounting system.
4.9. Pillar III, Management of assets and liabilities. The Government has a number of
arrangements in place for the effective management of assets and liabilities. Broadly, these are to
ensure that public investments provide value for money; assets are recorded and managed; fiscal
risks are identified; and debts and guarantees are prudently planned, approved, and monitored.
Monitoring of the financial positions of subnational governments and public corporations is
achieved through publication of audited annual financial statements on a reasonably timely basis,
although of the large number of barangays (village, district, or ward) about 30 percent have not
submitted financial statements for audit. The PEFA assessment found that the Government
operates a number of coordinating agencies that provide effective monitoring of public
investments by the central government, local government units, and GOCCs. Project investments
above PhP 1 billion are reviewed by the Investment Coordination Committee; local government
units are reviewed by a BLGF-operated financial performance monitoring system; and GOCCs
are reviewed by the Governance Commission for GOCCs through annual performance review,
quarterly monitoring of targets, and issuance of an audited annual report, generally within nine
months of year end.
4.10. There are some deficiencies in central government monitoring of physical and financial
assets. Procedures are in place but audits find that they are not respected adequately with an
absence of adequate asset registers and reports. More stringent management controls need to be
exercised, and accounting systems need to be re-developed to be more user-friendly and
effective. The procedures for competitive and transparent sale, transfer or disposal of non-
financial assets, and usage rights are established in legislation and generally respected.
Management practices, records, and controls over domestic and foreign debt and guarantees were
found to be effective, but there was a need for the publication of a medium-term debt
management strategy.
4.11. Pillar IV, Policy-based fiscal strategy. The PEFA assessment found that the fiscal
strategy and the budget are prepared with due regard to government fiscal policies, strategic
plans, and adequate macroeconomic and fiscal projections. The policy basis for the budget is
intended to ensure sustainability of the government’s fiscal strategy. This framing of the budget
is then supported by downstream budget execution practices that achieve the policy intent
through a medium-term expenditure framework. Arrangements for legislative scrutiny of the

2016 Philippines PEFA Assessment 30 June 2016
The GoP and Development Partners 96
budget were found to work well but the mid-year and year-end reports on progress of the fiscal
strategy are not submitted to the legislature.
4.12. Pillar V, Budget execution. Downstream budget implementation through well-supported
execution processes requires a system of effective standards and internal controls ensuring that
resources are obtained and used as intended. This area of the PEFA framework is the most
critical to attaining the goals of desirable budget outcomes: aggregate fiscal discipline, strategic
allocation of resources, and efficient service delivery. Administration and accounting procedures
for revenue were found to be effective according to the PEFA performance criteria. On the
expenditure side, the systems are in place for spending agencies to receive reliable information
on the availability of funds within which they can control commitments and make payments for
non-financial assets, goods, and services.
4.13. Controls over procurement, payroll expenditure, and non-salary expenditure were found
to have some weaknesses. These defects put at risk the sound basis established by the more
effective up-stream budget-cycle processes; this advance needs investment in more automated
systems to support staff in implementing more effective processes. The current processes do not
meet PEFA higher score requirements for reconciliation among approved staff lists; personnel
records and payroll data; internal controls over changes to personnel records and payroll;
procurement monitoring; use of competitive procurement methods; public access to complete,
reliable, and timely procurement information; procurement-complaint system; expenditure
commitment controls; payments controls; and coverage, timeliness and reporting of internal audit
results. The Government’s achievement of its policy goals needs further investment in the basic
systems for these common processes. The delays in conducting internal audit programs in an
environment where internal controls are not working well need to be corrected by greater
attention to internal audit processes and monitoring. The Government should consider
establishing a Central Internal Audit Unit to provide support and monitoring of agencies’ internal
audit arrangements.
4.14. Pillar VI, Accounting and reporting. Defects were found in the performance of the
accounting and reporting systems. It is critical that PFM systems are able to maintain accurate
and reliable records and disseminate appropriate reports at appropriate times to meet decision-
making, management, and statutory reporting needs. The current processes do not meet the
PEFA higher-score requirements for bank reconciliations; advance account reconciliations;
integrity of financial data, including adequacy of audit trails; timeliness and information quality
of in-year budget execution reports; and reliability of departmental and government-wide annual
financial reports prepared in accordance with accepted international accounting standards.
Development of an integrated accounting and financial management system will enable budget
execution to improve substantially through better decision-making and assured allocation and
use of funds for the intended purposes of fiscal discipline and service delivery.
4.15. Pillar VII, External scrutiny and audit. The external audit arrangements, for which the
Commission of Audit independently reviews and reports on public finances, were operating
satisfactorily. There is no Public Accounts Committee to examine and follow-up on the
implementation of audit recommendations for improvement by the Executive so this aspect of
external scrutiny of the PFM system is absent. Action by the legislature to undertake this

2016 Philippines PEFA Assessment 30 June 2016
The GoP and Development Partners 97
function is desirable. In its absence the function falls upon central agencies in the Executive.
There is a formal management response on recommendations of audited entities, and action is
taken on a majority of the recommendations. However, legislative scrutiny is also highly
desirable, and in its absence a higher standard of Executive response is needed. It would be
desirable to strengthen the role of internal audit in assisting management with making system
improvements identified by external audit reports.
4.2 Effectiveness of the internal control framework
4.16. An effective internal control system plays a vital role in addressing risks and providing
reasonable assurance that operations meet the four control objectives: (a) operations are executed
in an orderly, ethical, economical, efficient, and effective manner; (b) accountability obligations
are fulfilled; (c) applicable laws and regulations are complied with; and (d) resources are
safeguarded against loss, misuse, and damage. This analysis assesses the extent to which the
internal control system operating in the PFM system contributes to the achievement of those four
control objectives, based on available information obtained during the PEFA assessment,
including other PFM studies applied by the Government. Detailed findings concerning the main
elements of the five internal control components are summarized in a table at Annex 2 that also
highlights the current perceived gaps in the internal control system. This section also uses the
results of a study initiated by the World Bank at the request of the DBM Secretary. The
objective of the study was to review the existing financial control environment by reviewing the
existing DBM policies and practices as well as selected line departments.
4.17. There are international standards (ISSAI GOV 9100, Guidelines for Internal Control for
the Public Sector, issued by the International Organization of Supreme Audit Institutions) that
provide useful frameworks for control components, This analysis looks at the following:
Control environment,
Risk assessment,
Control activities,
Information and communication, and
Monitoring of the internal controls system.
A companion standard (ISSAI GOV 9120, Internal Control: Providing a Foundation for
Accountability in Government) provides guidance as to the separate roles of managers and
auditors in implementing control effectively.
4.18. Control environment. The control environment is set by the National Guidelines on
Internal Control Systems (NGICS) issued in 2008 by Department of Budget and Management,
supported by a Government Accounting and Audit Manual (GAAM), Volume III issued in 1992 and an Internal Audit Service governed by DBM Circular Letter No. 2008-05. This set of
procedures would provide a basis for an effective system of internal control if the management
and staff of government agencies were more energetically engaged in applying the guidelines.
This PEFA assessment and multiple internal audit and external audit reports demonstrate that
this is not yet the case. International guidance on effective internal control places most

2016 Philippines PEFA Assessment 30 June 2016
The GoP and Development Partners 98
importance on the personal and professional integrity and ethical values of management and
staff, including a supportive attitude toward internal control constantly throughout the
organization. As summarized in Annex 2, this requires that public sector authorities encourage a
strong commitment to competence and that the top and middle management’s philosophy and
operating style should set the tone for ethical application of internal control throughout the PFM
system. Mechanisms for achieving this change include an organizational structure based on
competence and program delivery and human resource management policies that reward ethical
conduct and penalize misbehavior. This should be supported by IT systems that assist with the
management and monitoring of program delivery. The most appropriate basis for a strong
internal control regime is a comprehensive Public Finance Act that provides a legislated
mandate.
4.19. The 2011 World Bank draft study on financial accountability and control highlighted the
potential for role ambiguity leading to inexact assignments of accountabilities.102
As a result, it is
more difficult to hold officers to account for control failures. The consequential potential for the
spread of impunity prejudices control over service delivery and fiscal discipline more generally.
The NGICS needs to be supported by PFM manuals that contain clear and comprehensive
codification of financial management rules and procedures, with explicit assignments of financial
accountabilities and defined sanctions for different types of rule violation and non-compliance.
An integrated financial management information system is required in order to do this well, as it
provides automatic mechanisms for recording and reporting of budget performance progress as
well as control of compliance.
4.20. The organizational structures to support internal controls should include an internal audit
that is independent from management, reports directly to the highest level of authority, and is
reviewed by the legislature or the Commission on Audit. PI 26 assesses internal audit and found
that internal audit units have been established in almost all central government agencies. Internal
audit units report directly to the head of the agency in most cases. This arrangement provides a
satisfactory basis for an effective internal audit function but is not yet fully implemented. The
assessment found that audit programs were sometimes delayed, and reports are not shared with
the Department of Budget and Management and Commission on Audit. There is no central
coordination in place.
4.21. Risk assessment. Risk management processes are used to provide efficient methods for
internal control effectiveness. An example of this is where the Commission on Audit performs
audits on a set of transactions in accordance with pre-defined high-risk criteria and performance
audits using an integrated results and risk-based approach that satisfies some of the conditions
for Dimension 30.1 (audit coverage and standards). Another is where internal audit units use
risk-based audit plans for their work, but this process is not widely applied.
4.22. Control activities. The PEFA assessment includes specific indicator dimensions on the
expenditure side for internal controls over payroll (PI-23), non-salary expenditure (PI-25), and
procurement (PI-24). A major impediment to management and staff effectiveness in applying
internal controls is the absence of a Government-wide user-friendly, integrated, and controlled
accounting system. The assessment for Dimension 25.2 (effectiveness of expenditure
commitment controls) found that the ability of the recording and reporting functions to report on

2016 Philippines PEFA Assessment 30 June 2016
The GoP and Development Partners 99
the segregation of expenditures and commitments by year of budget allocation is weak in the
absence of an integrated system. The rating for Dimension 25.3 (compliance with controls for
making payments) was affected by some non-compliance with controls and modified audit
opinions as reported by CoA audits.
4.23. Dimension 24.2 (use of competitive procurement methods) shows that in 2013 only 74
percent of the total value of contracts was awarded through competitive bidding. A good
procurement system ensures that procurement uses competitive methods, except for low-value
procurement under an established and appropriate threshold. The relatively high proportion of
procurement that is not subject to competitive bidding suggests that internal controls are not
performing adequately in this area. Another major support for internal control is public access to
information about procurement activities; two dimensions show these deficiencies. There is no
independent administrative procurement complaints system (Dimension 24.4).
4.24. On the revenue collection side, Dimension 19.3 assesses whether sufficient controls are
in place to deter evasion and ensure that instances of non-compliance are revealed, including
through collusion with representatives within a revenue administration; and this rated well. As
demonstrated by Dimension 3.2 (revenue composition outturn), the revenue collections for the
major taxes are different from the budget projections for those taxes. These variations are a cause
for considerable doubt over the adequacy of associated internal control systems for revenue.
However, assessment under Dimension 19.2 (management of risks to revenue) shows that the
Bureau of Internal Revenue has in place a comprehensive end-to-end compliance improvement
strategy for its risk management, which may lead to improvement. Dimension 19.4 – revenue
arrears monitoring – did not rate well with arrears older than 12 months at more than 75 percent
of the total revenue arrears.
4.25. Information and communication. Transactions, procedures, and rules, all information
needs to be identified, captured, and communicated in a form and timeframe that enables staff to
carry out their internal control and program responsibilities. Therefore, the internal control
system and all transactions and significant events should be fully documented. Computerized
information systems can produce reports that contain operational, financial and non-financial,
and compliance-related information that make it possible to run and control the operation to meet
service delivery goals and maintain fiscal discipline.
4.26. The performance indicators for the accounting, reporting, and recording system have low
ratings under the current systems. In order for the various Government manuals for
comprehensive PFM system management to rate higher on PEFA indicators, the accounting
system needs to be fully appraised for IFMIS. For Dimension 12.1 (financial asset monitoring),
the Commission on Audit has consistently raised issues resulting in qualified audit opinions with
balance discrepancies, dormant accounts, non-recognition of interest income, investments
without stock certificates, and subsidiary ledger problems for foreign investments. For
Dimension 12.2 (non-financial asset management), insufficient records are maintained and
verified for reliable compilation of end-of-year balances. For Dimension 26.1 (regularity of bank
reconciliations), the Commission on Audit has reported substantial deficiencies, and balances are
unreliable. For Dimensions 27.3 (clearance of advance accounts), despite repeated efforts,
significant advances remain outstanding long after the prescribed periods for settlement. For
2016 Philippines PEFA Assessment 30 June 2016
The GoP and Development Partners 100
Dimension 27.4 (financial data integrity processes), CoA audit opinions for government
departments’ annual financial statements are rarely unqualified because of lack of appropriate
control mechanisms to ensure accuracy and validity of financial data. For Dimension 28.3
(accuracy of the in-year budget reports), the reports are prepared manually using spreadsheet.
Although there is some level of data extraction from systems such as eBudget System and, not
all agencies and departments have fully rolled out these systems. Reliability of the information is
questionable considering the lack of appropriate control mechanisms to ensure accuracy and
validity of financial data.
4.27. Monitoring of the internal controls system. Monitoring arrangements are needed to
ensure a strong internal control framework. Several performance indicators found deficiencies in
agencies’ internal control that demonstrate a need for stronger internal audit action. Management
has the primary responsibility for monitoring the effectiveness of its internal control procedures,
especially by continuously maintaining a positive internal control environment. Management
would be greatly supported in managing its internal controls if transactions and significant events
are promptly recorded and properly classified. For the Government, this would be assisted by
improved IT systems. Many controls rely on the expectation that transactions and significant
events are to be authorized and executed only by persons acting within the scope of their
authority; and IT systems enable these controls to be systematically applied.
4.28. Stronger action could also be facilitated by increased central oversight of internal audit
activities. This internal control can be supplied through across-the-board external audit reviews
of internal audit performance that are then reported to the legislature for examination through the
Public Accounts Committee. More generally, the implementation of internal controls across the
public sector needs central coordination such as a single locus of responsibility for systematic
review of compliance and a clear process for enforcing sanctions or penalties for instances of
deviation. A Central Internal Audit Unit located in the Department of Budget and Management
should manage the Internal Audit Service and monitor the activities of the internal audit units.
This arrangement would provide assurance to the President through an annual report on whether
internal controls were being properly managed.
4.3 PFM strengths and weaknesses
4.29. This section assesses the extent to which the PFM system, as measured by the
performance indicators, constitutes an enabling factor for achieving the planned fiscal and
budgetary outcomes that encompass aggregate fiscal discipline, strategic allocation of resources,
and efficient use of resources for service delivery.
4.30. Aggregate fiscal discipline requires that the budget be delivered as planned, with
effective systems for ensuring financial compliance by all staff engaged in PFM activities. The
PFM functions that are focused on compliance must work well as measured by relevant PFM
performance indicators. The most relevant of these indicators and their assessment results
indicate that compliance and fiscal discipline at the component level are inadequate, and that
performance needs significant changes to improve financial management systems that support
accounting and reporting:

2016 Philippines PEFA Assessment 30 June 2016
The GoP and Development Partners 101
In-year control of spending. PI-1 (aggregate expenditure outturn) rated “D” and PI-2
(expenditure composition outturn) rated “D+”, implying a need for better information
systems to support control and provide budget reliability, and more consistent and
integrated reporting frameworks.
In-year control of taxes. PI-3 Dimension 1 (aggregate revenue outturn) rated “A”, but
PI-3 Dimension 2 (revenue composition outturn) rated “C”, demonstrating a problem for
the individual taxes in that the collections do not match expectations
Timely accounting and reporting. PI-27 (financial data integrity) rated “C+” and PI-28
Dimension 2 (timing of in-year budget reports) rated “D”, both poor results that prejudice
management capacity to exercise control over bank accounts and expenditures through
the year. PI-29 (annual financial reports) rated “C+”, taken overall these results
demonstrate the need for improvement in basic accounting systems that operate more
effectively and with proper audit trails and reconciliations so that expenditure can be
managed in accordance with budget intentions. Improved accounting is also needed to
remedy the present position where several audit opinions on departmental annual
accounts are qualified by the Commission on Audit.
Central control over cash. PI-21 Dimension 1 (consolidation of cash balances) rated “C”,
but PI-21 Dimension 2 (cash forecasting and monitoring) rated “A”, mixed results with
only ODA and Trust funds are yet to be incorporated into the consolidated cash balances
for a strong performance.
Adequate internal controls. Both the indicator for payroll controls and for non-salary
expenditure controls rated “B+”, indicating that the control framework is in place but is
not providing appropriate control.
Adequate external controls. PI-30 (external audit) rated “C+” with an important scope
deficiency in the audit of tax revenue, and PI-31 (legislative scrutiny of audit reports)
rated “D”. There is no Public Accounts Committee to routinely scrutinize audit reports
and build on the good work of the Commission on Audit in reporting on the audit of
expenditures and on defects in the adequacy of the financial statements of government
agencies.
4.31. Strategic allocation of resources requires planning and executing the budget to be in
line with government priorities aimed at achieving policy objectives. The most relevant
indicators and their ratings show that the upstream processes of budget formulation perform well
but their program allocations are not fully applied because of defects in the downstream
processes of in-year budget execution:
Well-managed policy based budget strategy. Indicators for fiscal strategy medium-term
perspective in expenditure budgeting budget preparation process, legislative scrutiny of
budgets, and predictability of in-year resource allocation all rated well, demonstrating
strength in the budget development process to set expenditure priorities in accord with
government intentions.

2016 Philippines PEFA Assessment 30 June 2016
The GoP and Development Partners 102
Credible budget that is implemented as passed. PI-2 (expenditure composition outturn)
rated “D+”, showing the final year-end result did not deliver the resource allocation
intended at the beginning of the year
Orderly execution of the budget with strong controls. The performance assessed for
revenue and expenditure processes show mixed results with a need to review and
improve the systems underlying delivery of the budget. The weak scores under
accounting and reporting demonstrate the difficulty for budget managers to monitor and
manage their budgets in the absence of basic tools for this purpose. Improvements would
allow these managers to keep expenditure on track with budget intentions at the
component level. Efficiency and economy may be improved with the establishment of an
independent procurement complaints mechanism, which would support more competitive
bidding.
Fiscal risks, assets and liabilities are well managed. PI-10 (fiscal risk reporting) rated
“B”, PI-11 (investment management) rated “B+”, PI-12 (asset management) rated “C+”
and P-13 (debt management) rated “B”, generally a strong performance in managing
assets and liabilities but with weaknesses in the systems for monitoring financial assets
leading to control weaknesses and qualified audit opinions.
4.32. Efficient service delivery requires that actual spending match budget allocations,
resources are available for service delivery as planned, and costs are minimized. Non-compliance
with the budget may lead to a shift across expenditure categories. The most relevant indicators
and their ratings show an appropriate budget development process but inadequate performance in
budget execution:
Credible budget that is implemented as passed. PI-2 (expenditure composition outturn)
rated “D+”, a major concern for service delivery as this indicator is crucial for providing
the resources needed to meet the policy intentions for the various economic sectors
Transparent budget information. PI-4 (budget classification) rated “C”, PI-5
(comprehensive budget documentation) rated “A”, PI-8 (performance information for
service delivery) rated “B+”, and PI-9 (public access to fiscal information) rated “B”,
generally providing a good performance in delivering on the constitutional requirement
for transparency of information on public finances.
Policy-based budgeting with a multi-year perspective. PI-17 (budget preparation
process) and PI-16 (medium-term perspective) rated “A”, again providing a sound basis
for the budget in setting service delivery plans.
Competitive tendering processes. PI-24 (procurement management) rated “C+”,
demonstrating a need to be more stringent in using competition and independent review
of complaints to deliver services at best cost and quality.

2016 Philippines PEFA Assessment 30 June 2016
The GoP and Development Partners 103
4.33. These results show overall that the Government has established strong and effective
budget development processes. However, the budget is not delivered in accordance with the
plans, and the budget execution process fails to deliver both at the aggregate level and the
component level. At the detailed level there is substantial variability between plans and outcomes
for both the revenue targets and the expenditure breakdowns. The PFM Committee is addressing
the downstream processes with its plans for implementing improved GIFMIS. The Government
has in place relatively effective internal audit and external audit arrangements that are supplying
management with information on where controls are failing, but there is insufficient response to
prevent continuing internal control deficiencies.
4.34. Management should take suitable actions with continued development of the proposed
information systems being considered by the PFM Committee. At present with only limited IT
systems the core PFM functions are being adversely affected by an ineffective reporting
environment. These information system issues also need to be addressed through stronger PFM
organizational arrangements, best supported by an appropriate law.103
4.35. In summary the PFM Committee should focus on strengthening the IT basis of PFM,
developing the accounting system to an adequate level specified by international standards, and
reinforcing the regulatory framework governing the PFM system. Guidance on design is
available from the World Bank’s handbook on IFMIS.104
An IFMIS offers the Government
significant benefits in managing public monies more effectively, including greater financial
control, improved monitoring of the government’s cash position and better planning for future
requirements, better fiscal reporting, and timely availability of a complete set of data to form a
reliable basis for budget formulation. The establishment of an effective system also contributes
directly to improving transparency and accountability.
4.4 Performance changes since the 2010 assessment
4.36. The 2010 PEFA assessment was intended to serve as a baseline for monitoring
subsequent progress in improving the performance of PFM systems in the Philippines. The
current assessment provides the opportunity to do this, serving as a successive assessment but
also a baseline for the future. The 2010 report included a summary assessment that identified
various departures from accepted international good practices at that time. It is convenient to
examine progress in rectifying these matters and identify where further progress is needed.
4.37. Budget reliability. Credibility of budget expenditure forecasts could not be assessed in
the 2010 report because the review period had frequent budget re-enactments and the budget
system could not provide reliable data on original expenditure appropriations. This has improved
in 2016 with budgets being enacted before the start of the fiscal year; but data on actual
expenditures in a comparable format is still elusive. Instead the current assessment bases the
analysis on the data available for committed amounts. The “D” rating is secured for aggregate
expenditure outturn. However, the budget system continues to cause difficulties in the
measurement of expenditure budgets due to the substantial use of allocations to Special Purpose
Funds. This reduces the capacity of the PFM system to manage resource allocation intentions
and creates risks for fiscal discipline as evidenced by the “D” score for expenditure composition
outturn. The 2010 report also noted that revenue forecasts were relatively realistic. This position

2016 Philippines PEFA Assessment 30 June 2016
The GoP and Development Partners 104
has deteriorated somewhat as the 2016 assessment shows significant differences between
estimates and outturns for the major revenue sources creating risks to expenditure financing and
the consequent service delivery that can be funded.
4.38. Transparency of public finances. Comprehensiveness and transparency of budget
reporting in the 2010 report was compromised by defects in the chart of accounts used for
expenditure reporting and lack of a public consolidated budget execution report in accordance
with the classification used for the budget. The 2016 assessment found that the situation had
been rectified. The Unified Accounts Code Structure was adopted in 2014 for budget
formulation, execution and reporting. It applies the GFS administrative and economic
classification. The National Expenditure Program provides the prior year’s outturn, revised
budget for the current year, and proposed budget for the next year on an obligation basis. The
Budget Expenditure and Sources of Finance Report provides details of expenditure and revenue
on a functional basis and per organizational entity (prior year, adjusted budget for the current
year, and budget year on an obligation basis). The 2010 report noted inadequate data on
resources made available to primary service delivery units. Funds utilization reports required by
the PFM arrangements were not being provided, and the lack of computer applications was seen
as an impediment to speedy resolution of the problem. In 2016 the situation has not been
resolved. A continued lack of integrated systems and automation limits the ability to monitor at
a central level.
4.39. Management of assets and liabilities. The 2010 report found overall monitoring of fiscal
risks from GOCCs to be deficient in quality. Since that report, the Government in 2011
established the Governance Commission for GOCCs with a focus on ensuring commercial
viability. The Commission collects information on GOCC’s financial performance on a quarterly
basis, publishes an annual report with consolidated information, and includes a condensed
version in the Government-wide Fiscal Risks Statement.
4.40. Policy-based fiscal strategy and reporting. The 2010 report found an orderly process of
budget preparation was affected by congressional delays in approving the budget. A MTEF was
being developed. In 2016 under the MTEF, each agency/department prepares a three-year rolling
budget set to accord with goals and objectives set under the Philippine Development Plan and
achieve intended resource allocations. In each of the three years, which were the subject of the
current assessment, the budget was enacted after legislative approval before the start of the fiscal
year.
4.41. Predictability and control in budget execution. The general weakness in reporting on
budget execution created by inconsistent classification frameworks as reported in 2010 has been
remedied. The revenue collection system was suffering from weak controls and enforcement.
Taxpayer registration, tax audit, and tax transfers were all found to be deficient. In 2016 revenue
administration was found to be much stronger. Both the Bureaus of Internal Revenue and
Customs operate various automated systems to assist with taxpayer information, filing, and
payment. Revenue audit programs have been systematized and achieved.
4.42. The 2010 system of managing releases of allotments through Special Allotment Release
Orders often created uncertainty about availability of funds for parts of agency budgets such as

2016 Philippines PEFA Assessment 30 June 2016
The GoP and Development Partners 105
capital outlays and maintenance and other operating expenses. Weak reporting on budget
execution made it difficult to establish the extent of in-year budget re-allocation, a major
accountability issue in the Philippines’ PFM system. In 2016 improvements have been achieved.
Since 2014, the General Appropriations Act stands as the government’s primary budget release
document and Notices of Cash Allocation are issued for a semester enabling agencies to plan and
commit for a six-month horizon.
4.43. In the 2010 report, internal audit units were functional only in a handful of agencies. By
2016, units had been established in all but 2 central government agencies covering revenue and
expenditure. Audit programs are largely completed, and the report is submitted to the Secretary
of the agency. Internal audit operates in accordance with the Philippine Government Internal
Audit Manual, but there is no quality assurance program to validate this.
4.44. Accounting and reporting. The 2010 report found inadequate reconciliation processes
for bank balances and for advances. This problem has continued in the 2016 PEFA assessment, a
serious concern for fiscal discipline. The 2010 report found that accounting, recording, and
reporting come out as areas where substantial work needs to be done in order for the Philippine
PFM system to be effective; this is replicated in the 2016 assessment.
4.45. External scrutiny and audit. The Commission on Audit conducts comprehensive audits
raising both systemic and compliance issues in reports. However, the accountability remains
weak as these reports are not used by the legislature for oversight, and it does not have a formal
role in the scrutiny of these audit reports. External audit reports continue to be submitted to the
head of the audited entity; and in the absence of a strong legislative or independent executive
oversight, the potential for improvements through recommendations is lost. Both the 2010 and
2016 reports found that no regular congressional hearings to discuss findings in the CoA reports
occurred during the respective review periods — a major weakness for all aspects of budget
outcomes, especially fiscal discipline.

106
Chapter 5. Government PFM Reform Process
5.1. Chapter 5 discusses the Government’s overall approach to PFM reform and describes
recent and on-going reform initiatives to improve PFM performance. This chapter has been
contributed entirely by the Government of the Philippines.
5.1 Approach to PFM reforms
5.2. The Government of the Philippines has in recent years pursued PFM reform through
different channels: (a) PFM Reform Roadmap; (b) Good Governance and Anti-Corruption
Cluster Plan, which includes the Philippines’ commitments to the Open Government
Partnership; and (c) several stand-alone initiatives. Though these are distinct reform streams,
they overlap to an extent.
5.3. Based on work initiated in mid-2009 undertaken by senior managers from the oversight
agencies (DBM, DoF, BTr, and CoA) and with World Bank assistance, the Government in
February 2011 launched the PFM Reform Roadmap for 2011-2015. It was a broad PFM reform
agenda for the Government covering six projects that aimed to strengthen PFM, including
fundamental changes to systems and processes.105
Several of the Roadmap projects received
direct implementation support from the Public Financial Management Project (PFMP) supported
by Australia’s DFAT. A mid-term review of the PFM Reform Roadmap was conducted in 2014-
2015, which led to its updating in May 2015. The PFM Reform Roadmap for 2015-2016 focuses
on delivery of the reforms from the design phase of the original roadmap.106
5.4. The implementation of the PFM Reform Roadmap follows from an Executive Order,107
which established a comprehensive four-level governance structure: (a) principals, composed of
the DBM and DoF secretaries and CoA chairperson; (b) PFM Committee, composed of senior
managers from Department of Budget and Management, Commission on Audit, Department of
Finance, and Bureau of the Treasury; (c) a DBM-based project management office supported by
Australia’s DFAT to manage and coordinate the reform and provide technical assistance; and (d)
six project implementation units that provide technical implementation support for the six
projects.108
5.5. There are no publicly available reviews or evaluations of the PFM Reform Roadmap.
Implementation monitoring was done through regular PFM Committee meetings, PFM Project
Steering Committee, and annual conferences.
5.6. In the Updated PFM Reform Roadmap, the delivery of reforms shifted to agency-specific
management of initiatives, and the coordination was handled by the DBM-based PFM project
unit, embedding responsibility for implementation within agencies rather than project
implementation units. Henceforth, the reforms proceeded as laid down in Figure 5.1.

2016 Philippines PEFA Assessment 30 June 2016
The GoP and Development Partners 107
Figure 5.1. The Updated PFM Roadmap Summary (2015-2016)
5.7. The Good Governance and Anti-Corruption (GGAC) Cluster Plan 2012-2016 was
launched by the Administration in early 2012.109
Its aim was to improve transparency,
accountability, and citizen engagement. It included initiatives such as zero-based budgeting,
CSO participation in budgeting, publication of a citizen’s budget, procurement and
implementation of a comprehensive information system, performance-based incentive system,
and publication of fiscal risk statement.110
The Philippines’ commitment to Open Government
Partnership is included in the GGAC Cluster Plan. Introduced in January 2014, an updated and
restructured GGAC Cabinet Cluster Action Plan 2013-2016 included new, on-going, stand-alone
PFM activities as well as some initiatives from the original PFM Reform Roadmap.
Implementation of the updated GGAC Cluster Plan during 2015 has generally been on track.111
5.2 Recent and on-going reform actions
5.8. The PFM Committee and the GGAC Cluster are the main forums for coordination and
monitoring of the reforms. In the original Roadmap, the PFM Committee was supported by the
inter-agency project implementation units for each reform, namely (a) the budget reporting and
performance management, (b) treasury cash management operations, (c) accounting and auditing
reforms, (d) GIFMIS, (e) capacity building, and (f) management of contingent liabilities.
5.9. The sub-committees or project implementation units aimed to respond directly to the
identified major gaps and weaknesses in the Government’s PFM system as identified by the 2010
PEFA assessment. These included the following:
• Limited ability to assess implementation capacity for the budget;
• Weak reporting processes for budget execution;
• Delayed approval of the General Appropriations Act;

2016 Philippines PEFA Assessment 30 June 2016
The GoP and Development Partners 108
• Lack of information system capable of capturing resource flows;
• Limited role of Congress in budget oversight and in reviewing/authorizing in-year
budget amendments; and
• Weak processes for revenue administration, monitoring and management of expenditure
arrears, oversight of contingent liabilities and associated fiscal risks, and financial
accountability as manifested in qualified CoA audit reports.
The PFM Reform Roadmap for 2011-2015 was a response to the need for reforms, which were
initiated as follows:
a) Budget reporting and performance management. Progress has been achieved with the
harmonization, streamlining, and refinement of reporting requirements among the
oversight agencies, particularly Commission on Audit and Department of Budget and
Management. The DBM/CoA-formulated UACS was rolled out for the 2014 budget
preparation process and adopted in 2014 for accounting and reporting and integrating
budget formulation and execution. Technical training was started in 2014, and eNGAS
was updated into a UACS-compliant version in 2015. Other activities under this project
implementation unit include DBM-developed, performance-informed, budgeting and
revised GAA and NEP formats; and use of the Unified Reporting System for the Budget
and Financial Accountability Reports, which unifies and streamlines CoA and DBM
reporting requirements. The UACS is providing the key link to harmonize CoA and DBM
reports.
b) Treasury cash management operations. Improved quality and timeliness of information
provides the starting point for improved cash management and reducing borrowings,
thereby generating savings. A TSA system, maintained by the Bureau of the Treasury in
Bangko Sentral ng Pilipinas, was established in 2014. The process involved closing many
unnecessary NGA bank accounts and consolidating the remainder in the B Tr. The new
approach also required banks to remit all BIR and BoC collections one day after receipt
in exchange for a transaction fee starting in 2014. It was planned that once a GIFMIS is
operational, the TSA system would facilitate electronic processing of payments to further
improve the Government’s fiscal performance. The DBM mandated the check-less
payment system through direct bank transfer for NGA disbursements; as at end 2015, 81
percent of national government disbursements are done under this system.
c) Accounting and auditing reforms. The current CoA focus is on alignment of the
Government’s accounting and audit standards with international standards. This is an
ongoing task, particularly as international standards continue to evolve. Accurate and
meaningful reporting of financial transactions requires consistent application of
standards. The Commission on Audit has also adopted the Philippine Public Sector
Standards on Auditing (PPSSA). Training on both new standards is currently on-going.
The Government Accounting Manual for National Government Agencies was also
prescribed in October 2015 for use effective January 1, 2016.
d) GIFMIS. Implementation of a major integrated financial management system has been
central to PFM reforms since their genesis. The GIFMIS was defined as the technology
2016 Philippines PEFA Assessment 30 June 2016
The GoP and Development Partners 109
centrepiece of the reforms in establishment of the PFM Committee under EO 55. The
project aimed at phasing out the many disjointed financial management systems and
processes through implementation of a common system that would simplify reporting:
Track I. A centralized National Payroll System and Comprehensive Human
Resource Information System is being developed to enable the national
government, local government units, and GOCCs to process human resource and
payroll information electronically and make direct salary payments into individual
bank accounts. To date, this initiative is being implemented in the form of
upgrading the Government Management Information System. 112
Track II. In 2012-2013, a comprehensive conceptual design together with functional
and technical specifications was developed for an integrated financial management
information system covering fiscal planning, budget preparation, budget execution,
and financial reporting. The government-wide project was tendered in 2013, but
failed; a successful re-tendering in 2014 did not result in a contract award. This was
due to concerns of scalability, feasibility, costs, and benefits to the government
considering its wide application. The project was recalibrated, and the Budget and
Treasury Management System was proposed. This scaled-down system will cover
DBM and BTr systems and functions for budget execution and accountability. The
Budget and Treasury Management System is expected to have its departmental
launch in January 2017 with the flexibility to be rolled-out to the spending agencies
in the future. The scale-up will require procurement of additional user licenses and
training.
e) Citizen participation. The CSO participation in the national budget formulation has been
developed and formalized. Dovetailing early efforts in 2010 to create spaces for CSO
participation in the budget process, the Government introduced (i) Budget Partnership
Agreements between national government agencies and GOCCs and partner-CSOs
during budget preparation and execution; (ii) bottom-up budgeting where grassroot-level
communities and CSOs engage their local government units in formulating and
implementing local poverty reduction action plans funded through the national budget;
and (iii) piloted citizen participatory audits in national government agencies through CoA
and CSO collaboration.
At the end of 2015, there were 11 national government agencies and 5 GOCCs that had
entered into Budget Partnership Agreements with 244 CSOs. A total of 1,423
municipalities and cities are implementing over PhP 60.39 billion in bottom-up budgeting
projects, which were funded in the 2013-2015 budgets.113
The Commission on Audit
conducted citizen participatory audits in 2014-2016, for which 3 audit reports were
written and published.114
The citizen participatory audit garnered 37 CSOs comprising of
32 non-government organizations and 5 academic institutions.
f) Management of contingent liabilities. A stocktaking of contingent liabilities and
estimation related to guaranteed loans for GOCCs, guarantees issued by GOCCs and
implicit liabilities was conducted through IMF technical assistance. It is essential for

2016 Philippines PEFA Assessment 30 June 2016
The GoP and Development Partners 110
Government to have an accurate view of the scope and value of its contingent liabilities
so that the potential impact on the budget can be properly understood and risks managed
accordingly. A list of contingent liabilities was prepared to facilitate central monitoring
and management of guaranteed loans. A separate project with ADB is assisting the
Bureau of the Treasury and Department of Finance in the valuation, inventory,
monitoring, and management of contingent liabilities associated with public–private
partnerships projects; this effort aims to strengthen the government’s capacity to manage
these projects, while simultaneously accelerating their development to address
infrastructure shortage.
5.10. The Government also undertook stand-alone initiatives distinct from the PFM Reform
Roadmap and GGAC Cluster Plan. The focus of the stand-alone initiatives has been on
expenditure management areas and tax system management. These initiatives include the
following:
a) GAA as release document. Since 2014, the General Appropriations Act has served as the
primary fund release document to improve the predictability of budget releases and the
pace of agency disbursements.
b) Performance-informed budgeting. Adoption of performance-informed budgeting in the
2014 national budget aimed to reflect the link between the funds allocated for
government programs and their projected results and outcomes. For the first time,
nonfinancial performance indicators and targets were presented side by side with the
agency financial budgets. The organizational performance indicators framework provided
the necessary foundation for the implementation of performance-informed budgeting.
c) Parliamentary expenditure oversight. A Joint Congressional Oversight Committee on
Public Expenditures was set up with the 2014 General Appropriations Act in a bid to
strengthen Congressional oversight of implementation of the national budget. This
Committee was convened and held one meeting on June 8, 2015. This could be an
appropriate venue to discuss the in-year budget execution reports, financial statements
and audit reports.
d) Internal audit. The DBM-provided training activities on the implementation of the
DBM-issued 2011 Philippine Government Internal Audit Manual were provided to all
national agencies and corporations to capacitate the newly created internal audit units in
the different government entities.
e) Online submission of budget proposal system. The Department of Budget and
Management introduced the system in 2013 for departments and agencies to undertake
real-time submission of consolidated budget proposals which significantly improved the
efficiency of budget preparation.
f) Tax reforms. The Department of Finance took the lead in the BIR and BoC
administrative and policy reforms. The passage of adjusted excise rates for alcohol and
cigarettes (or “sin” products) yielded additional resources equivalent to 1 percent of
2016 Philippines PEFA Assessment 30 June 2016
The GoP and Development Partners 111
GDP; this amount was earmarked to implement a universal health coverage program to
improve access to quality health facilities in the different regions and localities and to
enhance the access of indigents and senior citizens to health services. The continuous
pursuit of better compliance measures in the Bureau of Internal Revenue and Bureau of
Customs, including a drastic reorganization in the Bureau of Customs in 2014, also
significantly improved the annual growth and predictability of the inflow of tax
collections, providing more fiscal space to restructure the budget toward priority
expenditure areas.
5.13. In summary, the implementation of the PFM Reforms for 2011-2015 has yielded many
results that shifted the Government’s PFM reform program trajectory to a higher level in terms
of fiscal discipline and allocative and technical efficiency as well as transparency and citizen
empowerment. The PEFA results have shown the need for continued reforms through inclusion
of the following:
Development of GIFMIS. Automation of government-wide PFM systems is one of the
core elements of the reform program. Its design needs to follow review of the processes
and information flows and associated requirements for specific functions. The system
needs to include sub-components covering accounting and reporting practices in the line
agencies. A diagnostic study needs to review the existing state of transaction processing
systems and availability of timely information for budget management. Procedures and
control structures will be reviewed as part of a business processes study. Revenue
agencies need an integrated financial management information system that enables
efficient transaction processing in accordance with the prescribed controls for their
relative transactions. The Department of Budget and Management also needs a system to
monitor the budget execution process and produce timely and up-to-date budget
execution reports for economic management. For this, it will require up-to-date
information on programs and projects executed by many spending units distributed across
the country.
Passage and execution of the Public Financial Management Law. The budget cycle
must be authorized by legislation that supports the Constitutional provisions for the
Government’s management of the national finances. Delays in relevant legislation have
been extensive, but the Legislature is now in a position to enact the relevant laws. As
part of the implementation of the PFM Law, reviews of relevant internal control and top-
level agency assurance arrangements by principal accounting officers need to be
conducted against ISSAI and other relevant standards and practices. This process would
lead to recommendations and proposals for the appropriate assurance arrangements.
Review of revenue forecasting. There was substantial under-performance in some
collections. Unreliable revenue estimation has significant impact on the Government’s
ability to deliver services. Revenue prediction arrangements for the main revenue types
from the the Bureau of Internal Revenue and the Bureau of Customs needs to be further
developed and supported by suitable information systems, forecasting tools, and
monitoring processes.

2016 Philippines PEFA Assessment 30 June 2016
The GoP and Development Partners 112
A procurement practices review needs to be conducted in accordance with good
international practices. An independent appeals process needs to be developed. The
extent of competitive tendering is to be reviewed to ensure the most cost effective
practices are applied to support realization of the Government’s budget intentions.
A review of internal audit arrangements needs to be conducted against standards of the
Institute of Internal Auditors to assess opportunities for improvement. Proposals for the
introduction of audit committees at agency level and central coordination of internal audit
guidance need to be developed for consideration by the Government. As a
complementary step, the roles of Principal Accounting Officers in providing assurance on
internal controls as part of the Annual Audit Reports process need to be reviewed.
Review of SAI coverage and processes against ISSAI governance and quality
management standards needs to be conducted for consideration by Commission on Audit.
Design for the conduct of programs of revenue audits that are relevant to the country
needs to be developed for consideration by Commission on Audit.
Legislative arrangements for scrutiny of CoA reports. The possibilities to advance the
likelihood of suitable legislative committee arrangements for scrutiny of external audit
reports should be explored considering globally established good practices. This action
needs to be taken up by the legislature.
5.14. The current Updated PFM Reform Roadmap (2015-2016) aims for continuing and future
reforms as follows:
PFM Framework Law is meant to institutionalize the reforms, strengthen the oversight
function and clarify the budget and fiscal administration rules and processes. With the
assistance of DFAT, IMF, and World Bank, a PFM Framework Bill was crafted in 2014
and filed both in the Senate and House in 2015. The intention is to refile the bill in the
next congressional term.
Government Comptroller General, a function in process of being established, will
oversee compliance with existing PFM rules and regulations, including CoA-prescribed
financial reporting requirements. Using the Budget and Treasury Management System
and its accounting functionalities, the office will also consolidate Government-wide
financial statements to assist the Executive in managing financial operations.
Strengthening performance orientation of budget preparation and management is
underway with a variety of budget reforms such as strengthening the medium-term
budget and the M&E systems, and the shift to a Program Expenditure Classification
Budget Structure with appropriate performance indicators and targets. These involve
building on previous progress with output budgeting to strengthen the focus on program
strategies and outcomes in the budget structure in order to facilitate the linkage with
planning and M&E.
2016 Philippines PEFA Assessment 30 June 2016
The GoP and Development Partners 113
PFM certificate program. While policies, processes, and systems are all important,
equally so is the ability of Government staff at all levels to perform the tasks required for
an effective PFM system. Capacity building is embedded into the implementation of all
the individual reform initiatives above. It is also important to have a program in place to
support skills and knowledge development on a systematic, ongoing basis. The
Government has developed a PFM Competency Framework that maps the necessary
skills, knowledge, and attitudes that must be developed in public financial managers
across the bureaucracy. This was followed by the rollout of a PFM Certification Course
as well as ongoing efforts to build a PFM Institute under Department of Budget and
Management to serve as a permanent body for PFM-related training, certification, and
other capacity development endeavors.
5.15. The 2014 updated and restructured Good Governance and Anti-Corruption Cabinet
Cluster Action Plan 2013-2016 also includes several PFM-related activities:
CSO engagement in the National Budget Process. Policy consultations and review of
budget process are ongoing for participatory budgeting and joint drafting of guidelines on
CSO accreditation and release of funds to CSOs.
Budget and Treasury Management System is being developed for DBM and BTr
operations with the target to go live by January 2017. Subsequently, it is to be rolled out
to all agencies, subject to the procurement of additional software licenses.
Comprehensive Human Resource Information System and National Payroll System will be forthcoming in the form of updating the Government Manpower Information
System.
Local Government Unit PFM project provides local government units with strategic
directions to strengthen their PFM system toward improved revenue generation and
expenditure management. The strategy requires the implementation of an LGU PFM
improvement plan as a precondition to access funds through bottom-up budgeting and
various other national government assistance programs.
Open data. The Department of Budget and Management improved openness and
transparency by making the 2015 Government budget and other documents available
online at http://data.gov.ph.
Bottom-up budgeting engages municipalities in preparing community-level poverty
reduction plans, which are funded by the budget.
Philippine Government Electronic Procurement System (PhilGEPS). System
requirement study has been completed, and the detailed specifications document has been
developed. System testing is ongoing.
5.3 Institutional Considerations

2016 Philippines PEFA Assessment 30 June 2016
The GoP and Development Partners 114
5.16. The PFM Reform Program is led and owned by the Government of the Philippines. The
Government has set out clear goals in the PFM Reform Roadmap and the updated GGAC
Cabinet Cluster Action Plan for improving the PFM system. The PFM reform enjoyed strong
political backing from the Office of the President.
5.17. The support of the development partners is generally relevant to and aligned with the
needs of the Government of the Philippines. Development partners are supporting the
Government’s PFM reform through the following activities:
DFAT/Australian Aid supports the Department of Budget and Management in coordinating and
implementing the PFM Reform Roadmap (through DBM-based project management office, TSA
design, UACS design, and conceptual design of GIFMIS Track II); support to national government
agencies (eNGAS in DPWH, internal audit in DepEd, FMIS in DepEd, and internal control and
internal audit in DSWD); and support for external oversight (citizen participation in audit,
cooperation between Congress and Commission on Audit, and CSO engagement in the budget
process).
Asian Development Bank has earlier supported several initiatives, including public-private
partnerships, capacity development as well as liquidity management in Bureau of Internal Revenue,
treasury operations and capital market reforms in Bureau of the Treasury, data management for
performance reporting, assessment in Department of Budget and Management, and LGU finance and
fiscal decentralization reform.
European Union supports DBM and DILG activities in strengthening PFM in local government
units.
IMF has provided technical assistance to strengthen BIR tax policy and administration and has also
supported the drafting of the PFM Framework Law.
United States Treasury plans to support the Bureau of the Treasury in organizational strengthening,
developing staff capacities, and improving asset management.
World Bank is supporting the Government of the Philippines in strengthening public finances (tax
policy reform dialogue, and fiscal risk and debt management); enhancing public delivery
performance (PFM Framework Law, PFM systems change management, and improving civil service
performance); and improving demand-side pressure for accountability (Open Data, Medium-term
Information and Communications Technology Harmonization Initiative, Philippine Business
Registry reforms, and reconstruction participatory audit).
5.18. The PFM Competency Framework marked the shift to a more strategic approach toward
human resource development for public financial management. This will serve as the overall
human resource strategy or public sector reform that could be linked to PFM reform activities.
5.19. The reform efforts have initially been concentrated in the oversight agencies to develop a
strengthened PFM framework in terms of systems and procedures. Involvement of national
government agencies has taken place in several areas once certain initiatives have been
implemented such as rolling out the Unified Accounts Code Structure, closing bank accounts for
the TSA preparation, establishing grassroots participatory budgeting, and implementing the new
PPSAS. There are examples of reform implementation delays that have adversely affected the
operations of national government agencies such as the delay of the UACS rollout by one year
with regard to accounting and reporting, and a UACS-compliant eNGAS not being prepared on
time. Also, no change management strategy has been developed as part of the PFM reform

2016 Philippines PEFA Assessment 30 June 2016
The GoP and Development Partners 115
process, which would have been beneficial to ensure that the reform message was effectively
communicated, understood, and implemented throughout the Government, especially regarding
capacity building in national government agencies.

116
Annex 1: Performance Indicator Summary
Pillars and
Performance Indicators (PIs) Sco
rin
g
Meth
od
2016
Dimension Rating Overall
Score (i) (ii) (iii) (iv)
Pillar I. Budget reliability
PI-1 Aggregate expenditure outturn M1 D D
PI-2 Expenditure composition outturn M1 D C A D+
PI-3 Revenue outturn M2 A C B
Pillar II-III. KEY CROSS-CUTTING ISSUES:
II. Transparency of public finances
PI-4 Budget classification M1 C C
PI-5 Budget documentation M1 A A
PI-6 Central government operations outside financial reports M2 A A C B+
PI-7 Transfers to subnational governments M2 A A A
PI-8 Performance information for service delivery M2 A A C B B+
PI-9 Public access to fiscal information M1 A A
III. Management of Assets and Liabilities
PI-10 Fiscal risk reporting M2 C C A B
PI-11 Public Investment Management M2 A A A B A
PI-12 Public Asset Management M2 C C B C+
PI-13 Debt Management M2 A A D B
Pillars IV-VII. BUDGET CYCLE
IV. Policy-based Fiscal Strategy and Budgeting
PI-14 Macroeconomic and fiscal forecasting M2 A B A A
PI-15 Fiscal Strategy M2 A B C B
PI-16 Medium-term perspective in expenditure budgeting M2 A A B A A
PI-17 Budget preparation process M2 A A A A
PI-18 Legislative scrutiny of budgets M1 B A A B B+
V. Predictability and Control in Budget Execution
PI-19 Revenue administration M2 B B A D B
PI-20 Accounting for revenue M1 A A A A
PI-21 Predictability of in-year resource allocation M2 C A A A B+
PI-22 Expenditure arrears M1 B C C+
PI-23 Payroll controls M1 B B B A B+
PI-24 Procurement management M2 B B B D C+
PI-25 Internal controls on non-salary expenditure M2 A B B B+
PI-26 Internal audit M1 A B C B C+
VI. Accounting and Reporting
PI-27 Financial data integrity M2 D A C C C+
PI-28 In-year budget reports M1 A D C D+
PI-29 Annual financial reports M1 B C A C+
VII. External Scrutiny and Audit
PI-30 External audit M1 C C B B C+
PI-31 Legislative scrutiny of audit reports M2 D D D D D

2016 Philippines PEFA Assessment 30 June 2016
The GoP and Development Partners 117
Pillars and
Performance Indicators (PIs)
2016 PEFA Assessment
Score Description of requirements met
Pillar I. Budget Reliability
PI-1 Aggregate expenditure outturn D
The obligations incurred exceeded the range of 85% to
115% of the original budget in all of the last three fiscal
years (2012 to 2014).
PI-2 Expenditure composition
outturn D+
The functional composition variance exceeded 15% and
economic composition variance was less than 15% in 2 of
the last 3 years. Average actual expenditure charged to
contingency vote was less than 3%.
PI-3 Revenue outturn B
Aggregate revenue outturn was between 97% and 106% in
2 of the last 3 years and revenue composition variance
remained below 15% in the last 3 years.
Pillar II. Transparency of Public Finances
PI-4 Budget classification C
The Unified Accounts Code Structure was implemented in
2014 for budget formulation, execution and reporting. It
applies the GFS administrative and economic
classification. Full rollout to execution is still underway
and reporting is adjusted for compliance at aggregate
level.
PI-5 Budget documentation A The 2016 budget documentation fulfills 10 of 12
information benchmarks, including all the basic elements.
PI-6
Central government
operations outside financial
reports
B+
Revenue and expenditure outside government financial
reports is less than 1% of total revenue and expenditures.
Detailed financial reports of the majority of extra-
budgetary units are submitted within 9 months of the end
of the fiscal year.
PI-7 Transfers to subnational
governments A
All transfers to LGUs are based on clearly defined set of
rules and procedures. Information on transfers is provided
by DBM early in the budget cycle.
PI-8 Performance information for
service delivery B+
Performance information (both financial and non-
financial) is presented in the budget documentation;
performance results are published by most departments on
websites; and the executive summary of all annual audit
reports list the outputs achieved. PETS was recently
conducted for DepEd; and evaluations of service delivery
have been carried out and published for the majority of the
departments.
PI-9 Public access to fiscal
information A
The Government makes available to the public all of the 5
basic elements and all additional elements of information.
Pillar III. Management of Assets and Liabilities
PI-10 Fiscal risk reporting B
Annual audit reports from GOCCs and LGUs are received
but with delays. Fiscal risk statement comprehensively
covers significant contingent liabilities and other risks.

2016 Philippines PEFA Assessment 30 June 2016
The GoP and Development Partners 118
Pillars and
Performance Indicators (PIs)
2016 PEFA Assessment
Score Description of requirements met
PI-11 Public investment
management A
All major capital investment projects are subject to ICC
approval requiring review of technical, financial,
economic, environmental, institutional, social, and
sensitivity analysis. Guidelines are published by NEDA
for the costing (including all life-cycle costs) and
selection. Monitoring is done by implementing agencies.
PI-12 Public asset management C+
CoA audit reports include substantial observations
pointing to absence of up-to-date and complete financial
asset registers. Fixed asset registers exist, but
comprehensive management and statistical reports are not
published annually. The procedures for competitive and
transparent disposal of nonfinancial assets are established
in legislation and generally respected but do not require
reporting to legislature.
PI-13 Debt management B
Detailed debt data (domestic and foreign) is maintained
and published by BTr. The data is updated monthly,
reconciled monthly, and presented 2 months from the
reference period. Legislation provides clear authorization
to DoF to review, approve, and manage debt. Ceilings are
prescribed in law. Medium-term debt strategy in the form
of strategic guidelines is in place but not published.
Pillar IV. Policy-based Fiscal Strategy and Budgeting
PI-14 Macroeconomic and fiscal
forecasting A
Macroeconomic projections are prepared for 3 years and
used in the annual budget preparation by DBM. These are
reviewed and approved by DBCC and updated mid-year.
Forecasts of the budget sensitivity analysis and debt
sustainability are published.
PI-15 Fiscal strategy B
Impact of proposed policy changes for revenue and
expenditure is estimated for a 3-year horizon. A fiscal
strategy, including mostly quantitative fiscal objectives, is
prepared for up to 6 years, submitted to Congress and
published. DBCC publishes a mid-year and year-end
report on Government’s progress of its fiscal strategy but
these are not submitted to the legislature.
PI-16 Medium-term perspective in
expenditure budgeting A
Government prepares a 3-year rolling budget allocated by
administrative, economic, and program classification; and
3-year plans include cost information. Budget ceilings
based on the agencies’ forward estimates are issued as part
of pre-budget documents. Deviations from previous
forecasted budget are explained in the budget documents.
Majority of agencies align their activities to the priority
program of the Government.
PI-17 Budget preparation process A
A clear and comprehensive annual budget calendar is
issued, allowing sufficient time for submission by
departments. The guidance includes the approved “hard”
budget ceilings per department and agency. The President
has in each of the last 3 years submitted the budget
proposal to Congress more than 5 months before the start
of the fiscal year.

2016 Philippines PEFA Assessment 30 June 2016
The GoP and Development Partners 119
Pillars and
Performance Indicators (PIs)
2016 PEFA Assessment
Score Description of requirements met
PI-18 Legislative scrutiny of
budgets B+
Both Houses of Congress have established, comprehensive
procedures that are respected. They scrutinize the budget
proposal submitted, which includes fiscal policies,
aggregates, and detailed estimates for revenue and
expenditure. MTFF and priorities are not included in the
budget document. In each of the last 3 years, the budget
was approved before the start of the fiscal year. Expansion
of the total expenditure is not allowed but extensive
reallocations are permitted.
Pillar V. Predictability and Control in Budget Execution
PI-19 Revenue administration B
BIR provides easy access to comprehensive and up-to-date
information about taxpayers’ rights, obligations, and
procedures, including right to redress. It uses a
comprehensive end-to-end compliance improvement
strategy for its risk management. The DoF Fiscal
Intelligence Unit has expanded its scope. BIR conducts
audit, investigation and prosecution of cases under the
Run-After-Tax-Evaders (RATE) program. BoC
implements Run-After-The-Smugglers (RATS) and DoF
created Fiscal Intelligence Unit to eliminate smuggling.
Target outputs are exceeded. In 2014, the stock of revenue
arrears includes those arrears older than 12 months, which
are more than 75% of the total revenue arrears.
PI-20 Accounting for revenue A
BIR and BoC comply with TSA. Monthly submissions are
consolidated and published by BTr, which does monthly
reconciliations.
PI-21 Predictability of in-year
resource allocation B+
TSA is in place for revenues collected by BIR and BoC
and is being rolled out for expenditure. Accounts for
foreign-funded projects and those trust accounts with legal
basis remain outside the TSA. Cash flow forecast is
prepared and updated monthly. Departments can commit
for a 6-month horizon and any realignment requires
request by the concerned department or agency and should
be approved by DBM.
PI-22 Expenditure arrears C+
CoA requirement for the submission of year-end reports
includes the aging of expenditure arrears. Stock of
expenditures arrears is no more than 6% of the total
obligations incurred for the past 3 years.
PI-23 Payroll controls B+
Payroll and personnel records are not integrated, but
reconciliation is conducted monthly. Changes are
processed timely, but delays may occur in receipt of
documents to initiate the process. Biometric attendance
systems minimize the risk of ghost workers, and specific
procedures are conducted in audit as well. Control exists
on the authority and basis for the changes to personnel
records and payroll.

2016 Philippines PEFA Assessment 30 June 2016
The GoP and Development Partners 120
Pillars and
Performance Indicators (PIs)
2016 PEFA Assessment
Score Description of requirements met
PI-24 Procurement management C+
APCPI maintains data for contracts on content, value and
vendor. The data are accurate and complete for most of
the contracts procured using different methods for goods,
services, and works. 74% of contracts in 2014 were
awarded through competitive methods. 5 of the 6 key
procurement information elements are complete and
reliable for NGAs representing 75% of procurement
operations (by value). There is no independent
administrative procurement complaints system provided
for under the Government Procurement Reform Act.
PI-25 Internal controls on non-
salary expenditure B+
NGICS prescribes a comprehensive set of controls,
including segregation of duties. Commitment controls
exist but with continuing appropriations, and absence of
automation are challenging to monitor. Most CoA audit
opinions are modified, but instances on non-compliance
with payment procedures are not the main cause.
PI-26 Internal audit C+
Internal audit units are established in all agencies
conducting compliance, operations and management audit.
Quality assurance does not exist and reports are submitted
only to the head of the entity audited. Audit programs
prepared are completed but with delays and responses to
recommendations are received from management within
12 months.
Pillar VI. Accounting and Reporting
PI-27 Financial data integrity C+
Reconciliation of bank accounts and clearance of advances
occurs with much delay. While access to records is
restricted, often without audit trail, the quality and
reliability of financial reporting process is low due to use
of spreadsheet, which lacks controls for assuring financial
data integrity.
PI-28 In-year budget reports D+
Format of in-year reports comprehensively cover
expenditures and comparison with budget estimates.
Timely submission is not achieved for most reports and
due to the use of spreadsheets these often contain
mistakes.
PI-29 Annual financial reports C+
Annual Financial Report includes information on revenue,
expenditure, financial assets, financial liabilities,
guarantees, and long-term obligations. Comparison of
budget with outturn is provided in ARAOD, 1997 and
enhanced to ARAAOD in 2014. Major spending agencies
submit financial statements for audit within 9 months of
fiscal year-end. The 2014 audited financial statements of
NGAs included disclosure on compliance with PPSAS in
the notes to financial statements.
Pillar VII. External Scrutiny and Audit
PI-30 External audit C+
PPSSA, based on ISSAI, were adopted and applied for all
audits. The scope of the audit covers the entire
government but excluding verification of BIR-collected
revenues. Audit reports are submitted to the head of the

2016 Philippines PEFA Assessment 30 June 2016
The GoP and Development Partners 121
Pillars and
Performance Indicators (PIs)
2016 PEFA Assessment
Score Description of requirements met
auditee entity within 9 months of receipt of the financial
reports for audit and formal responses are received in a
timely manner. CoA’s independence is laid down in the
Constitution, and it has unrestricted access except for BIR
revenues.
PI-31 Legislative scrutiny of audit
reports D
There is no formal scrutiny of audit reports by the
legislature.

122
Annex 2: Summary of Observations on the Internal Control
Framework
Internal control components
and elements Summary of observations
1. Control environment There is a strong regulatory framework. The Philippines Constitution, Article
XI, provides a strong imperative through its provisions on the accountability of
public officers, supported by comprehensive Government instructions in the
Administrative Code, National Guidelines on Internal Control Systems, and
Government Internal Audit Manual. These instructions provide standards to
guide each government agency in developing its detailed and comprehensive
system of internal controls. Agency characteristics such as mandate, functions,
nature of activities, operating environment, human resource profile, size, and
organizational structure will have to be considered in developing or improving
the individual controls. A strong and responsive internal control system is an
essential component of an organization’s internal and external processes.
This regulatory framework is shown to be effective by the results assessed for
PI- 23 and PI-25 on internal controls over payroll and non-salary expenditure,
which were rated “B+”. PI-25.3 on compliance with payment rules and
procedures was rated “B”, and the assessment found that most payments
comply with regular payment procedures. The CoA-conducted audits identify
instances of non-compliance, which need to be corrected; but in the majority of
cases, these exceptions are not the main causes of qualified opinions on the
annual accounts. They are therefore not considered to seriously compromise
the control environment as a whole but are significant in some cases. A more
comprehensive, integrated, computerized accounting system for processing
government transactions can provide a user-friendly set of controls that are
applied automatically to prevent instances of failure.
1.1 The personal and
professional integrity and
ethical values of management
and staff, including a
supportive attitude toward
internal control constantly
throughout the organization.
The Administrative Code states that public officers and employees must at all
times be accountable to the people; serve them with utmost responsibility,
integrity, loyalty, and efficiency; act with patriotism and justice; and lead
modest lives. This principle relates to accountability, norms of conduct and
ethical standards, and performance of the management and staff, including the
manner by which an agency operates and provides public service.
1.2. Commitment to
competence
The Administrative Code requires Government employees to commit and
demonstrate competence in the conduct of their duties and responsibilities.
Each one, from the head of agency to the rank and file, must work for the
achievement of the agency’s objectives. They must show full support for
internal control and the continual improvement of systems and processes that
would increase the efficiency and effectiveness of the agency.
1.3. The “tone at the top” (i.e.,
management’s philosophy and
operating style)
The Administrative Code provides that all resources of the Government shall
be managed, expended, or utilized in accordance with law and regulations and
safeguarded against loss or wastage through illegal or improper disposition to
ensure efficiency, economy, and effectiveness in government operations. The
responsibility to take care that such policy is faithfully adhered to rests directly
with the head of the government agency.

2016 Philippines PEFA Assessment 30 June 2016
The GoP and Development Partners 123
1. Control environment There is a strong regulatory framework. The Philippines Constitution, Article
XI, provides a strong imperative through its provisions on the accountability of
public officers, supported by comprehensive Government instructions in the
Administrative Code, National Guidelines on Internal Control Systems, and
Government Internal Audit Manual. These instructions provide standards to
guide each government agency in developing its detailed and comprehensive
system of internal controls. Agency characteristics such as mandate, functions,
nature of activities, operating environment, manpower profile, size, and
organizational structure will have to be considered in developing or improving
the individual controls. A strong and responsive internal control system is an
essential component of an organization’s internal and external processes.
This regulatory framework is shown to be effective by the results assessed for
PI- 23 and PI-25 on internal controls over payroll and non-salary expenditure,
which were rated “B+”. PI-25.3 on compliance with payment rules and
procedures was rated “B”, and the assessment found that most payments
comply with regular payment procedures. The CoA-conducted audits do
identify instances of non-compliance, which need to be corrected; but in the
majority of cases, these exceptions are not the main causes of qualified
opinions on the annual accounts. They are therefore not considered to seriously
compromise the control environment as a whole but are significant in some
cases. A more comprehensive, integrated, computerized accounting system for
processing government transactions can provide a user-friendly set of controls
that are applied automatically to prevent instances of failure.
1.1 The personal and
professional integrity and
ethical values of management
and staff, including a
supportive attitude toward
internal control constantly
throughout the organization.
The Administrative Code states that public officers and employees must at all
times be accountable to the people; serve them with utmost responsibility,
integrity, loyalty, and efficiency; act with patriotism and justice; and lead
modest lives. This principle relates to accountability, norms of conduct and
ethical standards, and performance of the management and staff, including the
manner by which an agency operates and provides public service.
1.2. Commitment to
competence
The Administrative Code requires Government employees to commit and
demonstrate competence in the conduct of their duties and responsibilities.
Each one, from the head of agency to the rank and file, must work for the
achievement of the agency’s objectives. They must show full support for
internal control and the continual improvement of systems and processes that
would increase the efficiency and effectiveness of the agency.
1.3. The “tone at the top” (i.e.,
management’s philosophy and
operating style)
The Administrative Code provides that all resources of the Government shall
be managed, expended, or utilized in accordance with law and regulations and
safeguarded against loss or wastage through illegal or improper disposition to
ensure efficiency, economy, and effectiveness in government operations. The
responsibility to take care that such policy is faithfully adhered to rests directly
with the head of the government agency.
1.4. Organizational structure The Administrative Code provides the basis for Government organization
structures. The Code organizes departments on the basis of major functions to
achieve simplicity, economy, and efficiency in government operations and
minimize duplication and overlapping of activities. Adequate authority shall be
delegated to subordinate officials. Administrative decisions and actions shall,
as much as feasible, be at the level closest to the public. The organizational
structure is to provide the framework within which the activities of an agency
are planned, executed, controlled, and reviewed. It is to consider key areas of
authority and responsibility and the appropriate lines of reporting.

2016 Philippines PEFA Assessment 30 June 2016
The GoP and Development Partners 124
1.5. Human resource policies
and practices
Departments have human resource development services with divisions for
staff development, employees’ benefits and payroll. The Administrative Code
provides for entrance based on competitive examination, or based on highly
technical qualifications; and for advancement through merit and fitness. There
is periodic and continuing review of the performance through the performance
evaluation promulgated by the Civil Service Commission. There is also a
policy on discipline.
2. Risk assessment For departments and agencies the NGICS requires effective and efficient
systems of risk management and internal control for PFM. It mandates the
establishment of standards on risk management in public service organizations.
It has a section on risk assessment with specifications on risk identification,
analysis and evaluation.
PI 19 revenue administration included an assessment of the approach to
revenue risk management and rated it B for both BIR and BoC.
For GOCCs annual performance agreements set out the components of internal
control. The agreements include a charter statement and a strategy map,
together with identification of indicators for measurement of performance. For
LGUs summarized risks are identified and presented in annual Fiscal Risks
Statements.
2.1 Risk identification The NGICS includes - The purpose of doing risk identification is to generate a
comprehensive list of risks based on factors that might enhance, prevent,
degrade or delay the achievement of the general control objectives. This will
include identifying the risks in case of not pursuing an opportunity.
Comprehensive identification is very important because a risk that is not
identified will not be included in the next step of analyzing risks.
2.2 Risk assessment
(significance and likelihood)
The NGICS includes - After the identification, it is necessary to consider
possible causes and scenarios that would show what consequences can occur.
All significant causes should be considered to estimate the risk.
2.3 Risk evaluation The NGICS includes - This is about developing an understanding of the risk
and providing an input to risk evaluation and to decisions on whether risks
need to be responded to, as well as on the most appropriate response strategies
and methods. The objective of evaluating risks is to assist in coming up with a
decision on which risks need treatment based on the results of the risk analysis.
2.4 Risk appetite assessment The NGICS includes - An organization should apply risk identification tools
and techniques, which are suited to its objectives and capabilities, and to the
risks faced.
2.5 Responses to risk (transfer,
tolerance, treatment or
termination)
The NGICS includes - Risk evaluation may lead to a decision to undertake
further analysis or a decision not to treat the risk in any way but maintain
existing risk controls (INTOSAI Guidelines for Internal Control Standards for
the Public Sector). Responses to risks can be divided into the four categories.
In some instances, risks can be transferred, tolerated or terminated. However,
in most instances, the risk will have to be treated. The results of risk evaluation
are an input to prioritizing treatment implementation. Risk evaluation may lead
to a decision to undertake further analysis or a decision not to treat the risk in
any way but maintain existing risk controls (INTOSAI Guidelines for Internal
Control Standards for the Public Sector). The NGICS gives some illustrations
on risk treatment.

2016 Philippines PEFA Assessment 30 June 2016
The GoP and Development Partners 125
3. Control activities The NGICs has a section setting out control activities. In PI-25, internal control
was examined. It was found that the Accounting Division, in charge of
recording and keeping the books, is usually under the Financial Management
Service and is separate from the Administrative Service, which normally
handles the cashiering function. Procurement is also a separate function that
works alongside the Bids and Awards Committee. Functions and
responsibilities, as well as clear procedures in handling transactions, are also
outlined in Volume 1 of the NGAS Manual and the Government Accounting
Manual for National Government Agencies.
3.1 Authorization and approval
procedures The CoA-prepared Government Accounting Manual sets out the systems of
authorization, policies, standards, and accounting procedures and reports used
by the agencies to control operations and resources and enable the various units
to meet their objectives. These systems and work processes are integral to the
operations of agencies and are to be consistently applied by all units in the
public service. These procedures or activities are implemented in order to
achieve the control objectives of safeguarding resources, ensuring the accuracy
of data and enabling adherence to laws, policies, rules and regulations.

2016 Philippines PEFA Assessment 30 June 2016
The GoP and Development Partners 126
3.2 Segregation of duties
(authorizing, processing,
recording, reviewing)
The NGICS sets out the usual internal control components, including
segregation of duties. Key duties and responsibilities need to be divided or
segregated among different people to reduce the risk of error or fraud. This
includes separating the assignment of responsibilities for processing,
reviewing, recording, custody, and approval/authorization of certain
transactions.
PI-25.1 segregation of duties is rated “A”. Segregation of duties exists
throughout the process. Management override of controls occurs in some
instances but not the majority.
3.3 Controls over access to
resources and records
The NGICS sets out the usual internal control instructions for access over
resources, assets, and facilities.
PI-27.4, financial data integrity processes, is rated “C”. While access to records
is restricted, often there is no audit trail; and the quality and reliability of
financial reporting process is low due the absence of an integrated accounting
and reporting system for government transactions. The practice of using
spreadsheets that lack built-in controls for preparation of financial reports
reduces assurance of financial data integrity.
3.4 Verifications The NGICS sets out the usual internal control instructions for verification —
review of transactions to check the propriety and reliability of documentation,
costing, or mathematical computation. It includes checking the conformity of
acquired goods and services with agreed quantity and quality specifications.
The verification procedures should be built-in in every transaction. This is an
internal checking procedure to avoid errors or fraud.
3.5 Reconciliations The NGICS sets out the usual internal control instructions for reconciliation of
financial and non-financial data. Operating procedures of every office require
that the cash records of the accounting and the cash units should be regularly
reconciled.
PI-27.1, bank account reconciliation, was rated “D”. While monthly bank
reconciliation statements are prescribed per law, issues of non-preparation,
delayed submission, and non-recording of reconciling items are substantial as
per CoA audit reports that cite unreliable cash balances.
3.6 Reviews of operating
performance
The NGICS includes the evaluation of agency performance, which covers the
financial position and results of operation of an agency. The Administrative
Code provides that the President, through the Secretary of Budget and
Management, shall evaluate on a continuing basis the quantitative and
qualitative measures of agency performance.
3.7 Reviews of operations,
processes and activities
The NGICS includes the Organizational Performance Indicator Framework,
which is a useful tool in expenditure and budget accountability. The
Framework directs resources of an agency toward its major final outputs that
are linked to sectoral and societal goals.
3.8 Supervision (assigning,
reviewing and approving,
guidance and training)
The NGICS provides that supervision and control includes the authority to act
directly whenever a specific function is entrusted by law or regulation to a
subordinate. It provides guidance on administrative supervision.
4. Information and
communication
A performance evaluation system guidebook is used for GOCCs.

2016 Philippines PEFA Assessment 30 June 2016
The GoP and Development Partners 127
5. Monitoring In departments and agencies, monitoring of internal control is dealt with in the
NGICS covering ongoing monitoring and the work of the Internal Audit
Service. Monitoring the internal control activities themselves should be clearly
distinguished from reviewing the operations of a unit, which is an internal
control activity performed by the unit and its management.
PI-26, Internal Audit, found that internal audit has been formally established in
most agencies and that audit programs are largely completed, but with delays.
The performance is rated “C+”.
Monitoring of GOCCs is exercised through a quarterly report to the
Government. Monitoring of LGUs is exercised through a substantial
performance monitoring system with multiple indicators, including fiscal risks,
financial position, and debts. The performance indicator on fiscal risk
reporting for GOCCs and LGUs is rated “B”. Audited annual reports for these
entities are usually published by CoA within 9 months of year-end.
5.1 Ongoing monitoring In the agency structure, the Financial and Management Service is tasked to
assist agency management in the ongoing monitoring of internal controls by
regular management surveys of the organizational structure, human resource,
and operations.
Control in government departments and agencies, according to NGICS,
includes checking the completeness of transaction documents and reports.
Transaction documentation has to be complete in order to substantiate the
transaction. Operational and financial reports are tools for monitoring
performance, subsequent planning, and decision-making. These reports have to
be checked at the source and by the management of the operating unit
concerned. These reports have to be certified for accuracy by management of
the office concerned before they are submitted to the report users.
5.2 Evaluations In the agency structure, the Internal Audit Service is mandated to conduct a
separate evaluation or appraisal of the internal control system to determine
whether internal controls are well designed and properly operated. The Internal
Audit Service in departments and equivalent agencies shall consist of two
divisions: Management Audit Division and Operations Audit Division.
External review is carried out by the Commission on Audit. The Constitution,
as well as the Administrative Code, provides that where the internal control
system of the audited agencies is inadequate, CoA may adopt such measures,
including temporary or special pre-audit as necessary and appropriate to correct
the deficiencies.
5.3 Management responses PI-26.4 examined response to internal audits and was rated “B”. Internal audit
reports provide recommendations that are presented to the head of the audited
unit. Management response is solicited to indicate corresponding action plan,
and a formal response is received in most instances within 12 months.
However the report is not shared beyond the audited unit with, for example, the
oversight agencies (DBM, DoF, and CoA).
128
Annex 3A. PEFA Assessment Management Organization
Oversight Team – PFM Committee chaired by Department of Budget and Management:
o Undersecretary Laura B. Pascua (DBM)
o Undersecretary Janet B. Abuel (DBM)
o Former Commissioner Heidi L. Mendoza (Commission on Audit – CoA)
o Assistant Commissioner Lourdes Castillo (CoA)
o Assistant Commissioner Aracadio B. Cuenco, Jr. (CoA)
o Director Luzvi Chatto (CoA)
o Undersecretary Gil S. Beltran (Department of Finance – DoF)
o Assistant Secretary Ma. Teresa Habitan (DoF)
o Treasurer Roberto B. Tan (Bureau of the Treasury – BTr)
o Deputy Treasurer Sharon P. Almanza (BTr)
*Alternate members for DBM - Undersecretary Richard E. Moya and Undersecretary Luz M.
Cantor
Assessment Manager:
o Robert R. Taliercio, Practice Manager, World Bank
Assessment Team Leaders and Team Members:
o Saeeda Sabah Rashid, Sr. Public Sector Specialist, World Bank
o Pazhayannur K. Subramanian, Lead Financial Management Specialist, World Bank
o Rogier Van den Brink, Lead Economist and Program Leader, World Bank
o Bonnie Ann Sirois, Sr. Financial Management Specialist, World Bank
o Kai-Alexander Kaiser, Sr. Economist, World Bank
o Karl Kendrick Tiu Chua, Sr. Country Economist, World Bank
o Cecilia D. Vales, Lead Procurement Specialist, World Bank
o Justine Espina Letargo, Communications Officer, World Bank
o Tomas JR. Sta. Maria, Financial Management Specialist, World Bank
o Aisha Lanette De Guzman, Financial Management Specialist, World Bank
o Maria Liennefer Rey Penaroyo, Financial Management Analyst, World Bank
Review of Concept Note
Date of review of draft Concept Note was March 31, 2015. All invited reviewers provided
comments, except DFAT. The date of the final Concept Note was June 3, 2015.
Invited reviewers:
Andrew James Mackie, Sr. Financial Management Specialist, World Bank
Ivor Beazley, Sr. Public Sector Specialist, World Bank
PEFA Secretariat
Daniel Featherston, Counsellor – Economic, DFAT
Warren Turner, Senior Public Management Specialist, ADB
Sandeep Saxena, Senior Economist, IMF
2016 Philippines PEFA Assessment 30 June 2016
The GoP and Development Partners 129
Review of the Assessment Report
Date of review of the draft report was March 23, 2016. All invited reviewers provided
comments. The date of the final Assessment Report is May 25, 2016.
Invited reviewers:
Andrew James Mackie, Sr. Financial Management Specialist, World Bank
Ivor Beazley, Sr. Public Sector Specialist, World Bank
PEFA Secretariat
Daniel Featherston, Counsellor – Economic, DFAT
Warren Turner, Senior Public Management Specialist, ADB
Sandeep Saxena, Senior Economist, IMF

2016 Philippines PEFA Assessment 30 June 2016
The GoP and Development Partners 130
Annex 3B: Persons Consulted
DBM
Laura B. Pascua – UnderSecretary, Budget Policy & Strategy
Richard E. Moya – UnderSecretary, Chief Information Officer/Organization &
Systems Improvement
Maxine Tanya Hamada – Assistant Secretary, Monitoring & Evaluation Sector
Rolando Toledo – Director, Fiscal Planning and Reforms Bureau
Cristina Clasara – Director, Operations, Social & Human Development
Ma. Lourdes Baguio – Officer-in-charge, Information and Communications
Technology and System Service
Aldrin Aquino – Coordinator, PFM Committee Secretariat
Ma. Cecilia Narido – Operations, Social & Human Development
Agnes Cipriano - PFM Committee Secretariat
Jobelle Sicat - PFM Committee Secretariat
DoF
Ma. Luisa Notario – Chief Administrative Officer, Budget Division
Elsa Agustin – Director, Policy Division
Rommel Roxales – Planning Officer, Fiscal Policy & Planning Office
Lolita Verdadero - Chief Accountant
BTr Sharon Almanza – Deputy Treasurer, Operations Subsector
John Kenneth Trinidad - Debt Strategy and Planning Division
BIR
Leonor Villalon-Rogers – ACIR, Planning & Management Service
Elvira R. Vera – ACIR, Collection Service
Claro B. Ortiz – ACIR, Internal Affairs Service
Erlinda A. Simple – ACIR, Assessment Service
James H. Roldan – ACIR, Enforcement & Advocacy Service
Marissa Cabreros – ACIR, Legal Service
Zenaida Chang – ACIR, Finance Service
Marilou del Rosario – OIC-ACIR, Client Support Service
Ione Alejo – Chief, Performance Evaluation Division
Rosa Bella B. Javerina – Asst. Chief, Revenue Accounting Division
Felipa Birginias – OIC-Chief, Planning & Programming Division
Lizabel Valderrama – OIC-Asst. Chief, Research & Statistics Division
Larry Barcelo – Atty., COS Legal Matters
Helen Vista – Atty., Enforcement & Advocacy Service
Laarni Angeles – Planning & Programming Division
BoC
Jesusa Dimpna Lejos – OIC Director, Financial Management Office
Cecile Marie Soriano – Director
Arturo Lachica – Deputy Commissioner
CoA Luzvi Pangan-Chatto – Director, Accounting Systems Development and Other
Services Office, Government Accountancy Sector
NEDA Kenneth Tanate – Assistant Director-General and Chief of Staff
GCG
Ma. Angela Ignacio – Commissioner
Clarence Glenn G. Pascual – Director, Corporate Governance Office
Paolo E. Salvosa – Director, Office of the Commissioner
GPPB Dennis Santiago – Executive Director, GPPB-Technical Support Office
House of
Representatives
Secretariat
Elena Ramos – Committee Secretary, Appropriations Committee
Senate Secretariat Ma. Victoria Cruz-Francia
Rommel Patacsil

2016 Philippines PEFA Assessment 30 June 2016
The GoP and Development Partners 131
Annex 3C: Sources of information
Documents:
Executive Orders (EOs) and Republic Acts (RAs)
EO no. 292, series 1987, Instituting the “Administrative Code of 1987”
Republic Act no. 8182, “ Official Development Assistance Act of 1996”
EO no. 55, series 2011, “Directing the integration and automation of government financial
management systems”
RA no. 4860, “Foreign Borrowing Act”
EO no. 93, series 1993, “Establishing the Regional Project Monitoring and Evaluation
System”
EO no. 43, series 2011, “Pursuing our social contract with the Filipino People through the
reorganization of the Cabinet Clusters”
EO no. 285, series 1987, “Abolishing the general services administration and transferring
its functions to appropriate government agencies”
EO no. 323, series 2000, “Constituting an inter-agency privatization council and creating a
privatization and management office under DOF for the continuing privatization of
government assets and corporations”
EO no. 127, series 1987, “ Reorganization of DOF”
EO no. 449, series 1997, “ Realigning the organization of the Bureau of the Treasury”
RA no. 1000, “An act authorizing the President of the Philippines to issue bonds to
finance public works and projects for economic development”
RA no. 245, “An act authorizing the Secretary of Finance to borrow to meet public
expenditures”
RA no. 9135, “Tariff and Customs Code of the Philippines”
DBM
Budget of Expenditures and Sources of Financing
National Expenditures Program
General Appropriations Act
DBM National and Local Budget Issuances (e.g., Budget Call, Guideline on release of
funds, Budget Fora, Guideline on Internal Revenue Allotment, Budget Priorities
Framework)
The President’s Budget Message
People’s Budget
Mid-year and year-end reports
Fiscal Risks Statement
Unified Reporting System generated submission report

2016 Philippines PEFA Assessment 30 June 2016
The GoP and Development Partners 132
CoA
Annual Report on Allotments, Obligations and Disbursements
Annual Report on Appropriations, Allotments, Obligations and Disbursements
Annual Audit Reports
Annual Financial Reports (including Financial Performance Reports)
Consolidated Audit Report on Official Development Assistance Programs and Projects
Special Audit Reports (e.g., Government-wide performance audit, sectoral performance
audit, agency-based performance audit, special studies, rate audit)
The Government Accounting Manual for National Government Agencies
Pertinent CoA circulars, resolutions and other issuances
BIR
Inventory of accounts receivable/delinquent accounts
Comparative internal revenue collections and goals by tax type
Monthly internal revenue collection by tax type
Operations memoranda relevant to the assessment
Revenue Special Order (internal memorandum)
Bureau of Internal Revenue’s rules (memorandum orders and circulars) and regulations
Sample memorandum of agreement with authorized agent bank for collection and
remittance of National Internal Revenue taxes/customs duties
Treasury Circular for implementing guidelines on the use of Treasury Single Account
Monthly reconciliation of Consolidated report on daily collections against - list of
remittance for Internal revenue taxes as of August and September, 2015
Data on number of registered taxpayers for 2010 to 2015
Post Campaign Evaluation Dipstick for Public Awareness Campaign to encourage more
taxpayers to pay their correct taxes
BoC
Post-Entry Audit (PEA) Primer – PEA system and recordkeeping requirements
Month of March, April and May statement of remittance by authorized agent banks thru
Summary on daily collection of customs, taxes and levies for March, April and May (per
bank)
Consolidated Report on daily collection of customs duties, taxes and other levies (Month
of May)
Reconciliation of revenue accounting division for the period of March, April and May (per
bank)
Bureau of Customs’ rules (memorandum orders and circulars) and regulations
BTr
List of cash accounts with outstanding reconciling items (report to BTr)
Cash Operations report

2016 Philippines PEFA Assessment 30 June 2016
The GoP and Development Partners 133
Statistical data from Bureau of the Treasury and Department of Finance
a) National government fiscal position
b) National government revenue
c) National government cash expenditures
d) National government cash operations
e) Outstanding public sector debt
f) National government outstanding debt
GCG
Performance Evaluation System (PES) Guidebook
GOCCs interim performance scorecard (3 samples)
GOCCs performance agreement for calendar year 2015 (3 samples)
1st and 2
nd quarter PES report (samples)
Other documents
Philippine Development Plan 2011-2016
List of NEDA Board confirmed and approved projects
Investment Coordination Committee guidelines and procedures
IMF’s Philippine Fiscal Transparency Report
Public Expenditure Tracking Survey
Local Government Code
Joint Circulars for UACS adoption and manual and creation of UACS website
UACS Manual
Websites:
Official Gazette of the Republic of the Philippines – www.gov.ph
Bangko Sentral ng Pilipinas (BSP) – http://www.bsp.gov.ph/
Bureau of Customs (BoC) – www.customs.gov.ph
Bureau of Internal Revenue (BIR) – www.bir.gov.ph
Bureau of Local Government Finance (BLGF) – http://blgf.gov.ph/
Bureau of the Treasury (BTr) – www.treasury.gov.ph/
Commission on Audit (CoA) – http://www.coa.gov.ph/
Department of Budget and Management (DBM) – http://www.dbm.gov.ph/
Department of Finance (DoF) – http://www.dof.gov.ph/
Good Governance and Anti-Corruption Cabinet Cluster – http://www.gov.ph/governance/
Governance Commission for Government Owned or Controlled Corporations (GCG) –
http://gcg.gov.ph
Government Procurement Policy Board (GPPB) – http://www.gppb.gov.ph/
The House of Representatives - www.congress.gov.ph
National Economic and Development Authority (NEDA) – http://www.neda.gov.ph/
Public-Private Partnership (PPP) Center – http://ppp.gov.ph/
The Senate of the Philippines – www.senate.gov.ph
Unified Accounts Code Structure – http://www.uacs.gov.ph
2016 Philippines PEFA Assessment 30 June 2016
The GoP and Development Partners 134
Open Budget Survey - http://www.internationalbudget.org/
International Monetary Fund (IMF) - https://www.imf.org

2016 Philippines PEFA Assessment 30 June 2016
The GoP and Development Partners 135
Annex 4: Data for PI‐1, PI‐2 and PI-3
Table A4.1: Data for PI-1 and PI-2, 2012
(PhP millions)
% Administrative or
functional head Budget Actual
Adjusted
budget Deviation
Absolute
deviation
DoF
184,765.02
180,612.93 151,055.76 29,557.17 29,557.17 19.57
DepEd
267,776.97
240,534.19 218,922.69 21,611.50 21,611.50 9.87
DPWH
205,228.94
158,031.62 167,786.16 (9,754.54) 9,754.54 5.81
DND
161,376.68
125,271.01 131,934.48 (6,663.47) 6,663.47 5.05
DILG
128,865.56
124,617.58 105,354.82 19,262.76 19,262.76 18.28
DSWD
59,724.45
55,774.83 48,828.08 6,946.75 6,946.75 14.23
DoH
41,876.48
34,413.61 34,236.37 177.24 177.24 0.52
DoA
66,301.10
56,887.57 54,204.87 2,682.70 2,682.70 4.95
DOTC
36,289.81
19,487.20 29,668.95 (10,181.75) 10,181.75 34.32
State universities and colleges
29,745.09
29,272.62 24,318.28 4,954.34 4,954.34 20.37
DENR
21,449.24
17,257.16 17,535.96 (278.80) 278.80 1.59
COMELEC
19,347.49
9,014.44 15,817.66 (6,803.22) 6,803.22 43.01
Judiciary
19,251.82
17,748.99 15,739.44 2,009.55 2,009.55 12.77
DAR
18,520.60
12,400.67 15,141.63 (2,740.96) 2,740.96 18.10
ARMM
14,733.80
14,237.32 12,045.71 2,191.61 2,191.61 18.19
DFA
14,468.47
11,778.46 11,828.79 (50.33) 50.33 0.43
DOST
11,833.31
10,293.32 9,674.40 618.92 618.92 6.40
Justice
11,635.11
10,831.21 9,512.35 1,318.86 1,318.86 13.86
Congress
11,202.41
9,929.89 9,158.60 771.29 771.29 8.42
Other Executive Offices
12,075.23
9,881.60 9,872.18 9.42 9.42 0.10
Others (= sum of rest)
477,533.61
334,771.45 390,410.49 (55,639.04) 55,639.04 14.25
Allocated expenditure
1,814,001.22
1,483,047.67 1,483,047.67 - 184,224.22
Interest & principal on debt
706,139.31
706,139.31
Contingency
9,414.83
6,926.35
Total expenditure
2,529,555.36
2,196,113.33
Overall (PI-1) variance 13.2%
Composition (PI-2) variance 12.4%
Contingency share of budget 0.27%

2016 Philippines PEFA Assessment 30 June 2016
The GoP and Development Partners 136
Table A4.2: Data for PI-1 and PI-2, 2013
(PhP millions)
% Administrative or
functional head Budget Actual
Adjusted
budget Deviation
Absolute
deviation
DoF
140,898.03
137,227.82 115,879.94 21,347.88 21,347.88 18.42
DepEd
299,904.03
280,609.03 246,652.58 33,956.45 33,956.45 13.77
DPWH
230,115.61
200,528.67 189,255.91 11,272.76 11,272.76 5.96
DND
168,847.77
165,379.87 138,866.88 26,512.99 26,512.99 19.09
DILG
140,610.02
131,407.41 115,643.07 15,764.34 15,764.34 13.63
DSWD
78,574.91
69,606.74 64,623.02 4,983.72 4,983.72 7.71
DoH
48,454.68
40,932.73 39,850.98 1,081.74 1,081.74 2.71
DoA
76,267.18
66,612.98 62,725.06 3,887.92 3,887.92 6.20
DOTC
39,717.71
28,300.78 32,665.37 (4,364.59) 4,364.59 13.36
State universities and colleges
37,739.96
36,707.28 31,038.79 5,668.49 5,668.49 18.26
DENR
28,939.75
25,260.80 23,801.16 1,459.64 1,459.64 6.13
COMELEC
18,850.13
15,243.55 15,503.07 (259.52) 259.52 1.67
Judiciary
20,173.26
18,876.72 16,591.26 2,285.46 2,285.46 13.78
DAR
24,074.41
13,432.17 19,799.72 (6,367.55) 6,367.55 32.16
ARMM
18,140.75
17,984.81 14,919.65 3,065.16 3,065.16 20.54
DFA
14,861.59
13,618.63 12,222.74 1,395.89 1,395.89 11.42
DOST
14,232.58
13,267.49 11,705.42 1,562.07 1,562.07 13.34
Justice
13,348.88
12,675.62 10,978.63 1,696.99 1,696.99 15.46
Congress
11,891.43
10,104.06 9,779.97 324.09 324.09 3.31
Other Executive Offices
14,199.33
10,440.20 11,678.07 (1,237.87) 1,237.87 10.60
Others (= sum of rest)
581,518.75
354,227.25 478,263.32 (124,036.07) 124,036.07 25.93
Allocated expenditure
2,021,360.76
1,662,444.61 1,662,444.61 -
272,531.19
Interest & principal on debt
783,246.00
557,028.40
Contingency
13,782.69
9,325.73
Total expenditure
2,818,389.45
2,228,798.74
Overall (PI-1) variance 20.9%
Composition (PI-2) variance 16.39%
Contingency share of budget 0.33%

2016 Philippines PEFA Assessment 30 June 2016
The GoP and Development Partners 137
Table A4.3: Data for PI-1 and PI-2, 2014
(PhP millions)
% Administrative or
functional head Budget Actual
Adjusted
budget Deviation
Absolute
deviation
DoF
138,140.82
133,412.67 101,694.86 31,717.81 31,717.81 31.19%
DepEd
309,658.76
274,459.54 227,960.90 46,498.64 46,498.64 20.40%
DPWH
302,110.59
190,534.45 222,404.17 (31,869.72) 31,869.72 14.33%
DND
143,222.97
138,088.36 105,436.18 32,652.18 32,652.18 30.97%
DILG
160,000.48
143,035.87 117,787.25 25,248.62 25,248.62 21.44%
DSWD
103,658.09
86,135.27 76,309.78 9,825.49 9,825.49 12.88%
DoH
56,781.44
47,228.15 41,800.68 5,427.47 5,427.47 12.98%
DoA
74,695.59
56,697.10 54,988.51 1,708.59 1,708.59 3.11%
DOTC
59,354.94
34,107.99 43,695.21 (9,587.22) 9,587.22 21.94%
State universities and
colleges
42,902.27
38,883.67 31,583.28 7,300.39 7,300.39 23.11%
DENR
30,083.72
23,825.60 22,146.67 1,678.93 1,678.93 7.58%
COMELEC
6,615.82
5,439.17 4,870.36 568.81 568.81 11.68%
Judiciary
21,957.88
19,443.77 16,164.69 3,279.08 3,279.08 20.29%
DAR
30,445.53
12,161.67 22,413.03 (10,251.36) 10,251.36 45.74%
ARMM
22,850.84
22,450.91 16,822.06 5,628.85 5,628.85 33.46%
DFA
15,489.31
13,371.16 11,402.74 1,968.42 1,968.42 17.26%
DOST
14,694.14
12,630.66 10,817.36 1,813.30 1,813.30 16.76%
Justice
14,568.17
13,640.93 10,724.62 2,916.31 2,916.31 27.19%
Congress
12,545.34
10,506.38 9,235.48 1,270.90 1,270.90 13.76%
Other Executive Offices
18,473.90
13,327.59 13,599.90 (272.31) 272.31 2.00%
Others (= sum of rest)
655,342.72
354,919.21 482,442.40 (127,523.19) 127,523.19 26.43%
Allocated expenditure
2,233,593.32
1,644,300.12 1,644,300.12 - 359,007.59
Interest on debt
793,583.00
541,910.30
Special Purpose Fund for
LGUs
50,397.47
41,321.95
Total expenditure
3,077,573.79
2,227,532.37
Overall (PI-1) variance 27.6%
Composition (PI-2) variance 21.83%
Contingency share of budget 1.34%

2016 Philippines PEFA Assessment 30 June 2016
The GoP and Development Partners 138
Table A4.4: Results Matrix for PI-1 and PI-2
Year For PI-1: Total expenditure
variation
For PI-2.1: Composition
variance
For PI-2.3:
Contingency share
2012 86.82% 12.42%
0.65% 2013 79.08% 16.39%
2014 72.38% 21.83%
Table A4.5: Data for PI-2.2, 2012
Economic head
(PhP billions)
% Budget Actual
Adjusted
budget Deviation
Absolute
deviation
Maintenance and other
operating expenses 703.89 622.53 594.10 28.43 28.43 4.78
Capital Outlays 510.45 304.35 430.84 (126.49) 126.49 29.36
Personnel Services 599.65 556.17 506.12 50.05 50.05 9.89
Financial expenses 307.83 307.83 259.82 48.01 48.01 18.48
Total expenditure 2,121.82 1,790.88 1,790.88 - 252.98
Composition Variance 14.13%
Table A4.6: Data for PI-2.2, 2013
Economic head
(PhP billions)
% Budget Actual
Adjusted
budget Deviation
Absolute
deviation
Maintenance and other
operating expenses
813.35
703.11
685.48 17.63 17.63 2.57
Capital Outlays
587.00
348.29
494.71 (146.42) 146.42 29.60
Personnel Services
621.01
611.04
523.38 87.66 87.66 16.75
Financial expenses
333.90
322.54
281.41 41.13 41.13 14.62
Total expenditure
2,355.26
1,984.98
1,984.98 - 292.84
Composition Variance 14.75%

2016 Philippines PEFA Assessment 30 June 2016
The GoP and Development Partners 139
Table A4.7: Data for PI-2.2, 2014
Economic head
(PhP billions)
% Budget Actual
Adjusted
budget Deviation
Absolute
deviation
Maintenance and other
operating expenses
886.30
735.27
673.30 61.97 61.97 9.20
Capital Outlays
687.73
272.99
522.45 (249.46) 249.46 47.75
Personnel Services
658.11
634.80
499.95 134.85 134.85 26.97
Financial expenses
354.11
321.65
269.01 52.64 52.64 19.57
Total expenditure
2,586.25
1,964.71
1,964.71 - 498.92
Composition Variance 25.39%
Table A4.8: Results Matrix for PI-2.2
Year Composition variance
2012 14.13%
2013 14.75%
2014 25.39%
Table A4.9: Data for PI-3, 2012
Economic head
(PhP millions)
% Budget Actual
Adjusted
budget Deviation
Absolute
deviation
Tax Revenue
Taxes on income and profits 670,977 642,515
659,932 (17,417) 17,417 2.6%
Taxes on property 2,794 3,615
2,748 867 867 31.5%
Taxes on goods and services 406,583 425,078
399,890 25,188 25,188 6.3%
Taxes on imports 347,073 289,866
341,360 (51,494) 51,494 15.1%
Grants
Grants from international organizations - 99 - 99 99
Grants from other government units
- - -
Other Revenues
Premiums, fees, and claims related to nonlife
insurance and standardized guarantee schemes
69,446
81,332
68,303 13,029 13,029 19.1%
Sum of rest
63,750
92,428
62,700 29,728 29,728 47.4%
Total Revenue
1,560,623
1,534,933
1,534,933 - 137,822
Overall variance 98.4%
Composition variance 9.0%

2016 Philippines PEFA Assessment 30 June 2016
The GoP and Development Partners 140
Table A4.10: Data for PI-3, 2013
Economic head
(PhP millions)
% Budget Actual
Adjusted
budget Deviation
Absolute
deviation
Tax Revenue
Taxes on income and profits
759,186
718,210 746,243 (28,033) 28,033 3.8%
Taxes on property
3,918
3,552 3,851 (299) 299 7.8%
Taxes on goods and services
504,765
509,010 496,160 12,850 12,850 2.6%
Taxes on imports
340,000
304,925 334,204 (29,279) 29,279 8.8%
Grants
Grants from international organizations - 321 - 321 321
Grants from other government units
- - -
Other Revenues
Premiums, fees, and claims related to nonlife insurance and standardized guarantee schemes
78,258
30,541 76,924 (46,383) 46,383 60.3%
Sum of rest
59,729
149,533 58,710 90,823 90,823 154.7%
Total Revenue
1,745,856
1,716,092 1,716,092 - 207,988
Overall variance 98.3%
Composition variance 12.1%
Table A4.11: Data for PI-3, 2014
Economic head
(PhP millions)
% Budget Actual
Adjusted
budget Deviation
Absolute
deviation
Tax Revenue
Taxes on income and profits 853,200 784,859 806,895 (22,036) 22,036 2.7%
Taxes on property 5,291 5,450 5,004 446 446 8.9%
Taxes on goods and services 613,331 560,530 580,044 (19,514) 19,514 3.4%
Taxes on imports 408,096 369,277 385,948 (16,671) 16,671 4.3%
Grants
Grants from international organizations - 233 - 233 233
Grants from other government units
- - -
Other Revenues
Premiums, fees, and claims related to nonlife
insurance and standardized guarantee schemes 75,441 32,771 71,347 (38,576) 38,576 54.1%
Sum of rest 62,691 155,407 59,289 96,118 96,118 162.1%
Total Revenue 2,018,050 1,908,527
1,908,527 -
193,594
Overall variance 94.6%
Composition variance 10.1%
Table A4.12: Results Matrix for PI-3
Year Total revenue deviation Composition variance
2012 98.4% 9.0%
2013 98.3% 12.1%
2014 94.6% 10.1%

2016 Philippines PEFA Assessment 30 June 2016
The GoP and Development Partners 141
Annex 5: Summary Assessment based on Old Methodology
Performance Indicators
Sco
rin
g
Meth
od
2010
2016
Dimension Ratings Overall
Score
Dimension Ratings Overall
Score (i) (ii) (iii) (iv) (i) (ii) (iii) (iv)
A – Credibility of the Budget
PI-1 Aggregate expenditure outturn compared to
original approved budget M1 NR NR D D
PI-2 Composition of expenditure outturn compared to original approved budget
M1 NR NR D A D+
PI-3 Aggregate revenue outturn compared to
original approved budget M1 A A A A
PI-4 Stock and monitoring of expenditure
payment arrears M1 C D D+ C D D+
B – Comprehensiveness and Transparency
PI-5 Classification of the budget M1 D D C C
PI-6 Comprehensiveness of information included
in budget documentation M1 B B A A
PI-7 Extent of unreported government operations M1 A A A A A A
PI-8 Transparency of inter-governmental fiscal
relations M2 A B C B A B A A
PI-9 Oversight of aggregate fiscal risk from other
public sector entities M1 C B C+ B B B
PI-10 Public access to key fiscal information M1 C C A A
C – Policy Based Budgeting
PI-11 Orderliness and participation in the annual
budget process M2 B A D B A A A A
PI-12 Multi-year perspective in fiscal planning, expenditure policy and budgeting
M2 C D C D D+ B A B B B+
D – Predictability and Control in Budget Execution
PI-13 Transparency of taxpayer obligations and
liabilities M2 D C B C B B B B
PI-14 Effectiveness of measures for taxpayer
registration and tax assessment M2 C C C C B A B B+
PI-15 Effectiveness in collection of tax payments M1 A C D D+ A A A A
PI-16 Predictability in the availability of funds for commitment of expenditures
M1 A D D D+ A A A A
PI-17 Recording and management of cash
balances, debt and guarantees M2 B B B B B B B B
PI-18 Effectiveness of payroll controls M1 C B C C C+ B B C C C+
PI-19 Competition, value for money and controls in procurement
M2 B B B B B B B B B
PI-20 Effectiveness of internal controls for non-
salary Expenditure M1 C C D D+ C B C C+
PI-21 Effectiveness of internal audit M1 D D C D+ C C C C
E – Accounting, Recording and Reporting
PI-22 Timeliness and regularity of accounts
reconciliation M2 D D D D D D
PI-23 Availability of information on resources
received by service delivery unit M1 D D C C
PI-24 Quality and timeliness of in-year budget
reports M1 D D D D A D C D+
PI-25 Quality and timeliness of annual financial
statements M1 B D B D+ B B B B
F – External Scrutiny and Audit
PI-26 Scope, nature and follow-up of external audit M1 A NA B B+ A D B B
PI-27 Legislative scrutiny of the annual budget law M1 B A A C C+ B A A B B+
PI-28 Legislative scrutiny of external audit reports M1 D D D D D D D D

2016 Philippines PEFA Assessment 30 June 2016
The GoP and Development Partners 142
Table A5.2: Distribution of Ratings by Indicator – Old Methodology
Core Dimensions of Performance 2010 Ratings 2016 Ratings Total
indicators A / B C / D A / B C / D
Credibility of the budget 1 3 1 3 4
Comprehensiveness and transparency 3 3 5 1 6
Policy-based budgeting 1 1 2 - 2
Predictability and control in budget execution 2 7 6 3 9
Accounting, recording and reporting - 4 1 3 4
External scrutiny and audit 1 2 2 1 3
Total 8 20 17 11 28
Table A5.3: Distribution of Ratings by Dimensions – Old Methodology
Core Dimensions of Performance 2010 Ratings 2016 Ratings Total
indicators A / B C / D A / B C / D
Credibility of the budget 1 4 2 4* 5
Comprehensiveness and transparency 6 4 9 1 10
Policy-based budgeting 2 5 7 - 7
Predictability and control in budget execution 10 18 19 9 28
Accounting, recording and reporting 2 7 4 5 9
External scrutiny and audit 5 5 6 4 10
Total 26 43 47 23 69
* Indicator was revised in 2011 to add a dimension.
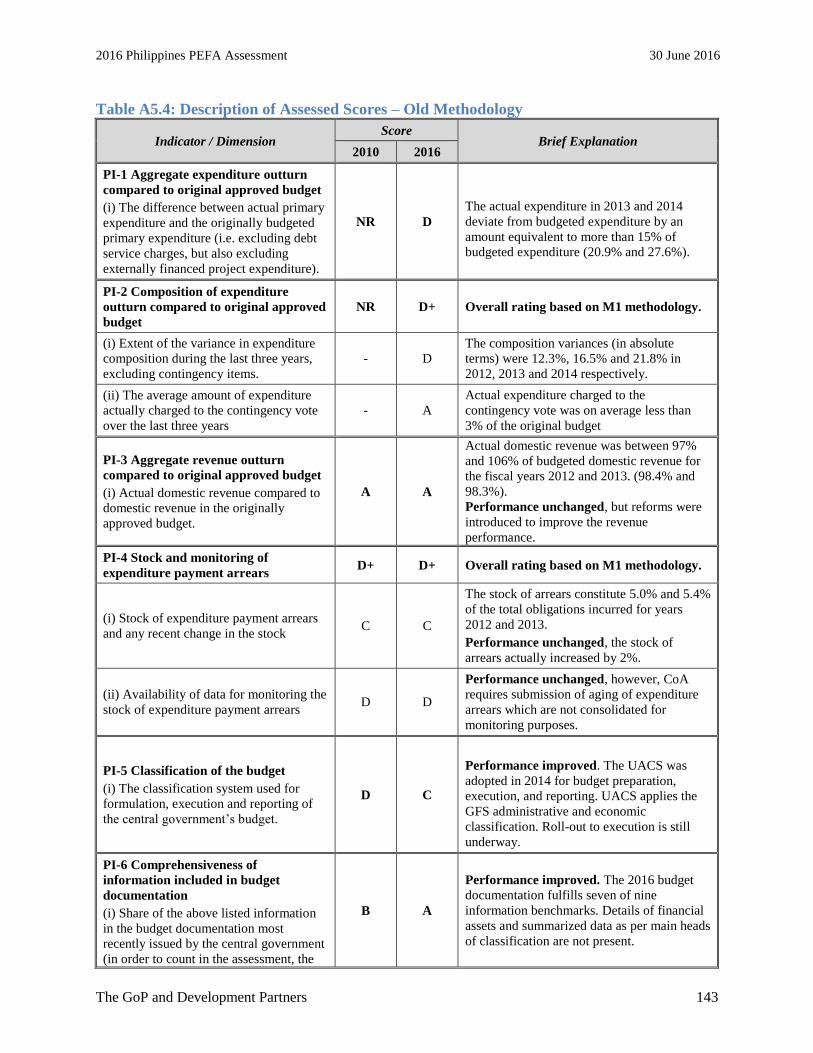
2016 Philippines PEFA Assessment 30 June 2016
The GoP and Development Partners 143
Table A5.4: Description of Assessed Scores – Old Methodology
Indicator / Dimension Score
Brief Explanation 2010 2016
PI-1 Aggregate expenditure outturn
compared to original approved budget
(i) The difference between actual primary
expenditure and the originally budgeted
primary expenditure (i.e. excluding debt
service charges, but also excluding
externally financed project expenditure).
NR D
The actual expenditure in 2013 and 2014
deviate from budgeted expenditure by an
amount equivalent to more than 15% of
budgeted expenditure (20.9% and 27.6%).
PI-2 Composition of expenditure
outturn compared to original approved
budget
NR D+ Overall rating based on M1 methodology.
(i) Extent of the variance in expenditure
composition during the last three years,
excluding contingency items.
- D
The composition variances (in absolute
terms) were 12.3%, 16.5% and 21.8% in
2012, 2013 and 2014 respectively.
(ii) The average amount of expenditure
actually charged to the contingency vote
over the last three years
- A
Actual expenditure charged to the
contingency vote was on average less than
3% of the original budget
PI-3 Aggregate revenue outturn
compared to original approved budget
(i) Actual domestic revenue compared to
domestic revenue in the originally
approved budget.
A A
Actual domestic revenue was between 97%
and 106% of budgeted domestic revenue for
the fiscal years 2012 and 2013. (98.4% and
98.3%).
Performance unchanged, but reforms were
introduced to improve the revenue
performance.
PI-4 Stock and monitoring of
expenditure payment arrears D+ D+ Overall rating based on M1 methodology.
(i) Stock of expenditure payment arrears
and any recent change in the stock C C
The stock of arrears constitute 5.0% and 5.4%
of the total obligations incurred for years
2012 and 2013.
Performance unchanged, the stock of
arrears actually increased by 2%.
(ii) Availability of data for monitoring the
stock of expenditure payment arrears D D
Performance unchanged, however, CoA
requires submission of aging of expenditure
arrears which are not consolidated for
monitoring purposes.
PI-5 Classification of the budget
(i) The classification system used for
formulation, execution and reporting of
the central government’s budget.
D C
Performance improved. The UACS was
adopted in 2014 for budget preparation,
execution, and reporting. UACS applies the
GFS administrative and economic
classification. Roll-out to execution is still
underway.
PI-6 Comprehensiveness of
information included in budget
documentation
(i) Share of the above listed information
in the budget documentation most
recently issued by the central government
(in order to count in the assessment, the
B A
Performance improved. The 2016 budget
documentation fulfills seven of nine
information benchmarks. Details of financial
assets and summarized data as per main heads
of classification are not present.

2016 Philippines PEFA Assessment 30 June 2016
The GoP and Development Partners 144
Indicator / Dimension Score
Brief Explanation 2010 2016
full specification of the information
benchmark must be met).
PI-7 Extent of unreported government
operations A A Overall rating based on M1 methodology.
(i) The level of extra-budgetary
expenditure which is unreported i.e. not
included in fiscal reports
A A
No change in the process. Per interview, all
the information, activities and operations of
the department/bureau are reported and
disclosed in the annual audit reports of the
respective agencies.
(ii) Income/expenditure information on
donor-funded projects which is included
in fiscal reports.
A A
No change in the process. There is a
separate annual audit report being undertaken
by CoA for special projects financed by
grants or donor-funding,
PI-8 Transparency of inter-
governmental fiscal relations B A
Performance improved under (iii) as BLGF
fiscal reporting coverage improved.
(i) Transparent and rules based systems in
the horizontal allocation among SN
governments of unconditional and
conditional transfers from central
government (both budgeted and actual
allocations)
A A Performance unchanged. System and
process remains the same.
(ii) Timeliness of reliable information to
SN governments on their allocations from
central government for the coming year
B B
Performance unchanged. The information
on transfers is regulated by DBM and the
respective allocations are provided early.
(iii) Extent to which consolidated fiscal
data is collected and reported for general
government according to sectoral
categories
C A
Performance improved. Annual audited
reports of majority LGUs are issued and
published by CoA within nine months of the
year-end
PI-9 Oversight of aggregate fiscal risk
from other public sector entities C+ B Performance improved in all dimensions.
(i) Extent of central government
monitoring of autonomous government
agencies and public enterprise
C B
Performance improved, GCG conducts an
annual performance review and published
these data annually. The risk information is
consolidated in the Government-wide Fiscal
Risk Statement (FRS).
(ii) Extent of central government
monitoring of SN governments‟ fiscal
position
B B
Performance unchanged, BLGF monitors
the fiscal position and debt of the LGUs. The
information collated by BLGF for inclusion
into the FRS.
PI-10 Public access to key fiscal
information
(i) Number of the above listed elements
of public access to information that is
fulfilled (in order to count in the
assessment, the full specification of the
information benchmark must be met).
C A
The government makes available five of the
listed types of information. The performance
improved as the government made several
reforms to disclose public information.
PI-11 Orderliness and participation in
the annual budget process B A Performance improved in all dimensions.

2016 Philippines PEFA Assessment 30 June 2016
The GoP and Development Partners 145
Indicator / Dimension Score
Brief Explanation 2010 2016
(i) Existence of and adherence to a fixed
budget calendar B A
A clear annual budget calendar exists, which
allows NGAs more than 10 weeks to
complete their detailed estimates on time
(ii) Clarity/comprehensiveness of and
political involvement in the guidance on
the preparation of budget submissions
(budget circular or equivalent)
A A
National Budget Memoranda are clear and
very comprehensive. These also include the
approved “hard” budget ceilings per
department and agency.
(iii) Timely budget approval by the
legislature or similarly mandated body
(within the last three years)
D A
The President has in each of the last three
years approved the budget before the start of
the fiscal year.
PI-12 Multi-year perspective in fiscal
planning, expenditure policy and
budgeting
D+ B+ Performance improved in all dimensions.
(i) Preparation of multi -year fiscal
forecasts and functional allocations C B
Performance improved. MTFFs were
prepared for the last two years. Departments /
agencies prepare a three-year rolling budget
based on the issued hard budget ceiling.
(ii) Scope and frequency of debt
sustainability analysis D A
Performance improved. Debt sustainability
analysis, previously lacking, is present in the
Fiscal Risk Statement report.
(iii) Existence of sector strategies with
multi-year costing of recurrent and
investment expenditure
C B
Performance improved based on the PFM
reforms initiated by DBM. The budget
preparation covers program budgeting which
sets the priority programs and its related
costs.
(iv) Linkages between investment
budgets and forward expenditure
estimates
D B
Performance improved, major investments
are identified based on the priority programs,
while recurrent costs are budgeted by the
implementing agencies. Budget ceilings are
directly related to the forward estimates.
PI-13 Transparency of taxpayer
obligations and liabilities C B
Performance improved in (i) and (ii)
through the reforms made in BIR and BoC.
(i) Clarity and comprehensiveness of tax
liabilities D B
Performance improved. Laws and its related
implementing rules and regulations for most
major taxes are comprehensive and updated
online, however, these, are still complex for
the taxpayers/importers and the assigned
bureaus have fairly limited discretionary
powers.
(ii) Taxpayer access to information on tax
liabilities and administrative procedures C B
Performance improved as the BIR and BOC
are disclosing comprehensive and updated
information through their respective websites,
though this information is not always user-
friendly to the public/user.
(iii) Existence and functioning of a tax
appeals mechanism B B
No change in the process. Additional
information was provided by the BIR in the
website through rulings and circular.
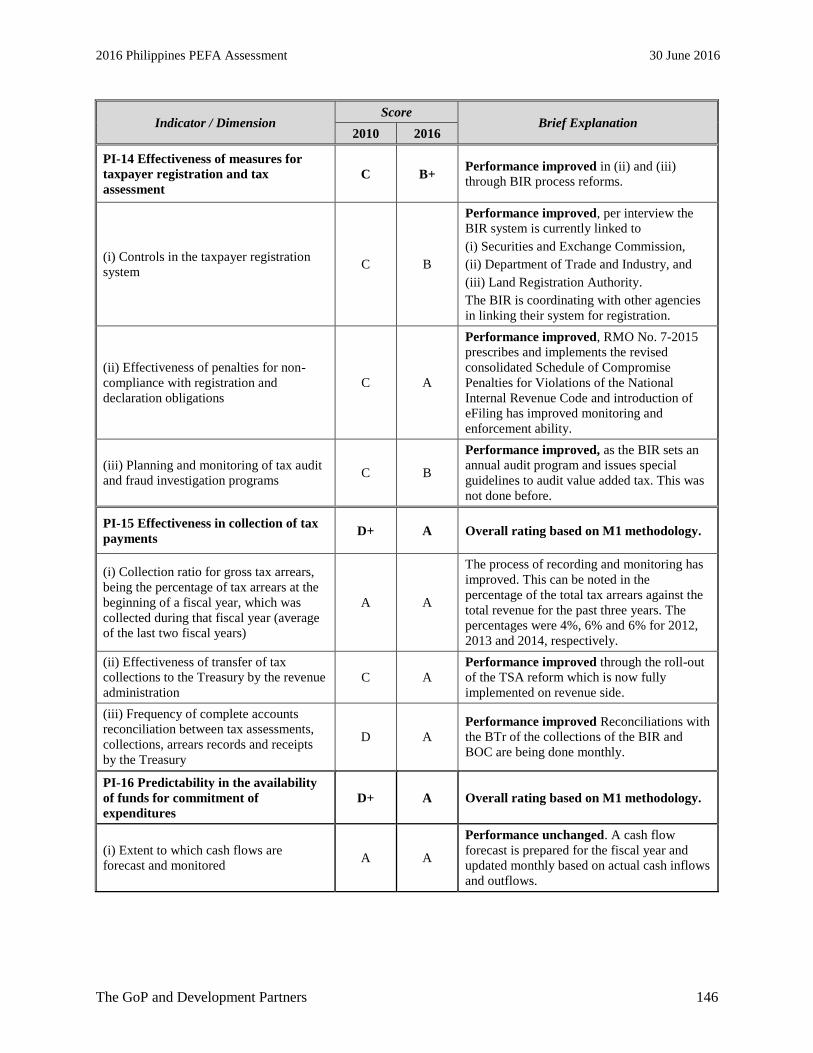
2016 Philippines PEFA Assessment 30 June 2016
The GoP and Development Partners 146
Indicator / Dimension Score
Brief Explanation 2010 2016
PI-14 Effectiveness of measures for
taxpayer registration and tax
assessment
C B+ Performance improved in (ii) and (iii)
through BIR process reforms.
(i) Controls in the taxpayer registration
system C B
Performance improved, per interview the
BIR system is currently linked to
(i) Securities and Exchange Commission,
(ii) Department of Trade and Industry, and
(iii) Land Registration Authority.
The BIR is coordinating with other agencies
in linking their system for registration.
(ii) Effectiveness of penalties for non-
compliance with registration and
declaration obligations
C A
Performance improved, RMO No. 7-2015
prescribes and implements the revised
consolidated Schedule of Compromise
Penalties for Violations of the National
Internal Revenue Code and introduction of
eFiling has improved monitoring and
enforcement ability.
(iii) Planning and monitoring of tax audit
and fraud investigation programs C B
Performance improved, as the BIR sets an
annual audit program and issues special
guidelines to audit value added tax. This was
not done before.
PI-15 Effectiveness in collection of tax
payments D+ A Overall rating based on M1 methodology.
(i) Collection ratio for gross tax arrears,
being the percentage of tax arrears at the
beginning of a fiscal year, which was
collected during that fiscal year (average
of the last two fiscal years)
A A
The process of recording and monitoring has
improved. This can be noted in the
percentage of the total tax arrears against the
total revenue for the past three years. The
percentages were 4%, 6% and 6% for 2012,
2013 and 2014, respectively.
(ii) Effectiveness of transfer of tax
collections to the Treasury by the revenue
administration
C A
Performance improved through the roll-out
of the TSA reform which is now fully
implemented on revenue side.
(iii) Frequency of complete accounts
reconciliation between tax assessments,
collections, arrears records and receipts
by the Treasury
D A
Performance improved Reconciliations with
the BTr of the collections of the BIR and
BOC are being done monthly.
PI-16 Predictability in the availability
of funds for commitment of
expenditures
D+ A Overall rating based on M1 methodology.
(i) Extent to which cash flows are
forecast and monitored A A
Performance unchanged. A cash flow
forecast is prepared for the fiscal year and
updated monthly based on actual cash inflows
and outflows.

2016 Philippines PEFA Assessment 30 June 2016
The GoP and Development Partners 147
Indicator / Dimension Score
Brief Explanation 2010 2016
(ii) Reliability and horizon of periodic in-
year information to departments on
ceilings for expenditure commitment
D A
Performance improved. Since 2014, the
GAA stands as the government’s primary
budget release document. An agency can
begin obligating funds as soon as the GAA is
enacted on the very first working day of the
fiscal year. For multi-year PPAs, Multi Year
Obligation Authority is necessary prior to
entering into contracts. Cash allotment is
made every six months.
(iii) Frequency and transparency of
adjustments to budget allocations, which
are decided above the level of
management of departments
D A
Performance improved. In 2015, DBM
issued National Budget Circular No. 559
dated June 26, 2015 to provide guidelines in
the realignment of funds
PI-17 Recording and management of
cash balances, debt and guarantees B B Overall rating based on M2 methodology.
(i) Quality of debt data recording and
reporting B B
Performance unchanged, debt records are
complete, updated and reconciled on a
monthly basis. Mid-year reports present the
National Government debt information.
(ii) Extent of consolidation of the
government’s cash balances B B
Performance unchanged, daily cash
balances data are consolidated when reports
are received from different authorized banks.
(iii) Systems for contracting loans and
issuance of guarantees B B
No change in the process, loan contracting
and issuance of guarantee still follows the
same guideline and procedure
PI-18 Effectiveness of payroll controls C+ C+ Overall rating based on M1 methodology.
(i) Degree of integration and
reconciliation between personnel records
and payroll data
C C
Performance unchanged. DBM maintains
GMIS at the central level; however, this is not
linked to each agency’s personnel records and
payroll data, which is paid at the regional
level. DepEd, for instance, adopts a
decentralized system allowing the Regional
Offices to manage their own records and
process their payroll through the Regional
Payroll Service Unit.
(ii) Timeliness of changes to personnel
records and the payroll B B
Performance unchanged. Delays occur in
processing changes to payroll for some and
not the majority of instances.
(iii) Internal controls of changes to
personnel records and the payroll C C
Performance unchanged. CoA’s audit
observations include payroll system
deficiencies, including lapses in the controls
and procedural practices that resulted in the
double issuance of pay slips, inclusion in the
database of transferred, retired, resigned and
deceased personnel, rejected payrolls and

2016 Philippines PEFA Assessment 30 June 2016
The GoP and Development Partners 148
Indicator / Dimension Score
Brief Explanation 2010 2016
canceled payroll checks, among others.
(iv) Existence of payroll audits to identify
control weaknesses and/or ghost workers C C
Performance unchanged. While payroll
audits are performed by CoA as part of their
regular audit of an agency’s financial
statements, there is little evidence that checks
for ghost workers are being conducted.
PI-19 Competition, value for money
and controls in procurement B B Overall rating based on M2 methodology.
(i) Use of open competition for award of
contracts that exceed the nationally
established monetary threshold for small
purchases
B B
The total value of contracts awarded through
competitive methods in 2014 was PhP 35.4
billion for central government agencies and
PhP 26.2billion or 74% was done through
competitive bidding.
(ii) Justification for use of less
competitive procurement methods B B
Results of APCPI Indicator 2 on Alternative
Mode showed that there is justification for
more than 70% of the contracts procured
through alternative methods.
(iv) Existence and operation of a
procurement complaints mechanism B B
The procurement law, Republic Act No. 9184
has a well-defined procurement complaint
mechanism. However, there is no
independent administrative body that resolves
complaints.
PI-20 Effectiveness of internal controls
for non-salary expenditure D+ C+ Overall rating based on M1 methodology.
(i) Effectiveness of expenditure
commitment controls C C
Performance unchanged. Agencies commit
based on the GAA and in some instances,
through DBM-issued Special Allotment
Release Orders; thus limiting the
expenditures that can be incurred. Notice of
Cash Allocations, on the other hand,
constrains the agency from releasing funds
due to cash availability which essentially is
not linked with commitment control. CoA
reports indicate expenditures in excess of
obligations.
(ii) Comprehensiveness, relevance and
understanding of other internal control
rules/procedures
C B
Performance improved. In October 2008,
DBM issued circular (No. 2008-8) on
National Guidelines on Internal Control
Systems (NGICS) which serve as a guide to
the heads of MDAs in designing, installing,
implementing, and monitoring their
respective internal control system. Further in
May 2011, DBM issued circular (No. 2011-5)
on the Philippine Government Internal Audit
Manual to complement NGICS and serve as a
guide to the MDAs in strengthening their

2016 Philippines PEFA Assessment 30 June 2016
The GoP and Development Partners 149
Indicator / Dimension Score
Brief Explanation 2010 2016
internal control systems. Trainings and
workshops on NGICS and PGIAM
implementation had been conducted to
MDAs.
(iii) Degree of compliance with rules for
processing and recording transactions D C
Performance improved. Number of
unmodified opinion increased and adverse
opinion decreased based on CY2013 audit
reports (compared to previous assessment).
However, despite NGICS and PGIAM
implementation, CoA audit reports still
indicated a substantial number of findings
concerning lapses in internal control resulting
in significant misstatements in the financial
statements as well as occurrences of
transactions not compliant with existing rules
and regulations. Also, due to maintaining
financial records in spreadsheet format, there
is little evidence that controls over access to
financial information exist.
PI-21 Effectiveness of internal audit D+ C Overall rating based on M1 methodology.
(i) Coverage and quality of the internal
audit function D C
Performance improved. Internal Audit
Service/Internal Audit Units have now been
established in most government agencies;
although not efficiently and effectively
functioning due to lack of substantial
trainings to further develop competencies of
audit personnel. In DOTC, there is non-
adherence to independence since Internal
Audit Service/Internal Audit Units is
reporting to the Undersecretary of
Operations.
(ii) Frequency and distribution of reports D C
Performance improved. DPWH and DOTC
completed their respective audit plans during
2014 and were able to issue internal audit
reports. Internal Audit Units established in all
NGAs regularly issue reports to the head of
the entity but not to DBM or CoA.
(iii) Extent of management response to
internal audit findings C C
Performance unchanged. In every internal
audit report issued, Internal Audit
Service/Internal Audit Units provide
recommendations that are presented to the
Head of the audited unit and the Department
Secretary. Management response is solicited
to indicate corresponding action plan that will
be undertaken. However, no validation is
completed to verify actions have been
completed.

2016 Philippines PEFA Assessment 30 June 2016
The GoP and Development Partners 150
Indicator / Dimension Score
Brief Explanation 2010 2016
PI-22 Timeliness and regularity of
accounts reconciliation D D Overall rating based on M2 methodology.
(i) Regularity of bank reconciliation D D
Performance unchanged. CoA audit reports
cite unreliable cash balances and include a
significant number of findings and
observations concerning non-preparation or
delayed submission of bank reconciliation
statements.
(ii) Regularity of reconciliation and
clearance of suspense accounts and
advances
D D
Performance unchanged. Based on CoA
audit observations, long outstanding
unliquidated advances run to millions of
pesos. For the suspense account, DoJ
maintains Other Property, Plant and
Equipment which is captioned as “for
reclassification” since 2012. DOTC, on the
other hand, created suspense payable
accounts to lodge prior year balances subject
to reconciliation.
PI-23 Availability of information on
resources received by service delivery
units
(i) Collection and processing of
information to demonstrate that resources
were actually received (in cash and in
kind) by the most common front-line
service delivery units (focus on primary
schools and primary health clinics) in
relation to the overall resources made
available to the sector(s), irrespective of
which level of government is responsible
for the operation and funding of those
units
D C
Overall rating based on M1 methodology.
Performance improved. MDAs (which
includes DepEd and DoH) submit a
consolidated Statement of Appropriations,
Allotments, Obligations, Disbursements and
Balances (SAAODB) on a quarterly basis to
Department of Budget and Management. This
report reflects information on resources
received by the frontline service delivery
units whether sub-allotted by the Central
Office or directly released by DBM to
Regional Offices. However, there is no
evidence that in-kind resources received by
service delivery units are compiled at least
annually. CoA’s audit reports also indicate
lack of efficient monitoring of resources for
service delivery units.
PI-24 Quality and timeliness of in-year
budget reports D D+ Overall rating based on M1 methodology.
(i) Scope of reports in terms of coverage
and comparability with budget estimates D A
Performance improved. Numerous reports
with a new format are required to be
submitted by the line departments and
agencies to both CoA and DBM. DBM
requires 4 Budget Execution Documents and
10 Budget and Financial Accountability
Reports.

2016 Philippines PEFA Assessment 30 June 2016
The GoP and Development Partners 151
Indicator / Dimension Score
Brief Explanation 2010 2016
(ii) Timeliness of the issue of reports D D
Performance unchanged. Timely
submission remained to be a challenge among
a number of line departments and agencies.
As of September 11, 2015, there are still a
number of line departments and agencies that
are flagged pending on their submission of
the March and June Budget and Financial
Accountability Reports.
(iii) Quality of information D C
Performance improved. Delay in the
submission compromised the relevance of the
information. In addition, reliability may prove
questionable considering the lack of
appropriate control mechanisms to ensure
accuracy and validity of financial data.
PI-25 Quality and timeliness of
financial statements D+ B Overall rating based on M1 methodology.
(i) Completeness of the financial
statements B B
Performance unchanged. CoA Annual
Financial Reports provides relative complete
information for national and local
government and GOCCs. Qualified audit
opinion on BTr - national government Books
indicating incomplete financial statements.
Annual financial statements of Agencies,
which are the bases of consolidation, are
mostly given a qualified opinion.
(ii) Timeliness of the submission of the
financial statements D B
Performance improved. Based on the
information obtained from CoA, submission
of Agency financial statements are submitted
between February and May
(iii) Accounting standards used B B
Performance unchanged. In 2014, CoA
adopted PPSAS, which is based on IPSAS
with some exceptions. In the previous years,
NGAS was applied.
PI-26 Scope, nature and follow-up of
external audit C+ B+ Overall rating based on M1 methodology.
(i) Scope/nature of audit performed
(including adherence to auditing
standards
A A
Performance unchanged. PPSSA was
adopted on January 29, 2013. In 2011, an
integrated results and risk-based audit
methodology was adopted.
(ii) Timeliness of submission of audit
reports to legislature - D
CoA is not mandated by law to submit the
annual audited financial statements to
Congress; although, it submits a copy of the
report upon request by the latter. 2014 audit
reports have not yet been received by both
House and Senate. Furthermore, the House
confirmed that 2013 audit reports were
received only in 2015. Annual audit reports
are uploaded on CoA website.

2016 Philippines PEFA Assessment 30 June 2016
The GoP and Development Partners 152
Indicator / Dimension Score
Brief Explanation 2010 2016
(iii) Evidence of follow up on audit
recommendations B B
Performance unchanged. A formal response
as well as full/partial implementation of
recommendations was in place for majority of
the observations raised.
PI-27 Legislative scrutiny of the annual
budget law C+ B+ Overall rating based on M1 methodology.
(i) Scope of legislature’s scrutiny B B
Performance unchanged. The legislature’s
review covers fiscal policies and aggregates
for the coming year as well as detailed
estimates of expenditure and revenue.
Legislative scrutiny is limited to what is
submitted by the Executive in their budget
proposal.
(ii) Extent to which the legislature’s
procedures are well-established and
respected
A A
Performance unchanged. The House of
Representatives through the Congressional
Policy and Budget Research Department
issued “A Legislator’s Guide in Analyzing
the National Budget”.
(iii) Adequacy of time for the legislature
to provide response to budget proposals
both detailed estimates, and where
applicable, for proposals on macro-fiscal
aggregates earlier in the budget
preparation cycle (time allowed in
practice for all stages combined)
A A
Performance unchanged. Timely approval
by the House and Senate of and endorsement
to the President of the GAA.
(iv) Rules for in-year amendments to the
budget without ex-ante approval by the
legislature
C B
Performance improved. Per EO 292, the
President has extensive authority for budget
reallocations, expansion is not allowed. In
year administrative reallocations are
transparent and processes have been
improved subsequent to decision on the
Disbursement Acceleration Program.
PI-28 Legislative scrutiny of external
audit reports D D Overall rating based on M1 methodology.
(i) Timeliness of examination of audit
reports by the legislature (for reports
received within the last three years)
D D
Performance unchanged. Based on the
discussion with House’s Committee of
Appropriation’s Secretariat and Senate’s
Legislative Budget Research and Monitoring
Office, there is no designated committee in
both Senate and House that carries out the
function of reviewing and scrutinizing the
external audit reports for the purpose of
issuing recommended actions based on CoA
observations. There may be instances when
CoA auditors are called for
(ii) Extent of hearings on key findings
undertaken by the legislature D D
(iii) Issuance of recommended actions by
the legislature and implementation by the
executive
D D

2016 Philippines PEFA Assessment 30 June 2016
The GoP and Development Partners 153
Endnotes
1 World Bank, Philippines, Public Expenditure and Financial Accountability (Report No. 54584-PH, May 2010). 2 Following Administrative Order No. 119 (29 March 1989), DBM was directed to promulgate rules, regulations, or circulars for
strengthening the internal control systems. Memorandum Order No. 277 (19 January 1990) specified that this was not to be
interpreted so as to diminish the powers and functions of Commission on Audit. 3 Commission on Audit is authorized to promulgate accounting (and auditing) rules and regulations based on the Constitution
(Article IX, Part D, Section 2, para 2). 4 Provided for under Constitution Article IX, Part D, the Commission on Audit is charged with carrying out external audit of
LGUs and GOCCs (Book V, Subtitle B, Chapter 3, Section 7, para 5b) as well as formulating accounting rules and regulations
for LGUs (para 10a). The Commission is likewise charged with preparing the Annual Financial Report for GOCCs (para 9f)
and LGUs (para 10f). 5 The Supreme Court ruling from July 2014 made it clear though that this needs to be based on law. 6 Less than one quarter of the 2015 National Government budget was subject to direct legislative approval since about 33% of the
total was automatic appropriations (interest payment, internal revenue allotments and special accounts), 17% was for SPFs and
unprogrammed funds, and 29% were for personnel expenditure. 7 To ensure continuity in government operations, the Philippine Constitution [Section 25 (7) of Article VI] provides that the
General Appropriations Act for the preceding fiscal year shall be deemed re-enacted for the ensuing fiscal year if Congress fails
to pass the General Appropriations Bill and shall remain in force and effect until a General Appropriations Act is passed by
Congress. 8 Development Budget Coordination Committee comprises the DBM Secretary (Chairman), DoF Secretary, NEDA Director-
General, BSP Governor, and a representative from the Office of the President. Its tasks include establishing the level of the
annual government expenditure programs; determining expenditure allocations; allocating funds for each development activity;
assessing the reliability of revenue estimates; recommending tax or other revenue measures as well as the extent and type of
borrowings; and conducting periodic reviews of costs, accomplishments, and performance standards. The regulative basis of
the DBCC is Section 7 (1) Chapter 2 (NEDA Board), Title II (Other Bodies) in Book V (Office of the President) of the EO No.
292 Instituting the Administrative Code of 1987. 9 The Unified Accounts Code Structure is based on DBM/CoA/DoF Joint Circular No. 2013-1 (UACS adoption and Manual),
Joint Circular No. 2014-1 (UACS implementation), and Circular Letter No. 2015-2 (creation of UACS website). 10 The budget preparation and appropriation processes are described under PI-11 and PI-27. 11 Article VII Section 22 (1) of the Constitution of the Republic of the Philippines. 12 Chapter 3 Budget Preparation in Book VI (National Government Budgeting) of the Executive Order No. 292 Instituting the
'Administrative Code of 1987’. 13 Section 44, Book VI of EO 292 of 1987. 14 Section 8 (b) of Republic Act no. 8182 ‘ODA Act’ dated 11 June 1996, as amended by Republic Act no. 8555. 15 Article 409 of the Implementing Rules and Regulations of Republic Act no. 7160 of the Local Government Code. 16 http://www.dbm.gov.ph/wp-content/uploads/Issuances/2014/Local%20Budget%20Memorandum/LBM%20No.68.pdf. 17http://www.dbm.gov.ph/wpcontent/uploads/Issuances/2015/Local%20Budget%20Memorandum/LOCAL%20BUDGET%20M
EMORANDUM%20NO.%2070.pdf. 18 http://www.dbm.gov.ph/wp-content/uploads/Issuances/2014/Local%20Budget%20Circular/LBCNo.104.pdf;
http://www.dbm.gov.ph/wp-content/uploads/Issuances/2014/Local%20Budget%20Circular/LBCNo105.pdf; and
http://www.dbm.gov.ph/wpcontent/uploads/Issuances/2015/Local%20Budget%20Circular/LOCAL%20BUDGET%20CIRCU
LAR%20No.%20107.pdf 19http://www.dbm.gov.ph/wpcontent/uploads/Issuances/2015/Local%20Budget%20Memorandum/LBMNo.69_GUIDELINES%2
0AND%20PROCEDURES%20IN%20THE%20RELEASE%20AND%20UTILIZATION%20OF%20THE%20SHARE%20OF
%20PROVINCES%20FROM%20THE%20CY%202012%20COLLECTION%20OF%20BURLEY%20AND%20NATIVE%2
0TOBACCO%20EXCISE%20TAX%20PURSUANT%20TO%20REPUBLIC%20ACT%20(RA)%20NO.%2082.pdf; and
http://www.dbm.gov.ph/wpcontent/uploads/Issuances/2015/Local%20Budget%20Memorandum/LOCAL%20BUDGET%20M
EMORAMDUM%20NO.%2071.pdf. 20 http://www.dap.edu.ph/rbpms/agency-performance/ 21 http://www.dbm.gov.ph/?page_id=8766 22 http://serp-p.pids.gov.ph/home/index.html# 23
Government Financial Institutions, Government Instrumentalities with Corporate Powers, and Government Corporate Entities
differ from GOCCs, but are often referred to as GOCCs as well. 24 2016 Proposed Budget (August 2015), p. 18: http://www.dbm.gov.ph/?page_id=13550. 25 http://gcg.gov.ph/site/public_files/Annual%20Reports/The%20First%20200%20Days%20Report.pdf.; and
http://gcg.gov.ph/site/public_files/gcg14036673542013%20Annual%20Report%20optimized.pdf. 26 Fiscal Risk Statement 2013, op. cit., p. 13. 27 Fiscal Risk Statement 2013, op. cit., p. 23.

2016 Philippines PEFA Assessment 30 June 2016
The GoP and Development Partners 154
28 http://www.dbm.gov.ph/?page_id=9010. 29 Significant in this case is defined as 0.5% of the total national government expenditure. 30 Detailed engineering studies are considered part of project implementation and require prior ICC approval for funding and
project start. The evaluation of the proposal is done on the entire project rather than on the detailed engineering investment
alone. 31 http://www.neda.gov.ph/wp-content/uploads/2013/10/Revised-ICC-Guidelines-and-Procedures-as-of-4-March-2005.pdf 32 http://www.neda.gov.ph/wp-content/uploads/2013/10/Revisions-on-ICC-Guidelines-and-Procedures_1billion.pdf. 33 Section 2.6 of the BOT Law, implementing rules and regulations provide that approval of projects shall be approved as
follows: (a) for projects of the national line agencies and GOCCs implemented through BOT and its variant schemes; i) those
costing up to Php300 million shall be submitted to ICC for its approval; and ii) those costing more than Php300 million shall be
submitted to the NEDA Board for its approval, upon recommendation of ICC; and (b) for local BOT projects to be
implemented by local government units costing above Php200 million. 34 Section 7.2b of the 2013 Revised Joint Venture Guidelines provides that the approving authority shall be the NEDA Board
Investment Coordination Committee for the following projects: (a) Infrastructure projects as defined under Section 5.9 of these
Guidelines with government contribution amounting PhP 150 million and above; (b) Projects that are public utilities as defined
under Section 5.11 of these Guidelines with government contribution amounting PhP 150 million and above; (c) Negotiated
joint ventures that are initiated by a private sector proponent with government contribution amounting PhP 150 million and
above; and (d) Projects that are not related to primary corporate mandate with government contribution amounting PhP 150
million and above. 35http://www.neda.gov.ph/wp-content/uploads/2013/10/Revised-ICC-Guidelines-and-Procedures-as-of-4-March-2005.pdf 36
The ICC Technical Working Group, comprising NEDA Secretariat, DoF, DENR Environmental Management
Bureau, and PPP Center, jointly undertakes specific aspects of the appraisal of PPP projects. 37 http://www.neda.gov.ph/wp-content/uploads/2013/10/ICC-Project-Evaluation-Procedures-and-Guidelines-as-of-24-June-
2004.pdf. 38 http://www.neda.gov.ph/list-neda-board-confirmed-icc-approved-projects/ 39 http://www.neda.gov.ph/wp-content/uploads/2015/05/Consolidated-CIIP-as-of-15-May-2015.xlsx. 40 http://www.neda.gov.ph/wp-content/uploads/2013/12/CIIP-Guidelines-as-of-06-March-2015.xlsx. 41 IMF Country Report no. [15/156]. 42 DBM National Budget Memorandum no. 123, 28 January 2015. 43 The National Project Monitoring Committee is an interagency committee mandated primarily to coordinate and oversee the
implementation of the regional project M&E system. 44 NEDA Regional Offices serve as Secretariat to RPMCs. 45 http://www.dbm.gov.ph/?page_id=4273. 46 http://www.gov.ph/2011/05/13/executive-order-no-43/. 47 Registry of Public Infrastructure shall be used to record properties for use by the general public. A separate Registry shall be
maintained for each class of property or asset (e.g., Plaza, Parks and Monuments; Roads, Highways and Bridges; Ports,
Harbors, Seawalls, River Walls and Others; Runways; Railways; Waterways, Aqueducts, etc.; and Irrigation Canals and
Laterals, etc.). For proper costing, the original construction cost and any major repairs undertaken shall be posted in the
respective Registry. It shall be maintained by the Accounting Unit of the agency. 48 Registry of Reforestation Projects shall be used to record expenses incurred on reforestation projects. It shall be maintained by
the Accounting Unit of the agency implementing reforestation projects.
49 Registry of Public Infrastructure Summary shall be used to summarize all the public infrastructures of the agency. The total of
each registry shall be posted in the summary and the total public infrastructures shall be disclosed in the notes to the financial
statements,
50 This is a consolidated report that comprises the general government sector, non-financial public corporations, and financial
public corporations. The coverage of the debt data includes the debt of the LGUs because it is part of the general government
sector. 51 The report is comprised of actual obligations for loans/bonds, both direct and assumed, and securities (domestic and foreign)
and contingent obligations in form of national government guarantees. The national government debt report is disclosed two
months from reference period. The report is published before the end of March the following year. 52 http://www.treasury.gov.ph/?page_id=746 53 Under EO 127 (January 1987), 127-A (July 1987) and 292 (July 1987). 54 Under EO 449, series 1997 and Republic Act (RA) 1000. 55 Reports on guarantee fees billed and collected and GOCCs that have not been able to service the National government
guaranteed borrowings. 56 Under RA No. 4860 or the Foreign Borrowings Act, RA No. 245 authorizing the Secretary of Finance to borrow to meet public
expenditures, and RA. No. 8182 as amended by RA 8555 for contracting Official Development Assistance loans and grants 57 DOF, 2010. Annual Report 58 http://www.dbm.gov.ph/wp-content/uploads/BESF/BESF2016/D.pdf 59 BESF Table A.2.
2016 Philippines PEFA Assessment 30 June 2016
The GoP and Development Partners 155
60 BESF Table A.1. 61 BESF Table A.6. 62 http://www.dbm.gov.ph/ 63 For 2014 (http://budgetngbayan.com/2014-peoples-budget-2857), 2015 (http://budgetngbayan.com/2015-peoples-proposed-
budget-2885), and 2016 http://www.dbm.gov.ph/?page_id=13550. 64 This key areas is organized according to the following thematic clusters; (a) good governance and anti-corruption; (b) human
development and poverty reduction; (c) economic development; (d) security, justice and peace; and (e) climate change
adaptation and mitigation. 65 EO No. 43, series of 2011. 66 This approach was established in 2013 budget preparation in order to focus the budget on identified necessary program and to
ensure that the key agencies participating in the program coordinate their targets and activities to facilitate program execution.
A matrix of priority program with the corresponding agencies/departments was attached in order to provide proper guidance to
the participating agencies and departments. 67 Consist of tourism development program, infrastructure development program, basic education for all, universal health
program, agriculture development program, conditional cash transfer program, and climate change adaptation program. 68 DBM, April 25, 2013. National Budget Memorandum No. 118. 69 This framework is designed especially to link planning (medium-term outlook) with the annual budget and to link the
budgetary expenditures with the desired outcome. This framework also facilitates the systematic determination of the fiscal
space (available uncommitted funds) available for allocation among the key program, taking account of the future cost of
approved and ongoing programs as well as validate commitment under the forward estimate process and the fiscal
consolidation strategy of the national government. 70 DBM, 28 January 2015. National Budget Memorandum No. 123. 71 The two-tier budgeting approach separates the evaluation of agency proposals for on-going and existing programs/projects
from new spending proposals and the expansion of on-going and existing programs/projects. Under Tier1, the budgetary
requirements are determined through the forward estimate process. In Tier 2, the departments/agencies propose their new
spending based on the spending areas and strategies identified in the Budget Priorities Framework. 72 National Budget Memorandum no. 124. 73 http://www.dbm.gov.ph/?page_id=11897. 74 The planning-budgeting framework used by the government to provide a three-year forward perspective to the decision-making
process during budget preparation. This uses the forward estimate process. 75 A budgeting approach that uses performance information to assist in deciding where the government funds will go. 76 A program evaluation approach through which every function within an organization is analyzed for its needs and costs. 77 An approach to facilitate and incentivizes inter-agency collaboration along contract areas to ensure priority programs are
planned, budgeted and implemented in a coordinated manner. 78 An approach to ensure that the prioritized list of programs is incorporated. It also strengthens the capacity of the LGUs to plan,
budget and execute programs. 79 An approach to separate the evaluation of agency proposals for ongoing/existing programs from the new spending/the
expansion of the ongoing/existing programs. The objective is to decongest and systematize the decision-making process for
these two different types of programs during budget preparation. 80 http://www.dbm.gov.ph/?page_id=9769 81 http://www.bir.gov.ph/ . 82 http://knowyourtaxes.ph/home. 83 Departmental Order No. 44-2014, 17 June 2014 – post-entry audit guidelines under the Fiscal Intelligence Unit. 84 The scope of post-entry audit has been expanded to cover importers who commit plain and simple errors in the import
declaration. Importers must be cognizant of importation laws, rules and regulations so that import entries are accurate and
error-free. 85 RMO No. 19-2015, 15 September 2015. 86 The eLAMS enforces management and control of audit conducts as well as to monitor the workload of concerned case/revenue
officer’s audit. 87 http://www.bir.gov.ph/images/bir_files/annual_reports/annual_report_2014/iacep.html. 88 http://www.gov.ph/governance/wp-content/uploads/2015/06/Run-After-the-Smugglers-RATS-Program1.pdf. 89 http://www.tariffcommission.gov.ph/previous-website/ra9135.html. 90 Customs Memorandum Circular 83-2014, 19 June 2014 and DoF Department Order No. 44-2014, 17 June 2014. 91 BIR Operations Memorandum No. 12-09-001, 5 September 2012, mandating to properly identify the accounts receivable and
delinquent accounts cases in the inventory of the concerned BIR offices. 92 BIR Revenue Memorandum Order No. 11-2014, 7 February 2014. 93 BIR Revenue Memorandum Order No. 22-2015, 12 October 2015. 94 http://www.bir.gov.ph/images/bir_files/annual_reports/annual_report_2014/actscg.html. 95 BIR internal Operations Memorandum No. 4-2014 and the policy and guidelines through RMO No. 35-2014. 96 http://www.treasury.gov.ph/wp-content/uploads/2015/10/mo_cor_revenues.pdf.

2016 Philippines PEFA Assessment 30 June 2016
The GoP and Development Partners 156
97 Data includes the consolidated report on daily collection and daily collection summary. The consolidated reports on daily
collection are reconciled with BSP’s list of remittances for the respective bureaus while the daily collection summaries are
reconciled with the BTr’s summary of collection report. 98 The MDS is a procedure whereby disbursements by national government agencies, chargeable against the account of the
Treasurer of the Philippines, are effected through the government servicing banks. 99 Per National Budget Circular Nos. 551 and 556 dated January 2, 2014 and January 5, 2015, respectively. 100 CoA Circular No. 2012-001, June 14, 2012 101 http://www.gov.ph/1998/10/30/executive-order-no-38-s-1998/ 102 Financial Control and Accountability in the Philippines, World Bank, June 17, 2011. 103 With the support of IMF, World Bank, and DFAT, the Government initiated the drafting of a PFM Bill to legislate several
budget-related matters, prudent fiscal discipline, and financial management. The Bill was filed in Senate as SB 2719 on April
14, 2015, and in the House of Representatives as HB 6117 on September 8, 2015. 104 Ali Hashim, “A Handbook on Financial Management Information Systems for Government: A Practitioners Guide for Setting
Reform Priorities, Systems Design, and Implementation”, World Bank, 2014. 105 Philippines PFM Reforms Roadmap – Consolidated Matrix of Identified Gaps, Strategies and Desired Results, as of 13
January [Annex to GIFMIS Committee Resolution No. 01-2011], GoP, 2011. 106 The Updated PFM Reform Roadmap 2015-2016”, GoP, May 2015. 107 Executive Order No. 55 Directing the Integration and Automation of Government Financial Management Systems, GoP,
September 6, 2011. The Executive Order established the PFM Committee, outlined its deliverables, and stated its authority and
functions. 108 The PIUs are not dedicated implementation units as the staff have ordinary duties. 109 A total of five high-level Cabinet Clusters were set up in 2011 with EO No. 43 to advise the President and recommend policy
measures and operational matters in their respective areas. The GGAC Cluster is the only cluster chaired by the President. 110 The GGAC Cluster Plan covered 34 initiatives under transparency, accountability, and citizen engagement. 111 Cabinet Cluster on Good Governance and Anti-Corruption – Governance Cluster Initiatives Status Reports (available from
http://www.gov.ph/governance/), GoP. The updated and restructured GGAC Cabinet Cluster Action Plan included 30
initiatives under three areas (transparency and citizens’ empowerment; public sector performance; and, anti-corruption
measures) and priority legislation under a fourth area (policy environment for good governance). 112 Track I originally aimed to improve the functionality and interface of existing BTR, CoA, and DBM systems. The change in
focus toward a human resource and payroll system took place during 2012. 113 http://openbub.gov.ph/wb_gaa_chart 114 Published audit reports on CAMANAVA flood control, QC garbage collection, and Marikina maternal health component of
conditional cash transfer. Ongoing projects being audited are on farm-to-market roads; tourism road; WASH facilities; and
DRRM.