Embed Size (px)
Citation preview

Report No. 1 5658-CHA
ChinaFruit and Vegetable Marketing PerformanceNovember 6,1996
Rural and Social Development Operations DivisionChina and Mongolia DepartmentEast Asia and Pacific Regional Office
Doacmune of te W d Bank
Pub
lic D
iscl
osur
e A
utho
rized
Pub
lic D
iscl
osur
e A
utho
rized
Pub
lic D
iscl
osur
e A
utho
rized
Pub
lic D
iscl
osur
e A
utho
rized

CURRENCY EQUIVALENTS(as of May 1996)
Currency Unit= Yuan (Y)$1.00 = Y 8.30
Y 1.00 = $0.12
FISCAL YEAR
January 1 - December 31
WEIGHTS AND MEASURES
Metric Systemand
1 hectare = 15 muI jin = 0.5 kg
PRINCIPAL ABBREVIATIONS AND ACRONYMS USED
GDP - Gross Domestic ProductGVAO - Gross Value of Agricultural OutputMIT - Ministry of InternalTradeMOA - Ministry of AgricultureSSB - State Statistical BureauVAT - Value Added Tax
Vice President (Acting) Nicholas C. Hope, EAPDirector : Nicholas C. Hope, EA2Division Chief Joseph Goldberg, EA2RSStaff Member Albert Nyberg, EA2RS

CONTENTS
PREFACE ................................ , iii
EXECUTIVE SUMMARY .v
1. INTRODUCTION .1A. Sector Overview .1B. Objectives .2C. Report Organization .2
2. PRODUCTION AND CONSUMPTION .3A. Production Structure .3B. Consumption .5C. Prices .8D. Income Impacts on Consumption and Production .9
3. REGULATORY AND POLICY FRAMEWORK .10A. Regulatory Issues .10B. Policy .12C. Market Information .14
4. MARKET STRUCTURE .16A. The Marketing Chain .17B. Post-Harvest Handling and Quality Control .19
5. MARKET PERFORMANCE .23A. Operational and Allocative Efficiency .23B. Price Transmissivity .26
6. CONCLUSIONS AND RECOMMENDATIONS .30
ANNEX 1: RULES AND REGULATIONS GOVERNING THE USE OFCHEMICALS ON FRUIT AND VEGETABLES .35
STATISTICAL ANNEX .39
- ii -
TABLES IN TEXT
Table 2.1: Per Capita Purchases (Urban) and Consumption (Rural) ofSelected Food Items .......................................................... 7
Table 2.2: Expenditure and Own Price Elasticities .......................................................... 7Table 4.1: Free-Market Sales Volume ......................................................... 16Table 5.1: Beijing Wholesale-Retail Market Margins ...................................................... 27Table 5.2: Construction of Synthetic Price Margins ......................................................... 28Table 5.3: Illustrative Price Margins ......................................................... 28
FIGURES IN TEXT
Figure 2.1: Consumer Price Seasonal Indices .......................................................... 8Figure 5.1: Seasonal Sales Distribution ......................................................... 25Figure 5.2: Monthly Distribution of Annual Sales (Three Wholesale Markets) .............. 25
- iii -
PREFACE
This report is largely based on the findings of a World Bank mission that visitedChina in October 1995. The mission members were Albert Nyberg (EA2RS-missionleader), Zhengxuan Zhu (EA2CH-Operations Officer, Agriculture), Edward Chobanian(Consultant-Agroindustry), and Donald Taylor (Consultant-Marketing Specialist).
The mission worked closely with counterpart staff from the Green FoodDevelopment Center of the State Farms Bureau, Ministry of Agriculture, who providedconsiderable background information, statistical data, and logistical support. Ms. ChengConghong (Vice Chairperson) was the principal counterpart and Messrs./Ms. Dou Ming,Li Furong, and Sun Hong accompanied the mission on field visits. Staff of the Ministryof Agriculture, Beijing, Shanghai, Shandong, and Yunnan Municipal/Provincial Bureausof Agriculture were helpful in providing production and marketing information duringmany discussions. Particularly helpful and interesting were the numerous State Farmmanagers, smallholder farmers, exporters, traders and trading company staff, wholesalemarket managers and staff, and retailers who provided information on market operations.

- v -
EXECUTIVE SUMMARY
Conclusions
1. A decade of rapid income growth, particularly for urban residents, has led toincreased expenditures for fruits and vegetables and increased demand for a wide varietyof foods while reducing demand for food staples such as cabbage. This has translatedinto higher producer prices for vegetables (relatively more stable prices for fruits), adoubling and tripling of vegetable and fruit areas, and increased farmer income.Vegetable production has shifted away from cabbage toward "finer" vegetables-although cabbage remains the most widely grown and consumed vegetable. Fruitproduction remains concentrated in traditional apples and citrus.
2. Fruit and vegetable marketing has evolved from a planned distribution system to abroad network of competitive and well-integrated markets. Price levels and price changesare rapidly and widely transmitted to market centers across China by networks ofwholesalers and traders. Provincial and municipal authorities have intervened modestlyin fruit and vegetable factor markets (land and input subsidies, etc.), but the productmarket has been largely left to the nonpublic sectors. This largely private wholesale-retail marketing system is highly competitive and internally efficient, despite highmarketing margins, and has performed impressively over the past decade. Othermarketing entities, such as institutional vendors, processors, and exporters exist but theyserve niche markets and do not offer competition to the wholesale-retail system. Withoutcompetitive systems such as distribution centers, auctions, farmer-retailer contracting,etc., it is not possible to determine or ensure the wholesale-retail system is efficient.
3. Government should maintain a flexible regulatory framework toaccommodate the development of more efficient marketing systems. The complexityof future systems will preclude direct government intervention lest efficiency bereduced. Further adjustments in the prevailing marketing system will be necessary toaccommodate complex changes in future market channels, institutions, volumes, andcomposition. High-volume, low-margin systems have developed elsewhere and moreefficient alternative marketing structures will evolve in China to provide an increasinglyurban population with an increasingly diverse array of food items.
The Role of Government in Marketing
4. Reducing quantity and quality losses is the most important initiative forimproving market efficiency, increasing farmer incomes, and reducing urbanconsumer food expenditures. Reducing estimated marketing losses from 30 to 20percent would save 19 million tons of vegetables for sale and consumption, with afarmgate value of Y 17.5 billion (1994). Various methods are employed in other

- vi -
countries to enhance quality and reduce losses but these have not been widely adopted inChina, which reflects the lack of understanding of their benefits. Without suchinformation, risk-averse farmers and low-margin traders have no adoption incentive.Over time, these methodologies will become industry norms but adoption could beaccelerated by widely demonstrating their benefits. This could be accomplished by, first,establishing a Post-Harvest Research Institute, under the Ministry of Agriculture, todevelop systematic information on marketing losses and test alternative methods forreducing those losses. These would include practices such as on-farm precooling ofvegetables, farm-level sorting and grading, and technologies such as rigid crates for on-farm harvesting and off-farm transportation, alternative packaging materials, mechanicalhandling and conveying equipment, alternative transport modes including refrigeratedrail/road transport, temporary use of cold storages, etc. Second would be farmereducation using traditional training and extension materials plus pilot projects todemonstrate the efficacy of these practices and technologies.
5. Standardized grades would assist in increasing farm income, give consumersmore options, permit traders to base their purchase on samples, and improve theusefulness of market information. But equally important, grades are essential fordeveloping the export trade. Grading is implicit at all transfer points, but is notinstitutionalized. Without Government guidance, grades and standards would emergeover time, but the sector may face multiple and inconsistent grades before an industrystandard is agreed. This initiative also would require substantial training of both farmersand marketing staff.
6. Given the potential health risk from toxic residues and unsanitaryvegetables, enforcement of existing phytosanitary regulations should bestrengthened. Strict adherence to these regulations is necessary to further develop theexport market. Farmer training is an important element in improving regulatorycompliance.
7. The Government could assist market development by consolidating themarketing information system and making it more comprehensive. To improve theefficiency of production and market decisions, the market information system should beconcentrated in one ministry, expanded to include information from sources other thanwholesale markets, and distribute quantity information along with price data. Also,situation and outlook information (assessment of production conditions and probablemarketings) should be disseminated similar to that currently released by the Ministry ofAgriculture for grains and oilseeds.
8. Village-based cooperative marketing organizations would increase farmincome by providing participants with increased market power, reducing the pricerisk of individual farmers, and permitting them to enjoy a portion of the marketingmargin. Such organizations are difficult to organize and manage effectively.Consequently, some organizational assistance would probably be required ofGovernment; but it is critical that farmers, not Government control the cooperatives.

- vii -
9. Various producer subsidies through the National and Municipal Vegetable BasketProjects have contributed to increased suburban vegetable production, improved farmerincomes, and made available a wide variety of vegetables at "reasonable" cost. Theseinitiatives have demonstrated the efficacy of "protected" production, which is now widelypracticed. Given this success, it is timely to refocus project objectives towardimproving marketing efficiency.
10. Discontinue the guidance price policy. It was designed to protect urbanconsumers from "price gouging" by retailers but it has been relatively ineffective. Giventhe numerous retailers in urban centers, competition should effectively prevent excessivemargins.
Another Consideration
11. The abundant labor force, limited land resources, and diverse agroclimaticenvironment suggests China has a potential comparative advantage in horticulturalproduction. However, this potential should be further studied as this study did notundertake a comparative advantage analysis of horticultural crops. With a comparativeadvantage, farm income could be increased not only by producing more vegetables tomeet increasing domestic requirements, but also to serve the regional export market.Foreign exchange earnings from horticultural exports should be greater than the foreignexchange savings that would result from producing import substitution crops such asgrain, oilseeds, and cotton. To exploit that potential, improvements would be required inmarket infrastructure and product quality.

- 1 -
1. INTRODUCTION
1.1 Horticultural crops comprise one of the most dynamic subsectors of agriculture.China's farmers now produce more than 150 million tons of fruits and vegetablesannually, making China the world's largest fruit and vegetable producer. A combinationof two major factors has led to this rapid growth. The relaxation of government controlsover the subsector permitted farmers to reallocate their resources to more efficientproduction modes. The subsequent fruit and vegetable supply response was possible onlybecause consumers were demanding more fresh vegetables, which increased prices,thereby sending incentive signals to farmers. Rising fruit and vegetable productionincreased farmer incomes despite marketing inefficiencies.
A. SECTOR OVERVIEW
1.2 Between 1984 and 1994, the Gross Value of Agricultural Output (GVAO)increased from about Y 560 to Y 980 billion (1990 constant terms) implying an averagegrowth rate of about 5.5 percent (Annex Table AL.1). Fruit and vegetable areas arerelatively small but, due to their high value, they contribute a disproportionately largeshare of agricultural output value. The real gross output value of vegetables (includingmelons) increased at an average annual rate of 10.5 percent between 1984 and 1994 andthe share of GVAO contributed by vegetables increased from 6 to 9 percent. A portion ofthis increase is attributable to changes in the production mix as higher-quality (andhigher-value) vegetables were increasingly produced. The output value of fruitproduction is not reported separately but is included with other perennial tree crops (tea,mulberry, etc.). The importance of cereal production is declining but continues to makethe largest contribution to GVAO accounting for 25 percent of agricultural value in 1994.
1.3 China's food self-sufficiency objective has lingered from the prereform period.Self-sufficiency ratios in the two major food components, grain and fruits andvegetables, reflect different pictures. Since 1978, grain self-sufficiency has twice cycledfrom less than to greater than 100 percent and in 1995 again became a net importer.Alternatively, fruit and vegetable self-sufficiency has consistently improved with netexports continuing to increase (1985-94).
1.4 Per capita consumption of fruits and vegetables now exceeds that of food grainboth in terms of quantity and value. Consumer expenditures for vegetables haveincreased rapidly, although the quantity consumed has declined as consumption patternshave shifted away from coarse to "fine" vegetables. Also, far greater quantities of bothfruits and vegetables are consumed by high-income earners than by low-income earners.

- 2 -
B. OBJECTIVES
1.5 As the Government disengaged from direct intervention in fruit and vegetablemarketing, the market structure was transformed into a highly competitive wholesale-retail marketing system, which has adapted well to the rapidly changing demand andsupply situation. However, the marketing process remains costly. The overall purposesof this study were to assist in: (a) identifying means and methods of improving themarketing process that would contribute to further increasing farmer incomes, and(b) better defining Government's role in regulating markets while relying on marketforces to promote alternative marketing systems and achieve supply-demand balances.
1.6 Specific objectives of the study were to:
(a) determine a policy and regulatory environment conducive to efficient foodmarketing;
(b) identify government marketing roles in information services andregulatory issues such as grades and standards, health and hygiene, etc.;
(c) identify constraints to the adoption of practices and technology whichwould improve marketing efficiency;
(d) assess the status of competitive market structures, marketing institutionsand channels and prospects for future development; and
(e) determine if "price spikes" occurred in the fruit and vegetable market (asoccurred in food grain prices) during 1993-95 and, if so, identify theircauses.
C. REPORT ORGANIZATION
1.7 Recent changes in fruit and vegetable supplies and farm prices are reviewed in thefirst section of Chapter 2. Secondly, demand and consumption and the future implicationof income changes on demand is discussed. Lastly, it reviews consumer prices. Chapter3 reviews the regulatory and policy framework applying to fruits and vegetable marketsand discusses the role of government in: (a) introducing-enforcing grades and standards,and (b) collecting-disseminating market information. Market structures are discussed inChapter 4, including the problems of post-harvest handling and quality control. Chapter5 analyzes market performance in terms of efficiency and price transmission. Chapter 6contains the study's conclusions and recommendations.

-3-
2. PRODUCTION AND CONSUMPTION
A. PRODUCTION STRUCTURE
2.1 Almost all vegetables are produced on small farms. Statistical data suggest that 2to 3 percent of the vegetable and melon areas are on State Farms, but much of this land issubleased to individual farmers and the mode of production is distinctly small farm;however, the State Farm may perform some of the marketing functions. The structure ofState Farms better lends itself to fruit production and marketing and they account for 2 to3 percent of actual fruit production.
2.2 The vegetable area (including melons), of 10 million hectares (ha) in 1994,occupies about 10 percent of the planted agricultural area of China, but vegetable land isdouble and triple cropped, resulting in vegetables occupying a smaller proportion of thecultivated area. Anecdotal evidence suggests that area and production under "protectedcultivation" (plastic tunnels and greenhouses) have increased very rapidly, but officialstatistics do not separately record this information. As orchards are perennial crops, theircultivated and planted areas coincide (7.2 million ha in 1994).
Sources of Growth
2.3 Detailed area and production data by vegetable variety are limited but suggest thatvegetable subsector growth is attributable to the expansion of land allocated to vegetableproduction, and changes in vegetable composition with "fine" vegetables (snow peas,green garlic, green beans, cucumber, etc.) replacing "staple" vegetables (Chinesecabbage, round cabbage, radish, etc.). Cabbage area declined by 100,000 ha between1989 and 1991, but still occupied 19 percent of the total vegetable area. The area plantedto many of the "fine" vegetables increased by 20 percent or more over the same threeyears. Although the vegetable area is expanding, total vegetable production and averageyields are declining because lower-yielding fine vegetables are replacing high-yieldingcabbage.
2.4 The fruit area and production increased by more than 225 and 250 percent,respectively, over the decade; suggesting that area increases accounted for most of theincreased production. Apples and citrus are the most important fruits, collectivelyaccounting for 50 percent of fruit production. Pears, bananas, and grapes comprise thesecond tier, accounting for a further 25 percent of production; numerous temperate andtropical fruits comprise the balance.
2.5 In the absence of an age distribution of trees, it is difficult to assess productivitychanges in orchard crops as different varieties commence and reach full production atvarious ages. Given this caveat, it appears that virtually all of the production increases of

- 4 -
300 and 90 percent for apples and pears were attributable to expanded areas. Citrusproduction increased by 275 percent, assisted by a 50 percent increase in yield. Grapeand banana production quadrupled and yields doubled. It must be appreciated that grapesand bananas each occupy only about 2 percent of the fruit orchard area.
Locations of Growth
2.6 The total vegetable area doubled between 1984 and 1994, in part, due toimplementation of the Vegetable Basket Project (paras. 3.12-3.14), which includedinfrastructure and production input subsidies. Shandong expanded its vegetable area by200 percent over the decade and surpassed Sichuan as the leading vegetable province in1994 (in terms of area). The highest rate of vegetable growth was in the group ofsouthern provinces (Guangdong, Guangxi, Fujian, and Hainan), which more than tripledthe planted areas. Other important vegetable-producing provinces include Hubei, Henan,and Jiangsu. The area planted to melons fluctuated widely, but generally increased overthe 1985-94 decade. The major melon production areas are the North China Plain and thelower Yangtze valley.
2.7 Apples are produced throughout the country, except for the southern tier ofprovinces, but are concentrated in the high-yielding North China Plain. Citrus productionis located primarily in the southern and coastal provinces. Banana production is highlyconcentrated in the southern provinces, particularly Guangdong, which produces morethan 50 percent of the nation's output. Although grapes are widely scattered across thecountry, there are two concentrations, Xinjiang Autonomous Region and the North ChinaPlain; each area contributes about one-third of national production. National pearproduction, which occurs in every province, increased the least of the five major fruits.
Trade Impacts on Supply
2.8 A wide variety of fresh and selected dried fruits-vegetables are imported but thevolume is minor, typically less than 1,000 tons per variety, except for tropical fruits,which are imported in significant quantity. However, exports of fresh/dried fruits-vegetables have increased rapidly in recent years, totaling over 3.5 million tons and $3.0billion in 1994 and 1995. Exports reduced domestic supplies by about 2 percent.
2.9 Although international trade has a relatively unimportant supply impact, the tradestatistics for fruits reveal important quality aspects of production and consumption.Vegetable statistics are too aggregated to evaluate individual varieties. About 265,000tons of apples were exported during the three-year period 1992-94. The nominal exportprice (unit value) was $413 per ton. Apple imports, although small, have doubled in eachof the last five years; 1994 imports were 3,438 tons. The average import price during1992-94 was $925 per ton, or more than double the export unit value. This demonstratesa small but growing demand for high-quality, high-value produce that is not met fromdomestic producers. It also demonstrates the need to introduce grades and standards intothe food marketing system. The same pattern emerges for orange exports and imports.

The average unit value of exports and imports was $372 and $590 per ton, respectively,for 1992-94; meanwhile the "world" price of oranges' averaged $444 per ton.
2.10 As horticultural production is labor-intensive and given China's resourceendowment, especially the diverse agroclimatic environment, it should enjoy acomparative advantage in fruit and vegetable production. Thus, in addition to serving thelarge domestic market, Chinese production could potentially service a regional exportmarket. However, to exploit that potential, quality must be improved and additionalinfrastructure must be developed. This further illustrates the need for the introductionand usage of standardized grades.
Prices are Increasing
2.11 National annual average farmgate prices for fresh vegetables (collectively) andindividually for apples and citrus/oranges were reported until 1992, and subsequentlydiscontinued (Annex Table A4.1). However, price indices have been computed through1994. These prices and price indices reflect not only price changes in the variouscommodities, but also incorporates quality and composition changes. The index of freshvegetable prices (farmgate) increased rapidly from the mid-1980s. Prices doubledbetween 1985 and 1990, and doubled again by 1994, increasing much more rapidly thanthe overall farm product price index and providing an important incentive for farmers toproduce more vegetables. In contrast, the farmgate fruit price index increased by only 45and 20 percent, respectively, during the two time intervals.
2.12 Fresh vegetable prices, in constant terms, increased by 150 percent between 1984and 1992, although they experienced a "down cycle" in 1988-89. The real price of applesand citrus/oranges reached a peak in 1988 and plateaued for apples; but citrus/orangeprices declined and in 1992 were below 1984 prices.
2.13 There is anecdotal evidence indicating a supply shift is occurring in vegetableproduction, but without more detailed statistics it is not possible to measure this shift.Given the increasing real average prices, it appears demand for fine, high-qualityvegetables is increasing more rapidly than supply. The price increases are a partialreflection of the composition change with less coarse and more fine vegetablesproduced/sold. Alternatively, it appears that increases in apple and citrus production haveexceeded demand increases.
B. CONSUMPTION
2.14 Cross-section data from the annual urban consumption and expenditure surveysconducted by the State Statistical Bureau (SSB) clearly indicate that per capitaconsumption of fruits and vegetables increase as incomes increase; this is fully consistent
World Bank; Commodity Markets and the Developing Countries, A World Bank Quarterly. EECindicative imnport price (CIF) Paris, navel oranges, Mediterranean Exporters.

- 6 -
with consumption theory. However, these data just as clearly indicate that vegetableconsumption declined during the 1985-94 decade-a period when urban incomesincreased rapidly.
2.15 It is difficult to reconcile these two data sets. But, declining per capita vegetableconsumption may be partially explained by the changing preference of Chineseconsumers for improved quality and less quantity. Earlier vegetable consumptionconsisted primarily of coarse vegetables, such as cabbage, but as incomes increased overtime consumers prefer more "fine" vegetables. [Although declining in importance,cabbage remains the most important vegetable in the diet, 32.3 kilograms (kg)/capita in1994.]
2.16 Other possible explanations for declining vegetable consumption include:(a) vegetable purchase statistics in earlier years overstated consumption as substantialwastage occurred-particularly in winter-stored vegetables, such as cabbage; and(b) improved grading, quality control, and marketing increased the edible proportion ofthe vegetables marketed; thus, losses formerly absorbed by consumers are nowconsidered post-harvest losses.
2.17 Parallel changes in per capita consumption of grain and fresh vegetables by urbanand rural consumers are illustrated in Table 2.1. Fruits and vegetables are the mostimportant component of urban diets in both expenditure and volume terms. Urban percapita fresh vegetable consumption remained relatively stable during the 1980s butstarted to decline in 1990; by 1994 consurnption was about 20 percent below the 1988peak of 147 kg. Between 1992 and 1994, per capita consumption of fresh vegetablesdeclined marginally (from 124.9 to 120.7 kg) but expenditure increased more than 50percent. This further indicates the shift from low- to high-quality (price) vegetables andin the face of rapid price increases confirms a high expenditure elasticity for vegetables.Consumers in the highest income decile consume about 40 percent more fresh vegetablesthan consumers in the lowest income decile. Urban fruit consumption data are availableonly since 1992 and have averaged about 40 kg per capita. Consumers in the highestincome decile consume about 100 percent more fruit than those in the lowest decile.Rural household consumption of fresh vegetables reportedly declined from a 1984 peakof 140 to 107 kg/capita in 1994 with a precipitous decline between 1992 and 1993. In theabsence of a major calamity, such a decline seems improbable and it is likely that achange occurred in survey techniques, methodology, or definition.
Elasticity Coefficients
2.18 Several scholars have estimated income (or expenditure) and price elasticitycoefficients for selected food items. Some of the more recent are those estimated by Fan,et al.,2 Gao, et al.3, and Chern and Wang.4 Different models were used, different
2 Fan, Shenggen, E. Wailes, and G. Cramer, "Household Demand in Rural China: A Two-Stage LES-AIDS Model," American Journal ofAgricultural Economics, Vol. 77 (February 1995), pp. 54-62.

- 7 -
disaggregation levels were employed (Fan, et al. analyzed only rural households and Gao,et al. analyzed only urban households), and varying results were obtained. Chern andWang used a more sophisticated model and estimated elasticities under conditions ofnonrationing and rationing, using quadratic expenditure systems, and are summarized inTable 2.2.
TABLE 2.1: PER CAPITA PURCHASES (URBAN) AND CONSUMPTION (RURAL) OFSELECTED FOOD ITEMS
(kg/capita)
Urban Consumers Rural ConsumersYear Grain Fresh Vegetables Grain /a Fresh Vegetables
1980 257.0 127.01981 145.4 152.3 256.0 124.01982 144.6 159.1 260.0 132.01983 144.5 165.0 260.0 131.01984 142.1 149.0 267.0 140.01985 134.8 144.4 257.0 131.01986 137.9 148.3 259.0 134.01987 133.9 142.6 259.0 130.01988 137.2 147.0 260.0 130.01989 133.9 144.6 262.0 133.01990 130.7 138.7 262.0 134.01991 127.9 132.2 255.5 127.01992 111.5 124.9 250.5 129.11993 97.8 120.6 266.0 107.4/l1994 101.7 120.7 260.6 107.9/l
/a Trade grain (unprocessed).Lb There is no official explanation for the precipitous decline in consumption between 1992 and 1993.
Source: China Statistical Yearbook, various issues.
TABLE 2.2: EXPENDITURE AND OWN PRICE ELASTICITIES /a
No rationing lk Rationing l2Item Expenditure Own Price Expenditure Own Price
Grain -0.06 0.05 - -Fresh Vegetables 0.47 -0.42 -0.36 -0.59Dry Vegetables 1.15 -0.88 -1.08 -0.97Fruits 1.58 -1.09 -0.88 -0.95
/a Linear systems estimates yielded statistically similar coefficients; thus, only the quadratic systemestimates are listed.
Lb As both grain and vegetable oil were rationed during the 1985-90 period, the systems were estimatedusing two alternative specifications; the first assumed all grain and vegetable oil were unrationedmarket purchases, and the second assumed all grain and vegetable oil expenditures were quota rationpurchases with coupons.
3 Gao, X.M., E. Wailes, and G. Cramer, "Partial Rationing and Chinese Urban Household Food DemandAnalysis," Journal of Comparative Economics, Vol. 22 (1996), pp. 43-62.
4 Chem, Wen S. and G. Wang, "The Engel Function and Complete Food Demand System for ChineseUrban Households," China Economic Review, Vol. 4, No. 1, 1994, pp. 35-57.

- 8 -
C. PRICES
Consumer Prices
2.19 Since 1980, retail vegetable prices have increased consistently and more rapidlythan retail prices in general. The All Retail Price Index increased 250 percent between1978 and 1994, while fresh vegetables increased by 500 percent (85 percent increasebetween 1990 and 1994). Government intervention in the vegetable market has beenminor since the mid-1980s and retail vegetable prices have generally moved in parallelwith farmgate prices.
Seasonal Prices5
2.20 Some vegetables are available for only a few months during and immediatelyfollowing harvest as they are too perishable or of too little value to store fresh, but manyvegetable varieties are available year-round as winter crops are either grown in southernlocations or in sheltered production facilities (greenhouses and plastic tunnels). Storablefruits are placed in cold storage following harvest for off-season consumption.
2.21 A seasonal price index was calculated for Chinese cabbage to represent atraditional vegetable "staple." Also, fresh vegetable and fresh fruit seasonal price indiceswere constructed by consolidating six vegetable price indices (tomatoes, cucumbers,sweet peppers, celery, eggplant, and cauliflower) and three fruit indices (apples, pears,and oranges). The indices are represented in Figure 2.1. The seasonal index starts withSeptember rather than January to accommodate Chinese cabbage, which is generallyavailable for only 7 to 8 months of the year.
FIGURE 2.1: CONSUMER PRICE SEASONAL INDICES
160
14 0 - - - - - - - - - - - - - -
40
Sep Oct Nov Dec Jan Feb Mar Apr May Jun Jul Aug
+--Fruit --- Vegetables +-Cabbage]
5 Derived from monthly retail prices in 20 major cities using 1988 to 1995 data.
- 9 -
2.22 Cabbage and fine vegetable prices follow traditional seasonal patterns, which arevery low during summer, increasing during autumn and winter to reach peaks in earlyspring. The volatility of individual vegetables is much greater than indicated by theaggregate index as individual vegetable price peaks may be four times the level of pricelows. Despite large increases in winter greenhouse production over the past severalyears, there is no indication that summer-winter price differentials have diminished.Separate indices were constructed for a few cities (Beijing, Shanghai, Shenyang, Wuhan,and Chengdu) to evaluate seasonal price variation geographically. The only discernibledifference was the tendency for more volatile prices to prevail in northern cities and lessvolatility in the south. There is no evidence of abnormal price volatility, or "spikes," invegetable prices in late 1993 or early 1994.
2.23 Fruits mature and are harvested over a 2- to 3-month period. Fruits have betterstorability than vegetables; consequently, fruit prices have less seasonal volatility thanvegetables. The fruit price index is lowest during harvest months, and graduallyincreases (consistent with storage costs) over the winter and peaks just prior to thefollowing harvest. Intraseasonal price volatility is ±20 percent. There is no evidence thatseasonal price fluctuations diminished between 1988 and 1995.
D. INCOME IMPACTS ON CONSUMPTION AND PRODUCTION
2.24 Income-induced dietary changes in Chinese consumers are occurring at relativelylow income levels as Chinese food consumption patterns are similar to those achieved inneighboring countries at per capita income levels two to three times higher than China'scurrent level. Derived elasticities indicate that as incomes increase, Chinese consumerswill eat more fruit; but consumption statistics from other East Asian countries suggestthat at high-income levels, total fruit consumption will plateau and eventually decline.But Chinese incomes are unlikely to reach these levels within the near future, despitehigh growth rates. As Chinese consumers demand greater fruit variety, new varieties willbe planted. But yields of traditional fruits average 25 to 35 percent of the yields in nearbycountries; therefore, applying more modern production practices and technology wouldpermit China to meet future fruit consumption requirements from the area that iscurrently devoted to fruit orchards. However, in reality, slow adoption of thesemethodologies will likely result in increased fruit orchard areas in the near term.
2.25 The transition toward consuming a wider variety of vegetables will doubtlesslycontinue, but total vegetable consumption is unlikely to decline much further as percapita consumption is already relatively low by East Asian standards. For every kilogramof "fine" vegetables that replace cabbage in the collective Chinese diet, about 50,000 haof additional land is needed to produce the replacement vegetables due to the much loweryield of "fine" vegetables. However, yields of "fine" vegetables are about 50 percent ofthe yields in nearby East Asian countries, again indicating that much of the increasedproduction requirement could potentially be met through increased productivity.

- 10-
3. REGULATORY AND POLICY FRAMEWORK
A. REGULATORY ISSUES
3.1 Government marketing agencies are typically bureaucratic and inefficient andunable to react rapidly to market conditions. Thus, marketing functions are best left tothe private sector. However, the Government has important roles in market regulationand policy. These include grades and standards for both health/nutrition issues (exposureto hazardous chemical and biological residues) and for differentiating products, licensingfees and taxes, and accurate market information.
Phytosanitary
3.2 The phytosanitary regulatory framework is appropriate; however, enforcement islax. A series of rules and regulations govern nonchemical fertilizer and pesticide use onfruits and vegetables. The Ministry of Agriculture is responsible for enforcing theseregulations and phytosanitary/quarantine stations are located in major markets and atsome rail stations, seaports, and airports. If produce moves outside the province oforigin, a phytosanitary certificate is required. Chemical fertilizers and green manures arepromoted for use on vegetables; animal manures are discouraged and human waste isprohibited. However, it is neither possible to supervise applications by all farmers nortest for pesticide residuals on all marketed produce, and it is acknowledged that bothanimal and human waste are frequently applied as fertilizer. Most pesticides approvedfor vegetable application are relatively nontoxic and rapidly degrade. Pesticideregulations are contained in Annex 1. Zero pesticide residue is required for export items.
The Benefits of Introducing Grades and Standards
3.3 Most fruits and vegetables are marketed by variety without regard to quality.Consequently, quality is determined by each buyer's individual criteria, by visualinspection. There would be several benefits if quality were quantified and defined as aspecific grade. Produce would be more precisely described, permitting buyers topurchase on the basis of description, or samples, instead of individually sorting throughan entire shipment of produce. It would differentiate produce, permitting farmers toreceive differentiated prices for their produce and earn a higher income. It wouldfacilitate market reporting as prices would apply to specific grades of vegetables, not toan "average" grade. Also, the differentiated prices would benefit low-income consumersby making available lower-quality produce at lower prices.
3.4 Despite the lack of official grades, grading is a routine element in the marketingprocess. Exporters carefully grade the produce destined for export lest the importer rejectthe consignment. Luxury supermarkets just as carefully grade the produce they receive

- 11 -
prior to making it available for sale. Some wholesalers who purchase for resale in largecity markets grade and purchase only that produce which meets their individual criteria.Most retailer vendors make quality separations of their produce to enable them to chargedifferential prices. Consumers implicitly grade the products when they individuallyselect the particular vegetable they wish to purchase.
3.5 But, grades and standards have not been institutionalized save for the GreenFoods trademark. (The Green Foods Development Center is a subsidiary of the StateFarms Bureau of MOA). Their standards were developed because of an incident ofassumed pesticide poisoning on fruits and vegetables. Green Food standards integratevarious environmental, production, processing, and marketing factors. Criteria include,inter alia: (a) production on suitable soils in an environmentally sound manner; (b) pestmanagement must not rely solely on chemical pesticides; (c) plant nutrition must not relysolely on chemical fertilizers nor include human waste; and (d) the resulting productsmust be "clean" and free of chemical residues. Production conditions are monitored andthe produce is inspected. If all the criteria are met, the produce is permitted to be soldusing the Green Food logo. Vegetables sold under the Green Food trademark representonly a fraction of total vegetable sales, but they are sold at premium prices.
Tax and Fees Impacts on Marketing Costs
3.6 The Government licenses various activities and either charges fees or authorizesmarketing agencies to do so to cover certain expenses. Also, the Government levies taxesfor revenue. In this regard, wholesale markets are authorized to levy fees on marketparticipants, based on produce value, and collect value-added taxes (VAT) on behalf ofGovernment. Maximum wholesale market fees are 2 percent and fruit/vegetable VAT is7 percent. Retail vegetable vendors are exempt from VAT.
3.7 However, the Government must ensure that informal charges do not place anonerous burden on marketing agencies. Some Chinese provinces allegedly levy fees fortruck transit that are 10 to 15 percent of the produce value. While transit fees arejustified, and are levied on freight transporters who use public roads in most countries,the fee level should be an appropriate contribution to road maintenance and services andnot a major revenue source. Transporting fruit from Yunnan to Shanghai requirestransiting four provinces, which could increase the marketing cost by 60 percent if all theprovinces charged a 15 percent transit fee. Some municipalities/provinces issue specialpermits to vegetable transporters, which (theoretically) exempt them from"extraordinary" fees and levies.
Market Entry
3.8 Entry into fruit and vegetable marketing is exceptionally open. Retail vendingrequires only payment of a market stall fee (Y 4 to Y 6/day) to the district authorities.Some retail marketplaces are unable to accommodate new retailers as available space isfully occupied. However, this constraint is often avoided by selling in a nearbyunauthorized location or by itinerant peddling. Also, marketplaces in new residential

- 12-
areas are frequently opened. There are no constraints to operating a fruit and vegetableshop in a permanent structure other than zoning regulations. Private entrepreneurs haverented numerous convenience food stores (previously state retail outlets), some of whichstock high-value fruits.
3.9 Becoming a fruit and vegetable wholesale trader is considerably simpler thantrading in other agricultural commodities where minimum capitalization requirementsmust be met. A wholesaler must have a tax document, readily obtained from the TaxOffice, specifying the tax rate and type (7 percent VAT on wholesale fruits andvegetables). The only other requirement is a license issued by the Industry andCommerce Bureau located in the wholesale marketplace. The wholesale marketadministration levies a fee on the value of the produce sold and charges rental fees for thespace occupied.
3.10 Many new marketplaces are municipally owned but collective and othernongovemment-owned marketplaces are increasing rapidly (Annex Table A3.1). Landfor market construction is a serious constraint and is the principal reason that most newmarkets have suburban locations. Market management must register with the Tax Officeto collect VAT on its behalf. Other requirements include arranging for CommerceBureau representation, market information collection-dissemination, and meetingenvironment regulations on sanitation and waste disposal.
B. POLICY
3.11 Market liberalization commenced in 1985 in the smaller cities but, by 1988, wasextended to medium and large cities as well. As the central government relaxed itsresponsibility for supplying urban residents, the authority to intervene in markets wasdelegated to provincial, municipal, and city officials. Day-to-day responsibility restedwith the Agriculture and Commercial Bureaus. An element of municipal policy was topreserve agricultural land generally and vegetable land particularly. Beijing Municipalityaddressed this issue by requiring 1.5 units of new agricultural land be developed toreplace each unit of agricultural land lost to urbanization.
3.12 A National Vegetable Basket Project was introduced by MOA in 1988 with theobjectives of adjusting/improving supplies, reforming production and marketing,rationalizing prices, strengthening market infrastructure, and improving year-roundsupply availability. Under state auspices three national production "bases" weredeveloped: (a) a subtropical base in Guangdong/Guangxi/Fujian provinces; (b) a summer-autumn base in Shandong/Anhui/Henan; and (c) a Chinese cabbage base in North China.It was anticipated that the establishment of these bases would assist in providing year-round supplies and reduce seasonal price volatility.
3.13 Basically, however, municipal governments were responsible for their ownvegetable supplies and they proceeded to develop vegetable production "bases" in nearbyand distant suburbs for seasonal production and a portion of off-season supplies. Eachcity specified an amount, or proportion, of the suburban vegetable base land on which

- 13 -
Chinese cabbage was to be planted for autumn production. Except for the cabbagerequirement, farmer participants were free to grow the varieties of their choice, with theproviso that the produce be sold in wholesale or retail markets within the municipality. Avariant of this process operated in Shanghai where, in addition, the municipality wouldcontract with local farmers for eight specific vegetables (Chinese cabbage, roundcabbage, bok choy-two varieties, radish, celery, spinach, and a leafy vegetable) to bedelivered to designated wholesale markets. The municipality also contracts with farmergroups in other provinces for vegetables but without specifying variety, price, or quantity.Vegetable Basket Projects have been remarkably effective in increasing croppingintensity of vegetable land and expanding the availability of winter and off-seasonvegetables.
3.14 The municipal governments provided subsidized infrastructure (all-season roads,irrigation, electricity, etc.), inputs (fertilizer, pesticide, plastic for mulch and protectedproduction, and metal frames for greenhouses and tunnels), and one-time cash subsidiesto convert land to vegetable use. New wholesale facilities were promoted and partiallyfinanced (subsidized) to diversify marketing channels and new technologies wereintroduced, particularly "protected" (under plastic) production and new varieties that werehigher yielding and more resistant to pests, and more tolerant of drought and temperatureextremes-to extend the traditional season.
3.15 It is estimated that Beijing Municipality, county, and local governments investedY 700 million in the vegetable production base between 1992 and 1994. Similarly,various jurisdictions invested Y 250 million to establish 20,000 mu of plastic tunnels insuburban Shanghai. Inputs are made available at prices 33 to 50 percent below marketprices and one-time cash payments of Y 100 to Y 200/mu are paid.
3.16 Investments in suburban production bases and production subsidies have resultedin a Beijing vegetable self-sufficiency ratio of about 0.70. However, about 75 percent ofthe vegetables marketed in wholesale markets originate in other provinces. Alternatively,about 25 or 30 percent of the Shanghai wholesale market supplies are obtained from otherprovinces. Much of these supplies are obtained through formal economic links withproduction centers in other provinces and joint ventures between the municipality and theproduction center (county).
3.17 The Vegetable Basket Project is now moving into the next phase with newobjectives and goals. Some of the more important are: (a) improve quality-50 percentof all marketing will be "clean" vegetables by 2000; (b) further increase protectedproduction and reduce volume disparities between peak and slack seasons; (c) expandfarmer marketing organizations to increase marketing scale and lower cost; (d) strengthenmarket information network; and (e) improve post-harvest handling, including sorting-grading.
3.18 Municipal governments established a Guidance Price Policy in 1994 in reactionto rapid and large food price increases and to prevent retail "price gouging." This policy,
- 14 -
enforced by municipal and district price bureaus and departments, established maximumretailer margins and applied to 13 selected vegetables, but were often exempted duringseasonal production periods. Guidance prices are based on the wholesale price; thus;
if the wholesale price is: maximum permissible margin is:Y 1.00 or more perjin (in = 0.5 kg) 50 percentY 0.70-1.00 perjin 40 percentY 0.70 or less per jin 30 percent
Guidance prices apply to: Chinese cabbage, round cabbage, cucumber, celery, eggplant,sweet (green) pepper, tomato, spinach, greens, lentil, potato, radish, and white gourd.The Municipal/District Price and Industrial Commerce Bureaus monitor retail prices andif the price exceeds the guidance level, the retailer is subject to a fine. It is doubtful thatthis policy has been effective in curtailing price increases.
Cabbage Policy
3.19 Cabbage receives individual policy attention by municipal governments. Whenfarmers agree to participate in the Vegetable Basket-Vegetable Production Baseprograms, they also agree to plant a specified amount, or proportion, of their land tocabbage in the autumn production cycle. The cabbage requirement ranges from one-fourth to one-third of the vegetable base, except farmers are exempted from thisrequirement if their land is under protected production (greenhouses and plastic tunnels).NMunicipal programs tend to fall into two categories: (a) the municipality agrees to buy aminimum quantity at a minimum price and sells, through state shops, to consumers atprices not to exceed a specified maximum [Beijing requires 80,000 mu of cabbage beplanted, agrees to purchase 100,000 tons at Y 0.16/kg, injects a Y 0.0684/kg handlingsubsidy and sells at prices not to exceed Y 0.26/kg. Parallel sales occur in the freemarkets, and retail prices were maintained below Y 0.26 in 1994]; and (b) themunicipality specifies only the cabbage area, may or may not provide a cash subsidy on amu basis, and lets the market determine prices [Kunming requires that cabbage be plantedin 25 percent of the autumn-planted vegetable base, and provides a Y 100/mu cashsubsidy].
C. MARKET INFORMATION
3.20 Market information in China has historically been gathered as inputs forgovernment policy decisions (a chief concern is vegetable price inflation), ratherthan utilized to assist in the more efficient operation of markets. Fruit and vegetablemarket information systems are still in their infancy and several different marketinformation systems are in effect. The MOA Information Center maintains the widestnetwork and assembles information from: (a) within the Ministry; (b) wholesale marketsunder MOA management/ownership; (c) other ministries and bureaus; and (d) cities/municipalities. The Information Center is responsible for primary analysis anddistribution. Summaries are published in the Economic Daily newspaper, radio andtelevision networks, and disseminated to 42 major wholesale markets, 35 cities/
- 15 -
municipalities and 800 subscribers, on a nonpaying basis. The Ministry of Internal Trade(MIT) Information Center undertakes similar but independent data collection, analyses,and dissemination.
3.21 SSB assembles information from various ministries, bureaus, provinces andmunicipalities and is the source of official marketing statistics. The Price Bureaumonitors and records price information (but not volume data) in the retail markets, whichalso is transmitted to MOA and MIT Information Centers. This information, collecteddaily, is consolidated into monthly averages, which limits its analytical value as much ofthe price volatility is moderated in the averaging process.
3.22 Major wholesale markets maintain a market information office and publish daily(or weekly) market reports for local media and subscribers. Detailed price (daily average,minimum, and maximum), quantity, value, and variety information are maintained by thewholesale markets as they are the basis for market fees and taxes. But only the price andvariety information is evaluated and published. Quantity information is valuable anduseful in analyzing prices and price changes and should be distributed along with theprice data to assist market participants to make better-informed decisions. To improvethe efficiency of production and marketing decisions, the "data base" orientation ofprevailing market information systems must be expanded to include information fromsources other than wholesale markets. This would include crop reporting on fruits andvegetables currently undertaken on grains to provide qualitative assessment of productionconditions and probable marketings. The regular reporting of farmers' planting intentionsand actual plantings of specific vegetable varieties are indicators of future marketsupplies and permit farmers to adjust their production mix to incorporate varieties likelyto be in short supply. This becomes more important as consumers' income andconsumption of nontraditional vegetables increase. Also, reports on fruits in storagewould provide further information on potential marketings.

-16-
4. MARKET STRUCTURE
4.1 Between 1978 and 1994, the total number of rural free markets doubled and urbanfree markets increased from zero to 17,880. Growth in free-market sales (real value) wasremarkable, increasing at an annual rate of 18 percent, reaching Y 900 billion in 1994-about one-half of which were food items. Annex Table A3.1 indicates the rapid growthin the traded value (current and constant terms) of major agricultural commodity groupsfrom 1978 to 1994.
4.2 Growth in quantity marketed TABLE 4.1: FREE-MARKET SALES VOLUME
(through free markets) was equallyremarkable (Annex Table A3.2). Table 1988 1994 Growth Rate
4.1 summarizes the sales volume and (million tons) (percent)growth rate between 1988 and 1994 for Grain 7.07 22.35 23grain, fruits, and vegetables. The sales Fruit 9.54 26.32 19
volume of vegetables is three times that Vegetables 26.51 64.10 17
of grain and double that of fruits; theannual growth rate was 17 to 23 percent for the various commodities.
4.3 The physical volume of grain sold through free markets remains a relatively smallproportion of total sales and consumption, reflecting Government's continued desire tocontrol grain marketing. However, the volume of fruits and vegetables sold through freemarkets, coupled with sales by farmers to nonagricultural residents and on-farmconsumption, is a very high proportion of production and consumption.
4.4 Since the mid-1980s, fruit and vegetable marketing has become increasinglyliberalized and pure competition conditions are generally met in all marketing stages. Aportion of the competition derives from nonprivate-market participants and in isolatedareas, where traded volumes are small, either municipal government or private-sectormarket dominance may exist. Municipal governments own, manage, and/or supervisemany market facilities, but active market intervention is limited primarily to establishingretail guidance prices and does not impact on market competitiveness.
4.5 Each municipality has its own structure of vegetable market ownership. Butregardless of the structure, a common element is a rapid increase in the proportion ofsales through free markets. Between the mid-1980s and mid-1990s the vegetablemarketing structure in Beijing changed from 220 state retail shops to 60 wholesalemarkets and 90,000 individual retail sellers and vendors-although 143 of the state shopsremain. Various estimates suggest that countrywide, 80 to 90 percent of retail fruit andvegetable sales are through private outlets at market-determined prices. Similarly, 75 to80 percent of nationwide wholesale fruit and vegetable sales are estimated to be throughfacilities managed by nongovernment entities.
- 17 -
A. THE MARKETING CHAIN
Producer Marketing
4.6 Small farmers sell an estimated 50 percent of their produce to traders at thefarmgate. The Government encourages direct retail sales by farmers and those locatednear urban centers often sell an estimated 25 percent of their produce in this manner.Other marketing arrangements include: direct wholesale marketing without use of traderintermediaries; and direct farm sales to institutions (this applies to very high-qualityproduce and consists of both spot and short-term contract sales). There is no evidence ofvegetable farmer marketing associations/cooperatives although some farmers jointlytransport their vegetables to the market; however, villagers often collectively marketfruit.
4.7 Successful farmer marketing cooperatives obligate individual participants to forgosome of their independence and rely on business-oriented managers for efficientmarketing decisions (i.e., to enable farmers to receive a larger share of consumers'expenditures). The establishment of such cooperatives often requires governmentassistance in organizing, advising leadership, and providing some infrastructure.However, it is crucially important for management to be farmer-controlled as thefundamental objective is to increase farmer member incomes, an objective that is dilutedby government-controlled cooperatives that are influenced by consumer as well asproducer interests.
Wholesale Marketing
4.8 There are approximately 2,100 fruit and vegetable wholesale markets nationwidethat fall into four management-supervision categories. The Ministry (Bureau) ofAgriculture typically manages wholesale markets in production areas where produce isassembled for shipment to consumption areas. Urban wholesale markets are largelymanaged and supervised by Departments within either (a) the Ministry of Internal Trade,or (b) the Municipality (Industry and Commerce Bureau). The final category is thecollective wholesale market, which includes village and farmer collectives, and groups oflocal entrepreneurs. Many of these markets have evolved from farmers' free marketsestablished early in the liberalization period and comprise some of the largest volumemarkets.
4.9 Wholesale market facilities vary widely. Some are open-air, in crowdedcongested areas with no display space, others are spacious open-air markets with samplesdisplayed alongside parked trucks, others are covered areas (floor and roof without walls)with display space and sorting/grading facilities, and still others include enclosedmultistory buildings with managerial, financial, and information offices with spaceavailable for storage. However, wholesale markets have neither integral cold storagefacilities, loading/unloading platforms, nor mechanical handling equipment.
4.10 Large cities have numerous wholesale markets that compete against each other assellers and buyers patronize the market of their choice. Wholesale markets vary in sizewith 500 or more sellers offering up to 5,000 tons per day in the larger markets. Traders

- 18-
from other provinces tend to patronize these larger markets. Smaller "neighborhood"wholesale markets handle more locally grown produce and individually handle smallervolumes than do the larger markets; although collectively they handle about 50 percent ofthe marketed produce. Market proximity is an important selection criterion for farmers aswell as retailers and institutional buyers.
4.11 There are wholesale markets in surplus production areas (counties) throughoutChina, some of which are quite large (Shouguang, Shandong). Buyers in these largermarkets represent both companies and individuals, and include state organizations,private trading organizations, institutions (schools, hospitals, hotels, military units, etc.),traders, and farmers. Traders purchasing produce for sale in deficit vegetable areas oftenbuy on a graded basis (i.e., they sort the vegetables in the market and buy only the itemsthat meet their quality criteria). Some marketing firms have horizontally integrated bystationing representatives in several producer wholesale markets to procure specificquantities and qualities of various produce for shipment and sale in various urbanwholesale markets. All of these representatives (agents) are in daily contact with theirprincipals and add their own knowledge to publicly available information, permitting theprincipal to direct specific procurement requests to the market agent that can make the"best buy."
Retailing is Overwhelmingly Small Scale, Private, and Highly Competitive
4.12 The bulk of retail sales are through vendors in temporary street markets (open foronly 2 to 3 hours in the early morning or late afternoon), or in semipermanent markets,with individual stalls open throughout most of the day. Only a small volume of retailtransactions occur in permanent structures such as supermarkets and convenience stores.Retailer vendors purchase their daily supplies from wholesalers and transport it to theretail site utilizing bicycles, tricycles and carts, and join farmer retailers who similarlytransport their own produce to market. Daily transactions of individual vendors, whotypically specialize in one group of commodities, fall within a 50 to 100 kg range.
4.13 Although some grading is undertaken in wholesale markets, a large portion of theproduce remains ungraded until it reaches the retailer. Retailers grade the material anddifferentiate prices for the various qualities. Also, vendors lower their prices near the endof the day as they have limited provision for overnight storage. Despite strongcompetition, retail margins are relatively high because operations are small-scale andphysical losses (costs) are high.
4.14 Several entrepreneurs propose to expand prepackaged fruit and vegetable sales inconvenience stores and supermarkets. However, there is no research indicating Chineseconsumers prefer prepackaging over self-select bins, which is practiced in most ofChina's retail markets and in retail outlets of most countries. Luxury supermarkets sellprepackaged fruit and vegetables but the clientele is predominately expatriate.Introducing prepackaged fresh vegetables designed for domestic consumers, withoutmarket research supporting this preference, could be a costly mistake.

- 19 -
Institutional Procurement
4.15 Institutions (academic institutions, hospitals, restaurants, hotels, military, somesupermarkets, etc.) employ three procurement methods: (a) self-procurement at thewholesale market; (b) daily order placement with specialized vendors late the previousevening or early in the morning, with mid-morning delivery; and (c) small volumesthrough direct purchase from suburban producers of fine vegetables. The latter twoarrangements involve excellent quality produce and require cleaning and pregrading-orthe institution (supermarket) will grade and return the cull material. The vendor typicallyfinances these transactions with weekly, biweekly, or monthly settlement.
Export Marketing
4.16 Fruit and vegetable exports total some 3.5 million tons ($3.0 billion), which is aminor proportion of production. Hong Kong and Japan are the destinations of most of theexports. It appears that exports to Japan are demand-driven. Japanese importers visitChina to identify potential sources of supply for specific high-quality vegetables. Jointventures are often formed with State Farm suppliers to produce specific varieties. About25 percent of requirements are contracted and the remaining 75 percent are spot procuredat the farmgate or wholesale market. When contracted, the importer prefinances a portionof the production costs. Also, the importer monitors production development, specifiesharvest date, arranges for delivery of standard or refrigerated containers (as required) tothe production area, and overland and sea transport. Farmers are paid cash for washed,cleaned, and graded vegetables that are packaged in 10 kg boxes and packed in containersin the field.
Processing
4.17 Although Chinese consumers eat a small amount of pickled and dried food items,most fruits and vegetables are consumed fresh. Few, if any, vegetables are producedspecifically for processing and no specific market channels apply to vegetables forprocessing. A small amount of vegetables are dehydrated, primarily for export. Butprocessors dehydrate "on demand"; they do not maintain stocks of dried vegetables butprocess only following receipt of an export order with spot purchase of raw material fromfarmers or in the wholesale market. Fruit juices are widely canned and consumed, butcanned fruits and vegetables are not an important element of the diet. A very smallfrozen fruit and vegetable market exists for institutions (hotels, etc.) and affluentconsumers who patronize supermarkets. Until frozen fruits and vegetables become morecompetitively priced and Chinese households increase their freezer-refrigeration capacity,frozen fruit and vegetable production and consumption will remain unimportant.
B. POST-HARVEST HANDLING AND QUALITY CONTROL
4.18 Historically, Chinese agricultural research addressed grain, vegetable oilseed, andcotton production issues; only recently has Government broadened its focus to providemodest attention to fruits and vegetables. However, production issues remain the locus ofconcern with no structured research addressing post-harvest losses of fruits and
- 20 -
vegetables. Post-harvest loss information is available only in the form of anecdotalobservations, estimates, and educated guesses.
4.19 Field handling following harvesting has a major impact on the quality of producethat enters the market channels. Most farmers have no knowledge of standardizing-grading (sizing, coloring, blemishes and bruise damage, etc.); thus, farm-level sorting islimited to the removal of physically damaged items. Also, field heat remains in theproduce as farmers practice neither mechanical nor water cooling. (Some vacuumcooling is applied to produce destined for export.)
4.20 Packing/packaging. Although fruits are packed in cardboard boxes of 10 to20 kg, vegetables are typically "overpacked" in bags, baskets, or other nonrigidcontainers and are "overstacked" on trucks, in storage, and in the market, causing severebruising and compression damage, leading to physical losses and quality deterioration.Some semiperishable vegetables such as onions, carrots, and potatoes can withstand suchtreatment, but most cannot. The use of sturdy, rigid packing containers would eliminatemuch of this problem. Also, the absence of mechanical handling equipment at markettransfer points results in rough manhandling and further quantity and quality losses. Bothvegetables and fruits are hand stacked, loaded and unloaded-palletizing and mechanicalhandling (including conveyors) is not practiced. An exception is export produce, whichis placed in freight containers after cleaning and grading at the production center (para.4.16). The further downstream these losses occur, the greater the cost as considerabletransportation and handling costs are incurred on the entire volume of produce.
4.21 In addition to precooling, rigid packaging, and mechanical handling, there areother marketing practices and handling technologies that would improve or maintainquality and value. But their application may be inefficient for lower-value produce as themarginal cost of improved handling may be greater than the marginal benefits ofincreased quantity and quality and greater than the marginal cost of incrementalproduction. These include:
Practice/technology Impact
Farm-level cleaning, Washing, standardizing produce by size and color and removing blemishedgrading, and sorting items to improve quality and value.
Cold storage Maintain quality and extend availability of seasonal production throughrefrigeration [more sophisticated controlled atmospheric storage refrigerates aninert gas environment (oxygen removed), but is unused in China].
Waxing Polishes fruit, leaving it with an attractive finish and reduces the respirationrate of fruit, thus extending its storage life. [vegetable waxing would beapplicable only to varieties with very high value.]
Based on subjective evaluation, post-harvest losses constitute a significant inefficiency inmarketing and largely accounts for the wide price spreads for fruits and vegetablesbetween farmer and consumer.

- 21 -
4.22 There is no general cold chain system for fruits and vegetables, although there areindividual operators of cold storage facilities and refrigerated transport. The availablerefrigerated storage facilities are used primarily for meat and fish and secondarily forfruit, but rarely for vegetables. There are several manufacturers of insulated andrefrigerated trucks, but they are used primarily for higher-value processed and preparedfoods. Railroads have semirefrigerated rail cars but they are rarely, if ever, used forvegetables. Also, with the exception of up-scale supermarkets and some conveniencestores, there is no retail-level refrigeration; street vendlors are obliged to sell their stockthe same day it is brought to market, particularly during summer months.
4.23 Fruits are often placed in cold storage for several months but with few exceptions(e.g., green garlic) vegetables are not. There are several reasons why refrigerated storageof vegetables is not more widely practiced: (a) the value of most vegetables is lowrelative to fruits-and to the refrigerated storage costs; (b) the storability of mostvegetables is relatively short (compared to fruits), even under refrigerated conditions[cold storage can extend the seasonal availability of vegetables only briefly]; and (c) thepricing of refrigerated storage is unattractive to relatively small volumes and rapidturnover. Owners of cold storage facilities have not learned how to merchandise theirservice by customizing it to meet the needs of different potential customers. Cold storagerental is typically based on individual rooms with minimum capacity of 100 tons for aone-month minimum period. A vegetable trader more typically requires 24 to 48 hourstorage for only a few tons. Therefore, cold storage operators should consider alternativepricing schedules (i.e., 24 hours, one week, etc.) and alternative space rental (i.e.,provision for renting space by the cubic meter as well as by the "room").
Agricultural Market Research and Extension
4.24 Horticultural research must expand beyond production issues to include marketresearch, quality maintenance, and post-harvest handling (field cooling, packaging,transporting, storage, etc.). The development of grades and standards should be a priorityelement of market research. This would permit prices and qualities to be better relatedand could be integrated into the market information network. In the absence of rigorousanalysis of post-harvest losses using alternative packaging materials, transport, andstorage modes, there is considerable uncertainty regarding which post-harvest _cLmologyto employ to reduce marketing costs. Market research information should be integratedinto extension programs just as production research is currently extended.
Infrastructure and Marketing Efficiency
Transportation
4.25 Various types of vehicles are used locally to transport fruits and vegetables fromfarm to market and local transport does not appear to be a marketing constraint.Similarly, truck transportation between production and nearby consuming areas (e.g.,Shouguang to Beijing) also appears sufficient. In several instances, as part of the"vegetable basket" program, municipal governments have provided subsidized transport

- 22 -
loans to families/groups to encourage fruit and vegetable transport. However, vehiclesused for fruit and vegetable transport are predominantly uninsulated and nonrefrigerated.The exception appears to be vendors who provide high-quality produce to institutionalcustomers (hotels, etc.). A priori, insulated or refrigerated truck transport would appearto be efficient; but since they are rarely used, they are apparently perceived to beinefficient.
4.26 Transcountry transport infrastructure is an important limiting factor to improvingmarketing efficiency and reducing post harvest losses. Transport infrastructure growthhas not been commensurate with the rapid growth of the economy and the need to moveincreasing volumes of freight. Road networks are inadequately developed to facilitaterapid movement over long distances and backhaul opportunities have not developed.Some firms are developing plans to move fruits and vegetables long distances byrefrigerated truck (Kunming to Shanghai), but economic viability requires commoditybackhauling.
4.27 Rail transport would appear to be a solution to fruit and vegetable transport, butuncontrolled temperatures and lengthy transit times limit usage to semiperishablecommodities such as onions, potatoes, etc. Refrigerated containers are used in exportingvegetables and facilitating intermodal transport of fruits and vegetables. However, thevalue of most vegetables is too low to absorb the cost of refrigerated container handling.
4.28 Small quantities of perishable vegetables are packed in insulated boxes (withfrozen thermal containers) and shipped medium distances by rail. These shipments aremade as high-cost, accompanied personal effects but are more rapid than typical railfreight shipments. Wastage is alleged to be less than 5 percent for these shipments. Thespeed and minimal loss makes this a viable transport option for some relatively high-value products. Similarly, air cargo is used for some fruit, vegetable, and flowershipments to a few Southeast Asian countries. However, the high cost prohibits domesticuse except for high-value, off-season produce and specialty items for some institutionalusers.

- 23 -
5. MARKET PERFORMANCE
A. OPERATIONAL AND ALLOCATIVE EFFICIENCY
5.1 The Chinese Government, like governments elsewhere, intervenes indirectly inthe vegetable market by supporting research on horticultural production, new seed varietydevelopment, improved agronomic practices, etc., in efforts to expand vegetable supplies(shift supply function outward). In addition, China's municipalities have provided cash,infrastructure, investment, and input subsidies to vegetable producers. These subsidieshiave: (a) intensified supply expansion; and (b) limited (but not eliminated) consumerprice increases.
5.2 While these interventions distort resource use at the production level, subsequentprices in the marketing chain are basically left to market forces-except for retailguidance prices, which are perceived to be relatively ineffective. Evaluation of marketprices suggests they are generally competitively determined, but are not necessarilyefficient. This potential inefficiency applies to both wholesale and retail leveltransactions.
5.3 Wholesale markets are certainly competitive. The large number of marketplacesand participants that compete for business ensures that transfer prices are competitivelydetermined. But without competitive systems that would provide an alternative methodof moving vegetables from producers to consumers, it is difficult to conclude that thewholesale marketing system is efficient.
5.4 In some large cities (Shanghai), distribution centers have replaced some wholesalemarkets in providing nonperishable products to convenience stores-and are beginning tohandle some perishable products such as vegetables. This should be encouraged asdistribution centers are likely to be more efficient and have external benefits, includingreduced traffic. The variety, quality and amount of vegetable exports are such a smallproportion of production that they constitute a niche market rather than competition.Institutional procurement (large enterprises, military, schools/universities, hotels, etc.) isa small but important component of vegetable demand, which might be more efficientlyhandled through farmer-buyer contracts that could be based on wholesale market pricesbut would benefit by physically bypassing the wholesale market. Although efficient,contracting is unlikely to develop until cooperative farmer marketing associationsdevelop that can consolidate, soIt, and grade farm produce and demonstrate the capacityto organize vegetable supplies on a regular and recurring basis. Auctioning is potentiallyan efficient marketing mode but cannot be practiced without defined grades and standardsto permit sample inspection and selling.

- 24 -
5.5 The retail vegetable market also is highly competitive as demonstrated by theestimated 90,000 Beijing retailers. But, given the large number of retailers and Beijing'sdaily vegetable requirements, each retailer handles only 100 to 150 kg per day; thus,"acceptable" incomes can be generated only with high margins. Therefore, while theretail market also is competitive, it also is not particularly efficient. Efficiency lies inretailer/vendors handling a larger volume with reduced unit margins to enable them toenjoy "reasonable" profits/incomes while providing consumers with lower-pricedproduce. The high-volume, low-margin structure prevails in many other countries.
5.6 Retailer associations that would facilitate large-volume procurement, and perhapsbypass one or more marketing stages, have not developed, but could be an efficientstructure. Although some trading organizations appear to be horizontally integrated withmarket agents widely dispersed in many wholesale markets, vertically integratedmarketing organizations that would perform several marketing functions have notdeveloped except for a few State Farms, which have integrated production with somemarketing activities. An innovative retailing experiment is underway involving itinerantvending whereby insulated vans enter residential areas and stay for a brief period to sellfresh produce prior to moving to another residential area. This practice is too recent toevaluate its efficiency.
Seasonality of Vegetable Marketing
5.7 The seasonality of vegetable production and marketing differs widely between thevarious climatic areas. Subsidized investments and inputs have led to substantialincreases in "protected production" of winter vegetables. Separate statistics ofgreenhouse-tunnel production are not maintained but anecdotal evidence suggests veryrapid increases during the last three to four years. Notwithstanding large increases in off-season production, a notable seasonality applies to vegetable prices and marketedvolumes. There has been remarkably little change in seasonal sales distribution ofvegetables in Beijing over the past decade. Monthly vegetable marketings are bimodal,with a modest peak in late spring-early summer (June and July) and another sharp peak inNovember. The large volume of cabbage marketed in November and stored for winterconsumption distorts the picture of overall vegetable availability. The monthly salesvolumes for 1984 and 1994, as a proportion of annual sales, are indicated in Figure 5.1.Seasonal price indices better reflect, in a countercyclical manner, the availability ofvegetables (when prices are high, availability is low and vice versa).
5.8 Figure 5.2 illustrates marketing seasonality differences between three majorwholesale markets (1994/95). Beijing, Shouguang (Shandong), and Chenggong(Yunnan) represent a major consumption center, a northern temperate production center,and a subtropical, high-altitude production center, respectively. As Shouguang-areawinters are relatively mild and protected, vegetables are produced and marketedthroughout the year; monthly volumes are greatest between December and March, withthe lowest volumes in late spring-early summer. In contrast, monthly sales volumes are

- 25 -
relatively stable in Chenggong; minimum throughput is in February (about 6 percent ofthe annual total) and maximum in June (about 12 percent of the annual total).
FIGURE 5.1: SEASONAL SALES DISTRIBUTION (DAZHONGSI, BEIJING)
25
15
l0
Jan Feb Mar Apr May Jun Jul Aug Sep Oct Nov Dec
+1 984 -- 1 9941
FIGURE 5.2: MONTHLY DISTRIBUTION OF ANNUAL SALES
(\THREE WHOLESALE MARKETS)
15
0i __ /t
Jan Feb Mar Apr May Jun Jul Aug Sep Oct Nov Dec
0 +Beiing iShougu ngoChngg|

- 26 -
Intraseasonal Price Volatility
5.9 Individual vegetable prices have quite volatile day-to-day movements. This isdue, in large part, to inadequate market information and lack of forward planning and, toa lesser extent, the risks associated with producing and marketing vegetables. Thepractice of disseminating market prices-but not marketed volumes-occasionallymisleads farmers who exacerbate volatility by marketing large volumes the day followinghigh wholesale prices as many farmers react similarly to the high price; a market glutwith very low prices typically results.
B. PRICE TRANSMISSIVITY
Spatial Price Differentials
5.10 Four wholesale vegetable price ratios were derived for 190 city pairs to evaluateprice differentials, using 1995 data. Shanghai and Xining (Qinghai) prices were thehighest, followed by Chengdu and Beijing. Vegetable prices in other east coast cities,such as Qingdao and Tianjin, were at medium levels; that is, much lower than Shanghaiand Beijing but considerably higher than many inland cities (Dalian and Guangzhou wereexcluded due to insufficient data). The lowest prices were found in Kunming, whichwere 14 percent below the second-lowest prices in Guiyang. Price differentials weresmall between relatively nearby cities located in either vegetable-deficit or surplus areas.For example, aggregate prices differed by about 5 percent between Shenyang andChangchun, and Jinan and Yantai. The greatest price differentials of 100 and 75 percentwere found between Kunming-Shanghai/Xining and Kunming-Chengdu/Beijing,respectively. A few anomalies occur, but the price differentials are consistent with anintegrated national market. The set of price ratio matrices are contained in Annex TableA5.2.
5.11 Upstream/downstream price transmissivity and geographic price integration areindicators of competitive markets. Unfortunately, inconsistent data sets do not permitrigorous transmissivity analyses. Farmgate price data are available only on an annualbasis, retail prices on a monthly basis, and wholesale prices on a weekly basis-butavailable only from January 1, 1995. However, many wholesale market sellers arefarmers who compete directly with wholesale vendors who collect produce from otherfarmers; also, discussions in several wholesale markets led to the conclusion that, insurplus areas, farmgate prices are very similar to wholesale prices.
5.12 A covariance analysis was applied to data covering nine different vegetables overa 21-month period (late-1993 to mid-1995) for two wholesale markets, one in a majorproduction area (Shouguang, Shandong) and another in a major consumption area(Dazhongsi, Beijing). These data were highly correlated with a correlation coefficientgreater than 0.85 for most individual vegetables. Also, on average , the Beijing priceswere 37 percent higher than the Shandong prices, with high percentage differences onlow-value vegetables (potatoes) and low percentage differences on high-value vegetables(celery). These coefficients suggest a relatively high degree of competition as would be
- 27 -
expected as both markets have several hundred market participants, many of whom buyin the Shouguang market to sell in the Dazhongsi market. The 37 percent marginbetween the two wholesale markets is modest considering the distance between the twomarkets and the handling required.
Wholesale Market Integration
5.13 The lack of government intervention in fruit and vegetable marketing and pricinghas permitted an integrated national market to develop. Price levels and price movementsin various markets should be similar but not precisely the same. High price covariancecoefficients between markets reflect a high degree of integration and low coefficientsreflect a high degree of market segregation.
5.14 Weekly price data were used to derive 566 covariance coefficients for fourvegetables (tomatoes, cucumber, sweet pepper, and eggplant) between 19 cities. Forty-six percent of the coefficients were 0.7 or higher and 76 percent were 0.5 or higher,indicating high levels of covariance and well-integrated markets. A few negativecoefficients were derived, but the overwhelming majority of coefficients were highlypositive. Not surprising was the tendency for correlation coefficients to decline thefarther apart the paired cities; for example, prices were closely correlated betweenNanjing and Shanghai, Chanchun and Shenyang, Jinan and Qingdao, but poorlycorrelated between Beijing and Wuhan, Fuzhou and Chengdu, Chanchun and Xian,Guiyang and Xining, etc. The coefficients derived for Kunming and other city priceswere the least correlated of all city pairs. This perhaps reflects the limited transport anddifficulty of moving produce from Yunnan province. The coefficient matrices arecontained in Annex Table A5.3.
Price Margins
5.15 In the absence of weekly data, monthly TABLE 5.1: BEIJINGretail-wholesale price margins were evaluated for WHOLESALE-RETAIL MARKET
six important vegetables. The vegetable varieties MARGINSand the price margins, which range from 23 to 69 (Percent)percent, are indicated in Table 5.1. The markup oncabbage, eggplant and potatoes exceeds the Vegetable Marginguidance price norms, but they are similar to Chinese Cabbage 61anecdotal evidence found in the markets and are Tomatoes 45consistent with comments by market officials. Cucumbers 23Sweet Peppers 23
Eggplant 635.16 Building on empirical studies, a series of Potatoes 69costs and margins were synthesized to illustrate theincrease in transfer prices as vegetables pass through the marketing channels. Thissynthesis is contained in Table 5.2. It is important to note that there are two types ofcosts contained in the table; those related to the value of the produce (taxes, managementfees, etc.) and those unrelated to the value (transport, stall rental, etc.). Therefore, if the

- 28 -
farmgate price changes the margins would also change. Table 5.3 indicates the marginsunder two different farmgate price assumptions, Y 1.00 and Y 2.00/kg.
TABLE 5.2: CONSTRUCTION OF SYNTHETIC PRICE MARGINS
ConstructionCost Volume
(Yuan) (kg)
Farmgate Price (Y 1.00/kg) 1,000.00 1,000
Transport cost: Farrn to Shouguang Wholesale Market(30 km c Y 2.00/t-km 60.00
Shouguang Market CostsManagement fees (1.5%) 15.00Taxes (3.5%) 35.00Boxes (Y 2.00/box of 25 kg, one time reusable) 40.00Other wholesale costs (weighing, etc. - Y 0.1 0/kg) 100.00
Profit (10%) 125.00Physical Losses (10%) 100
Value and Quantity, ex-Shouguang (Y 1.53/kg) 1,375.00 900
Transport to Beijing (Dazhongsi Wholesale Market)(Y 0.30/kg x 900 kg) 270.00
Dazhongsi Market CostsManagement fee (2.0%) 27.50Taxes (5-7%) 68.75Other wholesale costs (weighing, etc. - Y 0.10/kg) 90.00
Profit (10%) 183.13Physical Losses (10%) 90
Value and quantity, ex. Dazhongsi (Y2.49/kg) 2,014.38 810
Retailer CostExit fee from wholesale market (2%) 40.29Stall rental (Y 5.00/day assume 100 kg/stall/day) 40.50Transport and other selling costs (Y 0.02/kg) 16.20
Profit (20%) 422.27Physical Losses (12-15%) 110
Value and Quantity of Retail Sales to Consumers 2,533.64 700
Consumer Price (Y 3.62/kg)
5.17 There are several reasons TABLE 5.3: ILLUSTRATIVE PRICE MARGINSwhy these synthetic marginsmay not prevail. The most Farrngate Price
important is competition with YlOO/kg ( Y2.00/kg
production areas nearer to Farmgate to wholesale I 53 41Beijing; such competition would Wholesale I to wholesale II 63 48force agencies/individuals in the Wholesale II to retail 45 44
marketing channels serving the

- 29 -
distant market to reduce their profit margins or otherwise find marketing efficiencies,such as reducing transport costs. Also, some vegetables such as carrots would have lesswastage in the marketing chain, thereby reducing costs. The implied profit margins areattractive, but substantial risk is involved; if the Shouguang Market wholesaler transacted30 tons per month, the gross profit would be Y 3,750 (excluding capital costs); theDazhongsi Market wholesaler would incur a monthly gross profit of Y 6,100 (excludingcapital costs) with 30 tons of transactions; and the retailer would earn Y 1,500 grossprofits by selling 100 kg/day for 25 working days per month.
5.18 A cursory examination of the present market system for fruits and vegetablesindicates that a large proportion of the price spread is due to large losses (or the perceivedrisk of such losses) occasioned by the lack of appropriate post-harvest handling, storage,and shipping facilities. If, in the above synthesis, physical losses could be reducedfrom 30 to 20 percent throughout the entire system (say 6 percent in each wholesalemarket and 8 percent in the retail market), and all other costs were maintained, importantbenefits would accrue. Farmers could receive 20 percent more for their producewithout affecting consumer prices, or consumers could obtain vegetables at 12percent less cost without affecting farmgate prices, or a combination of higherfarmgate prices and lower consumer prices could accrue.
- 30 -
6. CONCLUSIONS AND RECOMMENDATIONS
Production and Consumption
6.1 Fruit production has increased rapidly over the past decade, primarily due toincreased area as there has been virtually no productivity increase. This increase hasoccurred in the face of a real price decline since 1988 for most fruits, suggesting thatnonprice incentives were influential in expanding fruit areas. As an incentive to develop"wasteland" into agricultural land, developers are accorded long-term (50 years or more)land rights. Tree crops are adaptable to slopes and other less accessible and untillableareas and development of orchards on these lands may account for the fruit areaexpansion.
6.2 The vegetable areas also have expanded rapidly, particularly in the early 1990s,but these increases have been in parallel with rapid price increases. Although cabbageremains the major vegetable, its production has shifted in favor of "fine" vegetables. Thecombination of increasing prices and shift to higher-value vegetables has resulted in avery rapid increase in the farm value of vegetables.
6.3 A transition in food consumption and dietary patterns is underway, stimulated byrapidly increasing incomes, particularly by urban residents. The per capita consumptionof energy foods, such as cereal staples, is declining while the consumption of high-protein livestock products is increasing. Similarly, vegetable consumption is evolving;although consumption of coarse vegetables such as cabbage remains high, expendituresfor "fine" vegetables are increasing rapidly-although physical quantities of vegetableconsumption are declining.
6.4 Fruit consumption also is highly correlated with increasing income, as indicatedby an expenditure elasticity of 1.58. Survey data indicate that per capita consumption offruits by urban residents in the highest income decile is more than twice as high asconsumers in the lowest income decile. These trends will likely continue, consistent withcontinued income growth.
Regulations and Policies
6.5 The phytosanitary regulatory framework for production and marketing of fruitsand vegetables is strong but enforcement remains weak. Given the potential risks fromtoxic residues and unsanitary fruits and vegetables, compliance with health andphytosanitary regulations is particularly important. Furthermore, strict adherence isnecessary to develop a successful export trade. Better regulatory enforcement is needed,along with increased farmer training on phytosanitary risks and regulations. Despite theimportance of grading and the implicit grading occurring at all stages of marketing,

- 31 -
grades and standards remain ad hoc except for the institutionalized Green Foodstrademark, which incorporates a defined set of quality standards but remains unimportantin terms of total consumer purchases of fruits and vegetables. The general lack of definedgrades represents a loss to farmers who are unable to obtain premium prices for higher-quality produce, a loss to consumers as neither lower-priced, lower-quality nor high-priced, high-quality produce is identified and defined for low-income and affluentconsumers, respectively. Also, the absence of standard grades makes the marketingprocess more costly as many wholesalers feel they cannot rely on samples and visuallyinspect entire lots of produce. The introduction of grades would have other benefitsincluding improved market information (see para. 6.10). It is recommended that fruitand vegetable grades be developed and introduced to improve narketing efficiency. Anintensive and large-scale training program for farm leaders, market personnel, andinspection/enforcement staff would be necessary.
6.6 The tax and fee structure applying to fruit and vegetable marketing is quitemodest and considerably less than that applied to the marketing of manufactured productsand does not unnecessarily burden market participants. Market fees vary by site andlocation of the wholesale market, but competition between wholesale markets appears tolimit the fees to justifiable cost (plus profit) levels-although the more efficient marketsgenerate impressive profits. Of more concern to marketing agencies is the levying ofunofficial fees. This applies particularly to levies imposed by jurisdictions on vehicletransit, which is alleged to be as high as 15 percent of the value of products transportedacross the province.
6.7 The National Vegetable Basket project, introduced in 1988, was responsible fordeveloping three national vegetable bases. However, most fruit and vegetable productionand marketing policy has been delegated to provinces/municipalities. Municipalgovernments have introduced their own vegetable basket projects to secure adequatesupplies for residents. This has been implemented by subsidizing suburban vegetablebases and through contracting with vegetable surplus areas in other locales. Theseprojects have been quite successful in generating additional supplies and the productionsubsidies have reduced urban consumer expenditure for vegetables. Also, the subsidizedinfrastructure (roads, irrigation, etc.) and inputs (fertilizer and plastic for greenhouses/tunnels), and cash subsidies provided important production incentives and contributed tomultiple cropping and increased farmer income. It is not clear, however, that thesesubsidies have assisted in reducing the urban-rural income gap; in fact, the gap may havewidened.
6.8 Given the recent success in increasing urban vegetable supplies, the future focusshould be directed more toward improving farmer incomes. In this regard, the goals ofthe next phase of the vegetable basket project should be to address improvedmarketing efficiency, particularly to: (a) expand farmer marketing organizations;(b) strengthen market information networks; and (c) improve post-harvest handling.

- 32 -
6.9 The guidance price policy was introduced to protect urban consumers from "pricegouging" by retailers during a period of rapidly rising prices. However, given the numberof retailers in urban centers, competition should effectively keep margins "reasonable."It is recommended that the policy be discontinued and other responsibilities beallocated to enforcement staff Similarly, the objective of the municipal cabbage policywas to ensure an adequate supply of low-cost vegetables to urban consumers, particularlylow-income consumers. But it would be more efficient, and it is recommended todiscontinue municipal intervention and let market forces determine cabbage supplies.If vulnerable groups are perceived to consume too few vegetables, the problem could bebetter addressed through targeted subsidies.
6.10 China has multiple market information networks for fruits and vegetables.Parallel networks are maintained by MOA and MIT, both of which undertake primaryinformation analyses and distribution. Although price and quantity information iscollected, only price data are analyzed and disseminated. Quantity information isvaluable and useful in analyzing price changes and should be a regular element of themarket information disseminated. Also, as grades and standards are developed, the priceand quantity information should be reported for the individual grades of the variousvegetable varieties. It is recommended that market information responsibility beconcentrated in one ministry, that quantity statistics be included in the informationdisseminated, and that market information be expanded to include estimates ofplantings and production forecasts.
Market Structure and Performance
6.11 Growth in free-market sales of food items has been remarkably rapid in recentyears. The volume of fruit and vegetables sold via these markets has grown at an 18percent annual rate since 1988. The market structure between producers and consumersconsists primarily of highly competitive wholesalers and retailers. Other marketingentities, such as institutional vendors, processors, and exporters exist but they servemarket niches rather than offer competition to the wholesale-retail system. Withoutcompetitive systems it is not possible to conclude that the prevailing wholesale-retailstructure is efficient, although it is internally competitive. The Government shouldneither promote nor prohibit the development of particular marketing systems.Competitive entrepreneurs will identify and implement potentially more efficientmarketing systems, but a priori successes and failures cannot be determined. Thus, it isimportant that neither the state nor local governments enact regulations that wouldinhibit the development of alternative and more efficient marketing systems, other thaneconomywide regulations applying to international investments.
6.12 One element missing in the current structure is organized farmer marketing.Smallholder production has proven to be efficient but similar atomistic farm-levelmarketing is not efficient. Organized cooperative marketing organizations, which couldbe village based, would reduce the price risks of individual farmers, provide them withmore market power, and should improve farmer incomes. Also, joint marketing through

- 33 -
farmer marketing organizations would facilitate standardized grading and packagingthrough commonly owned packing sheds. It is recommended that Government assist indeveloping, but not control, such marketing organizations.
6.13 Reducing the number of times that fruit and vegetables are handled between farmand consumer will reduce post-harvest losses. Each additional handling createsadditional loss and/or quality deterioration. Efficient on-farm cleaning, grading andsorting would reduce regrading and repacking and could be achieved with modestinvestment in simple packing sheds, equipped with work counters and running water forwashing vegetables. These could be owned and operated by local farmer marketingorganizations. Vegetables are often left exposed to summer heat for several hours prior tocollection and shipment to the market. During the warm season, most vegetables wouldbenefit from precooling prior to shipment. The most efficient and simplest precoolingprocess is cold water immersion, provided clean water is available. Vegetable watering isprohibited in wholesale markets to prevent weight tampering; however, precoolingvegetables in cold water baths should be permitted and practiced on-farm to preservevegetable quality.
6.14 Through farmer and trader education, the use of nonrigid packing containers(baskets and bags) and the practice of multiple basket stacking should be discouraged.While phasing out the use of baskets, trucks could be fitted with racks to insert boardsbetween basket layers to reduce bruising and compression losses. Rigid crates for fieldharvesting and transport to the packing sheds should be encouraged and uniformcarton sizes with appropriate load factor specifications for marketing should beintroduced. This could best be accomplished through farmer marketing cooperatives, ifthey existed. But without some form of intervention or demonstration, adoption ratesmay be slow.
6.15 While improvements could be made in the current structure, improvements in thepost-harvest handling system would have a greater efficiency impact. The industry sorelyneeds a post-harvest research institute to systematically develop information on marketlosses and adapt loss-reducing technologies/practices to local conditions. This includesthe spectrum of marketing activities starting with on-farm, precooling of vegetables.Other technologies and practices include on-farm methods and materials for handling andtransporting vegetables, on-farm cleaning and grading, alternative packing/packagingmaterials, mechanical handling equipment, alternative transport modes includingrefrigerated transport, and temporary use of cold storage at urban markets (it appears thatvegetables are of insufficient value to absorb cold storage costs; however, this issueshould be systematically examined by a research institute). It is strongly recommendedthat a post-harvest research institute be established under MOA auspices. Althoughoutside the scope of this study, improving the transportation infrastructure would make animportant contribution toward improving vegetable marketing efficiency.
6.16 Although each major city has its own production bases and wholesale markets,they are well integrated into a national market. Price differentials between markets are

- 34-
very much a function of the distance between them, but price changes are readilytransmitted between geographically separated markets. The high price marginsbetween transfer points within the marketing chain reflect quantity and qualitylosses and technical inefficiencies, not the lack of competition.
6.17 Price margins between major transfer points are high but are justified basedupon apparent costs. Physical losses are a major contributor to marketing cost andreducing those losses is the single most important marketing issue. Research leading toimproved post-harvest handling and the introduction of grades and standards wouldgreatly reduce those losses. Reducing estimated marketing losses from 30 to 20 percentwould provide an additional 19 million tons of vegetables (farmgate value of Y 17.5billion-I 994) for sale and consumption.
6.18 Municipal wholesale markets are well integrated into a national market, withspatial price differentials largely determined by transport and other marketing costs.Price changes in one market center are rapidly transmitted to other centers, but the degreeof transmissivity declines as the distance between market centers increases. Improvedtransport infrastructure and facilities would reduce price differentials, which are currentlyas great as 100 percent (Kunming and Shanghai).

- 35- ANNEX 1
ANNEX 1: RULES AND REGULATIONS GOVERNING THEUSE OF CHEMICALS ON FRUIT AND VEGETABLES
I. In order to safely use chemicals in fruit and vegetable production, and ensure thepeople's health, the Chinese government has set a series of standards/rules andregulations governing the use of such chemicals. The details follow.
2. These rules and regulations were formulated by the Environment ProtectionDepartment of the Ministry of Rural and Urban Construction in 1984, and theAgricultural Department of the Ministry of Agriculture in 1987, which are still effective.
3. The General principles are:
(a) Chemicals are not allowed to be widely used unless they have beenregistered and tested for at least five years and a report on chemicalresidues submitted.
(b) Use of highly toxic chemicals are strictly forbidden, especially invegetable production.
(c) The safe utilization period is set for each and every chemical.
4. The Identification Institute for Chemicals of the Chinese Academy of AgriculturalSciences is responsible for registration of the chemicals.
5. The Extension Center of the Ministry of Agriculture is responsible for trainingand guiding the farmers in chemical application as per the following:
(a) training of the chemical salesmen in rural areas to enable them to giveapplication advice to the farmers who buy the chemicals.
(b) the salesmen assist farmers in field application of purchased chemicals.
6. Contracting chemical application to specialized plant protection companies is nowunder consideration. This would make specialized teams responsible for purchasing andtimely application of chemicals.
7. The criteria for toxicity classification of the Ministry of Agriculture is as follows:

- 36 - ANNEX 1
High Medium Low
Oral toxicity (rats) Ld5O (mg/kg) <50 50-500 >500Oral toxicity (rats) Ld5O (mg/kg) (24 hours) <200 200-1,000 >1,000Respiratory toxicity (rats) Lc50(mg/M3) (1 hour) <2 2-10 >10Common Carp TLM (48 hours) <1 1-10 >10
8. However, the lack of good management, inadequate hygiene supervision of thevegetable market, and due to readjustment of the extension system, highly toxicchemicals and chemicals that leave high residues are still used in some vegetable growingareas, resulting in periodic chemical poisoning.
9. To reinforce the rules and regulations applying to agricultural chemicals, theMinistry of Agriculture, Ministry of Public Health, Ministry of Internal Trade, theNational Environment Protection Agency and the State Industry and CommerceAdministration issued a joint circular on November 15, 1995 reiterating the importance offollowing the set standards, as follows:
(a) All vegetable production bases must control pollution. This applies toexisting vegetable production bases that must relocate if existing pollutionis extremely serious. Before constructing new vegetable bases, pollutioncontrol must be considered.
(b) Strengthen chemical management in the vegetable producing area. Salesof highly toxic and high-residual chemicals in suburban vegetable bases isprohibited. Supervision and inspection of chemical manufacturingenterprises is required to be undertaken by County and Townshipdepartments of industry and commerce, agriculture, hygiene, environmentand trade.
(c) Use of highly-toxic and high-residual chemicals vegetables is prohibited.The agricultural departments of the counties and townships are required toorganize training for vegetable farmers and provide guidance in pestmanagement and control. Comprehensive and biological control areencouraged. Safe application periods for various chemicals have beenestablished.
(d) The marketing of polluted or toxic vegetables is prohibited. Food hygienesupervision agencies at various levels are required to strengthen theirsupervision of the markets. Violators of these rules and regulations will bepunished, and any contaminated vegetables will be burned.
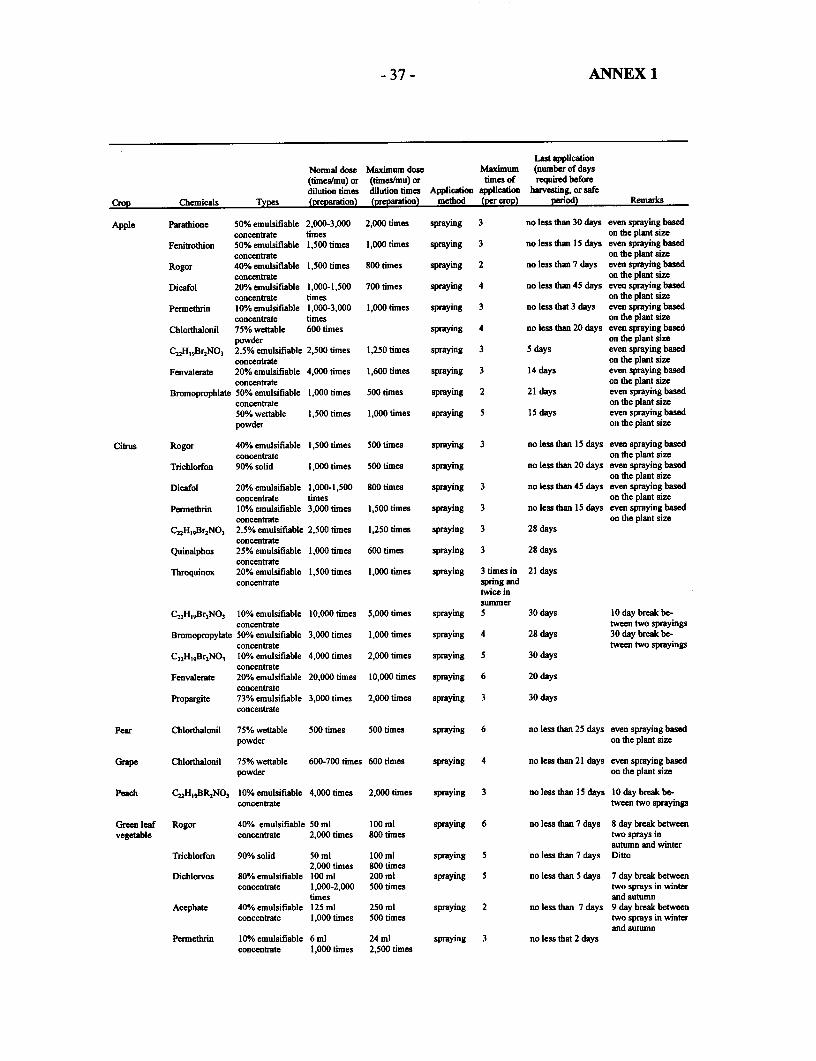
-37 - ANNEX 1
Last applicationNormal dose Maximum dose Maximum (number of days
(times/mu) or (times/mu) or times of required beforedilution times dilution times Application application harvesting, or safe
Crop Chemicals Types (preparation) (preparation) method (per crop) period) Remarks
Apple Parathione 50% emulsifiable 2,000-3,000 2,000 times spraying 3 no less than 30 days even spraying basedconcentrate times on the plant size
Fenitrothion 50% emulsifiable 1,500 times 1,000 times spraying 3 no less tan 15 days even spraying basedconcentrate on the plant size
Rogor 40% emulsifiable 1,500 times 800 times spraying 2 no less than 7 days even spraying basedconcentrate on the plant size
Dicafol 20% emulsifiable 1,000-1,500 700 times spraying 4 no less than 45 days even spraying basedconcentrate times on the plant size
Permnethrin 10%o emulsifiable 1,000-3,000 1,000 times spraying 3 no less that 3 days even spraying basedconcentrate times on the plant size
Chlorthalonil 75% wettable 600 times spraying 4 no less than 20 days even spraying basedpowder on the plant size
C22H19Br2NO3 2.5% emulsifiable 2,500 times 1,250 times spraying 3 5 days even spraying basedconcentrate on the plant size
Fenvalerate 20% emulsifiable 4,000 times 1,600 times spraying 3 14 days even spraying basedconcentrate on the plant size
Bromoprophlate 50% emulsifiable 1,000 times 500 times spraying 2 21 days even spraying basedconcentrate on the plant size50% wettable 1,500 times 1,000 times spraying 5 15 days even spraying basedpowder on the plant size
Citrus Rogor 40% emulsifiable 1,500 times 500 times spraying 3 no less tan 15 days even spraying basedconcentrate on the plant size
Trichlorfon 90% solid 1,000 times 500 times spraying no less than 20 days even spraying basedon the plant size
Dicafol 20%/0 emulsifiable 1,000-1,500 800 times spraying 3 no less than 45 days even spraying basedconcentrate times on the plant size
Pernethrin 10% emulsifiable 3,000 times 1,500 times spraying 3 no less than 15 days even spraying basedconcentrate on the plant size
C22Hj9Br2NO3 2.5% emulsifiable 2,500 times 1,250 times spraying 3 28 daysconcentrate
Quinalphos 25% emulsifiable 1,000 times 600 times spraying 3 28 daysconcentrate
Throquinox 20% emulsifiable 1,500 times 1,000 times spraying 3 times in 21 daysconcentrate spring and
twice insummer
C22Hi9Br2NO3 10% emulsifiable 10,000 times 5,000 times spraying 5 30 days 10 day break be-concentrate tween two sprayings
Bromopropylate 50% emulsifiable 3,000 times 1,000 times spraying 4 28 days 30 day break be-concentrate tween two sprayings
C.nH,9Br2NO3 10% emulsifiable 4,000 times 2,000 times spraying 5 30 daysconcentrate
Fenvalerate 20% emulsifiable 20,000 times 10,000 times spraying 6 20 daysconcentrate
Propargite 73% emulsifiable 3,000 times 2,000 times spraying 3 30 daysconcentrate
Pear Chlorthalonil 75% wettable 500 times 500 times spraying 6 no less than 25 days even spraying basedpowder on the plant size
Grape Chlorthalonil 75% wettable 600-700 times 600 times spraying 4 no less than 21 days even spraying basedpowder on the plant size
Peach C22H19BR2NO3 10% emulsifiable 4,000 times 2,000 times spraying 3 no less than 15 days 10 day break be-concentrate tween two sprayings
Green leaf Rogor 40% emulsifiable 50 ml 100 ml spraying 6 no less than 7 days 8 day break betweenvegetable concentrate 2,000 times 800 times two sprays in
autumn and winterTrichlorfon 90% solid 50 ml 100 ml spraying 5 no less than 7 days Ditto
2,000 times 800 timesDichlorvos 80% emulsifiable 100 ml 200 ml spraying 5 no less than 5 days 7 day break between
concentrate 1,000-2,000 500 times two sprays in wintertimes and autumn
Acephate 40% emulsifiable 125 ml 250 ml spraying 2 no less than 7 days 9 day break betweenconcentrate 1,000 times 500 times two sprays in winter
and autumnPermetbrin IO
0/* emulsifiable 6 ml 24 ml spraying 3 no less that 2 days
concentrate 1,000 times 2,500 times
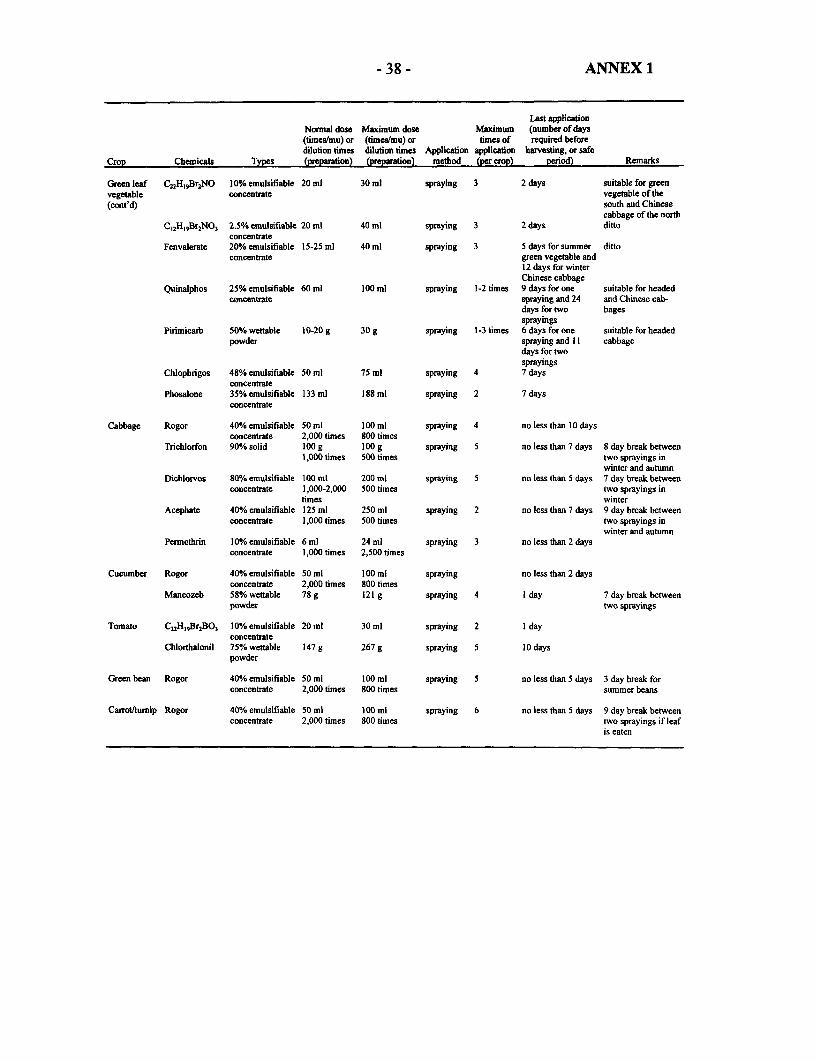
- 38 - ANNEX 1
Last applicationNormal dose Maximum dose Maximum (number of days(timestmu) or (times/mu) or times of required beforedilution times dilution times Application application harvesting, or safe
Crop Chemicals Types (preparation) (preparation) method (per crop) period) Remarks
Green leaf C22H9Br2NO 10% emulsifiable 20 ml 30 ml spraying 3 2 days suitable for greenvegetable concentrate vegetable of the(cont'd) south and Chinese
cabbage of the northC,2H,9Br2NO3 2.5% emulsifiable 20 ml 40 ml spraying 3 2 days ditto
concentrateFenvalerate 20% emulsifiable 15-25 ml 40 ml spraying 3 5 days for summer ditto
concentrate green vegetable and12 days for winterChinese cabbage
Quinalphos 25% emulsifiable 60 ml 100 ml spraying 1-2 times 9 days for one suitable for headedconcentrate spraying and 24 and Chinese cab-
days for two bagessprayings
Pirimicarb 50%/ wettable 10-20 g 30 g spraying 1-3 times 6 days for one suitable for headedpowder spraying and II cabbage
days for twosprayings
Chlophrigos 48% emulsifiable 50 ml 75 ml spraying 4 7 daysconcentrate
Phosalone 35% emulsifiable 133 ml 188 ml spraying 2 7 daysconcentrate
Cabbage Rogor 40% emulsifiable 50 ml 100 ml spraying 4 no less than 10 daysconcentrate 2,000 times S00 times
Tnchlorfon 90°/. solid 100 g 100 g spraying 5 no less than 7 days 8 day break between1,000 times 500 times two sprayings in
winter and autumnDichlorvos 80% emulsifiable 100 ml 200 ml spraying 5 no less than 5 days 7 day break between
concentrate 1,000-2,000 500 times two sprayings intimes winter
Acephate 40% emulsifiable 125 ml 250 ml spraying 2 no less than 7 days 9 day break betweenconcentrate 1,000 times 500 times two sprayings in
winter and autumnPermethrin 100% emulsifiable 6 ml 24 ml spraying 3 no less than 2 days
concentrate 1,000 times 2,500 times
Cucumber Rogor 40% emulsifiable 50 ml 100 ml spraying no less than 2 daysconcentrate 2,000 times 800 times
Mancozeb 58% wettable 78 g 121 g spraying 4 I day 7 day break betweenpowder two sprayings
Tomato C22H,,Br2BO3 10% emulsifiable 20 ml 30 ml spraying 2 1 dayconcentrate
Chlorthalonil 75% wettable 147g 267 g spraying 5 10 dayspowder
Green bean Rogor 40% emulsifiable 50 ml 100 ml spraying 5 no less than 5 days 3 day break forconcentrate 2,000 times 800 times summer beans
Carrot/turnip Rogor 40YO emulsifiable 50 ml 100 ml spraying 6 no less than 5 days 9 day break betweenconcentrate 2,000 times 800 times two sprayings if leaf
is eaten

- 39- STATISTICAL ANNEX
STATISTICAL ANNEX

- 41- STATISTICAL ANNEX
STATISTICAL ANNEX
List of Tables
Al .1 Gross Output Value of AgricultureAl.2 Vegetable and Melon Area, by Region and Province, 1984-94A1.3 Area in Fruit Orchards, by Region and Province, 1984-94A1.4 Apple Area by Region and Province, 1984-94A1.5 Citrus Area by Region and Province, 1984-94A1.6 Pear Area by Region and Province, 1984-94A1.7 Grape Area by Region and Province, 1984-94A1.8 Apple Production by Region and Province, 1984-94A1.9 Citrus Production by Region and Province, 1984-94A1.10 Pear Production by Region and Province, 1984-94Al. 11 Grape Production by Region and Province, 1984-94A1.12 Fruit and Vegetable Production on State FarmsA1.13 Fruit and Vegetable Exports, 1987-95
A2.1 Urban Purchases and Rural Consumption of Selected Food ItemsA2.2 Urban Vegetable Consumption by Income GroupA2.3 Urban Grain Consumption by Income GroupA2.4 Urban Grain Expenditures by Income GroupA2.5 Implicit Grain Price by Income GroupA2.6 Annual Per Capita Urban Expenditures Selected Items
A3.1 Growth of the Free Market System, 1978-94A3.2 Open Market Sales Volume, 1988-94A3.3 Retail Sales by Peasants to Non-Agricultural Residents
A4.1 Average Purchasing Prices and Price Indices of Selected Farm Products, 1978-92A4.2 Vegetable and Fruit Price IndicesA4.3 Price IndicesA4.4 Seasonal Price Indices, Selected Fruits and Vegetables, 1988/89-1994/95
A5.1 Price Ratios Between Wholesale Markets in Various CitiesA5.2 Wholesale Markets Covariance Coefficients

- 42 - STATISTICAL ANNEX
Table A1.la: GROSS OUTPUT VALUE OF AGRICULTURE(Million yuan, current prices)
All Crop Grain VegetablesYear Agriculture Agriculture Total MainLa & melons
1984 321,413 219,512 144,990 124,387 18,4141985 361,949 227,980 142,178 122,609 24,5131986 401,301 249,830 158,132 137,339 29,2761987 467,570 283,793 170,512 147,982 37,9181988 586,527 327,688 190,467 166,113 49,0981989 653,473 367,446 219,551 192,471 53,5511990 766,209 448,174 270,492 240,944 61,1191991 815,703 466,276 265,154 236,956 66,6521992 908,471 504,024 286,760 257,640 80,8861993 1,099,553 660,514 318,095 267,090 103,4751994 1,575,047 916,922 462,407 396,112 140,106
/a Variously recorded as Main Product and as Cereals.
Sources: SSB, Yearbook of Rural Statistics of China, various issues.
Table A1.lb: GROSS OUTPUT VALUE OF AGRICULTURE(Million yuan, constant 1990 prices)
All Crop Grain VegetablesYear Agriculture Agriculture Total MainLa & melons
1984 562,895 384,434 253,923 217,841 32,2491985 582,849 367,118 228,950 197,438 39,4731986 613,610 382,003 241,792 209,998 44,7651987 645,815 391,979 235,514 204,395 52,3731988 694,115 387,796 225,405 196,583 58,1041989 722,868 406,467 242,866 212,910 59,2381990 766,209 448,174 270,492 240,944 61,1191991 792,714 453,135 257,681 230,278 64,7741992 842,737 467,555 266,011 238,998 75,0331993 899,798 540,519 260,307 218,568 84,6771994 977,683 569,163 287,031 245,880 86,968
/a Variously recorded as Main Product and as Cereals.
Sources: SSB, Yearbook of Rural Statistics of China, various issues.
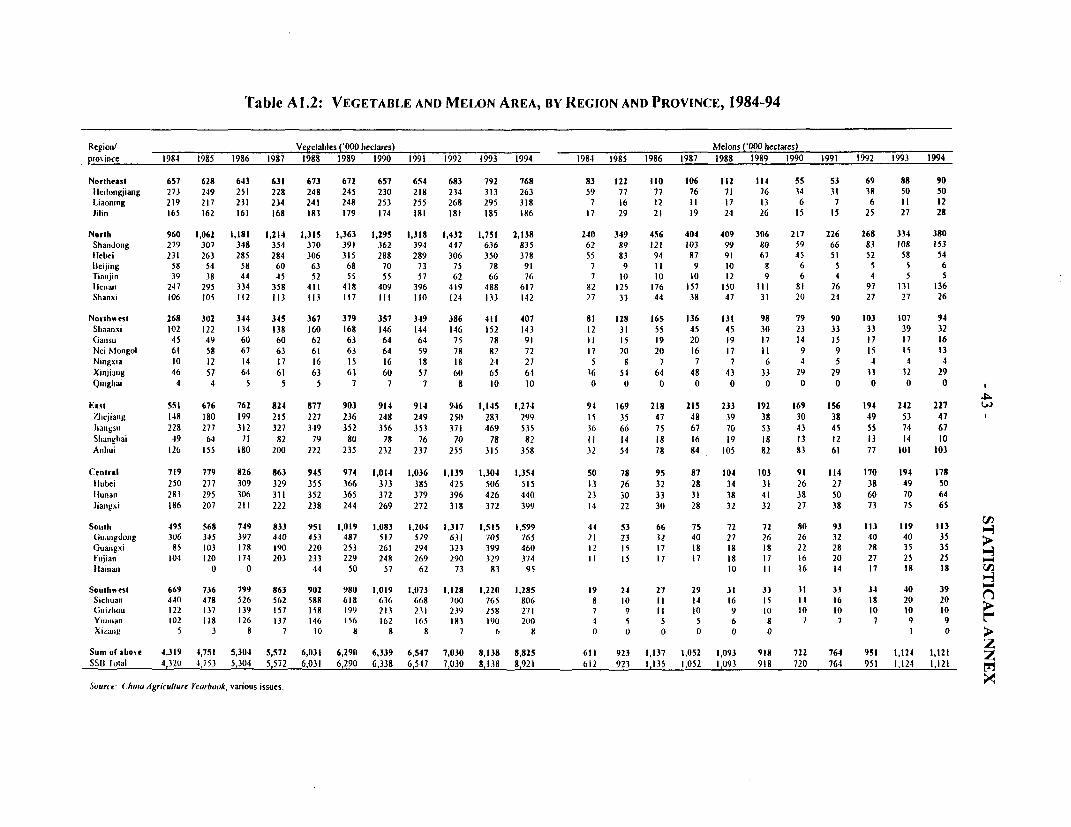
Table A 1.2: VEGETABLE AND MELON AREA, BY REGION AND PROVINCE, 1984-94
Regiont/ Vegelables ('000 hectares) Melons ('000 hectares)pro%ince 1984 1985 1986 1987 1988 1989 1990 1991 1992 1993 1994 1984 1985 1986 1987 1988 1989 1990 1991 1992 1993 1994
Northeast 657 628 643 631 673 672 657 654 683 792 768 83 122 110 106 112 114 55 53 69 88 90lleilongjiang 273 249 251 228 248 245 230 218 234 313 263 59 77 77 76 71 76 34 31 38 50 50Liaoning 219 217 231 234 241 248 253 255 268 295 318 7 16 12 11 17 13 6 7 6 11 12Jilin 165 162 161 168 183 179 174 181 181 185 186 17 29 21 19 24 26 15 15 25 27 2S
North 960 1,062 1,181 1,214 1,315 1,363 1,295 1,318 1,432 1,751 2,138 240 349 456 404 409 306 217 226 268 334 380Shandong 279 307 348 354 370 391 362 394 447 636 835 62 89 121 103 99 80 59 66 83 108 153lIebei 231 263 285 284 306 315 288 289 306 350 378 55 83 94 87 91 67 45 51 52 58 54Beijing 58 54 58 60 63 68 70 73 75 78 91 7 9 11 9 10 8 6 5 5 5 6Tiaijin 39 38 44 45 52 55 55 57 62 66 76 7 10 10 10 12 9 6 4 4 5 5lIleian 247 295 334 358 411 418 409 396 419 488 617 82 125 176 157 150 III 81 76 97 131 136Shanxi 106 105 112 113 113 117 III 110 124 133 142 27 33 44 38 47 31 20 24 27 27 26
NorthsAest 268 302 344 345 367 379 357 349 386 411 407 81 128 165 136 131 98 79 90 103 107 94Sliaanxi 102 122 134 138 160 168 146 144 146 152 143 12 31 55 45 45 30 23 33 33 39 32Ganisu 45 49 60 60 62 63 64 64 75 78 91 11 15 19 20 19 17 14 15 17 17 16Nei Nlongol 61 58 67 63 61 63 64 59 78 82 72 17 20 20 16 17 11 9 9 15 15 13Ningxia 10 12 14 17 16 15 16 18 18 24 27 5 8 7 7 7 6 4 5 4 4 4Xinjialug 46 57 64 61 63 63 60 57 60 65 61 36 54 64 48 43 33 29 29 33 32 29Qingliai 4 4 5 5 5 7 7 7 8 10 10 0 0 0 0 0 0 0 0 0 0 0 I
East 551 676 762 824 877 903 914 914 946 1,145 1,274 94 169 218 215 233 192 169 156 194 242 227 t-Zlicjiaiig 148 180 199 215 227 236 248 249 250 283 299 15 35 47 48 39 38 30 38 49 53 47Jianigsui 228 277 312 327 349 352 356 353 371 469 535 36 66 75 67 70 53 43 45 55 74 67Shanghai 49 64 71 82 79 80 78 76 70 78 82 11 14 18 16 19 18 13 12 13 14 10Anhui 126 155 180 200 222 235 232 237 255 315 358 32 54 78 84 105 82 83 61 77 101 103
Central 719 779 826 863 945 974 1,014 1,036 1,139 1,304 1,354 50 78 95 87 104 103 91 114 170 194 178llubei 250 277 309 329 355 366 373 385 425 506 515 13 26 32 28 34 31 26 27 38 49 50llunan 283 295 306 311 352 365 372 379 396 426 440 23 30 33 31 38 41 38 50 60 70 64Jiaiigxi 186 207 211 222 238 244 269 272 318 372 399 14 22 30 28 32 32 27 38 73 75 65
South 495 568 749 833 951 1,019 1,083 1,204 1,317 1,515 1,599 44 53 66 75 72 72 80 93 113 119 113Gi.rngdong 306 345 397 440 453 487 517 579 631 705 765 21 23 32 40 27 26 26 32 40 40 35Guaungxi 85 103 178 190 220 253 261 294 323 399 460 12 Is 17 18 18 18 22 28 28 35 35Fuijian 104 120 174 203 233 229 248 269 290 329 374 11 15 17 17 18 17 16 20 27 25 25llainaun 0 0 44 50 57 62 73 83 95 10 11 16 14 17 18 18 CQ
Souchvsest 669 736 799 863 902 980 1,019 1,073 1,128 1,220 1,285 19 24 27 29 31 33 31 33 34 40 39 b^Sicliuan 440 478 526 562 588 618 636 668 700 765 806 8 10 11 14 16 15 14 16 18 20 20(,millou 122 137 139 157 158 199 213 211 239 258 271 7 9 II 10 9 10 10 10 10 10 10Yunnall 102 118 126 137 146 156 162 165 183 19( 200 1 5 5 5 6 8 7 7 7 9 9Xizaoug 5 3 8 7 10 8 8 8 7 6 8 0 0 0 0 0 0 1 0 >
Sum o( abo%e 4,319 4,751 5,304 5,572 6,031 6,290 6,339 6,547 7,030 8,138 8,825 611 923 1,137 1,052 1,093 918 722 764 951 1,124 1,121ZSSU lotal 4,320 4,753 5,304 5,572 6,031 6,290 6,338 6,547 7,030 8,138 8,921 612 923 1,135 1,052 1,093 918 720 764 951 1,124 1,121 ZSourie: ChinaAgricuiiure teareboo, various issues.

-44- STATISTICAL ANNEX
Table A1.3: AREA IN FRUIT ORCHARDS, BY REGION AND PROVINCE, CHINA, 1984-94('000 hectares)
Region/province 1984 1985 1986 1987 1988 1989 1990 1991 1992 1993 1994
Northeast 320 325 380 338 473 466 464 474 487 517 560Heilongjiang 19 15 17 19 25 14 19 23 29 22 45Liaoning 281 289 340 289 404 398 390 391 391 420 435Jilin 20 21 24 30 44 54 55 61 68 75 80
North 778 1,040 1,428 1,705 1,887 2,067 1,764 1,700 1,918 2,122 2,531Shandong 288 373 529 634 679 669 641 614 761 788 853Hebei 256 352 470 567 650 831 627 601 636 731 942Beijing 24 28 31 37 43 46 48 50 51 52 59Tianjin 14 17 22 28 31 31 29 29 28 29 32Henan 114 159 238 276 297 302 234 215 228 279 372Shanxi 82 111 137 164 187 188 185 192 214 243 273
Northwest 231 271 371 491 591 632 669 701 770 927 1,114Shaanxi 99 110 165 219 262 289 305 334 380 478 607Gansu 35 46 69 109 144 154 165 170 186 217 247Nei Monggol 24 24 23 26 30 30 36 39 43 60 66Ningxia 7 8 12 15 20 23 27 28 30 32 36Xinjiang 63 80 98 115 129 130 130 125 125 134 152Qinghai 3 3 5 7 6 6 6 6 6 6 6
East 167 205 294 378 434 423 414 409 407 430 521Zhejiang 99 124 166 202 219 223 222 226 216 210 230Jiangsu 38 47 70 101 124 111 105 101 112 128 173Shanghai 4 5 8 9 10 9 9 9 10 13 14Anhui 26 29 50 66 81 80 78 73 69 79 104
Central 188 205 246 300 339 372 397 449 454 552 659Hubei 58 66 79 94 102 112 118 129 124 165 194Hunan 88 96 114 144 162 178 191 213 223 250 271Jiangxi 42 43 53 63 75 82 88 107 107 137 194
South 363 488 709 931 1,047 1,091 1,134 1,235 1,411 1,471 1,410Guangdong 192 282 440 587 619 639 645 658 699 682 485Guangxi 56 65 86 116 133 133 154 188 259 281 355Fujian 115 141 184 228 251 278 298 355 416 459 505Hainan 44 41 37 34 37 49 65
Southwest 172 202 243 264 297 318 339 349 371 416 457Sichuan 127 148 175 193 214 226 238 241 247 271 287Guizhou 7 8 15 14 18 21 23 26 30 36 41Yunnan 37 45 53 57 63 70 77 82 93 109 128Xizang I I I 1 2 1 1 1 1 1 2
Sum of above 2,219 2,736 3,672 4,408 5,068 5,369 5,181 5,318 5,818 6,435 7,251SSB total 2,219 2,736 3,672 4,508 5,066 5,372 5,179 5,318 5,818 6,435 7,264
Sources: China Agriculture Yearbook, various issues.
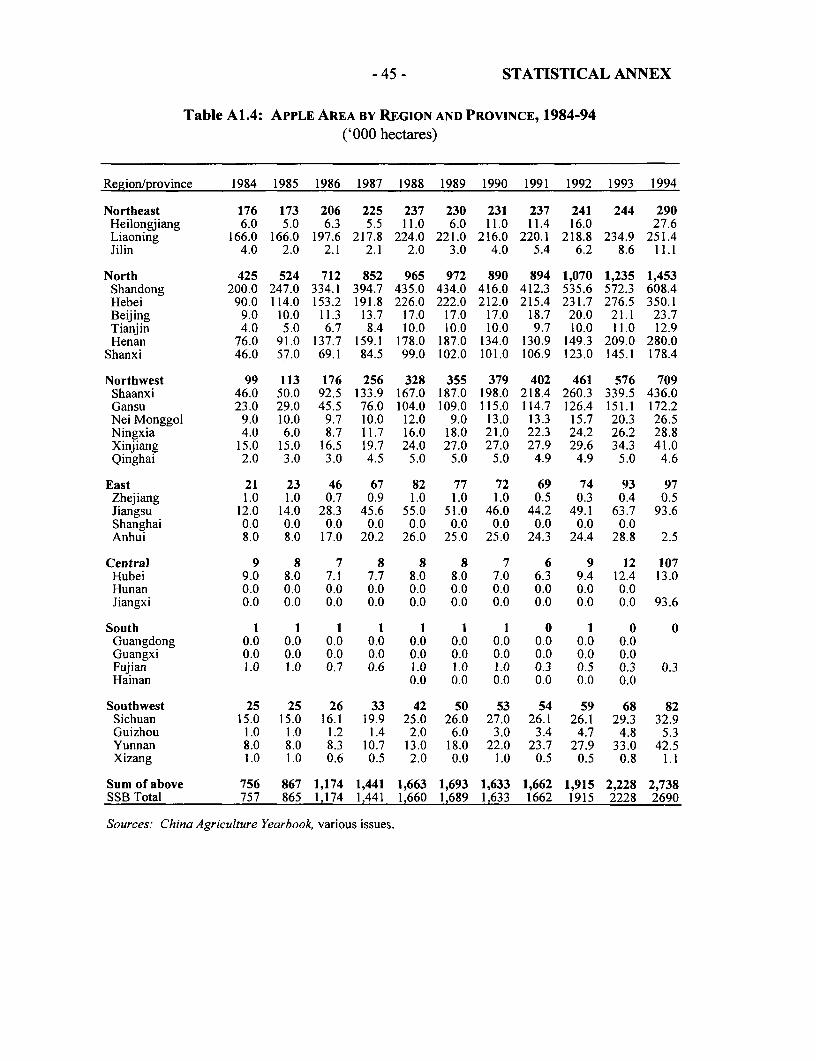
-45 - STATISTICAL ANNEX
Table A1.4: APPLE AREA BY REGION AND PROVINCE, 1984-94('000 hectares)
Region/province 1984 1985 1986 1987 1988 1989 1990 1991 1992 1993 1994
Northeast 176 173 206 225 237 230 231 237 241 244 290Heilongjiang 6.0 5.0 6.3 5.5 11.0 6.0 11.0 11.4 16.0 27.6Liaoning 166.0 166.0 197.6 217.8 224.0 221.0 216.0 220.1 218.8 234.9 251.4Jilin 4.0 2.0 2.1 2.1 2.0 3.0 4.0 5.4 6.2 8.6 11.1
North 425 524 712 852 965 972 890 894 1,070 1,235 1,453Shandong 200.0 247.0 334.1 394.7 435.0 434.0 416.0 412.3 535.6 572.3 608.4Hebei 90.0 114.0 153.2 191.8 226.0 222.0 212.0 215.4 231.7 276.5 350.1Beijing 9.0 10.0 11.3 13.7 17.0 17.0 17.0 18.7 20.0 21.1 23.7Tianjin 4.0 5.0 6.7 8.4 10.0 10.0 10.0 9.7 10.0 11.0 12.9Henan 76.0 91.0 137.7 159.1 178.0 187.0 134.0 130.9 149.3 209.0 280.0
Shanxi 46.0 57.0 69.1 84.5 99.0 102.0 101.0 106.9 123.0 145.1 178.4
Northwest 99 113 176 256 328 355 379 402 461 576 709Shaanxi 46.0 50.0 92.5 133.9 167.0 187.0 198.0 218.4 260.3 339.5 436.0Gansu 23.0 29.0 45.5 76.0 104.0 109.0 115.0 114.7 126.4 151.1 172.2Nei Monggol 9.0 10.0 9.7 10.0 12.0 9.0 13.0 13.3 15.7 20.3 26.5Ningxia 4.0 6.0 8.7 11.7 16.0 18.0 21.0 22.3 24.2 26.2 28.8Xinjiang 15.0 15.0 16.5 19.7 24.0 27.0 27.0 27.9 29.6 34.3 41.0Qinghai 2.0 3.0 3.0 4.5 5.0 5.0 5.0 4.9 4.9 5.0 4.6
East 21 23 46 67 82 77 72 69 74 93 97Zhejiang 1.0 1.0 0.7 0.9 1.0 1.0 1.0 0.5 0.3 0.4 0.5Jiangsu 12.0 14.0 28.3 45.6 55.0 51.0 46.0 44.2 49.1 63.7 93.6Shanghai 0.0 0.0 0.0 0.0 0.0 0.0 0.0 0.0 0.0 0.0Anhui 8.0 8.0 17.0 20.2 26.0 25.0 25.0 24.3 24.4 28.8 2.5
Central 9 8 7 8 8 8 7 6 9 12 107Hubei 9.0 8.0 7.1 7.7 8.0 8.0 7.0 6.3 9.4 12.4 13.0Hunan 0.0 0.0 0.0 0.0 0.0 0.0 0.0 0.0 0.0 0.0Jiangxi 0.0 0.0 0.0 0.0 0.0 0.0 0.0 0.0 0.0 0.0 93.6
South 1 1 1 1 1 1 1 0 1 0 0Guangdong 0.0 0.0 0.0 0.0 0.0 0.0 0.0 0.0 0.0 0.0Guangxi 0.0 0.0 0.0 0.0 0.0 0.0 0.0 0.0 0.0 0.0Fujian 1.0 1.0 0.7 0.6 1.0 1.0 1.0 0.3 0.5 0.3 0.3Hainan 0.0 0.0 0.0 0.0 0.0 0.0
Southwest 25 25 26 33 42 50 53 54 59 68 82Sichuan 15.0 15.0 16.1 19.9 25.0 26.0 27.0 26.1 26.1 29.3 32.9Guizhou 1.0 1.0 1.2 1.4 2.0 6.0 3.0 3.4 4.7 4.8 5.3Yunnan 8.0 8.0 8.3 10.7 13.0 18.0 22.0 23.7 27.9 33.0 42.5Xizang 1.0 1.0 0.6 0.5 2.0 0.0 1.0 0.5 0.5 0.8 1.1
Sum of above 756 867 1,174 1,441 1,663 1,693 1,633 1,662 1,915 2,228 2,738SSB Total 757 865 1,174 1,441 1,660 1,689 1,633 1662 1915 2228 2690
Sources: China Agriculture Yearbook, various issues.

-46- STATISTICAL ANNEX
Table A1.5: CITRUS AREA BY REGION AND PROVINCE, 1984-94('000 hectares)
Region/province 1984 1985 1986 1987 1988 1989 1990 1991 1992 1993 1994
Northeast 0 0 0 0 0 0 0 0 0 0 0Heilongjiang 0 0 0 0 0 0 0 0 0 0 0Liaoning 0 0 0 0 0 0 0 0 0 0 0Jilin 0 0 0 0 0 0 0 0 0 0 0
North I 1 2 2 3 5 6 6 4 4 0Shandong 0 0 0 0 0 0 0 0 0 0 0Hebei 0 0 0 0 0 0 0 0 0 0 0Beijing 0 0 0 0 0 0 0 0 0 0 0Tianjin 0 0 0 0 0 0 0 0 0 0 0Henan I 1 2 2 3 5 6 6 4 4Shanxi 0 0 0 0 0 0 0 0 0 0
Northwest 5 7 12 13 15 15 15 15 11 11 10Shaanxi 5 7 11 12 14 14 14 14 11 10 9Gansu 0 0 2 1 1 1 1 1 1 1 1Nei Monggol 0 0 0 0 0 0 0 0 0 0Ningxia 0 0 0 0 0 0 0 0 0 0 0Xinjiang 0 0 0 0 0 0 0 0 0 0 0Qinghai 0 0 0 0 0 0 0 0 0 0 0
East 64 82 102 124 127 130 133 141 137 133 161Zhejiang 58 74 97 112 116 119 122 130 126 122 132Jiangsu 2 4 0 4 4 3 4 4 5 4 4Shanghai I 1 2 3 3 3 3 3 4 4 5Anhui 3 3 3 4 4 5 4 4 3 3 21
Central 138 157 193 243 278 307 327 364 321 377 422Hubei 32 41 53 66 72 79 86 92 81 95 97Hunan 74 81 98 126 143 159 169 188 187 203 213Jiangxi 32 35 42 52 63 69 72 85 54 80 112
South 94 138 209 321 360 383 388 400 412 382 326Guangdong 32 61 96 177 192 198 193 184 173 147 85Guangxi 29 33 45 56 65 69 72 75 86 76 78Fujian 33 44 69 88 100 113 120 138 151 157 160Hainan 3 3 3 3 3 3 3
Southwest 100 122 150 161 173 185 193 197 201 219 220Sichuan 94 114 136 146 154 163 169 172 176 186 188Guizhou 3 4 9 9 11 13 14 15 15 20 19Yunnan 3 4 5 6 8 9 10 11 11 13 13Xizang 0 0 0 0 0 0 0 0 0
Sum of above 402 507 668 864 956 1,025 1,062 1,123 1,087 1,126 1,139SSB Total 401 507 672 864 955 1,026 1,061 1,123 1,087 1,126 1,139
Sources: China Agriculture Yearbook, various issues.

-47 - STATISTICAL ANNEX
Table A1.6: PEAR AREA BY REGION AND PROVINCE, 1984-94('000 hectares)
Region/province 1984 1985 1986 1987 1988 1989 1990 1991 1992 1993 1994
Northeast 63.0 64.0 65.7 69.0 76.0 79.0 81.0 82.9 85.1 97.6 109.3Heilongjiang 0.3 0.7 1.0 1.0 1.0 1.3 1.5 2.7 5.0Liaoning 58.0 59.0 59.7 60.6 63.0 62.0 62.0 61.5 62.5 69.9 76.1Jilin 5.0 5.0 5.7 7.7 12.0 16.0 18.0 20.1 21.1 25.0 28.3
North 132.0 160.0 200.0 223.3 241.0 226.0 211.0 209.2 225.3 245.1 274.4Shandong 29.0 31.0 34.1 36.7 40.0 40.0 38.0 34.6 45.1 43.0 16.0Hebei 67.0 89.0 122.5 138.7 151.0 136.0 127.0 129.8 134.7 159.0 202.7Beijing 6.0 7.0 6.9 7.3 7.0 7.0 7.0 7.7 7.8 7.5 8.2Tianjin 2.0 2.0 2.3 2.8 3.0 3.0 3.0 2.7 2.6 2.6 2.9Henan 11.0 11.0 11.9 12.9 13.0 13.0 10.0 8.5 8.1 5.0 16.0Shanxi 17.0 20.0 22.3 24.9 27.0 27.0 26.0 25.9 27.0 28.0 28.7
Northwest 22.0 27.0 33.9 44.0 55.0 59.0 65.0 71.5 81.1 99.2 129.1Shaanxi 5.0 5.0 7.0 9.9 12.0 12.0 13.0 15.5 18.9 27.3 41.0Gansu 6.0 9.0 12.6 16.3 21.0 22.0 25.0 27.9 31.2 36.0 41.4Nei Monggol 4.0 4.0 4.1 5.1 7.0 9.0 11.0 12.4 14.2 16.3 22.5Ningxia 1.0 1.0 0.8 0.9 1.0 1.0 1.0 1.1 1.1 1.4 1.7Xinjiang 5.0 7.0 8.7 10.8 13.0 14.0 14.0 13.7 14.7 17.2 21.5Qinghai 1.0 1.0 0.7 1.0 1.0 1.0 1.0 0.9 1.0 1.0 1.0
East 31.0 31.0 35.9 40.3 45.0 43.0 41.0 39.5 40.4 43.4 46.0Zhejiang 7.0 7.0 7.1 7.6 8.0 8.0 7.0 7.1 7.0 7.3 8.0Jiangsu 13.0 13.0 13.6 14.9 17.0 16.0 15.0 14.2 15.6 17.1 33.6Shanghai 1.0 1.0 1.2 1.1 1.0 1.0 1.0 0.8 0.9 1.3 1.2Anhui 10.0 10.0 14.0 16.7 19.0 18.0 18.0 17.4 16.9 17.7 3.2
Central 25.0 25.0 22.2 23.5 24.0 24.0 25.0 24.5 29.1 41.6 54.9Hubei 13.0 13.0 11.6 13.2 14.0 14.0 14.0 13.3 15.5 22.1 29.9Hunan 7.0 7.0 6.5 6.2 6.0 6.0 6.0 6.5 7.3 10.3 11.5Jiangxi 5.0 5.0 4.1 4.1 4.0 4.0 5.0 4.7 6.3 9.2 13.6
South 6.0 10.0 13.1 14.6 15.0 15.0 16.0 18.4 21.1 24.4 24.4Guangdong 0.0 5.0 7.1 7.9 8.0 8.0 8.0 7.9 7.6 6.8 3.0Guangxi 2.0 1.0 1.7 2.0 2.0 2.0 2.0 3.1 3.5 4.1 5.4Fujian 4.0 4.0 4.3 4.7 5.0 5.0 6.0 7.4 10.0 13.5 16.0Hainan
Southwest 23.0 22.0 23.6 26.6 31.0 34.0 42.0 36.8 39.1 45.6 53.2Sichuan 10.0 10.0 10.5 12.4 16.0 18.0 25.0 19.0 19.9 21.7 25.6Guizhou 1.0 1.0 1.7 1.9 2.0 3.0 3.0 3.0 3.6 4.9 6.3Yunnan 12.0 11.0 11.4 12.2 13.0 13.0 14.0 14.5 15.6 19.0 21.3Xizang 0.1 0.0 0.0 0.0 0.3 0.0 0.0 0.0
Sum of above 302.0 339.0 394.4 441.3 487.0 480.0 481.0 482.8 521.2 596.9 691.4SSB Total 301.0 338.0 394.5 142.7 487.0 482.0 481.0 482.8 521.2 587.3 750.1
Source: China Agriculture Yearbook, various issues.
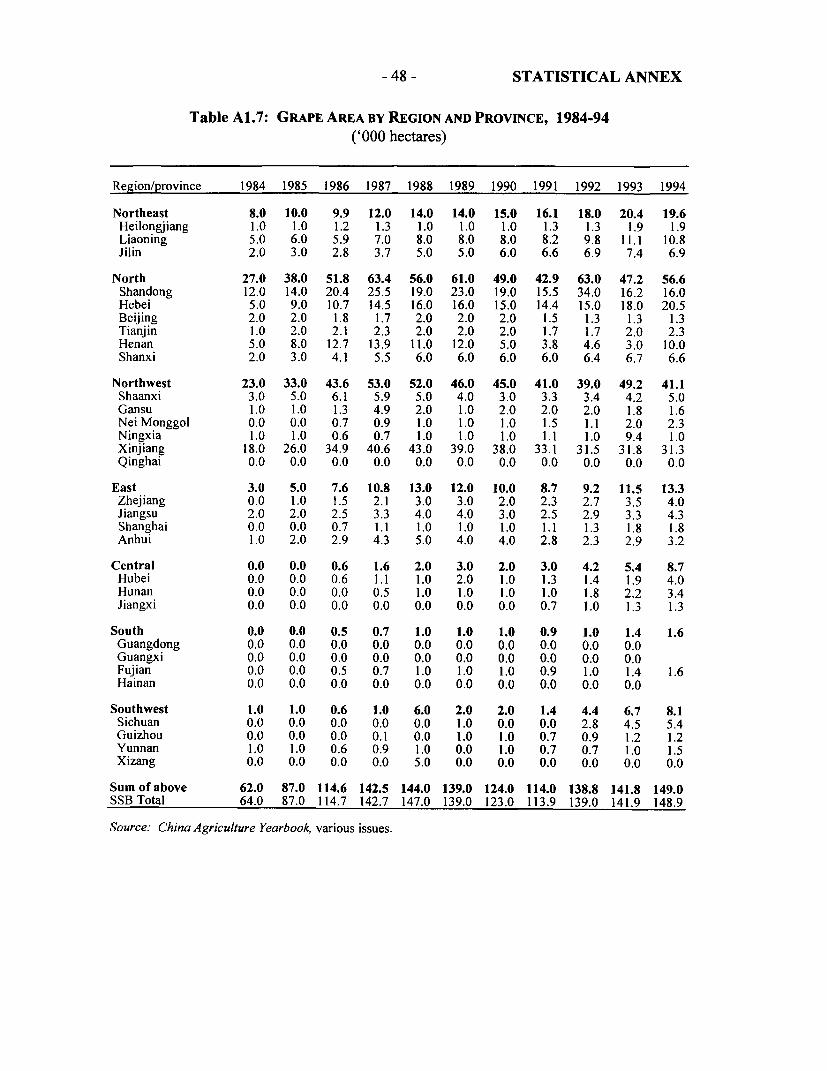
-48 - STATISTICAL ANNEX
Table A1.7: GRAPE AREA BY REGION AND PROVINCE, 1984-94('000 hectares)
Region/province 1984 1985 1986 1987 1988 1989 1990 1991 1992 1993 1994
Northeast 8.0 10.0 9.9 12.0 14.0 14.0 15.0 16.1 18.0 20.4 19.6Heilongjiang 1.0 1.0 1.2 1.3 1.0 1.0 1.0 1.3 1.3 1.9 1.9Liaoning 5.0 6.0 5.9 7.0 8.0 8.0 8.0 8.2 9.8 11.1 10.8Jilin 2.0 3.0 2.8 3.7 5.0 5.0 6.0 6.6 6.9 7.4 6.9
North 27.0 38.0 51.8 63.4 56.0 61.0 49.0 42.9 63.0 47.2 56.6Shandong 12.0 14.0 20.4 25.5 19.0 23.0 19.0 15.5 34.0 16.2 16.0Hebei 5.0 9.0 10.7 14.5 16.0 16.0 15.0 14.4 15.0 18.0 20.5Beijing 2.0 2.0 1.8 1.7 2.0 2.0 2.0 1.5 1.3 1.3 1.3Tianjin 1.0 2.0 2.1 2.3 2.0 2.0 2.0 1.7 1.7 2.0 2.3Henan 5.0 8.0 12.7 13.9 11.0 12.0 5.0 3.8 4.6 3.0 10.0Shanxi 2.0 3.0 4.1 5.5 6.0 6.0 6.0 6.0 6.4 6.7 6.6
Northwest 23.0 33.0 43.6 53.0 52.0 46.0 45.0 41.0 39.0 49.2 41.1Shaanxi 3.0 5.0 6.1 5.9 5.0 4.0 3.0 3.3 3.4 4.2 5.0Gansu 1.0 1.0 1.3 4.9 2.0 1.0 2.0 2.0 2.0 1.8 1.6Nei Monggol 0.0 0.0 0.7 0.9 1.0 1.0 1.0 1.5 1.1 2.0 2.3Ningxia 1.0 1.0 0.6 0.7 1.0 1.0 1.0 1.1 1.0 9.4 1.0Xinjiang 18.0 26.0 34.9 40.6 43.0 39.0 38.0 33.1 31.5 31.8 31.3Qinghai 0.0 0.0 0.0 0.0 0.0 0.0 0.0 0.0 0.0 0.0 0.0
East 3.0 5.0 7.6 10.8 13.0 12.0 10.0 8.7 9.2 11.5 13.3Zhejiang 0.0 1.0 1.5 2.1 3.0 3.0 2.0 2.3 2.7 3.5 4.0Jiangsu 2.0 2.0 2.5 3.3 4.0 4.0 3.0 2.5 2.9 3.3 4.3Shanghai 0.0 0.0 0.7 1.1 1.0 1.0 1.0 1.1 1.3 1.8 1.8Anhui 1.0 2.0 2.9 4.3 5.0 4.0 4.0 2.8 2.3 2.9 3.2
Central 0.0 0.0 0.6 1.6 2.0 3.0 2.0 3.0 4.2 5.4 8.7Hubei 0.0 0.0 0.6 1.1 1.0 2.0 1.0 1.3 1.4 1.9 4.0Hunan 0.0 0.0 0.0 0.5 1.0 1.0 1.0 1.0 1.8 2.2 3.4Jiangxi 0.0 0.0 0.0 0.0 0.0 0.0 0.0 0.7 1.0 1.3 1.3
South 0.0 0.0 0.5 0.7 1.0 1.0 1.0 0.9 1.0 1.4 1.6Guangdong 0.0 0.0 0.0 0.0 0.0 0.0 0.0 0.0 0.0 0.0Guangxi 0.0 0.0 0.0 0.0 0.0 0.0 0.0 0.0 0.0 0.0Fujian 0.0 0.0 0.5 0.7 1.0 1.0 1.0 0.9 1.0 1.4 1.6Hainan 0.0 0.0 0.0 0.0 0.0 0.0 0.0 0.0 0.0 0.0
Southwest 1.0 1.0 0.6 1.0 6.0 2.0 2.0 1.4 4.4 6.7 8.1Sichuan 0.0 0.0 0.0 0.0 0.0 1.0 0.0 0.0 2.8 4.5 5.4Guizhou 0.0 0.0 0.0 0.1 0.0 1.0 1.0 0.7 0.9 1.2 1.2Yunnan 1.0 1.0 0.6 0.9 1.0 0.0 1.0 0.7 0.7 1.0 1.5Xizang 0.0 0.0 0.0 0.0 5.0 0.0 0.0 0.0 0.0 0.0 0.0
Sum of above 62.0 87.0 114.6 142.5 144.0 139.0 124.0 114.0 138.8 141.8 149.0SSB Total 64.0 87.0 114.7 142.7 147.0 139.0 123.0 113.9 139.0 141.9 148.9
Source: China Agriculture Yearbook, various issues.

- 49 - STATISTICAL ANNEX
Table A1.8: APPLE PRODUCTION BY REGION AND PROVINCE, 1984-94('000 tons)
Region/province 1984 1985 1986 1987 1988 1989 1990 1991 1992 1993 1994
Northeast 708.0 569.1 559.8 653.6 644.1 680.2 793.5 604.8 1,027.3 1,264.8 1,156.4Heilongjiang 11.0 15.6 9.0 10.9 15.9 14.3 22.9 21.9 33.9 53.7 64.0Liaoning 684.0 547.8 546.9 637.5 621.5 655.7 759.2 570.5 979.4 1,196.1 1,069.1Jilin 13.0 5.8 4.0 5.2 6.6 10.2 11.4 12.3 14.0 15.0 23.2
North 1,765.0 2,446.2 2,146.2 2,839.1 2,828.8 2,893.5 2,509.5 2,816.7 3,869.6 5,450.8 6,993.0Shandong 1,167.0 1,453.9 1,269.2 1,569.8 1,603.1 1,560.2 1,431.8 1,626.5 2,353.3 3,322.7 4,063.3Hebei 249.0 467.7 391.1 578.6 522.7 543.7 467.6 531.0 619.0 773.2 1,002.2Beijing 44.0 50.7 49.3 63.1 65.3 69.7 74.1 74.6 91.4 106.6 125.6Tianjin 14.0 22.9 24.5 33.3 30.1 36.1 31.1 35.9 39.2 43.6 50.8Henan 176.0 277.5 276.4 438.3 416.0 513.5 358.5 380.5 530.6 871.0 1,191.0Shanxi 115.0 173.4 135.7 156.0 191.5 170.4 146.4 168.3 236.1 333.6 560.0
Northwest 294.0 422.8 420.6 506.1 590.8 644.3 736.4 864.5 1,313.3 1,926.6 2,461.4Shaanxi 94.0 140.9 151.6 212.5 237.6 277.4 349.3 505.2 843.0 1,310.0 1,785.6Gansu 79.0 98.5 110.3 127.9 154.3 158.2 174.5 184.6 226.1 315.2 365.9Nei Monggol 14.0 20.3 18.9 19.4 22.8 22.0 22.8 23.3 29.0 32.6 29.8Ningxia 23.0 26.6 26.2 33.3 31.4 41.8 34.8 17.2 43.4 62.9 60.1Xinjiang 73.0 125.0 102.0 100.3 128.7 131.9 140.5 119.7 154.6 187.2 202.5Qinghai 11.0 11.6 11.6 12.8 16.0 13.0 14.4 14.5 17.4 18.7 17.4
East 92.0 92.5 128.6 142.7 168.8 160.1 165.1 124.0 196.9 256.7 434.8Zhejiang 1.0 1.1 I.3 1.3 1.0 0.9 0.6 0.5 0.6 0.6 0.6Jiangsu 71.0 65.6 97.2 94.0 112.1 104.5 106.3 83.7 123.6 177.7 214.3Shanghai 0.0 0.0 0.0 0.0 0.0 0.0 0.0 0.0 0.0 0.0Anhui 20.0 25.8 30.2 47.3 55.7 54.8 58.2 39.8 72.6 78.4 219.9
Central 5.0 7.3 5.5 15.1 9.5 16.8 12.0 23.7 22.1 28.9 24.2Hubei 5.0 7.3 5.5 15.1 9.5 16.8 12.0 23.7 22.1 28.9 24.2Hunan 0.0 0.0 0.0 0.0 0.0 0.0 0.0 0.0 0.0 0.0 0.0Jiangxi 0.0 0.0 0.0 0.0 0.0 0.0 0.0 0.0 0.0 0.0 0.0
South 0.0 0.2 0.2 0.2 0.3 0.1 0.1 0.1 0.1 0.2 0.1Guangdong 0.0 0.0 0.0 0.0 0.0 0.0 0.0 0.0 0.0 0.0 0.0Guangxi 0.0 0.0 0.0 0.0 0.0 0.0 0.0 0.0 0.0 0.0 0.0Fujian 0.0 0.2 0.2 0.2 0.3 0.1 0.1 0.1 0.1 0.2 0.1Hainan 0.0 0.0 0.0 0.0 0.0 0.0 0.0
Southwest 77.0 75.9 75.8 107.1 102.2 103.8 102.6 106.6 126.5 141.2 148.0Sichuan 46.0 47.7 48.8 68.4 63.0 61.0 62.9 67.0 78.4 81.4 87.6Guizhou 1.0 5.7 2.1 4.5 3.7 4.5 4.3 4.4 3.3 3.8 3.8Yunnan 16.0 18.9 21.4 30.4 31.2 34.8 31.1 31.3 40.5 52.1 53.3Xizang 14.0 3.6 3.6 3.8 4.3 3.6 4.4 4.0 4.3 4.0 3.3
Sum of above 2,941.0 3,614.1 3,336.8 4,263.8 4,344.4 4,498.9 4,319.3 4,540.4 6,555.8 9,069.2 11,217.9SSB Total 2,941.0 3,614.1 3,336.8 4,263.8 4,344.4 4,498.9 4,319.3 4,540.4 6,555.8 9,069.5 11,127.9

- 50 - STATISTICAL ANNEX
Table A1.9: CITRUS PRODUCTION BY REGION AND PROVINCE, 1984-94('000 tons)
Region/province 1984 1985 1986 1987 1988 1989 1990 1991 1992 1993 1994
Northeast 0.0 0.0 0.0 0.0 0.0 0.0 0.0 0.0 0.0 0.0 0.0Heilongjiang 0.0 0.0 0.0 0.0 0.0 0.0 0.0 0.0 0.0 0.0 0.0Liaoning 0.0 0.0 0.0 0.0 0.0 0.0 0.0 0.0 0.0 0.0 0.0Jilin 0.0 0.0 0.0 0.0 0.0 0.0 0.0 0.0 0.0 0.0 0.0
North 0.0 0.2 0.0 0.5 0.6 1.4 1.3 1.9 0.3 0.9 1.7Shandong 0.0 0.0 0.0 0.0 0.0 0.0 0.0 0.0 0.0 0.0 0.0Hebei 0.0 0.0 0.0 0.0 0.0 0.0 0.0 0.0 0.0 0.0 0.0Beijing 0.0 0.0 0.0 0.0 0.0 0.0 0.0 0.0 0.0 0.0 0.0Tianjin 0.0 0.0 0.0 0.0 0.0 0.0 0.0 0.0 0.0 0.0 0.0Henan 0.0 0.2 0.5 0.6 1.4 1.3 1.9 0.3 0.9 1.7Shanxi 0.0 0.0 0.0 0.0 0.0 0.0 0.0 0.0 0.0 0.0 0.0
Northwest 3.0 5.6 5.4 8.2 6.4 12.5 9.7 17.3 3.6 14.9 8.4Shaanxi 3.0 5.2 5.1 7.6 5.9 11.6 8.9 15.9 2.0 13.2 7.1Gansu 0.0 0.4 0.3 0.6 0.4 0.9 0.9 1.4 1.6 1.7 1.2Nei Monggol 0.0 0.0 0.0 0.0 0.0 0.0 0.0 0.0 0.0 0.0 0.0Ningxia 0.0 0.0 0.0 0.0 0.0 0.0 0.0 0.0 0.0 0.0 0.0Xinjiang 0.0 0.0 0.0 0.0 0.0 0.0 0.0 0.0 0.0 0.0 0.0Qinghai 0.0 0.0 0.0 0.0 0.0 0.0 0.0 0.0 0.0 0.0 0.0
East 200.0 314.9 392.0 597.9 309.8 803.7 861.4 1,124.5 813.0 1,239.0 1,483.9Zhejiang 179.0 285.4 361.5 549.1 286.0 724.7 797.3 1,064.2 738.5 1,135.2 1,392.7Jiangsu 16.0 24.0 21.3 33.3 9.3 41.2 31.3 35.4 21.2 39.7 31.0Shanghai 3.0 2.9 6.4 10.2 12.9 29.9 25.8 17.2 52.9 58.9 56.5Anhui 2.0 2.5 2.8 5.2 1.7 7.9 7.0 7.8 0.4 5.1 3.7
Central 324.0 286.3 618.3 732.3 408.2 1,094.2 773.1 1,369.8 510.6 1,109.2 973.4Hubei 58.0 76.6 104.5 171.7 60.4 272.6 130.8 284.0 141.2 271.8 303.5Hunan 210.0 140.7 402.0 434.8 256.3 647.9 466.0 816.7 298.7 716.9 669.9Jiangxi 56.0 69.0 111.8 125.8 91.6 173.6 176.3 269.1 70.7 120.4 ??
South 499.0 608.6 909.7 1,146.5 1,309.5 1,714.8 2,266.2 2,734.2 2,709.0 2,790.0 2,815.5Guangdong 267.0 366.4 552.3 723.5 900.9 1,095.8 1,514.2 1,756.8 1,707.3 1,459.5 1,248.1Guangxi 147.0 138.9 221.8 234.5 196.0 291.0 340.9 388.7 415.9 527.3 580.8Fujian 85.0 103.4 135.6 188.5 208.4 323.2 406.8 583.9 579.1 792.8 976.0Hainan 4.3 4.8 4.3 4.7 6.7 10.4 10.5
Southwest 474.0 592.6 622.4 738.5 525.5 934.5 943.2 1,084.9 1,123.6 1,407.1 1,349.1Sichuan 458.0 574.7 599.7 710.7 498.7 893.6 901.5 1,031.5 1,066.3 1,325.6 1,262.6Guizhou 8.0 9.4 13.4 16.4 14.9 24.0 22.4 28.5 29.2 40.4 40.1Yunnan 8.0 8.5 9.3 11.4 12.0 17.0 19.3 24.9 28.1 41.1 46.4Xizang 0.0 0.0 0.0 0.0 0.0 0.0 0.0 0.0 0.0 0.0 0.0
Sum of above 1,500.0 1,808.3 2,547.8 3,223.8 2,560.0 4,561.1 4,854.9 6,332.5 5,160.1 6,561.0 6,631.9SSB Total 1,499.0 1,808.3 2,548.0 3,223.8 2,560.0 4,561.1 4,854.9 6,332.5 5,160.1 6,561.0 6,631.0

- 51 - STATISTICAL ANNEX
Table A1.10: PEAR PRODUCTION BY REGION AND PROVINCE, 1984-94('000 tons)
Region/province 1984 1985 1986 1987 1988 1989 1990 1991 1992 1993 1994
Northeast 211.0 203.5 202.7 224.5 247.1 222.4 233.0 265.7 286.5 371.6 380.2Heilongiiang 1.0 0.5 0.7 0.9 1.3 1.2 10.8 8.0 7.2 9.6 10.9Liaoning 188.0 173.1 171.8 177.8 195.1 174.4 166.8 204.8 222.9 300.1 324.0Jilin 22.0 29.9 30.2 45.8 50.7 46.8 55.4 52.9 56.4 61.9 45.3
North 1,235.0 1,217.4 1,377.4 1,433.8 1,528.5 1,385.6 1,249.7 1,320.7 1,514.2 1,635.7 2,215.7Shandong 346.0 296.3 319.0 343.2 394.1 359.4 314.9 343.6 433.5 473.9 604.7Hebei 679.0 738.1 873.8 904.0 924.9 824.9 763.0 814.0 885.2 964.1 1,345.1Beijing 54.0 45.0 44.5 48.9 57.7 63.7 59.1 68.1 67.9 76.3 107.2Tianjin 11.0 10.4 11.1 15.5 16.6 14.2 12.3 15.2 16.6 16.9 15.9Henan 55.0 64.2 51.3 54.3 52.7 54.7 37.3 30.5 45.6 46.2 84.7Shanxi 90.0 63.5 77.7 67.9 82.5 68.7 63.1 49.3 65.4 58.3 58.1
Northwest 90.0 129.2 124.5 130.7 160.8 173.5 178.1 212.2 263.5 314.4 389.1Shaanxi 10.0 11.7 14.2 16.8 20.3 20.9 20.5 35.8 49.3 60.9 81.4Gansu 36.0 43.6 54.2 47.2 59.1 63.4 63.3 71.0 93.6 115.8 127.8Nei Monggol 6.0 11.5 9.8 12.9 13.3 14.5 12.7 26.6 29.9 42.1 61.6Ningxia 3.0 2.9 3.8 4.0 4.2 4.0 4.8 1.7 5.1 4.6 4.9Xinjiang 29.0 52.6 37.6 43.1 55.8 63.4 70.6 71.9 79.0 84.8 106.9Qinghai 6.0 6.9 4.9 6.8 8.1 7.3 6.2 5.2 6.6 6.2 6.5
East 260.0 282.4 302.4 325.5 376.8 360.6 306.5 271.5 323.7 345.0 419.0Zhejiang 29.0 40.9 31.3 28.5 35.8 31.6 28.1 27.5 26.3 36.3 33.3Jiangsu 143.0 146.2 160.8 180.9 186.3 186.7 150.1 135.8 161.1 189.4 211.5Shanghai 15.0 18.6 12.9 13.3 15.4 12.7 11.5 12.8 14.1 13.9 12.8Anhui 73.0 76.7 97.4 102.8 139.4 129.6 116.8 95.4 122.2 105.4 161.4
Central 70.0 111.1 95.4 112.7 108.2 117.3 96.9 108.3 112.7 172.0 233.2Hubei 37.0 58.2 55.8 77.0 67.8 75.3 59.8 72.0 79.0 131.0 186.0Hunan 23.0 36.1 23.8 21.8 22.7 24.6 20.7 20.0 17.9 21.5 22.2Jiangxi 10.0 16.8 15.8 14.0 17.7 17.4 16.4 16.3 15.8 19.5 25.1
South 25.0 22.4 33.5 27.1 30.7 38.8 48.2 55.2 68.8 80.7 91.5Guangdong 6.0 7.2 9.6 7.2 9.4 10.5 12.7 15.3 20.4 19.4 19.6Guangxi 12.0 7.4 15.9 12.3 13.1 17.3 22.2 25.1 31.1 34.9 40.0Fujian 7.0 7.8 8.0 7.7 8.2 11.0 13.3 14.8 17.3 26.4 31.8Hainan
Southwest 210.0 171.0 211.9 234.8 269.3 266.6 240.2 264.6 276.9 297.9 314.3Sichuan 82.0 75.9 80.9 93.9 104.8 108.0 105.9 118.9 123.6 135.0 159.6Guizhou 21.0 22.5 32.0 35.4 39.1 38.8 35.9 34.4 27.8 28.3 33.2Yunnan 107.0 72.4 98.7 105.1 124.7 119.6 98.1 110.9 124.8 133.9 121.0Xizang 0.2 0.3 0.4 0.7 0.2 0.3 0.4 0.7 0.7 0.5
Sum of above 2,101.0 2,137.0 2,347.7 2,489.1 2,721.3 2,564.8 2,352.6 2,498.0 2,846.3 3,217.2 4,042.9SSB Total 1,499.0 1,808.3 2,548.0 640.9 2,721.3 2,565.0 2,352.8 2,497.8 2,846.1 3,217.2 4,042.9

- 52 - STATISTICAL ANNEX
Table A1.11: GRAPE PRODUCTION BY REGION AND PROVINCE, 1984-94('000 tons)
Region/province 1984 1985 1986 1987 1988 1989 1990 1991 1992 1993 1994
Northeast 25.0 25.1 28.6 48.2 73.4 94.2 97.5 114.8 152.6 186.2 204.3Heilongjiang 1.0 0.9 1.0 1.3 2.5 2.0 3.1 4.4 4.3 7.7 8.9Liaoning 20.0 20.9 23.5 35.0 53.1 72.2 73.6 89.9 121.8 146.2 158.2Jilin 4.0 3.3 4.1 11.9 17.8 20.0 20.8 20.5 26.5 32.3 37.1
North 129.0 150.2 182.5 264.4 329.1 355.8 296.5 304.7 364.8 473.9 543.5Shandong 56.0 79.3 92.2 141.1 185.7 210.7 139.4 131.6 142.1 188.2 179.5Hebei 22.0 25.8 31.4 43.8 71.5 67.1 80.9 100.0 128.2 164.9 223.5Beijing 15.0 10.8 10.7 12.9 10.8 12.1 12.8 12.8 13.0 14.0 15.9Tianjin 5.0 5.6 6.4 8.1 11.0 14.4 17.4 17.7 20.4 24.7 27.0Henan 25.0 22.8 35.0 50.9 39.8 40.4 30.7 23.9 37.7 55.8 68.3Shanxi 6.0 5.9 6.8 7.7 10.3 11.1 15.3 18.7 23.4 26.3 29.4
Northwest 123.0 159.5 187.8 258.4 287.4 323.3 367.0 387.4 443.5 490.0 503.8Shaanxi 4.0 6.8 16.4 23.7 27.7 24.1 20.2 17.7 18.6 21.3 30.7Gansu 0.5 0.5 1.1 2.3 3.4 6.8 6.1 7.5 6.0 7.1NeiMonggol 2.0 1.8 1.9 2.9 3.9 4.6 5.5 6.1 5.1 10.9 11.1Ningxia 1.0 0.8 1.1 1.9 2.4 2.4 3.5 1.8 3.2 4.2 3.7Xinjiang 116.0 149.6 167.8 228.8 251.0 288.8 330.9 355.6 409.0 447.5 451.1Qinghai 0.0 0.1 0.0 0.1 0.1 0.1 0.1 0.1 0.1 0.1
East 15.0 21.3 33.9 56.6 85.8 81.5 79.1 88.7 113.5 133.9 170.5Zhejiang 2.2 4.1 10.9 19.9 18.7 22.3 24.3 41.6 49.9 61.6Jiangsu 7.0 8.6 13.3 17.1 26.1 26.7 24.2 22.4 27.7 33.9 49.4Shanghai 1.9 2.0 5.0 10.2 16.0 16.2 20.4 24.7 29.6 31.9Anhui 8.0 8.6 14.6 23.7 29.6 20.1 16.4 21.6 19.5 20.5 27.7
Central 2.0 1.8 2.8 6.5 7.2 8.8 8.1 8.8 12.4 16.0 22.4Hubei 1.0 1.1 1.8 2.2 2.2 2.9 3.1 3.0 4.9 6.7 12.2Hunan 3.2 3.6 4.4 3.5 4.3 5.1 6.6 7.2Jiangxi 1.0 0.7 1.0 1.1 1.4 1.5 1.5 1.5 2.4 2.7 3.0
South 0.0 0.6 0.8 1.2 1.9 2.0 2.7 3.8 5.7 8.0 13.3Guangdong 0.0Guangxi 0.0Fujian 0.6 0.8 1.2 1.9 2.0 2.7 3.8 5.7 8.0 13.3Hainan
Southwest 3.0 2.7 5.2 5.5 7.5 8.0 7.6 7.6 34.7 46.8 64.2Sichuan 0.0 26.5 36.1 50.6Guizhou 1.0 0.8 2.5 2.8 2.7 3.0 3.1 3.9 3.8 4.1 5.4Yunnan 2.0 1.9 2.7 2.6 4.8 5.0 4.5 3.8 4.4 6.6 8.1Xizang 0.0
Sum of above 297.0 361.3 441.6 640.8 792.3 873.6 858.5 915.8 1,127.2 1,354.8 1,522.1SSB Total 1,499.0 1,808.3 2,548.0 640.9 792.2 874.2 858.5 915.9 1,125.1 1,354.8 1,522.1
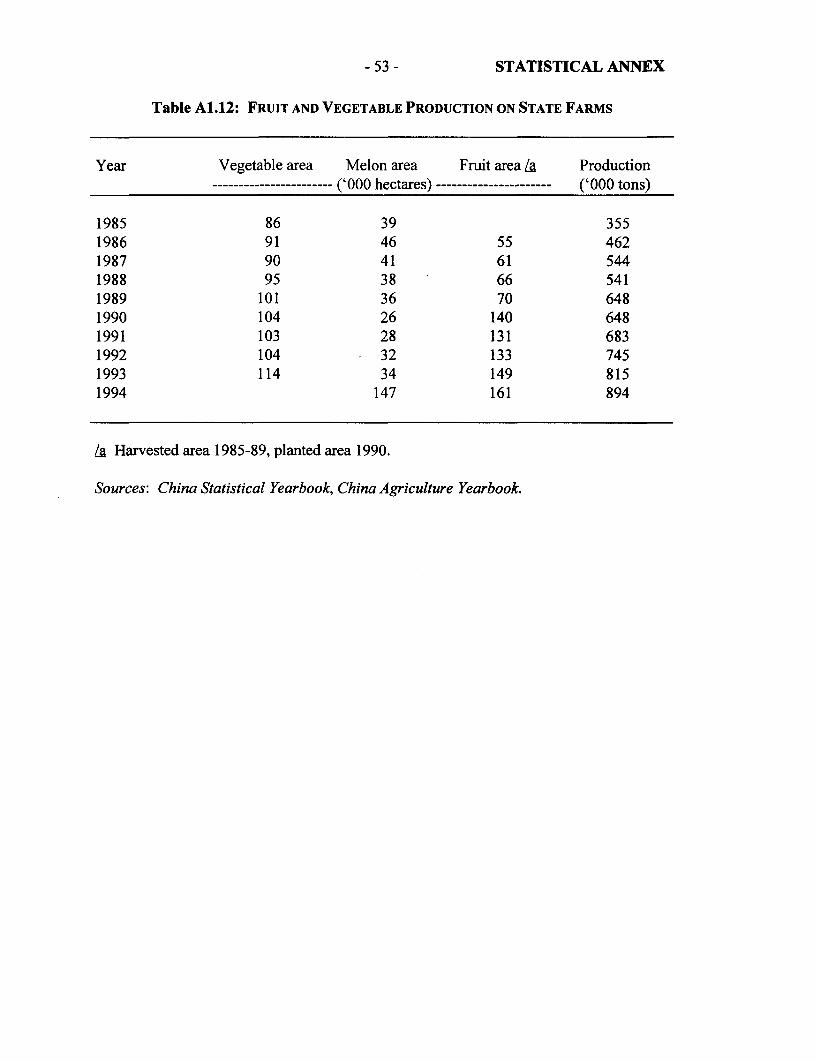
- 53 - STATISTICAL ANNEX
Table A1.12: FRUIT AND VEGETABLE PRODUCTION ON STATE FARMS
Year Vegetable area Melon area Fruit area La Production----------------------- ('000 hectares) ---------------------- ('000 tons)
1985 86 39 3551986 91 46 55 4621987 90 41 61 5441988 95 38 66 5411989 101 36 70 6481990 104 26 140 6481991 103 28 131 6831992 104 - 32 133 7451993 114 34 149 8151994 147 161 894
/a Harvested area 1985-89, planted area 1990.
Sources: China Statistical Yearbook, China Agriculture Yearbook.

- 54 - STATISTICAL ANNEX
Table A1.13: FRUIT AND VEGETABLE EXPORTS (1987-95)
Vegetables Dry Fruits /aYear Total Fresh Mushroom Pulses Total Apples Citrus
('000 tons)
1987 642 387 2 3 244 60 761988 766 474 2 6 281 88 751989 821 495 2 5 252 70 711990 893 543 3 7 226 62 661991 1,036 596 3 8 164 24 431992 1,380 560 16 970 280 38 611993 1,400 840 21 800 420 119 811994 1,540 860 26 1,460 490 107 1271995 1,580 810 27 1,040 490 109 132
($ million)
1987 341.6 106.7 11.9 22.6 101.4 26.3 35.81988 476.1 134.1 14.8 49.0 125.7 39.4 38.31989 523.6 151.7 14.5 39.6 108.5 27.1 34.61990 577.6 172.2 12.9 47.9 102.9 25.6 31.11991 669.7 204.3 12.1 42.9 78.7 1.0 22.61992 833.6 234.0 85.6 287.5 268.3 20.3 32.41993 950.7 351.5 100.5 261.2 331.5 48.0 37.81994 1,257.0 419.6 232.5 437.4 396.4 41.1 54.21995 1,571.3 484.1 341.7 359.0 445.0 45.3 55.7
/a Includes fresh/dried nuts from 1992 onward.
Source: China's Customs Statistics Monthly, Economic Information & Agency, HongKong.
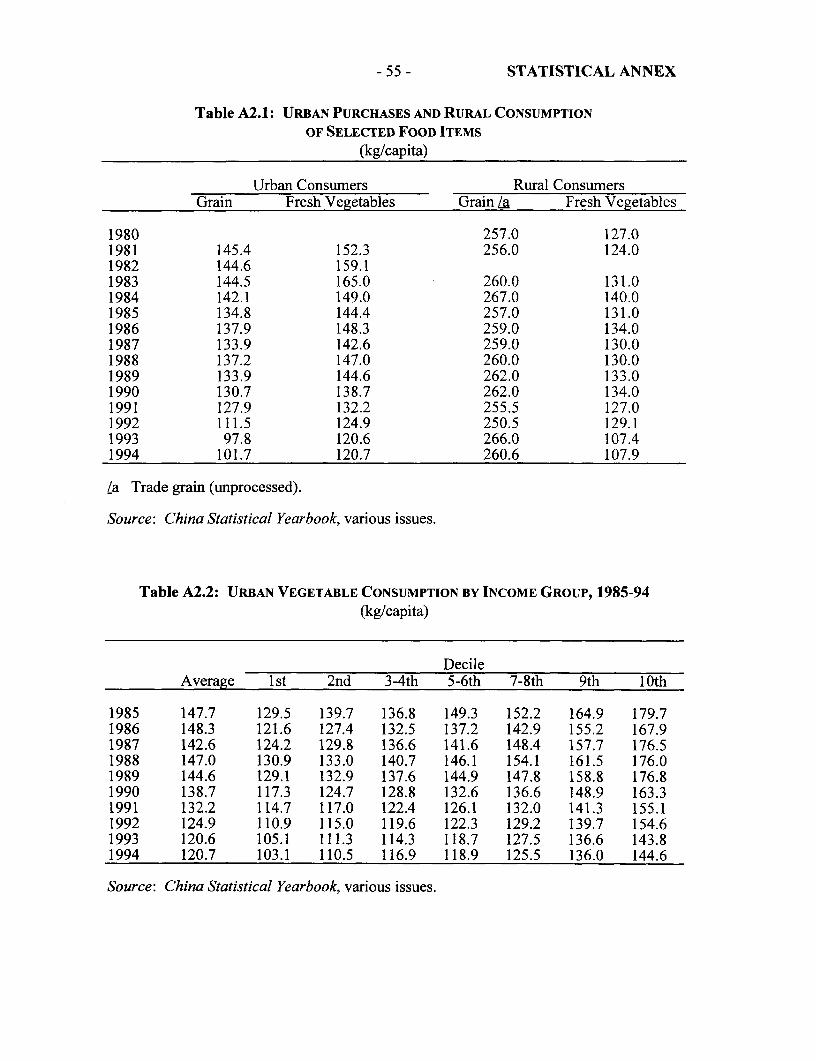
- 55 - STATISTICAL ANNEX
Table A2.1: URBAN PURCHASES AND RURAL CONSUMPTIONOF SELECTED FOOD ITEMS
(kg/capita)
Urban Consumers Rural ConsumersGrain Fresh Vegetables Grain L Fresh Vegetables
1980 257.0 127.01981 145.4 152.3 256.0 124.01982 144.6 159.11983 144.5 165.0 260.0 131.01984 142.1 149.0 267.0 140.01985 134.8 144.4 257.0 131.01986 137.9 148.3 259.0 134.01987 133.9 142.6 259.0 130.01988 137.2 147.0 260.0 130.01989 133.9 144.6 262.0 133.01990 130.7 138.7 262.0 134.01991 127.9 132.2 255.5 127.01992 111.5 124.9 250.5 129.11993 97.8 120.6 266.0 107.41994 101.7 120.7 260.6 107.9
La Trade grain (unprocessed).
Source: China Statistical Yearbook, various issues.
Table A2.2: URBAN VEGETABLE CONSUMPTION BY INCOME GROUP, 1985-94(kg/capita)
DecileAverage 1 st 2nd 3-4th 5-6th 7-8th 9th 10th
1985 147.7 129.5 139.7 136.8 149.3 152.2 164.9 179.71986 148.3 121.6 127.4 132.5 137.2 142.9 155.2 167.91987 142.6 124.2 129.8 136.6 141.6 148.4 157.7 176.51988 147.0 130.9 133.0 140.7 146.1 154.1 161.5 176.01989 144.6 129.1 132.9 137.6 144.9 147.8 158.8 176.81990 138.7 117.3 124.7 128.8 132.6 136.6 148.9 163.31991 132.2 114.7 117.0 122.4 126.1 132.0 141.3 155.11992 124.9 110.9 115.0 119.6 122.3 129.2 139.7 154.61993 120.6 105.1 111.3 114.3 118.7 127.5 136.6 143.81994 120.7 103.1 110.5 116.9 118.9 125.5 136.0 144.6
Source: China Statistical Yearbook, various issues.

- 56 - STATISTICAL ANNEX
Table A2.3: URBAN GRAIN CONSUMPTION BY INCOME GROUP, 1985-94(kg/capita)
DecileAverage 1 st 2nd 3-4th 5-6th 7-8th 9th 10th
1985 131.2 125.5 128.2 127.3 130.4 133.2 139.2 147.11986 137.9 134.0 135.4 136.7 138.0 140.4 148.0 159.51987 133.9 128.3 130.5 131.5 130.8 134.8 141.5 149.11988 137.2 129.9 131.0 133.8 135.5 138.6 144.8 157.41989 133.9 130.1 129.4 129.1 131.9 134.0 141.6 154.41990 130.7 124.0 125.8 127.9 129.0 131.3 137.8 149.11991 127.9 120.1 122.5 123.4 126.5 128.9 138.8 148.71992 111.51993 97.81994 101.7
Source: China Statistical Yearbook, various issues.
Table A2.4: URBAN GRAIN EXPENDITURES BY INCOME GROUP, 1985-94(Yuan)
DecileAverage 1st 2nd 3-4th 5-6th 7-8th 9th 10th
1985 62.28 55.08 56.16 59.28 62.52 65.04 68.76 74.401986 64.80 57.00 60.72 60.96 63.36 65.52 69.84 77.041987 66.92 59.28 61.72 64.51 66.44 69.30 73.56 79.201988 75.66 65.09 68.45 72.43 75.29 78.94 84.15 93.341989 81.88 70.88 74.55 77.05 81.13 85.48 91.82 102.781990 84.48 70.78 75.70 80.18 83.64 88.80 96.18 106.611991 102.53 87.47 92.95 97.04 102.80 106.90 115.44 126.521992 104.42 96.96 99.85 100.19 103.34 106.04 111.76 122.881993 129.96 119.14 124.77 126.40 128.97 132.57 141.60 145.101994
Source: China Statistical Yearbook, various issues.
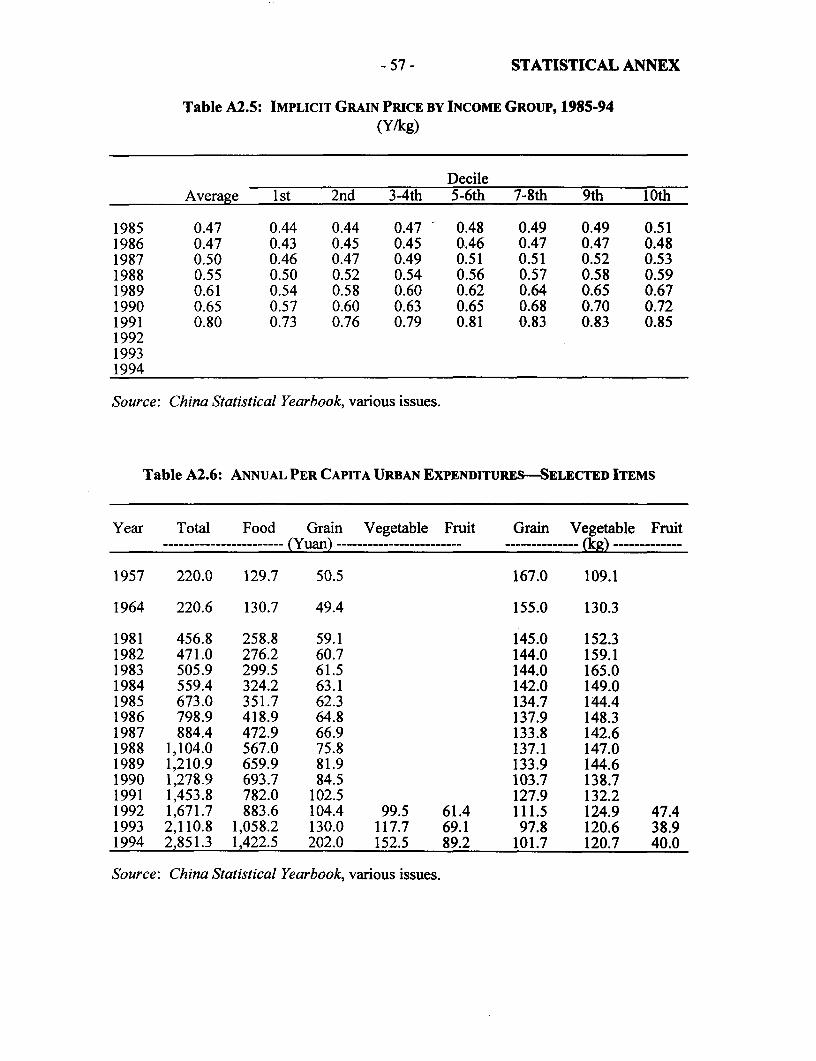
-57 - STATISTICAL ANNEX
Table A2.5: IMPLICIT GRAIN PRICE BY INCOME GROUP, 1985-94(Y/kg)
DecileAverage 1 st 2nd 3-4th 5-6th 7-8th 9th 10th
1985 0.47 0.44 0.44 0.47 - 0.48 0.49 0.49 0.511986 0.47 0.43 0.45 0.45 0.46 0.47 0.47 0.481987 0.50 0.46 0.47 0.49 0.51 0.51 0.52 0.531988 0.55 0.50 0.52 0.54 0.56 0.57 0.58 0.591989 0.61 0.54 0.58 0.60 0.62 0.64 0.65 0.671990 0.65 0.57 0.60 0.63 0.65 0.68 0.70 0.721991 0.80 0.73 0.76 0.79 0.81 0.83 0.83 0.85199219931994
Source: China Statistical Yearbook, various issues.
Table A2.6: ANNUAL PER CAPITA URBAN EXPENDITURESELECTED ITEMS
Year Total Food Grain Vegetable Fruit Grain Vegetable Fruit---------------------- (Yuan) ------------------------ --- (kg)-
1957 220.0 129.7 50.5 167.0 109.1
1964 220.6 130.7 49.4 155.0 130.3
1981 456.8 258.8 59.1 145.0 152.31982 471.0 276.2 60.7 144.0 159.11983 505.9 299.5 61.5 144.0 165.01984 559.4 324.2 63.1 142.0 149.01985 673.0 351.7 62.3 134.7 144.41986 798.9 418.9 64.8 137.9 148.31987 884.4 472.9 66.9 133.8 142.61988 1,104.0 567.0 75.8 137.1 147.01989 1,210.9 659.9 81.9 133.9 144.61990 1,278.9 693.7 84.5 103.7 138.71991 1,453.8 782.0 102.5 127.9 132.21992 1,671.7 883.6 104.4 99.5 61.4 111.5 124.9 47.41993 2,110.8 1,058.2 130.0 117.7 69.1 97.8 120.6 38.91994 2,851.3 1,422.5 202.0 152.5 89.2 101.7 120.7 40.0
Source: China Statistical Yearbook, various issues.

Table A3.1: GROWT1 OF TIIE FREE-MARKET SYSTEM, 1978-94
1978 1979 1980 1981 1982 1983 1984 1985 1986 1987 1988 1989 1990 1991 1992 1993 1994
Number of Miarkets 33,302 38,993 40809 43,013 44,775 48,003 56,500 61,337 67,610 69,683 71,359 72,130 72,759 74,675 79,188 83,001 84,463Urban 0 2,226 2,919 3,298 3,591 44,488 6,144 8,013 9,701 10,908 12,181 13,111 13,106 13,891 14,510 16,450 17,880Rural 33,302 36,767 37,890 39,715 41,184 3,515 50,356 53,324 57,909 58,775 59,178 59,019 59,653 60,784 64,678 66,551 66,583
(V billion in current tcrms)
ValueofTradc 12.5 18.3 23.5 28.7 33.3 38.6 45.7 63.2 90.7 115.7 162.1 197.4 216.8 262.2 353.0 534.3 898.2Urban 0.0 1.2 2.4 3.4 4.5 5.6 7.5 12.1 24.4 34.7 54.5 72.4 83.8 107.9 158.3 265.2 456.9Rural 12.5 17.1 21.1 25.3 28.8 33.0 38.2 51.2 66.2 81.0 107.6 125.0 133.0 154.3 194.7 269.1 441.3CompositionGrain & Edible Oils 2.0 2.9 3.4 3.6 3.9 4.3 4.6 5.0 7.1 8.5 10.8 14.3 14.7 16.5 21.3 35.0 59.5Meat/Poultry/Eggs 2.1 3.3 4.2 5.1 5.8 7.3 9.2 14.0 24.7 32.0 46.0 57.1 61.9 706 85.9 110.3 162.6Aquatic Products 0.5 0.7 0.9 1.2 1.5 1.9 2.4 3.3 6.4 8.5 12.3 15.8 18.2 22.4 29.2 41.4 62.9Vegetables 1.4 1.7 2.2 2.6 2.7 3.3 3.8 4.9 9.7 13.1 19.3 23.8 26.4 33.2 43.5 58.2 85.0Fruits 0-4 0.6 0.8 0.9 1.0 1.3 1.6 2.6 5.9 8.3 12.3 16.1 18.4 23.3 29.1 40.3 57.2Fodder/Farm tools 1.0 1.2 0.7 0.8 1.1 1.2 1.3 1.4 1.5 1.6 1.8 2.2 2.3 2.5 3.0 3.7 5.0Large Animals 2.1 3.0 2.7 3.9 4.5 4.2 3.6 3.3 3.1 3.3 3.8 3.9 3.8 4.4 4.8 5.7 7.9
(Y billion in constant terms)
Value of Trade 32.4 40.7 47.7 54.8 62.1 70.0 80.0 101.8 138.6 159.8 191.9 218.3 216.8 254.8 327.5 437.2 557.5 00ulrban 0.0 2.7 4.9 6.5 8.4 10.1 13.2 19.4 37.4 47.9 64.5 80.0 83.8 104.9 146.8 217.1 283.6Rural 32.4 38.0 42.8 48.3 53.7 59.9 66.8 82.4 101.2 111.9 127.3 138.3 133.0 150.0 180.6 220.2 273.9CompositionGrain & Edible Oils 5.2 6.4 7.0 6.9 7.4 7.9 8.0 8.0 10.9 11.7 12.8 15.8 14.7 16.0 19.8 28.6 36.9Meat/Poultry/Eggs 5.5 7.4 8.5 9.7 10.7 13.2 16.1 22.6 37.7 44.2 54.4 63.1 61.9 68.6 79.7 90.2 101.0Aquatic Products 1.3 1.5 1.9 2.3 2.8 3.4 4.2 5.3 9.8 11.8 14.6 17.5 18.2 21.8 27.1 33.8 39.0Vegetables 3.7 3.8 4.4 4.9 5.1 6.0 6.7 7.9 14.8 18.1 22.8 26.3 26.4 32.3 40.3 47.6 52.8Fruits 1.0 1.3 1.5 1.7 1.9 2.4 2.8 4.1 9.1 11.5 14.5 17.8 18.4 22.7 27.0 33.0 35.5Fodder/Farm tools 2.7 2.6 1.4 1.6 2.0 2.1 2.3 2.2 2.3 2.2 2.2 2.5 2.3 2.4 2.7 3.0 3.1Large Animals 5.4 6.6 5.4 7.4 8.5 7.5 6.2 5.2 4.8 4.5 4.5 4.3 3.8 4.2 4.4 4.6 4.9 3
Note: Free Markets are basically rctail, but include some rural wholesale markets.
Source: SSB, China Statistical Yearbook, various issues.
X

-59- STATISTICAL ANNEX
Table A3.2: OPEN-MARKET SALES VOLUME, 1988-94(Million tons)
Commodity 1988 1989 1990 1991 1992 1993 1994
Cereals 7.07 6.88 7.7 9.24 12.18 18.17 22.35Edible Oil 0.61 0.51 0.72 1.02 1.31 2.07 8.60Pork 5.02 5.44 6.19 7.10 7.29 10.72 9.43Beef 0.4 0.44 0.50 0.77 0.88 1.21 1.20Mutton 0.22 0.33 0.36 0.33 0.38 0.56 0.48Poultry 1.17 1.17 1.31 1.40 1.56 2.07 2.10Eggs 1.46 1.41 1.58 1.80 2.19 3.28 3.08Aquatic products 2.67 3.00 3.38 4.88 4.77 7.06 6.65Vegetables 26.51 30.85 33.16 38.26 45.71 60.59 64.10Fruits 9.54 10.88 12.48 15.62 18.01 23.20 26.32
Sources: China Commerce Yearbook, various issues; Rural Statistical Yearbook ofChina, 1994, p.2 6 1.
Table A3.3: RETAIL SALES BY PEASANTS TO NONAGRICULTURAL RESIDENTS
Dry/Fresh Dry/FreshVegetables Fruits Grain Grain
.-------------------- (Y million) ---------------------- (Million tons)
1978 600 170 830 1,200
1980 1,100 380 1,800 3,1001981 1,630 585 2,090 3,6001982 1,780 710 2,467 4,2501983 2,160 990 2,540 4,5001984 - 3,130 1,500 2,666 4,7501985 4,650 2,200 2,808 5,5001986 6,000 3,070 3,276 6,3001987 6,702 3,680 4,098 6,6101988 10,496 5,468 4,751 6,7161989 12,051 6,655 5,438 6,1791990 13,390 8,300 4,999 6,0431991 16,340 9,600 5,823 7,1011992 19,320 10,590 7,024 8,01719931994
Source: Rural Statistical Yearbook of China.

-60- STATISTICAL ANNEX
Table A4.1: AVERAGE PURCHASING PRICES AND PRICE INDICES OF SELECTED FARMPRODUCTS, 1978-94
Average Purchasing PricesNominal Prices, Y/ton Constant 1990 Prices, Y/ton Producer Price Index (1978=100)
Citrus/ Fresh Citrus/ Fresh Fresh Dry/FreshYear Apples Oranges Vegetables Apples Oranges Vegetables Overall Vegetables Fruits
1978 309.0 367.0 82.0 614.0 729.2 162.9 100.0 100.0 100.0
1979 122.1 112.2 102.8
1980 344.0 445.0 104.0 630.0 814.9 190.5 130.8 102.4 109.5
1981 346.0 515.0 112.0 618.8 921.1 200.3 138.5 129.1 111.3
1982 387.0 481.0 106.0 681.1 846.5 186.6 141.5 128.2 114.3
1983 418.0 538.0 110.0 731.8 941.9 192.6 147.7 132.8 124.5
1984 529.0 696.0 118.0 916.4 1,205.7 204.4 153.6 131.0 150.7
1985 754.2 1,076.1 198.0 1,213.4 1,731.3 318.6 166.8 197.1 187.9
1986 845.6 1,055.1 225.0 1,282.6 1,600.4 341.3 177.5 199.5 202.9
1987 866.8 1,114.3 279.0 1,239.1 1,592.9 398.8 198.8 251.7 221.6
1988 1,269.0 1,980.3 308.0 1,545.0 2,411.1 375.0 244.5 329.5 309.3
1989 1,371.9 1,204.3 271.0 1,408.8 1,236.7 278.3 281.2 386.5 279.0
1990 1,480.5 1,349.5 416.0 1,480.5 1,349.5 416.0 273.9 372.2 272.1
1991 1,468.6 1,233.1 451.0 1,443.9 1,212.4 443.4 268.4 401.2 290.6
1992 1,549.1 1,196.7 562.0 1,464.4 1,131.2 531.3 277.5 447.0 269.6
1993 314.7 549.3 271.0
1994 440.3 742.1 324.9
Source: China Statistical Yearbook, various years and China Rural Statistical Yearbook, various years.

- 61- STATISTICAL ANNEX
Table A4.2: VEGETABLE AND FRUIT PRICE INDICES(1990 = 100)
Free-Market Price Indices Urban Retail Price IndexVegetables Fruits la
Year Fresh Dried Fresh Dried Fresh Vegetables
1980 41.9 53.0 41.0 34.01981 47.7 55.3 44.7 37.41982 49.0 57.8 47.2 37.61983 54.1 58.7 52.5 55.9 42.51984 52.2 56.1 55.8 56.1 45.71985 63.4 59.9 72.1 58.4 61.41986 67.8 70.5 80.6 61.5 63.41987 80.9 80.0 87.8 73.0 74.71988 105.3 96.8 107.3 87.1 98.31989 105.0 108.9 108.5 108.8 100.41990 100.0 100.0 100.0 100.0 100.01991 102.3 108.6 104.0 97.0 106.11992 118.1 125.3 100.3 100.1 116.31993 145.1 134.51994 196.1 183.2
/a Fresh and dry fruit price index computed collectively until 1983.
Sources: SSB, China Trade and Price Statistics in 1987; China Statistical Yearbook,various issues.
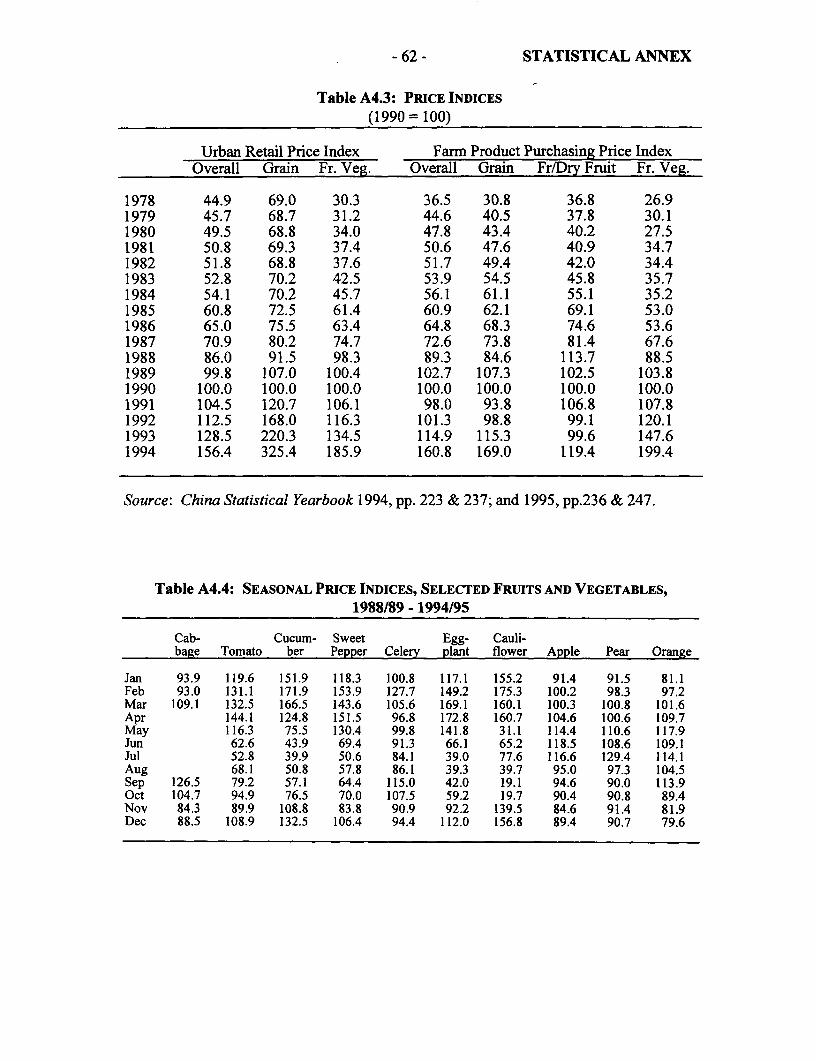
-62- STATISTICAL ANNEX
Table A4.3: PRICE INDICES(1990 = 100)
Urban Retail Price Index Farm Product Purchasing Price IndexOverall Grain Fr. Veg. Overall Grain Fr/Dry Fruit Fr. Veg.
1978 44.9 69.0 30.3 36.5 30.8 36.8 26.91979 45.7 68.7 31.2 44.6 40.5 37.8 30.11980 49.5 68.8 34.0 47.8 43.4 40.2 27.51981 50.8 69.3 37.4 50.6 47.6 40.9 34.71982 51.8 68.8 37.6 51.7 49.4 42.0 34.41983 52.8 70.2 42.5 53.9 54.5 45.8 35.71984 54.1 70.2 45.7 56.1 61.1 55.1 35.21985 60.8 72.5 61.4 60.9 62.1 69.1 53.01986 65.0 75.5 63.4 64.8 68.3 74.6 53.61987 70.9 80.2 74.7 72.6 73.8 81.4 67.61988 86.0 91.5 98.3 89.3 84.6 113.7 88.51989 99.8 107.0 100.4 102.7 107.3 102.5 103.81990 100.0 100.0 100.0 100.0 100.0 100.0 100.01991 104.5 120.7 106.1 98.0 93.8 106.8 107.81992 112.5 168.0 116.3 101.3 98.8 99.1 120.11993 128.5 220.3 134.5 114.9 115.3 99.6 147.61994 156.4 325.4 185.9 160.8 169.0 119.4 199.4
Source: China Statistical Yearbook 1994, pp. 223 & 237; and 1995, pp.2 3 6 & 247.
Table A4.4: SEASONAL PRICE INDICES, SELECTED FRUITS AND VEGETABLES,
1988/89 - 1994/95
Cab- Cucum- Sweet Egg- Cauli-bage Tomato ber Pepper Celery plant flower Apple Pear Orange
Jan 93.9 119.6 151.9 118.3 100.8 117.1 155.2 91.4 91.5 81.1Feb 93.0 131.1 171.9 153.9 127.7 149.2 175.3 100.2 98.3 97.2Mar 109.1 132.5 166.5 143.6 105.6 169.1 160.1 100.3 100.8 101.6Apr 144.1 124.8 151.5 96.8 172.8 160.7 104.6 100.6 109.7May 116.3 75.5 130.4 99.8 141.8 31.1 114.4 110.6 117.9Jun 62.6 43.9 69.4 91.3 66.1 65.2 118.5 108.6 109.1Jul 52.8 39.9 50.6 84.1 39.0 77.6 116.6 129.4 114.1Aug 68.1 50.8 57.8 86.1 39.3 39.7 95.0 97.3 104.5Sep 126.5 79.2 57.1 64.4 115.0 42.0 19.1 94.6 90.0 113.9Oct 104.7 94.9 76.5 70.0 107.5 59.2 19.7 90.4 90.8 89.4Nov 84.3 89.9 108.8 83.8 90.9 92.2 139.5 84.6 91.4 81.9Dec 88.5 108.9 132.5 106.4 94.4 112.0 156.8 89.4 90.7 79.6
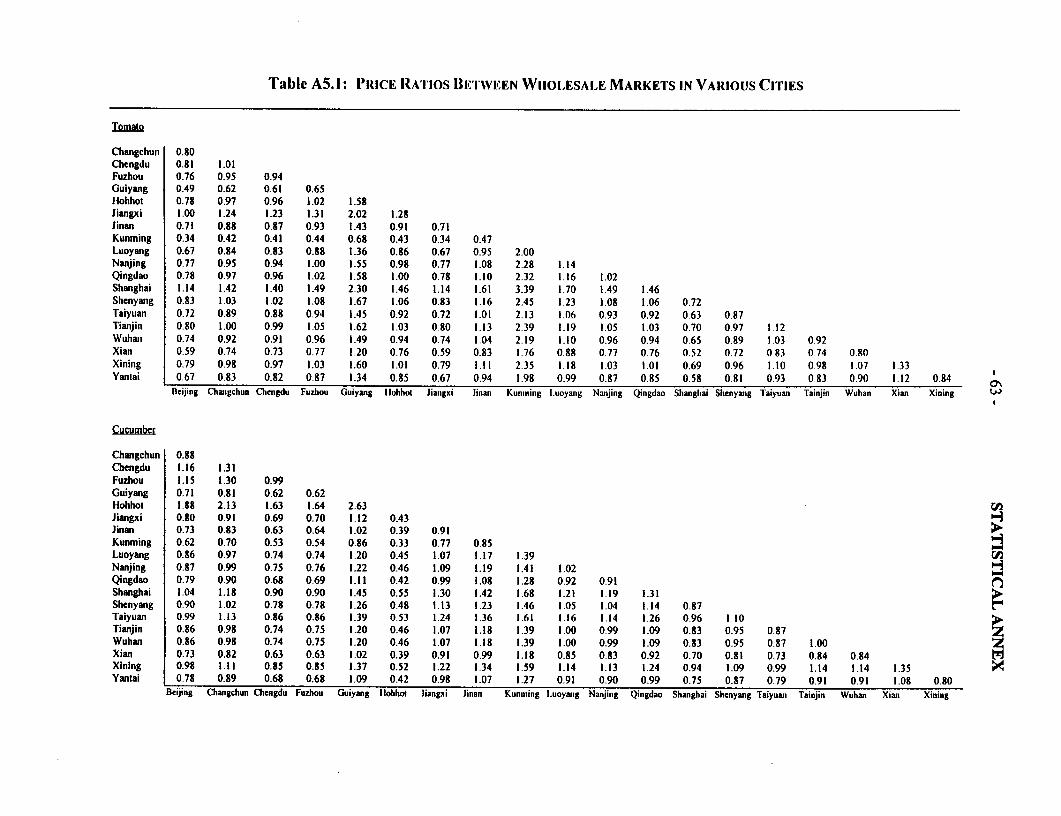
Table A5.I: PRIUcE RATIIOS BlETIWEEN WIIOI,ESAI,E MARKETS IN VAUIOUS CITIES
Tomato
Changchun 0.80Chengdu 0.81 1.01Fuzhou 0.76 0.95 0.94Guiyang 0.49 0.62 0.61 0.65Hohhot 0.78 0.97 0.96 1.02 1.58Jiangxi 1.00 1.24 1.23 1.31 2.02 1.28Jinan 0.71 0.88 0.87 0.93 1.43 0.91 0.71Kunming 0.34 0.42 0.41 0.44 0.68 0.43 0.34 0.47Luoyang 0.67 0.84 0.83 0.88 1.36 0.86 0.67 0.95 2.00Nanjing 0.77 0.95 0.94 1.00 1.55 0.98 0.77 1.08 2.28 1.14Qingdao 0.78 0.97 0.96 1.02 1.58 1.00 0.78 1.10 2.32 1.16 1.02Shanghai 1.14 1.42 1.40 1.49 2.30 1.46 1.14 1.61 3.39 1.70 1.49 1.46Shenyang 0.83 1.03 1.02 1.08 1.67 1.06 0.83 1.16 2.45 1.23 1.08 1.06 0.72Taiyuani 0.72 0.89 0.88 0.94 1.45 0.92 0.72 1.01 2.13 1.06 0.93 0.92 0.63 0.87Tianjin 0.80 1.00 0.99 1.05 1.62 1.03 0.80 1.13 2.39 1.19 1.05 1.03 0.70 0.97 1.12Wuhan 0.74 0.92 0.91 0.96 1.49 0.94 0.74 1.04 2.19 1.10 0.96 0.94 0.65 0.89 1 03 0.92Xian 0.59 0.74 0.73 0.77 1.20 0.76 0.59 0.83 1.76 0.88 0.77 0.76 0.52 0.72 0 83 074 0.80Xining 0.79 0.98 0.97 1.03 1.60 1.01 0.79 1.11 2.35 1.18 1.03 1.01 0.69 0.96 1.10 0.98 1.07 1.33Yanlai 0.67 0.83 0.82 0.87 1.34 0.85 0.67 0.94 1.98 0.99 0.87 0.85 0.58 0.81 0.93 0 83 0.90 1.12 0.84 O
Beijing Chaungchun Chengdu Fuzhou Guiyang Ilohhot Jiaungxi Jinam KuLiniini I.uoyang Nanjing Qingdao Shanghai Shenyang Taiyuan Tainjin Wuhan Xian Xining w
Cucumbor
Changchun 0.88Chengdu 1.16 1.31Fuzhou 1.15 1.30 0.99Guiyang 0.71 0.81 0.62 0.62Hohhot 1.88 2.13 1.63 1.64 2.63 wJiangxi 0.80 0.91 0.69 0.70 1.12 0.43 3Jinan 0.73 0.83 0.63 0.64 1.02 0.39 0.91 ;Kunming 0.62 0.70 0.53 0.54 0.86 0.33 0.77 0.85Luoyang 0.86 0.97 0.74 0.74 1.20 0.45 1.07 1.17 1.39Nanjing 0.87 0.99 0.75 0.76 1.22 0.46 1.09 1.19 1.41 1.02 -Qingdao 0.79 0.90 0.68 0.69 1.11 0.42 0.99 1.08 1.28 0.92 0.91Shanghai 1.04 1.18 0.90 0.90 1.45 0.55 1.30 1.42 1.68 1.21 1.19 1.31Shenyang 0.90 1.02 0.78 0.78 1.26 0.48 1.13 1.23 1.46 1.05 1.04 1.14 0.87laiyuan 0.99 1.13 0.86 0.86 1.39 0.53 1.24 1.36 1.61 1.16 1.14 1.26 0.96 1.10Tianjin 0.86 0.98 0.74 0.75 1.20 0.46 1.07 1.18 1.39 1.00 0.99 1.09 0.83 0.95 0.87 ZWuhan 0.86 0.98 0.74 0.75 1.20 0.46 1.07 1.18 1.39 1.00 0.99 1.09 0.83 0.95 0.87 1.00 ZXian 0.73 0.82 0.63 0.63 1.02 0.39 0.91 0.99 1.18 0.85 0.83 0.92 0.70 0.81 0.73 0.84 0.84Xining 0.98 1.11 0.85 0.85 1.37 0.52 1.22 1.34 1.59 1.14 1.13 1.24 0.94 1.09 0.99 1.14 1.14 1.35Yantai 0.78 0.89 0.68 0.68 1.09 0.42 0.98 1.07 1.27 0.91 0.90 0.99 0.75 0.87 0.79 0.91 0.91 1.08 0.80
Beijing Changchun Chengdu Fuzhou Guiyang llohhot Jiangxi Jinan Kunming L.uoyang Nanjing Qingdao Shanghai Shenyang Taiyuan Tainjin Wuhan Xian Xining

Table A5.1: PRICE RATIOS BETWEEN WIIOI,ESALE MAIRKETS IN VARIOUS CITIES (continued)
Swel Pepl&
Changchun 0.78Chengdu 1.28 1.63Fuzhou 1.36 1.73 1.06Guiyang 1.13 1.45 0.39 0.83llohhot 0.90 1.15 0.70 0.66 0.79Jiangxi 1.18 1.51 0.93 0.87 1.05 1.32Jinan 1.01 1.29 0.79 0.74 0.89 1.12 0.85Kunming 1.23 1.57 0.96 0.90 1.08 1.37 1.04 1.22Luoyang 0.84 1.08 0.66 0.62 0.74 0.94 0.71 0.84 0.69Nanjing 0.97 1.24 0.76 0.72 0.86 1.08 0.82 0.97 0.79 1.16Qingdao 1.02 1.31 0.80 0.76 0.91 1.14 0.87 1.02 0.84 1.22 1.05Shanghai 1.22 1.56 0.95 0.90 1.08 1.36 1.03 1.21 0.99 1.45 1.25 1.19Shenyang 0.83 1.06 0.65 061 0.74 0.93 0.70 0.83 0.68 0.99 0.86 0.81 0.68Taiyuan 0.98 1.26 0.77 0.73 0.87 1.10 0.83 0.98 0.80 1.17 1.01 0.96 0.81 1.18Tianjih 0.95 1.22 0.75 0.70 0.84 1.06 0.80 0.95 0.78 1.13 0.98 0.93 0.78 1.14 0.97Wuhan 0.88 1.13 0.69 0.65 0.78 0.98 0.75 0.88 0.72 1.05 0.91 0.86 0.73 1.06 0.90 0.93Xian 0.92 1.18 0.72 0.68 0.81 1.02 0.78 0.91 0.75 1.09 0.95 0.90 0.76 1.11 0.93 0.97 1.04Xining 1.39 1.78 1.09 1.03 1.23 1.55 1.18 1.38 1.14 1.66 1.43 1.36 1.14 1.67 1.41 1.46 1.58 1.52Yantai 0.92 1.18 0.72 0.68 0.82 1.03 0.78 0.92 0.75 1.10 0.95 0.90 0.76 1.11 0.94 0.97 1.05 1.01 0.66
Beijing Changchun Chengdu Fuzhou Guiyang llohhot Jiangxi Jijian Ktnming l.uoyang Nanjing Qingdao Shanghai Shenyang Taiyuan lainjin Wuhan Xian Xining oEkggplnn
Changchiun 1.03Chengdu 1.06 1.03Fuzhou 1.29 1.25 1.21Guiyang 0.75 0.73 0.71 0.59Hohhot 0.80 0.77 0.75 0.62 1.06Jiangxi 1.18 1.14 1.11 0.92 1.56 1.48Jinan 0.89 0.86 0.84 0.69 1.18 1.12 0.76Kunming 0.62 0.60 0.58 0.48 0.82 0.77 0.52 0.69Luoyang 0.82 0.79 0.77 0.63 1.08 1.02 0.69 0.91 1.32Nanjing 1.13 1.10 1.07 0.88 1.50 1.42 0.96 1.27 1.83 1.39 -Qingdao 0.87 0.84 0.82 0.67 1.15 1.09 0.73 0.97 1.40 1.06 0.76Shanghai 1.36 1.32 1.28 1.06 1.80 1.71 1.15 1.53 2.20 1.67 1.20 1.57 3Shenyang 1.01 0.98 0.95 0.78 1.34 1.27 0.86 1.13 1.63 1.24 0.89 1.17 0.74Taiyuan 1.22 1.18 1.15 0.95 1.62 1.53 1.04 1.37 1.98 1.50 1.08 1.41 0.90 1.21TianjinWuhan 0.83 0.80 0.78 0.64 1.09 1.03 0.70 0.93 1.34 1.01 0.73 0.95 0.61 0.82 0.68Xian 0.67 0.65 0.63 0.52 0.89 0.84 0.57 0.75 1.09 0.82 0.59 0.77 0.49 0.66 0.55 0.81 zXining 1.55 1.49 1.46 1.20 2.05 1.94 1.31 1.73 2.50 1.90 1.36 1.78 1.14 1.53 1.27 1.87 2.30Yantai 0.80 0.77 0.75 0.62 1.06 1.00 0.68 0.89 1.29 0.98 0.70 0.92 0.58 0.79 0.65 0.96 1.19 0.52
Beijing Changchun Chengdu Fuzhou Guiyang Ilohhot Jiangxi Jinan Kunming Luoyanig Nanjing Qingdao Shanghai Shenyang Taiyuan Tainjin Wuhan Xian Xining
Note: The ratio rcflects price in the city on the vertical axis as a proportion of price in city on the horizontal axis (1995 wholesale priccs) (e.g. the tomato pricc in Shanghai is 146%ofthe price inQingdao).

Tablc A5.2: WHOLESALE MARKETS COVAIRIANCE COEFFICIENTS
Ton;aies
Changchun 0.70Chengdu 0.89 0.77Fuzhou - -
Guiyang 0.61 0.47 0.44 -Ilohhot 0.58 0.79 0.78 - 0.59Jiangxi Leping - - - 0.54 -
Jinan Qilipu 0.85 0.69 0.85 - 0.64 0.72 -Kunming 0.23 0.56 0.12 - 0.22 0.43 - 0.10Nanjing 0.57 0.63 0.79 - 0.57 0.52 - 0.74 0.38Qingdao 0.74 0.63 0.91 - 0.68 0.56 - 0.82 0.24 0.76Shanghai 0.64 0.46 0.51 - 0.29 0.54 - 0.75 - 0.57 0.44Shenyang 0 71 0.91 0.71 - 0.38 0.91 0.69 0.58 0.30 0.68 0.30Tianjin 0.37 0.30 0.78 - 0.70 0.36 - 0.44 0.21 0.62 0.64 0.62 0.71Taiyuan 0.76 0.84 0.62 - 0.77 0.93 - 0.69 0.46 0.35 0.62 0.35 0.81 0.33Wuhan 0.42 0.24 0.46 - 0.43 0.37 - 048 0.36 0.13 0.33 0.13 031 0.47 0.40Xi'an 0.70 0.73 0.67 - 0.42 0.77 - 0.72 0 44 0.77 0.44 0.46 0.53 0.33 0 54 0.27Xinihg 0.50 0.82 0.66 0.37 0.68 - 0.45 0.80 0.28 0.35 0.28 0.55 0.22 0 63 0 42 0 84Yanlai 0.88 0 80 0.93 - 0.71 0.78 - 0.9() 0 31 0.80 0.79 0.80 0.82 0.68 0.67 0.32 0.76
Beijinig Changchun Chenigdu Fuzliou Giyanig lloholi Jiangxi Jinlanl Kuinming Nanyjing Qingdao Shanghai Shenyang Tianjin Taiyuan Wuhan Xi'anLeping
Cuculnber If
Changchuli 0.63Chengdu 0.69 0.77Fuzhou 0.67 0.66 0.77Guiyang 0.71 0.50 0.28 0.66llohhot 0.65 0.46 0.92 0.80 0.73Jiangxi Leping 0.39 0.46 0.70 0.35 - -
Jinan Qilipu 0.66 0.77 0.70 0.75 0.35 0.74 0.26Kunming 0.20 0.28 0.22 0.60 0.81 0.35 0.30 0.38Nanjing 0.54 0.68 0.85 0.78 0.69 0.82 0.52 0.65 0.37Qingdao 0.77 0 82 0.80 0.77 0.50 0.77 0.30 0.87 - 0.86Shanghai 0.47 0.52 0.75 0.67 0.71 0.78 0.34 0.65 0.42 0.81 0.69 -tShenyang 0.68 0.90 0.72 0.52 0.58 0.82 0.35 0.73 - 0.77 0.70 0.60 r_Tianjin 0.65 0.47 0.65 0.69 0.82 0.53 0.22 0.61 0.09 0.52 0.76 0.48 0.74 _Taiyuan 0.55 0.65 0.84 0.78 0.73 0.91 0.62 0 55 0.20 0.54 0.76 0.47 0.79 0.45Wuhan 0.64 0.83 0.86 0.62 0.48 - 0 77 0 71 0.33 0.88 0.77 0.67 0.73 0.50 0.71Xi'an 0 66 0 76 0.89 0.69 0.47 0.86 0.47 0.69 0.33 0 82 0.74 0.74 0.77 0.65 0.78 0 80Xining 0 30 0.32 0.80 0 75 0.76 0.41 0.32 0.32 - 0.37 0.75 0.30 0 66 0.29 0.28 0.50 0 81 >.Yantai 0 79 0.84 0.93 0.80 - 0.89 - 0.81 0.23 - 0.85 0 80 072 0.77 0 90 0 86 0.83 Z4
Beijing D Changchun Chengdu Fuzhou Guiyang Hohho( Jiangxi lina. Kunming Nanjing Qingdao Shanghai Shenyang Tianjin Taiyuan Wuhan Xi'an ZLeping

Table A5.2: WHOLESALE MARKETS COVARIANCE COEFFICIENTS (continued)
Sweet Pepper
Changchuo 0.73Chengdu 0.84 0.61Fuzbou 0.74 0.34 0.67Guiyang 0.47 0.53 0.24 0.64Hohhot 0.84 0.72 0.92 0.71 0.67Jiangxi Leping 0.66 0.25 0.43 0.71 0.68 0.73Jinan Qilipu 0.76 0.43 0.33 0.64 0.23 0.31 0.55Kunming - - - - -
Nanjinig 0.70 0.38 0.72 0.81 0.70 0.70 0.56Qingdao 0.94 0.67 0.79 0.73 0.22 0.88 0.68 0.81 - 0.69Shanghai 0.86 0.56 0.84 0.77 0.39 0.82 0.63 0.84 - 0.87 0.90Shenyang 0.83 0.73 0.63 0.44 0.34 0.81 - 0.69 - 0.57 0.65 0.82Tianjin 0.80 0.52 0.86 0.79 0.62 0.80 0.70 0.75 - 0.76 0.82 0.94 0.83Taiyuan 0.28 0.28 0.85 0.63 0.60 0.94 0.51 0.24 - 0.63 0.79 0.79 0.88 0.75Wuhan 0.69 0.51 0.76 0.67 0.17 - 0.65 0.67 - 0.61 0.52 0.65 0.61 0.69 0.74Xi'an 0.87 0.63 0.84 0.67 0.63 0.88 0.51 0.80 - 0.70 0.67 0.82 0.83 0.87 0 84 0.78Xining 0.56 0.85 0.30 0.58 0.35 0.75 0.46 0.70 - 0.47 0.81 0.88 0.55 0.70 0,73 0.67 0.59Yaittai 0.87 0.72 0.86 0.73 0.75 0.85 0.65 0.58 - 0.77 0.73 0.87 0.83 0.89 0.79 0.71 0.86
ieijing D Clhangchun Cliegtiu F%whou Giwiyang Ilolhilot iangxi Jinat Kuitiilig Nanjing Oingdao Shanghai Shenyang Tiaijin Taiyuan Wuihan Xianl.Uinhag
Changchun 0.72Chengdu 0.89 0.66Fuzhou 0.67 0.81 -Guiyang 0.50 0.32 0.51 0.34Hohhot 0.69 0.76 0.74 -
Jiangxi Leping 0.72 0.77 0.57 0.61 - 0.88linan Qilipu 0.73 0.64 0.76 0.67 0.37 0.80 0.84Kunming 0.57 0.70 0.42 0.36 0.20 - 0.40 0.54Nanljilng - - 0.76 0.72 0.60 - 0.88 - 0,48 >Qingdao 0.85 0.72 0.75 0.80 0.64 0.89 0.79 0.96 0.51 0.96 0-Shanghai 0.43 0.53 0.71 0.71 0.37 0.42 0.88 0.41 0.50 0.70 0.91 7?Shenyang 0.69 0.85 0.73 0.78 0.28 0.84 - 0.77 0.83 0.78 0.77 0.79 -3Tianjin - - - - - 0.13 - - - - - -Taiyuan 0.26 0.24 0.70 0.68 0.38 0.84 0.84 0.28 0.54 - 0.68 - 0.77 -Wuhan 0.62 0.68 0.60 0.51 0.27 - 0.71 0.59 0.69 0.59 0.54 0.71 0.64 - 0.76Xi'an 0.70 0.56 0.60 0.53 0.58 0.73 0.37 0.69 0.54 0.68 0.69 0.86 0.61 - 0.90 0.74 >Xiniuig - - - - - 0.40 - - - - - - - - - -Yantai 0.90 0.80 0.83 0.75 0.47 0.77 - 0.83 0.56 0.88 0.81 0.78 0.71 - 0.65 0.65 0.67 4
Beijing D Changchun Chengdti Fuzliou Guiyang llohhol Jiangxi Jinan Ktnming Nanjing Qingdao Shanghai Shenyang Tianjin Taiyuan Wuhan Xi'anI.eping


- X
-~ ~ ~ ~ ~ ~ ~ ~ ~ ~ ~ ~ ~ ~~~~~~~~~
~~~~~- 4.. . . 4
.~ ~ ~ ~ ~ ~ ~ ~ ,4 - 2.: 4.-C