Embed Size (px)
Citation preview
Report No. 1 3073-CHA
ChinaUrban Environmental ServiceManagementDecember 31, 1994
Environment and Urban Development DivisionChina and Mongolia DepartmentEast Asia and Pacific Regional Office
Document of the World Bank
Pub
lic D
iscl
osur
e A
utho
rized
Pub
lic D
iscl
osur
e A
utho
rized
Pub
lic D
iscl
osur
e A
utho
rized
Pub
lic D
iscl
osur
e A
utho
rized

CURRENCY EQUIVALENTS(January 1, 1995)
Currency = RenminbiCurrency Unit = Yuan (Y)Y 1.00 = 100 fenY 1.00 = $0.12$1.00 = Y 8.5
FISCAL YEAR
January 1 - December 31
WEIGHTS AND MEASURES
Metric System
PRINCIPAL ABBREVIATIONS AND ACRONYMS USED
As - ArsenicBOD - Biological Oxygen DemandBOT - Build-Operate-TransferCd - CadmiumCPI - Consumer Price IndexCOD - Chemical Oxygen DemandCOPD - Chronic Obstructive Pulmonary DiseaseCr - ChromiumCWSA - China Water Supply AssociationEIA - Environmental Impact AssessmentEPB - Environmental Protection BureauGDP - Gross Domestic ProductHg - MercuryISW - Industrial Solid Wastem 3 - Cubic MeterMCon - Ministry of Constructionmg - MilligramMSW - Municipal Solid WasteNEPA - National Environmental Protection AgencyNO. - Nitrogen OxideNPC - National People's CongressO&M - Operation and MaintenancePb - LeadSO2 - Sulfur DioxideSOE - State-Owned EnterpriseSSB - State Statistical BureauTSP - Total Suspended ParticlesTVE - Township and Village EnterpriseUfW - Unaccounted-for WaterUN - United NationsWHO - World Health Organization

CONTENTS
Preface .m........ . .. . . .. . .. . . .. . . .. . . .. . . .. . . .. . .Executive Summary ..................... V
1 Urban China: Threatened Environment ................... 1
A. Introduction .................................. 1B. Urban China ................................. 2C. The Urban Environment .......................... 6D. Reform and Urban Governance ...................... 11
2 Urban Environmental Management ...................... 14
A. Introduction .................................. 14B. Municipal EPB Structure and Functioning ................ 14C. Issues ...................................... 16D. Conclusion ................................... 23
3 Urban Environmental Services ......................... 24
A. Introduction .................................. 24B. Urban Environmental Services: Organization and Financing .... 24C. Water Supply ................................. 30D. Sewerage and Wastewater Treatment ................... 40E. Solid Waste .................................. 45F. Paying for a Healthy Environment .................... 48G. Efficient Organization and Regulatory Relationships ... ...... 50
Endnotes ......................................... 57

- 11 -
TABLES IN TExr
1.1 Size Distribution of Chinese Cities, 1992 ...... . . . 31.2 Capital, Profits, and Financial Revenue in Chinese Cities .. . . 61.3 Annual Health Impact of TSP in Urban China ...... . . 81.4 Pollutant Discharges from SOEs, 1981-92 ...... . . 9
2.1 TVE Contributions to National Pollution Loads ..... ....... . . . . 172.2 Pollution Loads at Da Qiao ........ . . . .......... . . . . . . . 18
3.1 Municipal Service Company Performance (1991) .... ........ . . . 263.2 Sources of Funds for Urban Maintenance and Construction, 1991 .... . 283.3 Application of Funds for Urban Maintenance and Construction,
By Type of Service, 1991 ....... . . ......... . . . . . . . 293.4 Per Capita Supply of Domestic Water from Municipal Systems ..... . 303.5 Water Supply by City Size, Municipal and Enterprise Systems, 1991 . . . 313.6 Length and Density of Municipal Drains and Sewers ... ........ . . 413.7 Number and Capacity of Municipal Wastewater Treatment Plants .... . 443.8 Municipal Solid Waste and Nightsoil Disposal ..... ........ . . . . 46
BOXES IN TExT
1.1 Urban Populations, Towns, and Cities ...................... 2
2.1 The Organization and Staffing of EPBs ..................... 15
3.1 On-Budget versus Off-Budget Income and Expenditures .. ....... . . 263.2 Water Price Reform in Jinzhou ....... . . . ......... . . . . . . . 353.3 Wastewater Pollutant Removal Efficiencies ...... ......... . . . . 43
FIGURES IN TExT
1.1 Municipal Govemment Organization (Shenyang, Liaoning Province) . . . 51.2 Urban TSP, SO2 and NO, Levels, Northem and Southem China, 1981-92 71.3 Municipal and Industrial Wastewater Discharges ...... . . . . . . . . . 10
3.1 Urban Water Consumption, 1990: Selected Cities (Population:> 1 Million) and Some International Comparisons .. ........ . 33
3.2 Altemative Demand Scenarios ....... . . .......... . . . . . . . 373.3 Bogota, Colombia and Shanghai, China: Water Price
and Consumption ........ . .. . ............ . . . . . . . 39

- iii -
PREFACE
This report is based on the work of a team staffed by Lee Travers (IaskManager), Edouard Motte, Andrew Hamer, Sun Chongwu, Guillermo Yepes, JeremyWarford, Jodi Felberg (Bank), David Jackson, Ma Xiaoying, Li Qun and Michael Einhorn(Consultants). Valuable assistance and insights were provided to the team by the staff ofthe Ministry of Construction, the lead Chinese counterpart agency, especially Mr. ZhangYaoru, Director, and Ms. Liu Yuming, Engineer, and by the staff of the NationalEnvironmental Protection Agency, including Mr. Liu Chunyu, Deputy Director, and Mr.Tang Dingding, Division Chief. Missions in October 1993 and March 1994 visited thecities of Kunming and Wuhan and express their appreciation for the contribution of thegovernments of those cities and of Yunnan and Hubei Provinces for their support of thiseffort. With Norwegian government support, gratefully acknowledged, the consulting firmNorplan A.S, analyzed the delivery of urban environmental services in the cities ofKunming and Wuhan, providing additional insight into the issues addressed in this study.
Working papers on Chinese practices, copies of which are available in thefiles, were prepared on (a) The Financing of Urban Infrastructure Services, (b) TheEnvironmental Protection System, (c) Solid Waste Management, and (d) Public UtilityServices.

- Al -

EXECUTIVE SUMMMARY
i. China must strengthen government intervention to protect the environmentas the transition to a market economy continues, for markets alone fail to reflect the socialcosts of pollution. Environmental deterioration will be avoided during this period of rapidindustrial growth only if the government can continue to improve and implementenvironmental regulations and pricing, credit control, and direct investment. For urbanenvironmental management, this report recommends augmenting existing strategies in thefollowing ways:
(a) increase the financial and social cost of violating environmental standards,while strengthening public participation and environmental education;
(b) assert effective regulatory control over township and village enterprises(TVEs);
(c) enact and enforce hazardous waste legislation;
(d) expand collective treatment of wastewater and solid waste; and
(e) charge tariffs for water supply, wastewater treatment, and solid wastedisposal that encourage careful use and provide resources for sustainable,high quality, service delivery.
ii. This report finds Chinese urban environmental services generally to beunderpriced, resulting in excess demand, unsustainable levels of pollution, and inadequatefunds to meet investment needs. To meet social and individual service needs, this reportrecommends:
(a) adjusting water tariffs to produce positive real rates of return on revaluedassets, an action that would double average tariffs but would also save Y 4.5billion per year in investment costs by the year 2000;
(b) adjusting sewerage use fees for full cost recovery from domestic,commercial, and enterprise users. For cities requiring primary treatment,this would add approximately Y 0.40 per m3 to water bills; and
(c) setting solid waste collection and disposal fees to cover the cost ofcollection, properly designed landfills, or other safe disposal methods. Thiswould increase the typical household solid waste charge by about Y 3 permonth.

- vi -
iii. Urban Chinese residents and enterprises have the financial resources to meetthe full cost of environmental services. However, this report emphasizes the need todeliver these services with the highest possible level of managerial efficiency and drawson international experience with incentive regulation to suggest means of enhancing thatefficiency.
A. BACKGROUND
iv. China's increased spending on pollution control, from 0.40 percent of GDPin 1980 to 0.67 percent in 1992, coupled with improved environmental regulation, hasallowed advances in some areas of pollution control, yet remains insufficient to deal withthe nearly threefold increase in the output of heavy industry over the same period.Dangerous levels of total suspended particulates (TSP) have been reduced, as have state-owned enterprise (SOE) discharges of heavy metals to rivers and lakes. Nevertheless,these achievements have only slowed, not stopped, deterioration of highly industrializedurban areas. TSP levels remain well above levels considered unsafe by the World HealthOrganization (WHO), sulfur dioxide (SO2) concentrations exceed the lowest Chinese airquality standard, few urban rivers reach the lowest acceptable Chinese water qualitystandard, groundwater quality continues to fall at an alarming rate, and petroleumdischarges to surface waters are increasing after an initial decline. Growing pollution fromTVEs lacks effective regulation and, perhaps most troubling, rates of industry compliancewith environmental regulations appear to be dropping.
v. Institutional responsibility for urban environmental management rests withtwo groups: the municipal EPBs, which implement national and local environmentalpolicies under the guidance of municipal government and the National EnvironmentalProtection Agency (NEPA); and the city bureaus and companies responsible for watersupply, sewerage, wastewater treatment, and solid waste collection and disposal under theguidance of the Municipal Construction Commission and the Ministry of Construction(MCon). However, these institutions have not been given sufficient authority or permittedsustainable financial arrangements to efficiently manage China's urban environment.Efficient urban environmental management requires a policy environment that providesrules and incentives to control pollution at source (through cleaner production processesand in-plant treatment of pollutants) or, if more economic, to collectively treat wastestreams (through wastewater treatment plants, landfills, etc.), and institutions powerfulenough to enforce the rules.
B. URBAN CHINA
vi. China has the world's largest urban population, at over 324 million people,and is growing at 4.6 percent annually. Thirty-two cities have populations of over 1million, while the largest, Shanghai, has 8.8 million. Chinese cities have long hadpowerful, stable administrative structures responsible for planning and implementing urbandevelopment. This power has grown markedly over the past decade, as national andprovincial governments decentralized expenditure authority to city administrations, whichresulted in an 11 percent annual increase in real municipal expenditures per capita. At the

- vii -
same time, real urban incomes per capita grew at 6 percent per year, making Chinese citiesand citizens much wealthier than they were a decade ago.
vii. Although the ongoing reforms have strengthened cities, new pressures haverequired frequent adjustments to urban strategies. Several reforms will directly impact theenvironmental sector, including the further separation of state-owned enterprises (SOEs)from government control, hardening SOE budget constraints, greater regulatory control byEPBs, and tax reforms to shift an increasing share of revenues from cities to the centralgovernment. Under the new reforms, township and village enterprises (TVEs) have grownrapidly and have created special regulatory difficulties. Moreover, the failure to reformprices for urban environmental services, such as water supply and wastewater treatment,have slowed investment and quality gains in these critical areas, whereas price reforms forenergy have aided environmental management efforts. This report recommends severalmarket reforms to improve the management of key environmental services.
C. ENVIRONMENTAL MANAGEMENT
viii. Ineffective regulatory control and economic disincentives undermineenvironmental management in urban China. This report recommends several policyimprovements to address these weaknesses:
ix. Raise the Cost of Violating Standards. SOE water pollution controlequipment operates at about 50 percent efficiency because low fines, low monitoring rates,and hardening budget constraints make pollution violations an attractive alternative forplant managers. Pollution fees and fines, if levied at all, total no more than Y 0.40/i 3,whereas in-plant wastewater treatment costs Y 0.70-0.80/m3. Chinese firms will have noeconomic incentive to improve pollution control efficiency unless the expected cost ofviolations is raised through substantially higher fines and more frequent monitoring.
x. Strengthen Public Participation and Environmental Education. Chinamust encourage citizen monitoring of polluters and broadly publicize how cases of firmscaught violating standards are resolved. Citizen monitoring complements EPB monitoringby increasing the social cost of polluting to enterprises. Pollution already draws publiccomplaints: 130,000 complaints against polluters were filed at EPBs in 1991, and thisnumber is growing. However, effective implementation of environmental controls willrequire more than just citizen monitoring-it will require public understanding and support.Education can play a role in explaining how compliance with regulations and increasedcosts for environmental services can protect the environment; publicity campaigns canequate good corporate citizenship with effective pollution abatement. Internationalexperience shows that education and campaign efforts work best when accompanied byincreasing financial costs of noncompliance. Furthermore, to enhance public participationand education, the government must continue to give EPBs a high level of politicallegitimacy. Although some provinces are considering reducing the EPB rank in thegovernment hierarchy as part of their restructuring efforts, this report finds that such actionwould send the wrong message to urban residents and firms about government priorities.

- viii -
xi. Assert Effective Regulatory Control Over TVEs. Small, dispersed TVEsconcentrate in peri-urban areas and pollute the same air and watersheds as urban industries.TVE industrial growth and pollution are rapidly increasing. TVEs produced 37 percentof industrial output in 1992, and are estimated to produce 22 percent of wastewater outputand 19 percent of air pollution. However, unlike urban enterprises, TVEs remainessentially unregulated because they are difficult to monitor. But because TVE pollutionis concentrated in a few industries (such as coke production, leather tanning, chemicalproduction, electroplating, and pulp and paper production), this report recommends thatNEPA publish expected pollution coefficients for the few alternative technologies that theseindustries use. In the absence of specific abatement technologies, EPB authorities couldlevy presumptive pollution fees based on production rather than on direct monitoring. Iffirms believe they outperform the presumptive benchmarks, they can be given the optionto pay for direct monitoring to establish that fact. Municipal and county EPBs mustcollaborate to develop a mass-based pollution permit system for implementation in urbanand peri-urban areas. Moreover, county EPBs will need institutional strengthening, aprocess that will be facilitated by working with the municipal EPBs.
xii. Approve and Implement Hazardous Waste Legislation. Chinese industryis required to process or safely store 50 million tons of hazardous waste which it generateseach year. But no agency is responsible for hazardous waste monitoring and, as a result,violations become known only after an accident results in injury or immediate economicloss. In 1991, 2,800 recorded pollution accidents resulted in nearly 1,900 injuries. Butthese numbers pale in comparison to the potential damage that could be done to theambient environment and human health by hazardous waste pollution. Draft legislationwhich gives EPBs regulatory authority over hazardous wastes should be implemented withno further delay.
xiii. Develop Municipal Wastewater Treatment. Many urban lakes and riversare condemned to serve as waste sinks because of excessive volumes of municipalwastewater and inadequately pretreated industrial wastewater. Only 4.5 percent ofcombined municipal and industrial wastewaters receive collective treatment, and 15 percentreceive pretreatment. Collective treatment works can economically treat municipalwastewater and may be the most efficient means of treating many industrial waste streams.This report recommends that treatment plants, which must continuously monitor theirinfluent, are better placed to enforce discharge standards than the EPBs. Treatment tariffsbased on waste loads, with surcharges for violations of agreed levels, will encouragetreatment plants to accurately measure loads. Treatment plants, in turn, should bemonitored by the provincial EPB to ensure compliance with discharge standards.
D. MuNIcIPAL SERVICES
xiv. Municipal environmental services-which need not be municipally owned-provide community access to and control of natural resources, and colleciively treatpollutant discharges within the community. Efficient management of these servicessupplies them at or near the socially optimal level. However, this is not the case in urbanChina. Low water prices encourage excess demand and result in financially unsustainable
- ix -
water companies that must be subsidized to remain operational. Low prices for sewerage,wastewater treatment, and solid waste handling and treatment lead to excess effluent andinsufficient revenues. Unlike water, these services do not receive correspondingly largemunicipal subsidies to meet investment and operational needs. Correct pricing ofmunicipal services will manage demand and reduce pollution, while improved sectororganization and incentives will encourage efficient service delivery.
Water Supply
xv. Municipalities directly provide about 80 percent of piped domestic water and30 percent of enterprise water, with the remainder supplied by enterprises themselves.Nearly 90 percent of the urban population is served by water systems (97 percent in largecities), 24-hour supply is common and water plant output generally meets qualityguidelines. Building-level metering is universal and customer arrears are extremely low,as are commercial losses through illegal connections or malfunctioning meters. However,low construction and material quality, combined with inadequate plant and systemmaintenance, substantially reduce system service life and increase the long-run cost ofsupply.
xvi. Overexploitation and Falling Real Prices. China has per capita raw watersupplies below international averages, yet total industrial and domestic per capita urbanconsumption rivals that of water abundant countries like Canada. Enterprises consumewater at levels two to three times international best practice, despite water quotas andincreased recycling. Per capita domestic consumption, which rose 35 percent over the1980s, and industrial use levels have been sustained in part by the very striking fall in thereal price of water since 1980. By 1989, inflation had driven the real price of water tohalf the 1980 level. At the same time, supply costs rose. By the late 1980s, many citieshad overexploited or polluted nearby raw water sources and the need to tap distant sourcesdrove up the real costs of new supply by over 7 percent per year. Recognizing animminent water crisis, some cities began tariff increases in the late 1980s and recapturedsome, but far from all, of the real revenue losses. On the whole, current water pricesremain about half the average level needed for self-sustaining water company operations,and even farther below the socially optimal price, itself equal to the rapidly rising long runmarginal cost of supply.
xvii. Managing Water Demand. The estimated 10 million m3/day shortfall inurban water supply can be reduced, future investment needs constrained, efficient industrialwater use encouraged, and system quality and quantity improvements financed if Chinesecities aggressively use price as a water demand management tool. Little research has beendone on Chinese household water price and income elasticities of demand. However, onestudy estimated domestic water demand in Shanghai and found a price elasticity of -0.38and an income elasticity of 0.22, both consistent with international experience. Industrialdemand elasticities have not been estimated because binding water use quotas, rather thanprice, have heretofore determined consumption for most firms. Until prices rise to thepoint where they balance enterprise supply and demand, their price elasticities will be low;however, above that point, they can be expected to be large. International experience
x
shows that firms typically have long-run price elasticities of demand for water well abovethose of households. To be sure, price increases will not end the need for new investmentin water supply. The severe water shortages in North China, where 1992 domesticsupplies fell below 40 liters per day in 18 cities, can be effectively addressed only by acombination of improved pricing and investment in supply.
xviii. Water quotas are economically inefficient and should be abandoned in favorof price-based water demand management. As the first step toward socially optimalpricing, this report recommends a demand management policy that sets water tariffs toensure a positive rate of return on revalued assets and enable capital market access forinvestment needs. Ground and surface water must be protected from overexploitation byincreasing enterprise raw water extraction fees to a level that, on average, equates theirself-supply costs to municipal supply costs. A water demand management program of thistype would reduce sector investment needs by an estimated Y 4.5 billion annually by theyear 2000, free enterprises from input quotas, and allow cities to reallocate the 12 percentof municipal urban infrastructure budget that currently finances water investments.
Sewerage and Wastewater Treatment
xix. Inadequate Protection. Low sewerage system coverage and inadequatetreatment levels result in contaminated groundwater and polluted urban surface water.Nearly 40 percent of urban China is unserved by sewers, with wastewater going directlyinto lakes and rivers. According to current municipal investment plans, 30 percent ofurban China will still remain unserved in the year 2000. Only 4.5 percent of municipalwastewater flows receive treatment of any kind, while industrial pretreatment raises overalltreatment rates to 17 percent. The year 2000 goal is a modest 25 percent. Low seweragecoverage and inadequate treatment levels destroy ambient water quality, and, based oninternational experience, disproportionately burden the poor, who are less likely to haveaccess to safe water supplies.
xx. Lack of Funding. Chinese cities have little incentive to invest in sewerageand wastewater treatment because they receive little or no income for handling wastewaterdischarges. Current regulations permit enterprises to be charged for sewerage use, but nothouseholds, and the recommended fee does not allow full recovery of operational andinvestment costs. Only half of China's cities have assessed sewerage use fees, most at therecommended rate of Y 0.08/m3 (based on 80 percent of water use). EPBs have recentlybeen authorized to charge enterprises a separate wastewater damage fee of Y 0.08/m3
(unless they are already paying more under the pollution levy fee system). However, thelatter fee cannot be used for sewerage system maintenance, construction, or operationsbecause EPB charges remain within the environmental protection system. Perhaps becauseuntreated wastewater affects downstream cities more than the producing city, municipalwastewater handling and treatment have lagged behind national needs.
xxi. A Program of Intervention. Given the low quality of urban surface waters,known downstream effects, and widespread aquifer pollution, the national governmentshould require the 203 largest and medium-size cities to provide primary treatment (withprovision for expansion to secondary) within ten years for any discharge that reducesreceiving water quality to below irrigation use standards. Such treatment would reduce

- xi -
pollution loads by some 30 percent from those cities, which account for over 80 percentof total loads. All cities should be required to design and develop sewerage systems thatfacilitate the later addition of treatment works, and which provide immediate treatment ifreceiving water quality cannot meet either irrigation use standards within 3 kilometers ofwastewater discharge points, or standards for domestic raw water at the nearestdownstream community extraction point.
xxii. The estimated cost of this wastewater investment program is Y 4.3 billionper year ($490 million) over the next 10 years, or about three times the current annualinvestment in sewerage systems. The implied 15 percent increase in the annual urbaninfrastructure construction program would be offset by the drop in water supply investmentresulting from the new water demand management program. Under the wastewatertreatment program, user fees would cover all costs, with the possible exception of stormdrainage services, which could be covered from general revenues. Sewerage tariffs forhouseholds and small enterprises would continue to be levied against 80 percent of wateruse but charges for larger enterprises would be based on metered loads. Water users inuntreated parts of the system would also pay the full treatment fee to reflect the damagecaused by untreated wastewater. User fees in a primary treatment system would totalabout Y 0.40/mi of water consumed, a level close to the current average price of water.The combined impact of the water and sewerage tariff increases would triple averageeffective water prices. That new price would accurately reflect the true cost of deliveringsafe water and collecting and treating wastewater. It would encourage water-savingbehavior, postpone investment in new supply, and promote sewerage and treatment systemsthat are economically sized. Any delay in implementing the program will simply force theconstruction of larger and more costly systems in the future.
Solid Waste
xxiii. Good Collection, Poor Disposal. Solid waste collection operations are runwell for a country at China's income level. Municipal and district governments, andneighborhood committees, share responsibility for domestic solid waste collection anddisposal services, with districts generally responsible for transportation and disposal.Households carry wastes to neighborhood collection points, with pickup 3 to 7 times perweek in core urban areas. Private and municipal recycling firms recover much of themarketable waste, but estimates of individual city recycling rates range widely from 5 to35 percent. Recycling aside, disposal services in urban China are poor. Most municipalsolid waste is disposed of in unmanaged dumps that have no provision for leachate controlor methane flaring or use. Leachates from these dumps have contaminated surface watersand aquifers in many cities.
xxiv. The improper disposal of industrial solid wastes exacerbates these problems.In 1992, industries dumped over 10 million tons of solid waste into urban rivers and lakes.Because industries make their own disposal arrangements, effective regulation is difficult.While continuing to allow free contracting for waste hauling, mandatory use of licensedsanitary landfills would protect society from random dumping.
xxv. The Sanitary Landfill Response. While some landfills are well run, mostare poorly controlled, fail to meet government standards, and inadequately handle leachates

- xii -
and methane. The single largest improvement in solid waste handling would be theprovision of adequately engineered and managed landfills, and the requirement to usethem. Landfill operations enjoy large economies of scale, which argues for municipaloperation in large cities and regional landfills near concentrations of smaller cities. Landavailability largely determines landfill costs. In Tianjin, for example, the cost of pickup,transfer, and disposal to a high-standard landfill is Y 55/ton, or about Y 16/capita/year.If these costs are representative, then the typical charge for domestic waste ofY 5/capita/year would have to triple to fully fund proper solid waste handling and disposal.Industrial waste disposal fees would also rise as unmanaged dumps are closed. Intensiveeducation, careful monitoring of illegal dumping, and high fines imposed on violators willencourage acceptance of these solid waste policies.
Paying for an Improved Environment
xxvi. Tariffs supporting improved environmental services will reassign the costsof treatment to polluters and, in the long run, reduce social costs by improving the qualityof water and land. Much of the relocation of raw water supplies going on today wouldhave been avoided had wastewater and solid waste been handled properly over the past twodecades. Still, the suggested tariffs will substantially increase the cost of water,wastewater, and solid waste handling to enterprises and consumers. For enterprises, theimpact on production costs will depend on current water use efficiency and management'sability to adjust to the new price regime. In most urban industries, water contributes avery small proportion of total production cost, usually under 1 percent, and the impact ofeven large price increases need not have a large impact on output prices. Solid waste costincreases would have an even smaller impact.
xxvii. Analysis shows that urban consumers are well positioned to absorb both theindirect and direct costs of an improved environment. Under current pricing policies, thewater bill takes only 0.4 percent of total income for the poorest 5 percent of urbanhouseholds. Their total utility bill, which includes water, fuel, electricity, and wastecollection, takes 4.6 percent of total income. The recommended water, wastewater, andsolid waste charges would increase the total utility outlay among this income group toabout 5.8 percent of total income. By comparison, on average they spend 6.3 percent oftheir income on cigarettes, alcohol, and tea. Moreover, real income growth rates for thepoorest 5 percent households have matched those of their wealthier counterparts for mostof the past decade. Therefore, the proposed cost increase for environmental services couldbe recaptured through real income growth in a single year. The one group that may needspecial protection from the proposed tariff increases is the 0.5 percent of China's urbanpopulation that lives below the poverty line. They generally rely on government incomesupplements for their subsistence and this report recommends that the supplements beincreased to maintain their consumption levels.
Increasing Sector Efficiency
xxviii. The proposed tariff increases would provide the means for asubstantial increase in the quality of services, but rising costs will put pressure on citiesto simultaneously improve operating and managerial efficiency. An important step towardincreasing sector efficiency will be to operate all municipal services on an independent

- xiii -
accounting basis. Simultaneously, managers must be trained on cost accountingtechniques, so that they can make use of China's new enterprise accounting system toidentify cost savings in their operations.
xxix. International experience provides valuable lessons for increasing sectorefficiency. Companies must be provided a stable regulatory environment that uses pricingas the basis for demand management. Regulators must allow efficient companies tomaintain their real income even in periods of high inflation. To reduce political pressure,municipal regulators should avoid case-by-case tariff increases in favor of pricing formulasthat include automatic inflation adjustors. The formulas can be based on agreed investmentand management goals and structured to encourage efficiency gains rather than simply passcosts through to consumers. As the market economy matures, cities may want toexperiment with a competitive bidding process to contract out the management of watersystems. In Shanghai and other cities, BOT (build-operate-transfer) operations of newwater plants are being considered to mobilize capital and managerial expertise.
xxx. The operation of sewerage and solid waste systems by government bureausgenerally suits the current level of system development. However, managerial demandswill increase as systems expand, treatment plants are built, and independent accounting isadopted. In larger cities, enterprise organization and an incentive-driven regulatoryenvironment will be justified. In most countries, urban solid waste operations tend toremain under municipal bureau control. However, these bureaus often play only acoordinating role, contracting out collection, and sometimes disposal services, toindependent firms. Many Chinese cities already have experience in contracting out fornightsoil collection, and the principles are no different for solid waste. However, theoperation of landfills requires special attention because the social cost of impropermanagement is high. Privately run landfills must be carefully regulated, an expensiveprocess that leads many cities to opt for self-operation to ensure proper control.
Conclusion
xxxi. China now has an urgent need to reorient the provision of urbanenvironmental services toward the market economy. The failure to do so would condemnurban residents to a deteriorating environment and poor quality, but increasingly expensive,services that do not protect them from the growing stream of urban domestic and industrialpollutants. While the imposition of user fees may be politically difficult, city leaders mustrecognize that the costs will be paid directly or indirectly, and that the current choice torely on indirect payment leads to excess demand, on the one hand, and an inability to meetneeds, on the other. The result in the end is greater pollution and higher total costs forthe service provided. The avoidance of adequate user fees also denies city leaders full useof a powerful and efficient tool, collective treatment of pollutants, as they seek the mostcost-effective means of sustaining an environment supportive of economic growth.

xX

- 1 -
1. URBAN CHINA: THREATENED ENVIRONMENT
A. INTRODUCnION
1.1 Efficient urban environmental management complements the control ofpollution at source with the collective treatment of particular waste streams to hold overallpollution loads to sustainable levels. Because markets alone will rarely induce firms orconsumers to restrict sufficiently their polluting outputs, governments turn to regulation,taxation, or other instruments to provide the needed signals. In many cases, and herewastewater and solid waste stand out, the most efficient control may require a combinationof source and collective treatment of the waste stream. In other cases, such as airpollution, collective treatment options are generally uneconomic and govemment relies onsource control alone.
1.2 A 1992 Bank sector study, China: Environmental Strategy Paper (ReportNo. 9669-CHA), analyzed China's rural and urban environmental problems,environmental management systems, and the mix of command and control and economicinstruments used to control pollution at its source. That study identified opportunities toimprove management strategies and move closer to the least-cost mix of policyinstruments. In response to those opportunities, the Chinese govemment developed aprogram of policy research and experimentation and ecological monitoring funded by anIDA credit (Credit 2522). The policy work focuses on improving economic instruments,particularly pollution taxes, and experimenting with cleaner production alternatives to end-of-pipe treatment for pollution abatement. Other recommendations of the strategy paper,particularly in support of local environmental master planning, have been incorporated inBank- and IDA-funded urban environmental projects such as the Beijing EnvironmentalProject (Loan 3415/Credit 2312) and the Shanghai Environment Project (Loan 3711).
1.3 The current study revisits, for urban China, a subset of the source-controlissues, but concentrates on the collective treatment of wastewater and solid waste that wasoutside the scope of the previous study. Because water supply and policy influencewastewater outcomes so directly, that sector, too, has been included in this study.'Chapter 1 highlights features of urban China critical to regulation and collective serviceprovision, particularly municipal organization and financial resources. It then characterizesthe changes in ambient environmental indicators over the past decade and concludes bynoting recent economic reforms expected to strongly influence urban environmentalregulation or collective services. Chapter 2 analyzes urban environmental regulation,recommends measures to improve regulation of township and village enterprises (TVEs);and calls for approval and implementation of pending hazardous waste legislation;increased investment in sewerage and wastewater treatment; strengthened environmentalmonitoring; and increased public education and participation. Chapter 3 shows the

- 2 -
importance of price-based demand management in improving and sustaining water,sewerage, and solid waste services and discusses organizational and incentive regulationstrategies cities can use to increase service efficiency.
Box 1.1: URBAN POPULATIONS, TOWNS, AND CITIES
In 1992, 746 million people, or 64 percent of the national population, lived within thepolitical boundaries of China's 517 cities. However, the cities incorporate rural hinterlands of varyingsize and only 164 million of the city population held the coveted 'nonagricultural residence permit'that gave them full rights to residence and services in urban neighborhoods. The others retained userights to agricultural land and settlement rights in associated villages and were defined as rural,regardless of the type or location of their employment. Both population concepts differ from theChinese census definition of urban, which yields an official urban population of 324 million, the 28percent of the population noted in this report.
Urban people live in either towns or cities. Towns, which may be located within cityboundaries, numbered over 14,000 in 1992 and held about a third of the registered nonagriculturalpopulation and a larger proportion of people working in nonagricultural employment. Designation asa town or city increases a jurisdiction's financial and administrative power, with cities having muchmore autonomy than towns. The seat of county government automatically gains town status, whilevillages with over 10 percent of their population, at least 2,000 people, holding nonagriculturalresidence status can request town designation. Towns fall under county government jurisdiction forplanning and other administrative purposes.
Cities become such through State Council approval. Towns may confidently seek citystatus if their nonagricultural population exceeds 80,000, their total output value exceeds Y 600million, and they function as the center of the local economy. Cities have either county-level,prefectural-level, or provincial status. The prefectural-level cities, which numbered 191 in 1992,incorporate rural counties and, in the urban core, city districts, each with county-level governmentstatus. County-level cities are smaller, less wealthy, and have less concentrated populations. Theyalso have fewer administrative and financial powers than prefectural-level cities.
China's three largest cities, Shanghai, Beijing, and Tianjin, with nonagriculturalpopulations of 8.8 million, 6.6 million, and 5 million, respectively, have provincial-level status. Thisgives them legislative independence and fiscal powers not enjoyed by other cities.
The large migrant population holding official residence status in one place (usually arural area) and living and working in another (most often urban or peri-urban), boosts actual urbanpopulations above reported levels. Recent estimates put the migrant population at about 100 million,although many live and work in peri-urban areas, rather than in the urban core.
B. URBAN CEINA
1.4 Population. China has the world's largest urban population, at 324 millionin 1992, but an urbanization rate of only 28 percent (Box 1.1). The low urbanization rateis a relic of the urban policy in place from the late 1950s through the mid-1980s thatsought to maximize resources available for industrial investment by increasing labor forceparticipation rates while holding down urban infrastructure investment. The policy had asits centerpiece the careful control of population movement through residence permitscoupled with grain rationing. The latter gave cities sufficient power over both housing and

- 3 -
grain markets that unsanctioned migration became very difficult. With acceleratingeconomic growth and a relaxation of control on migration, urban growth rates averaged4.2 percent through the 1980s, lagged with the economic slowdown from 1989 to 1991,and then jumped to nearly 6 percent with the economic boom in 1992. With therecognition that cities are functioning as growth poles, and with the need to find jobs foran estimated 100 million underemployed rural people, the debate in China has shifted fromwhether to allow urban growth to how to accommodate it. Over the next two decades,urban jobs are expected to absorb most of the increment to the national labor force.
1.5 The 517 Chinese cities range widely in size. The largest, Shanghai, witha nonagricultural population of 8.8 million, is one of 32 Chinese cities with populationsover 1 million people. The smallest city, Wanding in Yunnan Province, has but 3,500nonagricultural residents and gained city status because of its strategic, international borderlocation. The cities are concentrated in the eastern half of China, particularly on theseaboard and lower Yangtze River Valley. Their overall size distribution is shown inTable 1.1.
Table 1.1: SIZE DISRBUTION OF CHINESE CITIES, 1992
Population >2 million 1-2 million 500,000- 200,000- < 200,000_ _ _ _ 4 _ _ 1 million 500,000 _
Number of 10 22 30 141 314Cities _ _ _ _ _ _ __ __
Source: Ministry of Construction (MCon).
1.6 Administration. China's development strategy from the 1950s through thelate 1970s sought to create locally self-sufficient economies centered on industrial cities.Based on the expectation of large-scale nuclear war, this strategy fostered stable, powerfuladministrative structures. Local leaders were given broad latitude in the execution ofrelevant national and provincial policy and local administrations were expected to plan andundertake their own development. National plans and budgets aggregated andcomplemented those local plans. Enterprise tax and profit flows passed through municipalor county government coffers, with municipalities retaining a local share of about one thirdand remitting the remainder to the provincial governments, which in turn remitted thecentral government share.2 Centrally and provincially owned enterprises, as well aspoorer areas, were supported through operating or investment reflows from the center andprovinces, funded by surpluses from more prosperous areas. In poorer regions, greaterdependence on higher-level funding reduced administrative independence, but the latternonetheless remained substantial.
1.7 Although China's development approach changed over the 1980s and nowsupports economic integration and the flow of resources to higher-return areas, municipalpower has not weakened. Of the Y 361 billion in 1991 nationwide budgetary revenue,Y 140 billion accrued to the central government and Y 139 billion accrued to the then 479city governments (the remaining Y 82 billion went to county, prefectural, and provincial

governments).3 By 1991, municipal governments retained two thirds of their on-budgetrevenues and, directly or through their subordinate enterprises, now remain responsible forthe bulk of all new investment and control most urban employment.
1.8 Cities have well-staffed administrations. In addition to employing staff toundertake the regulatory, police, and administrative work typical of cities everywhere,Chinese cities must staff bureaus that supervise city industrial and commercial enterprisesas well as manage the flow of new investments (see Figure 1.1). Some environmentalservices, particularly water and gas, are provided by municipally owned corporationssupervised by the Construction Commission or Public Utility Bureau, while others suchas municipal solid waste disposal are provided directly by city bureaus. MunicipalEnvironmental Protection Bureaus (EPBs) oversee enterprise compliance withenvironmental laws and regulations and manage the use of pollution levy fee loans andgrants for pollution control investments.
1.9 To ease administration, medium and large cities are divided into districts,each with its own government and budget. In turn, districts are divided into neighborhoodcommittees, which have elected leaders and very modest budgets, but are consideredcitizen organizations rather than government offices (hence neighborhood committeeemployees are not on the city payroll). District organization parallels that of the city, withdistrict counterparts to the city's legal, administrative, public utility, and otherorganizations. District offices undertake much of the daily work of govemment, including,among the environmental services, drainage and sewerage, and solid waste collection anddisposal. District governments themselves rely on neighborhood committees for someservices, such as street sweeping. District governments may run businesses and earnrevenue through fees for their services.4 The degree of district financial self-sufficiencyvaries throughout the country, with some districts wholly self-financing and others needingtransfer payments.
1.10 Counties under cities operate with independent budgets, controlling their ownrevenues and expenditures, although revenues typically include transfers from the urbancore. For strategic planning purposes, the counties are subordinate to the urban core,which can help cities solve transboundary problems. However, the urban core control isnot absolute and county officials may successfully demand offsetting investment or otherprivileges if they forgo opportunities on behalf of the urban core. For example, afterShanghai decreed an industrial exclusion zone along the upper Huangpu River to protectwater supplies, they assisted Qingpu county with industrial investment outside the exclusionzone to offset lost investment opportunities within it.
1.11 Wealth and Income. Table 1.2 shows the remarkable consistency of theper capita stock of industrial capital across city size, and that capital is somewhat moreprofitable in cities with over 1 million people. The latter cities generated 48 percent ofall profit and tax revenue from 40 percent of the capital base in 1992. As a consequence,their on-budget financial revenue share ran over 24 percent above their population share.By contrast, the 314 smallest cities averaged per capita on-budget financial revenues lessthan two thirds those of the larger cities.

- 5 -
Figure 1.1: MuNICIPAL GOVERNmENT ORGANIZATION(SHENYANG, LIAONING PRovINcE)
Shenyang
Bureau Import Company Bur'eCaugr*
WPlannin avin oreign con iea rban n uragl Con- ShEducan Shnang Sc|eces& Teh
anutry Prouon onenelPro Be rolsbu
C oesiss on I Lred Compani trction CoB isi Compn Cion m pan
PEletrolnic W ior"g Phenrdscg heEduction yeang1
_aBur* *u _ Tr*Cmp gny Cupanyu
gricultal o OMchanical Eqpt | Shnyang burbuaMatchlurgicn Import & Export C c
Bureau Company Company Public Health|
LihtInut ShLnggCt Induotr Shenyangministrai _Proodn ExporMt inTrnsport
Bureau laport Co pany Bureau D i Irural ti-
Bureau ~~urea
Wu r ng MetSl T Minorl Shenyang Envi- Sood rain Satno S;Indu!try _ Productz rotnantal Pro - Bus |Trolle busl Agriculture|Burtr au Cod iny tacsniration Bureau |Ctpany CoBureau
Electronics 9 Uvn Pi:ducts| Sh n ng M Htoorological I Industry & q Ilcport E E Sport hnPlanng o B BureauBureau l CoBpany u uBureau q
Weights Public Material
| A[gr!cultur&lI Food & Oil. l Shenyang UXrban B | ubli a*urt|H chi... Imlport i. Export Conntructiou I
Bureau l Company l |Buruu r Bureau Civil Adui..
| | Light Indust; | | Shnyang Con- | | llbood l [ Bureau r 1 BureauAdtinistrgesi c 9tructiof Surb r eintn hst
Bureau p vee Bureau o 75 on p t pop tio tural alvctra-domestic wateruse was barely halflarge-city leve ls.
5In the lgest cities, 5fi6.tion puruen
I I Trsd i Co_orc | [Shenyang Con-have a e togas forcookin, bruction the smallest citis on 63 p t hv gsi(mtivs
l~~~~~~-1 I il Bureau |rl Bureal| u*u 1 .5uru
Rurs l c Sall TR i dShennang Lond v 6 Poodp n mrin-r litionnl Scur- au Industry Adeini t t Adrinistrhtiou b c eureu A c ity s urfau
tration Bur vau c l Bureau 5
l~~~~~~~~~~~~~~~ansrt |- -tati tic 1 LaborLlAd ini trti.n AdBnsrto Bureau Jru
| Bureau | Bureau F .. . .. .To rr H te il P iBureau B lureau
| W ight. L Mae- |_ ate;rial
| Audit Bureau
1.12 Higher municipal income translates into higher levels of urban services. Inthe nine largest cities, 97 percent of urban residents have access to tap water, but insmaller cities, tap water supplies reach only 75 percent of the population and averagedomestic water use was barely half large-city levels.' In the largest cities, 56.6 percenthave access to gas for cooking, but in the smallest cities only 6.3 percent have gas (mostuse coal). Residents of smaller cities do have 16 percent more living space per capita anduse more electricity than residents of the largest cities.' All city sizes showed significantincreases in service levels over the past 1S years.

-6 -
Table 1.2: CAPrIAL, PRoFiTs, AND FINANCIAL REVENE iN CNESE CrrES(as a percentage of all cities, 1992)
Population >2 1-2 million 500,000 - 200,000 - < 200,000million 1 million 500,000
Nonagricultural 22.5 18.5 13.1 24.4 21.5population _
Enterprise 21.3 18.4 14.4 27.9 17.9Capital
Enterprise 27.5 20.6 13.5 20.8 17.6Profits plusTaxes
City On-Budget 30.9 20.0 10.9 21.5 16.6Revenue
Note: The enterprise capital totals do not reflect depreciation.
Source: SSB, Zhongguo Chengshi Tongji Nianjian, 1992, SSB Publishing House, Beijing,1992.
1.13 Urban residents enjoy incomes reflecting the high national income sharegenerated in cities. Urban Chinese incomes average 3.1 times those of rural people, a gapthat has been growing in recent years. And in-kind income and subsidies boost urbanincome another 50 percent above average nominal wages.7 Urban Chinese own anaverage of 74 color televisions per 100 families, have 52 refrigerators, and 83 washingmachines, while rural households have only 8, 2, and 12, respectively. Urban personalsavings account balances totaled Y 1,558 per capita in 1991, a cushion equal to 91 percentof annual average cash income. Housing space is tight, with only 7.1 m' per capita, buthas doubled since 1980.9 The relatively high and rising incomes and assets of urbanpeople make the application of beneficiary financing to collective urban services bothpractical and necessary.
C. THE URBAN ENONMENT
1.14 The 9.2 percent annual growth of urban industrial output since 1981 hascreated much of the wealth reported above. Over the same period, a very active pollutionsource control program coordinated by the National Environmental Protection Agency(NEPA) has allowed the growth to occur without equally rapid increases in ambientpollution loads. Although some important types of pollution have been reduced, manyambient indicators remain at unacceptably high levels and much remains to be done in eachof air, water, and solid waste pollution.

Figure 1.2: URBAN TSP, SO2 AND NOX LEvELs,
NORTHERN AND SOURN CHINA, 1981-92
TSP LEVELS:NORTHERN AND SOUTHERN CHINA
1981-1992
mg/rm3
0.8
0.6 _
0.41
0.2 _
1 82 83 84 86 86 87 88 89 90 91 on
Year
- North -South
SO. LEVELS:NORTHERN AND SOUTHERN CHINA
1981-1992
an/m s0.14
0 . O 6 _s / O S
0.04
0.02 _
1 82 83 84 86 88 87 88 89 90 91t 92
Year
- North )* South
NO. LEVELS:NORTHERN AND SOUTHERN CHINA
1981-1992
ms/m3
30 -
20 -
10_
° 82 83 84 85 86 87 88 89 90 91 92Year
-North * South
- 8 -
1.15 Air Pollution. As Figure 1.2 shows, urban air pollution has remained highover the past decade. China has defined acceptable air quality levels in three grades,which match the World Health Organization (WHO) guidelines for sulfur dioxide (SO2),but are less strict for total suspended particulates (TSP).'° The lowest level, grade 3,specifies maximum TSP of 0.5 mg/m3; sulfur dioxide (SO2) of 0.10 mg/m3; and oxides ofnitrogen (NO.) of 0.15 mg/m3. The Chinese standard defines grade 3 quality as that withinwhich the human population can avoid acute or chronic pollution-induced illness and all"except sensitive" plants and animals can maintain normal growth."1 Above grade 3,pollution levels put the human population at risk of acute or chronic pollution-relatedailments. China's significant achievements in TSP reduction, attributable to industrialstack gas controls and switching to cleaner household fuels, have brought TSP generallybelow dangerous levels. NO. levels have not deteriorated over the past decade, remaininggenerally grade 1 in southern cities and grade 2 in northern. Only one city, Wuhan, fallsoutside grade 3 and another 4 cities have just moved into grade 3.12 Unfortunately, SO2levels do not display the same progress and leave Chinese cities with pollutantconcentrations generally above grade 3. The government expects ambient S02 levels tocontinue increasing through the decade and, given the rapid increase in motor vehicle milesand lack of effective abatement, NO, can be expected to increase as well in major cities.
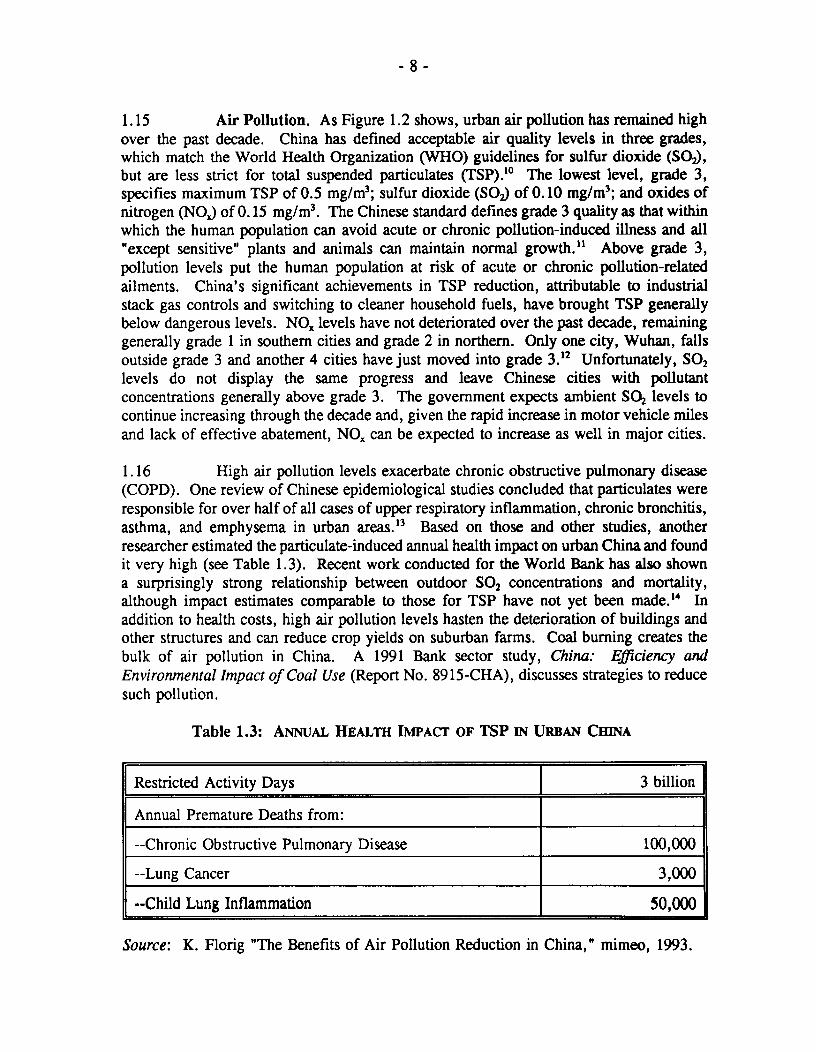
1.16 High air pollution levels exacerbate chronic obstructive pulmonary disease(COPD). One review of Chinese epidemiological studies concluded that particulates wereresponsible for over half of all cases of upper respiratory inflammation, chronic bronchitis,asthma, and emphysema in urban areas.13 Based on those and other studies, anotherresearcher estimated the particulate-induced annual health impact on urban China and foundit very high (see Table 1.3). Recent work conducted for the World Bank has also showna surprisingly strong relationship between outdoor SO2 concentrations and mortality,although impact estimates comparable to those for TSP have not yet been made.'4 Inaddition to health costs, high air pollution levels hasten the deterioration of buildings andother structures and can reduce crop yields on suburban farms. Coal burning creates thebulk of air pollution in China. A 1991 Bank sector study, China: Efficiency andEnvironmental Impact of Coal Use (Report No. 8915-CHA), discusses strategies to reducesuch pollution.
Table 1.3: ANNUAL HEALTH IMPAcr OF TSP iN URBAN CHINA
Restricted Activity Days | 3 billion
Annual Premature Deaths from:
--Chronic Obstructive Pulmonary Disease 100,000
--Lung Cancer 3,000
--Child Lung Inflammation 50,000
Source: K. Florig "The Benefits of Air Pollution Reduction in China," mimeo, 1993.

1.17 Water Pollution. China's ambient water quality standards also accord withintemational practice. The government defines five ambient water quality levels, of whichthe top three permit direct human contact and use as raw water sources for potable watersystems. Level 4 is restricted to industrial water use and recreational use not involvingdirect human contact and level 5 to irrigation. In the most recently published water qualitysurvey (1991), at least some sections of rivers in 54 of 58 reporting cities failed to meeteven level 5 standards."5 Because of their pollution loads, these waters have feweconomic uses-except as waste sinks.
1.18 Phenol and petroleum were the water quality index components most oftenresponsible for the failure to meet minimum acceptable standards. A decade earlier, heavymetals posed an equally large threat, but through pretreatment requirements, China hasmade substantial progress in limiting heavy metal discharges from SOEs, as can be seenfrom Table 1.4. Although petroleum discharges have increased since 1985, all other listedpollutants decreased significantly. Unfortunately, NEPA does not include TVE pollution,an important and growing pollution source, in their accounting of discharges.
Table 1.4: PoLLuTANT DISCHARGES FROM SOES, 1981-92(tons/year)
1981 1985 1992
Mercury (Hg) 62 33 22
Cadmium (Cd) 236 184 138
Chromium (Cr) 2,367 1,547 383
Lead (Pb) 3,006 1,825 973
Arsenic (As) 1,200 1,119 872
Phenol 21,297 11,242 6,361
Cyanide 8,692 6,689 3,484
Petroleum 131,408 62,433 65,076
Source: 1981 and 1985: Dili Xuebao, Vol. 45. No. 2, June 1990, pp. 178-186, reportedin JPRS-TEN-91-003, February 5, 1991, p. 23. 1992: National EnvironmentalProtection Agency (NEPA), Zhongguo Huanjing Nianjian 1993 (EnvironmentalYearbook of China 1993), p. 67.
1.19 While industrial water usage per unit of output continues to be very high byinternational standards, water use quotas and water recycling requirements have keptindustrial wastewater quantities from growing in recent years and discharges failing to meetstandards have fallen. By contrast, urban domestic and commercial wastewater dischargeshave climbed rapidly (see Figure 1.3).

- 10 -
Figure 1.3: MuNICIpAL AND INDuSTRIAL WASTEWATER DISCHARGES(Billion m3 /year, Selected Years)
Billion m3/year30 30
25 -- - - - 25
20 - - - - - - - - - - - - - - - - - - - - - - - E 20
15…… - - -- - - - - - - - - 15
10……-- - - - - - - - - - -10
5 - - -- - - -- - - -5
15 __11111 E I 1110 1 , BO
84 87 90 92
Years
MMunicipal LIEIUMeets Ind Standards EITotal Industrial
Note: Industrial standard data Is not avoilable for 1984.
1.20 Chinese analyses of surface water describe small urban streams and riversas more highly polluted than the larger rivers tested in the 1991 survey. That finding isconsistent with the use of many such streams as sewers, the very low 4.5 percent treatmentrate for wastewater captured by sewerage systems in Chinese cities, and the fact that only50 percent of industrial wastewater discharges meet standards. Lakes and ponds serve asrepositories of pollutants carried by rivers and are therefore even more highly polluted.
1.21 Groundwater, too, has suffered badly from pollution. That pollution hasseveral possible sources, primary among them being recharge from polluted surface watersand leachate from thousands of uncontrolled solid waste dumps. MCon reports that45 percent of urban aquifers now suffer from pollution. Groundwater quality is steadilyworsening; in 1983, 20 percent of wells tested failed to meet drinking water standards,while in a 1986 retest, 33 percent failed. This trend is particularly alarming given themassive overextraction from urban aquifers, very slow recovery rate from aquifer pollutionand the very high cost of remediation.
1.22 Problems with water pollution and falling water tables have forced cities tomove to increasingly distant and hence more expensive raw water sources. Some examplesof this problem include the need to close existing wells after pollution rendered waterundrinkable in Jinzhou, Liaoning Province, and construct a replacement well field expectedto cost $18 million; and to move Shanghai's primary water intake at a cost of $300 millionbefore the current intake is overwhelmed by industrial pol ution. After farmers in QujingCity, Yunnan province, had to stop drinking river water because of upstream urbanpollution, a new, well-based water system was installed for them. But not even that

- 11 -
allowed them to resume irrigation, which had also to be abandoned after pollutants in thelocal river water poisoned their crops.
1.23 The loss of existing potable water sources is the most readily quantified costof water pollution. Other costs include damage to agriculture and aquaculture, theadditional treatment costs for water drawn from sources not meeting the highest standard,increased morbidity and mortality for users of polluted water, and the loss of amenity valuein rivers and lakes fouled by pollution. Estimates have not been made of the sum of suchlosses, but they would appear to be large and growing.
1.24 Solid and Hazardous Waste. Solid and hazardous wastes have an impactthat may not be apparent for decades. Leachate (or, for liquid hazardous wastes, leakage)pollutes the land, surface water and underlying aquifers. Landfills with the very highorganic content common in China emit substantial amounts of methane, which in a well-designed landfill is collected and flared or used for power generation. MCon statistics for1991 state that only 11.9 percent of the combined solid waste and nightsoil load that yearwas disposed of in a way that posed no future threat to the environment. That same year,enterprises dumped some 10 million tons of industrial solid waste directly into lakes orstreams. The impact of such solid waste handling has not been estimated, but it clearlycontributes to the water quality problems described above.
1.25 Hazardous waste, by definition, poses a greater threat than other municipaland industrial wastes. NEPA estimated that in 1991, SOEs generated 50 million tons ofhazardous waste, including 23 million tons of chemical industry residues. In the absenceof a system to track the generation and handling of such wastes, municipalities facesubstantial uncertainty as to what wastes may affect them and how they are being handled.However, the impact of some mishandling is known, in the form of 2,800 recordedpollution accidents in 1991 causing Y 75 million in direct damages and injury to some1,900 people. Although no analysis was provided of which pollutants caused the damage,presumably hazardous wastes were the major cause.
1.26 Ranking Pollution Damage. Qualitative description of damage associatedwith air, water, and solid waste pollution can be done mu_h more easily than quantitativeevaluation. The latter is beginning with Bank support under the auspices of environmentalmaster planning in a small number of Chinese cities."6 That work will yield informationon which pollutants have the worst impact on specific environments. The results will belocation-specific, for geography plays a large role in determining the external costs of anygiven pollution load and who will bear those costs. Clearly air, water, and solid wastepollution sources already generate a substantial financial and economic burden. Todetermine which to give primacy in an urban abatement program will require a carefulanalysis of relative risk and the existing ambient loads and the dynamics of those loads.
D. REFORM AND URBAN GOVERNANCE
1.27 China's high environmental stress is an outcome not simply of the highgrowth rates of the last 15 years, but also of government choices about the nature of that

- 12 -
growth. Government at various levels has utilized regulatory and pricing power, creditcontrol, and direct investment to influence enterprise handling of potential pollutants. Thelevel of municipal infrastructure investments in, and pricing policies for, collectiveenvironmental services has also played an important role in determining municipalenvironmental quality. The roles played by various levels of government and by theenterprise sector have themselves varied over time and influenced the choice ofinstruments. As noted in para. 1.7, the reform program has generally strengthened citiesby increasing their control of locally-based enterprises and locally generated revenues.However, some of the latest reforms have been designed to redistribute power toenterprises or the central government. Recent reforms likely to play particularly importantroles in urban environmental management performance include those in enterprisemanagement, tax policy, and price policy.'7
1.28 Enterprise Management. A consistent goal of enterprise reform, criticalto the successful transformation of the economy, has been to force enterprises to increaseefficiency by producing for the market rather than to the government plan, and to manageinputs to maximize profit under a hard budget constraint. Concurrently, enterprisemanagers have been given increased power and autonomy. The reforms imply aweakening of enterprise management bureau authority-authority that, by the mid-1980s,resided primarily in city governments. To encourage that change, the central govemmenthas led a movement to restructure government by significantly reducing employment inbureaus that manage SOEs. The guiding principle is to chInge the government role fromdirect management of the economy to indirect management through transparent regulation.But this transition is far from complete, with administrative intervention continuing in suchkey areas as credit allocation. The incomplete transition has particular impact on the workof EPBs and on the efficiency of municipally provided collective environmental services.
1.29 Tax Policy. The large annual real expenditure increases enjoyed by thelarge and medium cities over the past 15 years were financed primarily by increasing theirrevenue retention rate, which rose for the 15 largest cities from 26 percent in 1981 to63 percent in 1991, while their on-budget revenue increased only 1.6 percent annually inreal terms. In January 1994, the central government restructured the tax system. In theold tax system, receipts flowed via local government, as the collection agent, to the centralgovernment. The flow was controlled in different ways for different provinces, withcontracts ranging from fixed transfers to percentage sharing schemes over a fixed base.All of the arrangements gave considerable discretionary authority, and the bulk ofincremental income, to local government. The new tax system categorizes taxes as thosereserved to central government or shared with local government, both of which are to becollected directly by central government tax offices, versus those reserved to localities andcollected by them. The new system seeks to raise the elasticity of central tax revenue toeconomic growth and, although local government tax revenues should continue to rise,increases will likely be slower than under the old system.
1.30 Price Reform. In the late 1970s, the central and local governmentscontrolled some 95 percent of all prices. Prices have been gradually decontrolled, until,by 1991, only 30 percent of consumer goods and 42 percent of raw material prices

- 13 -
remained under either central or local Price Bureau jurisdiction. Urban planners estimatethat in terms of the urban consumer price index, large cities now control the prices ofperhaps 20 percent of the market basket.'" The prices remaining under administrativecontrol include many critical to urban environmental services. In particular, water, gas,sewerage, and similar services are kept under a combination of national, provincial, andmunicipal price controls. The government has yet to put in place a pricing mechanism forurban environmental services that sustains service levels and adequately manages demand.
- 14 -
2. URBAN ENVIRONMENTAL MANAGEMENT
A. INTRODUCTION
2.1 The ambient air and water quality figures cited previously suggest a recordof mixed success in urban environmental management. As discussed in this chapter, thechief obstacles to effective environmental management are significant gaps in regulatorycontrol and problems in SOE implementation of existing regulations. The solutionsproposed here include institutional innovations and new instruments to improve regulatorycontrol over TVEs; broadening the mandate of municipal EPBs to include hazardous wastecontrol; shifting wastewater management strategies toward greater reliance on seweragecompanies; increasing the cost of noncompliance with agreed standards; and encouragingcitizen participation to lower monitoring costs, while increasing public education to bolsterpolitical support for environmental protection.
B. MuNICIPAL EPB STRucrulE AND FUNCTIONING
2.2 The National Context: Organization and Instruments. The NationalEnvironmental Protection Agency (NEPA), which is the executive arm of the State CouncilEnvironmental Protection Committee, drafts and interprets national environmentallegislation and standards, tracks sectoral and local environmental regulations, maintainsenvironmental data bases, and conducts research on environmental policy and performance.However, NEPA does not have implementation authority. That authority resides in theprovincial and local governments and their environmental protection bureaus.
2.3 China uses a familiar set of command and control instruments to reduceindustrial pollution, complemented by fees and fines for effluents over the limit. Thecommand and control instruments include environmental impact assessments at the projectfeasibility stage; a licensing system for new projects that prohibits their construction priorto EPB approval of the planned environmental safeguards or their operation unless thosesafeguards are installed and maintained; and pollutant concentration limits on effluentsfrom all enterprises. NEPA is now leading experiments in the use of location-specific,mass-based discharge permit systems designed to overcome the shortcomings of theconcentration-based system.
2.4 Economic instruments have become increasingly important in Chinesepollution control. The most important instrument is the "overstandard pollution levy fee"for enterprise air or water effluents. Firms and production lines established since theenvironmental regulations went into force must meet pollution standards. But operationsestablished before the regulations may, with a license, continue to discharge above thestandard at the cost of paying a concentration-based "overstandard pollution levy fee."

- 15 -
Although regarded as too low to induce abatement on its own, the fee produced Y 2.4billion in income for the EPB system in 1993, with nearly 80 percent of that earmarkedfor pollution abatement projects and the rest funding local EPB administrative, research,and monitoring systems. EPB licenses permitting overstandard effluents may incorporatea requirement to meet standards within a stipulated period of time. An enterprise violatingstandards or its license may be fined or shut down in addition to paying fees. China:Environmental Strategy Paper (Report No. 9669-CHA) analyzes these instruments in detail.
Box 2.1: TEE ORGANIZATION AND STAFFING OF EPBs
An organization chart is shown below for the EPB system in Kunming, a city of 1.5million people that serves as the capital of Yunnan Province. The EPB itself has a staff of 51, 40 ofwhom have technical qualifications. The research institute has 38 staff and the environmentalmonitoring station has 66. Between them, those two units have 58 engineers. The county EPBs (herelabeled Environmental Protection Offices) and monitoring stations each have between 5 and 8 staff,few of whom are technically qualified. These groups must monitor the more than 5,000 factorieswithin Kunming City boundaries and the 50,000 TVEs within the municipal boundaries.
ORGANIZATION OF THE KUNMING ENVIRONMENTAL PROTECTION BUREAU
Yunnan ProvinceKunming Municipal EnvironmentalPeople's Government| Protection Bureau
|Kunming l.lUrban & Rural| CountyConstruction GovernmentCommittee
Kunming Environmental Protection Bureau
Director
Deputy Director Chief Engineer
General Science Natural Social Pollution Law andAdminis- Research & Environment Environment Supervision Regulationtration Education Administration Administration Division SectionOffice Section Section Section
Kunming Kunming Kunming Tong LongEnvironment Environment Environment River CountyProtection Science Monitoring Environment Environmental
Services Research Station Monitoring ProtectionCompany Institute (KEMS) Station Office (CEPO)(KUPSC) (KESRI) (TLEMS)
CountyEnvironmental
Note: Single lines indicate administrative control; Honitoringdouble lines indicate technical leadership. Station

- 16 -
2.5 EPB Structure. Some of the implementation challenges facing EPBs derivefrom their place in the govemmental hierarchy. In a situation common to localgovemment agencies in China, EPB staff work under the dual leadership of a centralgovemment ministry and local political leaders (see Box 2.1). NEPA, through provincialEPBs, guides municipal and county EPB work in professional matters such asenvironmental testing protocols. But the municipal govemment controls EPB budgets,staffing, and other administrative functions. The EPB subordination to the localgovemment marks the national political intent that these bureaus, and environmental goals,be integrated fully into the local development process. To further strengthen theintegration, monitoring and implementation responsibilities are shared with staff in othermunicipal bureaus and enterprises. For example, most local bureaus of industrialministries have environmental sections responsible for monitoring regulatory complianceby industries under that ministry. In 1992, staff engaged in environmental work butemployed by non-EPB bureaus and enterprises were estimated to number 250,000,compared to the 75,000 people working within the EPBs. A local govemment committedto environmental goals can thus bring considerable talent to bear to ensure a healthyenvironment, but few checks exist on a local govemment that chooses to temporarilyignore environmental concerns in favor of industrial growth.
2.6 As one check on local govemment, central and provincial governments mustmaintain the EPB system at a high level of political legitimacy. This legitimacy comeswhen political leaders support EPBs enforcing national and provincial environmental laws,when they ensure EPBs a rank in the bureaucracy at least equal to those they mustregulate, and when they provide adequate budgets for effective operation. The verynecessary efforts now underway to streamline bureaucracies in China need not exempt theEPB system. Yet, it must be recognized that the reforms make environmental work moredifficult by weakening the industrial ministries that once took much of the responsibilityfor ensuring compliance with environmental laws. Failure to strengthen the EPB systemas the market economy grows will increase the difficulty of effective environmentalregulation.
C. ISSUES
TVE Regulation
2.7 The remainder of this chapter discusses four major issues now confrontingurban environmental managers. These are (a) ineffective regulation of TVE pollution; (b)the failure to enact hazardous waste control legislation; (c) inadequate use of municipalsewerage and wastewater treatment; and (d) noncompliance with environmental regulations.
2.8 TVE Pollution. EPBs have failed to vigorously apply existing regulationsto the most rapidly growing industrial sector-township and village enterprises. In 1980,when the current regulatory system was being developed, TVEs accounted for only8.6 percent of industrial output, but by 1992 that had jumped to 36.8 percent and thegrowth rate has not slowed since.'9 Although township and village industry includes ahigher proportion of less-polluting light industry compared to the SOE industrial sector,

- 17 -
a 1985 study showed the TVE con-ribution to national pollution loads to be nonethelesssubstantial. In 1984, TVEs accounted for 18.8 percent of industrial output and generatedover 10 percent of water pollution, over 9 percent of air pollution and 11 percent of solidwaste loads. With no major shift in the TVE industrial structure, by 1992, the total TVEpollution loads must have grown substantially (see Table 2. 1).20
Table 2.1: TVE CONTRIBMUTONS TO NATIONAL POLLuON LOADS(Percent)
Water Air Solid Waste
1984 actual 10.7 9.3 11.1
1992 estimated | 22 19 23
Note: 1992 estimates based on 1984 ratio of total output to pollution. Solid wastesinclude an unspecified amount of hazardous waste. Source: 1984: Ministry ofAgriculture.
2.9 TVE polluting outputs would be less worrying if they were uniformlydistributed in China's vast rural hinterland, but they are not. TVEs cluster tightly aroundthe markets they serve, which are primarily in medium and large cities. Thus, TVEeffluents burden the same air and watersheds as urban industry. A 1989 NEPA studyfound a large urban impact from TVE pollution in coastal provinces from Zhejiang northto Liaoning.2" Such an impact was also noted in a study done on water quality atShanghai's proposed new raw water intake site. The intake on the Huangpu River is beingmoved upstream to Da Qiao to escape pollution from a major urban industrial zoneadjacent to the current intake. Water quality at the new site is good, but testing identifiedsome industrial pollutants, which prompted an effort to locate and control the sources. TheShanghai municipal EPB has a good data base on SOE polluters within the municipalityand found that of the hundreds of SOEs in the upper Huangpu, 12 industrial enterprisescollectively contribute the bulk of SOE phenol and oil pollution and a significant share ofother pollutants (see Table 2.2). However, a modeling study showed that those SOEsaccount for a far lower percentage of the total pollutants actually measured at Da Qiao.The remaining pollution load comes from a variety of sources, including TVEs andagricultural runoff. Those potential threats to the new municipal water intake fall outsidethe traditional scope of municipal EPB control.22
2.10 TVE Control Problems. Most TVEs are found in counties, not cities, andcity EPBs lack direct authority over them even when TVE effluents harm the cityenvironment (Box 2.1, above). This is no less true for the large Chinese municipalities,whose administrative boundaries incorporate suburban counties. As noted in Chapter 1,despite being subject to general municipal control, suburban counties have a large measureof autonomy. TVEs provide an important source of employment and township governmentrevenue within counties. Unlike SOEs, TVEs work under hard budget constraints andhave sustained their growth through flexible, market-oriented management. Thosemanagers, while rapidly increasing their market share over the past decade, have avoided

- 18 -
Table 2.2: POLLuTION LOADS AT DA QIAO
Pollutant From 12 SOEs as apercentage of all SOE From 12 SOEs as aindustrial pollution in percentage of all pollution
the Da Qiao area measured at Da Qiao
COD 29 4
BOD 18 13
Phenol 88 11
Oil 71 8
Ammonia 30 3
Source: Consultant's studies for the Shanghai Environment Project.
coming under many of the regulatory controls applied to SOEs in the same markets.Although some county govemments now apply environmental regulations to TVEs, mostlack the staff to implement the regulatory system used in the cities. NEPA staff estimatethat 40 percent of excess pollution discharge taxes go uncollected, the bulk of them fromTVEs.
2.11 Effectively Controlling TVE Pollution: Presumptive Taxation. The TVEregulation problem can no longer be ignored. Local governments commonly attribute theregulatory lapse to two factors: weak county EPBs and the difficulty of effectivelymonitoring dispersed small enterprises. Yet, those constraints can be dealt with.Monitoring can initially focus on the small number of well-studied industries-includingcoke and chemical production, leather tanning, electroplating, and pulp and paper-thatproduce the bulk of TVE pollution. Firms within those industries utilize a very smallnumber of alternative technologies, the pollution loads from which have been or can easilybe established.23 Based on the production processes used, NEPA can publish performancetables for each industry linking pollution to the firm's output and the presence of specifiedabatement technologies. Those tables in turn can be used as the basis for a mass-basedpollution load permit system dependent on enterprise location. Once mass-based permitsare issued, county EPBs would levy presumptive pollution fees based on production ratherthan direct environmental monitoring. If firms believe they outperform the presumptivebenchmarks, they can be given the option of paying for an extended period of monitoringto establish that fact. Superior performances would then be rewarded with either lowerfees or permission to expand output. County EPBs may need additional staff and technicaltraining to carry out their expanded work program, but equally important will be the roleof the municipal EPB, which must lead an effort to analyze the overall distribution ofpollution within the larger municipality and establish a municipality-wide mass-basedpermit system. If county EPBs have difficulty implementing the permit system, they couldcentralize county pollution levy fee collections and associated abatement investments under

- 19 -
the municipal EPB. This expanded work program suggests the need for reassessing thestaffing levels and skills mix of the municipal EPBs as well as those of the county.
Hazardous Waste
2.12 Hazardous Waste Generation. The second major gap in EPB control hasbeen the lack of hazardous waste regulation. Industrial enterprises generate an estimated50 million tons a year of hazardous waste in China, including 23 million tons of chemicalindustry residues. Existing regulations require enterprises to safely store or recycle thosewastes, but without detailed tracking or reporting requirements, the government lacksaccurate knowledge of waste quantities or handling. Of the total, NEPA estimates that30 million tons are disposed of after treatment, another 13 million tons are recycled, and7 million tons are either stored waiting disposal or discharged to the environment. Inpreparation for hazardous waste regulation, Beijing, Shanghai, and other major cities haveconducted hazardous waste inventories in recent years. Working with Beijing andShanghai under Bank-funded projects, international consultants are assisting with thedevelopment of strategies for handling hazardous waste. They have found that enterprisesaggressively seek profitable recycling opportunities and have documented many cases ofappropriate treatment. However, inappropriate uses, such as fueling low-temperatureboilers with chemical residues, occur frequently enough to cause alarm. In 1991 NEPArecorded over 2,800 water, air, and solid waste pollution accidents, most presumablyassociated with hazardous waste discharges, which caused direct economic losses of Y 75million and nearly 1,900 injuries.
2.13 Regulatory Needs. In the absence of clear regulatory authority, mostmunicipal EPBs pay little attention to hazardous wastes until damage causes citizencomplaint. However, much of the damage that does occur, especially to soil and aquifers,may not be obvious for years, so total damage must be well above reported figures.NEPA understands the importance of improved hazardous waste regulation and has drafteda law that reflects international practice, utilizing a tracking system that follows the wastesfrom the point of generation to final disposal. Ratification of the law has been delayed,reportedly because of industry concern over compliance costs. But damages are alreadyhigh enough that the national government must now ratify and implement the hazardouswaste legislation to avoid what will otherwise be enonnous long-run costs of improperhazardous waste-handling. Once passed, EPBs will face a monitoring challenge moredaunting than for other pollutants and they will need to develop the expertise to helpdevelop the specialized disposal facilities needed to handle hazardous wastes.
Wastewater Treatment and Monitoring
2.14 Causes of Degradation. The continued failure of most urban surface waterto reach minimum acceptable quality and the rapid degradation of aquifers noted in Chapter1 have a number of causes. These include the TVE pollution discussed above, as well asrapid growth in untreated municipal wastewater and the persistent failure of SOEs to meeteffluent standards. On the latter point, random inspections of enterprise wastewatertreatment facilities over the years have turned up high violation rates. A large-scale NEPA

- 20 -
investigation in the late 1980s showed only 36 percent of the units operating at greater than80 percent efficiency and only half at more than 50 percent efficiency. EPB chiefs inindividual cities and provinces report similar results for recent spot checks of equipment.Consistent with this experience, NEPA statistics show very little increase since 1987 in theamount of SOE wastewater discharges meeting standards (see Figure 1.3). Inadequatesewerage reticulation systems and the meager 4.5 percent coverage of municipalwastewater treatment plants contribute to low water quality.
2.15 The Need for Municipal Treatment Plants. A rapid increase in municipalwastewater treatment plants and associated sewerage systems is key to improving ambientwater quality. Such treatment plants are the only effective means of dealing with thegrowing domestic and commercial wastewater loads, which will continue to increase aspeople move to housing with flush toilets and farmer preference for chemical fertilizersover nightsoil leads to increased nightsoil disposal into sewers (or worse, waterways).Furthermore, treatability studies conducted under Bank-funded projects have shown thatwastewater from enterprises meeting Chinese standards for discharges to sewerage systemscan be successfully treated in combination with domestic wastewater, even when theindustrial component reaches 50 percent or more of total load, allowing those wastestreams to also enter the municipal treatment plants.?' Studies in Fushun and other citieshave also shown collective treatment at municipal plants to be more cost-effective thanin-plant treatment for many industrial enterprises. Chapter 3 reviews the design andfinancing requirements for this proposal, while the changes in the regulatory frameworkneeded to make the proposal work are described here.
2.16 A Shift in Monitoring and Charging Responsibilities. The constructionof municipal treatment plants creates two sorts of problems under the current regulatoryenvironment. First, treatment plants are not exempt from EPB effluent dischargestandards, so may be monitored and charged by EPB, despite the fact that their solefunction is to ameliorate pollution. In essence, they are responsible to EPB for pollutantsflowing into their plant despite the fact the contributing upstream enterprises should havealready been regulated within acceptable levels by EPB. Second, enterprises themselvesface duplicate charges for effluents. EPB now levies two water effluent fees, the"wastewater discharge fee" applied to all discharges meeting effluent discharge standards,and a second, higher, fee "the overstandard pollution levy fee" for licensed discharges notmeeting standards. In addition, municipal sewerage systems charge an "urban wastewatertreatment facility use fee" for discharges to sewers, with the fee level city-determined anddependent on treatment provided. Clearly, the current regulatory system has beenstructured for an environment in which municipal treatment plants play little role inassuring adequate quality discharges.
2.17 EPBs must continue as the primary regulator of water quality. However,where municipal treatment plants operate, responsibilities must be rebalanced to alloweffective treatment plant operation and financing. Municipal treatment plants may need toset stricter discharge limits than those required by EPB, and need the authority to monitorenterprise discharges and enforce standards. Given that treatment plant operations requireconstant testing of the waste stream and that load-based treatment fees encourage loadmonitoring by the treatment plant, treatment plants have a stronger incentive than EPBs
----------- -----

- 21 -
to monitor aggressively. This suggests that enterprise water effluent monitoringresponsibilities should shift to treatment plants from EPB. EPB would continue to monitortreatment plant effluent and collect the overstandard pollution levy fee for any dischargesnot meeting standards. In a change from current practice, this study recommends that theprovincial, rather than the municipal, EPB assume responsibility for municipal treatmentplant monitoring. Such a change would politically separate the regulator from themunicipal owner of the treatment plant and would encourage more explicit concern withdownstream impacts of the wastewater.
2.18 Enterprises should not have to pay two agencies for their wastewaterdischarges to municipal treatment plants. The enterprise water effluent fee (discussedfurther in Chapter 3) should include treatment costs and an additional fee for any pollutingcomponent unlikely to be removed by the treatment plant (for example, a primarytreatment plant would not remove phenols). The additional pollution fee would be passedon to EPB through municipal treatment plant overstandard pollution levy fee payments.
2.19 Competitive Treatment Options. The proposed approach would leaveconnection to the municipal system optional for one class of enterprises. To encourageglobal treatment efficiency, enterprises with a history of fully meeting current dischargestandards, which discharge to water bodies meeting at least the minimum acceptable(Class 5) water quality standard and which cause no degradation of the quality of thereceiving water below the discharge point, would be permitted to opt out of the municipalsystem.' Such enterprises would continue to be monitored and regulated by themunicipal EPB. This option would be attractive only to enterprises generating largewastewater volumes, but would allow such enterprises to tailor their intemal treatment tothe specific composition of their waste load and may provide an efficient altemative to useof the municipal system.
Noncompliance with Regulations
2.20 Treatment Costs Versus Levy Fees. Chinese cities cannot wait for thecompletion of the wastewater treatment plant building program before improving enterpriseperformance in meeting effluent standards. Unfortunately, enterprises have a powerfulfinancial incentive to idle in-plant treatment works. Case studies in Guangdong Provinceand elsewhere found that in industries where in-plant wastewater treatment costs rangedfrom Y 0.70 to Y 0.80/rn3, the pollution levy fee was but Y 0.04 to Y 0.20/n3?.6 NEPAhas acknowledged that fee levels have never been high enough to encourage treatment,and, indeed, that fee levels are often below the operation and maintenance (O&M) costsfor installed treatment plant.27 But higher fees will be effective only if they arevigorously enforced.
2.21 Although EPBs conduct random compliance inspections, staff and equipmentconstraints keep the frequency of such inspections low. Furthermore, when measuring airpollution, inspections usually require advance notice because EPB needs enterpriseassistance in placing and powering monitoring equipment. When violations are discovered,sanctions are weak. Fines are typically levied only after repeated violations or serious

- 22 -
environmental accidents. Hubei Province's Wuhan City, with 3.8 million people, aconcentration of heavy industry and industrial pollution, and a low compliance rate inenterprise abatement facilities, levied only Y 160,000 in fines in 1992. The single largestfine, Y 10,000, was laid against a nightclub for noise and odor problems. YunnanProvince's EPB leaders explained their low fines as reflecting a combination of theoffender's inability to pay and administrative intervention to protect profits. In Kunmingin 1992, the largest fine, Y 20,000, was assessed for a paper mill accidental wastewaterdischarge that killed farm animals and destroyed crops."
2.22 Increasing the Cost of Noncompliance. Both theory and internationalexperience show that a combination of infrequent monitoring and low fines for violationsencourages noncompliance.29 In the past, China used a strategy in which compliance withenvironmental regulation was one of a broad set of social and financial concerns to whichSOE managers were expected to respond. Responsive managers were rewarded withaccess to capital and other markets, status, and other benefits. However, with the moveto a market economy and reduced enterprise social roles, the state has fewer rewards tooffer and the strategy appears to be losing effectiveness. To offset this, the expectedfinancial penalty for noncompliance must increase, which requires some combination ofincreased fines and an increased inspection rate. Note that increasing inspection ratesimplies much higher administrative costs than increasing fines, due to the need for staffand equipment sufficient to carry out the inspections. Increased fines are therefore a keyelement of the strategy. To increase the social cost to enterprises of violations andstrengthen the consensus for environmental management, increased citizen participationshould also be encouraged.
2.23 Increasing Citizen Participation. In its environmental protection law,China recognizes and encourages citizen participation in environmental management.30Citizens do, in fact, take advantage of the opportunity to bring violations to the attentionof EPBs. In 1991, EPBs at various levels received over 55,000 letters and 82,000 visitscomplaining about pollution of various types. Air pollution was most commonly reported,although water pollution and excessive noise also received much attention. NEPA reportsthat about 90 percent of the letters and 75 percent of the visits were acted on during thatyear. Public pressure can be a powerful tool. A Bank mission visiting one large Chinesecity was unable to meet the vice-mayor in charge of environmental work, for he had beensummoned to the provincial capital to explain why a persistent solid waste problemremained unresolved. The summons came after affected villagers had written many lettersto the provincial government complaining of inaction by the city.
2.24 Community participation will be most effective if successful efforts arewidely publicized. This already happens on a sporadic basis, but municipal EPBs shouldconsistently publish accounts of the major cases brought to them and their handling ofthose cases in order to educate people both about environmental problems and the potentialto solve them. EPBs should also regularly publish the results of their own monitoringprogram, naming noncomplying firms and agreed remedies, and encouraging citizenmonitoring of future compliance. EPB leaders in some cities have successfully used thethreat of such publicity as a tool to induce compliance.

- 23 -
2.25 NEPA should encourage broader use of the media through specific guidanceto local EPBs on the topic. NEPA itself has managed several impressive national publicitycampaigns to strengthen the consensus for environmental action. In one ongoing effort thathas stimulated mayors to take a more direct interest in environmental issues, major citiesundergo an annual environmental assessment, rankings from which are published innational and provincial newspapers. NEPA also runs special campaigns, such as one thatpublicly identified the nation's 3,000 worst polluting enterprises, producers of an estimated65 percent of SOE pollution, and demanded action to abate their pollution. And theNational People's Congress (NPC) has begun an inspection campaign to assess the qualityof environmental regulation in various localities. Experience in other market economieshas proven the value of sustained, well-publicized attention of this type in fostering thepublic support needed to invest in a sustainable environment.
D. CONCLUSION
2.26 Environmental managers in China have drafted legislation to regulatehazardous waste, a major gap in regulatory control. It is now imperative to ratify andimplement that legislation. The largest gap in regulatory implementation, that of TVEs,will be perhaps harder to address, but the need is now compelling and the study hasrecommended an approach that will focus on large polluters and minimize regulatorydemands. The difficult problems surrounding compliance with current regulations needto be addressed through a multifaceted strategy. For wastewater, treatment services mustbe provided citywide. Once treatment plants begin operating, they need correspondingregulatory power over the effluents they must treat and can assume this responsibility frommunicipal EPBs. In turn, provincial EPBs can monitor treatment plant output and ensurecompliance with ambient quality standards. For air pollution and wastewater dischargesoutside the sewerage system, financial and social incentives for regulatory compliance mustbe increased. Higher fines, coupled with greater use of citizen participation in monitoringviolations, will help EPBs realize this goal.

- 24 -
3. URBAN ENVIRONM1ENTAL SERVICES
A. INTRODUCION
3.1 Urban environmental services and environmental regulation stronglycomplement one another, an observation particularly true of the water, sewerage, and solidwaste services analyzed in this sector study. The quality and cost of urban water will bedetermined in part by how effectively regulation prevents or minimizes wastewater or solidwaste discharges that pollute raw water sources.31 Wastewater quality will be muchaffected by the level of pretreatment before industrial discharge, although, as this studyargues, at economically viable pretreatment levels, the residual industrial loads may stillrequire centralized treatment when added to domestic and commercial wastewater.Wastewater volume and quality will in turn be influenced by water pricing and otherdemand management policies. And, the constituents and handling of solid waste dependson regulation as well as on municipal collection strategies.
3.2 These relationships are illustrated in the following analysis of urbanenvironmental services, which demonstrates that the regulatory and financing strategiesnow being pursued will not allow sector needs to be fully met. Increased water prices areneeded in a program of water demand management which will substantially reduce theneed for new water supply and sewerage investments and generate funds for service qualityimprovements. Sewerage and wastewater treatment investments must nevertheless increaseappreciably if water costs, and surface water and aquifer pollution are to be reduced.Much greater investment in solid waste disposal is also needed. The chapter concludes byshowing that people can afford the proposed program and recommending organizationalchanges to foster more efficient service delivery.
B. URBAN ENviRONMENTAL SERviCEs: ORGANIZATION AND INANCNG
3.3 Organization and Regulation of Municipal Services. The Ministry ofConstruction (MCon), which reports directly to the State Council, regulates the provisionof urban water, sewerage, and solid waste services. The Ministry sets performancestandards, including physical and financial performance, for the various services. To helpguarantee adherence to standards, major investments in the sector require independentappraisal by the Ministry. Municipalities also look to the Ministry for guidance inimplementing new management approaches. The provincial analog of the Ministry is theConstruction Bureau, with functions analogous to those of the Ministry. The Bureauensures that Ministry regulations are observed in the province, and has the power toregulate areas not addressed by the Ministry and to set more stringent standards than thoseset at the national level. The Bureaus play a key role in the allocation of provincial fundsto urban infrastructure projects. Finally, at the municipal level, the Construction

- 25 -
Commission manages sector service delivery. As Figure 1.1 (p. 5) shows, theCommission coordinates a number of bureaus and companies that actually deliver theservices. While responsibilities and bureau and company names vary somewhat acrosscities, all urban environmental services are the responsibility of municipal govemment andare provided either at the municipal or district level, directly or through city-ownedcompanies.
3.4 In medium and large cities, water and gas are supplied by municipalcompanies, while drainage and sewerage services are provided by district governments.32
Sewage treatment plants covering more than one district are city-run and, if needed, thecity helps districts finance both initial sewerage investments and operating costs. Smallcities operate without district governments and, there, the city itself takes responsibility forservices provided by district governments in the larger cities. Municipal solid wastepickup and disposal are typically a district responsibility, although neighborhoodcommittees in some places arrange the pickup and transfer to district vehicles and citiesmay run major transfer stations and landfills. Enterprises take responsibility for their ownsolid waste disposal, often by contracting with the district solid waste agency for thatservice. Municipally-owned service companies maintain segregated accounts and have,since July 1, 1993, used accounting systems quite similar to international practice.33 Adistinct advantage of managing services through a company rather than a governmentagency is that unlike government agencies, companies may borrow from banks. This hasbecome important since 1988, when cities began to abandon the practice of covering capitalcosts entirely through municipal grant funding. However, capital grants continue and, inexchange for access to municipal funds, companies remit negotiated shares of theirdepreciation funds and operating profits to the city.
3.5 Financial Performance. Nominal municipal company profits have longbeen artificially increased by applying unrealistically low depreciation rates andmanipulating tax payments, but even then performance has been unimpressive (see Table3.1). Bank analysis of nominally profitable water companies in project cities has shownall but one to be suffering negative retums on revalued capital.' Where companies sufferlosses, operating subsidies are provided by the municipality. In 1991, 80 percent of totalwater company operating subsidies were paid in the five cities of Beijing, Tianjin, Dalian,Qingdao, and Jinan. All are in water-short areas of North China with a very high marginalcost of supply. Gas company subsidies were more common. Only 7 of the 56 cities withtown gas operations and 36 of the 167 liquid petroleum gas companies reported a profit.
3.6 Municipal Budgets: Past Growth and Potential Constraints. Rapidlygrowing fiscal resources have given cities the means to substantially increase theirinfrastructure and other investments over the past 15 years. From 1981 to 1991, the 15largest cities had on-budget real per capita expenditure growth rates averaging 11.3 percenta year, while the next largest 59 cities had expenditure growth rates of about 15 percentper year. On-budget per capita real revenue growth rates were lower, at 1.6 percentannually for the 15 largest cities and 4.6 percent annually for the next 59 largest. Withlagging revenue growth, much of the increased expenditure was financed by higher on-budget revenue retention rates. In 1981, retention rates averaged 26 and 29 percent,

- 26 -
Table 3.1: MUmCIPAL SERVICE COMPANY PERFORMANCE (1991)(Y million)
Water Gas
Production value 4,680 2,850
Total profits 386 (532)
-Operating subsidies 304 588
respectively, for the two groups of cities; by 1991 they had risen to 63 and 70 percent.Off-budget revenues (see Box 3.1) accruing to local government finance bureaus grew atless than the inflation rate over the period, but those to administrative bureaus soared atan 18 percent annual real rate, equaling 31 percent of local government on-budget revenueby 1991. These figures testify to the rapid decentralization of expenditure authority duringthe first decade of reform.35
Box 3.1: ON-BUDGET VERSUS OFF-BUDGET REVENUE AND ExPENDrruREs
The Chinese government defines revenues and expenditures as either on-budget or off-budget. The budget figures approved by the national and local People's Congresses are in theon-budget category, although central government rules guide the use of both types of funds and requirethat their use be included in local plans.
On-budget revenues include taxes of all kinds; SOE profit remittances; and assortedother revenue such as that from repayments of finance bureau capital construction loans. On-budgetexpenditures include infrastructure investment (including that in enterprises made through the budget);government administration; national defense; and public health, education and safety.
Off-budget revenues include local surtaxes; some local bureau income such as roadmaintenance fees; and enterprise retained earnings held in designated funds such as the enterprise socialwelfare fund. Off-budget expenditures are typically earmarked by revenue source and includeenterprise investment; urban infrastructure maintenance; administrative expenses; and some transfersto higher-level governments such as budget-balance funds.
Off-budget funds equaled 59 percent of on-budget in 1982, a figure that grew to94 percent by 1991. Fully three quarters of the off-budget funds accrue to enterprises and their sectorbureaus, and nearly half of the expenditures are used for fixed-capital investments or major overhaulexpenses. The next largest claimant, with less than 10 percent, is worker social welfare expenses.
3.7 The central government recently moved to halt any further erosion of itsexpenditure share. The tax reforms implemented in January 1994 restructured the taxsystem and bolstered the central government share, while guaranteeing local governmentstheir 1993 nominal revenue level in 1994. If the new tax system meets its goals, municipalrevenue growth will become less elastic to overall economic growth. Off-budget revenue
- 27 -
will assume greater importance in cities, and municipal service subsidies will be harder tofinance.
3.8 Municipal expenditures in China cover not only the administrative, publicsafety, social welfare, and urban infrastructure costs common in all countries, but alsosubstantial public housing and enterprise investment.6 The high GDP growth rate createsdemand for massive investments in urban infrastructure. As a result of these exceedinglydiverse demands on municipal government resources, and with expectations rising asquickly as GDP, municipal governments continue to face difficult trade-offs amongelements in their investment programs. Many municipalities divert money from operationsand maintenance needs to fund new investments, which themselves may be launched beforefull funding has been identified.
3.9 Sources of Infrastructure Funding. Total funding for municipally providedurban services reached Y 26.6 billion in 1991. This amount equals 27 percent ofmunicipal on-budget expenditures, but a much smaller proportion of total municipalexpenditures. The latter, like funding for urban services, comes from many more sourcesthan municipal on-budget revenue. Table 3.2 summarizes on- and off-budget funds usedfor all urban maintenance and construction activities performed by municipal governmentsin 1991. The table does not consolidate income and expenditures of municipally ownedcompanies such as the water and gas companies, but does include profits and certain otherremittances from those companies to the cities. Those are included in "other revenue," asare sewerage fees. The income of water, gas, and district heating companies would addanother 31 percent to the totals in Table 3.2, an indication of their relative importance inoverall financing.37
3.10 The table illustrates the great diversity in structuring local finance and thewidely varying access to central govemment and other extemal resources. The fundingranges were taken from averages for all cities in a province; if individual city data wereavailable, the ranges would be even greater.
3.11 Application of Infrastructure Funding. Although municipal companiesoperate under independent budgets, many of their capital costs are paid from municipally-generated resources (including domestic and foreign loans and grants). Of expendituresfor urban construction and maintenance, fully 22 percent supported water and gas supplycompanies (see Table 3.3). That support went primarily to capital construction, whichtook 43 percent of all expenditures. Maintenance claimed another 37 percent andoperations only 20 percent.
3.12 Reporting categories for revenue and expenditures do not permit readyanalysis of financing strategies for specific services. A comparison of Tables 3.2 and 3.3shows only three categories-housing, parks and environmental sanitation-that appear todefine equivalent services. Each of those cases shows subsidies for the service, with thatfor environmental sanitation substantially larger than those for parks and housing.38 Buteven that conclusion may be wrong, for in many cities the neighborhood committee playsan important role in moving solid wastes, compensated through user fees, and neither their

- 28 -
Table 3.2: SOURCES OF FUNDS FOR URBAN MAINTENANCE ANDCONSTRUCTION, 1991
Contribution to total funds (%)
National Provincial RangeSource of Funds Average
Urban Maintenance and Construction Tax and 36 15-73Public Utilities Surcharge
Local Government Grant 10 2-24
Domestic Loan 9 0-28
Central Government On-Budget Investment 3 0-35
Central Government Financial Grant 1 0-6
Water Resources Fee 1 0-6
Foreign Grant or Loan 4 0-14
Housing Rental Income 7 2-19
Park Income 3 1-9
Environmental Sanitation Income 1 0-4
Other Revenues 24 6-38
Note: Cities in Tibet have a unique funding pattern and have been excluded from therange. The national average does not sum to 100 due to rounding. The provincialrange shows the low and high provincial average values.
Source: MCon.
income nor expenditures are recorded here. Many other services also rely on diverseincome sources that are not consolidated in one budget, preventing urban leaders fromknowing the true relative cost of services.
3.13 Tariffs for Urban Services. Most urban services operate under conditionsof excess demand, but municipalities usually lack the authority to regulate demand throughtariff increases. The central government, through the Price Bureau system, controlled keyurban tariffs until 1991, when that right was granted to the provinces. Some provincesthen gave cities pricing authority, but most did not. The central government itselfcontinues to interfere in service pricing. In a 1993 ruling, the central government forbadethe application of sewerage tariffs to households and capped enterprise sewerage tariffs ata rate well below handling and treatment costs. Then, in early 1994, in response togrowing inflation, the central government declared a moratorium on price increases for 20

- 29 -
Table 3.3: APPLICATION OF FuNDS FOR URBAN MAINENANCEAND CONSTRUCTION, BY TYPE OF SERVICE, 1991
Type of Service: Claim on total (%)
Housing 11
Water Supply 12
Town Gas 10
Public Transport 3
Other Public Infrastructure Construction 34
Parks 8
Environmental Sanitation 9
Other 13
Note: Drainage and wastewater treatment capital construction fall in the "Other PublicInfrastructure Construction" category, as do roads and bridges.
Source: MCon.
urban services, among them gas and water. The practice of underpricing urban servicesencourages excessive consumption and creates pressure for overinvestment.
3.14 Economically optimal tariffs can play a powerful role in managing demandin a market economy. Unlike other areas of the economy, in urban services Chinacontinues to rely on the planned economy methods of quotas, supply cutoffs, andexhortation to control demand. But abundant evidence exists that in a market economy,prices control demand more efficiently than the alternative methods. Quotas and supplycutoffs play a useful role in emergencies, but distort development if used continuously.Education complements proper tariffs by explaining why demand must be managed and byshowing consumers how to make the best use of scarce resources.
3.15 How effective are prices in regulating demand? That depends on currentincomes, use levels, the weather, and other factors. Price regulation will not be successfulif consumers cannot control their utility bill by controlling their consumption. Here, thewidespread practice of metering provides Chinese cities with a prerequisite for managementof water, wastewater, and gas demand. Because consumers need time to adjust theirconsumption patterns, the short-run response to a price increase may be less than the long-run response. This pattern was seen in developed market economies after the oil shocksof the 1970s, where the long-run elasticity of demand for petroleum was much greater thanthe short run.

- 30 -
3.16 Interpreting the Data. Before turning to the analysis of specificenvironmental services, two cautions are in order. First, the analysis cites official statisticson environmental service coverage. Chapter 1 noted the various ways in which theChinese count the urban population (Box 1.1). Most city service obligations extend onlyto nonagricultural residents, who in 1991 totaled 149 million people compared to the 305million "urban" population shown in the statistical yearbook that year. Therefore, thefigures for percent of population covered should be interpreted as coverage for the built-upurban core, not that area plus the city suburbs. To the extent that services such as sewagetreatment and domestic gas protect water and air quality, the coverage figures overstate theprotection provided by city investments. Second, the number of cities grew from 233 in1981 to 479 in 1991. Where growth in total supply is reported, it has not been normalizedto reflect the growth in city numbers.
C. WATER SUPPLY
3.17 Supply Trends. Among possible environmental investments, Chinesemunicipal leaders give top priority to adequate supply of potable water. Of the urbanenvironmental services listed in the Seventh Five-Year Plan (1985-90), only water supplyfully met its target. In contrast to water, expansion of sewerage, sewage treatmentcapacity, town gas, roads, and public transport all fell well below target. A lack ofcomparable statistics makes it difficult to track the coverage of municipally provided watersince the early 1980s. But per capita domestic supply increased rapidly over the period(see Table 3.4).39
Table 3.4: PER CAPITA SUPPLY OF DOMESrIC WATERFROM MUNICIPAL SYSTEMS
1980 1985 1988 1991
Supply(liters/capita/day) 128 151 163 174
3.18 Rising average supply levels mask high variability of supply across thecountry. Northern Chinese water resources generally are far below those available in thesouth. In 1991, 18 cities, all in north China, reported that daily average per capitadomestic water consumption from enterprise and municipal sources fell below 40 liters.In recent decades, to meet increasing water needs, many areas in north China haveconsumed water well above sustainable levels by exploiting previously untapped aquifers.Extraction fees, if charged at all, were no higher than those in water-abundant areas andmunicipal water was delivered at prices near the national average. This pricing strategysupported increasing consumption and short-term growth, but has also resulted in massivedrawdown of aquifers in many places. Damage from pollution has exacerbated theproblem. The overextraction of groundwater has led to significant land subsidence in 45of China's medium and large cities. In Taiyuan, one of north China's major industrialcities, the water table was lowered by some 50 meters over 20 years. Subsidence nowaffects 300 km2 in the city, reaching 2 meters in some places. A water transfer project

- 31 -
designed to sustain growth in Taiyuan and Datong, another large industrial city, wouldrequire an estimated investment of $1.4 billion plus the large annual costs associated withlifting the water 600 meters. Unsustainable extraction over much of north China has begunto require radical, expensive intervention, and a shift away from the agricultural andindustrial production structures fostered by a cheap water policy.
3.19 Diverse Sources. City governments share water supply responsibilities withenterprises, which have built small systems to supply their own needs and those of theirworkers.40 In 1991 enterprises pumped 54 percent of total urban supply. The municipalsystems concentrate on household and commercial service, supplying 85 percent of alldomestic users, but only 31 percent of enterprise consumption. Domestic water is suppliedvia standpost, communal taps, or the increasingly dominant household connection. Thecombination of municipal and enterprise systems in the largest cities provides nearlycomplete coverage to their nonagricultural population and supports domestic consumptionlevels that are high by international standards (Table 3.5). Smaller cities leave someresidents dependent on private or collective wells, surface water, or other sources, buttypically provide good supply volume to those served.
Table 3.5: WATER SUPPLY BY C1TY SizE,MuNIcIPAL AND ENTERPRISE SYSTEmS, 1991
(479 Cities)
All > 2 1 - 2 500,000- 200,000- < 200,000Cities million million 1 million 500,000
Percentage of 88.6 99.0 94.7 93.2 83.8 75.3populationserved
Average daily 205 293 163 188 204 154per capitadomesticconsumption(lite rs) _ _ _ _ _ _ _ _ _ _ _ _ _ _ _ _ _ _ _ _ _ _ _ _ _ _ _ _ _ _ _ _ _ _ _ _ _ _ _
Source: SSB, Chengshi Tong/i Nianjian, 1992, pp. 32, 33.
3.20 Quality Supply. Chinese drinking water standards match internationalpractice and, at least in the medium and large cities, water plant output generally meetsthose standards.4" Even when plants meet output standards, problems can arise due togroundwater infiltration of the delivery system. However, little evidence exists of healthproblems related to drinking water. Here, the Chinese tradition of boiling their drinkingwater serves as an effective safeguard against system failures. Surveys of urban residentshave shown water quality to attract little notice except in Shanghai, where phenols in theraw water cause taste problems, and occasionally in other cities when high chlorine dosinghas been needed. In medium and large cities, 24-hour water supply is generally achieved,although some small cities fail to reach this goal.

- 32 -
3.21 System Management Quality. Chinese water utilities report excellentunaccounted-for water (UfW) rates, one of the most common measures of water supplysystem physical and administrative quality. UfW measures the difference between waterdelivered from plants and that billed to customers. Differences arise due to leakage,unmetered legal uses (such as fire hydrants), malfunctioning meters and illegal connections.Singapore is generally credited with the best performance of any country, with about7 percent UfW. Well-run European and North American urban systems have UfW from15 to 25 percent and in developing countries figures above 40 percent are common.Chinese cities reported average leakage at 8.4 percent in 1991, which, if correct, wouldrepresent exceptionally good performance. However, municipal pipe breakage rates andpipe and pipe joint quality call into question the low reported rates. The low leakage ratesapparently are reported in response to national operating guidelines that penalize highUfW, but rather than encouraging good management the guidelines may simply encouragefalse reporting. China performs well in other aspects of UfW, with very high meteringrates and low illegal and unbilled connections. Accurate UfW figures are critical formanagers designing maintenance programs. UfW of 10 percent leaves little room for cost-effective increases in maintenance effort, while a 40 percent rate may justify such aneffort.4 2
3.22 Excessive Consumption. The domestic supplies reported in Table 3.5 arehigh by developing country standards and the increases since 1980 parallel the rising realincome of the urban population. Despite repeatedly voiced government concern over watershortages, when enterprise consumption is included, per capita consumption in Chinesecities compares well with that in other countries (see Figure 3.1). In fact, consumptionis so high, the real cost of additional supply are rising so quickly, and budgetaryconstraints are sufficiently tight that China's water demand management policy needs aradical overhaul. The basis of the new policy must accord with the reformed marketorganization of the economy and rely much more on price to guide enterprise andhousehold consumption choices.
3.23 The current demand management policy sets quotas for industrial water useand recycling rates. It complements those rules with experimentation on new water savingtechnologies and some earmarked financial support for their installation. Water reuse rateshave risen significantly, yet numerous studies continue to show Chinese industry usingwater far above international best-practice levels, with the worst-performing industries atthree to four times those levels. Moreover, the need to meet additional demand throughmore distant or difficult-to-access sources has driven up the cost of new supply. In thethree years from 1988 to 1991, the average investment cost for an m3/day of new supplyin China rose 23 percent in real tenns.43 This increase is consistent with internationalexperience and the rate of increase can only be expected to grow over time.'
3.24 Valuing Water. Maximizing water use efficiency in a market economyrequires setting the price of water at its long-run marginal supply cost, the cost of waterfrom the most expensive supply source, valued at current prices.45 At any price belowthat, users at the margin will pay less than the cost of production, encouraging overuse ofthe resource. Furthermore, in the OECD countries, China, and other nations using the
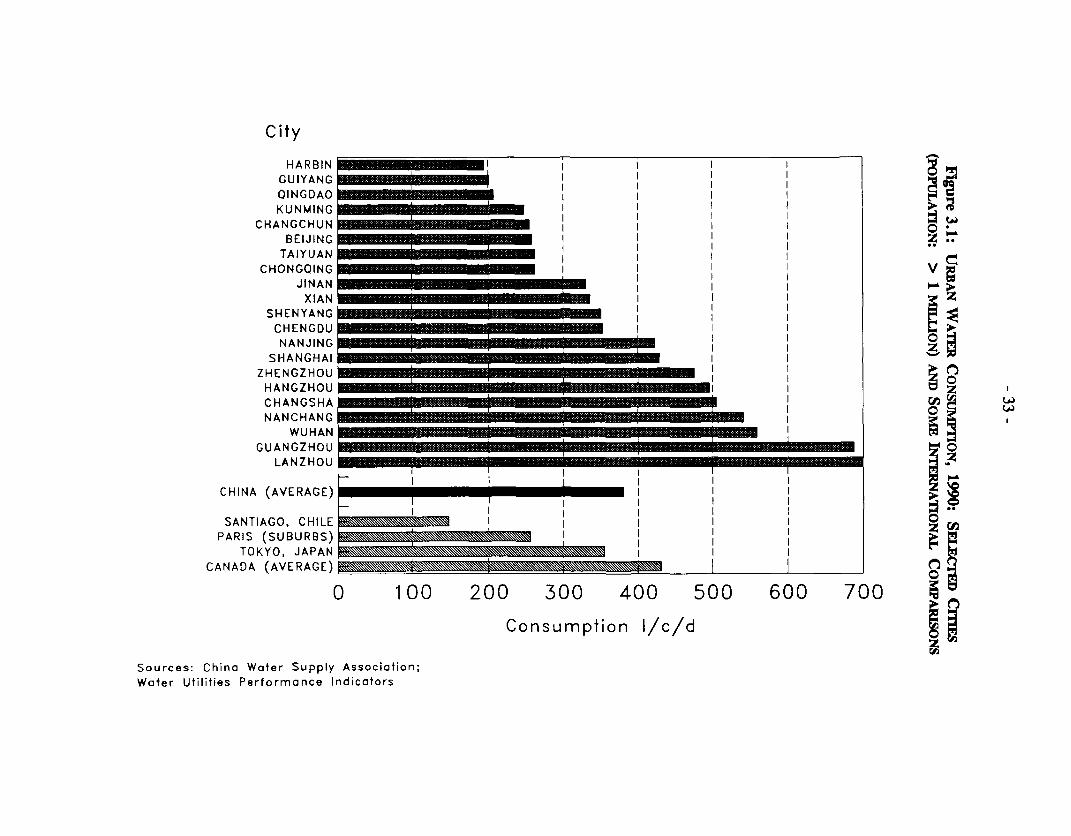
City
HARBIN I - i -I
-GUIYANG p I iQINGDAO I pKUNMING I i
CHANGCHUN I IBEIJING _ i
TAIYUAN IICHONGQING _ I i
JINAN _ I IXIAN I I
SHENYANG -------CHENGDU ----- I I-N A N JIN G ---- ------- - -z -----
SHANGHAI - I IZHENGZHOU -------------
HANGZHOU --------- zCHANGSHA I ------NANCHANG =
WUHAN -----------GUANGZHOU °
LANZHOU
CHINA (AVERAGE) I
SANTIAGO, CHILE 0PARIS (SUBURBS)
TOKYO, JAPANCANADA (AVERAGE) O i
0 100 200 300 400 500 600 700
Consumption I/c/d
Sources: China Water Supply Association;Water Utilities Performance Indicators

- 34 -
"polluter pays" principle to determine responsibility for pollution damages, dischargers ofwastewater must also be charged a fee equal to the marginal cost of the damage caused bytheir pollution. Again, a lower fee will encourage excessive wastewater discharges.Current water prices fall far below the price needed to induce consumers to use waterefficiently. A new pricing policy is therefore needed that moves in stages toward theoptimal price and has the advantage of managing demand increases to lower sectorinvestment needs.'
3.25 Municipal water prices are too low. Most Chinese cities not only chargebelow the cost of marginal supply but below the average cost of supply, if that wereproperly measured. This forces water companies to look to municipal grants for newinvestment and major overhauls. Although national water pricing policy calls for a profitof 15 percent on the production cost of water, in 1991 the average water company profitrate on production cost reached less than 2 percent.47 Even then, the recorded productioncost was held down by deferring maintenance and depreciating historically valued capitalat rates well below those common in market economies. Use of the historic cost of capitalto establish a public utility rate base is not uncommon in other economies, but it provesto be particularly damaging in a period of high inflation in any economy. A preferredmeasure of enterprise welfare is the rate of return on revalued assets and that, for mostChinese water supply companies, has been negative in recent years. However, a verysmall number of Chinese cities have moved boldly to place their water operations on a self-sustaining basis, generating sufficient revenue to meet their own capital needs (see Box3.2).
3.26 The practice of enterprise self-supply has helped cities limit municipalinvestment in the water sector. However, enterprises have been charged, if at all, rawwater extraction fees of no more than Y 0.04/ton. Marginal delivered water costs to theenterprises vary substantially, but are reported to be below current municipal tariffs andwell below the average incremental cost of new supply in virtually all cities. Whetherenterprises self-supply or take supply from municipal systems, most cities must constraindemand through water use quotas. If additional supplies permit larger quotas, enterpriseshave willingly made use of them at current prices. This demonstrates a willingness-to-paythat exceeds current tariffs and, based on market economy experience that shows largeefficiency gains from using price rather than quotas to allocate inputs, suggests that pricesshould be raised to the point where quotas can be abandoned.4" For self-supplied water,this can be achieved by raising the raw water abstraction fee until average enterprise self-supply costs approach the new municipal tariff. Such a fee will be location-dependent, andcan be set for each city by analyzing water production costs at representative enterprises.By using industry average production costs, individual enterprises are encouraged tooperate efficiently, because they capture any cost savings.
3.27 The proposed sector pricing strategy follows that of Jinzhou, Shanghai, andother model operations by moving as a first step to water tariffs that provide a positive rateof return on revalued assets. Although this constitutes pricing based on average, notmarginal, cost, where new water supply can be acquired at a cost close to current averagecosts as, for example, in Wuhan, the price adjustment will be very close to the optimal

- 35 -
Box 3.2: WATER PRICE REFORM IN JINZHOU
The city of Jinzhou in Liaoning Province has become a pioneer in water companyfinances. At a time when municipal finances were strained by other infrastructure developmentdemands, Jinzhou was faced with the need to serve the growing port city of Jinxi and to replace rawwater supplies contaminated by industrial pollution. Jinzhou decided to raise prices sufficiently tomake water operations self-supporting and to generate the funds needed for the new investment. Awater price increase of 50 percent in early 1992 did not slow the growth of industrial or residentialdemand, which had not been met in previous years due to supply constraints. In May 1993, industrialwater prices were raised an additional 42 percent to Y 0.84/r 3 and, in July 1993, household priceswere raised by two thirds to Y 0.50/m3 .
With the latest increases, block tariffs were introduced for industry, with water at theY 0.84/m3 rate for consumption up to 90 percent of the previous year's consumption. From 90 to100 percent, prices are Y 1.24/r 3 , and from 100 to 110 percent, Y 1.64/m3 . Industry has beenoperating under consumption quotas for some years and water company officials predicted that neitherindustrial nor domestic consumption would fall in response to the latest price increases. They reportthat experience in the first months bears out their prediction. Jinzhou has moved incrementally, yetquickly, to discover enterprise and domestic willingness-to-pay for increasingly scarce water. Theaverage price has now reached the marginal cost of supply and the company had a before-tax net returnon revalued assets of nearly 8 percent in 1993. That will drop in 1994 as assets increase with theconstruction program financed under a Bank loan. But, critically, the company will be able to generatesufficient revenue to finance that loan with no recourse to city subsidies. The only risk in the strategyis that long-run price elasticities of demand may be higher than short-run, leaving new supplyunderutilized.
system price. In cities such as Kunming, utilizing several supply sources of widelyvarying costs, tariffs based on the average supply cost will produce excess consumption.For most, the adjustment to cover average cost will require a substantial real tariffincrease. The average cost approach has the advantage of being readily understood by andeasily justified to consumers. As consumers are educated to the new demand managementpolicies, have time to adapt to them, and their demand response becomes known,companies can move toward fully optimal marginal pricing.
3.28 Raising water prices sufficiently to permit unsubsidized water companyoperation, and increasing raw water extraction fees enough to discourage overuse of self-supplied water, will reduce demand and provide the financial resources water companiesneed to increase maintenance and service quality and expand system coverage. Cities willthen be able to reallocate the 10 percent of the infrastructure budget that now goes to waterand will enjoy substantial increases in water extraction fee income. Both changes willprovide resources to finance critical municipal needs or permit a reduction in the lessefficient indirect taxes.
3.29 Demand Impact. The impact of tariff changes on total investment neededin the water and wastewater sectors will be very substantial in the long run. A tool usedto help estimate the impact of change is that of the elasticity of demand. Price elasticityof demand measures consumer demand response to a price change. Numerous studies of

- 36 -
household price elasticity for water in developing countries show it to range from about-0.10 to -0.45. A study of Shanghai data showed a value of -0.38, consistent withinternational experience. The interpretation of the Shanghai value is that for a 10 percentincrease in the real price of water, demand will fall by 3.8 percent. Similarly, if the realprice falls by 10 percent, demand will rise by 3.8 percent. A second elasticity issimultaneously at work: the income elasticity of demand. This concept is based on theobservation that purchasing decisions are affected by income as well as price. In aneconomy such as China's, with rapidly rising real incomes, this can have a powerfuladditional effect on demand. In Shanghai, the income elasticity was estimated at 0.22.Thus, if real incomes rise by 10 percent in a year, water demand will rise 2.2 percent inaddition to any price effect.
3.30 Enterprises behave analogously to households. If prices increase they adjustwater consumption to maximize profits, with actual changes depending on their ability toconserve or recycle water. If their unit sales rise, their demand for water will increase,to the extent that its role in production is directly related to output. Few internationalstudies on industrial water demand have been done, but those done show higher priceelasticity than for households. Estimates have not been made for China because firms basewater use on quotas rather than price, so elasticities cannot be estimated. However, theprice elasticities of industrial demand can be expected to be very low until the water pricerises sufficiently that it, rather than quotas, determine firm demand. After that point, ahigh elasticity can be expected, reflecting the ample opportunities for water saving.
3.31 The industrial response to water price changes raises the issue of short-versus long-run elasticities. In the long run, say over three to five years, a firm can installnew, more water-efficient plant and equipment if water price changes make it worthwhile,but in the short run, say the first year, fewer options will be available and the short-runresponse may thus appear very low. Studies in gasoline markets, for example, have shownshort-run price elasticities of -0.32 and long-run of -0.55.49 A reason to phase in priceincreases is to allow time for the long-run elasticities to become known.
3.32 Under current pricing strategies, total water sector supply would have togrow by about 56 percent between now and the year 2004 to meet demand. Under apricing strategy that allows water companies a positive real rate of return and increases rawwater extraction fees for enterprises accordingly, total demand would not exceed 1994levels until the year 2001 (see Figure 3.2).5° Of course, investment would need to growsomewhat faster than the supply requirements shown because water surpluses are not easilytransferred to underserved cities and new water sources must be developed to replace thoselost to pollution. But even meeting those requirements, investment can be cut to perhapsa third of the level otherwise required. Operating costs will follow the investment patternand they, too, will be much lower than otherwise for any given standard of service.
3.33 Recall also that due to the full exploitation of easily used raw water sources,by the late 1980s the real cost of increments to water supply was rising rapidly. The costof developing new supply in 1991, the last year for which figures are available, wasY 1,575/m3/day in 1994 yuan. By the year 2004, that is estimated to rise to Y 3,870/n3!

Daily Demand (mil m3)200 -
Scenario 1 '150 ---------------------------
Scenario 2
100 -------- ' ----------------~
Scenario3 3
50 ----------------------------
91 92 93 94 95 96 97 98 99 9 1 2 3 4
Year
Scenario 1 is current water demand; scenario 2 Is water demand with full pricing; scenario 3 Iswastewater demand with sewage tariffs. (See endnote #50 for underlying assumptions.)

- 38 -
day in 1994 yuan. In this, water behaves very differently from the cost of providingroads, bridges, drains, or other elements of the urban infrastructure. The cost of thoseinvestments can be expected to change with the rate of inflation for civil works-onlywater adds the element of increasing scarcity to the underlying inflation rate." If demandis not managed more effectively than it is now, annual development costs for municipalsystems will rise from Y 3.7 billion a year now to 8.2 billion in 2000 and 14.5 billion in2004 (all in 1994 yuan). Price-driven demand management will hold investment below the1994 level, saving Y 4.5 billion a year by the year 2000. Additional savings will beenjoyed in sewerage investment, discussed below.
3.34 The recommended demand management strategy has been used successfullyin large cities elsewhere. A notable example is BogotA, Colombia, a city of over 5 millionpeople in a country with per capita gross national product much higher than China's.There, water and sewerage rates (which are billed together, with sewerage charges basedon water use) have been steadily increasing in real terms over the past 15 years to meetgrowing operational and investment requirements. From 1975 to 1990, the price per m3
of water increased by 88 percent in real terms, while the per capita demand decreased from203 liters/day to 160 liters/day (see Figure 3.3). Wastewater flows over the period showeda corresponding decrease.
3.35 Over the 1975-90 period, the population served in BogotA increased from2.7 million to 5.1 million and enterprises continued to grow normally. The reduction inper capita water consumption represents an aggregate annual water saving by 1990 ofnearly 220,000 m3/day, enough to serve a population of about 1.3 million at 1990consumption levels. The savings in sewerage facilities have been correspondingly large.Unfortunately, BogotA has not captured the full benefit of this reduced demand becausethey expected less response to price and built higher-capacity water supply plants than theynow need.
3.36 In contrast to BogotA, the real price of water in Shanghai (and most otherChinese cities) fell between 1975 and 1990, with some increases beginning the latter year.With the real price of water falling 45 percent between 1984 and 1990 (and incomesrising), Shanghai residential per capita water use increased 55 percent, from 85 liters perday to 132 liters per day. Wastewater flows increased at the same pace over this period.The 25 percent increase in the real water price in late 1990 led to a small decrease inconsumption in 1991 (see Figure 3.3).
3.37 At this critical turning point in urban public finance, Chinese cities cannotafford to overlook the great strength of the market economy in using prices, adjustedthrough a predictable, transparent process, to manage demand. As discussed later, therapid growth of the economy will permit this to be done without threatening the standardof living of the urban population.

- 39 -
Figure 3.3: BOGOTA, COLOMBIA AND SHANGHAI, CHINA:WATER PRICE AND CONSUMPTION
BOGOTA COLOMBIA (1975-1989)Average Water Price and Consumptlon
WtW CVonumpiond r210 so
19' .. . . .. . . .. . . . .......... '40
180 ..... ... . ........... _ 30
_N Cww"On165 .. . . .... , 20
5 76 77 78 79 80 81 82 83 84 86 86 87 88 89Year
- Water Consumptlon -)* 1984 ColS/m3
SHANGHAI, CHINA (1980-1993)Domestic Water Price and Consumption
Water Consumption Veld Price
80 81 82 83 84 85 86 87 88 89 90 91 92 93Yeaw
Water Consumption -O- 1978 YUan/m3

- 40 -
D. SEWERAGE AND WASJEWATER TREATMENT
3.38 Wastewater. A very high percentage of piped urban water flows on aswastewater (generally, about 80 percent of water used becomes wastewater-the remainderis consumed, evaporates or is absorbed directly into the soil). The manner in which thewastewater drains and how (or if) it is treated has a large impact on the urban environmentand on the health of the populace, especially the poor. If receiving waters have sufficientvolume to dilute the waste stream and other users are at a sufficient distance from thedischarge point, little treatment may be needed to maintain receiving water quality atadequate levels. The water quality of the Yangtze above Shanghai demonstrates the powerof dilution and the breakdown of pollutants through natural processes within the waterbody. Despite absorbing generally untreated discharges from major upstream cities suchas Nanjing, Wuhan, and Chongqing; and from tens of medium and small cities; as well asfertilizer, pesticide, and other runoff from thousands of square kilometers of farms, theYangtze meets Class I standards even in low-flow periods. Plumes of polluted water canbe seen at discharge points into the river all along its length, but these are soon dissipatedand metabolized within this very large body of water. Shanghai adds a waste load not soeasily handled and State Oceanography Bureau patrol vessels have occasionally found algaeblooms ("red tides") covering up to 130 km2 in the East China Sea off the mouth of theYangtze that they attribute to pollution.52
3.39 Pollution Damage. Most streams, rivers, and lakes within or belowChinese cities lack the powerful natural treatment capabilities of the Yangtze, leading tothe very low water quality reported in Chapter 1. Heavy pollution in such rivers can havehigh economic costs. Those costs include the need to replace or provide additionaltreatment for degraded potable water supplies; the loss of agricultural and fisheriesproduction; and the loss of recreational and amenity value. The loss of raw water sourcesfor municipal supply appears to be particularly severe and the main cause of the rapidincrease in water supply costs noted earlier. For example, the Hun River in LiaoningProvince recharges the aquifer used for drinking water by the provincial capital ofShenyang. However, the Hun passes through the large industrial city of Fushun 20 kmabove the aquifer and Fushun's industrial and domestic discharges pollute the river and theaquifer, which forced Shenyang to construct a 51 km long, Y 564 million (then $108million) conveyor to the Dahuofang Reservoir on the Hun upstream of Fushun. That doesnot solve the pollution problem, for much of Fushun's wastewater discharges to anirrigation canal that farmers continue to use despite its failure to meet irrigation usestandards. Fushun has now begun work on a sewerage system upgrade and 250,000m3/day primary treatment plant that will cost Y 300 million and substantially reduce thedownstream threat from their wastes.
3.40 The one reported Chinese effort to assess the damage from water pollutionwas a two-year research project completed in 1987 that spanned 20 provinces and 57 cities.The researchers estimated that if effective measures to control water pollution were nottaken, wastewater discharges would cause direct losses of over Y 273 billion in the 15years to 2002." The study itself has not been published, preventing independentassessment of its assumptions and methodology, but the damage estimate averages some
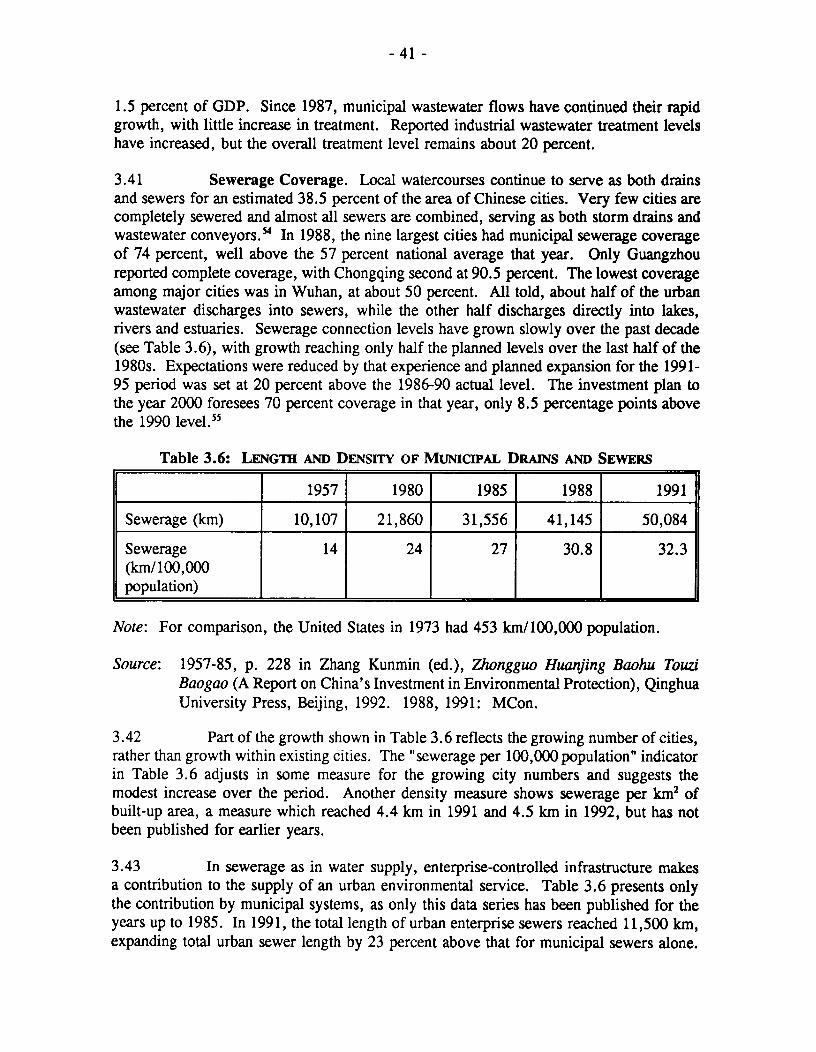
- 41 -
1.5 percent of GDP. Since 1987, municipal wastewater flows have continued their rapidgrowth, with little increase in treatment. Reported industrial wastewater treatment levelshave increased, but the overall treatment level remains about 20 percent.
3.41 Sewerage Coverage. Local watercourses continue to serve as both drainsand sewers for an estimated 38.5 percent of the area of Chinese cities. Very few cities arecompletely sewered and almost all sewers are combined, serving as both storm drains andwastewater conveyors.5' In 1988, the nine largest cities had municipal sewerage coverageof 74 percent, well above the 57 percent national average that year. Only Guangzhoureported complete coverage, with Chongqing second at 90.5 percent. The lowest coverageamong major cities was in Wuhan, at about 50 percent. All told, about half of the urbanwastewater discharges into sewers, while the other half discharges directly into lakes,rivers and estuaries. Sewerage connection levels have grown slowly over the past decade(see Table 3.6), with growth reaching only half the planned levels over the last half of the1980s. Expectations were reduced by that experience and planned expansion for the 1991-95 period was set at 20 percent above the 1986-90 actual level. The investment plan tothe year 2000 foresees 70 percent coverage in that year, only 8.5 percentage points abovethe 1990 level.55
Table 3.6: LENGTH AND DENSrrY OF MUNICEPAL DRANS AND SEWERS
1957 1980 1985 1988 1991
Sewerage (km) 10,107 21,860 31,556 41,145 50,084
Sewerage 14 24 27 30.8 32.3(km/100,000population)
Note: For comparison, the United States in 1973 had 453 km/100,000 population.
Source: 1957-85, p. 228 in Zhang Kunmin (ed.), Zhongguo Huanjing Baohu TouziBaogao (A Report on China's Investment in Environmental Protection), QinghuaUniversity Press, Beijing, 1992. 1988, 1991: MCon.
3.42 Part of the growth shown in Table 3.6 reflects the growing number of cities,rather than growth within existing cities. The "sewerage per 100,000 population" indicatorin Table 3.6 adjusts in some measure for the growing city numbers and suggests themodest increase over the period. Another density measure shows sewerage per km2 ofbuilt-up area, a measure which reached 4.4 km in 1991 and 4.5 km in 1992, but has notbeen published for earlier years.
3.43 In sewerage as in water supply, enterprise-controlled infrastructure makesa contribution to the supply of an urban environmental service. Table 3.6 presents onlythe contribution by municipal systems, as only this data series has been published for theyears up to 1985. In 1991, the total length of urban enterprise sewers reached 11,500 km,expanding total urban sewer length by 23 percent above that for municipal sewers alone.

- 42 -
The sewerage coverage rates reported in para. 3.38 include enterprise sewers, which arefound within the very large combined industrial and residential compounds typical of largeSOEs.
3.44 Sector Organization and Funding. For cities organized into districts, thatlevel of govemment takes responsibility for maintenance of drainage and sewerage works,while planning and construction are handled by the municipal government. And, becausedrains and sewers run under or along roads, the same bureau typically handles bothoperations. Just under 9 percent of the 1991 municipal infrastructure construction budgetwent to drainage, sewerage, and sewage treatment, an 84 percent real increase over the1988 level. Nearly 11 percent of the smaller overhaul budget went to the same purpose.These two items totaled Y 1.6 billion, but unfortunately operating costs were not reported,so that total system costs are unavailable. In any case, the costs are well above the totalsewerage fee collections of Y 750 million in 1991. Only some 300 of the cities collectedthe fee, which covers drainage, sewerage and treatment. Where the fee is collected, it isusually at the guideline rate of Y 0.08/i 3 charged against 80 percent of waterconsumption. A central government circular prohibits charging households or schools andother social institutions for sewerage services, removing about 40 percent of total dischargefrom the tariff base. Full recovery of primary treatment costs in cities studied by Bankmissions requires a 1994 tariff of about Y 0.50/i 3 (applied to all users), of whichoperating and maintenance costs take about Y 0.27/e3. Improvement to secondarytreatment boosts the total to Y 0.77/e3 for all costs and Y 0.37/m3 for operations andmaintenance alone (see Box 3.3 for treatment definitions). With costs running above thoseof water production, but without the benefit of correspondingly large charges, wastewatertreatment places a heavy burden on municipal budgets.
3.45 Urban drains and combined sewers often collect a level of debris thatreduces drainage capacity enough to impair seriously their ability to handle storm loadswithout flooding. In Kunming, wastewater treatment plant managers attribute wastewaterinflows below design levels to siltation of the sewerage system. While design errors mayplay a role, sewerage system managers generally attribute maintenance problems to theirlack of funds to hire work crews. This explanation is consistent with observed shortagesof maintenance allocations in other sectors. The problem can be linked directly to thefailure to charge adequately for the service and becomes especially serious whenwastewater treatment, with its much higher costs, becomes necessary.
3.46 Municipal Wastewater Treatment. Where, as is the general rule,municipal wastewater treatment plants are bureau-run, the municipal budget consolidatesthe capital, operating, and maintenance costs into the overall infrastructure budget. Theconstruction and overhaul budgets cited in para. 3.41 therefore include those costs. Theimpact of inadequate funding has been greater for treatment than conveyance, as the 1992treatment rate of 4.5 percent indicates. Not only is coverage low, but extrapolating fromthe small sample of plants visited, design and management problems have been much morecommon with wastewater treatment plants than water treatment plants. For two plants, thecity failed to provide adequate sewerage connections, leaving substantial idle capacity.Another plant appeared to have not been functioning for some time before being visited by

- 43 -
Box 3.3: WASTEWATER POLLUTANT REMOVAL EmCIECIS
Conventional wastewater treatment includes primary, secondary, and tertiary treatment,the final level depending on the quality of effluent required. Many alternative treatment technologiescan be used. The following descnbes a system often found in land-short medium and large citiesneeding to process large wastewater volumes.
Primary wastewater treatment passes the wastewater through screens to remove largematter, through a chamber where grit settles out, into a tank that permits suspended solids to settle out,and then discharges the effluent. The settled sludge is removed periodically, dewatered, and put inlandfills (or used as a soil conditioner if free of heavy metals). This process typically removes about30 percent of the BOD in the wastewater, and most heavy metals.
Secondary treatment follows the primary stage by passing the effluent through a tank ortanks that have large numbers of bacteria that break down the organic particles in the wastewater (theactivated sludge process). Typically, the bacteria are aerobic and to sustain the process requires thatoxygen be added to the water, usually through paddles, propellers, or air injectors. After a stage ofthoroughly mixing the bacteria with the organic matter, the effluent flows into a sedimentation tankwhere the digested material settles to the bottom. Again, the sludge is removed and dewatered andthe effluent is discharged. This process typically brings BOD removal percentages up to about 85 to95 percent. The large power requirements for adding oxygen and the additional plant raise totaltreatment costs about 50 percent above those of primary treatment alone. Needed management skillsfar exceed those for primary treatment and because industrial wastes such as arsenic kill the bacteria,the process requires adequate industrial pretreatment.
Tertiary treatment follows the secondary stage with filtration, typically sand filters orsand mixed with activated carbon, depending on the nature of the effluent. Chlorination or similarprocesses kill bacteria. Removal percentages climb as high as needed and costs at least double thosefor prinmary treatment alone.
a mission. Yet another took nine years to build and put into operation, instead of theplanned three years, due to funding shortages. After several years of operation, one planthas never been able to dewater sludge because of faulty machinery and so dumps thesludge directly to the sea. In fact, sludge disposal is a problem for all plants. Most hadplanned to sell or give away the sludge for use as a soil conditioner, but farmers arereluctant to use it. Although farmer reluctance can be attributed to the low nutritive valueof the sludge, if industrial wastewater has been treated, the likely presence of heavy metalsalso argues against agricultural use.
3.47 Table 3.7 shows the recent development of treatment plants. Of the 87plants in operation nationwide in 1991, 16 had a capacity under 10,000 m3/day, with mostof those around 5,000 m3/day. As discussed in Chapter 2, polluting enterprises have anobligation to treat their wastewater and that pretreatment boosts the overall treatment rateto the levels given in Table 3.7. National plans to the year 2000 call for the total urbantreatment rate to reach 25 percent and municipal treatment to reach 6.2 percent.

- 44 -
Table 3.7: NuMBER AND CAPACITY OF MUNICIPAL WASTEWATERTREATMENT PLANTS
1988 1991 1992
Number of cities with treatment 41 58plants__ _ _ _ _ __ _ _ _ _ _ __ _ _ _ _ _
Number of treatment plants 69/40 87/53 100/68(total/with secondary treatment)
Percentage of municipal wastewatertreated
Including industrial 14.9% 17.3%pretreatment
Provided to all wastewater once 3.8% 4.5%in the system
Source: MCon; SSB, Chengshi Tongji Nianjian 1992, Beijing.
3.48 The damage from wastewater includes direct economic impacts such asincreased water system costs for downstream communities and damage to aquatic life andirrigated crops. It also includes less easily measured amenity costs in the loss of value tooily, odoriferous wastes in rivers and lakes. The optimal level of wastewater treatment canbe calculated in terms of the cost of averting damage, but will be location and pollutantspecific. In turn, the least-cost strategy will be pollutant specific. If current BOD loadscan be safely absorbed in surface water, but phenols or petroleum cause problems, anindustrial treatment strategy will be needed, whereas excessive BOD will probably requirea municipal treatment plant with primary or secondary treatment.
3.49 A Program of Intervention. Given the low quality of urban surface watersand known downstream impacts, including growing aquifer pollution, the nationalgovernment should now mandate rapid expansion of sewerage systems and treatment.From all evidence, the current national goals of 6.5 percent municipal treatment and25 percent overall wastewater treatment for the year 2000 fail to meet China's needs. Allcities should be required to expand their sewerage systems to a minimum of 90 percentcoverage of built-up area within five years. Medium and large cities should be requiredto provide at least primary treatment (with provision for expansion to secondary) in aphased 10-year program unless receiving waters continue to maintain their quality atupstream levels. Treatment should be required for any discharge to receiving waters thatalready fail to meet the lowest irrigation standards. Primary treatment would reducepollution loads from medium and large cities, which account for over 80 percent of totalloads, by at least 30 percent. As expertise develops in wastewater treatment systems,small cities should be incorporated into the mandatory treatment program.

- 45 -
3.50 The estimated investment cost of such a sewerage and wastewater treatmentprogram would be about Y 4.3 billion per year ($490 million) over 10 years, or abouttriple recent sewerage investment levels and a 15 percent increment to the annual urbaninfrastructure construction program. To partially offset that investment increase, thesuggested water demand management program would cut investment in the water sectorby an amount equaling at least 7 percent of the infrastructure construction program, leavingno more than an 8 percent net increase in urban infrastructure investment.
3.51 Simply building new treatment plants will not solve the problem. Althougha formal study of treatment plant operation has not been published, industry sourcesestimate that funding shortages have forced most treatment plants to shut down operations,in part or full. To avoid that waste of investment, plant construction should not beginabsent city implementation of the tariff regime needed to finance operations. However,some Chinese cities that have introduced such tariffs have found them difficult to collect.Resistance is not surprising, given that international experience shows a low willingnessto pay for wastewater treatment. One method used to overcome this problem is to billjointly water and wastewater charges, taking advantage of the high willingness to pay forwater.
3.52 User fees should be set to cover all costs, but recognizing that the systemsalso provide storm drainage services, municipalities may choose to pay that portion ofexpenses from general revenues. For equity, and to broaden the customer base, allpolluters, including households, should pay for treatment. Households and small enterprisetariffs would be levied against 80 percent of water use and for other enterprises againstmetered loads. Here, China's program of metering all water users offers a double pay-off.Not only can water use be properly attributed, but in any community very consistentrelationships exist between domestic water use and wastewater loads. Householdwastewater charges can therefore be billed with a high degree of accuracy based on wateruse, with very low additional billing costs. Jointly issued water and wastewater bills willreinforce for consumers the link between water use and wastewater production andencourage careful water use. For equity, and recognizing the damage caused by untreatedwastewater, water users in any untreated part of the system would still pay the full fee.The user fees would raise the effective price of water use to firms and households. Basedon data from recent Bank-supported projects, the increase would be close to the currentaverage water tariff. This will further encourage water-saving behavior, again postponethe need for investment in new water supply, and allow sewerage and treatment systemsto be designed to smaller, more economical capacities. Figure 3.1 reflects the additionalwater investment savings that would accompany the user fee strategy for wastewater.
E. SoLID WAsm
3.53 Municipal Solid Waste. Per capita generation of municipal solid waste(MSW) remains low, at an estimated 285 kg/person/year.5 In 1992, collected urbandomestic waste totaled 82.6 million tons and nightsoil 30 million tons, of which 28.3million tons was placed in MCon-approved landfills, composted, or otherwise treated. The

- 46 -
1992 landfill rate of 25.1 percent follows a trend of growing attention to solid wastehandling in recent years (see Table 3.8).
Table 3.8: MUNICIPAL SoLED WAsrE AND NIGHTSOIL DIsPOsAL
1988 1991 1992
Total municipal solid waste and nightsoil 81.0 104.0 112.6(million tons)
Percentage landfilled or treated 1.0 11.9 25.1
Source: MCon Annual Reports.
3.54 Municipal and district governments, and neighborhood committees shareresponsibility for solid waste collection and disposal services. Although the model variesby city, the municipality typically sets policy and may provide centralized transport andlandfill services, while the districts collect wastes, operate local transfer stations, and inmost cities operate dumps. Neighborhood committees provide street sweeping and mayoffer house-to-house pickup and disposal to local transfer stations. If the neighborhoodcommittee does not pick up at the household, residents bring their waste to neighborhoodbins. Apartment buildings rely on chutes to basement collection rooms. Full servicecoverage is provided to core urban areas, with collection intervals ranging from daily toonce every three days. On the urban fringe, MSW coverage drops to about 75 percent.
3.55 From district transfer stations the waste is hauled to dumps, landfills, orcomposting centers. Most districts contract with local agricultural villages for the dumpland, land which has no provision for capturing leachate or methane. MCon recognizesthe environmental threat posed by these dumps and has encouraged the investment insanitary landfills and treatment plants that has led to much safer handling of wastes in somecities. The policy goal is to raise sanitary landfill or treatment from the current 25 percentlevel to at least 55 percent by the year 2000.
3.56 Industrial Solid Waste. Industrial solid waste (ISW) results in much largerwaste streams than the MSW addressed above. Cities estimated that 620 million tons ofISW was generated in 1992, 50 million tons of which was hazardous. Enterprises areresponsible for disposal of their own wastes, with the stipulation that hazardous wastedumping sites be controlled and protected from leaching. Enterprises may contract withthe district government to collect their wastes or they may deliver with their own vehiclesto city landfills. Despite attempts to limit such activities, MCon estimates that industriesdumped over 10 million tons of industrial solid waste to rivers and lakes in 1992.
3.57 Recycling. The solid waste collection and disposal system is complementedby a waste products recycling industry. Some 40 percent of ISW was recycled in 1992,either by enterprises or municipal recycling agencies. For domestic and small enterprisewaste, the recycling industry relies on small scale private and collective enterprises thatprovide door-to-door collection of, and on-the-spot payment for, any metals, plastics,

- 47 -
paper, or other products for which a market exists. The industry includes scavengers whosort waste at various points in the system, including neighborhood collection points anddistrict dumps. The industry provides good coverage of urban neighborhoods andefficiently manages the marketable part of the waste stream. Reliable estimates of totalrecycled tonnage have not been made, but individual city studies show MSW recyclingrates ranging from 5 percent to 35 percent.
3.58 Financing. For collection services, the household pays a monthly fee,typically Y 1.5, about 0.2 percent of average monthly income. In cities surveyed, the feecovers no more than collection costs, with disposal costs borne by the city budget. Districtsanitation departments often receive an annual subsidy from the city and may earnadditional income through fee-for-service collection of industrial solid waste or otheractivities. In surveyed cities, the combination of income sources permitted adequatefinancing of collection operations.
3.59 Engineers with wide experience in other countries judge the collectionoperations adequate. Streets are swept, waste pickups are dependable, transfer stationsoperate properly and vehicle fleets are maintained. Nonetheless, this service frequentlyrates as that with which urban residents are least satisfied, primarily because scavengers,overflow, and careless dumping lead to piles of unsightly and malodorous waste aroundneighborhood bins. These problems would be reduced by replacing existing collection binswith large capacity containers that can be mechanically loaded into collection vehicles.That would end the manual double-handling of wastes that is partially responsible for thecurrent problems.
3.60 Disposal. Sanitary engineers and environmentalists do not give China'slandfills high marks. While some well-run landfills exist, most are poorly controlled, oftenfailing to meet MCon standards, with inadequate handling of leachates and methane.Because such landfills have been identified as a major source of aquifer pollution, thesingle largest improvement in solid waste handling in China would be provision ofadequately engineered and managed landfills. High quality landfills complementwastewater treatment efforts and can safely handle treatment plant sludge. Internationalexperience and economies of scale both show the value of operating such landfills at themunicipal level in large cities and regionally for small cities. China has a few goodexamples of such landfills to draw upon, such as Shanghai's, and more are being built,some with foreign financing. As with wastewater treatment, not every locale needssophisticated solid waste handling and careful analysis of local waste streams, soils, andaquifers is necessary before deciding the standard of construction or whether alternativessuch as incineration or composting are attractive.
3.61 Landfill costs themselves are but a part of total handling costs, which all willvary with land availability. A recent study for Tianjin indicates costs of about Y 55 perton for pickup, transfer, and disposal. At current domestic solid waste generation rates,that equals about Y 16 per capita in annual municipal solid waste costs, compared withcharges that now average perhaps Y 5 per capita across Chinese cities. Domestic user feesmust therefore rise to finance these costs and industrial waste disposal fees would also rise,

- 48 -
as uncontrolled dumps are closed. Chinese studies show a willingness to pay for domesticsolid waste services that is little above current fee levels. Imposition of the new fees willtherefore require intensive consumer education on the damage from current practices andanticipated improvements from the new systems.
F. PAYING FOR A HEALTHY ENVIRONMENT
3.62 To date, Chinese cities have failed to charge the full cost of providingenvironmental services. But how much does this practice cost cities? Water and gas, thebest candidates for full cost recovery, including self-financing of new capacity, togethercommanded 38 percent of the urban infrastructure construction budget in 1991 and20 percent of the major overhaul budget. Their substantial operating subsidies werereported earlier. The financial burden of sewage treatment remains light because so fewcities practice it. However, the economic costs of that practice may be large indeed, asdownstream users suffer, as does groundwater. Solid waste collection costs do appear tobe covered by fees. However, the use of unprotected dumps for waste, while cheap, leadsto problems with pests, greenhouse gasses, and leachate. The first transmits disease, thesecond destroys the atmosphere, and the third destroys the groundwater. In brief, citieshave chosen a strategy that burdens future generations as well as their neighbors.
3.63 Tariff Strategy. Tariffs should be designed to allow full cost recovery ineach sector.57 For the water sector this will lead to consumption based on willingness topay, the best test of the value of a service. Water tariffs should be the same for all usersunless the relative cost of serving them varies. In wastewater treatment and solid wastedisposal, willingness to pay is typically below full handling costs, because the polluter doesnot suffer the full effects of the pollution. In these situations, countries make politicaljudgments about responsibility for the pollution damage. China has opted for the "polluterpays" standard shared by many other countries. Proper implementation of that standardrequires accurate measurement of pollution and China's ability to do that has beendemonstrated. This approach does not distinguish between households and enterprises intheir tariff burden, except as it reflects different pollution loads.
3.64 Impact on Enterprises. The suggested tariffs will substantially increase thedirect cost of water, wastewater, and solid waste handling to enterprises and consumers.Enterprises have abundant opportunities to save water, but those savings themselves havecosts. Production cost increases will vary with the current water use efficiency of theenterprise and managerial talent in adjusting to the new price regime. In most industries,water is a very small proportion of total production cost, usually well under 1 percent, andthe impact of even large price increases need not have a large impact on output prices.Solid waste cost increases would have an even smaller impact. The possibility of reducingenterprise profits should not play a role in setting tariffs. Keeping tariffs low to maintainprofits simply encourages excess use of water and generation of wastes, while allowingenterprises to avoid the fundamental restructuring they need for long run survival. Urbanenvironmental services must be delinked from problems of enterprise reform.
- 49 -
3.65 Impact on Households. For households, two principal reasons for failingto exploit beneficiary financing are often cited in China. One is that when price-settingis politicized, political leaders are held accountable for price increases. No mayor wantsto be blamed for "avoidable" tariff or tax hikes. The second is the pervasive belief thaturban households are poor and that price increases involved in making public services self-sustaining are flatly "unaffordable." Analysis shows that urban consumers are wellpositioned to absorb both the direct and indirect costs of an improved environment. Realhousehold income growth has averaged above 5 percent annually for more than a decade.To date, Chinese urban income policies have effectively prevented urban poverty, the rateof which is below 0.5 percent of the urban population. Under current pricing policies, forthe poorest 5 percent of urban households, the water bill takes only 0.4 percent of totalincome. Adding other utility and service costs such as household fuels, electricity, andwaste collection, the total rises to 4.6 percent. A tripling of the real price of water (whichwould subsume wastewater treatment) plus solid waste disposal costs, assuming fulldisplacement of other consumption, would increase the total utility outlay to 5.8 percentof income. That compares to expenditures of 6.3 percent of income among the poorest oncigarettes, alcohol, and tea.58 More important, the real income growth rates of the lowest5 percent of households have matched those of wealthier cohorts over most of the pastdecade, allowing the proposed increment in cost to be recaptured through real incomegrowth in a single year.
3.66 Chinese citizen expenditures on urban services are well below those foundin market economies, where full cost recovery from beneficiaries of public services isapproached. They are also well below rural expenditures for water. A study in 75counties of six provinces showed village families paying an average of 3.1 percent of theirincome for water alone.59 Consequently, there may be a political affordability issue butthere is no economic affordability issue.'
3.67 Strategies to Assist the Poor. Impoverished households raise the onechallenge to these tariff-setting rules. The very poorest urban families, probably not morethan 0.5 percent of the population, have not enjoyed the rapid income increases of the restand many depend on municipal welfare payments for subsistence. These families must beprotected from cost-of-living increases and the most effective means of doing so is toincrease their welfare payments. Those payments, funded from general city revenues, willnot constitute a major demand on the budget. Another approach to protecting poorhouseholds is to offer block tariffs (sometimes called lifeline tariffs) that provide for a lowtariff on very low volume consumers, followed by compensatingly higher rates thereafter.In water supply and sewerage, for example, the low rate (no lower than the current realtariff level) could apply to the first 5,000 liters per month of household consumption.However, these tariffs become economically and administratively efficient only when alarge percentage of users are poor and the city government lacks an effective social welfaresubsidy program. As China fits neither of those conditions, the increased welfare paymentto compensate for higher tariffs is the preferred approach.

- 50 -
G. EFFICIENT ORGANIZATION AND REGULATORY RELATIONSHIPS
3.68 Introduction. Based on international experience, citizens accept thelegitimacy of user fees that fully cover urban service costs if they receive responsive,quality service that they perceive of as efficiently delivered. International market economyexperience suggests three fundamental, interrelated factors that encourage efficient service.These are (a) choice of an appropriate organizational form for the deliverer of services;(b) organization of the service delivery market to encourage competition; and (c) regulationof economic activity and the market to provide a stable, dependable framework foreconomic decisionmaking and environmental protection.
3.69 No one organizational form, be it government bureau, state-ownedenterprise, cooperative enterprise, or private enterprise necessarily outperforms others inall possible urban service roles. Which will be best depends on the scale and complexityof the operations, sources of finance, and community tradition. However, onecharacteristic is important to all of them-an accounting structure that allows clearcalculation of service costs. Only when costs can be attributed to particular outcomes willmanagers know how to adjust operations to lower costs, will the public be able to decideif the service is efficient, and will the service provider be able to charge users aneconomically efficient tariff.
3.70 The organization of the market in which the service provider works willdetermine what incentives managers have to discover high-quality, cost-effective solutions.The markets with the strongest incentives are those which are consumer responsive, thatis, the consumer has choices and can therefore reject low quality, high cost services. Insome markets, such as industrial solid waste collection, competition is easy to foster. Thetrucks needed for solid waste collection are widely owned, allowing a variety of enterprisesto offer solid waste collection and disposal to industries, which can then choose the bestcombination of price and service. Even when a service is a monopoly in the short run, asmight be a municipal water system in its command area, in the long run the provider couldface competitive pressure in at least two ways. First, if the state owned the assets, theycould contract for management via competitive bidding, a system common in France andused in some developing countries (notably Guinea). The management contract would berebid at regular intervals to maintain pressure on the current manager to perform well.Second, it may be possible for large users to self-supply services. This happens in watersupply in China, where half of the municipal supply is self-supplied by enterprises(although currently not, as shown earlier, under competitive conditions), and can beencouraged in sewerage and wastewater treatment, where large wastewater producers mayfind it more economic to upgrade in-plant treatment rather than hook up to the municipalsystem.
3.71 Competitive markets can develop when an economy has clearly definedproperty rights and transparent, legal means of transferring those rights; when contractsare enforceable; and when actual or potentially competing suppliers face equal access tocredit, labor, and other markets. All of those attributes are strengthened when market

- 51 -
participants perceive government as committed to the market and to the value ofcompetition.
3.72 Bureau Organization. As noted earlier, solid waste, sewerage, andwastewater treatment services in almost all Chinese cities are managed directly by citygovernment bureaus. Bureau staff are civil servants, with salaries determined through civilservice schedules. Civil service rules also determine promotion, transfer and otherpersonnel actions. As government agencies, the service providers do not have segregatedaccounts, depreciation of capital, and other features of enterprise accounting that allowready analysis of service costs. While service fees may be charged, any surplus accruesautomatically to the municipal budget and any shortfall is covered through a transfer fromthat budget. Capital investments are financed through the budget and the activity cannotincur debt. As a result, and in a situation not unique to China, attempts at analyzing thefinancial performance of these sectors have not been wholly successful. This analysis ofbureau performance suggests that the current organizational form fails to meet the first ofthe efficiency criteria, which calls for accounting that permits appropriate pricing that canbe fully justified to consumers. Despite this problem, the overall organization of themarket does allow competitive forces for some consumers, partially offsetting theseproblems. This is particularly true in solid waste.
3.73 Solid Waste. Improper collection or disposal of solid wastes leads to veryhigh social costs in urban areas. Because of these externalities and because governmentintervention can lower the transactions costs of organizing efficient service to largenumbers of small users, city governments everywhere tend to intervene in the market fordomestic solid waste handling. The sector requires regulation, but lacks the scale thatwould justify city-level independent regulatory commissions. For this reason, bureauregulatory control continues to make sense. Nonetheless, organization to increaseaccountability or competitive forces can be used to lower costs. China already employssome of these forces, including neighborhood accountability and competition in ISWhandling.
3.74 Neighborhood Accountability. One critical MSW component with highconsumer accountability is the widespread use of neighborhood committees to provideneighborhood street sweeping, and in some cities, waste collection services. Theneighborhood committees provide a variety of services. In local sanitation work theytypically provide street sweeping and may opt to provide other services, such as door-to-door collection of nightsoil or domestic waste. Where they provide services, they do sowith full cost recovery, charging users accordingly. Because service areas are so smalland the relatively immobile population is well known to one another, this cooperativeservice delivery, often hiring workers living in the neighborhood but also free to hireoutside labor, maintains a high level of consumer accountability.
3.75 Competitive Markets in ISW. The largest part of the market open tocompetition is in industrial and construction waste collection and handling, which accountsfor 85 percent of the tonnage in the urban solid waste stream. Enterprises are responsiblefor handling their own wastes, which means that they are free to provide the service

- 52 -
themselves or contract for it. In practice, both approaches are used and that part of themarket is competitive. Municipal sanitation bureaus in some cities compete for the rightto provide these services and, with an existing infrastructure of transfer stations anddisposal sites, may be a cost-effective provider. However, they may also have unfaircompetitive advantages in not properly costing their service and not having to pay directlyfor their capital. Therefore, in terms both of bureau service delivery and deepening theexisting competitive market in ISW handling, the single most important innovation will beto establish bureau solid waste operations as an autonomousfinancial entity. China widelyuses this form of organization, termed "administrative unit managed as a company" inother sectors. That first step will allow proper costing of services and therefore give citymanagers and citizens a basis on which to judge service efficiency. Knowing true costs,managers will also be better placed to lower those costs. As experience with financiallyautonomous provision of ISW and MSW services deepens, managers may want to moveto a completely autonomous corporate form. This would permit a move to broadercompetition to provide services, in which the newly formed corporation would be just oneof the bidders.
3.76 Contracting for MSW? One approach gaining popularity in other marketeconomies where municipal provision of MSW services is costly is to contract withenterprises to handle portions or all of the current municipal collection, transfer, ordisposal obligation. In fact, many Chinese cities already contract for that entire range ofservices in nightsoil handling. Building on that experience could lead to cost savings inmunicipal solid waste. A model contract for district level contracting of MSW serviceshas been prepared under the Bank-funded Shanghai Environment Project and is availablefor study by other cities. Another element of the MSW process that could be handledthrough competitive contract is the provision of landfill services. However, this shouldbe done only when the municipality provides careful regulatory oversight. The financialincentive for the operator to cut corners on leachate or gas control can be quite substantial,and hazardous wastes must be kept out of the waste stream unless the landfill has beenespecially designed for that use. In summary, it is recommended that all cities movebureaus to autonomous accounting for solid waste services, with an eye toward openingup the core MSW collection, transfer, and disposal system to competition andaccountability.
3.77 Sewerage and Wastewater Treatment. The motivation for governmentadministration of sewerage follows that of solid waste: improper collection or disposal ofwastewater leads to very high social costs in urban areas. As with solid waste, governmentintervention can lower the transaction costs of organizing efficient service for largenumbers of small users. In the absence of collective organization, the service is rarelyprovided. However, unlike solid waste, sewerage services do not lend themselves tocompetitive supply by a large number of autonomous agencies. This is because of the verylarge capital costs of the system, capital with little value in other uses. Additionally,integrated reticulation systems and treatment plants enjoy scale economies that implyoptimal service by a very small number of suppliers.6' Furthermore, the master planningneeded to realize the scale economies can only be done by an agency with a municipal or,

- 53 -
possibly, regional perspective (though the planning agency and the sewerage systemoperator need not be one and the same).
3.78 District Control. When, as in most Chinese cities, municipal wastewaterdischarges through combined wastewater/stormwater systems, without treatment to surfacewaters, the current bureau organization may offer the most efficient management. Thisis because drainage costs, a large proportion of the total, are derived from indirect revenuesources, and the construction and maintenance of the system is closely connected with roadbuilding and maintenance operations.62 Those services are often provided by the samebureau, allowing ready coordination. At this level of operation, this study affirms theChinese large city practice of master planning, investment phasing, and design criteriabeing provided by the city bureau, while districts operate and maintain the system.However, analogous to the solid waste operations, as sewerage operations develop, andparticularly as cities begin to charge fees that cover the cost of service, establishingindependent accounting for sewerage operations will become critical so that those costs canbe known. And, as in other bureau operations, managers may be able to reduce certaincosts by contracting for services in a competitive market. In sewerage, such contractedservices could include removing debris from storm or combined sewers.
3.79 As wastewater treatment becomes more common, the current sectororganization will likely prove inadequate. Coordination problems will develop whentreatment plants serve more than one district. As budgets and staff size grow and technicaldemands multiply, managers will need the increased autonomy that only corporateorganization can provide. Small cities with a single treatment plant may continue to findbureau organization the most cost-effective, but for the same reason that all large citiesnow have independent water companies, they will want sewerage under corporatemanagement. Indeed, Chinese cities may find that the engineering, financial, andadministrative demands in sewerage and wastewater treatment resemble those of waterclosely enough to make it worthwhile to transfer sewerage assets to their water companies.Singapore and many cities in Europe and North America have joint water and wastewateroperations. Even if independent companies are formed, large administrative economiescan be enjoyed if the sewerage companies use the water companies to bill users chargedon a percentage-of-water-use basis. Contracting for billing in that way constitutes anotherexample of out-sourcing to reduce costs, opportunities for which should be aggressivelysought.
3.80 Water Supply. Chinese cities have long recognized the value of organizingmunicipal water services under water companies. The large investments in the sector haveneeded the planning guidance of a city agency and the organizational flexibility of acorporation to provide the best service. Yet, this organizational form has not yetsufficiently matured to capture all major efficiency gains. Most of the problemsexperienced by the water sector are common to the SOE sector in China (of which watercompanies are a part). As such, the solutions to many sector problems, such as companysocial welfare obligations; the lack of long-term capital markets; and the need to gothrough government bureaus for access to short-term capital markets, will be solved onlyas part of the general solution to generic SOE problems. Other problems are sector-

- 54 -
specific and revolve around the fact that water companies provide monopoly services, thecoverage, quality, and price of which affect the daily lives of municipal residents and areoften taken to serve as indicators of able governance. Whether general or sector specific,changes can be made now that improve efficiency and leave water companies well placedto take advantage of improvements in the overall economic environment.
3.81 As enterprises, water companies use accounting conventions broadlyconsistent with international practice. The move to this accounting system occurred onlyin mid-1993, when all SOEs made the change. The original system met the needs of SOEsunder the planned economy, where economic efficiency took a back seat to meetingphysical output targets using a planned physical input stream. Under this system,accountants recorded expenditures and income, but not within a structure that allowed easyanalysis of financial flows, which is one of the main objectives of the new system. Thenew system allows managers to focus on a different target, that of minimizing the expenseof producing to meet market demand. Such accounting systems allow managers toaccurately analyze their cost structure and the impact on that structure of organizationalor other changes. However, few water company managers have adapted to the change incompany goals, and indeed lack staff with the experience necessary to undertake analysisin support of those goals. In this, again, water companies exhibit qualities common to allSOEs. However, with the move to the market, most SOEs have been exposed to muchmore severe competition than have water companies, and thus their managers have a muchgreater incentive to learn new managerial skills. Below, some means of increasingcompetitive pressure will be suggested. But those or similar ideas will be of little valuebefore managers learn to use the accounting and other tools for more efficient managementalready available to them. To encourage this, a group such as the China Water SupplyAssociation (CWSA) should develop informational or instructional material that showsmanagers the power inherent in the new accounting system. These materials could bedeveloped through a program in which MCon or CWSA staff or consultants work closelywith one or more water systems that have successfully introduced the mechanics of the newaccounting system, to develop guidelines for fnancial and operational analysis and for theuse of analytical results. After demonstrating improvements in the test system, the casestudy can be prepared along with the technical explanations to give managers specific,successful strategies for using the new system.
3.82 Recent research has shown that services delivered by corporations, eventhose using modern management tools, will not necessarily be delivered any moreefficiently than by a government bureau. A practical precondition for superiorperformance appears to be that the corporation function within a well-defined, incentive-driven regulatory environment characterized by an arms-length relationship withgovernment.63 By increasing water prices to full cost-recovery levels, the governmentwill provide water companies the resources to finance their own expansion, recognizingthat the capital needs for expansion will be slowed by the relatively higher, but stillaffordable, price of water. This self-financing capacity will significantly disentangle theenterprise/government relationship, although the government may need to assist with accessto bank loans if political criteria continue to govern loan distribution. To foster long-runplanning in water companies, municipalities can enter into service contracts with them.

- 55 -
The contracts must specify company obligations with respect to water quality and quantity,service expansion, billing practices, internal funding of the investment program,noncompliance penalties and other variables that the municipality deems relevant. In thecontract, the municipality will agree to a pricing formula effective for the life of thecontract. Variations on such contracts have been used in France, the United Kingdom,Spain and a variety of developing countries, usually with a contract length of five yearsor longer. Sample contracts are readily available.
3.83 In some countries, notably France, management firms compete for the rightto manage water operations. However, the relative inexperience of the Chinese watersector with market management suggests that for the near future, an alternative approachmight be preferred. In this approach, current management will negotiate an operationalcontract of the type discussed above. The city administration will, as part of that contract,stipulate a pricing formula drawing on lessons in incentive regulation. The base price forthe formula must be one allowing an adequate rate of retum. The formula should thenadjust for the impact of inflation, incorporate expected efficiency gains in the companyover time, and make necessary allowances for capacity expansion or quality improvements.
3.84 The inflation adjustment needs to capture the effect of price changes outsideof company control. It should not be based on actual company input use pattems, for ifit changes with the company input mix, the company will have no incentive to alter theinput mix for greatest efficiency. To ease the regulatory burden and enhance publicunderstanding of the pricing system, several countries use their consumer price index (CPI)to adjust prices. To incorporate (and encourage) expected efficiency gains, the pricingformula can include an annual downward adjustment. Efficiency gains can come frommany sources, including improved leak detection, increased labor efficiency, andinvestment in more efficient pumps. If regulators perceive good opportunities fororganizational or other changes to substantially reduce costs, the efficiency coefficient canbe set at a higher level. In UK water operations, efficiency gains have been expected tohold annual tariff adjustments to 1 percent per year below the CPI increase. Intelecommunications, with its higher rate of innovation, a reduction of 3 percent a year hasbeen used. Along with inflation and efficiency adjustments, regulators may include anadjustment to finance system expansion or upgrading. Such adjustments will be systemspecific and negotiated along with the expansion or upgrading obligation.
3.85 Conclusion. China now has the opportunity to reorient the provision ofurban environmental services toward the market economy. The failure to do so wouldcondemn urban people to poor quality, but nonetheless increasingly expensive, service thatdoes not protect them from the growing stream of urban domestic and industrial pollutants.While the imposition of user fees may appear politically difficult, city leaders mustrecognize that the costs will be paid directly or indirectly, and that the current choice torely on indirect payment leads to excess demand, on the one hand, and an inability to meetneeds, on the other. It leads in the end to greater pollution and higher total costs for theservice that is provided. It also denies city leaders full use of a powerful and efficienttool, collective treatment of pollutants, as they seek the most cost-effective means ofsustaining an environment supportive of economic growth.

- 56 -

- 57 -
ENDNOTES
1. Effective urban environmental management involves much more than the activitiesanalyzed in this or the previous study. For example, historic preservation, openspace, and noise regulation are among the areas that a comprehensive regulatorystrategy will address. Investment strategies, including private or municipalgovernment investments in gas supplies and district heating to help reduce airpollution, also need to be considered. A recent sector study that analyzes thedynamics of urban land use (China: Urban Land Management Options for anEmerging Market Economy, Report No. 10692-CHA) addresses the critical issueof industrial location, which has a large impact on environmental outcomes.
2. This simplifies a more complex system in which some revenues, such as customsreceipts, went directly to the central government. See World Bank, China:Budgetary Policy and Intergovernmental Fiscal Relations (Report No. 1 1094-CHA),July 1993.
3. For the city income: State Statistical Bureau (SSB), Zhongguo Chengshi TongjiNianjian 1992 (Urban Statistical Yearbook of China 1992), SSB Publishing House,Beijing, p. 573. For central and other, SSB, Zhongguo Tongji Nianjian 1993(Statistical Yearbook of China, 1993), SSB Publishing House, Beijing, p. 229.
4. In some cities, district governments are allowed to control, and capture the bulk ofthe proceeds from, land sales in their district. Although they must fund anyresettlement from those proceeds, districts can net substantial income through thisactivity.
5. See Chapter 3 for details.
6. All data from SSB, Zhongguo Chengshi Tongji Nianjian 1992 (Urban StatisticalYearbook of China 1992), SSB Publishing House, Beijing.
7. Azizur Rahman Khan, K. Griffin, C. Riskin, and Zhao Renwei, 'HouseholdIncome and Its Distribution in China," China Quarterly, 132, December 1992,p. 1035.
8. SSB, Zhongguo Chengshi Tongji Nianjian 1992 (Urban Statistical Yearbook ofChina 1992), p. 715; SSB, Zhongguo Tong/i Nianjian 1992 (Statistical Yearbookof China 1992), p. 283.
9. See SSB, Zhongguo Tong/i Nianjian 1993 (Statistical Yearbook of China 1993),SSB Publishing House, Beijing, 1993, pp. 93, 280, 289, 320. SSB, ZhongguoChengshi Tong/i Nianjian 1992 (Urban Statistical Yearbook of China 1992), p. 32for 1991 housing. These income and asset figures reflect a sample of the registerednonagricultural population. Unregistered urban migrants would not fare as well.

- 58 -
10. China's guidelines for S02 range from 0.02 to 0.10 mg/m3 (annual average),compared to a WHO recommended 0.05 mg/m3 , while China's TSP guidelinesrange from 0.15 to 0.50 mg/m3 (daily average) compared to WHO's 0.12 mg/m3.
11. Standard GB3095-82 "Air Environmental Quality Standard." Separate standardsare given for daily average readings, and one-time peak readings. In addition, anannual average daily standard is given for SO2. The figures quoted in the text andin the charts for TSP and NO. are daily averages and for SO2, annual averages.
12. NEPA, Zhongguo Huanjing Nianjian, 1993 (Environmental Yearbook of China1993), Beijing, 1993, p. 265.
13. Z.Y. Xu, Y.P. Feng, and G.H. Yu, "The Health Effect of Air Pollution onCitizens in Liaoning Cities," presented at the International Conference onEnvironmental Impact of Air Pollution, Beijing, 1991, cited in H. Keith Florig,"The Benefits of Air Pollution Reduction in China," mimeo, 1993.
14. Xiping Xu, "Report of the World Bank Consultation on Air Pollution, Health, andEconomic Damage in China," mimeo, 1993.
15. NEPA, Zhongguo Huanjing Nianjian 1993 (Environmental Yearbook of China1993), p. 259-263.
16. In Beijing under the Beijing Environment Project (Loan 3415/Credit 2312),Shanghai under the Shanghai Environment Project (Loan 3711) and in Changzhouunder the Southern Jiangsu Environmental Project (Loan 3582).
17. Many aspects of the reform program have been analyzed in a series of World Bankpublications. These include the 1991/92 Country Economic Memorandum Reformand the Role of the Plan in the 1990s; Urban Housing Reform: Issues andImplementation Options (9222-CHA); and Internal Market Development (12291-CHA).
18. The level of control varies greatly between cities. Small cities that "import" mostof their products control less than does a city like Shanghai that produces many ofits own consumer goods.
19. SSB, Zhongguo Tongii Nianjian 1981 and 1993 (Statistical Yearbook of China 1981and 1993), Beijing, SSB Publishing House.
20. A variety of estimates exist for TVE pollution. The best sources appear to be jointMinistry of Agriculture/National Environmental Protection Agency studiesundertaken for 1984 and 1989. The results of both are reported in Ministry ofAgriculture, Xiangzhen Qiye Nianjian, 1992 (Township and Village EnterpriseYearbook), Beijing, 1992. The reported estimates based on the 1989 study aresubstantially below the 1992 estimates shown in the text, but the 1989 estimates arethe sum of pollution from the one third of TVE industry sampled. If the 1989
- 59 -
results are extrapolated to all TVE industry that year, and growth factored in, theyare consistent with the estimates presented. The 1992 air pollution estimates alsoaccords with TVE energy consumption estimates for that year. Mr. Zhihong Zhangprovided valuable insights into this issue.
21. See NEPA, Quanguo Xiangzhen Qiye, Huanjing Wuran Duice Yanjiu (Study ofEnvironmental Pollution Countermeasures in Township and Village Enterprises),Jiangsu People's Publishing House, Nanjing, 1993.
22. Nonpoint sources of pollution, as typified by the agricultural runoff likelyresponsible for a share of the biological oxygen demand (BOD), chemical oxygendemand (COD) and ammonia loads at Da Qiao, have generally not been on theenvironmental control agenda in China. The high rates of fertilizer and pesticideuse must result in at least localized problems and those deserve closer scrutiny byNEPA.
23. Much of this work was done in NEPA's earlier study of TVIEs.
24. This result depends in part on the highly dilute nature of most industrialwastewater. Changes in water demand management policy recommended inChapter 3 would reduce dilution and perhaps lower the acceptable ratio of industrialto other wastewaters entering treatment plants.
25. Current discharge standards are based on the ambient quality sought for thereceiving waters. No change in that approach is proposed, but the proposal todisallow discharge to water bodies failing to meet Class 5 standards is morestringent than current requirements. The "no degradation' requirement would beestablished through a monitoring protocol measuring quality at a fixed distance, say500 meters, downstream of the discharge point.
26. The virtue of the low fee is that it will almost never pay an enterprise to dilutewastewater in an effort to meet the standards.
27. China Daily, June 28, 1991, p. 3.
28. When an accident results in injury or the destruction of property, the offendingenterprise may be forced to provide compensation to the injured party, as was thepaper mill. Such compensation may be settled through direct negotiation, withcourt or EPB mediation, or through civil suit. In 1991, NEPA reports that the sumof compensation for all pollution accidents that year reached Y 41 million.However, field interviews revealed that a large percentage of compensation claimsare settled privately, for sums unknown to EPB. The Y 41 million thus representsa lower bound.
29. Antonio Estache and Kangbin Zhang, "Managing Pollution Control in Brazil,"Policy Research Working Papers, WP5929, July 1992, discuss the theoretical issuesand their application to Brazil.

- 60 -
30. See Zhang Kunming, Jin Ruilen (eds.), A Course in China's EnvironmentalProtection Law. Tsinghua University Press, Beijing, 1992.
31. Water pollution can also result from airbome pollutants, a growing problem withthe acid rains of southwest China.
32. One must distinguish in China between an administrative organization managed asand called a "company," with independent accounts but eligible for budgetarytransfers and at least some of whose staff are part of the govemment cadre system(the shiye danwei, qiyehua guanli) and enterprises organized under the companylaw, which are not eligible for budgetary transfers and whose staff are not in thecadre system.
33. Municipal officials differentiate two types of enterprise that operate with theChinese word for "company" in their title. The first type, common in medium andlarge city water supply, operates under SOE rules that give it independent financialstatus (with no automatic claim on govemment subsidies if losses are sustained).Nonetheless, the parent municipal bureau reviews budgets, appoints seniormanagement, and directly finances capital investment or arranges bank loans atpreferential rates for that purpose. The second type of company, common insmaller cities or for services such as town gas and district heating, functions as partof a city bureau in every way except accounting. Although the company maintainssegregated accounts, the parent bureau remains responsible for covering any losses.The bureau role in the daily operations of the company is correspondingly greaterthan in the first case.
34. A further, and damaging, means of increasing nominal profits has been to delaymaintenance work.
35. This paragraph does not capture fully the fiscal relationship between cities and thecentral govemment. The higher on-budget revenue retention rates were partiallyoffset by the reassignment of certain taxes and enterprise ownership to the centralgovernment. Available data does not allow calculation of the value of the variousoffsets.
36. With recent reforms, enterprise capital should now come from the financial sector.
37. The 31 percent includes some double counting, as profits remitted to localgovemments by some companies are included under 'other income' in Table 3.1.
38. Note that the housing category includes only municipally-owned housing. Mosthousing is owned by enterprises and not included here. The expenses shown do notinclude depreciation, because although housing services are increasingly organizedin companies responsible for their own profits and losses, those companies do nottake ownership of the capital stock. The environmental sanitation category includesmore than trash pickup and disposal. In many cities (though not all) responsibility

- 61 -
for drains and sewers rests with the city bureau handling solid waste and thoseexpenses are then included in this category.
39. Chinese statistics assign water to either production or domestic uses. The domesticsupply figures include both household supply and supply to canteens, restaurants,offices, bath houses, and other nonhousehold uses. Evidence from one provinceshows that in cities with a high proportion of modem housing, some 70 percent oftotal "domestic" use occurs in the household. In other cities that proportion dropsbelow 50 percent.
40. Larger SOEs often house workers in what can be very expansive companycompounds. Thousands of people may be housed by a single enterprise.
41. The one general concern with current practice is the prechlorination of raw waterhigh in organic compounds. Experience in other countries has shown this to resultin complex chlorinated organic compounds not easily removed by treatment,difficult to detect, and carcinogenic. If pretreatment is necessary, alternatives suchas ozone pretreatment must be explored.
42. The water tariff plays an important role in deciding the level of maintenance effort.Low water prices mean a low return to UfW reduction efforts.
43. Derived from the average cost of new urban supply, as reported by MCon, for1988 and 1991, deflated by the construction materials index. These are the mostrecent available supply cost figures.
44. See World Bank, "Development and the Environment, " World Development Report1992, p. 102.
45. Maximum efficiency is reached when all pricing is at marginal economic, ratherthan financial, costs. The financial costs understate economic costs in this sector.
46. This study does not address the very important question of intersectoral waterdistribution. Current government policy gives primacy of use to urban areas, butthat does not answer the need for rural demand management.
47. Based on figures provided by the Chinese Water Supply Association.
48. This pricing strategy also eliminates the monitoring and other enforcement costs ofa quota system.
49. For gasoline demand in OECD countries, Robert McRae, "Gasoline Demand inDeveloping Asian Countries," in The Energy Journal, Vol. 15, No. 1, 1994,p. 149.
50. The analysis assumed an underlying urban population growth rate of 4 percent peryear, with household real income growth per capita at 5 percent per year. Thosefactors determine the increase in the domestic demand, assuming an income

- 62 -
elasticity of demand for water is 0.22, the actual value for Shanghai. Industrialdemand in the "no change" scenario continues to be quota constrained and was setat the 2 percent per year growth rate of recent years.
To estimate the impact of a price change, household price elasticity of demand forwater was assumed to be -0.20. This is about half the -0.38 rate found inShanghai, but was set at that level because of three considerations. First, to avoidoverestimating the positive impact of the new demand scenario. Second, torecognize that the Shanghai demand elasticity was estimated in a period of generallyfalling prices and that the elasticity may not be symmetrical with respect todirection of price change. Third, that as per capita consumption falls, the elasticitycan be expected to fall.
Enterprise real output growth was assumed to be 8 percent annually over theperiod, with an elasticity of demand with respect to output of 0.2. Enterprise priceelasticity of demand was assumed to be -0.20. The latter figure is very low byinternational experience, but reflects two concerns. First, not to overestimate thepositive impact. Second, until prices become more important than quotas, the trueelasticity will be close to zero.
Water price changes were assumed to be phased in over three years beginning 1995for both domestic and enterprise users, with a 100 percent net increase in supplycosts to both types of users. In fact, enterprise users will experience an increaselower than that if they use municipal water, which will move to unitary pricing.Enterprise self-supplied prices will rise more than 100 percent, leaving the netwater increase shown.
Wastewater price changes were assumed to be phased in over three years beginning1995 for both domestic and enterprise users. Enterprises will be charged on a load,not volume, basis. Current charges (when applied) average Y 0.16/rn3 (includingthe NEPA charge). The estimate assumes an increase to Y 0.60/m3 on a volumebasis, or Y 0.44/m3 increase, which is near current industrial water price levels.Domestic users will be billed against 80 percent of water use, at a price about150 percent above the current water price, so a net price increase of 120 percentwas used in the calculations.
51. All civil works may face increasing real costs from resettlement in China's land-scarce cities. To the extent that land is taken for roads or other projects, theycould face increasing real costs.
52. Renmin Ribao (People's Daily), September 19, 1987, p. 3. Of course, upstreamloads reduce the assimilative capacity below Shanghai, so do contribute to theproblem.
53. Reported in the People's Daily, Overseas Edition, September 11, 1987, p. 1.

- 63 -
54. Drainage and sewerage have separate functions and very different consequences inurban areas, as drainage deals with storm run-off and sewerage with wastewater.However, the prevalence of combined systems in China and the lack of studiescarefully disaggregating the two have led us to discuss them here as if they wereone. Investment operations must consider the possibly substantial benefits ofcompletely separating the two systems. The systems can be modelled jointly andseparately to test which will maximize net benefits.
55. "Gongcheng Jianshe Yu Jianzhuye, Shinian Jihua he 'Ba Wu' Jihua" (ConstructionEngineering and the Construction Industry, Ten-Year Plan and Eighth Five-YearPlan), agreed at the December, 1991, National Construction Work Conference,mimeo, p. 8.
56. The government estimates average municipal solid waste at 440 kg/person/year.However, a study in Beijing comparing actual tonnage with estimated tonnage basedon collection vehicle capacity reduced 1992 estimates there from 3.83 million tonsto 1.56 million tons, or nearly 60 percent, and showed average generation at 285kg/person/year. With its relatively high consumer incomes and northern location,Beijing should be above the national average in waste generation, so that figure isused instead of the government estimate.
57. As discussed earlier, for water the goal is pricing at the long-run marginal cost ofsupply.
58. Based on a 1990 urban household income survey.
59. World Bank Staff Appraisal Report, China: Rural Water Supply and SanitationProject, Report No. 10028-CHA, Annex 19.
60. The fact that cities like Qingdao in Shandong and Dalian in Liaoning Province havetariffs well above those elsewhere, without experiencing "social unrest' suggestspolitical fears are exaggerated.
61. Clearly, the construction of the systems and operating inputs can themselves beobtained on competitive markets, introducing efficiency on that side. This arguesagainst, for example, sole sourcing pipes from wholly-owned subsidiaries ofsewerage operations.
62. Drainage can be funded from user fees or through special assessments for thisservice. When using the special assessment approach in other market economies,charges are often based on land area ("frontage") or land value, each of whichembodies a distinct equity approach. But either of those approaches avoids thedifficult issue of attributing possible contributions to storm damage (through thenature of land use) or the likely damage to specific property (through choices aboutbuilding siting). Those two factors would be incorporated into an optimal tariffmodel and in their absence and particularly where land markets are seriously

- 64 -
distorted and land use patterns have been determined less by the users than by thestate, as owner of all urban land, payment via indirect tax revenue cedes no moreon the equity side than would payment based on a frontage or assessed valuationapproach.
63. If government itself acts as an aggressive entrepreneur, the same result can beobtained without the arms-length relationship and in a less transparent environment.A number of analysts argue that this approach characterizes the township andvillage enterprise sector in China (see, for example, I.J. Singh and Gary Jefferson,"State Enterprises in China: Down to Earth from Commanding Heights," inTransition, Vol. 4, No. 8, October-November 1993, pp. 9-10).


![[Urban transportation]city presentation shanghai(china)](https://img.pdfslide.us/doc/110x75/55d75d3abb61eb5f118b45e8/urban-transportationcity-presentation-shanghaichina.jpg)