Embed Size (px)
Citation preview

REPORT No. ~~()
THE AL’I’D’UDEEFFECTmON AIR SPEED
TWO PA3TS
By MAYO D. IIERSEY, FIMNKLIFI L. HUNT, and HERBERT
13ureau of Standards
INDICATORS
N. EATOIN
691


.-.-r,.:= -‘....
s-.+.
.-k.
,.
.
FRENCH PITOT VENTURI
TOUSSAlt+T LEPERE TYPE
,,, . ... . . . .. ,. .,’easel+---*=....:- “““
““””~’”’’’’’””’e”-em_~7,:,. -, .. 7’. c :~
~-’”g___.
$$iiL.,:..-.,:.,.‘.,
,-,.. , ,.
,? + - *..~_~.. .,. ,
+,L r..,,..,..=.=,---, -J -4. ~“”;,,.-----.- - ?E=l . . . .,, -d
,; ;- .,.-. ,., . .
.+
FGE Rtl AN COU9LE VENTLIRI
BRUHN TYPE-._-.
FIG. 1.–VENTURI TLfEES,693

.
REPORT ~Oc 110.
THE ALTITUDEEFFECT ON AIRSPEED INDICATORS.By M. D. HERSEY, F. L. HUNT, and H. N. EATON.
~Buresu of Standards.)
PART L
THEORETICAL I2ITRODUCTION.
This report was begun in the fall of 1917 in connection with the testirg of air speed indi-cators b-y the Bureau of Stmdards, and prepared at the request of the National AdvisoryCommittee for .Aeronautics.
L OUTLINE 0)? INFORMATION REQUHtED.
In order to canvert the readings of zn air speed indicator, after correcting for ordinaryinstrumental errors, into true air speed, two steps are necessary:
(a] Arbitrary designation of standard atmospheric conditions near sea level.(b) Determination of the effect on the performance of the instrument., of the
departure from those conditions -which “may be met at any aItitude.In order to take. the fist step (a), it is necessary to have a complete enumeration of the
conditions which influence hhe aerodynamic performance. It -would nob be enough to specifystandard density, urdess it -were known that changes of densiby aIone could modify theperformance a~ a given speed.
To carry out the second step (b), iti is necessary to secure, theoretically or experimentally,such information as wouId provide data for drawing up a complete set of curves connectingthe performance of the instrument,, on the one hand, with. each of the variabks governing itsperformance, on the other hand.
For example, in the case of the Pitot-Yenturi type, a family of’ curves would be necessaryconnecting the ditl’erential pressure with speed> air density> air viscosity, and any other factorswhich appreciably alter the differential pressure.
Precisely similar information is desirable for alI the other typ~s of air speed indicators.These instruments, so farm aerodynamic performance is concerned, maybe classified somewlmtias fouo-ws :
1. Rotating surface type (MoreU, etc.).2. Direct impact type.
(a) ‘With surface in a fixed direckion (pressure plate, etc.).(b) With variable direction of surface. (Pensuti, etc.)
3. Differential pressure type.(a) Pitot tube (with static or with suction openings).(7)) Venturi tube (with or without static openings; single or double throat).(c) Pitot-Venturi (Toussaint-Lep5re; Zahm nozzle, U. S. Navy; modiEed
Za,hm nozzle, U. S. Army).4. .& flow type (Proufiy].5. Nonmechanical types (hot wire, etc.).
Descriptiv-e details of all these types are to be found in another paper:
rG~XWJAl+?~rton Aeronautic InstrumentsjI~wstfgafion of Air Speed Indicators, by F. L. Hunt: h“atiormlAdtiwry Committeefor i
Aemnautiq to be publkhed k+ter.693
——
.

694 ANhTUAL REPORT NATIONAL AD171SORT COMMITTEE FOR AERONAUTICS.
This investigation -was undertaken to supply, in some measure, the information outlinedabove as desirable. The extent to which such irdormation N-aspreviously available is indicatedin the folIowing section deaIing with the assumptions customarily made.
2. ASSUMPTIONS CUSTOMARILY MADE. =
It has ordinarily been assumed that the density alone is su~cicnt to fix the standardatmospheric condition, (a), and that as regarck departure from this condition, (tJ), the indica-tion of the instrument at a given speed is directly proportioned to the density-for air speedindicahrs of the direct impact and differential pressure types and prwtimlly indcpcll(lent ofdeusity for indicators of the rotating vane t~~pe. In fac~, the direct impact timl differentialpressure types are colloquially, though not scientifically, spoken of as ‘ ‘PV2” instrume[ltsand the rotating vane type as “true air speed” instruments.
The PV’assumption is fairly sfitisfactory for direct impact and for Pito~ tuk instruments,but less so for Venturi tubes. In the case of the I?itot, it is recognized that ti more aecuratcresult can be deduced at the higher speeds by allowing for adiabatic compression of tho air;and in the case of the Venturi, it is found by the present experiments that the viscosity of. theair has to be taken into account at the lower speeds and higher altitudes.
Disregarding compressibility and -viscosity, the correction for altitucle is customarily mncleby the formula
(1)
in which w is the true and t+ the indicated speed and r the reIative density a~ the Ievcl inquestion, i. e.,
P~=
Po(3
where p is the acturd and p. the standard density. At 20,000 feet the rehltive density is abou}
one-half, so for that altitude w= vt-@ or the true speed is about 40 per cent greater tkn thoindicated speed.
For graduating the dials to go with the Pitot-Venturi tubes of Armwican mrinufacture, such~j the United States Army tube illustrated in figure 1, tho Zahm nozzle fornmIa 2
p =.00313” V2 (3)
is employedj in which v denotes the speed in miles per hour corresponding to a differential! prw-sure p inches of water,
This formula assumes for thestandard air density 1.221 x 1o-sgms~cms, which is the rlcnsity dryair would possess at a temperature of 16° C. under the normal sea Icvcl pressure of 760 mm,mercury.
3. LIMITATIONS OF DEDUCTIVE THEORIES.
By means of thermodynamic reasoning, treating the atmosphem as an ideal gas, it is possibleto throw the I?itot tube formula into a more gencrai one
in which the correction term O stands for a certain compl~cntcd function which vanishes for aperfectly incompressible fluid, or for zero speed. For a speed of 110 miIes per hour P is of theorder of 0.5 per cent and should not be neglected if the most probable rwdt k required; and yetso many simplifying assumptions have to be introduced in the. derivation tlia[ tho result is no~entirely free from doubt.3
e=. s2strictly, ?= 17.s8 @
..—
$E,Buckh@am, on the Theoryof the Fitot tube, Technical RCPOrtNo. Z NationalAdvisoryChmmitteeforAoronrmtfes, N15.

THE ALTITUDE EFFECT ON AJlt SPEED INDICATORS. 695
In just the same way a thermodynamic formuIa for the Venturi tube can be deduced, whichattempts to take account of the geometrical shape of khe tube and the compressibdit~ of the air:but in this wise the simplifying assumptions -which hwe to be introduced are so appalNing, thatthe resuIt is only of academic interest. For ~~ample, it has to be assumed that the fluid is freefrom turbulence and at the same time without ticosity: and if~ disturbances outside of the tubehave to be ignored. ‘IX& means that the problem has to be treated Like thai of a continuoushydraulic pipe line, and that two instruments baring the same interior channel would generatethe same suction tit the throat, no matter if one of them had a very much bigger bulge on theoutside, such as to ckg a lot of air &long with it-a concision contrary to experience.
.It. best the thermodynamic forrnuk could ordy hope to show the effect,of compressibility, sofar as properties of the fluid are concerned, since tiscosity and turbulence are excluded at thestart. I“et Lhe experiments -which will be reported here pro-re that the cornpmssibifik~ eflect isa comparatively negligible one. Thus the Venturi tube problem is too complicated to be hamfIedwith adv-antag by purely deducti~e methods at present.
4, DIMENSIONAL THEORY.
i%fruitfti compromise between purely deductive theory on the one hand and interminableexperimenting on the other hand: is made possible by dimensional reasoning.~
—
C’onsider, first, the~enturi tibe. Let p denote the differential pressure (i. e., suction) gener-ated at. a speed u, the tube being pointed head on (i. e., without jaw) into a perfectly undis-turbed medium (the atmosphere, for example, or water). Ih is understood that the speed v hasremained constant for some moments so that a steady state is established. Let the mechanicalproperties of the medium be specified b~ its density P, -riscosity p, and compressibility modulusof elasticity E. (h account of the rapid mowme~ts involved, it. will be the adiabatic, not theisothermaI~ eksticity -which is needed. -
The three properties p, p, arid 1? are defined in the uswd way. Thus the density is the massper unit volume,
. Mp=~7 (5)
The ~iscosity i~ the shearing stress per unit rate of shear, i. e.,
(6)
in which-f is the tangential force per unit areaj or shearing stress, brought into pla~ by distorting ,
or shearing the fluid at such a rate that a T’douiy .g’dht ~, is set UP. Here dv is the differ-
ence in speed between the top and bottom surface of a layer d; units thick. The elasticity is theincrease of h~ drost atic pressure P per uni~ dmreasc of volume measured as a fraction of the
The medium wHI be assumed homogeneous so ~~at P, I-L, and ~haTG the same Va~UeSat ~1 Poin%both inside and outside the nozzle. Thk is admittedly an approximation, for the fluid is sIigbtIy
warmer where most compressed, and so all of its constants are a trfie different at such a point.Finally let L? stand for any agreed-upon linear dimension of the nozzle, as for example, thethroah di arneter.
Under these circumstances the differential pr=sure p evidently depends on the speed V,on the mechanical properties of the fluid~ p, y! and E, and on the absolute size D and the geo-
*Cf.E.BuckinghauxDimensimmITheoryofWiid TunneIExperiment%Smithsxdm?diw. Paps, Y.62+ pp. 15+ 1916;MK14EsperimenlaaIIdthe FO.W@ Empirkal Equaticms,~~cticns A- ~. ~. E., ~. ~, PP. ~~~> 1915=
696 ANNUAL,REPORT ATATIONAL ADVISORY CON_~l’TTEE FOR AERONAUTICS.
metrical shape of the nozzle. Under the conception of shape are to be included the roughnessof the surfaces and the contour of all adjacent parts that may cause disturbance. If no furtherphysical quantities are apparent which can sensibly influence the phenomenon, then somo rela-tion
p= funct (v, p, Y, E, D) (s)
must exist, the specific form of which remains to be discovered by experiment., but which willbe the same for all geometrically similm systems.
The object of our investigation, so far as Venturi tubes are co~cerned, consists in deter-mining the form of that equation; an d there will be an ~nalogous equation for every other iypeof air speed indicabor. It has to be clone experimentally, but dimensional reasoning serves tosimplify the planning of the experiments, and the interpretation of the observations.
Since equation (8) is physically complete, it must, when written out in full, ha~e the samedimensions on both sides. The dimensions of the constituent quantities are qs follows, ttikingmass (m), length (1), and time (t) for the necessary fundamental units:
It can now be shown by the mtheorem (Buckingham, 10C. cit.) or verified by inspection thatthe only form (8) can take, which will meet the requirement for dimensional homogenci ty, isidentical with, or reducible to, the general equation
‘=pwfunct(%”3 (9)
It will be useful to write out two modifications of this equation. The velocity of sound in afluid, (7, is given by the well-known expression
(10)
Hence E, where it occurs in (9) abo-ve, can equWy well be replaced by p(Y2,so (9] can berewritten
‘“e’ :)pv (11) ‘
using the symbol # to denote some unknown function of the two arguments, or in[?epcn~lcnt,v-ariablcs, inside the parenthesis. This equation is of interest in connection with Lhe watcr-channeI experiments, to be descxibed later.
Again, it is a weU-known thermodynamic result that
E=KP (12)
for an ideal gas, K being the specific heat ratio (about 1.4) and P the barometric pressure.(This relation follows from (7) in conjunction with the adiabatic compression equa~ionF’ V’ = const.) Replacing Eby iis equivalent KP in (9) gives
%+?”$) (13)
The unknown functions @Iand + are different, though they might ha~e been kept identical byQ,
()writing –
vinstead of ~ in (11). This equation, (13), is of interest in connection with the
. .observations in a wind stream at reduced barometric pressure, which remain to be described.

THE ALTITUDE EFFECT ON AIR WEED IXDICMTORS. 697
It is essentiaI to realize that in equations (II) and (13) there are only two independent
variable+ riot -fire, as in (8). Thus in equation (13) ‘the dependent variab~e ~- is expressed
mp KPas a function of the two independent variables ~ and r+. Readers not accustomed to this
point of view may be helped b-y a change of notation: Trite y for $$, x for.Drp @—~ andzforz
Then (13) becomes simplyF
!/=4 (V z) (14)
an ordinary surface in three coordinates. It is by such a surface (or family of plarte curves)that the experiment.aI observations ought to be depicted, instead of attempting to separate outthe original quantities as in (8). They can be separated later, after the best possible empiricalexpression (14) has been fitted to the p~otted points.
By means of the equations just deduced, especizdly (11) and (13), a comparatively econom-ical program of experimental work can readiIy be laid out.
The foregoing anaIysis applies -&houb change of notation to aII ditTerentiaI pressure instru-ments of rigid shape. To extend it to direct impact instruments requires that the performancebe expressed by F, the toiaI force acting, instead of by the differential pressure p. 13eferring to
nequation (9), replace p by ~ to preserve the dimensions unchanged and the resuIt becomes
‘=@D2f4%”5) (15)
This is Lhe general equation for a pressure-plate air speed indicator. Except for extraordhari]ylow speeds the viscosity can Rot enter -rery seriously, consequently as an approximation whichis safer the higher the speed,
For since * is a single argument., if a change in viscosity causes no change in force, ~othingu
Drp”eIse that controls the magnitude of ~ can do so either; hence the whole argument drops out.
For speeds beIom, say, 150 miles an hour, where there is not much compression, (16) reduces to
F= COJIStX pg~, (17)
an example of the PIPlaw. The constant is the same for pressure pIates of different sizes pro-vided they are strictIy geometrically similar in all essentizd parts-incIuding the sharpnes ofthe edges, and proximity of the connections-and aIso provided, as was stated in the begin-ni~g, that the instrument is me-ring head on into an undisturbed atmosphere. Probablythese conditions can be more easily fuIfXied for pressure pIates, and for Pitot tubes, than theycan for Vent uri tubes.
When the direction of the surface is not tied, but free to change under increasing forceof impact subject to the control of a spring as in the Pensuti air speed indicator, the problemis Rot so simpIe. The stiffness of the spring, S (force per unit displacement), no-w enters asan additional wriable, so that (15) has ~o be expanded &o the form-
(DrpF= PIYD2funct ~, -$ +&)
h. the ordina~y case where -riscosity and compressibfity are negligible
()F plPD funct -&
instead of to (17). Some interesting conclusions applicablements can at once be draw-n from t.h~~equation.
.
(18)
this reduces to
(19)
to the Pemsuti and simiIar instru-

698 ANNUAL REPORT NATION-AL ADVISORYCOMMITTEE TOR AERONAUTICS.
Let A’ stand for tho new argument -& Thell~ (X) must be some function which shwts
at the origin and approaches aseymptoticalIy a maximum value, for an intlniteIj stiff spring,equal to the constant of equation (17); for equation (19) should reduce to (17) if the geometricalshape is constant. Hence in general the force (and th~refore deflection) -rarics with speed lessrapidly than the squarej and with density less rapidIy than the first power.
The altitude elf ect on instruments of [he PensuLi class can now lw deduced from observ u-tions made at sea leveI with varying speed. Suppose that a series of such observations gave
where n is some numerical value probably between 1 and 2. Then since (20) must IM a specialcase of (19),
j (x) ~x’-; (21)
.“. F= COIIStx p%nd+%-+ (22]whence
Fccp; (23)
Thus the observation that the force ~aries -with’ the r~th power of the speed, leads by virtue
of (19) to the inference that the force would vary with the ~ power of the density, and with
certain other powers of the size D and spring stiffness S.By going back and difl?erentiating equation (19), a still inure general relation for lk ~ltitude
effect in terms of the speed effect can be obtained, namely,
(24)
‘his applies to all diree~ impact instruments operating over the intermediate range of spcxxiswhere neither viscosit~ nor con~prcssihiIity have to be considered. Like other results aflordcdby dimensional reasoning, it is not limited by any assumption or restriction as to the geometricalcomplexity of the instrument or the irregularity of the motion set up in the fluid.
5. EXPERIMENTAL PROGRAM.
The experiments to be reported in this publication all relate to Venturi tubw and may begroupe{i as follows:
(a) Water channel experiments to determine the degree of dynamical simiIfirit.yattaiuuble between air and water, and to discover whether comprcssibili tyhas to be taken into account. ._
(h) observations in a wind stream at reduced pre&ure so as to dc.termine the efTcc~of density and viscositj’ by direct experiment,
(c) AirpIane observations as a practic.a].cl]eck on the foregoing laboratory results.(d) Ordinary wind tunnel tests.
The need for these various experimm ts and the inferences -possibi~ from each can bc readilyseen in the light of the dimensional theory which has just been developed.
It was thought [hat for some purposes water channel observations on air spee<i nozzImwould be more convenient than wind tunneI tests provided a reasonable dcgrcc of dyntimicalsimilarity proved att~inabIe. From equation (11) neglecting com.pressibiIity the conditionfor simikirit~’ is found to be
(25)

THE WTITUDE EFmcT o~ Am SPEED IN DKTATO&S. 699
This condition can be fuIfiIled by towing the nozzle through the -mt.er at a speed SIOW
enough to compensate for the relatively Iwrer wdue which the kinematic -r-iscositLy~ has in
water compared to air. Thus, denot~~ kinematic ticmity b~ v, and distinb~ishing the water .
channel observations b-v primes, equation \25) reduces te
‘V[ Vt D—=_ ._ .‘v v D’
(26)
.\t a temperature of 160 C. the kinematic -viscosity of water is about one-thirteenth that of air;hence the corresponding speed in witer -wouId be about one-thirteenth of the speed in air pro- ,
videcl the same nozzle is u~ed so that Df = D. Under these corresponding conditions equation(9) shows thrtt
from which
002= E’ ? 2.P’ p’ ‘v’
(27)
Thus the clifferenfiiaI pressure p which the nozzle would generate in air at a speed v can be pre-dicted by obsertig the -due p’ realized in water ati a speed l“, provided the assumptions madeare correct.
The most vioIent assumption macle is that the effect of compressibility can be neglected inpassing from such an incompressible ffuid as -writer to such an easily cempresible one as air.The value of E is aboufi 20,000 times greater for water than fer air. Thermoclynamic theorysugg~ & that the more re~dfly Compressible fluid s~oukl give the greater diieren t.iaf pressure
at any one speed, mm if the effect of compressibility is appreciable at alI, it will be brought outin an exaggerated degree by the water channel experiments.
Dvp,To test this assumption, observed values of $ may be pIot ted as ordinates againstt ~
as abscissas, both for observations in air and in water. If the infiuence G~ compressibility isneg~oibIe the tlvo CWVG, however fire=@ar, ought to ccincide. If they do ~ot, then it k
impossible to reprexmt the results satisfactorily on a two-coordinate dia=gram; a third asisZ for-.
values of ~, should be constructed and the data shown on a surface in space as impLied by
equation (11).It turns out, as wiLI be shown irt detaiI Iater, that ccmpressibiliiy is practimdly but nob
wholl~ negligible. The agreement between wind tunneI and water channel obser~ations issuffiment for predicting the order of magnitude of the clifferent ial pressure available from anytube of ne~ desigg, and the water channe] tests are also adequate for detecting sma~ differencesin the performance of nozzIes produced in quantity from the same pattern.
lf, however, the effect of mrying the compressibility is found to be comparatively smalIwhen contrasting two media so ditlerent as air and water, then it wdl undoubtedly be negligiblealtogether where the use of the nozzle is confined to air aIone. This is the mosi significant resultof the water channeI investigation, and warrants proceeding to the next series of experimentswith attention directed to. density rind viscosity rather than to compressibility.
These next experiments were made in a wind stream at reduced pressure, the apparatusconsisting of a small airtight tank, referred to as the -vacuum wind tunnel. In this way airdensities corresponding to -rarious altitudes, and viscosities corresponding to wmious terupera-—
Bl?p
tures, could be reahzed in the Laboratory. The resu-dts are plotted with -$ against. — asP
before, since there is now no question of a third coordinate.

700 ANNUAL REPORT NATION-&LADVISORYC.OMMITTWE FOR AERONAUTICS.
Clearly if the pvz law holds, -$ will remain constant over the full range of comlit ions
DL~p ‘experienced; thai is, the curve will be a horizontal straight line, parallel to the -~ axis. For a
Pitot tube the ordirmte of this line wilI be one-half, since p = + p&. For a Zahm nozzle prefor-mingin accordance with equation (3) the ordinate would be 3.2.
./my departure from horizontality not only signifies a departure from the PV2law as regardsthe mathematical form in -which p and v enter the law, but evidently also signifies tha~ anotherphysical quantity, viscosity, has begun to pIay a part. This complicates the altitude correc-tion; for the viscosity as welI as the density will be different at diflwent atmospheric temperat-ures. It will be seen that the curve dots have a considerable slope at low air speeds such asoccur in the flight of dirigibles and the landing of airplanes, but not at the higher speeds.
This result was anticipated frow the water channel experiments and ako from anotherinteresting circumstance. In developing the smaller modified Zahm nozzle for the Army ithas been learned that it was not found possible to keep the new design geometrically similarto the originaI Zahm nozzle and stilI preserve the original calibration curve. This fact alonois evidence that viscosity makes a difference. For”by (13) the size D can not entm unless [hoviscosity does also.
Having demonstrated &he effect of viscosity and densi~y under laboratory conditions,which had the advantage of direct control of the separate variables but the disadvantage of rLrestricted space not perfectly simulating free air conditions, it seemed worth while to proceedwith airplane tests. This was done, and the results will be found plotted, as beforcj withp against ~. They agree qualitatively with. the e~rlier laboratory results and nflordp>
more reliable numerical vaIues, aIthough not extending to such low densities,Finally the results of ordinary wind tunnel tests on several different types of Venturi tubes
are brought together for comparison. These too are reported by the dimensionless coordinatediagram, which is particularly welI adapted for drawing inferences in regard to the altitmdeeffe’ct,
It was not feasib~e or necessary to make a.11the different kinds of tests on each of the tubes.The actual sequence followed is given beIow:
1. Water channel and wind tunnel tests on two French Venturi tubes, Bridin type,one single and one double,
2. Vacuum wind tunnel tests on one American Pitot-Venturi tube, United StatesArmy modified Zahrn type.
3. Airplane flight tests on the foregoing Pitot-Venturi tube.4. Study of ordinary wind tunnel data, taken at different times, on two of the fore-
going tubes and on a French P1tot-Venturi, Toussaint Lephe type, and aGerman doubIe Venturi, Bruhn type.
These tubes, together with the original Zahm nozzle, are shown in the photograph, figure 1.

REPORT’No.
THE ALTI’ITJDEEFFECT ON AIR
110.
SPEED INDICATOR%By U. D. HERSEY, F. L. HUNT, and H. N. EATON.
PART IL
13XPERlMENTS WITH WiMTUIU TUBES.
L WATER CFIANNEL EXPERIMENTS.
For the purpose of fiesting the two French Venturi tubes in water the 400-foot. to-wingtank of the Bureau of Standards was pIaced at our djsposaI by Mr. W. F. Stutz, whose coopera-fiion in this feature of the work is acknowledged. The nozzIe under investigation was mountedabout 40 cm. below the surface of the water on a rigid rod extending ~erticalIy downfrom the electric car which runs aIong a track over the tank. The speed of the car could becontrolled and measured with a accuracy of the order of I or 2 per cent. The differentialpressure was measured on a raercurY manometer connected with the nozzIe by wwt-er-filled
+ ~/o-3
FIG. 2.—WaLer c?ximel experiments.
tubing. At the high speeds and Iarge suctions met in the lash few observations on the doubleVenturi an error may exist due to time lag, of such a nature as to make the reeorded valuesof the differential pressure too Iow. In those particular instances it was difhult to be sure thatthe manometer had risert to its rmximum value in the short time interval available. Asidefrom this, it is thoughk unIikeIy that any important errors can have crept in. Due considera-tion was given to the necessity for avoiding turbulence and general movement of the water,and for keeping the deptth of i.nmersion sufEcient to avoid surface disturbances.
701

702 ANNUAL REPORT NATIONAL ADVISORY co.mmm FOR .M3R0NAti-TICk
Thus with a depth of immersion of 13 cm. one test at ~ speed of 4.77 miles per hour gave adifferential pressure of 29.2 inches of water ; a second test at the same speed gave 30,8 inches;while a third test at the same speed, upon increasing the depth to 40 cm,, gave subst~ntiallythe same result, 30,3 inches.
The following data were obtained for fihe French single Veniuri (A, Fig. I ) in water and areplotted in fig. 2:
French single Vmturi, in water.
Speed(miIes
perhour).
1.292.682.732.773.974.77’5.255.447.087.108.67
Differ-ential
preesure(incheswater).
i:8.4
2!: :30.342.246.184.680.2
132.0
.
— —
1.12 3,2401.63 q 700L 40 6,8301. Go 6,9301.73 9, !)001.66 11,9001.90 13,1001.94 13,6002.01 17,7001.85 17>7002. m 21,700
—
For convenience, the dimensionless variabIe ~ may be tmmcd the TCMUC P( rfvrrnance,
since it shows the ratio of the differential pressure generated by the nozzle in questicnj to ~wice.il)p
that generated by a Pitot tube. Likewise ~ may be termed the gmwalimi sywcd, since tho
speed factor v is commonly the most important of the four, and since any given prrccntagcvariation of D, p, or ~ would have just the same effect on the relative performarwc as the cor-responding Yariation of speed, which is ordinarily the easiest factor to ‘rary. This ,variable,Dvp—, occurs frequently in problems of fluid mechanics where it serves to measure the degree ofw
turbulence in the fluid; hence it has been suggeste~ by Dr. IL Buckingham that the termturbulence variable would be of some advantage.
In computing the relative performance and generalized speed the values for speed and fordifferential pressure given in the first two columns were changed over to c. g. s. units; an arbi-trary linear dimension of 1 cm. was taken for D in all cases; the density of the water wastaken to be p = 1 gram/cm’; and its viscosity, since the water was at the temperature of melt-ing ice, was assumed to be p= 0.0179 dyne-sec.;cm2. The values of the relative performfinrewere thus found to range from about one to two (i. e., from twice to four times the diflcr-ential pressure of a Pitot tube) and those of the generalized speccl from about three thousandto twenty thousand. Since these variables are dimensionless, the same numerical values wouh.1prevail in any other system of normal units, such as the foot, pound-mass, second system;or the foot, pound-weight, second system.
A generalized speed of 20,000 units (With D = 1 cm.) corresponds to about 06 miles perhour in air having the standard condition
p = 1.221 X 10⁻³ g/cm:K= 1.81 X 10-i g/cm. sec.
this last being the viscosity of air at the standard temperature, 16° C. It corresponds to alwu t130 miles per hour at 20,000 feet altitude, where the density is haIf as great if the temperatureis unchanged.

THE fiTITLIDE EFFECT o~ MR SPEED IsDKMTORk 763
The rew-dt-scm the double Venturi (B, fig. 1) wer< worked up in the stime manner and arealso p]o tted in fi=~e 2. SCM black circIes represent water chtimel obser-rations; open circIesare for the air observations, which will be described directly. In towing the doubIe Venturi adepth of immersion of 60 cm. was maintained.
It is seen that the ticosity effect (slope of the curve) is more pronounced for the doubletube than for the single one: a sia@ficant point -when taken in conjunction with the fact thatit has been “the French practice to use the double tube on Iow speed and the single tube on highspeed craft.
The foregoing water ckmeI experiments were made in the winter of 1917-18 with thehelp of Mr. Bailey Tomnshend.
The same nozzIes were given a wind tunnel calibration at the authors’ request under thedirectio~ of Dr. A.. F. Z&m at the Washington Na-ry Yard, leading to the resuIts which areplotted for air in tigyu-e 2. To illustrate the method of reduction, the following table is givencontaining the data and results for the French single Venturi:
French .n-ngk Tc-nhm”, in air.
.
Differen-tial
presmre(incheswater).
]. ~3.555. w8.15
10.451
Speed(rams ~ Dvp
perhour).
~@ -j-
30 1.% 9, ~3(32.26 12, 33a
: 2. 2-! 15:40060 2.31 M, 50370 2.16 21,603
In computing ~@ andDtJp~ for air the -ralues taken for density and viscosity were, in c. g. s.
nnits, 1.223 x 10-: and 1.78x 10–<, respectively. The former is the value used for standard den-sity at the Washington N’avy yard tunnel; the latter is the ticosity of air at 100 C., whichwas assumed to be the actuaI air temperature. In computing Pbait is not necessary to cor-rect for the departure of actual density in the tunnel from standard density, since the data for
weed are based on P1tot tube rezding~. The ~alues of ‘r’y on the other hand may be several
per cent in error due to this cause, but this correction is ~ot worth going into here, became theDC’
empirical values for ~ are not appreciab~y influenced by small changes of —; the cur-resi-f’
are nearIy flat. As before D is arbitrarily taken equal to 1 cm.The tlriaI results are plotted in figure 2, using open circles, and are seen to fall slight}~
higher up cm the diagram than the solid circles for water.The wind tunnel results on the doubIe T’entw-i were computed and plotted in the same
manner. Here the divergence between air and mater results is quite pronounced at the highspeed end of the range. This. may in part be attributed to an esperimentaI error in the waterobservations alreacly mentioned; that error is probabI~ negligible, but in the right direction tocreate the ohser-d difference.
For both the si~~le and double Venturi the reIative performance in air is higher than in water;this presumably is due to the great difference in compressibility of the two media; the effectoperates quaIitati\-eI~ in the d~ection suggested by thermod~namic reasoning: but is not so
Iarge as might ha~-e been expected.The relati~e pdormanee of the double ~’enturi is seen to be from two to three times that
of the single tube; the viscosity effect., as judged from the sIope of the cur-ve, is also decidedlygreater for the doubIe JTenturi. .—
~~~~1+~
...-
—
..—
—.

704 MWWJAL REPORT NATIONAL ADVISORS COMMITTEE FOR AfiRONAUTIC%
2. EXPERIMENTS Al’ REDUCED PRESSURE IN A WIND STREAM.
No doubt the most nod feature of the present invcsfigat ion is the work at reduced pressurein n wind sbream, by means of which the Conditiom a~ Wly a]titu(]e. could hc reproduced bthe laboratory.’ Tti’s was done by means of a small vacuum wind tunml, which WM plarcdat tile xuthors’ disposal by Dr. H. C. DMinson. The apparatus consisted of an air-tight irontank, cent aining a high speed Sirocco blower and a wooden box with w working space for thewind stre%m 8 inches square and 2 feet long. ‘The Mower was mounted d the exit end of tllcchannel and driven through a stuflhg box by a motor outsid c. At the entrance cntl n llOncy-comb wm constructed for tho usual purpose, together with a piemmeter for determining win(?speed. The nozzle under test was mounted in the m~ddlc of LIWworking spare and co[lncctcdto a water manometer in the room outside. The static connectio~ of the piezomct cr unit wasan aunu Ia.rseries of holes in the walls of the wind &mneI near the grid of impact openings; mtul)e led from this point directly through the outer v-ail of the iron container to one s!de of nwater manometer. The impact pressure grid is similarly commctcd to the other side of tlwsame manometer. A mercurial barometer Ior detmmining the absolute pressure in the windstream is conrwctcd to the static side of that manometer. ‘he entire arrangement is slict,cbcdout in f~gure.3. Temperature was measured roughly by a thermometer Iocatcd ouhidc of thethroat in the returning air stremn and viewed through z glass window.
I ‘: *:.H.!212- Y,., ..-:.fi ~p !=QJ. .: -“---”===—-”.->--— —-, “ .’‘
: : ., ______ ._ ..- ——; i,~-:~;j- .—. .—-. —-— . . . . . . ..
P/ezoAefer
I
/Yozyz/e ‘“under TP5f.
i%erfnomc+er\
L—— —.—.._5-=.. ~
Fm. 3,—Vacuum wind tunnel.
In taking observations the uswd procedure was to holcl the internal pressure approximate l’lyconstan~ by means of the vacuum pump while varying tho speed of tho blower st~y I)y stlq),This process wou~d then be rcpeztcd at a diffcrcmt pressure. Arti fici~l clmnges of Mnp(wktnrewere not undertakou.
The working range of conditions co-rered wm approximntclj’ as follows:Air speed, from 30 to 6.5 miles pcr hour;Pressure, 36 to 76 ems. of mercury;Temperature, 20° to 2S0 C.

THE ALTITUDE EFFECT ON AIR WIZED IllDIC&I!ORS. 705
The fired results of the ~acuurn mind tunneI experiment me plotted -with the usual dimen-sionless varifibles in figure -4, .4. nd B. These two diaggams are numerically identicaI and ha-rebeen repeated merely to a~oicl confusion in identifying some of the incli-riduaI points.
FIG. 4-Vacuum wbcl tumIeI resuits on United States Army Fitot-Venturi.
Thus in figure 4 A, a contrast has been indicated between points for which the compressi-
hiIity factor ~ is high, and those for which it is low. SoLid black circles are used for high
values and open &rcIes for low ~alues. The reIative significance of the black and -whitepoints is therefore the same in this diagram as it was i~ the plot for the -water channel experi-ments, figure 2. Evidently there is no cordation between the relati~e performance and thiscompressibility variable. The same eume would rew.dt from either group of data.
As a matter of interest, aIthough no Ionger a necessary Iogical step, @re 4 B has beencxmstruc.ted to show tdso that there is no correlation between relati~e performance and density,
thus further substanti~ti~g the concision that the relative performance ~g depends solely on
“rp In this diagram the bIack circles are for h@ -raIues of the airthe generalized speed ~.
demsi~v ~, and open circles for low =ralues. Etidently the same curve would he establishedeven i; the black points alone, or the white points alone, had been used.
The procedure for putting in the black c.ircks, both in figure 4 .k and figure 4 B, -was simply
to make note of the ~geatesi and Ieast numerical -raIue of the quantity in question——KY
orpv=‘p—+md then dh-ide the intervaI into two equal parts. It was not necessary to specially
f+’compute ~ because this is etidentIy proportional to the ratio of the mercurial barometer
reaclkg B to the PiLot pressure liz computed from the piezometer reading; aCtUaIIY, this ratiowas used instead.

706 ANNUAL REPORT NATIONAL ADVISORY CWMM.ITTEE FOR AIIROXAUT’lCS.
The cia~a from which figure 4 was plotted arc given in the following tuble:
Thcuum wind tunnel data.
1
RunNo.
1
2
3
4
5
6
7
8
9
10
[11
2
Temp.0 c.
. .
202122
23
24
24
25
26
28
28
27
28
28
3
Iworn.? mm.mere.
430430428
425411407406405
393391390390390
385385385385385
415432489539589643707754
620618618618618
535535534535531
440453
436440
‘ 440440
377375373373373
369367399408
4
h, cm.water.
_—
1.301.682.04
0.540.571.521.962.10
0.520.981.49L 882. 0s
0.520.921.431.812.05
0.561.061.811.972.012.072.262.28
0.821.362.082.312.98
0.661.181.782.172.55
0.570.99
0.531.441.912.31
0.470.851.31L 641.96
0.450.781.682.08
5
it. Vent.h, cm.water.
13.2016.5020.30
4.324.65
13.4517,7320.95
4.208.13
U. 9516.7519.95
4.087.62
12.7015.8019.65
4.459.14
16.4918.2919.1821.0023.9022.60
7.1112.3219.9025.3030.50
5.5910.5016.2520.1525.15
4.078.38
4.1912.5817.2521. Z()
3.816.99
u. 1714.1017.15
3<436.10
14.7218.55
11P,; A 10-’.
8.619.76
10.70 ‘
5.475.51&93
10.1510.50
5.13-7.038.669.75
10.25
5.07 _6.638.429.47
10.10
5.437.62
10.6211.7012.3013. OQ14.3014.85
8.0310.3012.8013.45 ;15.25
6.648.90
10. ‘JO12.1013.05
5.567.48
5. 38_8.94
10.30m 30
.$;; ”
7:s0.8.729.54
4.545. w5.86
10.30
7
I’itot~ cm.rater.
1.832.282.72
0.870.922.122.632.80
0.851.482.092.562.79
0.85L 412.022.472.76
0.901.562.412.592.622.682.932.95
1.181.822.692.993.89
1.021.652.362.843. 3-i
0.921.46
0.862.012.573.04
0.781.31L 902.302.66
0,751.242.662.79
8
Ppv~
3.623.623.74
2.482..553.183.383.75
2.482.773.093.283.58
2.412.693.143.213.55
2.502.933.423.533.653.934.093.83
3.053.383.704.233.93
i?. 753. HI3.463.553.81
2.252.87
2.443.133.3?3.50
2.452.662.943.073.16
2.272.472.783.33
.
9
omjresfautor
B~
—..
235189158
489449192154145
461.2651S6152140
452273191157139
462277203207225239242255
526340229206159
528324226189160
481310
506218172145
48328619(3162140
491296150149
.
10
M%tiveiemiiy
~Po
0.559.557.551
.546
.527
.523
.521
.519
.503
.501
. 4CEJ
. 49!3,499
. 4!32,492.492.492.492
.528
.551
.625
.690
.752
.821
.904
.962
.788
. 7S6
. 7S6
. 7S6
.786
.676
.676
.675
.676
.671
.556
.570
.553
.558
. 55s
.558
.477
.475
.471
.471
.471
.466
.464
.501
.515

THE ALTITUDE EFFEC5C ON AIR SPEED INDICATORS. 707
In this table cdurnns 1, 2, and 3 are self-explanatory. The piezometer reading h, Of COI-umn 4 is gi-ren in ems. of -water by reducing the observations fiaken on an inclined manometer.The Pitot-1’enturi head h, of column 5 was derived in tthe same manner. The particular tubeinvestigated was United States Army modified Zahm nozzle L’o. 30. Values of the generalized
Dvpspeed, ~ > with D = 1 cm., were computed just as in the case of the Frenoh Jrenturi tubes of
figure 2.’ For the viscosity of air at different temperatures, Sutherkmdk formula
(29)
was referred to, with pa= 17.3 x 10⁻⁵for the viscosity at 0° C in c. g. s. units, and with Suther-land’s constant A’= 119.4, @denot~y absolute temperature in degrees mnrtigrade.
The air speed v was obtained from the piezometer rea.dhg h, ai any density p by theformula -
(30)
in which the coefficient (7 has the approtiate -due 54.3. This -vaIue was found sfitiently—‘l’P but a more a~aet method wasclose when determin@ v for the purpose of computing ~;
foLlowed for deter-w v w-hen computing ~” The coefficient (7is not. strictly a const ant, but
DPP ‘ DL’p .in fact a slowly _varuyingfunction of — dropping off from about 57.6 to 50.5 vihiIe ~ m-
W’m-eases from 51000 to 20,000. It was determined esperimentfly by calibration @nst aPitot tube in the ~acuum mind tunnel, this Pitot tube in turn hating been calibrated againsta stamhml Pitot tube in the Bureau of Standards wind tunnel. The results of this experiment
“rp(D= I cm.) as d.MCkS~were plotted in the form of a cur-v-ewith ~ as ordinate %~~t ~1
where & denotes the reading of a st.andard-PiLot tube. This curve was -well determined with alarge number of points and gives the ratio needed for con-rerting piezometer readings i~to theequivalent standard Pitot tube redirgs which are tabulated in column 7. Since by the stznd- ‘ard Pitot tube formula the head in ems. of water is
hz=,%p%~x~o
and since from (30) in the same units
h, =$1
it folIows that
or
Thus the average vaIue 1.5 obser~ecl experimentally for the ratio # gives rise to the zp -1
proximate -ralue 54.3, mentioned abo-re, for the coefficient P. Incidentally it is interesting tonote the great difference between the performance constant of the piezometer and thatof a Pitot tube, the Pitot head reading for a given air speed in the ~acuum wind tunneI being50 per cent greater than that of the piezometer. This is probabIy accounted for b~ the factthat the piezometer integrates the air flow o-rer the cross section, while the Pitob reads themaximum velocity. The fu~ther fact that this rztio is nok constant but decreases slightly for

708 ANNU-W-REPORT NATIONAL ADVISORY COMMITTEE FOR AERONAUTICS.
Dl)pincreasing values of — suggests that the velocity distribution rrnd s[tite of turbulcrrco in
Ptho vacuum wind tunnel will appreciably differ for different conditions.
Column S shows the relative performance ~ for the PitoWenturi tube. The pressure y
is determined by converting the head }L.Agken in coIumn 5 into dynes per squaro cm. to corre-spond with the c. g. s. units employed throughout for the density an{l air speed. ‘1’hc air speedfor this column is determined from Formula 30 by using the appropriate value of tl~e cocif.lcicll~
BC from the empirical curve. The compressibility factor ~- in column 9 isj actually, in milli-
meters of mercury per centimeter of water. This fac~or is ;akcn m a. subs~itut,c fur tl~o qual~-
tity ~~ to which it is proportional. If the ratio # were ,gi~cn as a dimensionless ratio, for,
exwnple ems. of water per cm. of water, the vtilues in column 9 would be 1.36 times w large,showing that the impact pressure of the moving air stream in these experiments v-rwicd fromabout 1/650 to 1/165 of w atmosphere. The rarefaction in the throat of the l~enturi is aboubfive times as much.
Sirnilarly the relative density & is shown in cohrmn 10. This varied from about 0.44 up
to about 0.91 taking for the standard density, as before, the value 1.221 X 10-’ gms./cm.S, whichcorresponds to a barometer reading 130= 760 mm., ancl temperature 160 C!. Theso VH]LICSare
B dcomputed by dividing the relative pressure ~ by the rela tivc absolute twnpera~ure ~> in which
do= 289° i!.absolute.o 0 .
Inspection of the finrrI plot A or B, figure 4, shows a very prouounccd slope, the obsm-vcddata for relative performance starting far below the normal value 3.2 assumed in [he specifica-tions for the instrument, and rising to a value somewhat higher.
ReaJizing the difficulty of discovering w-hat might ho.ppen on an airplnne in free flight10,000 feet above the earth, from observations conducted in a space 8 inchw square by 2 feetlong, it was originally expected to attach only qualitfltivc significance to the rcsulk of the vacuumwind tunnel experiment.
I$_everiheless it seemed worih while to determine in what rcspoct the conditions of theexperiment differed from the conditions of free flight, so m to judge in wdlich ciircction, if a t all,the observed data WOUIC1be expected to deviate.
Aside from errors of observation> four f undamentai circumstances are worth comic] cri n~:(1) The proximitj~ of the walls of the channel to the instrument might disturb tlm flmy;
bu~ it is difficult to judge whether this WOUIC1increase or decrease the performance of fh uomle.(2) The velocity distribution over the crow section miglli var~ in such a way} N-hen iho
density and speed of the air are changed, that the actual vcIocit,y m the neighborhood of theinstrument orifices would fail to bear a constant ratio to the irrtegratml velocity given by L11Opiezomreter. In the modified Zahm nozzle the Pitot opening and the upstream Venturi op?ningare sepmated by a transverse distance of several inches, or nearly half the diameter of the chan-nel. At low densities or low speeds, where the meclium is not so excessively turbulent, theveIocity distribution might conceivably be more sharply parabolic than it would at the lri,ghcrspeeds and densities. ln this event the relative performance of the nozzIe would apparentlyincrease with increasing vahres of speed and density. However, no direct evidence of anappreciable change in veIocit.y distribution was detected during an extensive series of cxpcri-men ts in which the velocities at clifferent points in the cross section were explored ~vith a Pitu ttube. Up to within one inch of either wa~, the velocity at any point bore a practically constantratio of 1.4 to the a-rerage integrated velocity. The velocities varied irregularly as much as6 per cent or 7 per cent abo~e or below this average ratio. This -variation, if syshmatic, should
from dimensional considerations be some function of ‘~; th~t is, practically, some func~ion of
tho product VP; but the curves p~ottcd in that manner did nob show any systematic tmndcncy.

TELR ALTITUDE EFFECT ON AIR SPEED INDICATORS. 709
(31 The unsteady state of the Ho-w might give instrument readings perceptibly dfierentfrom those corresponding to a steady state. Some fluctuation of speed -was una-roidabIe. 11’owit is commonI.~ recognized that the gean reading of a,Pitot tube acted on by a rapidIy fluctuatingcurrent of air IS higher than the wlue which m-oukl result from the same speed if actually steady;for the l’itot head is proportiontil to the square of the speed, but the square root of the meanr.alue of & is greater than the mean -due of v itself. If the same reasoning is extendccl a stepfurther it leads to the conclusion that tbe mean reading of an instrument actuated by a forceproportional to some po~er of the sp~ed higher than the second wiLI be mom great Iy augmentedby fluctuations than the corresponding reading of ~n instrument like the Pitot tube acted onb~ a force actudy proportional to the second power of the speed. The pIot of the vacuumwind tunnel results does show t,hak the Pitot-Trenturi tube generates a cliffwent ial pressureproportional to a higher power of speed than the second. This explanation wouhl Iewl us toexpect abnormally high readings for the reIat.ive performance of the l’itot-Tenturi tube as aresuh of the unste~dy state, cdthcmgh it is not a’pparent just how Iarge the effect wouId be, andit is doubtIess smaIL
(4] A further source of esp~anat ion Iies in the excessive degree of turbulence undoubtedlyexist~~ in this small apparatus, which was put together from availabIe parts without the usualrefinements of a.larger wind tunneL It seems possible that rot;~t~~ elements of fluid goirg intothe entrance cone of the- Venturi might to some exte~t become straightened out, thus fiereasingthe actual speed of air through the throat beyond the average Iinear speed of the approachingfluid. If this hypothesis is correct a reIat ively greater performance shouId be expect ed from theI’enturi in a turbulent medium than in a uniform medium. l[oreo~er the same coudition ofturbuhmce might diminish the piezometer read~a due to the impact of ecldies again+ thestat ic openings, thus further accenr,uatbg the same effect. The hypothesis regardirg tur-bulence w-m tested experimental-j-, to a limited degree, by repeat-m: the observations on zPito&~entmri tube in an orJinary wincl tunnel with and withou~ a netting across the tunneI inthe approaching air stream. A negati~e result was obtained. The netting appeared to haveno effecfi. This test -was not considered conclusi~e how-ever, because the amount of turbulencecreated by the nettingg was probably trifhng compared tith that realIy exist~~ in the vacuumwind tunnel.
.\t au e-rents comparison of the vacuum wind tunneI results with the flight test resuIts andordinary wind tunrd data gi-ren below, indicates thati the relative performance shown in’ figure4 is numericdy greater than would be the case in free &~ht} altho~~h qualitatively correct asregards tbe ~ffecfi of variations in speed} clensit-y, ancl viscosity.
The -racuum wind tunnel experiments were carried orL with the help of Mr. Howard O.Ste:lrns, ~hfle t~le \~eIocity distribution was observed by Mr. Atherkm H. Mears and Mr. W“. G.
3. MWMNE 01MER~MZON5L
Thro@ courtesy of the Engineerhg Di-rision of the Air Service at MeC’ook FieId, flighttests ha~e been made by one of the authors on the same Pitot-Tenturi tube tested in the vacuum_wind tunnel. The resdts are pIotted in figure 5, choosing the same variables and the same scaleas before. High density points are shown by solid bIack circIes, Iow density by ope~ circIes.The rage of condit itms experienced was approximately as folIows:
.&peed, from 56 to 126 miLes per hour;Pressure, 43 to 75 ems. of mercury;Temperature, – 12° to 0~ C.
Thus the densities are somewhat higher arid the spseds about twice as k@h as in the vacuumwind tunneI, so that the range of variables hardly owdaps, although the plane was flown as slow21S56 miles per hour qqd qt altiiwlcs apfxoximatk~ 15jO~0 feet,
*

710 ANNUAL REPORT NATIONAL. AD171SORY COl!iMITC1311 I?OR .4ERONAUTIL!S.
s
li~ t I I IFLIGHT TEST ONUS. ARIYY P/TO?_ - VLWTURI’
4
●
..--- *-- -- - =- 8- --- --- —-- --- --- --- --- --- --- -
3C@- <
A ‘ 0
P~7.?
2
,
./
a 4 8 /2 /6 20 24 28 32 36 40 44Dv.0 ~,o.~-zz-
I’lc. 5.—Flighttest on Umwl States .knny Pitot-Venturi.
The data from which figure 5 was plotted are shown , somewhat abridged, in the folIowin$
table:Flight test data.
●
1
E1apsedtime
minutes),
o
2
:
il20
%3338404547505658Go65
2
Indicated air speed(miles per hour).
X.
v,.
o71.470.563.765.461.357.856.961.560.3-58.886.749.2
101.881.750.6
113.590.451.5
131.2
-
71.:70.064. S67.463.059.658.061. ~61.059.583.653.099.578. s540
117.586.053.0
125.0
P~
—.
. . . . . .3.183.243. IQ3.023.033.003.113.183.123.113.442,763.353.412.802.983.553.033.51
4
Iso-&ermalJtitude(feet).
5
!emp.0 c.
–8–9–6–5–.2
o
–:–7
–1!–12–1?–5–4–4
o0
-;
6
telativedensity
P
z
.. . . . . . .1.041
. 91M
.931
. 8s6
.853
.783
.726
.684
. !347
.642
.619
.631
.746
. ?49
.745
.879
.885
.8831. O(UI
-
7
Ihp
T<lo-~.
—–
.......23. G22.2~o. ~20.118.416.815.716.415.815.421.513.927.621.814.934. s25.515.741.5
In t’his table the indicated air speeds T’, and T’, are the readings of a King and Munro airspeed indicator, respectiveIyJ after pureIy instrumental corrections have been applied. These
corrections -were obtained zfter the flight by direct calibration againsb standard water columnsgrtiduated in miles per hour according to the Zahm and l?ito~ formulns, respectively. ‘rho
King air speed indicator was a carcfulIy selectied instrument of the standard American Armypattern conne@ed with the modified Zahm nozzle No. 30 under investigation. The Munroindicator was a suitable instrument of Briiish make connected to an R. A. F. Pitot head, During

THE ALTITUDE EFFECT ON AIR SPEED INDICATORS. 711
the calibratio~ of the two instruments f@t coriditions were cIoseIy reproduced in the labora-tory and corree.t ions determined experiment alIy for the same readings and instrument. tempera-tures experienced during the f@ht.
The Pitot-T’enturi head -was mounted on the left-hand outer strut of the airpIane (DH-4),about one-third of the distance down from the upper plane. The Pitot head was mounted in alike position on the right-hand outer strut. The heads were carefulIy placed so that, the dis-tance down from the upper phme w-as the same in both cases, the object. of the flight being tocompare the performance of the Pitot-J7ent.uri with a Pitot, head rather than to determine abso-lute air speed. The altimeter and air speed indicators were mounted in a vertical position inthe cockpit. /“
The indicated air speeds T’l and ~z are needed for determining the relative performance;the true air speed is computed from the Pitot reading ~z by making due allowance for the de-crease of density at. different altitudes; and at the higher altitudes the true air speeds are about20 per cent greater than the indicated wIues. /
In computing relative performance -$, in which p denotes the differential pressure of the
Pitot-Venturi nozzIe under investigation; p the air density and v the true air speed, use is madeof the fact that the diEferentiaI pressure generated by a Pitot tube is one-haIf PF. The numeri-cal value needed for the relative performance in column 3 is therefore simply one-half the ratioof the head generated by the Pitot-Venturi nozzle to that of a Pitot tube. From the standardformulas
()A,= ~ 217.8s,
for the Zahrn nozzle, and‘J-z’
(–?‘2= 45.2 ‘for the Pitot, it, is seen thzt
()&=3.~ ~ 2PI,+ 2
The isothermal altitucle given in column 4 is the ordinary 10° C. altimeter reading correctedfor purely instrumental errors by subsecluent laboratory comparison under the same pressuresand temperatures experienced in flight. The altimeter Kas set to read 200 feet ah the startof the flight, this be~~ approximately the 10“ C. altitude corresponding to the actual barometricpressure at the ground.
The air temperatures given in column 5 were observed with a large strut thermometer.The relative density in column 6 gi~es as before the ratio of the actuaI density of the atmos-
phere to the standard value 1.221 x 10–’ gms./cm3 The density is figured as before from thebarometric pressure and absoIute temperature, the pressure in turn being derived from theisothmnaI altitude of coIumn 4 b]- reference to the standard 10° C. pressure-altitude tabIe.
FinaIIy, in coIumn 7 values of the genera.Iized speed ‘~ are computed (taking the arbi-
trary Linear dimension D = 1 cm. as before) by reference to the formuIa
44.7 T“z
“= 6
in which r denotes the relati~e density ~; and by taking the viscosity from Sutherland’s for-PO
mula, as in previous computations. AS seen from inspection of the tabIe, the procedure duringthe flight was to secure a wide -rariation of speed by diving and straightening out at severaldifferent aItitudes.
The &al pIot, as indicated before, shows qualitative agreement with the vacuum windtunnel observations at the lower speeds and densities while approaching the normaI value3.2 for reIative performance (as assumed in Lhe instrument specficatims) at the higher speeds
Dvpand de~<ities; or, s~~ict~y E+pcaking, at the higher vahnx of the generalized speed, —. Practi-
F

712 Ah’NUAL REPORT NATIONAL ADVISORS CO_LIMI~EE FOR AERONAUTICS. —
tally the same curve would result had either the high density or Iow density observationsbeen t~kcn by themselves.
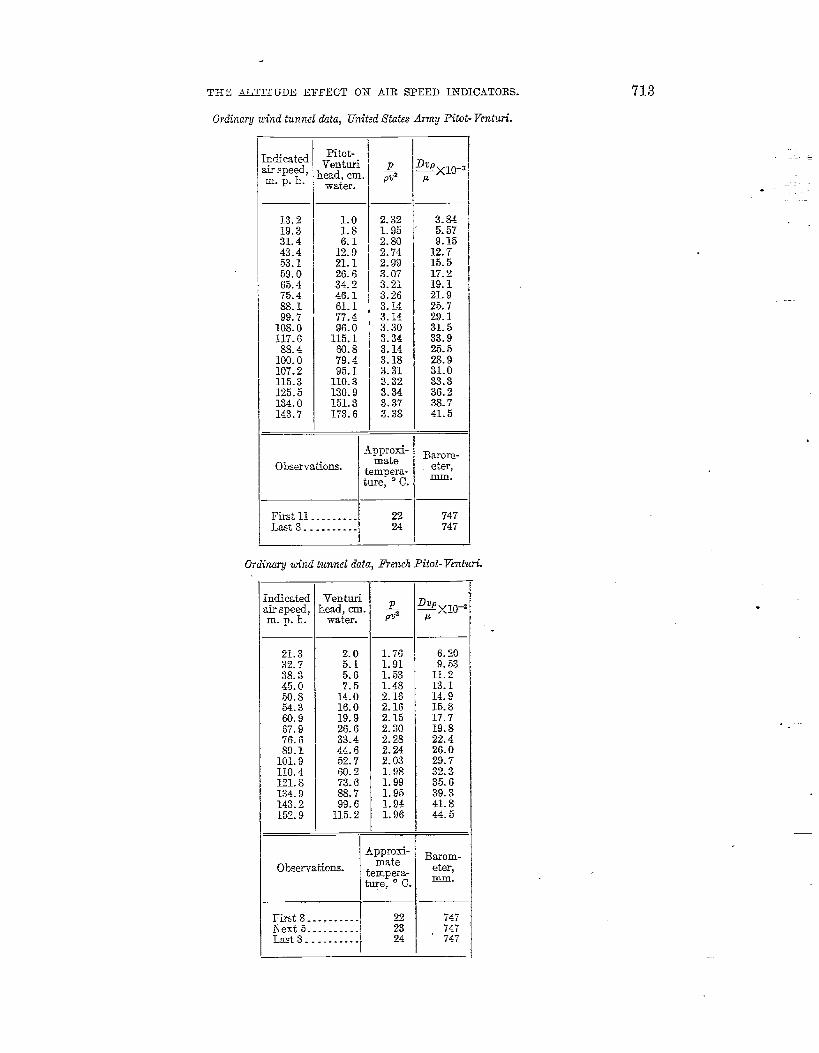
4. ORDINARY WIND ‘lWNNEL DAT.4.
The same United States Army Pitot-Venturi tube (h~o. 30] investigated in the vacuumwind tunnel and in free flight had been tested in the 3-foot wind tunnel of the Bureau c+fStandards. For the purpose of a check on the foregoing expwimcn ts tJle ordinary wimltunnel rmuIts, furnished through courtesy of Dr. Lyman J. Briggs, were now rccomputu[in dimensionless coordinates and ha+e been plotted in figure 6. The wstdts are in C1OSCmgrco-ment with the flight test and in qualitative agreeme~lt with the vzcuurn wind iunne] result+showing a graduaI but pronounced falling off in relative performance toward the lowrer valuesof generalized speed.
7 - 7 ~ .\
. e. Ger mn DouMe 1.@n7’w~
6 — — — —– — —___ _- . .
1— ——
ORM.%?)’ W//vD 70XWLZ /?f3UL m
s — Y —
~ .
p~.? - — . — .- ——
4 ——
1-”-” :-- “-” : _~. u.s.A.P/to f- V437turi- - —-
..- --- b-- --- a--- --- --- --- --- k-- - -- -- -- -- -- --- ---
3 — — — — — — — ~ === == — — - — — — —— — — — —.
/ ‘ .—
0/ 0
2‘re~ @J .+”jdf - f+nftir,/ * e
o .
— — . — _ . _ _ _ _ _ _ _ _
/
—— —
+ 8 /.2 /6 20 28 32Dv,o ~ ,:3
36 40 44
TFIG. 6.—Ordinary wind tunnel results.
It is of interest to note the applicability of the dimensionless coordinate diagram to ordinmywind tm-mcl data with the consequent possibility of inferences regarding the dtitudc cflect,or change in performance at the reduced densities ad varying viscosities which may bc met,at different altitudes. On this account the method has been extended to two other well-knownair speed nozzles, the French Pitot-Venturi (Toussaint-~ep~re type) arid a German cIoublcVenturi (Bruhn type), which were tested in the Bweau wind tunnel for tho purpose of thisinvestigation. These results also are pIotted in figure 6, In all cases the scattering of ok.er-
vations for Iow vaIues of generalized speed is undoubtedly accidental, due to the very smallheads available at the water column under those conditions.
The data for these wind tunnel tests are given in the three” accompanying talh. Theindicated air speed -values in the first columnl obtained from the readings of an incIined manom-eter, afford data for the actual Pitot heads by means of the usual formulas. By comparingthis Pitot head with the observed head on the nozzle under test the values of relative pu -forrnance are derived, and the generalized speed is computed as before.
THE ALTITUDE El?FEOT ON AIR SPEED IXDICATOES.
Ordinary u-ind tunnel data, United States Army Pitot- Venturi.
Pitd- ~ndicated, ~e=tti
I~ !DUP
k ‘Pe~~ ; ~e3d, ~m. y X1(I-’m. P. h. ~a~er.
@
13.2 Lo 2.32 3.8419.3 L 8 L 95 “ 5.5731.4
.
43.4 ~ 1:: ; ‘ ::; 4: F53.1 : ~~.~ \ ~.~ 15.559.0 I 26.6 I 3.07 17.265.4 I 34.2 I 3.21 19. I75.4 ;;: : I 3.26 2L 988.1 3. M 25.799.7 77.4 3.14 29. I
108.0 96.0 3.30 31.5117.6 115. I 3.34 33.988.4 30.8 3.14 25.5
100.0 79. ~ 3.18 28.9107.2 95.1 I 3.3L 31.0115.3 no. 3
I3.32 33.3
125.5 130.9 3.34 3G. 2134.0 151.3 3.37 38.7143. y 173.6 3.38 4L 5
d.bw=- B=om.Observations.
matetempera- et.er,
ture, 0 C. -.
Firetll . . . . . . . . . 22 747Lass S . . . . . . . . . . 24 747
t
Ordinay wind tunrwl Ma, Frmh Pitot- Ten furi.
ndicatedir speed,m. P. h.
21.332.738.345.0
2::60.967.976.689.1
101.9110.4121.8134.9143.2~5~. 9
Venturila, cm.water.
2.05.15. G7.5
14.016.019.926.633.444.652.7~. ~73.6%3.799.6
11.5.2
I
L 761.911.531.482.162.16~. 152.302.282.242.03L 98L 991.95L 94L 96
Approzi-
Okervatims. matetempera-ture, e C.
1
First 8-. -.-.-...\ ~~Next 5 . . . ..- . . ..~ 23I@t3- . . . ..----l 24
I
h!p~xm+
6. ~o
9.5311.213.114.9Hi. 817.719.822.426.029.732.335.639.341.844.5
Barom-eter,mm.
.
.—

714 ANNUAL REPORT NATIONAL ADVISORY COMMITTEE I?OR .4.EROATAUTICS.
Cbdinaq un”ndtunnel data, Gkman double venturi.
ndicated!ir speed,m. p. ~.
17.728. I37.644.247.350.151.053.054.956.660.461.367.367.976.076.286.588.292.4
101.6
Venturiead, cm.water.
Ii:20.731.736.24L 543.04!’. 150.553.062.665.087.380.3
102.7102.5131.8137.8150.2172. 5“
P,07
4.475.265.876.56.506.666. Co6.706.706.666.876,907.706.977.107.077.077.077.006.70
‘Vp~ ~ ~Q-:
5.108.1010.912.813.714.514.715.315.816.417.417.819.419.621.922.024.825.526.729.4
Approxi- Baro-Observations.
mate meter,&p:r:- mm, ,.
1,2 . . . . . . . . . . . ...1 23 747.33,4,6,8,9,11,13,
15 . . . . . . . . . . . . . 24 747.35,7,10,12,14,16-
20 . . . . . . . . . . . . . 25 747.3
In this connection the statement made earlier mav be recalled with re~ard to the numerical
relation of the gwmdized speed scale to actual air ~peed under sea-level conditions; namely,that a generalized speed of 20,000 units, with D = I cm. (approximately the middle of th range)
s-
\SWVF cm W[ND 7LWZEL R5SUL m I
4 —— — —
...- —.- , .=-—. . . ~
.- --- --- --- --- -.
3 *I
pp“.? — — — — — — — — — — — —
2 -. -- —=
r — — — — —
/ — — — — — — — — — –— — — — — — — - — — —
. . _ _ _ _ _ _ _ _ _ _ _
0 4 8 /.? /6 .?0 24 28 3.? 36 -@ 44Dv@-77-- %/0-3
FIG. 7.—Saint-CyrwWJ tunnelresults.

THE ALTITVDE EFFECT ON AIR s.F~D INDICATORS. 7i5
corresponds to about 66 miles per hour in a sea-level atmosphere. Thus landing speeds} sh.Ilingspeeds, and speeds of interesi in dirigible work Iie to the Ieft of the middIe, mhiIe ordinary air-plane speeds are well to the right in figure 6 and similar diagrams.
In comection with the ordinary viind tumd result-s, obser~ations -which were made in thesmaII instrument wind tunnel at the Aerotechnie hstitute at St. Cyr a be Of i~terest, ~dhave been pIotted in figure 7. This diagram shows the results of two tests made by Lieut.John A. C. Wsrner and one of the present authors in h’o-rember, 191s, on another sample ofthe smaII L~nited States Army type Pitot-TTenturi tube (h’o. 23). This investigation was madeunder the general direction of Wj. George K Brettl Chief, Airplane Instrument and TestingDivision, A. E. F. Air Service, through courtesy of the French Section Technique.
To illustrate the procedure it is sufficient to give the data from one of the two tests, whichwill be found in the following table:
4St.Cyrm.rultunneldata, United Slates Army Pifot- Knhri.
Tempwatwe, 11° C; barometer, 744.5 mm.
Pitothl, cm.water.
2.001.853.954.053.706.66.59.69.7
Lo. 113.213.813.918.819.020.02(3+~22.523.420.82&926.228.029.025.025.814.614.79.29.45.8
::;3.1
Pitot-Venturi&&.
10.7.
A:;24.821. s40.038.957.458.760-784.188.483.1
122.7~~. 5126.71.2&7”M-4.2147.0132.7168. G164.5176.5184.7156.7162.7
93. I93. I54.956.735.733.721.418.3
2.682.623.003.062.953.032.992.993.023.013.193.203.193.273.203.173.163.213.143.193.143.143.153. M3.133-153.193.173.023.123.2Q3.062.972.95
bp;X1O-3
11.8u. 316.616.816.021.422.225.826.026.630.331.031.136.236.337.337.739.640.3343.1”43-Z42.744. I45.04L 642.431.932.025.325.620.119.615.814.7
,.
.—
The Pitot head hI sriven b~ the fist COIW in cm. of water, when compared ~th the-u
observed head on the Pito&Venturi in the second column, affords values for the relatiw per-
formance reported in the third cohmm. In computing the ‘$, density and viscosity are de-
rived as usual from the barometer and thermometer readings. The tm.mair speed v was obtained
from the Pitot rezding by reference to a calibration curve furnished by the Section Technique,showing the rewdt of a comparison between the St. @-r Pitot and the French standard Pitotat the Eitlel Laboratory.

716 A2NNUAI.REPORT NATIONAL ADVISORY COMMI’rTEE FOR AERoNAUTICS.
As in the previous experiment, t~e relative performance approaches quit,e closely to theDvp
numerical vaIue 3.2 for high values of ~> but f alk off gradually at the lower vaIues.
5. GRAPHICAL COMPARISON OF RESULTS.
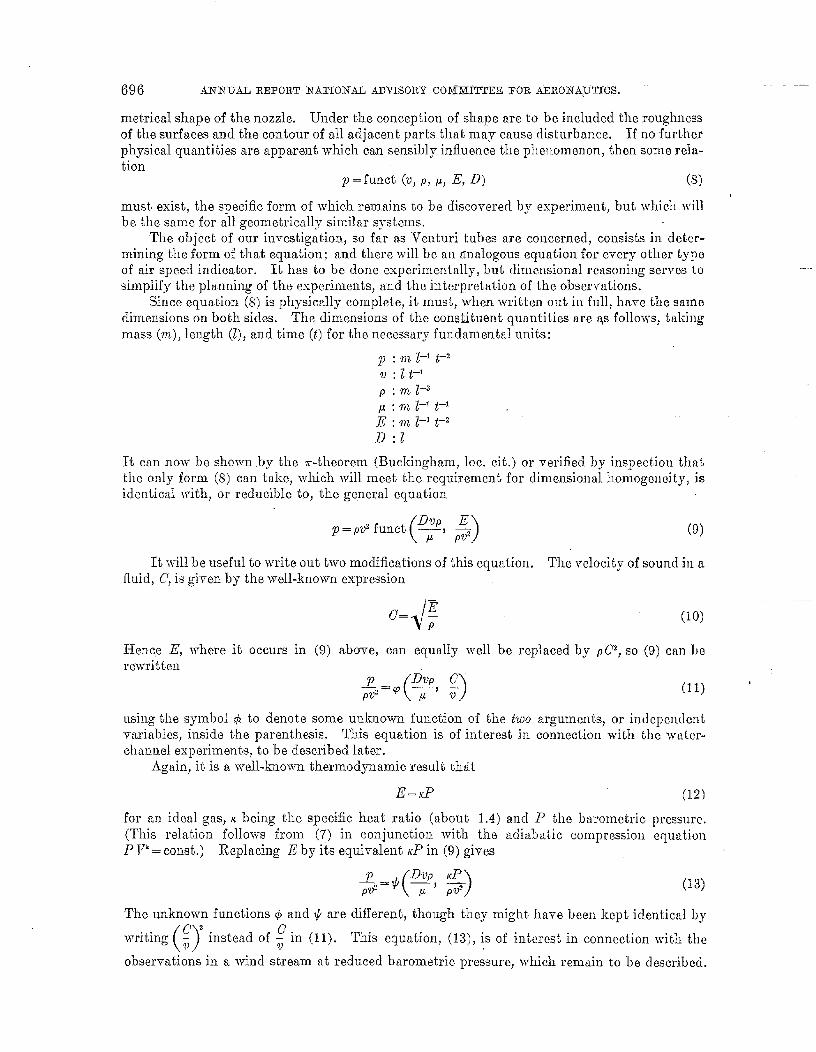
The results previously discussed for the performance of five different types of air-speednozzles in air are brought together for convenient co_fnparison in figure 8. To avoid confusion,the plotted points are left. out but all may be seen upon consulting the previous ditigrmns,The curve shown for the United States Army modified Zahm type of Pito~-lren[.uri is an averageof the flight test and ordinary wind-tunnel results for No. 30. IL is seen to agree very closelywith the St, Cyr test on the other nozzle, No. 23.
These curves will not be further discussed in the present papm, but evidently merit carefulexamination by those interested in the details of performance of the various types of air-speedindicator, and provide the necessary experimental basis for inferences regarding the altitudeeffect.
t?
7
6
5
P~yz
4
3
2’
/
Q
.
— — \—..=—
/ ~ Ger 070/7 uoub/ e pen +uri
JFren Ch Do ub/e Venfuri/ —
—.L_-
y
//
IG~P@/C AL CUA%W30N of Emfom.,ANcr CURYE.S/
/
U.S. A. pi~of - Wfffd ri ‘.
--- -.. --_, ___ ___ -. &-- -. —_ ___ ___ ___ ___ _- L -- --- ___ --- __ _-/ ~
4 8 [2 /6 20 24 28 32 36 ,40 &O@
.- . .
P—x /o-3
FIG. &-GraphkrJ comparison of performance curves.
& SUGGESTIONS FOR FURTHER INVESTIGATION.
h conclusion, it is suggested that convenient graphical or analy~ical methods shoukl bedeveloped for computing thq altitude correction in practical problems from empirical data suchas are afforded by figure 8. Moreover, for the purpose of securing the most exact numericalvalues, the vacuum wind-tunnel work might well be continued with the use of improved f acili ties.

THE A.LTITUDEEFFECT ON NR SPEED IN~lc~ToRS. 717
Such a program has in fact been begun. A new tunneI with a working space nearly four timesthe cross section of the pretious one is under construction; it is intended to install this tunneI inone of the Iarge aItitude chambers of the Bureau of Standards, in which both the temperatureamI pressure can be controlled over a wider range than before. FinalIy, additional @pes ofair speed indicator other than Venturi tube should be investigated, verif~~ the observationswith reference to several sample instruments of each type. The laboratory experiments shouldalso be closely paralIeled, so fa_r as praeticable, by observations t&en at low speeds in Jighter-than-air craft, and at l@h altitudes in airplanes. This imrestigation of the altitude effeci isprimarily of importance in connection with low-speed or high-altitude flight; for the altituclecorrection under the conditions of high-speed tli@t near sea level is suftlciently w-ell given formost instruments by the simple PN law.
o