Embed Size (px)
Citation preview

Managing the prison estate
Ministry of Justice and National Offender Management Service
Reportby the Comptroller and Auditor General
HC 735 SESSION 2013-14 12 DECEMBER 2013

The National Audit Office scrutinises public spending for Parliament and is independent of government. The Comptroller and Auditor General (C&AG), Amyas Morse, is an Officer of the House of Commons and leads the NAO, which employs some 860 staff. The C&AG certifies the accounts of all government departments and many other public sector bodies. He has statutory authority to examine and report to Parliament on whether departments and the bodies they fund have used their resources efficiently, effectively, and with economy. Our studies evaluate the value for money of public spending, nationally and locally. Our recommendations and reports on good practice help government improve public services, and our work led to audited savings of almost £1.2 billion in 2012.
Our vision is to help the nation spend wisely.
Our public audit perspective helps Parliament hold government to account and improve public services.
Report by the Comptroller and Auditor General
Ordered by the House of Commons to be printed on 11 December 2013
This report has been prepared under Section 6 of the National Audit Act 1983 for presentation to the House of Commons in accordance with Section 9 of the Act
Amyas Morse Comptroller and Auditor General National Audit Office
6 December 2013
Ministry of Justice and National Offender Management Service
HC 735 London: The Stationery Office £16.00
Managing the prison estate

This study examines whether the prison estate strategy is likely to improve the value for money of holding all prisoners remanded and sentenced by the courts.
© National Audit Office 2013
The text of this document may be reproduced free of charge in any format or medium providing that it is reproduced accurately and not in a misleading context.
The material must be acknowledged as National Audit Office copyright and the document title specified. Where third party material has been identified, permission from the respective copyright holder must be sought.
Links to external websites were valid at the time of publication of this report. The National Audit Office is not responsible for the future validity of the links.
Printed in the UK for The Stationery Office Limited on behalf of the Controller of Her Majesty’s Stationery Office
2609833 12/13 PRCS

The National Audit Office study team consisted of: Diana Brady, Harry Hagger Johnson, Claire Hardy, Nathan James, Tim Phillips, Saria Usman and Rebecca Webb, under the direction of Aileen Murphie.
This report can be found on the National Audit Office website at www.nao.org.uk/2013-prison-estate
For further information about the National Audit Office please contact:
National Audit Office Press Office 157–197 Buckingham Palace Road Victoria London SW1W 9SP
Tel: 020 7798 7400
Enquiries: www.nao.org.uk/contact-us
Website: www.nao.org.uk
Twitter: @NAOorguk
Contents
Key facts 4
Summary 5
Part OneValue for money 11
Part TwoCost, quality and performance 19
Part ThreeSystem-wide impacts 33
Part FourPopulation 38
Appendix OneOur audit approach 45
Appendix TwoOur evidence base 47
4 Key facts Managing the prison estate
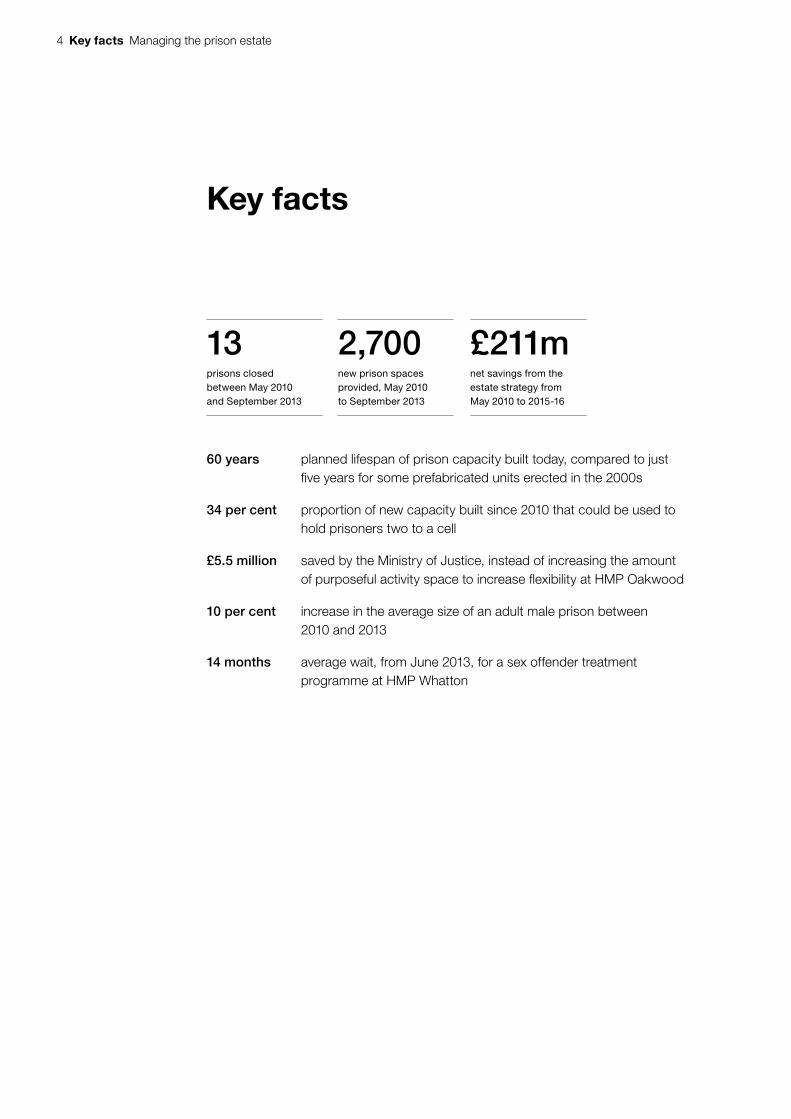
Key facts
60 years planned lifespan of prison capacity built today, compared to just five years for some prefabricated units erected in the 2000s
34 per cent proportion of new capacity built since 2010 that could be used to hold prisoners two to a cell
£5.5 million saved by the Ministry of Justice, instead of increasing the amount of purposeful activity space to increase flexibility at HMP Oakwood
10 per cent increase in the average size of an adult male prison between 2010 and 2013
14 months average wait, from June 2013, for a sex offender treatment programme at HMP Whatton
13 2,700 £211mprisons closed between May 2010 and September 2013
new prison spaces provided, May 2010 to September 2013
net savings from the estate strategy from May 2010 to 2015-16

Managing the prison estate Summary 5
Summary
1 The National Offender Management Service (the Agency) is an executive agency of the Ministry of Justice (the Ministry). It is responsible for the prison system in England and Wales. It runs some 130 prisons, which vary considerably in age, type, size and the resources required to operate them. Since 2010, through an estate strategy, the Agency has made major changes to its land and buildings. It has closed some prisons, expanded others and built more on new sites.
2 This report looks at the value for money of these changes, considering whether they have:
• reduced resource costs (Part Two); and
• improved quality and performance (Part Two) – in terms of security, safety, decency, and providing ‘purposeful activity’.
3 We also examine how estate changes may be affecting the prison system overall (Part Three). Finally, we consider how the Agency, working with other government bodies, might reduce the prison population by managing key offender groups better. In particular, we consider those serving indeterminate sentences and foreign national prisoners (Part Four).
4 We carried out fieldwork between May and September 2013. This included: reviewing the Agency’s estate strategy, prison closure methodology and business cases for new capacity; statistical and financial analysis; and interviews with officials. We visited prisons, including some that were closing and others that had recently opened. Appendix One has further details.
Key findings
Estate strategy
5 Since 2010, the Agency has taken a welcome longer-term approach to estate development, after many years of reacting to rapidly increasing prisoner numbers. The Agency’s estate strategy now considers cost and quality, avoiding the worst aspects of recent prison construction (paragraphs 1.6 and 1.9).
6 Understandably, however, the estate strategy’s focus is cost reduction and this has limited how far it can address quality and performance. Consequently, the Agency’s decision-making has sometimes traded good quality and performance for greater savings. For example, it closed some high-performing prisons before new prisons were performing well (paragraphs 1.10, 2.29 and 2.32).

6 Summary Managing the prison estate
7 The Ministry and the Agency utilise good forecasts of prisoner numbers and have good contingency plans as they implement estate changes. In particular, the Agency responded effectively to an unexpected spike in prisoner numbers after the riots in 2011 (paragraph 1.13).
Cost
8 By the end of 2013-14, the Agency’s prison estate changes will have contributed £71 million of savings since 2010. By 2015-16, the total will have reached £211 million, with further savings accruing at a rate of £70 million a year thereafter. This does not include savings from additional closures and new construction announced in September 2013. The savings represent the difference between running costs at closed prisons and running costs at newly-opened capacity, as well as one-off receipts from land sales. The figure has been reduced to reflect implementation costs (paragraph 2.11).
9 The Agency’s methodology for identifying prisons to close allows it to compare prison costs, despite their varying roles and differing populations. However, it excludes new prisons, including PFI prisons, several of which are among the most expensive prisons to run. It excludes them because they are modern prisons and because of the cost and difficulty of terminating contracts early (paragraphs 2.4 to 2.6).
10 The Agency’s project management of closures and new construction has been efficient. Prisons are closed in three months and the two new prisons, HMPs Oakwood and Thameside, were completed on time and within budget (paragraph 2.12).
Quality
11 During the 2000s, the Agency often increased prison capacity with prefabricated units, which had short lifespans (some as low as five years) and provided few additional facilities. The new capacity the Agency builds now is of a significantly higher quality and includes facilities, in addition to accommodation. It has a planned lifespan of 60 years (paragraphs 2.8 and 2.23).
12 New accommodation is good and modern, with integrated toilet and shower facilities and safety features that reduce the risk of self-harm and suicide. However, in some new accommodation prisoners routinely share cells, some of them in overcrowded conditions. Twelve per cent of prisoners in new capacity are sharing cells, which is against United Nations and Council of Europe guidelines. In time, up to 34 per cent of the accommodation built since 2010 could be used to hold prisoners two to a cell. At the recently-announced new prison in Wrexham, prisoners could be expected to share in 58 per cent of cells (paragraphs 2.14 to 2.15 and 2.19 to 2.20).

Managing the prison estate Summary 7
13 The Ministry now builds flexibly, so it can easily convert prisons to category B status (the second highest security status). Building to a higher security specification initially, though slightly more expensive in the short term, is good value for money as authorities are likely to change a prison’s role several times during its life. The Ministry arranges new prisons with clear sight lines that require fewer staff for security and makes greater use of closed circuit television, reducing operating costs (paragraphs 2.21 and 2.22).
14 New capacity, however, is not so flexible when it comes to purposeful activity facilities, so the Agency will struggle to provide adequate activity for certain populations at some sites. HMP Oakwood, in particular, does not provide a typical mix of purposeful activity to meet its current population’s needs. This is because the Agency decided not to increase the amount of purposeful activity facilities during construction because greater flexibility would have cost an estimated additional £5.5 million. The contractor now running Oakwood has undertaken to provide sufficient purposeful activity within the current setting but is finding it hard to do so (paragraph 2.24).
Performance
15 The Agency has chosen to exclude assessments of prison performance, both its own and those of HM Inspectorate of Prisons, from decision-making about prison closures. The Agency could incorporate a measure of performance into its closure methodology without abandoning its primary focus on cost reduction, but believes this would reduce the savings made; the Agency instead seeks to improve performance through other initiatives. Of the 18 prisons the Agency closed or selected for closure since 2010, however, 8 performed well in their most recent Agency or inspectorate assessment (paragraphs 2.28 and 2.29).
16 The Agency considers whether prisons it could close have unique facilities. But before April 2013, it did not consider the number of accredited offender behaviour programmes that a prison was running before closing it. When HMP Shepton Mallet closed in March 2013, the Agency lost 34 places on sex offender treatment programmes, which were not re-provided elsewhere (paragraphs 2.5 and 2.26).
17 It is difficult for new prisons to achieve high performance: the two newest were two of three that scored the lowest mark in prison ratings for 2012-13, and received negative reports from inspectors. Internal management information shows a small improvement at both prisons during 2013-14 to date. The Ministry’s benefits realisation plans for new capacity do not include measures of quality or performance, but only focused on the number of places and their cost (paragraph 2.32).

8 Summary Managing the prison estate
Effectiveness
18 The combined effects of closures and new construction to date have increased the average size of an adult male prison by 10 per cent since 2010, with further increases planned. One way the estate strategy saves money is by closing small prisons and replacing them with larger ones that bring economies of scale (paragraph 3.2).
19 There is no evidence that smaller prisons are better at reducing reoffending than large ones, but data indicate that small prisons can find it easier to perform better than large ones in other respects. Evidence from surveys show that prisoners tend to be more engaged in smaller establishments and small prisons consistently do better, on average, in the Agency’s internal performance ratings and in independent inspections. We think that more needs to be done to examine the apparent relationship between prison size and effectiveness (paragraph 3.5).
Population
20 Reducing prisoner numbers, where possible, still represents the best way to save money in prisons in the medium and long term. Even with cheaper new capacity, every 1,000 places in the prison system cost, on average, £28 million a year. Prisoner numbers are affected by crime levels, government policy and sentencing practice but also by the way that prisoners are managed (paragraph 4.8).
21 The Agency might be able to free up more spare capacity itself if prisoners serving indeterminate sentences had more access to accredited courses, which could reduce their risk of causing harm to the public. Most prisoners on indeterminate sentences have completed at least one course, as part of a plan to reduce their risk of causing harm, which would enable the Parole Board to release them had risk reduced sufficiently. However, many need more than one course to reduce their risk adequately, as well as other interventions. The Agency does not collate information about course waiting lists, though it plans to do so. Prisoners awaiting a sex offender treatment course in June 2013, at a prison specialising in holding sex offenders, were likely to wait on average 14 more months, at a cost of £23,000 per prisoner. The Agency has protected the budget for accredited programmes in relative terms, since 2010-11, but the number of programmes completed has dropped by some 5 per cent (paragraphs 4.3 to 4.5).
22 The Home Office removes over 1,000 foreign national offenders from the UK every quarter, but it is currently removing 14 per cent fewer than in 2009. Removing more prisoners would allow the Agency to reduce prison capacity. This could happen if the Home Office prioritised cases better, improved case administration and used the foreign national offender-only prisons, that the Agency has created, more effectively (paragraphs 4.8, 4.10, 4.13 and 4.15).
Managing the prison estate Summary 9
Conclusion on value for money
23 The current strategy for the prison estate in England and Wales is the most coherent and comprehensive for many years. It has reduced operating costs quickly. Through capital investment of £370 million, it has provided good-quality accommodation, suitable for prisoners with a range of security categorisations for decades to come. The strategy is a significant improvement in value for money over the short term and reactive approaches of the early and mid-2000s.
24 Implementation of the estate strategy has resulted in the closure of several high-performing prisons, whose performance is not yet matched by new establishments. The Agency has a number of non-estate initiatives which aim to improve prison performance across the board, but the loss of high-performing prisons, in the short term, is regrettable in value-for-money terms. The Agency urgently needs to improve new prisons and also to consider if it can close fewer high-performing ones in future. Longer term, prisons need more flexible purposeful activity facilities, if they are to address the risks of all prisoners well, and the Agency needs to understand more about the performance consequences of building very large male prisons.
Recommendations
a When it closes a high-performing prison, the Agency should explore the reasons for its success and disseminate these.
b Building on savings initiatives to date, the Agency should explore further options to reduce the cost of some PFI and privately-run prisons. Further savings at these prisons could reduce the savings the Agency will have to find from public-sector prisons and the likelihood that more of these, including high-performing ones, will have to close.
c The Agency should consider including prison performance in its methodology for selecting prisons to close, giving it an appropriate weight alongside other criteria.
d The Ministry and the Agency should consider purposeful activity facilities in the same way as security features. They should ensure enough purposeful activity, including a good range of activity, for all the main types of prisoner a prison could hold over its lifetime, and for its operational capacity.
e Starting with HMPs Oakwood and Thameside, the Agency should monitor the wider performance of new prisons, as well as places and cost, in determining the success of projects. For example, it should consider its own and the inspectorate’s performance ratings.

10 Summary Managing the prison estate
f The Ministry should conduct more research into what makes a prison high performing. Given the direction of its estate strategy, it should prioritise further work to examine the relationship between prison size and effectiveness.
g Where prison closures reduce the number of places on offender behaviour programmes, the Agency should replace them at other establishments so that there is no net reduction. More generally, alongside better targeting of existing resources, it should increase the number of places on offender behaviour programmes, or introduce alternatives, to address the large backlog of indeterminate-sentenced prisoners in the system.
h The Home Office should prioritise foreign national offender cases according to the likelihood of removal, and should not pursue cases which are highly unlikely to have a successful outcome. It should also improve how it administers foreign national offender cases by:
• putting caseworkers in foreign national offender-only prisons; and
• standardising and indexing case files better so new caseworkers can understand them more quickly.
Managing the prison estate Part One 11
Part One
Value for money
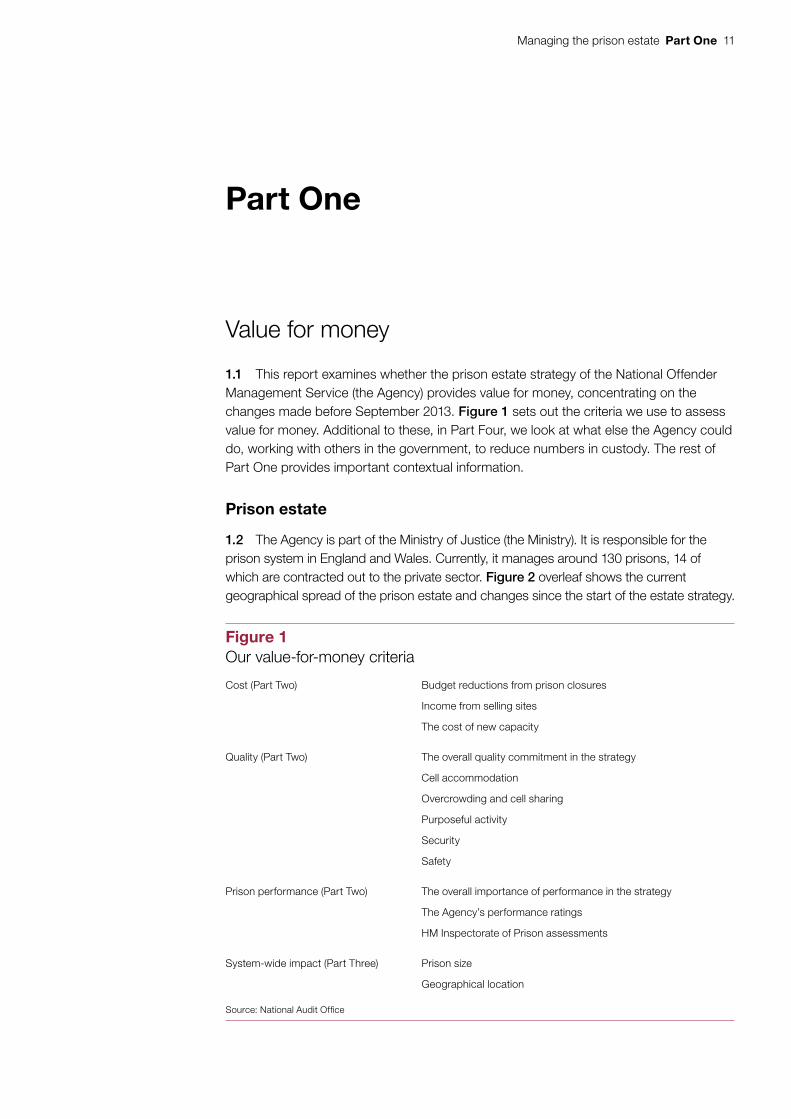
1.1 This report examines whether the prison estate strategy of the National Offender Management Service (the Agency) provides value for money, concentrating on the changes made before September 2013. Figure 1 sets out the criteria we use to assess value for money. Additional to these, in Part Four, we look at what else the Agency could do, working with others in the government, to reduce numbers in custody. The rest of Part One provides important contextual information.
Prison estate
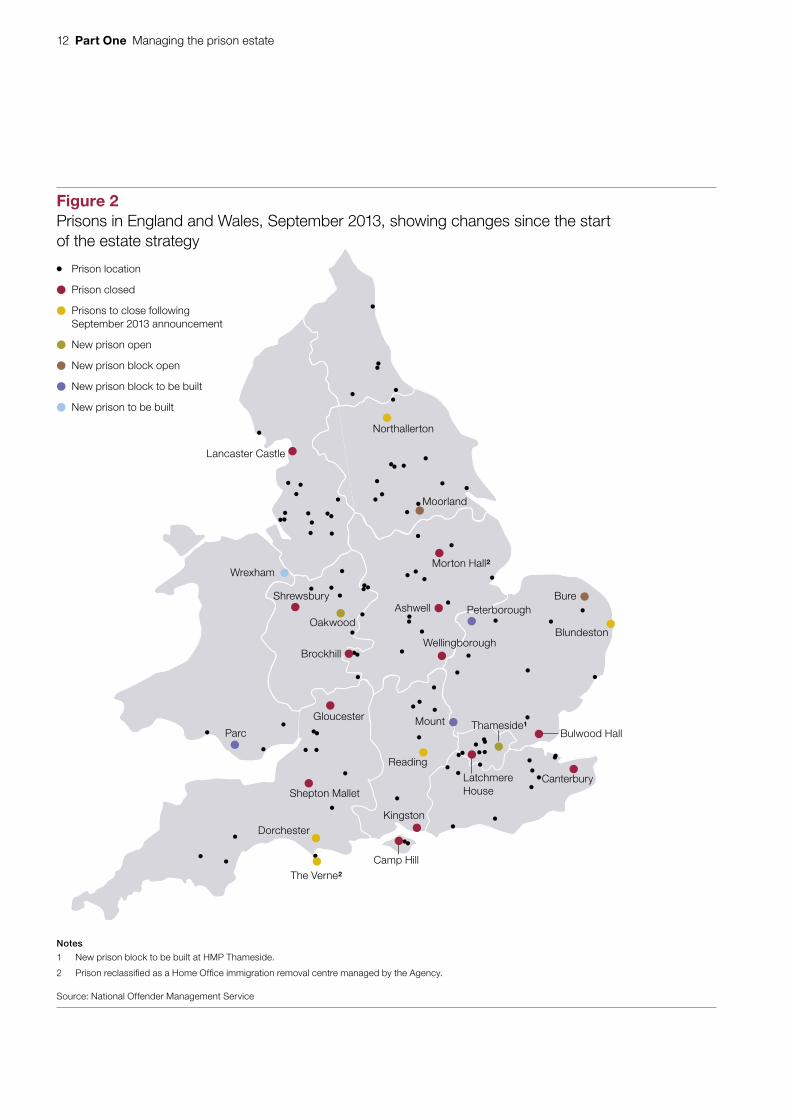
1.2 The Agency is part of the Ministry of Justice (the Ministry). It is responsible for the prison system in England and Wales. Currently, it manages around 130 prisons, 14 of which are contracted out to the private sector. Figure 2 overleaf shows the current geographical spread of the prison estate and changes since the start of the estate strategy.
Figure 1Our value-for-money criteria
Cost (Part Two) Budget reductions from prison closures
Income from selling sites
The cost of new capacity
Quality (Part Two) The overall quality commitment in the strategy
Cell accommodation
Overcrowding and cell sharing
Purposeful activity
Security
Safety
Prison performance (Part Two) The overall importance of performance in the strategy
The Agency’s performance ratings
HM Inspectorate of Prison assessments
System-wide impact (Part Three) Prison size
Geographical location
Source: National Audit Offi ce
12 Part One Managing the prison estate
Figure 2Prisons in England and Wales, September 2013, showing changes since the startof the estate strategy
Prison location
Prison closed
Prisons to close following September 2013 announcement
New prison open
New prison block open
New prison block to be built
New prison to be built
Notes
1 New prison block to be built at HMP Thameside.
2 Prison reclassifi ed as a Home Offi ce immigration removal centre managed by the Agency.
Source: National Offender Management Service
Parc
Dorchester
Shepton Mallet
Camp HillThe Verne2
Kingston
Reading
Canterbury
Bulwood HallThameside1
Latchmere House
MountGloucester
BrockhillWellingborough
Oakwood
ShrewsburyAshwell Peterborough
Morton Hall2Wrexham
Bure
Blundeston
Moorland
Northallerton
Lancaster Castle
Managing the prison estate Part One 13
1.3 Prisons differ by size, age, security categorisation and the types of prisoners they hold. Like the prison systems of other developed nations, the Agency’s estate has evolved over centuries, containing prisons of numerous designs and in varied states of repair. Over a quarter of the prisons currently in use opened before 1900 and only one-fifth date entirely from after 1990.
1.4 The ‘certified normal accommodation’ of a prison is the number of prisoners it can hold while providing good, decent accommodation. The average certified normal accommodation of a male prison is currently 670 prisoners and of a female prison 330, though size, especially for male prisons, varies greatly. ‘Operational capacity’ is the total number of prisoners a prison can hold, without serious risk to good order, security and the proper running of the regime. Prisons holding more prisoners than their certified normal accommodation are overcrowded.
Prison population
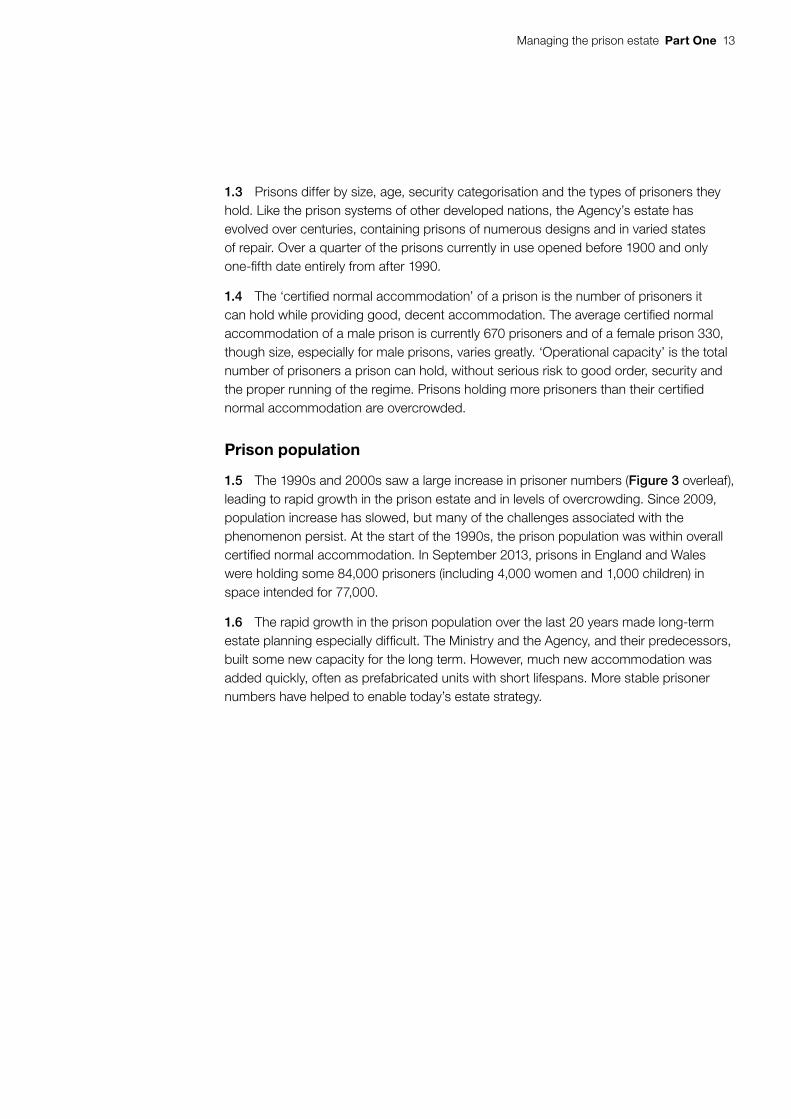
1.5 The 1990s and 2000s saw a large increase in prisoner numbers (Figure 3 overleaf), leading to rapid growth in the prison estate and in levels of overcrowding. Since 2009, population increase has slowed, but many of the challenges associated with the phenomenon persist. At the start of the 1990s, the prison population was within overall certified normal accommodation. In September 2013, prisons in England and Wales were holding some 84,000 prisoners (including 4,000 women and 1,000 children) in space intended for 77,000.
1.6 The rapid growth in the prison population over the last 20 years made long-term estate planning especially difficult. The Ministry and the Agency, and their predecessors, built some new capacity for the long term. However, much new accommodation was added quickly, often as prefabricated units with short lifespans. More stable prisoner numbers have helped to enable today’s estate strategy.

14 Part One Managing the prison estate
Fig
ure
3P
rison
er n
umbe
rs, 1
990
to 2
013
Pop
ulat
ion
M
ale
43
43
43
43
47
49
53
58
62
62
61
63
66
69
70
72
74
76
78
79
79
81
84
81
(000
)
Fe
mal
e 2
2 2
2 2
2 2
3 3
3 3
4 4
4 4
4 4
4 4
4 4
4 4
4
(000
)
To
tal
45
45
45
45
49
51
55
61
65
65
65
66
71
73
75
76
78
80
83
84
83
85
88
85
popu
latio
n
(000
)
No
te
1 D
ata
has
bee
n ro
und
ed to
the
near
est t
hous
and.
Sou
rce:
Min
istr
y of
Jus
tice
100,
000
90,0
00
80,0
00
70,0
00
60,0
00
50,0
00
40,0
00
30,0
00
20,0
00
10,0
00 0
1990
1991
1992
1993
1994
1995
1996
1997
1998
1999
2000
2001
2002
2003
2004
2005
2006
2007
2008
2009
2010
2011
2012
2013

Managing the prison estate Part One 15
Budget reductions
1.7 The most important factor behind the new estate strategy, however, is the Agency having to make £894 million of recurring savings by the end of 2014-15 (Figure 4). This dictates the strategy’s emphasis on cost reduction and also explains why the Agency has moved so quickly to implement it. The strategy depends on new prisons being cheaper to run than existing ones. In total, the Agency plans to produce gross savings through closing prison capacity of £170 million by 2014-15. However, this excludes all closure costs and the cost of building and operating new accommodation. The Agency uses this gross target as a management tool but has not produced a net target, which would more accurately reflect the actual savings.
1.8 Estate savings should be seen in the context of:
• overall budget reductions at the Ministry, whose resource budget is reducing from £8.3 billion in 2010-11 to £6.8 billion in 2014-15;
• total annual resource spending on prisons, which was £2.2 billion in 2012-13 (not including central overheads); and
• other costs being cut to reach the Agency’s £894 million target (front line efficiencies; savings on probation services; and organisational restructuring).
Figure 4Agency savings requirements, 2011-12 to 2014-15
Savings target (£m)
Note
1 Figures do not add up to £894 million due to rounding.
Source: National Audit Office
2011-12 2012-13 2013-14 2014-15
0
-50
-100
-150
-200
-250
-300
229246
274
150
16 Part One Managing the prison estate
Estate strategy
1.9 The Agency’s estate strategy came into force in 2010. The strategy’s objectives are to:
• reduce resource costs;
• create durable, good-standard accommodation; and
• provide an estate that meets offenders’ needs better, allowing more to work and be kept closer to their homes.
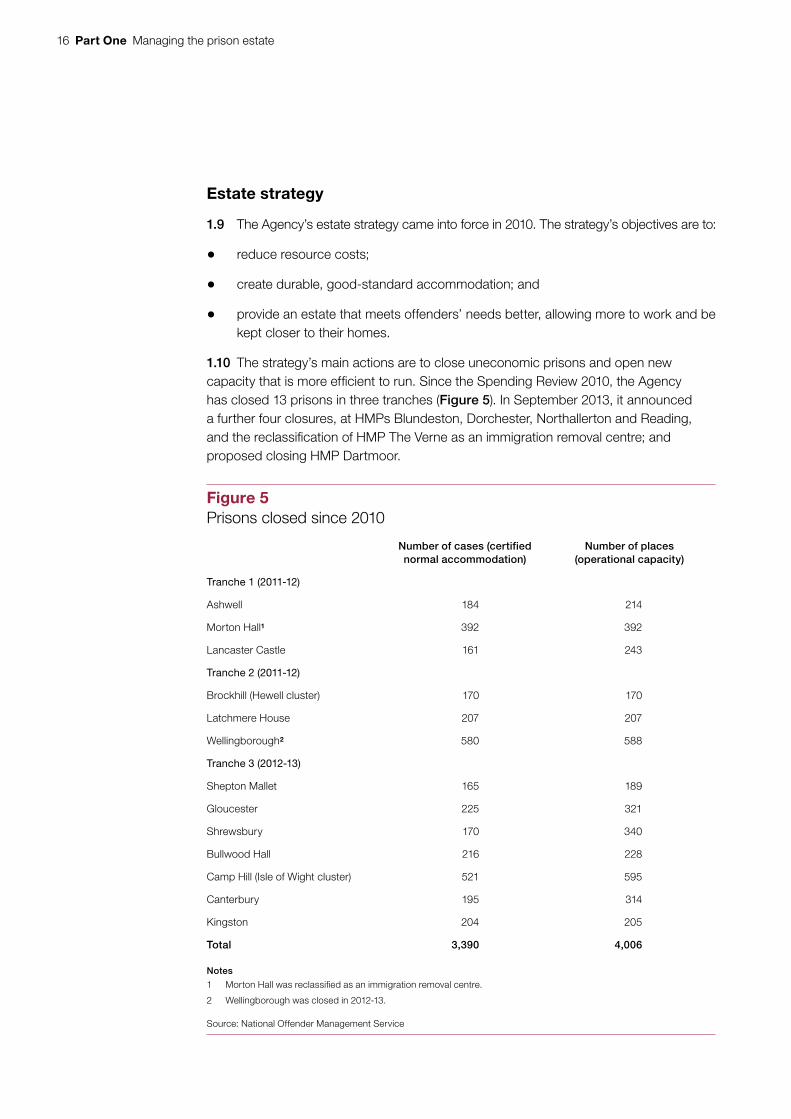
1.10 The strategy’s main actions are to close uneconomic prisons and open new capacity that is more efficient to run. Since the Spending Review 2010, the Agency has closed 13 prisons in three tranches (Figure 5). In September 2013, it announced a further four closures, at HMPs Blundeston, Dorchester, Northallerton and Reading, and the reclassification of HMP The Verne as an immigration removal centre; and proposed closing HMP Dartmoor.
Figure 5Prisons closed since 2010
Number of cases (certified normal accommodation)
Number of places (operational capacity)
Tranche 1 (2011-12)
Ashwell 184 214
Morton Hall1 392 392
Lancaster Castle 161 243
Tranche 2 (2011-12)
Brockhill (Hewell cluster) 170 170
Latchmere House 207 207
Wellingborough2 580 588
Tranche 3 (2012-13)
Shepton Mallet 165 189
Gloucester 225 321
Shrewsbury 170 340
Bullwood Hall 216 228
Camp Hill (Isle of Wight cluster) 521 595
Canterbury 195 314
Kingston 204 205
Total 3,390 4,006
Notes
1 Morton Hall was reclassifi ed as an immigration removal centre.
2 Wellingborough was closed in 2012-13.
Source: National Offender Management Service
Managing the prison estate Part One 17
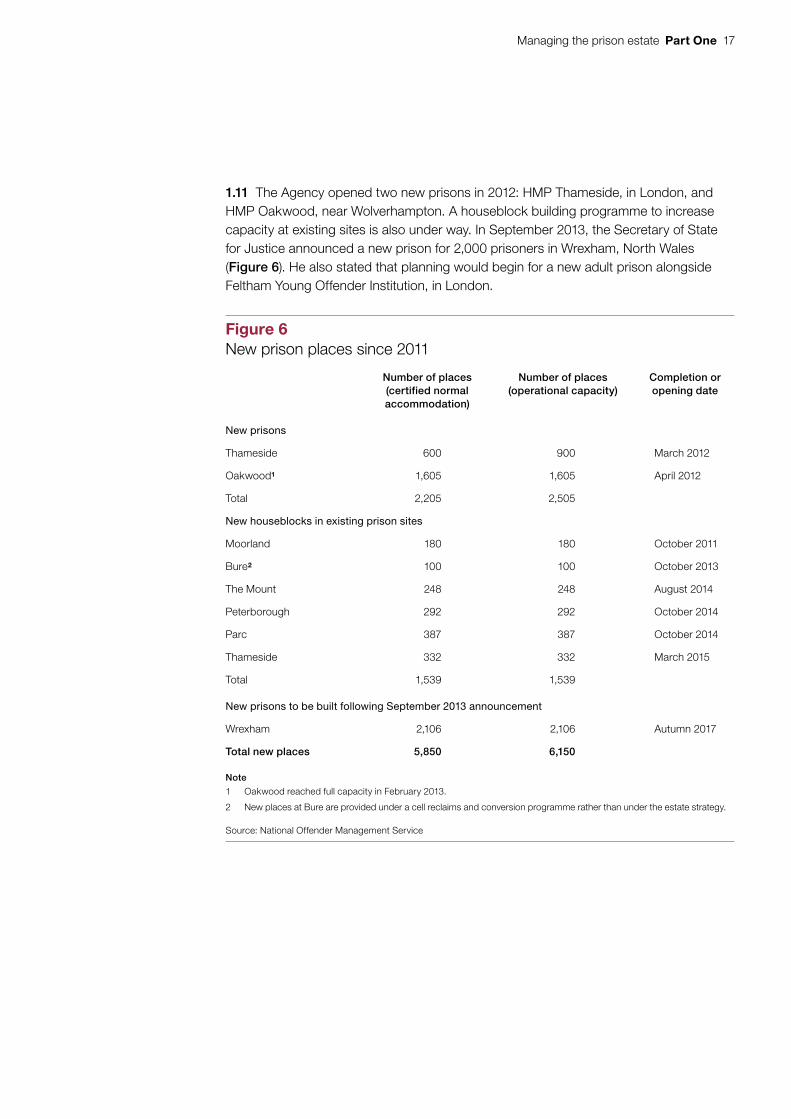
1.11 The Agency opened two new prisons in 2012: HMP Thameside, in London, and HMP Oakwood, near Wolverhampton. A houseblock building programme to increase capacity at existing sites is also under way. In September 2013, the Secretary of State for Justice announced a new prison for 2,000 prisoners in Wrexham, North Wales (Figure 6). He also stated that planning would begin for a new adult prison alongside Feltham Young Offender Institution, in London.
Figure 6New prison places since 2011
Number of places (certified normal accommodation)
Number of places (operational capacity)
Completion or opening date
New prisons
Thameside 600 900 March 2012
Oakwood1 1,605 1,605 April 2012
Total 2,205 2,505
New houseblocks in existing prison sites
Moorland 180 180 October 2011
Bure2 100 100 October 2013
The Mount 248 248 August 2014
Peterborough 292 292 October 2014
Parc 387 387 October 2014
Thameside 332 332 March 2015
Total 1,539 1,539
New prisons to be built following September 2013 announcement
Wrexham 2,106 2,106 Autumn 2017
Total new places 5,850 6,150
Note
1 Oakwood reached full capacity in February 2013.
2 New places at Bure are provided under a cell reclaims and conversion programme rather than under the estate strategy.
Source: National Offender Management Service

18 Part One Managing the prison estate
Population forecasting and management
1.12 The Agency’s forecasts of prisoner numbers and its population management techniques play an important part in the estate strategy. The Agency has acted more quickly than ever when reconfiguring prison capacity. This has involved moving thousands of offenders, many dangerous, while continuing to take all the offenders imprisoned by the courts.
1.13 Over the past five years, the Agency’s forecasts of prisoner numbers have been accurate (Figure 7), allowing it to plan with increasing confidence. An NAO team, looking at forecasting across government, examined these forecasts and found that the Ministry had developed them with appropriate data and input from users and stakeholders. It had combined a number of models to reflect changes at different points in the criminal justice system. In 2013, the population is below the lowest projection, that the Agency made in 2010. With updated forecasts issued annually, the Agency cautiously continues to plan for the middle forecast. Planning for the middle forecast helped it respond effectively to the sudden spike in prisoner numbers after the riots in summer 2011.
Figure 7Population forecasts from 2010 and actual population, 2010 to 2013
Prisoner numbers (000)
High forecast 88,000 89,300 90,800 92,000 92,800 93,600
Medium forecast 87,100 87,700 88,400 88,700 88,600 88,500
Low forecast 86,100 85,900 85,700 85,200 84,200 83,100
Actual 85,002 84,634 85,617 83,005
Source: National Audit Office analysis of Ministry of Justice data
100
95
90
85
80
75
2010 2011 2012 2013 2014 2015 2016
Managing the prison estate Part Two 19
Part Two
Cost, quality and performance
2.1 This part looks at the impact of the National Offender Management Service’s (the Agency’s) estate strategy on the value for money of spending on prisons. It considers prison costs, estate quality and reported performance, as assessed by both the Agency and its independent inspectorate.
Cost
2.2 Making cost savings was the main impetus behind the Agency’s estate strategy. Costs, as well as being higher than was sustainable across the prison system given spending reductions, varied greatly. The programme of targeted closures and new construction addresses both issues.
Closures
2.3 As set out in Figure 8 overleaf, the 13 closures have released some £104 million annually back to the Agency. In addition, the Ministry of Justice (the Ministry) has sold two sites, bringing in one-off income of £24 million (£22.5 million of it from the sale of Latchmere House). It has secured £21 million of income annually from the Home Office to run immigration removal centres in closed prisons. Meanwhile, the cost of the 13 closures, including the cost of voluntary early departure schemes, has been £57 million.
2.4 The Agency chose the 13 prisons it has closed, and the 5 selected for closure by the end of 2013-14, using a specific methodology. This combines an economic ranking of all prisons with the professional judgement of senior officials. The economic ranking comprises:
• a statistical model to adjust actual prison resource costs, so prisons are comparable regardless of their current security category or other variables;
• an assessment of likely maintenance costs and local rates over 25 years;
• potential income from selling sites; and
• an offset for any charges to exit private finance contracts.
2.5 Senior officials also assess each prison’s strategic importance, for example whether an establishment has special security features or unique facilities, such as manufacturing workshops or drug wings. They consider geographical location too as some regions are short of prison capacity while others have too much.

20 Part Two Managing the prison estate
2.6 The Agency has exempted the most strategically important prisons from closure, irrespective of running costs. This exemption accords with good practice. Due to a separate review, it has also exempted female prisons from closure. Finally, early on, it decided to exempt recently-built prisons because they provide modern accommodation; 13 of the 14 privately-run prisons are recently built and, in these cases, the Agency also judged that the cost of exiting long-term contracts would be too high and the negotiations required to do so protracted. This assessment was no doubt correct, but several private prisons were inefficient according to the economic ranking. That the Agency did not consider them for closure, therefore, demonstrates one of the potential weaknesses of long-term contracts. The Agency is seeking to improve the efficiency of all publicly-run prisons through its ‘benchmarking’ programme, which standardises and reduces staff numbers and introduces a new ‘core day’ to standardise the time prisoners spend out of their cell. The Agency has made some progress in improving the efficiency of private prisons, including negotiating a mixture of one-off cash savings and longer-term efficiency savings, but its ability to do so is limited by long-term contracts.
Figure 8Savings from prison closures
Resource expenditure
2010-11(actual)
2011-12(actual)
2012-13(actual)
2013-14(budget)
2014-15 2015-16 Cumulative position by 2015-161
Budgets released by closures (£m)
2011-12 closures -28.5 -32.8 -32.8 -32.8 -32.8 -159.7
2012-13 closures -4.0 -15.4 -15.4 -15.4 -50.0
March 2013 closures
-55.9 -55.9 -55.9 -167.8
Total budget released by closures1
-28.5 -36.7 -104.1 -104.1 -104.1 -377.5
Income from Home Office2
-8.7 -8.7 -20.6 -20.6 -20.6 -79.3
Total1 -37.3 -45.5 -124.7 -124.73 -124.7 -456.8
Income from land sales -24.0 -24.0
Cost of closures 0.5 8.9 18.6 23.9 3.0 2.1 57.2
Savings net of cost of closures1
0.5 -28.3 -50.8 -100.8 -121.7 -122.6 -423.7
Notes
1 Numbers may not add up due to rounding.
2 Income from the Home Offi ce is for former prisons which the Agency runs as immigration removal centres.
3 Gross savings for 2014-15 should be compared with the Agency’s target of making £170 million of gross savings annually by 2014-15. It expects to make a further £31 million savings from the recently announced closures and £2 million savings by reassigning another prison as an immigration removal centre.
Source: National Audit Offi ce analysis of Ministry of Justice and National Offender Management Service data
Managing the prison estate Part Two 21
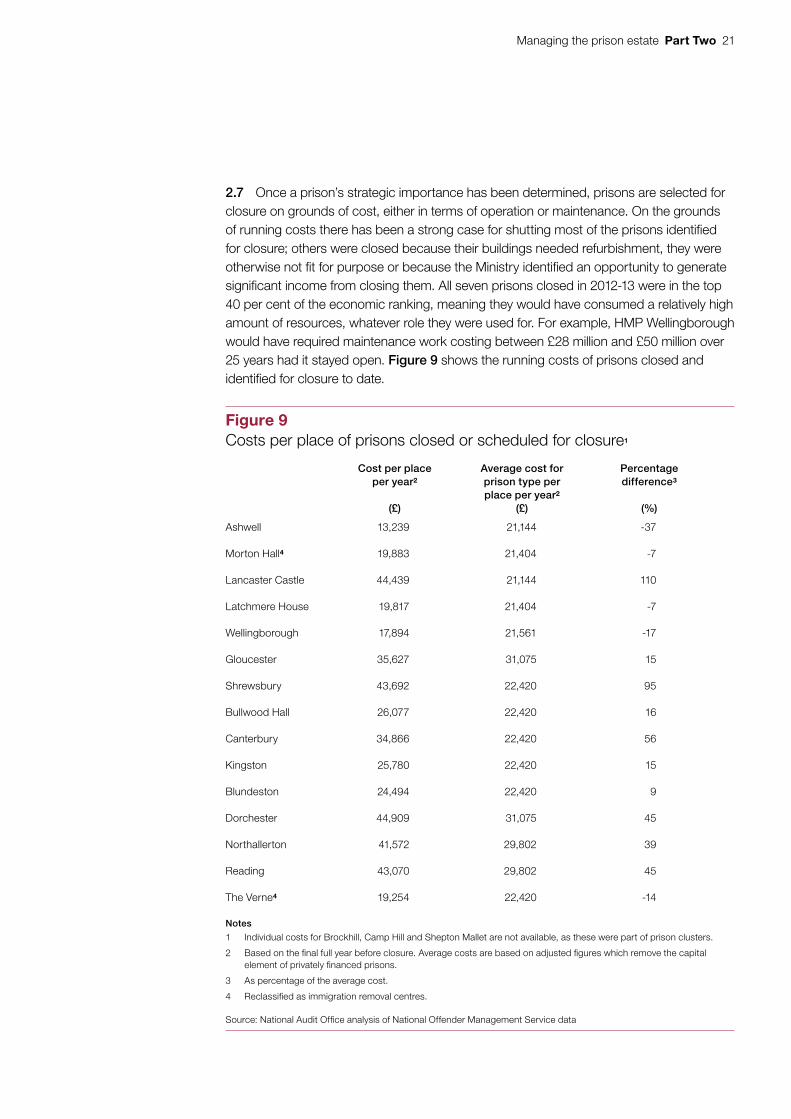
2.7 Once a prison’s strategic importance has been determined, prisons are selected for closure on grounds of cost, either in terms of operation or maintenance. On the grounds of running costs there has been a strong case for shutting most of the prisons identified for closure; others were closed because their buildings needed refurbishment, they were otherwise not fit for purpose or because the Ministry identified an opportunity to generate significant income from closing them. All seven prisons closed in 2012-13 were in the top 40 per cent of the economic ranking, meaning they would have consumed a relatively high amount of resources, whatever role they were used for. For example, HMP Wellingborough would have required maintenance work costing between £28 million and £50 million over 25 years had it stayed open. Figure 9 shows the running costs of prisons closed and identified for closure to date.
Figure 9Costs per place of prisons closed or scheduled for closure1
Cost per placeper year2
(£)
Average cost forprison type perplace per year2
(£)
Percentagedifference3
(%)
Ashwell 13,239 21,144 -37
Morton Hall4 19,883 21,404 -7
Lancaster Castle 44,439 21,144 110
Latchmere House 19,817 21,404 -7
Wellingborough 17,894 21,561 -17
Gloucester 35,627 31,075 15
Shrewsbury 43,692 22,420 95
Bullwood Hall 26,077 22,420 16
Canterbury 34,866 22,420 56
Kingston 25,780 22,420 15
Blundeston 24,494 22,420 9
Dorchester 44,909 31,075 45
Northallerton 41,572 29,802 39
Reading 43,070 29,802 45
The Verne4 19,254 22,420 -14
Notes
1 Individual costs for Brockhill, Camp Hill and Shepton Mallet are not available, as these were part of prison clusters.
2 Based on the fi nal full year before closure. Average costs are based on adjusted fi gures which remove the capital element of privately fi nanced prisons.
3 As percentage of the average cost.
4 Reclassifi ed as immigration removal centres.
Source: National Audit Offi ce analysis of National Offender Management Service data

22 Part Two Managing the prison estate
New capacity
2.8 The Ministry manages the building of new capacity, to the Agency’s specifications. The principal aim is for new capacity to be more efficient than current averages, in terms of annual running costs and long-term durability. Regarding durability, new capacity built today is a significant improvement on much of what was being constructed when we last looked at this issue, in 2005.1 Then, much new accommodation had either a 30-year lifespan (for brick-clad steel-framed units) or a 10- to 25-year lifespan (for mobile temporary units), with some structures estimated to last as little as five years without refurbishment. Now, the Ministry builds prisons with an estimated lifespan of 60 years, which, when combined with low running costs, makes for a much better return on investment.
2.9 Two of the Agency’s three completed new capacity projects deliver low running costs (Figure 10). At HMP Oakwood, the cost per place in 2012-13 was £15,500 a year, 31 per cent less than the average for category C establishments; the Agency expects this to drop to £12,000 per place from 2013-14. At HMP Moorland, the estimated cost of a place in the new houseblock is 21 per cent less than the category C average. Savings are mostly due to economies of scale and increased use of closed circuit television, which allow reduced staffing, but also reflect greater energy efficiency, lower maintenance costs and, at Oakwood, the result of competitive tendering.
1 Comptroller and Auditor General, National Offender Management Service: Dealing with increased numbers in custody, Session 2005-06, HC 458, National Audit Office, October 2005.
Figure 10Steady state running costs at new accommodation
Cost per placeper year1
(£)
Average cost forprison type perplace per year2
(£)
Percentagedifference3
(%)
Moorland houseblock (category C)
17,630 22,420 -21
Oakwood(category C)
12,000 22,420 -46
Thameside(category B local)
50,1002 31,080 61
Notes
1 Based on certifi ed normal accommodation for the fi rst quarter of 2013-14. Costs cited are for 2012-13, except at Oakwood and Thameside, where they are budget fi gures for 2013-14.
2 Costs have been adjusted to exclude charges for capital investment.
3 As a percentage of the average cost.
Source: National Audit Offi ce analysis of National Offender Management Service data

Managing the prison estate Part Two 23
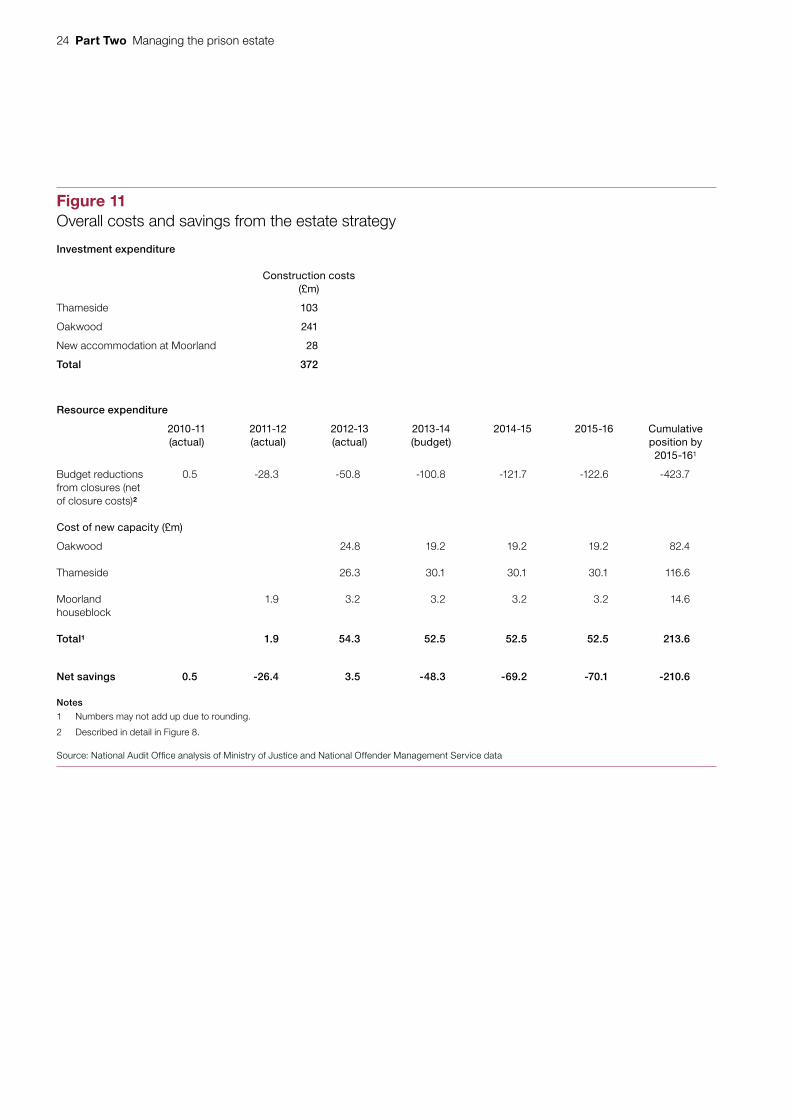
2.10 At HMP Thameside, the Agency has not succeeded in achieving below-average running costs. Under its 25-year PFI contract with Serco it pays some £50,000 per place per year (not including construction costs); on average category B local prisons cost £31,000 per place. The Agency told us that it always planned to overcrowd HMP Thameside because it needs places in London. However, factoring in overcrowding, the cost per prisoner is some £34,000 compared to an average of £25,000. The Agency says the higher cost is due to the London location, which prevented a larger, more efficient establishment from being built. HMP Thameside is currently the most expensive local prison per prisoner in London, except HMP Belmarsh, which has a maximum security wing. The Agency told us it plans to build new capacity that is similar to Oakwood in future.
2.11 Investment to build new capacity to date has cost £372 million. Running the new prison places is also a cost to the Agency. But these places cost less than closed prisons, so the Agency is still able to make savings of £70 million a year at steady state (Figure 11) overleaf. Between the start of 2010-11 and the end of 2013-14, the savings, net of all resource costs but not of the cost of constructing the new capacity, will have amounted to £71 million. Assuming no further land sales, by the end of 2015-16, the total savings from actions taken under the estate strategy to date will be £211 million. Further savings are anticipated from closures and new-build projects now under way.
2.12 The Agency’s project management of the estate strategy has been efficient. The Ministry and the Agency together have achieved closures and new builds to time and budget:
• Despite having no recent experience of closing prisons, the Agency has developed an effective process for this, which takes just three months.
• On visits to three closing prisons in March 2013 (HMPs Bulwood Hall, Camp Hill and Shepton Mallet), we saw efforts to minimise uncertainty for prisoners and successful attempts to reuse plant and equipment.
• However, we heard of some prisoners who would be delayed applying for parole because they were moving to new prisons. Also, many staff were not notified about the outcome of voluntary early departure applications until their prisons had closed, increasing feelings of uncertainty.
• HMPs Oakwood and Thameside opened, as scheduled, in March and April 2012 respectively.
• HMP Thameside cost 6 per cent less to construct than planned and HMP Oakwood 12 per cent less.
24 Part Two Managing the prison estate
Figure 11Overall costs and savings from the estate strategy
Investment expenditure
Construction costs(£m)
Thameside 103
Oakwood 241
New accommodation at Moorland 28
Total 372
Resource expenditure
2010-11(actual)
2011-12(actual)
2012-13(actual)
2013-14(budget)
2014-15 2015-16 Cumulative position by 2015-161
Budget reductions from closures (net of closure costs)2
0.5 -28.3 -50.8 -100.8 -121.7 -122.6 -423.7
Cost of new capacity (£m)
Oakwood 24.8 19.2 19.2 19.2 82.4
Thameside 26.3 30.1 30.1 30.1 116.6
Moorland houseblock
1.9 3.2 3.2 3.2 3.2 14.6
Total1 1.9 54.3 52.5 52.5 52.5 213.6
Net savings 0.5 -26.4 3.5 -48.3 -69.2 -70.1 -210.6
Notes
1 Numbers may not add up due to rounding.
2 Described in detail in Figure 8.
Source: National Audit Offi ce analysis of Ministry of Justice and National Offender Management Service data

Managing the prison estate Part Two 25
Quality
2.13 The prison estate’s quality encompasses several factors, including accommodation; cell sharing and overcrowding; facilities outside the cell; and security and safety. Under the estate strategy, the Agency considers quality more than it did in the 2000s, when prisoner numbers were rising rapidly. Overall, the strategy commits the Agency to:
• provide good but not luxurious modern accommodation for prisoners, with improved safety features;
• maintain, rather than decrease or increase, levels of overcrowding;
• ensure that new establishments have flexibility as to the security category of prisoners they can hold; and
• ensure that new capacity has enough purposeful activity for prisoners.
Cell accommodation
2.14 All new cell accommodation provides a good standard of accommodation for prisoners. By contrast, at some prisons the Agency closed, wings contained accommodation that was no longer satisfactory. Most importantly, in new buildings all cells have integrated screened toilets and over 90 per cent have integrated showers. Some new cells contain telephones (the use of which is controlled and may be monitored by prison staff) and, at HMP Thameside, terminals to book activities and order meals. In focus groups, prisoners generally recognised the improvement in accommodation, as has the independent inspectorate.
2.15 In-cell telephones, as well as allowing prisoners to maintain family contact (important for successful rehabilitation), also contribute to prisoner safety. Other modern design features that improve prisoners’ safety include removing permanent ligature points from cells and better fire detection systems. Removing the need to unlock prisoners to wash helps to reduce staff costs.

26 Part Two Managing the prison estate
Overcrowding and cell sharing
2.16 Overcrowding places a strain on prison facilities, reduces the amount of activity each prisoner can engage in and can impair decency. The Agency agrees that overcrowded conditions are suboptimal, but it is not aiming to reduce overcrowding as part of the estate strategy. Overcrowding is efficient in the short term because prisons do not typically receive extra budget when their prisoner numbers increase. Conversely, we estimate that to end overcrowding without reducing the population, over £900 million of capital expenditure would be required, which is not realistic.2
2.17 Despite not being targeted, the overall overcrowding rate (the number of prisoners held in overcrowded conditions each day) has dropped slightly from 24.1 per cent in 2010-11 to 23.4 per cent in 2012-13. This is mainly due to the lower population. Figure 12 shows how the change over three years varies by prison type, with male local prisons (which serve the courts and, thus, have the biggest turnover of prisoners) consistently very overcrowded.
2.18 Overcrowding rates also varied greatly at the 13 prisons that have now closed, from zero to 96 per cent overcrowding at HMP Shrewsbury, a male local prison. In the new capacity, there is currently no overcrowding at HMP Oakwood, but 63 per cent overcrowding at HMP Thameside. There is potential to overcrowd Oakwood, if necessary, up to 48 per cent, by holding 500 more prisoners there than at present.
2.19 As well as overcrowding, the level of cell sharing is a key measure of decency, according to the UN Standard Minimum Rules for the Treatment of Prisoners and the Council of Europe.3 The rules are non-binding guidelines for UN members and state that “each prisoner shall occupy by night a cell or room by himself”. In common with a number of other developed countries, this is a criterion that the English and Welsh prison system has never met, despite complying with most others.
2.20 Currently, across the prison system, around 20 per cent of prisoners live two to a cell, or in a small number of cases three to a cell. The Agency houses three prisoners to a cell where cells are larger and it considers that the conditions are safe and decent. Overall, 12 per cent of the new cells built since 2010 are holding two prisoners. If HMP Thameside was full, and HMP Oakwood was overcrowded up to its potential operational capacity, this would increase to 34 per cent. Sometimes cell sharing counts as overcrowding; at HMP Thameside, for instance, over 500 prisoners currently live two to a cell, all in overcrowded conditions. But, at the new prison in Wrexham, 58 per cent of cells will be doubled, none of which will count as overcrowding as they will have been designed to hold two prisoners, and there will be sufficient purposeful activity for the whole population. In focus groups, only a minority of prisoners actually want to share cells, with most citing privacy, and some safety, to explain why not.
2 Based on building 6,000 new places at an average capital cost for a new prison place of £158,000.3 United Nations, Standard Minimum Rules for the Treatment of Prisoners, 1955, 1956 and 1977.

Managing the prison estate Part Two 27
Figure 12Overcrowding levels, 2010-11 to 2012-13
Source: National Audit Office analysis of National Offender Management Service data
Male category C
Male local
Young offender
Cluster/mixed
Female
Male other
Total
0 5 10 15 20 25 30 35 40 45 50
Percentage
2010-11
2011-12
2012-13
13.7
14.0
12.7
10.6
14.7
15.3
18.7
15.7
16.2
4.2
4.6
3.8
2.9
3.1
2.2
24.3
23.4
24.1
47.5
47.4
46.3

28 Part Two Managing the prison estate
Security
2.21 The Agency builds flexibility into new prisons by designing them to convert easily to category B status (the second highest security category). This is good planning, given that these prisons, intended to last 60 years, will likely be redesignated more than once. Many of the closed prisons were not so flexible in the categories of prisoner they could hold.
2.22 At HMPs Thameside and Oakwood, and at the new Wrexham prison, a modified hub-and-spoke design is used for houseblocks. This gives officers good visibility along several wings at once from a central point. Combined with increased closed circuit television, this is a major factor in reducing staff numbers. At Oakwood, however, the design is not as efficient as it could be. Offices, classrooms and other walled-off areas are built into houseblocks’ central core, blocking sightlines and creating blind spots.
Purposeful activity
2.23 Purposeful activity (education, training and work, and courses aimed at rehabilitation and reducing reoffending) is vital to prison life. However, over many years a large number of prisons have struggled to provide enough for their populations (whether measured against targets or in the expert view of the inspectorate). Statistics, that the Agency no longer collects centrally, show that the prisons that have now closed provided slightly more purposeful activity than average: 25.4 hours per prisoner per week compared to 24.7 hours. Meanwhile, all new capacity, including new houseblocks at existing sites, is supposed to come with purposeful activity facilities to meet the population’s requirements. We found that, unlike the approach in the mid-2000s, all new accommodation was now constructed with purposeful activity. However, there have been problems with the quantity and variety of what was provided.
2.24 Just as different prisoners present different security risks, so they require different types and amounts of purposeful activity. Yet, when constructing new capacity, the Ministry does not plan purposeful activity with the same flexibility as it does security. The Ministry, acting on the Agency’s specifications, has designed two new prisons with purposeful activity that was mainly tailored to the needs of the first type of prisoner each establishment was due to hold. This is likely to limit these sites’ long-term flexibility:
• HMP Oakwood, originally planned as a local prison, does not have the typical mix of purposeful activity necessary for a population where all prisoners work. Local prisons have large remand populations, who are not required to work. But Oakwood now contains only sentenced offenders. The Ministry considered increasing the amount of purposeful activity in Oakwood, at the time that it changed the population to sentenced prisoners – in the business case – but decided not to spend the £5.5 million this would have cost. The contractor now running the prison, G4S, agreed to provide a high level of purposeful activity with the current facilities (32.5 hours per prisoner per week), but has struggled to do so.

Managing the prison estate Part Two 29
• HMP Thameside has much purposeful activity space overall, but, unusually for a prison, no workshops. These are important to meet the government’s aim to have more prisoners working and the Agency is now considering how to provide some.
2.25 The Agency told us it had learned lessons from HMPs Oakwood and Thameside for its new prison at Wrexham, which will begin life as a category C training prison. Figure 13 shows how it will have enough purposeful activity for all 2,106 prisoners, including a large number of workshops.
2.26 HMP Oakwood is running around 120 places on accredited offender behaviour programmes this year; these address specific problems related to prisoners’ offending. There are so far no such programmes running at HMP Thameside. When the Agency closed HMP Shepton Mallet, it did not re-provide elsewhere the sex offender treatment programmes that it ran. This caused a drop of 34 places, or 3 per cent, in the number of places across the system. (Part Four contains further information about waiting lists for these programmes.) The Agency told us that it now ensures that offender behaviour programmes are provided elsewhere whenever a prison closes.
Figure 13Planned purposeful activity at Wrexham
Source: Ministry of Justice
Workshops
Education-based classrooms
Houseblock and catering
Group and interview rooms
Skills area
External activities
Kitchen
Sports areas
Unallocated areas
0 100 200 300 400 500 600 700 800 900
Number of places
850
381
168
141
134
130
74
20
202
30 Part Two Managing the prison estate
Reported performance
2.27 Two long-running assessments provide a rounded and comparable view of each prison’s performance: the Agency’s own annual prison performance ratings and HM Inspectorate of Prisons’ regular inspection reports. Though the Agency values these assessments in general, it has chosen not to take them into account in its estate strategy.
Closures
2.28 The Agency has excluded measures of performance from its closure methodology. It excluded performance because it assesses that:
• performance fluctuates and is more affected by staff than by sites and buildings;
• it can improve all prisons, so they become high performing, through initiatives including benchmarking and competitive tendering, and so make up for lost high-performing capacity; and
• incorporating performance as a criterion would incorrectly suggest to establishments that good performance alone would be enough to keep them open even if they are expensive to run.
2.29 The Agency does not want to close high-performing prisons, but leaving performance out of decision-making has made it easier to do so. Of the 18 prisons closed or identified for closure so far, 8 were high performing in their most recent inspectorate or Agency assessment, compared to 3 which were poor performing; 4 were high-performing in both assessments (Figure 14). The Agency has a good understanding of many of the factors that contribute to good performance, but it took no specific additional steps to learn from the high-performing prisons it closed.
2.30 The Agency’s contention that performance at prisons fluctuates over time is not wholly borne out by its own ratings, in which 44 per cent of prisons kept the same rating, and thus the same position relative to other prisons, for the last three years. The inspectorate’s reports also indicate that performance is often slow to change. Even where there is fluctuation, this can indicate improving performance. The Agency could include performance as a criterion in its closure methodology without making it the definitive criterion.

Managing the prison estate Part Two 31
Figure 14Reported performance1 at prisons affected by the estate strategy
Most recent Agencyperformance rating
(1 = lowest; 4 = highest)
Most recent inspectorate‘healthy prison’ test
(4 = lowest; 16 = highest)
Prisons closed or scheduled for closure
Ashwell 3 14
Morton Hall2 4 14
Lancaster Castle 3 11
Brockhill3 3 12
Latchmere House 3 12
Wellingborough 3 9
Shepton Mallet 4 15
Gloucester 2 8
Shrewsbury 4 13
Bullwood Hall 3 13
Camp Hill3 3 8
Canterbury 2 12
Kingston 3 15
Blundeston 3 10
Dorchester 3 13
Northallerton 4 14
Reading 3 12
The Verne2 3 10
New prisons
Oakwood 1 6
Thameside 1 8
Notes
1 High-performing prisons are those that score 4 on the Agency’s ratings or 13 or above on the inspectorate’s test. Poor-performing prisons score 1 or 9 or below respectively. The average inspectorate rating for the adult estate, based on the most recent inspections was 12. The Agency’s rating system changed in 2012-13. The average rating for the adult estate in 2010-11 was 3.1; in 2011-12 was 3.3; and in 2012-13 was 3.
2 Reclassifi ed as immigration removal centres.
3 Ratings for Brockhill and Camp Hill relate to their clusters (Hewell and the Isle of Wight respectively).
Source: National Audit Offi ce analysis of National Offender Management Service and HM Inspectorate of Prisons data

32 Part Two Managing the prison estate
New capacity
2.31 When new prisons begin holding prisoners, they become subject to inspections and the Agency’s routine performance monitoring. The Ministry also monitors the benefits of new capacity through ‘benefits realisation plans’, in line with good practice. As with the closure methodology, however, these plans do not include performance or quality. Instead, they focus on the number of places created, the cost of construction and steady state running costs. We would expect mature benefits realisation plans to place more emphasis on performance outputs and outcomes.
2.32 Recent routine assessments of new prisons’ performance are negative (Figure 14), though this does not appear to be primarily the result of their design. What this does show is the difficulty of shutting high-performing capacity and replacing it quickly with high-performing capacity elsewhere because new prisons take time to settle down. HMPs Oakwood and Thameside were two of the three prisons to receive the lowest Agency rating in 2012-13, although internal management information shows some small improvement at both prisons during 2013-14. Prisons receiving large numbers of prisoners from closed establishments can also see a dip in performance. A recent inspection at HMP Bristol found this had happened there after the closure of HMP Gloucester.4
4 HM Chief Inspector of Prisons, Report on an unannounced inspection of HMP Bristol, 6–17 May 2013, September 2013.

Managing the prison estate Part Three 33
Part Three
System-wide impacts
3.1 As well as having a direct impact on the prisons involved, the estate strategy is changing the shape of the prison system in England and Wales as a whole. This part considers some of these changes.
Prison size
3.2 The estate strategy is increasing the average size of prisons. It is doing this principally to increase economies of scale. The average size of adult male prisons has grown by 10 per cent since 2010 (Figure 15) and will rise further, while the cost of the estate has reduced by £70 million annually.
Prison size and reoffending
3.3 The effectiveness of prison is difficult to measure. Punishment, deterrence and rehabilitation are all legitimate aims of sentencing. But assessing their success is hard to express quantitatively. Reduced reoffending is often seen as the most valuable effect a sentence can have, but reoffending rates are actually reconviction rates, which only capture crimes for which people are found guilty. The relationship between what happens in prison and how prisoners react on release remains hard to analyse, and causation hard to establish.
Figure 15Average size of male adult prisons, 2010 to 2013
Certified normal accommodation
(% increase)
Operationalcapacity
(% increase)
Averagepopulation
(% increase)
May 2010 609 7151 679
September 2013 670 (10%) 782 (9%) 744 (10%)
Note
1 Operational capacity is from January 2011, as the Agency did not report operational capacity in earlier months.
Source: National Offender Management Service

34 Part Three Managing the prison estate
3.4 In recent years, the Ministry of Justice (the Ministry) has developed reporting on reoffending rates by individual prison. This is useful for tracking progress on payment-by-results projects, where performance at a single prison is monitored. But it cannot be used to compare performance at different prisons or to indicate what the differences between prisons mean. Most prisoners spend their sentences in multiple prisons. In particular, it cannot demonstrate whether prison size makes a difference to this key outcome.
Prison size and wider performance
3.5 We reviewed evidence of whether there is a link between size and performance, as some commentators including prison inspectors and academics have argued, to understand whether smaller prisons are better, on average, on issues such as prisoner safety, motivation and engagement. Data show that some large prisons score well for safety, motivation and engagement, while some small ones score poorly. But some statistical analyses, which control for other factors, indicate that smaller prisons, on average, may be more conducive environments for working with prisoners, in particular:
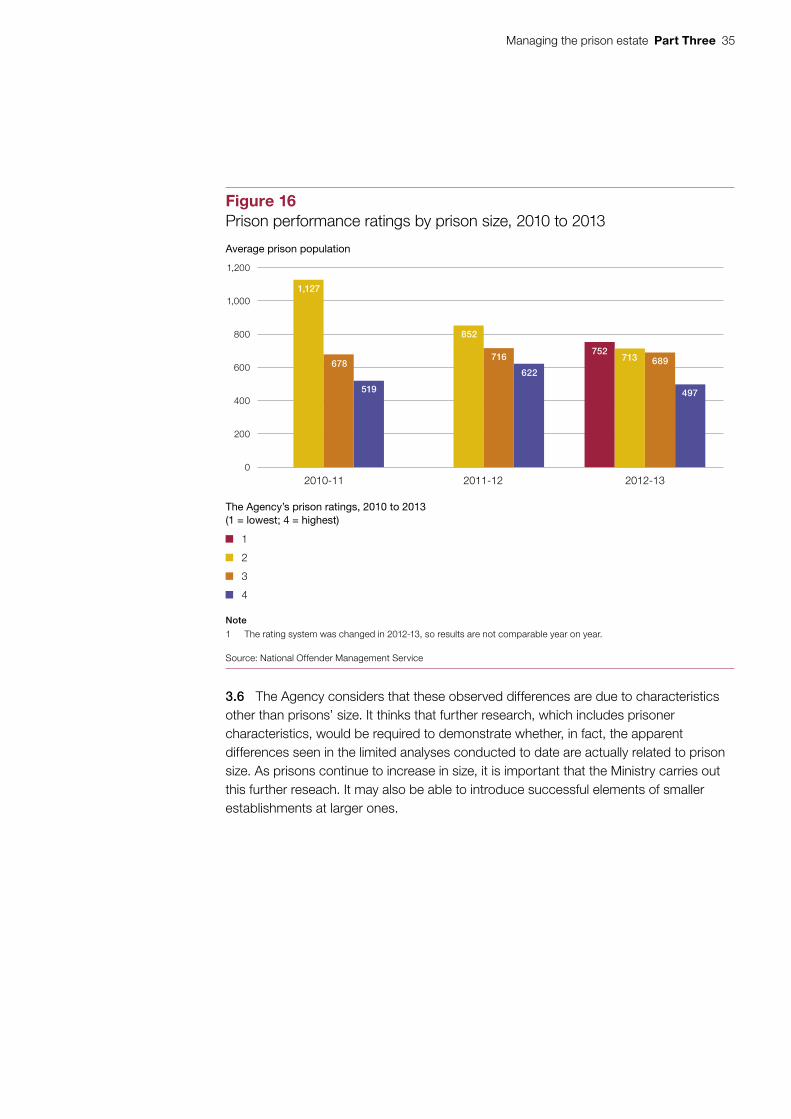
• The National Offender Management Serivce’s (the Agency’s) own performance ratings, which consistently rate smaller prisons more highly. It is important to note that these ratings were not compiled to test this issue specifically (Figure 16).
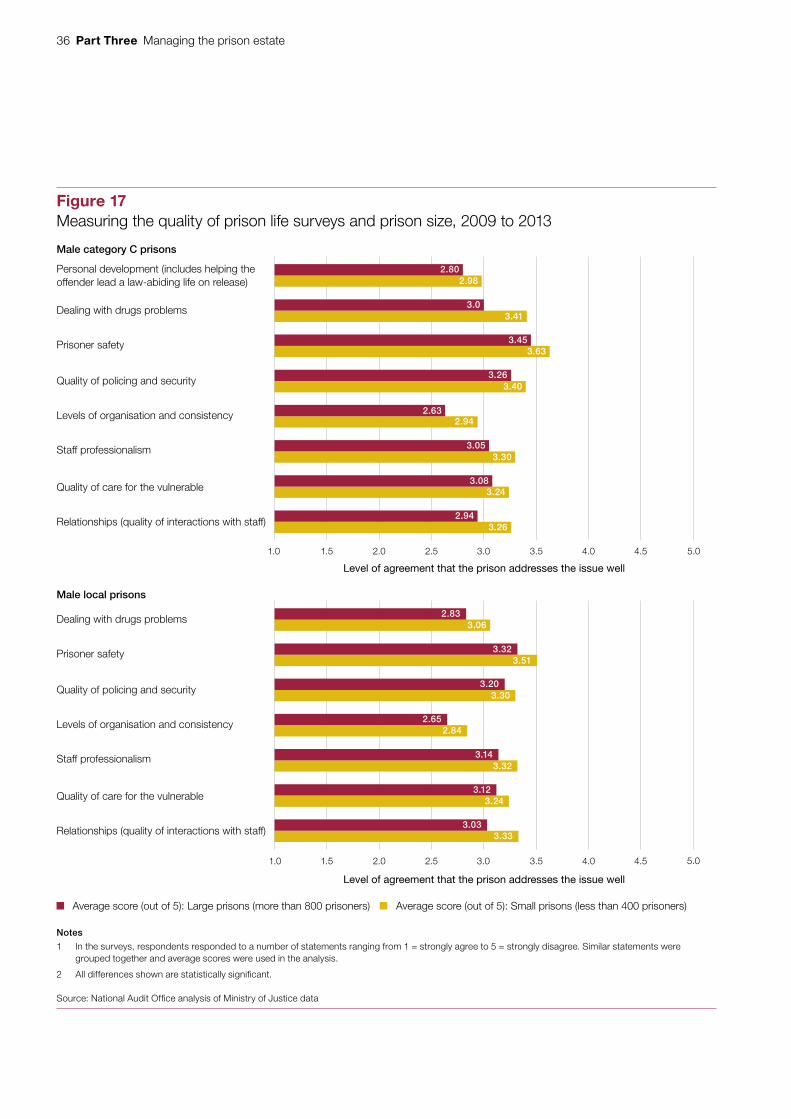
• The Agency’s own data, from ‘measuring the quality of prison life’ surveys between 2009 and 2013, showed there was a small but statistically significant correlation between prison size and how prisoners assess their time in custody. Prisoners in small prisons are consistently more positive than those in larger ones, according to tests we were able to run on the data. (See Apendix Two for further details.) This is not primarily a matter of prisoner comfort but is about the quality of relationships prisoners form and levels of professionalism, safety and security (Figure 17 on page 36).5
• HM Inspectorate of Prisons’ research from 2009, which showed that “size was the most influential factor in how prisons performed against … tests of safety and respect, and overall”, with prisons holding 400 or fewer prisoners “significantly more likely to perform well… than larger prisons holding more than 800 prisoners”.6 The then Chief Inspector described this finding as ‘important’ and said it should influence decisions “about the size and shape of the prison population”.
5 The analysis controlled for prison type, age and overcrowding but could not take account of prisoner characteristics, like previous offending, prisoner age and attitudes, or sentence length.
6 HM Inspectorate of Prisons, The prison characteristics that predict prisons being assessed as performing ‘well’: A thematic review, January 2009.
Managing the prison estate Part Three 35
3.6 The Agency considers that these observed differences are due to characteristics other than prisons’ size. It thinks that further research, which includes prisoner characteristics, would be required to demonstrate whether, in fact, the apparent differences seen in the limited analyses conducted to date are actually related to prison size. As prisons continue to increase in size, it is important that the Ministry carries out this further reseach. It may also be able to introduce successful elements of smaller establishments at larger ones.
Figure 16Prison performance ratings by prison size, 2010 to 2013
Average prison population
Note
1 The rating system was changed in 2012-13, so results are not comparable year on year.
Source: National Offender Management Service
2010-11 2011-12 2012-13
1,200
1,000
800
600
400
200
0
The Agency’s prison ratings, 2010 to 2013(1 = lowest; 4 = highest)
1
2
3
4
1,127
678
519
852
716
622
752713 689
497
36 Part Three Managing the prison estate
Figure 17Measuring the quality of prison life surveys and prison size, 2009 to 2013
Male category C prisons
Personal development (includes helping the offender lead a law-abiding life on release)
Dealing with drugs problems
Prisoner safety
Quality of policing and security
Levels of organisation and consistency
1.0 1.5 2.0 2.5 3.0 4.0
Level of agreement that the prison addresses the issue well
Notes
1 In the surveys, respondents responded to a number of statements ranging from 1 = strongly agree to 5 = strongly disagree. Similar statements were grouped together and average scores were used in the analysis.
2 All differences shown are statistically significant.
Source: National Audit Office analysis of Ministry of Justice data
Average score (out of 5): Small prisons (less than 400 prisoners) Average score (out of 5): Large prisons (more than 800 prisoners)
Staff professionalism
Quality of care for the vulnerable
Relationships (quality of interactions with staff)
3.5 4.5 5.0
2.802.98
3.03.41
3.453.63
3.263.40
2.632.94
3.053.30
3.083.24
2.943.26
Male local prisons
Dealing with drugs problems
Prisoner safety
Quality of policing and security
Levels of organisation and consistency
1.0 1.5 2.0 2.5 3.0 4.0
Level of agreement that the prison addresses the issue well
Staff professionalism
Quality of care for the vulnerable
Relationships (quality of interactions with staff)
3.5 4.5 5.0
2.833.06
3.323.51
3.203.30
2.652.84
3.143.32
3.123.24
3.033.33

Managing the prison estate Part Three 37
Prison location
3.7 The Agency aims to hold prisoners as near to their homes as possible, to preserve family ties, support resettlement work and reduce escort costs. Experts agree that distance from home is a key variable in performance against resettlement.7 In recent years, however, prison capacity has not matched demand. The estate strategy is improving this. Since 2010, the Agency has reduced places in five out of six regions with spare capacity, and increased capacity in three out of five regions with an under supply. Figure 18 shows that there is still far to go. The planned Wrexham prison will reduce under supply in both Wales and the North West, and expansions at HMPs Thameside and Feltham will do the same in London.
3.8 One innovative way the Agency uses spare capacity is niche prisons. These hold populations with less routine access to family members. In recent years, foreign national offender-only prisons have operated in the East of England, Kent and Sussex, and the South Central region. Sex offender-only prisons have been created on the Isle of Wight, which is also in the South Central region. In theory, niche prisons mean staff can build expertise working with particular types of offender. The Agency is yet to evaluate this.
7 For instance, HM Inspectorate of Prisons, Prison characteristics.
Figure 18Demand by region, June 2013
Prisonersproduced
Prison places Spare capacity Under supply of places
East Midlands 6,626 9,211 2,585 (28%) –
East of England 5,710 8,799 3,089 (35%) –
Greater London 17,595 9,550 – 8,045 (84%)
Kent and Sussex 3,650 5,545 1,895 (34%) –
North East 3,853 4,956 1,103 (22%) –
North West 12,690 11,038 – 1,652 (15%)
South Central 4,096 5,386 1,290 (24%) –
South West 4,978 6,036 1,058 (18%) –
Wales 4,621 2,335 – 2,286 (98%)
West Midlands 7,913 7,663 – 250 (3%)
Yorkshire and Humberside
9,065 8,733 – 332 (4%)
Unknown 3,045 – – –
Total 83,842 79,252 11,020 (14%) 12,565 (16%)
Source: National Offender Management Service

38 Part Four Managing the prison estate
Part Four
Population
4.1 This part looks at two ways in which the National Offender Management Service (the Agency), working with other parts of the government, could reduce the size of the prison population by removing prisoners more quickly when it is safe and appropriate to do so. It builds on our previous work, which considered how to reduce the number of short-sentenced prisoners and limit the use of juvenile custody.8 Reducing population size lowers costs by itself, as less capacity is needed, and would allow the Agency to accelerate its estate strategy.
Prisoners with indeterminate sentences
4.2 Prisoners with indeterminate sentences are serious offenders whom the courts jail until they can demonstrate they no longer pose a serious risk to the public. They are either life-sentenced prisoners (except those on whole-life tariffs) or prisoners with indeterminate sentences of imprisonment for public protection, received between 2005 and 2012. They cannot be released until they complete minimum tariffs and some may never be released because they remain dangerous. There are some 13,200 indeterminate-sentenced prisoners, 47 per cent of whom have served their minimum tariff (Figure 19). It is for the Parole Board (the Board) to decide when post-tariff, indeterminate-sentenced prisoners are safe to release. The Board relies, to a great extent, on completed offender behaviour programmes to evidence risk reduction and it often keeps prisoners in custody who have not completed such programmes, though programme completion itself does not guarantee release.9 The Agency told us it would like the Board to put more emphasis on other interventions, but the Board continues to view offender behaviour programmes as very important and believes that a cultural shift across the entire justice system would be needed to change this.
8 Comptroller and Auditor General reports, Managing offenders on short custodial sentences, Session 2009-10, HC 431, National Audit Office, March 2010; and The youth justice system in England and Wales: Reducing offending by young people, Session 2010-11, HC 663, National Audit Office, December 2010.
9 Ministry of Justice, The decision-making process at parole reviews (indeterminate imprisonment for public protection sentences), Research Summary 1/12, February 2012. This states that “the most distinctive characteristics of prisoners released on parole are related to evidence of progress … Two characteristics in particular are: demonstrations of change related to offending behaviour treatment programmes and time in open prison.”

Managing the prison estate Part Four 39
4.3 When indeterminate sentences of imprisonment for public protection came in, in 2005, the number of prisoners who could only be released by the Board grew rapidly. But the number of offender behaviour programme places did not keep pace, meaning it became difficult, especially for prisoners with short minimum tariffs, to make timely progress towards release, even with other interventions. The Agency’s offender managers often deem that a prisoner needs more than one programme to address their risks. In September 2012, the European Court of Human Rights ruled that the Agency’s slowness in providing courses to three prisoners constituted arbitrary detention, an infringement of their human rights.10 By 2013, 79 per cent of indeterminate-sentenced prisoners had completed at least one programme. But, while the Board operates with delays of its own (which have reduced in recent years), the Agency is not providing enough offender behaviour programmes to allow all indeterminate-sentenced prisoners to make timely progress towards release.
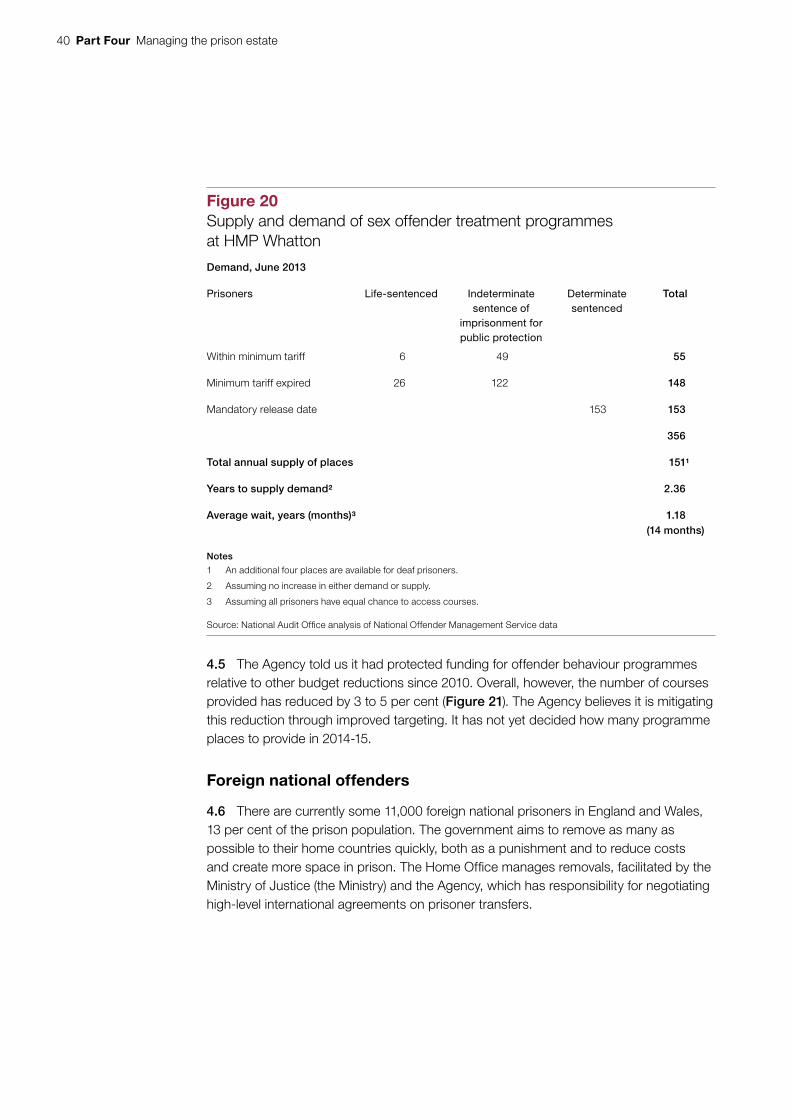
4.4 The Agency keeps no central record of waiting lists for courses, though it plans to in future, and some prisons do not have complete waiting lists. At HMP Whatton, the prison with the highest number of prisoners on indeterminate sentences of imprisonment for public protection and a centre of excellence for work with sex offenders, waiting lists are long. The Agency gives Whatton funding for 155 places on sex offender treatment programmes annually. Given the current supply, the average waiting time from June 2013 (not including prior periods of waiting) will be 14 months (Figure 20 overleaf). Waiting lists vary from course to course but the governor told us that indeterminate-sentenced prisoners sometimes wait longer than prisoners who have to be released on a set date. The cost of 14 months in custody at Whatton is £23,000 per prisoner, while the cost of providing additional programmes, though variable, is around £4,000 per completion and £5,500 for sex offender programmes. Although course completion alone does not necessarily reduce a prisoner’s risk such that the Parole Board will consider them safe to release.
10 European Court of Human Rights, Case of James, Wells and Lee v the United Kingdom, September 2012.
Figure 19Indeterminate sentence prisoners, June 2013
Number of prisoners Number that have servedtheir minimum tariff
Life-sentenced 7,566 2,647 (35%)
Indeterminate sentences of imprisonment for public protection
5,620 3,549 (63%)
Total 13,186 6,196 (47%)
Note
1 A further 204 prisoners with indeterminate sentences had an unknown status, concerning their minimum tariffs.
Source: Ministry of Justice
40 Part Four Managing the prison estate
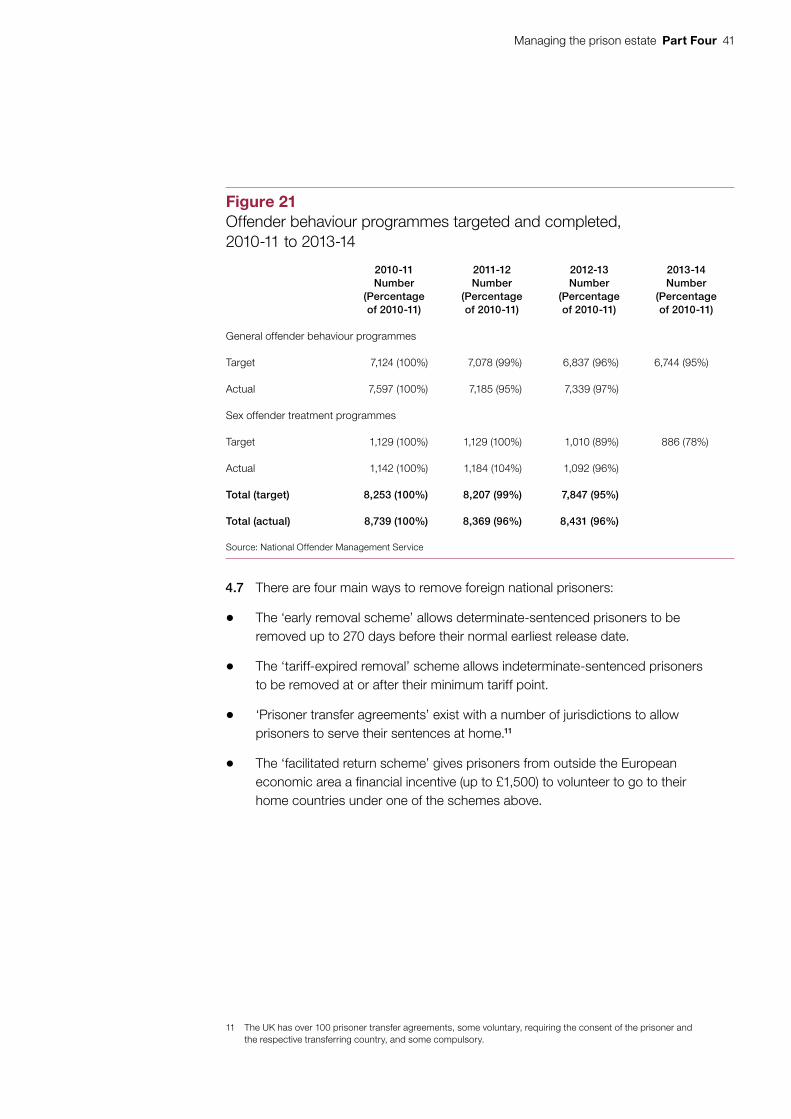
4.5 The Agency told us it had protected funding for offender behaviour programmes relative to other budget reductions since 2010. Overall, however, the number of courses provided has reduced by 3 to 5 per cent (Figure 21). The Agency believes it is mitigating this reduction through improved targeting. It has not yet decided how many programme places to provide in 2014-15.
Foreign national offenders
4.6 There are currently some 11,000 foreign national prisoners in England and Wales, 13 per cent of the prison population. The government aims to remove as many as possible to their home countries quickly, both as a punishment and to reduce costs and create more space in prison. The Home Office manages removals, facilitated by the Ministry of Justice (the Ministry) and the Agency, which has responsibility for negotiating high-level international agreements on prisoner transfers.
Figure 20Supply and demand of sex offender treatment programmes at HMP Whatton
Demand, June 2013
Prisoners Life-sentenced Indeterminatesentence of
imprisonment for public protection
Determinate sentenced
Total
Within minimum tariff 6 49 55
Minimum tariff expired 26 122 148
Mandatory release date 153 153
356
Total annual supply of places 1511
Years to supply demand2 2.36
Average wait, years (months)3 1.18(14 months)
Notes
1 An additional four places are available for deaf prisoners.
2 Assuming no increase in either demand or supply.
3 Assuming all prisoners have equal chance to access courses.
Source: National Audit Offi ce analysis of National Offender Management Service data
Managing the prison estate Part Four 41
4.7 There are four main ways to remove foreign national prisoners:
• The ‘early removal scheme’ allows determinate-sentenced prisoners to be removed up to 270 days before their normal earliest release date.
• The ‘tariff-expired removal’ scheme allows indeterminate-sentenced prisoners to be removed at or after their minimum tariff point.
• ‘Prisoner transfer agreements’ exist with a number of jurisdictions to allow prisoners to serve their sentences at home.11
• The ‘facilitated return scheme’ gives prisoners from outside the European economic area a financial incentive (up to £1,500) to volunteer to go to their home countries under one of the schemes above.
11 The UK has over 100 prisoner transfer agreements, some voluntary, requiring the consent of the prisoner and the respective transferring country, and some compulsory.
Figure 21Offender behaviour programmes targeted and completed, 2010-11 to 2013-14
2010-11Number
(Percentage of 2010-11)
2011-12Number
(Percentage of 2010-11)
2012-13 Number
(Percentage of 2010-11)
2013-14 Number
(Percentage of 2010-11)
General offender behaviour programmes
Target 7,124 (100%) 7,078 (99%) 6,837 (96%) 6,744 (95%)
Actual 7,597 (100%) 7,185 (95%) 7,339 (97%)
Sex offender treatment programmes
Target 1,129 (100%) 1,129 (100%) 1,010 (89%) 886 (78%)
Actual 1,142 (100%) 1,184 (104%) 1,092 (96%)
Total (target) 8,253 (100%) 8,207 (99%) 7,847 (95%)
Total (actual) 8,739 (100%) 8,369 (96%) 8,431 (96%)
Source: National Offender Management Service
42 Part Four Managing the prison estate
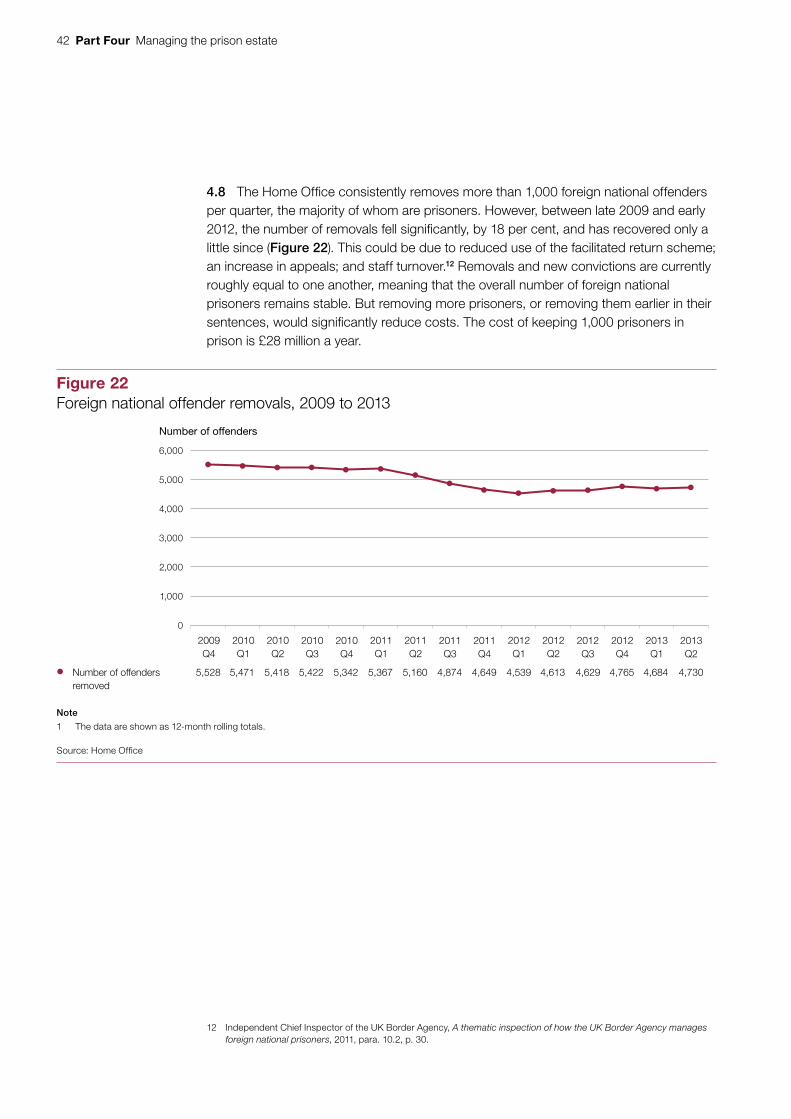
4.8 The Home Office consistently removes more than 1,000 foreign national offenders per quarter, the majority of whom are prisoners. However, between late 2009 and early 2012, the number of removals fell significantly, by 18 per cent, and has recovered only a little since (Figure 22). This could be due to reduced use of the facilitated return scheme; an increase in appeals; and staff turnover.12 Removals and new convictions are currently roughly equal to one another, meaning that the overall number of foreign national prisoners remains stable. But removing more prisoners, or removing them earlier in their sentences, would significantly reduce costs. The cost of keeping 1,000 prisoners in prison is £28 million a year.
12 Independent Chief Inspector of the UK Border Agency, A thematic inspection of how the UK Border Agency manages foreign national prisoners, 2011, para. 10.2, p. 30.
Figure 22Foreign national offender removals, 2009 to 2013
Number of offenders
Number of offenders 5,528 5,471 5,418 5,422 5,342 5,367 5,160 4,874 4,649 4,539 4,613 4,629 4,765 4,684 4,730 removed
Note
1 The data are shown as 12-month rolling totals.
Source: Home Office
6,000
5,000
4,000
3,000
2,000
1,000
0
2009Q4
2010Q1
2010Q2
2010Q3
2010Q4
2011Q1
2011Q2
2011Q3
2011Q4
2012Q1
2012Q2
2012Q3
2012Q4
2013Q1
2013Q2

Managing the prison estate Part Four 43
Increasing removals
4.9 The government is currently exploring options to remove more prisoners. Our previous audits of immigration performance suggest that process improvements could be a source of increased performance and when we looked at current practice on foreign national offenders we found a number of areas that could be improved.
4.10 The Home Office rates the cases of foreign national prisoners serving longer than 12 months for ‘removability’ (Figure 23), but does not prioritise casework on this basis; Home Office staff prioritise cases according to release dates, irrespective of their rating, and rarely abandon a case even if it is unlikely to result in removal. While this sends a strong message to potential foreign offenders, it ties up finite resources on less productive work, meaning some easy-to-remove offenders spend longer in custody here. Most of the large number of unrated cases have a long time left to serve until their earliest release date.
Figure 23‘Removability’ ratings for foreign national prisoner cases, May 2013
Total Percentageof all cases
(%)
Green (removable within three months) 93 2
Amber (removable within six months) 266 5
Red (removable within one year) 474 10
Black (no clear date for removal; difficult to remove) 1,883 39
Not rated 2,167 44
Total 4,883 100
Source: National Audit Offi ce analysis of Home Offi ce data
44 Part Four Managing the prison estate
4.11 We requested 20 case files where removal had not taken place quickly, to understand the complexities involved and potential solutions.13 By the time we reviewed them, three cases had led to successful deportation and four had been closed with a decision not to deport. Together the cases highlighted a number of issues.
4.12 First, we found delays beyond the Home Office’s control, including:
• offenders hiding their true identities;
• complex human rights issues;
• European economic area nationality and residency issues; and
• difficulties securing travel documentation from foreign countries.
4.13 However, we also identified delays that the Home Office could have avoided or reduced:
• Some cases were left for many months, with no action taken to chase information or act on it when received.
• Most files were bulky with no effective indexing system to guide caseworkers, of whom there might be many on long cases. This made it unnecessarily time-consuming for new staff.
• Some records were poor, making progress difficult. Problems included files incorrectly linked and files with unacknowledged duplicates.
• In one case, the Home Office wrongly attempted to deport an individual who had not been sentenced for a criminal offence and who had earlier been granted asylum.
4.14 From the Agency’s point of view, its main responsibility is to tell the Home Office quickly that a foreign national offender is in custody. In all but one case we looked at, this had happened. However, Home Office sampling shows that a fifth were not referred within 30 days.
4.15 Since 2011, the Agency has also maintained some foreign-national-only prisons, to make it easier for the Home Office to interact with offenders. This is potentially a useful development. However, when we visited one such prison, HMP Huntercombe, we found that the Home Office had not been able to recruit sufficient staff to work there. In any event, on-site Home Office staff were not actually responsible for the cases of prisoners there. They only acted as conduits for information to and from caseworkers elsewhere and did not have access to Home Office IT. Most prisoners in a focus group we ran told us they had had little communication with the Home Office since arriving at the prison. The Home Office has now provided access to its main computer case management systems for staff at HMP Huntercombe and this will be available at HMP Maidstone by the end of 2013.
13 The cases were not a representative sample. Results cannot be extrapolated across the population.

Managing the prison estate Appendix One 45
Appendix One
Our audit approach
1 We examined the prison estate strategy that the National Offender Management Service (the Agency) and the Ministry of Justice (the Ministry) developed, and whether it is likely to improve the value for money of holding all prisoners remanded and sentenced by the courts. We reviewed how far:
• the current prison estate helps the Agency to provide value for money;
• the Agency’s estate strategy can improve value for money; and
• the Ministry and Agency had implemented the Agency’s estate strategy, adhering to the principles of value for money.
2 We applied an analytical framework with evaluative criteria, which consider the optimal way to update the custodial estate to meet the Agency’s current needs and policy objectives. By ‘optimal’ we mean the most desirable possible, within existing constrictions and constraints. In this case, constraints include the estate itself; the capital cost of replacing the estate; and prisoners’ requirements.
3 Our audit approach is summarised in Figure 24 overleaf. Our evidence base is described in Appendix Two.
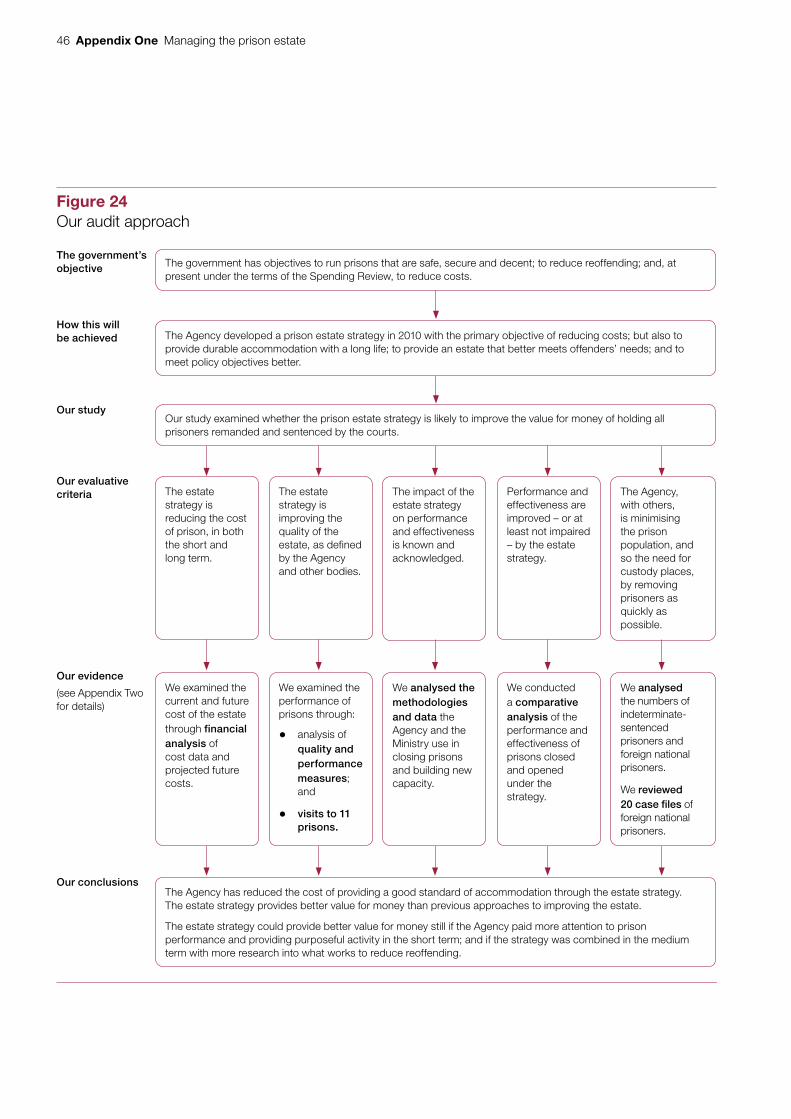
46 Appendix One Managing the prison estate
Figure 24Our audit approach
The government’s objective
How this will be achieved
Our study
Our evaluative criteria
Our evidence
(see Appendix Two for details)
Our conclusions
The estate strategy is reducing the cost of prison, in both the short and long term.
The impact of the estate strategy on performance and effectiveness is known and acknowledged.
The estate strategy is improving the quality of the estate, as defined by the Agency and other bodies.
The government has objectives to run prisons that are safe, secure and decent; to reduce reoffending; and, at present under the terms of the Spending Review, to reduce costs.
The Agency developed a prison estate strategy in 2010 with the primary objective of reducing costs; but also to provide durable accommodation with a long life; to provide an estate that better meets offenders’ needs; and to meet policy objectives better.
Our study examined whether the prison estate strategy is likely to improve the value for money of holding all prisoners remanded and sentenced by the courts.
The Agency has reduced the cost of providing a good standard of accommodation through the estate strategy. The estate strategy provides better value for money than previous approaches to improving the estate.
The estate strategy could provide better value for money still if the Agency paid more attention to prison performance and providing purposeful activity in the short term; and if the strategy was combined in the medium term with more research into what works to reduce reoffending.
The Agency, with others, is minimising the prison population, and so the need for custody places, by removing prisoners as quickly as possible.
Performance and effectiveness are improved – or at least not impaired – by the estate strategy.
We examined the current and future cost of the estate through financial analysis of cost data and projected future costs.
We analysed the methodologies and data the Agency and the Ministry use in closing prisons and building new capacity.
We examined the performance of prisons through:
• analysis of quality and performance measures; and
• visits to 11 prisons.
We analysed the numbers of indeterminate- sentenced prisoners and foreign national prisoners.
We reviewed 20 case files of foreign national prisoners.
We conducted a comparative analysis of the performance and effectiveness of prisons closed and opened under the strategy.

Managing the prison estate Appendix Two 47
Appendix Two
Our evidence base
1 We reached our conclusions on whether the National Offender Management Service’s (the Agency’s) prison estate strategy represents value for money after analysing evidence collected between March and October 2013. We applied an analytical framework with evaluative criteria, which consider what an optimal prison estate strategy would include and could achieve. Our audit approach is outlined in Appendix One.
2 We assessed whether the Agency’s estate strategy was reducing the cost of prison, both in the short and long term:
• We reviewed the Agency’s estate strategy and supporting documentation to ascertain how the strategy plans to save money in the short and long term.
• We visited 11 prisons and conducted semi-structured interviews with governors and directors to identify how the strategy was saving money at establishments. We visited three prisons that were closing, two new prisons and a prison with a new houseblock to assess the impact of the estate strategy on prisons, staff and prisoners. Figure 25 overleaf shows the prisons visited.
• We analysed financial data on:
• costs of running prisons;
• forecasts for future costs;
• annual savings from closing prisons;
• cost of new prisons; and
• one-off costs to close prisons and build new capacity.
• We conducted semi-structured interviews with key Agency and Ministry of Justice (Ministry) staff members to ascertain the detailed goals and timetable for reducing costs and to understand how the Agency calculated its savings.

48 Appendix Two Managing the prison estate
3 We considered whether the estate strategy was improving quality, as defined by the Agency and other bodies (principally HM Inspectorate of Prisons).
4 We considered how far the Ministry and the Agency knew and acknowledged the impact of the estate strategy on performance and effectiveness:
• We reviewed the Agency’s estate strategy and supporting documentation. In particular, we reviewed the Agency’s methodology for selecting prisons to close, through document review and semi-structured interviews. We identified whether the methodology reflected performance and quality, to understand whether attempts were made to retain highly performing prisons.
• We reviewed HM Inspectorate of Prisons’ reports and analysed the results of prisoner surveys. We focused on prisons closed under the strategy and new prisons, to compare their quality and performance.
Figure 25Prisons visited
Prison Prison type Run by Notes
HMP Bullwood Hall Male category C NOMS1 Closed in March 2013. Former foreign national offender hub.
HMP Camp Hill Male category C NOMS Closed in March 2013
HMP Shepton Mallet Male category C NOMS Closed in March 2013
HMP Altcourse Male local G4S
HMP Huntercombe Male category C NOMS Foreign national offender hub
HMP Moorland Male category C NOMS New houseblock added in 2011
HMP Oakwood Male category C G4S New prison, completed 2012
HMP Peterborough Male and female local Sodexo Justice Services
HMP Thameside Male local Serco New prison, completed 2012
HMP Whatton Male category C NOMS Special regime for sex offenders
HMP Whitemoor Male dispersal NOMS High security
Note
1 National Offender Management Service
Source: National Audit Offi ce

Managing the prison estate Appendix Two 49
• On our prison visits, we conducted semi-structured interviews with prison governors and directors. We held 9 focus groups with between 8 and 12 prisoners, to understand their experience of custody.
• We analysed the results of the Agency’s own performance monitoring and its prisoner surveys to compare the performance of all prisons, including new and closed prisons.
• We analysed the numbers of prisoners in overcrowded conditions and shared cells.
• We reviewed the Ministry’s forecasting of prisoner numbers through semi-structured interviews with senior staff and analysis of previous forecasts.14
5 We assessed whether the estate strategy was improving performance and effectiveness:
• We reviewed HM Inspectorate of Prison’s reports on prisons to identify how far prisoners in different places were held safely and decently.
• We analysed the results of recent Agency prisoner surveys, ‘measuring the quality of prison life’, to identify whether prisoner perceptions of life in prison varied by prison size. We ran the Kruskal-Wallis and Mann-Whitney U tests to examine differences between small, medium and large prisons. We also conducted a multiple regression analysis with age, size and overcrowding as predictors and different aspects of quality of life in prison as outcome variables.
• We analysed data on prison capacity and prison population, to identify the level of overcrowding and the scope for the estate to hold all prisoners.
• We conducted semi-structured interviews with key Agency and Ministry staff.
• On our 11 prison visits, we saw different types of conditions in which prisoners are held and talked to them and to staff.
• We looked at data and other evidence on the relationship between the size of prisons and their effectiveness, and on location and effectiveness.
14 Our review of the forecasting of prison population is included as a case study in our report on forecasting across government.

50 Appendix Two Managing the prison estate
6 We examined how far the Agency, working with other parts of the government, was minimising the prison population, and so custody places, by removing prisoners safely and quickly.
• We analysed Agency and Home Office data on foreign national prisoners to identify the number of foreign national prisoners and to assess how quickly they were being removed.
• Similarly, we analysed the Agency’s data on prisoners serving indeterminate prison sentences to assess how many had completed their minimum tariff but were still being held in prison. We specifically analysed data from HMP Whatton, which has a high proportion of prisoners on indeterminate sentences. We examined the number of programmes it runs to address offender behaviour and prisoners waiting for programmes to identify the length of waiting lists.
• We selected 20 foreign national offender cases that appeared, from the data, to have been subject to delays. We reviewed the case files to identify the reasons for delays and scope for improvements.
• We conducted semi-structured interviews with key Agency and Home Office staff to determine the processes for identifying foreign national prisoners and to understand the barriers to removing them quickly.

This report has been printed on Evolution Digital Satin and contains material sourced from responsibly managed and sustainable forests certified in accordance with the FSC (Forest Stewardship Council).
The wood pulp is totally recyclable and acid-free. Our printers also have full ISO 14001 environmental accreditation, which ensures that they have effective procedures in place to manage waste and practices that may affect the environment.
Design and Production by NAO Communications DP Ref: 10304-001

Published by TSO (The Stationery Office) and available from:
Online www.tsoshop.co.uk
Mail, telephone, fax and email TSO PO Box 29, Norwich NR3 1GN Telephone orders/general enquiries: 0870 600 5522 Order through the Parliamentary Hotline Lo-Call 0845 7 023474 Fax orders: 0870 600 5533 Email: [email protected] Textphone: 0870 240 3701
The Houses of Parliament Shop 12 Bridge Street, Parliament Square, London SW1A 2JX Telephone orders/general enquiries: 020 7219 3890 Fax orders: 020 7219 3866 Email: [email protected] Internet: http://www.shop.parliament.uk
TSO@Blackwell and other accredited agents
£16.00
9 780102 987249
ISBN 978-0-10-298724-9