Embed Size (px)
Citation preview
REPORT
Analysis of Alternative
Winter Reliability Solutions
for New England Energy Markets
Prepared for:
GDF SUEZ Energy North America,
Prepared by:
Energyzt Advisors, LLC
August 2015
Analysis of Alternative Winter Reliability Solutions
for New England Energy Markets
DISCLAIMER
Energyzt is a global collaboration of energy experts who create value for our
clients through actionable insights. Combining deep industry expertise with state
of the art analytical capabilities, we help companies make informed business
decisions that create competitive advantage. Any views expressed in this report
do not necessarily reflect the views of other experts associated with Energyzt.
Forward looking projections are based on the assumptions described in the
report and conclusions are based on those assumptions. Information and
assumptions contained in this report are based in whole or in part on
information obtained from various sources and Energyzt makes no assurances as
to the accuracy of any such information and defer to the representations made by
the source.
NO WARRANTY, WHETHER EXPRESS OR IMPLIED, INCLUDING THE
IMPLIED WARRANTIES OF FITNESS FOR A GIVEN PURPOSE, ARE
GIVEN OR MADE BY ENERGYZT IN CONNECTION WITH THIS REPORT.
IN NO EVENT SHALL ENERGYZT BE LIABLE TO ANY PARTY AS A
RESULT OF THE USE OF THIS REPORT FOR ANY DIRECT, INDIRECT,
SPECIAL, INCIDENTAL, OR CONSEQUENTIAL DAMAGES.
For further information, please contact:
Tanya Bodell, Executive Director: [email protected]
Zander Arkin, Senior Managing Director: [email protected]
COPYRIGHT © 2015 Energyzt Advisors, LLC All rights reserved.
Analysis of Alternative Winter Reliability Solutions
for New England Energy Markets
Page i
TABLE OF CONTENTS
1 INTRODUCTION ............................................................................................................................. 1
1.1 Purpose of report .................................................................................................................. 1
1.2 Summary of conclusions ..................................................................................................... 2
2 WINTER RELIABILITY – IS THERE REALLY AN ISSUE? ................................................. 4
2.1 Energy market background ............................................................................................... 4
2.1.1 Natural gas demand peaks in the winter ............................................................. 5
2.1.2 Demand for electricity peaks in the summer ..................................................... 7
2.2 Winter experiences the past three years ..................................................................... 9
2.2.1 Winter 2012/13 caught the market unprepared ............................................. 9
2.2.2 Winter 2013/14 had a number of transient events impacting supply . 12
2.2.3 Winter 2014/15 experienced significant market response ...................... 16
3 ALTERNATIVE SOLUTIONS TO WINTER RELIABILITY .............................................. 18
3.1 Natural gas delivery infrastructure is sufficient .................................................... 19
3.2 LNG imports can be contracted to meet peak needs ............................................ 27
3.3 Dual-fuel capability already exists ............................................................................... 33
3.4 Canadian import alternatives bear consideration ................................................. 36
4 ANALYSIS AND RESULTS ........................................................................................................ 36
4.1 Cost analysis ......................................................................................................................... 37
4.2 Market analysis ................................................................................................................... 41
4.2.1 Base Case: Shows declining demand for natural gas .................................. 41
4.2.2 Dual-fuel capability provides a flexible, peaking solution ......................... 43
4.2.3 A new Canadian transmission line proposed as a baseload solution .... 47
5 IMPACT OF GOVERNMENT INTERVENTION .................................................................. 48
6 CONCLUSIONS ............................................................................................................................. 51
APPENDIX A: About Energyzt APPENDIX B: GE MAPS Data Sources and Input Assumptions
Analysis of Alternative Winter Reliability Solutions
for New England Energy Markets
Page ii
TABLE OF FIGURES
Figure 1: Natural gas demand in New England by end-use ............................................. 5
Figure 2: Monthly peak and average gas demand in New England ............................. 6
Figure 3: Average daily natural gas prices in New England ............................................ 7
Figure 4: LNG pipeline supply to New England ................................................................. 10
Figure 5: Difference between basis differentials for daily demand levels ............... 17
Figure 6: Demand for natural gas in New England vs. pipeline capacity ............... 19
Figure 7: Pipeline capacity load duration curve .................................................................. 20
Figure 8: Natural gas basis differentials in New England............................................... 21
Figure 9: Illustration of winter reliability supply curve and 2013/14 winter .......... 22
Figure 10: Illustration of supply curve with expansions and new pipelines .......... 25
Figure 11: Map of proposed LNG export facilities in the Maritimes ......................... 26
Figure 12: Map of existing LNG import facilities in New England ............................ 28
Figure 13: Historic LNG prices at Everett vs. existing pipeline .................................... 30
Figure 14: Monthly LNG sendout in New England ........................................................... 32
Figure 15: Dual-fuel capability in New England ................................................................. 33
Figure 16: Nameplate capacity of natural gas-fired dual-fuel units ........................... 34
Figure 17: Cost of dual-fuel capability in new units .......................................................... 35
Figure 18: Duration curve of basis differentials by year .................................................. 38
Figure 19: Comparative cost analysis ....................................................................................... 39
Figure 20: Base Case -- Natural gas consumption by electric generation ................ 43
Figure 21: Dual-fuel generation switch from gas to oil (MW) ....................................... 45
Figure 22: Reduction in natural gas consumption due to dual-fuel units ............... 46
Figure 23: Impact on annual natural gas consumption from Canadian imports . 48
Analysis of Alternative Winter Reliability Solutions
for New England Energy Markets
Page ES-1
EXECUTIVE SUMMARY
In New England, significant discussion and analysis has occurred in recent years
regarding the reliability of electricity and natural gas markets in the winter. The
winters of 2012/13 and 2013/14 experienced extreme weather and a series of
transient infrastructure and commercial conditions that caused natural gas prices
to soar, establishing new levels of natural gas basis differentials, along with
corresponding increases in electricity prices.
In competitive energy markets, such as those that exist in New England, high
prices generally indicate a shortage of supply for given demand levels. In
keeping with this assumption, certain market participants have advocated for
extraordinary government intervention to mandate regulated electric ratepayer
funding of a new natural gas pipeline, implicitly claiming that high prices are
signaling a shortage of pipeline delivery capability and a failure of the market to
respond appropriately. Some have gone as far as to claim that New England gas
and electric reliability are at risk. These claims are unsupported.
The proposed electricity ratepayer funding of additional gas pipeline capacity is
an expensive and dangerous proposition in terms of ratepayer cost and healthy
market function in New England. Energyzt’s review and analysis of recent
events and future gas and electric market conditions in New England, embodied
in this report, support the following conclusions:
1. Existing infrastructure is more than adequate. Existing pipeline, pipeline
expansions already underway and other natural gas supply infrastructure
is more than adequate to meet winter peaking needs. In fact, the
electricity system has maintained required reserve margins during some
of the most extreme conditions over the past three winters despite
numerous force majeure challenges. The issue is not lack of infrastructure,
but insufficient commercial contracts to access existing energy
EXECUTIVE SUMMARY Analysis of Alternative Winter Reliability Solutions for New England Energy Markets
Page ES-2
infrastructure.1 Winter 2014/15 illustrates the positive impact of utilizing
existing infrastructure.
2. Winter prices reflected a transient peaking problem. High prices from
the winters of 2012/13 and 2013/14 reflect a peaking problem and lack of
commercial arrangements with existing infrastructure, not a baseload
issue that justifies new pipeline capacity. High basis differentials for
natural gas in New England during the past three winters occurred
during only a few of the highest peak demand days of the year (when
incremental delivery infrastructure was available but had not been
arranged for in advance to ensure commercial availability at a price
certain).
3. The market is responding with dual-fuel capability and LNG contracts.
This past winter 2014/15 has demonstrated the powerful ability of
competitive natural gas and electricity markets to respond to price signals.
Dual-fuel units providing up to 6,000 MW (700 to 900 million cubic feet
per day) of gas demand reduction on an as-needed basis already have
been recommissioned, and gas distribution companies have entered into
new long-term contracts for LNG imports. As a result, realized basis
differentials this past winter were roughly half of what they were in
Winter 2013/14 and are expected to reduce even further as existing
infrastructure is contracted and otherwise made available. ISO-NE’s Pay-
for-Performance program also could motivate innovative, market-based
solutions to winter reliability, including potential conversion of additional
gas-fired units to dual-fuel capability.
4. New Pipeline Capacity already is being built. The Atlantic Bridge
Project, Spectra’s Algonquin Incremental Market (AIM) Project, and other
expansion projects are expected to increase pipeline delivery capacity by
around 600 million cubic feet per day by winter 2017/18. This new
1 In addition to this report, Energyzt performed an analysis focused explicitly on the adequacy of
existing infrastructure on behalf of the New England Power Generator’s Association, “Report:
Winter Reliability Analysis of New England Energy Markets,” October 2014,
http://nepga.org/14/10/energyzt-report-on-winter-reliability/
EXECUTIVE SUMMARY Analysis of Alternative Winter Reliability Solutions for New England Energy Markets
Page ES-3
pipeline capacity needs to be included in any assessment of costs and
benefits of an additional pipeline.
5. Public policy does not support new pipeline infrastructure. Federal and
state policies are promoting non-gas-fired generation such as renewables,
low load growth from energy efficiency and demand response, and
market-based performance incentives in New England competitive
capacity markets to ensure electric generation capacity is available when it
is needed most. These programs are projected to flatten if not decrease
natural gas consumption from the electric generation sector. Emerging
technologies such as distributed generation and battery storage are likely
to further moderate peak demand. Government intervention to build a
new gas pipeline to supply future natural gas demand from the power
sector is inconsistent with these programs.
6. A new pipeline subsidized by electric ratepayers violates the
beneficiary pays principle. Given existing energy infrastructure,
expansions already underway, and other market responses to winter peak
prices, a new pipeline subsidized by electricity ratepayers will overserve
the New England market, resulting in a glut of natural gas throughout the
year that is likely to flow to markets outside of New England into Canada
and overseas. This would leave New England ratepayers paying for the
cost of building a new pipeline for twelve months of the year, and
reselling back unused capacity at a lower rate for at least nine months to
natural gas shippers selling into other markets.
The lowest cost and lowest risk way to meet power generation demand and
reduce natural gas prices in the New England market in the near to medium
term is to contract with existing infrastructure, including LNG imports and dual-
fuel capability, that can provide peaking response at little to no capital cost and
without ratepayer commitment. With existing infrastructure and projected
needs over the next ten years, there is plenty of time to monitor how existing
policy initiatives, infrastructure availability, market response and therefore new
pipeline infrastructure needs evolve over the long-term. The solution is
contracting, not construction.
Analysis of Alternative Winter Reliability Solutions
for New England Energy Markets
1 INTRODUCTION
Natural gas delivery and electric utility reliability in New England has come
under scrutiny given the past few unusually cold winters. As an increasing
amount of the region’s electric generating capacity relies on natural gas, there is
an expressed concern among certain constituents that supply of natural gas is
inadequate to meet existing and future power generation demand needs.
As a result of this concern, multiple proposals have been discussed, including an
approach by the region’s governors, to increase natural gas delivery capability
into New England with a new natural gas pipeline. Rather than rely on private
parties risking private capital in response to market forces, however, government
proposals recommend using region-wide tariffs assessed on regulated electricity
ratepayers to support large pipeline infrastructure investments or otherwise
committing ratepayers regionally to fund those investments.2 This would be a
mistake.
Instead of mandating a new pipeline funded by electricity ratepayers or
taxpayers, contracting to utilize existing infrastructure would be the more cost-
effective and lower risk approach in the near term as announced projects to
increase pipeline capacity funded through more traditional market-based
funding mechanisms proceed.3
1.1 Purpose of report
Energyzt has been retained to review energy market conditions in New England
and to compare the costs, benefits and market impacts of alternative proposals to
2 New England States Committee on Electricity, “Addressing New England’s Energy
Challenges,” p. 23 (www.nescoe.com/uploads/ RegionalInfrastructure_NECouncil_30Jun2014.pdf
accessed 8/14/14).
3 Increasing use of existing infrastructure before committing ratepayers to significant capital costs
is in keeping with prudent planning under vertical integration of investor owned utilities. Under
NEESPLAN 4, the New England Electric System resource planning strategy emphasized the
importance of the option value to ratepayers of avoiding long term fixed cost commitments.
Analysis of Alternative Winter Reliability Solutions
for New England Energy Markets
Page 2
address winter reliability. Alternatives to building a new natural gas pipeline
include:
Leveraging existing pipeline expansions currently underway in the
region;
Contracting with existing liquefied natural gas (LNG) infrastructure more
effectively to meet short-term winter needs; and
Utilizing existing gas-fired combined cycle units (CCGT) with dual-fuel
(gas and oil) capability.
All of these alternatives are more cost-effective solutions than building a new
natural gas pipeline funded by electricity ratepayers.
Also under consideration for reasons other than winter reliability, is
development of a high-voltage transmission line from Canada to import
hydroelectric energy into New England. This option could serve to diversify the
fuel mix, but would not be an effective solution to winter reliability on a stand-
alone basis as it would have a year-round impact and tend to displace oil-fired
units operating on the margin. As a result, dual-fuel capability and LNG are
cost-effective, flexible peaking solutions to a winter peaking problem.
1.2 Summary of conclusions
The conclusions supported by the analyses embodied in this report are
summarized below:
1) Energy infrastructure is adequate when more fully utilized: Existing
energy infrastructure in New England is more than adequate to meet
winter peaking needs for the near to medium term and is the most cost-
effective and economically efficient solution compared to building a new
natural gas pipeline. High winter natural gas prices the past few years
reflect a peaking problem caused by transient events combined with lack
Analysis of Alternative Winter Reliability Solutions
for New England Energy Markets
Page 3
of utilization of existing dual-fuel and natural gas infrastructure, not a
lack of baseload pipeline delivery infrastructure.
2) Electricity markets are not causing the shortfall: Market responses to
high prices in recent winters already have resulted in a significant
reduction of electricity and natural gas prices. Reliability reserve margins
have been met and maintained during the most extreme conditions in the
power sector, indicating adequate power sector infrastructure. A number
of programs already underway have made better use of existing power
generation resources and natural gas supply, moderating power prices
this past winter. Furthermore, public policy initiatives already in place
are likely to result in negligible increase in natural gas-fired generation
demand over the next decade. Both DOE projections and our own
analysis indicate that, in the absence of a major policy shift, the demand
for natural gas from the electric power sector is not driving the need for a
new natural gas pipeline in New England.4
3) Electricity ratepayers will not benefit: So long as commercial contracts
are in place to access existing gas and power infrastructure, in addition to
incremental capacity expansion of existing pipelines already underway,5
New England electricity ratepayers will achieve winter reliability at a
normal and efficient price level. Forcing electricity ratepayers to fund a
new pipeline will result in a glut of pipeline capacity in New England,
likely leading to higher total costs to ratepayers and supporting the export
of U.S. gas supplies from the Marcellus to foreign markets in Canada and
overseas year-round.
4 Public policy initiatives that artificially decrease variable energy prices (e.g., excess gas pipeline
delivery capacity financed by long-term cross-industry commitments) could impact the resource
mix. Increasing pipeline supply outside of market economics could financially strain non-gas-
fired generation resources (e.g., nuclear), potentially accelerating their retirement. Subsidizing
gas prices below competitive market levels also could increase the relative competitiveness of
gas-fired generation, ironically increasing New England’s reliance on natural gas.
5 Incremental capacity expansions include the Atlantic Bridge Project, Spectra’s Algonquin
Incremental Market (AIM) Project, and other expansions. In addition, Northeast Energy Direct
(NED) has announced that it is proceeding with building a new pipeline, with nearly half of the
proposed capacity subscribed by local distribution companies.
Analysis of Alternative Winter Reliability Solutions
for New England Energy Markets
Page 4
The solution is to contract with existing energy infrastructure to provide winter
peak solutions while market incentives and market-based programs already in
place secure and diversify New England’s energy supply.
2 WINTER RELIABILITY – IS THERE REALLY AN ISSUE?
Before analyzing alternative solutions to a problem, it is prudent to understand
the nature of the problem. This section describes the experience of the past three
winters to identify: 1) the underlying cause of the perceived natural gas shortage;
and 2) what high prices truly are signaling. Our conclusion is that high winter
prices are indicative of a failure to more fully utilize existing energy
infrastructure, and not an indicator of insufficient pipeline capacity. Existing
energy infrastructure can be utilized more cost-effectively, especially given
current world market prices for LNG and oil. Therefore, the appropriate remedy
is to improve utilization of existing infrastructure, not commit electricity
ratepayers to new capital investment.
2.1 Energy market background
New England generally enjoys a synergistic relationship between natural gas
and electricity markets. Demand for natural gas peaks in the winter months as
cold weather increases heating requirements while electric load peaks in the
summer for cooling needs. The result is an ability to capitalize on otherwise
underutilized assets when needed for each energy market to meet its peak
demand needs.
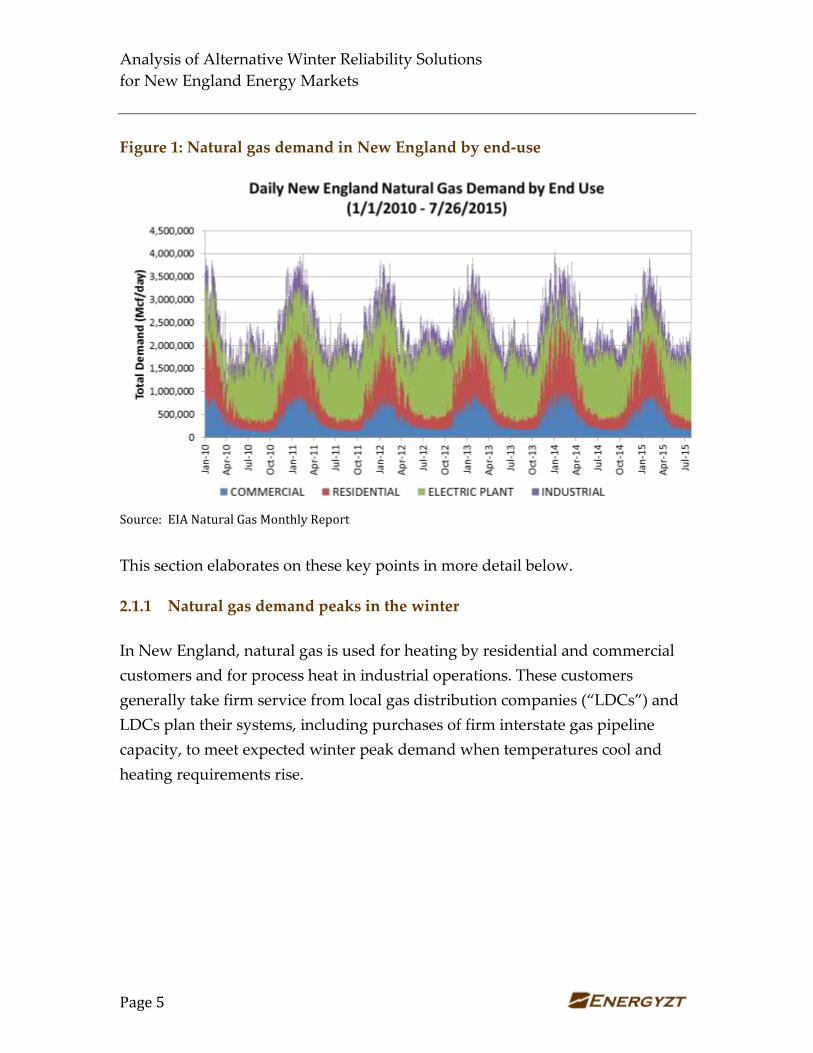
Figure 1 plots natural gas demand by end use over the past five years,
illustrating this relationship and three key points. First, although Winter 2013/14
shows higher peak demand spikes compared to prior winters, there is no
discernable trend regarding growth in total demand for natural gas during the
winter season. Second, demand spikes during Winter 2013/14 were driven by
increases in residential requirements during cold snaps. Third, the power sector
was able to provide swing demand in response to higher prices when required.
Analysis of Alternative Winter Reliability Solutions
for New England Energy Markets
Page 5
Figure 1: Natural gas demand in New England by end-use
Source: EIA Natural Gas Monthly Report
This section elaborates on these key points in more detail below.
2.1.1 Natural gas demand peaks in the winter
In New England, natural gas is used for heating by residential and commercial
customers and for process heat in industrial operations. These customers
generally take firm service from local gas distribution companies (“LDCs”) and
LDCs plan their systems, including purchases of firm interstate gas pipeline
capacity, to meet expected winter peak demand when temperatures cool and
heating requirements rise.
Analysis of Alternative Winter Reliability Solutions
for New England Energy Markets
Page 6
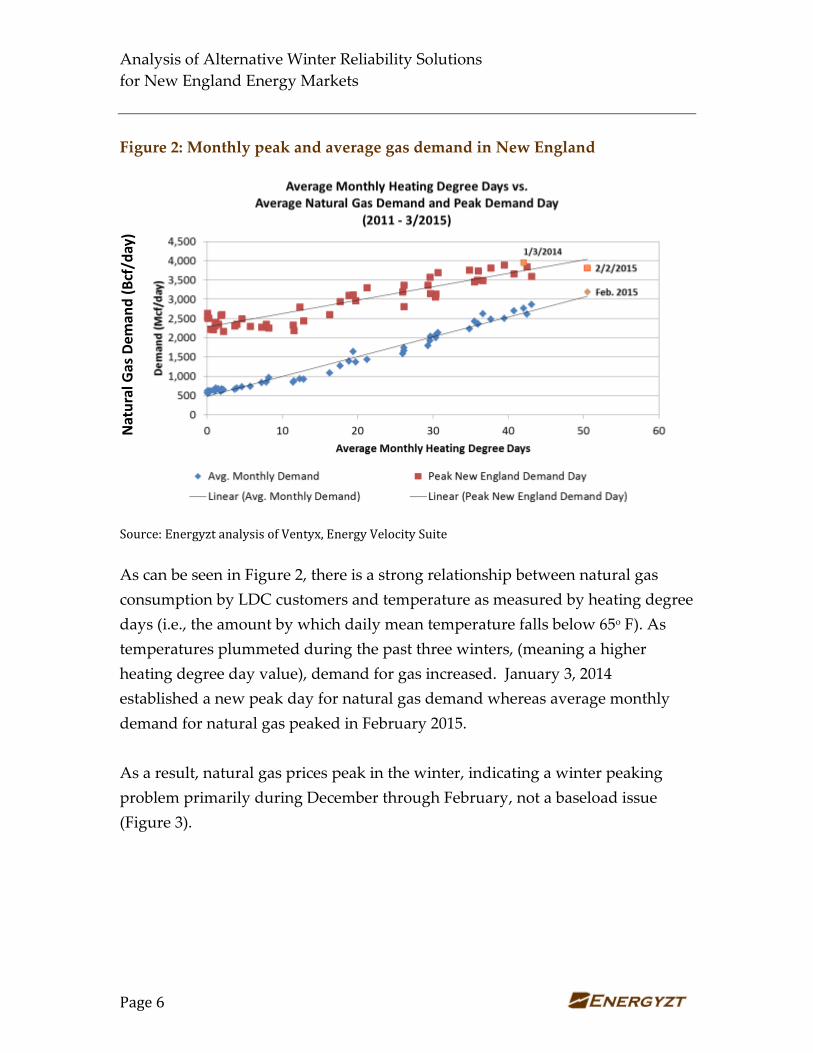
Figure 2: Monthly peak and average gas demand in New England
Source: Energyzt analysis of Ventyx, Energy Velocity Suite
As can be seen in Figure 2, there is a strong relationship between natural gas
consumption by LDC customers and temperature as measured by heating degree
days (i.e., the amount by which daily mean temperature falls below 65o F). As
temperatures plummeted during the past three winters, (meaning a higher
heating degree day value), demand for gas increased. January 3, 2014
established a new peak day for natural gas demand whereas average monthly
demand for natural gas peaked in February 2015.
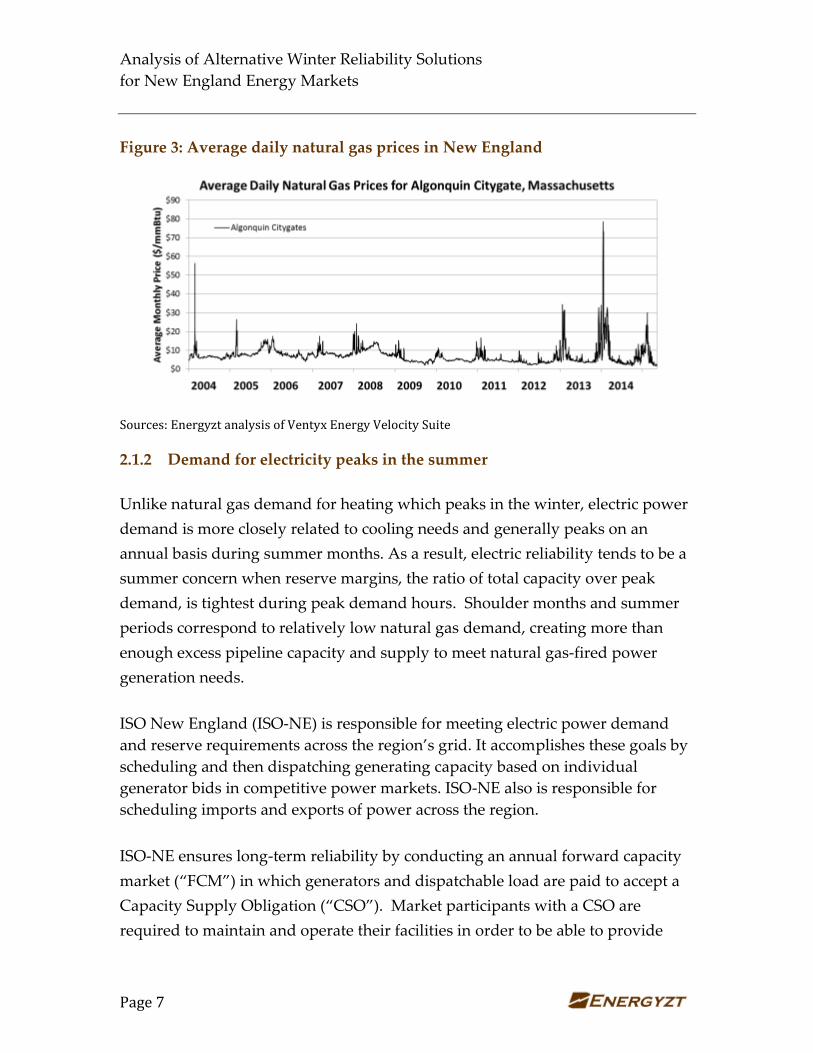
As a result, natural gas prices peak in the winter, indicating a winter peaking
problem primarily during December through February, not a baseload issue
(Figure 3).
Nat
ura
l Gas
Dem
and
(B
cf/d
ay)
Analysis of Alternative Winter Reliability Solutions
for New England Energy Markets
Page 7
Figure 3: Average daily natural gas prices in New England
Sources: Energyzt analysis of Ventyx Energy Velocity Suite
2.1.2 Demand for electricity peaks in the summer
Unlike natural gas demand for heating which peaks in the winter, electric power
demand is more closely related to cooling needs and generally peaks on an
annual basis during summer months. As a result, electric reliability tends to be a
summer concern when reserve margins, the ratio of total capacity over peak
demand, is tightest during peak demand hours. Shoulder months and summer
periods correspond to relatively low natural gas demand, creating more than
enough excess pipeline capacity and supply to meet natural gas-fired power
generation needs.
ISO New England (ISO-NE) is responsible for meeting electric power demand
and reserve requirements across the region’s grid. It accomplishes these goals by
scheduling and then dispatching generating capacity based on individual
generator bids in competitive power markets. ISO-NE also is responsible for
scheduling imports and exports of power across the region.
ISO-NE ensures long-term reliability by conducting an annual forward capacity
market (“FCM”) in which generators and dispatchable load are paid to accept a
Capacity Supply Obligation (“CSO”). Market participants with a CSO are
required to maintain and operate their facilities in order to be able to provide
Analysis of Alternative Winter Reliability Solutions
for New England Energy Markets
Page 8
power (or reduce demand) when called upon by ISO-NE. There is a system of
penalties if parties are unable to meet their CSO. In addition to penalties, ISO-NE
is implementing positive incentives in the form of a “Pay-for-Performance”
program as part of the FCM starting in June 2018. The FCM therefore will
provide a market-based mechanism, in addition to market-based energy prices,
to ensure that generation capacity and load response are available when most
needed (e.g., during extreme weather conditions).
The seasonal differential between the natural gas demand peak and the
electricity peak tends to mitigate supply risk as winter peak generally represents
a lower level of demand for electric power and therefore lower gas-fired
generation requirements. Consequently, most natural gas fired generators do not
purchase long-term firm capacity on pipelines. Instead, they rely on firm
capacity that is available on the secondary market or non-firm capacity which is
generally abundant in the summer when electric demand peaks to its highest
levels. However, non-firm pipeline capacity can be subject to curtailment in
winter when the opportunity cost of not being able to run on pipeline gas
generally has been lower. Even if higher electric energy prices emerge in the
winter, gas units at the margin generally only recover their variable costs
through energy prices. The decision to incur additional fixed costs to improve
their winter peaking gas supply is only justified where the cost is exceeded by
projected energy margin opportunity.6
Starting in June 2018, the Pay-for-Performance reforms to the FCM will improve
incentives for fuel supply certainty during winter peaking periods. Natural gas
delivery curtailments that occurred the past three winters to non-firm delivery
customers, such as gas-fired generators, should be less likely to occur with a
6 The ISO-NE winter reliability program originally was designed around a subsidy mechanism to
cover seasonal oil inventory costs. While the program added an LNG component in Winter
2014/15, the program is not designed to access fuel sources other than oil, thereby distorting
incentives to access other existing energy infrastructure options. This should be remedied with
the market-based Pay-for-Performance program.
Analysis of Alternative Winter Reliability Solutions
for New England Energy Markets
Page 9
market-based approach to incentivize procurement of winter peaking fuel
supply.
2.2 Winter experiences the past three years
2.2.1 Winter 2012/13 caught the market unprepared
Following the mild winter of the year before, Winter 2012/13 was much colder.
Although actual peak load was less than the 50/50 forecast,7 sustained cold
weather tried the system and highlighted areas where the markets were
unprepared.
In particular, ISO-NE identified five areas of reliability concerns created by the
growing dependence on natural gas-fired generation:8
Nonfirm transportation: Lack of firm fuel arrangements for
delivery to gas-fired generators could and did result in curtailment.
Imperfect coordination: Difference in timing between gas and
electricity markets limited response to changing power system
conditions.
Lack of Readiness by oil-fired generators: Infrequent operations
by oil-fired generators resulted in low oil inventories and
operational challenges.
Pipeline Constraints: Shifts in natural gas flows challenged gas
delivery.
7 Kirby, K., Vice President, Market Operations, ISO-NE, “ISO New England Winter Operational
Experiences and Regional Actions,” Presentation to FERC, May 16, 2013,
http://www.ferc.gov/CalendarFiles/20130516134342-2-ISO-NE.pdf
8 Ibid., p. 8.
Analysis of Alternative Winter Reliability Solutions
for New England Energy Markets
Page 10
Pipeline Outages: Availability of gas-fired generation could be
jeopardized during pipeline outages.
It is important to note that none of these stated reliability concerns mandate the
need for a new pipeline, and most can be addressed in more cost-effective ways.
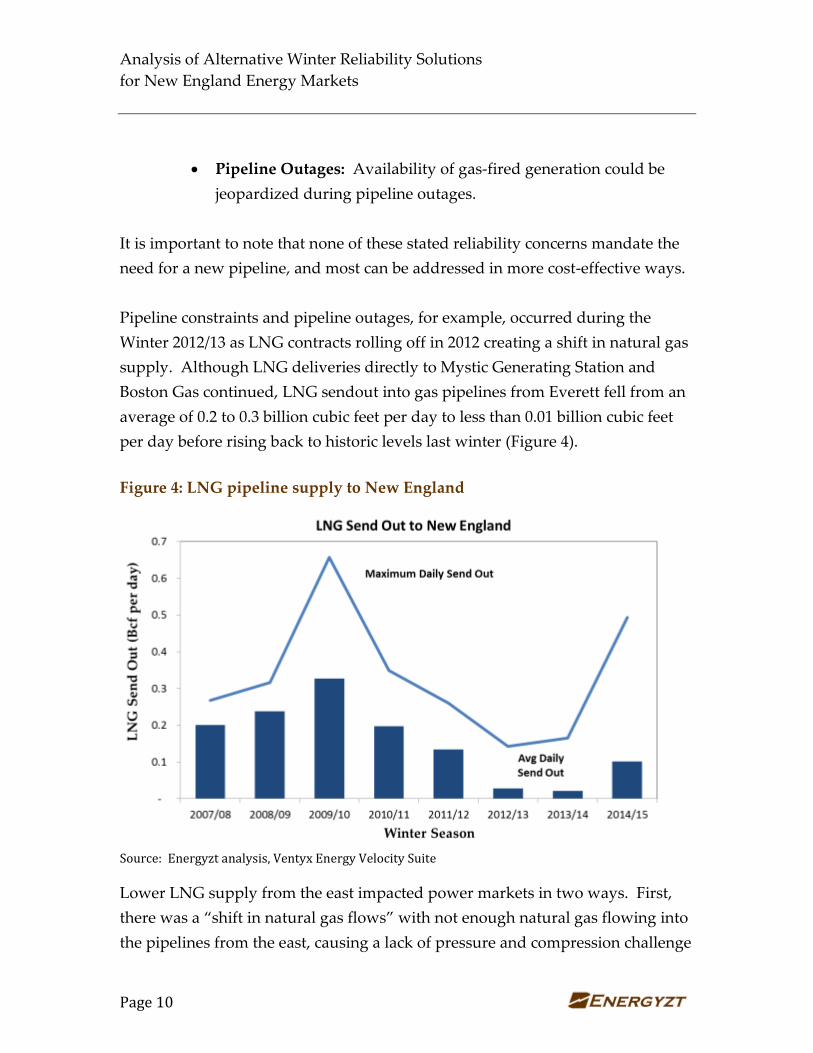
Pipeline constraints and pipeline outages, for example, occurred during the
Winter 2012/13 as LNG contracts rolling off in 2012 creating a shift in natural gas
supply. Although LNG deliveries directly to Mystic Generating Station and
Boston Gas continued, LNG sendout into gas pipelines from Everett fell from an
average of 0.2 to 0.3 billion cubic feet per day to less than 0.01 billion cubic feet
per day before rising back to historic levels last winter (Figure 4).
Figure 4: LNG pipeline supply to New England
Source: Energyzt analysis, Ventyx Energy Velocity Suite
Lower LNG supply from the east impacted power markets in two ways. First,
there was a “shift in natural gas flows” with not enough natural gas flowing into
the pipelines from the east, causing a lack of pressure and compression challenge
Analysis of Alternative Winter Reliability Solutions
for New England Energy Markets
Page 11
as gas deliveries progressed from supply originating in the west. Second, lower
LNG supply from the east eliminated the diversification of fuel supply that New
England historically has enjoyed, causing pipeline operational issues to have a
greater impact on the system. Although high prices had a limited impact on
LNG imports that had not already been reserved, natural gas did flow from
Canadian sources, mitigating some of the challenges with bringing in gas from
the west.
Lack of coordination between natural gas and electricity markets also created
challenges. Differences in the timing of natural gas elections versus energy
market bid schedules meant that natural gas-fired generators could not respond
in a timely way to ISO-NE dispatch requests. ISO-NE already has addressed this
issue by shifting the day-ahead market timing to be earlier9 and engaging in
greater information sharing with gas pipelines.10
In addition, dual-fuel capability in New England was not ready to run. High oil
prices combined with lack of need during prior winters encouraged plant owners
to sell the oil out of their tanks or otherwise minimize tank inventory, limiting
supply when most needed and most lucrative. The lower LNG supply, limited
oil inventory, and a number of other short-term supply constraints created high
prices in Winter 2012/13.
9 Docket No. ER13-895, effective May 23, 2013. In April 2015, FERC issued a final order that
declined to adopt the NOPR proposal to move the start of the gas day earlier by five hours
concluding that the record in the proceeding did not justify changing the start time, but
recognizing that several regional efforts address the misalignment. 151FERC ¶ 61,049, Docket
No. RM14-2-000; Order No. 809, Coordination of the Scheduling Processes of Interstate Natural
Gas Pipelines and Public Utilities, Issued April 16, 2015. http://www.ferc.gov/whats-new/comm-
meet/2015/041615/M-1.pdf
10 Docket No. ER13-356, effective January 24, 2013 to April 30, 2013, although not invoked.
Analysis of Alternative Winter Reliability Solutions
for New England Energy Markets
Page 12
Lastly, gas-fired generators had not contracted for firm gas supply, for reasons
that already have been discussed.11 The lack of firm natural gas supply and
inconsistency between nonfirm supplies and bidding schedules into New
England’s power markets forced many of them to be unavailable during high
priced hours of production.12 ISO-NE has developed an interim performance
incentive program to motivate generating capacity resources to deliver when
required, with planned implementation of a market-based Pay-for-Performance
program in 2018.13
2.2.2 Winter 2013/14 had a number of transient events impacting supply
Having learned its lesson from events during Winter 2012/13, energy markets
were better prepared. The ISO-New England Winter Reliability Initiative
supported fuel contracting to be available at dual-fuel and oil units when needed
and a number of market rules with the sole purposes of creating consistency
between natural gas and electricity markets were underway.14
11 In addition, FERC found that ISO-NE would still have to pay capacity payments to gas-fired
generators even when nonfirm gas was not available. FERC Order on Rehearing, Docket No.
EL13-66-001, new England Power Generators Association, Inc. v. ISO New England Inc.,
December 6, 2013, http://www.ferc.gov/CalendarFiles/20131206161403-EL13-66-001.pdf
12 It is noteworthy that even had some of these gas-fired generators held firm transportation, a
real-time dispatch by ISO-NE may have left them unable to access supply since the dispatch
would be well after the interday or evening nomination cycle and pipelines would not have
packed the pipe to support those withdrawals, illustrating a potential impact of gas-electric
coordination issues.
13 ISO-NE, frustrated that FCM generation capacity resources were not available when most
needed, embarked on a Winter Reliability program for the next winter with the longer term goal
of establishing appropriate market mechanisms to encourage natural gas-fired generators to do
whatever is required to be available and ready to perform, including contracting to ensure
reliable delivery of required gas supply. ISO-NE modified the “Failure-to-Reserve” penalty rate
to reflect replacement costs and modified the trigger for the “Failure-to-Activate” penalty. A
different program was developed for Winter 2013/14 and Winter 2014/15. Over the longer term,
ISO-NE is developing a market-based solution in accordance with FERC Order ER14-2407.
14 The first Winter Reliability Program, implemented during winter 2013/14, provided incentives
for dual-fuel units and oil-fired generators to store more fuel that could be accessed in the event
of a natural gas shortage.
Analysis of Alternative Winter Reliability Solutions
for New England Energy Markets
Page 13
Yet a number of short-term emergency situations tested the markets:
Extreme Weather: The polar vortex swirled into the entire eastern part of
the United States, freezing most of the states east of the Mississippi from
Canada to Texas. Normally warm-weather states were caught without
adequate infrastructure to deal with record lows and snow.
Problems in Other Jurisdictions: System emergencies in neighboring
jurisdictions (e.g., Quebec and PJM) created extreme but temporary
electricity import disruption due to frozen coal piles and general
unpreparedness of energy infrastructure to respond to extreme cold.15
Equipment Failure: Natural gas pipeline equipment failure (e.g., Texas
Eastern Pipeline) decreased natural gas deliveries into the northeast and
interrupted non-firm supply.
Market Coordination: Lack of coordinated electricity and natural gas
scheduling protocols precluded natural gas-fired units from accessing
nonfirm gas supplies that were released in time for real-time markets.
LNG Commercial Contracts for Supply: LNG continued to be contracted
at lower levels than historic sendout, including supply to Mystic and
Boston Gas system under existing contracts continued, albeit at lower
levels.
Yet, despite a number of constraining conditions, wholesale electricity market
reserve margins were never violated due to lack of natural gas supply.
Furthermore, all firm natural gas delivery obligations were met and there was no
interruption of electric service.
15 Neighboring jurisdictions such as PJM also have the same winter peak issues as New England.
As the experience with imports from Hydro-Québec showed in December 2013 when power
flows were curtailed in order to meet Québec reserve margins and in December 2014 when a
transmission outage limited power flows into New England, relying on long-distance supply has
its own risks.
Analysis of Alternative Winter Reliability Solutions
for New England Energy Markets
Page 14
Events during January 7, 2014, the day experiencing the tightest reserve margins,
illustrate how short-term issues constrained the system, not a baseload shortage
of natural gas delivery infrastructure. On that day, the following occurred:16
Generation Capacity was called. ISO-NE called upon generators
representing a total CSO of 30,703 MW. In addition to the CSO capacity,
around 2,980 MW of installed capacity was available, resulting in a total
capacity in the region of 33,683 MW.
Units were unavailable. From this total, ISO-NE reports that 4,677 MW
were unavailable due to both unit outages and the unavailability of gas.
This total is comprised in part by 1,500 to 1,700 MW of generation with
outages and 1,000 MW of reductions to seasonal claimed capacity.17
Additionally, there were up to 1,280 MW of gas fired generation that
could not confirm in a timely manner whether they would be able to
procure sufficient gas for operations -- many of these units “later called
and advised they were available.”18
Commitment was not optimized. There were an additional 5,921 MW of
installed capacity that was not available on peak because of start time
constraints, meaning that this capacity had not been scheduled in advance
by ISO-NE. Low day-ahead demand clearing pushed some of the unit
commitment needed to meet actual peak to after the day-ahead process,
limiting ISO-NE to generation with lead times less than 12 hours. Still, net
of even these outages and scheduling constraints, a total of 23,085 MW of
in-region capacity was available to serve peak demand.
16 ISO-NE, “January 2014 FERC Data Request,” p. 1, http://www.iso-ne.com/static-
assets/documents/pubs/spcl_rpts/2014/iso_ne_response_ferc_data_request_january_2014.pdf .
It is important to note that January 7th was not the coldest day nor the peak demand for natural
gas. However, it did occur during a very cold period that, according to ISO-NE, was among the
coldest 5% of all days over the prior twenty years.
17 ISO-NE, “January 2014 FERC Data Request,” p. 10.
18 ISO-NE, “January 2014 FERC Data Request,” p. 2.
Analysis of Alternative Winter Reliability Solutions
for New England Energy Markets
Page 15
Net imports were negligible. In its day ahead planning, ISO-NE had
expected to import 1,100 MW from New York in addition to
approximately 2,200 MW from Canada.19 During the operating day, not
only did New England not receive these imports, it actually exported
1,480 MW to New York, of which 500 MW was emergency power to PJM
during eight of the peak hours that day. During the peak hour, ISO-NE
reports net imports of 752 MW. Combining in-region resources with net
imports produces total available capacity of 23,836 MW.
Reserve margins were met. ISO-NE load during the peak hour was
21,432 MW. This left 2,404 MW of capacity available for required reserves.
Generators were dispatched to meet this load and to supply a required
reserve margin of 2,360 MW to provide contingency protection (i.e.,
operating reserves). This reserve capacity was either synchronized or
capable of being synchronized quickly in the event that a significant
outage of a generator or transmission tie line had occurred.20
The net result was that ISO-NE was able to meet its reliability obligations (load
and reserves) with 44 MW of surplus capacity. At first glance this might appear
to be a tight margin. However, ISO-NE also supplied 500 MW in emergency sales
to PJM and had approximately 6,000 MW of capacity that had not been
scheduled for dispatch, in part due to the expected imports totaling 2,600 MW
more than what was received on net.
During the winter day in 2014 with the tightest reserve margins, reliability was
maintained and emergency exports from New England into PJM were delivered.
Basis differentials and delivered gas prices were, however, still very high
reflecting lower levels of contracting with existing energy infrastructure.
19 ISO-NE, Daily Capacity Status worksheet (http://www.iso-
ne.com/sys_ops/mornrpt/daily_capacity_status.xls accessed 8/14/14)
20 The calculation of the reserves required in any particular hour depends on system conditions
since it is meant to cover capacity that would be required if the largest transmission or generation
contingencies were to occur.
Analysis of Alternative Winter Reliability Solutions
for New England Energy Markets
Page 16
2.2.3 Winter 2014/15 experienced significant market response
The market was better prepared for Winter 2014/15.21 As measured by heating
degree days, this winter was more extreme than the prior two and yet emergency
events did not occur and the market was prepared to utilize existing energy
infrastructure much more effectively:
LNG Contracts: Aside from its Mystic and Boston Gas system
commitments, LNG sendout increased to around half of its historic
levels.22
Dual-fuel units: The ISO-NE Winter Reliability program ensured dual-
fuel capability was fueled and available, supplying nearly 1 million MWh
of secondary fuel generation in lieu of gas consumption.23
Natural gas/electricity coordination: Market rule changes to better
coordinate the natural gas and electricity markets were in place.
Oil prices had fallen: Compared to the previous winters when oil prices
were at around $100 per barrel, oil prices had fallen to around $60 per
barrel, offering a lower cost alternative making oil-fired generation more
economic than natural gas in certain hours.
As a result, Winter 2014/15 experienced basis differentials at half the levels of the
prior two winters. Many of the temporary commercial and physical issues from
the previous two winters had been resolved. Market price signals, combined
21 ISO News, “New England power system performed well through winter 2014/15,” April 7,
2015, http://isonewswire.com/updates/2015/4/7/new-england-power-system-performed-well-
through-winter-20142.html 22 Merchant generator interest in LNG contracting is likely to increase when the Pay-for-
Performance reforms to FCM deliveries commence in Winter 2018/19, the first winter that will not
have an administrative winter reliability program focused on oil inventories.
23 ISO-NE modified its 2013/14 Winter Reliability program to address reliability concerns during
cold weather conditions. The program provided guaranteed payments for fuel that was not used
by the end of the season, encouraging oil and dual-fuel generators to increase oil inventories, for
natural-gas-fired generators to contract for liquefied natural gas to augment pipeline gas, and for
new demand-response resources to be available. The program enjoyed significant participation
by generators.
Analysis of Alternative Winter Reliability Solutions
for New England Energy Markets
Page 17
with the ISO-NE Winter Reliability Programs, had caused market participants to
begin to increase their contracted fuel supplies and the availability of existing
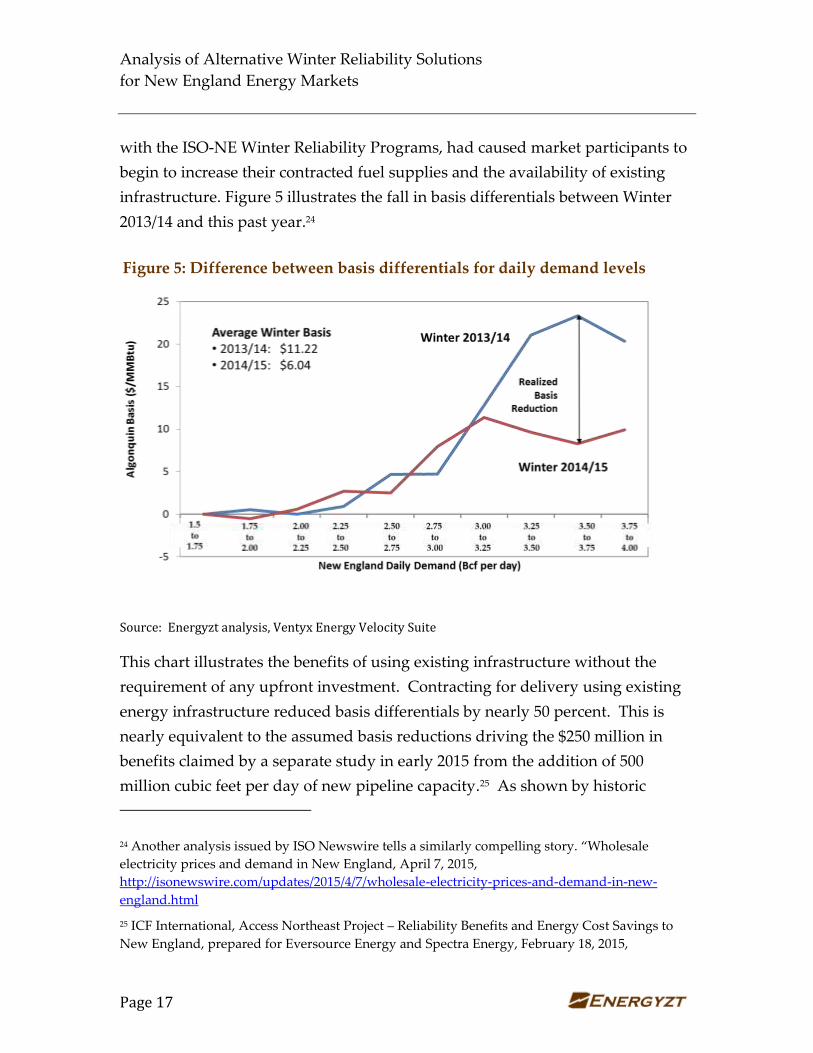
infrastructure. Figure 5 illustrates the fall in basis differentials between Winter
2013/14 and this past year.24
Figure 5: Difference between basis differentials for daily demand levels
Source: Energyzt analysis, Ventyx Energy Velocity Suite
This chart illustrates the benefits of using existing infrastructure without the
requirement of any upfront investment. Contracting for delivery using existing
energy infrastructure reduced basis differentials by nearly 50 percent. This is
nearly equivalent to the assumed basis reductions driving the $250 million in
benefits claimed by a separate study in early 2015 from the addition of 500
million cubic feet per day of new pipeline capacity.25 As shown by historic
24 Another analysis issued by ISO Newswire tells a similarly compelling story. “Wholesale
electricity prices and demand in New England, April 7, 2015,
http://isonewswire.com/updates/2015/4/7/wholesale-electricity-prices-and-demand-in-new-
england.html
25 ICF International, Access Northeast Project – Reliability Benefits and Energy Cost Savings to
New England, prepared for Eversource Energy and Spectra Energy, February 18, 2015,
Analysis of Alternative Winter Reliability Solutions
for New England Energy Markets
Page 18
experience, contracting with existing infrastructure can realize benefits
equivalent to a new natural gas pipeline without the upfront capital investment.
Existing infrastructure and competitive alternatives were able to meet New
England’s winter reliability needs with minimal natural gas price volatility
despite record-setting cold temperatures and snowfall. A mere 50 percent of
historic average LNG flows into New England markets and the dispatch of duel-
fuel and oil units maintained required reserve margins and reduced gas prices
and volatility by half.
Going forward, reactivated generation capacity, market-based incentives under
development by ISO-NE, lower oil prices and new LNG contracts26 will cap New
England gas prices and basis differentials. Referring to a winter when existing
infrastructure was caught unprepared or experienced a number of transient
events lead to a gross overestimate of potential benefits of new infrastructure
investment.
3 ALTERNATIVE SOLUTIONS TO WINTER RELIABILITY
This section builds off the historic analysis above to describe alternative solutions
to addressing winter reliability, including the following:
1) New pipeline capacity
2) LNG imports
3) Dual-fuel capability
4) Canadian imports
http://accessnortheastenergy.com/wp-content/uploads/2015/02/ICF-Report-on-Access-Northeast-
Project.pdf
This study also overstates potential benefits because it did not consider proposed pipeline
expansions, dual-fuel capability and LNG imports in its projections.
26 Fitzgerald, J., “Distrigas says fuel deals should prevent future gas shortages,” The Boston
Globe, May 11, 2015, https://www.bostonglobe.com/business/2015/05/10/distrigas-inks-big-lng-
deals/guafPlHwoFG4bhENhaERYK/story.html
Analysis of Alternative Winter Reliability Solutions
for New England Energy Markets
Page 19
The next section describes our analysis of the costs and benefits of dual-fuel
capability and Canadian imports via a new HVDC transmission line.
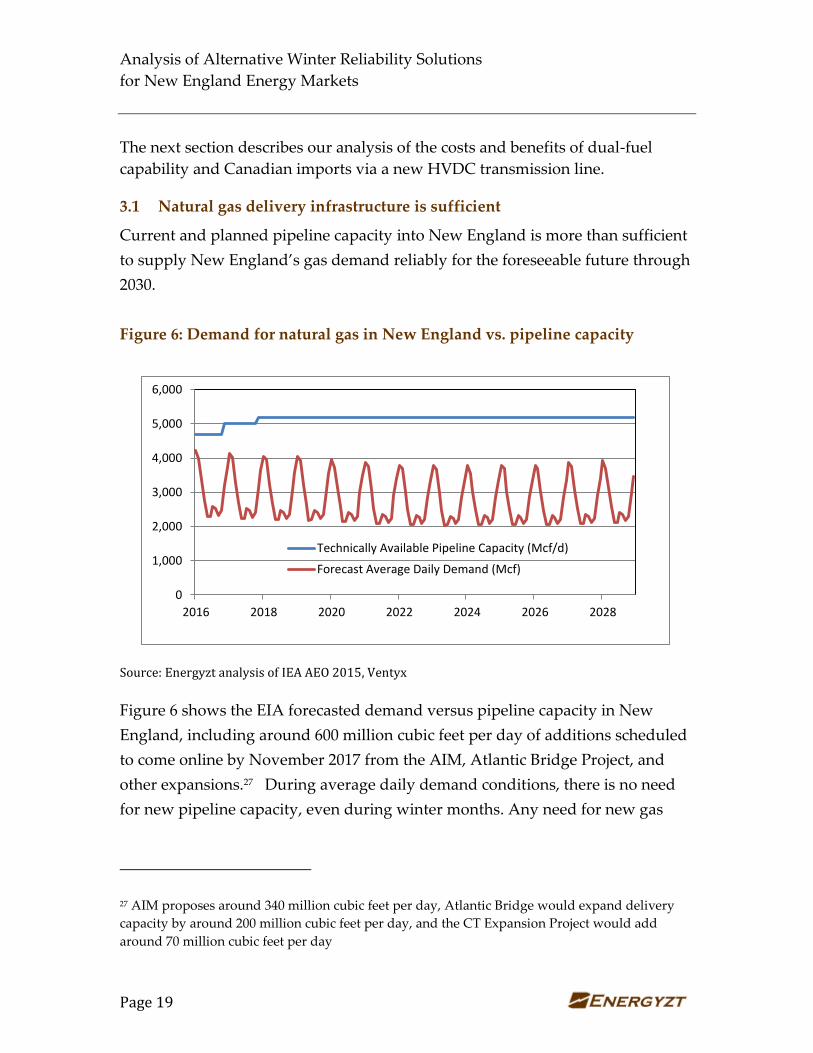
3.1 Natural gas delivery infrastructure is sufficient
Current and planned pipeline capacity into New England is more than sufficient
to supply New England’s gas demand reliably for the foreseeable future through
2030.
Figure 6: Demand for natural gas in New England vs. pipeline capacity
Source: Energyzt analysis of IEA AEO 2015, Ventyx
Figure 6 shows the EIA forecasted demand versus pipeline capacity in New
England, including around 600 million cubic feet per day of additions scheduled
to come online by November 2017 from the AIM, Atlantic Bridge Project, and
other expansions.27 During average daily demand conditions, there is no need
for new pipeline capacity, even during winter months. Any need for new gas
27 AIM proposes around 340 million cubic feet per day, Atlantic Bridge would expand delivery
capacity by around 200 million cubic feet per day, and the CT Expansion Project would add
around 70 million cubic feet per day
0
1,000
2,000
3,000
4,000
5,000
6,000
2016 2018 2020 2022 2024 2026 2028
Technically Available Pipeline Capacity (Mcf/d)
Forecast Average Daily Demand (Mcf)
Analysis of Alternative Winter Reliability Solutions
for New England Energy Markets
Page 20
delivery capability to meet winter reliability issues is a peaking issue, not a
baseload problem.
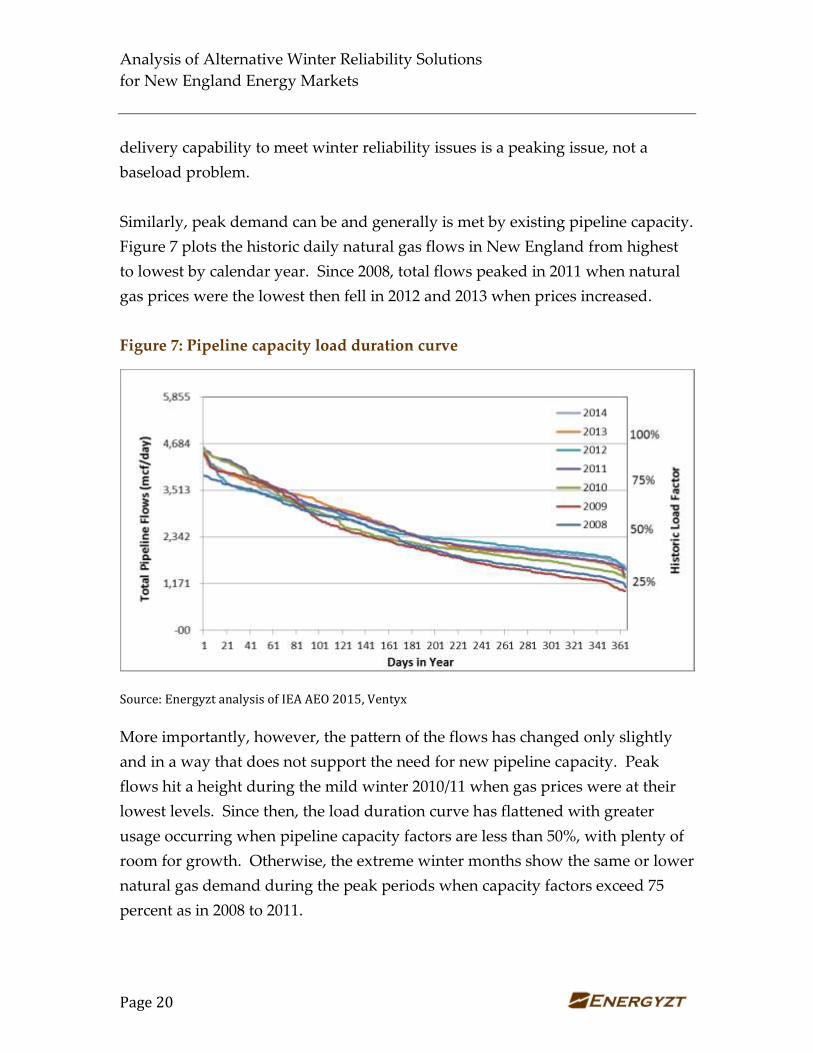
Similarly, peak demand can be and generally is met by existing pipeline capacity.
Figure 7 plots the historic daily natural gas flows in New England from highest
to lowest by calendar year. Since 2008, total flows peaked in 2011 when natural
gas prices were the lowest then fell in 2012 and 2013 when prices increased.
Figure 7: Pipeline capacity load duration curve
Source: Energyzt analysis of IEA AEO 2015, Ventyx
More importantly, however, the pattern of the flows has changed only slightly
and in a way that does not support the need for new pipeline capacity. Peak
flows hit a height during the mild winter 2010/11 when gas prices were at their
lowest levels. Since then, the load duration curve has flattened with greater
usage occurring when pipeline capacity factors are less than 50%, with plenty of
room for growth. Otherwise, the extreme winter months show the same or lower
natural gas demand during the peak periods when capacity factors exceed 75
percent as in 2008 to 2011.
Analysis of Alternative Winter Reliability Solutions
for New England Energy Markets
Page 21
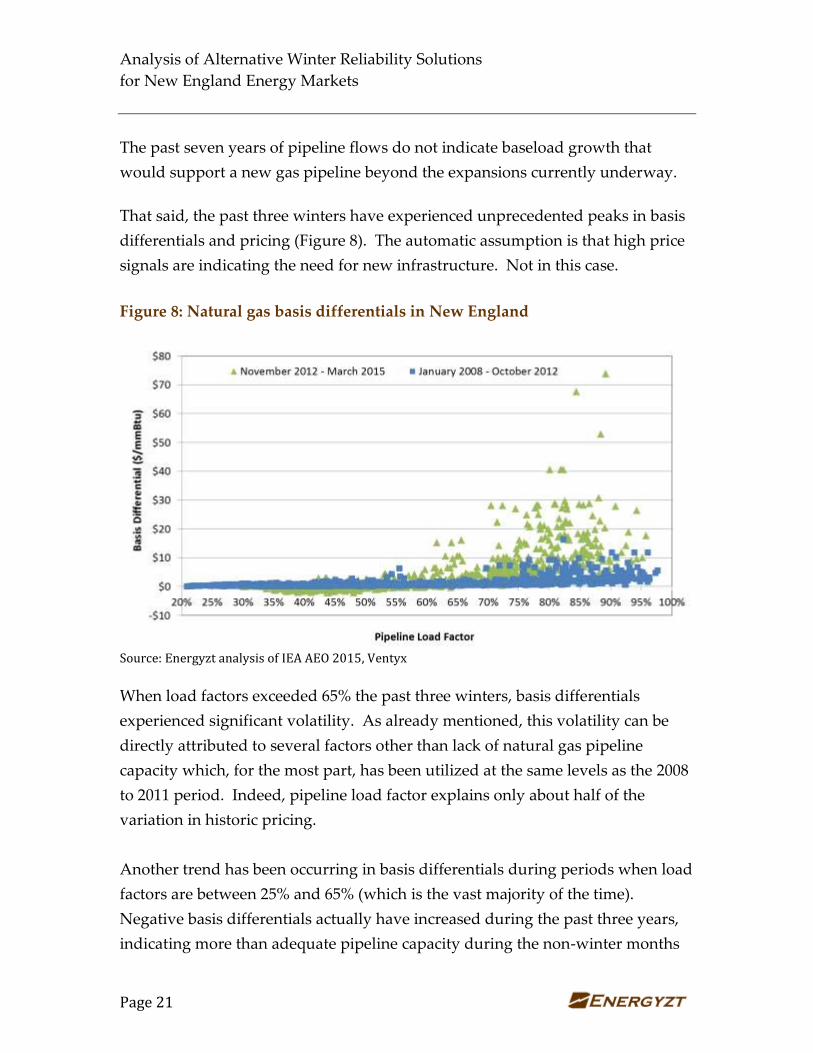
The past seven years of pipeline flows do not indicate baseload growth that
would support a new gas pipeline beyond the expansions currently underway.
That said, the past three winters have experienced unprecedented peaks in basis
differentials and pricing (Figure 8). The automatic assumption is that high price
signals are indicating the need for new infrastructure. Not in this case.
Figure 8: Natural gas basis differentials in New England
Source: Energyzt analysis of IEA AEO 2015, Ventyx
When load factors exceeded 65% the past three winters, basis differentials
experienced significant volatility. As already mentioned, this volatility can be
directly attributed to several factors other than lack of natural gas pipeline
capacity which, for the most part, has been utilized at the same levels as the 2008
to 2011 period. Indeed, pipeline load factor explains only about half of the
variation in historic pricing.
Another trend has been occurring in basis differentials during periods when load
factors are between 25% and 65% (which is the vast majority of the time).
Negative basis differentials actually have increased during the past three years,
indicating more than adequate pipeline capacity during the non-winter months
Analysis of Alternative Winter Reliability Solutions
for New England Energy Markets
Page 22
to bring New England natural gas prices in alignment with Marcellus
production, and reiterating that this is a winter peaking problem.
Other factors have driven the cost of delivered gas in New England to new levels
– not a lack of pipeline capacity. As already discussed, these factors include the
underutilized LNG sendout capability, initially limited fuel switching capability,
electricity import constraints and pipeline compression equipment failures.
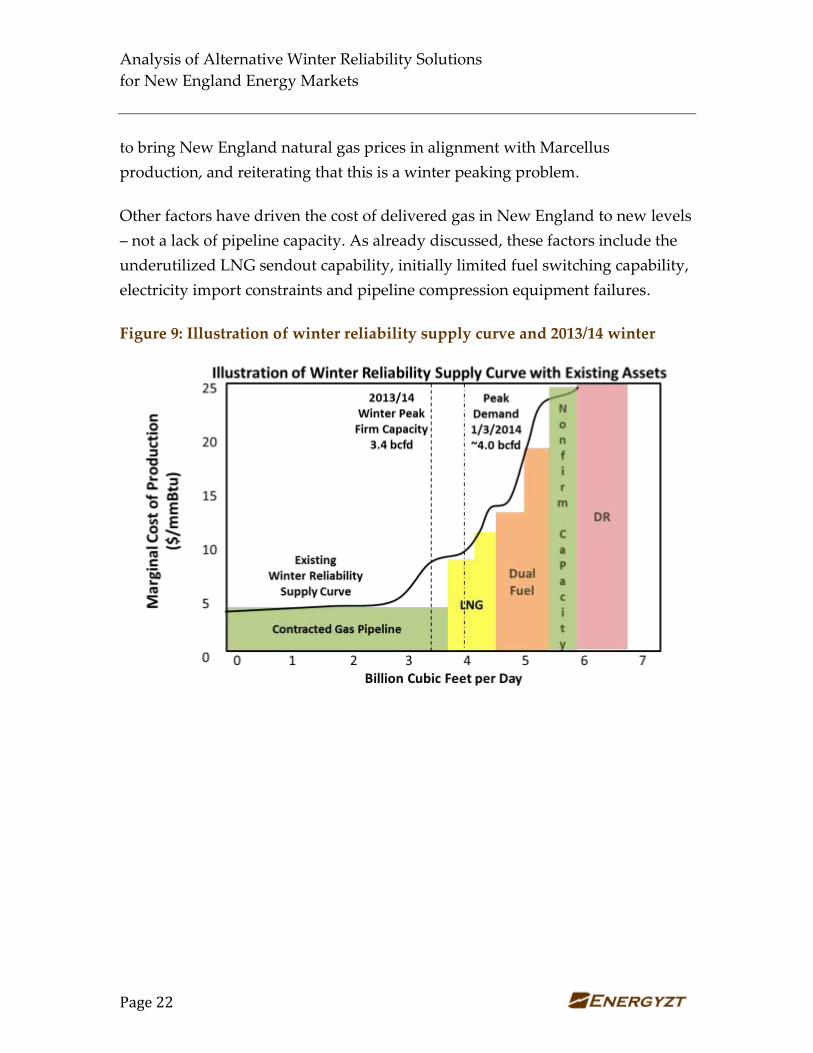
Figure 9: Illustration of winter reliability supply curve and 2013/14 winter
Analysis of Alternative Winter Reliability Solutions
for New England Energy Markets
Page 23
Source: Energyzt analysis
Figure 9 illustrates the winter reliability supply curve under normal conditions
utilizing existing energy infrastructure and during Winter 2013/14. Under
normal conditions, there is more than enough natural gas pipeline capacity to
meet peak firm delivery commitments of 3.4 per day and even the maximum
demand that occurred on January 3, 2014 at average natural gas prices of around
$10 per mmBtu. LNG and dual-fuel capability provide incremental peaking
resources, which tend to be less expensive than nonfirm pipeline delivery of gas
supply during super winter peaks when natural gas prices spike to above oil
prices.
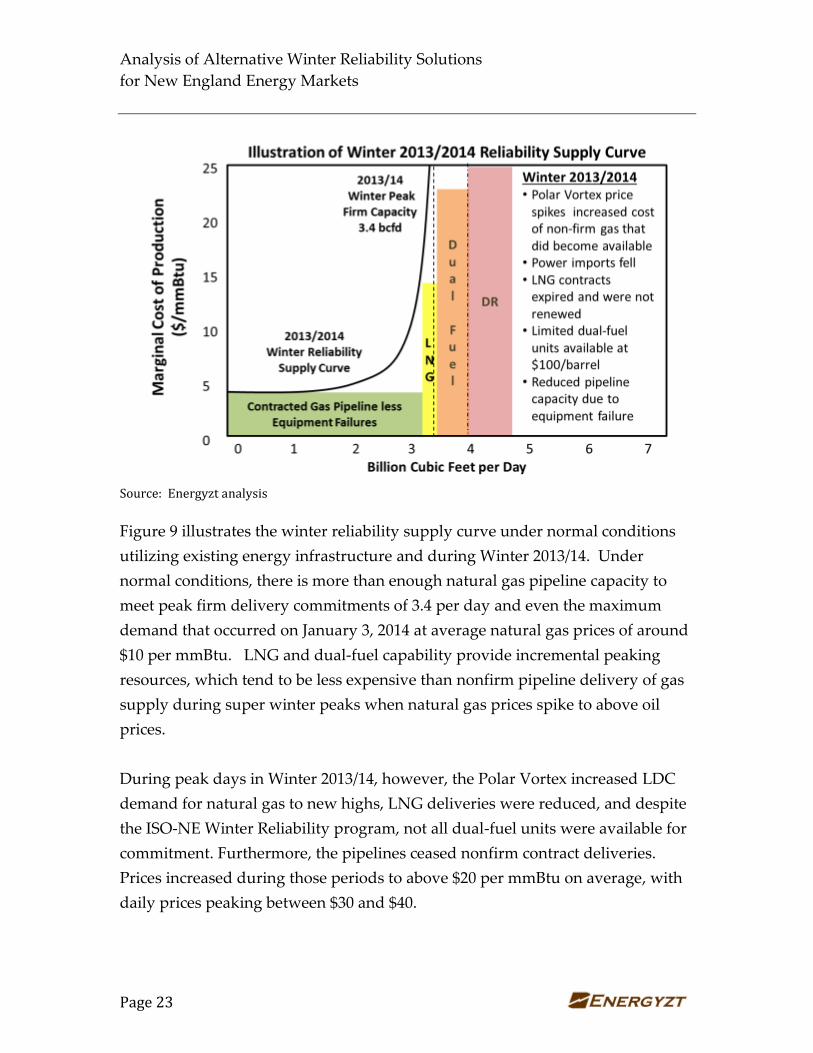
During peak days in Winter 2013/14, however, the Polar Vortex increased LDC
demand for natural gas to new highs, LNG deliveries were reduced, and despite
the ISO-NE Winter Reliability program, not all dual-fuel units were available for
commitment. Furthermore, the pipelines ceased nonfirm contract deliveries.
Prices increased during those periods to above $20 per mmBtu on average, with
daily prices peaking between $30 and $40.
Analysis of Alternative Winter Reliability Solutions
for New England Energy Markets
Page 24
Although total demand for natural gas is increasing in the region, peak demand
has not changed significantly according to natural gas flows into New England.
Prices signals that occurred in New England during winter peak periods indicate
the need for more contracting of existing infrastructure and resources rather than
the need for new pipeline construction. There is more than enough existing
energy infrastructure to meet winter peak needs.28 Contracting existing
infrastructure and resources provides a peaking solution to a peaking problem
and can ensure reliable gas supply for the near term while decreasing basis
differentials to historic levels, as was seen last winter.
In addition, there is incremental delivery capacity of 600 million cubic feet per
day from the proposed expansions (i.e., Atlantic Bridge, AIM, and CT Expansion
Project) coming online in 2016 through 2018. If this additional capacity is
included, assuming historic levels of contracted energy delivery infrastructure,
average basis differentials will shift downwards during winter months.
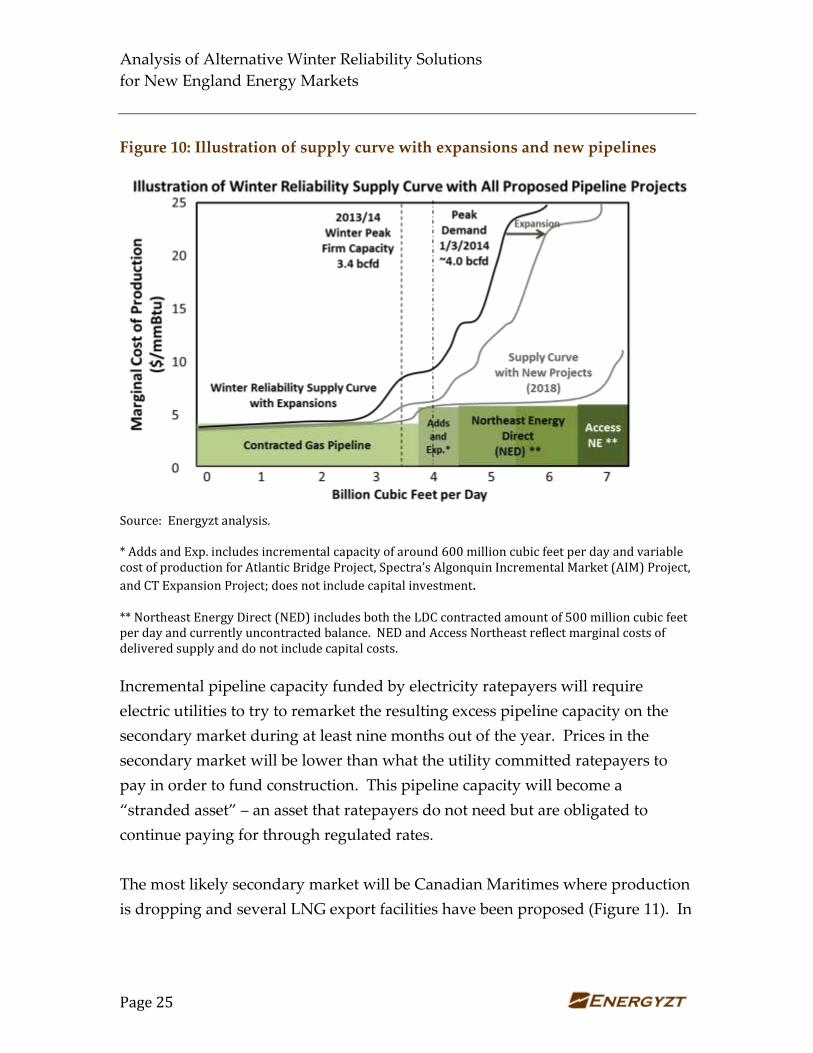
Additional delivery capacity from a new pipeline funded by electricity
ratepayers will only serve to flood the market with natural gas, creating an
uneconomic infrastructure investment that is disruptive to functioning energy
markets in New England (Figure 10).
28 Energyzt, “Report: Winter Reliability Analysis of New England Energy Markets,” Prepared on
behalf of the New England Power Generator’s Association, October 2014,
http://nepga.org/14/10/energyzt-report-on-winter-reliability/
Analysis of Alternative Winter Reliability Solutions
for New England Energy Markets
Page 25
Figure 10: Illustration of supply curve with expansions and new pipelines
Source: Energyzt analysis. * Adds and Exp. includes incremental capacity of around 600 million cubic feet per day and variable cost of production for Atlantic Bridge Project, Spectra’s Algonquin Incremental Market (AIM) Project,
and CT Expansion Project; does not include capital investment. ** Northeast Energy Direct (NED) includes both the LDC contracted amount of 500 million cubic feet per day and currently uncontracted balance. NED and Access Northeast reflect marginal costs of delivered supply and do not include capital costs.
Incremental pipeline capacity funded by electricity ratepayers will require
electric utilities to try to remarket the resulting excess pipeline capacity on the
secondary market during at least nine months out of the year. Prices in the
secondary market will be lower than what the utility committed ratepayers to
pay in order to fund construction. This pipeline capacity will become a
“stranded asset” – an asset that ratepayers do not need but are obligated to
continue paying for through regulated rates.
The most likely secondary market will be Canadian Maritimes where production
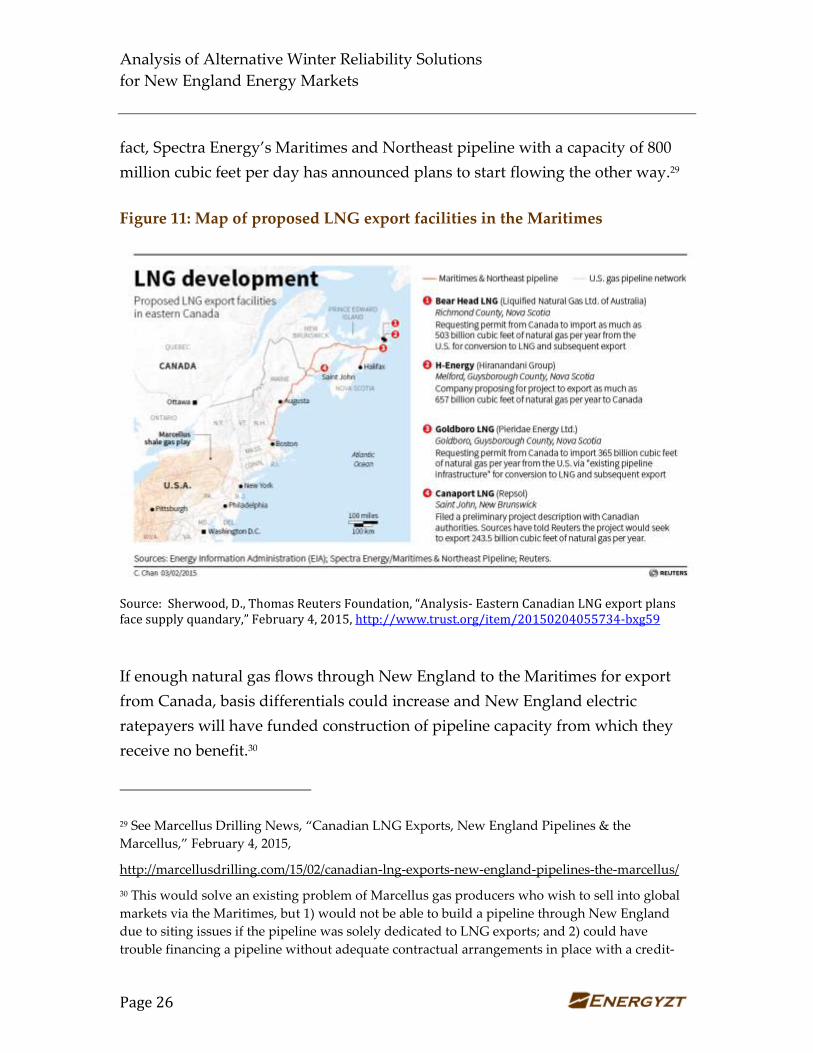
is dropping and several LNG export facilities have been proposed (Figure 11). In
Analysis of Alternative Winter Reliability Solutions
for New England Energy Markets
Page 26
fact, Spectra Energy’s Maritimes and Northeast pipeline with a capacity of 800
million cubic feet per day has announced plans to start flowing the other way.29
Figure 11: Map of proposed LNG export facilities in the Maritimes
Source: Sherwood, D., Thomas Reuters Foundation, “Analysis- Eastern Canadian LNG export plans face supply quandary,” February 4, 2015, http://www.trust.org/item/20150204055734-bxg59
If enough natural gas flows through New England to the Maritimes for export
from Canada, basis differentials could increase and New England electric
ratepayers will have funded construction of pipeline capacity from which they
receive no benefit.30
29 See Marcellus Drilling News, “Canadian LNG Exports, New England Pipelines & the
Marcellus,” February 4, 2015,
http://marcellusdrilling.com/15/02/canadian-lng-exports-new-england-pipelines-the-marcellus/
30 This would solve an existing problem of Marcellus gas producers who wish to sell into global
markets via the Maritimes, but 1) would not be able to build a pipeline through New England
due to siting issues if the pipeline was solely dedicated to LNG exports; and 2) could have
trouble financing a pipeline without adequate contractual arrangements in place with a credit-
Analysis of Alternative Winter Reliability Solutions
for New England Energy Markets
Page 27
In summary, there is ample existing and planned energy delivery infrastructure
in New England to ensure reliable, competitively priced natural gas supply
during winter peak periods. The addition of proposed electricity ratepayer-
funded pipeline(s) is an unnecessary capital cost and risk that may eventually
harm New England ratepayers, not benefit them. Given anticipated market
conditions, government-mandated funding of a new pipeline using electricity
ratepayer dollars is likely to expose those ratepayers to a needless infrastructure
investment to the benefit of gas suppliers, pipeline owners, Canadian Maritime
LNG export facilities and foreign buyers of US LNG.31
3.2 LNG imports can be contracted to meet peak needs
In addition to sufficient natural gas pipeline capacity to provide reliable delivery
during most winter peak conditions, New England has a substantial amount of
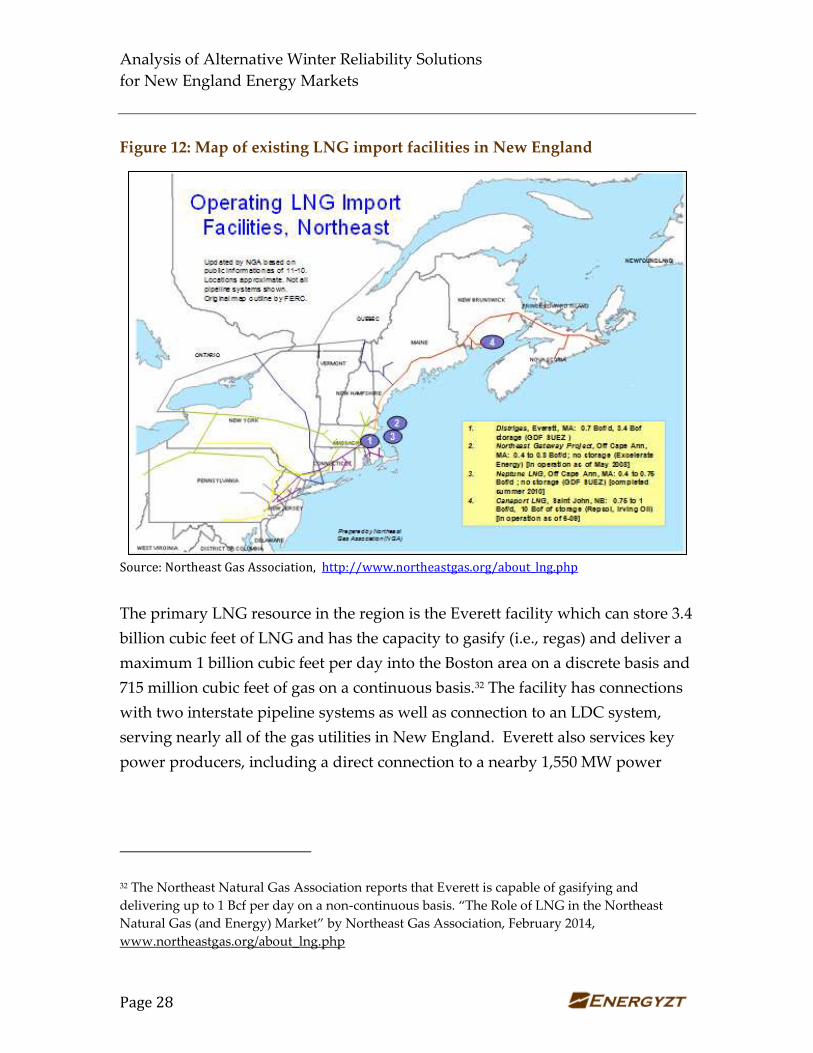
LNG import capacity. New England benefits from four LNG import facilities,
including Canaport in Canada; three are located off the coast of New England
(Figure 12).
worthy entity to support financing. See Sherwood, D., Thomas Reuters Foundation, “Analysis-
Eastern Canadian LNG export plans face supply quandary,” February 4, 2015,
http://www.trust.org/item/20150204055734-bxg59
31 Ibid., The Marcellus gas industry appears to acknowledge the benefits that will accrue to its
market participants,
One of the biggest arguments anti-pipeliners have is ‘the gas won’t even stay
here, it will be exported.’ The argument goes that New England rate payers must
help foot the bill for the new pipelines that will come to New England to deliver
enough supply that there won’t be shortages of gas during the three coldest
winter months–December through February. If New Englanders foot the bill
and then the gas goes somewhere else–if big companies exporting it in Canada
are the beneficiaries, is that not unfair? We acknowledge such a case can be
made. To which we say, figure out how to make it fair. Figure out how to lessen
the burden on New England rate payers.
(emphasis added)
Analysis of Alternative Winter Reliability Solutions
for New England Energy Markets
Page 28
Figure 12: Map of existing LNG import facilities in New England
Source: Northeast Gas Association, http://www.northeastgas.org/about_lng.php
The primary LNG resource in the region is the Everett facility which can store 3.4
billion cubic feet of LNG and has the capacity to gasify (i.e., regas) and deliver a
maximum 1 billion cubic feet per day into the Boston area on a discrete basis and
715 million cubic feet of gas on a continuous basis.32 The facility has connections
with two interstate pipeline systems as well as connection to an LDC system,
serving nearly all of the gas utilities in New England. Everett also services key
power producers, including a direct connection to a nearby 1,550 MW power
32 The Northeast Natural Gas Association reports that Everett is capable of gasifying and
delivering up to 1 Bcf per day on a non-continuous basis. “The Role of LNG in the Northeast
Natural Gas (and Energy) Market” by Northeast Gas Association, February 2014,
www.northeastgas.org/about_lng.php
Analysis of Alternative Winter Reliability Solutions
for New England Energy Markets
Page 29
plant.33 This deliverability is incremental to the pipeline capacity since it is an
injection of the commodity near the end of the pipe, a so-called back flow.
There are two other offshore facilities (Neptune and Northeast Gateway) at
which tankers are able to unload LNG via specially designed regasification ships,
then deliver the fuel into regional pipelines by a submarine connection. At full
capacity, this infrastructure could deliver up to 1.35 billion cubic feet per day into
New England. Given market economics, however, the two LNG buoy facilities of
Neptune have been temporarily shut down, although Gateway flowed
somewhat during the past winter. Nevertheless, the existing infrastructure
remains available, under appropriate commercial terms, to meet near-term
reliability requirements.
Finally, there are multiple small-scale peak shaving facilities under the control of
LDCs which rely, in part, on truck deliveries of LNG from Everett. According to
the Northeast Gas Association, New England LDCs control 16 billion cubic feet
of storage at these facilities and have delivery capability of approximately 1.4
billion cubic feet per day.34 The delivery capability from Everett to these peak
shavers is estimated to be 100 million cubic feet per day via trucks.35 In total,
deliverability from the existing LNG facilities (on-shore and off-shore) is 3.7
billion cubic feet per day, nearly the maximum demand for natural gas in New
England.
LNG import capacity has played a critical role in maintaining winter reliability as
it provides a flexible, diversified and competitive supply option for natural gas.
Existing LNG infrastructure represents enough delivery capacity to meet the
entire winter peak demand (i.e., 3.7 billion cubic feet per day) on a continuous
33 GDF Suez, http://www.suezenergyna.com/lng-operations/
34 Ibid.
35 “DOMAC Facts & Figures” by Distrigas of Massachusetts (www.distrigas.com/
ourcompanies/lngna-domac.shtml accessed 8/14/14)
Analysis of Alternative Winter Reliability Solutions
for New England Energy Markets
Page 30
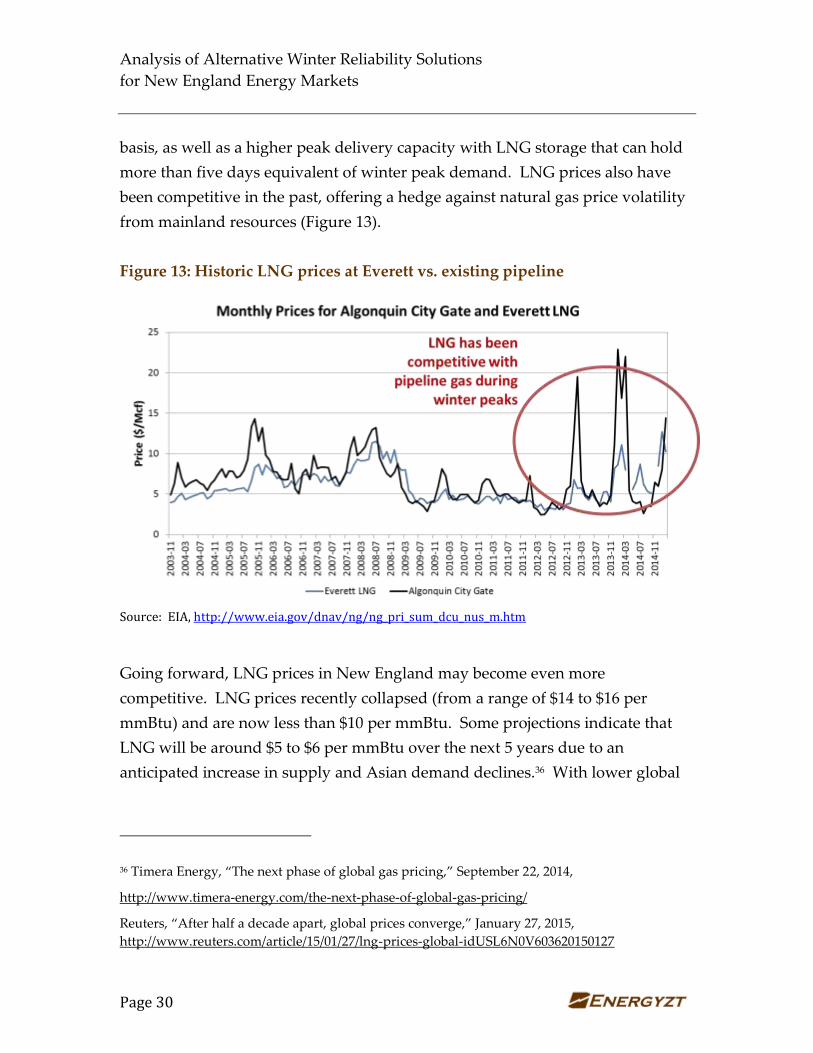
basis, as well as a higher peak delivery capacity with LNG storage that can hold
more than five days equivalent of winter peak demand. LNG prices also have
been competitive in the past, offering a hedge against natural gas price volatility
from mainland resources (Figure 13).
Figure 13: Historic LNG prices at Everett vs. existing pipeline
Source: EIA, http://www.eia.gov/dnav/ng/ng_pri_sum_dcu_nus_m.htm
Going forward, LNG prices in New England may become even more
competitive. LNG prices recently collapsed (from a range of $14 to $16 per
mmBtu) and are now less than $10 per mmBtu. Some projections indicate that
LNG will be around $5 to $6 per mmBtu over the next 5 years due to an
anticipated increase in supply and Asian demand declines.36 With lower global
36 Timera Energy, “The next phase of global gas pricing,” September 22, 2014,
http://www.timera-energy.com/the-next-phase-of-global-gas-pricing/
Reuters, “After half a decade apart, global prices converge,” January 27, 2015,
http://www.reuters.com/article/15/01/27/lng-prices-global-idUSL6N0V603620150127
Analysis of Alternative Winter Reliability Solutions
for New England Energy Markets
Page 31
prices for oil and LNG, New England’s LNG import options are an economic
solution to a winter peaking problem.
A number of other studies have examined the economic benefits of LNG to New
England, and we do not reproduce their results here except to note the impact of
LNG on winter reliability and prices.37 Based on our analysis, LNG has been
critical to maintaining reliability and lower basis differentials during winter
months. An important part of the New England winter peaking energy portfolio
since the 1970s, LNG became a baseload resource, supplying natural gas into
New England year round during the 2000s. More recently, LNG import facilities
in New England have been underutilized, as illustrated in Figure 13 below.
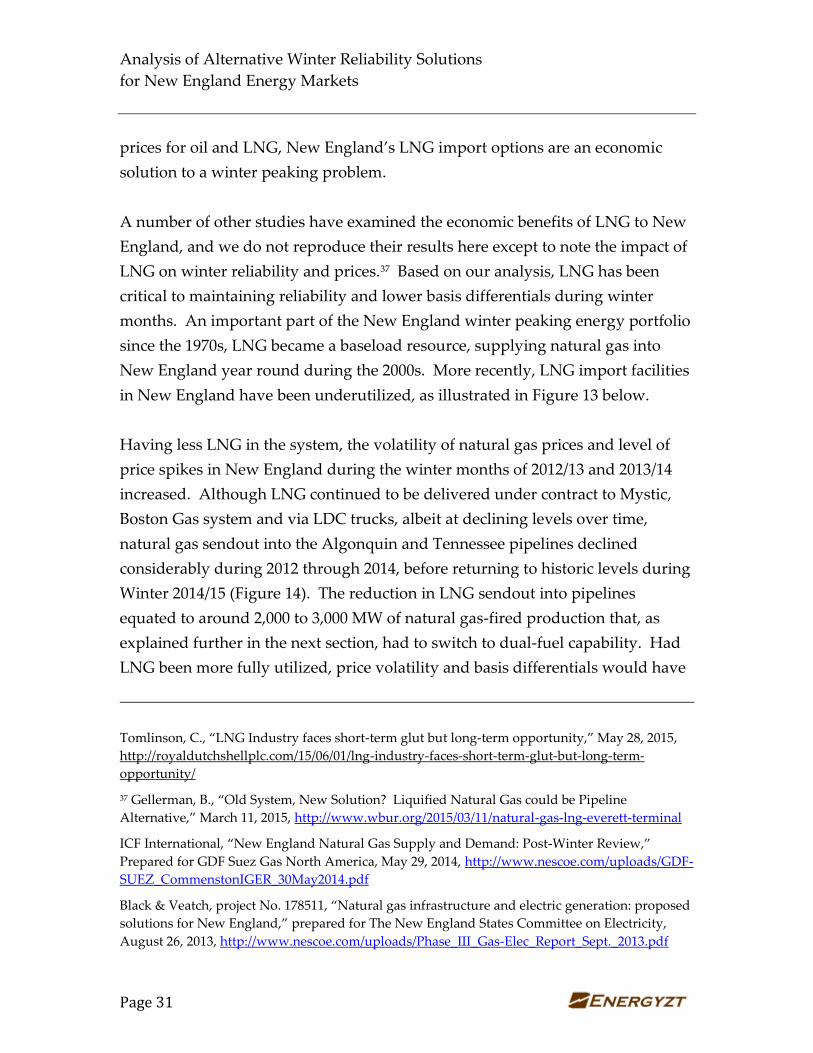
Having less LNG in the system, the volatility of natural gas prices and level of
price spikes in New England during the winter months of 2012/13 and 2013/14
increased. Although LNG continued to be delivered under contract to Mystic,
Boston Gas system and via LDC trucks, albeit at declining levels over time,
natural gas sendout into the Algonquin and Tennessee pipelines declined
considerably during 2012 through 2014, before returning to historic levels during
Winter 2014/15 (Figure 14). The reduction in LNG sendout into pipelines
equated to around 2,000 to 3,000 MW of natural gas-fired production that, as
explained further in the next section, had to switch to dual-fuel capability. Had
LNG been more fully utilized, price volatility and basis differentials would have
Tomlinson, C., “LNG Industry faces short-term glut but long-term opportunity,” May 28, 2015,
http://royaldutchshellplc.com/15/06/01/lng-industry-faces-short-term-glut-but-long-term-
opportunity/
37 Gellerman, B., “Old System, New Solution? Liquified Natural Gas could be Pipeline
Alternative,” March 11, 2015, http://www.wbur.org/2015/03/11/natural-gas-lng-everett-terminal
ICF International, “New England Natural Gas Supply and Demand: Post-Winter Review,”
Prepared for GDF Suez Gas North America, May 29, 2014, http://www.nescoe.com/uploads/GDF-
SUEZ_CommenstonIGER_30May2014.pdf
Black & Veatch, project No. 178511, “Natural gas infrastructure and electric generation: proposed
solutions for New England,” prepared for The New England States Committee on Electricity,
August 26, 2013, http://www.nescoe.com/uploads/Phase_III_Gas-Elec_Report_Sept._2013.pdf
Analysis of Alternative Winter Reliability Solutions
for New England Energy Markets
Page 32
declined, as experienced during the winter of 2014/15 when LNG imports
returned to roughly half of their 2008-20011 historic winter levels and sendout to
pipelines approached historic levels.
Figure 14: Monthly LNG sendout in New England
Source: Energyzt analysis of GDF Suez data underlying semi-annual reports to FERC
LNG import facilities are an existing energy asset that can provide winter
reliability without expensive infrastructure investment costs and risks.
Decreasing prices for LNG and substantial import capacity make LNG
particularly valuable to New England, providing an immediately available,
highly flexible competitive option to pipeline gas without any required capital
investment or associate electricity ratepayer commitment. Although a recent
announcement indicates that distribution companies in New England are
entering into long-term contracts for LNG, this resource continues to be
Analysis of Alternative Winter Reliability Solutions
for New England Energy Markets
Page 33
underutilized.38 LNG should be considered as a potentially competitive resource
in any economic analysis of alternatives to provide winter reliability.
3.3 Dual-fuel capability already exists
ISO-NE’s winter reliability program recognized the existing assets of dual-fuel
capability among generators in New England. During the past two winters, the
winter reliability program helped to ensure that fuel oil was available to allow
for these generators to run even if natural gas was not available or when gas was
more expensive than oil.
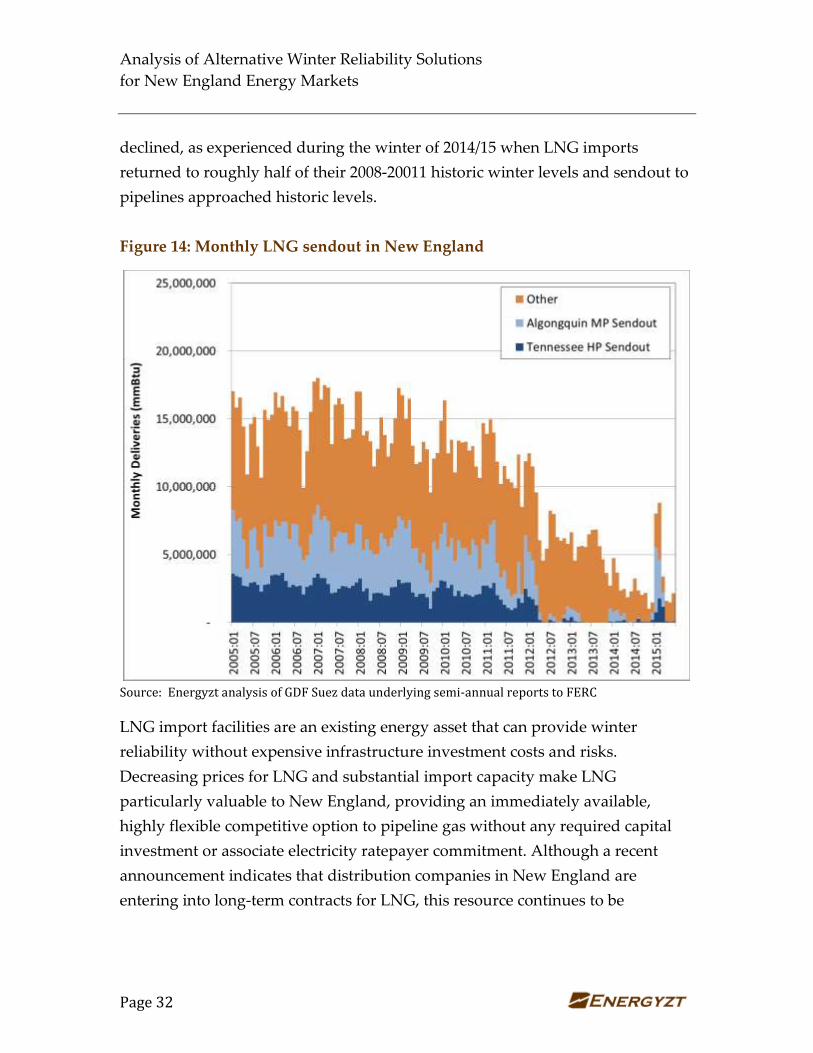
Figure 15: Dual-fuel capability in New England
Sources: EIA Form 816 via Ventyx, 2014 NERC Report on Polar Vortex
As indicated in Figure 15, New England has around 46 plants representing
nameplate capacity of nearly 7,000 MW of dual-fuel capability where natural gas
38 Business Wire, “Distrigas to Fulfill Multiple LNG Contracts with Gas Utilities in New England;
One Agreement Spans 10 Years of Supply,” May 11, 2015,
http://www.businesswire.com/news/home/20150511005685/en/Distrigas-Fulfill-Multiple-LNG-
Contracts-Gas-Utilities#.VaTLXn_bLmQ
Analysis of Alternative Winter Reliability Solutions
for New England Energy Markets
Page 34
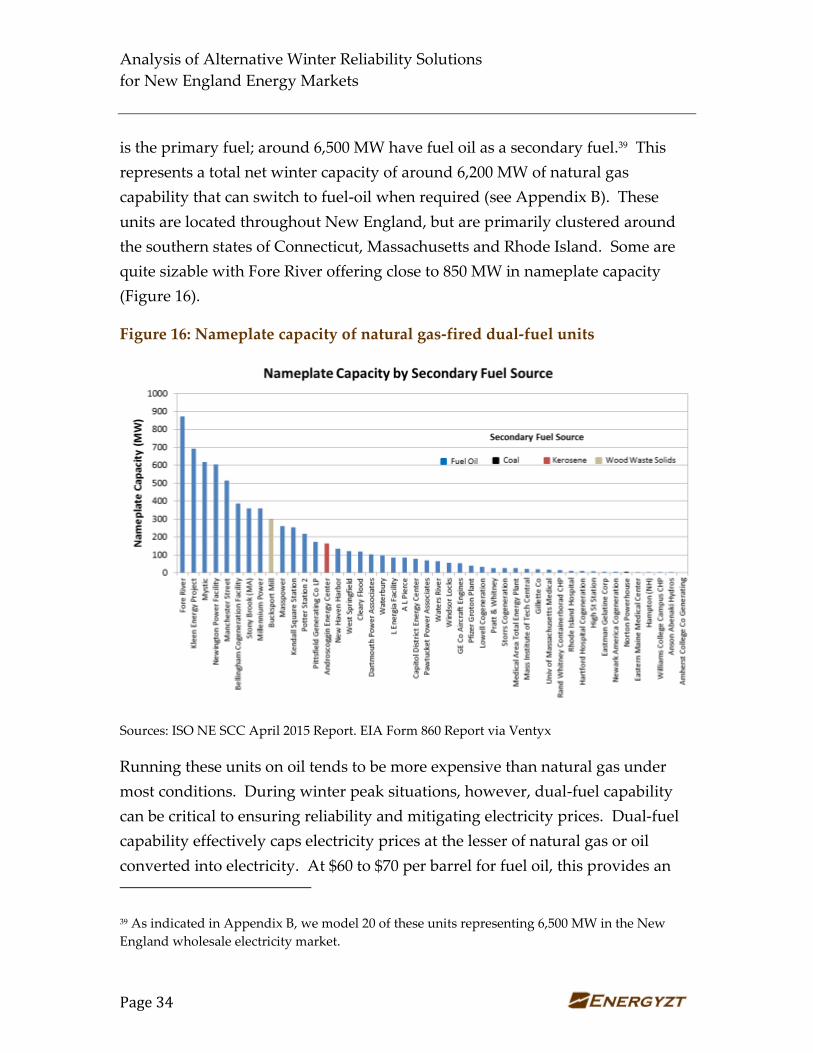
is the primary fuel; around 6,500 MW have fuel oil as a secondary fuel.39 This
represents a total net winter capacity of around 6,200 MW of natural gas
capability that can switch to fuel-oil when required (see Appendix B). These
units are located throughout New England, but are primarily clustered around
the southern states of Connecticut, Massachusetts and Rhode Island. Some are
quite sizable with Fore River offering close to 850 MW in nameplate capacity
(Figure 16).
Figure 16: Nameplate capacity of natural gas-fired dual-fuel units
Sources: ISO NE SCC April 2015 Report. EIA Form 860 Report via Ventyx
Running these units on oil tends to be more expensive than natural gas under
most conditions. During winter peak situations, however, dual-fuel capability
can be critical to ensuring reliability and mitigating electricity prices. Dual-fuel
capability effectively caps electricity prices at the lesser of natural gas or oil
converted into electricity. At $60 to $70 per barrel for fuel oil, this provides an
39 As indicated in Appendix B, we model 20 of these units representing 6,500 MW in the New
England wholesale electricity market.
Analysis of Alternative Winter Reliability Solutions
for New England Energy Markets
Page 35
effective cap on natural gas prices in New England at around $12 to $15 per
mmBtu and electricity prices of between $100 and $150 per MWh.
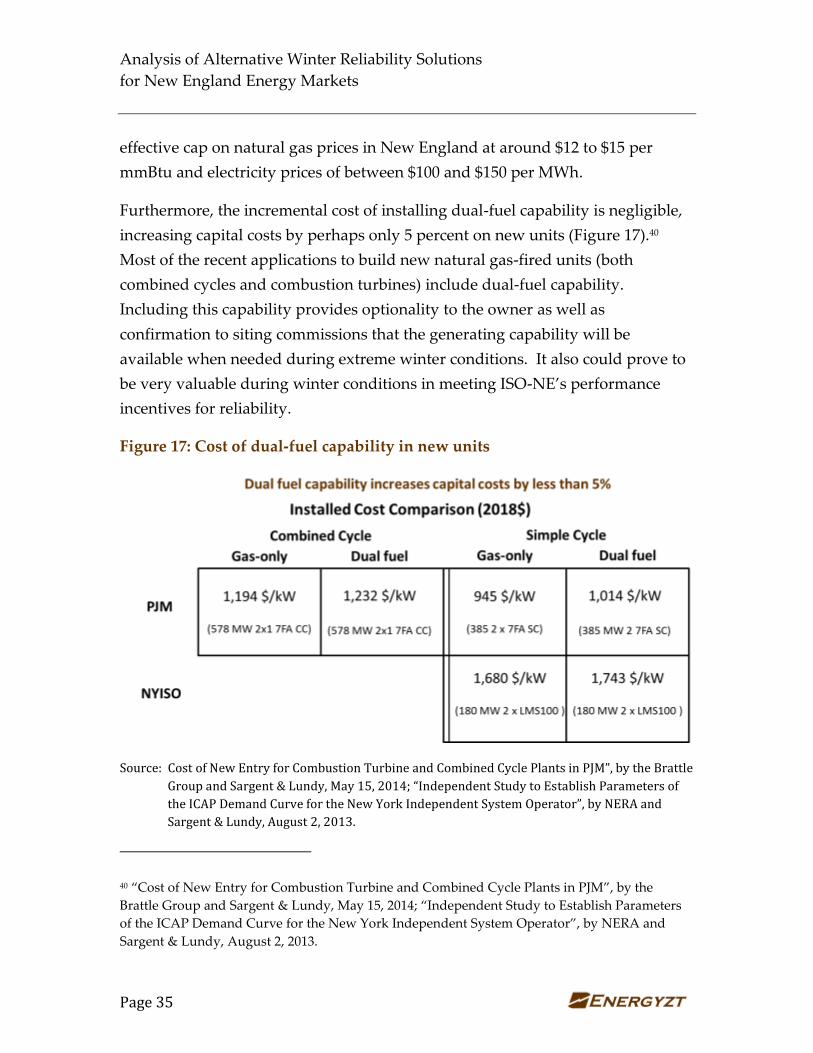
Furthermore, the incremental cost of installing dual-fuel capability is negligible,
increasing capital costs by perhaps only 5 percent on new units (Figure 17).40
Most of the recent applications to build new natural gas-fired units (both
combined cycles and combustion turbines) include dual-fuel capability.
Including this capability provides optionality to the owner as well as
confirmation to siting commissions that the generating capability will be
available when needed during extreme winter conditions. It also could prove to
be very valuable during winter conditions in meeting ISO-NE’s performance
incentives for reliability.
Figure 17: Cost of dual-fuel capability in new units
Source: Cost of New Entry for Combustion Turbine and Combined Cycle Plants in PJM”, by the Brattle
Group and Sargent & Lundy, May 15, 2014; “Independent Study to Establish Parameters of
the ICAP Demand Curve for the New York Independent System Operator”, by NERA and
Sargent & Lundy, August 2, 2013.
40 “Cost of New Entry for Combustion Turbine and Combined Cycle Plants in PJM”, by the
Brattle Group and Sargent & Lundy, May 15, 2014; “Independent Study to Establish Parameters
of the ICAP Demand Curve for the New York Independent System Operator”, by NERA and
Sargent & Lundy, August 2, 2013.
Analysis of Alternative Winter Reliability Solutions
for New England Energy Markets
Page 36
In addition, it is possible to convert existing natural gas units to dual-fuel
capability to increase the flexibility and diversification of New England’s power
mix. The possibility of and costs of conversion are extremely site specific and
would need to be assessed on a case-by-case basis. Market-based Pay-for-
Performance will allow natural gas-fired generators without existing dual-fuel
capability to assess the relative costs of converting versus procuring LNG, firm
delivery capacity, or other fuel-security measures in winter months.
Currently, there is more than enough existing dual-fuel capability in New
England to provide energy options in the event of natural gas delivery shortfalls.
These units also serve to mitigate prices for natural gas and electricity.
3.4 Canadian import alternatives bear consideration
There are two proposals to develop HVDC transmission lines to bring
hydroelectric imports into New England from Canada totaling 2,400 MW of new
non-gas-fired generation capacity. If even half of that amount of hydroelectric
power comes into New England, it would be more than double the capacity of
recently announced retirements of non-gas-fired generating capacity and
anticipated new builds, negating the need for an incremental natural gas pipeline
to support natural gas-fired generation on a baseload basis. However, as our
analysis shows in section 4.2.3, a new transmission line from the north may
displace gas throughout the year, but does not necessarily provide a flexible or
effective solution to winter reliability issues.
Although transmission of hydroelectric power from Canada is not being
proposed as a winter peaking solution, but as a means of meeting environmental
renewable energy targets and emissions limits, it could have an impact on total
gas demand in the region. The potential gas demand impact of a new
transmission line importing hydroelectric power into New England is analyzed
in the next section.
4 ANALYSIS AND RESULTS
To provide further insight into potential impacts of dual-fuel capability and a
new transmission line into New England from Canada, this section describes the
Analysis of Alternative Winter Reliability Solutions
for New England Energy Markets
Page 37
results of our economic analysis of the cost of the alternatives described above.
In examining these alternatives, we focus on winter reliability, assess market
conditions with and without these alternatives and perform a sensitivity analysis
on normal versus extreme market conditions. In addition, we run a market
model to understand the potential impact on natural gas consumption by the
electricity sector and associated energy prices.
4.1 Cost analysis
As already mentioned, price signals indicate a peaking problem. In general,
peaking problems require peaking solutions. Building a new natural gas
pipeline is a baseload solution that can have adverse consequences on the
market, exacerbating already negative basis differentials during the nine months
of the year when winter peaking capability is not required. That said, a baseload
solution can be a more cost effective approach if overall average costs are lower
than a peaking solution for a given number of peaking events.
To examine the relative cost of a new pipeline compared to LNG and dual-fuel
capability, it is important to understand how often a problem occurs. Figure 18
shows the price duration curve for natural gas basis differentials at Algonquin
Citygate compared to TETCO 3. Although basis differentials traditionally have
been calculated against Henry Hub, they are calculated against PJM’s natural gas
prices to determine whether there is a pipeline constraint between the two
natural gas trading hubs, one of which is physically closer to Marcellus Shale,
that can be remedied with additional pipeline capacity.
During the 2010 to 2012 calendar year, natural gas prices rarely deviated by more
than $5 per mmBtu between the two delivery hubs. In 2013 and 2014, basis
differentials above $5 per mmBtu occurred during 60 delivery days. As existing
energy infrastructure resumed delivery (e.g., dual-fuel units and LNG sendout
into pipelines), basis differentials fell during Winter 2014/ 2015 and exceeded $5
per mmBtu during fewer than 45 delivery days.
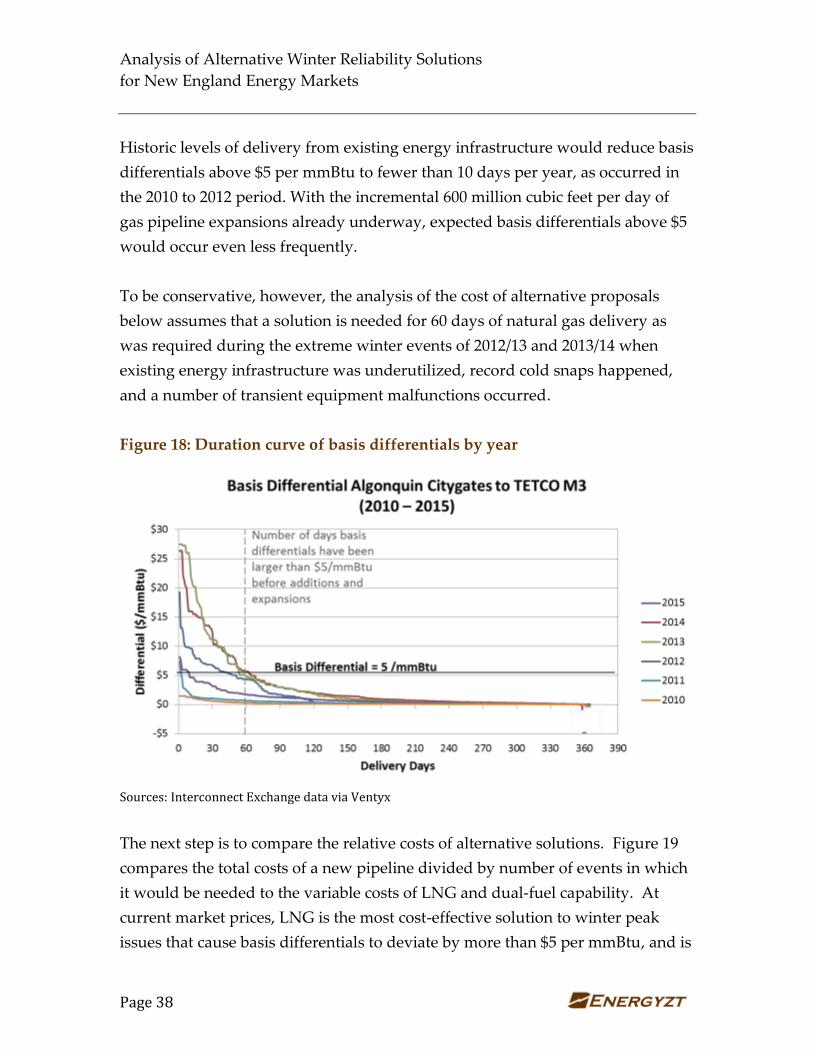
Analysis of Alternative Winter Reliability Solutions
for New England Energy Markets
Page 38
Historic levels of delivery from existing energy infrastructure would reduce basis
differentials above $5 per mmBtu to fewer than 10 days per year, as occurred in
the 2010 to 2012 period. With the incremental 600 million cubic feet per day of
gas pipeline expansions already underway, expected basis differentials above $5
would occur even less frequently.
To be conservative, however, the analysis of the cost of alternative proposals
below assumes that a solution is needed for 60 days of natural gas delivery as
was required during the extreme winter events of 2012/13 and 2013/14 when
existing energy infrastructure was underutilized, record cold snaps happened,
and a number of transient equipment malfunctions occurred.
Figure 18: Duration curve of basis differentials by year
Sources: Interconnect Exchange data via Ventyx
The next step is to compare the relative costs of alternative solutions. Figure 19
compares the total costs of a new pipeline divided by number of events in which
it would be needed to the variable costs of LNG and dual-fuel capability. At
current market prices, LNG is the most cost-effective solution to winter peak
issues that cause basis differentials to deviate by more than $5 per mmBtu, and is
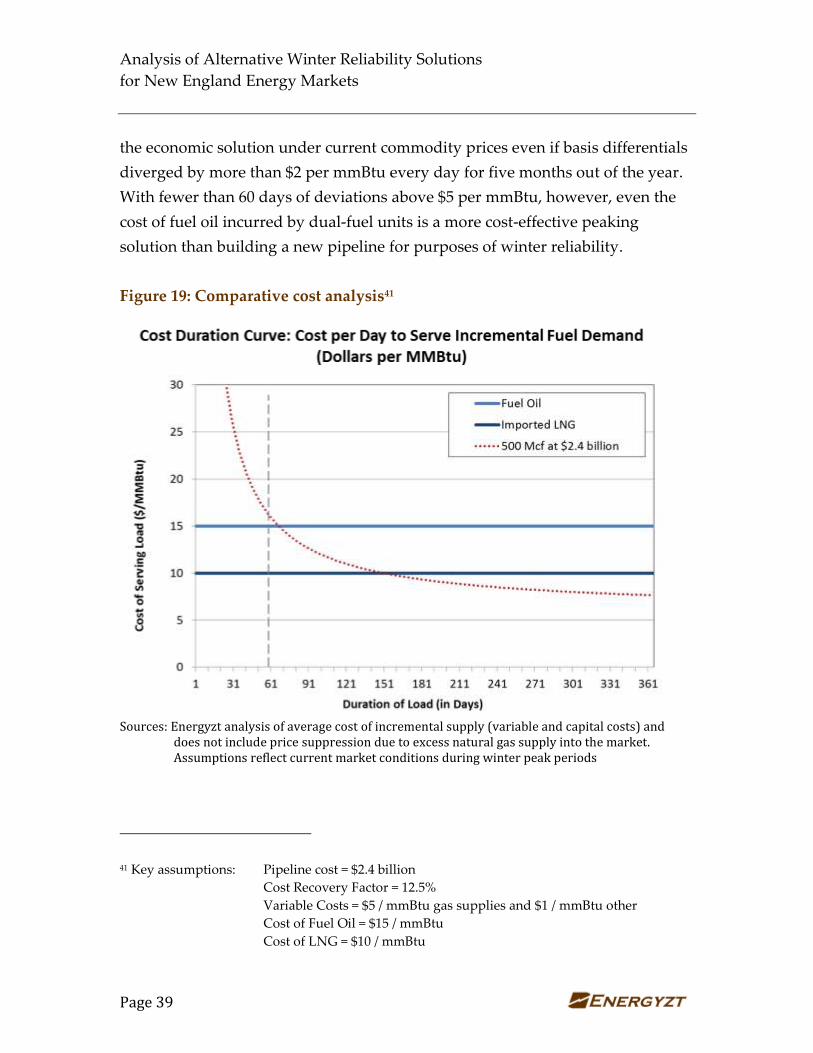
Analysis of Alternative Winter Reliability Solutions
for New England Energy Markets
Page 39
the economic solution under current commodity prices even if basis differentials
diverged by more than $2 per mmBtu every day for five months out of the year.
With fewer than 60 days of deviations above $5 per mmBtu, however, even the
cost of fuel oil incurred by dual-fuel units is a more cost-effective peaking
solution than building a new pipeline for purposes of winter reliability.
Figure 19: Comparative cost analysis41
Sources: Energyzt analysis of average cost of incremental supply (variable and capital costs) and
does not include price suppression due to excess natural gas supply into the market. Assumptions reflect current market conditions during winter peak periods
41 Key assumptions: Pipeline cost = $2.4 billion
Cost Recovery Factor = 12.5%
Variable Costs = $5 / mmBtu gas supplies and $1 / mmBtu other
Cost of Fuel Oil = $15 / mmBtu
Cost of LNG = $10 / mmBtu
Analysis of Alternative Winter Reliability Solutions
for New England Energy Markets
Page 40
Proponents of a new pipeline have argued that increasing natural gas delivery
capability into New England will reduce natural gas prices and create benefits
for electricity consumers in the form of lower electricity prices. These analyses
are problematic for the following reasons:
1) Winter Price Spikes: Historic prices realized only during winter periods
when existing energy infrastructure was not being utilized should not be
the reference case used to calculate benefits as market conditions reflect a
transient event caused by failure to contract existing energy infrastructure
which already is being addressed.
2) LNG Availability: Some of these studies assume LNG will not be
available going forward or will be too expensive. In fact, there currently is
an oversupply of LNG due to shale production and decreasing demand
from Asia, lowering LNG prices to very competitive levels. As already
mentioned, contracts already are being entered into by New England
natural gas distribution companies to lock in lower priced LNG under
current market conditions. Such contracts for LNG delivery from the east
may free-up firm pipeline capacity coming in from the west.
3) Pipeline Expansions Underway: An additional 600 million cubic feet per
day of pipeline capacity, funded by traditional funding mechanisms and
not electricity ratepayers, already is underway and projected to come
online by 2018. This capacity needs to be included in any assessment of
the impact on winter reliability.
4) Equivalent Benefits of Existing Infrastructure: As seen during Winter
2014/15, appropriate contracting with existing infrastructure decreased
basis differentials by half compared to the prior winter. Any benefit in
lower gas (and therefore electricity) prices that can be achieved by a new
gas pipeline also can be achieved by utilizing existing energy
infrastructure such as dual-fuel capability and LNG. Therefore, benefits
are close to equivalent for a given mmBtu of natural gas addition or
Analysis of Alternative Winter Reliability Solutions
for New England Energy Markets
Page 41
displacement when new pipeline capacity is required to meet winter
reliability needs, making the analysis one of comparative costs.42
As shown by the experience last winter and described in more detail in section
3.1, when existing energy infrastructure is utilized as was done historically, basis
differentials return to historic levels.
4.2 Market analysis
To project demand for natural gas from the electricity sector and to assess the
impact of dual-fuel capability and a transmission line from Canada, we use an
updated GE Maps model of New England using the most recent ISO-NE CELT
reports and EIA Annual Energy Outlook projections. Our base case and
scenarios are provided in Appendix B. This section summarizes our results.
4.2.1 Base Case: Shows declining demand for natural gas
The initial base case sets a market projection under assumptions supported by
the most recent 2015 CELT report. The 2015 CELT report implements
information on announced retirements and capacity additions as well as load
forecasts.
In addition, the base case assumes the ISO-NE projections that implement a
number of policy initiatives that serve to diversify the fuel base and lower
emissions including RPS requirements, RGGI emissions targets, distributed
generation, net metering, and energy efficiency.
The net result of these programs is a limited need for new natural gas-fired
generation capacity going forward. Under 2015 CELT assumptions, assuming
construction of new generation that has cleared the forward capacity market and
renewable build-out to reflect policy initiatives, we project that new natural gas-
42 Although the variable cost of each option may differ, they would be displacing the most
expensive resource in the supply stack, effectuating a decrease in basis differentials and absolute
prices, unless the proposal is to flood the market, in which case prices would artificially revert to
the marginal cost of the resource that would now be on the margin.
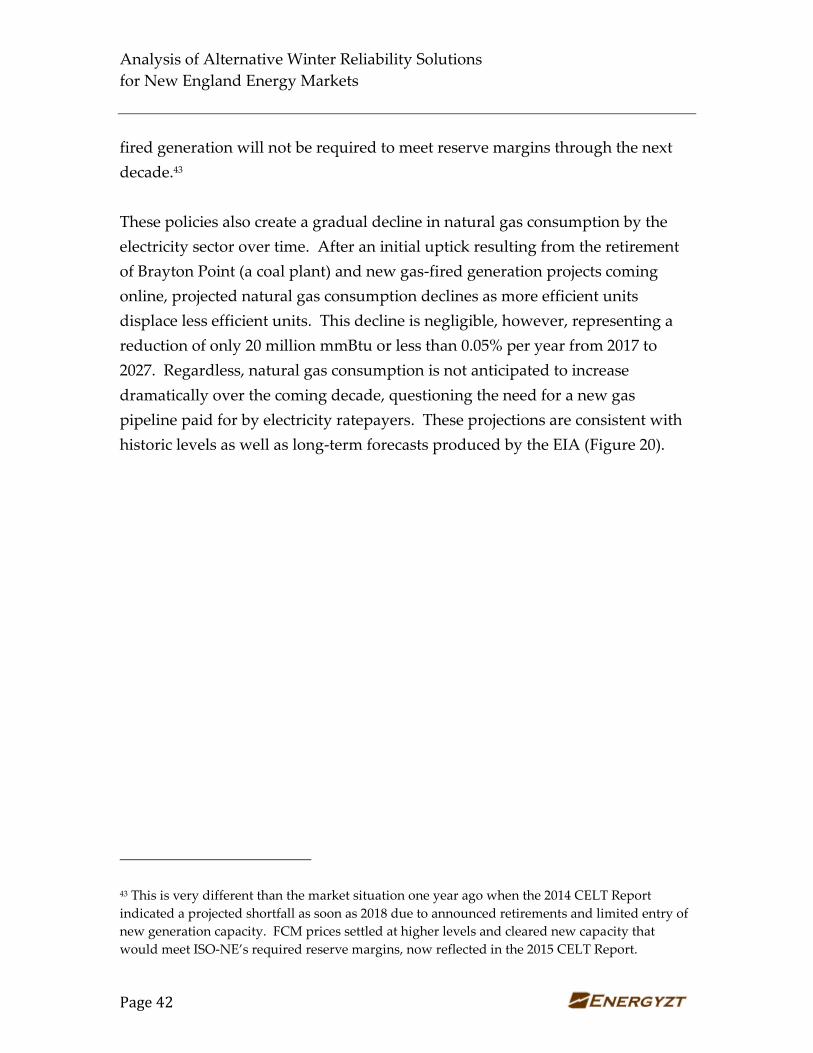
Analysis of Alternative Winter Reliability Solutions
for New England Energy Markets
Page 42
fired generation will not be required to meet reserve margins through the next
decade.43
These policies also create a gradual decline in natural gas consumption by the
electricity sector over time. After an initial uptick resulting from the retirement
of Brayton Point (a coal plant) and new gas-fired generation projects coming
online, projected natural gas consumption declines as more efficient units
displace less efficient units. This decline is negligible, however, representing a
reduction of only 20 million mmBtu or less than 0.05% per year from 2017 to
2027. Regardless, natural gas consumption is not anticipated to increase
dramatically over the coming decade, questioning the need for a new gas
pipeline paid for by electricity ratepayers. These projections are consistent with
historic levels as well as long-term forecasts produced by the EIA (Figure 20).
43 This is very different than the market situation one year ago when the 2014 CELT Report
indicated a projected shortfall as soon as 2018 due to announced retirements and limited entry of
new generation capacity. FCM prices settled at higher levels and cleared new capacity that
would meet ISO-NE’s required reserve margins, now reflected in the 2015 CELT Report.
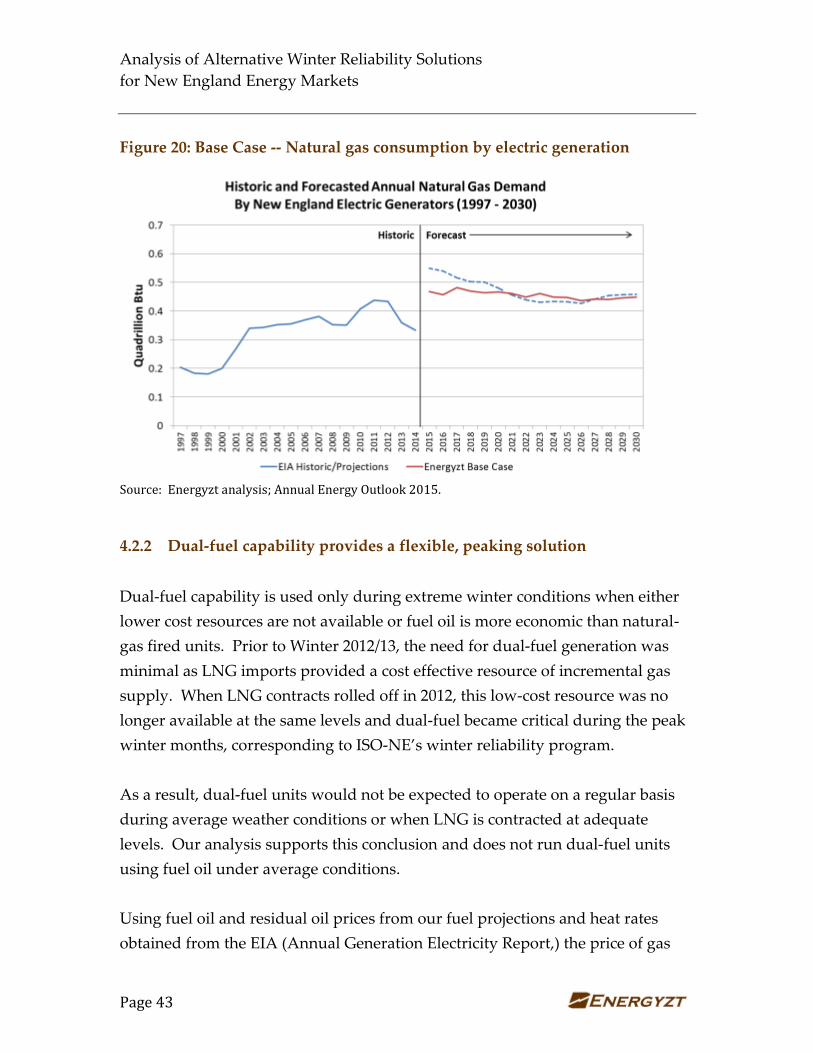
Analysis of Alternative Winter Reliability Solutions
for New England Energy Markets
Page 43
Figure 20: Base Case -- Natural gas consumption by electric generation
Source: Energyzt analysis; Annual Energy Outlook 2015.
4.2.2 Dual-fuel capability provides a flexible, peaking solution
Dual-fuel capability is used only during extreme winter conditions when either
lower cost resources are not available or fuel oil is more economic than natural-
gas fired units. Prior to Winter 2012/13, the need for dual-fuel generation was
minimal as LNG imports provided a cost effective resource of incremental gas
supply. When LNG contracts rolled off in 2012, this low-cost resource was no
longer available at the same levels and dual-fuel became critical during the peak
winter months, corresponding to ISO-NE’s winter reliability program.
As a result, dual-fuel units would not be expected to operate on a regular basis
during average weather conditions or when LNG is contracted at adequate
levels. Our analysis supports this conclusion and does not run dual-fuel units
using fuel oil under average conditions.
Using fuel oil and residual oil prices from our fuel projections and heat rates
obtained from the EIA (Annual Generation Electricity Report,) the price of gas
Analysis of Alternative Winter Reliability Solutions
for New England Energy Markets
Page 44
would need to be in the low $20’s per mmBtu to power plants – significantly
above our typical projected gas prices for New England that are in the $3.60 to
$4.60 per mmBtu with short-term peaks in the winter up to around $10 per
mmBtu. Once natural gas prices do exceed that level, however, dual-fuel units
become economic and can be used to mitigate electricity prices and ensure
winter reliability. They are insurance against extreme weather conditions and
emergency events.
To test the responsiveness of dual-fuel units to gas and oil prices, we ran GE
MAPs using alternative natural gas prices indexed to oil for the winter months of
December, January, February and March in the years 2015, 2020 and 2025.
From these sensitivity runs we can conclude that switching from gas to oil is a
direct function of the price differential between gas and oil. Even a small
differential of gas prices exceeding oil prices results in switching 3,464 MW from
gas to oil in market conditions such as those during the winter months of 2015.44
As the price differential between natural gas and oil gets larger, more gas is
displaced. For example, a price difference of $5.00 per mmBtu in 2020 switches
nearly the entire fleet of dual-fuel units. As more efficient units come online, less
natural gas is required per megawatt-hour of production, and the need for dual-
fuel capability declines over time for a given price differential (Figure 21).
44 This responsiveness is a result of the model which assumes efficient dispatch to optimize
production, and may not be representative of real-world conditions such as those which were
experienced during Winter 2012/13 when dual-fuel capability was not prepared to deliver.
However, it does illustrate the potential flexibility that can be achieved with proper planning and
optimized bidding behaviour reflecting relative costs of alternative fuel sources.
Analysis of Alternative Winter Reliability Solutions
for New England Energy Markets
Page 45
Figure 21: Dual-fuel generation switch from gas to oil (MW)
Year (Winter - 2nd Week January)
Natural gas price
adder to oil 2015 2020 2025
$ (0.50) 0 0 0
$ (0.10) 0 0 0
$ 0.00 560 0 0
$ 0.20 3,464 4,575 4,054
$ 0.50 3,313 4,575 4,054
$ 1.00 3,464 4,575 4,243
$ 5.00 4,770 5,827 4,736
$ 10.00 4,770 5,827 5,354
Source: Energyzt analysis, GE MAPs model runs under extreme market conditions and variable
ratios of natural gas versus distillate prices
We also examined projected gas consumption under extreme winter conditions
with no LNG, as occurred during Winter 2012/13 and Winter 2013/14, but with
dual-fuel capability. To control for other factors, we kept electric load constant
even though electricity demand could increase during extreme winter events.45
As shown in Figure 22, conversion to dual-fuel capability during cold weather
conditions can decrease demand from natural gas-fired generation dual-fuel
units, reducing natural gas consumption by 10 million mmBtu for the season. In
2020, the month of January experiences a 7.4 million mmBtu reduction in natural
gas consumption, illustrating the importance of intermonth flexibility to address
winter weather which can vary from week to week.
45 Given demand response and participation of load reductions in New England’s, increases in
electricity demand could be mitigated by higher prices during extreme weather conditions.
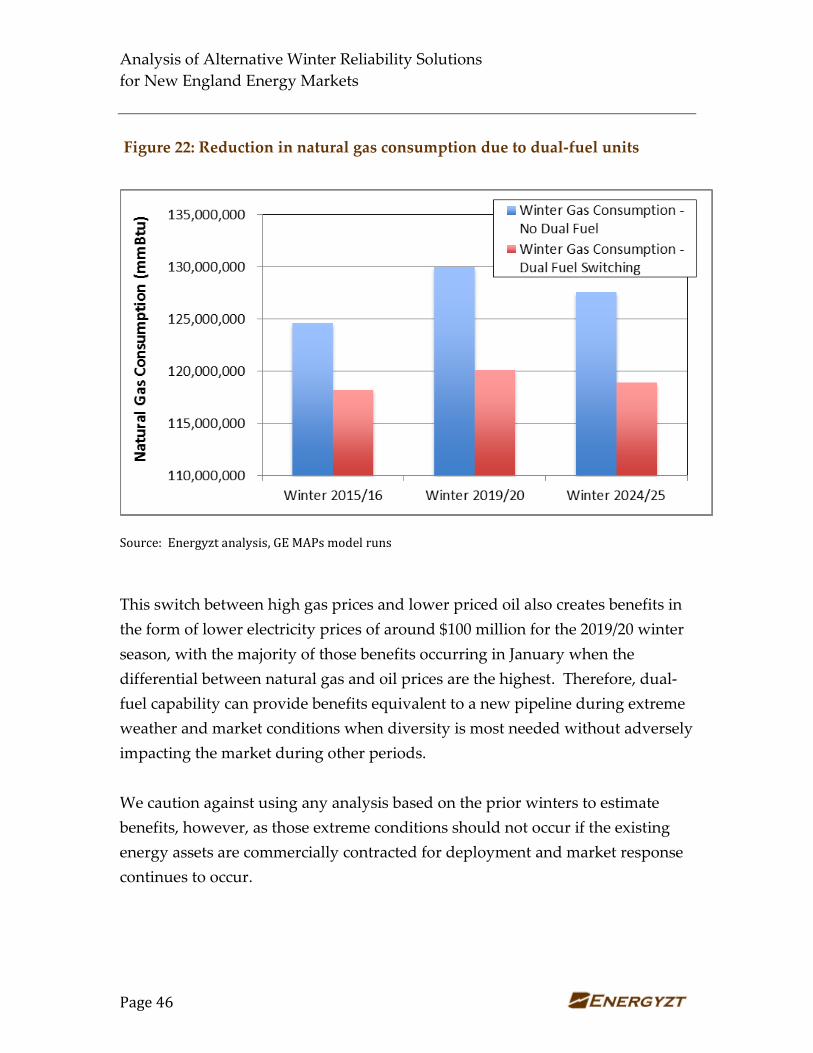
Analysis of Alternative Winter Reliability Solutions
for New England Energy Markets
Page 46
Figure 22: Reduction in natural gas consumption due to dual-fuel units
Source: Energyzt analysis, GE MAPs model runs
This switch between high gas prices and lower priced oil also creates benefits in
the form of lower electricity prices of around $100 million for the 2019/20 winter
season, with the majority of those benefits occurring in January when the
differential between natural gas and oil prices are the highest. Therefore, dual-
fuel capability can provide benefits equivalent to a new pipeline during extreme
weather and market conditions when diversity is most needed without adversely
impacting the market during other periods.
We caution against using any analysis based on the prior winters to estimate
benefits, however, as those extreme conditions should not occur if the existing
energy assets are commercially contracted for deployment and market response
continues to occur.
Analysis of Alternative Winter Reliability Solutions
for New England Energy Markets
Page 47
4.2.3 A new Canadian transmission line proposed as a baseload solution
New England electric distribution companies in Massachusetts, Rhode Island,
and Connecticut have developed a Clean Energy RFP to solicit bids for
renewable resources which include building new HVDC transmission lines from
Canada for hydroelectric imports. There are two known proposals to develop an
HVDC transmission line to bring hydroelectric imports into New England from
Canada totaling 2,400 MW of new non-gas-fired generation capacity. As a
sensitivity case, we assumed half of that amount of transmission capacity is built
and fully utilized for imports into New England during peak hours throughout
the year.
The effect of adding a 1,200 MW transmission line from Canada to the Base Case
for peak hour delivery is summarized in Figure 23. Such a project would
decrease natural gas consumption by around 40 million mmBtu per year, with
around 2.5 to 3 million mmBtu per month reduction during winter months.
Interestingly, the transmission line may displace less natural gas during winter
months than dual-fuel units. First, 1,200 MW of inframarginal supply coming in
from Canada is less than 6,200 MW of dual-fuel switching capability that is
available to meet winter reliability needs if properly contracted.46 Second,
displaced units are more likely to include oil-fired or other non-gas fired
generation peaking units during winter peak conditions. Lastly, long-distance
delivery from a winter-peaking electric system may introduce a new set of
delivery risks.47 The analysis shows that the Canadian transmission line, as a
46 The analysis does not assume use of the pipeline during off-peak hours and does not assume
any curtailment of interruptible energy from Canada.
47 Emergency conditions occurred in New England during the two extreme winters on December
13, 2013 and December 4, 2014 when significant curtailment of Canadian imports occurred. In
2013, curtailment occurred due to loads running over forecast and imports to the U.S. required
in-Province to meet reserve margins. In 2014, over 2,000 MW of imports from Canada were cut
due to a fault on high voltage transmission lines, later found to be the result of sabotage.
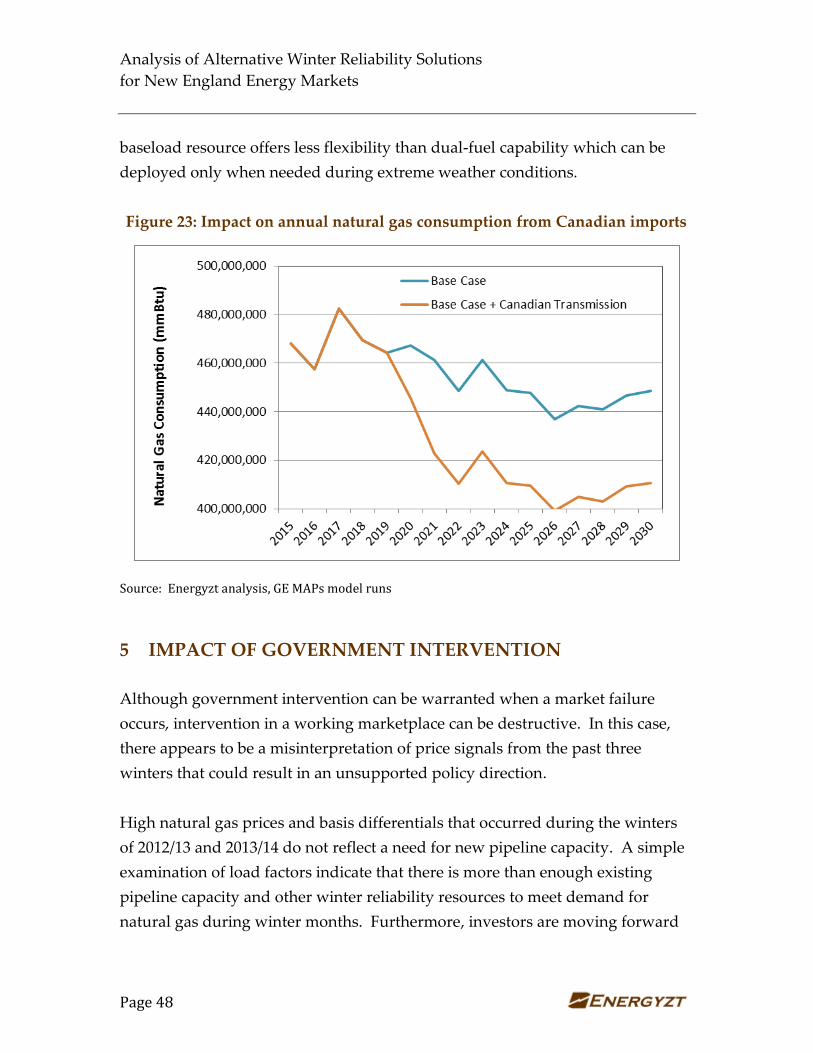
Analysis of Alternative Winter Reliability Solutions
for New England Energy Markets
Page 48
baseload resource offers less flexibility than dual-fuel capability which can be
deployed only when needed during extreme weather conditions.
Figure 23: Impact on annual natural gas consumption from Canadian imports
Source: Energyzt analysis, GE MAPs model runs
5 IMPACT OF GOVERNMENT INTERVENTION
Although government intervention can be warranted when a market failure
occurs, intervention in a working marketplace can be destructive. In this case,
there appears to be a misinterpretation of price signals from the past three
winters that could result in an unsupported policy direction.
High natural gas prices and basis differentials that occurred during the winters
of 2012/13 and 2013/14 do not reflect a need for new pipeline capacity. A simple
examination of load factors indicate that there is more than enough existing
pipeline capacity and other winter reliability resources to meet demand for
natural gas during winter months. Furthermore, investors are moving forward
Analysis of Alternative Winter Reliability Solutions
for New England Energy Markets
Page 49
with expanding existing pipelines to provide more than 600 million cubic feet
per day of delivery capacity.
Instead, price spikes during those winters reflect the rolling off of certain LNG
contracts that previously had mitigated winter price spikes by providing up to
650 million cubic feet per day of sendout capability and an average daily sendout
of 200 million cubic feet per day. When LNG contracts were not renewed, New
England did not enjoy the price mitigation, diversification, pipeline compression
from the east to counter inflows from the west, and reliability LNG historically
offered the region. Combined with transient events such as compressor
equipment failure and withdrawn imports from other jurisdictions due to their
own winter emergencies, plus limited dual-fuel capability the first winter, prices
spiked.
Once dual-fuel capability was assured through the ISO-NE winter reliability
program and LNG imports resumed, albeit at half of historic levels this past
winter, basis differentials were reduced by nearly half despite the same extreme
winter conditions if not worse. This reduction in basis differentials is equivalent
to public estimates of the benefit of a new pipeline, but without the upfront
infrastructure investment.
Going forward, dual-fuel capability and LNG provides economic solutions with
the benefits of diversification. Responding to market prices, gas distribution
companies have entered into long-term contracts for LNG. ISO-NE is developing
a market-based approach to ensuring capacity availability and performance
when needed as part of its performance incentive program that is agnostic to fuel
type to be implemented in 2018. Dual-fuel capability continues to be available
and is being added as a standard offering on new natural-gas fired generating
units. New pipeline capacity through expansions are underway to implement
more than 600 million cubic feet per day of delivery capacity. The extreme price
signals New England experienced during Winter 2012/13 and 2013/14 should not
repeat themselves again unless these investments do not proceed and/or the
Analysis of Alternative Winter Reliability Solutions
for New England Energy Markets
Page 50
region fails to commercially contract to use the existing energy infrastructure
already in place.
If the government were to move forward with proposals to fund a new pipeline
with regulated electricity ratepayer funding, an uneconomic solution will occur.
A new natural gas pipeline is not required now or for at least the next decade
under current policies that promote renewables, energy efficiency and demand
response given existing and planned energy infrastructure. If a transmission line
from Canada is built as part of the clean energy program to reduce carbon
emissions and increase renewables, there will be even less need for a new natural
gas pipeline. Proceeding with the proposal to build another 500 to 1,000 million
cubic feet per day of additional pipeline capacity funded by electricity ratepayers
will simply flood the market.
With negative price differentials (which we already are seeing during non-winter
months) and lack of demand, gas imports from Marcellus will find its natural
market, most likely in the Maritimes for export as LNG. Spectra already has
announced that it expects natural gas flows from the Maritimes into New
England to be reversed. Natural gas trade journals acknowledge that a new
pipeline could be used at least nine months of the year to flow natural gas into
Canada. In effect, electricity ratepayers will have subsidized a natural gas
pipeline for the benefit of Marcellus Shale producers, gas marketers, and
Canadian LNG export facilities.
Government intervention in working markets creates long-term problems.
Energy markets are dynamic, constantly changing and adjusting to market
forces. The energy markets in New England are working, and price signals from
the past few winters are signaling a need to contract for existing energy
infrastructure, not to build new pipelines. The market is responding by doing so.
Moving forward with a new pipeline funded by electricity ratepayers risks
stranded investment and ratepayer burden for the benefit of a number of other
market participants. Such an intervention will confound and inhibit future
competitive market investment, possibly leading to future capacity shortages
Analysis of Alternative Winter Reliability Solutions
for New England Energy Markets
Page 51
and/or a trend of increasing reliance on government support by private investors
for new infrastructure as is being required by proponents of the plan to rely on
electricity ratepayers.
Furthermore, funding a new pipeline through the electricity sector is inconsistent
with other policies that already are being funded for by electricity ratepayers and
result in a projected decline for natural gas in New England wholesale electricity
markets.
Given anticipated market conditions, the most recent projections by ISO-NE, and
environmental policies in place at the state and federal levels, a government-
mandated funding of a new pipeline using electricity ratepayer dollars (which
has never been done before) is likely to expose those ratepayers to a needless
infrastructure investment to the benefit of others.
6 CONCLUSIONS
Although the extreme winters of 2012/13 and 2013/14 created peak prices with
higher than average basis differentials, these price signals do not indicate a
shortfall in baseload delivery capacity. In reality, there is a significant amount of
underutilized natural gas pipeline capacity with more being built, as well as
significant amount of existing infrastructure that offers an economic source of
diversification and reliability.
Winter peak price signals reflect a divergence in basis differentials above $5 per
mmBtu less than 60 days out of the year. This is reflective of a peaking problem
that is best solved with a peak solution, not a baseload infrastructure investment.
Fortunately, there is a significant amount of existing energy infrastructure
already in place and being expanded to meet winter reliability requirements,
including existing pipeline capacity, dual-fuel capability, LNG import
infrastructure and planned pipeline expansions that do not rely on electric
ratepayers subsidizing a new natural gas pipeline. A moderate level of
contractual arrangements were in place for Winter 2014/15 and price spikes
Analysis of Alternative Winter Reliability Solutions
for New England Energy Markets
Page 52
experienced the previous winter were reduced by half. Additional underutilized
capacity remains available and using it more fully could have an even greater
positive impact for the region.
To test our hypothesis that dual-fuel capability is sufficient to address winter
peaks, with and without LNG imports, we ran our market model through 2030.
The results confirm our expectation that dual-fuel capability is not needed under
average conditions but serves as an insurance policy for extreme winter
conditions when other energy infrastructure is not available. Dual-fuel capability
can generate benefits in the form of lower electricity prices to electricity
consumers of around $100 million during the 2019/20 winter season with
contracting conditions similar to Winter 2012/13 and Winter 2013/14, and reduce
natural gas consumption by up to 7.4 million mmBtu per month when needed
most under projected conditions. A new transmission line from Canada reduces
gas consumption year round, but by less than the full 1,200 MW of capability, or
around 2.5 million mmBtu per month, due to oil-fired generation displacement.
Dual-fuel capability is a more flexible peaking resource.
There are a number of policy initiatives in place that lower new natural gas
demand and preclude the need for a new pipeline. Federal and state programs
to support renewable resources which minimize future projections of natural gas
demand as well as low load growth expected due to demand response and
energy efficiency programs limit the potential growth of natural gas demand in
New England. Under the base case, natural gas consumption in New England is
expected to increase in 2017 due to the retirement of Brayton Point, followed by a
steady decline as more efficient natural gas units come online. Consistent with
the EIA’s long-term projections, natural gas demand in New England is not
projected to increase under current projections of market conditions and
environmental policy, but to decline.
In the near-term, more than 600 million cubic feet per day of pipeline expansion,
new LNG contracts entered into by gas distribution companies, and ISO-New
England’s programs to ensure performance in the forward capacity market are
Analysis of Alternative Winter Reliability Solutions
for New England Energy Markets
Page 53
market-based solutions that will mitigate winter reliability concerns and high
energy prices. The potential for lower cost, non-gas-fired generation imports via
a transmission line from Canada, if built as part of the clean energy program,
also will diversify the generation base in New England.
As a result, energy infrastructure is adequate over the next ten years to support
winter reliability. Significant conversion to natural gas-fired generation is
required to justify new pipeline capacity, which is expected to be limited by
other policies that support renewables, imports and limited load growth. Even
during extreme winter conditions, new pipeline capacity is not required to meet
New England natural gas demand needs given existing infrastructure, current
market conditions, and policy initiatives. In the meantime, market-based
solutions are occurring in the context of policy initiatives that propose to
diversify our power production resources and resolve concerns about an
overreliance on natural gas.
New England has competitive markets for both natural gas and electricity. These
markets have shown a keen ability to respond to market price signals and winter
reliability programs, as seen during the 2014/15 winter. The combination of LNG
imports and dual-fuel units reduced basis differentials by close to 50 percent,
roughly the same benefits as public estimates of a new pipeline, without any
upfront capital cost. This benefit can be expected to continue, without the capital
investment associated with building a new natural gas pipeline funded by
electricity ratepayers, so long as commercial contracts are in place to utilize
existing infrastructure.
If there is a market failure contributing to high winter prices, it is due to a lack of
incentive to enter into contracts to utilize existing capacity. High prices have
created an incentive. ISO-NE market-based performance incentive programs
motivate contracting with existing infrastructure. Competitive energy markets in
New England respond to incentives, as seen by the experience from Winter
2014/15. They can be expected to respond as conditions change going forward.

Analysis of Alternative Winter Reliability Solutions
for New England Energy Markets
Page 54
Contracts, not construction, are required. New England’s energy markets are
working.

APPENDIX A: About Energyzt Analysis of Alternative Winter Reliability Solutions for New England Energy Markets
APPENDIX A: About Energyzt
GLOBAL TEAM OF ENERGY EXPERTS
APPLIED EXPERIENCE
Energyzt is a global collaboration of energy
experts who create value for our clients
through actionable insights. Combining
deep industry expertise with state of the art
analytical capabilities, we help companies
make informed business decisions that
create competitive advantage. With
changing dynamics of the energy industries
increasing market uncertainty and business
risk, a more rigorous approach is required.
MULTIDISCIPLINED EXPERTISE
Energyzt is structured into three functional
areas of excellence that include advisory
services, industry analytics, and support for
business development functions. Energyzt
consists of a core team of energy experts
representing the power sector, transmission,
natural gas industry, coal markets,
environmental policy and finance, along with
an overseas team that offers operational
research, software programming and
modeling support.
Members of the Energyzt team have long-
standing history working in industry, economic
consulting firms, management consulting firms,
private equity, research companies, engineering
companies and government. The combination
of industry expertise, market experience, and
advanced analytics brings a unique set of
market insights that are supported by facts and
defensible in a court of law or regulatory
hearing.
APPENDIX B: GE MAPS Data Sources and Input Assumptions Analysis of Alternative Winter Reliability Solutions for New England Energy Markets
Page B-1
APPENDIX B:
GE MAPS Data Sources and Input Assumptions
B.1: OVERVIEW OF GE MAPS MARKET MODEL
In this study, Energyzt used the GE Multi-Area Production Simulation (“MAPS”)
market model to forecast future electricity prices, generation, production costs and fuel
consumption within ISO-NE, the New England electricity market.
MAPS is a detailed optimization model that simulates the hourly operation of
individual generating units and power flows across the transmission system within a
electricity pool or pools1. MAPS is widely used in the electricity industry and was
developed originally 40 years ago by GE.
For purposes of this analysis, ISO-NE was represented as a single pool and simulations
were run for 2015 to 2030. Imports/exports from/to other pools in the Eastern
Interconnect were modeled as hourly flows, based on historical data from 2011 – 2013.
This simplification of the Eastern Interconnect was appropriate for this analysis because
of the focus on ISO-NE and the relatively simple transmission interconnections between
ISO-NE and surrounding regions.
From the detailed hourly simulations, power prices,2 emissions, generation, duel
consumption and operating costs were estimated across the ISO-NE system.
The purpose of the MAPS simulations was to quantify, for the ISO-NE electricity
market, the potential benefits of alternative solutions to winter reliability. In addition to
1MAPS performs a security constrained least-cost dispatch of the generation system, and takes into
account the effect of possible transmission outages in the optimization process. Consequently the
generation solution is robust.
2 MAPS estimates electricity prices based on locational marginal pricing, which is the price-setting
methodology deployed by ISO-NE and other U.S. electricity markets
APPENDIX B: GE MAPS Data Sources and Input Assumptions Analysis of Alternative Winter Reliability Solutions for New England Energy Markets
Page B-2
realistic forecasts of natural gas demand for purposes of understanding the need for a
new natural gas pipeline, we calculated the benefits of dual-fuel-capability units and of
additional transmission capacity to bring hydroelectric power from Canada during
peak hours.
MAPS was run to simulate the following:
1. Base Case that reflects the 2015 ISO-NE CELT Report with dual-fuel
capability
2. Base Case with no dual-fuel capability
3. Base Case with additional electricity imports from Canada starting in 2020 via
a new 1,200 MW transmission line during peak hours
4. Scenario 1 with extreme gas prices in winter months
5. Scenario 3 with extreme gas prices in winter months
In MAPS, with extreme winter prices representing a cold winter with low LNG imports,
such as what occurred in the 2012/13 and 2013/14 winters, a dual-fuel-capable units
switch to FO2 when this is less expensive than gas.
Assumptions underlying these model runs are described more fully below.
B.2. GE MAPS DATA ASSUMPTIONS
Key assumptions in MAPS include the following:
Demand: Peak and energy demand forecasts are input into the model on an
annual basis and converted into hourly demands using historical demand
patterns
APPENDIX B: GE MAPS Data Sources and Input Assumptions Analysis of Alternative Winter Reliability Solutions for New England Energy Markets
Page B-3
Supply: Existing generation is modeled at the unit level, based on historical
operating characteristics, including capacity, variable operation and
maintenance (“O&M”) costs, heat rates, emissions rates and other operating
parameters such as minimum up and down times.
Capacity Build-out: New generation is based on announced projects that are
under construction or, in some cases, permitted. The characteristics of new
generation are based on existing units, or expected technologies, as
appropriate.
Fuel Costs: Forecasted fuel prices for coal, gas and oil are represented on a
weekly, monthly or annual basis as necessary and are incorporated into the
calculation of the marginal cost of production for each generating unit.
Emissions Costs: The cost of emissions is incorporated into the marginal cost
of production. Forecasted prices for CO2, SO2 and NOx allowances are
combined with assumed emissions rates for each unit, to give an emissions
cost per MWh for each unit.
Transmission: GE MAPS contains a representation of the ISO-NE
transmission system in the form of a load flow, which incorporates known
and expected transmission constraints.
In conducting this analysis, Energyzt started with a GE-supplied database for ISO-NE.
This was significantly updated using publicly-available energy market data,
specifically:
Reports issued by ISO-NE covering demand, generation and transmission
Generating unit data from ABB’ Velocity Suite (“Energy Velocity”)
Fuel price forecasts, primarily based on the U.S. Energy Information
Administration (“EIA”) and Energy Velocity
Emissions allowance prices from emissions brokers
A more detailed description of key variables is provided below.
APPENDIX B: GE MAPS Data Sources and Input Assumptions Analysis of Alternative Winter Reliability Solutions for New England Energy Markets
Page B-4
B.2.1 Demand Forecasts
In MAPS, ISO-NE electricity demand is represented by hourly demand forecasts for
each ISO-NE load area. These demand forecasts are constructed using historical hourly
load patterns for each area, combined with annual peak load and energy forecasts based
on ISO-NE projections.
The annual energy and peak demand forecasts used in this study were based on the
ISO-NE forecasts prepared as part of the 2015 CELT Report (May 15, 2015). These
forecasts cover 2015 - 2024.
The ISO-NE demand forecasts are based on estimates of the underlying rate of historical
electricity growth, with separate bottom–up forecasts of the effect of energy efficiency
(passive demand response) and of the growth of behind-the-meter solar PV, both of
which are growing substantially and reduce demand and lower overall growth rates.
For the period 2015 – 2024, energy efficiency is estimated to grow from 1,685 MW to
3,579 MW and behind the-meter-solar PV from 145 MW to 450 MW.
In the market simulations, Energyzt used the net ISO-NE demand forecasts (i.e.
adjusted for energy efficiency and behind-the-meter solar PV.)3 The average annual
growth rate for net peak demand from this forecast from 2015 to 2024 is 0.5%. For
annual energy demand, in the ISO-NE net forecast this remains relatively constant,
effectively 0% growth from 2015 to 2024.
Projected annual energy and peak demand forecasts are shown in Figures B-1 and B-2.
3 By using the net demand forecast, these resources do not need to be modeled explicitly.
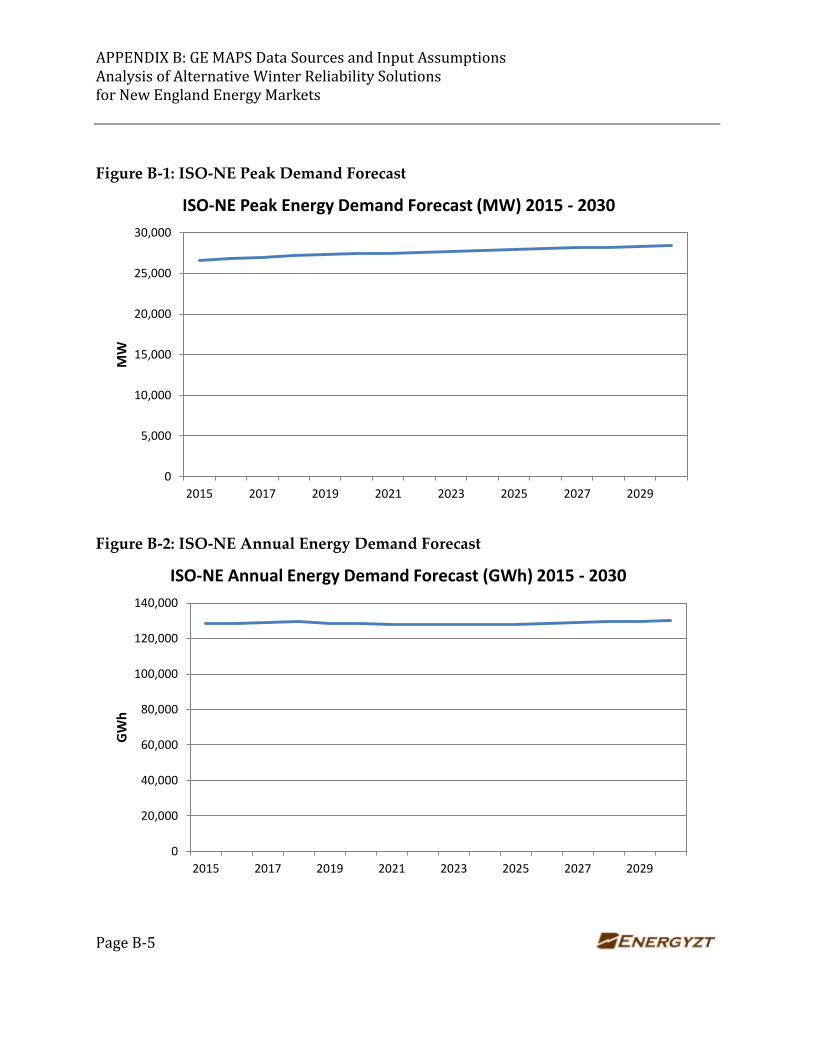
APPENDIX B: GE MAPS Data Sources and Input Assumptions Analysis of Alternative Winter Reliability Solutions for New England Energy Markets
Page B-5
Figure B-1: ISO-NE Peak Demand Forecast
Figure B-2: ISO-NE Annual Energy Demand Forecast
0
5,000
10,000
15,000
20,000
25,000
30,000
2015 2017 2019 2021 2023 2025 2027 2029
MW
ISO-NE Peak Energy Demand Forecast (MW) 2015 - 2030
0
20,000
40,000
60,000
80,000
100,000
120,000
140,000
2015 2017 2019 2021 2023 2025 2027 2029
GW
h
ISO-NE Annual Energy Demand Forecast (GWh) 2015 - 2030
APPENDIX B: GE MAPS Data Sources and Input Assumptions Analysis of Alternative Winter Reliability Solutions for New England Energy Markets
Page B-6
Many utilities utilize demand response programs to reduce peak loads and cap energy
market prices in times of high system demand or capacity shortages. The MAPS
simulations include demand response resources, based on the ISO-NE forecasts of
demand response as per CELT 2015 and the corresponding Forward Capacity Auction.
In this analysis, Energyzt assumed active demand response of 647 MW, based on the
CELT report.
B.2.2 Generation Capacity
The MAPS database used for the simulations includes the existing and expected
thermal and renewable generation in the ISO-NE market over the period of the
simulation. As the starting point for this analysis, Energyzt explicitly adjusted the GE
MAPS database to match the existing and planned generation listed in the ISO-NE 2015
CELT as of April 2015.
The generating capacity available in each future year changes to reflect planned and
likely retirements and new generation. The retirement assumptions used in the analysis
are based on ISO-NE approved retirements as of April 2015. Specific new generation
additions are based on new units identified in the 2015 CELT report, the ISO-NE
Forward Capacity Auction 9 (February 2015) and the Energy Velocity new unit
database. Typically, these specific new units are either under construction, permitted,
or have PPA agreements.
In addition to these named new units, the simulation includes expected new renewable
generation in ISO-NE, primarily solar and wind. New solar generation is based on the
2015 CELT report, and represents utility or merchant solar generation. Distributed solar
APPENDIX B: GE MAPS Data Sources and Input Assumptions Analysis of Alternative Winter Reliability Solutions for New England Energy Markets
Page B-7
generation – i.e. behind-the-meter PV – is not included as this has been subtracted from
the ISO-NE demand forecast used in the simulations.4
The 2015 CELT report does not include an explicit forecast of new wind generation
other than near-term units under construction. Energyzt’s forecast of new wind
generation assumes around 50% of the current proposals for interconnection of wind
plants will proceed. This is consistent with the expectation that the majority of new
wind resources will be located in Maine, where around 1,000 MW of additional wind
can be added before additional transmission into the rest of ISO-NE will be needed.
With respect to new hydro and biomass generation in ISO-NE, Energyzt assumes only
the projects listed in the interconnection queue.
As discussed previously, the ISO-NE CELT 2015 demand forecasts have low annual
growth rates over the period of the simulation because of the expected effect of energy
efficiency and behind-the-meter solar PV. Nonetheless, towards the end of the period,
some additional generic thermal capacity is likely to be needed to maintain ISO-NE’s
reserve margin at 15%. Given the nature of the ISO-NE generation system, and the
addition of significant new wind capacity, Energyzt has assumed these new generic
thermal additions will be gas-fired combustion turbines.
Retirements
The 2015 ISO-NE CELT report identifies announced retirements. Energyzt retires these
units in the model on the projected retirement date.
4 Total solar installations includes 1) behind-the-meter installations; 2) solar projects under construction;
3) announced solar projects; and 4) generic solar installations included as part of the build-out to meet
environmental objectives such as lower emissions under RGGI.
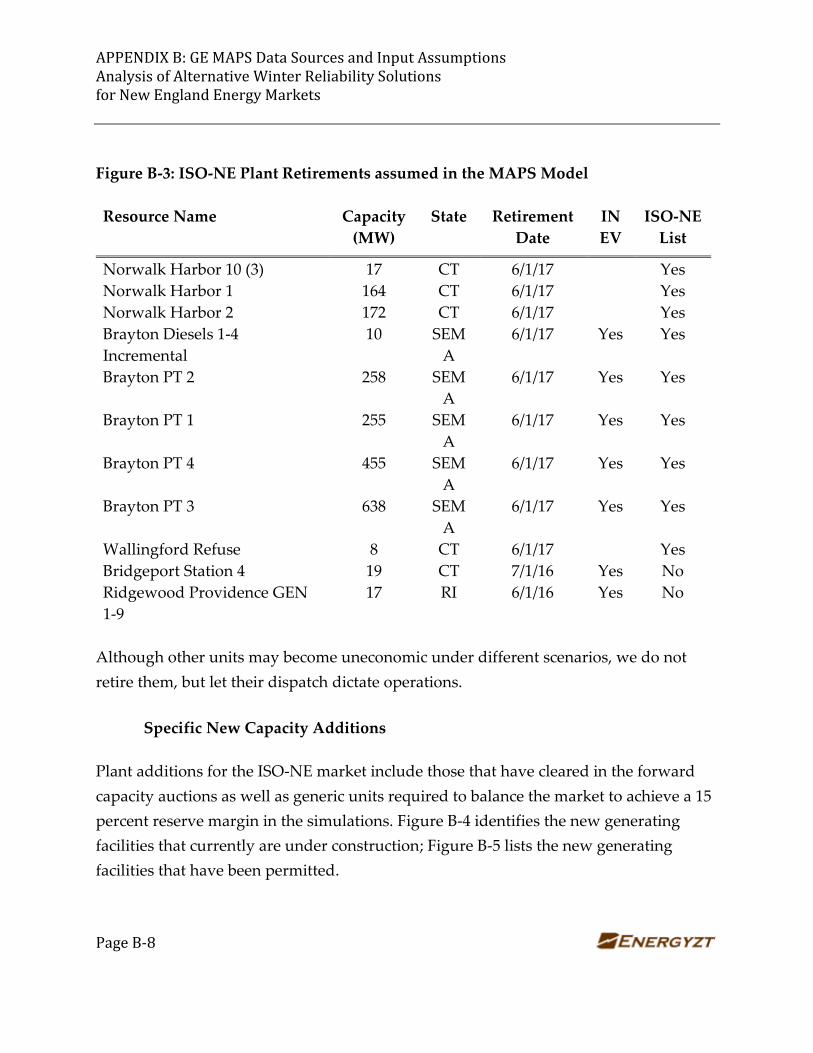
APPENDIX B: GE MAPS Data Sources and Input Assumptions Analysis of Alternative Winter Reliability Solutions for New England Energy Markets
Page B-8
Figure B-3: ISO-NE Plant Retirements assumed in the MAPS Model
Resource Name Capacity
(MW)
State Retirement
Date
IN
EV
ISO-NE
List
Norwalk Harbor 10 (3) 17 CT 6/1/17 Yes
Norwalk Harbor 1 164 CT 6/1/17 Yes
Norwalk Harbor 2 172 CT 6/1/17 Yes
Brayton Diesels 1-4
Incremental
10 SEM
A
6/1/17 Yes Yes
Brayton PT 2 258 SEM
A
6/1/17 Yes Yes
Brayton PT 1 255 SEM
A
6/1/17 Yes Yes
Brayton PT 4 455 SEM
A
6/1/17 Yes Yes
Brayton PT 3 638 SEM
A
6/1/17 Yes Yes
Wallingford Refuse 8 CT 6/1/17 Yes
Bridgeport Station 4 19 CT 7/1/16 Yes No
Ridgewood Providence GEN
1-9
17 RI 6/1/16 Yes No
Although other units may become uneconomic under different scenarios, we do not
retire them, but let their dispatch dictate operations.
Specific New Capacity Additions
Plant additions for the ISO-NE market include those that have cleared in the forward
capacity auctions as well as generic units required to balance the market to achieve a 15
percent reserve margin in the simulations. Figure B-4 identifies the new generating
facilities that currently are under construction; Figure B-5 lists the new generating
facilities that have been permitted.
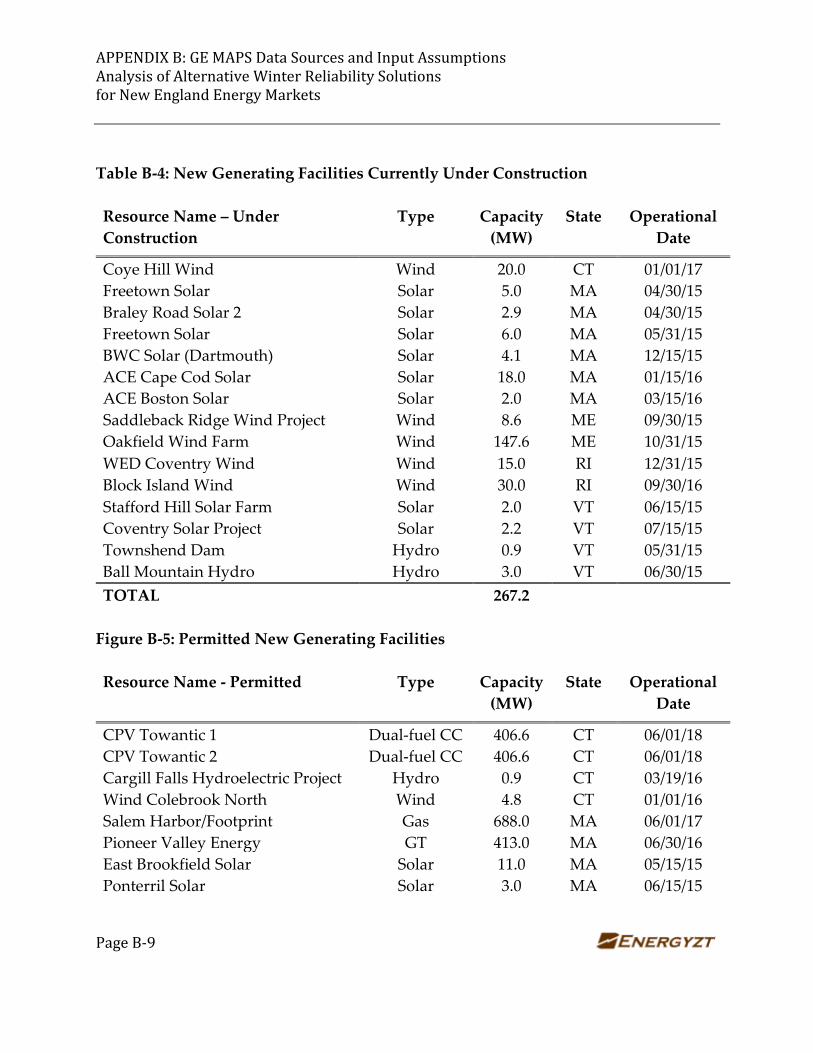
APPENDIX B: GE MAPS Data Sources and Input Assumptions Analysis of Alternative Winter Reliability Solutions for New England Energy Markets
Page B-9
Table B-4: New Generating Facilities Currently Under Construction
Resource Name – Under
Construction
Type Capacity
(MW)
State Operational
Date
Coye Hill Wind Wind 20.0 CT 01/01/17
Freetown Solar Solar 5.0 MA 04/30/15
Braley Road Solar 2 Solar 2.9 MA 04/30/15
Freetown Solar Solar 6.0 MA 05/31/15
BWC Solar (Dartmouth) Solar 4.1 MA 12/15/15
ACE Cape Cod Solar Solar 18.0 MA 01/15/16
ACE Boston Solar Solar 2.0 MA 03/15/16
Saddleback Ridge Wind Project Wind 8.6 ME 09/30/15
Oakfield Wind Farm Wind 147.6 ME 10/31/15
WED Coventry Wind Wind 15.0 RI 12/31/15
Block Island Wind Wind 30.0 RI 09/30/16
Stafford Hill Solar Farm Solar 2.0 VT 06/15/15
Coventry Solar Project Solar 2.2 VT 07/15/15
Townshend Dam Hydro 0.9 VT 05/31/15
Ball Mountain Hydro Hydro 3.0 VT 06/30/15
TOTAL 267.2
Figure B-5: Permitted New Generating Facilities
Resource Name - Permitted Type Capacity
(MW)
State Operational
Date
CPV Towantic 1 Dual-fuel CC 406.6 CT 06/01/18
CPV Towantic 2 Dual-fuel CC 406.6 CT 06/01/18
Cargill Falls Hydroelectric Project Hydro 0.9 CT 03/19/16
Wind Colebrook North Wind 4.8 CT 01/01/16
Salem Harbor/Footprint Gas 688.0 MA 06/01/17
Pioneer Valley Energy GT 413.0 MA 06/30/16
East Brookfield Solar Solar 11.0 MA 05/15/15
Ponterril Solar Solar 3.0 MA 06/15/15
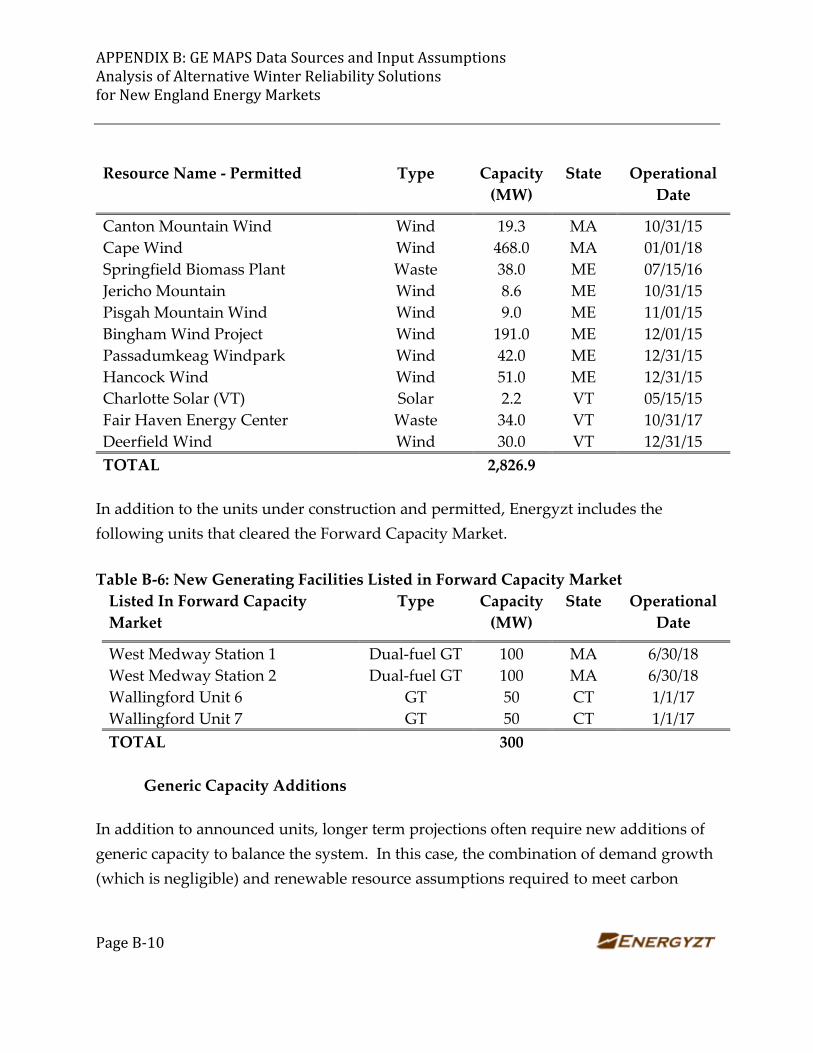
APPENDIX B: GE MAPS Data Sources and Input Assumptions Analysis of Alternative Winter Reliability Solutions for New England Energy Markets
Page B-10
Resource Name - Permitted Type Capacity
(MW)
State Operational
Date
Canton Mountain Wind Wind 19.3 MA 10/31/15
Cape Wind Wind 468.0 MA 01/01/18
Springfield Biomass Plant Waste 38.0 ME 07/15/16
Jericho Mountain Wind 8.6 ME 10/31/15
Pisgah Mountain Wind Wind 9.0 ME 11/01/15
Bingham Wind Project Wind 191.0 ME 12/01/15
Passadumkeag Windpark Wind 42.0 ME 12/31/15
Hancock Wind Wind 51.0 ME 12/31/15
Charlotte Solar (VT) Solar 2.2 VT 05/15/15
Fair Haven Energy Center Waste 34.0 VT 10/31/17
Deerfield Wind Wind 30.0 VT 12/31/15
TOTAL 2,826.9
In addition to the units under construction and permitted, Energyzt includes the
following units that cleared the Forward Capacity Market.
Table B-6: New Generating Facilities Listed in Forward Capacity Market
Listed In Forward Capacity
Market
Type Capacity
(MW)
State Operational
Date
West Medway Station 1 Dual-fuel GT 100 MA 6/30/18
West Medway Station 2 Dual-fuel GT 100 MA 6/30/18
Wallingford Unit 6 GT 50 CT 1/1/17
Wallingford Unit 7 GT 50 CT 1/1/17
TOTAL 300
Generic Capacity Additions
In addition to announced units, longer term projections often require new additions of
generic capacity to balance the system. In this case, the combination of demand growth
(which is negligible) and renewable resource assumptions required to meet carbon
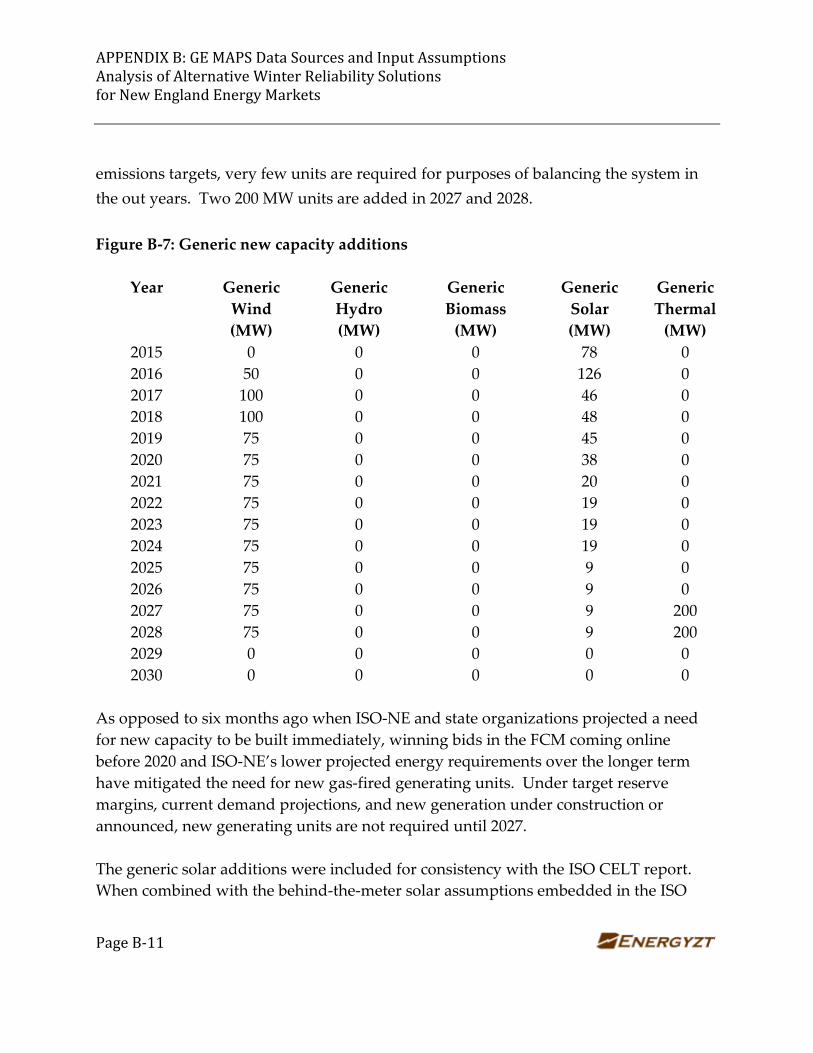
APPENDIX B: GE MAPS Data Sources and Input Assumptions Analysis of Alternative Winter Reliability Solutions for New England Energy Markets
Page B-11
emissions targets, very few units are required for purposes of balancing the system in
the out years. Two 200 MW units are added in 2027 and 2028.
Figure B-7: Generic new capacity additions
Year Generic
Wind
(MW)
Generic
Hydro
(MW)
Generic
Biomass
(MW)
Generic
Solar
(MW)
Generic
Thermal
(MW)
2015 0 0 0 78 0
2016 50 0 0 126 0
2017 100 0 0 46 0
2018 100 0 0 48 0
2019 75 0 0 45 0
2020 75 0 0 38 0
2021 75 0 0 20 0
2022 75 0 0 19 0
2023 75 0 0 19 0
2024 75 0 0 19 0
2025 75 0 0 9 0
2026 75 0 0 9 0
2027 75 0 0 9 200
2028 75 0 0 9 200
2029 0 0 0 0 0
2030 0 0 0 0 0
As opposed to six months ago when ISO-NE and state organizations projected a need
for new capacity to be built immediately, winning bids in the FCM coming online
before 2020 and ISO-NE’s lower projected energy requirements over the longer term
have mitigated the need for new gas-fired generating units. Under target reserve
margins, current demand projections, and new generation under construction or
announced, new generating units are not required until 2027.
The generic solar additions were included for consistency with the ISO CELT report.
When combined with the behind-the-meter solar assumptions embedded in the ISO
APPENDIX B: GE MAPS Data Sources and Input Assumptions Analysis of Alternative Winter Reliability Solutions for New England Energy Markets
Page B-12
load projections, solar projects under construction, and announced solar projects, total
solar additions are anticipated to be 850 MW by 2020, with another 150 MW of solar
additions thereafter.5
Imports
ISO-NE is connected to NYISO, Ontario, Quebec and New Brunswick through six AC
and DC interfaces. Power is imported and exported across these interfaces, with the
magnitude of the import or export varying with the time of day and month.
Historically, in recent years the average monthly net flow into ISO-NE from external
pools ranged from 1,000 MW to 2,200MW.
The MAPS model used for these simulations represents just the ISO-NE market area.
To ensure imports and exports are accounted for correctly, Energyzt used 2011-2013
historical data to estimate the monthly average peak and offpeak hourly flows into or
out of ISO-NE for each of the six interfaces. Assuming that the transmission limits
across the interfaces do not change, this avoids needing to represent the adjoining pools
within the model.
B.2.3 Natural Gas Forecasts
Natural gas price forecasts were developed for a Base Case and Extreme Weather Case
on a monthly or weekly basis as required for the analysis. These forecasts were
prepared for each of four major natural gas pricing Hubs in New England - Algonquin
City Gate, Dracut, Iroquois-Zone 2, and Dominion South. They were also prepared for
Henry Hub in Louisiana and the Marcellus region in Pennsylvania. The basic drivers
for these forecasts were the EIA Annual Energy Outlook 2015 Long Range Reference
Case natural gas price series.
5 Although less than the ISO-NE stated expectation of 2,000 MW of solar capacity on the system, the
assumptions are consistent with ISO-NE projections.
APPENDIX B: GE MAPS Data Sources and Input Assumptions Analysis of Alternative Winter Reliability Solutions for New England Energy Markets
Page B-13
Within MAPS, each gas-fired unit is assigned a gas price based on the pipeline/hub that
serves that site.
The Base and Extreme Weather cases relied on gas price assumptions at Henry Hub and
then applied “basis differentials” - differences between the prices at delivery points in
New England and the Henry Hub or Marcellus points - to estimate the final delivered
prices. Because of the large volatility that has been experienced in gas prices both
seasonally, monthly, and even weekly (for the Extreme Weather case), the build-up of
these forecasts required daily gas prices and quantities at each of the points. The
historical data on delivered prices were downloaded from Energy Velocity based on
EIA reports from utilities and power generators.
Base Case Assumptions
The Base Case represents a plausible future scenario with normal weather trends,
pipeline capacity additions, imports of LNG, and, over time, more natural gas coming
from the Marcellus Region and blending in with Gulf Coast gas shipped by the existing
long-distance pipelines. Monthly price volatility was captured in the Henry Hub prices
as well as the basis differentials.
Short-term and long-term price forecasts for Henry Hub were based on the EIA Short
Term Natural gas Outlook (May 2015) and the AEO 2015 Reference Case (April 2015)
that goes out to the year 2040. These were compared to a number of other public and
private sources for reasonableness and as a quality check, and were selected because
they represent well-established and publically available sources.
Historical basis differentials were calculated on a monthly basis for the last three years
(2013 – 2015) from the historical data by direct calculation and then weight- averaged on
a monthly and year-to-year basis. The prices are expressed in 2014$ per mmBtu
APPENDIX B: GE MAPS Data Sources and Input Assumptions Analysis of Alternative Winter Reliability Solutions for New England Energy Markets
Page B-14
delivered to each of the Hubs adjusted for inflation using deflators from the Annual
Energy Outlook.
Figure B-8 shows the price paths for the key Hubs and seasonal volatility declining over
time due to the new supplies of gas coming into the region due to the announced
pipeline expansion projects. Underlying the projection there is an immediate reduction
in winter basis differentials reflecting partial contracting for LNG and dual-fuel
capability as seen last winter with another reduction to reflect the commercial operation
date of an additional 600 million cubic feet per day of pipeline capacity resulting from
the AIM project, Atlantic Bridge pipeline and CT Expansion. Thereafter, gas prices
follow a slow growth pattern consistent with EIA’s outlook and the national and global
natural gas supply and demand balances.
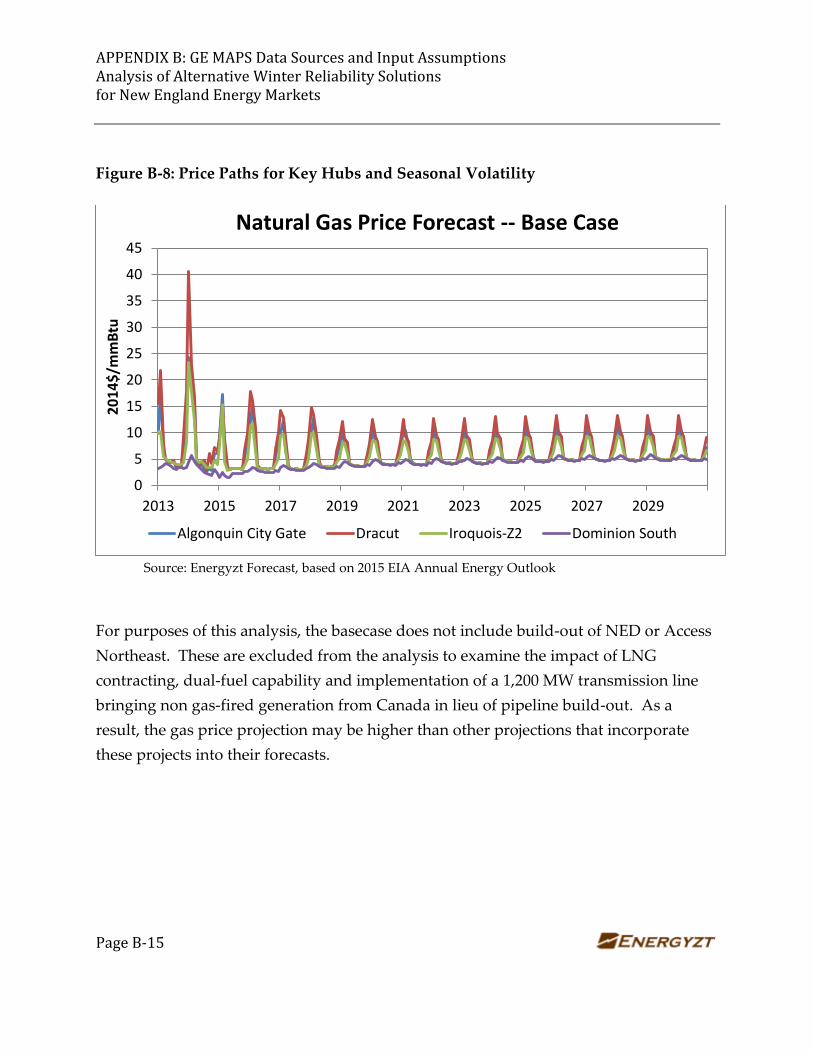
APPENDIX B: GE MAPS Data Sources and Input Assumptions Analysis of Alternative Winter Reliability Solutions for New England Energy Markets
Page B-15
Figure B-8: Price Paths for Key Hubs and Seasonal Volatility
Source: Energyzt Forecast, based on 2015 EIA Annual Energy Outlook
For purposes of this analysis, the basecase does not include build-out of NED or Access
Northeast. These are excluded from the analysis to examine the impact of LNG
contracting, dual-fuel capability and implementation of a 1,200 MW transmission line
bringing non gas-fired generation from Canada in lieu of pipeline build-out. As a
result, the gas price projection may be higher than other projections that incorporate
these projects into their forecasts.
0
5
10
15
20
25
30
35
40
45
2013 2015 2017 2019 2021 2023 2025 2027 2029
20
14
$/m
mB
tu
Natural Gas Price Forecast -- Base Case
Algonquin City Gate Dracut Iroquois-Z2 Dominion South
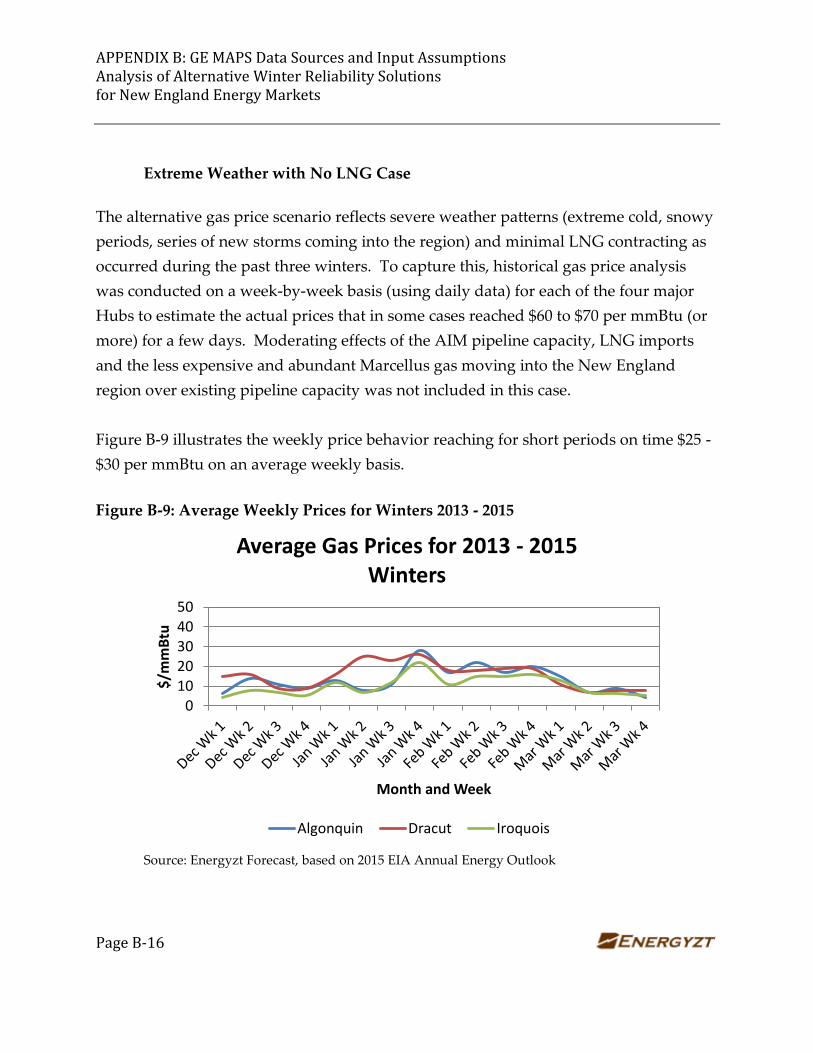
APPENDIX B: GE MAPS Data Sources and Input Assumptions Analysis of Alternative Winter Reliability Solutions for New England Energy Markets
Page B-16
Extreme Weather with No LNG Case
The alternative gas price scenario reflects severe weather patterns (extreme cold, snowy
periods, series of new storms coming into the region) and minimal LNG contracting as
occurred during the past three winters. To capture this, historical gas price analysis
was conducted on a week-by-week basis (using daily data) for each of the four major
Hubs to estimate the actual prices that in some cases reached $60 to $70 per mmBtu (or
more) for a few days. Moderating effects of the AIM pipeline capacity, LNG imports
and the less expensive and abundant Marcellus gas moving into the New England
region over existing pipeline capacity was not included in this case.
Figure B-9 illustrates the weekly price behavior reaching for short periods on time $25 -
$30 per mmBtu on an average weekly basis.
Figure B-9: Average Weekly Prices for Winters 2013 - 2015
Source: Energyzt Forecast, based on 2015 EIA Annual Energy Outlook
01020304050
$/m
mB
tu
Month and Week
Average Gas Prices for 2013 - 2015 Winters
Algonquin Dracut Iroquois
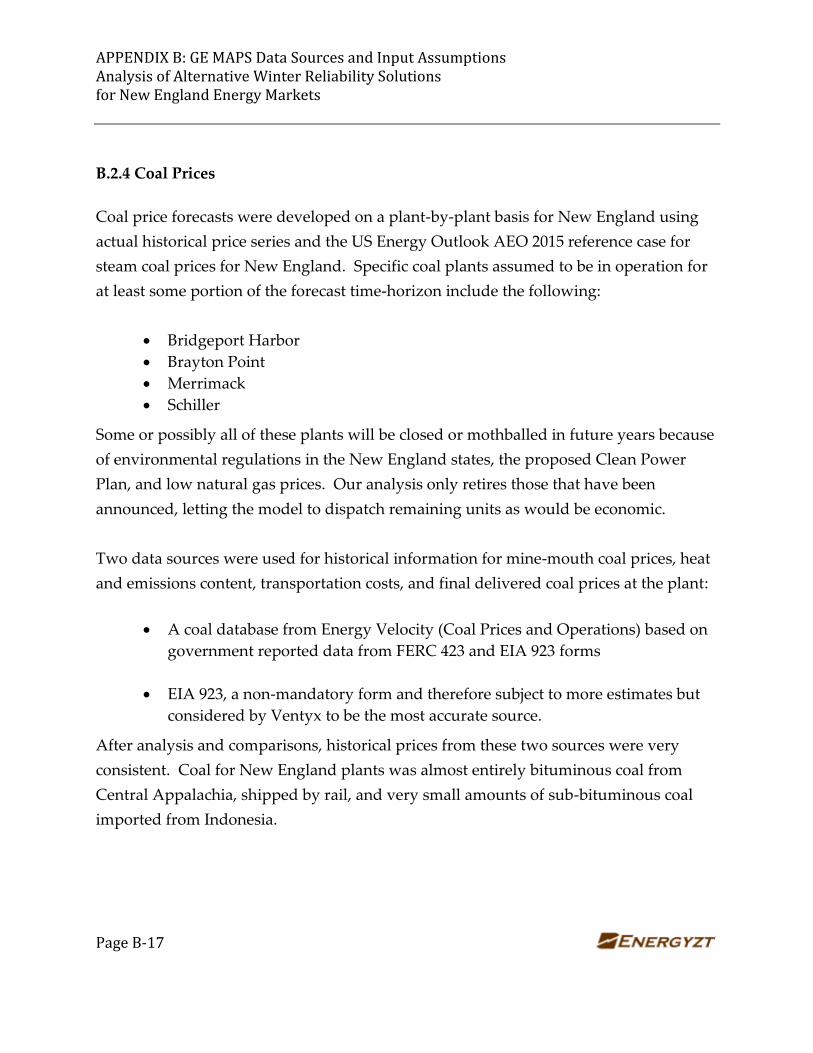
APPENDIX B: GE MAPS Data Sources and Input Assumptions Analysis of Alternative Winter Reliability Solutions for New England Energy Markets
Page B-17
B.2.4 Coal Prices
Coal price forecasts were developed on a plant-by-plant basis for New England using
actual historical price series and the US Energy Outlook AEO 2015 reference case for
steam coal prices for New England. Specific coal plants assumed to be in operation for
at least some portion of the forecast time-horizon include the following:
Bridgeport Harbor
Brayton Point
Merrimack
Schiller
Some or possibly all of these plants will be closed or mothballed in future years because
of environmental regulations in the New England states, the proposed Clean Power
Plan, and low natural gas prices. Our analysis only retires those that have been
announced, letting the model to dispatch remaining units as would be economic.
Two data sources were used for historical information for mine-mouth coal prices, heat
and emissions content, transportation costs, and final delivered coal prices at the plant:
A coal database from Energy Velocity (Coal Prices and Operations) based on
government reported data from FERC 423 and EIA 923 forms
EIA 923, a non-mandatory form and therefore subject to more estimates but
considered by Ventyx to be the most accurate source.
After analysis and comparisons, historical prices from these two sources were very
consistent. Coal for New England plants was almost entirely bituminous coal from
Central Appalachia, shipped by rail, and very small amounts of sub-bituminous coal
imported from Indonesia.
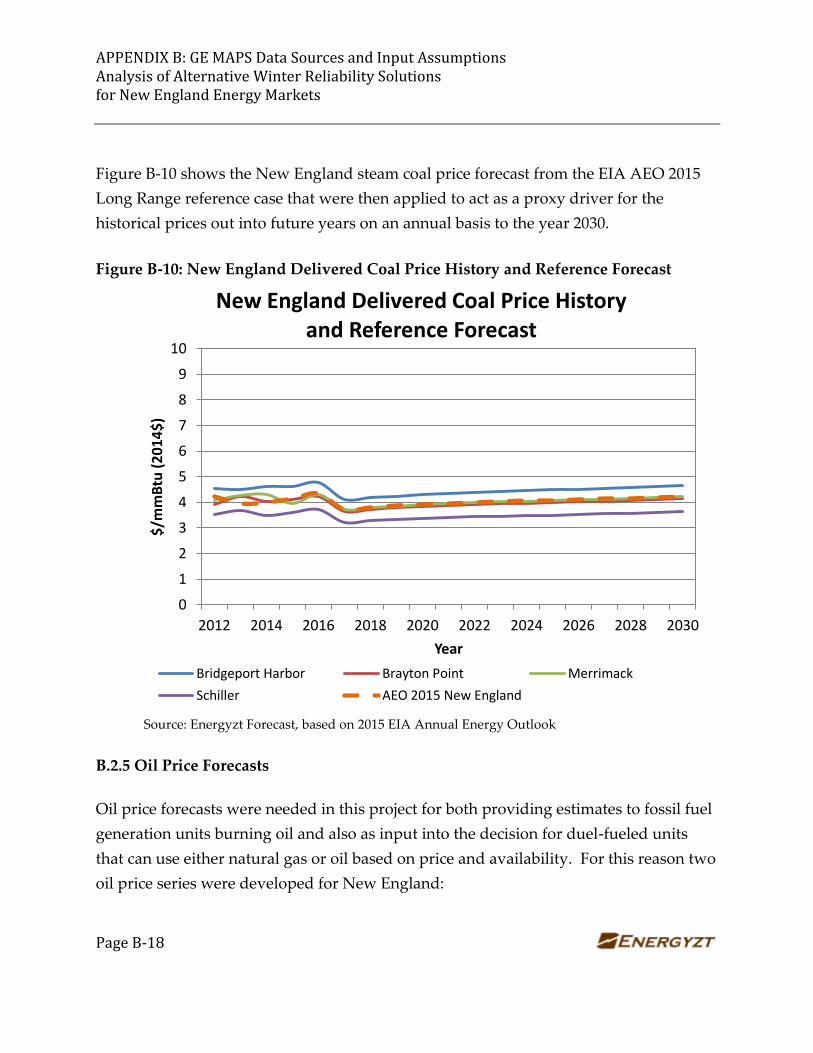
APPENDIX B: GE MAPS Data Sources and Input Assumptions Analysis of Alternative Winter Reliability Solutions for New England Energy Markets
Page B-18
Figure B-10 shows the New England steam coal price forecast from the EIA AEO 2015
Long Range reference case that were then applied to act as a proxy driver for the
historical prices out into future years on an annual basis to the year 2030.
Figure B-10: New England Delivered Coal Price History and Reference Forecast
Source: Energyzt Forecast, based on 2015 EIA Annual Energy Outlook
B.2.5 Oil Price Forecasts
Oil price forecasts were needed in this project for both providing estimates to fossil fuel
generation units burning oil and also as input into the decision for duel-fueled units
that can use either natural gas or oil based on price and availability. For this reason two
oil price series were developed for New England:
0
1
2
3
4
5
6
7
8
9
10
2012 2014 2016 2018 2020 2022 2024 2026 2028 2030
$/m
mB
tu (
20
14
$)
Year
New England Delivered Coal Price History and Reference Forecast
Bridgeport Harbor Brayton Point Merrimack
Schiller AEO 2015 New England
APPENDIX B: GE MAPS Data Sources and Input Assumptions Analysis of Alternative Winter Reliability Solutions for New England Energy Markets
Page B-19
Light fuel oil that was assumed to be #2 distillate fuel oil (the primary
petroleum product used in New England)
Heavy fuel oil that was assumed to be #6 residual-fuel oil.
Monthly historical prices were obtained from Energy Velocity for each power plant in
New England that consumed oil over the last five years. Future prices were then
estimated on an annual basis using the EIA AEO 2015 Long Range Reference Case for
the #2 fuel oil and #6 residual-fuel oil price series, as well as by reference to the Chicago
Mercantile Exchange (CME) future price strip for oil. Annual prices for future years
were then converted to monthly prices using historical intra-year variations. As a point
of reference, the EIA Long Range forecast showed crude oil prices (expressed in 2013
constant dollar terms) reaching $83/barrel in 2020 and over $100/barrel by 2025.
Monthly price series were expressed in 2014$ per mmBtu delivered to New England
and adjusted for inflation using deflators from the Annual Energy Outlook (Figure B-
11).
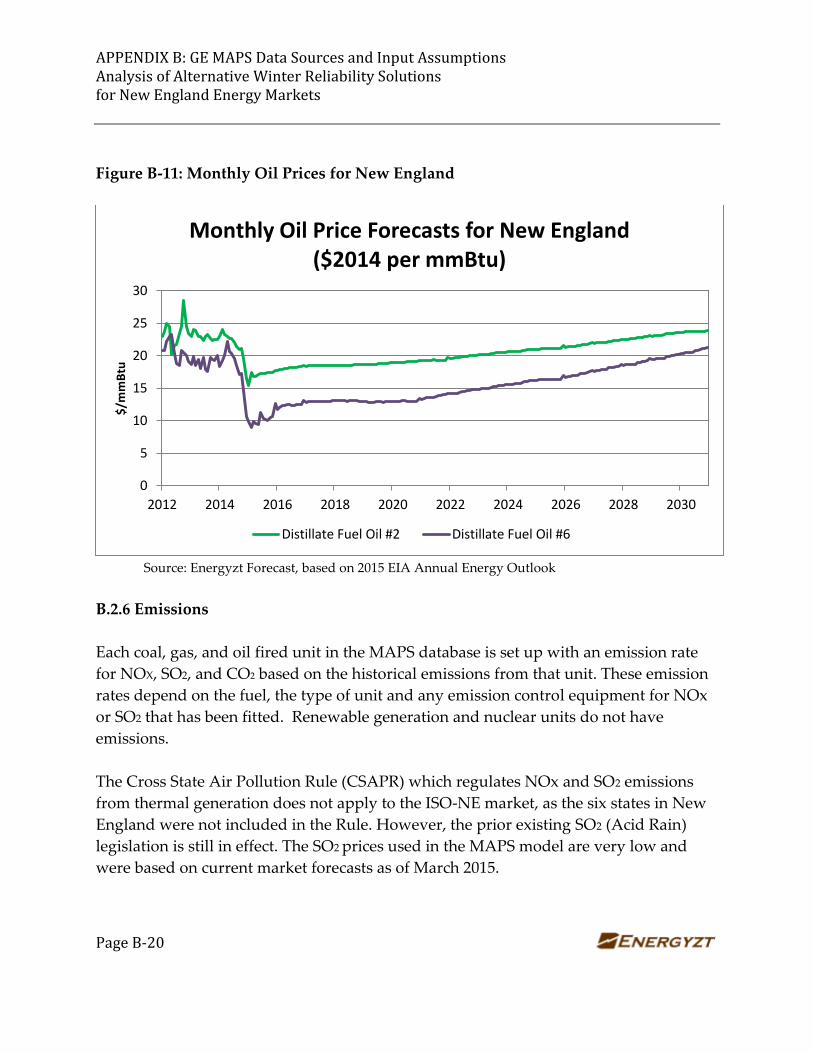
APPENDIX B: GE MAPS Data Sources and Input Assumptions Analysis of Alternative Winter Reliability Solutions for New England Energy Markets
Page B-20
Figure B-11: Monthly Oil Prices for New England
Source: Energyzt Forecast, based on 2015 EIA Annual Energy Outlook
B.2.6 Emissions
Each coal, gas, and oil fired unit in the MAPS database is set up with an emission rate
for NOX, SO2, and CO2 based on the historical emissions from that unit. These emission
rates depend on the fuel, the type of unit and any emission control equipment for NOx
or SO2 that has been fitted. Renewable generation and nuclear units do not have
emissions.
The Cross State Air Pollution Rule (CSAPR) which regulates NOx and SO2 emissions
from thermal generation does not apply to the ISO-NE market, as the six states in New
England were not included in the Rule. However, the prior existing SO2 (Acid Rain)
legislation is still in effect. The SO2 prices used in the MAPS model are very low and
were based on current market forecasts as of March 2015.
0
5
10
15
20
25
30
2012 2014 2016 2018 2020 2022 2024 2026 2028 2030
$/m
mB
tu
Monthly Oil Price Forecasts for New England ($2014 per mmBtu)
Distillate Fuel Oil #2 Distillate Fuel Oil #6
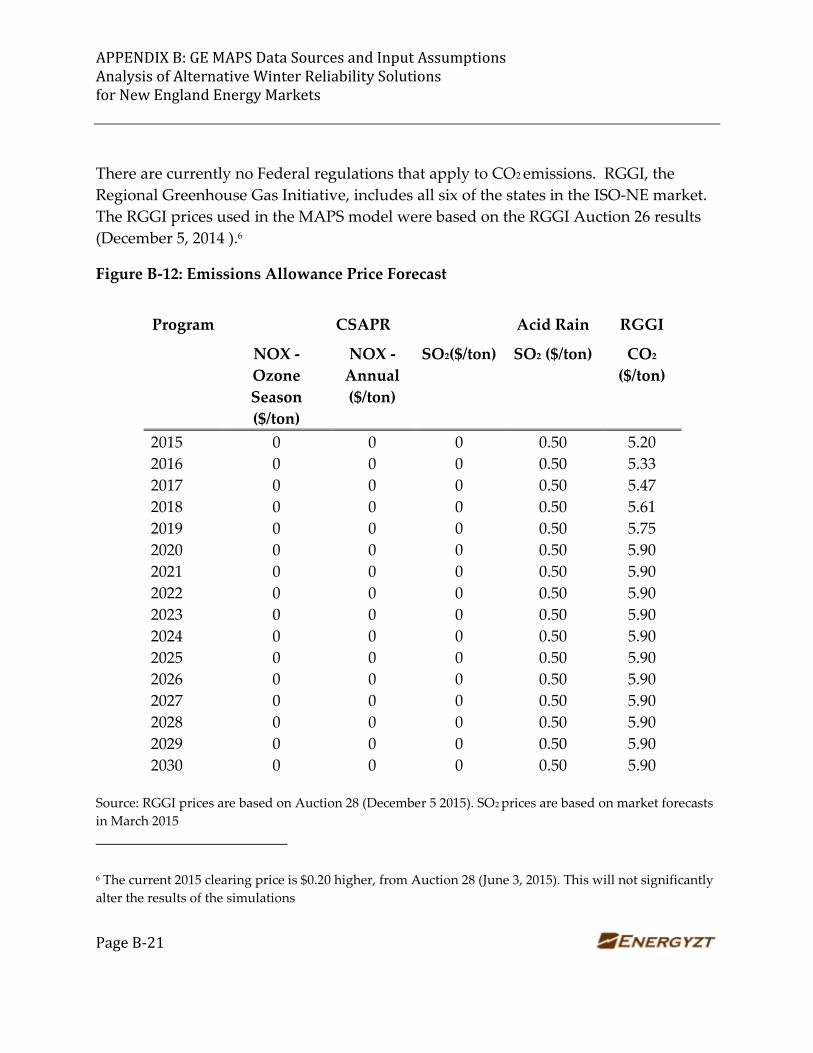
APPENDIX B: GE MAPS Data Sources and Input Assumptions Analysis of Alternative Winter Reliability Solutions for New England Energy Markets
Page B-21
There are currently no Federal regulations that apply to CO2 emissions. RGGI, the
Regional Greenhouse Gas Initiative, includes all six of the states in the ISO-NE market.
The RGGI prices used in the MAPS model were based on the RGGI Auction 26 results
(December 5, 2014 ).6
Figure B-12: Emissions Allowance Price Forecast
Program CSAPR Acid Rain RGGI
NOX -
Ozone
Season
($/ton)
NOX -
Annual
($/ton)
SO2($/ton) SO2 ($/ton) CO2
($/ton)
2015 0 0 0 0.50 5.20
2016 0 0 0 0.50 5.33
2017 0 0 0 0.50 5.47
2018 0 0 0 0.50 5.61
2019 0 0 0 0.50 5.75
2020 0 0 0 0.50 5.90
2021 0 0 0 0.50 5.90
2022 0 0 0 0.50 5.90
2023 0 0 0 0.50 5.90
2024 0 0 0 0.50 5.90
2025 0 0 0 0.50 5.90
2026 0 0 0 0.50 5.90
2027 0 0 0 0.50 5.90
2028 0 0 0 0.50 5.90
2029 0 0 0 0.50 5.90
2030 0 0 0 0.50 5.90
Source: RGGI prices are based on Auction 28 (December 5 2015). SO2 prices are based on market forecasts
in March 2015
6 The current 2015 clearing price is $0.20 higher, from Auction 28 (June 3, 2015). This will not significantly
alter the results of the simulations
APPENDIX B: GE MAPS Data Sources and Input Assumptions Analysis of Alternative Winter Reliability Solutions for New England Energy Markets
Page B-22
B.2.7 Transmission
The MAPS model used for this analysis contains a summer peak load flow that
represents the 2014 load flow case developed by ISO-NE. Within the GE MAPS model,
transmission line limits are based on the actual ratings provided in the ISO-NE load
flow case. In addition, flow gates, interface limits, and contingencies are based on a
variety of sources, including:
Documentation provided by GE MAPS
Recent nomograms posted on various ISO/RTO websites
Recent Regional Transmission Assessments published by local
transmission providers, RTOs, ISOs, or ISO-NE
B.3. SCENARIOS
B.3.1 Canadian HDVC transmission project
There has been considerable discussion over the last decade of the potential benefits for
ISO-NE of importing hydro power from Canada, in a manner similar to the existing
Phase II DC transmission line that runs from Quebec to Massachusetts.
In the Base Case simulations, there are no additional import paths other than those that
currently exist. An alternative scenario assumes a 1,200 HVDC transmission line is
added by 2020 into New England.
Given the significant amount of additional solar and wind power that already is
included in the analysis to meet environmental policy and emissions targets, the
simulation assumes that imports will only occur during peak hours when it is most
valuable to ISO-NE.
B.3.2 Dual-fuel Units
There are roughly 6,200 MW (winter capacity) of existing thermal units in ISO-NE that
can also run either natural gas or fuel oil (FO2 or FO6). To investigate the implications
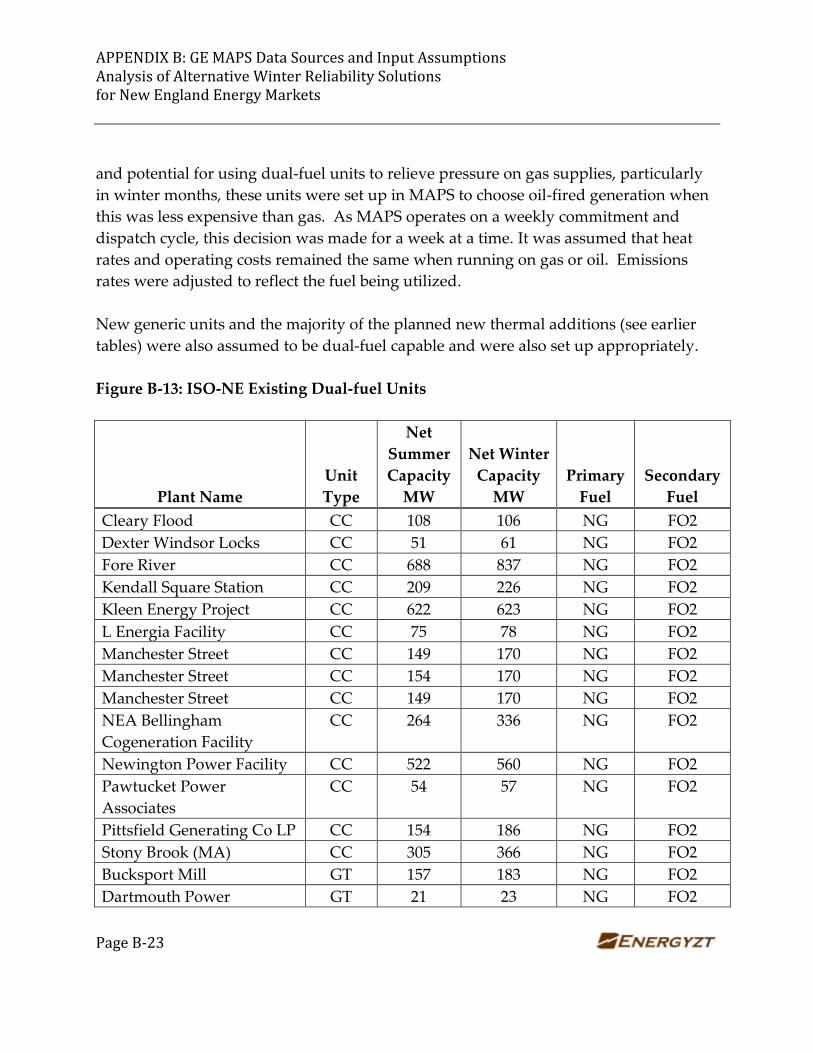
APPENDIX B: GE MAPS Data Sources and Input Assumptions Analysis of Alternative Winter Reliability Solutions for New England Energy Markets
Page B-23
and potential for using dual-fuel units to relieve pressure on gas supplies, particularly
in winter months, these units were set up in MAPS to choose oil-fired generation when
this was less expensive than gas. As MAPS operates on a weekly commitment and
dispatch cycle, this decision was made for a week at a time. It was assumed that heat
rates and operating costs remained the same when running on gas or oil. Emissions
rates were adjusted to reflect the fuel being utilized.
New generic units and the majority of the planned new thermal additions (see earlier
tables) were also assumed to be dual-fuel capable and were also set up appropriately.
Figure B-13: ISO-NE Existing Dual-fuel Units
Plant Name
Unit
Type
Net
Summer
Capacity
MW
Net Winter
Capacity
MW
Primary
Fuel
Secondary
Fuel
Cleary Flood CC 108 106 NG FO2
Dexter Windsor Locks CC 51 61 NG FO2
Fore River CC 688 837 NG FO2
Kendall Square Station CC 209 226 NG FO2
Kleen Energy Project CC 622 623 NG FO2
L Energia Facility CC 75 78 NG FO2
Manchester Street CC 149 170 NG FO2
Manchester Street CC 154 170 NG FO2
Manchester Street CC 149 170 NG FO2
NEA Bellingham
Cogeneration Facility
CC 264 336 NG FO2
Newington Power Facility CC 522 560 NG FO2
Pawtucket Power
Associates
CC 54 57 NG FO2
Pittsfield Generating Co LP CC 154 186 NG FO2
Stony Brook (MA) CC 305 366 NG FO2
Bucksport Mill GT 157 183 NG FO2
Dartmouth Power GT 21 23 NG FO2
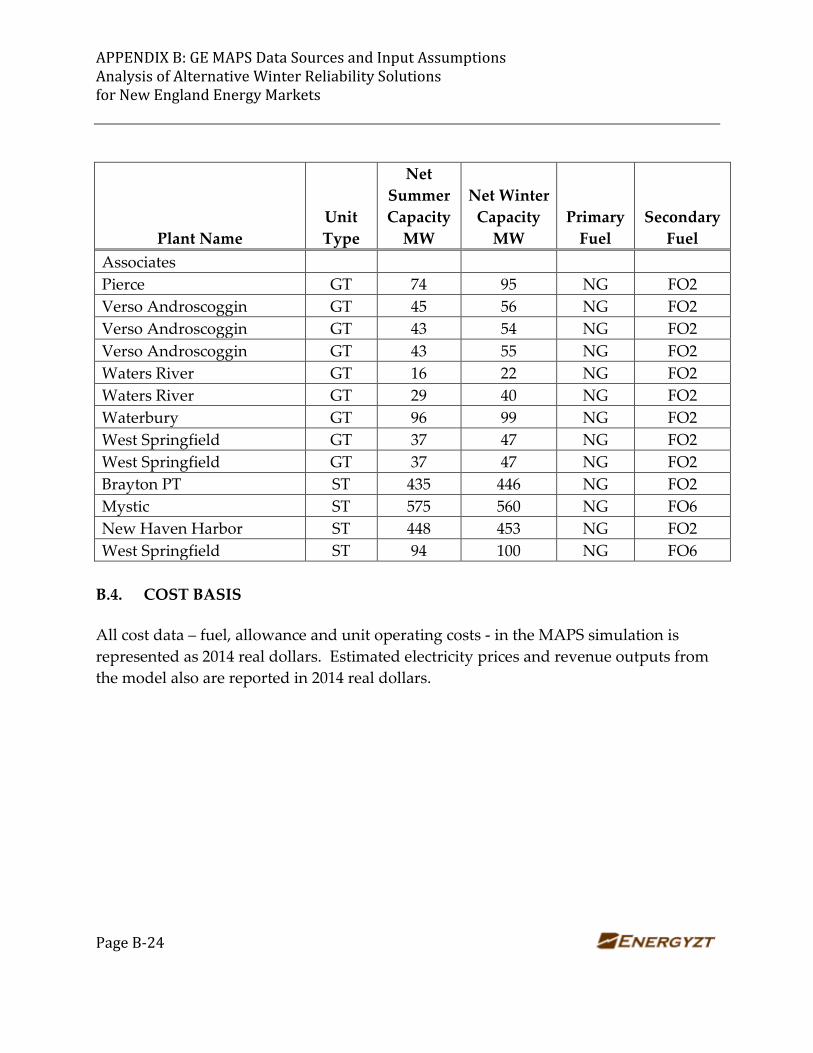
APPENDIX B: GE MAPS Data Sources and Input Assumptions Analysis of Alternative Winter Reliability Solutions for New England Energy Markets
Page B-24
Plant Name
Unit
Type
Net
Summer
Capacity
MW
Net Winter
Capacity
MW
Primary
Fuel
Secondary
Fuel
Associates
Pierce GT 74 95 NG FO2
Verso Androscoggin GT 45 56 NG FO2
Verso Androscoggin GT 43 54 NG FO2
Verso Androscoggin GT 43 55 NG FO2
Waters River GT 16 22 NG FO2
Waters River GT 29 40 NG FO2
Waterbury GT 96 99 NG FO2
West Springfield GT 37 47 NG FO2
West Springfield GT 37 47 NG FO2
Brayton PT ST 435 446 NG FO2
Mystic ST 575 560 NG FO6
New Haven Harbor ST 448 453 NG FO2
West Springfield ST 94 100 NG FO6
B.4. COST BASIS
All cost data – fuel, allowance and unit operating costs - in the MAPS simulation is
represented as 2014 real dollars. Estimated electricity prices and revenue outputs from
the model also are reported in 2014 real dollars.