Embed Size (px)
Citation preview

DOCUMENT RESUME
ED 317 125 HE 023 335
AUTHOR Russell, Susan H.; And OthersTITLE Institutional Policies and Practices Regarding
Faculty in Higher Education; Contractor Report. 1988National Survey of Postsecondary Faculty. SurveyReport.
INSTITUTION National Center for Education Statistics (ED),Washington, DC.
REPORT NO NCES-90-333PUB DATE Jan 90NOTE 108p.; Data Series: DR-NSOPF-87/88-1.20.PUB TYPE Statistical Data (110) -- Reports - Descriptive (141)
--.Tests/Evaluation Instruments (160)
EDRS PRICE 2601/PC05 Plus Postage.DESCRIPTORS Collective Bargaining; College Administration;
*College Faculty; Employment Practices; *FringeBenefits; Higher Education; National Surveys;Personnel Policy; Personnel Selection; *RetirementBenefits; *Teacher Employment Benefits; TeacherRetirement; *Tenure; Tenured Faculty
IDENTIFIERS *National Survey of Postsecondary Faculty
ABSTRACTThis report, based on a survey of 480 academic
officers in accredited nonproprietary institutions of highereducation, focuses on institutional policies concerning tenuresystems, hirir- practices, and employee benefits. Survey results arebroken down by the following categories: 4-year public, 4-yearprivate, 2-year public, and other (2-year private and religious,medical, and other specialized institutions that offer degreesranging from the bachelor's to the doctorate). The 4-year schools arealso broken down into three types: major research universities, otherdoctorate-granting universities, and comprehensive and liberal artsschools. Through 26 tables, three figures, and textual discussions,the report covers: (1) estimates of total instructional faculty atall institutions, average number of faculty per institution, anddistribution of faculty across academic ranks; (2) changes in thenumber of full-time regular and tenured instructional faculty between1986 and 1987; (3) scope and operation of tenure systems and certaininstitutional policies and administrative measures related to tenure;(4) presence of collective bargaining units for instructionalfaculty; and (5) employee benefits available to faculty. Appendicespresent technical notes concerning survey design, standard errortables, as well as the survey questionnaire. (JDD)
*************************************************************4x********* Reproductions supplied by EDRS are the best that can be made *
* from the original document. *
***********************************************************************

,..."0.0400taa-wassi'"
U.S. DEPARTMENT OF EDUCATIONOffice of Educational Research and ImprovementEDU IONAL RESOURCES INFORMATION
CENTER (ERIC)
This document has been reproduced aseceived from the person or organizationoriginating it
0 Minor changes have bee I made to improvereproduction quality
Pointe of ..lew or opinions staled in th.sdocumint do not necessarily represent officialOERI position or policy
4
...11001.e

NATIONAL CENTER FOR EDUCATION STATISTICS
Survey Report January 1990
1988 National Surveyof Postsecondary Faculty (NSOPF-88)
Institutional Policies andPractices Regarding Facultyin Higher EducationContractor Report
Susan H. RussellRobert C. CoxCynthia L. WilliamsonSRI InternationalMenlo Park, CA 94025
Joann T. PorterProject OfficerNational Center for Education Statistics
Data Series:DR-NSOPF-87/88-1.20
U.S. Department of EducationOffice of Educalional Research and Improvement NCES 90-333

U.S. Department of EducationLauro F. CavazosSecretary
Office of Educational Research and improvementChristopher T. CrossAssistant Secretary
National Center for Education StatisticsEmerson J. ElliottActing Commissioner
Information ServicesSharon K. HornDirector
National Center for Education Statistics
"The purpose of the Center shall be to collect, andanalyze, and disseminate statistics and other datarelated to education in the United States and in othernations."Section 406(b) of the General EducationProvisions Act, as amended (20 U.S.C. 1221e-1).
January 1990
Contact:Linda Zimbler(202) 357-6834
4

Foreword
Instructional faculty in colleges and universities have a crucial role inour society. They are teachers, researchers, and resource persons. Theyaffect higher education's public service function. They make a significantcontribution to the Nation's technological advances. For this reason, it islittle wonder that there are many national, State, and institutional-levelissues surrounding this unique population. Yet, very little is known aboutthem. Very few recent national studies have been conducted to collect databeyond the total counts and average salaries of full-time faculty.
To fill the information gap, the National Center for Education Statistics(NCES) in the Office of Educational Research and Improvement of the U. S.Department of Education established a faculty study in 1987. The first cycleof the study, completed in 1988, collected data on faculty and faculty issuesfrom three sources: institutional academic officers, department chairs, andfaculty members. The study is to be repeated once every four years; the nextis scheduled for 1991-92.
This report is one in a series of publications on faculty to be releasedby NCES. It is based on data provided by institutional academic officers,with special focus on institutional policies concerning tenure systems,hiring practices, and employee benefits.
We hope that the report will stimulate discussions on faculty issues. Wealso hope it will encourage further in-depth analyses of the data provided bythis study.
Samuel S. PengDirectorPostsecondary EducationStatistics Division
iii
5
Martin FrankelChief
Cross-Sectional StudiesBranch

Acknowledgments
We would like to express our appreciation to the many people who madevaluable contributions to this report. In particular, we acknowledge theguidance provided by NSOPF's project officers at the National Center forEducation Statistics (NCES), Vonda Kiplinger, Joanell Porter, and LindaZimbler; by their supervisors, Roslyn Korb and Marty Frankel; and by SamuelPeng, Director of the Postsecondary Education Statistics Division at NCES.
We would like to thank Debra Gerald and Charles Hammer of NCES for theirreview and comments on the report. We also wish to thank Debra Carter,American Council on Education, and Susan Hill, National Science Foundationfor their review of the report. Additional technical review of the reportwas provided by Leslie Silverman of NCES. Editorial and publication help wasprovided by Gerard Devlin, Publications Branch, Information Services, Officeof Educational Research and Improvement.
We are very appreciative of the significant contribution provided by MaryHancock, who had major project responsibilities during the data collection,data processing, and early analysis programming activities. We also aregrateful for the ongoing support and guidance provided by our projectsupervisor at SRI, Marian Stearns.
Katherine Moore and James Fairweather of the Center for the Study ofnigher Education at Penn State University served as successive leaders of theCSHE subcontract team. Their contributions, and those of their colleaguesRobert Hendrickson, William Coombs, and S. V. Martorana, were invaluablethroughout the project, but especially on study design and analysis issues.
Also, we wish to thank the members of our advisory committee, whoseknowledge of and various perspectives on the study issues contributedimportantly to both the richness of the study and its relevance to the highereducation community. Finally, our gratitude is extended to the thousands ofindividuals who participated in the study, including institutionalcoordinators, administrators, department chairpersons, and faculty members.Clearly, the study could not have been completed without their cooperation.
iv

Highlights
The following results are based on estimates reported by a singleindividual reporting for the institution.
Faculty Size and Composition
I The instructional faculty in two- and four-year public and privatenon-profit accredited institutions, numbered approximately 825,000 inthe 1987 fall term. This included 491,000 full-time regularinstructional faculty (60 percent of the total), 180,000 part-timeregular faculty (22 percent), 23,000 full-time temporary faculty(3 percent), and 131,000 part-time temporary faculty (16 percent).
Four-year institutions employed 73 percent of all full-time regularhigher education faculty and 52 percent of the part-time faculty. Incontrast, public two-year institutions employed only 18 percent of thefull-time regular faculty but about 40 percent of the part-timefaculty. The remaining higher education institutions--privatetwo-year, and religious, medical, and other specializedschools--employed 9 percent of the full-time and 8 percent of thepart-time regular faculty.
Among four-year schools, public institutions accounted for 65 percentof full-time regular faculty and private institutions accounted for35 percent. The 213 research and doctoral universities (both publicand private) employed 53 percent of the total for four-year schools.The 1,157 public and private comprehensive universities and liberalarts colleges (mainly private) employed 47 percent of the four-yeartotal.
The three professorial ranks (professor, associate professor, andassistant professor) accounted for most of the full-time regularfaculty working at four-year institutions, both public (90 percent)and private (87 percent), but for only 34 percent of the full-timeregular faculty at public two-year schools.
Employment Changes
1 The net change in the number of full-time regular faculty employed byinstitutions represented in the sample from fall term 1986 to fallterm 1987 was an increase of 0.5 percent.
1 None of the aggregate changes by type and control of institutionsexceeded 0.9 percent.
7

I About 2 percent of fall 1986 full-time regular faculty members retiredbetween the 1986 and 1987 fall terms. Across all institutions,retiring faculty members accounted for 26 percent of all departingfu.1-time regular faculty.
I About 25 percent of departing faculty at four-year schools rPtired,compared to 45 percent at public two-year schools. Among tenuredfaculty, 55 percent of those who departed retired.
Tenure Systems
1 Tenure systems for full-time instructional faculty were found at71 percent of all institutions. They were at almost all four-yearschools, but at only 62 percent of public two-year schools.
I Tenured faculty constituted 59 percent of the aggregate full-timeregular faculty, and tenure-track (but not tenured) faculty made up22 percent.
I Almost all higher education institutions (93 percent) had taken somekind of action during the years preceding the survey to reduce thenumber or percentage of their tenured faculty.
Collective Bargaining
Collective bargaining units for full-time regular faculty were foundat 31 percent of all higher education institutions. Bargaining unitsrepresented the entire full-time regular faculty at 24 percent ofinstitutions.
111 Among four-year schools, public institutions were far more likely thanprivate institutions to have at least some unionized faculty(40 percent vs. 14 percent). Fifty-eight percent of public two-yearschools had some unionized faculty.
Employee Benefits
A retirement plan of some kind was available to full-time faculty in98 percent of all higher education institutions.
I Institutional retirement subsidies for full-time faculty were providedby 87 percent of all institutions and by
. 11 over 90 percent of allfour-year schools; 78 percent of public two-year schools subsidizedretirement benefits.
vi

I Subsidized medical insurance or medical care was provided for at leastsome of the full-time instructional faculty at 99 percent of allhigher education institutions. Fifty-nine percent provided dentalinsurance or dental care.
Private institutions were far more likely than public institutions tooffer reduced tuition at the home institution or grants toward tuitionat other institutions. For example, tuition benefits for children offull-time faculty were provided by 99 percent of private four-yearschools and 47 percent of public four-year schools.
Child care assistance remained an uncommon benefit, supported by only4 percent of all institutions. Wellness and health promotion pro-grams, another relatively new benefit, were more common, however.Such programs were subsidized by.31 percent of institutions.
I Flexible or "cafeteria-style" benefit programs, in which faculty areallowed to select a subset of benefits most appropriate to theirindividual needs from a wider range of benefits, were available at16 percent of all institutions.
I For full-time faculty, higher education institutions contributed anaverage of 21 percent of salary to benefits packages.
vii
9

Foreword
Table of Contents
Page
iii
Acknowledgments iv
Highlights v
Section 1: Intro action 1
Section 2: Dimensions of the Instructional Faculty 3
Estimated Size of the Instructional Faculty 3
Number and Types of Faculty per Institution 4
The Distribution of Academic Ranks 5
Section 3: Faculty Dynamics 13
Section 4: Tenure Systems 21
Section 5:
Section 6:
Summary
The Scope of Tenure Systems 21
Tenure System Operations 21
Policies and Administrative Measures Bearing onTenure Systems 22
Collective Bargaining 33
Employee Benefits 39
Retirement Plans 39
Other Employee Benefits 40
Flexible Benefit Plans 41
Institutional Contributions to Faculty Benefit Plans 41
Appendices
Appendix A:
47
Technical Notes 49
Overview 50
Institutional Sampling Strategy 50
Weight Calculations 53
Data Collection 53
Data Processing 54
Accuracy of Estimates 54
ix
10
Page
Appendix 13: Standard Error "ables 57
Appendix C: The Survey Questionnaire 87
Figures
2.1 Number and distribution of instructional faculty, by faculty type:Fall 1987 6
2.2 Number of higher education institutions, by type of institution:Fall 1987
7
2.3 Numbe'- and distribution of full-time regular instructional faculty,by type and control of institution 8
Tables
2.1 Number and distribution of higher education instructional faculty(in thousands), by faculty type and type and control ofinstitution: Fall 1987 9
2.2 Percentage of higher education institutions with full-time regular,part-time regular, full-time temporary, and part-time temporaryfaculty, by type and control of institution: Fall 1987 10
2.3 Mean number of faculty per higher education institution, by facultytype and type and control of institution: Fall 1987 11
2.4 Percentage distribution of full-time regular faculty in highereducation institutions, by academic rank and type and control ofinstitution: Fall 1987 12
3.1 Net percentage change from fall 1986 to fall 1987 in full-timeregular faculty and percentage distribution of higher educationinstitutions, by direction of net change and type and control ofinstitution: Fall 1987 15
3.2 Net percentage change in tenured faculty and percentagedistribution of higher education institutions, by direction ofnet change and type and control of institution: Fall 1987 16
3.3 Arrival and departure of higher education institutions' full-timeregular faculty, by type and control of institution: Fall 1987 .... 17
3.4 Retirement of higher education institutions' full-time regularfaculty, by type and control of institution: Fall 1987 18

Page
3.5 Percentage distribution of higher education institutions' departingtenured faculty, by reason for departure and type and control ofinstitution: Fall 1987 19
4.1 Percentage of higher education institutions with tenure systems forfull- and part-time faculty, by type and control of institution:Fall 1987 24
4.2 Tenure system and tenured faculty as percentages of highereducation institutions' full-time regular faculty and tenuredfaculty as a percentage of tenure system faculty, by type andcontrol of institution: Fall 1987 25
4.3 Percentage of higher education institutions' tenure-track facultyconsidered for tenure in tie 1986-8, academic year and percentageconsidered who were granted tenure, by type and control ofinstitution: Fall 1987 26
4.4 Percentage of higher education institutions that limit time ontenure track without tenure, by type and control of institution:Fall 1987 27
4.5 Percentage distribution of higher education institutions thatlimit time on tenure track, by maximum number of years on tenuretrack without tenure and type and control of institutionsFall 1987 28
4.6 Percentage of higher education institutions that ha7e an upperlimit on the percentage of tenured faculty, by type and control ofinstitution: Fall 1987 29
4.7 Percentage of higher education institutions taking specifiedactions during the past three years that may lead to reductionsin tenured faculty, by type and control of instioition:Fall 1987 30
4.8 Percentage of higher ;cation institution:, taking any action
during the past three . ors that may have the effect of reducingtenured faculty, by tl and control of institution: Fall 1987 .... 31
5.1 Percentage of higher education institutions with collectivebargaining for full-time regular faculty, by level of representationand type and control of institution: Fall 1987 34
5.2 Percentnge of full-time regular faculty at higher educationinstitutions with collective bargaining for full-time regularfaculty, by level of representation and type and control ofinstitution: Fall 1987 35
xi
12

Page
5.3 Percentage of higher education institutions with collectivebargaining for part-time faculty, by level of representation andtype and control of institution: Fall 1987 36
5.4 Percentage of part-time faculty at higher education institutionswith collectime bargaining for part-time regular faculty, by levelof representation and type and control of institution: Fall 1987 .. 37
6.1 Percentage of higher education institutions at which retirementplans for full-time regular faculty were available and subsidized,by type of plan and type and control of institution: Fall 1987 .... 42
6.2 Percentage of higher education institutions at which retirementplans for part-time faculty were available and subsidized, bytype of plan and type and control of institution: Fall 1987 43
6.3 Percentage of higher education institutions providing specifiedbenefits to at least some full -time regular faculty, by type andcontrol of institution: Fall 1987 44
6.4 Percentage of higher education institutions with flexible benefitsplans for full- and part-time regular faculty, by type and controlof institution: Fall 1987 45
6.5 Average percentage of salary contributed to total benefitspackages of higher education faculty, by type and control ofinstitution: Fall 1987 46
Appendix A (Technical Notes) Tables
A.1 Distribution of institutions in the universe, sample andrespondent group, by institutional stratum 52
A.2 Distribution of institutions in the universe and respondent group,by institutional groupings used in the report 53
Appendix B (Standard Error) Tables
B.2.1 Number and distribution of higher education instructionalfaculty, by faculty type and type and control of institution:Fall 1987 58
B.2.2 Percentage of higher education institutions with full-timeregular, part-time regular, full-time temporary, and part-timetemporary faculty, by type and control of institution:Fall 1987 59
xii
13

Page
B.2.3 Mean number of faculty per higher education institution, by
faculty type and type and control of institution: Fall 1987 60
B.2.4 Percentage distribution of full-time regular faculty in highereducation institutions, by academic rank and by type and control
of institution: Fall 1987 61
B.3.1 Net percentage change from fall 1986 to fall 1987 in full-time
regular faculty and percentage distribution of higher education
institutions, by direction of net change and type and control of
institution: Fall 1987 62
B.3.2 Net percentage change in tenured faculty and percentagedistribution of higher education institutions, by direction ofnet change and type and control of institution: Fall 1987 63
8.3.3 Arrival and departure of higher education institutions' full-time
regular faculty, by type and control of institution: Fall 1987 .. 64
B.3.4 Retirement of higher education institutions' full-time regularfaculty, by type and control of institution: Fall 1987 65
B.3.5 Percentage distribution of higher education institutions'departing tenured faculty, by reason for departure and type and
control of institution: Fall 1987 66
B.4.1 Percentage of higher education institutions with tenure systemsfor full- and part-time faculty, by type and control of
institution: Fall 1987 67
B.4.2 Tenure system and tenured faculty as percentages of higher
education institutions' full-time regular faculty and tenuredfaculty as a percentage of tenure system faculty, by type andcontrol of institution: Fall 1987 68
B.4.3 Percentage of higher education institutions' tenure-trackfaculty considered for tenure in the 1986-87 academic year andpercentage considered who were granted tenure, by type and control
of institution: Fall 1987 69
B.4.4 Percentage of higher education institutions that limit time ontenure track without tenure, by type and control of institution:
Fall 1987 70
B.4.5 Percentage distribution of higher education institutions thatlimit time on tenure track, by maximum number of years on tenuretrack without tenure and type and control of institution:Fall 1987 71
xli' 14

Page
B.4.6 Percentage of higher education institutions that have an upperlimit on the percentage of tenured faculty, by type and controlof institution; Fall 1987 72
B.4.7 Percentage of higher education institutions taking specifiedactions during the past three years that may lead to reductionsin tenured faculty, by type and control of institution:Fall 1987 73
8.4.8 Percentage cf higher education institutions taking any actionduring the past three years that may have the effect of reducingtenured faculty, by type and control of institution: Fall 1987 .. 74
8.5.1 Percentage of higher education institutions ce.th collectivebargaining for full-time regular faculty, by level ofrepresentation and type and control of institution: Fall 1987 ... 75
8.5.2 Percentage of full-time regular faculty at higher educationinstitutions with collective bargaining for full-time regularfaculty, by level of representation and type and control ofinstitution: Fall 1987 76
B.5.3 Percentage of higher education institutions with collectivebargaining for part-time faculty, by level of representationand type and control of institution: Fall 1987 77
B.5.4 Percentage of part-time faculty at higher education institutionswith collective bargaining for Dart-time regular faculty, bylevel of representation and type and control of institution:Fall 1987 78
B.6.1 Percentage of higher education institutions at which retirementplans for full-time regular faculty were available andsubsidized, by type of plan and type and control of institution:Fall 1987 79
B.6.2 Percentage of higher education institutions at which retirementplans for part-time faculty were available and subsidized, bytype of plan and type and control of institution: Fall 1987 81
B.6.3 Percentage of higher education institutions providing specifiedbenefits to at least some full-time regular faculty, by type andcontrol of institutions Fall 1987 83
B.6.4 Percentage of higher education institutions with flexiblebenefits plans for full- and part-time regular faculty, by typeand control of institution: Fall 1987 85
xiv
15

Page
8.6.5 Average percentage of salary contributed to total benefitspackages of higher education faculty, by type and control ofinstitution: Fall 1987 86
xv
16

Section 1: introduction
Surprisingly, although faculty directly affect the quality of educationin higher education institutions and perform much of the research and devel-
opment work on which this nation's technological and economic advancement
depend, there is very little current, comprehensive information on them.
The primary purpose of the 1988 National Survey of Postsecondary Faculty
(NSOPF-88) was to fill this information gap.
NSOPF-88 was the first comprehensive survey of higher educationinstructional facultyl to be conducted by the National Center for EducationStatistics (NCES) since 1963. It gathered information regarding thebackgrounds, responsibilities, workloads, salaries, benefits, and attitudesof both full- and part-time instructional faculty in their many and varied
higher education institutions. In addition, information was gathered frominstitutional and department-level respondents on such issues as facultycomposition, new hires, and departures and recruitment, retention, and tenure
policies.
There were three major components of the study: a survey of institu-
tional level respondents (designated by the institution's chief executiveofficer) at a stratified random sample of 480 U.S. colleges and universities;
a survey of a stratified random sample of 3,029 eligible departmentchairpersons (or their equivalent) within the participating 4-yearinstitutions; and a survey of a stratified random sample of 11,013 eligible
faculty members within the participating institutions. Response rates to the
three surveys were 88 percent, 80 percent, and 76 percent, respectively.
This report presents results of the survey of institutions. Reports from the
remaining two surveys will be forthcoming.
The universe of institutions from which the sample was selected was allaccredited nonproprietary U.S. postsecondary institutions that grant atwo-year (A.A.) or higher degree and whose accreditation at the higher
education level is recognized by the U.S. Department of Education. This
includes religious, medical and other specialized postsecondary institutions
as well as two- and four-year nonspecialized institutions. According to the
1987 Integrated Postsecondary Education Data System (IPEDS) file, this
1lnstructional faculty were defined as those who had at least some regularinstructional duties (such as teaching one or 11.-L.e courses or advising or
supervising students' academic activities), in for-credit higher education
courses during the 1987 fall term. In this report, this group is referred
to interchangeably as "instructional faculty," "teaching faculty," and,
simply, "faculty."
1
17

universe comprised 3,159 institutions. The universe of this study does notinclude proprietary two- and four-year postsecondary institutions or lessthan two-year postsecondary institutions.
In this report, the survey results are broken down by the followingcategories: four-year public, four-year private, two-year public, and other(two-year private and religious, medical, and other specialized institutionsthat offer degrees ranging from the bachelor's to the doctorate).2 Thefour-year schools also are broken down into three types: major researchuniversities, other doctorate-granting universities, and comprehensive andliberal arts schools. All differences cited in the text are significant atthe .05 level, and pair-wise t tests were used to test for the statisticalsignificance of observed differences. (See appendix A for more details ofthe institutional categories, the survey methodology and the reliability ofthe data.)
The remainder of this report is organized as follows: Section 2 outlinesthe dimensions of the instructional faculty at institutions of highereducation, including estimates of total instructional faculty at allinstitutions, the average number of faculty per institution, and thedistribution of faculty across academic ranks. These estimates are based oninstitutional respondents' reports of the number of faculty and the number offaculty by rank. These estimates of the number of faculty will differsomewhat from estimates derived from lists of faculty provided by sampledinstitutionti. Section 3 describes changes in the number of full-time regularand tenured instructional faculty between 1986 and 1987. Section 4 examinesthe scope and operation of tenure systems, as well as certain institutionalpolicies and administrative measures related to tenure. Section 5 reports onthe presence of collective bargaining units for instructional faculty.Section 6 summarizes employee benefits that are available to faculty.
'There were too few cases in each of the subgroups comprising the "other":ategory to justify presentation of separate estimates. See appendix A.
2 18

Section 2: Dimensions of the instructional Faculty
Estimated Size of the Instructionkl Faculty
Based on institutional respondents, during the 1987 fall term, there were825,000 instructional faculty in U.S. higher education institutions,including 491,000 full-time regular, 180,000 part-time regular, 23,000full-time temporary, and 131,000 part-time temporary faculty3 (figure2.1). These faculty were employed in a total of 3,159 higher educationinstitutions, approximately equal numbers of which were two- and four-yearinstitutions (1,174 and 1,370, respectively). Another 615 were religious,medical, or other speciclized institutions. Among the four-year schools, 104were major research universities, 109 were other doctoral institutions, 577were comprehensive institutions, and 580 were liberal arts schools (figure2.2).
Although four-year institutions comprised only 43 percent of the totalinstitutions, they employed 73 percent of the full-time regular faculty--47percent in public four-year schools and 26 percent in private four-yearschools (figure 2.3). Eighteen percent were employed by public two-yearschools and 9 percent by other kinds or" higher education institutions. Ofthe full-time regular faculty employed by four-year institutions, 38 percentwere employed by the major research universities, 15 percent by otherdoctoral universities, and 47 percent by comprehensive and liberal artsinstitutions.
Table 2.1 presents the distribution of instructional faculty, by facultytype (regular and temporary, full- and part-time) and type and control ofinstitution. Four-year institutions employed 65 percent of all highereducation instructional faculty. Faculty members at public two-year schoolsrepresented 26 percent of all higher education faculty. Total faculty at allother higher education institutions was 8 percent of the grand total.
Across all higher education institutions, full-time regular faculty madeup 60 percent of the instructional faculty as a whole, while the remaining 40percent were employed either part time, on a temporary basis, or both.Private four-year schools supported a larger proportion of part-time facultythan public four-year schools (40 percent vs. 23 percent). At public two-year schools, part-time faculty outnumbered full-time faculty. Thi,ty-fivepercent of the public two-year school faculty worked part time on a regularbasis and 23 percent worked part time on a temporary basis, whereas only41 percent were in the full-time regular group.
3The definitions of terms used in this report are based on the items in thequestionnaire and are defined in appendix A.
3
19

Regular faculty (iull- and part-time) constituted 82 percent of theoverall higher education instructional faculty. Temporary faculty membersoccupied 24 percent of all teaching positions at public two-year schools and22 percent at private four-year schools, but just 13 percent at public four-year schools. Full-time faculty (regular and temporary) comprised 63 percentof the overall faculty, and part-time faculty comprised 38 percent.
lumber and Types of Faculty Der Institution
Full-time regular instructive l faculty were present at all four-yearschools (table 2.2). A teaching staff made up entirely of part-time facultywas reported by only 1 percent of the 3,159 higher education institutions.
Part-time regular faculty were present at about three-quarters of thepublic (74 percent) and private (73 percent) four-year schools and publictwo-year schools (79 percent), but at only about one-half (53 percent) of theinstitutions of other types. Research universities were more likely thanother four-year schools to have some part-time regular faculty.
Full-time temporary faculty were employed by 34 percent of allinstitutions--98 percent at the research universities and 16 percent atpublic two-year schools. Part-time temporary faculty were present at 56percent of all institutions. They were most often present at the researchand doctoral universities (92 percent and 84 percent).
Tabie 2.3 displays average numbers of full-time regular, part-timeregular, full-time temporary, part-time temporary, and total instructionalfaculty per institution. (Institutions reporting zero faculty of a giventype were included in calculating mean values.) As reported by institutionalrespondents, average faculty size varied considerably by institutionalstratum. Public and private research universities had an average of 1,315full-time regular instructional faculty per institution. With the additionof part-time and temporary faculty, mean total faculty of these schools stoodat 1,853. Doctoral universities were typically less than one-half as large,averaging 496 full-time regular and 755 total faculty. Other four-yearschools averaged 144 full-time regular and 227 total faculty.
Public two-year colleges employed 92 full-time regular and 222 totalfaculty on average. Public four-year institutions had an average of 478full-time regular and 661 total faculty, while private four-year institutionshad averages of 143 full-time regular and 246 total faculty. The privatefour-year group included man, relatively small liberal arts colleges, butthis was not the only reason for the difference in typical size betweenpublic and private institutions. Public universities of each type--research,doctoral, and comprehensive--also were larger on average than their privatecounterparts.
4
20

The Distribution of Academic links
The percentage distribution of academic ranks among full-time regularinstructional faculty appears in table 2.4. The three professorial ranksaccounted for most of the full-time regular faculty at four-yearinstitutions, both public (89 percent) and private (87 percent). Comparedwith private four-year institutions, public four-year institutions had alarger share of full professore (38 percent vs. 31 percent) and a smallershare of assistant professors (24 percent vs. 29 percent). The proportion offull professors at research universities (40 percent) was greater than thecorresponding proportions at doctoral universities (34 percent) and otherfour-year schools (33 percent). In contrast to four-year schools, publictwo-year schools accorded professorial titles to only one-third (34 percent)of their full-time regular faculty. Another one-third (33 percent) had thetitle of instructor. The remaining one-third had a variety of job titles,including titles that do not signify a formal academic rank.
5 21

Figure 2.1 Number and distribution of higher education instructional faculiy,by faculty type: Fail 1987 (Total = 825,000)
Full-time regular491,000 (60%)
Part-time regular180,000 (22%)
NOTE: Temporary faculty includes visiting, acting, or adjunct faculty.
Part-time temporary131,000 (16%)
Full -time temporary23,000 (3%)
SOURCE: U.S. Department of Education, National Center for Education Statistics,"1988 National Survey of Postsecondary Faculty," institutional respondent survey.
226

Figure 2.2 Number of public and private, non-profit higher education Institutions,by type of institution: Fall 1987 (Total 3,159)
Liberal arts580
Two-year1,174
SOURCE: 1987 Integrated Postsecondary Data System.
7
Comprehensive577
SVNAstil' %*.N.
*4AAT \
CootOrat109
e
Research104
23
Religious308
Other254
Medical53

Figure 2.3 Number and distribution of full-time regular Instructional faculty In highereducation Institutions, by type and control of Institution: Fall 1987
Four-year private126,000 (26%)
Four-year public231,000 (47%)
Doctoral57,000 (15%)
Other 1/44,000 (9%)
Two-year public 2/90,000 (18%)
All institutions 3/ (Total = 491,000)
Research137,000 (38%)
Four-year Institutions (Total le 357,000)
Comprehensive& liberal arts
166,000 (47%)
1/ Includes private two-year and religious, medical, and other specialized four-year Institutions.
2/ Private two-year colleges not listed separately because of too few cases for reliable estimates.3/ All accredited, nonproprietary U.S. postsecondary Institutions that grant a two-year (A.A.)
or hig_her degree and whose accreditation at the higher education level Is recognized by theU.S. Department of Education.
SOURCE: U.S. Department of Education, National Center for Education Statistics,"1988 National Survey of Postsecondary Faculty," institutional respondent survey.
824

Table 2.1--Number and distribution of higher education instructional faculty (in thousands), byfaculty type and type and control of institution: Fall 1987
Type and controlof institution
Totalnumber of
institutions
Totalfaculty
Reaular Temporary 1/
Full-time Part-time Full-time Part-time
Number Percent Number PeKcent Number Percent )Numbs} Percent Number Percent
All institutions 2/ 3,159 825 100 491 60 180 22 23 3 131 16
Four-year public 483 319 100 231 72 46 14 14 4 29 9
Four-year private 887 218 100 126 58 45 21 6 3 40 19
Two-year ,ublic 3/ 981 218 100 90 41 75 35 3 1 50 23
Other 4/ 808 70 100 44 63 14 20 1 1 11 16
Four-year, by type
Research 104 193 100 137 71 27 14 11 6 18 10
Doctoral 109 82 100 54 66 12 15 2 3 13 16
Comprehensiveand liberal arts 1,157 262 100 166 63 52 20 6 2 38 14....111
1/ Visiting, acting, or adjunct faculty.
2/ All accredited, nonproprietary U.S. postsecondary institutions that grant a two-year (A.A.) or higherdegree and whose accreditation at the higher education Level is recognized by the U.S. Department ofEducation.
3/ Private two-year colleges not listed separately because of too few oases for reliableestimates.
4/ lcludes private two-year, religious, medical, and other specialized institutions that offer degreesranging from the bachelor to the doctorate.
NOTE: Percentages may not add to 100 because of rounding.
SOURCE: U.S. Department of Education, National Center for Education Statistics, "1988 National Surveyof Postsecondary Faculty, Institutional Respondent Survey."

Table 2.2--Percentage of higher education institutions with full-timeregular, part-time regular, full-time temporary, and part-timetemporary faculty, by type and control of institutionsFall 1987
Type and controlof i st .ution
Totalnumber ofsti utions
R tggaaj
Full-time Part-time
_Pe cent Percent
:Temporary 11
Full-time,
Percent
Part -time
Percent
All institutions 21 3,159 99 70 34 56
Four-year public 483 100 74 74 69
Four-year private 887 100 73 42 65
Two-year public 31 931 98 79 16 37
Other 4/ 808 97 53 25 60
Four-year, by type
Research 104 100 91 98 92
Doctoral 109 100 57 77 84
Comprehensiveand liberal arts 1,157 100 73 47 62
1/ Visiting, acting, or adjunct faculty.
21 All accredited, nonproprietary U.S. postsecondary institutions that granta two-year (A.A.) or higher degree and whose accreditation at the highereducation level is recognized by the U.S. Department of Education.
3/ Private two-year colleges not listed separately because of too fewoases for reliable estimates.
41 Includes private two-year, and religious, medical, and other specializedinstitutions that offer degrees ranging from the bachelor to thedoctorate.
SOURCE: U.S. Department of Education, National Center for EducationStatistics, "1988 National Survey of Postsecondary Faculty, InstitutionalRespondent Survey."
'°2 6

Table 2.3 - -Mean number of faculty per higher education institution, by faculty type andtype and control of institution: Fall 1987
Total Regular 6.--TV1122US1.--_Type and control number of Totalof institution institutions faculty Full-time Part-time Full-time Part-time
All institutions 2/ 3459 261 155 57 7 41
Four-year public 483 661 478 95 28 60
Four-year private 887 246 143 51 6 46
Two-year p,Ablic *4/ 981 222 92 77 3 51
Other 4/ 808 86 54 17 1 14
Four-year, by type
Research 104 1,853 1,315 255 106 177
Doctoral 109 755 496 115 22 122
Comprehensiveand liberal arts 1,157 227 45 5 33
1/ Visiting, acting, or adjunct faculty.
2/ All accredited, nonproprietary U.S. postsecondary institutions that grant atwo-year (A.A.) or higher degree and whose accreditation at the higher educationlevel is recognized by the U.S. Department of Education.
3/ Private two-year colleges not listed separately because of too few cases forreliable estimates.
4/ Includes private two-year, religious, medical, and other specialized institutionsthat offer degrees ranging from the bachelor to the doctorate.
SOURCE: U.S. Department of Education, National. Center for Education Statistics,"198: National Survey of Postsecondary Faculty, Institutional Respondent Survey."
11
27

Table 2.4--Percentage distribution of full-time regular faculty in higher educationinstitutions, by academic rank and type and control of institutions Fall 1987
Type and controlof institution
Full-time regular Professors
Instructors
Otherranks 1/11, Associate
Number (inseent_____Percent
,assistant
Percent Percent Percent Percent
All institutions 2!
,thousand
491 100 30 24 24 11 11
Four-year public 231 100 38 27 24 5 5
Four-year private 126 100 31 27 29 7 6
Two-year public 3/ 90 100 12 11 11 33 34
Other 4! 44 100 23 22 31 13 10
Four-year, by type
Research 137 300 40 27 24 4 5
Doctoral 54 100 34 29 24 5 8
Comprehensiveand liberal arts 166 100 33 27 28 7 4
1/ Includes lecturers and full-time faculty with no formal rank.
2/ ill accredited, nonproprietary U.S. postsecondary institutions that grant a two-year (A.A.)or higher degree and whose accreditation at the higher education level is recognized by theU.S. Department of Education.
3/ Private two-year colleges not Listed separately because of too few cases for reliableestimates.
4/ Includes private two-year, religious, medical, and other specialised institutions thatoffer degrees ranging from the bachelor to the doctorate.
NOTE: Percentages may not add to 100 because of rounding.
SOURCE: U.S. Department of Education, National Center for Education Statistics, "1988 NationalSurvey of Postsecondary Faculty, Institutional Respondent Survey."
2812

Section 3: Faculty Dynamics
During the period between the 1986 and 1987 fall terms. institutionalrespondents indicated that the total number of full-time regularinstructional faculty in institutions of higher education increased by 0.5percent (one-half of one percent)4 (table 3.1). Percentages ofinstitutions with increases and decreases were the same (39 percent each).
The rate of increase at private four-year schools was 0.9 percent. Therewas no significant change at public four-year schools. Rates of change wereabout the same for research universities, doctoral universities, and otherfour-year schools (0.7 percent to 0.8 percent). At public two-year schools,the number of full-time regular instructional faculty was virtuallyunchanged. In all groups of institutions, except for those in the "other"category, schools reporting an increase were more numerous than schoolsreporting a decrease. Note that the percentage of schools with no net changeis closely related to the typical size of institutions in a given group.Smaller schools were more likely to report no net change. Additionally,schools with an increased number of faculty were more prevalent amongresearch universities (65 percent) than among comprehensive and liberal artsschools (43 percent), but the reported difference in net increase betweendoctoral universities and comprehensive and liberal arts schools is notstatistically significant).
Changes in tenured full-time regular instructional faculty between the1986 and 1987 fall terms also were relatively modest (table 3.2). Across allinstitutions with tenure systems, the net result of arrivals, departures, andthe granting of tenure was an increase of 1.0 percent in tenured faculty.About one-half (53 percent) of all institutions with tenure systems reportedan increase in tenured faculty. About one-third (32 percent) reported adecrease.
At private four-year institutions, tenured faculty increased by 1.9percent, and individual schools were considerably more likely to have anincrease (56 percent) rather than a decrease (25 percent) in tenuredfaculty. At public four-year institutions similar numbers of schoolsreported increases (52 percent) as reported decreases (45 percent).
4This net percentage change equals the sum of new faculty members minus thesum of departing faculty members divided by the total number of faculty onboard during the 1986 fall term. Note, if a faculty member left oneuniversity in the sample and moved to another that was in the sample, he orshe would be counted in the departure category of one university and in thearrival category of another university.

The number of full-time instructional faculty hired by colleges anduniversities during the 1986-87 academic year was equivalent to 7.5 percentof the number of full-time regular instructional faculty present during the1986 fall term (table 3.3). The same period also witnessed the departure(from a given campus) of 7.0 percent of the faculty present during the 1986fall term.
Rates of arrival and departure were quite uniform across research,doctoral, and other four-year institutions (7.7 percent to 7.9 percent forarrival, 6.9 percent to 7.1 percent for departure). Public two-year schoolshad lower rates of arrival (5.5 percent) and departure (5.5 percent).
About 2 percent of full-time regular faculty members retired between the1986 and 1987 fall terms (table 3.4). Across all institutions, retiringfaculty accounted for one-quarter (26 percent) of all departing full-timeregular faculty. Retirement rates were highest at public two-year schools,from which 2.5 percent of full-time regular faculty retired, representing 45percent of all departures. Among four-year schools, faculty who retired frompublic schools represented somewhat larger shares of full-time regularfaculty than did those who retired from private schools (1.9 percent vs. 1.4percent), and the former also comprised a larger percentage of all departingfull-time regular faculty (27 percent vs. 20 percent).
Among tenured faculty, retirement accounted for about one-half(55 percent) of all departures during the 1986-87 academic year (table 3.5).One-third of departing tenured faculty (33 percent) left to assume positionselsewhere. The remaining 12 percent left for various reasons, includingdeath and disability, formal removal for cause, and dismissal due toinstitutional retrenchment (i.e., budget pressure or program closure).Removal for cause and retrenchment together accounted for only 2 percent ofall departures.
14
30

Table 3.1--Net percentage change from fall 1986 to fall 1987 in full-time regular facultyand percentage distribution of higher education institutions, by direction ofnet change and type and control of institutions Fall 199%
Type and control
--911121III2tial--.Shousands
Full-timereaular,facultv
Institutionswith full-timereaular faculty
Direction of net changein full-time regular
faculty. 1986-87
Number infall term1986 (in
Net
percentagechange,986-87
Netincrease
No
changeNet
decrease
_flber Pe .c t Perce t .erce t Percent
All institutions 1/ 487 0.5 3,115 100 39 23 39
Four-year 354 0.8 1,370 100 46 18 35
Public 229 0.7 483 100 52 10 37
Private 125 0.9 887 100 43 23 34
Two-year public 2/ 90 <0.1 964 100 42 22 36
Other 3/ 43 -0.6 781 100 21 31 48
Four-year, by type
Research 135 0.8 104 100 65 0 35
Doctoral 53 0.8 109 100 60 6 34
Comprehensiveand liberal arts 166 0.7 1,157 100 43 21 36
1/ All accredited, nonproprietary U.S. postsecondary institutions that grant a two-year(A.A.) or higher degree and whose accreditation at the higher education level isrecognized by the U.S. Department of Education.
2/ Private two-year colleges not listed separately because of too few cases forreliable estimates.
3/ Includes private two -year, religious, medical, and other specialized institutions thatoffer degrees ranging from the bachelor to the doctorate.
NOTE: Percentages may not add to 100 because of rounding.
SOURCE: U.S. Department of Education, National Center for Education Statistics, "1988National Survey of Postsecondary Faculty, Institutional Respondent Survey."
15
31

Table 3.2--Net percentage change in tenured faculty and percentage distribution ofhigher education institutions, by direction of net change and type and controlof institutions Fall 1987
Type and controlof _institution
Tenured facultyInstitutions
with tenuredfaculty
Direction of net changein tenured faculty 1986-87
Number infall term1986 (in
thousands,
Netpercentage
change,1986-87
Netincrease
Nochange
Net
decrease
Number Percent Percent Percent Percent,
All institutions 1/ 285 1.0 2,209 100 53 15 32
Four-year public 153 0.4 480 100 52 3 45
Four-year private o7 1.9 811 100 56 19 25
Two-year public 2/ 50 0.9 593 100 54 13 32
Other 3/ 15 4.9 325 100 44 23 33
Four-year, by type
Research 88 0.6 104 100 66 4 31
Doctoral 33 1.1 106 100 56 4 40
Comprehensiveand liberal arts 101 0.9 1,081 100 53 15 32
1/ All accredited, nonproprietary U.S. postsecondary institutions that grant a two-year(A.A.) or higher degree and whose accreditation at the higher education level isrecognized by the U.S. Department of Education.
2/ Private two-year colleges not listed separately because of too few cases for reliableestimAtes.
3/ Includes private two-year, religious, medical, and other specialized institutions thatoffer degrees ranging from the bachelor to the doctorate.
NOTE: Percentages may not add to 100 because of rounding.
SOURCE: U.S. Department of Education, National Center for Education Statistics, "1988Notional Survey of Postsecondary Faculty, Institutional Respondent Survey."
16
32

Table 3.3--Arrival and departure of higher educationinstitutions' full-time regular faculty,by type and control of institutions Fall 1987
Type and controlof institution
1986 full-timeregularfaculty New hires Departures
Number
(in thousands) Percent Percent
All institutions 1/ 487 7.5 7.0
Four-year public 229 7.6 6.9
Four-year private 125 8.1 7.1
Two-year public 2/ 90 5.5 5.5
Other 3/ 43 9.5 10.1
Four-year, by type
Research 135 7.7 6.9
Doctoral 53 7.9 7.1
Comprehensiveand liberal arts 166 7.8 7.1
1/ All accredited, nonproprietary U.S. postsecondaryinstitutions that grant a two-year (A.A.) or higherdegree and whose accreditation at the higher educationlevel is recognised by the U.S. Department of Education.
2/ Private two-year colleges not listed separately becauseof too few cases for reliable estimates.
3/ Includes private two-year, religious, medical, and otherspecialized institutions that offer degrees ranging fromthe bachelor to the doctorate.
SOURCE: U.S. Department of Education, National Center forEducation Statistics, "1988 National Survey of PostsecondaryFaculty, Institutional Respondent Survey."
17
33

Table 3.4--Retirement of higher education institutions' full-timeregular faculty, by type and contra/ of institution:Fall 1987
Type and controlof institution
Total1986 full-time
regularfaculty
Departing1986 full-time
regularfaculty
Retiring facultyas a nercenta &e of:
Number(in thousands)
Number(in thousands)
Full-timeregular
Alldepartures
All institutions 1/ 487 34 1.8 26
Four-year public 229 16 1.9 27
Four-year private 125 9 1,4 20
Two-year public 2/ 90 5 2.5 45
Other 3/ 43 4 1.3 13
Four-year, by type
Research 135 9 1.5 22
Doctoral 53 4 1.7 24
Comprehensiveand liberal arts 166 12 1.9 26
1/ All accredited, nonproprietary U.S. postsecondary institutions thatgrant a two-year (A.A.) or higher degree and whose accreditation atthe higher education level is recognized by the U.S. Department ofEducation.
2/ Private two-year colleges not listed separately because of too fewcases for reliable efttimates.
3/ Includes private two-year, religious, medical, and other specializedinstitutions that offer degrees ranging from the baohelor to thedoctorate.
SOURCE: U.S. Department of Education, National Center for EducationStatistics, "1988 National Survey of Postsecondary Faculty,Institutional Respondent Survey."
18

Table 3.5--Percentage distribution of higher education institutions' departing tenuredfaculty, by reason for departure and type and control ofinstitution: Fall 1987
Type an' nontrolof institution
Departingtenured faculty__
Assumedanotherposition
Remc.adfor cause Retrenched
Otherreasons 1/
Number (inthousands) Percent
_Retired
Percent Percent Percent Percent Percent
All institutions 2/ 14.0 100 55 33 1.2 0.8 10
Four-year public 7.2 100 57 32 0.5 0.0 10
Four-year private 3.1 100 52 35 0.6 0.4 12
Two-year public 3/ 2.5 100 58 25 3.9 3.4 9
Other 4/ 1.2 100 36 52 0.5 1.0 10
Four-year, by type
Research 3.8 100 54 35 0.0 0.0 12
Doctoral 1.5 100 59 32 0.2 0.3 9
Comprehensiveand liberal arts 5.0 100 57 31 1.0 0.1 11
1/ For example, death, disability.
2/ All accredited, nonproprietary U.S postsecondary institutions that grant a two-year (A.A.)or higher degree and whose accreditation at the higher education level is recognized by the U.S.
Department of Education.
3/ Private two-year colleges not listed separately because of too few cases for reliableestimates.
4/ includes private two-year, religious, medical, and other specialized institutions that offerdegrees ranging from the bachelor to the doctorate.
NOTE: Percentages may not add to 100 because of rounding.
SOURCE: U.S. Department of Education, National Center for Education Statistics, "1988 NationalSurvey of Postsecondary Faculty, Institutional Respondent Survey."
19
35

Section 4: Tenure Systems
The Scope of Tenure Systems
Tenure systems for full-time faculty were reported by respondents at 71percent of all institutions (table 4.1). All research universities, 97percent of doctoral universities, 99 percent of public four-year schools and91 percent of private four-year schools had tenure systems for full-timefaculty. For institutions of "other" types, 42 percent reported tenuresystems. Additionally, tenure systems for full-time faculty were in place atonly 62 percent of the public two-year schools. Only 6 percent of allinstitutions reported a tenure system for faculty members working less thanfull time.
Most full-time regular faculty participated in tenure systems. Tenuresystem faculty--including tenured faculty and tenure-track faculty5--constituted 81 percent of full-time regular faculty across all institutions(table 4.2). Tenured faculty alone constituted 59 percent of full-timeregular faculty (tenure-track faculty made up the remaining 22 percent oftenure system faculty). Public four-year schools reported higher percentagesof both tenure system faculty and tenured faculty than the private four-yearschools.
Table 4.2 also indicates that tenured faculty occupied 72 percent of alltenure system positions. At public four-year schools, 74 percent of tenuresystem faculty had tenure (i.e., the ratio of tenured faculty to tenure-trackfaculty was about 3 to 1). At private four-year schools, 66 percent oftenure system faculty had tenure (a ratio of 2 to 1 between tenured andtenure-track faculty). Tenured faculty made up 85 percent of the tenuresystem faculty at public two-year schools (a 4 to 1 ratio). The differencebetween public two-year schools and four-year schools may be related to thefact that tenure decisions at the former typically occur at an earlier stagein the employment of a tenure-track faculty member (see "Policies andAdministrative Measures..." below).
Tenure System Operations
During the 1986-87 academic year, 16 percent of all tenure-trackinstructional faculty were formally considered for tenure (table 4.3).
5Tenure-track faculty are those who do not yet have tenure but who will beconsidered for tenure within some (usually specified) period of timefollowing their hire.

Tenure was granted to 79 percent of those considered. Public and privatefour-year schools reviewed 17 percent and 13 percent of tenure-track faculty,respectively, granting tenure to 76 percent and 80 percent of the candidatesconsidered. Public two-year schools reviewed 27 percent of tenure-trackfaculty and granted tenure to 87 percent of those considered. While it wouldappear that public two-year institutions grant tenure to higher proportionsof those considered for tenure than four-year institutions, there were nosignificant differences in the proportion granted tenure among these types ofinstitutions.
Policies and Admin strative Measures Bearin: Tenure S stems
Institutions with tenure systems often set an upper limit on the numberof years that a full-time faculty member may remain on tenure track withouttenure (table 4.4). This was reported to be the case for 97 percent of thepublic four-year schools and 80 percent of the private four-year schools.Among four-year schools that imposed limits, the specified period wastypically set at 6 or 7 years (table 4.5). All research universities in thesurvey sample allowed tenure-track faculty at least 6 years to becomeestablished. Public two-year institutions, on the other hand, were likely toreview tenure-track faculty at an earlier stage of employment, about 70percent reported tenure limits of 5 years or less. Comments written on thequestionnaires indicated that at some public two-year institutions tenure isconsidered "automatic" after 1 year of teaching.
Institutional policies regarding the timing of tenure review appear to berelatively stable. Only 3 percent of all institutions reported any changeduring the 3 years preceding the survey. Both upward and downwardadjustments were reported, but upward adjustment of one or two years was thetypical response for these few institutions.
Relatively few institutions set limits on the percentage of full-timeinstructional faculty that may be tenured (table 4.6). Institutions withlimits of this kind ranged from about 0 to about 20 percent of four-yearprivate schools and comprehensive and liberal arts schools (22 percent and 21percent, respectively).
Twenty-eight percent of all institutions offered early or phasedretirement to tenured faculty members during the 3 years preceding the survey(table 4.7). This practice was most commonly reported by research anddoctoral universities (64 percent and 49 percent).
Administrative measures that may have the effect of reducing the propor-tion of tenured faculty include the tightening of standards for grantingtenure and the replacement of tenured positions with fixed-term contract posi-tions. As reported by an institutional respondent, during the 3 yearspreceding the survey, 21 percent of all institutions either raised standardsfor granting tenure or tightened the application of existing standards. Atightening of standards occurred most frequently at the doctoral universities
22
37

(32 percent). During the same 3-year period, it was reported that 14 percentof all institutions replaced some tenured positions with fixed-contractpositions.
The great majority of colleges and universities have in recent yearspursued policies or introduced measures that may effectively reduce thepercentage of tenured faculty. This includes policy changes (time on tenuretrack without tenure, percentage of tenured faculty), the operation of earlyor phased retirement plans, and various administrative measures (raisedstandards for granting tenure, replacing tenured with fixed-contractpositions, other measures). Ninety-three percent of all institutionsreported that one or more of these steps had been taken during the 3 yearspreceding the survey (table 4.8).
23
38

Table 4.1--Percentage of higher education institutions with tenuresystems for full- and part-time faoulty, by type andcontrol of institution: Fall 1987
Institutions with Institutions withfull -time raaul4r faculty_ start -time faculty
Type and controlof institution Number
All institutions 1/ 3,115
Four-year public 483
Four-year private 887
Two-year public 2/ 964
Other 3/ 781
Percent withtenure
systems
71
Number
3,093
Percent withtenure
systems
6
99 483 12
91 885 8
62 981 5
42 744 2.
Four-year, by type
Research 104
Doctoral 109
Comprehensiveand liberal arts 1,157
100 102 22
97 109 17
93 1,157 8
1/ All accredited, nonproprietary U.S. postsecondary institutions thatgrant a two-year (A.A.) or higher degree and whose accreditation atthe higher education level is recognized by the U.S. Department ofEduostion.
2/ Private two-year colleges not listed separately because of too fewcases for reliable estimates.
3/ Includes private two-year, religious, medical, and other specializedinstitutions that offer degrees ranging from the bachelor to thedoctorate.
SOURCE: U.S. Department of Education, National Center for EducationStatistics, "1988 National Survey of Postsecondary Faculty,Institutional Respondent Survey."
24
39

Table 4.2--Tenure system and tenured faculty as percentages of highereducation institutions' full-time regular faculty and tenuredfaculty as a percentage of tenure system faculty, by type and
control of institution: Fell 1987
Type and control
F
Ir10M
Number(.n Thousands)
Percent intenuresyste s
Percenttenured
Numberin t ousandii
Percenttenured__Jatinstitution
All institutions 1/ 491 81 59 398 72
Four-year public 231 90 67 207 74
Four-year private 126 82 54 104 66
Two-year public 2/ 90 66 56 59 85
Other 3/ 44 63 36 28 56
Four-year, by type
Research 137 88 64 120 74
Doctoral 54 84 61 46 72
Comprehensiveand liberal arts 166 87 61 146 70
1/ All accredited, nonproprietary U.S. postsecondary institutions that grant
a two-year (A.A.) or higher degree and whose accreditation at the higher
education level is recognized by the U.S. Department of Education.
2/ Private two-year colleges not listed separately because of too few cases for
reliable estimates.
3/ Includes private two-year, religious, medical, and other specializedinstitutions that offer degrees ranging from the bachelor to the doctorate.
SOURCE: U.S. Department of Education, National Center for Education Statistics,"1988 National Survey of Postsecondary Faculty, Institutional Respondent Survey."

Table 4.3--Percentage of higher education institutions' tenure-trackfaculty 1/ considered for tenure in the 1986-87 academicyear and percentage considered who were granted tenure, bytype and control of institution: Fall 1987.
Type and controlof institution
1986 Con4ELSilisIIttalsi
Percentconsideredfor tenurein 1986 -81
1986 tenure trackconsidered fsttimara__
faculty
Percentgrantedtenure
Numberthousands)
Number(mn thousands),(in
All institutions 2/ 110 16 17 79
Four-year public 52 17 9 76
Four-year private 36 13 5 80
Two-year public 3/ 10 27 3 87
Other 4/ 12 11 1 75
Four-year, by type
Research 32 15 5 76
Doctoral 13 18 2 78
Comprehensiveiber 44 15 7 78
1/ Tenure track faculty are those who do not yet have tenure but whowill be considered for tenure within some (usually specified) periodof time following their hire.
2/ All accredited, nonproprietary U.S. postsecondary institutions thatgrant a two-year (A.A.) or higher degree and whose accreditation atthe higher education level is recognized by the U.S. Department ofEducation.
3/ Private two-year colleges not listed separately because of too fewcases for reliable estimates.
4/ Includes private two-year, religious, medical.. and other specialisedinstitutions that offer degrees ranging from the bachelor to thedoctorate.
SOURCE: U.S. Department of Education, National Center for EducationStatistics, "1988 National Survey of Postsecondary Faculty,Institutional Respondent Survey."

Table 4.4--Percentage of higher education institutions thatlimit time on tenure track without tenure, by typeand control of institution; Fall 1987
Institutions withtenure lystems
Type and controlof institution Number
Percent thatlimit time ontenurot eck
All institutions 1/ 2,209
Four-year public 480
Four-year private 811
Two-year public 2/ 593
Other 3/ 325
83
97
80
83
67
Four-year, by type
Research 104
Doctoral 106
Comprehensiveand liberal arts 1,081
94
94
85
1/ All accredited, nonproprietary U.S, postsecondaryinstitutions that grant two-year (A.A.) or higher degree and
whose accreditation at the ligher education level isrecognized by the U.S. Department of Education.
2/ Private two-year colleges not listed separately because of
too few cases for reliable eatimates.
3/ Includes private two-year, religious, medical, and otherspecialized institutions that offer degrees ranging from the
bachelor to the doctorate.
SOURCE; U.S. Department of Education, National Center forEducation Statistics, "1988 National Survey of Postsecondary
Faculty, Institutional RIpondent Survey."
27 42

Table 4.5--Percentage distribution of higher education institutions thatlimit time on tenure track, by maximum number of years on tenuretrack without tenure and type and control of institution:Fall 1987
Type and controlof institution
Institutionsthat limit timeon tenure track
Institutions with time limits of;
Lessthan
5 years
Number Percent Percent
5 years
Percent
6years
Percent
7 _Years
Morethan
7 years
Percent Percent
All institutions 1/ 1,825 100 17 10 26 37 10
Four-year public 467 100 2 14 38 42 3
Four-year private 651 100 0 4 32 46 18
Two-year public 2/ 491 100 53 17 12 18 0
Other 3/ 217 100 14 8 11 45 22
Four-year, by type
Research 97 100 0 0 15 67 18
Doctoral 100 100 0 15 25 49 11
Comprehensiveand liberal arts 921 100 1 8 38 42 11
1/ All accredited, nonproprietary U.S. postsecondary institutions thatgrant a two-year (A.A.) or higher degree and whose accreditation atthe higher education level is recognized by the U.S. Department ofEducation.
2/ Private two-year colleges not listed separately because of too fewcases for reliable estimates.
3/ Includes private two-year, religious, medical, and other specializedinstitutions that offer degrees ranging from the bachelor to thedoctorate.
NOTE: Percentages may not add to 100 because of rounding.
SOURCE: U.S. Department of Education, National Center for EducationStatistics, "1988 National Survey of Postsecondary Faculty,Institutional Respondent Survey."

Table 4,6-- Percentage of higher education institutions that have anupper limit on the percentage of tenured faculty, by typeand control of institution: Fall 1987
Type and controlo in titution
Institutions withtenure systems
umber
Percentthat limitpercentage of
tenure facult
All institutions 1/
Four-year public
Four-year private
Two-year public 2/
Other 3!
2,209
480
811
593
325
13
10
22
3
8
Four-year, by type
Research 104 2
Doctoral 106 4
Comprehensiveand liberal arts 1,081 21
AMIN=1
1/ All accredited, nonproprietary U.S. postsecondary institutionsthat grant a two-year (A.A.) or higher degree and whose accreditationat the higher education level is recognized by the U.S. Department ofEducation.
21 Private two-year colleges not listed separately because of too fewcases for reliable estimates.
3! Includes private two-year, religious, medical, and other
specialized institutions that offer degrees ranging from the bachelorto the doctorate.
SOURCE: U.S. Department of Education, National Center for EducationStatistics, "1988 National Survey of Postsecondary Faculty,Institutional Respondent Survey."
29
44

Table 4.7Percentage of higher education institutions taking specifiedactions during the past three years that may lead toreductions, in tenured faculty, by type and control ofinstitution, Fall 1987
=111, IMII110111M
Type and controlin titution
Number ofinstitutionswith tenures Lem
ttauS have:
Offered Raisedearly/phased tenureretir
Percent
Replacedtenured withfixed-termMatti:1;3A
Percent L__Pereent
All institutions 1/ 2,209 28 21 14
Four-year public 480 41 22 17
Four-year private 811 28 26 18
Two-year public 2/ 593 31 14
Other 3/ 325 6 19 9
IFS
Four-year, by type
Research 104 64 22 15
Doctoral 106 49 32 14
Comprehensiveand liberal arts 1,081 '3 24 18
11 All accredited, nonproprietary U.S. postsecondary institutions thatgrant a two-year (A.A.) or higher degree and whose accreditation atthe higher education level is recognized by the U.S. Department ofEducation.
2/ Private two-year colleges not listed separately because of too fewoases for reliable estimates.
3/ Includes private two-year, religious, medical, and other specializedinstitutions that offer degrees ranging from the bachelor to thedoctorate.
SOURCE: U.S. Department of Education, National Center for EducationStatistics, "1988 National Survey of Postsecondary Faculty,Institutional Respondent Survey."
30
45

Table 4,8--Percentage of higher education institutions taking any actionduring the past three years that may have the effect ofreducing tenured faculty, by type and control of institutionsFall 1987
Typo and controlof institution
Institutions withtenure systems
1 11 ber
Percent thathave takenan ctio
All institutions 1/ 2,209 93
Four-year public 480 96
Four-year private 811 93
Two-year public 21 593 95
Other 3/ 325 85
Four-year, by type
Research 104 95
Doctoral 406 97
Comprehensiveand liberal arts 1,081 93
1/ All accredited, nonproprietary U.S. postsecondary institutions thatgrant a two-year (A.A.) or higher degree and whose accreditation atthe higher education level is recognized by the U.S. Department ofEducation.
2/ Private two-year colleges not listed separately because of too fewcases for reliable estimates.
3/ includes private two-year, religious, medical, and other specializedinstitutions that offer degrees ranging from the bachelor to thedoctorate.
SOURCE: U.S. Department of Education, National Center for EducationStatistics, "1988 National Survey of Postsecondary Faculty,Institutional Respondent Survey."
31 46

Section 5: Collective Bargaining
Collective bargaining units for at least some full-time instructionalfaculty were present at 31 percent of all institutions (table 5.1). At 24percent of institutions, bargaining units represented the entire full-timeregular instructional faculty. At 7 percent of institutions, bargainingunits included only a part of the full-time regular instructional faculty.
Among four-year schools, bargaining units were present at 40 percent ofpublic institutions, but at just 14 percent of private institutions. Atresearch universities, partial representation was more common than represen-tation of the entire full-time faculty. Public two-year institutions had thehighest level of full-time faculty unionization (58 percent with a bargainingunit, 44 percent with representation of all full-time faculty).
Institutions at which collective bargaining units were present employed34 percent of all full-time regular instructional faculty (table 5.2).Institutions at which bargaining units represented the entire full-timefaculty employed 22 percent of full-time regular instructional faculty.
Fourteen percent of higher education institutions had collectivebargaining units for at least some part-time faculty, and 9 percent hadbargaining units that represented all part-time faculty (table 5.3).Contrasts noted above for full-time faculty--between public and privatefour-year schools and between research universities and other four-yearschools--also were observed among part-time faculty, although at loweroverall rates.
Institutions with collective bargaining units for at least some part-timefaculty employed 26 percent of all part-time instructional faculty (table5.4). Institutions at which bargaining units represented all part-timefaculty employed 14 percent of part-time instructional faculty.
33 47

Table 5.1--Percentage of higher education institutions withcollective bargaining for full-time regular faculty,by level of representation and type and control ofinstitution: Fall 1987
Institutions with
Bargaining unit
full-time regular All Somefaculty full-time
regularfull-timeregular
Type and ocntrolPercent withbargaining
faculty faculty
of institution Number units Percent Percent
All institutions 1/ 3,115 31 24 7
Four-year public 483 40 29 12
Four-year private 887 14 12 3
Two-year public 2/ 964 58 44 14
Other 3! 781 12 11 1
Four-year, by type
Researcn 104 24 5 18
Doctoral 109 17 9 8
Comprehensiveand liberal arts 1 157 24 20
1/ All accredited, nonproprietary U.S. postsecondary institutionsthat grant a two-year (A.A.) or higher degree and whoseaccreditation at the higher education level is recognized bythe U.S. Department of Education.
2/ Private two-year colleges not listed separately because of toofew cses for reliable estimates.
3/ Includes private two-year, religious, medical, and otherspecialized institutions that offer degrees ranging from thebachelor to the doctorate.
NOTE: Because of rounding, the percentage :c institutions withall or some faculty represented may not add up to the percentage ofinstitutions with bargaining units.
SOURCE: U.S. Department of Education, National Center for EducationStatistics, "1988 National Survey of Postsecondary Faculty,Institutional Respondent Survey."
34
48

Table 5,2--Percentage of full-time regular faculty at highereducation institutions with collective bargaining forfull-time regular faculty, by level of representation andtype and control of institution: Fall 1987
Full-time :regularfacult
Bargaining unitincludes:
All SomePercent at full-time full-timeinstitutions regular regular
with faculty facultyType and control Number bargainingof institution (in thousands) units Percent Percent_
All institutions 1/ 491 34 22 12
Four-year public 231 38 21 18
Four-year private 126 9 6 4
Two-year public 2/ 90 63 53 10
Other 3/ 44 20 13 7
Four-year, by type
Research 137 24 4 19
Doctoral 54 16 7 9
Comprehensiveand liberal arts 166 35 27 8
1/ All accredited, nonproprietary U.S. postsecondary institutionsthat grant a two-year (A.A.) or higher degree and whoseaccreditation at the higher education level is recognized bythe U.S. Department of Education.
2/ Private two-year colleges not listed separately because of toofew cases for reliable estimates.
3/ Includes private two-year, religious, medical, and otherspecialized institutions that offer degrees ranging from thebachelor to the doctorate.
NOTE: Because of rounding, the percentage of institutions withall or some faculty represented may not add up to the percentage ofinstitutions with bargaining units.
SOURCE: U.S. Department of Education, National Center for EducationStatistics, "1988 National Survey of Postsecondary Faculty,Institutional Respondent Survey."
35
49

Table 5.3--Percentage of higher education institutions withcollective bargaining for part-time faculty, by levelof representation and type and control ofinstitution: Fall 1987
Type and controlof institution
Institutions withpart-time faculty
Bargaining unitincludes:
All
part-timefaculty
Somepart-timefacultyPercent with
bargainingNumber units Percent Percent
All institutions 1/ 3,093 14 9 5
Four-year public 483 26 17 9
Four-year private 885 5 2 3
Two-year public 2! 981 20 12 8
Other 3/ 744 8 8 0
Four-year, by type
Research 102 20 2 19
Doctoral 109 12 10 2
Comprehensiveand liberal arts 1157 11 7 4
1/ All accredited, nonproprietary U.S. postsecondary institutionsthat grant a two-year (A.A.) or higher degree and whoseaccreditation at the higher education level is recognized bythe U.S, Department of Education.
2/ Private two-year colleges not listed separately because of toofew cases for reliable estimates.
3! Includes prI.T.te two-year, religious, medical, and other
specialized institutions that offer degrees ranging from thebachelor to the doctorate.
NOTE: Because of rounding, the percentage of institutions withall or some faculty represented may not add up to the percentage ofinstitutions with bargaining units,
SOURCE: U.S. Department of Education, National Center for EducationStatistics, "1988 National Survey of Postsecondary Faculty,Institutional Respondent Survey."
36
50

Table 5.4Percentage of part-time faculty at higher educationinstitutions with collective bargaining for part-timefaculty, by level of representation and type andcontrol of institution: Fall 1987
Type and controlof institution
All institutions 1/
Part-time facultyBargaining unit
includes:
Percent atinstitutions
withNumber bargaining
(in thotisosi) units
All Somepart-time part-timefaculty faculty
Percent Percent
311 26 14 11
Four-year public 75 42 24 18
Four-year private 86 10 1 9
Two-year public 2/ 125 30 19 12
Other 3! 25 11 11 0
Four-year, by type
Research
Doctoral
Comprehensiveand liberal art
45 15 2 12
26
90
10 6 4
18 16
1/ All accredited, nonproprietary U.S. postsecondary institutionsthat grant a two-year (A.A.) or higher degree and whoseaccreditation at the higher education level is recognized bythe U.S. Department of Education.
2/ Private two-year colleges not listed separately because of toofew cases for reliable estimates.
31 Includes private two-year, religious, medical, and otherspecialized institutions that offer degrees ranging from thebachelor to the doctorate.
NOTE: Because of rounding, the percentage of institutions withall or some faculty represented my not add up to the percentage ofinstitutions with bargaining units.
SOURCE: U.S. Department of Education, National Center for EducationStatistics, "1988 National Survey of Postsecondary Faculty,Institutional Respondent Survey."

Section 6: Employee Benefits
The survey covered e variety of specific employee benefits that collegesand universities provide to instructional faculty:
1 Retirement plansI Medical insurance (or subsidized care)I Dental insurance (or subsidized care)I Life insuranceI Disability insuranceI Tuition benefits for spouseI Tuition benefits for children1 Paid maternity leaveI Paid paternity leaveI Child care benefitsI Wellness programsI Housing assistanceI Subsidized meals
Information also was provided on the availability of flexible benefit optionsand the mean percentage of salary that institutions contribute to benefitspackages for full- and part-time instructional faculty.
Retirement Plans
Retirement plans of one kind or another were available to full-timeinstructional faculty at 98 percent of all institutions of higher education(table 6.1). Retirement benefit plans subsidized by the institution alsowere standard. Subsidies for full-time faculty were provided by 87 percentof all institutions and by well over 90 percent of all four-year schools.Only 78 percent of public two-year schools offered subsidized retirementbenefits.
TIAA/CREF (Teachers' Insurance and Annuity Association/College RetirementEquities Fund) was the most commonly reported retirement plan for full-timefaculty. Sixty percent of all institutions supported TIAA/CREF as an optionand 47 percent provided subsidies through this plan. Both public and privatefour-year institutions offered TIAA/CREF, but private institutions were morelikely to subsidize faculty participation (77 percent vs. 54 percent).
State retirement plans for full-time faculty were made available by 89percent of the public four-year schools and 95 percent of the public two-yearschools. Subsidies were provided by 78 percent of the public four-yearschools and 72 percent of the public two-year schools. State plans werevirtually unavailable to faculty in private institutions.
Forty-one percent of all institutions provided eligibility for full-timefaculty to participate in deferred income retirement plans under sections401(k) and 403(b) of the income tax code, yet only 10 percent of institutionsused these plans as vehicles for providing subsidized faculty benefits.
Other kinds of retirement plans for full-time faculty were offered by 32percent, and subsidized by 21 percent of all institutions. Private four-yearschools were more likely than their public counterparts to subsidize theseplane (26 percent vs. 14 percent).
Forty-three percent of all institutions provided retirement plan eligi-bility for part-time faculty (table 6.2). Only 31 percent made contributionsto these plans. Public institutions were far more likely than privateinstitutions to provide both eligibility and subsidies for part-timefaculty. Access to State pension plans was particularly important in thisrespect. About one-half of the public two-year schools (50 percent) andfour-year schools (53 percent) made State retirement plans available topart-time faculty. Most of these schools also subsidized State plans (39percent and 46 percent). Research universities were more likely thaninstitutions of other types to subsidize both TIAA/CREF and 401(k)/403(b)plans for part-time faculty.
Other Emtlovee Benefits
Subsidized medical insurance or medical care was provided for at leastsome part of the full-time instructional faculty at 99 percent of allinstitutions of higher education (table 6.3). Life insurance coverage wasoffered by 88 percent of institutions. Disability insurance was provided by79 percent of all institutions and by 94 percent of private four-yearschools Fifty-nine percent of institutions provided dental insurance ordental care, with a notably high proportion of research universities (81percent) providing such coverage.
In the area of support for the education of spouses and children offull-time faculty, private institutions were far more likely than publicinstitutions to offer reduced tuition at the home institution or grantstoward tuition at other institutions. Tuition benefits for children offull-time faculty were provided by 99 percent of private four-year schools,as compared to just 47 percent of public four-year schools.
Paid maternity leave was supported by one-half (49 percent) of allinstitutions. Paid paternity leave, on the other hand, was offered by only10 percent of all institutions. Public four-year schools (14 percent) andtwo-year schools (17 percent) were somewhat more likely to offer paidpaternity leave than private four-year schools (5 percent). Child careassistance remained an uncommon benefit, supported by only 4 percent of allinstitutions.
Wellness and health promotion programs (fitness, smoking cessation, etc.)
40
53

were subsidized by 31 percent of all institutions. Housing assistance andsubsidized meals were supported by 11 percent of all institutions. Suchbenefits were rarely supported by public institutions.
Flexible Benefit Plans
Flexible or "cafeteria-style" benefit programs were available tofull-time faculty at 16 percent of all institutions and to part-time timefaculty at 6 percent of all institutions (table 6.4). Flexible benefits forfull-time faculty were at least as common among public two-year schools (21percent) as among public and private four-year schools (12 percent and 18percent).
Institutional Contributions to Faculty Benefits Plans
Table 6.5 shows the mean percentages of salary that institutionscontributed to benefits packages for full- and part-time instructionalfaculty. Almost all colleges and universities provided some subsidizedbenefits, contributing an average of 21 percent of salary to benefitspackages for full-time faculty. Average rates of contribution were fairlyuniform across various types of institutions, with slightly higher ratesreported by public two- and four-year schools (22 percent and 24 percent).
Benefits for part-time faculty were provided by 55 percent of allinstitutions. Contributions were made by three-quarters (76 percent) ofpublic four-year schools, 57 percent of public two-year schools, and 47percent of private four-year schools. Ninety-one percent of researchuniversities and 80 percent of doctoral universities made contributions,compared to 52 percent of comprehensive and liberal arts schools. The
institutions that did provide some benefits for part-time faculty contributedan average of 14 percent of salary to benefits packages. Public four-yearschools tended to contribute more than private four-year schools, andresearch universities tended to contribute more than doctoral or otherfour-year schools.
41
54

Table 6.1--Percentage of higher education institutions et which retirement plans forfull-time regular faculty were available and subsidized, by type of plan andtype and control of institution; Fall 1987
Type and controlof institution
Institutionswith
full-timeregularfaculty
Any retirementPlan TIAA/CREF 1/ State plan
Available Subsidized Available Subsidized Available Subsidized
Number Percent Percent Percent Percent , Percent Percent
All institutions 2/ 3,115 98 87 60 47 46 36
Four-year public 483 100 92 77 5', 89 78
Four-year private 887 100 97 84 77 4 0
Two-year public 3/ 964 100 78 39 23 95 72
Other 4/ 781 92 85 49 40 8 6
Four-year, by type
Research 104 100 96 84 70 49 43
Doctoral 109 100 98 92 76 54 52
Comprehensiveand liberal arts 1 157 100 80 68 30 24
Type and controlof institution
401(k)1403(b) Any other plan
Available Subsidized Available Subsidized
Percent Percent. Percent Percent
All institutions 2/ 41 10 32 21
Four-year public 63 11 25 14
Four-year private 41 14 37 26
Two-year public 3/ 41 5 22 7
Other 4/ 27 12 43 37
Four -veer, by type
Research 71 22 43 26
Doctoral 64 14 21 10
Comprehensiveand liberal arts 45 12 33 23
1/ Teachers Insurance and Annuity Association/College Retirement Equities Fund.
2/ All accredited, nonproprietary U.S. postsecondary institutions that grant a two-year (A.A.)or higher degree and whose accreditation at the higher education level is tucognized by theU.S. Department of Education.
3/ Private two-year colleges not listed separately because of too few cases fc,.. reliableestimates.
4/ includes private two-year, religious, medical, and other specialized institutions the.t offerdegrees ranging from the bachelor to the doctorate.
SOURCE; U.S. Department of Education, National Center for Education Statistics, "1988 NationalSurvey of Postsecondary Faculty, Institutional Respondent Survey."
42 55

Table 6.2-- Percentage of higher education institutions at which retirement plans forpart-time faculty were available and subsidized, by type of plan and type andcontrol of institution: Fall 1987
Type and oontrolof institution
Institutionswith
part-timefacul
Any retirementcoin TIAA/CREF 1/ State plan
, ab S bs d zed Ave able Subsidized
Number ___ Percent Percent Percent Percent Percent Percent
All institutions 2/ 3,093 43 33. 20 13. 25 20
Four-year public 483 62 53 36 16 53 46
Four-year private C85 25 18 19 15 0 0
Two-year public 3/ 981 56 43 11 7 50 39
Other 4/ 744 34 16 22 4 2
Four-year, by type
Research 102 79 70 59 47 38 36
Doctoral 109 71 59 48 24 43 41
Comprehensiveand liberal arts 1,157 32 24 20 12 15 13
Type and controlf inst utio
401(k)/403(b) Anv other Plan
Available Subsidized Available Subsidized
Pe ce t cent
All institutions 2/ 20 5 9 3
Four-year public 41 5 16 6
Four-year private 12 1 6 4
Two-year public 3/ 19 7 5
Other 4/ 17 5 11 4
INIMINNO
Four-year, by type
Research 54 17 26 12
Doctoral 39 4 15 1
Comprehensiveand Liberal arts 18 1 8 4
1/ Teachers Insurance and Annuity Association/College Retirement Equities Fund.
2/ All accredited, nonproprietary U.S. postsecondary institutions that grant a two -year (A.A.)or higher degree and whose accreditation at the higher education level is recognized by theU.S. Department of Education.
3/ Private two-year colleges not listed separately because of too few cases forreliable estimates.
41 Includes private two-year, religious, medical, and other specialized institutions that offerdegrees ranging from the bachelor to the doctorate.
SOURCE! U.S. Department of Education, National Center for Education Statistics, "1938 NationalSurvey of Postsecondary Faculty, Institutional Respondent Survey,"
43 56

Table 6.3--Percentage of higher education institutions providing specified benefits to at leastsome full-time regular faculty, by type and control of institution; Fall 1987
Institutionswith Tuition Tuition
full-time Medical benefits benefits Dentalregular insurance Life Disability for for insurancefaculty or care insurance insurance children spouse or care
Type and controlof institution Number Percent Porcent Percent Percent Percent Percent
All institutions 1/ 3,115 99 88 79 65 63 59
Four-year public 483 98 90 76 47 53 62
Four-year private 887 99 88 94 99 94 44
Two-year public 2/ 964 97 85 70 41 46 73
Other 3/ 781 100 89 75 69 55 55
Four-year, by type
Research 104 100 94 86 58 49 81
Doctoral 109 99 96 91 76 79 57
Comprehensiveand liberal arts 1,157 99 88 88 83 83 47
Paid Paidmaternity Wellness Housing paternity
leave Program Meals leave Child careType and controlof institution Percent
,assistance
Percent Percent Percent Percent Percent
All institutions 1/ 49 31 11 11 10 4
Four-year public 54 40 5 1 14 7
Four-year private 60 39 15 16 5 2
Two-year public 2/ 44 31 0 0 17 4
Other 3/ 40 15 24 23 4 7
Four-year, by type
Research 66 51 21 3 8 8
Doctoral 64 45 9 0 21 10
Comprehensiveand liberal arts 56 38 11 13 7 3
1/ All accredited, nonproprietary U.S. postsecondary institutions that grant a two-year (:.A.)or higher degree and whose accreditation at the higher education level is recognized by theU.S. Department of Education.
2/ Private two-year colleges not listed separatvly because of too few cases for reliableestimates.
3/ Includes private two-year, religious, medical, and other specialized institutiuns that offerdegrees ranging from the bachelor to the doctorate.
SOURCE: U.S. Department of Education, National Center for Education Statistics, "1988 NationalSurvey of Postsecondary Faculty, Institutional Respondent Survey."
44

Table 6.4Percentage of higher education institutions with flexiblebenefits plans for full- and part-time regular faculty,by type and control of institution: Fall 1987
Institutions withfall -time regular faculty
Institutionspart-time
withLimuWar_____
Percentwith flexiblebenefits plans
Percentwith flexiblebenefits plansfor full-time
Type and control regular for part-timeof institution Number faculty Number faculty
All institutions 11 3,115 16 3,093 6
Four-year public 483 12 483 4
Four-year private 887 18 885 6
Two-year public 2/ 964 21 981 6
Other 3/ 781 11 744 8
Four-year, by type
Research 104 14 102 7
Doctoral 109 20 109 12
Comprehensiveand liberal arts 1,157 16 1157 5
1/ All accredited, nonproprietary U.S. postsecondary institutions thatgrant a two-year (A.A.) or higher degree and whose accreditation atthe higher education level is recognized by the U.S. Department ofEducation.
2/ Private two-year colleges not listed separately because of too fewCases for reliable estimates.
3/ Includes private two-year, religious, medical, and other specializedinstitutions that offer degrees ranging from the bachelor to thedoctorate.
SOURCE: U.S. Department of Education; National Center for EducationStatistics, "1988 National Survey of Postsecondary Faculty,Institutional Respondent Survey."

Table 6.5--Average percentage of salary contributed to total benefits packages ofhigher education faculty, by type and control of institution: Fall 1987
Number of
Peroentageof salary
contributed
Institutions withpart-time faculty Percentage
of salaryinstitutions to benefits Percent contributed
with package for offering to benefitsfull-time full-time any benefits package forType and control regular regular to part-time part-timeof institution faculty faculty Number faculty faculty
All institutions 1/ 3,115 21 3,093 55 14
Four-year public 483 24 483 76 18
Four-year private 887 20 885 47 12
Two-year public 2/ 964 22 981 57 14
Other 3/ 781 17 744 48 11
Four-year, by type
Research 104 24 102 91 19
Doctoral 109 22 109 80 16
Comprehensiveand liberal arts 1,157 21 1,157 52 14
1/ All accredited, nonproprietaryU.S. postsecondary institutions that grant a
two-year (A.A.) or higher degree and whose accreditation at the higher educationlevel is recognized by the U.S. Department of Education.
2/ Private two-year colleges not listed separately because of too few cases forreliable estimates.
3/ Includes private two-year, religious, medical, and other specialized institutionsthat offer degrees ranging from the bachelor to the doctorate.
SOURCE: U.S. Department of Education, National Center for Education Statistics,"1988 National Survey of Postsecondary Faculty, Institutional Respondent Survey."
46 59

Summary
There are several issues surrounding instructional faculty in highereducation institutions that the data from the NSOPF survey of institutionalrespondents begin to address. One such issue is the use of part-time facultyand its possible effect on instructional quality. From the data presented inthis report, it is clear that higher education institutions make extensiveuse of part-time and/or temporary faculty, that is faculty who are notexpected to have a full-time commitment to their teaching responsibilities.Across all higher education institutions, 40 percent of instructional facultyare employed either part time and/or on a temporary basis. In publictwo-year schools this situation is even more extreme, in that only 40 percentof all instructional faculty have permanent, full-time status. Moreover, notonly does a relatively high proportion of instructional faculty not have fullcommitment to the institution, but institutions generally are not committedto supporting part-time faculty, either in terms of granting tenure or interms of providing them with retirement or other benefits.
Another set of issues focuses on faculty tenure. These issues concernthe number of tenured faculty and the ability of nontenured faculty toachieve tenure status. As the data in this report indicate, mostinstitutions have a tenure system (71 percent) and most higher educationfaculty are in an institution with a tenure system (81 percent). Of thosefaculty in a tenure system, 72 percent have tenure. Furthermore, of the 16percent of all faculty considered for tenure in the 1986-87 academic year, 79percent were granted tenure.
Institutions seem to be trying to reduce the number of tenured facultythrough changes in institutional policy, however. Ninety-three percent ofinstitutional respondents indicated that their institution had taken one ormore steps to reduce the number of tenured faculty over a three year period.That these steps are not extremely effective is evidenced by the 1 percentincrease in the number of tenured faculty between 1986-87 and 1987-88.
A third issue area concerns prospects of faculty shortages over the nextfew years, due to faculty leaving the institution and an inability to replacedeparting faculty. While no estimates of the number of faculty that willleave are available in these institution-level data, data on the net changein the number of faculty (departures vs. new hires) between academic year1986-87 and fall, 1987 indicate no net change in the number of full-timefaculty in public institutions, and a small increase (.9 percent) in thenumber of faculty in private four-year institutions.
47
60

Appendix A: Technical Notes
61

Appendix A: Technical Notes
The 1988 Notional Survey of Postsecondary Faculty (NSOPF-88) was
conducted under contract to the National Center for Education Statistics
(NCES). It was conducted in accordance with the Congressional mandate to
NCES in P.L. 93-380. The General Provisions Act, 20 USC 1221e-1, Section
406(b), requires NOES to "collect, collate, and from time to time report full
and complete statistics on the condition of education in the United States;
conduct and publish reports on specialized analyses of the meaning and
significance of such statistics;..."
There were three major components of the study: a survey of institu-
tional lee l respondents at a stratified random sample of 480 U.S. colleges
and universities; a survey of a stratified random sample of 3,029 eligible
department chairpersons (or their equivalent) within the participating
institutions; and a survey of a stratified random sample of 11,013 eligible
faculty members within the participating institutions. This report describes
the findings from the institution survey.
Overview
NSOPF-88 was conducted from December 1987 through October 1988. A total
of 480 degree-granting institutions (two-year, four-year, or advanced degree)
were randomly selected, stratified by a modified Carnegie classification and
size--where size was defined as the number of faculty. Within each stratum,
institutions were randomly selected. Of those selected, 449 agreed to
participate and provided lists of their fall, 1987, instructional faculty and
department chairpersons. From each four-year institution, faculty anddepartment chairpersons were stratified by program area and selected; from
each two-year school, simple random samples of faculty and department chairs
were selected; and from the specialized schools, only faculty were sampled.
At all institutions, faculty were stratified on the basis of employment
status, full- and part-time. Questionnaire responses were obtained from 424
institution respondents (88 percent), 2,427 department chairpersons (80percent) and 8,383 faculty members (76 percent).
Institutional Sammlina Strategy
The design of NSOPF-88 called for the selection of a sample of 480 insti-
tutions from the universe of accredited, nonproprietary U.S. postsecondary
institutions that grant a two-year (A.A.) or higher degree and whose accredi-
tation at the higher education level is recognized by the U.S Department of
Education. The sampling frame was the 1987 Integrated Postsecondary Educa-
tion Data System (IPEDS) file, which contained a total of 3,159 institutions

that met the study criteria. The sample was stratified into 12 primarystrata following the Carnegie classification system (which is based onlevel of degree offered and emphasis on research) and control (public vs.private). The 12 strata are as follows:
Research universities, public and private: The 104 leading universitiesin Federal research funds. Each of these universities awards substantialnumbers of doctorates across many fields.
Other doctorate - granting universities, public and private.
Comprehensive colleges and universities, public and private: Offerliberal arts and professional programs; master's degree is the highestdegree offered.
Liberal arts colleges: Smaller and generally more selective thancomprehensive colleges and universities. Primarily offer bachelor'sdegrees, although some offer master's degrees.
Two-year colleges, public and private. Offer'certificate or degreeprograms through the Associate of Arts level.
Religious colleges. Primary purpose is to offer religious instruction ortrain members of the clergy.
Medical schools. Award most of their professional degrees in medicine.Includes only those institutions that appear in the Higher EducationGeneral Information Survey (HEGIS) as separate campuses.
Other: Includes a wide range of professional and other specializedcolleges and universities that offer degrees ranging from the bachelor'sto the doctorate. At least 50 percent of the degrees awarded are in asingle specialized field. Includes schools of health professions otherthan medicine, law, engineering, business, fine arts, and so on.
Table A.1 presents, for each cell, the number of institutions in theuniverse, the number in the sample, and the number of institutional levelsurvey respondents. To select the sample, institutions within each of the 12primary strata were ordered on the basis of approximate number of faculty.Each primary stratum was then divided into three or four substrata based onthe faculty counts. (Usually, the first substratum contained the largestinstitutions whose combined faculty totaled 25 percent of all faculty in theprimary stratum, the second substratum contained the next largest institu-tions whose combined faculty totaled 25 percent of all faculty, and so on,)
*A Classification of Institutions of Higher Education, 1987 Edition, TheCarnegie Foundation for the Advancement of Teaching (Princeton, NJ).
51
63

Table A.1--Distribution of institutions in the universe, sample, andrespondent group, by institutional stratum
Universe SAMPLE Respondents
Public research 71 45 40Private research 33 25 19Public doctoral 63 30 29Private doctoral 46 20 14Public comprehensive 325 75 72Private comprehensive 252 40 37Liberal arts 580 40 36Public two-year 981 100 93Private two-year 193 20 16Religious 308 20 14Medical 53 20 17Other 254 45 37
TOTAL 3159 480 424
A designated number of institutions was randomly sampled from each sizesubstratum, generally as a function of the number of faculty represented. Inmost cases, fewer institutions were sampled from the substrata with thelargest institutions than from those with smaller institutions. However,because there are fewer large than small institutions, the sampling rateswere much higher for large institutions than for small institutions.
For most of these strata, the samples are too small to provide a rea-sonable level of accuracy in reporting the institutional level results.Accordingly, for this report, we have combined most of the strata intogroupings of public four-year, private four-year, and public two-year. Wealso have broken out the results for four-year schools by research, doctoral,and other four-year schools. Table A.2 shows the universe and respondentsizes of each of these groups.
52
64

Table A.2--Distribution of institutions in the universe and respondent group,by institutional groupings used in the report
Universe Respondents
Public four-year 459 141Private four-year 911 106
Public two-year 981 93
Four-year, by typeResearch 104 59
Doctoral 109 43Other four-year 1,159 145
Weight Calculatiq
The weighted data in this report sum to the IPEDS total number ofaccredited, nonproprietary institutions by primary stratum and sizesubstratum. Initial weights were calculated as the inverse of theprobability of selection with institutional strata based on Carnegieclassification and size. Sample weights were adjusted to account forinstitution/respondent nonresponse by multiplying the initial sample weightsby the reciprocal of the response rate.
Data Collection
The first stage of the data collection process involved obtaining eachsampled institution's agreement to participate, and, subsequently, obtaininglists of faculty and department chairpersons in these institutions. A totalof 449 (94 percent) of the 480 institutions agreed to participate and sentfaculty lists.
Institutional respondent questionnaire data were collected between theend of April and mid-September, 1988. Data collection procedures consistedof an initial mailing, two followup mailings, and telephone reminder calls asnecessary. The final response rate was 94 percent of institutions thatagreed to participate and 88 percent of those in the original sample.
5365

Data ProcessinK
Data processing included manual edits, coding of "other specify"responses, and a computer-based editing system to check data for rangeerrors, logical inconsistencies, and erroneous skip patterns. For erroneousskip patterns, values were logically assigned on the basis of the presence orabsence of responses within the skip pattern, as feasible given the responsesprovided. For errors that could not be corrected in this fashion, the hardcopy questionnaire was inspected, and, if necessary, the respondent wascalled back to try to resolve the problem.
As a final step, stochastic imputations were performed on about 2 percentof the questionnaires to fill in selected questionnaire items that hadmissing data. This was done using the response to the omitted item given bya randomly selected other respondent within the same institutional stratumand, if possible, substra4um.
Accuracy of Estimates
Error in the estimates provided in this report are derived from twosources: sampling errors and nonsampling errors. Nonsampling errors areextremely difficult to estimate. They may be caused by a variety of factors,including inability to provide accurate information (for example, because ofincomplete or out-of-date records), refusal to provide information, differ-ences in interpreting the questions, respondent errors, and errors made inrecording the data. No estimates of nonsampling error for these data havebeen made.
Sampling errors occur because the estimates are based on a sample ofindividuals in the population rather than on the entire population. Samplingerrors can be estimated using statistical procedures in which a statisticcalled a standard error is calculated. The standard errors were calculatedusing partially balanced repeated replicates. The tables in appendix Bpresent the standard error, along with the unweighted number of respondents(n), for each estimate presented in this report. The standard errors may beused to calculate confidence intervals around each estimate and to comparetwo or more estimates to determine if they are statistically different fromone another.
To calculate at the 95 percent confidence interval, the standard error ismultiplied by 1.96 and the product is added to and subtracted from theestimate to produce a range. In repeated sampling, 95 out of 100 intervalsconstructed in this way would cover the true population value.
Comparisons noted in this report are significant at the .05 level asdetermined by a pairwise t-test for independent samples. The standard errorof the difference between two estimates was calculated as
SEd
54
66

When multiple comparisons were made, the acceptable minimum significancelevel was decreased by means of the Bonferroni adjustment. This adjustmenttakes into account the increased likelihood, when making multiplecomparisons, of finding significant pairwise differences simply by chance.With this adjustment, the significance level being used for each comparison(.05) is divided by the total number of comparisons being made. For example,for comparisons among public four-year, private four-year, and publictwo-year schools, there are three pairs of comparisons. Thus, theappropriate significance level is .05/3 = .0167, rather than .05.
55 67

Appendix B: Standard Error Tables
i

Table 2.2.1 -- Number and distribution of higher education instructional faculty, by faculty type and type andcontrol of institution: Fall 1987
1
I Total
Inumber of
Type and control I rerpondentelof institution __1(unweighted)1
I
Lotal faculty
Regular Temporary 1/
Full-time Part -time Full-time Part-ti e
Number1Perne tI
Number Percentl_NumberI I
Lit berI I
NumberIPercelt
All institutions 2/ 424 824,686 100 490,999 59.54 180,299 21.86 22,664 2.75 130,724 15.85
Standard error 39,274 24,951 1.23 11,862 1.08 3,155 0.39 12,036 1.24
Four-year public 143 319,363 100 230,858 72.29 45,859 14.36 13,752 4.31 20,894 9.05
Standard error 14,094 10,919 1.22 4,088 1.14 2,078 0.64 2,979 0.90
Four-year privatc 104 217,867 100 126,435 58.03 45,410 20.84 5,583 2.56 40,438 18.56
Standard error 20,503 11,623 2,38 7,915 2.91 1,368 0.66 6,091 2.29
Two-year public 3/ 93 217,625 100 89,814 41.27 75,090 34.50 2,534 1.16 50,187 23.06
Standard error 12,576 5,168 2.32 8,689 3.27 1,197 0.54 7,557 2.97
Other 4/ 84 69,831 100 43,893 62.86 13,939 19.96 795 1.14 11,204 16.04
Standard error 8,904 6,487 3.87 2,431 3.22 266 0.38 2,900 3.96
Four-year, by type
Research 59 192,707 100 136,729 70,95 28,542 13.77 11,066 5.74 18,370 9.53
Standard error 13,988 8,367 2.67 4,454 2.23 2,173 0.97 5,169 2.42
Doctoral 43 82,308 100 54,080 65.70 12,485 15.17 2,413 2.93 13,330 16.19Standard error 9,831 5,810 3.92 4,685 5.47 673 0.82 3,487 4.45
Comprehensiveand liberal arts 145 262,215 100 166,484 63.49 52,242 19.92 5,857 2.23 37,633 14.35Standard error 15,805 10,053 1.48 5,247 1.45 1,725 0.67 4,274 1.46
1/ Visiting, acting, or adjunct faculty.
2/ All accredited, nonproprietary U.S. postsecondary institutions that grant a two-year (A.A.) or higher degreeand whose accreditation at the higher education level is recognized by the U.S. Department of Education.
3/ Private two-year colleges not listed separately because of too few cases for reliable estiamtes.
4/ Includes private two-year, religious, medical, and other specialized institutions that offer degreesranging from the bachelor to the doctorate.
NOTE: Percentages may not add to 100 because of rounding.
SOURCE: U.S. Department of Education, National Center for Education Statistics, "1988 National Survey ofPostsecondary Faculty."
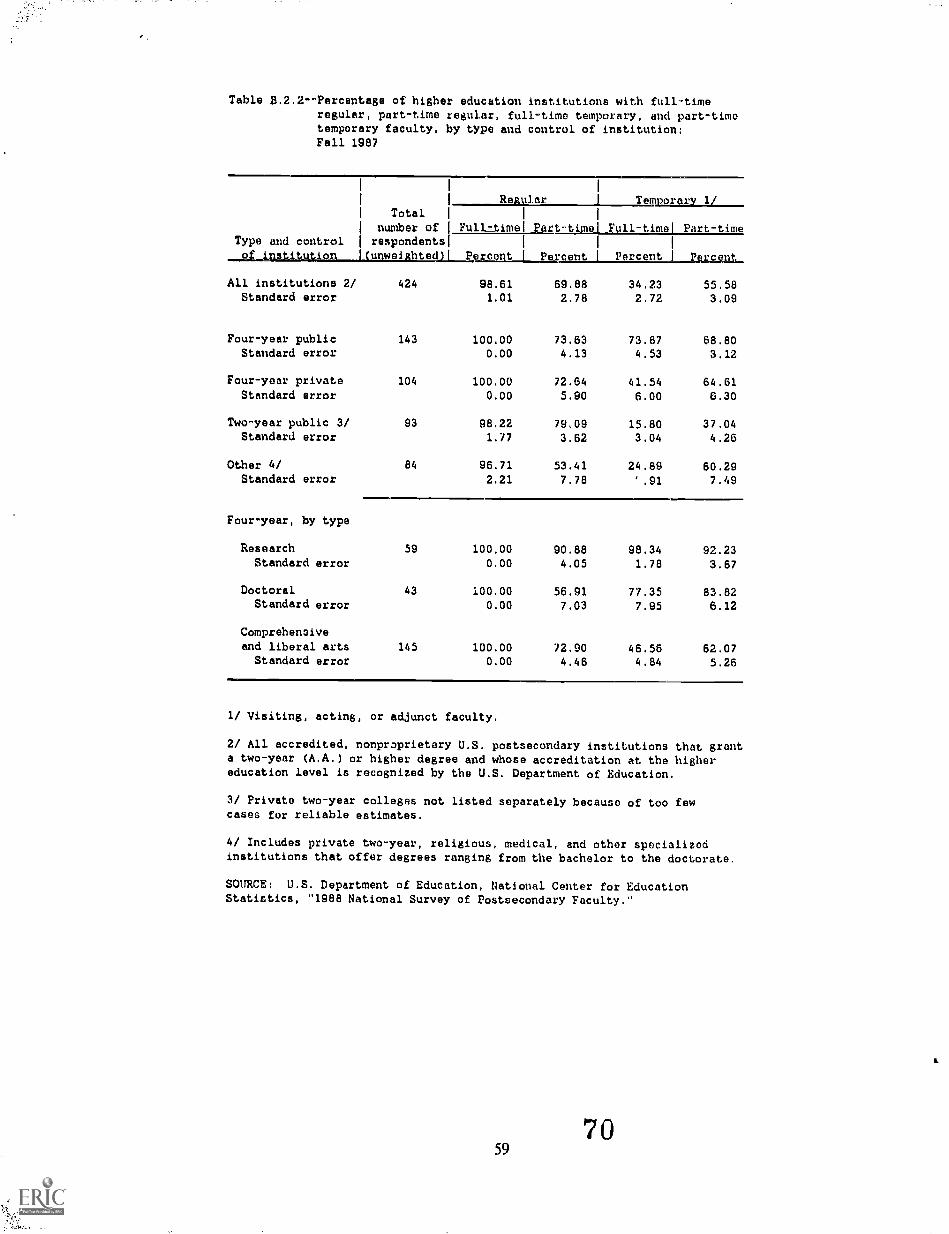
Table B.2.2--Percentage of higher education institutions with full-timeregular, part-time regular, full-time temporary, and part-timetemporary faculty, by type and control of institution:Fall 1987
1 1 1
1 1Regular. I Temporary 1/
1 Total 1
1 1
number of IYu11:14agi_Part-timel Full-timel Part-timeType and control I respondents!
1 1
Percent1
Percent I Percent_sf_inati=0112.ngtweihtedjipercent
All institutions 2/ 424 98.61 69.88 34.23 55.58Standard error 1.01 2.78 2.72 3.09
Four-year public 143 100.00 73.63 73.87 68.80Standard error 0.00 4.13 4.53 3.12
Four-year private 104 100.00 72.64 41.54 64.61Standard error 0.00 5.90 6.00 6.30
Two-year public 3/ 93 98.22 79.09 15.80 37.04Standard error 1.77 3.62 3.04 4.26
Other 4/ 84 96.71 53.41 24.89 60.29Standard error 2.21 7.78 ' .91 7.49
Four-year, by type
Research 59 100.00 90.88 98.34 92.23Standard error 0.00 4.05 1.78 3.67
Doctoral 43 100.00 56.91 77.35 83.82Standard error 0.00 7.03 7.95 6.12
Comprehensiveand liberal arts 145 100.00 72.90 46.56 62.07Standard error 0.00 4.46 4.84 5.26
1/ Visiting, acting, or adjunct faculty.
2/ All accredited, nonpraprietary U.S. postsecondary institutions that granta two-year (A.A.) or higher degree and whose accreditation at the highereducation level is recognized by the U.S. Department of Education.
3/ Private two-year colleges not listed separately because of too fewcases for reliable estimates.
4/ Includes private two-year, religious, medical, and other specializedinstitutions that offer degrees ranging from the bachelor to the doctorate.
SOURCE: U.S. Department of Education, National Center for EducationStatistics, "1988 National Survey of Postsecondary Faculty."
7059

Table B.2.3--Mean number of faculty per higher education institution, by faculty typeand type and control of institution; Fall 1887
Type and controlof institttio
I Total I
I number of I
I respondents' TotalLiunweighted) facul.t
I
I. Regular1
L Temporary V
I I
Full-time Part-ti eI I
Full-time Part-time
All institutions 2/ 424 261.06 155.43 57.07 7,17 41,38Standard error 7.22 4.58 3.61 1.06 3.53
Four-year public 143 661.28 478.02 94.96 28.48 59.83Standard error 28.39 21.82 8.17 4.60 6.84
Four-year private 104 245.61 142.53 51.19 6.29 45.59Standard error 14.32 6.66 8.019 1.59 6.11
Two-year public 3/ 93 221.84 91.55 76.54 2.58 51.36Standard error 11.47 5.00 9.36 1.23 7.27
Other 4/ 84 86.42 54.32 17.25 0.98 13.87Standard error 9.86 7.21 3.25 0.39 4.16
Four-year, by type
Research 59 1,852.95 1,314.70 255.22 106.40 176.63Standard error 76.87 47.66 43.35 20.58 47.75
Doctoral 43 755.12 496.15 114.55 22.14 122.29Standard error 53.34 35.40 45.02 6.32 33.06
Comprehensive 145
and liberal arts 226.63 143.89 45.15 5.06 32.53Standard error 6.30 3.78 4.07 1.54 3.39
1/ Visiting, acting, or adjunct faculty.
2/ All accredited, nonproprietary U.S. postsecondary institutions that grant atwo-year (A.A.) or higher degree and whose accreditation at the higher educationlevel is recognized by the U.S. Department of Education.
3/ Private two-year colleges not listed separately because of too fow cases forreliable estimates.
4/ Includes private two-year, religious, medical, and other specialized institutionsthat offer degrees ranging from the bachelor to the doctorate.
SOURCE: U.S, Department of Education, National Center for Education Statistics,"1988 National Survey of Postsecondary Faculty, Institutional Respondent Survey."

Table 8.2.4-Percentage distribution of full-time regular faculty in higher education institutions, byacademic rank and type and control. of institution: Fall. 1987
Number of1 1
respondents1
1
with1 Professors
1
full-time Full-time regular 11 1 1 Other
regular faculty I Full (Aseetpiate 1Asaistant Imtructoral ranks ALType and control faculty
1 1 1 1 1
of institution (onwelzhted) Number 1 Percent 1 Percentl_Piwent I Percent Percent I Percent
All institutions 2/ 420 490,999 100 30.36 23.77 23.59 11.29 10.99Standard error. 24,951 0.72 0.38 0.50 1.01 1.14
Four-year public 143 230,858 100 38.39 27.49 24.47 4.96 4.68Standard error 10,919 0.66 0.48 0.50 0.34 0.71
Four-year private 104 126,435 100 31.39 26.63 28.76 6.86 6.37Standard error 11,623 1.12 1.07 1.31 0.68 1.84
Two-year public 3/ 92 89,814 100 11.68 10.87 10.51 32.93 34.02Standard error 5,168 2.53 1.66 1.80 5.58 5.52
Other 4/ 81 43,893 100 23.42 22.34 30.81 13.11 10.32Standard error 6,487 1.73 1.29 2.25 1.83 3.25
Four-year, by type
Research 59 136,729 100 39.99 26.82 23.74 3.99 5.45Standard error 8,367 1.44 0.94 0.63 0.61 0.78
Dcztoral 43 54,080 100 34.04 28.87 24.37 4.98 7.74Standard error 5,810 1.00 1.31 0.88 0.61 2.41
Comprehensiveand liberal arts 145 166,484 100 33.18 26.94 28.36 7.19 4.34Standard error 10,053 0.73 0.52 0,64 0.55 1.16
1/ Includes lecturers and full-time fa,x1ty with no formal rank.
2/ All accredited, nonproprietary U.S. postsecondary institutions that grant a two-year (A.A.) or higherdegree and whose accreditation at the higher education level is recognized by the U.S. Department ofEducation.
3/ Private two-year colleges not listed separately because of too few cases forreliable estimates.
4/ Includes private two-year, religious, medical, and other specialized institutions that offer degreesranging from the bachelor to the doctorate.
NOTE: Percentages may not add to 100 because of rounding.
SOURCE: U.S. Department of Education, National Center for Education Statistics, "1988 National Survey ofPostsecondary Faculty."
61 72

Table 8.3.1--Net percentage change from fall 1986 to fall 1987 in full-time regular facultyand percentage distribution of higher education institutions, by direction of netchange and type and control of institution: Fall 1987
Type and controlof institution
Full-timeregular faculty
Institutions
with full-timefaculty
Direction of net changein full-time regular
faculty. 1986-87
1
1Net
Number inlpercentagofall term' change,
1986 1 1986-87
1 1
Net 1 No 1 Net_increasel change I decrease
__mall;1
Number of1
respondents'Liunweightedli_Percent_i
1 1
Percent I Percent 1 Percent
All institutions 1/ 487,462 0.504 420 100 38.59 22.74 38.66Standard error 24,567 0.228 3.30 2.70 3.40
Four-year public 228,936 0.663 143 100 52.43 10.15 37.42
Standard error 10,450 0.386 5.06 3.99 5.43
Four-year private 125,334 0.934 104 100 42.87 22.79 34.34
Standard error 11,510 0.367 4.82 6.12 7.15
Two-year public 2/ 89,748 0.042 92 100 42.14 22.09 35.77
Standard error 5,295 0.364 5.90 4.17 4.06
Other 3/ 43,443 -0.618 81 100 20.81 31.27 47.92Standard error 6,391 1.199 5.52 8.36 9.89
Four-year, by type
Research 135,242 0.822 59 100 64.74 0.00 35.26Standard error 8,101 0.378 6.70 0.00 6.70
Doctoral 53,223 0.835 43 100 59.65 6.47 33.88Standard error 5,586 0.487 7.97 4.21 9.76
Comprehensiveand liberal arts 165,806 0.683 145 100 43.32 21.10 35.58Standard error 9,965 0.424 4.28 4.46 5.25
1/ All accredited, nonproprietary U.S. postsecondary institutions that grant a two-year(A.A.) or higher degree and whose accreditation at the higher education level isrecognized by the U.S. Department of Education.
2/ Private two-year colleges not listed separately because of too few cases forreliable estimates.
3/ Includes private two-year, religious, medical, and other specialized institutions thatoffer degrees ranging from the bachelor to the doctorate.
NOTE: Percentages may not add to 100 because of rounding.
SOURCE: U.S. Department of Education, National Center for Education Statistics, "1988National Survey of Postsecondary Faculty."
62

Table B.3.2--Net percentage change in tenured faculty and percentage distribution ofhigher education institutions, by direction of net change and type and control ofinstitution: Fall 1907
Type and controlo i stit
Tenured faculty Institutionswith tenured faculty
Direction of net changein tenured faculty, 1986-87
I NetNumber in1percentagefall term' change,
986 1986-87
Net 1
increaselNo 1 Net
change I decreaseNumber ofrespondentsunwei hte Pe can _i_P cent ercent ercent
All institutions 1/ 285,359 1.044 :47 52.90 14.74 32.37Standard error 14,560 0.495 3.82 3.49 3.60
Four-year public 153,493 0.358 142 100 52.43 2.93 44.64Standard error 7,657 0.718 4.58 1.75 5.07
Four-year private 67,193 1.859 99 100 55.59 19.44 24.97Standard error 6,208 0.650 7.60 5.40 5.85
Two-year public 2/ 49,770 0.909 64 100 54.41 13.12 32.47Standard error 3,979 0.795 5.79 4.57 5.84
Other 3/ 14,902 4.879 42 100 44,08 23.39 32.52Standard error 2,586 3.366 11.47 15.52 14.30
Four-year, by type
Research 87,520 0.638 59 100 65.73 3.58 30.71Standard error 5,826 1,189 7.78 3.80 7.63
Doctoral 32,505 1.070 42 100 55.72 3.92 40.36Standard error 2,934 0.734 8.17 3.27 8.08
Comprehensiveand liberal arts 100,662 0.886 140 100 53.21 15.16 31.64Standard error 6,140 0.347 5.46 4.52 4.51
1/ All accredited, nonproprietary U.S. postsecondary institutions that grant a two-year(A.A.) or higher degree and whose accreditation at the higher education level isrecognized by the U.S. Department of Education.
2/ Private two-year colleges not listed separately because of too few cases forreliable estimates,
3/ Includes private two-year, religious, medical, and other specialized institutions thatoffer degrees ranging from the bachelor to the doctorate.
NOTE: Percentages may not add to 100 because of rounding.
SOURCE: U.S. Department of Education, National Center for Education Statistics, "1988National Survey of Postsecondary Faculty."
63 74

Table 8.3.3--Arrival and departure of higher education institutions'full-time regular faculty, by type and control ofinstitution: Fall 1987
Type and control
ution
Number ofrespondents
with full-timeregularfacultyin 1986
1 1
1986 11
full-time 11
regular 11
facuka---LAULJILMLLJIMELtall
un edLtI thnber. Percent Percentt
All institutions 1/ 420 487,462 7.511 7,007Standard error 24,587 0.226 0.236
Four-year publicStandard error
Four-year privateStandard error
Two-year public 2/Standard error
Other 3/
143
104
92
81
228,93610,450
125,334
11,510
89,7485,295
43,443Standard error 6,391
Four-year, by type
7.608 6.9450.458 0.376
8.081 7,147
0.486 0.444
5.516 5,474
0.490 0.268
9.482 10.1001.157 0.715
Research 59 135,242 7.705 6.883Standard error 8,101 0.427 0.564
Doctoral 43 53,223 7.941 7.106Standard error 5,506 0.640 0.507
Comprehensiveand liberal arts 145 165,806 7.779 7.096
Standard error 9,965 0.432 0.321,1/ All accredited, nonproprietary U.S. postsecondary institutions thatgrant a two-year (A.A.) or higher degree and whose accreditation atthe higher education level is recognized by the U.S. Department ofEducation.
2/ Private two-year colleges not listed separately because of too fewcases for reliable estimates.
3/ Includes private two-year, religious, medical, and other specializedinstitutions that offer degrees ranging from the bachelor to thedoctorate.
SOURCE: U.S. Department of Education, National Center for EducationStatistics, "1988 National Survey of Postsecondary Faculty."
64
75

Table 8.3.4Retirement of higher education institutions' full-time regularfaculty, by type and control of institution: Fall 1987
Number of Total 1 Departingrespondents 1986 1 1988
with full-time full-timel full-time Retiring facultyregular regular 1 regular as a percentage of:
Type and controlfacultyin 1986
faculty I flcults,1
Full-timel All1
nstitution 1 (unweighted) L Number L Number 1 regular iderartures
All institutions 1/ 420 487,462 34,157 1.814 25.89Standard error 24,567 1,993 0.092 1.40
Four-year public 143 228,936 15,899 1.867 26.88Standard error 10,450 1,018 0.097 1.42
Four-year private 104 125,334 8,957 1.429 20.00Standard error 11,510 910 0.134 2.23
Two-year public 2/ 92 89,748 4,913 2.453 44.81Standard error 5,295 401 0.218 4.79
Other 3/ 81 43,443 4,388 1.329 13.16Standard error 6,391 726 0.317 3.53
Four-year, by typo
Research 59 135,242 9,309 1.528 22.20Standard error 8,101 742 0.134 2.56
Doctoral 43 53,223 3,782 1.720 24.21Standard error 5,586 459 0.164 2.61
Comprehensiveand liberal arts 145 165,806 11,766 1.860 26.21Standard error 9,965 840 0.120 1.71
1/ All accredited, nonproprietary U.S. postsecondary institutions thatgrant a two-year (A.A.) or higher degree and whose accreditation atthe higher education level is recognized by the U.S. Department ofEducation.
2/ Private two-year collegua not listed separately because of too fewoases for reliable estimates.
3/ Includes private two-year, religious, medical, and other specializedinstitutions that offer degrees ranging from the bachelor to thedoctorate.
SOURCE: U.S. Department of Education, National Center for EducationStatistics, "1988 National Survey of Postsecondary Faculty."

Table B.3.5--Peroentage distribution of higher education institutions' departing tenured faculty, by reasonfor departure and type and control of institution: Fall 1987
Type and controlo nstitut on
I Number of I
I respondentsI
'with tenured'
Departingtenured faculty
I
I Retired
I I I
Assumed II I
I another I Removed I I Other
I position Ifor causeARetrencheAdreaaona_lL
I facultynwei hte
I
Number Percent erce t e antI I
P .ceitI
Percent Percent
All institutions 2/ 347 13,975 100 54.59 32.98 1.152 0.782 10.50
Standard error 923 2.20 1.90 0.540 0.172 0.57
Four-year public 142 7,166 100 57.31 31.73 0.529 0.000 10.43
Standard error 457 2.20 2.78 0.206 0.000 1.29
Four-year private 99 3,093 100 52.44 35.06 0.569 0.383 11.55
Standard error 381 4.01 4.17 0.413 0.282 1.88
Two-year public 3/ 64 2,546 100 57.89 25.43 3.908 3.356 9.41
Standard error 315 6,47 4.46 2.731 1.153 1.39
Other 4/ 42 1,170 100 36.39 51.58 0.513 1.026 10.49
Standard error 279 8.73 8.65 0.388 0.916 3.69
Four-year, by type
Research 59 3,803 100 53.55 34.72 0.046 0.042 11.64
Standard error 341 3.50 4.00 0.051 0.037 1.90
Doctoral 42 1,472 100 59.16 31.87 0.170 0.283 8.51
Standard error 173 4.02 3.98 0.161 0.240 1.53
Comprehensiveand liberal arts 140 4,984 100 56,61 31.46 1.028 0.122 10.77
Standard error 396 2.89 2.35 0.402 0.131 1.01
1/ For example, death, disability.
2/ All accredited, nonproprietary U.S. postsecondary institutions that grant a two-year (A.A.) or higherdegree and whose accreditation at the higher education level is recognized by the U.S. Department ofEducation.
3/ Private two-year colleges not listed separately because of too few cases for
reliable estimates.
4/ Includes private two-year, religious, medical, and other specialized institutions that offer degreesranging from the bachelor to the doctorate.
NOTE: Percentages may not add to 100 because of rounding.
SOURCE: U.S. Department of Education, National Center for Education Statistics, "1988 National Survey ofPostsecondary Faculty."

Table B.4.1--Percentage of higher education institutions with tenuresystems for full- and part-time faculty, by type andcontrol of institution: Fall 1987
Institutions with Institutions withfull -time regular fecultyl part-time faculty
Number of 'Percent with Number of 'Percent withType and control respondents' tenure I respondents' tenure
LipIssterrostitutionweilmueihtedsstems
All institutions 1/ 420 70.92 418 6.27Standard error 3.77 1.22
Four-year public 143 99.44 143 12.37Standard error 0.59 2.94
Four-year private 104 91.48 103 7.94Standard error 4.19 3.04
Two-year public 2/ 92 61.53 93 5.34Standard error 5.20 3.07
Other 3/ 81 41.54 79 1.54Standard error
Four-year, by type
ResearchStandard error
DoctoralStandard error
8.98 1.01
59 100.00 58 22.160 00 4.61
43 97.48 43 16.532.84 5.20
Comprehensiveand liberal arts 145 93.47
Standard error 3.19145 7.72
2.36
1/ All accredited, nonproprietary U.S. postsecondary institutions thatgrant a two-year (A.A.) or higher degree and whose accreditation atthe higher education level is recognized by the U.S. Department ofEducation.
2/ Private two-year colleges not listed separately because of too fewcases for reliable estimates.
3/ Includes private two-year, religious, medical, and other specializedinstitutions that offer degrees ranging from the bachelor to thedoctorate.
SOURCE: U.S. Department of Education, National Center for EducationStatistics, "1988 National Survey of Postsecondary Faculty."
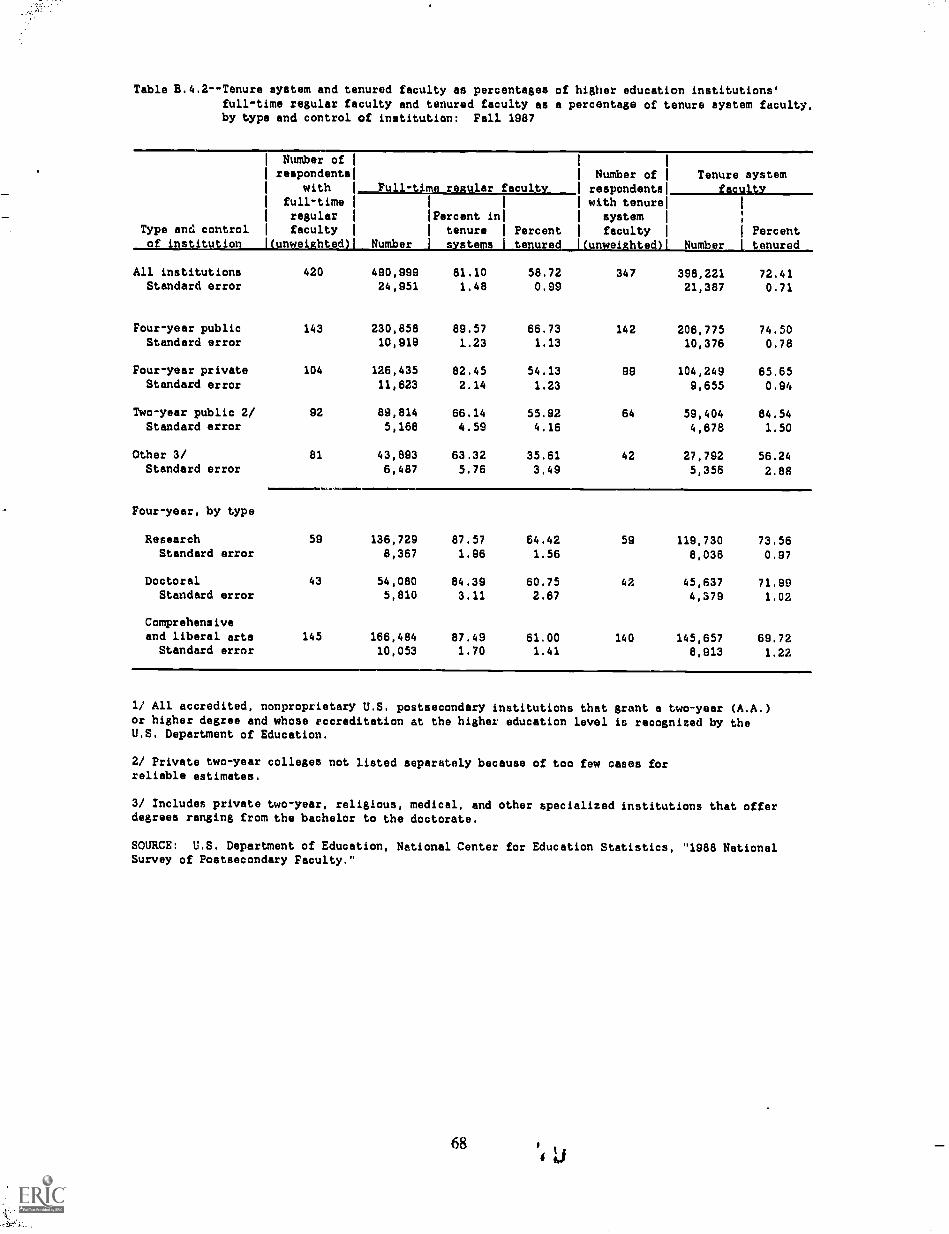
Table B.4.2--Tenure system and tenured faculty as percentages of higher education institutions'full-time regular faculty and tenured faculty as a percentage of tenure system faculty,by type and control of institution: Fall 1987
Type and controlof institution
Number ofrespondents
withfull-timeregularfaculty
un ei hted
__Full-time regular faculty
Number
'Percent inlI tenure I Percent
s ste s to ured
Number ofrespondentswith tenure
systemfaculty
unwei hte
Tenure systemfaculty
' PercentNumber tenured
All institutions 420 490,999 81.10 58.72 347 388,221 72.41Standard error 24,951 1.48 0.99 21,387 0.71
Four-year public 143 230,858 89.57 66.73 142 206,775 74.50Standard error 10,919 1.23 1.13 10,376 0.78
Four-year private 104 126,435 82.45 54.13 99 104,249 65.65Standard error 11,623 2.14 1.23 9,655 0.94
Two-year public 2/ 92 89,814 66.14 55.92 64 59,404 84.54Standard error 5,168 4.59 4.16 4,678 1.50
Other 3/ 81 43,893 63.32 35.61 42 27,792 56.24Standard error 6,487 5.76 3.49 5,356 2.88
Ii......11.0a=1111
Four-year, by type
Research 59 136,729 87.57 64.42 59 119,730 73.56Standard error 8,367 1.96 1.56 8,036 0.97
Doctoral 43 54,080 84.39 60.75 42 45,637 71.99Standard error 5,810 3.11 2.67 4,379 1.02
Comprehensiveand liberal arts 145 166,484 87.49 61.00 140 145,657 69.72Standard error 10,053 1.70 1.41 8,913 1.22
1/ All accredited, nonproprietary U.S. postsecondary institutions that grant a two-year (A.A.)or higher degree and whose eccreditation at the higher education level is recognized by theU.S. Department of Education.
2/ Private two-year colleges not listed separately because of too few cases forreliable estimates.
3/ Includes private two-year, religious, medical, and other specialized institutions that offerdegrees ranging from the bachelor to the doctorate.
SOURCE: U.S. Department of Education, National Center for Education Statistics, "1988 NationalSurvey of Postsecondary Faculty."
68

Table 8.4,3--Percentage of higher education institutions' tenure-trackfaculty 1/ considered for tenure in the 1986-87 academic yearand percentage considered who were granted tenure, by type andcontrol of institution: Fall 1987
1986 tenure track 1986 tenure trackNumber ofrespondentswith tenure
faculty._ faculty consideredfor tenure
1 Percenttrack considered 1 Percent
Type and control faculty for tenure 1 grantedof institution Cunweigy.ed Number lin 1986-87 Number I tenure
All institutions 2/ 347 109,954 15.82 17,396 78.68Standard error 7,216 0.76 978 2.07
Four-year public 142 51,704 17.22 8,901 76.25Standard error 2,938 0.86 539 2.60
Four-year private 99 36,240 12.60 4,568 79.56Standard error 3,621 1.02 439 2.18
Two-year public 3/ 64 9,615 26.78 2,574 87.34Standard error 1,363 3.46 185 6.09
Other 4/ 42 12,395 10.91 1,352 75.25Standard error 2,643 1.62 212 10.31
Four-year, by type
Research 59 31,530 14.84 4,680 75.90Standard error 2,564 0.91 379 2.38
Doctoral 42 12,677 17.56 2,225 77.98Standard error 1,487 1.73 252 4.24
Comprehensiveand liberal arts 140 43,738 15,01 6,564 78.22Standard error 3,060 1.14 517 3.72
1/ Tenure track faculty are those who do not yet have tenure but whowill be considered for tenure within some (usually specified) periodof time following their hire.
2/ All accredited, nonproprietary U.S. postsecondary institutions thatgrant a two-year (A.A.) or higher degree and whose accreditation atthe higher education level is recognized by the U.S. Department ofEducation.
3/ Private two-year colleges not listed separately because of too fewcases for reliable estimates.
4/ Includes private two-year, religious, medical, and other specializedinstitutions that offer degrees ranging from the bachelor to the doctorate.
SOURCE: U.S. Department of Education, National Center for EducationStatistics, "1988 National Survey of Postsecondary Faculty."

Table B.4.4--Percentage of higher education institutions that limittime on tenure track without tenure, by type and controlof institution: Fall 1987
Typo and controlof institution
Institutions withtenure systems
Number of 1
respondents 1
u wei hte )
Percent thatlimit time ontenure tr ck
All institutions 1/ 347 82.63Standard error 2.83
Four-year public 142 97.26Standard error .1.36
Four-year private 99 80.18Standard error 5.37
Two-year public 2/ 64 82.83Standard error 5.27
Other 3/ 42 66.72Standard error 9.65
Four-year, by type
Research 59 93.55Standard error 3.10
Doctoral 42 93.73Standard error 4.08
Comprehensiveand liberal arts 140 85.14Standard error 3.77
1/ All accredited, nonproprietary U.S. postsecondary institutions thatgrant a two-year (A.A.) or higher degree and whose accreditation atthe higher education level is recognized by the U.S. Department ofEducation.
2/ Private two-year colleges not listed separately because of too fewcases for reliable estimates.
3/ Includes private two-year, religious, medical, and other specializedinstitutions that offer degrees ranging from the bachelor to thedoctorate.
SOURCE: U.S. Department of Education, National Center for EducationStatistics, "1988 National Survey of Postsecondary Faculty."

Table B.4.5--Percentage distribution of higher education institutions that limittime on tenure track, by maximum number of years on tenure trackwithout tenure and type and control of institution: Fall 1987
Type and control
Institutio a with time limits of:
1 1
Institutions Less1
1 More
that limit time than1
I1 than
1 1
Number of 11
respondentslle Per ent Percent Percent ercent Percen Percent
All institutions 1/Standard error
Four-year publicStandard error
Four-year privateStandard error
298 100 16.57 10.37 25.78 37.41 9.86
2.36 2.12 2.75 3.29 3.03
137 100 2.47 13.89 38.31 42.01 3.32
2.01 3.36 4.62 5.61 1.10
81 100 0.00 3.92 31.85 46.32 17.910.00 3,26 7.16 5.55 6.00
Two-year public 2/ 51 100 53.25 16.70 12.39 17.66 0.00
Standard error 8.04 4.98 6.51 7.36 0.00
Other 3/ 29 100 13.60 7.85 10.90 45. '.3 22.16Standard error 12.15 7.07 5.60 20.24 20.07
Four-year, by type
Research 55 100 0.00 0.00 14.84 66.75 18.41Standard error 0.00 0.00 5.13 5.46 4.04
Doctoral 40 100 0.00 15.05 24.80 49.02 11.13
Standard error. .0.00 4,96 6.87 8.64 5.69
Comprehensiveand liberal arts 123 100 1.25 8.18 37.69 41.68 11.19
Standard error 1.04 2.72 5.10 5.23 3.95
1/ All accredited, nonproprietary U.S. postsecondary institutions that granta two-year (A.A.) or higher degree and whose accreditation at the highereducation level is recognized by the U.S. Department of Education.
2/ Private two-year colleges not listed separately because of too fewcases for reliable estimates.
3/ Includes private two-year, religious, medical, and other specializedinstitutions that offer degrees ranging from the bachelor to the doctorate.
NOTE: Percentages may not add to 100 because of rounding.
SOURCE: U.S. Department of Education, National Center for Education Stati4tics,"1988 National Survey of Postsecondary Faculty."

Table 13.4,6Percentage of higher education institutions that have anupper limit on the percentage of tenured faculty, bytype and control of institution: Fell 1887
Type and controlof institution
Institutions withtenure aysteMs
Number ofrespondents
I (unwei&hted)
1
1Percent
1 that limit1 percentage of(tenured faculty
All institutions 1/ 347 12.58
Standard error 2.66
Four-year ',abide 142 10,03
Standard error 3.11
Four-year private 99 22.40
Standard error 5.74
Two-year public 2/ 64 3.50
Standard error 2.28
Other 3/ 42 8.35
Standard error 4.23
Four-year, by type
Research 59 1.63
Standard error 1.72
Doctoral 42 3.07
Standard error 2.65
Comprehensiveand liberal arts 140 20.72
Standard error 4.51
1/ All accredited, nonproprietary U.S. postsecondary institutions thatgrant a two-year (A.A.) or higher degree and whose accreditation atthe higher education level is recognized by the U.S. Department ofEducation.
2/ Private two-year colleges not listed separately because of too few
cases for reliable estimates.
3/ Includes private two-year, religious, medical, and other specializedinstitutions that offer degrees ranging from the bachelor to the
doctorate.
SOURCE: U.S. Department of Education, National Center for EducationStatistics, "1988 National Survey of Postsecondary Faculty."

Table 2.4.7 -- Percentage of higher education institutions takingspecified actions during the past three years thatmay lead to reductions in tenured faculty, by type andcontrol of institution: Fall 1987
Inst,1121Lopluttlityju_
I I
II Replaced
Number of Offered I Raised 'tenured with
respondents early /phased) tenure I fixed-termwith tenure retirement standards i positions
Type and control systemsI I
of institution !(unweiehted)I Percent11..All institutions 1/ 347 28.28 20.74 13.77
Standard error 3.24 3.32 2.49
Four-year public 142 41.04 21.60 16.59
Standard error 4.66 3.74 3.89
Four-year private 99 27.96 25.64 18.47
Standard error 4.66 6.58 4.62
Two-year public 2/ 64 30.73 14.21 7.76
Standard error 5.69 5.01 3.62
Other 3/ 42 5.74 19.17 8.78
Standard error 3.65 6.84 5.22
Four-year, by type
Research 59 63.97 21.67 15.27
Standard error 7.45 5.51 5.22
Doctoral 42 48.58 31.80 13.63
Standard error 7.35 8.38 4.80
Comprehensiveand liberal arts 140 28.28 23.62 18.42
Standard error 4.38 4.68 3.89
1/ All accredited, nonproprietary U.S. postsecondary institutions thatgrant a two-year (A.A.) or higher degree and whose accreditation atthe higher education level is recognized by the U.S. Department ofEducation.
2/ Private two-year colleges not listed separately because of too fewcases for reliable estimates.
3/ Includes private two-year, religious, medical, and other specializedinstitutions that offer degrees ranging from the bachelor to thedoctorate.
SOURCE: U.S. Department of Education, National Center for EducationStatistics, "1988 National Survey of Postsecondary Faculty."
73
84

Table 8.4.8- -Percentage of higher education institutions taking any actionduring the past three years that may have the effect ofreducing tenured faculty, by type and control of institution:
Fall 1937
Type and controlof institution 1
Institutions withtenure 3 stem
Number ofrespondents(unweiehted)
1 Percent that1 have takenI any action
All institutions 1/ 347 92.80
Standard error 2.67
Four-year public 142 95.59
Standard error 1.73
Four-year private 89 92.83
Standard error 3.36
Two-year public 2/ 64 94.65
Standard error 3.36
Other 3/ 42 85.21
Standard error 13.75
Four-year, by type
Research 58 94.78
Standard error 3.24
Doctoral 42 97.18
Standard error 2.27
Comprehensiveand liberal arts 140 93.44
Standard error 2.20
1/ ALL accredited, nonproprietary U.S. postsecondary institutions thatgrant a two-year (A.A.) or higher degree and whose accreditation atthe higher education level is recognized by the U.S. Department ofEducation.
2/ Private two-year colleges not listed separately because of too fewcanes for reliable estimates.
3/ Includes private two-year, roligicus, medical, and other specializedinstitutions that offer degrees ranging from the bachelor to thedoctorate.
SOURCE: U.S. Department of Education, National Center for EducationStatistics, "1988 National Survey of Postsecondary Faculty."

Table B.5.1--Percentage of higher education institutions withcollective bargaining for full-time regular faculty, bylevel of representation and type and control ofinstitution: Fall 1887
Type and control
institution
Institutions withfull-time regular
faculty
Bargaining unitincludes:
All I Somefull -time) full-time
regular I regularfaculty L_f, a ultvNumber of 'Percent with
respondents bargaining(unweighted)I units PerconLI_ Percent__91,
All institutions 1/ 420 31.25 24.09 7.16Standard error 2.09 2.20 1.54
Four-year public 143 40.14 28.63 11.50Standard error 3.78 5.31 3.71
Four-year private 104 14.23 11.68 2.55Standard error 3.83 4.49 1.35
Two-year public 2/ 92 58.02 44.19 13.84Standard error 3.60 4.32 3.85
Other 3/ 81 12.09 10.60 1.49Standard error 3.62 3.76 0.90
Four-year, by type
Research 59 23,70 5.44 18.27Standard error 4.38 2.37 4.68
Doctoral 43 16.67 8.77 7.89Standard error 5.72 4.43 3.73
Comprehensiveand liberal arts 145 23.96 19.59 4.37Standard error 2.77 3.19 1.39
..11
1/ All accredited, nonproprietary U.S. postsecondary institutionsthat grant a two-year (A.A.) or higher degree and whoseaccrelitation at the higher education level is recognized bythe U.S. Department of Education.
2/ Private two-year colleges not listed separately because of toofew cases for reliable estimates.
3/ Includes private two-year, religious, medical, and otherspecialized institutions that offer degrees ranging from thabachelor to the doctorate.
NOTE: Because of rounding, the percentage of institutions withall or some faculty represented may not edd up to thepercentage of institutions with bargaining units.
SOURCE: U.S. Department of Education, NatioLll Center for EducationStatistics, "1988 National Survey of Postsecondary Faculty."

Table 8.5.2-- Percentage of full-time regular faculty at higher educationinstitutions with collective bargaining for full-time regularfaculty, by level of representation and type and control ofinstitution: Fall 1987
Full-time regularBargaining unit
includes:Number of faculty
1
respondents1
All 1 Somewith 1 Percent at full-timel full-time
full-time 1institutions regular 1 regularregular
1with faculty I faculty
Type and control faculty 1 bargaining1
of institution 1(unweighted)1 Number 1 units I Percent 1 Percent
All institutions 1/ 420 490,999 33.61 22.00 11.61Standard error 24,951 ..78 1.35 2.00
Four-year public 143 230,858 38.07 20.57 17.51Standard error 10,919 3,96 3.02 4.11
Four-year private 104 126,435 9.25 5.55 3.70Standard error 11,623 2.30 1.92 2.33
Two-year public 2/ 92 89,814 63.28 53.29 9.98Standard error 5,168 4.03 4.94 3.18
Other 3/ 81 43,893 19.60 12.92 6.68Standard error 6,487 6,79 6.21 4.14
Four-year, by type
Research 59 136,729 23.70 4.41 19.29Standard error 8,367 4.82 1.90 5.18
Doctoral 43 54,080 15.59 6.62 8.97Standard error 5,810 5.72 4.27 3.98
Comprehensiveand liberal arts 145 166,484 35.30 26.97 8.33Standard error 10,053 2.31 2.96 2.86
1/ All accredited, nonproprietary U.S. postsecondary institutions that granta two-year (A.A.) or higher degree and whose accreditation at the highereducation level is recognized by the U.S. Department of Education.
2/ Private two-year colleges not listed separately because of too fewcases for reliable estimates.
3/ Includes private two-year, religious, medical, and other specializedinstitutions that offer degrees ranging from the bachelor to the doctorate.
NOTE: Because of rounding, the percentage of institutions with all or somefaculty represented may not add up to the percentage of institutions withbargaining units.
SOURCE: U.S. Department of Education, National Center for EducationStatistics, "1988 National Survey of Postsecondary Faculty.'
Table B.5.3--Percentage of higher education institutions withcollective bargaining for part-time faculty, by levelof representation and type and control ofinstitution: Fall 1987
Institutions withfaculty
Bargaining unit
Allpart-time
Somepart-time
____part-time
Type and controlNumber of 'Percent withrespondents bargaining
:acuity faculty
of institution I(unweixhted)i units Percent Percent
All institutions 1/ 418 13.87 8.79 5.07Standard error 1.21 1.39 1.23
Four-year public 143 26.04 16.80 9.44Standard error 4.28 3.69 2.29
Four-year private 103 4.57 1.71 2.86Standard error 1.94 1.51 1.25
Two-year public 2/ 93 20.46 12.04 8.41Standard error 2.65 3.55 2.98
Other 3/ 79 8.34 7.88 0.46Standard error 3.17 3.10 0.57
Fc.ar-year, by type
Research 58 20.28 1.71 18.57Standard error 5.26 1.83 4.89
Doctoral 43 12.44 10.15 2.29Standard error 4.43 4.71 2.23
Comprehensiveand liberal arts 145 11.40 7.13 4.27Standard error 2.43 1.95 1.18
1/ All accredited, nonproprietary U.S. postsecondary institutionsthat grant a two-year (A.A.) or higher degree and whoseaccreditation at the higher education level is recognized bythe U.S. Department of Education.
2/ Private two-year colleges not listed separately because of toofew cases for reliable estimates.
3/ Included private two-year, religious, medical, and otherspecialized institutions that offer degrees ranging from thebachelor to the doctorate.
NOTE: Because of rounding, the percentage of institutions withall or some faculty represented may not add up to thepercentage of institutions with bargaining units.
SOURCE: U.S. Department of Education, National Center for EducationStatistics, "1988 National Survey of Postsecondary Faculty."
77

Table 13.5.4--Percentage of part-time faculty at higher education institutionswith collective bargaining for part-time faculty, by level ofrepresentation and type and control of institution: Fall 1987
1
1 Part-time facultyBargaining unit
nc_ludesNumber of 1
1 1
respondents'1 Percent at All 1 Some
with1 'institutions part -timed part-time
part-time 1 1 with faculty I facultyType and control faculty 1
1 bargaining1
of institution IC umweighted)1 Number I units Percent 1 Percent
All institutions 1/ 418 311,022 25.77 14.40 11.37Standard error 18,596 2.74 2.09 2.42
Four-year public 143 74,753 41.60 23.96 17.64Standard error 4,951 5.89 4.17 3.93
Four-year private 103 85,849 9.57 0.76 8.82Standard error 10,323 4.54 0.73 4.48
Two-year public 2/ 93 125,277 30.40 18.81 11.60Standard error 10,362 5.89 5.38 4.08
Other 3/ 78 25,143 10.94 10.60 0.34Standard error 3,700 4,88 4.92 0.40
Four-year, by type
Research 58 44,912 14.68 2.40 12.28Standard error 6,992 6.02 2.95 4.46
Doctoral 43 25,815 10.04 5.68 4.36Standard error 5,069 3.78 4.32 4.35
Comprehensiveand liberal arts 145 89,875 33.53 17.82 15.71Standard error 7,108 14 2.52 4.65
1/ All accredited, nonproprietary U.S. postsecondary institutions that granta two-year (A.A.) or higher degree and whose accreditation at tne highereducation level is recognized by the U.S. Department of Education.
2/ Private two-year colleges not listed separately because of too fewcases for reliable estimates.
3/ Includes private two-year, religious, medical, and other specializedinstitutions that offer degrees ranging from the bachelor to the doctorate.
NOTE: Because of rounding, the percentage of institutions with all or somefaculty represented may not add up to the percentage of institutionswith bargaining units.
SOURCE: U.S. Department of Education, National Center for EducationStatistics, "1988 National Survey of Postsecondary Faculty."

Table B.6.1--Percentage of higher education institutions at which retirement plans for full-time
regular faculty were available and subsidized, by type of plan and type and control
of institution: Fall 1987
Type and controlof imstitutiop
Number ofrespondents(
withfull-timeregularfaculty
kunweighted)i_farcent
1 I
Any retirement I
I plan I
1
1
TIAA/CREF 1/ 1 State plan
I I 1
IAvilahlbsichsidizedAvailahle"ag.LiizedI 1
I
1 1 1
_1 _Percent 1
I 1 1
Percent 1 Percent I Percent I Percent
All institutions 2/ 420 97.95 87.21 60.21 47.25 46.15 35.99
Standard error 1.31 1.84 2.82 3.43 2.43 2.22
Four-year public 143 100.00 92.22 76.74 53.53 88.95 78.26
Standard error 0.00 1.91 3.59 6.73 2.74 3.18
Four-year private 104 100.00 97.:0 83.96 77.45 3.65 0.23
Standard error 0.00 1.82 4.67 5.61 3.55 0.24
Two-year public 3/ 92 100.00 77.74 38.80 22.58 94.51 72.25
Standard error 0.00 4.72 4.46 5.38 2.94 5.00
Other 4/ 81 91.84 84.56 49.42 39.51 8.31 5.74
Standard error 5.33 5.24 8.13 5.29 2.88 2.37
Four-year, by type
Research 59 100.00 96.29 84.39 70.36 49.14 42.93
Standard error 0.00 2.44 3,52 5.44 5.41 4.91
Doctoral 43 100.00 97.90 91.75 75.86 54.33 52.23
Stanoard error 0.00 2.42 4.49 4.60 5.29 5.60
Comprehensiveand liberal arts 145 100.00 95.06 80.18 68.25 30.39 24.06
Standard error 0.00 1.76 3.79 4.84 3.27 1.98
=.1111111M
1/ Teachers Insurance and Annuity Association/College Retirement Equities Fund
2/ All accredited, nonproprietary U.S. postsecondary institutions that grant a two-year (A.A.)
or higher degree and whose accreditation at the higher education level is recognized by the
U.S. Department of Education.
3/ Private two-year colleges not listed separately becauNe of too few C8303 for
reliable estimates.
4/ Includes private two-year, religious, medical, and other specialized institutions that offer
degrees ranging from the bachelor to the doctorate.
SOURCE: U.S. Department of Education, National Center for Education Statistics, "1968 National
Survey of Postsecondary Faculty."

Table B.6.1--Percentage of higher education institutions atwhich retirement plans for full-time regularfaculty wmre available and subsidized, by type ofplan and type and control of institution:Fall 1987--continued
Type and controlof institution
1
401 403 1LUZLcL_.,j_._Anumr Plan1 1 1
AvailableiSubsidizediAVAilablelSubsidized
1 1 1
Percent I Percent I Percent I Percent
All institutions 2/Standard error
Four-year publicStandard error
Four-year privateStandard error
Two-year public 3/Standard error
Other 4/Standard error
Four-year, by type
ResearchStandard error
DoctoralStandard error
Comprehensiveand liberal artsStandard error
40.74 10.35 31.92 21.033.41 2.17 2.79 2.83
63.33 10.68 25,39 13.87
5.09 3.06 4.81 3.84
40.62 14.38 36.76 26.45
6.66 4.66 5.72 4.28
40.67 5.17 22.10 6.76
6.88 2.37 3.85 3.22
27.01 11.94 42.57 36.90
6.11 4.86 7.02 6.55
71.28 21.95 43.20 26.316.51 4.01 5.68 5.61
64.27 14.33 21.08 10.42
6.39 4.21 6.93 6.04
45.12 12.17 32.91 22.725.86 3.83 3.96 3.71
1/ Teachers Insurance and Annuity Aotociation/College Retirement Equities Fund
2/ All accredited, nonproprietary U.S. postsecondary institutions that grant a two-year (A.A.)or higher degree and whose accreditation at the higher education level is recognized by theU.S. Department of Education.
3/ Private two-year colleges not listed separately because of too fw cases forreliable estimates.
4/ Includes private two-year, religious, medical, and other specialLzed institutions that offerdegrees ranging from the bachelor to the doctorate.
SOURCE: U.S. Department of Education, National Center for Education Statistics, "1988 NationalSurvey of Postsecondary Faculty."
8091

Table 8.6.2 -- Percentage of higher education institutions at which retirement plans for
part -time faculty were available and subsidized, by type of plan and type and
control of institution: Fall 1987
Type and controlof institution I(i
Number ofrespondents
withpart-timefaculty
II
Any retirement I I
__plan _j_______TIAA/CREF 1/ l State plan
1 1 1 11
AvailabletAglakilaedl AvailablIjSubsidizedl Avai1ableiSubsidized
1 1 1 1 1
lnweighted)I Percent L__Percent Percent Percent Percent Percent
All institutions 2/ 418 42.85 30.71 19.85 10.79 25.26 20.18
Standard error 3.69 3.73 1.67 1.55 2.96 2.78
Four-year public 143 62.41 52.61 35.75 16.05 52.94 46.48
Standard error 5.40 5.14 3.90 2.74 4.77 4.34
Four-year private 103 25.41 17.69 19.37 14.89 0.23 0.23
Standard error 4.14 4.31 3.75 3.76 0.24 0.24
Two-year public 3/ 93 55.97 42.91 11.13 6.85 49.99 38.97
Standard error 6.25 6.94 2.62 1.36 7.34 7.60
Other 4/ 79 33.60 15.89 7.1.60 7.70 4.46 2.08
Standard error 8.05 6.69 :1.32 2.82 1.84 0.95
Four-year, by type
Research 58 79.45 69.79 59.24 47.09 38.14 36.03
Standard error 4.99 6.51 5.88 6.63 5.56 5.45
Doctoral 43 71.41 58.64 47.86 24.05 43.26 40.51
Standard error 5.08 6.26 6.65 5.69 6.55 5.92
Comprehensiveand liberal arts 145 31.75 23.80 19.99 11.67 14.82 12.56
Standard error 3.41 3.49 3.32 3.39 1.66 1.34
1/ Teachers Insurance and Annuity Association/College Retirement Equities Fund
2/ All accredited, nonproprietary U.S, postsecondary institutions that grant a two-year (A.A.)
or higher degree and whose accreditation at the higher education level is recognized by the
U.S. Department of Education.
3/ Private two-year colleges not listed separately because of too few cases for reliable
estimates.
4/ Includes private two-year, religious, medical, and other specialized institutions that offer
degrees ranging from the bachelor to the doctorate.
SOURCE: U.S. Department of Education, National Center for Education Statistics, "1988 National
Survey of Postsecondary Faculty."
81 92

Table 3.6.2-Percentage of higher education institutions atwhich retirement plans for part -time faculty wereavailable and subsidised, by type of plan and type
and control of institution: Fall 1987-continued
1 1
1401.---_-__Mit1160=11111111111--1 1 1 1
I_vailablelSubsidisedi AvailableiSubsidized
Type and control
41illititlaiS2D--LJI
I I I I
All institutions 2/ 20.07 4.51 8.79 3.16
Standard error 1.76 1.50 1.70 1.04
Four-year public 40.97 4.87 16.15 6.00
Standard error 4.46 1.85 3.87 2.07
Four-year private 12.03 0.94 6.49 3.80
Standard error 2.12 0.40 3.55 2.83
Two-year public 3/ 19.27 7.07 5.35 0.38
Standard error 4.14 3.34 2.70 0.39
Other 4/ 17.14 5.17 11.28 4.23
Standard error 6.25 4.77 3.54 2.39
Four-year, by type
Research 53.90 17.28 26.24 12.45
Standard error 7.70 3.46 6.13 3.91
Doctoral 39.04 4.19 14.89 1.38
Standard error 7.15 3.21 5.72 1.50
Comprehensiveand liberal arts 17.88 0.83 7.99 4.19
Standard error 2.30 0.51 3.07 2.28
1/ Teachers Insurance and Annuity Association /College Retirement Equities Fund
2/ All accredited, nonproprietary U.S. postsecondary institutions that grant a two-year (A.A.)
or higher degree and whose accreditation at the higher education level is recognized by the
U,S. Department of Education.
3/ Private two-year colleges not listed separately because of too few oases for
reliable estimates.
4/ Includes private two-year, religious, medical, and other specialized institutions that oftor
degrees ranging from the bachelor to the doctorate.
SOURCE: U.S. Department of Education, National Center for Education Statistics, "1988 National
Survey of Postsecondary Faculty."
82
93

Table B.6.3--Percentage of higher education institutions providing specified benefits to at leastsome full-time regular faculty, by type and control of institution: Fall 1987
Type and controlof i sti ution
Number ofrespondents
withfull-timeregularfaculty
tun ted
I I I I I
I I I Tuition 1 Tuition 1
Medical 1I
1 benefits 1 benefits 1 Dentalinsurancel Life dDisabilityl for 1 for 1 insuranceor care I insurance] insurancel children I mouse I or care
I
Pe c o t cent P rcent Percept Percent
All institutions 1/ 420 98.59 67.72 79.21 65.42 63.24 58.50Standard error 0.73 2.10 2.67 1.79 1.84 3.45
Four-year public 143 98.26 90.24 76.12 47.30 53.23 61.73Standard error 1.58 2.01 4.81 3.62 4.11 4.25
Four-year private 104 99.31 88.10 94.18 98.81 94.24 44.25Standard error 0.74 4.17 3.61 0.34 3.84 5.24
Two-year public 2/ 92 97.31 85.45 70.10 40.74 46.13 73.09Standard error 2.02 3.84 5.36 5.03 5.75 4.71
Other 3/ 81 99.56 88.54 75.35 69.16 55.33 54.69Standard error 0.54 3.36 8.78 8.03 6.25 9.59
Four-year, by type
Research 59 100.00 93.79 85.99 58.18 49.02 81.10Standard error 0.00 3.24 5.35 5.44 6.77 5.19
Doctoral 43 98.62 95.67 90.67 76.04 78.61 56.96Standard error 1.55 2.89 3.06 7.01 7.40 7.93
Comprehensiveand liberal arts 145 98.88 87.77 87,70 83.10 82.66 47.04Standa.d error 0.84 3.36 3.49 1.82 3.28 4.42
1/ All accredited, nonproprietary U.S. postsecondary institutions that grant a two-year (A.A.)or higher degree and whose accreditation at the higher education level is recognized by theU.S. Department of Education.
2/ Private two-year colleges not listed separately because of too few cases forreliable estimates.
3/ Includes private two-year, religious, medical, and other specialized institutions that offerdegrees ranging from the bachelor to the doctorate.
SOURCE: U.S. Department of Education, National Center for Education Statistics, -1988 NationalSurvey of Postsecondary Faculty."

Table 3.6.3-Percentage of higher education institutions providing specified benefitato at least some full-time regular faoulty, by type and control ofinstitution: Fall 1987--oontinued
1
Typo and control 1
"
Ipaid
weI
Iliumlass_1
arni''
Dr ICK"leave
I
HousingHotiln1Meals
I
rePt:!cnlitYlchil4
car
1
care1 r-lasvo
Percent_Percent Percent
All institutions 1/ 48.96 30.81 10.97 10.60 9.57 4.48Standard error 3.35 3.34 1,83 2.11 1.90 1.04
Four-year public 53.80 39.64 5.36 1.43 13.98 7.45Standard error 5.22 4.96 1.91 1.44 3.86 1.99
Four-year private 59.61 39.19 14.79 16.10 4.56 1.67Standard error 4.68 8.27 4.95 3.74 2.39 1.10
Two-year public 2/ 44.23 31.37 0.00 0.00 16.74 3.79Standard error 4.36 5.47 0.00 0.00 4.50 2.08
Other 3/ 39.71 15.16 23.83 23.11 3.67 6.67rtandard error 11.19 3.84 4.33 9.36 1.39 2.75
Four-year, by type
Research 65.58 51.00 21.10 3.08 7.86 8.13Standard error 6.69 7.21 5.98 1.89 3.71 3.75
Doctoral 64.14 44.80 9.00 0.00 21.44 9.95Standard error 7.32 7.09 4.94 0.00 6.23 5.10
Comprehensiveand liberal arts 56.23 37.79 10.8" 12.66 6.60 2.73Standard error 4.16 6.74 3.6: 2.81 2.95 1.05
1/ All accredited, nonproprietary U.S. postsecondary institutions that grant a two-year (A.A.)or higher degree and whose accreditation at the higher education level is recognized by theU.S. Department of Eduoation.
2/ Private two-year colleges not listed separately because of too few cases forreliable estimates.
3/ Includes private two-year, religious, medical, and other specialized institutions that offerdegrees ranging from the bachelor to the doctorate.
SOURCE: U.S. Department of Education, National Center for Education Statistics, "1988 NationalSurvey of Fostssoondary Faculty."
84 95

Table 8.6.4-Percentage of higher education institutions withflexible benefits plans for full- and part-timeregular faculty, by type and control of institution:Fall 1987
/7.=10.
Institutions withfulL-time regular faculty
Institutions withnart-time faculty
Percentwith flexiblebenefits plans
Percentwith flexible
Number of for full-time Number of benefits plansType and control respondents regular respondents for part-timeof institution (unweiRhted) faculty (unweighted) faculty
All institutions 1/ 420 18.38 418 6.37Standard error 3.21 1.65
Four-year public 143 11.98 143 4.13Standard error 2.95 1.07
Four-year private 104 18.16 103 6.07
Standard error 4.60 3.13
Two-year public 2/ 92 21.20 93 6.21Standard error 6.52 3.25
Other 3/ 81 11.11 79 8.41Standard error 4.85 4.74
Four-year, by type
Research 59 14.17 58 7.00
Standard error 5.06 3.52
Doctoral 43 19.69 43 11.65Standard error 5.90 5.37
Comprehensiveand liberal arts 145 15.79 145 4.66Standard error 3.85 2.40
1/ All accredited, nonproprietary U.S. postsecondary institutions thatgrant a two-year (A.A.) or higher degree and whose accreditation atthe higher education level is recognized by the U.S. Department ofEducation.
2/ Private two-year colleges not listed separately because of too fewcases for reliable estimates.
3/ Includes private two-year, religious, medical, and other specializedinstitutions that offer degrees ranging from the bachelor to thedoctorate.
SOURCE: U.S. Department of Education, National Center for EducationStatistics, "1988 National Survey of Postsecondary Faculty."

Table B,6.5--Average percentage of salary contributed to total benefits
packages of higher education faculty, by type and control ofinstitution: Fall 1987
Percentage Institutions withNumber of of salary Hart -tune faculty_ Percentage
respondents contributed of salarywith to benefits
1 Percent contributedfull-time package for 1 offering to benefitsregular full-time Number of I any benefits package for
Type and control faculty regular respondents I to part-time part-timefaculty I(,pweightod)I faculty faculty
All institutions 1/ 420 20.59 418 54.99 13.70Standard error 0.36 3.75 0.57
Four-year public 143 24.40 143 76.14 17,69Standard error 0.71 3.25 1.16
Four-year private 104 20.14 103 46.92 12.16Standard error 0.69 5.38 1.04
Two-year public 2/ 92 22.02 93 57.49 13.68Standard error 0.60 5.90 1.36
Other 3/ 81 16.97 79 47.57 11.47Standard error 1.13 8.66 0.98
Four-year, by type
Research 59 24.37 58 90.86 19.18Standard -r 0.55 4.03 1.20
Doctoral 43 22.05 43 79.50 15.72Standard error 1.05 7.02 1.14
Comprehensiveand liberal arts 145 21.36 145 52.16 13.85
Standard error 0.63 4.52 0.96
1/ All accredited, nonproprietary U.S. postsecondary institutions that grant atwo-year (A.A.) or higher degree and whose accreditation at the higher educationlevel is recognized by the U.S. Department of Education.
2/ Private two-year colleges not listed separately because of too few cases forreliable estimates.
3/ Includes private two-year, religious, medical, and other specialized institutionsthat offer degrees ranging from the bachelor to the doctorate.
SOURCE: U.S. Department of Education, Notional Center for Education Statistics,"1988 National Survey of Postsecondary Faculty."

Appendix C: The Surey Questionnaire

NATIONAL SURVEY OF POSTSECONDARY FACULTY
Institutional Questionnaire
PLEASE READ THESE INSTRUCTIONS
This questionnaire was designed to be completed by spokespersons in l-
and 4-year postsecondary institutions of all sizes. Because there is
such a wide variety of these institutions, some of the questions may notbe worded quite appropriately for your institution. We would appreciate
your tolerance of these difficulties.
If our_institution has multiple campuses. please answer only for the
campus to which the questionnaire was addressed.
If your institution has BOTH_layf_astilty and those assigned by areligious order, a few questions may require different answers for thetwo groups. If this occurs, please call Dr. Susan Russell (collect) at
415-859-4164 for instructions on how to proceed. We apologize for any
inconvenience this may cause you.
Obtaining counts of different kinds of faculty is an important part ofthis study. If you cannot provide "hard" data for some of the "numbers"questions, please provide your best estimates.
I. On what type of academic calendar does your institution operate?
(PLEASE CIRCLE ONE NUMBER)
Semester
Trimester 2
Quarter 3
4 - I - 4 calendar 4
Other (PLEASE SPECIFY BELOW) 5
PLEASE IEEL Many of our questions ask about the status of yourinstitution during the 1987 Fall Term. By this, we meanwhatever academic term was in progress on October 15, 1987.
88
99

FULL-TIME INSTRUCTIONAL FACULTY
PLEASE READ:
By full-time instructional faculty, we mean those members of yourinstitution's instruction/research staff who are employed full-time(as defined by the institution) and whose regOar assignment includesinstruction.
Include:
Regular full-time instructional faculty.Those who contribute their services, such as members of religiousorders.Those on sabbatical leave.Administrators such as department chairs or deans who hold full-timefaculty rank and whose regular assignment includes instruction.
Do not include:
Replacements for faculty on sabbatical leave.Others with adjunct, acting, or visiting appointments.Faculty on leave without pay.Teaching assistants.
2. During the 1987 Fall Term, did your institution have an full-timeinstructional faculty, as defined above?
(PLEASE CIRCLE ONE NUMBER)
Yes 1
No 2 --> SKIP TO PAGE 8
Note: Questions about your full-time instructional faculty are on pages 2 - 7.
Questions about your part-time instructional faculty are on pages 8 - 9.
3. Does your institution have a tenure system for any of your full-time instructionalfaculty?(PLEASE CIRCLE ONE NUMBER)
Yes 1

FULL-TIME INSTRUCTIONAL FACULTY, (continued)
4. During the 1987 Fall Term, how many full-time instructional faculty members did yourinstitution have in each of the categories below?
If there are no academic ranks at your institution, please completegaly the line for "other full-time instructional faculty."
(PLEASE ENTER A NUMBER IN EACH CATEGORY; IF NONE, PLEASE ENTER "0")
Professor:
Associate Professor:
Assistant Professor:
Instructor:
Lecturer:
Other full-time instructionalfaculty, including those withno academic ranks:
TOTAL FULL-TIME INSTRUCTIONALFACULTY DURING 1987 FALL TERM:
5. During the 1987 Fall Term, how many full-timg instructional faculty with visiting,acting, or adjunct appointments did your institution have?Note: These individuals shmild ng appear in your other counts of full-timeinstructional faculty provided in this questionnaire.
(PLEASE GIVE YOUR BEST ESTIMATE IF "HARD" DATA ARE NOT AVAILABLE)
6. How many full-time instructional faculty did your institution have in each of thefollowing categories?
(PLEASE ENTER A NUMBER IN EACH CATEGORY; IF NONE, PLEASE ENTER "0")
Number on the staff during the 1986 Fall Term:(NOTE: Nineteen eighty-lix)
Number who retired, between the beginning ofthe 1986 Fall Term and the beginning of the1987 Fall Term:
Number who left the institution between thebeginning of the 1986 Fall Term and thebeginning of the 1987 Fall Term, for reasonsother than retirement:
Number on the staff at the beginning of the1987 Fall Term who were hired sincethe beginning of the 1986 Fall Terri:
90 101

FULL-TIME INSTRUCTIONAL_FACULT (continued)
IF Ng TENURE SYSTEM, PLEASE SKIP TO QUESTION 13, ON PAGE 6.
7. During the 1986-87 academic year (i.e., Fall '86 through Spring '87), how manyinstructional faculty at your institution were considered for tenure, and how manywere granted tenure?
(PLEASE ENTER A NUMBER IN EACH CATEGORY; IF NONE, PLEASE ENTER "0")
Number considered for tenure:
Number granted tenure:
8. During the 1986 and 1987 Fall Terms, how many tenured and tenure-track instructionalfaculty did your institution have?
(PLEASE ENTER A NUMBER IN EACH CATEGORY; IF NONE, PLEASE ENTER "0")
Tenured instructional faculty:
Tenure-track (but not tenured)instructional faculty:
1986 Fall Term 1987 Fall Term
9. How many tenured instructional faculty (if any) left your institution for eacha the following reasons between the beginning of the 1986 Fall Term and thebeginning of the 1987 Fall Term?
(PLEASE ENTER A NUMBER IN EACH CATEGORY; IF NONE, PLEASE ENTER "0")
Through retirement:
To assume another position:
Formally removed for cause (e.g, forneglect of duty, incompetence, moralturpitude, fraud, or insubordination):
011111
Dismissed because of institutionalbudget pressures or program closures:
For other reasons (e.g., death, disability):
10291

FULL-TIME INSTRUCTIONAL FACULTY (continued)
10. Is there a maximum number of years an instructional faculty member can be on atenure track and not receive tenure at your institution?
(PLEASE CIRCLE ONE NUMBER AND SPECIFY THE MAXIMUM, IF APPLICABLE)
Yes 1
MAXIMUM:
No 2
11. Does your institution currently have an upper limit (either formal or informal) onthe percentage of full-time instructional faculty who are tenured?
(PLEASE CIRCLE ONE NUMBER AND SPECIFY PERCENTAGE, IF APPLICABLE)
Yes... . . . . . . 1
UPPER LIMIT:
No 2
12. During the past three years, has your institution done any of the following?
(PLEASE CIRCLE ALL THAT APPLY AND SPECIFY NUMBERS, IF APPLICABLE)
Offered optional early or phased retirement . . . 1
NUMBER WHO EXERCISED THIS OPTIONIN THE 1986-87 ACADEMIC YEAR:
Changed the upper limit on the percentage offull-time faculty who may be tenured . . . . . . 2
PREVIOUS PERCENTAGE:
Changed the maximum number of years a personcan be on tenure track and not receive tenure . . 3
PREVIOUS MAXIMUM NUMBER OF YEARS:
Replaced some tenured or tenure-track positionswith fixed-term contract positions 4
Raised the standards for granting tenure ortightened the application of the standards . . . 5
Taken other actions designed to lower the per-cent of tenured faculty, or having that effect(PLEASE SPECIFY TYPE OF ACTIONS BELOW:) 6
None of the above 0
92103

FULL-TIME INSTRUCTIONAL FACULTY, (continued)
13. Are any of your full-time instructional faculty legally represented by a union (orother association) for purposes of collective bargaining?
(PLEASE CIRCLE ONE NUMBER AND SPECIFY PERCENT, IF APPLICABLE)
Yes . . . . . . . . . 1
ABOUT WHAT PERCENT?
No 2
14. Which of the following employee benefits are available to Any, of your full-timeinstructional faculty?
(PLEASE CIRCLE ALL THAT APPLY)
Free or subsidized wellness program or healthpromotion program (e.g., fitness program,smoking cessation program) 01
Paid maternity leave 02
Paid paternity leave 03
Subsidized medical insurance or medical care . . 04
Subsidized dental insurance or dental care . . . 05
Subsidized disability insurance 06
Subsidized life insurance 07
Tuition remission/grants at this or otherinstitutions for spouse 08
Tuition remission /grants at this or otherinstitutions for children 09
Subsidized child care. . . 10
Subsidized housing/mortgages 11
Free or subsidized meals 12
None of the above 00
10493

FULL-TINE INSTRUCTIONAL FACULTY, (continued)
15. Please indicate whether each of the retirement plans listed below is available to atleast some of your full-time instructional faculty. For those that are available,please specify whether they are subsidized by your institution and the approximatenumber of full-time instructional faculty who participate in each.
(PLEASE CIRCLE ONE NUMBER FOR EACH PLAN AND SPECIFY NUMBERS, AS APPLICABLE)
AVAILABLEApproximate number
Not Subsidized by Not subsidized full-time instructionalavailable institution_ by institution faculty participants
T1AA/CREF 1 2 3
State plan 1 2 3
401(k) or403(b) plan 1 2 3
Other retirementplan 1 2 3
16: Does your institution have a "cafeteria-style" benefits plan for your full-timeinstructional faculty? (A cafeteria-style plan is one under which staff can tradeoff some benefits for others, following guidelines established by the institution.)
Yes 1
No 2
17. What is the average percentage of salary that is contributed by your institution toa full-time instructional faculty member's total benefits package?
94
105
70

PART-TIME INSTRUCTIONAL FACULTY
PLEASE READ:
By part-time instructional faculty, we mean those members of your institution'sinstruction/research staff who are employed part-time (as defined by the insti-tution) and whose regular assignment at your institution includes instruction.
Include:
Regular part-time instructional faculty.Those who contribute their services, such as members ef religious orders.Part-time rep',cements for faculty on sabbatical leave or leave without pay.Others with pi 1-time adjunct, acting, or visiti4 appointments.
Do not include:
Faculty on leave without pay.Teaching assistants.
18. During the 1987 Fall Term, did your institution have Aly part-time instructionalfaculty, as defined above?
Yes 1
No . . . 2 --> SKIP TO END OF PAGE 9
19. During the 1987 Fall Term, how many part-time instructional faculty did yourinstitution have?
(PLEASE GIVE YOUR BEST ESTIMATE IF "HARD" DATA ARE NOT AVAILABLE)
20. How many of these part-timers (as indicated in Question 19) had adjunct, acting, orvisiting appointments?
(PLEASE GIVE YOUR BEST ESTIMATE IF "HARD" DATA ARE NOT AVAILABLE)
MIN=MMIMIIMSEMMININOI.
21. Does your institution have a tenure system for any of your part-time instructionalfaculty?
Yes 1

PART-TIME INSTRUCTIONAL FACULTY (continued)
22. Are any of your part-time instructional faculty legally represented by a union (or
other association) for purposes of collective.bargaining?
(PLEASE CIRCLE ONE NUMBER AND SPECIFY PERCENT, IF APPLICABLE)
Yes...... . . . I
WHAT PERCENT?
No 2
23. Please indicate whether each of the retirement plans listed below is available to at
least some of your part-time instructional faculty. For those that are available,
please specify the approximate number of part-time instructional faculty who
participate in each.
(PLEASE CIRCLE ONE NUMBER FOR EACH PLAN AND SPECIFY NUMBERS, AS APPLICABLE)
Not
available
AVAILABLE Approximate
Subsidized byinstitution
number
Not subsidized part-time instructional
by institution faculty participants
TIAA/CREF 1 2 3
State plan 1 2 3
401(k) or403(b) plan 1 2 3
Other retirementplan 1 2 3
24. Does your institution have a "cafeteria-style" benefits plan for your part-time
instructional faculty? (A cafeteria-style plan is one under which staff can trade
off some benefits for others, following guidelines established by the institution.)
Yes 1
No . . 2
25. What is the average percentage of salary that is contributed by your institution to
part-time instructional faculty members' total benefits package?
0/0
THANK YOU VERY MUCH FOR YOUR PARTICIPATION
Please return this completed questionnaire in the enclosed franked envelope to:
National Survey of Postsecondary Faculty
SRI International, P.O. Box 2124, Menlo Park, CA 94025-2124
*U.S. GOVERNMENT PRINTING OFFICE: 1990 -262- 91t/ 00501;

108