Embed Size (px)
Citation preview

No.
REPORT
FOR
THE STUDY
ON
THE DEVELOPMENT OF PULP AND PAPER INDUSTRY
IN
THE REPUBLIC OF LITHUANIA
NOVEMBER 2000
UNICO INTERNATIONAL CORPORATION
M P I
J R
0 0 - 1 8 4
JAPAN INTERNATIONAL COOPERATION AGENCY (JICA) MINISTRY OF ECONOMY, THE REPUBLIC OF LITHUANIA


ACKNOWLEDGEMENT
This study report compiles the results of research and study conducted for the proposed
pulp mill project, which was carried out between February and October 2000, including
three field surveys. The final report consists of the main text, the executive summary
and the Investment Guide (in English). The Investment Guide is designed to provide
information on the pulp mill project for potential foreign investors.
The main text consists of 12 chapters, covering the analysis of the pulp and paper
markets, raw materials, candidate mill sites, environmental assessment, mill design,
construction and operation plans, estimation of required capital investment and
financing plan, project’s financial analysis and evaluation, investment environment
study and the current state of the existing paper product industries.
The study team consists of consultants representing UNICO International Corporation
and other consulting firms of Japan, and consulting engineers of Sweden’s Jaakko
Pöyry Consulting AB, led by Mr. Masaaki Shiraishi of UNICO. The Lithuanian
counterpart is the Industrial Strategy Bureau of the Ministry of Economy and a steering
committee was established to confer upon important agenda, organized by
representatives of the Ministry of Economy, the Ministry of Environment and the LDA
and chaired by Mr. Osavaldas �iuksys, Vice Minister of the Ministry of Economy. In
addition, a working group organized by staff of related ministries was appointed to lead
collaborative efforts in the actual research and study process.
The study was conducted smoothly and completed as scheduled in cooperation of
members of the counterpart ministries, other government organizations, local
governments, environmental groups (NGOs), offices of international organizations in
Lithuania, private enterprises and other entities, groups and individuals.
We are pleased to confirm that the study has found the feasibility of the pulp mill
project in Lithuania. To bring the project requiring a large amount of investment into
reality, however, much efforts will be required by the Lithuanian government,
particularly its Task Force Team that is mandated to attract investors to the project.
We sincerely hope that this report will help potential investors who are interested in this
project to make their decision.

Finally, we would like to express our gratitude to those who have been taking part in or
providing guidance and assistance for this study, including many members of the
government ministries and organizations in various countries.

MEASUREMENT UNITS AND PREFIXES The SI (International System of Units) is used as basic system for measurement units (base units and derived units) and for prefixes. Certain non SI-units are used because of their practical importance and common use. Non SI-units are shown in italic. 1. Measurement units
Symbol Unit Physical quantity Note a annum, year time A ampere electric current C coulomb electric quantity, electric
charge A· s
0C degree Celcius temperature (t) t (0C) = T (K) – 273.15 cd candela luminous intensity d day time 24 h g gram mass h hour time 3600 s ha hectare area 10 000 m2
Hz hertz frequency J joule energy, quantity of heat N· m K kelvin temperature (T) thermodynamic temperature kg kilogram mass L litre volume 1 dm3
m metre length m2 square metre area m3 cubic metre volume See note 1) mb millibar pressure 100 Pa, meteorology only m/s metre per second speed, velocity m/s2 metre per second squared acceleration min minute time 60 s mol mole amount of substance, chemical
substance
N newton force Pa pascal pressure N/m2
rad radian plane angle s second time t tonne mass 1000 kg, used with prefixes kilo
and mega only V volt electric potential W/A W watt power J/s Wh watthour energy

Notes: 1) For wood raw material the following units are used
m3 sob Volume of round wood measured as solid volume over (on, with) bark (cubic metre solid volume over bark).
m3 sub Volume of round wood measured as solid volume under (without) bark (cubic metre solid volume under bark).
m3 st Volume of round wood measured in stack/pile including volume of intermediate air
m3 l Volume of chips measured in pile including volume of intermediate air (cubic metre loose volume)
2) If not specifically specified m3 and m3 s denotes m3 sub.
2. Prefixes
Prefix Name Factor p pico 10-12 n nano 10-9 µ micro 10-6 m milli 10-3 c centi 10-2 Not strictly SI-units but may be used in conjunction with the metre. d deci 10-1 Not strictly SI-units but may be used in conjunction with the metre. k kilo 103 M mega 106 G giga 109 T tera 1012 P peta 1015 E exa 1018
3. ABBREVIATIONS AND ACRONYMS 3-1. Common abbreviations
AAC Annual allowable cut - maximum allowable wood
harvest
AD, ADt Air dry, air dry ton(s).
For pulp 1 000 kg at 10% moisture content
AOX Absorbable organic halogens, a standard method for analysis of halogenated organic compounds
BAT Best available technology BCTMP Bleached CTMP BD, BDt Bone dry, bone dry ton(s).
1 000 kg of bone dry e.g. wood or - more seldom - pulp
BHKP Bleached hardwood kraft pulp BHSP Bleached hardwood sulphite pulp BKP Bleached kraft pulp

bl Bleached BODx Biochemical oxygen demand in (x) days BSKP Bleached softwood kraft pulp BSSP Bleached softwood sulphite pulp C&F Cost and freight Cf., cf. Compare CIF Cost, insurance and freight CMP Chemi-mechanical pulp COD Chemical oxygen demand CO2 Carbon dioxide CTMP Chemi-thermomechanical pulp DIP Deinked pulp DS, ds Dry solids ECF Elemental chlorine-free Cl2 is not used e.g. for example EIA Environmental Impact Assessment EMAS Eco Management and Audit Scheme ESP Electrostatic precipitator excl. excluding, exclusive FB Fibreboard FOB Free on board GDP Gross domestic product GNP Gross national product HP High pressure HW, hw Hardwood Deciduous tree species i.e. that is incl. including, inclusive IPPC Integrated pollution prevention and control
directive From EU
LP Low pressure LPG Liquefied petroleum gas MAI Mean annual increment MDF Medium density fibreboard MP Medium pressure NBSKP Northern bleached softwood kraft pulp Norscan North American and Scandinavian market pulp
suppliers
NOx Nitrogen oxides (NO, NO2)

ob Over bark OD, ODt Oven dry, oven dry ton(s) OSB Oriented strand board - a type of reconstituted
wood panel
PB Particle board pH Measure of acidity/alkalinity of a solution PPI Pulp & Paper International - trade magazine ppm Parts per million RCF Recycled fibre ROE Return on equity ROI Return on investment SCMP Semi-chemical mechanical pulp SO2 Sulphur dioxide sob Solid over bark e.g. m3 sob, solid volume of
wood measured over (on) bark in cubic metre
spp Species (plural) SS Suspended solids sub Solid under bark e.g. m3 sub, solid volume of
wood measured under (without) bark in cubic metre
SW, sw Softwood Coniferous species SWOT Strengths, weaknesses, options, threats. TCF Totally chlorine-free TEF Totally effluent-free TMP Thermo-mechanical pulp TOC Total organic carbon TOX Total organic halogens TSS Total suspended solids ub under bark UKP Unbleached kraft pulp unbl Unbleached VAT Value added tax
3-2. Organisations
CEPI Conféderation Européenne de l'industrie des pâtes, papiers et cartons.
CIS Commonwealth of Independent States (former USSR excl. Baltic countries)
EBRD European Bank for Reconstruction and

Development EU European Union FAO Food and agriculture organisation of the United
Nations
FSC Forest stewardship Council IFC International Finance Corporation ISO International Organisation for Standardisation ITTO International Tropical Timber Organisation JICA Japan International Co-operation Agency LDA Lithuanian Development Agency MEC Lithuanian Centre of Forest Economics NGO Non-government organisation OECD Organisation for economic co-operation and
development
WB World Bank WWF World wild fund for nature
3-3. Currencies DEM German mark EEK Estonian kronor EUR European euro FIM Finnish mark JPY Japanese yen LAT Latvian ….. LTL Lithuanian litas SEK Swedish kronor USD United States dollars

i
CONTENTS
Chapter 1 BACKGROUND OF THE PROJECT
1.1 Republic of Lithuania: Country and People ........................................................1 - 1
1.2 Political and Social Conditions...........................................................................1 - 3
1.3 Outline of the Lithuanian Economy ....................................................................1 - 7
1.4 Industry.............................................................................................................1 - 12
1.5 Manufacturing Industry .....................................................................................1 - 16
1.6 Forestry.............................................................................................................1 - 19
1.7 Forestry and Wood products ..............................................................................1 - 45
Chapter 2 PULP AND PAPER MARKET
2.1 Domestic Market ...............................................................................................2 - 1
2.2 Neighboring Markets .........................................................................................2 - 5
2.3 World Market ....................................................................................................2 - 12
2.4 Market Trend of European Major Countries .......................................................2 - 18
2.5 Consolidation of Pulp and Paper Industries in Industrialized Countries
through M&A Activities ....................................................................................2 - 36
Chapter 3 RAW MATERIALS
3.1 Potential Supply Sources and Major Issues ........................................................3 - 1
3.2 Sawmill Wood Wastes and Chips.......................................................................3 - 9
3.3 Material Procurement Planning Framework........................................................3 - 13
Chapter 4 MILL SITE
4.1 Introduction.......................................................................................................4 - 1
4.2 Site selection method..........................................................................................4 - 3
4.3 Initially identified site alternatives – "Long List of Candidate Sites"...................4 - 24
4.4 Site screening – "Short List of Potential Sites"...................................................4 - 31
4.5 Recommendation – "List of Most Favourable Sites" ..........................................4 - 35
ii
CONTENTS
Chapter 5 ENVIRONMENTAL ASPECTS
5.1 General..............................................................................................................5 - 1
5.2 Environmental Legislation in Lithuania ..............................................................5 - 2
5.3 Applicable Environmental Standards for the Project ...........................................5 - 22
5.4 Proposed Technical Measures for Environmental Improvement...........................5 - 30
5.5 Estimated Pollution Loads..................................................................................5 - 38
5.6 Environmental Impacts ......................................................................................5 - 43
Chapter 6 PULP MILL DESIGN
6.1 Products and Specifications ...............................................................................6 - 1
6.2 Production Capacity ..........................................................................................6 - 5
6.3 Selection and Description of the Production Process ...........................................6 - 18
6.4 Outline of Mill Facilities and Equipment ............................................................6 - 36
6.5 Unit Consumption..............................................................................................6 - 57
6.6 Mill Layout .......................................................................................................6 - 68
Chapter 7 MILL CONSTRUCTION PLAN
7.1 Mill Construction Plan.......................................................................................7 - 1
7.2 Construction schedule........................................................................................7 - 4
Chapter 8 PROJECT COST ESTIMATE AND FINANCING PLAN
8.1 Project Cost Estimate.........................................................................................8 - 1
8.2 Financing Plan...................................................................................................8 - 6
Chapter 9 OPERATION PLAN
9.1 Company Organization and Workforce...............................................................9 - 1
9.2 Production Schedule ..........................................................................................9 - 8
Chapter 10 FINANCIAL ANALYSIS
10.1 Major Assumptions............................................................................................10 - 1
10.2 Production and Sales Plan..................................................................................10 - 2
10.3 Operating Cost ..................................................................................................10 - 4

iii
CONTENTS
10.4 Results of Financial Analysis .............................................................................10 - 8
10.5 Sensitive Analysis..............................................................................................10 - 11
10.6 Overall Evaluation of Financial Feasibility.........................................................10 - 14
10.7 Conclusion ........................................................................................................10 - 15
Chapter 11 INVESTMENT PROMOTION STUDY
11.1 Institutional Framework and Structure Related to Foreign Direct
Investment .........................................................................................................11 - 1
11.2 Current State of Operations by Foreign Firms in t ..............................................11 - 6
11.3 Case Study Analysis of Foreign Firms Operating in the Country.........................11 - 10
11.4 Current State of Operations by Foreign Firms in Latvia......................................11 - 16
11.5 Current State of Operations by Foreign Firms in Estonia ....................................11 - 25
11.6 Business Environments in the Baltic States as Perceived by Foreign Firms..........11 - 32
11.7 Competitive Analysis of the Baltic States ...........................................................11 - 33
11.8 SWOT (Strength/Weakness/Opportunity/Threat) Analysis of Lithuania..............11 - 49
11.9 Questionnaire Survey of Potential Investors: Result and Analysis .......................11 - 53
11.10 Major Characteristics of Pulp and Paper Making Business and Foreign
Investment Promotion Measures.........................................................................11 - 55
11.11 Need for Policies and Programs Focusing on Foreign Investment ........................11 - 59
Chapter 12 CURRENT STATE OF THE PAPERMAKING INDUSTRY IN
LITHUANIA AND MAJOR ISSUES 1
12.1 Current State of Paper Manufacturers in Lithuania and Major Issues..................12 - 1
12.2 Collection and Recycling of Waste Paper: Current State and Major Issues ..........12 - 18
12.3 Conclusion ........................................................................................................12 - 45

iv
CONTENTS
【Tables】
Table 1.2.1 Labor Force and Employment..............................................................1 - 5
Table 1.2.2 Employment Population by Economic Activity (3rd Quarter of
1999) ..................................................................................................1 - 6
Table 1.3.1 Balance of Payments ...........................................................................1 - 10
Table 1.3.2 Major Countries for Foreign Trade ......................................................1 - 11
Table 1.4.1 Production of Industrial Sub-Sectors ...................................................1 - 14
Table 1.4.2 Industrial Sub-Sectors and Share of Production (1998) ........................1 - 15
Table 1.6.1 Forest Areas by Species and Ownership...............................................1 - 22
Table 1.6.2 Forest Areas by Forest Type and Group ..............................................1 - 23
Table 1.6.3 Growing Stock Volume by Forest Type and Species ............................1 - 23
Table 1.6.4 Forest Area by Type and Age Class.....................................................1 - 27
Table 1.6.5 Growing Stock Volume by Type and Age Class...................................1 - 28
Table 1.6.6 Growing Stock Volume Per Hectare by Type and Age Class ................1 - 29
Table 1.6.7 Estimated Mean Annual Increment ......................................................1 - 29
Table 1.6.8 Forest Area by Type and Maturity.......................................................1 - 32
Table 1.6.9 Stock Volume by Forest Type and Maturity.........................................1 - 33
Table 1.6.10 Stock Volume Per Hectare by Forest Type and Maturity......................1 - 33
Table 1.6.11 Removal in 1997-1999 ........................................................................1 - 37
Table 1.6.12 Details of Removal in 1999 .................................................................1 - 38
Table 1.6.13 Yearly Changes in Stumpage Sales Volume from State Forests ............1 - 40
Table 1.6.14 Logging Operations by State Forest Enterprises ...................................1 - 40
Table 1.6.15 Operation Record of Forwarders(1999) ..........................................1 - 41
Table 1.6.16 Working Record of Wagon Forwarders with Grapple Cranes ...............1 - 41
Table 1.6.17 Average Contract Price for Logging Operations ...................................1 - 42
Table 1.6.18 Domestic Wood Consumption Trends ..................................................1 - 43
Table 1.6.19 Industrial Log Consumption Trends.....................................................1 - 43
Table 1.7.1 World Wood Product Consumption .....................................................1 - 45
Table 1.7.2 Regional Breakdown of Exports/Imports of Wood Products
(1994).................................................................................................1 - 46
Table 1.7.3 Worldwide Production and Exports of Wood products .........................1 - 46
Table 1.7.4 Production of Wood Industry in Lithuania ...........................................1 - 54
Table 1.7.5 Activities of Wood Industry Enterprises ...............................................1 - 55
Table 1.7.6 Sales Structure of Wood Industry ........................................................1 - 56
v
CONTENTS
Table 1.7.7 Export Shares of Wood Industry..........................................................1 - 56
Table 1.7.8 Productivity by Industrial Subsectors (1998) .......................................1 - 58
Table 1.7.9 Production Import Export Consumption of Sawnwood in Four
Countries ............................................................................................1 - 59
Table 1.7.10 Sales of Wood Products by Major Manufacturers ................................1 - 60
Table 1.7.11 Production of Wood Panels by Major Producers ..................................1 - 61
Table 1.7.12 Furniture Production by Major 20 Producers .......................................1 - 61
Table 2.1.1 Production of Pulp and Paper in Lithuania (1950~1992) ......................2 - 2
Table 2.1.2 Pulp and Paper Production, Export, Import and Consumption
(1997~1999) .......................................................................................2 - 2
Table 3.1.1 Roundwood Export & State Forest Enterprises' Pulpwood Sales ..........3 - 1
Table 3.1.2 Main Export Countries ........................................................................3 - 2
Table 3.1.3 State Forest Enterprises' Pulpwood Sales by Species ............................3 - 2
Table 3.1.4 Outline of Roundwood Supply.............................................................3 - 5
Table 3.2.1 The Number of Sawmills by Log Volume Purchased from State
Forest Enterprises (1999) ....................................................................3 - 9
Table 3.2.2 Sawmills' Production Volume..............................................................3 - 10
Table 3.3.1 Territory Allotment to 9 District Offices ..............................................3 - 14
Table 3.3.2 Estimated Pulpwood Procurement by District Offices (2011-2020) ......3 - 16
Table 3-3.3 Transportation Disances between District Offices and Proposed
Mill Sites ............................................................................................3 - 16
Table 3.3.4 Wood Weight by Species.....................................................................3 - 18
Table 3.3.5 Transportation Cost Comparison between by Railway Wagon
and by Truck from District Offices to Proposed Mill Sites ...................3 - 19
Table 3.3.6 Transportation Costs for the Candidate Sites .......................................3 - 20
Table 3.3.7 Dynamics of Pulpwood Prices by Species ............................................3 - 21
Table 3.3.8 ulpwood Price Comparison between Actual and Calculated Ones
in May 2000 .......................................................................................3 - 24
Table 3.3.9 Procurement Volume of Pulp wood by Plunge District Office...............3 - 26
Table 3.3.10 Procurement Volume of Pulpwood by Siauliai District Office ..............3 - 27
Table 3.3.11 Procurement Volume of Pulpwood by Kupiskis District Office.............3 - 28
Table 3.3.12 Procurement Volume of Pulpwood by Utena District Office .................3 - 29
Table 3.3.13 Procurement Volume of Pulpwood by Vilnius District Office ...............3 - 30

vi
CONTENTS
Table 3.3.14 Procurement Volume of Pulpwood by Varena District Office ...............3 - 31
Table 3.3.15 Procurement Volume of Pulpwood by Kazlu Ruda District Office........3 - 32
Table 3.3.16 Procurement Volume of Pulpwood by Taurage District Office .............3 - 33
Table 3.3.17 Procurement Volume of Pulpwood by Jonava District Office................3 - 34
Table 3.3.18 C&F of Pulpwood at Proposed Mill Sites ............................................3 - 35
Table 4.3.1 List of Potential Mill Sites – Long List ...............................................4 - 24
Table 4.4.1 Site Screening – Valuation of Factors Considered ...............................4 - 32
Table 5.2.1 Maximum permissible concentrations (for DO minimum conc.)
in river waters, suitable for fishing.......................................................5 - 5
Table 5.2.2 Classification of river waters ...............................................................5 - 5
Table 5.2.3 Permitted pollution levels in treated wastewater, discharged to
surface waters. ....................................................................................5 - 7
Table 5.2.4 Maximum permissible concentrations of emissions by stationary
combustion sources. Solid fuels. New sources......................................5 - 10
Table 5.2.5 Hygienic maximum permissible concentrations in ambient air ..............5 - 11
Table 5.2.6 Swedish recommendations regarding noise, expressed as the
largest equivalent noise level outside inhabited buildings. New
industries. ...........................................................................................5 - 14
Table 5.2.7 Tax rates for normal taxes. Water pollutants. Stationary sources..........5 - 18
Table 5.2.8 Tax rate coefficients for penalty taxes. Water pollutants....................5 - 18
Table 5.2.9 Tax rates for normal taxes. Air pollutants. Stationary sources..............5 - 19
Table 5.2.10 Tax rate coefficients for penalty taxes. Air pollutants...........................5 - 19
Table 5.3.1 Water emissions with BAT. Kraft pulp mills.(EU BREF Document.) ...5 - 26
Table 5.3.2 Atmospheric emissions with BAT. Kraft pulp mills.
(EU BREF Document.) .......................................................................5 - 27
Table 5.5.1 Water emissions – from Mill and after Effluent treatment, to
Recipient. (Monthly averages) .............................................................5 - 39
Table 5.5.2 Atmospheric emissions ........................................................................5 - 40
Table 5.5.3 Solid wastes to incineration and landfill, as dry solids. Estimations.......5 - 41
Table 5.6.1 Water emissions from the Mill, related to the transports by the river.
River data from 1998 (av.) and 1999 (av. and monthly variation). ........5 - 46
Table 5.6.2 Flow data of rivers Neris and Nemunas. ..............................................5 - 46

vii
CONTENTS
Table 5.6.3 Atmospheric emissions from the Mill. Total emissions in the
districts and in Lithuania 1998.............................................................5 - 49
Table 6.1.1 Major Factors Considered in Selection of Pulp Products ......................6 - 3
Table 6.2.1 Production Capacity and Operation Plan..............................................6 - 5
Table 6.2.2 Log Supply Conditions and Consumption ............................................6 - 6
Table 6.2.3 Installed Base of Kamyr Continuous Cooking Process by Year of
Installation ..........................................................................................6 - 11
Table 6.2.4 Installed Capacity of Kymyr Continuous Cooking Process (up to
1999), Pulp Production (1998) and Forest Area (1997) by Region........6 - 14
Table 6.3.1 Relative Comparison of Bleaching Costs by Metsa Botnia ...................6 - 20
Table 6.3.2 Comparison of Bleaching Costs by Sequence.......................................6 - 21
Table 6.3.3 ECF Bleaching Sequence Selected for the Project.................................6 - 23
Table 6.4.1 Production Capacities and Operation Plan ...........................................6 - 36
Table 6.4.2 Wood Supply Conditions and Consumption .........................................6 - 37
Table 6.4.3 List of Bleaching Chemicals ................................................................6 - 43
Table 6.5.1 Unit Consumption and Cost of Pulpwood Logs ....................................6 - 57
Table 6.5.2 Unit Consumption and Cost of Chemicals ............................................6 - 58
Table 6.5.3 Unit Consumption and Cost of the Fuel for the Lime Kiln ....................6 - 58
Table 6.5.4 Unit Consumption and Cost of Packaging Materials.............................6 - 59
Table 6.5.5 Pulp Mill Heat(Steam) Balance ...........................................................6 - 64
Table 6.5.6 Pulp Mill Power Balance.....................................................................6 - 66
Table 8.1.1 Breakdown of Plant Construction Cost ................................................8 - 2
Table 8.1.2 Disbursement Schedule........................................................................8 - 4
Table 8.1.3 Total Investment Cost .........................................................................8 - 5
Table 8.2.1 Disbursement and Interest During Construction ...................................8 - 7
Table 9.1.1 Estimate of Gross Annual Wage per Job Category...............................9 - 2
Table 9.1.2 Estimate of Gross Annual Wage per Job Category...............................9 - 2
Table 9.1.3 Yearly Manning Schedule in Progress..................................................9 - 3
Table 9.1.4 Number of Employees & Gross Annual Wage Rate per
Departments/Job Categories ................................................................9 - 4
Table 9.1.5 Wage Level.........................................................................................9 - 5
Table 9.1.6 Wages per Job Categories in Sweden ...................................................9 - 6

viii
CONTENTS
Table 9.2.1 1st Year (2007) Production .................................................................9 - 10
Table 9.2.2 2nd Year (2008) Production ................................................................9 - 10
Table 10.2.1 Capacity Utilization of Pulp Mill .........................................................10 - 2
Table 10.3.1 Variable Costs in Full Capacity Utilization ..........................................10 - 4
Table 10.3.2 Annual Fixed Cost ..............................................................................10 - 5
Table 10.4.1 Financial Ratios and Profit B.E.P. .......................................................10 - 9
Table 10.5.1 Tale of Sensibility Analysis .................................................................10 - 11
Table 10.6.1 Overall Evaluation of Financial Feasibility ..........................................10 - 14
Table 11.2.1 Recent Trends in Foreign Direct Investment in Lithuania......................11 - 6
Table 11.2.2 Breakdown of Foreign Direct Investment by Country of Origin
(Outstanding at the end of 1999)..........................................................11 - 7
Table 11.2.3 Breakdown of Foreign Direct Investment by Industry
(Outstanding as of January 2000) (%) .................................................11 - 8
Table 11.3.1 List of Foreign Firms Interviewed........................................................11 - 10
Table 11.3.2 Role of Foreign Firms Operating in Lithuania and Major Markets........11 - 11
Table 11.3.3 Background and Reason for Investment ...............................................11 - 12
Table 11.3.4 Current Issues Facing Foreign Firms and Their Future Outlook
for the Business Environment ..............................................................11 - 13
Table 11.3.5 Strengths (Advantages) and Weaknesses (Disadvantages) of
Lithuania for Foreign Investment .........................................................11 - 15
Table 11.4.1 Recent Trends in Foreign Direct Investment in Latvia ..........................11 - 16
Table 11.4.2 Breakdown of Foreign Direct Investment by Country of Origin
(1999).................................................................................................11 - 17
Table 11.4.3 Breakdown of Foreign Direct Investment by Industry (1999)................11 - 17
Table 11.4.4 List of Foreign Firms Interviewed........................................................11 - 18
Table 11.4.5 Role of Foreign Firms Operating in Lithuania and Major Markets........11 - 19
Table 11.4.6 Background and Reason for Investment ...............................................11 - 20
Table 11.4.7 Current Issues Facing Foreign Firms and Their Future Outlook
for the Business Environment ..............................................................11 - 21
Table 11.4.8 Strengths (Advantages) and Weaknesses (Disadvantages) of
Latvia for Foreign Investment..............................................................11 - 23
Table 11.4.9 Key Areas of Improvement in Government Service ..............................11 - 24
Table 11.5.1 Recent Trends in Foreign Direct Investment in Estonia.........................11 - 25

ix
CONTENTS
Table 11.5.2 Breakdown of Foreign Direct Investment by Country of Origin
(Outstanding as of 1999) .....................................................................11 - 25
Table 11.5.3 Breakdown of Foreign Direct Investment by Industry
(Outstanding Value as of 1999) ...........................................................11 - 26
Table 11.5.4 List of Foreign Firms Interviewed........................................................11 - 27
Table 11.5.5 Role of Foreign Firms Operating in Estonia and Major Markets ...........11 - 28
Table 11.5.6 Background and Reason for Investment ...............................................11 - 28
Table 11.5.7 Current Issues Facing Foreign Firms and Their Future Outlook
for the Business Environment ..............................................................11 - 29
Table 11.5.8 Strengths (Advantages) and Weaknesses (Disadvantages) of
Estonia for Foreign Investment ............................................................11 - 31
Table 11.7.1 Summary Table of Government Bond Ratings .....................................11 - 34
Table 11.7.2 Country Rankings (Developing Countries in Europe, the CIS and
Asia)...................................................................................................11 - 35
Table 11.7.3 Rankings by Economists......................................................................11 - 36
Table 11.7.4 Currency Exchange Rates of the Baltic States ......................................11 - 40
Table 11.7.5 Aggregate Amount of Direct Investment Per Capita in Central
and East European Countries (Up to 1998) ..........................................11 - 42
Table 11.7.6 EBRD’ s Evaluation on Progress of Transformation to Market
Economy.............................................................................................11 - 43
Table 11.7.7 Basic Data ..........................................................................................11 - 43
Table 11.7.8 Comparison of Major Cost Indices in the Baltic States (1999)..............11 - 44
Table 11.7.9 Comparison of tax system in the Baltic states.......................................11 - 45
Table 11.7.10 Comparison of the Existing Institutions and Systems Related to
Promotion of Foreign Investment .........................................................11 - 47
Table 11.7.11 Comparison of current status of business factors in the Baltic
states ..................................................................................................11 - 48
Table 11.9.1 Result of the questionnaire survey........................................................11 - 54
Table 11.10.1 Tax Incentives for FEZ in Lithuania and Latvia ...................................11 - 57
Table 11.11.1 Task force team by stages....................................................................11 - 62
Table 12.1.1 Paper and Paperboard Demand in Lithuania (Actual and
Forecast).............................................................................................12 - 1
Table 12.1.2 Production and Consumption of Paper and Paperboard in
Lithuania ............................................................................................12 - 2

x
CONTENTS
Table 12.1.3 Recent Trends in Production of Paper and Paperboard and
Export Ratio (1*) ................................................................................12 - 2
Table 12.1.4 Comparison of Pulp/Paper and Other Industries in Lithuania (*1) ........12 - 3
Table 12.1.5 GDP Trends in Lithuania ....................................................................12 - 3
Table 12.1.6 Production Capacities and Actual Production Volumes of Paper
and Paperboard Manufacturing Companies..........................................12 - 5
Table 12.1.7 Domestic Waste Paper Market, Imports and Exports (Thousand
Tons) ..................................................................................................12 - 12
Table 12.2.1 Waste Paper Purchase by Major Paper Manufacturers, by Operator ....12 - 26
【Figures】
Figure 1.6.1 Forecast Classification and Area in Lithuania ......................................1 - 21
Figure 1.6.2 Pine Forest Type .................................................................................1 - 24
Figure 1.6.3 Spruce Forest Type .............................................................................1 - 25
Figure 1.6.4 Birch Forest Type ...............................................................................1 - 25
Figure 1.6.5 Volume per ha. By Age Class & Forest Type.......................................1 - 30
Figure 1.6.6 Estimated Mean Annual Increment ......................................................1 - 30
Figure 1.6.7 Forest Resource Trends in Lithuania....................................................1 - 35
Figure 1.6.8 General Flow of Logging Operations (1999) ........................................1 - 39
Figure 3.1.1 Distribution of 9 District Offices and Collection Zones ........................3 - 8
Figure 3.3.1 Dynamics of Pulpwood Prices by Species (1).......................................3 - 22
Figure 3.3.1 Dynamics of Pulpwood Prices by Species (2).......................................3 - 23
Figure 4.2.1 Site Screening Procedure Layout .........................................................4 - 5
Figure 4.3.1 Map of Potential Mill Sites..................................................................4 - 25
Figure 4.5.1 The Most Favourable Potential Mill Sites ............................................4 - 35
Figure 5.2.1 EIA process in Lithuania. ....................................................................5 - 3
Figure 6.2.1 Pulp Flow - during BSKP operation.....................................................6 - 7
Figure 6.2.2 Pulp Flow - during BHKP operation....................................................6 - 8
Figure 6.2.3 Pulp Flow - during BSKP & BHKP operation in equal proportion........6 - 9

xi
CONTENTS
Figure 6.3.1 Pulp Mill Steam Flow Schematic.........................................................6 - 31
Figure 6.3.2 Pulp Mill Water Flow Diagram ...........................................................6 - 34
Figure 6.4.1 Flow Sheet ..........................................................................................6 - 51
Figure 6.4.2 Flow Sheet ..........................................................................................6 - 53
Figure 6.4.3 Evaporator flow diagram.....................................................................6 - 55
Figure 6.4.4 Water balance within the pulp mill.......................................................6 - 56
Figure 6.5.1 Pulp Mill Heat (Steam) Flow Diagram.................................................6 - 65
Figure 6.5.2 Power Flow Diagram ..........................................................................6 - 67
Figure 6.6.1 Mill Layout.........................................................................................6 - 69
Figure 7.2.1 Construction Schedule.........................................................................7 - 5
Figure 8.2.1 Libor (1999.5~2000.5) ......................................................................8 - 8
Figure 8.2.2 Short-term Interest in Lithuania (1998-1999) ....................................8 - 8
Figure 9.1.1 Company Organization and Manning table <In Full Operation>...........9 - 7
Figure 11.7.1 Real GDP Growth Rates .....................................................................11 - 37
Figure 11.7.2 Export Growth Trends (Over Previous Year) .......................................11 - 38
Figure 11.7.3 Exports to Former Socialist Economies (Percentage Share of
Total)..................................................................................................11 - 38
Figure 11.7.4 Recent Changes in Exchange Rate Against the U.S. Dollar
(Indexed when 1996 = 1) .....................................................................11 - 40
Figure 11.7.5 Recent Changes in Net Foreign Direct Investment in the Baltic
States ..................................................................................................11 - 41

Chapter 1 BACKGROUND OF THE PROJECT

1 - 1
Chapter 1 BACKGROUND OF THE PROJECT
1.1 Republic of Lithuania: Country and People
(1) Geography
The Republic of Lithuania is located in the southeast coast of the Baltic Sea,
bounded by Lativia on the north, Belarus on the east, and Poland and
Kaliningrad (detached territory of Russia) on the south. It has land area of
65300 square km and is situated at a western edge of the East European plain.
Its terrain is generally flat and the highest elevation is 293m above the sea level.
It is endowed with natural resources, especially water resources; 772 rivers and
as many as 2800 lakes of varying sizes account for 1.5% of total land area.
Also, forests cover 30.5% (1994400 ha) and cultivatable land 60.2% (3928100
ha). An area along the Baltic Sea, extending 90km, contains resort areas,
wildlife sanctuaries, and ports and harbors. The country is generally under a
climate intermediate between maritime and continental, with the inland areas
being under a stronger influence of the continental climate. The mean daily
temperature is –4.9℃ in January and 17.2℃ in July.
(2) History
The Balt, ancestor of Lithuanian, settled in the southern part of the Baltic Sea
in around 2000 B.C. The name “Lithuania” was first appeared in an ancient
manuscript dated 1004 B.C. In the early 13th century, Grand Duke
Mindaugus founded the dukedom of Lithuania and grew to a great duchy
extending from the Baltic Sea to the Black Sea in the early 14th century. In
the late 14th century, it joined to the kingdom of Poland in a union by marriage.
Poland gradually dominated, and in 1568, Lithuania became a subject state of
Poland under the Lublin union. In 1795, with the third division of Poland,
Lithuania was annexed by Russia. In 1918, it declared independence at the
end of the First World War and the Republic of Lithuania was formed.
In 1940, the Lithuanian parliament decided to join the Soviet Union under the
pressure of the Soviet military force. The country was then occupied by Nazi
Germany between 1941 and 1944 and came under the Soviet Union after the
Second World War. In 1988, the Lithuanian independence movement
“Sajudis” was created with the emergence of perestroika in the Soviet Union

1 - 2
and quickly spread throughout the country. In March 1990, “Sajudis” won an
election of the Supreme Council, which later declared the restoration of
Lithuaninan independence. After the Soviet’s military sanctions (the Vilnius
incident), its independence was recognized by many countries in August 1991,
followed by UN admittance in September. In February 1993, Algirdas
Brazauskas was elected to the first president through general elections. In
August, the withdrawal of the Soviet forces was completed.
(3) Population and language
Lithuania has 3700800 population as of January 1999. Its capital, Vilnius,
has population of 578000, Kaunas 414000, and Klaipeda 203000. People
residing urban areas account for 68% of total population. The population
density is 56.7 per square km. Esnic composition is Lithuanian 80%, Russian
9.4%, Polish 7%, and others 3.6% (e.g., Belorussian, Ukranian and Latvian).
The official language is Lithuanian, which originated in Sanskrit and belongs
to the Baltic language group, the Indo-European stock.
(4) Currency
The unit of currency is Litas (LTL) which is currently pegged to the U.S. dollar
at a fixed exchange of rate of USD1 = 4 LTL. However, the Currency Board
intends to abolish the current system as soon as government finance becomes
stable and plans to introduce an Euro/U.S. dollar-pegged system in 2001,
eventually a float rate system.

1 - 3
1.2 Political and Social Conditions
(1) Administrative unit
The country is divided into 10 administrative units (districts or counties), each
of which is managed by a governor who is appointed by the cabinet.
Municipalities consist of 12 cities and 44 regions, each of which has a local
administrative body and a local assembly organized by elected representatives
(three-year term).
(2) Education
The basic education system in Lithuania consists of four-year elementary
schools, four-year primary schools and four-year gymnasium (secondary
schools), totaling twelve years. Compulsory education covers up to 16 years
old. There are 2327 elementary and primary schools throughout the country,
with total enrollment of approximately 540000.(1996/97).
In addition, there are 106 vocational training schools (2-4 years), and more
than 300 adult educational institutions (both formal and informal), and
advanced educational institutions (including seven universities and six
academies), which participate in the EC’s TEMPUS program.
(3) Transportation infrastructure
Lithuania is strategically located in a transportation hub connecting the EU
countries and Eastern Europe. The north-south corridor consists of inland
transportation routes connecting Scandinavia and Central Europe, while the
east-west routes link Europe and the CIS countries.
The country has an ice free port of Klaipeda which handles 20% (16 million
tons annually) of cargoes loaded and unloaded at all the ports on the eastern
part of the Baltic region. It has extended rail networks with total length of
1997km. In 1993, they were linked with the Polish rail system at Sestokai.
Also, they have good access to Russia, Belarus, Ukraine, Estonia and Germany.
The country also boasts well-developed road networks, more than 90% of
which are paved, higher than the European average. Inland access extends to
all directions, including Germany and Eastern Europe via Poland, the Baltic

1 - 4
States, and Russia via Belarus. It also has airports, and natural gas and oil
pipelines.
(4) Communication
The country has reliable postal service as well as courier services including
DHL, Federal Express, TNT and UPS. Telephone service has expanded
rapidly in recent years, and optic fiber cables are widely installed to allow
extensive digital communication. Also, the cellular phone market is
exploding as joint ventures with foreign telecoms (Denmark and Belgium) and
Motorola are emerging. Also the Internet connectivity and e-mail service are
expanding.
(5) Work force and unemployment rate
The unemployment rate in Lithuania has recently been on the rise, as the
working population remains flat. Yearly changes in unemployment rate are
shown below.
1995 6.22%
1996 6.98%
1997 5.89%
1998 6.42%
1999 8.4%
2000 11.1%
Note: The figure in 2000 is as of may (Economic and Social Development in
Lithuania).

1 - 5
Table 1.2.1 Labor Force and Employment
(Unit : Person)
1995 1996 1997 1998 1999
Labor Force 1752600 1783500 1773700 1769800 1804800
Employed 1643600 1659000 1669200 1656100 1660800
93.78% 93.02% 94.11% 93.58% 92.02%
Public Sector 600000 584600 538500 526800 518100
34.23% 32.78% 30.36% 29.77% 28.71%
Private Sector 1043600 1074400 1130700 1129300 1142700
59.55% 60.24% 63.75% 63.81% 63.31%
Unemployed 109000 124500 104500 113700 148700
6.22% 6.98% 5.89% 6.42% 8.24%
Source : Labor Market and Employment B324 1999 Statistics Lithuania
The number of employees in the public sector has been declining year after
year, probably due to the effects of administrative reforms, falling below 30%.
On the other hand, employment in the private sector remains almost unchanged.
Stagnated employment, together with growth of the potential work force,
causes the gradual rise in unemployment rate. Breakdown of the working
population by sector reveals a more detailed picture, as shown below (third
quarter of 1999) (see Table 1.2.2):
Agriculture/forestry 339000 20.41%
Manufacturing 284100 17.11%
Commerce/repair 234400 14.11%
Education 160900 9.69%
Construction 115900 6.98%

1 - 6
Table 1.2.2 Employment Population by Economic Activity (3rd Quarter of 1999)
Economic Sector
Person % Person % Person %
Agriculture, Hunting and Forestry 15400 2.97% 323600 28.32% 339000 20.41%
Fisning 100 0.02% 1400 0.12% 1500 0.09%
Mining and Quarrying 400 0.08% 2700 0.24% 3100 0.19%
Manufacturing 25200 4.86% 258900 22.66% 284100 17.11%
Electricity, Gas and Water Supply 37400 7.22% 300 0.03% 37700 2.27%
Construction 5300 1.02% 110600 9.68% 115900 6.98%
Trade and Repair of Cars & Household Goods 4000 0.77% 230400 20.16% 234400 14.11%
Hotels and Restaurants 1500 0.29% 27700 2.42% 29200 1.76%
Transport and Storage 36300 7.01% 49200 4.31% 85500 5.15%
Communication 8100 1.56% 11500 1.01% 19600 1.18%
Financial Intermediation 8900 1.72% 7500 0.66% 16400 0.99%
Real Estate and Renting Business 24500 4.73% 30400 2.66% 54900 3.31%
Public Administration and Defence 71100 13.72% 0 0.00% 71100 4.28%
Education 149900 28.93% 11000 0.96% 160900 9.69%
Health and Social Work 94400 18.22% 15200 1.33% 109600 6.60%
Other Community, Scial & Personal Service 35600 6.87% 58800 5.15% 94400 5.68%
Private household Service 0 0.00% 3500 0.31% 3500 0.21%
TOTAL 518100 100.00% 1142700 100.00% 1660800 100.00%
Source : Labor Market and Employment B324 1999 Statistics Lithuania
Public Sector Private Sector Total
Notably, sectors which production stagnates in recent years are major
employers in the job market, explaining the increase in unemployment rate.
Jobless people are equally divided between male and female. On the other
hand, the jobless rate appears to be inversely proportional to the level of
education, except for female with higher education that shows a higher
unemployment rate. The unemployment rate for male with vocational
training is higher than that for female with the same educational background.
Educational level Overall composition Male Female
Higher Education 5.2% 38.3% 61.7%
Special Secondary 17.0% 37.6% 62.4%
Vocational 40.7% 58.7% 41.3%
Unskilled 37.1% 49.1% 50.9%
Thus, a fundamental approach to the easing of unemployment is to promote the
manufacturing sector, particularly labor-intensive, light industries (dominated
by small- and medium-sized enterprises) requiring less skills, which are
expected to create a large number of jobs.

1 - 7
1.3 Outline of the Lithuanian Economy
1.3.1 Baltic States and Central/Eastern Europe
Economies in the Baltic States and the CEFTA countries dropped sharply in
their rapid transition to a market economy until 1994. They turned upward in
1995 and 1996, with resumption of GDP growth. In 1997 and 1998, however,
the currency crisis in Russia hit them hard again and most countries suffered
stagnation of GDP growth in the two consecutive years. In particular, Czech
and Romania recorded negative growth in 1998. In fact, these upheavals are
viewed as a general phenomenon in the former Soviet Union and Central and
Easter Europe that are still struggling to cast off their old economic structure
molded under the centrally planned, uncompetitive market system.
Nevertheless, these economies have successfully suppressed hyperinflation that
broke out in the initial stage of transition and inflation rates are generally
stabilized at one-digit levels. On the other hand, unemployment rates in the
countries remain unchanged or increase slight at relatively high levels. For
instance, Poland and Slovakia registered the double-digit rates in 1997 and
1998.
Government finance is chronically in deficit in most countries (except for
Latvia), which is further increasing. Similarly, most countries are suffering
from the persistent deficit on current account, which is much larger than the
budget deficit.
1.3.2 Lithuanian Economy
(1) Domestic production
As shown in the chart, Lithuania’s GDP showed violent ups and downs on a
quarterly basis (between 1997 and the first quarter of 1999). When equalized
over the period, the economy remained flat, no signs of upward trend. In
particular, GDP recorded negative growth of 10.7% (in rear term) in 1993 due
to the economic turmoil triggered by the energy crisis at the end of 1992 (when
energy supply from Russia became unstable). It dropped to a level one half
that in 1989. Then, as the country made a strategic shift from the previous
dependence on the sluggish domestic market and the former Soviet markets to

1 - 8
the participation in the West European market (as aided by the free trade
agreement with a number of countries), the economy showed solid signs of
recovery, which has been clearly felt after 1995. In 1997 and 1998, however,
the Russian currency crisis hit the economy hard in 1998 and 1999 and the
economic growth rate turned into negative again. This indicates that the
Lithuanian economy is still heavily dependent on Russia.
GDP Growth Rate
1991 - 5.7 %
1992 - 21.3 %
1993 - 16.2 %
1994 - 9.8 %
1995 3.3 %
1996 4.7 %
1997 7.3 %
1998 5.1 %
1999 - 4.1 %
Source : Statistical Yearbook of Lithuania 1998,
Economic and Social Development in Lithuania 5/2000
Looking at the sectoral share of GDP, agriculture and industry are on the
declining trend, while commerce and service expand rapidly. Note that,
according to the country’s classification of economic activities, the industrial
sector includes, in addition to the manufacturing industry, mining, electricity,
gas, water supply, wood production, and fishery. The energy sector, such as
petroleum refining, power generation and transmission, hot water supply, and
gas supply, account for approximately 30% of industrial output.
(2) Currency and inflation
The Lithuanian government inaugurated its own currency, Litas, in June 1993,
and introduced a floating system. However, as inflation did not subside, the
government pegged the local currency to the U.S. dollar in April 1994 under
the Litas Stabilization Law (USD1 = 4 Litas). As a result, the inflation rate
dropped from 1163% in 1992 to 35.6% in 1995, 13.1% in 1996, 8.4% in 1997,
2.4% in 1998, and 0.3% in 1999. At the same time, however, the pegging to

1 - 9
the U.S. dollar adversely affects the country’s export competitiveness (as the
U.S. dollar is strong against the Euro). It is important to watch the country’s
currency and foreign exchange policies carefully, including anticipated reforms
of the Currency Board system.
The consumer price index is relatively stabilized at 174.0 in 1996, 189.4 in
1997, 199.1 in 1998, and 187.9 in 1999 (1994 = 100).
(3) Government finance
The government budget is continuously in deficit. Tax revenues account for
95-96% of total revenues. VAT represents more than 50%, social insurance
25-30%, and income tax 12-17%. The income tax increases its share recently.
Social welfare accounts for 30-38% of total expenditures and medical 10-14%.
Government finance
(Unit: Million Litas)
Revenues Expenditures Deficit
1995 5758.0 6196.8 - 438.8
1996 6720.2 7510.2 - 790.0
1997 8237.5 8612.4 - 374.9
1998 9377.8 9915.6 - 537.8
1999 8983.6 9108.7 - 125.1
(Source : Economic and Social Development in Lithuania 5/2000B111)
(4) Current and trade accounts
Both the current and trade accounts have been in chronic deficit, which is
financed by the surplus on the capital account. In particular, steady expansion
of foreign direct investment contributes greatly to the overall balance-of-
payment surplus, while a deficit on the trade account is increasing (See Table
1.3.1.).

1 - 10
Table1.3.1 Balance of Payments
Items of Accounts 1995 1996 1997
103 USD 103 USD 103 USDTrade of Goods
Exports (FOB) 2706.1 3413.2 4192.4Imports (FOB) -3404.0 -4309.3 -5339.9Balance -697.9 -896.1 -1147.5
Trade of ServiceExports 485.2 797.5 1031.8Imports -498.1 -676.7 -897.4Balance -12.9 120.8 134.4
Other Income & PaymentsReceived 50.9 52.0 80.4Paid -63.7 -143.0 -278.8Balance -12.8 -91.0 -198.4
Balance of Goods, Services & Income -723.6 -866.3 -1211.5
Current Transfers Received 112.3 149.4 237.0Current Transfers Paid -3.0 -5.6 -7.0
Current Balance -614.3 -722.5 -981.5
Capital AccountCapital Account (net) -39.0 5.5 4.1Direct Investment Abroad -1.0 -0.1 -27.0Direct Investment from Abroad 72.6 152.4 354.5Portfolio Investment Assets -10.5 -26.9 7.7Portfolio Investment Liabilities 26.6 89.6 180.5Other Investment Assets -36.1 -170.4 -219.3Other Investment Liabilities 482.8 601.0 709.1Net Errors and Omissions 287.2 66.7 195.9
Ocerall Balance 168.3 -4.7 224.0
Source : The Europa World Yearbook 1999 V0l. II
(5) External trade
Lithuania has signed bilateral free trade agreements with 24 countries (EU,
EFTA and CEFTA countries, Ukraine, and the Baltic States), of which the
agreements with 17 countries have been effectuated. The country abolished
tariff on textile products from and to the EU countries.
In 1998, Lithuania exported 14842.4 million Litas (USD3710.6 million) of
goods and imported 23174.3 million Litas (USD5793.6 million) , with a deficit
of 8331.9 million Litas (USD5793.6 million). In 1999, the trade deficit
totaled 7323 million Litas (USD1831 million).

1 - 11
Major export items are petroleum products, mineral products (including
electricity), textile and apparel products, machinery and equipment, and
chemicals. Major import items are mining products including petroleum and
natural gas, machinery and equipment, chemicals, and transportation
equipment.
Major trade partners are still Russia and other countries in the former Soviet
Union, Central and East European countries (including Belarus, Ukraine,
Latvia and Poland), although their share has been declining year after year (see
Table 1.3.2). As shown in Table 1.3.2, Germany is the largest trade partner
among the EU countries with dominant shares in both exports and imports – a
notable trend commonly seen among the Baltic States and Central and East
European countries. Other trade partners in the EU include Finland, Denmark,
Sweden and Italy for exports, and the Netherlands, the U.K., Sweden and
Denmark for imports.
Table 1.3.2 Major Countries for Foreign Trade
(Unit : %)
1993 1994 1995 1996 1997
Country Export Import Export Import Export Import Export Import Export Import
Russia 33.1 53.7 28.2 39.3 20.4 31.2 24.0 25.9 24.5 24.3
Germany 6.8 9.7 11.5 13.8 14.4 14.3 12.8 15.8 11.4 18.7
Belorussia 7.4 3.3 6.5 3.8 10.8 3.6 10.2 2.4 10.3 2.4
Ukraine 11.2 6.2 6.1 5.0 7.5 3.7 7.7 3.3 8.8 1.9
Latvia 7.3 1.5 8.4 2.7 7.1 3.3 9.2 3.3 8.6 3.4
Pland 7.0 2.2 5.0 4.0 3.9 4.2 3.2 5.1 2.3 5.8
Denmark 2.4 2.6 3.5 3.8 4.3
Unite Kingdom 1.6 0.9 2.3 1.4 3.1 3.1 2.8 3.9 3.2 3.3
Nederland 2.8 5.2 4.9 3.3 2.8
Others 22.8 20.1 26.8 27.4 27.9 33.1 26.8 36.5 28.1 35.9
Total 100.0 100.0 100.0 100.0 100.0 100.0 100.0 100.0 100.0 100.0
Source : Wood Industry of Lithuania -Overview (1999)

1 - 12
1.4 Industry
1.4.1 Industry and Industrial policy
The industrial sector in Lithuania has undergone the hardships during the
economic turmoil, and many enterprises in a wide range of industries went
bankrupt. It is still in the process of rehabilitating itself. Many enterprises
are restructuring themselves under the government support. The government
is implementing industrial policy aiming at full-scale industrial development,
which goes beyond the traditional recovery efforts to regain the previous
production levels (during the Soviet era), accompanied by export expansion.
This policy emphasizes the support for relatively small, light industries that
exist in great number. SMEs account for a sizable portion of the economy
(6% of GDP in 1996). The government has designated the following three
areas as the means to expand industrial output by SMEs:
a. Environmental betterment and development of technology that produces
less environmental loads
b. Development of wood products and the fostering of the sawmills industry
c. Development of agriculture-related technology
This policy appears to represent the strategic focus to promote sustainable
industrial development with technological advancement by taking advantage of
low-cost, highly skilled work force and leveraging domestic reusable resources.
Major industrial sectors in Lithuania include agriculture and forestry, wood
processing, food processing, chemical, machinery, electrical and electronics,
energy and construction materials. Industrial output (including agriculture,
forestry and fishery) accounts for around 40% of GDP and employment share
reaches 41%. Breakdown of domestic production and value added by sector
is shown in Table 1.4.1, 1.4.2.
1 - 13
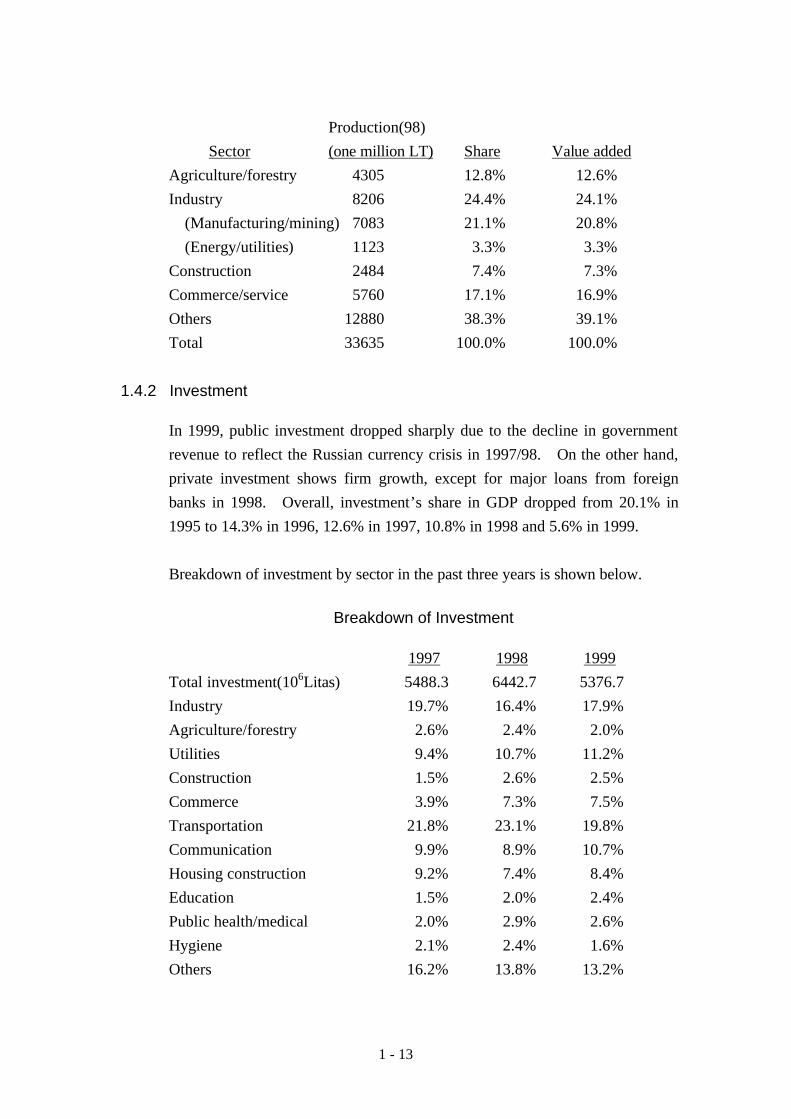
Production(98)
Sector (one million LT) Share Value added
Agriculture/forestry 4305 12.8% 12.6%
Industry 8206 24.4% 24.1%
(Manufacturing/mining) 7083 21.1% 20.8%
(Energy/utilities) 1123 3.3% 3.3%
Construction 2484 7.4% 7.3%
Commerce/service 5760 17.1% 16.9%
Others 12880 38.3% 39.1%
Total 33635 100.0% 100.0%
1.4.2 Investment
In 1999, public investment dropped sharply due to the decline in government
revenue to reflect the Russian currency crisis in 1997/98. On the other hand,
private investment shows firm growth, except for major loans from foreign
banks in 1998. Overall, investment’s share in GDP dropped from 20.1% in
1995 to 14.3% in 1996, 12.6% in 1997, 10.8% in 1998 and 5.6% in 1999.
Breakdown of investment by sector in the past three years is shown below.
Breakdown of Investment
1997 1998 1999
Total investment(106Litas) 5488.3 6442.7 5376.7
Industry 19.7% 16.4% 17.9%
Agriculture/forestry 2.6% 2.4% 2.0%
Utilities 9.4% 10.7% 11.2%
Construction 1.5% 2.6% 2.5%
Commerce 3.9% 7.3% 7.5%
Transportation 21.8% 23.1% 19.8%
Communication 9.9% 8.9% 10.7%
Housing construction 9.2% 7.4% 8.4%
Education 1.5% 2.0% 2.4%
Public health/medical 2.0% 2.9% 2.6%
Hygiene 2.1% 2.4% 1.6%
Others 16.2% 13.8% 13.2%

Table 1.4.1 Production of Industrial Sub-Sectors
1993 1994 1995 1996 1997 Growth Rate Potential Indicator
103 Litas % 103 Litas % 103 Litas % 103 Litas % 103 Litas % % Index
10.00 Extraction and Agglomeration of Peat 25479 0.2% 39271 0.3% 37049 0.2% 51425 0.2% 46597 0.2% 16.29% 3.2% 0.2%
11.00 Extraction of Crude Oil 47011 0.4% 35878 0.3% 63777 0.4% 105822 0.5% 134215 0.6% 29.99% 17.2% 1.1%
14.00 Quarrying of Stone, Clay and Sand 25547 0.2% 45843 0.3% 45302 0.3% 68885 0.3% 92737 0.4% 38.03% 15.0% 1.0%
15.00 Manufacture of Food and Beverages 3387794 25.4% 3460633 25.1% 4781421 26.8% 6059443 27.4% 5785070 24.7% 14.31% 352.9% 23.2%
16.00 Manufacture of Tobacco Products 48081 0.4% 133162 1.0% 220467 1.2% 340257 1.5% - - 91.99% 141.3% 9.3%
17.00 Manufacture of Textiles 823143 6.2% 849655 6.2% 1068095 6.0% 1233222 5.6% 1311867 5.6% 12.36% 69.1% 4.5%
18.00 Manufacture of Apparels & Fur Dyeing 341022 2.6% 394140 2.9% 680717 3.8% 972219 4.4% 1377711 5.9% 41.77% 245.3% 16.1%
19.00 Manufacture of Leather & Leather Products 162972 1.2% 175122 1.3% 194790 1.1% 278377 1.3% 360663 1.5% 21.97% 33.8% 2.2%
20.00 Manufacture of Wood & Wood Products 302995 2.3% 441707 3.2% 630334 3.5% 592317 2.7% 902354 3.8% 31.37% 120.6% 7.9%
21.00 Manufacture of Pulp, Paper & Paperboard 88272 0.7% 143210 1.0% 251512 1.4% 241697 1.1% 287691 1.2% 34.36% 42.1% 2.8%
22.00 Publishing, Printing, Recorded Media 48642 0.4% 145114 1.1% 214747 1.2% 365997 1.7% 460078 2.0% 75.37% 147.8% 9.7%
23.00 Manufacture of Refined Petroleum Products 2541628 19.1% 2084191 15.1% 2014014 11.3% 2823010 12.7% 3488135 14.9% 8.24% 122.4% 8.1%
24.00 Manufacture of Chemicals & Chemical Products 386499 2.9% 543463 3.9% 1066200 6.0% 1315312 5.9% 1221945 5.2% 33.34% 173.6% 11.4%
25.00 Manufacture of Rubber & Plastic Products 28362 0.2% 50732 0.4% 95598 0.5% 178736 0.8% 249560 1.1% 72.23% 76.8% 5.1%
26.00 Manufacture of Non-metallic Mineral Products 396912 3.0% 488343 3.5% 601290 3.4% 644501 2.9% 639855 2.7% 12.68% 34.6% 2.3%
27.00 Manufacture of Basic Metals 39800 0.3% 43525 0.3% 58123 0.3% 68725 0.3% 67909 0.3% 14.29% 4.1% 0.3%
28.00 Manufacture of Fabricated Metal Products 114424 0.9% 134390 1.0% 244390 1.4% 247953 1.1% 301027 1.3% 27.36% 35.1% 2.3%
29.00 Manufacture of Machinery and Equipment 530932 4.0% 533499 3.9% 620315 3.5% 567320 2.6% 572993 2.4% 1.92% 4.7% 0.3%
30.00 Manufacture of Office Machinery and Compon't 13795 0.1% 15539 0.1% 17240 0.1% 22433 0.1% 9022 0.0% -10.07% -0.4% 0.0%
31.00 Manufacture of Electric Machinery & Apparatus 143845 1.1% 115031 0.8% 181448 1.0% 346193 1.6% 454080 1.9% 33.29% 64.4% 4.2%
32.00 Manufacture of Radio, TV & Communication Eq. 487988 3.7% 351884 2.6% 482733 2.7% 516132 2.3% 505993 2.2% 0.91% 2.0% 0.1%
33.00 Manufacture of Medical, Precision & Optical Instruments 91901 0.7% 119961 0.9% 76455 0.4% 112112 0.5% 147697 0.6% 12.59% 7.9% 0.5%
34.00 Manufacture of Motor Vehicles 34926 0.3% 21310 0.2% 24635 0.1% 43899 0.2% 41131 0.2% 4.17% 0.7% 0.0%
35.00 Manufacture of Other Transport Equiopment 143994 1.1% 272389 2.0% 248360 1.4% 298765 1.3% 336515 1.4% 23.64% 33.9% 2.2%
36.00 Manufacture of Furniture & n.e.c. 283118 2.1% 270209 2.0% 336492 1.9% 439454 2.0% 510817 2.2% 15.90% 34.6% 2.3%
37.00 Recycling of Metal Waste and Scrap 19764 0.1% 47689 0.3% 114421 0.6% 43239 0.2% 49414 0.2% 25.75% 5.4% 0.4%
40.10 Electric Power Generation & Distribution 1213173 9.1% 1267000 9.2% 1728369 9.7% 2238773 10.1% 2119232 9.0% 14.96% 135.2% 8.9%
40.20 Gas Production and Distribution 896901 6.7% 636825 4.6% 718679 4.0% 738653 3.3% 682378 2.9% -6.61% -19.2% -1.3%
40.30 Steam & Hot-water Production & Distribution 591367 4.4% 698000 5.1% 777913 4.4% 945821 4.3% 1055513 4.5% 15.59% 70.1% 4.6%
41.00 Waste Water Gathering, Treatment & Distribution 63783 0.5% 216000 1.6% 276237 1.5% 246932 1.1% 252740 1.1% 41.09% 44.3% 2.9%
TOTAL 13324070 100.0% 13773715 100.0% 17871123 100.0% 22147624 100.0% 23464939 100.0% 15.20% 1519.8% 100.0%
Source : Statistical Yearbook of Lithuania 1998
Economic Activity

1 - 15
Table 1.4.2 Industrial Sub-Sectors and Share of Production (1998)
No. Industrial SubsectorShare(%)
No. Industrial SubsectorShare(%)
1Manufacture of food products andbeverages
29.1 11Manufacture of electrical machinery andapparatus
2.2
2Manufacture of refined petroleumproducts
19.9 12Publishing, printing and reproduction ofrecorded media
2.1
3Manufacture of wearing apparel, dressingand dying of fur
7.2 13 Manufacture of other transport equipment 1.9
4Manufacture of chemical and chemicalproducts
7.1 14Manufacture of fabricated metal products,except machinery and equipment
1.5
5 Manufacture of textiles 7.0 15Manufacture of pulp, paper and paperproducts
1.4
6Manufacture of other non-metallic mineralproducts
3.2 16Manufacture of leather and leatherproducts
1.3
7Manufacture of wood and wood products(except furnitues)
3.0 17Manufacture of rebber and plasticproducts
1.1
8 Manufacture of machinery and equipment 2.8 18 Extraction of petroleum 0.7
9Manufacture of radio, television andcommunincation equipment and apparatus
2.8 19Manufacture of medical, precision andoptical instruments
0.7
10Manufacture of furniture manufacturing ofn.e.c.
2.3 20 Quarrying of stone, clay and sand 0.5

1 - 16
1.5 Manufacturing Industry
(1) Major industries and production activities
Table 1.4.1 shows production, GDP share and annual average growth rate of
the industrial sector between 1993 and 1997. The current state of major
industries in the manufacturing sector is summarized as follows.
a. The food processing industry still shows steady growth and maintains the
largest share.
b. The petroleum refining industry, although the second largest, has a number
of uncertainties compared to the food processing industry, such as a high
percentage of product exports, unreliable crude oil sources, and price
volatility in the international commodity market.
c. The non-metallic product sector including petroleum and natural gas
maintains a stable share of 3%.
d. In the textile and apparel sector, the downstream segment grows strongly, as
opposed to the stagnated upstream segment (textile), and is becoming a
prospective sector for the country that has a major advantage in low-cost
and highly skilled work force.
e. The wood products sector maintains its firm position, although growth
appears to slow down.
f. The pulp and paper industry remains unchanged, although lacking stability.
g. The furniture subsector has a high prospect for future growth.
h. Among other light industries, tobacco, printing and publishing, and rubber
and plastics processing are showing healthy growth, while the leather
industry is in the stable status.
i. Among the machinery and electrical/electronics industries, metalworking
and electrical equipment subsectors grow steadily, while the metal,
machinery and electronics subsectors are sluggish, although they are
expected to play an important role.
j. The medical equipment, automotive and other transportation equipment,
and office equipment subsectors remain stable with slow growth.
(2) Employment and labor productivity
Employment by the industrial sector (mining, manufacturing and energy)
accounts for 20% of the total. Within the sector, the manufacturing sector

1 - 17
accounts for 17.1% (284100 employees), the second largest next to agriculture
among all economic sectors.
Industrial subsectors are ranked according to the number of employees, as
follows. Light industries are major employers in the country’s industrial
sector. No. of No. of employees Subsector Employment establishments per establishment
① Food processing 46714 434 107.6
② Textile 24822 118 210.4
③ Sewing 24281 231 105.1
④ Machinery 16027 104 154.1
⑤ Wood products 14408 452 31.9
⑥ Non-metal 11745 15 106.4
⑦ Furniture 11265 174 64.7
⑧ Electronics/
household appliance 9292 31 299.8
⑨ Chemical 7624 59 129.2
⑩ Other transportation
equipment 6575 41 160.4
Labor productivity per employee in 1998 is shown in Table 1.5.2. Top ten
subsectors among 25 subsectors are listed below.
Labor productivity Subsector (thousand Litas/employee)
① Oil exploration and drilling 276.20
② Chemical 163.84
③ Metal recycling 99.48
④ Food processing 98.59
⑤ Electrical machinery 90.85
⑥ Sand and quarry mining 81.95
⑦ Rubber and plastics 79.03
⑧ Transportation equipment 67.68
⑨ Printing and publishing 58.87
⑩ Electronic equipment 57.92
⑬ Pulp and paper 57.01
⑲ Furniture 42.39
⑳ Sawmill and wood processing 37.56

1 - 18
(3) Export ratio
To reflect the fact that the domestic market is fairly small and purchase power
remains stagnated, most industrial subsectors (except for publishing and
printing, sand and quarry mining, and utilities) export large portions of their
products. In fact, 10 out of 25 subsectors record the export ratio exceeding
70%, and 16 more than 50%. The average export ratio of 25 subsectors (not
including utilities) is 52.4%. This clearly indicates that most industries in the
country are inherently required to obtain competitiveness in export markets if
they are to survive in the increasingly open marketplace. This means, the
government should preferably pursue industrial policy to foster specific
industries that can maintain competitiveness in the open market, rather than
industrial promotion through protection.

1 - 19
1.6 Forestry
1.6.1 World Forestry and Forestry Product Supply and Demand
(1) World forestry trend
The general environment surrounding the world forestry and forest-related
industries is becoming complex as debates over their environmental, economic,
social and cultural roles are heating including academic aspects. Efforts are
being made to develop standards for sustainable forest management under the
philosophy that forests should perform vital and continuous functions of
supplying important products, helping environmental conservation, and
providing social benefits. At the same time, an emphasis is made on
management of forests as an ecological system having diverse economic and
environmental benefits, demanding stronger protection of the forest
environment and its biological diversity. The emphasis on environmental
aspects of forest has initiated various efforts to promote the effective use of
wood products, including recycling, and to incorporate environmental
consideration into international trade, such as the ISO certification
requirements, the addition of specific tree species to the protection list of the
Washington Convention. At the same time, it is important to address the
needs of people who depend on forest resources and consider their interest as
part of the issues related to allocation of forest resources and their social and
cultural benefits. Thus, the government must address its forest development
policy by coordinating conflicting interests of diverse groups who have
different incentives and concern.
(2) World forest area
Throughout the world, forests have been steadily disappearing, although its rate
has gradually slowed down. Major factors for forest loss include the
conversion of forest to farmland due to pressure on increased food production,
extensive infrastructure development accompanying economic development
programs, and growth of demand for forest products driven by economic
development. As they are primarily caused by population growth and
economic development in developing countries, the declining trend is expected
to continue in the years to come.
1 - 20
According to the SOFO report, world forests disappeared at a rate of 11.3
million ha per year between 1990 and 1995, totaling 56.3 million ha which is
equivalent to 1.6% of the world forest area (3454 million ha in 1995). The
annual average rate of decline is 0.3%. During the period, an average 13.7
million ha of natural forest disappeared. This means that it was partly
compensated for by an increase in artificial forest (2.4 million ha), mainly in
industrialized countries.
Thus, the recent trend is that natural forests continue to disappear, although at a
declining rate due to controlled cutting, while artificial forests increase steadily.
Nevertheless, natural forests decrease at a much faster pace than the increase in
artificial forest, resulting in the continued disappearance of natural forest and a
further decrease in total forest area. As a result, debates will continue
between the opposition to environmental destruction due to harvesting of
natural forest and the desire of developing countries to use the forest industry
as a source of economic growth.
1.6.2 Forest Industry in Lithuania
(1) Forest and forest area
Forest land areas in Lithuania account for 30% of the national land area and are
classified as follows. For land use classification purposes, they are divided
into forested areas and non-forest areas.
Non-forested areas include clear cut areas, dead islands, blanks, seedling
nurseries, nurseries, seed orchards, and firebreaks.
Forested areas are divided into four forest protection groups as follows:
Group 1 Strict reserves forests
Group 2 Special purpose forests – ecosystem preserving and recreational
Group 3 Protective forests
Group 4 Commercial forests
These four forest groups are subject to the following restrictions on cutting:
Group 1 Cutting is prohibited
Group 2 Thinning is permitted, but final cutting is prohibited

1 - 21
Group 3 Thinning is permitted, and final cutting is conditionally permitted
(depending on the cut area and method)
Group 4 No restriction
Among the four groups, Group 3 and 4 forests are covered in this report as
exploitable forests.
Figure 1.6.1 Forecast Classification and Area in Lithuania
Source: Lithuanian Forest Statistics 1998
Forested area1888.0
(Group 1)Strict reserves
forests20.6
(Group 2)Special-purpose
forests229.4
(Group 3)Protective
forests266.6
(Group 4)Commercial
forests1371.4
Clear cut areasDead standsBlanksLand for afforestationNurseries & seed orchards
Non-forested area90.4
250.0 (13.2%) 1638.0 (86.8%)
Forest land area1978.4
(1000ha)
(2) Forest types, wood species, and ownership patterns
Forests in Lithuania are dominated by mixed forests of coniferous and
broadleaf species. As shown in the table below, they are classified into nine
forest types, of which three types (pine, spruce and birch) hold an 80% share.
Thus these species are widely seen in the country. On the other hand, alder
forests account for only 12%, including black and grey. This suggests flat
topography with poor drainage.
Before independence from the Soviet Union, all forests in the country were
state owned, although they were managed by different ministries and agencies.
After independence, ownership of all forests was transferred to State Forest
Enterprises under the Ministry of Forestry. Then, it was decided to return
forests that were nationalized in 1941 to their previous owners or heirs, and
their returning is underway. As of January 1, 2000, the total forest area that
was returned to private ownership reached 373900 ha, accounting for 41% of

1 - 22
the total area to be returned (908200 ha). However, the actual pace of
returning is said to be behind the original schedule.
Note that harvest activities are prohibited in forests that are to be returned to
private ownership.
State forests are managed by 42 State Forest Enterprises and 4 national parks,
under the supervision of the Department of Forests and Protected Areas, the
Ministry of Environment.
State Forest Enterprises also supervise and provide guidance for
privately-owned forests by assigning at least one private forest consultant to
each forest, who provides extension service for privatized forests in the areas
of forest management and logging approval.
As shown in Table 1.6.1, state forests are characterized by a much higher
percentage of coniferous species than private forests, which, on the other hand,
are dominated by birch and grey alder.
Table 1.6.1 Forest Areas by Species and Ownership
(1000 ha) Private and
Forest type State forests reserve for Total forests privatization
% % % Pine 408.7 41.7 293.4 32.3 702.1 37.2 Spruce 256.8 26.2 185.1 20.4 441.9 23.4 Birch 173.2 17.7 202.0 22.2 375.2 19.9 Aspen 27.6 2.8 24.8 2.7 52.4 2.8 Black alder 57.7 5.9 50.8 5.6 108.5 5.7 Grey alder 11.1 1.1 100.2 11.0 111.3 5.9 Oak 14.7 1.5 18.9 2.1 33.6 1.8 Ash 26.5 2.7 24.3 2.7 50.8 2.7 Other 3.5 0.4 8.7 1.0 12.2 0.6 Total 979.8 100.0 908.2 100.0 1888.0 100.0 % 51.9 48.1 100.0 Forest type is named according to the dominating tree species based on standing volumeSouce:Lithuanian Forest Statistics 1998
Table 1.6.2 shows breakdown of forest areas by forest type and group. Of
1880000 ha of forested area, exploitable forests (Groups 3 and 4) account for
87%, or 1638000 ha.

1 - 23
Table 1.6.2 Forest Areas by Forest Type and Group
(1000 ha) Forest group Sub total Forest group Sub total Total1 2 % 3 4 % %
Pine 13.0 115.4 128.4 51.4 124.7 448.9 573.6 35.0 702.0 37.2 Spruce 2.2 38.3 40.5 16.2 43.6 357.9 401.5 24.5 442.0 23.4 Birch 2.8 29.5 32.3 12.9 41.6 301.3 342.9 20.9 375.2 19.9 Aspen 0.2 3.0 3.2 1.3 4.8 44.4 49.2 3.0 52.4 2.8 Black alder 1.7 9.8 11.5 4.6 17.7 79.3 97.0 5.9 108.5 5.7 Grey alder 0.1 15.2 15.3 6.1 21.4 74.6 96.0 5.9 111.3 5.9 Oak 0.4 8.5 8.9 3.6 4.8 19.9 24.7 1.5 33.6 1.8 Ash 0.1 4.7 4.8 1.9 5.1 40.9 46.0 2.8 50.8 2.7 Other 0.1 5.0 5.1 2.0 2.9 4.2 7.1 0.4 12.2 0.6 Total 20.6 229.4 250.0 100.0 266.6 1371.4 1638.0 100.0 1888.0 100.0 % 13.2 86.8 100.0Souce:Lithuanian Forest Statistics 1998
Forest type
Table 1.6.3 shows growing stock volume by forest type and species
Table1.6.3 Growing Stock Volume by Forest Type and Species
(1000 m3) Forest
type
Total
volume Pine Spruce Other Birch Aspen Bl.alder G.alder Oak Ash Other
Total
volume
Pine 144653 122978 12690 18 7870 342 201 196 270 10 78 144653
% 100.0 85.0 8.8 0.0 5.4 0.2 0.1 0.1 0.2 0.0 0.1 41.6
Spruce 84922 4953 58347 23 10891 4027 2045 1623 1651 868 494 84922
% 100.0 5.8 68.7 0.0 12.8 4.7 2.4 1.9 1.9 1.0 0.6 24.4
Birch 60825 1631 7641 2 37900 5627 3763 2252 551 1103 355 60825
% 100.0 2.7 12.6 0.0 62.3 9.3 6.2 3.7 0.9 1.8 0.6 17.5
Aspen 11215 38 1535 1760 6319 240 372 304 469 178 11215
% 100.0 0.3 13.7 0.0 15.7 56.3 2.1 3.3 2.7 4.2 1.6 3.2
Black
alder
19780 116 1394 3492 391 13397 452 40 406 92 19780
% 100.0 0.6 7.0 0.0 17.7 2.0 67.7 2.3 0.2 2.1 0.5 5.7
Grey
alder
10775 47 314 1039 370 260 8176 113 224 232 10775
% 100.0 0.4 2.9 0.0 9.6 3.4 2.4 75.9 1.0 2.1 2.2 3.1
Oak 6026 89 741 1 523 553 57 155 3152 313 442 6026
% 100.0 1.5 12.3 0.0 8.7 9.2 0.9 2.6 52.3 5.2 7.3 1.7
Ash 7635 5 441 798 847 276 415 370 4265 218 7635
% 100.0 0.1 5.8 0.0 10.5 11.1 3.6 5.4 4.8 55.9 2.9 2.2
Other 1734 163 83 772 98 94 21 83 115 68 937 1734
% 100.0 9.4 4.8 4.2 5.7 5.4 1.2 4.8 6.6 3.9 54.0 0.5
Total 347565 130020 83186 116 64371 18570 20260 13724 6566 7726 3026 347565
% 100.0 37.4 23.9 0.0 18.5 5.4 5.8 4.0 1.9 2.2 0.9 100.0
Source: Lithuanian Forest Statistics 1998

1 - 24
The breakdown of forest area and growing stock volume by species is shown
below. Differences between percentage shares of forest area and growing
stock volume are relatively large for birch, aspen and grey alder.
Percentage share of Forest are
Percentage share of Growing stock
volume Difference
Pine 37.2 37.4 +0.2 Spruce 23.4 23.9 +0.5 Birch 19.9 18.5 -1.4 Aspen 2.8 5.4 +2.6 Black alder 5.7 5.8 +0.1 Grey alder 5.9 4.0 -1.9 Oak 1.8 1.9 +0.1 Ash 2.7 2.2 -0.5 Others 0.6 0.9 +0.3 Total 100.0 100.0
(3) Forested area, growing stock and growth increment by forest type and age class
Figures 1.6.2, 1.6.3, and 1.6.4 show forested areas of pine, spruce and birch
species by age group, respectively. Pine and birch forests are characterized
by relatively small percentages of young and mature stands. On the other
hand, spruce forests are dominated by young stand, while mature stand
accounts for relatively large portions.
Figure 1.6.2 Pine Forest Type
22.4
36.4
50.8
102.7106.4
83 79.874.3
62.5
43.7
17.1
8.112.4
0
10
20
30
40
50
60
70
80
90
100
110
120
1 2 3 4 5 6 7 8 9 10 11 12 13
Age class: (10 years)
Th
ou
, h
a

1 - 25
Figure 1.6.3 Spruce Forest Type
67.7
54.9
33.930.8
36.3
54.5
62.7
53.6
26.7
11.6
52.4 1.7
0
10
20
30
40
50
60
70
80
1 2 3 4 5 6 7 8 9 10 11 12 13
Age c lass : (10 years )
Th
ou
, h
a
Figure 1.6.4 Birch Forest Type
11.1
22.1
42.1
72.1
95.5
72
35.2
18.4
5.80.8 0.1
0
10
20
30
40
50
60
70
80
90
100
110
1 2 3 4 5 6 7 8 9 10 11 12 13
Age class: (10 years)
Th
ou
, h
a
Tables 1.6.4 shows forest area by forest type and age class, Table 1.6.5
growing stock volume by forest type and age class, and Table 1.6.6 stock
volume per ha by forest type and age class.

1 - 26
Table 1.6.6 shows the growing stock volume per ha as calculated from data in
Tables 1.6.4 and 1.6.5. The stock volume per ha of all the forests reaches
184m3, which ranks middle among forest-rich countries in Europe.
Figure 1.6.5 shows growing stock volumes of pine, spruce and birch forests
that dominate forest resources in Lithuania. According to the data, the stock
volume in pine forests remains mostly unchanged for age class 11 or higher
forests, and their growth appear to stagnate. Similarly, age class 8 or higher
spruce forests seem to lose the stock volume slightly. For age class 9 or
higher birch forests, a clear decline in stock volume is observed.

Table 1.6.4 Forest Area by Forest Type and Age Class(ha)
Forest Age class (10 Years) type 1 2 3 4 5 6 7 8 9 10 11 12 13 計 Pine 22422 36388 50843 102672 106364 82962 79795 74309 62504 43697 17144 8034 12407 699541
% 3.2 5.2 7.3 14.7 15.2 11.9 11.4 10.6 8.9 6.2 2.5 1.1 1.8 100.0 Spruce 67680 54941 33958 30780 36321 54541 62680 53597 26689 11569 5027 2390 1743 441916
% 15.3 12.4 7.7 7.0 8.2 12.3 14.2 12.1 6.0 2.6 1.1 0.5 0.4 100.0 Birch 11140 22051 42125 72070 95480 72002 35177 18388 5848 805 110 13 375209
% 3.0 5.9 11.2 19.2 25.4 19.2 9.4 4.9 1.6 0.2 0.0 0.0 0.0 100.0 Aspen 3615 2705 4978 9975 12728 10454 5145 2175 507 76 52358
% 6.9 5.2 9.5 19.1 24.3 20.0 9.8 4.2 1.0 0.1 0.0 0.0 0.0 100.0 Black alder 6664 10888 14318 17517 17320 19406 12572 6266 2541 785 136 49 108462
% 6.1 10.0 13.2 16.2 16.0 17.9 11.6 5.8 2.3 0.7 0.1 0.0 0.0 100.0 Grey alder 9242 34102 38860 22442 5629 955 93 111323
% 8.3 30.6 34.9 20.2 5.1 0.9 0.1 0.0 0.0 0.0 0.0 0.0 0.0 100.0 Oak 399 395 1170 3098 3814 4020 3451 3147 2471 1906 1404 1546 6758 33579
% 1.2 1.2 3.5 9.2 11.4 12.0 10.3 9.4 7.4 5.7 4.2 4.6 20.1 100.0 Ash 2885 4900 5482 7845 8798 7513 5161 3877 2037 1050 568 327 300 50743
% 5.7 9.7 10.8 15.5 17.3 14.8 10.2 7.6 4.0 2.1 1.1 0.6 0.6 100.0 Other 435 1067 2024 3268 2500 1638 1053 591 386 1479 250 86 66 14843
% 2.9 7.2 13.6 22.0 16.8 11.0 7.1 4.0 2.6 10.0 1.7 0.6 0.4 100.0 Total 124482 167437 193758 269667 288954 253491 205127 162350 102983 61367 24639 12445 21274 1887974
% 6.6 8.9 10.3 14.3 15.3 13.4 10.9 8.6 5.5 3.3 1.3 0.7 1.1 100.0
Source: LITHUANIAN FOREST STATISTICS 1998
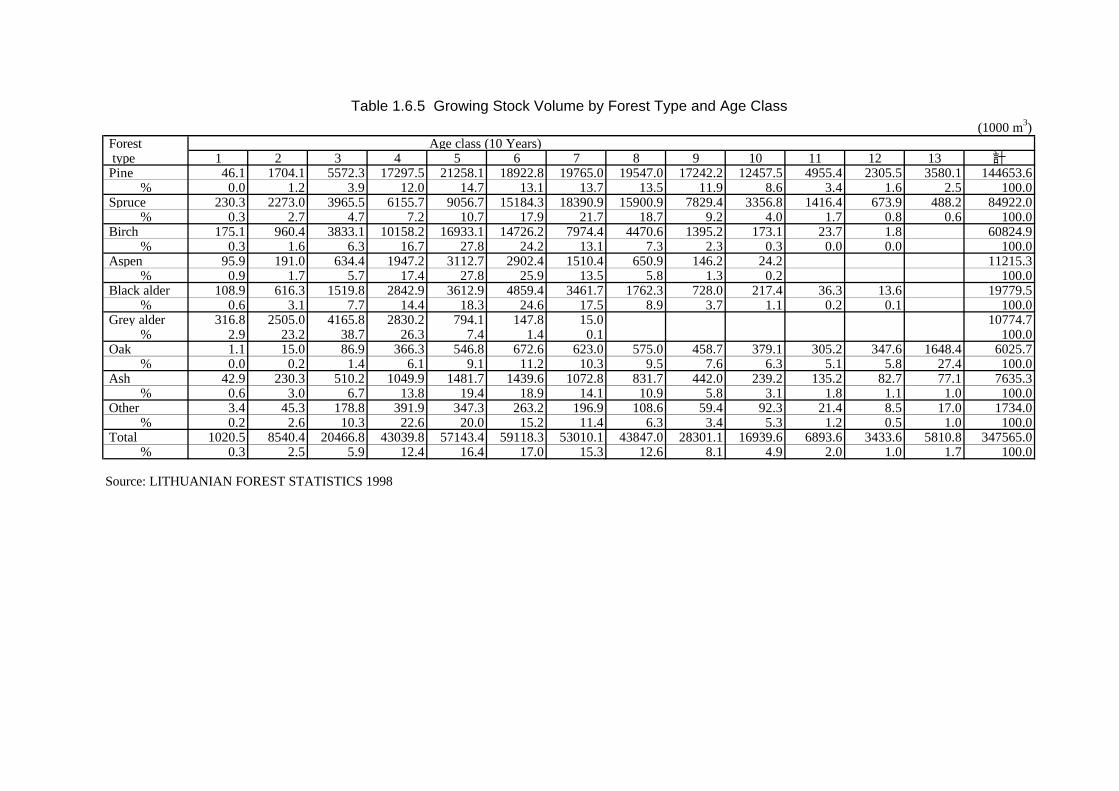
Table 1.6.5 Growing Stock Volume by Forest Type and Age Class(1000 m3)
Forest Age class (10 Years) type 1 2 3 4 5 6 7 8 9 10 11 12 13 計 Pine 46.1 1704.1 5572.3 17297.5 21258.1 18922.8 19765.0 19547.0 17242.2 12457.5 4955.4 2305.5 3580.1 144653.6
% 0.0 1.2 3.9 12.0 14.7 13.1 13.7 13.5 11.9 8.6 3.4 1.6 2.5 100.0 Spruce 230.3 2273.0 3965.5 6155.7 9056.7 15184.3 18390.9 15900.9 7829.4 3356.8 1416.4 673.9 488.2 84922.0
% 0.3 2.7 4.7 7.2 10.7 17.9 21.7 18.7 9.2 4.0 1.7 0.8 0.6 100.0 Birch 175.1 960.4 3833.1 10158.2 16933.1 14726.2 7974.4 4470.6 1395.2 173.1 23.7 1.8 60824.9
% 0.3 1.6 6.3 16.7 27.8 24.2 13.1 7.3 2.3 0.3 0.0 0.0 100.0 Aspen 95.9 191.0 634.4 1947.2 3112.7 2902.4 1510.4 650.9 146.2 24.2 11215.3
% 0.9 1.7 5.7 17.4 27.8 25.9 13.5 5.8 1.3 0.2 100.0 Black alder 108.9 616.3 1519.8 2842.9 3612.9 4859.4 3461.7 1762.3 728.0 217.4 36.3 13.6 19779.5
% 0.6 3.1 7.7 14.4 18.3 24.6 17.5 8.9 3.7 1.1 0.2 0.1 100.0 Grey alder 316.8 2505.0 4165.8 2830.2 794.1 147.8 15.0 10774.7
% 2.9 23.2 38.7 26.3 7.4 1.4 0.1 100.0 Oak 1.1 15.0 86.9 366.3 546.8 672.6 623.0 575.0 458.7 379.1 305.2 347.6 1648.4 6025.7
% 0.0 0.2 1.4 6.1 9.1 11.2 10.3 9.5 7.6 6.3 5.1 5.8 27.4 100.0 Ash 42.9 230.3 510.2 1049.9 1481.7 1439.6 1072.8 831.7 442.0 239.2 135.2 82.7 77.1 7635.3
% 0.6 3.0 6.7 13.8 19.4 18.9 14.1 10.9 5.8 3.1 1.8 1.1 1.0 100.0 Other 3.4 45.3 178.8 391.9 347.3 263.2 196.9 108.6 59.4 92.3 21.4 8.5 17.0 1734.0
% 0.2 2.6 10.3 22.6 20.0 15.2 11.4 6.3 3.4 5.3 1.2 0.5 1.0 100.0 Total 1020.5 8540.4 20466.8 43039.8 57143.4 59118.3 53010.1 43847.0 28301.1 16939.6 6893.6 3433.6 5810.8 347565.0
% 0.3 2.5 5.9 12.4 16.4 17.0 15.3 12.6 8.1 4.9 2.0 1.0 1.7 100.0
Source: LITHUANIAN FOREST STATISTICS 1998

Table 1.6.6 Growing Stock Volume per ha. By Forest Type and Age Class
Forest Age class (10 Years) type 1 2 3 4 5 6 7 8 9 10 11 12 13 計 FCA Pine 2 47 110 168 200 228 248 263 276 285 289 287 289 207 101 Spruce 3 41 117 200 249 278 293 297 293 290 282 282 280 192 71 Birch 16 44 91 141 177 205 227 243 239 215 215 138 162 61 Aspen 27 71 127 195 245 278 294 299 288 318 214 41 Black alder 16 57 106 162 209 250 275 281 287 277 267 278 182 61 Grey alder 34 73 107 126 141 155 161 97 31 Oak 3 38 74 118 143 167 181 183 186 199 217 225 244 179 121 Ash 15 47 93 134 168 192 208 215 217 228 238 253 257 150 101 Other 8 42 88 120 139 161 187 184 154 62 86 99 258 117 Total 8 51 106 160 198 233 258 270 275 276 280 276 273 184 FCA : Final Cutting Age (Years) Souce : Lithuanian Forest Statistics 1998
Table 1.6.7 Estimated Mean Annual Increment
Forest Forest Age (years) type 5 15 25 35 45 55 65 75 85 95 105 115 125 FCA Pine 0.4 3.1 4.4 4.8 4.4 4.1 3.8 3.5 3.2 3.0 2.8 2.5 2.3 101 Spruce 0.7 2.8 4.7 5.7 5.5 5.1 4.5 4.0 3.5 3.1 2.7 2.5 2.2 71 Birch 3.1 2.9 3.6 4.0 3.9 3.7 3.5 3.2 2.8 2.3 2.1 1.2 61 Aspen 5.3 4.7 5.1 5.6 5.4 5.0 4.5 4.0 3.4 3.4 41 Black alder 3.3 3.8 4.2 4.6 4.6 4.6 4.2 3.7 3.4 2.9 2.5 2.4 61 Grey alder 6.9 4.9 4.3 3.6 3.1 2.8 2.5 31 Oak 0.6 2.5 3.0 3.4 3.2 3.0 2.8 2.4 2.2 2.1 2.1 2.0 2.0 121 Ash 3.0 3.1 3.7 3.8 3.7 3.5 3.2 2.9 2.6 2.4 2.3 2.2 2.1 101 Other 1.6 2.8 3.5 3.4 3.1 2.9 2.9 2.5 1.8 0.7 0.8 0.9 2.1 Total 1.6 3.4 4.2 4.6 4.4 4.2 4.0 3.6 3.2 2.9 2.7 2.4 2.2 FCA : Final Cutting Age (Years)
(m3/ha)
(m3/ha,year)

1 - 30
Figure 1.6.5 Volume per ha. By Age Class & Forest Type
0
50
100
150
200
250
300
350
1 2 3 4 5 6 7 8 9 10 11 12 13
Age class: (10 years)
m3 /
ha
Pine Spruce Birch
Figure 1.6.6 Estimated Mean Annual Increment
0
1
2
3
4
5
6
5 15 25 35 45 55 65 75 85 95 105 115 125
Forest Age (years)
M.A
.I.
Pine Spruce Birch Ash
Table 1.6.7 shows the annual average increment, which is estimated from the
stock volume per ha by forest type and age class in Table 1.6.6. (Note that the
stock volume per ha for each age class is calculated as the stock volume for
forest age of (age class x 10 years – 5 years).

1 - 31
Figure 1.6.6 plots some data in Table 1.6.7. According to the chart, the final
cutting age generally agrees with the forest age at which the annual average
increment reaches its peak for some species, namely aspen, black, alder and
grey alder.
For other species, the final cutting age is much later than with the forest age at
which the annual average increment reaches its peak. As determination of the
final cutting age is largely affected by the productive diameter class, it tends to
be longer than the peak forest age. Judging from the fact that 1 million m3 of
fuelwood are used annually, it is speculated that the grey alder forest is used as
the short rotation forest.
Table 1.6.8 shows forest area by forest type and maturity and Table 1.6.9
growing stock volume by forest type and maturity.
Comparing the percentage share of mature forest area in Table 1.6.7 and the
standard ratio of mature forest area (when the forest area assumed to be same
for every age class), both pine and spruce trees have a relatively small
percentage of mature forest, while broad-leaved forests, excepting ash, have a
larger percentage of mature forest than the standard ratio, while young stand is
much smaller in percentage share.

1 - 32
Table 1.6.8 Forest Area by Type and Maturity
(1000 ha)groupe of maturity
Forest young middle- premature mature Total Standard % type stand aged of mature Pine 213.1 343.6 107.6 37.8 702.1
% 30.4 48.9 15.3 5.4 100.0 17 Spruce 187.4 90.8 116.3 47.4 441.9
% 42.4 20.5 26.3 10.7 100.0 20 Birch 33.2 209.7 72.0 60.3 375.2
% 8.8 55.9 19.2 16.1 100.0 14 Aspen 6.4 5.0 10.0 31.0 52.4
% 12.2 9.5 19.1 59.2 100.0 20 Black alder 17.6 49.2 19.4 22.3 108.5
% 16.2 45.3 17.9 20.6 100.0 14 Grey alder 9.3 34.1 38.9 29.0 111.3
% 8.4 30.6 35.0 26.1 100.0 25 Oak 5.1 18.8 2.9 6.8 33.6
% 15.2 56.0 8.6 20.2 100.0 14 Ash 21.1 25.4 3.1 1.2 50.8
% 41.5 50.0 6.1 2.4 100.0 17 Other 2.3 5.3 1.9 2.7 12.2
% 18.9 43.4 15.6 22.1 100.0 Total 495.5 781.9 372.1 238.5 1888.0
% 26.2 41.4 19.7 12.6 100.0 Standard % of mature : when areas of all classes are equal. Souce : Lithuanian Forest Statistics 1998
Classification by maturity in the above table can be translated to classification
by cutting age as shown below.
groupe of maturity Forest young middle- premature mature type stand aged Pine,Ash 1-40 41-80 81-100 101... Spruce 1-40 41-60 61-80 81... Birch,B.alder 1-20 21-50 51-60 61... Aspen 1-20 21-30 31-40 41... G.alder 1-10 11-20 21-30 31... Oak 1-40 41-100 101-120 121...

1 - 33
Table 1.6.9 Stock Volume by Forest Type and Maturity
(1000 m3)groupe of maturity
Forest young middle- premature mature Total type stand aged Pine 24677 79510 29765 10852 144804
% 17.0 54.9 20.6 7.5 100.0 Spruce 12624 24241 34292 13765 84922
% 14.9 28.5 40.4 16.2 100.0 Birch 1135 30924 14726 14039 60824
% 1.9 50.8 24.2 23.1 100.0 Aspen 287 634 1947 8347 11215
% 2.6 5.7 17.4 74.4 100.0 Black alder 725 7976 4859 6219 19779
% 3.7 40.3 24.6 31.4 100.0 Grey alder 317 2505 4166 3787 10775
% 2.9 23.2 38.7 35.1 100.0 Oak 469 3255 653 1648 6025
% 7.8 54.0 10.8 27.4 100.0 Ash 1833 4826 681 295 7635
% 24.0 63.2 8.9 3.9 100.0 Other 200 683 287 415 1585
% 12.6 43.1 18.1 26.2 100.0 Total 42267 154554 91376 59367 347564
% 12.2 44.5 26.3 17.1 100.0 Souce : Lithuanian Forest Statistics 1998
Table 1.6.10 shows stock volume per ha by forest type and maturity.
Compared to the stock volume of 184m3/ha for all forests, that for mature
forest is 249m3/ha.
Table 1.6.10 Stock Volume Per Hectare by Forest Type and Maturity
(m3/ha)groupe of maturity
Forest young middle- premature mature Total type stand aged Pine 116 231 277 287 206 Spruce 67 267 295 290 192 Birch 34 147 205 233 162 Aspen 45 127 195 269 214 Black alder 41 162 250 279 182 Grey alder 34 73 107 131 97 Oak 92 173 225 242 179 Ash 87 190 220 246 150 Other 87 129 151 154 130 Total 85 198 246 249 184 Souce : Lithuanian Forest Statistics 1998

1 - 34
(4) Historical trends in Lithuania forest resources
Figure 1.6.7 shows cutting trends and dynamics of forests in Lithuania, on the
basis of Lithuanian Forest Statistics 1998 and Lithuanian Forestry and Timber
Industry Development Programme Resolution (27.9.1994). Notably, vigorous
cutting at a rate of 6 million m3 per year over three decades, starting in 1921,
seriously reduced forest resources in the country.
Statistical data show that the average stock volume per ha was 76m3 in 1948.
This figure is applied to pine forests in Figure 1.6.5 of this report, it is
equivalent to the stock volume for 25 years old (the current stock volume of
184m3/ha for around 45 years old). Together with the low percentage (5%) of
mature forest, most mature forests seem to have been cut in the late 1940s or
the early 1950s.
Then, great efforts have presumably been made to restore forest resources
through restrained cutting and reforestation over five decades. As the stock
volume has recovered to a significant level to warrant sustainable growth,
further growth is expected in the future, although there are some problems to
be overcome.
Figure 1.6.7 shows the annual removal rates since 1938, which depict excess
cutting in the early years.
(1000m3) Year Stock volume Annual cut Removal rate (%) 1938 158000 6700 4.24 1948 125000 5330 4.26 1961 137000 3000 2.19 1973 198000 3100 1.57 1983 266000 3200 1.20 1993 334000 4270 1.28 1998 348000 5123 1.47
348000 (6200) 1.78
Thus, the annual removal rate exceeded 4% of the stock volume, compared to
the annual allowable cut of 6.2 million m3 that is equivalent to 1.78% of the
recent stock volume.

1 - 35
Figure 1.6.7 Forest Resource Trends in Lithuania
6000
4000
2000
0
300
200
100
0
150
100
50
0
40
20
0
12
10
8
6
4
2
0
1920 1930 1940 1950 1960 1970 1980 1990 2000
60406700 6580
5330
37603000 3100 3200
42705123
158125 137
198231
266297
334 348
1938 '48 '61 '73 '78 '83 '88 '93 1998
1938 '48 '61 '73 '78 '83 '88 '93 1998
1938 '48 '61 '73 '78 '83 '88 '93 1998
1938 '48 '61 '73 '78 '83 '88 '93 1998
144
7688
114128
146
160
50
163
180184
48
32 36 3943
4547 49 51
11.6
5
6.9
8.29
10.9
12.6
FELLING (1000m3)
MEAN GROWING STOCK (m3/ha)
AVERAGE AGE OF STANDS (YEARS)
AREA OF MATURE STANDS IN % OF TOTAL FOREST AREA
GROWING STOCK VOLUME (1000000m3)

1 - 36
(5) Cutting trends
Table 1.6.11 shows cutting trends between 1997 and 1999 and Table 1.6.12
detailed data in 1999.
Cutting is primarily carried out by State Forest Enterprises which manage state
forests. At present, the annual cut reaches 5 million m3, of which that of
privately-owned forests exceeded 1 million m3 in 1999 for the first time. As
the ratio of state forests to private forests will become 52:48 when all the
nationalized forests are returned to private ownership, the cut in private forests
is expected to grow rapidly in the near future.
Data in Table 1.6.11 can be summarized as follows.
Percentage share of state-owned forests
Private forests Total
1997 82.6% 17.4% 100% 1998 83.7 16.3 100 1999 79.3 20.7 100
Final cutting Thinning Total 1997 47.7% 52.3% 100% 1998 52.6 47.4 100 1999 58.5 41.5 100
Notably, the cutting volume for thinning and sanitation cutting purposes
account for more than 40% of total. From the 1999 data in Table 1.6.12, it is
revealed that selective sanitation cutting represents a majority of thinning and
sanitation cutting. This reflects the fact that extensive cutting was carried out
to remove wind-fallen trees and insect damaged trees, which mainly occurred
in spruce forests in 1993.

Table 1.6.11 Removal in 1997-1999 (1000 m3)
Area Cutting in State Forest Allowed to cut in Total1999 Sub-Total Cut by Forest Enterprise Cut by Other Logging Co. Private Forest
ha removal commercial removal commercial removal commercial area removal removal %Ⅰ.Final cutting,Total 11880.0 2248.0 1643.2 2212.3 1639.8 35.7 3.4 7098.0 632.7 2880.7 58.5Ⅱ.Thinning & Sanitation cutting,Total 156667.0 1602.8 774.1 1085.3 727.5 517.5 46.6 29978.0 304.8 1907.6 38.7Ⅲ.Other Intermediate cutting,Total 2917.0 51.9 27.2 36.1 25.1 15.8 2.1 3417.0 84.1 136.0 2.8Ⅳ.Total 171464.0 3902.7 2444.5 3333.7 2392.4 569.0 52.1 40493.0 1021.6 4924.3 100.0
% 79.3(100.0) (85.4) (14.6) 20.7 100.0
Area Cutting in State Forest Allowed to cut in Total1998 Sub-Total Cut by Forest Enterprise Cut by Other Logging Co. Private Forest
ha removal commercial removal commercial removal commercial area removal removal %Ⅰ.Final cutting,Total 11117.0 2137.3 1554.4 2129.5 1551.7 7.8 2.7 3958.0 430.5 2567.8 52.6Ⅱ.Thinning & Sanitation cutting,Total 183755.0 1875.8 899.8 1247.1 805.5 628.7 94.3 34684.0 307.1 1554.2 31.8Ⅲ.Other Intermediate cutting,Total 3372.0 73.5 42.9 55.6 38.4 17.9 4.5 3088.0 55.9 129.4 2.7Ⅳ.Total 198244.0 4086.6 2497.1 3432.2 2395.6 654.4 101.5 41730.0 793.5 4880.1 100.0
% 83.7(100.0) (84.0) (16.0) 16.3
Area Cutting in State Forest Allowed to cut in Total1997 Sub-Total Cut by Forest Enterprise Cut by Other Logging Co. Private Forest
ha removal commercial removal commercial removal commercial area removal removal %Ⅰ.Final cutting,Total 11925.0 2118.1 1527.9 2108.1 1525.2 10.0 2.7 2385.0 337.7 2455.8 47.7Ⅱ.Thinning & Sanitation cutting,Total 197935.0 2024.3 1046.8 1405.4 922.3 618.9 124.5 63184.0 492.6 1898.0 36.9Ⅲ.Other Intermediate cutting,Total 3745.0 109.1 77.0 98.8 74.6 10.3 2.4 2567.0 67.3 176.4 3.4Ⅳ.Total 213605.0 4251.5 2651.7 3612.3 2522.1 639.2 129.6 68136.0 897.6 5149.1 100.0
% 82.6(100.0) (85.0) (15.0) 17.4 100.0removal : including fuelwood, commercial : without fuelwoodSouce : Department of Forests & Protected Areas

1 - 38
Table 1.6.12 Details of Removal in 1999
(1000 m3)
Area Cutting in State Forest Allowed to cut in 1999 Sub-Total Cut by Forest Enterprise Cut by Other Logging Co. Private Forest
ha removal commercial removal commercial removal commercial area removal removal %
Ⅰ.Final cutting,Total 11880.0 2248.0 1643.2 2212.3 1639.8 35.7 3.4 7098.0 632.7 2880.7 58.5
Ⅱ.Thinning & Sanitation
cutting,Total 156667.0 1602.8 774.1 1085.3 727.5 517.5 46.6 29978.0 304.8 1907.6 38.7
Ⅲ.Other Intermediate
cutting,Total 2917.0 51.9 27.2 36.1 25.1 15.8 2.1 3417.0 84.1 136.0 2.8
Ⅳ.Total 171464.0 3902.7 2444.5 3333.7 2392.4 569.0 52.1 40486.0 1021.6 4924.3 100.0
Details of Ⅰ.Final cutting,Total
Spruce 3546.0 566.9 429.9 562.9 429.1 4.0 0.8 3735.0 297.4 864.3 30.0
Pine & Others 1770.0 379.8 338.3 378.9 338.1 0.9 0.2 1607.0 117.0 496.8 17.2
① Coniferous,Total 5316.0 946.7 768.2 941.8 767.2 4.9 1.0 5342.0 414.4 1361.1 47.2
Oak 145.0 23.7 14.1 23.5 14.1 0.2 0.0 66.0 9.2 32.9 1.1
Ash & Others 79.0 14.2 7.7 14.0 7.7 0.2 0.0 141.0 11.2 25.4 0.9
② Hardbroadleaves,Total 224.0 37.9 21.8 37.5 21.8 0.4 0.0 207.0 20.4 58.3 2.0
Birch 3379.0 649.4 478.2 643.5 477.9 5.9 0.3 852.0 102.8 752.2 26.1
Black alder 1151.0 268.3 184.4 266.9 184.4 1.4 0.0 188.0 34.5 302.8 10.5
Aspen & Others 1810.0 345.7 190.6 322.6 188.5 23.1 2.1 509.0 60.6 406.3 14.1
③ Softbroadleaves,Total 6340.0 1263.4 853.2 1233.0 850.8 30.4 2.4 1549.0 197.9 1461.3 50.7
Ⅰ.Final cutting,Total 11880.0 2248.0 1643.2 2212.3 1639.8 35.7 3.4 7098.0 632.7 2880.7 100.0
(①+②+③)
Details of Ⅱ.Thinning & Sanitation cutting,Total
① Pre-commercial 13357.0 25.0 5.2 14.3 5.1 10.7 0.1 109.0 1.8 26.8 1.4
thinning
② Commercial 7108.0 279.0 174.9 257.1 171.3 21.9 3.6 1057.0 31.8 310.8 16.3
thinning
③ Thinning 8826.0 498.8 340.7 487.8 338.5 11.0 2.2 2879.0 96.1 594.9 31.2
④ Selection-
sanitation cutting 127376.0 800.0 253.3 326.1 212.6 473.9 40.7 25933.0 175.1 975.1 51.1
Ⅱ.Thinning & Sanitation
cutting,Total 156667.0 1602.8 774.1 1085.3 727.5 517.5 46.6 29978.0 304.8 1907.6 100.0
(①+②+③+④)
Of Final cutting,Total
9637.0 2043.8 1498.0 2014.3 1495.0 29.5 3.0 2429.0 503.1 2546.9 88.4
148.0 17.8 12.9 17.4 12.8 0.4 0.1 135.0 15.5 33.3 1.2
figures in column % show percentage to Final cutting,Total
Of Other Intermediate cutting,Total
65.0 7.4 5.1 6.8 4.9 0.6 0.2 16 2.2 9.6
Souce : Department of Forests & Protected Areas
Total
Clear final cutting
Clear sanitary cutting
Clear sanitary cutting

1 - 39
(6) Logging operation
Figure 1.6.8 illustrates a general flow of logging operations in 1999. Notably,
even in state forests that accounted for 80% of the annual cut in 1999, 82% of
felling and bucking operations and 30% of yarding to forest roads were
commissioned to private contractors. On the national average, direct
operation by State Forest Enterprises account for 47% of total logging
operation. As state forests are returned to private ownership and harvesting of
private forests increases, private loggers will grow in number and skills will
improve.
Figure 1.6.8 General Flow of Logging Operations (1999)
Source: Center of Forest Economics
Felling &Bucking
Forwardingor Skidding
By Themselves
0.6 (18%)
By Contractors
2.7 (82%)
2.3 (69%)(47%)
1.0 (31%)(20%)
By Private Persons & Companies
1.6
1.6(33%)
State ForestEnterprises3.3 (85%)
StumpageSales
0.6 (15%)
State Forests3.9 (80%)
Private Forests1.0 (20%)
Removal in 1999 (1000000 m3)4.9 (100%)
Table 1.6.13 shows yearly changes in stumpage sales volume in state forests.
The figure grew 50% in 1993 due to a large number of wind-fallen trees.
Loggers who have logged these trees must have improved their skills, which
should be utilized in the future.

1 - 40
Table 1.6.13 Yearly Changes in Stumpage Sales Volume from State Forests
(1000000 m3) Total Removal in State Forest of which Stumpage Sales %
1991 3.32 0.72 21.71992 3.34 0.77 23.11993 4.61 2.33 50.51994 4.00 1.47 36.81995 5.28 1.62 30.71996 4.77 0.91 19.11997 4.25 0.64 15.11998 4.09 0.66 16.11999 3.90 0.57 14.6
Souce : Center of Forest Economics
Table 1.6.14 shows the changes in transportation and handling methods used
by State forest Enterprises. Clearly, they have been using the whole stem
method less and less – the traditional method used in the Soviet Union to haul
whole logs to a stockyard (mostly near a rail station) by a skidder or a truck.
The method’s percentage share declined to 7% in 1999. Among short wood
methods, called the Scandinavian method, skidding using a horse or farm
tractor has also been on the decline, increasingly replaced with the forwarding
method using a forwarder or a wagon vehicle with a grapple crane hauled by a
farm tractor.
Table 1.6.14 Logging Operations by State Forest Enterprises
(1000 m3) Skidding and Forwarding
Whole stem Skidding Skidding Forwarding Shortwood method method by Horses by Tractors by Forwarders Sub-total
% % % % %1997 3425 562 16.4 152 4.4 1228 35.9 1482 43.3 2862 83.61998 3281 436 13.3 107 3.3 937 28.6 1801 54.9 2845 86.71999 3239 228 7.0 59 1.8 1004 31.0 1948 60.1 3011 93.0
Souce : Department of Forests & Protected Areas
Total Year
Table 1.6.15 shows an operation record of forwarders in 1999. This is the
operation record of 56 forwarders (2 models) out of 76 owned by State Forest
Enterprises throughout the country. Each forwarder was operated for 216
days per year on average and handled 23000 m3 by working for 12 – 13 hours
per day and based on 1.7 shifts. (106m3/day/unit, 61m3/shift/unit)

1 - 41
This is a highly efficient operation, although work was mainly performed over
flat terrain, but the forwarder is very expensive, reportedly over EUR200000
per unit.
Table 1.6.15 Operation Record of Forwarders(1999)
Name of No. of Worked Days Worked Shifts Forwarded Volumes Machines Machines all M. per M. all M. per Day all M. per M. per Day,M per Shift,M
days days shifts shifts 1000m3 1000m3 m3 m3
Timberjack 33 7842 237.6 12959 1.7 734.9 22.3 93.7 56.7 Valmet 32 6196 193.6 11474 1.9 748.9 23.4 120.9 65.3 Total 65 14038 216.0 24433 1.7 1483.8 22.8 105.7 60.7 M : Machine(s) Souce : Department of Forests & Protected Areas
Table 1.6.16 shows an operation record of wagon forwarders equipped with
grapple cranes, which are hauled by farm tractors. Compared to forwarders
that are specially designed for forestry operation, it is advantageous to use the
less costly farm tractor.
Although the handling capacity per shift/unit is less than one half that of the
forwarder, the farm tractor is far cheaper, reportedly around EUR73000. Also,
small-scale harvesting in private forests is expected to increase in the near
future, logging operation using the wagon will likely become pervasive.
Table 1.6.16 Working Record of Wagon Forwarders with Grapple Cranes
Name of No. of Worked Days Worked Shifts Forwarded Volumes Machines Machines all M. per M. all M. per Day all M. per M. per Day,M per Shift,M
days days shifts shifts 1000m3 1000m3 m3 m3
Patu 27 3911 144.9 4114 1.1 124.1 4.6 31.7 30.2 Weimer 15 2617 174.5 2789 1.1 77.4 5.2 29.6 27.8 RDM 9 1539 171.0 1972 1.3 45.0 5.0 29.2 22.8 Nokka 9 1524 169.3 1574 1.0 46.8 5.2 30.7 29.7 PV-8 4 571 142.8 765 1.3 14.2 3.6 24.9 18.6 Sveteka 1 169 169.0 169 1.0 6.3 6.3 37.3 37.3 Krona 1 194 194.0 194 1.0 8.2 8.2 42.3 42.3 Total 66 10525 159.5 11577 1.1 322.0 4.9 30.6 27.8 M : Machine(s) Souce : Department of Forests & Protected Areas
Table 1.6.17 shows the average logging operation prices contracted by State
Forest Enterprises to subcontractors.

1 - 42
The contract price for a combination of felling, cutting and yarding operations
is lower than that of each operation because high levels of work efficiency can
be maintained due to clear cutting as well as work in pipe forests.
Clearly, the ability to maintain this cost advantage will hold the key to further
growth of forestry in Lithuania.
Table 1.6.17 Average Contract Price for Logging Operations
(LTL/m3,(USD/m3))Average Contract Price
Felling & Forwarding Total Felling & Year Bucking Forwarding1997 12.8(3.2) 11.8(3.0) 24.6(6.2) 22.0(5.5)1998 13.2(3.3) 12.8(3.2) 26.0(6.5) 22.1(5.5)1999 12.9(3.2) 14.0(3.5) 26.9(6.7) 23.0(5.8)
Source: Department of Forests and Protected Areas
(7) Domestic wood consumption
Table 1.6.18 estimates wood consumption in Lithuania from the cutting
volume in the country and log exports and imports.
Table 1.6.19 shows industrial log consumption in the above table estimated
from production statistics of wood products and log supply by State
Enterprises.
As reliable statistical data are difficult to obtain, industrial log consumption in
the country is assumed to be 3 million m3 annually and fuelwood consumption
1 million m3.

1 - 43
Table 1.6.18 Domestic Wood Consumption Trends
(1000m3sub)1997 1998 1999
Removals 5150 4880 4920
Log Import 100 86 79
Log Export 764 786 937
Apparent
Consumption 4486 4180 4062
industrial log 3336 3010 2892
fuelwood 1150 1170 1170
Souce : Center of Forest Economics NAUJIENOS No.1 (12)
Table 1.6.19 Industrial Log Consumption Trends
Production Estmated Consump.(1000m3sub) Unit 1997 1998 1999 1997 1998 1999
Sawn-timber 1000m3 1250 1150 1150 2800 2500 2500
Plywood 1000m3 29.5 35.7 31.5 100 100 100
Particleboard 1000m3 169.8 159.1 100.3 300 200 100
Fibreboard 1000000m2 19.0 20.0 12.2 200 200 100
3400 3000 2800
Souce: Center of Forest Economics
(8) Annual increment and annual allowable cut (1999 – 2008)
First of all, the annual increment of all forests in Lithuania is estimated at 11.6
million m3 sob (forested area of 1,888,000 ha x 6.14m3/ha), whereas the
present annual allowable cut amounts to 5 million m3 sob). This is explained
as shown in the table below (Lietuvos Misku Istekliai Noudojimo Perspektyvos
by A. Kuliesis)
(million m3) National mean annual growth 11.6 Decrease due to natural dead -1.1 Portions belonging to Groups I and II (15%)
-1.7
Net – Groups III and IV 8.8 Saleable portions (83%) 7.3 Unable to cut due to immaturity -1.1 Net – allowable cut 6.2
The annual allowable cut currently announced is as follows.

1 - 44
Potential Use of timber Resources
YEAR FORECASTED CUTTING VOLUME (Million m3)
1999-2008 6.2 2009-2018 6.7 2019-2028 7.1
(9) Truck and rail transportation costs
The truck transportation cost incurred by Nemensines State Forest Enterprise is
reported as follows:
Loading and unloading costs: 5LT/m3
Transportation charge per km: 2.4LT/km, truck load of 20-22m3
Thus, assuming that a 20m3 load is transported for a distance of 100km:
2.4×100km+5×20=340LTL/20m3≒17LTL/m3
Rail transport (350km from Nemencines to Kleipeda Port)
Lading cost: 7-8LT/m3
Freight charge per car: 1000LT – 50m3 load per ca = 20LT/m3
Total: 27-28LT/m3
The transportation cost for chips from a private sawmill is estimated as
follows:
Transportation charge per km: 1.7LT/km – truck load of 21m3 (solid cubic
metre)
(10) Reforestation cost
According to Nemencines State Forest Enterprise, the reforestation cost
including soil (land) preparation to plant 7000 – 10000 nursery trees is 900 –
1400LT/ha, or USD225 – 350/ha.
As the cutting rotation in Lithuania is relatively long, it is important for the
industry to reduce the reforestation cost.

1 - 45
1.7 Forestry and Wood products
1.7.1 Worldwide Wood product Supply and Demand Situation
(1) Wood product demand
According to the 1994 FAO statistics, fuelwood accounted for 56% of wood
product demand in the world, and industrial use 44%. In industrialized
countries, fuelwood demand represented 15% and industrial consumption 85%.
In contrast, the former accounted for 81% and the latter 19% in developing
countries. Generally speaking, industrial demand is roughly proportional to
population and income, while fuelwood demand decrease with income growth.
Table 1.7.1 World Wood Product Consumption
(Unit:100万m3)
Category 1970 1980 1994 1995
Roundwood
World 2463 3499 3358 4056
Industrialized countries 1258 1559 1318 -
Developing countries 1206 1947 2122 -
Fuelwood
World 1185 1780 1891 1923
Industrialized countries 187 234 191 -
Developing countries 998 1546 1700 -
Industrial
World 1278 1718 1891 2133
Industrialized countries 1070 1318 1051 -
Developing countries 208 401 417 -
Overall, industrial demand in industrialized countries will remain flat or grow
slightly, whereas that in developing countries will grow rapidly to reflect high
growth rates of both economy and population. Meanwhile, fuelwood demand
in developing countries will decline gradually. As a result, worldwide wood
product demand will grow largely due to brisk demand in developing countries,
led by Asia. The FAO predicts that world log demand will reach 5 billion m3
in 2010.

1 - 46
(2) Trade structure for wood products
In terms of overall trade structure, both exports and imports of wood products
are controlled by industrialized countries. The bulk of wood product trade
takes place among Europe, North America and Asia. Notably, Asian
countries which are currently major exporters of wood products are losing
export capacities due to fast-growing economies accompanied by rapid growth
of domestic demand. And some of them may turn into importers. It should
also be noted that only 20-30% of wood products produced worldwide are
traded in the international market, and remaining 70-80% in the domestic
markets.
Table 1.7.2 Regional Breakdown of Exports/Imports
of Wood Products (1994)
Region Export Import
Europe 43% 45%
North America 32% 17%
Asia 13% 31%
(3 regions) (88%) (93%)
Latin America 4% 3%
Africa 2% 2%
Oceania 3% 2%
Former Soviet Union 3% 0%
Table 1.7.3 Worldwide Production and Exports of Wood products
Wood products 1970 1994
Production Export Production Export
(Million m3)
Industrial logs 1278 93.6 1467 113.4 ( 7.7%)
Sawmill products 415 57.4 413 107.6 (26.1%)
Plywood 70 9.7 127 38.2 (30.1%)
Pulp 103 16.9 172 31.6 (18.4%)
Paper/paperboard 126 23.4 269 72.7 (27.0%)

1 - 47
(3) Regional supply and demand balance
According to the FAO forecast, the present supply and demand balance will
basically be maintained at least until 2010 without a significant supply shortage
or long-term price hikes. In the meantime, consumption will shift to paper,
paperboard and panel products, so that industrial log production will shift to
smaller diameter products.
In any case, the world supply and demand structure will primarily consist of
North America, Asia and Europe. Regions that serve as uncertain factors on
the supply side are Russia and the Pacific Rim countries, including South
America, which have high potential to grow as major sources of artificial forest
wood. Supply and demand outlooks in the three regions are described as
follows.
1) North America
In the U.S., coniferous tree may become short supply between 2000 and 2010,
but as plantations in South and Northwest will grow to tradable volume by
2010, long-term availability will not likely become a problem. The supply
shortage up to 2010 will be compensated for by the use of surplus broadleaf
tree or imports.
In Canada where coniferous tree is mainly consumed and its forest resources
are mainly natural (primary) forests, supply is expected to decline in response
to the growing environmental concern. On the other hand, broad-leaved
forests have sufficient stock to meet requirements, so long as the market accept
hardwood.
Exports of softwood logs from North America to the Pacific Rim market (Asia)
are limited to those harvested from privately owned secondary forests, because
the U.S. government bans their exports from public forests in West, and
provincial governments in Canada impose similar restriction.
2) Europe
According to the ETTS forecast, log production in European forests is expected
to grow gradually, whereas wood product demand will grow constantly. As a
result, prices will likely rise, although the long-term price trend will be

1 - 48
relatively stable. Supply and demand forecast up to 2020 indicates that
demand for sawmill products, plywood, pulp and paper will grow at 20% -
80% annually. On the other hand, the annual removal will remain 70% of the
net growing stock (slightly more than one half the total supply volume) and net
imports of wood products from other regions (excluding logs) will increase 55
– 80 million m3, especially in the form of paper and pulp as well as logs.
3) Asia
While Asia expands production at the fastest pace, it will continue to face
supply shortage, which is most acute in the world. The shortage will occur
for plywood and veneer at the beginning of the 21st century, and pulp and paper
shortages will become serious. For many wood products, consumption in
Asia reaches the same or higher level than that in Europe, and demand growth
exceeds supply in most products. The shortage is expected to be covered by
imports from the former Soviet Union, Oceania and Americas (North and
South Americas), together with harvest from plantations in Asia. Notably, the
recent closedown of a large number of small paper mills in China suggests the
country intends to reduce the cost burdens related to environmental protection
by increasingly relying on imports. This means that paper and pulp imports
by China will grow rapidly, also driven by the country’s economic growth.
(4) Wood product market trends
1) Sawmill products
According to the FAO’s 1997 statistics, world sawmill product demand ranged
between 430 – 400 million m3 annually. Softwood accounted for 70% and
hardwood 30%. Softwood imports are dominated by the U.S., followed by
Japan, the U.K., Italy and Germany. For hardwood, the large importer is
China, followed by Japan, Italy, Thailand and the U.S.
The FAO’s forecast based on the past data between 1983 and 1997 indicates
that world demand will grow at an annual 1.7% after 1998. This means an
annual average increase of 2.68 million m3 up to 2020. Regionally, demand
in North America will increase by 2-3%, while West Europe will remain
unchanged and increase slightly and Asian demand will grow at around 1% as
China’s rapid growth will more than compensate for contracted demand in
Japan. Demand in Latin America will continue to level off.

1 - 49
2) Plywood
World plywood demand ranges between 50 and 55 million m3, 37% of which
are imported. The major exporter is Indonesia (41%), followed by Malaysia
(18%). These two countries account for a combined share of nearly 60%.
The largest importer is Japan, followed by China, the U.S., Germany and South
Korea. Four countries in Asia, Japan, China, South Korea and Singapore,
account for a combined share of 54% to total imports. The U.S. is the largest
plywood consuming country in terms of consumption per 1000 population
(39m3), followed by Europe (9m3), Asia (7m3) and South America (5m3).
In both Indonesia and Malaysia, timber for veneer production are harvested
from natural forests in Borneo. Recently, however, logging camps are
moving into remote areas to make logging operations increasingly
uneconomical and cause steady reduction of log supply. As a result, smaller
diameter logs will be used for veneer production, leading to the rise in
production cost and increased competition with OSB and other substitutive
products.
In overall consideration of the above factors, the bulk of plywood currently
traded in the world market is harvested from natural forests in tropical areas.
However, the production cost rises gradually due to increasingly unfavorable
harvesting conditions, while smaller logs are increasingly used. As a result,
smaller diameter wood will become a principal material for plywood in the
near future. According to other information sources, the plywood industry in
the U.S. is using roundwood of 30cm or small diameters, and OSB is receiving
attention as a promising alternative.
The long-term demand forecast indicates that demand in China will maintain
high growth rates of 3-4% annually and become the largest consuming country
in 2010, compared to the U.S. which was the largest consumer in 1997 but will
decline thereafter. Overall, total demand will expand from 52.8 million m3 in
1997 to 66.1 million m3 in 2010 and 77.2 million m3 in 2020, with an annual
average growth rate of 1.06 million m3.
3) Particleboard

1 - 50
World particleboard demand amounts to around 70 million m3, of which 15.8
million m3 (22.5%) are procured through imports. Major importing countries
are the U.S., Germany, the U.K., Japan and Italy (in that order). Imports by
North American and European countries account for more than 80% of world
total imports. Major exporting countries are also in these regions, namely
Canada, Benelux, Germany, France and Austria. European exports accounts
for slightly over 93% of the world total.
In fact, North American and European countries dominate world particle board
production, consumption and trade by controlling 80% or more share. World
demand grew at a healthy 8.2% between 1993 and 1997. Among regions, the
U.S. and Asia were fast growing, 19.4% and 13% respectively.
4) Fiberboard
Worldwide fiberboard demand totaled 23360000 m3 in 1997. Of total,
insulation boards accounted for 24%, hardboards 31%, and MDF 45%. The
three segments grew 0%, 1.92% and 8.3% during the past four years, indicating
rapid growth of the largest segment, MDF.
A. Insulation board
Regionally, demand declined in North and Central Americas, Europe and
the Pacific region during the four-year period, compared to some surges in
South America, Asia and Africa. In particular, demand in Europe dropped
by 37% and North and Central Americas by 23%. South America
experienced 96% growth and Asia 84%.
The largest importer is China, followed by the U.S., Germany, the U.K. and
Italy. Demand in China grew nearly six fold (480%) between 1993 and
1997. The U.S. recorded modest growth of 11.2% and Germany 15%.
The U.K. registered negative growth of 18%.
The largest exporting country is Canada, followed by Poland, Italy, the U.S.,
and France. During the four-year period, only the U.S. exports decreased
by 41%, while Canada boosted 48%, Poland 430%, Italy 160% and France
71%.

1 - 51
World demand, however, did not increase at all during the four-year period.
Production fell 7.2% probably because the industry anticipated sluggish
demand. Insulation boards account for the smallest percentage of
fiberboard (20% in 1997) and their future prospect is not very bright.
B. MDF
MDF is the most widely used fiberboard product. It is mainly produced in
Europe (34%), Asia (28) and North and Central Americas (25%). Demand
grew at an annual average rate of 17% between 1995 and 1997, and
accounted for 47% of total fiberboard consumption (1997). One fourth of
MDF products is traded in the export market, which is dominated by Europe
(53% of total volume), followed by Asia (16%) and the Pacific States (11%).
Europe is also the major importing region (47%) and Asia (35). The two
regions hold a combined share of 82%.
Japan and China are major importers, accounting for 29%, followed by the
U.K., the U.S., Spain and Germany. Major exporting countries include
Malaysia (590000 tons; 13.4%), Italy, France, New Zealand, Canada, and
Chile (340000 tons; 7.7%).
Overall, Europe has become the major exporter by boosting exports,
whereas Asia is the largest net exporter despite the fact that production
expands rapidly. In North and Central Americas, production and demand
are mostly in balance.
World demand, although forecast is not totally reliable due to inadequate
MDF trade statistics (1995 – 1997), is expected to grow at an annual 8.2%
between 1997 and 2020, with 4.2% between 2010 and 2020. Among
major consuming regions and countries, South Asia, China and Latin
America will grow faster than 10% between 1997 and 2010. The U.S. and
Japan will grow at 8% while Europe will slow down to 2.6%.
C. Hardboard
As in the case of insulation board, hardboard is overwhelmed by MDF and
its growth rate hovers at 3-4%. North and Central Americas and Europe
are major importers (particularly Germany and the U.K.), while North and

1 - 52
Central Americas (including Canada), Germany and Brazil are major
exporting regions.
5) Others
Production of OSB grows rapidly in North America as it is increasingly used as
one of the most popular structural panels, together with wafer board. In 1993,
OSB accounted for 28% of structural panel demand in the U.S. market,
compared to a mere 1% in 19980, and replaced the bulk of plywood made from
softwood. OSB is mostly used for housing and its production is expected
grow further. Also it can substitute for plywood, production is expected to
increase in order to meet demand in export markets such as North America.
In North America, OSB can be made from low-valued, smaller diameter trees
of diverse specifies, both softwood and hardwood. Together with cost
structure (wood raw material accounts for 35-40% of total variable cost and
labor slightly over 20%), OSB may become a strategic product for production
in Lithuania which has cost advantages in these two areas.
In addition, other products such as finger joint and LVL will be increasingly
supplied according to the domestic and export market needs.
1.7.2 Wood Product Industries in Lithuania
(1) Major subsectors
Wood product industries in Lithuania are classified into the following six
subsectors:
a. Sawmill and wood processing
b. Wood fiber, paper and paperboard
c. Paper and paperboard processing
d. Printing
e. Publishing
f. Furniture
As discussed in 1.6.1, the country has rich forest resources that have high
potential to grow to wood product industries. In this connection, however, it
is important to examine competition for raw materials between the large pulp
and paper project and the existing wood product industries. To address this
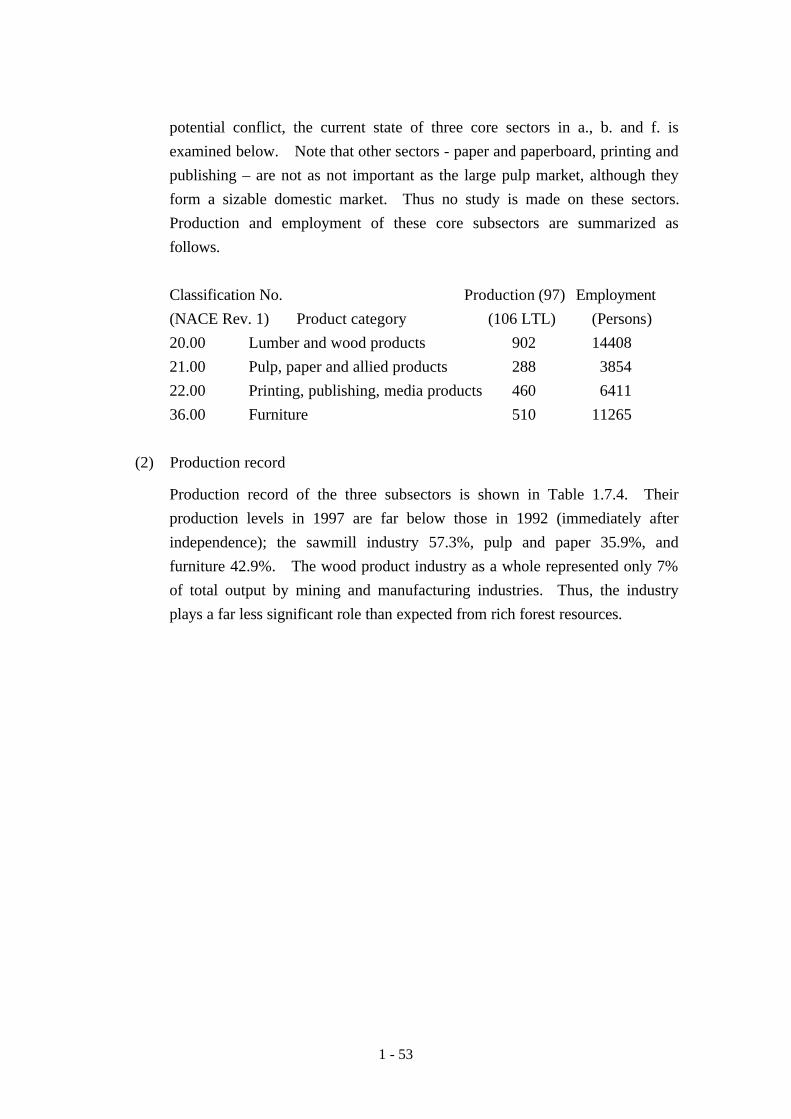
1 - 53
potential conflict, the current state of three core sectors in a., b. and f. is
examined below. Note that other sectors - paper and paperboard, printing and
publishing – are not as not important as the large pulp market, although they
form a sizable domestic market. Thus no study is made on these sectors.
Production and employment of these core subsectors are summarized as
follows.
Classification No. Production (97) Employment
(NACE Rev. 1) Product category (106 LTL) (Persons)
20.00 Lumber and wood products 902 14408
21.00 Pulp, paper and allied products 288 3854
22.00 Printing, publishing, media products 460 6411
36.00 Furniture 510 11265
(2) Production record
Production record of the three subsectors is shown in Table 1.7.4. Their
production levels in 1997 are far below those in 1992 (immediately after
independence); the sawmill industry 57.3%, pulp and paper 35.9%, and
furniture 42.9%. The wood product industry as a whole represented only 7%
of total output by mining and manufacturing industries. Thus, the industry
plays a far less significant role than expected from rich forest resources.

1 - 54
Table 1.7.4 Production of Wood Industry in Lithuania
1 9 9 3 1 9 9 4 1 9 9 5 1 9 9 6 1 9 9 7
(1000 litas) ( % ) (1000 litas) ( % ) (1000 litas) ( % ) (1000 litas) ( % ) (1000 litas) ( % )
Timber & Timber Products
Production 302995 2 .87 441707 4 .03 630334 4 .39 592317 3 .25 NA
Production Index 60.1 48 .2 48 .2 54 .5 57 .3
Pulp, Pper, Paperboard & their Products
Production 88272 0 .84 143210 1 .31 251512 1 .75 241697 1 .33 NA
Production Index 32.3 35 .9 41 .3 38 .7 35 .9
Furniture Industry
Production 283118 2 .68 270209 2 .47 336492 2 .34 439454 2 .41 NA
Production Index 88.0 53 .4 43 .5 39 .8 42 .9
All Industries
Production 110558846 100 1 0 9 5 5 8 9 0 100 1 4 3 6 9 9 2 5 100 1 8 2 2 1 0 9 5 100 NA
Production Index 65.3 45 .9 46 .3 47 .9 50 .3
Note: Prouction Index: 1992=100
Source: Statistical Yearbook of Lithuania 1998
Industrial Sub-sector
There are 452 establishments in the sawmill industry, 19 in the pulp and paper
industry, and 174 in the furniture industry. Note that they are mostly small in
size, excepting those in the pulp and paper industry. For instance, in the
sawmill industry, top thirty manufacturers accounted for 36% of sales and 27%
of employment in 1998 (Table 1.7.5).
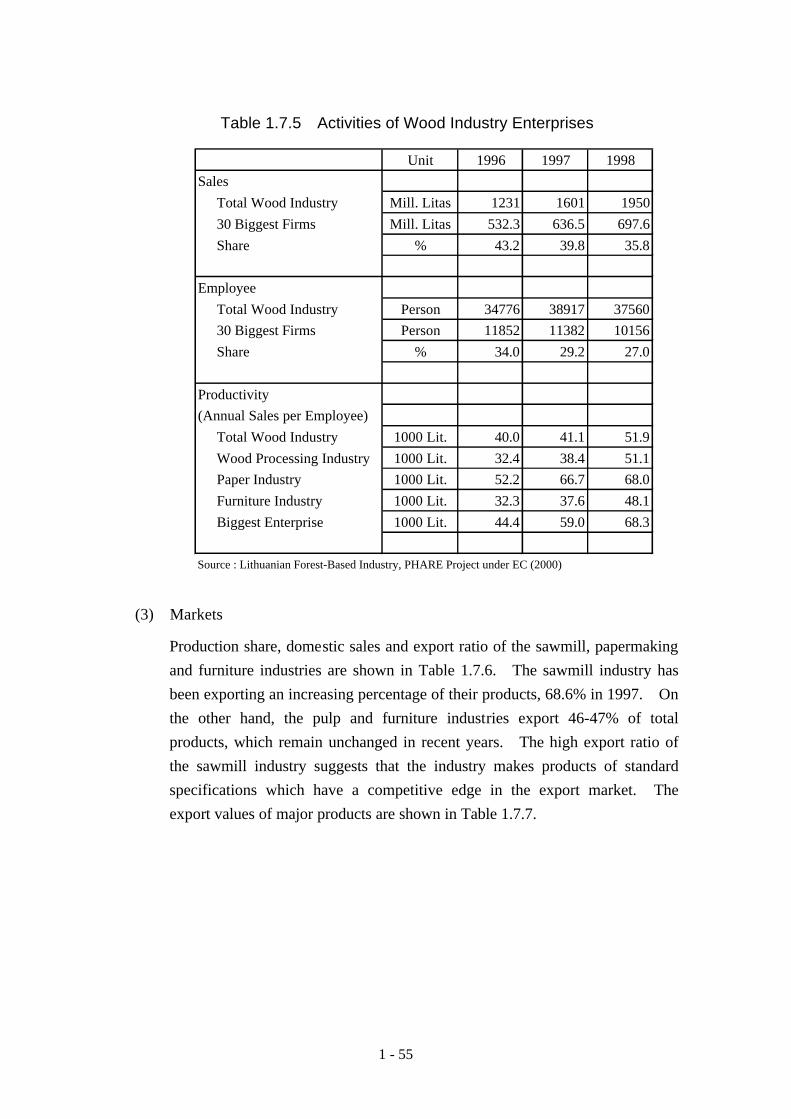
1 - 55
Table 1.7.5 Activities of Wood Industry Enterprises
Unit 1996 1997 1998
Sales
Total Wood Industry Mill. Litas 1231 1601 1950
30 Biggest Firms Mill. Litas 532.3 636.5 697.6
Share % 43.2 39.8 35.8
Employee
Total Wood Industry Person 34776 38917 37560
30 Biggest Firms Person 11852 11382 10156
Share % 34.0 29.2 27.0
Productivity
(Annual Sales per Employee)
Total Wood Industry 1000 Lit. 40.0 41.1 51.9
Wood Processing Industry 1000 Lit. 32.4 38.4 51.1
Paper Industry 1000 Lit. 52.2 66.7 68.0
Furniture Industry 1000 Lit. 32.3 37.6 48.1
Biggest Enterprise 1000 Lit. 44.4 59.0 68.3
Source : Lithuanian Forest-Based Industry, PHARE Project under EC (2000)
(3) Markets
Production share, domestic sales and export ratio of the sawmill, papermaking
and furniture industries are shown in Table 1.7.6. The sawmill industry has
been exporting an increasing percentage of their products, 68.6% in 1997. On
the other hand, the pulp and furniture industries export 46-47% of total
products, which remain unchanged in recent years. The high export ratio of
the sawmill industry suggests that the industry makes products of standard
specifications which have a competitive edge in the export market. The
export values of major products are shown in Table 1.7.7.

1 - 56
Table 1.7.6 Sales Structure of Wood Industry
Year Share Domestic Sales Export SalesSector/Sub-sector (%) (%) (%)
Total Industry 1993 100.0 46.0 54.01994 100.0 53.7 46.31995 100.0 57.5 42.51996 100.0 50.6 49.41997 100.0 46.7 53.3
Wood Industry 1993 1.2 78.5 21.51994 1.5 64.0 36.01995 1.7 50.5 49.51996 2.8 39.4 60.61997 2.2 31.2 68.8
Paper Industry 1993 1.1 47.8 52.21994 1.5 53.8 46.11995 1.9 60.3 39.71996 1.4 50.0 50.01997 1.4 53.8 46.2
Furniture Industry 1993 2.5 51.6 48.41994 2.3 53.0 47.01995 1.9 54.5 45.51996 2.4 53.5 46.81997 2.0 53.9 46.1
Source : Wood Industry in Lithuania - Overview (1999)
Table 1.7.7 Export Shares of Wood Industry
Sub-sector 1995 1996 1997
106 USD % 106 USD % 106 USD %
Logs 53.5 30.1 23.1 11.7 21.9 11.2
Sawn Timber 84.2 47.4 120.3 60.8 105.8 55.3
Plywood 6.9 3.9 8.9 4.5 6.0 3.0
Particle Board 4.4 2.5 9.4 4.8 16.8 8.6
Fiber Board 10.3 5.8 11.0 5.6 10.1 5.2
Other Products 18.5 10.4 25.2 12.6 32.7 16.7
Total 177.8 100.1 197.9 100.0 193.3 100.0
Source : Wood Industry in Lithuania - Overview (1999)
1 - 57
(4) Labor productivity and fixed assets
Labor productivity and assets of the sawmill, papermaking and furniture
industries are shown in Table 1.7.8. Labor productivities of the three
subsectors are lower than the national average for the mining and
manufacturing industries (79150 Litas).
(5) Production of major products
Production trends in major sawmill products in Lithuania, Latvia, Sweden and
Finland are shown in Table 1.7.9.
Production record of sawmill products, wood boards, paper and paperboard,
match and furniture by major manufacturers in Lithuania is presented in Table
1.7.10~12.

1 - 58
Table 1.7.8 Productivity by Industrial Subsectors (1998)
Production Change in Fixed Assets during 1998
Economic Subsector per Worker per Worker/Hr. Beginning of '98 Investment in '98 Depreciated in '98 End of '98
(Litas/Worker) (Litas /Hour) 1000 Litas 1000 Litas 1000 Litas 1000 Litas
C+D Mining, Quarrying & Mfg. 79.15 47.39 11773778 2083112 800388 13048423
10 Peat Extraction 33.49 19.26 67019 11306 1859 76466
11 Crude Oil Extraction 276.20 152.37 142226 23373 2222 163377
14 Quarrying of Stone, Clay, Sand 81.95 44.80 118129 23538 2790 138877
15 Food and Beverages Production 98.59 56.99 2608241 675408 199029 3084621
16 Tobcco Production - - - - - -
17 Textile Manufacturing 49.59 30.89 1207738 96511 73240 1230793
18 Apparel Manufacturing 50.96 31.94 253312 70018 8958 314381
19 Leather Products Manufacturing 34.62 22.19 143734 21584 10120 155198
20 Wood & Wood Products Mfg. 37.56 23.14 506833 80037 43657 543213
20.1 Sawing & Sawmill Products 35.85 22.61 107027 25234 6090 126171
20.2 Wood Panel & Board Production 52.95 31.62 139802 14373 25437 128738
20.3 Joinery Products Manufacturing 30.10 18.47 123982 25530 7640 141872
20.4 Wooden Container Production 51.12 31.49 116794 9013 2534 123273
20.5 Other Wood Products 22.60 13.88 19228 5887 1956 23159
21 Pulp, Paper and Paperboard 57.01 33.04 262399 29248 17297 271559
22 Printing and Publishing 58.87 31.27 317090 63719 32756 343663
23 Petroleum Refining - - 1084089 174240 12890 1245439
24 Chemical Products 163.84 96.57 1214952 148284 49861 1313375
25 Rubber and Plastics products 79.03 45.51 123250 30883 2809 150632
26 Non-metallic Mineral Products 55.37 31.87 784843 288285 178193 894935
27 Basic Metal Products 41.47 23.84 82576 3678 1557 84697
28 Metal Fabrication 46.12 26.66 254743 40723 22916 272550
29 Machinery and Equipment 30.12 20.26 820172 32502 23734 828940
30 Office Machinery and Computors 15.68 9.60 35209 2716 3316 34609
31 Electrical Machinery 90.85 55.53 169458 43598 24839 188217
32 Electronics Machinery 57.92 36.93 453777 49585 24524 478838
33 Medical Equipment & Opticals 55.63 30.81 227695 19525 6605 240615
34 Motor Vehicles 30.52 27.88 53764 1561 4951 50374
35 Other Transport Equipment 67.68 37.39 361117 47398 20117 388398
36 Furniture Manufacturing 42.39 24.55 292472 72434 10490 354416
37 Waste Metal Recycling 99.48 54.07 43215 791 288 43718
Source : Statistics Lithuania 1998 (A400)
NACENo.

Table 1.7.9 Production Import Export Consumption of Sawnwood in Four Countries(Unit: 1000 cubic meter)
PRODUCT 1993 1994 1995 1996 1997 1993 1994 1995 1996 1997 1993 1994 1995 1996 1997 1993 1994 1995 1996 1997Exchange Rate 0.232 0.251 0.250 0.250 0.250 1.506 1.788 1.897 1.816 1.722 ###### ###### 1.308 1.270 1.134 ###### ###### 1.308 1.270 1.134
Sawnwood(C)Production 627 700 865 1350 1160 401 750 950 1510 2550 8305 9700 9400 9300 10600 12538 13616 14737 14170 15419
1 Import 0 13 19 26 120 2 4 6 2 21 109 153 129 91 176 98 134 155 99 108Export 92 273 728 1046 849 254 700 1292 1268 2030 6188 7158 7343 7009 7509 10040 10423 10301 11632 10900Consumption 535 44 155 330 431 150 54 -336 244 541 2226 2695 2186 2382 3267 2596 3327 4591 2637 4627(Unit Expt Value $/m3) 84.49 104.26 106.54 101.53 109.26 122.32 93.40 99.99 149.14 149.11 174.10 214.65 237.08 208.32 220.41 182.61 226.60 249.26 216.04 229.99
Sawnwood(NC)Production 72 60 75 100 90 45 200 350 104 150 70 48 80 70 70 200 200 200 200 200Import 0 4 5 8 14 0 1 1 1 4 49 62 52 58 66 76 114 139 115 116
2 Export 7 16 39 52 115 20 124 195 164 140 32 49 34 27 26 27 43 38 17 20Consumption 65 48 41 56 -11 25 77 156 -59 14 87 61 98 101 110 249 271 308 298 296(Unit Expt Value $/m3) 177.71 230.94 149.97 167.48 131.33 141.80 261.85 262.28 186.19 192.86 330.00 355.82 465.53 513.33 517.19 366.41 238.37 188.47 570.29 440.85
Wood-Based PanelsProduction 159 155 156 197 267 187 238 236 281 310 1224 1369 1444 1668 1784 817 833 979 931 930Import 1 26 38 45 56 1 6 9 6 11 78 80 99 93 132 370 444 566 521 603
3 Export 44 87 105 152 210 74 154 162 226 251 842 969 1021 1156 1199 250 305 365 423 385Consumption 116 94 90 91 113 114 91 84 61 70 460 480 522 605 717 936 972 1180 1029 1148(Unit Expt Value $/m3) 179.16 202.66 223.67 210.75 170.47 248.91 238.14 276.69 356.32 359.63 524.74 568.89 655.58 551.30 528.89 274.96 298.30 345.11 321.59 357.90
PlywoodProduction 15 15 15 21 30 58 63 73 103 120 621 700 778 869 987 73 85 108 119 113
4 Import 1 10 4 6 4 0 1 3 0 1 16 18 22 21 23 98 126 112 135 184Export 10 20 19 22 19 41 46 54 92 100 542 626 667 795 861 38 49 63 112 95Consumption 6 5 n.a. 6 15 17 19 22 11 21 1 1 1 1 1 133 162 157 142 202(Unit Expt Value $/m3) 372.30 392.95 362.63 404.73 299.68 356.59 482.50 486.24 488.54 490.00 686.19 730.00 821.69 665.71 617.94 422.63 449.63 627.94 379.55 444.38
Particle BoardProduction 90 75 70 110 168 101 148 130 143 150 439 477 475 605 603 597 609 632 577 612
5 Import 0 12 30 32 42 0 2 5 5 8 13 10 22 13 35 158 186 293 263 287Export 16 30 36 72 137 22 92 85 107 120 195 200 224 238 196 128 140 133 147 157Consumption 74 57 64 71 73 80 58 50 41 38 257 287 273 380 442 627 655 792 693 742(Unit Expt Value $/m3) 67.56 85.30 123.08 130.67 123.01 77.91 96.53 96.09 186.92 183.33 158.69 196.62 263.23 220.84 228.28 178.66 200.88 297.75 258.75 304.80
HardboardProduction - - 50 45 48 - - 21 23 27 - - 74 74 74 - - 107 106 116
6 Import - - 1 1 2 - - 0 0 0 - - 11 8 10 - - 41 35 40Export - - 44 40 37 - - 18 22 23 - - 62 56 57 - - 41 38 27Consumption - - 7 6 13 - - 3 1 4 - - 23 26 27 - - 107 103 129(Unit Expt Value $/m3) - - 200.80 225.95 213.11 - - 144.44 262.45 260.87 - - 384.11 371.16 350.88 - - 390.46 402.29 417.54
MDFProduction 0 0 1 1 1 2 6 6 6 505 490 490
7 Import 0 1 1 27 27 34 74 48 47Export 4 4 4 4 10 23Consumption 2 2 2 2 29 29 36 442 467 612(Unit Expt Value $/m3) 476.75 466.00 433.00 280.75 313.20 267.91
Insulation BoardProduction 15 17 15 20 20 38 37 37 40 40 67 55 116 116 76
8 Import 0 0 0 2 2 19 11 8 16 17 12 12 12 10 16Export 4 2 3 16 14 1 3 3 3 4 48 56 112 104 71Consumption 11 15 12 6 8 56 45 42 53 53 31 11 16 22 21(Unit Expt Value $/m3) 165.00 224.50 390.33 109.63 143.00 n.a. n.a. n.a. n.a. n.a. 107.06 106.46 130.40 152.03 160.65
Source : FAO Yearbook Forest Products 1997
LITHUANIA LATVIA FINLAND SWEDEN

1 - 60
Table 1.7.10 Sales of Wood Products by Major Manufacturers
Sales Amount Nos. of Employees1996 1997 1996 1997
Name of Manufacturer 106 USD 106 USD Person Person
1 Klaipedos Mediena 16.4 21.6 1103 14242 Grigiskes 18.9 18.6 1512 13643 Medienos Plausas 10.1 10.5 534 4544 Narbutas and Ko 5.9 9.5 245 2645 Giriu Bisonas 4.7 9.2 207 2456 Klaipedos Baldai 7.4 7.6 400 4397 Ochoco Lumber 2.3 7.3 69 898 Lietuvos Tara 7.0 7.0 713 5549 Silutes Baldai 5.6 5.7 770 611
10 Kauno Baldai 5.3 5.2 697 61111 Silunga 5.4 4.9 279 26012 Klaipedos Kartonas 5.2 4.7 697 61113 Voke-III 2.6 4.3 21114 Staliu Gaminiai 4.4 3.8 32615 Pajurio Mediena 2.3 3.5 205 20416 Libra Gruppe 3.2 23417 Vilniaus Baldu Kombinatas 2.6 2.8 416 34418 Freda 2.4 2.8 253 25919 Panevezio Baldai 3.5 2.7 371 28020 Venta 2.8 2.3 491 45521 Karige 1.5 2.3 205 23822 Skraja 2.5 2.2 340 22923 Siguldos Baldai 2.1 9124 Vilniaus Mediena 1.7 2.1 113 11225 Timbex Arima 1.2 1.9 96 12226 Baldai Jums 1.3 1.9 151 18227 Sakuona 1.7 1.8 190 30228 Ukmerges Baldai 2.3 1.7 352 26729 Azuolas 1.5 1.7 200 11530 Taurages Tauras 1.6 1.6 213 172
Source : Wood Industry in Lithuania - Overview (1999)

1 - 61
Table 1.7.11 Production of Wood Panels by Major Producers
Manufacturers Unit 1990 1994 1995 1996 1997
Particle Board
Klaipedos Mediena 1000 m3 61.9 72.2 68.5 68.3 84.4
Giriu Bizonas 1001 m3 129.0 2.7 1.2 42.0 83.5
Total 190.9 74.9 69.7 110.3 167.9
Fiber Board
Girgiskes Mill m2 14.8 14.0 13.6 14.7 15.4
Medienos Plausas Mill m3 1.1 1.7 1.5 2.3 2.1
Total 15.9 15.7 15.1 17.0 17.5
Table 1.7.12 Furniture Production by Major 20 Producers
Production Number of Employees
Company Name 1996 1997 1996 1997
103 USD 103 USD Person Person
Narbutas and Ko 5.9 9.5 245 264
Klaipedos Baldai 7.4 7.6 400 439
Silutes Baldai 5.6 5.7 770 611
Kauno Baldai 5.3 5.2 697 611
Voke III 2.6 4.3 n.a. 211
Vilniaus Baldu Kombinatas 2.6 2.8 416 344
Freda 2.4 2.8 258 259
Panevezio Baldai 3.5 2.7 371 280
Venta 2.8 2.3 491 455
Karige 1.5 2.3 205 238
Source : Wood Industry in Lithuania -Overview (1999)

Chapter 2 PULP AND PAPER MARKET

2 - 1
Chapter 2 PULP AND PAPER MARKET
2.1 Domestic Market
(1) Trend of Domestic Market
Pulp and paper production in Lithuania turned upward from 1950, as shown
in the Table 2.1.1, and maintained an annual production level of 200 thousand
tons until 1991 just before the independence, after it reached the level in the
second half of 1970. On the basis of the performance of 1989, Lithuania
exported 36% of production to the former Soviet Union and COMECON
countries, which means they served as one of the supply bases of uulp and paper
in the region.
Production 255000 tons
Consumption 162000 tons
Export 93000 tons
Following the collapse of the Soviet Union, however, the economy and industry
of Lithuania was severely damaged due to the deterioration of the economic
environment, which is summarized as follows:
a. Slump of economic activity and reduction of consumption caused by the
collapse of the former -Soviet economic region and confusion thereof.
b. Collapse of the banking system, turmoil in the foreign exchange system
following to the issuance of new currencies by the newly born independent
countries, which resulted in the batter economy. in those area.
c. Deterioration of trade activities due to various barriers imposed on export
and import by the newly born independent countries.
d. Economic turmoil and financial difficulty in Russia, the largest trade partner
of Lithuania, which adversely affected the country’ s balances of payment
due to the advance payment requirement for imports from Russia and
frequent payment delay for exports from Lithuania.
Under these circumstances, the National economies of Lithuania experienced
severe recession, thus consumption decreased and their pulp and paper
industries were in severe slump.

2 - 2
Table 2.1.1 Production of Pulp and Paper in Lithuania (1950~1992)
(Unit: 1000t) Product 1950 1960 1970 1980 1990 1991 1992
Mechanical Pulp 7.5 17.2 23.9 47 38 37.5 20.1 Sulfite Pulp 18.5 30.9 38.2 47 40 32.8 19.8 PULP 26 48.1 62.1 94 78 70.3 39.9 Paper 19.5 48.1 102.1 107.9 100.7 101.2 34.9 Board 11.3 35.3 50.3 127.5 116.9 113.3 49.5 Paper and Paper Board 30.8 83.4 152.4 235.4 217.6 214.5 84.4
Source: FSDP-MAIN Page 19 Ministry of Industry and Trade Statistic
In 1992, the dramatic changes in the economy and society caused production
and consumption of pulp and paper products to plummet, and the industry
underwent hard time. While consumption gradually recovered with the
subsequent political stability, production failed to show a significant comeback
and the growing consumption being satisfied by increased imports, as seen in
Table 2.1.2.
Table 2.1.2 Pulp and Paper Production, Export, Import and Consumption
(1997~1999)
(Pulp・Paper・Board) (Unit:1000t)
Wood Pulp Waste Pulp Paper Board 1997 Production Import Export Consumption 1998 Production Import Export Consumption 1999 Production Import Export Consumption
1.7 11.4 11.1
2.0
1.3 15.1 13.0
3.4
0 5.9 3.9 2.0
24.8 0.6 0
25.4
24.3 0.8 0
25.1
36.1 0.1 0.1
36.0
15.2 76.1 25.4 65.9
26.0 77.1 19.6 83.5
33.8 67.7 10.8 90.7
9.5 4.1 1.6
12.0
11.3 3.8 1.5
13.6
3.0 3.8 1.3 5.5
Source: Ministry of Economy Statistic Data
“ Detail list as per Appendix 1”

2 - 3
(2) Present supply and demand situation
The main products during 1997 ~ 1999 are Jute liner, corrugating medium and
tissue paper, all of which were made from wastepaper. The pulpwood pulp
production facilities were shut down as can be seen in the description of
domestic mills mentioned below.
a. Grigeskes
Founded in 1926, the millproduced 400 tons of fiberboard and tissue paper
per month respectively, by using the domestic pulpwood and wood tip for
the fiberboard, and the domestic wastepaper and imported wood pulp for the
tissue paper. It also produced groundwood pulp..
b. AB Klaipedos Kartonas
Founded in 1898, the millproduced 900 tons of corrugating liner and 3000
tons of medium paper per annum by using mainly the domestic wastepaper.
The sulphite pulp plant which was built in 1930 was closed in1994.
c. AB Nahjieji Verkiai
The oldest paper mill, founded in 1860, is currently manufacturing sanitary
and household paper like tissue, toilet rolls etc.
d. Medienos Plausas
The mill produces such paper wares as corrugated board, fiberboard and
pulp mold. The main product is corrugated board, which accounts for 80%
of total production, with monthly production reaching 50 million m2.
e. Kaunas Paper
Founded in 1932 as an only one printing factory in Lithuania. The mill has
an off-coater machine and is capable of producing coated paper. However, it
now mainly produces secondary products like notebook, using the
domestic waste paper and imported pulpwood pulp from Kaliningrades.
f. Pabrade Cardboard Factory
Founded in 1929, the mill started production of paperboard in 1945, and is
currently making book cover using dissolved wastepaper. The production
in 1997 was 1690 tons.

2 - 4
The domestic mills which had previously produced more than 250000 tons of
pulp and paper per year now produce less than 40000 tons only using the
facilities that become obsolete. Under these circumstances, it may be difficult
to expect further expansion without the fundamental rehabilitation of production
facilities. In the meantime, therefore, it seems to be a logical choice for the
mills to continue production using mainly wastepaper and to rely on import for
such paper as printing and writing, demand of which is expected to grow
steadily.

2 - 5
2.2 Neighboring Markets
(1) Latvia
1) Pulp and paper mills
Before independence, the country had four pulp and paper mills which met
domestic demand.
a. Sloka Pulp and Paper
The largest mill in the country produced more than 90000 tons of
unbleached sulphite , recycled fiber and groundwood pulp, and 100000 tons
of paper and paperboard per year between 1983 and 1987 After 1993,
however, the mill was forced to decrease production due to skyrocketed
energy costs and was finally closed down in 1996.
b. Ligatne Paper
The oldest paper mill in Latovia commenced operation in 1815. The mill
produced 15000 tons of paper products per year by four small paper
machines. Production declined after the country’ s independence, and now
limit to production of small lot operation such as cigarette paper.
c. Jaunciem Paper
The mill produced 16000 tons of paper products per year using two
machines. The No.2 machine was suspended in 1992, and the No. 1
machine also discontinued operation in 1993. At present, only one
processing line to produce paper sack and facsimile roll is in operation.
d. Jugla Paper
An only state-owned paper mill in the country. Its operation was assigned
to Jugla Papers Co. on a rental basis. The mill has two machines to
produce 16000 tons of paper altogether and other two machines to produce
8000 tons of paperboard annually. Although the machines are slow and
inefficient in energy consumption, they are well maintained and operated in
good condition, capable of producing 25000 tons of paper and paperboard
annually The mill employs 440 workers.

2 - 6
2) Present position of supply and demand
Production, import and export in the recent three years
(Unit: 1000t) Paper & Paperboard Pulp Production 1997 16.0 0 1998 25.0 0 1999(Est.) 30.0 0 Import 1997 85.0 0.5 1998 90.0 0.5 1999 (Est.) 95.0 2.0 Export 1997 10.0 0 1998 12.0 0 1999(Est.) 15.0 0
Production, import and export by grade in 1997
(Unit: 1000t) Production Import Export
Newsprint 3.0 12.5 2.0 Non-coat 1.0 6.7 woodfree 0 “ 2.0 mechanical 0 Coat 16.8 woodfree 0 “ 2.0 mechanical 0 Waste-fluting 1.0 5.6 0 Corrugated Board 10.0 8.0 4.5 Wrapping 1.0 6.0 0.5 Kraft Liner 0 10.5 0 Tissue 0 5.4 0 Others 0 9.5 3.0 NBKP 0 0.3 0 UKP 0 0.2 0 Total (16.0) (85.5) (10.0)
3) Latvia Pulp Project
On March l, 2000, the Ministry of Agriculture and Forestry entered into a basic
agreement with Metsaliitto of Finland and Sodra of Sweden to establish Baltic
Pulp, a company to prepare for construction of a pulp mill in Latovia.
According to Dr. Arnis Treimanis, Technical Director of Pulp Mill Project
Group, whom the study team interviewed, the project was originally studied in
1995, when feasibility study was conducted by JAAKKO POYRY under the
financial assistance by SIDA (Swedish Development Cooperation Agency).
Metsaliitto and Sodra conducted field surveys by themselves during 1998 and
1999, based on which it was decided to establish the joint venture. The project

2 - 7
plan will be finalized by December 31, 2002. If the final plan is approved by
the parties concerned, construction of 600000-ton kraft pulp mill will start.
The major concern for the project is to secure wood supply of 3 million m3
which are required to produce 600000 tons of kraft pulp annually. At this
moment, however, the government has guaranteed supply of s 1.2 to 1.4 million
m3. In addition, the private sector so far promised to supply one million m3 ,
but without guarantee. As for the location of the proposed plant,
Dr.Treimanis mentioned that Livani will be the No.1 site to be selected. And if
so, as the area is close to forest resources of Lithuania, he personally thinks, if
any good plan can be worked out for the mutual benefit.
(2) Estonia
1) Present supply and demand situation
At present, three enterprises are engaged in production of pulp, paper and
paperboard products after the turmoil in the early 1990. The mills produced
48000 tons of unbleached softwood kraft pulp and 50000 tons of kraft paper
and household paper products in1998. The study team visited “ Horizon Pulp
and Paper Co.” the largest mill , in cooperation with the Ministry of
Economy and obtained the following information.
The company was originally established as Kehra Paper in 1938, which
produced kraft paper for the agricultural use to supply to the entire Soviet
Union until 1990. The company terminated the operation due to the economic
disorder triggered by the country’ s independence and the collapse of the
former Soviet Union. In 1995, the mill’ s facilities and equipment were
bought by Tolaram Group, an Indian owned Singapore-based textile trading
company, through the introduction of the Ministry of Economy. The mill was
reopened in 1996 and run steadily thereafter as follows.

2 - 8
Product types: Sack Kraft Paper(integrated production from UKP)
Tissue Paper (waste pulp)
1996 1997 1998 1999 2000(p) 2001(p) 2002(p)
Production (t) 19486 34350 42525 45000 47433 56100 61050
Export (1000 USD) 8200 16820 21450 22960 - - -
Note: 1USD =14.5EEK
(p) = plan
Export Area (in 1999) USA/Europe Asia Africa Others
47% 29% 5% 19%
2) Forest resources and utilization
Forest area : 2 million ha..
Maximum annual removal : 7.81 m3
Net annual increment of exploitable forest : 10 million m3
(60% softwood, 40% hardwood)
Actual removal (1998) : 6.1 million m3
Export of roundwood : 3.8 million m3
(Pulpwood 2.7 million m3)
Destination (1997) : Sweden (56%), Finland (22%),
Norway (12%), Others (10%)
3) Pulp mill project
The study team interviewed officials of the Ministry of Economy and felt that
the government is eager to invigorate the national economy by building and
operating a pulp mill in cooperation with a foreign capital and engineering.
In the special incentive package which the government prepared to attract
foreign investors, it was mentioned as follows:
“ It will be feasible but probably not the best solution to meet the whole demand
of the pulp mill by exploiting Estonian sources because the proposed pulp mill
will be located in the the area where no pulpwood consuming industries are
located closely
Demand for pulpwood in the neighbor countries is small. At the moment
competition for pulpwood is low especially in Russia and Belarus due to the
lack of processing industry. Also, part of the existing export flow from these
regions to the Scandinavian countries and limited amounts to other countries via

2 - 9
the Russian ports might favor an Estonian pulp mill due to shorter transport
distances.
Substantial volumes of pulpwood are harvested annually in the neighboring
areas of Estonia. The bulk of the annual pulpwood harvested in the
neighboring area can be imported to Estonia. Some of the Scandinavian
pulpwood imports are already now being transported through the Estonian
territory and it could be re-routed to secure the wood supply of the planned
pulp mill.
The neighboring regions (Leningrad, Novgorod and Pskov Oblasts, Belarus,
Latvia and Lithuania) produce 6.5 million m3 of coniferous pulpwood and 3.3
million m3 of deciduous pulpwood. Within the next five years the annual
pulpwood yield is expected to grow by 2.4 million m3 in softwood and 3.2
million m3 in hardwood.
There is a huge potential of wood raw material, and for economic reasons, there
is strong public pressure to utilize forest resources within the wood
procurement region of the proposed Estonian pulp mill.”

2 - 10
(3) Poland
Production, Import, Export, Consumption
(Unit:1000t) Production Import Export Consumption 1997 1998 1997 1998 1997 1998 1997 1998
Newsprint 80 92 26 18 45 36 61 74 Coated Woodfree 0 0 172 197 4 5 168 192 " Mechanial 0 0 69 80 0 0 69 80 Uncoated Woodfree 386 410 59 49 230 198 215 261 " Mechanial 84 91 126 154 7 10 203 235 Sanitary & Household 160 150 24 30 40 50 144 130 Other Paper 8 7 10 11 6 7 12 11 Corrugated Board 497 510 168 171 143 153 522 528 Wrapping paper 238 263 10 12 105 110 143 165 Other boards 187 188 90 90 35 36 242 242 Paper&Board Total 1640 1711 754 812 615 605 1779 1918 Pulp BKP 341 350 152 154 59 47 434 457 UKP 319 353 6 7 1 0 324 360 BSP 0 0 20 10 0 0 20 10 USP 0 0 1 0 0 0 1 0 SCP 78 71 0 0 0 0 78 71 Mechanical 102 103 5 6 0 0 107 109 DP 43 43 5 5 32 26 16 22 Pulp Total 883 920 189 182 92 73 980 1029 (Market Pulp) 120 120 189 182 92 73
Source P.P.I.
Re: According to supplemental information of P.P.I., Frantschach Swiecie, the
sole manufacturer of DP pulp in Poland, terminated production in February
1999 by closing down the 43000-ton mill.
Krapkowice decided to shut down a 35000-ton UKP production in April 2000.
The major reason for closedown of the two mills is loss of competitiveness..
Foreign investment trends
Foreign direct investment has been rapidly growing since 1994 as follows:
(Million USDUSD valued at the year end)
1994 : 4300
1995 : 6800
1996 : 12000

2 - 11
1997 : 20600
1998 : 30800
Major investing countries at the end of 1998
(Million USDUSD)
Germany : 5100
USA : 4900
France : 2400
Italy : 2000
Foreign investment in the polish pulp and paper industry (as of the end of 1999)
(Million USA)
Investor Country Amount Type of Industry (Name of Mill)
International Paper USA 465 Pulp and Paper (Kwidzyn SA / Klucze SA)
Framondi NV Austria 175 -ditto- (Frantsch Swiecie SA)
Intercelulosa AB Sweden 108 -ditto- (Intercell SA)
Trebruk AB Sweden 72 -ditto- (Kostrzyn SA)
Kappa Packaging Netherlands 45 Packaging paper
In addition, foreign investment has been made for about 20 local mills.
Summary of the interview with the Polish Pulp and Paper Research Institute
(Mr. Piotr Stanislawczyk, Director)
The country ranks the seventh in land area in Europe (313683 km2) and the
sixth in population (38.7 million). The economy has been growing steadfastly
since 1992 as follows.
GDP growth rates; 1993 (103.8%) 1994 (105.2%) 1995 (107%) 1996 (106%)
1997 (106.9%) 1998 (104.8%)
The country’ s paper consumption is 50 kg per capita, which is extremely small
among the industrialized countries in West Europe. Concurrentlywith the
growth of GDP, consumption of paper has been increasing year after year to
require further expansion of production facilities. For this reason, the
government and the private sectors concerned are looking for foreign
investment, but don’ t proceed as expected. Instead, imports increase to meet
the growing demand.

2 - 12
2.3 World Market
(1) General market trends
In 1998, production and consumption of pulp, paper and board decreased in
Asia and North America as the financial crisis occurred in Thailand and
Indonesia in the third quarter of 1997 and the economic recession of East Asia,
i.e. Japan and South Korea. On the other hand, Europe experienced firm
growth. Production exceeded 82 million tons of paper and board, an increase
of 3.1% over 1997, that represents an all time record.
From the second quarter of 1999, the market condition improved to real
growth all over the world. In particular, paper and board production in the
major producing countries and regions at the end of 1999 grew as
followsUSA (2.2%), Canada (8%), Europe (3.0%), Japan (2.5%)
The figures for the first quarter of 2000 continued to show positive growth.
Many countries expect the “ millennium effect” which hopefully boost demand
in both the graphics sector with an increase in publishing worldwide and the
packaging sector with increased consumption of packaged goods.
(2) Production Trend
Wood pulp Production in the World (1985 - 1999) (Unit:1000t)
Region 1985 1990 1995 1998 1999 1999/1998 (%)CEPI 28870 31682 33967 37986 38201 0.6Russia 9834 10081 4863 3993 4750 19.0USA 48296 56397 59909 58376 57074 -2.2Canada 20040 22839 25442 23642 25387 7.4China 8796 13325 24571 18211 16425 -9.8Japan 9040 11151 10980 10838 10911 0.7Indonesia 221 786 2022 3430 3800 10.8Brazil 3648 4364 5845 6720 7204 7.2Chile 836 804 2113 2210 2434 10.1South Africa 788 1564 1547 1845 2118 14.8Australia 898 1047 1010 949 872 -8.1Others 10501 11850 11134 8421 9952 18.1WORLD TOTAL 141768 165890 183403 176621 179128 1.4
Source: CEPI ANNUAL STATISTICS 1999

2 - 13
Paper and Paperboard production in the World (1997 - 1999) (Unit:1000t)
Region 1985 1990 1995 1998 1999 1999/1998 (%)CEPI 48638 61486 73330 82789 85241 3.0Russia 10031 10718 4070 3664 4467 21.9USA 60959 71965 81000 75812 77480 2.2Canada 14448 16466 18705 18724 20208 7.9China 11197 17328 24000 32053 29608 -7.6Japan 20469 28088 29663 29886 30631 2.5Indonesia 500 1438 3429 5487 6977 27.2Brazil 4022 4844 5856 6524 6889 6.4Chile 385 462 557 642 796 24.0South Africa 1489 1904 1871 2047 2041 -0.3Australia 1546 2011 2297 2542 2540 -0.1Others 19257 23412 32302 33388 48831 16.3WORLD TOTAL 192941 240122 277080 293558 315709 7.5
Source: CEPI ANNUAL STATISTICS 1999
Production Increase/Decrease of Paper & Paperboard (1998:1999)
(Unit: %) CEPI AF&PA CPPA Japan Paper
Association
Newsprint 3.1 -0.9 7.3 0.9 Uncoat Mechnical - 1.6 -3.8 17.2 -5.4
Uncoat Woodfree 2.3 1.7 5.6 1.5 Coat 4.8 2.5 1.3 8.4 Sanitary & Household 4.9 n.a. 5.9 2.5 Wrappings 2.0 n.a. -3.5 -2.3
Boards 2.6 2.6 6.4 1.7
TOTAL 3.0 2.2 8.0 2.5
Source: CEPI Annual Statistics 1999
CEPI : Confederation of European Paper Industries
AF&PA : American Forest and Paper Association
CPPA : Canadian Pulp and Paper Association
JPPA : Japan Pulp and Paper Association
Source: Attached sheet No.7: Newsprint/Printing & Writing Paper Production by
Region from 1990 to 1999
Attached sheet No.8: Paper and Pulp---Production, Import, Export and
Apparent Consumption of Major Countries (97/98)

2 - 14
(3) Sales Price Trend
Market pulp prices (NBSKP:Northern Bleached Softwood Pulp) which reached
a bottom at USD360 per ton (C&F) at the fourth quarter of 1985 turned up
ward continuously to the level of USD830 at the second quarter of 1989 and
maintained till the second quarter of 1990. As it is shown in the Appendix9, it
started to fall to the level of USD500 in September 1991 and recovered to
USD600 in June 1992, and again started to fall from December 1992 to hit
below USD400 in September 1993.
The cause for such abrupt fluctuation of prices might be explained on the basis
of the statistic data issued by CPPA(Canadian Pulp and Paper Association), the
largest manufacture of market pulp in the world, as per Reference Tables 1998.
1. World production capacity (152 million tons/1985 increased to 189 million
tons/1998)
2. World production (132 million tons/1985 increased to 159 million
tons/1997) Please refer to the Appendix 2
3. Production of sulphate pulp (108 million tons/1997=68%) Appendix 3
4. Out of total production, integrated pulp (that is produced for use as raw
material in production of paper at the same mill) occupies a larger portion,
and a portion of so called “ market pulp” is about 23 million tons on the
basis of 1998 performance. Appendix 6
5. Production capacity of market pulp (27 million tons/1985 increased to 41
milliontons/1998) which means excess capacity, though it may include some
obsolete and un-economical machines. Appendix 5
6. The overall production capacity is 189 million tons against the actual
production of 159 million tons in 1997, which means excess capacity even in
the integrated pulp sector too. Appendix 2 (It also includes inefficient
machines too)
7. Under such constitution of excess production capacity, when an
accumulation of inventory in the world market exceeds over a certain level,
the market price starts to fall due to the lack of new orders, and the mills are
forced to curtail production.
In addition to the inadequate operation, profitability is affected by the collapse
in market pulp prices and the resultant softening of paper prices. When a level
of inventory is adjusted below normal line, the operating rate and price tends to
recover.

2 - 15
However , sooner or later good profitability attracts full operation and
investment in new machines which can lead to another period of overcapacity.
That is why paper and board is called as a cyclical business. The above trend
might be seen from the Appendix 10, “ Chemical market pulp operating rates by
quarter” and “ Inventories by month” . Reached the historical high at Northern
BSKP USD1000 and BHKP USD865 in October 1995, market pulp prices
continued to fall in three consecutive years (1996 ~ 1998) down to a USD400
level. The prices turned upward in second quarter of 1999 as a result of the
vigorous curtailment of operations and closure of several mills by mainly the
North American producers. The price of BSKP is said to be around USD720
at the third quarter of 2000.
In addition to the unstable situation of the pulp market, the paper and
paperboard industries continued to suffer from overcapacity which pushed
prices down, in some cases dramatically, eroding company profitability.
International Paper, the No.1 company in the field of paper manufacturing in
USA, suffered a net loss of 80 million USD in 1997 partly because of
economical confusion in east Asia. In Japan, Oji paper , the largest maker in
Japan, also suffered a net loss of 30 million USD in the accounting year ending
March 1998 due to severe deterioration of almost all grades of paper prices.
In the Pulp and Paper Statistics 1999, the Japan Paper Association explained the
situation as follows;
【The Pulp and Paper Industry -supply and demand imbalance, deteriorated
profitability due to price erosion -Back in 1997, paper and paperboard
production and shipment reached record highs despite the slowdown of the
economy. As the economy began to turn downward in 1998, and more
definitely toward the end of the year,the paper market also started to show
clear sings of decline. In the face of stagnant domestic demand, both production
and shipment dropped sharply with the inventory increasing higher than the
normal level. The oversupply market, deflationary climate and pressure from
users made the market prices push down through out the year and this price
erosion became the primary factor to worsen the corporate profitability.】
From the second quarter of 1999, the prices began to turn upward following
the recovery of the pulp market, improvement of supply and demand balance

2 - 16
due to picking up of demand in the fields of printing paper and container board
with most probably the millennium effects.
This favorable situation is now deemed to last long as very little new production
capacity is expected within the next few years among the major pulp and paper
producing countries.
(4) Demand Forecast
Mr. John Dillon, Chairman and Chief Executive Officer of International Paper
mentioned in the opening article of 1999 Annual Report as follows;
【Market fundamentals are extremely promising. Demand for our products is
strong, the supply is well balanced with demand within our industry, and
importantly very little new production capacity is expected within the next few
years. The U.S economy remains healthy, Asia continues to recover and
Europe is rebounding strongly.】
Finnish Forest Industries Federation mentioned in their book “ Key to the
Finnish Forest Industry 1998” as follows:
【Long range forecast indicate continuing growth in world demand for forest
products. Consumption of paper and paperboard is expected to increase at an
average annual rate of 2.5 per cent up to the year 2010. The average annual
rate of growth in European consumption is forecast to be below 2 per cent in
the same period. The strongest growth will be in consumption of printing and
writing papers.】
Demand for paper and paperboard in major countries is moving as follows;
In North American countries, it turned upward month by month after hit the
bottom in the fourth quarter of 1998, and keeps it’ s trend on.
In European countries under CEPI, the figures for the first quarter of 2000
confirm that the latter part of last year’ s upswing in output has been more than
maintained into the new year with an 8% increase in total paper production over
the first quarter of 1999. Especially, demand for coated woodfree expanded
largely.
In Japan shipments in 1999 rose 2.5 percent for the domestic market, which was
greater than the overall economic growth. The direct cuuses for the increase
in shipments and production were the increase in advertising expenditures in

2 - 17
anticipation of the economic recovery as well as the increase in sales of
information and communication equipment, which posted the record high.
Printing paper and ultra light weight coated paper were benefited most, the
shipment of which increased over 9 % while total paper shipment increased
3.2% than the previous year.
As for South Korea, after the severe recession in 1998, the economy recovered
drastically during 1999 with the results that the shipments rose 18.8% for the
domestic market and 6.5% for the export, thus brought production up by 14.5%
than the previous year.
In Taiwan, although a tempo of recovery is sluggish due to a major earthquake,
shipments rose 5.3% for the domestic market and production increased 3% than
the previous year.
Market pulp supply in international trade became tight in the middle of 1999,
chiefly because the recovery of paper and paperboard demand and production in
such major markets as Asia, Europe and North America. It is also considered
partly because the decrease of supply caused by shutdown of uneconomical
mills in the North America due to strict environmental protection regulation and
persistent price deterioration, and the withdrawal of Indonesia from pulp
exports following the completion of Pulp and Paper Integration.
Under these circumstances, market pulp prices prices in the international market
turned upwards as mentioned in the Appendix 9 and the inventories being
decreased rapidly.
The consensus view, therefore, appears to be brighter expecting further
expansion of demand in paper and paperboard, and recovery of profitability as a
whole.
For reference: see Appendix 11 Forecast of Pulp, Paper and Board Production
Capacity Expansion by FAO, Appendix 12 Production of Paper and Board in
West Europe and in Other Main Countries (1990 – 1999)

2 - 18
2.4 Market Trend of European Major Countries
(1) General Market Ttrend (CEPI countries as a whole)
The variation of market situation after 1995 in the European Paper Industries
were as follows.
1995: Strong booking which led to an increase in paper and board production
of almost 7% in the first half of the year, evaporated during the summer,
forcing many machines to stop so that production collapsed by almost
10% in the 4th.quarter, giving only a marginal increase of 1.2% in output
for the year as a whole. The price of market pulp jumped up to
USD1000 (Northern BSKP).
1996: The low activity seen in the second half of 1995 continued into 1996
resulting in a sharp decline in production until the end of June and a
strong recovery during the summer months, continuation until the end of
the year, giving a slight decrease of yearly production by 0.7%. The
price of market pulp turned down abruptly to USD520 in April.
1997: The industry returned to a consistently strong performance in 1997.
Paper and Board production in 1997 reached a new record level of 80.3
million tons. Trade was particularly active, with both exports and
imports (including Intra CEPI trade) showing strong increase of 13.8%
and 12.3% respectively over 1996. Production of pulp for
papermaking was also increased by 9.2% and the apparent consumption
rose by 8.3%. The price of market pulp moved up and down in the line
of USD600 and finally settled at USD580 at the end of the year.
1998: Following a successful end to the previous year, the industry began 1998
on a high note with record first quarter pulp and paper production
figures The momentum carried through to half year a total year-on-year
increase running at over 5%. Unfortunately this rosy picture was
blighted somewhat during the latter months of the year. Nevertheless,
by the end of 1998 the member countries of CEPI had produced over 82
million tons of paper and board, an increase of 3.1% over 1997. The
price of market pulp turned down again to the level of USD460 at the
end of the year, in spite of production curtailment by the mills, but due
to slow down of the economies in Asia and supply and demand
unbalance remained in the North America.

2 - 19
1999: Began with the trend of dull movements at the latter parts of the
previous year, the fall was arrested during the spring months and
completely reversed by the end of the year.
In 1999, the industry produced 85.2 million tons of paper and board, an
increase of 3.0% over 1998 as follows, and this represents on all time
record level of output.
1999 1998 Change
(1000t) (1000t) (%)
Newsprint 10434 10116 3.1
Uncoated mechanical 5723 5816 -1.6
Coated mechanical 7996 8071 -0.9
Uncoated woodfree 9471 9257 2.3
Coated woodfree 9402 8529 10.2
Sanitary & Household 5033 4796 4.9
Case materials 19320 18620 3.8
Folding boxboards 6993 6926 1.0
Wrappings 3518 3448 2.0
Others for package 3639 3643 -0.1
Others 3712 3567 4.1
TOTAL 85241 82789 3.0
Wood pulp for papermaking production increased marginally over 1998
(+0.6%) to 38.2 million tons. As with paper and board, this figure represents a
record level of output. The majority of pulp imports from outside the CEPI (7.2
million tons) came from North America (61%) and a further 26% from Latin
America.
The price of market pulp turned upwards from the second quarter and settled at
USD600 at the end of the year.
Source: CEPI Annual Report from 1995 to 1999
(2) West European and Scandinavian Markets
① Paper and Paperboard Production(1999)
(Unit: million tons)
Germany 16.7 (20%)
Finland 12.9 (16%)
Sweden 10.1 (12%)

2 - 20
France 9.6 (12%)
Italy 8.6 (10%)
U.K. 6.6 ( 8%)
Spain 4.4 ( 5%)
Austria 4.1 ( 5%)
Netherlands 3.3 ( 4%)
Norway 2.2 ( 3%)
Others 4.6 ( 6%)
Total Production: 83 (100%)
② Wood pulp Production(1999)
(Unit: million tons)
Finland 11.6 (32%)
Sweden 10.7 ( 30%)
France 2.6 ( 7%)
Norway 2.3 ( 7%)
Germany 1.9 ( 5%)
Portugal 1.8 ( 5%)
Spain 1.7 ( 5%)
Austria 1.5 ( 4%)
Others 1.7 ( 5%)
Total Production: 35.8 (100%)
Source: CEPI
③ Paper and Paperboard Capacity in Western Europe by OWNERSHIP (1999)
(Unit: million tons)
Finish Companies 27
Swedish “ 13
Norwegian “ 4
Other European “ 41
Non-European “ 7
Source: Finish Forest Industries Federation, FAO
Total Capacity 92

2 - 21
④ Location of Paper and Paperboard Capacity owned by FINNISH
Companies (2000)
(Unit: million tons)
in Finland 14.3 (46%)
in Germany 5.2 (17%)
in Sweden 3.8 (12%)
in North America 2.6 ( 8%)
in France 1.6 ( 5%)
in U.K. 1.2 ( 4%)
in Other Europe 1.4 ( 5%)
in Other Countries 0.7 ( 2%)
Total Capacity 30.5
Source: Finish Forest Industires Federation
⑤ Wood pulp Production by CEPI countries, Finland and Sweden
(Unit:1000 t.) 1990 1995 1996 1997 1998 1999
CEPI Total 32540 34263 32680 35886 36512 36749
Finland 8886 10088 9692 11088 11355 11579
Sweden 9913 10186 9847 10496 10548 10695
% of Finland 27.3 29.4 29.7 31.1 31.1 31.5
% of Sweden 30.5 29.7 30.1 29.2 28.9 29.1
The above data indicate that Finland and Sweden have strong influence in the
world pulp and paper industries as investors as well as supply sources of raw
materials and products.
(3) Notes on major producing countries
① Finland
a. Position of Forest Industry in the Export Sector (1999)
Total value 232.6 billion FIM (100%)
1 Forest industry (29%)
2 Electronics and electric industry (28%)
3 Basic metal industry and engineering (25%)
4 Chemical industry (10%)
5 Textile and clothing industry (2%)
Other (6%)

2 - 22
b. Current State of Forest Industry in Finland 1999
PRODUCT Production Exports No. of Plants
Paper industry (mill tons) 10.3 9.4 28 Paperboard industry (mill tons) 2.6 2.2 14 Pulp industry (mill.tons) 11.6 1.9 43 Market pulp 2 1.8 14 Sawmilling industry (mill.m3) 11.7 8.4 170 Plywood industry (1000 m3) 1076 939 16 Particle board industry (1000 m3) 439 183 3 Fibre board industry (1000 m3) 96 62 2
c. Domestic and Overseas Production Capacities
PRODUCT in Finland Abroad Total
Paper and Board (mill.tons) 14.1 13.4 27.5 Pulp (mill.tons) 13.5 6.8 20.3
As seen above, the forest industry is the largest and most important
industrial sector in the country and is moving toward consolidation through
merger and acquisition between major manufacturers, including Swedish
ones (as seen in the Stora-Enso deal), in an attempt to align themselves with
the integration of Europe, as seen in the establishment of the EU, and
growing competition in the international market as a result of the
increasingly globalized economy. At present, the industry in Finland is
dominated by the following three groups.
Turnover in 1999 (billion FIM) Stora Enso Oy 63.2 (36.7%) UPM-Kymmene Oy 49.1 (28.5%) Metsaliitto 33.9 (19.7%) Total Turnover 172 (in Finland 100)
(in abroad 72)
Overseas, they have acquired 22 paper manufacturers in West Europe, 3 in
North America, 1 in Latin America, and 1 in Asia (as of 1998).
The aggressive moves apparently are aiming for industrial restructuring to
end a vicious cycle of excess capital investment and oversupply which has
traditionally been prevailing in the industry, similar to aggressive M&A

2 - 23
activities of North American companies, such International Paper and
Weyehaeuser.
d. Product sales and distribution channels
Before joining the EU, the country promoted exports through two
cooperatives, FINCELL and FINPAP, which were dissolved in 1995 when
the country obtained the EU membership. Since then, individual paper
manufacturers have been managing their own sales organizations by
establishing local sales companies in major markets for direct sales to major
customers, in addition to the use of local sales agents and distributors.
e. General view of the pulp project in Lithuania
Finnish paper makers believe that the world pulp production capacity is on
the oversupply side, including North and South Americas and seem to
oppose a new mill project in the short- and medium-terms. At the same
time, they have strong interest in forest resources in the Baltic region due to
geographical proximity and expect that the need for new capacity will arise
as standards of living in the Middle East and Africa rise with increasing
political stability. On the other hand, they are pessimistic about political
stability and economic recovery in Russia and the CIS countries and are thus
reluctant to investment in the region. Finally, they show general interest in
the Chinese market because of political and economic stability.
Reference: Attached Sheet No.13 Finish Pulp,Paper and Paperboard
Production from 1989 to 1998
Production and Delivery of Market
Wood pulp from 1995 to 1998
Attached Sheet No.14 Delivery of Market Pulp per
Country
② Sweden
a Position of Forest Industry in the Export Sector (1999)
Total Value : 701 billion SEK
1 Electronic goods and computers (22%)
2 Other engineering products (21.5%)
3 Forest industry products (13.4%)
4 Motor vehicles, automotive partsautomoative parts (12.4%)
5 Other chemical products (5.7%)

2 - 24
6 Pharmaceutical products (4.7%)
7 Iron and steel (4.6%)
Others (15.7%)
b. Pulp and Paper Production in Sweden
Production Capacity
Paper and Board (Mill. tons) 10.9
Pulp 11.4
c. Production of Paper and Paperboard Production Trends
(Unit: 1000t) 1996 1997 1998 1999
Newsprint 2283 2411 2478 2508 Printing and writing Mechanical paper 752 915 1012 1042 Woodfree coated 527 569 541 556 Woodfree uncoated 892 975 992 1019 Tissue paper 297 292 299 294 Corrugated Material Kraftliner 1506 1516 1475 1563 Others 404 454 435 477 Paperboard for Packaging 1456 1531 1565 1484 Wrapping paper Sack paper 501 536 541 573 Others 379 410 413 430 Other paper and paperboard 22 147 128 125 TOTAL 9019 9756 9879 10071
d. Pulp Production Trends (Unit: 1000 t)
(For the market) 1997 1998 1999 1997 1998 1999
Mechanical 2959 3026 3029 321 322 356 SCMP 266 236 257 0 0 0 Sulphite 720 688 656 292 294 311 BSKP 3382 3360 3428 2241 2240 2293 BHKP 1189 1223 1303 442 459 529 UKP 1982 2016 2020 113 96 58 TOTAL 10498 10549 10693 3409 3411 3547 Source: Swedish Forest Industries Federation

2 - 25
e. Restructuring efforts of the Swedish pulp and paper industry and capital
spending
In 1998, STORA in Sweden and ENSO in Finland agreed on the
mega-merger deal (the new company will be headquartered in Helsinki,
Finland). Then in 1999, two Swedish companies, MODO and SCA, agreed
to merge their woodfree paper production and sales departments to form a
joint venture. The deal gave birth to the third largest woodfree paper
manufacturer in Europe (USD2.2 billion in annual sales and 6000
employees), next to STORA/ENSO and UPM/KYMMENE. The new
company’ s production division will reportedly be controlled by SCA and
the sales division by MODO. As for capital spending by Swedish pulp and
paper companies, it peaked out in 1996 and has been gradually on the
decline. In 1999, capital expenditures totaled 6.4 billion SEK, all of which
were spent for maintenance and refurbishment of existing facilities and
equipment, while new mill construction including any plan was not seen.
d. Product sales and distribution channels
Swedish companies have their own sales companies in major markets for
direct sales to major customers, and local agents and distributors in other
countries. For instance, SODRA, the largest maker, has subsidies in the
U.K., Germany, France, the Netherlands and Norway, and use Northern
Pulp Company in Spain and the Netherlands. Paperboard makers, such as
AssiDoman and Korsnas have corrugated board, sheet or sack plants in
major market to build up integrated production systems from pulp, paper to
processing. They also have sales offices in major markets including the
U.K., Germany and France for extensive marketing activities including final
products.
e. General view of the Lithuanian pulp project
As they have already committed to the Latvian project, they show no interest
in the Lithuanian project.
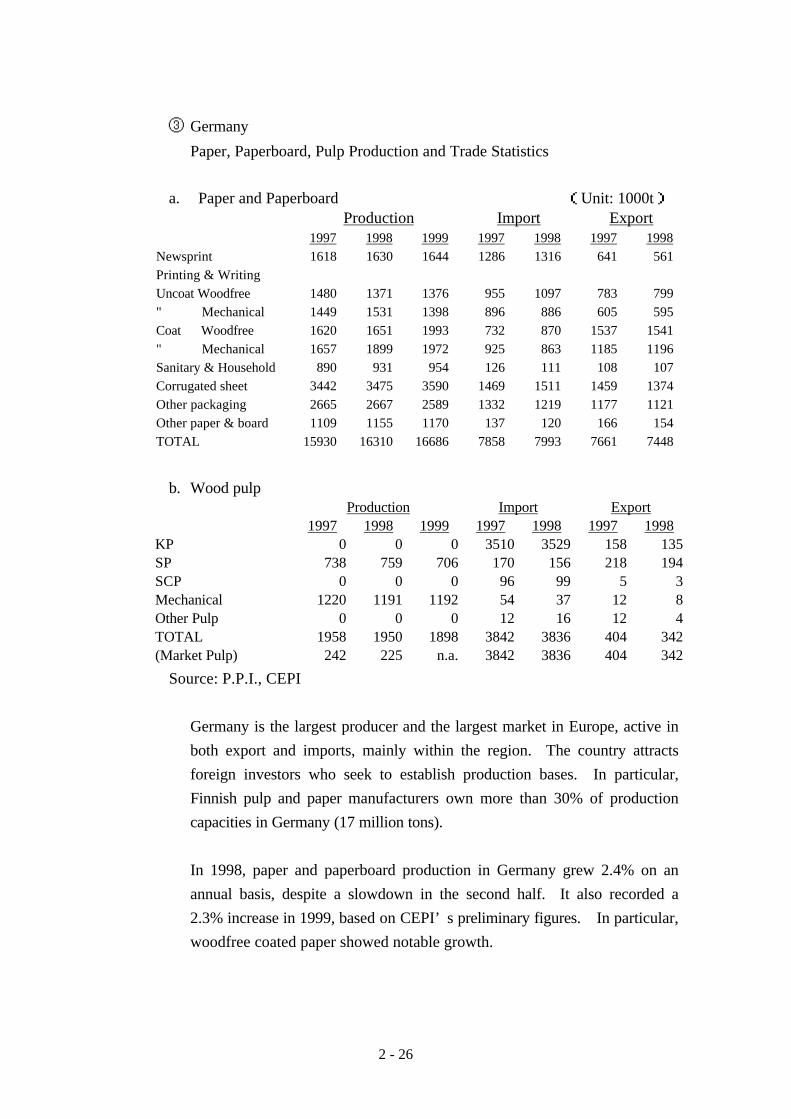
2 - 26
③ Germany
Paper, Paperboard, Pulp Production and Trade Statistics
a. Paper and Paperboard (Unit: 1000t) Production Import Export 1997 1998 1999 1997 1998 1997 1998
Newsprint 1618 1630 1644 1286 1316 641 561 Printing & Writing Uncoat Woodfree 1480 1371 1376 955 1097 783 799 " Mechanical 1449 1531 1398 896 886 605 595 Coat Woodfree 1620 1651 1993 732 870 1537 1541 " Mechanical 1657 1899 1972 925 863 1185 1196 Sanitary & Household 890 931 954 126 111 108 107 Corrugated sheet 3442 3475 3590 1469 1511 1459 1374 Other packaging 2665 2667 2589 1332 1219 1177 1121 Other paper & board 1109 1155 1170 137 120 166 154 TOTAL 15930 16310 16686 7858 7993 7661 7448
b. Wood pulp Production Import Export 1997 1998 1999 1997 1998 1997 1998
KP 0 0 0 3510 3529 158 135 SP 738 759 706 170 156 218 194 SCP 0 0 0 96 99 5 3 Mechanical 1220 1191 1192 54 37 12 8 Other Pulp 0 0 0 12 16 12 4 TOTAL 1958 1950 1898 3842 3836 404 342 (Market Pulp) 242 225 n.a. 3842 3836 404 342
Source: P.P.I., CEPI
Germany is the largest producer and the largest market in Europe, active in
both export and imports, mainly within the region. The country attracts
foreign investors who seek to establish production bases. In particular,
Finnish pulp and paper manufacturers own more than 30% of production
capacities in Germany (17 million tons).
In 1998, paper and paperboard production in Germany grew 2.4% on an
annual basis, despite a slowdown in the second half. It also recorded a
2.3% increase in 1999, based on CEPI’ s preliminary figures. In particular,
woodfree coated paper showed notable growth.

2 - 27
<Industrial restructuring and capital spending>
Previously, Germany did not have kraft pulp production facilities and totally
depended upon imports. Last year, Mercer International converted a
160,000-ton sulphite pulp mill in Rosenthal to a bleached software kraft pulp
(BSKP) production facility with design capacity of 280000 tons by investing
USD348 million. The renovated mill started commercial operation as the
first market kraft pulp production base in the country. Mercer initially
planned to sell the mill to the Metsaliitto MetsaSerla Group in Finland.
After the failed negotiation, the company decided on renovation. In
addition, it reportedly has a plan to install a batch digester and boost
production capacity to 550000 tons per year, although the Pulp and Paper
Industry Association (VDP) holds a negative view and expects that the
Rosenthal mill will eventually be sold to the Metsa Group.
c. General view of the Lithuanian pulp project
The VDP is negative about investment in the new BSKP mill project with
financial burdens and management commitment, although it has general
interest in the Lithuanian project. As Germany has close relations with
Scandinavian countries, it is watchful for the moves in the region,
particularly Finland.

2 - 28
④ France
Paper, Paperboard, Pulp Production and Trade Statistics
a. Paper and Board (Unit: 1000 t) Production 1988 1995 1996 1997 1998 1999
Newspring 374 890 783 909 922 1098 Printing and Writing 2486 3186 3141 3351 3102 3252 Sanitary and Household 298 488 508 535 514 535 Case Materials 1867 2641 2724 2912 3193 3196 Wrappings 466 414 389 428 418 387 Carton Board 606 741 730 733 737 809 Other Paper and Board 217 256 256 276 275 326 TOTAL 6313 8616 8531 9144 9161 9603 (Production Capacity) 6550 9620 9805 9960 10140 n.a. Import 3737 4655 4772 5507 5808 n.a. Export 1965 3639 3921 4322 4287 n.a. Apparent Consumption 8085 9633 9382 10330 10682 n.a. Per capita (kg) 144.4 165.4 160.4 175 175.4 n.a.
b. Pulp Production 2191 2819 2516 2831 2677 2592 Import 1744 1872 1944 2060 2052 n.a Export 407 417 362 510 515 n.a Number of Mills Integrated 16 15 14 14 14 n.a. Market Pulp 5 5 6 6 6 4 Source: COPACEL (Confedertion de l'industrie Francaise des Papiers, Cartons
et celluloses)
The French economy started to recover in 1997. In 1998, GDP showed the
highest growth rate of 3.2% in the EU (2.8% on average) and the economy
is considered to be strongest in West Europe. Paper and paperboard
production also reflected the favorable economic condition and registered
the highest growth rate of 7.2% in 1997. In 1998, it kept moderate growth
of 0.2% in 1998 and soared 4.8% in 1999 (preliminary figures). On the
other hand, pulp (NBSK) prices for papermaking dropped from USD610 in
the fourth quarter of 1997, to USD520 in the first quarter of 1998 and
USD460 in the yearend. In 1999, however, inventory levels declined
worldwide, and together with increased paper production, to bring the price
upward in the second quarter.

2 - 29
c. General view on the Lithuanian pulp project
In France, there are four market pulp manufacturers, and two are partly
owned by Scandinavian companies. Naturally, they show cautious and cold
reactions to a new mill project by reflecting their parents’ view to look for
market stability.
On the other hand, the Lithuanian project receives attention, with some
expectation, from non-integrated mills which do not have their own pulp
production facilities and manufacture paper and paperboard products by
purchasing market pulp, as well as importers and distributors, because they
feel alerted by the growing wave of industrial consolidation, led by M&A
activities involving large paper companies in North America and Scandinavia,
accompanied by increased integration from raw material to papermaking,
and expansion of direct sales channels.
On June 22, the study team met Mr. Freville, honorary president (former
president) of the AAPPT (Agent Association of Pulp and Paper Traders) and
received various materials (presentation of John Claes). It is recommended
to contact him from time to time to collect relevant information.
⑤ The U.K.
Paper, Paperboard, Pulp Production and Trade Statistics
a. Production of Paper and Paperboard (Unit: 1000 t) 1991 1992 1993 1994 1995 1996 1997 1998 1999
Newsprint 671.8 699.8 741.3 769.2 873.3 975.7 1030.3 1045.5 1070.5
Printing and Writing 1478.1 1568.6 1587.9 1732.3 1733.8 1729.8 1752.2 1742.4 1745
Sanitary and Household 455.4 473.1 543.6 557.5 566.9 596.1 638.5 634.5 718.3
Corrugated case Mat. 1364.4 1381.1 1368.8 1559.5 1667.9 1690.6 1754 1760.2 1812.9
Packaging Papers 89.4 92 151.3 158.7 147.4 149.8 155.1 159.8 140.6
Packaging Boards 652.2 669.9 689.6 707.7 718.5 686.2 708.2 670.4 573
Other Paper & Board 239.8 243.6 318.9 358.2 385.1 396.5 441.4 463.8 514.7
TOTAL 4951 5128 5401 5843 6093 6225 6480 6477 6575
In 1998, production declined slightly due to a slowdown in the second half.
It declined 2% in the first quarter of 1999, but showed a strong recovery in
the second quarter. On an annualized basis, it grew 1.5% and went over
6.5 million tons for the first time in history. Product-wise, coated printing
and writing paper exceeded the uncoated one, and mechanical paper

2 - 30
outperformed woodfree. Production of packaging paper (wrapping paper
grade) and packaging board (grey board) declined due to the mill shutdowns
between the second half of 1998 and the first half of 1999.
Industry Structure 1999 Capacity of Paper and Board Number of Mills % of Total Capacity
0 - 10000 22 102761 (1.5%)
10001 - 25000 21 365055 (5.2%)
25001 - 50000 18 634395 (9.1%)
50001 - 100000 17 1286558 (18.5%)
100001- 200000 11 1673502 (24.1%)
200001- 300000 6 1460268 (21.0%)
300001- 750000 3 1431080 (20.6%)
TOTAL 98 6953619 (100%)
a. Paper and Board (Unit: 1000t)
IMPORT 1991 1992 1993 1994 1995 1996 1997 1998 1999
Newsprint 1327.5 1315.6 1353.4 1705.8 1508.1 1450.5 1530.8 1645.6 1720.2
Printing and Writing 2056.2 2271.9 2558.7 2803 2806.5 2836.3 3201.4 3209.3 3399.1
Sanitary & Household 128.6 168.7 207.3 202.6 241.5 233.9 258.7 295.2 253.4
Corrugated Case Mat. 927.6 951.7 943.1 939.3 893.6 961.1 1007.4 970.3 913.7
Packaging Paper 345.8 335.4 371.5 346.7 324.9 308.5 353.3 327.1 302.8
Packaging Board 746 821.3 811.7 667.5 684.3 704.5 749.5 770.5 776.3
Other Paper and Board 83.5 94 89 94.9 90.2 89.6 86.3 178.1 155.8
TOTAL 5615 5959 6335 6760 6549 6584 7187 7396 7521
EXPORT
Newsprint 148.6 155.3 152.4 166.2 148.5 187 221 183.6 198.6
Printing and Writing 573.8 668.7 430.1 506.2 503 503.8 534.8 494.1 483
Sanitary & Household 25.2 29.9 26.5 24.2 17.3 14.8 20 19 24.8
Corrugated Case Mat. 231.2 227.2 152.2 181 131.8 156.7 176.4 182.5 199.4
Packaging Paper 66.6 72.4 34 37 33.5 37.9 43.8 40.9 46.3
Packaging Board 270.8 287.5 168.5 188.6 183.3 169 208.7 210.2 167.2
Other Paper and Board 72.5 78.1 139 166.5 192.7 204.1 234.4 259 313.7
TOTAL 1389 1519 1103 1270 1210 1273 1439 1389 1433
Source: The Paper Federation of Great Britain
"Reference Statistics 2000

2 - 31
b. Wool Pulp Import Trends for Papermaking by Country of Origin
(Unit: ADt) Country of Origin 1996 1997 1998 1999 Austria 1253 2832 1822 311 Belgium 5090 Belgium/Lux. 3293 1928 71 Denmark 39 419 775 2 Finland 182482 193934 173529 126822 France 7841 17976 16507 10330 Germany 11996 16063 4511 8597 Greece 9 1 Irish 1417 841 239 145 Italy 3631 931 272 189 Netherlands 0 677 1476 259 Portugal 89539 70276 90262 104781 Spain 77703 70838 61530 64458 Sweden 144678 159580 166480 165391 Norway 49225 35864 31592 36416 Switzerland 714 410 690 478 Czech Republic 2185 1807 1904 2475 Estonia 6902 2428 3931 Latvia 435 Lithuania 21 Russia 21189 27721 22959 24876 Morocco 3172 6349 2350 South Africa 21202 21356 25213 23927 Swaziland 18 Tunisia 40 25 Canada 265778 279214 281951 272004 USA 296613 310743 270382 243032 Argentina 3752 6962 1004 1938 Bahamas 1200 5778 467 Brazil 201752 252049 233673 246840 Chile 121396 104265 88449 58795 Ecuador 3747 China 193 35 Hong Kong 3 Indonesia 438 4701 22794 18257 Japan 21 Thailand 3104 48 508 2700 Australia 29 537 New Zealand 0 Others 1242 2995 509 347 TOTAL 1523785 1599179 1505458 1423723

2 - 32
c. Wood Pulp Import Trends for Papermaking by Grade (1999) (Excluding EU
Countries)
(Unit: ADt) Grade USA Canada Brazil Chile Indonesia Norway Russia S.Africa Others
TMP 0 33594 0 0 0 963 0 0 0
Mechanical 6 179 20 0 0 2359 19 0 0
Semi-chemical 59 5798 0 0 0 826 0 0 0
UKP 0 5979 39 692 0 0 3083 369 0
BSKP 69372 166972 7806 31005 0 24985 7126 23558 0
BHKP 173171 42227 238975 27099 18257 3 14647 0 470
Sulphite 425 17255 0 0 0 7280 0 0 9
TOTAL 243033 272004 246840 58796 18257 36416 24875 23927 479
Source: The Paper Federation of Great Britain
The country produced around 500000 tons of pulp (mechanical and
semi-mechanical pulp) up to 1998. Then, three mills were closed down in
1999 and additional three mills will terminate operation in 2000, reducing
total capacity by 180000 tons.
d. General view on the Lithuanian pulp project
For the U.K. pulp and paper industry which reduces pulp production and
increases imports, overseas production seems to be out of concern. During
the visit, the study team only obtained general data on the industry.
⑥ Italy
Production, Import, Export and Apparent Consumption
a. Paper and Paperboard
(Unit: 1000 t)
year Production Import Export APP.
Consumption 1990 6180 2617 1188 7609 1991 6388 2712 1273 7827 1992 6638 3173 1348 8463 1993 6715 3143 1626 8232 1994 7287 3587 1749 9125 1995 7371 3521 1889 9003 1996 7487 3325 2013 8799 1997 8031 3857 2253 9635 1998 8253 3934 2250 9937 1999 8568 4173 2436 10305

2 - 33
b. Wood Pulp
(Unit: 1000 t)
year Production Import Export APP.
Consumption 1990 596.4 2049.8 69.9 2576 1991 509.4 2309.1 59.5 2759 1992 442.1 2451.1 12.4 2881 1993 424.5 2477.2 34.2 2867 1994 460.9 2666 26.7 3100 1995 490.5 2714.2 17.8 3187 1996 447.2 2784.9 18.4 3214 1997 467.6 3030.2 11.9 3486 1998 462.5 3075.7 12.9 3525 1999 444.2 3008.2 15.4 3547
Source:ASSOCARTA 2000
Production grew strongly in the first half of 1998 and declined slightly in the
latter half. On an annual basis, it recorded the highest growth rate 10.0%,
well over the previous boom of 7.3% in 1997, and reached 8250000 tons.
After some slowdown, production showed a firm recovery since the second
half of 1999 and registered a all time of 8560000 tons, a 3.8% increase over
1998.
Italy is the fifth largest paper producer in Europe and consumes more than
10 million tons annually. On the other hand, it produces less than 500000
tons of pulp. In particular it entirely depends on imports for kraft pulp
supply and is the second largest importer next to Germany, amounting to 2.5
million tons annually. (The country imports a total of over 3 million tons
annually after 1997.)
Reference: Attached Sheet No. 15 Wood pulp Production, Trade and
Apparent Consumption of Europe
(Major Countries)
Attached Sheet No.16 Pulp Import to CEPI countries
c. General view on the Lithuanian pulp project
The industry, which entirely imports pulp, appears to have concern about the
industrial restructuring, as seen in aggressive M&A activities of large pulp
and paper makers in North America and Scandinavia, and closedowns of
unprofitable market pulp mills in North America, which may unfavorably

2 - 34
increase market control of the supplier side. And they showed strong
interest in mill projects planned in the Baltic region. The following is an
excerpt of a report made by ASSOCARTA which studied the Baltic states in
last March.
“ This report on the potential of the paper pulp market in the Baltic states has been
prepared as part of the strategic imports Project of the Foreign Trade institute (I.C.E.)
for 1998.
The documentation and information on which the report itself is based was gathered
during a research mission undertaken in March 1999 financed by the ICE with the
technical backing of the Helsinki office and the institute’ s local operatives. It is
important to note that the report is in effect a follow-up to similar projects undertaken in
previous years into the wood pulp markets in Chile, Indonesia, South Africa, Argentina
and Brazil always under the same Strategic Import Project. (Intermediate sentences
omitted)
The legitimate interest of the Baltic States governments in utilizing their natural
resources at local level to create new economic development opportunity has lead
Estonia, Latovia and Lithuania to launch important projects for the installation of large
scale paper pulp facilities (5-600000 tons/year). These projects, envisaging Western
Europe as the principle market outlet for the potential production, are of significant
interest to the Italian paper industry which, after Germany, is the main consumer within
the European market. As mentioned above, the effective possibility of obtaining the
immense financial resources necessary to undertake the projects as envisaged is still to be
verified. Moreover, it is considered that the eventual realization of one of the projects
would inevitably have the effect of impeding the development of the other two, at least
over the medium term.
However, despite the significant number of unknown quantities in financial terms, all the
projects have indubitably solid foundations from a basic economic point of view, and so
it would be opportune that Italian operators follow developments with some attention.
Finally, as regards the paper industry, since the closure and drastic restructuring of the
obsolete facilities operating during the Soviet era, the three Baltic States have been
looking for potential partners to develop joint ventures.
Particular interest has been shown by local operators in the tissue paper sector, for
which considerable growth in internal demand is forecast in the short term as a result of
the increasing per-capita income level of the population of the entire Baltic region.
(Note that Italy is the largest producer of sanitary paper in Europe and Italian
manufacturers are aggressively acquiring companies in the U.K. and France.)

2 - 35
ASSOCARTA plans to send a research mission to the Baltic states in October 2000. It
is recommended that the Lithuanian government keep close communication with it.

2 - 36
2.5 Consolidation of Pulp and Paper Industries in Industrialized Countries through M&A Activities
The pulp and paper industry has been traditionally undergoing cyclical ups and
downs with significant price fluctuation, which is caused by aggresive capital
spending and capacity expansion. For instance, the Alex Brown Research
Institute under a German bank reports the following four cases:
1989-1991 12 newsprint paper making machines were installed in the U.S. and
Canada to create concern about oversupply, and prices fell to the
lowest level in the fifteen years.
1994 - 1996 Container board production capacity increased rapidly in the U.S.
and corrugating medium prices plummeted from USD525 to
USD200/ton.
1995 - 1999 Pulp production capacity in Southeast showed a rapid increase and
prices leveled off since 1996.
1998 - 2002 Sanitary paper making machines are installed at an accelerated pace
to create price pressure.
The industry is now seeing the wave of mega-merger deals in recent years.
(See Attached Sheet No. 20 “ Restructuring through merger and acquisition” )
Unlike the M&A boom in the 1980s, which was characterized by money
game-oriented TOB, the recent M&A activities have two distinctive objectives:
1. To establish strategic alliance between dominant companies: A primary
example is International Paper’ s merger of Union Camp (ranked 8th in the U.S.
and 17th in the world in 1998) in 1999 to rationalize capital investment by
avoiding duplication of efforts.
2. To integrate production facilities and jettison unprofitable facilities: A typical
example is the merger of Stone Container with Smerfit, which resulted in
closedown of the 1.6 million ton container board capacity, followed by
acquisition of St. Laurent Paper to add.
Most pulp and paper companies in North America have been afflicted with low
returns form sluggish market conditions and reduced margins due to deteriorated
cost competitiveness. They are now looking for sustainable growth through

2 - 37
industrial restructuring that leads to increased competitiveness and rationalization
of capital projects.
In Europe, global M&A initiatives are rampant, led by STORA/ENSO – a paper
giant formed by STORA in Sweden and ENSO in Finland – which acquired
Consolidated of the U.S. and became the second largest company in the 1998
world ranking, followed by UPM-Kymmen.
Most European makers have been launching extensive rationalization/cost
reduction efforts since the early 1990s, which have helped them to establish sound
financial base. After 1998, they have been restraining capital investment within
depreciation expenses. Today, European companies account for approximately
30% of world pulp and paper capacity and have significant market clouts. They
are now moving toward further consolidation and sustainable growth of the
industry through aggressive merger and acquisition.
Mr. Dillon, chairman of International Paper, made the following statement in the
company’ s 1999 Annual Report:
“ Traditionally, we favored capital projects that would yield increased production
capacity. No more. Today, we are investing discretionary capital in ways to
meet market needs.”
<References>
1 Pulp, Paper and Paperboard-Production, Trade and Apparent Consumption of
LITHUANIA
2 World wood pulp statistics(Production Capacity and Production by Region)
3 -” -(Production Capacity and Production by Grade)
4 North America and Scandinavian “ Wood Pulp statistics” (Production Capacity
and Production by Grade)
5 World Wood Pulp Statistics (Market Pulp Production Capacity by Region &
Grade)
6 North America and Scandinavia “ Wood Pulp Shipments by Grade, Destination
and Chemical Market Pulp Shipment by Destination”
7 Newsprint and Printing & Writing Production Statistics
8 Paper and Pulp-Production, Import, Export and Appar. Consumption of Major
Countries

2 - 38
9 Northern Bleached Softwood Kraft Pulp (NBSK) Prices
10 North America and Scandinavia (Chemical Market Pulp Operating Rates by
Quarter)
11 Forecast of Production Capacity Expansion by FAO
12 Production of Paper and Paperboard in West Europe and in other Main Countries
13 Finnish Pulp, Paper and Paperboard Production from 1989 to 1998
14 Finland “ Delivery of Market Pulp per Country
15 Production of Wood pulp for Paper Making in Europe(Major Markets only)
16 Pulp Import to CEPI Countries
17 Pulp Import to Italy
18 Paper-Pulp Enterprises Rank 50
19 Pulp and Paper Performance of Major Enterprises in the World
20 Restructuring through merger and acquisition in the World Paper Industries
References attached:
CEPI Annual Statistics 98
The Finish Forest Industries Federation “ Fact and Figures 1998”
The Swedish Forest Industries “ Fact and Figures 1999”
The Reference Statistics of the Paper Federation of Great Britain
COPACEL Rapport Annual 1998 (French Version)
VDP Papier 2000 (Germany Version)
IL Settore Delle Paste per Carta nei Paesi Baltici (Italian Version)
Presentation of John Claes, Paris June 22nd, 2000 年

Attached Sheet No.1Unit: 1000 t.
Pulp, Paper and Paperboard -Production, Trade and Apparent Consumption
ITEM PRODUCTION IMPORT EXPORT APPARENT CONSUMPTION1997 1998 1999 1997 1998 1999 1997 1998 1999 1997 1998 1999
Newsprint 0 0 0 17.4 20 19 1.2 2.2 0.8 16.2 17.8 18.2Woodfree Uncoated 0.2 0.7 1 10.4 9.6 8.5 4.3 3.8 2.4 6.3 6.5 7.1 Coated 0 0 0 6 5.6 6.2 0.7 0.7 0.3 5.3 4.9 5.9Mechanical Uncoated 0 0 0 2.1 1.2 1.87 0.1 0.05 0.02 2 1.15 1.85 Coated 0 0 0 2.7 5.8 5.9 0.1 0.1 0.06 2.6 5.7 5.84Corrugating sheet Virgin fibre liner 0 0 0 14.6 12.1 8.7 8.3 5.5 3.7 6.3 6.6 5 Waste based liner 2.6 7 16 0.2 0.4 0.3 4.2 3.2 1.38 -1.4 4.2 14.92 Virgin fibre fluting 0 0 0 3.3 0.4 0.71 1.9 0 0 1.4 0.4 0.71 Waste based fluting 2 4.4 7.8 0 0 0 0 0 0 2 4.4 7.8Other wrapping paper 2.3 2.4 0.9 0.2 0.5 0.3 0.04 0.08 0.24 2.46 2.82 0.96Tissue & Towelling 7.9 11.5 8 0.1 0.3 0.23 0.6 0.4 0.8 7.4 11.4 7.43Other paper 0.2 0 0.1 19.1 21.2 16 4 3.6 1.13 15.3 17.6 14.97Other board 9.5 11.3 3 4.1 3.8 3.8 1.6 1.5 1.26 12 13.6 5.54 TOTAL 24.7 37.3 36.8 80.2 80.9 71.51 27.04 21.13 12.09 77.86 97.07 96.22
PULP Bleached sulphate 0 0 0 2.7 0.5 0.376 1.7 0 0 1 0.5 0.376 Unbleached sulphate 0 0 0 0.1 0.1 0.167 0 0 0 0.1 0.1 0.167 Bleached sulphite 0 0 0 6.8 13 4.7 4.6 10.6 3.8 2.2 2.4 0.9 Unbleched sulphite 0 0 0 0.5 1.4 0.014 0.2 1.2 0 0.3 0.2 0.014 Mechanical 1.7 1.3 0 0.02 0.01 0.04 3.3 0.6 0.08 -1.58 0.71 -0.04 Other woodpulp 0 0 0 1.3 0.1 0.6 1.3 0.6 0.002 0 -0.5 0.598Wastepaper pulp 24.8 24.3 36.1 0.6 0.8 0.05 0 0 0.14 25.4 25.1 36.01 TOTAL 26.5 25.6 36.1 12.02 15.91 5.947 11.1 13 4.022 27.42 28.51 38.025
Source: Lithuanian Ministry of Economy

Attached Sheet No. 2WORLD WOOD PULP STATISTICS
【Production Capacity by Region】 Unit:1000tYear Canada USA NordicW.EuropeE.EuropeLatin Am Japan Asia Africa Oceania Total1985 23157 52763 21180 10966 17181 6427 12014 3770 2167 2681 1523061986 23784 53785 21555 11460 17165 6528 12299 4120 2306 2718 1557201987 24015 55056 21545 11788 17193 6708 12253 4456 2334 2473 1578211988 24744 56522 22745 12121 15407 7033 12858 3930 2391 2702 1604531989 25455 57661 22880 12760 14185 7578 13157 3812 2437 2694 1626191990 26278 58513 23695 13831 14476 8051 13495 3967 2487 2683 1674761991 27238 59841 23707 13332 14845 8483 15082 4374 2517 2779 1721981992 27065 61000 23056 14082 14998 9512 15126 5375 2587 2758 1755591993 26243 60622 24680 14000 14926 9977 15276 6129 2650 2649 1771521994 26661 61009 23844 12557 14024 10240 14814 5867 2611 2810 1744371995 27551 61686 25707 13501 14806 10379 14615 8096 2598 2766 1817051996 27908 61735 25880 13615 13369 10700 14724 8179 2681 2769 1815601997 28005 63808 26733 12869 12383 11363 15029 10890 2366 2838 1862841998 28291 63172 27260 13000 12468 11822 15532 12896 2381 2837 1896591999 28136 As a % of
【Pulp Production by Region】 Capacity1985 20242 48058 19076 10386 12804 5877 9279 3418 1622 2054 <87.2> 1328161986 21556 50576 19278 10754 13518 6114 9240 3616 1642 2020 <88.8> 1383141987 22865 52836 20388 11102 14351 6215 9733 3783 1628 2072 <91.9> 1449731988 23535 54246 21275 11655 14633 6541 10415 3919 1749 2205 <93.6> 1501731989 23422 54955 21646 11910 14584 6570 10987 3831 1847 2305 <93.5> 1520571990 22605 56026 20968 11870 13771 6519 11328 4530 2297 2261 <90.9> 1521751991 23096 56490 20457 12255 11527 7166 11729 4652 2306 2387 <88.3> 1520651992 22653 58029 20125 11484 10542 8361 11200 4755 2340 2268 <86.4> 1517571993 22896 57070 21460 10570 5788 9609 10582 5485 2639 2338 <83.8> 1484371994 24649 58509 22813 10885 6215 8920 10564 5748 1976 2350 <87.5> 1526291995 25402 59682 22759 11395 7414 9396 11120 7453 2422 2418 <88.7> 1594611996 24352 58291 21793 11056 6107 9852 11061 8520 2422 2328 <85.8> 1557821997 24970 59360 23873 11561 6087 9697 11360 8026 2209 2234 <85.6> 1593771998 23558 57941 24324 12188 n.a. n.a. 10829 n.a. n.a. n.a. n.a.1999 10910
Source: CPPA Reference Tables 1998CEPI Annual Report 1999JPPA " " 2000

Attached Sheet No. 3WORLD WOOD PULP STATISTICS (Unit:1000t.
【Production Capacity by GRADE】Year BSKP BHKP UKP Sulphite High Yield Others Total1985 29746 25346 38341 11312 36665 10896 1523061986 30752 26510 38415 11203 37742 11098 1557201987 30821 27685 38635 11052 38790 10838 1578211988 31897 28568 39278 9975 40741 9994 1604531989 32625 30415 39313 10340 41793 8133 1626191990 32849 32369 39453 10799 43722 8284 1674761991 33996 34807 38922 9758 43688 11027 1721981992 34962 37303 39402 9001 43872 11019 1755591993 35795 38656 39109 8237 44341 11014 1771521994 34769 39689 38925 7912 43752 9390 1744371995 35169 41960 39024 7752 45991 9809 1797051996 36430 42753 39502 7756 45733 9386 1815601997 36964 46389 40545 7518 46480 8388 186284 (revised)1998 37248 48914 40431 7430 46999 8637 1896591999 As a % of
【Total Pulp Production by GRADE】 Capacity1985 25684 21885 34973 10274 29955 10045 132816 <87.2>1986 27954 24098 35405 9093 31237 10527 138314 <88.8>1987 29056 26100 36567 10306 32447 10497 144973 <91.9>1988 30102 26960 37160 10637 34364 10950 150173 <93.6>1989 30530 28461 37220 10306 35143 10397 152057 <93.5>1990 30714 30266 35153 9098 36417 10527 152175 <90.9>1991 31373 32121 34708 8161 35868 9834 152065 <88.3>1992 30670 32724 34658 8111 35818 9776 151757 <86.4>1993 31816 34270 32203 6615 34380 9153 148437 <83.8>1994 32747 37398 32945 6225 34445 8869 152629 <87.5>1995 33994 39985 34461 6476 37224 7321 159461 <88.7>1996 33003 40498 32915 6062 35360 7944 155782 <85.8>1997 33885 41415 33334 6066 36762 7915 159377 <85.6>1998 34099 42528 33270 5889 34141 n.a. n.a.1999
Source: CPPA Reference Tables 1998

Attached Sheet No. 4North America and Nordic "Wood Pulp Statistics"
【Production Capaity】 Total (Unit:1000t.)Year BSKP BHKP UKP Sulphite HighYield SCMP1985 24868 13573 24396 4781 22630 5439 Total1986 25373 14398 24469 4665 23332 5392 976291987 25916 15168 24549 4525 23890 5506 995541988 26503 16184 24961 4327 25015 5613 1026031989 26721 17114 25135 4367 25700 5566 1046031990 27146 17650 25468 4254 27221 5655 1073941991 28031 18429 25552 4000 27966 5616 1095941992 28630 19411 25559 3621 27580 5609 1104101993 28643 20422 25101 3343 27860 5517 1108861994 28455 21253 25258 3129 27896 5348 1113391995 29073 21650 25288 3159 28724 5396 1132901996 30192 21860 25348 3079 29039 5253 1147711997 30720 22741 26428 2813 28283 5773 1167581998 31258 23054 26320 2630 30478 4698 1184381999 As a % of
【Production】 Capacity1985 22816 13230 22244 4119 19888 4653 86950 <90.9>1986 23556 14598 23067 3977 20766 4888 90852 <93.1>1987 24832 15490 24167 4102 21883 5017 95491 <95.9>1988 25360 16374 24296 4137 23083 5165 98415 <95.9>1989 25563 17002 24108 4034 23476 5140 99323 <95.0>1990 25235 16610 24311 3882 23858 5114 99010 <92.2>1991 25295 17246 24099 3469 23615 5016 98740 <90.1>1992 27066 18159 24251 3096 23042 5047 100661 <91.2>1993 26850 19178 23701 3037 23715 4886 101367 <91.4>1994 27899 21026 24263 3039 24347 4916 105490 <94.7>1995 28676 21258 24530 3077 25477 4773 107791 <95.1>1996 28144 20996 23634 2750 24138 4634 104296 <90.9>1997 27236 20234 22993 2614 25230 5015 103332 <88.5>1998 29575 21290 23170 2245 24159 4948 105387 <89.0>1999
Source: CPPA Reference Tables 1998

Attached Sheet No. 5WORLD WOOD PULP STATISTICS
【Market Pulp Production Capacity by Region】 Unit:1000t.Year Canada USA Nordic W. Europe E. EuropeLatin Ame. Japan Asia Africa Oceanea Total1985 7505 5615 6110 3270 n.a. 2395 880 480 435 635 273251986 7740 6065 6295 3560 n.a. 2410 820 475 430 655 284501987 7935 6180 6255 3680 n.a. 2465 795 480 450 685 289251988 8135 6775 6040 3890 n.a. 2555 765 520 450 680 298101989 8535 6895 6060 3985 n.a. 2785 765 655 450 670 308001990 8565 7285 6325 4005 n.a. 2715 755 790 455 695 315901990 9170 7885 6130 4040 n.a. 3285 775 860 455 725 333251992 9655 8420 6325 3855 n.a. 4180 790 815 515 625 351801993 9500 8575 6190 3650 n.a. 4240 730 960 570 695 351101994 10150 8350 5990 3970 n.a. 4430 740 1115 575 700 360201995 11020 8790 5955 4100 n.a. 4595 790 1960 630 665 385051996 11400 8435 6445 4160 n.a. 5060 820 2045 685 705 397551997 11550 8485 6540 4280 n.a. 5185 815 2755 680 750 410401998 11535 8500 6540 4210 n.a. 5615 805 2855 630 820 415101999
【Market Pulp Production Capacity by Grade】 Unit:1000t.Year BSKP BHKP UKP Sulphite High Yield Total1985 13030 8565 1805 2090 1835 273251986 13675 8860 1830 2120 1965 284501987 13675 9410 1760 2045 2035 289251988 14045 9925 1735 1940 2165 298101989 14300 10345 1660 1910 2585 308001990 15010 10575 1600 1855 2550 315901991 15535 11470 1665 1790 2865 333251992 16520 12465 1590 1580 3025 351801993 16920 12525 1550 1500 2615 351101994 16940 13170 1575 1675 2670 360301995 17620 14340 1635 1725 3185 385051996 18205 14650 1795 1730 3375 397551997 18375 15680 1925 1745 3315 410401998 18590 16185 1925 1590 3220 41510 Source: CPPA Reference Tables 19981999

Attached Sheet No. 6
North America and Nordic "Wood Pulp Statistics"【Market Pulp Shipments by Grade】 (Unit:1000t.)
Year BSKP BHKP UKP Sulphite High Yield SCMP Total1985 10551 3818 642 1094 1223 32 173601986 11418 4347 563 1079 1281 35 187231987 12062 4673 600 1126 1355 31 198471988 12148 4915 629 1030 1572 37 203311989 11898 5004 469 883 1707 33 199941990 10956 4717 522 914 1753 33 188951991 11597 4952 506 902 1668 33 196581992 12347 5340 432 851 1692 33 206951993 12748 5633 462 737 1706 33 213191994 13635 6091 492 787 2066 33 231041995 13362 5921 437 751 2200 33 227041996 13614 5744 538 675 2047 33 226511997 14617 5879 571 658 2147 33 239051998 14606 5290 460 487 2170 33 230461999
【Market Pulp Shipments by Destination】Asia &
Year Canada USA W.Europe Nordic E.Europe Latin Ame. Japan Africa Oceania Total1985 934 4569 6659 1090 119 520 1532 1832 106 173611986 982 4941 7056 1214 173 592 1823 1785 157 187231987 1079 5065 7231 1249 207 708 1969 2138 200 198461988 1077 5259 7520 1200 222 568 2199 2112 173 203301989 1000 5019 7725 1170 240 410 2433 1835 162 199941990 913 4709 7407 1139 212 535 1891 1949 140 188951991 868 4459 8033 941 148 541 1949 2596 121 196561992 870 4540 8615 958 138 595 2053 2799 129 206971993 924 5029 8124 992 125 785 2200 3019 124 213221994 972 5458 8706 1144 128 828 2573 3188 106 231031995 1033 5490 8479 1155 137 795 2511 3007 96 227031996 955 5124 8322 1027 167 797 2360 3792 107 226511997 998 5871 8729 1140 158 962 2340 3636 70 239041998 999 5918 8552 1177 195 850 2101 3169 84 230451999
【Chemical Market Pulp Shipmentsby Destination】1985 840 4461 6094 951 114 480 1354 1705 106 161051986 881 4831 6503 1066 162 559 1618 1635 152 174071987 959 4953 6686 1095 190 670 1754 1956 198 184611988 952 5122 6916 995 205 516 1941 1907 168 187221989 935 4791 7022 989 219 360 2110 1669 159 182541990 828 4502 6684 947 192 466 1586 1765 139 171091991 748 4276 7306 773 125 464 1720 2426 119 179571992 834 4304 7882 776 113 537 1841 2556 128 189711993 888 4805 7409 838 102 723 1964 2729 123 195811994 913 5237 7829 958 105 750 2284 2826 103 210051995 941 5260 7554 943 109 751 2236 2580 96 204701996 906 4862 7561 865 147 763 2091 3270 107 205721997 931 5596 7973 996 139 881 2063 3077 68 217241998 922 5672 7783 1004 173 800 1817 2594 78 208431999
Source: CPPA Reference Table 1998

Attached Sheet No. 7
【Newsprint Production Statistics】 Unit : 1000m/tA. Total Newsprint Production by RegionYear W.Europe N.Europe E.Europe Canada U.S.A. L.America Japan Asia Africa Oceania W.Total1990 3913 4694 2087 9068 5997 1023 3479 1627 420 670 329781991 3946 4324 1838 8855 6206 1023 3516 1655 405 702 324701992 3992 4315 1246 8753 6425 882 3253 1867 387 738 318581993 4221 4710 1282 9136 6412 798 2917 2219 401 734 328301994 4434 4833 1368 9299 6335 805 2972 2511 390 738 336851995 5006 4441 1793 9226 6352 932 3098 2786 392 755 347811996 4876 4522 1587 9025 6304 945 3132 3268 392 720 347711997 5272 4730 1556 9204 6545 965 3192 3844 392 700 364001998 5129 4875 n.a. 8581 6575 n.a. 3265 n.a. n.a. n.a. n.a.1999 5461 4868 n.a. n.a. 6518 n.a. 3295 n.a. n.a. n.a. n.a.
【Printing and Writing Paper Statistics】B. World (Region)1990 16108 6794 2351 3600 18910 2446 9251 8006 615 444 685251991 16577 6940 2015 3688 18669 2567 9730 8439 592 425 696421992 16871 7157 1425 3742 19866 2685 9610 9237 536 321 714501993 17079 7942 1287 4194 20348 2875 9516 6932 629 314 711161994 19031 8800 1101 4429 21793 3076 9805 8880 600 362 778771995 19096 9250 1339 4882 21701 3026 10565 10050 502 378 807891996 18917 8855 1452 4689 21225 3096 10811 11189 501 365 811001997 20702 10571 n.a. 4962 24387 n.a. 11112 n.a. n.a. n.a. n.a.1998 20526 11123 n.a. 5154 24180 n.a. 10903 n.a. n.a. n.a. n.a.1999 21181 11377 n.a. n.a. n.a. n.a. 11348 n.a. n.a. n.a. n.a.
Source:FAO1997, CPPA Reference Tables 1998, CEPI Production Statistics 4th quarter 1999 and JPA2000
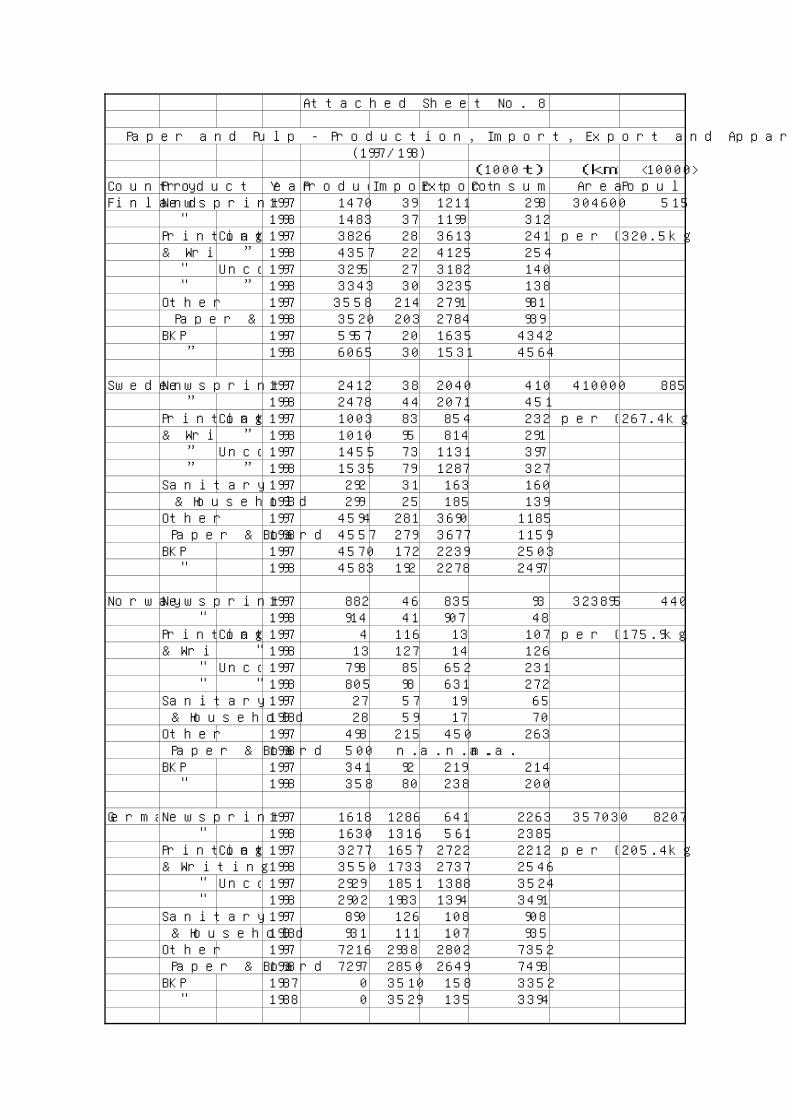
Attached Sheet No. 8
Paper and Pulp - Production, Import, Export and Apparent Consumption of Major Countries (1997/198)
(1000t) (km2) <10000>Country Product Year Production Import Export Consumption Area PopulationFinland Newsprint 1997 1470 39 1211 298 304600 515
" 1998 1483 37 1199 312Printing Coat 1997 3826 28 3613 241 per Capita320.5kg& Writing ” 1998 4357 22 4125 254 " Uncoat 1997 3295 27 3182 140 " ” 1998 3343 30 3235 138Other 1997 3558 214 2791 981 Paper & Board1998 3520 203 2784 939BKP 1997 5957 20 1635 4342 ” 1998 6065 30 1531 4564
Sweden Newsprint 1997 2412 38 2040 410 410000 885 ” 1998 2478 44 2071 451Printing Coat 1997 1003 83 854 232 per Capita267.4kg& Writing ” 1998 1010 95 814 291 ” Uncoat 1997 1455 73 1131 397 ” ” 1998 1535 79 1287 327Sanitary 1997 292 31 163 160 & Household 1998 299 25 185 139Other 1997 4594 281 3690 1185 Paper & Board 1998 4557 279 3677 1159BKP 1997 4570 172 2239 2503 " 1998 4583 192 2278 2497
Norway Newsprint 1997 882 46 835 93 323895 440 " 1998 914 41 907 48Printing Coat 1997 4 116 13 107 per Capita175.9kg& Writing " 1998 13 127 14 126 " Uncoat 1997 798 85 652 231 " " 1998 805 98 631 272Sanitary 1997 27 57 19 65 & Household 1998 28 59 17 70Other 1997 498 215 450 263 Paper & Board 1998 500 n.a. n.a. n.a.BKP 1997 341 92 219 214 " 1998 358 80 238 200
GermanyNewsprint 1997 1618 1286 641 2263 357030 8207 " 1998 1630 1316 561 2385Printing Coat 1997 3277 1657 2722 2212 per Capita205.4kg& Writing 1998 3550 1733 2737 2546 " Uncoat 1997 2929 1851 1388 3524 " 1998 2902 1983 1394 3491Sanitary 1997 890 126 108 908 & Household 1998 931 111 107 935Other 1997 7216 2938 2802 7352 Paper & Board 1998 7297 2850 2649 7498BKP 1987 0 3510 158 3352 " 1988 0 3529 135 3394

France Newsprint 1997 909 493 605 797 551500 6090 " 1998 923 460 578 805Printing Coat 1997 1759 1622 1238 2143 per Capita175.4kg & Writing " 1998 1606 1820 1164 2262 " Uncoat 1997 1592 1146 716 2022 " " 1998 1495 1252 694 2053Sanitary 1997 397 251 291 357 & Household 1998 386 268 276 378Other 1997 4350 2035 1608 4777 Paper & Board 1998 4623 2028 1673 4978BKP 1997 1087 1854 272 2669 " 1998 1056 1854 264 2646
Italy Newsprint 1997 180 461 8 633 301308 5760 " 1998 190 458 5 643Printing Coat 1997 1890 780 837 1833 per Capita172.2kg & Writing " 1998 1916 863 825 1954 " Uncoat 1997 860 654 133 1381 " " 1998 863 661 125 1399Sanitary 1997 1026 52 437 641 & Household 1998 1102 58 468 692Other 1997 4076 1892 831 5137 Paper & Board 1998 4174 1875 818 5231Chemical 1997 83 2873 6 2950 Pulp 1998 79 2932 9 3002
U.K. Newsprint 1997 1030 1531 211 2350 245050 6110 " 1998 1043 1646 192 2497Printing Coat 1997 636 1640 230 2046 per Capita204.2kg & Writing " 1998 661 1765 237 2189 " Uncoat 1997 878 1322 246 1954 " " 1998 862 1409 227 2044Sanitary 1997 639 259 32 866 & Household 1998 635 299 4 930Other 1997 3032 2196 646 4582 Paper & Board 1998 3031 2090 704 4417BKP 1997 0 1432 3 1429 " 1998 0 1416 15 1401
Spain Newsprint 1997 143 396 49 490 504780 3985 " 1998 192 412 38 566Printing 1997 900 1208 494 1614 per Capita152.4kg & Writing 1998 884 1368 518 1734Sanitary 1997 328 108 61 375 & Household 1998 393 101 68 426Other 1997 2596 1110 587 3119 Paper & Board 1998 2726 1215 597 3344BKP 1997 1224 471 717 978 " 1998 1287 475 702 1060

Russia Newsprint 1997 1194 1 822 373 17075400 14810 " 1998 1394 2 1016 380Printing 1997 447 81 183 345 per Capita13.2kg & Writing 1998 470 75 241 304Sanitary 1997 93 3 0 96 & Household 1998 115 2 0 117Other 1997 1581 89 442 1228 Paper & Board 1998 1561 85 493 1153BKP 1997 1178 21 681 518 " 1998 1205 18 746 477
USA Newsprint 1997 6545 6503 967 12081 9372614 27031 " 1998 6503 6521 781 12243Printing Coat 1997 8450 1521 639 9332 per Capita336.5kg & Writing " 1998 8287 1866 639 9514 " Uncoat 1997 14292 3245 795 16742 " " 1998 14494 3497 704 17287Sanitary 1997 5832 170 86 5916 & Household 1998 5990 160 90 6060Other 1997 49688 1914 7373 44229 Paper & Board 1998 49181 2095 6772 44504Chemical Pulp 1997 50292 5310 5483 50119 " 1998 49078 5065 4734 49409
Canada Newsprint 1997 9208 17 8247 978 9976136 3068 " 1998 8581 39 7362 1258Printing Coat 1997 1142 430 866 706 per Capita238.1kg & Writing " 1998 1230 481 944 767 " Uncoat 1997 3820 432 3103 1149 " " 1998 3924 494 3161 1257Sanitary 1997 617 109 80 646 & Household 1998 624 104 103 625Other 1997 4182 1192 2188 3186 Paper & Board 1998 4365 1252 2215 3402BKP 1997 10967 184 8118 3033 " 1998 10849 196 8075 2970
Japan Newsprint 1997 3192 628 29 3791 377800 12650 " 1998 3265 620 90 3795Printing Coat 1997 5722 387 512 5597 per Capita236.8kg & Writing " 1998 5749 285 570 5464 " Uncoat 1997 5390 included in coat 5390 " " 1998 5154 " 5154Sanitary 1997 1715 0 0 1715 & Household 1998 1659 0 0 1659Other 1997 14995 309 422 14882 Paper & Board 1998 14059 265 446 13878BKP 1997 7852 2572 59 10365 " 1998 7606 2393 37 9962

China Newsprint 1997 730 453 3 1180 9596961 125510 " 1998 740 236 0 976Printing Coat 1997 142 828 22 948 per Capita n.a. & Writing " 1998 132 1428 20 1540 " Uncoat 1997 5100 240 29 5311 " " 1998 5152 349 25 5476Sanitry 1997 2280 20 55 2245 & Household 1998 2310 29 0 2339Chemical Pulp 1997 1385 865 0 2250 " 1998 1310 1863 n.a. 3173
Korea Newsprint 1997 1592 14 279 1327 99222 4610 " 1998 1700 0 808 892 " 1999 1718 n.a. n.a. n.a. per Capita 113.7kgPrinting Coat 1997 1169 56 599 626 & Writing " 1998 1118 17 802 333 " " 1999 1302 n.a. 823 n.a. " Uncoat 1997 836 56 67 825 " " 1998 630 7 63 574 " " 1999 784 n.a. 24 n.a.Sanitary 1997 332 0 4 328 & Household 1998 272 0 4 268 " 1999 291 n.a. 17 n.a.BKP 1997 394 1505 0 1899 " 1998 249 1408 0 1657
Taiwan Newsprint 1997 63 432 0 495 35788 2180 " 1998 84 407 0 491 " 1999 79 n.a. 0 n.a. per Capita221.9kgPrinting Coat 1997 322 65 53 334 & Writing " 1998 323 65 64 324 " " 1999 341 n.a. 77 n.a. " Uncoat 1997 417 128 36 509 " " 1998 402 112 37 477 " " 1999 399 n.a. 31 n.a.Sanitary 1997 267 27 29 265 & Household 1998 262 26 32 256 " 1999 278 n.a. 35 n.a.BKP 1997 346 602 3 945 " 1998 339 531 1 869
Source: P.P.I.,CEPI, AF&PA, CPPA, JPPA

Attached Sheet No. 9
Northern Bleached Softwood Kraft MARKET PULP(NBSK) PRICES-Monthly Figures in USD per tonYear Jan. Feb. Mar. Apr. May June July Aug. Sept. Oct. Nov. Dec.1990 830 830 830 830 830 830 800 800 800 800 800 7601991 720 700 700 650 580 580 560 540 500 500 520 5201992 540 540 580 580 580 600 600 600 600 600 600 5001993 450 450 400 400 400 400 400 400 390 390 390 3901994 440 440 460 510 510 510 510 630 630 700 700 7001995 750 750 820 825 825 925 925 925 925 1000 1000 9251996 825 650 550 520 520 520 520 550 550 560 560 5601997 560 520 510 510 540 560 580 580 610 610 600 5801998 560 540 500 530 550 550 550 520 480 460 460 4601999 460 460 460 480 500 520 520 520 560 560 600 6002000 630 630 630 670 670 700 720
Source: 1990-1992 By research of JPPA, dtd. Nov.26, 19981993-2000/Mar. " P.P.I. Processed by Assocarta(Italian Assn.)2000/Apr.-July " Mitsui & Co.

Attached Sheet No. 10North America and Nordic "Wood Pulp Statistics"
【Chemical Market Pulp Operating Rates by Quarter】 <%>Year Q-1 Q-2 Q-3 Q-4 Total1985 92.6 85.2 86.8 89 88.41986 88.5 88.2 92.7 94 90.91987 96.2 95.8 99.5 97.1 97.21988 100.6 92.6 98.9 95.8 971989 99.8 95.7 96.8 90.5 95.71990 92 85.6 84.1 84.9 86.61991 89.9 84.5 81.6 87.1 85.71992 93.3 87 89.3 88.4 89.51993 89.6 85.7 85 85.5 86.51994 93.2 92.8 92.1 92.5 92.61995 96.6 93.1 97.9 87.7 93.81996 83.5 83.7 91.9 89.1 87.21997 93.6 90.5 91.1 88.4 90.91998 85.9 86.6 85.7 86.7 86.21999
【Chemical Market Pulp Inventories by Month】 Unit:1000t.Year Jan. Feb. Mar. Apr. May June July Aug. Sept. Oct. Nov. Dec.1985 1788 1836 1790 1643 1466 1478 1504 1528 1384 1504 1562 13261986 1330 1306 1131 1024 1080 943 1014 1030 894 890 1018 8471987 1000 1022 867 907 925 801 955 1053 854 870 897 6761988 915 900 797 815 767 671 798 844 772 798 852 6751989 890 897 764 804 841 786 943 1033 992 1068 1182 10261990 1418 1470 1388 1402 1448 1400 1702 1656 1485 1464 1450 13531991 1487 1596 1578 1554 1575 1612 1643 1741 1467 1440 1378 12371992 1400 1403 1250 1269 1295 1125 1286 1509 1563 1637 1840 18471993 2045 2115 1974 1888 1810 1848 1956 2070 1933 1751 1603 14121994 1501 1536 1425 1325 1252 1265 1284 1267 1111 1162 1205 10531995 1160 1177 1187 1199 1136 1020 1249 1266 1284 1584 1856 19931996 2332 2595 2574 2126 1827 1527 1720 1766 1736 1756 1930 19261997 2066 2138 1984 1752 1645 1575 1696 1778 1621 1582 1764 17691998 1931 1836 1532 1473 1434 1521 1836 1523 1759 1662 1650 15931999

Attached Sheet No.11WOODPULP, PAPER and PAPER BOARD
Forecast of Production Capacity Expansion by FAOUnit:1000 t.
Region Paper and Paper Board Woodpulp for Paper Making Production Capacity Annual Change Production Capacity Annual Change
1992 1997 2002 <92-96> <97-02> 1992 1997 2002 <92-96><97-02>
World Total 283121 324905 349796 2.8 1.5 174642 186322 198324 1.3 1.3
Canada 18799 20401 21699 1.6 1.2 27065 28005 28479 0.7 0.3USA 81449 93104 96630 2.7 0.7 60550 61809 62586 0.4 0.3North/West Europe 74743 87636 98208 3.2 2.3 37035 40507 43046 1.8 1.2Japan 33071 33271 34898 0.1 1.0 15126 15029 15901 -0.1 1.1East Europe,exUSSR 16623 12400 13124 -5.7 1.1 14145 12383 12773 -2.6 0.6Deveoped Countries 5344 6155 6691 2.9 1.7 4249 4548 5020 1.4 2.0 (Others) Asia 37152 53703 58314 7.6 1.7 5788 11458 14220 14.6 4.4 (China) 19793 23355 24755 3.4 1.2 2184 3135 3320 7.5 1.2 (Korea) 6008 10289 11242 11.4 1.8 480 836 836 11.7 0.0 (Indonesia) 3309 7242 7242 17.0 0.0 939 4312 6032 35.6 6.9 (Thailand) 1574 3283 4548 15.8 6.7 0 518 518 0.0 (Others) 6468 9534 10527 2185 2657 3514Others 15940 18235 20232 2.7 2.1 10684 12583 16299 3.3 5.3

Attached Sheet No. 12Production of Paper and Paper Board in West Europe and in Other Main Countries(1990~1999)
Unit: 1000 t.COUNTRY 1990 % 1991 % 1992 % 1993 % 1994 % 1995 % 1996 % 1997 % 1998 % 1999 %
69476E.U. 59137 100 59984 101.4 62182 105.1 63928 108.1 117.5 70179 118.7 69822 118.1 75736 128.1 77547 131.1 79811 135.0 Germany 11873 100 12132 102.2 12942 109.0 13034 109.8 14457 121.8 14827 124.9 14733 124.1 15930 134.2 16311 137.4 16686 140.5 Finland 8965 100 8760 97.7 9130 101.8 9966 111.2 10879 121.3 10841 120.9 10349 115.4 12148 135.5 12702 141.7 12947 144.4 Sweden 8427 100 8349 99.1 8378 99.4 8779 104.2 9284 110.2 9170 108.8 9019 107.0 9759 115.8 9879 117.2 10077 119.6 France 7049 100 7319 103.8 7695 109.2 7975 113.1 8682 123.2 8616 122.2 8529 121.0 9144 129.7 9164 130.0 9603 136.2 Italy 6180 100 6389 103.4 6639 107.4 6716 108.7 7287 117.9 7371 119.3 7488 121.2 8031 130.0 8254 133.6 8568 138.6 U.K. 4825 100 4951 102.6 5128 106.3 5402 112.0 5843 121.1 6090 126.2 6222 129.0 6478 134.3 6477 134.2 6568 136.1 Spain 3446 100 3426 99.4 3449 100.1 3351 97.2 3501 101.6 3684 106.9 3770 109.4 3968 115.1 4197 121.8 4435 128.7 Austia 2932 100 3090 105.4 3252 110.9 3301 112.6 3603 122.9 3599 122.7 3653 124.6 3817 130.2 4010 136.8 4142 141.3 Netherlands 2742 100 2862 104.4 2835 103.4 2857 104.2 3010 109.8 2967 108.2 2987 108.9 3159 115.2 3180 116.0 3252 118.6 Belgium 1201 100 1126 93.8 1139 94.8 1027 85.5 1247 103.8 1313 109.3 1328 110.6 1500 124.9 1538 128.1 1664 138.6 Portugal 780 100 866 111.0 958 122.8 876 112.3 949 121.7 977 125.3 1025 131.4 1078 138.2 1132 145.1 1164 149.2 Greece 347 100 323 93.1 307 88.5 320 92.2 380 109.5 387 111.5 354 102.0 347 100.0 322 92.8 322 92.8 Denmark 335 100 356 106.3 294 87.8 287 85.7 314 93.7 301 89.9 323 96.4 335 100.0 345 103.0 347 103.6 Ireland 35 100 35 100.0 36 102.9 37 105.7 40 114.3 36 102.9 42 120.0 42 120.0 36 102.9 36 102.9
West Europe Others 3115 100 3043 97.7 2988 95.9 3294 105.7 3574 114.7 3697 118.7 3513 112.8 3789 121.6 3838 123.2 3971 127.5 Norway 1820 100 1784 98.0 1684 92.5 1965 108.0 2147 118.0 2262 124.3 2094 115.1 2209 121.4 2259 124.1 2240 123.1 Switzerland 1295 100 1259 97.2 1304 100.7 1329 102.6 1427 110.2 1435 110.8 1419 109.6 1580 122.0 1579 121.9 1731 133.7
North America 87929 100 88679 100.9 91841 104.4 94606 107.6 98991 112.6 100559 114.4 100408 114.2 105189 119.6 104623 119.0 107908 122.7 U.S.A. 71463 100 72120 100.9 75243 105.3 77072 107.8 80683 112.9 81845 114.5 81989 114.7 86223 120.7 85899 120.2 87682 122.7 Canada 16456 100 16559 100.6 16598 100.8 17534 106.5 18308 111.2 18714 113.7 18419 111.9 18966 115.2 18724 113.7 20226 122.8
Japan 28088 100 29053 103.4 28322 100.8 27762 98.8 28527 101.6 29663 105.6 30013 106.9 31015 110.4 29888 106.4 30631 109.1
Source: CEPI, FAO, AF&PA, CPPA, JPPA, ASSOCARTAFor Reference Korea 8369 7750 8875 Taiwan 4507 4223 4349
Source: JPPA

Attached Sheet No. 13Finnish Pulp, Paper and Paperboard Production from 1989 to 1998
Unit:1000 t.Products 1989 1990 1991 1992 1993 1994 1995 1996 1997 1998
Chemical Pulp 5543 5159 4897 4914 5465 5844 5782 5736 6620 6718 Sulphate 5224 4870 4682 4914 5465 5844 5782 5736 6620 6718 Sulphite 318 289 215 0 0 0 0 0 0 0Mechanical Pulp 3203 3293 3157 3156 3401 3631 4306 3957 4469 4637Semi-chemical Pulp 373 434 432 458 472 487 0 0 0 0TOTAL PULP 9119 8886 8486 8528 9339 9962 10088 9693 11089 11355
Paper 6780 7078 6851 7075 7834 8546 8595 8023 9543 10116Paperboard 1973 1889 1926 2078 2156 2363 2346 2419 2606 2586
TOTAL PAPER 8753 8966 8777 9153 9990 10909 10941 10442 12149 12703
Production of Market Chemical Woodpulp in Finland Delivery of Market Woodpulp per Quality(フィンランド市販化学パルプ生産統計資料) 品質別市販パルプ納入統計資料)
1995 1996 1997 1998 Unit: tons 1995 1996 1997 1998 Unit: tonsBleached Sulphate 1431352 1615287 1791293 1729835 1380648 1604195 1808480 1730578 (Softwood) 789145 895870 1014570 968926 755983 881743 1028768 967868 (Hardwood) 642207 719417 776723 760909 624665 722452 779712 762710Unbleached Sulphate 43531 38209 35184 25430 39071 37693 32170 29806
Total 1474883 1653496 1826477 1756265 1419719 1641868 1840650 1780384

Attached Sheet No. 14FINLAND Delivery of MARKET PULP per Country (Source: Finnish Forest Ind. Federation)
Unit: tons
1995 1996 1997 1998Austria 12663 27809 20322 17330Belgium 26352 25243 26337 18755Finland 207284 159358 204765 191045France 136080 152453 153110 107794Germany 567994 625918 679113 687879Ireland 816 1587 2329 2701Italy 49266 66733 87989 105514Netherlands 37586 59757 42052 37216Portugal 35329 50104 63037 48017Spain 5478 19803 11082 12417Denmark 145 198 22 10Greece 3205 3827 2104 1035Sweden 32099 34407 61205 63081United Kingdom 180989 245230 248402 235587Norway 7334 622 0 54Switzerland 41063 38573 78219 72807 Western Europe 1343683 1511622 1680088 1603240
Bulgaria 608 1000 738 300Croatia 18 0 0 0Czech Republic 795 1556 3583 5023Hungary 3316 2053 5 2325Malta 100 425 667 131Poland 302 3593 1761 6851Russia 2181 5587 5555 7064Slovakia 366 472 628 968Slovenia 1279 3747 4753 9809Turkey 885 8865 1032 6010Ukraine 18 689 596 98Yugoslavia 0 28 139 63Others 92 105 25 0 Eastern Europe 9960 28120 19482 38642
U.S.A. 3427 3918 4307 4828Others 31 14 105 48 America 3458 3932 4876
Algeria 0 0 0 989Egypt 1158 0 70 0Morocco 100 124 2085 53South Africa 60 90 120 121Tunisia 891 1560 2086 2222Others 1060 1258 1047 1280 Africa 3269 3032 5408 4665
China 5098 20215 18319 25284Inida 1926 3250 5929 3508Indonesia 11976 4777 16650 17101Iran 868 3078 4970 2960Israle 13664 18925 26354 26069Japan 19688 23114 27855 14684Lebanon 1943 2585 8159 6041Malesia 315 1091 663 478Philipines 498 795 2410 316South Korea 0 10553 7710 3942Syria 300 1 1251 988Taiwan 1314 1076 2353 6730Thailand 0 1911 5928 570Vietnam 1352 1381 2150 1623Others 387 2410 519 665 Asia 59329 95162 131220 110959
Other Countries 20 20 40 0
GRAND TOTAL 1419719 1641888 1840650 1762382

Attached Sheet No. 15 PRODUCTION OF WOODPULP FOR PAPER MAKING IN EUROPE (MAJOR MARKETS ONLY)
Country 1990 1995 1997 1998 1990=100 Market Pulp Only NUMBER OF MILLS BY VOLUME 1998 1998 1998 1998 (Unit: 1000 t.) (%) Production Domestic Total Less than 10001- 50000- 100001- Over Delivery Delivery 10000 t/y 50000 t/y 100000t/y 250000t/y 250000t/y
Austria 1459 1466 1475 1491 102 310 81 284 2 2 1 7 1Belgium 477 443 406 380 80 146 72 204 0 0 1 2 0Finland 8886 10088 11088 11354 128 1756 191 1760 2 5 6 12 20France 2205 2817 2829 2674 121 669 428 667 3 3 1 8 4Germany 2338 1950 1957 1949 83 0 0 0 3 6 7 9 0Italy 591 455 467 462 78 0 0 0 1 6 4 2 0Netherlands 189 148 137 129 68 0 0 0 0 1 0 1 0Norway 2275 2485 2337 2420 106 286 45 283 0 4 4 3 4Portugal 1449 1616 1703 1708 118 1068 77 1039 0 0 1 3 3Spain 1519 1576 1560 1608 106 982 287 982 3 2 3 5 2Sweden 9913 10186 10496 10541 106 2794 441 2786 0 6 8 12 20U.K. 595 638 623 583 98 0 0 0 0 0 2 1 1
(Reference Data)Canada 22605 25402 24850 23556 104 9739 839 9881 Source: CEPI: Confederation of European Paper Ind.
1997 1997 AF&PA. American Forest & Paper Assn.U.S.A. 56025 59679 59358 n.a. 106 8545 n.a. n.a. CPPA: Canadian Pulp & Paper Assn.Japan 11140 10978 11365 10833 97 1224 1222 0 JPA: Japan Paper Assn.Latin America 6426 9293 n.a. n.a.

Attached Sheet No. 16Wood Pulp Import Statistics <1998> Unit: 1000 t.D. Pulp Import to CEPI Countries TO Austria Belgium Denmark Finland France Germany ItalyNetherlands Portugal Spain Sweden U. K. Total EU Czech Rep NorwaySwitzerland Total CEPIFROMAustria 3 n.a. 0 9 46 137 5 0 1 0 2 203 4 10 217Belgium 2 n.a. 0 47 12 45 268 0 0 1 0 375 0 7 381Denmark 0 0 3 1 3 9 2 0 0 1 1 19 0 2 21Finland 18 46 n.a. 107 670 94 45 14 53 174 1220 12 1 73 1306France 5 16 n.a. 1 71 147 80 1 93 0 17 431 0 18 448Germany 27 16 n.a. 3 19 149 656 0 4 12 5 891 10 6 907Ireland 0 0 n.a. 0 0 0 3 0 0 0 0 3 0 0 3Italy 1 0 n.a. 0 1 2 0 1 0 0 5 0 0 5Netherlands 0 9 n.a. 0 3 4 6 2 0 0 2 26 0 1 26Portugal 54 9 n.a. 8 101 219 48 310 117 69 90 1025 4 9 33 1071Spain 49 6 n.a. 7 62 138 140 40 9 12 62 524 1 3 37 565Sweden 177 58 n.a. 9 312 726 251 273 14 45 167 2032 13 102 47 2194United Kingdom 0 0 n.a. 0 3 1 1 80 0 2 0 87 0 0 88Total EU 333 163 n.a. 30 664 1892 1027 1717 71 277 148 518 6841 45 115 232 7233Czech Republic 18 3 n.a. 0 28 39 36 0 0 5 2 130 9 139Norway 11 7 n.a. 6 94 98 36 50 0 1 51 32 386 0 11 397Slovak Republic 2 4 n.a. 2 8 0 0 0 0 16 0 16Switzerland 3 4 n.a. 0 8 17 69 15 0 5 0 1 121 1 122Total SEPI 367 181 n.a. 36 796 2054 1168 1782 71 284 204 552 7494 45 115 252 7907Other West Europe 0 0 n.a. 0 0 0 0 0 0 0 0 0 0 0Total West Europe 367 181 n.a. 36 796 2054 1168 1782 71 284 204 552 7494 46 115 252 7907Eastern Europe 9 19 n.a. 5 21 100 117 0 15 0 27 314 93 1 407U.S.A. 29 52 n.a. 2 364 295 663 270 1 99 17 270 2062 5 27 2095Canada 46 96 n.a. 8 380 870 664 87 11 83 10 282 2538 1 69 2608Brazil 39 37 n.a. 0 222 209 136 44 0 6 3 233 929 0 35 964Other Latin America 12 24 n.a. 2 123 118 182 12 56 2 90 620 0 36 656Japan 0 )19 n.a. 0 0 0 0 0 0 19 0 0 19Other Asia 10 ) n.a. 0 17 35 128 2 19 4 23 238 0 10 249Africa 87 ) n.a. 0 36 9 41 0 3 0 28 203 0 0 203Oceania 0 n.a. 0 0 1 0 0 0 0 1 0 0 2Others 0 n.a. 0 80 0 0 0 1 81 5 8 0 94TOTAL 599 426 n.a. 53 2040 3691 3099 2183 96 565 240 1506 14498 151 123 432 15203
Source: Confedertion of European Paper Industries-Trade Statistics 1998(CEPI)

Attached Sheet No.17IMPORT OF WOODPULP TO ITALY
(Unit: 1000 t)1990 1991 1992 1993 1994 1995 1996 1997 1998 1999
WORLD Total 2049.8 2309.1 2451.1 2477.2 2666 2714.2 2784.9 3030.2 3075.7 3118.2(From) Germany 18.8 32.1 38.3 34.5 59.7 73.3 82.2 114.4 128.7 118.9 France 128.1 143.8 158.7 118.2 131.2 117.5 93.8 145.4 146.9 147.7 Netherlands 0.1 0.1 0.7 1.1 1.3 13.6 21.5 9.5 5.8 10.2 Belgium/Lux. 17 12 12.1 1.1 18.2 26.4 48.6 59.8 44.6 35.8 U.K. 0.6 0.6 0.6 0.6 0.9 0.9 0.3 0.6 1 0.7 Ireland 0 0 0 0 0 0 0 0 0 0 Denmark 32 27.7 20.3 16.5 28.5 30.2 25.6 33.7 8.4 0 Greece 0 0 0 0 0 0 0 0 0 0 Portugal 61.3 59.4 49.9 58.2 64.5 62.6 59.4 42.7 48.1 51.5 Spain 95 87.3 94.1 78 107.4 108.3 112.7 129.8 138.6 145.3 Sweden 214.2 307.8 292.1 306 292.3 234.7 200 220.2 251.5 290.8 Finland 111.2 96.9 99.1 91.3 86.6 51 67.4 91.8 94 145.4 Austria 108 76.2 93.2 111.4 108 111.2 128.7 159.2 136.9 137.8 Norway 32.7 23.9 25.5 35.2 46.2 27.1 25.3 18.4 35.7 30.1 Switzerland 26.5 34.6 35 30.7 34.7 33.2 39.4 74.2 68.9 76
EAST EUROPE 257.5 139.4 174.7 298.1 <261.4> <321.7> <250.6> <197.3> <153.2> <134.2> Russia n.a n.a n.a n.a 162.1 217.5 135.9 79.6 41.9 20.7 Czech Rep. n.a n.a n.a n.a 22 18 22.4 31.2 35.6 35 Bulgaria n.a n.a n.a n.a 21.9 14.9 16.9 18.7 16.9 15.8 Slovenia n.a n.a n.a n.a 12.5 18.3 15.3 34.9 25.4 26 Croatia n.a n.a n.a n.a 22 20.5 25 25.9 32 31.6
U.S.A. 426.3 623.5 643.4 497.2 516.3 534.7 601.6 650.6 662.7 579.4 Canada 409 480.2 502.8 532.6 626.7 646.6 617.4 696.2 664.1 699.7
LATIN AMERICA Brazil 42.1 82.6 84.4 108.1 109.3 84.9 110.7 103.3 135.8 173.4 Chile 10.1 21 57.3 92.4 102.3 120.6 162.7 176.5 180.5 188.7 Others 20.9 7.1 9.9 6.6 8.4 10 6.9 4.8 1.6 0.2
ASIA 1.4 0.2 0.2 0.1 <3.1> <63.7> <87.4> <54.4> <127.8> <101.6> Indonesia n.a n.a n.a n.a 0.1 48.9 78.3 53.1 114.1 71.8 Thailand n.a n.a n.a n.a 2.8 14.7 8.8 1.1 13.1 28.9 Others n.a n.a n.a n.a 0.2 0.1 0.3 0.2 0.6 0.9
AFRICA Marocco 16 14.9 17.9 17.3 23.7 13.5 21.3 21.1 19.1 26.6 South Africa 14.3 30.1 32.8 38.6 33.1 27.1 19.3 26.1 18 20.2 Others 3.1 4.8 4.5 3.1 2.2 2.4 1.8 0.2 3.8 4
Austria/Ocea. 3.6 2.9 3.6 0.3 0 0 0.3 0 0 0
Others Source: ASSOCARTA(Italian Pulp and Paper Association)

Attached Sheet No. 18 Source: P.P.I. PAPER・PULP ENTERPRISES RANK 50(1998) RANK SALES 1998/1997 NAME of COMPANY COUNTRY1998 1997 million USD %
1 1 15310 -3.4 International Paper USA2 3 8949 5.8 Stora Enso Finland, Sweden3 4 8545 2.4 Kimberly Clark USA4 2 7911 -9.6 Oji Seisi Japan 5 5 7789 8.9 UPM Kymmene Finland 6 6 7301 0.6 Fort James USA7 9 5797 10 Svensca Cellulosa Sweden8 7 5675 -12.8 Nippon Seisi Japan 9 8 5652 2.4 Georgia Pacific USA10 10 5270 -2.6 Arjo Wiggins Appleton U.K.11 11 4879 0.6 Stone Container USA12 12 4640 -3.3 Champion International USA13 13 4300 -6.7 Weyerhaeuser USA14 14 4117 12.3 Jefferson Smurfit Group Ireland15 18 3996 41.7 Sappi South Africa16 15 3919 9.2 Metsa Serla Finland17 17 3484 2.4 Union Camp USA18 19 3310 1.7 Mead USA19 16 3007 -1.7 Amcor Australia20 20 2653 -18.1 Jefferson Smurfit Corp. USA21 22 2556 -3.8 Westvaco USA22 25 2515 15.8 Assi Doman Sweden23 26 2446 9.3 Willamette Industries Inc USA24 31 2385 19.5 Asia Pulp and Paper Singapor25 24 2294 2.8 Daio Seisi Japan 26 23 2141 18.6 Sonoco Products USA27 28 2138 3.5 Modo Sweden28 27 2133 4 Abitibi Consolidated Canada29 21 2065 -16.4 Daishowa Seisi Japan 30 30 2018 -2.2 Temple Inland USA31 35 1983 23.8 Consolidated Papers USA32 43 1847 36.8 Bowater USA33 33 1793 3.7 Haindl Germany34 34 1752 9.2 Boise Cascade USA35 40 1700 13.3 Tenneco Packaging USA36 32 1679 -2.9 Rengo Japan 37 39 1654 18.1 Cascades Canada38 38 1649 16.8 Norske Skog Industria Norway39 36 1640 5.7 Cartiere Burgo Italy40 41 1587 7.7 Kappa Packaging Netherlands41 29 1548 -9.5 Fletcher Challenge New Zealand42 42 1436 3.1 Franchati Austria43 46 1342 19.1 Domtar Canada44 37 1325 -6.9 Mitsubishi Seisi Japan 45 50 1293 16.6 Rock Tenn USA46 47 1265 8 Myllykoski Finland47 63 1217 47.4 Donohue Canada48 49 1136 -0.3 Riverwood International USA49 52 1045 -3.1 Potlatch Corp USA50 56 1005 8 Maria Mellhow Austria
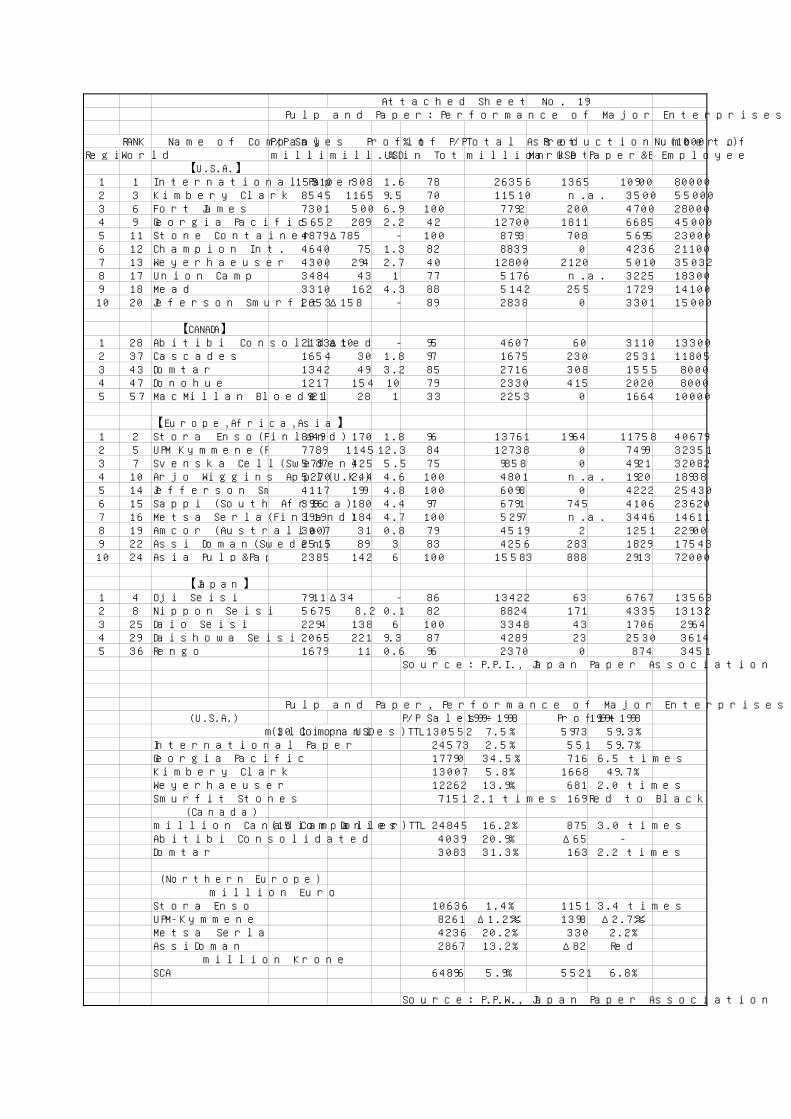
Attached Sheet No. 19 Pulp and Paper: Performance of Major Enterprises in the World(1998)
RANK Name of Company P/P Sales Profit % of P/P Total Asset Production (1000 t.) Number ofRegion World million USD mill.USD % in Total Salemillion USD Market PulpPaper&Board Employee
【U.S.A.】1 1 International Paper 15310 308 1.6 78 26356 1365 10900 800002 3 Kimbery Clark 8545 1165 9.5 70 11510 n.a. 3500 550003 6 Fort James 7301 500 6.9 100 7792 200 4700 280004 9 Georgia Pacific 5652 289 2.2 42 12700 1811 6685 450005 11 Stone Container 4879 Δ785 - 100 8793 708 5695 230006 12 Champion Int. 4640 75 1.3 82 8839 0 4236 211007 13 Weyerhaeuser 4300 294 2.7 40 12800 2120 5010 350328 17 Union Camp 3484 43 1 77 5176 n.a. 3225 183009 18 Mead 3310 162 4.3 88 5142 255 1729 1410010 20 Jeferson Smurfit 2653 Δ158 - 89 2838 0 3301 15000
【CANADA】1 28 Abitibi Consolidated 2133 Δ10 - 95 4607 60 3110 133002 37 Cascades 1654 30 1.8 97 1675 230 2531 118053 43 Domtar 1342 49 3.2 85 2716 308 1555 80004 47 Donohue 1217 154 10 79 2330 415 2020 80005 57 MacMillan Bloedel 921 28 1 33 2253 0 1664 10000
【Europe,Africa,Asia】1 2 Stora Enso(Finland) 8949 170 1.8 96 13761 1964 11758 406792 5 UPM Kymmene(Finland) 7789 1145 12.3 84 12738 0 7499 323513 7 Svenska Cell(Sweden) 5797 425 5.5 75 9858 0 4921 320824 10 Arjo Wiggins Appl(U.K.) 5270 244 4.6 100 4801 n.a. 1920 189385 14 Jefferson Smu.(Ireland) 4117 199 4.8 100 6098 0 4222 254306 15 Sappi (South Africa) 3996 180 4.4 97 6791 745 4106 236207 16 Metsa Serla(Finland) 3919 184 4.7 100 5297 n.a. 3446 146118 19 Amcor (Australia) 3007 31 0.8 79 4519 2 1251 229009 22 Assi Doman(Sweden) 2515 89 3 83 4256 283 1829 1754310 24 Asia Pulp&Paper(Singa) 2385 142 6 100 15583 888 2913 72000
【Japan】1 4 Oji Seisi 7911 Δ34 - 86 13422 63 6767 135632 8 Nippon Seisi 5675 8.2 0.1 82 8824 171 4335 131323 25 Daio Seisi 2294 138 6 100 3348 43 1706 29644 29 Daishowa Seisi 2065 221 9.3 87 4289 23 2530 36145 36 Rengo 1679 11 0.6 96 2370 0 874 3451
Source: P.P.I., Japan Paper Association
Pulp and Paper, Performance of Major Enterprises of Northcan(1999)(U.S.A.) P/P Sales 1999÷1998 Profit 1999÷1998
million USD (30 Companies)TTL 130552 7.5% 5973 59.3%International Paper 24573 2.5% 551 59.7%Georgia Pacific 17790 34.5% 716 6.5 timesKimbery Clark 13007 5.8% 1668 49.7%Weyerhaeuser 12262 13.9% 681 2.0 timesSmurfit Stones 7151 2.1 times 169 Red to Black
(Canada)million Canadian Doller (15 Companies)TTL 24845 16.2% 875 3.0 timesAbitibi Consolidated 4039 20.9% Δ65 -Domtar 3083 31.3% 163 2.2 times
(Northern Europe)million Euro
Stora Enso 10636 1.4% 1151 3.4 timesUPM-Kymmene 8261 Δ1.2% 1398 Δ2.7%Metsa Serla 4236 20.2% 330 2.2%AssiDoman 2867 13.2% Δ82 Red
million KroneSCA 64896 5.9% 5521 6.8%
Source: P.P.W., Japan Paper Association

Attached Sheet No. 20
Restructuring through Merger and Acquisition in the World Paper Industries
(Since 1999)
USA International Paper Acquired Union Camp at $6.6 billion
Weyerhaeuser Acquired MacMillan Bloedel of Canada at $2.45 billion
and the second largest corrugated cardboard
manufacturer in the world.
Georgia Pacific Acquired Unisource Worldwide at $850 million.
Kimberly Clark Acquired Attisholz AG, a tissue manufacturer in
Switzerland and became the largest bathroom tissue
manufacturer in Europe.
Smurfit・Stone Container Sold share of Abitibi Consolidate, slashed corrugated
cardboard/market pulp capacities in the U.S., and sold a
newsprint mill. Planing to acquire St.Lawrent Paper
Board at $1.4 billion in 2000.
Canada Abitibi Consolidated Plans to acquire Donohue at 7.1 billion Canadian
Dollars in2000.becoming the giant newsprint
manufacturer controlling 16% of the world market.
Tembec Acquired a NBKP mill of Crestbrookand a BCTMP mill
of Donohue. In 2000, the company plans to acquire a
NBKP mill of Fort James, jointly with Kruger
Canfor Acquired Northwood at635 million Canadian Dollar
and became the largest market pulp maker in Canada.
Finland Stora・Enso Acquired Consolidated (31st in world ranking) at 4.9
billion Euro in 2000 and became the second largest in
the world.
Sweden Svenska Cellulosa Merged with Modo’ s woodfree paperdivision to
establish Modo Paper and became the third largest in
Europe.
Source: Pulp & Paper Week, JPA” Pulp & Paper No.616”

Attached Sheet No. 21
GRADE DEFINITIONS
The definitions below are intended to give a broad guide to the major grades specified
in
the report.
PULP
The report shows figures for total pulp production, i.e. both integrated pulp and market
pulp. Integrated pulp is pulp that is produced for use as row material in production of
paper at the same mill, or for shipment by a producing mill to other mills, which it
owns, controls or with which is affiliated within the same country. Market pulp is
pulp that
is sold in open competition with that of other producers. All pulp exported exported
from the producing country is considered to be market pulp.
MECHANICAL PULPS
Stone Groundwood pulp produced by grinding wood into relatively short fibres. This
pulp is used mainly in newsprint and wood-containing papers, like LWC and SC
papers.
Thermo-mechanical (TMP) pulp produced in a thermomechanical process where wood
particles are softened by steam before entering a pressurized refiner. TMP has mainly
the same end uses as Stone Groundwood.
Variants of the abkove two processes produce pressurized stone groundwood pulp and
refiner mechanical pulp.
SEMI-CHEMICAL PULPS
Semi-chemical pulp produced in a two-stage process which involves partial digestion
with chemicals, followed by mechanical treatment in a disc refiner. This pulp is mainly
used in production of fluting medium for corrugated board.
Chemi-thermomechanical(CTMP) pulp produced in a similar way to TMP, but the wood
particles are chemically treated before entering the fefiner. This pulp has properties
suited to tissue manufacture. Some CTMP pulp is used in printing and writing grade.
CTMP pulp is classified under semi-chemical pulps in the Harmonised System of the
Customs co-operation council. In FAO, as well as other industry, such chemi-thermo-
mechanical pulps are grouped with mechanical pulp.
CHEMICAL PULPS
Sulphite pulp produced by cooking wood chips in a pressure vessel in the presence of
bisulphite liquor. End-uses range from newsprint, printing and writing papers, tissue

and sanitary papers. Sulphite can be either bleached or unbleached.
Sulphate (or Kraft) pulp produced by cooking wood chips in pressure vessel in the
presence of a sodium hydroxide (soda) liquor. The pulp may be unbleached or bleached
End uses are widespread, with bleached pulp particularly used for graphic papers,
tissue and carton boards. Unbleached pulp is commonly used in liner for corrugated
board, wrappings, sack and bag papers, envelopes and other unbleached speciality
papers.
DISSOLVING PULPS
Pulp which is highly refined, bleached sulphite or sulphate pulp with a high content
of alpha (pure cellulose) fibre. Its normal end-uses are the production of rayon,
acetate. cellophane. explosives etc. It is also used in speciality papermaking.

Chapter 3 RAW MATERIALS

3 - 1
Chapter 3 RAW MATERIALS
3.1 Potential Supply Sources and Major Issues
(1) Supply sources
In Lithuania, there are three types of pulpwood supply sources, as shown
below.
* The following five species that are currently exported as pulpwood logs
Spruce
Pine
Birch
Aspen
Alder
* Fuelwood
Most fuelwood logs can also be used as pulpwood logs for BKP production
in terms of diameter and length, unless species are not limited.
* Wood wastes from sawmills
Chips that can be generated from sawmill wastes are discussed in the next
section. Potential supply sources of domestic pulpwood logs (currently
exported) and fuelwood logs are examined below.
1) Export pulpwood materials
As shown in Table 1.6.18 “Domestic Wood Consumption Trends,” logs
exports from the country in recent years range between 760000 and 940000 m3,
most of which are reportedly pulpwood logs. Log sales by State Forest
Enterprises – major suppliers of export logs – including export volume by
market are summarized below.
Table 3.1.1 Roundwood Export & State Forest Enterprises' Pulpwood
Sales
(1000m3)1996 1997 1998 1999
Log Export 952 764 786 936 S.F.E..' Sales 769 703 662 707 Souce: Center of Forest Economics S.F.E. : State Forest Enterprises

3 - 2
Exports to Russia are reportedly shipped to three pulp mills in Kaliningrad and
those to Latvia appear to be sent to Sweden.
Table 3.1.2 Main Export Countries
(1000m3)1996 1997 1998 1999
Sweden 257 373 387 505 Poland 73 26 90 205 Russia 443 273 209 147 Latvia 28 36 85 47 Total 801 708 771 904 Souce: Center of Forest Economics Table 3.1.3 State Forest Enterprises' Pulpwood Sales by Species
(1000m3)1996 1997 1998 1999
Spruce P. 536 317 202 209 Pine P. 47 76 91 105 Birch P. 150 245 318 364 Aspen P. 34 54 49 28 Alder P. 2 11 2 1 Total 769 703 662 707 P. : Pulpwood Souce: Center of Forest Economics
The major specifies for export is shifting from spruce to birch, while demand
for aspen and alder is relatively small.
2) Fuelwood logs
Fuelwood production and consumption in the country is estimated at around 1
million m3 per year. As pointed out earlier, fuelwood logs are basically same
as pulpwood logs, except for species, and in fact they are used as
“technological wood” to produce particleboards and fireboards. As the
proposed 500,000 ton pulp mill require 2.5 million m3 of pulpwood logs, a
variety of logs need to be collected, not only pulpwood logs that are currently
exported, but logs of diameter and length that are not suitable for sawmill
production or other industrial uses, including fuelwood logs. The possible
shortage of fuelwood due to conversion is discussed in the next section on
sawmill wastes.

3 - 3
3) Wood supply outlook
The study team received wood supply forecast data from the Forest Inventory
and Management Institute, national research organization on forest resources
and accounting. The report, entitled the “Report on Structure of Roundwood
Supply for the Next Two Decades (2000 – 2020) from the Commercial Forests
in Lithuania,” forecasts the annual average wood supply volume for the periods
between 2000 and 2010 and between 2011 and 2020 by State Forest Enterprise,
and 18 species (Scotch pine, Pinus Banks, mountain pine, Norway spruce,
larch, oak, ash, maple, horn beam, elm, birch, black alder, aspen, gray alder,
lime polar, goat willow, and willow).
The report also presents supply forecast by type of lumber and fuelwood.
Lumber is classified into five types by diameter class (top diameter over bark),
namely Large (d>=25.1), Medium I (25.0>d>=17.1), Medium II
(17.1>=d>=13.6), Medium Total, and Small (13.5>=d>=5.6). Same
estimation is made for state-owned forests.
The institute is currently compiling supply forecast for the next three decades,
including Forest Group 2, logging residues and branches, and has presented its
outline to the study team. In short, it contains the annual average supply
forecast for the three periods between 2000 and 2010, between 2011 and 2020,
and between 2021 and 2030 for the following categories:
- Total, state-owned forests and private forests
- Species (pine, spruce, oak, ash, birch, black alder, aspen, gray alder, others,
and total)
- Harvest category (final cutting, thinning, sanitary, and total)
- Lumber, fuelwood, logging residue and branch
- Lumber’s diameter class (see above)
The institute is currently compiling detailed data for publication in November
2000. Key data are shown in Table 3.1.4 “Wood Supply Outline (2001 –
2030).”
The proposed pulp mill is assumed to operate at 80% of capacity in the first
year (2007), 95% in the second year (2008) and 100% in the third year and

3 - 4
afterwards. Based on these operating rates, wood demand trends in the initial
years are expected as follows.
2007 2008 2009 and afterwards
Wood demand for domestic industry 3000 3000 3000
Demand by the new pulp mill 1960 2328 2450
Total 4960 5328 5450
As pulpwood log supply is expected to be very tight between 2008 and 2010,
the wood material procurement plan should be established on the basis of
fuelwood conversion. Supply and demand will be balanced in 2011 and
afterwards.
4) Major issues related to wood material supply
For forestry in Lithuania, there are two major issues to be solved to meet the
anticipated demand for 2.5 million m3 of pulpwood logs by the new pump mill.
First of all, the country exports 1 million m3 of pulpwood logs annually.
Based on the annual allowable cut, forest resources in the country are not
capable of meeting the new demand by the proposed pulp mill, while
continuing the present level of exports. Clearly, it is imperative divert
currently exported logs to the new mill operation.
Secondly, the bulk of forests in the country are now private owned, and the
average forest area per owner is very small, 3 ha on the average. This means
procurement needs to be made from a large number of forest owners (private
forests are expected to represent 48% of the total in the near future). Efforts
should be made to procure logs from small owners in an efficient manner by
keeping good relationships with them.

3 - 5
Table3.1.4 Outline of Roundwood Supply
(2001---2010) (1000m3)Large MediumⅠ MediumⅡ Medium Small Log Fuel wood Grandd>25 17<d<=25 13.5<d<=17 Total 13.5<d<=5.6 Total Total
State Forests Softwood 730.2 409.2 332.0 741.2 341.8 1813.2 187.1 2000.3
Hardwood 430.5 266.1 396.7 662.8 262.3 1355.6 453.8 1809.4 Total 1160.7 675.3 728.7 1404.0 604.1 3168.8 640.9 3809.7 Private Forests
Softwood 248.4 210.3 219.2 429.5 266.0 914.7 186.4 1130.3 Hardwood 263.4 182.2 448.3 630.5 279.5 1358.3 414.0 1587.4 Total 511.8 392.5 667.5 1060.0 545.5 2273.0 600.4 2717.7 Grand Total Softwood 978.6 619.5 551.2 1170.7 607.8 2727.9 373.5 3130.6 Hardwood 693.9 448.3 845.0 1293.3 541.8 2713.9 867.8 3396.8 Total 1672.5 1067.8 1396.2 2464.0 1149.6 5441.8 1241.3 6527.4 Total of P.R. 1759.1 991.8 998.1 2150.1 921.4 4830.6 975.7 5806.3 Difference -86.6 76.0 398.1 313.9 228.2 611.2 265.6 721.1 P.R.: Previous Report : Report on structure of roundwood supply for the next two decade (2000-2020)
from the commercial forests in Lithuania
(2011---2020)Large MediumⅠ MediumⅡ Medium Small Log Fuel wood Grandd>25 17<d<=25 13.5<d<=17 Total 13.5<d<=5.6 Total Total
State Forests
Softwood 744.5 405.4 331.4 736.8 532.5 2013.8 208.5 2222.3 Hardwood 348.5 218.3 353.3 571.6 316.7 1236.8 439.9 1676.7 Total 1093.0 623.7 684.7 1308.4 849.2 3250.6 648.4 3899.0 Private Forests Softwood 533.9 334.6 287.6 622.2 400.9 1557.0 202.0 1759.0 Hardwood 278.2 191.5 459.7 651.2 344.4 1273.8 455.6 1729.4 Total 812.1 526.1 747.3 1273.4 745.3 2830.8 657.6 3488.4 Grand Total Softwood 1278.4 740.0 619.0 1359.0 933.4 3570.8 410.5 3981.3 Hardwood 626.7 409.8 813.0 1222.8 661.1 2510.6 895.5 3406.1 Total 1905.1 1149.8 1432.0 2581.8 1594.5 6081.4 1306.0 7387.4 Total of P.R. 1909.1 1050.5 980.0 2195.3 1305.1 5409.5 888.9 6298.4 Difference -4.0 99.3 452.0 386.5 289.4 671.9 417.1 1089.0 P.R.: Previous Report
(2021---2030)Large MediumⅠ MediumⅡ Medium Small Log Fuel wood Grandd>25 17<d<=25 13.5<d<=17 Total 13.5<d<=5.6 Total Total
State Forests Softwood 775.4 430.6 368.1 798.7 676.4 2250.5 234.5 2485.0 Hardwood 322.3 195.6 333.1 528.7 313.0 1164.0 410.3 1574.3 Total 1097.7 626.2 701.2 1327.4 989.4 3414.5 644.8 4059.3 Private Forests Softwood 724.9 409.8 341.0 750.8 515.7 1991.4 219.8 2211.2 Hardwood 284.0 179.8 442.1 621.9 363.6 1269.5 447.1 1716.6 Total 1008.9 589.6 783.1 1372.7 879.3 3260.9 666.9 3927.8 Grand Total Softwood 1500.3 840.4 709.1 1549.5 1192.1 4241.9 454.3 4696.2 Hardwood 606.3 375.4 775.2 1150.6 676.6 2433.5 857.4 3290.9 Total 2106.6 1215.8 1484.3 2700.1 1868.7 6675.4 1311.7 7987.1 Souce: Forest Inventory and Management Institute

3 - 6
(2) Proposals to secure wood supply sources
1) Export pulpwood logs
At present, pulpwood logs produced in Lithuania are exported via Klaipeda
Port, Pagegia or Kybartai station (destined to Kaliningrad), Sestokai station
(Poland), and Sarkiai or Mazeikiai station (Latvia).
To intercept these flows and divert them to the proposed pulp mill, it is
proposed to establish pulpwood log collection points (referred to as “district
offices”) at the following four stations:
1. Plunge station: To collect logs that are currently shipped to Klaipeda.
2. Taurage: To collect logs that are currently shipped to Pagegiai
3. Kazlu Ruda: To collect logs that are currently shipped to Kybartai and
Sestokai
4. Siauliai: To divert logs that are currently shipped to Sarkiai and Mazeikiai
These four district offices will perform the following functions:
1. Negotiation with State Forest Enterprises on log purchase, contract
administration, acceptance, and transportation to the mill
2. Negotiation with private forest owners on log purchase, contract
administration, delivery management, and transportation to the mill
3. Operation and management of log storage yards (referred to as “terminals,”
each having land area of 2 –3ha and used to store pulpwood logs purchased
by district offices and load them to rail freight cars.
4. Inspection and acceptance of pulpwood logs
2) Small lot procurement from private forest owners
As State Forest Enterprises have expertise and experience in handling logs and
own handling and transportation facilities and equipment (including rail
stations), district offices should ask them to transport purchased logs by rail or
truck to the mill site.
On the other hand, procurement from private forest owners will likely be made
in small lot (e.g., a small truck load). It is therefore proposed to establish the
following district offices at key railway stations, which will be responsible for
procurement service:
1. Kupiskis

3 - 7
2. Utena
3. Jonava
4. Vilnius
5. Varena
Together with the four district offices proposed above, the nine district offices
will be established to ensure sufficient geographical coverage (see Figure3.1.1)
3) Use of fuelwood logs
It is already discussed in the previous section.
4) Acceptance of logs by weight
It is proposed to accept log delivery on the basis of weight, which is
particularly suitable for small logs.
5) Imports of pulpwood logs
At present, Lithuania exports 1 million m3 of pulpwood logs annually.
Exporters handling the trade (closely associated with foreign pulp companies)
will not likely give up their business easily to the new pulp mill as they have
large stakes in facilities and goodwill. If they intend to continue exports in
competition with the paper mill, supply will become very tight up to 2010 and
pulpwood log prices will inevitably rise sharply. If this occurs, imports from
Belarus and Latvia are recommended as a temporary measure. In this
connection, it is important to secure import channels in advance.


3 - 9
3.2 Sawmill Wood Wastes and Chips
(1) Supply potential and major issues
1) The number and size of sawmills
Table 3.2.1 presents the number of sawmills by purchase volume from State
Forest Enterprises.
Table 3.2.1 The Number of Sawmills by Log Volume Purchased from State
Forest Enterprises (1999)
(A) (B) (C) (D) Percentage of Volume purchased Nummber of Average volume
volume purchased from S.F.E.. mills purchased from
from S.F.E..(%) (1000m3) S.F.E. (1000m3) Plywood & boardmills ① 16 291.0 4 72.8 Log volume purchased from S.F.E.. by sawmills
>10000m3 33 599.7 27 22.2 5000-10000m3 14 254.5 39 6.5 1000-5000m3 25 454.4 199 2.3 100-1000m3 12 218.1 556 0.4
Total 100 1817.7 825 2.2
'Total except ① 84 1526.7 821 1.9
(E) (F) (G) (H) Percentage of Volume purchased Total volume Average total volume
Log volume purchased volume purchased from P.F. (S.F.E+P.F.) (S.F.E+P.F.)
from S.F.E. by sawmills from P.F..(%) (1000m3) (1000m3) (1000m3)
>10000m3 39 382.2 981.9 36.4 5000-10000m3 17 162.2 416.7 10.7
1000-5000m3 30 289.6 744.0 3.7 100-1000m3 14 139.0 357.1 0.6
Total 100 973.0 2499.7 3.0 S.F.E..: State Forest Enterprises, P.F.: Private Forests, Source: Calculated by using Center of Forest Economics' data
Compared to the estimated consumption of sawmill logs (2.5 million m3) in
Table 1.6.19 “Industrial Wood Consumption Trends,” 1526700 m3 accounts for
61%. Generally, sawmills obtain 80% of their log requirements from State
Forest Enterprises. As seen in Figure 1.6.8 “Flow of Logging Operations
(1999),” 1.6.2(6) “Logging Operations,” private logging operations account for
33% of the total, reaching 1.6 million m3, so that it is reasonable to contribute
that they contribute 39% of the total deficit in sawmill logs, 973000 m3
(equivalent to 61% of 1.6 million m3).
There are no statistical data available to show movement of logs harvested in
private forests to sawmills. In any case, assuming that the same percentage of

3 - 10
logs from private forests as state-owned forests is purchased by sawmills, 66
large sawmills (purchasing more than 5000m3 of logs from state-owned
forests) seem to account for an anomalously high share. For instance, 27
sawmills which purchase more than 1000m3 of logs from state-owned forests
(see Table 3.2.1) produce an average 16700 m3 (36400 m3 x estimated yield of
46%), which far exceeds the average sawmill production of 11700m3 in Table
3.2.2.
Table 3.2.2 Sawmills' Production Volume
(1000m3) No Name Place 1998 1999 Remarks
1 Pajurio mediena Klaipeda 16.4 32.7 exporting chips without barks2 G.Kaminsko jm. Prienai 18.0 21.0 selling chips without barks to3 Birzuuredija Birzai 16.6 19.0 boardmill4 Timbex Arima Radviliskis 15.0 14.75 Baltic Wood Mazeikiai 10.4 14.0 exporting chips without barks6 Silunga Alytus 3.9 13.47 Ukmerges uredija Ukmerge 8.9 9.78 Jonavos uredija Jonava 8.4 9.39 Vilniaus mediena Vilnius 8.1 8.4
10 Taurages uredija Taurage 9.0 8.211 S.Bagdono jm. Siauliai 8.0 10.012 Klijuota mediena Kaunas 10.0 10.013 Dubravos uredija Kaunas 6.8 7.814 Egle Kazlu Ruda 7.715 Nemencines uredija Vilnius 10.1 7.316 Oslo Wood Vilnius 6.8 6.917 Jurbarko uredija Jurbarkas 6.7 6.818 Kaisiadoriu uredija Kaisiadorys 9.9 6.819 Juodeliai Marijampole 6.0 8.0
Total 179.0 221.7 Average 9.9 11.7
Source: Center of Forest Economics
Aside from some questionable items, Table 3.2.1 present the first target group
of 27 large sawmills which are considered to be potential sources of debarked
chips (in fact, 3 produce debarked chips), among 821 sawmills in the country.
Some of them produce chips with barks and sell them to customers.
A logical option is to contract with these sawmills to supply chips with barks to
the new mill, while assisting them in making wood wastes into fuelwood
products by providing financial and technical assistance. The arrangement
should be done during the mill construction period.

3 - 11
2) Current state of waste chip production
While there are more than 800 sawmills of varying size throughout the country,
only three facilities produce barked chips by installing debarking and chipping
facilities (Nos.1, 2 and 5 in Table 3.2.2). Some sawmills have chipping
facilities and produce chips with barks. In fact, sawmills under State Forest
Enterprises reported chip sales of 45300m3 (sales price 25 LTL) in 1999.
3) Productive use of wood wastes generated from sawmills
For sawmills which do not have chipping facilities, disposal of wood wastes
(barks, cutting wastage and sawmills wastes) is a serious problem. Some
sawmills are occupied by wood wastes generated over years. Thus, purchase
of waste chips by the new pulp mill must be a good news for many saw mills.
It will provide incentive for sawmills to invest in debarking and chipping
facilities.
Some sawmills produce stick fuels from cutting wastage and barks which are
crushed into power and heat treated. Fuelwood products are an important raw
material for forestry, and if such fuels can be widely used to replace fuelwood
products, it is highly desirable from the viewpoint of promoting the effective
use of natural resources.
Reference data
Annual sawmill log consumption 2500000m3
Amount of barks generated (12%) 300000m3
Amount of cutting wastage generated (25%) 625000m3
Amount of chips generated (25%) 625000m3
Amount of sawmill products generated (50%) 1250000m3
(2) Preliminary proposal for wood material sourcing
1) To establish a collection system for 2.5 million m3 of pulpwood logs.
2) After the mill operation has started, to contract with sawmills near the pulp mill,
which are specialized in processing softwood, to supply waste chips to the mill.
Waste chips can be a stable supply source so long as the sawmill continues to
operate, and there is no risk for the pulp mill to secure logs to produce chips.

3 - 12
If the arrangement works well, the contract can serve as a model case to be
followed by other sawmills.
3) Also, a large quantity of softwood chips serves as another advantage. In fact,
the establishment of the waste chip collection system should be given of
highest priority after the pulpwood log collection system in 1) is established.
4) Once the purchase of waste chips increases, the relationship with sawmills
grows to encourage the establishment of the mutually beneficial relationship.

3 - 13
3.3 Material Procurement Planning Framework
(1) Wood material procurement plan
To meet pulpwood requirements of 2.5 million m3 (accounting for 40% of the
annual allowable cut), procurement should be made from forest resources
throughout the country. The procurement process starts from the
establishment of key collection points. The nine district offices should be
established as proposed in 3.1 (2) 1) and 2) and their service areas should be
delineated.
1) Delineation of service areas of the nine district offices
Service areas of the nine district offices were delineated with reference of
jurisdictions of State Forest Enterprises and on the basis of distance data
measured on the map. The results are shown in Table 3.3.1 and Figure 3.1.1.
2) Procurement of pulpwood logs from state-owned forests
State Forest Enterprises will become major pulpwood suppliers for the new
mill. In fact, it is impossible to procure 2.5 million m3 of logs without their
cooperation. They have expertise and experience in mass production, sales
and transportation of wood and own related facilities and equipment. It is
therefore desirable to have them transport purchased logs by rail or truck to the
mill site. As they are expected to supply more than one half of pulpwood
requirements for the mill, their cooperation will be helpful, particularly during
the initial period of mill operation. Note that payment should be made within
40 days after delivery of pulpwood logs (to be shorted to 30 days).

3 - 14
Table 3.3.1 Territory Allotment to 9 District Offices
(%) District Office Plunge Siauliai Kupiskis Utena Vilnius Varena Kazlu Ruda Taurage Jonava Total
No. No. State Forest E.1 3 Birzu 100 1002 41 Veisieju 20 80 1003 5 Ignalinos 100 1004 9 Kaisiadoriu 100 1005 10 Kauno 100 1006 13 Kedainiu 100 1007 21 Panevezio 40 60 1008 23 Prienu 40 60 1009 24 Radviliskio 100 100
10 25 Raseiniu 100 10011 33 Taurages 100 10012 36 Traku 50 25 25 10013 30 Siauliu 100 10014 31 Silutes 50 50 10015 8 Jurbarko 100 10016 1 Alytaus 70 30 10017 4 Druskininku 100 10018 45 Dzukijos NP 100 10019 39 Valkininku 40 60 10020 19 Nemencines 100 10021 29 Salcininku 100 10022 17 Marijampoles 100 10023 28 Sakiu 100 10024 22 Plunges 100 10025 26 Rietavo 60 40 10026 18 Mazeikiu 70 30 10027 34 Telsiu 100 10028 20 Pakruojo 100 10029 7 Joniskio 100 10030 35 Tytuvenu 70 30 10031 38 Utenos 70 15 15 10032 2 Anyksciu 30 30 40 10033 43 Zarasu 100 10034 15 Kupiskio 100 10035 6 Jonavos 100 10036 11 Dubravos 10 90 10037 12 Kazlu Rudos 100 10038 16 Kursenu 100 10039 27 Rokiskio 50 50 10040 32 Svencioneliut 100 10041 37 Ukmerges 100 10042 40 Varenos 100 10043 14 Kretingos 100 10044 42 Vilniaus 80 20 10045 44 Aukstaitijos NP 100 10047 47 Zemaitijos NP 100 10048 48 Traku INP 0
Distance from Gaiziunai ( km )( by Rayway )*1 223 123 201 216 90 133 72 215 7( by Road ) 224 135 146 109 124 163 85 168 7
Distance from Alytus ( km )( by Rayway )*1 398 298 376 383 257 286 103 390 182( by Road ) 275 229 240 220 100 45 107 219 125
Distance from Vievis ( km )( by Rayway )*1 271 171 249 168 42 85 98 263 55( by Road ) 247 218 212 192 38 119 108 191 90
*1: From Mr.Liljeblad's Data (Source: Ministry of Transport and Communications)

3 - 15
3) Small-lot purchase from private forest owners
As discussed earlier, pulpwood logs from private forests need to be purchased
from a large number of forest owners, each in relatively small quantities
(although the use of brokers may be considered). Thus an elaborate collection
system should be planned and established to ensure efficient collection and
transportation of purchased logs.
Basically, purchased logs should be transported by each district office to
specific collection points for temporary storage, from which they are
transported by truck or rail on a dairy basis.
Each district office should perform the following functions, together with
required facilities:
① Terminal’s storage capacity: 30000 at maximum (land area of 3ha)
② Terminal facilities and equipment to load, unload and handle logs to trucks
or rail freight cars (including large log loader)
③ Inspection and acceptance capabilities at terminals (availability of
inspector)
④ Contract administration and payment capabilities (Exporters currently
purchasing logs make payment within a few days after delivery.)
4) Quantity of pulpwood logs to be handled by each direct office
The report, entitled the “Report on Structure of Roundwood Supply for the
Next Two Decades (2000 – 2020) from the Commercial Forests in Lithuania,”
published by the Forest Inventory and Management Institute (not including
Forest Group 2), forecasts the annual average cut for each of two periods
(2000-2010 and 2011-2020) for each State Enterprise, state-owned forests or
private forests, species, lumber or fuelwood (for lumber, by diameter class).
For the annual average cut by lumber and species during the 2011 – 2020
period, a total of the figures for Small (13.5>=d>=5.6; top diameter over bark,
em), Medium II (17.1>=d>=13.6) were added to those for Medium Total (oak,
ash, maple, horn beam, elm, gray alder, willow, each quantity is small) to
obtain the total value for each district office, as shown in Table 3.3.2.

3 - 16
Table 3.3.2 Estimated Pulpwood Procurement by District Offices (2011--2020)
(1000m3) District Softwood Hardwood Birch Aspen Alder Others Grand Offices Total Pine Spruce Others Total Total % Plunge 177.6 31.9 145.6 0.2 139.9 58.0 14.5 48.30 19.00 317.5 12.9 Siauliai 127.3 14.4 112.8 0.1 161.9 61.6 23.2 45.9 31.2 289.1 11.8 Kupiskis 77.7 21.5 56.1 0.10 130.4 51.1 13.5 48.8 17.0 208.1 8.5 Utena 176.6 94.0 82.4 0.2 128.9 59.0 10.2 53.1 6.6 305.5 12.4 Vilunius 185.0 110.7 73.5 0.7 66.5 33.7 5.6 21.5 5.6 251.4 10.2 Varena 192.7 159.8 30.0 2.8 40.8 20.9 2.9 10.1 7.0 233.4 9.5 Kazlu Ruda 117.7 57.0 60.1 0.5 78.8 29.0 7.1 28.5 14.2 196.4 8.0 Taurage 148.3 37.5 110.8 0.1 114.9 45.0 13.4 40.3 16.2 263.2 10.7 Jonava 177.6 67.5 110.1 0.1 215.2 82.7 28.3 61.6 42.7 392.8 16.0 Total 1380.3 594.1 781.4 4.8 1077.1 440.9 118.6 358.0 159.6 2457.36 100.0
% 56.2 43.8 100.0
(2) Log transportation costs
The supplier (seller) will bear transportation costs up to the district office
terminal, and the pulp mill (buyer) will bear the unloading cost (truck or rail
freight car) at the terminal.
If the State Forest Enterprise or the large supplier transports logs directly from
the logging site to the mill, not via the direct office terminal, the purchase price
will be determined by adding the transportation cost (truck or rail) from the
district office and the mill and the loading cost at the terminal.
Table 3.3.3 shows distances between the district offices and the candidate mill
sites, as indicated in lower columns of Table 3.3.1 “Service Areas of District
Offices.”
Table 3-3.3 Transportation Disances between District Offices and
Proposed Mill Sites
District Office Plunge Siauliai Kupiskis Utena Vilnius Varena Kazlu Ruda Taurage Jonava
Distance from Gaiziunai( km )( by Rayway )*1 223 123 201 216 90 133 72 215 7( by Road ) 224 135 146 109 124 163 85 168 7
Distance from Alytus( km )( by Rayway )*1 398 298 376 383 257 286 103 390 182( by Road ) 275 229 240 220 100 45 107 219 125
Distance from Vievis( km )( by Rayway )*1 271 171 249 168 42 85 98 263 55( by Road ) 247 218 212 192 38 119 108 191 90
*1: From Mr.Liljeblad's Data (Source: Ministry of Transport and Communications)

3 - 17
1) Comparison of truck and rail transportation costs between the district offices
and the candidate mill sites
In the case of rail transport, the per-ton transportation cost varies between
40-ton and 70-ton freight cars. The unit transportation cost for the 70-ton
freight car is approximately 65% of that for the 40-ton car.
Comparison of truck and rail transportation costs between the district offices
and the candidate mill sites is made on the basis of the following data.
① In the case of rail transport, the unit transportation cost (freight charge for
the 40-ton car was applied as it is not certain if the 70-ton car is always
available) was calculated on the basis of distances between the candidate
sites and key stations, which were estimated from data furnished by the
Ministry of Transport and Communications, and the loading cost is
estimated at 4LTL/ton.
② In the case of truck transport, the transportation cost is assumed to be
2.4LTL/km on the basis of data obtained from the Nemencines and
Ukmerges State Enterprises, and the loading cost is estimated at 3LTL/ton.
③ 1 ton = 1sub from Table 3.3.4 “Wood Weight by Species.”
④ In “Rail/Truck” column in Table 3.3.5 “Comparison of Truck and Rail
Transportation Costs Between the Direct Offices and the Candidate Sites,”
“R” is specified if rail transport has cost advantage and “T” for truck.
Note that rail transport does not always shows cost advantage at a longer
distance as it may take a significantly different route from truck transport.

3 - 18
Table 3.3.4 Wood Weight by Species
(kg /m3) Species Green Wood Half Dried Wood
Pine 863.0 600.0 Spruce 794.0 550.0 Birch 878.0 710.0 Aspen 762.0 530.0 Black alder 827.0 590.0 Grey alder 800.0 520.0 Oak 1020.0 800.0 Ash 924.0 780.0 Maple 960.0 750.0 Horn beam 988.0 790.0 Elm 950.0 740.0 Lime 792.0 580.0 Source: Depertment of Forests and Protected Areas

3 - 19
Table 3.3.5 Transportation Cost Comparison between by Railway Wagon and by Truck from District Offices to Proposed Mill Sites
District OfficeState F. E. Plunge Siauliai Kupiskis Utena Vilnius Varena Kazlu Ruda Taurage Jonava
Distance from Gaiziunai( by Rayway ) km 223 123 201 216 90 133 72 215 LTL/t *1 22 18 22 22 10 18 11 22Loading cost LTL/t 4 4 4 4 4 4 4 4 Total 26 22 26 26 14 22 15 26
( by Road ) km 224 135 146 109 124 163 85 168 @ LTL/km 0.109 0.109 0.109 0.109 0.109 0.109 0.109 0.109 LTL/t 24 15 16 12 14 18 9 18Loading cost LTL/t 3 3 3 3 3 3 3 3 Total 27 18 19 15 17 21 12 21
Rail or Truck R T T T R T T T T
Distance from Alytus( by Rayway ) km 398 298 376 383 257 286 103 390 182 LTL/t *1 22 18 22 22 17 18 11 22 14Loading cost LTL/t 4 4 4 4 4 4 4 4 4 Total 26 22 26 26 21 22 15 26 18
( by Road ) km 275 229 240 220 100 45 107 219 125 @ LTL/km 0.109 0.109 0.109 0.109 0.109 0.109 0.109 0.109 0.109 LTL/t 30 25 26 24 11 5 12 24 14Loading cost LTL/t 3 3 3 3 3 3 3 3 3 Total 33 28 29 27 14 8 15 27 17
Rail or Truck R R R R T T T R T
Distance from Vievis( by Rayway ) km 271 171 249 168 42 85 98 263 55 LTL/t *1 18 14 16 13 8 10 10 17 9Loading cost LTL/t 4 4 4 4 4 4 4 4 4 Total 22 18 20 17 12 14 14 21 13
( by Road ) km 247 218 212 192 38 119 108 191 90 @ LTL/km 0.109 0.109 0.109 0.109 0.109 0.109 0.109 0.109 0.109 LTL/t 27 24 23 21 4 13 12 21 10Loading cost LTL/t 3 3 3 3 3 3 3 3 3 Total 30 27 26 24 7 16 15 24 13
Rail or Truck R R R R T R R R R&T
*1: From Mr.L'iljeblad's Data (Souce: Ministry of Transpot & Communications
2) Comparison of the candidate sites based on transportation cost
Transportation costs for the candidate sites were estimated on the basis of
pulpwood volume procured by each district office (Table 3.3.2) and the unit
transportation cost, truck or rail, selected from Table 3.3.5. The results are
summarized in Table 3.3.6 indicating that Gaiziunai (Jonava City) is the best
location from the standpoint of pulpwood transportation cost.

3 - 20
Table 3.3.6 Transportation Costs for the Candidate Sites
District Volume To Gaizunai To Alytus To Vievis
Offices (1000m3) R. or T. LTL /m3 (1000 LTL) R. or T. LTL /m3 (1000 LTL) R. or T. LTL /m3 (1000 LTL) Plunge 317.46 R 26 8253.96 R 26 8253.96 R 22 6984.12 Siauliai 289.14 T 18 5204.52 R 22 6361.08 R 18 5204.52 Kupiskis 208.06 T 19 3953.14 R 26 5409.56 R 20 4161.20 Utena 305.46 T 15 4581.90 R 26 7941.96 R 17 5192.82 Vilunius 251.41 R 14 3519.74 T 14 3519.74 T 7 1759.87 Varena 233.41 T 21 4901.61 T 8 1867.28 R 14 3267.74 Kazlu Ruda 196.40 T 12 2356.80 T 15 2946.00 R 14 2749.60 Taurage 263.20 T 21 5527.20 R 26 6843.20 R 21 5527.20 Jonava 392.82 T 0.00 T 17 6677.94 R&T 13 5106.66 Total 2457.36 15.59 38298.87 20.27 49820.72 16.26 39953.73 Index 100 130.0840469 104.3209108
(3) Purchase prices
1) Market price trends and statistical adjustment
Market prices of pulpwood logs in Lithuania are indicated as FOB Klaipeda or
at the border (with Kaliningrad, Poland and Latvia) as they are currently
exported in entire quantity. The unloading cost is borne by the buyer
(exporter), and so is the transportation cost after the boarder in the case of land
transport.
Price trends by species in Table 3.3.7 are based on sales prices of State Forest
Enterprises (Free Klaipeda Harbour & Lithuanian Borders) from July 1993 to
May 2000. These are illustrated in Figure 3.3.1 in the form of a linear
regression equation obtained by the method of least squares for each species.
Table 3.3.8 compares the theoretical price in May 2000 estimated from the
regression analysis and the actual market price. The former was calculated
because of significant fluctuation of pulpwood log prices which makes the
current price deviate largely from the past trend and renders it unsuitable for
the basis of financial analysis.

3 - 21
Table 3.3.7 Dynamics of Pulpwood Prices by Species
(LTL/m3) (LTL/m3)Year Month Pine Spruce Birch Aspen Alder Year Month Pine Spruce Birch Aspen Alder1993 7 41 36 49 1997 1 93 72 95 56 45
8 43 41 51 2 93 78 96 57 459 45 44 54 38 3 93 77 96 56 45
10 46 41 57 32 4 93 77 98 57 4511 43 40 52 24 5 92 79 98 56 4512 46 44 52 31 6 89 82 96 57 46
1994 1 55 46 55 26 7 83 73 95 54 452 59 56 59 33 8 80 73 92 54 453 65 57 66 32 9 81 75 92 51 454 72 63 72 38 10 81 74 93 53 455 74 64 75 36 11 82 76 97 53 456 79 75 81 44 12 83 79 98 51 457 82 76 83 50 1998 1 88 87 105 58 458 78 76 83 48 2 85 86 106 59 459 82 75 84 46 3 88 86 107 55 45
10 96 87 96 51 47 4 93 87 112 57 4511 100 90 103 57 46 5 92 88 112 58 4512 104 94 109 61 53 6 93 88 112 59 45
1995 1 107 102 117 70 56 7 94 87 113 57 452 107 105 116 74 53 8 94 91 112 57 453 114 107 116 73 55 9 94 92 113 58 454 112 104 119 65 56 10 94 92 111 56 455 105 103 123 69 57 11 94 91 106 596 97 101 125 68 53 12 94 92 106 587 96 98 126 73 55 1999 1 92 92 104 548 93 100 126 72 55 2 92 92 103 509 100 92 127 72 58 3 90 91 100 58
10 104 86 127 72 45 4 89 91 94 5411 103 82 119 64 45 5 84 84 84 5212 95 81 98 56 45 6 82 82 81 55
1996 1 87 73 95 53 45 7 82 80 82 492 77 67 83 49 8 82 78 82 563 71 66 84 45 9 82 79 82 564 72 62 76 40 10 82 80 81 485 78 59 67 40 11 82 82 81 51 406 85 53 77 40 12 82 81 80 57 407 78 55 79 40 2000 1 82 89 82 508 82 56 79 41 42 2 82 89 82 489 82 58 82 47 40 3 82 90 82 49
10 85 63 87 46 42 4 82 88 82 4911 85 66 88 48 42 5 82 83 82 5012 85 69 89 50 42
Souce: Center of Forest Economics


3 - 24
Table 3.3.8 Pulpwood Price Comparison between Actual and Calculated Ones in May 2000
(LTL/m3) Actual Price (A) Calculated (B)/(A)*100 in May, 2000 Price (B)
Pine 82 92.48 113 Spruce 83 90.17 109 Birch 82 99.71 122 Aspen 50 56.56 113 Alder 38.82
2) Estimation of purchase prices
As discussed in 3.1 (2) 1), the following four district offices (Plunge, Taurage,
Kazulu Ruda, and Siauliai) will be established to intercept and divert pulpwood
logs for exports to the proposed mill.
Obviously, purchase prices by the pulp mill must be at least same as current
export prices. At lower price levels, the district offices will not be able to
compete with exporters. Thus, the purchase price by the four district offices
is assumed to be the current export price.
Similarly, purchase prices by other five district offices (Kapiskis, Utena,
Jonava, Vilnius, Varena) are assumed to be same as export prices, and these
prices are based on FAF, i.e., export prices less the transportation cost between
the district office and the mill site, which are assumed to be the purchase price
at terminal by the five district offices. As a result, the purchase price will
vary among the district offices.
This price setting is at least equivalent to or better than the current prices
offered by exporters to suppliers, depending upon the logging location, and
therefore constitutes the minimum purchase condition required to compete with
export demand.
3) Estimation of mill prices
Basic assumptions
① Quantity of pulpwood logs to be procured by each of the nine district
offices is obtained from Table 3.3.2.

3 - 25
② The transportation cost for each office uses the lowest cost (Gaiziunai)
among those listed in Table 3.3.8.
③ The pulpwood log price for each office is based on the price data in Table
3.3.8 (comparing the theoretical and actual prices in May 2000) and is
determined according to the principles discussed in 3.3 (3) 2).
④ The cost related to the district office’s terminal and its operation is assumed
to be 5.6LTL/ton (including the unloading (truck) and loading (rail) costs,
lining and administration costs), based on the data in Sweden (12SEK/ton =
USUSD1.4/ton). Then, the loading cost (4LTL for rail and 3LTL for
truck) is added to assume a risk of cost increase related to the new terminal
construction.
The results of the above estimation are summarized in Tables 3.3.9 through
3.3.17. In addition, Table 3.3.18 “Mill Prices for the Candidate Sites”
compares the mill prices for Gaiziunai and other two candidate sites.

Chapter 4 MILL SITE

4 - 1
Chapter 4 MILL SITE
4.1 Introduction
The Lithuanian Forest Sector Master Plan, prepared 1992-1993 during the first
phases of the Lithuanian Forest Sector Development Programme (FSDP),
recommended that further studies should be carried out concerning the feasibility
of a new green-field kraft pulp mill in Lithuania with a possible production start
before end of year 2005. The Lithuanian Government and concerned ministries and
institutions supported the proposal and some minor studies were conducted during
the end of the 90’s. The present study has encompassed a more detailed analysis of
possible investment alternatives, including more detailed discussions and
screening of potential mill sites for the mill.
Already during the course of the Master Plan Project some potential areas for a new
kraft pulp mill were tentatively discussed. However, at that stage no field surveys,
nor any technical/financial analyses, were carried out, and no specific sites
identified. The suggestions of potential areas for a new mill were based on rough
judgements and tentative information about wood supply, infrastructure conditions,
possible access to fresh water and potential waste water recipients, etc. No
environmental restrictions were included at that stage.
The regions and mill site areas, tentatively identified in the Master Plan Project,
have been used as a basis for this study. However, the list of potential sites has been
revised and new alternatives added in order to broaden the geographical coverage.
Below, in Section 4.2, the methodology applied in the process for screening out
suitable and most favourable mill sites is briefly described. The potential areas
investigated, are presented in Section 4.3. Additional information on concerned
counties and specific sites are presented in Annexes 4-1 and 4-2 respectively (see
end of Chapter 4). In Section 4.4 below, the findings from this screening and
evaluation of potential sites are presented. The most favourable sites selected and
suggested for further analyses are presented in Section 4.5.
Specific consideration in the site selection process has been taken to environmental
restrictions and the possible actions available to mitigate negative effects of a mill

4 - 2
establishment. These issues are discussed below but are discussed more in detail in
Chapter 5 – “Environmental Aspects”.
It should be noticed that the word "site" is used in this report in a somewhat broader
sense. It is thus not the intention to exactly point out and decide upon the borders of
the different sites, but to limit the area, where a possible mill could be located, to a
level allowing for relevant and reliable technical analyses and economic
calculations on a pre-feasibility level.
It should further be noticed that, although the primary goal of present study is to
analyse the potential for a Lithuanian pulp mill, a possible paper mill to be built at a
later point of time is also, when relevant, considered in the analyses and site
selection process.

4 - 3
4.2 Site selection method
4.2.1 Screening procedure
A stepwise approach has been applied in the evaluation and screening of
potential mill sites. In the first step a list of potential areas – districts (rajonas)
and sub-districts - was prepared where a mill site possibly could be located. This
list was primarily based on the preliminary recommendations from the
Lithuanian Forest Sector Master Plan Project. The list was complemented with
new areas, identified during the preparation and the initial work of this study,
and which were considered of great interest as potential places for location of a
pulp mill.
In a second step, representatives of the Consultant's team visited all proposed
counties and districts. In cooperation with local authorities and experts, more
specific areas or possible mill sites were identified. These identified and locally
suggested sites made up the first "Long List" of potential sites for the pulp mill.
After some complements during the course of the study the "Long List" of mill
sites finally encompassed 20 sites. See further Section 4.3 below.
During the first field survey, the site area, infrastructure conditions, water supply
and possible recipient of treated wastewater, etc., was reviewed for each site on
the "Long List". Meetings were held in all places with local politicians on county
(apskritis), district (rajona) and sub-district levels, as well as with environmental
specialists and relevant technical experts.
The information obtained from the field visits and data received from local
sources were thereafter further analysed and complemented with information
and viewpoints from Ministries, state institutes, NGOs and private enterprises,
etc. Information was gathered for example about water flow in rivers, identified
as possible sources of raw water for the mill and as recipients of treated
wastewater, about local environmental restrictions, including possibly protected
rivers (species of fishes), and about infrastructure conditions of relevance for the
study. Aspects considered in the survey and analysis of potential sites are listed
and further discussed below.

4 - 4
Based on the findings from the initial field surveys and analyses of potential sites,
a "Short List" of most promising mill sites was prepared and presented in the
Interim Report of the study. This first screening of sites was tentative and the
Short List was later complemented with a few new interesting alternatives.
In the next phase of the site screening process, a number of additional visits were
paid to the sites on the Short List and complementary discussions organised with
local authorities, NGOs, and representatives of local organisations and
enterprises. Visits were also paid to some new sites identified and included in the
survey. Successively the Short List was reduced to finally end up in a "List of
most favourable sites".
Before the final selection of most favourable sites a series of seminars were
given to a broad public in the districts and cities concerned. The seminars
focused the environmental aspects of a new pulp mill. The feed back from the
seminars have been integrated to the final screening of most favourable sites.
During the whole process, close contacts have been maintained with relevant
central authorities, especially the Ministry of Economics and the Ministry of
Environment, including the Department for Forestry and Protected Areas.
Contacts - for information exchange and for gathering relevant data for the study
- have also been taken with a number of other Ministries, state agencies,
institutions as well as branch associations and individual enterprises in the
private sector. Especially can be mentioned Ministry of Transports; the state
railway and energy companies; road transport associations; harbour authorities
and shipping agencies; the geological, hydrological and meterological institutes;
the Forest Inventory and Planning Institute in Kaunas; etc. just to mention a few.
It should be noticed that no geological survey has been carried out at this stage,
nor has any organized contacts been taken with concerned landowners. Some
contacts and information exchange with landowners have nevertheless taken
place and made up an important input to the site screening process, however,
principally only on an ad hoc basis.
It has been the intention to identify and suggest only two sites as the most
favourable. However, present list includes three alternative sites. At this stage of
the project these three finally selected sites are considered of more or less equal

4 - 5
interest. They should all be subject for further more detailed analyses, especially
as concerns their environmental and financial advantages and disadvantages,
before they are rejected or finally selected.
Figure 4.2.1 Site Screening Procedure Layout
Long List - potential areas
Mill Site Selection procedure
Visits and reviews of sites
Short List - most promising
Complementary surveys
Most favourable sites
FinalReport
InterimReportAdditional sites
(1) Issues considered in screening procedure
For each potential site identified a valuation of various factors of relevance to the
location of the mill have been carried out. Following factors have been
specifically considered in the site screening process.

4 - 6
Supply of Wood Raw Material
・supply of domestic pulp wood (round wood)
・supply of chips from domestic sawmills
・possibilities for import of wood raw material
Water Supply and Recipient of Treated Wastewater
・supply of process water
・supply of potable water
・recipient of treated wastewater
Energy Supply and Solid Handling
・nearness to power lines
・nearness to gas pipelines
・nearness to local district heating system
・nearness to solid waste deposit
Transport Infrastructure
・transports of wood raw material
・transports of end products (pulp)
・transports of other necessities and goods
・main roads and site access roads - road transports
・railway system - railway transports
・harbour and harbour facilities - sea transports
Mill Site Characteristics
・available area and expansion opportunities
・topography and geological conditions
・ownership status
Specific Environmental Issues
・impact on water flow due to use of fresh water
・impact of discharged treated wastewater
・effects of emissions to the air
・handling of solid waste
・traffic, noise, smell and other disturbances in nearby residential areas
・sensitive surrounding areas

4 - 7
Other Aspects
・access to research, development and educational resources
・availability of skilled labour
・housing/accommodation conditions
・political and local support
・social aspects
Above factors and the principles for including possible unconditional
requirements or desirable considerations in the site screening procedure, are
further discussed below. Some factors have been given a higher priority than
other, for example environmental restrictions, possible source of process water,
possible recipient of treated wastewater, wood supply and infrastructure
conditions.
The relevant legislative and environmental restrictions to be considered are also
elaborated in Chapter 5 – “Environmental Aspects”.
4.2.2 Supply of wood raw material
The basis for the pre-feasibility study has been that the calculated demand for
wood raw material for the mill should be fully supplied from domestic sources –
round wood pulpwood and sawmill chips. Opportunities for future import of
wood raw material should be considered as a positive factor but not primarily be
included in the supply basis for the mill.
(1) Supply of domestic pulpwood (round wood)
The Forest Inventory and Management Planning Institute in Kaunas has carried
out new up-to-date calculations on future potential sustainable cut. Present forest
management system and harvesting regulations have been adopted in the
calculations. The results of the calculations are presented in Chapter 3 "Raw
Material" above. They clearly show that there are possibilities to fully supply the
pulp mill with domestic wood.
However, although the calculations on future potential cut can be considered as
conservative, the whole country principally must be included in the wood supply
area for the mill. Forest resources are scattered and distributed over the whole
country with less densely forested regions in the west and more densely forested

4 - 8
areas, especially conifers, in the east. Central Lithuania has a higher share of
mixed forests. Both conifers and broadleaved species will be used as raw
material for the mill.
To minimise wood transport costs, sites located to the centre point of the forest
resources are more favourable compared to sites in the outskirts of the country.
The centre point of the wood supply area is tentatively judged to lay in a sector
east or north of Kaunas.
Competition for the domestic wood raw material can mainly be expected from
Nordic countries – export through Klaipeda harbour or via Latvia – or from a
possible future new Latvian pulp mill. Also Russian pulp mills in the
Kaliningrad area have during the last decade been major importers of Lithuanian
round wood. However, the paying capacity of these mills is limited and can be
expected to be further reduced, unless new investments are made in the mills.
Export to Nordic countries, primarily Sweden is today mainly made through the
Klaipeda harbour. The cost competitive advantage for a Lithuanian pulp mill can
roughly be compared to the harbour and sea transport costs from Klaipeda to
harbour in the importing country. The farther east a new Lithuanian pulp mill
will be located, the less competitive will it be in the western parts of Lithuania,
compared to foreign wood buyers.
The greatest competition from Latvia can be expected in northern and
north-eastern Lithuania while Polish buyers will be more interested in wood
from the southern regions. It can be noticed that the Latvian pulp mill project is
planning for an import of close to 1 million m3 sub/a of which a marginal
quantity or some 10% is expected to come from Lithuania. This implies that
locations farther north (to meet Latvian competition) or farther south (to meet
competition from Poland and Kaliningrad) would be more advantageous, thus
contrary to each other.
On the basis of above, a mill location in the central of Lithuania is judged most
advantageous considering wood supply, wood transportation costs and
competitiveness towards other potential major wood buyers.

4 - 9
(2) Supply of chips from domestic sawmills
Part of the wood raw material for the mill is expected to come from domestic
sawmills. Presently, however, only three sawmills in Lithuania are equipped
with debarking devices allowing them to produce pulp chips of required quality.
Currently chips are sold from these sawmills mainly to Swedish buyers – pulp
mills. These sawmills are
・Pajurio Mediena Klaipeda
・Kaminskas sawmill in Prienai
・Baltic Wood in Maeikiai
Generally speaking the sawmill industry in Lithuania is still rather undeveloped.
The average capacity and production level is low and larger strategic
investments are still rather rare. Principally there is no new modern sawmill in
Lithuania and a comprehensive restructuring and modernisation of the sector is
required for the industry to stay competitive and profitable.
It can be expected that a number of larger sawmills will be built within the next
years to come following the development in Estonia and Latvia. It can also be
expected that new large sawmills besides one or two in Klaipeda will be inland
located close to the forest areas. Thus the centre point for the supply of sawmill
chips can be expected to be close to the centre point for the round wood supply,
and the preferable location of the new pulp mill is - also from this point of view -
in the central parts of Lithuania.
Once a pulp mill is decided to be built and the site is known, this will most
probably influence locations and investments in the sawmill sector, as sales of
pulp chips is an important source of income to the sawmills.
(3) Possibilities for import of wood raw material
Although this study is basically assuming that the new mill will be supplied with
wood raw material from domestic sources, import of wood may become a reality
once the mill is built and in operation. Thus, favourable conditions for future
wood import, is considered an advantage in the mill site evaluation.
Russia and Belarus provide the best opportunities for import of pulpwood to
Lithuania. Possibly also minor quantities can be imported from Latvia and

4 - 10
Poland, however, competition is expected to be harder and prices higher in these
countries.
Imported wood from Russia and Belarus may be delivered by truck from areas
nearby the Lithuanian border supporting a location of a new pulp mill to the
eastern parts of Lithuania, in areas where efficient road transports are possible.
However, train is considered to be the main transport mean for imported wood.
Thus good railway connections to the mill site are required, preferably in
combination with a location of the mill to eastern parts of Lithuania.
4.2.3 Water supply and recipient of treated wastewater
(1) Supply of process water
The demand for fresh water for the process and for cooling purposes of the
planned mill is calculated at 1.0 - 1.2 m3/s. A large part of the consumed water is
used only as cooling water, which is not polluted. This water is discharged from
the process as clean water, but with a temperature rise. A fraction of this heated,
clean water will be used as process water for the pulp mill, while the remaining
fraction will be discharged directly as a clean effluent.
Consequently, the capacity of the raw water source, being a river in the normal
case, must be related to the approximate mill water consumption of maximum
1.2 m3/s. The environmental impact of this size of water consumption is further
discussed below.
This total water consumption is based on a relatively low consumption of
process water for the pulp mill, 30 m3 per ton of pulp. This water consumption is
regarded as BAT (Best Available Technique). Theoretically, it may be possible
to reduce the water consumption further by applying more advanced closed
cycle technology in the mill, methods which, however, are not fully established
today.
Principally all fresh water taken in to the mill is discharged back after the
process, either as clean, but heated cooling water, or as partly polluted water
from the pulping process. Thus when one and the same river will serve both as
source of fresh water to the mill and as recipient of the discharged waste water,
the total water flow in the river is only marginally influenced down streams the
water outlet. This is the general situation for all potential sites considered, except

4 - 11
those in western Lithuania for which wastewater is assumed to be discharged
directly through pipeline to the Baltic Sea.
For this reason, the supply of fresh water is not considered a major issue for the
inland locations, as the river's capacity as recipient of treated wastewater will
make up the main restriction. For sites discharging wastewater directly to the
Baltic Sea, the minimum flow in the fresh water source should not be below 5 to
10 times the calculated water consumption in order to avoid severe damages
down streams. For environmentally sensitive rivers even this may be a too
generous condition.
(2) Supply of potable water
Access to drinking water from the community system would be advantageous.
However, the lack of municipal potable water at the site is not considered a
serious disadvantage. Lithuanian ground water reserves are substantial and
drilling of new ground water wells for the mill’s need is considered fully realistic
and may even be economically favourable compared to using municipal water.
Principally, today all drinking water in Lithuania, with very few exceptions, is
taken from the ground water and with enough capacity and good water quality.
Drinking water/potable water will be needed from the very first beginning of the
construction of the mill.
(3) Recipient of treated wastewater
The discharge of wastewater will include a polluted fraction of about 0.5 m3/s
(after effluent treatment) corresponding to the process water consumption of 30
m3 per tonne of pulp. In addition 0.5 - 0.7 m3/s of clean, but heated water
(temperature up to about 45 oC) will be discharged. The polluted effluent will be
efficiently treated by biological treatment, but still have a certain content of, e.g.,
organic matter and nutrients. Therefore it is important that the recipient for the
effluent, if this is a river, has a large water flow, in order to minimise the impact
on the river's water quality.
There are no exact limits set up for the minimum water flow required. This
varies by the local conditions and the sensitivity of the recipient river. However,
a flow of minimum 30 to 50 times the discharge of partly polluted water is

4 - 12
judged to result in sufficient dilution and acceptable low impact to the water
quality.
4.2.4 Energy supply and solid waste handling
(1) Nearness to power transmission lines
Nearness to high voltage transmission lines is favourable both for the supply of
necessary power to the mill and for delivering possible surplus generated in the
mill. The latter is an economic and technical question but also an administrative
and organisational matter to be solved with responsible energy company.
For the initial screening of mill sites nearness to a 110 kV power line connection
point is considered necessary. This is further justified when considering a
possible second stage including building of a paper mill.
(2) External fuel supply – nearness to gas pipelines
A modern pulp mill is practically self-supporting on fuel assuming that all wood
residues are used as fuel in a power boiler in addition to the recovery boiler.
However, some external fuel may occasionally be needed. This can preferably
be natural gas with lower environmental impact than fuel oil. Nearness to a gas
pipeline of sufficient capacity is thus a favourable factor to a potential mill site.
(3) Local nearby district heating system
As said above, a modern pulp mill is in principle self-sufficient in fuel. There
may even be good prospects for delivery of heat to a nearby district heating
system. This is not considered a factor of major importance in the site selection
but nearness to a district heating system may add profitability to the project.
(4) Solid waste deposit
As a result of the pulp production also various types of wastes will be produced.
These waste products are generally less hazardous to the environment but must
be taken care of and deposited under controlled conditions or otherwise
processed and eliminated. Typical types of waste products are bark, sludge from
wastewater treatment, ash, etc.
It is the intention that the planned pulp mill shall have its own solid waste
deposit area. In case a municipality deposit is located close to the mill site, with

4 - 13
capacity to take care of the industrial waste, this deposit may be considered
instead.
As mentioned above bark, other wood wastes and sludge as far as possible will
be used internally for fuel.
4.2.5 Transport infrastructure
(1) Transports of wood raw material
A pulp mill of the size now proposed with a capacity of 500 000 ADt per year
will consume some 2.4 Mm3sub of wood annually, corresponding to 7100 m3sub
per 24 hours or some 8000 m3sob/d.
The bulk of the wood raw material will be made up of domestic round wood and
chips from sawmills. Wood and chips will to a great extent be delivered to the
mill by trucks. At long distances, railway transport is expected to be competitive.
The main part of possibly imported wood, is assumed to be delivered by train,
but trucks can also be considered from nearby areas in for example Belarus.
(2) Transports of end products (pulp)
The mill will tentatively produce some 500 000 ADt per year of market pulp. If,
in a possible later stage, a paper mill be built and integrated to the pulp mill,
corresponding amounts of paper and paper products will be produced and
transported from the mill. The most realistic markets for both the pulp and
possible future paper products are the Central and West European countries –
Germany, Benelux, UK, Italy etc.
There are principally two main alternatives for transport of finished products
from the mill to the markets
・ by truck or railway to Klaipeda, by boat to Central / West European harbour,
and then once again by truck or railway to the final destination,
・ by truck/railway from the mill directly via Poland to final destination in
Central/Western Europe.
If the first option is chosen a location close to Klaipeda is most favourable from
the pulp delivery point of view. However, no sites have been possible to find in
or quite adjacent to the harbour area. For all sites a shorter or longer transport by

4 - 14
truck or train to the harbour has to be considered, including necessary storing
facilities at the harbour. The shorter land transport to the harbour the better. It is
judged, however, that possible advantage of short land transport for the pulp will
be outbalanced by the disadvantage of longer wood transports.
For the second option – road or railway transport directly to European buyer – a
location in the centre or south region of Lithuania is most favourable. Presently
direct transport by train is not possible as the Lithuanian and central European
railway systems have different width of the gauge. Reloading in Šeštokai in
southern Lithuania is required. There are, however, plans to build a new line of
European standard from the Polish border to Kaunas. See further below,
"Railway system – railway transports".
A mill location in central Lithuania, with good railway connection and good
access to the main road net, is judged most favourable. This will allow for
optimal flexibility as concerns pulp deliveries and be the most cost-efficient
alternative considering transport costs for both pulp and wood raw material.
(3) Transports of other necessities and goods
The production of pulp requires, in addition to the wood raw material, also other
necessities such as chemicals, fuels, etc. The quantities of these necessities are in
total terms substantial, but small compared to the volumes of wood consumed.
Generally, the flow of these necessities to the mill has a marginal or very low
impact on the location of the mill.
Nevertheless, these transport flows must be considered and carefully planned for,
as they may be classified as hazardous transports and may cause severe damages
to ground or environment, or make up a risk for nearby residents, in case of a
traffic accident.
Good infrastructure with proper main roads and good access roads to the mill
site, as well as good railway connections, which do not demand that these
transports pass through densely populated residential areas, are favourable.
When using railway transports it is generally not possible to avoid populated
areas as most railway lines pass directly through cities and villages.
Transports of solid waste produced will be short distance transports and do
principally not influence the site selection.

4 - 15
(4) Main roads and site access roads – Road transports
For all sites specific access roads to the mill site have to be built and included in
the investments for the project. The construction cost per km of these roads are
judged rather equal for all sites as far as bridges or specific intersections not have
to be included. The length required to reach public roads will vary somewhat.
More important is the standard of nearby main public roads. Preferably there
shall also be good public roads going in all directions of relevance for road
transports of wood and possibly also pulp and other necessities. Investments and
improvements in the public road net is not included in the investment for this
project but must be the responsibility of Lithuanian Government and authorities.
Major improvement in the public road net is a long term undertaking. Thus poor
public roads to the mill site is considered a severe disadvantage.
According to present Lithuanian road and traffic legislation the maximum gross
vehicle weight (GVW) is 40 tonnes, allowing for a load of some 25 tonnes per
vehicle. This is comparable to many EU countries but much lower than the
allowed GVW and load capacity in for example Sweden (60 tonnes max GVW)
and Finland. The low allowed load for trucks increases the competitiveness of
railway transports.
(5) Railway system – Railway transports
The Lithuanian Railway Company – Lietuvos Geleûinkeliai (LG) – is presently
the only railway company operating in Lithuania. LG is fully state owned with
responsibility for both infrastructure and transport services. There are plans to
split the company in a number of smaller companies of which some
simultaneously would be sold out and privatised. According to present plans,
separate companies will be established for infrastructure facilities, goods freight,
passenger traffic, maintenance and service of rolling equipment, etc.
Infrastructure and fixed facilities will remain the responsibility of the state
through the Ministry of Transport. Restructuring may be finished in the end of
year 2000 or beginning next year, at the earliest.
For the main part of the Lithuanian railway net the gauge is 1520 mm, which is
the standard gauge in the CEECs and somewhat wider than the standard gauge

4 - 16
(1435 mm) used in, for example, Poland and most West European countries.
Currently only some 22 km of railway from the Polish border to Šeštokai has the
west-European standard. Thus reloading or change of axles of railway wagons
has to take place before entering the border to Poland. A similar reloading
station is located on the Polish side of the border.
According to Lithuanian railway authorities there are presently plans to build -
in a first step - a new railway line from Šeštokai to Kaunas with Central/West
European standard, thus eliminating the need for reloading at the border. The
investment plans also includes upgrading of the line from Šeštokai to the Polish
border. In a possible second step the railway will be extended through Kaunas to
Jonava and northwards forming the start of a Baltic railway corridor. A mill
location along this new line would be favourable if railway transports to the
European markets are considered.
(6) Harbour and harbour facilities – Sea transports
Klaipeda harbour is the only harbour in Lithuania at the Baltic Sea. It has
capacity to handle also the pulp from a possible new mill and it should be
possible to find a suitable area for necessary storing buildings for the pulp if
desirable.
As mentioned above there is however not enough place for a pulp mill in the
harbour area, nor in any adjacent site.
4.2.6 Mill site characteristics
(1) Available area and expansion opportunities
It is estimated that a minimum area of 130 ha is required for the pulp mill
including areas for roads, wood storing and solid waste deposit, etc. However,
considering also a possible future paper mill, the area demanded at this stage is
set to 150 ha at a minimum. The possibilities to further expand the site (up to 200
ha) is considered an advantage which for example would allow for a future
sawmill adjacent to the pulp mill.
(2) Topography and geological conditions
Flat land is preferred, although slightly rolling may sometimes be positive from
drainage point of view. Good geological conditions are important to keep

4 - 17
investments for access roads, railway connections and other construction works
at an acceptable level.
The topography at the sites has been generally reviewed at the field visits for
each site, more detailed for the sites screened out for the Short List. No
geo-technical investigations have been carried out at this stage but geo-technical
conditions are roughly judged based on optical review of surface, topography,
etc., combined with preliminary information from local representatives and
other local projects.
(3) Ownership status
Ownership status is normally an important factor to consider. However, it is
judged that in this case the ownership, whether state or privately owned land,
will not make up a major problem. As support for the project is required from
both Government and local administration, it can be assumed that conditions for
acquisition of land for the mill will be similar for all potential sites. Private
owners, in most cases, are also supposed to be happy to get a chance to sell their
land. The price of the land may differ depending on location in the country,
nearness to cities or other competition for the land.
The right for foreign investors to acquire or lease industrial land in Lithuania is
not discussed here but should be seriously analysed as to the effect it may have
for the realisation of the project. According to present legislation foreigners have
the right to buy industrial land. However, it seems as if the bureaucracy is still
rather heavy, causing unnecessary problems and delays in the process.
4.2.7 Specific environmental issues
Consideration to environmental impacts of a new pulp and paper mill have been
given highest possible priority in the site selection. Pulp and paper mills used to
be heavy polluters of the environment and still are in some countries, where the
industry has not yet been modernised, applying today's best available technique
(BAT). Applying BAT in modern bleached kraft pulp mills means significantly
reduced atmospheric and water emissions, as compared to older mills. The
discussion below and in Chapter 5 is limited to the kraft pulping only. In case a
paper mill will be added, it would still be the kraft pulp mill that would
contribute to the main part of the environmental impact.

4 - 18
The impacts caused by atmospheric emissions and water emissions from modern
bleached kraft mills are the two types of impacts that are most significant. They
are also those, which are specific for this type of industry and are therefore
specifically discussed below. A general discussion about these emissions is
given in Chapter 5. Other types of impacts are for instance solid waste
generation and noise, which are of a more general nature.
The environmental aspects, which have been considered in the site selection are
the following:
・ Use of fresh water and possible down streams problems due to changes in
water flow, specifically during periods of low natural flow.
・ Waste water discharges to recipient and risks for down streams problems
caused by pollutants from the mill.
・ Emissions to air and possible problems related to air quality or smell in
nearby residential areas
・ Solid waste production and possible problems related to handling, processing
or deposit at land fills
・ Traffic, noise and other disturbances in nearby residential areas
・ Risks for disturbances in nearby sensitive (protected) areas
It should be noticed that consideration to these factors has been possible only at a
limited extent during this study of the project. All these aspects must be further
considered in the Environmental Impact Assessment (EIA), which has to be
performed in a later stage of the project. Certain requirements regarding air
quality, noise level and water quality in the river (in case of wastewater
discharge to a river) have to be complied with in designing and operating the mill.
These data will be part of the Environmental Permit for the mill. Calculations of
such data have not been carried out in this study.
(1) Impact on water flow due to use of fresh water
The use of fresh water from rivers (or lakes) influences the water flow and the
biotopes for fishes and other animals and plants living in or along the river. To
limit these effects the use of fresh water must not exceed a certain percentage of
the minimum flow of the river. In case the same river is used as recipient for the
polluted water from the mill, the total water flow will be only marginally

4 - 19
affected. In this case the river as recipient of wastewater is considered to be the
limiting factor.
In case wastewater is discharged to another river or lake than the one used for
fresh water, or to the Baltic Sea, the percentage of fresh water taken out will be
important. Great environmental problems can be foreseen if the source river is
not big enough compared to the volume taken out for the mill. These problems
may concern the wildlife as well as tourism and leisure time activities.
As mentioned above the demand for fresh water for the mill is calculated to be
maximum about 1.2 m3/s. The demand also depends on the temperature of the
river from where the water is taken. As a significant fraction of the water is used
for cooling purposes, the highest demand is in the summer, when also the water
level in rivers and lakes normally is at the minimum level.
(2) Impact of discharged treated wastewater
Most of the discussed possible mill sites, except a few in Klaipeda and Kretinga
Districts, are located inland, and thus the recipient for the wastewater must be a
river (or a lake). The impact of the mill wastewater to the river water quality is
directly depending on the river water flow. Consequently, the decisive factor
here is the river water flow, a higher flow being more advantageous than a lower.
All rivers show large annual variations as regards the flow. The lowest flow rates
must be considered here. Also the classification of the river must be considered.
A lower class, meaning a cleaner river, implies a river being less suitable as a
wastewater recipient.
Some potential mill sites are identified in the Klaipeda and Kretinga area, in
which case the wastewater could possibly be discharged, by a long-distance pipe,
directly to the Baltic Sea. This option would probably be the most advantageous,
from the point of view of water pollution.
As mentioned above, the water pollution from modern kraft pulp mills has been
considerably reduced, compared to older mills. This means that also a relatively
small river could be acceptable as a recipient in the normal situation. However, it
is also necessary to consider the risk of temporarily increased water emissions,
in connection with disturbances in the mill. In such cases the risk of negative
influence on the river water quality is, of course, larger for a smaller river.

4 - 20
Therefore, our opinion is that a mill location at a low-flow, relatively clean river
should be avoided.
This factor is parallel to the question of water supply for the mill - a higher river
water flow being generally more advantageous than a lower flow, both from the
water supply and the wastewater discharge point of view.
(3) Effects of emissions to the air
The Environmental Permit for the mill, according to the present legislation, will
include a number of air quality parameters, e.g. the concentrations of sulphur
dioxide and nitrogen oxides, which must not be exceeded outside the sanitary
zone. This zone is usually defined as an area surrounding the industry at a
distance of 1 km from the fence. For a pulp mill of this type and size we would,
however, recommend a minimum distance from the mill to nearby main
residential areas, which exceeds this 1 km limit. A distance of 4-5 km would be
recommended, although 2-3 km could be accepted. The main reason is the risk
of odour load from the mill. The odour load is normally of low significance at
modern mills, although temporarily increased loads could occur in connection
with disturbances.
Consequently, the main factor to be considered here is the distance from the mill
to main residential areas. Also the dominating wind direction is of importance, a
mill location in the wind direction “downstream” the city being preferential.
(4) Handling of solid waste
Concerning the solid waste generation, and the possible problems related to
handling, processing or deposit at landfills, we regard the significance of these
problems as relatively similar in comparing the different sites, and thus not
decisive at this stage of the site selection process.
(5) Traffic, noise and other disturbances in nearby residential areas
Concerning the noise from the mill, the distance from the mill to main residential
areas is a decisive factor. Noise, vibrations and air pollution caused by traffic are
disturbing factors, the magnitude of which depends upon the position of main
roads to the mill relative to residential areas. As the traffic load to and from the
mill will be rather high, main roads remote from residential areas are more
advantageous.

4 - 21
(6) Sensitive surrounding areas
Lithuania is rich in protected areas, sensitive rivers and creeks, etc. which must
be protected, as well as areas of special interest for tourism and leisure time
activities. Depending on type of protected or valuable area, a larger or smaller
buffer zone has to be considered.
The surroundings of protected and otherwise sensitive or valuable areas have as
far as possible been avoided when identifying possible mill sites. However, it
has not been possible to fully avoid this and the possible impact to these areas of
a new pulp mill must be further investigated and assessed in later Environmental
Impact Assessment.
4.2.8 Other aspects
(1) Access to research, development and educational resources
Kaunas can be considered the centre in Lithuania as concerns research,
development and education related to the forestry and forest industry sector. To
Kaunas city is located Kaunas University of Technology with departments for
pulp and paper industry and for wood mechanical industry. To Kaunas is further
located the Agriculture Academy with the Forestry Faculty, Kaunas
Technological College, Kaunas Centre for Training of Building Workers and the
Forest Inventory and Planning Institute.
In Girionys, some 10-15 km southeast of Kaunas, are located the Forestry
Research Institute and Kaunas Forestry College.
Cooperation with these institutions and use of their services are facilitated the
closer to Kaunas the mill will be established.
(2) Availability of skilled labour
A modern pulp mill of the size discussed for Lithuania requires some 600 to 800
people for the operation of the mill. People needed for local workshops,
transportation etc. is not included in those figures. In general a mill creates
indirect employment of 3-5 times that of the mill operation itself, which means
that some 2000 – 4000 persons will benefit through employment directly or
indirectly from the mill. Staff and labour for the forestry operations are not

4 - 22
included and will be required in addition. However, as forestry operations are
ongoing already today only a limited number of new employment opportunities
will be created in the forestry sector.
It should be noticed that a high percentage of the labour in the mill must have a
comparably high education and skill as today's pulp and paper mills are
technically advanced and economically sensitive to disturbances in the
operations.
Thus high unemployment in an area is not enough to secure the supply of skilled
labour for the mill. A potential area for location of the mill must be attractive for
labour and for their families. Nearness to relevant research and educational
institutions is also an advantage.
(3) Accommodation/housing conditions
The number of labour assumed to be employed at the mill, including also
indirectly employed people, will require facilities for accommodation and
housing. A municipal of reasonable size within reasonable transport distance is
required.
Already during the construction and erection phases of the mill the demand for
accommodations will be substantial. Thousands of workers will be engaged
during this period, to a great extent also foreign experts and labour, thus
demanding for a large number of temporary accommodation opportunities
(hotels, private houses, etc.)
(4) Political and local support
Any project of the size now discussed will require the support from the
Government and the Parliament. However, the local support is as important as
the national support. Thus backing up from local politicians and the local
administration, as well as acceptance for the project from the public, are
essential factors to be considered in the site selection process. No foreign
investor is assumed to enter a project of this magnitude and high economical
risks in case there is a potential risk for disturbances during the construction
period of the mill or later on when production has started. Such lack of support
and risks for disturbances may be based on real facts or may be of emotional

4 - 23
character related to large foreign investments or to the forest industry, which
used to be a major polluter of air and water. In these later cases a massive,
impartial awareness campaign founded on facts may improve the situation.
Consideration to the local support and acceptance of the project has only partly
been possible at this stage of the study but will be a major issue at later stages.
(5) Social consideration
Social effects, positive or negative, related to a new pulp mill are difficult to
integrate in the site selection process and impossible to quantify. Nevertheless,
consideration to social aspects should be a part of the process and impacts as far
as possible identified and analyzed. For negative effects a mitigation plan shall
be elaborated.
Positive social impacts of a new pulp mill are considered comparably neutral as
to the different potential mill sites, although there are some differences. This
concerns for example new employment, general economic growth in the region
and related growth of the social sector in form of possible new schools, better
public service, improved communication services, etc.
Negative social effects of a new pulp mill may vary largely but is generally of a
minor magnitude for the society, although not for the individuals affected. This
type of negative impact may be related to expropriation of land and necessity for
families to move from their homes. These types of social effects should be
avoided as far as possible but it is assumed that they can be handled in a
dignified manner and people hit properly compensated.
The social impact of a new pulp mill has only marginally been possible to
include in the site selection process.

4 - 24
4.3 Initially identified site alternatives – "Long List of Candidate Sites"
The following areas and sites have been identified as potential places for location
of a new pulp mill. They are listed without priority in alphabetical order of county
and district. In several districts more than one site have been identified and
surveyed. They are denominated 1, 2 etc. but are also given a simpler short name.
Table 4.3.1 List of Potential Mill Sites – Long List
Site No
County/ Apskritis
District (Rajona)
No
Location Short name
1 Alytus Alytus 1 North Alytus city and industrial area, between road 130 and river Nemunas
Alytus North
2 2 South Alytus city, at river Nemunas north side on former military area
Alytus South
3 Alytus VarÅna 1 East Matuizos village Matuizos 4 2 Northwest of railway and river Merkis crossing in Pamerkiai
village Pamerkiai
5 Kaunas Jonava 1 North industrial area, northeast Jonava city Jonava North 6 2 Southeast Jonava city, west Rukla municipality Jonava Rukla 7 Kaunas KÅdainiai 1 Industrial area east of Këtdainiai city KÅdainiai 8 KlaipÅda KlaipÅda 1 Southwest of LÅbartai village LÅbartai 9 2 South-southwest of waste deposit plant at Dumpai village Dumpai 10 3 West of Mickai village, between railway and Klaipedos Kanalas Mickai 11 KlaipÅda Kretinga 1 East of Tñbausiai village Tñbausiai 12 2 West of DarbÅnai municipality, west of artificial lake DarbÅnai 13 KlaipÅda ŠilutÅ 1 South of PagÅgiai municipality and railway station PagÅgiai
South 14 2 North of PagÅgiai municipality, north of railway PagÅgiai
North 15 Utena Ignalina 1 Area around Ciûiunai village Ciûiunai 16 2 North of Janionys village Janionys 17 3 East of Visaginas town, at nuclear power plant Visaginas 18 Vilnius Šven¹iony
s 1 Southwest of PabradÅ and Karkaûiške municipalities, east of
railway PabradÅ
19 Vilnius Traikai 1 North of Vievis municipality Vievis 20 2 GrigiškÅs Paper and Hardboard Plant GrigiškÅs

4 - 25
Totally 20 potential sites are listed above. During the initial reviews and field
surveys a number of additional sites have been discussed but rejected at an early
stage and not further analysed.
Each site alternative is briefly presented below. Profiles of counties and
potential mill sites are further presented in Annex 4-1 and 4-2 respectively.
Figure 4.3.1 Map of Potential Mill Sites
20
5
432
1
1098
7
6
15
1413
1211
1918
1716
20
5
432
1
1098
7
6
15
1413
1211
1918
1716
20
5
432
1
1098
7
6
15
1413
1211
1918
1716
(1) Alytus North – Alytus District, Alytus County
The proposed area for the site – presently primarily agriculture land – is located
north of the City of Alytus. The site is located close to the major industrial area,
including among others the Silunga Sawmill. Good infrastructure, near to main
public roads, although transports from south and east have to pass around the
city to reach the site. A new bridge over nearby river Nemunas is planned to be
built. River Nemunas is also the possible source for process water and the
recipient for treated wastewater. Railway and electric power transmission grid to
the area. Close to one district heating plant in Alytus city and close to the city’s
new wastewater treatment plant.

4 - 26
(2) Alytus South – Alytus District, Alytus County
The potential area for the site is located south of the city of Alytus at the former
military area along river Nemunas' north side, upstream city centre. No power
supply and no railway connection to the area. Railway connection probably
difficult to build due to environmental restrictions in nearby botanical reserve.
Good road connections. River Nemunas makes up the possible source for
process water as well as recipient for wastewater.
(3) Matuizos – Varena District, Alytus County
Proposed site is located close to the old brick factory in the village Matuizos.
The railway from Vilnius southwards to Belarus passes through village. Power
line to village. Poor access road to Varena and to main road A4 from Vilnius,
some 10-15 km southwest of site. Process water to be taken from river Merkys
some 5 km north or west of site. River Merkis also makes up the only possible
recipient of wastewater. (Area not visited during site field survey).
(4) Pamerkiai – Varena District, Alytus County
The proposed site is located in the typical small, old countryside village of
Pamerkiai with a few hundreds of inhabitants, at the intersection of river Merkys
and the railway from Vilnius southwards to Belarus. The site, presently
agriculture land, is located in a mixed agriculture and forest landscape. Nearest
main public road is road A4 from Vilnius, some 4 km north of the site. Low
standard, gravelled road to the site. Nearest power supply connection point can
be found some 4-5 km south of the site in village Matuizos. River Merkis makes
up the only possible source for process water as well as the only recipient for
wastewater.
(5) Jonava North – Jonava District, Kaunas County
The proposed site is located northeast of Jonava City in a flat mainly forested
area with scattered agriculture land. The site is neighbouring an existing
industrial area, including among others the sawmill of Jonava State Forest
Enterprise and the district heating plant (0.5-1 km away). Distance to residential
areas rather short or about 1-2 km. Distance to nearby river Neris - to be used as
process water source and waste water recipient – is about 1-1.5 km. Railway

4 - 27
through Jonava City. Close to electricity grid and to good public main roads in
most directions.
(6) Jonava Rukla – Jonava District, Kaunas County
The site is located opposite river Neris from Jonava city centre, neighbouring the
industrial area of Achema chemical and fertiliser industry, and west of the
municipality of Rukla, former military area. Generally good infrastructure with
nearby main public roads, power supply and railway connection close to the area.
The proposed site is slightly hilly. Distance to Rukla residential area is rather
short or about 2 km and to river Neris for process water 1.5-2 km and for
discharging treated wastewater some 4-5 km downstream Jonava city.
(7) KÅdainiai – KÅdainiai District, Kaunas County
A possible site for a pulp mill is proposed east of the town of Kedainiai in an
existing industrial area – chemical and fertilizer industries, etc. The site is made
up of flat grassland, somewhat swampy, but underneath ground is said to be
good for heavy buildings (no ground survey carried out). Railway and electric
power available in the area. Good roads. The area is bordering the new road Via
Baltica now under construction. Limited supply of process water from river
Obelis or river NevÅûis, which also makes up the only possible recipient for
wastewater.
(8) LÅbartai – KlaipÅda District, Klaipeda County
Flat area with extensively used grassland and agriculture land, east of Klaipeda
City, southwest of the small village of LÅbartai. Some 10 km to nearest main
residential areas in Klaipeda or Gargzdai. Medium/low standard access roads to
the site and some 3-4 km distance to the main public road from Klaipeda to
Šilute. About 4 km to railway and about 10 km to harbour area. The site is
neighbouring the cemetery of Klaipeda and also close to the wastewater
treatment plant in Dumpai. Limited possibilities for supply of process water
from river Minija some 2 km away. Possible waste water discharge through
pipeline directly to the Baltic Sea.

4 - 28
(9) Dumpai – KlaipÅda District, KlaipÅda County
The site is located near the village Dumpai, close to and south of the wastewater
treatment plant and solid waste deposit. The site area is bordering the main road
from KlaipÅda to Šilute. The railway is passing close to the area but opposite
the main road. Conditions for process supply and wastewater recipient are
similar as for LÅbartai above.
(10) Mickai - KlaipÅda District, KlaipÅda County
The site is located west of the small village Mickai, between the railway and the
artificial channel KlaipÅdas Kanalas. The site area is bordering the main road
and the railway from KlaipÅda to Šilute. The area is slightly hilly. Conditions
for process water supply and wastewater recipient are similar as for Lebartai
above.
(11) Tñbausiai – Kretinga District, KlaipÅda County
Proposed area is mainly made up of agriculture land, some 2-3 km east of the
main road KlaipÅda – Kretinga – Darbenai, nearby the village Tñbausiai.
Process water from river Akmena and nearby artificial lake/dam. Treated
wastewater to be discharged through pipeline directly to the Baltic Sea some 14
– 15 km away. Railway line 3-4 km away. Good road connection southwards to
Klaipeda and eastwards to Plunge etc.
(12) DarbÅnai - Kretinga District, KlaipÅda County
The proposed site is located some 4 – 5 km west of DarbÅnai municipality and
west of adjacent artificial lake/dam, which would serve as the source for process
water. Treated wastewater to be discharged directly through pipeline to the
Baltic Sea some 6 – 7 km westwards. Poor access road to site (4-5 km) from
main road KlaipÅda – Kretinga – DarbÅnai. Railway connection possible in
DarbÅnai with further connections to Latvia in north and the Lihuanian railway
system in south.
(13) PagÅgiai South – Šilute District, KlaipÅda County
The site is located 1-2 km south of PagÅgiai residential area. The proposed site
is made up of a slightly hilly area close to river Nemunas at the border to
Kaliningrad, about 1 km to river. Land area between the proposed site and river

4 - 29
Nemunas normally flooded once or twice a year. Nemunas makes up the
possible source for process water and the possible recipient of wastewater.
Opposite the river on the Kaliningrad side, is the Russian pulp mill Celulose
Combinatas Sovetsk Tilze, which is a heavy polluter of the river. The site is
located close to the railway station in PagÅgiai and close to main roads of rather
good standard, going in three directions to KlaipÅda, Taurage and Jurbarkas
respectively.
(14) PagÅgiai North – Šilute District, KlaipÅda County
A second area for the pulp mill site in PagÅgiai is proposed in the former
military area – mainly flat, wooded land - north of the main road to KlaipÅda
and north of PagÅgiai residential area, 1 - 2 km. Distance to railway about 1 km,
or less. Other conditions similar to above site.
(15) Ciziunai – Ignalina District, Utena County
East of lake Dysnai in rolling agriculture landscape. Medium standard road
passing the area, no railway (min. 10 km away). Process water to be taken from
lake Dysnai, which also must be used as recipient for treated wastewater. Lake
Dysnai is Lithuania’s 2nd largest lake with an area of 2.4 ha, however, rather
shallow. Outflow through lake Dysnykstis and river Dysnai eastwards through
Belarus to Latvia and river Daugava.
(16) Janionys – Ignalina District, Utena County
Main alternative site proposed in the district, some 20 – 30 km northeast of
Ignalina city. Located at a small lake and river Dysna with limited supply of
fresh water. River Dysna flows southwards to Belarus and thereafter to river
Daugava through Latvia to the Baltic Sea. Flat, extensively used agriculture land.
Distance to main road (medium standard) some 2 km, no railway (8 – 10 km
away).
(17) Visaginas – Ignalina District, Utena County
The proposed site is located between the City of Visaginas and lake Drukši÷,
bordering the area of the Ignalina nuclear plant. The area is an heavily exploited
industrial area. Process water to be supplied from the lake - 3.6 ha, 32 m deep –
which also makes up the potential recipient for wastewater. Water temperature

4 - 30
in lake (said to vary between 15 and 35 oC) is strongly influenced by cooling
water from nuclear plant. Locally good infrastructure – access roads, railway,
power supply. High standard main road going south to Ignalina city.
(18) Pabrade – Šven¹ionys District, Vilnius County
A possible area for a pulp mill site has been proposed southwest of the village
Karkeiške and some 5 – 8 km south of Pabrade. The site area is bordering the
railway and is also close to river Zeimena. The main road from Vilnius to
Ignalina is passing opposite both the railway and the river from the site. Limited
supply of process water from the river, which is also environmentally sensitive
and partly protected. Possible recipient of wastewater is river Neris some 4-6 km
southwards.
(19) Vievis –Trakai District, Vilnius County
The proposed area for the site is located north of Vievis municipality, between
railway and river Neris. Flat, mainly agriculture area. Good infrastructure with
main road A1 from Vilnius to Klaipeda passing south the area as well as the
railway. Good conditions for power supply from nearby Elektrenai power plant.
(20) GrigiškÅs – Trakai District, Vilnius County
The site of AB Grigiškes Paper and Board Industry. The site is located in the
residential area in the center of the town of Grigiškes, some 20 km west of
Vilnius. The site is located between and along the main road from Vilnius to
Klaipeda and the river Neris downstreams Vilnius. The area is an industrial area
including AB Grigiškes’ tissue and hardboard factories and belonging energy
production plant and facilities for handling and storing of wood and finished
products. Good infrastructure including main road, railway connection and
power supply. Limited area available for a possible pulp mill.

4 - 31
4.4 Site screening – "Short List of Potential Sites"
Based on the field surveys carried out, complemented with desk analyses of
gathered information and on discussions with relevant experts, the "long list" of
candidate sites was reduced to a "short list" of most promising mill sites.
The prepared "short list", initially presented in the Interim Report of the study,
included the following sites
・Alytus North, Alytus District
・Jonava North, Jonava District
・Jonava Rukla, Jonava District
・LÅbartai, Klaipeda District
・Dumpai, Klaipeda District
The potential sites Vievis, Mickai, Tubausiai and Darbenai were added to the "long
list" after that the tentatively "short list" had been prepared. Surveys and analyses
of these sites resulted in that site Vievis was also included in the "short list".
It should be noticed that some sites from Klaipeda District are on the "short list"
although the fresh water supply is considered not enough for these sites. The
conditions for these sites, as well as other alternatives close to the Baltic Sea coast
- Mickai, Tubausiai and Darbenai - are commented separately below.
The Tables below indicate the results of the initial valuation of each of the factors
considered. Principally (+++) means that the conditions for the site for that specific
aspect is very favourable or have very small negative impact, (++) means that the
conditions are good but not perfect and (+) that the conditions are acceptable
without any specific advantages. (0) means that the conditions for the factor
considered are not acceptable or it can be expected that a realization of a pulp mill
project will result in serious negative effects.

4 - 32
Table 4.4.1 Site Screening – Valuation of Factors Considered
Supply of wood raw material Water supply and recipient of
treated wastewater Short name Supply of
domestic wood
Supply of sawmill chips
Import of wood
Supply of process water
Supply of potable water
Recipient of wastewater
Alytus North ++ ++ + +++ ++ +++ Alytus South ++ ++ + +++ ++ ++ Matuizos + + +++ + ++ 0 Pamerkiai + + +++ + ++ 0 Jonava North +++ +++ ++ +++ ++ ++ Jonava Rukla +++ +++ ++ +++ ++ +++ KÅdainiai ++ ++ + + ++ 0 LÅbartai + + 0 0
1 ++ 0
2
Dumpai + + 0 01 ++ 02 Mickai + + 0 01 ++ 02 Tñbausiai + + 0 01 ++ +2 Darbenai + + 0 01 ++ +++2 PagÅgiai South + + 0 +++ ++ +++ PagÅgiai North + + 0 +++ ++ +++ Ciûiunai + + ++ +++ ++ 0 Janionys + + ++ +++ ++ 0 Visaginas + + ++ +++ ++ + PabradÅ + + +++ + ++ + Vievis +++ +++ +++ +++ ++ +++ GrigiškÅs ++ ++ +++ +++ ++ +++
1 Supply of fresh water from rivers is considered not enough. However, possibilities to improve water supply through ground
water wells and in some cases by artificial reservoirs (dams) have been discussed. 2 Discharge of wastewater to the Baltic Sea is considered but judged not possible for LÅbartai, Dumpai and Mickai sites due
to Kursin Marios and Neringa National Park which have to be passed. For Tñbausiai and Darbenai long pipes to the Baltic
Sea are assumed.
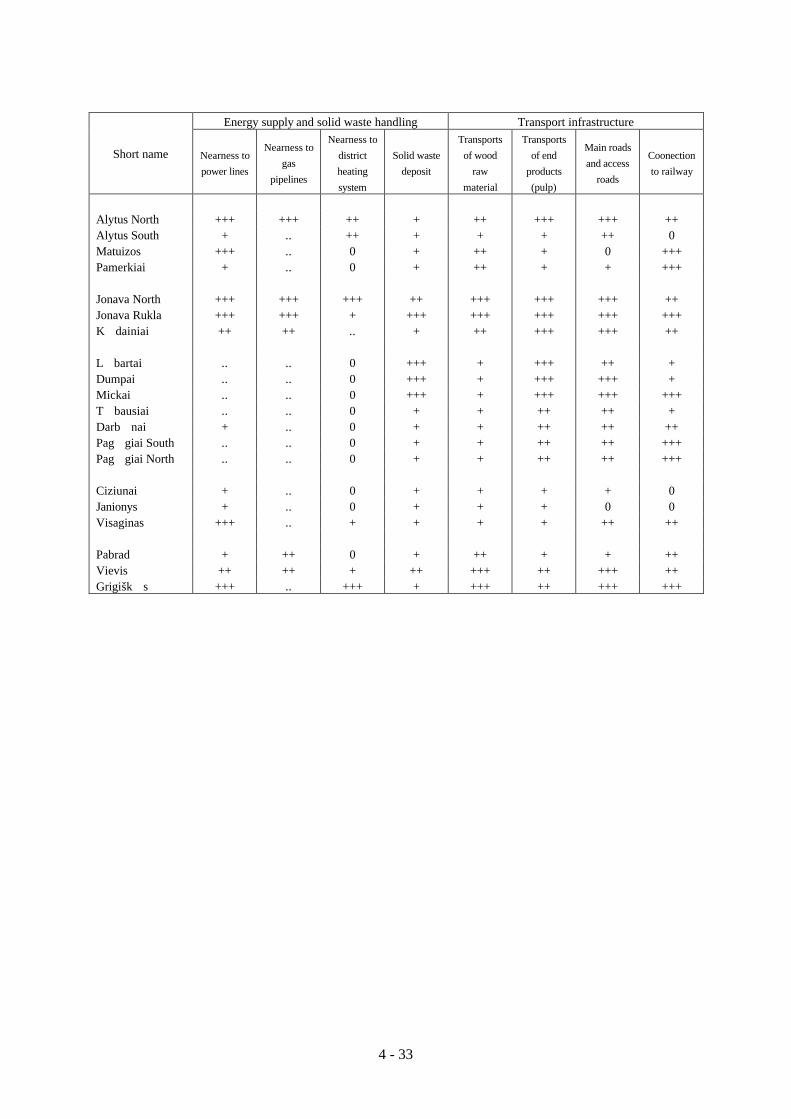
4 - 33
Energy supply and solid waste handling Transport infrastructure
Short name Nearness to
power lines
Nearness to
gas
pipelines
Nearness to
district
heating
system
Solid waste
deposit
Transports
of wood
raw
material
Transports
of end
products
(pulp)
Main roads
and access
roads
Coonection
to railway
Alytus North +++ +++ ++ + ++ +++ +++ ++ Alytus South + .. ++ + + + ++ 0 Matuizos +++ .. 0 + ++ + 0 +++ Pamerkiai + .. 0 + ++ + + +++ Jonava North +++ +++ +++ ++ +++ +++ +++ ++ Jonava Rukla +++ +++ + +++ +++ +++ +++ +++ KÅdainiai ++ ++ .. + ++ +++ +++ ++ LÅbartai .. .. 0 +++ + +++ ++ + Dumpai .. .. 0 +++ + +++ +++ + Mickai .. .. 0 +++ + +++ +++ +++ Tñbausiai .. .. 0 + + ++ ++ + DarbÅnai + .. 0 + + ++ ++ ++ PagÅgiai South .. .. 0 + + ++ ++ +++ PagÅgiai North .. .. 0 + + ++ ++ +++ Ciziunai + .. 0 + + + + 0 Janionys + .. 0 + + + 0 0 Visaginas +++ .. + + + + ++ ++ PabradÅ + ++ 0 + ++ + + ++ Vievis ++ ++ + ++ +++ ++ +++ ++ GrigiškÅs +++ .. +++ + +++ ++ +++ +++

4 - 34
Mill site characteristics Specific environmental issues Other aspects
Short name Avail- able area
Topo- graphy and
geology
Owner- ship
status
Sensitive surroun-
dings (environ-mentally)
Use of fresh water
Waste water
discharge
Emis- sions to air
Traffic, noise etc
Availabi- lity of skilled labour
Housing/ accommo-
dation
Alytus North +++ ++ ++ + +++ ++ ++ + ++ ++ Alytus South + ++ +++ + +++ + + + ++ ++ Matuizos +++ ++ .. ++ + 0 ++ +++ 0 0 Pamerkiai +++ ++ ++ ++ + 0 ++ +++ 0 0 Jonava North + ++ ++ ++ +++ + ++ + +++ ++ Jonava Rukla +++ ++ +++ ++ +++ ++ ++ +++ +++ ++ KÅdainiai +++ ++ .. ++ + 0 .. + ++ ++ LÅbartai +++ ++ + + 0 01 + + ++ + Dumpai +++ ++ + ++ 0 01 ++ ++ ++ + Mickai +++ ++ + + 0 01 ++ ++ ++ + Tñbausiai +++ ++ .. ++ + ++ ++ ++ 0 0 DarbÅnai +++ ++ ++ ++ + ++ ++ +++ 0 0 PagÅgiai South
+++ ++ .. ++ +++ ++ ++ ++ 0 0
PagÅgiai North
+++ ++ .. ++ +++ ++ ++ ++ 0 0
Ciziunai +++ ++ .. ++ +++ 0 ++ +++ 0 0 Janionys +++ ++ +++ ++ ++ 0 ++ +++ 0 0 Visaginas +++ ++ .. ++ +++ + ++ ++ ++ + PabradÅ +++ ++ .. ++ + + ++ ++ + 0 0 Vievis +++ ++ ++ + +++ ++ ++ ++ +++ ++ GrigiškÅs + ++ +++ ++ +++ ++ 0 + +++ ++
1 Please refer to notes on previous page.

4 - 35
4.5 Recommendation – "List of Most Favourable Sites"
(1) Most favourable sites
The final list of potential mill sites, selected and recommended as the most
favourable ones, includes three sites
・Alytus North
・Jonava Rukla
・Vievis
Figure 4.5.1 The Most Favourable Potential Mill Sites
These site alternatives are recommended for further consideration and analyses
in next step of the Lithuanian pulp mill project.
All these sites are located at large rivers, large enough to serve as both source of
fresh process water and recipient of treated waste water, namely river Nemunas
for Alytus North and river Neris for the other site alternatives. These rivers are
the two main rivers in Lithuania. River Neris is joining river Nemunas in the
centre of Kaunas city, from where Nemunas flows westwards along the
Russian/Kaliningrad border to Kurši÷ Marios to finally reach the Baltic Sea at
the harbour of Klaipeda.

4 - 36
The sites are located to areas with generally good infrastructure. Distances to
main public road of good standard, railway, power transmission line and gas
pipeline are generally short, minimising investments outside the site borders.
There are international airports in both Kaunas and Vilnius within 1 to 1 ½ hour
travelling by car from each site.
Conditions as concern access to potable water, solid waste deposit and
possibilities to connect to local district heating system vary between the site
alternatives. These issues are, however, generally judged to be possible to solve
without any major problems.
All sites are further favourably located in the central regions of the wood supply
area, except for Alytus North, which location to the south is somewhat less
advantageous in this respect in comparison to the others. This involves longer
transport distances and higher wood transport costs for the Alytus alternative.
For wood import by train or truck, Vievis is somewhat more favourably located
than Jonava Rukla, while Alytus North has the disadvantage of substantially
longer railway transports to reach the site.
Conditions for export and delivery of pulp to main clients – tentatively assumed
to be located in Central or Western Europe – vary somewhat between the sites
and whether sea transport via Klaipeda is considered or direct land transport to
client via Poland by truck and train. Distances from Alytus North are somewhat
shorter when land transport is considered but slightly longer if sea transport via
Klaipeda will be applied. The conditions for Jonava Rukla and Vievis are
principally equal to each other whichever delivery method is applied. The
possible future Baltic Corridor (railway) passing Jonava and connecting
Lithuania with the European standard railway system, would be a great
advantage to the Jonava Rukla alternative. However, this will not be realised
within a near future. The Via Baltica highway through the Baltic states and
Poland will be an advantage to all alternatives. The Lithuanian part is now under
construction.
All three places can offer nearness to medium sized municipalities – Alytus,
Jonava and ElektrÅnai respectively. Alytus and Jonava are considered more

4 - 37
attractive and can offer more services and variation to its residents. Jonava and
Vievis are also reasonably close located to Kaunas and Vilnius respectively.
Possibilities to attract and employ skilled workers are tentatively considered
quite comparable for the three sites, possibly with a small advantage for Jonava.
The distance to Kaunas, the centre for research and education in the forestry and
forest industry sector, is reasonably short from all three sites and should not
make up any obstacle for cooperation with the institutions in Kaunas. The same
can be assumed for authorities, institutions and enterprises in Vilnius.
The expected environmental impact of a pulp mill is judged to be on an
acceptable low level with no major differences between the three site
alternatives (see comment on Regional Parks below). However, for better
information and knowledge of the environmental impact of the project and
necessary mitigation actions, a comprehensive Environmental Impact
Assessment (EIA) must be carried through. The EIA must consider not only
present pulp mill project but also other existing and possible future polluters in
the area. An EIA is also required according to Lithuanian legislation.
It is expected that Best Available Technique (BAT) is applied in the mill and the
pulping process, including modern technique to clean process water and to
control smell and emissions to the air. Nevertheless, there will be discharges of
wastewater and emissions to the air. The impact to river Nemunas and river
Neris should be comparable for the three sites, river Neris having a somewhat
lower average flow until the junction with Nemunas in Kaunas. Concern has
been raised for negative impact on one drinking water source (ground water
wells) close to river Neris at Kaunas. The issue has to be further studied.
The impact and disturbances to nearby residential areas by emissions to the air,
heavy traffic and noise, is judged roughly equivalent for the sites considered. All
sites are located to the favourable side of main residential areas considering
direction of dominating winds. For all three sites there are smaller villages and
scattered individual dwelling-houses within a distance of 1-2 km. Leisure time
areas are located within a few km from the sites in Alytus (along bank of river
Nemunas) and at Vievis (north of small lake).
An EIA must especially assess the impact to the Regional Parks at Alytus and
Vievis respectively (effluents to rivers, emissions to air, impact on leisure time

4 - 38
activities, etc.). These Regional Parks are primarily established to protect green
areas close to the rivers. For both Alytus North and Vievis, the most favourable
alternative from a technical point of view, seems to be to pass the area of the
Regional Parks with pipelines for fresh water (Vievis) and for wastewater
(Vievis and Alytus North). The legal possibilities for this are not known at
present nor the actual impact to the parks. For both sites, alternatives for the
pipelines can be found, however, implying longer distances.
The social impact to the surroundings of all three sites will be positive, except
for a smaller group of people directly concerned by the mill construction and
possibly later nearby disturbances from the production. No great differences in
this respect are foreseen for the recommended sites.
No major differences in the local support for the project have been noticed. So
far local politicians and other representatives have shown a positive attitude
towards the project, promising their full support. Information to NGOs and the
public has been given on each place in the form of a seminar/workshop.
However, this should not be considered as enough and further activities are
required to fulfil the local population's legitimate demands for information and
opportunities to express their opinions.
(2) Comments to site alternatives close to the Baltic Sea
The "long list" and "short list" of potential mill sites included a number of sites
located in Klaipeda County, Districts of Klaipeda and Kretinga respectively. All
these alternatives are considered less favourable from a wood supply and wood
transport point of view. Their possible advantage as concerns export and
transports of the pulp to European buyers does not compensate for this. No site is
located directly at the coast with possibilities for own quay and shipping to
Europe of pulp. All sites require truck or railway transports to Klaipeda harbour.
None of these sites are located at a river large enough to serve as source for fresh
water. For this reason the possibility to use ground water also as mill process
water – exclusively or as a complement to other sources - has been discussed.
The idea is not unrealistic but can at this stage not be verified. Special geological
and ground water supply studies have be carried out to estimate the available

4 - 39
quantities. Lithuania has vaste sources of good quality ground water and
principally all municipal water is currently supplied from ground water.
The sites in Klaipeda and Kretinga Districts have primarily been identified in
order to find one alternative from where discharges of treated wastewater can be
discharged directly through pipeline to the Baltic Sea. From this point of view,
Darbenai seems to offer the best conditions. A pipeline of some 7 km to the coast
and some additional km to the Baltic Sea will be required. DarbÅnai is also
located at an artificial lake, which can serve partly or fully as a source of fresh
water.
The alternative sites in Klaipeda District – Lebertai, Dumpai and Mickai – are all
judged to face too large environmental problems. Pipelines for wastewater have
to pass the Kursiu Marios and the Neringa National Park to reach the Baltic Sea.
A site location in western Lithuania discharging wastewater directly to the Baltic
Sea is presently not recommended.

A4 - 1
Annex 4-1
Selected Counties (Apskritis) - Profiles in Brief

A4 - 3
Alytus County (Region) – Alytus Apskritis – in brief
Alytus County is the southernmost county of Lithuania. It is bordering to Poland in the
west and to Belarus in south and east. In northwest, north and northeast Alytus county
borders the counties of Marijampoles, Kaunas and Vilnius respectively.
The total land area amounts to 542 500 ha of which
37.5 %
45.6 %
4.5 %
2.1 %
2.3 %
8.0 %
agricultural land
forest land
lakes, rivers, etc.
residential areas
infrastructure and industry
others
Alytus county encompasses three districts (rajonas)
・Alytus district
・Lazdijai district
・Varena district
and two municipal administrative units
・Alytus City
・Druskininkai
The population of the county amounts to 203 000 inhabitants of which
• 61% in urban areas
• 39% in rural areas
Alytus makes up the main city within the county with approximately 77 000 inhabitants.
County administration resides in Alytus City. Other main municipalities are Druskininkai,
Lazdijai and Varena.
Main agriculture areas are found in the western and northern parts of the county, while
eastern and southern parts mainly are forested. It is the most densely forested county in
Lithuania. Major industries are found in the textile, chemical, food, construction and
machine manufacturing sectors. Largest industries are located to Alytus such as AB
Snaiges (household refrigerator manufacturer), AB Alita (bubbling wine distillery), AB
A4 - 4
Alytus Tekstiles (cotton textile and thread producer) and AB Dainava (Sewing factory).
Alytus hard board mill is currently shut down. Silunga sawmill in Alytus city, earlier part
of Alytus Housebuilding Combinate, used to be the largest sawmill in Lithuania but is
today running only at a very low capacity level. Other small sawmills, furniture industries,
carpentries etc. can be found in the county.
The school and education system is well built up. No universities or high schools/colleges
are located to the county.
The main road net is generally good with mainly 2-lane, paved roads with an ordinary
width of 8 to 10 m.
The railway from Vilnius to Belarus is passing through the eastern part of the county
through the town of Varena. There is also a railway, ending in Alytus city, connecting
westwards in Šeštokai to the railway from Kaunas to Poland. A railway terminal is
located to Šeštokai connecting the Lithuanian railway system with the western European
standard railway system.
The county is rich of small lakes and rivers, especially in the western and northern areas.
River Nemunas, Lithuania's largest river flows northwards from Belarus through the
county. River Merkis coming from northeast and passing through Varena, joins river
Nemunas at Druskininkai.
The county includes the Dzekija National Park and a number of nature reserves, regional
parks and state reserves.

A4 - 5
Kaunas County (Region) –Kauno Apskritis – in brief
Kaunas County is located in the centre of Lithuania. It is bordering to Alytus county in
south, Marijampoles and Taurages in west, Šiauliai and Panaveys in north, and to Vilnius
county in east. It is the only county in Lithuania not bordering any foreign country.
The total area amounts to 817 000 ha
Kaunas county encompasses six districts (rajonas)
・Jonava district
・Kaunas district
・Kedainiai district
・Kaišiadorys district
・Prienai district
・Raseiniai district
and two municipal administrative units
・Kaunas City
・Birstonas City
The population of the county amounts to some 760 000 inhabitants
Kaunas makes up the main city with approximately 415 000 inhabitants which makes
Kaunas the second largest city in Lithuania. County administration resides in Kaunas City.
Other main municipalities are Kedainiai, Jonava, Prienai and Raseiniai.
Kaunas county can be characterised as a mixed agriculture and industrial area. Kaunas is
the main industrial city, well known for its fabrics and clothes manufacturing industry.
This has also been the main type of industry in Raseiniai. Jonava and Kedainiai are
mainly known for their chemical and fertiliser production plants. Kaunas Paper Mill in
the city of Kaunas is still operating but currently on a very low level and future
development opportunities are discouraging. Several smaller sawmills, furniture
industries and other mechanical wood industries are found in the county.
The school and education system is well built up with a number of university units,
colleges and other high education institutions. Especially can be mentioned Kaunas
Technological University with departments for mechanical wood processing and for pulp
and paper production, Vytautas Magnus University, Agriculture Academy (with Forestry

A4 - 6
Faculty) and Kaunas Forestry College. Kaunas makes up the centre in Lithuania as
concerns research, development and education related to forestry and forest industry.
Kaunas county has a strategic location in the middle of Lithuania with very good
infrastructure. The main highway from Belarus and Vilnius, through Kaunas, crosses the
county on its way to Klaipeda. Other main public roads, crossing the county in most
directions, are generally of good standard with mainly 2-lane, paved roads with an
ordinary width of 8 to 10 (12) m.
The county is crossed by a number of main roads, including
・A1 from Belarus (Minsk) and Vilnius to Klaipeda
・A5 from Kaunas to Marijampoles and further south to Poland
・A6 from Kaunas to Jonava, Ukmerges, Utena to Daugavpils in Latvia
・A8 through Kedainiai and northwards to Panaveys
Other main roads run westwards to Jurbarkas and further along river Nemunas to
Klaipeda, and southwards to Alytus.
Via Baltica planned to connect Helsinki with Berlin crosses the county from north to
south on its way to Poland, and passes the cities of Kedainiai and Kaunas. Major
construction work is currently ongoing within the county in order to finalise the
Lithuanian link of the road.
Main railways run in most directions from Kaunas – northwards through Jonava and
Kedainiai, eastwards through Kaišiadorys, and southwards to Poland. Kaunas makes up
one of the most important railway hubs in Lithuania. A new railway line of West
European standard is planned to be built from Kaunas to the Polish border. Kaunas
International Airport is located a few km northeast of the city along the main road to
Jonava.
Kauno Marios at Kaunas city, one of Lithuania's major lakes, is an artificial lake. River
Nemunas, coming from Alytus in the south, flows through Kauno Marios and passes
Kanuas city on its way eastwards to the Baltic Sea. River Neris, the second largest river in
Lithuania, comes from Vilnius and joins river Nemunas in Kaunas city. Other important
rivers are Nevezis flowing southwards through Kedainiai city to river Nemunas, Dubysa
passing Raseiniai district on its way south to Nemunas, and Šventoji joining river Neris in
Jonava city.

A4 - 7
The county includes no national park but three regional parks along river Nemunas, river
Dubysa and Kauno Marios, and a number of other nature reserves and state reserves.

A4 - 8
Klaipeda County (region) – Klaipeda Apskritis – in brief
Klaipeda County is the westernmost county of Lithuania. It is bordering the Baltic Sea
and has a total coastline of about 100 km. It borders Russia/ Kaliningrad in the south and
Latvia in the north. To the east Klaipeda county borders the counties of Telšiai and
Taurages.
The total area is 574 600 ha of which
56.4 %
23.0 %
9.6 %.
2.7 %
8.2 %
agricultural land
forest land
lakes, rivers, etc
urban areas
others
Klaipeda county encompasses four districts (rajonas)
・Klaipeda district
・Kretinga district
・Šiluté district
・Skoudas district
and three municipal administrative units
・Klaipeda city
・Neringa municipality
・Palanga city
The population amounts to 416 000 inhabitants. Klaipeda City makes up the main
municipality with over 200 000 inhabitants. Other important municipalities are Šilute,
Kretinga and Palanga. The county administration resides in Klaipeda city.
Klaipeda county is a typical agricultural region, whereas major industries can also be
found, primarily in Klaipeda City. The nearness to the Baltic Sea and the long coastline –
made up of a continuous sand beach between the Kaliningrad and the Latvian borders,
except for the harbour area in the City of Klaipeda – makes Klaipeda county to the most
important region in Lithuania for recreation and tourism. Besides companies built up and
based on the activities in the harbour (shipping, ship building, ship repair and
maintenance, fishing, etc.) can be mentioned Philip Morris and Siemens in Klaipeda and
Fast Food in Gargzdai all established during the 90ies. Klaipeda Cardboard Mill is still

A4 - 9
running but at a very low production level. The sulphite pulp and the groundwood pulp
production is closed since beginning of the 90ies. The possibilities for development are
limited due to the mill's location close to major residential areas and present technical and
financial status of the company. Other important wood based industries are the
particleboard mill, the veneer plant and some sawmills, all located to Klaipeda city.
The school and education system is well built up with University in Klaipeda and lower
education institutions.
The infrastructure is well built up with main roads, railways, harbour and international
airport. The main highway A1 from Vilnius and Kaunas ends up in Klaipeda. Other main
public roads of good standard run soutwards to Šilute and further eastwards to Jurbarkas
and Kaunas, and from Klaipeda northwards to Kretinga, Palanga and Latvia.
Railways are coming from north, east and south to Klaipeda city. The harbour of
Klaipeda also includes a railway ferry terminal with connection to Germany.
The harbour in Klaipeda City, the only harbour at the Baltic Sea in Lithuania, is of utmost
importance to the city and the whole country. An offshore oil terminal for loading of oil to
and from the refinery in Mazeikiai, has recently also been built at Butinge close to the
Latvian border.
Palanga international airport, some 30 km north of Klaipeda, has direct connection to
Germany (Hamburg, Frankfurt), Denmark (Billund), Sweden (Kristianstad), Norway
(Solo) and Russia (Moscow, St Petersburg).
Klaipeda county is short of rivers and lakes except for river Nemunas flowing along the
border to Russia/Kaliningrad into Kursiu Marios and the Baltic Sea. Rivers like river
Dane and river Minija are comparatively small and environmentally sensitive.
Klaipeda county encompasses several environmentally sensitive and protected areas like
・Neringa National Park
・Nemunas Delta Regional Park
・Pajerio Regional Park
・Salantu Regional Park
as well as a number of other protected areas, e.g. the river Minija.

A4 - 10
Utena County (region) – Utena Apskritis – in brief
Utena county in the eastern part of Lithuania borders the counties of PanavÅû in the
north and Vilnius in the south. Utena county is also bordering Latvia in northeast and
Belarus in east.
The total area amounts to 720 000 ha
Utena county encompasses five districts (rajonas)
・Anykšeiai district
・Ignalina district
・Moletai district
・Utena district
・Zarasai district
The population of the county amounts to some 202 000 inhabitants
Utena city makes up the main city in the county with approximately 36 000 inhabitants.
County administration resides in Utena city. Other main municipalities are Anykšeiai,
Ignalina, Visaginas, Moletai and Zarasai.
Utena county can be characterised as a rural agriculture area with primarily only light and
small to medium size industries, except the nuclear power plant in Ignalia district, close to
Visaginas town.
The school and education system is rather well built up on lower education levels but with
no university units, colleges or other high education institutions.
There are two important main roads crossing the county - the A6 from Kaunas, Ukmerges
to Utena and eastwards to Daugavpils in Latvia and further east, and the south-north road
between Utena and Vilnius. Other main public roads, crossing the county in most
directions, are generally of lower standard with mainly 2-lane, paved roads with an
ordinary width of 8 to 10 m.
The railway passing Ignalina and Visaginis connects the eastern parts of the county to
Latvia in north (and further east/northwards) and to Vilnius in the south. The railway to
Utena city ends in the city and connects in the south to the railway to Vilnius.

A4 - 11
The county is rich in, generally shallow, lakes and small rivers and creeks. There is no
major river passing the county. The outflows of the major lakes Dysnai and Drñkši÷ go
to Belarus and further on to river Daugava in Latvia before joining the Baltic Sea in Riga.
The county encompasses Aukštaitijos National Park, and a number of other regional
parks, nature reserves and state reserves.

A4 - 12
Vilnius County (Region) – Vilnius Apskritis – in brief
Vilnius County, located in eastern Lithuania, borders Belarus in south and east. In north
it borders the counties of Utena and PanavÅûys, and in west the counties of Kaunas and
Alytus.
The total area of Vilnius county amounts to 965 000 ha of which
• 49 % agricultural land
Vilnius county encompasses seven administrative districts (rajonas)
・ElektrÅnai district
・Šal¹ininkai district
・Širvintos district
・Šven¹ionys district
・Trakai district
・Ukmerges district
・Vilnius district
and one municipal administrative unit
・Vilnius City
The population of the county amounts to 894 000 inhabitants of which
• 79.5 % in urban areas
• 20.5 % in rural areas
Vilnius makes up the main city and the capital of Lithuania. Vilnius with approximately
415 000 inhabitants is the largest city in Lithuania. County administration resides in
Vilnius City as well as the Government and Parliament (Seimas) of Lithuania. Other
important municipalities in the county are for example Ukmerges, ElektrÅnai, Trakai,
Lentvaris, Šal¹ininkai and Šven¹ionys.
Vilnius county is dominated by the Capital Vilnius which can be characterised as a mixed
governmental, industrial and education city. Areas outside of Vilnius are typical rural
agriculture areas. Presently foodstuff processing industries are the most important type of
industries together with clothes manufacturing, wood based industries, beverage and
chemical production as well as other types of light industry and construction work. AB

A4 - 13
Grigiskes, located some 20 km west of Vilnius in the town of Grigiskes, produces tissue
and hardboard as their main products. The company is principally the only pulp and paper
industry in Lithuania that has managed to develop and reached profitable increasing
production. Other wood based industries are Pabrade Paper Mill and Naujuju Verkiu
Paper Mill, both with very low production, as well as a number of small sawmills and
furniture industries of varying size.
The school and education system is well built up with a number of university units,
colleges and other high education institutions. Especially can be mentioned Vilnius
University and Vilnius Technical University.
The infrastructure of Vilnius county is well built up especially in the central and western
districts. The eastern districts, both in south and north, are typical rural districts with
poorer public road net. The main highway from Belarus crosses the county on its way to
Kaunas and Klaipeda. Also the main road to northwest towards Ukmerges and
PanavÅûys is of highway standard. Other main public roads, crossing the county in most
directions, are generally of good standard with mainly 2-lane, paved roads with an
ordinary width of 8 to 10 (12) m.
Vilnius city is an important railway hub and railways run in most directions from the city
– westwards to Kaunas and Klaipeda, to southeast through Varena to Belarus, south- and
eastwards to Belarus, and to northeast through Pabrade and Ignalina to Daugavpils in
Latvia.
Vilnius international airport is located a few km south of the city.
River Neris, the second largest river in Lithuania, flows through Vilnius city westwards
and joins river Nemunas in Kaunas city. Other rivers are mainly small, like river
¦eimena passing PabradÅs, and generally environmentally sensitive. The county is rich
of lakes, normally shallow.
The county encompasses Trakai National Park, Neris Regional Park between Vilnius and
ElektrÅnai and a number of other nature reserves and state reserves.
A4 - 15
Annex 4-2
Potential Mill Sites - Profiles in Brief
Note 1 All distances presented are rough estimates as the definite borders of the mill
site are not decided. Distances refer to distance outside mill site to connect to
roads, railways, power lines, process water source and wastewater recipient,
etc.
Note 2 Figures are more accurate for those sites finally selected as the most favourable
sites (Alytus North, Jonava Rukla and Vievis).
Note 3 Environmental restrictions are only occasionally commented, but are discussed
in more detail in Chapter 5.

A4 - 17
Proposed mill site: Alytus North
County (Apskritis) Alytus District (Rajona) Alytus Location of site North Alytus city (6-9 km) and north industrial area (2-4 km), between road 130
and river Nemunas Site characteristics Slightly rolling agriculture land, with a few dwelling-houses scattered in the
area. Potentially available area exceeds 200 ha with possibilities to further expand.
Land ownership Mainly private land – 90 % - a few (5-6) rather large farms (30-60ha each). Surroundings To the east and north flows river Nemunas, the largest river in Lithuania. North
of the proposed mill site the River Nemunas Regional Park is situated encompassing the banks and nearby areas of river Nemunas. To the west is mainly agriculture land and the main road from Alytus to Kaunas. Urban areas in south (Alytus city), about 5 km to main residential areas in city, scattered dwelling-houses especially to the east towards Nemunas west bank.
Process water supply
River Nemunas east of site at 2-3 km distance, south border of regional park. Steep banks at river Nemunas, difference of 50-60 m to site level. The textile industry has its own water intake from Nemunas with over capacity and is selling treated water (filtered) to nearby industries
Potable water supply
Municipal
Waste water treatment
Own plant on site initially assumed. Alytus new municipal waste water treatment plant close to the area, 3-4 km. The plant – located between the industrial area and river Nemunas north of the city - has been built in cooperation with Denmark Waste water from textile plant returned to community system
Wastewater recipient
River Nemunas north of site within regional park, approx. 3 km. Alternatively south of (upstreams) regional park, 2-3 km.
Power supply 110 kV and 330 kV power lines close to site, 1 km Access to natural gas Gas pipeline – high, medium and low pressure – between road and river Roads Main road 130 Alytus – Kaunas passes a few km to the west of the site. River
Nemunas makes up an obstacle for traffic coming from south or east. However, a new bridge planned over the river and further passing through industrial area connecting to main road 130 – forming part of a new "ring way" - will improve wood transport conditions to the mill site.
Railway connection Railway connection available in adjacent industrial area, 2-3 km Solid waste deposit Probably own deposit to be prepared Local district heating system
District heating plant situated in industrial area.
Others Sawmill (Silunga) and other wood based industries (wooden houses, windows, doors, etc.) situated in nearby industrial area. The hardboard factory has been shut down. It is planned to be dismantled and sold. Mineral wool factory dismantled. No cultural heritages known. Growing important leisure time area along Nemunas banks, although presently said to be only marginally utilised
Special notes Pipeline for treated effluent water has to cross part of the regional park on the south bank of river Nemunas if discharging to the north is considered. Discharging to the east, south of the regional park, will influence the raw water intake that has to be moved further south (upstreams) to avoid effluent water in the fresh raw water .

A4 - 18
Proposed mill site: Alytus South
County (Apskritis) Alytus District (Rajona) Alytus Location of site South to southeast of Alytus city at river Nemunas north bank on
former military area, between the river and road 128 running from Alytus eastwards to Vilnius.
Site characteristics Flat, open, presently unused land. Former military area. Potentially available area about 1x1.5 km (150 ha) or less, with limited possibilities to expand.
Land ownership State owned. Surroundings The proposed site is surrounded by river Nemunas to the south and
east, a botanical nature reserve area to the west and further west and north by the city of Alytus. About 2 km to nearest main residential area and another 2 km to the centre of the city. Opposite side of river Nemunas mainly forested areas.
Process water supply River Nemunas, 0.5 km Potable water supply Municipality Waste water treatment Own plant on site initially assumed. Wastewater recipient River Nemunas, north of site, upstreams the city, 0.5-1.0 km Power supply In city Access to natural gas Roads Road 128 passing the site in west-east direction. Railway connection Nearest railway line in the city, 7-8 km away, with limited
possibilities to build a new line to the mill (passing the nature reserve)
Solid waste deposit Probably own deposit to be prepared Local district heating system District heating system in city Others Special notes

A4 - 19
Proposed mill site: Matuizos
County (Apskritis) Alytus District (Rajona) VarÅna Location of site East of Matuizos village, close to the old brick factory Site characteristics Land ownership Surroundings Typical forest area with some scattered agriculture land. Nearest
village Matuizos and some 10 km away the small town of Varena. Varena is the largest district in Lithuania by area – 2400 km2 – but the least densely populated. Total population amounts to 36 000 of which 10 500 in the town of Varena. About 65 % of the land is forested – mainly by pine.
Process water supply River Merkis Potable water supply Waste water treatment Own plant on site initially assumed. Wastewater recipient River Merkis Power supply 110 kV power line to village Matuizos Access to natural gas Roads Rather poor road to Varena. Nearest main road is road A4 from
Vilnius some 15 km from site Railway connection Railway Vilnius – Belarus passes village Matuizos Solid waste deposit No, own deposit has to be prepared Local district heating system No Others River Merkis is considered to be a clean river with 22 different
species of fish. Downstreams Pamerkiai there is a Geological Reserve Area. Further down streams, Merkis is passing Dzukijos National Park, before reaching river Nemunas in the municipality of Merkine.
Special notes Site not visited, information through local authority representatives.

A4 - 20
Proposed mill site: Pamerkiai
County (Apskritis) Alytus District (Rajona) VarÅna Location of site Northwest of railway and river Merkis intersection in Pamerkiai
village Site characteristics Flat agriculture and forest land on the north side of river Merkis and
west of the railway line. Minimum 150 ha possible to find with possibilities for further expansions (forest land)
Land ownership Mixed. Agriculture land private, forest land mainly state owned. Surroundings The small village of Pamerkiai and Varena town. Pamerkiai is a
typical old poor countryside village with an estimated population of some 100 – 200 persons. People mainly living from agriculture business. Varena is the largest district in Lithuania by area – 2400 km2 – but the least densely populated. Total population amounts to 36 000 of which 10 500 in the town of Varena. About 65 % of the land is forested – mainly by pine.
Process water supply River Merkis Potable water supply Own ground water well Waste water treatment Own plant on site initially assumed. Wastewater recipient River Merkis Power supply 110 kV power line in Matuizos some 4 km southwards. Access to natural gas Roads Poor access road to mill site, gravelled, from main road A4 from
Vilnius to Belarus, Distance to road A4 some 4-5 km Railway connection Railway Vilnius – Belarus passing along mill site Solid waste deposit No, own deposit has to be prepared Local district heating system No Others River Merkis is considered to be a clean river with 22 different
species of fish. Downstreams Pamerkiai there is a Geological Reserve Area. Further down streams, Merkis is passing Dzukijos National Park, before reaching river Nemunas in the municipality of Merkine. Dominating wind from southwest
Special notes

A4 - 21
Proposed mill site: Jonava North
County (Apskritis) Kaunas District (Rajona) Jonava Location of site North of industrial area, northeast of Jonava city Site characteristics Flat, mainly forested land (pine, average age some 50 years) with a
few small farms. Available area less than 150 ha (120 ha) with no possibilities to expand. Area surrounded by roads and high voltage power lines. Geological conditions are good, mainly sandy soils, ground water level unknown but drainage is considered no problem. Risk for pollution through ground water judged very low. Analyses were made around Achema some years ago with no specific risks noticed.
Land ownership 30 % private, 6 farms with rather poor small scale farming activities, remaining area state owned (State Forest Fund)
Surroundings Industrial area to southwest between mill site and Jonava residential areas. About 1.5-2 km to nearest main residential areas. To the south power lines, main road from Ukmerge to Jonava and river Neris. To the north and east primarily agriculture land with scattered villages and dwelling-houses. Main municipalities Jonava city, 35 000 inhabitants, and Kaunas some 30 km southwest, 400 000 inhabitants. Main industry is Achema AB producing nitrogen fertilisers, urea, ammonia, and others. Private company.
Process water supply River Neris, 1-1.5 km Potable water supply Municipal or own ground water well. Waste water treatment Own plant on site initially assumed.
Municipal waste water treatment plant close to river Neris in southern part of town. Pumping station close to railway station in central Jonova, capacity of pumping 20 000 m3/day, present use about 5-6 000 m3
Wastewater recipient River Neris. Discharge of wastewater up streams the town might cause problems as concerns permits, pumping to existing pump station judged less realistic.
Power supply 330 and 110 kV power lines adjacent to mill site. 1 km to transformer station of 330/110 kV
Access to natural gas Gas pipeline available at district heating plant, 0.5-1 km Roads Short access road, 1 km required, to reach main road A6 to Kaunas in
southwest and Ukmerge in northeast. Railway connection In Jonava city, railroad connection to industrial area, 1 km away Solid waste deposit Municipal deposit south of river Neris, about 5 km, alternatively own
deposit Local district heating system District heating plant in industrial area, 0.5-1 km Others Jonava State Forest Enterprise's sawmill situated opposite road to
mill site. Dominating winds are coming from southwest. No cultural heritages known.
Special notes To discharge treated effluent water down streams the city is judged difficult

A4 - 22
Proposed mill site: Jonava Rukla
County (Apskritis) Kaunas District (Rajona) Jonava Location of site Southeast of Jonava city, west of Rukla municipality, between
railway and road 143 Site characteristics Slightly hilly landscape with mainly sandy soils, but also parts of
more swampy character judged not to cause any drainage problems. Area mainly covered by forest or bushes. Available area exceeds 200 ha with possibilities to further expansion
Land ownership State owned land, partly former military area. Marginal parts privately owned.
Surroundings To the west mixed agriculture and forest land with some villages and scattered dwelling-houses, to the north the industrial area of Achema chemical plant (fertiliser producer) and further west on opposite side of river Neris the residential areas of Jonava. To the east mainly forest land, river Neris and the municipality of Rukla.In south mainly forest land and former military area (partly still in use). Main municipalities are Jonava city, 35 000 inhabitants, and Kaunas some 30 km southwest, 400 000 inhabitants. Main industry is Achema AB producing nitrogen fertilisers, urea, ammonia, and others. Private company.
Process water supply River Neris upstreams Jonava, east of mill site, 1.5-2 km Potable water supply Municipal ground water field in Rukla or own ground water well Waste water treatment Own plant on site initially assumed.
Waste water treatment plant in Rukla only used to a small share of its capacity. Treated water discharged to Neris.
Wastewater recipient River Neris down streams Jonava centre, 4-5 km Power supply 110 kV (2 km) and 330 kV (1 km) power lines available Access to natural gas High pressure and low pressure gas pipelines along border of site Roads Access roads to be improved 3-4 km. good connection to main road
A6 Kaunas-Jonava-Ukmerge etc. Two-lane road to southeast to Elektrenai and main road A1Vilnius-Kaunas-Klaipeda
Railway connection West of mill site, Gaiûiñnai railway station (presently unused) with good conditions for parking railway wagons and for train movements, 1 km. Connection to Achema railway line judged to be too steep.
Solid waste deposit Municipal deposit, 1.5-2.5 km Local district heating system Possibilities to connect to district heating system in Rukla. Others Dominating winds are coming from southwest.
Rukla facilities were built for military purposes and the area used to be intensively used by the military, presently used to some extent for Lithuanian military and housing of illegally arrived immigrants (waiting to be returned to their country of origin) No cultural heritages known.
Special notes

A4 - 23
Proposed mill site: KÅdainiai
County (Apskritis) Kaunas District (Rajona) KÅdainiai Location of site Eastern part of industrial area east of KÅdainiai city Site characteristics Flat grassland, somewhat swampy, but underneath ground is said to
be good for heavy buildings (no ground survey carried out). Land ownership Surroundings Proposed site situated in existing industrial area. Surroundings
mainly agriculture land with scattered forest areas and scattered dwelling-houses and small villages. KÅdainiai is a typical industrial town with large bio-chemical industry – e.g. AB Kedainu Bio-Chemija – producing additives for animal, furforal, etc. Grain storage, sugar factory and others. Only minor wood working industries in the area
Process water supply River Obelis or river NevÅûis, limited supply Potable water supply Municipal Waste water treatment Own plant on site initially assumed. Wastewater recipient River NevÅûis Power supply 110 kV power line, a few km Access to natural gas Roads Good road connections in most directions. The area is bordering the
new road Via Baltica now under construction Railway connection Main railway Vilnius-Klaipeda, roughly 2-3 km away Solid waste deposit Local district heating system Others Special notes

A4 - 24
Proposed mill site: LÅbartai
County (Apskritis) KlaipÅda District (Rajona) KlaipÅda Location of site East of KlaipÅda City, southwest of the small village of Lebartai. Site characteristics Flat area with extensively used grassland and agriculture land Land ownership Mainly private or in process to be privatised. Presently some 20-30
owners Surroundings Typical agriculture area with scattered villages and individual
dwelling-houses. Some 10 km to nearest main residential areas in KlaipÅda or Gargzdai. The site is neighbouring the cemetery of KlaipÅda and also close to the wastewater treatment plant in Dumpai.
Process water supply River Minija, 2 km away, limited supply. Protected area. Ground water wells (?) Process water from Kurši÷ Marios not considered as salt water is penetrating Kurši÷ Marios about 30 days per year up to a line of roughly 1/3 of Lithuanian part of lagoon.
Potable water supply Own ground water wells Waste water treatment Own plant on site initially assumed.
New waste water treatment plant, start-up in 1999, with full mechanical and biological treatment at Dumpai. Cleaned water pumped and discharged in Kurši÷ Marios. The area also includes handling/storing facilities for hazardous waste, as well as a new solid waste deposit.
Wastewater recipient Pipeline directly to the Baltic Sea. Pipeline has to pass Kurši÷ Marios as well as Neringa National Park, which probably is not acceptable. The possibility to discharge waste water into the harbour area has been discussed, together with the waste water from the municipality plant, but is presently not further considered.
Power supply Access to natural gas Roads Medium/low standard access roads to the site and some 3-4 km
distance to the main public road from KlaipÅda to ŠilutÅ. Railway connection Railway Klaipeda-Silute, 4 km Solid waste deposit Nearby municipal deposit in Dumpai or own deposit Local district heating system No Others Dominating wind from seaside/west.
River Minja protected for biological/ecological reasons. River considered as cleaner than river Dana from Kretinga. Salmon and trouts can be found in Minja, although not very common.
Special notes

A4 - 25
Proposed mill site: Dumpai
County (Apskritis) KlaipÅda District (Rajona) KlaipÅda Location of site South to southeast of waste deposit plant at Dumpai. Site characteristics Flat, presently unused grassland Land ownership Mainly private or in process to be privatised. Presently some 30-40
owners Surroundings Typical agriculture area with scattered villages and individual
dwelling-houses. Some 10 km to nearest main residential areas in KlaipÅda or Gargzdai. The site is neighbouring the wastewater treatment plant and solid waste deposit in Dumpai.
Process water supply River Minija, 2 km away, limited supply. Ground water wells (?) Process water from Kurši÷ Marios not considered as salt water is penetrating Kurši÷ Marios about 30 days per year up to a line of roughly 1/3 of Lithuanian part of lagoon.
Potable water supply Own ground water well Waste water treatment Own plant on site initially assumed.
New waste water treatment plant, start-up in 1999, with full mechanical and biological treatment at Dumpai. Cleaned water pumped and discharged in Kurši÷ Marios. The area also includes handling/storing facilities for hazardous waste, as well as a new solid waste deposit.
Wastewater recipient Pipeline directly to the Baltic Sea Pipeline has to pass Kurši÷ Marios as well as Neringa National Park, which probably is not acceptable. The possibility to discharge waste water into the harbour area has been discussed, together with the waste water from the municipality plant, but is presently not further considered.
Power supply Access to natural gas Roads The site area is bordering the main road from KlaipÅda to ŠilutÅ Railway connection The railway Klaipeda-Silute is passing close to the area but opposite
the main road. Solid waste deposit Nearby municipal deposit in Dumpai or own deposit Local district heating system No Others Dominating wind from seaside/west.
River Minja protected for biological/ecological reasons. River considered as cleaner than river Dana from Kretinga. Salmon and trouts can be found in Minja, although not very common.
Special notes
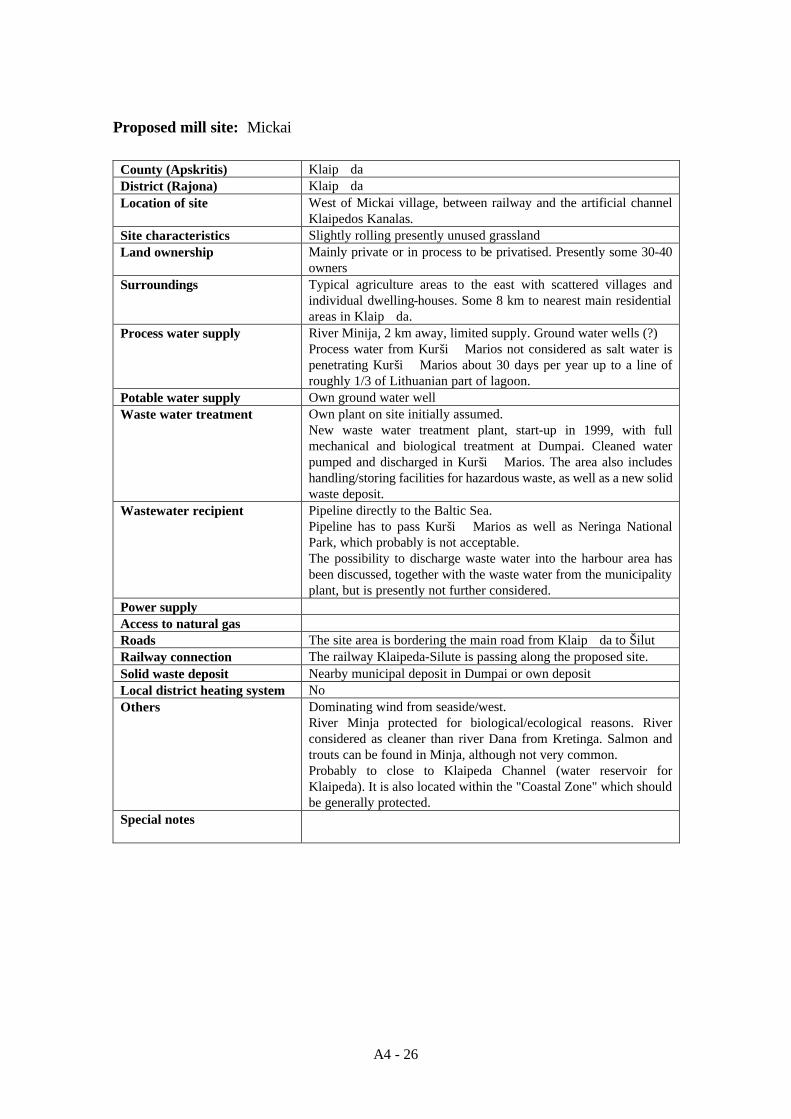
A4 - 26
Proposed mill site: Mickai
County (Apskritis) KlaipÅda District (Rajona) KlaipÅda Location of site West of Mickai village, between railway and the artificial channel
Klaipedos Kanalas. Site characteristics Slightly rolling presently unused grassland Land ownership Mainly private or in process to be privatised. Presently some 30-40
owners Surroundings Typical agriculture areas to the east with scattered villages and
individual dwelling-houses. Some 8 km to nearest main residential areas in KlaipÅda.
Process water supply River Minija, 2 km away, limited supply. Ground water wells (?) Process water from Kurši÷ Marios not considered as salt water is penetrating Kurši÷ Marios about 30 days per year up to a line of roughly 1/3 of Lithuanian part of lagoon.
Potable water supply Own ground water well Waste water treatment Own plant on site initially assumed.
New waste water treatment plant, start-up in 1999, with full mechanical and biological treatment at Dumpai. Cleaned water pumped and discharged in Kurši÷ Marios. The area also includes handling/storing facilities for hazardous waste, as well as a new solid waste deposit.
Wastewater recipient Pipeline directly to the Baltic Sea. Pipeline has to pass Kurši÷ Marios as well as Neringa National Park, which probably is not acceptable. The possibility to discharge waste water into the harbour area has been discussed, together with the waste water from the municipality plant, but is presently not further considered.
Power supply Access to natural gas Roads The site area is bordering the main road from KlaipÅda to ŠilutÅ Railway connection The railway Klaipeda-Silute is passing along the proposed site. Solid waste deposit Nearby municipal deposit in Dumpai or own deposit Local district heating system No Others Dominating wind from seaside/west.
River Minja protected for biological/ecological reasons. River considered as cleaner than river Dana from Kretinga. Salmon and trouts can be found in Minja, although not very common. Probably to close to Klaipeda Channel (water reservoir for Klaipeda). It is also located within the "Coastal Zone" which should be generally protected.
Special notes
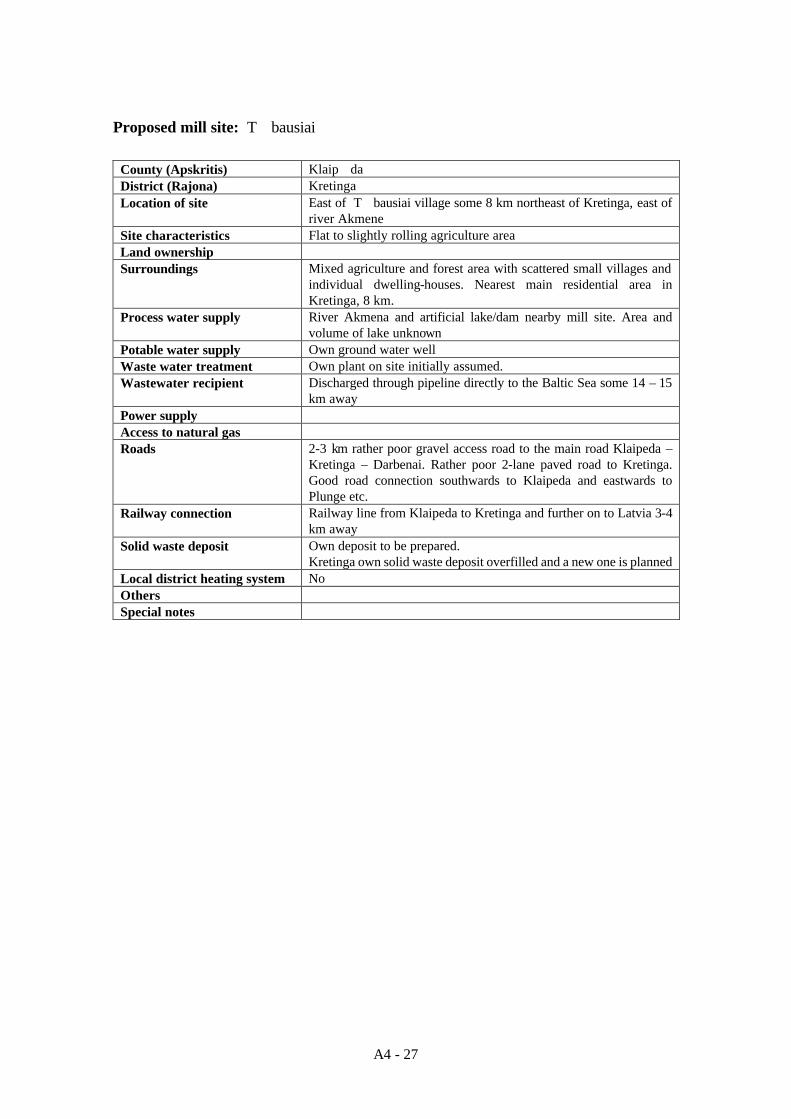
A4 - 27
Proposed mill site: Tñbausiai
County (Apskritis) KlaipÅda District (Rajona) Kretinga Location of site East of Tñbausiai village some 8 km northeast of Kretinga, east of
river Akmene Site characteristics Flat to slightly rolling agriculture area Land ownership Surroundings Mixed agriculture and forest area with scattered small villages and
individual dwelling-houses. Nearest main residential area in Kretinga, 8 km.
Process water supply River Akmena and artificial lake/dam nearby mill site. Area and volume of lake unknown
Potable water supply Own ground water well Waste water treatment Own plant on site initially assumed. Wastewater recipient Discharged through pipeline directly to the Baltic Sea some 14 – 15
km away Power supply Access to natural gas Roads 2-3 km rather poor gravel access road to the main road Klaipeda –
Kretinga – Darbenai. Rather poor 2-lane paved road to Kretinga. Good road connection southwards to Klaipeda and eastwards to Plunge etc.
Railway connection Railway line from Klaipeda to Kretinga and further on to Latvia 3-4 km away
Solid waste deposit Own deposit to be prepared. Kretinga own solid waste deposit overfilled and a new one is planned
Local district heating system No Others Special notes

A4 - 28
Proposed mill site: DarbÅnai
County (Apskritis) KlaipÅda District (Rajona) Kretinga Location of site West of DarbÅnai municipality, 4-5 km, and west of neighbouring
artificial lake/dam Site characteristics Flat, presently extensively used agriculture land. Totally some 400
ha of which only some 200 ha are used. Sandy soils, about 1 m to clay, lowland area where drainage may become a problem.
Land ownership Privately owned Surroundings Mixed agriculture and forest area with scattered small villages and
individual dwelling-houses. Nearest main residential area in DarbÅnai municipality, 4-5 km, 1500 inhabitants.
Process water supply Artificial lake/dam in river Darba. Supply ? The lake is up to 20 m deep, estimated avarge 7-8 m, and has a total area of 110 ha.
Potable water supply Own ground water well Waste water treatment Own plant on site initially assumed. Wastewater recipient Discharged through pipeline directly to the Baltic Sea some 7 km
away Power supply 110 kV power lines in DarbÅnai, 4-5 km Access to natural gas Roads Poor access road to site (4-5 km) - partly gravelled, partly paved -
from main road Klaipeda – Kretinga – DarbÅnai. Rather poor 2-lane paved road to Kretinga
Railway connection Railway connection possible in DarbÅnai, 3-4 km, with further connections to Latvia in north and the Lihuanian railway system to the south
Solid waste deposit Own deposit to be prepared. Local district heating system No Others Distance to Palanga International Airport 12-15 km. Special notes

A4 - 29
Proposed mill site: PagÅgiai South
County (Apskritis) KlaipÅda District (Rajona) ŠilutÅ Location of site South of PagÅgiai municipality, 1-2 km, and railway station, close
to river Nemunas at the border to Kaliningrad, about 1 km to river. Site characteristics Slightly hilly area Land ownership Surroundings Mixed agriculture and forest land with scattered small villages and
individual dwelling-houses. Areas south and west of side down to river Nemunas typical lowland areas commonly flooded.
Process water supply River Nemunas Potable water supply Own ground water well Waste water treatment Own plant on site initially assumed. Wastewater recipient River Nemunas Power supply Access to natural gas Roads The main road through the town - from Klaipeda to Kaunas – is of
rather good standard, paved some 8 – 10m in width. There is also a road of similar standard going northeast to Taurage and main road A1. Bridge over Nemunas to Kaliningrad in Panemune.
Railway connection Close to the railway station in PagÅgiai and railway line from Klaipeda, Jurbarkas and Kaliningrad
Solid waste deposit Own deposit to be prepared Local district heating system No Others Special notes Land area between the proposed site and river Nemunas normally
flooded once or twice a year. Opposite the river on the Kaliningrad side, is the Russian pulp mill Celulose Combinatas Sovetsk Tilze, which is a heavy polluter of the river.

A4 - 30
Proposed mill site: PagÅgiai North
County (Apskritis) KlaipÅda District (Rajona) ŠilutÅ Location of site North of PagÅgiai municipality, 1-2 km, and north of main road to
Klaipeda and railway, former military area Site characteristics Mainly flat, wooded land Land ownership Surroundings Mixed agriculture and forest land with scattered small villages and
individual dwelling-houses. Areas south and west of side, down to river Nemunas typical lowland areas commonly flooded.
Process water supply River Nemunas Potable water supply Own ground water well Waste water treatment Own plant on site initially assumed. Wastewater recipient River Nemunas Power supply Access to natural gas Roads The main road through the town - from Klaipeda to Kaunas – is of
rather good standard, paved some 8 – 10m in width. There is also a road of similar standard going northeast to Taurage and main road A1. Bridge over Nemunas to Kaliningrad in Panemune.
Railway connection Close to railway Klaipeda – Taurage and Kaliningrad, 1-2 km. Solid waste deposit Own deposit to be prepared Local district heating system No Others Special notes Opposite the river on the Kaliningrad side, is the Russian pulp mill
Celulose Combinatas Sovetsk Tilze, which is a heavy polluter of the river.

A4 - 31
Proposed mill site: %iûiunai
County (Apskritis) Utena District (Rajona) Ignalina Location of site Area around %iûiunai village, east of lake Dysnai. Site characteristics Slightly rolling agriculture landscape Land ownership Surroundings Bordering lake Dysnai in west. Mainly agriculture land in other
directions in the neighbourhood mixed with small forest areas, farther away more forested land. Sparsely populated area with scattered small villages and individual dwelling-houses.
Process water supply Lake Dysnai Potable water supply Own ground water well Waste water treatment Own plant on site initially assumed. Wastewater recipient Lake Dysnai Power supply North of lake Dysnai, 7-8 km Access to natural gas Roads Medium standard road passing the area Railway connection No railway, minimum 8-10 km away Solid waste deposit Own deposit to be prepared Local district heating system No Others Special notes Lake Dysnai is Lithuania’s 2nd largest lake with an area of 2.4 ha,
however, rather shallow. Outflow through lake Dysnykstis and river Dysnai eastwards through Belarus to Latvia and river Daugava

A4 - 32
Proposed mill site: Janionys
County (Apskritis) Utena District (Rajona) Ignalina Location of site North of Janionys village, some 20 – 30 km northeast of Ignalina
city. Site characteristics Flat, extensively used agriculture land Land ownership Privately owned (one owner) Surroundings Mainly agriculture land mixed with forest areas. Sparsely populated
with small villages and few individual dwelling-houses Process water supply Small lake and river Dysna Potable water supply Own ground water well Waste water treatment Own plant on site initially assumed. Wastewater recipient River Dysna Power supply West of lake Dysnai, 6-8 km Access to natural gas Roads Poor access road, 2 km, to medium standard public road Railway connection No, railway line 7-9 km away Solid waste deposit Own deposit to be prepared Local district heating system No Others Special notes River Dysna flows southwards to Belarus and thereafter to river
Daugava through Latvia to the Baltic Sea.
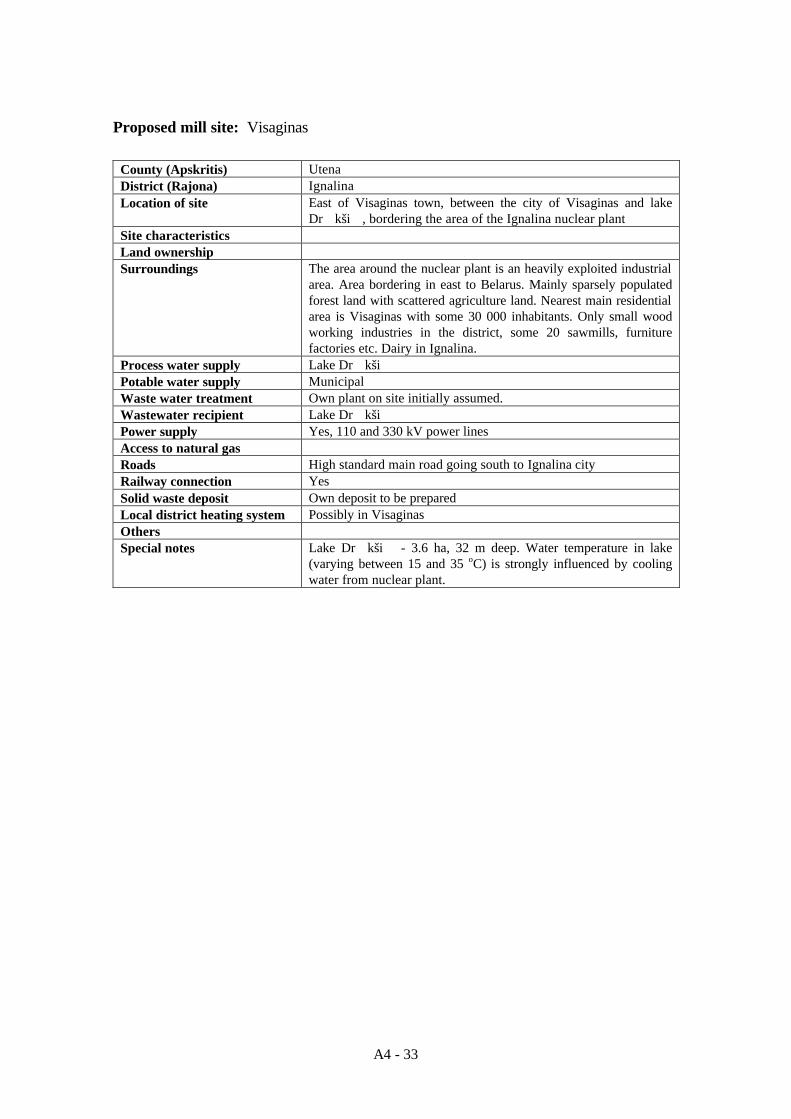
A4 - 33
Proposed mill site: Visaginas
County (Apskritis) Utena District (Rajona) Ignalina Location of site East of Visaginas town, between the city of Visaginas and lake
Drñkši÷, bordering the area of the Ignalina nuclear plant Site characteristics Land ownership Surroundings The area around the nuclear plant is an heavily exploited industrial
area. Area bordering in east to Belarus. Mainly sparsely populated forest land with scattered agriculture land. Nearest main residential area is Visaginas with some 30 000 inhabitants. Only small wood working industries in the district, some 20 sawmills, furniture factories etc. Dairy in Ignalina.
Process water supply Lake Drñkši÷ Potable water supply Municipal Waste water treatment Own plant on site initially assumed. Wastewater recipient Lake Drñkši÷ Power supply Yes, 110 and 330 kV power lines Access to natural gas Roads High standard main road going south to Ignalina city Railway connection Yes Solid waste deposit Own deposit to be prepared Local district heating system Possibly in Visaginas Others Special notes Lake Drñkši÷ - 3.6 ha, 32 m deep. Water temperature in lake
(varying between 15 and 35 oC) is strongly influenced by cooling water from nuclear plant.

A4 - 34
Proposed mill site: PabradÅ
County (Apskritis) Vilnius District (Rajona) Šven¹ionys Location of site Southwest of PabradÅ, 5-8 km, and close to Karkaûiške
municipalities, east of railway railway Site characteristics Land ownership Surroundings Mainly flat forest land with cattered agriculture areas. Pabrade is a
small town with about 7000 inhabitants, of which 70 % Polish and 15 % Lithuanian origin. Pabrade Paper Industry and a British medical company are the main industries in the town. There is also a Centre for Illegal Immigrants (transfer centre) in the town.
Process water supply River ¦eimena, limited supply. Protected river. Potable water supply Own ground water well Waste water treatment Own plant on site initially assumed.
Pabrade has its own waste water treatment plant, mech. + biol. treatment, new.
Wastewater recipient River ¦eimena or possibly river Neris, 4-6 km southwards Power supply Access to natural gas Natural gas for heating available - gas pipeline through village Roads Main road from Vilnius to Ignalina is passing, however, opposite
both the railway and the river from the site Railway connection Bordering the railway to Vilnius from Latvia (Russia) Solid waste deposit Own deposit to be prepared Local district heating system No Others ¦eimena used to be the cleanest river in Lithuania and is today
protected upstream river Neris. Presently the paper mill is using only recycled paper. Water is taken from river Dubinga/Spengla (?) and the artificial pond upstream the mill. Water supply said to be relatively constant – upstream dam at lake Arinas. Drinking water is taken from groundwater.
Special notes

A4 - 35
Proposed mill site: Vievis
County (Apskritis) Vilnius District (Rajona) Trakai Location of site North of Vievis municipality, north of main road A1 and railway Site characteristics Flat grassland/agriculture land without any buildings or farms except
one pig farm. Land ownership Private Surroundings To the north mixed agriculture and forest land, to the south primarily
agriculture land and the municipality of Vievis with some 6000 inhabitants. In southwest ElektrÅnai town with 16500 inhabitants. Pig farm and some food stuff industries within a few km distance
Process water supply River Neris east (5 km) or north (6 km) of site Potable water supply Own ground water wells Waste water treatment Own plant on site initially assumed.
Waste water treatment plant in Alseninkai with biological treatment serving Elektrenai and Vievis. Planned for a capacity of 40 000 m3/d but built only to half capacity, 20 000 m3/d. Actual usage/flow at present about half of present capacity. Treated water discharged through 2-3 km long pipe – self flowing – to small creek Alosa. Discharged water makes up more than 50 % of water flow in Alosa. Alosa flows into Neris.
Wastewater recipient River Neris east (5-6 km) or north (6-7 km) of site Power supply 110 kV power line, 3 km Access to natural gas High pressure gas pipeline along main road Vilnius – Kaunas Roads Good infrastructure with main road A1 from Vilnius to Klaipeda
passing south the area Railway connection Railway Vilnius Klaipeda, 2.5-3.5 km Solid waste deposit Possibly municipal, alternatively own deposit Local district heating system Possibilities to connect in Vievis. District heating in Vievis is
supplied from different small facilities using mainly heavy oil. Also electricity is used and some plants can use gas.
Others Dominating winds are from south-west. Power production in ElektrÅnai power station from heavy oil and natural gas. The power plant is a major polluter, only one unit of 8 has some type of filter for flue gas cleaning. Public concern for additional polluter to the area is great.
Special notes Pipelines for process water and for treated effluent water have to pass Neris Regional Park when pipelines to the east are considered. The northern alternative will avoid the regional park. For a site location somewhat westwards, may possibly also the lake at Elektrenai municipality be considered as a potential fresh water source with discharging of effluent water northwards of the site to river Neris (downstreams regional park), total distance for fresh and effluent water approx. 15-16 km.

A4 - 36
Proposed mill site: GrigiškÅs
County (Apskritis) Vilnius District (Rajona) Trakai Location of site AB GrigiškÅs Paper and Hardboard Plant. The site is located in the
residential area in the center of the town of GrigiškÅs, some 20 km west of Vilnius. The site is located between and along the main road from Vilnius to Klaipeda and the river Neris downstreams Vilnius.
Site characteristics The area is an industrial area including AB GrigiškÅs’ tissue and hardboard factories and belonging energy production plant and facilities for handling and storing of wood and finished products. Available area limited, less than 150 ha. No further expansion possibilities.
Land ownership Privately owned industrial site Surroundings Residential areas of GrigiškÅs town. North of town and river Neris
mainly forest land, south of town mixed agriculture and forest land Process water supply River Neris Potable water supply Municipal, or possibly own ground water well Waste water treatment Own plant on site initially assumed. Wastewater recipient River Neris Power supply 110 kV power line on site Access to natural gas Roads Bordering main road A1 from Vilnius to Klaipeda Railway connection Railway line on the site Solid waste deposit Own deposit to be prepared Local district heating system Yes, in town Others Special notes

Chapter 5 ENVIRONMENTAL ASPECTS

5 - 1
Chapter 5 ENVIRONMENTAL ASPECTS
5.1 General
Lithuania has adopted the principles of sustainable development. Accordingly, a
new Lithuanian Environmental Strategy was formulated in 1996. This is one basis
for the preparation and successive amendment of the environmental legislation.
The environmental legislation in Lithuania, including laws and ordinances, covers
the following areas, which are relevant for the implementation and operation of a
new pulp and paper mill:
* Environmental impact assessments
* Water quality
* Air quality
* Solid waste handling
* Noise
* Environmental monitoring
* Protected areas
* Taxes on Pollution and Natural resources
Relevant issues of this legislation are summarized in the following section 5.2. The
information has been collected basically through contacts with officials at the
Ministry of the Environment, in charge of the different areas.
As Lithuania is a member candidate of the European Union, the environmental
legislation will gradually be adapted to the corresponding EU legislation. This
adaptation work is now going on in several areas.
The IPPC Directive of the EU (Integrated Pollution Prevention and Control) shall
be in force in Lithuania from 2003-01-01.
The new kraft pulp mill is proposed to be built and operated, utilising the latest
proven technology for minimising impact on the environment, also designated as
Best Available Technique (BAT). The anticipated emissions to water and
atmosphere will correspond to low levels, comparable with the most modern pulp
mills that are in operation today.

5 - 2
5.2 Environmental Legislation in Lithuania
5.2.1 Environmental impact assessments – Environmental decisions
The following law governs the implementation of Environmental Impact
Assessments in Lithuania:
* Law on Environmental Impact Assessments of the Republic of Lithuania,
adopted on April 18, 2000
In addition there are the following Ministerial Orders:
* Methodological Guidelines on Screening
* Regulations on preparation of the Environmental Impact Assessment
Program and Report
* The Order on Informing the public and Participation of the public in the EIA
Process
Object of the EIA is any proposed economic activity, which might have
significant effects on the environment, by virtue of its nature, size or proposed
location. Such activities are specified in two lists:
1) List of Types of Economic Activities that shall be subject to the
Environmental Impact Assessment (Annex I)
2) List of Types of Economic Activities that shall be subject to the Screening for
Obligatory Environmental Impact Assessment (Annex II)
The List under 1) above includes i.a. “Wood processing industry / Production of
cellulose, paper and card-board”, which means that for this industry the EIA is
obligatory, and no screening is required.
The new EIA legislation is based on the new EU Directive 97/11/EC. The new
law implies a simplified process, compared to the old law.
The EIA process, according to the new law, is schematically shown in Figure
5.2.1.

5 - 3
Figure 5.2.1 EIA process in Lithuania.
ANNEX I ANNEX II
Screening
Decision of competentauthority regarding
obligatory EIA
Informing the republic about the obligatory EIA/Screeningdecision
EIA programme
Conclusions of the relevant parties of the EIA regarding theprogramme
Approval of the EIA programme
EIA Report
Presenting the EIA Report to the public; Public proposals
Conclusions of the relevant parties of the EIA regarding thereport/the possibilities for performing the proposed activity
Decision of the competent authority regarding the proposedactivity
Informing the public about the decision
Some important issues of the EIA process are (note: the screening is not required
for a pulp and paper industry):
* The proponent (i.e. the investor of the project) applies first to the Municipal
Administration (environmental division), in the district (municipality or city)
where the project shall be implemented, concerning the Screening for EIA

5 - 4
* The Screening is handled by the Ministry of Environment (MoE) or the
Regional Environmental Protection department
* Information to the public about an obligatory EIA (acc. to Annex I) or
Screening decision (acc. to Annex II)
* In case of obligatory EIA, or if the Screening results in a requirement for an
EIA, the next step is the preparation of a Programme for the EIA, made by the
proponent
* The MoE approves the Programme, after hearing of the other Relevant
parties (the “Relevant parties” in the EIA process are the Ministry of Health
Protection and the Ministry of Interior Affairs/Fire Protection Department)
* The proponent performs the EIA and submits to the MoE.
* The MoE or the Regional Department of the MoE (i.e. one of the “Competent
Authorities”) makes a quality control of the EIA, and then takes the decision.
The proponent shall then submit an application for implementing the project,
together with the decision of the MoE, to the County Administration. This
Administration gives the final permit for the project, which is based on the EIA.
Concerning the application of EU regulations - emission standards etc. - in the
setting of permit standards, Lithuania will basically follow these. In those cases
the Lithuanian regulation may be stricter than the corresponding EU regulation,
the Lithuanian regulation will be applied.
5.2.2 Water quality
(1) Water quality standards
A new system for classification of surface waters and water quality standards,
based on EU Directives, is in the process of being prepared. This should be
finished by 2002.
(2) Classification of rivers
According to an existing, old Regulation the water quality in a river, suitable for
fishing, must fulfil certain requirements. This means that limit values for 24
different parameters must not be exceeded (MPC = maximum permissible
concentrations). Some of the 24 MPC values are given in Table 5.2.1. The legal

5 - 5
implication of this is not fully clear – basically it can be regarded as a kind of
recommendation.
Table 5.2.1 Maximum permissible concentrations (for DO minimum conc.)
in river waters, suitable for fishing
Parameter MPC Dissolved oxygen (DO) > 6 mg/l BOD7 2.3 mg O2/l Ammonium-nitrogen 0.39 mg N/l Nitrite-nitrogen 0.02 mg N/l Total nitrogen 2 mg N/l Phosphate-P 0.08 mgP/l Chloride 300 mg/l Sulphate 100 mg/l Total P 0.2 mgP/l Mineral oil 0.05 mg/l Anionic surfactants 0.1 mg/l Phenols 0.001 mg/l
In addition there are limits for calcium, magnesium, sodium, potassium, and
eight heavy metals.
All rivers in Lithuania, about 47 separate rivers, are classified according to the
water quality. It shall be stressed, however, that this is an unofficial
classification, without any legal implication. The basic meaning is informative.
The six Classes are from “Very clean” to “Very high polluted”. The following
parameters are considered, and for each Class each parameter must comply with
a certain interval: BOD7, Inorganic Nitrogen, Phosphate-phosphorus (PO4-P)
and Bacteria (coli). As examples the data for three classes are given in Table
5.2.2.
Obviously, the actual Class of any river may depend on the parameter to be
considered.
Table 5.2.2 Classification of river waters
Quality classes I IV VI Parameter
Very clean Average polluted Very highly polluted BOD7 mg/l < 2.3 5.9 – 9.2 > 20.7 Inorganic nitrogen mg N/l < 0.3 2.6 – 7.5 > 15.0 Phosphate mg P/l < 0.03 0.13 – 0.29 > 0.50 Bacteria, coli no:s/l < 1000 < 1 000 000 > 10 7

5 - 6
(3) Regulations for wastewater discharge
The permits for wastewater discharges are primarily based on absolute
discharges of pollutants (e.g. as kg/d), while concentrations are basically used
for control purpose (see also section 5.2.2 (4)). Existing regulations, so far, only
specify limit values as concentrations.
A Regulation is in force, No. 127 of 24 July 1997, concerning
* Wastewater quality for discharge to receiving waters, i.e. surface waters
This is obviously formulated with respect to municipal (urban) wastewater
and its treatment. It is not clear to what extend this Regulation is applied for
industries, with wastewater differing in character from urban wastewater.
However, there is no special regulation applicable particularly for industrial
wastewaters. So it must be assumed that this regulation can be applied also
for industries, discharging wastewater directly to a recipient.
This Regulation includes limit values in the form of concentrations.
A switch to EU standards is underway. The EU standards shall be in effect by
2002, and fully implemented by 2015. Relevant EU directives:
* Proposal for a Water Framework Directive
* Council Directive 91/271/EEC of 21 May 1991 concerning urban wastewater
treatment.
This mentioned Regulation for wastewater quality requires treatment to certain
limit values before discharge to receiving waters; see Table 5.2.3. The “size of
treatment plant” refers to wastewater flow and/or person equivalents (p.e.), i.e.
the number of people connected to the plant, or the corresponding amount of
BOD or other pollutant. (1 p.e. is defined as 70 g of BOD7/d, or 70 g of
suspended solids/d, or 12 g of N/d, or 2.7 g of P/d.)
The BOD and COD values in Table 5.2.3, at least for the larger plant sizes,
require, according to our conclusion, that urban wastewater must be treated by a
normal type, normal efficiency biological treatment plant.

5 - 7
Table 5.2.3 Permitted pollution levels in treated wastewater, discharged to surface waters.
Permitted max. concentrations Pollutants Size of treatment plant Average annual
mg/l Max. momentary
mg/l BOD7 < 5 m3 / d
5 m3 / d, 5 000 p.e. 5 000 – 10 000 p.e.
> 10 000 p.e.
30 25 20 15
50 40 30 25
COD < 10 000 p.e. > 10 000 p.e.
100 75
150 120
Total phosphorus, as P
> 10 000 p.e. 1.5 2.5
Total nitrogen, as N 10 000 – 100 000 p.e. > 100 000 p.e.
20 15
35 25
Settleable solids < 100 000 p.e. > 100 000 p.e.
30 25
45 35
In addition there are general limit values for 22 other parameters, in wastewater
discharged to surface waters. Some of these are the following:
Chloride 500 mg/l
Active chlorine 0.6 mg/l
Sulphide 0.5 mg/l
Sulphate 300 mg/l
Anionic surfactants 1.5 mg/l
Nonionic surfactants 2.0 mg/l
Mineral oil 1.0 mg/l
Phenols 0.2 mg/l
There are also limit values for 12 metals, e.g. cadmium, chromium, copper,
mercury and manganese.
(4) Environmental permits – Limit setting with respect to water quality
Environmental permits, as mentioned above, are set based on absolute
discharged amounts , e.g. as kg per 24 h or per month. It can be noted that this is
a requirement for the application of the environmental tax system, see section
5.2.8. The permit will always be based on the EIA, which is required for each
new project.
The principle in the limit setting is that the required quality of the discharged
wastewater shall be based on the required quality of the river water. A certain

5 - 8
river flow value must be assumed for the calculation. Here is normally chosen
the lowest value, which occurs with 95 % probability, i.e. with maximum 20
years interval. The minimum 30 days’ average has usually been chosen here, but
at present this is not clear – it might be possible instead to choose the 95 %
minimum annual average.
Many rivers are controlled by dams, to give “environmental water flows”. The
above calculations shall be based on such flows.
The system described above may be changed when the adaptation to EU
regulations has been finalised.
(5) Raw water withdrawal from rivers or groundwater
Rivers
Withdrawal of water from a river will require a permit (included in the
environmental permit) that will specify the maximum withdrawal. The question
of how much water that may be withdrawn cannot be exactly answered at this
stage. However, withdrawal of e.g. 10 % of the 95 % probability minimum value
would probably not be a problem.
Groundwater
No definite rules are used for groundwater abstraction permits. Permits are
given by the Lithuanian Geology Service. However, it is not very common to use
groundwater for industrial purpose; there must be very good reasons for this.
Special drills for industrial purpose are usually not applied.
5.2.3 Air quality
(1) New Law on Air protection
A new Law was taken November 1999:
* Law on Environmental Air Protection
This Law reflects definitions etc from EU Regulations and Directives.
Some important items of this Law:
1. List of Priorities:
1) Increased efficiency of the energy consumption
2) Reduced pollution from vehicles
3) Implementation of BAT

5 - 9
2. Air Quality Management
shall be based on the assessment of air quality, according to the EU Council
Directive 96/62/EC, Directive on Ambient Air Quality Assessment and
Management, 27 Sept 1996.
The new Law will be completed with a number of special Decrees and Acts,
which are now being developed within a project funded by the World Bank
(WB).
Provisions must be taken to convert EU regulations to Lithuanian terms until
2002. This is a requirement for starting the membership negotiations with the
EU.
Regulations and permitting will particularly include a number of
environmental limits, according to a list of parameters set up by the EU. This
reflects the requirements of the Law to
* Protect the environment
* Protect the health of humans.
The EU list of parameters includes the following:
SO2 , NO2 , Particles ( = Dust ) , Fine particles/Soot , Ozone , Benzene , Carbon
monoxide , PAH , Lead , Cadmium , Arsenic , Nickel , Mercury.
Some of these are significant for pulp mills, i.e. SO2 , NO2 , Particles , Fine
particles/Soot and Carbon monoxide.
New standards will be defined and applied after the WB project is finalized.
(2) Existing regulations
Maximum permissible concentrations
An existing regulation on maximum permissible concentrations of air emissions
is the following:
* Maximum Permissible Concentrations of Emissions by Stationary
Combustion Sources, LAND 12-98 (1998-04-30)
LAND = Lithuanian Environmental Normative Document
This regulation is based on EU Directive 88/609 EEC. Separate MPC’s are
given for gaseous, liquid and solid fuels, and for existing and new sources. The
data for solid fuels, new sources are given in Table 5.2.4.

5 - 10
Table 5.2.4 Maximum permissible concentrations of emissions by stationary combustion sources. Solid fuels. New sources.
Maximum permissible concentration, mg/Nm3 Thermal capacity
MW SO2 NOx CO Particulates
Standard O2 conc.
%
1 – 20 2 000 650 1000 400 6 % > 20 – 50 2 000 650 1000 300 6 % > 50 – 100 2 000 650 700 200 6 %
> 100 – 500 2000 – 400 (even decrease)
400 500 100 6 %
> 500 400 400 300 50 6 %
Sulphur content of fuel oil
According to a special Law, only liquid fuels, which conform to the quality fixed
by the Ministries of Economy, Environment and Transportation, may be used in
Lithuania. At present the sulphur content must not exceed 2.5 % w/w. This shall
be changed to 1 %, which is ratified so far by the Ministry of Economy, but not
by the other Ministries.
Hygienic limit values
Regulations are in force concerning hygienic limit values (maximum
permissible concentrations, MPC) for ambient air quality. These include a very
large number of parameters. Some of those, with relevance to the pulp and paper
industry, are given in Table 5.2.5. For most of the parameters two values are
given, a short-term limit based on 1/2-hour average, and a long-term value based
on 24-hours average.
These hygienic MPC values are at present used in the permitting, e.g. for a new
industry. But, of course, only those parameters relevant for the type of industry
are considered. The way the MPC values are used in permitting is described in
section 5.2.2 (3).

5 - 11
Table 5.2.5 Hygienic maximum permissible concentrations in ambient air
Parameter MPC ½-h values, mg/m3 MPC 24-h values, mg/m3 Particles, inorganic (dust) 0.5 0.15 Dust of Limestone, CaCO3 0.5 (prel.) - Dust of Calcium oxide, CaO 0.3 (prel.) - Dust of Sodium sulphate, NaSO4
0.5 0.05 Sulphur dioxide SO2 0.5 0.05 Carbon monoxide CO 5 3 Nitrogen dioxide NO2 0.085 0.04 Nitrogen monoxide NO 0.4 0.06 Hydrogen sulphide H2S 0.008 - Methyl mercaptan 0.000009 - Dimethyl sulphide 0.08 - Hydrocarbons C1–C10 as C 5 1.5
Generally in Lithuania the largest concerns are for the acidifying gases, i.e.
sulphur dioxide and nitrogen oxides. But the acidifying gases are to a large part
“imported” from the West, e.g. Poland and Germany. It is estimated that 70 –
80 % of the air pollution of this type in Lithuania originates from other countries.
The sulphite pulp mill in Klaipeda, which is now closed, caused big
environmental problems, i.a. because of the emissions of sulphur dioxide.
There is a regular monitoring of certain of these parameters, particularly SO2 ,
NOx and Dust, in 14 places in Lithuania, in totally 23 stations. These include 10
major cities and industrial areas, as well as 4 stations for background data, with
little anthropogenic influence. The results are published annually. Data from
1998 for the cities Jonava, Kedainiai, Klaipeda and Vilnius show, for instance,
the following.
* SO2 : the concentrations were far below the MPC values (approx. 10 % of the
MPC values)
* NOx : the 24-hour averages were below the MPC value (approx. 50 %),
while the ½-hour averages were exceeded by approx. 10-50 %, and by 300 %
in Vilnius.
* Dust: the 24-hour averages were below the MPC value (approx. 30 – 60 %
below), while the ½-hour averages were below the MPC in Klaipeda but
exceeded the MPC by approx. 30 – 100 % in Jonava, Kedainiai and Vilnius.
(3) Environmental permits – Limit setting with respect to air quality
The limit setting with respect to air quality is based on the emissions of certain
pollutants and the calculated quality of air. This is further described below.

5 - 12
Regarding the permit for a new pulp mill the greatest concern will be on sulphur
dioxide and nitrogen oxides. This means e.g. that the use of low sulphur oil will
be a requirement. This will not be a problem for the proposed new pulp mill, as
only natural gas will be used fossil fuel.
The procedure in the permit setting includes the following steps:
1) Define/calculate emissions from the source (e.g. the industry)
2) Use a dispersion model to calculate concentrations in ambient air
3) Compare with hygienic MPC (today), or with other values (future)
4) If calculated values higher than MPC etc.- further measures must be taken.
New standards will be applied after the WB project is finalised.
There are no specific requirements valid for the pulp and paper industry.
However, it was mentioned in a discussion with the Ministry of the Environment,
that for a new pulp mill “BAT (best available technique) must be used”, “i.e. the
latest know-how and the cleanest technology, not the cheapest”, and that EU
regulations must be followed.
As regards the permitting for a new pulp mill (or any industry), it cannot be
specified at present, which of the parameters of Table 5.2.5, or of the EU list,
that would be included in the permit. Whichever parameters be chosen, the
principle is that the MPC values must not be exceeded outside the so-called
sanitary zone (but may be exceeded inside the zone). This zone surrounds the
industry at a distance from the fence, which is usually 1 km (may be 0.5 km in
some cases).
The concentrations of the different pollutants in the ambient air, at various
distances from the industry, can be calculated based on the emissions (in
absolute amounts, e.g. tons per 24 h), and utilizing a dispersion calculation
model. In Lithuania is presently used the AIRVIRO model. This model was
developed by the Swedish Meteorological and Hydrological Institute, and is
available for use by the Ministry of Environment. It takes into account several
parameters that influence the pollutant concentrations, such as the different
meteorological data.
Based on these calculations, the maximum permissible emissions can be chosen,
with the aim that the MPC values shall not be exceeded outside the sanitary
zone.
5.2.4 Solid waste handling
Legislation that controls waste handling include

5 - 13
* Environmental Protection Law of the Republic of Lithuania
(1992, No 5-75; 1996, No 57-1325; 1997, No 65-1540)
* Waste Management Law of the Republic of Lithuania (1998, No 61-1726)
* Implementation Law of Waste Management Law of the Republic of
Lithuania (1998, No 61-1729)
Other relevant documents are
* Draft National Waste Management Strategy and Action Programme:
Resolution No 593, 1999-05-17
* Waste Management Regulations: Decree No 217, 1999-07-14
A “Regulation on landfill of waste” is being prepared.
The mentioned regulations are adapted to corresponding regulations of the
European Union.
The Waste Management Law of 1998 will be changed this year.
Waste Management Plans are now being prepared, according to the following
timetable:
* National Strategy Waste Management Plan: 2001-12-31
* Counties Waste Management Plans: 2002-06-30
* Municipal Waste Management Plans: 2002-12-31
As regards the pulp and paper industry there are no special regulations in force.
The general legislation has to be applied. Concerning a new pulp mill, it can be
assumed that requirements concerning the waste handling will be included in the
Environmental Permit. Taking into account a realistic time schedule for this
project, the above mentioned Waste Management Plans, as well as the
“Regulation on landfill of waste” will most likely be in force, when the detail
plans for the pulp mill project will be worked out.
5.2.5 Noise
Questions concerning noise regulations are handled by the Ministry of
Environment, Housing and Technical Regulations Department. The following
information is based on contacts with this Department.
Noise issues are handled also by
* The Centre of State Public Health
* The Hygiene Institute
At present only an old Soviet regulation is in force: Maximum 55 dB(A) at the
border of residential areas. This applies at industries as well as at roads.

5 - 14
Adaptation to EU regulations is planned. An EU document underway, to be
applied when it comes into force, is the following, which is now available as a
draft proposal, presented to the European Parliament:
* Directive on the approximation of the laws of the Member States related to
the noise emissions by equipment used outdoors.
A preliminary document is COM (1998) 46 final – 98/0029 (COD) 18/2 98.
In Lithuania there is at present a new council being formed, for handling the
question of reducing noise levels in cities, “Commission for protection against
noise”. Participants are i.a. the Hygiene Institute, the Technical University
Health Office and the Ministry of the Environment.
As an international example can be mentioned the following recommended
noise limitations, presently applied in Sweden for “new industries”. It is most
likely that future regulations in Lithuania will apply these or stricter limits.
Table 5.2.6 Swedish recommendations regarding noise, expressed as the largest equivalent noise level outside inhabited buildings. New industries.
Time of the day Largest equivalent noise level Day-time – weekdays 07.00 – 18.00 Evening-time and holidays 18.00 – 22.00 Night-time 22.00 – 07.00
50 dB(A) 45 dB(A) 40 dB(A)
Momentary noise in night-time may not exceed 55 dB(A). If the noise includes often recurrent sounds and/or audible tones, the equivalent noise level shall be decreased by 5 dB(A).
5.2.6 Environmental monitoring
* Law on Environmental Monitoring Nr VIII – 529, 1997
This Law specifies required monitoring concerning Air, Water etc on three
levels:
- National
- Municipal
- Company
The Joint Research Center of the Ministry of Environment is the authority
responsible for monitoring.
Article 12 regulates “Monitoring by legal entities”, as follows (in brief):
1) Legal entities shall conduct monitoring of pollution sources and their impact
to the environment by notifying and providing information to the governing
and self-management institutions of the state.

5 - 15
2) The Ministry of Environment shall set up a list of legal entities and “natural
persons” subject to the conducting of monitoring.
3) According to the procedures, set up by the Ministry of Environment, legal
entities shall hand over their environmental monitoring data to the
Environment Monitoring Data Fund. Correspondingly, the data on forests
and soils are to be handed over to the Ministry of Agriculture and Forestry
and the Lithuanian Geology Service, according to the procedures set up by
the latter.
5.2.7 Protected areas
* Law on Protected Areas of the Republic of Lithuania,
No 1-301, 9 November 1993
This Law will not be discussed in detail here. We will only comment one item of
the law, which is related to restrictions in constructing plants etc. in protected
areas. The reason is that, in the case of the sites in Alytus and Elektrenai/Vievis,
pipes for fresh water and wastewater to and from the Mill may have to be drawn
across State Regional Parks. The activities in this type of parks are regulated in
the Law. (The Mill sites would, however, not encroach the Parks.)
This Law’s Article 25 “Determination of activities in state parks” points out i.a.
that
“In state parks it is prohibited to…..lay down transit communication lines..…“
In case water and wastewater pipelines would be defined as transit
communication lines, this formulation might be an obstacle to these sites. The
relevant authority must take the decision in this matter.
5.2.8 Environmental taxes
The Ministry of Environment, Environmental Strategies Department, handles
questions on environmental taxes. This department also handles questions on
* Investments for environmental protection measures – questions concerning
grants and loans
* Cooperation issues in environmental protection – i.e. cooperation between i.a.
the construction sector, territorial planning, forestry
* Integration with the EU – environmental issues
* Institutional building
* Management of programmes for environmental protection

5 - 16
This section describes the tax system. The integration with EU is summarized in
section 5.2.9.
(1) Environmental taxes - General
This system is referred to as the economical instruments for environmental
protection. Legally the system is established by the following laws:
* Law on Charges for Environmental Pollution, Nr VIII-1183, of May 13,
1999.
* Law about Charges for the Use of Natural Resources
These two laws will be applied for a pulp and paper mill as follows:
1. Taxes shall be paid based on the emissions of certain pollutants
2. A tax shall be paid based on the consumption of water from a natural source,
for instance a river
These taxes are deducted from the gross revenue when computing a taxable
profit.
For a pulp and paper mill, using a river as the water source, the pollution tax will
be significantly higher than the natural resources tax.
(2) Pollution taxes – Stationary sources
General
For an industry, for example a pulp and paper mill, the system will work as
follows:
* there will be set limit values for the emissions of certain pollutants; these are
given in the Environmental Permit
* if the emissions are below these limits, a normal charge or tax is paid for each
emission, in proportion to the amount of the emission (e.g. as tons per year)
* if the emission of any pollutant is above the limit, a penalty charge is paid, for
the part that is above the limit.
The limits are set individually for each enterprise or industry.
The taxes are paid for water and atmospheric emissions, from stationary sources.
Also for atmospheric emissions from mobile sources (vehicles) taxes are paid,
based on the fuel consumption. This refers to vehicles that are used
commercially, i.e. for production purposes or for passenger transports.
If an enterprise is taking measures for reducing an emission below the limit, it
has a 3 years’ respite to do this, and does not have to pay the penalty charge

5 - 17
during this time. This requires that the measures aim at reducing the emission to
a value less than 90 % of the limit.
As mentioned above, adaptation of the Lithuanian environmental legislation to
the corresponding EU legislation is presently going on. It cannot be exactly
specified at present to what extent this will influence the pollution tax
regulations. So far, it must be assumed that the present taxation system shall be
used also in the future.
However, the EU adaptation will include the introduction of certain charges with
relation to the generation of waste, i.e. for
* packaging (glass, paper, plastics etc.)
* luminescent lamps
* accumulators for vehicles
* oil filters for cars
Tax rates and penalties for stationary sources
The taxation system is regulated according to the Law on Charges for
Environmental Pollution.
The normal taxes are calculated by the use of a set of factors, the tax rates. The
calculation is done by multiplying as follows:
Tax (e.g. Lt/a) = Emission (e.g. t/a) * Tax rate
The penalty taxes are calculated by further multiplying the above Tax by tax rate
coefficients. The penalty tax is calculated and paid for that part of the emission
which exceeds the emission limit.
The normal tax rates and the tax rate coefficients are given in the following
Tables 5.2.7 and 5.2.8 for water pollutants and Tables 5.2.9 and 5.2.10 for air
pollutants. As is clear from the tables, the tax rates are raised each year.
It shall be pointed out that only parameters that are relevant for the industry or
enterprise in question, and that are regulated in the Environmental permit, are
considered for the tax calculation.
As shown in the tables, only BOD - not COD - is used as the water pollution
parameter for organic matter. There are at present no plans for adding or
switching to COD. Also in the Environmental permits only BOD is included.
COD may be used by operators or in monitoring systems.
However, COD is used as a regulatory parameter in the Regulation for
wastewater discharge, see section 5.2.2. There is a trend in the EU, as well as in
other parts of the world, to switch to COD as the main parameter for

5 - 18
characterizing organic matter in wastewater. It can be expected that this will be
the case also in Lithuania in the future.
The “Pollutant groups” according to the tables are specified in a separate
regulation:
* Taxable Pollutants According to Groups. Regulation Nr 53, January 18, 2000
including two parts: I. Pollutants to water, soil and deeper soil (42 chemical
elements and compounds), and II. Pollutants to Atmosphere (abt. 280 chemical
elements and compounds).
Table 5.2.7 Tax rates for normal taxes. Water pollutants. Stationary
sources.
Tax rates Lt/ton Year Pollutants 2001 2002 2003 2004
BOD7 573 649 714 765 Total nitrogen 435 435 550 600 Total phosphorus 1480 1480 2000 3000 Suspended solids 210 248 281 309 Sulphate SO4
2 - 2 2 2 2 Chloride Cl - 9 9 9 9 Pollutant groups I
8700460
8700460
8700460
8700460
II 792710 792710 792710 792710
III 129250 129250 129250 129250
IV 29290 29290 29290 29290
V 2871 2871 2871 2871
Table 5.2.8 Tax rate coefficients for penalty taxes. Water pollutants.
Pollutants Coefficients BOD7 10 Total nitrogen 5 Total phosphorus 10 Suspended solids 1.5 Sulphate SO4
2 - 1.5 Chloride Cl - 1.5 Pollutant groups I 100 II 50 III 10 IV 5 V 2

5 - 19
Table 5.2.9 Tax rates for normal taxes. Air pollutants. Stationary sources.
Tax rates Lt/ton Year Pollutants 2001 2002 2003 2004
SO2 225 268 288 311 NOx 386 405 479 587 Vanadium pentoxide 11485 11485 11485 11485 Dust, organic + inorganic 1) 184 184 184 184 Pollutant groups I
1210
1210
1210
1210
II 570 570 570 570 III 74 74 74 74 IV 13 13 13 13
1) Excluding particles from burning solid, liquid or gaseous fuels, and asbestos
particles.
Table 5.2.10 Tax rate coefficients for penalty taxes. Air pollutants.
Pollutants Coefficients SO2 1.5 NOx 1.5 Vanadium pentoxide 300 Dust, organic + inorganic 1.5 Pollutant groups I 300 II 50 III 30 IV 1.5
The pollutant groups of Tables 5.2.9 and 5.2.10 include for instance the
following components, of relevance to a kraft pulp mill:
Group I Mercaptan
Group II Particles from burning solid, liquid or gaseous fuels
Group III Sodium sulphate
Group IV Carbon monoxide, calcium carbonate, calcium oxide.
(3) Pollution taxes - Mobile sources
The pollution taxes for mobile sources (vehicles) are specified in the same
Regulation Nr 53, of January 18, 2000. The tax is here calculated based on the
consumption of fuel. Different types of vehicles are specified: automobiles etc.,
ships, railways and airplanes, and different types of fuels: gasoline, diesel oil,
heavy oil (with different sulphur contents) and gas (from liquid oil and natural
gas). Only two examples shall be mentioned:

5 - 20
* Automobiles etc., with gasoline as fuel. The tax is 18 Lt/ton fuel in 2001 and
24 Lt/ton in 2004.
* Ships, with diesel oil as fuel. The tax is 31 Lt/ton in 2001 and 45 Lt/ton in
2004.
(4) Natural resources taxes
An enterprise, e.g. a pulp and paper mill, is subject to taxation for the use of
state-owned natural resources (state-owned land, continental shelf, fossil fuels
etc.) for commercial purposes. In this case the law is applicable only for the use
of water from rivers.
The tax is calculated as follows:
Tax (e.g. Lt/a) = Water consump. (e.g. m3/a) * 0.005 Lt/m3 * Index factor
The Index factor is changed by time, depending on the inflation. During the first
half of 2000 the Index factor was:
1 quarter 1.255
2 quarter 1.278
5.2.9 EU Adaptation
There is a national planning in force for integration to the European Union. As
far as concerns the environment, the Environmental Strategies Department
presently handles the following issues:
* Improvement of the laws, to fulfill EU requirements
* Institutional building, to fulfill EU requirements
* Improvements concerning the following issues, to fulfill EU standards:
1) Municipal wastewater treatment
2) Reduced atmospheric emissions from boilers
3) Waste handling
The planning, concerning these issues, shall be finished until 2003. The required
measures concerning 1) – 3) above shall be finished until 2015. Estimated
investments amount to 1 billion Euro, which is supposed to be partly covered
(50 %) by ISPO funds and structural funds.
5.2.10 Relevant Government Offices
The Government office, responsible for the preparation and formulation of the
Environmental Legislation, is the

5 - 21
* Ministry of the Environment
Some of the units of this Ministry, which have been consulted during this Study,
are:
* Territorial planning department – Environmental Impact Assessment
Division
* Environmental Strategy Department
* Environmental Technologies Division
* Environmental Quality Department – Air Division
* Environmental Quality Department – Water Division
* Joint Research Center (responsible for monitoring)
* Forest and Protected Areas Department
On the Regional (County – Apskritis) level, there are Regional Environmental
Departments, which are subdivisions of the Ministry of Environment.
The following two Ministries have the role of “Relevant parties” in the EIA
process:
* Ministry of Health Protection
* Ministry of Interior Affairs – Fire Protection Department
The following authority is responsible for ground water issues:
* Lithuanian Geology Service

5 - 22
5.3 Applicable Environmental Standards for the Project
5.3.1 Environmental Standards in Lithuania
There are no regulations or standards in the Lithuanian environmental legislation,
particularly valid for the pulp and paper industry. Concerning water and air
emissions, as well as noise, it must be assumed that all those different standards
that are summarised above, and that are relevant, will be applied also for a new
pulp mill. However, as described above, part of the legislation is presently under
revision, for adapting to the European Union legislation. Therefore it can not yet
be exactly specified which standards that will be applied for this project. Also,
the environmental permit will be set individually for each new plant, so there are
some degrees of freedom for the authorities in setting the emission limits.
Environmental permits for the pulp and paper industry in the European Union
will, from the near future and on, be set according to the IPPC system, which is
described below. Lithuania will also follow this system.
5.3.2 Helsinki Convention
Here shall also be mentioned the Helsinki Convention, i.e. the Convention on
the Protection of the Marine Environment of the Baltic Sea Area, 1974. As a
state situated at the Baltic Sea, Lithuania has agreed to follow this Convention.
The Convention stipulates that the Contracting parties “shall take all appropriate
measures
- to control and minimise land-based pollution of the marine environment of
the Baltic Sea Area
- to control and strictly limit pollution by noxious substances and nutrients”
The work for fulfilling the intentions of the Convention is managed by
HELCOM, i.e. the “Baltic Marine Environment Protection Commission” or
Helsinki Commission. HELCOM has formulated recommendations for parts of
the pulp and paper industry, i.a. kraft pulp mills (1996). These include
definitions of Best Available Techniques (similar to the EU definitions, see
below) as well as recommended emission limit values for water and atmospheric
emissions. For instance, the HELCOM recommendations for bleached kraft
specify max 15 kg COD/ADt to water (mills starting operation after 1 January
1997) and max 1 kg sulphur/ADt to atmosphere (after 1 January, 2000). We
assume that the EU recommendations will be followed in Lithuania in the future.
Also, emission limits formulated on the basis of the EU recommendations can be

5 - 23
expected to become stricter than the HELCOM recommendations. For these
reasons, the HELCOM recommendations will not be further discussed here.
5.3.3 European Union regulatory requirements
(1) General
Lithuania is a membership candidate for the European Union. Planning is
underway for adaptation to EU directives, regulations, standards etc., also in
environmental matters. This is a requirement for starting the membership
negotiations. However, membership can probably not be a reality until within 5
– 10 years. In any case, we regard it as most relevant to summarise some of the
planning, which is going on within the EU, concerning the pulp and paper
industry and the environment.
No “environmental regulations” are in force in the EU, on the central level,
regarding particularly the pulp and paper industry. What is in force is the IPPC
Directive (Integrated Pollution Prevention and Control Directive) and a
Reference Document on “Best Available Techniques in the Pulp and Paper
Industry”. These documents shall serve as a base for each state in the Union, in
establishing their own regulations, emission limits etc. They are briefly
commented in the following sections.
(2) IPPC Directive
The complete title of this document is: COUNCIL DIRECTIVE 96/61/EC of 25
September 1996 Concerning Integrated Pollution Prevention and Control.
The Directive aims at contributing to a high level of protection of the
environment as a whole and a sustainable production, by adopting an integrated
approach of industrial pollution. The Directive was to be translated into national
law in each Member State by October 1999, being applicable to new plants at
that date, and to existing plants by 2007.
The Directive is applicable to several industrial activities, including in practice
98 % of the industry within the EU. The list of industries includes e.g.:
“6.1. Industrial plants for the production of
(a) Pulp from timber or other fibrous materials
(b) Paper and board with a production capacity exceeding 20 tonnes per day”

5 - 24
The Directive has adopted the principle of subsidiarity in the setting of emission
limits. This means that ELVs – emission limit values – shall be defined at local
level, by local authorities, taking into account the local environmental and
industrial conditions. So no special “EU limit values” will be established.
The term “integrated” has been interpreted as threefold, e.g. by CEPI
(Confederation of European Paper Industries, paper given by Ms A. Carpentier,
Environmental director, at the Finnish Paper Engineers’ Association Annual
Meeting, Helsinki, March 31, 2000):
1. The Directive is part of an overall environmental framework
2. “Multi-media approach”: a request to consider all polluting sources and
receiving media in an integrated way.
3. Requirement for a cost/benefit assessment for the selection of BAT (Best
Available Techniques). The choice of BAT must ensure a fair balance
between the resources to be spent on pollution abatement and the proven and
realistic advantages for the environment of such measures, while not
overseeing technical aspects.
The Directive requests from local authorities to adopt ELVs (emission limit
values) in the individual permits on the basis of BAT (Best Available
Techniques), as defined by the Directive. The Directive also requires that no
technique should be prescribed, and that the technical conditions on the site, its
geographical situation and the local environmental conditions should be taken
into account when setting ELVs.
The BAT concept is defined in detail as follows.
BAT – Best Available Techniques: “the most effective and advanced stage in the
development of activities and their methods of operation which indicate the
practical suitability of particular techniques for providing in principle the basis
for emission limit values designed to prevent, and where that is not practicable,
generally to reduce emissions and the impact on the environment as a whole.”
Techniques “shall include both the technology used and the way in which the
installation is designed, built, maintained, operated and decommissioned”.
Available techniques “shall mean those developed on a scale which allows
implementation in the relevant industrial sector, under economically and
technically viable conditions, taking into consideration the costs and advantages,
whether or not the techniques are used or produced inside the Member State in
question, as long as they are reasonably accessible to the operator”

5 - 25
Best “shall mean the most effective in achieving a high general level of
protection of the environment as a whole”.
The development of the BAT concept for the pulp and paper industry is
summarised in the next section.
(3) BAT Reference Document (BREF) – Pulp and paper industry
The full title of this so-called BREF document is:
* Reference Document on Best Available Techniques in the Pulp and Paper
Industry. July 2000.
The BREF is an official publication of the European Communities. It was
produced by the IPPC Bureau (Seville, Spain) according to the IPPC Directive,
article 16, which requires the European Commission to organise “an exchange
of information between Member states and industry”. This means i.a. that the
industry has had an active role in producing this document, through CEPI
(Confederation of European Paper Industries). (The document is available on
the Internet via the website http://eippcb.jrc.es.)
The BREF defines BAT – best available techniques – for the pulp and paper
industry sector wise, and states expected or experienced emission levels when
BAT is applied. It shall be pointed out that the BREF document does not give
“required emission limit values to be applied within the EU”, or something like
that. It rather reflects present day knowledge and experience from the industry,
basically in Europe. The BREF document is intended to be used as a reference
and background for the national environmental authorities in setting their
emission limit vales. These should, in each state and each separate case, be based
on local conditions, concerning technical, economical and environmental issues.
Below are given, for reference purpose, “General BAT for all processes” as well
as “BAT for Kraft pulp processing”, according to the BREF document. The
other processes, of which BAT is defined in the BREF, are “Sulphite pulping”,
“Mechanical pulping and chemi-mechanical pulping”, “Recycled fibre
processing” and “Papermaking and related processes”.
In the Tables 5.3.1 and 5.3.2 are given the expected levels of water emissions
and atmospheric emissions, when BAT is applied.
General BAT for all processes
* Training, education and motivation of staff and operators
* Process control optimisation

5 - 26
* Sufficient maintenance, to maintain a high efficiency of the technical units
and the abatement techniques
* Environmental management system (EMS), which clearly defines the
responsibilities for environmentally relevant aspects.
Water emissions
Kraft pulp mills – Best available techniques for reducing emissions to water
* Dry debarking of wood
* Increased delignification ahead of the bleach plant by extended or modified
cooking and additional oxygen stages
* Brown stock: Highly efficient washing and closed cycle screening
* Elemental chlorine free (ECF) bleaching with low AOX or Totally chlorine
free (TCF) bleaching
* Recycling of some, mainly alkaline process water from the bleach plant
* Effective spill monitoring, containment and recovery system
* Stripping and reuse of condensates from the evaporation plant
* Sufficient capacity of black liquor evaporation plant and the recovery boiler
to cope with the additional liquor and dry solids load
* Collection and reuse of clean cooling waters
* Buffer tanks for storage of occasional discharge of cooking and recovery
liquors and dirty condensates, to prevent upsets in external effluent treatment
* Primary (mechanical) and biological effluent treatment
Table 5.3.1 Water emissions with BAT. Kraft pulp mills.
(EU BREF Document.)
Flow m3 /ADt
COD Kg/ADt
BOD kg/ADt
TSS kg/ADt
AOX Kg/ADt
Total N kg/ADt
Total P Kg/ADt
Bleached Pulp
30 – 50 8 – 23 0.3 – 1.5 0.6 – 1.5 < 0.25 0.1– 0.25 0.01-0.03
Unbleached Pulp
15 – 25 5 – 10 0.2 – 0.7 0.3 – 1.0 - 0.1 – 0.2 0.005- 0.02
“m3 /ADt” and “kg/ADt” mean “per air dry ton of produced pulp”.
These emission levels, referring to pulping only, are stated to be associated with
the use of “a suitable combination” of the mentioned BAT techniques. They are
to be regarded as annual averages. The water flow is polluted water, assuming
that cooling water and other clean waters are discharged separately. In integrated
mills the emissions from papermaking have to be added.

5 - 27
Atmospheric emissions
Kraft pulp mills – Best available techniques for reducing emissions to air
* Collection and incineration of concentrated malodorous gases and control of
the resulting SO2 emission
* Diluted malodorous gases from various sources are also collected and
incinerated and the resulting SO2 is controlled
* TRS (total reduced sulphur) emission of the recovery boiler is mitigated by
efficient combustion control and CO (carbon monoxide) measurement
* TRS emission of the lime kiln is mitigated by controlling the excess oxygen,
by using low-S fuel, and by controlling the residual soluble sodium in the
lime mud fed to the kiln
* The SO2 emission from the recovery boiler (RB) is controlled by firing high
dry solids conc. black liquor in the RB and/or by using a flue gas scrubber
* Control of NOx emission from the RB (i.e. by ensuring proper mixing and
division of air in the boiler), lime kiln and from auxiliary boilers by
controlling the firing conditions, and also by appropriate design
* SO2 emissions from auxiliary boilers are reduced by using bark, gas, low
sulphur oil and coal, or controlling S emissions with a scrubber
* Flue gases from recovery boilers, auxiliary boilers (for bio fuels and/or fossil
fuels) and lime kilns are cleaned with electrostatic precipitators (ESP) to
mitigate dust emissions.
Table 5.3.2 Atmospheric emissions with BAT. Kraft pulp mills.
(EU BREF Document.)
Dust kg/ADt SO2 (as S)
kg/ADt
NOx (NO+NO2
as NO2) kg/ADt
TRS (as S)
kg/ADt
Bleached and Unbleached Pulp
0.2 – 0.5 0.2 – 0.4 1.0 – 1.5 0.1 – 0.2
These emission levels are process emissions, stated to be associated with the use
of “a combination” of the mentioned BAT techniques. They are to be regarded
as annual averages and are valid at standard conditions. Emissions from
auxiliary boilers, e.g. due to the production of steam used for drying of pulp
and/or paper, are not included (these are also given in the BREF). The values
refer to the contribution of pulping only. In integrated mills the emissions from

5 - 28
steam boilers or power plants, required for the energy needed for the
papermaking, have to be added.
Solid wastes
The BREF document points out the following important items concerning the
minimisation and handling of solid wastes:
* Minimisation the generation of solid wastes and recover, recycle and reuse
these materials as far as possible
* Separate collection of waste fraction at source and, if necessary, intermediate
storage of residuals/waste to make possible an appropriate handling of
remaining waste products
* Incinerating all non-hazardous organic material (bark, wood waste, effluent
sludge etc.) in an auxiliary boiler, specially designed for burning of moist,
low calorific value fuels (as e.g. fluidised bed boilers)
* External utilisation of residuals/waste as substitutes in forestry, agriculture or
other industries, if possible.
Energy consumption
The BREF document gives an extensive list of energy saving measures,
according to the following main groups:
* Measures for a high heat recovery and a low heat consumption
* Measures for low consumption of electric power
* Measures for high generation of electric power
The document further states that energy efficient kraft pulp and paper mills
consume heat and power approximately as follows:
* Non-integrated kraft pulp mills: 10 - 14 GJ/ADt process heat and 0.6 - 0.8
MWh/ADt of power
* Integrated bleached kraft pulp and paper mills: 14 - 20 GJ/ADt process heat
and 1.2 – 1.5 MWh/ADt of power
5.3.4 Expected permitting for a new pulp mill
A new pulp mill project in Lithuania must be designed to ensure the principles of
sustainability, concerning the forestry as well as the industrial components. It
can be concluded that the Lithuanian authorities, in formulating the
Environmental Permit and setting the emission limit values (ELV’s) for a new
pulp mill, will take into account the relevant EU Directives – for instance the

5 - 29
IPPC Directive and the corresponding BAT Reference Document – that are in
force at that time. In addition, local technical, economical and environmental
conditions will be taken into account.
There will also be applied a tax system for the discharge of water and air
pollutants, and for the use of surface (river) water.
Details concerning the requirements and ELV’s cannot be anticipated at this
stage. The scope of the Permit will, however, most likely contain at least the
following items:
* Maximum withdrawal of fresh water from the water source
* Requirements for the arrangement of wastewater discharge
* Limits for water emissions, given as absolute amounts, e.g. tons per day, tons
per month etc.
* Requirements for the water quality in the receiving water, if a river, after the
wastewater discharge
* Limits for atmospheric emissions, given as absolute amounts, e.g. tons per
day, tons per month etc., and possibly also as concentrations
* Requirements for the air quality outside a sanitary zone of the mill
* Limit values for noise
* Requirements for the handling of solid waste, particularly for the design, load
and operation of a landfill

5 - 30
5.4 Proposed Technical Measures for Environmental Improvement
5.4.1 General
The kraft pulp mill causes water emissions by effluent from the pulping and
bleaching processes, air pollution by exhaust gases from the recovery boiler, the
lime kiln and the bark furnace, and offensive odour produced by sulphur
compounds contained in the effluent and in exhaust gases (hydrogen sulphide,
methyl mercaptan, methyl sulphides, i.e. the TRS, total reduced sulphur). In
addition the mill generates certain amounts of solid wastes, hazardous wastes,
and noise. Further comments about the environmental impacts are given in
section 5.5.
The following measures are proposed to control the different types of pollution.
Further details are given in Chapter 6.
5.4.2 Water Pollution Control
(1) Dry debarking of wood
Dry debarking means that very little water is consumed. Water is added only for
washing the logs and in winter for de-icing the incoming logs. There is an
extensive recycling of water in the process, so the effluent and the water
pollution will be very low.
(2) Extended/Modified cooking and Oxygen delignification
The latest technology in the cooking will be used, which means a high degree of
delignification without affecting the pulp quality and the yield. Further
delignification will be done by a two-stage oxygen delignification, from which
the waste water is recycled to the recovery system. These processes will also
include modern, efficient equipment for pulp washing and screening, which
means low water consumption and highly efficient recycling of spent liquors to
the recovery system.
This process technology means the lowest possible lignin content in the pulp
before the bleaching. Kappa numbers would typically be about 20 (softwood
pulp) and 15 (hardwood pulp) after the cooking, and about 8-12 (softwood) and
8-10 (hardwood) after the oxygen stage.

5 - 31
(3) ECF and TCF bleaching
The low content of lignin in the pulp before bleaching, as mentioned above, will
consequently give a low consumption of bleach chemicals and a low pollution
(e.g. measured as COD) from the bleaching. By using the ECF bleaching or the
TCF bleaching, based on the chemicals ozone, peroxide, oxygen and, in the case
of ECF, small amounts of chlorine dioxide, very low (ECF) or zero (TCF)
emissions of chlorinated organic material will be obtained in the effluent. The
present knowledge and experience shows that ECF and TCF effluents are low in
terms of toxicity to water-living organisms (compared to the older bleaching
technology) and close to being equal in this respect. This refers to the acute
(lethal) as well as the so-called sublethal toxic effects.
Note: Chlorinated organic material is usually measured as AOX, “adsorbable
organic halogen”.
The main concept will be ECF bleaching, mainly for market reasons. The plant
will be designed in such a way, that also TCF bleaching will be possible.
(4) Recycling of bleach plant effluent
The technology of bleach plant effluent recycling, aiming at the “total effluent
free mill” (TEF), is today not yet fully developed and not commercially
available, although R&D work is going on, e.g. in Scandinavia. We consider for
this mill, however, a limited recycling of alkaline bleach effluents, aiming at a
rather low but realistic effluent flow and water emission from the bleach plant.
(5) Stripping and reuse of condensates
This measure refers to digester (cooking) and evaporation condensates, which
are partly contaminated with COD-material (mainly turpentine and methanol)
and reduced, odorous sulphur compounds (TRS compounds). The more
contaminated condensates will be treated in a decanter for turpentine removal
and a stripping column (a type of distillation unit, heated with steam), for
removal of the turpentine, the methanol and the TRS compounds. The turpentine
and methanol, as well as the TRS, will be collected and incinerated. This is part
of the odour control system. The treated condensate from the stripper, as well as
the cleaner condensates, will be partly reused, for instance for pulp washing and
in the causticizing plant, thereby reducing the total water consumption. Residual
condensates will be sent to the effluent treatment.

5 - 32
(6) Collection and recycling of spillages
This refers primarily to black liquor spillages, coming from the cooking and
evaporation areas as a result of accidental and temporary upsets in the process.
Liquor spillages will add to the BOD and COD emission and may disturb the
biological effluent treatment. Two principles are applied: First, process
equipment is designed to avoid spillages as far as possible. Secondly, any spills
occurring, particularly those more heavily concentrated, are detected, collected,
stored and then recycled into the mill’s chemical recovery system (evaporation
and recovery boiler) for final incineration of the organic contaminants. Installed
equipment includes a number of pump pits, a collection and storage tank, a
piping system and a control system. In addition the evaporation plant and the
recovery boiler will be given sufficient capacity for this additional input.
A similar system will be installed for the collection of white liquor spillages,
from the causticizing department etc., and recycling these spills to the
causticizing.
(7) Separation and recycling of clean waters
Clean waters refer to waters, which are used in the mill without being polluted.
These waters should be discharged separately in order not to load the effluent
treatment plant. This requires separate piping and sewers for the clean waters, in
order to separate them from the polluted effluent. The main part of the clean
waters is cooling waters, used e.g. in the evaporation and the power plants. In
this case it is also assumed that a main part of the used and heated cooling waters
will be used as fresh water supply to the pulp mill. This procedure will
substantially reduce the total water consumption in the mill.
Another flow of clean waters is the storm waters (rain waters). These will be
collected in separate canals and also discharged separately, i.e. not be allowed to
load the effluent treatment plant.
(8) Effluent treatment
Effluent treatment – i.e. the purification of polluted wastewaters – will be
accomplished in a primary – secondary treatment plant. This will include
basically the following steps:
* Primary clarification, for the removal of fibres and other suspended matter.

5 - 33
* Pretreatment by equalisation, cooling, neutralisation (pH control) and
nutrient addition.
* Biological (secondary) treatment in a low-loaded activated sludge plant, for
the removal of organic matter, e.g. measured as BOD and COD
* Sludge handling, i.e. dewatering of the mixed fibre (primary) sludge and
excess biological (secondary) sludge, to reach a high solids content suitable
for a subsequent incineration.
The sludge will be incinerated together with bark in the power boiler.
5.4.3 Air pollution control
(1) Dust control
Dust emissions (particles) from the recovery boiler, the lime kiln and the power
boiler will be reduced by treating the flue gases by electrostatic precipitators
(ESP’s).
(2) Reduced sulphur emissions
Reduced SO2 emission from recovery boiler
The emission of sulphur dioxide (SO2) from the recovery boiler will be reduced
by concentrating the black liquor to a high dry solids content in the evaporation
plant. The aim is to reach about 75 % dry solids before the recovery boiler.
In addition there will be installed an SO2 scrubber, to treat the flue gases from
the boiler for further SO2 removal.
Reduced TRS emission from recovery boiler
Total reduced sulphur (TRS) emission from the recovery boiler will be
minimised by applying an efficient process control for the boiler.
Reduced sulphur emission from lime kiln
SO2 and TRS emissions from the lime kiln will be minimised by an efficient
wash of the lime mud, ahead of the kiln, and by using natural gas (sulphur free)
as the fuel for the kiln.

5 - 34
(3) Odour control
Odour control includes the collection and incineration of malodorous gases, i.e.
the TRS gases (total reduced sulphur) from several positions in the pulp mill.
These are also called the NCG, non-condensable gases. These gases occur as:
* Concentrated (strong) gases, in a relatively small gas (air) volume. The
strong gases contain about 90 % of the total TRS. They originate from certain
positions in the cooking and evaporation plants.
* Diluted (weak) gases, in a much larger gas (air) volume. The weak gases
contain about 10 % of the total TRS. The weak gases originate from several
other positions in the cooking, washing and evaporation plants and from the
sewer system.
The first step is to collect the strong gases in a piping system and blow them to
an incineration plant, for oxidation of the TRS compounds to SO2. This
incineration can be done in the recovery boiler or the lime kiln, but it is here
suggested to use a separate incinerator, equipped with a steam boiler. In this case
the formed SO2 will be removed in a separate scrubber.
This measure is one of the most important for reducing the odour load from the
kraft mill, and it is normal practice at modern mills.
Even more efficient odour removal can be obtained by collecting and
incinerating also the weak gases. It is suggested for this project to collect also
the weak gases, in order to minimize the odour load as far as possible. These
gases would be incinerated in the recovery boiler.
(4) NOx control
The formation of nitrogen oxides (NOx) in the recovery boiler, the lime kiln and
the bark furnace will be reduced by applying certain process designs and
appropriate process control.
5.4.4 Solid waste handling
Different types of process specific wastes, non-hazardous, are generated,
basically the following:

5 - 35
* Bark (mainly organic)
* Other wood wastes (organic)
* Ashes from the power boiler (mainly inorganic, or mineral)
* Green liquor dregs from the causticizing plant (inorganic, or mineral)
* Lime slaker grits from the causticizing plant (inorganic, or mineral)
* Sludge from the effluent treatment (organic)
In addition various non process specific wastes are generated:
* Scrap metals, glass etc. – partly recyclable
* Hazardous wastes, e.g. spill oil, chemicals, luminescent lamp tubes etc.
* General garbage (similar to domestic waste)
The principles for handling these wastes will be as follows:
Incineration of bark and other organics
Bark, other wood wastes, and sludge from the effluent treatment (“biofuels”)
will be incinerated in the power boiler, for destruction and for the generation of
heat and steam.
Recycling of certain wastes
Recyclable wastes are e.g. scrap metal, glass, paper. Such wastes will be
separately collected, and supplied, as far as possible, to external operators, that
are specialised in the recycling of such materials.
Landfill of certain wastes
Wastes that have to be landfilled, assuming present technology, are mainly the
inorganic wastes, i.e. the green liquor dregs, the lime slaker grits and the ashes.
This may include also smaller amouts of bark that are contaminated with sand,
gravel etc., which makes the incineration difficult.
The particular landfill area to be used is not specified. There are two basic
options:
* Use a near-by municipal landfill area, if available at a suitable distance and if
the capacity is sufficient
* Install the mill’s own landfill area
Whichever option is chosen, we can assume that the Lithuanian “Regulation on
landfill of waste”, now being prepared, will have to be followed.
Primarily it is assumed that a municipal waste disposal area can be used. Such
landfill areas are, or will probably be, available at a suitable distance from all the

5 - 36
discussed sites. The capacities and other conditions for disposing the mill’s
wastes have, however, not been studied so far.
If the mill’s own landfill area has to be arranged, certain precautions must be
taken. These include i.a. the following.
* Potential sites for the landfill must be examined with regard to ground water,
ground material (permeability, depth), topographic conditions and
surroundings.
* The landfill must be located and designed so there is no risk of contamination
of ground water. Bottom lining to prevent this may be required.
* The deposited waste must be distributed and compressed in a manner, such
that air pockets, which might lead to fires or other danger for landfill staff, are
avoided.
* The waste should be covered continuously with a suitable material in order to
minimise drainage and leachate formation due to rainfall.
* The leachate, which should be only a small volume if the covering is done
properly, should be drained out and collected in such a way that monitoring is
easily performed
* If the leachate contains larger quantities of impurities, it should be treated, for
instance in the mill’s effluent treatment plant
Hazardous wastes
Hazardous wastes shall be separately collected and supplied to external
operators that are specialised in the handling of such materials.
General garbage
General garbage, similar to domestic municipal wastes, is also generated at the
pulp mill. Those fractions of this waste, which cannot be recycled, shall be
landfilled at a nearby municipal landfill disposal area.
Two options for further waste handling, which may be applied in the future, shall
be mentioned here. The application of these will require that present R&D
activities and practical experiences in different countries will appear to be
successful:
* Composting of sludge from the effluent treatment, possibly together with
some bark, for the production of a soil product
* Spreading of biofuel ashes in forests, for the purpose of recycling of a
material which has fertilizing properties.

5 - 37
5.4.5 Noise Control
Important sources of noise in the mill area are:
* The wood handling area – loading and unloading of logs, operation of the
debarking plant
* Transportation of chips
* Fans, cyclones and other types of stationary equipment
* Transports on the mill site
Also transports to and from the mill site are an important source of noise in the
surroundings.
The actual noise levels substantially depend on the equipment selected, the
location (with reference to the topography and the screening potential),
installation techniques, the degree of insulation of particularly noisy equipment,
the mill layout and the building materials used. All these items, must be
considered in the efforts for reducing the total noise level from the mill.

5 - 38
5.5 Estimated Pollution Loads
5.5.1 General
This section specifies estimated water emissions, atmospheric emissions and
solid waste generation. The data are based on the assumption that Best Available
Techniques will be applied. As regards the water and atmospheric emissions,
these will depend on several factors, such as the process types, the choice and
design of process equipment and pollution abatement equipment, the level of
process control and the process and operation conditions. All these issues cannot
be specified in detail in a pre-feasibility study, and therefore the emission levels
must be regarded as estimations, but still typical for a modern mill, applying
BAT.
The estimated emission levels are such that have been achieved in practice at
modern mills. They are fairly low, but not necessarily the very lowest, which
have ever been reached. These estimated emissions are also at such levels, that
we judge would be accepted by the Lithuanian authorities in a future situation.
Further and closer estimations of the emissions must be elaborated in a future
EIA.
The estimated emission data are based on the production data, on experienced
specific emissions, i.e. emission values per ton of pulp, and – concerning water
emissions – on experienced removal rates in the effluent treatment.
The production data are assumed as follows:
Total Softwood Hardwood
BKP BKP BKP
Operations days, d/a 340 188 152
Annual prod., ADt/a 500000 254256 245743
Daily prod., ADt/d 1471 1350 1620
5.5.2 Water emissions
(1) Process effluent
The estimated water emissions are given in Table 5.5.1. This refers to the
process water which is being polluted by use in the pulping processes and then
treated in the effluent treatment plant before discharge. There will also be a clean
effluent – section 5.5.2 (2).

5 - 39
Table 5.5.1 Water emissions – from Mill and after Effluent treatment,
to Recipient. (Monthly averages)
Water m3/d
TSS t/d COD t/d
BOD7
t/d Phosph.kg P/d
Nitrogen t N/d
AOX *) t/d
From Mill to Effluent treatment 44 000 10 49 17.5 ca 60 ca 0.3 ca 0.5 From Effluent treatment to Recipient
44 000 2 16 0.8 30 0.25 0.22
To Recipient Specific data 30 m3/ADt
1.4 kg/ADt
11 kg/ADt
0.6 kg/ADt
20 g/ADt
0.17 kg/ADt
0.15 kg/ADt
*) AOX emission only during ECF pulp production.
The estimated emissions after the effluent treatment are based on experiences
from similar effluents and processes. The efficiencies in the biological treatment
are assumed to be, i.a., the following:
COD 65 – 70 %
BOD 95 %
Phosphorus ca 50 %
AOX 50 – 60 %
Concerning Nitrogen, only a slight removal can be expected, in the range of 10 –
20 %.
Another important parameter, of which no figures are given here, is the toxicity
to water-living organisms, for instance fish. This matter is further discussed in
section 5.6. In brief, the effluent from this mill, utilising the most modern
process technology and efficient biological treatment, is expected to give no
acute (lethal) toxicity to fish.
(2) Total water consumption and effluent discharge
The total water consumption, i.e. the flow of water with has to be withdrawn
from the water source (the river), will be approximately 1.0 – 1.2 m3/s. Of this
amount about 0.5 m3/s will be used as process water, which will end up as the
effluent according to section 5.5.2 (1). The remaining part will be used in the
mill without being polluted, mainly as cooling water. This part of the consumed
water will be discharged directly to the recipient as clean water, but with an
increased temperature, approximately 40 – 50 oC.

5 - 40
In order to save water, i.e. to reduce the withdrawal of water from the river, it is
suggested to use part of the spent and heated cooling water as process water
supply to the pulp mill.
In summary the following approximate effluent flows will be obtained:
m3/s m3/d
Treated effluent, from Effluent treatment plant 0.5 44 000
Cooling water and other clean waters 0.5-0.7 42 – 60 000
Total 1.0-1.2 86 – 104 000
5.5.3 Atmospheric emissions
The estimated atmospheric emissions are given in Table 5.5.2.
Table 5.5.2 Atmospheric emissions
t/d t/a kg/ADt Dust 0.6 200 0.4 Sulphur dioxide as SO2 as S
0.9 0.45
306 153
0.6 0.3
TRS as S 0.15 51 0.1 Total sulphur, as S 0.6 204 0.4 NOx as NO2 1.75 600 1.2
In addition we have estimated the total emission of carbon monoxide, CO, to
approximately 0.5 kg CO/ADt, or 750 kg CO/d. (The basis for this estimation is
very limited, compared to the other parameters.)
CO is not included among those parameters, of which the EU has specified
expected BAT emissions. CO, however, is included in the present Lithuanian
legislation, i.e. in the list of MPC’s of stationary combustion sources (Table
5.2.4), the list of hygienic MPC’s (Table 5.2.5) and the legislation on pollution
taxes.
The estimated emissions can be compared with the MPC’s of Table 5.2.4. The
corresponding regulation is in force, but it is not clear to what extent it is
applicable to the kraft pulp mill. Anyhow the main atmospheric polluters in the
mill – i.e. the recovery boiler, the lime kiln and the bark furnace – must all be
regarded as “combustion sources”.
Based on calculated and estimated flue gas flows from these units, the expected
concentrations in the flue gases have been estimated to reach approximately the
following levels:

5 - 41
Dust 15 – 50 mg/Nm3
SO2 60 – 80 mg/Nm3
NOx 100 – 300 mg/Nm3
CO appr. 50 mg/Nm3.
These concentrations are significantly lower than the MPC values.
5.5.4 Solid waste generation
The largest fraction of the solid wastes is the bark, from the debarking of the
wood raw material, including also some wood wastes. This amount will be
substantially reduced by incineration. Sludge from the effluent treatment will be
incinerated together with the bark. The residue from the incineration, the ashes,
will be landfilled.
The estimated amounts of these mentioned wastes, together with the other
wastes which must be landfilled, are summarised in Table 5.5.3. The given data
are estimations, which shall be regarded as typical data for a modern kraft mill,
utilising BAT.
Table 5.5.3 Solid wastes to incineration and landfill, as dry solids.
Estimations.
Total generation of solid wastes Type of waste
Specific generation of solid wastes kg DS/Adt
t DS/d t DS/a
To Incineration Bark and wood wastes 253 372 126 500 Sludge 11 16 5 500 Total to Incineration 264 388 132 000 To Landfill Ashes from incineration 6 9 3 050 Green liquor sludge 15 22 7 500 Lime grit and sludge 5 7.5 2 550 Bark wastes 5 7.5 2 550 Others 4 6 2 050 Total to Landfill 35 52 ca 18 000
The solid wastes, to be disposed on landfill, are not dry in practice. The dry
solids content may be in the range of 50 – 60 %, as an average. Assuming 60 %
DS content, the total amount of solid wastes to landfill would be about 30 000
tons/annum. Expressed as volume, the figure would be approximately the same,
i.e. about 30 000 m3 / annum.

5 - 42
The other types of wastes, i.e. recyclable wastes, hazardous wastes and general
garbage, represent much smaller amounts and volumes, compared to the above.
The specific generation of these types of waste can vary extensively, and
therefore it is not meaningful to give any estimated figures here.
5.5.5 Environmental taxes
We have estimated the expected environmental taxes. The emissions etc. used
for this estimation are the following:
Water pollutants BOD7 0.8 t/d
Total N 0.25 t/d
Total P 30 kg/d
TSS 2 t/d
Sulphate 9 t/d
Chloride 4 t/d
Air pollutants SO2 0.9 t/d
NOx 1.8 t/d
Dust 0.08 t/d from Lime kiln
Dust 0.44 t/d from Rec boiler, and Power boiler
H2S 0.15 t/d
CO 0.75 t/d
Fuel consumption Gasoline 35 t/a
Diesel 180 t/a
Water consumption River water 1.2 m3/s
Note: Sulphate and Chloride (estimated values) are included in this calculation,
according to the Law, although these compounds are normally not regarded as
“pollutants”.
The total environmental tax was estimated to the level of 1.4 MLt/year.

5 - 43
5.6 Environmental Impacts
5.6.1 General – Modern kraft pulp mills
(1) Water emissions
Through the recent development of the pulp bleaching processes and the
pollution control methods, the industry has reached a considerable reduction of
the impacts, which are caused by the mill effluents. This refers to the main types
of impacts, typical for pulp mill effluents, i.e. caused by the emissions of
suspended solids (fibres, etc.), oxygen consuming substances and toxic
substances.
Suspended solids are normally at such low levels that problems with solids
deposits outside the mills would not be found.
Emissions of readily oxygen consuming substances, measured as BOD
(biochemical oxygen demand), are also very low, provided that an efficient
biological treatment is installed. This means that the traditional problem of
oxygen deficit in the recipient water, in the vicinity of the discharge point, is
virtually eliminated, as regards modern mills.
Toxic effects include lethal toxicity (mortality) to water living organisms, as
well as other so-called sub-lethal effects (for instance the reproducibility of fish).
Substantial reductions of the toxic effects have been reached by three different
ways:
• the general reduction of organic substances emissions, through changes and
improvements in the pulping systems
• the change of the bleaching processes towards the non-chlorine and
non-chlorine compounds processes, i.e. ECF and TCF bleaching (elemental
chlorine free and total chlorine free)
• the introduction of efficient biological effluent treatment
These results have been extensively demonstrated, both through laboratory tests
and through larger long-term tests in model ecosystems. Toxic effects caused by
effluents from modern mills with ECF bleaching and AOX levels below 1.5 kg
per ton of pulp are generally very low, and show no variations related to the
AOX level. This indicates that the chlorinated organics in these effluents do not
contribute significantly to the toxicity. This means also that the remaining minor
toxic effects are virtually the same for ECF and TCF bleach effluents.

5 - 44
The emissions of nutrients, i.e. nitrogen and phosphorus compounds, have not
been reduced at the same degree as the other types of pollutants, mentioned
above. These emissions may still contribute to the eutrophication effects in areas,
where either nitrogen or phosphorus is a controlling factor for the algal growth.
However, in many areas, for instance the Baltic, the contribution of the pulp
industry to the eutrophication would be small, as other nitrogen and phosphorus
sources are much larger, such as municipal effluents and agriculture.
(2) Atmospheric emissions
The main types of atmospheric environmental impacts of modern kraft mills are
caused by the emissions of particles, sulphur containing substances, and
nitrogen oxides (NOx). Of these the sulphur containing substances are the most
important.
Particles emissions are generally of less significance at modern mills, due to
efficient abatement technology. Problems, mainly aesthetic in nature, can occur
in the near vicinity of the mill, in cases of disturbances in the mill, due to the
precipitation of particles.
The impact from the sulphur containing substances can be divided in two
categories, odour and acidification. The odorous, or foul smelling, gases are
hydrogen sulphide, organic sulphides and methyl mercaptan. At older kraft mills
these could cause heavy odour loads, also at larger distances, due to the very low
odour threshold of these compounds, particularly the mercaptan. The low
concentrations causing the odour, do not, however, give any health hazard.
At modern mills, an efficient reduction of the atmospheric emissions has been
achieved by internal process measures, as well as flue gas treatment. This refers
also to the odour problems, which have been substantially reduced. These may
have significance only in the near vicinity of the mill, and at larger distances
only in connection with temporary disturbances.
Acidification is caused by the emissions of sulphur dioxide (SO2) and nitrogen
oxides (NOx). This is not a local effect, instead the SO2 and NOx emissions from
the pulp mill adds to the total emissions from all other sources of these gases, in
the region, in the country as a whole and in neighbouring countries.
To give an idea of the significance of the pulp industry's contributions to these
emissions, the following 1994 data for Sweden can be mentioned. Sweden has
an important pulp industry. Still this industry contributed only by about 16% of
the total SO2 emissions and about 7 % (including transports) of the total NOx

5 - 45
emissions. The figures can be compared to the emissions from traffic, which
contributed by 28 % of the SO2 emissions and 62 % of the NOx emissions.
5.6.2 Environmental impacts from the new pulp mill
(1) General – Aspects on forestry
This section covers only those impacts, which are caused by the Mill itself and
its operation, particularly the water and atmospheric emissions. Impacts on the
forests and their flora and fauna, caused by forestry operations, and impacts
from the transportation of wood and other raw material, as well as transports of
pulp, were not covered in this study.
It can be expected that the forestry business will increase in Lithuania,
independently of whether a new pulp mill is built or not, to a level corresponding
to the sustainable annual allowable cut. This development will probably be
speeded up in case a pulp mill is built.
An increased forestry activity may cause severe impact to the forests and the
nature, unless mitigation actions are considered in logging operations, technical
development, reforestation etc. There are no reasons to believe, or any
indications, that a new pulp mill will influence the development and the
environmental impacts in a more negative way, than the option that a mill is not
being built. However, the forestry operations and the wood transports must be
considered in the future EIA and be seriously analysed as to their environmental
impacts.
(2) Water emissions
We discuss here primarily the inland sites, i.e. the impacts on rivers Neris and
Nemunas, as these sites are presently regarded as the more interesting ones. As
regards the possible coastal sites, in the Kretinga district, some brief comments
are also given.
Inland sites
We refer here to the discussed sites in Elektrenai/Vievis, Jonava and Alytus. We
have compared the expected emissions with the transports of pollutants by the
rivers, as follows. The latter are based on the available statistical data for the
rivers Neris and Nemunas. These include, i.a., flow data and contents of COD,
BOD, nitrogen, phosphorus and suspended solids. The results are given as mill

5 - 46
emissions in percentages of the transport of the same pollutants by the rivers,
near the mill sites, Table 5.6.1. For river Neris, the comparisons have to be done
at two different locations, as the river flow and quality changes along the river.
Table 5.6.1 Water emissions from the Mill, related to the transports by the
river. River data from 1998 (av.) and 1999 (av. and monthly variation).
Neris downstream Vilnius
Neris downstream Jonava
Nemunas downstream Alytus
COD % -99 -98
av. 10 (4 – 18) av. 6
av. 5 (2 – 12) av. 2.6
av. 2 (0.9 – 4) av. 2.3
BOD7 % -99 -98
av. 2.3 (1 – 4) av. 1.6
av. 1.8 (0.8 – 4.4) av. 1.5
av. 0.6 (0.4 – 1.4) av. 0.5
Tot N % -99 -98
av. 1.6 (0.7 – 3) av. 1.2
av. 1 (0.4 – 2.5) av. 0.5
av. 0.6 (0.2 – 1.7) av. 0.7
Tot P % -99 -98
av. 2.8 (1.2 – 5) av. 2
av. 2 (0.8 – 4.5) av. 1.3
av. 0.9 (0.5 – 2) av. 0.9
TSS % -99 -98
av. 2.5 (1 – 4.5) av. 2.4
av. 1.5 av. 0.6
av. 0.4 av. 0.5
Typical flow data of the rivers are given in Table 5.6.2.
Table 5.6.2 Flow data of rivers Neris and Nemunas.
Neris downstream Vilnius
Neris downstream Jonava
Nemunas downstream Alytus
Flow m3/s annual av.
109
220
255
monthly av. variation 50 – 200 90 – 400 131 – 483 daily av. variation - 80 – 590 98 – 572
The percentage figures of Table 5.6.1 can also be interpreted as the approximate
increase of the concentration of each pollutant in the river water, caused by the
Mill effluent, at the point of discharge. The monthly variations of 1999 reflect
the fact that the river flows and pollutant transports have an annual variation,
with highest values in spring and lowest values in summer – autumn.
In the case of river Neris, the flows and pollutant transports were relatively low
during 1999, thus giving an indication of the worst situation.
The levels of dilution of the effluent in the rivers are approximately as follows,
as average and monthly variation (based on the polluted effluent only):
Neris downstream Vilnius av. 200 (100 – 400)
Neris downstream Jonava av. 400 (200 – 800)
Nemunas downstream Alytus av. 500 (250 – 1000)

5 - 47
The contribution from the Mill to the total pollution transport by the rivers can be
regarded in general as small. At least in the cases of Neris downstream Jonava
and Nemunas downstream Alytus, the emissions from the Mill are not likely to
give any significant impact on the situation in the rivers. This refers to normal
and undisturbed operation in the Mill. A future EIA will have to consider, for
instance, the risks of temporary raised emissions, due to disturbances in the Mill,
and their impact on the rivers.
As regards the site at Alytus, river Nemunas is the recipient, and it gives the
highest dilution of the effluent, considering the three sites. However, in the
Alytus case also the lake just upstream Kaunas (Kauno marios) will be affected.
This particular problem will require a special consideration.
Coastal site
This refers to the two discussed sites in the Kretinga district, Klaipeda County,
i.e. Darbenai and Tubausiai. These sites are located about 7 and 10 km from the
coastal line. One problem with these sites is the shortage of fresh water for the
Mill, which is discussed in section 4.2.3.
The effluent would have to be pumped through a pipeline of approximately 10 -
15 km length. The pipeline would discharge into the Baltic Sea at some
kilometres from the coastal line, with an arrangement for a high grade of dilution
of the effluent, in order to minimise the impacts on the coastal area and the sea
water. The pipe would need significant costs for the installation and also for the
operation. This arrangement would, however, represent the particular advantage
of this site: The risk of contaminating the river waters by the mill effluent would
be eliminated. The higher immediate dilution of the effluent, which is possible in
the Baltic, means that this can be regarded as a less sensitive recipient, compared
to the rivers.
Actual impacts that could be expected in the Baltic cannot be specified at this
stage. This will be a question of the EIA, if this site option is to be considered.
However, it is assumed that the pipe length and the dilution can be chosen in
such a way as to virtually eliminate any impact from the effluent on the water
quality near the coastal line.
Inland/Coastal location – Natural purification - Conclusion
When discussing the inland and coastal locations, it should be pointed out that
river Neris discharges into river Nemunas, downstream Kaunas, and Nemunas

5 - 48
into the Kursiu Lagoon and further into the Baltic. So the effluent finally ends up
in the Baltic, irrespective of the Mill site. In the inland cases the effluent
undergoes some “natural purification” in the rivers and the lagoon. This means a
virtually complete removal of the BOD, probably a significant removal of
suspended solids, and only slight or negligible removals of nitrogen and
phosphorus. COD will also be removed only slightly, as most of the COD after
an efficient biological treatment is non-, or only slowly, biodegradable.
The BOD removal, and some COD removal, will occur through biological
degradation under the consumption of oxygen. Due to the low BOD content of
the effluent this will influence the dissolved oxygen (DO) in the rivers at a very
low rate. The DO contents in these rivers are normally on a high level,
corresponding to the saturation 85 – 120 % (Neris) and 70 – 115 % (Nemunas).
In the coastal case these purification processes will occur in the sea water.
The most serious risk of influencing the recipient water quality is connected to
the risk of upsets in the Mill, which can lead to temporary discharges of effluents
with raised pollutant concentrations. This problem will, however, be efficiently
counteracted by the installation of various safety systems, spill collection
volumes etc. However, the risk of obtaining serious impacts from incidents of
this kind is lower with the coastal location.
In summary, our opinion is that the coastal location in general is a better option
than the inland location, from the point of view of water pollution.
(3) Atmospheric emissions
It is not possible at this stage to estimate the air quality in the surroundings of the
Mill, resulting from the expected atmospheric emissions. This will have to be
done within the later EIA. We have instead summarised the total emissions of
the main pollutants, and compared them with the same emissions in the actual
cities/districts, according to available statistical data (“Natural resources and
environmental protection 1998”. Statistics Lithuania, A501. Vilnius 2000). Also
data from the chemical industry ACHEMA, the largest industry in Jonava city, is
included (data provided by Jonava District).
The Trakai district is included, as the Vievis site was previously located in this
district. Now, 2000, Elektrenai has formed a new district of its own, where
Visevis is located.

5 - 49
Table 5.6.3 Atmospheric emissions from the Mill. Total emissions in the districts and in Lithuania 1998.
Alytus
City and
district
total
Jonava
district
total
Jonava
ACHEMA
industry
Trakai
district
total
Kretinga
district
total
Lithuania Total Atmosph.
pollutants
Mill
emission
Stationary sources Stationary
sources
Mobile
sources
tons/a Dust 200 149 276 1 609 111 7 300 2 300 SO2 306 1 209 506 72 20 611 40 74 500 1 200 NOx 600 169 520 450 1 858 52 14 800 37 500 CO 255 361 6 088 6 700 1 415 312 25 900 318 900
The data in the table give an indication of the estimated Mill emissions in
relation to present emissions from other sources. The emissions are locally
significant, compared to the present emissions in the actual districts, but are in
some cases higher, in some cases lower. The relatively high emissions in the
Trakai district most likely originate from the power plant in Elektrenai.
The local effects of these emissions, in terms of air quality outside the sanitary
zone, will have to be studied in the later EIA.
The most obvious local effect will be the odour, caused by the TRS compounds
(total reduced sulphur). This odour can be perceived as unpleasant, even when
the TRS concentrations are very low. However, in this case, as in other modern
kraft pulp mills, the most modern and efficient systems for reducing the TRS
emissions will be applied. This means that the odour will be very low, although
not really unnoticeable. During normal operation some odour will most likely be
noticed within the Mill area and in the near vicinity. At larger distance, i.e. a few
km, no odour will be noticed. Operation problems, which may occur from time
to time, will temporarily increase the odour level also at larger distances, which
may give rise to complaints. However, this situation will not give any health
problems.
Local effects in residential areas, incl. odour, will be limited, due to the fact that
main wind directions are around south-west. In the main site options the Mill
location will be north (Alytus, Vievis) or south-east (Jonava) of the main
residential areas.
The emissions from the Mill are very low in relation to the total Lithuanian
emissions. The percentages are as follows, based on the emissions from
stationary sources and from all sources (total = stationary + mobile sources):

5 - 50
Stationary Total
Dust 2.7 % 2.1 %
SO2 0.4 % 0.4 %
NOx 4 % 1.2 %
CO 1 % 0.1 %
(4) Solid waste landfill
This discussion refers to both the options, i.e. the Mill’s own landfill or a nearby
municipal landfill. The most significant impact of the solid waste handling will
be the appearance of the landfill area, i.e. mainly an esthetical impact. Other
impacts could be:
* Odour from the landfill itself
* Drain water and leachate originating from the landfill, causing odour, as well
as contamination of ground waters and surface waters
* Noise, caused by the transports of the wastes and by the handling of the
wastes on the landfill
In order to minimize these impacts, particular care must be taken when choosing
the location of and designing the landfill. See also section 5.4.4.
5.6.2 Environmental Impact Assessment
It shall be noted that a detailed Environmental Impact Assessment has not been
carried out within the scope of the pre-feasibility study. This has to be done at a
later stage of the project, according to the legislation, which is summarised in
section 5.2.1.
An EIA will have to cover several issues, which were not covered in this study,
i.a. the following:
• If the estimated water emissions will cause acceptable or unacceptable
changes in the river water quality, based on the required water quality data,
which have possibly been established at that point of time.
• To what extent the aquatic life in the rivers may possibly be affected
• The sensitivity of the rivers in terms of usage for recreation, fishing etc.

5 - 51
• The risks of temporary raised emissions, due to disturbances in the Mill, and
their impact on the rivers
• If the estimated air emissions will cause acceptable or unacceptable changes
in the ambient air quality, based on the required air quality data, which have
possibly been established at that point of time.
• The risk of odour in residential areas
• The impact of transports (raw materials, products and chemicals, externally,
as well as internal transports in the mill area)
• The impacts on forests and biodiversity

Chapter 6 PULP MILL DESIGN

6 - 1
Chapter 6 PULP MILL DESIGN
6.1 Products and Specifications
6.1.1 Selection of pulp products and reasons
(1) Objective and nature of the study
1) To assist existing operators and investors in expanding and developing
business; or
2) To attract new operators and investors.
In the former case, there are sufficient data and criteria available to determine
viability of the contemplated applications (and needs) of major products and
their markets (future prospects). Past experience, knowledge and know-how
are used as the basis of analyzing the study results and data, leading to a final
plan. On the other hand, the latter case should rely on statistical data and
neutral evaluation criteria that are applied to all study items to be considered.
In this case, it is important to evaluate study results and data obtained under a
variety of conditions from broad perspectives, rather than specific cases, in the
planning process. In particular, the present study is designed to develop a
plan to build a large pulp mill that has international competitiveness, while not
competing with existing paper and paperboard manufacturers in the country,
which are on the decline. Thus, the study should address the issues facing the
local industry so that the new mill will not be caught in the same problem.
(2) Major considerations in selection of market pulp products
Pulp and paper products are closely related to each other, and their selection in
the production plan involves a delicate balancing act similar to design of a new
coin (pulp products on one face and paper products on the other). Major
considerations required in selection of market pulp products are summarized as
follows:
1) Application: The most critical factor
2) Market: Europe (export market)
3) Raw materials: softwood and hardwood that are already planted

6 - 2
4) Competitors: Nordic Countries’ and North American pulp manufacturers
for softwood; and South European and South American pulp manufacturers
for hardwood
5) Cost competitiveness: Found in raw material and labor, while the average
level for other factors
6) Technology competitiveness: Average level
7) Production process: Latest and field-proven process
8) Production equipment: Field-proven equipment that is reliable in operation
and maintenance
9) Construction cost: Not significant difference in mill construction cost so far
as market pulp products are made
10)Timing of construction: It is desirable to make the new mill come on stream
when the market turns upwards and before it reaches its peak, although the
cyclic nature of the pulp market makes timely construction difficult.
Preliminary evaluation of the above items from 1) through 10) in comparison
to potential competitors indicates that promising pulp products for the project
are very limited. In fact, BSKP and BHKP are considered as primary
candidates.
(3) Reasons for selection of BSKP and BHKP
a. Europe is the world largest importer of pulp products. In 1999, it imported
nearly 14 million ADt of pulp.
b. As European countries exported a combined total of 9.7 million ADt in the
same year, the region's net imports amounted to 4.3 million ADt. Note
that some countries import woods in and outside of Europe and produce
pulp products for exports.
c. BSKP and BHKP are most widely used market pulp products, which
demand is expected to grow steadily in Europe.
d. If the country intends to foster the pulp and paper industry as a strategic
sector that utilizes the country's rich forest resources, the best strategy is to
produce BSKP and BHKP at large pulp mills in the country, thereby to use
logs currently exported to European countries as a raw material for pulp
production and export pulp products to neighboring countries in Europe.

6 - 3
e. Meanwhile, reconstruction of the existing paper and paperboard companies
must wait until the national economy recovers and consumption grows to
create an opportunity for production of paper products using locally
supplied pulp.
Table 6.1.1 compares BSKP, BHKP and other pulps.
Table 6.1.1 Major Factors Considered in Selection of Pulp Products
BSKP BHKP YKP UKP TMP Grade
Production
Description ADt/y >5000000 >500000 ≒350000 ≒350000 ≒180000
1) Printing and writing paper ○ ◎
2) Office paper ○ ◎
3) Coated base paper ○ ◎
4) Household and sanitary
paper ○ ◎
5) Newsprint and magazine ◎ ◎
6) Package, box and container ◎ ◎ ◎ ◎
① A
pplic
atio
n
7) Board (liner) ◎
1) Area Entire Europe Entire Europe Entire Europe Entire Europe Entire Europe
2) Customer Paper
company Paper company
Newsprint
maker Board maker
Newsprint
maker
② M
arke
t
3) Sales volume Large Large Small Medium Medium
1) Wood N L N N N&L
2) Chemicals Self-made/pur
chase
Self-made/purc
hase
Self-made/purc
hase
Self-made/purc
hase Purchase
3) Fuel Natural gas Natural gas Natural gas Natural gas
③ R
aw m
ater
ials
4) Electricity Internal
generation
Internal
generation
Internal
generation
Internal
generation Purchase
④ Competitors
Nordic
countries,
North America
Southern
Europe, South
America
Nordic
countries,
North America
Nordic
countries,
North America
Latvia,
Nordic
countries
⑤ Cost competitiveness High High Relatively low Poor Poor
⑥ Technology competitiveness High High High High High
⑦ Production process Very complex Very complex Complex Slightly
complex Simple
⑧ Production line Continuous
one train
Continuous one
train
Continuous one
train
Continuous one
train
Continuous
multi train
⑨ Construction cost High High High High Low
⑩ Construction period (months) 24~36 24~36 24~36 24~36 16~20
YKP : (=Yellow Kraft Pulp = semi-bleached Kraft Pulp)

6 - 4
6.1.2 Product specifications
As the proposed products are assumed to be sold to the general market at the
present, product specifications are established to serve wide applications, as
follows:
- Type : ECF (or TCF) BSKP and BHKP
- Grade : Paper grade
- Market : Mainly Europe
- Brightness : 80°- 90°ISO
- Moisture content : 10% (air dry (AD))
- Product type : Sheet pulp

6 - 5
6.2 Production Capacity
6.2.1 Design Capacity
Based on the results of the field survey, design capacity of the BKP mill is
established as follows.
Table 6.2.1 Production Capacity and Operation Plan
Unit BSKP BHKP Total or average a. Operating days d/a 188 152 340* b. Production capacity ratio 1.00* 1.20* c. Daily average production ADt/d 1350 1620 1471 d. Annual production ADt/a 254257 245743 500000*
Note: 1. The figures marked by * mark are established as design standards for
the project.
2. The operating days of the BSKP mill (188 days) are estimated from
consumption of softwood and hardwood in Table 6.2.2 “Log Supply
Conditions and Consumption.”
3. The daily average production at the BSKP mill (1350ADt/d) is
calculated as follows:
500000 / (188 x 1 + 152 x 1.2) = 1350
6.2.2 Log Supply Plan and Consumption
Based on the results of the field survey and the data furnished by the Forest
Bureau, log supply to the BKP mil is assumed to be composed of softwood
55% and hardwood 45% (on a debarked lumber basis).

6 - 6
Table 6.2.2 Log Supply Conditions and Consumption
Unit BSKP BHKP Total or average a. Species Spruce & pine Birch, etc. b. Log weight/unit volume kg/ m3 sub 405* 427 * c. Unit volume m3 sub /ADt 5.30** 4.48** 4.90** d. Composition % 55.0* 45.0* 100
e. Annual log consumption m3 sub /a 1346939 1102041 2450000
Note: 1. The figures marked by * are established as design standards for the
project.
2. The figures marked by ** are estimated from those marked by*.
See Annex 1 “Lithuania Pulp Mill” for detail.
3. The annual log consumption (2450000 sub m3/a) is calculated as
follows:
500000 /(55/(5.30 x 100) + 45/(4.48 x 100))= 2450000
Figure 6.2.1 shows the “pulp flow” during BSKP operation, Figure 6.2.2
during BHKP operation, and Figure 6.2.3 during the BSKP/BHKP operation in
equal proportions.
Note that the operating condition in Figure 6.2.3 is a hypothetical situation for
convenience of presentation and calculation.

6 - 7
Figure 6.2.1 Pulp Flow - during BSKP operation
Wood(sob) Daily Ave.Pulp Production 1350 ADt/d
8269 m3sob/d Wood density(ave.) 405 kg/m3
3256 BDt/d Bark density(assumed) 325 kg/m3
Ave. unit wood consum. 5 m3/ADtChip Daily wood consumption 7152 m3sub/d
0 m3sub/d Chip Rate 0 %0 BDt/d Baek and Fine Recovery Efficiency 92 % BDt
363 BDt/d Wood to bark and fine 20 % m3
Wood2893 BDt/d Wood Handlig and 87 %
Barking Yield (wood m3 sob to sub)
Bark Fines TotalChip from wood 363 145 507
Knot Rate: 145 BDt/d Chip from outside 0 0 0(to Chip) Chip Total 363 145 507
2 % 2748 BDt/d 18 % to Bark Boiler 332 133 46561 ADt/d (W.L. as A.A. to BD chip)
Wood to Chip Hand. Yield 95.0 %Chip toChip Handlig Yield 99.0 %
1591 ADt/d 1523 ADt/d (to Evaporator)
Cooking Yield: 47.9 % Washing (to chip fed to digester)
8 ADt/d1516 ADt/d (to Evaporator) Washing recovery: 0.5 %
(to Blow Pulp )
15 ADt/d Reject Rate: 1.0 %1441 ADt/d (to washed pulp)
O2 Deligni. Shrinkage: 2.0 %29 ADt/d (to screened pulp)
1412 ADt/d (to Evaporator)
Bleaching Shrinkage: 3.4 %Return Rate: (to unbleached pulp)(to product) 48 ADt/d
2 % 1364 ADt/d (to effluent treatment)27 ADt/d
BKP Screening Loss: 0.5 %(to bleached pulp)
7 ADt/d1357 ADt/d (to Bark Boiler or others)
Pulp M/C Losses: 0.5 %(to screened pulp)
7 ADt/d1350 ADt/d (to effluent treatment)
Total Yield: 42.0 %(to sub wood)
1350 ADt/d
Pulp BaleFinishing Line
Bleached StockScreening
Pulp DryingMachine
Brown StockScreening
O2 Deligni.
Bleaching
Generation of Bark and Fines BDt/d
Chip Storage and Handling
Cooking
Recievement and Barking
Chip Preparation
WoodRecievement
Chip Wood Handling

6 - 8
Figure 6.2.2 Pulp Flow - during BHKP operation
Wood(sob) Daily Ave.Pulp Production 1620 ADt/d
8400 m3sob/d Wood density(ave.) 427 kg/m3
3471 BDt/d Bark density(assumed) 325 kg/m3
Ave. unit wood consum. 4 m3/ADtChip Daily wood consumption 7266 m3sub/d
0 m3sub/d Chip Rate 0 %0 BDt/d Recovery Efficiency 90 % BDt
369 BDt/d Wood to bark and fine 20 % m3
Wood(sub)3102 BDt/d Wood Handlig and 87 %
Barking Yield (wood m3 sob to sub)
Bark Fines TotalChip from wood 369 155 524
Knot Rate: 155 BDt/d Chip from outside 0 0 0(to Chip) Chip Total 369 155 524
2 % 2947 BDt/d 17 % to Bark Boiler 332 140 47265 ADt/d (W.L.as A.A. to BD chip)
Wood toChip Hand. Yield 95.0 %Chip toChip Handlig Yield 99.0 %
1520 ADt/d 1820 ADt/d (to Evaporator)
Cooking Yield: 53.6 %(to chip fed to digester)
9 ADt/d1812 ADt/d (to Evaporator) Washing recovery: 0.5 %
(to Blow Pulp )
18 ADt/d Reject Rate: 1.0 %1729 ADt/d (to Bark Boiler or others) (to washed pulp)
O2 Deligni. Shrinkage: 2.0 %35 ADt/d (to screened pulp)
1694 ADt/d (to Evaporator)
Bleaching Shrinkage: 3.4 %Return Rate: (to unbleached pulp)(to product) 58 ADt/d
2 % 1636 ADt/d (to effluent treatment)32 ADt/d
BKP Screening Loss: 0.5 %(to bleached pulp)
8 ADt/d1628 ADt/d (to Bark Boiler or others)
Pulp M/C Losses: 0.5 %(to screened pulp)
8 ADt/d1620 ADt/d (to effluent treatment)
Total Yield: 47.0 %(to sub wood)
1620 ADt/d
Pulp BaleFinishing Line
Screening
Pulp DryingMachine
Screening
O2 Deligni.
Bleaching
Bleached Stock
and Handling
Cooking
Washing
Brown Stock
ChipPreparation
Generation of Bark and Fines BDt/d
Chip Storage
Chip Wood HandlingRecievement and Barking
WoodRecievement

6 - 9
Figure 6.2.3 Pulp Flow - during BSKP & BHKP operation in equal proportions
Wood(sob) Daily Ave.Pulp Production 1471 ADt/d
8327 m3sob/d Wood density(ave.) 415 kg/m3
3352 BDt/d Bark density(assumed) 325 kg/m3
Ave. unit wood consum. 5 m3/ADtChip Daily wood consumption 7203 m3sub/d
0 m3sub/d Chip Rate 0 %0 BDt/d Recovery Efficiency 91 % BDt
365 BDt/d Wood to bark and fine 20 % m3
Wood(sub)2986 BDt/d Wood Handlig and 87 %
Barking Yield (wood m3 sob to sub)
Bark Fines TotalChip from wood 365 149 515
Knot Rate: 149 BDt/d Chip from outside 0 0 0(to Chip) Chip Total 365 149 515
2 % 2837 BDt/d 17.5 % to Bark Boiler 332 136 46863 ADt/d (W.L.as A.A. to BD chip)
Wood toChip Hand. Yield 95.0 %Chip toChip Handlig Yield 99.0 %
1559 ADt/d 1656 ADt/d (to Evaporator)
Cooking Yield: 50.5 %(to chip fed to digester)
8 ADt/d1648 ADt/d (to Evaporator) Washing recovery: 0.5 %
(to Blow Pulp )
16 ADt/d Reject Rate: 1.0 %1569 ADt/d (to Bark Boiler or others) (to washed pulp)
O2 Deligni. Shrinkage: 2.0 %31 ADt/d (to screened pulp)
1538 ADt/d (to Evaporator)
Bleaching Shrinkage: 3.4 %Return Rate: (to unbleached pulp)(to product) 52 ADt/d
2 % 1486 ADt/d (to effluent treatment)29 ADt/d
BKP Screening Loss: 0.5 %(to bleached pulp)
7 ADt/d1478 ADt/d (to Bark Boiler or others)
Pulp M/C Losses: 0.5 %(to screened pulp)
7 ADt/d1471 ADt/d (to effluent treatment)
Total Yield: 44.3 %(to sub wood)
1471 ADt/d
WoodRecievement
Chip Wood HandlingRecievement and Barking
ChipPreparation
Brown StockScreening
O2 Deligni.
Generation of Bark and Fines BDt/d
Chip Storage and Handling
Cooking
Washing
Machine
Pulp BaleFinishing Line
Bleaching
Bleached StockScreening
Pulp Drying

6 - 10
6.2.3 Selection of Production Capacity
Production capacity of the green field pulp mill should be selected in
consideration of the following factors.
(1) General trend in capacity increase
The capacity trend since the 1950s is well reflected in the installed capacity
trend of the Kamyr continuous digesters, the mainstream equipment for
production of BKP, the most popular market pulp. In the 1970s, the 500 –
1000 ADt/d range was the largest capacity level, and then 1500 – 2000ADt/d
mills were constructed between the late 1980s and the early 1990s.
From the late 1990s to the present, 1800 – 2000ADt/d mills were constructed
or announced, as well as 1500ADt/d mills.
Up to the early 1990s, the largest single line KP plant, with continuous digester,
both for softwood and hardwood, were build in North America, South America
and Asia/Oceania, but not in Europe. Then, some were built in Nordic
Countries during the late 1990s, although they do not produce market pulp.
To this date, the largest single line BSKP capacity, with continuous digester, is
483000 ADt/a. The largest single line BHKP capacity is 542000 ADt/.
Note that the above single line BKP capacities were calculated from UKP daily
design capacities of existing mills, as announced, multiplied by the yield of
BKP (bleached KP) vs. UKP (unbleached KP), 94%, the overall operating
efficiency of 90%, and annual operating days of 340.
See Table 6.2.3 “Installed Base of Kamyr Continuous Cooking Process by
Year of Installation” for detail.

Table 6.2.3 Installed Base of Kamyr Continuous Cooking Process by Year of Installation2000-08-15
North America Europe Aisa, Oceania Latin America Africa Total (Ahlstrom *3) (Kvaerner *2) (Kvaerner *2) (Kvaerner *2) (Ahlstrom *3)
SW HW Total SW HW Total SW HW Total SW HW Total SW HW Total SW HW Total1950-1959Design capacity UKP ADt/d *1 1300 0 1300 1900 125 2025 465 390 855 0 0 0 0 0 0 3665 515 4180Installed base (unit) 6.0 0.0 6.0 17.0 3.0 20.0 4.0 4.0 8.0 0.0 0.0 0.0 0.0 0.0 0.0 27.0 7.0 34.0Average capacity UKP Adt/d/unit 217 217 112 42 101 116 98 107 136 74 123Max. capacity UKP Adt/d/unit 350 200 60 150 180 350 1801960-1969Design capacity UKP ADt/d *1 36705 4088 40793 13230 1915 15145 2020 1472 3492 490 100 590 550 0 550 52995 7575 60570Installed base (unit) 78.0 7.0 85.0 37.0 9.0 46.0 11.0 9.0 20.0 1.0 1.0 2.0 2.0 0.0 2.0 129.0 26.0 155.0Average capacity UKP Adt/d/unit 471 584 480 358 213 329 184 164 175 490 100 295 275 275 411 291 391Max. capacity UKP Adt/d/unit 900 1,080 820 500 420 420 490 100 300 900 1,0801970-1979Design capacity UKP ADt/d *1 13700 4818 18518 21615 1960 23575 4550 3652 8202 378 3418 3796 1450 270 1720 41693 14118 55810Installed base (unit) 22.0 8.0 30.0 37.5 5.5 43.0 11.5 8.5 20.0 1.5 4.5 6.0 3.0 1.0 4.0 77.0 26.0 103.0Average capacity UKP Adt/d/unit 623 602 617 576 356 548 396 430 410 252 760 633 483 270 430 541 543 542Max. capacity UKP Adt/d/unit 1275 950 1000 860 660 640 255 1350 835 270 1275 13501980-1989Design capacity UKP ADt/d *1 17663 6593 24256 8500 4792 13292 4735 4252 8987 900 1063 1963 782 0 782 32580 16700 49280Installed base (unit) 20.0 10.0 30.0 11.5 8.5 20.0 9.5 8.5 18.0 1.5 1.5 3.0 1.0 0.0 1.0 43.5 28.5 72.0Average capacity UKP Adt/d/unit 883 659 809 739 564 665 498 500 499 600 709 654 782 782 749 586 684Max. capacity UKP Adt/d/unit 1325 1410 1100 1060 800 750 800 1000 782 1325 14101990-1998Design capacity UKP ADt/d *1 13851 11647 25498 4309 3712 8021 3403 12534 15937 3028 6147 9175 750 534 1284 25340 34574 59914Installed base (unit) 10.5 10.5 21.0 5.0 5.0 10.0 6.5 12.5 19.0 3.0 4.0 7.0 1.0 1.0 2.0 26.0 33.0 59.0Average capacity UKP Adt/d/unit 1319 1109 1214 862 742 802 523 1003 839 1009 1537 1311 750 534 642 975 1048 1015Max. capacity UKP Adt/d/unit 1680 1820 1300 1200 1390 1750 1210 1885 750 534 1680 18851950-1998Design capacity UKP ADt/d *1 83219 27145 110364 49554 12504 62058 15173 22300 37473 4796 10728 15524 3532 804 4336 156272 73481 229753Installed base (unit) 136.5 35.5 172.0 108.0 31.0 139.0 42.5 42.5 85.0 7.0 11.0 18.0 7.0 2.0 9.0 302.5 120.5 423.0Average capacity UKP Adt/d/unit 610 765 642 459 403 446 357 525 441 685 975 862 505 402 482 517 610 543Max. capacity UKP Adt/d/unit 1680 1820 1300 1200 1390 1750 1210 1885 835 543 1680 1885
Sources: Contract delivery record furnished by Kvaemer and Sumitomo Heavy Industries/Ahlstrom (as of 1999)
*1 The digester’s nominal capacity is indicated in volume of production of unbleached pulp, which is 10-12% larger than output of bleached pulp due to loss in the bleaching and screening processes.
*2 Kamyr was established in 1920 by KMW of Sweden (pulp and paper machine manufacturer) and Myren of Norway (machinery manufacturer), and joined by Ahlstrom of Finland (leading pulp and papermanufacturer/plant manufacturer) in 1934. The company has long known in Japan as a leading pulp and paper machine manufacturer in Scandinavia. It started research and development on the continuous digester,using a pilot plant, in 1938, which was commercialized in 1949. The first unit came on stream in 1950. After the decades of dominance in the industry, Kamyr was divided into Pulping Division of Kvaermer ofNorway and Ahlstrom of Finland in 1990, which are currently competitors.
*3 Kamyr Inc., under Sweden Kamyr, primarily operated in North America (excluding Mexico) and Africa. As a result of division of the parent company in 1990, the company became a subsidy of Ahlstrom and hasbeen competing with Kvaerner’s Pulping Division. In 1999, the two companies announced consolidation of their pulp and paper plant divisions into a new company in order to rationalize their operations in responseto the persistent recession in the pulp and paper industry. However, they failed to obtain the approval of the European Commission and they are now pursuing separate strategies. Reportedly, the merger proposal wasopposed by Valmet, a leading pulp and paper manufacturer in Finland (which acquired Sunds, a Swedish pulp and paper machine manufacturer), although details are not known.
6 - 12
The above data partly explain the present assumption that “the annual
production of 500000 ADt (daily production of 1500AD) BKP mill is the
breakeven point for economic viability.” The higher capacity is clearly
favorable as fixed costs such as depreciation and labor decrease in relative
terms. In particular, for a market pulp maker located in an area of rich wood
resources, which is designed to export products to major areas of consumption,
the capacity must be large enough to reduce the fixed cost per ADt, thereby to
compensate for the large capital requirement and the high transportation cost
for long haul to the market.
It should be noted, however, that the annual capacity of 500000 ADt is not the
minimum requirement for all the market BKP mill projects. The feasibility
seems to be evaluated rather in rather overall consideration of log supply
capacity and price, product market environment (supply and demand, price
forecast), locational conditions including the environment, and the funding
environment (availability of equity capital, loan capacity, interest rate).
Based on the above analysis, the contemplated 500000 ADt/a BKP mill
producing BSKP and BHKP is considered to be the largest scale and seems to
be a very attractive project.
(2) Application: Sales or captive consumption
In the case of market BKP production, a strong tendency exists to maximize
capacity in order to minimize construction costs, maintenance costs and labor
and other costs per production unit (ton). This is a logical choice for the BKP
production process that is a complex, capital-intensive process consisting of a
large number of equipment and needs to be operated on a continuous basis
while keeping material, chemical and energy balances among interrelated
processes, including pulp production, chemical recovery, power and pollution
control. As a result, the construction cost for the BKP process is much higher
than that for other production processes of the pulp and paper industry. As
the project plans to sell all of pulp produced at the mill, production capacity
should be set at the maximum allowable level in terms of raw material
availability, thereby to maximize cost competitiveness of products.

6 - 13
(3) Wood supply source
1) Northern forest
Northern forest has a relatively long growing period, with some variation
between natural forest and plantation and between coniferous and broad-leaved
trees. Thus, the supply source must be selected in forest areas where trees can
be harvested and exploited when the proposed mill has been constructed.
Two forest regions meet this requirement, North America and Europe
(including Russia) (forest areas grown since the 1960s). In 1998, North
America (U.S. and Canada) accounted for 46.0% of world pulp production of
183 106ADt. In the region, there were a number of large KP mills that
accounted for 48.0% of world UKP production capacity as of 230 103ADt/d
(using the Kamyr continuous process) up to 1999. The large production base
is located close to a huge market and wide natural forest as a source of raw
material supply.
Europe also accounts for a major share (23.5%) of world pulp production and
27.0% of world UKP production capacity. Within Europe, Nordic countries
although having abundant forest resources, are presently net importer of logs,
for economic reasons.
Forest in Lithuania belongs to northern forest and accounts for more than 30%
of the country’s land area (6500 103ha). Furthermore, its stock is gradually
increasing. Thus, the mill capacity plan needs to take into account this factor.
2) Southern forest
With some variation between natural forest and plantation and between
coniferous and broad-leaved trees, southern forest has a relatively short
growing period. As a result, forest areas that can be converted to afforested
areas will be included as a potential source of wood supply, in addition to
forest areas where trees can be harvested and exploited when the proposed mill
is constructed. Two regions meet this requirement: South America (forest
grown since the 1970s) and Indonesia (forest grown since the 1990s). The
former accounted for 5.8% of world pulp production in 1998 and 6.7% of
world UKP production capacity. On the other hand, the latter represented

6 - 14
2.4% and 2.6%, respectively. Table 6.2.4 summarizes pulp production
capacity, production volume and forest area by region.
Table 6.2.4 Installed Capacity of Kymyr Continuous Cooking Process (up
to 1999), Pulp Production (1998) and Forest Area (1997) by Region
Region Major features
North America
Europe Asia/
Oceania South
America Africa Total
Installed process Design capacity UKP ADt/d 110364 62058 37473 15524 4336 229753 Percentage share % 48.0 27.0 16.3 6.8 1.9 100.0 Number of units installed 172 139 85 18 9 423 Percentage share % 40.7 32.9 20.1 4.3 2.1 100.0 Average capacity UKP ADt/day/unit 642 446 441 862 482 543 Percentage share % 118.1 82.2 81.2 158.8 88.7 100.0 Maximum design capacity 1820 1300 1750 1885 482 1885 UKP ADt/day/unit
Pulp production (Total) 103AD/ty 83043 42301 41917 10472 2576 180309 Percentage share % 46.1 23.5 23.2 5.8 1.4 100.0 Forest area 106ha (*1) 456 962 565 950 520 3454 Percentage share % 13.2 27.8 16.3 27.5 15.1 100.0
Sources *1: State of The World’s Forest 1997
3) BSKP
BSKP, made from softwood, is primarily produced in the northern hemisphere
where coniferous forests are widely distributed. Major exporters of market
BSKP are Canada, the U.S., Sweden, Norway, Finland, and Russia.
In Canada and the U.S., BSKP is mainly made from waste softwood of
sawmills, although there are huge coniferous forest resources compared to
other countries, they are required to exploit forest resources on a sustainable
basis for the interest of ensuring global environmental protection. In Nordic
Countries, BSKP is mainly made from round softwood, furthermore
sustainable development of forest industries had been established already, but
the cost of softwood for BSKP has a tendency to increase gradually. As a
result in general, they are keen to secure stable supply of BSKP materials.
This is evidenced in the fact that leading pulp and paper manufactures in North
America and Nordic countries are investing in coniferous tree plantation
projects in Chile and Uruguay. Thus, it is a very rational choice for Lithuania
to produce BSKP by using softwood available locally on a sustainable basis too
mentioned above, so long as the project can fulfill various conditions (a.
economy, b. environment and c. technology).

6 - 15
4) BHKP
BHKP, made from hardwood, is widely produced all over the world because of
global distribution of broad-leaved trees. Among a variety of species
available, eucalyptus is increasingly planted and used for pulp production
because of various advantages: fast growing under the temperate climate;
excellent pulping characteristics; and suitability for production of various types
of paper.
In Lithuania, both coniferous and broad-leaved forests are growing. The annual
growing volume of both forests reach to the level that exceeds the rate of
consumption for sawmill and firewood purposes.
Among broad-leaved, birch is most widely produced, followed by alder and
aspen. Birch is exported to Nordic countries at a rate of a few hundred
thousand m3 per year and is widely recognized as the good BHKP material.
The mean annual increment (MAI) of these species is less than one fifth of that
of eucalyptus in South America, but the log price of the BHKP material is
governed by a number of factors, including geography, infrastructure and labor
cost. Thus, hardwood materials in Lithuania can competed with those
available in South America if sufficient forest resources are made available.
5) Log supply to the proposed pulp mill
The results of the two field surveys indicate that the available log stock, which
can be most effectively and economically exploited, is estimated at around 2.5
million m3 sub/year (debarked). Of total, softwood accounts for 55% and
hardwood 45%. This supply capacity matches the proposed BKP capacity of
500000 ADt/y.
Based on the above supply capacity, the softwood price for BSKP production
was set at USD26.63/m3 sub or USD141.07/ADt, and the hardwood price for
BHKP production at USD20.36/m3 sub or USD91.32/ADt. These prices are
very attractive and are considered as one of the major economic advantages for
the project, in addition to merit of scale of the proposed BKP mill.

6 - 16
(4) Market, Supply and Demand, and Price Fluctuation
1) Distance from the mill site to the market and transportation requirements
If the mill is located within a relatively short distance from the market,
transportation cost saving allows it to compete with a larger mill that is
remotely located, so long as such cost saving exceeds an increased construction
cost per unit of production (ton) for the smaller mill.
2) Supply and Demand, and Price Fluctuation
Market pulp is an internationally traded commodity which price fluctuates
greatly due to the changes in supply and demand situation. In this study, the
BSKP price is assumed to be at USD640/ADt and the BHKP price at
USD615/ADt by taking into account the prices in the second quarter of 2000
and transportation costs to the European market.
As a larger capacity is more sensitive to the decline in pulp prices, the
proposed mill should be designed to ensure a high level of efficiency to
minimize the production cost.
(5) Allowance for future production increase and capacity expansion
The scale of production should be considered by taking into account possible
production increase and capacity expansion in the future. This must be
clearly addressed before a mill site is acquired, and careful consideration
should be given to industrial water supply and discharge facilities, service
pipes and cables, access to main roads and other non-process facilities and
equipment, as to whether a future expansion plan can be accommodated
6.2.4 Result of Capacity Selection
In consideration of the factors discussed in 6.2.3, conceptual design of the
proposed mill was developed under the assumption that the mill capacity is
500000 ADt/a. In the process, technical study and research was conducted in
due consideration of the fact that a green field BKP mill project will have
significant impacts, both environmentally and economically, on investors and
stakeholders in the area around the mill site. The results of economic and
environmental surveys are reported in separate chapters. In particular, full

6 - 17
environmental consideration is given to the conceptual design, because: ① the
BKP mill is generally considered as a major source of environmental impacts;
② Lithuania has no modern BKP mill and has not produced chemical pulp
for nearly 10 years; and ③ EU environmental standards are expected to be
applied in due course (Lithuania has applied EU membership and times for full
membership about 2004. Realistically, however, the process will most certainly
require a longer time.) .
As a result, the study team proposes a project to build and operate a market
pulp mill which can take advantages of various comparative advantages of the
country and which is widely and feasibly located in an area where raw wood
materials are available in abundant. Major reasons for the capacity selection,
together with other considerations are summarized as follows:
a. At present, the BKP mills, with a single line capacity as of 500000 ADt/a,
will be one of the largest single line in the world.
b. Market pulp production needs to be cost competitive and a larger capacity
offers a significant advantage due to a relatively small percentage of fixed
cost.
c. The field survey to assess log supply capacity indicates that a total of 2.5
million m3/year is feasible. The supply volume matches the total capacity
of 500000 tons as well as the BSKP and BHKP production capacities.
d. To reduce the influence of price fluctuation in the highly volatile pulp
market, it is desirable to build a mill with low production costs.
e. Site and other conditions, including the possibility of future expansion,
should be considered in the mill site selection process.
f. Other conditions required to obtain public acceptance, considering social
and environmental impacts, should be examined.

6 - 18
6.3 Selection and Description of the Production Process
6.3.1 Process Selection
The production process was selected in consideration to the following factors:
(1) The ability to make high quality pulp;
(2) Excellent unit consumption of logs, chemicals and energies;
(3) The adaptability to pollution control measures; and
(4) Incorporation of excellent and field proven technology.
6.3.2 Description of Main Production Processes
(1) Dry debarking
The drum barker is designed to remove barks by utilizing friction of logs in a
large, rotating drum. In this case, as in other modern mill, dry debarking
process will be used.
The dry debarking process consumes water only for log washing and de-icing
purposes. As water can be easily recycled, the effluent is much less (0.5 – 2.5
m3/ton pulp) and thus less water pollutants are discharged, compared to the
older debarking process. Also, bark has less moisture content to improve
energy efficiency of the bark boiler.
In consideration of the above advantages, the project will use the dry debarking
process.
(2) Continuous digester
There are two types of digesters available, continuous and batch. The batch
type has recently been the objective of an subject to an important development
and has various advantages over the continuous type. However, the
continuous type is widely used at large pulp mills.
In consideration of the field proven record of operation, the project will use the
continuous digester.
A continuous digester of larger size uses a two-vessel liquid phase structure
where the cooking liquor impregnation stage is separated from the cooking

6 - 19
stage and the indirect heating method is used. As high pressure impregnation
is carried out in an independent stage separated from the digester, chips are
well impregnated, making them suitable also for cooking of softwood which
requires a longer time for impregnation than hardwood. As for indirect
heating, the digester is filled with the cooking liquor, which is heated by a
feeding and circulating line between the two vessels to allow uniform heat
transfer throughout the digester and produce high quality pulp.
Recently, new continuous cooking methods are used, including MCC
(modified continuous cooking), EMCC (extended modified continuous
cooking) and ITC (iso-thermal cooking). These methods are designed to
ensure uniform cooking so as to perform delignification by minimizing the
yield loss. As a result, reduction of bleaching chemicals and effluent loads as
well as good pulp quality can be achieved. The project will use the ITC
method that has most recently been developed. The method performs
delignification throughout the digester, so that the cooking temperature is
lower than other methods and delignification does not increase steam
consumption or affect the yield, while ensuring pulp strength.
(3) Oxygen delignification
Oxygen delignification is performed to remove lignin left after the cooking
process, without affecting the strength characteristics of the pulp. It is carried
out under the alkali condition and uses the oxidization power of oxygen. The
effluent from the process is recycled to the black liquor recovery system.
As a result, if caustic soda (NaOH) is newly added to the process as alkali, the
amount of sodium recovered from the effluent increases to change the sodium
balance. It is usually avoided by adding oxidized white liquor instead of
caustic soda. Also, magnesium sulfate (MgSO4) is added to keep pulp
strength.
Oxygen delignification is performed in either one or two stages. Naturally,
the two- stage process achieves a higher degree of delignification. As an
increased level of oxygen delignification helps to reduce the consumption of
bleaching chemicals, together with reduced water emission, the project will
employ the two-stage process.

6 - 20
(4) Bleaching sequence
The proposed mill will use the ECF (elemental chlorine free) bleaching process
and minimizes the use of ClO2 (chlorine dioxide) as a bleaching agent, by
using ozone. (The reason is stated later.) At the same time, as the TCF
(totally chlorine free) process is used in various countries including Germany,
design consideration will be given to TCF adaptability.
1) Reason for selection of the ECF bleaching sequence
a. Bleaching cost
Comparison of bleaching costs with or without ozone, as appeared in
various reports and source materials, reveals that the cost is lower when
ozone is used, for both the ECF and TCF processes. It should be noted
that cost figures shown in the source materials vary significantly as different
unit prices of chemicals were used for cost calculation. In particular, unit
prices of on-site chemicals (i.e., ozone and ClO2) vary greatly as some
include capital (equipment) costs and others do not. Therefore, direct
comparison of cost figures in different reports should be avoided.
After cost advantage of ozone is identified, further cost comparison is made
to analyze the use of ozone and its cost impacts. There are many cases of
comparing the ECF costs with or without ozone. On the other hand, there
are few cases of comparing the ECF and TCF costs when ozone is used,
including relative comparison by Metsa Botnia (Table 6.3.1). According
to the table, the TCF cost is approximately 30% higher than the ECF cost
(110/85=1.3; and 100/75=1.3). Furthermore, in both processes, the cost
for hardwood is approximately 10% lower than that for softwood.
Table 6.3.1 Relative Comparison of Bleaching Costs by Metsa Botnia
Softwood Hardwood ECF with ClO2 100 95 ECF with O3 & ClO2 85 75 TCF with H2O2 185 165 TCF with O3 & H2O2 110 100
Sources : Results presented from Metsa Botnia at the 1995 Non Chlorine Bleaching
Conference

6 - 21
Then, comparison is made for the costs with and without ozone. The ECF
cost is 15% - 20% lower when ozone is used (85/100=0.85; 75/95=0.79),
and the TCF cost is 40% lower (110/185=0.59; and 100/165=0.61).
Table 6.3.2 is an essential extract from a table comparing the ECF and TCF
costs, obtained from VALMET, containing sequence and cost data only.
In this table, ozone is denoted as Z, and the top two items represent the ECF
and TCF costs when ozone is used. In this example, the TCF cost is 10%
higher than the ECF cost. Also, the ECF cost with ozone is lower than that
without ozone, and the TCF cost without ozone (TCF-P; P stands for
peroxide) is significantly higher than that with ozone.
Table 6.3.2 Comparison of Bleaching Costs by Sequence
Sequence Cost(USD/ADt) ECF-Z (QZ)(EO)DnD 22.4 TCF-Z (OP)(ZQ)(PO) 24.7 TCF-P (OP)Q(PO) 42.4 ECF-light (OP)(DQ)(PO) 24.3~25.7
Sources:VALMET
In conclusion, the costs for both ECF and TCF decrease when ozone is used.
Comparing the ECF and TCF costs when ozone is used, the latter is 10-30%
higher than the former.
b. Pulp quality
Chlorine and ClO2, particularly the latter, have high selectivity in removing
lignin contained in wood, and they have been indispensable for obtaining
BKP with high brightness and strength. The TCF pulp is bleached without
using chlorine or ClO2, and instead oxygen, hydrogen peroxide or zone is
used. However, oxygen and ozone are much less selective about lignin to
limit the amount of use, while hydrogen peroxide shows a relatively low
delignification effect. As a result, it is difficult to attain high brightness
for the TCF pulp.
Recently, the TCF process has been improved to attain a high level of
brightness equivalent to commercial products (90% ISO) through reduction
of bleaching loads or the improvement of the bleaching method. To
6 - 22
reduce bleaching load, delignification needs to be intensified by lowering
the kappa number through cooking. However, if cooking is continued to a
low kappa number, hemicellulose in wood is removed with lignin because
the cooking process is not as lignin selective as the bleaching process,
leading to loss of pulp yield. This makes the TCF process less favorable.
Also, the excessive use of ozone is said to damage fibers and may adversely
affect pulp strength. Thus, the TCF process is less advantageous from the
viewpoint of pulp quality (brightness and strength).
c. Environmental impacts
As for the COD and BOD emission levels contained in the effluent from the
bleaching process, there is little difference between the ECF and TCF
processes. As for AOX (adsorbable organic halogens), the emission level
from the ECF process is significantly low (<0.3 kg/ADt).
As for recovery of the bleaching effluent, the TCF process is considered to
be advantageous because of its operating principle. However, as the
process uses a large amount of hydrogen peroxide (H2O2), metal elements
affecting its effect (e.g., manganese, iron and copper) must be removed
from process water. This can be accomplished by intensive chelating
treatment or acid wash of pulp, but the chelating agents in use, DTPA and
EDPA, are only slowly biodegradable under normal conditions, but are not
regarded as particularly harmful substances.
In summary, there are, from the environmental point of view, no obvious
reason to select TCF in stead of ECF.
d. Future outlook
The Nordic Countries is the largest producer of the ECF and TCF pulp, but
the majority of makers now prefer the ECF pulp, because the TCF pulp is
more costly despite the little difference in environmental impact. Users in
Germany previously purchased the TCF pulp at premium prices, which
mostly disappeared due to the price decline caused by a supply glut
occurred in the second half of 1995. This is perhaps one of the reasons
why the TCF pulp has lost popularity.

6 - 23
Many industry sources believe that the weak position of the TCF pulp will
not change at least in the next ten years. Nevertheless, as some countries,
such as Germany, still use the TCF pulp, the process needs to be designed
with adaptability to the TCF process.
2) Bleaching sequence selected
Table 6.3.3 shows the ECF bleaching sequence (with ozone) to be employed at
the proposed mill.
Table 6.3.3 ECF Bleaching Sequence Selected for the Project
Species Bleaching sequence Softwood OO(QZ)(PO)DD Hardwood OO(QZ)(EO)D
Note: This bleaching sequence is characterized as the ECF process that
minimizes the cost of ClO2 or H2O2 by adding ozone.
3) Switching from ECF to TCF
If switching to the TCF process is required, various types of sequences are
available. For instance, if the capital cost is to be minimized, the TCF-1
sequence (shown below) is desirable. On the other hand, the TCF-2 sequence
may be preferable for reduction of hydrogen peroxide or improvement of pulp
quality (brightness or strength).
Possible TCF bleaching sequences
TCF-1: OO(QZQ)(PO)P
TCF-2: OOQ (OP)(OZ)(PO)
(5) Use of commercial sodium chlorate (chlorate)
Chlorine dioxide (ClO2) used as a bleaching agent needs to be made on site,
and sodium chlorate (NaClO3) (generally referred to as “chlorate), an essential
agent for the production process may be commercially purchased or made on
site by installing an electrolytic plant using salt. This choice depends on
whether or not chlorate is available at a reasonable price, and in the later case,
on-site production is selected in many cases.
The project will use commercial chlorate for the following reasons.

6 - 24
1) As discussed in the section on bleaching sequence, the project will consume
a relatively small amount of ClO2 compared to the mill size (7.2 tons/day),
due to the use of the ECF process with ozone. As a result, a relatively
small amount of chlorate (11.9 tons/day) will be used.
2) Chlorate can easily be purchased (imported).
3) At present, the ECF process is considered to be suitable for the project.
However, possible switching to the TCF process should be considered. As
the TCF process does not use chlorate at all, the installation of the
electrolytic plant will be wasted if switching occurs. Thus, it is desirable
to use the commercial product in the initial stage, and if switching becomes
inevitable, the final choice should be made by taking into account cost and
other factors.
6.3.3 Pulp Drying
(1) Pulp Dryer and finishing line
The bleached pulp is dewatered in the pulp machine, then dried in the pulp
dryer, cut in sheet form in the cutter-layboy, pressed, wrapped, labeled, and
unitized in the bale handling processes.
Bleached pulp is drawn from bleached high-density storage with consistency
control to the machine chest. The pulp stock in the machine chest is
pumped through a consistency control to suction of the primary fan pump.
The primary fan pump dilutes the pulp stock for screening and cleaning
through a pressure screens and multi-stage centrifugal cleaner system. The
cleaner accept pulp is sent to a pressurized pulp machine head box at 1.0 –
1.5% consistency.
Pulp sheet of approximately 630 – 810 g/m2 is formed in the wire part.
The sheet is press de-watered to dryness of approximately 50% through a
three-stage press section.
Three methods are available to dry pulp; air-borne dryer, flash dryer, and
cylinder dryer. From point of view of quality of dried pulp, heat economy,
and the space requirement, an air-borne dryer with low-pressure steam as heat
source should be chosen.

6 - 25
The pressed sheet enters an air-borne dryer and is dried to dryness of 90%
(moisture 10%). The dried pulp sheet is cut to size in cutter-layboy.
A pulp sheet sample should be taken every half an hour for quality test and
inspection.
The heat of dryer exhaust air is recovered, as hot air (for dryer air supply) and
hot water, by means of air-air heat exchanger and water heater.
The piles of pulp sheet are pressed through a hydraulic bale press, wrapped
with wrapping sheet, which is made of the same pulp, printed of logo,
identifications and specifications, wired, and then unitized to 6- or 8-bale high
units. After the bale press, the finishing line will be split to two lines in order
to handle the planned production capacity.
All these processes of pressing, wrapping, printing, wiring, and unitizing will
be performed automatically by means of PLC (programmable logic controller)
(2) Warehouse
8-high unitized pulp bales will be stored in the warehouse until shipment.
6.3.4 Description of Recovery and Power Processes
(1) Black liquor evaporator
The weak black liquor delivered from digester–brownstock area is stored in the
weak black liquor storage tanks. The solids concentration in the weak black
liquor is expected to be approximately 15%.
The weak black liquor is concentrated by a sextuple effect steam driven
evaporator and a concentrator to a concentration sufficiently high, typically to
75% solids, to sustain efficient and stable combustion in the chemical recovery
boiler.
In the multi-effect evaporator, when softwood black liquor is evaporated, soap
will precipitate at black liquor concentration of approximately 25%. A
soap-skimming vessel will be required at this point.

6 - 26
The steam condensate is returned to the boiler house. The final effect
evaporator vapour is condensed with cooling water. Most of the warm
cooling water return will be used in the pulping process as warm water.
The surplus portion of the warm water is returned to the river.
The condensate from the evaporated black liquor is segregated into two
portions, highly contaminated, and lightly contaminated condensates. The
highly contaminated portion will be steam stripped of its volatile contaminants,
i.e. predominately methanol and reduced forms of sulphur. The strip cleaned
condensate and lightly contaminated condensate will be recycled to the pulping
and causticizing processes as process water. The stripper overhead vapour
will be, after condensing out water, oxidized in an incinerator. The resulting
sulphur dioxide in the incinerator flue gas will be scrubbed in a scrubber using
dilute caustic soda solution and recycled back to the cooking process.
(2) Recovery Boiler
The strong black liquor from the black liquor evaporator/concentrator is burned
in the chemical recovery boiler. The function of recovery boiler is to
reduce various sulphur compounds in the black liquor to sodium sulphide, one
of the essential ingredients for wood cooking, in the furnace bed with
in-sufficient oxygen and high temperature. The remaining inorganic matter
in the black liquor is converted to sodium carbonate.
The sodium sulphide, sodium carbonate, together with various impurities, exit
recovery boiler as a molten mixture of inorganic salts, called smelt, at about
900 °C. The smelt is dissolved in recycled wash water from causticizer
called “weak wash” and turned to cooking liquor(white liquor) through a series
of chemical reaction in causticizer plant and recycled back to digester.
Burning of the organic portion of black liquor generates sufficient heat to
sustain combustion in the recovery boiler and generates steam at high pressure
without supplemental fuel.
The recovery boiler flue gas is cleaned of its solid particles(dust) through an
electro-static precipitator, and scrubbed with dilute caustic soda solution to
scrub-off any remaining sulphur compound gases. The scrubber effluent is
recycled into cooking liquor loop.

6 - 27
The precipitator catch, mainly sodium sulphate particles, is returned to the
recovery boiler furnace together with catch from the ash bunker. The
scrubber effluent is recycled back to the cooking liquor cycle. The scrubbed
and cleaned recovery boiler flue gas is discharged to atmosphere.
The recovery boiler is equipped with natural gas burning facilities. The
natural gas burners will be used only for boiler warming-up at start-ups, and in
case of abnormal operations.
The recovery boiler will have to be equipped with soot blower system using
steam, in order to blow-clean the accumulation of salt cake fine particles on the
boiler tubes
(3) Power boiler
The residue from wood de-barking and wood chip screening processes are,
combined with other organic debris from the pulping process, pulp screen
rejects and sludge from the effluent treatment, burned in the power boiler to
generate steam.
The flue gas from the power boiler is cleaned of its solid particles through an
electro-static precipitator before discharged to atmosphere. The ash from the
power boiler is carried away for landfill.
The power boiler is equipped with natural gas burning facilities. The natural
gas burners will be used mainly for mill start-up time to produce sufficient
steam to generate power by the turbo-generator system. Also natural gas can
be used in case when shortages of steam occur in the pulping process.
(4) Steam
Figure 6.3.1 attached shows the schematic flow of steam in the pulp mill. In
this study, high-pressure steam specification is selected as 11 MPa pressure and
515°C temperature. These figures are rather high in comparison to
conventional Kraft pulp mill. The reason of selecting higher pressure
–temperature for the steam is to generate as much power as possible and;
To run power intensive ozone generator and generate ozone as one of the
bleaching chemicals.

6 - 28
To assure energy self-sufficiency of the pulp mill particularly after the nuclear
power plant de-commission, when the increase of utility power cost is
expected.
- Boiler technology is available.
(5) Turbo-generator
High-pressure steam generated in the chemical recovery boiler and power
boiler is expanded in a steam turbine. The steam turbine generates electric
power through a close-coupled power generator. The steam turbine
discharges steam in two different pressures, one medium-pressure (1200 kPa),
and another low-pressure (300 kPa) steam.
The medium- and low-pressure steam is, after temperature adjustment by
de-super heaters, sent to pulping processes. The medium-pressure steam is used
mostly in digester where a high cooking temperature of 170 °C is required and,
in small quantity, in steam ejector services. The low-pressure steam is used
for pulp dryer, black liquor evaporator, and other miscellaneous heat
consumers.
The electric power generated in the generator is parallel connected with the
utility power, as explained later, and serves as electric power source for the
pulp mill.
(6) Utility power substation and power distribution
The appropriate voltage level of utility power connection for the relatively
small amount of power is 10kV. The utility power transformer, switchgear
and metering station will be installed at the mill fence (territory line). The
utility and self-generated power will be paralleled and distributed throughout
the mill. The voltage levels in the mill will be 13.8kV (at generator), 6kV,
500V, and 220V. Motors equal to, or larger than 150kW should be run by
6kV.
(7) Stand-by power generator
As explained in 6.5.3 (3) “Power balance in pulp mill” section below, a parallel
run of self-generated and utility power is necessary at all time although the
pulp mill will be basically power self-sufficient.
The reliability of utility power is high in Lithuania. In case of mill
turbo-generator trip, the proposed capacity of power contract is sufficient to
6 - 29
keep the essential and hazardous equipment running. To best judgment of the
writer, stand-by power generator is not necessary.
(8) Emergency power generator
An emergency diesel power generator of a few hundred kVA should be
installed in the mill to use in case of total power outage. The diesel fuel
should be drawn from the diesel fuel storage tank for the on-site vehicles.
(9) Air compressor center
Compressed air used for various power sources (mainly in pulp dryer) and for
automatic process controls is generated in the air compressor center by oil-free
air compressors.
The air will be dried through a desiccant type air dryer to a dew point of minus
40 °C and distributed throughout the mill in two pipeline systems, one for
pneumatic power, and another for process controls.
(10) Process Control System
A DCS (distributed control system) network will control the mill processes.
The DCS system will communicate with the mill-wide information system, and
PLC (programmable logic controller) systems through communication links.
Two main control rooms, one in pulping area, and another in power area, will
be provided with sufficient number of operator interface terminals. Other
smaller control centers will be located in dryer wet part, chemical preparation
area, and in wood handling area, and in effluent treatment area.
Entire DCS system will be tied to a common data highway so that any control
station can monitor any part of the mill.
For security of the operation, appropriate redundancies, including UPS
(un-interruptible power supply), should be built-in in the system.
(11) Mill-wide Information system
Mill-wide information system will obtain process raw data from DCS system
and monitor, compute, and display mill management data. Also the systems
function includes;
- Material in/out monitoring and documentations
- Wood, chemicals, fuel, power

6 - 30
- Purchase order and production schedule controls
- Maintenance scheduling and spare parts controls
- Warehouse control
- Woodyard control
- Intermediate storage control
- Bale handling and identifications.
- Effluent and emission monitoring

FIgure 6.3.1 Pulp Mill Steam Flow Schematic
Soot Blower Steam
RecoveryBoiler
PowerBoiler
PowerGenerator
TurbineBypass
TurbineBypass
Desuper-Heater
Desuper-Heater
SteamTurbine
Medium-Pressure Steam
to Process
Low-PressureSteam toProcess
High-Pressure Steam Header
Extraction
Exhaust

6 - 32
6.3.5 Common Service Systems
(1) Process water
1) Mill water intake and treatment
Figure 6.3.2 is the outline diagram of water flow through the pulp mill.
Three mill water intake pumps are assumed. Each pump has capacity of half
of the mill water requirement. In normal operation, two pumps are run with
the third one being stand-by.
The river system in Lithuania appears to have rather high hardness (150 to 200
mg/L as CaCO3). The mill water should be softened to less than 100 mg/L
(as CaCO3) hardness by one of the chemical softening processes such as cold
lime softening process. In the cold lime softening process, the calcium
causing hardness (mainly in form of water soluble calcium bicarbonate) is
precipitated in form of calcium carbonate and calcium sulphate, using quick
lime and sulphuric acid. The small amount of lime for this purpose can be
diverted from the limekiln and sulphuric acid from the chlorine dioxide
generation plant.
The suspended solids in water, both coming from the water source and from
the softening process, are precipitated in the mill water clarifier and filtered-out
through a system of sand-filters. To accelerate the precipitation, coagulation
reagents, polymer, alum, caustic soda etc. will be used here as required.
Necessity of further treatment processes for metal ions or silica should be
determined after the mill-site and water source selections are finalized and
detailed analysis of the water becomes available.
Clarified and filtered water is stored in the mill water reservoir. Sand filter
backwash water and the clarifier under-flow sludge are returned to the river.
The mill water reservoir is the source of mill process water, cooling water, and
fire fighting water. The mill water and cooling water pump suctions will be
installed higher than the fire fighting water pump suction so that a certain
amount of water is always reserved for fire fighting.
The mill water pumps supply mill water, and the cooling water pumps supply
cooling water.

6 - 33
2) Boiler feed water treatment
Mill water is used as source of boiler feed water.
Boiler feed water should be treated by anion and cation exchange resin beds.
The recovered condensate from the pulping process should also be polished by
ion exchange beds. The ion exchange beds are regenerated using caustic soda
and hydrochloric acid.
The boiler feed water is further treated by oxygen scavenger, and other
treatment chemicals as required.
3) Potable water
Potable water will be taken from municipal water supply.

6 - 34
Figure 6.3.2 Pulp Mill Water Flow Diagram
River
1106
789
70 87 160
320
44
469
33
Sludge79
10
511
River
1050
Scale 1000 L/sec
Pond Evaporation
Warm Water
Chips &Chemicals
MiscellaneousEvaporations
Stacks
Mill waterTreatment
SurfaceCondenser
PulpingProcess
EffluentTreatment
Bac
k-w
ash
& S
ludg
e
BoilerFeedwater
Miccellaneous Coolers
6 - 35
(2) Effluent Treatment Facilities
1) Process description
The proposed effluent treatment plant is shown by a simplified flow sheet in
Figure 6.4.2. The process is basically a biological treatment plant, based on
low-loaded activated sludge, and with appropriate pre-treatment stages.
- Primary clarification, for the removal of fibres and other suspended solids,
is carried out in a circular settling basin.
- Equalization pond, for equalizing variations in the effluent flow and
composition.
- Spill pond, for the temporary collection of liquor spills and other highly
contaminated effluents, and the subsequent bleeding into the treatment
plant.
- Pretreatment by cooling in a cooling tower. This is required, as the effluent
is expected to hold a temperature above 40 oC, which is not suitable for the
biological process.
- Pretreatment by neutralization (pH control). The effluent is expected to be
below the optimal pH range of 6.5 – 8, and pH control with lime is
anticipated.
- Pretreatment by nutrient dosage. The content of phosphorus and nitrogen
compounds in the effluent is expected to be not sufficient for the biological
process. Chemicals like phosphoric acid (for P) and urea (for N) will have
to be added.
- Biological (secondary) treatment in a low-loaded activated sludge plant.
The main units of this plant are the Aeration Basin, incl. a selector basin
(for improving sludge quality), and the Secondary Clarifiers for sludge
removal. The removed biological sludge (biosludge) will be mainly
recycled to the aeration, to keep a high sludge concentration in the plant.
- Sludge handling, i.e. dewatering of the mixed fibre (primary) sludge and
excess biological (secondary) sludge, to reach a high solids content, suitable
for a subsequent incineration.
The sludge dewatering will include a separate pre-thickener for excess
biosludge, a sludge mix tank for the fibre/biosludge and dewatering equipment
in the form of a belt filter press (optionally: a screw press). The press will be
integrated with a pre-dewatering stage for the mixed sludge.

6 - 36
6.4 Outline of Mill Facilities and Equipment
In this section, major facilities and equipment of the proposed pulp mill are
summarized in the order of: (1) major production facilities and equipment; (2)
major utilities; (3) effluent treatment system; and (4) other auxiliary facilities and
equipment. Then, all the facilities and equipment are shown in (5) general flow
sheet.
Note that general profiles of mill facilities and equipment shown here are based
on major features, capacities, unit consumption, efficiency and other parameters
of production processes described in Chapter 6. Section 3. Proposed production
capacities and operation plan are shown in Table 6.4.1
Table 6.4.1 Production Capacities and Operation Plan
Unit BSKP BHKP Total,(Av.) Operation of the mill d/a 188 152 340 Production rate 1.00 1.20 - Daily average production ADt/d 1350 1620 (1471) Annual production ADt/a 254257 245743 500000
(same to Table 6.2.1)
These data also form the basis of estimating the mill construction and pulp
production costs.
Yet, the facility and equipment data shown here are preliminary in nature, as
determined under various assumptions made by the study team and relevant local
conditions obtained through the field surveys. For a formal mill construction
project, if decided, feasibility study should therefore be carried out, followed by
preliminary design to reflect detailed analysis of updated data and information.
The data and information presented in this study can be used as a vital guide at
the project implementation stage.

6 - 37
6.4.1 Major Production Facilities and Equipment
(1) Wood handling facilities
- To remove barks and contaminants from logs, which would affect pulp
quality, in order to produce chips of uniform size for the subsequent pulping
process.
- The mill is designed to process logs, both hardwood and softwood, their
receiving, storage, debarking, chipping and handling systems.
- Anti-freeze measures are required for the winter.
- Barks and wood wastes generated from the process will be burned in the
bark boiler.
- Wood supply conditions and consumption are summarized in Table 6.4.2.
Table 6.4.2 Wood Supply Conditions and Consumption
Unit BSKP BHKP Total,(Av.) Wood species Spruce, etc Birch, etc Wood density Kg/ m3 sub 405 427 (415) Unit wood consumption m3 sub /ADt 5.30 4.48 (4.90) Wood supply ratio % 55.0 45.0 100.0 Daily wood consumption m3 sub /d 7152 7266 (7203) Annual wood consumption m3 sub /a 1346939 1102041 2448980
(same to Table 6.2.2)
1) Wood receiving
* Truck scale (40 tons) : 2 sets
* Grapple truck : 4 sets
2) Wood storage yard
* Storage capacity : 30 days
* Area (34000m2 x 5) : 1700000 m2
3) Debarking and chipping
In the Nordic Countries, logs are de-iced before debarking during the winter.
The same practice will be followed in this project.
System configuration
* Drum barker : 2 sets
* Chipper (310 sub m3/h/set) : 2 sets

6 - 38
* Chip storageyard
Storage capacity : 5 days
Area (5000m2 x 4) : 20000 m2
* Chip screen system : 1 set
(2) Pulping and Bleaching
1) Cooking facilities: one line
a. In the cooking process, wood chips received from the wood handling
process are mixed with the cooking liquor and are sent to the digester
for pulping.
b. Wood chips, after the preheating and deairing process, are impregnated
and cooked.
c. The white liquor, used for cooking, is primarily composed of caustic
soda (NaOH) and sodium sulphide (Na2S).
d. Selection of the continuous digester was discussed in 6.3.2 (2).
e. Specifications of the digester
* Type: Continuous digester, 2 vessel liquid phase type,
* Cooking system : ITC (Iso-thermal cooking)
* Nominal design capacity : USKP 1625 ADt/d, UHKP 1950 ADt/d
* Digester dimensions : 9.2mφx60mH (Approx.2500m3)
2) Washing system: one line
a. A mixture of pulp and the black liquor (the effluent from the cooking
process, containing organic matters such as lignin as well as inorganic
compounds) discharged from the digester is washed and separated.
The washed pulp is sent to the UKP screening process, while the black
liquor is sent to the evaporator through the weak black liquor tank).
b. System configuration
* Pressure diffuser washer : 1 set
* High density tower : 3000m3 x 1 set
3) UKP screening system: one line
a. Knots and contaminants contained in the pulp after the washing process
are separated and removed.
b. System configuration

6 - 39
* Knot separation system : 3 sets
(Knotter, knot washer and sand separator)
* UKP screening system : 3 sets
1 – 3 stage pressure screen
Reject refiner
* UKP washer : 1 set
4) Oxygen delignification system: one line
a. As discussed in 6.3.2 (3), oxygen delignification will be carried out in
two stages. Two treatment methods are available, medium consistency
system (10-15%) and high consistency system (25-30%). The former
is employed for the project on account of lower capital cost and better
reactivity.
b. System configuration
* Two-stage O2 reactor : 1 set
5mφ x 31.9mH (507m3) x 2
* Two-stage washing : 1 set
9.2mφ diffuser + wash press (1.5mφ x 6mL)
5) Bleaching system: one line
a. As the unbleached pulp still contains lignin and other colored materials
after the cooking and oxygen delignification processes, bleaching is
required to obtain pulp of high brightness. The kraft pulp process
usually uses a multistage bleaching system that adds various chemicals
in several stages, because high quality pulp (in terms of brightness
and/or strength) can be obtained at low cost.
b. The bleaching sequence is the ECF process using ozone. The
background for selection is discussed in 6.3.2 (4).
c. Kappa numbers at the entrance to the bleaching process (or at the exit
from the oxygen delignification process) are targeted at 12 for BSKP
and 1 for BHKP.
Note): The kappa number is one measure of the degree of cooking and a
smaller number means a higher level of delignification.
d. The target brightness is 89% ISO.
e. The medium consistency system (around 10%) is used.
f. System configuration

6 - 40
* Multistage bleaching system (mixer, bleaching tower, washer): 1set
* BKP high density tower
For BSKP : 3000 m3
For BHKP : 3000 m3
(3) Pulp drying
1) BKP screening system: one line
a. The system is designed to remove contaminants in the bleached pulp and
consists of pressure screens, cleaners to remove heavy weight contaminants
and light weight contaminants.
b. System configuration
* Pressure screen : 3 sets
* Heavy weight contaminant cleaner: 3 sets
* Light weight contaminant cleaner : 3 sets
2) Pulp Dryer: one line
* Speed : 250 m/min as design, 171 m/min operation
* Trim width : 9600 mm
* Basis weight range : 850 g/m2 normal
* Sheet moisture
At dryer entrance : 50%
At dryer outlet : 10%
* Wire part : Fourdrinier type
* Press part : Three-press
* Dryer type : Steam heated air-borne dryer
Including sheet cooler section.
* Cutter-Layboy
Sheet size : 690 x 820 mm, 14 cut
* Auxiliary
Dryer exhaust heat recovery system.
Vacuum system.
3) Hydraulic bale press
* Quantity : Two
* Capacity : 1700 ton

6 - 41
4) Finishing line
* Quantity : Two lines
* Function : Bale wrapping
Bale tying
Bale printing
8-unit unitizing
(4) Chemical Preparation System
1) Causticizing facilities: one line
a. When the black liquor is burned in the recovery boiler, lignin and other
organic components contained in the liquor contribute to steam
generation, whereas inorganic components generate smelt (mainly
composed of caustic soda and sodium sulphide).
b. In the causticizing process, the smelt is dissolved in the weak liquor
(supernatant liquor obtained from cleaning of dregs) to form the green
liquor, form which dregs are separated and removed. Then, sodium
carbonate (Na2CO3) contained in the remaining green liquor reacts with
lime milk (Ca(OH)2) generated from calcined lime (CaO) to produce
caustic soda(NaOH). As a result, the white liquor primarily composed
of caustic soda and sodium sulphide(Na2S) is obtained and used as a
cooking chemical.
c. Separation of dregs from the green liquor and removal of lime mud from
the white liquor are performed by clarifiers. For treatment of the white
liquor, a disc type clarifier is used to prevent loss of the chemicals.
The green liquor dregs are handled as a solids waste, and send to landfil.
The lime mud is burned in the lime kiln(see below).
d. System configuration
* Green liquor clarifier : 1 set
* Dregs filter : 1 set
Precoat type, 4.5mφ x 80mL (112m2)
* White liquor clarifer
Disc type, 6500m3 (white liquor)
* Lime mud washer : 1 set
32.2mφ x 10.0mH (4,140m3)
* Sludge filter : 1 set

6 - 42
Precoat type, 4.5mφ x 8.0mL
2) Lime kiln facilities:one line
a. The lime kiln burnes the lime mud (mainly composed of CaCO3)
separated from the white liquor clarifier.
b. Natural gas (no sulphur content) is used as the fuel for the lime kiln (at a
rate of 70600m3/day) in order to minimize the emission of SO2 gas.
Also, an electrostatic precipitator is used to remove particulate contained
in the flue gas from the kiln.
c. System configuration
* Lime kiln : 1 set
Long rotary kiln, 3.6mφ x 106mL, 510 CaOt/d
* Natural gas firing equipment: 1 set
* Lime mud feeding equipment: 1 set
* Electrostatic precipitator : 1 set
3) Bleaching chemical preparation facilities
a. The bleaching chemicals are roughly divided into purchased chemicals
and on-site generation chemicals, which type, application and average
consumption (t/d) are listed in Table 6.4.3.
b. According to the table, sulfuric acid (H2SO4) accounts for major
portions of the purchased chemicals. It is used in the bleaching process
as well as for generation of ClO2.
c. Caustic soda (NaOH) is used in the bleaching process and for SO2
scrubbing of the emission from the recovery boiler. Consumption for
the latter purpose (0.5t/d) is not included in the table.
d. Among on-site generation chemicals, about a half of oxygen
consumption is primarily used for generation of ozone.
e. ClO2 is generated by the R8 method that does not generate chlorine as a
by-product.
f. Chemicals used for ClO2 generation (R8 method) are sodium chlorate
(NaClO3), sulfuric acid, methanol (CH3OH) and salt (NaCl).
g. General description of bleaching chemical preparation facilities and
equipment
* For each of the purchased chemicals, receiving and charging
facilities are provided.

6 - 43
* For the on-site generation chemicals, the following equipment is
provided:
① Oxygen and ozone: Chemical generation and charging
② ClO2: Generation and charging system (R8 method)
③ Oxidized white liquor (OWL): Oxidization and charging system
Table 6.4.3 List of Bleaching Chemicals
Chemical Use of chemicals Av.Consumption (t/d as 100%)
Purchased chemicals
NaOH H2O2 H2SO4 DTPA MgSO4 NaClO3 NaCl CH3OH
Bleaching ditto ditto ,ClO2 generation Bleaching ditto ClO2 generation ditto ditto
17.0 2.2
44.7 1.5 3.0
11.9 0.2 1.1
On site generation chemicals
Oxygen Ozone ClO2 OWL(Oxidized white liquor)
O2 delignification , Ozone generation Bleaching ditto O2 delignification
53.7
10.3 7.2
25.7
6.4.2 Major Utilities
(1) Recovery and Power
1) Black liquor evaporator/concentrator
Quantity : One
Evaporator type : Sextuple effect, steam driven, falling-film type
evaporator.
Concentrator type : Forced circulation crystallizer concentrator
Evaporative capacity : 15,400 t/d H2O
Input black liquor : 15% solids, 60 °C
Output black liquor : 75% solids
Steam supply : 300 kPa(g), 150 °C
2) Recovery Boiler
Quantity : One
Type : Tomlinson type.
Capacity : 3,100 t/d solids

6 - 44
Steam condition : 11 MPa(g), 515 °C
Auxiliary fuel : Natural gas
Auxiliaries : Feed water deaerator
(3)-Motor driven feed water pumps
Electro-static precipitator
Flue gas SO2 scrubber
Economizer
Flue gas-air heater
Steam air heater
Soot blower
3) Power boiler
Quantity : One
Steam generating capacity
Wood waste only : 80 t/h
With auxiliary fuel : 110 t/h
Steam condition : 11 MPa(g), 515 °C
Auxiliaries : Feed water deaerator
(3)-Motor driven feed water pumps
Electro-static precipitator
Economizer
Flue gas air heater
Soot blower
4) Steam turbine
Quantity : One
Type : Extraction-back pressure turbine
Capacity : 60 MW
Inlet steam : 11 MPa(g), 515 °C
Extraction steam : 1200 kPa(g)
Exhaust steam : 300 kPa(g)
5) Power generator
Quantity : One
Capacity : 70 MVA
Coupling : Direct coupled to steam turbine

6 - 45
Voltage : 13.8 kV
Cycle : 50 Hz
6) Emergency diesel power generator
Quantity : One
Capacity : 200 kVA
(2) Water intake and water treatment facilities
Water intake and water treatment facilities are designed based on the water
consumption of proposed BKP mill as of 1.1 m3/sec(=65m3/ADt), shown in the
“Figure 6.3.2 Pulp Mill Water Diagram”.
1) Raw water intake
a. Intake weir or bank: 1unit
b. Intake pump: Flow rate – 0.72m3/sec x head 50m x motor capacity 475kW
x 3 units (one standby unit)
c. Pipeline: Inner diameter 1000mm x 1500mL (flow rate – 2m/sec)
2) Water treatment plant
a. Grid chamber: 10m (W) x 80m(L) x 5.5m(D) x 2 units
b. Mixing tank: 6m(W) x 6m(L) x 4.5m(D) x 2 units
c. Coagulation tank: 22m(W) x 15m(L) x 4.0m(D) x 2 units
d. Settlement tank: 22m(W) x 56m(L) x 5.0m(D) x 2 units (2 sludge
scrapers/unit)
e. Chemical charger: 1 set
f. Rapid sand filtration system: 8m(W) x 25m(L) x 5.0m(D) x 2 units
3) Mill water supply system
a. Water tank: 30m(W) x 60m(L) x 4.0m(D) x 1 unit
b. Pump: Flow rate – 0.72m3/sec x head 35m x motor capacity 320kW x 3
units (one standby unit)
c. Piping: One set

6 - 46
Simplified data of raw water condition and consumption in this country are
shown in Annex6.2, Table 1“Water Quality of Selected Rivers in Lithuania”
and Table 2 “Water Consumption in Lithuania”
6.4.3 Effluent Treatment Plant design
A summary of basic design data is given below.
(1) Design data
1) Effluent flow a1. calculated 44000 m3/d
a2. calculated 1850 m3/h
b1. design 50000 m3/d
b2. design 2100 m3/h
2) COD a. calculated 49 t/d
a. design 54 t/d
3) BOD a. calculated 17.5 t/d
b. design 20 t/d
(2) Primary clarifier: One
1) Surface load, design 0.8 m3/m2, h
2) Area 2600 m2
3) Clarifier, diam. 58 m
(3) Neutralization basin: One
1) Retention time, design 10 min
2) Volume 350 m3
(4) Equalization basin: One
1) Earthen pond, sloping walls
2) Retention time, design 12 h
3) Volume 25000 m3
4) Dim. D * W * L 4 * 66 * 110 m e.g.
(5) Spill pond: One
1) 12 h Earthen pond, sloping walls

6 - 47
2) Volume 25 000 m3
3) Dim. D * W * L 4 * 66 * 110 m e.g.
(6) Activated sludge plant: One
1) Aeration basin
a. Concrete basin
b. Volume, total 42000 m3
c. Retention time 20 h
d. COD load 1.3 kg/m3, d
e. BOD load 0.48 kg/m3, d
f. Dim. D * W * L 8 * 60 * 90 m e.g.
2) Selector basin
Part of the Aeration basin
a. Volume 3500 m3
b. Retention time design 1.7 h
3) Aeration
a. Oxygenation capacity approx 1700 kg O2/h
(at standard conditions)
(7) Secondary clarifiers: Two
a. Surface load, design 0.6 m3/m2, h
b. Area Total 3500 m2
c. Clarifiers, diam 48 m
(8) Sludge dewatering: One
1) Design data
a. Sludge amounts, calc.
* Fibre 9.5 t DS/d
* Biological 6.5 t DS/d
* Total 16 t DS/d
* Sludge amounts, design
* Fibre 16 t DS/d
* Biological 8 t DS/d
* Total 24 t DS/d
2) Sludge thickener
a. for Biological sludge, diam. 20 m

6 - 48
b. concrete basin one (1) unit
3) Sludge tank
a. for mixed sludge, volume 300 m3
b. concrete basin one (1) unit
4) Sludge dewatering
a. capacity 1200 kg DS/h
b. belt press or screw press with pre-dewatering unit :one (1)unit
6.4.4 Auxiliary Facilities and Equipment
(1) Auxiliary facilities
1) Administration building: 2000m2, one storey, with a standard set of
equipment and fixture
2) Laboratory: 300m2, two storeys, with a standard set of equipment and
fixture
3) Maintenance workshop; 1200m2, one storey, with a standard set of
equipment and fixture
4) Warehouse: 1200m2, one storey, with a standard set of equipment and
fixture
5) Canteen: 2400m2, one storey, with a standard set of equipment and fixture
6) Training facility: 1250m2, one storey, with a standard set of equipment and
fixture
7) Clinic: 750m2, one storey, with a standard set of equipment and fixture
8) Others:
(2) Auxiliary equipment
1) General: As required
2) Fire prevention/fighting: As required
3) Roads: Access road (1000m) and site roads
4) Rail track: Industrial track (2000m) connected to the primary line, and yard
tracks
5) Fences and outlying structures: 5000m plus gates and other structures as
required
6) Piping support: As required
7) Underground piping:

6 - 49
a. Water intake pipeline between the intake reservoir and the water
treatment plant at the mill (1500m)
b. Effluent discharge line between the effluent treatment plant and the
discharge point (2500m)
c. Piping within the mill site: As required
8) Exterior lighting: As required
9) Telephone and telecommunication systems: As required
10)Lightning conductor and grounding system: As required
11)Power transmission and receiving systems: a branch line from the power
company’s 110kV line, transformation to 13.8kV, a substation within the
mill site, and switch gears and other receiving equipment: Cost sharing will
be negotiated separately
12)Natural gas receiving system: 25 million m3 per year from the gas company:
As required (Cost sharing will be negotiated separately)
6.4.5 Process Flow Diagrams
(1) General flow
Figure 6.4.1 shows a block diagram showing the general configuration and
process flow at the BKP mill, including major production processes, power and
utilities systems, water intake and treatment plant and effluent treatment plant.
(2) Process flow sheet
The major equipment of the BKP mill and principal interconnections of them
are shown in“Figure 6.4.2 General Flow Sheet”.
As there are generally several options for the process flow and equipment, the
flow sheet shown here is considered to be an example.
Because technological innovation and development is underway in all areas of
the process flow, the flow sheet will be subject to various changes in details at
the stage of project implementation. Nevertheless, the general process flow
for the proposed BKP mill as a whole will likely be maintained.

6 - 50
(3) Evaporator flow diagram
Figure 6.4.3 shows the general process flow of the black liquor concentration
system, which works under a relatively simple operating principle but is fairly
large in scale. The process flow is shown here for two purposes: (a) to
present the process flow of this section, which is only roughly shown in the
general flow sheet; and (b) to shed a spot light on a major water consuming
area where the bulk of cooling water is used to condense steam evaporated in
the final stage.
(4) Water balance within the pulp mill
Figure 6.4.4 shows the water balance within the entire pulp mill. This
represents a detailed view of “the pulping process” that is shown as part of the
mill water flow diagram in Figure 6.3.2, which explains importance of water at
the BKP mill and water balance.
Note that the amount of process effluent discharge is estimated at 27 –
30m3/ADt. These figures are feasible and have to be targeted at a stage of the
engineering of proposed BKP mill.
As the increase in process water consumption leads to the increases in
production and effluent treatment costs, and may give increased pollution loads,
proper control measures should be considered in the process and equipment
selection process, followed by their design.
Generally, the increased recycling of effluent from the pulp bleaching-leading
to a closed cycle process – would result in the accumulation of foreign matters
within the closed system and require additional costs to control or clean them.
Thus, the development of the closed cycle should be progressed by addressing
these problems step by step.


Figure 6.4.3 Evaoporator flow diagram (Lithuania Pulp Mill Project BSKP & BHKP 500000 ADt/a) Cooling Water
to NCG treatment
Steam Ejecter
BC
LF from 2-6EDF
4EF 5EF
L.P. Steam from SC
from Pulping Process Oxidat. Mixer Air
to Boiler Feed from Pulping Process
Water Tank to Recovery Boiler
Strong Black Weak Black
Drain Liquor Tank Liquor Tank Tank
Black Liquor to Pulping & Causticizing Process
Condensete from B.L.Vapor
Condensate from Steam
Steam and B.L. Vapor
Flash SteamCooling Water
2731341
Unit:kg/hM.P.Steam
3216
19267097 4365
123697 432939 200145 4422425841 195780 SC
4422 from 3EDF 86382
68462 2796 225696 97651
67615 79376 81913261700 341076 422989
1E(A) 1E(B) 1E(C) 2E 3E 4E
194085
5E 6E
845
125623 261700 109398
194085 341076 237443
15607 185545 7023
15087 6503 7543
94293
4292
1301 393298 79466
101901
94293 21070 15542
43440 35766Steam 618484
80571 123697 Strip. 79206 Low Load High Load Oxidized
Condensate Condensate W.B. Liquor
Tank Tank Tank
out
Discription kg/h Discription kg/h
15607
94293 562765
in
W.B.Liquor 618484S.B.Liquor 123697
H.L.Cond. 43440 Cnt. Water 562765
M.P.Steam 3216 Steam Drain 0
L.P.Steam 101901 Steam Drain 80571
Cool Water 2731341 Warm Water 2731341
Miscellaneous 0 Miscellaneous 7
Total 3498381 Total 3498381

Unit:[m3/ADt]
Proceess Effluent 27~30m3/ADt0.2 Chemicals 0.5
10.0
L.P.Steam 4.0 7.0 2.1 1.00.1 H.P.Steam 1.5 0.0 4.9 0.3
4.0
2.20.1
0.5 4.1 3.7 9.0 0.0 0.7 0.6 11.4 8.0 2.1 Barks & Fines
1.70.7
0.00.6 Notes
: Water in Wood and Pulp0.0 3.7 8.3 0.5 : Process Water and Effluent
Chemicals 0.07 : White, Black and Green Liquor 1.1 : Steam & Condensate1.4 etc. : Chemicals
0.3 : Vapor and Flue Gas1.4 2.8
0.64.2
4.5 5.7 48.5 0.00.5 for C.W. 9.7 to Solids Waste Treatment Plantt
for S.W. 1.0 to River for etc. 3.0 to River
1.0from Water Resources
MPS 1.6 0.1 Origin Carrier LPS 4.1 0.1 Wood Products
Chemical EvaporationMill Water Flue Gas
Effluewnt(clean) Effluewnt(cont.)
m3/ADt vs L/sec conversion coefficient=1471/24/3600*1000=
Figure 6.4.4 Water balance within the pulp mill
2.7 21.0
(with ECF : ZQ-PO-D-D Sequence)
Wood
& Chipping Screening, O2 Delign.
1.4 7.6
Debarking Digester, Washing 2.2 Bleaching 6.7
Lime Kiln 8 bodys/6 effects Preparation
46.3
Causticizing Evaporators 46.325.3
Stripper
3.023.7
Recovery Boiler Boiler Feed 1.5 0.6 Effluent Water Water Treatment Treatment
Power Boiler Fresh Water
Turbine Generator In Out
26.7Treatment 36.1
m3/ADt L/sec m3/ADt L/sec2.68 46 0.10 20.07 1 1.00 17
62.21 1059 1.08 180 36.07 6140 26.70 455
Total 64.95 1106 Total
BKP
64.95 110617.03
62.2
62.8
Bleac. Chemi.
Drying

6 - 57
6.5 Unit Consumption
6.5.1 Unit Consumption of Materials and Sub-Materials
(1) Pulpwood logs
Table 6.5.1 shows unit consumption and cost of pulpwood logs.
Table 6.5.1 Unit Consumption and Cost of Pulpwood Logs
Unit price (USD/sub m3)
Unit consumption (sub m3/ADt)
Unit cost (USD/ADt)
BSKP 26.63 5.30 141.07 BHKP 20.36 4.48 91.32
The unit consumption value of 5.30 for BSKP is based on the 55:45
consumption ratio of spruce and pine, and 4.48 for BHKP is obtained from the
ratio of Alder 36%, Aspen 18% and Birch 46%.
The unit cost of BSKP, estimated from the unit price of pulpwood logs and the
above unit consumption data, is USD141.07/ADt, and that of BHKP
USD91.32/ADt. Thus, the log cost for BSKP is approximately 50% higher
than that for BHKP.
(2) Chemicals
Table 6.5.2 shows unit consumption and cost of chemicals. From this table,
the following findings are made.
a. The cost for bleaching chemicals including oxygen delignification is
USD20.22/ADt for BSKP and USD15.48/ADt for BHKP. Thus, the
former is 30% higher than the latter.
b. The total cost for chemicals, including calcined lime for the lime kiln,
caustic soda for the SO2 scrubber, and chemicals for effluent treatment,
USD21.96/ADt for BSKP and USD17.22/ADt for BHKP.
c. Sodium sulphide (Na2SO3) generated as a result of SO2 recovery from the
scrubber is used as a supplemental chemical for sodium and sulphur.

6 - 58
Table 6.5.2 Unit Consumption and Cost of Chemicals
BSKP BHKP
Unit price (USD/t)
Unit consumption
(kg/ADt)
Unit cost (USD/ADt)
Unit consumption
(kg/ADt)
Unit cost (kg/ADt)
(Blea.Chem.) NaOH Oxygen H2O2 H2SO4 DTPA Ozone OWL MgSO4 Sub total
280 80
1000 90
1580 200 40
500
15 20 3 25 1 7 15 4
4.20 1.60 3.00 2.25 1.58 1.40 0.60 2.00
16.63
8
18 0
25 1 7
20 0
2.24 1.44 0 2.25 1.58 1.40 0.80 0 9.71
(Act.Cl) NaClO3 NaCl H2SO4 CH3OH Sub total
475 95 90
350
6.3 0.1 4.2 0.6
2.99 0.01 0.38 0.21 3.59
10.1
0.2 6.7 1.0
4.80 0.02 0.60 0.35 5.77
Total 20.22 15.48 (Lime kiln) CaO
50
5.5
0.28
5.5
0.28
(SO2 scrubber) NaOH
280
0.34
0.10
0.34
0.10
Total(chemical) 20.60 15.86 Water Treatment Effluent Treatment Urea H3PO CaO Polyelectrolyte
170 320 50
3780
0.61 0.08 2.38 0.03
1.00
0.10 0.03 0.12 0.11 0.36
0.61 0.08 2.38 0.03
1.00 0.10 0.03 0.12 0.11 0.36
Grand total 21.96 17.22
(3) Fuel for the lime kiln
Natural gas (no sulfur content) is used as the fuel for the lime kiln. Table
6.5.3 shows unit consumption and cost of natural gas.
Table 6.5.3 Unit Consumption and Cost of the Fuel for the Lime Kiln
Unit price (USD/m3)
Unit consumption (m3/ADt)
Unit cost (USD/ADt)
Natural gas 0.086 48 4.13

6 - 59
(4) Product packaging materials and other proportional costs
The costs for packaging materials, including steel wire and wire cloth for the
pulp machine, are summarized in Table 6.5.4. The total cost is assumed to be
USD2.50/ADt.
Table 6.5.4 Unit Consumption and Cost of Packaging Materials
Unit price (USD/kg)
Unit consumption (kg/ADt)
Unit cost (USD/ADt)
Steel wire(2.18mm) 0.82 1.94 1.59 Wire cloth 0.90 Others 0.01 Total 2.50
6.5.2 Supply Methods and Conditions for Materials and Sub-materials
(1) Logs
1) Supply method
Pulpwood logs are cut into specific length in a logging area, with barks and are
transported by trucks and rail freight cars to the mill site directly or via an
intermediate wood yard. In the case of truck transport, logs are measured on a
truck scale at the service gate of the mill. Logs carried by rail are transferred
to road vehicles on the yard track. They are delivered to mill wood yards
according to specifies and unloaded by grabble tracks for storage.
2) Supply conditions
The pulp production process produces BSKP using softwood (spruce and pine)
and BHKP using hardwood (Birch, Alder and Aspen) in an alternate cycle.
The log supply plan should therefore be established in line with the alternative
production schedule, allowing direct delivery of logs to the conveyor system.
(2) Chemicals
1) Supply method
Most chemicals used by the pulp mill are transported by trucks or railways
(plus maritime transport) from foreign countries and are delivered to receiving
and storage facilities within the mill site.

6 - 60
2) Supply conditions
General conditions are as follows.
a. Solid matters, such as chlorate (NaClO3), magnesium sulfate (MgSO4) and
chelate (DTPA) are packaged according to specifications and are loaded to
containers (10 – 20 tons) for transportation and delivery.
b. Liquids such as sulfuric acid (H2SO4), caustic soda (NaOH), hydrogen
peroxide (H2O2) and methanol (CH3OH) are transported by trucks or rail.
c. Gases, if necessary, are delivered in special cylinders or tank cars.
6.5.3 Required Utilities and Unit Consumption
(1) Heat requirement of pulp mill
The departmental unit consumption of heat in the pulp mill is shown in Figure
6.5.1.
The proposed pulp mill is basically heat self-sufficient as will be explained in
the next section. The only use of fossil fuel in the pulp mill will be at the lime
kiln, which requires temperature of over 800 °C, and at recovery and power
boilers as start-up and auxiliary fuel only.
(2) Cost of fuel
The choice of fossil fuel is natural gas from the cost, equipment, and
environmental point of view. The natural gas will be taken from the adjacent
pipeline. The gas distribution company (Lithuanian Gas) will install the
necessary pipeline extension to the mill site, metering station, and, if necessary,
pressure reducing station(s) at their cost. The cost of natural gas, at the
time this report is written, is 343 Litas (USD85.8) /1000m3. This price does
not include 18% VAT. One m3 of gas contains 8000kCal (33500MJ) of heat
value in low-heat-value unit.
Assuming the number and duration of major and minor shut-downs of the pulp
mill, the natural gas consumption and the cost to produce one AD ton of pulp,
not including consumption in the lime kiln, is as follows;
Peak consumption; 35000 m3/h
Annual consumption; 1245000 m3/a

6 - 61
Cost of natural gas; Softwood cooking Hardwood cooking
USD 0.23/ADt USD 0.19/ADt
(3) Power requirement of pulp mill
The departmental unit consumption of electric power in the pulp mill is shown
in Figure 6.5.2.
The proposed pulp mill is basically power self-sufficient as will be explained in
the next section. However, the mill has to be connected to the utility power
grid at all time because of the following reasons.
1) The pulp mill of the design as proposed here has no capability to adjust its
power generating capacity. The electric power is a byproduct of steam, which
is produced exactly as the pulping processes demand. Moment by moment
balance of the generated and consumed power varies continuously. The
utility connection will absorb this unbalance; one time the power may flow
from the grid to the mill, another time it may flow from mill to grid.
2) To start-up the pulp mill from a total shutdown, the minimum electric power
has to be taken from the grid until one of the boilers is put in operation and the
self-generated electric power becomes available. This amount is estimated to
be approximately 2.5MW and duration several hours.
3) In case of self-generating turbo-generator trip, the utility power will be used to
run temporarily the essential, and hazardous drives, such as boiler fans and
feed water pumps, until the turbo-generator operation is resumed, or a safe
shut-down state is achieved
(4) Cost of electric power
The entire electric power demand of Lithuania is met by 80% of one of the two
1,300 kVA nuclear power stations at Ignalina. However, the nuclear power
plant is scheduled to be de-commissioned in near future. The electric power
cost and other situations such as power buy-back policy will certainly change
after the nuclear plant shutdown. However, it is impossible to predict the
changes and their magnitudes at present. The production cost calculation in
this report is based on present power cost.

6 - 62
The power line voltages in Lithuania are 330kV, 110kV, 35kV, and 10kV, 6kV
in which 35kV and 6kV lines are being phased out and no new installation is
built.
There are three choices of electric power tariff. Assuming that the utility
connection is10kV
1) Fixed charge : 0.178 Litas/kWh
2) Variable charge : Charge varies by the day of week and
time of day
Mon – Fri
08:00 – 11:00 : 0.253 Litas/kWh
18:00 – 20:00 : 0.253 Litas/kWh
23:00 – 07:00 : 0.123 Litas/kWh
Rest of the day : 0.157 Litas/kWh
Sat – Sun
All day : 0.123 Litas/kWh
3) Demand charge
Monthly installed capacity charge : 21100 Litas/MW
Energy charge : 0.123 Litas/kWh
The above figures do not include VAT
Due to the nature of the utility power consumption as explained above, that is,
although, little power is drawn from the grid most of the time, a sizable
capacity connection has to be maintained at all time, it is inconceivable to
obtain a power contract with the utility company in any form other than
“Demand charge”.
As explained above, the power may flow from mill to grid or grid to mill in
normal operation. In most developed countries, the power sent-back from the
user to the utility company is paid by the utility company as one of the
measures to promote co-generation and independent power producing
businesses. However, in Lithuania, where there is over-capacity in generating
power, the utility company will have little interest to buy-back power from the
users. There is presently no power buy-back policy in Lithuania and it is

6 - 63
unlikely to have a contract with the utility company with this “power
buy-back” term.
The buy-back power price is assumed zero in this report.
The estimate of power cost to produce one AD ton of pulp is as follows;
Contract capacity : 5.0 MW
Estimated ours in a year to use full capacity : 27 hours
Average power draw from utility : 0.15 MW
(Using “Demand Charge” rate as above)
Softwood pulp production : USD0.78/ADt
Hardwood pulp production : USD0.65/ADt
6.5.4 Energy Consumption and Balance
A Kraft pulp mill can generate its own energy needs, heat and electric power.
(1) Steam and power generation in pulp mill
One ton of wood will produce approximately 400kg (zero moisture) of
bleached pulp. The remaining wood turns into de-barking waste, fine wood
chips (rejects from chip screens), and black liquor (non-cellulose portion of
wood dissolved in water together with in-organic chemicals used for cooking),
and a small portion into the effluent stream. All of them except the effluent
stream are usable and will be used as fuel in the pulp mill.
The function and operation of chemical recovery boiler, Power boiler, and
steam turbine are explained in the section 6.3.4 “Description of Recovery and
Power Processes”. The generated medium- and low-pressure steam and
electric power will all be used in the pulp mill.
(2) Heat balance of pulp mill
Table 6.5.5 and Figure 6.5.1 attached show heat balance in the pulp mill
estimated to best of the knowledge of the writer for hardwood cooking and
softwood cooking.

6 - 64
Table 6.5.5 Pulp Mill Heat(Steam) Balance
Unit consump
Softwood Hardwood Average Remarks
Area MJ/ADt MW MW MW Wood handling 150 2.34 2.81 2.55 Cooking 2050 32.03 38.44 34.9 Washing & Screening 0 0 0 0 O2 delignification 400 6.25 7.5 6.81 Bleaching 500 7.81 9.38 8.51 Bleach Chemical Prep. 70 1.09 1.31 1.19 Bleach Stock Screening 0 0 0 0 Pulp Drying 2850 44.53 53.44 48.51 Evaporation 4100 64.06 76.88 69.79 Recovery Boiler 610 9.53 11.44 10.38 Power Boiler 0 0 0 0 Causticizing 0 0 0 0 Lime Kiln 0 0 0 0 Miscellaneous 2170 33.91 40.69 36.94 Total Consumption 12900 201.55 241.89 219.58 Self generated 246.99 226.71 237.92 Overall Heat balance 45.44 -15.18 18.34
Hardwood species produce more pulp from a given amount of wood than
softwood species. This means that hardwood produces less black liquor,
therefore less steam and less power, than softwood. Storing the black liquor
in large storage tanks should equalize this unbalance. More black liquor is
burned than produced by drawing down the stored black liquor when hardwood
is being cooked, and less black liquor is burned than produced storing the
excess liquor in the storage tanks when softwood is being cooked.
The pulp mill is basically heat self-sufficient. The excess heat as steam
should be condensed in a blow-down condenser. The condensate from the
condenser will be returned to the boiler and the hot water produced can be
conveniently used in the pulping process as hot water.

6 - 65
Figure 6.5.1 Pulp Mill Heat (Steam) Flow Diagram
Scale 500 MW61.17
Wood Waste as Fuel61.17
8.7648.97
61.9998
Smelt Loss274.73 Blowdown Loss
49.13
Desuper heater2.16 Heat spent for
Power generation52.17
57.73
Wood handling 2.55Heat Shortage (Make-up Fuel) Cooking 34.90
3.47 O2 delignification 6.81
Bleaching 8.51
Bleach Chemical Prep. 1.19
Pulp Drying 48.51
Evaporation 69.7950
Recovery Boiler 10.38
Miscellaneous 36.94
Natural Gas LimeKiln 35.75
Enthalpy Base Zero degC Liquid Water
273.84
364.13Black Liquor
as Fuel364.13
StackLoss
ChemicalRecovery
Boiler
Stack LossBlowdown
Loss
Steam Turbine
Wood wasteBoiler
Boiler F
eed Water

6 - 66
(3) Power balance of pulp mill
Table 6.5.6 and Figure 6.5.2 attached show the power balance in the pulp mill
estimated to best of the knowledge of the writer for hardwood cooking and
softwood cooking.
Table 6.5.6 Pulp Mill Power Balance
Unit
consump Softwood Hardwood Average Remarks
Area kWH/ADt MW MW MW Wood handling 55 3.09 3.71 3.37 Cooking 65 3.66 4.39 3.98 Washing Screening 55 3.09 3.71 3.37 O2 delignification 45 2.53 3.04 2.76 Bleaching 83 4.67 5.60 5.09 Bleach Chemical Prep. 71 3.99 4.79 4.35 1* Bleach stock Screening 40 2.25 2.70 2.45 Pulp Drying 105 5.91 7.09 6.43 Evaporation 30 1.69 2.03 1.84 Recovery Boiler 60 3.38 4.05 3.68 Power Boiler 30 1.69 2.03 1.84 Causticizing 20 1.13 1.35 1.23 Lime Kiln 10 0.56 0.68 0.61 Miscellaneous 136 7.65 9.18 8.33 Total Consumption 805 45.28 54.34 49.33 Self generated 55.51 50.95 53.47 Overall Powert balance 10.23 -3.39 4.14
Note 1*:Ozone generator included
The difference of power balance between softwood and hardwood cooking
should be equalized by the operation mentioned in “Heat balance of pulp mill”
section.
The pulp mill is basically power self-sufficient. However, a connection to
utility power grid has to be maintained at all time as explained in the section
6.5.3 “Required Utilities and Unit Consumption” c. “Power Requirement of
Pulp Mill”

6 - 67
Figure 6.5.2 Power Flow Diagram
Scale 50 MW49.56
0.23Export to Grid
49.330
Import from Grid
Wood handling 3.37
Cooking 3.98
Washing Screening 3.37
O2 delignification 2.76
Bleaching 5.09
Bleach Chemical Prep. 4.35
Bleach Stock Screening 2.45
Pulp Drying 6.43
Evaporation 1.84
Recovery Boiler 3.68
Power Boiler 1.84
Causticizing 1.23
Lime Kiln 0.61
Miscellaneous 8.33
TurboGenerator

6 - 68
6.6 Mill Layout
As a final mill site has not been decided, a general layout was made for a
hypothetical 150ha flat land of 1500m x 1000m.
Needless to say, it is imperative to examine the site before the final decision as to
suitability for mill construction and operation, together with potential problems,
by using detailed topographic and survey maps as well as soil data including
bearing capacity.
(1) Important considerations to mill layout
1) Good access to outside roads and facilities
a. Road and rail connections to allow efficient transportation and delivery of
raw materials and sub-materials
b. Efficient shipment and transportation of products
c. Efficient connections to the water intake and effluent discharge points
2) Efficient flow of goods between processes
In addition to transportation infrastructure, including roads and rail, efficient
flow of goods between processes within the mill site is critical for the 500000
ADt/a BKP mill that handles and consumes large amount s of materials and
produces nearly 2000 tons of products. The well-designed and operated
material handling, storage and transportation system serves as the basis of
smooth production and quality control, while helping to reduce operating costs
by minimizing loss of materials and energy.
3) Minimization of environmental impacts to the surrounding habitants
The impacts of emission of smell, dust, vibration and noise are highly affected
with the distance and/or dominant wind direction from the origins of emission
to the resident area, therefore the potential origins, even if in the mill site,
should be located to minimize the impacts considering those factors.
4) Future expandability (including possibility of the paper mill)
(2) Conceptual mill layout
See Figure 6.6.1 “Mill Layout.”

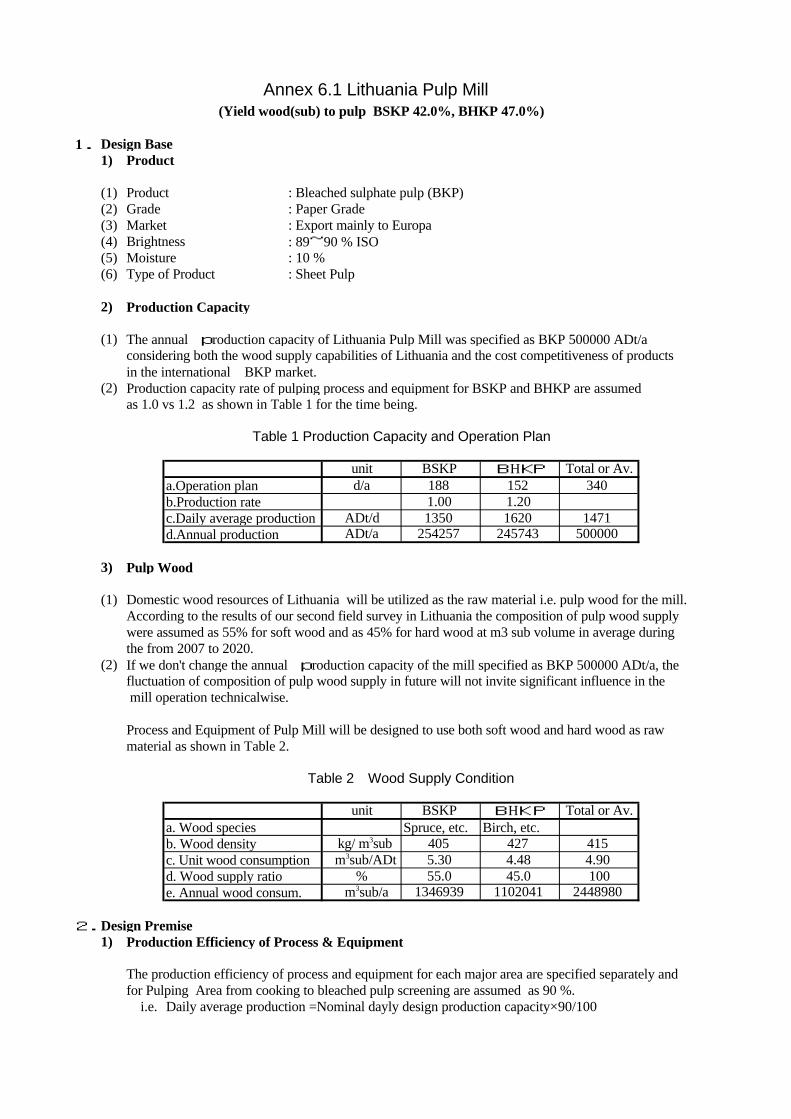
Annex 6.1 Lithuania Pulp Mill
1. Design Base1) Product
(1) Product : Bleached sulphate pulp (BKP) (2) Grade : Paper Grade(3) Market : Export mainly to Europa(4) Brightness : 89~90 % ISO(5) Moisture : 10 %(6) Type of Product : Sheet Pulp
2) Production Capacity
(1) The annual production capacity of Lithuania Pulp Mill was specified as BKP 500000 ADt/aconsidering both the wood supply capabilities of Lithuania and the cost competitiveness of products in the international BKP market.
(2) Production capacity rate of pulping process and equipment for BSKP and BHKP are assumedas 1.0 vs 1.2 as shown in Table 1 for the time being.
a.Operation plan b.Production rate c.Daily average production d.Annual production
3) Pulp Wood
(1) Domestic wood resources of Lithuania will be utilized as the raw material i.e. pulp wood for the mill. According to the results of our second field survey in Lithuania the composition of pulp wood supply were assumed as 55% for soft wood and as 45% for hard wood at m3 sub volume in average during the from 2007 to 2020.
(2) If we don't change the annual production capacity of the mill specified as BKP 500000 ADt/a, thefluctuation of composition of pulp wood supply in future will not invite significant influence in the mill operation technicalwise.
Process and Equipment of Pulp Mill will be designed to use both soft wood and hard wood as raw material as shown in Table 2.
a. Wood species Spruce, etc. Birch, etc. b. Wood density c. Unit wood consumption d. Wood supply ratioe. Annual wood consum.
2.Design Premise1) Production Efficiency of Process & Equipment
The production efficiency of process and equipment for each major area are specified separately and for Pulping Area from cooking to bleached pulp screening are assumed as 90 %. i.e. Daily average production =Nominal dayly design production capacity×90/100
m3sub/a 1346939 1102041 2448980% 55.0 45.0 100
m3sub/ADt 5.30 4.48 4.90kg/ m3sub 405 427 415
Table 2 Wood Supply Condition
unit BSKP BHKP Total or Av.
ADt/a 254257 245743 500000ADt/d 1350 1620 1471
1.00 1.20d/a 188 152 340
(Yield wood(sub) to pulp BSKP 42.0%, BHKP 47.0%)
Table 1 Production Capacity and Operation Plan
unit BSKP BHKP Total or Av.

2) Cooking Chemicals-White Liquor
Active alkali to BD chip % as Na2O based on BD chip fed to digesterSulphidity %
3) Pulp Yield to Wood without bark (sub)
(1) The barking losses was specified as 13.5% to the volume of raw wood withbark(m3 sob) i.e. the barking yield is 86.5% to the volume of raw wood withbark(m3 sob)
(2) The chip handling losses were specified as 5% to raw wood without bark(m3 sub) i.e. the chip handling yield is 95% to raw wood without bark(m3 sub).(chip handling =chipping, chip piling, reclaming, screening and conveying)
(3) The final pulping yield were specified to be for BSKP 42% and for 47% both to BD weight of wood without bark (sub)
(4) The losses of each process from washin to drying were specified as shown Table 4.(5) The losses and yield of cooking process were estimated based on those prmises from (2) to (4)
mentioned above at our convenience for design.
Accu. Accu.losses yield yield Unit yield Unit
Process % % % kg/ADt % % % kg/ADt1 Raw Wood with bark 100 116 2477 3345 100 116 2214 35872 Barking 13.5 86.5 100 2143 2893 452 13.5 86.5 100 1915 3102 4843 Chip screen & handling 5.0 95.0 95.0 2036 2748 145 5.0 95.0 95.0 1819 2947 1554 Cooking 52.1 47.9 45.5 975 1316 1432 46.4 53.6 50.9 975 1579 13685 Washing 0.5 99.5 45.3 970 1310 7 0.5 99.5 50.7 970 1571 86 UKP Screening 1.0 99.0 44.8 960 1296 13 1.0 99.0 50.1 960 1556 167 O2 Delignification 2.0 98.0 43.9 941 1271 26 2.0 98.0 49.1 941 1525 318 Bleaching 3.4 96.6 42.4 909 1227 43 3.4 96.6 47.5 909 1473 529 BKP Screening 0.5 99.5 42.2 905 1221 6 0.5 99.5 47.2 905 1465 7
10 Drying(=Final products) 0.5 99.5 42.0 900 1215 6 0.5 99.5 47.0 900 1458 7
Accu.losses yield yield Unit
Process % % % kg/ADt1 Raw Wood with bark 100 116 2348 34522 Barker 13.5 86.5 100 2031 2986 4663 Chip screen & handling 5.0 95.0 95.0 1929 2837 1494 Cooking 49.5 50.5 48.0 975 1434 14035 Washing 0.5 99.5 47.8 970 1426 76 UKP Screening 1.0 99.0 47.3 960 1412 147 O2 Delignification 2.0 98.0 46.3 941 1384 288 Bleaching 3.4 96.6 44.8 909 1337 479 BKP Screening 0.5 99.5 44.5 905 1330 7
10 Drying(=Final products) 0.5 99.5 44.3 900 1324 7
Daily balanceBDt/d
Table 4 Yield of pulping process 2/2
BSKP and BHKPProcess Material flow
Daily balance Daily balanceBDt/d BDt/d
Table 4 Yield of pulping process 1/2
BSKP HBKPProcess Material flow Process Material flow
18.0 17.030 30
Table 3 Cooking Chemical (White Liquor)
BSKP BHKP

4) Wood Density & Unit Wood Consumption
(1) We didn't performe any laboratory pulping test to confirm the pulpabilities of Lithuanian severalwood species suppused to use as raw materials and to assure the propaty of products made ofthem, but applied data and informations offered by menbuer of our study team and counterpartnerns of Lithuania as the premise of mill design.
(2) Therefore the potential invester of this project will need to performe some procedure to confirmthose more directly at least, eventhough we aer expecting that there would not appear big discrepancies between the conclusions derived from results of new test and the conclusions in our report.
ratio yield m3- ratio yield m3- ratio yield m3- kg/m3 sub % % sub/t % % sub/t % % sub/t
1. Spruce,stemwood 400 55.0 42.0 5.362. Spruce,branches 600 0.0 42.0 3.573. Pine 410 45.0 42.0 5.23 Soft Wood Ave. 405 100 42.0 5.304. Alder 360 36.0 47.0 5.325. Aspen 400 18.0 47.0 4.796. Birch 490 46.0 47.0 3.917 .Oak 600 0.0 47.0 3.198. Mixed Species Balsam Poplar 400 0.0 47.0 4.79 Hard Wood Ave. 427 100 47.0 4.481. Spruce,stemwood 400 30.3 42.0 5.362. Spruce,branches 600 0.0 42.0 3.573. Pine 410 24.8 42.0 5.234. Alder 360 16.2 47.0 5.325. Aspen 400 8.1 47.0 4.796. Birch 490 20.7 47.0 3.917 .Oak 600 0.0 47.0 3.198. Mixed Species Balsam Poplar 400 0.0 47.0 4.79 SW & HW Total Ave. 415 100 44.3 4.90
5) Dry Solids of Black Liquor
(1) The figure of total organic DSt/d was calculated based on the losses pulping process including cooking, washing and O2 Delignification
(2) The figure of total inorganic DSt/d was calculated based on the cooking chemical substances.
a. Total Organic b. Total Inorganic c. Total Solids DSt/d 2248 2200 2226
DSt/d 783 793 787DSt/d 1465 1407 1439
Species Density
Table 6 Dry Solids of Black Liquor
unit BSKP BHKP SB & HB Ave.
Table 5 Wood Density & Unit Wood Consumption
Wood BSKP(55%) BHKP(45%) Average

1. The water consumption of proposed BKP mill
As the BKP mill requires a large amount of fresh water, it is important to secure a reliable source
of raw water and a recipient of effluent to be discharged.
In fact, they constitute the most fundamental requirements to be considered in the mill site selection.
The water unit consumption of proposed BKP mill is 65m3/ADt, 27-30m3/ADt of which is used
as process water and residual 35-38m3/ADt of which is used for another purposes such as
cooling water, sealing water, boiler feed water and etc., in the mill.
The process water as of 27-30 m3/ADt is sent to effuluent treatment plant before diccharge to
the recipient, and the as of residual 35-38m3/ADt is sent directly to the same.
The total anuual water consumption comes to 32 millions m3/a (=1.1 m3/sec x 3,600 x 24 x 340 ), and
this figure is a fairly large amount but it is expected to be acceptable considering with the flow volume of
rivers closeto any of the three candidate sites.
General water consumption data in the country are shown in “Table 1 Water Consumption in Lithuania”.
At present, industrial water consumption in the country amounts to 58 millions m3/a.
Unit: thousand m3/year
Industrial Household Power Agriculture Fish Others Total Surface Ground
generation farming water water
Alytus 2740 4216 924 137 13801 187 22004 15762 6243
Kauno 18407 23216 1991394 779 20211 409 2054415 2028808 25608
Klaipedos 10393 19447 1767 0 2467 243 34317 11432 22885
Mrijampoles 1805 7174 51 45 4990 41 14106 5945 8161
Panvezio 5445 10232 753 278 3500 276 20483 6362 14122
Siauliu 1916 3273 626 368 6918 62 18163 7704 10459
Taurages 184 3145 67 73 0 46 3515 52 3463
Telsiu 5760 4064 2094 188 1100 0 13206 7165 6041
Utenos 2250 9198 2782482 66 10723 28 2804747 2793235 11513
Vilinius 9393 36173 4848 326 29338 7 80085 39546 40539
合 計 58293 120139 4785007 2259 93047 1297 5065042 4916009 149033
Sources 2. :Natural resources and environmental protection A501/Lithuania Statistics
Department 1998. Water use by Utenos (power company) is cooling water for its nuclear power plant.
2. The quality of river water
The quality of mill water is a very important issue for the proposed BKP mill.
The quality of river(s) water which are flowing closed to the candidate sites areshown in Table 2 “Water
quality of Selected Rivers in Lithuania”. Generally, the water of those rivers are characterized by high
levels of total hardness requiring a slihgt additional water treatment costs.
Annex 6.2 Information of River Water in Lithuania
Table 1 Water Consumption in Lithuania by Type of Use (1998)

Unit : mg/lTappi Stand. Neris Nemunas
for BKP upstream of Rusnes Production Left bank Center Right bank Left bank Right bank Left bank Right bank Left bank Right bank Center Right bank
Temperature Minmum ℃ 0.4 0.4 0.4 0.3 0.3 0.5 1.0 0.1 0.0 10 0.3 Maximum 22.6 22.3 22.6 25 25 25 25.0 25.6 25.4 22.1 22.1 Average 9.6 9.6 9.6 9.3 9.7 9.3 10.1 10.7 10.7 16.1 14.5Turbidity(as SiO2) 25Transparency Minmum cm 6.0 6.0 6.0 4.0 5.0 5.0 1.0 11.0 12.0 10.0 11.0 Maximum 20.0 20.0 22.0 25.0 24.0 25.0 25.0 22.0 22.0 20.0 20.0 Average 13.0 13.0 14.0 13.0 14.0 15.0 10.1 17.0 17.0 16.0 17.0Oduor non non non middle middle middle middle non non non nonColor (platinum unit) 5゜ yellow yellow yellow yellow yellow yellow yellow yellow yellow yellow yellowpH - Minmum 7.95 8.04 8.00 7.80 7.80 7.80 7.8 7.4 7 8.1 8.0 Maximum 8.86 8.86 8.76 8.80 8.60 8.50 8.4 9 9 9.0 9.0 Average 8.45 8.46 8.44 8.15 8.17 8.13 8.14 8.24 8.25 8.5 8.5Hardness (as CaCO3) 100 180 175 180 225 210 205 230 200 205 210 215 Minmum mg ekv/l 2.6 2.2 2.3 3.8 3.9 3.8 4.4 3.8 4.0 3.8 4.3 Maximum 4.7 4.7 4.7 5.6 4.9 4.5 5.0 4.2 4.2 4.5 4.3 Average 3.6 3.5 3.6 4.5 4.2 4.1 4.6 4.0 4.1 4.2 4.3Silica Solubility as SiO2 20 Minmum mg/l 4.2 4.2 4.2 1.3 1.3 1.4 1.8 5 4.7 1.0 1.0 Maximum 5.6 5.5 5.5 4.0 4.0 4.0 4.0 5.2 5.1 4.0 4.0 Average 5.0 4.8 4.9 2.7 2.4 2.5 2.7 5.1 4.9 2.6 2.6Ferric contents (as Fe) 0.1 Minmum mg/l 0.20 0.10 0.10 0.16 0.15 0.01 0.15 0.29 0.23 0.01 0.10 Maximum 0.50 0.50 0.50 0.48 0.36 0.66 0.31 0.42 0.4 0.30 0.30 Average 0.36 0.30 0.32 0.30 0.27 0.34 0.26 0.36 0.33 0.13 0.20Manganese(as Mn) 0.05 Minmum mg/l 1.2 1.2 1.2 12.0 12.0 7.8 9.7 11.0 13.0 9.7 12.0 Maximum 30.0 22.0 22.0 22.0 24.0 15.0 21.0 15.0 16.0 17.0 17.0 Average 13.6 7.3 10.8 16.5 18.5 10.1 16.9 13.0 14.2 13.9 15.3
Table 2 Water Quality of Selected Rivers in Lithuania
downstream of Vilnius upstream of Yonava downstream of Yonava downstream of Alytus