Embed Size (px)
Citation preview

REPORT
Filamin A mediates isotropic distribution of appliedforce across the actin networkAbhishek Kumar1, Maria S. Shutova2, Keiichiro Tanaka1, Daniel V. Iwamoto3, David A. Calderwood3,4, Tatyana M. Svitkina2, andMartin A. Schwartz1,4,5
Cell sensing of externally applied mechanical strain through integrin-mediated adhesions is critical in development andphysiology of muscle, lung, tendon, and arteries, among others. We examined the effects of strain on force transmissionthrough the essential cytoskeletal linker talin. Using a fluorescence-based talin tension sensor (TS), we found that uniaxialstretch of cells on elastic substrates increased tension on talin, which was unexpectedly independent of the orientation of thefocal adhesions relative to the direction of strain. High-resolution electron microscopy of the actin cytoskeleton revealed thatstress fibers (SFs) are integrated into an isotropic network of cortical actin filaments in which filamin A (FlnA) localizespreferentially to points of intersection between SFs and cortical actin. Knockdown (KD) of FlnA resulted in more isolated, lessintegrated SFs. After FlnA KD, tension on talin was polarized in the direction of stretch, while FlnA reexpression restoredtensional symmetry. These data demonstrate that a FlnA-dependent cortical actin network distributes applied forces overthe entire cytoskeleton–matrix interface.
IntroductionLive cells sense and respond to externally generated stretch,shear, and compression, and internal changes in actomyosincontractility (Geiger et al., 2009). Applied forces can vary byseveral orders of magnitude and on temporal scales from sub-seconds to days. Immediate responses are thought to mainlyinvolve protein conformational changes that lead to changes inbinding affinities or enzymatic activity (Vogel and Sheetz, 2006;Hsu et al., 2010; Humphrey et al., 2014; Goult et al., 2018). Ul-timately, these events regulate signaling pathways, gene ex-pression, and changes in cell and tissue phenotype. Over the pastdecade, our molecular understanding of mechanotransductionhas rapidly expanded. However, major questions remain abouthow applied forces are distributed and act upon force-sensitivemolecules.
The cell–ECM interface is a critical location for mechanicalregulation. The focal adhesion (FA) protein talin is a key com-ponent of this linkage and a key player in mechanotransduction.Talin contains an N-terminal FERM domain that binds to in-tegrin β subunit cytoplasmic tails. Talin’s C-terminus is com-prised of a rod domain consisting of 13 helix bundles with twobinding sites for F-actin: ABS2 (actin binding site 2) betweenresidues 951 and 1327 and ABS3 near C-terminal between
residues 2300 and 2541 (Himmel et al., 2009; Atherton et al.,2015; Klapholz and Brown, 2017). These helix bundles werefound to open under force, exposing cryptic vinculin-bindingsites, such that tension induces vinculin recruitment and rein-forcement of the link to actin (Patel et al., 2006; del Rio et al.,2009; Hirata et al., 2014). Previous studies measuring forceacross talin showed that talin tension requires actomyosincontractility and is modulated by ECM stiffness (Austen et al.,2015; Kumar et al., 2016, 2018).
In vivo, most, if not all, cells respond to mechanical stretch.These effects are most prominent in cardiac cardiomyocytes andfibroblasts, vascular endothelial and smooth muscle cells, in-testinal smooth muscle, and multiple cell types in the lung,where mechanical stretch plays major roles in development andphysiology. In vitro, cyclic uniaxial mechanical stretching ofnonmuscle cell types induces orientation perpendicular to thedirection of stretch, with similar orientation of FAs and the actincytoskeleton (Wang et al., 2004; Kaneko et al., 2009; Hsu et al.,2010; Nagayama et al., 2012). Presumably, these events are aconsequence of forces transmitted through the integrin–talin–actin linkage, but our understanding of how these forces aretransmitted is limited. The goal of this study was to investigate
.............................................................................................................................................................................1Yale Cardiovascular Research Center, Yale University School of Medicine, New Haven, CT; 2Department of Biology, University of Pennsylvania, Philadelphia, PA;3Department of Pharmacology, Yale University, New Haven, CT; 4Department of Cell Biology, Yale University, New Haven, CT; 5Department of Biomedical Engineering,Yale University, New Haven, CT.
Correspondence to Martin A. Schwartz: [email protected]; Abhishek Kumar: [email protected].
© 2019 Kumar et al. This article is distributed under the terms of an Attribution–Noncommercial–Share Alike–No Mirror Sites license for the first six months after thepublication date (see http://www.rupress.org/terms/). After six months it is available under a Creative Commons License (Attribution–Noncommercial–Share Alike 4.0International license, as described at https://creativecommons.org/licenses/by-nc-sa/4.0/).
Rockefeller University Press https://doi.org/10.1083/jcb.201901086 2481
J. Cell Biol. 2019 Vol. 218 No. 8 2481–2491
Dow
nloaded from http://w
ww
.rupress.org/jcb/article-pdf/218/8/2481/1382109/jcb_201901086.pdf by guest on 26 Novem
ber 2021

the role of talin in cell responses to strain using our previouslydescribed talin tension sensor (TS). Our results unexpectedlyshowed that polarized forces from uniaxial stretch are trans-mitted to talin in a depolarized way. Further analysis showedthat an actin cytoskeletal network that requires filamin A (FlnA)redistributes the applied force.
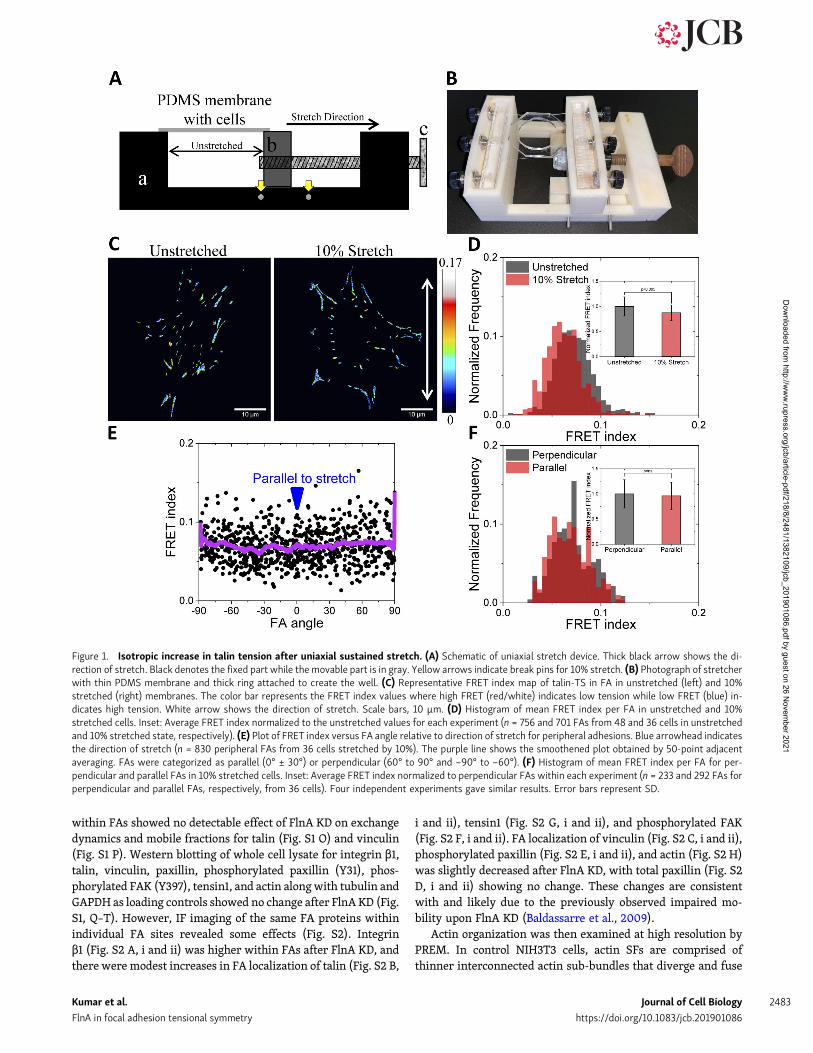
Results and discussionTalin tension within FAs increases after uniaxialsustained stretchTo apply uniaxial stretch to live cells, we built custom uniaxialstretchers by 3D printing (Fig. 1, A and B). The magnitude ofstretch was precisely controlled using break pins located on thebase of stretcher. Strain profiles with polydimethylsiloxane(PDMS) membranes were determined by imaging fluorescentbeads before and after stretch in the central region of thestretcher that was used for cell imaging (Fig. S1 A). Bead tracks,obtained using particle imaging velocimetry (PIV; Fig. S1 B),showed that displacements parallel and perpendicular to thedirection of stretch were uniform in these regions (Fig. S1, C andD) as shown previously (Shao et al., 2013). For 10% stretch alongthe x axis, there was compression of 3.3 ± 0.2% along the y axis,consistent with previous results (Shao et al., 2013). The force ontalin was measured using the previously characterized fluores-cence resonance energy transfer (FRET)–based TS in which thedonor fluorophore, EGFP, is linked to an acceptor fluorophore,tagRFP through a 40–amino acid spring-like peptide (Kumaret al., 2016, 2018). Tension extends the spring and decreasesFRET efficiency in a well-defined way (Grashoff et al., 2010). InTalin-TS, this module is inserted into the flexible linker betweentalin’s head and rod regions, where it registers force between theintegrin binding site in the N-terminus and F-actin– andvinculin-binding sites in the C-terminus (Fig. S1 E). The controlsensor, talin-CS, with the module affixed to the C-terminus,localizes similarly but does not register tension (Fig. S1 E).
Talin1−/−mouse embryonic fibroblasts transfected with talin-TS were plated on fibronectin-coated ∼400-µm-thick PDMSmembranes assembled into the stretch device. Well-spread cells6 h after plating were left untreated or uniaxially stretched by10% and then immediately fixed in the same state with 4%paraformaldehyde. The total time taken to manually turn thescrew and add fixative is ∼10 s. PDMS membranes weremounted in their stretched or unstretched state on a glass slideand imaged, and the FRET index within FA calculated. Fig. 1 Cshows a pseudo-colored FRET index map of talin tension withinFA in unstretched and stretched cells with corresponding colorbar (high FRET index value indicates low tension, and low FRETindex value indicates high tension). Immediately after 10%stretch, FRET index within FA reproducibly decreased, indicat-ing higher tension on talin (quantified in Fig. 1 D). As expected,FRET index for the talin-CS control did not change after 10%stretch (Fig. S1, F and G).
We next examined the stretch response as a function of FAorientation relative to the direction of stretch. Mean FRET indexper FA in peripheral FAs was plotted against absolute FA angle,with 0° being the direction of stretch. When FAs oriented at
angles within ±30° of 0 or 90° were binned and classified asparallel or perpendicular, respectively, there was no significantdifference in FRET index after stretch (Fig. 1, E and F). Thisresult was surprising given that FAs are connected to actomy-osin stress fibers (SFs) that are the main source of tensionon talin (Kumar et al., 2016). Actin bundles in the directionof stretch will increase in length, whereas those parallelwill not. This finding prompted us to consider whether thereare additional cytoskeletal networks that contribute to forcetransmission.
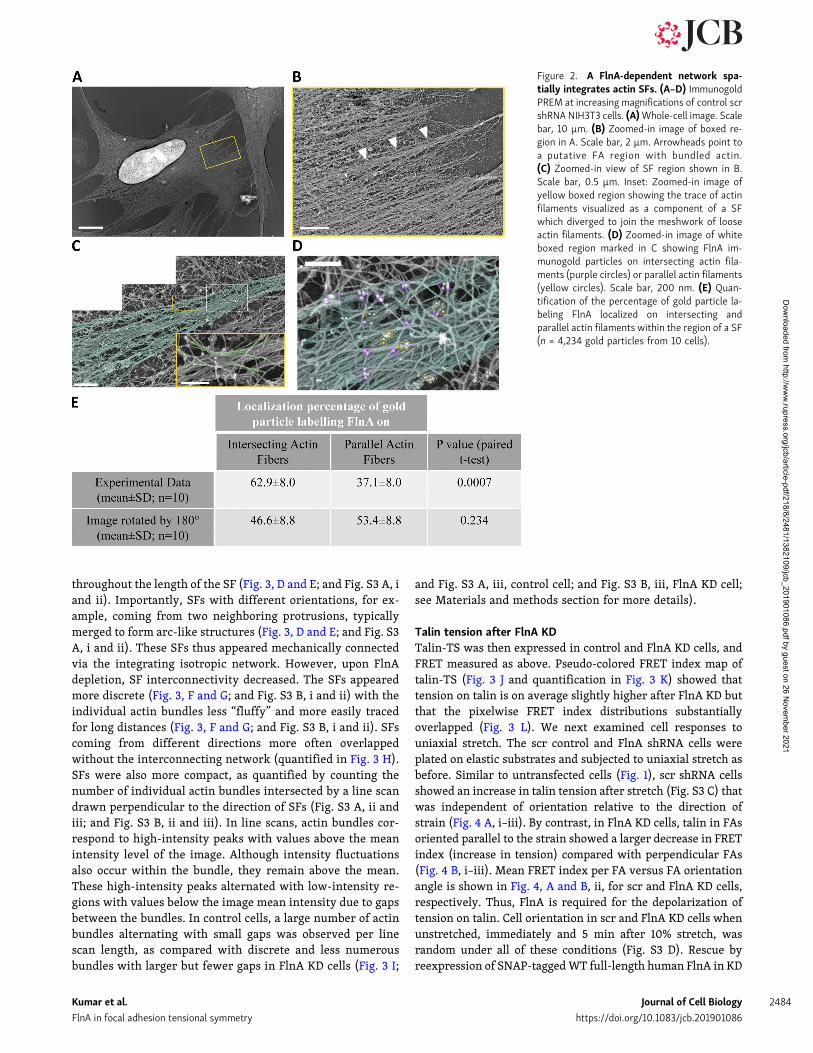
A FlnA-dependent network spatially integrates actin SFbundlesUltrastructural analysis of the actin cytoskeleton in culturedcells revealed an isotropic network of cortical filaments beneaththe plasma membrane into which SF bundles are integrated(Svitkina, 2007, 2018; Eghiaian et al., 2015). This network istherefore positioned to mediate the redistribution of forces ob-served above. FlnA is a major actin cross-linker in a majority ofcell types including fibroblasts and, because of its length andflexibility, is a likely candidate for connecting SFs into the iso-tropic actin network (Zhou et al., 2010; Razinia et al., 2012).Indeed, platinum replica immuno-EM (PREM) in combinationwith 18-nm immunogold staining of FlnA revealed FlnA on theactin cytoskeleton throughout the cell but with higher frequencyat points of intersection between SF bundles and the isotropicnetwork (Fig. 2, A–D). Quantitative analysis of the gold particlelocalization within SFs revealed that 62.9 ± 8.0% of the particleswere localized within immediate proximity of sites where iso-tropic actin filaments intersected the SF at high (>30°) angles,whereas 37.1 ± 8.0% were found on the parallel actin filamentbundles >18 nm from an intersection (Fig. 2 E). To test whetherthis preferential localization of FlnA at the sites of intersectionwas specific, we repeated the quantification after rotating thePREM images by 180° but keeping the gold particle positionsfixed. Particle counts at sites of intersection versus along SFswere 46.6 ± 8.8% and 53.4 ± 8.8%, respectively, which was sig-nificantly different from the unrotated images (P value =0.0007; Fig. 2 E). In some cases, the same actin filament wasvisualized as a component of a SF but then diverged or frayed tojoin the meshwork of loose actin filaments (Fig. 2 C, inset).
SFs become less interconnected after FlnA knockdown (KD)We next tested the effect of FlnA KD on cell and FA morphologyand actin organization using lentiviral infection of shRNA inNIH3T3 fibroblasts, followed by selection in puromycin. Im-munofluorescence (IF) imaging (Fig. 3 A) and immunoblotting(Fig. 3 B) using FlnA antibody showed that FlnA was reduced by>97% (Fig. S1 J). Confocal imaging of phalloidin-labeled F-actinshowed no obvious changes in actin organization betweenscrambled (scr) and FlnA shRNA cells (Fig. 3 A; Feng et al.,2006). We further labeled FAs by transfecting cells transientlywith talin-TS (Fig. 3 C) to assess changes in adhesion morphol-ogy. Cell area (Fig. S1 K), FA area (Fig. S1 L), and FA aspect ratio(Fig. S1 M) were not significantly different after FlnA KD. Fur-ther, the FA orientation with respect to cell orientation was nodifferent after FlnA KD (Fig. S1 N). Photobleaching small regions
Kumar et al. Journal of Cell Biology 2482
FlnA in focal adhesion tensional symmetry https://doi.org/10.1083/jcb.201901086
Dow
nloaded from http://w
ww
.rupress.org/jcb/article-pdf/218/8/2481/1382109/jcb_201901086.pdf by guest on 26 Novem
ber 2021
within FAs showed no detectable effect of FlnA KD on exchangedynamics and mobile fractions for talin (Fig. S1 O) and vinculin(Fig. S1 P). Western blotting of whole cell lysate for integrin β1,talin, vinculin, paxillin, phosphorylated paxillin (Y31), phos-phorylated FAK (Y397), tensin1, and actin alongwith tubulin andGAPDH as loading controls showed no change after FlnA KD (Fig.S1, Q–T). However, IF imaging of the same FA proteins withinindividual FA sites revealed some effects (Fig. S2). Integrinβ1 (Fig. S2 A, i and ii) was higher within FAs after FlnA KD, andthere were modest increases in FA localization of talin (Fig. S2 B,
i and ii), tensin1 (Fig. S2 G, i and ii), and phosphorylated FAK(Fig. S2 F, i and ii). FA localization of vinculin (Fig. S2 C, i and ii),phosphorylated paxillin (Fig. S2 E, i and ii), and actin (Fig. S2 H)was slightly decreased after FlnA KD, with total paxillin (Fig. S2D, i and ii) showing no change. These changes are consistentwith and likely due to the previously observed impaired mo-bility upon FlnA KD (Baldassarre et al., 2009).
Actin organization was then examined at high resolution byPREM. In control NIH3T3 cells, actin SFs are comprised ofthinner interconnected actin sub-bundles that diverge and fuse
Figure 1. Isotropic increase in talin tension after uniaxial sustained stretch. (A) Schematic of uniaxial stretch device. Thick black arrow shows the di-rection of stretch. Black denotes the fixed part while the movable part is in gray. Yellow arrows indicate break pins for 10% stretch. (B) Photograph of stretcherwith thin PDMS membrane and thick ring attached to create the well. (C) Representative FRET index map of talin-TS in FA in unstretched (left) and 10%stretched (right) membranes. The color bar represents the FRET index values where high FRET (red/white) indicates low tension while low FRET (blue) in-dicates high tension. White arrow shows the direction of stretch. Scale bars, 10 µm. (D) Histogram of mean FRET index per FA in unstretched and 10%stretched cells. Inset: Average FRET index normalized to the unstretched values for each experiment (n = 756 and 701 FAs from 48 and 36 cells in unstretchedand 10% stretched state, respectively). (E) Plot of FRET index versus FA angle relative to direction of stretch for peripheral adhesions. Blue arrowhead indicatesthe direction of stretch (n = 830 peripheral FAs from 36 cells stretched by 10%). The purple line shows the smoothened plot obtained by 50-point adjacentaveraging. FAs were categorized as parallel (0° ± 30°) or perpendicular (60° to 90° and −90° to −60°). (F) Histogram of mean FRET index per FA for per-pendicular and parallel FAs in 10% stretched cells. Inset: Average FRET index normalized to perpendicular FAs within each experiment (n = 233 and 292 FAs forperpendicular and parallel FAs, respectively, from 36 cells). Four independent experiments gave similar results. Error bars represent SD.
Kumar et al. Journal of Cell Biology 2483
FlnA in focal adhesion tensional symmetry https://doi.org/10.1083/jcb.201901086
Dow
nloaded from http://w
ww
.rupress.org/jcb/article-pdf/218/8/2481/1382109/jcb_201901086.pdf by guest on 26 Novem
ber 2021
throughout the length of the SF (Fig. 3, D and E; and Fig. S3 A, iand ii). Importantly, SFs with different orientations, for ex-ample, coming from two neighboring protrusions, typicallymerged to form arc-like structures (Fig. 3, D and E; and Fig. S3A, i and ii). These SFs thus appeared mechanically connectedvia the integrating isotropic network. However, upon FlnAdepletion, SF interconnectivity decreased. The SFs appearedmore discrete (Fig. 3, F and G; and Fig. S3 B, i and ii) with theindividual actin bundles less “fluffy” and more easily tracedfor long distances (Fig. 3, F and G; and Fig. S3 B, i and ii). SFscoming from different directions more often overlappedwithout the interconnecting network (quantified in Fig. 3 H).SFs were also more compact, as quantified by counting thenumber of individual actin bundles intersected by a line scandrawn perpendicular to the direction of SFs (Fig. S3 A, ii andiii; and Fig. S3 B, ii and iii). In line scans, actin bundles cor-respond to high-intensity peaks with values above the meanintensity level of the image. Although intensity fluctuationsalso occur within the bundle, they remain above the mean.These high-intensity peaks alternated with low-intensity re-gions with values below the image mean intensity due to gapsbetween the bundles. In control cells, a large number of actinbundles alternating with small gaps was observed per linescan length, as compared with discrete and less numerousbundles with larger but fewer gaps in FlnA KD cells (Fig. 3 I;
and Fig. S3 A, iii, control cell; and Fig. S3 B, iii, FlnA KD cell;see Materials and methods section for more details).
Talin tension after FlnA KDTalin-TS was then expressed in control and FlnA KD cells, andFRET measured as above. Pseudo-colored FRET index map oftalin-TS (Fig. 3 J and quantification in Fig. 3 K) showed thattension on talin is on average slightly higher after FlnA KD butthat the pixelwise FRET index distributions substantiallyoverlapped (Fig. 3 L). We next examined cell responses touniaxial stretch. The scr control and FlnA shRNA cells wereplated on elastic substrates and subjected to uniaxial stretch asbefore. Similar to untransfected cells (Fig. 1), scr shRNA cellsshowed an increase in talin tension after stretch (Fig. S3 C) thatwas independent of orientation relative to the direction ofstrain (Fig. 4 A, i–iii). By contrast, in FlnA KD cells, talin in FAsoriented parallel to the strain showed a larger decrease in FRETindex (increase in tension) compared with perpendicular FAs(Fig. 4 B, i–iii). Mean FRET index per FA versus FA orientationangle is shown in Fig. 4, A and B, ii, for scr and FlnA KD cells,respectively. Thus, FlnA is required for the depolarization oftension on talin. Cell orientation in scr and FlnA KD cells whenunstretched, immediately and 5 min after 10% stretch, wasrandom under all of these conditions (Fig. S3 D). Rescue byreexpression of SNAP-taggedWT full-length human FlnA in KD
Figure 2. A FlnA-dependent network spa-tially integrates actin SFs. (A–D) ImmunogoldPREM at increasing magnifications of control scrshRNA NIH3T3 cells. (A)Whole-cell image. Scalebar, 10 µm. (B) Zoomed-in image of boxed re-gion in A. Scale bar, 2 µm. Arrowheads point toa putative FA region with bundled actin.(C) Zoomed-in view of SF region shown in B.Scale bar, 0.5 µm. Inset: Zoomed-in image ofyellow boxed region showing the trace of actinfilaments visualized as a component of a SFwhich diverged to join the meshwork of looseactin filaments. (D) Zoomed-in image of whiteboxed region marked in C showing FlnA im-munogold particles on intersecting actin fila-ments (purple circles) or parallel actin filaments(yellow circles). Scale bar, 200 nm. (E) Quan-tification of the percentage of gold particle la-beling FlnA localized on intersecting andparallel actin filaments within the region of a SF(n = 4,234 gold particles from 10 cells).
Kumar et al. Journal of Cell Biology 2484
FlnA in focal adhesion tensional symmetry https://doi.org/10.1083/jcb.201901086
Dow
nloaded from http://w
ww
.rupress.org/jcb/article-pdf/218/8/2481/1382109/jcb_201901086.pdf by guest on 26 Novem
ber 2021
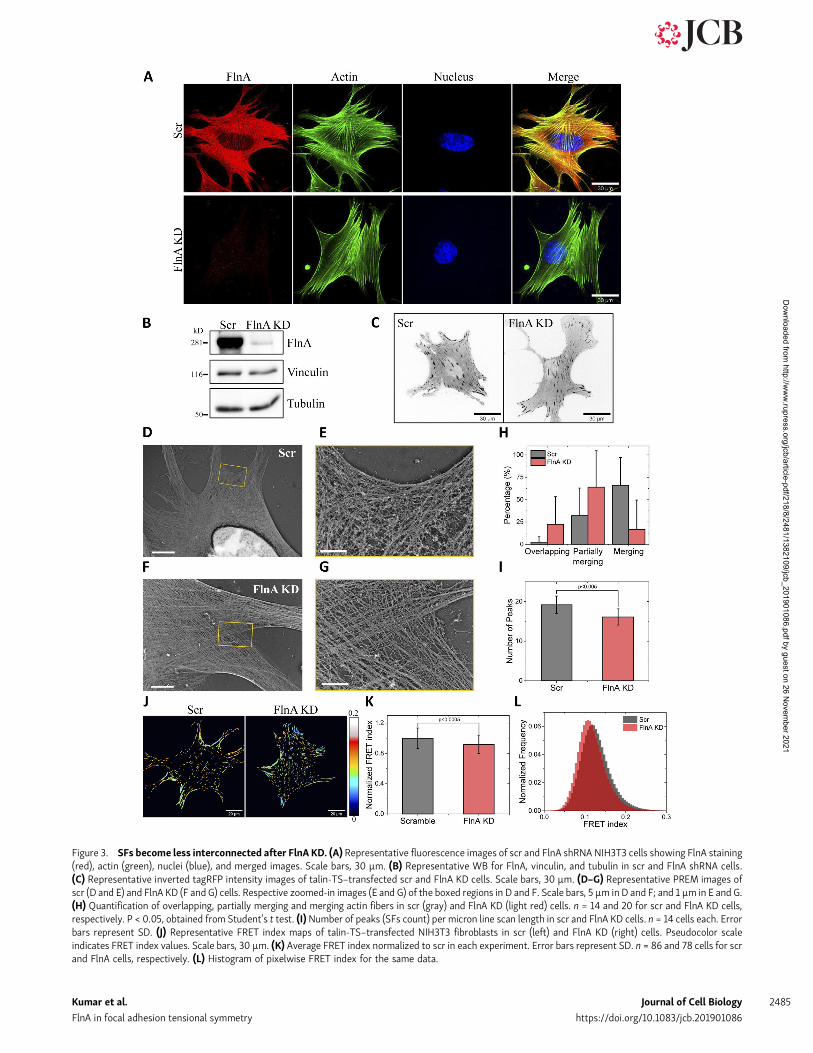
Figure 3. SFs become less interconnected after FlnA KD. (A) Representative fluorescence images of scr and FlnA shRNA NIH3T3 cells showing FlnA staining(red), actin (green), nuclei (blue), and merged images. Scale bars, 30 µm. (B) Representative WB for FlnA, vinculin, and tubulin in scr and FlnA shRNA cells.(C) Representative inverted tagRFP intensity images of talin-TS–transfected scr and FlnA KD cells. Scale bars, 30 µm. (D–G) Representative PREM images ofscr (D and E) and FlnA KD (F and G) cells. Respective zoomed-in images (E and G) of the boxed regions in D and F. Scale bars, 5 µm in D and F; and 1 µm in E and G.(H) Quantification of overlapping, partially merging and merging actin fibers in scr (gray) and FlnA KD (light red) cells. n = 14 and 20 for scr and FlnA KD cells,respectively. P < 0.05, obtained from Student’s t test. (I)Number of peaks (SFs count) per micron line scan length in scr and FlnA KD cells. n = 14 cells each. Errorbars represent SD. (J) Representative FRET index maps of talin-TS–transfected NIH3T3 fibroblasts in scr (left) and FlnA KD (right) cells. Pseudocolor scaleindicates FRET index values. Scale bars, 30 µm. (K) Average FRET index normalized to scr in each experiment. Error bars represent SD. n = 86 and 78 cells for scrand FlnA cells, respectively. (L) Histogram of pixelwise FRET index for the same data.
Kumar et al. Journal of Cell Biology 2485
FlnA in focal adhesion tensional symmetry https://doi.org/10.1083/jcb.201901086
Dow
nloaded from http://w
ww
.rupress.org/jcb/article-pdf/218/8/2481/1382109/jcb_201901086.pdf by guest on 26 Novem
ber 2021
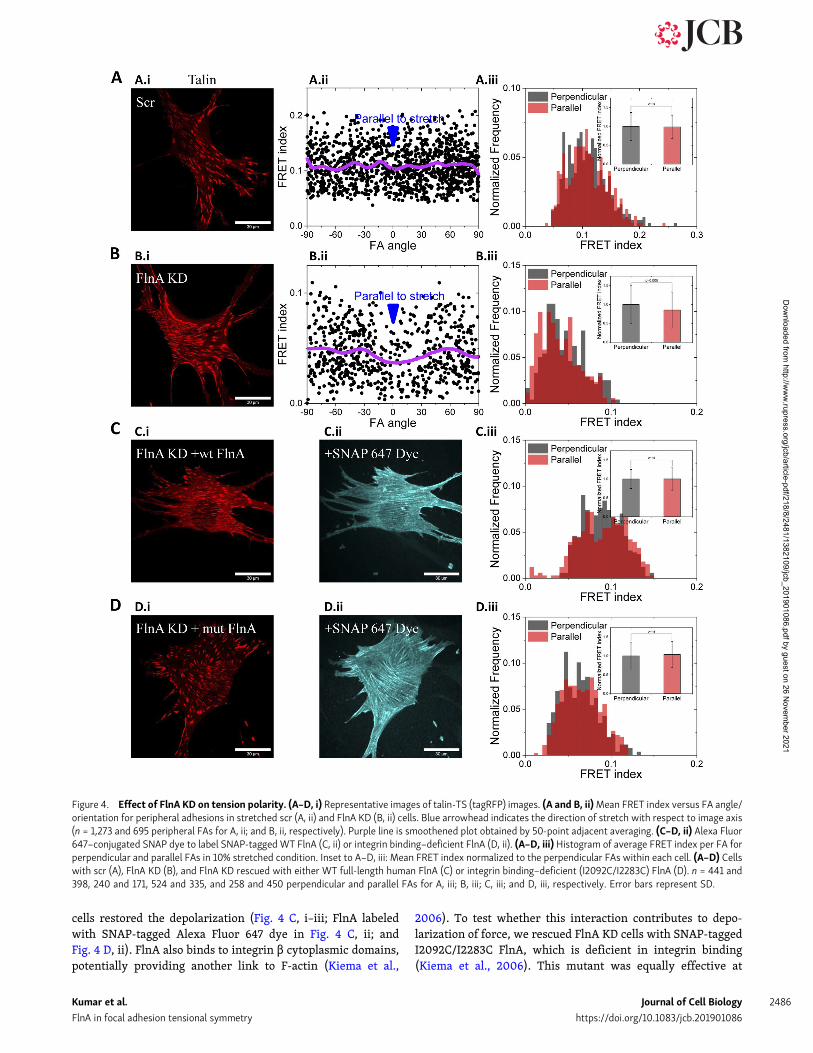
cells restored the depolarization (Fig. 4 C, i–iii; FlnA labeledwith SNAP-tagged Alexa Fluor 647 dye in Fig. 4 C, ii; andFig. 4 D, ii). FlnA also binds to integrin β cytoplasmic domains,potentially providing another link to F-actin (Kiema et al.,
2006). To test whether this interaction contributes to depo-larization of force, we rescued FlnA KD cells with SNAP-taggedI2092C/I2283C FlnA, which is deficient in integrin binding(Kiema et al., 2006). This mutant was equally effective at
Figure 4. Effect of FlnA KD on tension polarity. (A–D, i) Representative images of talin-TS (tagRFP) images. (A and B, ii)Mean FRET index versus FA angle/orientation for peripheral adhesions in stretched scr (A, ii) and FlnA KD (B, ii) cells. Blue arrowhead indicates the direction of stretch with respect to image axis(n = 1,273 and 695 peripheral FAs for A, ii; and B, ii, respectively). Purple line is smoothened plot obtained by 50-point adjacent averaging. (C–D, ii) Alexa Fluor647–conjugated SNAP dye to label SNAP-tagged WT FlnA (C, ii) or integrin binding–deficient FlnA (D, ii). (A–D, iii) Histogram of average FRET index per FA forperpendicular and parallel FAs in 10% stretched condition. Inset to A–D, iii: Mean FRET index normalized to the perpendicular FAs within each cell. (A–D) Cellswith scr (A), FlnA KD (B), and FlnA KD rescued with either WT full-length human FlnA (C) or integrin binding–deficient (I2092C/I2283C) FlnA (D). n = 441 and398, 240 and 171, 524 and 335, and 258 and 450 perpendicular and parallel FAs for A, iii; B, iii; C, iii; and D, iii, respectively. Error bars represent SD.
Kumar et al. Journal of Cell Biology 2486
FlnA in focal adhesion tensional symmetry https://doi.org/10.1083/jcb.201901086
Dow
nloaded from http://w
ww
.rupress.org/jcb/article-pdf/218/8/2481/1382109/jcb_201901086.pdf by guest on 26 Novem
ber 2021
restoring the polarized response in talin tension upon uniaxialstretch (Fig. 4 D, i–iii).
These studies yielded the unexpected result that an ani-sotropic stretch led to an isotropic increase in tension on talinacross the whole cell. This depolarized response required theactin cross-linker FlnA but did not require FlnA binding tointegrins. These results fit well with ultrastructural visuali-zation of a cortical actin network that connects and integratesSFs with different orientations/directions (Svitkina, 2007,2018). Here, we find that FlnA localizes preferentially to siteswhere the mesh-like isotropic actin cytoskeleton links to actinSF bundles and that FlnA depletion disrupts connectivity be-tween SFs from different directions without significantchanges in cell spread area or FA area and aspect ratio (Fig. 3;Baldassarre et al., 2009). Results from a conformation-sensitive FlnA biosensor suggested that FlnA in cells is un-der tension (Nakamura et al., 2014). We speculate that whencells are stretched, tension increases in both the actin SFs andthe isotropic cortical actin network according to their visco-elasticity. As an essential load-bearing element between thesenetworks, FlnA would thus play a major role in transferringtension between them to redistribute and equalize forceson FAs.
These results may be relevant to the ability of FlnA to pro-mote cell survival under mechanical load (Pinto et al., 2014).Cyclic strain increases expression of FlnA, which promotes ri-gidity and mechanical stability of the cortical actin cytoskeleton(D’Addario et al., 2001; Zhou et al., 2010; Razinia et al., 2012).Force application was found to rapidly decrease plasma mem-brane potential, which, in FlnA-deficient cells, contributed toirreversible cell depolarization and cell death (Kainulainen et al.,2002). The ability of FlnA to redistribute applied forces is likelyto contribute to its function in promoting cell survival understrain.
While tension on talin may be independent of strain direc-tion, the subsequent evolution of the cytoskeleton need not be.During sustained uniaxial stretch, there is an orientation-independent rapid induction of FA growth/reinforcement thatis followed by orientation-dependent slow FA disassembly, animportant step for enforcing alignment of cells perpendicular tothe direction of stretch (Faust et al., 2011; Chen et al., 2013). FAsgrow along actin SFs that serve as scaffolds for recruitment of FAcomponents, a role that is distinct from SF contractility (Choiet al., 2008). Thus, our findings do not conflict with results thatparallel and perpendicular FAs remodel differently in responseto uniaxial stretch (Chen et al., 2013) and align perpendicular tothe direction of cyclic uniaxial stretch (De et al., 2007; Faustet al., 2011). Indeed, detailed imaging suggested that remodel-ing begins with differential responses of the SFs rather than theFAs (Lee et al., 2010), while SFs show remodeling events in re-sponse to stretch at regions far from FAs (Smith et al., 2010).Thus, despite the lack of polarity at the level of talin tension, theorientation of SFs may therefore confer polarized cell responsesto applied forces.
In summary, these results reveal a key role for FlnA in in-tegrating FAs and SFswith the isotropic cortical actin network tomediate rapid distribution of forces and thereby modulate cell
responses. Further understanding of this “asymmetry breaking”process and its implications for cell mechanics and signaling willbe important for understanding both physiological and patho-logical responses to force, and diseases such as aneurysm anddevelopmental disorders related to filamin mutations (Zhouet al., 2010; Razinia et al., 2012).
Materials and methodsCell culture and plasmid transfectionTalin1−/− cells (Priddle et al., 1998) were cultured in DMEM/F12 (Gibco) with 10% FBS (Gibco), penicillin-streptomycin(Gibco), β-mercaptoethanol (5 µl in 500 ml; Sigma-Aldrich),and sodium bicarbonate (8 ml of 7.5% [weight by volume] in500 ml media; Sigma-Aldrich). NIH3T3 (ATCC) fibroblastswere cultured in DMEM (Gibco) with 10% FBS (Sigma-Aldrich) and penicillin-streptomycin (Gibco). Talin-TS was asdescribed (Kumar et al., 2016). SNAP-tagged WT and integrinbinding–deficient mutant FlnA constructs were derived fromcorresponding plasmids WT (pcDNA3-FlnA-GFP) and FlnAwith mutations I2092C/I2283C (Kiema et al., 2006; Lad et al.,2007) by replacing EGFP with the sequence encoding SNAP.All plasmids were constructed using PCR-based oligonucleo-tide synthesis and Gibson cloning and were confirmed by DNAsequencing. Talin1−/−mouse embryonic fibroblast and NIH3T3cells were transfected with Talin-TS and/or SNAP-tagged FlnAvectors using Jetprime reagent (Polyplus) and Lipofectamine2000 (Invitrogen), respectively, according to the manu-facturers’ protocol.
Antibody and dye labelingThe following primary antibodies were diluted in TBS with0.1% Tween 20 (Sigma-Aldrich) and used overnight at 4°C:rabbit polyclonal anti-human FlnA antibody, which cross-reacts with mouse FlnA (1:1,000 for Western blot [WB] and1:200 for IF; Kiema et al., 2006; Heuze et al., 2008; Iwamotoet al., 2018); mouse vinculin (1:2,000 for WB and 1:1,000 forIF; clone hVIN-1; V9131; Sigma-Aldrich), mouse tubulin(1:2,000 for WB; clone DM1a; T9026; Sigma-Aldrich), mousetalin (1:2,000 for WB and 1:500 for IF; clone 8d4; T3287;Sigma-Aldrich), integrin β1 (1:200 for WB; Chan and Hemler,1993), Alexa Fluor 647–conjugated Armenian hamster integrinβ1 (1:1,000 for IF; clone HMβ1-1; #102214; Biolegend); rabbitpaxillin (1:2,000 for WB and 1:500 for IF; ab32084; Abcam);rabbit phosphorylated Y31 paxillin (1:500 for WB and 1:400for IF; 44-720G; Invitrogen); rabbit tensin1 (1:2,000 for WBand 1:500 for IF; SAB4200283; Sigma-Aldrich); rabbit phos-phorylated Y397 FAK (1:2,000 for WB and 1:500 for IF; #3283;Cell Signaling Technology); goat anti-actin (1:2,000 for WB;C-11; sc-1615; Santa Cruz Biotechnology); and rabbit GAPDH(1:2,500 for WB; #2118; Cell Signaling Technology). Actin waslabeled using Alexa Fluor 647–conjugated phalloidin (1:200 inPBS; Molecular Probes). Nuclei were labeled using Hoechst33342 (1:1,000 in PBS; Molecular Probes). SNAP-tagged filaminwas labeled using Alexa Fluor 647–conjugated cell-permeableSNAP dye (1:200 in cell culture media; New England Biolabs).
Kumar et al. Journal of Cell Biology 2487
FlnA in focal adhesion tensional symmetry https://doi.org/10.1083/jcb.201901086
Dow
nloaded from http://w
ww
.rupress.org/jcb/article-pdf/218/8/2481/1382109/jcb_201901086.pdf by guest on 26 Novem
ber 2021

FlnA KDFlnA was depleted using lentivirus targeting mouse shRNA(sequence 59-CTAGAAGCTCCCATGGCAATG-39) in pLKO.1 vec-tor. For lentivirus production, HEK 293Tx cells (ATCC) wereplated overnight at 70% confluency in 10-cm dishes and trans-fected with either scr or FlnA shRNA plus equal amounts of thetwo third-generation packaging plasmids (Addgene) using Lip-ofectamine 2000 (Invitrogen) according to the manufacturer’sprotocol. Transfection media were replaced after 6 h withstandard culture media. Lentivirus particle-rich media werecollected after 48 h and centrifuged at 300 g at 4°C for 15 min.For infection, this supernatant plus 4 µg/ml polybrene wasadded to NIH3T3 cells plated overnight at 70% confluency. 1 dlater, infection media were replaced with fresh growth medium.After 2 d, cells were replated, and the next day, 6 µg/ml puro-mycin was added. Cells were used after 5 d of selection, whichwas sufficient to kill control, uninfected cells.
Stretching cellsThe uniaxial stretcher was fabricated by 3D printing (YaleCenter for Engineering Innovation and Design, New Haven, CT)as shown in Fig. 1, A and B. Membranes were made from PDMSSylgard 184 (Dow Corning) by thoroughly mixing the base andcuring agent in a 10:1 ratio. Thin (∼400 µm) membranes used∼7.5 g in a 15-cm Petri plate; thick rings for creating wells used∼45 g in a 10-cm Petri plate. PDMS was polymerized at 80°C for3 h for curing. Membranes (29 mm × 44 mm) were cut and at-tached to the stretcher. Thick PDMS rings with inner diametersof 19 mmwas kept on the membranes to create wells to hold thecells and culture medium. The devices were UV sterilized for20 min in a tissue culture hood and then coated with 10 µg/mlfibronectin. Cells were plated on the membrane at low densityfor 6 h before stretching. The thick PDMS ring was removed,stretch was applied, and cells were immediately fixed using 4%paraformaldehyde in PBS. Cells were washed four or five timeswith PBS. The PDMS membranes (in their stretched or un-stretched state) were glued to a plastic slide, which was thenglued to a glass slide for stability. Cells were mounted usingProlong Gold mounting medium, and the PDMS membraneswere cut from the stretcher and imaged within 2–3 d.
Calibration of uniaxial stretcher deviceTo calibrate the strain profile of the uniaxial stretcher, 2-µmyellow-green fluorosphere carboxylate fluorescent beads (In-vitrogen) were adhered to the PDMS membrane assembled inthe device as follows: the PDMS was silanized by adding 300 µlof (3-aminopropyl) triethoxysilane (Sigma-Aldrich) at roomtemperature for 15 min. Bead solution was prepared by mixing5 ml borate buffer (0.76 g sodium tetraborate decahydrateand 1 g boric acid [Sigma-Aldrich] in 200 ml water, stirred at70°C until clear, pH adjusted to 7.4 by adding more boricacid and stirring), 50 µl N-(3-dimethylaminopropyl)-N9-ethyl-carbodiimide hydrochloride (EDC; Sigma-Aldrich) solution(5 mg EDC in 500 µl water), and 2 µl of stock bead suspension.1 ml freshly prepared bead solution was placed on the freshlysilanized membrane and incubated for 2 h at room temperature.The membranes were thoroughly washed with water, and
the density of the beads was checked under a fluorescencemicroscope.
For characterization, the device was kept upside down on themicroscope slide holder, and four different regions of interests(1,785 µm × 1,785 µm), each within the central region of the wellon the membrane, were imaged using 4× objective (0.2 NA; PlanApo Nikon) before and after 10% stretch. Paired bead imageswere aligned using Template Matching plugin in ImageJ (Na-tional Institutes of Health) by choosing a 250 pixel × 250 pixelregion in the center of image. Averaged relative beads dis-placement vector was determined using PIV using the IterativePIV (cross-correlation) plugin in ImageJ. Three-pass PIV analysiswas performed using 256 × 256, 128 × 128, and 64 × 64 pixelinterrogation window size. Post-PIV processing was performedusing the normalized median test, and invalid vectors were re-placed by median vectors. PDMS has a Poisson’s ratio of ∼0.5,which means that to conserve the volume of the total materialunder a given stretch, there will be compression close to 50%.However, the profile of stretch and compression depends on theaspect ratio of the membrane used and the boundary conditions.As shown earlier (Shao et al., 2013), the central region has auniform strain profile that is also found our custom-built uni-axial stretcher. For 10% stretch along the x axis, there is com-pression of 3.3 ± 0.2% along the y axis. Both stretch andcompression strain profiles are uniform in the areas of thePDMS used for plating cells and imaging before/after stretch.
FA threshold and error in angle estimationFA segmentation was performed as described before (Kumaret al., 2016, 2018). Images were individually checked manuallyafter segmentation. To estimate the error in angle calculation,four different thresholding conditions were applied to FAswithin the same cell, and themask from each condition was usedto get the angle of the ellipse that best fits the mask usingImageJ. Fig. S1 H shows inverted intensity image of FAs from acell along with four different threshold masks (Fig. S1 I, upperpanel) in decreasing order of lower-intensity cut-off and cor-responding ellipse (Fig. S1 I, lower panel) that best fits these FAmasks. The angle of the FA was estimated from the major axis ofthese ellipse. The average SD in angle measurement was de-termined to be 1.2 ± 0.7° from n = 10 FAs. FAs oriented at angleswithin ±30° of 90° and 0° were segregated into perpendicularand parallel; thus, angle estimation and FA classification arevery robust without any overlap between the two categories.
Imaging and analysisFRAP experiments were performed on a microscope (Eclipse Ti;Nikon) equipped with a spinning disk confocal imaging system(Ultraview Vox; PerkinElmer) and an electron-multiplyingcharged-coupled device camera (C9100-50; Hamamatsu Pho-tonics), using a 100×, 1.4 NA oil objective. Cells were maintainedat 37°C with humidity and CO2 control. Images were acquiredusing Velocity 6.6.1 software. Three prebleach images at 2-sintervals and then a laser pulse at 100% power of the 488-nmline were used to bleach a circular region of 1 µm diameter.Time-lapse images were then acquired every 5 s for 2.5 min.Images were corrected for photobleaching during image
Kumar et al. Journal of Cell Biology 2488
FlnA in focal adhesion tensional symmetry https://doi.org/10.1083/jcb.201901086
Dow
nloaded from http://w
ww
.rupress.org/jcb/article-pdf/218/8/2481/1382109/jcb_201901086.pdf by guest on 26 Novem
ber 2021

acquisition, and normalized FRAP curves were plotted in Origin(9.1; 64 bit). FRET imaging and analyses were done as describedpreviously (Kumar et al., 2016). ImageJ was used for basic im-age processing. All analyses were done using custom-writtensoftware (MATLABR2014a; MathWorks; Kumar et al., 2016). Allof the graphs were plotted in Origin (9.1; 64 bit). For statisticalanalysis, data distribution was assumed to be normal, but thiswas not formally tested. P value for statistical significance wasdetermined from Student’s t test, and one-way ANOVA analysiswas performed to check the statistical significance in Originsoftware for all the plots in figures.
PREMCells were plated on coverslips coated with 10 μg/ml fibronectinand cultured overnight. Detailed procedures for PREM and im-munogold staining were described previously (Svitkina andBorisy, 1998, 2006; Svitkina, 2007, 2009). Briefly, cells wereextracted for 2min at room temperature with 1% Triton X-100 inPEM buffer (100mMPipes-KOH, pH 6.9, 1 mMMgCl2, and 1 mMEGTA) containing 30% glycerol and 10 µM phalloidin (Sigma-Aldrich). 10 µM phalloidin was added at all subsequent stepsbefore fixation. After three quick rinses with PEM buffer,detergent-extracted cells were incubated with FlnA antibody at1:200 in PEM buffer for 30 min at room temperature. Sampleswere rinsed twice in PEM, incubated in the third change of PEMfor 15 min, and fixed with 2% glutaraldehyde in PBS for 20 min.Samples were quenched with 2 mg/ml NaBH4 in PBS, washedthree times in PBS, incubated with goat Alexa anti-rabbit sec-ondary antibody (Molecular Probes) for 40 min, washed threetimes in PBS, blocked in 0.1% bovine serum albumin, incubatedovernight with 18-nm gold-conjugated donkey anti-goat anti-body (Jackson ImmunoResearch), and washed and fixed with 2%glutaraldehyde. Samples were then fixed with tannic acid anduranyl acetate, critical point dried, coated with platinum andcarbon, transferred onto EM grids, and analyzed using a JEM1011 transmission EM (JEOL USA) operated at 100 kV. Imageswere captured with an ORIUS 832.10W CCD camera (Gatan) andpresented in inverted contrast.
PREM image analysisQuantification of the SF connection types at the lamella junc-tions was done on PREM images taken at 20,000× magnifica-tion. The SFs at the lamella junctions were manually classifiedinto one of three categories: merging, partially merging, oroverlapping (not merging). The quantification was done on 36lamella junctions (14 control cells) and 34 lamella junctions(20 FlnA-depleted cells). Analysis of SF interconnectivity wasdone on PREM images taken at 20,000× magnification usingMetamorph imaging software (Molecular Devices). Line scans of3 µm length (1,200 pixels) were drawn across the cell lamellaperpendicular to the direction of SFs. The pixels correspondingto the SFs (actin bundles) appear bright (high pixel intensity),and the gaps between them are dark (low pixel intensity).Continuous bright pixels, which were above average pixel in-tensity in the line scan, were considered as one actin bundle, orintensity peak. The number of intensity peaks permicrometer ofa line scan was counted in line scans of 14 control and 14 FlnA KD
cells and represented as mean ± SD. Quantification of im-munogold particles was done on PREM images taken at≥60,000× magnification after contrast enhancement to distin-guish the gold particles from other bright objects. Color labelingof other structures of interest was performed using Hue/Satu-ration tool in Adobe Photoshop to avoid obscuring the structuraldetails. FlnA immunogold particles located on SFs were classi-fied into two categories: (1) located on crossing actin filamentsand (2) located on parallel actin filaments. The gold particlesfrom the two groups were color-labeled in red or green using abrush tool in Adobe Photoshop and counted. In total, we ana-lyzed 4,234 gold particles from a 137-µm2 SF area of 10 cells.
Online supplemental materialFig. S1 shows the calibration of custom-made uniaxial stretchdevice; schematic of control and TS; control talin-CS FRET inunstretched and 10% stretch conditions; estimate of the error inFA angle determination; quantification of FlnA KD from WBs;and various comparisons of morphometric parameters, FRAPcurves, and total proteins in control and FlnA KD cells. Fig. S2shows the difference in localization of various FA-associatedproteins within individual adhesions by IF image quantifica-tion in scr and FlnA KD cells. Fig. S3 shows additional PREMimages of scr and FlnA KD cells and representative line scans,and quantification of talin-TS FRET index and cell orientation (atdifferent time points) of scr and FlnA KD cells in unstretchedand 10% stretched conditions.
AcknowledgmentsWe thank Koen Van Den Dries, Tyler D. Ross, and Tristan P.Driscoll for help in fabricating uniaxial stretcher devices.
This work was supported by the U.S. Department of Defense/Army Research Office through Multidisciplinary University Re-search Initiative grant W911NF1410403 to M.A. Schwartz and Na-tional Institutes of Health grant R01 GM 095977 to T.M. Svitkina.
The authors declare no competing financial interests.Author contributions: A. Kumar and M.A. Schwartz con-
ceived the project and designed the experiments. A. Kumarcarried out the experiments and analyzed the data. M.S. Shutovaand T.M. Svitkina carried out EM and data analysis. K. Tanakamade the FlnA-SNAP plasmids. D.V. Iwamoto and D.A. Calderwoodprovided the shRNA for FlnA KD and EGFP-tagged WT andmutant FlnA constructs. A. Kumar wrote the first draft. M.A.Schwartz revised the manuscript with input from all authors.
Submitted: 15 January 2019Revised: 3 May 2019Accepted: 17 June 2019
ReferencesAtherton, P., B. Stutchbury, D.Y. Wang, D. Jethwa, R. Tsang, E. Meiler-
Rodriguez, P. Wang, N. Bate, R. Zent, I.L. Barsukov, et al. 2015. Vinculincontrols talin engagement with the actomyosin machinery. Nat. Com-mun. 6:10038. https://doi.org/10.1038/ncomms10038
Austen, K., P. Ringer, A. Mehlich, A. Chrostek-Grashoff, C. Kluger, C.Klingner, B. Sabass, R. Zent, M. Rief, and C. Grashoff. 2015.
Kumar et al. Journal of Cell Biology 2489
FlnA in focal adhesion tensional symmetry https://doi.org/10.1083/jcb.201901086
Dow
nloaded from http://w
ww
.rupress.org/jcb/article-pdf/218/8/2481/1382109/jcb_201901086.pdf by guest on 26 Novem
ber 2021

Extracellular rigidity sensing by talin isoform-specific mechanicallinkages. Nat. Cell Biol. 17:1597–1606. https://doi.org/10.1038/ncb3268
Baldassarre, M., Z. Razinia, C.F. Burande, I. Lamsoul, P.G. Lutz, and D.A.Calderwood. 2009. Filamins regulate cell spreading and initiation of cellmigration. PLoS One. 4:e7830. https://doi.org/10.1371/journal.pone.0007830
Chan, B.M., and M.E. Hemler. 1993. Multiple functional forms of the integrinVLA-2 can be derived from a single alpha 2 cDNA clone: interconversionof forms induced by an anti-beta 1 antibody. J. Cell Biol. 120:537–543.https://doi.org/10.1083/jcb.120.2.537
Chen, Y., A.M. Pasapera, A.P. Koretsky, and C.M. Waterman. 2013.Orientation-specific responses to sustained uniaxial stretching in focaladhesion growth and turnover. Proc. Natl. Acad. Sci. USA. 110:E2352–E2361.https://doi.org/10.1073/pnas.1221637110
Choi, C.K., M. Vicente-Manzanares, J. Zareno, L.A. Whitmore, A. Mogilner,and A.R. Horwitz. 2008. Actin and alpha-actinin orchestrate the as-sembly and maturation of nascent adhesions in a myosin II motor-independent manner. Nat. Cell Biol. 10:1039–1050. https://doi.org/10.1038/ncb1763
D’Addario, M., P.D. Arora, J. Fan, B. Ganss, R.P. Ellen, and C.A. McCulloch.2001. Cytoprotection against mechanical forces delivered through beta1 integrins requires induction of filamin A. J. Biol. Chem. 276:31969–31977. https://doi.org/10.1074/jbc.M102715200
De, R., A. Zemel, and S.A. Safran. 2007. Dynamics of cell orientation. Nat.Phys. 3:655–659. https://doi.org/10.1038/nphys680
del Rio, A., R. Perez-Jimenez, R. Liu, P. Roca-Cusachs, J.M. Fernandez, andM.P. Sheetz. 2009. Stretching single talin rod molecules activates vin-culin binding. Science. 323:638–641. https://doi.org/10.1126/science.1162912
Eghiaian, F., A. Rigato, and S. Scheuring. 2015. Structural, mechanical, anddynamical variability of the actin cortex in living cells. Biophys. J. 108:1330–1340. https://doi.org/10.1016/j.bpj.2015.01.016
Faust, U., N. Hampe, W. Rubner, N. Kirchgessner, S. Safran, B. Hoffmann,and R. Merkel. 2011. Cyclic stress at mHz frequencies aligns fibroblastsin direction of zero strain. PLoS One. 6:e28963. https://doi.org/10.1371/journal.pone.0028963
Feng, Y., M.H. Chen, I.P. Moskowitz, A.M. Mendonza, L. Vidali, F. Nakamura,D.J. Kwiatkowski, and C.A. Walsh. 2006. Filamin A (FLNA) is requiredfor cell-cell contact in vascular development and cardiac morphogen-esis. Proc. Natl. Acad. Sci. USA. 103:19836–19841. https://doi.org/10.1073/pnas.0609628104
Geiger, B., J.P. Spatz, and A.D. Bershadsky. 2009. Environmental sensingthrough focal adhesions. Nat. Rev. Mol. Cell Biol. 10:21–33. https://doi.org/10.1038/nrm2593
Goult, B.T., J. Yan, and M.A. Schwartz. 2018. Talin as a mechanosensitivesignaling hub. J. Cell Biol. 217:3776–3784. https://doi.org/10.1083/jcb.201808061
Grashoff, C., B.D. Hoffman, M.D. Brenner, R. Zhou, M. Parsons, M.T. Yang,M.A. McLean, S.G. Sligar, C.S. Chen, T. Ha, and M.A. Schwartz. 2010.Measuring mechanical tension across vinculin reveals regulation offocal adhesion dynamics. Nature. 466:263–266. https://doi.org/10.1038/nature09198
Heuze, M.L., I. Lamsoul, M. Baldassarre, Y. Lad, S. Leveque, Z. Razinia, C.Moog-Lutz, D.A. Calderwood, and P.G. Lutz. 2008. ASB2 targets fila-mins A and B to proteasomal degradation. Blood. 112:5130–5140. https://doi.org/10.1182/blood-2007-12-128744
Himmel, M., A. Ritter, S. Rothemund, B.V. Pauling, K. Rottner, A.R. Gingras,andW.H. Ziegler. 2009. Control of high affinity interactions in the talinC terminus: how talin domains coordinate protein dynamics in celladhesions. J. Biol. Chem. 284:13832–13842. https://doi.org/10.1074/jbc.M900266200
Hirata, H., H. Tatsumi, C.T. Lim, and M. Sokabe. 2014. Force-dependentvinculin binding to talin in live cells: a crucial step in anchor-ing the actin cytoskeleton to focal adhesions. Am. J. Physiol.Cell Physiol. 306:C607–C620. https://doi.org/10.1152/ajpcell.00122.2013
Hsu, H.J., C.F. Lee, A. Locke, S.Q. Vanderzyl, and R. Kaunas. 2010. Stretch-induced stress fiber remodeling and the activations of JNK and ERKdepend on mechanical strain rate, but not FAK. PLoS One. 5:e12470.https://doi.org/10.1371/journal.pone.0012470
Humphrey, J.D., E.R. Dufresne, and M.A. Schwartz. 2014. Mechano-transduction and extracellular matrix homeostasis. Nat. Rev. Mol. CellBiol. 15:802–812. https://doi.org/10.1038/nrm3896
Iwamoto, D.V., A. Huehn, B. Simon, C. Huet-Calderwood,M. Baldassarre, C.V.Sindelar, and D.A. Calderwood. 2018. Structural basis of the filamin A
actin-binding domain interaction with F-actin. Nat. Struct. Mol. Biol. 25:918–927. https://doi.org/10.1038/s41594-018-0128-3
Kainulainen, T., A. Pender, M. D’Addario, Y. Feng, P. Lekic, and C.A.McCulloch. 2002. Cell death and mechanoprotection by filamin a inconnective tissues after challenge by applied tensile forces. J. Biol. Chem.277:21998–22009. https://doi.org/10.1074/jbc.M200715200
Kaneko, D., Y. Sasazaki, T. Kikuchi, T. Ono, K. Nemoto, H. Matsumoto, and Y.Toyama. 2009. Temporal effects of cyclic stretching on distribution andgene expression of integrin and cytoskeleton by ligament fibroblastsin vitro. Connect. Tissue Res. 50:263–269. https://doi.org/10.1080/03008200902846270
Kiema, T., Y. Lad, P. Jiang, C.L. Oxley, M. Baldassarre, K.L. Wegener, I.D.Campbell, J. Ylanne, and D.A. Calderwood. 2006. The molecular basis offilamin binding to integrins and competition with talin. Mol. Cell. 21:337–347. https://doi.org/10.1016/j.molcel.2006.01.011
Klapholz, B., and N.H. Brown. 2017. Talin - the master of integrin adhesions.J. Cell Sci. 130:2435–2446. https://doi.org/10.1242/jcs.190991
Kumar, A., M. Ouyang, K. Van den Dries, E.J. McGhee, K. Tanaka, M.D. An-derson, A. Groisman, B.T. Goult, K.I. Anderson, and M.A. Schwartz.2016. Correction: Talin tension sensor reveals novel features of focaladhesion force transmission andmechanosensitivity. J. Cell Biol. 214:231.https://doi.org/10.1083/jcb.20151001207062016c
Kumar, A., K.L. Anderson, M.F. Swift, D. Hanein, N. Volkmann, and M.A.Schwartz. 2018. Local Tension on Talin in Focal Adhesions Correlateswith F-Actin Alignment at the Nanometer Scale. Biophys. J. 115:1569–1579. https://doi.org/10.1016/j.bpj.2018.08.045
Lad, Y., T. Kiema, P. Jiang, O.T. Pentikainen, C.H. Coles, I.D. Campbell, D.A.Calderwood, and J. Ylanne. 2007. Structure of three tandem filamindomains reveals auto-inhibition of ligand binding. EMBO J. 26:3993–4004. https://doi.org/10.1038/sj.emboj.7601827
Lee, C.F., C. Haase, S. Deguchi, and R. Kaunas. 2010. Cyclic stretch-inducedstress fiber dynamics - dependence on strain rate, Rho-kinase andMLCK. Biochem. Biophys. Res. Commun. 401:344–349. https://doi.org/10.1016/j.bbrc.2010.09.046
Nagayama, K., Y. Kimura, N. Makino, and T. Matsumoto. 2012. Strainwaveform dependence of stress fiber reorientation in cyclicallystretched osteoblastic cells: effects of viscoelastic compression of stressfibers. Am. J. Physiol. Cell Physiol. 302:C1469–C1478. https://doi.org/10.1152/ajpcell.00155.2011
Nakamura, F., M. Song, J.H. Hartwig, and T.P. Stossel. 2014. Documentationand localization of force-mediated filamin A domain perturbationsin moving cells. Nat. Commun. 5:4656. https://doi.org/10.1038/ncomms5656
Patel, B., A.R. Gingras, A.A. Bobkov, L.M. Fujimoto, M. Zhang, R.C. Lid-dington, D. Mazzeo, J. Emsley, G.C. Roberts, I.L. Barsukov, and D.R.Critchley. 2006. The activity of the vinculin binding sites in talinis influenced by the stability of the helical bundles that make up thetalin rod. J. Biol. Chem. 281:7458–7467. https://doi.org/10.1074/jbc.M508058200
Pinto, V.I., V.W. Senini, Y. Wang, M.P. Kazembe, and C.A. McCulloch. 2014.Filamin A protects cells against force-induced apoptosis by stabilizingtalin- and vinculin-containing cell adhesions. FASEB J. 28:453–463.https://doi.org/10.1096/fj.13-233759
Priddle, H., L. Hemmings, S. Monkley, A. Woods, B. Patel, D. Sutton, G.A.Dunn, D. Zicha, and D.R. Critchley. 1998. Disruption of the talin genecompromises focal adhesion assembly in undifferentiated but not dif-ferentiated embryonic stem cells. J. Cell Biol. 142:1121–1133. https://doi.org/10.1083/jcb.142.4.1121
Razinia, Z., T. Makela, J. Ylanne, and D.A. Calderwood. 2012. Filamins inmechanosensing and signaling. Annu. Rev. Biophys. 41:227–246. https://doi.org/10.1146/annurev-biophys-050511-102252
Shao, Y., X. Tan, R. Novitski, M. Muqaddam, P. List, L. Williamson, J. Fu, andA.P. Liu. 2013. Uniaxial cell stretching device for live-cell imaging ofmechanosensitive cellular functions. Rev. Sci. Instrum. 84:114304.https://doi.org/10.1063/1.4832977
Smith, M.A., E. Blankman, M.L. Gardel, L. Luettjohann, C.M. Waterman, andM.C. Beckerle. 2010. A zyxin-mediated mechanism for actin stress fibermaintenance and repair. Dev. Cell. 19:365–376. https://doi.org/10.1016/j.devcel.2010.08.008
Svitkina, T. 2007. Electron microscopic analysis of the leading edge in mi-grating cells. Methods Cell Biol. 79:295–319. https://doi.org/10.1016/S0091-679X(06)79012-4
Svitkina, T. 2009. Imaging cytoskeleton components by electron microscopy.Methods Mol. Biol. 586:187–206. https://doi.org/10.1007/978-1-60761-376-3_10
Kumar et al. Journal of Cell Biology 2490
FlnA in focal adhesion tensional symmetry https://doi.org/10.1083/jcb.201901086
Dow
nloaded from http://w
ww
.rupress.org/jcb/article-pdf/218/8/2481/1382109/jcb_201901086.pdf by guest on 26 Novem
ber 2021

Svitkina, T.M. 2018. Ultrastructure of the actin cytoskeleton. Curr. Opin. CellBiol. 54:1–8. https://doi.org/10.1016/j.ceb.2018.02.007
Svitkina, T.M., and G.G. Borisy. 1998. Correlative light and electron micros-copy of the cytoskeleton of cultured cells. Methods Enzymol. 298:570–592. https://doi.org/10.1016/S0076-6879(98)98045-4
Svitkina, T.M., and G.G. Borisy. 2006. Correlative Light and Electron Mi-croscopy of the Cytoskeleton. In Cell Biology. Third edition. J.E. Celis,editor. Academic Press, Burlington. 277–285. https://doi.org/10.1016/B978-012164730-8/50156-8
Vogel, V., andM. Sheetz. 2006. Local force and geometry sensing regulate cellfunctions. Nat. Rev. Mol. Cell Biol. 7:265–275. https://doi.org/10.1038/nrm1890
Wang, J.H., G. Yang, Z. Li, and W. Shen. 2004. Fibroblast responses to cyclicmechanical stretching depend on cell orientation to the stretching direc-tion. J. Biomech. 37:573–576. https://doi.org/10.1016/j.jbiomech.2003.09.011
Zhou, A.X., J.H. Hartwig, and L.M. Akyürek. 2010. Filamins in cell signaling,transcription and organ development. Trends Cell Biol. 20:113–123.https://doi.org/10.1016/j.tcb.2009.12.001
Kumar et al. Journal of Cell Biology 2491
FlnA in focal adhesion tensional symmetry https://doi.org/10.1083/jcb.201901086
Dow
nloaded from http://w
ww
.rupress.org/jcb/article-pdf/218/8/2481/1382109/jcb_201901086.pdf by guest on 26 Novem
ber 2021