Embed Size (px)
Citation preview

Report
9th TAF TSI Implementation Status Report ERA-REP-114 - IMPL-2018-02
120 Rue Marc Lefrancq | BP 20392 | FR-59307 Valenciennes Cedex 1 / 95 Tel. +33 (0)327 09 65 00 | era.europa.eu
Report
9th TAF TSI IMPLEMENTATION STATUS REPORT OF THE EUROPEAN UNION AGENCY FOR RAILWAYS –2nd HALF 2018
Drafted by Validated by Approved by
Name Mickael Varga Filip Skibinski Pio Guido
Position Telematics Coordinator Project Officer Head of Unit
Date 23/05/2019 24/05/2019 24/05/2019
Signature Signed Signed Signed
Document History
Version Date Comments
0.1 02/03/2019 1st draft
0.2 29/03/2019 2nd dratf: incorporation of agreed items from the 27 03 2019 TAF cooperation WG meeting (GIS maps, new annexes etc)
0.3 24/05/2019 Incorporation of remarks from CER, NCP CH, NCP HU, NCP DE and NCP LU.

2
Contents
Contents 2
Abbreviations...................................................................................................................................................... 3
Reference documents ........................................................................................................................................ 5
Reference legislation .......................................................................................................................................... 5
Table of Figures .................................................................................................................................................. 7
1. Executive summary ............................................................................................................................. 8
2. Introduction ...................................................................................................................................... 11
3. Context .............................................................................................................................................. 12
4. Participation in the 9th Reporting Session........................................................................................ 16
i. Responses to the survey ................................................................................................................... 16
ii. Participation per company type ........................................................................................................ 18
5. Data Basis for evaluation .................................................................................................................. 20
6. Implementation monitoring of TAF TSI functions ............................................................................. 22
i. Common Reference Files – Primary Location Codes (IMs) ............................................................... 22
ii. Common Reference Files - Company Code (all companies) ............................................................. 24
iii. Common Interface Implementation (all companies) ........................................................................ 26
iv. Train Running Information (IMs and RUs-F) ..................................................................................... 29
v. Train Composition Message (IMs and RUs-F) ................................................................................... 32
vi. Consignment Note Data (RUs-F) ....................................................................................................... 34
vii. Wagon Movement (RUs-F) ................................................................................................................ 36
viii. Wagon and Intermodal Unit Operating Database (RUs-F) ............................................................... 38
ix. Rolling Stock Reference Database (WKs) .......................................................................................... 40
x. Reasons for not starting implementation of TAF/TAP TSI functions ................................................ 42
xi. Degree of implementation at European level ................................................................................... 43
7. Common Sector Tools ....................................................................................................................... 45
8. Conclusion and Findings .................................................................................................................... 46
9. Upcoming next reporting session .................................................................................................... 47
i. Functions to be reported in the next report ..................................................................................... 47
ii. Calendar for next reporting .............................................................................................................. 47
ANNEX 1: Distribution of freight fleet per country in Europe .......................................................................... 48
ANNEX 2: Responses contact list v9 ................................................................................................................. 49
ANNEX 3: Responses contact list v8 ................................................................................................................. 55
ANNEX 4: GIS Maps with TAF masterplan dates per function ......................................................................... 59
ANNEX 5: DEVELOPMENT TABLES PER FUNCTION AND PER COUNTRY THROUGHOUT THE REPORTING SESSIONS ....................................................................................................................... 72
1. Development of Company Codes RUs / WKs / IMs .......................................................................... 72
2. Development of IM functions ........................................................................................................... 73
3. Development of RU / WK functions .................................................................................................. 84

3
Abbreviations
Abbreviation Definition
CC Company Code
CEF Connecting Europe Facility
CER Community of European Railway and Infrastructure Companies
CI Common Interface
CRD Central Reference Database
DI Degree of Implementation
EC European Commission
ECM Entity in Charge of Maintenance
EIM European Rail Infrastructure Managers
EPTO European Passenger Transport Operators
ERA European Union Agency for Railways (also referred to as Agency)
ERFA European Rail Freight Association
ESC European Shippers’ Council
ETA Estimated Time of Arrival
GCU General Contract for Use of Wagons
GIS Geographical Information System
ICG Implementation Cooperation Group
IM Infrastructure Manager
INEA Innovation and Networks Executive Agency
JSG Joint Sector Group
NCP National Contact Point
PCS Path Coordination System by RNE
PM2 Official Project Management Methodology of the European Commission
RailData International organisation of European cargo Railway Undertakings. It is established as special group of the International Union of Railways (UIC)
RISC Rail Interoperability and Safety Committee
RNE Rail Net Europe
RSRD Rolling Stock Reference Database
RSRD2 Rolling Stock Reference Database implementation made by UIP members
RU Railway Undertaking
TAF Telematics Applications for Freight

4
Abbreviation Definition
TCM Train Composition Message
TIS Train Information System developed by RNE
TRI Train Running Information
TSI Technical Specification for Interoperability
UIC Union Internationale des Chemins de fer
UIRR International Union for Road-Rail Combined Transport
UIP International Union of Wagon Keepers
UITP International Organisation for Public Transport
UNIFE Association of the European Rail Industry
WIMO Wagon and Intermodal Unit Operational Database
WK Wagon Keeper

5
Reference documents
Ref. N° Title Reference Version
(1) TAF-TSI Master Plan
TAF Master Plan – v4.0 17.01.2013
(2) NOTE TO ERA EXECUTIVE DIRECTOR: Assessment of TAF TSI implementation by the European Railway Agency
Ref. Ares(2014)1706338 26.05.2014
(3) 1st Status Report in 2014 of the European Railway Agency for European Commission regarding the Implementation of TAF TSI.
1st Status Report ERA-REP-114 - IMPL-2015-01
21.04.2015
(4) 2nd Status Report in 2014 of the European Railway Agency for European Commission regarding the Implementation of TAF TSI.
2nd Status Report ERA-REP-114 - IMPL-2015-02
27.11.2015
(5) 3rd TAF TSI Implementation Status Report of the European Union Agency for Railways – 2nd Half 2015
3rd TAF TSI Implementation Status Report ERA-REP-114-
IMPL-2016-01.
26.07.2016
(6) 4th TAF TSI Implementation Status Report of the European Union Agency for Railways – 1st Half 2015
4th TAF TSI Implementation Status Report ERA-REP-114-
IMPL-2016-02.
22.12.2016
(7) 5th ERA TAF TSI Implementation Cooperation Group held on 22nd and 23rd March 2017
Minutes_TAF_Cooperation Group_20170322_23_Draft_v02
27.03.2017
Reference legislation
Ref. N° Document Reference Title Last Issue
[1] Directive 2008/57/EC Interoperability of the rail system 17.06.2008
[1] Directive (EU) 2016/797 Directive of the European Parliament and of the Council of 11 May 2016 on the interoperability of the rail system within the European Union
11.05.2016
[2] TAF TSI Regulation No 1305/2014
Commission Regulation (EU) No 1305/2014 of 11 December 2014 on the technical specification for interoperability relating to the telematics applications for freight subsystem of the rail system in the European Union and repealing the Regulation (EC) No 62/2006
11.12.2014
[3] Corridor Regulation N° 913/2010
Regulation (EU) No 913/2010 of the European Parliament and of the Council of 22 September
22.09.2010
6
Ref. N° Document Reference Title Last Issue
2010 concerning a European rail network for competitive freight
[4] CEF Regulation Regulation (EU) No 1316/2013 of the European Parliament and of the Council of 11 December 2013 establishing the Connecting Europe Facility, amending Regulation (EU) No 913/2010 and repealing Regulations (EC) No 680/2007 and (EC) No 67/2010
11.12.2013

7
Table of Figures
Figure 1: Agency TAF TSI Implementation Cooperation Group process. ........................................................ 11 Figure 2: PM2 project lifecycle. ........................................................................................................................ 15 Figure 3: Reporting Schedule for the 10th Reporting wave ............................................................................. 47 Diagram 1: Evolution of participation over time ............................................................................................. 16 Diagram 2: Evolution of response rate over time ........................................................................................... 17 Diagram 3: Number of responses per country ................................................................................................ 17 Diagram 4: Evolution of responses per country .............................................................................................. 18 Diagram 5: Evolution of participating per company type over time ............................................................... 19 Diagram 6: Number of types of company per reporting session .................................................................... 20 Diagram 7: Number of types of company per reporting session .................................................................... 21 Diagram 8: Common Reference Files - Primary Location Codes (PLC) ............................................................ 22 Diagram 9: Evolution of PLC implementation ................................................................................................. 23 Diagram 10: Common Reference Files - Company Codes (CC)........................................................................ 24 Diagram 11: Evolution of implementation for Company Codes ..................................................................... 24 Diagram 12: Common Reference Files – Common Interface (CI) .................................................................... 26 Diagram 13: Evolution of implementation for Common Interface ................................................................. 27 Diagram 14: Train Running Information (TRI) ................................................................................................. 29 Diagram 15: Evolution of implementation for Train Running Information ..................................................... 30 Diagram 16: Implementation of TRI of IMs across European countries ......................................................... 31 Diagram 17: Train Composition Message (TCM) ............................................................................................. 32 Diagram 18: Evolution of implementation for Train Composition Message ................................................... 32 Diagram 19: Implementation of TCM of IMs across European countries ....................................................... 33 Diagram 20: Consignment Note Data (CND) ................................................................................................... 34 Diagram 21: Evolution of implementation for Consignment Note Data (CND) .............................................. 34 Diagram 22: Wagon Movement (WM) ............................................................................................................ 36 Diagram 23: Evolution of implementation for Wagon Movement (WM) ....................................................... 36 Diagram 24: Wagon and Intermodal Unit Operating Database ...................................................................... 38 Diagram 25: Evolution of implementation for WIMO ..................................................................................... 38 Diagram 26: Rolling Stock Reference Database .............................................................................................. 40 Diagram 27: Evolution of implementation for RSRD ....................................................................................... 41 Diagram 28: Reasons for not starting implementation of TAF/TAP TSI functions .......................................... 42 Diagram 29: Evolution of insufficient awareness of TAF/TAP requirements .................................................. 42 Diagram 30: Reported DI for IM functions ...................................................................................................... 43 Diagram 31: Reported DI for RUs-F functions ................................................................................................. 44 Diagram 32: Reported DI for WK functions ..................................................................................................... 44 Diagram 33: Common sector tools in use ....................................................................................................... 45

8
Map 1: Implementation of Primary Location Codes (IM) ............................................................................... 23 Map 2: Implementation of Company Codes (IM and RU) .............................................................................. 25 Map 3: Implementation of Common Interface (IM)....................................................................................... 27 Map 4: Implementation of Common Interface (RU) ...................................................................................... 28 Map 5: Implementation of Consignment Order Message (RU) ...................................................................... 35 Map 6: Implementation of Wagon Movement (RU) ...................................................................................... 37 Map 7: Implementation of WIMO (RU) .......................................................................................................... 39 Map 8: Implementation of RSRD (WK) ........................................................................................................... 41 Map 9: Masterplan for Primary Company Codes (IM) ................................................................................... 59 Map 10: Masterplan for Common Interface (IM) ........................................................................................... 60 Map 11: Masterplan for Primary Location Codes (IM) ................................................................................... 61 Map 12: Masterplan for Train Composition Message (IM) ............................................................................ 62 Map 13: Masterplan for Train Running Information (IM) .............................................................................. 63 Map 14: Masterplan for Company Codes (RU) ............................................................................................... 64 Map 15: Masterplan for Common Interface (RU) .......................................................................................... 65 Map 16: Masterplan for Consignment Order Message (RU) .......................................................................... 66 Map 17: Masterplan for Train Composition Message (RU) ............................................................................ 67 Map 18: Masterplan for Train Running Information (RU) .............................................................................. 68 Map 19: Masterplan for WIMO (RU) .............................................................................................................. 69 Map 20: Masterplan for Wagon Movement (RU) .......................................................................................... 70 Map 21: Masterplan for RSRD (WK) ............................................................................................................... 71
1. Executive summary
This report contains the data provided to report the status of the implementation by 31.12.2018 of the following TAF TSI [2] functions:
Reference Files Function:
o Company Codes
o Primary Location Codes
Common Interface Function
Train Running Information Function
Train Composition Message
Consignment Order Message
Wagon Movement
Wagon and Intermodal Unit Operational Database (WIMO)
Rolling Stock Reference Database (RSRD)
This 9th report provides a view of the implementation of these eight functions, agreed by the Agency TAF TSI Cooperation Group in October 2018. The first conclusion can be drawn from the fact that number of companies reporting has decreased compared to the previous report, because 172 companies responded out of potential 600 companies registered in the JSG Reporting Tool (http://taf-jsg.info/). Therefore the number of companies reported is close to 29% of the potential responding companies.

9
To better evaluate the current degree of implementation for each function, the data provided is compared to the baseline defined in the Master Plan (1)1 to implement the TAF TSI [2] regulation delivered by the European Rail Sector in 2013. The TAF-TSI Master Plan (1) was submitted to the TAF-TSI Steering Committee, DG MOVE and the Agency on 15th November, 2012. A total of 58 companies, representing over 85% of the total Tonne and Track Kilometres in Europe responded with their individual plans for implementation. The target dates are based on the corresponding TAF-TSI function to be implemented and they were set when 80% or more of the respondents indicated a final implementation.
The data provided is a self-declaration made by every company about the level of implementation of the above mentioned functions. Most of the data has been collected through an entity set-up by the European Rail Sector, the so called Joint Sector Group (JSG), to technically support the implementation of the system. The members of the JSG are:
CER2
UIC
EIM
UNIFE
UIRR
ESC
UIP
RNE
ERFA
RAILDATA
UITP
EPTO
In addition, the Agency has kept the “Degree of Implementation” for all companies, which have not delivered data for the current report, but data from preceding deliveries was available.
Regarding the function “Rolling Stock Reference Database”, the implementation data has been collected by the JSG in close cooperation with the International Union of Wagon Keepers, UIP. They have submitted to the Agency a file containing the status information of 97 companies across Europe.
The following key findings per TAF function can be highlighted:
In general terms, when we consider a reference group of companies reporting in the last three implementation reports, we can observe an increase of companies having finished implementation of the earliest TAF TSI functions.
1 See «Reference Documents» and http://www.era.europa.eu/Document-Register/Documents/TAF-TSI-Master-Plan.pdf . 2 See «Abbreviations» for acronyms.

10
The majority of IMs has completed the population of the Common Reference Files for locations on their network.
Company codes are already widely used within the sector, by both IMs and RUs. Nevertheless, some difficulties still remain in the process conducting to get the Company Codes, in particular for newcomers and wagon keepers.
The majority of RUs is still developing the common interface, while a more significant number of the IMs have already finished the implementation of the common interface.
The deployment of the Rolling Stock Reference Database has been already launched. Although the number of Railway Undertakings reporting about this function has significantly increased, still mainly UIP members have delivered data concerning the implementation of this function. Regarding the data delivered, these Wagon Keepers companies’ members of UIP have already completed the implementation of this function. Nevertheless, the accomplishment of this function considering the whole European fleet of wagons is clearly delayed.
The level of realisation of Train Running Information is progressing mostly in accordance with the implementation schedule quoted in the TAF TSI Master plan by 2017, in particular for the Infrastructure Managers, meanwhile the evolution for the Railway Undertakings has significantly improved meeting the milestones quoted in the TAF TSI Master Plan (1).
The level of fulfilment of the Wagon and Intermodal Unit Operational Database (+ the wagon movement) is improving in comparison with the realisation milestones committed on the TAF TSI Master Plan (1). Indeed, the actual value is however behind the expected implementation value by 2017, when half of Railway Undertakings respondents committed to deploy this function by 2016.
Regarding the level of implementation of the Train Composition Message, the actual implementation status is significantly below the expectations committed by the companies on the TAF TSI Master Plan (1).
Furthermore, the report identifies the TAF TSI functions where the sector shall allocate more resources to meet the target implementation date quoted in the TAF TSI Master Plan (1), in particular the Rolling Stock Reference Database, the Wagon and Intermodal Unit Operational Database and the Train Composition Message. These functions are either already delayed or on the way of not meeting the implementation deadlines quoted on the TAF TSI Master Plan (1).
In particular, this report shows that the implementation of the Rolling Stock Reference Database (RSRD) by 2nd half of 2018 is in average for the overall European rail sector delayed compared to the declared target implementation date in the Master Plan, 2015. The implementation data used in this report permits to conclude that the RUs have already started delivering information about the implementation of the TAF TSI [2] compliant RSRD database.

11
2. Introduction
This 9th Implementation Status Report is delivered in accordance with the legal frame provided by the Commission Regulation (EU) No 1305/2014 of 11 December 2014 on the Technical Specification for Interoperability relating to the Telematics Applications for Freight subsystem of the rail system in the European Union and repealing the Regulation (EC) No 62/2006 in force, TAF TSI [2]. In particular, Article 5 of the Regulation [2] attributes to the European Union Agency for Railways, named the Agency along the report, the task to assess and oversee the implementation of the Regulation to determine whether the agreed objectives and deadlines have been achieved and to provide an assessment report to the TAF steering committee. Furthermore, the European Commission (EC) issued a letter on 26.05.2014 (2) describing the tasks expected to be carried out by the Agency for the Assessment of TAF TSI [2] implementation. In addition, since June 2016 the Agency becomes a system authority for Telematics. This new role prescribed on article 23 of Regulation (EU) 2016/796 requires the Agency to assist the Commission in the monitoring of deployment of specifications for telematics applications in accordance with relevant TSIs. Beyond this, this activity meets the 4th Strategic Priority of the Agency work programmes 2018 – 2019, “Simplified Access for Customers”. On this basis, the Agency launched in October 2014 the Co-operation Group for the Implementation of Telematics Applications for Freight. The Co-operation Group performs the following tasks:
To assess the reports from the sector (companies, NCPs and RBs) about the TAF TSI [2] implementation.
To compare the data received with the content of the TAF TSI Master Plan (1) and assess the progress of implementation to determine whether the objectives pursued and deadlines have been achieved.
To use Key Performance Indicators (KPIs) previously agreed between the Agency and the Rail Sector to assess the evolution of the deployment of the system and report twice per year to the European Commission and to the TAF Steering Committee.
To perform a dissemination campaign to NCPs and assist them to follow-up the TAF TSI [2] implementation at national level.
All these activities are performed in close cooperation with the different stakeholders, who will provide implementation reports. The Figure below shows the process allowing the Agency to perform the above listed activities:
Figure 1: Agency TAF TSI Implementation Cooperation Group process.

12
The Agency has to inform the EC about the results of this monitoring and has to advise the EC about the possible changes needed. In a multimodal context, the Agency has to guarantee that any of the actions taken do not create additional obstacles for multimodal environment.
In addition, the effort made by the European rail sector to deploy the TAF TSI [2] system is also supported by the Connecting Europe Facility (CEF) [4] programme launched by the European Commission and managed by the INEA Executive Agency.
The CEF3 [4] will better mobilise private and public financing and allow for innovative financial instruments such as guarantees and project bonds to gain maximum leverage from this EU funding injection at it’s a financial tool at disposal of all the companies implementing TAF TSI [2] regulation.
3. Context
The final version of the TAF-TSI Master Plan (1), establishing the implementation timeline for the Regulation, was submitted to the TAF-TSI Steering Committee, DG MOVE and the Agency on 15th November 2012.
A total of 58 companies, representing over 85% of the total Tonnes and Track Kilometres in Europe responded with their individual plans for implementation. Target dates were set when 80% or more of the respondents indicated a final implementation. The target dates are based on the corresponding TAF-TSI function to be implemented.
An analysis, based on Corridor Regulation N° 913/2010 [3], was also incorporated into this Master Plan (1). As the Corridor Regulation specifically addresses Short Term Path Requests and Train Running Information, these were the only functions included. It should be noted that the TAF-TSI is a supporting tool – and not a prerequisite – for the implementation of Regulation N° 913/2010. Therefore the later date of implementation of the TAF-TSI should have no impact on the implementation of 913/2010.
In order to collect the data and to boost the involvement of the higher possible number of companies, the European Union Agency for Railways has closely worked with the European Rail Sector to set-up the appropriate mechanism to collect the data concerning the deployment of the above mentioned functions. Indeed, the European Rail Sector grouped through the entity Joint Sector Group (JSG) and the Agency has set-up two IT tools to collect and visualize the data submitted by the European rail companies, Infrastructure Managers, Railway Undertakings and Wagon Keepers. For this purpose the companies submit their information to the JSG IT tool through a Web service available for all the companies registered. For the time being the number of registered companies is 569 thanks to the information delivered by the National Contact Points (NCPs). Once the data is collected, the raw data is delivered to the Agency, who incorporates this information in the Agency IT tool for TAF TSI [2] monitoring. This IT tool comprises a database to store the data and a GIS tool to visualize on maps the progress of the implementation. There are three groups of maps:
Maps to report about common functions. These maps show the degree of implementation of the Reference Files (Company Codes and Primary Location Codes) and the Common Interface functions at European level.
3 https://ec.europa.eu/inea/en/connecting-europe-facility

13
Maps to report about RU-IM Communication functions. These maps show the degree of implementation at country level4 of the RU-IM Communication functions and there is an additional publication of the data per rail freight corridor in Europe as defined in the Corridor Regulation N° 913/2010 [3]. The presentation of the progress evolution per corridors underpins the implementation of Corridor Regulation N° 913/2010 [3]:
o Train Running Information,
o Train Preparation.
Maps to report about Railway Undertaking’s functions. These maps show the degree of implementation at country level of the functions to exchange data amongst Railway Undertakings and Wagon Keepers:
o Consignment Data Function,
o Wagon and Intermodal Unit Operational Database (WIMO) Function,
o Wagon Movement Function,
o Rolling Stock Reference Database and
o Train Composition Function.
The scope of the present 9th report is to inform about the deployment of the functions scheduled to be implemented by 2nd half 2018 in the Master Plan (1) delivered by the sector for the implementation of the TAF TSI [2] system. This temporary scope was agreed by the members of the Co-operation Group for the Implementation of Telematics Applications for Freight in the 8th meeting (7) held in October 2018, this report provides information about the implementation of the following functions:
Reference Files Function:
o Company Codes
o Primary Location Codes
Common Interface Function
Consignment Data Function
Rolling Stock Reference Database
Train Running Information Function
Wagon and Intermodal Unit Operational Database
Wagon Movement
Train Composition Function.
To have a common approach for all companies’ contributors submitting implementation information, a common criterion has been agreed with the representatives of the rail sector at the start of the reporting activities 2015 to assess the degree of deployment of TAF TSI functions. This criterion is based on the standard division in project phases of IT projects defined in the methodology for project management in use at the European Commission (PM2). Assuming that project phases are divisions within a project where extra control is needed to effectively manage the completion of a major deliverable, then it may be ideally
4 Degree of implementation at country level is based on the average of the degree of implementation of the individual reporting implementing entities (per function) multiplied with weighting factors (say market share) of these entities.

14
assimilated with each of the 12 TAF TSI functions identified in the TAF TSI Master Plan (1) to an individual IT reference implementation project.
Within every individual IT reference implementation project, we use percentages of completion as early indicators to track the progress made each period of one year (n-3, n-2, and n-1, n) over a 4-year time span. This allows detecting delays in the implementation of a particular function.
Therefore, taking into account the above mentioned assumptions, every function implementation may be considered as an individual project to be split in the following reference phases:
Initiating Phase: This phase may comprise those processes performed to define a new project or a new phase of an existing project by obtaining authorization to start the project or phase. This phase includes typically the following activities:
o Feasibility Study
o Business Case
o Gathering of Technical and Functional Requirements
These activities may correspond in an “optional” reference implementation to a Degree of Implementation (DI) between 0% and 25% for a particular function. If the DI is achieved at the beginning of the timeframe for the deployment of such a function, ideally deadline minus three years (deadline-3), the implementation of this function can be deemed on time.
Planning Phase: this phase includes typically those activities required to establish the scope of the project, refine the objectives, and define the course of action required to attain the objectives that the project was undertaken to achieve:
o Resource Planning
o Project Work Planning (Working Break Down Structure)
o Migration Planning
o Outsourcing Plan
o Risk Management Planning
These activities may correspond in an “optional” reference implementation to a Degree of Implementation (DI) between 25% and 50% for a particular function. If the DI is achieved ideally within the deadline minus two years (deadline-2) period, the implementation of this function could be deemed to be on time.
Executing Phase: this phase may comprise those processes performed to complete the work defined in the project management plan to satisfy the project specifications. This phase includes activities such as:
o Procurement
o Executing
o Testing (User Acceptance and system Integration)
o Training and Education
These activities may correspond in an “optional” reference implementation to a Degree of Implementation (DI) between 50% and 100% for a particular function. If the DI is achieved ideally within the deadline minus one year (deadline-1) period, the implementation of this function could be deemed to be on time.

15
Closing & Production: this phase may comprise those processes performed to finalise all activities across all phases to formally close the project. Therefore, it may include the delivery of the product/service, in the context of the TAF TSI [2] deployment, the delivery of the IT system implementing a particular TAF TSI [2] function moving to production environment. These activities correspond in an “optional” reference implementation to a Degree of Implementation (DI) of 100% for a particular function. If the DI is achieved within the deadline minus ideally one year (deadline-1) period, the implementation of this function could be deemed to be on time. This level of implementation means that the company is capable to use the system in production or is using already the system in production for a particular TAF TSI function.
The above explained phases are summarised in the following Figure explaining the expected commitment of resources made for every phase of the project.
Figure 2: PM2 project lifecycle.
Nevertheless, the different activities to be developed in the framework of a project to implement a particular TAF TSI [2] function should be adapted to the particular situation in every company. Therefore, every project may be assimilated, on a voluntary basis, to the addition of the four phases aforementioned (Initiating, Planning, Executing and Closing) establishing an optional comparable reference implementation to assess the progress of the implementation per company.
In conclusion, in the context of the Co-operation Group for TAF TSI Implementation there are two ways to report about the implementation of a particular TAF TSI function compared to the TAF TSI Master Plan (1):
on one hand, companies may declare the final delivery of a particular TAF TSI function within the deadline set out in the TAF TSI Master Plan (1); in this case the implementation of this function will be deemed to be on time, and thus DI = 100% -> Dark Green colour on the map;
on the other hand, companies may declare the Degree of Implementation (DI) for every function using the optional methodology aforementioned with different phases for the execution of the project. In this case, the declared Degree of Implementation will be colour-coded and displayed as follows:
o Project not launched: No data -> Blue colour on the map.

16
o Initiating Phase accomplished: 0% =< DI < 25% -> Red colour on the map.
o Planning Phase accomplished: 25% =< DI < 50% -> Orange colour on the map.
o Executing Phase accomplished: 50% =< DI < 100% -> Green colour on the map.
o Closing & Production accomplished: DI = 100% -> Dark Green colour on the map.
4. Participation in the 9th Reporting Session
i. Responses to the survey
The number of project managers invited to report about the implementation of the TAF TSI and TAP TSI is shown in
diagram 1 together with the number of responses received thereof. Starting from the first report, invitations and
responses have grown continuously. Despite the growing number of invitations in the present survey, feedback has
declined.
The 9th report includes 69 WKs submitted by UIP using RSRD2.
Diagram 1: Evolution of participation over time
Hence, the response rate, calculated as number of responses in relation to number of invitations, has dropped to 28,7
% (see diagram 2).
54
187
347 366 379457
545569 600
44 81156
157 167 194 186 214172
0
100
200
300
400
500
600
700
1st 2nd 3rd 4th 5th 6th 7th 8th 9th
Nu
mb
er
Reporting session
Evolution of participation
Number of invitations Number of responses

17
Diagram 2: Evolution of response rate over time
Diagram 3 displays the distribution of total responses per country. The feedback comprises 22 EU Member States plus
Switzerland and Turkey.
Diagram 3: Number of responses per country
Diagram 4 shows the distribution and the development of responses per country. The total number of responses in the 9th reporting period is 172, which is 42 lower than in the last session.
81,5%
43,3%
45,0%
42,9%
44,1%42,5%
34,1% 37,6%
28,7%
20%
30%
40%
50%
60%
70%
80%
90%
1st 2nd 3rd 4th 5th 6th 7th 8th 9thPe
rce
nta
ge o
f p
arti
cip
atio
n
Reporting session
Response rate
Percentage of participation
AT; 8
BE; 4
BG; 5
CH; 13
CZ; 25
DE; 25
EE; 1
ES; 8
FI; 1
FR; 13HU; 6
IE; 1
IT; 24
LU; 1
LV; 2NL; 3 PL; 10
PT; 6
RO; 1 SE; 5
SI; 3 SK; 4 TR; 1UK; 2
Responses per country

18
Diagram 4: Evolution of responses per country
ii. Participation per company type
Some companies in this survey may have multiple roles, such as RU and WK at the same time. Therefore, the total
number of responses displayed in diagram 1 (172 companies) and listed in Annex 2 is lower than the total number of
company types shown in diagram 5 hereafter (201 companies).
Compared to the previous survey, participation for all types of company has declined.
Annex 2 ‘Responses contact list v9’ to this report gives a detailed overview about the companies per country having
replied to the ninth session of TAF and TAP TSI implementation monitoring. Please note, that there are entities which
have reported on behalf of several companies.

19
Diagram 5: Evolution of participating per company type over time
19
23 24 2429
33
32 3527
25
56
7158 60 63 67
85
53
39
24 29 222
6074
107 108 106113
97
1 1 1 1 2 2 20
20
40
60
80
100
120
1st 2nd 3rd 4th 5th 6th 7th 8th 9th
Nu
mb
er
of
com
pan
y ty
pe
s
Reporting session
Participation per company type
IM RU F RU P WK AB

20
5. Data Basis for evaluation
To establish a wider sector representation, 111 companies from the previous survey, which have not replied this time,
are also taken into consideration. For companies having reported to both surveys, only the company information from
the 9th session is included.
Despite the lower participation in the 9th Reporting Session, the data basis for evaluation could be widened by
integrating companies from the previous survey.
Diagram 6 displays the total number of types of company (310) with their allocation to the following reporting sessions:
Companies only reporting to the 8th reporting session (top with light colour)
Companies reporting to both 8th and 9th reporting session (middle with normal colour)
New companies reporting to the 9th reporting session only (bottom with dark colour)
The data included in this report thus represents the whole year 2018.
The number of companies taken over from the last reporting is relatively high (111) while the number of new companies
in the present session is relatively low (17).
Diagram 6: Number of types of company per reporting session
Annex 3 ‘Responses contact list v8’ to this report lists the companies per country having replied to the eighth session of
TAF and TAP TSI implementation monitoring and not to the present one.
IM RU-F RU-P WK
8th 16 50 19 26
8+9th 25 46 15 96
9th 2 7 7 1
0
20
40
60
80
100
120
140
Nu
mb
er
of
com
pan
y ty
pe
s
Data basis for Implementation ReportIM = 43 / RU-F = 103 / RU-P = 41 / WK = 123

21
Since the seventh reporting session, replies from the previous survey have each time been considered. Diagram 7
displays the positive development of this data basis for evaluation as the combination of two subsequent surveys.
Diagram 7: Number of types of company per reporting session
272
297
311
250
260
270
280
290
300
310
320
7th 8th 9th
Nu
mb
er
of
com
pan
y ty
pe
s
Reporting session
Evolution of data basis for evaluation
Combination of 2 reporting sessions

22
6. Implementation monitoring of TAF TSI functions
i. Common Reference Files – Primary Location Codes (IMs)
The Target Implementation Milestone for realisation of the Primary Location Code Function (PLC) according to the TAF
TSI Masterplan was 2013. This activity corresponds to Primary Location Codes, which must be defined by IMs.
Consequently, the following diagram only refers to IMs. Responses refer to initial upload of primary location codes, but
update and maintenance process and use of codes is a different issue and not part of this report.
Diagram 8 indicates, that most IMs reported to have completed the Common Reference Files for locations on their
network. However, complete population of PLC is not yet reached. Regarding the level of fulfilment of PLC
implementation, diagram 8 shows 28 IMs with complete implementation. 16 out of 43 IMs in the evaluation are
considered with data from the previous survey.
Diagram 8: Common Reference Files - Primary Location Codes (PLC)
Diagram 9 shows the increase of complete implementation of PLC in relation to the growing number of IM responses.
10
41
28
0% 25% 50% 75% 100%
Level of fulfilment
PLC - level of fulfilment
Number of IMs (total 43)

23
Diagram 9: Evolution of PLC implementation
Map 1: Implementation of Primary Location Codes (IM)
Country in blue = no data
1923 24 24
2933 34
4043
16 18 20 20 22 23 22 2428
0
10
20
30
40
50
1st 2nd 3rd 4th 5th 6th 7th 8th 9th
Nu
mb
er
of
com
pan
ies
Reporting session
PLC - evolution of implementation
IMs responses IMs with complete implementation

24
ii. Common Reference Files - Company Code (all companies)
The Target Implementation Milestone for realisation of the Company Code Function (CC) according to the TAF TSI
Masterplan was 2013.
The bar chart below (diagram 10) is indicating the existence and use of company codes as part of the Common Reference
Files for IMs, RUs-F and WKs. For CCs only two predefined percentage steps exist, because either a company does have
an own CC or not. Most of companies having replied to the query possess a CC.
Diagram 10: Common Reference Files - Company Codes (CC)
According to Diagram 11, the number of companies with CCs has grown for all types of companies since the last survey.
Diagram 11: Evolution of implementation for Company Codes
83524
79
7
116
without CC with CC
Level of fulfilment
CC - level of fulfilment
Number of IMs (total 43) Number of RUs-F (total 103)
Number of WKs (total 123)
1923 24 24 29
3334 40 43
25
56
71
58
60 63
81
101 103
60
74
107 108114
119 123
15 17 19 2127 29 26
32 35
17
27 4139
52 54
67
78 79
44
59
92 96101
111 116
0
20
40
60
80
100
120
140
1st 2nd 3rd 4th 5th 6th 7th 8th 9th
Nu
mb
er
of
com
pan
ies
Reporting session
CC - evolution of implementationIMs responses RUs-F responses WKs responses
IMs with CCs RUs-F with CCs WKs with CCs

25
Map 2: Implementation of Company Codes (IM and RU)
Country in blue = no data

26
iii. Common Interface Implementation (all companies)
The Target Implementation Milestone for realisation of the Common Interface Function (CI) according to the TAF TSI
Masterplan was 2013.
Diagram 12 summarises the feedback related to the availability of CI and shows a difference in level of fulfilment
between IMs, RUs-F and WKs. The CI is completely implemented by 19 IMs, 32 RUs-F and 19 WKs. RSRD2 has yet not
implemented the CI. WKs using RSRD2 therefore form part of the 25% level.
Diagram 12: Common Reference Files – Common Interface (CI)
The development of complete implementation of the CI over time according to diagram 13 shows again the relation to
the number of responses per company type. There significant evolution of CI in production for RUs-F and only little
evolution for IMs and WKs up to December 2018.
14
2 26
19
45
138 5
32
22
72
37
19
0% 25% 50% 75% 100%
Level of fulfilment
CI - level of fulfilmentNumber of IMs (total 43) Number of RUs-F (total 103)
Number of WKs (total 123)

27
Diagram 13: Evolution of implementation for Common Interface
Map 3: Implementation of Common Interface (IM)
Country in blue = no data
1923 24 24
29 33 34 40 43
7 11 15 17 18 1918 18
1925
56
7158 60 63
81
101 103
0 912 7 8 9
20 24 32
60
74
107 108114 119 123
0 0 2 416 16 19
0
20
40
60
80
100
120
140
1st 2nd 3rd 4th 5th 6th 7th 8th 9th
Nu
mb
er
of
com
pan
ies
Reporting session
CI - evolution of implementationIMs responsesIMs with complete implementationRus-F responses

28
Map 4: Implementation of Common Interface (RU)
Country in blue = no data

29
iv. Train Running Information (IMs and RUs-F)
The Target Implementation Milestone for realisation of the Train Running Information message (TRI) according to the
TAF TSI Masterplan was end of 2017. This monitoring concerns only one aspect of the TAF TSI basic parameter ‘Train
running forecast’, the Train Running Information message. The Train Information System (TIS) is a common sector tool
managed by RNE. Messages sent by IMs to TIS or messages received by RUs from TIS through traditional interfaces are
considered as 75 % complete fulfilment and TAF messages sent or received by Common Interface are counted as 100 %
fulfilment.
Diagram 14 indicates 19 IMs and 39 RUs-F with 100 % level of fulfilment.
Diagram 14: Train Running Information (TRI)
Regarding diagram 15, both the number of IMs and RUs-F having implemented completely the TRI increased in
comparison to the 8th reporting session (plus 4 for both IMs and RUs-F).
14
2 3 5
19
37
12
69
39
0% 25% 50% 75% 100%
Level of fulfilment
TRI - level of fulfilment
Number of IMs (total 43) Number of RUs-F (total 103)

30
Diagram 15: Evolution of implementation for Train Running Information
Diagram 16 gives an impression about the state of implementation of TRI by IMs in countries across Europe. The IMs having the longest network have been taken as relevant for the country. For IMs still in development the current planned end date and the respective level of fulfilment is shown in diagram 16.
In CH, CZ and HU there are always two IMs having completed TRI implementation. Among the IMs there are 11 small companies, such as harbours, having responded to this survey. Contrary to the level of fulfilment of dominating IMs, such small companies across Europe have not even started projects.
23 24 24
2933 34
4043
3 5
5
1215
1215
19
56
71
5860 63
81
101 103
1016
89 12
2435
39
0
20
40
60
80
100
120
2nd 3rd 4th 5th 6th 7th 8th 9th
Nu
mb
er
of
com
pan
ies
Reporting session
TRI - evolution of implementation
IMs responses IMs with complete implementation
Rus-F responses RUs-F with complete implementation

31
Diagram 16: Implementation of TRI of IMs across European countries

32
v. Train Composition Message (IMs and RUs-F)
The Target Implementation Milestone for realisation of the Train Composition Message (TCM) as part of the Train Preparation Function according to the TAF TSI Masterplan was end of 2018. TCM is mandatory to be sent by RUs-F. However, implementation by IMs is also reported. Most of them are still developing this TAF TSI function.
Diagram 17: Train Composition Message (TCM)
Figures show a little increase in terms of complete implementation of TCM since last reporting session. 18 RUs-F out of 103 which replied to the survey have completely implemented the TCM while 11 out of 43 IMs have finished their duty.
Diagram 18: Evolution of implementation for Train Composition Message
18
46
4
11
38
1612
19 18
0% 25% 50% 75% 100%
Level of fulfilment
TCM - level of fulfilment
Number of IMs (total 43) Number of RUs-F (total 103)
34
40 43
8 1111
60 63
81
101 103
5 7 9 15 18
0
20
40
60
80
100
120
5th 6th 7th 8th 9th
Nu
mb
er
of
com
pan
ies
Reporting session
TCM - evolution of participationIMs responses IMs with complete implementation
RUs-F responses RUs-F with complete implementation

33
The European map (diagram 19) indicates the level of implementation regarding the TCM function for dominating IMs in each country. Where complete implementation has not yet been reached, current planned end date and level of fulfilment is given.
Among the IMs there are small companies, such as harbours, which have not even started projects.
Diagram 19: Implementation of TCM of IMs across European countries

34
vi. Consignment Note Data (RUs-F)
The Target Implementation Milestone for realisation of the Consignment Note Data function (CND) according to the TAF TSI Masterplan was end of 2017.
Diagram 20 indicates only 3 RUs-F out of 103 having finished implementation of CND.
Diagram 20: Consignment Note Data (CND)
Contrary to the evolution of responses the evolution of implementation for CND rests at a very low level for this function (diagram 21).
Diagram 21: Evolution of implementation for Consignment Note Data (CND)
51
16
24
93
0% 25% 50% 75% 100%
Level of fulfilment
CND - level of fulfilment
Number of RUs-F (total 103)
32 3 3
63
81
101 103
0
20
40
60
80
100
120
6th 7th 8th 9th
Nu
mb
er
of
com
pan
ies
Reporting session
CND - evolution of participationRUs with complete implementation RUs responses

35
Map 5: Implementation of Consignment Order Message (RU)
Country in blue = no data

36
vii. Wagon Movement (RUs-F)
The Target Implementation Milestone for realisation of the Wagon Movement function (WM) according to the TAF TSI Masterplan was end of 2016.
Responses to this questionnaire indicate 3 RUs-F having completed the WM function from a total of 103 companies.
Diagram 22: Wagon Movement (WM)
The evolution of implementation for WM rests at a very low level for this function (diagram 23). The RUs responses start from a lower level for this function in the 8th Reporting session, as it was reported for the first time without any add-on from the 7th query.
Diagram 23: Evolution of implementation for Wagon Movement (WM)
63
11 917
3
0% 25% 50% 75% 100%
Level of fulfilment
WM - level of fulfilment
Number of RUs-F (total 103)
2 3
85
103
0
20
40
60
80
100
120
8th 9th
Nu
mb
er
of
com
pan
ies
Reporting session
WM - evolution of participationRUs with complete implementation RUs responses

37
Map 6: Implementation of Wagon Movement (RU)
Country in blue = no data

38
viii. Wagon and Intermodal Unit Operating Database (RUs-F)
The Target Implementation Milestone for realisation of the Wagon and Intermodal Unit Operating Database function
(WIMO) according to the TAF TSI Masterplan was 2016.
The ‘Wagon and Intermodal Unit Operating Database’ function (WIMO) is relevant for RUs-F only. However, IMs
realising this function on behalf of RUs-F are not considered in the present report.
This function remains at a very low level of fulfilment with 4 companies having this function in production. The reason
for this must be further investigated. Companies claim that some requirements and the criteria for fulfilling are still
unclear (diagram 24).
Diagram 24: Wagon and Intermodal Unit Operating Database
Diagram 25 indicates the very low degree of completion for WIMO with no sign of improvement over time.
Diagram 25: Evolution of implementation for WIMO
56
26
125 4
0% 25% 50% 75% 100%
Level of fulfilment
WIMO - level of fulfilment
Number of RUs-F (total 103)
56
71
58 60 63
81
101 103
1 2 4 2 2 2 2 4
0
20
40
60
80
100
120
2nd 3rd 4th 5th 6th 7th 8th 9th
Nu
mb
er
of
com
pan
ies
Reporting session
WIMO - evolution of implementationRUs-F responses RUs-F with complete implementation

39
Map 7: Implementation of WIMO (RU)
Country in blue = no data

40
ix. Rolling Stock Reference Database (WKs)
The Target Implementation Milestone for realisation of the RSRD function according to the TAF TSI Masterplan was
2015.
The ‘Rolling Stock Reference Database’ function (RSRD) is relevant for companies which keep wagons. Those companies
might at the same time also be RUs or IMs.
Many companies intend fulfilling this functionality in a collaborative way via the common sector tool RSRD2. Information
delivered by UIP for RSRD2 means 100% of fulfilment. 77 WKs have implemented this function, out of which 68 WKs
thanks to RSRD2.
Diagram 26: Rolling Stock Reference Database
Following the higher participation to the survey, the evolution of implementation remains stable compared to the previous report (see diagram 27).
116
209
77
0% 25% 50% 75% 100%
Level of fulfilment
RSRD - level of fulfilment
Number of WKs (total 123)

41
Diagram 27: Evolution of implementation for RSRD
Map 8: Implementation of RSRD (WK)
Country in blue = no data
0
43
57
68 69 72 73 77
2
60
74
107 108114 119 123
0
20
40
60
80
100
120
140
2nd 3rd 4th 5th 6th 7th 8th 9th
Nu
mb
er
of
com
pan
ies
Reporting session
RSRD - evolution of implementationWKs with complete implementation WKs responses
42
x. Reasons for not starting implementation of TAF/TAP TSI functions
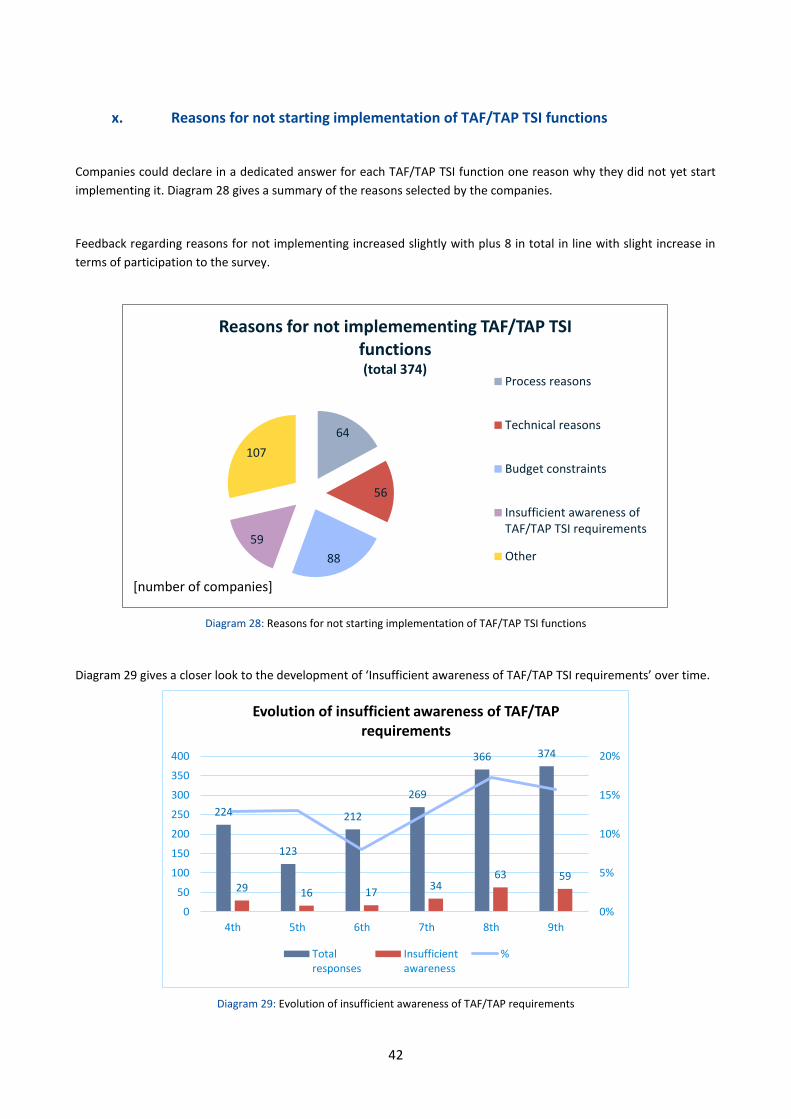
Companies could declare in a dedicated answer for each TAF/TAP TSI function one reason why they did not yet start
implementing it. Diagram 28 gives a summary of the reasons selected by the companies.
Feedback regarding reasons for not implementing increased slightly with plus 8 in total in line with slight increase in
terms of participation to the survey.
Diagram 28: Reasons for not starting implementation of TAF/TAP TSI functions
Diagram 29 gives a closer look to the development of ‘Insufficient awareness of TAF/TAP TSI requirements’ over time.
Diagram 29: Evolution of insufficient awareness of TAF/TAP requirements
64
56
88
59
107
Reasons for not implemementing TAF/TAP TSI functions(total 374)
Process reasons
Technical reasons
Budget constraints
Insufficient awareness ofTAF/TAP TSI requirements
Other
[number of companies]
224
123
212
269
366 374
29 16 1734
63 59
0%
5%
10%
15%
20%
0
50
100
150
200
250
300
350
400
4th 5th 6th 7th 8th 9th
Evolution of insufficient awareness of TAF/TAP requirements
Totalresponses
Insufficientawareness
%

43
The percentage given in diagram 29 as a green line, is calculated as the number of companies not being aware about
TAF/TAP in relation to all companies giving a reason for not starting to implement. It turns out, that this percentage
increased about 10 % since the 6th reporting session. Dedicated information sessions should be initiated as a mitigation
measure.
xi. Degree of implementation at European level
This chapter summarises the development of the Degree of Implementation (DI) at European level for the TAF TSI
functions since the beginning of reporting.
The DI in this report is defined as the relation of companies having fully implemented (100 %) the function compared to
the companies having replied to this query in %.
Diagram 30 shows the DI for functions to be implemented by IMs. Implementation of these functions show a mostly
positive trend relative to the last report. The only exception is the CI function, which shows a negative trend already
since five reporting sessions.
Diagram 30: Reported DI for IM functions
Diagram 31 indicates the evolution of implementation for RUs-F functions. Generally, the proportion of RUs having
finished implementation is considerably lower than for IMs. The DI for the CC function stays high at 77 %. For the CI, TRI
and TCM functions a positive trend is visible, but the other RUs-F functions stagnate at a low level of implementation.
8478
83
8376
7065
606579
7479
8893 88
76 80 81
37
48
6371
62 5853
4544
0
1321 21
41 4535
38
44
24 28 26
0
20
40
60
80
100
1st 2nd 3rd 4th 5th 6th 7th 8th 9th
De
gre
e o
f im
ple
me
nta
tio
n [
%]
Reporting session
Degree of implementation for IM functions
PLC CC CI TRI TCM

44
Diagram 31: Reported DI for RUs-F functions
Diagram 32 shows a positive trend for the reported DI for WKs in the present report.
Diagram 32: Reported DI for WK functions
68
48
5867
87 86 8377 77
0
16 1712 13
1425 24
3118
2314 15 19
30 35 38
8 11 11 1517
5 2 3 332 37 3 3 2 2
4
0
20
40
60
80
100
1st 2nd 3rd 4th 5th 6th 7th 8th 9th
De
gre
e o
f im
ple
me
nta
tio
n [
%]
Reporting session
Degree of implementation for RUs-F functionsCC CI TRI TCM CND WM WIMO
7380
86 89 8993 94
0 0 2 4
14 13 15
7277
64 64 63 61 63
0
20
40
60
80
100
3rd 4th 5th 6th 7th 8th 9th
De
gre
e o
f im
ple
me
nta
tio
n [
%]
Reporting session
Degree of implementation for WK functions
CC CI RSRD

45
7. Common Sector Tools
Participants of the questionnaire could select all common sector tools in use to meet some specific requirements of the
TAF/TAP TSI. The number of companies having indicated using such tools has grown slightly from 467 to 476 and are
summarised in diagram 33.
Diagram 33: Common sector tools in use
RSRD2 and TIS both are the most used Common Sector Tools.
In respect to the responses received from relevant types of companies, RSRD2 is in use by about 75 % and TIS is in use
by about 50 % of its potential users included in this query.
107
54
51128
40
4
41
87
Common sector tools (total 476)
Train Information System (TIS)
International Service Reliability (ISR)
Open Rail Freight Electronic Data Interchange User System(ORFEUS)Rolling Stock Reference Database (RSRD2)
Kapacita Dráhy (KADR)
Logistics Web Portal (LWP)
Optimised planning of the marshalling processes (EMAN)
HEROS Path Request WebApp (H20)
No common sector tool[Number of companies]

46
8. Conclusion and Findings
The number of companies having responded to the 9th questionnaire is, as always, significantly lower than the number
of companies having been invited. The response rate of 29 % of the current reporting session is the lowest one since
the beginning of reporting. There might be different reasons for this negative trend:
Companies are getting tired answering the same questions every six month
Little progress within the company to be reported
Other priorities before Christmas conflicting with the reporting period
Reduction of participation is observed across nearly all European countries, whereas Czech Republic and Poland account
already for more than half of the decline.
Participation has also declined for all types of companies, while RUs-F show the highest decline.
The inclusion of data from the previous reporting session is an effort to have a more complete view of the company’s
feedback and of the current level of implementation. The effect has been relatively high in the present report, as with
111 types of company a large number has been included in the evaluation.
The degree of implementation (DI) for the different TAF functions (diagrams 30 to 32) in the present report shows
generally a positive development. Degree of implementation of CC has the highest value for all types of companies. For
all other functions the degree of implementation for IMs is higher than the one for RUs.
The DI declines only for the two IM functions, CI and TCM. In these cases, the number of responding companies grows
steeper than the number of companies with complete implementation. This might partly be explained by the growing
number of smaller companies taking part, which normally are not advanced in TAF/TAP implementation.
For some TAF TSI functions there is a strong need to precisely define the compliance with TAF TSI regulation. For
example, for the WIMO function, companies claim that some requirements and the criteria for fulfilling are still unclear.
This task has been initiated from the sector and work is ongoing.
The degree of implementation (DI) as set out in diagrams 30 to 32 of this report is calculated from the responses to the
questionnaire. If companies not having responded would be also taken into calculation, the degree of implementation
would drop off.
RSRD2 and TIS remain the most used common sector tools following feedback to this survey. 75 % of responding
companies benefit from RSRD2, while it is 50 % for TIS.

47
9. Upcoming next reporting session
i. Functions to be reported in the next report
During the 9th TAF TSI Implementation Cooperation Group meeting held in March 2019, it was agreed to report about the following functions for the 10th Reporting wave in the frame of the TAF TSI regulation:
Primary location codes
Company codes
Common interface
Train running information
RSRD
WIMO
Train composition message
Consignment note data
Wagon Movement data
Train ready
Service Disruption
Train Running Interrupted Message
ii. Calendar for next reporting
In the frame of the 9th TAF TSI Implementation Cooperation Group meeting held in March 2019, it was agreed the following the schedule to report about the implementation of TAF TSI functions and RU-IM Communication for TAP TSI (10th Reporting wave):
IRG preparation of questionnaire – 10.04.2019
ERA-JSG consultation about questionnaire – 10.04.2019
Questionnaire publication – 20.05.2019
Opening JSG/CSG tool for reporting – 03-28.06.2019
ERA/JSG consultation about reports – 30.07.2019
Approving report at JSG – 18.09.2019
Presenting at ERA ICG – 16-17.10.2019
Feedback from ERA ICG Members – 15.11.2019
Publishing reports – 29.11.2019
Figure 3: Reporting Schedule for the 10th Reporting wave

48
ANNEX 1: Distribution of freight fleet per country in Europe
Country Valid registrations VVR / Eurostat
Wagons In GCU
Wagons In RSRD (Data provided by
RSRD2 – UIP)5
Austria 19.706 20.052 7.882
Belgium 40.375 10.426 17.361
Bulgaria 12865 3.492 244
Croatia
5.837 5
Czech Republic 53.885 40.503 20.251
Denmark 2.305 1 830
Estonia - 0 0
Finland - 4 -
Norway - 0 0
France 113.261 77.319 53.232
Germany 102.778 168.866 100.722
Greece 4.094 0 2.047
Hungary 12.918 11.649 646
Ireland - 0 0
Italy 44.482 26.519 31.137
Latvia 11.210 0 8.676
Lithuania - 0 0
Luxembourg 4.216 2.966 8432
Netherlands 21.957 18.058 7.026
Poland 109.165 70.435 22.924
Portugal 3.379 6 206
Romania 24.076 14.561 963
Slovakia 33.359 24.279 24.352
Slovenia 3.767 3.468 54
Spain 12.760 18.131 4.014
Switzerland 27.398 17.211 13.425
Sweden 12.760 8.820 4.083
United Kingdom
- 616 -
5 The table has been updated with the data provided by UIP-RSRD2.

49
ANNEX 2: Responses contact list v9
Nr. Member State
Type of Company Company name Reporting Entity
1 AT IM ÖBB Infrastruktur AG Heinze
2 AT RU-F/WK Rail Cargo Austria AG Senfter
3 AT WK Bahnbau Wels GmbH RSRD2
4 AT WK Felbermayr Transport- und Hebetechnik GmbH & Co KG RSRD2
5 AT WK GATX Rail Austria GmbH RSRD2
6 AT WK Logistik Service GmbH RSRD2
7 AT WK Propangas AG RSRD2
8 AT WK VTG Austria Ges.m.b.H. RSRD2
9 BE IM Infrabel
10 BE WK Lineas Group SA/NV RSRD2
11 BE WK Lineas Intermodal NV RSRD2
12 BE WK Lineas SA/NV RSRD2
13 BG IM NRIC
14 BG RU-F BDZ cargo
15 BG RU-F EXPRESS SERVICE OOD
16 BG RU-F PORT RAIL LTD
17 BG RU-F/WK DB Cargo Bulgaria EOOD
18 CH IM BLS-Netz AG
19 CH IM SBB AG, Division Infrastruktur
20 CH IM/RU-P/RU-F Schweizerische Südostbahn AG
21 CH RU-F BLS Cargo
22 CH RU-F SBB Cargo International AG SBB Cargo International
23 CH RU-F/WK SBB CARGO AG
24 CH RU-P SBB AG, Division Personenverkehr
25 CH WK Diversified Investments SA RSRD2
26 CH WK HASTAG (Zürich) AG RSRD2
27 CH WK MITRAG AG RSRD2
28 CH WK TRANSWAGGON AG RSRD2
29 CH WK VTG Schweiz GmbH RSRD2
30 CH WK WASCOSA AG Luzern RSRD2

50
Nr. Member State
Type of Company Company name Reporting Entity
31 CZ IM/RU-F/WK DBV-ITL, s.r.o.
32 CZ RU-F GJW Praha spol. s r.o.
33 CZ RU-F Ostravská dopravní společnost - Cargo,a s.
34 CZ RU-F Sokolovská uhelná, právní nástupce, a.s.
35 CZ RU-F/RU-P LTE Logistik a Transport Slovakia s.r.o. LTE Group
36 CZ RU-F/WK Advanced World Transport a.s.
37 CZ RU-F/WK ČD Cargo, a.s.
38 CZ RU-F/WK UNIPETROL Doprava s.r.o.
39 CZ RU-P Leo Express s.r.o.
40 CZ RU-P/WK Ceske drahy, a.s.
41 CZ WK ArcelorMittal Ostrava, a.s.
42 CZ WK Česká republika - Správa státních hmotných rzerv
43 CZ WK Coal Services a.s.
44 CZ WK DIAMO, státni podnik RSRD2
45 CZ WK Felbermayr Transport- und Hebetechnik spol.s.r.o. RSRD2
46 CZ WK KOS Trading a. s.
47 CZ WK Lafarge Cement, a.s. RSRD2
48 CZ WK Lovochemie, a.s.
49 CZ WK NH-TRANS, SE
50 CZ WK Railco a.s. RSRD2
51 CZ WK RYKO PLUS spol. s r.o.
52 CZ WK Spolek pro chemickou a hutní výrobu, akciová společnost
53 CZ WK Státní podnik DIAMO
54 CZ WK V.K.S. Vagon Komerc Speed, spol. s r.o. RSRD2
55 CZ WK VÁPENKA VITOŠOV s.r.o.
56 DE IM DB Netz AG
57 DE RU-F duisport rail GmbH
58 DE RU-F SBB Cargo International AG SBB Cargo International
59 DE RU-F/WK DB Cargo
60 DE RU-P DB Regio AG
61 DE WK AlzChem Trostberg GmbH RSRD2

51
Nr. Member State
Type of Company Company name Reporting Entity
62 DE WK Aretz GmbH und Co. KG RSRD2
63 DE WK BASF SE RSRD2
64 DE WK DAHER PROJECTS GmbH RSRD2
65 DE WK Ermewa GmbH RSRD2
66 DE WK ERR European Rail Rent GmbH RSRD2
67 DE WK GATX Rail Germany GmbH RSRD2
68 DE WK Kombiverkehr Deutsche Gesellschaft für kombinierten Güterverkehr mbH & Co. KG RSRD2
69 DE WK Mosolf Automotive Railway GmbH RSRD2
70 DE WK NACCO GmbH RSRD2
71 DE WK On Rail - Gesellschaft für Eisenbahnausrüstung und Zubehör mbH RSRD2
72 DE WK On Rail Gesellschaft für Vermietung und Verwaltung von Eisenbahnwaggons mbH RSRD2
73 DE WK Petrochem Mineralöl-Handels-GmbH RSRD2
74 DE WK TRANSWAGGON GmbH RSRD2
75 DE WK Tyczka Gase GmbH RSRD2
76 DE WK voestalpine Rail Center Königsborn GmbH RSRD2
77 DE WK Vossloh Logistics GmbH RSRD2
78 DE WK VTG Aktiengesellschaft RSRD2
79 DE WK VTG Rail Europe GmbH RSRD2
80 DE WK Zürcher Bau GmbH RSRD2
81 EE IM AS Eesti Raudtee (Estonian Railways)
82 ES IM ADIF
83 ES RU-F ACCIONA RAIL SERVICES S.A.
84 ES RU-F Logitren Ferroviaria, SA
85 ES RU-F RENFE MERCANCIAS
86 ES WK Ferrocarrils de la Generalitat de Catalunya RSRD2
87 ES WK Sociedad de estudios y explotacion de material auxiliar de transportes S.A. RSRD2
88 ES WK Transportes Ferroviarios Especiales S.A. RSRD2
89 ES WK VTG Rail Europe GmbH Sucursal en España RSRD2
90 FI RU-F/RU-P VR Group
91 FR IM SNCF Réseau
92 FR RU-F SNCF MOBILITES - Fret

52
Nr. Member State
Type of Company Company name Reporting Entity
93 FR RU-P SNCF Mobilités Voyageurs
94 FR WK ATIR-RAIL RSRD2
95 FR WK Compagnie Française de Produits Métallurgiques RSRD2
96 FR WK Ermewa SA RSRD2
97 FR WK EVS S.A. RSRD2
98 FR WK Millet SAS RSRD2
199 FR WK Monfer France SASU RSRD2
100 FR WK NACCO S.A.S. RSRD2
101 FR WK SOCOMAC RSRD2
102 FR WK STVA S.A. RSRD2
103 FR WK VTG France SAS RSRD2
104 HU AB VPE Vasúti Pályakapacitás-elosztó Kft.
105 HU IM GYSEV Zrt.
106 HU IM MÁV Hungarian State Railways
107 HU IM MMV Magyar Magánvasút Zrt.
108 HU RU-F Rail Cargo Hungaria Zrt.
109 HU RU-P MÁV-START
110 IE WK TOUAX Rail Ltd. RSRD2
111 IT IM Ferrovie Emilia Romagna (FER)
112 IT IM La Ferroviaria Italiana S.p.A.
113 IT IM RETE FERROVIARIA ITALIANA
114 IT IM/RU-F Ferrovie del Gargano
115 IT RU-F Captrain Italia Srl
116 IT RU-F DB Cargo Italia S.r.l.
117 IT RU-F Dinazzano Po SpA
118 IT RU-F Fuorimuro Servizi Portuali e Ferroviari srl
119 IT RU-F GTS Rail S.p.A.
120 IT RU-F HUPAC SpA
121 IT RU-F INRAIL S.p.A.
122 IT RU-F TX Logistik AG - Sede Secondaria Italiana
123 IT RU-F/WK Mercitalia Rail s.r.l.
124 IT RU-P Italo - Nuovo Trasporto Viaggiatori S.p.A.
125 IT RU-P SAD - Trasporto Locale SpA

53
Nr. Member State
Type of Company Company name Reporting Entity
126 IT RU-P SNCF Voyages Italia
127 IT RU-P Trasporto Ferroviario Toscano
128 IT RU-P Trenitalia SpA
129 IT RU-P Trenord Srl
130 IT RU-P TRENTINO TRASPORTI SPA
131 IT WK Giovanni Ambrosetti Auto Logistica S.p.A RSRD2
132 IT WK Lotras srl RSRD2
133 IT WK Monfer Cereali SRL RSRD2
134 IT WK SITFA SpA
135 LU IM/RU-F/RU-P/WK-AB
CFL
136 LV IM VAS Latvijas dzelzceļš (LDz)
137 LV RU-F/WK SIA LDZ CARGO (LDZ CARGO)
138 NL IM ProRail B.V.
139 NL RU-F Spitzke Spoorbouw BV
140 NL RU-F/RU-P Railexperts BV
141 PL IM PKP POLSKIE LINIE KOLEJOWE S.A.
142 PL RU-F Captrain Polska Sp. z o.o.
143 PL RU-F CTL LOGISTICS Sp. z o.o.
144 PL RU-F Kolej Bałtycka S.A.
145 PL RU-F/WK CEMET S.A.
146 PL RU-F/WK JSW Logistics Sp. z o.o.
147 PL RU-P Spółka „Łódzka Kolej Aglomeracyjna” sp. z o.o.
148 PL WK Felbermayr Immo Sp.z.o.o. RSRD2
149 PL WK GATX Rail Poland Sp. z o.o. RSRD2
150 PL WK Tankwagon Sp. z o. o. RSRD2
151 PT IM Infraestruturas de Portugal
152 PT RU-F Medway - Operador Ferroviário e Logístico de Mercadorias, SA
153 PT RU-F/WK TAKARGO
154 PT RU-P CP - Comboios de Portugal EPE
155 PT WK ADP Fertilizantes, S.A. RSRD2
156 PT WK CIMPOR - Serviços de Apoio à Gestão de Empresas, S.A. RSRD2

54
Nr. Member State
Type of Company Company name Reporting Entity
157 RO IM CFR
158 SE IM Trafikverket
159 SE RU-F CFL cargo Sverige AB
160 SE RU-F/WK Green Cargo
161 SE WK Stena Recycling AB RSRD2
162 SE WK TRANSWAGGON AB RSRD2
163 SI IM SŽ infrastruktura, d.o.o.
164 SI RU-F SŽ TOVORNI PROMET D.O.O.
165 SI WK Adria kombi d.o.o. RSRD2
166 SK RU-F/RU-P LTE Logistik a Transport Slovakia s.r.o. LTE Group
167 SK RU-F/RU-P ZSSK CARGO
168 SK WK Felbermayr Slovakia s.r.o. RSRD2
169 SK WK Ing. Alica Ovciariková A.O. RSRD2
170 TR WK TRANSWAGGON Vagon Isletmeleri Ltd. Sti. RSRD2
171 UK IM Network Rail Infrastructure Limited
172 UK RU-F/WK DB Cargo UK
55
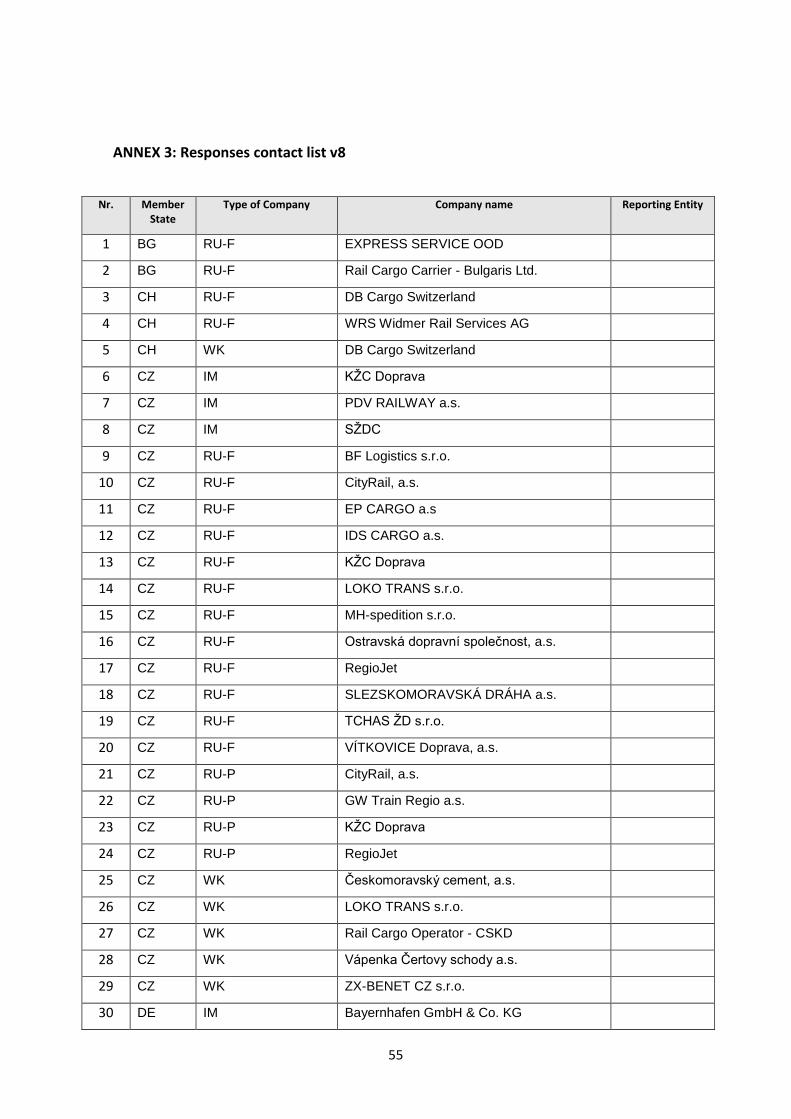
ANNEX 3: Responses contact list v8
Nr. Member State
Type of Company Company name Reporting Entity
1 BG RU-F EXPRESS SERVICE OOD
2 BG RU-F Rail Cargo Carrier - Bulgaris Ltd.
3 CH RU-F DB Cargo Switzerland
4 CH RU-F WRS Widmer Rail Services AG
5 CH WK DB Cargo Switzerland
6 CZ IM KŽC Doprava
7 CZ IM PDV RAILWAY a.s.
8 CZ IM SŽDC
9 CZ RU-F BF Logistics s.r.o.
10 CZ RU-F CityRail, a.s.
11 CZ RU-F EP CARGO a.s
12 CZ RU-F IDS CARGO a.s.
13 CZ RU-F KŽC Doprava
14 CZ RU-F LOKO TRANS s.r.o.
15 CZ RU-F MH-spedition s.r.o.
16 CZ RU-F Ostravská dopravní společnost, a.s.
17 CZ RU-F RegioJet
18 CZ RU-F SLEZSKOMORAVSKÁ DRÁHA a.s.
19 CZ RU-F TCHAS ŽD s.r.o.
20 CZ RU-F VÍTKOVICE Doprava, a.s.
21 CZ RU-P CityRail, a.s.
22 CZ RU-P GW Train Regio a.s.
23 CZ RU-P KŽC Doprava
24 CZ RU-P RegioJet
25 CZ WK Českomoravský cement, a.s.
26 CZ WK LOKO TRANS s.r.o.
27 CZ WK Rail Cargo Operator - CSKD
28 CZ WK Vápenka Čertovy schody a.s.
29 CZ WK ZX-BENET CZ s.r.o.
30 DE IM Bayernhafen GmbH & Co. KG

56
Nr. Member State
Type of Company Company name Reporting Entity
31 DE IM Container Terminal Halle (Saale) GmbH
32 DE IM evb Infrastrukture
33 DE IM Hafen Krefeld GmbH & Co. KG
34 DE IM Häfen und Güterverkehr Köln AG
35 DE IM HLB Basis AG, HLB Hessenbahn GmbH
36 DE RU-F Captrain CargoWest GmbH
37 DE RU-F Hafen Krefeld GmbH & Co. KG
38 DE RU-F HLB Basis AG, HLB Hessenbahn GmbH
39 DE RU-F MEG Mitteldeutsche Eisenbahn GmbH
40 DE RU-F RBH Logistics GmbH
41 DE RU-F RTB CARGO GMBH/VIAS GMBH
42 DE RU-P Hafen Krefeld GmbH & Co. KG
43 DE RU-P HLB Basis AG, HLB Hessenbahn GmbH
44 DE WK MEG Mitteldeutsche Eisenbahn GmbH
45 DE WK RBH Logistics GmbH
46 DK RU-F DB Cargo Scandinavia A/S
47 DK WK DB Cargo Scandinavia A/S
48 EE RU-F AS Operail
39 EE WK AS Operail
50 ES RU-F TF Transfesa
51 ES WK TF Transfesa
52 FI IM Finnish Transport Agency
53 FR RU-F ECR Euro Cargo Rail SA
54 FR WK ECR Euro Cargo Rail SA
55 HU RU-F DB Cargo Hungária Kft.
56 HU RU-F GYSEV CARGO Zrt.
57 HU WK DB Cargo Hungária Kft.
58 IT IM EAV srl
59 IT IM Gruppo Torinese Trasporti S.p.A.
60 IT RU-F SBB Cargo Italia
61 IT RU-P BUSINESS UNIT TRASPORTO FERROVIARIO di FERROVIE DEL SUD EST
62 IT RU-P Ente Autonomo Volturno s.r.l.

57
Nr. Member State
Type of Company Company name Reporting Entity
63 IT RU-P Ferrovie del Gargano
64 IT RU-P GRUPPO TORINESE TRASPORTI SPA
65 IT RU-P Italo - Nuovo Trasporto Viaggiatori S.p.A.
66 IT RU-P Trasporto Passeggeri Emilia Romagna SpA
67 IT WK Ambrogio Trasporti SpA
68 IT WK DB Cargo Italia Srl
69 IT WK Mercitalia Intermodal S.p.A.
70 LT IM JSC "Lithuanian Railways"
71 LT RU-F JSC "Lithuanian Railways"
72 LT RU-P JSC "Lithuanian Railways"
73 LT WK JSC "Lithuanian Railways"
74 NL RU-F DB Cargo Nederland N.V.
75 NL RU-P NS Reizigers & NS International
76 NL WK DB Cargo Nederland N.V.
77 NO IM Bane NOR
78 PL RU-F CARGO MASTER SP. Z O.O.
79 PL RU-F CD Cargo Poland Sp. z o.o.
80 PL RU-F CIECH CARGO SP. z o.o.
81 PL RU-F Colas Rail Polska SP.ZO.o
82 PL RU-F DB Cargo Polska Spółka Akcyjna
83 PL RU-F GRUPA AZOTY KOLZAP SP. Z O.O.
84 PL RU-F Inter Cargo Sp. z o .o.
85 PL RU-F LOTOS Kolej Sp. z o.o.
86 PL RU-F Pomorskie Przedsiębiorstwo Mechaniczno - Torowe sp. z o.o.
87 PL RU-F PROTOR Spółka z ograniczoną odpowiedzialnością Spółka komandytowa
88 PL RU-F Przedsiębiorstwo Napraw i Utrzymania Infrastruktury Kolejowej w Krakowie Sp. z o.o.
89 PL RU-F Stanisław Głowacz F.H.U. JMS
90 PL RU-F Zakład Inżynierii Kolejowej Sp. z o.o.
91 PL RU-P Arriva RP Sp. z o.o.
92 PL RU-P CARGO MASTER SP. Z O.O.
93 PL RU-P Koleje Śląskie sp. z o.o.

58
Nr. Member State
Type of Company Company name Reporting Entity
94 PL RU-P Stanisław Głowacz F.H.U. JMS
95 PL WK DB Cargo Polska Spółka Akcyjna
96 PL WK LOTOS Kolej Sp. z o.o.
97 PL WK Pomorskie Przedsiębiorstwo Mechaniczno - Torowe sp. z o.o.
98 PL WK Przedsiębiorstwo Napraw i Utrzymania Infrastruktury Kolejowej w Krakowie Sp. z o.o.
99 PL WK Zakład Inżynierii Kolejowej Sp. z o.o.
100 PT RU-P FERTAGUS
101 RO IM TRANSFEROVIAR GRUP SA
102 RO RU-F DB Cargo Rail Romania SRL
103 RO RU-F SNTFM "CFR MARFA" SA
104 RO RU-F TRANSFEROVIAR GRUP SA
105 RO WK DB Cargo Rail Romania SRL
106 RO WK SNTFM "CFR MARFA" SA
107 SE RU-F Hector Rail AB
108 SI WK SŽ TOVORNI PROMET D.O.O.
109 SK IM Slovak Railways - železnice Slovenskej republiky
110 SK RU-F BULK TRANSSHIPMENT SLOVAKIA, a.s.
111 SK RU-F TSS Grade a.s.
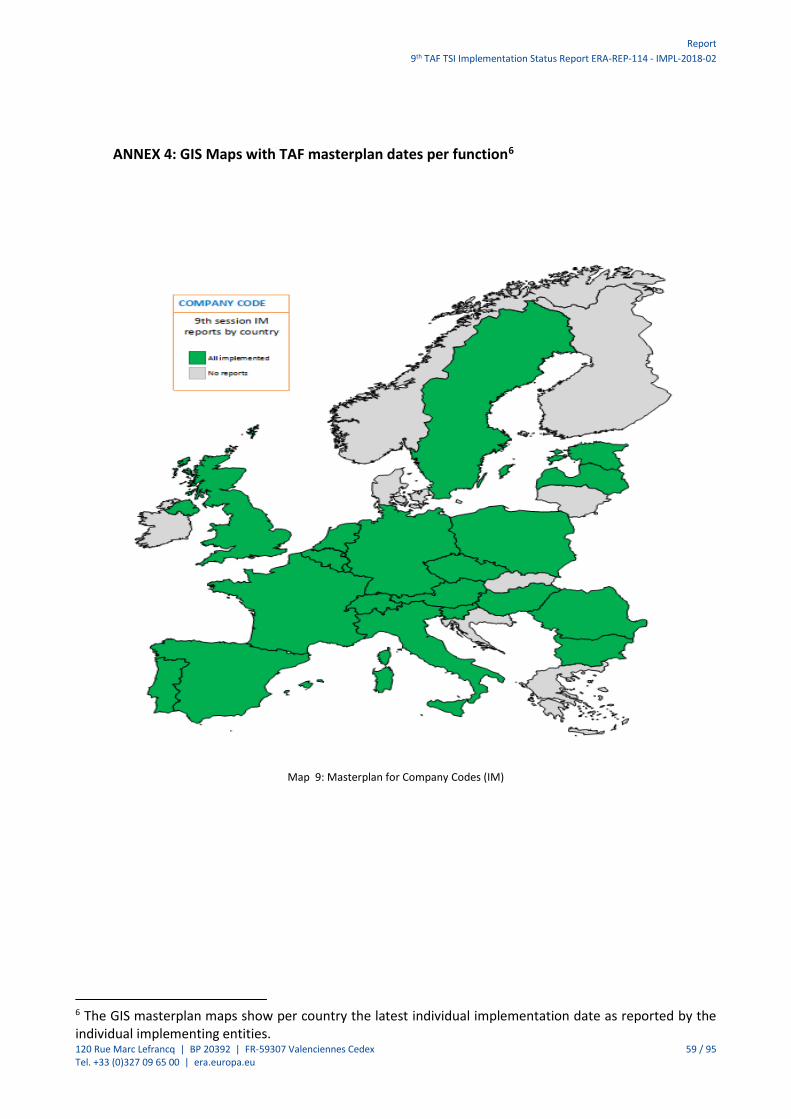
Report
9th TAF TSI Implementation Status Report ERA-REP-114 - IMPL-2018-02
120 Rue Marc Lefrancq | BP 20392 | FR-59307 Valenciennes Cedex 59 / 95 Tel. +33 (0)327 09 65 00 | era.europa.eu
ANNEX 4: GIS Maps with TAF masterplan dates per function6
Map 9: Masterplan for Company Codes (IM)
6 The GIS masterplan maps show per country the latest individual implementation date as reported by the individual implementing entities.

60
Map 10: Masterplan for Common Interface (IM)

61
Map 11: Masterplan for Primary Location Codes (IM)

62
Map 12: Masterplan for Train Composition Message (IM)

63
Map 13: Masterplan for Train Running Information (IM)

64
Map 14: Masterplan for Company Codes (RU)

65
Map 15: Masterplan for Common Interface (RU)

66
Map 16: Masterplan for Consignment Order Message (RU)

67
Map 17: Masterplan for Train Composition Message (RU)

68
Map 18: Masterplan for Train Running Information (RU)

69
Map 19: Masterplan for WIMO (RU)

70
Map 20: Masterplan for Wagon Movement (RU)

71
Map 21: Masterplan for RSRD (WK)

72
ANNEX 5: DEVELOPMENT TABLES PER FUNCTION AND PER COUNTRY THROUGHOUT THE REPORTING SESSIONS7
1. Development of Company Codes RUs / WKs / IMs
7 Legend: dark green = 100%, green = 75%, amber = 50% and red = 25% of implementation. White = no data.

Report
9th TAF TSI Implementation Status Report ERA-REP-114 - IMPL-2018-02
120 Rue Marc Lefrancq | BP 20392 | FR-59307 Valenciennes Cedex 73 / 95 Tel. +33 (0)327 09 65 00 | era.europa.eu
2. Development of IM functions

74

75

76

77

78

79

80

81

82

83

84
3. Development of RU / WK functions

85

86

87

88

89

90

91
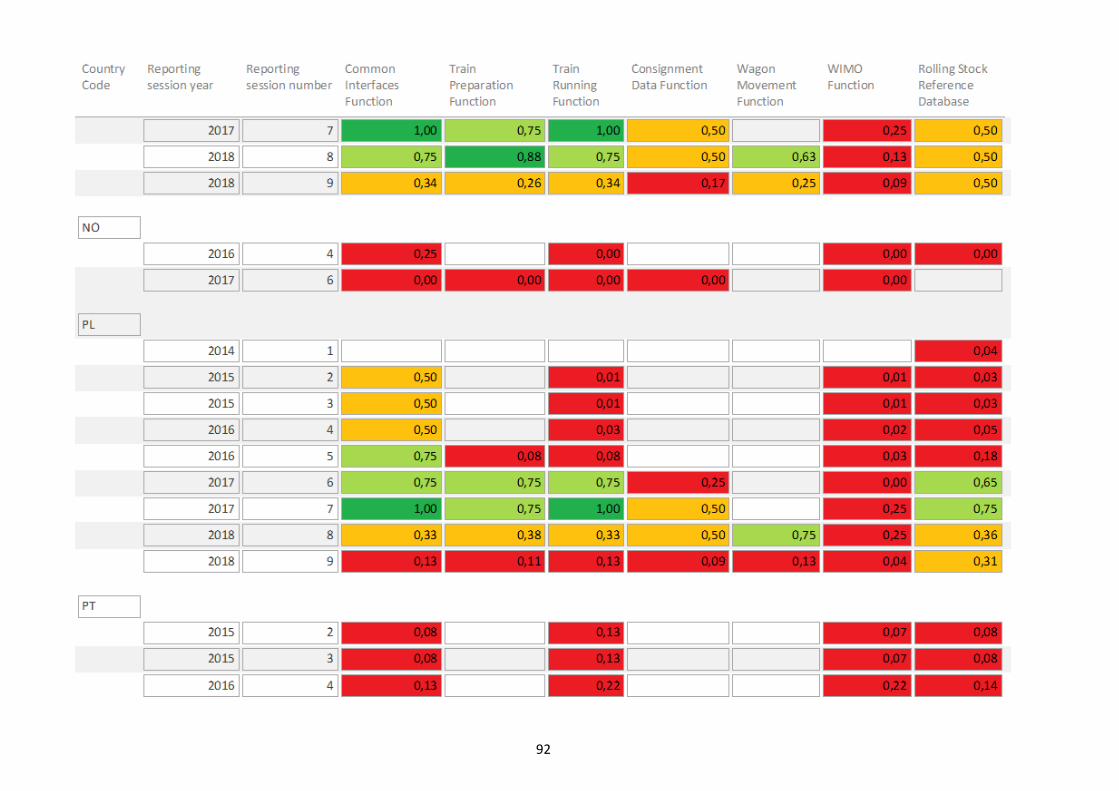
92

93

94

95