Embed Size (px)
Citation preview
TR-344 2009
Field Demonstration of the Performance of the L4DB®
Microbial Treatment System to Reduce Phosphorus and Other Substances from Dairy Lagoon Effluent
Final Report April 2008
By: S. Mukhtar, Texas AgriLife Research S. Rahman, Texas AgriLife Research
L. Gregory, Texas Water Resources Institute
Funded by the Texas State Soil and Water Conservation Board under CWA Section 319, EPA TSSWCB Project # 03-10
Partners: Texas AgriLife Extension Service
Texas Water Resources Institute Envirolink® LLC, Greeley, Kansas
Texas Water Resources Institute Technical Report
January 2009

2
Table of Contents Executive Summary............................................................................3
Introduction.........................................................................................6
L4DB® treatment system....................................................................................................... 7 Methods................................................................................................9
Layout of sampling scheme.................................................................................................... 9 Sludge depth (SD) measurement .......................................................................................... 13 Lagoon, tank and irrigation effluent sample collection........................................................ 13 Sample preparation and analysis .......................................................................................... 17 Statistical analysis ................................................................................................................ 19 Statistical analysis ................................................................................................................ 19
Results and Discussion......................................................................19
Environmental conditions..................................................................................................... 20 Lagoon performance............................................................................................................. 21
Sludge depth ..................................................................................................................... 21 Physicochemical characteristics of lagoon........................................................................... 24
pH ..................................................................................................................................... 25 Solids ................................................................................................................................ 27 Nutrients ........................................................................................................................... 35 Metals ............................................................................................................................... 44 Conductivity ..................................................................................................................... 48
Treatment Costs ................................................................................50
Conclusion .........................................................................................50
Challenges..........................................................................................52
Acknowledgement .............................................................................52
References..........................................................................................53
Appendix A........................................................................................56
3
Field Demonstration of the Performance of the L4DB® Microbial Treatment to Reduce Phosphorus and other
Substances from Dairy Lagoon Effluent
EXECUTIVE SUMMARY
Two upper North Bosque River segments were designated as impaired in 1998 due to point
source and nonpoint source (NPS) pollution of phosphorus (P) to these segments of the
watershed. As a result, two Total Maximum Daily Loads (TMDLs) were applied which called
for the reduction of annual loading and annual average soluble reactive P (SRP)
concentrations by about 50%. Under Clean Water Act (Section 319(h)), a new technologies
demonstration project was funded by the USEPA Region 6 and administered by the Texas
State Soil and Water Conservation Board (TSSWCB) for reducing water pollution associated
with dairy animal production systems. As part of this demonstration, the efficacy of a
prospective new technology (i.e.L4DB® microbial treatment system) was evaluated, which
may aid dairy farmers in reducing P from lagoon effluent. In many cases, this effluent is
applied to waste application fields (WAFs) as irrigation water; thus reducing P in the effluent
can have a direct impact on NPS pollution in the watershed.
Beginning in May 2006 a dairy’s anaerobic lagoon was treated with L4DB® microbes
at an average application rate of 65 gallons (246 L) of microbial solution/month for a period
of 12 months. Lagoon samples were collected monthly or bi-monthly from two different
profiles: lagoon supernatant (LS, sampled from top of the liquid level to 2ft (61 cm) depth)
and lagoon profile (LP, sampled from the entire depth of the lagoon) using a sludge judge (a
sampling tube with a check valve at the bottom to take lagoon sample at different depths). For
4
each LP and LS, 30 samples (3 samples per location × 10 locations) were collected during
each sampling event. A set of 15 LP and 15 LS samples were mixed separately to get two
composites of each for nutrients including P, solids, pH, conductivity and metals. In addition,
60 samples of lagoon effluent (hereafter IR) used to irrigate a nearby pasture were collected
bi-monthly from a riser located just upstream from the big gun irrigation unit. Fifteen IR sub-
samples were grouped together to get four IR composite samples. The IR composite samples
were also analyzed for the above mentioned physical and chemical constituents.
L4DB® microbial treatment reduced average sludge depth by 24% as compared to its
pre-treatment level (however, this reduction was 16%, when sludge measurement anomaly in
August 2006 was excluded). The microbial treatment also reduced averaged total solids (TS)
and total suspended solids (TSS) by 43 and 45%, respectively, for the LP, and 60 and 71%,
respectively, for LS. Conversely, these values increased by 124% for IR effluent over times.
This microbial treatment system was effective in reducing average total phosphorus
(TP) by 27 and 52% for the LP and LS, respectively, but not effective in reducing TP
concentration for IR effluent. Overall, no clear soluble reactive phosphorus (SRP) reduction
trends were observed for any sampling locations. Similar to the effect on TP, the L4DB®
treatment was effective in reducing total Kjeldahl nitrogen (TKN) from the LP (36%) and LS
(48%), but not effective in reducing potassium (K) for LP and LS. No clear trend of reducing
these nutrients from IR effluent was observed over time.
This microbial treatment system was effective in reducing metals concentration as
well. The average concentration reductions of Al, Ca, Cu, Fe, and Mn for LP were over 50%,
while the reduction seen in Mg was only 22%. Similarly, the concentration reductions
observed in LS samples were over 60% for the same suite of elements while Mg was reduced
5
by about 42%. No clear metal concentration reduction trends were observed for IR effluent.
As a result, it can be inferred that most of these solids, nutrients, and metal reductions were
likely due to microbial treatment, dilution of lagoon slurry by excessive rain and runoff as
well as settling of dead and degraded bacterial mass accumulated at the bottom of lagoon.
Additional measurements of lagoon sludge accumulation rate and constituents are warranted
to assess possible increase in nutrients and solids due to accelerated solids settling and
increased accumulation of microbial mass at the lagoon bottom.
6
INTRODUCTION
The bulk of the manure from animal feeding operations (AFOs) in the USA is applied
to crop and pastureland. Although manure is an excellent resource for plant nutrients and soil
conditioning, excessive land application rates and improper uses of manure can lead to
environmental concerns. Manure phosphorus (P) that is not utilized by plants represents one
of these concerns and can significantly impact surface water quality. Water quality
degradation due to nonpoint source phosphorus (P) contribution from effluent and manure
applied to waste application fields (WAFs) is a major concern in the Bosque River watershed.
In 1998 two upper North Bosque River segments (Upper North Bosque River – Segment
1255; North Bosque River – Segment 1226) were designated as impaired segments on the
Texas Clean Water Act, Section 303(d) list (TNRCC, 2001). This designation was the result
of excessive nutrient loading and aquatic plant growth in those segments. The changes in the
status of the Bosque River segments prompted the Texas Commission on Environmental
Quality (TCEQ) to develop TMDLs that address P loading to the designated segments. In
December of 2002, TCEQ approved the implementation plan for these TMDLs; these plans
were also approved by the Texas State Soil and Water Conservation Board (TSSWCB) in
January 2003. The TMDLs call for a reduction of the annual loading and annual average
soluble reactive P (SRP) concentrations by about 50%.
The TCEQ has cited pollution from nonpoint source agricultural operations (by way of
runoff) as the main source of contamination to these segments. As a result, reducing P from
dairy effluent applied to WAFs is vital step in protecting the quality of these water bodies.
Runoff from WAFs is not currently regulated because it is considered a nonpoint source, but
it’s impact on water bodies can be minimized by using on farm management practices to

7
reduce potential pollutants in dairy lagoon effluent applied to WAFs. There are currently a
number of dairy operations in the watershed using best management practices (BMPs) to
remove P and SRP from the wastewater; however, to meet the goals of the established
TMDLs, new, more effective and efficient BMPs are needed. One prospective BMP is the use
of L4DB® microbial treatment to remove P and other constituents from the effluent being
stored and treated in dairy lagoons.
This report outlines the performance of a patented liquid-borne L4DB® microbial
treatment (hereafter L4DB®) introduced by Envirolink® LLC, Greeley, Kansas. The
demonstration evaluated under this project was set-up to treat a single cell anaerobic lagoon at
a 300-head lactating cow free-stall dairy in the Bosque River watershed. Free-stall alleys were
flushed 4 times per week and scraped in the remaining time. During each flushing, 10,000-
12,000 gallons (37,854-45,425 L) of effluent was washed into the lagoon. As needed, this
effluent was used to irrigate hay and cropland at the dairy using a big gun irrigation system.
L4DB® treatment system
According to Envirolink®, the patented liquid-borne L4DB® microbial treatment is
derived from milk. Some of the physical and chemical properties of the L4DB® are listed in
Table 1. Prior to its application to the lagoon, the L4DB® was thoroughly mixed and applied
at an average rate of 65 gallons/month (246 L/month), which was predetermined by
Envirolink® based on the lagoon size, depth of water and solids in the effluent; monthly
L4DB® inputs are listed in Table 2. The L4DB® treatment was applied by spraying along the
perimeter of lagoon while continuously agitating the liquid surface using a water sprinkler and
lagoon effluent.
8
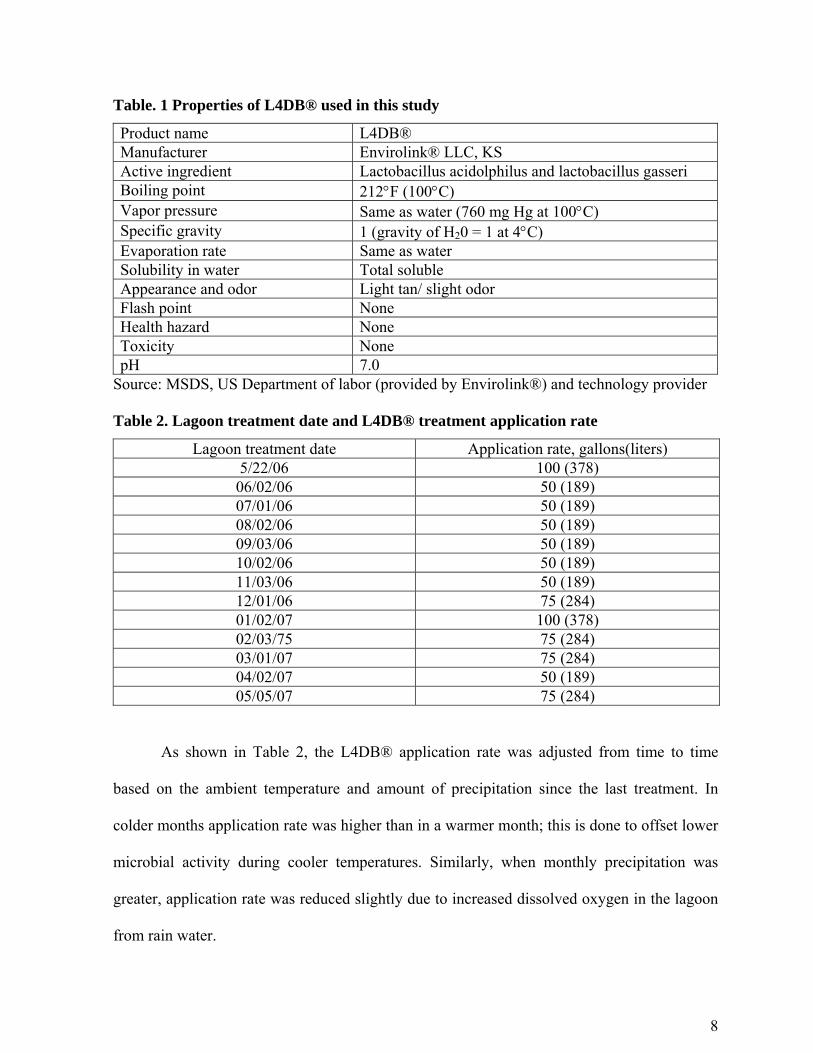
Table. 1 Properties of L4DB® used in this study
Product name L4DB® Manufacturer Envirolink® LLC, KS Active ingredient Lactobacillus acidolphilus and lactobacillus gasseri Boiling point 212°F (100°C) Vapor pressure Same as water (760 mg Hg at 100°C) Specific gravity 1 (gravity of H20 = 1 at 4°C) Evaporation rate Same as water Solubility in water Total soluble Appearance and odor Light tan/ slight odor Flash point None Health hazard None Toxicity None pH 7.0
Source: MSDS, US Department of labor (provided by Envirolink®) and technology provider
Table 2. Lagoon treatment date and L4DB® treatment application rate
Lagoon treatment date Application rate, gallons(liters) 5/22/06 100 (378) 06/02/06 50 (189) 07/01/06 50 (189) 08/02/06 50 (189) 09/03/06 50 (189) 10/02/06 50 (189) 11/03/06 50 (189) 12/01/06 75 (284) 01/02/07 100 (378) 02/03/75 75 (284) 03/01/07 75 (284) 04/02/07 50 (189) 05/05/07 75 (284)
As shown in Table 2, the L4DB® application rate was adjusted from time to time
based on the ambient temperature and amount of precipitation since the last treatment. In
colder months application rate was higher than in a warmer month; this is done to offset lower
microbial activity during cooler temperatures. Similarly, when monthly precipitation was
greater, application rate was reduced slightly due to increased dissolved oxygen in the lagoon
from rain water.
9
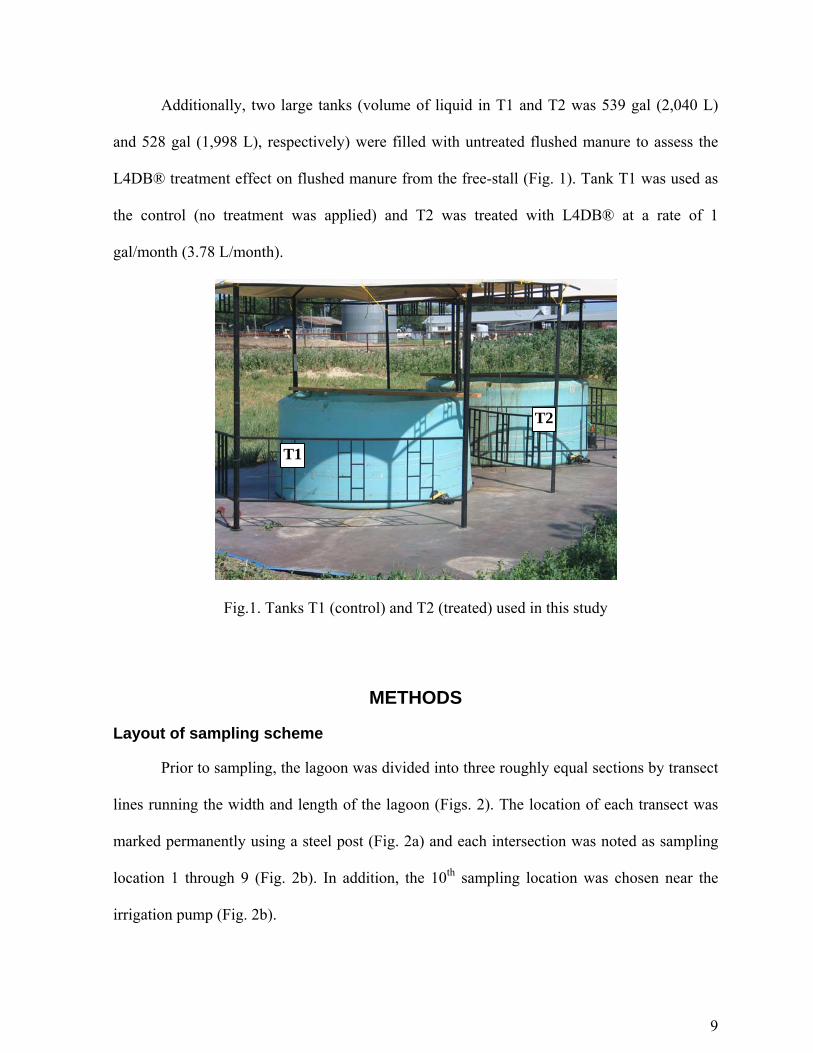
Additionally, two large tanks (volume of liquid in T1 and T2 was 539 gal (2,040 L)
and 528 gal (1,998 L), respectively) were filled with untreated flushed manure to assess the
L4DB® treatment effect on flushed manure from the free-stall (Fig. 1). Tank T1 was used as
the control (no treatment was applied) and T2 was treated with L4DB® at a rate of 1
gal/month (3.78 L/month).
Fig.1. Tanks T1 (control) and T2 (treated) used in this study
METHODS
Layout of sampling scheme
Prior to sampling, the lagoon was divided into three roughly equal sections by transect
lines running the width and length of the lagoon (Figs. 2). The location of each transect was
marked permanently using a steel post (Fig. 2a) and each intersection was noted as sampling
location 1 through 9 (Fig. 2b). In addition, the 10th sampling location was chosen near the
irrigation pump (Fig. 2b).
T1
T2

10
(a)
(b)
Fig. 2. a) Transect line running the width and length of the lagoon along with sampling location, and b) schematic of lagoon sampling layout. • Indicates lagoon sampling locations and sludge depth measurement locations; ⊗ indicates irrigation pump locations (not to scale)
1
2
3
4
5
6
7
8
9
10
282 ft (86 m)
232
ft (7
1 m
)
Influent input N
11
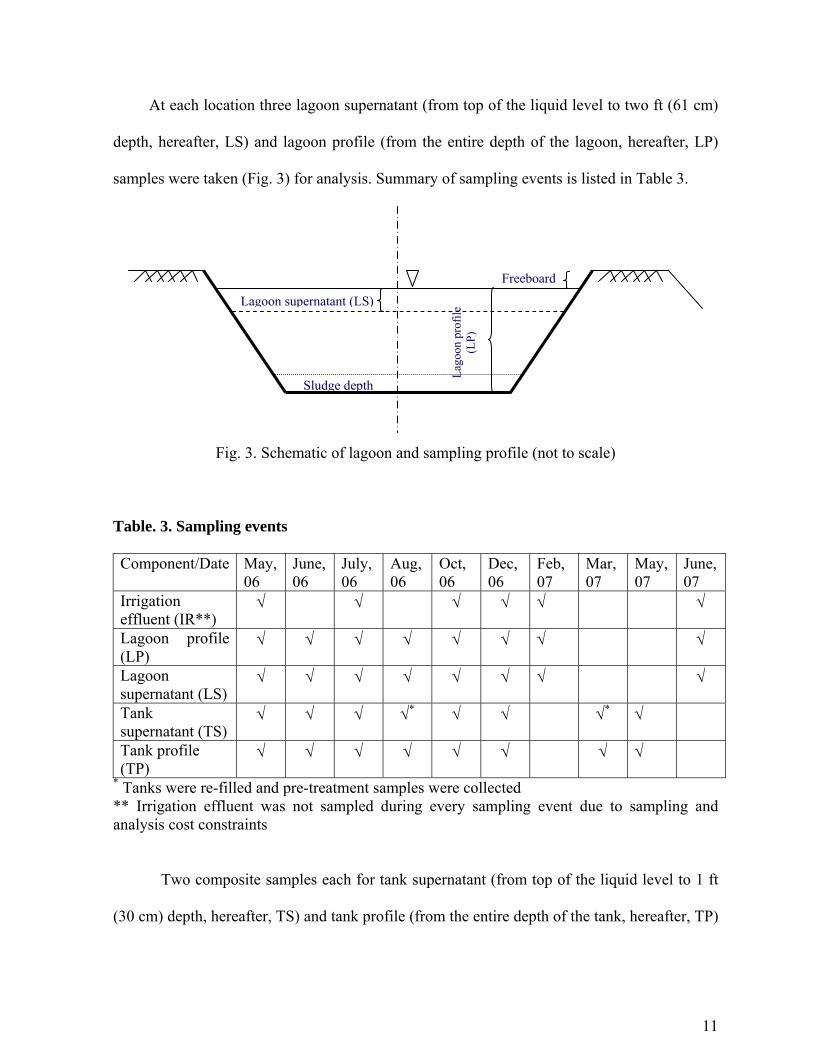
At each location three lagoon supernatant (from top of the liquid level to two ft (61 cm)
depth, hereafter, LS) and lagoon profile (from the entire depth of the lagoon, hereafter, LP)
samples were taken (Fig. 3) for analysis. Summary of sampling events is listed in Table 3.
Fig. 3. Schematic of lagoon and sampling profile (not to scale)
Table. 3. Sampling events
Component/Date May, 06
June, 06
July, 06
Aug, 06
Oct, 06
Dec, 06
Feb, 07
Mar, 07
May, 07
June, 07
Irrigation effluent (IR**)
√ √ √ √ √ √
Lagoon profile (LP)
√ √ √ √ √ √ √ √
Lagoon supernatant (LS)
√ √ √ √ √ √ √ √
Tank supernatant (TS)
√ √ √ √* √ √ √* √
Tank profile (TP)
√ √ √ √ √ √ √ √
* Tanks were re-filled and pre-treatment samples were collected ** Irrigation effluent was not sampled during every sampling event due to sampling and analysis cost constraints
Two composite samples each for tank supernatant (from top of the liquid level to 1 ft
(30 cm) depth, hereafter, TS) and tank profile (from the entire depth of the tank, hereafter, TP)
Sludge depth
Freeboard
Lago
on p
rofil
e (L
P)
Lagoon supernatant (LS)

12
samples were taken diagonally from 15 locations, respectively, for each tank during each
sampling event (Fig. 4). Due to high evaporation losses from the tanks, they were both
emptied and refilled twice with flushed manure during the course of this monitoring study. In
phase 1 (hereafter P1), the tanks were filled in May 2006 and sampled in May, June and July
2006. During phase 2 (hereafter P2), both tanks were emptied and refilled in August and
sampled in August, October and December 2006. No tank samples were taken in February
2007 due to presence of thick crust on the surface of manure in tanks as well as insufficient
tank water depth for TS and TP samples. Low tank volumes were replenished in March 2007
(hereafter, P3) and sampled in March and May 2007. Due to intermittent sampling, tank
parameters were evaluated and compared within each phase instead of comparing among
phases.
Fig. 4. Approximate tank sampling locations
As listed in Table 2, lagoon effluent (hereafter, IR) irrigated to nearby pasture land
(Coastal Bermuda grass) was collected bi-monthly from a riser located just upstream from the
big gun irrigation system. The big gun irrigation used a 20 HP centrifugal pump and a 4 inch
(10 cm) dia hose for effluent irrigation. Irrigation samples were collected every three minutes
for three hours yielding a total of 60 samples. Sample preparation and analysis for IR samples
13
have been discussed in the sample preparation and analysis section. For December 2006
sampling, the irrigation pump was moved from its original location (Fig. 2b) for repairs and
installed close to the shore of the lagoon. Once repaired, the pump was moved back to its
original location and stayed there for the remainder of the project. During IR sampling, flow
rate was monitored using a Greyline PDFM 4 Doppler flow meter (Massena, NY). Flow rates
were recorded on three minute intervals and ranged from 136-185 gpm (515-700 lpm) during
sampling events. At these rates, a total of 24,391 gallons (92,330 L) to 35,043 gallons
(132,651 L) IR effluent was pumped during that time.
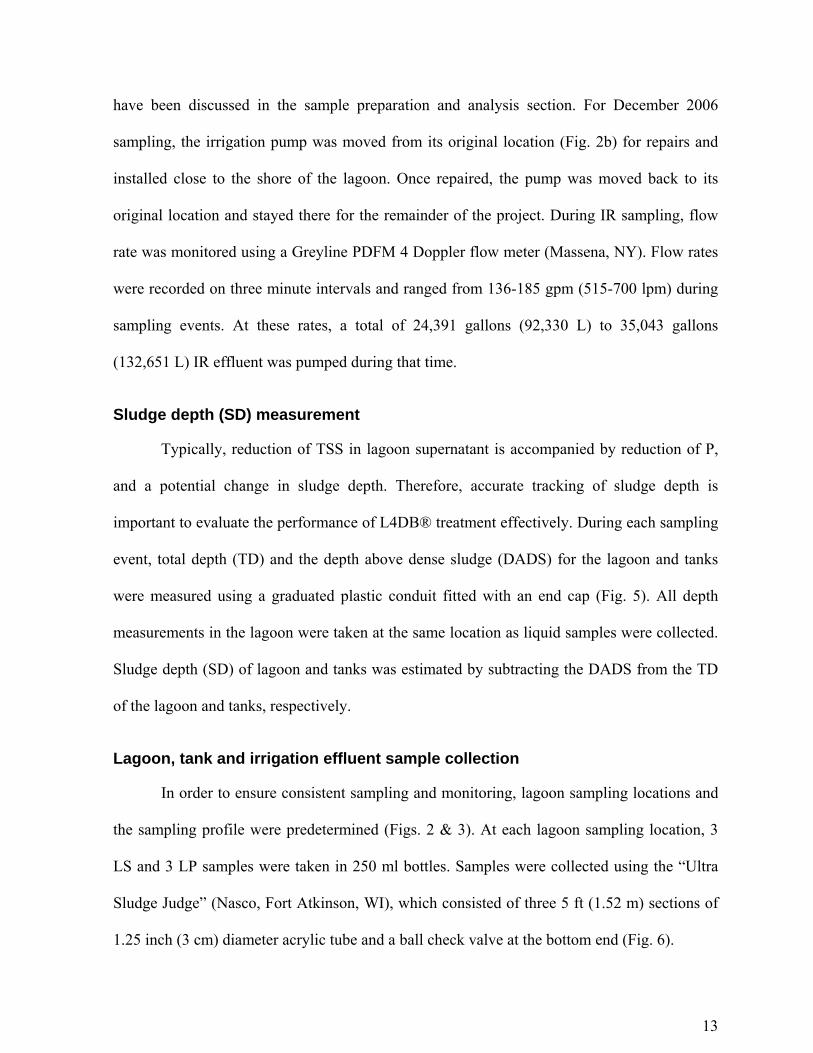
Sludge depth (SD) measurement
Typically, reduction of TSS in lagoon supernatant is accompanied by reduction of P,
and a potential change in sludge depth. Therefore, accurate tracking of sludge depth is
important to evaluate the performance of L4DB® treatment effectively. During each sampling
event, total depth (TD) and the depth above dense sludge (DADS) for the lagoon and tanks
were measured using a graduated plastic conduit fitted with an end cap (Fig. 5). All depth
measurements in the lagoon were taken at the same location as liquid samples were collected.
Sludge depth (SD) of lagoon and tanks was estimated by subtracting the DADS from the TD
of the lagoon and tanks, respectively.
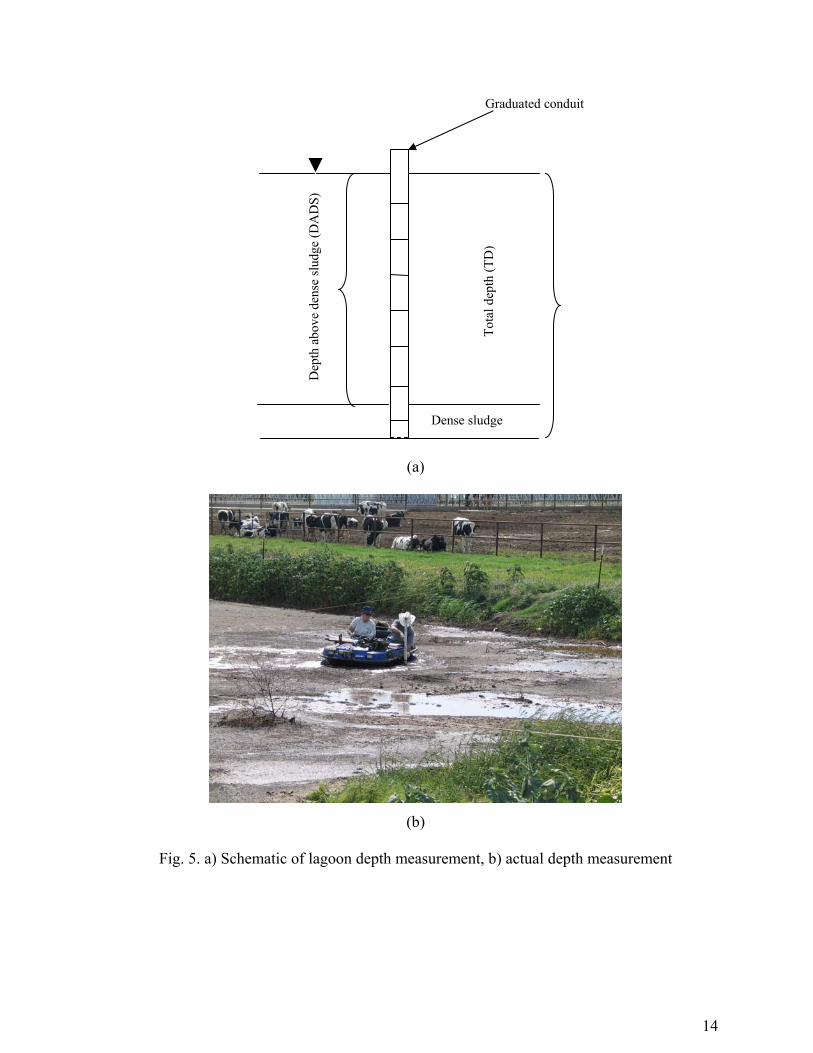
Lagoon, tank and irrigation effluent sample collection
In order to ensure consistent sampling and monitoring, lagoon sampling locations and
the sampling profile were predetermined (Figs. 2 & 3). At each lagoon sampling location, 3
LS and 3 LP samples were taken in 250 ml bottles. Samples were collected using the “Ultra
Sludge Judge” (Nasco, Fort Atkinson, WI), which consisted of three 5 ft (1.52 m) sections of
1.25 inch (3 cm) diameter acrylic tube and a ball check valve at the bottom end (Fig. 6).
14
(a)
(b)
Fig. 5. a) Schematic of lagoon depth measurement, b) actual depth measurement
Tota
l dep
th (T
D)
Graduated conduit
Dep
th a
bove
den
se sl
udge
(DA
DS)
Dense sludge
15
For LS sampling, the sampler was lowered slowly to the desired depth (2 ft, or 61 cm),
while for LP sampling, the sampler was lowered slowly until it rested above the dense sludge
at the bottom of lagoon. After lowering the tube at desired depth, it was gently pulled out of
the lagoon as straight as possible. A total of 30 LS (3 samples per location × 10 locations) and
30 LP (3 samples per location × 10 locations) samples were collected from lagoon during each
sampling event. Sample preparation and analysis for LS and LP will be discussed in the
following section.
Fig. 6. Lagoon sampling using a sludge judge
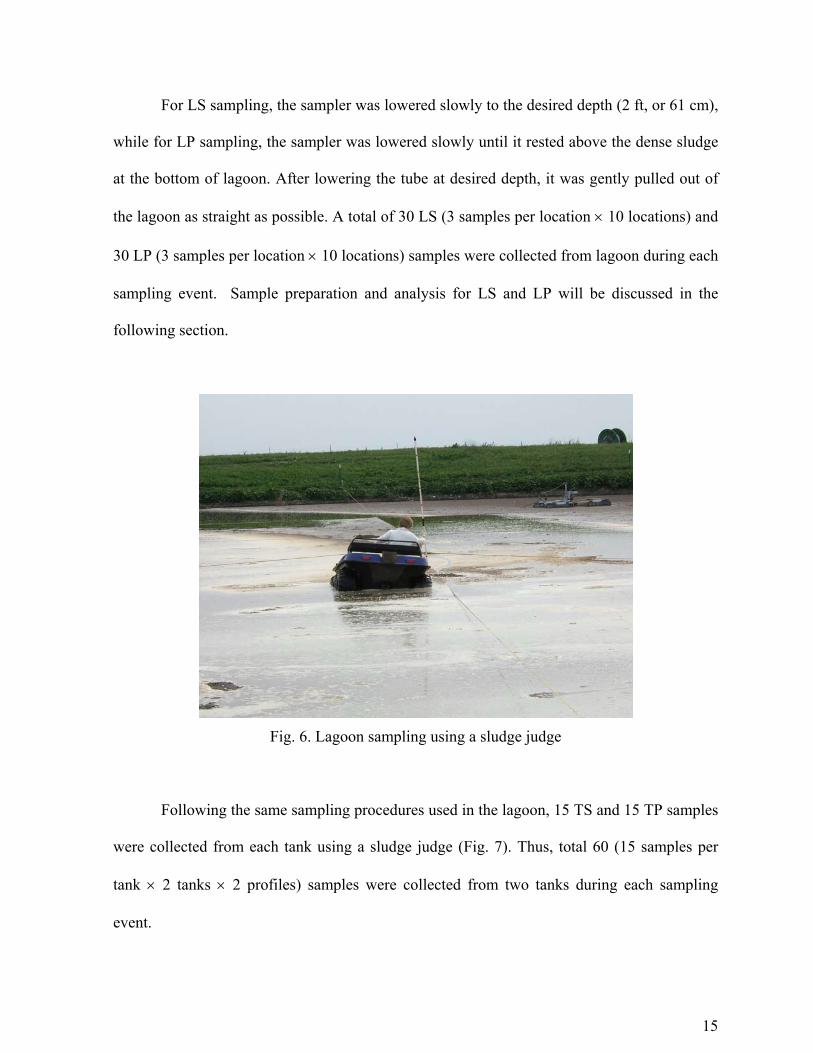
Following the same sampling procedures used in the lagoon, 15 TS and 15 TP samples
were collected from each tank using a sludge judge (Fig. 7). Thus, total 60 (15 samples per
tank × 2 tanks × 2 profiles) samples were collected from two tanks during each sampling
event.
16
Fig. 7. Tank supernatant sampling using a sludge judge
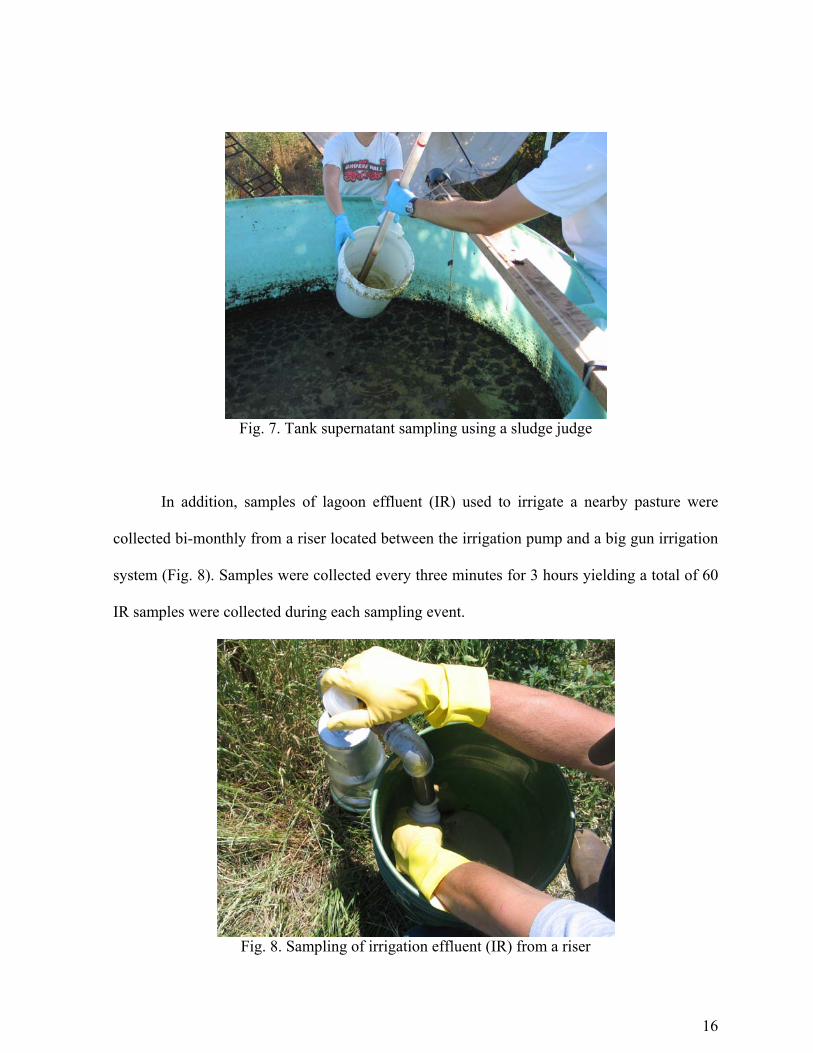
In addition, samples of lagoon effluent (IR) used to irrigate a nearby pasture were
collected bi-monthly from a riser located between the irrigation pump and a big gun irrigation
system (Fig. 8). Samples were collected every three minutes for 3 hours yielding a total of 60
IR samples were collected during each sampling event.
Fig. 8. Sampling of irrigation effluent (IR) from a riser
17
Within an hour of sampling, bottles kept on ice were transported to the Texas Institute
for Applied Environmental Research (TIAER) laboratory, at Tarleton State University in
Stephenville, Texas, for physiochemical parameter (i.e., nutrients, solids, metals, pH and
conductivity) analysis.
Sample preparation and analysis
After each sampling event, 15 LS samples were mixed together to obtain one LS
composite sample. Similarly, 15 LP samples were mixed together to obtain one LP composite
sample. In this way, two LS and two LP composite samples (LS1 & LP1 composited samples
from locations 1 through 5 and LS2 & LP2 composited samples from locations 6 through 10)
were prepared for analysis. Similarly, each set of 15 TS and 15 TP samples were mixed
separately to get two TS (T1S and T2S) and two TP (T1P and T2P) composite samples of
each for analysis. Also, 15 IR sub-samples were mixed separately to get one IR composite
sample. In this way, four IR (hereafter IR1, IR2, IR3, and IR4) samples were prepared for
subsequent analysis from each sampling event
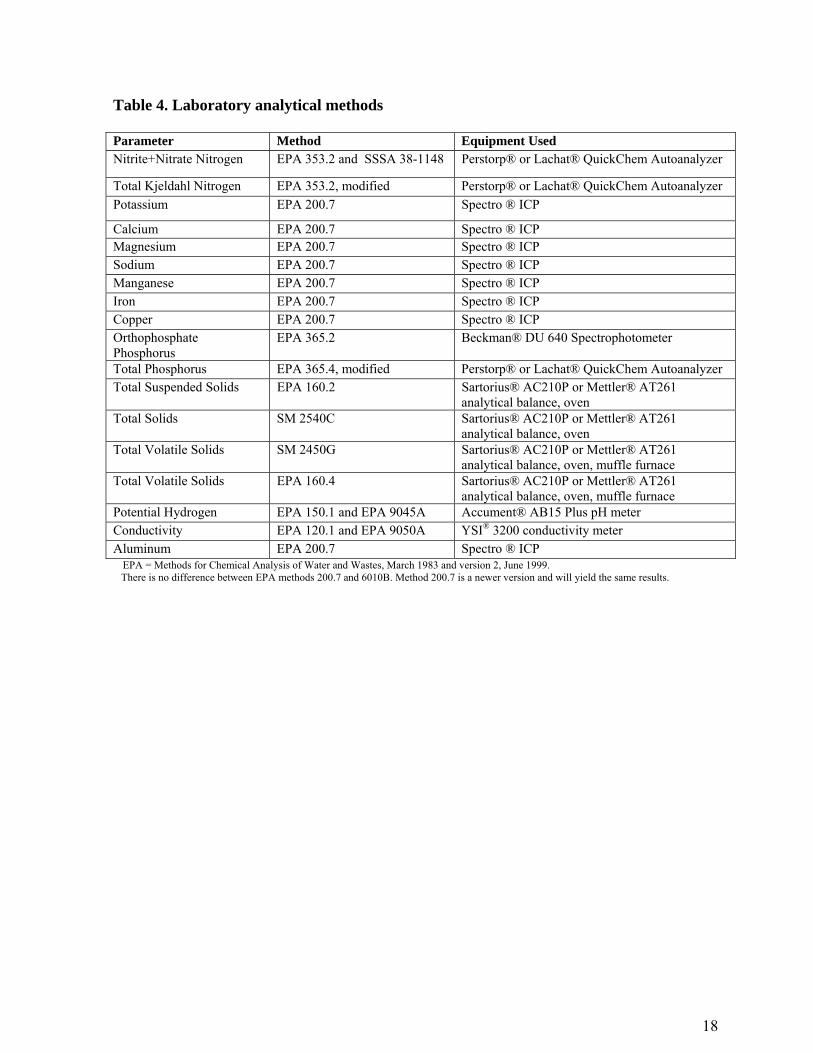
Using EPA laboratory procedures (Budde, 1995) and Standard methods (APHA, 2005)
(Table 4) all composited samples were analyzed for: Total Solids (TS), Total Volatile Solids
(TVS), Total Fixed Solids (TFS), Total Suspended Solids (TSS), Soluble Reactive Phosphorus
(SRP), Total Phosphorus (TP), Nitrate/Nitrite-Nitrogen (NNN), Total Kjeldahl Nitrogen
(TKN), Potassium (K), Aluminum (Al), Calcium (Ca), Magnesium (Mg), Sodium (Na),
Manganese (Mn), Iron (Fe), and Copper (Cu). Concentrations of Total Dissolved Solids
(TDS) were found by subtracting the concentrations of TSS from TS. Also pH and
conductivity were measured for each composite sample.
18
Table 4. Laboratory analytical methods
Parameter Method Equipment Used Nitrite+Nitrate Nitrogen EPA 353.2 and SSSA 38-1148 Perstorp® or Lachat® QuickChem Autoanalyzer
Total Kjeldahl Nitrogen EPA 353.2, modified Perstorp® or Lachat® QuickChem Autoanalyzer Potassium EPA 200.7 Spectro ® ICP
Calcium EPA 200.7 Spectro ® ICP Magnesium EPA 200.7 Spectro ® ICP Sodium EPA 200.7 Spectro ® ICP Manganese EPA 200.7 Spectro ® ICP Iron EPA 200.7 Spectro ® ICP Copper EPA 200.7 Spectro ® ICP Orthophosphate Phosphorus
EPA 365.2 Beckman® DU 640 Spectrophotometer
Total Phosphorus EPA 365.4, modified Perstorp® or Lachat® QuickChem Autoanalyzer Total Suspended Solids EPA 160.2 Sartorius® AC210P or Mettler® AT261
analytical balance, oven Total Solids SM 2540C Sartorius® AC210P or Mettler® AT261
analytical balance, oven Total Volatile Solids SM 2450G Sartorius® AC210P or Mettler® AT261
analytical balance, oven, muffle furnace Total Volatile Solids EPA 160.4 Sartorius® AC210P or Mettler® AT261
analytical balance, oven, muffle furnace Potential Hydrogen EPA 150.1 and EPA 9045A Accument® AB15 Plus pH meter Conductivity EPA 120.1 and EPA 9050A YSI® 3200 conductivity meter Aluminum EPA 200.7 Spectro ® ICP
EPA = Methods for Chemical Analysis of Water and Wastes, March 1983 and version 2, June 1999. There is no difference between EPA methods 200.7 and 6010B. Method 200.7 is a newer version and will yield the same results.
19
Statistical analysis
Analysis of variance (ANOVA) was performed to examine the treatment effects on
lagoon slurry and irrigated effluent solids, nutrients and metals at different sampling profiles
(LP, LS, and IR) using a general linear model in SAS. The differences among mean groups
were compared using the Duncan’s multiple range tests (Steel & Torrie, 1997) at a
significance level P of 0.05.
RESULTS AND DISCUSSION
Average daily ambient temperature and evapotranspiration (ET) data of the
Stephenville area (about 12 miles or 20 km from the dairy) was used to assess environmental
conditions during the monitoring period. Total monthly precipitation data for the dairy was
provided by the producer.
During the monitoring, period tank evaporation losses were not compensated by
addition of lagoon slurry; therefore, it was difficult to maintain a consistent TS and TP
sampling depth in tanks between scheduled tank effluent sampling events. As a result, both
tanks were re-filled twice during the monitoring period (Table 2); pre-treatment and treated
tank slurry samples were taken during each sampling event. Refilling the tanks with flushed
manure led to substantial variations in tank constituents; therefore, tank effluent
physiochemical characteristics were compared for the period between each tank filling
sampling event rather than among refilling of tanks. No clear and consistent trends for solids,
nutrients and metals were observed in tank effluent samples. Consequently, tank data and
physiochemical characteristics were not a true representation of lagoon environmental
20
conditions and sampling replication due to extreme outdoor environmental conditions were
not included in this report.
Environmental conditions
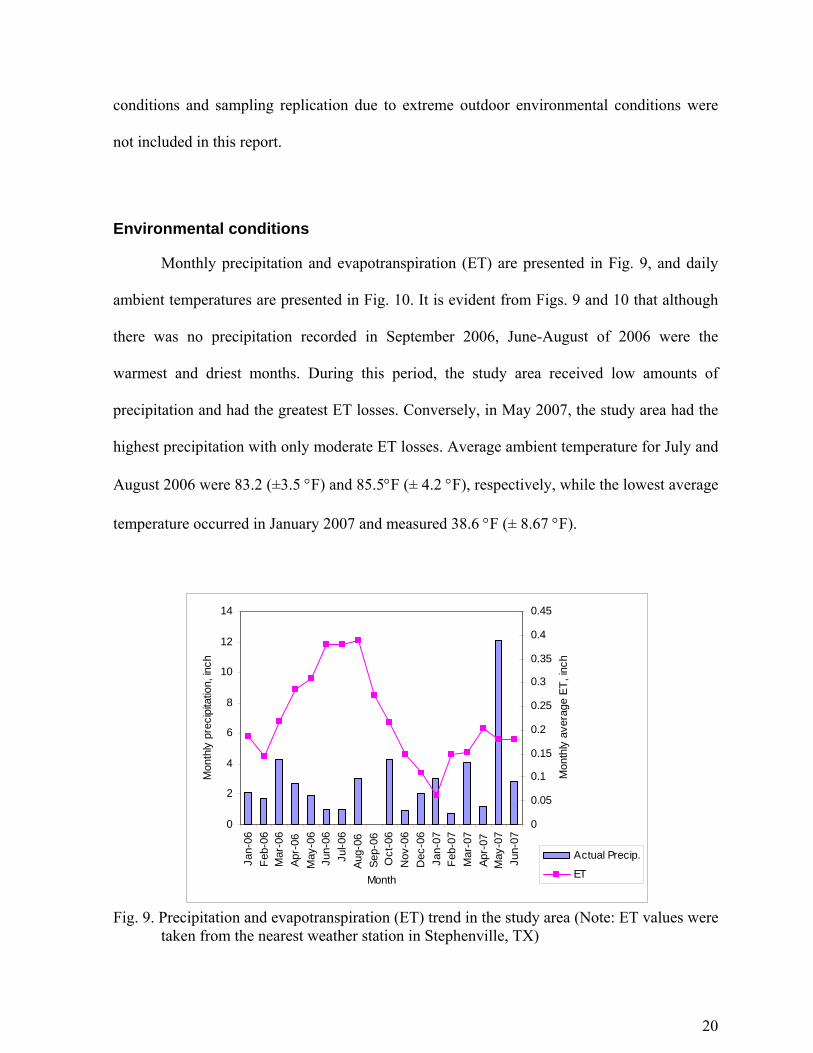
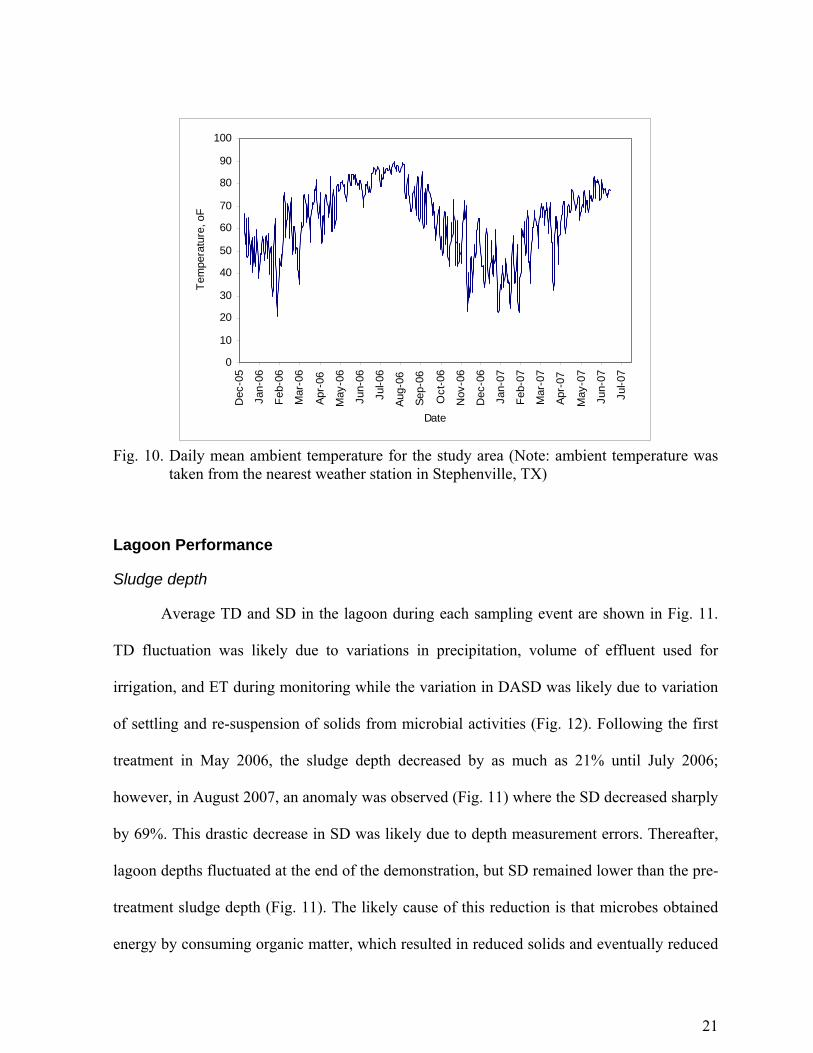
Monthly precipitation and evapotranspiration (ET) are presented in Fig. 9, and daily
ambient temperatures are presented in Fig. 10. It is evident from Figs. 9 and 10 that although
there was no precipitation recorded in September 2006, June-August of 2006 were the
warmest and driest months. During this period, the study area received low amounts of
precipitation and had the greatest ET losses. Conversely, in May 2007, the study area had the
highest precipitation with only moderate ET losses. Average ambient temperature for July and
August 2006 were 83.2 (±3.5 °F) and 85.5°F (± 4.2 °F), respectively, while the lowest average
temperature occurred in January 2007 and measured 38.6 °F (± 8.67 °F).
0
2
4
6
8
10
12
14
Jan-
06Fe
b-06
Mar
-06
Apr-
06M
ay-0
6Ju
n-06
Jul-0
6Au
g-06
Sep-
06O
ct-0
6N
ov-0
6D
ec-0
6Ja
n-07
Feb-
07M
ar-0
7Ap
r-07
May
-07
Jun-
07
Month
Mon
thly
pre
cipi
tatio
n, in
ch
0
0.05
0.1
0.15
0.2
0.25
0.3
0.35
0.4
0.45
Mon
thly
ave
rage
ET,
inch
Actual Precip.
ET
Fig. 9. Precipitation and evapotranspiration (ET) trend in the study area (Note: ET values were
taken from the nearest weather station in Stephenville, TX)
21
0
10
20
30
40
50
60
70
80
90
100
Dec
-05
Jan-
06
Feb-
06
Mar
-06
Apr-
06
May
-06
Jun-
06
Jul-0
6
Aug-
06
Sep-
06
Oct
-06
Nov
-06
Dec
-06
Jan-
07
Feb-
07
Mar
-07
Apr-
07
May
-07
Jun-
07
Jul-0
7
Date
Tem
pera
ture
, oF
Fig. 10. Daily mean ambient temperature for the study area (Note: ambient temperature was
taken from the nearest weather station in Stephenville, TX)
Lagoon Performance
Sludge depth
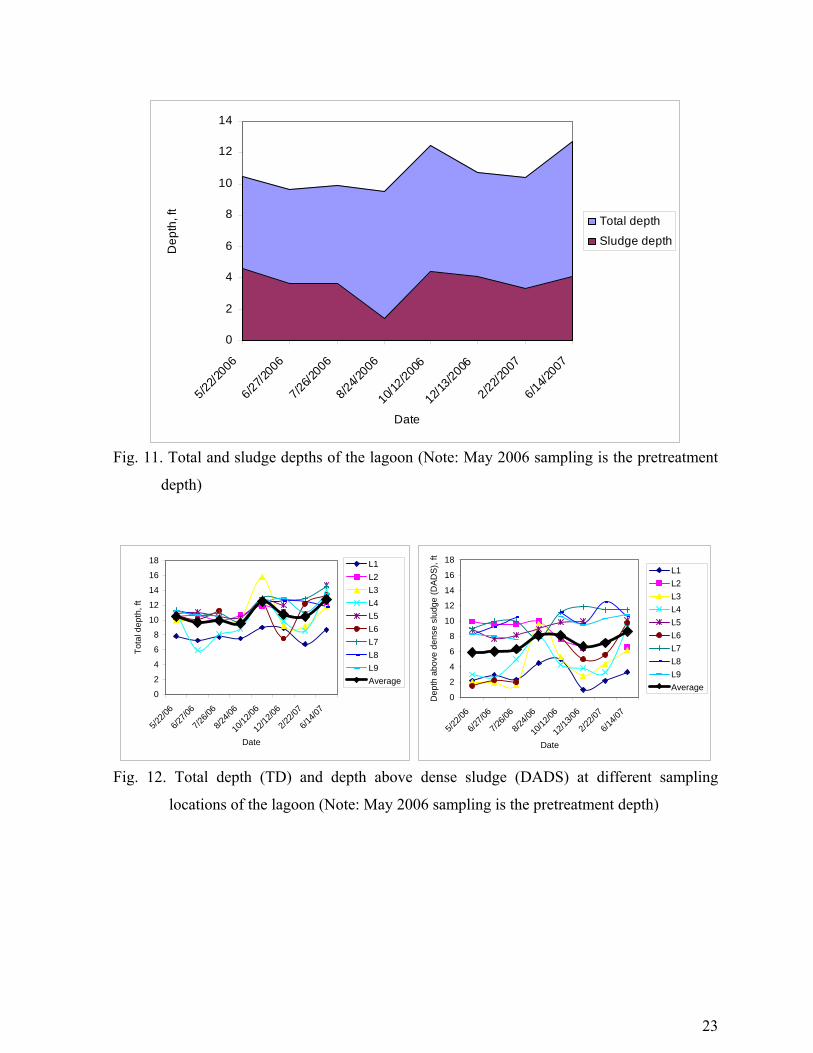
Average TD and SD in the lagoon during each sampling event are shown in Fig. 11.
TD fluctuation was likely due to variations in precipitation, volume of effluent used for
irrigation, and ET during monitoring while the variation in DASD was likely due to variation
of settling and re-suspension of solids from microbial activities (Fig. 12). Following the first
treatment in May 2006, the sludge depth decreased by as much as 21% until July 2006;
however, in August 2007, an anomaly was observed (Fig. 11) where the SD decreased sharply
by 69%. This drastic decrease in SD was likely due to depth measurement errors. Thereafter,
lagoon depths fluctuated at the end of the demonstration, but SD remained lower than the pre-
treatment sludge depth (Fig. 11). The likely cause of this reduction is that microbes obtained
energy by consuming organic matter, which resulted in reduced solids and eventually reduced

22
SD. Since sludge accumulation is composed of TFS and slowly degradable volatile solids
(Chastain et al., 2001), variations in SD are likely due to variation in these solids for this
lagoon. In addition, high variability in sludge depth was also likely due to re-suspension of
sludge from microbial activities as well as by wind-driven turbulence and gas lift (Reed et al.,
1995), annual cycle of storage, heating and organic matter accumulation (Hamilton et al.,
2006; Westerman et al., 2006). Overall, L4DB® treatment was effective in reducing sludge
depth by 24% (however, this reduction was 16%, when measurement anomaly in August 2006
was excluded) to its pre-treatment level. This reduction of SD due to microbial treatment is
likely to improve lagoon effluent characteristics, increase lagoon capacity and reduce
maintenance cost for this lagoon. Average SD for this lagoon was 34% of the TD. Greater
sludge depth means higher loading rate which is associated with higher TSS, TVS, TKN, as
well as conductivity of the lagoon (Sukias et al., 2001). Overall TD, DADS, and SD for this
lagoon during the monitoring period were 10.75 ft (±1.2), 7.11 ft (±1.06), and 3.64 ft
(±0.098), respectively.
Further analysis of sampling locations revealed that in a given sampling event no
significant differences in TD were observed among locations except for sites L1 and L4 (Fig.
2). Significant differences in DADS and SD measurement were observed among locations,
despite measuring these depths at nearly the same locations during all sampling events (Fig.
12). The overall large variation of SD measurement among locations indicates the difficulties
in measuring sludge accumulation in the lagoon.
23
0
2
4
6
8
10
12
14
5/22/2
006
6/27/2
006
7/26/2
006
8/24/2
006
10/12
/2006
12/13
/2006
2/22/2
007
6/14/2
007
Date
Dep
th, f
t
Total depth
Sludge depth
Fig. 11. Total and sludge depths of the lagoon (Note: May 2006 sampling is the pretreatment
depth)
0
2
4
6
8
10
12
14
16
18
5/22/0
6
6/27/0
6
7/26/0
6
8/24/0
6
10/12
/06
12/13
/06
2/22/0
7
6/14/0
7
Date
Dep
th a
bove
den
se s
ludg
e (D
ADS)
, ft
L1L2L3L4L5L6L7L8L9Average
0
2
4
6
8
10
12
14
16
18
5/22/0
6
6/27/0
6
7/26/0
6
8/24/0
6
10/12
/06
12/12
/06
2/22/0
7
6/14/0
7
Date
Tota
l dep
th, f
t
L1L2L3L4L5L6L7L8L9Average
Fig. 12. Total depth (TD) and depth above dense sludge (DADS) at different sampling
locations of the lagoon (Note: May 2006 sampling is the pretreatment depth)
24
Physicochemical characteristics of lagoon
In this section, physicochemical parameters (solids, nutrients and metals) analyzed for
LP, LS and IR samples (untreated and treated with bacteria) have been compared among
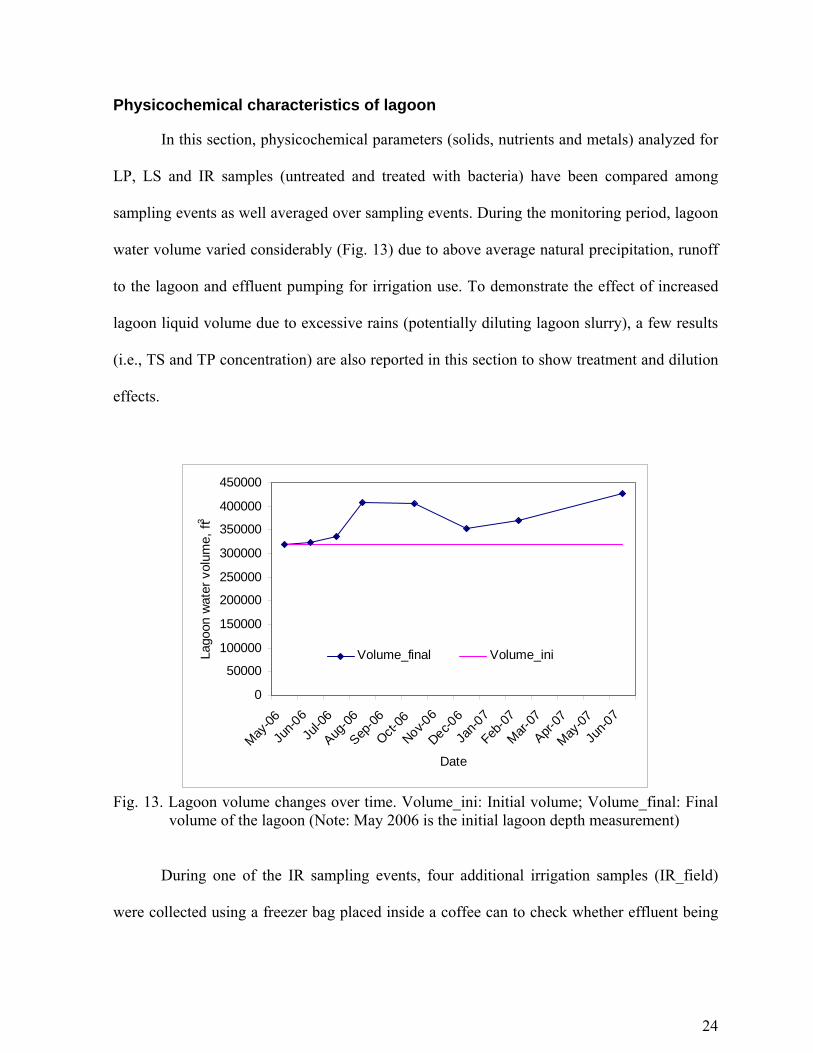
sampling events as well averaged over sampling events. During the monitoring period, lagoon
water volume varied considerably (Fig. 13) due to above average natural precipitation, runoff
to the lagoon and effluent pumping for irrigation use. To demonstrate the effect of increased
lagoon liquid volume due to excessive rains (potentially diluting lagoon slurry), a few results
(i.e., TS and TP concentration) are also reported in this section to show treatment and dilution
effects.
0
50000
100000
150000
200000
250000
300000
350000
400000
450000
May-06
Jun-0
6Ju
l-06
Aug-06
Sep-06
Oct-06
Nov-06
Dec-06
Jan-0
7
Feb-07
Mar-07
Apr-07
May-07
Jun-0
7
Date
Lago
on w
ater
vol
ume,
ft3
Volume_final Volume_ini
Fig. 13. Lagoon volume changes over time. Volume_ini: Initial volume; Volume_final: Final
volume of the lagoon (Note: May 2006 is the initial lagoon depth measurement)
During one of the IR sampling events, four additional irrigation samples (IR_field)
were collected using a freezer bag placed inside a coffee can to check whether effluent being
25
applied to the land had the same chemical make-up as the effluent sampled from the riser.
Coffee cans were placed at four random locations within the irrigated area. The IR_field
samples were analyzed individually for TS, TSS, TVS, SRP, TP and TKN and were compared
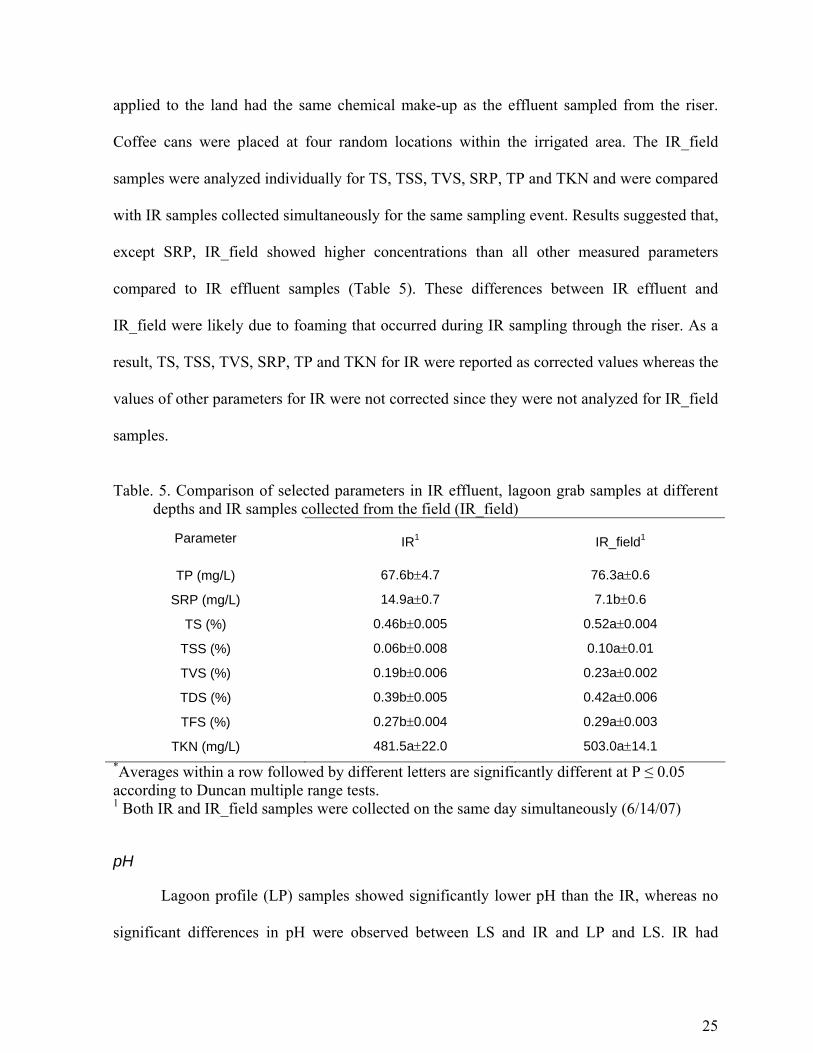
with IR samples collected simultaneously for the same sampling event. Results suggested that,
except SRP, IR_field showed higher concentrations than all other measured parameters
compared to IR effluent samples (Table 5). These differences between IR effluent and
IR_field were likely due to foaming that occurred during IR sampling through the riser. As a
result, TS, TSS, TVS, SRP, TP and TKN for IR were reported as corrected values whereas the
values of other parameters for IR were not corrected since they were not analyzed for IR_field
samples.
Table. 5. Comparison of selected parameters in IR effluent, lagoon grab samples at different
depths and IR samples collected from the field (IR_field)
Parameter IR1 IR_field1
TP (mg/L) 67.6b±4.7 76.3a±0.6
SRP (mg/L) 14.9a±0.7 7.1b±0.6
TS (%) 0.46b±0.005 0.52a±0.004
TSS (%) 0.06b±0.008 0.10a±0.01
TVS (%) 0.19b±0.006 0.23a±0.002
TDS (%) 0.39b±0.005 0.42a±0.006
TFS (%) 0.27b±0.004 0.29a±0.003
TKN (mg/L) 481.5a±22.0 503.0a±14.1 *Averages within a row followed by different letters are significantly different at P ≤ 0.05 according to Duncan multiple range tests. 1 Both IR and IR_field samples were collected on the same day simultaneously (6/14/07)
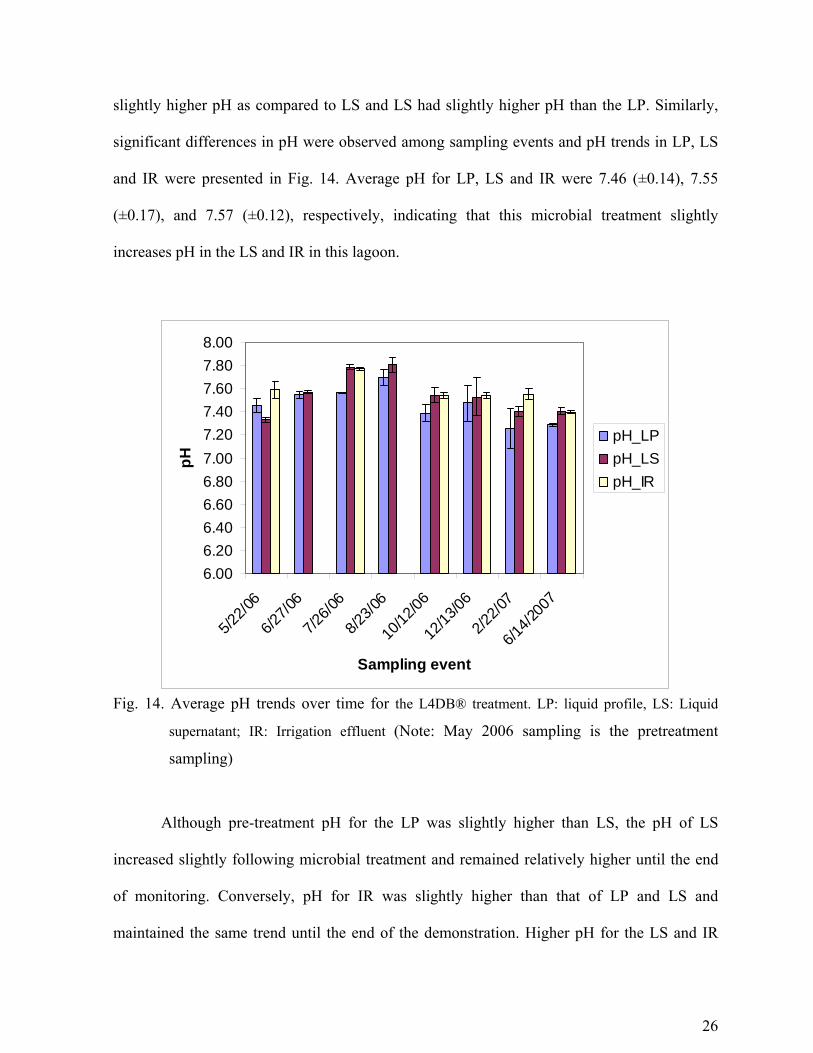
pH
Lagoon profile (LP) samples showed significantly lower pH than the IR, whereas no
significant differences in pH were observed between LS and IR and LP and LS. IR had
26
slightly higher pH as compared to LS and LS had slightly higher pH than the LP. Similarly,
significant differences in pH were observed among sampling events and pH trends in LP, LS
and IR were presented in Fig. 14. Average pH for LP, LS and IR were 7.46 (±0.14), 7.55
(±0.17), and 7.57 (±0.12), respectively, indicating that this microbial treatment slightly
increases pH in the LS and IR in this lagoon.
6.006.206.406.606.807.007.207.407.607.808.00
5/22/0
6
6/27/0
6
7/26/0
6
8/23/0
6
10/12
/06
12/13
/06
2/22/0
7
6/14/2
007
Sampling event
pH
pH_LPpH_LSpH_IR
Fig. 14. Average pH trends over time for the L4DB® treatment. LP: liquid profile, LS: Liquid
supernatant; IR: Irrigation effluent (Note: May 2006 sampling is the pretreatment
sampling)
Although pre-treatment pH for the LP was slightly higher than LS, the pH of LS
increased slightly following microbial treatment and remained relatively higher until the end
of monitoring. Conversely, pH for IR was slightly higher than that of LP and LS and
maintained the same trend until the end of the demonstration. Higher pH for the LS and IR
27
was likely due to lesser amount of organic matter in IR and LS samples as compared to LP.
All pH values as received from TIAER are listed in tables I through III in Appendix A.
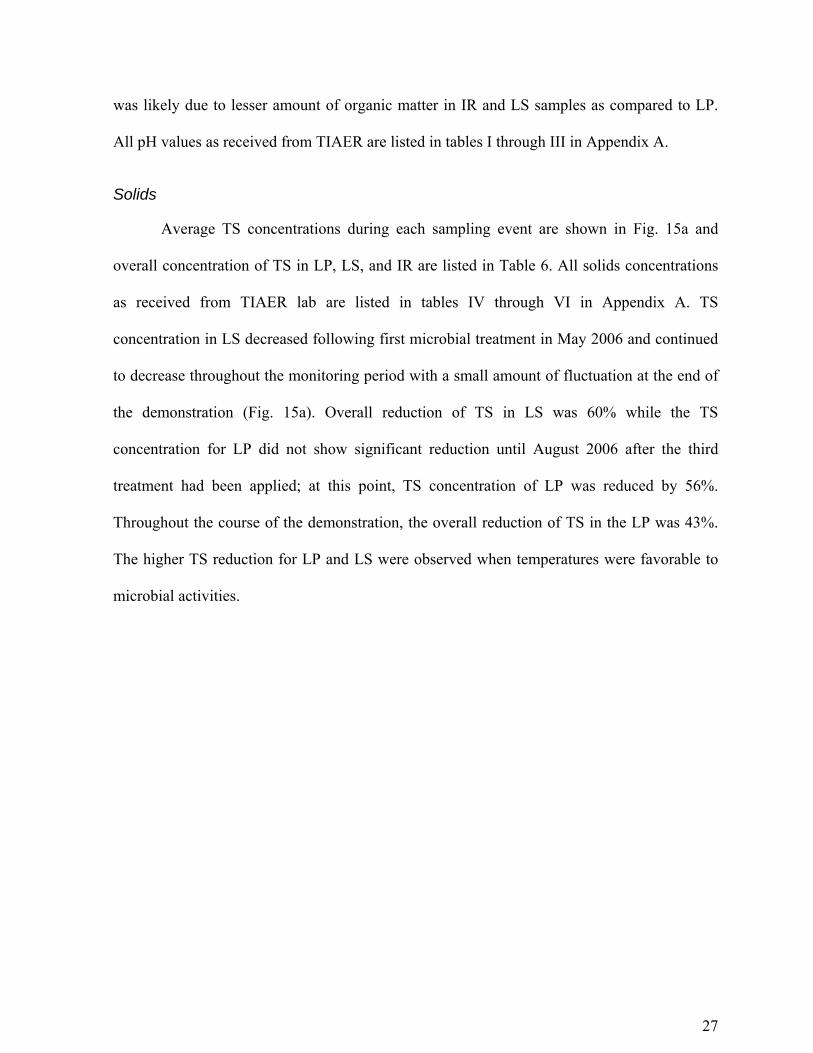
Solids
Average TS concentrations during each sampling event are shown in Fig. 15a and
overall concentration of TS in LP, LS, and IR are listed in Table 6. All solids concentrations
as received from TIAER lab are listed in tables IV through VI in Appendix A. TS
concentration in LS decreased following first microbial treatment in May 2006 and continued
to decrease throughout the monitoring period with a small amount of fluctuation at the end of
the demonstration (Fig. 15a). Overall reduction of TS in LS was 60% while the TS
concentration for LP did not show significant reduction until August 2006 after the third
treatment had been applied; at this point, TS concentration of LP was reduced by 56%.
Throughout the course of the demonstration, the overall reduction of TS in the LP was 43%.
The higher TS reduction for LP and LS were observed when temperatures were favorable to
microbial activities.
28
0
2
4
6
8
10
12
14
5/22/0
6
6/27/0
6
7/26/0
6
8/23/0
6
10/12
/06
12/13
/06
2/22/0
7
6/14/0
7
Sampling event
Tota
l Sol
ids
(TS)
, %TS_LPTS_LSTS_IR
(a)
0
2
4
6
8
10
12
5/22/0
6
6/27/0
6
7/26/0
6
8/23/0
6
10/12
/06
12/13
/06
2/22/0
7
6/14/2
007
Sampling event
Tota
l sol
ids
(TS
), %
TS_LP_TrtTS_LS_TrtTS_LS_DilTS_LP_Dil
Dilution effect
Treatment effect
(b)
Fig. 15. L4DB® treatment effects on: a) Total solids (TS) and b) dilution and treatment effect on TS. LP: liquid profile, LS: Liquid supernatant; Trt: Treatment, Dil: Dilution (Note: May 2006 sampling is the pretreatment sampling)
29
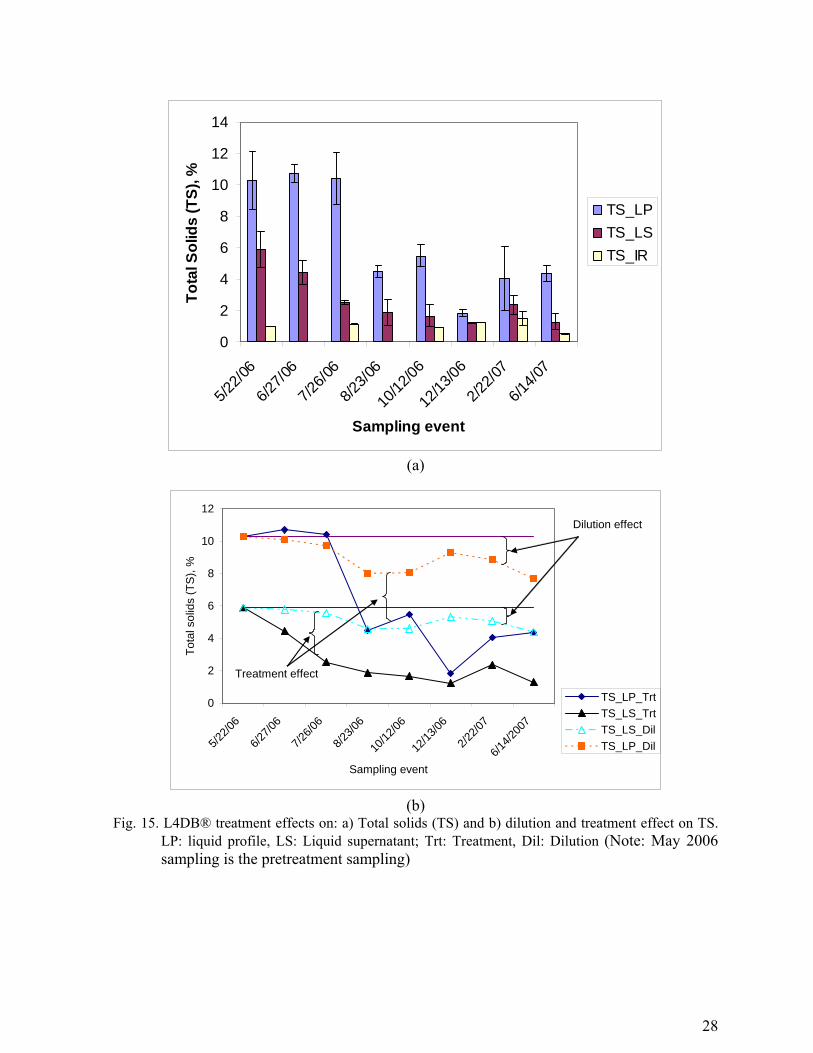
Table 6. Average TS, TSS, TDS, TVS and TFS for lagoon and irrigated effluent samples averaged over sampling events
Sampling location Parameter1
LP LS IR Total solids (TS) 6.45a*±3.47 2.66b±1.70 1.04c±0.34 Total suspended solids (TSS) 5.33a±3.64 1.93b±1.77 0.35c±0.42 Total dissolved solids (TDS) 1.30a±1.28 0.85ab±0.38 0.70b±0.17 Total volatile solids (TVS) 3.13a±1.41 1.49b±0.95 0.52c±0.24 Total fixed solids (TFS) 3.32a±2.14 1.16b±0.77 0.49b±0.12 * Averages within a row followed by different letters are significantly different at P ≤ 0.05 according to Duncan multiple range tests. 1 parameter is in %
The majority of TS concentration reduction in LP and LS samples occurred when
temperatures were favorable for microbial activity. As a result, the reduction of TS may be
caused by an increase in biological uptake. Conversely, average TS for IR showed a slight
increase (21%) as compared to its pre-treatment concentration (Fig. 15a), which could not be
explained.
To explore further whether this reduction of solids for LP and LS was likely due to
treatment or dilution effect, lagoon water volume changes were taken into account and TS
values were adjusted. As seen in Fig. 15b, changes in lagoon water volume can reduce TS
concentrations considerably as compared to pretreatment TS concentration due to a dilution
effect (TS concentration differences between pretreatment and adjusted for dilution). On the
other hand, TS for LP increased slightly following microbial treatment until July 2006 (third
treatment) (Fig. 15b). This was likely due to re-suspension of solids resulting from microbial
biodegradation of sludge; this phenomenon has also been observed by other researchers
(Converse and Karthikeyan, 2004). After July 2006, measured TS levels were always
significantly lower than the adjusted TS for dilution. Hence, the differences between the
30
measured and adjusted for dilution TS concentrations were likely due to microbial digestion of
solids, as well as solids settling at the bottom of the lagoon. In addition, volatile losses of
solids due to microbial activities might also contribute to reduction of TS from LP as indicated
by Zhu et al. (2000).
Overall, average TS for LP, LS and IR (Table 6) were greater than TS concentration
observed by Mukhtar et al. (2004), Barker et al. (2001; cited in Mukhtar et al., 2004), and
Converse and Karthikeyan (2004). Solids concentration for LS were also higher than the
typical 1% found in the supernatant of most anaerobic dairy lagoons suggesting that this
lagoon had a much higher solids loading than other lagoons. This could contribute to greater
sludge accumulation if this lagoon is not managed properly.
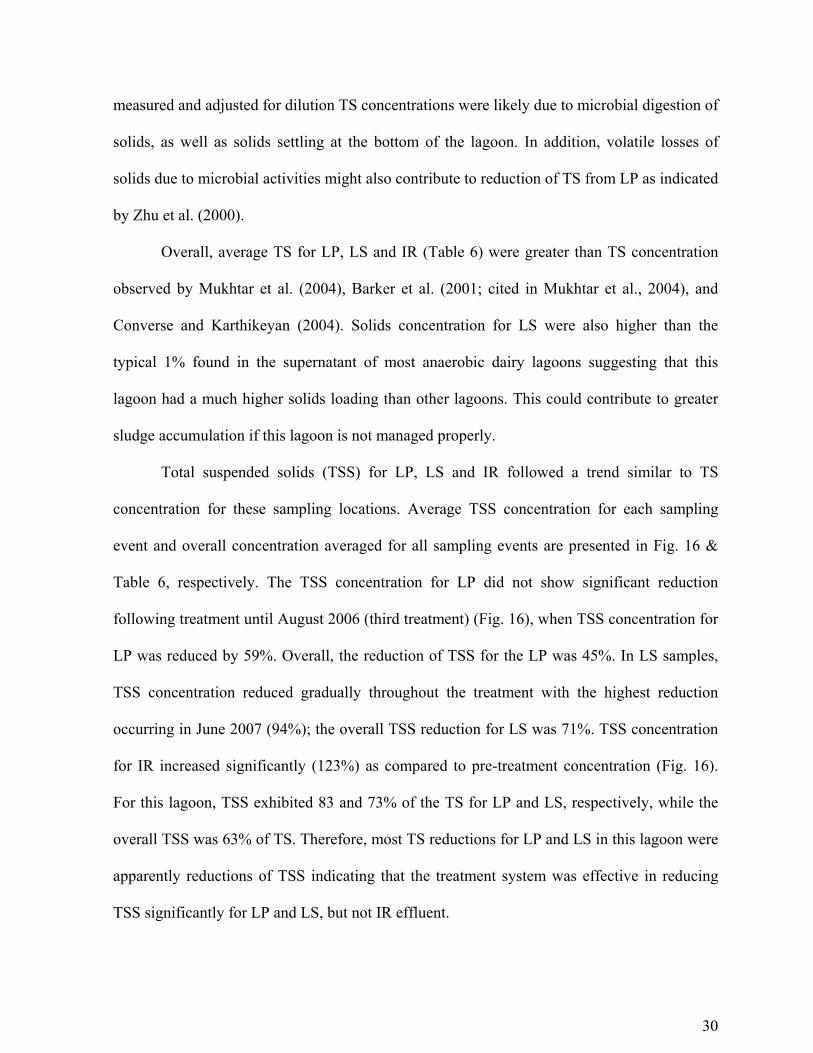
Total suspended solids (TSS) for LP, LS and IR followed a trend similar to TS
concentration for these sampling locations. Average TSS concentration for each sampling
event and overall concentration averaged for all sampling events are presented in Fig. 16 &
Table 6, respectively. The TSS concentration for LP did not show significant reduction
following treatment until August 2006 (third treatment) (Fig. 16), when TSS concentration for
LP was reduced by 59%. Overall, the reduction of TSS for the LP was 45%. In LS samples,
TSS concentration reduced gradually throughout the treatment with the highest reduction
occurring in June 2007 (94%); the overall TSS reduction for LS was 71%. TSS concentration
for IR increased significantly (123%) as compared to pre-treatment concentration (Fig. 16).
For this lagoon, TSS exhibited 83 and 73% of the TS for LP and LS, respectively, while the
overall TSS was 63% of TS. Therefore, most TS reductions for LP and LS in this lagoon were
apparently reductions of TSS indicating that the treatment system was effective in reducing
TSS significantly for LP and LS, but not IR effluent.
31
As expected, TS and TSS concentrations of LP were significantly greater than those of
LS and IR (Table 6). Averaged TSS for the LP was higher than the LS since suspended solids
degrade slowly and remain suspended in the entire LP. In addition, accumulated dead and
degraded bacterial mass at the bottom of lagoon might also contribute to increased solids
content for LP.
0
2
4
6
8
10
12
14
16
5/22/0
6
6/27/0
6
7/26/0
6
8/23/0
6
10/12
/06
12/13
/06
2/22/0
7
6/14/0
7
Sampling event
Tota
l Sus
pend
ed S
olid
s (T
SS),
%
TSS-LPTSS_LSTSS_IR
Fig. 16. L4DB® treatment effects on: a) Total suspended solids (TSS). LP: liquid profile, LS: Liquid
supernatant; IR: Irrigation effluent (Note: May 2006 sampling is the pretreatment
sampling)
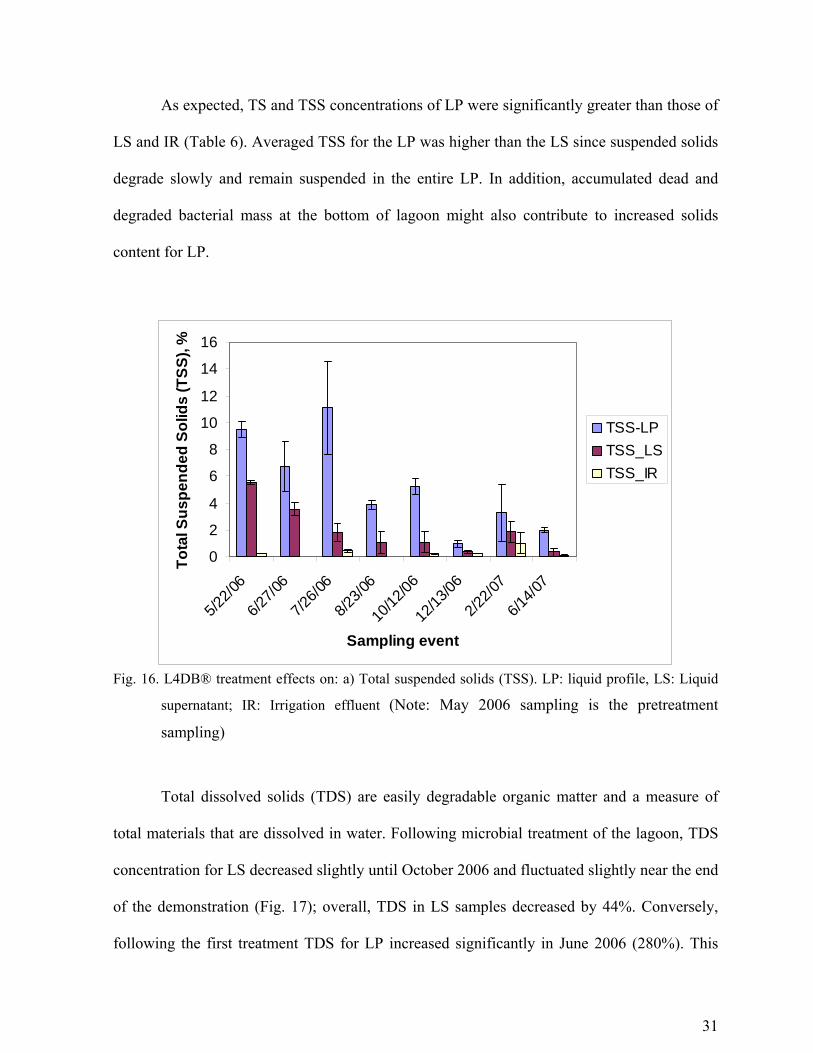
Total dissolved solids (TDS) are easily degradable organic matter and a measure of
total materials that are dissolved in water. Following microbial treatment of the lagoon, TDS
concentration for LS decreased slightly until October 2006 and fluctuated slightly near the end
of the demonstration (Fig. 17); overall, TDS in LS samples decreased by 44%. Conversely,
following the first treatment TDS for LP increased significantly in June 2006 (280%). This
32
drastic increase in TDS for the LP was likely due to rapid conversion of suspended solids into
dissolved solids by the microbes following the first treatment in the lagoon (Zhu et al., 2000).
Thereafter significant TDS reductions were observed in LP until October 2006 (75%), but
following October sampling, TDS fluctuated and its concentration increased by 125% in June
2007 from its pre-treatment (Fig. 17). Overall, TDS increased by 28% to its pre-treatment
level for LP, however excluding June 2006 and 2007 sampling events TDS decreased by 42%
from its pre-treatment in LP profile.
0
1
2
3
4
5
6
5/22/0
6
6/27/0
6
7/26/0
6
8/23/0
6
10/12
/06
12/13
/06
2/22/0
7
6/14/0
7
Sampling event
Tota
l dis
solv
ed s
olid
s (T
DS)
, %
TDS_LPTDS_LSTDS_IR
Fig. 17. L4DB® treatment effects on: a) Total dissolved solids (TDS). LP: liquid profile, LS: Liquid supernatant; IR: Irrigation effluent. (Note: May 2006 sampling is the pretreatment sampling)
Similarly, TDS concentration for IR fluctuated throughout the monitoring period but
increased slightly (3%) as compared to the IR pre-treatment concentration. Overall, the ratio
of TDS/TS was much higher in IR (0.67) than it was in LS (0.32) and LP (0.20). This implies
33
that about 67, 32 and 20% of TS in IR, LS and LP were dissolved solids, respectively.
Therefore, greater solids for IR are likely due to greater TDS content. This suggests that
microbes are more active in the supernatant as compared to the entire profile, where most of
the solids reduction was observed.
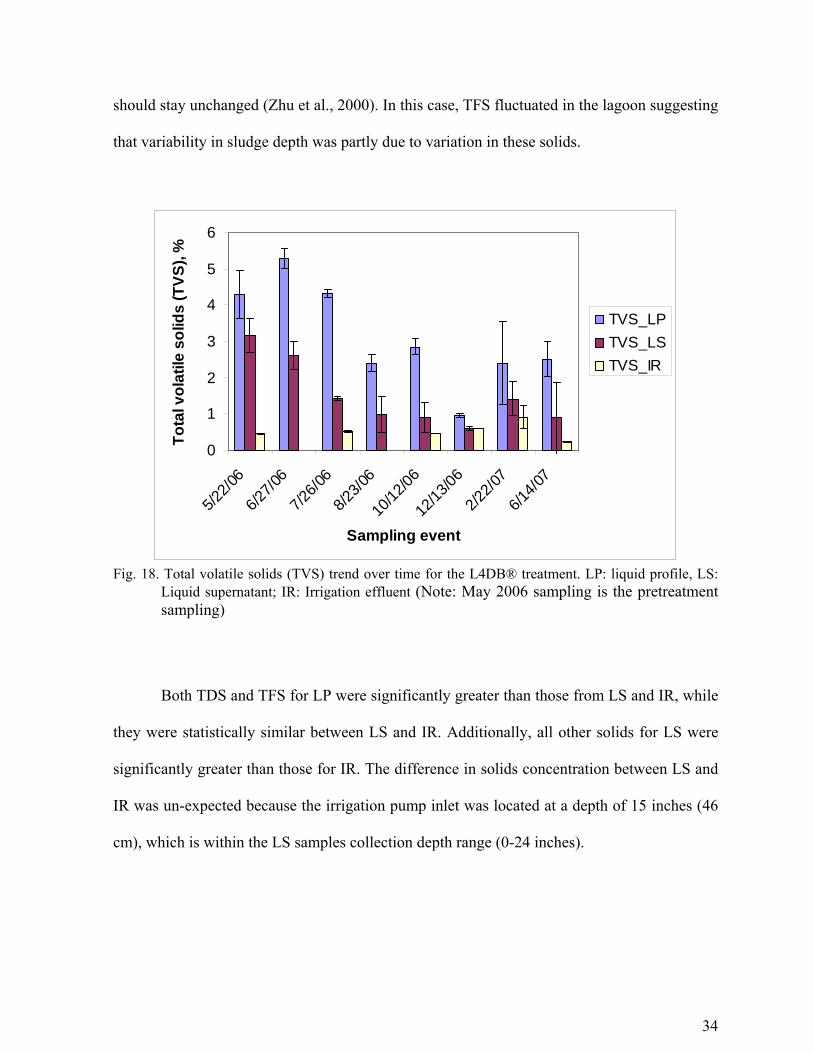
Total volatile solids (TVS) and TFS are presented in Figs. 18 and 19. Just as TS, TVS
did not show significant reduction in LP following treatment until August 2006 (third
treatment). After August, TVS concentration in LP decreased by 44% while December 2006
exhibited the highest single TVS reduction (78%). In total, TVS for the LP was 31% and it
constituted 48% of the TS. TVS concentration in LS responded similarly and gradually
decreased until December 2006; thereafter, values fluctuated slightly. The overall TVS
reduction for LS was 58% and TVS represent 56% of TS. IR samples showed no clear TVS
trends; overall TVS increased by 37%. This variation in TVS was likely due to variation in the
rate and extent of microbial biodegradation of organic compounds and the influence of flushed
water added to the lagoon (Wilkie, 2005).
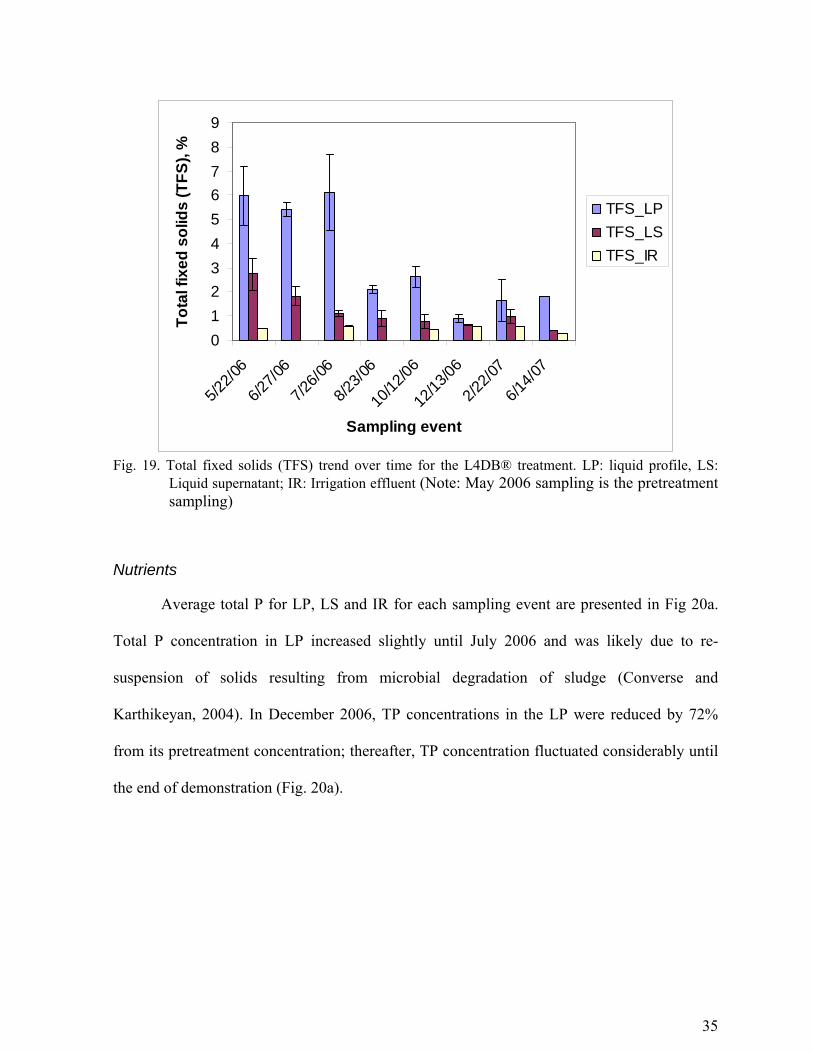
Total fixed solids (TFS) for LP, LS and IR followed a trend similar to TSS (Fig 19).
The TFS concentration for LP did not show significant reduction following treatment until
August 2006 (third treatment) when TFS concentration for LP decreased by 64%; the overall
reduction of TFS in LP was 51%. Total fixed solids (TFS) concentration in LS reduced
gradually throughout the monitoring period with the highest reduction occurring in June 2007
(85%) and the overall TFS reduction was 62%. Total fixed solids concentrations for IR
fluctuated throughout the monitoring period and showed an overall reduction of 9% (Fig. 19).
Typically, TFS is neither chemically reactive nor biologically degradable and theoretically it
34
should stay unchanged (Zhu et al., 2000). In this case, TFS fluctuated in the lagoon suggesting
that variability in sludge depth was partly due to variation in these solids.
0
1
2
3
4
5
6
5/22/0
6
6/27/0
6
7/26/0
6
8/23/0
6
10/12
/06
12/13
/06
2/22/0
7
6/14/0
7
Sampling event
Tota
l vol
atile
sol
ids
(TVS
), %
TVS_LPTVS_LSTVS_IR
Fig. 18. Total volatile solids (TVS) trend over time for the L4DB® treatment. LP: liquid profile, LS:
Liquid supernatant; IR: Irrigation effluent (Note: May 2006 sampling is the pretreatment sampling)
Both TDS and TFS for LP were significantly greater than those from LS and IR, while
they were statistically similar between LS and IR. Additionally, all other solids for LS were
significantly greater than those for IR. The difference in solids concentration between LS and
IR was un-expected because the irrigation pump inlet was located at a depth of 15 inches (46
cm), which is within the LS samples collection depth range (0-24 inches).
35
0123456789
5/22/0
6
6/27/0
6
7/26/0
6
8/23/0
6
10/12
/06
12/13
/06
2/22/0
7
6/14/0
7
Sampling event
Tota
l fix
ed s
olid
s (T
FS),
%
TFS_LPTFS_LSTFS_IR
Fig. 19. Total fixed solids (TFS) trend over time for the L4DB® treatment. LP: liquid profile, LS:
Liquid supernatant; IR: Irrigation effluent (Note: May 2006 sampling is the pretreatment sampling)
Nutrients
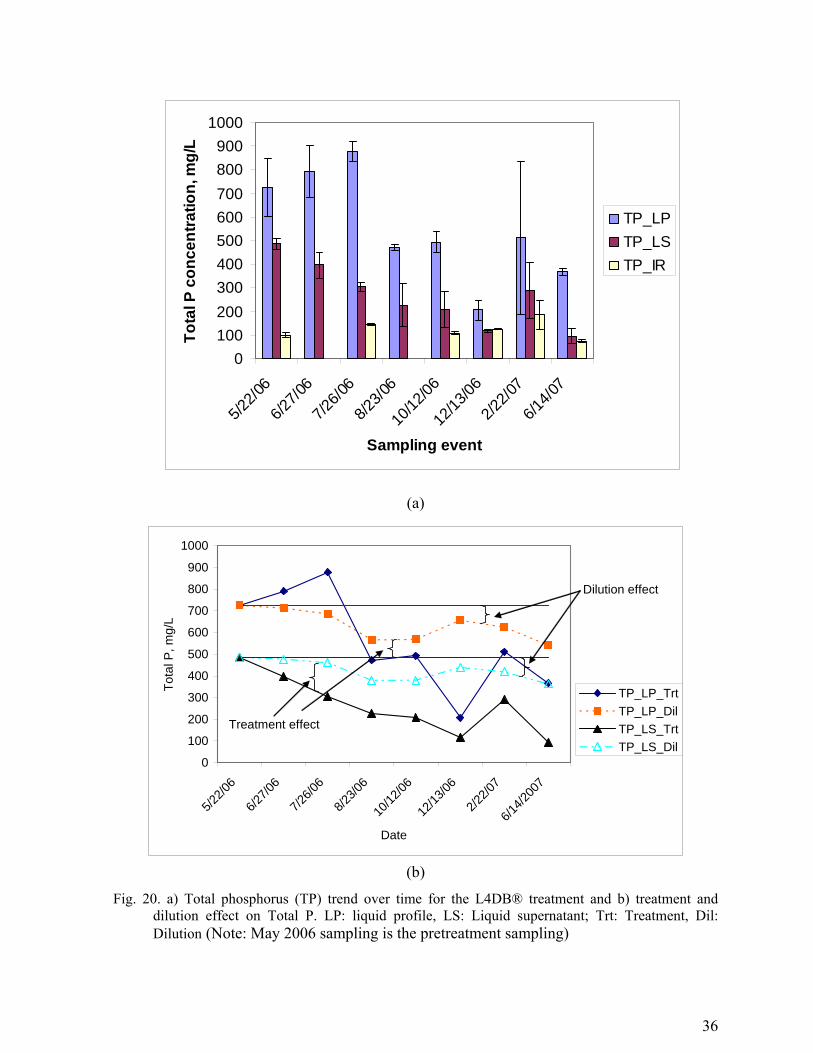
Average total P for LP, LS and IR for each sampling event are presented in Fig 20a.
Total P concentration in LP increased slightly until July 2006 and was likely due to re-
suspension of solids resulting from microbial degradation of sludge (Converse and
Karthikeyan, 2004). In December 2006, TP concentrations in the LP were reduced by 72%
from its pretreatment concentration; thereafter, TP concentration fluctuated considerably until
the end of demonstration (Fig. 20a).
36
0100200300400500600700800900
1000
5/22/0
6
6/27/0
6
7/26/0
6
8/23/0
6
10/12
/06
12/13
/06
2/22/0
7
6/14/0
7
Sampling event
Tota
l P c
once
ntra
tion,
mg/
L
TP_LPTP_LSTP_IR
(a)
0
100
200
300
400
500
600
700
800
900
1000
5/22/0
6
6/27/0
6
7/26/0
6
8/23/0
6
10/12
/06
12/13
/06
2/22/0
7
6/14/2
007
Date
Tota
l P, m
g/L
TP_LP_TrtTP_LP_DilTP_LS_TrtTP_LS_Dil
Dilution effect
Treatment effect
(b)
Fig. 20. a) Total phosphorus (TP) trend over time for the L4DB® treatment and b) treatment and dilution effect on Total P. LP: liquid profile, LS: Liquid supernatant; Trt: Treatment, Dil: Dilution (Note: May 2006 sampling is the pretreatment sampling)

37
Microbial consumption of suspended solids is the likely reason for TP reductions;
sedimentation of particulate P and degraded microbial cells at the bottom of the lagoon could
also influence TP levels in the lagoon. Throughout the course of the demonstration, TP was
reduced by an average of 27%.
Total P concentration for LS decreased gradually following microbial treatment until
August 2006 when it began to fluctuate somewhat for the remainder of the demonstration
(Fig. 20a). The highest single reduction in TP was 81% for LS samples and was observed in
June 2007 with the average reduction totaling 52% for the entire demonstration. The high TP
reduction in June was likely due to combination of increased microbial activities at a
favorable environmental condition, dilution resulting from runoff water contribution, as well
as the low evapotranspiration rate during that time (Fig. 20a).
In the case of IR effluent, overall TP concentration increased by 28% compared to its
pretreatment concentration and could be the cause of greater dissolved solids in the IR
effluent. No clear trend in TP levels was observed in IR samples; however, a weak correlation
(R2= 0.20) was observed between TP and TDS for IR effluent.
A dilution effect could have influenced reductions in TP for LP and LS. To evaluate
this theory, lagoon water volume changes were taken into account and TP concentration were
adjusted accordingly. As shown in Fig. 20b, dilution itself can reduce TP concentration
substantially from its pretreatment concentration as indicated by the dilution effect. After
adjusting samples for dilution, it was revealed that differences between treatment and dilution
adjusted TP concentrations were likely due to L4DB® microbial treatment (Fig. 20b). No
significant reduction in TP concentration was observed for the LP until August 2007, when TP
measured was significantly lower than TP adjusted for dilution. Although, measured TP
38
concentrations varied towards the end of monitoring, but these values were much lower than
those adjusted for dilution. Dilution analysis shows that the differences between treatment TP
and TP adjusted for dilution were likely due to treatment effects. Overall, significant
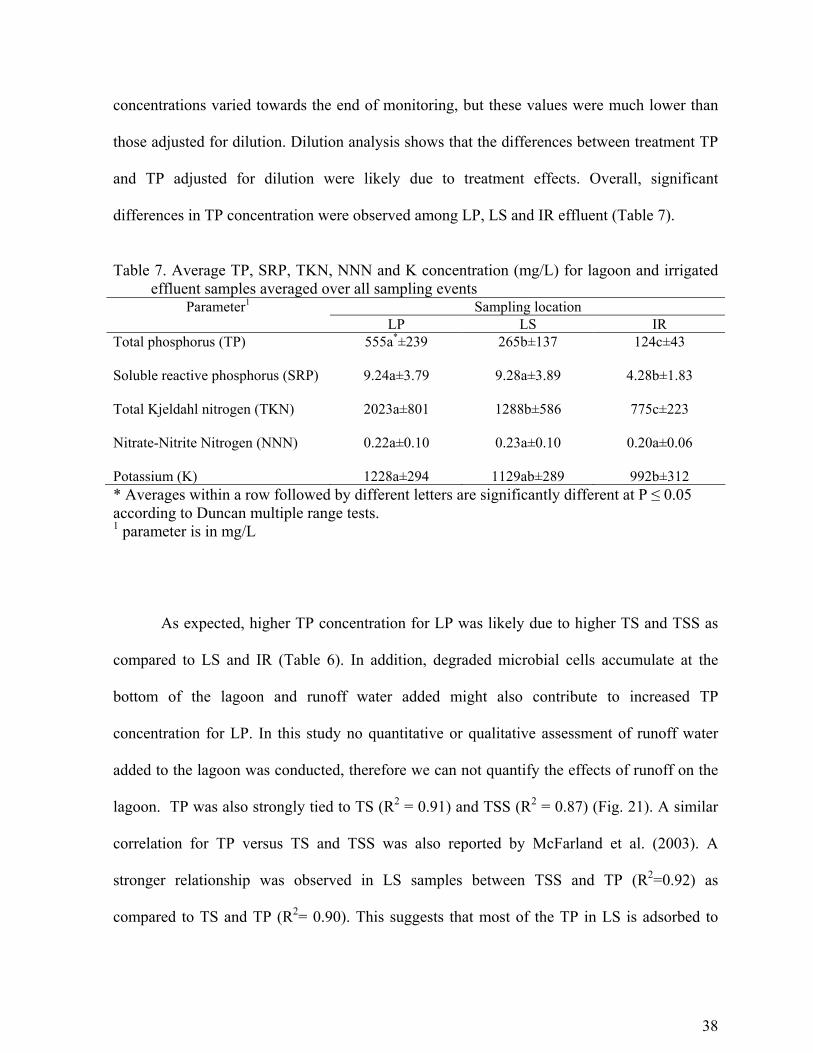
differences in TP concentration were observed among LP, LS and IR effluent (Table 7).
Table 7. Average TP, SRP, TKN, NNN and K concentration (mg/L) for lagoon and irrigated
effluent samples averaged over all sampling events Sampling location Parameter1
LP LS IR Total phosphorus (TP) 555a*±239 265b±137 124c±43 Soluble reactive phosphorus (SRP) 9.24a±3.79 9.28a±3.89 4.28b±1.83 Total Kjeldahl nitrogen (TKN) 2023a±801 1288b±586 775c±223 Nitrate-Nitrite Nitrogen (NNN) 0.22a±0.10 0.23a±0.10 0.20a±0.06 Potassium (K) 1228a±294 1129ab±289 992b±312 * Averages within a row followed by different letters are significantly different at P ≤ 0.05 according to Duncan multiple range tests. 1 parameter is in mg/L
As expected, higher TP concentration for LP was likely due to higher TS and TSS as
compared to LS and IR (Table 6). In addition, degraded microbial cells accumulate at the
bottom of the lagoon and runoff water added might also contribute to increased TP
concentration for LP. In this study no quantitative or qualitative assessment of runoff water
added to the lagoon was conducted, therefore we can not quantify the effects of runoff on the
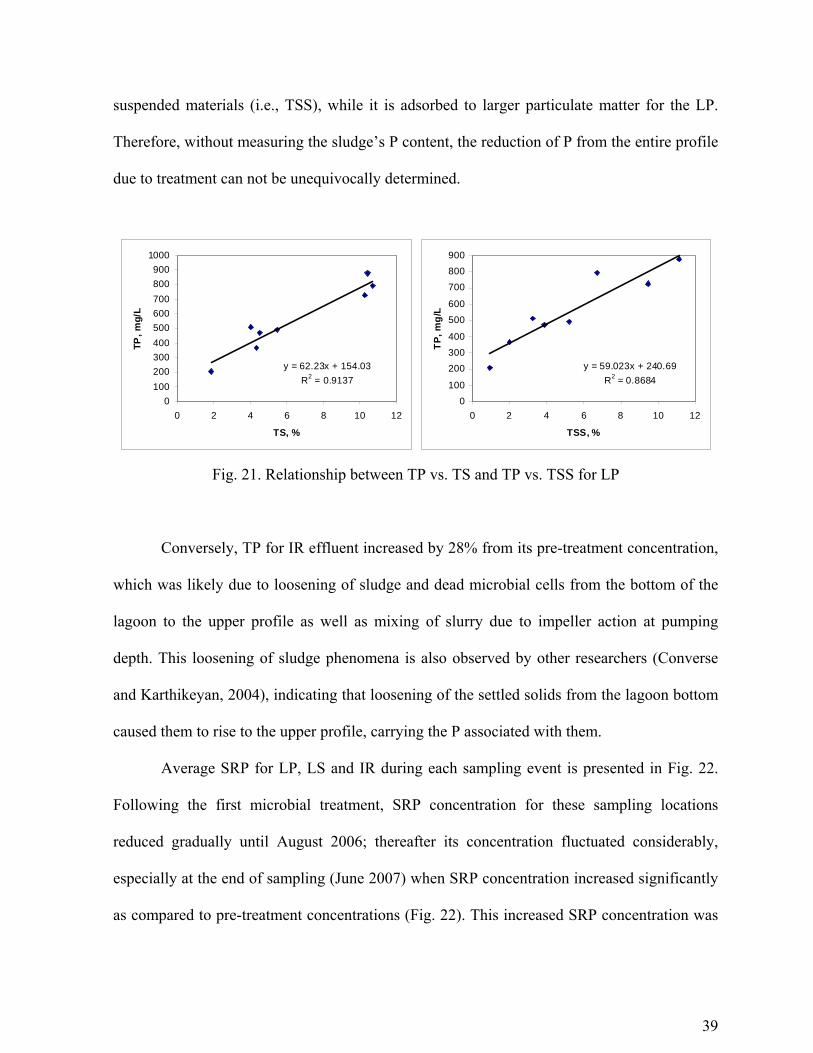
lagoon. TP was also strongly tied to TS (R2 = 0.91) and TSS (R2 = 0.87) (Fig. 21). A similar
correlation for TP versus TS and TSS was also reported by McFarland et al. (2003). A
stronger relationship was observed in LS samples between TSS and TP (R2=0.92) as
compared to TS and TP (R2= 0.90). This suggests that most of the TP in LS is adsorbed to
39
suspended materials (i.e., TSS), while it is adsorbed to larger particulate matter for the LP.
Therefore, without measuring the sludge’s P content, the reduction of P from the entire profile
due to treatment can not be unequivocally determined.
y = 62.23x + 154.03R2 = 0.9137
0100200300400500600700800900
1000
0 2 4 6 8 10 12
TS, %
TP, m
g/L
y = 59.023x + 240.69R2 = 0.8684
0
100
200300
400
500
600
700
800
900
0 2 4 6 8 10 12
TSS, %TP
, mg/
L
Fig. 21. Relationship between TP vs. TS and TP vs. TSS for LP
Conversely, TP for IR effluent increased by 28% from its pre-treatment concentration,
which was likely due to loosening of sludge and dead microbial cells from the bottom of the
lagoon to the upper profile as well as mixing of slurry due to impeller action at pumping
depth. This loosening of sludge phenomena is also observed by other researchers (Converse
and Karthikeyan, 2004), indicating that loosening of the settled solids from the lagoon bottom
caused them to rise to the upper profile, carrying the P associated with them.
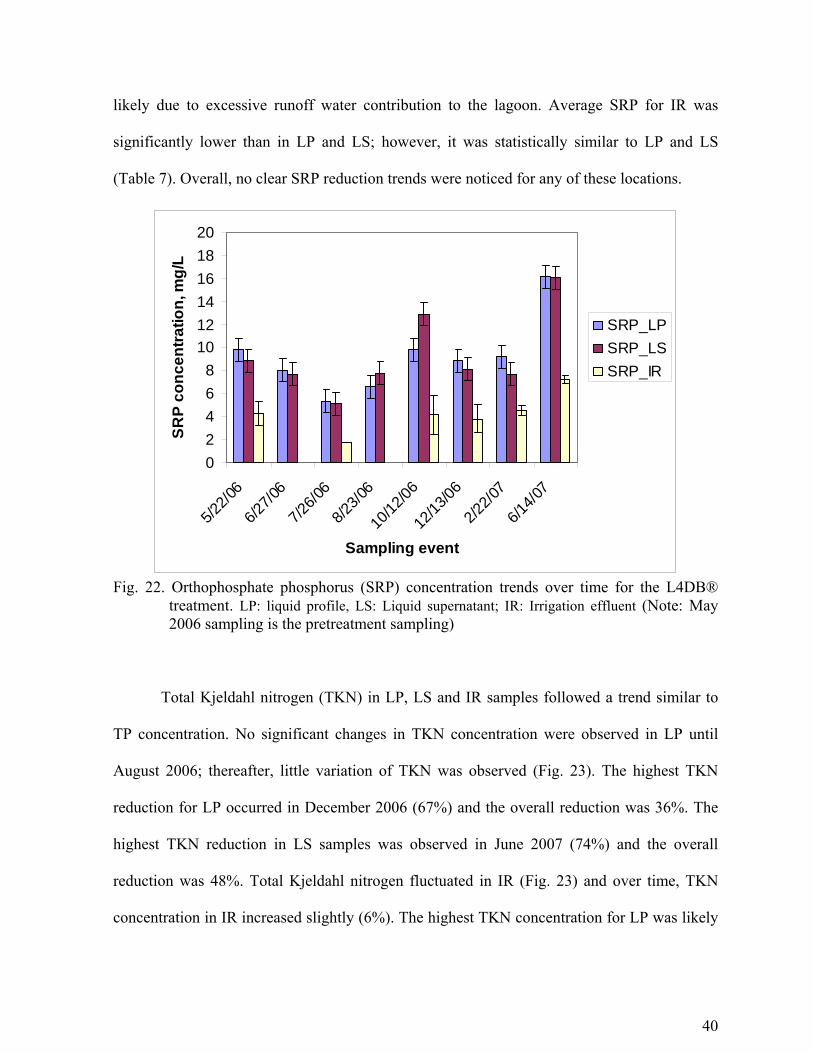
Average SRP for LP, LS and IR during each sampling event is presented in Fig. 22.
Following the first microbial treatment, SRP concentration for these sampling locations
reduced gradually until August 2006; thereafter its concentration fluctuated considerably,
especially at the end of sampling (June 2007) when SRP concentration increased significantly
as compared to pre-treatment concentrations (Fig. 22). This increased SRP concentration was
40
likely due to excessive runoff water contribution to the lagoon. Average SRP for IR was
significantly lower than in LP and LS; however, it was statistically similar to LP and LS
(Table 7). Overall, no clear SRP reduction trends were noticed for any of these locations.
02468
101214161820
5/22/0
6
6/27/0
6
7/26/0
6
8/23/0
6
10/12
/06
12/13
/06
2/22/0
7
6/14/0
7
Sampling event
SRP
conc
entra
tion,
mg/
L
SRP_LPSRP_LSSRP_IR
Fig. 22. Orthophosphate phosphorus (SRP) concentration trends over time for the L4DB®
treatment. LP: liquid profile, LS: Liquid supernatant; IR: Irrigation effluent (Note: May 2006 sampling is the pretreatment sampling)
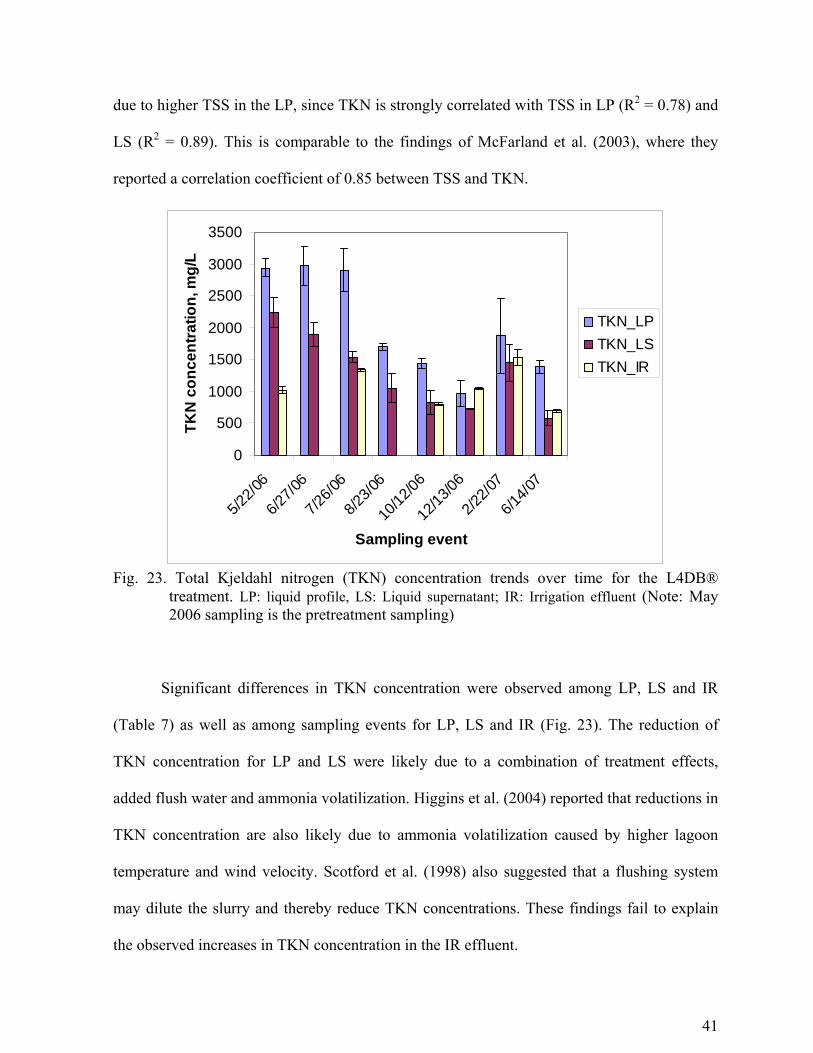
Total Kjeldahl nitrogen (TKN) in LP, LS and IR samples followed a trend similar to
TP concentration. No significant changes in TKN concentration were observed in LP until
August 2006; thereafter, little variation of TKN was observed (Fig. 23). The highest TKN
reduction for LP occurred in December 2006 (67%) and the overall reduction was 36%. The
highest TKN reduction in LS samples was observed in June 2007 (74%) and the overall
reduction was 48%. Total Kjeldahl nitrogen fluctuated in IR (Fig. 23) and over time, TKN
concentration in IR increased slightly (6%). The highest TKN concentration for LP was likely
41
due to higher TSS in the LP, since TKN is strongly correlated with TSS in LP (R2 = 0.78) and
LS (R2 = 0.89). This is comparable to the findings of McFarland et al. (2003), where they
reported a correlation coefficient of 0.85 between TSS and TKN.
0
500
1000
1500
2000
2500
3000
3500
5/22/0
6
6/27/0
6
7/26/0
6
8/23/0
6
10/12
/06
12/13
/06
2/22/0
7
6/14/0
7
Sampling event
TKN
con
cent
ratio
n, m
g/L
TKN_LPTKN_LSTKN_IR
Fig. 23. Total Kjeldahl nitrogen (TKN) concentration trends over time for the L4DB®
treatment. LP: liquid profile, LS: Liquid supernatant; IR: Irrigation effluent (Note: May 2006 sampling is the pretreatment sampling)
Significant differences in TKN concentration were observed among LP, LS and IR
(Table 7) as well as among sampling events for LP, LS and IR (Fig. 23). The reduction of
TKN concentration for LP and LS were likely due to a combination of treatment effects,
added flush water and ammonia volatilization. Higgins et al. (2004) reported that reductions in
TKN concentration are also likely due to ammonia volatilization caused by higher lagoon
temperature and wind velocity. Scotford et al. (1998) also suggested that a flushing system
may dilute the slurry and thereby reduce TKN concentrations. These findings fail to explain
the observed increases in TKN concentration in the IR effluent.
42
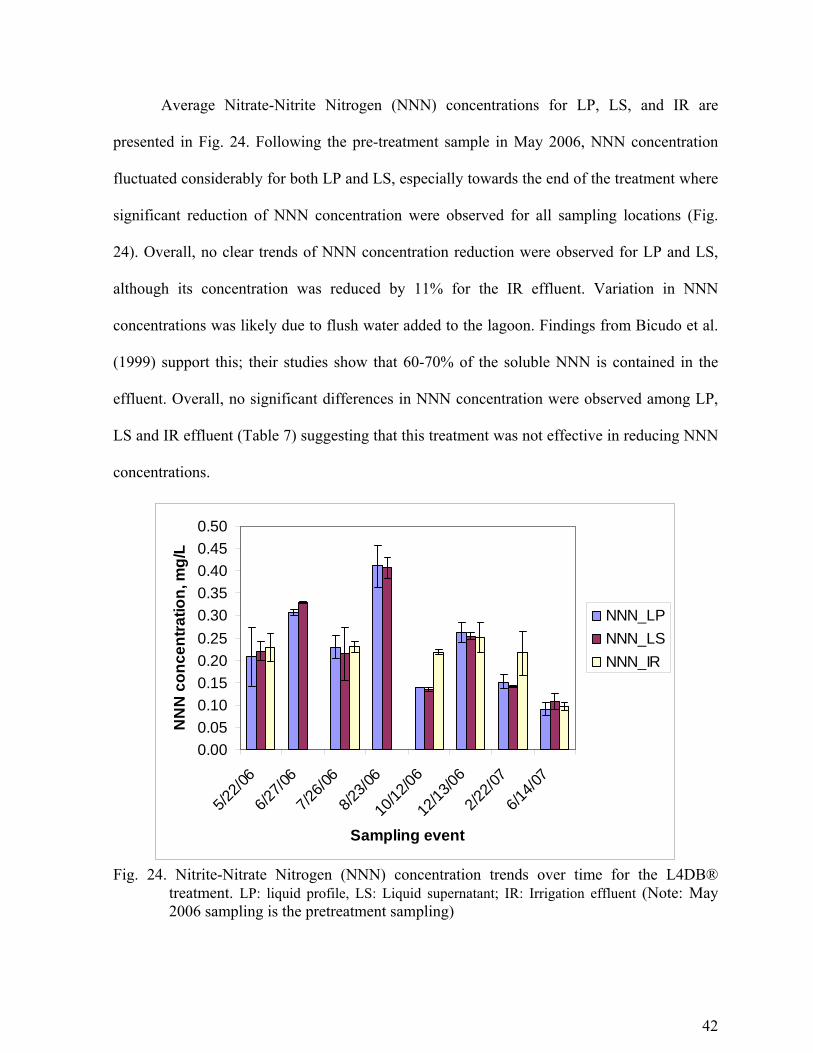
Average Nitrate-Nitrite Nitrogen (NNN) concentrations for LP, LS, and IR are
presented in Fig. 24. Following the pre-treatment sample in May 2006, NNN concentration
fluctuated considerably for both LP and LS, especially towards the end of the treatment where
significant reduction of NNN concentration were observed for all sampling locations (Fig.
24). Overall, no clear trends of NNN concentration reduction were observed for LP and LS,
although its concentration was reduced by 11% for the IR effluent. Variation in NNN
concentrations was likely due to flush water added to the lagoon. Findings from Bicudo et al.
(1999) support this; their studies show that 60-70% of the soluble NNN is contained in the
effluent. Overall, no significant differences in NNN concentration were observed among LP,
LS and IR effluent (Table 7) suggesting that this treatment was not effective in reducing NNN
concentrations.
0.000.050.100.150.200.250.300.350.400.450.50
5/22/0
6
6/27/0
6
7/26/0
6
8/23/0
6
10/12
/06
12/13
/06
2/22/0
7
6/14/0
7
Sampling event
NN
N c
once
ntra
tion,
mg/
L
NNN_LPNNN_LSNNN_IR
Fig. 24. Nitrite-Nitrate Nitrogen (NNN) concentration trends over time for the L4DB®
treatment. LP: liquid profile, LS: Liquid supernatant; IR: Irrigation effluent (Note: May 2006 sampling is the pretreatment sampling)
43
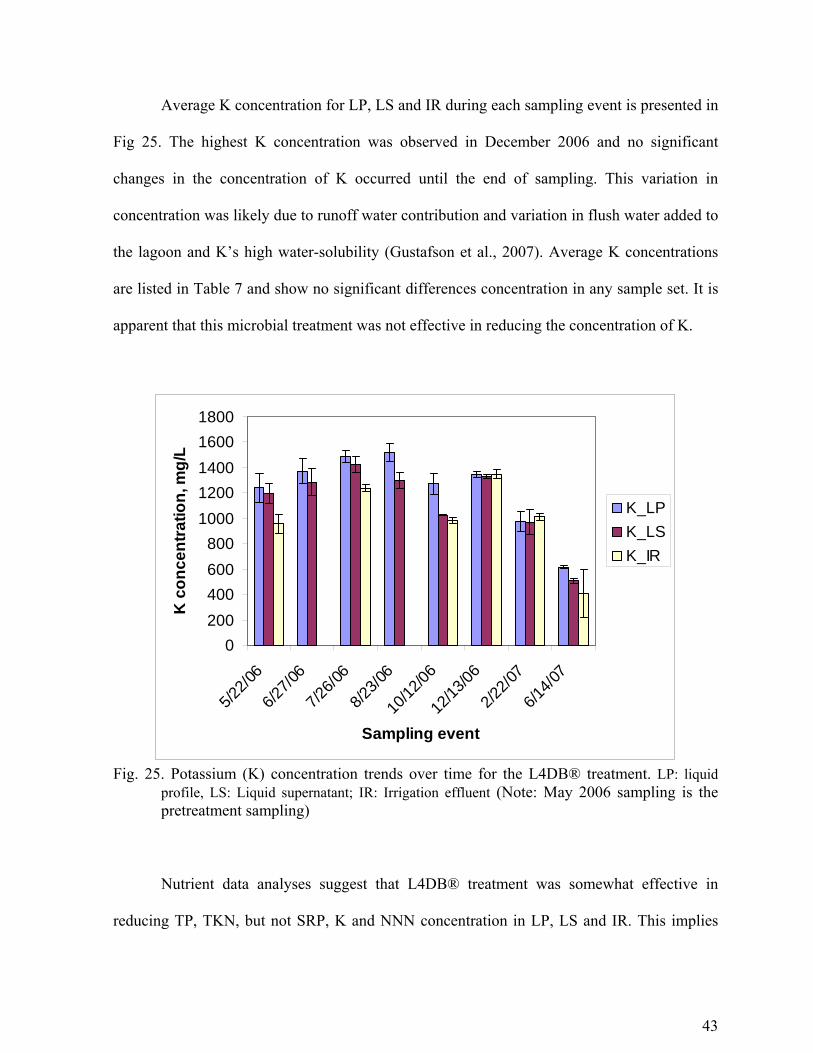
Average K concentration for LP, LS and IR during each sampling event is presented in
Fig 25. The highest K concentration was observed in December 2006 and no significant
changes in the concentration of K occurred until the end of sampling. This variation in
concentration was likely due to runoff water contribution and variation in flush water added to
the lagoon and K’s high water-solubility (Gustafson et al., 2007). Average K concentrations
are listed in Table 7 and show no significant differences concentration in any sample set. It is
apparent that this microbial treatment was not effective in reducing the concentration of K.
0200400600800
10001200140016001800
5/22/0
6
6/27/0
6
7/26/0
6
8/23/0
6
10/12
/06
12/13
/06
2/22/0
7
6/14/0
7
Sampling event
K c
once
ntra
tion,
mg/
L
K_LPK_LSK_IR
Fig. 25. Potassium (K) concentration trends over time for the L4DB® treatment. LP: liquid
profile, LS: Liquid supernatant; IR: Irrigation effluent (Note: May 2006 sampling is the pretreatment sampling)
Nutrient data analyses suggest that L4DB® treatment was somewhat effective in
reducing TP, TKN, but not SRP, K and NNN concentration in LP, LS and IR. This implies
44
that this microbial treatment was not highly effective in reducing nutrients that are water
soluble. Without accurate measurements of sludge nutrient content, it was difficult to ascertain
that the reduction of nutrients from these profiles was likely due to settling of solids including
dead and degraded bacterial mass accumulated at the bottom of lagoon. All nutrient
concentrations received from TIAER are also listed in tables I through III in Appendix A.
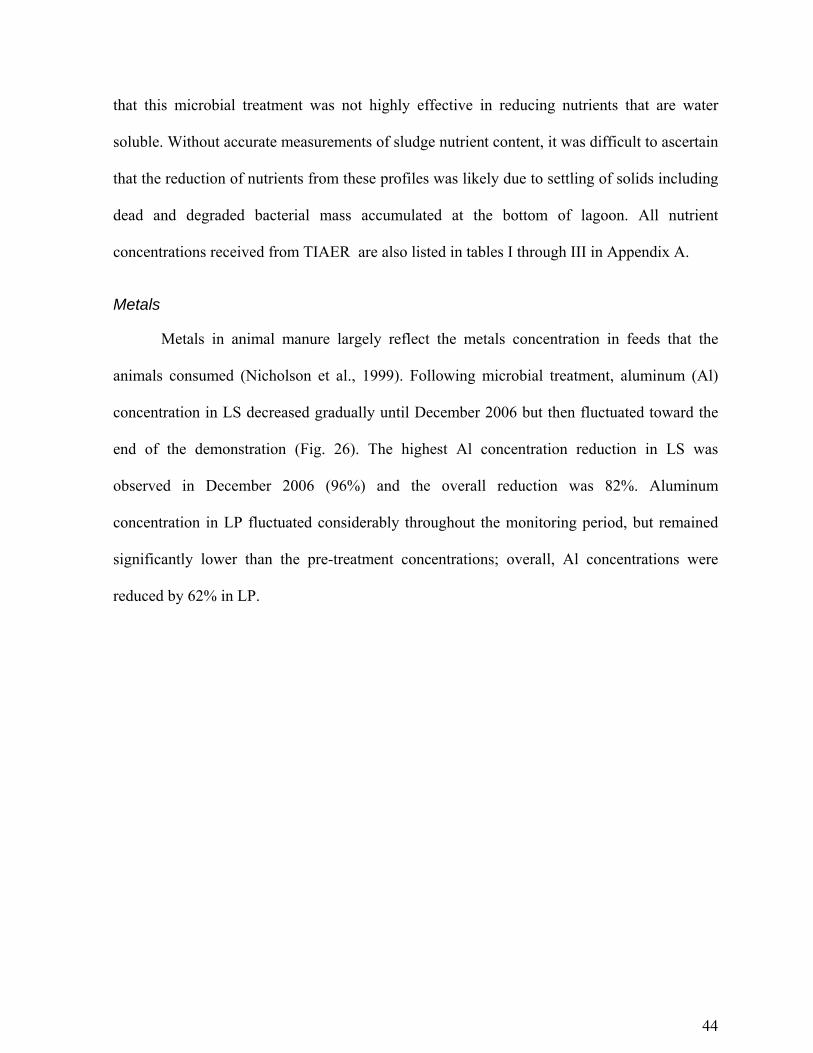
Metals
Metals in animal manure largely reflect the metals concentration in feeds that the
animals consumed (Nicholson et al., 1999). Following microbial treatment, aluminum (Al)
concentration in LS decreased gradually until December 2006 but then fluctuated toward the
end of the demonstration (Fig. 26). The highest Al concentration reduction in LS was
observed in December 2006 (96%) and the overall reduction was 82%. Aluminum
concentration in LP fluctuated considerably throughout the monitoring period, but remained
significantly lower than the pre-treatment concentrations; overall, Al concentrations were
reduced by 62% in LP.
45
050
100150200250300350400450500
5/22/0
6
6/27/0
6
7/26/0
6
8/23/0
6
10/12
/06
12/13
/06
2/22/0
7
6/14/2
007
Sampling event
Al c
once
ntra
tion,
mg/
L
Al_LPAl_LSAl_IR
Fig. 26. Aluminum (Al) concentration trends over time for the L4DB® treatment. LP: liquid
profile, LS: Liquid supernatant; IR: Irrigation effluent (Note: May 2006 sampling is the pre-treatment sampling)
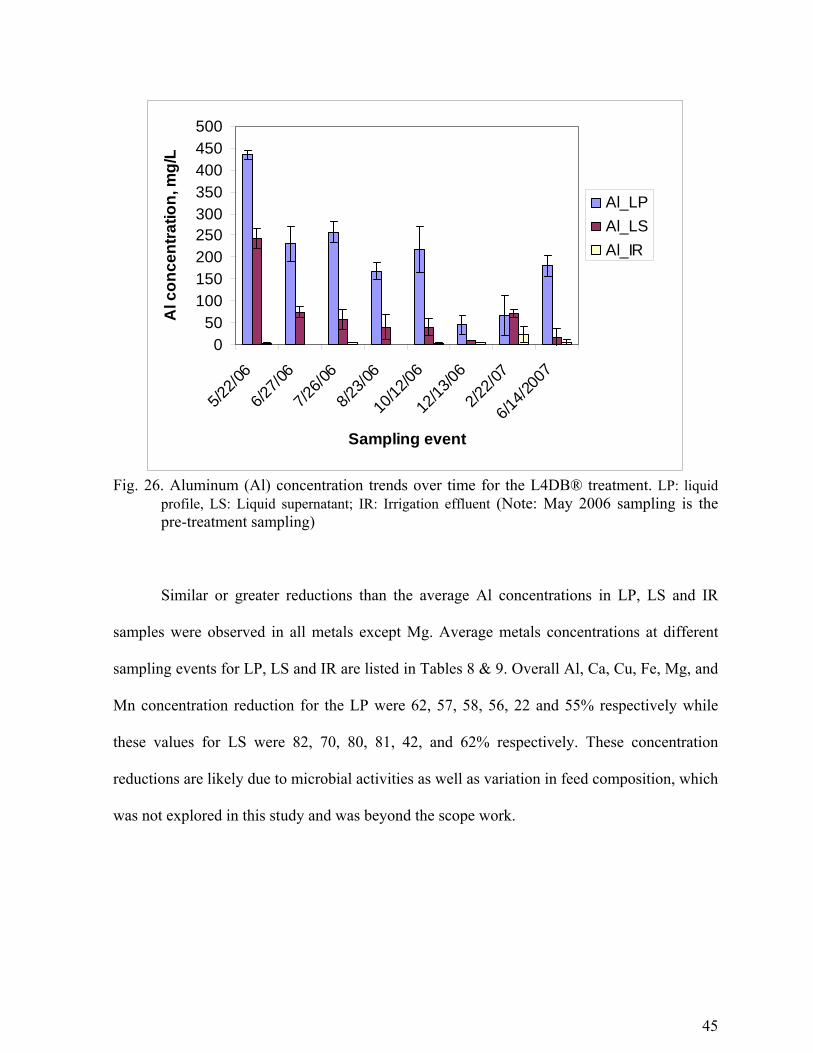
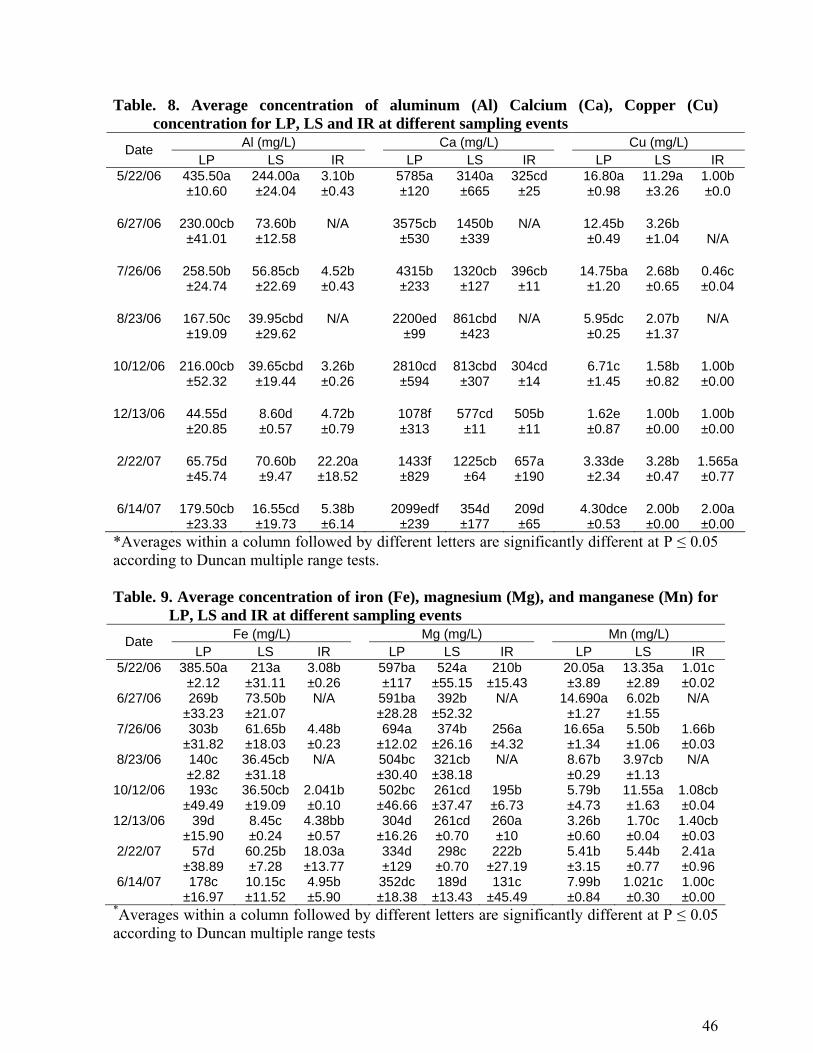
Similar or greater reductions than the average Al concentrations in LP, LS and IR
samples were observed in all metals except Mg. Average metals concentrations at different
sampling events for LP, LS and IR are listed in Tables 8 & 9. Overall Al, Ca, Cu, Fe, Mg, and
Mn concentration reduction for the LP were 62, 57, 58, 56, 22 and 55% respectively while
these values for LS were 82, 70, 80, 81, 42, and 62% respectively. These concentration
reductions are likely due to microbial activities as well as variation in feed composition, which
was not explored in this study and was beyond the scope work.
46
Table. 8. Average concentration of aluminum (Al) Calcium (Ca), Copper (Cu) concentration for LP, LS and IR at different sampling events
Al (mg/L) Ca (mg/L) Cu (mg/L) Date LP LS IR LP LS IR LP LS IR
5/22/06
435.50a ±10.60
244.00a ±24.04
3.10b ±0.43
5785a ±120
3140a ±665
325cd ±25
16.80a ±0.98
11.29a ±3.26
1.00b ±0.0
6/27/06
230.00cb ±41.01
73.60b ±12.58
N/A
3575cb ±530
1450b ±339
N/A
12.45b ±0.49
3.26b ±1.04 N/A
7/26/06
258.50b ±24.74
56.85cb ±22.69
4.52b ±0.43
4315b ±233
1320cb ±127
396cb ±11
14.75ba ±1.20
2.68b ±0.65
0.46c ±0.04
8/23/06
167.50c ±19.09
39.95cbd ±29.62
N/A
2200ed ±99
861cbd ±423
N/A
5.95dc ±0.25
2.07b ±1.37
N/A
10/12/06
216.00cb ±52.32
39.65cbd ±19.44
3.26b ±0.26
2810cd ±594
813cbd ±307
304cd ±14
6.71c ±1.45
1.58b ±0.82
1.00b ±0.00
12/13/06
44.55d ±20.85
8.60d ±0.57
4.72b ±0.79
1078f ±313
577cd ±11
505b ±11
1.62e ±0.87
1.00b ±0.00
1.00b ±0.00
2/22/07
65.75d ±45.74
70.60b ±9.47
22.20a ±18.52
1433f ±829
1225cb ±64
657a ±190
3.33de ±2.34
3.28b ±0.47
1.565a ±0.77
6/14/07
179.50cb ±23.33
16.55cd ±19.73
5.38b ±6.14
2099edf ±239
354d ±177
209d ±65
4.30dce ±0.53
2.00b ±0.00
2.00a ±0.00
*Averages within a column followed by different letters are significantly different at P ≤ 0.05 according to Duncan multiple range tests. Table. 9. Average concentration of iron (Fe), magnesium (Mg), and manganese (Mn) for
LP, LS and IR at different sampling events Fe (mg/L) Mg (mg/L) Mn (mg/L) Date
LP LS IR LP LS IR LP LS IR 5/22/06
385.50a
±2.12 213a
±31.11 3.08b ±0.26
597ba ±117
524a ±55.15
210b ±15.43
20.05a ±3.89
13.35a ±2.89
1.01c ±0.02
6/27/06
269b ±33.23
73.50b ±21.07
N/A
591ba ±28.28
392b ±52.32
N/A
14.690a ±1.27
6.02b ±1.55
N/A
7/26/06
303b ±31.82
61.65b ±18.03
4.48b ±0.23
694a ±12.02
374b ±26.16
256a ±4.32
16.65a ±1.34
5.50b ±1.06
1.66b ±0.03
8/23/06
140c ±2.82
36.45cb ±31.18
N/A
504bc ±30.40
321cb ±38.18
N/A
8.67b ±0.29
3.97cb ±1.13
N/A
10/12/06
193c ±49.49
36.50cb ±19.09
2.041b ±0.10
502bc ±46.66
261cd ±37.47
195b ±6.73
5.79b ±4.73
11.55a ±1.63
1.08cb ±0.04
12/13/06
39d ±15.90
8.45c ±0.24
4.38bb ±0.57
304d ±16.26
261cd ±0.70
260a ±10
3.26b ±0.60
1.70c ±0.04
1.40cb ±0.03
2/22/07
57d ±38.89
60.25b ±7.28
18.03a ±13.77
334d ±129
298c ±0.70
222b ±27.19
5.41b ±3.15
5.44b ±0.77
2.41a ±0.96
6/14/07
178c ±16.97
10.15c ±11.52
4.95b ±5.90
352dc ±18.38
189d ±13.43
131c ±45.49
7.99b ±0.84
1.021c ±0.30
1.00c ±0.00
*Averages within a column followed by different letters are significantly different at P ≤ 0.05 according to Duncan multiple range tests
47
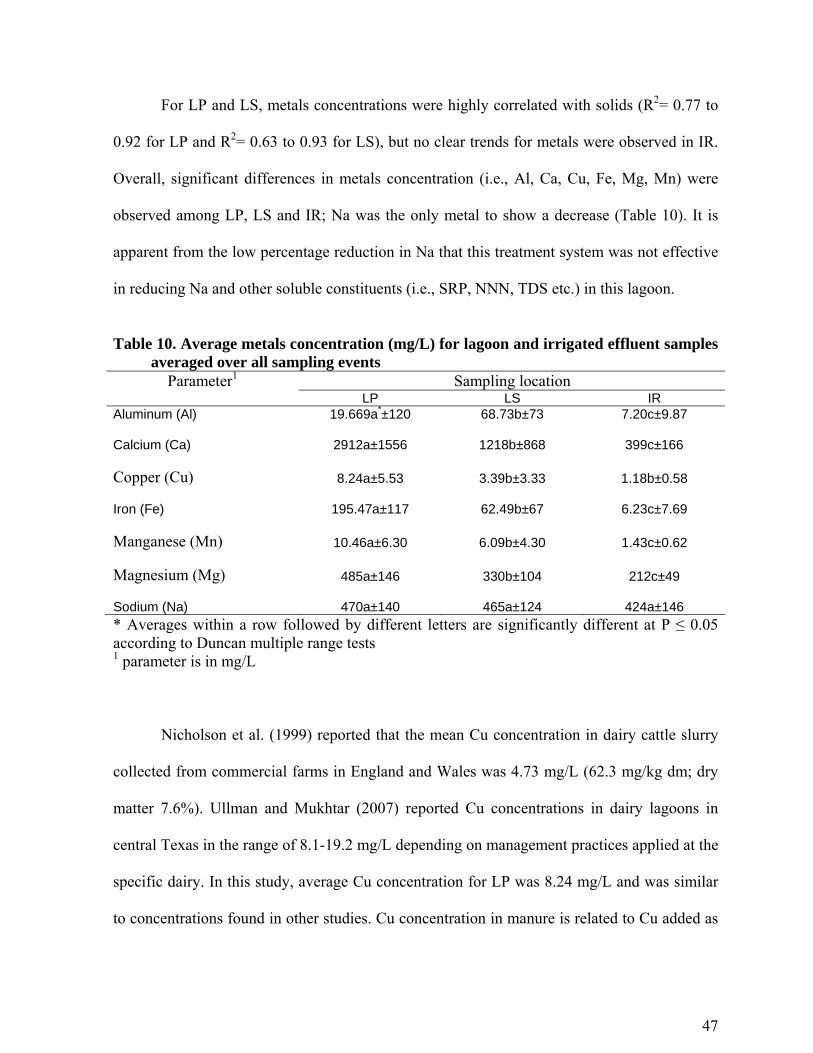
For LP and LS, metals concentrations were highly correlated with solids (R2= 0.77 to
0.92 for LP and R2= 0.63 to 0.93 for LS), but no clear trends for metals were observed in IR.
Overall, significant differences in metals concentration (i.e., Al, Ca, Cu, Fe, Mg, Mn) were
observed among LP, LS and IR; Na was the only metal to show a decrease (Table 10). It is
apparent from the low percentage reduction in Na that this treatment system was not effective
in reducing Na and other soluble constituents (i.e., SRP, NNN, TDS etc.) in this lagoon.
Table 10. Average metals concentration (mg/L) for lagoon and irrigated effluent samples
averaged over all sampling events Sampling location Parameter1
LP LS IR Aluminum (Al) 19.669a*±120 68.73b±73 7.20c±9.87 Calcium (Ca) 2912a±1556 1218b±868 399c±166 Copper (Cu) 8.24a±5.53 3.39b±3.33 1.18b±0.58 Iron (Fe) 195.47a±117 62.49b±67 6.23c±7.69 Manganese (Mn) 10.46a±6.30 6.09b±4.30 1.43c±0.62 Magnesium (Mg) 485a±146 330b±104 212c±49 Sodium (Na) 470a±140 465a±124 424a±146 * Averages within a row followed by different letters are significantly different at P ≤ 0.05 according to Duncan multiple range tests 1 parameter is in mg/L
Nicholson et al. (1999) reported that the mean Cu concentration in dairy cattle slurry
collected from commercial farms in England and Wales was 4.73 mg/L (62.3 mg/kg dm; dry
matter 7.6%). Ullman and Mukhtar (2007) reported Cu concentrations in dairy lagoons in
central Texas in the range of 8.1-19.2 mg/L depending on management practices applied at the
specific dairy. In this study, average Cu concentration for LP was 8.24 mg/L and was similar
to concentrations found in other studies. Cu concentration in manure is related to Cu added as
48
a supplement to feed (Li et al., 2005). In general, manures will contain higher Cu
concentration if feeds contained higher concentrations of Cu (Nicholson et al. 1999). In this
study feed composition was not analyzed; however, average concentration of metals (i.e., Ca,
Mg, Fe, etc.), except Mn, was much higher than those reported by Ullman and Mukhtar
(2007). All metals concentrations as received from TIAER are also listed in tables VI through
IX in Appendix A.
Conductivity
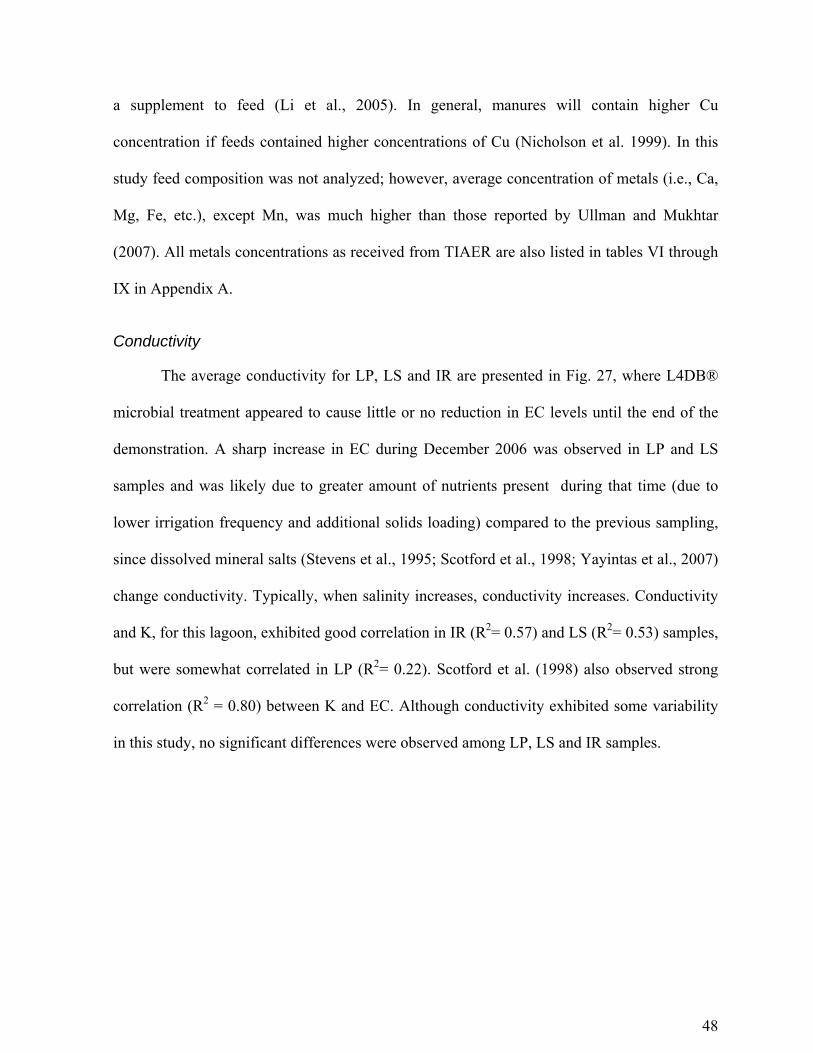
The average conductivity for LP, LS and IR are presented in Fig. 27, where L4DB®
microbial treatment appeared to cause little or no reduction in EC levels until the end of the
demonstration. A sharp increase in EC during December 2006 was observed in LP and LS
samples and was likely due to greater amount of nutrients present during that time (due to
lower irrigation frequency and additional solids loading) compared to the previous sampling,
since dissolved mineral salts (Stevens et al., 1995; Scotford et al., 1998; Yayintas et al., 2007)
change conductivity. Typically, when salinity increases, conductivity increases. Conductivity
and K, for this lagoon, exhibited good correlation in IR (R2= 0.57) and LS (R2= 0.53) samples,
but were somewhat correlated in LP (R2= 0.22). Scotford et al. (1998) also observed strong
correlation (R2 = 0.80) between K and EC. Although conductivity exhibited some variability
in this study, no significant differences were observed among LP, LS and IR samples.
49
0
2000
40006000
8000
10000
1200014000
16000
18000
5/22/0
6
6/27/0
6
7/26/0
6
8/23/0
6
10/12
/06
12/13
/06
2/22/0
7
6/14/2
007
Sampling event
Con
duct
ivity
, µS/
cm
Cond_LPCond_LSCond_IR
Fig. 27. Conductivity trends over time for the L4DB® treatment. LP: liquid profile, LS: Liquid
supernatant; IR: Irrigation effluent (Note: May 2006 sampling is the pretreatment sampling)
While statistically similar, the average conductivity for LS (9,184±2,052 μS/cm), was
slightly higher than LP (8,379±2,193 μS/cm) and IR (8,356±1,360 μS/cm). Safley et al.
(1993) reported that EC value of 8,000 μS/cm can inhibit bacterial population in livestock
treatment lagoon. In this lagoon, EC was higher than this suggested threshold value and might
have impacted L4DB® microbial performance in reducing physiochemical parameters of
slurry. All conductivity values as received from TIAER are also listed in tables I through III in
Appendix A.
50
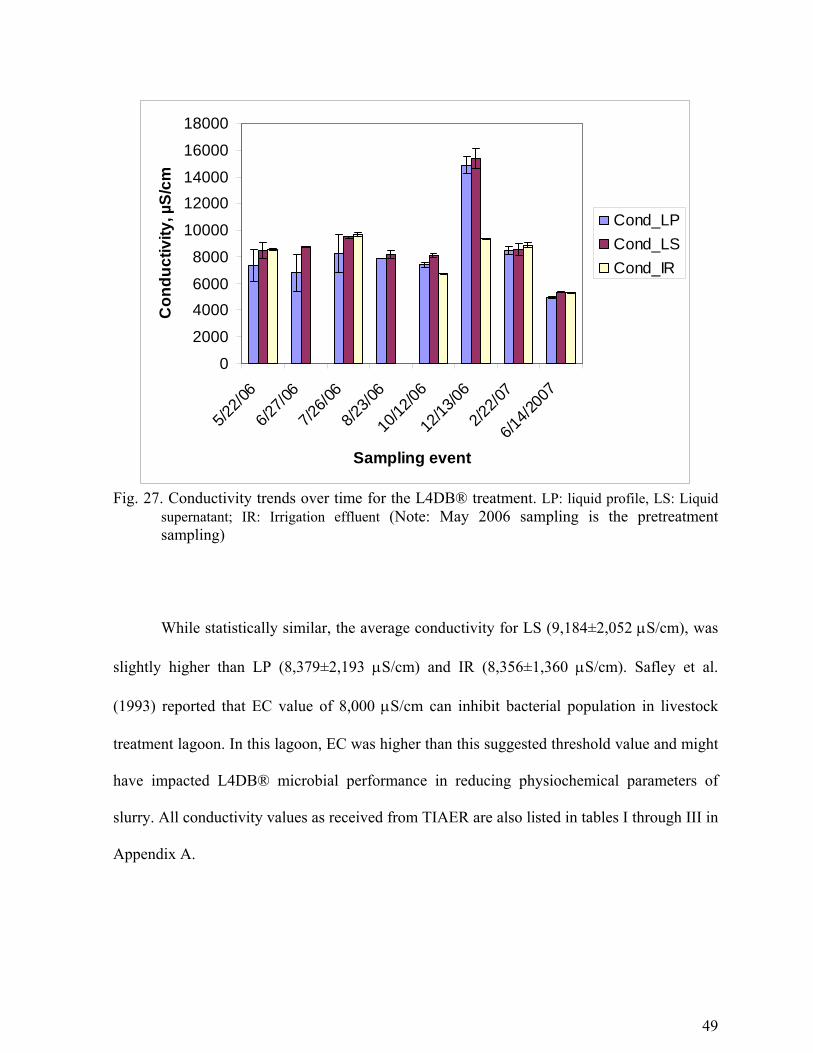
TREATMENT COSTS
Costs to implement this lagoon treatment method varied based on the daily amount of
manure and wastewater that is added to the lagoon, the existing lagoon capacity and sludge
depth, prior wastewater treatment (e.g., pretreatment of flushed manure for solids separation
before it flows to the lagoon), lagoon depth, and the number of lagoon cells in the wastewater
management system. In addition, the treatment costs will also vary with the type of manure
alley cleaning system used, such as flushing or vacuuming. The following cost matrix was
also provided by the technology provider:
Table 11. Cost to treat a lagoon with L4DB® microbial treatment
Herd size Unit cost ($/cow/month) $/cow/year
1000 1.00 12
1001-7000 0.60 ~ 0.90 7.2 ~ 10.8
>7001 0.30 ~ 0.60 3.6 ~ 7.2
Based upon the information in Table 11, for this 300-head dairy, the total cost to treat the
lagoon was estimated at $3900 for a 13 months period or $12/cow/year.
CONCLUSIONS
Effectiveness of L4DB® microbial treatment on an anaerobic lagoon was monitored
for one year. It appears that L4DB® microbial treatment was somewhat effective in reducing
solids and resulted in reducing sludge depth by 24% (however, this reduction was 16%
excluding the measurement anomaly in August 2006). The L4DB® treatment was also highly
51
effective in reducing TS, TSS, TVS and TFS in the LS, but less effective in reducing these
solids from LP and no clear trends were observed for irrigation effluent (IR). Over time,
L4DB® treatment reduced TS (43%), TSS (45%), TDS (42%), TVS (31%), and TFS (51%) in
LP samples, while they were reduced by 60, 71, 44, 58, and 62% respectively for LS samples.
Similarly, reductions of phosphorus were likely due to microbial uptake of P from LS and LP;
however, P continues to be mobile until settling occurs (Farve et al., 2004). The trend shown
in this report confirms that due to microbial activities P was very mobile in LP profile as
compared to LS. Overall, L4DB® treatment was somewhat effective in reducing TP, TKN,
but was not effective in reducing SRP, NNN and K concentrations. Average concentrations of
TP and TKN in the LP were reduced by 27 and 36%, respectively while these constituents
were reduced by 52 and 48% in the LS. Significant metal concentration reductions were
observed for the LP (ranged from 22 to 62%) and the LS (ranged from 42 to 82%), while
metals concentration increased slightly for IR over time. Although conductivity exhibited
considerable variability, no significant differences in conductivity were observed among LP,
LS and IR samples.
Variable performance and poor reduction of nutrients in few cases were likely due to
over loading of the lagoon as well as varied treatment application rates. The technology
provider pre-determined the application rate for this lagoon based on experiences, but not by
measuring environmental conditions of the lagoon. It might be useful to conduct a lab-scale
study to determine the effective application rate based on varying conditions of temperature,
manure nutrient and metals loading and existing sludge level in lagoons to be treated.
Therefore, it could be inferred that most of these solids, nutrients, and metal reduction
were likely due to microbial treatment, dilution of lagoon slurry due to excessive rain and
52
runoff water as well as settling of dead and degraded bacterial mass accumulated at the bottom
of lagoon. Additional measurements of lagoon sludge accumulation rate and constituents are
warranted to assess possible increase in nutrients and solids due to accelerated solids settling
and increased accumulation of microbial mass at the lagoon bottom.
CHALLENGES
Tanks were used to mimic the repeatability of lagoon treatment with microbes and to
get additional information on treatment effectiveness. Tank evaporation losses caused
significant difficulty in maintaining a consistent TS and TP sampling depth in tanks. As a
result, it remains a challenge to obtain replicated data on treatment effectiveness in outdoor
environmental conditions under tank environment. It is apparent that microbial treatment was
more effective in the lagoon supernatant than the entire profile but, without accurate
assessment of pre- and post-treatment sludge characteristics, it is premature to conclude how
effective the treatment was in reducing nutrient, metals and solids in the lagoon. The foremost
challenge is to collect and monitor the lagoon sludge sample for an extended period of time
prior to, during and after treatment to determine solids, nutrients and metal content of the
lagoon that will enable a determination to be made regarding the effectiveness of the applied
treatment.
ACKNOWLEDGEMENT
Funding for this project was provided by the Texas State Soil and Water Conservation
Board using EPA-CWA section 319 (h) program support. Envirolink® LLC from Greeley,
Kansas is the technology provider.
53
REFERENCES
APHA. 2005. Standard Methods for Examination of Water and Wastewater, 21st ed.
Washington, D.C.: American Public Health Association (APHA).
Barker, J. C., J. P. Zublena, and F. R. Walls. 2001. Animal and poultry manure production and
characterization. North Carolina Cooperative Extension Service. Available at:
http://www.bae.ncsu.edu/programs/extension/manure/awm/program/barker/a&pmp&c/
cover_page_apmp&c.html. Accessed 21 February, 2006.
Bicudo, J. R., L. M. Safley Jr. and P. W. Westerman. 1999. Nutrient content and sludge
volumes in single-sell recycle anaerobic swine lagoons in North Carolina.
Transactions of the ASAE. 42(4): 1087-1093
Budde, W. L. 1995. Laboratory analytical chemistry methods manuals. USEPA document No.
EPA-600/4-88/039 Springfield, VA.: National Technical Information Service.
Chastain, J. P., M. B. Vanotti and M. M. Wingfield. 2001. Effectiveness of liquid-solid
separation for treatment of flushed dairy manure: A case study. Applied Engineering in
Agriculture. 17(3): 343-354
Converse, J. C. and K. G. Karthikeyan. 2004. Nutrient and solids separation of flushed dairy
manure by gravity settling. Applied Engineering in Agriculture. 20(4): 503-507
Farve, M., W. Harris, F. Dierberg and K. Portier. 2004. Association between phosphorus and
suspended solids in an Everglades treatment wetland dominated by submersed aquatic
vegetation. Wetlands Ecology and Management. 12: 365-375
Gustafson, G. M., E. Salomon and S. Jonsson. 2007. Barn balance calculations of Ca, Cu, K,
Mg, Mn, N, P, S and Zn in a conventional and organic dairy farm in Sweden.
Agriculture, Ecosystems and Environment. 119: 160-170
Hamilton, D. W., B. Fathepure, C. D. Fuhage, W. Clarkson and J. Laiman. 2006. Tratment
lagoons for animal agriculture. In: Animal Agriculture and the Environment: National
Center for Manure and Animal Waste Management White Papers, 547-574, J. M. Rice,
D. F. Cadwell and F. J. Humenik, eds. ASABE, St. Joseph, MI
Higgins, S. F., S. A. Shearer, M. S. Coyne and J. P. Fulton. 2004. Relationship of total
nitrogen and total phosphorus concentration to solids content in animal waste slurries.
Applied Engineering in Agriculture. 20(3): 355-364
54
Li, Y., D. F. McCrory, J. M. Powell, H. Saam, and Jackson-Smith. 2005. A survey of selected heavy metal concentrations in Wisconsin dairy feeds. Journal of Dairy Science, 88(8): 2911-2922
McFarland, A. M. S., L. M. Hauck, and A. P. Kruzic. 2003. Phosphorus reductions in runoff
and solids from land applied dairy effluent using chemical amendments: an
observation. 2003. The Texas Journal of Agriculture and Natural Resource. 16: 47-59
Mukhtar, S., J. L. Ullman, B. W. Auvermann, S. E. Feagley, T. A. Carpenter. 2004. Impact of
anaerobic lagoon management on sludge accumulation and nutrient content for dairies.
Transactions of the ASAE. 47(1): 251-257
Nicholson, F. A., B. J. Chambers, J. R. Williams and R. J. Unwin. 1999. Heavy metal contents
of livestock feeds and animal manures in England and Wales. Bioresource
Technology. 70: 23-31
Reed, S. C., R. W. Crites and E. J. Middlebrooks. 1995. Natural Systems for Waste
Management and Treatment, 2nd ed., McGraw Hill Inc, New York.
Scotford, I. M., T. R. Cumby, R. P. White, O. T. Carotn, F. Lorenz, U. Hatterman, G. Provolo.
1998. Journal of Agricultural Engineering Research. 71: 291-305
Steel, R.G.D., and J.A. Torrie. 1997. Principles and Procedures of Statistics, A Biometrical
Approach. 3rd ed. New York, NY, USA: McGraw-Hill Inc.
Stevens, R. J., C. J. O’Bric and O. T. Carton. 1995. Estimating nutrient content of animal
slurries using electrical conductivity. Journal of Agricultural Science, Cambridge.
125: 233-238
Sukias, J. P. S., C. C. Tanner, R. J. Davies-Colley, J. W. Nagels, and R. Wolters. 2001. Algal
abundance, organic matter, and Physico-chemical characteristics of dairy farm
facultative ponds: Implications for treatment performance. New Zealand Journal of
Agricultural Research. 44: 279-296.
Texas Commission on Environmental Quality (TCEQ). 1998. Clean water act section 303(d)
list and schedule for development of total maximum daily loads (TMDLs). Available
at: http://www.tceq.state.tx.us/assets/public/comm_exec/pubs/sfr/058_98/. (Accessed
03 April 2007)
Texas Commission on Environmental Quality (TCEQ). 2006. Nonpoint source water pollution
management program. Austin, Texas, Texas Commission on Environmental Quality.
Available at: http://www.tceq.state.tx.us/compliance/monitoring/nps/mgmt-plan/.
55
(Accessed: 21 April, 2006)
Texas Commission on Environmental Quality (TCEQ). 2007. Water quality in the North and
Upper Bosque rivers. January 2007: Status report of activities to address elevated
nutrient concentrations.
Texas Natural Resource Conservation Commission (Now TCEQ). 2001. Two Total Maximum
Daily Loads for Phosphorus in the North Bosque River. The Strategic Assessment
Division, Austin, Texas. Texas Commission on Environmental Quality.
Ullman, J. L. and S. Mukhtar. 2007. Impact of dairy housing practices on lagoon effluent
characteristics: Implications for nitrogen dynamics and salt accumulation. Bioresource
Technology. 98: 745-752
Westerman, P. W., J. Arogo Ogejo, G. L. Grabow and M. E. Adcock. 2006. Swine anaerobic
lagoon nutrient concentration variation with season, lagoon level and rainfall. ASABE
paper No. 064146. St. Joseph, MI
Wilkie, A. C. 2005. Anaerobic digestion of dairy manure: Design and process considerations.
In Dairy Manure Management: Treatment, Handling, and Community Relations.
NRAES-176, Ithaca, NY, p 301-312.
Yayintas, O. T., S. Yilmaz, M. Turkoglu and Y. Dilgin. 2007. Determination of heavy metal
pollution with environmental physicochemical parameters in waste water of Kocabas
Stream (Biga, Canakkale, Turkey) by ICP-AES. Environmental Monitoring
Assessment. 127: 389-397
Zhu, J., P. M. Ndegwa and A. Luo. 2000. Changes in swine manure solids during storage may
affect separation efficiency. Applied Engineering in Agriculture. 16(3): 571- 575

56
APPENDIX A
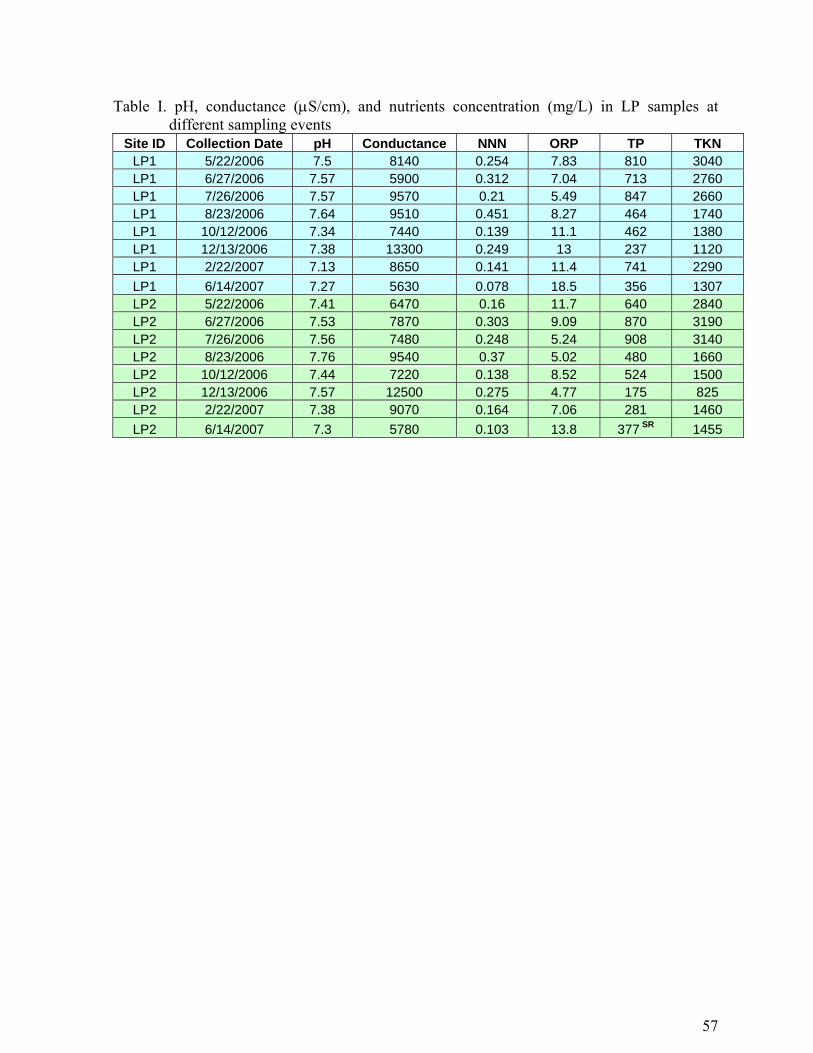
57
Table I. pH, conductance (μS/cm), and nutrients concentration (mg/L) in LP samples at different sampling events
Site ID Collection Date pH Conductance NNN ORP TP TKN LP1 5/22/2006 7.5 8140 0.254 7.83 810 3040 LP1 6/27/2006 7.57 5900 0.312 7.04 713 2760 LP1 7/26/2006 7.57 9570 0.21 5.49 847 2660 LP1 8/23/2006 7.64 9510 0.451 8.27 464 1740 LP1 10/12/2006 7.34 7440 0.139 11.1 462 1380 LP1 12/13/2006 7.38 13300 0.249 13 237 1120 LP1 2/22/2007 7.13 8650 0.141 11.4 741 2290 LP1 6/14/2007 7.27 5630 0.078 18.5 356 1307 LP2 5/22/2006 7.41 6470 0.16 11.7 640 2840 LP2 6/27/2006 7.53 7870 0.303 9.09 870 3190 LP2 7/26/2006 7.56 7480 0.248 5.24 908 3140 LP2 8/23/2006 7.76 9540 0.37 5.02 480 1660 LP2 10/12/2006 7.44 7220 0.138 8.52 524 1500 LP2 12/13/2006 7.57 12500 0.275 4.77 175 825 LP2 2/22/2007 7.38 9070 0.164 7.06 281 1460 LP2 6/14/2007 7.3 5780 0.103 13.8 377 SR 1455
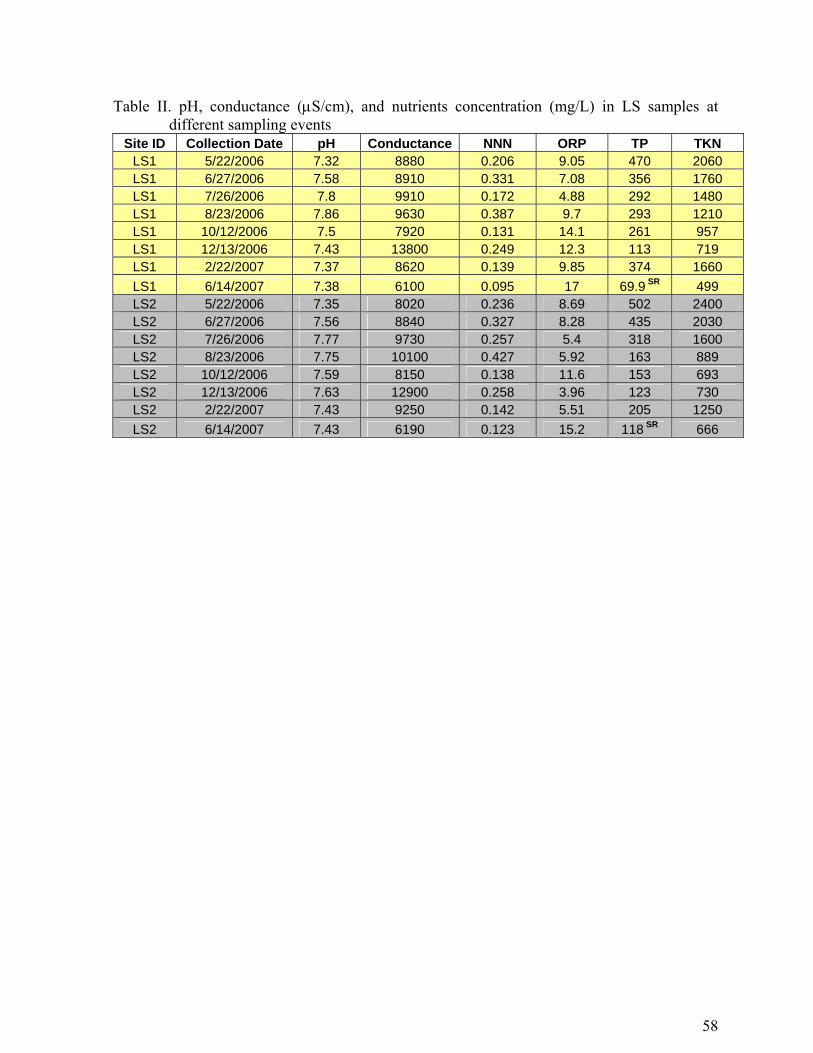
58
Table II. pH, conductance (μS/cm), and nutrients concentration (mg/L) in LS samples at different sampling events
Site ID Collection Date pH Conductance NNN ORP TP TKN LS1 5/22/2006 7.32 8880 0.206 9.05 470 2060 LS1 6/27/2006 7.58 8910 0.331 7.08 356 1760 LS1 7/26/2006 7.8 9910 0.172 4.88 292 1480 LS1 8/23/2006 7.86 9630 0.387 9.7 293 1210 LS1 10/12/2006 7.5 7920 0.131 14.1 261 957 LS1 12/13/2006 7.43 13800 0.249 12.3 113 719 LS1 2/22/2007 7.37 8620 0.139 9.85 374 1660 LS1 6/14/2007 7.38 6100 0.095 17 69.9 SR 499 LS2 5/22/2006 7.35 8020 0.236 8.69 502 2400 LS2 6/27/2006 7.56 8840 0.327 8.28 435 2030 LS2 7/26/2006 7.77 9730 0.257 5.4 318 1600 LS2 8/23/2006 7.75 10100 0.427 5.92 163 889 LS2 10/12/2006 7.59 8150 0.138 11.6 153 693 LS2 12/13/2006 7.63 12900 0.258 3.96 123 730 LS2 2/22/2007 7.43 9250 0.142 5.51 205 1250 LS2 6/14/2007 7.43 6190 0.123 15.2 118 SR 666
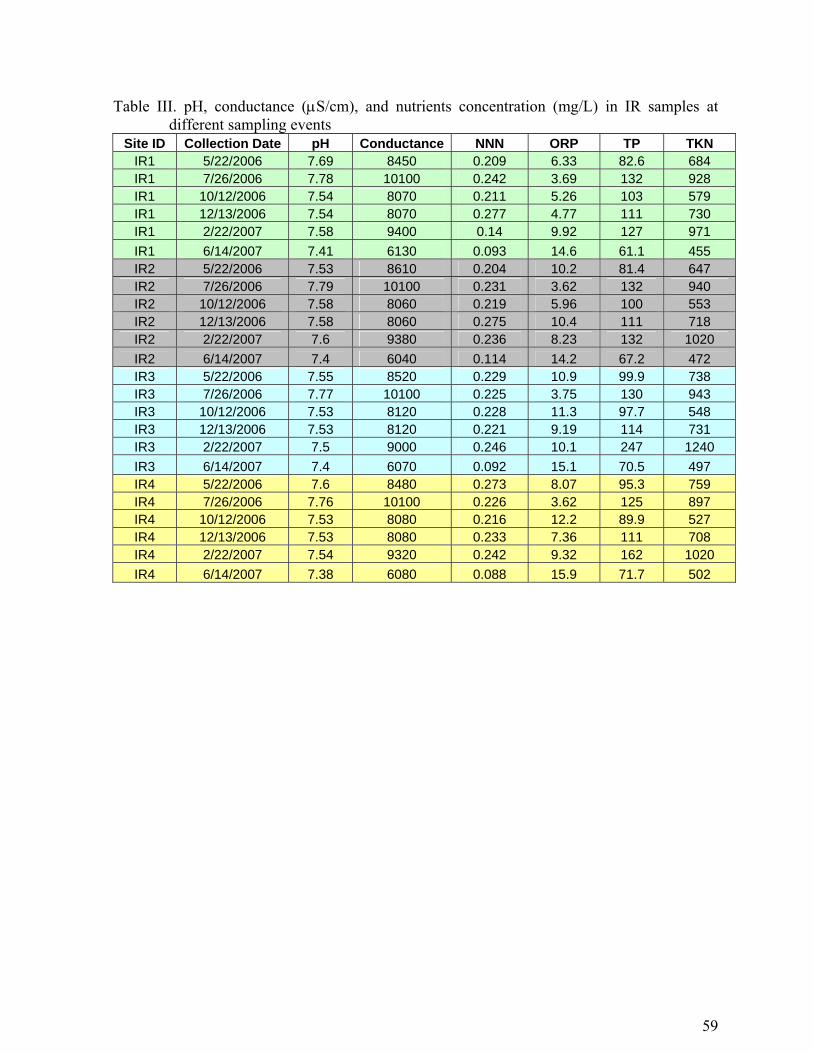
59
Table III. pH, conductance (μS/cm), and nutrients concentration (mg/L) in IR samples at different sampling events
Site ID Collection Date pH Conductance NNN ORP TP TKN IR1 5/22/2006 7.69 8450 0.209 6.33 82.6 684 IR1 7/26/2006 7.78 10100 0.242 3.69 132 928 IR1 10/12/2006 7.54 8070 0.211 5.26 103 579 IR1 12/13/2006 7.54 8070 0.277 4.77 111 730 IR1 2/22/2007 7.58 9400 0.14 9.92 127 971 IR1 6/14/2007 7.41 6130 0.093 14.6 61.1 455 IR2 5/22/2006 7.53 8610 0.204 10.2 81.4 647 IR2 7/26/2006 7.79 10100 0.231 3.62 132 940 IR2 10/12/2006 7.58 8060 0.219 5.96 100 553 IR2 12/13/2006 7.58 8060 0.275 10.4 111 718 IR2 2/22/2007 7.6 9380 0.236 8.23 132 1020 IR2 6/14/2007 7.4 6040 0.114 14.2 67.2 472 IR3 5/22/2006 7.55 8520 0.229 10.9 99.9 738 IR3 7/26/2006 7.77 10100 0.225 3.75 130 943 IR3 10/12/2006 7.53 8120 0.228 11.3 97.7 548 IR3 12/13/2006 7.53 8120 0.221 9.19 114 731 IR3 2/22/2007 7.5 9000 0.246 10.1 247 1240 IR3 6/14/2007 7.4 6070 0.092 15.1 70.5 497 IR4 5/22/2006 7.6 8480 0.273 8.07 95.3 759 IR4 7/26/2006 7.76 10100 0.226 3.62 125 897 IR4 10/12/2006 7.53 8080 0.216 12.2 89.9 527 IR4 12/13/2006 7.53 8080 0.233 7.36 111 708 IR4 2/22/2007 7.54 9320 0.242 9.32 162 1020 IR4 6/14/2007 7.38 6080 0.088 15.9 71.7 502
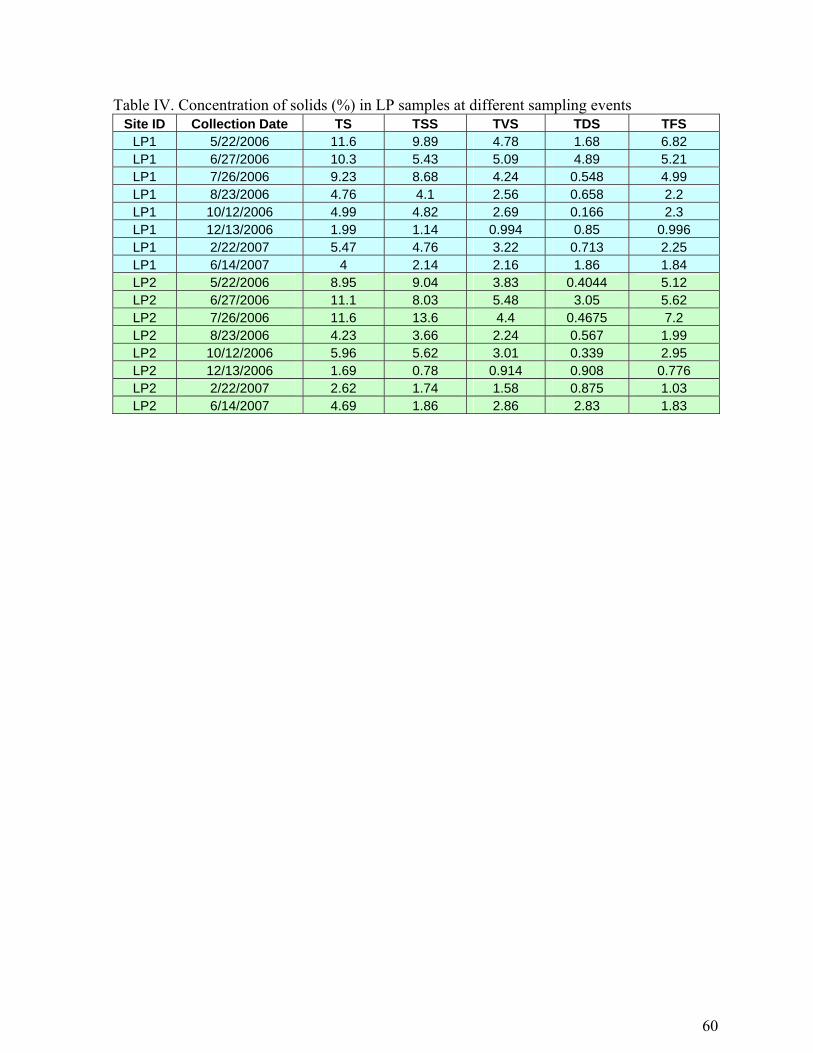
60
Table IV. Concentration of solids (%) in LP samples at different sampling events Site ID Collection Date TS TSS TVS TDS TFS
LP1 5/22/2006 11.6 9.89 4.78 1.68 6.82 LP1 6/27/2006 10.3 5.43 5.09 4.89 5.21 LP1 7/26/2006 9.23 8.68 4.24 0.548 4.99 LP1 8/23/2006 4.76 4.1 2.56 0.658 2.2 LP1 10/12/2006 4.99 4.82 2.69 0.166 2.3 LP1 12/13/2006 1.99 1.14 0.994 0.85 0.996 LP1 2/22/2007 5.47 4.76 3.22 0.713 2.25 LP1 6/14/2007 4 2.14 2.16 1.86 1.84 LP2 5/22/2006 8.95 9.04 3.83 0.4044 5.12 LP2 6/27/2006 11.1 8.03 5.48 3.05 5.62 LP2 7/26/2006 11.6 13.6 4.4 0.4675 7.2 LP2 8/23/2006 4.23 3.66 2.24 0.567 1.99 LP2 10/12/2006 5.96 5.62 3.01 0.339 2.95 LP2 12/13/2006 1.69 0.78 0.914 0.908 0.776 LP2 2/22/2007 2.62 1.74 1.58 0.875 1.03 LP2 6/14/2007 4.69 1.86 2.86 2.83 1.83
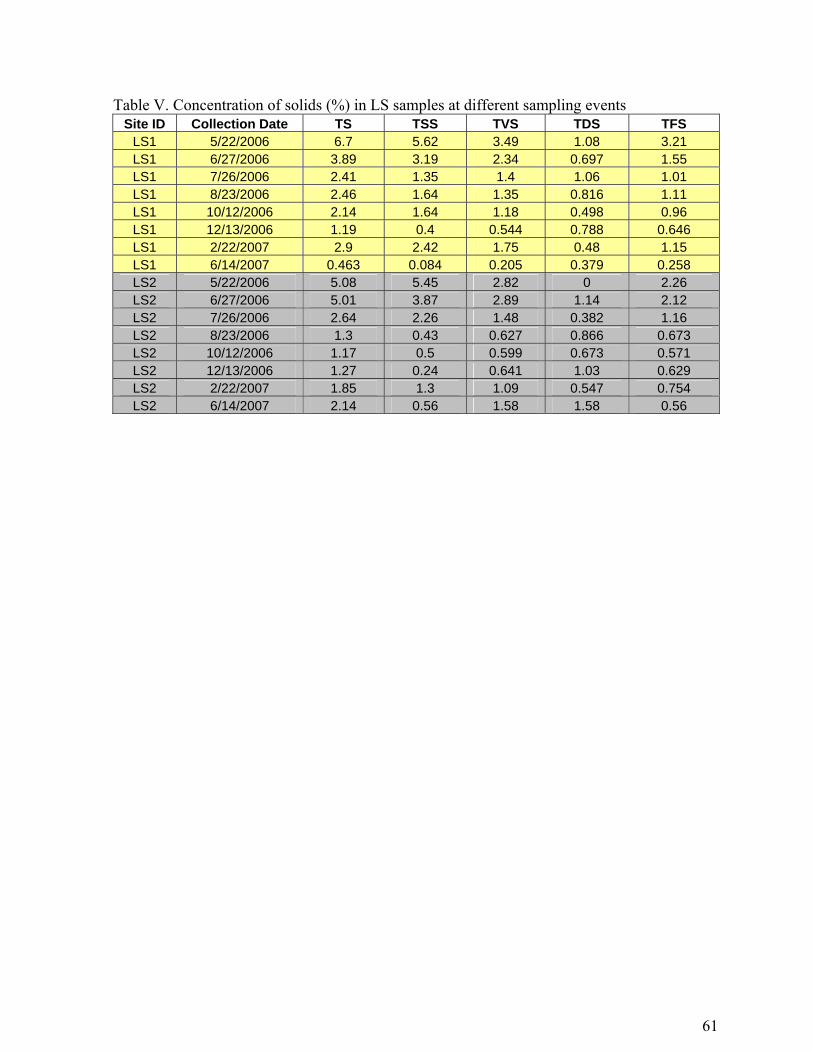
61
Table V. Concentration of solids (%) in LS samples at different sampling events Site ID Collection Date TS TSS TVS TDS TFS
LS1 5/22/2006 6.7 5.62 3.49 1.08 3.21 LS1 6/27/2006 3.89 3.19 2.34 0.697 1.55 LS1 7/26/2006 2.41 1.35 1.4 1.06 1.01 LS1 8/23/2006 2.46 1.64 1.35 0.816 1.11 LS1 10/12/2006 2.14 1.64 1.18 0.498 0.96 LS1 12/13/2006 1.19 0.4 0.544 0.788 0.646 LS1 2/22/2007 2.9 2.42 1.75 0.48 1.15 LS1 6/14/2007 0.463 0.084 0.205 0.379 0.258 LS2 5/22/2006 5.08 5.45 2.82 0 2.26 LS2 6/27/2006 5.01 3.87 2.89 1.14 2.12 LS2 7/26/2006 2.64 2.26 1.48 0.382 1.16 LS2 8/23/2006 1.3 0.43 0.627 0.866 0.673 LS2 10/12/2006 1.17 0.5 0.599 0.673 0.571 LS2 12/13/2006 1.27 0.24 0.641 1.03 0.629 LS2 2/22/2007 1.85 1.3 1.09 0.547 0.754 LS2 6/14/2007 2.14 0.56 1.58 1.58 0.56
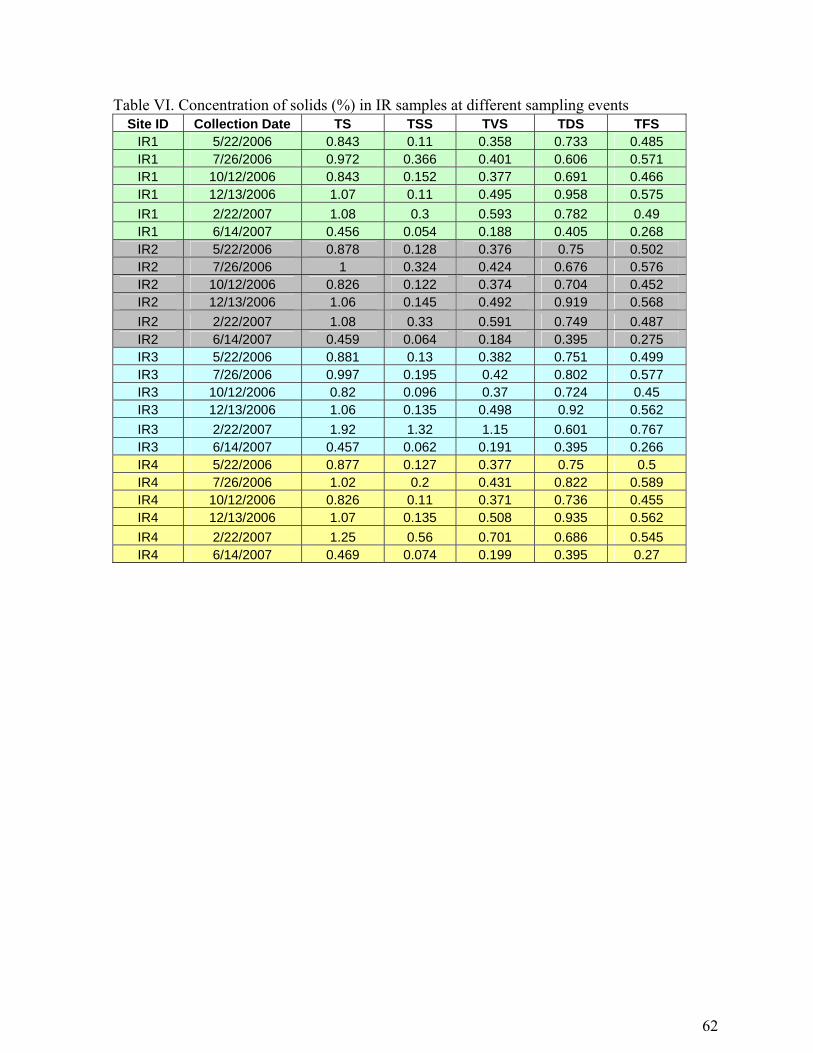
62
Table VI. Concentration of solids (%) in IR samples at different sampling events Site ID Collection Date TS TSS TVS TDS TFS
IR1 5/22/2006 0.843 0.11 0.358 0.733 0.485 IR1 7/26/2006 0.972 0.366 0.401 0.606 0.571 IR1 10/12/2006 0.843 0.152 0.377 0.691 0.466 IR1 12/13/2006 1.07 0.11 0.495 0.958 0.575 IR1 2/22/2007 1.08 0.3 0.593 0.782 0.49 IR1 6/14/2007 0.456 0.054 0.188 0.405 0.268 IR2 5/22/2006 0.878 0.128 0.376 0.75 0.502 IR2 7/26/2006 1 0.324 0.424 0.676 0.576 IR2 10/12/2006 0.826 0.122 0.374 0.704 0.452 IR2 12/13/2006 1.06 0.145 0.492 0.919 0.568 IR2 2/22/2007 1.08 0.33 0.591 0.749 0.487 IR2 6/14/2007 0.459 0.064 0.184 0.395 0.275 IR3 5/22/2006 0.881 0.13 0.382 0.751 0.499 IR3 7/26/2006 0.997 0.195 0.42 0.802 0.577 IR3 10/12/2006 0.82 0.096 0.37 0.724 0.45 IR3 12/13/2006 1.06 0.135 0.498 0.92 0.562 IR3 2/22/2007 1.92 1.32 1.15 0.601 0.767 IR3 6/14/2007 0.457 0.062 0.191 0.395 0.266 IR4 5/22/2006 0.877 0.127 0.377 0.75 0.5 IR4 7/26/2006 1.02 0.2 0.431 0.822 0.589 IR4 10/12/2006 0.826 0.11 0.371 0.736 0.455 IR4 12/13/2006 1.07 0.135 0.508 0.935 0.562 IR4 2/22/2007 1.25 0.56 0.701 0.686 0.545 IR4 6/14/2007 0.469 0.074 0.199 0.395 0.27
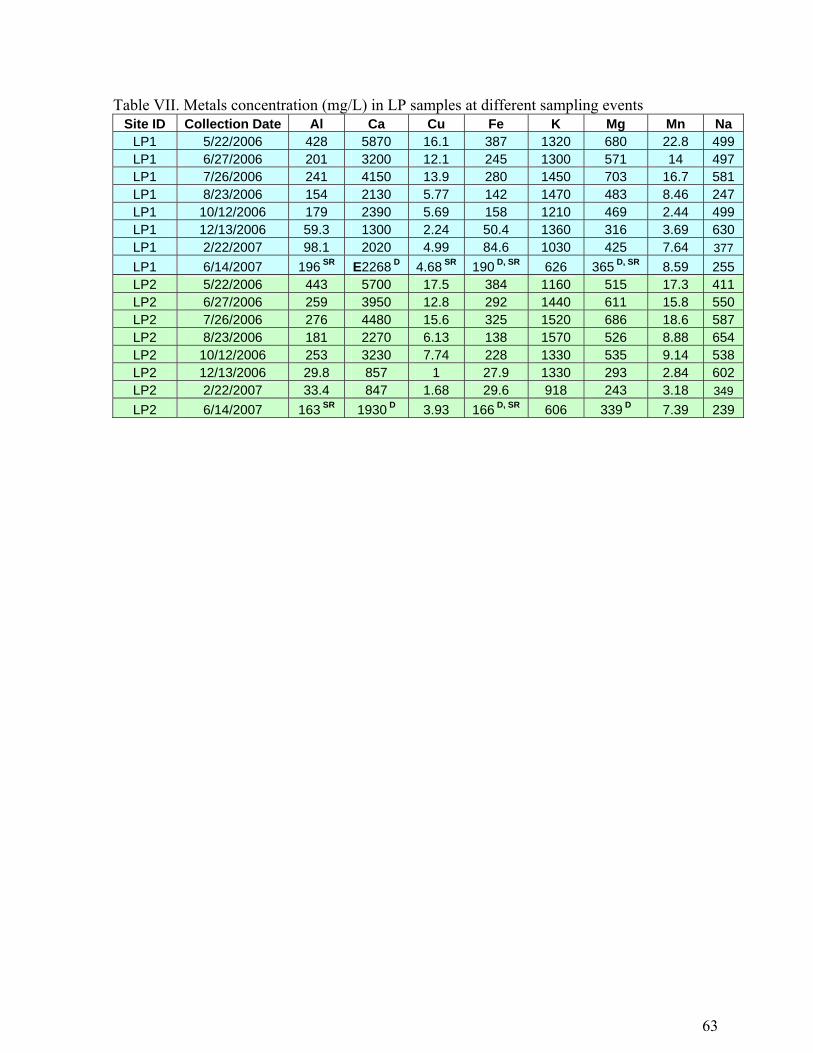
63
Table VII. Metals concentration (mg/L) in LP samples at different sampling events Site ID Collection Date Al Ca Cu Fe K Mg Mn Na
LP1 5/22/2006 428 5870 16.1 387 1320 680 22.8 499 LP1 6/27/2006 201 3200 12.1 245 1300 571 14 497 LP1 7/26/2006 241 4150 13.9 280 1450 703 16.7 581 LP1 8/23/2006 154 2130 5.77 142 1470 483 8.46 247 LP1 10/12/2006 179 2390 5.69 158 1210 469 2.44 499 LP1 12/13/2006 59.3 1300 2.24 50.4 1360 316 3.69 630 LP1 2/22/2007 98.1 2020 4.99 84.6 1030 425 7.64 377 LP1 6/14/2007 196 SR E2268 D 4.68 SR 190 D, SR 626 365 D, SR 8.59 255 LP2 5/22/2006 443 5700 17.5 384 1160 515 17.3 411 LP2 6/27/2006 259 3950 12.8 292 1440 611 15.8 550 LP2 7/26/2006 276 4480 15.6 325 1520 686 18.6 587 LP2 8/23/2006 181 2270 6.13 138 1570 526 8.88 654 LP2 10/12/2006 253 3230 7.74 228 1330 535 9.14 538 LP2 12/13/2006 29.8 857 1 27.9 1330 293 2.84 602 LP2 2/22/2007 33.4 847 1.68 29.6 918 243 3.18 349 LP2 6/14/2007 163 SR 1930 D 3.93 166 D, SR 606 339 D 7.39 239
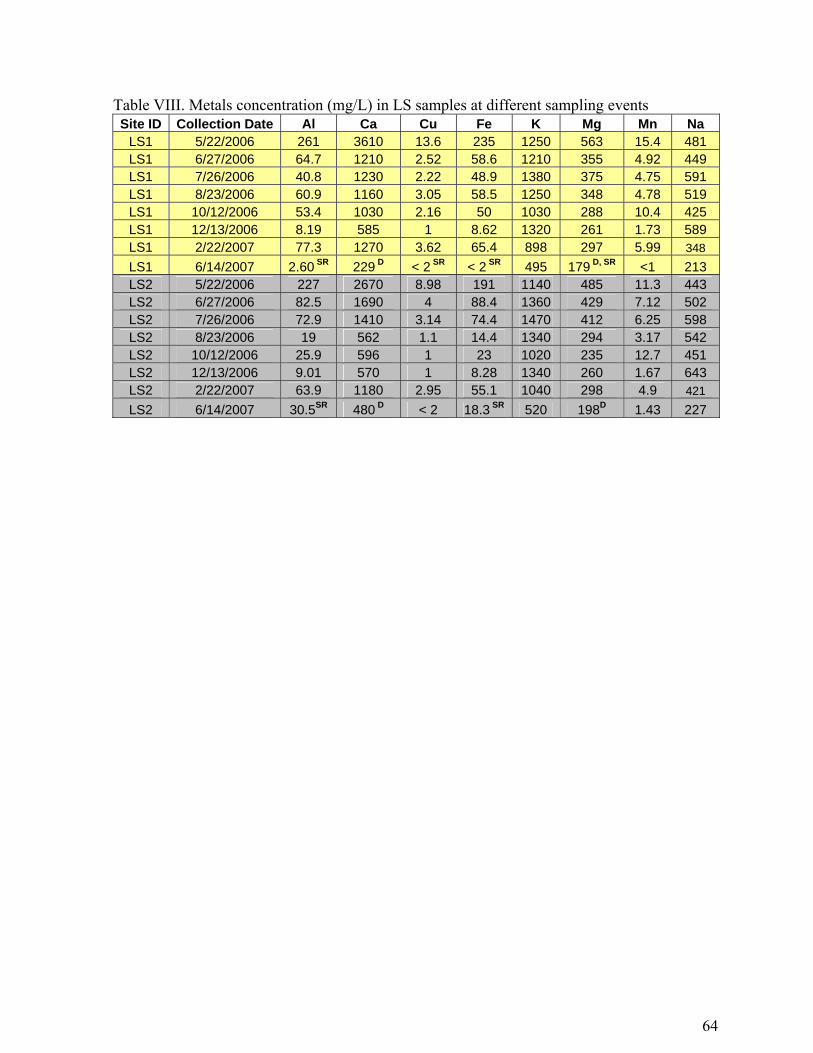
64
Table VIII. Metals concentration (mg/L) in LS samples at different sampling events Site ID Collection Date Al Ca Cu Fe K Mg Mn Na
LS1 5/22/2006 261 3610 13.6 235 1250 563 15.4 481 LS1 6/27/2006 64.7 1210 2.52 58.6 1210 355 4.92 449 LS1 7/26/2006 40.8 1230 2.22 48.9 1380 375 4.75 591 LS1 8/23/2006 60.9 1160 3.05 58.5 1250 348 4.78 519 LS1 10/12/2006 53.4 1030 2.16 50 1030 288 10.4 425 LS1 12/13/2006 8.19 585 1 8.62 1320 261 1.73 589 LS1 2/22/2007 77.3 1270 3.62 65.4 898 297 5.99 348 LS1 6/14/2007 2.60 SR 229 D < 2 SR < 2 SR 495 179 D, SR <1 213 LS2 5/22/2006 227 2670 8.98 191 1140 485 11.3 443 LS2 6/27/2006 82.5 1690 4 88.4 1360 429 7.12 502 LS2 7/26/2006 72.9 1410 3.14 74.4 1470 412 6.25 598 LS2 8/23/2006 19 562 1.1 14.4 1340 294 3.17 542 LS2 10/12/2006 25.9 596 1 23 1020 235 12.7 451 LS2 12/13/2006 9.01 570 1 8.28 1340 260 1.67 643 LS2 2/22/2007 63.9 1180 2.95 55.1 1040 298 4.9 421 LS2 6/14/2007 30.5SR 480 D < 2 18.3 SR 520 198D 1.43 227
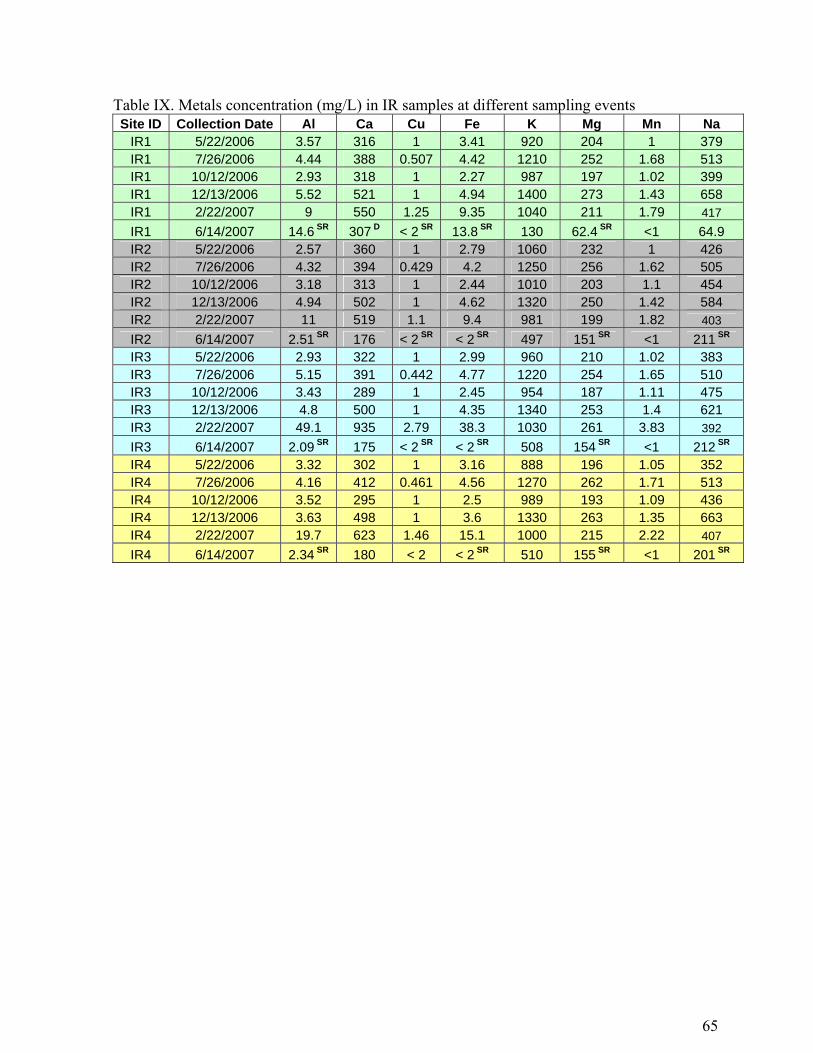
65
Table IX. Metals concentration (mg/L) in IR samples at different sampling events Site ID Collection Date Al Ca Cu Fe K Mg Mn Na
IR1 5/22/2006 3.57 316 1 3.41 920 204 1 379 IR1 7/26/2006 4.44 388 0.507 4.42 1210 252 1.68 513 IR1 10/12/2006 2.93 318 1 2.27 987 197 1.02 399 IR1 12/13/2006 5.52 521 1 4.94 1400 273 1.43 658 IR1 2/22/2007 9 550 1.25 9.35 1040 211 1.79 417 IR1 6/14/2007 14.6 SR 307 D < 2 SR 13.8 SR 130 62.4 SR <1 64.9 IR2 5/22/2006 2.57 360 1 2.79 1060 232 1 426 IR2 7/26/2006 4.32 394 0.429 4.2 1250 256 1.62 505 IR2 10/12/2006 3.18 313 1 2.44 1010 203 1.1 454 IR2 12/13/2006 4.94 502 1 4.62 1320 250 1.42 584 IR2 2/22/2007 11 519 1.1 9.4 981 199 1.82 403 IR2 6/14/2007 2.51 SR 176 < 2 SR < 2 SR 497 151 SR <1 211 SR IR3 5/22/2006 2.93 322 1 2.99 960 210 1.02 383 IR3 7/26/2006 5.15 391 0.442 4.77 1220 254 1.65 510 IR3 10/12/2006 3.43 289 1 2.45 954 187 1.11 475 IR3 12/13/2006 4.8 500 1 4.35 1340 253 1.4 621 IR3 2/22/2007 49.1 935 2.79 38.3 1030 261 3.83 392 IR3 6/14/2007 2.09 SR 175 < 2 SR < 2 SR 508 154 SR <1 212 SR IR4 5/22/2006 3.32 302 1 3.16 888 196 1.05 352 IR4 7/26/2006 4.16 412 0.461 4.56 1270 262 1.71 513 IR4 10/12/2006 3.52 295 1 2.5 989 193 1.09 436 IR4 12/13/2006 3.63 498 1 3.6 1330 263 1.35 663 IR4 2/22/2007 19.7 623 1.46 15.1 1000 215 2.22 407 IR4 6/14/2007 2.34 SR 180 < 2 < 2 SR 510 155 SR <1 201 SR