Embed Size (px)
Citation preview
Report ECHA-UFZ contract ECHA/2014/341
Analysis of the relevance and adequateness of using Fish Embryo Acute Toxicity (FET) Test Guidance (OECD 236) to fulfil the information requirements and addressing concerns under REACH
14.04.2016
Dr. Stefan Scholz
Dr. Nils Klüver
Dr. Ralph Kühne
Contact:
Dr. Stefan Scholz (project leader)
Helmholtz Centre for Environmental Research – UFZ
Department of Bioanalytical Ecotoxicology
Permoserstr. 15
04318 Leipzig
Germany
Email: [email protected]
Phone: +49 341 235 1080
Report ECHA-UFZ contract ECHA/2014/341 1
Disclaimer
This report was commissioned by the European Chemicals Agency. The opinions expressed in this report including Annexes do not necessarily reflect the views or the official position of the European Chemicals Agency.
Usage of the information remains under the sole responsibility of the user. The European Chemicals Agency does not accept any liability with regard to the use that may be made of the information contained in this document.
©-2016-European Chemicals Agency.
All rights reserved. Certain parts are licensed under conditions to the European Chemicals Agency
Report ECHA-UFZ contract ECHA/2014/341 2
Index
Preface .................................................................................................................................. 4
1. Extended summary............................................................................................................ 5
2. Introduction ....................................................................................................................... 9
3. Material and methods .......................................................................................................11
3.1. Fish embryo database update ....................................................................................11
3.2. Collection of mode of action data and structural information ......................................13
3.2.1. Assignment of modes of action ............................................................................13
3.2.2. Collection of physico-chemical property information ............................................14
3.2.3. Structural domain analysis and grouping .............................................................14
3.3. Collection of corresponding acute fish toxicity data ....................................................15
3.4. Correlation and statistical outlier analysis...................................................................16
3.5. Computation of analyses ............................................................................................16
4. Results .............................................................................................................................18
4.1. Fish embryo database update ....................................................................................18
4.2. Identification of physicochemical properties ...............................................................18
4.3. Availability of corresponding acute fish toxicity data ...................................................18
4.4. Application of quality filters and selection of substances for the comparative analysis of fish embryo and acute fish toxicity ................................................................................19
4.5. Distribution of substance characteristics for the final dataset .....................................27
4.5.1. Distribution of physico-chemical characteristics in the final dataset. ....................27
4.5.2 Distribution of structural domains ..........................................................................29
4.5.3. Distribution of LC50s .............................................................................................34
4.5.4. Distribution of excess toxicities ............................................................................35
4.5.5. Distribution of modes of action .............................................................................36
4.6. Correlation analysis of fish embryo versus acute fish toxicity test ..............................37
4.7. Association of weak FET toxicity with modes of action ...............................................39
4.9. Association of physico-chemical and toxicological characteristics with substances of weaker FET toxicity. ..........................................................................................................42
4.10. Identification of substances deviating by a factor of more than 10 or 100 in the fish embryo test .......................................................................................................................50
4.11. Identification of substances provoking no lethality in fish embryos ...........................54
4.12. Enrichment of structural domains in substances with a weaker toxicity in fish embryos ............................................................................................................................55
4.13. Enrichment for substances with higher capacity for metabolic transformation ..........57
Report ECHA-UFZ contract ECHA/2014/341 3
4.14. Comparison of FET and AFT LC50 for inorganic substances ....................................59
4.15. Comparison of FET and AFT LC50 for formulation and multi-constituent substances or products ............................................................................................................................59
4.16. Comparison of acute toxicity for different fish species ..............................................59
4.16.1. Correlation analysis and distribution of interspecies differences for different MoA ......................................................................................................................................59
4.16.2. Linear correlation analysis of AFT-interspecies differences and physicochemical/toxicological parameters .....................................................................70
4.16.3. Interspecies AFT differences for compounds requiring metabolic activation ......74
5. Discussion ........................................................................................................................75
5.1. Identification of fish embryo and corresponding acute fish toxicity data ......................75
5.2. Representation of substance characteristics in the selected dataset ..........................75
5.3.1. Physicochemical characteristics ..............................................................................76
5.3.2. Toxic ratios and mode of action ..............................................................................76
5.4. Correlation of FET and AFT data ...............................................................................77
5.5. Relation of FET/AFT ratios to the mode of action .......................................................78
5.6. Association of FET/AFT ratios with physicochemical and toxicological parameters ....78
5.7. Enrichment of structural domains for substances with weaker toxicity in the FET ......78
5.8. Role of metabolic activation .......................................................................................79
5.9. Substances with weaker toxicity in the FET ...............................................................79
5.10. Impact on species sensitivity on the correlation of FET-AFT ....................................80
5.11. FET-AFT correlation for inorganic substances and mulitconstituent compounds ......80
5.12. Interspecies correlation analysis of acute fish toxicity data .......................................81
6. Conclusions ......................................................................................................................82
7. References .......................................................................................................................85
8. ANNEX 1 ..........................................................................................................................88
8.1. Supplementing Excel tables .......................................................................................88
8.2. Comparison of experimental and predicted water solubility, log Kow and log Kaw data.89
8.3. Three letter substance abbreviations .........................................................................92
8.4. Substances with higher sensitivity in the FET (FET/AFT < 0.1) ..................................93
8.5. Structural domain analysis .........................................................................................94
8.5.1. Relative distribution of ECOSAR groups (structural alerts) in the final dataset .....94
8.5.2. Number of ChemProp domains in the dataset .....................................................96
8.6. Prediction of in vitro S9 metabolites using the OECD QSAR toolbox ....................... 100
Report ECHA-UFZ contract ECHA/2014/341 4
Preface
The fish embryo represents an alternative experimental model with a high versatility for applications to predict endpoints of regulatory interest. Most promising at present is the prediction of acute fish toxicity for the environmental hazard and risk assessment. A number of different studies have been conducted up to date aiming at the assessment of the predictive capacity of the fish embryo test for acute fish toxicity. The report represented here makes partial use of these existing analyses, in particular of a study published in 2015 (Klüver et al. 2015) by the authors of this report. In addition to the previous different criteria for the selection of compounds for a comparative analysis were used and newly available data were included. A major focus was given to identify and select compounds and studies with reliable effect concentrations in the FET. The criteria had been discussed with ECHA and the advisory board and modified/adjusted based on intermediate results and discussions.
We would like to acknowledge ECHA staff Dr. Marta Sobanska (Evaluation Unit, ECHA coordination of the analysis), Dr. Romanas Cesnaitis (Evaluation Unit), Dr. Laurence Deydier (Evaluation Unit), Dr. Simon Gutierrez Alonso (Biocides Unit), Dr. Anna-Maija Nyman (Evaluation Unit), Dr. Benoit Dilhac (Computation Assessment Unit) and Prof. Wim De Coen from ECHA Executive Office for their very helpful and stimulating discussion and suggestions during conduction of the analysis and preparation of the report. We also would like to thank Ralf-Uwe Ebert (Dpt. Ecological Chemistry, UFZ) for help with computation of QSAR and chemical domain analysis and Dr. Lisa Truong and Prof. Robert Tanguay, Oregon State University for providing raw data of a high throughput zebrafish embryo toxicity study published in 2014 (Truong et al. 2014).
Dr. Stefan Scholz 1
Dr. NIls Klüver 1
Dr. Ralph Kühne 2
1 Department of Bionalytical Ecotoxicology
2 Department of Ecological Chemistry
Helmholtz Centre for Environmental Research - UFZ
Leipzig, 14.04.2016
Report ECHA-UFZ contract ECHA/2014/341 5
1. Extended summary
The acute fish toxicity (AFT, OECD TG 203) is required to provide information on the acute toxicity of chemicals for environmental hazards and risk assessment. It is conducted as part of the registration of (industrial) chemicals under European regulations as well as other regulations. To reduce the number of tests on animals, the REACH Regulation promotes alternative methods for the hazard assessment of substances. For example, testing according to OECD Technical Guideline 236 (fish embryo acute toxicity test (FET)) has been suggested as one of the alternative methods to toxicity testing in adult fish.
The aim of this study was to assess the capacity of the FET test in predicting acute fish toxicity and to define the applicability domain of the FET test for regulatory purposes. The existing fish embryo data (acute - 96h LC50) were compared to data on adult fish toxicity (acute - 96h LC50) and the limits of applicability investigated by analysis of the relation of the results with respect to physicochemical parameters, structural domains, excess toxicities (i.e. the ratio of predicted baseline toxicity LC50 versus observed acute LC50, also called toxic ratio).
Therefore, an existing fish embryo LC50 database (Scholz et al., 2014, Klüver et al., 2015) was updated with recently published FET data. Corresponding acute fish toxicity data for rainbow trout, fathead minnow, bluegill and zebrafish were collected using the OECD toolbox and eChemPortal. The updated fish embryo database contained the results of 2 054 study entries representing 1 415 substances (based on different CAS numbers).
More than 98 % of the available study entries were generated with embryos of the zebrafish. It was noted that a wide variety of protocols had been used to generate fish embryo LC50, comprising static, semi-static and flow through studies, different stages and exposure durations and the use of different exposure vessels (plastic well plates, glass vessels). Further, analytical confirmation of exposure concentration was rarely conducted.
The OECD TG 236 was adopted in 2013 and only a limited number of studies performed according to this test guideline were available. Hence, by restricting this comparative analysis to studies performed strictly according to TG 236 would have significantly decreased the data entries and prevent the presented analysis. Therefore, the database was filtered to remove the FET studies that had questionable reliability by applying quality criteria that were considered as most influential to determine the LC50 in the fish embryo test.
The studies that were considered for the comparative analysis with acute fish toxicity were conducted with organic substances and the following test conditions:
(1) exposure for 96 and 120 hours1;
(2) a test concentration range up to at least 10-fold above the baseline toxicity;
(3) use of zebrafish embryos; and
(4) tests conducted within the water solubility limit of the test substance.
The criteria were set to avoid false negatives for the FET and over- or underestimation of toxicity due to data reliability and bioavailability issues. Inorganic substances, formulations
1 Studies in which the exposure was initiated between 0 and 8 hours post fertilisation (hpf) and cessated at 96 and 120 hpf were considered as 96- and 120-h exposure studies, respectively.
Report ECHA-UFZ contract ECHA/2014/341 6
and multi-constituent substances could not be investigated due to a lack of available data or a low number of data entries.
For hydrophobic or volatile substances, the effect concentrations in the FET - which is typically conducted using a (semi-)static setup - may be largely overestimated due to instable exposure concentrations. This was indicated by a comparison of studies and substances with and without observed mortality in the tested range of concentrations.
Dissociating compounds may result in a pH shift of exposure solutions. For many FETs the pH was not measured and/or adjusted. Hence, the non-guideline FET results could deviate from the acute fish toxicity test, which recommends adjusting pH conditions to neutral, due to a different dissociation (resulting in different bioconcentrations) and/or pH induced toxicity.
As a consequence, the following substances were not considered for the comparative analysis:
(5) substances with a log Kow > 4 and a log Kaw >-4 (if exposure concentrations were not confirmed by analytical chemistry); and
(6) substances which are likely to shift the pH of the test solution (if non-buffered test media were used in the FET study).
Application of all quality criteria resulted in a database of 156 studies representing 123 organic chemicals. For one study and chemical (clopyralide olamine) in this resulting dataset, the zebrafish embryo test did not reveal any mortality in the tested range of concentration.
Analysis of the representation of chemical structures indicated that 53 of the 111 ECOSAR structural domains were present in the dataset (five substances could not be classified). Using the program ChemProp (UFZ, 2015), 158 structural terms of various hierarchical levels were assigned.
With respect to the mode of action, about 38 % of the substances – in the final dataset of 123 chemicals - are known or predicted narcotic substances. Neurotoxicity/activity (11 %), mitochondrial electron transport inhibition (8.9 %) and reactivity (5.7 %) represented other modes of action that were found for more than 5 % of the substances. For 23 % of the test chemicals, no mode of action could be assigned using literature research and/or QSARs for acute fish toxicity for structural alerts (Russom et al. 1997; Verhaar et al. 1992).
The aim of this study was to define an applicability domain for the OECD TG 236. Based on the current analysis, it was not possible to define the applicability domain for hydrophobic or volatile substances (log Kow > 4 and a log Kaw >-4) due to the absence of reliable data. Further analysis is needed when more reliable FET data with analytical verification are available. Moreover, as the dataset consisted only of substances with a molecular weight below 500 g/mole it was also impossible to define the applicability domain for substances with molecular weights higher than 500 g/mole.
For the comparison of FET and AFT, the substances were grouped according to factors of 10 and 100 with respect to the ratio of FET to AFT LC50. In 22 % of the substances in the final dataset (27 substances), the FET deviated with >10 fold from the AFT, producing weaker toxicity in fish embryos. For these substances, the deviation of fish embryo toxicity from acute fish toxicity was in most cases observed regardless of the AFT test species. Of the substances with >10 fold weaker toxicity in FET, 59 % had >20 fold, 26 % with >50 fold and 15 % (= four compounds) had >100 fold weaker toxicity in FET.
Report ECHA-UFZ contract ECHA/2014/341 7
The maximum differences in LC50 between AFT and FET ranged from 28 (Danio rerio) to 2650 fold (Lepomis macrochirus), depending on the species used for the AFT. Data for different species of AFT were available for varying range of substances and therefore, variability among the species of AFT represents both variability among substances as well as species. The mean difference – calculated by comparison of FET with species-specific AFTs - in LC50 values showed a weaker FET toxicity by a factor of 3.9 to 50, while the factor of median difference based on logarithmic LC50 values was 1.8 to 3.6.
There were also six substances that exhibited higher toxicity in the FET, with an FET/AFT LC50 ratio <0.1. These may represent substances with a mode of action specific for embryonic development or the difference may arise from experimental uncertainty producing variation in the toxicity values.
The comparison of the zebrafish FET with LC50s of different species did not indicate that the observation of a weaker toxicity in the FET was dependent on the the species used in the AFT. However, a preliminary comparison of the acute fish toxicity data indicated that some degree of variability also applies for the AFT derived from different species It is at present not understood what causes this species variability and to which extent it may depend on experimental conditions and/or data quality of the AFT. Furthermore, a systematic analysis was hindered by the limited number of AFT data available for all four selected species. Therefore, to better understand what range of deviations would be acceptable for the FET in comparison to the AFT, further systematic studies on the range of species variability in the AFT would be required.
An analysis of the relation of the FET/AFT-ratio and physicochemical properties did not indicate that a weaker toxicity in the fish embryo (within the boundaries of physicochemical characteristics covered by the dataset) was related to certain physicochemical characteristics. Some correlation was observed for the association with an increasing pKa (weaker acids). However, the weaker sensitivity (>10 fold) of the FET could not be connected to any range of pKa that could be linked to a clear applicability domain regarding pKa alone.
Analysis of chemical structures indicated an enrichment of organic substances including phosphor, carbamate and amine groups for chemicals with a weaker sensitivity in the FET by a factor of 100 (n = 4). The chemical enrichments appear to reflect the association of certain chemical structures with biological effects i.e. organophosphates (compounds containing phosphor) and carbamates are known acetylcholine esterase inhibitors. However, it must be noted that this enrichment was based on a low number (n=4) of compounds and therefore does not allow to define an applicability domain by chemical structure. This is further supported by the observation that no enrichment of structural domains was observed for the substances with a moderately (10 to 100 fold) weaker sensitivity.
Regarding the mode of actions, the present analysis confirmed observations described previously in the scientific literature, i.e. that a weaker toxicity in the FET has been found particularly among neurotoxic compounds. Specifically, the present analysis revealed that 26% of the substances with a >10 fold weaker sensitivity in fish embryos represented substances with a neurotoxic mode of action. For FET/AFT ratio >100, three out of four compounds represented neurotoxicants. However, substances with a weaker sensitivity were also found among other modes of action, including narcotic compounds (39.1 % of the substances with a >10 fold FET/AFT ratio), and mitochondrial electron transfer inhibitors (4.35 % of the substances with a >10 fold FET/AFT ratio). Furthermore, 28 % of the substances could not be classified to any MoA. Therefore, except for the weak sensitivity to a
Report ECHA-UFZ contract ECHA/2014/341 8
neurotoxic mode of action - no other conclusion on the applicability domain regarding MoA could be drawn based on this study.
To evaluate a potential link between metabolic transformation capacity and weak toxicity the number of predicted in vitro S9 metabolites was compared to the FET/AFT ratio. However, this analysis did not reveal a higher number of predicted metabolic transformation products with lower toxicity in the fish embryo test. Hence, without further evidence it cannot be assessed whether a lack of metabolic activation is at least partially contributing to the weak toxicity of some compounds, namely the organophosphates in the fish embryo test. Assessment of the activation capacity of fish embryos would require additional experimental analyses, e.g. the comparative FET/AFT assessment of substances known to be metabolically activated, identification of their transformation products and/or experimental assessment of the transformation capacity of the fish embryo.
Due to the low number of studies with inorganic substances passing the quality filters [n=6] no assessment of the predictive capacity of the FET was possible at present. Further assessment is needed when more valid FET data are available. Similarly, multi-constituent formulations and substances have not been tested with the FET so far nor were not publically reported. Therefore, no assessment of the FET for its capacity to predict the acute toxicity of multi-constituent products could be made. Further assessment when more valid FET data are available would be needed.
Generally, a lack of quality data makes it challenging to conclude on several aspects of the applicability domain of FET. However, as the OECD TG 236 was published in 2013, it could possibly lead to more data being generated in the near future, which can be used for comparative analysis. This might also give more information on a wider range of substances (multi-constituents and UVCBs) and result in more certainty for hydrophobic or volatile substances. It is recommended that whenever possible the FET studies (especially with hydrophobic or volatile substances) are accompanied by chemical analytics for the verification of exposure concentrations and the additional evidence that the substance would fall within the applicability domain of FET.
The lack of reliable data could also be addressed more systematically, i.e. by promoting or funding research in the FET with e.g. a focus on substances with the highest concern for a reliable predictivity, such as neurotoxic and metabolically activated substances. Furthermore, additional endpoints targeting the identification of modes of action could improve the predictive capacity of the FET or specify whether the compound is in the application domain.
The variation indicated by preliminary assessment of AFT data from different fish species (used in OECD 203) could be analysed in detail in the future.
Report ECHA-UFZ contract ECHA/2014/341 9
2. Introduction
Acute fish toxicity represents a base set of information that is required by European regulations for the registration of (industrial) chemicals, biocidal and plant protection products, food additives and veterinary pharmaceuticals. For REACH and biocides, the information is used to perform an environmental risk assessment based on predicted no effect concentrations (PNEC). In REACH there is no requirement to provide acute fish toxicity from a certain fish species and data from one particular fish species are sufficient to derive a PNEC. However, on a global scale certain species such as rainbow trout, fathead minnow and bluegill are mainly used for acute toxicity assessment.
The fish embryo represents a promising alternative experimental system to predict acute fish toxicity. Fish embryos are considered as alternatives to animal testing, since early life stages probably feel less or no pain and distress and are therefore not protected by European animal welfare regulations (Embry et al. 2010; EU 2010; Halder et al. 2010). Embryos can be used until the stage of independent feeding. For the zebrafish, which is the species that has so far been mainly used for the fish embryo test, this refers to the stage of 5 dpf (days post fertilisation)(Strähle et al. 2012). First systematic studies that suggested the fish embryo test as a predictive model for the acute fish toxicity stem back from 1994 (Schulte and Nagel 1994). Since then, a number of comparative analyses have been conducted (Klüver et al. 2015; Knöbel et al. 2012; Lammer et al. 2009; Nagel 2002). Overall these studies have indicated a high concordance of LC50s derived from fish embryos and an almost equal sensitivity. Given these promising data, an OECD guideline for the acute fish embryo toxicity (TG 236) has been validated and established (Busquet et al. 2014) providing a basis for a potential regulatory application. This guideline suggested a couple of amendments to improve the predictive capacity such as exposure for at least 96 hours, presaturation of exposure vessels to avoid a decline in exposure concentrations or analytical verification of exposure concentrations. Prior to publication of the guideline a large variety of exposure protocols were used with exposure durations from 24 to 120 h, different exposure volumes and media and only a few studies were analysing exposure concentrations.
There are still concerns on the applicability domain of the acute fish embryo test. Some studies indicated that a limited metabolic activation and certain mode of action may lead to a weak sensitivity of the fish embryo test for certain substances (Klüver et al. 2015; Klüver et al. 2014; Knöbel et al. 2012). Furthermore, the earlier comparative assessments had used data generated with different protocols and substances. Studies that did not provoke toxicity in fish embryos have not been considered or analysed in detail. Recently, a study supported by the EPAA (European Partnership of Alternative Approaches to Animal Testing) indicated that certain type of substances may not be predicted appropriately by the fish embryo, particularly substances with a neurotoxic or neuroactive mode of action (Klüver et al. 2015). Analysis of fish embryo behaviour was able to identify these substances (e.g. azinphos-methyl, endosulfan, dieldrin, aldicarb, esfenvalerate). By including alternative endpoints (e.g. behavioural assays), it was suggested to improve the predictive capacity of the fish embryo test or indicate substances for which acute toxicity testing according to OECD TG 203 may still be required.
This study aims to analyse the predictive capacity of the fish embryo test with particular focus on identifying the potential test limitations and applicability domain. The focus was on the comparative assessment of fish embryo and acute fish toxicity data. In contrast to existing analyses a more robust quality assessment of fish embryo data has been implemented that
Report ECHA-UFZ contract ECHA/2014/341 10
was referring at least partially to the recommendations in the OECD testing guideline 236. The aim was to identify domains for which the acute fish embryo test might not be applicable. For these domains regulators could, for instance, still request acute fish toxicity data generated according to the TG 203.
For the comparative assessment an existing fish embryo database was first updated and corresponding acute fish toxicity data for selected species were identified. Subsequently, the database was filtered based on certain quality criteria. For this dataset the composition in terms of domains, mode of actions, range of toxicities, physicochemical characteristics, structures, toxic ratios, and metabolic transformation potential of the chemicals were analysed, in order to indicate any potential bias of the assessment and to identify limitations in the application domain. Furthermore, the acute fish toxicity of 4 selected fish species was compared to assess the variability of the acute fish toxicity test (TG 203) and to derive thresholds to identify substances with a weak toxicity in the fish embryo toxicity test.
Report ECHA-UFZ contract ECHA/2014/341 11
3. Material and methods
3.1. Fish embryo database update
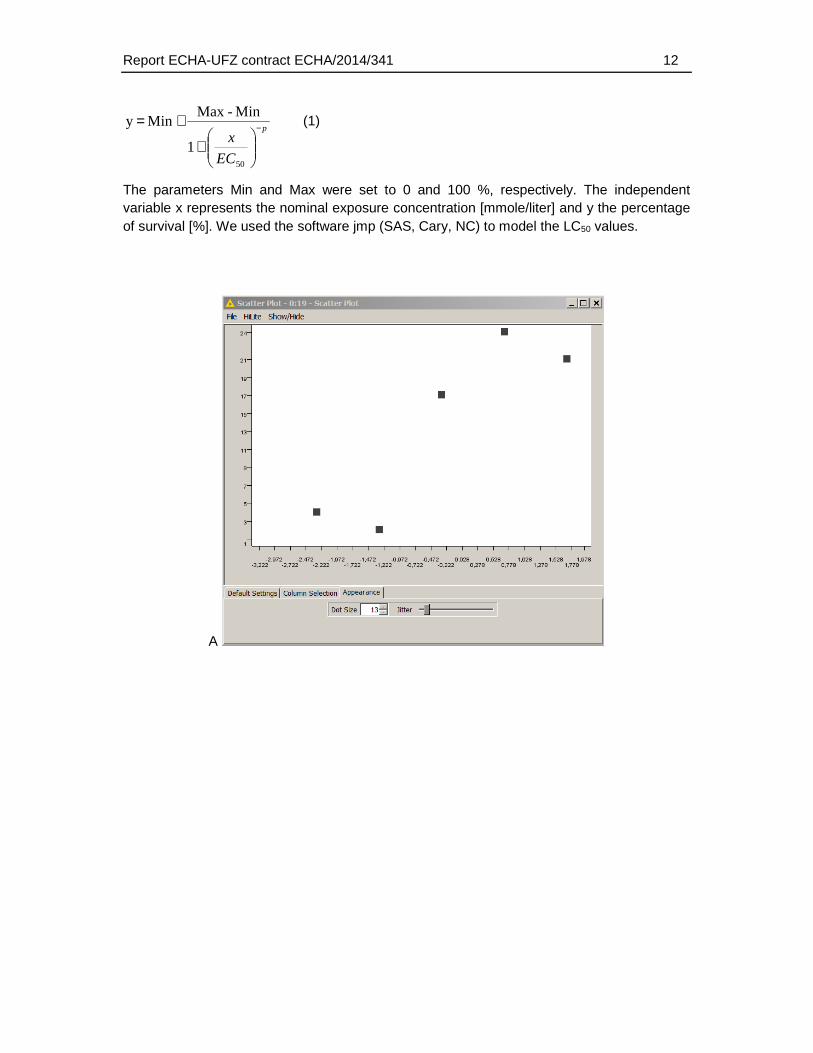
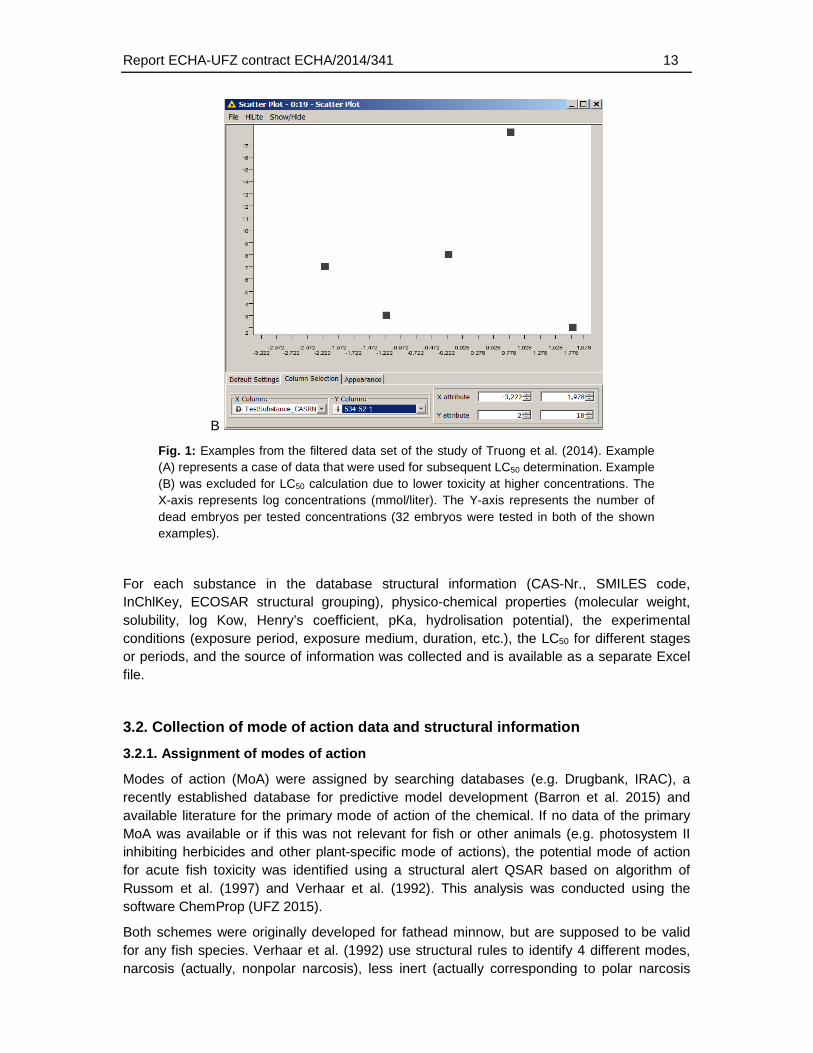
The database on fish embryo mortality published in 2014 (Scholz et al. 2014) was updated by searching for additionally published data after April 2013. For each compound, the data were collected by inspecting the original publication or report. The database was including the experimental conditions of the test, such as the test medium, the range of concentrations tested, the duration of exposure, the exposure scenario (static, semi-static, flow-through), the test temperature, oxygen-concentrations in the test and information of pH adjustment and measurement. For the latter, the pH was considered as non-measured and non-adjusted if any information on the pH was missing. Included in the database was a large scale high throughput study conducted by Oregon State University (Truong et al. 2014). In this study 1078 chemicals of the ToxCast phase 1 and 2 chemical library (http://www.epa.gov/NCCT/toxcast/chemicals.html) were tested using automatic dispension and static exposure of dechorionated zebrafish embryos from 6 to 120 hpf in 96 well plates in 100 µl exposure volume. Generally 4 technical replicates (for some substances repeated three times) were tested with a fixed concentration range (10fold dilution series) resulting in 32 or 96, respectively, embryos per tested concentration. Mortality of the chemicals was tested at 24 and 120 hpf. However, the analysis did not provide LC50 but a lowest effect level that was based on comparison of statistical differences. In order to obtain LC50 we reanalysed the raw dataset that was kindly provided by the authors of the study. This reanalysis indicated relatively high control mortality and/or no clear concentration response relationship for many substances (see below). Furthermore, for the majority of the substances no mortality or mortality below 50 % was observed. Therefore, in order to obtain LC50 concentrations we first filtered the dataset by removing data from plates that exhibited control mortality > 25 % (this relatively high level of control mortality was accepted given that the data were generated by a high throughput study but that most of the substances had not been tested in any other study). This filter resulted into removal of 387 plates representing 334 substances. However, since many chemicals were tested in replicates on more than one plate, finally only 50 substances were removed from the dataset by discarding data from plates with high mortality2. Subsequently, chemicals that were provoking ≥ 50 % mortality in at least one test concentration were identified. The analysis was conducted using a KNIME (www.knime.org) workflow and appropriate pivot tables and filters. The filtered substances were then manually analysed for concentration-response behaviour. Substances that exhibited a decreasing mortality at higher concentrations (< 50 %) were not used for LC50 analysis (10 substances in total, see Fig. 1 for an example). LC50 concentrations were determined by a concentration-response analysis of the raw data. It must be noted that due to the relatively high dilution factor the LC50s obtained from the study of Truong et al. (2014) exhibit some inaccuracy if compared to a study that used e.g. a dilution factor of 2. The LC50 values were estimated using the Hill-slope equation:
2 Note that the OECD TG 236 considers each well as an individual replicate for statistical analysis. Also AFT studies are often only based on one experiment with different concentrations and several individuals per concentrations. Therefore, it was not required that a study was conducted in more than one replicate.
Report ECHA-UFZ contract ECHA/2014/341 12
p
EC
x−
+
+=
50
1
Min -Max Min y (1)
The parameters Min and Max were set to 0 and 100 %, respectively. The independent variable x represents the nominal exposure concentration [mmole/liter] and y the percentage of survival [%]. We used the software jmp (SAS, Cary, NC) to model the LC50 values.
A
Report ECHA-UFZ contract ECHA/2014/341 13
B
Fig. 1: Examples from the filtered data set of the study of Truong et al. (2014). Example (A) represents a case of data that were used for subsequent LC50 determination. Example (B) was excluded for LC50 calculation due to lower toxicity at higher concentrations. The X-axis represents log concentrations (mmol/liter). The Y-axis represents the number of dead embryos per tested concentrations (32 embryos were tested in both of the shown examples).
For each substance in the database structural information (CAS-Nr., SMILES code, InChlKey, ECOSAR structural grouping), physico-chemical properties (molecular weight, solubility, log Kow, Henry’s coefficient, pKa, hydrolisation potential), the experimental conditions (exposure period, exposure medium, duration, etc.), the LC50 for different stages or periods, and the source of information was collected and is available as a separate Excel file.
3.2. Collection of mode of action data and structural information
3.2.1. Assignment of modes of action
Modes of action (MoA) were assigned by searching databases (e.g. Drugbank, IRAC), a recently established database for predictive model development (Barron et al. 2015) and available literature for the primary mode of action of the chemical. If no data of the primary MoA was available or if this was not relevant for fish or other animals (e.g. photosystem II inhibiting herbicides and other plant-specific mode of actions), the potential mode of action for acute fish toxicity was identified using a structural alert QSAR based on algorithm of Russom et al. (1997) and Verhaar et al. (1992). This analysis was conducted using the software ChemProp (UFZ 2015).
Both schemes were originally developed for fathead minnow, but are supposed to be valid for any fish species. Verhaar et al. (1992) use structural rules to identify 4 different modes, narcosis (actually, nonpolar narcosis), less inert (actually corresponding to polar narcosis
Report ECHA-UFZ contract ECHA/2014/341 14
and to some extent also to oxidative phosphorylation uncouplers), reactive (actually, corresponding to electrophiles etc.), and specific toxicity. The last class is defined only in examples and thus not complete. Since all modes including narcosis are actively searched by rules, in case of no occurrence of any structural rule no mode of action can be assigned. In some implementation this case is denoted as a fifth rule “unknown mode”. We consider this case as “no result at all”. Due to this restriction the number of chemicals identified for class 1 to 4 is typically rather small in comparison to the entire data set.
Russom et al. (1997) distinguished between seven different modes. Three of them are related to narcosis, i.e. nonpolar, polar, and ester narcosis. The others are oxidative phosphorylation uncouplers, reactive electrophiles/pro-electrophiles, acetylcholinesterase inhibitors, and central nervous system seizure agents. Substance without any triggering structural rule are considered as nonpolar narcotic chemical.
In order to assign the acute toxicity mode for the comparative assessment of fish embryo and acute fish toxicity a consensus mode of action was generated in case that both analyses were within the structural domain (“in” or “border in”). Data outside the structural domain (limited to “border out”) were used only in case of overlapping results of the Russom and Verhaar analysis. If the compound was outside the structural domain of the QSAR the MoA was reported as “Out of QSAR domain”.
The search for MoA was mainly limited to the substances that were finally selected for the comparative FET-AFT and AFT interspecies analysis. MoA available from databases were also assigned for substances not included in these comparisons. The QSAR-generated MoA was only used if the MoA was not available from a publication or a database.
3.2.2. Collection of physico-chemical property information
For each chemical in the zebrafish embryo database appropriate information on physico-chemical and structural data, such as log KOW, pka, Henry’s coefficient (log Kaw), water solubility, hydrolisation potential and molecular weight was collected. The main goal for collecting this information was to establish a set of substances and studies with data of high reliability. Furthermore, collection of physicochemical properties should enable the subsequent identification of substance characteristics for which the fish embryo test may show a limited predictive capacity of acute fish toxicity. Experimental physicochemical properties (log Kow, log Kaw, water solubility) were obtained from EPISUITE (Clements and Nabholz 1994). The main source of experimental data in EPISUITE is the SRC PhysProp database (http://www.srcinc.com/what-we-do/environmental/). Data in this database stem from various studies. It is not possible and was beyond the scope of this study to verify the reliability of these data. If no experimental data were available they were predicted using different programs, such as ChemProp, EPISUITE or ACD/Percepta (http://www.acdlabs.com/home/).
Predictions of log Kow and log Kaw with ChemProp were based on an unpublished consensus model combining four different fragment models.
3.2.3. Structural domain analysis and grouping
Structural domain analysis was conducted by two different approaches, by comparing functional groups determined by the in-house edition of ChemProp, and by assigning
Report ECHA-UFZ contract ECHA/2014/341 15
ECOSAR structural domains. The ChemProp approach was used for identifying structural domains without any a priory relation to toxicity or a specific endpoint. The aim was to probe for a potential enrichment of certain groups observed for substances with weaker toxicity in the zebrafish embryo.
For the whole data set and the respective subsets corresponding to different levels of FET and AFT similarity and deviation, an extensive inventory of occurring functional groups was created. The number of occurrences in total and the number of molecules with respective occurrences was recorded. For each functional group, the frequencies of occurrences in a subset were compared to the frequencies in the full set. This ratio was corrected by the sizes (i.e. substance numbers) of the subsets. In result, an enrichment factor for each group was obtained. The larger this factor was, the more specific was the respective group for the subset, and vice versa. In order to avoid random enrichment factors from structural domains that occur by a very low number the enrichments were only conducted if the domain occurred at least 5 times among the 121 chemicals used for the domain analysis. If the domain was not found in the reference dataset (i.e. substances with an FET/AFT ratio below 10) a value of 1 was assigned in order to allow the calculation of enrichment factors.
In addition to the ChemProp approach we also assigned chemical classes provided by ECOSAR (Clements and Nabholz 1994). However, the ECOSAR classes are limited to domains that have been of relevance for developing QSARs for acute fish toxicity and may not represent all relevant domains. The enrichment factors were calculated as described for the ChemProp structural domains.
3.3. Collection of corresponding acute fish toxicity data
Using the updated fish embryo database the corresponding acute fish toxicity data were collected for the four fish species Danio rerio (zebrafish), Pimophales promelas (fathead minnow), Lepomis macrochirus (bluegill) and Oncorhynchus mykiss (rainbow trout) by using the eChemPortal, OECD toolbox, US-EPA Fathead Minnow Acute Toxicity database and acute fish toxicity data from Belanger et al. 2013. The search was limited to data that were generated as described in or similar to the OECD TG 203 and that fulfilled certain quality criteria. For the eChemPortal the following query for short term toxicity to fish has been used to extract LC50 values:
● Study result type = Experimental result ● Reliability = 1, 2 and 43 ● Test guideline: OECD Guideline 203 ● GLP compliance: yes ● Test organisms: Danio rerio; Pimophales promelas; Lepomis macrochirus;
Oncorhynchus mykiss ● Test type; Water media type = all ● Total exposure <= 10000 week (96 h studies were manually selected) ● Effect concentrations, Endpoint = LC50
3 1 = reliable, 2 = reliable with restriction, 4 = not assigned. A low number of studies with a quality assessment of 4 had been identified. These studies were individually inspected and found to be conducted according to GLP and the OECD 203 guideline. Therefor these studies were considered for subsequent analyses.
Report ECHA-UFZ contract ECHA/2014/341 16
● Effect concentrations, Effect conc. = overlapping 0 – 10000 g/L ● Effect concentrations, Conc. Based on ● Effect concentrations, Basis for effect = all
For the OECD toolbox, CAS entries from the generated fish embryo toxicity database were used as query and aquatic toxicity for “mortality/LC50/96h/Actinopterygii” were extracted and only data for 96h acute fish tests were considered. Data from the different queries were first accumulated in an EXCEL spreadsheet. LC50 data with unclear entries (e.g. “LC50 100-300 mg/L”; “LC50 >...” or “LC50 <...” or acute test without concentration units (e.g. g/ha or ml/ha) have not been considered for the comparison. Duplicated values (representing the same study) for each species were removed.
Only acute fish toxicity data for which fish embryo data were available were used for further analysis. If for a substance more than one study per species was available the species-specific geometric mean of the LC50 was calculated and the min and max range of LC50 concentrations were gathered.
3.4. Correlation and statistical outlier analysis
Correlation analyses and hypothesis testing for the regression slope and intercept were conducted using a Deming Type II regression with the software SigmaPlot 13.0 (SysStat Software, Erkrath, Germany). Alternatively the package MethComp of the software “R” was used (https://www.r-project.org/). This type of regression analysis is based on the assumption that both the dependent and independent variables in correlation analysis exhibit variability. Other linear regression analyses consider variation only in one variable (e.g. either in the FET or AFT data). Statistical significant deviation of the regression and intercept from 1 or 0 respectively was analysed based on the F-test and p-values (< 0.05) computed with SigmaPlot. For Deming regression analysis in R the regression was considered as significant different from a slope of 1 or an intercept of 0 if the 2.5 and 97.5 confidence intervals were not including 1 or 0.
Statistical outliers in the regression analyses of inter-species comparison of acute fish toxicity and comparisons between FET and AFT LC50s were identified using a box plot analysis of the residuals of the regression analysis with the software IBM SPSS (IBM, Ehningen, Germany). Statistical outliers represented values with a more than 1.5-fold of the 25−75% percentile distance below or above the 25% percentile (lower whisker) or 75% percentile (upper whisker).. Furthermore, the statistical outlier analysis of the inter-species comparison of AFT LC50s was used to define thresholds for the identification of substances with a weaker toxicity in the fish embryo test.
3.5. Computation of analyses
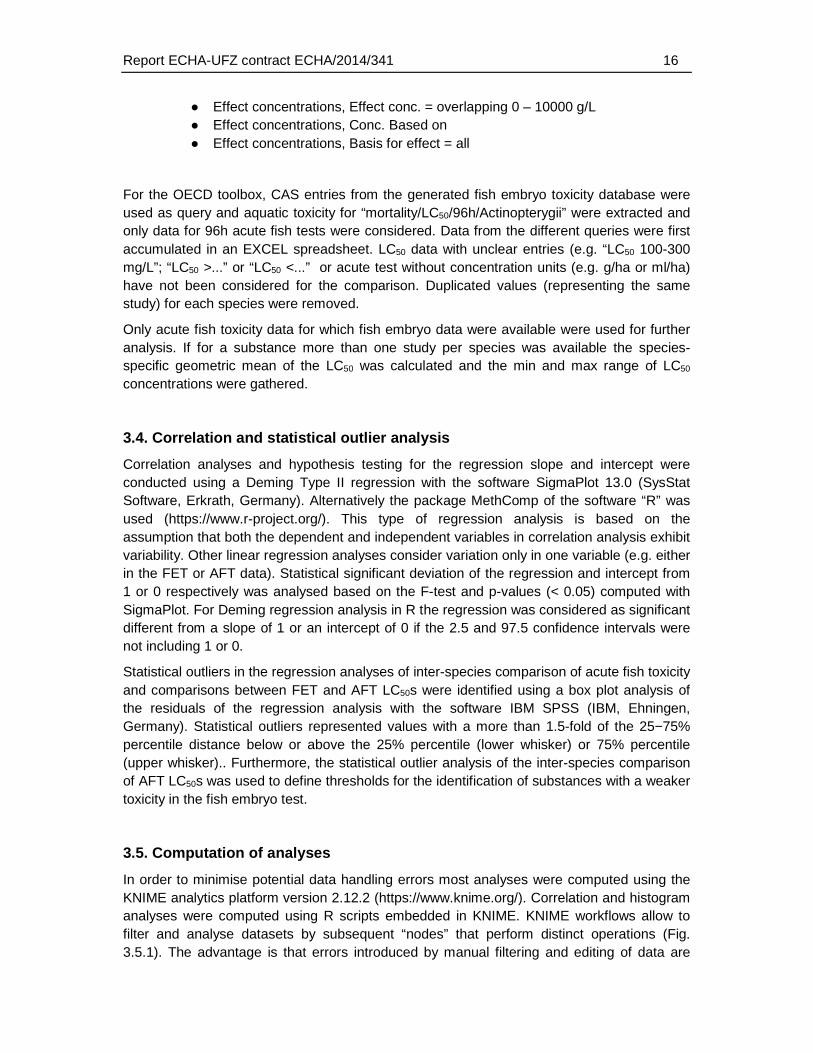
In order to minimise potential data handling errors most analyses were computed using the KNIME analytics platform version 2.12.2 (https://www.knime.org/). Correlation and histogram analyses were computed using R scripts embedded in KNIME. KNIME workflows allow to filter and analyse datasets by subsequent “nodes” that perform distinct operations (Fig. 3.5.1). The advantage is that errors introduced by manual filtering and editing of data are
Report ECHA-UFZ contract ECHA/2014/341 17
reduced and that the analysis work flow can be easily revised and repeated with different parameters.
The following specific R functions were used:
• Histogram analysis: hist (included in base package)
• Deming regression: Deming (package MethComp) Linear correlation analysis was conducted within the KNIME workflows using Pearson's product-moment coefficients.
Fig. 3.5.1. Example of a KNIME workflow. The presented example is a close-up of a workflow that combines an AFT and an FET database, extracts physicochemical data and calculates the log of the baseline toxicity.
Report ECHA-UFZ contract ECHA/2014/341 18
4. Results
4.1. Fish embryo database update
The updated fish embryo database was comprising 2065 study entries with only 29 entries (2%) not using the zebrafish embryo. Each study entry was referring to a substance tested in a particular study with a particular exposure start (but may comprise different exposure durations). The study entries for zebrafish represented 1415 chemicals (according to CAS numbers), i.e. some substances were tested in more than one study. The reproducibility of data available from more than one study that matched the quality criteria (26 substances) was high (see 4.4., Fig. 4.6.1). For only two compounds (malathion, paclobutrazol) a difference >100 fold could be found. The median difference was 1.5fold.
No lethality (LC50) was observed for a large number of study entries (1190). This high proportion (58 %) of studies with no lethality was observed previously (Scholz et al. 2014). A major reason for the lack of toxicity (mortality) for many of the substances tested in (zebra)fish embryos is likely caused by an inappropriate selection of test concentrations, particularly for unspecific acting polar substances. Some studies such as those of Padilla et al. (2012) and Truong et al. (2014) used arbitrary cut-offs of 80 and 64 µM, mainly for practical reasons for the preparation of test concentrations. Therefore, studies with inappropriate test concentrations have been removed from the database used for the comparative analysis with acute fish toxicity data (see 4.4. section Filtering for datasets that used an appropriate range of concentrations).
4.2. Identification of physicochemical properties
For the substances in the fish embryo database the corresponding physicochemical properties were identified (molecular weight, water solubility, log Kow, log Kaw, pka and hydrolysation capacity). Preference was given to experimental data (for water solubility, log Kow and log Kaw). Experimental water solubility data were available for 785 substances. Experimental log Kow and log Kaw could be identified for 767 and 535 substances. I.e. for about 30 – 50 % of the substances experimental data were available. For the remaining substances the properties were predicted using established (EPISUITE, ACD/Percepta) or internal (ChemProp 2015) approaches. It was beyond the scope of this study whether the substances for which the properties were predicted fall into the application domain. However, in order to select the appropriate prediction methods, various approaches were compared by conducting a correlation analysis of experimental and predicted values. Based on the correlation and the confidence intervals of slope and intercept the ACD/Percepta approach was selected for the prediction of log Kow and water solubility. For the log Kaw the EPISUITE fragment model (bond estimation) was applied.
4.3. Availability of corresponding acute fish toxicity data
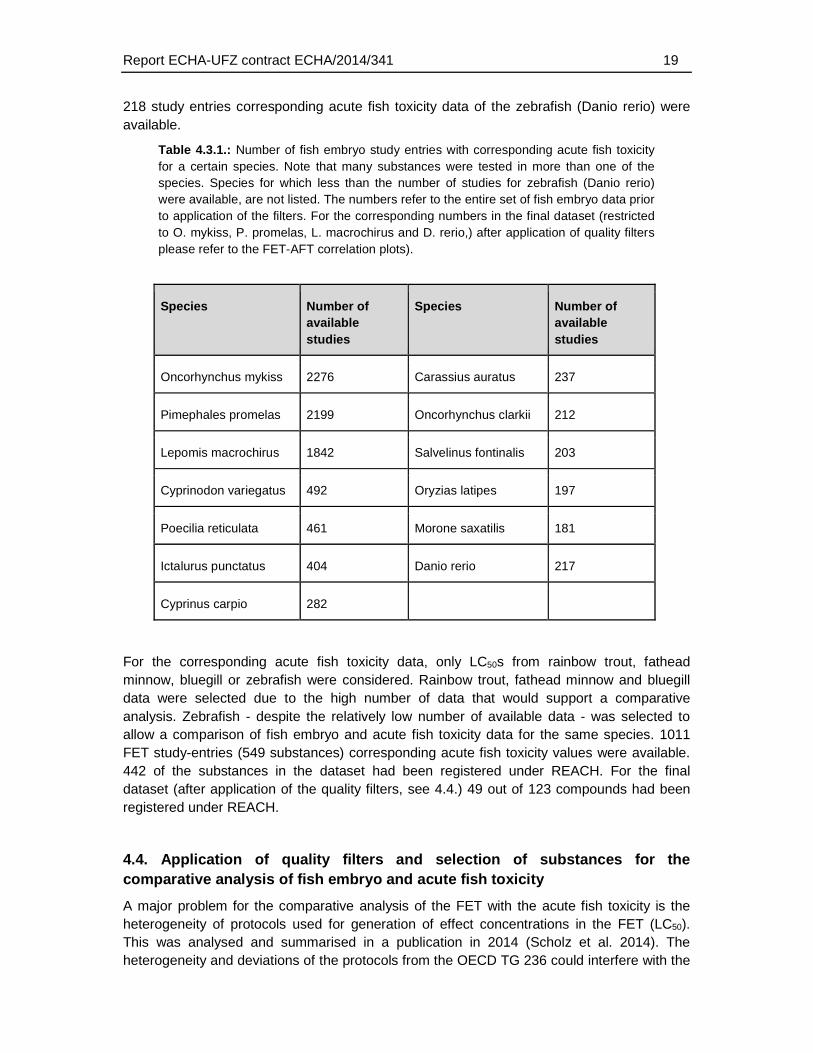
A screening of the entire fish embryo data base for available acute toxicity data in the OECD toolbox indicated that for a high proportion of chemicals tested in the fish embryo corresponding acute fish toxicity data were available. The major test species that had been used to derive these acute fish toxicity data were rainbow trout (Oncorhynchus mykiss), fathead minnow (Pimephales promelas) and Bluegill (Lepomis macrochirus) (Table 4.3.1. For
Report ECHA-UFZ contract ECHA/2014/341 19
218 study entries corresponding acute fish toxicity data of the zebrafish (Danio rerio) were available.
Table 4.3.1.: Number of fish embryo study entries with corresponding acute fish toxicity for a certain species. Note that many substances were tested in more than one of the species. Species for which less than the number of studies for zebrafish (Danio rerio) were available, are not listed. The numbers refer to the entire set of fish embryo data prior to application of the filters. For the corresponding numbers in the final dataset (restricted to O. mykiss, P. promelas, L. macrochirus and D. rerio,) after application of quality filters please refer to the FET-AFT correlation plots).
Species Number of available studies
Species Number of available studies
Oncorhynchus mykiss 2276 Carassius auratus 237
Pimephales promelas 2199 Oncorhynchus clarkii 212
Lepomis macrochirus 1842 Salvelinus fontinalis 203
Cyprinodon variegatus 492 Oryzias latipes 197
Poecilia reticulata 461 Morone saxatilis 181
Ictalurus punctatus 404 Danio rerio 217
Cyprinus carpio 282
For the corresponding acute fish toxicity data, only LC50s from rainbow trout, fathead minnow, bluegill or zebrafish were considered. Rainbow trout, fathead minnow and bluegill data were selected due to the high number of data that would support a comparative analysis. Zebrafish - despite the relatively low number of available data - was selected to allow a comparison of fish embryo and acute fish toxicity data for the same species. 1011 FET study-entries (549 substances) corresponding acute fish toxicity values were available. 442 of the substances in the dataset had been registered under REACH. For the final dataset (after application of the quality filters, see 4.4.) 49 out of 123 compounds had been registered under REACH.
4.4. Application of quality filters and selection of substances for the comparative analysis of fish embryo and acute fish toxicity
A major problem for the comparative analysis of the FET with the acute fish toxicity is the heterogeneity of protocols used for generation of effect concentrations in the FET (LC50). This was analysed and summarised in a publication in 2014 (Scholz et al. 2014). The heterogeneity and deviations of the protocols from the OECD TG 236 could interfere with the
Report ECHA-UFZ contract ECHA/2014/341 20
comparative analysis with acute fish toxicity. However, applying too stringent criteria (full compliance with the OECD TG 236) would result in very few studies for which a comparative analysis could be performed. Therefore, in order to make use of a large part of the existing FET data we screened the data for major protocol limitations that could have influenced the acute toxicity analysis. This was achieved by e.g. comparison of studies that derived an LC50 with studies where no mortality was observed or where no LC50 could be derived. Based on these analyses, the following filters were applied on the FET dataset in order to derive a subset with potential higher quality data (see Fig. 4.4.4) for an overview on all applied filters).
Fish embryo test species
The great majority of study entries (98 %) derived from FETs were conducted with the zebrafish. Therefore, all studies that were conducted with different species (29) were not considered and removed from the final dataset.
Inorganic substances Given the low number of inorganic substances for which zebrafish embryo LC50 data were available (23 substances in total; 23 studies have used 96 h or longer exposure durations) they were removed from the final dataset but were considered in a separate analysis.
Exposure duration
Historically, the first FET data were generated using relatively short exposures durations of ≤ 48 h. In contrast, the OECD guideline 236 proposes a 96-h exposure duration. The main reasons for the recommended 96 h exposure period are:
• Compatibility with the acute fish toxicity test, which is conducted for 96 h.
Furthermore, some substances may not reach internal concentration equilibrium or have lower internal concentrations in shorter exposure periods (<96 h) leading to reduced bioavailable concentrations in shorter exposure durations (Brox et al. 2014).
• Including of post-hatched stages may account for a potential barrier function of the chorion, although the evidence for a barrier function of the chorion is weak or only applies for large molecular weight substances (Scholz et al. 2008).
• Availability of targets that may not be expressed during early embryonic stages.
Therefore, all substances with an exposure period below 96 h (n= 464) were removed from the dataset. Studies that initiated the exposure between 0 and 8 hpf and analysed the mortality 96 or 120 hpf were considered as 96 h and 120 h exposure duration studies. Furthermore, studies that initiated the exposure at 24 hpf and analysed the mortality after 96-h exposure at 120 hpf were included as 96 h-exposure duration studies. Studies with exposure beyond the stage of 5 dpf were not considered since these stages would not be considered as non-protected stages by European regulation and would require licensing for animal experiments (Strähle et al. 2012).
Removal of substances tested at or above water solubility
In many FET studies substances were tested above the water solubility range. Hence, the resulting effect concentrations from these tests may represent an overestimation of effect
Report ECHA-UFZ contract ECHA/2014/341 21
concentration due to precipitation of test substances. This may also apply for lower test concentrations if the test solutions were prepared by dilution of a precipitated stock solution. Therefore, studies with LC50s above 0.5 times of the maximum water solubility were not considered for the final dataset. Studies with no observed mortality or LC50 were not considered for subsequent analysis if the maximum test concentration was exceeding water solubility.
Removal of studies with potential low or high pH in the exposure
The OECD TG 203 for acute fish toxicity requires that the pH of the exposure solutions is controlled and adjusted to neutral pH in case of deviation. For acidic and basic substances or zwitter ions the pH can have a strong influence on the dissociation grade and finally the bioavailability (charged substances may show a weak uptake). The FET has been often conducted without adjustment of pH (if no information on the pH was given, it was considered as non-measured and non-adjusted). Deviation of the pH from neutral conditions could result in a different dissociation and affect the uptake and internal concentrations. Hence, depending on the proportion of the neutral versus the charged from, the FET may underestimate or overestimate the effect concentrations. Furthermore, very strong deviations in the pH (below 5 or above 94) could result in toxicity and mask a potential chemical toxicity. As a pragmatic approach we removed studies with substances for which a pH <5 or >9 was calculated for saturation conditions. However, various studies used buffered exposure media (phosphate buffers, Tris buffer). These studies were not removed as it was assumed that the pH was maintained at neutral level by the buffer substances.
Filtering for datasets that used an appropriate range of concentrations
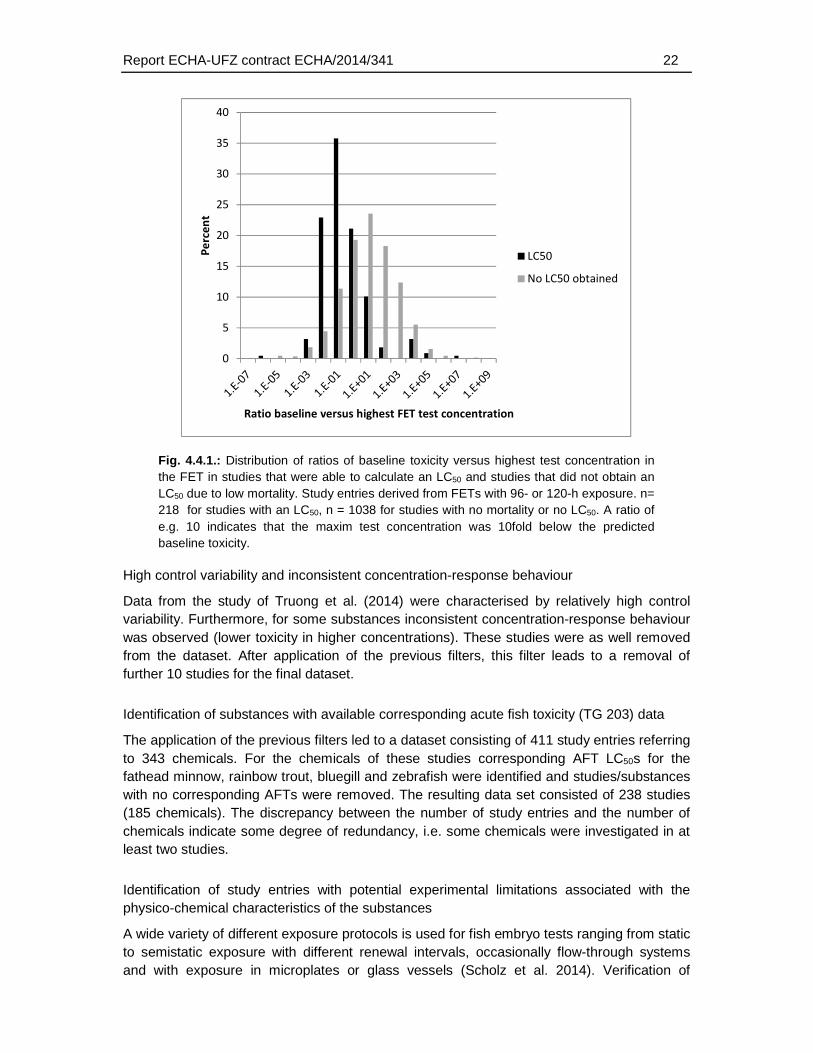
A large number of studies with no mortality or LC50 were derived from studies with a limited range of concentrations tested up to relatively low maximum concentrations of e.g. 64 or 80 µM (Padilla et al. 2012, Truong et al. 2014). In order to test whether for these studies the range of concentrations may have been limited, we compared the predicted baseline toxicity for neutral organics (narcosis) with the highest test concentration (Fig. 4.4.1.). If a substance exhibits only baseline toxicity no mortality may be observed if the test concentration would not include at least the baseline toxicity concentrations. The analysis of baseline effect concentrations versus maximum exposure concentrations indicated a strong difference between studies with and without mortality, particularly for substances that were tested only up to 10fold below the predicted baseline toxicity effect concentration. Since the analysis of acute fish toxicity LC50 indicated a difference of about 10fold and above between species and studies (10 to 14 percent of the study entries depending on the species that were compared, Fig. 4.16.1), substances that were tested only up to 10 fold of the baseline toxicity may exhibit a high probability to provoke no toxicity in the fish embryo due to an inappropriate concentration range. Therefore, all substances with no mortality or no LC50 in the FET and with a maximum test concentration below 10fold of the baseline toxicity were removed from the dataset. In total 893 studies with no toxicity were tested <10fold above the baseline toxicity, i.e. the minimal expected LC50.
4 The pH values of 3.7 and 10.2 represent the LC50s for low and high pH in the 96 h zebrafish embryo embryo test (Andrade et al., University of Aveiro, Portugal, personal communication).
Report ECHA-UFZ contract ECHA/2014/341 22
Fig. 4.4.1.: Distribution of ratios of baseline toxicity versus highest test concentration in the FET in studies that were able to calculate an LC50 and studies that did not obtain an LC50 due to low mortality. Study entries derived from FETs with 96- or 120-h exposure. n= 218 for studies with an LC50, n = 1038 for studies with no mortality or no LC50. A ratio of e.g. 10 indicates that the maxim test concentration was 10fold below the predicted baseline toxicity.
High control variability and inconsistent concentration-response behaviour
Data from the study of Truong et al. (2014) were characterised by relatively high control variability. Furthermore, for some substances inconsistent concentration-response behaviour was observed (lower toxicity in higher concentrations). These studies were as well removed from the dataset. After application of the previous filters, this filter leads to a removal of further 10 studies for the final dataset.
Identification of substances with available corresponding acute fish toxicity (TG 203) data
The application of the previous filters led to a dataset consisting of 411 study entries referring to 343 chemicals. For the chemicals of these studies corresponding AFT LC50s for the fathead minnow, rainbow trout, bluegill and zebrafish were identified and studies/substances with no corresponding AFTs were removed. The resulting data set consisted of 238 studies (185 chemicals). The discrepancy between the number of study entries and the number of chemicals indicate some degree of redundancy, i.e. some chemicals were investigated in at least two studies.
Identification of study entries with potential experimental limitations associated with the physico-chemical characteristics of the substances
A wide variety of different exposure protocols is used for fish embryo tests ranging from static to semistatic exposure with different renewal intervals, occasionally flow-through systems and with exposure in microplates or glass vessels (Scholz et al. 2014). Verification of
0
5
10
15
20
25
30
35
40
Pe
rce
nt
Ratio baseline versus highest FET test concentration
LC50
No LC50 obtained
Report ECHA-UFZ contract ECHA/2014/341 23
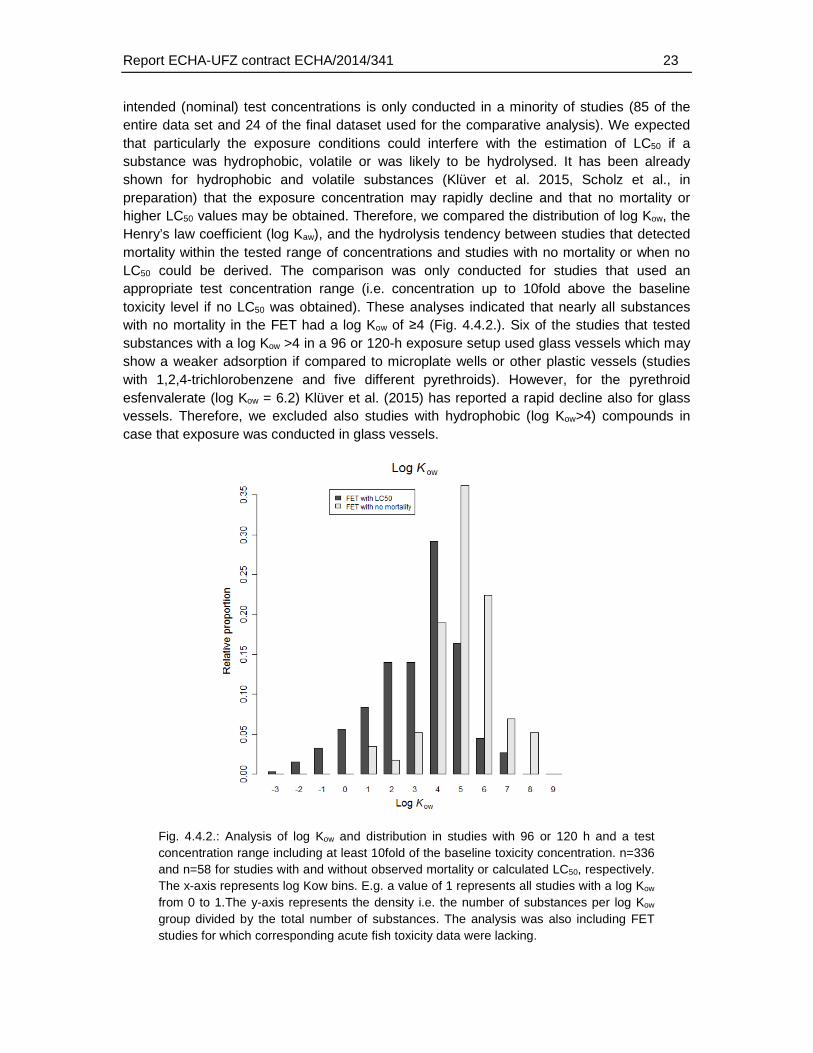
intended (nominal) test concentrations is only conducted in a minority of studies (85 of the entire data set and 24 of the final dataset used for the comparative analysis). We expected that particularly the exposure conditions could interfere with the estimation of LC50 if a substance was hydrophobic, volatile or was likely to be hydrolysed. It has been already shown for hydrophobic and volatile substances (Klüver et al. 2015, Scholz et al., in preparation) that the exposure concentration may rapidly decline and that no mortality or higher LC50 values may be obtained. Therefore, we compared the distribution of log Kow, the Henry’s law coefficient (log Kaw), and the hydrolysis tendency between studies that detected mortality within the tested range of concentrations and studies with no mortality or when no LC50 could be derived. The comparison was only conducted for studies that used an appropriate test concentration range (i.e. concentration up to 10fold above the baseline toxicity level if no LC50 was obtained). These analyses indicated that nearly all substances with no mortality in the FET had a log Kow of ≥4 (Fig. 4.4.2.). Six of the studies that tested substances with a log Kow >4 in a 96 or 120-h exposure setup used glass vessels which may show a weaker adsorption if compared to microplate wells or other plastic vessels (studies with 1,2,4-trichlorobenzene and five different pyrethroids). However, for the pyrethroid esfenvalerate (log Kow = 6.2) Klüver et al. (2015) has reported a rapid decline also for glass vessels. Therefore, we excluded also studies with hydrophobic (log Kow>4) compounds in case that exposure was conducted in glass vessels.
Fig. 4.4.2.: Analysis of log Kow and distribution in studies with 96 or 120 h and a test concentration range including at least 10fold of the baseline toxicity concentration. n=336 and n=58 for studies with and without observed mortality or calculated LC50, respectively. The x-axis represents log Kow bins. E.g. a value of 1 represents all studies with a log Kow from 0 to 1.The y-axis represents the density i.e. the number of substances per log Kow group divided by the total number of substances. The analysis was also including FET studies for which corresponding acute fish toxicity data were lacking.
Report ECHA-UFZ contract ECHA/2014/341 24
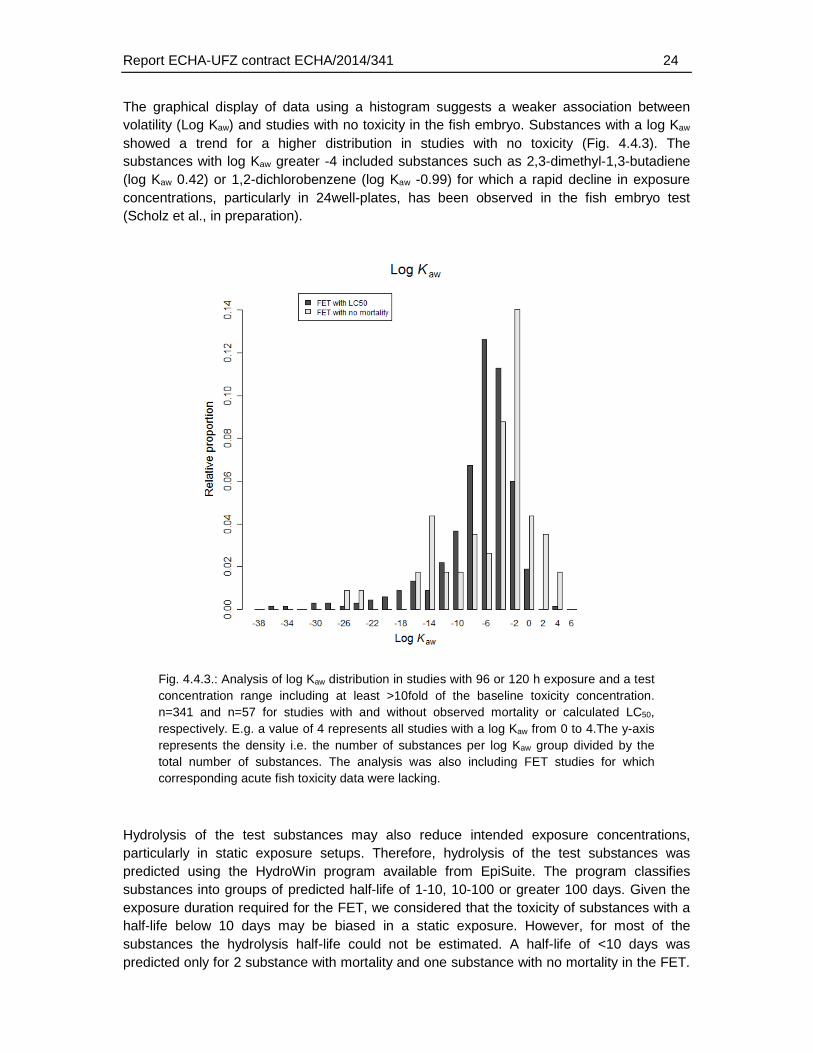
The graphical display of data using a histogram suggests a weaker association between volatility (Log Kaw) and studies with no toxicity in the fish embryo. Substances with a log Kaw showed a trend for a higher distribution in studies with no toxicity (Fig. 4.4.3). The substances with log Kaw greater -4 included substances such as 2,3-dimethyl-1,3-butadiene (log Kaw 0.42) or 1,2-dichlorobenzene (log Kaw -0.99) for which a rapid decline in exposure concentrations, particularly in 24well-plates, has been observed in the fish embryo test (Scholz et al., in preparation).
Fig. 4.4.3.: Analysis of log Kaw distribution in studies with 96 or 120 h exposure and a test concentration range including at least >10fold of the baseline toxicity concentration. n=341 and n=57 for studies with and without observed mortality or calculated LC50, respectively. E.g. a value of 4 represents all studies with a log Kaw from 0 to 4.The y-axis represents the density i.e. the number of substances per log Kaw group divided by the total number of substances. The analysis was also including FET studies for which corresponding acute fish toxicity data were lacking.
Hydrolysis of the test substances may also reduce intended exposure concentrations, particularly in static exposure setups. Therefore, hydrolysis of the test substances was predicted using the HydroWin program available from EpiSuite. The program classifies substances into groups of predicted half-life of 1-10, 10-100 or greater 100 days. Given the exposure duration required for the FET, we considered that the toxicity of substances with a half-life below 10 days may be biased in a static exposure. However, for most of the substances the hydrolysis half-life could not be estimated. A half-life of <10 days was predicted only for 2 substance with mortality and one substance with no mortality in the FET.
Report ECHA-UFZ contract ECHA/2014/341 25
Hence, for the given dataset it is not possible to conclude a strong incidence for an impact of hydrolysis on the results during the exposure period. Therefore, hydrolysis rate was not applied as a quality filter.
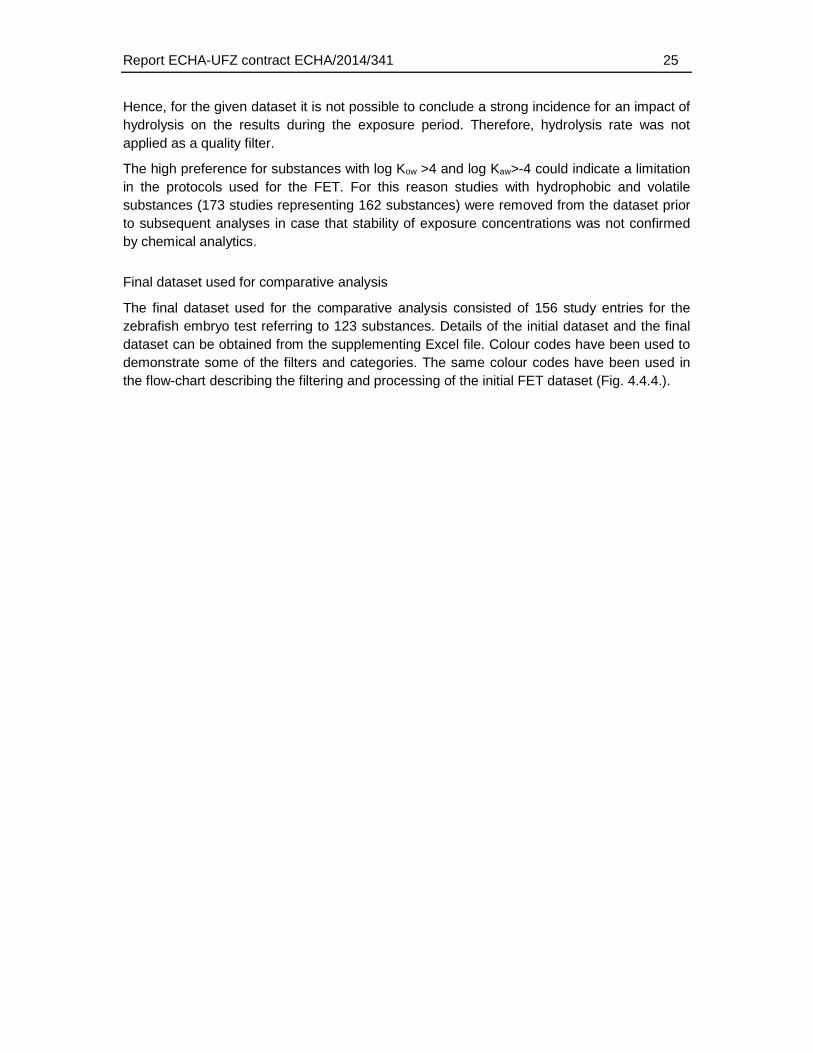
The high preference for substances with log Kow >4 and log Kaw>-4 could indicate a limitation in the protocols used for the FET. For this reason studies with hydrophobic and volatile substances (173 studies representing 162 substances) were removed from the dataset prior to subsequent analyses in case that stability of exposure concentrations was not confirmed by chemical analytics.
Final dataset used for comparative analysis
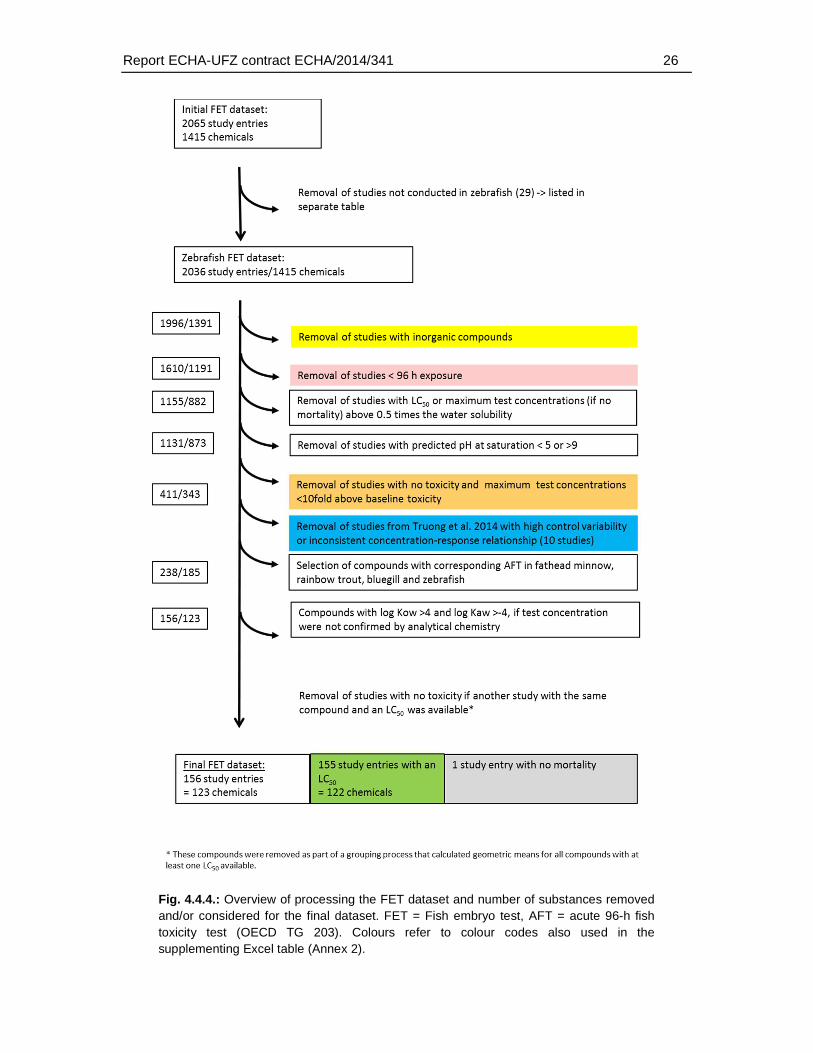
The final dataset used for the comparative analysis consisted of 156 study entries for the zebrafish embryo test referring to 123 substances. Details of the initial dataset and the final dataset can be obtained from the supplementing Excel file. Colour codes have been used to demonstrate some of the filters and categories. The same colour codes have been used in the flow-chart describing the filtering and processing of the initial FET dataset (Fig. 4.4.4.).
Report ECHA-UFZ contract ECHA/2014/341 26
Fig. 4.4.4.: Overview of processing the FET dataset and number of substances removed and/or considered for the final dataset. FET = Fish embryo test, AFT = acute 96-h fish toxicity test (OECD TG 203). Colours refer to colour codes also used in the supplementing Excel table (Annex 2).
Report ECHA-UFZ contract ECHA/2014/341 27
4.5. Distribution of substance characteristics for the final dataset
Crucial for the assessment of the fish embryo and its capacity to predict acute fish toxicity is its ability to predict the toxicity for a wide variety of structurally different substances with different physicochemical characteristics and diverse MoAs. If the fish embryo data set used for the comparative analysis would be biased by a strong preference for e.g. unspecific, baseline toxic substances, this could interfere with the assessment of its predictive capacity. In order to describe the fish embryo dataset the distribution of physico-chemical characteristics, structural domains, the mode of action and the toxic ratios were analysed for the 123 substances in the final dataset.
4.5.1. Distribution of physico-chemical characteristics in the final dataset.
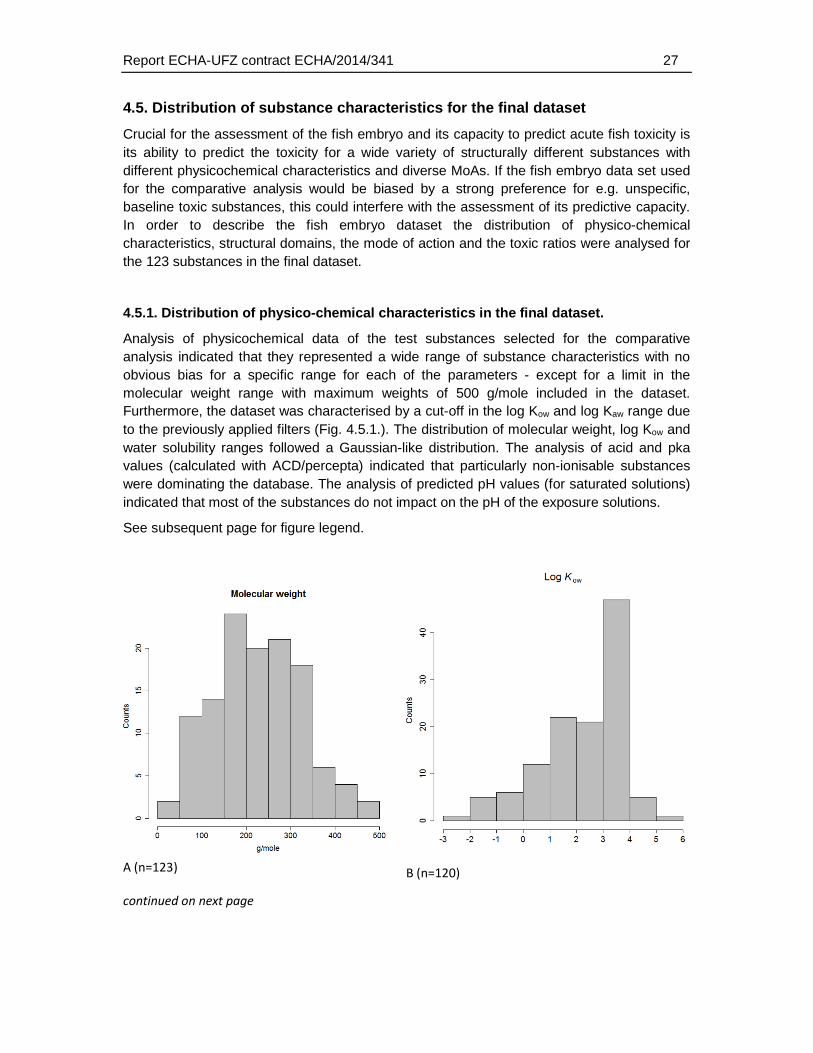
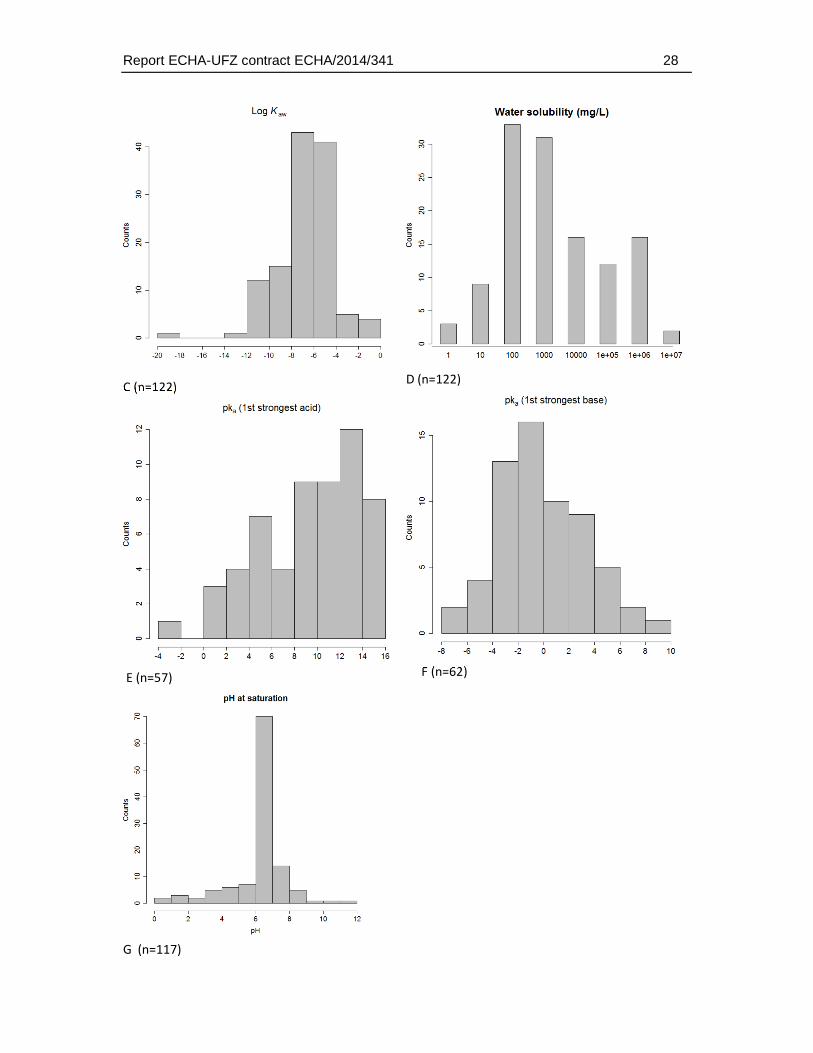
Analysis of physicochemical data of the test substances selected for the comparative analysis indicated that they represented a wide range of substance characteristics with no obvious bias for a specific range for each of the parameters - except for a limit in the molecular weight range with maximum weights of 500 g/mole included in the dataset. Furthermore, the dataset was characterised by a cut-off in the log Kow and log Kaw range due to the previously applied filters (Fig. 4.5.1.). The distribution of molecular weight, log Kow and water solubility ranges followed a Gaussian-like distribution. The analysis of acid and pka values (calculated with ACD/percepta) indicated that particularly non-ionisable substances were dominating the database. The analysis of predicted pH values (for saturated solutions) indicated that most of the substances do not impact on the pH of the exposure solutions.
See subsequent page for figure legend.
A (n=123)
continued on next page
B (n=120)
Report ECHA-UFZ contract ECHA/2014/341 28
C (n=122)
E (n=57)
G (n=117)
D (n=122)
F (n=62)
Report ECHA-UFZ contract ECHA/2014/341 29
Fig. 4.5.1.: Histograms of the distribution for selected physico-chemical properties. (A) Molecular weight, (B) log KOW, (C) Log Kaw, (D) water solubility, (E) pKa first strongest acid, (F) pKa first strongest base and (G) the predicted pH for saturated solutions. “Counts” refers to the number of substances in each of the histogram bins. The number (n) refers to the number of chemicals for which the corresponding property value was available or could be predicted. Hence, depending on the availability of corresponding physicochemical data the sample number varies for each of the plots. The total number of chemicals in the dataset was 123.
4.5.2 Distribution of structural domains
In order to analyse the structural variety in the dataset that was used for comparative analysis the distribution of chemical domains or groups was analysed by assigning ECOSAR structural groups and the identification of structural domains using the software ChemProp (see materials and methods for details). The advantage of using the ECOSAR structural domains is that they provide relative broad terms for chemical structures. The disadvantage of this approach is however, that the analysis is biased by assigning only domains that are of relevance for acute toxicity QSARs for certain classes of substances. Domains or substances that are not relevant are summarised as “neutral organics”. Therefore, the ChemProp functional group analysis was used as a second approach.
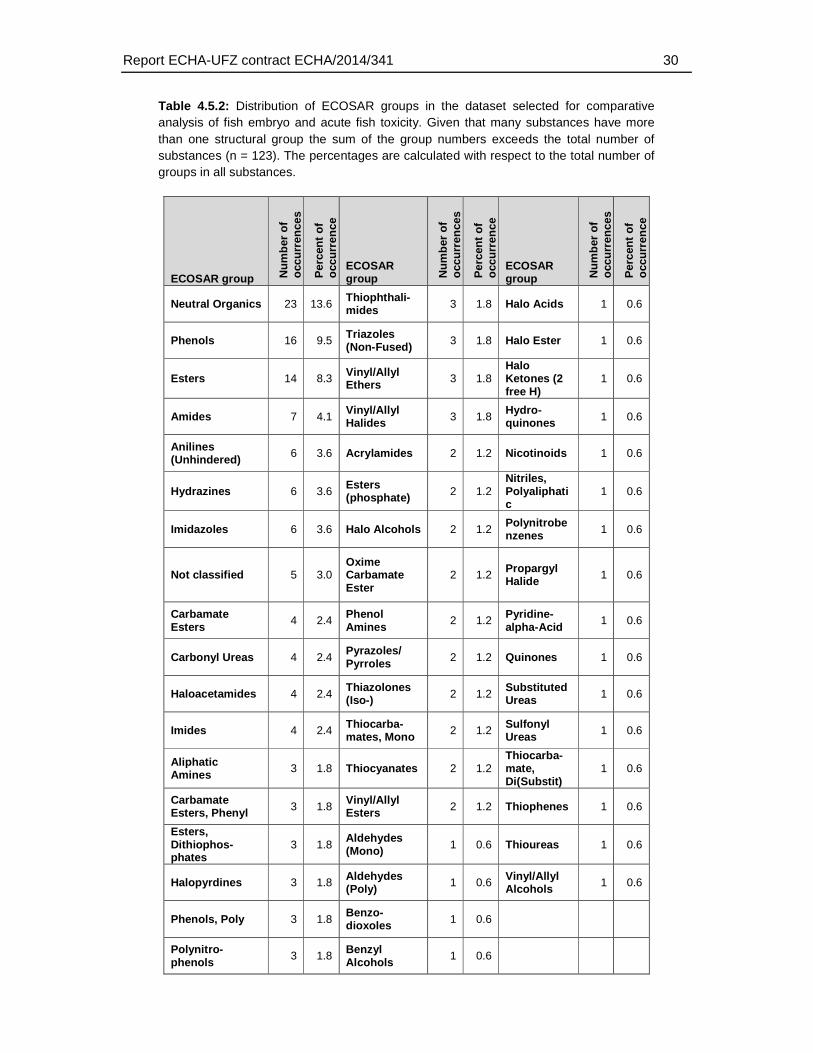
With respect to the ECOSAR domains, 53 of the 111 ECOSAR groups were represented by the dataset (5 substances could not be classified). Neutral organics, phenols and esters represented the three groups with the highest coverage (13.6, 9.5 and 8.3) percent of all groups). Many groups that are known to be associated with a specific biological action (e.g. thiocarbamates, neonicotinoids, esters (phosphate)) were included (Table 4.5.2.).
Report ECHA-UFZ contract ECHA/2014/341 30
Table 4.5.2: Distribution of ECOSAR groups in the dataset selected for comparative analysis of fish embryo and acute fish toxicity. Given that many substances have more than one structural group the sum of the group numbers exceeds the total number of substances (n = 123). The percentages are calculated with respect to the total number of groups in all substances.
ECOSAR group Nu
mb
er o
f o
ccu
rren
ces
Per
cen
t o
f o
ccu
rren
ce
ECOSAR group N
um
ber
of
occ
urr
ence
s
Per
cen
t o
f o
ccu
rren
ce
ECOSAR group N
um
ber
of
occ
urr
ence
s
Per
cen
t o
f o
ccu
rren
ce
Neutral Organics 23 13.6 Thiophthali-mides 3 1.8 Halo Acids 1 0.6
Phenols 16 9.5 Triazoles (Non-Fused) 3 1.8 Halo Ester 1 0.6
Esters 14 8.3 Vinyl/Allyl Ethers 3 1.8
Halo Ketones (2 free H)
1 0.6
Amides 7 4.1 Vinyl/Allyl Halides 3 1.8
Hydro-quinones 1 0.6
Anilines (Unhindered) 6 3.6 Acrylamides 2 1.2 Nicotinoids 1 0.6
Hydrazines 6 3.6 Esters (phosphate) 2 1.2
Nitriles, Polyaliphatic
1 0.6
Imidazoles 6 3.6 Halo Alcohols 2 1.2 Polynitrobenzenes 1 0.6
Not classified 5 3.0 Oxime Carbamate Ester
2 1.2 Propargyl Halide 1 0.6
Carbamate Esters
4 2.4 Phenol Amines
2 1.2 Pyridine-alpha-Acid
1 0.6
Carbonyl Ureas 4 2.4 Pyrazoles/ Pyrroles 2 1.2 Quinones 1 0.6
Haloacetamides 4 2.4 Thiazolones (Iso-) 2 1.2
Substituted Ureas 1 0.6
Imides 4 2.4 Thiocarba-mates, Mono 2 1.2 Sulfonyl
Ureas 1 0.6
Aliphatic Amines 3 1.8 Thiocyanates 2 1.2
Thiocarba-mate, Di(Substit)
1 0.6
Carbamate Esters, Phenyl 3 1.8
Vinyl/Allyl Esters 2 1.2 Thiophenes 1 0.6
Esters, Dithiophos-phates
3 1.8 Aldehydes (Mono) 1 0.6 Thioureas 1 0.6
Halopyrdines 3 1.8 Aldehydes (Poly) 1 0.6 Vinyl/Allyl
Alcohols 1 0.6
Phenols, Poly 3 1.8 Benzo-dioxoles 1 0.6
Polynitro-phenols
3 1.8 Benzyl Alcohols
1 0.6
Report ECHA-UFZ contract ECHA/2014/341 31
Given that the ECOSAR groups do only classify a limited number of chemical structures the distribution of structural domains was also analysed using the more detailed and unbiased ChemProp approach (UFZ, 2015). This analysis comprised different levels of hierarchy in chemical domains, ranging from e.g. representation of elements and basic combinations of them (e.g. C, P, S, N, NO, NCO directly bonded, H etc.), general structural terms (e.g. aromatic, triple bond), main functional groups (e.g., alcohols, carbonyls, amines), to very specific structural domain descriptions (e.g. epoxide-type cyclic ether, sulfonate, carbonyl at non-aromatic C). A total of 158 structural descriptors were retrieved by this analysis and were finally used to identify the enrichment of substances that exhibit a weaker toxicity in the fish embryo test. The full set of descriptors and the number of occurrences in the dataset is given in Table 4.5.3.
Report ECHA-UFZ contract ECHA/2014/341 32
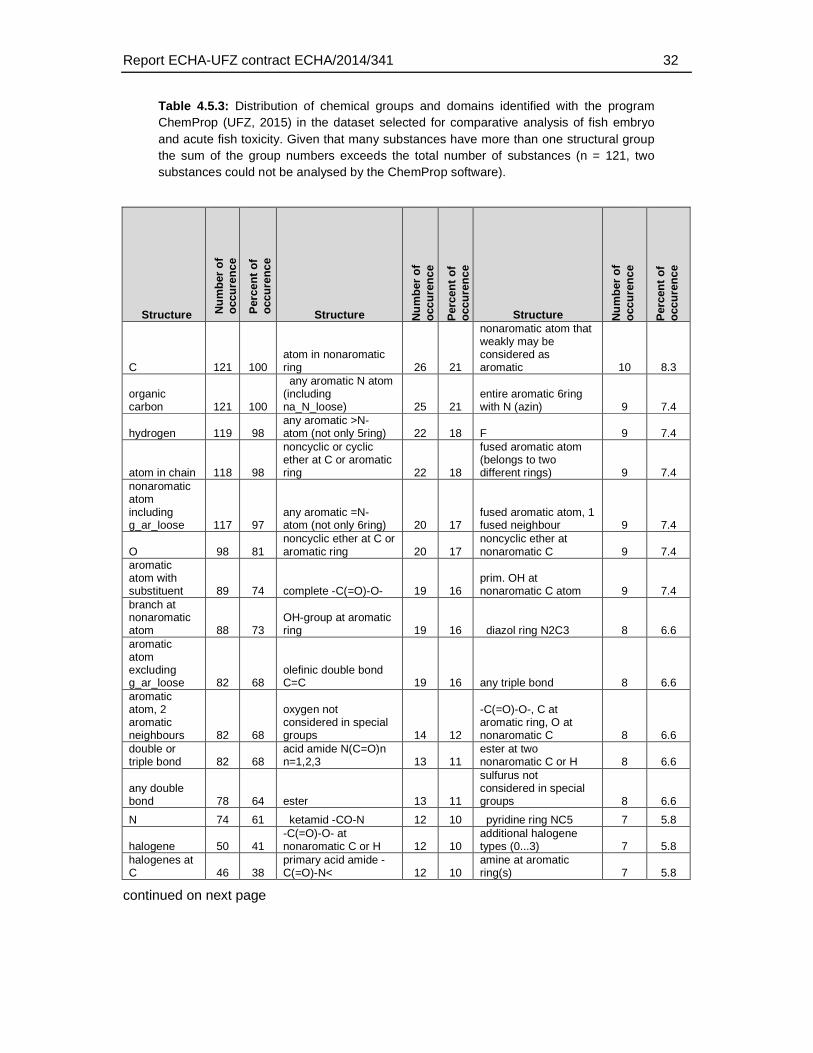
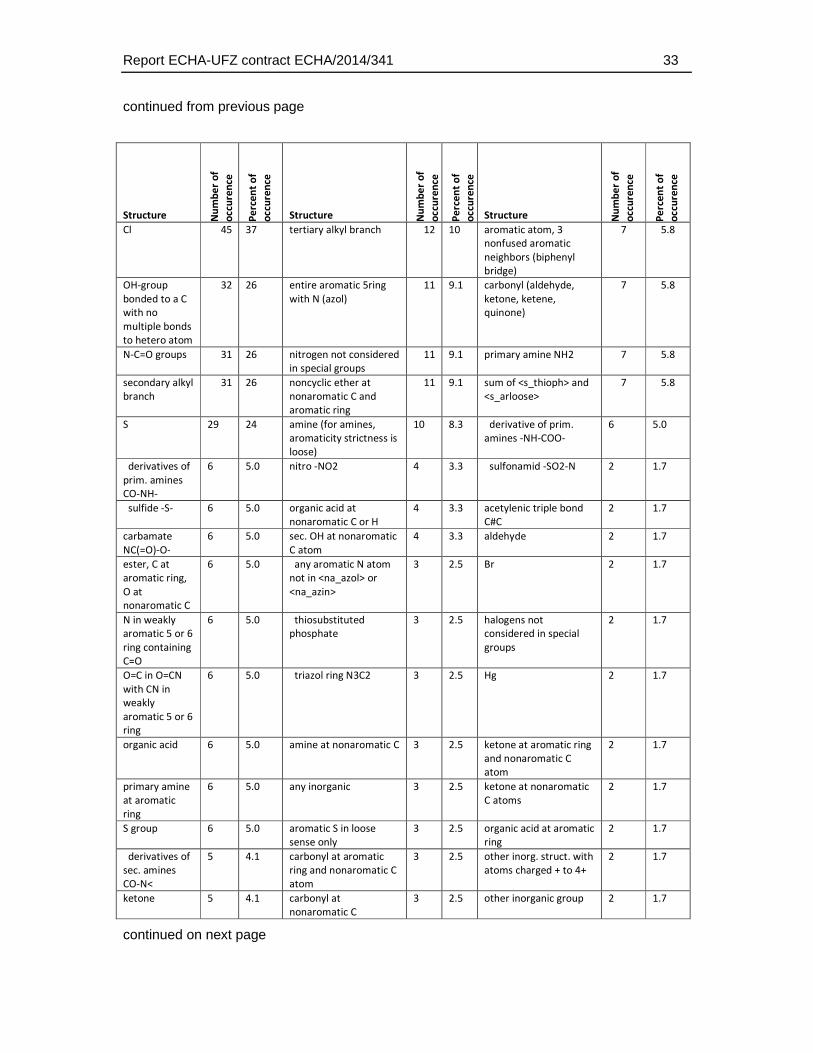
Table 4.5.3: Distribution of chemical groups and domains identified with the program ChemProp (UFZ, 2015) in the dataset selected for comparative analysis of fish embryo and acute fish toxicity. Given that many substances have more than one structural group the sum of the group numbers exceeds the total number of substances (n = 121, two substances could not be analysed by the ChemProp software).
Structure Nu
mb
er o
f o
ccu
ren
ce
Per
cen
t o
f o
ccu
ren
ce
Structure Nu
mb
er o
f o
ccu
ren
ce
Per
cen
t o
f o
ccu
ren
ce
Structure Nu
mb
er o
f o
ccu
ren
ce
Per
cen
t o
f o
ccu
ren
ce
C 121 100 atom in nonaromatic ring 26 21
nonaromatic atom that weakly may be considered as aromatic 10 8.3
organic carbon 121 100
any aromatic N atom (including na_N_loose) 25 21
entire aromatic 6ring with N (azin) 9 7.4
hydrogen 119 98 any aromatic >N- atom (not only 5ring) 22 18 F 9 7.4
atom in chain 118 98
noncyclic or cyclic ether at C or aromatic ring 22 18
fused aromatic atom (belongs to two different rings) 9 7.4
nonaromatic atom including g_ar_loose 117 97
any aromatic =N- atom (not only 6ring) 20 17
fused aromatic atom, 1 fused neighbour 9 7.4
O 98 81 noncyclic ether at C or aromatic ring 20 17
noncyclic ether at nonaromatic C 9 7.4
aromatic atom with substituent 89 74 complete -C(=O)-O- 19 16
prim. OH at nonaromatic C atom 9 7.4
branch at nonaromatic atom 88 73
OH-group at aromatic ring 19 16 diazol ring N2C3 8 6.6
aromatic atom excluding g_ar_loose 82 68
olefinic double bond C=C 19 16 any triple bond 8 6.6
aromatic atom, 2 aromatic neighbours 82 68
oxygen not considered in special groups 14 12
-C(=O)-O-, C at aromatic ring, O at nonaromatic C 8 6.6
double or triple bond 82 68
acid amide N(C=O)n n=1,2,3 13 11
ester at two nonaromatic C or H 8 6.6
any double bond 78 64 ester 13 11
sulfurus not considered in special groups 8 6.6
N 74 61 ketamid -CO-N 12 10 pyridine ring NC5 7 5.8
halogene 50 41 -C(=O)-O- at nonaromatic C or H 12 10
additional halogene types (0...3) 7 5.8
halogenes at C 46 38
primary acid amide -C(=O)-N< 12 10
amine at aromatic ring(s) 7 5.8
continued on next page
Report ECHA-UFZ contract ECHA/2014/341 33
continued from previous page
Structure Nu
mb
er
of
occ
ure
nce
Pe
rce
nt
of
occ
ure
nce
Structure Nu
mb
er
of
occ
ure
nce
Pe
rce
nt
of
occ
ure
nce
Structure Nu
mb
er
of
occ
ure
nce
Pe
rce
nt
of
occ
ure
nce
Cl 45 37 tertiary alkyl branch 12 10 aromatic atom, 3
nonfused aromatic
neighbors (biphenyl
bridge)
7 5.8
OH-group
bonded to a C
with no
multiple bonds
to hetero atom
32 26 entire aromatic 5ring
with N (azol)
11 9.1 carbonyl (aldehyde,
ketone, ketene,
quinone)
7 5.8
N-C=O groups 31 26 nitrogen not considered
in special groups
11 9.1 primary amine NH2 7 5.8
secondary alkyl
branch
31 26 noncyclic ether at
nonaromatic C and
aromatic ring
11 9.1 sum of <s_thioph> and
<s_arloose>
7 5.8
S 29 24 amine (for amines,
aromaticity strictness is
loose)
10 8.3 derivative of prim.
amines -NH-COO-
6 5.0
derivatives of
prim. amines
CO-NH-
6 5.0 nitro -NO2 4 3.3 sulfonamid -SO2-N 2 1.7
sulfide -S- 6 5.0 organic acid at
nonaromatic C or H
4 3.3 acetylenic triple bond
C#C
2 1.7
carbamate
NC(=O)-O-
6 5.0 sec. OH at nonaromatic
C atom
4 3.3 aldehyde 2 1.7
ester, C at
aromatic ring,
O at
nonaromatic C
6 5.0 any aromatic N atom
not in <na_azol> or
<na_azin>
3 2.5 Br 2 1.7
N in weakly
aromatic 5 or 6
ring containing
C=O
6 5.0 thiosubstituted
phosphate
3 2.5 halogens not
considered in special
groups
2 1.7
O=C in O=CN
with CN in
weakly
aromatic 5 or 6
ring
6 5.0 triazol ring N3C2 3 2.5 Hg 2 1.7
organic acid 6 5.0 amine at nonaromatic C 3 2.5 ketone at aromatic ring
and nonaromatic C
atom
2 1.7
primary amine
at aromatic
ring
6 5.0 any inorganic 3 2.5 ketone at nonaromatic
C atoms
2 1.7
S group 6 5.0 aromatic S in loose
sense only
3 2.5 organic acid at aromatic
ring
2 1.7
derivatives of
sec. amines
CO-N<
5 4.1 carbonyl at aromatic
ring and nonaromatic C
atom
3 2.5 other inorg. struct. with
atoms charged + to 4+
2 1.7
ketone 5 4.1 carbonyl at
nonaromatic C
3 2.5 other inorganic group 2 1.7
continued on next page
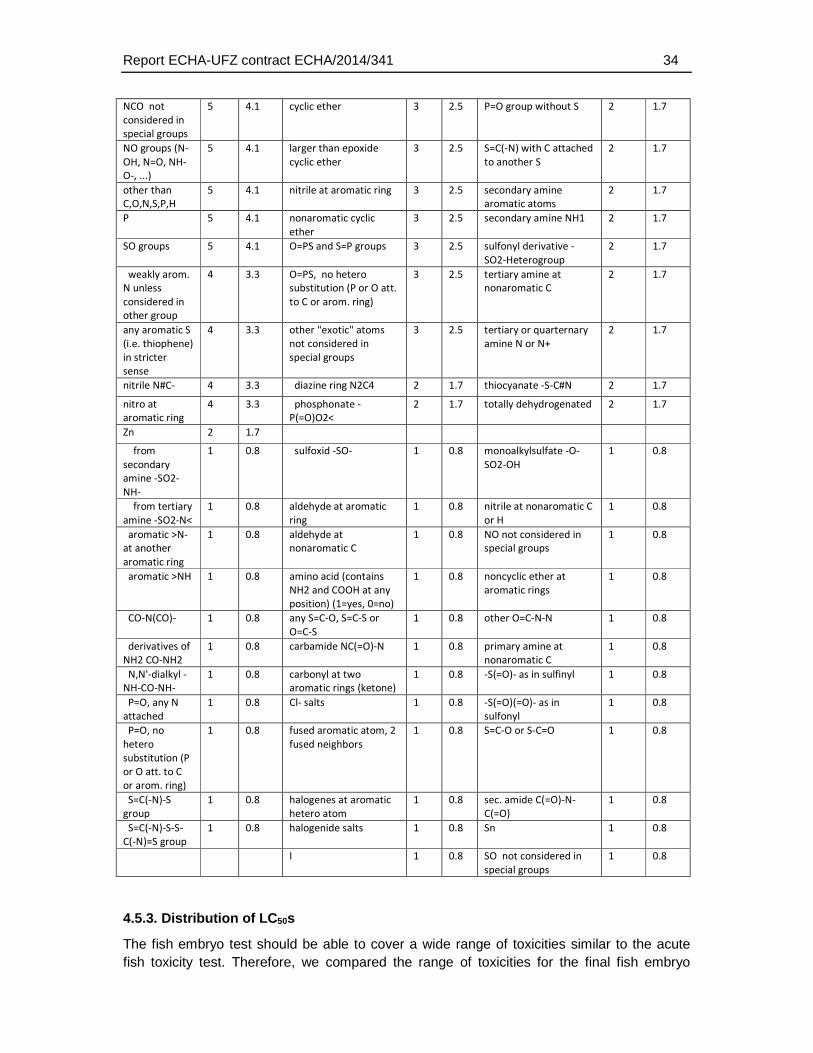
Report ECHA-UFZ contract ECHA/2014/341 34
NCO not
considered in
special groups
5 4.1 cyclic ether 3 2.5 P=O group without S 2 1.7
NO groups (N-
OH, N=O, NH-
O-, ...)
5 4.1 larger than epoxide
cyclic ether
3 2.5 S=C(-N) with C attached
to another S
2 1.7
other than
C,O,N,S,P,H
5 4.1 nitrile at aromatic ring 3 2.5 secondary amine
aromatic atoms
2 1.7
P 5 4.1 nonaromatic cyclic
ether
3 2.5 secondary amine NH1 2 1.7
SO groups 5 4.1 O=PS and S=P groups 3 2.5 sulfonyl derivative -
SO2-Heterogroup
2 1.7
weakly arom.
N unless
considered in
other group
4 3.3 O=PS, no hetero
substitution (P or O att.
to C or arom. ring)
3 2.5 tertiary amine at
nonaromatic C
2 1.7
any aromatic S
(i.e. thiophene)
in stricter
sense
4 3.3 other "exotic" atoms
not considered in
special groups
3 2.5 tertiary or quarternary
amine N or N+
2 1.7
nitrile N#C- 4 3.3 diazine ring N2C4 2 1.7 thiocyanate -S-C#N 2 1.7
nitro at
aromatic ring
4 3.3 phosphonate -
P(=O)O2<
2 1.7 totally dehydrogenated 2 1.7
Zn 2 1.7
from
secondary
amine -SO2-
NH-
1 0.8 sulfoxid -SO- 1 0.8 monoalkylsulfate -O-
SO2-OH
1 0.8
from tertiary
amine -SO2-N<
1 0.8 aldehyde at aromatic
ring
1 0.8 nitrile at nonaromatic C
or H
1 0.8
aromatic >N-
at another
aromatic ring
1 0.8 aldehyde at
nonaromatic C
1 0.8 NO not considered in
special groups
1 0.8
aromatic >NH 1 0.8 amino acid (contains
NH2 and COOH at any
position) (1=yes, 0=no)
1 0.8 noncyclic ether at
aromatic rings
1 0.8
CO-N(CO)- 1 0.8 any S=C-O, S=C-S or
O=C-S
1 0.8 other O=C-N-N 1 0.8
derivatives of
NH2 CO-NH2
1 0.8 carbamide NC(=O)-N 1 0.8 primary amine at
nonaromatic C
1 0.8
N,N'-dialkyl -
NH-CO-NH-
1 0.8 carbonyl at two
aromatic rings (ketone)
1 0.8 -S(=O)- as in sulfinyl 1 0.8
P=O, any N
attached
1 0.8 Cl- salts 1 0.8 -S(=O)(=O)- as in
sulfonyl
1 0.8
P=O, no
hetero
substitution (P
or O att. to C
or arom. ring)
1 0.8 fused aromatic atom, 2
fused neighbors
1 0.8 S=C-O or S-C=O 1 0.8
S=C(-N)-S
group
1 0.8 halogenes at aromatic
hetero atom
1 0.8 sec. amide C(=O)-N-
C(=O)
1 0.8
S=C(-N)-S-S-
C(-N)=S group
1 0.8 halogenide salts 1 0.8 Sn 1 0.8
I 1 0.8 SO not considered in
special groups
1 0.8
4.5.3. Distribution of LC50s
The fish embryo test should be able to cover a wide range of toxicities similar to the acute fish toxicity test. Therefore, we compared the range of toxicities for the final fish embryo
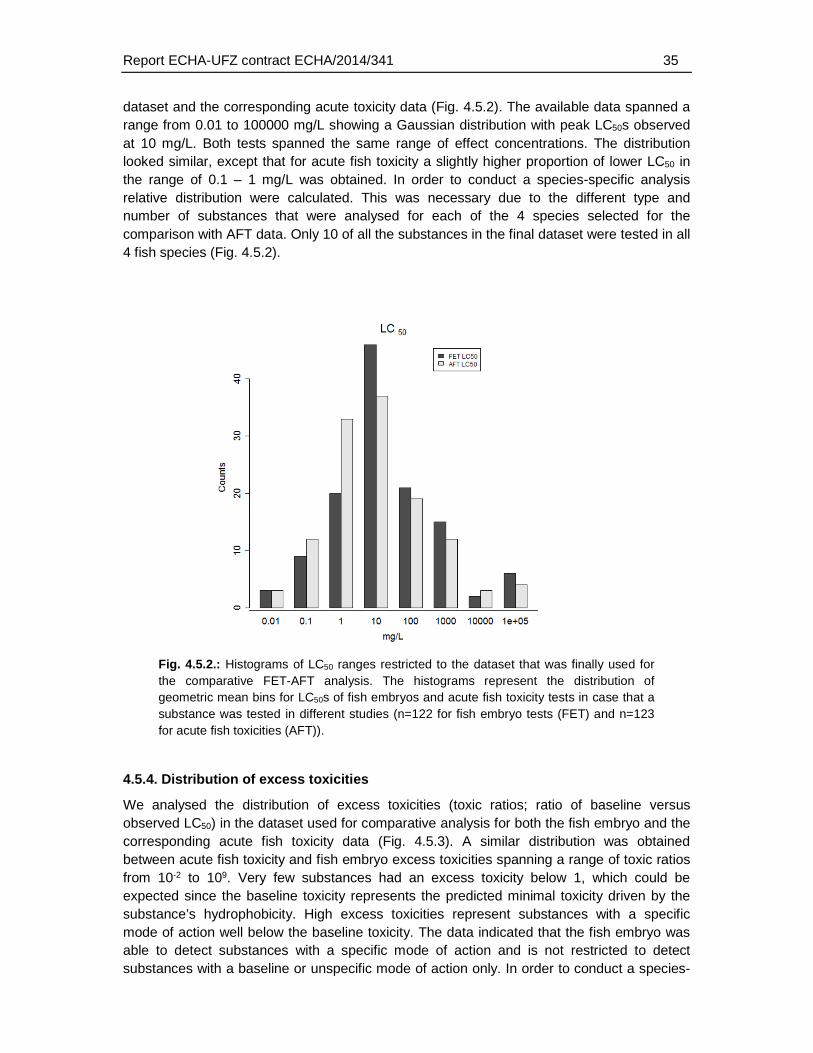
Report ECHA-UFZ contract ECHA/2014/341 35
dataset and the corresponding acute toxicity data (Fig. 4.5.2). The available data spanned a range from 0.01 to 100000 mg/L showing a Gaussian distribution with peak LC50s observed at 10 mg/L. Both tests spanned the same range of effect concentrations. The distribution looked similar, except that for acute fish toxicity a slightly higher proportion of lower LC50 in the range of 0.1 – 1 mg/L was obtained. In order to conduct a species-specific analysis relative distribution were calculated. This was necessary due to the different type and number of substances that were analysed for each of the 4 species selected for the comparison with AFT data. Only 10 of all the substances in the final dataset were tested in all 4 fish species (Fig. 4.5.2).
Fig. 4.5.2.: Histograms of LC50 ranges restricted to the dataset that was finally used for the comparative FET-AFT analysis. The histograms represent the distribution of geometric mean bins for LC50s of fish embryos and acute fish toxicity tests in case that a substance was tested in different studies (n=122 for fish embryo tests (FET) and n=123 for acute fish toxicities (AFT)).
4.5.4. Distribution of excess toxicities
We analysed the distribution of excess toxicities (toxic ratios; ratio of baseline versus observed LC50) in the dataset used for comparative analysis for both the fish embryo and the corresponding acute fish toxicity data (Fig. 4.5.3). A similar distribution was obtained between acute fish toxicity and fish embryo excess toxicities spanning a range of toxic ratios from 10-2 to 109. Very few substances had an excess toxicity below 1, which could be expected since the baseline toxicity represents the predicted minimal toxicity driven by the substance’s hydrophobicity. High excess toxicities represent substances with a specific mode of action well below the baseline toxicity. The data indicated that the fish embryo was able to detect substances with a specific mode of action and is not restricted to detect substances with a baseline or unspecific mode of action only. In order to conduct a species-
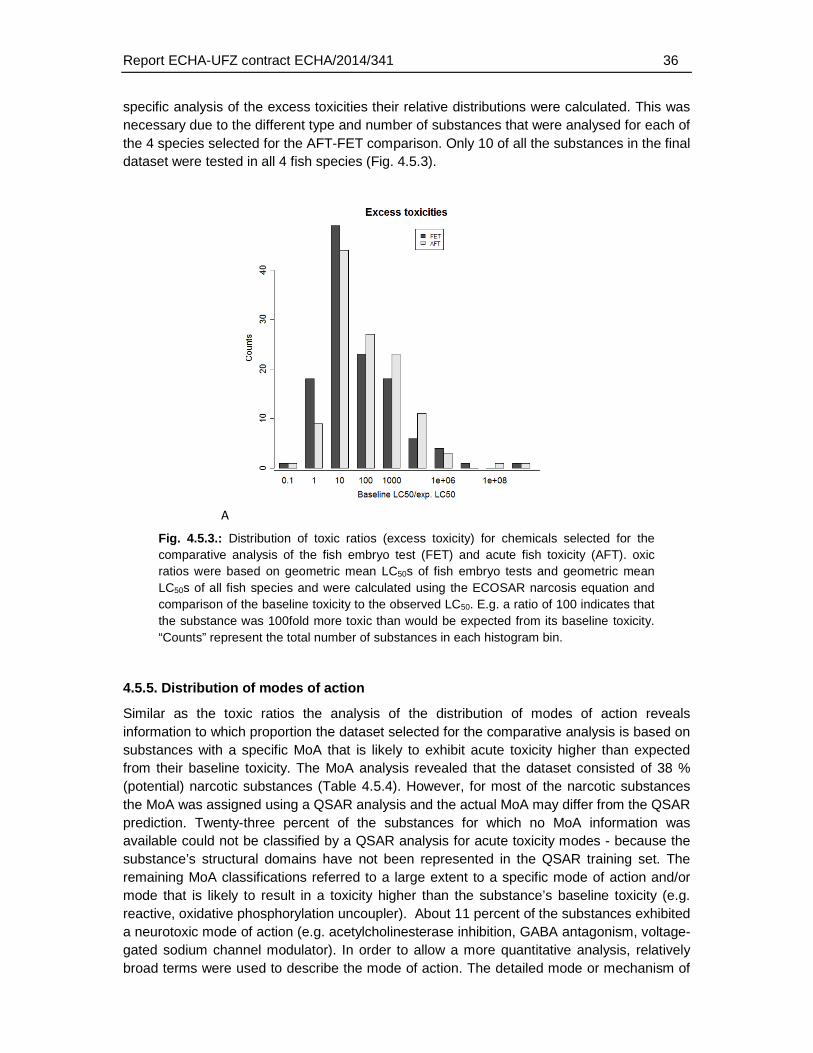
Report ECHA-UFZ contract ECHA/2014/341 36
specific analysis of the excess toxicities their relative distributions were calculated. This was necessary due to the different type and number of substances that were analysed for each of the 4 species selected for the AFT-FET comparison. Only 10 of all the substances in the final dataset were tested in all 4 fish species (Fig. 4.5.3).
A
Fig. 4.5.3.: Distribution of toxic ratios (excess toxicity) for chemicals selected for the comparative analysis of the fish embryo test (FET) and acute fish toxicity (AFT). oxic ratios were based on geometric mean LC50s of fish embryo tests and geometric mean LC50s of all fish species and were calculated using the ECOSAR narcosis equation and comparison of the baseline toxicity to the observed LC50. E.g. a ratio of 100 indicates that the substance was 100fold more toxic than would be expected from its baseline toxicity. “Counts” represent the total number of substances in each histogram bin.
4.5.5. Distribution of modes of action
Similar as the toxic ratios the analysis of the distribution of modes of action reveals information to which proportion the dataset selected for the comparative analysis is based on substances with a specific MoA that is likely to exhibit acute toxicity higher than expected from their baseline toxicity. The MoA analysis revealed that the dataset consisted of 38 % (potential) narcotic substances (Table 4.5.4). However, for most of the narcotic substances the MoA was assigned using a QSAR analysis and the actual MoA may differ from the QSAR prediction. Twenty-three percent of the substances for which no MoA information was available could not be classified by a QSAR analysis for acute toxicity modes - because the substance’s structural domains have not been represented in the QSAR training set. The remaining MoA classifications referred to a large extent to a specific mode of action and/or mode that is likely to result in a toxicity higher than the substance’s baseline toxicity (e.g. reactive, oxidative phosphorylation uncoupler). About 11 percent of the substances exhibited a neurotoxic mode of action (e.g. acetylcholinesterase inhibition, GABA antagonism, voltage-gated sodium channel modulator). In order to allow a more quantitative analysis, relatively broad terms were used to describe the mode of action. The detailed mode or mechanism of
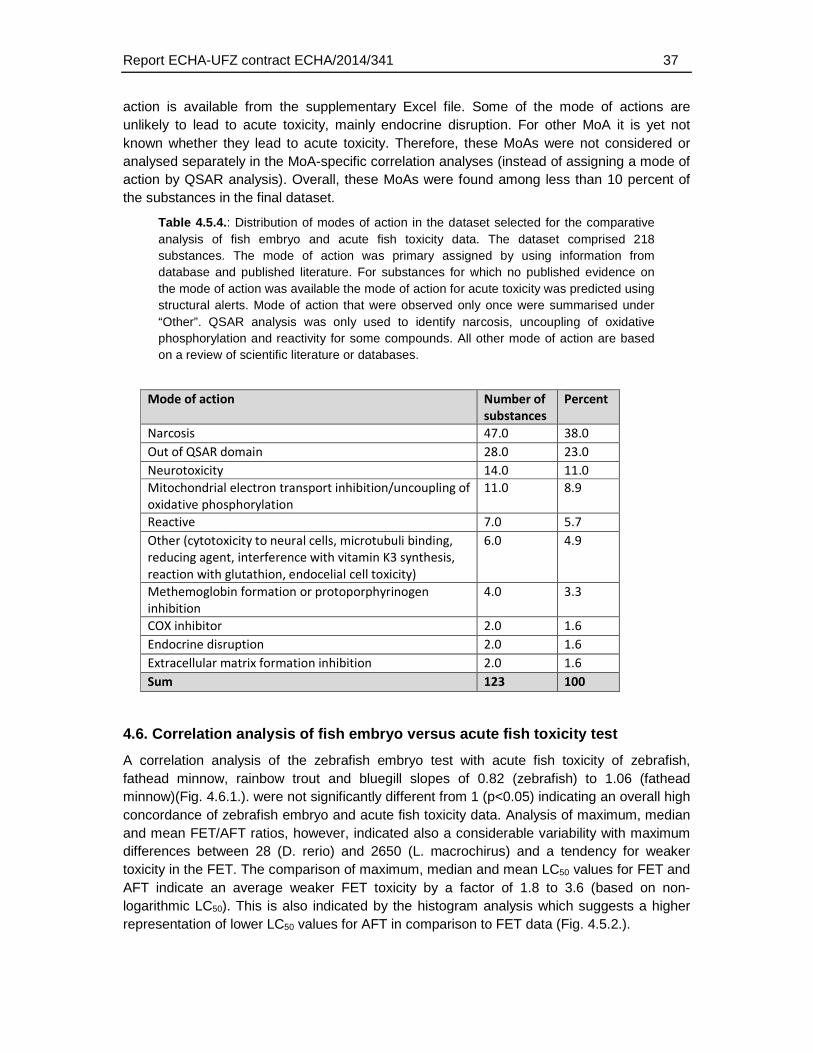
Report ECHA-UFZ contract ECHA/2014/341 37
action is available from the supplementary Excel file. Some of the mode of actions are unlikely to lead to acute toxicity, mainly endocrine disruption. For other MoA it is yet not known whether they lead to acute toxicity. Therefore, these MoAs were not considered or analysed separately in the MoA-specific correlation analyses (instead of assigning a mode of action by QSAR analysis). Overall, these MoAs were found among less than 10 percent of the substances in the final dataset.
Table 4.5.4.: Distribution of modes of action in the dataset selected for the comparative analysis of fish embryo and acute fish toxicity data. The dataset comprised 218 substances. The mode of action was primary assigned by using information from database and published literature. For substances for which no published evidence on the mode of action was available the mode of action for acute toxicity was predicted using structural alerts. Mode of action that were observed only once were summarised under “Other”. QSAR analysis was only used to identify narcosis, uncoupling of oxidative phosphorylation and reactivity for some compounds. All other mode of action are based on a review of scientific literature or databases.
Mode of action Number of
substances
Percent
Narcosis 47.0 38.0
Out of QSAR domain 28.0 23.0
Neurotoxicity 14.0 11.0
Mitochondrial electron transport inhibition/uncoupling of
oxidative phosphorylation
11.0 8.9
Reactive 7.0 5.7
Other (cytotoxicity to neural cells, microtubuli binding,
reducing agent, interference with vitamin K3 synthesis,
reaction with glutathion, endocelial cell toxicity)
6.0 4.9
Methemoglobin formation or protoporphyrinogen
inhibition
4.0 3.3
COX inhibitor 2.0 1.6
Endocrine disruption 2.0 1.6
Extracellular matrix formation inhibition 2.0 1.6
Sum 123 100
4.6. Correlation analysis of fish embryo versus acute fish toxicity test
A correlation analysis of the zebrafish embryo test with acute fish toxicity of zebrafish, fathead minnow, rainbow trout and bluegill slopes of 0.82 (zebrafish) to 1.06 (fathead minnow)(Fig. 4.6.1.). were not significantly different from 1 (p<0.05) indicating an overall high concordance of zebrafish embryo and acute fish toxicity data. Analysis of maximum, median and mean FET/AFT ratios, however, indicated also a considerable variability with maximum differences between 28 (D. rerio) and 2650 (L. macrochirus) and a tendency for weaker toxicity in the FET. The comparison of maximum, median and mean LC50 values for FET and AFT indicate an average weaker FET toxicity by a factor of 1.8 to 3.6 (based on non-logarithmic LC50). This is also indicated by the histogram analysis which suggests a higher representation of lower LC50 values for AFT in comparison to FET data (Fig. 4.5.2.).
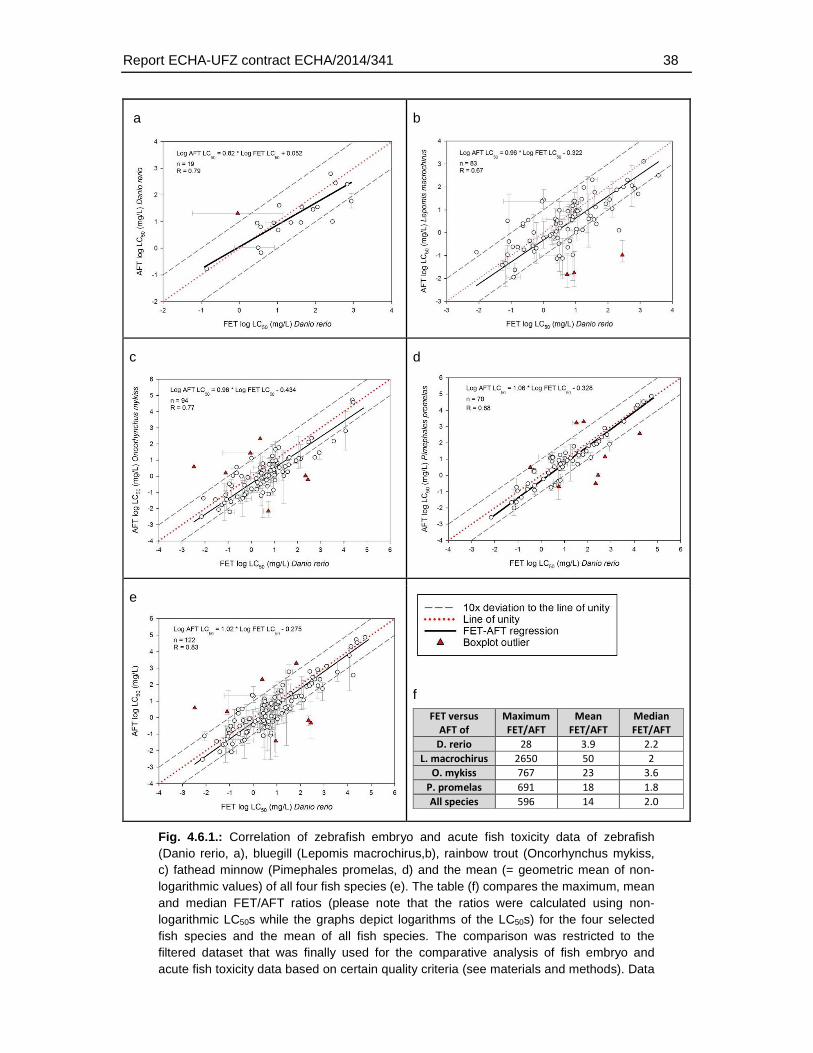
Report ECHA-UFZ contract ECHA/2014/341 38
a b
c d
e
f
FET versus
AFT of
Maximum
FET/AFT
Mean
FET/AFT
Median
FET/AFT
D. rerio 28 3.9 2.2
L. macrochirus 2650 50 2
O. mykiss 767 23 3.6
P. promelas 691 18 1.8
All species 596 14 2.0
Fig. 4.6.1.: Correlation of zebrafish embryo and acute fish toxicity data of zebrafish (Danio rerio, a), bluegill (Lepomis macrochirus,b), rainbow trout (Oncorhynchus mykiss, c) fathead minnow (Pimephales promelas, d) and the mean (= geometric mean of non-logarithmic values) of all four fish species (e). The table (f) compares the maximum, mean and median FET/AFT ratios (please note that the ratios were calculated using non-logarithmic LC50s while the graphs depict logarithms of the LC50s) for the four selected fish species and the mean of all fish species. The comparison was restricted to the filtered dataset that was finally used for the comparative analysis of fish embryo and acute fish toxicity data based on certain quality criteria (see materials and methods). Data
Report ECHA-UFZ contract ECHA/2014/341 39
points represent means of the logarithmic LC50 in case that data from more than one study for a specific fish species was available. Red triangles represent outliers that were identified based on a box plot analysis of the residuals of the regression. These outliers were, however, included in the regression analysis. The end of the error bars represent the lowest and highest LC50 obtained for a particular species (asymmetric distribution of error bars indicate that LC50 were generated in more than three studies). Hypothesis testing indicated that for all regression analysis the slope was significant different to 0 but not from 1 (p<0.05). For all analyses except the comparison with Danio rerio AFT the intercept was significant different to 0 (based on 95 % confidence intervals). See Annex 1 for an alternative representation of correlation plots (without statistical outlier removal) and three-letter codes for each data point to facilitate identification of corresponding chemicals.
4.7. Association of weak FET toxicity with modes of action
In order to identify whether the weaker toxicity in FET or a greater variability of the FET is related to MoAs of the test substance the distribution of MoAs in relation to the FET/AFT ratios was investigated. Higher FET/AFT ratios were particularly observed for non-narcotic substances, i.e. neurotoxic and reactive substances and for substances that interfere with mitochondrial respiration. This was also confirmed by correlation analyses that were conducted separately for different MoAs. Differences in variability are difficult to identify from the analysis given the different sample numbers. However, for neurotoxic compounds the strongest deviation from the line of unity was observed. I.e. on average the FET for neurotoxic compounds deviated by a factor 10 from the line of unity, while all other considered MoA scattered around the line of unity.
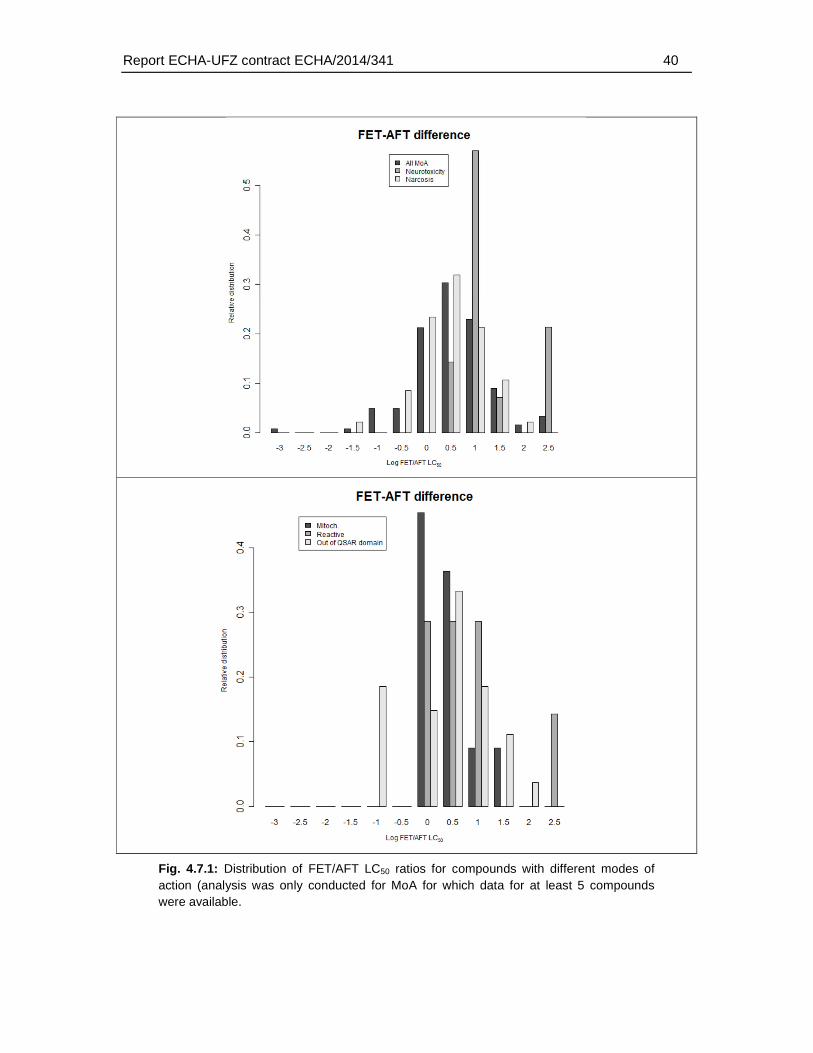
Report ECHA-UFZ contract ECHA/2014/341 40
Fig. 4.7.1: Distribution of FET/AFT LC50 ratios for compounds with different modes of action (analysis was only conducted for MoA for which data for at least 5 compounds were available.
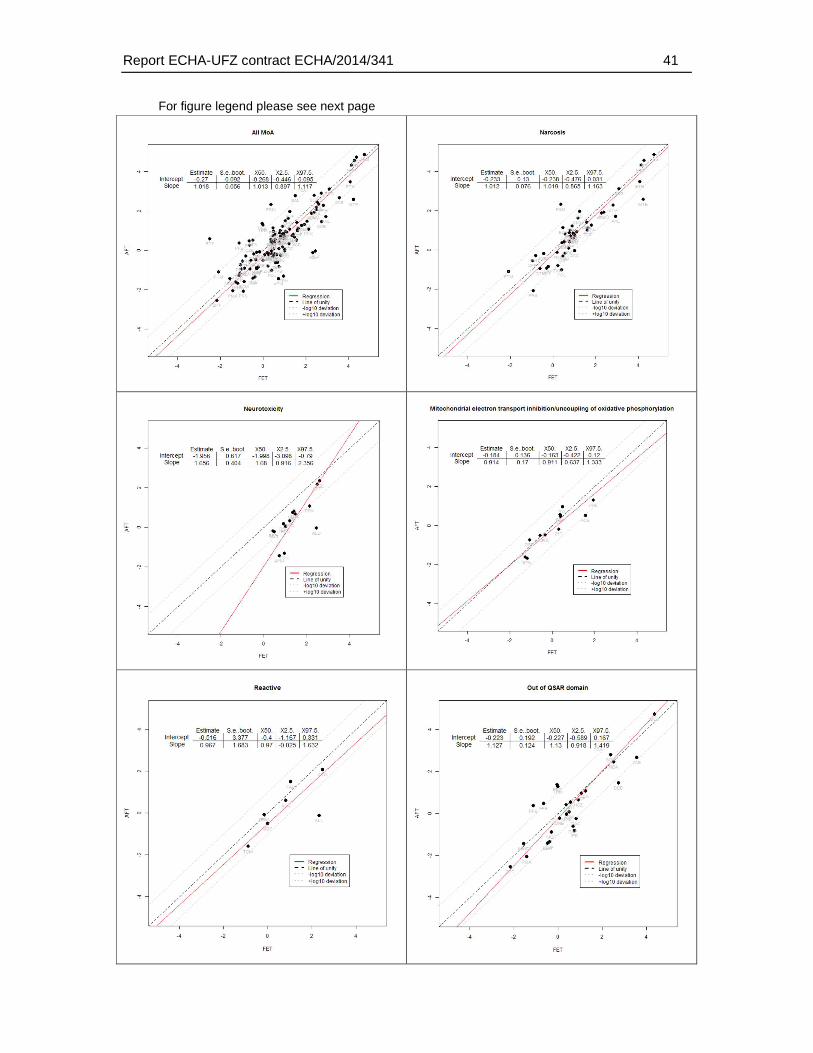
Report ECHA-UFZ contract ECHA/2014/341 41
For figure legend please see next page
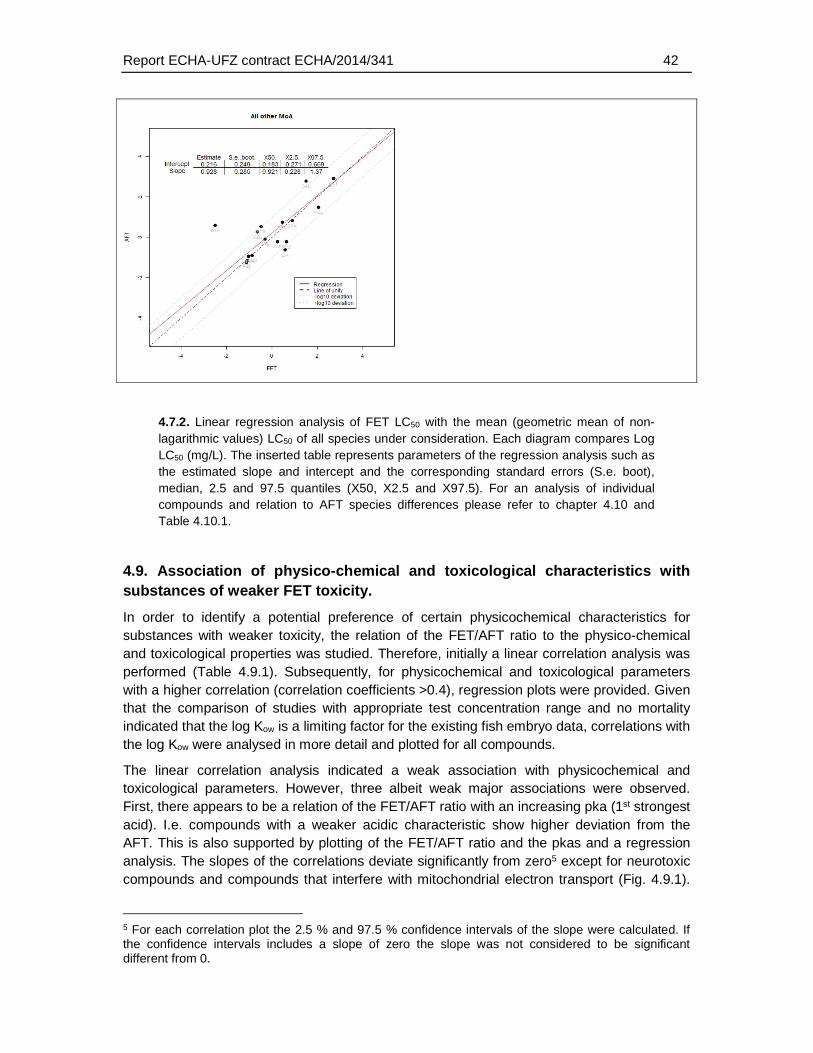
Report ECHA-UFZ contract ECHA/2014/341 42
4.7.2. Linear regression analysis of FET LC50 with the mean (geometric mean of non-lagarithmic values) LC50 of all species under consideration. Each diagram compares Log LC50 (mg/L). The inserted table represents parameters of the regression analysis such as the estimated slope and intercept and the corresponding standard errors (S.e. boot), median, 2.5 and 97.5 quantiles (X50, X2.5 and X97.5). For an analysis of individual compounds and relation to AFT species differences please refer to chapter 4.10 and Table 4.10.1.
4.9. Association of physico-chemical and toxicological characteristics with substances of weaker FET toxicity.
In order to identify a potential preference of certain physicochemical characteristics for substances with weaker toxicity, the relation of the FET/AFT ratio to the physico-chemical and toxicological properties was studied. Therefore, initially a linear correlation analysis was performed (Table 4.9.1). Subsequently, for physicochemical and toxicological parameters with a higher correlation (correlation coefficients >0.4), regression plots were provided. Given that the comparison of studies with appropriate test concentration range and no mortality indicated that the log Kow is a limiting factor for the existing fish embryo data, correlations with the log Kow were analysed in more detail and plotted for all compounds.
The linear correlation analysis indicated a weak association with physicochemical and toxicological parameters. However, three albeit weak major associations were observed. First, there appears to be a relation of the FET/AFT ratio with an increasing pka (1st strongest acid). I.e. compounds with a weaker acidic characteristic show higher deviation from the AFT. This is also supported by plotting of the FET/AFT ratio and the pkas and a regression analysis. The slopes of the correlations deviate significantly from zero5 except for neurotoxic compounds and compounds that interfere with mitochondrial electron transport (Fig. 4.9.1).
5 For each correlation plot the 2.5 % and 97.5 % confidence intervals of the slope were calculated. If the confidence intervals includes a slope of zero the slope was not considered to be significant different from 0.
Report ECHA-UFZ contract ECHA/2014/341 43
Second, an association of FET/AFT ratios with the toxic ratio (baseline versus observed LC50) was noted (Fig. 4.9.2). I.e. compounds that exhibit a weaker toxicity in the FET were characterised by a higher toxic ratio. The toxic ratio can be considered as an indicator of a specific mode of action. And third, for neurotoxic compounds and compounds out of the QSAR domain and other MoAs an association with the AFT LC50 could be found.
The initial analysis of FET data had indicated a bias for hydrophobic substances. I.e. for substances with a log Kow >4 a high percentage of studies did not observe any mortality – albeit an appropriate concentration range including the baseline toxicity was used. Since this could have been caused by inappropriate exposure conditions (adsorption to test vessels) substances with a log Kow > 4 were removed from the data set unless no chemical analytics had been conducted and confirmed the exposure concentrations. In order to test whether after excluding of high log Kow compounds there was no association of FET/AFT ratios with the log Kow, we compared the FET/AFT ratio of all MoAs and selected MoAs with the log Kow. Both the linear correlation analysis as well as the regression plot (n=120 for all modes of action and n=7 to 47 for specific mode of action) and regression parameters (slope not significant different from zero) did not indicate any relation of the FET/AFT ratio to the log Kow
(Fig. 4.9.4).
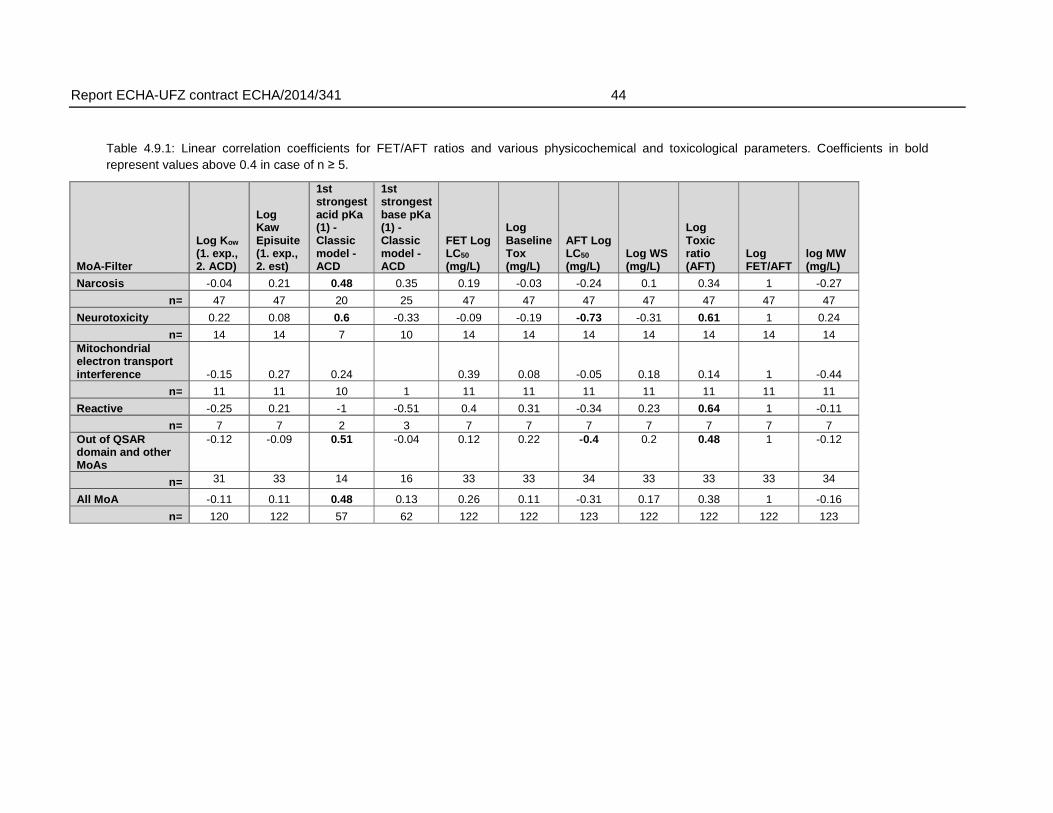
Report ECHA-UFZ contract ECHA/2014/341 44
Table 4.9.1: Linear correlation coefficients for FET/AFT ratios and various physicochemical and toxicological parameters. Coefficients in bold represent values above 0.4 in case of n ≥ 5.
MoA-Filter
Log Kow (1. exp., 2. ACD)
Log Kaw Episuite (1. exp., 2. est)
1st strongest acid pKa (1) - Classic model - ACD
1st strongest base pKa (1) - Classic model - ACD
FET Log LC50 (mg/L)
Log Baseline Tox (mg/L)
AFT Log LC50 (mg/L)
Log WS (mg/L)
Log Toxic ratio (AFT)
Log FET/AFT
log MW (mg/L)
Narcosis -0.04 0.21 0.48 0.35 0.19 -0.03 -0.24 0.1 0.34 1 -0.27
n= 47 47 20 25 47 47 47 47 47 47 47
Neurotoxicity 0.22 0.08 0.6 -0.33 -0.09 -0.19 -0.73 -0.31 0.61 1 0.24
n= 14 14 7 10 14 14 14 14 14 14 14 Mitochondrial electron transport interference -0.15 0.27 0.24 0.39 0.08 -0.05 0.18 0.14 1 -0.44
n= 11 11 10 1 11 11 11 11 11 11 11
Reactive -0.25 0.21 -1 -0.51 0.4 0.31 -0.34 0.23 0.64 1 -0.11
n= 7 7 2 3 7 7 7 7 7 7 7 Out of QSAR domain and other MoAs
-0.12 -0.09 0.51 -0.04 0.12 0.22 -0.4 0.2 0.48 1 -0.12
n= 31 33 14 16 33 33 34 33 33 33 34
All MoA -0.11 0.11 0.48 0.13 0.26 0.11 -0.31 0.17 0.38 1 -0.16
n= 120 122 57 62 122 122 123 122 122 122 123
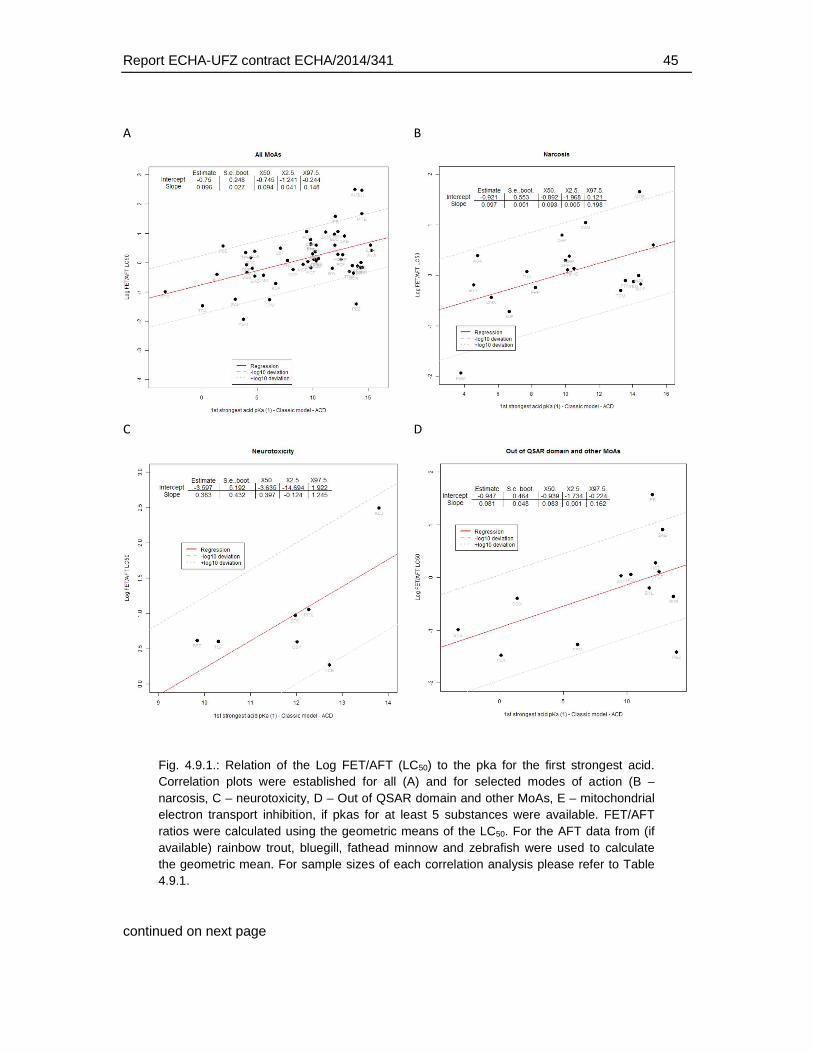
Report ECHA-UFZ contract ECHA/2014/341 45
A
B
C D
Fig. 4.9.1.: Relation of the Log FET/AFT (LC50) to the pka for the first strongest acid. Correlation plots were established for all (A) and for selected modes of action (B – narcosis, C – neurotoxicity, D – Out of QSAR domain and other MoAs, E – mitochondrial electron transport inhibition, if pkas for at least 5 substances were available. FET/AFT ratios were calculated using the geometric means of the LC50. For the AFT data from (if available) rainbow trout, bluegill, fathead minnow and zebrafish were used to calculate the geometric mean. For sample sizes of each correlation analysis please refer to Table 4.9.1.
continued on next page
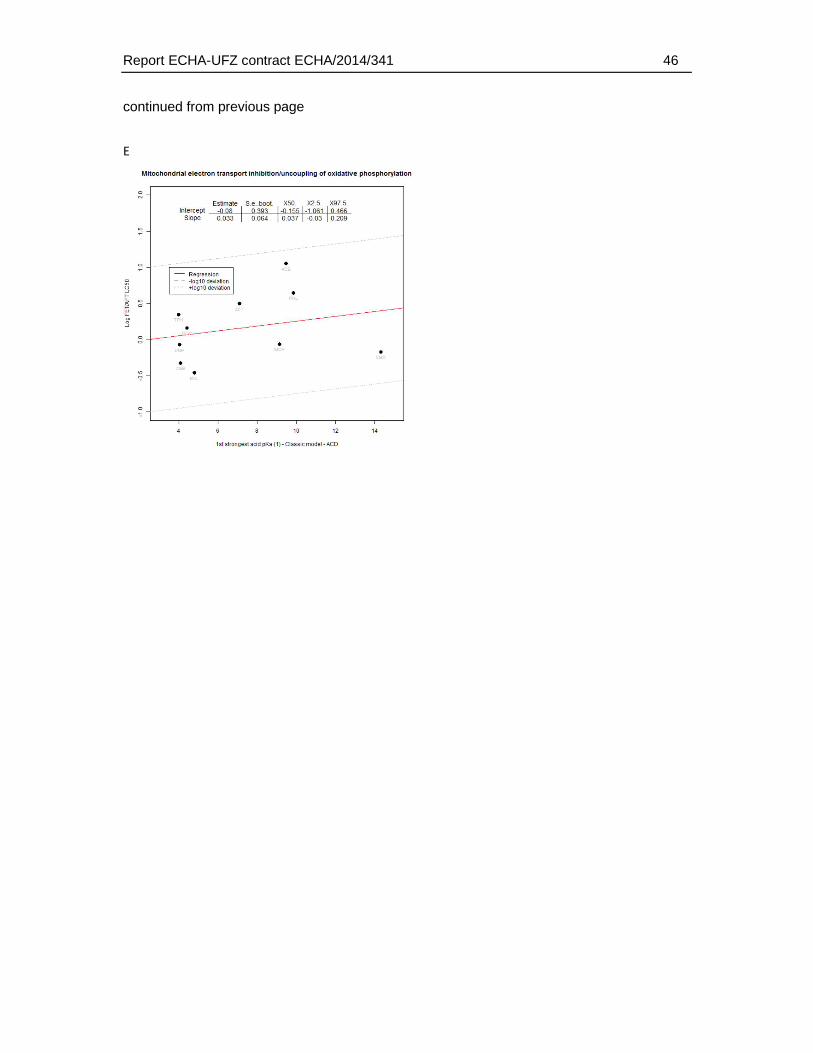
Report ECHA-UFZ contract ECHA/2014/341 46
continued from previous page
E
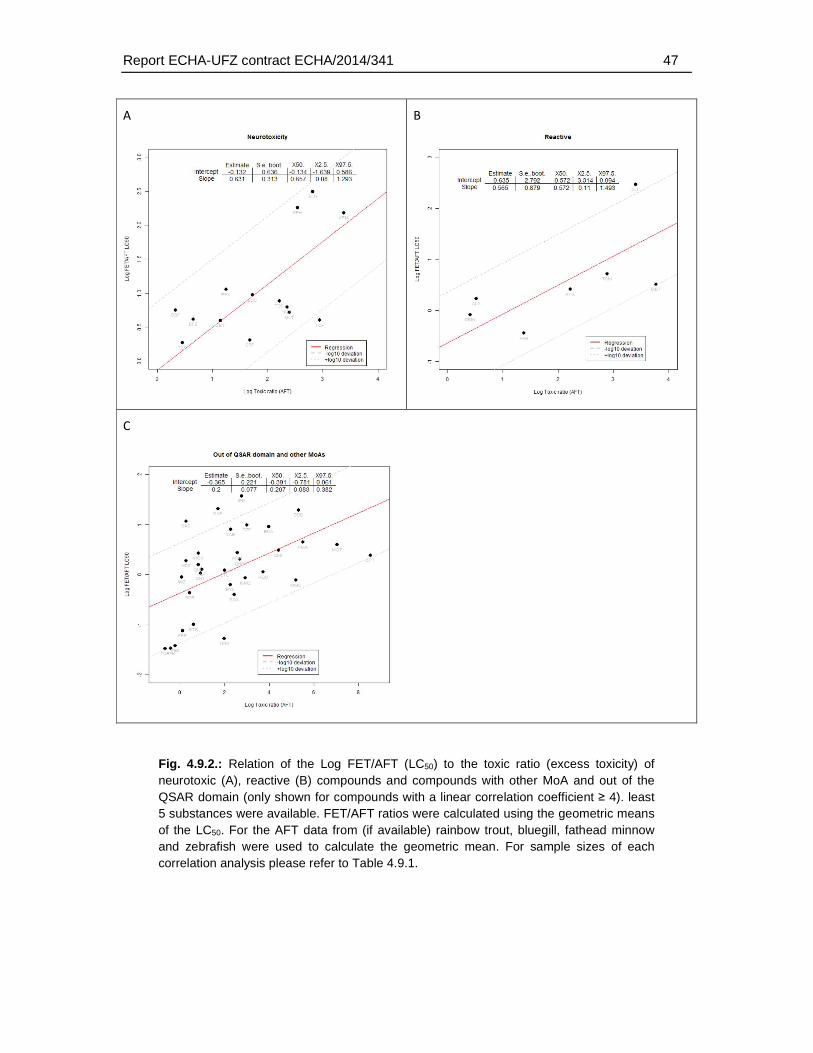
Report ECHA-UFZ contract ECHA/2014/341 47
A
B
C
Fig. 4.9.2.: Relation of the Log FET/AFT (LC50) to the toxic ratio (excess toxicity) of neurotoxic (A), reactive (B) compounds and compounds with other MoA and out of the QSAR domain (only shown for compounds with a linear correlation coefficient ≥ 4). least 5 substances were available. FET/AFT ratios were calculated using the geometric means of the LC50. For the AFT data from (if available) rainbow trout, bluegill, fathead minnow and zebrafish were used to calculate the geometric mean. For sample sizes of each correlation analysis please refer to Table 4.9.1.
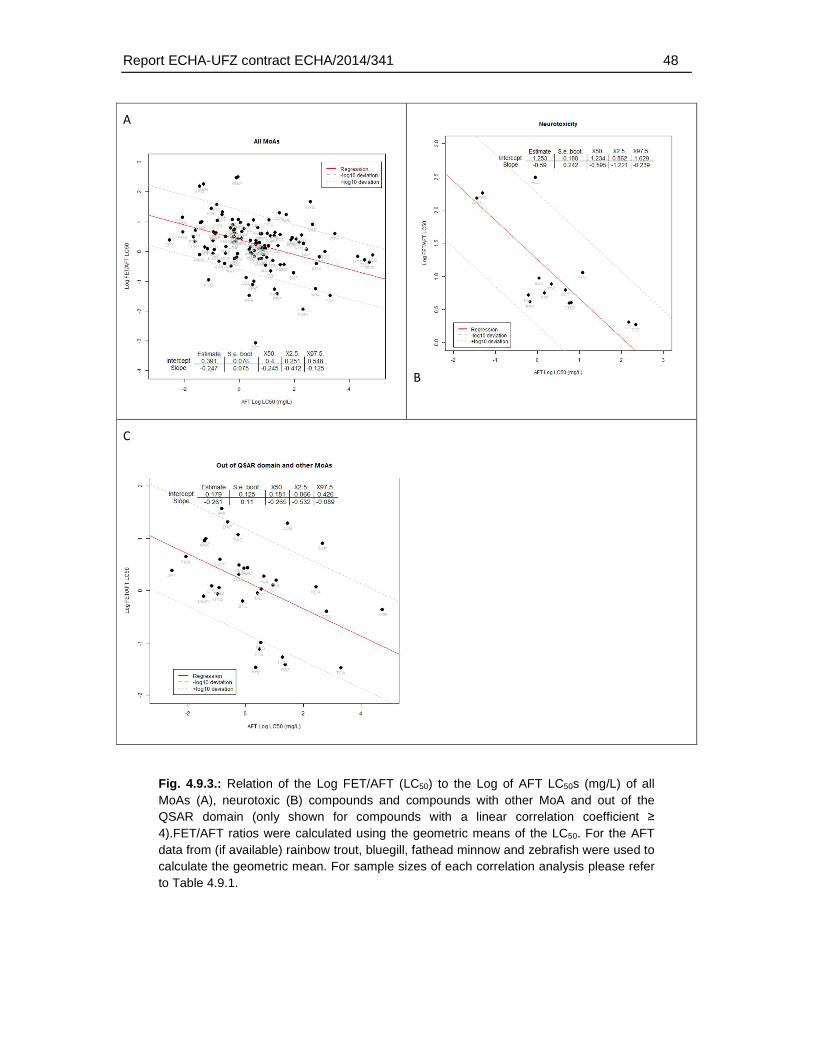
Report ECHA-UFZ contract ECHA/2014/341 48
Fig. 4.9.3.: Relation of the Log FET/AFT (LC50) to the Log of AFT LC50s (mg/L) of all MoAs (A), neurotoxic (B) compounds and compounds with other MoA and out of the QSAR domain (only shown for compounds with a linear correlation coefficient ≥ 4).FET/AFT ratios were calculated using the geometric means of the LC50. For the AFT data from (if available) rainbow trout, bluegill, fathead minnow and zebrafish were used to calculate the geometric mean. For sample sizes of each correlation analysis please refer to Table 4.9.1.
A
B
C
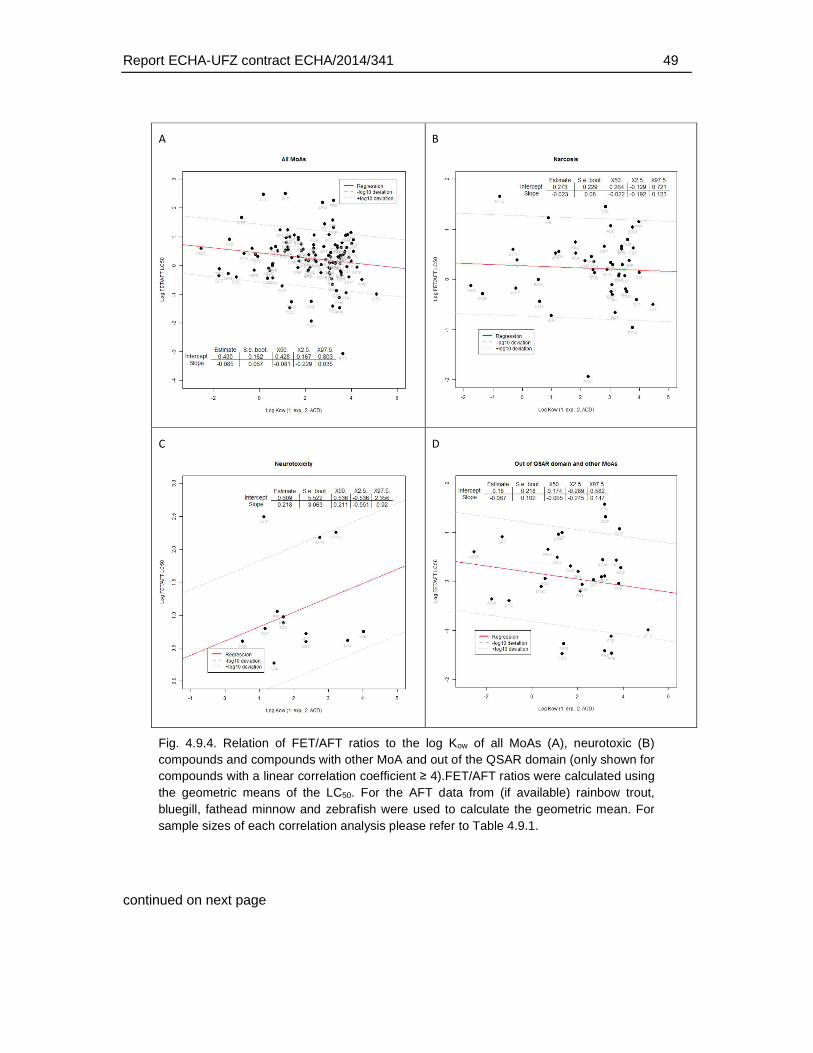
Report ECHA-UFZ contract ECHA/2014/341 49
A
B
C
D
Fig. 4.9.4. Relation of FET/AFT ratios to the log Kow of all MoAs (A), neurotoxic (B) compounds and compounds with other MoA and out of the QSAR domain (only shown for compounds with a linear correlation coefficient ≥ 4).FET/AFT ratios were calculated using the geometric means of the LC50. For the AFT data from (if available) rainbow trout, bluegill, fathead minnow and zebrafish were used to calculate the geometric mean. For sample sizes of each correlation analysis please refer to Table 4.9.1.
continued on next page
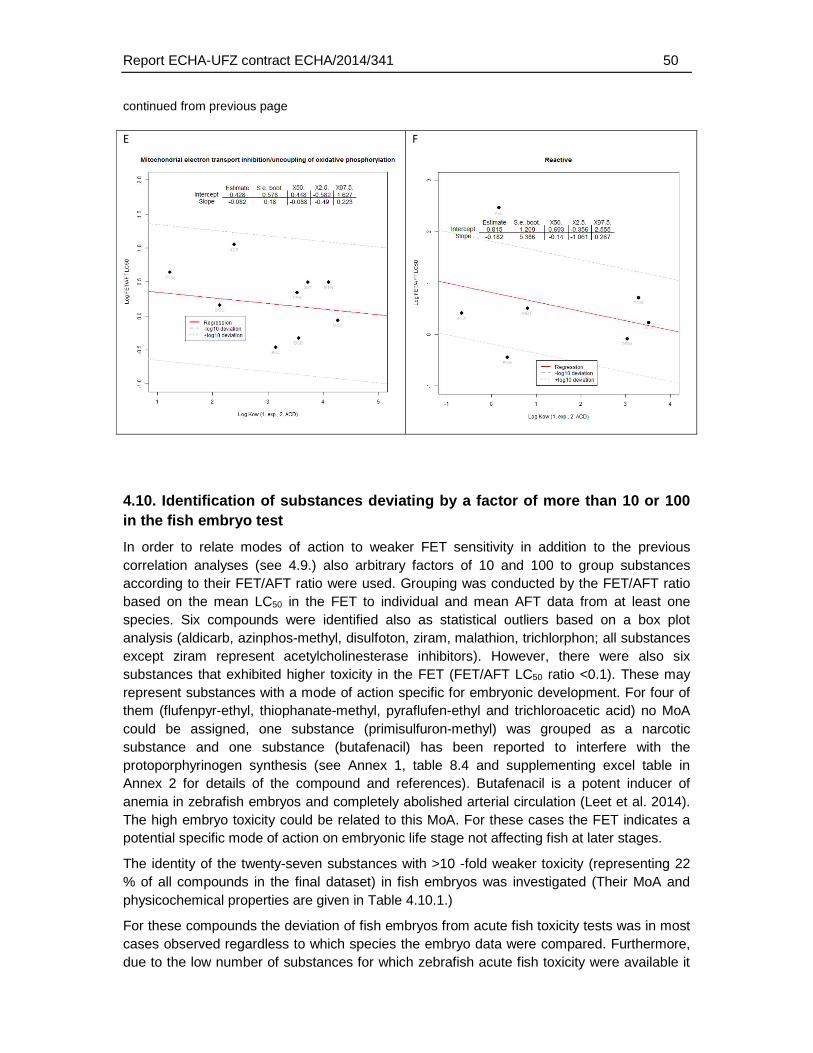
Report ECHA-UFZ contract ECHA/2014/341 50
continued from previous page
4.10. Identification of substances deviating by a factor of more than 10 or 100 in the fish embryo test
In order to relate modes of action to weaker FET sensitivity in addition to the previous correlation analyses (see 4.9.) also arbitrary factors of 10 and 100 to group substances according to their FET/AFT ratio were used. Grouping was conducted by the FET/AFT ratio based on the mean LC50 in the FET to individual and mean AFT data from at least one species. Six compounds were identified also as statistical outliers based on a box plot analysis (aldicarb, azinphos-methyl, disulfoton, ziram, malathion, trichlorphon; all substances except ziram represent acetylcholinesterase inhibitors). However, there were also six substances that exhibited higher toxicity in the FET (FET/AFT LC50 ratio <0.1). These may represent substances with a mode of action specific for embryonic development. For four of them (flufenpyr-ethyl, thiophanate-methyl, pyraflufen-ethyl and trichloroacetic acid) no MoA could be assigned, one substance (primisulfuron-methyl) was grouped as a narcotic substance and one substance (butafenacil) has been reported to interfere with the protoporphyrinogen synthesis (see Annex 1, table 8.4 and supplementing excel table in Annex 2 for details of the compound and references). Butafenacil is a potent inducer of anemia in zebrafish embryos and completely abolished arterial circulation (Leet et al. 2014). The high embryo toxicity could be related to this MoA. For these cases the FET indicates a potential specific mode of action on embryonic life stage not affecting fish at later stages.
The identity of the twenty-seven substances with >10 -fold weaker toxicity (representing 22 % of all compounds in the final dataset) in fish embryos was investigated (Their MoA and physicochemical properties are given in Table 4.10.1.)
For these compounds the deviation of fish embryos from acute fish toxicity tests was in most cases observed regardless to which species the embryo data were compared. Furthermore, due to the low number of substances for which zebrafish acute fish toxicity were available it
E
F
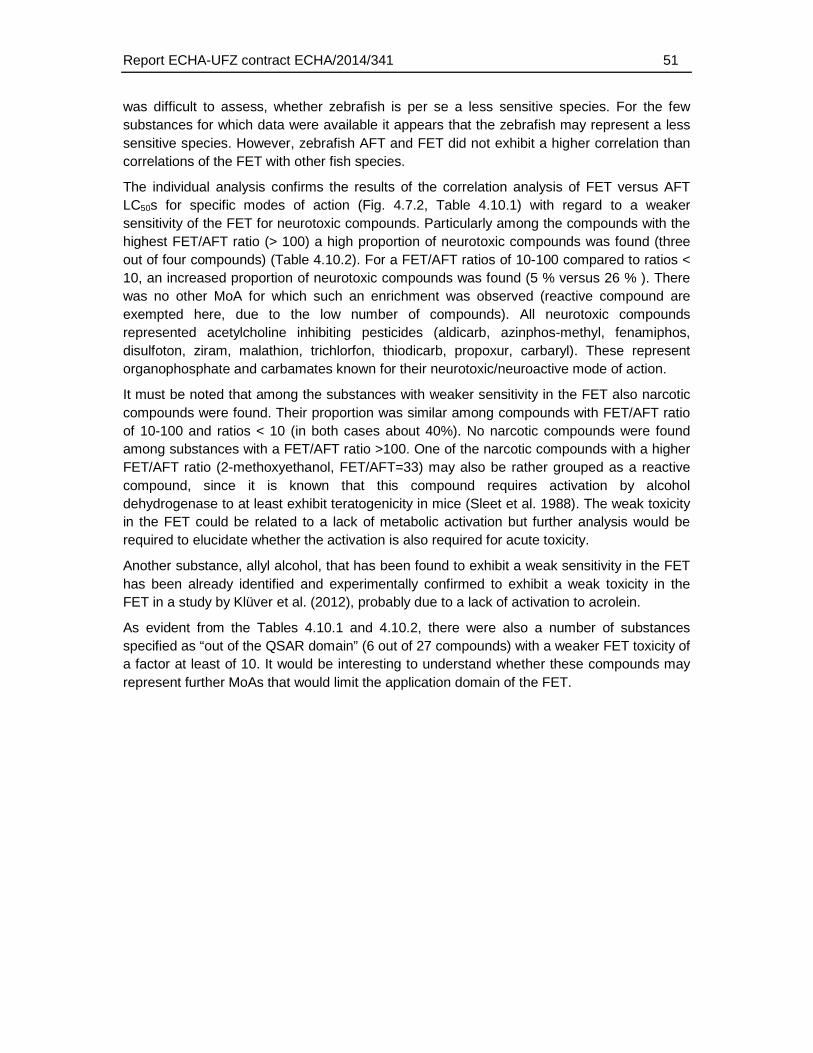
Report ECHA-UFZ contract ECHA/2014/341 51
was difficult to assess, whether zebrafish is per se a less sensitive species. For the few substances for which data were available it appears that the zebrafish may represent a less sensitive species. However, zebrafish AFT and FET did not exhibit a higher correlation than correlations of the FET with other fish species.
The individual analysis confirms the results of the correlation analysis of FET versus AFT LC50s for specific modes of action (Fig. 4.7.2, Table 4.10.1) with regard to a weaker sensitivity of the FET for neurotoxic compounds. Particularly among the compounds with the highest FET/AFT ratio (> 100) a high proportion of neurotoxic compounds was found (three out of four compounds) (Table 4.10.2). For a FET/AFT ratios of 10-100 compared to ratios < 10, an increased proportion of neurotoxic compounds was found (5 % versus 26 % ). There was no other MoA for which such an enrichment was observed (reactive compound are exempted here, due to the low number of compounds). All neurotoxic compounds represented acetylcholine inhibiting pesticides (aldicarb, azinphos-methyl, fenamiphos, disulfoton, ziram, malathion, trichlorfon, thiodicarb, propoxur, carbaryl). These represent organophosphate and carbamates known for their neurotoxic/neuroactive mode of action.
It must be noted that among the substances with weaker sensitivity in the FET also narcotic compounds were found. Their proportion was similar among compounds with FET/AFT ratio of 10-100 and ratios < 10 (in both cases about 40%). No narcotic compounds were found among substances with a FET/AFT ratio >100. One of the narcotic compounds with a higher FET/AFT ratio (2-methoxyethanol, FET/AFT=33) may also be rather grouped as a reactive compound, since it is known that this compound requires activation by alcohol dehydrogenase to at least exhibit teratogenicity in mice (Sleet et al. 1988). The weak toxicity in the FET could be related to a lack of metabolic activation but further analysis would be required to elucidate whether the activation is also required for acute toxicity.
Another substance, allyl alcohol, that has been found to exhibit a weak sensitivity in the FET has been already identified and experimentally confirmed to exhibit a weak toxicity in the FET in a study by Klüver et al. (2012), probably due to a lack of activation to acrolein.
As evident from the Tables 4.10.1 and 4.10.2, there were also a number of substances specified as “out of the QSAR domain” (6 out of 27 compounds) with a weaker FET toxicity of a factor at least of 10. It would be interesting to understand whether these compounds may represent further MoAs that would limit the application domain of the FET.
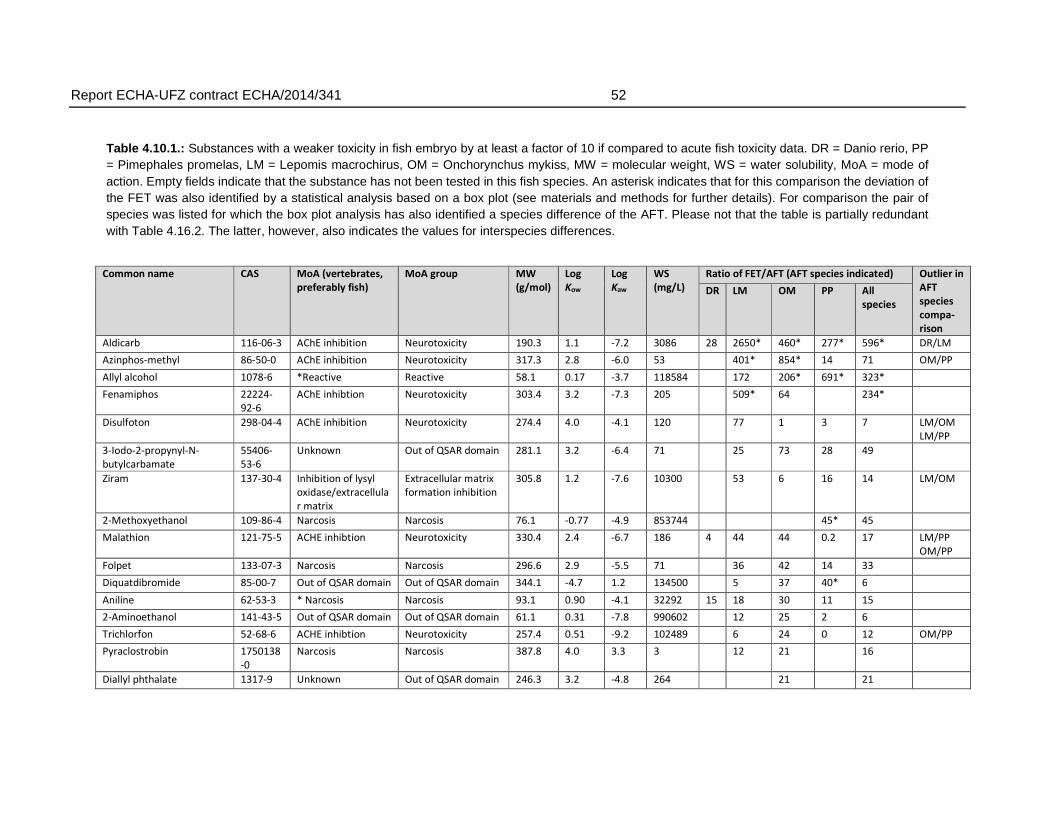
Report ECHA-UFZ contract ECHA/2014/341 52
Table 4.10.1.: Substances with a weaker toxicity in fish embryo by at least a factor of 10 if compared to acute fish toxicity data. DR = Danio rerio, PP = Pimephales promelas, LM = Lepomis macrochirus, OM = Onchorynchus mykiss, MW = molecular weight, WS = water solubility, MoA = mode of action. Empty fields indicate that the substance has not been tested in this fish species. An asterisk indicates that for this comparison the deviation of the FET was also identified by a statistical analysis based on a box plot (see materials and methods for further details). For comparison the pair of species was listed for which the box plot analysis has also identified a species difference of the AFT. Please not that the table is partially redundant with Table 4.16.2. The latter, however, also indicates the values for interspecies differences.
Common name CAS MoA (vertebrates,
preferably fish)
MoA group MW
(g/mol)
Log
Kow
Log
Kaw
WS
(mg/L)
Ratio of FET/AFT (AFT species indicated) Outlier in
AFT
species
compa-
rison
DR LM OM PP All
species
Aldicarb 116-06-3 AChE inhibition Neurotoxicity 190.3 1.1 -7.2 3086 28 2650* 460* 277* 596* DR/LM
Azinphos-methyl 86-50-0 AChE inhibition Neurotoxicity 317.3 2.8 -6.0 53 401* 854* 14 71 OM/PP
Allyl alcohol 1078-6 *Reactive Reactive 58.1 0.17 -3.7 118584 172 206* 691* 323*
Fenamiphos 22224-
92-6
AChE inhibtion Neurotoxicity 303.4 3.2 -7.3 205 509* 64 234*
Disulfoton 298-04-4 AChE inhibition Neurotoxicity 274.4 4.0 -4.1 120 77 1 3 7 LM/OM
LM/PP
3-Iodo-2-propynyl-N-
butylcarbamate
55406-
53-6
Unknown Out of QSAR domain 281.1 3.2 -6.4 71 25 73 28 49
Ziram 137-30-4 Inhibition of lysyl
oxidase/extracellula
r matrix
Extracellular matrix
formation inhibition
305.8 1.2 -7.6 10300 53 6 16 14 LM/OM
2-Methoxyethanol 109-86-4 Narcosis Narcosis 76.1 -0.77 -4.9 853744 45* 45
Malathion 121-75-5 ACHE inhibtion Neurotoxicity 330.4 2.4 -6.7 186 4 44 44 0.2 17 LM/PP
OM/PP
Folpet 133-07-3 Narcosis Narcosis 296.6 2.9 -5.5 71 36 42 14 33
Diquatdibromide 85-00-7 Out of QSAR domain Out of QSAR domain 344.1 -4.7 1.2 134500 5 37 40* 6
Aniline 62-53-3 * Narcosis Narcosis 93.1 0.90 -4.1 32292 15 18 30 11 15
2-Aminoethanol 141-43-5 Out of QSAR domain Out of QSAR domain 61.1 0.31 -7.8 990602 12 25 2 6
Trichlorfon 52-68-6 ACHE inhibtion Neurotoxicity 257.4 0.51 -9.2 102489 6 24 0 12 OM/PP
Pyraclostrobin 1750138
-0
Narcosis Narcosis 387.8 4.0 3.3 3 12 21 16
Diallyl phthalate 1317-9 Unknown Out of QSAR domain 246.3 3.2 -4.8 264 21 21
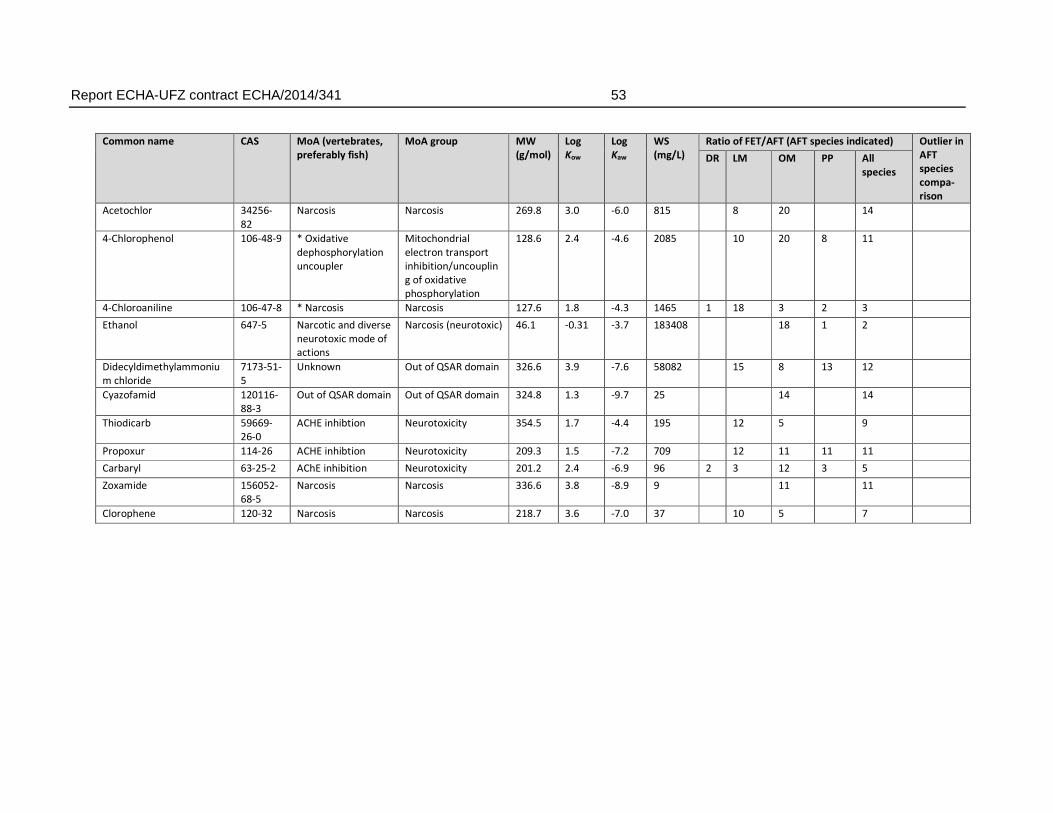
Report ECHA-UFZ contract ECHA/2014/341 53
Common name CAS MoA (vertebrates,
preferably fish)
MoA group MW
(g/mol)
Log
Kow
Log
Kaw
WS
(mg/L)
Ratio of FET/AFT (AFT species indicated) Outlier in
AFT
species
compa-
rison
DR LM OM PP All
species
Acetochlor 34256-
82
Narcosis Narcosis 269.8 3.0 -6.0 815 8 20 14
4-Chlorophenol 106-48-9 * Oxidative
dephosphorylation
uncoupler
Mitochondrial
electron transport
inhibition/uncouplin
g of oxidative
phosphorylation
128.6 2.4 -4.6 2085 10 20 8 11
4-Chloroaniline 106-47-8 * Narcosis Narcosis 127.6 1.8 -4.3 1465 1 18 3 2 3
Ethanol 647-5 Narcotic and diverse
neurotoxic mode of
actions
Narcosis (neurotoxic) 46.1 -0.31 -3.7 183408 18 1 2
Didecyldimethylammoniu
m chloride
7173-51-
5
Unknown Out of QSAR domain 326.6 3.9 -7.6 58082 15 8 13 12
Cyazofamid 120116-
88-3
Out of QSAR domain Out of QSAR domain 324.8 1.3 -9.7 25 14 14
Thiodicarb 59669-
26-0
ACHE inhibtion Neurotoxicity 354.5 1.7 -4.4 195 12 5 9
Propoxur 114-26 ACHE inhibtion Neurotoxicity 209.3 1.5 -7.2 709 12 11 11 11
Carbaryl 63-25-2 AChE inhibition Neurotoxicity 201.2 2.4 -6.9 96 2 3 12 3 5
Zoxamide 156052-
68-5
Narcosis Narcosis 336.6 3.8 -8.9 9 11 11
Clorophene 120-32 Narcosis Narcosis 218.7 3.6 -7.0 37 10 5 7
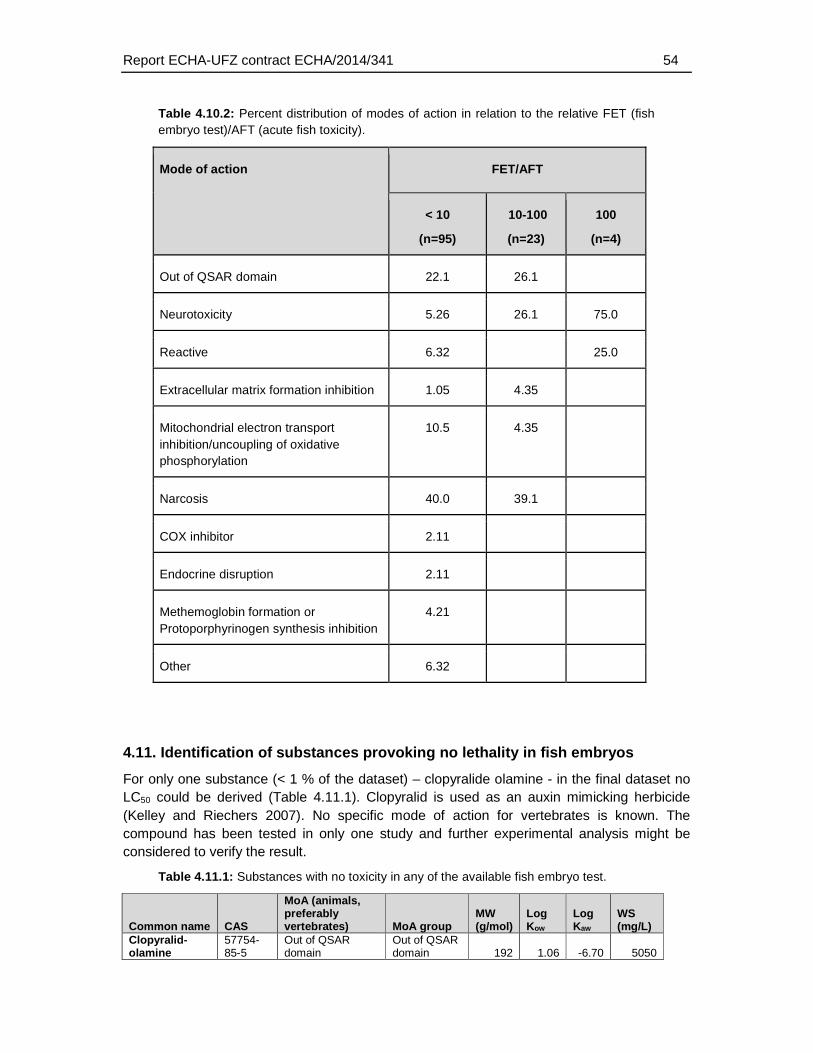
Report ECHA-UFZ contract ECHA/2014/341 54
Table 4.10.2: Percent distribution of modes of action in relation to the relative FET (fish embryo test)/AFT (acute fish toxicity).
Mode of action FET/AFT
< 10
(n=95)
10-100
(n=23)
100
(n=4)
Out of QSAR domain 22.1 26.1
Neurotoxicity 5.26 26.1 75.0
Reactive 6.32 25.0
Extracellular matrix formation inhibition 1.05 4.35
Mitochondrial electron transport inhibition/uncoupling of oxidative phosphorylation
10.5 4.35
Narcosis 40.0 39.1
COX inhibitor 2.11
Endocrine disruption 2.11
Methemoglobin formation or Protoporphyrinogen synthesis inhibition
4.21
Other 6.32
4.11. Identification of substances provoking no lethality in fish embryos
For only one substance (< 1 % of the dataset) – clopyralide olamine - in the final dataset no LC50 could be derived (Table 4.11.1). Clopyralid is used as an auxin mimicking herbicide (Kelley and Riechers 2007). No specific mode of action for vertebrates is known. The compound has been tested in only one study and further experimental analysis might be considered to verify the result.
Table 4.11.1: Substances with no toxicity in any of the available fish embryo test.
Common name CAS
MoA (animals, preferably vertebrates) MoA group
MW (g/mol)
Log Kow
Log Kaw
WS (mg/L)
Clopyralid-olamine
57754-85-5
Out of QSAR domain
Out of QSAR domain 192 1.06 -6.70 5050
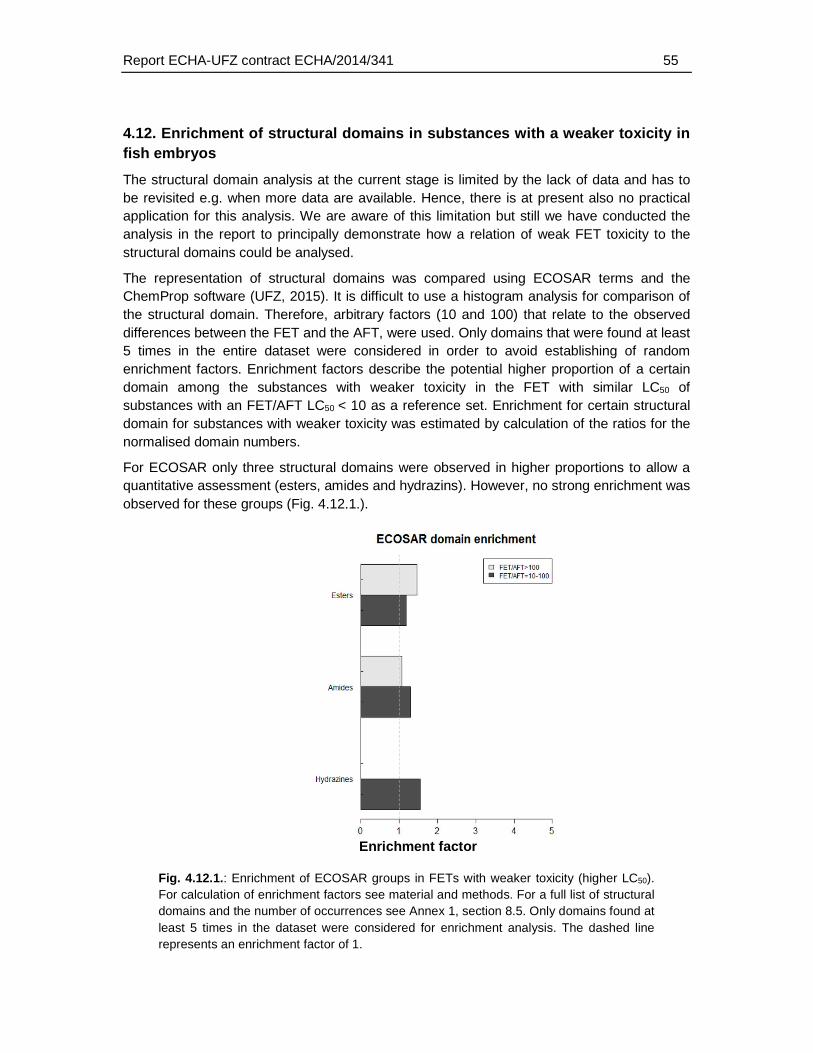
Report ECHA-UFZ contract ECHA/2014/341 55
4.12. Enrichment of structural domains in substances with a weaker toxicity in fish embryos
The structural domain analysis at the current stage is limited by the lack of data and has to be revisited e.g. when more data are available. Hence, there is at present also no practical application for this analysis. We are aware of this limitation but still we have conducted the analysis in the report to principally demonstrate how a relation of weak FET toxicity to the structural domains could be analysed.
The representation of structural domains was compared using ECOSAR terms and the ChemProp software (UFZ, 2015). It is difficult to use a histogram analysis for comparison of the structural domain. Therefore, arbitrary factors (10 and 100) that relate to the observed differences between the FET and the AFT, were used. Only domains that were found at least 5 times in the entire dataset were considered in order to avoid establishing of random enrichment factors. Enrichment factors describe the potential higher proportion of a certain domain among the substances with weaker toxicity in the FET with similar LC50 of substances with an FET/AFT LC50 < 10 as a reference set. Enrichment for certain structural domain for substances with weaker toxicity was estimated by calculation of the ratios for the normalised domain numbers.
For ECOSAR only three structural domains were observed in higher proportions to allow a quantitative assessment (esters, amides and hydrazins). However, no strong enrichment was observed for these groups (Fig. 4.12.1.).
Fig. 4.12.1.: Enrichment of ECOSAR groups in FETs with weaker toxicity (higher LC50). For calculation of enrichment factors see material and methods. For a full list of structural domains and the number of occurrences see Annex 1, section 8.5. Only domains found at least 5 times in the dataset were considered for enrichment analysis. The dashed line represents an enrichment factor of 1.
Enrichment factor
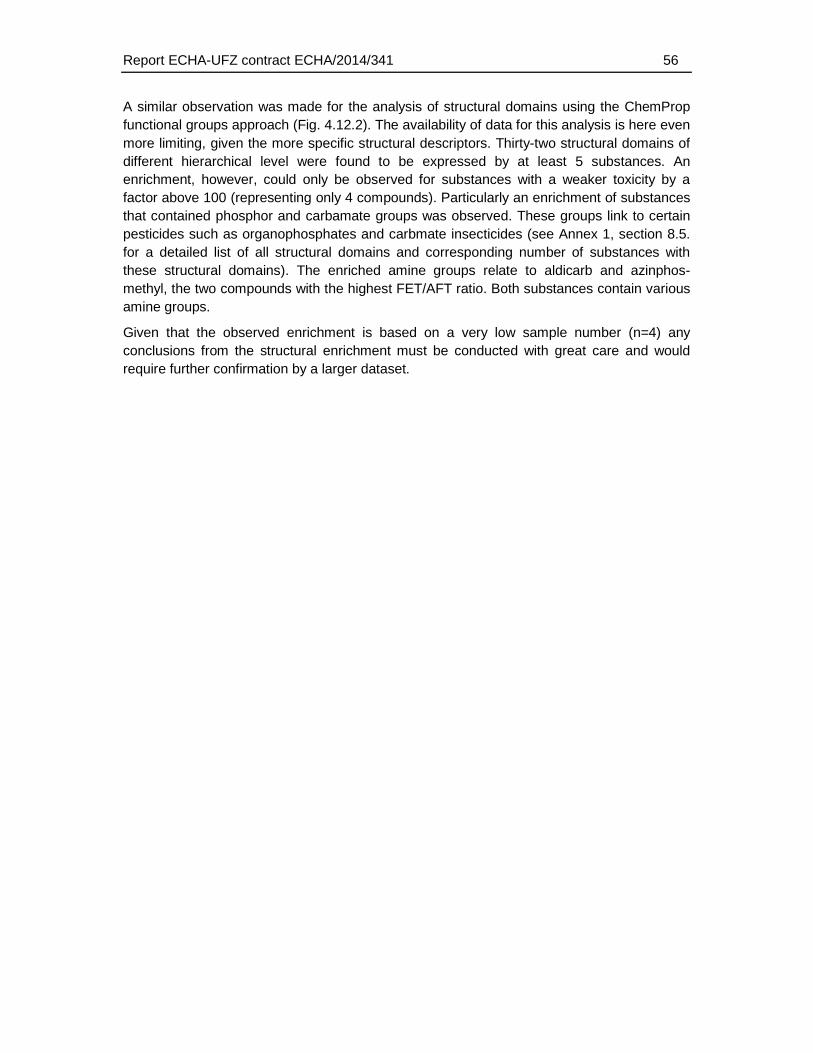
Report ECHA-UFZ contract ECHA/2014/341 56
A similar observation was made for the analysis of structural domains using the ChemProp functional groups approach (Fig. 4.12.2). The availability of data for this analysis is here even more limiting, given the more specific structural descriptors. Thirty-two structural domains of different hierarchical level were found to be expressed by at least 5 substances. An enrichment, however, could only be observed for substances with a weaker toxicity by a factor above 100 (representing only 4 compounds). Particularly an enrichment of substances that contained phosphor and carbamate groups was observed. These groups link to certain pesticides such as organophosphates and carbmate insecticides (see Annex 1, section 8.5. for a detailed list of all structural domains and corresponding number of substances with these structural domains). The enriched amine groups relate to aldicarb and azinphos-methyl, the two compounds with the highest FET/AFT ratio. Both substances contain various amine groups.
Given that the observed enrichment is based on a very low sample number (n=4) any conclusions from the structural enrichment must be conducted with great care and would require further confirmation by a larger dataset.
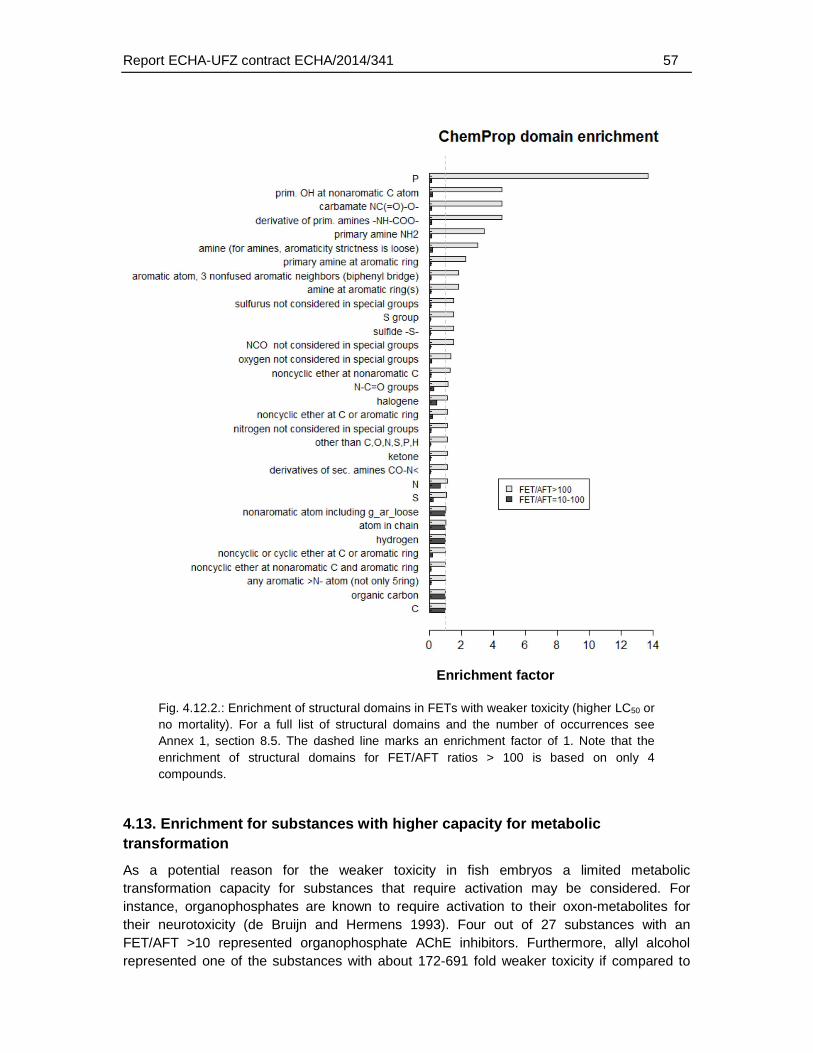
Report ECHA-UFZ contract ECHA/2014/341 57
Fig. 4.12.2.: Enrichment of structural domains in FETs with weaker toxicity (higher LC50 or no mortality). For a full list of structural domains and the number of occurrences see Annex 1, section 8.5. The dashed line marks an enrichment factor of 1. Note that the enrichment of structural domains for FET/AFT ratios > 100 is based on only 4 compounds.
4.13. Enrichment for substances with higher capacity for metabolic transformation
As a potential reason for the weaker toxicity in fish embryos a limited metabolic transformation capacity for substances that require activation may be considered. For instance, organophosphates are known to require activation to their oxon-metabolites for their neurotoxicity (de Bruijn and Hermens 1993). Four out of 27 substances with an FET/AFT >10 represented organophosphate AChE inhibitors. Furthermore, allyl alcohol represented one of the substances with about 172-691 fold weaker toxicity if compared to
Enrichment factor
Report ECHA-UFZ contract ECHA/2014/341 58
acute fish toxicity of all considered fish species. For allyl alcohol, a limited metabolic activation has been indicated in an experimental study (Klüver et al. 2014). 2-Methoxyethanol is another compound with weak toxicity in the FET, for which at least for the induction of teratogenic effects in mice (Sleet et al. 1988), an activation by alcohol dehydrogenase is required. A limited capacity for metabolic activation may apply also for the organophosphates but would require experimental verification. However, carbamate AChE inhibitors also exhibit a weaker toxicity in the fish embryo and there is no evidence for a requirement of metabolic activation of these substances for their acute toxicity in adult fish.
In order to conduct a more quantitative estimation of whether substances with a high metabolic transformation potential may be enriched among substances with a weaker toxicity in fish embryos we used the OECD toolbox to predict S9 metabolites, i.e. transformation products that could be predicted to be observed with incubation of liver S9 supernatant. An initial comparison with the OECD toolbox prediction tool for in vivo metabolism indicated that this tool did not indicate many known metabolites such as e.g. the oxon-metabolite of azinphos-methyl. In contrast, these metabolites were predicted for S9 in vitro metabolism.
It is beyond the scope of this study to analyse each of the predicted individual transformation products and whether they may exhibit a higher toxicity as the parent substance. Therefore, the analysis was restricted to the assessment of the number of substances for which metabolic transformation products could be predicted and how many transformation products would be predicted for each of the substances. There was no apparent association of substances with a higher number of predicted metabolites with higher FET/AFT ratio (Fig. 4.13.1). Hence, the quantitative assessment of predicted S9-metabolites did not provide further support that a reduced metabolic transformation capacity of the fish embryo could contribute to a weaker toxicity.
Fig. 4.13.1: Relation of the number of predicted S9 in vitro metabolic transformation substances to the FET/AFT ratio. The analysis was conducted with the OECD toolbox.
Report ECHA-UFZ contract ECHA/2014/341 59
4.14. Comparison of FET and AFT LC50 for inorganic substances
The FET database – without application of any quality filters – contained 41 entries for inorganic substances representing 20 substances (or 17 substances respectively, if the different copper salts are combined). Therefore, no assessment of the FET for its capacity to predict the acute toxicity of inorganic compounds could be made.
4.15. Comparison of FET and AFT LC50 for formulation and multi-constituent substances or products
Multi-constituent formulations and substances have not been tested in the FET so far or were not publically available. Therefore, no assessment of the FET for its capacity to predict the acute toxicity of multi-constituent products could be made.
4.16. Comparison of acute toxicity for different fish species
The comparison of FET and AFT data indicated that for a number of compounds the FET exhibited a weaker toxicity. Albeit there is an indication that part of this weaker sensitivity can be explained by e.g. an insensitivity of the FET to some MoAs and potentially a limited metabolic capacity for individual compounds, the weaker sensitivity has to be considered also in the context of AFT species sensitivities. Many regulations such as REACH accept that the assessment of acute toxicity for fish is based on the LC50 analysis of only one species without preference for the type of species. Hence, assessment of the fish embryo predictive capacity should be conducted with reference to the overall interspecies variability of acute fish toxicity using the same type of data analysis as conducted for the FET-AFT comparison.
A limitation for the analysis of the AFT-interspecies analysis is that if the analysis would be restricted to the FET final dataset, for only a low number of compounds AFT data from different species would be available. Therefore, this analysis was extended to compounds of the entire FET dataset (i.e. dataset prior to application of the quality filters). A disadvantage of this analysis, is however, that comparisons are based on different sets of substances. The AFT interspecies analysis was restricted to the three species that are mostly used to derive AFT data (rainbow trout, bluegill, fathead minnow) and the zebrafish, i.e. the species mostly used in the FET. For 337 substances of the fish embryo database an interspecies correlation and relation to physicochemical/toxicological properties could be analysed.
4.16.1. Correlation analysis and distribution of interspecies differences for different MoA
The correlation coefficients of 0.86 to 0.98, the slopes between 0.97 and 1.03 and the very small intercepts that were mostly not significant different to 0 indicated a high overall interspecies correlation and similar sensitivity (Fig. 4.6.1.). However, this assessment is based on means of the log LC50 and there are examples where tests in different studies even
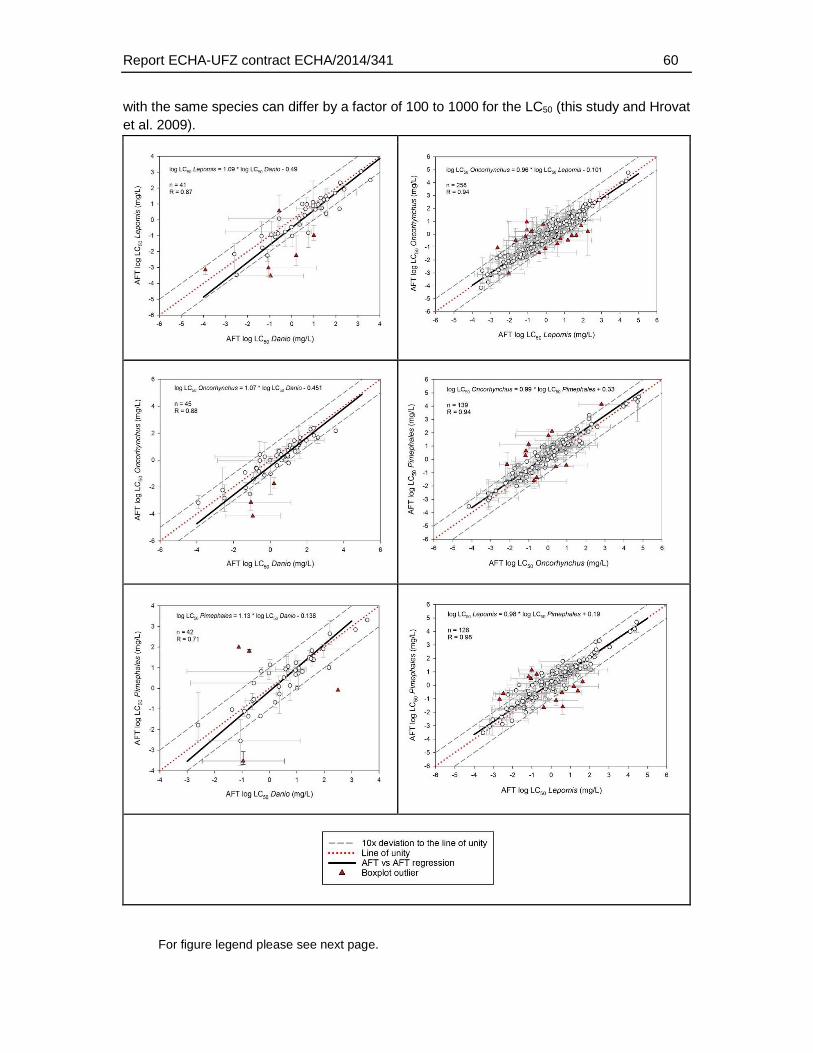
Report ECHA-UFZ contract ECHA/2014/341 60
with the same species can differ by a factor of 100 to 1000 for the LC50 (this study and Hrovat et al. 2009).
For figure legend please see next page.
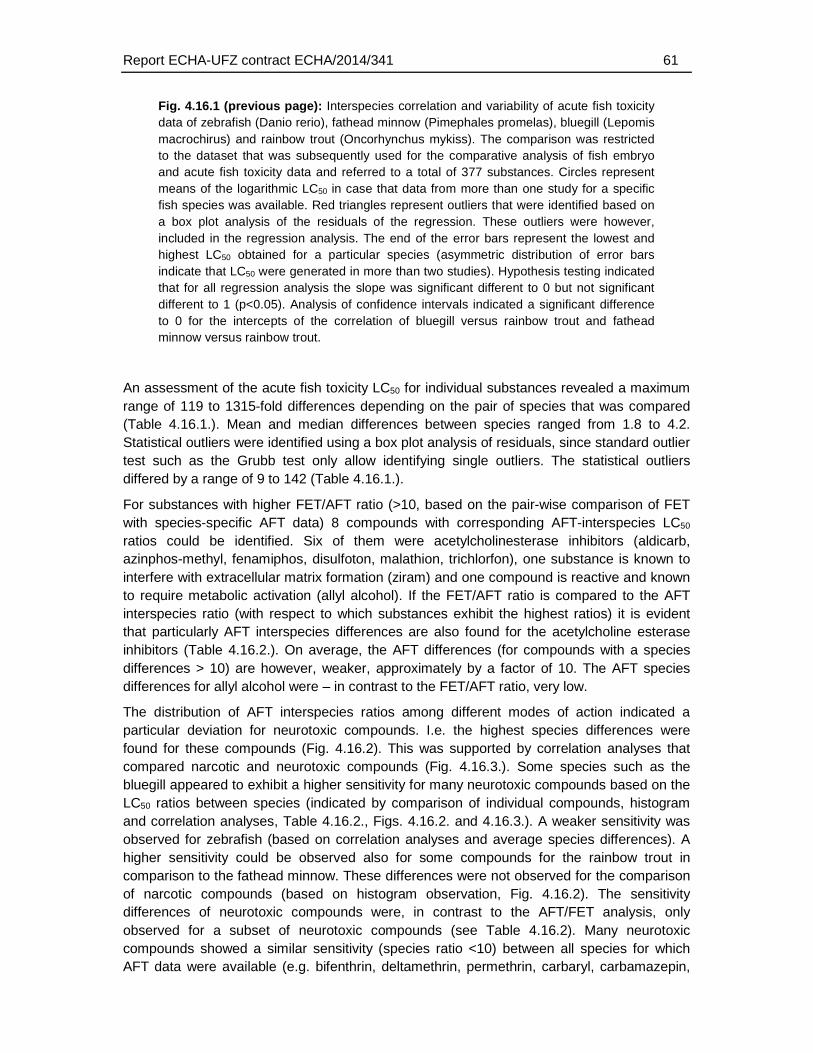
Report ECHA-UFZ contract ECHA/2014/341 61
Fig. 4.16.1 (previous page): Interspecies correlation and variability of acute fish toxicity data of zebrafish (Danio rerio), fathead minnow (Pimephales promelas), bluegill (Lepomis macrochirus) and rainbow trout (Oncorhynchus mykiss). The comparison was restricted to the dataset that was subsequently used for the comparative analysis of fish embryo and acute fish toxicity data and referred to a total of 377 substances. Circles represent means of the logarithmic LC50 in case that data from more than one study for a specific fish species was available. Red triangles represent outliers that were identified based on a box plot analysis of the residuals of the regression. These outliers were however, included in the regression analysis. The end of the error bars represent the lowest and highest LC50 obtained for a particular species (asymmetric distribution of error bars indicate that LC50 were generated in more than two studies). Hypothesis testing indicated that for all regression analysis the slope was significant different to 0 but not significant different to 1 (p<0.05). Analysis of confidence intervals indicated a significant difference to 0 for the intercepts of the correlation of bluegill versus rainbow trout and fathead minnow versus rainbow trout.
An assessment of the acute fish toxicity LC50 for individual substances revealed a maximum range of 119 to 1315-fold differences depending on the pair of species that was compared (Table 4.16.1.). Mean and median differences between species ranged from 1.8 to 4.2. Statistical outliers were identified using a box plot analysis of residuals, since standard outlier test such as the Grubb test only allow identifying single outliers. The statistical outliers differed by a range of 9 to 142 (Table 4.16.1.).
For substances with higher FET/AFT ratio (>10, based on the pair-wise comparison of FET with species-specific AFT data) 8 compounds with corresponding AFT-interspecies LC50 ratios could be identified. Six of them were acetylcholinesterase inhibitors (aldicarb, azinphos-methyl, fenamiphos, disulfoton, malathion, trichlorfon), one substance is known to interfere with extracellular matrix formation (ziram) and one compound is reactive and known to require metabolic activation (allyl alcohol). If the FET/AFT ratio is compared to the AFT interspecies ratio (with respect to which substances exhibit the highest ratios) it is evident that particularly AFT interspecies differences are also found for the acetylcholine esterase inhibitors (Table 4.16.2.). On average, the AFT differences (for compounds with a species differences > 10) are however, weaker, approximately by a factor of 10. The AFT species differences for allyl alcohol were – in contrast to the FET/AFT ratio, very low.
The distribution of AFT interspecies ratios among different modes of action indicated a particular deviation for neurotoxic compounds. I.e. the highest species differences were found for these compounds (Fig. 4.16.2). This was supported by correlation analyses that compared narcotic and neurotoxic compounds (Fig. 4.16.3.). Some species such as the bluegill appeared to exhibit a higher sensitivity for many neurotoxic compounds based on the LC50 ratios between species (indicated by comparison of individual compounds, histogram and correlation analyses, Table 4.16.2., Figs. 4.16.2. and 4.16.3.). A weaker sensitivity was observed for zebrafish (based on correlation analyses and average species differences). A higher sensitivity could be observed also for some compounds for the rainbow trout in comparison to the fathead minnow. These differences were not observed for the comparison of narcotic compounds (based on histogram observation, Fig. 4.16.2). The sensitivity differences of neurotoxic compounds were, in contrast to the AFT/FET analysis, only observed for a subset of neurotoxic compounds (see Table 4.16.2). Many neurotoxic compounds showed a similar sensitivity (species ratio <10) between all species for which AFT data were available (e.g. bifenthrin, deltamethrin, permethrin, carbaryl, carbamazepin,
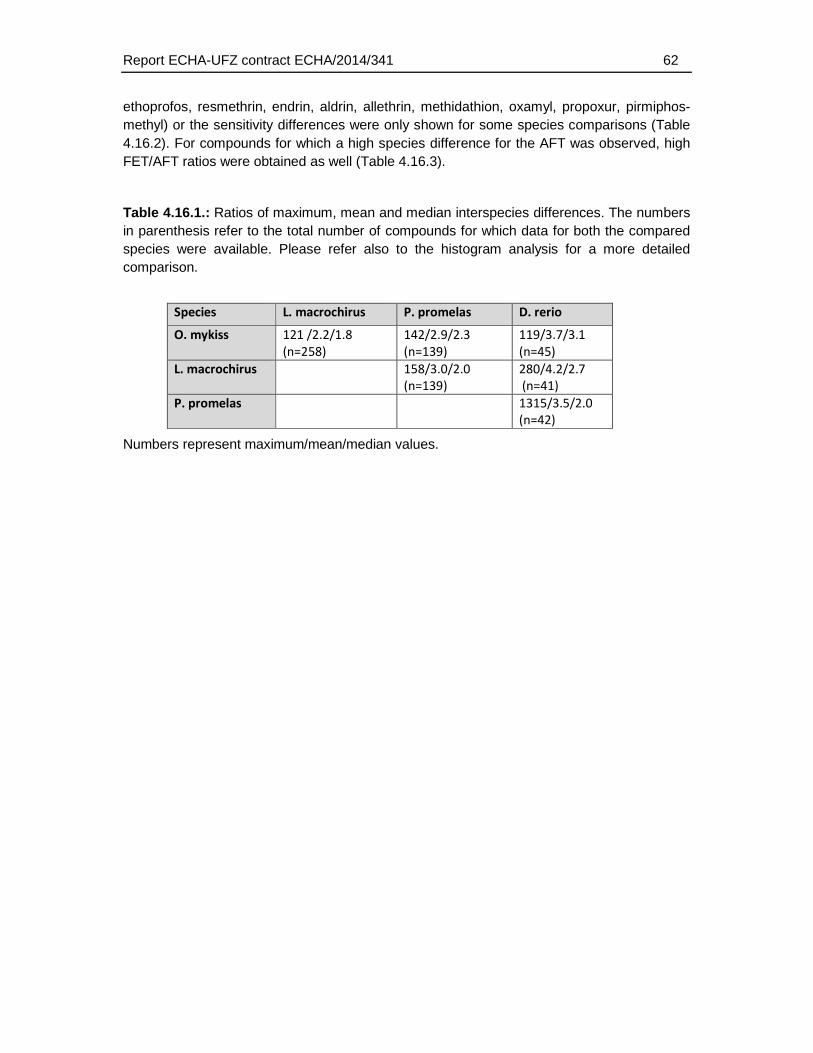
Report ECHA-UFZ contract ECHA/2014/341 62
ethoprofos, resmethrin, endrin, aldrin, allethrin, methidathion, oxamyl, propoxur, pirmiphos-methyl) or the sensitivity differences were only shown for some species comparisons (Table 4.16.2). For compounds for which a high species difference for the AFT was observed, high FET/AFT ratios were obtained as well (Table 4.16.3).
Table 4.16.1.: Ratios of maximum, mean and median interspecies differences. The numbers in parenthesis refer to the total number of compounds for which data for both the compared species were available. Please refer also to the histogram analysis for a more detailed comparison.
Species L. macrochirus P. promelas D. rerio
O. mykiss 121 /2.2/1.8
(n=258)
142/2.9/2.3
(n=139)
119/3.7/3.1
(n=45)
L. macrochirus 158/3.0/2.0
(n=139)
280/4.2/2.7
(n=41)
P. promelas 1315/3.5/2.0
(n=42)
Numbers represent maximum/mean/median values.
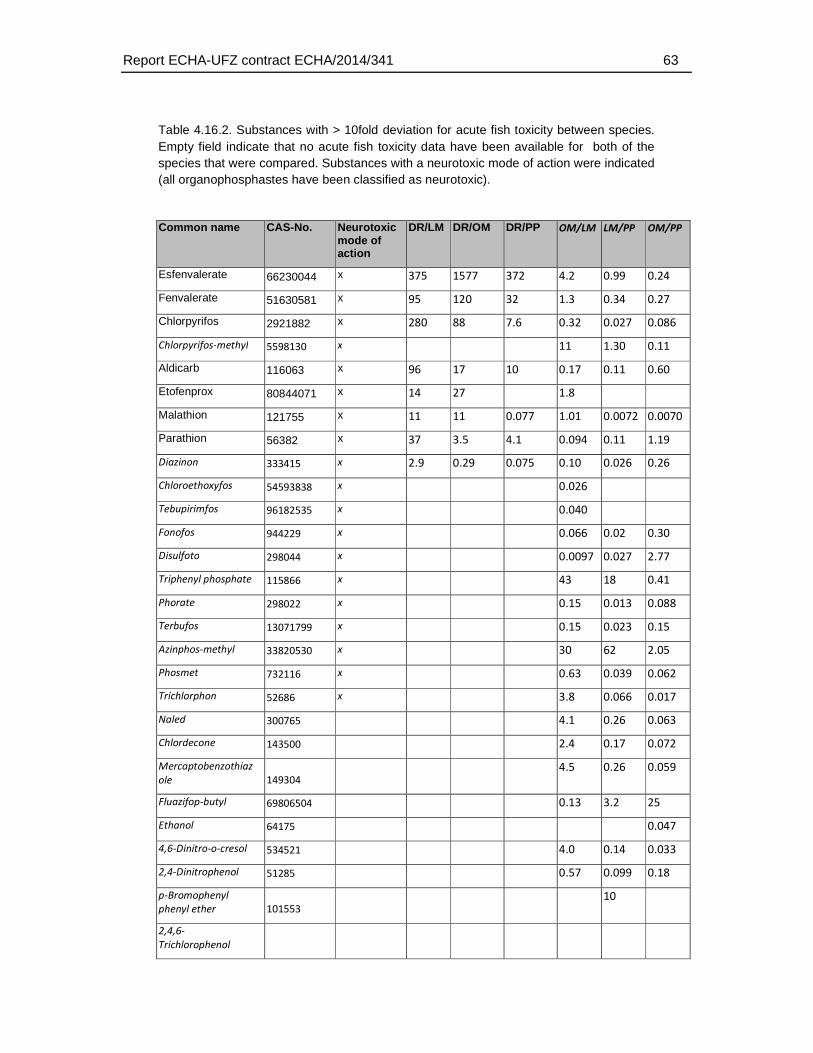
Report ECHA-UFZ contract ECHA/2014/341 63
Table 4.16.2. Substances with > 10fold deviation for acute fish toxicity between species. Empty field indicate that no acute fish toxicity data have been available for both of the species that were compared. Substances with a neurotoxic mode of action were indicated (all organophosphastes have been classified as neurotoxic).
Common name CAS-No. Neurotoxic mode of action
DR/LM DR/OM DR/PP OM/LM LM/PP OM/PP
Esfenvalerate 66230044 x 375 1577 372 4.2 0.99 0.24
Fenvalerate 51630581 x 95 120 32 1.3 0.34 0.27
Chlorpyrifos 2921882 x 280 88 7.6 0.32 0.027 0.086
Chlorpyrifos-methyl 5598130 x 11 1.30 0.11
Aldicarb 116063 x 96 17 10 0.17 0.11 0.60
Etofenprox 80844071 x 14 27 1.8
Malathion 121755 x 11 11 0.077 1.01 0.0072 0.0070
Parathion 56382 x 37 3.5 4.1 0.094 0.11 1.19
Diazinon 333415 x 2.9 0.29 0.075 0.10 0.026 0.26
Chloroethoxyfos 54593838 x 0.026
Tebupirimfos 96182535 x 0.040
Fonofos 944229 x 0.066 0.02 0.30
Disulfoto 298044 x 0.0097 0.027 2.77
Triphenyl phosphate 115866 x 43 18 0.41
Phorate 298022 x 0.15 0.013 0.088
Terbufos 13071799 x 0.15 0.023 0.15
Azinphos-methyl 33820530 x 30 62 2.05
Phosmet 732116 x 0.63 0.039 0.062
Trichlorphon 52686 x 3.8 0.066 0.017
Naled 300765 4.1 0.26 0.063
Chlordecone 143500 2.4 0.17 0.072
Mercaptobenzothiaz
ole 149304
4.5 0.26 0.059
Fluazifop-butyl 69806504 0.13 3.2 25
Ethanol 64175 0.047
4,6-Dinitro-o-cresol 534521 4.0 0.14 0.033
2,4-Dinitrophenol 51285 0.57 0.099 0.18
p-Bromophenyl
phenyl ether 101553
10
2,4,6-
Trichlorophenol
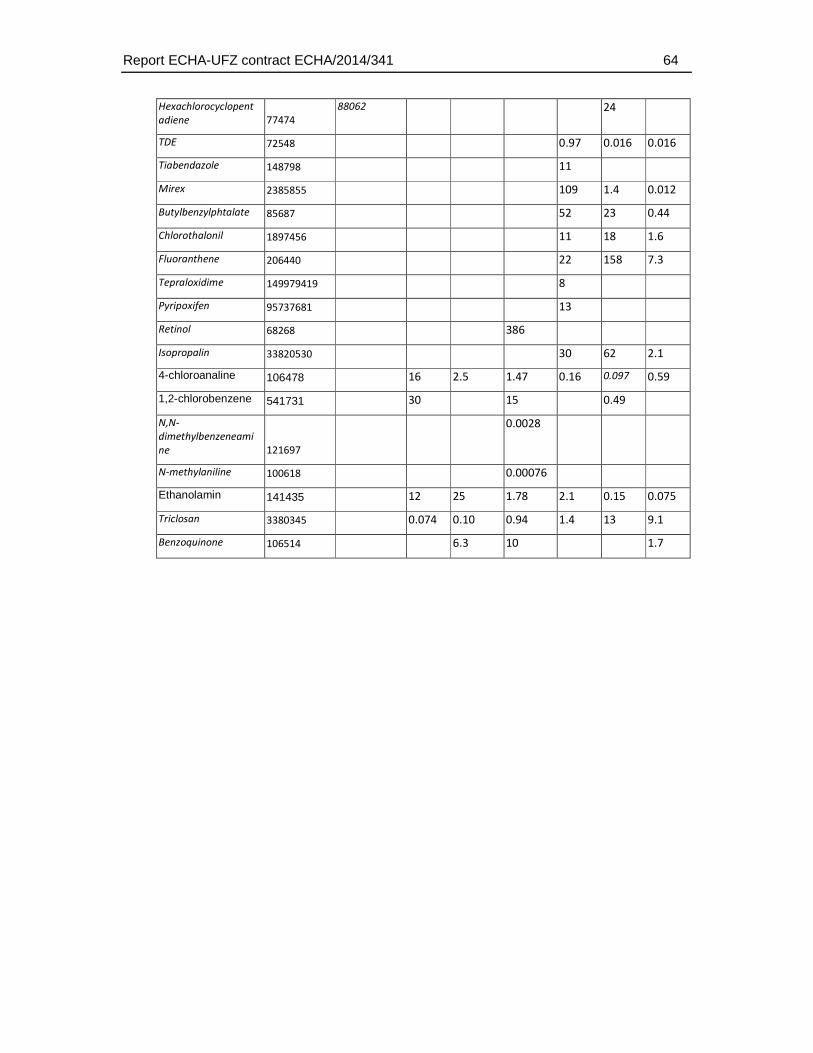
Report ECHA-UFZ contract ECHA/2014/341 64
Hexachlorocyclopent
adiene 77474
88062 24
TDE 72548 0.97 0.016 0.016
Tiabendazole 148798 11
Mirex 2385855 109 1.4 0.012
Butylbenzylphtalate 85687 52 23 0.44
Chlorothalonil 1897456 11 18 1.6
Fluoranthene 206440 22 158 7.3
Tepraloxidime 149979419 8
Pyripoxifen 95737681 13
Retinol 68268 386
Isopropalin 33820530 30 62 2.1
4-chloroanaline 106478 16 2.5 1.47 0.16 0.097 0.59
1,2-chlorobenzene 541731 30 15 0.49
N,N-
dimethylbenzeneami
ne 121697
0.0028
N-methylaniline 100618 0.00076
Ethanolamin 141435 12 25 1.78 2.1 0.15 0.075
Triclosan 3380345 0.074 0.10 0.94 1.4 13 9.1
Benzoquinone 106514 6.3 10 1.7
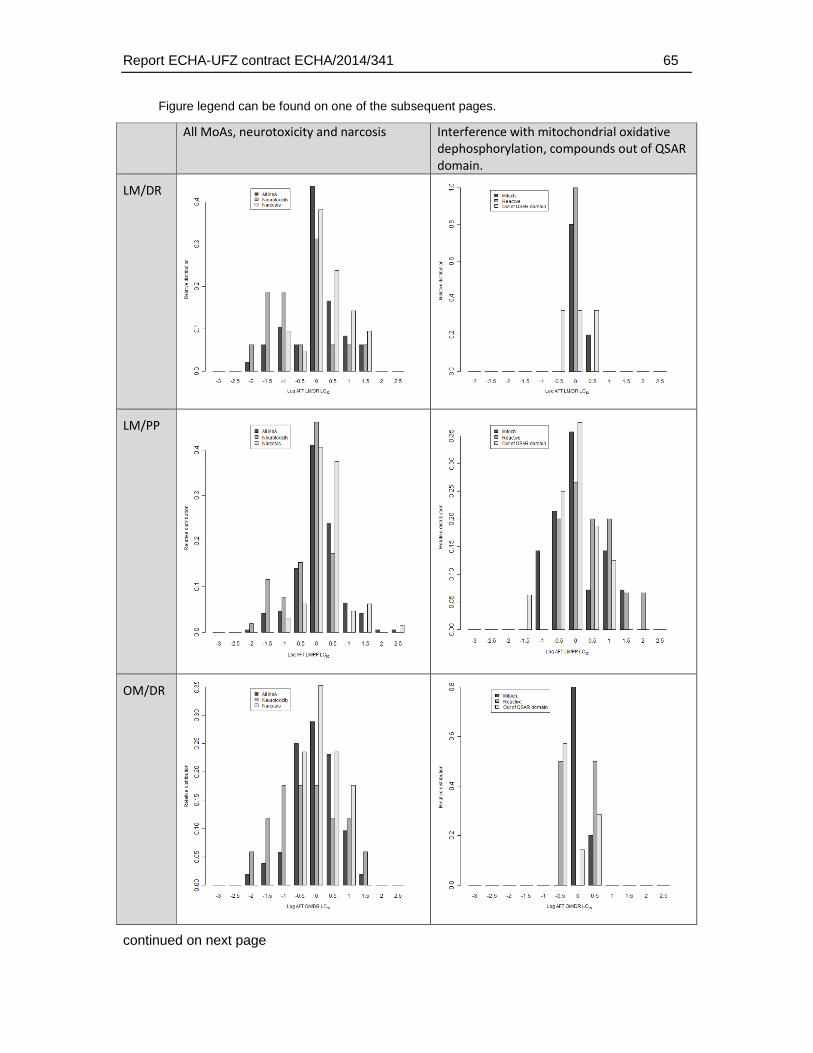
Report ECHA-UFZ contract ECHA/2014/341 65
Figure legend can be found on one of the subsequent pages.
All MoAs, neurotoxicity and narcosis Interference with mitochondrial oxidative
dephosphorylation, compounds out of QSAR
domain.
LM/DR
LM/PP
OM/DR
continued on next page
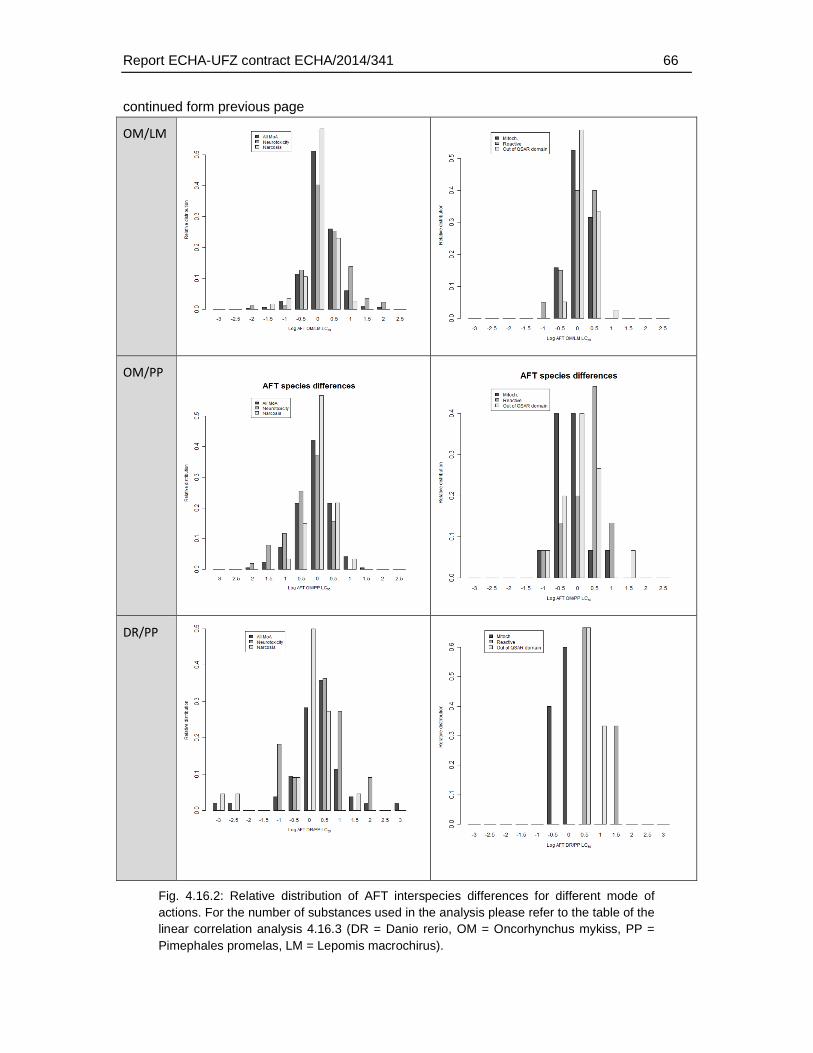
Report ECHA-UFZ contract ECHA/2014/341 66
continued form previous page
OM/LM
OM/PP
DR/PP
Fig. 4.16.2: Relative distribution of AFT interspecies differences for different mode of actions. For the number of substances used in the analysis please refer to the table of the linear correlation analysis 4.16.3 (DR = Danio rerio, OM = Oncorhynchus mykiss, PP = Pimephales promelas, LM = Lepomis macrochirus).
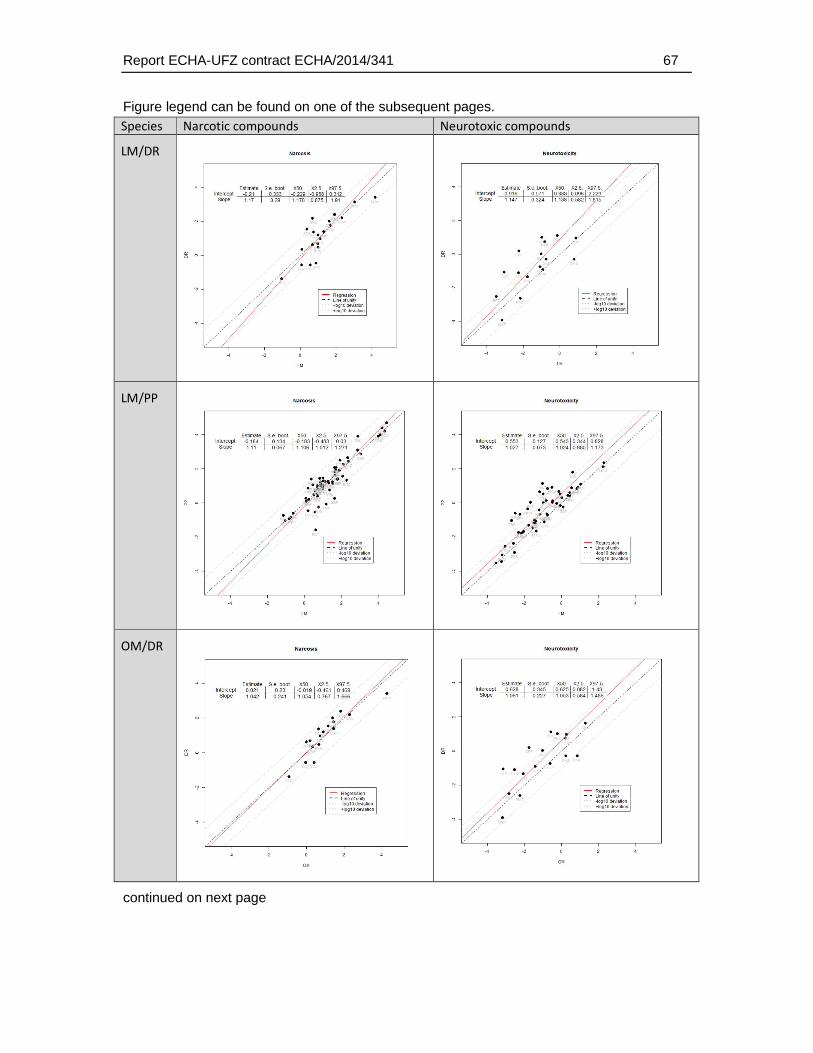
Report ECHA-UFZ contract ECHA/2014/341 67
Figure legend can be found on one of the subsequent pages. Species Narcotic compounds Neurotoxic compounds
LM/DR
LM/PP
OM/DR
continued on next page
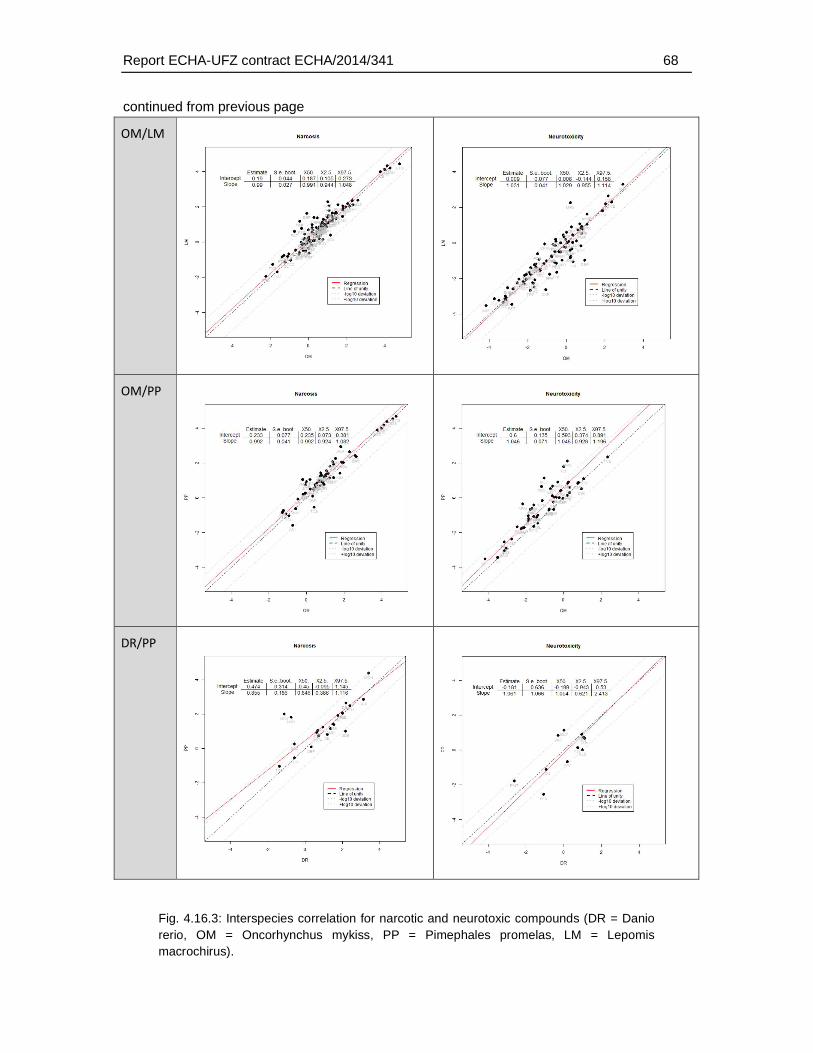
Report ECHA-UFZ contract ECHA/2014/341 68
continued from previous page
OM/LM
OM/PP
DR/PP
Fig. 4.16.3: Interspecies correlation for narcotic and neurotoxic compounds (DR = Danio rerio, OM = Oncorhynchus mykiss, PP = Pimephales promelas, LM = Lepomis macrochirus).
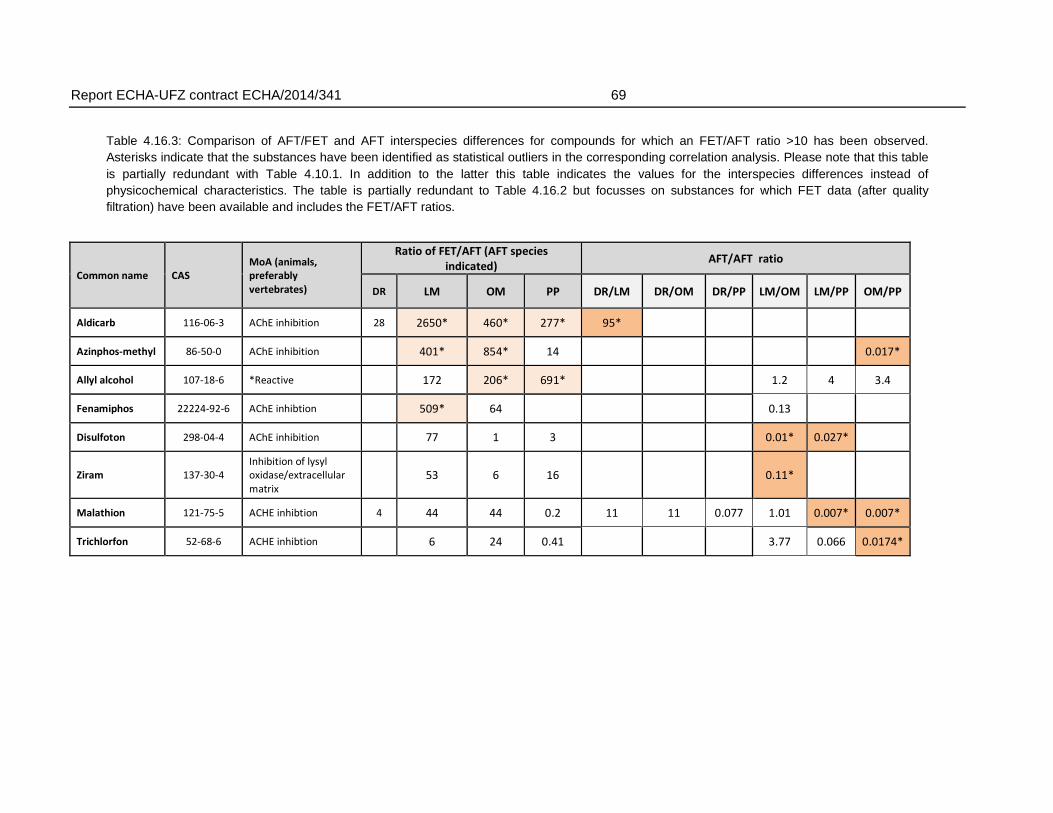
Report ECHA-UFZ contract ECHA/2014/341 69
Table 4.16.3: Comparison of AFT/FET and AFT interspecies differences for compounds for which an FET/AFT ratio >10 has been observed. Asterisks indicate that the substances have been identified as statistical outliers in the corresponding correlation analysis. Please note that this table is partially redundant with Table 4.10.1. In addition to the latter this table indicates the values for the interspecies differences instead of physicochemical characteristics. The table is partially redundant to Table 4.16.2 but focusses on substances for which FET data (after quality filtration) have been available and includes the FET/AFT ratios.
Common name CAS
MoA (animals,
preferably
vertebrates)
Ratio of FET/AFT (AFT species
indicated) AFT/AFT ratio
DR LM OM PP DR/LM DR/OM DR/PP LM/OM LM/PP OM/PP
Aldicarb 116-06-3 AChE inhibition 28 2650* 460* 277* 95*
Azinphos-methyl 86-50-0 AChE inhibition 401* 854* 14 0.017*
Allyl alcohol 107-18-6 *Reactive 172 206* 691* 1.2 4 3.4
Fenamiphos 22224-92-6 AChE inhibtion 509* 64
0.13
Disulfoton 298-04-4 AChE inhibition 77 1 3 0.01* 0.027*
Ziram 137-30-4
Inhibition of lysyl
oxidase/extracellular
matrix
53 6 16 0.11*
Malathion 121-75-5 ACHE inhibtion 4 44 44 0.2 11 11 0.077 1.01 0.007* 0.007*
Trichlorfon 52-68-6 ACHE inhibtion 6 24 0.41 3.77 0.066 0.0174*
Report ECHA-UFZ contract ECHA/2014/341 70
4.16.2. Linear correlation analysis of AFT-interspecies differences and physicochemical/toxicological parameters
Similar as for the comparison of FET/AFT ratios, the association of AFT interspecies differences with physicochemical and toxicological parameters was generally weak (Fig. 4.16.4). The strongest and most consistent association was found for the relation to the toxic ratio, particularly for the comparison of L. macrochirus and P. promelas. I.e. compound with a specific mode of action (toxicity below the baseline toxicity) tend to show more pronounced differences not only between the FET and the AFT but also between different species of the AFT. The association of the acidic pka found for the FET/AFT ratios could partially also be observed for the AFT interspecies comparison.
Table 4.16.4: Linear correlation coefficients for the comparison of AFT interspecies differences (based on log LC50s) with various physicochemical and toxicological parameters.
See next three pages for the table.
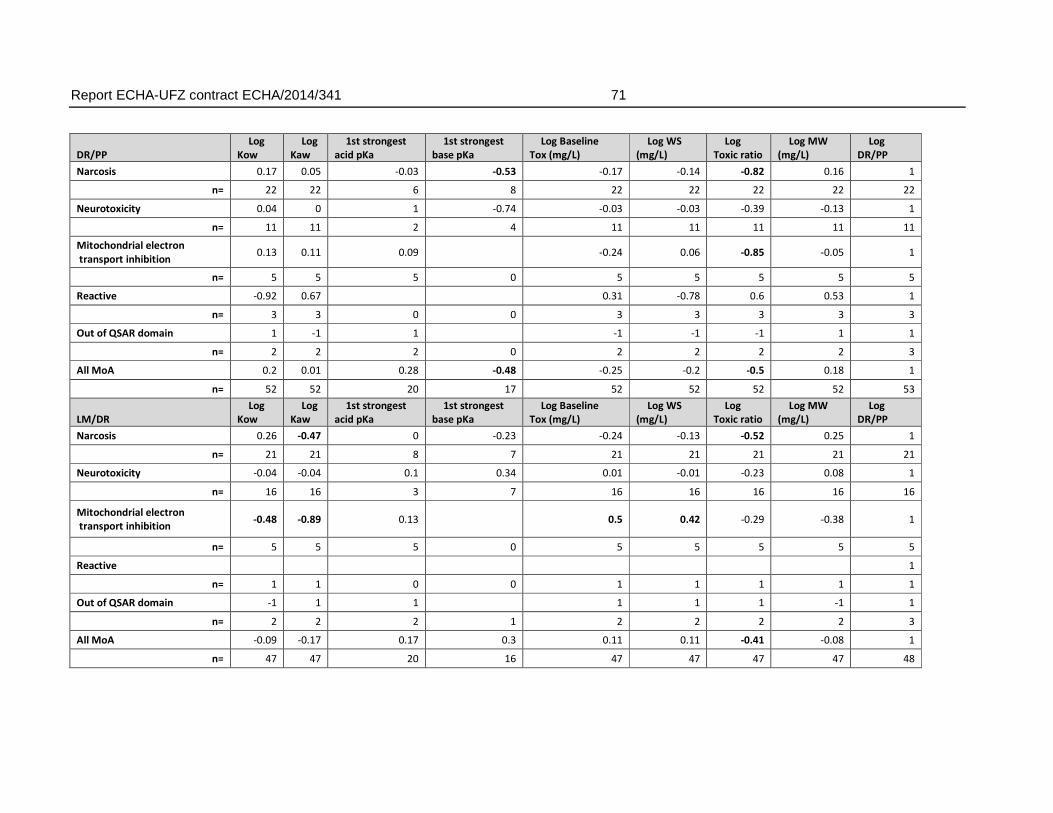
Report ECHA-UFZ contract ECHA/2014/341 71
DR/PP
Log
Kow
Log
Kaw
1st strongest
acid pKa
1st strongest
base pKa
Log Baseline
Tox (mg/L)
Log WS
(mg/L)
Log
Toxic ratio
Log MW
(mg/L)
Log
DR/PP
Narcosis 0.17 0.05 -0.03 -0.53 -0.17 -0.14 -0.82 0.16 1
n= 22 22 6 8 22 22 22 22 22
Neurotoxicity 0.04 0 1 -0.74 -0.03 -0.03 -0.39 -0.13 1
n= 11 11 2 4 11 11 11 11 11
Mitochondrial electron
transport inhibition 0.13 0.11 0.09
-0.24 0.06 -0.85 -0.05 1
n= 5 5 5 0 5 5 5 5 5
Reactive -0.92 0.67
0.31 -0.78 0.6 0.53 1
n= 3 3 0 0 3 3 3 3 3
Out of QSAR domain 1 -1 1
-1 -1 -1 1 1
n= 2 2 2 0 2 2 2 2 3
All MoA 0.2 0.01 0.28 -0.48 -0.25 -0.2 -0.5 0.18 1
n= 52 52 20 17 52 52 52 52 53
LM/DR
Log
Kow
Log
Kaw
1st strongest
acid pKa
1st strongest
base pKa
Log Baseline
Tox (mg/L)
Log WS
(mg/L)
Log
Toxic ratio
Log MW
(mg/L)
Log
DR/PP
Narcosis 0.26 -0.47 0 -0.23 -0.24 -0.13 -0.52 0.25 1
n= 21 21 8 7 21 21 21 21 21
Neurotoxicity -0.04 -0.04 0.1 0.34 0.01 -0.01 -0.23 0.08 1
n= 16 16 3 7 16 16 16 16 16
Mitochondrial electron
transport inhibition -0.48 -0.89 0.13
0.5 0.42 -0.29 -0.38 1
n= 5 5 5 0 5 5 5 5 5
Reactive
1
n= 1 1 0 0 1 1 1 1 1
Out of QSAR domain -1 1 1
1 1 1 -1 1
n= 2 2 2 1 2 2 2 2 3
All MoA -0.09 -0.17 0.17 0.3 0.11 0.11 -0.41 -0.08 1
n= 47 47 20 16 47 47 47 47 48
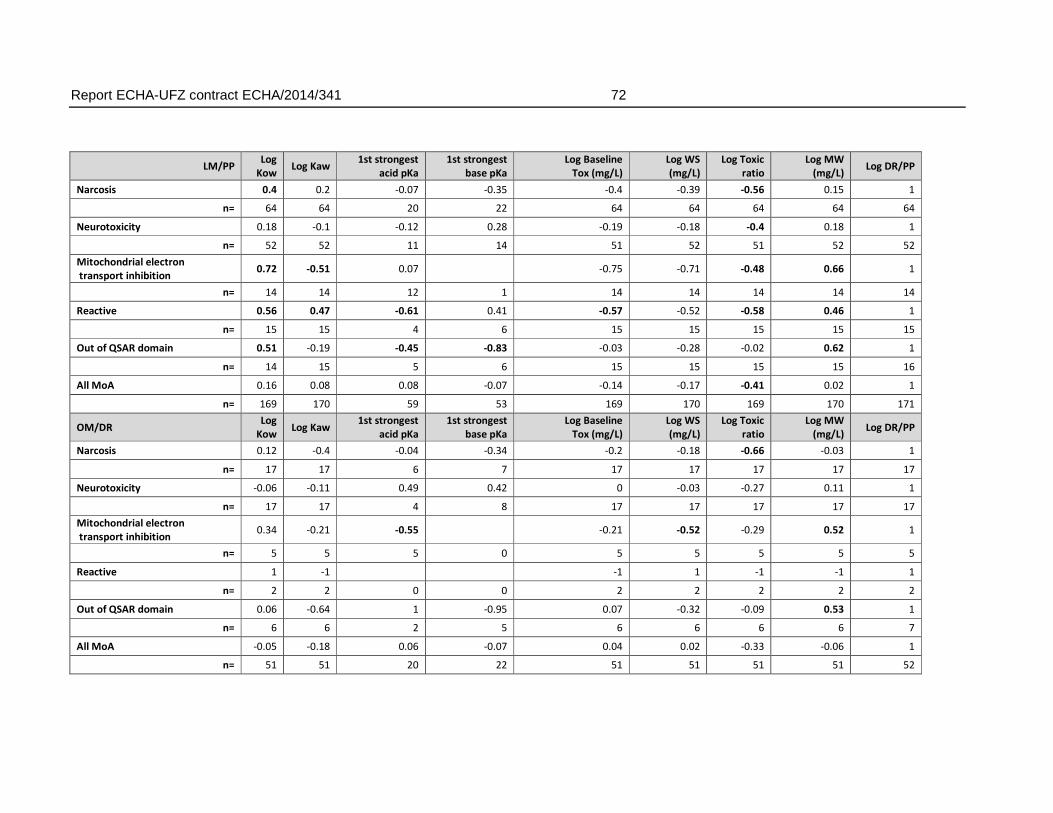
Report ECHA-UFZ contract ECHA/2014/341 72
LM/PP Log
Kow Log Kaw
1st strongest
acid pKa
1st strongest
base pKa
Log Baseline
Tox (mg/L)
Log WS
(mg/L)
Log Toxic
ratio
Log MW
(mg/L) Log DR/PP
Narcosis 0.4 0.2 -0.07 -0.35 -0.4 -0.39 -0.56 0.15 1
n= 64 64 20 22 64 64 64 64 64
Neurotoxicity 0.18 -0.1 -0.12 0.28 -0.19 -0.18 -0.4 0.18 1
n= 52 52 11 14 51 52 51 52 52
Mitochondrial electron
transport inhibition 0.72 -0.51 0.07
-0.75 -0.71 -0.48 0.66 1
n= 14 14 12 1 14 14 14 14 14
Reactive 0.56 0.47 -0.61 0.41 -0.57 -0.52 -0.58 0.46 1
n= 15 15 4 6 15 15 15 15 15
Out of QSAR domain 0.51 -0.19 -0.45 -0.83 -0.03 -0.28 -0.02 0.62 1
n= 14 15 5 6 15 15 15 15 16
All MoA 0.16 0.08 0.08 -0.07 -0.14 -0.17 -0.41 0.02 1
n= 169 170 59 53 169 170 169 170 171
OM/DR Log
Kow Log Kaw
1st strongest
acid pKa
1st strongest
base pKa
Log Baseline
Tox (mg/L)
Log WS
(mg/L)
Log Toxic
ratio
Log MW
(mg/L) Log DR/PP
Narcosis 0.12 -0.4 -0.04 -0.34 -0.2 -0.18 -0.66 -0.03 1
n= 17 17 6 7 17 17 17 17 17
Neurotoxicity -0.06 -0.11 0.49 0.42 0 -0.03 -0.27 0.11 1
n= 17 17 4 8 17 17 17 17 17
Mitochondrial electron
transport inhibition 0.34 -0.21 -0.55
-0.21 -0.52 -0.29 0.52 1
n= 5 5 5 0 5 5 5 5 5
Reactive 1 -1
-1 1 -1 -1 1
n= 2 2 0 0 2 2 2 2 2
Out of QSAR domain 0.06 -0.64 1 -0.95 0.07 -0.32 -0.09 0.53 1
n= 6 6 2 5 6 6 6 6 7
All MoA -0.05 -0.18 0.06 -0.07 0.04 0.02 -0.33 -0.06 1
n= 51 51 20 22 51 51 51 51 52
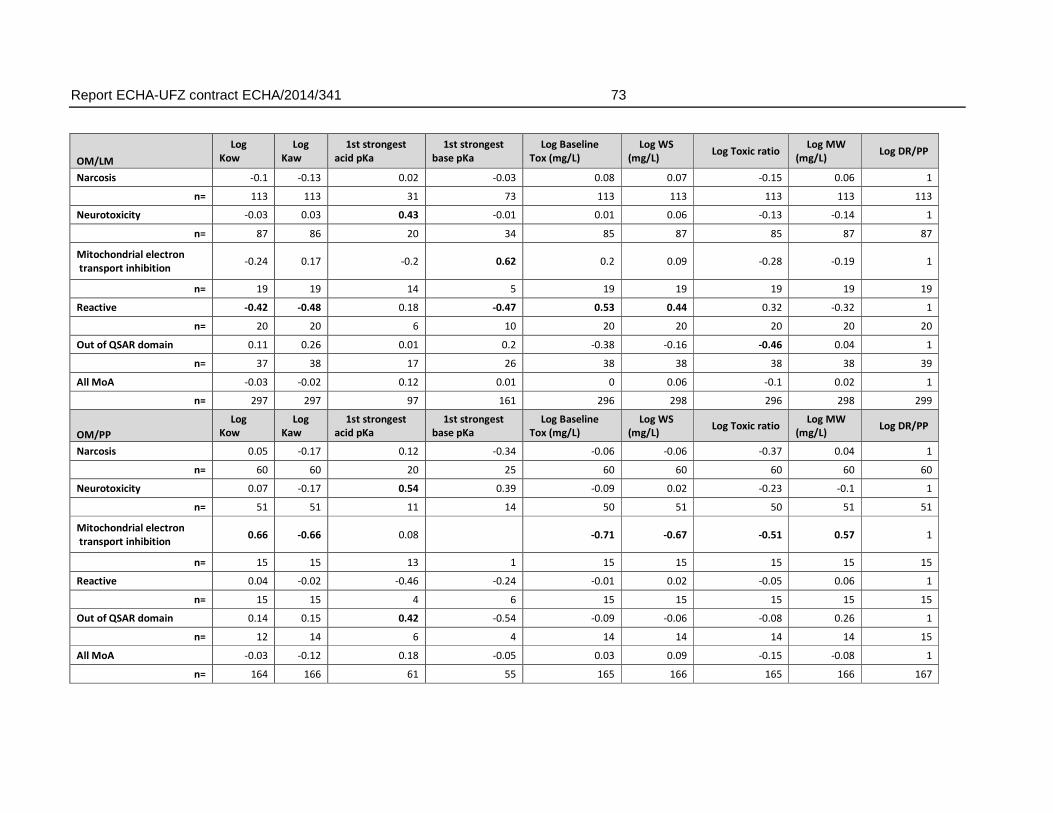
Report ECHA-UFZ contract ECHA/2014/341 73
OM/LM
Log
Kow
Log
Kaw
1st strongest
acid pKa
1st strongest
base pKa
Log Baseline
Tox (mg/L)
Log WS
(mg/L) Log Toxic ratio
Log MW
(mg/L) Log DR/PP
Narcosis -0.1 -0.13 0.02 -0.03 0.08 0.07 -0.15 0.06 1
n= 113 113 31 73 113 113 113 113 113
Neurotoxicity -0.03 0.03 0.43 -0.01 0.01 0.06 -0.13 -0.14 1
n= 87 86 20 34 85 87 85 87 87
Mitochondrial electron
transport inhibition -0.24 0.17 -0.2 0.62 0.2 0.09 -0.28 -0.19 1
n= 19 19 14 5 19 19 19 19 19
Reactive -0.42 -0.48 0.18 -0.47 0.53 0.44 0.32 -0.32 1
n= 20 20 6 10 20 20 20 20 20
Out of QSAR domain 0.11 0.26 0.01 0.2 -0.38 -0.16 -0.46 0.04 1
n= 37 38 17 26 38 38 38 38 39
All MoA -0.03 -0.02 0.12 0.01 0 0.06 -0.1 0.02 1
n= 297 297 97 161 296 298 296 298 299
OM/PP
Log
Kow
Log
Kaw
1st strongest
acid pKa
1st strongest
base pKa
Log Baseline
Tox (mg/L)
Log WS
(mg/L) Log Toxic ratio
Log MW
(mg/L) Log DR/PP
Narcosis 0.05 -0.17 0.12 -0.34 -0.06 -0.06 -0.37 0.04 1
n= 60 60 20 25 60 60 60 60 60
Neurotoxicity 0.07 -0.17 0.54 0.39 -0.09 0.02 -0.23 -0.1 1
n= 51 51 11 14 50 51 50 51 51
Mitochondrial electron
transport inhibition 0.66 -0.66 0.08
-0.71 -0.67 -0.51 0.57 1
n= 15 15 13 1 15 15 15 15 15
Reactive 0.04 -0.02 -0.46 -0.24 -0.01 0.02 -0.05 0.06 1
n= 15 15 4 6 15 15 15 15 15
Out of QSAR domain 0.14 0.15 0.42 -0.54 -0.09 -0.06 -0.08 0.26 1
n= 12 14 6 4 14 14 14 14 15
All MoA -0.03 -0.12 0.18 -0.05 0.03 0.09 -0.15 -0.08 1
n= 164 166 61 55 165 166 165 166 167
Report ECHA-UFZ contract ECHA/2014/341 74
4.16.3. Interspecies AFT differences for compounds requiring metabolic activation
Table 4.16.3. can also be analysed with respect to the impact on metabolic activation. Given that many organophosphates require metabolic activation (de Bruijn and Hermens 1993) it is noteworthy that these compounds (azinphos-methyl, fenamiphos, malathion, trichlorfon) also show higher species differences with maximum observed AFT differences by a factor of 8 (fenamiphos), 59 (azinphos-methyl, trichlorfon) and 142 (malathion). This may indicate that metabolic capacity is also impacting on species differences. However, it is difficult to estimate, whether the observed differences are primarily related to the MoA or the metabolic capacity. Weak species differences were observed for allyl alcohol. This indicates a similar metabolic capacity of the considered fish species, at least for the enzyme involved in the activation of allyl alcohol.
Report ECHA-UFZ contract ECHA/2014/341 75
5. Discussion
5.1. Identification of fish embryo and corresponding acute fish toxicity data
An initial screening of all available fish embryo LC50s indicated that corresponding fish acute toxicity data could be obtained mainly for the species rainbow trout, fathead minnow and bluegill. Therefore, all subsequent analyses were restricted to these species to enable a species-specific comparative assessment. This allowed to estimate to which extent the selection of species for comparison may influence the assessment of the predictive capacity of the zebrafish embryo and to consider the overall variability in acute fish toxicity for the assessment of the fish embryo test. Although only a relatively small number of acute toxicity data were available for zebrafish they were also included in the comparative analysis to allow an intra-species comparison of acute fish toxicity and fish embryo data.
A set of quality criteria that favoured mainly the use of data from fish embryo tests with 96 or 120 h of exposure, the use of an appropriate range of test concentrations for substances with mortality, the availability of substances with corresponding acute fish toxicity and exclusion of studies with potential experimental limitation was applied. Based on these filters, a subset of the database comprising 156 study entries and 123 chemicals was established. The major difference to previously used dataset was the incorporation of two large-scale studies conducted by the US-EPA (Padilla et al. 2012) and the University of Oregon (Truong et al. 2014). Furthermore, these two studies were contributing with a large number of substances with a specific biological activity, due to the representation of many pesticides (approximately 40 % based on study entries for these two studies). Both studies together contributed to 61 of the 123 chemicals with 25 substances tested in both studies. With respect to previous comparative analyses (Belanger et al. 2013; Klüver et al. 2015; Lammer et al. 2009) the final dataset for comparative assessment was smaller despite that initially a higher number of studies were available. However, in contrast to the previous studies, quality filters were applied to select data for the analysis.
The quality filters were addressing some of the limitations that were found in many FET studies, such as e.g. exceeding of the water solubility range, lack for pH assessment or too short exposure protocols if compared to the OECD TG236. In contrast to acute fish toxicity studies conducted for regulatory assessment, many FET studies did not apply chemical analytics to confirm the exposure concentrations. Particularly hydrophobic substances could rapidly adsorb to the microwell plates commonly used in FET studies and lead to a decline in exposure concentrations. If stability of exposure concentrations is not confirmed this could lead to an overestimation (higher LC50) of effect concentrations (Klüver et al. 2015; Riedl and Altenburger 2007; Schreiber et al. 2008). The study of Riedl et al. (2007) revealed that chemicals with a log KOW higher than 3 or a Henry coefficient (log Kaw) higher than −4 were less effective in microplate assays. The retrospective analysis of FET studies confirmed these findings, since studies that did not detect mortality despite the application of an appropriate test concentrations range comprised to a large extend substances with a log Kow>4 and a log Kaw>-4.
5.2. Representation of substance characteristics in the selected dataset
In order to assess the predictive capacity of the fish embryo test it is important that the dataset selected for comparative analysis with acute fish toxicity data is not biased by certain
Report ECHA-UFZ contract ECHA/2014/341 76
substance characteristics. For this reason, the distribution of physicochemical characteristics and structural domains, excess toxicity and mode of action (MoA) were analysed.
5.3.1. Physicochemical characteristics
The distribution of molecular weight, log KOW, pka and maximum water solubility levels did not reveal any obvious bias of the dataset except for a limitation in the molecular weight range which did not exceed 500 g/mole (Fig. 4.5.1.) with the analysis performed. Furthermore, due to the application of quality filters only a low proportion of hydrophobic and volatile substances is included. Apart from these constraints the dataset showed a wide distribution of physico-chemical properties with Gaussian-like distribution. For substances with higher hydrophobicity, volatility and molecular weight the fish embryo may also reveal valid results if appropriate protocols are used (Schreiber et al. 2008). However, based on the present analysis this cannot be concluded and require further assessment. The publication of the OECD TG 236 guideline in 2013 may lead to a larger proportion of higher quality data in the future that may allow to extend the comparative assessment beyond the domain of this study.
5.3.2. Toxic ratios and mode of action
The fish embryo dataset represented a wide variety of LC50 levels spanning 8 orders of magnitude with a majority of substances with an LC50 between 1 and 100 mg/L (Fig. 4.5.2). A very similar distribution of LC50 was observed for the corresponding acute fish toxicity data with peak representation of LC50 data in the range of 10 mg/L for both tests. Observation of the histogram analysis indicated a higher representation of lower LC50 values for the AFT, which could indicate a slightly higher sensitivity of the AFT (which is also supported by the comparative FET-AFT assessment, see below).
Equally or even more important than representation of a variety of LC50s, physicochemical characteristics and structural domains is the distribution of characteristics which are linked to the substances mode of action (MoA). An MoA-related analyses of the selected dataset was conducted by analysis of excess toxicity (toxic ratio) and the identification of published information on the mode of action.
The excess toxicity or toxic ratio describes the relationship of observed toxicity to the baseline toxicity. The baseline toxicity or narcosis can be considered as the minimal toxicity of a substance that is mainly based on the accumulation of the substances in biological membranes (Schultz 1989) and the unspecific interaction with cellular membranes. Baseline toxicity is determined by the hydrophobicity and can be predicted by the log Kow as a measure of hydrophobicity. The toxicity of unspecific, narcotic substances can be very well predicted by the log Kow. However, specifically acting substances show toxicities with LC50 up to several orders of magnitude below the predicted baseline LC50. In case that the fish embryo database used for the comparative analysis would be biased by an overrepresentation of narcotic substances without specific modes of action, a high correlation of acute fish and fish embryo toxicity would not be surprising. However, it is important to include specifically acting substances with a high toxic ratio into a comparative dataset in order to estimate whether the fish embryo is able to predict substances with specific mechanisms of action. Given that previous fish embryo test meta-analyses have indicated an overall close to 1:1 correlation of fish embryo and acute fish toxicity, excess toxicities for fish embryos were calculated using the baseline toxicity of acute fish toxicity from ECOSAR.
Report ECHA-UFZ contract ECHA/2014/341 77
Analyses of the fish embryo data indicated that more than 30 % of the toxic ratios were greater than 100 with toxic ratios up 109 indicating that the fish embryo is principally able to identify substances with a specific mode or mechanism of action (Fig. 4.5.3.). Similar as for the distribution of LC50s there was a slightly higher proportion for toxic ratios >10 in the AFT, indicating a potential overall higher sensitivity of the AFT (Fig. 4.5.3.).
5.4. Correlation of FET and AFT data
In order to identify limitations of the FET and to identify domains for which the FET will give the highest correlation and predictivity to the AFT, a correlation analysis was conducted. In contrast to previous analyses also FET studies in which no mortality was observed were considered. However, nearly all studies that did not detect mortality also did not pass the quality filters e.g. they were conducted with shorter exposure protocols or with hydrophobic and volatile substances. Only one substance (represdenting 0.8 % of all substances), clopyralid-olamine, an auxin mimicking herbicide (Kelley and Riechers 2007), was identified. Given the lack of further substances with no mortality it is difficult to draw any conclusions on the potential failure of the FET to detect mortality. Furthermore, similar substances were not found among the substances with weaker FET toxicity. Whether the weak toxicity of clopyralide-olamine represents a systematic bias or limitation of the FET is difficult to assess. A conclusion based on the finding for only one compound could be biased since the deviation may result also from a limitation of the study that is not evident from the experimental protocol. Therefore, further (experimental) analysis would be required to estimate whether a proportion of compounds that provoke AFT would fail to provoke any acute toxicity in the FET even in case that appropriate testing protocols are used.
The AFT interspecies correlation and comparison had indicated some degree of variability for the acute fish toxicity. Using species-specific geometric means of the LC50 differences by a factor of 10 were observed frequently and often exceeded a factor of 100. Therefore, we selected two thresholds (10 and 100) for the identification of substances with a weaker toxicity in the FET. It must be noted that these threshold are not arbitrary but are based on the descriptive statistics of the AFT interspecies comparison. Furthermore, the threshold of 10 is within the AFT variability range and hence may exhibit a weak capacity to identify domains for which the FET could exhibit a weaker toxicity. The two thresholds were also applied to more clearly identify trends for the enrichment of MoAs or physicochemical characteristics determining an outlier.
Correlation analysis of zebrafish embryos to the acute toxicity of zebrafish, rainbow trout, fathead minnow and bluegill (Fig. 4.7.1.) revealed a similar but slightly lower correlations (0.83 versus 0.95 for the correlation coefficients of all species as a previous analysis ((Belanger et al. 2013). Also the slopes of 1.02 (this study) and 0.99 (Belanger et al. 2013) were very similar. If compared to the AFT interspecies comparison a greater variability was noted. However, this may be due to the use of geometric means for the correlation analysis, since in contrast to the AFT most of FET data are based on individual data instead of mean values. An intra-species comparison for AFT and FET of the zebrafish only, did not demonstrate a higher correlation than comparisons of the zebrafish FET to other species. Unfortunately zebrafish AFT data were lacking for most of the substances for which a weak toxicity was observed for the FET. The only substance, for which zebrafish FET data were available was aldicarb, for which the zebrafish AFT exhibited a weaker sensitivity if compared to the AFTs of bluegill, fathead minnow and rainbow trout.
Report ECHA-UFZ contract ECHA/2014/341 78
5.5. Relation of FET/AFT ratios to the mode of action
The analysis of the distribution of the FET/AFT ratios among different MoA and correlation analysis restricted to certain MoAs provided strong evidence that particularly compounds with a neurotoxic MoA (mainly acetylcholinesterase inhibition) exhibited a weaker toxicity in the FET. If compared to narcotic compounds, an average weaker toxicity by a factor of 10 could be estimated for 39% of substances with narcotic MoA. However, individual compounds may show a much higher deviation depending also on the species that is used for the AFT comparison. For instance, the maximum difference between FET and AFT was observed for aldicarb, a carbamate and acetylcholinesterase inhibiting pesticide (2650 if compared to bluegill AFT). Furthermore, 28 % of the substances could not be classified to any MoA. Therefore, - except for the weak sensitivity to a neurotoxic mode of action - no other conclusion on the applicability domain regarding MoA could be drawn based on this study.
5.6. Association of FET/AFT ratios with physicochemical and toxicological parameters
The comparison with physicochemical parameters (Table 4.9.1) did not provide evidence for a relation to FET/AFT ratios. The strongest, albeit still weak association was found with the pka of the 1st strongest acid (Fig. 4.9.2). There is no mechanistic explanation for this association. Compounds with a high pka would not be dissociated at neutral pH while compounds with a low pka would show a preference for the charged form even at neutral pH. Hence, the latter may result in a weaker uptake and lower FET/AFT ratio particularly if the pH is not adjusted. However, the opposite was observed, i.e. neutral compounds showed a higher FET/AFT ratio. It must be noted that the association is very weak and that the data are very scattered. Hence, given the lack of a mechanistic support, the observed association could have occurred randomly.
No association was found between the log Kow and the FET/AFT ratio (Fig. 4.9.2). Given the previously applied filter that removed all substances with a log Kow >4 (unless no chemical analytics was performed) from the dataset, it could be expected that the dataset should not provide evidence for a dependency of the FET/AFT ratio on the log Kow.
For toxicological parameters (Figures 4.9.1. and 4.9.2.), the associations were also weak but relatively strong associations were observed for the relation of the FET/AFT ratio to the toxic ratio and the AFT LC50 particularly for neurotoxic compounds. This is likely to be associated with the neurotoxic mode of action since neurotoxic compounds exhibit a high toxic ratio and lower AFT LC50. Given the potential weakness of the FET to detect the acute toxicity of neurotoxic compounds an association of the toxic ratio and the AFT LC50 with the FET/AFT ratio could be expected.
5.7. Enrichment of structural domains for substances with weaker toxicity in the FET
Analysis of representation of structural domains indicated only a weak enrichment of certain structural domains. The most prominent result was an enrichment for substances with phosphor, carbamate and amine groups for functional groups analysed with ChemProp (Fig. 4.12.2.) These groups are associated with organophosphates and carbamate AChE inhibitors and hence, their enrichments may be related to the mode of action. However, this
Report ECHA-UFZ contract ECHA/2014/341 79
conclusion must be made with care, since it is based on the analysis of only four compounds with an FET/AFT ratio > 100.
5.8. Role of metabolic activation
Fish embryos are principally able to transform substances that require metabolic activation. This has been shown for the analysis of developmental toxicity of proteratogenic substances (Weigt et al. 2011) and by internal concentration time course analysis (Brox et al. 2014; Kühnert et al. 2013). However, the capacity may depend on the enzymatic system required for activation. So far, only one example has been reported that reveals a limited transformation of the parent substance (allyl alcohol) as the major reason for a weak toxicity in fish embryos (Klüver et al. 2014). The meta-analysis presented here also does not provide clear evidence for a limitation in biotransformation activity. Using the OECD toolbox prediction tool it was not possible to demonstrate an enrichment of substances with high metabolisation potential for FETs with weaker toxicity (Fig. 4.10.1). A detailed analysis of each of the potential metabolites may be required for a better assessment of the role of the biotransformation capacity but was beyond the scope of this study. However, one of the modes of action associated with a weaker toxicity in fish embryos, inhibition of acetylcholinesterases, is known to require activation by cytochrome P450 enzyme for the transformation of organophosphates to their active oxon-metabolites (de Bruijn et al. 1993). Although the gene expression of cytochrome P450 enzymes has been demonstrated in early stages of zebrafish (Goldstone et al. 2010), the activity of this enzyme in embryonic stages is not known and it cannot be excluded that - in addition to the neurotoxic mode of action - a weak metabolic activation may contribute to the low toxicity in fish embryo for the organophosphates. Assessment of the activation capacity of fish embryos would require additional experimental analyses, e.g. the comparative assessment of substances known to be metabolically activated, identification of transformation products and/or experimental modification of the transformation capacity of the fish embryo.
5.9. Substances with weaker toxicity in the FET
Analysis of individual substances that deviate by at least a factor of 10 in the fish embryo and the acute toxicity test indicated not only a weaker sensitivity of fish embryos for neurotoxic MoA (Table and Fig. 4.10.1., Table 4.10.2), 33 % represented neurotoxic substances (all of them AChE inhibitors) but also 29 % represent narcotics. Although this indicates an enrichment for neurotoxic compounds, the question remains, why also narcotic compounds deviate in the FET. A potential explanation could be an unknown specific mode of action for which the fish embryo exhibits a weaker sensitivity. However, the occurrence of narcotic compounds may also reflect the overall variability that has also been found by comparison of AFT for different fish species (see below).
The weaker sensitivity for neurotoxic substances has been found in a previous study (Klüver et al. 2015) that aimed at establishing a priority list for experimental analyses to study the mechanism leading to a weaker sensitivity in fish embryos. In this study it was discussed that neurotoxic substances may not cause a respiratory failure syndrome in fish embryos since the oxygen supply or gas exchange in fish embryo is mainly provided via diffusion and is not dependent on the function of the cardiovascular system. Particularly AChE inhibitors are known for this respiratory failure syndrome mediated by the accumulation of the acetylcholine transmitter in the synaptic cleft of cholinergic neurons in the brain and in the
Report ECHA-UFZ contract ECHA/2014/341 80
muscles (Russom et al. 2014). Due to this interference the function of the respiratory system is compromised leading to a reduced oxygen supply and finally death of the animal. In fish embryos experimental studies have shown that uptake and distribution of the oxygen is not dependent on a functional cardiovascular system (Jacob et al. 2002; Rombough 2002). Hence, many neurotoxic substances exhibit low toxic ratios in fish embryos (Klüver et al. 2015; Massei et al. 2015) if the assessment is based on mortality alone. Therefore, it was proposed to include alternative endpoints (behaviour analysis or embryonic movement, motility assessment) to improve the sensitivity and the predictive capacity of the FET for neurotoxic modes of action. By including these endpoints Klüver et al. (2015) demonstrated an increased sensitivity of the fish embryo closer to the LC50s observed for acute fish toxicity. Therefore, Klüver et al. (2015) suggested that neurotoxic substances may at least be identified by analysis of alternative endpoints and either used to trigger a subsequent acute fish toxicity test according to the OECD TG 203 or even predict AFT.
While the enrichment of neurotoxic mode of actions indicates a potential limitation of the fish embryo for the detection of certain mode of action, the high proportion of hydrophobic substances among outliers before application of quality filters indicate a limitation in the experimental design of many studies. Some studies (Padilla et al. 2012, Truong et al. 2014) used plastic 96 well microplates and an exposure volume of 250 and 100 µl per embryo (in contrast to 2 ml per embryo as suggested by the OECD TG 236). The absorption of substances to the plastic material of the microplates can lead to a rapid decline in the exposure concentration. This has been observed for very hydrophobic substances such as esfenvalerate even for exposure in glass vessels (Klüver et al. 2015). Furthermore, the high hydrophobicity could lead to a decline in exposure concentration due to the high bioaccumulation potential of these substances (Kühnert et al. 2013). The OECD TG 236 has addressed these limitations by e.g. suggesting presaturation of plates, exposure volumes of 2 ml and analytical verification of exposure concentration. Due to these experimental limitations it is at present difficult to conclude whether the FET would show an appropriate high correlation to the AFT also for hydrophobic and volatile substances. If more studies would strictly apply to the OECD Technical Guideline 236, future studies and data may provide support that – provided an appropriate experimental design is used – the FET is exhibiting a high correlation also for these physicochemical properties.
5.10. Impact on species sensitivity on the correlation of FET-AFT
The comparison of the zebrafish FET with LC50s of different species did not indicate that species sensitivity had a major impact (Table 4.10.1). The higher concordance to zebrafish AFT could be biased by the low number of substances available for an intra-species FET-AFT comparison.
5.11. FET-AFT correlation for inorganic substances and mulitconstituent compounds
Due to the low number of data (17 substances) and only a subset of this compound fulfilling the quality criteria (n=6) it was not possible to conclude on the FET sensitivity for inorganic compounds. Likewise, an assessment of multiconsituent compounds was not possible since no data were publically available.
Report ECHA-UFZ contract ECHA/2014/341 81
5.12. Interspecies correlation analysis of acute fish toxicity data
Albeit the comparative analysis of the FET and AFT has indicated a weakness of the FET - particularly for neurotoxic substances and potentially for substances that require metabolic activation - these findings need to be reviewed in relation to the AFT species sensitivity. A major question is whether the observed deviations in relation to e.g. the mode of action may also occur between different species that are used to provide AFT data for regulatory purposes.
Therefore, the data of three of the most commonly used fish species corresponding to the FET database - fathead minnow, rainbow trout bluegill and zebrafish - were analysed. The analysis of AFT data indicated that an interspecies variability on the basis of geometric means of the LC50 is common (> 10 percent of all substances deviated by at least a factor of 10). Based on individual data this variability can lead to differences by about a factor of 100 for the selected set of substances. However, overall the differences between AFT data appear to be weaker indicated by the regression analysis and the maximum, mean and median differences (see section 4.12.). Given the particular weakness of the fish embryo test for neurotoxic compounds the hypothesis was tested whether neurotoxic compounds may also show pronounced differences between different species. This was indeed observed for some of the species comparisons and was not evident for other mode of actions. However, there were also many compounds with equal sensitivity between species. For the neurotoxic compounds that deviate between species, the differences were less pronounced than for the FET-AFT comparison. Based on the limited data available it can be estimated that the differences of FET to the AFT are about a factor of 10fold greater than between the AFT of different species. However, for individual compounds the differences may be stronger.
Hence, this comparison indicated that species differences may partially but not fully cover the weakness of the FET for neurotoxic compounds and potentially also for compounds with other MoA. Alternatively, the difference between species and FET versus AFT data may be explained by different mechanism. For instance, metabolic activation, degradations or insensitivity at the target site could be hypothesized. However, a systematic (experimental) analysis is required to conclude on the mechanisms.
Report ECHA-UFZ contract ECHA/2014/341 82
6. Conclusions
The following conclusions have been derived from the report.
Study design
• Analytical verification of the exposure concentration, an appropriate exposure volume and/or frequent renewal of the exposure concentration are critical, in particular for hydrophobic and volatile substances. These critical aspects have been considered and taken into account in the OECD TG 236 for the acute fish embryo toxicity test. However, many historical studies were not generated with a proper consideration of these aspects, with consequent limitations on the results.
• In the current study, a set of appropriate quality criteria were applied to filter the dataset of publically available data to remove potential unreliable FET results and hence to increase the reliability of the comparative analysis; e.g. studies with effect concentrations exceeding the water solubility limit or studies with too short exposure duration according to the OECD TG 236 requirements were removed from the results to be analysed. Based on these filters, out of the initial data set of 2 064 study entries (covering 1 415 chemicals), a subset of more reliable data comprising 156 study entries and covering 123 chemicals was selected for further analysis.
• It is anticipated that due to the publication of the OECD TG 236 in 2013, the number of data generated meeting the OECD TG 236 will increase in the future. Future availability of studies with analytical verification of the test solutions, and hence reliable results, would allow the analysis to be extended to a wider range of substances including hydrophobic or volatile substances.
• To increase the number of data, regulators, industry and funding organisations may also promote to provide these data, particularly for compounds with characteristics that were not covered in the dataset or that have been indicated to exhibit a potentially weaker sensitivity in the FET (e.g. hydrophobic substances, neurotoxic substances and substances known to require metabolic activation).
FET/AFT comparison
• There were 27 substances with >10 -fold weaker toxicity in fish embryos than in adult fish (representing 22 % of substances in the final dataset). For these substances, the deviation of fish embryo toxicity from acute fish toxicity was in most cases observed regardless of species that provided the AFT LC50.
• There were also six substances that exhibited a higher toxicity with an FET/AFT LC50 ratio <0.1. These may represent substances with a mode of action specific for embryonic development.
• In contrast to previous analyses, FET studies showing no mortality were principally not excluded. However, except for one study they did not pass the quality filter or there was no corresponding AFT study available. Hence, due to the limited number of available data it is not possible to draw any systematic conclusion when a compound may exhibit no acute toxicity in the FET.
• The comparison of the zebrafish FET with LC50s of different species did not indicate that the observation of a weaker toxicity in the FET was dependent on the species used in the
Report ECHA-UFZ contract ECHA/2014/341 83
AFT. However, a preliminary comparison of the acute fish toxicity data indicated that some degree of variability also applies for the AFT derived from different species. It is at present not understood what causes this species variability and to which extent it may depend on experimental conditions and/or data quality. Furthermore, a systematic analysis was hindered by the limited number of AFT data available for all four selected species. Therefore, to better understand what range of deviations would be acceptable for the FET in comparison to the AFT, further systematic studies on the range of species variability in the AFT would be required.
Applicability domain of the FET test
• Due to low stability of hydrophobic substances in static exposure, particularly when conducted in microwell plates, all studies with hydrophobic (log Kow>4) compounds were excluded from the analysis unless the stability of exposure concentrations was confirmed by chemical analysis. Based on the current study (low representation of compounds with Kow>4 and a maximum Kow of 5.1), it is not possible to conclude whether the FET test correlates with acute fish toxicity for hydrophobic substances (log Kow>4); further analysis would be needed when more valid FET study data are available.
• Substances with a high log Kaw showed a trend for a higher distribution in studies with no toxicity in the FET. The substances with log Kaw greater than -4 included substances such as 2,3-dimethyl-1,3-butadiene (log Kaw 0.42) or 1,2-dichlorobenzene (log Kaw -0.99) for which a rapid decline in exposure concentrations, particularly in 24 well plates, has been observed in the fish embryo test. Therefore, all studies with volatile compounds (log Kaw>-4) were excluded from the analysis unless the stability of exposure concentrations were confirmed. Hence, based on the current analysis it is not possible to conclude on the applicability domain of the FET test for substances of high volatility (log Kaw > -4). Further assessment when more valid FET study data are available would be needed.
• No substances with higher molecular weight above 500 g/mol are included in the dataset. Therefore, based on the current analysis it is not possible to conclude if the FET test correlates with acute fish toxicity for substances of high molecular weight (MW >500 mg/mol). Further assessment when more valid FET data are available would be needed.
• An analysis of the relation of the FET/AFT-ratio and physicochemical properties did not indicate that a weaker toxicity in the fish embryo was related to certain physicochemical characteristics. Some correlation was observed for the association with an increasing pKa (weaker acids). However, the weaker sensitivity (>10 fold) of the FET could not be connected to any range of pKa failing to indicate a limitation in the applicability domain for a certain range of the pKa.
• Regarding neurotoxic compounds, the previously described weaker FET sensitivity was confirmed and indicated by the enrichment of neurotoxic compounds among compounds with a higher FET/AFT ratio and by a correlation analysis of neurotoxic compounds.
• Further analysis of the distribution of the FET/AFT ratios among different modes of action showed >10 fold weaker sensitivity of fish embryos not only for neurotoxic substances but also for narcotic compounds, mitochondrial electron transfer substances and for substances that could not be classified to any MoA. Therefore, except for the weak sensitivity to a neurotoxic mode of action - no other conclusion on the applicability domain regarding MoA could be drawn based on this study.
Report ECHA-UFZ contract ECHA/2014/341 84
• With respect to the ECOSAR domains, 53 out of the 111 ECOSAR groups were
represented by the present dataset (five substances could not be classified). This means that 50% of chemical categories have not been covered by FET data. It is at present not clear, whether all of these classes are relevant for acute toxicity, particularly for an excess toxicity (higher toxic ratio due to a specific mode of action). Hence, a more detailed analysis of these ECOSAR classes and if they relate to a specific mode of action is required. Depending on the results more FET results on compounds from other chemical classes may be necessary before making a conclusion on how FET could be used to fulfil information requirements for REACH.
• To evaluate a potential link between metabolic transformation capacity and weak toxicity the number of predicted in vitro S9 metabolites was compared to the FET/AFT ratio. However, this analysis did not reveal a higher number of predicted metabolic transformation products with lower toxicity in the fish embryo test.
• Assessment of the activation capacity of fish embryos would require additional experimental analyses, e.g. the comparative FET/AFT assessment of substances known to be metabolically activated, identification of their transformation products and/or experimental assessment of the transformation capacity of the fish embryo.
Comparison of FET/AFT for inorganic substances
• Given the very limited availability of quality data for inorganic compounds [n=6] no assessment of the predictive capacity of the FET was possible at present. Further assessment when more valid FET data are available would be needed.
Comparison of FET/AFT for multi-constituent formulations
• Multi-constituent formulations and substances have not been tested in the FET so far or were not publically available. Therefore, no assessment of the FET for its capacity to predict the acute toxicity of multi-constituent products could be made. Further assessment when more valid FET data are available would be needed.
Report ECHA-UFZ contract ECHA/2014/341 85
7. References
Barron, M., Lilavois, C., Martin, T., 2015. MOAtox: A comprehensive mode of action and acute aquatic toxicity database for predictive model development. Aquat. Toxicol. 161, 102-107.
Belanger, S.E., Rawlings, J.M., Carr, G.J., 2013. Use of fish embryo toxicity tests for the prediction of acute fish toxicity to chemicals. Environ. Toxicol. Chem. 32, 1768-1783.
Brox, S., Ritter, A.P., Küster, E., Reemtsma, T., 2014. A quantitative HPLC–MS/MS method for studying internal concentrations and toxicokinetics of 34 polar analytes in zebrafish (Danio rerio) embryos. Analytical and Bioanalytical Chemistry, 1-10.
Busquet, F., Strecker, R., Rawlings, J.M., Belanger, S.E., Braunbeck, T., Carr, G.J., Cenijn, P., Fochtman, P., Gourmelon, A., Hübler, N., Kleensang, A., Knöbel, M., Kussatz, C., Legler, J., Lillicrap, A., Martínez-Jerónimo, F., Polleichtner, C., Rzodeczko, H., Salinas, E., Schneider, K.E., Scholz, S., Brandhof, E.-J.v.d., van der Ven, L.T.M., Walter-Rohde, S., Weigt, S., Witters, H., Halder, M., 2014. OECD validation study to assess intra- and inter-laboratory reproducibility of the zebrafish embryo toxicity test for acute aquatic toxicity testing. Regul. Toxicol. Pharmacol. 69, 496-511.
Clements, R.G., Nabholz, J.V., 1994. ECOSAR: a computer program and user’s guide for estimating the ecotoxicity of industrial chemicals based on structure activity relationships. EPA-748-R-93-002. U.S. Environmental Protection Agency, Office of Pollution Prevention and Toxics 7403., Washington, DC.
de Bruijn, J., Hermens, J., 1993. Inhibition of acetylcholinesterase and acute toxicity of organophosphorous compounds to fish: a preliminary structure-activity analysis. Aquat. Toxicol. 24, 257-274.
de Bruijn, J.H.M., Seinen, W., Hermens, J., 1993. Biotransformation of organophosphorus compounds by rainbow trout (Oncorhynchus mykiss) liver in relation to bioconcentration. Environ. Toxicol. Chem. 12, 1041-1050.
Embry, M.R., Belanger, S.E., Braunbeck, T.A., Galay-Burgos, M., Halder, M., Hinton, D.E., Léonard, M.A., Lillicrap, A., Norberg-King, T., Whale, G., 2010. The fish embryo toxicity test as an animal alternative method in hazard and risk assessment and scientific research. Aquat. Toxicol. 97, 79-87.
EU, 2010. Directive 2010/63/EU of the European Parliament and of the Council of 22 September 2010 on the protection of animals used for scientific purposes. OJ European Union L 276, 34-79.
Goldstone, J., McArthur, A., Kubota, A., Zanette, J., Parente, T., Jonsson, M., Nelson, D., Stegeman, J., 2010. Identification and developmental expression of the full complement of Cytochrome P450 genes in Zebrafish. BMC Genomics 11, 643.
Halder, M., Léonard, M., Iguchi, T., Oris, J.T., Ryder, K., Belanger, S.E., Braunbeck, T.A., Embry, M.R., Whale, G., Norberg-King, T., Lillicrap, A., 2010. Regulatory aspects on the use of fish embryos in environmental toxicology. Integr. Environ. Assess. Manag. 6, 484-491.
Hrovat, M., Segner, H., Jeram, S., 2009. Variability of in vivo fish acute toxicity data. Regul. Toxicol. Pharmacol. 54, 294-300.
Jacob, E., Drexel, M., Schwerte, T., Pelster, B., 2002. Influence of hypoxia and of hypoxemia on the development of cardiac activity in zebrafish larvae. Am J Physiol Regul Integr Comp Physiol 283, R911-917.
Kelley, K.B., Riechers, D.E., 2007. Recent developments in auxin biology and new opportunities for auxinic herbicide research. Pestic. Biochem. Phys. 89, 1-11.
Klüver, N., König, M., Ortmann, J., Massei, R., Paschke, A., Kühne, R., Scholz, S., 2015. Fish embryo toxicity test: identification of compounds with weak toxicity and analysis of
Report ECHA-UFZ contract ECHA/2014/341 86
behavioral effects to improve prediction of acute toxicity for neurotoxic compounds. Environ. Sci. Technol. 49, 7002-7011.
Klüver, N., Ortmann, J., Paschke, H., Renner, P., Ritter, A.P., Scholz, S., 2014. Transient overexpression of adh8a increases allyl alcohol toxicity in zebrafish embryos. PLoS ONE 9, e90619.
Knöbel, M., Busser, F., Rico Rico, A., Kramer, N.I., Hermens, J.L.M., Hafner, C., Tanneberger, K., Schirmer, K., Scholz, S., 2012. Predicting adult fish acute lethality with the zebrafish embryo: relevance of test duration, endpoints, compound properties and exposure concentration analysis. Environ. Sci. Technol. 46, 9690-9700.
Kühnert, A., Vogs, C., Altenburger, R., Küster, E., 2013. The internal concentration of organic substances in fish embryos - a toxicokinetic approach. Environ. Toxicol. Chem. 32, 1819–1827.
Lammer, E., Carr, G.J., Wendler, K., Rawlings, J.M., Belanger, S.E., Braunbeck, T., 2009. Is the fish embryo toxicity test (FET) with the zebrafish (Danio rerio) a potential alternative for the fish acute toxicity test? Comp. Biochem. Phys. C 149, 196-209.
Leet, J.K., Lindberg, C.D., Bassett, L.A., Isales, G.M., Yozzo, K.L., Raftery, T.D., Volz, D.C., 2014. High-content screening in zebrafish embryos identifies butafenacil as a potent inducer of anemia. PLoS ONE 9, e104190.
Massei, R., Vogs, C., Renner, P., Altenburger, R., Scholz, S., 2015. Differential sensitivity in embryonic stages of the zebrafish (Danio rerio): The role of toxicokinetics for stage-specific susceptibility for azinphos-methyl lethal effects. Aquat. Toxicol. 166, 36-41.
Nagel, R., 2002. DarT: The embryotest with the zebrafish Danio rerio - a general model in ecotoxicology and toxicology. Alternativen zu Tierexperimenten 19 (Suppl 1/02), 38-48.
Riedl, J., Altenburger, R., 2007. Physicochemical substance properties as indicators for unreliable exposure in microplate-based bioassays. Chemosphere 67, 2210-2220.
Rombough, P., 2002. Gills are needed for ionoregulation before they are needed for O(2) uptake in developing zebrafish, Danio rerio. J Exp Biol 205, 1787-1794.
Russom, C.L., Bradbury, S.P., Broderius, S.J., Hammermeister, D.E., Drummond, R.A., 1997. Predicting modes of toxic action from chemical structure: acute toxicity in the fathead minnow (Pimephales promelas). Environ. Toxicol. Chem. 16, 948-967.
Russom, C.L., LaLone, C.A., Villeneuve, D.L., Ankley, G.T., 2014. Development of an adverse outcome pathway for acetylcholinesterase inhibition leading to acute mortality. Environ. Toxicol. Chem. 33, 2157-2169.
Scholz, S., Fischer, S., Gündel, U., Küster, E., Luckenbach, T., Voelker, D., 2008. The zebrafish embryo model in environmental risk assessment—applications beyond acute toxicity testing. Environmental Science and Pollution Research 15, 394-404.
Scholz, S., Ortmann, J., Klüver, N., Leonard, M., 2014. Extensive review of fish embryo acute toxicities for the prediction of GHS acute systemic toxicity categories Regul. Toxicol. Pharmacol. 69, 572-579.
Schreiber, R., Altenburger, R., Paschke, A., Küster, E., 2008. How to deal with lipophilic and volatile organic substances in microtiter plate assays. Environ. Toxicol. Chem. 27, 1676-1682.
Schulte, C., Nagel, R., 1994. Testing acute toxicity in the embryo of zebrafish, Brachydanio rerio, as an alternative of the acute fish test: preliminary results. ATLA-Alternatives to Laboratory Animals 22, 12-19.
Schultz, T.W., 1989. Nonpolar narcosis: a review of the mechanism of action for baseline aquatic toxicity. Aquatic toxicology and hazard assessment 12, 104-109.
Report ECHA-UFZ contract ECHA/2014/341 87
Sleet, R., Greene, J., Welsch, F., 1988. The relationship of embryotoxicity to disposition of 2-methoxyethanol in mice. Toxicol. Appl. Pharmacol. 93, 195-207.
Strähle, U., Scholz, S., Geisler, R., Greiner, P., Hollert, H., Rastegar, S., Schumacher, A., Selderslaghs, I., Weiss, C., Witters, H., Braunbeck, T., 2012. Zebrafish embryos as an alternative to animal experiments - A commentary on the definition of the onset of protected life stages in animal welfare regulations. Reprod. Toxicol. 33, 128-132.
Truong, L., Reif, D.M., St Mary, L., Geier, M.C., Truong, H.D., Tanguay, R.L., 2014. Multidimensional In Vivo Hazard Assessment Using Zebrafish. Tox. Sci. 137, 212-233.
UFZ, 2015. Department of Ecological Chemistry. ChemProp (Chemical Properties Estimation Software System) 6.3, 2015, license available without cost, see www.ufz.de/ecochem/chemprop for further information.
Verhaar, H.J.M., Van Leeuwen, C.J., Hermens, J.L.M., 1992. Classifying environmental pollutants. 1: Structure-activity relationships for prediction of aquatic toxicity. Chemosphere 25, 471-491.
Weigt, S., Huebler, N., Strecker, R., Braunbeck, T., Broschard, T.H., 2011. Zebrafish (Danio rerio) embryos as a model for testing proteratogens. Toxicology 281, 25-36.
Report ECHA-UFZ contract ECHA/2014/341 88
8. ANNEX 1
8.1. Supplementing Excel tables
The following Excel tables were submitted together with this report:
AFTs_FINAL (ALL+GEOMEAN)_04112015.xlsx - contains all corresponding acute fish toxicity data
ECHA_FET database 11122015.xlsx - updated fish embryo acute toxicity LC50 database
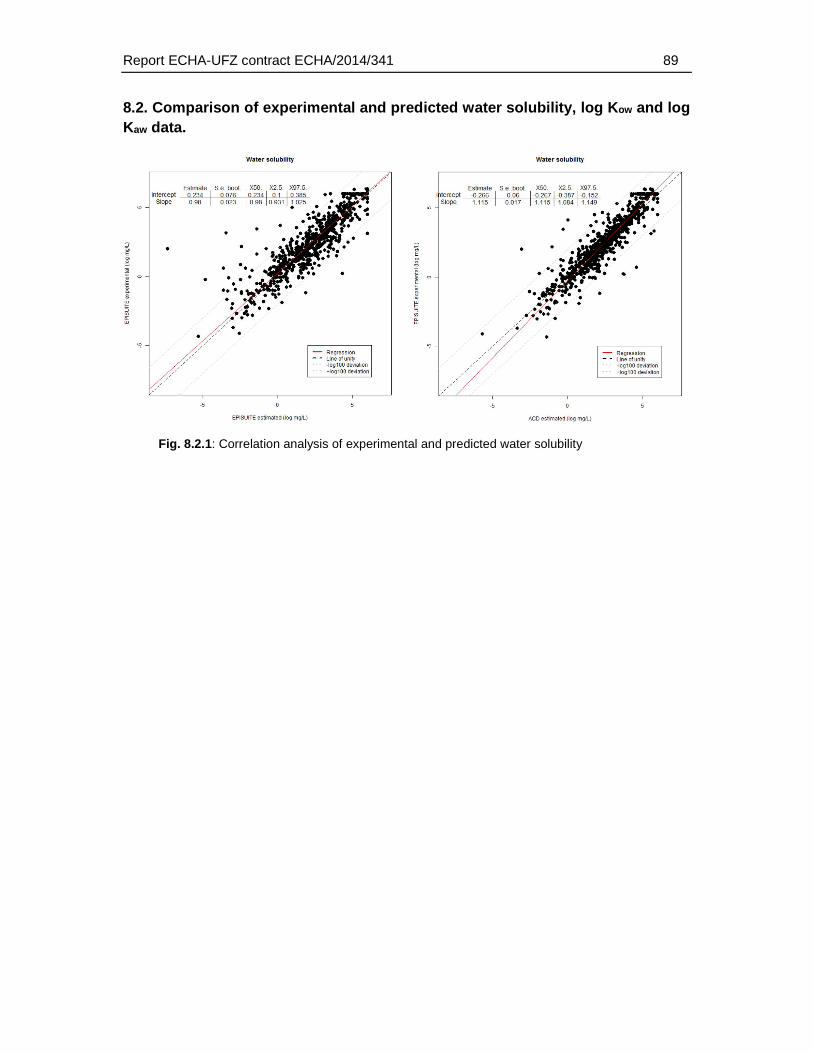
Report ECHA-UFZ contract ECHA/2014/341 89
8.2. Comparison of experimental and predicted water solubility, log Kow and log Kaw data.
Fig. 8.2.1: Correlation analysis of experimental and predicted water solubility
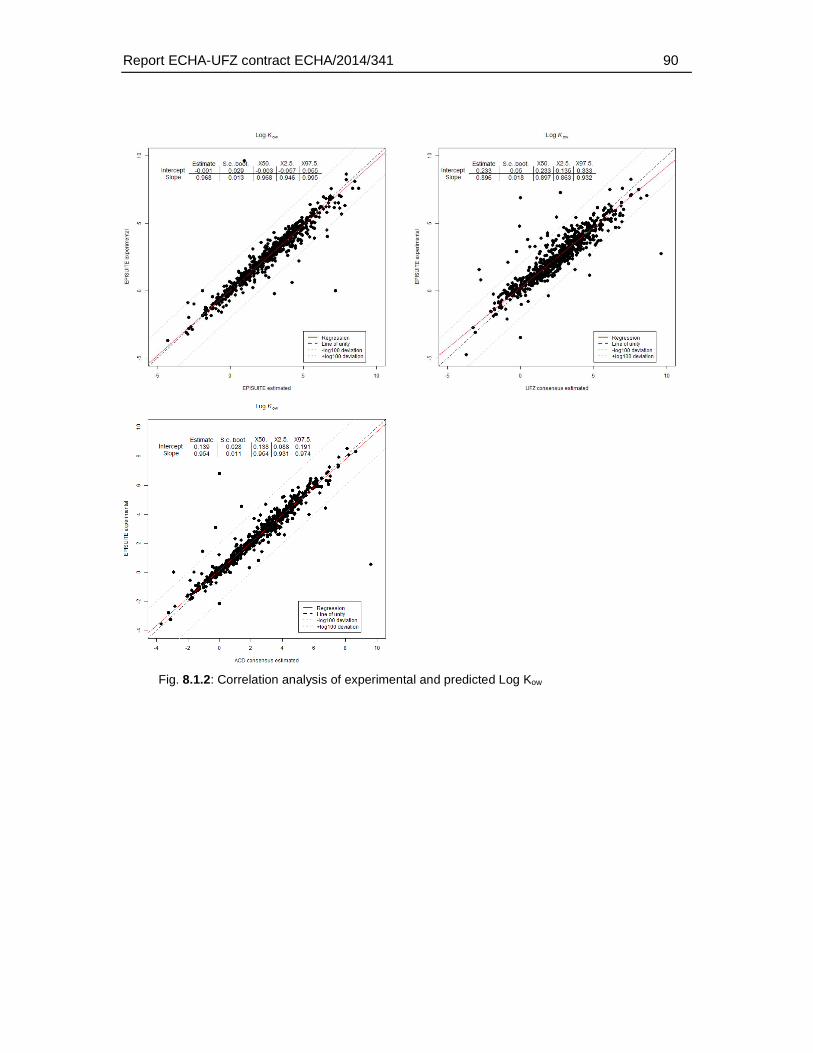
Report ECHA-UFZ contract ECHA/2014/341 90
Fig. 8.1.2: Correlation analysis of experimental and predicted Log Kow
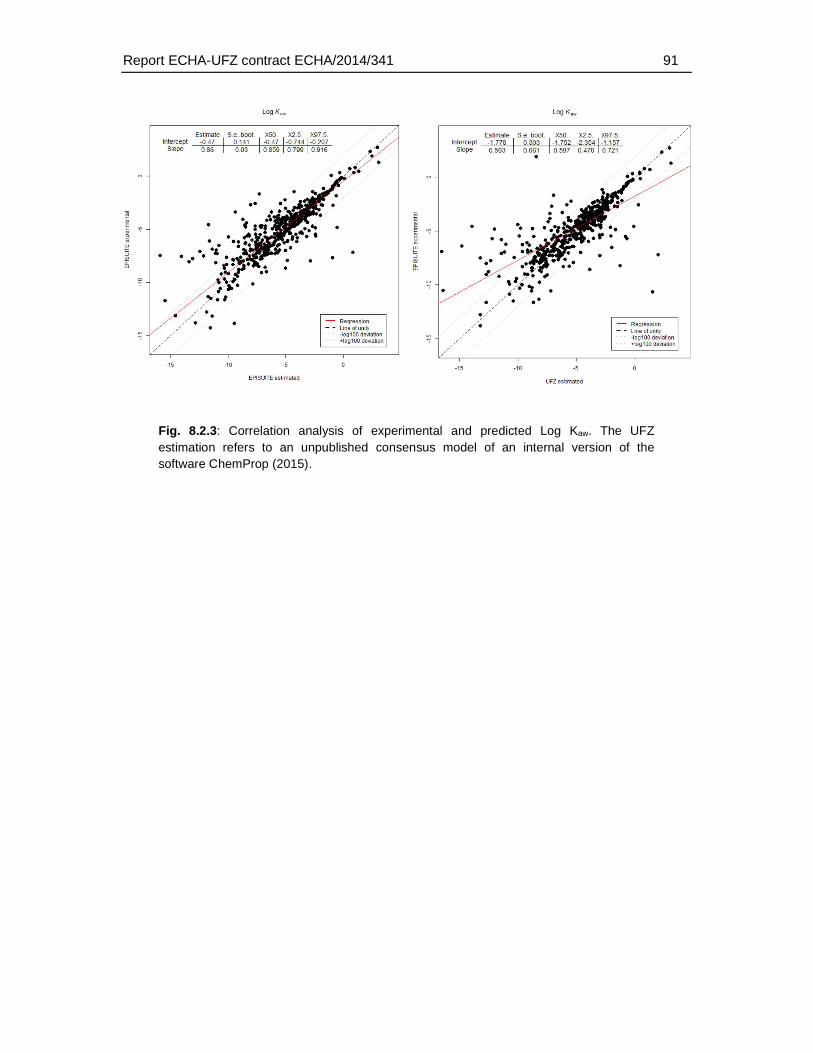
Report ECHA-UFZ contract ECHA/2014/341 91
Fig. 8.2.3: Correlation analysis of experimental and predicted Log Kaw. The UFZ estimation refers to an unpublished consensus model of an internal version of the software ChemProp (2015).
Report ECHA-UFZ contract ECHA/2014/341 92
8.3. Three letter substance abbreviations
For abbreviations please refer to the supplement excel file with FET data:
ECHA_FET database 06112015corr.xlsx
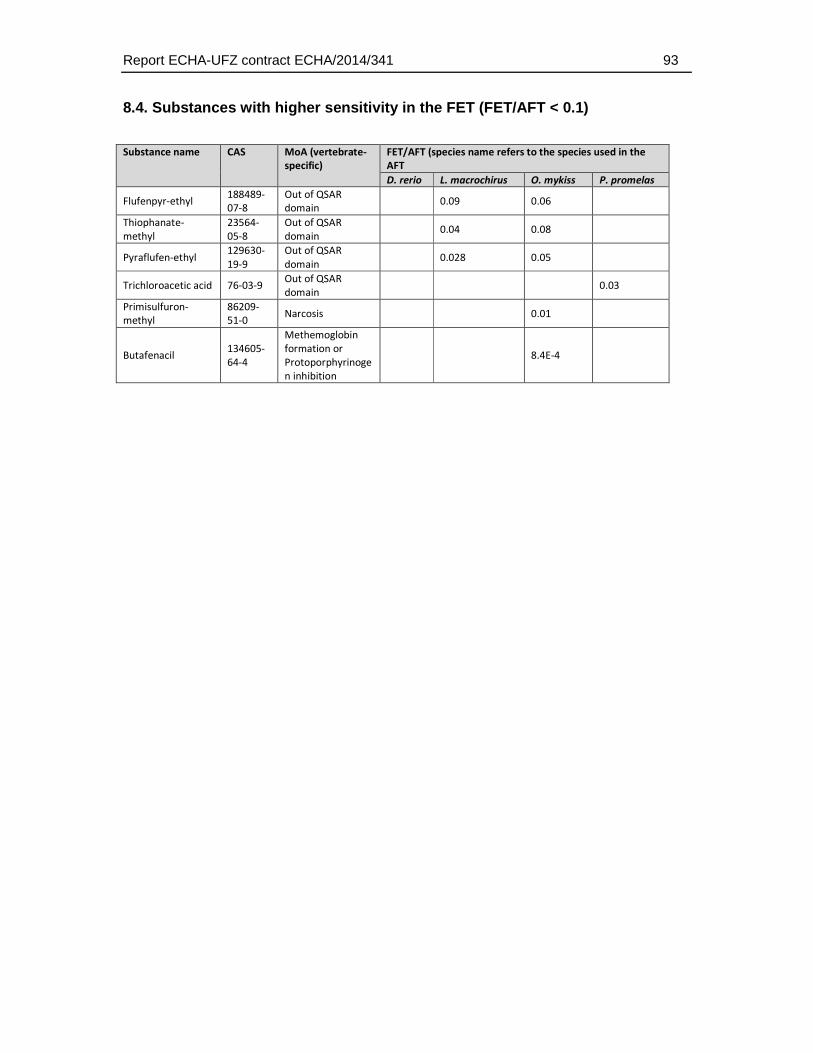
Report ECHA-UFZ contract ECHA/2014/341 93
8.4. Substances with higher sensitivity in the FET (FET/AFT < 0.1)
Substance name CAS MoA (vertebrate-
specific)
FET/AFT (species name refers to the species used in the
AFT
D. rerio L. macrochirus O. mykiss P. promelas
Flufenpyr-ethyl 188489-
07-8
Out of QSAR
domain 0.09 0.06
Thiophanate-
methyl
23564-
05-8
Out of QSAR
domain 0.04 0.08
Pyraflufen-ethyl 129630-
19-9
Out of QSAR
domain 0.028 0.05
Trichloroacetic acid 76-03-9 Out of QSAR
domain 0.03
Primisulfuron-
methyl
86209-
51-0 Narcosis 0.01
Butafenacil 134605-
64-4
Methemoglobin
formation or
Protoporphyrinoge
n inhibition
8.4E-4
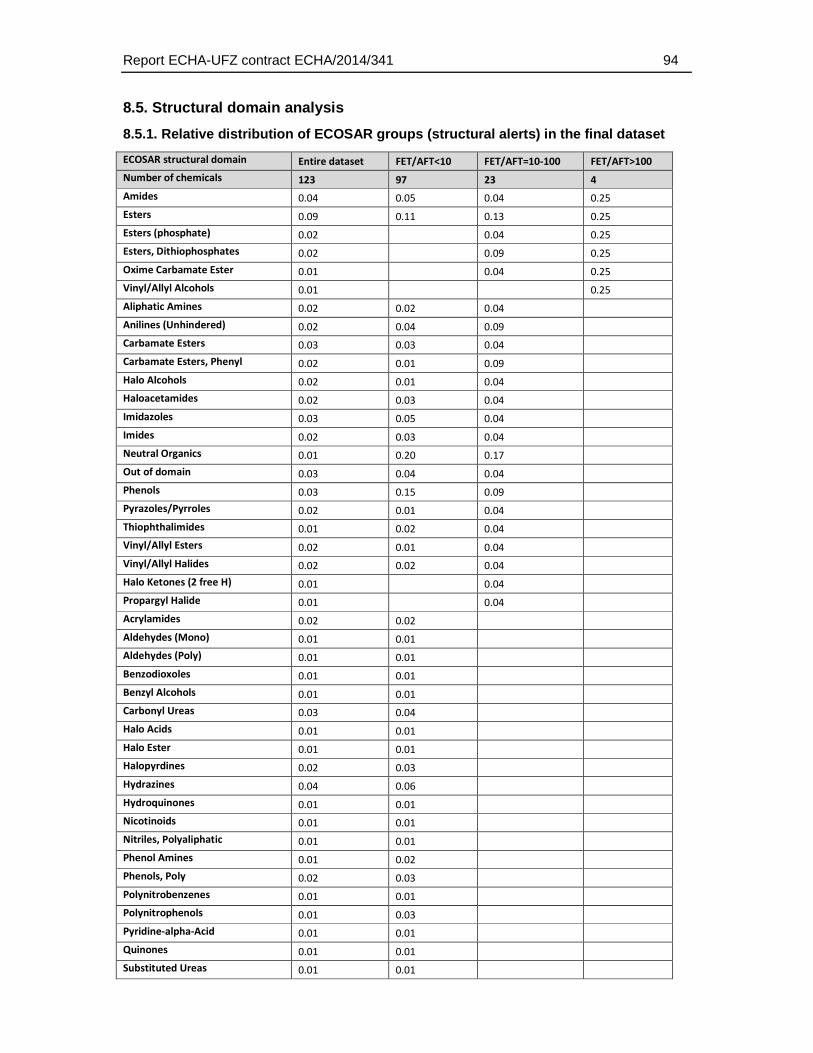
Report ECHA-UFZ contract ECHA/2014/341 94
8.5. Structural domain analysis
8.5.1. Relative distribution of ECOSAR groups (structural alerts) in the final dataset
ECOSAR structural domain Entire dataset FET/AFT<10 FET/AFT=10-100 FET/AFT>100
Number of chemicals 123 97 23 4
Amides 0.04 0.05 0.04 0.25
Esters 0.09 0.11 0.13 0.25
Esters (phosphate) 0.02
0.04 0.25
Esters, Dithiophosphates 0.02
0.09 0.25
Oxime Carbamate Ester 0.01
0.04 0.25
Vinyl/Allyl Alcohols 0.01
0.25
Aliphatic Amines 0.02 0.02 0.04
Anilines (Unhindered) 0.02 0.04 0.09
Carbamate Esters 0.03 0.03 0.04
Carbamate Esters, Phenyl 0.02 0.01 0.09
Halo Alcohols 0.02 0.01 0.04
Haloacetamides 0.02 0.03 0.04
Imidazoles 0.03 0.05 0.04
Imides 0.02 0.03 0.04
Neutral Organics 0.01 0.20 0.17
Out of domain 0.03 0.04 0.04
Phenols 0.03 0.15 0.09
Pyrazoles/Pyrroles 0.02 0.01 0.04
Thiophthalimides 0.01 0.02 0.04
Vinyl/Allyl Esters 0.02 0.01 0.04
Vinyl/Allyl Halides 0.02 0.02 0.04
Halo Ketones (2 free H) 0.01
0.04
Propargyl Halide 0.01
0.04
Acrylamides 0.02 0.02
Aldehydes (Mono) 0.01 0.01
Aldehydes (Poly) 0.01 0.01
Benzodioxoles 0.01 0.01
Benzyl Alcohols 0.01 0.01
Carbonyl Ureas 0.03 0.04
Halo Acids 0.01 0.01
Halo Ester 0.01 0.01
Halopyrdines 0.02 0.03
Hydrazines 0.04 0.06
Hydroquinones 0.01 0.01
Nicotinoids 0.01 0.01
Nitriles, Polyaliphatic 0.01 0.01
Phenol Amines 0.01 0.02
Phenols, Poly 0.02 0.03
Polynitrobenzenes 0.01 0.01
Polynitrophenols 0.01 0.03
Pyridine-alpha-Acid 0.01 0.01
Quinones 0.01 0.01
Substituted Ureas 0.01 0.01
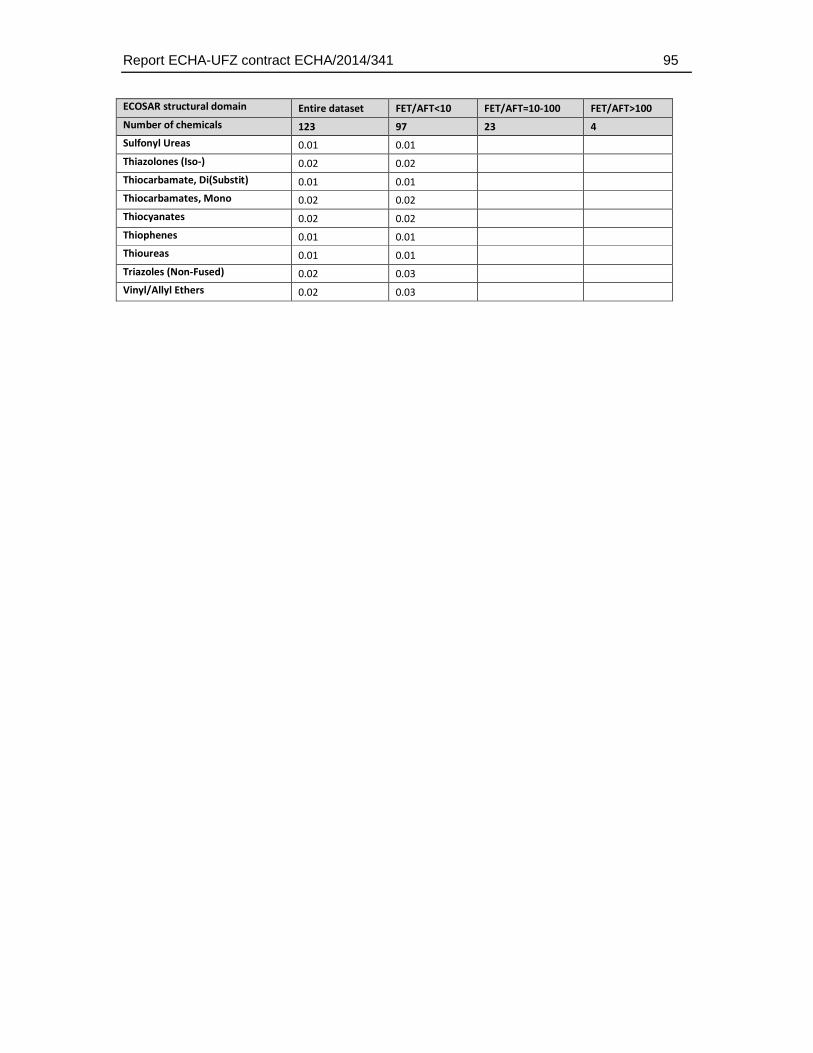
Report ECHA-UFZ contract ECHA/2014/341 95
ECOSAR structural domain Entire dataset FET/AFT<10 FET/AFT=10-100 FET/AFT>100
Number of chemicals 123 97 23 4
Sulfonyl Ureas 0.01 0.01
Thiazolones (Iso-) 0.02 0.02
Thiocarbamate, Di(Substit) 0.01 0.01
Thiocarbamates, Mono 0.02 0.02
Thiocyanates 0.02 0.02
Thiophenes 0.01 0.01
Thioureas 0.01 0.01
Triazoles (Non-Fused) 0.02 0.03
Vinyl/Allyl Ethers 0.02 0.03
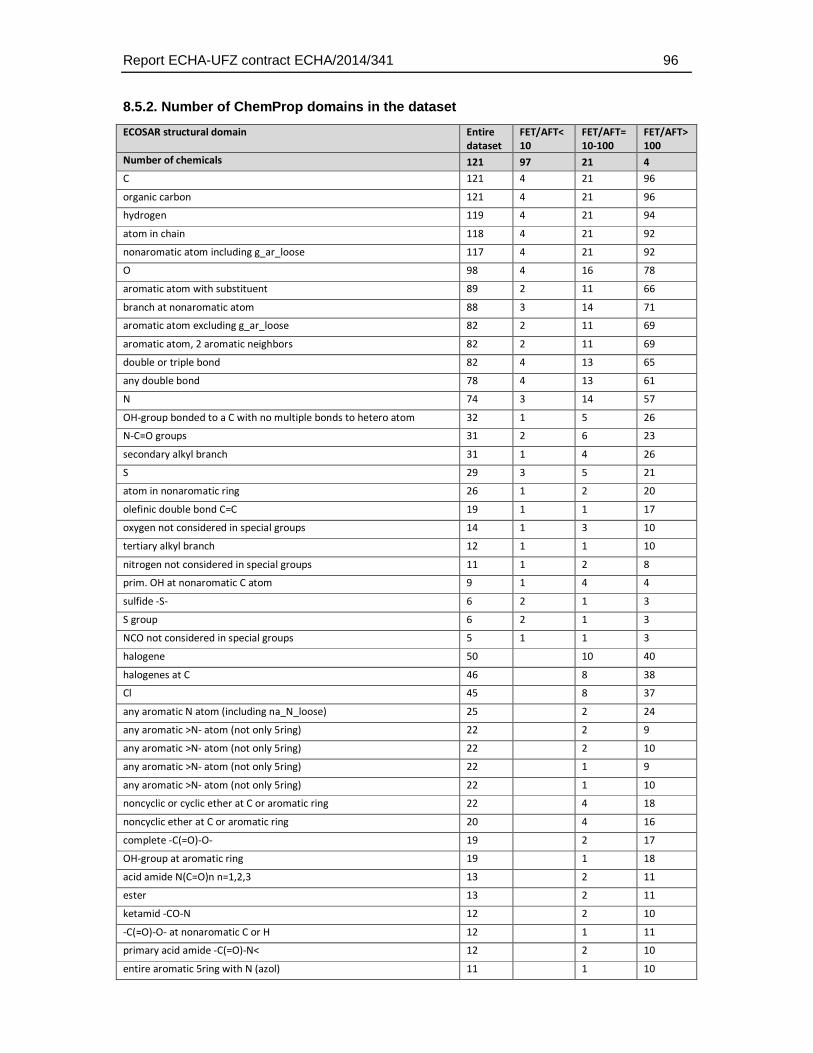
Report ECHA-UFZ contract ECHA/2014/341 96
8.5.2. Number of ChemProp domains in the dataset
ECOSAR structural domain Entire
dataset
FET/AFT<
10
FET/AFT=
10-100
FET/AFT>
100
Number of chemicals 121 97 21 4
C 121 4 21 96
organic carbon 121 4 21 96
hydrogen 119 4 21 94
atom in chain 118 4 21 92
nonaromatic atom including g_ar_loose 117 4 21 92
O 98 4 16 78
aromatic atom with substituent 89 2 11 66
branch at nonaromatic atom 88 3 14 71
aromatic atom excluding g_ar_loose 82 2 11 69
aromatic atom, 2 aromatic neighbors 82 2 11 69
double or triple bond 82 4 13 65
any double bond 78 4 13 61
N 74 3 14 57
OH-group bonded to a C with no multiple bonds to hetero atom 32 1 5 26
N-C=O groups 31 2 6 23
secondary alkyl branch 31 1 4 26
S 29 3 5 21
atom in nonaromatic ring 26 1 2 20
olefinic double bond C=C 19 1 1 17
oxygen not considered in special groups 14 1 3 10
tertiary alkyl branch 12 1 1 10
nitrogen not considered in special groups 11 1 2 8
prim. OH at nonaromatic C atom 9 1 4 4
sulfide -S- 6 2 1 3
S group 6 2 1 3
NCO not considered in special groups 5 1 1 3
halogene 50 10 40
halogenes at C 46 8 38
Cl 45 8 37
any aromatic N atom (including na_N_loose) 25 2 24
any aromatic >N- atom (not only 5ring) 22 2 9
any aromatic >N- atom (not only 5ring) 22 2 10
any aromatic >N- atom (not only 5ring) 22 1 9
any aromatic >N- atom (not only 5ring) 22 1 10
noncyclic or cyclic ether at C or aromatic ring 22 4 18
noncyclic ether at C or aromatic ring 20 4 16
complete -C(=O)-O- 19 2 17
OH-group at aromatic ring 19 1 18
acid amide N(C=O)n n=1,2,3 13 2 11
ester 13 2 11
ketamid -CO-N 12 2 10
-C(=O)-O- at nonaromatic C or H 12 1 11
primary acid amide -C(=O)-N< 12 2 10
entire aromatic 5ring with N (azol) 11 1 10
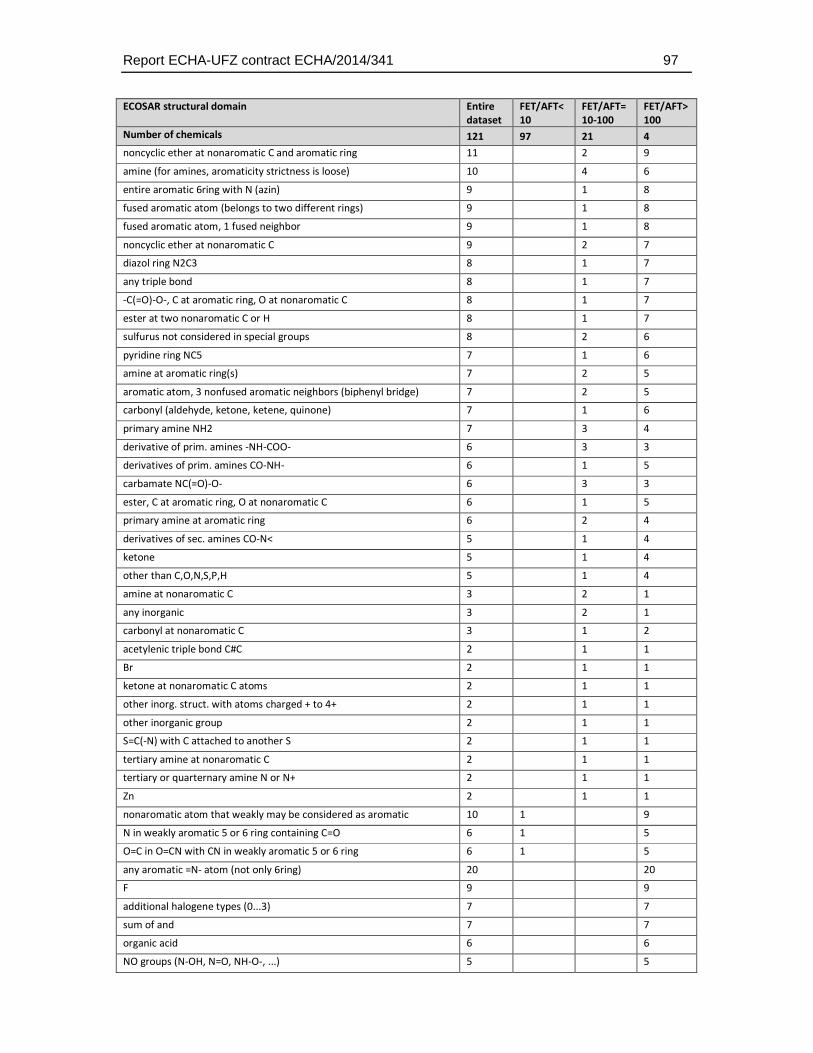
Report ECHA-UFZ contract ECHA/2014/341 97
ECOSAR structural domain Entire
dataset
FET/AFT<
10
FET/AFT=
10-100
FET/AFT>
100
Number of chemicals 121 97 21 4
noncyclic ether at nonaromatic C and aromatic ring 11 2 9
amine (for amines, aromaticity strictness is loose) 10 4 6
entire aromatic 6ring with N (azin) 9 1 8
fused aromatic atom (belongs to two different rings) 9 1 8
fused aromatic atom, 1 fused neighbor 9 1 8
noncyclic ether at nonaromatic C 9 2 7
diazol ring N2C3 8 1 7
any triple bond 8 1 7
-C(=O)-O-, C at aromatic ring, O at nonaromatic C 8 1 7
ester at two nonaromatic C or H 8 1 7
sulfurus not considered in special groups 8 2 6
pyridine ring NC5 7 1 6
amine at aromatic ring(s) 7 2 5
aromatic atom, 3 nonfused aromatic neighbors (biphenyl bridge) 7 2 5
carbonyl (aldehyde, ketone, ketene, quinone) 7 1 6
primary amine NH2 7 3 4
derivative of prim. amines -NH-COO- 6 3 3
derivatives of prim. amines CO-NH- 6 1 5
carbamate NC(=O)-O- 6 3 3
ester, C at aromatic ring, O at nonaromatic C 6 1 5
primary amine at aromatic ring 6 2 4
derivatives of sec. amines CO-N< 5 1 4
ketone 5 1 4
other than C,O,N,S,P,H 5 1 4
amine at nonaromatic C 3 2 1
any inorganic 3 2 1
carbonyl at nonaromatic C 3 1 2
acetylenic triple bond C#C 2 1 1
Br 2 1 1
ketone at nonaromatic C atoms 2 1 1
other inorg. struct. with atoms charged + to 4+ 2 1 1
other inorganic group 2 1 1
S=C(-N) with C attached to another S 2 1 1
tertiary amine at nonaromatic C 2 1 1
tertiary or quarternary amine N or N+ 2 1 1
Zn 2 1 1
nonaromatic atom that weakly may be considered as aromatic 10 1 9
N in weakly aromatic 5 or 6 ring containing C=O 6 1 5
O=C in O=CN with CN in weakly aromatic 5 or 6 ring 6 1 5
any aromatic =N- atom (not only 6ring) 20 20
F 9 9
additional halogene types (0...3) 7 7
sum of and 7 7
organic acid 6 6
NO groups (N-OH, N=O, NH-O-, ...) 5 5
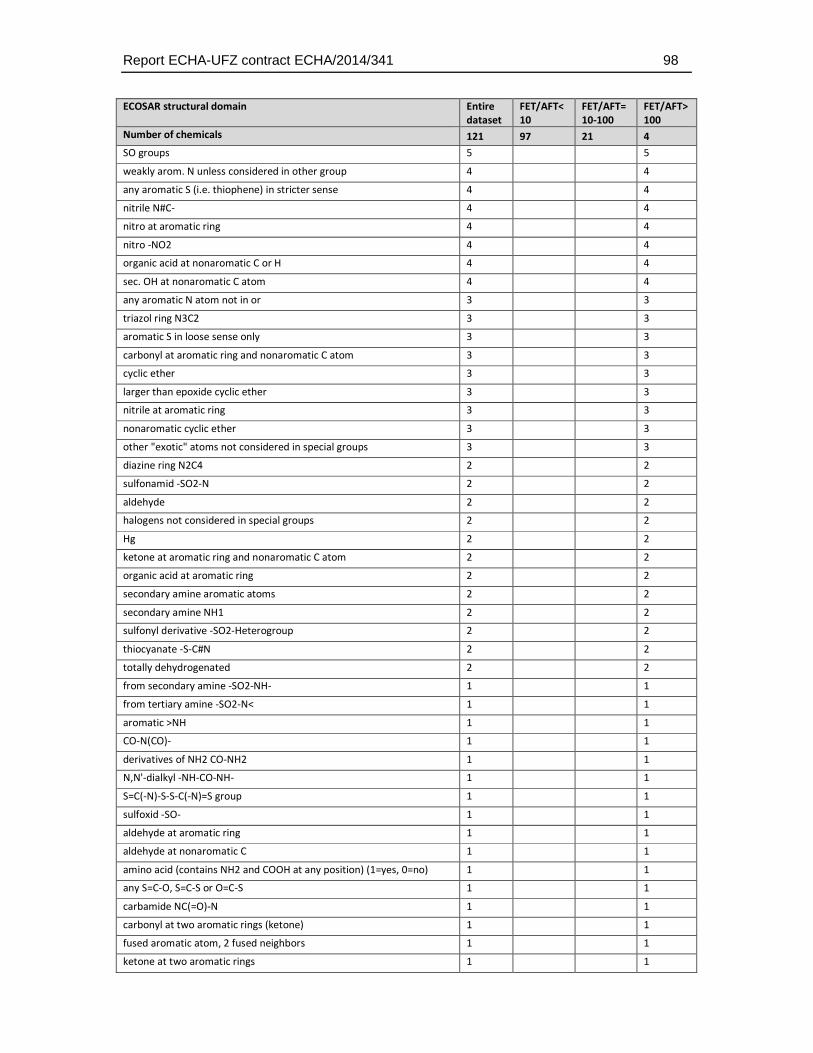
Report ECHA-UFZ contract ECHA/2014/341 98
ECOSAR structural domain Entire
dataset
FET/AFT<
10
FET/AFT=
10-100
FET/AFT>
100
Number of chemicals 121 97 21 4
SO groups 5 5
weakly arom. N unless considered in other group 4 4
any aromatic S (i.e. thiophene) in stricter sense 4 4
nitrile N#C- 4 4
nitro at aromatic ring 4 4
nitro -NO2 4 4
organic acid at nonaromatic C or H 4 4
sec. OH at nonaromatic C atom 4 4
any aromatic N atom not in or 3 3
triazol ring N3C2 3 3
aromatic S in loose sense only 3 3
carbonyl at aromatic ring and nonaromatic C atom 3 3
cyclic ether 3 3
larger than epoxide cyclic ether 3 3
nitrile at aromatic ring 3 3
nonaromatic cyclic ether 3 3
other "exotic" atoms not considered in special groups 3 3
diazine ring N2C4 2 2
sulfonamid -SO2-N 2 2
aldehyde 2 2
halogens not considered in special groups 2 2
Hg 2 2
ketone at aromatic ring and nonaromatic C atom 2 2
organic acid at aromatic ring 2 2
secondary amine aromatic atoms 2 2
secondary amine NH1 2 2
sulfonyl derivative -SO2-Heterogroup 2 2
thiocyanate -S-C#N 2 2
totally dehydrogenated 2 2
from secondary amine -SO2-NH- 1 1
from tertiary amine -SO2-N< 1 1
aromatic >NH 1 1
CO-N(CO)- 1 1
derivatives of NH2 CO-NH2 1 1
N,N'-dialkyl -NH-CO-NH- 1 1
S=C(-N)-S-S-C(-N)=S group 1 1
sulfoxid -SO- 1 1
aldehyde at aromatic ring 1 1
aldehyde at nonaromatic C 1 1
amino acid (contains NH2 and COOH at any position) (1=yes, 0=no) 1 1
any S=C-O, S=C-S or O=C-S 1 1
carbamide NC(=O)-N 1 1
carbonyl at two aromatic rings (ketone) 1 1
fused aromatic atom, 2 fused neighbors 1 1
ketone at two aromatic rings 1 1
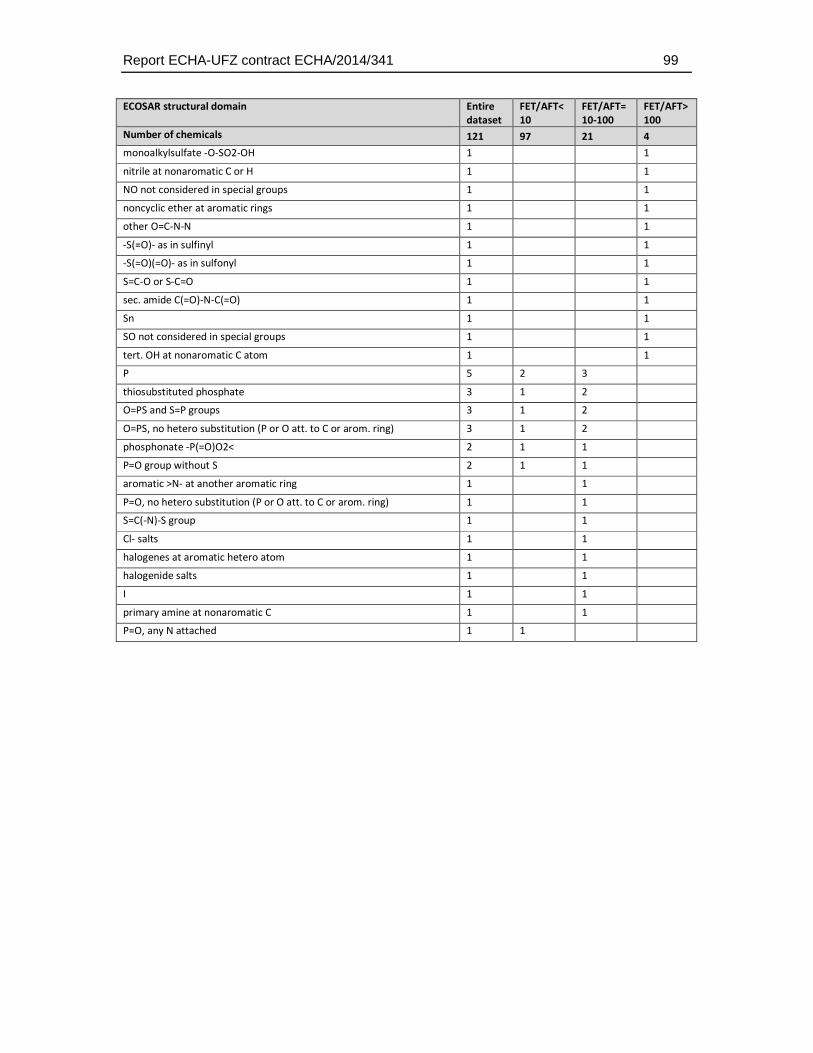
Report ECHA-UFZ contract ECHA/2014/341 99
ECOSAR structural domain Entire
dataset
FET/AFT<
10
FET/AFT=
10-100
FET/AFT>
100
Number of chemicals 121 97 21 4
monoalkylsulfate -O-SO2-OH 1 1
nitrile at nonaromatic C or H 1 1
NO not considered in special groups 1 1
noncyclic ether at aromatic rings 1 1
other O=C-N-N 1 1
-S(=O)- as in sulfinyl 1 1
-S(=O)(=O)- as in sulfonyl 1 1
S=C-O or S-C=O 1 1
sec. amide C(=O)-N-C(=O) 1 1
Sn 1 1
SO not considered in special groups 1 1
tert. OH at nonaromatic C atom 1 1
P 5 2 3
thiosubstituted phosphate 3 1 2
O=PS and S=P groups 3 1 2
O=PS, no hetero substitution (P or O att. to C or arom. ring) 3 1 2
phosphonate -P(=O)O2< 2 1 1
P=O group without S 2 1 1
aromatic >N- at another aromatic ring 1 1
P=O, no hetero substitution (P or O att. to C or arom. ring) 1 1
S=C(-N)-S group 1 1
Cl- salts 1 1
halogenes at aromatic hetero atom 1 1
halogenide salts 1 1
I 1 1
primary amine at nonaromatic C 1 1
P=O, any N attached 1 1
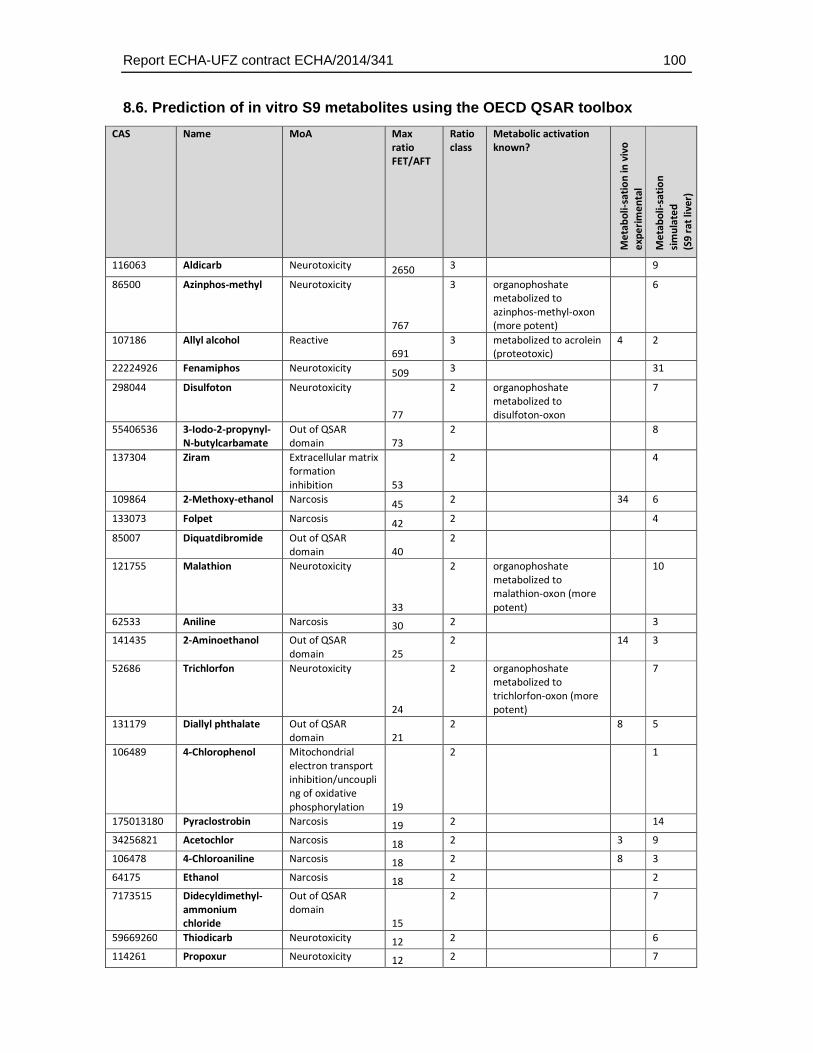
Report ECHA-UFZ contract ECHA/2014/341 100
8.6. Prediction of in vitro S9 metabolites using the OECD QSAR toolbox
CAS Name MoA Max
ratio
FET/AFT
Ratio
class
Metabolic activation
known?
Me
tab
oli
-sa
tio
n i
n v
ivo
ex
pe
rim
en
tal
(ma
mm
als
) M
eta
bo
li-s
ati
on
sim
ula
ted
(S9
ra
t li
ve
r)
116063 Aldicarb Neurotoxicity 2650 3 9
86500 Azinphos-methyl Neurotoxicity
767
3 organophoshate
metabolized to
azinphos-methyl-oxon
(more potent)
6
107186 Allyl alcohol Reactive
691
3 metabolized to acrolein
(proteotoxic)
4 2
22224926 Fenamiphos Neurotoxicity 509
3 31
298044 Disulfoton Neurotoxicity
77
2 organophoshate
metabolized to
disulfoton-oxon
7
55406536 3-Iodo-2-propynyl-
N-butylcarbamate
Out of QSAR
domain 73
2 8
137304 Ziram Extracellular matrix
formation
inhibition 53
2 4
109864 2-Methoxy-ethanol Narcosis 45
2 34 6
133073 Folpet Narcosis 42
2 4
85007 Diquatdibromide Out of QSAR
domain 40
2
121755 Malathion Neurotoxicity
33
2 organophoshate
metabolized to
malathion-oxon (more
potent)
10
62533 Aniline Narcosis 30 2 3
141435 2-Aminoethanol Out of QSAR
domain 25
2 14 3
52686 Trichlorfon Neurotoxicity
24
2 organophoshate
metabolized to
trichlorfon-oxon (more
potent)
7
131179 Diallyl phthalate Out of QSAR
domain 21
2 8 5
106489 4-Chlorophenol Mitochondrial
electron transport
inhibition/uncoupli
ng of oxidative
phosphorylation 19
2 1
175013180 Pyraclostrobin Narcosis 19 2 14
34256821 Acetochlor Narcosis 18 2 3 9
106478 4-Chloroaniline Narcosis 18 2 8 3
64175 Ethanol Narcosis 18 2 2
7173515 Didecyldimethyl-
ammonium
chloride
Out of QSAR
domain
15
2 7
59669260 Thiodicarb Neurotoxicity 12 2 6
114261 Propoxur Neurotoxicity 12 2 7
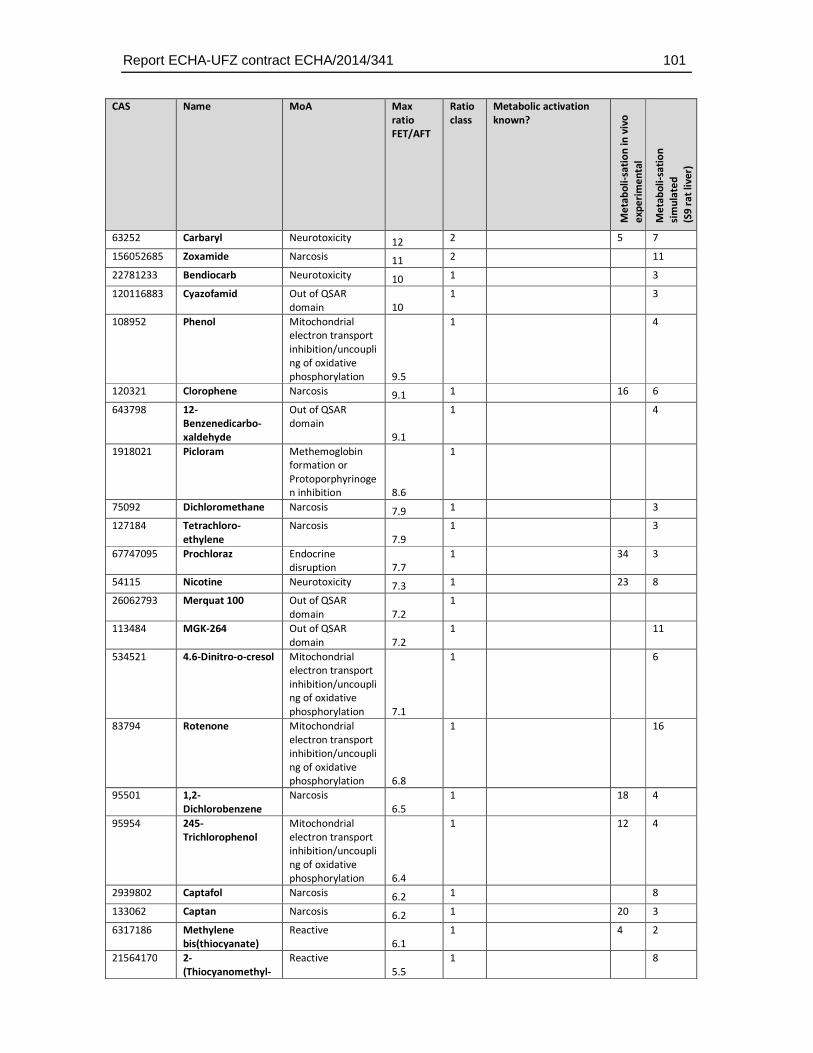
Report ECHA-UFZ contract ECHA/2014/341 101
CAS Name MoA Max
ratio
FET/AFT
Ratio
class
Metabolic activation
known?
Me
tab
oli
-sa
tio
n i
n v
ivo
ex
pe
rim
en
tal
(ma
mm
als
) M
eta
bo
li-s
ati
on
sim
ula
ted
(S9
ra
t li
ve
r)
63252 Carbaryl Neurotoxicity 12 2 5 7
156052685 Zoxamide Narcosis 11 2 11
22781233 Bendiocarb Neurotoxicity 10 1 3
120116883 Cyazofamid Out of QSAR
domain 10
1 3
108952 Phenol Mitochondrial
electron transport
inhibition/uncoupli
ng of oxidative
phosphorylation 9.5
1 4
120321 Clorophene Narcosis 9.1 1 16 6
643798 12-
Benzenedicarbo-
xaldehyde
Out of QSAR
domain
9.1
1 4
1918021 Picloram Methemoglobin
formation or
Protoporphyrinoge
n inhibition 8.6
1
75092 Dichloromethane Narcosis 7.9 1 3
127184 Tetrachloro-
ethylene
Narcosis
7.9
1 3
67747095 Prochloraz Endocrine
disruption 7.7
1 34 3
54115 Nicotine Neurotoxicity 7.3 1 23 8
26062793 Merquat 100 Out of QSAR
domain 7.2
1
113484 MGK-264 Out of QSAR
domain 7.2
1 11
534521 4.6-Dinitro-o-cresol Mitochondrial
electron transport
inhibition/uncoupli
ng of oxidative
phosphorylation 7.1
1 6
83794 Rotenone Mitochondrial
electron transport
inhibition/uncoupli
ng of oxidative
phosphorylation 6.8
1 16
95501 1,2-
Dichlorobenzene
Narcosis
6.5
1 18 4
95954 245-
Trichlorophenol
Mitochondrial
electron transport
inhibition/uncoupli
ng of oxidative
phosphorylation 6.4
1 12 4
2939802 Captafol Narcosis 6.2 1 8
133062 Captan Narcosis 6.2 1 20 3
6317186 Methylene
bis(thiocyanate)
Reactive
6.1
1 4 2
21564170 2-
(Thiocyanomethyl-
Reactive
5.5
1 8
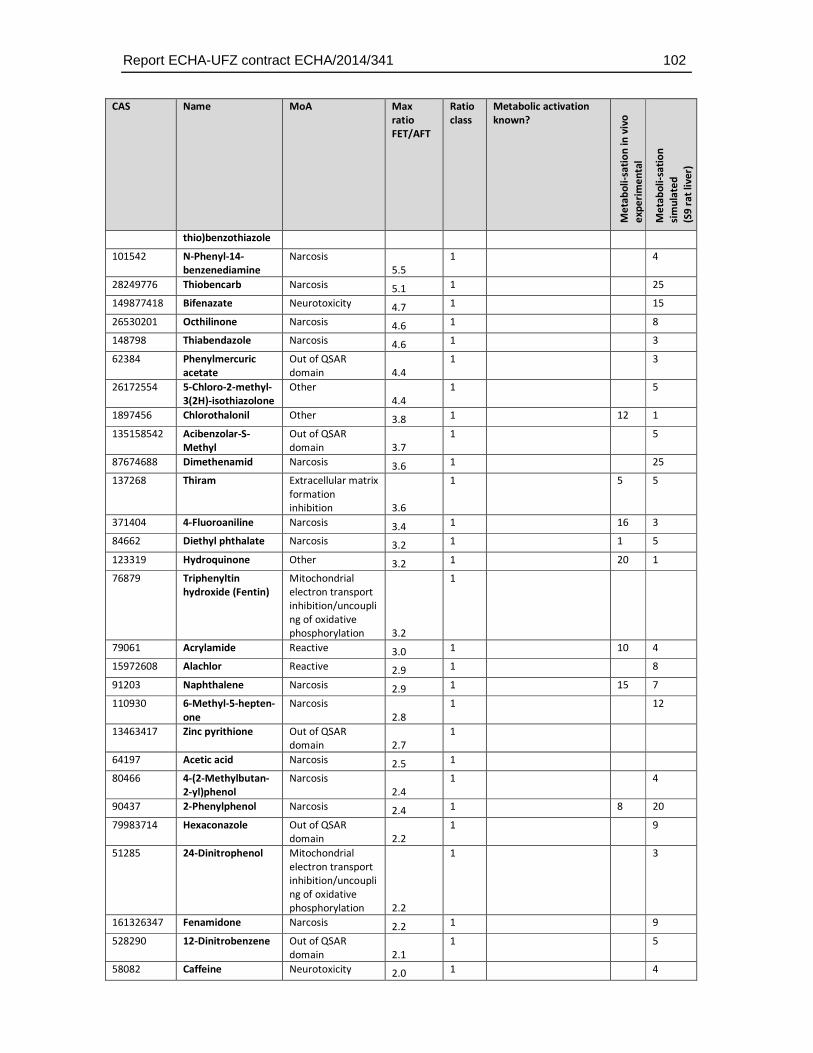
Report ECHA-UFZ contract ECHA/2014/341 102
CAS Name MoA Max
ratio
FET/AFT
Ratio
class
Metabolic activation
known?
Me
tab
oli
-sa
tio
n i
n v
ivo
ex
pe
rim
en
tal
(ma
mm
als
) M
eta
bo
li-s
ati
on
sim
ula
ted
(S9
ra
t li
ve
r)
thio)benzothiazole
101542 N-Phenyl-14-
benzenediamine
Narcosis
5.5
1 4
28249776 Thiobencarb Narcosis 5.1 1 25
149877418 Bifenazate Neurotoxicity 4.7 1 15
26530201 Octhilinone Narcosis 4.6 1 8
148798 Thiabendazole Narcosis 4.6 1 3
62384 Phenylmercuric
acetate
Out of QSAR
domain 4.4
1 3
26172554 5-Chloro-2-methyl-
3(2H)-isothiazolone
Other
4.4
1 5
1897456 Chlorothalonil Other 3.8 1 12 1
135158542 Acibenzolar-S-
Methyl
Out of QSAR
domain 3.7
1 5
87674688 Dimethenamid Narcosis 3.6 1 25
137268 Thiram Extracellular matrix
formation
inhibition 3.6
1 5 5
371404 4-Fluoroaniline Narcosis 3.4 1 16 3
84662 Diethyl phthalate Narcosis 3.2 1 1 5
123319 Hydroquinone Other 3.2 1 20 1
76879 Triphenyltin
hydroxide (Fentin)
Mitochondrial
electron transport
inhibition/uncoupli
ng of oxidative
phosphorylation 3.2
1
79061 Acrylamide Reactive 3.0 1 10 4
15972608 Alachlor Reactive 2.9 1 8
91203 Naphthalene Narcosis 2.9 1 15 7
110930 6-Methyl-5-hepten-
one
Narcosis
2.8
1 12
13463417 Zinc pyrithione Out of QSAR
domain 2.7
1
64197 Acetic acid Narcosis 2.5 1
80466 4-(2-Methylbutan-
2-yl)phenol
Narcosis
2.4
1 4
90437 2-Phenylphenol Narcosis 2.4 1 8 20
79983714 Hexaconazole Out of QSAR
domain 2.2
1 9
51285 24-Dinitrophenol Mitochondrial
electron transport
inhibition/uncoupli
ng of oxidative
phosphorylation 2.2
1 3
161326347 Fenamidone Narcosis 2.2 1 9
528290 12-Dinitrobenzene Out of QSAR
domain 2.1
1 5
58082 Caffeine Neurotoxicity 2.0 1 4
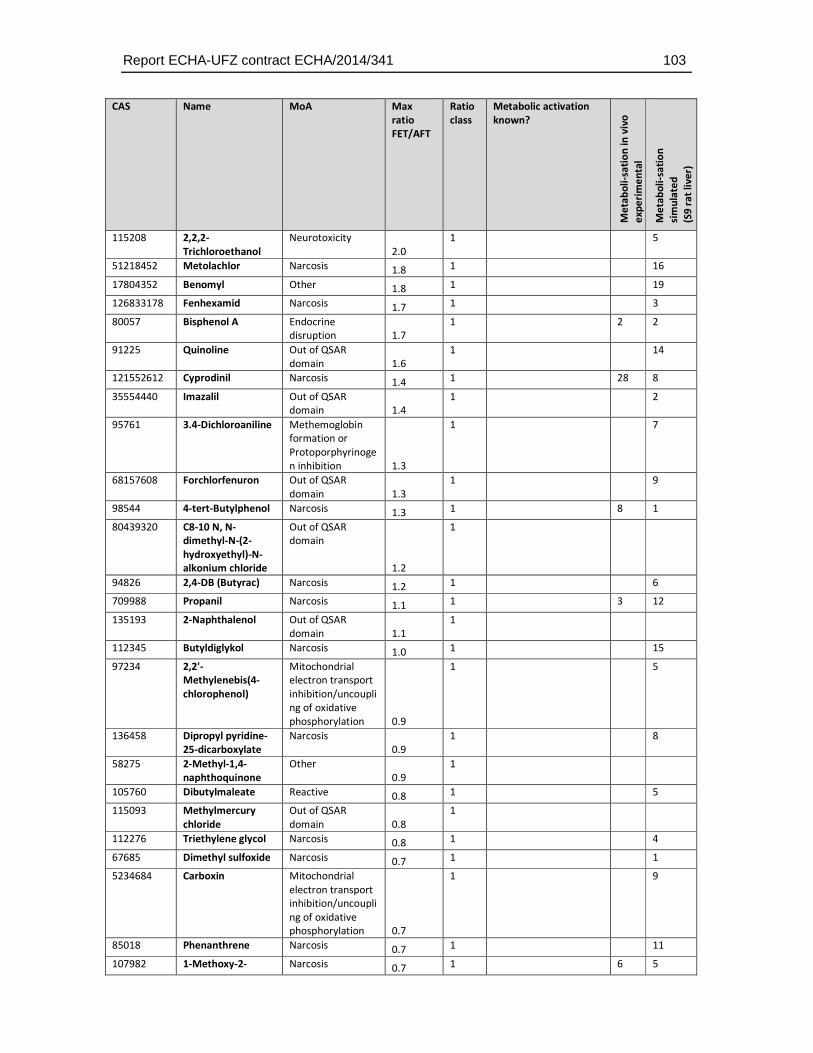
Report ECHA-UFZ contract ECHA/2014/341 103
CAS Name MoA Max
ratio
FET/AFT
Ratio
class
Metabolic activation
known?
Me
tab
oli
-sa
tio
n i
n v
ivo
ex
pe
rim
en
tal
(ma
mm
als
) M
eta
bo
li-s
ati
on
sim
ula
ted
(S9
ra
t li
ve
r)
115208 2,2,2-
Trichloroethanol
Neurotoxicity
2.0
1 5
51218452 Metolachlor Narcosis 1.8 1 16
17804352 Benomyl Other 1.8 1 19
126833178 Fenhexamid Narcosis 1.7 1 3
80057 Bisphenol A Endocrine
disruption 1.7
1 2 2
91225 Quinoline Out of QSAR
domain 1.6
1 14
121552612 Cyprodinil Narcosis 1.4 1 28 8
35554440 Imazalil Out of QSAR
domain 1.4
1 2
95761 3.4-Dichloroaniline Methemoglobin
formation or
Protoporphyrinoge
n inhibition 1.3
1 7
68157608 Forchlorfenuron Out of QSAR
domain 1.3
1 9
98544 4-tert-Butylphenol Narcosis 1.3 1 8 1
80439320 C8-10 N, N-
dimethyl-N-(2-
hydroxyethyl)-N-
alkonium chloride
Out of QSAR
domain
1.2
1
94826 2,4-DB (Butyrac) Narcosis 1.2 1 6
709988 Propanil Narcosis 1.1 1 3 12
135193 2-Naphthalenol Out of QSAR
domain 1.1
1
112345 Butyldiglykol Narcosis 1.0 1 15
97234 2,2'-
Methylenebis(4-
chlorophenol)
Mitochondrial
electron transport
inhibition/uncoupli
ng of oxidative
phosphorylation 0.9
1 5
136458 Dipropyl pyridine-
25-dicarboxylate
Narcosis
0.9
1 8
58275 2-Methyl-1,4-
naphthoquinone
Other
0.9
1
105760 Dibutylmaleate Reactive 0.8 1 5
115093 Methylmercury
chloride
Out of QSAR
domain 0.8
1
112276 Triethylene glycol Narcosis 0.8 1 4
67685 Dimethyl sulfoxide Narcosis 0.7 1 1
5234684 Carboxin Mitochondrial
electron transport
inhibition/uncoupli
ng of oxidative
phosphorylation 0.7
1 9
85018 Phenanthrene Narcosis 0.7 1 11
107982 1-Methoxy-2- Narcosis 0.7 1 6 5
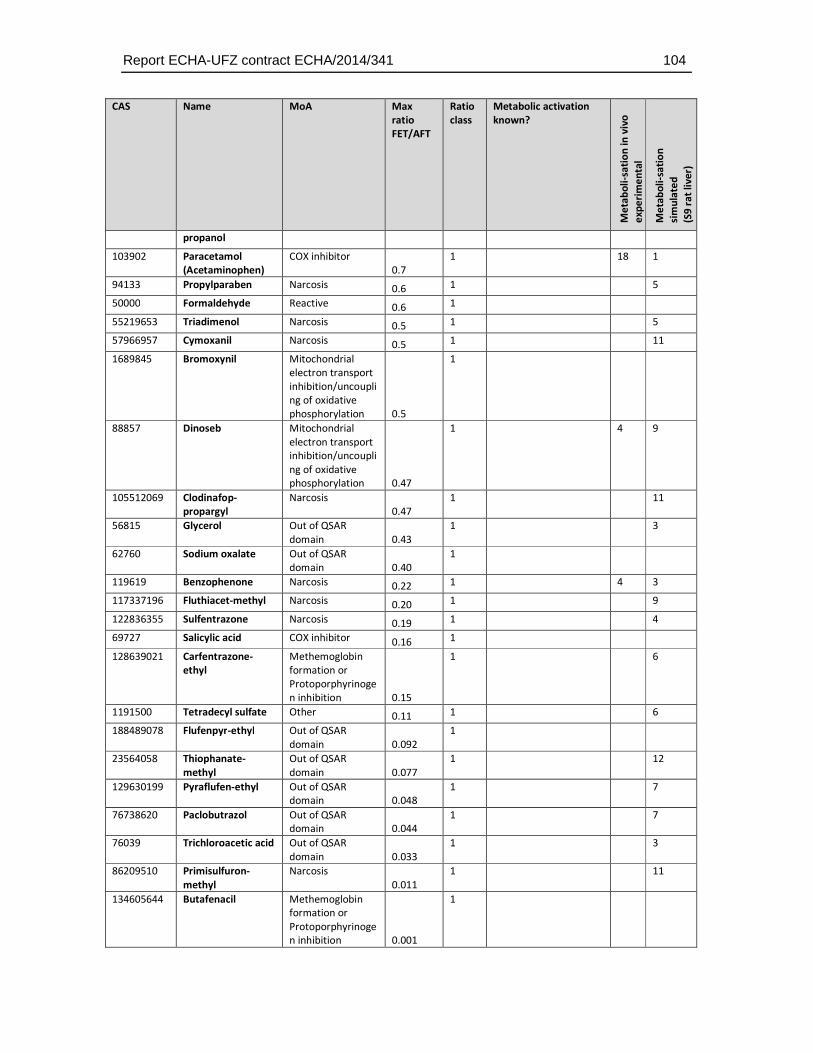
Report ECHA-UFZ contract ECHA/2014/341 104
CAS Name MoA Max
ratio
FET/AFT
Ratio
class
Metabolic activation
known?
Me
tab
oli
-sa
tio
n i
n v
ivo
ex
pe
rim
en
tal
(ma
mm
als
) M
eta
bo
li-s
ati
on
sim
ula
ted
(S9
ra
t li
ve
r)
propanol
103902 Paracetamol
(Acetaminophen)
COX inhibitor
0.7
1 18 1
94133 Propylparaben Narcosis 0.6 1 5
50000 Formaldehyde Reactive 0.6 1
55219653 Triadimenol Narcosis 0.5 1 5
57966957 Cymoxanil Narcosis 0.5 1 11
1689845 Bromoxynil Mitochondrial
electron transport
inhibition/uncoupli
ng of oxidative
phosphorylation 0.5
1
88857 Dinoseb Mitochondrial
electron transport
inhibition/uncoupli
ng of oxidative
phosphorylation 0.47
1 4 9
105512069 Clodinafop-
propargyl
Narcosis
0.47
1 11
56815 Glycerol Out of QSAR
domain 0.43
1 3
62760 Sodium oxalate Out of QSAR
domain 0.40
1
119619 Benzophenone Narcosis 0.22 1 4 3
117337196 Fluthiacet-methyl Narcosis 0.20 1 9
122836355 Sulfentrazone Narcosis 0.19 1 4
69727 Salicylic acid COX inhibitor 0.16 1
128639021 Carfentrazone-
ethyl
Methemoglobin
formation or
Protoporphyrinoge
n inhibition 0.15
1 6
1191500 Tetradecyl sulfate Other 0.11 1 6
188489078 Flufenpyr-ethyl Out of QSAR
domain 0.092
1
23564058 Thiophanate-
methyl
Out of QSAR
domain 0.077
1 12
129630199 Pyraflufen-ethyl Out of QSAR
domain 0.048
1 7
76738620 Paclobutrazol Out of QSAR
domain 0.044
1 7
76039 Trichloroacetic acid Out of QSAR
domain 0.033
1 3
86209510 Primisulfuron-
methyl
Narcosis
0.011
1 11
134605644 Butafenacil Methemoglobin
formation or
Protoporphyrinoge
n inhibition 0.001
1