Embed Size (px)
Citation preview
Report Development of the car fleet in EU28+2 to achieve the Paris Agreement target to limit global warming to 1.5°C 20. September 2018
Development of the car fleet in EU28+2 to achieve the Paris Agreement target
to limit global warming to 1.5°C
Development of the car fleet in EU28+2 to achieve the Paris Agreement target to limit global warming to 1.5°C
2
Deutsches Zentrum für Luft- und Raumfahrt e.V. Institut für Fahrzeugkonzepte Pfaffenwaldring 38-40 D-70569 Stuttgart Head of Institute Project leader Prof. H. E. Friedrich Bent van den Adel, M.Sc. Tel.: +49 (0)711/6862-256 Tel.: +49 (0)711/6862-8287
Title Development of the car fleet in EU28+2 to achieve the Paris Agreement
target to limit global warming to 1.5°C
Authors Bent van den Adel ([email protected])
Ulrike Kugler
Stephan Schmid
Project GP-EU-CAR
Commissioned by Greenpeace Belgium
Haachtsesteenweg 159, 1030 Brussel, Belgium
File Name 20180907_GP_EUCarFleet_1.5.docx
File Path G:\41313-TBS\03-Projekte\3019795_GP-EU-CAR\Report
Version No. Changes No. of pages Date
1 23 12. September 2018
Written by (Date, Signature) Checked (Date, Signature) Approved (Date, Signature)
DLR-FK-QM-VD-02-0-02
Development of the car fleet in EU28+2 to achieve the Paris Agreement target to limit global warming to 1.5°C 3
Contents
1. Introduction ..................................................................................................................... 6
2. Carbon Budgeting ........................................................................................................... 7
3. Passenger Car Sector in EU28+2 ................................................................................... 10
3.1. New Vehicle Sales ................................................................................................... 10
3.2. Passenger Cars in Use.............................................................................................. 10
3.3. Scenarios for New Vehicles Sales and Car Stock to stay within the CO2 Budget ......... 11
4. Outlook on Implications on other Sectors ................................................................... 19
5. Summary ........................................................................................................................ 20
6. References ..................................................................................................................... 21
7. Annex – VECTOR21 – Vehicle Scenario Technology Model ......................................... 23
Development of the car fleet in EU28+2 to achieve the Paris Agreement target to limit global warming to 1.5°C 4
Figures Figure 2-1: Direct CO2 emissions from passenger cars, other transport modes and other sectors in
EU28+2 between 2005 and 2015 ............................................................................................. 9
Figure 3-1: Sales of new passenger cars in EU28+2 between 2006 and 2017 ........................... 10
Figure 3-2: Powertrain concepts used for the scenarios; ........................................................... 12
Figure 3-3: Assumption on development of CO2-fleet emission target for new passenger cars in
EU28 ...................................................................................................................................... 12
Figure 3-4: Scenario results from VECTOR21 for the new vehicle sales in EU28+2 in the reference
scenario. ................................................................................................................................ 13
Figure 3-5: Scenario result from VECTOR21 for the development of the car stock in EU28+2 in
the reference scenario. ........................................................................................................... 14
Figure 3-6: Scenario results from VECTOR21 for the development of the TTW CO2-emissions
from the car stock in EU28+2 in the reference scenario............................................................ 14
Figure 3-7: Scenario results from VECTOR21 for the new vehicle sales in EU28+2 in the 50%-
likelihood scenario. ................................................................................................................. 15
Figure 3-8: Scenario result from VECTOR21 for the development of the car stock in EU28+2 in
the 50%-likelihood scenario. .................................................................................................. 16
Figure 3-9: Scenario results from VECTOR21 for the development of the TTW CO2-emissions
from the car stock in EU28+2 in the 50%-likelihood scenario. ................................................. 16
Figure 3-10: Scenario result from VECTOR21 for the new vehicle sales in EU28+2 in the 66%-
likelihood scenario. ................................................................................................................. 17
Figure 3-11: Scenario result from VECTOR21 for the development of the car stock in EU28+2 in
the 66%-likelihood scenario. .................................................................................................. 18
Figure 3-12: Scenario results from VECTOR21 for the development of the TTW CO2-emissions
from the car stock in EU28+2 in the 66%-likelihood scenario. ................................................. 18
Figure 7-1. Model approach of vehicle technology scenario model VECTOR21 .......................... 23
Tables Table 2-1: Annual anthropogenic CO2 emissions of EU28+2 ...................................................... 8
Table 2-2: Remaining CO2 budgets for EU28+2 to stay below 1.5°C increase of global mean
temperature ............................................................................................................................. 8
Table 2-3: Remaining CO2 budgets for Passenger Cars in EU28+2 to stay below 1.5°C increase of
global mean temperature.......................................................................................................... 9
Development of the car fleet in EU28+2 to achieve the Paris Agreement target to limit global warming to 1.5°C 5
Glossary
a Year
BEV Battery Electric Vehicle
CNG Compressed Natural Gas
CO2 Carbon Dioxide
CV Conventional Vehicles
EU28 European Union (28 member states)
EU28+2 European Union (28 member states), Switzerland and Norway
EV Electric Vehicle
FCEV Fuel Cell Electric Vehicle
GHG Greenhouse Gas
Gt Giga tons (109 Tons)
HEV Hybrid Electric Vehicle
H2 Hydrogen
ICE Internal Combustion Engine
IPCC Intergovernmental Panel on Climate Change
LPG Liquefied Petroleum Gas
LULUCF Land Use, Land Use Change and Forestry
Mt Mega Tons (106 Tons)
PHEV Plug-in Hybrid electric Vehicle
Pkm Passenger Kilometres
T Ton
TtW Tank-to-Wheel
UNFCCC United Nations Framework Convention on Climate Change
Vkm Vehicle Kilometres
TTW Tank-to-Wheel
WTT Well-to-Tank
ZEV Zero emission vehicle
Development of the car fleet in EU28+2 to achieve the Paris Agreement target to limit global warming to 1.5°C 6
1. Introduction This study explores how the passenger car market and stock in the EU28 plus Switzerland and
Norway (EU28+2) has to develop, to ensure that the cumulated CO2 emissions of the private
mobility sector stay below the corresponding CO2 budget to fulfil the Paris Treaty. Therefore, it is
differentiated between a scenario to keep the mean global temperature increase to 1.5°C with a
likelihood of 50% and of 66%. Over the last decade, the emissions from the EU28+2 car
segment have changed little. If this trend continues in the next decade the passenger car CO2
budget for EU28+2 would be completely depleted in the 50% scenario within 10 years. In the
66% scenario the carbon budget would be depleted within 5 years.
For the scenarios, only the market developments of CO2 emitting vehicles are taken into account.
Therefore, it is assumed for this particular study that zero emission vehicles (e. g. battery electric
vehicles (BEV) and fuel cell electric vehicles (FCEV)) will fill up the new car sales. Therefore, the
Vehicle Technology Scenario Model VECTOR211 only considers six different drivetrains such as
diesel- and petrol-hybrids (HEV) and petrol plug-in hybrids (PHEV), as well as more efficient
modern diesel and petrol drivetrains. Within the simulation runs, the new vehicle sales are
calculated. Furthermore, the sales numbers are used to calculate the vehicle stock using the
VECTOR21 stock model, which also gives the amount of the TTW (Tank-to-Wheel) CO2 emissions
on a yearly basis.
Beside the measures targeting the technical composition of the new vehicle market and the car
stock, other paths to reduce the CO2 emissions from the private transport sector also exist.
Synthetic fuels, as well as a change in behaviour, such as a model shift, are examples. Those
options are not part of this study but should be taken into account by drawing potential paths to
reduce the CO2 emissions and, thus, limit global warming.
1 www.vector21.de
Development of the car fleet in EU28+2 to achieve the Paris Agreement target to limit global warming to 1.5°C 7
2. Carbon Budgeting In the Paris Treaty, the members of the United Nations Framework Convention on Climate
Change (UNFCCC) set the target to keep global warming well below 2°C and to pursue efforts to
limit the increase in mean global temperature to 1.5°C above pre-industrial levels (UNFCCC
2016).
When modelling net anthropogenic warming due to CO2 emissions, the concept of a global
carbon budget (i.e. (UNEP 2015),(Le Quéré et al. 2017)) in combination with likelihoods to stay
below a certain mean global temperature increase is often used. This concept illustrates that, to
be able to limit global warming to a certain rise in temperature (i.e. 1.5°C), there is only a limited
amount of greenhouse gases left that can be emitted. Starting in 2011, the global CO2 budget
(=cumulative CO2 emissions) amounted up to 400 Gt CO2 emissions for a 66% likelihood and
550 Gt CO2 emissions for a 50% likelihood to stay below 1.5°C increase in global mean
temperature increase (Pachauri, Mayer, and Intergovernmental Panel on Climate Change 2015).
The Global Carbon Project2 publishes a yearly update of global carbon emissions. From 2011 to
2016, global CO2 emissions from fossil fuels and industry summed up to 214.3 Gt, with an
annual average of 35.7 Gt (Boden, Marland, and Andres 2017).
Following the regional figures given in (Friedlingstein et al. 2014), EU283 had a share in global
anthropogenic emissions (fossil fuel combustion and cement production) of 9.7% in 2013 and
9.2% in 2014 (2013: 3.5 Gt CO2, 2014: 3.4 Gt CO2). These figures are in line with the data
submitted under the United Nations Framework Convention on Climate Change UNFCCC (Table
2-1). Including Norway and Switzerland, EU28+2 had an average share in global CO2 emissions
between 2011 and 2015 of 10.4%. This share is applied to the global carbon budget and
amounted for the EU28+2 at the end of 2010: 57 Gt CO2 (50% likelihood) and 42 Gt CO2 (66%
likelihood). Over the period of 2011-2015, EU28+2 have emitted 18.08 Gt of CO2 emissions.
Subtracting these CO2 emissions, the remaining carbon budgets for the EU28+2 are 38.7 Gt of
CO2 emissions at the end of 2015 (50% likelihood) or 23.1 Gt CO2 (66% likelihood) (Table 2-2).
If emission levels as of today were to continue over the next years, the CO2 budgets for EU28+2
would be depleted in 9 years (50% likelihood) or even 5 years (66% likelihood) from 2018 on.
2 http://www.globalcarbonproject.org/carbonbudget/17/data.htm 3 EU28 member states: Austria, Belgium, Bulgaria, Croatia, Cyprus, Czech Republic, Denmark, Estonia, Finland, France, Germany, Greece, Hungary, Ireland, Italy, Latvia, Lithuania, Luxembourg, Malta, Netherlands, Poland, Portugal, Romania, Slovakia, Slovenia, Spain, Sweden, United Kingdom

Development of the car fleet in EU28+2 to achieve the Paris Agreement target to limit global warming to 1.5°C 8
Table 2-1: Annual anthropogenic CO2 emissions of EU28+24
CO2 emissions [Gt] 2011 2012 2013 2014 2015
EU28 3.78 3.72 3.63 3.46 3.49
Norway 0.04 0.04 0.04 0.04 0.04
Switzerland 0.04 0.04 0.04 0.04 0.04
Sum (EU28+2) 3.86 3.80 3.71 3.54 3.57
Share of global CO2 emissions5 11% 11% 10% 10% 10%
(UNFCCC 2017)
Table 2-2: Remaining CO2 budgets for EU28+2 to stay below 1.5°C increase of global mean temperature
CO2 budgets for EU28, Norway and
Switzerland [Gt] at the end of… 2010 2015
66% likelihood 41.6 23.1
50% likelihood 57.2 38.7
For the last decade, passenger cars in EU28+2 have had a share of 13-15% of total CO2
emissions in that region (Figure 2-1) and 57-58% of CO2 emissions from transport (road
transportation, domestic aviation, domestic navigation and railways6). Total anthropogenic CO2
emissions (without agriculture and LULUCF7) in EU28, Switzerland and Norway have decreased by
18% (2015 vs. 2005). :
However, CO2 emission reductions in transport in the same period of time have been significantly
smaller and decreased by 6%. While CO2 emissions of other transport modes (light and heavy
duty trucks, motorcycles, domestic aviation, domestic navigation and railways) have decreased by
8%, CO2 emissions of passenger cars have been reduced slightly less: -5%. In 2015, CO2
emissions from passenger cars in the EU28+2 amounted to 536 Mt (of 2,648 Mt CO2 in total).
Following the top-down methodology, carbon budgets for passenger cars in EU28+2 are
deducted (Table 2-3):
The CO2 emission share of passenger cars in 2015 (15% of total CO2 emissions) was used to calculate the starting budget at the end of 2010: 8.6 Gt CO2 (50% likelihood) and 6.3 Gt CO2 (66% likelihood).
4 without Agriculture and Land Use, Land Use Change and Forestry (LULUCF) 5 From fossil fuel combustion and industrial processes as given in (Boden, Marland, and Andres 2017) 6 Fuel-driven only; electric traction is reported within the energy sector 7 Land Use, Land Use Change and Forestry

Development of the car fleet in EU28+2 to achieve the Paris Agreement target to limit global warming to 1.5°C 9
From these CO2 budgets, annual CO2 emissions from passenger cars until the end of 2015 were subtracted: 2.6 Gt CO2 in sum for 2011-2015 based on statistical data from (UNFCCC 2017)
Figure 2-1: Direct CO2 emissions from passenger cars, other transport modes and other sectors in EU28+2
between 2005 and 2015 (UNFCCC 2017)
From 2016 on, the remaining CO2 budgets for passenger cars in EU28+2 are 6.0 Gt (50%
likelihood) and 3.6 Gt (66% likelihood). If the current annual CO2 emissions from passenger cars
continue, the carbon budget would be completely depleted in the 50% scenario within 10 years
and in the 66% scenario within 5 years. The top-down analysis of the remaining carbon budgets
for passenger cars in EU28+2 shows that quick and stringent CO2 emission reductions are
necessary to stay below a 1.5°C increase in global mean temperatures. Either CO2 savings from
other areas need to be identified or stringent CO2 emissions reductions are necessary from
passenger cars.
Table 2-3: Remaining CO2 budgets for Passenger Cars in EU28+2 to stay below 1.5°C increase of global
mean temperature
CO2 budgets for EU28, Norway and
Switzerland [Gt] at the end of… 2010 2015
66% likelihood 6.3 3.6
50% likelihood 8.6 6.0
0,0
0,5
1,0
1,5
2,0
2,5
3,0
3,5
4,0
4,5
2005 2006 2007 2008 2009 2010 2011 2012 2013 2014 2015
CO
2e
mis
sio
ns
for
EU2
8+C
H+N
O [
Gt]
Passenger Cars
Other transport modes
Energy, Industry,
Waste
-18%

Development of the car fleet in EU28+2 to achieve the Paris Agreement target to limit global warming to 1.5°C 10
3. Passenger Car Sector in EU28+2
3.1. New Vehicle Sales Sales of new passenger cars in EU28+2 amounted to around 16 million vehicles per year before
the economic crisis. Sales experienced a decline up to 2013, and have been rising since then
(Figure 3-1). In 2017, 15.6 million new passenger cars were sold in that region, reaching pre-
economic-crisis levels. The main sales markets are: Germany (23% of sales in 2017), the United
Kingdom (17%), France (14%), Italy (13%) and Spain (8%). Although Poland has the 6th biggest
passenger car fleet in the EU (see chapter 3.2), sales of new vehicles are small and amounted to
3% of total EU28 sales in 2017 (Switzerland: 2% of EU28+2; Norway: 1%).
Figure 3-1: Sales of new passenger cars in EU28+2 between 2006 and 2017 (ACEA 2018)
The distribution of vehicle sizes give another insight into the market: in 2015, 30% of the new
cars sold within EU28 belonged to the small vehicle segment (e.g. Fiat Panda, VW Polo), another
40% to the medium segment (e.g. VW Golf, Audi A4) and 30% to the vehicles of larger size (e.g.
Audi A6, BMW 7-series, Mercedes Benz SLK, Ford S-Max, Nissan Navara, VW Transporter-T5)
(ICCT 2016).
3.2. Passenger Cars in Use In EU28+2 in 2015, there were 259 million passenger cars in use (ACEA 2017). Their number has
been increasing by 4% over 4 years (2011-2015). The highest amount of passenger cars is to be
found in Germany with 45 million in 2015 (18% of the total EU28+2 fleet), followed by Italy (37
million, 15%), the United Kingdom (34 million, 13%), France (32 million, 13%), Spain (22 million,
9%) and Poland (21 million, 8%).

Development of the car fleet in EU28+2 to achieve the Paris Agreement target to limit global warming to 1.5°C 11
Passenger cars in the EU are predominantly driven by liquid fuels. In 2015, more than 97% of all
passenger cars were using petrol or diesel, 2% were using liquefied petroleum gas (LPG) and
natural gas (NG) and 0.5% were electrified (of which 80% were hybrid vehicles and 20% BEV as
well as plug-in hybrid electric vehicles (PHEV)) (ACEA 2017).
The share of petrol and diesel driven cars varies from member state to member state. In 2015,
Germany showed a slightly higher share of petrol driven cars (66%), while France had a slightly
higher share of diesel driven cars (64%). Of the EU28 member states, the Netherlands had the
highest share of (hybrid) electric vehicles in its fleet in 2015 (2.7%, of which 15% are PHEV and
BEV). Of the markets with the highest amount of (hybrid) electric vehicles within the EU, the
United Kingdom had the highest share in 2015 (1.1%, of which 36% are PHEV and BEV). (ACEA
2017)
The passenger car fleet in Switzerland is likewise predominantly petrol and diesel fuelled. In 2017,
electric vehicles had a share of 1.8% of the total fleet (Bundesamt für Statistik 2018). Norway has
adopted various policies to enhance the market penetration of EV. Consequently, sales of new
BEV have reached a share of nearly 40% in Norway in 2017 (EAFO 2018). This in turn leads to a
comparatively high share of electrically driven passenger cars in the Norwegian fleet: 3% in 2015
and 4% in 2016 (Statistics Norway 2017).
3.3. Scenarios for New Vehicles Sales and Car Stock to stay within the CO2 Budget
There are two main pathways for decarbonising passenger car fleets:
targeting the market penetration of alternative powertrains via new vehicle sales and
targeting the existing vehicle fleets, see e.g. (Öko-Institut et al. 2016).
An ambitious, explorative scenario up to 2050 is set up to analyse technological options for new
passenger cars using the Vehicle Technology Scenario Model VECTOR21 (see Annex 7). This new
vehicle sales scenario is then used as an input to model vehicle stock scenarios. The analysis
encompasses the four major EU passenger car markets Germany, France, United Kingdom and
Italy, as well as the major eastern European market Poland.
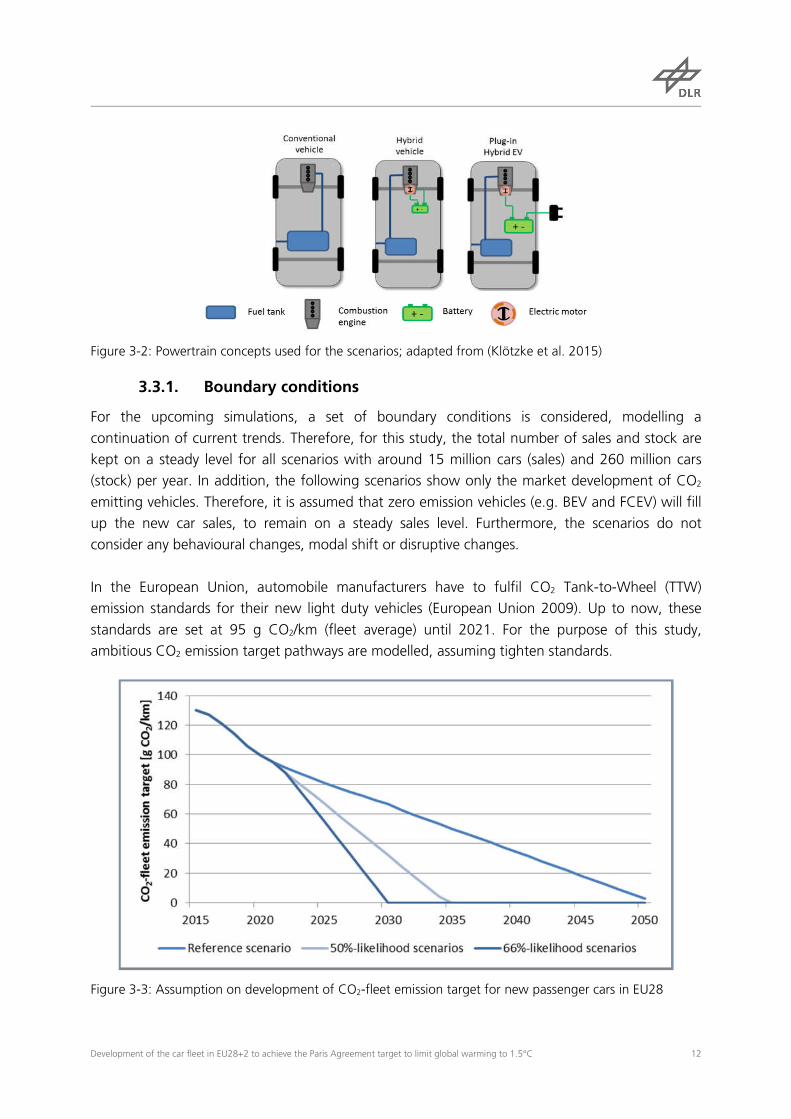
Within this study, three base powertrain concepts are modelled (Figure 3-2): conventional vehicle
(CV), hybrid electric vehicles (HEV) and plug-in hybrid electric vehicles (PHEV)8. In total, six
different drivetrains are taken into account (petrol, petrol HEV, petrol PHEV, diesel, diesel HEV
and compressed natural gas (CNG)).
8 Including range extended electric vehicles (REEV)
Development of the car fleet in EU28+2 to achieve the Paris Agreement target to limit global warming to 1.5°C 12
Figure 3-2: Powertrain concepts used for the scenarios; adapted from (Klötzke et al. 2015)
3.3.1. Boundary conditions
For the upcoming simulations, a set of boundary conditions is considered, modelling a
continuation of current trends. Therefore, for this study, the total number of sales and stock are
kept on a steady level for all scenarios with around 15 million cars (sales) and 260 million cars
(stock) per year. In addition, the following scenarios show only the market development of CO2
emitting vehicles. Therefore, it is assumed that zero emission vehicles (e.g. BEV and FCEV) will fill
up the new car sales, to remain on a steady sales level. Furthermore, the scenarios do not
consider any behavioural changes, modal shift or disruptive changes.
In the European Union, automobile manufacturers have to fulfil CO2 Tank-to-Wheel (TTW)
emission standards for their new light duty vehicles (European Union 2009). Up to now, these
standards are set at 95 g CO2/km (fleet average) until 2021. For the purpose of this study,
ambitious CO2 emission target pathways are modelled, assuming tighten standards.
Figure 3-3: Assumption on development of CO2-fleet emission target for new passenger cars in EU28
Development of the car fleet in EU28+2 to achieve the Paris Agreement target to limit global warming to 1.5°C 13
Vehicle Taxes according to current legislation, purchase premiums (e. g. United Kingdom’s Plug-In
Grant or Germany’s “Umweltbonus”) and other incentives for passenger cars with lower CO2
emissions (e. g. France’s bonus-malus system) are part of the modelling framework and are
extrapolated.
The scenarios (50% and 66% likelihood) consist of copious modelled measures, which lead to a
reduction of CO2 emissions from the car stock. Examples include increasing fuel prices or
strengthened CO2-regulations (see Figure 3-3). Prices for conventional fuels (diesel and petrol)
almost double compared to today’s level due to increasing raw oil prices (>130 €2010/bbl in 2050)
and stringently fuel taxation (assumption based on IEA 2016).
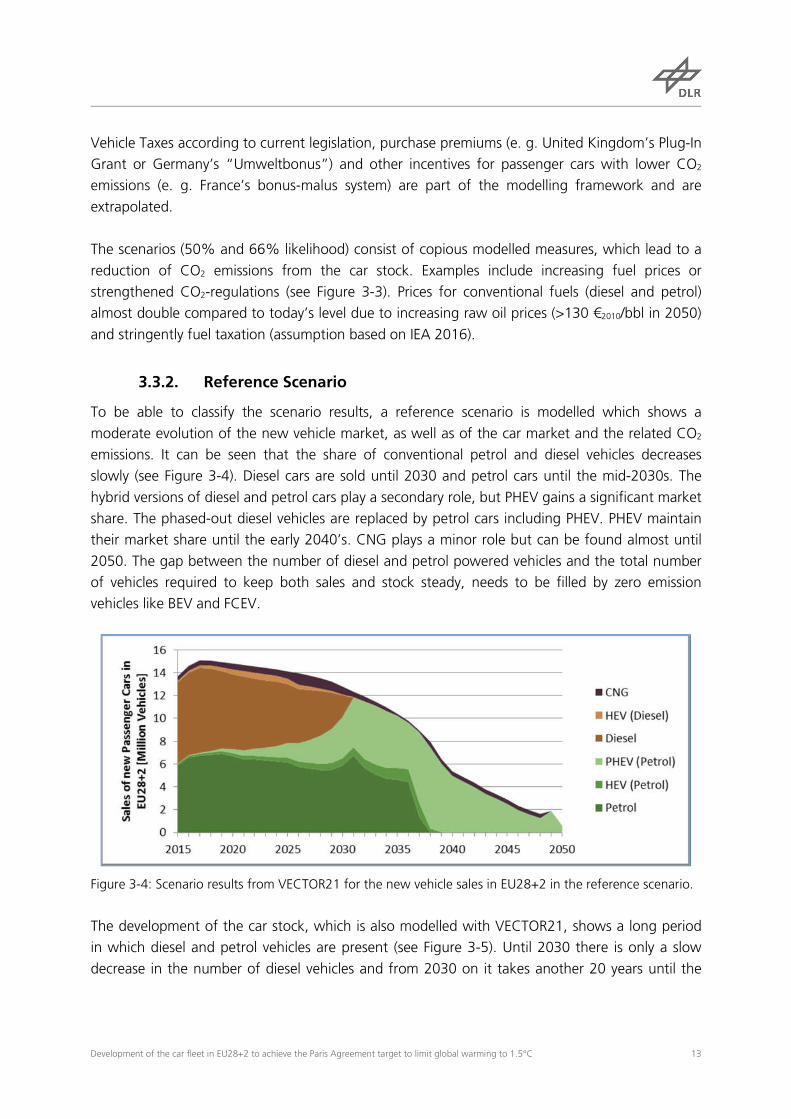
3.3.2. Reference Scenario
To be able to classify the scenario results, a reference scenario is modelled which shows a
moderate evolution of the new vehicle market, as well as of the car market and the related CO2
emissions. It can be seen that the share of conventional petrol and diesel vehicles decreases
slowly (see Figure 3-4). Diesel cars are sold until 2030 and petrol cars until the mid-2030s. The
hybrid versions of diesel and petrol cars play a secondary role, but PHEV gains a significant market
share. The phased-out diesel vehicles are replaced by petrol cars including PHEV. PHEV maintain
their market share until the early 2040’s. CNG plays a minor role but can be found almost until
2050. The gap between the number of diesel and petrol powered vehicles and the total number
of vehicles required to keep both sales and stock steady, needs to be filled by zero emission
vehicles like BEV and FCEV.
Figure 3-4: Scenario results from VECTOR21 for the new vehicle sales in EU28+2 in the reference scenario.
The development of the car stock, which is also modelled with VECTOR21, shows a long period
in which diesel and petrol vehicles are present (see Figure 3-5). Until 2030 there is only a slow
decrease in the number of diesel vehicles and from 2030 on it takes another 20 years until the
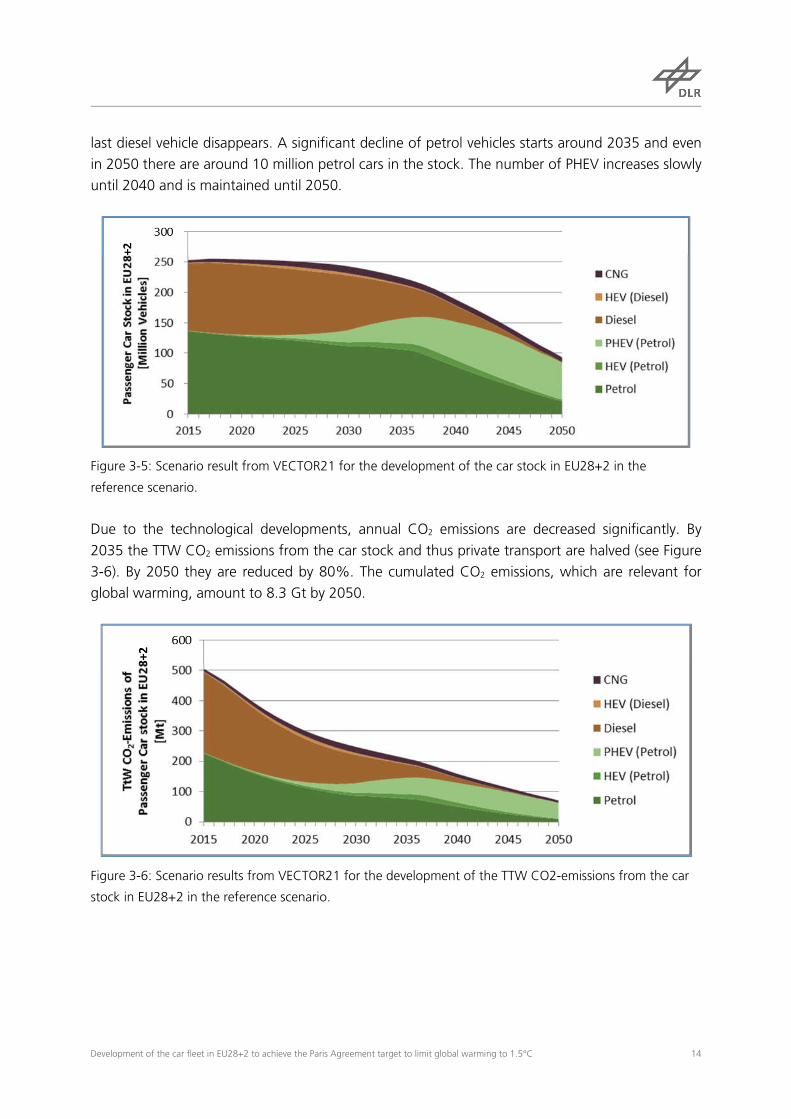
Development of the car fleet in EU28+2 to achieve the Paris Agreement target to limit global warming to 1.5°C 14
last diesel vehicle disappears. A significant decline of petrol vehicles starts around 2035 and even
in 2050 there are around 10 million petrol cars in the stock. The number of PHEV increases slowly
until 2040 and is maintained until 2050.
Figure 3-5: Scenario result from VECTOR21 for the development of the car stock in EU28+2 in the
reference scenario.
Due to the technological developments, annual CO2 emissions are decreased significantly. By
2035 the TTW CO2 emissions from the car stock and thus private transport are halved (see Figure
3-6). By 2050 they are reduced by 80%. The cumulated CO2 emissions, which are relevant for
global warming, amount to 8.3 Gt by 2050.
Figure 3-6: Scenario results from VECTOR21 for the development of the TTW CO2-emissions from the car
stock in EU28+2 in the reference scenario.

Development of the car fleet in EU28+2 to achieve the Paris Agreement target to limit global warming to 1.5°C 15
3.3.3. 50%-likelihood scenario
The stringent emission reduction requirements of the 1.5°C carbon budget (6.0 Gt CO2 with
50%-likelihood and 3.6 Gt CO2 with 66% likelihood, see Table 2-3) mean that in addition to an
ambitious market development of new vehicles, today’s energy consumption and CO2 emissions
of existing passenger car fleets in EU28+2 (see chapter 2) will have to decrease. The vehicle stock
module of VECTOR21 was used to model effects on energy consumption and CO2 emissions of
the EU28+2 car fleet. The assumed rates of change in the passenger car fleet thus follow the
climate imperative of the 1.5°C target to illustrate a potential path.
The measures in the 50%-likelihood scenario lead to a vehicle market with a slight decrease in
sales of diesel and petrol vehicles from 2018 and 2019 with an increasing decline in the following
years as can be seen in Figure 3-7. While for 2018 conventional diesel and petrol sales reach 7
million cars each, in 2025 the diesel cars sales fall below 500,000 new vehicles and in 2027 the
same happens to petrol cars. Even the hybrid models cannot help to keep the market share of
diesel and petrol cars much longer. Only the PHEV, which is also equipped with a petrol driven
engine but can recharge the battery externally, has a significant market share until 2035. CNG
can maintain its market share until 2030 but does not gain higher proportions. The gap between
the number of diesel and petrol powered vehicles and the required number of new vehicles needs
to be filled by zero emission vehicles. In 2038, only zero emission vehicles like BEV and FCEV are
sold in EU28+2 referring to the scenario results of VECTOR21.
Figure 3-7: Scenario results from VECTOR21 for the new vehicle sales in EU28+2 in the 50%-likelihood
scenario.
Due to the current discussions about diesel and petrol cars (e.g. city bans, air quality, CO2) we
assume that conventional vehicles will not stay in the stock as long as they did in the past.
Therefore conventional vehicles disappear gradually from the vehicle stock. Thus, the number of
diesel and petrol cars is reduced by almost 50% by 2025 in the scenario. But due to the survival
rates, it takes a long time until the last of these cars vanish. Conventional diesel cars remain in the
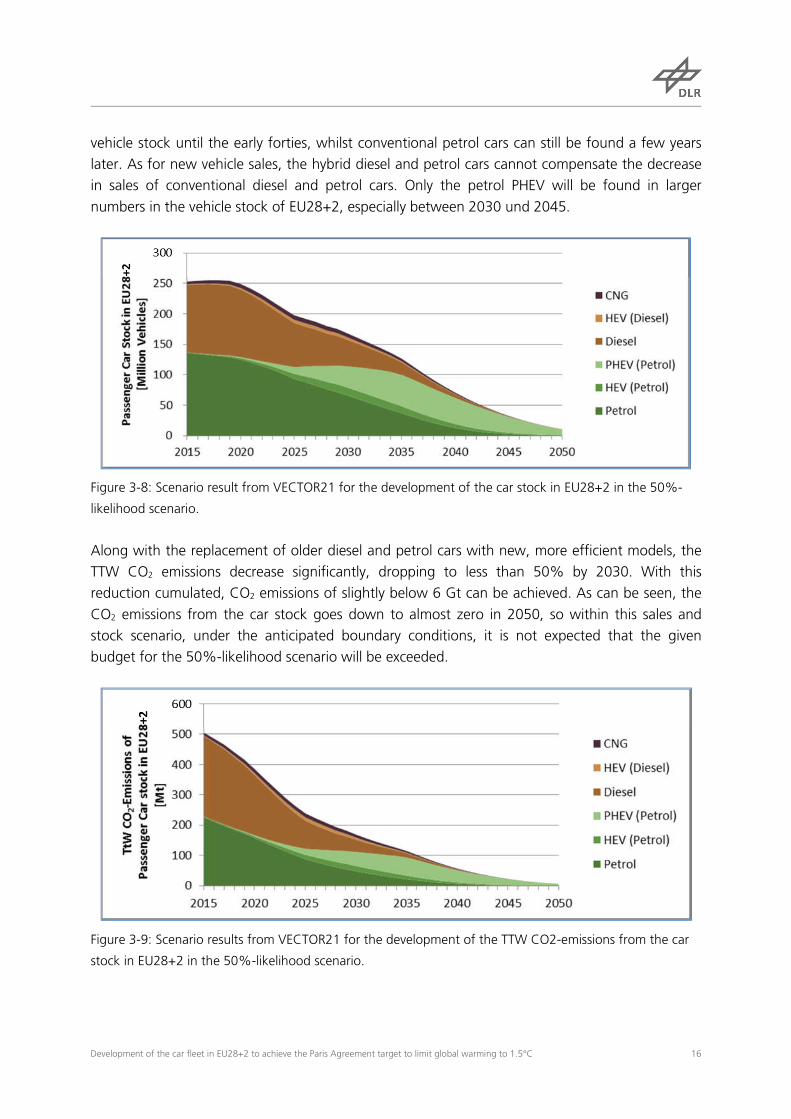
Development of the car fleet in EU28+2 to achieve the Paris Agreement target to limit global warming to 1.5°C 16
vehicle stock until the early forties, whilst conventional petrol cars can still be found a few years
later. As for new vehicle sales, the hybrid diesel and petrol cars cannot compensate the decrease
in sales of conventional diesel and petrol cars. Only the petrol PHEV will be found in larger
numbers in the vehicle stock of EU28+2, especially between 2030 und 2045.
Figure 3-8: Scenario result from VECTOR21 for the development of the car stock in EU28+2 in the 50%-
likelihood scenario.
Along with the replacement of older diesel and petrol cars with new, more efficient models, the
TTW CO2 emissions decrease significantly, dropping to less than 50% by 2030. With this
reduction cumulated, CO2 emissions of slightly below 6 Gt can be achieved. As can be seen, the
CO2 emissions from the car stock goes down to almost zero in 2050, so within this sales and
stock scenario, under the anticipated boundary conditions, it is not expected that the given
budget for the 50%-likelihood scenario will be exceeded.
Figure 3-9: Scenario results from VECTOR21 for the development of the TTW CO2-emissions from the car
stock in EU28+2 in the 50%-likelihood scenario.
Development of the car fleet in EU28+2 to achieve the Paris Agreement target to limit global warming to 1.5°C 17
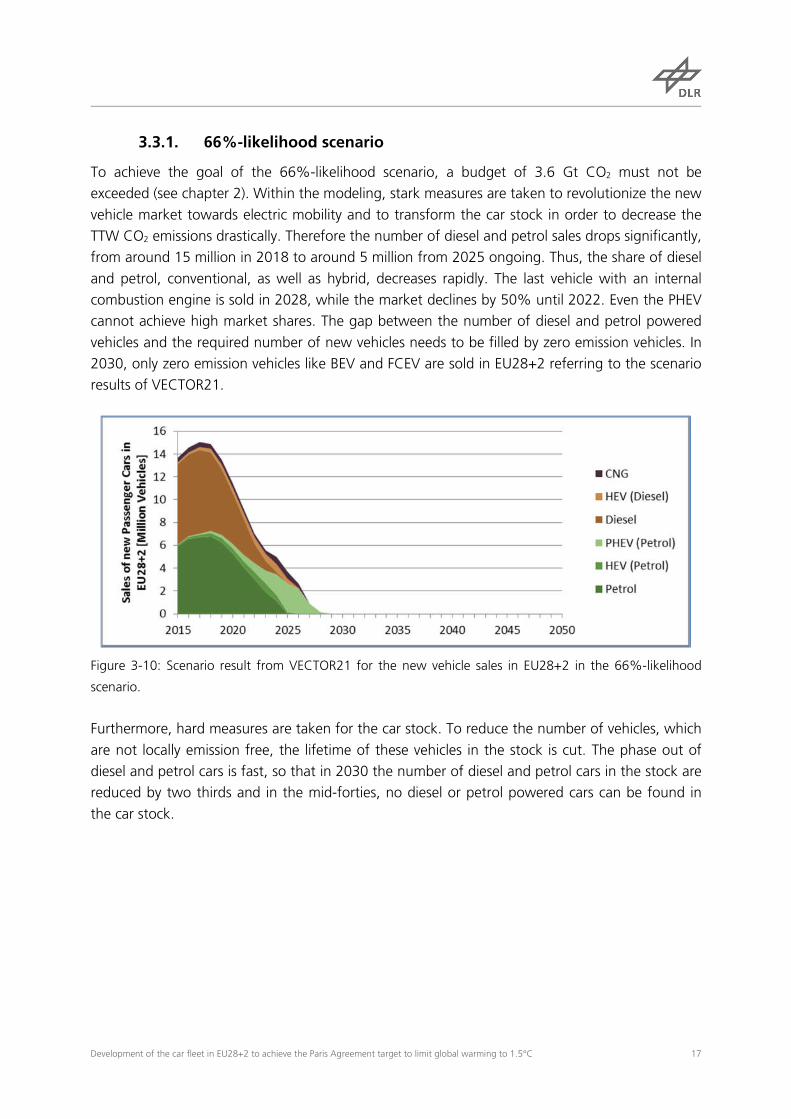
3.3.1. 66%-likelihood scenario
To achieve the goal of the 66%-likelihood scenario, a budget of 3.6 Gt CO2 must not be
exceeded (see chapter 2). Within the modeling, stark measures are taken to revolutionize the new
vehicle market towards electric mobility and to transform the car stock in order to decrease the
TTW CO2 emissions drastically. Therefore the number of diesel and petrol sales drops significantly,
from around 15 million in 2018 to around 5 million from 2025 ongoing. Thus, the share of diesel
and petrol, conventional, as well as hybrid, decreases rapidly. The last vehicle with an internal
combustion engine is sold in 2028, while the market declines by 50% until 2022. Even the PHEV
cannot achieve high market shares. The gap between the number of diesel and petrol powered
vehicles and the required number of new vehicles needs to be filled by zero emission vehicles. In
2030, only zero emission vehicles like BEV and FCEV are sold in EU28+2 referring to the scenario
results of VECTOR21.
Figure 3-10: Scenario result from VECTOR21 for the new vehicle sales in EU28+2 in the 66%-likelihood
scenario.
Furthermore, hard measures are taken for the car stock. To reduce the number of vehicles, which
are not locally emission free, the lifetime of these vehicles in the stock is cut. The phase out of
diesel and petrol cars is fast, so that in 2030 the number of diesel and petrol cars in the stock are
reduced by two thirds and in the mid-forties, no diesel or petrol powered cars can be found in
the car stock.
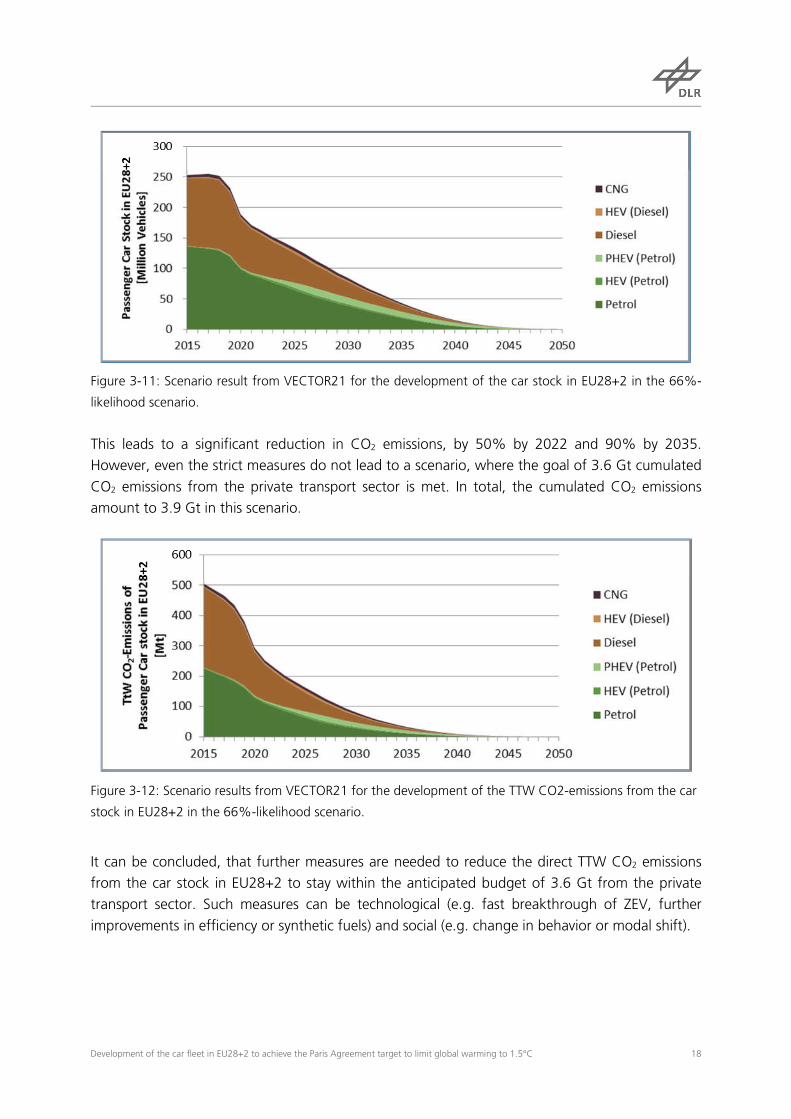
Development of the car fleet in EU28+2 to achieve the Paris Agreement target to limit global warming to 1.5°C 18
Figure 3-11: Scenario result from VECTOR21 for the development of the car stock in EU28+2 in the 66%-
likelihood scenario.
This leads to a significant reduction in CO2 emissions, by 50% by 2022 and 90% by 2035.
However, even the strict measures do not lead to a scenario, where the goal of 3.6 Gt cumulated
CO2 emissions from the private transport sector is met. In total, the cumulated CO2 emissions
amount to 3.9 Gt in this scenario.
Figure 3-12: Scenario results from VECTOR21 for the development of the TTW CO2-emissions from the car
stock in EU28+2 in the 66%-likelihood scenario.
It can be concluded, that further measures are needed to reduce the direct TTW CO2 emissions
from the car stock in EU28+2 to stay within the anticipated budget of 3.6 Gt from the private
transport sector. Such measures can be technological (e.g. fast breakthrough of ZEV, further
improvements in efficiency or synthetic fuels) and social (e.g. change in behavior or modal shift).
Development of the car fleet in EU28+2 to achieve the Paris Agreement target to limit global warming to 1.5°C 19
4. Outlook on Implications on other Sectors It is to be anticipated that a number of consequences will follow from the scenarios. The energy
and the automotive sector will be influenced considerably, with other areas also affected. As can
be seen in the scenario results, the number of diesel and petrol vehicles decreases significantly. It
can be supposed that the demand for cars in the EU28+2 will not abate in the same extent. Thus,
under the assumption that the car will play a role in private mobility in the future, comparable to
today, the gap has to be filled by zero emission vehicles. That requires a tremendous change in
the automotive sector with a sharp growth in production and development capacities of BEV and
FCEV. Associated therewith, negative effects on employment in the automotive sector can be
expected. On the other hand, new business models enable job opportunities. Furthermore, FCEV
and particularly BEV are resource-consuming products. Huge amounts of rare earth and other
materials like lithium are required.
Since this study aims to show paths to reduce the TTW emission of CO2, the model result in
significant reductions in fossil fuels. Hence, hydrogen and electricity need to be available in the
required amounts. Moreover, they need to be produced and distributed. Particularly for
hydrogen, this is a huge challenge. Last but not least, to reduce not only the TTW but also the
WTT (well-to-tank) CO2 emissions, the production of hydrogen and electricity needs to be based
on renewable resources. In this context, some experts are discussing the introduction of synthetic
fuels, which could be another option to reduce the overall CO2 emissions from the car stock.
Beside CO2 free energy sources, behavioural changes can have positive effects on the greenhouse
gas emissions from private transport, e.g. a growth in bicycle use or public transport to reduce
the amount of passenger cars.

Development of the car fleet in EU28+2 to achieve the Paris Agreement target to limit global warming to 1.5°C 20
5. Summary The primary objective of the study was to show how the European new car market and the
corresponding stock could develop to meet a certain greenhouse gas budget for private transport
in EU28+2 (EU28 plus Norway and Switzerland). The budget was derived by taking the current
share of emissions from private transport in relation to the total emissions of CO2 in EU28+2 and,
thus, calculating the remaining budget based on the global remaining CO2 budget to keep the
mean global warming under 1.5 °C, with a likelihood of 50% (and 66% respectively).
The composition of new vehicle sales and the car stock was determined with the Vehicle
Technology Scenario Model VECTOR21. Hence, it was possible to assume boundary conditions
that entail an alteration of the composition towards more efficient and vehicles with less CO2
emissions. It could be shown that, under the presumption that the private car will play a role
similar to that of today, the shift towards CO2-free technologies needs to happen very fast. This
comes in part from the fact that cars have a certain lifetime in the car stock, which means that
their emissions will be there for several years.
In the 50% likelihood scenario, conventional diesel and petrol cars are phased out by the end of
the next decade. Hybrid diesel and petrol cars - particularly plug-in hybrids - are sold until the
middle of the 2030s. Due to the survival-rates of the cars in the stock, conventional diesel and
petrol cars can be found on the streets until the mid-2040s. Plug-in hybrids in this scenario will
outlast 2050. The share of diesel and petrol powered cars in this scenario leads to cumulated CO2
emissions which will stay within the given budget for the private transport sector.
Further measures in the scenario parameters show further decline of diesel and petrol cars in the
second scenario. This scenario aims to keep the budget under tightened constraints which will
lead to a 66%-likelihood to limit mean global warning to 1.5°C. Although conventional diesel
and petrol cars disappear from the new car market by 2025, and PHEV by 2028, they stay in the
car stock until the early-2040’s. The number of diesel and petrol cars in the stock is almost halved
by 2025, as are CO2 emissions. The CO2 budget is exceeded by 10%. Therefore, further
measures, especially a behavioral change towards other transport modes like walking, cycling or
public transport, are necessary to be able to limit the cumulated CO2 emissions to the given
budget.
Since this study only investigated the TTW emissions, a closer look has to be taken at the
upstream chain of the energy supply of electricity and hydrogen to be able to give a definitive
conclusion to the question. The same also applies for synthetic and renewable fuels if they are
taken into consideration.

Development of the car fleet in EU28+2 to achieve the Paris Agreement target to limit global warming to 1.5°C 21
6. References ACEA. 2017. “Vehicles in Use - Europe 2017.” Brussels: European Automobile Manufacturers
Association. http://www.acea.be/statistics/article/Report-Vehicles-in-Use.
ACEA. 2018. “Consolidated Registrations - by Country.” European Automobile Manufacturers
Association (ACEA). G:41313-TBS03-Projekte3019795_GP-EU-
CARWP2_Passenger_Car_SectorStatistikdatenPC_90-
17_by_country_Enlarged_Europe.xlsx.
http://www.acea.be/statistics/article/consolidated-figures-by-country.
Boden, T.A., G. Marland, and R.J. Andres. 2017. “Global, Regional, and National Fossil-Fuel CO2
Emissions.” Emission inventory. Oak Ridge, USA: Carbon Dioxide Information
Analysis Center, US DOE. http://cdiac.ess-
dive.lbl.gov/trends/emis/tre_glob_2014.html.
Brokate, Jens, Christoph Schimeczek, and Horst E. Friedrich. 2017. “A Disaggregated Approach
to Model International Passenger Car Markets and Their Interdependencies.” In .
Genf.
Bundesamt für Statistik. 2018. “Strassenfahrzeuge – Bestand, Motorisierungsgrad (Vehicles -
Stock, Engine Type).” Neuchâtel, Schweiz. G:41313-TBS03-Projekte3019795_GP-
EU-
CARWP2_Passenger_Car_SectorStatistikdaten20180307_Strassenmotorfzge_Schwei
z.xlsx. https://www.bfs.admin.ch/bfs/de/home/statistiken/mobilitaet-
verkehr/verkehrsinfrastruktur-fahrzeuge/fahrzeuge/strassenfahrzeuge-bestand-
motorisierungsgrad.html.
EAFO. 2018. “EV Market Share in 2017.” 2018. http://www.eafo.eu/.
European Union. 2009. Regulation (ec) No 443/2009 of the European Parliament and of the
Council. EC 443/2009. http://eur-lex.europa.eu/legal-
content/DE/TXT/?uri=CELEX:32009R0443.
Friedlingstein, P., R. M. Andrew, J. Rogelj, G. P. Peters, J. G. Canadell, R. Knutti, G. Luderer, et al.
2014. “Persistent Growth of CO2 Emissions and Implications for Reaching Climate
Targets.” Nature Geoscience 7 (10): 709–15. https://doi.org/10.1038/ngeo2248.
ICCT. 2016. “European Vehicle Market Statistics - Pocketbook 2016/17.” Berlin: International
Council on Clean Transportation (ICCT) Europe.
https://www.theicct.org/sites/default/files/publications/ICCT_Pocketbook_2016.pdf.
IEA. 2016. “World Energy Outlook 2016.” Paris: Internation Energy Agency. G:\41313-TBS\10-
Referenzdaten\IEA_WEO.
Development of the car fleet in EU28+2 to achieve the Paris Agreement target to limit global warming to 1.5°C 22
Klötzke, Matthias, Benjamin Frieske, Ole Soukup, Thorsten Koska, Hanna Hüging, Katrin Bienge,
Michael Ritthoff, et al. 2015. “Begleitforschung zu Technologien, Perspektiven und
Ökobilanzen der Elektromobilität.”
Kugler, Ulrike, Matthias Klötzke, Stephan Schmid, Wojciech Gis, Tuuli Järvi, Heidi Auvinen, and
Christoph Schimeczek. 2015. “Scenario Report, with an in-Depth Description of the
Scenarios’ Background.” Project deliverable D6.2. eMAP. Stuttgart: DLR Institut für
Fahrzeugkonzepte.
Le Quéré, Corinne, Robbie M. Andrew, Pierre Friedlingstein, Stephen Sitch, Julia Pongratz,
Andrew C. Manning, Jan Ivar Korsbakken, et al. 2017. “Global Carbon Budget
2017.” Earth System Science Data Discussions, November, 1–79.
https://doi.org/10.5194/essd-2017-123.
Mock, Peter. 2010. “Entwicklung Eines Szenariomodells Zur Simulation Der Zukünftigen
Marktanteile Und CO2-Emissionen von Kraftfahrzeugen (VECTOR21).” Stuttgart:
Universität Stuttgart.
Öko-Institut, DLR, IFEU, and Infras AG. 2016. “Endbericht Renewbility III - Optionen Einer
Dekarbonisiserung Des Verkehrssektors.” Berlin.
Pachauri, R. K., Leo Mayer, and Intergovernmental Panel on Climate Change, eds. 2015. Climate
Change 2014: Synthesis Report. Geneva, Switzerland: Intergovernmental Panel on
Climate Change.
Propfe, Bernd. 2016. “Marktpotentiale Elektrifizierter Fahrzeugkonzepte Unter Berücksichtigung
von Technischen, Politischen Und ökonomischen Randbedingungen.” Universität
Stuttgart.
Schimeczek, Christoph, Matthias Klötzke, Ulrike Kugler, and Stephan Schmid. 2015. “Report on
Enhanced Model Algorithm and Model Calibration.” EMAP Project deliverable D6.1.
Stuttgart: DLR Institut für Fahrzeugkonzepte.
Statistics Norway. 2017. “Registered Vehicles.” Ssb.no. March 28, 2017.
http://www.ssb.no/en/transport-og-reiseliv/statistikker/bilreg/aar/2017-03-28.
UNEP. 2015. “The Emissions Gap Report 2015.” Synthesis Report. Nairobi: United Nations
Environment Programme (UNEP). http://www.unep.org/emissionsgapreport2015/.
UNFCCC. 2016. “Report of the Conference of the Parties on Its Twenty-First Session, Held in Paris
from 30 November to 11 December 2015.” January 29, 2016.
https://unfccc.int/resource/docs/2015/cop21/eng/10.pdf.
UNFCCC. 2017. “National Inventory Submissions.” United Nations Framework Convention on
Climate Change.
http://unfccc.int/national_reports/annex_i_ghg_inventories/national_inventories_sub
missions/items/10116.php#fn1.
Development of the car fleet in EU28+2 to achieve the Paris Agreement target to limit global warming to 1.5°C 23
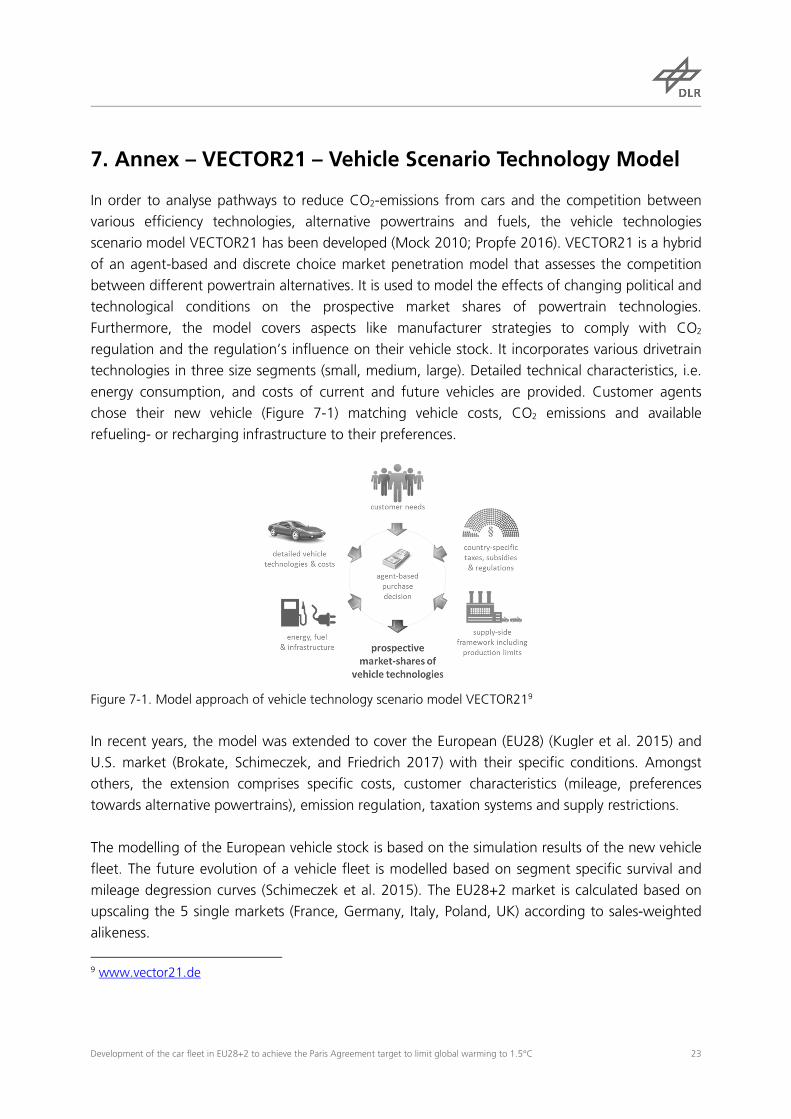
7. Annex – VECTOR21 – Vehicle Scenario Technology Model
In order to analyse pathways to reduce CO2-emissions from cars and the competition between
various efficiency technologies, alternative powertrains and fuels, the vehicle technologies
scenario model VECTOR21 has been developed (Mock 2010; Propfe 2016). VECTOR21 is a hybrid
of an agent-based and discrete choice market penetration model that assesses the competition
between different powertrain alternatives. It is used to model the effects of changing political and
technological conditions on the prospective market shares of powertrain technologies.
Furthermore, the model covers aspects like manufacturer strategies to comply with CO2
regulation and the regulation’s influence on their vehicle stock. It incorporates various drivetrain
technologies in three size segments (small, medium, large). Detailed technical characteristics, i.e.
energy consumption, and costs of current and future vehicles are provided. Customer agents
chose their new vehicle (Figure 7-1) matching vehicle costs, CO2 emissions and available
refueling- or recharging infrastructure to their preferences.
Figure 7-1. Model approach of vehicle technology scenario model VECTOR219
In recent years, the model was extended to cover the European (EU28) (Kugler et al. 2015) and
U.S. market (Brokate, Schimeczek, and Friedrich 2017) with their specific conditions. Amongst
others, the extension comprises specific costs, customer characteristics (mileage, preferences
towards alternative powertrains), emission regulation, taxation systems and supply restrictions.
The modelling of the European vehicle stock is based on the simulation results of the new vehicle
fleet. The future evolution of a vehicle fleet is modelled based on segment specific survival and
mileage degression curves (Schimeczek et al. 2015). The EU28+2 market is calculated based on
upscaling the 5 single markets (France, Germany, Italy, Poland, UK) according to sales-weighted
alikeness.
9 www.vector21.de