Embed Size (px)
Citation preview

Reportby the Comptroller and Auditor General
Department of Health and NHS England
Stocktake of access to general practice in England
HC 605 SESSION 2015-16 27 NOVEMBER 2015

Our vision is to help the nation spend wisely.
Our public audit perspective helps Parliament hold government to account and improve public services.
The National Audit Office scrutinises public spending for Parliament and is independent of government. The Comptroller and Auditor General (C&AG), Sir Amyas Morse KCB, is an Officer of the House of Commons and leads the NAO, which employs some 810 people. The C&AG certifies the accounts of all government departments and many other public sector bodies. He has statutory authority to examine and report to Parliament on whether departments and the bodies they fund have used their resources efficiently, effectively, and with economy. Our studies evaluate the value for money of public spending, nationally and locally. Our recommendations and reports on good practice help government improve public services, and our work led to audited savings of £1.15 billion in 2014.

Report by the Comptroller and Auditor General
Ordered by the House of Commons to be printed on 26 November 2015
This report has been prepared under Section 6 of the National Audit Act 1983 for presentation to the House of Commons in accordance with Section 9 of the Act
Sir Amyas Morse KCB Comptroller and Auditor General National Audit Office
24 November 2015
HC 605 | £10.00
Department of Health and NHS England
Stocktake of access to general practice in England

This report examines patient expectations and experience of access to general practice, and the demand for, and capacity of, general practice.
© National Audit Office 2015
The material featured in this document is subject to National Audit Office (NAO) copyright. The material may be copied or reproduced for non-commercial purposes only, namely reproduction for research, private study or for limited internal circulation within an organisation for the purpose of review.
Copying for non-commercial purposes is subject to the material being accompanied by a sufficient acknowledgement, reproduced accurately, and not being used in a misleading context. To reproduce NAO copyright material for any other use, you must contact [email protected]. Please tell us who you are, the organisation you represent (if any) and how and why you wish to use our material. Please include your full contact details: name, address, telephone number and email.
Please note that the material featured in this document may not be reproduced for commercial gain without the NAO’s express and direct permission and that the NAO reserves its right to pursue copyright infringement proceedings against individuals or companies who reproduce material for commercial gain without our permission.
Links to external websites were valid at the time of publication of this report. The National Audit Office is not responsible for the future validity of the links.
10834 11/15 NAO

The National Audit Office study team consisted of: Jenny George and Andy Serlin, with assistance from Kia Abbasi, Michael Burke, Anjeli Chadha and Dhan Hussain, under the direction of Laura Brackwell.
This report can be found on the National Audit Office website at www.nao.org.uk
For further information about the National Audit Office please contact:
National Audit Office Press Office 157–197 Buckingham Palace Road Victoria London SW1W 9SP
Tel: 020 7798 7400
Enquiries: www.nao.org.uk/contact-us
Website: www.nao.org.uk
Twitter: @NAOorguk
Contents
Key facts 4
Summary 5
Part OneIntroduction 12
Part TwoDemand for general practice 17
Part ThreeDistribution of GP practices 23
Part FourAvailability of appointments 25
Part FiveConvenience of services 33
Part SixContinuity of care 37
Part SevenStaffing and capacity 40
Appendix OneOur audit approach 48
Appendix TwoOur evidence base 50
Appendix ThreeLimitations of data on access to general practice 53

4 Key facts Stocktake of access to general practice in England
Key facts
£7.7bnfunding for general practice in 2014-15
372man estimate of the number of general practice consultations in 2014-15
89%of patients in 2014-15 said they could get an appointment when they last tried to book one
7,875 GP practices in England in 2014, with 125,300 full-time equivalent staff
37,000 full-time equivalent GPs (including trainee GPs) at September 2014
51.4 hours average number of hours GP practices are open per week
92% of patients live within 2 kilometres of a GP surgery
63 to 114 range in the number of GPs and nurses per 100,000 people, after adjusting for factors such as age and need
12% of general practice training places were unfi lled in 2014/15
27% of patients in 2014-15 said it was not easy to get through to the GP practice on the telephone

Stocktake of access to general practice in England Summary 5
Summary
1 Most of the contact that people have with the NHS is with general practice. One estimate indicates that there were 372 million general practice consultations in 2014-15. General practitioners (GPs) work with nurses and other staff to provide advice and treatment on a wide range of health issues.
2 In 2014, there were around 37,000 full-time equivalent GPs (including trainee GPs) working in 7,875 practices across England.1 Practices are independent contractors, typically companies owned by an individual GP or group of GPs that provide care to a registered list of patients at one or more surgery sites. In 2014-15, NHS England spent £7.7 billion on general practice. Spending on general practice fell in real terms in 2011-12 and 2012-13, but increased in the following 2 years. As a proportion of total health spending, however, spending on general practice fell between 2010-11 and 2014-15. In 2014, NHS England committed to spending a higher proportion of its budget on primary care over the next 5 years.2
3 NHS England contracts with practices to provide a range of services. The GP contract stipulates core services that practices must provide, and core hours when patients must be able to access services (8 am to 6.30 pm, Monday to Friday). However, this does not mean that practices have to be open during all core hours, provided they meet the reasonable needs of patients. Until April 2015, NHS England commissioned all general practice services but in many areas clinical commissioning groups now have a role in commissioning these services.
4 The Department of Health (the Department) is ultimately accountable for securing value for money from spending on health services, including general practice. It sets objectives for NHS England through an annual mandate and holds it to account for the outcomes the NHS achieves. The Department also holds Health Education England to account for ensuring that the future general practice workforce has the right numbers and skills.
Why are we looking at access to general practice?
5 Accessing general practice is the first step for most patients in diagnosing and treating health problems. GPs and other staff play a crucial role in treating minor medical conditions, managing patients’ conditions in the community and referring them for hospital treatment or social care where appropriate.
1 In this report, unless otherwise stated, the data on GPs cover both fully qualified GPs and trainee GPs.2 Primary care refers to general practice, as well as other services such as dental care and ophthalmic care.

6 Summary Stocktake of access to general practice in England
6 Good access to general practice matters for patients themselves and for the health system. Poor access can cause stress and frustration for patients at a time when they may already be worried, and may prolong discomfort or pain. Prompt diagnosis and treatment are important in achieving the best health outcomes for those patients whose conditions will not get better on their own.
7 Good access to general practice reduces pressure on other parts of the NHS, particularly hospital accident and emergency (A&E) departments. This helps the health system to make the best use of its resources. Research has estimated that in 2012-13, 5.8 million patients attended A&E or walk-in centres because they were unable to get an appointment or a convenient appointment in general practice. We estimated that a typical consultation in general practice costs £21, whereas hospitals are paid £124 for a visit to A&E.
8 Improving access to general practice is a priority for the government. It has committed to recruiting 5,000 extra doctors working in general practice, and to ensuring that people have access to general practice from 8 am to 8 pm, 7 days per week, by 2020. The Department and NHS England have a range of initiatives to improve access. These include a workforce action plan and the Prime Minister’s GP Access Fund, which has been piloting different approaches, including extended opening hours.
9 Reflecting the vital role general practice plays in the health and care system, and the level of public interest, we have decided to carry out a programme of work on this topic. This first report pulls together data on access to general practice from a variety of sources to provide a comprehensive and independent stocktake of the current position. It covers:
• the demand for general practice (Part Two);
• patient expectations and experience of accessing general practice (Parts Three to Six); and
• staffing and capacity in general practice (Part Seven).
We plan to build on the stocktake in a second report on how effectively the Department and NHS England oversee and support general practice and the impact of their initiatives to improve access.
10 There are several different ways of looking at access to general practice, and our work focused on 4 important aspects (Figure 1). We did not cover the quality of care or aspects such as physical access to GP premises. We also did not examine out-of-hours GP services as we reported on these in 2014.3
3 Comptroller and Auditor General, Out-of-hours GP services in England, Session 2014-15, HC 439, National Audit Office, September 2014.

Stocktake of access to general practice in England Summary 7
11 We set out our audit approach and evidence base in Appendices One and Two. Appendix Three outlines limitations in the data that restricted aspects of our analysis.
Key findings
Patient expectations and experience of access
12 Overall, the vast majority of patients report a positive experience of access to general practice, with 89% reporting in 2014-15 that they could get an appointment. Three-quarters of patients got an appointment within the timeframe they wanted. Only 12% of patients reported a poor experience of making the appointment (paragraphs 4.5 to 4.7).
13 However, some patients report problems in accessing general practice, and overall satisfaction is slowly declining:
• Availability of appointments
The proportion of patients reporting they were able to get an appointment fell from 91% in 2011-12 to 89% in 2014-15. Patient satisfaction with the process of making appointments has declined each year since 2011-12. For example, in 2014-15, 27% of patients reported it was not easy to get through to the GP practice on the telephone, compared with 19% in 2011-12 (paragraphs 4.5 and 4.7).
• Continuity of care
The percentage of patients who reported they were able to see their preferred GP always, almost always or most of the time fell from 66% in 2011-12 to 60% in 2014-15 (paragraph 6.4).
Figure 1Key elements of access to general practice covered in this study
• Whether patients can access services that are close to their home (distribution of GP practices).
• Whether patients can get appointments when required and within reasonable timeframes (availability of appointments).
• Whether patients can access GP practices at convenient times and in flexible ways (convenience of services).
• Whether patients can access the same professional each time if they need or want to (continuity of care).
Source: National Audit Offi ce

8 Summary Stocktake of access to general practice in England
14 A fifth of patients report that opening hours are not convenient, and meeting the government’s commitment on extending access to general practice will require significant change. The percentage of patients reporting that opening times are not convenient increased from 17% in 2011-12 to 20% in 2014-15. On average, GP practices were open for 51.4 hours per week in 2014. The government has committed to provide access to general practice from 8 am to 8 pm, 7 days per week by 2020. This will require significant change as, for example, at October 2014, only 18% of patients had access (within 2 kilometres) on every weeknight to a GP surgery that was open until 8 pm. NHS England is funding pilot projects with extended opening hours, but evidence on the level of demand for appointments outside of core hours is mixed (paragraphs 5.4 to 5.10).
15 Different patient groups have different expectations of access to general practice, with younger patients more likely to want an appointment quickly, whereas patients aged 75 and over are more likely to value continuity of care. Understanding the needs and expectations of different patient groups would help practices to tailor their staffing and appointment systems to their patient populations. The data indicate that:
• In 2014-15, 75% of patients aged 75 and over had a preferred GP, compared with 38% of those who are under 75 and generally well.
• A survey we commissioned in September 2015 found that 58% of people aged 18 to 64 felt being able to book a same-day appointment was important, compared with 49% of respondents aged 65 or over.
• The same survey found that patients from black and minority ethnic groups appear to have different expectations from patients from a white ethnic background. Patients from black and minority ethnic groups tend to want more same-day appointments, and are less likely to consider an appointment with a member of practice staff other than a GP to be acceptable (paragraphs 4.8, 6.3 and 7.9).
16 Older people were more likely to report they were able to access appointments, while people from a white ethnic background reported better access than those from other ethnic groups. The 2014-15 GP Patient Survey found that experience varied by age and ethnic group:
• Older patients were more likely than younger patients to be able to get an appointment, more likely to rate the appointment as convenient, and more likely to receive continuity of care if they wanted it. This is likely to reflect that a higher proportion of younger patients are in employment so may find it difficult to attend appointments during working hours. We also found that younger patients have different expectations: they are more likely to expect same-day or next-day access to general practice than older patients (paragraphs 4.8, 5.11 and 6.5).
• Patients of a white ethnic background reported the best access to general practice, with 11% saying in 2014-15 they had been unable to get an appointment compared with 19% of Asian patients. And 62% of white patients who wanted continuity of care received it, compared with 47% of black patients and 47% of Asian patients (paragraph 6.5 and Figure 11).

Stocktake of access to general practice in England Summary 9
17 Deprived areas tend to have a lower ratio of GPs and nurses to patients, and where the ratio is lower it is harder for patients to get appointments. The distribution of general practice staff across the country does not reflect need. NHS England allocates funding to local areas using weighted populations that reflect factors such as demographics, health needs and local costs. Despite this inequalities remain, with the combined number of GPs and nurses in each local area ranging from 63 to 114 per 100,000 weighted population. Patients living in more deprived areas had, on average, a lower ratio of general practice staff to patients and, unsurprisingly, we found that it was harder to book and access appointments where the ratio of staff to patients was lower. However, the gap between ratios of general practice staff to patients in the most and least deprived areas has narrowed since 2010 (paragraph 7.15).
18 Nationally, 92% of people live within 2 kilometres of a GP surgery, but there are stark differences between urban and rural areas. Only 1% of people in urban areas do not have a GP surgery within 2 kilometres, compared with 37% in rural areas. More than 80% of people overall have at least 2 GP surgeries within this distance, which helps to promote patient choice (paragraphs 3.3 and 3.6).
19 GP practices’ working arrangements affect the proportion of patients who can get appointments. The availability of appointments varies significantly between different practices – the proportion of patients unable to get an appointment ranged from 0% to 52% in 2014-15. We found that much of this variation could not be explained by demographic factors, practice characteristics or supply of general practice staff. This suggests that the way practices work is an important factor. Practices have different processes for allocating and booking appointments, for example some practices give only same-day appointments (paragraph 4.9).
Demand and supply in general practice
20 Demand for general practice is increasing, but the Department and NHS England do not have up-to-date data to estimate the number of consultations. The population is increasing, and people are living longer with multiple medical conditions. This is likely to increase not only the level of activity in general practice but also the complexity. For example, the number of patients aged 75 or over, who use general practice most often, is predicted to grow by 38% in the next 10 years. The Department and NHS England have not routinely collected data on activity levels in general practice since 2008-09 but data from that year have been extrapolated to give an estimate of 372 million consultations in 2014-15. However, this estimate assumes that the number of consultations has continued to grow at the same rate as in previous years, and it is not clear whether this assumption reflects current patterns of use (paragraphs 2.2, 2.6 to 2.9 and 7.7).

10 Summary Stocktake of access to general practice in England
21 The organisations that we spoke to highlighted that general practice is under increasing pressure, with demand rising by more than capacity. The widely used estimate of 372 million consultations in 2014-15 suggests activity has increased by 3.5% per year on average between 2004 and 2014 compared with a 2.0% increase in general practice staffing. But the lack of firm data on activity makes it difficult for NHS England to assess how many staff are required (paragraphs 7.7 and 7.16).
22 The number of GPs rose by an average of 1.8% each year between 2004 and 2014, but problems in recruiting and retaining GPs are increasing, which will make it more difficult to meet demand. Organisations that we spoke to raised concerns that the pressures facing general practice risk making it seem an unattractive career choice, and 12% of training places in 2014/15 remained unfilled. At the same time, higher proportions of GPs are leaving the profession. In particular, the proportion of GPs aged 55 to 64 leaving approximately doubled between 2005 and 2014. The Department has committed to providing an extra 5,000 doctors working in general practice by 2020. NHS England and Health Education England, together with other relevant bodies, have a workforce action plan designed to improve the recruitment and retention of GPs (paragraphs 7.6 and 7.16 to 7.18).
23 Most people requesting an appointment ask to see or speak to a GP, but practices are increasingly using other staff to help manage demand. In 2014-15, 83% of patients wanted to consult a GP specifically but GPs make up only 29% of the general practice workforce. There are 125,300 full-time equivalent staff in total, as GPs work with mixed teams of staff, including nurses, administrative staff and a range of other professionals such as pharmacists. The proportion of consultations handled by nurses or other general practice staff increased from 25% in 1995-96 to 38% in 2008-09. The limited data collected since then suggest that this trend has continued, supported by a significant increase in the number of other staff providing patient care over the past 10 years. Recent research found that 27% of GP appointments were potentially avoidable, including patients who could have been seen by another member of practice staff. Our September 2015 survey indicates people may often be willing to see other staff. For example, 65% of respondents felt it was acceptable to consult a nurse if their GP was not available. Different practices vary significantly in their staffing mix and we found the evidence was inconclusive when we examined the effect of making greater use of nurses on patient experience (paragraphs 7,4, 7.5 and 7.8 to 7.13 and Figure 17).
24 Important gaps in the available data limit the ability of the Department and NHS England to make well-informed decisions about general practice. No national data are currently collected on the number, complexity or reasons for consultations in general practice. This means the Department and NHS England, as well as local commissioners, do not have a robust understanding of the demand for services. In addition, data on the general practice workforce are not complete, which makes it harder to identify where pressures are greatest and where more capacity is needed. Gaps include data on the use of locum GPs and the recruitment and retention of practice nurses. NHS England does not understand how different practices prioritise and manage the demand for appointments and cannot assess which systems provide better access for patients (paragraphs 2.3, 2.6, 4.9, 7.1, 7.3, 7.4 and 7.16).

Stocktake of access to general practice in England Summary 11
Conclusion
25 People’s experience of accessing general practice remains positive, with almost 9 in 10 patients in 2014-15 reporting that they were able to get an appointment when they last requested one. However, patient satisfaction with access has declined gradually but consistently. Further, there is considerable variation, with different patient and practice characteristics appearing to have a significant effect on patient experience. Worsening access to general practice matters: if patients cannot access general practice they are more likely to suffer poorer health outcomes, or to use other, more expensive, NHS services such as A&E departments.
26 Against the background of increasing demand and pressure on NHS resources, the challenge is how to maintain people’s positive experience of accessing general practice and reduce variation. The Department and NHS England are working to improve access but they are making decisions without fully understanding either the demand for services or the capacity of the current system. Given the important role general practice plays in the health and care system, the Department and NHS England need better data so they can make well-informed decisions about how to use limited resources to best effect. As they take action to improve access, it will be important to track systematically the impact of the changes on patients and the health and care system itself.
Recommendations
a The Department and NHS England should improve the data they collect on demand and supply in general practice. There are significant gaps in the data available, particularly on the number and type of consultations, in stark contrast to the detailed data available on hospital activity. Better data would help with workforce planning and with proactively managing demand.
b NHS England should research how different practices’ appointment-booking and other working arrangements drive variations in access. Such insights would help NHS England and practices themselves to understand the effect of different approaches, such as same-day appointments, on key indicators of access.
c NHS England and clinical commissioning groups should influence people’s behaviour to help practices make best use of available capacity. Most patients want to see a GP, but GPs make up only 29% of the general practice workforce and they alone are unlikely to be able to deal with the rising demand for services. NHS England and clinical commissioning groups should raise people’s awareness about the different options available and when to use them. General practices themselves also have an important role to play in influencing people’s behaviour.
d While making changes designed to improve access, NHS England should analyse the impact on different patient groups. There are currently significant inequalities in different groups’ experience of access. NHS England needs to ensure that its new initiatives work to reduce these inequalities, as well as to improve access overall.

12 Part One Stocktake of access to general practice in England
Part One
Introduction
What is general practice?
1.1 General practice is seen as the front door to the NHS, with NHS England estimating that roughly a million people consult their general practice each day. General practitioners (GPs), working alongside nurses and other staff, give advice and treatment to a registered list of patients on a wide range of health issues. They address more minor medical conditions and manage patients’ conditions in the community where appropriate. They also refer patients to specialists within hospital, community or mental health services or social care services for further advice or treatment.
1.2 At September 2014, there were 7,875 general practices in England, with an average-sized practice providing care to just over 7,000 people. The size of practices varies considerably: one-fifth serve fewer than 3,500 patients and one-fifth serve more than 10,500 patients. Overall, general practice is increasing in scale: an average-sized practice in 2014 had 1,000 more patients than in 2004. The increase is partly due to some smaller practices merging, resulting in a quarter of practices now operating at 2 or more sites.
Responsibilities and accountabilities
1.3 The system for general practice involves a variety of bodies (Figure 2). General practices themselves are independent contractors, and are typically owned and managed by an individual GP or group of GPs. NHS England contracts with these practices to provide a range of services for their registered patients, including consultation, treatment, referral to other services and liaison with other healthcare professionals. The contract stipulates that services should be available within core hours of 8 am to 6.30 pm on Monday to Friday but allows each practice the freedom to adjust opening hours to meet the reasonable needs of its patients. Some practices also provide out-of-hours care, although most practices have opted out of this responsibility, meaning that these services are provided through separate contracts with other providers.4
4 Comptroller and Auditor General, Out-of-hours GP services in England, Session 2014-15, HC 439, National Audit Office, September 2014.

Stocktake of access to general practice in England Part One 13
Figure 2Responsibilities and accountabilities for general practice
Department of Health
Ultimately responsible for securing value for money from spending on healthcare
Sets overall policy for primary care, including general practice
Source: National Audit Offi ce
NHS England
Accountable for the outcomes achieved by the NHS, including primary care
Manages the contracts for general practice
7,875 general practices
Independent contractors that provide essential and additional personal medical services to a list of registered patients
37,000 full-time equivalent general practitioners
Partner, contractor and trainee GPs working within area-based general practices
Care Quality Commission
Inspects and regulates quality and safety in general practice
Health Education England
Provides national leadership for planning and developing the general practice workforce
13 local education and training boards
Responsible for the education and training of GPs and other practice staff
209 clinical commissioning groups
From 1 April 2015 some clinical commissioning groups have delegated responsibility for co-commissioning primary care alongside NHS England
Accountable to

14 Part One Stocktake of access to general practice in England
1.4 Until April 2015, NHS England was responsible for commissioning general practice services, with its area teams managing the contracts with individual practices. From 1 April 2015, 63 of the 209 clinical commissioning groups took on fully delegated responsibility for commissioning general practice. A further 86 took on joint commissioning responsibility with NHS England. NHS England continues to commission general practice in the remaining areas of the country, and remains responsible for the proper functioning of the commissioning system as a whole.
1.5 As the steward of the health and care system, the Department of Health (the Department) is ultimately accountable for securing value for money from spending on health services, including general practice. The Department sets objectives for NHS England through an annual mandate, and holds it to account for the outcomes the NHS achieves. The 2015-16 mandate includes requirements for general practice, ranging from supporting vulnerable people to keep them out of hospital, to online booking and patient records, to highlighting and reducing variation between local areas. The Department also sets objectives for Health Education England through an annual mandate and, among other things, holds it to account for ensuring the future general practice workforce has the right numbers and skills.
Funding general practice
1.6 The Department allocates funding to NHS England for a wide range of services, including primary care and hospital, community and mental health services. In 2014-15, it gave NHS England £97.4 billion.
1.7 NHS England decides how much of its total budget should be allocated to primary care. It then allocates the medical element of primary care funding between general practices, based on the number of patients on their registered lists, adjusted for demographic characteristics, health needs and local costs. NHS England also makes additional payments to practices based on extra services that they may provide and to cover items such as premises development and medicines. It also makes payments to incentivise practices to provide high-quality care.

Stocktake of access to general practice in England Part One 15
1.8 In 2014-15, NHS England spent £7.7 billion on general practice (8% of its budget). Spending on general practice fell in real terms in 2011-12 and 2012-13, but increased in real terms in the following 2 years (Figure 3). Overall, spending on general practice reduced as a proportion of total health spending between 2010-11 and 2014-15. Over that period, total spending on health increased by 5.0%, whereas spending on general practice increased by only 1.1%. In contrast, spending on hospital, community and mental health services increased by 4.7%. In October 2014, NHS England committed to allocating a higher proportion of the NHS budget to primary care over the next 5 years.
Figure 3Annual change in spending on general practice, 2011-12 to 2014-15
Annual change (%)
Spending on general practice increased in real terms in 2013-14 and 2014-15
3.0
2.0
1.0
0
-1.0
-2.0
-3.0
Note
1 Limitations in the available data mean it is not possible to present entirely comparable spending. The data on general practice represent cash spent each year. The data for the Department of Health represent the budget allocated and spent each year, and so allow for spending accrued in other years.
Source: National Audit Office analysis of Health and Social Care Information Centre data andDepartment of Health accounts
2011-12 2012-13 2013-14 2014-15
Change in real-terms spending on general practice
Change in total real-terms spending by Department of Health
-0.7
0.6
-0.6
0.5
0.9
2.7
1.51.1

16 Part One Stocktake of access to general practice in England
Why does access to general practice matter?
1.9 Accessing general practice is the first step for many patients in diagnosing and treating medical conditions. Good access matters for the following reasons:
• Difficulties and delays in accessing general practice can cause stress and frustration, and prolong discomfort or pain, for patients who have health concerns.
• Prompt diagnosis and treatment can be important in achieving the best health outcomes for those patients with health problems that will not get better on their own. If patients cannot see their GP, they may decide to do nothing. The GP Patient Survey found that, in 2014-15, 13% of patients who had been unable to get a convenient appointment did not see or speak to anyone else about their concern.5 From the data we do not know how many of these patients had health problems that did get better on their own.
• Good access to general practice can reduce pressure on other parts of the NHS and help them to deal with more urgent cases. For example, research in 2013 found that local areas where more patients received GP appointments within 2 weekdays had lower rates of self-referred accident and emergency (A&E) or walk-in centre attendance.6 Other research in 2013 found that areas where more patients could consult their preferred GP had fewer emergency admissions to hospital.7 Poor access leads to greater pressure on services such as A&E departments. Research in 2014 estimated that, in 2012-13, 5.8 million visits to A&E or walk-in centres followed patients not being able to get an appointment or a convenient appointment in general practice.8
• Good access can help the NHS make efficient use of its resources. It costs more for people to use A&E services than to use general practice. We have estimated that a typical consultation in general practice costs £21, whereas hospitals are paid £124 for a visit to A&E. In addition, commissioners pay for general practice in a block amount (where payments are not based on the number of cases handled), and for A&E services according to volume. Therefore, dealing with patients in general practice where appropriate, rather than in A&E, means that commissioners have more money available for other health services.
5 Data for the GP Patient Survey are collected on a rolling basis, with data collated every 6 months and combined with the previous dataset to give an annual picture. The 2014-15 data we present in this report were published in July 2015, covering data collected between July and September 2014 and January and March 2015.
6 TE Cowling et al, Access to Primary Care and Visits to Emergency Departments in England: Population-Based Study, June 2013.
7 S Gunther et al, What aspects of primary care predict emergency admission rates? A cross sectional study, BMC Health Services Research, vol 13 no. 11, January 2013.
8 TE Cowling et al, ‘Access to general practice and visits to accident and emergency departments in England: a cross-sectional analysis of a national patient survey’, British Journal of General Practice, vol.64, no. 624, July 2014.

Stocktake of access to general practice in England Part Two 17
Part Two
Demand for general practice
2.1 This part of the report considers the available information on the demand for, and use of, general practice.
Current position and trends
Increasing demand
2.2 The demands on general practice are rising as the population grows and changes. The number of people with 2 or more long-standing health conditions is rising, and the proportion and absolute numbers of older people are expected to increase in the future. People aged 75 or older use general practice the most, and this age group is expected to increase by more than one-third in the next 10 years. Figure 4 overleaf shows how different groups of patients make differing use of general practice.
2.3 The organisations that we spoke to told us that important reasons why demand is increasing include:
• Elderly patients and those with multiple conditions, requiring longer consultations
Some types of patients tend to need longer consultations. However, no data are collected nationally on the type of health concern, its complexity, or the time spent on each consultation.
• Consultations for non-health issues
Research in 2015 estimated that almost one-fifth of GPs’ consultation time is spent discussing matters such as welfare, debt and personal relationships.9 Nearly three-quarters of GPs felt this time had increased over the past year.
• Increasing pressures on social care and community health services
These can be alternative sources of support and care for patients.
9 Citizens Advice, A Very General Practice, July 2015.

18 Part Two Stocktake of access to general practice in England
Figure 4Patients’ use of general practice
Patient profile Patients aged 75 or over
Patients with long-term physical conditions
Patients with mental health problems
Patients that are generally well
Children and young people
Size of patient population in England, 2015
4.5 million people are aged 75 or over
(8% of the population)
12.3 million people are aged 18 to 74 with a long-term condition
(22% of the population)
26.3 million people are aged 18 to 74 and have no long-term condition
(48% of the population)
3.5 million people are aged under 5
(6% of the population)
8.1 million people are aged 5 to 17
(15% of the population)
5.4 million people are aged 18 to 64 with a common mental health problem
(10% of the population)
2.4 million people are aged 18 to 64 with at least 2 psychiatric disorders
(4% of the population)
Growth rate in next 10 years
Projected growth of 38% in the next 10 years
Overall growth in incidence of long-term conditions fairly stable in the next 10 years, but patients with multiple conditions projected to increase by 50%
No data available
Projected growth of 0.3% for people aged 0 to 4 in the next 10 years, and 11% for people aged 5 to 17Projected growth
of 2% in the next 10 years
Use of general practice, 2015
Patients aged 75 or over make up an estimated 19% of consultations in general practice
Patients aged 15 to 74 make up an estimated 68% of consultations in general practice
Patients aged under 15 make up an estimated 13% of consultations in general practice
Patients of all ages with long-term conditions account for an estimated 50% of consultations
Patients with multiple conditions account for an estimated 32% of consultations
Notes
1 Percentages may not sum to 100% due to rounding.
2 The 4 most common long-term conditions reported in the 2009 General Lifestyle Survey related to the musculoskeletal system, heart and circulatory system, respiratory system, and endocrine and metabolic system.
Sources: National Audit Offi ce analysis of data from Offi ce of National Statistics, Health and Social Care Information Centre and Institute of Public Care; Department of Health, Long Term Conditions Compendium of Information, May 2012; C Salisbury et al, ‘Epidemiology and impact of multimorbidity in primary care: a retrospective cohort study’, British Journal of General Practice, vol 61, no. 582, January 2011

Stocktake of access to general practice in England Part Two 19
2.4 The organisations we spoke to also suggested that changes in how health and social care are provided may have increased activity in general practice. Firstly, there is a long-standing aim to move care out of hospitals and treat people in the community where possible. GPs are often at the heart of integrated health and social care planning for patients with long-term conditions. Secondly, services such as the NHS 111 telephone advice service are partly operated by non-clinical call handlers who use automated triage software to assess the urgency of each call. These arrangements are regarded as relatively risk averse and more likely to direct people to their GP or another part of the NHS. Of people who called NHS 111 in 2014-15, 62% were advised to attend primary or community care.
2.5 As well as time spent with patients during consultations, the overall workload of a GP practice includes administrative work, such as attending meetings and collecting data. In 2015, the British Medical Association received survey responses from more than 15,000 of its members about what would help them to deliver general practice better: 76% said increased core funding; 74% said an increase in the number of GPs; and 64% said a reduction in bureaucracy. There has been little work to evaluate whether administration in general practice has increased in recent years. However, NHS England has taken action to lessen some aspects, such as reducing the amount of data practices are required to report for quality payments.
Number of consultations
2.6 The Department and NHS England have not routinely collected data on the number of consultations since 2008-09. This means there is no estimate of activity in general practice based on current data, in contrast with the hospital sector where there is detailed data on daily activity.
2.7 In 2008-09, there were an estimated 304 million general practice consultations in England. This estimate was based on research commissioned by the Department with a sample of 496 practices, covering 4.3 million patients.10 The research estimated that the number of consultations had increased by 35% over the 13 years between 1995-96 and 2008-09. In 2009, the Department discontinued this research, which had been carried out each year until then.
10 The sample size varied each year. It covered 122 practices and 1.0 million patients in 1995-96.

20 Part Two Stocktake of access to general practice in England
2.8 Since then, attempts to estimate activity levels have suggested that the number of consultations has continued to grow:
• In 2014, the Royal College of General Practitioners commissioned Deloitte to project estimates of the number of consultations forward to 2014-15 and beyond, by applying the previous rate of increase in consultations for different age groups to published population estimates. This method projected average annual growth of 3.5% between 2004-05 and 2014-15, leading to an estimate of 372 million consultations in 2014-15. This estimate is now widely quoted in the health sector. Deloitte also modelled a second scenario in which consultation rates increased half as quickly, but these are not being commonly used.
• Research by the Nuffield Trust in 2015 with a non-representative sample of 337 practices covering 3.2 million patients found that the total number of consultations in that sample rose by an average of 3.1% per year between 2010-11 and 2013-14, slightly below the rate of growth projected by Deloitte. Limitations resulting from differences in how practices recorded data meant that the Nuffield Trust was not able to estimate reliably the total number of consultations in England.
2.9 With no large-scale data collected since 2008-09, it is impossible to know whether these estimates are accurate. In particular, projections based on 2008-09 data become more uncertain as time passes, and the assumption that consultation rates continue to increase at the same rate should be treated with caution. An IT service to extract data from general practice clinical systems has been in development since 2007, and has the potential to provide the data needed to quantify activity levels. But, as we reported in July 2015, the project is significantly delayed and not working as expected.11 In May 2015, the Department and NHS England commissioned research into consultation rates and patient experience based on a random sample of 250,000 patients. The research is expected to be published in early 2016.
Interesting variations between age groups
2.10 The latest data on the extent to which different age groups use general practice date from 2008-09. These data showed that:
• on average, people aged 85 or over had 13 general practice consultations per year, compared with fewer than 4 for those aged 15 to 24. The oldest age groups also had the highest growth between 1995-96 and 2008-09, with rates almost doubling for patients aged 85 and over (Figure 5); and
• an estimated 30% of consultations were with patients aged 65 or over (Figure 6 on page 22). These patients comprised 16% of the population at that time.
11 Comptroller and Auditor General, General Practice Extraction Service – Investigation, Session 2015-16, HC 265, National Audit Office, July 2015.

Stocktake of access to general practice in England Part Two 21
0
2
4
6
8
10
12
14
6.2
7.6
Under 5
2.4 2.5
5 to 14
3.13.6
15 to 24
3.4
4.3
25 to 44
3.8
5.0
45 to 64
5.3
7.2
65 to 74
6.5
10.3
75 to 84
7.0
13.0
85 and over
Figure 5Number of times in a year people consult a general practice by age group, 1995-96 and 2008-09
Consultation rate per year
Consultation rates in general practice have increased the most for older age groups
Note
1 Based on 1.0 million registered patients in 122 practices in 1995-96 and 4.3 million registered patients in 496 practices in 2008-09.
Source: National Audit Office analysis of Health and Social Care Information Centre data
1995-96 2008-09

22 Part Two Stocktake of access to general practice in England
Figure 6Proportion of total consultations by age group, 2008-09
30% of consultations in 2008-09 were with patients aged 65 or over
Age group Percentage of consultations, 2008-09
(%)
Percentage of population, 2008
(%)
Under 5 8 6
5 to 14 5 12
15 to 24 8 13
25 to 44 23 28
45 to 64 25 25
65 to 74 13 8
75 to 84 12 6
85 and over 5 2
Notes
1 May not sum to 100% due to rounding.
2 Based on 4.3 million registered patients in 496 practices.
Source: National Audit Offi ce analysis of Health and Social Care Information Centre data

Stocktake of access to general practice in England Part Three 23
Part Three
Distribution of GP practices
3.1 This part of the report sets out whether GP practices, and their individual surgeries, are located where people can access them easily.
Current position and trends
3.2 Evidence indicates that people want access to general practice close to where they live. A survey commissioned by Monitor in 2014 found that 77% of respondents who had registered with their current GP practice in the past 10 years reported the main reason for their choice was the practice’s location near to their home.12 Our analysis of practice populations shows that at April 2015, 79% of patients were registered at the GP surgery closest to their home, or at one within 1 kilometre of it.13
3.3 Nationally, 92% of people live within 2 kilometres of a GP surgery. The 8% who do not typically live in rural locations. In rural areas, 37% of people have no GP surgery within 2 kilometres, compared with only 1% of people in urban areas.
3.4 The number of GP practices fell from 8,542 in 2004 to 7,875 in 2014, a decrease of 8%. The reduction reflects the fact that, as well as some practices closing, others have merged. However, as we do not have full data on the distribution of GP surgeries in previous years, we could not assess the effect of changes in the number and location of GP surgeries on how far people have to travel to reach their nearest practice.
3.5 Practices are increasingly working collaboratively in networks or federations. Such arrangements may help them make efficiencies and offer a wider range of services that may not be viable for an individual practice to provide. NHS England told us that work is underway to compile data on the number and location of networks and federations, and the facilities and services that they share. Without these data we were unable to analyse the effect of networks and federations on patient access to general practice, for example how far they may have to travel, and the impact on their experience.
12 Ipsos MORI, Exploring patient choice in GP services, December 2014. 3,315 people surveyed.13 We analysed a patient’s distance to the nearest surgery operated by the GP practice they are registered with.

24 Part Three Stocktake of access to general practice in England
3.6 People moving to a new area need to register with a local practice to gain access to general practice services. We found that 81% of people have a choice of surgery within 2 kilometres (Figure 7). However, in reality, this choice may in some cases be constrained. This is because practices can apply to NHS England to close their patient list and decline new registrations if they consider they do not have sufficient capacity to see additional patients. Patients may have to register at a practice further away, or may not be able to register with a local practice at all. NHS England does not collate information centrally on the number of practices that have closed their lists.
Figure 7How close patients live to general practice surgeries
Percentage of population
81% of people are within 2 kilometres of at least 2 GP surgeries
Note
1 Distances have been calculated as straight lines between postcodes.
Source: National Audit Office analysis of Health and Social Care Information Centre data
Within 3 km
Within 2 km
Within 1 km
0
10
20
30
40
50
60
70
80
90
100
At least 1surgery
At least 2surgeries
At least 3surgeries
At least 4surgeries
At least 5surgeries

Stocktake of access to general practice in England Part Four 25
Part Four
Availability of appointments
4.1 This part of the report sets out whether patients can get appointments at general practices when they want them, and how satisfied they are with the process of making appointments.
Current position and trends
Expectations of availability
4.2 The Department has not set standards for the maximum time people should have to wait to access general practice. This contrasts with hospital care, where the NHS Constitution gives patients the right to access services within maximum waiting times. The GP Patient Survey asks patients to remember when they last wanted an appointment and when they got one, but data are not collected on the actual time between patients requesting and having an appointment.
4.3 In September 2015, a survey that we commissioned from Ipsos MORI found that only 30% thought it was acceptable to wait longer than 4 days for a GP appointment (Figure 8 overleaf). These findings are supported by the GP Patient Survey, which found that in 2014-15, 52% of patients wanted an appointment on the same day or next working day, and a further 24% wanted one a few days later. The government has committed that by 2020 all patients aged over 75 will be guaranteed a same-day appointment with a GP if they need it.
4.4 However, people also think it is important to be able to book routine appointments in advance. Our survey found that 67% of people said it was important to be able to book a routine appointment at least a few days in advance, compared with 56% who said it was important to have same-day access.14
14 On a scale of 0 to 10, where 0 represented not at all important and 10 represented very important, we defined important as 7 to 10.

26 Part Four Stocktake of access to general practice in England
On the same day, 12%
1 to 2 days, 36%
3 to 4 days, 23%
5 to 7 days, 24%
8 or more days, 5%
0
10
20
30
40
50
60
70
80
90
100
Figure 8How long people are prepared to wait for a GP appointment
Percentage of respondents
30% of people surveyed thought it was acceptable to wait longer than 4 days for a GP appointment
Notes
1 Respondents were asked ‘If you had a health condition/situation which meant you needed to consult your GP but which was not an urgent matter, how long would you find it acceptable to wait for an appointment with your GP? This might be a condition such as a cough, a rash, or back pain or to seek advice on medication.’
2 Percentages rounded to the nearest whole number. Totals may not sum due to rounding.
3 Based on sample of 1,588 respondents, after excluding those who responded ‘don’t know’.
Source: Ipsos MORI survey for the National Audit Office, September 2015
Stocktake of access to general practice in England Part Four 27
Experience of availability
4.5 The GP Patient Survey indicates that the vast majority of people requesting an appointment received one. In 2014-15, when asked whether they were able to get an appointment to see or speak to someone, 89% reported they were able to do so, although this represented a slight decline from 91% in 2011-12.15
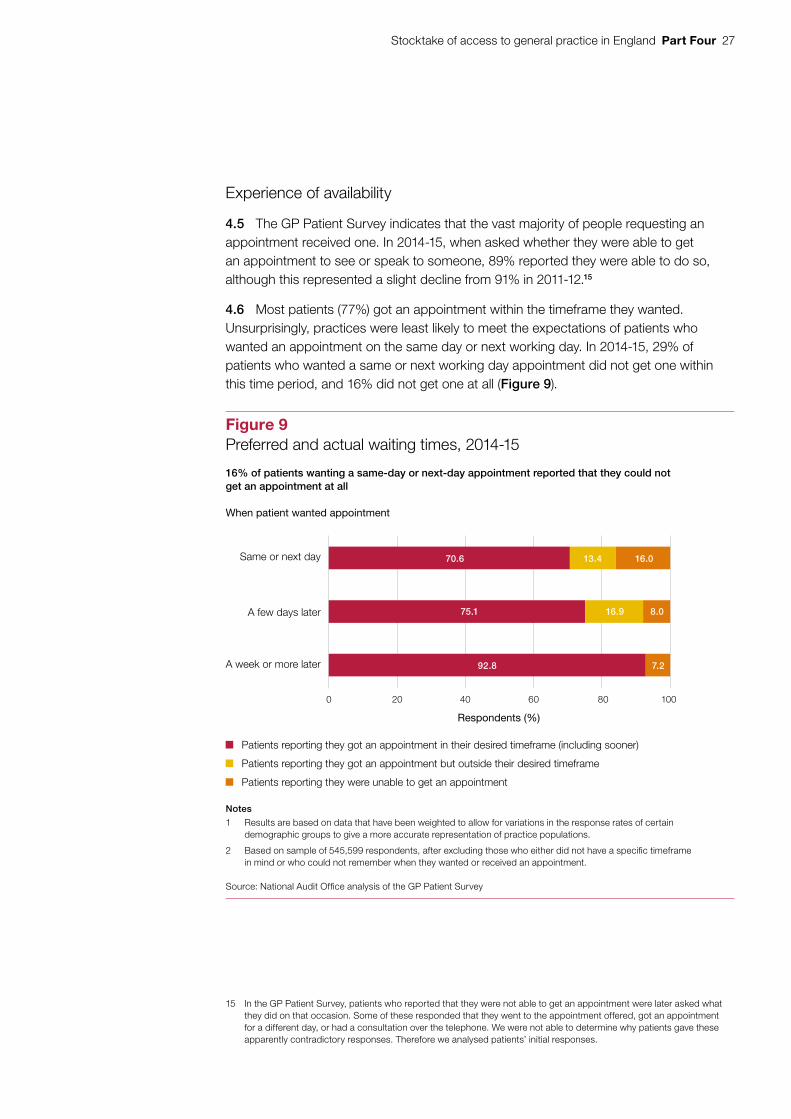
4.6 Most patients (77%) got an appointment within the timeframe they wanted. Unsurprisingly, practices were least likely to meet the expectations of patients who wanted an appointment on the same day or next working day. In 2014-15, 29% of patients who wanted a same or next working day appointment did not get one within this time period, and 16% did not get one at all (Figure 9).
15 In the GP Patient Survey, patients who reported that they were not able to get an appointment were later asked what they did on that occasion. Some of these responded that they went to the appointment offered, got an appointment for a different day, or had a consultation over the telephone. We were not able to determine why patients gave these apparently contradictory responses. Therefore we analysed patients’ initial responses.
7.292.8
16% of patients wanting a same-day or next-day appointment reported that they could not get an appointment at all
Figure 9Preferred and actual waiting times, 2014-15
Notes
1 Results are based on data that have been weighted to allow for variations in the response rates of certain demographic groups to give a more accurate representation of practice populations.
2 Based on sample of 545,599 respondents, after excluding those who either did not have a specific timeframe in mind or who could not remember when they wanted or received an appointment.
Source: National Audit Office analysis of the GP Patient Survey
Same or next day
A few days later
A week or more later
0 20 40 60 80 100
Respondents (%)
Patients reporting they got an appointment in their desired timeframe (including sooner)
Patients reporting they got an appointment but outside their desired timeframe
When patient wanted appointment
Patients reporting they were unable to get an appointment
70.6
75.1
13.4
16.9
16.0
8.0

28 Part Four Stocktake of access to general practice in England
4.7 The GP Patient Survey shows that, while most patients were able to get an appointment, an increasing minority are reporting difficulties in their experience of making an appointment:
• The proportion of patients reporting a poor experience of making an appointment increased from 8% in 2011-12 to 12% in 2014-15.
• In 2014-15, 27% of patients said it was not easy to get through to their GP practice on the telephone, up from 19% in 2011-12.
• The proportion of patients who said the receptionist was unhelpful increased from 9% in 2011-12 to 11% in 2014-15.
Interesting variations in patient experience
4.8 Different patient groups report differing experiences of making and accessing appointments. Our analysis indicates that the main factor influencing experience appears to be a patient’s age:
• Experience of making an appointment improves with age, as does reported ability to get an appointment (Figure 10). Patients of different ages value different aspects of access. For example, our survey in September 2015 found that 58% of people aged 18 to 64 said being able to book appointments on the same day was important, compared with 49% of people aged 65 or over.16
• After taking age into account, patients who are generally well reported a slightly better experience of making and accessing appointments than those with long-term conditions.
• After taking age into account, patients in paid employment reported a poorer experience of making and accessing appointments than those not in employment.
• There are disparities in the experience of people from different ethnic groups. Asian patients in particular reported higher levels of dissatisfaction (Figure 11 on page 30). Our survey also revealed differences in expectations, with 65% of black and minority ethnic respondents saying same-day appointments were important, compared with 55% of white respondents.17
16 Based on 1,342 respondents aged 18 to 64 and 370 respondents aged 65 or over.17 Based on 1,435 white respondents and 213 black and minority ethnic respondents.

Stocktake of access to general practice in England Part Four 29
0 5 10 15 20 25 30 35
30.6
28.8
27.2
22.3
19.6
Not easy to get through on telephone
17.0
14.8
10.8
5.7
3.3
Receptionist not helpful
15.8
14.8
12.9
7.3
5.0
Poor experience of making appointment
14.8
14.1
11.6
6.2
4.5
Unable to get appointment
11.0
11.0
8.03.7
2.9
Appointment not convenient
Figure 10Patient experience of making appointments by age group, 2014-15
Younger patients generally report a poorer experience of making appointments
Notes
1 Results are based on data that have been weighted to allow for variations in the response rates of certain demographic groups to give a more accurate representation of practice populations.
2 Analysis excludes patients who responded ‘don't know’, ‘haven’t tried’ or ‘can’t remember’. After these adjustments, the respective sample sizes were: not easy to get through on telephone − 812,416; receptionist not helpful − 824,880; poor experience of making appointment − 816,050; unable to get appointment − 789,816; and appointment not convenient − 692,322.
Source: National Audit Office analysis of the GP Patient Survey
Percentage of respondents
18 to 24 25 to 44 45 to 64 65 to 74 75 and over

30 Part Four Stocktake of access to general practice in England
Figure 11Patient experience of making appointments by ethnic group, 2014-15
19% of Asian patients reported in 2014-15 that they were not able to get an appointment, compared with 11% of white patients
Notes
1 Results are based on data that have been weighted to allow for variations in the response rates of certain demographic groups to give a more accurate representation of practice populations.
2 Analysis excludes patients who responded ‘don't know’, ‘haven’t tried’ or ‘can’t remember’. After these adjustments, the respective sample sizes were: not easy to get through on telephone – 809,550; receptionist not helpful – 821,982; poor experience of making appointment – 813,145; unable to get appointment – 787,090; and appointment not convenient – 690,118.
Source: National Audit Office analysis of the GP Patient Survey
Unable to get appointment
Appointment not convenient
Not easy to get through on telephone
Receptionist not helpful
Poor experience of making appointment
0 5 10 30 35 4015 20 25
Percentage of respondents
White Mixed Asian Black Other
25.8
28.8
36.2
26.7
28.8
10.9
13.6
17.0
8.8
11.5
11.9
15.1
17.4
11.2
12.2
10.5
13.1
19.3
14.5
15.1
7.5
12.2
15.1
8.8
11.7

Stocktake of access to general practice in England Part Four 31
4.9 There is considerable variation between practices in the proportion of patients unable to get an appointment, ranging from 0% to 52% (Figure 12).18 Our analysis found that only 27% of this variation could be explained by differences in patient demographics, health and employment profile, size of the practice list, the number and mix of staff, rurality and deprivation. This implies that practices’ appointment-booking systems and other working arrangements also play an important part. Practices vary in how they allocate and book appointments. For example, some practices give only same-day appointments, while others allow advance booking. NHS England does not hold information on practices’ appointment-booking systems so it cannot assess which systems contribute to better patient experience.
18 In the GP Patient Survey, sample sizes for individual practices can be small, meaning differences reported at practice-level may not be statistically significant.
Figure 12Proportion of patients unable to get an appointment by practice, 2014-15
There is large variation in the proportion of patients unable to get an appointment at each practice
Percentage of practices
Notes
1 Results are based on data that have been weighted to allow for variations in the response rates of certain demographic groups to give a moreaccurate representation of practice populations.
2 Based on a sample of 797,926 respondents from 7,872 practices, after excluding patients who responded ‘can’t remember’.
Source: National Audit Office analysis of the GP Patient Survey
0
10
20
30
40
50
60
70
80
90
100
0 10 20 30 40 50 60 70
Percentage of patients unable to get an appointment
GP practices
In the bottom performing one-fifth of practices, more than 17% of patients could not get an appointment
In the top performing one-fifth of practices, less than5% of patients could not get an appointment

32 Part Four Stocktake of access to general practice in England
4.10 We found no notable difference between practices of different sizes in whether patients could get appointments. However, significantly higher proportions of patients in larger practices reported problems with getting through on the telephone or a generally poorer experience of making an appointment (Figure 13). Larger practices tend to be in more deprived areas.
Figure 13Patient experience of making appointments by practice size, 2014-15
Larger practices have more patients reporting problems in making appointments
Size of practice (number of registered patients)
Percentage of patients reporting not easy to get
through on telephone(%)
Percentage of patients reporting poor experience of making an appointment
(%)
Percentage of patients unable to get
an appointment(%)
Under 4,000 18 10 11
4,000 to 7,999 26 12 11
8,000 to 14,999 32 14 11
15,000 or more 32 14 12
Notes
1 Results are based on data that have been weighted to allow for variations in the response rates of certain demographic groups, to give a more accurate representation of practice populations.
2 Analysis excludes patients who responded ‘don’t know’ or ‘can’t remember’. After these adjustments, the respective sample sizes were: not easy to get through on telephone – 809,550; poor experience of making appointment – 813,145; unable to get appointment – 787,090.
Source: National Audit Offi ce analysis of the GP Patient Survey

Stocktake of access to general practice in England Part Five 33
Part Five
Convenience of services
5.1 This part of the report sets out how patients rate the convenience of access to general practice, by looking at practice opening hours and types of consultation.
Current position and trends in opening hours
5.2 Obtaining an appointment at a convenient time is an important element of access, as, for example, not everyone can take time off work to visit their GP. The convenience of appointments also influences whether people make the best use of health services. For example, we have previously found that rates of A&E attendance were lower in areas where people were more satisfied with general practice opening hours.19
5.3 The standard GP contract stipulates core hours, when patients must be able to access services, of 8 am to 6.30 pm on weekdays, totalling 52.5 hours per week. However, this does not mean that practices have to be open for appointments during all core hours, provided they meet the reasonable needs of patients.
5.4 Improving access to general practice is a priority for the government. It plans, by 2020, to give all patients access to general practice from 8 am to 8 pm, 7 days per week, totalling 84 hours per week. The government considers that health services should be available when people need them and has also pointed out the economic cost of patients having to take time away from work for medical appointments.
5.5 In October 2013, NHS England launched the Prime Minister’s GP Access Fund, which is piloting different ways of improving access to general practice during 2014-15 and 2015-16. The initiatives include extended opening hours and the use of Skype or other online appointments. There are 57 pilot projects covering 18 million patients. NHS England published an evaluation of the Prime Minister’s GP Access Fund in October 2015, but has not yet completed its cost analysis or implementation plan for extending access to general practice across the country.
19 National Audit Office, Investigating the impact of out-of-hours GP services on A&E attendance rates: multilevel regression analysis, September 2015.

34 Part Five Stocktake of access to general practice in England
5.6 Evidence on the level of demand for extended opening hours specifically is mixed:
• A survey commissioned by Monitor in 2014 found that 14% of respondents said evening and weekend opening was one of the top 5 things they look for in a general practice.20
• Research in 2015 found that weekend opening is much less important than evening opening during the week when people are choosing a GP practice.21 However, respondents to our survey in September 2015 said it was just as important to be able to see or consult with someone on a Saturday or Sunday as it was to consult with someone after 6.30 in the evening.22
• The Prime Minister’s GP Access Fund evaluation, also in 2015, found high take-up of extended hours appointments in the week and on Saturday mornings, but very low take-up on Sundays.23
5.7 Data collected by NHS England in October 2014 show that GP practices were open to patients for a mean average of 51.4 hours per week.24 We do not have data on how opening hours have changed in recent years, but dissatisfaction with opening hours in general practice appears to be growing:
• In the GP Patient Survey, patients reporting that their surgery is not open at convenient times increased from 17% in 2011-12 to 20% in 2014-15.
• In the survey commissioned by Monitor in 2014, of people who reported that evening and weekend opening was one of the top 5 things they looked for in a general practice, 46% felt their practice was below expectations in this respect.25
5.8 NHS England’s data also show that, at October 2014, practices’ opening hours varied considerably:
• 22% of practices opened on Saturdays and 2% opened on Sundays.
• 5% of practices were open for 60 or more hours per week, and 4% of practices were open for less than 40 hours.
• Larger practices typically opened for longer. Practices with 15,000 or more patients were on average open for 55 hours, compared with an average of 49 hours for practices with fewer than 5,000 patients.
20 Ipsos MORI, Exploring patient choice in GP services, December 2014; based on 3,192 responses.21 M Lagarde et al, ‘Determinants of the choice of GP practice registration in England: Evidence from a discrete choice
experiment’, Health Services, vol. 119 issue 4, April 2015. 22 In our survey, 57% of respondents said it was important to be able to see or consult with someone after 6.30 in the
evening, compared with 56% on a Saturday or Sunday.23 Mott MacDonald, Prime Minister’s Challenge Fund: Improving Access to General Practice, First Evaluation Report,
October 2015.24 NHS England collects data on opening hours from GP practices but, where a practice has more than 1 surgery,
information on individual surgeries’ opening hours is not currently stored in a systematic way. Therefore in our analysis we assumed that all GP surgeries within a practice are open at the same times, although this will not always be the case.
25 Ipsos MORI, Exploring patient choice in GP services, December 2014; 429 people answered that particular question.

Stocktake of access to general practice in England Part Five 35
5.9 Through network and federation arrangements, practices may share extended opening hours. This means that patients can attend nearby practices if their practice is not open, for example, on a Saturday. Our survey in September 2015 found that 53% of respondents felt it was acceptable to see a different GP at a nearby practice if they could not get an appointment with their own GP, compared with 25% who felt it was unacceptable.26
5.10 With no robust data on networks and federations available, we were unable to assess their impact on improving access to general practice through extended opening hours. However, our analysis of opening hours at October 2014 shows that 58% of the population live within 2 kilometres of a GP surgery open on Saturdays, but only 18% have access (within 2 kilometres) on every weeknight to a GP surgery that is open until 8 pm (Figure 14 overleaf). This indicates that small local networks of GP practices may not be sufficient to provide access for 84 hours each week, and that more practices will need to extend their opening hours by 2020 to meet the government’s commitment.
Interesting variations in patient experience
5.11 The GP Patient Survey reveals variation in how satisfied different patient groups were in 2014-15 with current general practice opening hours:
• Satisfaction with opening hours increases with age: 27% of patients aged 18 to 44 reported that opening hours were inconvenient, compared with just 4% of patients aged 75 and over.
• 30% of patients in paid employment reported that opening hours were inconvenient, compared with 8% of patients who are not working.
• Of those in employment, 45% of patients who could not take time away from work to see their GP reported that opening hours were inconvenient, compared with 23% of patients who could take time away from work.
Different types of consultation
5.12 Different ways of working, such as telephone, Skype or online consultations, can improve convenience for patients or efficiency for practices, or both. NHS England does not routinely collect data on which practices have online consultation arrangements, so we were not able to review the extent to which practices use these arrangements, or assess how patients rate such ways of accessing general practice.
5.13 The GP Patient Survey found that 90% of people surveyed in 2014-15 asked to see a professional for a face-to-face consultation. However, 58% of respondents to our survey in September 2015 considered it was acceptable to have a telephone consultation when a face-to-face appointment was not available.
26 On a scale of 0 to 10, where 0 represented not at all acceptable and 10 represented very acceptable, we defined unacceptable as responses from 0 to 3 and acceptable as responses from 7 to 10.

36 Part Five Stocktake of access to general practice in England
5.14 Telephone consultations are increasing but still represent a small proportion of the total: 8% of patients in 2014-15 reported speaking to a GP or nurse on the telephone, up from 5% in 2011-12. However, there is some evidence of patient dissatisfaction with telephone consultations. Our analysis of the GP Patient Survey found that patients who wanted to see a GP at the surgery but instead had a telephone consultation were more than twice as likely to report that it was an inconvenient appointment or that it was a poor experience of making an appointment. The Prime Minister’s GP Access Fund evaluation in October 2015 found telephone consultations were more popular and successful than options such as Skype or online consultations, but that more work was needed to find the model which provides optimum patient satisfaction and cost-effectiveness.
0 20 40 60 80 100
Saturday
GP surgery providing extended hours access
Figure 14How close patients live to practices with extended opening hours, October 2014
Most patients do not have access to the full range of extended opening hours at nearby practices
Notes
1 Data taken from e-declaration submissions from GP practices to NHS England, October 2014.
2 Based on responses from 7,837 practices.
3 We have assumed that all surgery sites operated by a practice have the same opening hours.
Source: National Audit Office analysis of NHS England data
Proportion of patients
Within 2 km Within 3 kmWithin 1 km
Every weeknight until 8 pm
6.7
17.8
27.6
At least 3 weeknights until 8 pm51.2
36.4
15.2
32.9
57.6
69.8
At least 1 weeknight until 8 pm44.5
68.9
78.5
Sunday22.2
13.6
5.0

Stocktake of access to general practice in England Part Six 37
Part Six
Continuity of care
6.1 This part of the report considers whether continuity of care is important to patients, and whether those who prefer continuity are able to access it.
Current position and trends
Expectations of continuity
6.2 Many people value a continuing relationship with the same health professional each time, although the proportion of patients with a preferred GP is declining. In the 2014-15 GP Patient Survey, 53% of patients reported that they had a preferred GP, compared with 57% in 2011-12. Data on whether patients would like a preferred GP have not been collected.
6.3 Some patient groups in particular value continuity: people aged 75 and over and those with long-term physical or mental health conditions were significantly more likely to have a preferred GP, compared with those who were generally well (Figure 15). Our survey in September 2015 revealed a similar pattern.27
27 In our survey, 54% of respondents aged 65 or over said it was important to be able to see or consult with the same GP each time, compared with 46% with respondents aged 18 to 64.
Figure 15Importance of continuity of care to patients by patient group, 2014-15
Older people and those with long-term health conditions are more likely to have a preferred GP
Patient profile Proportion of patients who have a preferred GP to see or speak to
(%)
Aged 18 to 74, generally well 38
Aged 18 to 74, long-term conditions 60
Aged 18 to 74, mental health problem 73
Aged 75 and over 75
Notes
1 Results are based on data that have been weighted to allow for variations in the response rates of certain demographic groups to give a more accurate representation of practice populations.
2 Based on sample of 828,467 respondents, after excluding those reporting that there was usually only one GP at their GP surgery.
Source: National Audit Offi ce analysis of the GP Patient Survey
38 Part Six Stocktake of access to general practice in England
Experience of continuity
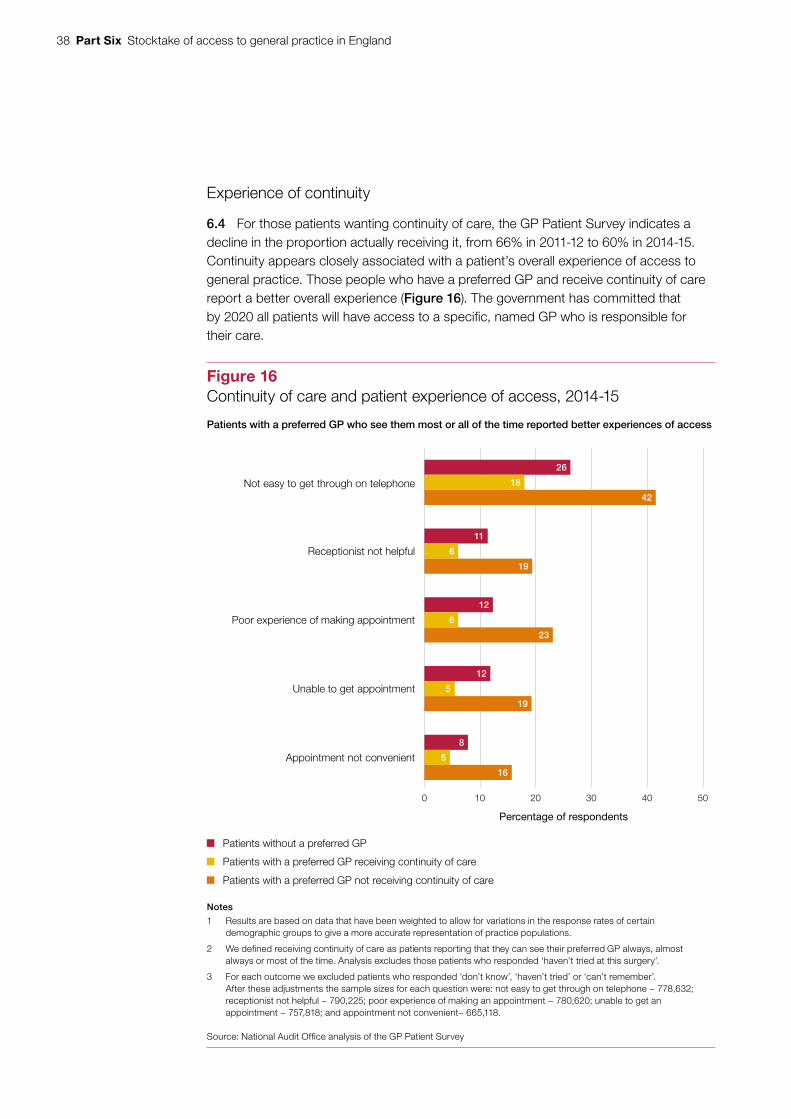
6.4 For those patients wanting continuity of care, the GP Patient Survey indicates a decline in the proportion actually receiving it, from 66% in 2011-12 to 60% in 2014-15. Continuity appears closely associated with a patient’s overall experience of access to general practice. Those people who have a preferred GP and receive continuity of care report a better overall experience (Figure 16). The government has committed that by 2020 all patients will have access to a specific, named GP who is responsible for their care.
0 10 20 30 40 50
Not easy to get through on telephone
Receptionist not helpful
Unable to get appointment
Appointment not convenient
26
18
42
11
6
19
12
Poor experience of making appointment 6
23
19
12
5
8
5
16
Figure 16Continuity of care and patient experience of access, 2014-15
Patients with a preferred GP who see them most or all of the time reported better experiences of access
Notes
1 Results are based on data that have been weighted to allow for variations in the response rates of certain demographic groups to give a more accurate representation of practice populations.
2 We defined receiving continuity of care as patients reporting that they can see their preferred GP always, almost always or most of the time. Analysis excludes those patients who responded ‘haven’t tried at this surgery’.
3 For each outcome we excluded patients who responded ‘don’t know’, ‘haven’t tried’ or ‘can’t remember’. After these adjustments the sample sizes for each question were: not easy to get through on telephone − 778,632; receptionist not helpful − 790,225; poor experience of making an appointment − 780,620; unable to get an appointment − 757,818; and appointment not convenient− 665,118.
Source: National Audit Office analysis of the GP Patient Survey
Percentage of respondents
Patients with a preferred GP receiving continuity of care
Patients with a preferred GP not receiving continuity of care
Patients without a preferred GP

Stocktake of access to general practice in England Part Six 39
Interesting variations between patient groups and practices
6.5 Of those people who wanted continuity of care, we identified variations in the experience of different patient groups:
• In 2014-15, 62% of patients of a white ethnic background reported they had received continuity of care, compared with 47% of Asian patients and 47% of black patients.
• The proportion of patients reporting they had received continuity of care increased with age. Of those aged 75 and over, 72% reported they had received continuity, compared with 51% of those aged 18 to 44.
6.6 There is also variation between practices. In the fifth of practices where patients reported the greatest continuity, more than 76% of those patients who wanted it received continuity of care, compared with less than 47% of patients at the fifth of practices performing least well on this indicator. The organisations that we spoke to told us that a number of factors influence a practice’s ability to provide continuity of care, including the number of GPs in a practice, the level of part-time working and appointment-booking arrangements. The organisations highlighted that practices are often faced with balancing providing quick access to appointments with ensuring continuity for those patients who want it; this is particularly challenging when practices are also dealing with increasing demand.

40 Part Seven Stocktake of access to general practice in England
Part Seven
Staffing and capacity
7.1 This part of the report looks at whether the general practice workforce has sufficient capacity to meet demand. We cover the workforce in general and then focus on the supply of GPs in more depth. Full equivalent data on nurses working in general practice were not available.
The general practice workforce
7.2 At September 2014, there were around 37,000 full-time equivalent GPs working in 7,875 practices across England. Some practices have only 1 fully qualified permanent GP (often called single-handed practices). At large practices there may be 10 or more GPs working together.
7.3 GPs can have different roles in a practice – some are full or part practice owners; others are salaried GPs employed by the practice. In addition to these 37,000 GPs, there are locum GPs who work across practices as required. Complete data are not available on the use of locums within general practice, but there is anecdotal evidence that they account for an increasing proportion of the workforce.
7.4 GPs work within mixed teams of staff to provide services. At September 2014, only 29% of the general practice workforce were GPs (Figure 17). Practice nurses (12%), other staff providing direct patient care (7%), and administrative, clerical and other staff (51%) made up the remainder. The Department has started collecting additional data on staffing, such as the composition of the direct patient care category (which includes health care assistants, phlebotomists and pharmacists), although the data are not yet complete and work is ongoing to improve the quality.

Stocktake of access to general practice in England Part Seven 41
Growth in the general practice workforce
7.5 The general practice workforce increased by 2% per year on average between 2004 and 2014. By far the highest growth was in the category of direct patient care (a 10% annual increase).
7.6 The 2.0% annual growth in general practice staff was substantially more than the average annual increase of 1.2% in staff working in hospital, community and mental health services over the same period (Figure 18 overleaf). In contrast, the average annual increase in the number of GPs (1.8%) was considerably less than the 2.9% average annual increase in doctors working in hospital, community and mental health services.
7.7 The organisations that we spoke to considered that general practice is under increasing pressure in part because demand is rising by more than capacity. This view is supported by comparing growth in the workforce with the estimated increase in the number of consultations. Estimates (based on extrapolated previous sample data) projected an annual average increase of 3.5% in the number of consultations between 2004-05 and 2014-15 (paragraph 2.8), compared with the average annual increase of 2.0% for general practice staff over the same period. This analysis does not take into account the complexity of consultations, which is also likely to be increasing. The organisations expressed concern that the increasing pressure and workload could be a risk to patient safety.
Figure 17General practice staff, September 2014
A total of 125,300 full-time equivalent staff worked in general practice in September 2014, an increase of 22,300 since September 2004
Staffing group Full-time equivalent
Total practice staff (%)
Change since 2004
Growth since 2004(%)
Average annual growth, 2004 to 2014
(%)
GP 36,900 29 +5,900 19.0 1.8
Nurse 15,100 12 +1,500 11.1 1.1
Direct patient care 9,300 7 +5,700 158.3 10.0
Administrative, clerical and other
64,100 51 +9,200 16.8 1.6
All staff 125,300 100 +22,300 21.6 2.0
Note
1 Staff numbers rounded to the nearest 100. Totals may not sum due to rounding.
Source: Health and Social Care Information Centre

42 Part Seven Stocktake of access to general practice in England
Managing demand by using different types of staff
7.8 As noted above, the composition of the general practice workforce has changed in recent years, reflecting in part the sector’s attempts to reduce pressure on GPs by using other clinical staff for some consultations. Traditionally, most consultations have been with a GP. But the proportion of consultations carried out by others has increased considerably:
• Between 1995-96 and 2008-09 (the latest national estimate of activity) consultations with nurses and staff other than GPs increased from 25% to 38% of total consultations.
• Research by the Nuffield Trust found that, in its sample, between 2010-11 and 2013-14, GP consultations increased by only 0.6% a year, compared with 2.6% for consultations with nurses and 5.7% for consultations with other staff, including pharmacists, physiotherapists and speech therapists. However, data limitations mean it is difficult to fully understand these patterns (paragraph 2.8).
2.3
1.1
0 0.5 1.0 1.5 2.0 2.5 3.0
1.8
2.9GPs and doctors
1.1
0.9Nurses
Other staff
2.0
1.2All staff
Figure 18Average annual increase in general practice and hospital, community and mental health services staffing, 2004 to 2014
Overall numbers of staff in general practice have increased at a higher rate than in hospital, community and mental health services
Note
1 Based on full-time equivalent numbers.
Source: National Audit Office analysis of Health and Social Care Information Centre data
Average annual change (%)
General practice
Hospital, community and mental health services

Stocktake of access to general practice in England Part Seven 43
7.9 The 2014-15 GP Patient Survey found that 83% of patients contacting a GP practice for an appointment wanted to consult a GP. Our survey in September 2015 found that when a GP was not available 65% of people felt it would be acceptable to see a nurse who was able to prescribe instead (compared with 13% who felt it unacceptable). A smaller proportion (54%) felt it would be acceptable to see a pharmacist or other professional trained to deal with the situation (compared with 20% who felt it unacceptable).28 Levels of acceptability were much lower for black and minority ethnic patients, however: only 53% felt it acceptable to see a nurse rather than a GP, and 43% felt it acceptable to see a pharmacist or other professional.
7.10 We looked at available data on the mix of staff employed by different practices, and found very different staffing models for similar-sized practices. For example, one practice with approximately 7,000 patients employed 7 GPs and 1 nurse, compared with a similar-sized practice that employed 4 GPs and 7 nurses.
7.11 We also reviewed the impact of staffing mix on patient experience. How patients experience access is complex, as factors such as expectation and the type of health concern influence how people perceive their experience. Our analysis was inconclusive, showing that:
• after adjusting for a range of factors such as age, deprivation and practice size, practices employing a higher ratio of nurses to GPs had worse patient experience of accessing the GP practice;
• the 2014-15 GP Patient Survey found that those patients who originally wanted to see a GP but saw a nurse instead reported similar satisfaction as those who saw a GP; and
• patient satisfaction was generally higher for patients who wanted to see, and did see, a nurse rather than a GP, although this may reflect that their health concerns were likely to be more minor.
7.12 Some organisations that we spoke to told us that general practice would be more able to meet rising demand if practices made better use of alternative staff and services, and educated patients about when it was appropriate to see a nurse or another person, such as a pharmacist or counsellor, rather than a doctor. They also noted, however, that it was important for patients to consult with the right professional first time. They highlighted the risk that patients would have unnecessary additional appointments if this did not occur.
7.13 Research commissioned by NHS England found that, based on a sample of GPs, 27% of GP consultations were potentially avoidable contacts, including patients who could have been seen by others in the practice or by pharmacists.29 NHS England now collects data on other clinical staff employed by general practices. However, no data are collected centrally on the presence of other clinical staff within general practice that are funded outside the GP contract, such as physiotherapy services paid for by clinical commissioning groups.
28 On a scale of 0 to 10, we defined responses from 0 to 3 as unacceptable and 7 to 10 as acceptable.29 NHS Alliance, Making Time in General Practice, October 2015.

44 Part Seven Stocktake of access to general practice in England
Interesting trends and variations across the workforce
7.14 Our analysis of workforce data showed some interesting trends and variations:
• Increase in the number of female GPs
Women now make up 50% of full-time equivalent GPs, up from 37% 10 years ago. A higher proportion of female GPs work part-time compared with their male counterparts, although more female GPs worked full-time in 2014 compared with 2010.
• An older workforce
The workforce in general practice is typically slightly older than in other parts of the NHS. In 2014, 22% of full-time equivalent fully trained GPs were aged 55 or over, compared with 20% of fully trained hospital doctors. Also, an estimated 28% of full-time equivalent nurses working in general practice were aged 55 or over, compared with 13% working in hospital, community and mental health services.
• Higher proportions of older GPs in urban and deprived areas
For example, we found that in the 20 clinical commissioning groups with the highest population density, 16% of fully trained GPs were aged 60 or over, compared with a national rate of 9%.
Interesting variations between local areas
7.15 General practice staff are not distributed across the country according to need. We compared levels of staffing within each area to its population weighted by demographic characteristics, health needs and local costs (as used by NHS England to allocate funding to reflect the need for healthcare). The data below cover both GPs and nurses, as many practices use nurses to provide services traditionally supplied by GPs. But the trends we observed were similar for GPs alone. We found the following:
• There is a large disparity between clinical commissioning group areas in the number of GPs and nurses per 100,000 weighted population. This ranges from 114 in Sheffield to 63 in Swale (Figure 19).
• Deprived areas tend to have fewer GPs and nurses per weighted population, although research has indicated that people in these areas tend to live closer to a practice.
• Although there remains significant disparity between different areas in the number of general practice staff, the disparity has reduced since 2010. In 2010, the most deprived areas had on average 19.2 fewer GPs and nurses per 100,000 weighted population than the least deprived areas. By 2014, this gap had narrowed to 4.9 GPs and nurses.
• Patients at practices where there are fewer GPs and nurses for each patient unsurprisingly report more problems in making and accessing appointments (Figure 20 on page 46).

Stocktake of access to general practice in England Part Seven 45
Figure 19Full-time equivalent GPs and nurses per 100,000 people (weighted for age and need) by clinical commissioning group, September 2014
Urban areas typically have fewer GPs and nurses per weighted population
Source: National Audit Offi ce analysis of NHS England data and Health and Social Care Information Centre data
Full-time equivalent GPs and nurses per 100,000 people, weighted for age and need
63 to less than 84 GPs and nurses
84 to less than 93 GPs and nurses
93 to less than 114 GPs and nurses

46 Part Seven Stocktake of access to general practice in England
Increasing the number of GPs
7.16 Ensuring there are enough GPs will be crucial if general practice is to meet increasing demand. The government has committed to providing an additional 5,000 doctors working in general practice by 2020 to improve access. However, due to the lack of reliable data on the number of consultations, the Department and NHS England do not know how many more GPs are required to meet demand. Nor do they have detailed data on the number or use of locum GPs, or on staff vacancies in general practice. This limits their understanding of where current pressures lie.
7.17 There are difficulties in both recruiting and retaining GPs. The Royal College of General Practitioners and the British Medical Association expressed concern to us that the pressures facing the profession risked making general practice seem an unattractive career choice. The Department and Health Education England, the body responsible for training and workforce development in health, increased the number of training places for general practice by 199 in 2014/15. However, they were able to fill only 88% of these places, down from 96% in the previous year (Figure 21).
7.18 At the same time, more GPs are leaving the profession. Between 2005 and 2014, the proportion of GPs aged between 55 and 64 that left approximately doubled (Figure 22). The most recent National GP Worklife Survey, in 2015, found that the level of job satisfaction reported by GPs was lower than in all surveys undertaken since 2001. Other surveys also indicate dissatisfaction with the workload in general practice. NHS England and Health Education England, together with the British Medical Association and the Royal College of General Practitioners, have a workforce action plan, which includes measures to recruit and retain staff in general practice and to re-attract those who have left the sector. It is too early to evaluate the impact of these schemes on capacity in general practice.
Figure 20How the number of GPs and nurses affects patient experienceThere are more reported problems in making and accessing appointments in areas with lower staffing
Full-time equivalent GPs and nurses per 100,000 population (weighted by age and need), September 2014
63 to less than 84(%)
84 to less than 93(%)
93 to less than 114(%)
Percentage unable to get an appointment, 2014-15
13.3 11.0 9.9
Percentage reporting appointment was inconvenient, 2014-15
9.0 8.2 7.3
Percentage reporting poor experience of making an appointment, 2014-15
14.4 12.2 10.7
Notes
1 GP Patient Survey results are based on data that have been weighted to allow for variations in the response rates of certain demographic groups to give a more accurate representation of practice populations. Analysis excludes patients who responded ‘don’t know’. After this adjustment the sample size for each question was: unable to get an appointment – 798,175; inconvenient appointment – 699,152; and poor experience of making an appointment – 824,865.
2 We chose the bandings so that there were approximately the same number of clinical commissioning groups within each banding. Percentages given are averages of clinical commissioning groups within that banding.
Source: National Audit Offi ce analysis of the GP Patient Survey, NHS England data and Health and Social Care Information Centre data

Stocktake of access to general practice in England Part Seven 47
Figure 21Available and fi lled places for GP training, 2009/10 to 2014/15
A significant proportion of GP training places remained unfilled in 2014/15
Academic year Number of training places available
Number of training places filled
Percentage of places filled
2009/10 2,719 2,626 96.6
2010/11 2,732 2,800 102.5
2011/12 2,672 2,658 99.5
2012/13 2,687 2,669 99.3
2013/14 2,850 2,744 96.3
2014/15 3,049 2,688 88.2
Source: Health Education England
0
5
10
15
20
25
Under 35 35 to 44 45 to 54 55 to 59 60 to 64 65 and over
7.0
3.82.6
6.2
10.7
18.0 18.0
7.36.1
3.9
15.5
17.9
Figure 22Proportion of GPs leaving profession in 2005 and in 2014, by age group
Percentage leaving in a year
More GPs are leaving the profession than in 2005, especially GPs aged between 55 and 64
Note
1 Analysis excludes trainee GPs.
Source: National Audit Office analysis of Health and Social Care Information Centre data
2005 2014

48 Appendix One Stocktake of access to general practice in England
Appendix One
Our audit approach
1 This report examines access to general practice by pulling together data from a variety of sources. We reviewed:
• the demand for general practice;
• patients’ expectations and experience of accessing general practice; and
• capacity in general practice.
2 In this report we set out the current position on access to general practice, including trends and variations. We also point out limitations in the available data.
3 In looking at patient expectations and experience of accessing general practice we focused on 4 important aspects of access: where GP surgeries are located, the availability of appointments, the convenience of services and continuity of care. Optimal access would be that everyone in England has reasonable access to general practice and can get an appointment when they feel they need one at a convenient location at a convenient time, with their preferred GP if they have one.
4 Our audit approach is summarised in Figure 23. Our evidence base is described in Appendix Two.

Stocktake of access to general practice in England Appendix One 49
Figure 23Our audit approach
The Department of Health and NHS England’s objectives
Our overall view
Our evidence
(see Appendix Two for details)
Analysis of activity data collected by QResearch andthe Nuffield Trust.
Analysis of the GP Patient Survey commissioned by NHS England.
Omnibus survey of the public’s expectations of general practice.
Interviews with a range of organisations.
Analysis of published data on staffing within general practice.
Analysis of other key datasets.
Interviews with a range of organisations.
Our study framework What is known about patient
needs and expectations for access to general practice and how are these changing?
What capacity is there within general practice and how does this vary?
What is patients’ experience of access to general practice and how does this vary?
Analysis of the GP Patient Survey commissioned by NHS England.
Analysis of other key datasets.
Mapping of GP surgery locations against local populations.
Interviews with a range of organisations.
Good access to general practice is important as it is often the first step for patients in diagnosing and treating health problems. GPs and other staff play a crucial role in treating minor medical conditions, managing patients’ conditions in the community and referring them for hospital treatment or social care where appropriate. Poor access to general practice can have a significant impact on health outcomes and how the NHS uses its resources.
How this will be achieved The Department of Health is ultimately accountable for securing value for money from spending in health services,
including general practice. It sets objectives for NHS England through an annual mandate and holds it to account for the outcomes the NHS achieves.
NHS England contracts general practices to provide a range of services for their registered patients. The GP contract stipulates core services that practices must provide, and core hours when patients must be able to access services.
Improving access to general practice is a priority for the government. It has committed to recruiting 5,000 extra doctors in general practice, and to ensuring access from 8 am to 8 pm, 7 days per week, by 2020. The Department of Health and NHS England have a range of initiatives to improve access to general practice.
Our studyWe examined patient expectations and experience of access to general practice, and the demand for, and capacity of, general practice.
People’s experience of accessing general practice remains positive, with almost 9 in 10 patients in 2014-15 reporting that they were able to obtain an appointment when they last requested one. However, patient satisfaction with access has declined gradually but consistently. Further, there is considerable variation, with different patient and practice characteristics appearing to have a significant effect on patient experience. Worsening access to general practice matters: if patients cannot access general practice they are more likely to suffer poorer health outcomes, or to use other, more expensive, NHS services such as A&E departments.
Against the background of increasing demand and pressure on NHS resources, the challenge is how to maintain people’s positive experience of accessing general practice and reduce variation. The Department and NHS England are taking steps to improve access but they are making decisions without fully understanding either the demand for services or the capacity of the current system. Given the important role general practice plays in the health and care system, the Department and NHS England need better data in order to make well-informed decisions about how to use limited resources to best effect. And, as they take action to improve access, it will be important to track systematically the impact of the changes on patients and the health and care system itself.

50 Appendix Two Stocktake of access to general practice in England
Appendix Two
Our evidence base
1 We compiled our summary of the current position on access to general practice using evidence we collected between May and September 2015.
2 Our work examined the current position, trends and variation in access to general practice. It did not cover the quality of care provided by general practice, aspects such as physical access to practice premises, or out-of-hours GP services. It also did not evaluate how the Department of Health and NHS England seek to support and oversee general practice, or the impact of current initiatives to improve access. The work was not designed to support a conclusion on value for money.
3 In the absence of a universally accepted definition of access, we focused on 4 aspects that emerged as critical from our conversations with stakeholders and review of available data:
• distribution of GP practices: whether patients can access services that are close to their home;
• availability of appointments: whether patients can get appointments when required and within reasonable timeframes;
• convenience of services: whether patients can access GP practices at convenient times and in flexible ways; and
• continuity of care: whether patients can access the same professional each time if they need or want to.
4 We analysed activity data collected by QResearch on behalf of the Department of Health, and by the Nuffield Trust. Estimates based on these data indicated recent trends in numbers of consultations and consultation type, as well as demand for general practice among patients from different age groups.

Stocktake of access to general practice in England Appendix Two 51
5 We analysed data from the GP Patient Survey commissioned by NHS England. We used these data to identify trends in patient expectations and experiences of accessing general practice. We also explored variation in responses across different groups of patients or practices.
6 Data for the GP Patient Survey are collected on a rolling basis, with data collated every 6 months and combined with the previous dataset to give an annual picture. The 2014-15 data we present in this report were published in July 2015, covering data collected between July and September 2014 and January and March 2015.
7 While the overall sample size is large (more than 850,000 respondents in 2014-15), samples at individual GP practices can be small and hence practice-level results come with wide confidence intervals. The survey relies on patients recounting their past and often most recent experience of general practice rather than recording live data about how and when patients access services.
8 We commissioned a short survey about the public’s expectations of general practice. We included 5 questions in the Capibus face-to-face omnibus survey conducted by Ipsos MORI. We used the survey to explore people’s expectations about waiting times for appointments and alternatives to general practice appointments, and preferences when making appointments. The research was conducted between 4 and 21 September 2015. Questions were asked of 1,645 adults across England aged 18 and over. The survey data were weighted by age, gender, region, social grade, household tenure, working status and ethnicity to be nationally representative of the adult population in England. Where we have presented differences in responses between demographic groups, we have tested these are significant at the 95% confidence level.
9 We mapped GP surgery locations against local populations. We used data on GP surgery locations published by the Health and Social Care Information Centre and local population data published by the Office for National Statistics. The mapping enabled us to assess how close people live to general practices, and how close they live to general practices with extended opening hours.
10 We analysed published data on staffing within general practice. We used data published by the Health and Social Care Information Centre to identify trends in the number and composition of the general practice workforce. It also highlighted variation across practices and across local areas in the use of different staffing groups and the number of staff used overall. We also looked at available data on the changing age and gender profile of the workforce, changing patterns of part-time working, and GPs leaving the profession.

52 Appendix Two Stocktake of access to general practice in England
11 We reviewed other key datasets. We looked at a wide range of data sources to explore issues relating to the demand and supply of general practice. These included:
• surveys of patients and the public commissioned by Monitor, Citizens Advice and Which?;
• data on the availability and use of online services;
• surveys of GPs carried out by the British Medical Association;
• data collected by the Primary Care Foundation and the NHS Alliance on the workload of GPs; and
• Health Education England data on GP training places.
12 We interviewed staff at the Department of Health and NHS England. The people we interviewed were responsible for leading on general practice commissioning, the Prime Minister’s GP Access Fund, nursing and allied health professions, and patient participation. The interviews helped us to identify key datasets and sources to use, as well as highlighting current initiatives and priorities. We also reviewed documents, including the GP contract and recent primary care strategies.
13 We interviewed a range of organisations involved in, or with an interest in, general practice. The organisations included: Health Education England, Healthwatch England, Monitor, the Royal College of General Practitioners, the Royal College of Nursing, the British Medical Association, the National Association of Primary Care, the Primary Care Foundation, Citizens Advice, The King’s Fund, and the Nuffield Trust. The interviews were designed to help us understand:
• the factors behind increases in demand for general practice and expectations for access;
• reasons for patient dissatisfaction with the appointment-booking process;
• recruitment and workload pressures; and
• barriers to ensuring good access for all patients.

Stocktake of access to general practice in England Appendix Three 53
Appendix Three
Limitations of data on access to general practice
1 Figure 24 overleaf lists the main limitations in data on access to general practice. NHS England has been seeking to address many of these limitations.

54 Appendix Three Stocktake of access to general practice in England
Figure 24Data limitations
Subject Limitation
Demand for general practice a) The latest available data on the number of consultations within general practice are from 2008-09and were based on a sample of general practices.
b) No data are collected nationally on the complexity of consultations.
Distribution of GP practices a) Full data are not yet available on networks and federations of general practices, or the facilities and services they share. Work is underway to compile these data.
b) No data are collated centrally on how many practices have closed their lists to new patients due to practice-level capacity constraints.
Availability of appointments a) No data are collected on how long patients actually wait between requesting and accessing appointments.
b) No data are available on the types of booking system used by each general practice, such as the number of same-day versus advance appointments, or rules about when patients need to telephone to make appointments.
Convenience of services a) NHS England routinely collects opening hours data from general practices but information about opening hours at individual practice sites is not stored in a systematic way.
b) NHS England does not have full information on practices using innovative appointment options such as Skype or online consultations.
Staffing and capacity a) The Health and Social Care Information Centre publishes annual data on headcount and full-time equivalent GPs and other practice staff. There is some concern about the accuracy of the full-time equivalent data at the individual practice level.
b) The available data on nurses and other practice staff are not as complete as those on GPs. For example, we do not have training data for nurses.
c) Experimental data have been published on other members of practice staff, such as healthcare assistants and allied health professionals. These data are not yet complete and work is ongoing to improve their quality.
d) It is not possible to split staffing data across different surgeries where practices have 2 or more surgeries in different locations.
e) No data are available on vacancy rates within general practice, and data on the use of locums and agency staff are incomplete.
f) The GP Workload Survey collected data on how GPs spend their working week. These data have not been collected since 2006-07. NHS England is involved in discussions to begin collecting these data again.
g) Incomplete data have been collected on workload and administrative burdens in general practice.
Source: National Audit Offi ce

This report has been printed on Evolution Digital Satin and contains material sourced from responsibly managed and sustainable forests certified in accordance with the FSC (Forest Stewardship Council).
The wood pulp is totally recyclable and acid-free. Our printers also have full ISO 14001 environmental accreditation, which ensures that they have effective procedures in place to manage waste and practices that may affect the environment.

£10.00
9 781786 040152
ISBN 978-1-78604-015-2
Design and Production by NAO Communications DP Ref: 10834-001