Embed Size (px)
Citation preview
Final Report
51A1199512 February 2010
Revision No 4
DEPARTMENT OF AGRICULTURE, FISHERIES AND FORESTRY
(DAFF)
LEGAL FOREST PRODUCTS ASSURANCE – A RISK ASSESSMENT FRAMEWORK FOR ASSESSING THE LEGALITY
OF TIMBER AND WOOD PRODUCTS IMPORTED INTO AUSTRALIA
51A11995
PREFACE
This report is issued by Poyry Forest Industry Pty Ltd (Pöyry) to the Department of Agriculture, Fisheries and Forestry (DAFF) for its own use. No responsibility is accepted for any other use.
The report provides a methodology for categorising imported wood products by illegality risk. The report also contains the opinion of Pöyry as to the usefulness of previous methodologies for quantifying trade in illegally-sourced wood products.
Pöyry has no responsibility to update this report for events and circumstances occurring after the date of this report.
Grant Fenton Rudolf van Rensburg
SENIOR CONSULTANT SENIOR CONSULTANT
Contact details:
Grant FentonLevel 5, (Box 22)437 St. Kilda RoadMELBOURNE, VIC 3004AustraliaTel. +61 3 9863 3700Fax +61 3 9863 3707
Poyry Forest Industry Pty Ltd
Copyright © Pöyry Forest Industryi

51A11995
SUMMARY
Poyry Forest Industry Ltd (Pöyry) has been engaged by the Department of Agriculture, Fisheries and Forestry (DAFF) to review existing methodologies for assessing illegality of imported timber and wood products. Based on this review, Poyry was to develop a more accurate and reliable methodology for quantifying the volume and value of illegally-sourced wood products imported into Australia. This project supports the Australian Government’s commitment to combat illegal logging and associated trade.
The methodology review concluded that the current methods lacked reliable data on which to base policy. Problems were found at each stage in the wood supply chain from accurate knowledge of the operating and regulatory environments covering sustainability and “legality” of forest management and timber harvesting, to data tracking the often complex log and subsequent product flows from the forests to primary and secondary manufacturing. Further complicating the situation is that much wood crosses borders via transhipment of logs and timber products from producer countries to secondary manufacturing countries and from there to consumer countries. When coupled with the imprecision in current trade statistics the review concluded that current methods to estimate volumes or values of timber and wood product imports from illegal sources are very unreliable.
These findings led Poyry to develop an alternative approach that is based on developing a risk assessment framework based on transparent assessments of governance arrangements within wood supplying countries.
Review of existing Methodologies and Approaches
Limited literature exists which either develops or describes in detail a methodology to estimate the volume and value of illegally logged timber and wood product trade. Most of this literature is limited to examining the process of the illegal timber trade and the legislative framework. Referenced academic research and scientific studies mainly focus on the environmental issues associated with illegal logging, rather than issues associated with illegal trade of timber and wood products.
The reviewed analyses used primarily secondary data sources, including unqualified estimates, anecdotal evidence, or were based on limited research. Many reports on illegal logging did not assess the accuracy or reliability of illegal logging estimates, and therefore can leave readers with a false impression of precision which can then be perpetrated via citations in other papers. We saw a number of instances where specific estimates were repeated in the reviewed reports with the citations occuring as circular references, and are not linked to the original source.
The following overviews the three most prevalent components of the methodologies reviewed. These include the mass balance approach, trade statistic discrepancies, and the application of country-level corruption indices. In some instances, these quantitative calculations were supported by qualitative assessments based on field investigation and interviews.
Copyright © Pöyry Forest Industryii

51A11995
Mass Balance ApproachThe mass balance approach maps timber flows for each country to identify discrepancies between legal log removals, legal imports, domestic production and exports. For this approach to be effective, it should be possible to compare reported export volumes with the mass balance estimates of export volumes. The usefulness of this method depends on the accuracy and availability of log supply data. However, this data is frequently unreliable and incomplete.The discrepancy between reported harvesting and actual supply can only be measured if reliable domestic wood to product conversion rates and production figures are available. Commonly, in many of the key wood product producing countries such as Indonesia, Malaysia and China, the downstream processing industry is extremely fragmented, particularly the sawn wood sector. In many sectors (especially sawmilling) it is impossible to estimate either the installed capacity, or to quantify production.
The mass balance approach is complex and difficult to calculate even in developed countries, where one would expect reasonably reliable trade and production data to be available.
Export Statistics
The comparison of export statistics from source countries with import statistics from receiving countries has been used in previous methodologies as an approach to identify potential illegally-sourced wood. However, analysis of trade data alone cannot be used to accurately estimate illegally-sourced trade. A review of regional trade statistics highlighted numerous discrepancies, including the misreporting of volume, incorrect HS-code classifications and the use of ‘Other’ as a description for a significant volume of trade. It is evident that, although value is consolidated and reported at the product group level, import volumes simply cannot be reported this way due to differences in the physical measurement processes between countries.
Corruption Indices
The application of country level corruption indices has been used to estimate volumes and values for illegal logging and the processing and trade in illegally-logged timber products. This approach relies on there being a definable relationship between the corruption indices and the volume and value of production. However, corruption indices are broadly based measures (that include non-forestry activities) and therefore do not necessarily capture the regulatory environment specific to the forest industry and the changes in that environment over time. For example, South Africa has a medium CPI, yet the forest industry in South Africa is largely based on plantation-sourced logs supplied by mostly private companies who have achieved FSC.
Risk Assessment Framework
Pöyry has considered the limitations of the previous methodologies applied in this area and has attempted to utilise the appropriate elements of these processes to develop a more robust methodology. Our research shows that direct quantification
Copyright © Pöyry Forest Industryiii
51A11995
of the volume and value of illegally-sourced wood products is extremely difficult, if not impossible, to measure with sufficient accuracy to produce reliable estimates. Rather than relying on an absolute figure for illegally-sourced wood product imports, the proposed methodology focuses on an assessment of risk of illegally sourcing imports based on the governance of the industry and regulatory environment in the country of harvest or production. The assessment process could apply to the forestry-growing and processing industry in each country, the individual industry sectors or even to individual products (such as sawn timber, paper or engineered wood products at the six-digit HS code level of differentiation.
This risk-based methodology stages are:
Stage 1 – Product Selection: The first stage in the process is to select the products or product groups to be assessed. Products are identified according to the World Customs Organisation Harmonised Commodity Description and Coding System (HS) to different HS code categories (e.g. 4 or 6 digit code according to the nature of the wood products for which risk of illegality is to be determined).
Stage 2 – Exporting Country Identification: Once a product/HS code has been selected, the import values of this product can be broken down by source country.
Stage 3 – Domestic Risk Assessment: The domestic risk assessment considers three risk areas; country-level corruption, industry governance (government) and industry measures. This assessment stage has deliberately been broadened to reduce reliance on the country-level risk factors alone, which we found to create potentially misleading impressions for certain countries with more robust industry-specific measures to control illegal activities. Consequently, the domestic risk assessment considers aspects such as forest management policy, regulatory environment and enforcement. The risk rating for an exporting country is more focused on the risk factors of industry governance rather than on the country as a whole. Industry measures are important to capture, but difficult to assess in a quantitative and consistent fashion. We believe recognised certification scheme accreditation offers a viable proxy to a qualitative assessment. Products manufactured using domestically-sourced raw material that is certified shall be considered low risk.
Stage 4 – Fibre Supply Surety: This stage of the assessment evaluates the percentage of imported raw material used to produce any given product in any given country. This percentage of the product is assigned a risk factor in line with the risk(s) associated with the supplying country(ies).
Stage 5 – Risk Rating: In this stage, the stage 3 and 4 risk ratings are combined to create an overall risk rating that incorporates the Domestic Risk and Fibre Supply Surety risk dimensions.
Further Development
The development required to enable the methodology to be implemented is detailed below.
The Domestic Risk Model requires further development through a stakeholder and industry expert consultation process. Discussion with organisations such as
Copyright © Pöyry Forest Industryiv

51A11995
Transparency International, ITTO and the World Bank, which have in-country experience, would be a logical starting point.
We recommend that the output from the DAFF commissioned report of forest certification schemes be assessed for inclusion in this methodology to assist with the risk assessment.
A database is required with the appropriate processing capability and functionality to process the large volume of trade statistics and to apply the respective industry, country-level and fibre surety risk factors.
The various review processes (frequency of review etc.) must be developed and responsibilities assigned.
Benefits of this Approach
The methodology has been developed to be implemented in Australia however the application of this methodology on a regional level is possible and a regionally coordinated approach will likely improve the chances of driving change in governance and reduce the diversion of suspect product to less discerning markets.
The methodology presented will provide a sufficiently reliable result while remaining straightforward to implement. Outputs from this process can be used to provide a risk assessment at the country, sector or six-digit HS code levels for forest products.
The results of the risk analyses can be used to track the success of initiatives to reduce the trade in illegally-sourced wood products in each of the supply countries. Risk profile adjustments will be subject to changes in the forestry governance arrangements which are observable over time.
The results can also be used by Australian importers as an information source of supply risk. The methodology could be adopted by industry associations, or at the regional level through one of the forestry processes. The results of the risk analyses should be a key consideration in the development of Industry codes with regard imported wood based products. By operating at the industry, sector or six-digit HS code level, this methodology would provide an important input for estimating the risk that products are derived from illegally-harvested sources. Importers could then seek to procure products covered by legally-sourced wood verification systems that have the capacity to address the level of risk that has been identified during the due diligence process.
Copyright © Pöyry Forest Industryv

51A11995
CONTENTS
PREFACE I
SUMMARYII
1 INTRODUCTION 1
2 LITERATURE REVIEW 3
2.1 Key Findings 32.2 Analysis of existing Approaches 42.2.1 Mass Balance Approach 52.2.2 Trade Statistics Discrepancies 62.2.3 Country-Level Corruption Indices 8
3 METHODOLOGY 10
3.1 Conceptual Framework 113.1.1 Process Stage Explanation 123.1.2 Worked Example for >6mm HW Sawnwood (HS440729) 193.2 Further Development of Methodology 233.3 Implementation of the Methodology 24
APPENDIX 1: LITERATURE REVIEW A1-1
APPENDIX 2A: AUSTRALIAN TRADE STATISTICS A2A-1
1 AUSTRALIAN TRADE STATISTICS 1
1.1 Introduction 11.2 Product Selection and Country of Origin 11.3 Product Sub-codes 71.4 Furniture 71.5 Paper and Board 101.6 Wood 15
APPENDIX 2B – IMPORT TABLES A2B-1
Appendix 3 – SFM Certification and Chain of Custody A3-1
Copyright © Pöyry Forest Industryvi

51A11995
1 INTRODUCTION
The consideration of an illegal logging policy to support the Government’s election commitments is a priority for the Department of Agriculture, Fisheries and Forestry (DAFF). In support of this work, the Forest and Wood Products Council (FWPC) has recommended the need for an up-to-date assessment of the risk, volume and value of illegally logged timber and wood products imported into Australia.
Ideally, development of a reliable methodology to assess which sources of wood and wood products were from legally-sourced supplies and which were not would be straightforward. In this ideal world, necessary production, import and export data and legal harvesting approval processes would be readily available and transparency would be the norm.
Unfortunately, based on our on-ground experience underscored by the knowledge gained from the literature review, the data needed to ascertain legality of wood is imperfect, and transparency associated with governance and management of timber production forests is limited. In the most glaring example of data shortcomings, import declarations (sawnwood, furniture, paper products, wood-based panels) do not currently require the country of origin (country of harvest) to be recorded. This means that furniture imported from China could incorporate wood from illegally-sourced logs from Congo and there would be no way to flag these imports as containing illegally-sourced wood.
We recognised early on the constraints imposed by data limitations and consequently went back to first principles to develop an alternative approach to quantifying illegally-sourced wood product imports.
One of the first stumbling blocks of any approach to this issue is dealing with the question of what constitutes a legal source of wood and what is an illegal source? We found many different definitions of “legality” in the literature review (Appendix 1). In our view, none of these allow a reliable practical demarcation between legally-sourced product and illegally-sourced product. By practical we mean a process that could be applied routinely to the range of wood products imported to this country.
Given the data limitations set out above we believe that such binary demarcation is simply not possible and consequently we did not attempt to formally assign products as being legally- or illegally-sourced. Instead, we have developed a risk-profiling approach to assign a higher or lower risk of a wood product being from illegal sources. The risk can be quantified by applying subjective and quantitative criteria that rely on a combination of country- and industry-specific expert knowledge, and reliable data from known sources.
The new element in the proposed method is that the assessment of governance extends from the national (exporting country) level through the industry sector level to the product level. Under this model, improvements in industry-specific governance through greater transparency and accountability of the legality of their business practices supported by monitoring and auditing requirements, enables the risk associated with a particular product sourced from a specific country to be adjusted accordingly. This allows a more nuanced evaluation of risk versus the alternative of applying the overall country risk, commonly measured by the
Copyright © Pöyry Forest Industry1
51A11995
Corruption Perception Index (“CPI”), and applying that across the board to the wood products-based industry in that country.
This report explains the conceptual framework for the proposed methodology which, if implemented, will enable a more robust assessment of the risk of importing illegally logged timber and wood products into Australia. In addition, components of the proposed methodology may also be utilised by importers to more accurately assess the legality risk of their timber and wood product imports in line with an industry code of conduct for the procurement of legally sourced timber and wood products.
The process followed by Pöyry in undertaking this study is illustrated Figure 1-1.Figure 1-1:Project Process
DAFF/Poyry kick off meeting
Project Methodology
Literature review
Australian Import Statistics
Review
SynopsisCritique
DAFF workshop
- Product identification
- Country Selection
Country ReviewDraft
methodology DAFF workshop Draft Report
Pöyry’s proposed methodology will be guided by the limitations of existing methodologies identified in the literature review, the trade statistics and in-country analyses of governance arrangements for both government and industry.
An example of the assessment process and resultant risk rating is provided for a hardwood sawnwood product. The methodology can also be applied to other products and sectors. We propose the following product categories as a way to ensure national consistency in the classification of products when applying the due diligence risk management process at a more targeted level:
Solid wood products;
Composite wood products;
Manufactured wood products;
Other manufactured wood products;
Wood packaging and pallets;
Pulp, paper and paperboard;
Other paper and paperboard products;
Wood fibre products; and
Other products of wood origin.
Copyright © Pöyry Forest Industry2
51A11995
2 LITERATURE REVIEW
The literature review was used to identify and to better understand previously reported methodologies for quantifying the volume of trade in illegal timber and wood products. This was also used to identify weaknesses or limitations as the basis for developing an alternative methodology. The focus of the review was on the forest product trade within countries in the Asia-Pacific region, although we canvassed publications from a much broader list of countries and regions to capture the key methodologies.
The key publications reviewed included:
Seneca Creek Associates and Wood Resources International 2004,” “Illegal” Logging and Global Wood Markets: The Competitive Impacts on the U.S. Wood Products Industry”. American Forest and Paper Association.
Pöyry Forest Industry, 2005, “Overview of illegal logging”. DAFF.
Schloenhardt, A., 2008. “The illegal trade in timber and timber products in the Asia Pacific region”, Australian Institute of Criminology, Canberra.
WWF, 2008. “Illegal wood for the European market”.
Smith, W., 2002. “The global problem of illegal logging”, ITTO Tropical forest update, Vol. 10, No 1. 2002.
Guertin, C., 2003. “Illegal logging and illegal activities in the forestry sector: Overview and possible issues for the UNECE Timber Committee and FAO European Forestry Commission”, Quebec wood export bureau.
FERN, 2002. “Illegal logging and the global trade in illegally-sourced timber; a crime against forests and people”.
Chatham House, 2004. “FLEGT & Trade- What will the impacts be?”, Royal Institute of International Affairs, London.
SCION, “Implications for the New Zealand Wood Products Sector of Trade Distortions due to Illegal Logging”. Ministry of Agriculture and Forestry. 2007
Limited literature exists which either develops or describes in detail a methodology to estimate the volume and value of illegally logged timber and wood product trade. The majority of this literature is limited to estimating the extent of illegal timber trade within a legislative and governance framework based primarily on an assessment of the broad corruption indices for individual countries. Most referenced academic research and scientific studies focus on the environmental issues associated with illegal logging, rather than issues of illegal trade.
2.1 Key Findings
The methodologies used to quantify legality typically lack robustness or reliability.
The data utilised in many of these analyses has been secondary, based on anecdotal evidence or on limited research.
Copyright © Pöyry Forest Industry3
51A11995
Many reports lack an assessment of the accuracy or reliability of illegal logging estimates.
The same estimates that appear in many of the reviewed reports rely on circular references, and are not linked to the original source. Only a small number of core documents provide the foundation for subsequent works.
Many of the published quantification approaches have relied significantly on country-based criteria such as the Corruption Perception Index (CPI) produced by Transparency International.
A process for accurately quantifying the illegal wood products trade is extremely difficult without significant investment in a much-improved data collection system.
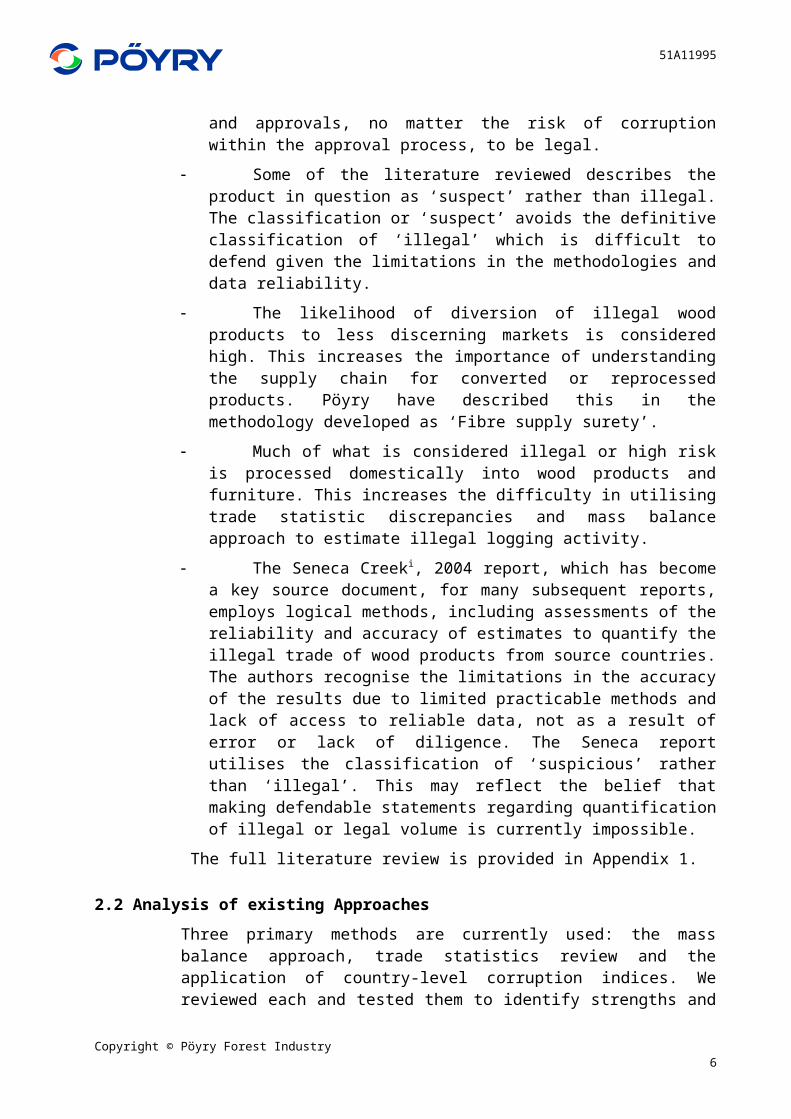
There are many definitions of “illegal” in the literature, illustrating the difficulty in defining the term. Some parties include unsustainable harvesting as illegal, whilst others consider all harvested wood supplied with the appropriate permits and approvals, no matter the risk of corruption within the approval process, to be legal.
Some of the literature reviewed describes the product in question as ‘suspect’ rather than illegal. The classification or ‘suspect’ avoids the definitive classification of ‘illegal’ which is difficult to defend given the limitations in the methodologies and data reliability.
The likelihood of diversion of illegal wood products to less discerning markets is considered high. This increases the importance of understanding the supply chain for converted or reprocessed products. Pöyry have described this in the methodology developed as ‘Fibre supply surety’.
Much of what is considered illegal or high risk is processed domestically into wood products and furniture. This increases the difficulty in utilising trade statistic discrepancies and mass balance approach to estimate illegal logging activity.
The Seneca Creeki, 2004 report, which has become a key source document, for many subsequent reports, employs logical methods, including assessments of the reliability and accuracy of estimates to quantify the illegal trade of wood products from source countries. The authors recognise the limitations in the accuracy of the results due to limited practicable methods and lack of access to reliable data, not as a result of error or lack of diligence. The Seneca report utilises the classification of ‘suspicious’ rather than ‘illegal’. This may reflect the belief that making defendable statements regarding quantification of illegal or legal volume is currently impossible.
The full literature review is provided in Appendix 1.
2.2 Analysis of existing Approaches
Three primary methods are currently used: the mass balance approach, trade statistics review and the application of country-level corruption indices. We reviewed each and tested them to identify strengths and weaknesses of the methodologies, and usefulness of results generated. As an adjunct we also identified components that could be incorporated into an alternative methodology.
Copyright © Pöyry Forest Industry4
51A11995
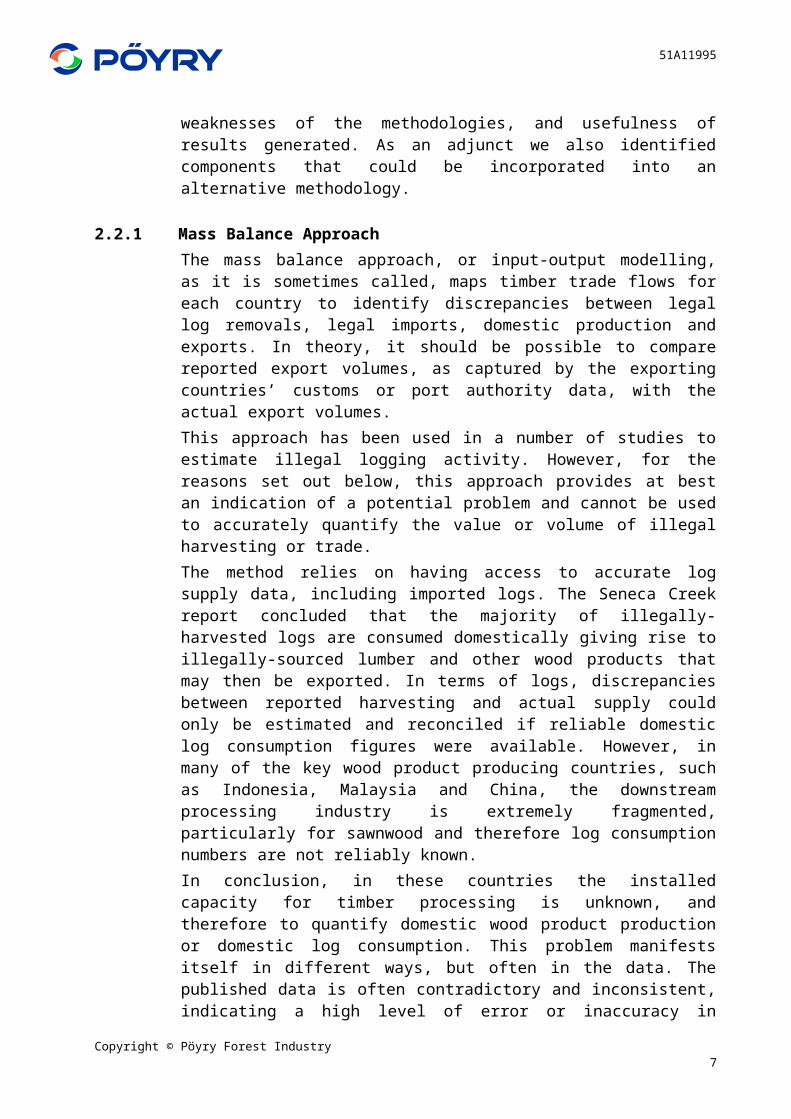
2.2.1 Mass Balance ApproachThe mass balance approach, or input-output modelling, as it is sometimes called, maps timber trade flows for each country to identify discrepancies between legal log removals, legal imports, domestic production and exports. In theory, it should be possible to compare reported export volumes, as captured by the exporting countries’ customs or port authority data, with the actual export volumes.This approach has been used in a number of studies to estimate illegal logging activity. However, for the reasons set out below, this approach provides at best an indication of a potential problem and cannot be used to accurately quantify the value or volume of illegal harvesting or trade.The method relies on having access to accurate log supply data, including imported logs. The Seneca Creek report concluded that the majority of illegally-harvested logs are consumed domestically giving rise to illegally-sourced lumber and other wood products that may then be exported. In terms of logs, discrepancies between reported harvesting and actual supply could only be estimated and reconciled if reliable domestic log consumption figures were available. However, in many of the key wood product producing countries, such as Indonesia, Malaysia and China, the downstream processing industry is extremely fragmented, particularly for sawnwood and therefore log consumption numbers are not reliably known.In conclusion, in these countries the installed capacity for timber processing is unknown, and therefore to quantify domestic wood product production or domestic log consumption. This problem manifests itself in different ways, but often in the data. The published data is often contradictory and inconsistent, indicating a high level of error or inaccuracy in recording. The following examples illustrate this point. In Figure 2-2 annual production statistics for a range of wood products change erratically year on year as reported by a single source.Figure 2-2:Indonesian Wood Product Production, 2000 - 2008
0
2
4
6
8
10
12
14
16
2000 2001 2002 2003 2004 2005 2006 2007 2008
- million m3/tonne -
Others
Pulp (Ton)
Particle board
Chipwood
Veneer
Sawntimber
Plywood
Source: Indonesian MoF
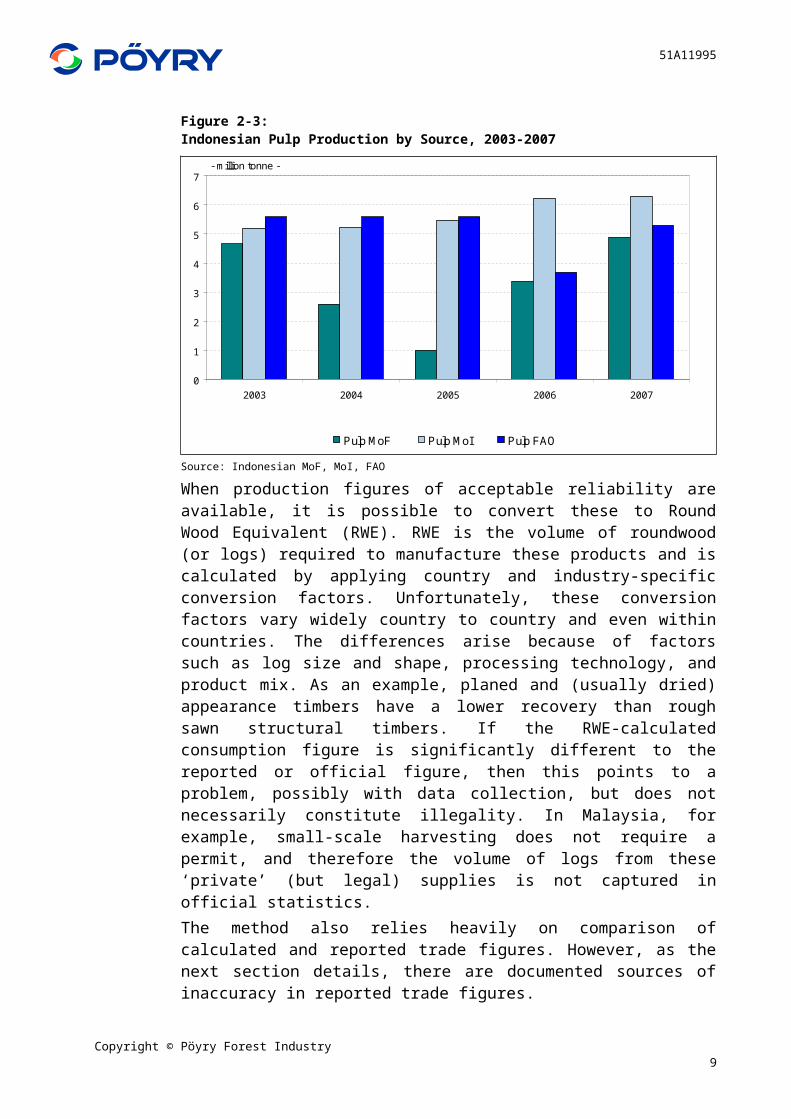
Figure 2-3 compares Indonesian pulp production figures for the years 2003 to 2007 as reported by the Ministry of Forestry, the Ministry of Industry and FAO. Significant discrepancies show up among the data sets, with no discernable pattern
Copyright © Pöyry Forest Industry5

51A11995
of deviation. Consequently, the output of any mass balance calculation and therefore the conclusions reached, would vary considerably depending on which data were used. These inconsistencies in data make it difficult to know which source to use in calculating the mass balance.Figure 2-3:Indonesian Pulp Production by Source, 2003-2007
0
1
2
3
4
5
6
7
2003 2004 2005 2006 2007
- million tonne -
Pulp MoF Pulp MoI Pulp FAO
Source: Indonesian MoF, MoI, FAO
When production figures of acceptable reliability are available, it is possible to convert these to Round Wood Equivalent (RWE). RWE is the volume of roundwood (or logs) required to manufacture these products and is calculated by applying country and industry-specific conversion factors. Unfortunately, these conversion factors vary widely country to country and even within countries. The differences arise because of factors such as log size and shape, processing technology, and product mix. As an example, planed and (usually dried) appearance timbers have a lower recovery than rough sawn structural timbers. If the RWE-calculated consumption figure is significantly different to the reported or official figure, then this points to a problem, possibly with data collection, but does not necessarily constitute illegality. In Malaysia, for example, small-scale harvesting does not require a permit, and therefore the volume of logs from these ‘private’ (but legal) supplies is not captured in official statistics.The method also relies heavily on comparison of calculated and reported trade figures. However, as the next section details, there are documented sources of inaccuracy in reported trade figures.
2.2.2 Trade Statistics Discrepancies
Another approach to identifying potential illegally-sourced wood products is to compare export statistics from the source country with import statistics from the receiving country. This exercise highlights a number of large discrepancies which indicate why analysis of trade data alone cannot be used to accurately estimate illegally-sourced trade:
Copyright © Pöyry Forest Industry6

51A11995
Trade figures can potentially include illegally-sourced wood products that have been exported legally and fully reported, i.e. the data for both exporting and importing countries will be consistent.
Volumes of illegal products may bypass controls in both the export and import countries as may legally produced product in order to avoid duties and customs. This may include smuggling or involve corruption at the port.
Descriptions of the World Customs Organisation Harmonised System are sometimes unclear and do not cover all products in sufficient detail to differentiate all products of interest from a legality perspective. As a result, inconsistencies in the classification of products, either intentionally or by mistake, may occur.
Recording to the incorrect code may be used to avoid export and import duties.
Mistakes in data capture are evident. These can be as simple as a misplaced decimal point.
The export country typically reports the value at Free on Board (FOB)ii, whereas the importing country typically declares a Cost Insurance & Freight (CIF)iii or Custom Import Value (CV) value. This can make reconciliation and discrepancy identification extremely difficult and create considerable inaccuracies. Although Australian Customs captures the data to make a single-value estimate of annual trade, the supporting data inputs are not publicly available.
Each country has its own system and associated reliability or diligence in collecting and collating the data.
The timing of the data capture creates discrepancies.
The use of ‘other’ for describing significant volumes of product is prevalent. This may be difficult to avoid without adding further complexity or levels to the HS system.
The classification of large volumes of paper products as ‘Country not specified’ has been noted. This is particularly evident for coated and uncoated paper imports.
Level of detail in product description and classification is lacking and perhaps difficult to improve on, given the already complex nature of the Harmonised System.
Copyright © Pöyry Forest Industry7

51A11995
Although the importation of wood species listed by CITES iv can only be undertaken with an importation license, available statistics do not indicate volumes of such products. One might assume that the granting of a license provides some assurance of legality.
Australian Customs does not record the species of solid wood products imported, nor whether certification under a recognised scheme has been achieved.
2.2.3 Country-Level Corruption Indices
Corruption indices have been utilised in a number of illegal logging and wood product studies. Since the correlation was made as part of the Seneca report, many have applied a corruption index factor to estimate illegal activity. There is some merit in applying this factor. However, it is commonly criticised for being overly simplistic. The corruption indices available can be of real value, but they are not usually adjusted to reflect the industry-specific risk or industry governance.
Nevertheless, there appears to be a strong correlation between the CPI and the perceived risk of illegal forest products being exported from key supply countries. However, use of a corruption index at a country level will not capture the robustness and enforcement of the systems within the forestry sector. Some countries ranked medium or high on the corruption index may already have appropriate forestry regulations, monitoring, auditing and enforcement in place.
Hence to be of real value, the CPI must be supported by other relevant analyses on an industry or product level. South Africa is a good example of this point. This country scores 4.9/10 on the Transparency International 2008 corruption index, which if applied in isolation would indicate a medium risk of sourcing illegal forest products. However, the forest industry in South Africa processes mainly plantation-sourced logs with over 85% of plantations FSC certified. The forestry sector is rigorously controlled by mostly private companies. Consequently, despite its unfavourable CPI rating, South Africa has a very low risk as a source of illegal logs or wood products.
Figure 2-4 illustrates how the risk ranking of South Africa may change if measured at an industry level rather than on the basis of the country level CPI.
Copyright © Pöyry Forest Industry8
51A11995
Figure 2-4:Perceived Corruption Relationship to % suspected illegal Supply
Our conclusion from the literature review and our review of the methodologies for estimating illegally-sourced wood is that direct quantification of volume and value of illegally-sourced wood products is extremely difficult, if not impossible, due to data limitations.
Copyright © Pöyry Forest Industry9
51A11995
3 METHODOLOGY
The lack of an available method to recommend for DAFF to apply to estimate illegally-sourced logs and wood products imports to Australia has led the report authors to develop the methodology outlined in this section as a practical way to circumvent these limitations.
The Pöyry approach assesses legality in terms of potential risk, using risk factors and criteria that we believe can provide a more reliable estimate. Rather than producing an absolute figure for illegally-sourced wood products, the methodology presented creates a framework for assessing the risk that timber and wood products are associated with illegally-sourced logs, and this can be applied periodically to flag changes as a consequence of improvements in governance. In addition, the risk assessment can be applied to a type of product or industry sector for individual countries.
As noted, changes in risk level will largely be driven by changes in governance both at a national-government and industry-sector level. This method may be applied to track the performance of initiatives of producer countries to reduce the importation of illegally-sourced timber and wood products.
Previous reports and methodologies focus on quantification at a point in time. The intention of this approach is to have a methodology that tracks progress in reducing illegally-sourced wood products. Such a tool would assist any future assessment of the effectiveness of policies developed to combat illegal logging and associated trade. Therefore, the method is intended to deliver confidence in the risk assessments generated, and also to be consistently replicable to detect change.
The methodology developed depends on the reliability of country import statistics. The analysis of wood product trade statistics has highlighted a need to improve reporting and reliability in some areas. A review of Australian import statistics and key imported wood products is provided in Appendix 2A.
We have allowed for the later inclusion of certification status as an element of the methodology, but have not considered this in the current process. This is because certification status is not currently captured by Australian customs, but is known to the importer. Pöyry believes certification status is an important factor which Australian importers could use as part of a responsible purchasing policy. A number of certification schemes focus on sustainability, while others focus only on verifying the legal origins of timber and wood products. The performance of some of these schemes is being independently assessed by a separate consultancy for DAFF, and we recommend that the output from this other report be assessed for inclusion in this methodology to assist with the risk assessment.
Copyright © Pöyry Forest Industry10

51A11995
3.1 Conceptual Framework
A five-stage methodology has been developed, as illustrated in Figure 3-5 below.Figure 3-5:Methodology Flow Diagram
ProductIdentification(HS codes ex
Australian customs)
Stage 1ProductIdentificationIdentifies imported productdown to 4-6 digit HarmonisedCommodity Description and CodingSystem (HS code)
Stage 3aDomestic Risk AssessmentEvaluates and weights the risk thatdomestic sources of logs to producethe product are from illegal sourcesusing 2 criteria: National (CPI) andIndustry Governance by Government
Stage 2Export CountryIdentificationIdentifies the country that is thesource of the imported product
Product 1 Product 2 Product 3
Country 1 Country 2 Country 3
Risk Factor Weighting Weighted Risk
CPI (country level)- published corruption index from
reputable source%
Industry Governance(Government)
Structured Forest PlanningRegulatory Environment
Transparency & AccountabilityEnforcement
Industry/Trade Data
%
Total Weighted Domestic Risk
Stage 4Fibre SupplySurety AssessmentEvaluates the risk that knownsources of imported fibre used toproduce the product imported toAustralia were from illegal sources
Risk Factor
legality of imported fibre supply- Identify source country (may not be country of origin)
- Apply Domestic Risk value-Consideration of domestic import controls
Total Imported Fibre Supply Risk by Each Supply Country
Stage 5Risk RatingProvides an aggregated riskrating for a specific product/country
Risk Factor x Risk rating
Total weighted domestic risk-CPI and Governance
% of fibre supplythat is from
domestic sources(not certified)
-
- Industry measures % of fibre supplycertified -
Total Imported fibre supply risk -Country 1
% of fibre supplyex country 1 -
Total Imported fibre supply risk -Country 2
% of fibre supplyex country 2 -
Total Imported fibre supply risk -Country ....
% of fibre supplyex country 3 -
Total Risk Rating
Stage 3bDomestic Risk AssessmentApplies a lower risk rating to theportion of imports that is known to becertified under a recognised scheme(this component of the DomesticRisk Model to be developed followingcertification scheme reviewconsultancy being undertaken forDAFF)
Risk Factor
Industry MeasuresPortion of Certified product is caterorised as low risk
Total % Certified
Copyright © Pöyry Forest Industry11
51A11995
The following explains in more detail each stage of the process and the further work required to bring this into practical application. This is followed by a worked example using >6mm HW sawnwood (HS440729) to illustrate how the methodology is applied.
3.1.1 Process Stage Explanation
Stage 1 - Product Selection
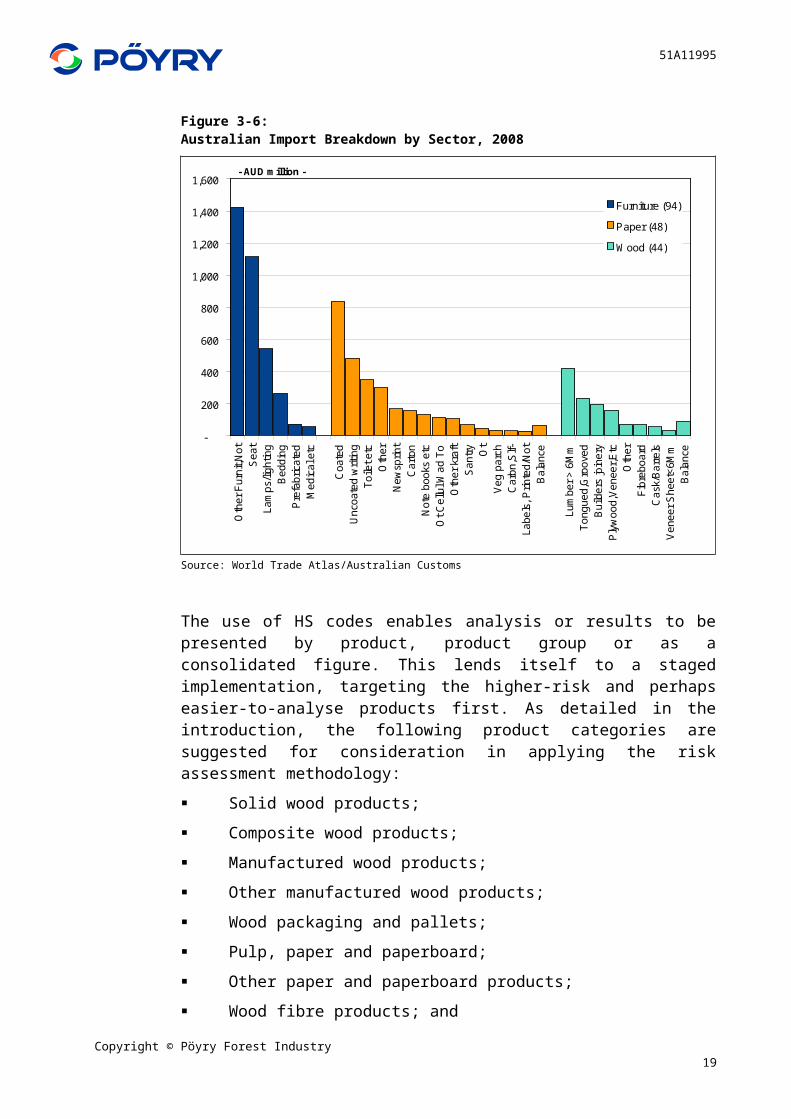
The first stage in the process is to select the products or product groups to be assessed. Products are identified according to the World Customs Organisation Harmonised Commodity Description and Coding System (HS) to different HS code categories (e.g. 4 or 6 digit according to the nature of the wood products for which risk of illegality is to be determined). This classification provides the consistency needed to ensure outputs are comparable over time. The three key product groups selected for more detailed review in this study are solid wood products and panels (HS44), paper products (HS48) and furniture (HS94). Figure 3-6 presents the product groups for the three key import categories down to a 4-digit HS code. These products are further broken down (to 6-digit HS level) in Appendix 2B.
For the purpose of illustrating the methodology >6mm HW sawnwood (HS440729) has been selected and we have taken this through the 5-stage process in the following section.Figure 3-6:Australian Import Breakdown by Sector, 2008
-
200
400
600
800
1,000
1,200
1,400
1,600
Oth
er F
urni
t,Not
Sea
tLa
mps
/ligh
ting
Bed
ding
Pre
fabr
icat
edM
edic
al e
tc
Coa
ted
Unc
oate
d w
ritin
gTo
ilet e
tcO
ther
New
sprin
tC
arto
nN
ote
book
s et
cO
t Cel
lul W
ad T
oO
ther
kra
ftS
antry O
tV
eg p
arch
Car
bn,S
lf-La
bels
, Prin
ted/
Not
Bal
ance
Lum
ber >
6M
mTo
ngue
d,G
roov
edB
uild
ers
join
ery
Ply
woo
d,V
enee
r,Etc
Oth
erFi
breb
oard
Cas
k/B
arre
lsV
enee
r She
et<6
Mm
Bal
ance
- AUD million -
Furniture (94)
Paper (48)
Wood (44)
Source: World Trade Atlas/Australian Customs
Copyright © Pöyry Forest Industry12

51A11995
The use of HS codes enables analysis or results to be presented by product, product group or as a consolidated figure. This lends itself to a staged implementation, targeting the higher-risk and perhaps easier-to-analyse products first. As detailed in the introduction, the following product categories are suggested for consideration in applying the risk assessment methodology:
Solid wood products;
Composite wood products;
Manufactured wood products;
Other manufactured wood products;
Wood packaging and pallets;
Pulp, paper and paperboard;
Other paper and paperboard products;
Wood fibre products; and
Other products of wood origin.
Domestic risk assessments for imported products produced from recycled and plantation-grown softwood fibre, such as newsprint, which have good forest governance arrangements and accredited systems of management in place, may be readily determined and may be accorded lower priority. In contrast, products sourced primarily from logs harvested from native forests, especially from tropical hardwood forests, will typically require more rigorous assessment. This is because these products are less likely to be supplied from sources with well-established governance arrangements and management systems. For the same reason more rigorous assessments will also likely be needed for product primarily obtained from less-structured sources such as small to medium enterprises, customary owners and local forest communities, in developing countries.
Stage 2 – Exporting Country Identification
Once a product/HS code has been selected, the import values of this product can be broken down by source country. Our research indicates that 95% of the total imported value for each selected product typically comes from a small number of countries. Consequently, we recommend focusing more resources on analysing these main supply countries, and fewer resources on the minor import countries. Country-level risk assessment is detailed in Stage 3.
The Australian customs import statistics, as made available by World Trade Atlas (WTA), identify the exporting or source country for wood product imports to Australia. However this may not be the original source country for the logs (or lumber) used to produce the product and this issue is dealt with in Stage 4 of the methodology.
Copyright © Pöyry Forest Industry13

51A11995
Stage 3 – Domestic Risk Assessment
The Domestic Risk Model (DRM) has three components:
1. Country-level corruption
2. Industry Governance (Government)
3. Industry Measures.
Component 1 – Country-Level Corruption
Measurement of country level corruption is possible through publicly available corruption perception indices. Pöyry has reviewed corruption indices published by the Global Integrity Index and Transparency International. The Corruption Perception Index (CPI) produced by Transparency International, has been selected as a basis for this methodology. This index has a comprehensive listing of countries, providing a country ranking and an absolute score from 1 to 10. It is this absolute score that is applied to the model.
The Corruption Perceptions Index (CPI) measures the perceived level of public-sector corruption in 180 countries and territories around the world. The CPI is a "survey of surveys", based on 13 different expert and business surveys.
The CPI 2009 is calculated using data from the following independent organisations:
Africa Development Bank- Country Policy and Institutional Assessments 2008
Asian Development Bank -Country Performance Assessment Ratings
Bertelsmann Foundation- Bertelsmann Transformation Index
Economist Intelligence Unit -Country Risk Service and Country Forecast 2009
Freedom House -Nations in Transit 2009
Global Insights, formerly World Markets Research Centre- Country Risk Ratings 2009
Institute for Management Development - World Competitiveness Report 2008 and 2009
Political and Economic Risk Consultancy, Hong Kong - Asian Intelligence 2008 and 2009
World Economic Forum - Global Competitiveness Report 2008 and 2009 (WEF 2008 and
World Bank - Country Policy and Institutional Assessments for IDA Countries (WB 2008).
Not all sources rank all countries of the index. Because the coverage of these surveys and assessments is not identical, the number of sources from which each country’s score is derived is not the same for all countries. A country must be covered by a minimum of 3 different sources to be ranked in the CPI. A full explanation of the Transparency International Corruption Perception Index is
Copyright © Pöyry Forest Industry14

51A11995
available at: www.transparency.org/policy_research/surveys_indicies/cpi/2009/methodology
The Transparency International CPI ranking applies a value from 1 to 10. The higher the number, the lower the level of perceived corruption. This score will be weighted as a component of the DRM.
Component 2 – Industry Governance (Government)
In our experience, much of the risk of illegally-sourced wood arises due to poor forestry sector governance at the national and/or regional government levels. Consequently, Component 2 of the methodology, assessment of industry governance, is primarily concerned with the regulatory environment, and focuses on controls at a national or regional government level.
By its very definition, illegality implies the breaking of laws or regulations. Consequently, we have developed criteria to first identify what laws/regulations countries/jurisdictions have in place to control the management and harvest of logs. We then seek to understand whether those laws/regulations are being implemented.
From the literature review we found that little work has been done to evaluate the quality of governance in the forestry sector. Consequently, given the importance of the governance assessment to the proposed methodology, significant effort will be required to develop robust governance assessment criteria. We believe that despite having an Australian import focus, the resulting criteria would also be applicable for other countries seeking to evaluate illegally-sourced wood.
Forest industry governance instruments and process, and the diligence (and independence) with which they are implemented differ widely among countries exporting forest products into Australia. Given this diversity, we believe this component of the domestic risk evaluation is most appropriately quantified by benchmarking the instruments and processes in source countries against criteria that specify the governance processes we believe to be essential to limit the risk of illegal logging.
The following are our recommended industry governance risk criteria (.). We believe these criteria cover the key instruments and mechanisms governments use to control forestry operations taking place under their jurisdiction. We have broken these risk criteria down to constituent risk elements that provide further clarity as to the specific industry governance elements to be used to evaluate supply countries.
Copyright © Pöyry Forest Industry15

51A11995
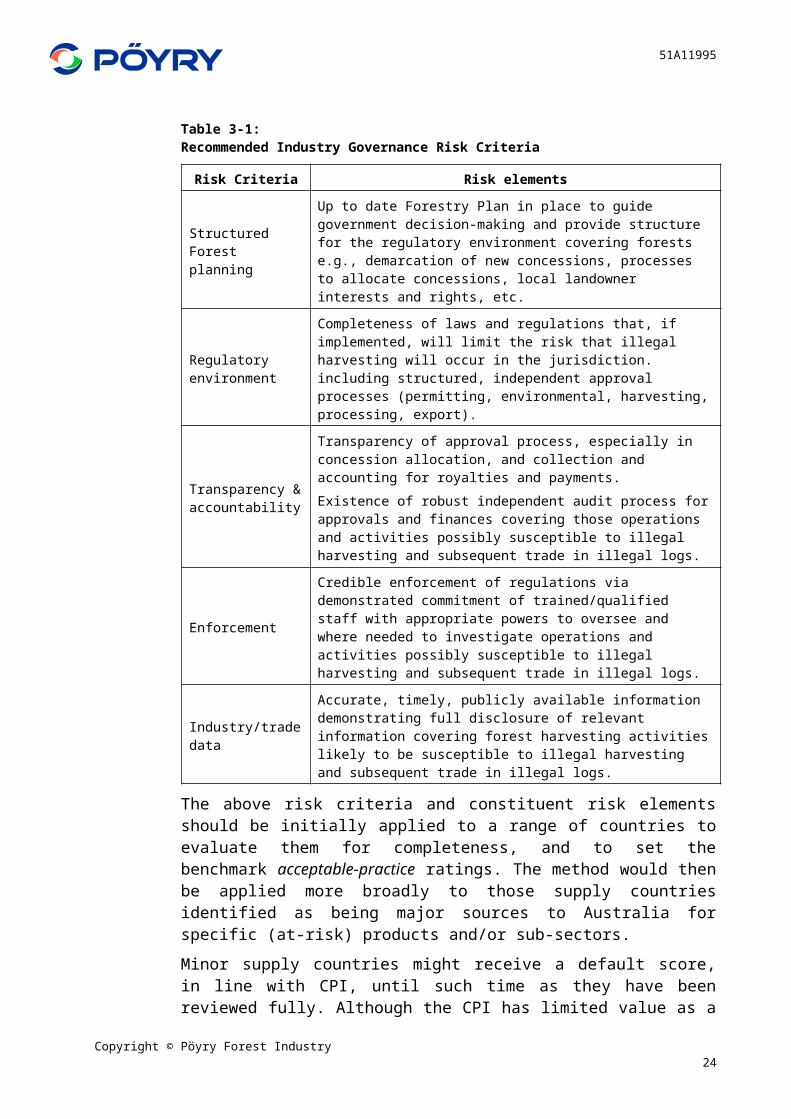
Table 3-1:Recommended Industry Governance Risk Criteria
Risk Criteria Risk elements
Structured Forest planning
Up to date Forestry Plan in place to guide government decision-making and provide structure for the regulatory environment covering forests e.g., demarcation of new concessions, processes to allocate concessions, local landowner interests and rights, etc.
Regulatory environment
Completeness of laws and regulations that, if implemented, will limit the risk that illegal harvesting will occur in the jurisdiction. including structured, independent approval processes (permitting, environmental, harvesting, processing, export).
Transparency & accountability
Transparency of approval process, especially in concession allocation, and collection and accounting for royalties and payments. Existence of robust independent audit process for approvals and finances covering those operations and activities possibly susceptible to illegal harvesting and subsequent trade in illegal logs.
Enforcement
Credible enforcement of regulations via demonstrated commitment of trained/qualified staff with appropriate powers to oversee and where needed to investigate operations and activities possibly susceptible to illegal harvesting and subsequent trade in illegal logs.
Industry/trade data
Accurate, timely, publicly available information demonstrating full disclosure of relevant information covering forest harvesting activities likely to be susceptible to illegal harvesting and subsequent trade in illegal logs.
The above risk criteria and constituent risk elements should be initially applied to a range of countries to evaluate them for completeness, and to set the benchmark acceptable-practice ratings. The method would then be applied more broadly to those supply countries identified as being major sources to Australia for specific (at-risk) products and/or sub-sectors.
Minor supply countries might receive a default score, in line with CPI, until such time as they have been reviewed fully. Although the CPI has limited value as a stand-alone measure of risk within the forestry sector, it provides some indication of risk until the necessary assessment of the regulatory environment and industry governance can be undertaken.
The party undertaking the assessment of industry governance, even with a well-defined ranking model, will need to have an in-depth understanding of sector level controls and be abreast of developments. There are a number of international organisations that focus on governance issues. These experts could be engaged to facilitate the development of the assessment process or to undertake the assessment. There may be scope to engage companies such as Transparency International to provide an industry-targeted index that is applicable at the regional level.
Another alternative is to utilise the findings and processes of the ITTO Objective 2000. In 2000 ITTO members re-stated their commitment, originally made in 1990 to moving as rapidly as possible towards achieving exports of tropical timber and
Copyright © Pöyry Forest Industry16

51A11995
timber products from sustainably-managed sources. This commitment was renamed 'ITTO Objective 2000'. It remains a central goal of the Organization, supported by renewed efforts to improve the respective capacities of governments, industries and communities to manage their forests, to add value to their forest products, and to maintain and increase the transparency of the trade and access to international markets.
Component 3 – Industry Measures
In well-regulated countries, evidence of adherence to externally-imposed (government) regulations is sufficient to reduce the risk of illegally-sourced logs/fiber entering the value chain. However, in some instances industry sectors and individual companies have been motivated to voluntarily adopt measures to reduce the risk that illegal logs/fiber will enter their value chain. Adopting these measures allows them to take a higher public profile, and through this to distance themselves from their peers who do not.
The most transparent of such mechanisms are the so-called certification schemes where companies select from among competing certification standards e.g., FSC and PEFC and go through a process to demonstrate that their operations meet the standards required. We noted earlier in the introduction to this section that we have not incorporated certification into this process for several reasons, but that this should be done once the findings from a separate consultancy are made available to DAFF.
Other than certification, we are aware of the following industry/company-based mechanisms to reduce the risk of illegal logs/fiber entering their sector/manufacturing processes:
Existence of industry bodies providing industry- or sector-level governance
Membership of international industry bodies
Visibility and reliability of production and trade data
Adoption of legality verification and chain of custody schemes to demonstrate product legality (measured as a portion of total supply)
Existence and appropriateness of industry codes and responsible purchasing policies
Presence of internal audit processes to ensure adherence to industry codes and/or government regulations.
However, the practicality of evaluating the above factors multiplies with the number of sectors/companies to be evaluated. The information needed to evaluate the effectiveness of self-imposed mechanisms is not available except via information supplied by the company/industry association.
Poyry has experience gained from valuing forestry and forest industry projects where we have to carefully evaluate company-supplied data covering log supplies and sources, approvals, plans, processing efficiencies etc. In our experience, many companies struggle to supply information in the first instance, and then the auditor and company have to commit significant time to develop a consensus view on key
Copyright © Pöyry Forest Industry17

51A11995
facts. Consequently we recommend that users firstly evaluate externally-verified sources of opinion on the legality of sources.
Therefore, we recommend that users evaluate the outputs from the separate certification consultancy to ascertain whether the findings from this work have application to this purpose. The criteria derived from this work would ideally be based around sources of data that could be independently verified. Examples include evidence of third-party certification and auditing. For this process, we recommend that the criteria to drive the third DRM component be finalised based on the outcome of the separate consultancy.
In the interim, we recommend the DRM just include the CPI and Industry Governance Components, and the relevant weightings during this interim period are discussed in the following section. As companies/sectors develop and can credibly verify that they have in place processes to reduce the risk of illegally-sourced logs/fibre/lumber entering their production processes, these can be recognised and the DRM score will reduce accordingly.
Domestic Risk Assessment Process
The following outlines how the values derived for the three DRM risk components are combined to give a domestic risk rating. We recommend that the risk components be weighted to emphasise the industry governance rating versus the country-level CPI value, as it is this component that will reflect the industry-specific focus that is the unique part of this methodology. The Industry Initiatives component, being certification, is an absolute. The percentage of raw material that is certified is considered low risk.
In recommending the initial settings below, we noted that the country-level CPI risk and industry governance components overlap. This is because forestry-specific regulations are more likely to be bypassed through corrupt activity. We have compensated via the weightings, and thus have biased the overall domestic risk score towards industry governance risk components over the country-level CPI risk. Applying these principles suggests a default 80% for industry governance and a 20% weighting to the country-level CPI risk.
We recommend that the above be applied to an initial suite of countries sectors/products and companies. The ranking system outlined above should be refined based on the experience gained from applying the benchmarks and importantly, evaluating the resolution that can be supported by available data sources.
This aspect of the methodology will require tapping expert opinion to explore and refine the risk factors and risk elements for each DRM component to focus on those deemed to be more robust. This should also involve external stakeholders with an interest in Australia’s position on this to ensure the appropriate elements are captured and that improvements in these elements of the risk assessment actually reflect an improvement in the risk profile for a given industry or product.
Stage 4 – Fibre Supply Surety
A portion of Australia’s wood product imports are produced in countries that are not the original source of the logs/fibre used in their production. Consequently, a
Copyright © Pöyry Forest Industry18

51A11995
mechanism is required to capture the risk that illegal logs/fibre/lumber are used to produce these products. The supply surety risk evaluation applies to countries reliant partly or wholly on imported logs/fibre/lumber, where the original source country is unknown, or where the country of origin is perceived to be of high risk.
A score card approach in developing a supply surety index considers imports as a percentage of total supply. This is expanded to incorporate the number of supply countries, the perceived risk of the respective supply countries, the type of wood product imported and the controls in place to address illegal wood product imports.
Of the total wood product imported, it is impossible to differentiate between product consumed domestically versus what is processed and re-exported. Given the complete lack of transparency and all of the problems associated with the mass balance approach we have adopted a simplistic approach to resolving this problem. This stage assumes that the proportion of imported log/fibre/lumber deemed to be at risk of being from illegal sources is applied to the total domestically-sourced log/fibre/lumber that country’s exports.
For example, if a country imports 20% (by volume) of the total volume of logs processed nationally, and all of this imported material is from sources at risk of being from illegal sources, then 20% of the sawnwood, 20% of wooden furniture, and 20% of wood fibre-based paper products exported from the manufacturing country would be assumed to be at risk of being from illegal sources according to the fibre surety index.
If the reporting of source country were to be introduced as mandatory in Australia, then this stage in the process would be considerably more robust.
Stage 5 – Risk Rating
The output of the previous stages is categorisation into an infinite number of risk categories. Given that the methodology creates an amalgam of quantitative and qualitative rankings out of a total (maximum) score of 10 we demarcated three categories “low”, “medium” and “high”. The recommended ranges for each category of the DRM components and the fibre surety are as follows:
“low” ≥6.6/10,
“medium” >3.3/10 and <6.6/10 and
“high” ≤3.3.
The calculation can stop here, or be further refined if certification or chain of custody evidence is available. Although this is not currently the case at a national level, individual importers know the status of their products and could adjust the risk factors accordingly.
3.1.2 Worked Example for >6mm HW Sawnwood (HS440729)
In order to illustrate this process, a single product, >6 mm hardwood sawnwood, has been selected. Although some of the trade figures contained in the illustrative example (Table 3-3 below) are real, the model is not intended to reflect the actual risk profile for this product and these countries.
Copyright © Pöyry Forest Industry19

51A11995
Stage 1 – Product Selection
For the purpose of illustrating the methodology, hardwood sawnwood (HS 440729 ‘other tropical wood’) has been selected.
Stage 2 – Exporting Country Identification
The following countries exported this product to Australia during 2008. They have been ranked in importance high to low in terms of volume.
Figure 3-7:Source Countries for imports of “>6mm HW sawnwood (HS440729)” to Australia
Indonesia MalaysiaPapua New
Guinea
Solomon Islands China Myanmar Thailand Other
% imports 56.2 22.3 7.3 2.8 2.6 2.5 1.6 4.8
0
10
20
30
40
50
60% of Australian imports of >6mm tropical HW sawnwood (HS 440729)
Source: WTA
Stage 3 – Domestic Risk Assessment
The domestic risk methodology (DRM) has three components.
Component 1 – Country-level corruption: actual CPI ratings for the identified export countries are shown in Figure 3-4. These ratings are inserted into the DRM and weighted 20% as part of the process to compile the aggregate domestic risk value.
Copyright © Pöyry Forest Industry20

51A11995
Figure 3-8:Transparency International Corruption Percentage Index for Exporters of tropical Hardwood to Australia, 2008
2.6
5.1
2
2.93.6
1.3
3.5
0
1
2
3
4
5
6
7
8
9
10
Indo
nesi
a
Mal
aysi
a
Pap
ua N
ew
Gui
nea
Sol
omon
Is
land
s
Chi
na
Mya
nmar
Thai
land
- CPI ranking (1-10) -Less corrupt
Most Corrupt
Component 2 – Industry Governance: The risk criteria and risk elements recommended as the starting point for this assessment were listed in the previous section. There is considerable work required to develop specific rankings for the range of countries potentially exporting illegally-sourced product into Australia, and also to rank what we termed best-practice benchmark countries. This work is outside the scope of this assignment.
The following provides an indicative ranking for PNG to highlight how the individual components are evaluated and the PNG relative ranking assigned.
Copyright © Pöyry Forest Industry21
51A11995
Table 3-2:Example of Industry Governance Rankings for PNG (indicative only)
Risk Criteria Risk elements PNG Rationale for rating
Structured Forest Planning
FMP exists yes
FMP quality 2 Old data underpinning
FMP Current & review 1 Out of date , legislative requirement not met
Regulatory environment 1 Not strong oversight of the sector, conflict of interest
Regulatory Environment
Robust laws and regulations 5 Good laws on the books
Codes of practice 3 Acceptable codes of practice
Enforcement & penalties 2 Lax enforcement and few penalties
Transparency and Accountability
Robust approval processes:(permitting, environmental, harvesting, processing &export
2 Not robust ,
Visibility of approval process 2 Not transparent
Visibility of funds distribution 2 Often not paid to traditional landowners
Financial accountability 2 Low levels of accountability
Audit for approvals and finances 2
Enforcement
powers to oversee, investigate & prosecute
2 Powers exist but are infrequently exercised
demonstrated commitment of trained/qualified staff
2 Enforcement understaffed and under resourced
Credible enforcement of regulations 2 Few prosecutions
Industry & Trade data
Publicly available 2 Limited coverage
Accurate 3 Small sample verified
Up to date 1 Data available very dated
Total aggregate score 2
Component 3 – Industry measures:
As discussed above, development of these criteria will be left pending the outcome from the separate DAFF certification consultancy.
Stage 4 – Fibre Supply Surety
As detailed in 3.1.1 the Fibre Supply Surety component address the risks associated with a suppling country relying on imported raw material for manufacture of the product exported to Australia.
The risk factors associated with these raw material products, by supply country, are captured and applied to the portion of product that is imported.
Copyright © Pöyry Forest Industry22
51A11995
Table 3-3 illustrates how each of the stages are considered in developing an overall risk profile for each supply country.Table 3-3:Worked Example, >6mm HW sawnwood (HS440729)Stage 1 Product Selection Timber >6mm HW (HS 440729)
Stage 2 Exporting Country Identification Indonesia Malaysia PNG Solomon IslandsChina Myanmar Thailand OtherPercentage 56.2 22.3 7.3 2.8 2.6 2.5 1.6 4.8
Stage 3 Domestic Risk AssessmentCPI (transparency International) 2.6 5.1 2 2.9 3.6 1.3 3.5
Weighting 20% 20% 20% 20% 20% 20% 20%Industry governance 5 3 2 2 6 1 5
Weighting 80% 80% 80% 80% 80% 80% 80%Total domestic risk rating 4.5 3.4 2.0 2.2 5.5 1.1 4.7
Domestic log supply 80% 80% 100% 100% 50% 90% 90% 0.82Sub total (%) 44.96 17.84 7.3 2.8 1.3 2.25 1.44 3.923106
Certified 10% 20% 10% 10% 30% 10% 35%Sub total (%) 4.50 3.57 0.73 0.28 0.39 0.23 0.50
Not certified 90% 80% 90% 90% 70% 90% 65%Sub total (%) 40.46 14.27 6.57 2.52 0.91 2.03 0.94
Stage 4 Fibre Supply SuretyImported supply (%) 11.24 4.46 0.00 0.00 1.30 0.25 0.16 3.98
Supply country 1 (value) 5.06 2.01 0.00 0.00 0.59 0.11 0.07Risk factor (ex log import risk) 2 3 3 4 5Supply country 1 (value) 3.37 1.34 0.00 0.00 0.39 0.08 0.05Risk factor (ex log import risk) 3 5 7 2 3Supply country 1 (value) 2.81 1.12 0.00 0.00 0.33 0.06 0.04Risk factor (ex log import risk) 5 5 4 3 4
The results of the risk calculation can be presented in a number of ways to assist the interpretation of the numerical results.
3.2 Further Development of Methodology
The development required to enable the methodology to be implemented is detailed below.
The accuracy of the model is dependent on the reliability/accuracy of Australian trade statistics. During the product selection stage, the availability of appropriate statistics and the completeness of the data should be assessed and corrective measures applied.
The Domestic Risk Model requires further development through a stakeholder and industry expert consultation process. Discussion with organisations such as Transparency International, ITTO and the World Bank, which have in-country experience, would be a logical starting point.
We recommend that the output from the DAFF commissioned report of certification schemes be assessed for inclusion in this methodology to assist with the risk assessment.
A database is required with the appropriate processing capability and functionality to process the large volume of trade statistics and to apply the respective industry, country level and fibre surety risk factors. The database must be able to deal with data in various formats as is the case with CPI and trade data country name formats.
Copyright © Pöyry Forest Industry23
51A11995
The various review processes (frequency of review etc) must be developed and responsibilities assigned.
3.3 Implementation of the Methodology
The methodology has been developed to be implemented in Australia however the application of this methodology on a regional level is possible and a regionally coordinated approach will likely improve the chances of driving change in governance and reduce the diversion of suspect product to less discerning markets.
The methodology presented will provide a sufficiently reliable result whilst not becoming complicated to a level that is cumbersome, confusing and difficult to manage. The participation of other regional countries, following agreement on the process and components of the risk analysis, would enable more resources to be applied to a targeted investigation of governance and would result in a lower investment for each participating country. As discussed previously, organisations such as Transparency International and ITTO who already undertake in-country analyses of risk in general and the effectiveness of forest management initiatives, may be able to support a Domestic Risk Analysis that is cost efficient.
The results of the risk analyses can be used to track the success of initiatives to reduce the trade in illegally-sourced wood products in each of the supply countries. The results can also be used by Australian importers as a resource for better understanding supply risk. Poyry believe the results of the risk analyses should be a key consideration in the development of Industry codes with regard imported wood based products and should assist with responsible purchasing decisions.
Copyright © Pöyry Forest Industry24

APPENDIX 1
Literature Review
Copyright © Pöyry Forest Industry1

51A11995
APPENDIX 1: LITERATURE REVIEW
Introduction
The purpose of this literature review is to gain an appreciation of the methodologies applied to quantifying the trade of illegal wood products and, where appropriate, to identify weaknesses or limitations in their usefulness. The focus of the review is on the forest product trade within countries in the Asia-Pacific region, although it quickly became evident that it was necessary to include publications focussing on a much broader list of countries and regions in order to capture the key publications.
Limited literature exists which either develops or describes in detail a methodology to estimate the volume and value of illegally logged timber and wood product trade. The majority of this literature is limited to examining the process of the illegal timber trade and the legislative framework. Most referenced academic research and scientific studies focus on the environmental issues associated with illegal logging, rather than illegal trade.
Generally, the data utilised in any of these analyses has been secondary, at best an unquantified estimate, based on anecdotal evidence or based on limited research. Many reports on illegal logging often do not include an assessment of the accuracy or reliability of illegal logging estimates and therefore can give the false impression to readers who quote these figures in good faith that the estimates are a true indication of the extent of illegal logging in any country. The same estimates that appear in many of the reviewed reports are referenced circularly, and are not linked to the original source.
Much of the literature about global trade of illegally logged timber and wood products is produced by environmental non-government organisations (ENGOs) and forestry-related associations. Many of these reports reference the findings presented in the Seneca Creekv, 2004 report, and thus the review of this report has been more comprehensive.
Findings
In undertaking the literature review, it became evident that many of the reports and work undertaken in providing estimates of illegal wood product volumes entering Australia has relied greatly on secondary, tertiary and extrapolated information that is generally available in the public domain, e.g. ENGO reports.
It is also evident that many of the published quantification approaches have relied significantly on country-based criteria such as the Corruption Perception Index (CPI) produced by Transparency International.
The literature review suggests that there are also many definitions of illegal, that the methodologies used to quantify legality lack robustness or reliability, and that only a small number of core documents have laid the foundation for subsequent works. The key assumptions from these core papers have been duplicated and re-
Copyright © Pöyry Forest IndustryA1-1
51A11995
used without further investigation into accuracy. Pöyry has focused its literature review on these core documents and the methodologies employed.
The Seneca report is the most comprehensive piece of work identified and reviewed by Pöyry. The Seneca report has become a key source document, the findings of which have been relied upon and quoted in many subsequent reports. This is perhaps indicative of the fact that the process for accurately quantifying the illegal wood products trade is extremely difficult without much improved data and the application of significant resources. Even with unlimited resources, the current lack of reporting systems and the inability to identify all corrupt or fraudulent undertakings mean that accurate quantification without the application of any subjective or arbitrary factors is currently unfeasible.
The Seneca report has employed logical methods, which include assessments of the reliability and accuracy of estimates, to quantify the illegal trade of wood products from selected countries. There are limitations in the accuracy of the results that the methodologies employed can deliver. This is not as a result of error nor lack of diligence but due to the limited practicable methods available without access to reliable data. The Seneca report utilises the classification of ‘suspicious’ rather than ‘illegal’. This perhaps reflects the belief that making defendable statements regarding quantification of illegal or legal volume is not currently possible.
The Seneca report includes an attempt at mass balance-type analyses of wood product trade. This may be overly simplistic and the base data assumptions from forest removals, trade data and domestic production are typically unreliable. The mass balance graphics as provided in the report are overly simplistic and do not capture the complexity of the wood products flow within these countries. Although, in theory, the mass balance approach can be quite useful in identifying suspicious trade activity, there are many barriers to its effective use. The mass balance approach relies on the availability of accurate log removal, domestic production and trade data. Domestic consumption of wood products is typically reported as apparent consumption and is calculated at Production + Imports – Exports. The real exports of a country can be compared to report only if domestic consumption and production figures are available with some confidence of accuracy. The complexity of the mass balance approach is further increased by the use of different, although appropriate, standards of measurement for various product groups.
An understanding of illegal logging is only somewhat useful in determining the legality of processed wood product imports. The likelihood of diversion of illegal wood products to less discerning markets is considered high. Much of what is considered illegal or high risk is processed domestically into wood products and furniture. The products can then be exported without the true volume of wood trade being captured. Pöyry cannot offer an estimate of the percentage of illegally-sourced wood products processed domestically with any confidence. It is clear that processed products are more difficult to trace back to the source and that domestic processing, particularly for the domestic market, effectively avoids border crossings where controls may be tighter.
From the number of papers reviewed, it is clear that a number of definitions of “illegal” have been applied. This illustrates the difficulty in defining legality. Some parties have included unsustainable harvesting whilst others consider all volume
Copyright © Pöyry Forest IndustryA1-2

51A11995
with the appropriate permitting and approvals, no matter the risk of corruption within the approval process, to be legal. There is no “right” definition, but this means that comparison of estimates is, by and large, impossible.
Some of the literature reviewed describes the product in question as ‘suspect’. This definition is somewhat more appropriate as it does not require the definitive classification as legal or illegal.
Literature Reviewed
1. Seneca Creek Associates and Wood Resources International 2004,” “Illegal” Logging and Global Wood Markets: The Competitive Impacts on the U.S. Wood Products Industry”. American Forest and Paper Association.
Synopsis
As the title suggests, the paper attempts to quantify the impact of illegally logged wood products on the US Wood Products Industry. The report focuses on key exporting and importing countries. It provides a comparison of the reported estimates of illegal production and trade by wood product, with revised estimates developed through infield research and country analysis.
The report provides not only an estimate of suspicious volume, but also clearly states the challenges in achieving accurate quantification of the problem. Key conclusions include:
The “illegal logging” issue is confused by, yet intricately related to, deforestation and poor forest practices.
The extent of illegal forest activity is impossible to know with any degree of certainty. Reported estimates are generally supported through anecdotal information only and supposition.
Investigation and analysis suggest that many of the reported estimates are, at least in some cases, probably exaggerated. Illegal activity of the type that rises to international significance is nevertheless pervasive in some countries.
Illegal logging is primarily a symptom of unclear or poorly enforced forest tenure, weak political institutions, corruption, inadequate natural resources planning and monitoring, and lax enforcement of sovereign laws and regulations.
Based on estimates and analysis of wood fibre flows, illegal forest activity represents between 5 and 10% of global industrial roundwood production, approximately 4% for softwood, and 15% for hardwood.
Most illegally produced timber is used domestically and does not enter international trade. The suspicious volume of roundwood that enters international trade represents in the order of just 1% of global production, for both softwood and hardwood. Seneca estimates that 12% of global softwood roundwood exports and as much as 17% of global hardwood roundwood exports are of suspicious origin. Less than 4% of global trade in softwood lumber and plywood originates from timber of suspicious origin, but as much as 23% of hardwood lumber exports, and 30% of hardwood plywood exports
Copyright © Pöyry Forest IndustryA1-3

51A11995
might be considered suspicious. This is largely attributed to the Indonesian situation, where a high percentage of production, and hence export, is thought to be illegal.
While trade data discrepancies offer a hint of existing problems with unreported trade, data discrepancies by themselves are not prima facie evidence that illegal trade has occurred.
The European Union (EU) is taking an approach that combines capacity building with voluntary measures to effect changes in European purchasing of imported timber and lumber products. The EU has enacted a plan to enter into bilateral agreements with non-EU countries to develop and implement export licensing that would be enforceable on EU imports of timber and sawnwood (lumber).
Neither Japan nor China has expressed any interest in similarly regulating imports from trading partners (nor has the United Statesvi or Canada).
In order to be effective, solutions to the illegal logging issue must reduce the spread between the costs of operating illegally and the costs of operating legitimately. The larger the spread between legal and illegal costs, the greater the returns from illegal activity. Policy makers should consider that raising costs for legal trade could have a perverse and unintended impact.
Apart from general trading rules through the World Trade Organization (WTO), the Convention on Trade in Endangered Species (CITES) is the only international legal instrument with enforceable provisions to restrict trade in specific species. A few commercially important timber species are listed under CITES. CITES data should correspond with official trade data, but frequently does not. Collection and analysis of trade data on listed species subject to CITES permits is not well-coordinated or supported. Ways to improve CITES information and data coordination should be explored.
In general, forest resource information and monitoring systems are inadequate in most of the countries where illegal activity is believed to be a problem. Governments should support improved information management systems through the ITTO, FAO or other extant international institutions.
Industry trade groups are increasingly adopting or strengthening codes of conduct that commit to purchasing legally procured and manufactured timber products. All of the major certification schemes include a standard to comply with all applicable legal and regulatory requirements.
It is generally accepted that solving the problem of illegal logging will take more than just strengthened enforcement capacity and trade restrictions. This problem does not exist in a vacuum, but is inextricably tied to other economic, social and political problems. History shows that, as economies grow, and as opportunities for education and healthcare improve, investments in natural resources and environment follow. However, in order to improve the effectiveness of programs aimed at reducing illegal logging in producing countries, donor countries should try to tie their efforts to broader programs aimed at improving economic opportunities for those living in the affected regions.
Copyright © Pöyry Forest IndustryA1-4

51A11995
The importance of this issue to the American Forest and Paper Association extends well beyond the economic value of the trade opportunities lost to US wood exporters. To the extent that the general public associates logging, in any country, with “illegal activity,” there is a danger of a negative impact on the “wood is good” image.
Methodology Employed
The quantification methodology is unclear to the reader. The report provides a correlation of the Seneca-estimated suspicious volume and the country corruption index. However, it remains unclear if the corruption index was relied on in calculating the percentage of trade classified as suspicious. The Seneca report utilised the classification of ‘suspicious’ rather than ‘illegal’. This perhaps reflects the belief that making defendable statements regarding quantification of illegal or legal volume is not currently possible.
The study applies regional averages for countries, where the share of illegal logging as a percentage of logging has not been investigated. There are, no doubt, other countries where illegal logging takes place. However, the volume of wood imported from these countries is insignificant by comparison, and therefore does not affect the overall calculation.
Each of the brief country profiles lacks specifics on methodology in reaching illegality estimates. The report provides some details of a mass balance-type analysis of key countries. It appears that there may be some flaws in the calculation of the sawn wood volumes, and therefore the findings lack credibility. It is also evident that extensive field work and interviews were undertaken. This would provide some first hand examples of what is happening and would have been invaluable when attempting the mass balance approach. Unfortunately, this would not be a viable component of a repeatable quantification methodology.
Although the Seneca report is now quite dated, the findings and assumptions contained in the report are frequently applied without any attempt to update or test current validity.
2. Pöyry Forest Industry, 2005, “Overview of illegal logging”. DAFF.
Synopsis
The report assesses the impact of trade in illegal or suspect forest products on Australian forest product imports. The report assesses the current and projected impacts in 5-10 years time. Projections were for increased sawnwood imports and strong demand for imported furniture. The estimates are used, first of all, to suggest a staged approach to improve market awareness of illegal products and the requirements of certification, secondly to work with supplying countries and companies to develop and strengthen certification and C-o-C systems.
The impact of illegal logging as an aggregate assessment of past studies was estimated at around AUD400 million of Australia’s forest products and wooden furniture imports, about 9% of the total value of these imports. Wooden furniture accounted for around half of this value.
Copyright © Pöyry Forest IndustryA1-5

51A11995
Key findings:
Most importers do not have formal structures in place to provide any high degree of certainty on either the origin of their imports to Australia or whether it has been obtained legally.
At the retail level, the awareness of the illegal logging problem seems relatively low.
The Asian supply market is becoming more complex as more trading of primary products occurs, increasing the difficulties of determining the origin of products.
Pöyry estimates that the amount of sawnwood obtained from suspicious sources is around 8% of Australia’s total sawnwood imports, or approximately 72 000 m3, to the value of around AUD50 million.
Of the 320 000 m3 of wood-based panels imported into Australia during 2003/04, approximately 11% is of suspect origins. This percentage represents a value of around AUD23 million, and is highest for veneer and plywood products, at 16% and 19% respectively.
The estimated impact of suspected illegally harvested logs on the imports of printing and writing paper is around 4% in volume and value terms, and represents around AUD56 million.
The estimated impact of suspected illegal activity on tissue imports is around 9% in value terms and represents around AUD11 million.
Pöyry assesses a list of nearly 90 countries supplying wooden furniture to Australia, and estimates that the potential suspected impact of illegal logging activity on imports (based on 2002/03 imports) is around 22%, or AUD162 million. The report states that the import data seems inconsistent. However, it is unclear in what way. The Furniture Industry Association of Australia believes the above impact is conservative. The figure in the summary table appears to have been increased based on the Furniture Industry Association input.
The Australian timber industry and timber product market, including wholesalers, hardware stores and even industry associations such as the Australian Timber Importers Federation, lacked any policies and procedures to detect and restrict timber imports from illegal or suspicious sources.
Methodology Employed
The report draws heavily upon data from the 2004 Seneca Creek report, Pöyry’s own experience and knowledge of the associated issues, WTO data and ABARE statistics. The report was conducted as a desk-based study with no field investigation.
The suspected illegally logged import volumes and values have been calculated based on the same percentages as applied in the Seneca report. The calculations for each product group are not shown in the report. However, for each product group, a country-based assessment is provided which lists the Transparency International Corruption Perceptions Index (TICPI) and provides a qualitative ranking of Management and Governance capability.
Copyright © Pöyry Forest IndustryA1-6

51A11995
A summary of estimates stated in ENGOs, forestry-related association and various international organisation reports is provided in the report, as evidence of the report estimates in circulation.
The flaw in this methodology is that it seems to take a rather simple approach to calculating suspicions or illegal material. The methodology relies on Australian trade statistics and the TICPI. In the absence of reliable industry statistics and an appreciation of the difficulty in measuring corrupt practices within the forest industry, the use of the TICPI has become a widely used indicator of suspicious activity.
3. Schloenhardt, A., 2008. “The illegal trade in timber and timber products in the Asia Pacific region”, Australian Institute of Criminology, Canberra.
Synopsis
This study analyses the scale of illegal timber trade in the Asia-Pacific region. It evaluates current trends in the logging, sourcing, trafficking, manufacturing, importing and consumption of illegal timber and timber products.
The study examines the role that organised criminal networks and legitimate businesses play in this illicit market. It provides a country-by-country profile of the legal and regulatory mechanisms to prevent and suppress the trade in illegally-sourced timber in the Asia-Pacific region, as well as examining the role of international and domestic organisations.
The study examines timber resources, the extent of illegal logging, policies and legislation and enforcement initiatives, providing an overview of the effectiveness of legislative frameworks that suppress trade at domestic, regional and international levels.
Key findings:
The true magnitude and value of illicit trade of timber is unknown, and much of the published data is speculative or anecdotal and not scientifically verifiable. Much of the available data is referenced circularly and not linked to an original source.
The study highlights the paucity of information for estimating the extent of the illegal timber trade in the Asia-Pacific region, which reflects the lack of coordinated policies and strategies for managing the problem.
Despite the vast array of documents, treaties, agreements and organisations relating to illegal trade in timber, there is no one mechanism specifically designed to suppress illegal logging and illicit trade.
The existing international legal and institutional framework is without enforceable mechanisms.
Most consuming countries in the region have few effective mechanisms to prohibit imports, but where there are control mechanisms, importation requirements are circumvented by false documentation, concealing imports, bribing officials or clandestine importing.
Copyright © Pöyry Forest IndustryA1-7

51A11995
There are often limited resources to monitor cross-border trade, particularly for countries where border areas are difficult to access.
It is more effective to reduce both the supply of, and demand for illegal timber and products by encouraging use of legally produced timber and alternative, non-timber based products. Raising consumer awareness of the problem among retailers and consumers, and creating incentives to purchase legal timber, is a challenge to be met.
There is no accepted industry-wide policy and standard for importation of timber and timber products into Australia.
The findings include statements about sustainability. It is evident that some parties, particularly ENGOs, consider unsustainable harvesting practices to constitute illegal logging.
Methodology Employed
The data and information used in this report come from a variety of secondary sources, both national and international. The author states that accurate ‘hard’ data about the illicit timber trafficking is non-existent. Most of the figures published in this report come from sources which are best estimates made on the basis of small samples, seizures, or other research.
4. WWF, 2008. “Illegal wood for the European market”
Synopsis
This study provides an estimate of the timber in Round Wood Equivalent (RWE) terms, considered illegal, imported into the European market.
Key findings:
The share of illegal logging in global wood production is estimated at 20 to 40%, and the economic loss through lost receipts for the state, industry and forest owners is estimated at USD15 billion/a.
Illegal logging is said to push wood prices down worldwide 7-16%.
Methodology Employed
All products in which wood is used as a raw material are included in the calculation. The EU foreign trade data from 2006, available on the website of Eurostatvi, is used as a base to calculate the quantity of raw timber that is needed to produce the imported products (raw timber equivalent). It is unclear how the wood component of furniture imports has been quantified and subsequently converted to RWE. The margin of error must be considerable and brings into doubt the reliability of the estimate.
For countries where illegal logging is known to take place on a significant level, but the share of illegal logging compared to the total is unknown, regional averages are calculated based on the same approach as in the 2004 Seneca report.
This RWE method was developed by the Bundesforschungsinstitut für Ländliche Räume, Wald und Fischerei in 2001 in order to show a more detailed picture of
Copyright © Pöyry Forest IndustryA1-8
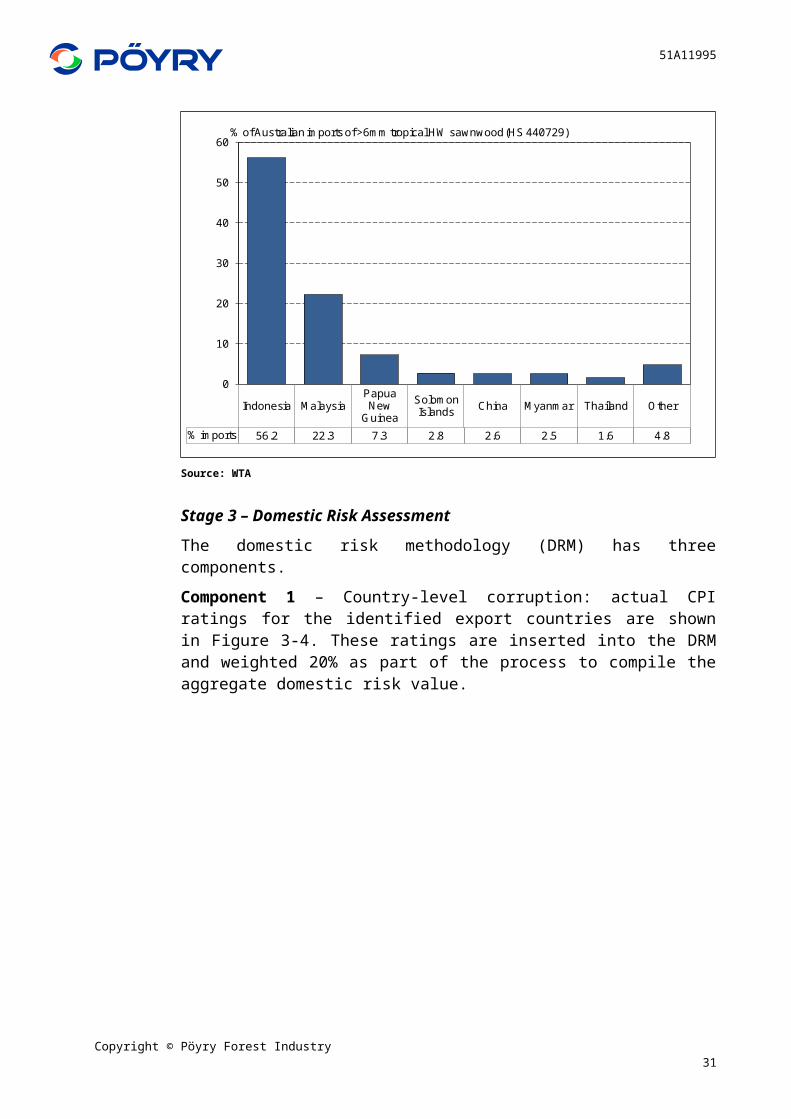
51A11995
wood flow. It shows the amount of raw material needed and the consumption in the end-consumer countries.
The calculation is simplistic as it applies the published percentage illegal logging to the export statistics. It is a difficult assumption to defend, and goes against other publications which conclude that much of what is harvested illegally is processed and consumed domestically.
Copyright © Pöyry Forest IndustryA1-9

51A11995
A Microsoft Access database is used to perform these calculations, for 250 000 datasets of Eurostat foreign trade data 2006.
Step 1 The total weight (tonnes) of each product imported is converted to roundwood equivalents (m³) by multiplying Eurostat data with a conversion factor specific for each product
RWE (m³) = Weight (t) * conversion factor (m³/t)
Step 2 The total EU import from each country is calculated by adding the RWE figures of all products
Total Import country A (m³ RWE) =
Import product 1 (m³ RWE) + Import product 2 (m³ RWE) +
Step 3 The illegal EU import from a specific country is calculated by multiplying the total import (m³ RWE) from this country with the share (%) of illegal logging in this country as referred in literature
Illegal Import country A (m³ RWE) =
Total Import country A (m³ RWE) * Share of illegal logging country A (%)
Step 4 The total EU imports of wood-based products deriving from illegal sources is calculated by adding the illegal imports from all countries
Total illegal import (m³ RWE) =
Illegal Import country A (m³ RWE) + Illegal Import country B (m³ RWE) +
Source: WWF, 2008
The conversion to RWE is extremely difficult to undertake without understanding the recoveries of each process. These recoveries are dependent on the technology employed, the type of product to be manufactured and the species and form of the resources.
5. Smith, W., 2002. “The global problem of illegal logging”, ITTO Tropical forest update, Vol. 10, No 1. 2002.
Synopsis
This report provides a general overview of the global problem of illegal logging. It states that the lack of reliable data is due partly to the fact that corrupt and illegal activities are conducted in secret and often in remote regions, and due also to the difficulty of quantifying volumes.
The paper includes discussion on what can be done to reduce illegal logging and monitoring approaches.
Methodology Employed
No new methodology is used to calculate the volume or value of illegally logged timber and wood products presented in this report. A simple table of the estimated percentage of wood harvested illegally from a number of ITTO producer countries is presented. This is simply a complementation of estimates previously stated in various ENGO and International organisation reports on illegal logging.
Copyright © Pöyry Forest IndustryA1-10
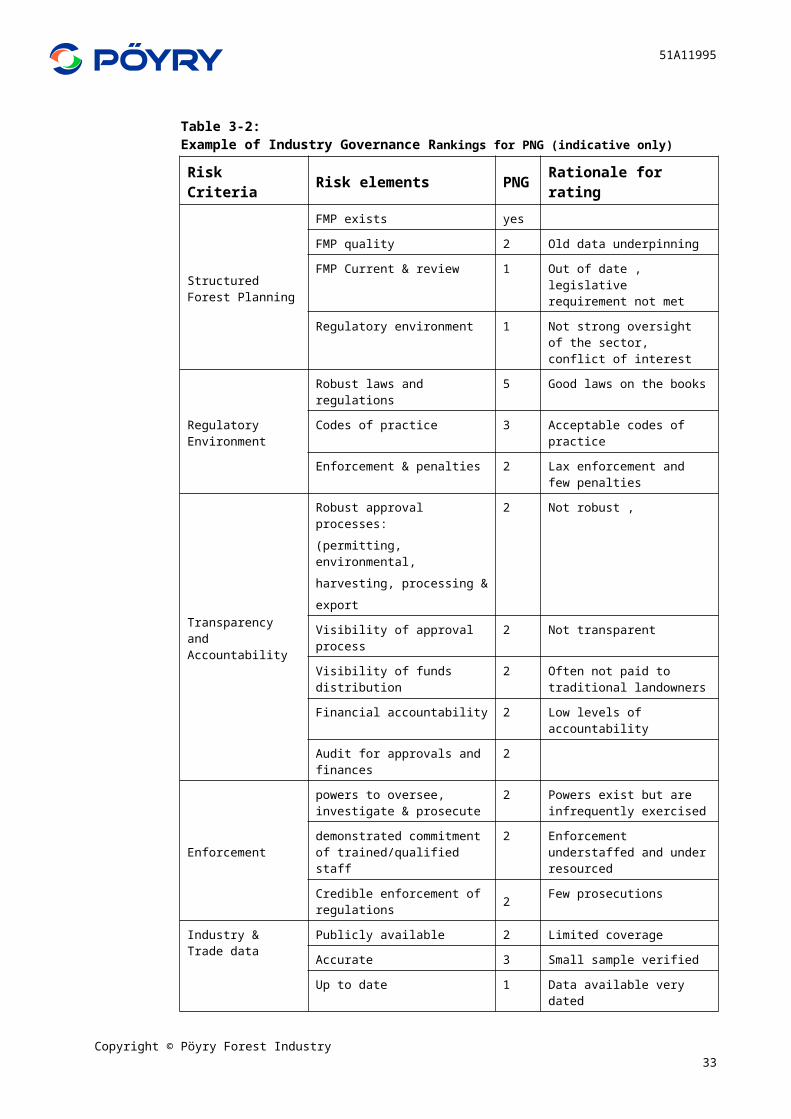
51A11995
1. Guertin, C., 2003. “Illegal logging and illegal activities in the forestry sector: Overview and possible issues for the UNECE Timber Committee and FAO European Forestry Commission”, Quebec wood export bureau.
Synopsis
This paper was presented as part of an expert presentation at the UNECE Timber Committee Market Discussion on 07-08 October 2003, Geneva, Switzerland. It provides a background of the origins of the illegal logging movement and an overview of the current situation in 2003.
A review is provided of the existing literature on illegal logging. It also includes reference to the statement by Kaimowizt, 2003, that most information about illegal logging is anecdotal or speculative. There is also reference to the fact that an AFPA study, (Random Lengths International, 2003) dismisses the data as unreliable.
Methodology Employed
No new methodology is used to calculate the volume or value of illegally logged timber and wood products in this presentation. The presentation simply lists a number of estimates previously stated in various ENGO and International organisations report on illegal logging.
Copyright © Pöyry Forest IndustryA1-11

51A11995
2. FERN, 2002. “Illegal logging and the global trade in illegally sourced timber; a crime against forests and people”.
Synopsis
The paper begins by recognising the difficulty obtaining accurate statistics for use in estimating illegal logging volumes and stating a reliance on other published estimates. The paper does not provide an alternate methodology. However, it:
Provides background of what illegal logging is, and ways to identify it
Encourages cooperation between countries to combat illegal log trade
Examines the use of existing financial instruments to address illegal activities (addresses money laundering and export agency finance related to illegal logging activity)
Discusses international bans and how they can be WTO-compatible (blood diamonds used as example).
In defining ‘illegal’. FERN states “Illegal logging takes place when timber is harvested, transported, bought or sold in violation of national laws”. The harvesting procedure itself may be illegal, including corrupt means to gain access to forests, extraction without permission or from protected areas, cutting of protected species or extraction of timber in excess of agreed limits. Illegalities may also occur during transport, including illegal processing and export, mis-declaration to customs, or avoidance of taxes and other charges.
Fern also goes on to say “There is no internationally accepted definition of what is illegal, but in many of the above-mentioned countries legislation is clear and adequate, only enforcement is lacking”. Pöyry believes this clearly demonstrates that the assessment of risk of illegal sourced imports cannot be undertaken without understanding the issues, controls and governance within each of the exporting counties and regions within countries.
FERN also distinguishes between sustainable and legal. “One note of caution: Legal does not mean sustainable and sustainable does not mean legal. Legally harvested timber can come from very badly managed forests, and harvests from well-managed forests can be illegal”.
Methodology Employed
No new methodology is used to calculate the volume or value of illegally logged timber and wood products. A simple table of the estimated percentage of wood harvested illegally from a number of ITTO producer countries is presented. It simply represents a compilation of estimates previously stated in various ENGO and international organisation reports on illegal logging.
Copyright © Pöyry Forest IndustryA1-12
51A11995
3. Chatham House, 2004. “FLEGT & Trade- What will the impacts be?”, Royal Institute of International Affairs, London.
Synopsis
The study analyses the potential impacts of the EU FLEGT Action Plan. It provides an OECD estimate that the global trade in timber is worth over GBP180 billion/a (OECD, 2001).
The paper discusses the analysis of trade data for the period 1997-2002. This is, of course, very dated now and probably does not reflect the current situation.
Key findings:
A mismatch of data between the declared direct imports of timber from Indonesia and Malaysia and the corresponding declared exports by Indonesia and Malaysia suggest that a large quantity of additional Indonesian timber is supplied indirectly to the EU, primarily through Malaysia (particularly as logs, sawnwood and plywood). An increasing amount is supplied via China (in furniture, plywood and other processed goods).
The study finds that data for Indonesia’s exports to the EU tends to match quite closely the EU’s imports from Indonesia. However, the discrepancies in Indonesian trade with China and Malaysia are more evident. The roundwood equivalent volume of the timber which Indonesia declares as exports to Malaysia is far lower than that which Malaysia declares as imports from Indonesia, even when an allowance for the error in converting weight into volume measures of exports and imports is factored in. The products where the major discrepancies arise are with logs and sawnwood. In the 6-year period 1997-2002, the overall annual discrepancies varied within the range of 0.7 to 1.7 million m3 RWE.
Methodology Employed
Chatham House employs the following approach:
Identify the scale and scope of illegal logging.
What are the objectives of the EU FLEGT Action Plan?
Develop a baseline scenario against which the impact of the Action Plan would be assessed.
Assess the impacts of the Action Plan on trade in wood-based products.
Review trends in the global wood-based products market and the key international, regional, and national initiatives influencing the manner in which trade is being conducted.
Interviews were held with stakeholders involved in the wood-based products trade to gain their perspective on the potential impact of the legality licensing approach.
The study focuses on the situation at that time, trends in China, Japan, the US and the EU, and the expected impact of the EU FLEGT Action Plan on each of the case study countries Indonesia, Brazil and Cameroon.
Copyright © Pöyry Forest IndustryA1-13
51A11995
The study uses Eurostat, UNECE, FAO, CIFOR data sources. No details are provided about the method used to compile the data presented throughout the report.
Copyright © Pöyry Forest IndustryA1-14

51A11995
4. SCION, “Implications for the New Zealand Wood Products Sector of Trade Distortions due to Illegal Logging”. Ministry of Agriculture and Forestry. 2007
Synopsis
The SCION report focuses on the potential impact on prices and volume for New Zealand Wood products in the domestic and international market from removing illegal wood supply. SCION runs two scenarios. Scenario one assumes no Russian log export Tax and Scenario 2 assumes the Russian log export tax would be implemented as intended.
SCION clearly states that the Seneca report has been influential in the assessments undertaken to classify the risks of timber products being illegally-sourced.
In one section of the report “The nature of illegal logging and trade” a useful review of key export countries has been undertaken. This section highlights the point that legality issues can be quite different for each country.
Key findings:
The removal of illegal log volumes from the market, not surprisingly, would have a positive effect on NZ export log prices. This would be particularly true for Korea and Japan who have relied on imports from Russia and Indonesia.
The domestic log market would improve less than the export market, as markets for New Zealand sawnwood are not considered to be large consumers of illegal logs or timber. Details of the volume and price outlook have been provided for a range of domestic and export products.
The effect on furniture prices is much smaller, as wood represents only a small component of the value of furniture.
Methodology Employed
The author has relied on estimates and methodologies from the Seneca report and the World Bank. An economic supply and demand model has been used to calculate the competitive equilibrium in international wood markets with and without illegal logging. It seems the report has not attempted to provide a fresh perspective on the actual value of illegally logged product, rather it attempts to analyse the effect of removing the reported volumes from the market.
Copyright © Pöyry Forest IndustryA1-15
51A11995
Other references analysed:
The following list of references were analysed but are not described here in detail, as they do not contain any new data or methodologies to be considered during this project.
Abt Associates Inc. 2006. “Illegal logging: a market-based analysis of trafficking in illegal timber”. Washington, DC: US Department of Justice, National Institute of Justice.
Brack, D., Gray, K., Hayman, G. 2002, “Controlling the international the trade in illegally logged timber and wood products”, Royal institute of international affairs, London, UK.
Contreras-Hermosilla et al. 2007, “The economics of illegal logging and associated trade”.
EUROPEAN UNION, 2002. “The EU & Forest Law Enforcement, Governance and Trade (FLEGT), FLEGT International Workshop” Brussels, April 22-24, 2002,
<http ://europa.eu.int./comm/external_relations/flegt/workshop/forest.htm.>
EIA & Telapak 2001. “Timber trafficking: illegal logging in Indonesia, South East Asia and international consumption of illegally sourced timber”.
<http://www.eia-international.org/cgi/reports/reports.cgi?t=template&a=26>
EIA & Telapak 2002. “Illegal logging and the international trade in illegally sourced timber: how CITES can help and why it should”.
<http://www.eia-international. org/files/reports38-1.pdf>
FAO, “State of the World’s Forests”, 2005
FERN & RIIA, 2002, “Controlling imports of illegal timber: Options for Europe”.
Fripp, E., 2006, Illegal Logging and Related Trade: Measuring the Global Response, Chatham House, available at:
<http://www.illegal-logging.info/item_single.php?item=document&item_id=373&approach_id=1>
GlobalTimber 2006. “Japan’s imports of illegal timber: an overview”. London: GlobalTimber. <http://www.globaltimber.org.uk/JapanIllegalTimber.doc>
<http://www.globaltimber.org.uk>
Greenpeace 2004. “The untouchables: Rimbunan Hijau’s world of forest crime and political patronage”. Amsterdam: Greenpeace International.
<http://www.greenpeace.org/australia/admin/image-library2/the-untouchables-report>
Greenpeace 2006. “Partners in crime: a Greenpeace investigation into Finland’s illegal timber trade with Russia”. Amsterdam: Greenpeace International.
ITTO, Annual Review and Assessment of the World Timber Situation, 2004
ITTO, Annual Review and Assessment of the World Timber Situation, 2005
Lawson, S., 2007, “Illegal Logging and Related Trade: Measuring the Global Response”, Chatham House, available at:
Copyright © Pöyry Forest IndustryA1-16
51A11995
<http://www.illegal-logging.info/item_single.php?item=document&item_id=561&approach_id=1>
Lawson, S., 2008, “Illegal Logging and Related Trade: Measuring the Global Response”, Chatham House.
LUMBER BUILDING MATERIALS DAILY, 2003. “Indonesia Hit Hard by Illegal Logging”. Press release,11 July 2003.
Mohd R 2001. “Overview of forest law enforcement in Peninsular Malaysia”. WWF: Malaysia.
ROSBALT NEWS AGENCY, 2003. “Russia Losing USD183 Million Annually from Illegal Disafforestation”. Press release, July 12, 2003.
Royal Institute of International Affairs, 2003. “Scale of illegal logging.
<http://illegal-logging.info/Scale.htm.>
Smith J, Obidzinsky K, Subarudi & Suramenggala I 2005. “Illegal logging, collusive corruption and fragmented governments in Kalimantan, Indonesia”. International forestry review 5(3): 293–302.
Stark T & Cheung SP 2006. “Sharing the blame: global consumption and China’s role in ancient forest destruction”. Amsterdam: Greenpeace International & Greenpeace China.
World Bank, 2002. “Sustaining Forests, A development strategy”, Washington DC, USA.
WWF, 2002. “The timber footprint of the G8 and China: Making the case for green procurement by government”. June 2002, 40 p.
WWF, “Failing the Forests: Europe’s Illegal Timber Trade”, November 2005.
www.illegal-logging.info
Copyright © Pöyry Forest IndustryA1-17

APPENDIX 2A
Australian Trade Statistics
Copyright © Pöyry Forest Industry
51A11955
APPENDIX 2A: AUSTRALIAN TRADE STATISTICS
1 AUSTRALIAN TRADE STATISTICS
1.1 Introduction
The focus of this report is on imported products. Methodology considerations are therefore dependent on the availability of reliable Australian import figures. Pöyry has utilised the World Trade Atlas (WTA) Trade Information Services’ internet system to access the necessary data. WTA data is classified under the Harmonised Systemvii. Trade databases, such as the WTA, rely on trade data supplied by participating countries. For Australia, the trade data is provided by Australian Customs. Australian imports are recorded on a Customs Import Value (CV). Although Australian Customs captures all the necessary data to make an analysis on a single value point, this data is not publicly available.
Each country has its own system and associated reliability or diligence in collecting and collating the data.
Trade data has been used to:
Provide value and volume import data for selected products
Identify the key countries of origin for key imported wood products
Identify discrepancies in reporting between the country of origin and Australia.
Trade data is useful in providing some direction in which to further investigate. The use of trade data has a number of limitations. The limitations in using differences in reported trade volumes as an indicator of legality has been addressed in Section 2.2.2 of the main report.
During review of the Australian Customs data, some reliability, completeness and availability issues have been identified. These will be discussed further in the following sections.
1.2 Product Selection and Country of Origin
Three key products that have been selected for more detailed review in this study are solid wood products and panels (HS44), paper products (HS 48) and furniture (HS94). Solid wood and paper products are somewhat easier to understand as the wood component can be accurately estimated and can be taken back to a Round Wood Equivalent (RWE) with relative ease. Furniture, on the other hand, is extremely difficult or even impossible to take back to RWE given the information available. The wood component of a piece of furniture, which is often upholstered veneer etc. is difficult to measure, and often the type of wood product, whether panel or solid, is unknown.
Figure 1-9 shows the three selected product groups relative to other Australian imports. Although seemingly insignificant as compared to products such as petrochemicals, machinery and vehicles, they amounted to AUD7.7 billion in 2008.
Copyright © Pöyry Forest IndustryA2A-1

51A11955
Figure 1-9:Australian Imports by Sector, 2008
-
5
10
15
20
25
30
35
40
Min
eral
Fue
l, O
il E
tcM
achi
nery
Veh
icle
s, N
ot R
ailw
ayE
lect
rical
Mac
hine
ryP
reci
ous
Sto
nes,
Met
als
Pha
rmac
eutic
alO
ptic
Pla
stic
Iron/
Ste
el P
rodu
cts
Airc
raft,
Spa
cecr
aft
Org
anic
Che
mic
als
Iron
And
Ste
elFu
rnitu
re &
Bed
ding
Rub
ber
Pap
er,P
aper
boar
dTo
ys &
Spo
rtO
ther
spe
cial
Wov
en A
ppar
elFe
rtiliz
ers
Kni
t App
arel
Inor
g ch
emM
isc
Che
mB
ever
ages
Mis
c fo
odA
lum
inum
Shi
ps A
nd B
oats
Woo
dFo
otw
ear
Per
fum
eB
ook
Cop
per
Mis
c te
xtile
Tool
/cut
lery
Art
of b
ase
met
alLe
athe
r/Sad
dR
ailw
ay;T
rf S
ign
Eq
Pre
serv
ed F
ood
Gla
ss &
Gla
ssw
are
Cer
amic
Pro
duct
sTa
nnin
g,D
ye,P
aint
Bak
ing
Rel
ated
Dai
ry,E
ggs,
Hon
eyS
alt;S
ulfu
r;Ear
th,S
tone
Fats
And
Oils
Mea
t,Fis
h,E
tcFi
sh A
nd S
eafo
odA
rms
And
Am
mun
ition
Edi
ble
Frui
t And
Nut
sS
oap,
Wax
,Et
Food
Was
te; A
nim
alS
tone
,Pla
str,C
emen
t,Etc
Coc
oaO
res,
Sla
g,A
shO
ther
- AUD billion -
Source: World Trade Atlas/Australian Customs
Copyright © Pöyry Forest IndustryA2A-2

51A11955
Each of these product groups grew in value terms from 2006-2008 (Error:Reference source not found). As the value of the Australian dollar appreciated against the US dollar in 2006 and remained relatively stable, on annual average terms, from 2007 to 2008, the increase cannot be attributed to exchange rate movement. Unfortunately, figures for quantity are unavailable for some product sub-groups and are therefore also unavailable at the parent or 2-figure HS code level. This results in further complexity in comparing reported trade volumes.
Of the three selected sectors, furniture imports are marked as the one of highest value (Figure 1-10). This is misleading, as a significant portion of the furniture imported has little or no wood component. Although the trade statistics indicate which furniture products have a wood component, it is currently impossible to identify the volume, type and source of the wood. Figure 1-10:Australian Imports by Sector, 2006 – 2008
-
500
1,000
1,500
2,000
2,500
3,000
3,500
4,000
Furniture (94) Paper (48) Wood (44)
- AUD million -
200620072008
Source: World Trade Atlas/Australian Customs
Copyright © Pöyry Forest IndustryA2A-3

51A11955
The key source countries of the three parent product groups have been identified as shown in Figure 1-11. The individual countries in total account for 85% of all imports by product group.
It is evident that China is a significant source country with regards to the three product groups and, in particular, furniture imports. China has limited forestry resources and therefore much of the exported product has been produced utilising imported fibre. New Zealand, in value terms, is the second largest supplier followed by Indonesia and Malaysia. Figure 1-11:Australian Paper, Furniture and Wood Imports by Country, 2008
0
500
1000
1500
2000
2500
3000
China
New Zea
land
Indon
esia
Malays
ia
United
Stat
es
German
y
Finlan
d
Italy
Thaila
nd
France
Vietna
m
Sweden
Japa
n
Taiwan
Belgium
Other
- AUD million -
Paper
Furniture
Wood
Copyright © Pöyry Forest IndustryA2A-4

51A11955
It is unsurprising that China has such a large share of the Australian market. China has become the leading global furniture exporter (Figure 1-12) utilising modern facilities and competitive labour to produce both high-end and low-cost furniture. Products supplied from China have a considerable risk of containing illegally-sourced fibre based on the relatively large volumes of imports and the risks associated with some of the supply countries including Malaysia, Russia and Indonesia.Figure 1-12:Australian Furniture Imports by Country, 2008
China 54%
Malaysia 7% Italy
5%Germany
4% United States 4%
Thailand 3% Vietnam
3%Indonesia 2% Taiwan
2%New Zealand 2%
Other14%
Source: World Trade Atlas/Australian Customs
Each of the other countries by comparison supplies relatively small volumes into the Australian market.
Malaysian manufactured wooden furniture relies on the domestic wood supply. There are some risks associated with Malaysian supply which exist due to failings in enforcement and the considerable variation in controls across the regions and across forest categories. Nonetheless, studies such as the independent report of Malaysia’s timber legality assurance system, indicate there is no widespread and systematic abuse of existing legal and regulatory systems as they pertain to the management of Malaysia’s forest resources and wood products industry, and that controls and procedures are by and large being implemented.
Copyright © Pöyry Forest IndustryA2A-5
51A11955
Figure 1-13 shows that paper and paperboard products are primarily sourced from China (15%) and New Zealand (15%). Indonesia, Japan, Singapore, Thailand and Malaysia account for a further 18% of total supply. It is worth noting (and concerning) that 15% of Australian paper imports in 2008 have been coded with ‘no country details’.Figure 1-13:Australian Paper and Board Imports by Country, 2008
No Country Details 15% Other
2%
Malaysia 2%
Thailand 3%
Singapore 3%
China 15%
New Zealand 15%
Finland 11%
United States 9%
Indonesia 6%
Germany 5%
Sweden 4% Japan
4%Belgium
3%Italy 3%
Source: World Trade Atlas/Australian Customs
Wood products coded under HS44 (wood) are primarily sourced from the Asia-Pacific region, with New Zealand, Indonesia, Malaysia and China accounting for 64% of the supply in 2008 (Figure 1-14).Figure 1-14:Australian Wood Product Imports by Country, 2008
New Zealand 24%
Indonesia 15%
China 14%
Malaysia 11% United States
5%
Canada 5%
France 4%
Germany 3%
Chile 3%
Other16%
Source: World Trade Atlas/Australian Customs
Copyright © Pöyry Forest IndustryA2A-6
51A11955
The wood sector category includes a range of timber, composite panel, engineered and prefabricated products. Each of these products has a different fibre requirement, and this will be discussed in detail in the following sections.
It is difficult to understand the risks for each of these supply countries until each of the key sub-products are reviewed.
1.3 Product Sub-codes
For each of the product sectors, sub-codes should be used to identify products that are high risk in terms of potentially containing an illegally-sourced wood component These sub-codes should be selected based on the significance of value, the wood component and the perceived risk level of the wood component.
The repeatability of the process is more important than the absolute number, and it is of no great significance if some minor volumes are not captured. A system to measure the level of legality risk associated with imports can be developed and implemented as a staged approach which may initially target a few selected product groups.Figure 1-15:Australian Import Breakdown by Sector, 2008
-
200
400
600
800
1,000
1,200
1,400
1,600
Oth
er F
urni
t,Not
Sea
tS
eat
Lam
ps/li
ghtin
gB
eddi
ngP
refa
bric
ated
Bui
ldng
Med
ical
etc
Coa
ted
Unc
oate
d w
ritin
gTo
ilet e
tcO
ther
New
sprin
tC
arto
nN
ote
book
s et
cO
t Cel
lul W
ad T
o S
ize
Oth
er k
raft
unco
ated
San
tryO
t Unc
oat,R
oll/S
heet
sV
eg p
arch
Car
bn,S
lf-C
py,E
t,Rol
lLa
bels
, Prin
ted/
Not
Oth
er
Lum
ber >
6M
m T
hick
Tong
ued,
Gro
oved
Bui
lder
s jo
iner
yP
lyw
ood,
Ven
eer,E
tcO
ther
Fibr
eboa
rdC
ask/
Bar
rels
Ven
eer S
heet
<6M
m T
hck
Oth
er
- AUD million -
FurniturePaperWood
Source: World Trade Atlas/Australian Customs
The export statistics detailed below are as provided by Australian Customs and reported by WTA. When country of origin is stated, this refers to the recorded supply country as per the trade statistics and may not represent the true origin of the import.
1.4 Furniture
(HS94)
Copyright © Pöyry Forest IndustryA2A-7

51A11955
In 2008, the value of furniture imported into Australia was AUD3.47 billion. It is obvious from the descriptions at the 4-digit HS code level that it is necessary to drill down to at least the 6-digit HS code to identify furniture containing some wood product. Furniture imports categorised as wooden include a range of manufacturing materials, both wood-based and other. Unlike the other wood products imported, it is impossible to quantify the volume of wood contained in this manufactured product. Of the total furniture import value in 2008, it is estimated that AUD1.356 billion is wooden furniture, or furniture that at least contained a wooden frame. Figure 1-16:Total Australian Furniture Import (2008)
0
200
400
600
800
1000
1200
1400
1600
Oth
er F
urni
t,Not
Sea
t
Sea
t (N
ot D
enta
l,Etc
)
Lam
ps,L
ight
ng,F
ittin
g
Arti
cles
Of B
eddi
ng
Pre
fabr
icat
ed B
uild
ng
Med
/Sur
g/D
en/V
et/E
tc.
9403 9401 9405 9404 9406 9402
- Value (cv) AUD million -
An additional AUD72 million of pre-fabricated housing has been imported. The trade data does not allow for further classification into materials. Given the availability of domestic wooden pre-fabricated housing, it appears likely that these may consist of polystyrene sandwich wall construction. It is unclear why pre-fabricated buildings are classified under the HS94 furniture code.Table 1-4:Furniture Imports containing Wood (2008)Description HS code Value (million)Other (not set) HS9403
Other wooden 940360 463
Wooden bedroom 940350 247
Wooden office 940390 67
Wooden kitchen 940340 36
Seat HS 9401 Other wooden upholstered 940161 479
Wooden frame not upholstered 940169 65
Total 1 356
The three largest categories of wood furniture are ‘Wooden bedroom’, ‘Other wooden’ and ‘Other wooden upholstered’. Combined, these three categories amounted to AUD1.189 billion in 2008, or 34% of total furniture imports by value.
Copyright © Pöyry Forest IndustryA2A-8

51A11955
Although the total value of furniture imports exceeds that of both paper and wood, the adjusted wooden furniture figure is much less than paper (HS48) at AUD2.9 billion, and in line with wood (HS44) at AUD1.3 billion.
Pöyry has broken down the available trade data for ‘Other wooden’ and ‘Wooden bedroom’ to identify key supply countries. Figure 1-17:‘Other Wooden’ Furniture Import Value by Origin (2008)
0
50
100
150
200
250
China Vietnam Malaysia Indonesia Poland Italy NewZealand
India Germany Lithuania Other
- Country of Origin -
- Value (cv) AUD million -
Source: WTA
The “Other” category is the largest single category of furniture imports. This category includes wall units, tables and outdoor furniture. China is, by far, the dominant supplier into Australia. Vietnam has emerged as an important producer of furniture, and now supplies more furniture into the Australian market than either Malaysia or Indonesia.
The overall value of ‘Wooden bedroom’ furniture is somewhat lower than ‘Other wooden’, but is still significant AUD247 million (in 2008). The difficulty remains determining what proportion of these HS codes represent the timber value.
Copyright © Pöyry Forest IndustryA2A-9
51A11955
Figure 1-18:‘Bedroom Wooden’ Furniture Import Value by Origin (2008)
0
20
40
60
80
100
120
140
160
China Malaysia Vietnam Indonesia Poland Lithuania Italy Taiwan Slovakia HongKong
Other
- Country of Origin -
- Value (cv) AUD million -
Source: WTA
Based on the Australian wooden furniture import data, Pöyry has selected China, Malaysia, Vietnam and Indonesia for further review.
Wood Use in Furniture
Identification of the type of wood product may vary, from being relatively straight forward for some lower-cost products, to extremely difficult for solid wood higher-value items.
The use of reconstituted panel for the manufacturing of flat-pack or knockdown furniture is prevalent throughout the Asia-Pacific region. Particleboard and MDF provide a lower-cost alternative to solid wood, utilising relatively low-cost wood raw material. Due to its relatively low value, particleboard is not typically a product suited to long export distances. Manufacturers of particleboard-based furniture are more likely to source the panel domestically. This is important to understand in assessing the potential legal origins of the product.
MDF is a slightly higher-value product, better suited to moulding and the application of decorative papers. Some higher-value fine furniture is also produced with an MDF substrate overlay or a decorative veneer.
Solid wood furniture, being typically of one species, is somewhat easier to trace back to the timber source. Generally, the species is known, and it can be ascertained if the species is available domestically or has been imported before manufacturing. The later is quite common in Asia, where they utilise high-value species from North America for fine furniture.
Copyright © Pöyry Forest IndustryA2A-10
51A11955
1.5 Paper and Board
(HS48)
Paper and paperboard includes a range of products, including fine papers, newsprint, paperboard and tissue products. Australia imports paper and paperboard in almost all categories, and total paper and paperboard imports in 2008 amounted to AUD2.9 billion.
Australian paper and paperboard imports come from a wide range of countries. China, New Zealand, Finland, the United States, Korea and Indonesia are the largest suppliers, each supplying in excess of AUD100 million worth of product each year. The paper and paperboard industry in Asia has grown strongly over the last two decades, particularly in Indonesia (during the 1990s) and China (in the 2000s). Australia’s import volumes from this region have increased correspondingly.
Paper and paperboard grades are produced from virgin pulp and recycled fibre (as well as various additives). The virgin pulp, in turn, is produced mainly from wood. Virgin pulp, recycled fibre and wood are all commodities that are widely traded internationally. This means that, in order to track products made from illegally logged wood, it is necessary to track the country of source of the paper, the source of the pulp used in the paper and the source of the wood used to produce the pulp. The wood fibre used in paper and paperboard is often grown in a different part of the world to where the paper and paperboard is produced. The fibre may be exported as woodchip/pulp logs or as pulp. Countries such as China which have limited fibre resources rely on imported pulp and fibre for paper manufacturing.
In particular, a large proportion of the paper and paperboard produced in northern Asia contains wood fibre grown elsewhere in the world. Some of these wood sources are countries considered to have a risk of illegal logging.
Paper and paperboard from Western Europe is also likely to contain a significant amount of wood fibre grown elsewhere in the world, as this region imports a lot of market pulp for its paper industry. However, most of this pulp and the wood which it is produced from come from lower risk sources in North and South America.
While the Scandinavian paper industry produces most of its own pulp, its pulp mills utilise a considerable amount of wood grown in Russia. However, the Scandinavian paper industry strives to maintain its strong environmental reputation, and has thorough procedures in place to minimise the risks of purchasing wood from illegal sources. The risk of illegally logged wood fibre being included in paper products from Scandinavia is considered to be quite low. However, while the Scandinavian companies are doing all they can to avoid using illegally logged wood, it is probably not possible to guarantee 100% compliance.
Other major suppliers of paper and paperboard to Australia, such as North America, New Zealand and South-east Asia, have more integrated industries, with wood, pulp and paper mostly produced within the one country, thus making it easier to track the source of the wood fibre used.
The three largest categories of paper that are imported into Australia are coated paper (HS4810), uncoated paper (HS4802) and tissue (HS4818). Together, they accounted for 69% of total paper imported in 2008.
Copyright © Pöyry Forest IndustryA2A-11

51A11955
Coated Paper (HS4810)
Coated paper is the largest category of paper and paperboard imported. All paper grades that are coated with clay or calcium carbonate fall in this category. Coated mechanicalviii grades (e.g. papers for high-circulation magazines) and coated woodfreeix grades (e.g. papers for higher-quality magazines, “coffee table” books, etc.) are the two main grades making up the coated paper category. These grades are imported into Australia in the form of sheets and reels. Typically, based on the country of origin and particular sub-grade of paper, about 60–80% of the total weight of the paper would be wood fibre.Figure 1-19:Coated Paper Import Value by Origin (2008)
Finland accounted for 40% of all coated paper imports in 2008. As stated in the introduction to this section, the Finnish suppliers are considered very reputable companies, and their products have low risk of containing wood fibre from illegal logging.
Italy is another significant source of coated paper supply to Australia, and is considered to have a low risk of using illegally logged wood. A significant proportion of the pulp used to make the paper in Italy is likely to have been produced outside of the country, but the source of the wood fibre used to make the pulp is considered low risk as it is primarily from plantation resources.
Korea and China are also major suppliers of coated paper into Australia. Both countries are short of wood fibre, thus much of the paper is produced from imported pulp, or from pulp produced domestically but from imported wood. Each country also produces some pulp from domestic wood.
Copyright © Pöyry Forest IndustryA2A-12
0
20
40
60
80
100
120
140
160
180
200
FinlandKorea Ita
ly Japan China Indonesia USA Sweden Germany Thailand Other
- Value, AUD million - -
- Country of Origin -

51A11955
Both countries import pulp and wood fibre from a large number of countries, although roughly 75% of the pulp imports are from low-risk sources such as North or South America. Suppliers of wood to the pulp mills in these countries include a number of higher-risk countries such as Russia, Indonesia and Papua New Guinea. Although Indonesia has developed large plantation resources for pulp manufacturing, much of this development has been achievable through the clearing of native forest.
Japanese paper is produced mostly from domestically produced pulp. However, the majority of the pulp is produced from imported wood. Approximately 75% of this wood comes from low-risk areas; Australia, South Africa and Chile. The remainder of the imported wood comes from within the Asia-Pacific region, where there is some risk with the wood supply. In general, the Japanese paper manufacturers are moving more towards using wood from lower-risk and certified sources.
Uncoated Paper (HS4802)
Uncoated papers are classified as uncoated mechanical and uncoated woodfree grades. Some high brightness newsprint may be included in this grade classification.Figure 1-20:Uncoated Paper Imports Value by Origin (2008)
0
10
20
30
40
50
60
70
80
90
100
Indonesia
Finland
China/HK
SwedenUSA
Thailand
Germany
Austria
South Africa
Belgium
Other
- Country of Origin -
- Value, AUD million - -
Indonesia and Finland are the dominant exporters of uncoated paper to Australia. However, imports from China have been increasing steadily in recent years, in line with the growth of the Chinese paper industry.
Indonesian imports are produced by integrated manufacturers who use domestic supplies of native and plantation wood to produce the pulp for their own paper-making operations. As the native forest resources decline in Indonesia, the plantation resource is becoming available as a replacement. However, there has
Copyright © Pöyry Forest IndustryA2A-13

51A11955
been a need to import a small amount of fibre from sources within the region, including Australia, Malaysia, the Philippines and Vietnam.
The comments provided earlier on the sources of pulp and wood fibre for the paper industries in Finland, China and Sweden are also applicable to the uncoated paper grade.
Tissue (HS4818)
Tissue is classified as non-converted product (jumbo rolls), converted including sanitary, and cellulose wadding. To suit end-use requirements, tissue can be made from 100% recycled pulp, from 100% wood pulp and a mixture of recycled and wood pulp. The majority of the tissue imported into Australia is produced from wood pulp.
The value of imported tissue jumbo rolls has been increasing at a rate of 5.6%/a. However, in 2008, the major importer of jumbo reels, ABC Tissue, started up a new tissue machine in Sydney, resulting in a significant drop in imports of jumbo rolls.
The figure below shows the countries of origin for tissue. Tissue from New Zealand accounted for 33% of imports in 2008. The New Zealand supplier is SCA which can be considered a low-risk, reputable supplier. The pulp and wood fibre used in its tissue is thought to be sourced entirely from within New Zealand.
Imports of converted and non-converted tissue from Indonesia and China have been increasing. The converted tissue rolls and napkins imported from China are believed to contain a mixture of recycled and wood pulp. Tissue imported from Indonesia is mostly made from wood pulp.Figure 1-21:Tissue Imports Value by Origin (2008)
0
10
20
30
40
50
60
70
80
90
New Zealand
Indonesia
Belgium/Lux
Germany
ChinaUSA
Thailand
Malaysia
Korea
Czech
Republic
Other
- Country of Origin -
- Value, AUD million - -
Copyright © Pöyry Forest IndustryA2A-14

51A11955
The comments made earlier in relation to other pulp and paper grades also apply to the wood supply sources and risks associated with the main suppliers of tissue grades to Australia.
1.6 Wood
(HS44)
A number of products fall within the wood HS44 code including sawnwood, engineered wood products, composite panels and veneer. Each of the key sub-products has been reviewed to identify key supply countries.Figure 1-22:Australian Wood (HS44) Imports (2008)
-
50
100
150
200
250
300
350
400
450
Lum
ber >
6M
m T
hick
Tong
ued,
Gro
oved
Bld
ers'
Join
ry+C
arpn
tr
Ply
woo
d,V
enee
r,Etc
Oth
r Arti
cles
Of W
ood
Fibr
brd
Of W
d/O
t Lig
n
Cas
k,B
arr,V
at,E
tc+P
ts
Ven
eer S
heet
<6M
mTh
ck
Mar
qtry
Et;J
wl C
se E
t
Par
ticle
+Sim
lr B
oard
Frm
e F
Pai
nt,P
hot,E
tc
Tabl
ewar
e+K
itche
nwar
e
Pac
k,E
tc;P
alle
t,Col
lr
Den
sfd
Blk
/Plt/
Str/
Pr
Fuel
In L
og;C
hips
,Etc
Tool
/Tl+
Bro
om B
ody,
Et
Woo
d C
harc
oal
Rou
gh,N
ot S
apw
ood
Hoo
pwoo
d;P
icke
ts,E
tc
Woo
d W
ool;W
ood
Flou
r
- Value (cv) AUD million -
Copyright © Pöyry Forest IndustryA2A-15

51A11955
Sawnwood >6 mm
(HS4407)
In 2008, Australia imported 733 500 m3 of timber (HS4407 lumber >6 mm thick), of which 616 503 m3 (84%) was coniferous.
Figure 1-23 below depicts the countries of origin for softwood timber. Not surprisingly, New Zealand timber accounted for almost 40% of all softwood timber imports in 2008. New Zealand supply is all plantation-grown and domestically-sourced, and is almost all radiata pine, and a small amount of Douglas fir.Figure 1-23:Australian Softwood Timber Imports (2008) by Source Country
0
50
100
150
200
250
New Zea
land
Canad
a
Austria
Czech
Rep
ublic
German
y
Estonia
Chile
Sweden
Finlan
d
Lithu
ania
United
Stat
es
China
Argenti
na
Russia
Papua
New
Guin
ea
Other
- Country of Origin -
- 1000 m3 -
Softwood from the southern hemisphere is generally from plantations, and considered to be low risk. The softwood timber supplied from the northern hemisphere is more likely to be sourced from natural forest.
Canada exported around 94 000 m3 of softwood timber to Australia in 2008. Almost all the softwood timber product going to Australia is from British Columbia (BC) and nearly all from coastal forests (63% western red cedar, 32% Douglas fir, 3% hemlock. Only 2% is from the interior forests of BC, being SPF (spruce, pine and fir)). The source in BC is natural forest. On the BC coast, around 65% of the annual allowable cut is classified as "old-growth", with the remainder being naturally-regenerated, second-growth (100-150 years old and relatively unmanaged).
European supply is generally coded under the broad categories of ‘coniferous wood sawn’ and ‘SPF’. Most fibre in European countries is from "managed natural forest".
Copyright © Pöyry Forest IndustryA2A-16

51A11955
In northern and central Europe, the forest areas are native species. These areas have always been forests, but the increment and quality is often improved with thinning, and sometimes with planting of good-quality seeds or seedlings.
Estonian sawnwood supply to Australia is most likely to come from Stora Enso Timber, the largest sawmill company in Estonia. This country has its own forest resources adequate for moderate-quality construction sawnwood, which is stronger than plantation radiata pine from Australia and New Zealand, but not as good as Nordic spruce or pine.
Generally, the softwood sawnwood imported from the principal supply countries is considered very low risk.
Figure 1-24 below depicts the countries of origin for hardwood timber. It is immediately evident that hardwood supply is predominantly from developing tropical/sub-tropical countries. Developing countries are more prone to corrupt practices and lack environmentally sound forest management practices.Figure 1-24:Australian Hardwood Timber Imports (2008) by Source Country
0
5
10
15
20
25
30
35
40
45
50
Malays
ia
Indon
esia
Papua
New
Guin
ea
United
Stat
es
Solomon
Islan
ds
China
United
King
dom
Fran
ce
Ecuad
or
New Zea
land
German
y
Peru
Ghana
Singap
ore
Canad
a
Other
- Country of Origin -
- 1000 m3 -
Malaysia accounted for 39% of Australian hardwood timber imports in 2008, followed by Indonesia (24%) and Papua New Guinea (PNG) (9%).
Imports from Malaysia have mostly been coded as meranti. This is a well-known timber in the Australian market which is utilised for door jambs, windows and architraves. Other Malaysian hardwood sawn timber species are generally coded as ‘Other’ under the HS system.
Imports from Indonesia have almost entirely been coded as merbau (kwila). This species can be utilised in structural applications, and is often used for outdoor furniture and decking.
Copyright © Pöyry Forest IndustryA2A-17

51A11955
Supply from Papua New Guinea (PNG), although comparatively small, deserves close scrutiny. PNG is one of the world’s largest remaining natural forest resources. Development in PNG is limited and largely confined to a few urban areas such as Moresby, Lae and Madang. The country has been exploited by foreign entities, and in recent decades, large volumes of logs have been removed. Domestic processing is limited, and currently there is little incentive to invest in domestic processing facilities. Pöyry understands that the PNG Government has shown some commitment to a phasing out of log exports. This, if it eventuates, will result in a significant increase in sawn timber supply, much of which will target the Australian market.
Tongue and Groove Timber
(HS4409)
The tongue and grove (T&G) product imports are commonly flooring and may include other T&G products such as wall panelling. Flooring can be produced from solid wood, be an engineered product or be a composite product such as laminate flooring. Laminate flooring is recorded in the WTA data as a fibreboard product of high density, under the heading of composite panels.Figure 1-25:Australian Softwood T&G Imports (2008) by Source Country
0
5
10
15
20
25
30
35
40
45
NewZealand
Chile China Finland Brazil UnitedStates
Canada Malaysia Estonia Argentina Other
- Country of Origin -
- Value (CV) AUD million -
The majority of softwood flooring imports are supplied from New Zealand and Chile. Both of these countries have significant plantation resources and are classified as low risk.
Flooring to the value of AUD4.8 million was imported from China in 2008. China is heavily reliant on log imports due to limited domestic supply. Softwood logs are most likely imported from New Zealand or Russia. Without a chain of custody or
Copyright © Pöyry Forest IndustryA2A-18

51A11955
an understanding of the species contained within these products, it is difficult to determine their illegality risk.Figure 1-26:Australian Hardwood T&G Imports (2008) by Source Country
0
10
20
30
40
50
60
70
80
90
100
Indonesia Malaysia China NewZealand
Germany Italy Brazil PapuaNew
Guinea
Fiji Taiwan Other
- Country of Origin -
- Value (CV) AUD million -
Australia imported hardwood T&G product to the value of AUD169 million in 2008. Not surprisingly, most of these timber imports came from the key Asian hardwood producing and processing countries Indonesia, Malaysia and China.
Engineered Wood Products
(HS4412)
The HS code 4412 is described as plywood/veneer. Laminated Veneer Lumber (LVL) is also captured within this code as it cannot be differentiated from plywood under the HS system. Although plywood imports totalled a relatively modest AUD159 million in 2008, the use of tropical timber, most commonly as a surface layer, indicates most of these product imports will be in a higher risk category.
Copyright © Pöyry Forest IndustryA2A-19
51A11955
Figure 1-27:Australian Plywood Imports (2008) by Source Country
0
5
10
15
20
25
30
35
40
45
- Country of Origin -
- Value (CV) AUD million - -
The plywood trade data descriptions are confusing but do describe the surface material used for plywood construction. It is commonplace in plywood production to have the best veneer on the outside for either visual or functional purposes. Many of the plywood product sub-codes have either a tropical or a non-coniferous outer layer. The New Zealand-sourced plywood (based on a review of the available data) appears to be limited to softwood plywood and LVL. Of most interest are the imports from Indonesia, Malaysia, China and Brazil.
Composite Panels
(HS4411, HS4410)
The trade in composite panels (MDF, HDF and particleboard) is limited by the relatively low value of the product and current levels of domestic supply relative to demand. In 2008, fibreboard imports amounted to AUD70 million, whilst particleboard imports totalled AUD18 million. Particleboard HS4411 also includes Oriented Strand Board (OSB). This product is not currently produced in Australia.
Copyright © Pöyry Forest IndustryA2A-20

51A11955
Figure 1-28:Australian Composite Panel Imports (2008) by Source Country
0
2
4
6
8
10
12
14
16
18
New Zea
land
China
German
y
Malays
ia
Belgium
South
Africa
United
Stat
es
German
y
New Zea
land
China
Austria
Belgium
Malays
ia
Thaila
nd
- Country of Origin -
- Value (CV) AUD million -
Fibreboard
Particleboard
Fibreboard
Fibreboard products are generally classified by density. Of the total fibreboard imports of AUD70 million, HS441192 ‘Fibreboard excluding MDF’ accounts for AUD27 million of this category. This product, given its relatively high density and the countries of origin, appears to be fibreboard made from a ‘wet’ process. This type of production has, by and large, been phased out in most developed countries. The product is generally favoured by car manufacturers for door linings. This code could also include door skins, either flat or profiled.
Copyright © Pöyry Forest IndustryA2A-21

51A11955
Figure 1-29:Australian Non-MDF Fibreboard Panel Imports (2008) by Source Country
0
1
2
3
4
5
6
7
8
9
China
German
y
South
Africa
Belgium
Malays
ia
Austria
Netherl
ands
New Zea
land
United
Stat
es
Canad
a
Other
- Country of Origin -
- Value (CV) AUD million -
The materials utilised in the manufacture of fibreboard can be sourced from sawmilling residues and as logs. These milling residues may be derived from logs of domestic or imported origin. The actual species and source of fibre is almost impossible to ascertain without a full chain of custody system in place. In some of the less developed countries that rely on numerous small suppliers, the administration of such a system might be crippling.
The next largest fibreboard product by value of imports is HS441114 MDF. This product has a density not exceeding 0.8 grams per cubic centimetre and its product range encompasses panels generally used in cabinetry.
Copyright © Pöyry Forest IndustryA2A-22

51A11955
Figure 1-30:Australian MDF Fibreboard Panel Imports (2008) by Source Country
0
2
4
6
8
10
12
14
16
18New
Zea
land
Mala
ysia
China
German
y
Portug
al
United
Stat
es
Canad
a
Irelan
d
Korea,
South
Ind
ia
Other
- Country of Origin -
- Value (CV) AUD million -
New Zealand is the dominant supplier of MDF to the Australian market, and has several MDF mills spread throughout the country. Output is manufactured almost entirely from radiata sawmill residues and round wood. This source of MDF is considered very low risk.
Malaysia has an established MDF industry which relies on a mix of plantation and limited native resources. The main species utilised is rubberwood with some acacia. Neither of these fibres are ideal for making MDF. The rubberwood contains rubber which repels paint, and acacia produces a very dark panel which has limited end-uses. The rubberwood resources have been contracting fast as land is converted to oil palm plantations. The fibre from palm trees is generally unsuitable for use in most panel products. However, there has been some research into the use of the husks after oil extraction..
Particleboard
Particleboard, like fibreboard, is made from a range of log and residue sources. Particleboard generally has a lower-value fibre furnish, although this is not always the case. As detailed previously, the AUD18 million in imports includes AUD5 million worth of OSB, which requires roundwood, as it is produced from much larger flakes.
Copyright © Pöyry Forest IndustryA2A-23

51A11955
Figure 1-31:Australian Particleboard (441011) Panel Imports (2008) by Source Country
0
1
2
3
4
5
6
New Zea
land
German
y
China
Austria
Belgium
Malays
ia
Thaila
nd
Spain
South
Africa
Sweden
Other
- Country of Origin -
- Value (CV) AUD million -
Of the particleboard imported, over 50% is coated with either a decorative laminate or melamine-impregnated paper. These products are commonly known as Melamine Faced Chip (MFC) and High Density Laminate (HDL).
The surfacing of particleboard adds significant value to an otherwise commodity product. Embossed printing techniques in Europe are more advanced than those seen in the Asia-Pacific region, providing a competitive advantage.
New Zealand supplies almost all of the raw particleboard, and a portion of the surfaced. The European countries Austria, Germany and Belgium, supply most of the surfaced particleboard. New Zealand and Western European countries are considered zero risk countries. The small volume of particleboard that comes from Asia amounted to only AUD2.4 million in 2008. The difficulty in understanding fibre supply sources and the low volume means that a full analysis of this product will not be undertaken. Illegality of the products will be assessed on a country-level risk only.
OSB imports originate almost entirely from Germany. The overall value of OSB imports is low, at AUD5 million (in 2008). Unlike North America and some parts of Europe, building practices in Australia do not result in high per-dwelling OSB consumption. OSB in Australia is often used for decorative shop outfitting or can be film-faced for construction end-uses.
Copyright © Pöyry Forest IndustryA2A-24

51A11955
Figure 1-32:Australian OSB (441012) Panel Imports (2008) by Source Country
0
0.5
1
1.5
2
2.5
3
3.5
4
4.5
5
Germany Chile Austria China Malaysia
- Country of Origin -
- Value (CV) AUD million -
Based on the practices in the supplying countries, and the relative scale of the imports, OSB imports can be considered very low risk.
Copyright © Pöyry Forest IndustryA2A-25

APPENDIX 2B
Australian Import Tables
Copyright © Pöyry Forest Industry

51A11955
APPENDIX 2B – IMPORT TABLES
WOOD HS44
n/a 1332
ValueVolume
Wood(44)
733 000 m3 421
ValueVolume
Lumber >6mm(4407 )
n/a 234
ValueVolume
T&G(4409 )
n/a 196
ValueVolume
Builders component(4418 )
241 000 m3 159
ValueVolume
Plywood /veneer(4412 )
n/a 72
ValueVolume
Other(4421 )
155 000 m3 70
ValueVolume
Fibreboard(4411 )
n/a 56
ValueVolume
Cask /Barrel(4416 )
n/a 33 .16
ValueVolume
Veneer sheet(4408 )
n/a 24
ValueVolume
Marqtry (4420 )
60 000 m3 18
ValueVolume
Particleboard(4410 )
n/a 24
ValueVolume
Balance(4402 -4406 , 4413 -4415 , 4417 , 4419
617 000 m3 406
ValueVolume
Coniferous(440710 )
46 614 m 3 54
ValueVolume
Other tropical(440729 )
24 153 m3 21
ValueVolume
Red Meranti(440726 )
9 567 m3 13
ValueVolume
Oak(440791 )
30 246 20
ValueVolume
Other non conifer(440799 )
x x
ValueVolume
Balance(
75 278 m3 65
ValueVolume
Coniferous(440910 )
n/a 169
ValueVolume
Non coniferous
n/a 46
ValueVolume
Door + frame(441820 )
634 000 m2 18
ValueVolume
Assembled flooring(441872 )
n/a 13
ValueVolume
Posts & beams(441860 )
277 000 m2 7
ValueVolume
Assembled flooring(441879
n/a 6
ValueVolume
Windows + frames(441810 )
n/a 106
ValueVolume
Other(441890 )
105 647 m3 46
ValueVolume
Plywood o /t bamboo(441239 )
57 969 m3 47
ValueVolume
Plywood o /t Bam .(trop )(441231 )
20 805 m3 15
ValueVolume
Plywood o /t Bam . Non conifer (441232 )
6 679 m3 2
ValueVolume
Bamboo ply(441210 )
47 197 m3 34
ValueVolume
Other(441299 )
29 069 m3 27
ValueVolume
Fibreboard exl MDF(441192 )
n/a 66
ValueVolume
Other (442190 )
8.8million 6
ValueVolume
Clothes hangers(442110 )
75 224 m3 23
ValueVolume
MDF(441114 )
12 842 m3 10
ValueVolume
MDF 5mm -9mm(441113 )
8 531 m3 6
ValueVolume
MDF <5mm(441112 )
18 811 m3 2
ValueVolume
MDF low density(441194 )
n/a 4
ValueVolume
Coniferous(440810 )
n/a 25
ValueVolume
Other non coniferous(440890 )
n/a 4
ValueVolume
Other Tropical (449839 )
42 872 m3 12
ValueVolume
Waferboard(441011 )
12 105 m3 5
ValueVolume
OSB(441012 )
n/a 1332
ValueVolume
Wood(44)
733 000 m3 421
ValueVolume
Lumber >6mm(4407 )
n/a 234
ValueVolume
T&G(4409 )
n/a 196
ValueVolume
Builders component(4418 )
241 000 m3 159
ValueVolume
Plywood /veneer(4412 )
n/a 72
ValueVolume
Other(4421 )
155 000 m3 70
ValueVolume
Fibreboard(4411 )
n/a 56
ValueVolume
Cask /Barrel(4416 )
n/a 33 .16
ValueVolume
Veneer sheet(4408 )
n/a 24
ValueVolume
Marqtry (4420 )
60 000 m3 18
ValueVolume
Particleboard(4410 )
n/a 24
ValueVolume
Balance(4402 -4406 , 4413 -4415 , 4417 , 4419
617 000 m3 406
ValueVolume
Coniferous(440710 )
46 614 m 3 54
ValueVolume
Other tropical(440729 )
24 153 m3 21
ValueVolume
Red Meranti(440726 )
9 567 m3 13
ValueVolume
Oak(440791 )
30 246 20
ValueVolume
Other non conifer(440799 )
x x
ValueVolume
Balance(
75 278 m
ValueVolume
Marqtry (4420 )
60 000 m3 18
ValueVolume
Particleboard(4410 )
n/a 24
ValueVolume
Balance(4402 -4406 , 4413 -4415 , 4417 , 4419
617 000 m3 406
ValueVolume
Coniferous(440710 )
46 614 m 3 54
ValueVolume
Other tropical(440729 )
24 153 m3 21
ValueVolume
Red Meranti(440726 )
9 567 m3 13
ValueVolume
Oak(440791 )
30 246 20
ValueVolume
Other non conifer(440799 )
x x
ValueVolume
Balance(
75 278 m3 65
ValueVolume
Coniferous(440910 )
n/a 169
ValueVolume
Non coniferous
n/a 46
ValueVolume
Door + frame(441820 )
634 000 m2 18
ValueVolume
Assembled flooring(441872 )
n/a 13
ValueVolume
Posts & beams(441860 )
277 000 m2 7
ValueVolume
Assembled flooring(441879
n/a 6
ValueVolume
Windows + frames(441810 )
n/a 106
ValueVolume
Other(441890 )
105 647 m3 46
ValueVolume
Plywood o /t bamboo(441239 )
57 969 m3 47
ValueVolume
Plywood o /t Bam .(
3 65
ValueVolume
Coniferous(440910 )
n/a 169
ValueVolume
Non coniferous
n/a 46
ValueVolume
Door + frame(441820 )
634 000 m2 18
ValueVolume
Assembled flooring(441872 )
n/a 13
ValueVolume
Posts & beams(441860 )
277 000 m2 7
ValueVolume
Assembled flooring(441879
n/a 6
ValueVolume
Windows + frames(441810 )
n/a 106
ValueVolume
Other(441890 )
105 647 m3 46
ValueVolume
Plywood o /t bamboo(441239 )
57 969 m3 47
ValueVolume
Plywood o /t Bam .(trop )(441231 )
20 805 m3 15
ValueVolume
Plywood o /t Bam . Non conifer (441232 )
6 679 m3 2
ValueVolume
Bamboo ply(441210 )
47 197 m3 34
ValueVolume
Other(441299 )
29 069 m3 27
ValueVolume
Fibreboard exl MDF(441192 )
n/a 66
ValueVolume
Other (442190 )
8.8million 6
ValueVolume
Clothes hangers(442110 )
75 224 m3 23
ValueVolume
MDF(441114 )
12 842 m3 10
ValueVolume
MDF 5mm -9mm(441113 )
8 531 m3 6
ValueVolume
MDF <5mm(441112 )
trop )(441231 )
20 805 m3 15
ValueVolume
Plywood o /t Bam . Non conifer (441232 )
6 679 m3 2
ValueVolume
Bamboo ply(441210 )
47 197 m3 34
ValueVolume
Other(441299 )
29 069 m3 27
ValueVolume
Fibreboard exl MDF(441192 )
n/a 66
ValueVolume
Other (442190 )
8.8million 6
ValueVolume
Clothes hangers(442110 )
75 224 m3 23
ValueVolume
MDF(441114 )
12 842 m3 10
ValueVolume
MDF 5mm -9mm(441113 )
8 531 m3 6
ValueVolume
MDF <5mm(441112 )
18 811 m3 2
ValueVolume
MDF low density(441194 )
n/a 4
ValueVolume
Coniferous(440810 )
n/a 25
ValueVolume
Other non coniferous(440890 )
n/a 4
ValueVolume
Other Tropical (449839 )
42 872 m3 12
ValueVolume
Waferboard(441011 )
12 105 m3 5
ValueVolume
OSB(441012 )
Copyright © Pöyry Forest Industry A2B-1

51A11955
FURNITURE HS94
n/a 3 472
ValueVolume
Furniture & Bedding(94)
n/a 1 423
ValueVolume
Other (not seat)(9403)
446 676t 1 115
ValueVolume
Seat(9401)
n/a 541
ValueVolume
Lamps/Lighting(9405)
n/a 264
ValueVolume
Bedding(9404)
n/a 72
ValueVolume
Prefabricated Building(9406)
n/a 57
ValueVolume
Medical/Surgical etc(9402)
n/a 462
ValueVolume
Other wood(940360)
n/a 317
ValueVolume
Other metal(940320)
n/a 247
ValueVolume
Wooden bedroom(940350)
n/a 166
ValueVolume
Other(940390)
n/a 36
ValueVolume
Wooden kitchen(940340)
n/a 67
ValueVolume
Wooden office(940330)
n/a 65
ValueVolume
Wooden frame not upholstered (940169)
n/a 232
ValueVolume
Metal framed(940171,940179)
n/a 171
ValueVolume
Parts of seats(940190)
n/a 479
ValueVolume
Other wooden upholstered (940161)
Copyright © Pöyry Forest Industry A2B-2

51A11955
PAPER HS48
n/a 2 925
ValueVolume
Paper & Paperboard(48)
761 564t 836
ValueVolume
Coated(4810)
446 676t 483
ValueVolume
Uncoated Writing(4802)
n/a 348
ValueVolume
Toilet Paper(4818)
n/a 300
ValueVolume
Other NESOI(4811)
198 834t 167
ValueVolume
Newsprint(4801)
60 073t 157
ValueVolume
Carton(4819)
n/a 133
ValueVolume
Registers/notebooks(4820)
n/a 114
ValueVolume
Papr/pbr/cel wadding to size (4823)
271 825 299
Value Volume
Pap/Pbrd, Writ/Prnt, clay ctd (481019)
201 867 215
Value Volume
Pap, LWC > 10% Mech (481022)
110 089 125
Value Volume
Pap/Pbrd for Writ/Prnt, clay ctd (481013)
90 120 100
Value Volume
Ppr/Pbrd Ex LWC etc Clay ctd (481029)
218 455 199
ValueVolume
Pap/Pbrd Unctd, Rolls (480261)
104 332 131
ValueVolume
Pap Unctd, 40-150 GSM, sheets (480256)
56 051 69
ValueVolume
Pap/Pbrd 40-150 GSM (480257)
n/a 185
ValueVolume
Sani/Dia & Sani art of Pap (481840)
n/a 63
ValueVolume
Handkerchiefs, Tis/Tow (481820)
37 059 70
ValueVolume
Toilet Pap (481810)
n/a 167
ValueVolume
Pap/Pbrd/cellulose wadding (481190)
n/a 68
ValueVolume
Gum/Adhesive pap/Pr sensitive (481141)
198 834t 167
ValueVolume
News, rolls/sheets (480100)
18 114 54
ValueVolume
Folding Cartons, non corrugated (481920)
13 309 47
ValueVolume
Sack and bag (481940)
n/a 79
ValueVolume
Rgstrs/Acct bks/Notebks/Lttr pad
(482010)
n/a 55
ValueVolume
Trays/dishes/cups (482369)
n/a 50
ValueVolume
Articles of Pap/pulp/pprbrd (482390)
101 900 107
ValueVolume
Kraft Pap/pbrd, Unctd Nesoi (4804)
51 693 37
ValueVolume
Kraft liner/rolls and sheets (480411)
14 943 29
ValueVolume
Kraft paper, Unctd, Unblchd (480439)
42 547 70
ValueVolume
Toilet pap/Sanitary stock pap (4803)
Copyright © Pöyry Forest Industry A2B-3

APPENDIX 3
SFM Certification
Copyright © Pöyry Forest Industry

APPENDIX 3 – SFM CERTIFICATION AND CHAIN OF CUSTODY
From an Australian perspective, the two international forest certifications schemes currently dominating are the FSC (Forest Stewardship Council) and the PEFC (Programme for the Endorsement of Forest Certification). Various national level schemes have also developed, some of which are recognised by, or are seeking recognition by the FSC or the PEFC. It may be necessary to evaluate the various national level schemes that are not recognised by the PEFC in order to reduce the burden on Australian importers. It would be feasible, no doubt, to publish a list of recognised schemes that importers could rely on in undertaking import risk assessments.
The FSC is an independent, non-governmental, non-profit organisation established to promote the responsible management of the world’s forests. The FSC has offices in 46 countries around the world. Products carrying the FSC label are independently certified to assure consumers that they come from well-managed forests.
The FSC accredits and monitors forest certification organisations such as SGS and SmartWood. These organisations are authorised to certify the management of specific forest areas. Once certified, there are regular visits to the forests to ensure that compliance is maintained. The FSC certification carries a high level of credibility with ENGOs and wood product markets, and assists with log marketing.
The PEFC is an independent, non-profit, non-governmental organisation, founded in 1999. It promotes sustainable managed forests through independent third party certification.
The PEFC is a global umbrella organisation for national forest certification schemes. These national schemes build upon the inter-governmental processes for the promotion of sustainable forest management.
i Seneca Creek and Associates. 2004. ““Illegal” Logging and Global Wood Markets: The Competitive Impacts on the U.S. Wood Products Industry”. Prepared for American Forest and Paper Association by Seneca Creek Associates and Wood Resources Internationalii Free On Board (F.O.B.) – A standard reference to the price of merchandise on the border or at a national port. In FOB contracts, the seller is obliged to have the goods packaged and ready for shipment at the place agreed upon, and purchaser agrees to cover all ground transport costs, and to insure against all risks in the exporting country, together with subsequent transport costs and expenses incurred in loading the goods onto the chosen means of transport.iii Cost, Insurance, and Freight Import Value (C.I.F.) – This value represents the landed value of the merchandise at the first port of arrival in the importing country. It is computed by adding "Import Charges" to the "Customs Value" and therefore excludes import duties. Custom Import Value (CV) – This value is generally defined as the price actually paid or payable for merchandise when sold for exportation, excluding import duties, freight, insurance, and other charges incurred in bringing the merchandise to the importing country.iv CITES – Convention on International Trade in Endangered Species.v Seneca Creek and Associates. 2004. ““Illegal” Logging and Global Wood Markets: The Competitive Impacts on the U.S. Wood Products Industry”. Prepared for American Forest and Paper Association by Seneca Creek Associates and Wood Resources Internationalvi Amendments to the LACEY Act have been made since the Seneca report was released. These amendments strengthen reporting requirements.vii Harmonised System - A multipurpose international product nomenclature developed by the World Customs Organization (WCO). It comprises about 5 000 commodity groups; each identified by a six-digit code, and aims to provide uniform classification. Custom Import Value (CV) – This value is generally defined as the price actually paid or payable for merchandise when sold for exportation, excluding import duties, freight, insurance, and other charges incurred in bringing the merchandise to the importing country.
Copyright © Pöyry Forest IndustryA3-1

The assessment process for a national forest certification system to join the PEFC involves a) first creating a national certification system in co-operation with different stakeholder groups within the society, and b) independent assessment of the scheme.
Chain of Custody (C-o-C)
Chain of Custody (C-o-C) is the chronological trail of documentation (in paper or electronic format) tracing from source to end-use. It is used to verify that wood has come from legal sources. The C-o-C is verified by independent, accredited experts.
The FSC and PEFC certification schemes include possibility for both forest management certification and certification of the C-o-C.
viii Mechanical grades of paper are those produced using pulp produced from a mechanical pulping process where the lignin in the wood is not removed.ix Woodfree grades of paper are those produced using pulp made from a chemical pulping process where the lignin in the wood is removed by chemical processes.
Copyright © Pöyry Forest IndustryA3-2