Embed Size (px)
Citation preview
Report D6.2, December 2016
Comparison of auctions and
alternative policy options for
RES-E support

Report D6.2, December 2016
Comparison of auctions and alternative policy options for RES-E support
Authors: Lena Kitzing (DTU), Marco Islam (DTU), Oscar Fitch-Roy (University of Exeter)
AURES; a coordination and support action of the EU Horizon 2020 program, grant number 646172.
Executive Summary
This report concludes the work carried out in the course of Task 6.2 of the AURES project. It is its aim to
compare auctions with alternative policy instruments and in particular, to examine under which circumstances
auctions may be superior and inferior to achieve intended policy targets. For that purpose, we identify a
number of potential drivers that might affect an instrument’s effectiveness, its efficiency and further success
criteria. Among this list of relevant drivers, the basis for our analysis is the factor risk, where our core focus is
on risk for policy makers. Assuming a world of uncertainty, particularly policy makers or regulators are
exposed to the risk of setting inefficient investment incentives by implementation of wrong policy. As such, the
aspect of risk is deemed one of the most important challenges for the deployment of RES. We demonstrate
that risk and uncertainty respectively constitute important factors understanding the decision-making of policy
makers regarding which instrument to use. However, we also point out that independent of its importance, the
factor risk constitutes only one of many factors, which may be relevant when selecting a policy instrument.
Our main analysis consists of two parts: First, we conduct a theoretical analysis, which summarises the
insights gathered by Weitzman (1974). It illustrates that with uncertainty regarding the marginal costs and
marginal benefits of RES, particularly the choice between price (e.g. a FIT) and quantity (e.g. an auction)
instruments will be decisive, since incorrect price or quota signals may have different effects. In essence,
while price schemes may reduce the risk of welfare losses given a relatively steep marginal cost and a
comparably flat marginal benefit curve, a quantity scheme may be superior if the relation between the two
curves is vice versa.
In the second part of our analysis, we employ modelled data by Held (2010) in order to build on the theoretical
insights and compare the slopes of real marginal cost of RES in different European countries. Our main
conclusions can be summarised as follows:
1. The incentives for the use of particular policy instruments to support the deployment of RES are both
country and technology specific. In general, it appears that the incentive to employ a quantity-based
mean such as an auction is larger when the natural resources of the technology that is to be
supported are abundant and if that technology is rather well developed. Besides that, it requires a
competitive market for an auction to be effective.
2. Since within a country the market and natural conditions of the different RES technologies and hence
their supply costs may vary considerably, it seems possible that there exist incentives for both price
and quantity support schemes. Our findings therefore provide an argument against a technology-
neutral support.
3. Our analysis stresses the importance to consider temporal developments. Since both the potentials
and the costs of the different RES technologies will change over time, so may the incentives for their
support. It is therefore not only necessary to conduct a static assessment of RES potentials and their
costs respectively but also to consider their dynamics
Our findings suggest that with uncertainty regarding the marginal costs and marginal benefits of RES, there
may be valid reasons for policy makers not to employ auctions, since under particular circumstances it may be

desirable not to control quantities but the price. As such, they raise the question whether pure support cost
minimisation should be the only goal when implementing regulatory policies. Our report develops useful
insights, which may serve to argue for exceptional cases towards the European Commission. Moreover, it
provides guidance to policy makers by indicating how to conduct similar yet case specific analyses.
Table of contents
1 Introduction ................................................................................................................................................... 6
1.1 Focus, approach and aim of this report ............................................................................................... 7
2 Context for the decision about optimal support instrument .......................................................................... 8
3 Academic discourse of support instrument choice ....................................................................................... 9
3.1 Direct Comparison of Policy Instruments ............................................................................................ 9
3.2 Prices vs. Quantities .......................................................................................................................... 12
4 Marginal cost curves of RES technologies: Steep or flat? ......................................................................... 15
4.1 Cost-potential curves for selected technologies ................................................................................ 16
4.1.1 Onshore Wind ................................................................................................................................ 16
4.1.2 Solar PV ......................................................................................................................................... 18
4.1.3 Biomass ......................................................................................................................................... 19
4.1.4 Comparison of Technologies ......................................................................................................... 21
4.2 Development of cost-curves over time .............................................................................................. 23
4.3 Preliminary Conclusions and Discussion ........................................................................................... 25
5 Impact of secondary policy objectives and socio-political feasibility on instrument choice........................ 27
5.1 National objectives: local impacts ...................................................................................................... 27
5.2 European objectives: contribution to internal market (Cross-border cooperation potential) ............. 28
5.3 State Aid compliance ......................................................................................................................... 29
6 Overall discussion and conclusions ........................................................................................................... 31
6.1 Relevance of the study for real life application .................................................................................. 31
6.2 Limitations of the study ...................................................................................................................... 32
6.3 Outlook: Are hybrid schemes the perfect compromise? .................................................................... 33
6.4 Concluding remarks ........................................................................................................................... 34
7 References ................................................................................................................................................. 35

6
1 Introduction
This report concludes Task 6.2 of the AURES project, in which we sought to analyse how auctions perform
relative to alternative control instruments. More precisely, the following analysis intends to answer the
research question when, i.e. under which circumstances, auctions may be superior or inferior to
achieve intended policy targets and the report thereby seeks to provide suggestions/recommendations for
policy makers on when to draw on auctions for RES support.
We explore this research question by paying particular focus to the market circumstances and policy
objectives that might make alternative support instruments more attractive. Thereby, we derive conclusions,
among other things, with respect to the typical (sub-sets of) technologies for which auctions do not seem
relevant and to the typical levels of maturity that technologies should have before auctions become
favourable.
In their latest State aid guidelines the European Commission (2014) demands the gradual introduction of
competitive bidding processes (auctions) for RES support in order to reduce market distortions and to enable
a cost-effective support. Member States may, however, refrain from employing auctions under certain
circumstances. The first mentioned alternative to auctions in the state aid guidelines are certificate trading
schemes. They are considered sufficiently market-based and competitive and may thus be used as
previously. For price-based schemes (such as administratively set feed-in tariffs or direct subsidies), several
concrete exceptions are named in the guidelines, e.g. for small installation sizes and demonstration projects.
See more detail on this in Section 5.3.
Further, Member States (MS) may be allowed to employ alternatives to auctions if they can convincingly
argue for circumstances in which only a very limited number of sites or projects are available, or the
implementation of auctions would lead to low project realisation rates or higher support levels (see more in
Section 5.3). These last points are perfectly relate to the policy success criteria defined in WP2 of this project.
Table 1 lists all seven criteria and indicators for measuring policy success.
If auctions lead to low project realisation rates, then they do not fulfil the success criterion of effectiveness.
Higher support levels per technology fail to address the policy objective of low support costs. Note that this
issue is not identical to reducing static efficiency, i.e. the reduction of generation costs. A consideration of
socio-political feasibility is more ambiguous. It acknowledges that policy makers might pursue multiple targets
with their energy policy, which are not only related to purely economic considerations of achieving the most
cost-efficient deployment of renewables up to the socially desired volume. There can be more complex policy
objectives that might be difficult to address with auctions, e.g. achieving a certain amount of technology
diversification (e.g. because of security of supply concerns), avoiding regional concentration of deployment
(e.g. because of system stability concerns), promoting local industry (although this explicit target has legal
feasibility issues especially in a European context), protecting small actors, enhancing social acceptability,
and more.
Which arguments are acceptable to the European Commission to justify exemptions from auctions remains to
be seen, as only a very limited number of cases is available at this moment. Compliance with the European
State aid guidelines is discussed further in Section 5.3.

7
Table 1: Policy success criteria and measurable indicators for assessing policy options as defined in the AURES project
Policy success criteria Measurable indicators
Effectiveness Realisation rate
Static efficiency Total generation costs
(Private) transaction costs
Administrative costs
Dynamic efficiency Private R&D investments
Evolution of market shares and costs of technologies over time
Support costs Average support level per technology (net of generation costs)
Total support costs (net of generation costs)
Local impacts Emissions, Reduction of fuel imports, promotion of local industry, regional
concentration of deployment, additional jobs in the sector
Socio-political feasibility Fit to decision makers’ institutional capacity, number of small actors, social
acceptability
Legal feasibility Compliance with state aid rules, internal market principals, other rules and
regulations
1.1 Focus, approach and aim of this report
The aim of this report is to explore when auctions may not be the favourable support instrument. We focus
mostly on economic aspects, in order to evaluate the effectiveness and efficiency of auctions, but we also
touch upon secondary policy objectives that may play a role. For answering the question of which support
instrument is favourable, two important aspects have to be known: First, under which economic circumstances
are auctions inferior to alternatives and second which alternative shall be used instead?
We approach these questions in several steps: First, we provide a context for the arguments that might be
brought forward as justification for not employing auctions for renewable support and elaborate on
interrelations between the success criteria and potential drivers behind. In doing so, we build on the insights
from task 6.1 of this project that already listed pros and cons of different alternative instruments. Second, we
review and set into perspective arguments for and against different support instruments that have been
brought forward in the academic discourse on the issue. Here we focus on studies that compare auctions with
alternative support instruments and analyse how each instrument performs under different economic
circumstances. Third, we go into detail thereby particularly focusing on the aspect of risk and analyse the
impact of market situations and policy objectives on the optimal choice of policy instrument. For this, we draw

8
on the strong theoretical foundation of policy instrument analysis that has been developed throughout the last
four decades. Finally, we exploit modelled data to show the practical relevance of the theoretical conclusions
for the optimal choice of policy instrument for different RES technologies. This allows us to draw specific
conclusions about which policy instrument (auction or alternative) may be favourable for different technologies
and different country-specific circumstances.
In this report, we thus aim to develop a more comprehensive understanding for when auctions are
economically favourable, and to provide assistance to policy makers for when alternatives should be
considered.
2 Context for the decision about optimal support
instrument
Figure 1: Overview over the main question and the focus and approach taken in this report
Figure 1 illustrates the research questions of the present report and how it approaches the challenges in the
context described above. It is apparent that multiple drivers may affect the defined success criteria of auctions
in similar ways. In this report we only briefly touch on the aspects of secondary objectives (through the impact
on domestic industry and social acceptance) and on Europeanisation (through cross-border support aspects).
Instead, our particular focus is on the factor risk, as risk for both investors and policy makers represents one
of the most important challenges for the deployment of RES and one of the major factors for the success of
competitive and market-based support instruments. It is thus an important goal to reduce risk elements by
means of prudent choice and correct adjustments of policy instruments.
In general, risk can be seen from an investor’s or a regulator’s perspective, where it is important to distinguish
between the two. For investors, risk constitutes an additional barrier exacerbating the participation in the
respective RES market. It increases investors’ costs of debt and their costs of equity respectively. For
regulators, on the other hand, risk, which comes along with uncertainty, may result in suboptimal policy and
thus may pose a jeopardy to societal welfare.
In the course of the following work, particularly the risks faced by policy makers shall be in the centre of
attention. For that purpose, we will build on a theoretical framework developed by Martin Weitzman (1974)
and employ modelled cost-potential data by Anne Held (2010) in order to perform our own analysis. This shall
Potential drivers:
Risk
Transaction cost
Secondary objectives
Europeanisation
Under which circumstances may
auctions be superior or inferior to
achieve intended policy targets?
For which technologies?
For which market situations?
For which policy objectives?
Main question addressed in this report: Assessing the appropriateness
of auctions and alternatives:
Affected success criteria:
Effectiveness
Support costs
Local Impacts
Socio-political feasibility
Drivers for the perfor-
mance of auctions and
alternatives:
Main focus of the
investigation:
Domestic industry
Social acceptance
Investor risk
Policy risk
(regulator’s regret)
Cross-border support
Internal market rules
9
help to provide answers to the research questions raised above. However, to account for the fact that risk only
constitutes part of the bigger picture, we also seek to set it into perspective through the additional sections on
secondary objectives and Europeanisation and discuss their potential impacts on the relevance of our study
for real life application.
3 Academic discourse of support instrument choice
Practically since their commercial emergence, it has been possible to observe a discussion about how to
efficiently support the deployment of RES. Until today, questions regarding the suitability of support
instruments are highly prominent and determine the agenda of environmental and energy policy respectively.
In this, scholars derive very different conclusions about which policy instrument should be employed when –
the discourse is highly controversial. In this light, this report cannot show any final conclusions, but it can
highlight some of the arguments brought forward and set them into perspective in regards to the questions
addressed here.
Broadly speaking, the literature comparing RES support instruments can be distinguished in two strands. The
first strand, usually building on empirical methods and case study analyses, is primarily concerned with
conducting direct comparisons of the different support instruments in place. Often, studies from this domain
consist of country specific analyses where the performance of a policy instrument is investigated in relation to
a different instrument in another country. The second strand, in contrast, is mostly of theoretic nature and
more general. It is less concerned with particular instruments as such but rather dedicated to develop an
understanding for the differences between price and quantity regulations – the two general criteria to
categorise all instruments. Research within this strand goes back until 1974, when Martin Weitzman published
his seminal article “Prices vs. Quantities”, which is highly relevant until today. The following review is intended
to provide an overview of the core literature of these two strands.
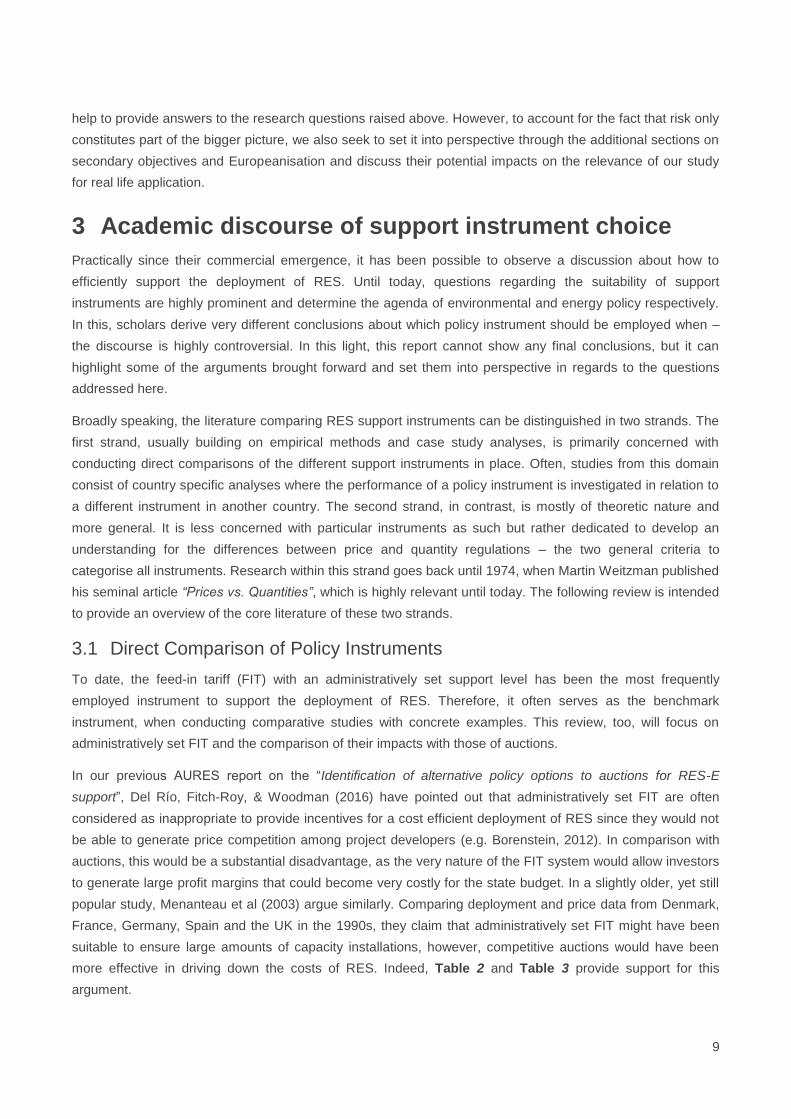
3.1 Direct Comparison of Policy Instruments
To date, the feed-in tariff (FIT) with an administratively set support level has been the most frequently
employed instrument to support the deployment of RES. Therefore, it often serves as the benchmark
instrument, when conducting comparative studies with concrete examples. This review, too, will focus on
administratively set FIT and the comparison of their impacts with those of auctions.
In our previous AURES report on the “Identification of alternative policy options to auctions for RES-E
support”, Del Río, Fitch-Roy, & Woodman (2016) have pointed out that administratively set FIT are often
considered as inappropriate to provide incentives for a cost efficient deployment of RES since they would not
be able to generate price competition among project developers (e.g. Borenstein, 2012). In comparison with
auctions, this would be a substantial disadvantage, as the very nature of the FIT system would allow investors
to generate large profit margins that could become very costly for the state budget. In a slightly older, yet still
popular study, Menanteau et al (2003) argue similarly. Comparing deployment and price data from Denmark,
France, Germany, Spain and the UK in the 1990s, they claim that administratively set FIT might have been
suitable to ensure large amounts of capacity installations, however, competitive auctions would have been
more effective in driving down the costs of RES. Indeed, Table 2 and Table 3 provide support for this
argument.
10
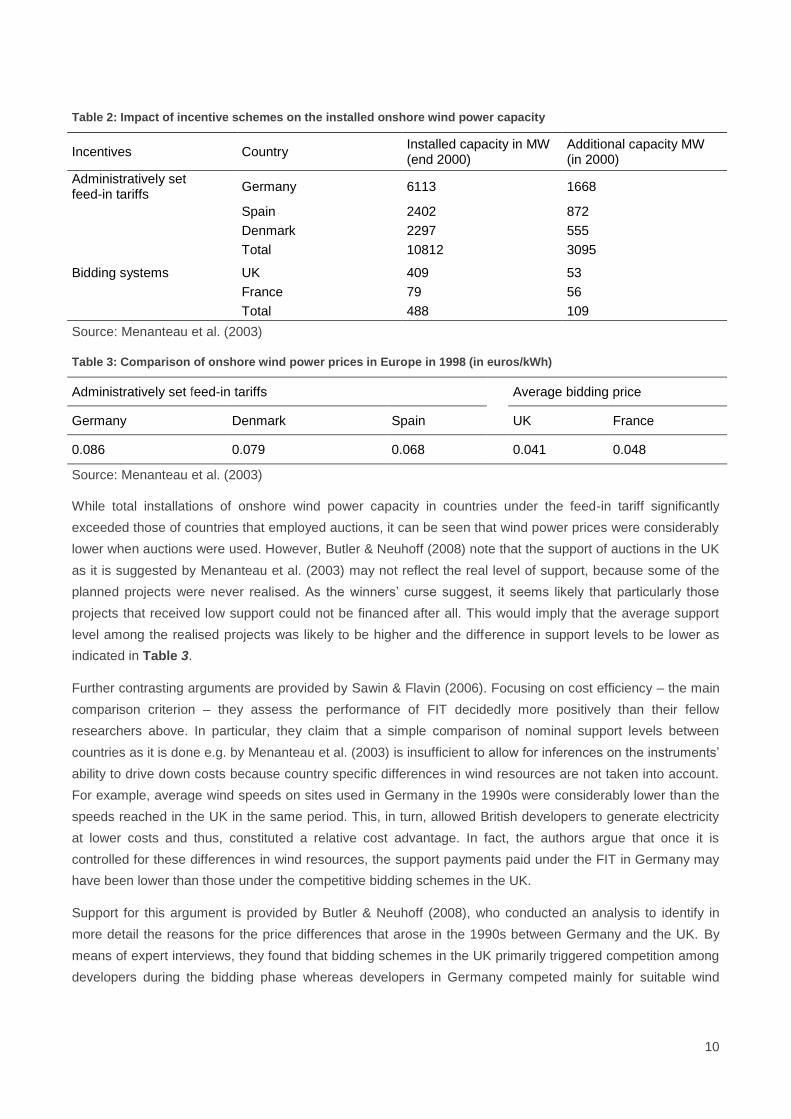
Table 2: Impact of incentive schemes on the installed onshore wind power capacity
Incentives Country Installed capacity in MW (end 2000)
Additional capacity MW (in 2000)
Administratively set feed-in tariffs
Germany 6113 1668
Spain 2402 872
Denmark 2297 555
Total 10812 3095
Bidding systems UK 409 53
France 79 56
Total 488 109
Source: Menanteau et al. (2003)
Table 3: Comparison of onshore wind power prices in Europe in 1998 (in euros/kWh)
Administratively set feed-in tariffs
Average bidding price
Germany Denmark Spain UK France
0.086 0.079 0.068 0.041 0.048
Source: Menanteau et al. (2003)
While total installations of onshore wind power capacity in countries under the feed-in tariff significantly
exceeded those of countries that employed auctions, it can be seen that wind power prices were considerably
lower when auctions were used. However, Butler & Neuhoff (2008) note that the support of auctions in the UK
as it is suggested by Menanteau et al. (2003) may not reflect the real level of support, because some of the
planned projects were never realised. As the winners’ curse suggest, it seems likely that particularly those
projects that received low support could not be financed after all. This would imply that the average support
level among the realised projects was likely to be higher and the difference in support levels to be lower as
indicated in Table 3.
Further contrasting arguments are provided by Sawin & Flavin (2006). Focusing on cost efficiency – the main
comparison criterion – they assess the performance of FIT decidedly more positively than their fellow
researchers above. In particular, they claim that a simple comparison of nominal support levels between
countries as it is done e.g. by Menanteau et al. (2003) is insufficient to allow for inferences on the instruments’
ability to drive down costs because country specific differences in wind resources are not taken into account.
For example, average wind speeds on sites used in Germany in the 1990s were considerably lower than the
speeds reached in the UK in the same period. This, in turn, allowed British developers to generate electricity
at lower costs and thus, constituted a relative cost advantage. In fact, the authors argue that once it is
controlled for these differences in wind resources, the support payments paid under the FIT in Germany may
have been lower than those under the competitive bidding schemes in the UK.
Support for this argument is provided by Butler & Neuhoff (2008), who conducted an analysis to identify in
more detail the reasons for the price differences that arose in the 1990s between Germany and the UK. By
means of expert interviews, they found that bidding schemes in the UK primarily triggered competition among
developers during the bidding phase whereas developers in Germany competed mainly for suitable wind
11
sites. As mentioned above, wind speeds in Germany are on average lower than in the UK because the
variance between the different sites is large. Logically, the differences in the wind resource are reflected in the
land lease. That is, while developers in the UK might have had to bear seemingly lower support but were able
to keep large parts of the revenue streams to build their own profit margins, support payments in Germany
were often passed on by the developers and reaped by land owners. As such, one factor to explain the
difference in the support levels was that developers in Germany had to pay higher charges for their land use
than developers in the UK.
Another important factor was the signalling effect of a slightly higher FIT. Compared to the British tenders,
which were often run in intermittent intervals and thus caused instable investment conditions (Del Río &
Linares, 2014), the German FIT entailed a more secure and encouraging investment climate (Lauber, 2004;
Mitchell, Bauknecht, & Connor, 2006). Since support payments were paid for all realised projects and
throughout their whole lifetime, the FIT inherently reduced possible risks as well as uncertainties and therefore
entailed relatively low capital costs (Ofgem, 2007). In turn, the security of the FIT stimulated the development
of the domestic production industry and generated competition in this sector. This development is considered
decisive and is regarded as the foundation for additional cost decreases, both domestically and across
borders. To date, the European market for wind production is mainly dominated by companies operating in
Germany, Denmark and Spain. All these countries implemented a FIT to support their wind industry.
As Kitzing & Mitchell (2014) emphasise, reducing risk exposure for private investors is particularly important
during the early stages of a transition period. Allowing investors to lower their costs of debt and their cost of
equity respectively, a reduction of risks ensures a fast deployment of RES and facilitates the growth of niches
where different technologies are protected to develop until they reach the stage to be integrated in the existing
energy system. It is commonly agreed that administratively set FIT, compared to auctions, entail lower market
risks. As such, they are often considered better suited to ensure the development and deployment of
technologies that are immature and not yet ready to compete on the markets (Batlle, Pérez-Arriaga, &
Zambrano-Barragán, 2012; Del Río & Linares, 2014). Moreover, while technology-specific FIT usually allow
different technologies to develop in parallel, only few (usually the cheapest technologies at the respective
point in time) manage to prevail under technology-neutral tendering schemes (Del Río & Linares, 2014; Lipp,
2007).
Finally, although usually disregarded in economic analyses, transaction costs often constitute a considerable
part of the costs of a support instrument. As such, they should play an important role when analysing an
instrument’s cost-effectiveness (Del Río & Linares, 2014). There is broad consensus that due to their
bureaucratic procedures and their complexity, the transaction costs of auctions are higher than those of
administratively set support (see e.g. Agnolucci, 2007; Finon & Menanteau, 2004). Particularly during the
auctions in France and the UK, they were an important factor for the low installation rates (Menanteau et al.,
2003). As emphasised by Del Río & Linares (2014), the high transaction costs of auctions may easily
outweigh some of their possible advantages, especially for small investors. While this might reduce market
competition and hamper the efficiency of auctions, it might as well lead to issues of social acceptance (Edge,
2006). Eventually, transaction costs may raise entry barriers and thereby impede the market access for
innovative yet undeveloped technologies.
12
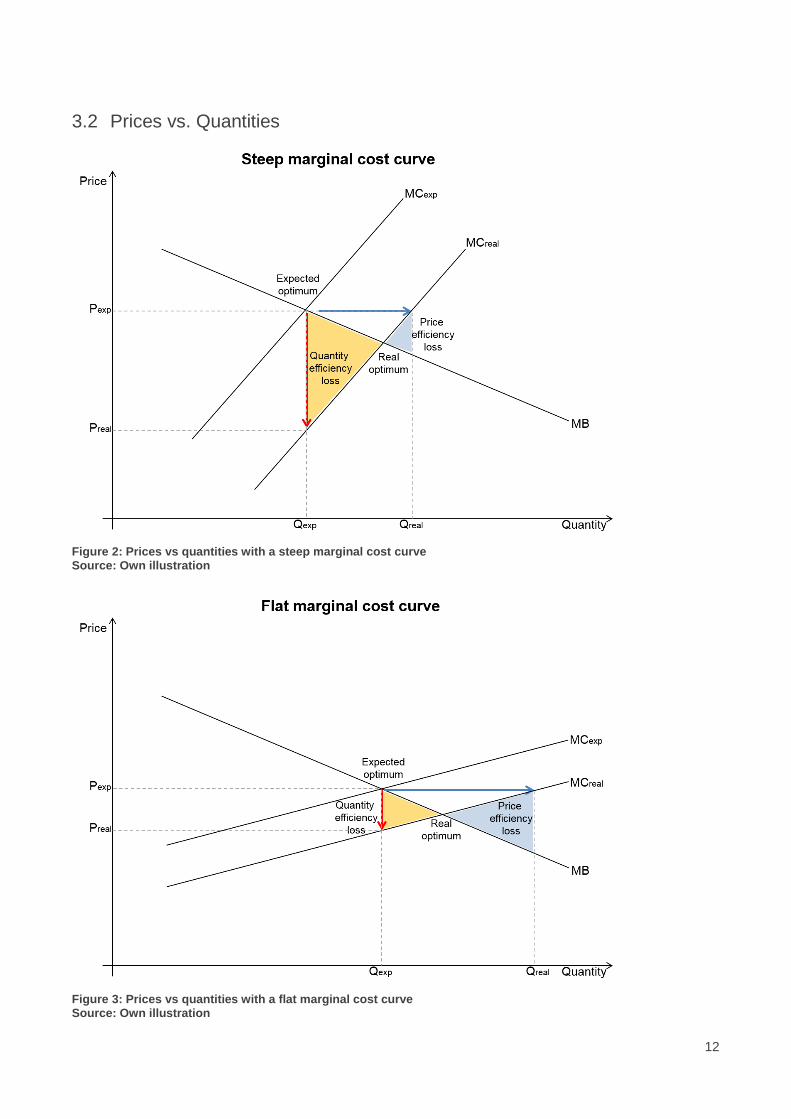
3.2 Prices vs. Quantities
Figure 2: Prices vs quantities with a steep marginal cost curve Source: Own illustration
Figure 3: Prices vs quantities with a flat marginal cost curve Source: Own illustration
13
In the remainder of this section, the focus of analysis shall be on the literature that is more theoretical. This
literature takes a rather general perspective and defines policy instruments somewhat more broadly. That is, it
does not in particular focus on comparing FIT and auctions based on their specific features and
characteristics but rather aims at understanding the core differences that come along with their nature. In
principal, all RES support instruments may be defined either as price or as quantity instruments depending on
which of the two variables is exogenously given by the instrument. Thus, FIT with a predetermined support
price can be considered a price instrument whereas auctions and tendering schemes may be understood as
quantity instruments.1 This part of the review intends to examine the above touched risk aspect in more detail,
where risk shall be regarded from the perspective of a regulator. It will summarise the theoretical arguments
for and against the two instruments and thereby lay out the foundation for the analysis that is to follow in
section 4.
It is an essential lesson from resource allocation theory that prices and quantities – the two means of control –
are strongly connected in that a particular outcome can always be achieved on two ways; either by setting a
price or by setting the corresponding quantity. In fact, in a well-functioning market (i.e. under perfect
competition) and one of perfect knowledge (i.e. under perfect information and certainty) there will be no
difference between the two means such that a preference for one or the other should not exist (see e.g.
Cropper et al., 1992; Weitzman, 1974). This symmetry between the two modes will blur, however, once the
strong assumption of certainty proves not to hold, and regulators are exposed to the risk of setting inefficient
incentives. In that case, both price and quantity instruments may entail fundamentally different results.
The disparity of price and quantity regulation was first demonstrated by Martin Weitzman (1974) in his much
cited paper “Prices vs Quantities”. The paper investigates a situation of uncertainty regarding the marginal
cost and the marginal benefit function, which implies an additional risk for the regulator to set inefficient prices
and quantities. More precisely, the uncertainty induces a change of the regulator’s optimisation problem; while
under certainty, the regulator had to determine the market clearing price or the corresponding quantity to
maximise social welfare, the regulator will, under uncertainty, aim at maximising the expected social welfare
and at the same time try to minimise the exposure to unexpected negative outcomes. As Weitzman’s (1974)
postulated theorem suggests, the latter can be achieved by a prudent choice between price and quantity
instruments.
The intuition of Weitzman’s (1974) proposition is illustrated in figure 2 and figure 3. If either marginal costs or
marginal benefits are predicted incorrectly, both price and quantity regulation will entail suboptimal results
implying a loss in societal welfare. Such welfare losses may have two different causes: First, if the actually
produced quantity is lower than in the real optimum, the marginal benefit of an increase in production would
outweigh its corresponding marginal costs. Thus, the welfare loss describes the lost surplus (quantity
efficiency loss). This is indicated by the yellow triangle. Secondly, if the actually produced quantity is larger
than the real optimum, the marginal costs of the additional production exceed the corresponding marginal
benefits. As such, this additional production is not desirable from a societal perspective (price efficiency loss).
This is indicated by the blue triangle.
1 In general, auctions do not per se need to be quantity instruments. In fact, this is only the case if a certain capacity to be
auctioned is predetermined and bids are selected on a price basis. However, it might as well be possible to determine a budget first and subsequently award the bidder who is able to ensure the largest capacity deployment with the given financial means. We disregard the latter case in this analysis since it is (so far) not of relevance in RES policy-making.
14
Both Figure 2 and Figure 3 provide examples where the actual marginal costs are lower than those
anticipated by the regulator. In that particular case, a quantity instrument may yield a price, which is lower
than expected, whereas a price instrument may lead to an undesirably large production (the two arrows
illustrate the discrepancies: red = price deviation under quantity instruments; blue= quantity deviation under
price instrument). However, the two figures also demonstrate that the extent of the undesired result (“the
regulator’s regret”) may differ depending on which instrument is employed. In the presence of uncertainty, it is
the slopes (elasticity) of the marginal cost and the marginal benefit curve that suggest which of the two
instruments to choose from. As can be seen in Figure 2, the expected social welfare under a quantity
instrument falls short of that under a price instrument, given the marginal cost curve is steeper than the
marginal benefit curve: The welfare loss under the quantity instrument (the yellow triangle) is larger than that
of the price instrument (blue triangle). However, if the slope of the marginal cost curve is gentle relative to that
of the marginal benefit curve, the quantity instrument will be superior (see Figure 3). In that particular case, a
price instrument such as a FIT would entail a larger loss to societal welfare (area of the blue triangle is larger
than that of the yellow triangle). This causal relation holds true independent of whether it is the marginal costs
or the marginal benefits that are mispredicted and whether those factors are over- or underestimated.
Not surprisingly, several scholars used the theoretical framework of Weitzman (1974)in the years following his
work. Particularly among environmental economists, some devoted themselves to the question of how
potential cost and benefit curves for emission abatement technologies might look like in order to allow for
inferences regarding the respective policy instrument. To date however, scientific insights in that respect are
fairly controversial. While both Del Río & Linares (2014) and Finon & Perez (2007) assume that marginal cost
curves of renewable energies are rather flat – providing an argument in favour of quantity instruments2 –
Kitzing & Mitchell (2014) advocate for a more differentiated view, namely, to distinguish between the different
technologies. In fact, they claim that the slope of marginal cost curves depends on the maturity of the
respective technology and will only be small if the technology is mature. By contrast, the marginal cost curves
of immature technologies would be relatively steep since the niches in which they develop are often small.
Usually, there exist only few equipment manufacturers for such technologies and only few sites may be
exploited so that cost differences between available projects are likely to be large. Given relatively constant
marginal benefits of emission reduction, the arguments laid out by Kitzing & Mitchell (2014) suggest,
therefore, to draw on price instruments when regulating the deployment of immature technologies.
Another interesting argument is presented by Stern (2007), who implies that cost and benefit curves may have
different shapes depending on whether the regulator adopts a short- or a long term perspective. Considering
the short term (e.g., a perspective of one year), Stern (2007) argues that it becomes progressively more
expensive to install additional renewable technologies unless it was possible to exploit further cost potentials
by R&D or adjust the available technology (both is assumed to be impossible under short time horizons).
Consequently, he assumes the short-term marginal cost curve to be relatively steep. On the other hand, the
short-term marginal benefit curve of RES is assumed to be rather flat. This reflects the fact that deployment
within a short time period will not have a considerable impact on the ultimate climate goals and it is, thus,
2 Although Del Río & Linares (2014) claim that flat curves of renewable energies provide a theoretical advantage for quantity instruments, they do not advocate for quantity regulation per se. In fact, they build their analysis on multiple cost factors among others e.g. transaction costs, which do not influence the shape of the curve.
15
justifiable if short-term deployment rates deviate (positively or negatively) from the respective short-term
targets. By contrast, adopting a long-term perspective, the slopes of the two curves might change. As Stern
(2007) suggests, it is the marginal benefit curve that will be steep (steeply decreasing) and the marginal cost
curve that will be rather flat (gently increasing) in the long term. While the steep decrease of the marginal
benefit curve expresses that it will be more important to employ renewable technologies as cumulative
emissions increase, the flat nature of the marginal cost curve reflects that the regulator will be able to adjust
the choice of technology and make use of technological developments in the long term.
Building on Weitzman (1974) theoretical suggestions, the notion of Stern (2007) implies that a price
instrument may be a useful tool for regulation, when policy makers adopt a short term view (e.g. when they
consider policies up to 1 – 3 years), whereas quantity instruments may be better suited for the long term (e.g.
for policies of 20 years or more). However, since in reality the transition from short to long term will be
continuous, the slope change of the two curves will be steady but slow. Therefore, the employment of both
regulation types in tandem might be advisable for the medium term, when large welfare losses for either
instrument can be ruled out. This recommendation is supported by Weitzman (1978) and will be further
discussed in section 6.3.
Preliminary Conclusions
The analysis above has demonstrated that risk aspects constitute an important factor understanding the
decision-making of policy makers regarding which instrument to use. Under uncertainty, particularly the choice
between price and quantity regulation can be decisive as Weitzman (1974) theoretical elaborations have
shown. While price instruments such as FIT may minimise the risk of welfare losses given the marginal cost
curve is relatively steeper than the marginal benefit curve, quantity means (e.g. auctions) may be superior
otherwise. Based on this theoretical foundation, it may now be interesting to understand which factors
influence the shape of the two curves and how they might look like in reality. We will address this issue in the
following section.
4 Marginal cost curves of RES technologies: Steep or
flat?
Although there is broad agreement on the theoretical implications that follow from Weitzman’s (1974)
theorem, insights from the theoretical discourse have found little application in real life policy-making. An
important reason for that might be that there is considerable uncertainty about the actual slope of the marginal
cost and benefit curves. As sketched in the review above, Del Río & Linares (2014) and Menanteau et al.
(2003) argue, for example, that cost curves for renewable technologies are relatively flat whereas Kitzing &
Mitchell (2014) claim the opposite – at least for immature technologies. Also, empirical research that has
focused on this issue is to date rather scarce as it is very difficult to gather the data that is necessary to
construct the cost curves. Particularly for real data, the enormous amount and the confidentiality makes it
nearly impossible to obtain them.
In order to overcome this issue, the analysis following in this section draws on the modelling outcome by Held
(2010), namely the cost-potential curves for onshore wind, solar and biomass for the year 2009, which have
already been used in the course of the RE-Shaping project (Hoefenagels et al. 2011). These curves are well
16
suited for the purpose of this analysis as they reflect the generation costs of different technologies depending
on realisable potentials until 2050. Nonetheless, the curves are subject to some simplifying assumptions,
which have been made during the modelling process. The following analysis shall not be understood as a
basis of decision-making but rather as a tool of decision aid. As the focus of analysis will only be on cost
curves, we do not intend to reflect the entire decision field of a policy maker but instead focus on one relevant
aspect that may be important when deciding which instrument to use. In particular, we seek to understand
under which circumstances those curves may be flat or steep.
4.1 Cost-potential curves for selected technologies
4.1.1 Onshore Wind As explained above, the cost-potential curves developed by Held (2010) stem from 2009 and account for
potentials realisable until the year 2050. This implies that certain restrictions (both technological and social),
which prevent an immediate deployment, can be overcome until then. In principal, two factors are important in
order to determine the potentials for wind energy; that is first the wind regime affecting the amount of energy
that can be harvested and second the available land, which restrains the capacity potential. Both the data to
determine the wind conditions and the data on the available land were taken from public databases (New et
al. 2002 and EEA 2002). However, to calculate the corresponding full-load hours, based on the given wind
conditions, it was necessary to define a reference turbine. For this purpose, Held (2010) selected a 2 MW
Vestas (V80) turbine. This determination of a reference turbine was important in order to make turbines at
different sites and under different wind regimes comparable. Nonetheless, it constitutes an important
simplification as in general, investors would adjust the turbine parameters (generator size, hub height and
rotor diameter) depending on the wind conditions. The power output and the corresponding full-load hours
respectively may therefore be underestimated at sites with relatively low wind speeds.
The second necessary component for the cost-potential curves are the electricity generation costs. In
principle, the factors determining the economic performance differ from technology to technology. For wind, it
is primarily the regional wind conditions as well as turbine parameters, which make up its quality and
determine the costs. The more wind can be harvested at a given site, the more profitable becomes the wind
power plant and the lower its levelised energy generation costs. However, since only one turbine type was
assumed for all different sites, investment as well as O&M costs are assumed to be the same. Differences in
costs can therefore only arise due to different wind conditions at the available sites. The cost-potential curves
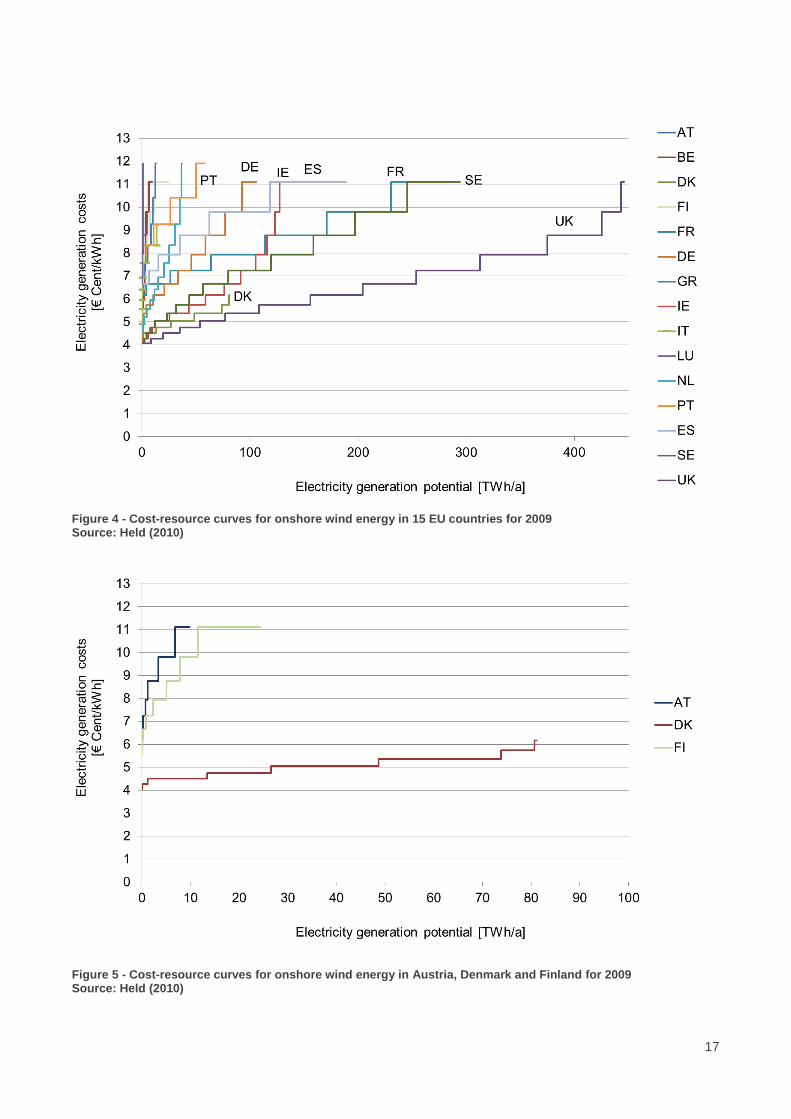
for onshore wind in different countries developed by Held (2010) are illustrated in Figure 4.
Figure 4 depicts the cost-potential curves estimated by Held (2010) for 15 EU member states in 2009. It can
be seen that the generation costs of onshore wind range from 4 €Cent/kWh to 12 €Cent/kWh. Note that, per
assumption, values outside this spectrum are not possible because only sites with an average wind speed of
min 5 m/s and max 9 m/s were considered in the model. Furthermore, the figure demonstrates that there are
considerable differences in the annual onshore wind potentials and the corresponding generation costs
among the countries. While in Denmark, for example, relatively much of the existing annual potential can be
reaped at low costs, Austria or the Netherlands face much less potential and a steeply increasing cost curve.
However, since the land areas of the EU countries as well as their population sizes differ to a large extent,
comparing the slope of their cost-potential curves may be misleading and has to be done with caution. It is
17
Figure 4 - Cost-resource curves for onshore wind energy in 15 EU countries for 2009 Source: Held (2010)
Figure 5 - Cost-resource curves for onshore wind energy in Austria, Denmark and Finland for 2009 Source: Held (2010)
18
obvious that a country large in size may have higher potential than a smaller country. Yet, it seems also likely
that the larger country has to supply a larger demand, if its population is large. Therefore, comparing e.g. the
cost curves of Luxemburg and the UK does not provide much information. To be able to interpret the cost
curves’ slope with respect to the framework developed by Weitzman (1974), they have to be seen in relation
to the countries’ demand curves (or marginal benefit curves).
An interesting comparison can be made for similar countries, e.g. between Denmark, Finland and Austria as
in Figure 5. Since the three countries have similar population sizes, it seems reasonable to assume that they
also have a similar demand for electricity. In Denmark, however, not only the amount of the available wind
potential but in particular the amount of high quality potential (i.e. low-cost) is considerably larger than in
Finland and Austria, which is reflected in the slope of the countries’ cost curves. While Denmark faces a
relatively flat cost-potential curve, the curves of Finland and Austria are comparably steep. Following
Weitzman (1974) theoretical argument, the incentive to employ a price instrument for regulation seems
therefore larger in Finland and Austria than in Denmark. More generally, the finding suggests that the
incentive to employ an auction is larger in countries with abundant wind resources. Yet, since we only
considered the countries’ cost curves relative to each other but did not compare them to each country’s actual
benefit curve, this insight cannot not be understood as a concluding recommendation regarding the countries’
regulation policy.
4.1.2 Solar PV Unlike for onshore wind, where cost potential curves were analysed for single countries within the EU, Held
(2010) considers cost potential curves for solar PV aggregated on the EU level. However, she distinguishes
between three different PV types, that is, installations on free fields, roof-integrated and façade integrated PV
plants. The generation potential of these three technologies depends on two factors; first the available land
area suitable for the installation of solar plants and second, the solar radiation. While the former determines
the capacity potential, solar radiation defines the quality of the sites. Similar to the wind speed, the radiation of
solar energy may fluctuate from location to location, which makes certain regions more attractive than others.
Particularly in northern Europe, the solar radiation intensity is considerably lower than in the South. In 2009,
when Held’s (2010) study was conducted, all three PV types were characterised by high investment costs,
although façade-integrated PV plants were still more than twice as expensive as plants on free fields, both in
the investment and in O&M. For that reason, the economic performance and the technologies’ cost-
effectiveness respectively were largely dependent on their energy generation, which again, was determined
by solar radiation. In order to estimate the electricity generation costs, Held (2010) employed solar radiation
data from the PVGIS database by the Institute for Environment and Sustainability (IES). Information regarding
the available area was drawn from a study by IEA (2002).
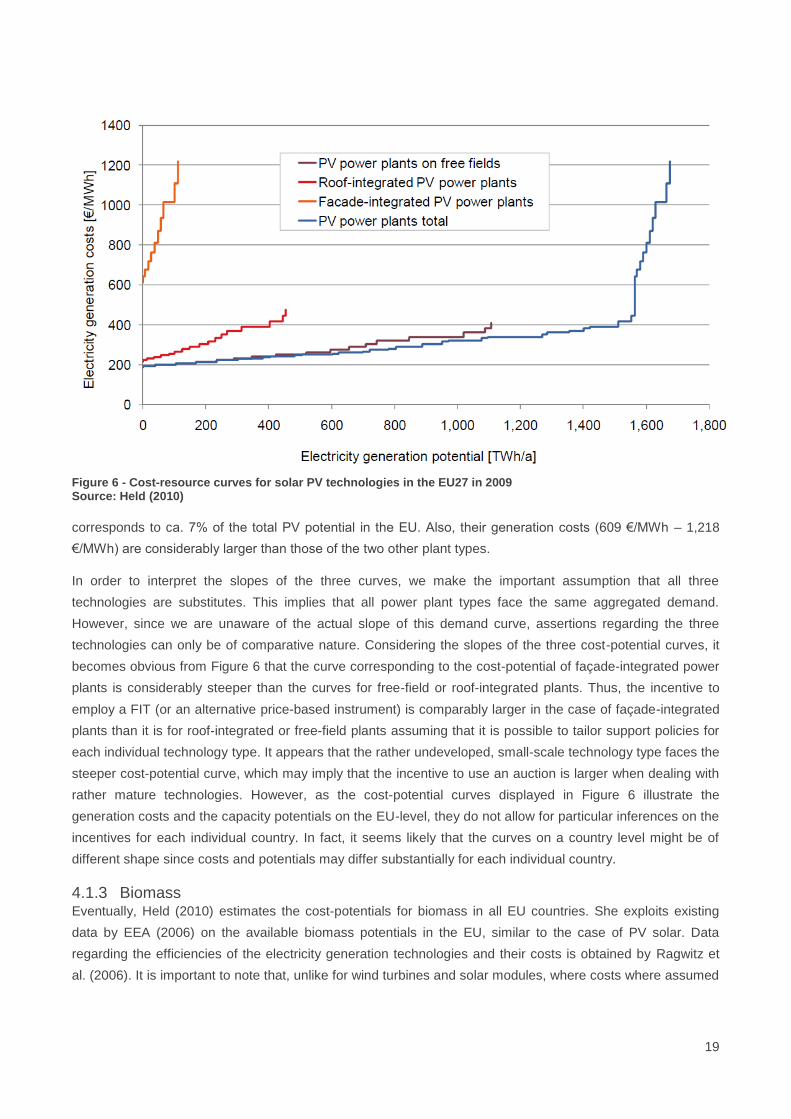
Figure 6 shows the cost-potential curves for the three different solar plant types aggregated on the EU level in
2009. With a yearly potential of more than 1,100 TWh, free field power plants constitute the technology with
the largest capacity potential. In addition, they have the lowest electricity generation costs (186 €/MWh – 411
€/MWh) among all three types, which correspond to an amount of 700 full-load hours in the north and 1,500
full-load hours in the south respectively. While the capacity potential of roof-integrated power plants amounts
to ca. 450 TWh per year, their generation costs (214 €/MWh – 474 €/MWh) are only slightly below those of
free-field plants. Façade-integrated plants have by far the lowest capacity of only 111 TWh, which
19
Figure 6 - Cost-resource curves for solar PV technologies in the EU27 in 2009 Source: Held (2010)
corresponds to ca. 7% of the total PV potential in the EU. Also, their generation costs (609 €/MWh – 1,218
€/MWh) are considerably larger than those of the two other plant types.
In order to interpret the slopes of the three curves, we make the important assumption that all three
technologies are substitutes. This implies that all power plant types face the same aggregated demand.
However, since we are unaware of the actual slope of this demand curve, assertions regarding the three
technologies can only be of comparative nature. Considering the slopes of the three cost-potential curves, it
becomes obvious from Figure 6 that the curve corresponding to the cost-potential of façade-integrated power
plants is considerably steeper than the curves for free-field or roof-integrated plants. Thus, the incentive to
employ a FIT (or an alternative price-based instrument) is comparably larger in the case of façade-integrated
plants than it is for roof-integrated or free-field plants assuming that it is possible to tailor support policies for
each individual technology type. It appears that the rather undeveloped, small-scale technology type faces the
steeper cost-potential curve, which may imply that the incentive to use an auction is larger when dealing with
rather mature technologies. However, as the cost-potential curves displayed in Figure 6 illustrate the
generation costs and the capacity potentials on the EU-level, they do not allow for particular inferences on the
incentives for each individual country. In fact, it seems likely that the curves on a country level might be of
different shape since costs and potentials may differ substantially for each individual country.
4.1.3 Biomass Eventually, Held (2010) estimates the cost-potentials for biomass in all EU countries. She exploits existing
data by EEA (2006) on the available biomass potentials in the EU, similar to the case of PV solar. Data
regarding the efficiencies of the electricity generation technologies and their costs is obtained by Ragwitz et
al. (2006). It is important to note that, unlike for wind turbines and solar modules, where costs where assumed
20
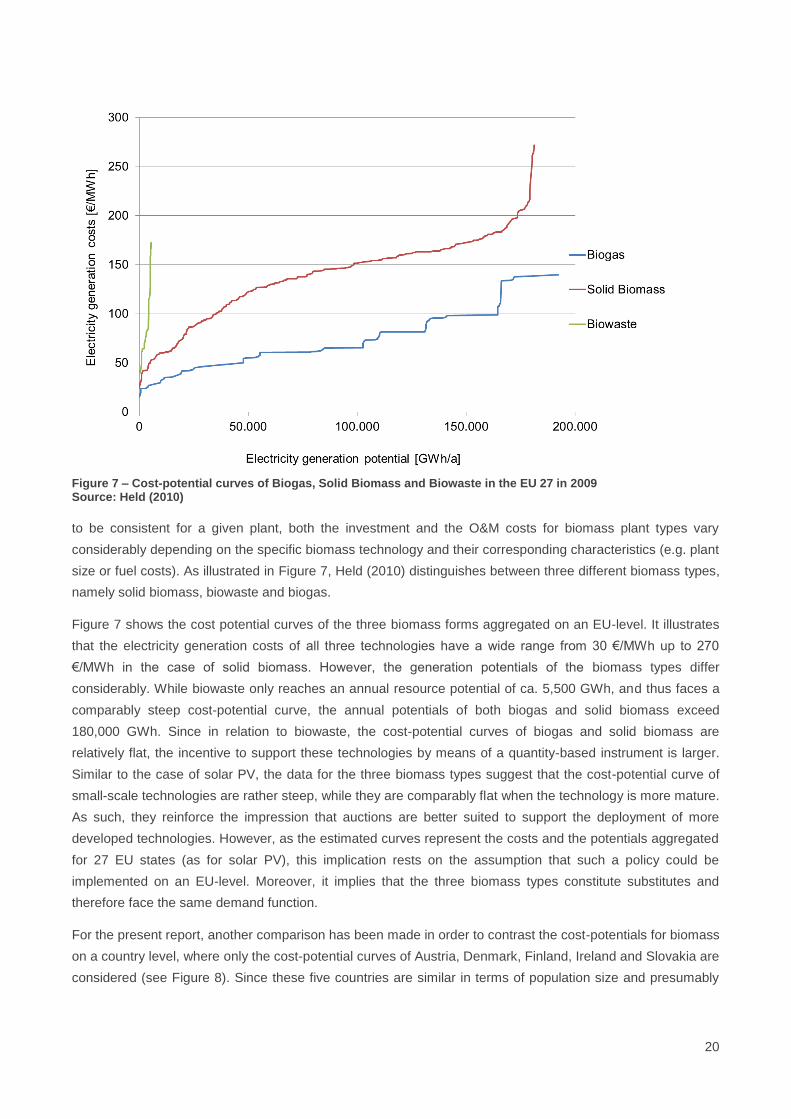
Figure 7 – Cost-potential curves of Biogas, Solid Biomass and Biowaste in the EU 27 in 2009 Source: Held (2010)
to be consistent for a given plant, both the investment and the O&M costs for biomass plant types vary
considerably depending on the specific biomass technology and their corresponding characteristics (e.g. plant
size or fuel costs). As illustrated in Figure 7, Held (2010) distinguishes between three different biomass types,
namely solid biomass, biowaste and biogas.
Figure 7 shows the cost potential curves of the three biomass forms aggregated on an EU-level. It illustrates
that the electricity generation costs of all three technologies have a wide range from 30 €/MWh up to 270
€/MWh in the case of solid biomass. However, the generation potentials of the biomass types differ
considerably. While biowaste only reaches an annual resource potential of ca. 5,500 GWh, and thus faces a
comparably steep cost-potential curve, the annual potentials of both biogas and solid biomass exceed
180,000 GWh. Since in relation to biowaste, the cost-potential curves of biogas and solid biomass are
relatively flat, the incentive to support these technologies by means of a quantity-based instrument is larger.
Similar to the case of solar PV, the data for the three biomass types suggest that the cost-potential curve of
small-scale technologies are rather steep, while they are comparably flat when the technology is more mature.
As such, they reinforce the impression that auctions are better suited to support the deployment of more
developed technologies. However, as the estimated curves represent the costs and the potentials aggregated
for 27 EU states (as for solar PV), this implication rests on the assumption that such a policy could be
implemented on an EU-level. Moreover, it implies that the three biomass types constitute substitutes and
therefore face the same demand function.
For the present report, another comparison has been made in order to contrast the cost-potentials for biomass
on a country level, where only the cost-potential curves of Austria, Denmark, Finland, Ireland and Slovakia are
considered (see Figure 8). Since these five countries are similar in terms of population size and presumably
21
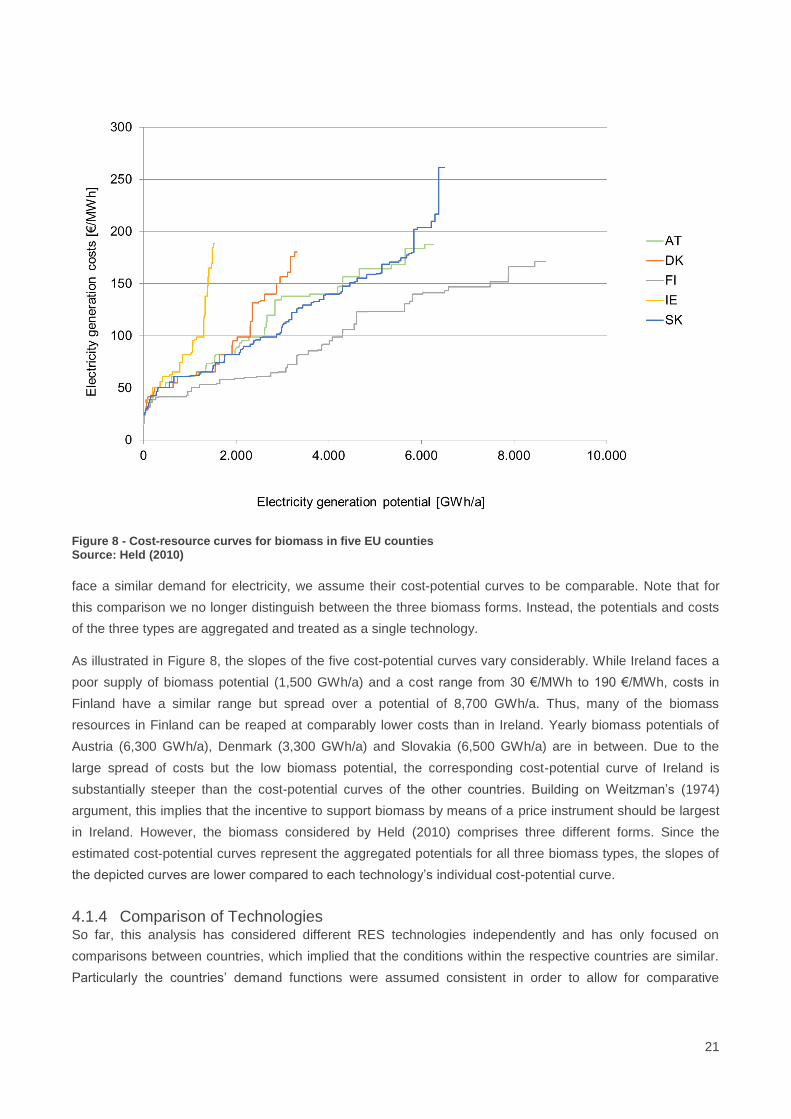
Figure 8 - Cost-resource curves for biomass in five EU counties Source: Held (2010)
face a similar demand for electricity, we assume their cost-potential curves to be comparable. Note that for
this comparison we no longer distinguish between the three biomass forms. Instead, the potentials and costs
of the three types are aggregated and treated as a single technology.
As illustrated in Figure 8, the slopes of the five cost-potential curves vary considerably. While Ireland faces a
poor supply of biomass potential (1,500 GWh/a) and a cost range from 30 €/MWh to 190 €/MWh, costs in
Finland have a similar range but spread over a potential of 8,700 GWh/a. Thus, many of the biomass
resources in Finland can be reaped at comparably lower costs than in Ireland. Yearly biomass potentials of
Austria (6,300 GWh/a), Denmark (3,300 GWh/a) and Slovakia (6,500 GWh/a) are in between. Due to the
large spread of costs but the low biomass potential, the corresponding cost-potential curve of Ireland is
substantially steeper than the cost-potential curves of the other countries. Building on Weitzman’s (1974)
argument, this implies that the incentive to support biomass by means of a price instrument should be largest
in Ireland. However, the biomass considered by Held (2010) comprises three different forms. Since the
estimated cost-potential curves represent the aggregated potentials for all three biomass types, the slopes of
the depicted curves are lower compared to each technology’s individual cost-potential curve.
4.1.4 Comparison of Technologies So far, this analysis has considered different RES technologies independently and has only focused on
comparisons between countries, which implied that the conditions within the respective countries are similar.
Particularly the countries’ demand functions were assumed consistent in order to allow for comparative

22
Figure 9 - Cost-potential curves for onshore wind and biomass in 2009 Source: Held (2010)
23
statements. Nonetheless, it is also possible to compare the technologies among each other to understand
whether different technologies require different means of support and to evaluate the suitability of a
technology neutral support. Focusing on specific country cases, such a “within-country” analysis allows
dropping the vague assumption on similar country demand functions. It implies, however, that all RES
technologies are substitutes and face the same demand.
Figure 9 depicts the cost-potential curves of biomass and onshore wind for the countries Denmark, Ireland
and Finland in 2009. Comparing the different technologies among each other stresses the point that an
analysis of a technology’s costs-potential curves with respect to the theoretical results by Weitzman (1974)
may only yield meaningful insights if it is set in relation to other technologies. It is obvious that in all three
cases the pattern of the two curves is the same: While the cost-potential curve of onshore wind is rather flat,
the cost-potential curve corresponding to biomass is comparably steep. The difference in the slopes is more
striking in the cases of Ireland and Denmark but even in Finland where the biomass potential is relatively
abundant and wind conditions are rather poor, the slopes of the two curves differ considerably. It is, therefore,
a possible implication of Figure 9 that onshore wind could be supported by different support means than
biomass even though this implication has to be treated with caution. This analysis has considered “biomass”
as one single technology and has left out that, in fact, it comprises three different biomass types (biogas, solid
biomass and biowaste). As seen before, all three biomass technologies may as well differ in terms of costs
and potentials.
The differences in the slopes of the cost-potential curves illustrated in Figure 9 provide a tangible argument
against a technology neutral support, which implies to treat all RES technologies equally. While for some
technologies, like onshore wind, the incentive to employ a quantity-based instrument may be high, other
technologies such as biomass and, in particular, immature technologies may be more efficiently supported by
means of a price regulation. In fact, a technology specific support that allows adjusting an instrument to the
individual needs of the technology could reduce the risk exposure for regulators by mitigating welfare losses in
case of suboptimal, ex ante regulation.
4.2 Development of cost-curves over time
Considering the aspect of time when analysing the cost-potentials of RES is important, as it allows existing
technologies to develop both in terms of efficiency improvements and cost reductions. Moreover, time may
affect the existing potentials for RES, since some of them will be exploited whereas new potentials may arise.
Not accounting for such dynamic considerations, the analysis conducted in section 4.1 did therefore only
provide a static perspective. This section intends to provide insights about the temporal development of the
technologies’ cost-potential curves.
Unfortunately, the cost-potential curves developed by Held (2010) constitute the most recent figures regarding
cost-potentials of RES and other cost-curves are not available. For that reason, an extensive analysis
considering the development of all RES technologies is not possible. The focus in this section will be on an
example case for solar PV in Germany, where the generation potentials modelled by Held (2010) have been
updated for the year 2014 according to data from the German Federal Ministry for Economic Affairs and
Energy (BMWi, 2015) and Agentur fuer Erneuerbare Energien (2016). Assumptions regarding cost
developments of solar modules are based on price data by PV-Xchange (2016). It is important to note that the
24
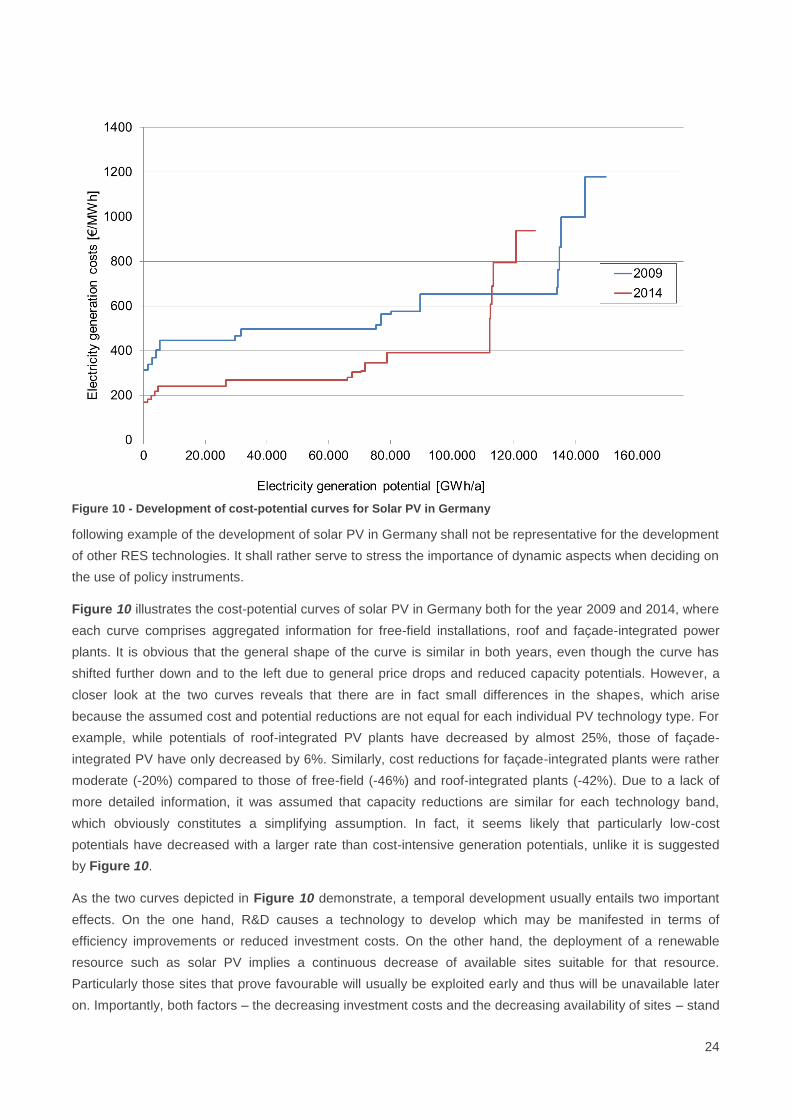
Figure 10 - Development of cost-potential curves for Solar PV in Germany
following example of the development of solar PV in Germany shall not be representative for the development
of other RES technologies. It shall rather serve to stress the importance of dynamic aspects when deciding on
the use of policy instruments.
Figure 10 illustrates the cost-potential curves of solar PV in Germany both for the year 2009 and 2014, where
each curve comprises aggregated information for free-field installations, roof and façade-integrated power
plants. It is obvious that the general shape of the curve is similar in both years, even though the curve has
shifted further down and to the left due to general price drops and reduced capacity potentials. However, a
closer look at the two curves reveals that there are in fact small differences in the shapes, which arise
because the assumed cost and potential reductions are not equal for each individual PV technology type. For
example, while potentials of roof-integrated PV plants have decreased by almost 25%, those of façade-
integrated PV have only decreased by 6%. Similarly, cost reductions for façade-integrated plants were rather
moderate (-20%) compared to those of free-field (-46%) and roof-integrated plants (-42%). Due to a lack of
more detailed information, it was assumed that capacity reductions are similar for each technology band,
which obviously constitutes a simplifying assumption. In fact, it seems likely that particularly low-cost
potentials have decreased with a larger rate than cost-intensive generation potentials, unlike it is suggested
by Figure 10.
As the two curves depicted in Figure 10 demonstrate, a temporal development usually entails two important
effects. On the one hand, R&D causes a technology to develop which may be manifested in terms of
efficiency improvements or reduced investment costs. On the other hand, the deployment of a renewable
resource such as solar PV implies a continuous decrease of available sites suitable for that resource.
Particularly those sites that prove favourable will usually be exploited early and thus will be unavailable later
on. Importantly, both factors – the decreasing investment costs and the decreasing availability of sites – stand
25
in contrast to each other. While a decrease in investment costs for solar PV causes its electricity generation
costs to drop (and thus a flattening of the cost curve), a reduced availability of suitable sites pressures the
generation costs to increase (making it steeper). Eventually, the remaining question is; which of the two
effects looms larger?
Providing a general answer to that question is nearly impossible as it depends decisively on the initial overall
potential of a technology as well as on its maturity level. Considering solar PV, a technology with large
amounts of high quality potentials in many European countries, it is likely that efficiency improvements are
dominant, which implies a continuously flattening cost-potential curve. Biomass, by contrast, constitutes a
technology whose resources are rather limited so that the cheapest fractions of the potential are readily
exploited. Since in this case electricity generation costs are likely to increase over time, the cost-potential
curve may become steeper.
4.3 Preliminary Conclusions and Discussion
Drawing on modelled cost and RES potential data by Held (2010), the previous analysis sought to extend
Weitzman’s (1974) solely theoretical discussion on the optimal use of price and quantity instruments and
provide an application to policy-making.
Our analysis has shown that implications based on the cost-potential curves of the three selected RES
technologies are both country- and technology-specific. It became obvious that the incentive to support e.g.
onshore wind by means of quantity regulation is considerably larger in countries with abundant wind
resources (e.g. Denmark or Ireland) than in countries where wind conditions are rather poor (e.g. Austria or
Finland). Moreover, we found that rather small-scale technology types such as façade-integrated PV plants or
biowaste provide a larger incentive for price-based instruments than their related pendants, that is, roof-
integrated or free field plants and biogas or solid biomass respectively. A possible explanation for this finding
could be the maturity level of the technology types, which might be responsible for the large cost differences
and the rigidity to adapt to less suitable sites.
However, since the focus of the analysis was only on cost-potential curves of selected RES technologies
(onshore wind, solar PV and biomass) and not on the technologies’ demand side, the analysis does not claim
to be complete and shall not be understood as a foundation for decision-making. Instead, it was its primary
goal to reflect on one important aspect when considering which instrument to employ and to point out avenues
on how analyse it.
Our analysis has further provided an argument in favour of a technology-specific support. Assuming that there
is no individual demand for onshore wind or biomass energy but only an aggregated demand for all RES, the
modelled cost-potential curves of the two technologies suggested that the incentive to support onshore wind
by means of quantity regulation is generally larger than in the case of biomass. This finding proved robust
independent of the different conditions for the two technologies among the EU countries. Furthermore, this
finding implies that in particular immature technologies, whose cost-potential curves are highly uncertain yet
presumably steep, may face a considerable disadvantage and may expose policy-makers to unnecessary
risks if they are pooled with rather mature technologies.
Eventually, we have shown the importance of temporal developments when deciding which of different
support instruments to employ and have pointed out two contrasting dynamic effects. While temporal
26
technological improvements may lead to efficiency gains or cost reductions, a shrinking availability of suitable
sites might pressure generation costs to increase. Therefore, it is, a priori, difficult to say whether a RES cost-
potential curve becomes steeper or flatter over time and thus whether the incentive to employ a quantity-
based mean such as an auction increases or decreases. Following the argumentation of Resch et al. (2004),
the answer to that question depends on the technologies’ penetration levels and their realisable potentials in
the different countries. Technologies with abundant potentials and promising prospects for decreasing
generation costs are likely to face flattening cost-potential curves (implying an increasing incentive for
auctions) whereas other resources with more limited potentials – e.g. biomass – might experience the
opposite. In either case, it is important to consider these dynamic aspects since the choice regarding the
optimal support scheme may change – e.g. during the maturation of a technology.
Since this analysis builds on the theoretical insights by Weitzman (1974), our findings and interpretations have
to be seen in the light of the assumptions that underlie his study. It shall therefore (once more) be emphasised
that our analysis, aiming at identifying practical incentives for different modes of control, rests on the
assumption that the given information regarding costs and generation potentials are either inadequate or
uncertain. This assumption is important as in an environment of complete knowledge and perfect certainty
both a quantity and a price-based instrument would be formally identical (compare elaborations in section
3.2). However, it is also realistic, since even for global regulators or social value-oriented planners, it is hardly
possible to obtain all necessary information, which would be needed for an accurate estimation.
Further, it is important to note, that our analysis does not employ real cost and real potential data but the
modelling outcome by Held (2010). This data, too, has been generated based on assumptions. One decisive
assumption that has been made in order to estimate the generation costs for each technology was that only
the location (more specifically its characteristics regarding resource availability) would determine the energy
output, yet it was disregarded that a technology adjustment could as well affect the generation. Held (2010)
assumed only one representative power plant per technology (one wind turbine, one PV panel etc.) to be in
place, which obviously constitutes a simplification. In fact, an adjustment of technology specific parameters
(e.g. the rotor length or the generator size of a wind turbine) may allow increasing the energy production
without changing the site where the technology is set up. It is possible that particularly the estimated costs of
sites with poor resource conditions have been overestimated. Accounting for this misprediction, the actual
RES cost-potential curve might be flatter than assumed in this analysis.
Following Weitzman’s (1974) argumentation, the optimal choice of support instrument under uncertainty
depends on the relation of elasticities of both marginal costs and marginal benefits. Nonetheless, as raised in
the beginning of this section, our analysis has only focused on the cost-potential curves of RES technologies
and thereby considered the technologies’ supply side. Their demand side, however, remained unconsidered.
To receive a better understanding in regards to our findings, it may be interesting to speculate about the
demand curve’s possible slope. It is then the decisive question whether each RES technology faces its own
demand or whether all RES are considered substitutes implying an aggregated demand function for all
technologies. In the former case, all RES would have to be treated individually and a comparison between the
technologies, as it is done in section 4.1.4, would be obsolete. Depending on the individual slope of each
technology’s demand function, it might then be possible that even technologies, with relatively steep cost-
potential curves (e.g. façade-integrated PV plants), should be supported by quantity-based instruments, while
RES with relatively flat cost curves (e.g. onshore wind), might as well attract price-based means. In the latter
27
case, however, if all RES were considered substitutes, this would be fundamentally different. Since in this
case all technologies would face the same, aggregated demand function, which would be comparably flat3,
only (if at all) the technologies with relatively flat cost-potential curves would qualify for the support of quantity-
based instruments. Unlike before, assuming an aggregated demand allows comparing the different
technologies’ cost-potential curves.
Although our analysis has not touched on all relevant points that would be necessary for a final
recommendation regarding the choice between price and quantity schemes, it has pointed out important
aspects that should be included in an assessment of policy instruments. It has illustrated the importance to
conduct similar analyses prior to an implementation of policy instruments in order to gain insights about the
market of RES technologies and to avoid unnecessary risks.
In regards to auctions for renewable support, one can conclude that the exemption rules set out by the
European Commission regarding immature technologies seem reasonable, as they typically show steeper
cost curves, which makes it more likely that a price-based instrument (such as an administratively set FIT)
would lead to higher welfare gains than a quantity-based instruments (such as auctions). To assess the
overall suitability of auctions in relation to other support schemes, it is, however, also necessary to quantify
the impact of additional factors – e.g. transaction costs – and to analyse their repercussions on resulting
competition levels. As emphasised by Del Rio & Linares (2014), these factors may in some instances
outweigh the theoretical benefits of a policy instrument and jeopardise its efficiency.
5 Impact of secondary policy objectives and socio-
political feasibility on instrument choice
5.1 National objectives: local impacts
As shown in Table 1, there exists a diverse set of policy success criteria. Amongst others, policy makers may
be concerned with the impact of renewable development on the domestic industry.
Kitzing (2016) has argued that especially for immature technologies, the revenue certainty provided in price
instruments can help spur technological progress, encourage investments into research and development,
and help building up a domestic supply chain for equipment manufacturing. This is, because with long-term
and foreseeable price developments, future surplus from cost reductions becomes predictable. This is crucial
for developers to undertake the often significant upfront research and development (R&D) investments
required for technological innovations (Menanteau et al., 2003). In quantity-based schemes, future prices are
unknown and this lack of market anticipation decreases R&D incentives – it seems strategically better to focus
on ‘organisational’ improvements and to procure new technologies externally (Finon & Menanteau, 2004; see
Menanteau et al., 2003). Johnstone et al. (2010) have shown with an empirical patent analysis that innovation
in quantity-based schemes occurs mostly for technologies close to market-competitiveness, whereas price-
based schemes spur innovation for more immature technologies. However, Söderholm & Klaassen (2007)
show that the positive innovation effect is highly dependent on finding the appropriate support levels. If they
3 By definition, an aggregated demand curve is never steeper than the flattest individual demand curve.
28
are set too high, then fewer incentives for cost reductions are provided. In European countries with price-
based feed-in tariff schemes, strong domestic technology industries have developed (e.g. Denmark,
Germany, Spain), whereas in countries with quantity-based tradable green certificate schemes, equipment is
often procured from abroad (e.g. UK), as shown by Söderholm & Klaassen (2007) for wind energy.
5.2 European objectives: contribution to internal market (Cross-border
cooperation potential)
An obvious reason for enlarging the scope of renewable support schemes to reach across borders is that cost
savings can be achieved, i.e. a specified output of electricity can be generated at lower overall costs when
countries reap the broader potentials from several countries. This means that renewable targets can be
reached more efficiently than if each country provided the output individually from their own territories.
An opening of support implies that countries offer to support installations that are placed in locations that do
not belong to their national territory. The country that ‘hosts’ the installation has to accept this placement.
Typically, the governments of the respective countries would enter a dedicated cooperation agreement,
regulating all specific conditions for the hosting (e.g. in regards to construction regulations and grid impacts)
and the transferring of the RES benefits.
It is the outspoken aim of the European Commission to encourage cross-border cooperation on renewable
support. Already in the first Renewable Energy Directive (RED) from 2009 (European Commission, 2009),
cooperation mechanisms were introduced to facilitate such cross-border cooperation for the achievement of
national renewable targets. The State Aid Guidelines from 2014 (European Commission, 2014) state that
“Operating aid schemes should in principle be open to other EEA countries and Contracting Parties of the
Energy Community to limit the overall distortive effects. It minimises costs for Member States whose sole aim
is to achieve the national renewables target laid down in Union legislation. […] The Commission will consider
positively schemes that are open to other EEA or Energy Community countries.”
In the first draft of the second Renewable Energy Directive (REDII)4 from November 2016, a demand for
cross-border cooperation is formulated: “Member States shall ensure that support for at least 10% of the
newly-supported capacity in each year between 2021 and 2025 and at least 15% of the newly-supported
capacity in each year between 2026 and 2030 is open to installations located in other Member States.” A
lesson from the debate on cooperation mechanisms is that most EU member states are reluctant to pay
support for RES installations in other countries, despite potential efficiency gains (Klessmann et al., 2014). A
major reason for this reluctance is the (anticipated or actual) low public acceptance of such cross-border
support. Hence, in practice a partial opening of support is expected to be most relevant – one that just fulfills
the requirements of the REDII.
The opening of support can in principle be undertaken using any type of support instrument. The draft REDII
states that “Support schemes may be opened to cross-border participation through, inter alia, opened tenders,
joint tenders, opened certificate schemes or joint support schemes.” However, different instruments have
different potential and characteristics in regards to the opening of support.
4 http://ec.europa.eu/energy/sites/ener/files/documents/1_en_act_part1_v7_1.pdf
29
Certificate schemes can typically only reasonably be opened through a complete joining of support schemes,
as done in the Sweden-Norway case. In this case, a partial opening (such as max. 15% of new installations
abroad) cannot be implemented reasonably. Any market fragmentation in form of quota or similar would
distort the price formation of the whole certificates market, which might be problematic for existing plants. On
the other hand, certificate schemes are suitable for full opening and cross-border operation, as they benefit
from larger markets and so increased competition.
There are no practical examples for opened FIT or FIP schemes. Since they typically do not feature any
volume control, a partial opening could in practice be rather problematic – because an allocation mechanism
of the ‘extra-territorial’ volumes would be missing without an auction or a similar allocation mechanism.
In contrast, auctions can rather easily be opened partially. This is due to two characteristics: 1) The focus of
each auction on new installations only; 2) the strict volume control within each auction. Hence, auctions seem
to be a suitable instrument for limited cross-border cooperation. Furthermore, the opening of auctions might
lead to better performance, as cross-border auctions might benefit from increased competition and reduction
of implicit collusion, which can again lead to efficiency gains.
It should be noted that general investment conditions significantly differ across countries. This applies for
natural conditions such as resource availability etc., but also for general economic and policy-based
conditions such as tax rates, fees, regulatory requirements and procedures, access to financing, and much
more. It is practically impossible to create a complete level playing field across countries for the purpose of
open renewable support. Such distorting differences in investment conditions need to be addressed outside
the support scheme itself. If there are massive differences in regulatory and economic conditions, this may
lead to distortions of the placement decision and thus create lower efficiency gains as well as acceptance
problems. Also, there might be a risk that countries start to ‘design the opened support scheme to increase
the competitive position of their ‘own’ projects. This might start some inefficient competition between
countries, which counteracts the idea of the support scheme opening and should be closely monitored.
5.3 State Aid compliance
As set out in the introduction to this report, the European Commission’s (2014) Guidelines on State aid for
environmental protection and energy 2014-2020 (EEAG) requires member states wishing to offer support to
renewable energy electricity generators from the 1st January 2017 to use “ instruments, such as auctioning or
competitive bidding process[es]” (109) to ensure that the cost of support is minimised. The use of such
instruments is presumed by the Commission to deliver RES support in way that “is proportionate and does not
distort competition to an extent contrary to the internal market”.
However, the EEAG (126) also allows for exemptions. In cases where member states can demonstrate that a)
“only one or a very limited number of projects or sites could be eligible”, b) “competitive bidding process would
lead to higher support levels (for example to avoid strategic bidding)” or c) “competitive bidding process would
result in low project realisation rates (avoid underbidding)” an application may be made to the Commission for
approval to use alternative support instruments. Member states may also provide support on a non-
competitive basis for installations less than 1MW capacity or for (non-wind) technology demonstration projects
up to 6MW or with up to six generation units (127). For an exemption to be granted, the member state must
demonstrate that the support does not over-compensate the producer – i.e. the support is no more than the
30
levelised cost of energy (LCOE) (including a return on capital and adjusted to reflect any investment aid) and
the realisable market price for the energy produced.
Since the publication of the EEAG in 2014, several member states have presented arguments to the
Commission for exemptions from the auctioning requirement and this short section reviews the arguments
made by member states and the outcomes of the Commission’s decision in each case. Three state aid
exemption cases are reviewed here from three member states: Bulgaria, Finland and Luxembourg.
Bulgaria’s Renewable Sources Act (ZEVI)
Source: State Aid SA.44840 (2016/NN) – Bulgaria Support for renewable energy generation in
Bulgaria - C(2016) 5205 final
The European Commission received a number of complaints about, inter alia, the potential non-compliance of
Bulgaria’s renewable energy feed-in tariff (ZEVI) with EU state-aid requirements. Primarily a concern about
over-compensation, the case also presented a potential conflict between Bulgaria’s ZEVI and the EEAG rules
on competitive allocation. Following the receipt of supporting evidence and clarification from Bulgaria, which
confirmed the level of support to be in line with point 131 of the EEAG and that non-competitive support was
offered only to projects with a capacity of 30kW or less, in line with point 127, the support system was
approved on the 4th August 2016.
Luxembourg’s renewable energy support modifications
Source: State Aid SA. 43128 (2015/N) – Luxembourg Modification du soutien aux SER au
Luxembourg - C(2016) 5433 final
In response to the upcoming EEAG deadline, the government of Luxembourg notified the European
Commission on the 21st of September 2015 of changes to its support system for renewable electricity. The
main change notified was the replacement of a feed-in tariff with a market premium system in which
generators would be responsible for selling their own output as well as other market obligations such as
balancing, as required by point 124 of the EEAG. For several reasons, however, Luxembourg’s renewable
electricity market was deemed eligible for exemptions from the requirement to allocate support through
competitive bidding processes. The Commission’s decisions were based on evidence that:
Luxembourg does not have any planned solar PV installations larger than the 1MW threshold set out
in EEAG point 127;
There is currently only one wind installation progressing through development in Luxembourg and that
nearly all development is carried out by one firm, fulfilling the exception criteria under 126(a) that “only
one or a very limited number of projects or sites could be eligible”;
Hydropower installations are typically less than 1MW, as exempted by point 127 of the EEAG and
only one project is anticipated to come forward during the lifetime of the EEAG, deemed adequate
grounds for exemption under point 126(a).
The European Commission found the Luxembourg plans compliant with EEAG on 26th of August, 2016.
Finland’s support for forest chip-fired CHP plants
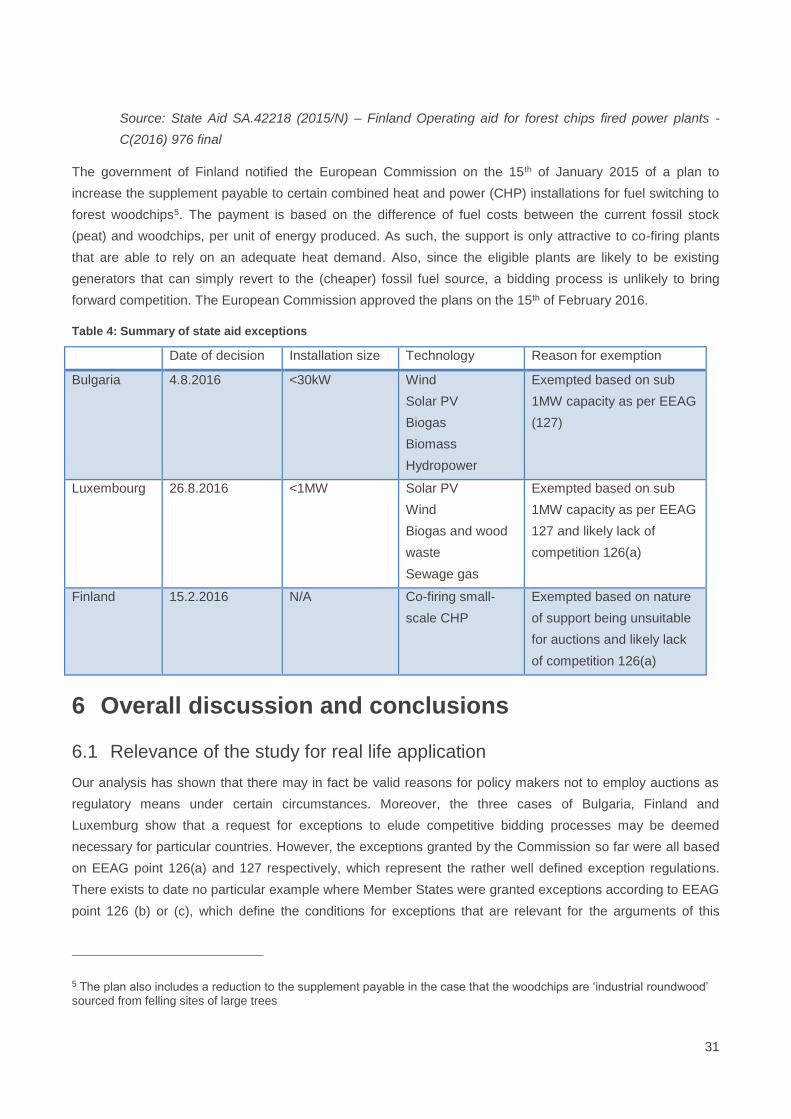
31
Source: State Aid SA.42218 (2015/N) – Finland Operating aid for forest chips fired power plants -
C(2016) 976 final
The government of Finland notified the European Commission on the 15th of January 2015 of a plan to
increase the supplement payable to certain combined heat and power (CHP) installations for fuel switching to
forest woodchips5. The payment is based on the difference of fuel costs between the current fossil stock
(peat) and woodchips, per unit of energy produced. As such, the support is only attractive to co-firing plants
that are able to rely on an adequate heat demand. Also, since the eligible plants are likely to be existing
generators that can simply revert to the (cheaper) fossil fuel source, a bidding process is unlikely to bring
forward competition. The European Commission approved the plans on the 15th of February 2016.
Table 4: Summary of state aid exceptions
Date of decision Installation size Technology Reason for exemption
Bulgaria 4.8.2016 <30kW Wind
Solar PV
Biogas
Biomass
Hydropower
Exempted based on sub
1MW capacity as per EEAG
(127)
Luxembourg 26.8.2016 <1MW Solar PV
Wind
Biogas and wood
waste
Sewage gas
Exempted based on sub
1MW capacity as per EEAG
127 and likely lack of
competition 126(a)
Finland 15.2.2016 N/A Co-firing small-
scale CHP
Exempted based on nature
of support being unsuitable
for auctions and likely lack
of competition 126(a)
6 Overall discussion and conclusions
6.1 Relevance of the study for real life application
Our analysis has shown that there may in fact be valid reasons for policy makers not to employ auctions as
regulatory means under certain circumstances. Moreover, the three cases of Bulgaria, Finland and
Luxemburg show that a request for exceptions to elude competitive bidding processes may be deemed
necessary for particular countries. However, the exceptions granted by the Commission so far were all based
on EEAG point 126(a) and 127 respectively, which represent the rather well defined exception regulations.
There exists to date no particular example where Member States were granted exceptions according to EEAG
point 126 (b) or (c), which define the conditions for exceptions that are relevant for the arguments of this
5 The plan also includes a reduction to the supplement payable in the case that the woodchips are ‘industrial roundwood’
sourced from felling sites of large trees
32
report. Nevertheless, the insights of our analysis may still be useful for real life policy application as they
provide a solid foundation to argue for exceptions.
It was demonstrated that under uncertainty neither quantity-based auctions nor price-based instruments such
as FIT or premiums will necessarily ensure welfare optimal results. In addition, both regulation modes require
extensive analyses a priori to their implementation in order to work efficiently. For that reason, it seems
difficult to argue in favour of any specific instrument particularly since both regulation modes should –
theoretically – be able to reach identical results. Nonetheless, the findings by Weitzman (1974) suggest that,
independent of the target to minimise the RES support price, the two regulation modes may entail different
total welfare effects. It was illustrated in Figure 2 that despite considerably lower support prices, the efficiency
loss of a quantity scheme outweighed the loss of the price scheme, which raises the question whether pure
support cost minimisation should be the ultimate goal. Against this background, our analysis develops useful
arguments. Moreover, it provides guidance to policy makers by indicating how to conduct similar yet case
specific analyses.
6.2 Limitations of the study
It is important to note that the present study contains several limitations with respect to both the analysis and
the employed modelling data. Therefore, the following section intends to raise and discuss some of the issues
that occurred in the course of this work.
1. Neglect of marginal benefits
As Weitzman (1974) has laid out in detail, the optimal choice of regulation under uncertainty depends on the
curvature of both the marginal cost and marginal benefit function. In fact, it is the relation of the two curves
around the optimal output level, which determines the theoretical suitability of price-based and quantity-based
modes. This study, however, has only focused on the marginal costs of RES and has neglected their benefit
function. As such, it has not been able to determine an equilibrium point. Focusing solely on the slope of the
marginal cost curve, our analysis only allows for comparative statements regarding incentives of different
policy instruments but not for explicit recommendations regarding their use. Nonetheless, this work does not
claim to be complete. It may only be seen as a useful approach covering an important part of the risk analysis,
which is necessary to determine the quality of an instrument.
2. Modelling assumptions
Since the employed data for the present analysis constitutes a modelling outcome, it is important to recall the
assumptions that underlie the corresponding model. As already noted by Held (2010) both her simulations for
onshore wind, solar PV and biomass rest on some simplifying assumptions. For example, in the case of
onshore wind, it has been assumed that atmospheric stability conditions would be neutral, implying that wind
speed variabilities would be the same in all EU member states. Certainly, this assumption is not entirely
accurate. Furthermore, Held (2010) simplified the estimations of her model by selecting only one reference
wind turbine for all available sites. However, since the energy production could be increased by adjusting (at
least) specific turbine parameters, some of the modelled power outputs might be underestimated and thus
corresponding generation costs might be too high.
33
Similarly, for solar power plants to be integrated at buildings, Held (2010) made the assumption that the
available area for those technologies could be estimated based on the number of inhabitants. This
assumptions, too, appears somewhat inaccurate, since the living-space per inhabitant might differ
considerably from country to country. For example, in the Netherlands where more than 90% of the population
lives in urban areas it may be considerably lower than in Poland where the share of the urban population is
only around 60%. Moreover, it was assumed that all PV plants would be optimally inclined, so that efficiency
losses would not occur. Since in reality this assumption is unlikely to hold true, the modelled energy
production from solar PV might be overestimated. Finally, it seems probable that particularly in well-suited PV
areas such as the southern parts of a country, a larger share of land area is dedicated for PV power plants
than assumed by Held (2010). This would imply an underestimation of the energy output and hence an
overestimation of the generation costs.
3. Role of additional impact factors (drivers)
Eventually, it should be recalled that in order to discuss rationales for the use of different policy instruments,
the core focus of the present report was on the factor risk. Other potentially relevant impact factors (e.g.
Europeanisation, local impacts or transaction costs), which might as well influence a policy maker’s instrument
choice, were only touched briefly but not analysed in detail. Our analysis may therefore only provide limited
insights. As mentioned before, it is not able to cover the entire decision field of a policy maker.
We have argued in section 5.1 that the various policy instruments may provide different incentives to help
building up a country’s domestic supply chain. Therefore, policy makers intending to support their local
industry may as well allow for such considerations when deciding on their regulation policy. Further, an
opening of boarders for the support of renewables can be an important argument for the instrument choice.
Such Europeanisation might allow extending the scope of RES support and reaping additional efficiency
gains. Eventually, as stressed by Del Río and Linares (2014), transaction costs – not considered in our
analysis – may outweigh some of the theoretical benefits of an instrument. In particular in markets with rather
small actors, transaction costs may hamper participation and result in undesireably low competition levels.
6.3 Outlook: Are hybrid schemes the perfect compromise?
Our analysis has demonstrated that support conditions for the various RES technologies may largely differ
among the EU countries. Even within a country, the specific technology types may face different potentials as
well as natural conditions, which, in turn, may be subject to temporal variations. A generic instrument of a
“one-size-fits-all” character therefore rarely seems to be an optimal solution. Instead, it may be advisable for
regulators to pursue a policy that is, to some extent, flexible for adjustments and, accounting for a
technology’s temporal maturation, open for mixtures of both price and quantity modes. In particular for
medium-term RES policies, such a hybrid scheme may be beneficial in order to ensure a smooth transition
from one regulation mode to the other (Stern, 2007).
Moreover, as concluded by Weitzman (1978), a mixed price-quantity scheme may in fact be the optimal
regulation system under uncertainty as it allows price and quantity instruments to safeguard each other. By
means of a theoretical model, it is shown that single price and single quantity schemes respectively may only
be superior under specific, extreme, conditions whereas a system including both price incentives and quantity
targets will be beneficial most of the time. Nonetheless, it is important to note that a random implementation of
34
a hybrid scheme – combining price and quantity modes at discretion – does not solve the regulator’s problem
of mitigating risk exposure. Instead, selecting a hybrid scheme requires the regulator to make similar analyses
in order to determine the optimal price-quantity mix.
6.4 Concluding remarks
Conducting a comparison between auctions and other regulatory policy instruments, the present study aimed
at investigating under which circumstances an auction may not be a favourable mean of support. For that
purpose, it has identified a number of potential drivers that might affect an instrument’s effectiveness, its
efficiency and further success criteria. Among this list of relevant drivers, the basis for our analysis was the
factor risk, where our core focus was on risk for policy makers – the regulator’s regret. Assuming a world of
uncertainty, particularly policy makers or regulators are exposed to the risk of setting inefficient investment
incentives by implementation of wrong policy. As such, the aspect of risk was deemed one of the most
important challenges for the deployment of RES. We have demonstrated that risk and uncertainty respectively
constitute important factors understanding the decision-making of policy makers regarding which instrument to
use. However, we have also pointed out that independent of its importance, the factor risk constitutes only
one of many factors, which may be relevant when selecting a policy instrument.
Our main analysis consisted of two parts: First, we have reviewed the findings of several scholars providing a
direct comparison between particular policy instruments. We have further built on the theoretical elaborations
by Weitzman (1974) and illustrated that with uncertainty regarding the marginal costs and marginal benefits of
RES, particularly the choice between price (e.g. a FIT) and quantity (e.g. an auction) instruments will be
decisive, since incorrect price or quota signals may have different effects. In essence, while price schemes
may reduce the risk of welfare losses given a relatively steep marginal cost and a comparably flat marginal
benefit curve, a quantity scheme may be superior if the relation between the two curves is vice versa.
In the second part of our analysis, we have employed modelled data by Held (2010) in order to build on these
theoretical insights and compare the slopes of real marginal cost of RES in different European countries.
Three insights prove to be important: First, the incentives for the use of particular policy instruments to support
the deployment of RES are both country and technology specific. In general, it appears that the incentive to
employ a quantity-based mean such as an auction is larger when the natural resources of the technology that
is to be supported are abundant and if that technology is rather well developed. Besides that, it requires a
competitive market for an auction to be effective. Second, since within a country the market and natural
conditions of the different RES technologies and hence their supply costs may vary considerably, it seems
possible that there exist incentives for both price and quantity support schemes. Our findings therefore
provide an argument against a technology-neutral support. Finally, the analysis has stressed the importance
to consider temporal developments. Since both the potentials and the costs of the different RES technologies
will change over time, so may the incentives for their support. It is therefore not only necessary to conduct a
static assessment of RES potentials and their costs respectively but also to consider their dynamics.
The findings of this study suggest that with uncertainty regarding the marginal costs and marginal benefits of
RES, there may in fact be valid reasons for policy makers not to employ auctions, as it may be desirable not
to control the volume. Thus, the important question is not necessarily how to optimise the design of an auction
but possibly how to substitute it. This may e.g. be the case if the regulator’s risk to set sub-optimal incentives
can be minimised by controlling the price. It is obvious that the allocation mechanism of an auction ensures
35
the minimisation of support prices. However, it was shown that under certain conditions (e.g. for particular
technologies or given the specific natural conditions in a country), it may not be worthwhile to reduce this price
to its minimum as it may lead to evitable efficiency losses and thus to an increased loss of societal welfare.
7 References
Agency, (IEA) International Energy. (2002). Potential for Building Integrated Photovoltaics. Retrieved March 25, 2008, from Online: http://www.iea-pvps.org/products/download/rep7_04.pdf
Agentur fuer Erneuerbare Energien. (2016). Foederal Erneuerbar. Retrieved November 28, 2016, from https://www.foederal-erneuerbar.de/landesinfo/bundesland/D/kategorie/solar
Agnolucci, P. (2007). The importance and the policy impacts of post-contractual opportunism and competition in the English and Welsh non-fossil fuel obligation. Energy Policy, 35(1), 475–486. http://doi.org/10.1016/j.enpol.2005.11.034
Batlle, C., Pérez-Arriaga, I. J., & Zambrano-Barragán, P. (2012). Regulatory design for RES-E support mechanisms: Learning curves, market structure, and burden-sharing. Energy Policy, 41, 212–220. http://doi.org/10.1016/j.enpol.2011.10.039
BMWi, B. fuer W. und E. (2015). Marktanalyse Photovoltaik-Dachanlagen.
Borenstein, S. (2012). The Private and Public Economics of Renewable Electricity Generation †. The Journal of Economic Perspectives, 26(1), 67–92. http://doi.org/http://dx.doi.org/10.1257/jep.26.1.67
Butler, L., & Neuhoff, K. (2008). Comparison of feed-in tariff, quota and auction mechanisms to support wind power development. Renewable Energy, 33(8), 1854–1867. http://doi.org/10.1016/j.renene.2007.10.008
Cropper, M. L., Oates, W. E., Carson, R., Cumberland, J., Dewitt, D., Fisher, A., … Dunn, J. (1992). Environmental Economics : A Survey, 30(2), 675–740.
Del Río, P., Fitch-Roy, O., & Woodman, B. (2016). Identification of alternative policy options to auctions for RES-E support, (March), 1–45.
Del Río, P., & Linares, P. (2014). Back to the future? Rethinking auctions for renewable electricity support. Renewable and Sustainable Energy Reviews, 35, 42–56. http://doi.org/10.1016/j.rser.2014.03.039
Edge, G. (2006). A harsh environment: the non-fossil fuel obligation and the UK renewables industry. Renewable Energy Policy and Politics: A Handbook for Decision-Making, 163–184.
EEA. (2002). Corine land cover 2000. Retrieved from http://www.eea.europa.eu/data-and-maps/data/corine-land-cover-2000-clc2000-seamless-vector-database
EEA, O. (2006). How much bioenergy can Europe produce without harming the environment (RPRT). EEA Report.
European Commission. (2009). Directive 2009/28/EC of the European Parliament and of the Council of 23 April 2009 on the promotion of the use of energy from renewable sources and amending and subsequently repealing Directives 2001/77/EC and 2003/30/EC. Official Journal of the European Union, 47.
European Commission. Guidelines on State aid for environmental protection and energy 2014-2020, Official Journal of the European Union (2014). European Comission. http://doi.org/10.1016/j.nucengdes.2011.01.052
Finon, D., & Menanteau, P. (2004). The Static and Dynamic Efficiency of Instruments of Promotion of Renewables. Energy Studies Review, 12(1), 53–83.
Finon, D., & Perez, Y. (2007). The social efficiency of instruments of promotion of renewable energies: A transaction-cost perspective. Ecological Economics, 62(1), 77–92. http://doi.org/10.1016/j.ecolecon.2006.05.011
36
Held, A. M. (2010). Modelling the future development of renewable energy technologies in the European electricity sector using agent-based simulation.
Hoefnagels, R., Junginger, M., Panzer, C., Resch, G., & Held, A. (2011). Long Term Potentials and Costs of RES - Potentials, Diffusion and Technological learning.
Johnstone, N., Haščič, I., & Popp, D. (2010). Renewable energy policies and technological innovation: evidence based on patent counts. Environmental and Resource Economics, 45(1), 133–155.
Kitzing, L. (2016). The Transition to a Renewable Energy System. In Renewable Energy: Sources, Applications and Emerging Technologies.
Kitzing, L., & Mitchell, C. (2014). Achieving energy transitions : Which RES policies are best applied when ? Reducing risk and creating an enabling environment. Energy Transitions, 5188(March), 3–4.
Klessmann, C., de Visser, E. de, Wigand, F., Gephart, M., Resch, G., & Busch, S. (2014). Cooperation between EU MS under the RES Directive. A report compiled within the European project “Cooperation between EU MS under the Renewable Energy Directive and interaction with support schemes.” from http://ec.europa.eu/energy/renewables/studies/doc/2014_design_features_of_support_schemes_tas k1.pdf
Lauber, V. (2004). REFIT and RPS: Options for a harmonised Community framework. Energy Policy, 32(12), 1405–1414. http://doi.org/10.1016/S0301-4215(03)00108-3
Lipp, J. (2007). Lessons for effective renewable electricity policy from Denmark, Germany and the United Kingdom. Energy Policy, 35(11), 5481–5495. http://doi.org/10.1016/j.enpol.2007.05.015
Menanteau, P., Finon, D., & Lamy, M. L. (2003). Prices versus quantities: Choosing policies for promoting the development of renewable energy. Energy Policy, 31(8), 799–812. http://doi.org/10.1016/S0301-4215(02)00133-7
Mitchell, C., Bauknecht, D., & Connor, P. M. (2006). Effectiveness through risk reduction: A comparison of the renewable obligation in England and Wales and the feed-in system in Germany. Energy Policy, 34(3), 297–305. http://doi.org/10.1016/j.enpol.2004.08.004
New, M., Lister, D., Hulme, M., & Makin, I. (2002). A high-resolution data set of surface climate over global land areas. Climate Research, 21(1), 1–25.
Ofgem. (2007). Reform of the Renewables Obligation 2006 : Ofgem ’ s response Table of Contents.
PV-Xchange. (2016). Preisindex. Retrieved November 28, 2016, from http://www.pvxchange.com/priceindex/Default.aspx?langTag=de-DE
Ragwitz, M., Resch, G., Faber, T., Haas-EEG, R., Hoogwijk, M., Voogt, M., & Rathmann-ECOFYS, M. (2006). Economic analysis of reaching a 20% share of renewable energy sources in 2020. Fraunhofer Institute for Systems and Innovation Research, Energy Economics Group & ECOFYS. By Order of the European Commission, DG Environment–ENV. C, 2.
Resch, G., Faber, T., Haas, R., & Huber, C. (2004). Experience curves vs dynamic cost-resource curves and their impact on the assessment of the future development of renewables. Energy & Environment, 15(2), 309–321.
Sawin, J., & Flavin, C. (2006). National policy instruments: Policy lessons for the advancement & diffusion of renewable energy technologies around the world. Renewable Energy. A Global Review of Technologies, Policies and Markets.
Stern, N. T. (2007). The economics of climate change. The Stern Review.
Söderholm, P., & Klaassen, G. (2007). Wind power in Europe: a simultaneous innovation–diffusion model. Environmental and Resource Economics, 36(2), 163–190.
Weitzman, M. L. (1974). Prices vs. Quantities. The Review of Economic Studies, 41(4), 477–491.
Weitzman, M. L. (1978). Optimal Rewards for Economic Regulation. American Economic Review, 68(4), 683–691.

37
AURES is a European research
project on auction designs for
renewable energy support (RES)
in the EU Member States.
The general objective of the
project is to promote an effective
use and efficient implementation
of auctions for RES to improve the
performance of electricity from
renewable energy sources in
Europe.
www.auresproject.eu