Embed Size (px)
Citation preview

October 2013
SHELL CANADA ENERGY
Appendix 6: Federally Listed Species at Risk Surveys
REPO
RT
Report Number: 10-1346-0001/7000/7019
Submitted to:Shell Canada Energy, January 2013
FEDERALLY LISTED SPECIES AT RISK SURVEYS
January 2013 Report No. 10-1346-0001/7000/7019 i
EXECUTIVE SUMMARY Environment Canada, in the March 31, 2010 letter from the Canadian Environmental Assessment Agency to Shell Canada Energy (Tiege 2010, pers. comm.), requested focused field surveys for wildlife species listed under the Species at Risk Act (SARA) and the Committee on the Status of Endangered Wildlife in Canada (COSEWIC) that breed within the Jackpine Mine Expansion (JME) and Pierre River Mine (PRM) Project Local Study Areas (LSAs). This report presents the methods and results of those surveys within the PRM Project (the Project) LSA, which were conducted in June and July 2012.
The list of target species for focused surveys was determined by Golder Associates Ltd. and Shell Canada in cooperation with Environment Canada. Focused surveys were conducted for common nighthawk, horned grebe, Canada warbler, olive-sided flycatcher and rusty blackbird in the PRM LSA. The common nighthawk, Canada warbler and olive-sided flycatcher are currently listed federally as ‘Threatened’ and are on Schedule 1 under the SARA. The western population of horned grebe and rusty blackbird are designated as ‘Special Concern’ by COSEWIC. Provincially, common nighthawk, horned grebe, Canada warbler and rusty blackbird are designated as ‘Sensitive’, while olive-sided flycatcher is listed as ‘Secure’.
Common nighthawk surveys were conducted at 66 plots on July 6 and 7, 2012. Forty-seven individual common nighthawks were recorded within survey plots in and around the PRM LSA. Mean relative abundance and density were highest in the lichen jack pine (a1) ecosite phase, followed by burned upland (BUu), blueberry jack pine-aspen (b1), and in cutblocks (CC). Twenty-one incidental observations of common nighthawks were recorded in seven different vegetation types.
Seven survey plots were surveyed for horned grebe between June 17 and 20, 2012. No detections of horned grebe were recorded in the LSA.
A total of 103 point counts were conducted during breeding bird SAR surveys from June 17 to 20, 2012. Forty-seven survey plots were surveyed specifically for Canada warbler, 31 for olive-sided flycatcher, 4 for rusty blackbird, and 25 for both olive-sided flycatcher and rusty blackbird due to their overlapping use of some wooded wetlands types. In all, one Canada warbler was observed in the dogwood white spruce (e3) ecosite phase, representing less than 0.02 individuals per hectare of high quality habitat sampled. No observations were made for olive-sided flycatcher or rusty blackbird within the survey plots. During avian species at risk surveys in 2012 in and around the PRM LSA, five Canada warblers were recorded incidentally; four in the dogwood white spruce (e3) ecosite phase and one in the dogwood balsam poplar-white spruce (e2) ecosite phase. Three incidental observations of olive-sided flycatcher were recorded in a cutblock (CC), as well as in wooded swamp (STNN), and shallow open water (WONN) wetlands types. One incidental observation of a rusty blackbird was recorded near a large shallow open water (WONN) wetlands type during the horned grebe surveys.

FEDERALLY LISTED SPECIES AT RISK SURVEYS
January 2013 Report No. 10-1346-0001/7000/7019 ii
Avian SAR were observed where they were expected to be found, thus supporting assumptions related to habitat associations for these species. Those same habitat associations were used to predict the effects of the Project on habitat for federally-listed SAR. Data from SAR surveys form a baseline against which future monitoring data may be compared. However, for these species there is no linkage between the results of the baseline surveys and the Environmental Impact Assessment. Data from focussed SAR surveys are not available elsewhere in the Oil Sands Region for comparison. However, even if such data were available, knowing whether abundances were relatively high or low in high quality habitats in the LSAs would not influence Environmental Impact Assessment predictions due to the beyond-regional scale at which populations of these rare species fluctuate. Observations of these SAR would be expected to exhibit high variability at any given location over time.

FEDERALLY LISTED SPECIES AT RISK SURVEYS
January 2013 Report No. 10-1346-0001/7000/7019 iii
Table of Contents 1.0 INTRODUCTION ............................................................................................................................................................... 1
2.0 METHODS ........................................................................................................................................................................ 3
2.1 Common Nighthawk Survey ................................................................................................................................ 3
2.1.1 Plot Selection ................................................................................................................................................. 3
2.1.2 Survey Methods ............................................................................................................................................. 4
2.1.3 Data Analysis ................................................................................................................................................. 4
2.2 Horned Grebe Survey .......................................................................................................................................... 5
2.2.1 Plot Selection ................................................................................................................................................. 5
2.2.2 Survey Methods ............................................................................................................................................. 5
2.2.3 Data Analysis ................................................................................................................................................. 6
2.3 Breeding Bird Species at Risk Survey ................................................................................................................. 6
2.3.1 Plot Selection ................................................................................................................................................. 6
2.3.2 Survey Methods ............................................................................................................................................. 9
2.3.3 Data Analysis ................................................................................................................................................. 9
3.0 RESULTS ....................................................................................................................................................................... 10
3.1 Common Nighthawk Survey .............................................................................................................................. 10
3.1.1 Observations and Habitat Descriptions ........................................................................................................ 10
3.1.2 Incidental Observations ................................................................................................................................ 12
3.2 Horned Grebe Survey ........................................................................................................................................ 12
3.2.1 Observations and Habitat Descriptions ........................................................................................................ 13
3.2.2 Incidental Observations ................................................................................................................................ 13
3.3 Breeding Bird Species at Risk Survey ............................................................................................................... 13
3.3.1 Observations and Habitat Descriptions ........................................................................................................ 13
3.3.2 Incidental Observations ................................................................................................................................ 18
4.0 SURVEY RESULTS AND APPLICABILITY TO ENVIRONMENTAL IMPACT ASSESSMENT FINDINGS................... 18
5.0 CLOSURE ....................................................................................................................................................................... 19
6.0 REFERENCES ................................................................................................................................................................ 20
6.1 Personal Communication ................................................................................................................................... 23

FEDERALLY LISTED SPECIES AT RISK SURVEYS
January 2013 Report No. 10-1346-0001/7000/7019 iv
TABLES Table 1 Federally Listed Species Potentially Breeding in the Local Study Areas ................................................................... 1
Table 2 Wildlife Surveys Conducted In and Around the Pierre River Mine Local Study Area, 2012 ...................................... 3
Table 3 Common Nighthawk Habitat Types Surveyed In and Around the Pierre River Mine Local Study Area, 2012 ......... 10
Table 4 Common Nighthawk Detections In and Around the Pierre Rive Mine Local Study Area, 2012 ............................... 12
Table 5 Horned Grebe Habitat Types Surveyed In and Around the Pierre River Mine Local Study Area, 2012 .................. 12
Table 6 Breeding Bird Species at Risk Habitat Types Surveyed In and Around the Pierre River Mine Local Study Area, 2012 ............................................................................................................................................................... 15
Table 7 Avian Species at Risk Detections by Habitat Type In and Around the Pierre River Mine Local Study Area, 2012 ........................................................................................................................................................................ 16
FIGURES Figure 1 The Jackpine Mine Expansion and Pierre River Mine Local Study Areas ................................................................. 2
Figure 2 Common Nighthawk Survey Plots and Observations In and Around the Pierre River Mine Local Study Area ........ 11
Figure 3 Horned Grebe Survey Plots In and Around the Pierre River Mine Local Study Area .............................................. 14
Figure 4 Breeding Bird Species at Risk Survey Plots and Observations In and Around the Pierre Rive Mine Local Study Area .............................................................................................................................................................. 17
APPENDICES Appendix A Incidental Observations
FEDERALLY LISTED SPECIES AT RISK SURVEYS
January 2013 Report No. 10-1346-0001/7000/7019 1
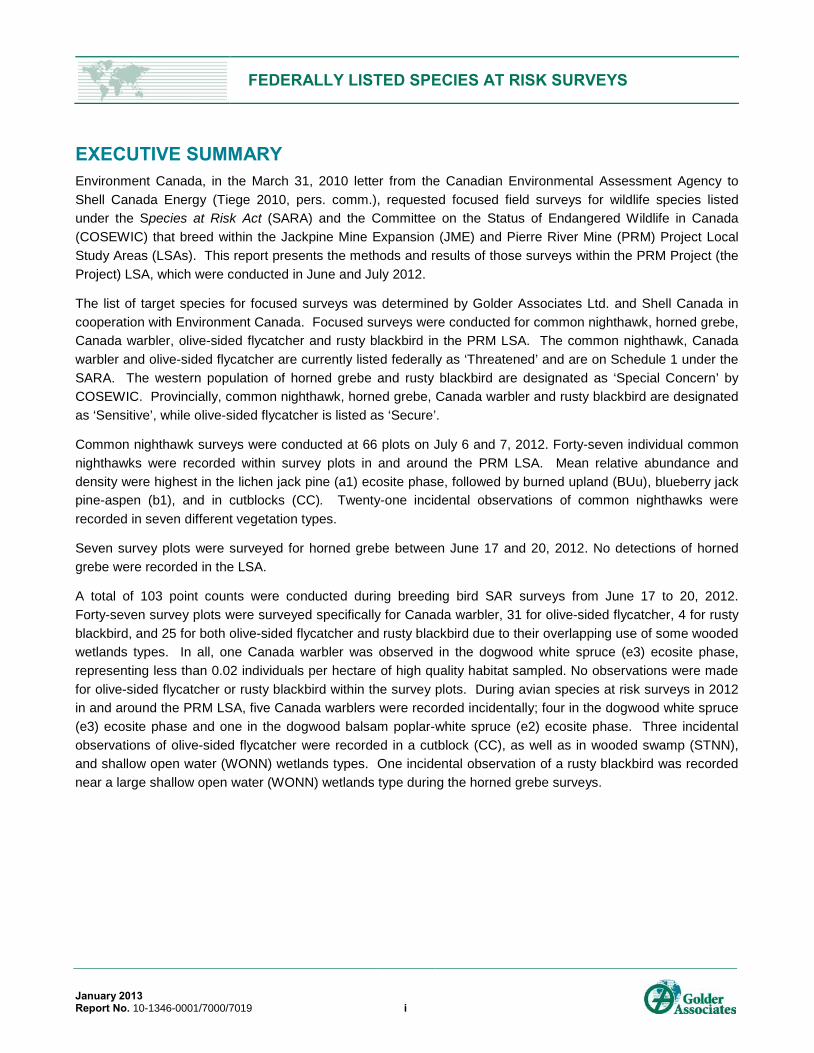
1.0 INTRODUCTION Environment Canada, in the March 31, 2010 letter from the Canadian Environmental Assessment Agency to Shell Canada Energy (Tiege 2010, pers. comm.), requested focused surveys for species listed under the Species at Risk Act (SARA) and the Committee on the Status of Endangered Wildlife in Canada (COSEWIC) that breed within the Jackpine Mine Expansion (JME) and Pierre River Mine (PRM) Project Local Study Areas (LSAs) (Table 1). This report presents the methods and results of those surveys within the PRM Project (the Project) LSA, which were conducted in June and July 2012. Species that potentially occur in the LSAs but do not breed there are less likely to be affected by the Project because their exposure is limited to migration, as opposed to the entire breeding period.
Table 1 Federally Listed Species Potentially Breeding in the Local Study Areas Common Name Latin Name Alberta(a) COSEWIC(b) SARA(b)
Canada warbler Cardellina canadensis Sensitive Threatened Schedule 1: Threatened common nighthawk Chordeiles minor Sensitive Threatened Schedule 1: Threatened horned grebe Podiceps auritus Sensitive Special Concern No Schedule, No Status olive-sided flycatcher Contopus cooperi May Be At Risk Threatened Schedule 1: Threatened rusty blackbird Eughagus caroinus Sensitive Special Concern Schedule 1: Special Concern short-eared owl Asio flammeus May Be At Risk Special Concern Schedule 3: Special Concern western (boreal) toad Bufo boreas Sensitive Special Concern Schedule 1: Special Concern wolverine (western population) Gulo gulo May Be At Risk Special Concern No Schedule: No Status wood bison Bison bison athabascae At Risk Threatened Schedule 1: Threatened woodland caribou Rangifer tarandus At Risk Threatened Schedule 1: Threatened yellow rail Coturnicops noveboracensis Undetermined Special Concern Schedule 1: Special Concern
(a) Alberta Sustainable Resources Development (ASRD) 2011. (b) Species at Risk Public Registry 2011.
The list of species to be surveyed was determined by Golder Associates Ltd. and Shell Canada in cooperation with Environment Canada (Wiacek 2011, pers. comm.). Baseline surveys conducted from 2005 to 2007 (Golder 2007) were sufficient for sampling federally listed mammalian (i.e., wolverine, wood bison and woodland caribou) and amphibian (i.e., western toad) species. Additional surveys were not required for all of the federally listed avian Species At Risk (SAR) that potentially breed in the LSAs (Wiacek 2011, pers. comm.). As adult short-eared owls are generally silent (Wiggins et al. 2006), standard owl survey protocols are inappropriate for this species. Focused yellow rail surveys were conducted in the JME and PRM LSAs (Figure 1) in 2009 (Shell 2009). Therefore, surveys for short-eared owls and additional surveys for yellow rail were not conducted. A SAR survey program for the remaining species was conducted in 2011 for the JME LSA (Golder 2011) but postponed until 2012 for the PRM LSA due to the 2011 Richardson Fire that affected an estimated 94% of the LSA. .

Big Creek
Muskeg
River
Ells River
Tar River
Asphalt Creek
Pierre River
Calum
et Ri
ver
Eymundson Creek
Joslyn Creek
Moos
e Cre
ek
Marguerite River
Wapasu Creek
Fort Creek
Jackpine Creek
Shelley Creek
Redclay Creek
Khah
ago C
reek
North
Stee
pban
k Rive
r
McCl
ellan
d Cree
k
Harry
's Sn
ye
McClelland Lake
Kearl Lake
Tp.95
Tp.99
Tp.96
Tp.97
Tp.98
Tp.100
Tp.94
Rg.8Rg.9Rg.10Rg.11Rg.12 Tp.101 Rg.7W4M
450000
450000
470000
470000
490000
4900006340
000
6340
000
6360
000
6360
000
6380
000
6380
000
6400
000
6400
000
I:\CLIE
NTS\
SHEL
L\10-
1346
-000
1\map
ping\m
xd\70
00\FI
NAL\F
ig_1_
The J
ackp
ine_M
ine_E
xpan
sion_
and_
Pierr
e_Mi
ne_L
SA_F
INAL
.mxd
³
ALBERTA DIGITAL BASE OBTAINED FROM ALTALIS LTD. (2004-2010) © GOVERNMENTOF ALBERTA. ALL RIGHTS RESERVEDDATUM: NAD83 PROJECTION: UTM ZONE 12
REFERENCE
LEGENDPUBLIC ROADWAYWATERCOURSEJACKPINE MINE EXPANSION LOCAL STUDY AREAPIERRE RIVER MINE LOCAL STUDY AREAOPEN WATER
Calgary, Alberta
JACKPINE MINE EXPANSION &PIERRE RIVER MINE PROJECT
PROJECTDESIGN
GISCHECKREVIEW
BSPT
18 Dec. 201218 Dec. 2012
FIGURE: 1
FILE No.REV. 0
10-1346-0001 SCALE AS SHOWN
TITLE
PROJECT
THE JACKPINE MINE EXPANSION AND PIERRERIVER MINE LOCAL STUDY AREAS
10 0 10
KILOMETRESSCALE 1:350,000
Shell Canada Limited
Athab
asca
Rive
r
Wesukemina Creek
lyinimin Creek
Firebag Creek
BSMGJ
20 Dec. 201220 Dec. 2012

FEDERALLY LISTED SPECIES AT RISK SURVEYS
January 2013 Report No. 10-1346-0001/7000/7019 3
2.0 METHODS Focused surveys were conducted in the PRM LSA in June and July, 2012, to target federally listed common nighthawk, horned grebe and breeding bird SAR (Table 2). Breeding bird SAR surveys focused on potential high-quality habitat for Canada warbler, olive-sided flycatcher and rusty blackbird.
Table 2 Wildlife Surveys Conducted In and Around the Pierre River Mine Local Study Area, 2012 Survey Type Survey Date(s) Number of Survey Plots Survey Locations
common nighthawk July 6 and 7, 2012 66 Figure 2 horned grebe June 17 to 20, 2012 7 Figure 3
breeding bird species at risk June 17 to 20, 2012
47 – Canada warbler 31 – olive-sided flycatcher 4 – rusty blackbird 21 – both olive-sided flycatcher and rusty blackbird
Figure 4
As these target species are rare, habitat associations derived from literature and expert knowledge were used to focus survey effort in habitats where the species were most likely to occur. This approach was necessary to gather data to estimate the occurrence, distribution and relative abundance of these rare species in the LSA, which may otherwise not be observed. However, focusing survey effort in high-suitability habitat means that the resultant data are likely to provide limited additional information on habitat associations and cannot be used to verify habitat models for the species.
2.1 Common Nighthawk Survey
2.1.1 Plot Selection Very little information is available regarding the habitat associations of common nighthawks in the boreal forest (Mahon 2011, pers. comm.). However, common nighthawks are nocturnal and insectivorous, feeding primarily on flying ants and beetles between dusk and dawn throughout open habitats (COSEWIC 2007a). Also, when nesting, eggs are laid directly on bare ground, which may be soil, gravel, sand or rock (COSEWIC 2007a). Generalizations drawn from research in other areas of the species’ range provide useful insight into the species habitat preferences. Literature suggests common nighthawks are associated with a variety of open or semi-open habitats, including forest clearings, burned areas, grassy meadows, rocky outcrops, sandy areas, grasslands, pastures, peat bogs, marshes, lake shores, quarries and mines (FAN 2007; Golder 2004; Peck and James 1983; Poulin et al. 1996; Species at Risk Public Registry 2011). Forested areas with low canopy closure may also provide suitable habitat for the common nighthawk (Hagar et al. 2004).
Surveys specifically for common nighthawks have not been conducted in the Oil Sands Region prior to those conducted in the JME LSA in 2011 (Golder 2011). Seventeen common nighthawks were recorded during these surveys, and were observed most often in lichen jack pine (a1), followed by burned upland (BUu), burned wetlands (BUw) and cutblocks (CC). Additionally, a combined twenty-eight incidental observations of common nighthawk were recorded in and around the JME LSA during wildlife surveys for the Wildlife and Wildlife Habitat Environmental Setting Report (Golder 2007) and SAR surveys in 2011 (Golder 2011). These observations occurred most often in burned wetlands (BUw), followed by lichen jack pine (a1), burned upland (BUu), disturbed (DIS), graminoid marsh (MONG) and wooded fen (FTNN) land cover types. Historical incidental observation data from the Oil Sands Region include observations in the lichen jack pine (a1) ecosite phase, and graminoid fen (FONG), shrubby fen (FONS), graminoid marsh (MONG), shallow open water (WONN) wetlands types, as

FEDERALLY LISTED SPECIES AT RISK SURVEYS
January 2013 Report No. 10-1346-0001/7000/7019 4
well as in shrubland (Sh), burned upland (BUu), burned wetlands (Buw) and one in disturbed-clearing (DIS) ecosite phases and wetlands types.
Survey plots were established in predicted high-quality habitat, which was primarily around cutblocks and large openings (e.g., uplands/open wetlands), as well as in or near lichen jack pine (a1) habitat. Although common nighthawk foraging habitat may include wooded fen (FTNN) and wooded bog (BTNN) wetlands types, these wetlands types were not specifically targeted due to limited survey time (dusk/dawn hours), and to enable surveyors to focus on habitat with a greater expected probability of nighthawk occurrence (i.e., high-quality habitat).
Survey plots were pre-selected before the survey using Alberta Vegetation Index (AVI) data in a Geographic Information System (GIS). However, avian biologists conducting the survey moved or eliminated plots that were not, upon field inspection, in habitat suitable for common nighthawks.
2.1.2 Survey Methods The best time to conduct common nighthawk surveys is during their breeding season (RIC 1998), which peaks in Alberta in June and July (FAN 2007). Common nighthawks are considered a crepuscular species, which means that they are most active during short periods around sunrise and sunset (Poulin et al. 1996).
Surveys consisted of standard point-counts and approximately followed the Resources Inventory Committee (RIC 1998) protocol for common nighthawks. The protocol recommends accompanying point counts with a call playback. However, an inventory in the Kootenay Region of British Columbia by Hausleitner and Dulisse (2008) tested the efficacy of the call playback method and found no significant difference between point counts conducted with and without playback. Therefore, point counts were not accompanied by call playback to avoid unnecessary disturbance of the target species.
Point counts were conducted within 100-m radius survey plots established in suitable, contiguous habitat, a minimum of 500 m apart. Surveys began at sunset and continued until the end of the dusk crepuscular period. Each point-count was five minutes in duration. Two minutes of silence preceded each point-count to allow birds to adjust to the presence of the observers.
Common nighthawks observed within and outside the plot were recorded, along with a distance and bearing for each individual observed. Observations outside the survey plot were recorded as incidental observations. There is evidence to suggest that recording the ‘booming’ of males may be the most accurate method of enumerating common nighthawks (Hausleitner and Dulisse 2008) due to their highly territorial nature during the breeding season (Poulin et al. 1996). Observers distinguished between both ‘calling’ and ‘booming’ nighthawks as recommended by Hausleitner and Dulisse (2008).
The date, time, observer, plot number, Global Positioning System (GPS) waypoint and any incidental wildlife observations were recorded at each point count location. Ecosite phase or wetlands type was determined. To reduce bias in bird detection, surveys were not conducted during periods of high winds, heavy rains or thick fog. Wind speeds greater than 20 km/hr are sufficient to interfere with auditory birding.
2.1.3 Data Analysis To estimate relative abundance and relative density of common nighthawks within each habitat type surveyed, the mean (i.e., average) number of common nighthawks per plot and the number of common nighthawks

FEDERALLY LISTED SPECIES AT RISK SURVEYS
January 2013 Report No. 10-1346-0001/7000/7019 5
detected per hectare of surveyed habitat were calculated. Standard deviation and 95% confidence intervals (i.e., the range of values that will include the true mean 95% of the time) were calculated for each habitat type. Statistical analysis of habitat associations was not conducted because only ecosite phases known to be suitable for common nighthawks were surveyed.
2.2 Horned Grebe Survey
2.2.1 Plot Selection While a majority of horned grebes prefer to breed in prairie and parkland habitats, some can also be found in boreal and subarctic zones (COSEWIC 2009). For breeding habitat, horned grebes preferentially select semi-permanent and permanent freshwater ponds and shallow bays or marshes containing open water and rich with emergent vegetation such as sedges, rushes and cattails (Stedman 2000). These habitat descriptions equate to shallow open water (WONN) and graminoid marsh (MONG) wetlands types, as well as the margins of lakes. Nests are built within a few metres of open water (Stedman 2000). Horned grebes have also been shown to breed in disturbed areas such as borrow pits in the Canadian boreal forest (Fournier and Hines 1999; Kuczynski 2009).
Horned grebes use ponds of a wide range of sizes for breeding (COSEWIC 2009). However, the available information on the pond size preference is somewhat contradictory. While some research suggests that horned grebes prefer small ponds of less than 1 ha (Faaborg 1976) or 0.3 to 2 ha (Fournier and Hines 1999), other research has suggested that larger waterbodies may be preferred (Heglund et al. 1994) and may also provide improved breeding success (Osnas 2003).
Surveys specifically for horned grebes have not been conducted in the Oil Sands Region prior to those conducted in the JME Project LSA in July 2011 (Golder 2011). Six individual horned grebes were recorded within plots in the JME LSA in lakes (LAKE) and shallow open water (WONN) wetlands types. Historical incidental observations of horned grebe in the Oil Sands Region have occurred in shallow open water (WONN) habitats.
Survey plots were established in predicted high-quality habitat, which was next to open waterbodies such as semi-permanent and permanent freshwater ponds and shallow bays or marshes containing open water and emergent vegetation such as sedges, rushes and cattails. These habitat descriptions equate to shallow open water (WONN) and graminoid marsh (MONG) wetlands types, as well as the margins of lakes. The size of survey plots varied with the size of each wetland surveyed and, in the case of large wetlands, the percentage of the wetland that was visible from the survey location.
Survey plots were pre-selected before the survey using AVI data in a GIS. However, avian biologists conducting the survey moved or eliminated plots that were not, upon field inspection, in habitat that was suitable for horned grebe or that could be surveyed effectively.
2.2.2 Survey Methods An established national survey protocol specifically for horned grebes does not currently exist in Canada (COSEWIC 2009). Horned grebe survey plots were established by Golder Associates Ltd. (Golder) using guidelines set in the Alberta Biodiversity Monitoring Institute: Wetland Field Data Collection Protocols vertebrate sampling criteria (ABMI 2010). The specific field procedures described below utilize observation stations accompanied by call playback as recommended by RIC (1999) for measuring presence/absence and relative

FEDERALLY LISTED SPECIES AT RISK SURVEYS
January 2013 Report No. 10-1346-0001/7000/7019 6
abundance of waterfowl and allies. Call playback was used, as it can increase accuracy in counting cryptic species of birds (Gibbs and Melvin 1993). In accordance with recommendations from RIC (1999), plots were placed at vantage points where the entire wetlands could be surveyed with unobstructed views, if possible, and were far enough apart that each could be considered an independent sample. In cases where part of the wetlands was obscured, the proportion of the wetlands surveyed was indicated. The approximate areal extent of the wetlands was determined, as well as an estimate of the proportion of the wetlands that was surveyed.
Horned grebes begin breeding in mid to late May (Stedman 2000). There is little evidence suggesting that the time of day plays a role in activity levels for this species (Stedman 2000). However, as wetlands species in general seem to have a spike in activity early and late in the day, an effort was made to survey during those periods (MMP 2010).
Upon arrival at a plot, observers would wait quietly for two minutes before beginning the survey. One observer began the call playback while the second observer scanned the wetlands with binoculars or spotting scope for a five-minute period, recording all horned grebes observed and heard, as well as all incidental wildlife observations. The call playback consisted of a set of three 20-second broadcasts separated by 30 seconds of silence. Where there were horned grebe observations during the five-minute survey, the number, sex (if possible), distance, bearing and type of detection (e.g., observed, heard) for each individual was recorded.
Date, time, observer, plot number, GPS waypoint, wind speed, cloud cover, temperature, ambient noise levels and ecosite phase or wetlands type was recorded at each point count location. Incidental wildlife observations were also recorded. To reduce bias in bird detection, surveys were not conducted during periods of high winds, heavy rains or thick fog. Wind speeds greater than 20 km/hr are sufficient to interfere with auditory birding.
2.2.3 Data Analysis To estimate relative abundance and relative density of horned grebes within each wetlands type surveyed, the mean (i.e., average) number of horned grebes per plot and the number of horned grebes detected per hectare of surveyed habitat were calculated. Standard deviation (i.e., variance) and confidence intervals (i.e., the range of values that will contain the true mean 95% of the time) were calculated for each habitat type. Statistical analysis of habitat associations was not conducted because only wetlands types suitable for horned grebes were surveyed.
2.3 Breeding Bird Species at Risk Survey
2.3.1 Plot Selection Habitat types predicted to be high quality for Canada warbler, olive-sided flycatcher and rusty blackbird were targeted. Plots were pre-selected before the survey in accessible locations to maximize survey efficiency. Avian biologists conducting the survey moved or eliminated plots that were not, upon field inspection, in habitat that was suitable for at least one of the target species.
Prior to the final selection of point count stations, field biologists conducted a reconnaissance of the project area and estimated that as much as 50% of the land area was affected by fires in 2011. Some of these areas were completely burned with both canopy and understorey impacted, while in some areas the canopy was intact but the understory was largely destroyed. Given the change in vegetation structure caused by the previous year’s fire, field biologists used professional judgement in the final selection of point count stations for all target species.
FEDERALLY LISTED SPECIES AT RISK SURVEYS
January 2013 Report No. 10-1346-0001/7000/7019 7
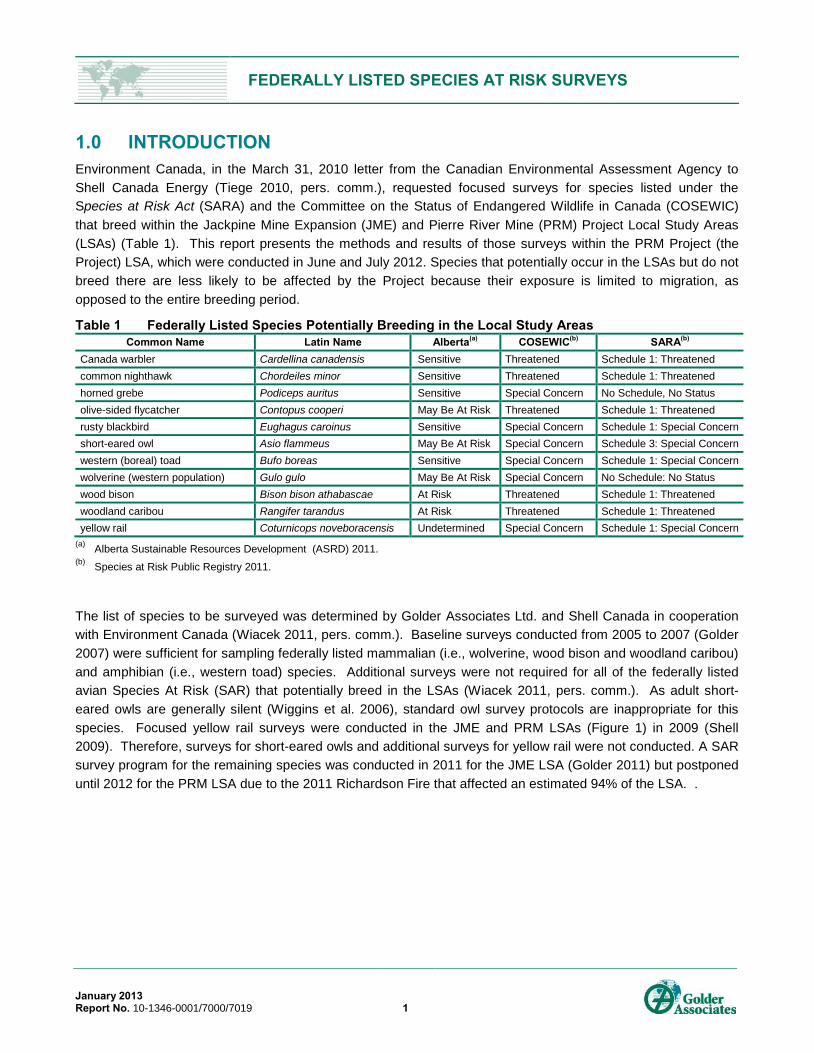
Canada Warbler In western North America, Canada warblers have been recorded breeding primarily in mature stands of mixed deciduous (i.e., trembling aspen and paper birch) forests (Campbell et al. 2001) and less commonly in mixedwood stands where white spruce was often the secondary canopy species (Campbell et al. 2007). In northeastern BC, Campbell et al. (2007) observed Canada warblers in deciduous-dominated stands about 75% of the time and in mixedwood stands about 25% of the time. This species appears to be absent from conifer-dominated stands (Campbell et al. 2007). Preferred forest stands have well-developed shrub layers (Reitsma et al. 2010).
This species can occur in younger stands (Bennett et al. 2000), but mature and old forests are preferred (Bennett et al. 2000; Campbell et al. 2001; Kirk et al. 1996; Schieck et al. 1995; Schieck and Song 2006). In northeastern Alberta, Schieck et al. (1995) reported highest densities in mature aspen and mixed deciduous forest stands greater than 120 years of age, less common in stands 50 to 65 years old, and absent from young stands 20 to 30 years of age. However, in northeastern BC, Campbell et al. (2007) observed Canada warblers occupying stands as young as 20 to 25 years old. Preferred sites in northeastern BC have closed upper canopies (15% to 80% cover; mean = 62%), open lower canopies and a dense shrub understorey (20% to 95% cover; mean = 79%; median = 80%) 2.5 to 3.5 m above ground (Campbell et al. 2007).
Foraging occurs among dense shrub between 0.3 m and 5.0 m above the forest floor (Enns and Siddle 1996; Robbins et al. 1989; Sabo and Holmes 1983; Sodhi and Paszkowski 1995). In Alberta, breeding habitat includes dense deciduous understorey taller than 1.5 m (Semenchuk 1992). The shrub layer of breeding sites is commonly dominated by green alder, prickly rose, red-osier dogwood, soopolallie, highbush cranberry, aspen saplings and birch saplings (Campbell et al. 2001, 2007). Soil moisture can be wet or dry (Campbell et al. 2001, 2007). Riparian or floodplain sites are often occupied, but upland areas are also used frequently for nesting in BC (Bennett et al. 2000; Campbell et al. 2001, 2007). In general, nesting occurs on or near the ground on sphagnum hummocks among roots of upturned stumps and fallen trees (Reitsma et al. 2010). Canada warblers may also use riparian and streamside thickets (Cooper et al. 1997), shrubs along forest edges (Campbell et al. 2001), and shrub-covered slopes and ravines (Cooper et al. 1997). In Alberta, dense willow stands are also used for nesting (Semenchuk 1992).
One observation for Canada warbler was recorded in the low-bush cranberry aspen (d1) ecosite phase, and one in the low-bush cranberry aspen-white spruce (d2) ecosite phase during previous breeding bird surveys in the LSAs (Golder 2007, Golder 2011). Historical survey and incidental data from the Oil Sands Region include observations in blueberry jack pine-aspen (b1), blueberry aspen-white spruce (b3), low-bush cranberry aspen (d1), low-bush cranberry aspen-white spruce (d2), low-bush cranberry white spruce (d3), dogwood balsam poplar-aspen (e1), dogwood balsam poplar-white spruce (e2), dogwood white spruce (e3), horsetail balsam poplar-aspen (f1), horsetail balsam poplar-white spruce (f2), Labrador tea/horsetail white spruce-black spruce (h1), shrubby swamp (SONS) and wooded swamp (STNN) ecosite phases and wetlands types (Golder 2007).
Point count survey locations were established in mature (greater than 60 year old) forest stands with well-developed shrubby understories, such as low-bush cranberry aspen (d1), blueberry jack pine-aspen (b1), blueberry aspen-white birch (b2), blueberry aspen-white spruce (b3), ecosite phases. During reconnaissance of the LSA prior to initiating surveys, much of the understorey typical of ecosite phases such as low-bush cranberry aspen (d1) had been burned, potentially making these sites unsuitable for nesting and foraging by Canada warblers. Shrubby and riparian habitats adjacent to deciduous forest were also potential survey targets.

FEDERALLY LISTED SPECIES AT RISK SURVEYS
January 2013 Report No. 10-1346-0001/7000/7019 8
Olive-Sided Flycatcher Olive-sided flycatchers are associated with a range of open areas containing tall trees or snags for perching and foraging (Altman and Sallabanks 2000). Open areas might include burned forest, open to semi-open mature forest stands, forest edges near natural openings such as meadows, rivers and wetlands, or forest edges near human-made openings such as logged areas (Altman and Sallabanks 2000). Preferred habitat in the boreal forest tends to occur in coniferous or mixedwood forest near wetlands (Altman and Sallabanks 2000). In western Canada, the olive-sided flycatcher is associated with early to mid-successional post-fire or post-clearcut forest with residual live trees, as well as old-growth mixedwood forest (Schieck and Song 2006).
Prime nesting habitat occurs in mature conifer forests associated with forest openings for foraging. Most nests are located in conifers, while deciduous trees are rarely used for nesting. Nests are built high in the tree on horizontal branches away from the trunk (Altman and Sallabanks 2000) and often beneath thick canopy cover (COSEWIC 2007b).
Three olive-sided flycatchers were detected in the vicinity of the LSA during previous baseline breeding bird surveys and targeted SAR surveys in graminoid fen (FONG), shrubby swamp (SONS), and open bog (BONN) wetlands types (Golder 2007, Golder 2011). Historical survey and incidental data from the Oil Sands Region include observations in a range of wetland types and ecosite phases, including blueberry jack pine-aspen (b1), Labrador tea-mesic jack pine-black spruce (c1), low-bush cranberry aspen-white spruce (d2), low-bush cranberry white spruce (d3), Labrador tea-subhygric black spruce-jack pine (g1), wooded bog (BTNN), shrubby fen (FONS), wooded fen (FTNN), graminoid fen (FONG), shrubby swamp (SONS), open bog (BONN),burned wetlands (BUw), burned uplands (BUu) and disturbed sites (DIS).
Point counts survey locations for olive-sided flycatchers were established near mature coniferous forest and in close proximity to burns, cutblocks, meadows, lakes or shrublands. Areas of the LSA that were burned from the 2011 fire were also selected as they contained features used by the species, such as exposed burned snags found in burned uplands (BUu). Edges around horsetail white spruce (f3) and cutblocks (CC) were also targeted, along with appropriate wetlands types such as wooded fen (FTNN), shrubby fen (FONS), and wooded swamp (STNN).
Rusty Blackbird Habitat requirements of rusty blackbirds are consistent across their range in western North America (Avery 1995; COSEWIC 2006). In general, rusty blackbirds inhabit isolated, low-elevation wetlands in coniferous and mixed forest habitats across the boreal region, including bogs, fens, muskegs, swamps, wet meadows, wet forest openings and floodplain forests (Avery 1995; COSEWIC 2006; Greenberg and Droege 1999; Shaw 2006). They also use shrubby riparian areas along the edges of lakes, beaver impoundments, rivers and other watercourses in coniferous and mixed forests (Campbell et al. 2001; COSEWIC 2006). Upland forested habitats and high-elevation wetlands are rarely used by rusty blackbirds (Avery 1995; Campbell et al. 2001; COSEWIC 2006; LaRue et al. 1995).
Rusty blackbirds were recorded in graminoid fen (FONG) and wooded fen (FTNN) wetlands types (Golder 2007, 2011). Historical survey and incidental data from the Oil Sands Region include observations in graminoid fen (FONG), shrubby fen (FONS), wooded fen (FTNN) and wooded bog (BTNN) wetlands types, as well as disturbed (DIS) habitats.
Point count survey locations were established in a range of wetlands types including fens, bogs, and swamps. In addition, shrubby areas near open water or along rivers/watercourses were surveyed.

FEDERALLY LISTED SPECIES AT RISK SURVEYS
January 2013 Report No. 10-1346-0001/7000/7019 9
2.3.2 Survey Methods Breeding bird surveys were conducted in accordance with standard technical procedures for point counts, based on methods described in Ralph (1993). Survey plots (i.e., point count stations) were established a minimum of 250 m apart and at least 100 m away from roads and 50 m from cutlines. Surveys began as early as half an hour before sunrise and continued no later than 10:00 a.m.
At each point count location, an initial two minutes of silence allowed the birds to adjust to the observer’s presence. A five-minute survey ensued, during which all species heard or observed were recorded. Observations were divided into those species heard within and outside a 50-m radius, and those heard within the first three minutes and in the following two minutes.
The approximate position of each individual bird in relation to the observer was illustrated on a sketch map of the point count location. In addition, the abbreviated species name, the sex of individuals and movements of individuals around the point count location were recorded. The movements of individuals were carefully monitored to minimize the probability of recounting birds within the same or adjacent plots.
Date, time, observer, plot number, GPS waypoint, and species flying through or above the canopy were recorded at each point count location. Incidental wildlife observations (i.e., all species beyond the 50 m radius plot) were recorded. Ecosite phase or wetlands type was determined.
To reduce bias in bird detection, surveys were not conducted during periods of high winds, heavy rains or thick fog. Wind speeds greater than 20 km/hr are sufficient to interfere with auditory birding.
2.3.3 Data Analysis For each SAR, the mean (i.e., average) number of individuals observed per plot and the number of individuals detected per hectare of surveyed habitat were calculated. The purpose of these calculations was to estimate the relative abundance and density of each species within a particular habitat type. Only individuals within a 50-m radius were included in the analysis. However, individuals observed outside the plot, as well as other avian SAR observed in and outside the plot, are included as incidental observations. Standard deviation (i.e., the amount of variation from the mean) and confidence intervals (i.e., the range of values that will contain the true mean 95% of the time) were calculated for each habitat type.
Some experts believe that density estimates should not be calculated for breeding songbird point count data that have not been adjusted for detectability (Marques et al. 2007). However, estimating relative abundance or relative density, if the variables (e.g., habitat type, weather) are consistent between surveys, is an acceptable index method for monitoring trends in populations over time (Bart et al. 2004).
Statistical analysis of habitat associations was not conducted because only specific habitat types were surveyed. However, a description of the habitats where Canada warblers, olive-sided flycatchers and rusty blackbirds were observed is provided.

FEDERALLY LISTED SPECIES AT RISK SURVEYS
January 2013 Report No. 10-1346-0001/7000/7019 10
3.0 RESULTS
3.1 Common Nighthawk Survey Common nighthawk surveys were completed in and around the PRM LSA on July 6 and 7, 2012. In total, 66 plots (i.e., point counts) were completed in 12 vegetation types, with most centred in cutblocks (CC), followed by burned uplands (BUu) and lichen jack pine (a1) vegetation types (Table 3).
Table 3 Common Nighthawk Habitat Types Surveyed In and Around the Pierre River Mine Local Study Area, 2012
Map Code Vegetation Type(a) Sample Plots
Number of Plots % of Total Plots Total Area Sampled [ha]
a1 lichen jack pine 8 12 25 b1 blueberry jack pine-aspen 3 5 9 BUu burned upland 10 15 31 CC cutblock 24 36 75 d1 low-bush cranberry aspen 4 6 13 d2 low-bush cranberry aspen-white spruce 5 8 16 FONS shrubby fen 1 2 3 FTNN wooded fen 2 3 6 MONG graminoid marsh 2 3 6 NWL lakes and ponds 1 2 3 STNN wooded swamp 5 8 16 WONN open water 1 2 3 Total 66 100 207
(a) Beckingham and Archibald (1996); Halsey et al. (2003). Note: Some numbers are rounded for presentation purposes. Therefore, totals do not necessarily equal the sum of the individual values.
3.1.1 Observations and Habitat Descriptions Forty-seven common nighthawks were recorded within plots in and around the LSA (Figure 2 and Table 4). Both relative abundance and density were highest in the lichen jack pine (a1) ecosite phase, followed by burned upland (BUu), blueberry jack pine-aspen (b1), and cutblock (CC) vegetation types (Table 4).
There were no detections in plots with low-brush cranberry as a dominant understorey (d1 and d2 ecosite phases). Common nighthawks were recorded in two of six wetlands types, including graminoid marsh (MONG) and wooded fen (FTNN).

I:\CLIE
NTS\
SHEL
L\10-
1346
-000
1\map
ping\m
xd\70
00\FI
NAL\F
ig_2_
Comm
on_N
ightha
wk_S
urvey
_Obs
ervati
on_P
RM_L
SA_F
INAL
.mxd
³
ALBERTA DIGITAL BASE OBTAINED FROM ALTALIS LTD. (2004-2010) © GOVERNMENTOF ALBERTA. ALL RIGHTS RESERVEDDATUM: NAD83 PROJECTION: UTM ZONE 12
REFERENCE
LEGEND!(
COMMON NIGHTHAWK SURVEY POINT
_̂COMMON NIGHTHAWK SURVEYPOINT WITH OBSERVATION
#*INCIDENTAL COMMON NIGHTHAWK OBSERVATIONPUBLIC ROADWAYWATERCOURSEPIERRE RIVER MINE LOCAL STUDY AREAOPEN WATER
DISTURBEDEXISTING AND APPROVED URBAN AND INDUSTRIAL LINEAR DISTURBANCE
Calgary, Alberta
JACKPINE MINE EXPANSION &PIERRE RIVER MINE PROJECT
PROJECTDESIGN
GISCHECKREVIEW
SQPT
25 Oct. 201217 Dec. 2012
FIGURE: 2
FILE No.REV. 0
10-1346-0001 SCALE AS SHOWN
TITLE
PROJECT
COMMON NIGHTHAWK SURVEY PLOTS ANDOBSERVATIONS IN AND AROUND THE PIERRE
RIVER MINE LOCAL STUDY AREA
4 0 4
KILOMETRES
Shell Canada Limited
!(
!(
!(
!(
!(
!( !(
!(
!(!(
!(!(
!(
!(
!(
!(
!(
!(!(
!(
!(
!(
!(
!(
!(!(
!(
!(
!(
!(!(
!(
!(
!(
!(
!(!(
!( !(!(
!(
#*
#*#*
#*
#*
#*
#*#*
#*
#*
#*#*
#*#*#*
#*
_̂
_̂
_̂
_̂
_̂
_̂
_̂
_̂
_̂
_̂
_̂
_̂
_̂
_̂
_̂
_̂
_̂
_̂
_̂
_̂
_̂
_̂
_̂
_̂
_̂
Tp.99
Tp.98
Tp.97
McClelland Lake
Athab
asca
Rive
r
Firebag River
OakleyLake
Calumet Lake
SmallSandyLake
Lillian Lake
CranberryLake
CrookedLake
Rg.9 Rg.11 Rg.10
Tp.100 Rg.8W4M
(4)
(4)
(3)
(3)
(3)
(2)
(2)
(2)
(2)
(2)
(2)
(2)
(2)
(2)
(2)
(2)
(2)
(2)
(2)
(2)(2)
460000
460000
470000
470000
480000
480000
6370
000
6370
000
6380
000
6380
000
6390
000
6390
000
EXISTING AND APPROVED URBAN AND INDUSTRIAL LINEAR DISTURBANCE
SCALE 1:175,000
NUMBERS INDICATE THE NUMBER OF INDIVIDUALS (>1)OBSERVED AT EACH OBSERVATION LOCATION.
NOTE:
BSMGJ
20 Dec. 201220 Dec. 2012

FEDERALLY LISTED SPECIES AT RISK SURVEYS
January 2013 Report No. 10-1346-0001/7000/7019 12
Table 4 Common Nighthawk Detections In and Around the Pierre Rive Mine Local Study Area, 2012 Map Code Vegetation Type(a) #
Plots # Observed Mean Relative
Abundance (±SD)
Relative Abundance Confidence Interval(b)
(95%)
Mean Relative Density (±SD)
Relative Density Confidence
Interval(b) (95%) a1 lichen jack pine 8 13 1.6 ± 1.5 (0.6, 2.7) 0.5 ± 0.5 (0.2, 0.8)
b1 blueberry jack pine-aspen 3 4 1.3 ± 0.6 (0.7, 2.0) 0.4 ± 0.2 (0.2, 0.6)
BUu burned upland 10 13 1.3 ± 1.1 (0.6, 2.0) 0.4 ± 0.3 (0.2, 0.6) CC cutblocks 24 15 0.6 ± 1.1 (0.2, 1.1) 0.2 ± 0.3 (0.1, 0.3)
d1 low-bush cranberry aspen 4 0 0.0 ± 0.0 - 0.0 ± 0.0 -
d2 low-bush cranberry aspen-white spruce
5 0 0.0 ± 0.0 - 0.0 ± 0.0 -
FONS shrubby fen 1 0 0.0 ± 0.0 - 0.0 ± 0.0 - FTNN wooded fen 2 1 0.5 ± 0.7 (0.2, 0.2) 0.2 ± 0.2 (0.0, 0.5) MONG graminoid marsh 2 1 0.5 ± 0.7 (0.2, 0.2) 0.2 ± 0.2 (0.0, 0.5) NWL lakes and ponds 1 0 0.0 ± 0.0 - 0.0 ± 0.0 - STNN wooded swamp 5 0 0.0 ± 0.0 - 0.0 ± 0.0 - WONN shallow open water 1 0 0.0 ± 0.0 - 0.0 ± 0.0 - Total 66 47 0.7 ± 1.1 (0.8, 1.4) 0.2 ± 0.3 (0.1, 0.3)
(a) Beckingham and Archibald (1996); Halsey et al. (2003). (b) Confidence intervals are calculated from sample data, and may underestimate or overestimate natural variability, depending on the
variation observed relative to that present in the total population. Note: SD = Standard Deviation. Zeros are reported due to lack of data at sample points. - = Confidence intervals cannot be calculated in the absence of observations.
3.1.2 Incidental Observations Twenty-one incidental observations of common nighthawks were recorded in seven different vegetation types within the PRM LSA in 2012 (Appendix A, Table A-1). More than half (n=12) of these observations occurred in the lichen jack pine (a1) ecosite phase and blueberry jack pine-aspen (b1) ecosite phase. The remaining nine observations occurred blueberry aspen-white spruce (b3) ecosite phases and in open vegetation types such as cutblocks (CC), bogs and fens.
3.2 Horned Grebe Survey Horned grebe surveys were completed in and around the PRM LSA in conjunction with other surveys from June 17 to 20, 2012. In total, 7 survey plots were completed in the shallow open water wetlands type (WONN; Table 5).
Table 5 Horned Grebe Habitat Types Surveyed In and Around the Pierre River Mine Local Study Area, 2012
Map Code Vegetation Type(a) Sample Plots
Number of Plots % of Total Plots Total Area Sampled [ha]
WONN shallow open water 7 100 22 (a) Beckingham and Archibald (1996); Halsey et al. (2003). Note: Some numbers are rounded for presentation purposes. Therefore, totals do not necessarily equal the sum of the individual values.

FEDERALLY LISTED SPECIES AT RISK SURVEYS
January 2013 Report No. 10-1346-0001/7000/7019 13
3.2.1 Observations and Habitat Descriptions Horned grebes were not recorded within any plots sampled in and around the LSA (Figure 3). Two plots on one of the largest water bodies within the LSA represented approximately half (11 ha) of the total wetland area surveyed. The five remaining plots surveyed other individual shallow open water (WONN) wetlands.
3.2.2 Incidental Observations No incidental observations of horned grebes were recorded during any avian SAR surveys in and around the PRM LSA in 2012.
3.3 Breeding Bird Species at Risk Survey Breeding bird SAR surveys were completed in and around the PRM LSA from June 17 to 20, 2012. In total, 103 plots (i.e., point counts) were completed in 19 vegetation types. Forty-seven plots targeted Canada warbler, of which over half were located in lowbush cranberry aspen (d1) and dogwood white spruce (e3) ecosite phases. Twenty-one plots targeted both olive-sided flycatcher and rusty blackbird due to their overlapping use of some wooded wetlands types. These plots were located in burned wetland (BUw), shrubby fen (FONS), wooden fen (FTNN), and wooden swamp (STNN) wetlands types. An additional thirty-one plots targeted only olive-sided flycatcher in burned upland (BUu), blueberry jack pine-aspen (d1), cutblocks (CC) and horsetail white spruce (f3) vegetation types. Four plots targeted only rusty blackbird in wooded bog (BTNN), graminoid fen (FONG), and shrubby swamp (SONS) vegetation types (Table 6).
3.3.1 Observations and Habitat Descriptions Targeted avian species at risk observations and relative population indexes are summarized by vegetation type in Table 7. Within the 47 plots sampled for Canada warbler, only one individual was detected in the dogwood white spruce ecosite phase (e3) near the northern extent of the LSA (Figure 4). The dominant canopy tree species at this plot were trembling aspen (Populus tremuloides) and white spruce (Picea glauca). Other overstorey tree species included jack pine (Pinus banksiana) and white birch (Betula papyrifera). Understorey species included green alder (Alnus viridi) and prickly rose (Rosa acicularis). Overall relative abundance in the dogwood white spruce (e3) ecosite phase averaged 0.1 individuals per plot, and less than 0.02 individuals per hectare across 38 ha sampled (Table 7).
Olive-side flycatchers were not detected in any of the four upland ecosite phases surveyed specifically for the species. Four wetland types were also surveyed for both olive-sided flycatchers and rusty blackbirds but no detections were made for either species. Three additional wetlands types were specifically surveyed for rusty blackbirds where none was detected.

I:\CLIE
NTS\
SHEL
L\10-
1346
-000
1\map
ping\m
xd\70
00\FI
NAL\F
ig_3_
Horn
ed_G
rebe_
Surve
y_plo
ts_an
d_ob
serva
tion_
in_the
_PRM
_Exp
ansio
n_LS
A_FIN
AL.m
xd
³
ALBERTA DIGITAL BASE OBTAINED FROM ALTALIS LTD. (2004-2010) © GOVERNMENTOF ALBERTA. ALL RIGHTS RESERVEDDATUM: NAD83 PROJECTION: UTM ZONE 12
REFERENCE
LEGEND!(
HORNED GREBE SURVEY POINTPUBLIC ROADWAYWATERCOURSEPIERRE RIVER MINE LOCAL STUDY AREAOPEN WATER
DISTURBEDEXISTING AND APPROVED URBAN AND INDUSTRIAL LINEAR DISTURBANCE
Calgary, Alberta
JACKPINE MINE EXPANSION &PIERRE RIVER MINE PROJECT
PROJECTDESIGN
GISCHECKREVIEW
SQPT
25 Oct. 201217 Dec. 2012
FIGURE: 3
FILE No.REV. 0
10-1346-0001 SCALE AS SHOWN
TITLE
PROJECT
HORNED GREBE SURVEY PLOTS INAND AROUND THE PIERRE RIVER MINE
LOCAL STUDY AREA
Shell Canada Limited
!(
!(!(
!(
!(
!( !(
Tp.99
Tp.98
Tp.97
McClelland Lake
Athab
asca
Rive
r
Firebag River
OakleyLake
Calumet Lake
SmallSandyLake
Lillian Lake
CranberryLake
CrookedLake
Rg.9 Rg.11 Rg.10
Tp.100 Rg.8W4M
460000
460000
470000
470000
480000
480000
6370
000
6370
000
6380
000
6380
000
6390
000
6390
000
EXISTING AND APPROVED URBAN ANDINDUSTRIAL LINEAR DISTURBANCE
4 0 4
KILOMETRESSCALE 1:175,000
BSMGJ
20 Dec. 201220 Dec. 2012

FEDERALLY LISTED SPECIES AT RISK SURVEYS
January 2013 Report No. 10-1346-0001/7000/7019 15
Table 6 Breeding Bird Species at Risk Habitat Types Surveyed In and Around the Pierre River Mine Local Study Area, 2012
Map Code Vegetation Type(a) Sample Plots
Number of Plots % of Total Plots Total Area Sampled [ha]
Canada warbler survey b2 blueberry aspen 6 6 5 b3 blueberry aspen-white spruce 3 3 2 b4 blueberry white spruce-jack pine 1 1 1 d1 low-bush cranberry aspen 19 18 15 d2 low-bush cranberry aspen-white spruce 7 7 6 e2 dogwood balsam poplar-white spruce 1 1 1 e3 dogwood white spruce 9 9 7 h1 Labrador tea/horsetail white spruce-black spruce 1 1 1
subtotal 47 46 38 olive-sided flycatcher survey b1 blueberry jack pine-aspen 8 8 6 BUu burned upland 19 18 15 CC cutblock 3 3 2 f3 horsetail white spruce 1 1 1
subtotal 31 30 25 rusty blackbird survey BTNN wooded bog 2 2 2 FONG graminoid fen 1 1 1 SONS shrubby swamp 1 1 1
subtotal 4 4 4 olive-sided flycatcher and rusty blackbird survey BUw burned wetland 1 1 1 FONS wooded swamp 5 5 4 FTNN wooded fen 7 7 6 STNN wooded swamp 8 8 6
subtotal 21 20 17 Total 103 100 83
(a) Beckingham and Archibald (1996); Halsey et al. (2003). Note: Some numbers are rounded for presentation purposes. Therefore, totals do not necessarily equal the sum of the individual values.

FEDERALLY LISTED SPECIES AT RISK SURVEYS
January 2013 Report No. 10-1346-0001/7000/7019 16
Table 7 Avian Species at Risk Detections by Habitat Type In and Around the Pierre River Mine Local Study Area, 2012
Map Code Vegetation Type(a) # Plots # Observed
Mean Relative Abundance
(±SD)
Relative Abundance
Confidence Interval (95%)
Mean Relative Density (±SD)
Relative Density Confidence
Interval (95%)
Canada warbler b2 blueberry aspen 6 0 0.0 ± 0.0 - 0.0 ± 0.0 -
b3 blueberry aspen-white spruce 3 0 0.0 ± 0.0 - 0.0 ± 0.0 -
b4 blueberry white spruce-jack pine 1 0 0.0 ± 0.0 - 0.0 ± 0.0 -
d1 low-bush cranberry aspen 19 0 0.0 ± 0.0 - 0.0 ± 0.0 -
d2 low-bush cranberry aspen-white spruce 7 0 0.0 ± 0.0 - 0.0 ± 0.0 -
e2 dogwood balsam poplar-white spruce 1 0 0.0 ± 0.0 - 0.1 ± 0.3 -
e3 dogwood white spruce 9 1 0.11 ± 0.33 (0.0, 0.33) 0.09 ± 0.27 (0.0, 0.26)
h1 Labrador tea/horsetail white spruce-black spruce
1 0 0.0 ± 0.0 - 0.0 ± 0.0 -
Total 47 1 0.02 ± 0.15 (0.0, 0.06) 0.02 ± 0.12 (0.0, 0.05) olive-sided flycatcher
b1 blueberry jack pine-aspen 8 0 0.0 ± 0.0 - 0.0 ± 0.0 -
BUu burned upland 19 0 0.0 ± 0.0 - 0.0 ± 0.0 - CC cutblock 3 0 0.0 ± 0.0 - 0.0 ± 0.0 - f3 horsetail white spruce 1 0 0.0 ± 0.0 - 0.0 ± 0.0 - Total 31 0 0.0 ± 0.0 - 0.0 ± 0.0 rusty blackbird BTNN wooded bog 2 0 0.0 ± 0.0 - 0.0 ± 0.0 - FONG graminoid fen 1 0 0.0 ± 0.0 - 0.0 ± 0.0 - SONS shrubby swamp 1 0 0.0 ± 0.0 - 0.0 ± 0.0 - Total 4 0 0.0 ± 0.0 - 0.0 ± 0.0 - olive-sided flycatcher and rusty blackbird survey BUw burned wetland 1 0 0.0 ± 0.0 - 0.0 ± 0.0 - FONS wooded swamp 5 0 0.0 ± 0.0 - 0.0 ± 0.0 - FTNN wooded fen 7 0 0.0 ± 0.0 - 0.0 ± 0.0 - STNN wooded swamp 8 0 0.0 ± 0.0 - 0.0 ± 0.0 - Total 21 0 0.0 ± 0.0 - 0.0 ± 0.0 -
(a) Beckingham and Archibald (1996); Halsey et al. (2003). Note: SD = Standard Deviation. Zeros are reported due to lack of data at sample points. The number of plots for olive-sided flycatcher and rusty blackbird include 20 plots where both species were surveyed for
simultaneously, and are therefore counted for each species. Total relative abundance and relative density per species represent overall measures for all habitat types combined.
- = Confidence intervals cannot be calculated in the absence of observations.

I:\CLIE
NTS\
SHEL
L\10-
1346
-000
1\map
ping\m
xd\70
00\FI
NAL\F
ig_4_
Bree
ding_
Birds
_Sur
vey_
plots_
and_
obse
rvatio
n_in_
the_P
RM_E
xpan
sion_
LSA_
FINAL
.mxd
³
ALBERTA DIGITAL BASE OBTAINED FROM ALTALIS LTD. (2004-2010) © GOVERNMENTOF ALBERTA. ALL RIGHTS RESERVEDDATUM: NAD83 PROJECTION: UTM ZONE 12
REFERENCE
LEGENDSURVEY LOCATION!( CANADA WARBLER!( OLIVE-SIDED FLYCATCHER!(
OLIVE-SIDED FLYCATCHER / RUSTY BLACKBIRD
!( RUSTY BLACKBIRDOBSERVATION LOCATION
_̂CANADA WARBLER SURVEYPOINT WITH OBSERVATION
#*INCIDENTAL CANADAWARBLER OBSERVATION
#*INCIDENTAL OLIVE-SIDED FLYCATCHER OBSERVATION
#*INCIDENTAL RUSTY BLACKBIRD OBSERVATION
PUBLIC ROADWAYWATERCOURSEPIERRE RIVER MINE LOCAL STUDY AREAOPEN WATER
DISTURBEDEXISTING AND APPROVED URBAN AND INDUSTRIAL LINEAR DISTURBANCE
Calgary, Alberta
JACKPINE MINE EXPANSION &PIERRE RIVER MINE PROJECT
PROJECTDESIGN
GISCHECKREVIEW
SQPT
25 Oct. 201217 Dec. 2012
FIGURE: 4
FILE No.REV. 0
10-1346-0001 SCALE AS SHOWN
TITLE
PROJECT
BREEDING BIRD SPECIES AT RISK SURVEY PLOTS AND OBSERVATIONS IN AND AROUND THE PIERRE
RIVER MINE LOCAL STUDY AREA
4 0 4
KILOMETRES
Shell Canada Limited
!(
!(
!(
!(
!(
!(
!(
!(
!(
!(
!(
!(!(
!(
!(
!(
!(
!(!(
!(
!( !( !( !(
!( !(!(
!(
!(
!(
!(
!(
!(
!(
!(
!(!(
!(
!(!(
!(
!(
!(
!( !(
!(!(
!(
!(
!(
!(
!(
!(
!(
!(
!(
!(
!(
!(
!(!(
!(!(
!(
!(
!(!(
!(
!(
!(!(!(
!(
!(
!(
!(
!(
!(
!(
!(
!(
!(!(
!(
!(
!(
!(
!(
!(
!(!(
!(
!(
!(
!(
!(
!(
!(!(
!(
!(
!(
_̂
#*#*#*
#*
#*#*#*
#*
Tp.99
Tp.98
Tp.97
McClelland Lake
Athab
asca
Rive
r
Firebag River
OakleyLake
Calumet Lake
SmallSandyLake
Lillian Lake
CranberryLake
CrookedLake
Rg.9 Rg.11 Rg.10
Tp.100 Rg.8W4M
460000
460000
470000
470000
480000
480000
6370
000
6370
000
6380
000
6380
000
6390
000
6390
000
EXISTING AND APPROVED URBAN ANDINDUSTRIAL LINEAR DISTURBANCE
SCALE 1:175,000
BSMGJ
20 Dec. 201220 Dec. 2012

FEDERALLY LISTED SPECIES AT RISK SURVEYS
January 2013 Report No. 10-1346-0001/7000/7019 18
3.3.2 Incidental Observations During avian SAR surveys in 2012 in and around the PRM LSA, five Canada warblers were recorded incidentally. Four observations occurred in the dogwood white spruce (e3) ecosite phase and one occurred in the dogwood balsam poplar-white spruce (e2) ecosite phase (Appendix A, Table A-1). All of these observations occurred during breeding bird point counts but were detected outside either the 50-m or 100-m plot radii and therefore were not included in the analysis. Land cover type was projected based on the approximate distance and bearing of the observation.
Three olive-sided flycatchers were observed incidentally (Appendix A, Table A-1). Two of these detections were made outside of the 50-m plot radius during a breeding bird point count in cutblocks (CC) and wooded swamp (STNN) vegetation types. Vegetation type was projected based on the approximate distance and bearing of the individuals observed. The third incidental olive-sided flycatcher was recorded adjacent to a large wetland (WONN) during the horned grebe survey. One incidental observation of a rusty blackbird was recorded at this same wetland.
4.0 SURVEY RESULTS AND APPLICABILITY TO ENVIRONMENTAL IMPACT ASSESSMENT FINDINGS
As avian SAR are rare, surveys for these species focus effort in habitat types predicted to be high quality. This is done to obtain a sufficient number of observations for calculating estimates of relative abundance where individuals are most likely to occur. Survey plots were selected for each SAR in habitat predicted to be high quality using habitat associations that were informed by the best available literature for each species and expert knowledge. Avian SAR were observed where they were expected to be found, thus supporting assumptions related to habitat associations for these species. Those same habitat associations were used to predict the effects of the Project on habitat for federally-listed SAR. Data from SAR surveys form a baseline against which future monitoring data may be compared.

FEDERALLY LISTED SPECIES AT RISK SURVEYS
January 2013 Report No. 10-1346-0001/7000/7019 19
5.0 CLOSURE We trust the above meets your present requirements. If you have any questions or require additional details, please contact the undersigned.
GOLDER ASSOCIATES LTD.
Prepared by: Reviewed by:
Sam Quinlan, M.Sc./Leslie Hunt, B.Sc. Martin Jalkotzy, M.E.Des. Wildlife Biologist Principal, Senior Wildlife Ecologist
Brock Simons, M.Sc. Wildlife Analyst LH/BS/MGJ/SNS/WES/jjm
\\golder.gds\calgary\Active\_2010\1346\10-1346-0001 - Shell JME & PRM Follow-Up 2\7000 SAR Survey\reporting\REPORT

FEDERALLY LISTED SPECIES AT RISK SURVEYS
January 2013 Report No. 10-1346-0001/7000/7019 20
6.0 REFERENCES ABMI (Alberta Biodiversity Monitoring Institute). 2010. Wetland field data collection protocols (10035), Version
2010-04-01. Alberta Biodiversity Monitoring Institute, Alberta, Canada. Report available at: http://abmi.ca
Altman, B. and R. Sallabanks. 2000. Olive-sided flycatcher (Contopus cooperi), The Birds of North America Online (A. Poole, Ed.). Ithaca: Cornell Lab of Ornithology. Available online: http://bna.birds.cornell.edu/bna/species/502. Accessed August 18, 2011.
ASRD (Alberta Sustainable Resources Development). 2011. The General Status of Alberta Wild Species 2010. Alberta Sustainable Resource Development, Fish and Wildlife Service Division. http://www.srd.alberta.ca/FishWildlife/SpeciesAtRisk/GeneralStatusOfAlbertaWildSpecies/GeneralStatusOfAlbertaWildSpecies2010/Default.aspx. Accessed August 18, 2011.
Avery, M.I. 1995. Rusty Blackbird. Number 200 in A. Poole and F. Gill (Eds.). The Birds of North America. The Academy of Natural Sciences of Philadelphia, Philadelphia.
Bart, J., S. Droege, P. Geissler, B. Peterjohn and C.J. Ralph. 2004. Density estimation in wildlife surveys. Wildlife Society Bulletin 32(4): 1242-1247.
Beckingham, J.D. and J.H. Archibald. 1996. Field Guide to Ecosites of Northern Alberta. Natural Resources Canada, Northern Forestry Centre, Northwest Region. Special Report 5. Edmonton, AB.
Bennett, S., P. Sherrington, P. Johnstone and B. Harrison. 2000. Habitat use and distribution of listed neotropical migrant songbirds in northeastern BC. In: Proceedings of a Conference on the Biology and Management of Species and Habitats at Risk (L. M. Darling, Editor), Kamloops, BC, Feb. 15-19, 1999. Vol 1. BC Ministry of Environment, Lands and Parks, Victoria, BC and University College of the Caribou, Kamloops, BC. 490 pp.
Campbell, R.W., N.K. Dawe, I. McTaggart-Cowan, J.M. Cooper, G. Kaiser, A.C. Stewart and M.C.E. McNall. 2001. The Birds of British Columbia, Vol. 4, Passerines: Wood-Warblers through Old World Sparrows. University of British Columbia Press, Vancouver, BC. 741 pp.
Campbell, R.W., M.I. Preston, M. Phinney, C. Siddle and J. Deal. 2007. Wildlife Data Centre: featured species – Canada Warbler. Wildlife Afield 4(2): 95-160.
Cooper, J.M., K.A. Enns and M.G. Shepard. 1997. Status of the Canada warbler in British Columbia. Wildlife Working Report no. WR-81. Ministry of Environment, Lands and Parks, Wildlife Branch, Victoria, BC.
COSEWIC (Committee on the Status of Endangered Wildlife in Canada). 2006. COSEWIC assessment and status report on the rusty blackbird Euphagus carolinus in Canada. Committee on the Status of Endangered Wildlife in Canada. Ottawa. vi + 28 pp.
COSEWIC. 2007a. COSEWIC assessment and status report on the common nighthawk Chordeiles minor in Canada. Committee on the Status of Endangered Wildlife in Canada. Ottawa. vi + 25 pp.
COSEWIC. 2007b. COSEWIC assessment and status report on the olive-sided flycatcher Contopus cooperi in Canada. Committee on the Status of Endangered Wildlife in Canada. Ottawa. vii + 25 pp.

FEDERALLY LISTED SPECIES AT RISK SURVEYS
January 2013 Report No. 10-1346-0001/7000/7019 21
COSEWIC. 2009. COSEWIC assessment and status report on the horned grebe (Podiceps auritus), western population and Magdalen Islands population, in Canada. Committee on the Status of Endangered Wildlife in Canada. Ottawa. vii + 42 pp.
Enns, K.A. and C. Siddle. 1996. The distribution, abundance, and habitat requirements of selected passerine birds of the Boreal and Taiga plains of British Columbia. Wildlife Working Report no. WR-76. Ministry of Environment, Lands and Parks, Wildlife Branch, Victoria, BC.
Faaborg, J. 1976. Habitat selection and territorial behavior of the small grebes of North America. Wilson Bulletin 88:390-399.
FAN (Federation of Alberta Naturalists). 2007. The Atlas of Breeding Birds of Alberta: A Second Look. Federation of Alberta Naturalists, Edmonton, AB. 626 pp.
Fournier, M.A. and J.E. Hines. 1999. Breeding ecology of the horned grebe Podiceps auritus in subarctic wetlands. Canadian Wildlife Service Occasional Paper Number 99. 34 pp.
Gibbs, J.P. and S.M. Melvin. 1993. Call-response surveys for monitoring breeding waterbirds. J. Wildl. Manage. 57:27-34.
Golder (Golder Associates Ltd.). 2004. 2004 Suncor Energy Wildlife Monitoring Program and Wildlife Assessment Update Year 5. Prepared for Suncor Energy Inc., Fort McMurray, AB. Prepared by Golder Associates Ltd.
Golder. 2007. Wildlife and Wildlife Habitat Environmental Setting Report for the Jackpine Mine Expansion & Pierre River Mine Project. Prepared for Shell Canada Limited. Calgary, AB. Submitted December 2007.
Golder (Golder Associates Ltd.). 2011. Federally Listed Species at Risk Surveys for the Shell Jackpine Expansion & Pierre River Mine Project. Submitted to Shell Canada Limited, November 2011. Calgary, AB. 23 pp
Greenberg, R. and S. Droege. 1999. On the decline of the Rusty Blackbird and the use of ornithological literature to document long-term population trends. Conservation Biology 13:553-559.
Hagar, J., S. Howlin and L. Ganio. 2004. Short term response of songbirds to experimental thinning of young Douglas-fir forests in the Oregon cascades. Forest Ecology and Management 199:333-347.
Halsey, L.A., D.H. Vitt, D. Beilman, S. Crow, S. Mehelcic and R. Wells. 2003. Alberta Wetlands Inventory Standards, Version 2.0. Alberta Sustainable Resource Development, Resource Data Branch. Edmonton, AB. 54 pp. ISBN: 0778523233.
Hausleitner, D. and J. Dulisse. 2008. Common nighthawk inventory in the Pend d’Orieille and Fort Shepherd Conservancy Area. Prepared for the Fish and Wildlife Compensation Program, Columbia Basin, Nelson, B.C. 17 pp.
Heglund, P.J., J.R. Jones, L.H. Frederickson and M.S. Kaiser. 1994. Use of boreal forested wetlands by Pacific Loons (Gavia pacifica Lawrence) and Horned Grebes (Podiceps auritus L.): relations with limnological characteristics. Hydrobiologia 279/280:171-183.

FEDERALLY LISTED SPECIES AT RISK SURVEYS
January 2013 Report No. 10-1346-0001/7000/7019 22
Kirk, D.A., A.W. Diamond, K.A. Hobson and A.R. Smith. 1996. Breeding bird communities of the western and northern Canadian boreal forest: relationship to forest type. Canadian Journal of Zoology 74:1749-1770.
Kuczynski, E.C. 2009. Habitat selection and food web relations of horned grebes (Podiceps auritus) and other aquatic birds on constructed wetlands in the Peace Parkland, Alberta, Canada. MSc Thesis. University of Alberta, Edmonton, Alberta. 188 pp.
LaRue, P., L. Bélanger and J. Huot. 1995. Riparian edge effects on boreal balsam fir bird communities. Canadian Journal of Forest Research 25: 555-566.
Marques, T.A., L. Thomas, S.G. Fancy and S.T. Bucklans. 2007. Improving estimates of bird density using multiple-covariate distance sampling. The Auk 124: 1229-1243.
MMP (Marsh Monitoring Program). 2010. Prairie and Parkland Marsh Monitoring Program – training kit and instructions for surveying marsh birds and their habitats. Bird Studies Canada, Saskatoon, SK. 27 pp.
Osnas, E.E. 2003. The role of competition and local habitat conditions for determining occupancy patterns in grebes. Waterbirds: The International Journal of Waterbird Biology 26(2): 209-216.
Peck, G.K. and R.D. James. 1983. Breeding bird of Ontario: nidicology and distribution. Vol 2. R. Ont. Mus., Toronto.
Poulin, R.G., S.D. Grindal and R.M. Brigham. 1996. Common nighthawk (Chordeiles minor). In The Birds of North America, No. 213 (A. Poole and F. Gill, eds.). The Academy of Natural Sciences, Philadelphia, PA, and the American Ornithologists’ Union, Washington, D.C. Available online at: http://bna.birds.cornell.edu/bna/species/213/articles/introduction. Accessed March 20, 2010.
Ralph, C.J. 1993. Designing and Implementing a Monitoring Program and the Standards for Conducting Point Counts. pp. 204-207 in Status and Management of Neotropical Migratory Birds. Finch, D.M. and P.W. Stangel, eds. Gen. Tech. Rep. RM-229. US Department of Agriculture, Forest Service Rocky Mountain Forest and Range Experiment Station, Fort Collins, Colorado.
Reitsma, L., M. Goodnow, M.T. Hallworth and C.J. Conway. 2010. Canada Warbler (Wilsonia canadensis). The Birds of North America Online (A. Poole, Ed.). Ithaca: Cornell Lab of Ornithology; Retrieved from the Birds of North America Online: http://bna.birds.cornell.edu/bna/species/421. Accessed August 18, 2011.
RIC (Resources Inventory Committee). 1998. Inventory methods for nighthawk and poorwill. Resources Information Standards Committee, Province of British Columbia. Standards for components of British Columbia’s biodiversity number 9. Victoria, British Columbia, Canada.
RIC. 1999. Inventory methods for waterfowl and allied species: Loonds, grebes, swans, geese, ducks, American Coot, and Sandhill Crane. Resources Information Standards Committee, Province of British Columbia. Standards for components of British Columbia’s biodiversity number 18. Victoria, British Columbia, Canada. Vii 82 pp.
Robbins, C.S., D.K. Dawson and B.A. Dowell. 1989. Habitat area requirements of breeding forest birds of the middle Atlantic states. Wildlife Monographs 103: 3-34.
Sabo, S.R. and R.T. Holmes. 1983. Foraging niches and the structure of forest bird communities in contrasting montane habitats. Condor 85:121–138.

FEDERALLY LISTED SPECIES AT RISK SURVEYS
January 2013 Report No. 10-1346-0001/7000/7019 23
Schieck, J., Nietfeld, M., and J.B. Stelfox. 1995. Differences in bird species richness and abundance among three successional stages of aspen-dominated boreal forests. Canadian Journal of Zoology 73:1417-1431.
Schieck, J. and S.J. Song. 2006. Changes in bird communities throughout succession following fire and harvest in boreal forests of western North America: a literature review and meta-analysis. Canadian Journal of Forest Research 36: 1299-1318.
Semenchuk, G.P. 1992. The Atlas of Breeding Birds of Alberta. Federation of Alberta Naturalists. Edmonton, AB. 393 pp.
Shaw, D. 2006. Breeding ecology and habitat affinities of an imperilled species, the Rusty Blackbird (Euphagus carolinus) in Fairbanks, Alaska. Preliminary Report to: United States Fish and Wildlife Service. Available at: http://www.alaskabird.org/?s=rusty+blackbird. Accessed April 21, 2011.
Shell. 2009. Jackpine Mine Expansion and Pierre River Project Environmental Impact Assessment Follow-up. 2009 Yellow Rail Surveys. October 2009.
Sodhi, N.S. and C.A. Paszkowski. 1995. Habitat use and foraging behavior of four parulid warblers in a second-growth forest. Journal of Field Ornithology 66:277–288.
Species at Risk Public Registry. 2011. http://www.sararegistry.gc.ca. Accessed August 17, 2011.
Stedman, S.J. 2000. Horned grebe (Podiceps auritus), The Birds of North America Online (A. Poole, Ed.). Ithaca: Cornell Lab of Ornithology. Available online: http://bna.birds.cornell.edu/bna/species/505. Accessed August 18, 2011.
Wiggins, D.A., D.W. Holt and S.M. Leasure. 2006. Short-eared owl (Asio flammeus). The Birds of North America Online (A. Poole, Ed.). Ithaca: Cornell Laboratory of Ornithology. Available online: http://bna.birds.cornell.edu/bna/species/062. Accessed August 18, 2011.
6.1 Personal Communication Mahon, L. (Wildlife Biologist, Canadian Wildlife Service, Environment Canada). 2011. Personal communication
with Brock Simons (Golder) on February 17, 2011.
Tiege, S. (Canadian Environmental Assessment Agency Section Head). Letter to Donald Crowe re: Jackpine Mine Expansion Oil Sands Mine – Additional Information Clarification for Federal Departments on March 31, 2010.
Wiacek, R. (Environmental Assessment Officer, Environment Canada). Personal communication with Martin Jalkotzy (Golder) on March 29, 2011.

FEDERALLY LISTED SPECIES AT RISK SURVEYS
January 2013 Report No. 10-1346-0001/7000/7019
APPENDIX A Incidental Observations

FEDERALLY LISTED SPECIES AT RISK SURVEYS
January 2013 Report No. 10-1346-0001/7000/7019 A-1
Table A-1 Avian Species at Risk Incidental Observations In and Around the Pierre River Mine Local Study Area, 2012
Survey Map Code Vegetation Type(a) Species at Risk Observations
Species Common Name # Observed
common nighthawk
a1 lichen jack pine common nighthawk 6 b1 blueberry jack pine-aspen common nighthawk 6 b3 blueberry aspen-white spruce common nighthawk 2 BTNN wooded bog common nighthawk 1 CC cutblock common nighthawk 3 FONS shrubby fen common nighthawk 2 FTNN wooded fen common nighthawk 1
horned grebe WONN shallow, open water olive-sided flycatcher 1 WONN shallow, open water rusty blackbird 1
breeding bird species at risk
e3 dogwood white spruce Canada warbler 4 e2 dogwood balsam poplar-white spruce Canada warbler 1 CC cutblock olive-sided flycatcher 1 STNN wooded swamp olive-sided flycatcher 1
(a) Beckingham and Archibald (1996); Halsey et al. (2003).

Golder Associates Ltd. 102, 2535 - 3rd Avenue S.E. Calgary, Alberta, T2A 7W5 Canada T: +1 (403) 299 5600