Embed Size (px)
Citation preview

REPORT
Audit of H2 2020 Performance Reports Iluka Resources Limited, Douglas Mine Pit 23 by-product disposal site
Submitted to:
Stuart Alexander Iluka Resources Limited
Locked Bag 1001
Hamilton Vic 3000
Submitted by:
Golder Associates Pty Ltd
Building 7, Botanicca Corporate Park 570 – 588 Swan Street Richmond, Victoria 3121
Australia
+61 3 8862 3500
19121052-011-R-Rev0
September 2021
September 2021 19121052-011-R-Rev0
i
Distribution List
Electronic Copy:
1x Iluka resources
1x Golder Associates
September 2021 19121052-011-R-Rev0
ii
Table of Contents
1.0 INTRODUCTION ......................................................................................................................................... 1
2.0 PLANNING PERMIT REQUIREMENTS ..................................................................................................... 1
2.1 Methodology ..................................................................................................................................... 1
2.2 Incoming Waste Monitoring Plan ..................................................................................................... 2
2.3 Environmental Management Plan .................................................................................................... 2
2.4 Rehabilitation and Vegetation Management Plan ............................................................................ 3
3.0 ENVIRONMENTAL AUDITOR .................................................................................................................... 3
4.0 SITE LOCATION ......................................................................................................................................... 4
5.0 INCOMING WASTE MONITORING PLAN PERFORMANCE REPORT ................................................... 5
6.0 ENVIRONMENTAL MANAGEMENT PLAN AND REHABILITATION PERFORMANCE REPORT ......... 5
7.0 REHABILITATION AND VEGETATION MANAGEMENT PLAN ............................................................... 6
8.0 OTHER PREVIOUS AUDIT FINDINGS ...................................................................................................... 6
9.0 REFERENCES .......................................................................................................................................... 11
10.0 IMPORTANT INFORMATION ................................................................................................................... 12
11.0 CLOSING .................................................................................................................................................. 12
TABLES
Table 1: Response to previous audit recommendations ...................................................................................... 7
Table 2: IWMP Performance Report Audit ........................................................................................................... 1
Table 3: EMP Performance Report Audit ............................................................................................................. 1
TABLES (attached)
Table A: Duplicate and blank analytical results – November 2020
FIGURES
Figure 1: Site Location Plan.................................................................................................................................. 5
APPENDICES
APPENDIX A IWMP Performance Report Audit
APPENDIX B EMP & RVMP Performance Report Audit
September 2021 19121052-011-R-Rev0
iii
APPENDIX C Iluka IWMP Performance Report H2 2020
APPENDIX D Iluka EMP & IWMP Performance Report H2 2020
APPENDIX E Important Information

September 2021 19121052-011-R-Rev0
1
1.0 INTRODUCTION
Golder Associates Pty Ltd (Golder) was engaged by Iluka Resources Limited (Iluka) to undertake an
independent audit of the Performance Reports for the Pit 23 By-products Disposal Facility, located in the
municipality of the Horsham Rural City in the Kanagulk area (the site). The independent audit (audit) is a
requirement of Planning Permit 15-105 (the planning permit), issued by Horsham Rural City Council (Council).
The Performance Reports, prepared by Iluka, provide a summary of the waste acceptance, monitoring and
management undertaken at the site during the half year ended 31 December 2020. The two Performance
Reports prepared by Iluka for H2 2020 are as follows:
Environmental Management Plan and Rehabilitation Performance Report (EMP Performance
Report) H2 2020; and,
Incoming Waste Monitoring Plan Performance Report (IWMP Performance Report) H2 2020.
The EMP Performance Report is audited against the criteria listed in Section 12.2 and 13.2 of Iluka’s Pit 23
Environmental Management Plan Rev 4 (EMP). Similarly, the IWMP Performance Report is audited against
the criteria listed in Section 6 of Iluka’s Pit 23 Incoming Waste Monitoring Plan Rev 4 (IWMP).
The H2 2020 Performance Reports are provided in APPENDIX C (IWMP)and APPENDIX D (EMP & RVMP).
The Performance Reports cover the period from 1 July 2020 to 31 December 2020.
2.0 PLANNING PERMIT REQUIREMENTS
Regarding the audit of the IWMP and EMP Performance Reports, the relevant conditions of the planning
permit include:
14 (e): annual auditing of records to verify compliance with the requirements of the Incoming Waste
Monitoring Plan (IWMP).
20: The annual performance report must be reviewed by an independent suitably qualified person with
expertise in risk management plans in the context of mines and quarries, and is an environmental auditor
appointed under the EP Act 1970.
31: The permit holder must submit an annual performance statement (within the wider EMP Annual
Report).
42: The permit holder must prepare an EMP and Rehabilitation performance review report covering its
compliance requirements under the various sub-components of the EMP and R&VMP [Rehabilitation and
Vegetation Management Plan] for provision to a suitably qualified environmental auditor as agreed by the
Responsible Authority annually or less frequently as agreed to in writing, by the Responsible Authority.
43: The environmental auditor must review the EMP and Rehabilitation performance review report and
provide conclusions on the report’s content against its key sub-components, and recommendations for
any required amendments to the plans (‘auditor’s review’).
2.1 Methodology
The Performance Reports were audited against the relevant requirements of Section 6 of the IWMP and
Section 12.2 and 13.2 of the EMP. Additional documentation was sought from Iluka as needed to provide
evidence of compliance with relevant sections of the IWMP and EMP.

September 2021 19121052-011-R-Rev0
2
Due to the limited activities occurring at the site, a site inspection was not conducted as part of the audit.
Assessment was therefore limited to desktop review of the Performance Reports and supporting
documentation.
The recommendations of the previous Performance Reports (AECOM, 2017; Golder, 2018; Golder, 2019;
Golder, 2020) were also considered and a review of Iluka’s response to these recommendations is provided in
Section 8.0.
The audit of the IWMP Performance Report, EMP Performance Report and actions undertaken regarding
previous audit report recommendations assessed compliance according to:
‘Compliant’. The information indicated that the relevant requirement of the planning permit or plan had
been met.
‘Not Compliant’. The information indicated that the relevant requirement of the planning permit or plan
had not been met.
‘Not Applicable’. The relevant requirement was not applicable due to the operational status of the plant or
the Auditor was unable to determine compliance due to the requirement being outside the scope of the
audit.
2.2 Incoming Waste Monitoring Plan
The IWMP has been prepared to satisfy the requirements of Condition 14 of the Planning permit, namely:
14. Within 90 days of the commencement of this permit operating, an Incoming Waste Monitoring Plan
(IWMP) must be submitted to the satisfaction of the responsible authority and the Department of Health
and Human Services for approval by the responsible authority. Three copies of the IWMP must be
submitted to the responsible authority. When approved by the responsible authority the IWMP will be
endorsed and it will then form part of this permit. The IWMP must provide for:
a. A monitoring and reporting system for ensuring that materials disposed of to Pit 23 are limited to
those permitted under the conditions of this permit;
b. Recording of the origin, per load weight and radioactive properties of each incoming load;
c. Monitoring to ensure all vehicles transporting waste have fully secured and contained loads and that
all waste loads have been transported in compliance with licensed requirements under the Radiation
Act 2005;
d. Records of any transport incidents or spills and remedial actions taken in the event of such incidents;
and
e. Annual auditing of records to verify compliance with the requirements of the IWMP.
This audit has reviewed the IWMP Performance Report against relevant planning permit criteria, and Section
6 of the IWMP.
2.3 Environmental Management Plan
The EMP has been prepared by Iluka to provide a framework for the management and monitoring of disposal
operations at Pit 23. The EMP outlines:
The operational, environmental and legal context for the permitted development;
The operational methods to be used;
September 2021 19121052-011-R-Rev0
3
Environmental issues that could compromise environmental performance if not managed appropriately;
and,
The monitoring program to be used for assessing the environmental performance and impact of Pit 23.
This audit has reviewed the EMP Performance Report against relevant planning permit criteria, and Section
12.2 and 13.2 of the EMP.
Previous Auditor recommendations to review the EMP have been considered by development of a revised
EMP (Revision 5.1). The Auditor’s review of the EMP Revision 5.1 has been provided separately (Golder,
2020c). We understand that EMP Revision 5.1 will be applied for monitoring and assessment from 2021
onwards. The H2 2020 monitoring and assessment of results were conducted under the Revision 4 EMP
(Iluka, 2017) and this Audit compares the performance reports to the requirements of the Revision 4 EMP.
2.4 Rehabilitation and Vegetation Management Plan
The Rehabilitation and Vegetation Management Plan 2017 (RVMP) has been prepared by Iluka to provide a
detailed management framework for rehabilitation of Pit 23. The RVMP outlines:
The end use and rehabilitation objectives for the subject land;
The methods to be used for rehabilitation and revegetation;
Key issues that may compromise rehabilitation outcomes; and,
Completion criteria and further monitoring post completion.
In relation to the audit of the Rehabilitation and Vegetation Management Plan 2017, the relevant planning
permit requirements are:
42: The permit holder must prepare an EMP and Rehabilitation performance review report covering its
compliance requirements under the various sub-components of the EMP and RVMP for provision to a
suitably qualified environmental auditor as agreed by the Responsible Authority annually or less
frequently as agreed to in writing, by the Responsible Authority.
43: The environmental auditor must review the EMP and Rehabilitation performance review report and
provide conclusions on the report’s content against its key sub-components, and recommendations for
any required amendments to the plans (‘auditor’s review’).
As of the writing of this audit, Pit 23 was still accepting material and as such, rehabilitation or revegetation has
not yet been undertaken by Iluka. There are therefore no findings regarding the RVMP.
3.0 ENVIRONMENTAL AUDITOR
This audit review was undertaken by Bruce Dawson who is appointed as an Environmental Auditor (Industrial
Facilities) under the Environment Protection Act 1970.
Bruce has over 30 years’ experience in environmental management issues, encompassing industrial planning
and assessment, auditing and policy development. Bruce joined Golder in 2010 as a Principal Environmental
Consultant leading the development of performance assurance and industry sustainability services in the
Melbourne office.

September 2021 19121052-011-R-Rev0
4
Bruce has extensive experience in assessing environmental performance and impact and associated
strategies for effective management of statutory obligations in waste management, industrial operations, land
development and infrastructure development.
Bruce was previously employed with the Environment Protection Authority Victoria for 24 years. He was part
of EPA’s executive leadership team for 8 years, providing a key role in leading operational and policy program
areas and lead implementation of EPA’s environmental audit program.
Bruce undertakes auditing and assessment of landfill design and construction and risks associated with landfill
gas migration. Bruce has extensive experience in development of environmental management plans and
environmental policy to reduce environmental impact and compliance risks.
Bruce was supported by the following Golder personnel:
Stephen Makin, Senior Hydrogeologist,
Coen Romalis, Environmental Scientist.
4.0 SITE LOCATION
The Douglas Mineral Sands Mine (shown in Figure 1) is located in the municipality of the Horsham Rural City
in the Kanagulk area. Iluka produces a number of by-products from its heavy mineral processing operation at
its mineral separation plant (MSP) in Hamilton. The by-products produced from this processing are
transported by truck from the Hamilton site to the Douglas Mine Site, where it is then disposed of in a mining
void known as Pit 23. Pit 23 is shown in Figure 1. The IWMP and EMP apply management controls
specifically to Pit 23 and its associated operations.

September 2021 19121052-011-R-Rev0
5
Figure 1: Site Location Plan
5.0 INCOMING WASTE MONITORING PLAN PERFORMANCE REPORT
The Auditor’s review of the IWMP Performance Report is attached as APPENDIX C. The review found that
the Performance Report is in accordance with Section 6 of the IWMP.
6.0 ENVIRONMENTAL MANAGEMENT PLAN AND REHABILITATION PERFORMANCE REPORT
The Auditor’s review of the EMP Performance Report is attached as APPENDIX D. The review found that the
Performance Report is generally in accordance with Section 12.2 and 13.2 of the EMP. The Auditor makes the
following recommendations:
September 2021 19121052-011-R-Rev0
6
Analysis results for one duplicate groundwater sample and one field blank sample were supplied (from
November 2020), along with laboratory reports for routine sampling. QAQC data quality validation
should be included in the annual performance report.
The EMP requires Iluka to construct groundwater elevation contours for each monthly groundwater
gauging round. Although groundwater hydrographs were reported for the monitoring period, which
indicate generally consistent water levels, only contours from the previous reporting period were
presented (June 2020). At least one interpretation from the reporting period should be supplied as part
of the Performance Report.
7.0 REHABILITATION AND VEGETATION MANAGEMENT PLAN
The RVMP reporting requirements are listed in Section 2.4 of this report. Iluka’s Performance Report for the
RVMP was included in the EMP Performance Report.
Due to the current and continued operation of Pit 23, no actions required by the RVMP were undertaken
during the H2 2020 reporting period.
8.0 OTHER PREVIOUS AUDIT FINDINGS
The audit of 2017 Mineral Sands By-product disposal reports (AECOM, 2017) was the first audit of the IWMP
and EMP undertaken. Iluka has responded to a number of these recommendations in the 2018 and 2019
reporting periods. Outstanding recommendations from these reports are provided below.
Additionally, the recommendations from the audit of the 2018, H1 2019, H2 2019 and H1 2020 reporting
periods by Golder (19121052-001-R, Golder, 2018; 19121052-003-R, Golder, 2019; 19121052-006-R, Golder,
2020a, 19121052-009-R, Golder, 2020b), are presented with Iluka’s response below.

September 2021 19121052-011-R-Rev0
7
Table 1: Response to previous audit recommendations
Previous Audit Recommendation Observation Action Completed in H2 2020? Recommendations
IWMP Performance Report
Golder, 2018:
Due to the infrequent disposal of
material Iluka should consider
revising the IWMP if it continues to be
impracticable to calculate a weekly
average for radionuclide properties.
The IWMP has been revised, with
Revision 5 dated 29 October 2019.
This was reviewed by the Auditor
(Golder, 2020c) and was considered
to satisfy this recommendation.
Completed -
Golder 2018:
As the IWMP will have been in
operation for two years as at 17 July
2019, a review should be undertaken
during the next reporting period. Iluka
has confirmed that a review has
commenced.
The IWMP has been revised, with
Revision 5 dated 29 October 2019.
This was reviewed by the Auditor
(Golder, 2020c) and was considered
to satisfy this recommendation.
Completed The IWMP now requires review after
a minimum of 3 years, so the next
review would be due by the end of
2023, considering Revision 5 came
into effect at the end of 2020.
EMP and RVMP Performance Report:
Golder 2018:
Future interpretations of results from
GW04 should consider whether this
well is located down-hydraulic
gradient from Pit 23 (i.e. is it on the
predicted flow path?).
Groundwater flow contours and
numerical model flow paths presented
in H1 2019 report indicate that GW04
is not directly down-gradient from Pit
23.
Completed Iluka report installation of an
additional bore between GW04 and
BW36A in October 2020. This bore
has been named GW04A and is
indicated to lie within the modelled
groundwater flow paths from Pit 23.
GW04A was included in the revised
EMP (Revision 5.1) as a down-

September 2021 19121052-011-R-Rev0
8
Previous Audit Recommendation Observation Action Completed in H2 2020? Recommendations
gradient bore, with GW04 retained as
a cross-gradient bore.
Golder 2018:
An additional well between BW36 and
GW04 is recommended to be
installed, considering that GW04 may
not be located down-hydraulic
gradient from Pit 23.
BW36 (blocked) was
decommissioned and replaced with a
new well BW36A in a similar location.
The spacing between BW36A and
GW04 of approximately 600 m is not
considered to meet the intent of the
monitoring network specified by the
EMP.
Completed Installation of an additional bore
GW04A has reduced the spacing to
approximately 350 m between
GW04A and BW36A and
approximately 250 m between GW04
and GW04A.
Golder, 2019; Golder, 2020a;
Golder, 2020b:
The EMP listed trigger levels for ion
ratios should be reconsidered to
identify consistent declining trends in
concentration outside a range of
natural fluctuation. Resampling for
confirmation of exceedances should
be conducted within the specified
timeframe.
EMP has been revised (Version 5.1)
for application to future monitoring.
Auditor comment provided separately
(Golder, 2020c).
Completed in EMP Rev 5.1. -
Golder 2018:
The EMP should be amended to refer
to SEPP (Waters) and description of
associated beneficial uses and
environmental quality objectives
EMP has been revised (Version 5.1)
for application to future monitoring.
This was reviewed by the Auditor
(Golder, 2020c) and was considered
to satisfy this recommendation.
Completed in EMP Rev 5.1. -

September 2021 19121052-011-R-Rev0
9
Previous Audit Recommendation Observation Action Completed in H2 2020? Recommendations
updated as required. Iluka should
review TDS groundwater monitoring
data to ensure the appropriate
groundwater segment as described in
SEPP (Waters) is identified.
General Recommendations
Golder 2018
The EMP contains a significant
amount of background information on
the environmental conditions relevant
to Pit 23. This information provides
useful context on the local conditions
and aids in interpretation of
monitoring results, however, to assist
in the implementation of the EMP, it is
recommended that this information be
simplified or removed from the EMP
(but available to the Auditor
undertaking the review).
EMP has been revised (Version 5.1)
for application to future monitoring.
This was reviewed by the Auditor
(Golder, 2020c) and was considered
to satisfy this recommendation.
Completed in EMP Rev 5.1. -
Golder 2018
The management actions and
monitoring requirements in the EMP
should be clarified and consolidated
to make it easier for Iluka personnel
to clearly identify requirements and
EMP has been revised (Version 5.1)
for application to future monitoring.
This was reviewed by the Auditor
(Golder, 2020c) and was considered
to satisfy this recommendation.
Completed in EMP Rev 5.1. -

September 2021 19121052-011-R-Rev0
10
Previous Audit Recommendation Observation Action Completed in H2 2020? Recommendations
associated procedures and to ensure
the contents of the Performance
Report align with the requirements of
the EMP.
Golder 2018
The reporting requirements currently
in Section 12.2 of the EMP should be
reviewed to ensure they are
consistent with all of the relevant
monitoring requirements contained in
Sections 7, 8 and 9 of the EMP
EMP has been revised (Version 5.1)
for application to future monitoring.
This was reviewed by the Auditor
(Golder, 2020c) and was considered
to satisfy this recommendation.
Completed in EMP Rev 5.1. -

September 2021 19121052-011-R-Rev0
11
9.0 REFERENCES
AECOM Audit of 2017 Mineral Sands By-product Disposal Annual Reports.
Golder Associates, 2018. Audit of 2018 Mineral Sands By-product Disposal EMP and IWMP Annual Reports
(19121052-001-Rev0).
Golder Associates, 2019. Audit of H1 2019 Mineral Sands By-product Disposal EMP and IWMP Annual
Reports (19121052-003-Rev1).
Golder Associates, 2020a. Audit of H2 2019 EMP and IWMP Performance Reports, Douglas Mine Pit 23 by-
product disposal site (19121052-006-Rev1).
Golder Associates, 2020b. Audit of H1 2020 EMP and IWMP Performance Reports, Douglas Mine Pit 23 by-
product disposal site (19121052-009-Rev0).
Golder Associates, 2020c. Review of Updated EMP and IWMP (19121052-004-L-Rev0).
Iluka Resources Ltd, 2016. Radiation Management Plan- Murray Basin Operations (Rev2) August 2016.
Iluka Resources Ltd, 2017. Incoming Waste Monitoring Plan (Rev 4) 5 April 2017.
Iluka Resources Ltd, 2017. Environment Management Plan (Rev 4) 6 July 2017.
Iluka Resources Ltd, 2017. Rehabilitation and Vegetation Management Plan (Rev3) 12 April 2017.
Iluka Resources Ltd, 2021. Planning Permit 15-105, EMP & Rehabilitation Performance Report – H2 2020.
(UDOCS 0058-1414587248-1098, FINAL_Rev0).
Iluka Resources Ltd, 2021. Planning Permit 15-105, Incoming Waste Monitoring Plan Report H2 – 2020
(UDOCS 0090-426461582-2341, Final Rev0).
Iluka Analytic Sampling Procedures
Analytical - Analysis using XRF 11/6/15.
Analytical - Moisture Determination 10/9/15.
Analytical - Sample Preparation - Fusion of Heavy Mineral 4/12/08.
Analytical - Sample Preparation - Pulverising Grinding Samples 18/10/14.
Analytical - Sample Preparation - Riffle Splitting 23/10/14.
Analytical - XRF QA 23/7/18.
High Volume Air Sampler, Sampling Procedure 26/7/17.
Trucking Procedures
Work Instruction for Loading of Monazite &Ilmenite CL product at Iluka MSP V8 Kalari P/L 28/09/2015.
Emergency Response Procedure for Non Conductor Magnetics V2 Kalari P/L 8/02/2011.
Work Instruction for unloading MSP rejects at Pit 23 V2 Kalari P/L 13/08/2015.

September 2021 19121052-011-R-Rev0
12
10.0 IMPORTANT INFORMATION
Your attention is drawn to the document titled - “Important Information Relating to this Report”, which is
included in APPENDIX E of this report. The statements presented in that document are intended to inform a
reader of the report about its proper use. There are important limitations as to who can use the report and
how it can be used. It is important that a reader of the report understands and has realistic expectations about
those matters. The Important Information document does not alter the obligations Golder Associates has
under the contract between it and its client.
11.0 CLOSING
If you have any queries about this report, please contact Bruce Dawson on 03 8862 3774 or at

September 2021 19121052-011-R-Rev0
13
Signature Page
Golder Associates Pty Ltd
Coen Romalis Bruce Dawson
Environmental Scientist Principal Environmental Consultant
CER/BED/cer
A.B.N. 64 006 107 857
Golder and the G logo are trademarks of Golder Associates Corporation
https://golderassociates.sharepoint.com/sites/107372/project files/6 deliverables/19121052-011-r h2 2020 performance review/19121052-011-r-rev0.docx

September 2021 19121052-011-R-Rev0
14
Tables
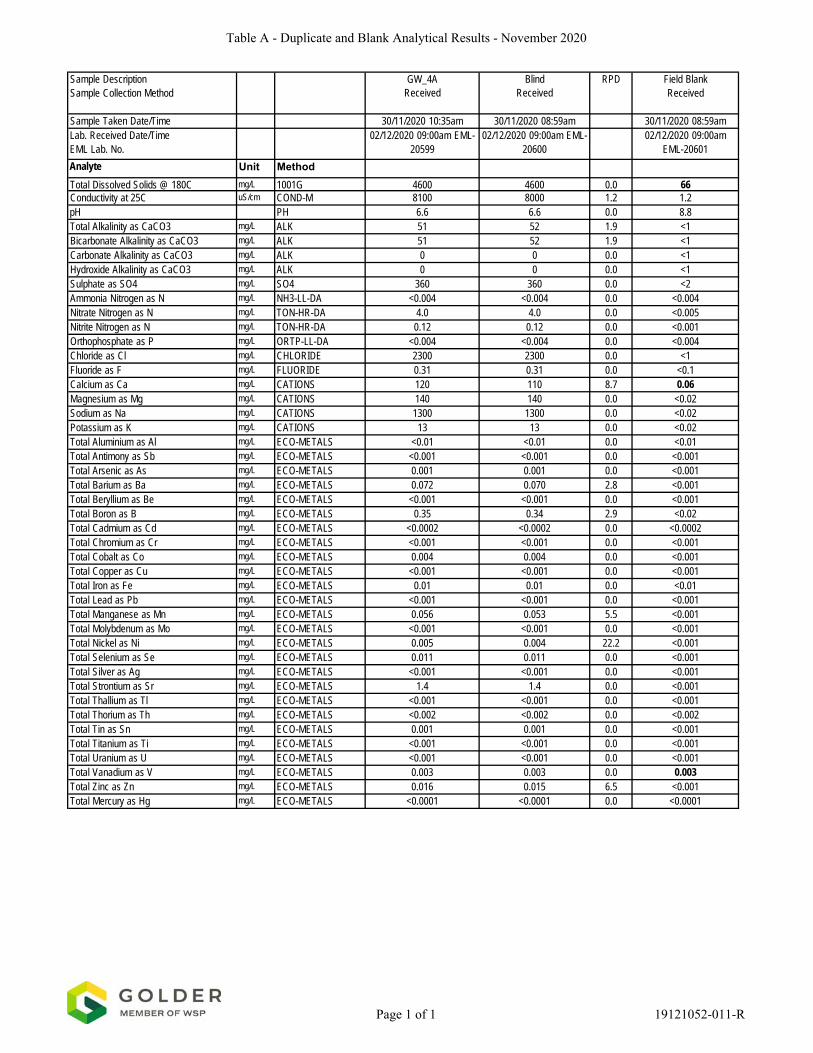
Table A - Duplicate and Blank Analytical Results - November 2020
RPD
Unit Method
mg/L 1001G 0.0uS/cm COND-M 1.2
PH 0.0mg/L ALK 1.9mg/L ALK 1.9mg/L ALK 0.0mg/L ALK 0.0mg/L SO4 0.0mg/L NH3-LL-DA 0.0mg/L TON-HR-DA 0.0mg/L TON-HR-DA 0.0mg/L ORTP-LL-DA 0.0mg/L CHLORIDE 0.0mg/L FLUORIDE 0.0mg/L CATIONS 8.7mg/L CATIONS 0.0mg/L CATIONS 0.0mg/L CATIONS 0.0mg/L ECO-METALS 0.0mg/L ECO-METALS 0.0mg/L ECO-METALS 0.0mg/L ECO-METALS 2.8mg/L ECO-METALS 0.0mg/L ECO-METALS 2.9mg/L ECO-METALS 0.0mg/L ECO-METALS 0.0mg/L ECO-METALS 0.0mg/L ECO-METALS 0.0mg/L ECO-METALS 0.0mg/L ECO-METALS 0.0mg/L ECO-METALS 5.5mg/L ECO-METALS 0.0mg/L ECO-METALS 22.2mg/L ECO-METALS 0.0mg/L ECO-METALS 0.0mg/L ECO-METALS 0.0mg/L ECO-METALS 0.0mg/L ECO-METALS 0.0mg/L ECO-METALS 0.0mg/L ECO-METALS 0.0mg/L ECO-METALS 0.0mg/L ECO-METALS 0.0mg/L ECO-METALS 6.5mg/L ECO-METALS 0.0
Lab. Received Date/Time EML Lab. No.
02/12/2020 09:00am EML-20599
02/12/2020 09:00am EML-20600
02/12/2020 09:00am EML-20601
Analyte
Sample DescriptionSample Collection Method
GW_4AReceived
BlindReceived
Field BlankReceived
Sample Taken Date/Time 30/11/2020 10:35am 30/11/2020 08:59am 30/11/2020 08:59am
pH 6.6 6.6 8.8Total Alkalinity as CaCO3 51 52 <1
Total Dissolved Solids @ 180C 4600 4600 66Conductivity at 25C 8100 8000 1.2
Hydroxide Alkalinity as CaCO3 0 0 <1Sulphate as SO4 360 360 <2
Bicarbonate Alkalinity as CaCO3 51 52 <1Carbonate Alkalinity as CaCO3 0 0 <1
Nitrite Nitrogen as N 0.12 0.12 <0.001Orthophosphate as P <0.004 <0.004 <0.004
Ammonia Nitrogen as N <0.004 <0.004 <0.004Nitrate Nitrogen as N 4.0 4.0 <0.005
Calcium as Ca 120 110 0.06Magnesium as Mg 140 140 <0.02
Chloride as Cl 2300 2300 <1Fluoride as F 0.31 0.31 <0.1
Total Aluminium as Al <0.01 <0.01 <0.01Total Antimony as Sb <0.001 <0.001 <0.001
Sodium as Na 1300 1300 <0.02Potassium as K 13 13 <0.02
Total Beryllium as Be <0.001 <0.001 <0.001Total Boron as B 0.35 0.34 <0.02
Total Arsenic as As 0.001 0.001 <0.001Total Barium as Ba 0.072 0.070 <0.001
Total Cobalt as Co 0.004 0.004 <0.001Total Copper as Cu <0.001 <0.001 <0.001
Total Cadmium as Cd <0.0002 <0.0002 <0.0002Total Chromium as Cr <0.001 <0.001 <0.001
Total Manganese as Mn 0.056 0.053 <0.001Total Molybdenum as Mo <0.001 <0.001 <0.001
Total Iron as Fe 0.01 0.01 <0.01Total Lead as Pb <0.001 <0.001 <0.001
Total Silver as Ag <0.001 <0.001 <0.001Total Strontium as Sr 1.4 1.4 <0.001
Total Nickel as Ni 0.005 0.004 <0.001Total Selenium as Se 0.011 0.011 <0.001
Total Tin as Sn 0.001 0.001 <0.001Total Titanium as Ti <0.001 <0.001 <0.001
Total Thallium as Tl <0.001 <0.001 <0.001Total Thorium as Th <0.002 <0.002 <0.002
Total Zinc as Zn 0.016 0.015 <0.001Total Mercury as Hg <0.0001 <0.0001 <0.0001
Total Uranium as U <0.001 <0.001 <0.001Total Vanadium as V 0.003 0.003 0.003
Page 1 of 1 19121052-011-R

September 2021 19121052-011-R-Rev0
APPENDIX A
IWMP Performance Report Audit

September 2021 19121052-011-R-Rev0
A1
Table 2: IWMP Performance Report Audit
Source & Requirement Observations Compliance Recommendations
Planning Permit Clause 14. Within 90 days of the
commencement of this permit operating, an Incoming
Waste Monitoring Plan (IWMP) must be submitted to the
satisfaction of the responsible authority and the
Department of Health and Human Services for approval
by the responsible authority. Three copies of the IWMP
must be submitted to the responsible authority. When
approved by the responsible authority the IWMP will be
endorsed and it will then form part of this permit. The
IWMP must provide for:
Compliant
a) A monitoring and reporting system for ensuring that
materials disposed of to Pit 23 are limited to those
permitted under the conditions of this permit
Section 3.1 of the IWMP Performance Report provides a
spreadsheet summary record stating material to be
disposed of is permitted.
No waste was disposed to Pit 23 during the H2 2020
reporting period.
Compliant
b) Recording the origin, per load weight and radioactive
properties of each incoming load.
Section 3.1 of the IWMP Performance Report provides a
spreadsheet summary recording the origin and load weight
of each material load.
Section 3.2 of the IWMP Performance Report provides a
summary of the radioactive properties of each material
load.
Compliant
September 2021 19121052-011-R-Rev0
A2
Source & Requirement Observations Compliance Recommendations
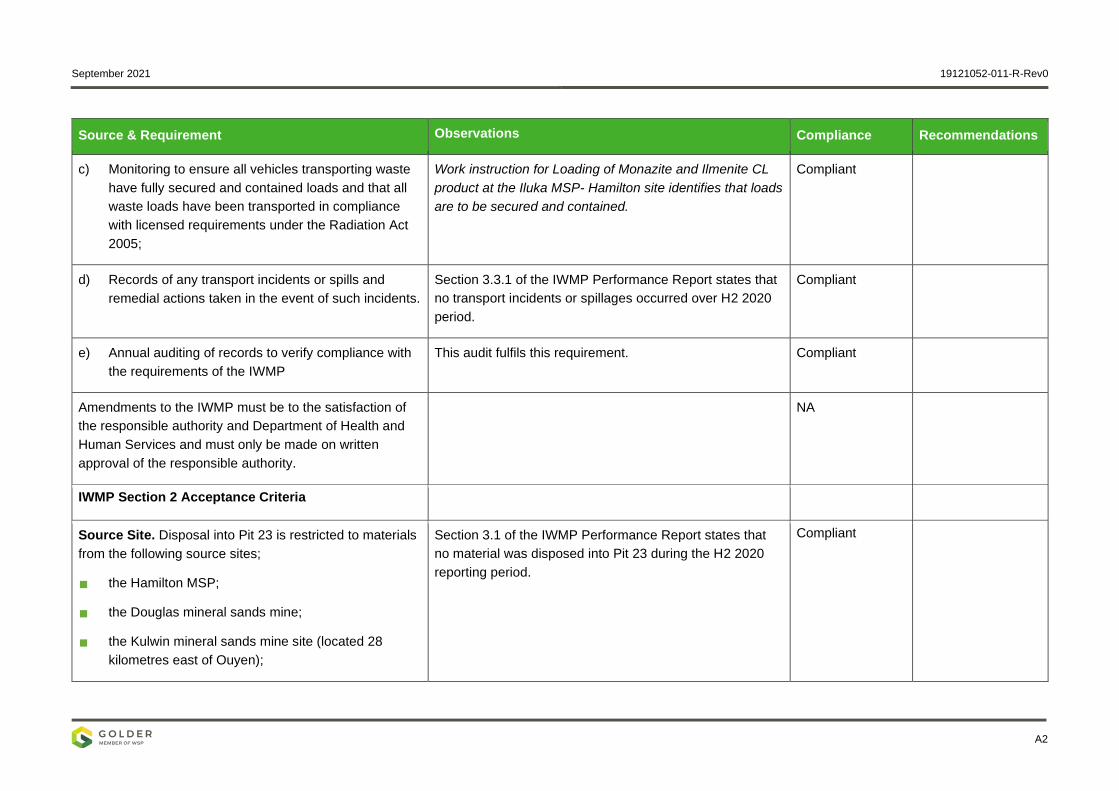
c) Monitoring to ensure all vehicles transporting waste
have fully secured and contained loads and that all
waste loads have been transported in compliance
with licensed requirements under the Radiation Act
2005;
Work instruction for Loading of Monazite and Ilmenite CL
product at the Iluka MSP- Hamilton site identifies that loads
are to be secured and contained.
Compliant
d) Records of any transport incidents or spills and
remedial actions taken in the event of such incidents.
Section 3.3.1 of the IWMP Performance Report states that
no transport incidents or spillages occurred over H2 2020
period.
Compliant
e) Annual auditing of records to verify compliance with
the requirements of the IWMP
This audit fulfils this requirement. Compliant
Amendments to the IWMP must be to the satisfaction of
the responsible authority and Department of Health and
Human Services and must only be made on written
approval of the responsible authority.
NA
IWMP Section 2 Acceptance Criteria
Source Site. Disposal into Pit 23 is restricted to materials
from the following source sites;
the Hamilton MSP;
the Douglas mineral sands mine;
the Kulwin mineral sands mine site (located 28
kilometres east of Ouyen);
Section 3.1 of the IWMP Performance Report states that
no material was disposed into Pit 23 during the H2 2020
reporting period.
Compliant
September 2021 19121052-011-R-Rev0
A3
Source & Requirement Observations Compliance Recommendations
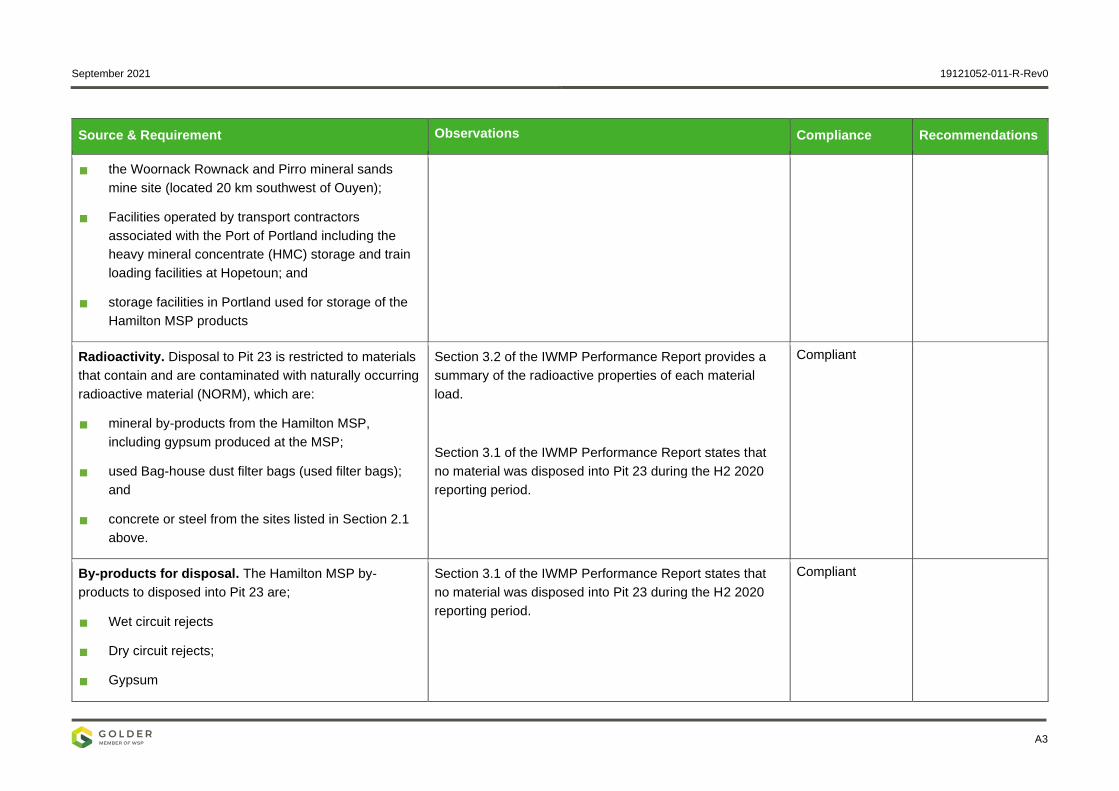
the Woornack Rownack and Pirro mineral sands
mine site (located 20 km southwest of Ouyen);
Facilities operated by transport contractors
associated with the Port of Portland including the
heavy mineral concentrate (HMC) storage and train
loading facilities at Hopetoun; and
storage facilities in Portland used for storage of the
Hamilton MSP products
Radioactivity. Disposal to Pit 23 is restricted to materials
that contain and are contaminated with naturally occurring
radioactive material (NORM), which are:
mineral by-products from the Hamilton MSP,
including gypsum produced at the MSP;
used Bag-house dust filter bags (used filter bags);
and
concrete or steel from the sites listed in Section 2.1
above.
Section 3.2 of the IWMP Performance Report provides a
summary of the radioactive properties of each material
load.
Section 3.1 of the IWMP Performance Report states that
no material was disposed into Pit 23 during the H2 2020
reporting period.
Compliant
By-products for disposal. The Hamilton MSP by-
products to disposed into Pit 23 are;
Wet circuit rejects
Dry circuit rejects;
Gypsum
Section 3.1 of the IWMP Performance Report states that
no material was disposed into Pit 23 during the H2 2020
reporting period.
Compliant

September 2021 19121052-011-R-Rev0
A4
Source & Requirement Observations Compliance Recommendations
Bag hose dust filter bags
Contaminated concrete and steel
Material Description and physical form. Import for
disposal into Pit 23 is restricted to the following materials:
non-liquid waste by-products associated with or
sourced though mineral sands processing
undertaken at the Hamilton MSP containing or
contaminated with NORM;
used dust filter bags from the Hamilton MSP
containing or contaminated with NORM; and
NORM-contaminated concrete and steel associated
with plant and infrastructure from the sites listed in
Section 2.1 above
Section 3.1 of the IWMP Performance Report states that
no material was disposed into Pit 23 during the H2 2020
reporting period.
Compliant
IWMP Section 3. Monitoring
In accordance with heavy vehicle mass management
requirements under Chain of Responsibility legislation
administered by the Department of Economic
Development, Jobs, Transport and Resources (DEDJTR),
the weight of every truck load of material to be disposed
of will be measured at the point of loading, or the nearest
possible location, prior to transport to the Douglas mine
site. The load weight shall be measured by one of the
following means;
Section 3.1 of the IWMP Performance Report lists the load
weight of each delivery to Pit23. During the H2 2020
reporting period, no material was disposed to Pit 23.
Iluka has advised that a public commercial calibrated
weighbridge is used to weigh material disposed into Pit23.
Compliant
September 2021 19121052-011-R-Rev0
A5
Source & Requirement Observations Compliance Recommendations
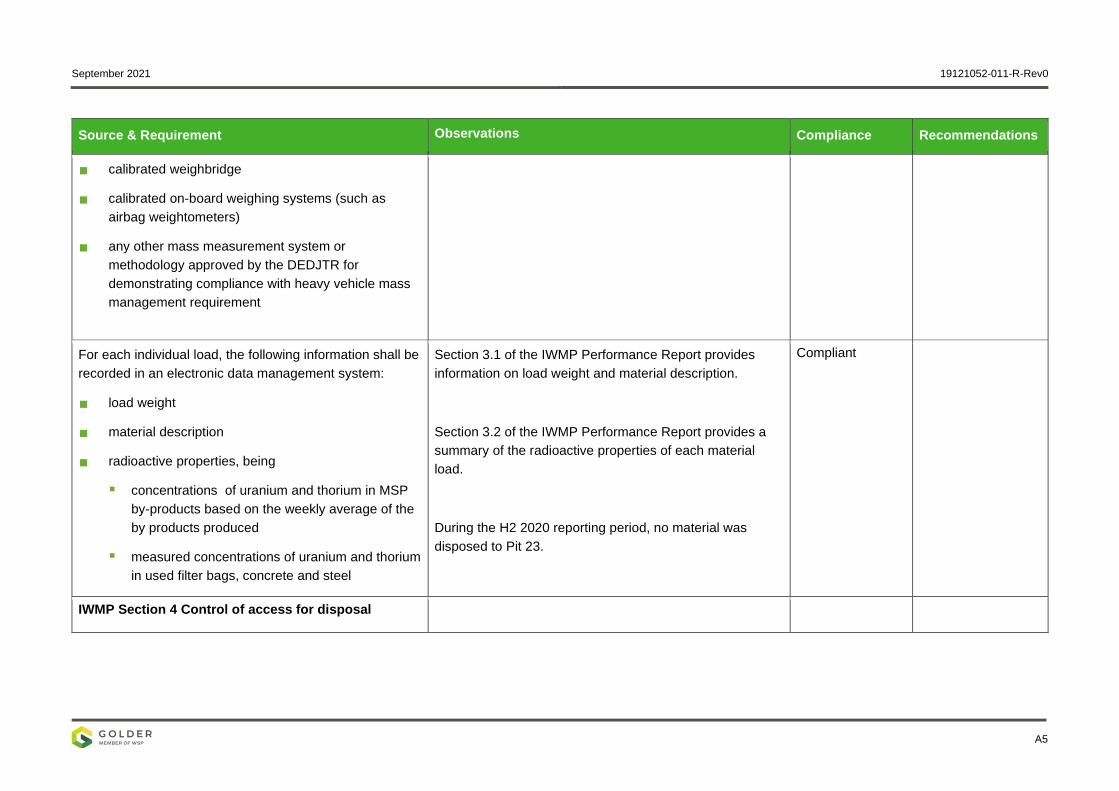
calibrated weighbridge
calibrated on-board weighing systems (such as
airbag weightometers)
any other mass measurement system or
methodology approved by the DEDJTR for
demonstrating compliance with heavy vehicle mass
management requirement
For each individual load, the following information shall be
recorded in an electronic data management system:
load weight
material description
radioactive properties, being
▪ concentrations of uranium and thorium in MSP
by-products based on the weekly average of the
by products produced
▪ measured concentrations of uranium and thorium
in used filter bags, concrete and steel
Section 3.1 of the IWMP Performance Report provides
information on load weight and material description.
Section 3.2 of the IWMP Performance Report provides a
summary of the radioactive properties of each material
load.
During the H2 2020 reporting period, no material was
disposed to Pit 23.
Compliant
IWMP Section 4 Control of access for disposal

September 2021 19121052-011-R-Rev0
A6
Source & Requirement Observations Compliance Recommendations
Prior to transport of materials to be disposed of in Pit 23,
vehicles will be checked:
for compliance with the ARPANSA Code of Practice
for Safe Transport of Radioactive Material; and
to confirm and ensure loads are fully secured and
contained.
Deliveries must enter the site via Elliotts Road and the
mine access road shown on the site plan (Figure 2).
All vehicles entering the site, including those carrying
materials for disposal to Pit 23, must be authorised and
must pass through a boom gate that may only be opened
with a swipe card issued to authorised personnel or by an
authorised Iluka employee at the site office. Each vehicle
must then stop at the site office to:
provide a record of the load being delivered (origin,
material type, load weight); and
comply with any site-specific requirements that apply
for entering the site.
Vehicles carrying materials for disposal for which the
required information is not provided or is not in
conformance with the permitted use will not be allowed to
dispose of their loads to Pit 23.
Work instruction for Loading of Monazite and Ilmenite CL
product at the Iluka MSP- Hamilton site reviewed.
Deliveries were not observed as part of this audit.
Furthermore, during the H2 2020 reporting period, no
material was disposed to Pit 23.
NA

September 2021 19121052-011-R-Rev0
A7
Source & Requirement Observations Compliance Recommendations
IWMP Section 5 Monitoring Program
In order to confirm the presence of NORM within the MSP
by-products, Table 2 in the IWMP specifies the samples
collected and quantity measurements made:
The MSP was not operating during H2 2020, so no data
was available.
NA
Bag-house dust filter bags.
Prior to transport, sections of used filter bag cloth of
approximately 100 x 100 mm will be cut from at least five
used filter bags per consignment and each section
submitted for analysis
The MSP was not operating during H2 2020 and the IWMP
Performance Report did not identify that filter bags were
disposed of during H2 2020, so no data was available.
NA

September 2021 19121052-011-R-Rev0
A8
Source & Requirement Observations Compliance Recommendations
NORM contaminated concrete and steel.
The sampling method applied will be dependent on the
precise nature of the material and will be developed and
applied on a case-by-case basis. Representative samples
of each consignment will be collected and submitted for
analysis
The MSP was not operating during H2 2020 and the IWMP
Performance Report did not identify that concrete and steel
were disposed of during H2 2020, so no data was
available.
NA
Mineral separation plant by-products. Analysis of MSP by-products is undertaken as follows:
desiccation within the MSP laboratory oven to
remove moisture;
pulverisation (as required) to produce a fine granular
matrix;
splitting to produce a representative sample of
appropriate size;
fusion of the sample to produce a glass bead; and
assay of the bead using an X-Ray Fluorescence
Spectrophotometer to determine the concentrations
of uranium and thorium.
The assay results are uploaded into Iluka’s production
statistics database as are the results of tonnage
measurements of the various streams. The data is then
used to calculate the uranium and thorium concentrations
in each of the wet circuits rejects, dry circuits rejects and
gypsum.
Analytical procedures were provided and reviewed. Compliant

September 2021 19121052-011-R-Rev0
A9
Source & Requirement Observations Compliance Recommendations
Analysis of filter bag samples will be undertaken at either
Iluka’s Hamilton laboratory or an external laboratory to
determine the concentrations of uranium and thorium.
Section 3.1 of the IWMP Performance Report states no
filter bags were disposed of to Pit 23 during H2 2020
reporting period.
NA
Samples of NORM contaminated concrete and steel will
be analysed at either Iluka’s MSP lab or an external
laboratory to determine the concentrations of uranium and
thorium.
Section 3.1 of the IWMP Performance Report states no
concrete or steel was disposed of into Pit 23 during H2
2020 reporting period.
NA
IWMP Reporting
All data generated from the monitoring described above
will be recorded electronically in a data base managed by
Iluka. On an annual basis a report will be prepared
showing the following:
For each load:
Source site
Load weight
Radioactive properties being:
▪ assigned concentration of uranium and thorium
in MSP mineral byproducts, based on weekly
averages of by-products produced; and
▪ measured concentrations of uranium and thorium
in used filter bags, concrete or steel.
Section 3.1 and 3.2 of the IWMP Performance report
provides the source, weight and radioactive properties of
the received material.
During the H2 2020 reporting period, no material was
disposed into Pit 23.
Compliant

September 2021 19121052-011-R-Rev0
A10
Source & Requirement Observations Compliance Recommendations
For the report period:
average concentration of uranium and thorium for
the MSP by-products, used filter bags, concrete and
steel;
total quantities of materials disposed of to Pit 23; and
records of any transport incidents or spills and
remedial actions taken in the event of such incidents.
Section 3.2 of the IWMP Performance Report provides
information on the radioactivity analysis of MSP by-
products disposed.
Section 3.3 of the IWMP Performance Report states no
transport incidents or spillages occurred during the
reporting period.
Compliant
The Performance Report will be provided to a suitably
qualified auditor who will complete an audit of the data
provided and compliance with this IWMP.
This report is provided in accordance with the requirement
of the IWMP.
Compliant
Copies of the Performance Report and the audit report will
be submitted to the Responsible Authority.
As the Auditor understands that Iluka will submit the
performance reports and the audit report when complete,
compliance with this requirement cannot be verified. Iluka
has advised that the previous performance report has been
submitted to Council.
Compliant
IWMP Review
This IWMP shall be reviewed and amended if necessary,
to take account of:
advances in knowledge and technology pertaining to
by-product disposal; included in this report.
any significant change in operations;
changes in applicable legislation or standards;
Compliant

September 2021 19121052-011-R-Rev0
A11
Source & Requirement Observations Compliance Recommendations
changes in Iluka’s EHS standards;
or every two (2) years, which-ever occurs soonest.
Proposals for amendment of this plan will be prepared to
the satisfaction of the Responsible Authority and the
Department of Health and Human Services.
No amendments to the IWMP have been submitted in H2
2020. A review and update of the IWMP is has been
undertaken and is anticipated to be submitted to the
Relevant Authority in H1 2021.
Compliant

September 2021 19121052-011-R-Rev0
APPENDIX B
EMP & RVMP Performance
Report Audit

September 2021 19121052-011-R-Rev0
B1
Table 3: EMP Performance Report Audit
Requirement Observations Compliance Recommendations
EMP Section 12.2
A review of performance will be completed and an
EMP and Rehabilitation Performance Report
prepared annually, or less frequently as may be
agreed with the Responsible Authority.
The Environmental Management Plan and Rehabilitation
Performance Report has been prepared for H2 2020.
Section 2.5 of the EMP Performance Report states that due
to continued operations within Pit 23, no actions relevant to
rehabilitation and vegetation management were undertaken
in the H2 2020 reporting period.
Compliant
Each EMP and Rehabilitation Performance Report
will include for the period from the previous EMP
and Rehabilitation Performance Report:
the total tonnage of materials disposed of; Section 3 of the EMP Performance Report states that no
wastes were disposed into Pit 23 during the H2 2020
reporting period.
Compliant
the average and maximum number of
deliveries of materials for disposal per day;
and
Section 3 of the EMP Performance Report states that no
wastes were disposed into Pit 23 during the H2 2020
reporting period.
Compliant
the results of all measurements of:
▪ noise levels made in response to a
complaint regarding noise;
Section 4.3 of the EMP Performance Report states that
because complaints regarding noise levels have not been
Compliant
September 2021 19121052-011-R-Rev0
B2
Requirement Observations Compliance Recommendations
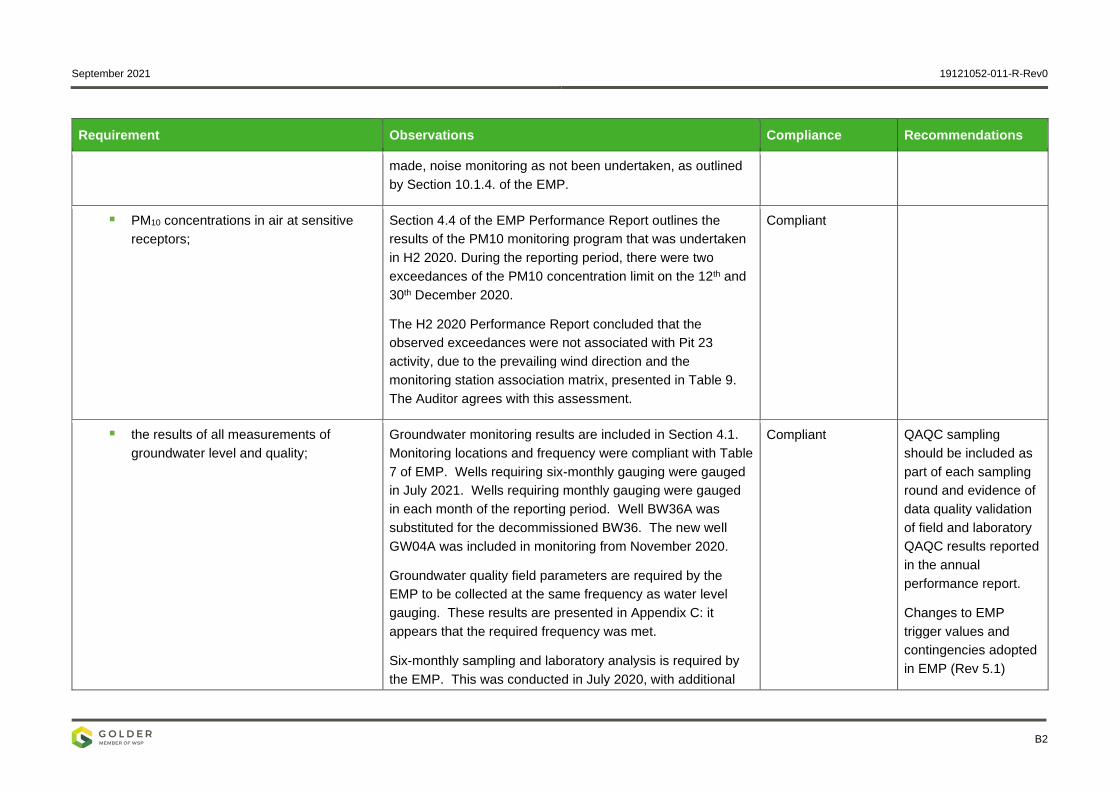
made, noise monitoring as not been undertaken, as outlined
by Section 10.1.4. of the EMP.
▪ PM10 concentrations in air at sensitive
receptors;
Section 4.4 of the EMP Performance Report outlines the
results of the PM10 monitoring program that was undertaken
in H2 2020. During the reporting period, there were two
exceedances of the PM10 concentration limit on the 12th and
30th December 2020.
The H2 2020 Performance Report concluded that the
observed exceedances were not associated with Pit 23
activity, due to the prevailing wind direction and the
monitoring station association matrix, presented in Table 9.
The Auditor agrees with this assessment.
Compliant
▪ the results of all measurements of
groundwater level and quality;
Groundwater monitoring results are included in Section 4.1.
Monitoring locations and frequency were compliant with Table
7 of EMP. Wells requiring six-monthly gauging were gauged
in July 2021. Wells requiring monthly gauging were gauged
in each month of the reporting period. Well BW36A was
substituted for the decommissioned BW36. The new well
GW04A was included in monitoring from November 2020.
Groundwater quality field parameters are required by the
EMP to be collected at the same frequency as water level
gauging. These results are presented in Appendix C: it
appears that the required frequency was met.
Six-monthly sampling and laboratory analysis is required by
the EMP. This was conducted in July 2020, with additional
Compliant QAQC sampling
should be included as
part of each sampling
round and evidence of
data quality validation
of field and laboratory
QAQC results reported
in the annual
performance report.
Changes to EMP
trigger values and
contingencies adopted
in EMP (Rev 5.1)

September 2021 19121052-011-R-Rev0
B3
Requirement Observations Compliance Recommendations
sampling at some locations to follow up trigger actions.
Laboratory reports from EML Chem and ALS were supplied,
which demonstrate NATA or equivalent accreditation. The
EMP (Section 7.6.8) requires analysis of QAQC samples as
part of each sampling round including field duplicates and
blank samples. Iluka has advised that the collection of QAQC
samples resumed in the November 2020 sampling round. A
laboratory report with a duplicate sample and a blank sample
was supplied for samples collected in November 2020.
Analysis for these samples was completed for metals,
nutrients and major ions, but analysis for radionuclides was
not reported.
The Auditor has assessed the relative percentage difference
between the primary sample and duplicate sample (Table A
attached). This indicates acceptable laboratory precision
based on the supplied results. The results of the field blank
sample indicated detectable concentrations of TDS (66
mg/L), calcium (0.06 mg/L) and vanadium (0.003 mg/L).
However, these concentrations are close to the respective
laboratory limits of reporting and orders of magnitude lower
than results from primary samples (for TDS and calcium) or
similar to results from primary samples (vanadium), so do not
indicate gross cross-contamination.
Comparison of Cl:SO4 and Na:Ca ratios were made as
required in the EMP. A decrease of more than 10%
compared to the previous six-monthly sample is a trigger for
should apply for
monitoring from 2021.
September 2021 19121052-011-R-Rev0
B4
Requirement Observations Compliance Recommendations
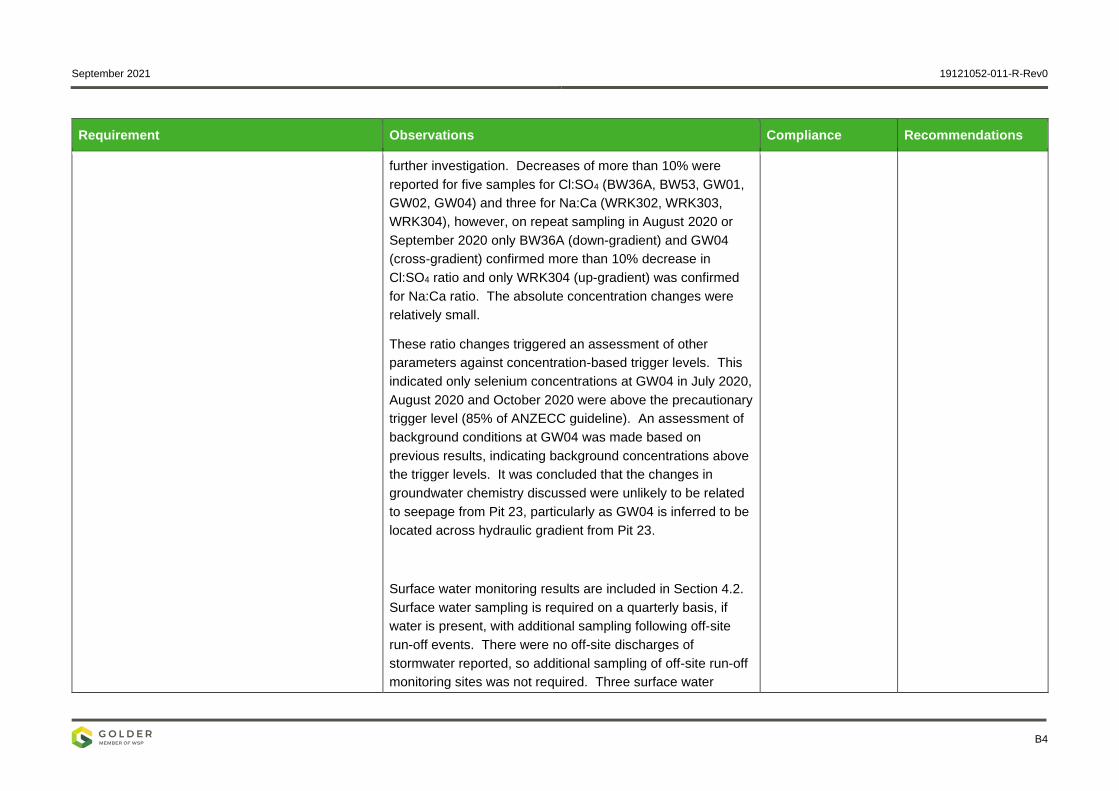
further investigation. Decreases of more than 10% were
reported for five samples for Cl:SO4 (BW36A, BW53, GW01,
GW02, GW04) and three for Na:Ca (WRK302, WRK303,
WRK304), however, on repeat sampling in August 2020 or
September 2020 only BW36A (down-gradient) and GW04
(cross-gradient) confirmed more than 10% decrease in
Cl:SO4 ratio and only WRK304 (up-gradient) was confirmed
for Na:Ca ratio. The absolute concentration changes were
relatively small.
These ratio changes triggered an assessment of other
parameters against concentration-based trigger levels. This
indicated only selenium concentrations at GW04 in July 2020,
August 2020 and October 2020 were above the precautionary
trigger level (85% of ANZECC guideline). An assessment of
background conditions at GW04 was made based on
previous results, indicating background concentrations above
the trigger levels. It was concluded that the changes in
groundwater chemistry discussed were unlikely to be related
to seepage from Pit 23, particularly as GW04 is inferred to be
located across hydraulic gradient from Pit 23.
Surface water monitoring results are included in Section 4.2.
Surface water sampling is required on a quarterly basis, if
water is present, with additional sampling following off-site
run-off events. There were no off-site discharges of
stormwater reported, so additional sampling of off-site run-off
monitoring sites was not required. Three surface water
September 2021 19121052-011-R-Rev0
B5
Requirement Observations Compliance Recommendations
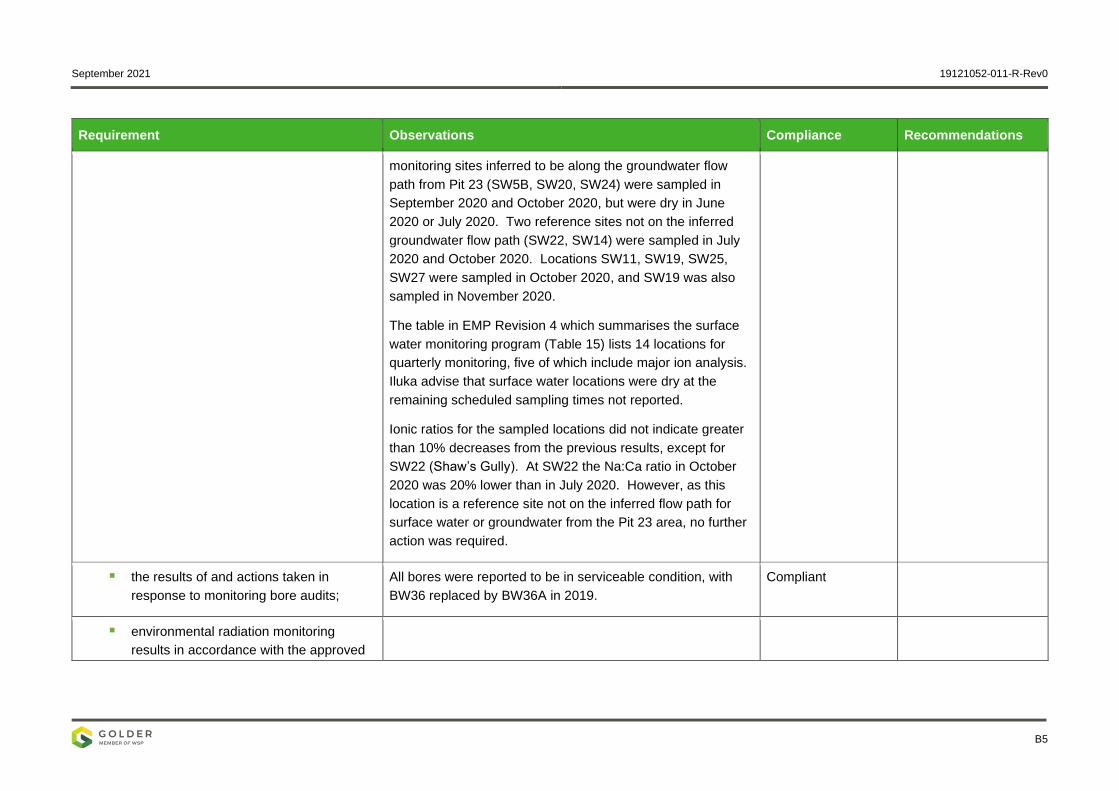
monitoring sites inferred to be along the groundwater flow
path from Pit 23 (SW5B, SW20, SW24) were sampled in
September 2020 and October 2020, but were dry in June
2020 or July 2020. Two reference sites not on the inferred
groundwater flow path (SW22, SW14) were sampled in July
2020 and October 2020. Locations SW11, SW19, SW25,
SW27 were sampled in October 2020, and SW19 was also
sampled in November 2020.
The table in EMP Revision 4 which summarises the surface
water monitoring program (Table 15) lists 14 locations for
quarterly monitoring, five of which include major ion analysis.
Iluka advise that surface water locations were dry at the
remaining scheduled sampling times not reported.
Ionic ratios for the sampled locations did not indicate greater
than 10% decreases from the previous results, except for
SW22 (Shaw’s Gully). At SW22 the Na:Ca ratio in October
2020 was 20% lower than in July 2020. However, as this
location is a reference site not on the inferred flow path for
surface water or groundwater from the Pit 23 area, no further
action was required.
▪ the results of and actions taken in
response to monitoring bore audits;
All bores were reported to be in serviceable condition, with
BW36 replaced by BW36A in 2019.
Compliant
▪ environmental radiation monitoring
results in accordance with the approved
September 2021 19121052-011-R-Rev0
B6
Requirement Observations Compliance Recommendations
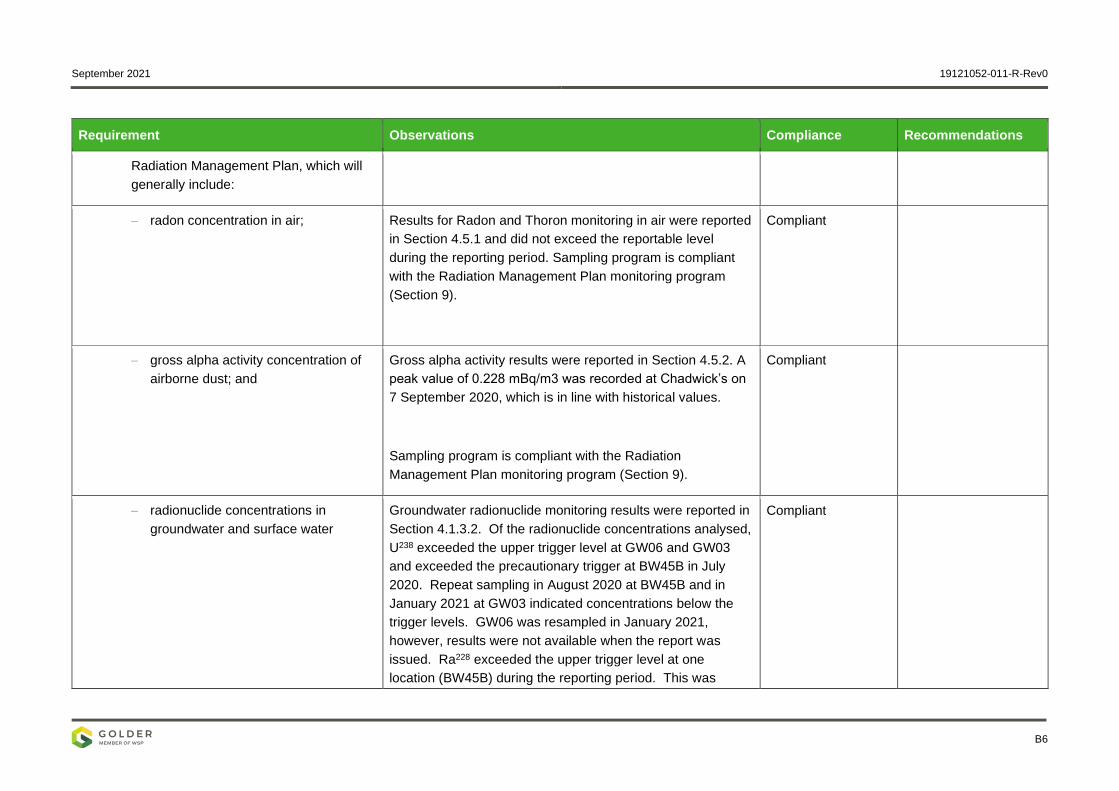
Radiation Management Plan, which will
generally include:
− radon concentration in air; Results for Radon and Thoron monitoring in air were reported
in Section 4.5.1 and did not exceed the reportable level
during the reporting period. Sampling program is compliant
with the Radiation Management Plan monitoring program
(Section 9).
Compliant
− gross alpha activity concentration of
airborne dust; and
Gross alpha activity results were reported in Section 4.5.2. A
peak value of 0.228 mBq/m3 was recorded at Chadwick’s on
7 September 2020, which is in line with historical values.
Sampling program is compliant with the Radiation
Management Plan monitoring program (Section 9).
Compliant
− radionuclide concentrations in
groundwater and surface water
Groundwater radionuclide monitoring results were reported in
Section 4.1.3.2. Of the radionuclide concentrations analysed,
U238 exceeded the upper trigger level at GW06 and GW03
and exceeded the precautionary trigger at BW45B in July
2020. Repeat sampling in August 2020 at BW45B and in
January 2021 at GW03 indicated concentrations below the
trigger levels. GW06 was resampled in January 2021,
however, results were not available when the report was
issued. Ra228 exceeded the upper trigger level at one
location (BW45B) during the reporting period. This was
Compliant
September 2021 19121052-011-R-Rev0
B7
Requirement Observations Compliance Recommendations
confirmed by resampling in August 2020. Bore BW45B is
located cross-hydraulic gradient from Pit 23, and has reported
similar Ra228 concentrations at each monitoring event since
2019. Bore GW06 is located up-hydraulic gradient from Pit
23, and has reported similar U238 concentrations since 2019.
Repeated radionuclide trigger exceedances were not
correlated with changes in major ion ratios, and were not
reported for down-gradient bores, so are unlikely to be related
to seepage from Pit 23.
Surface water radionuclide monitoring results were reported
in Section 4.2.2.2. There was no exceedance of trigger levels
for uranium or radium in surface water samples.
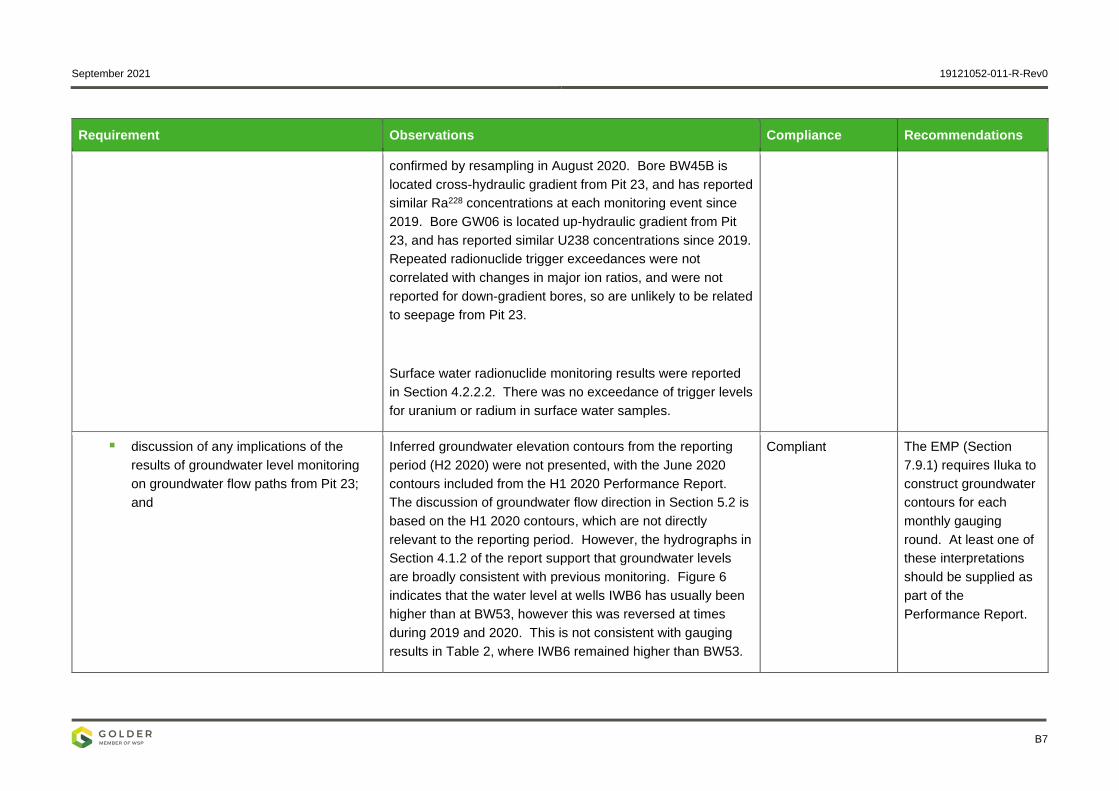
▪ discussion of any implications of the
results of groundwater level monitoring
on groundwater flow paths from Pit 23;
and
Inferred groundwater elevation contours from the reporting
period (H2 2020) were not presented, with the June 2020
contours included from the H1 2020 Performance Report.
The discussion of groundwater flow direction in Section 5.2 is
based on the H1 2020 contours, which are not directly
relevant to the reporting period. However, the hydrographs in
Section 4.1.2 of the report support that groundwater levels
are broadly consistent with previous monitoring. Figure 6
indicates that the water level at wells IWB6 has usually been
higher than at BW53, however this was reversed at times
during 2019 and 2020. This is not consistent with gauging
results in Table 2, where IWB6 remained higher than BW53.
Compliant The EMP (Section
7.9.1) requires Iluka to
construct groundwater
contours for each
monthly gauging
round. At least one of
these interpretations
should be supplied as
part of the
Performance Report.

September 2021 19121052-011-R-Rev0
B8
Requirement Observations Compliance Recommendations
▪ descriptions of any model review and
recalibration completed and the results of
subsequent model reruns;
An update to the groundwater model was released in
September 2019 (EMM, 2019), including water level
monitoring results from March 2019. Groundwater levels and
inferred hydraulic conductivity from newly installed wells were
broadly consistent with the values used in the model in the
area of Pit 23. Monitoring results reported do not trigger a
requirement for a further update of the groundwater model.
Compliant
the maximum elevation of the upper surface
of materials disposed of at the end of the
reporting period
Included in Section 5.4 of the EMP Performance Report. As
no waste was disposed during the H2 2020 reporting period,
the maximum elevation remains unchanged at 193 m AHD.
Compliant
a detailed discussion of all non-compliant
events including progress toward resolution;
Section 5.5 of the Performance Report states that there were
no non-compliances during the reporting period. This is
consistent with the monitoring results discussed above.
Compliant
a summary of comments and complaints
received and resulting actions;
Section 5.6 of the EMP Performance Report states that no
complaints or comments were received during the H2 2020
reporting period.
Compliant
completed actions from the previous year Section 5.7 outlines three completed actions from the previous reporting period:
Submission of the updated Pit 23 IWMP and EMP as
required by the default two-year review period.
Annual review of the Risk Analysis and Response Plan
(RARP) as per section 6 of the EMP.
Installation of groundwater monitoring bore GW04A located
between GW04 and BW36A.
Compliant

September 2021 19121052-011-R-Rev0
B9
Requirement Observations Compliance Recommendations
plans for the next reporting period; and This is addressed in Section 5.8 of the EMP Performance
Report, and includes:
Implementation of the ongoing monitoring requirements as
per the EMP.
Compliant
discussion on other matters considered
relevant by the Responsible Authority or
Iluka.
Section 5.9.1 of the EMP Performance Report confirms that
the geotechnical audit for 2020 was completed in December
2020. The next geotechnical audit is scheduled for
November 2021.
Section 5.9.2 states that the review of the Risk Analysis
Response Plan (RARP) was undertaken in November 2020.
The next review is scheduled for November 2021.
Compliant
Deficiencies identified in an EMP and
Rehabilitation Performance Report that can be
addressed without amendment of this plan will be
addressed as soon as practicable.
There was no section discussing this in the Performance
Report. The auditor notes that the EMP, IWMP and RVMP
have been updated in 2020, where deficiencies were
addressed.
Compliant
EMP and Rehabilitation Performance Reports will
be subject to review by an independent auditor as
described in Section 13.2 of the EMP
(Performance Review).
This audit report addresses the requirement. Compliant
EMP Section 13.2 Performance Review

September 2021 19121052-011-R-Rev0
B10
Requirement Observations Compliance Recommendations
The performance review function is, in part, an
audit function in that the selected auditor will be
required to audit EMP and Rehabilitation
Performance Report to confirm its completeness
and accuracy in terms of compliance of the
implementation of the plan and compliance with
established standards and limits. In addition to
these audit functions the selected auditor will be
invited to recommend amendments to the EMP to
ensure future compliance.
This audit report addresses the requirement. Compliant
There are a number of requirements of the expert
in this case, including:
· EPA auditor accreditation;
· independence (from Iluka);
· suitable qualifications;
· expertise in risk management plans in the
context of mines and quarries; and
· to the satisfaction of the Responsible Authority.
It is extremely unlikely that an expert meeting all of
these requirements exist, however, an expert may
choose to direct the work of others. A scope of
works will be prepared and a number of EPA
accredited auditors asked to submit proposals for
the completion of performance reviews. Iluka will
Iluka has selected Bruce Dawson to undertake the audit as a
suitably qualified Auditor appointed under the Environment
Protection Act 1970. More information about the auditor is
included in Section 3.0 of this report.
Compliant

September 2021 19121052-011-R-Rev0
B11
Requirement Observations Compliance Recommendations
select the best candidate and provide the
Responsible Authority with details of the candidate
and their proposal for completion of works. The
Responsible Authority may indicate its agreement
with the candidate selected or request that details
of an alternative be provided.
A copy of the selected auditor’s report will be
provided to the Responsible Authority with each
EMP Performance Report.
As the Auditor understands that Iluka will submit the
performance reports and the audit report when complete,
compliance with this requirement cannot be verified.
NA
Any deficiencies identified or recommendations
made by the auditor will be dealt with in
accordance with Conditions 44 and 45 of the
Permit, which require:
Copies of the EMP and Rehabilitation
Performance Report and the auditor’s report
to be provided to the Responsible Authority
with 28 days of receipt of the auditor’s report
As the Auditor understands that Iluka will submit the
performance reports and the audit report when complete,
compliance with this requirement cannot be verified.
NA
A description of steps to be taken, including
timeframes, to address any non-compliance
and recommendations identified in the EMP
and Rehabilitation Performance Report and
the auditor’s report be provided to the
Responsible Authority within 28 days of
submission of the EMP and Rehabilitation
As the Auditor understands that Iluka will submit the
performance reports and the audit report when complete,
compliance with this requirement cannot be verified.
NA

September 2021 19121052-011-R-Rev0
B12
Requirement Observations Compliance Recommendations
Performance Report to the Responsible
Authority; and
The Responsible Authority to determine
whether amendment to the EMP or RVMP is
required and the timeframe and conditions
under which such amendment is to occur.
EMP and RVMP have recently been reviewed and updated in
H2 2020.
NA The EMP and RVMP
have been reviewed by
the Auditor and the
Auditor understands
that they will be
adopted for the next
reporting period.
Copies of the EMP and Rehabilitation
Performance Report and the auditor’s report to be
provided to the Responsible Authority with 28
days of receipt of the auditor’s report
As the Auditor understands that Iluka will submit the
performance reports and the audit report when complete,
compliance with this requirement cannot be verified.
NA

September 2021 19121052-011-R-Rev0
APPENDIX C
Iluka IWMP Performance Report
H2 2020

Iluka Resources Limited Mineral Sands By-Product Disposal
Planning Permit 15-105
Crown Allotments 91, 94, 95, 96
Parish of Telangatuk
Incoming Waste Monitoring Plan Report H2– 2020
Iluka Ref: UDOCS 0090-426461582-2341
Contact: Ian Williams
Environment Superintendent, Murray Basin [email protected]

Iluka Resources Ltd Planning Permit 15-105: Mineral Sands By-Product Disposal (Pit 23)
Iluka Ref: UDOCS 0090-426461582-2341 Final (Rev 0)
Incoming Waste Monitoring Plan, Annual Report H2 2020
i
Document control
Revision Details of review or changes Prepared by Date
0 Final S. Alexander 8-02-2021

Iluka Resources Ltd Planning Permit 15-105: Mineral Sands By-Product Disposal (Pit 23)
Iluka Ref: UDOCS 0090-426461582-2341 Final (Rev 0)
Incoming Waste Monitoring Plan, Annual Report H2 2020
ii
Table of contents 1 EXECUTIVE SUMMARY ....................................................................................................... 3 2 INTRODUCTION.................................................................................................................... 4
2.1 PLANNING PERMIT 15-105 ......................................................................................................... 4 2.2 COMMENCEMENT OF THE PERMIT .......................................................................................... 4 2.3 ENDORSED PLANS ...................................................................................................................... 7 2.4 PERMIT CONDITION REQUIREMENT FOR AN IWMP ............................................................... 7 2.5 IWMP REPORTING REQUIREMENTS ........................................................................................ 7
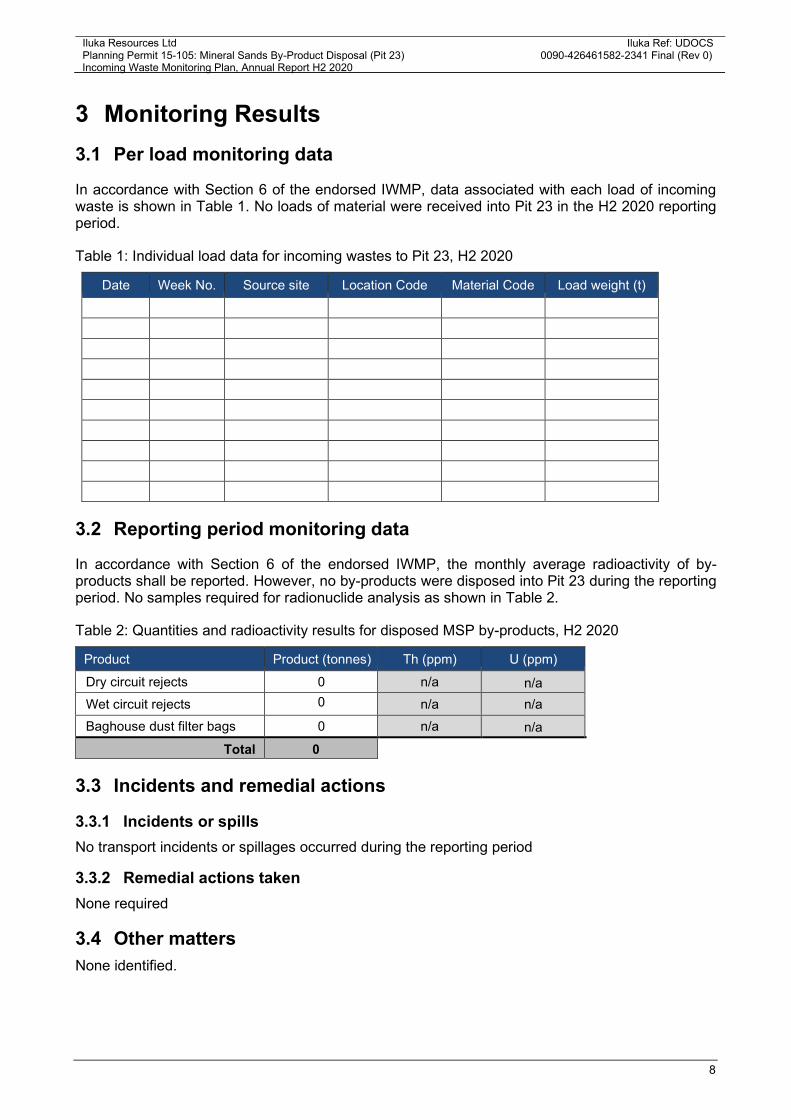
3 MONITORING RESULTS ...................................................................................................... 9 3.1 PER LOAD MONITORING DATA ................................................................................................. 9 3.2 REPORTING PERIOD MONITORING DATA ............................................................................... 9 3.3 INCIDENTS AND REMEDIAL ACTIONS ...................................................................................... 9 3.4 OTHER MATTERS ........................................................................................................................ 9
List of tables Table 1: Individual load data for incoming wastes to Pit 23, H2 2020 .............................................................. 9
Table 2: Quantities and radioactivity results for disposed MSP by-products, H2 2020 ..................................... 9
List of figures Figure 1: Douglas Mine and Pit 23 Regional Location ....................................................................................... 5
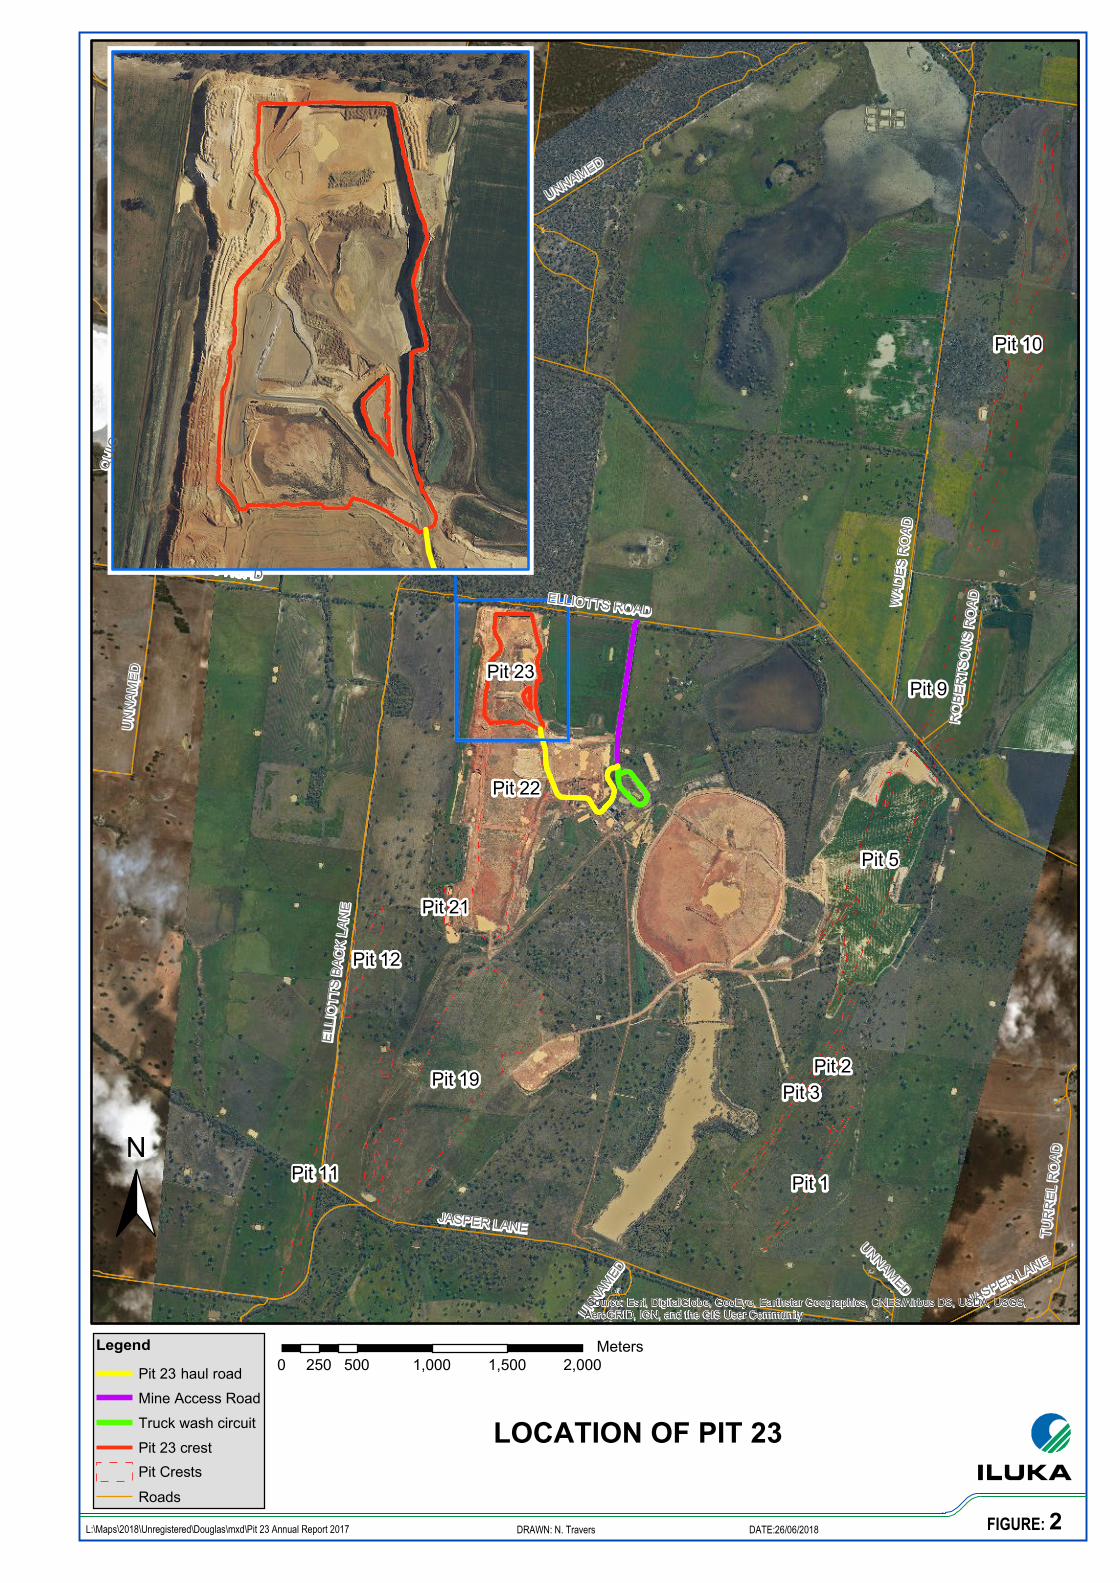
Figure 2: Pit 23 Location .................................................................................................................................... 6
Iluka Resources Ltd Planning Permit 15-105: Mineral Sands By-Product Disposal (Pit 23)
Iluka Ref: UDOCS 0090-426461582-2341 Final (Rev 0)
Incoming Waste Monitoring Plan, Annual Report H2 2020
3
1 Executive Summary Iluka Resources Limited (Iluka) operates the Pit 23 by-products disposal facility located at the Douglas Mine in the Kanagulk area and within the municipality of the Horsham Rural City. Pursuant to Planning Permit 15-105 issued by Horsham Rural City Council (HRCC), and the subsidiary Pit 23 Incoming Waste Monitoring Plan (IWMP), the Pit 23 facility is approved for the disposal of:
• non-liquid waste by-products associated with or sourced though mineral sands processing undertaken at the Iluka Hamilton Mineral Separation Plant (MSP) containing or contaminated with Naturally Occurring Radioactive Material (NORM);
• used dust filter bags from the Hamilton MSP containing or contaminated with NORM; and
• NORM-contaminated concrete and steel associated with plant and infrastructure from nominated Iluka sites within Victoria.
This report is submitted in accordance with Section 6 of the IWMP and provides a summary of the wastes received into Pit 23 (origin, volumes/weights and radioactive properties) and records of incidents and remedial actions applicable to the reporting period of 1st July 2020 to 31st December 2020. Key commentary on monitoring outcomes and performance against compliance objectives in the IWMP for the H2 2020 reporting period:
• No waste disposed into Pit 23 in the H2 2020 reporting period; and
• No transport incidents or spillages occurred.
Summary incoming waste data and incident information is provided in Section 3.
Iluka Resources Ltd Planning Permit 15-105: Mineral Sands By-Product Disposal (Pit 23)
Iluka Ref: UDOCS 0090-42641582-2341 Final (Rev 0)
Incoming Waste Monitoring Plan, Annual Report H2 2020
4
2 Introduction Iluka Resources Limited (Iluka) operates the Pit 23 by-products disposal facility located at the Douglas Mine in the Kanagulk area and within the municipality of the Horsham Rural City (Figure 1 and Figure 2). Pursuant to Planning Permit 15-105 issued by Horsham Rural City Council (HRCC), and the subsidiary Pit 23 Incoming Waste Monitoring Plan (IWMP), the Pit 23 facility is approved for the disposal of mineral separation by-products and used dust filter bags from the Iluka Hamilton Mineral Separation (MSP) which contain or are contaminated with Naturally Occurring Radioactive Material (NORM), and concrete and steel which contains or is contaminated with NORM associated with plant and infrastructure from nominated Iluka sites within Victoria.
2.1 Planning Permit 15-105
Under the Horsham Planning Scheme the subject land is in the Farming Zone and under the provisions of that zone a permit is required for use and development for Industry (Refuse Disposal). On 25th February 2017 Planning Permit 15-105, (the Permit) was issued by the Horsham Rural City Council as the Responsible Authority to allow:
Use and development of the land for the disposal of waste by-products associated with or sourced through mineral sands processing undertaken at the Hamilton Mineral Separation Plant (MSP), including waste by-products and contaminated materials resulting from the processing and transport operations as follows:
o By-products from the processing of heavy mineral concentrate at the Hamilton MSP;
o used dust filter bags from the Hamilton MSP; and
o Other chemically inert material contaminated with naturally occurring radioactive material.
in accordance with the endorsed plans.
2.2 Commencement of the Permit
Condition 1 of the Permit states:
This permit does not come into operation until:
a. Iluka has applied to the Department of Economic Development, Jobs, Transport and Resources to vary the 2003 Work Plan to identify a new endues utilisation of Pit 23 and to vary the rehabilitation plan; and
b. Iluka has applied to the Minister to surrender part of MIN 53671 (Pit 23); and
c. The Department of Economic Development, Jobs, Transport and Resources has approved the Work Plan Variation; and
d. The Minister has registered the partial surrender of MIN 5367.
The permit comes into operation on the same day the Work Plan Variation is approved, and the partial surrender of MIN 5367 is registered.
The Variation to the 2003 Douglas Mine Work Plan was approved on the 13th April 2017, and the partial surrender of MIN 5367 was registered on 11th May 2017, this being the date of commencement of the Permit.
1 Iluka Resources Douglas Mine – Mining Licence No. 5367 (‘MIN 5367’)

QUANTONG NATIMUK
!(!
VECTIS SOUTH
! D
A O R AD N ARO O JUH T AD I OR L N A SHA
M M
H HOR K U
O L E R
AI N E E D E N H O 5880000
P E R O A D
GYMBOWEN
DUFFHOLME
MITRE
ARAPILES
0 200 km
S.A. N.S.W.
MILDURA !
TOOAN
TOOAN EAST
OUYEN
!
Map Area
VIC
HAMILTON !
MELBOURNE
!
5920000 5920000
MIGA LAKE
Jilpanger N.C.R.
CLEAR LAKE
JALLUMBA
NURRABIEL
CONNANGORACH
TOOLONDO
BROOKSBY
DOUGLAS
5900000 5900000
HRCC-PP-15-105 MIN5367
TELANGATUK EAST
HARROW
N
Black Range State Park
0 2.5 5 km 5880000
Map Projection: MGA Zone 54
Legend
Douglas mine
Pit 23
HRCC-PP-15-105
MIN5367 tenement
DOUGLAS LOCATION PLAN
ORIG:
N.Travers
DRAWN: D.G.S.
SCALE: 1:250,000
(A4)
DATE: May 2018
DWG No:
247670 ver.00 FIGURE: 1
NATIMUK FRANCES ROAD
580000
560000
5600
00
5800
00
D A O R S E I N H C
WOMB K E ELANO M C
ROAD
AD
LKRO
NAGU
-KA
RROW
HA D
A O R
S D Y E E M
L A N
N U
BRANDTS ROA
Pit 10
Pit 23 Pit 9
Pit 22
Pit 5
Pit 21
Pit 12
N Pit 11
Pit 19
Pit 2 Pit 3
Pit 1
Legend
Pit 23 haul road 0 Mine Access Road Truck wash circuit Pit 23 crest Pit Crests
Roads
250
Source: Esri, DigitalGlobe, GeoEye, Earthstar Geographics, CNES/Airbus DS, USDA, USGS, AeroGRID, IGN, and the GIS User Community
Meters
500 1,000 1,500 2,000
LOCATION OF PIT 23
L:\Maps\2018\Unregistered\Douglas\mxd\Pit 23 Annual Report 2017
DRAWN: N. Travers
DATE:26/06/2018 FIGURE: 2

Iluka Resources Ltd Planning Permit 15-105: Mineral Sands By-Product Disposal (Pit 23)
Iluka Ref: UDOCS 0090-426461582-2341 Final (Rev 0)
Incoming Waste Monitoring Plan, Annual Report H2 2020
7
2.3 Endorsed Plans
Conditions 2, 3, 9, 14, 16 and 34 of the Permit relate to various management plans that once approved by the Responsible Authority will be endorsed to form part of the Permit, which includes:
• Incoming Waste Monitoring Plan (IWMP);
• Environmental Management Plan (EMP), incorporating; o Groundwater Monitoring and Management Plan (GWMMP); o Surface Water Monitoring and Management Plan (SWMMP); o Air Quality/Dust Control Plan (AQMP); and
• Rehabilitation and Vegetation Management Plan (R&VMP)
The plans were endorsed by Horsham Rural City Council on 17th July 2017. 2.4 Permit condition requirement for an IWMP
To ensure compliance with the permitted use (Section 2.1) the Permit includes the following condition concerning the requirement for and content of an IWMP:
Incoming Waste Monitoring Plan 14. Within 90 days of the commencement of this permit operation, an Incoming Waste Management Plan
(IWMP) must be prepared to the satisfaction of the Responsible Authority in consultation with the Department of Health and Human Services for the approval by the responsible authority. Three copies of the plan must be provided to the responsible authority. When approved by the responsible authority the IWMP will be endorsed and it will then form part of this permit. The IWMP must provide for
a) A monitoring and reporting system for ensuring that materials disposed of to Pit 23 are limited to those approved under the conditions of this permit;
b) Recording of the origin, per load weight and radioactive properties of each incoming load;
c) Monitoring to ensure all vehicles transporting waste have fully secured and contained loads and that all waste loads have been transported in compliance with licence requirements under the Radiation Act 2005;
d) Records of any transport incidents or spill and remedial actions taken in the event of such incidents; and
e) Annual audits of records to verify compliance with the requirements of the IWMP 2.5 IWMP reporting requirements
Section 6 of the IWMP states the following reporting requirements:
On an annual basis a report will be provided showing the following:
• For each load: o source site; o load weight; and o material description; and
• For the report period: o radioactivity of by-products on a monthly basis; and o total quantities of by-products disposed of to Pit 23.
The annual report will be provided to a suitably qualified auditor who will complete an audit of the data provided and compliance with this IWMP. Copies of the annual report and the audit report will be submitted to the Responsible Authority
These reporting requirements are addressed in the following sections.
Iluka Resources Ltd Planning Permit 15-105: Mineral Sands By-Product Disposal (Pit 23)
Iluka Ref: UDOCS 0090-426461582-2341 Final (Rev 0)
Incoming Waste Monitoring Plan, Annual Report H2 2020
8
3 Monitoring Results 3.1 Per load monitoring data
In accordance with Section 6 of the endorsed IWMP, data associated with each load of incoming waste is shown in Table 1. No loads of material were received into Pit 23 in the H2 2020 reporting period.
Table 1: Individual load data for incoming wastes to Pit 23, H2 2020
Date Week No. Source site Location Code Material Code Load weight (t)
3.2 Reporting period monitoring data
In accordance with Section 6 of the endorsed IWMP, the monthly average radioactivity of by- products shall be reported. However, no by-products were disposed into Pit 23 during the reporting period. No samples required for radionuclide analysis as shown in Table 2.
Table 2: Quantities and radioactivity results for disposed MSP by-products, H2 2020
Product Product (tonnes) Th (ppm) U (ppm)
Dry circuit rejects 0 n/a n/a Wet circuit rejects 0 n/a n/a Baghouse dust filter bags 0 n/a n/a
Total 0 3.3 Incidents and remedial actions
3.3.1 Incidents or spills No transport incidents or spillages occurred during the reporting period
3.3.2 Remedial actions taken None required
3.4 Other matters None identified.

September 2021 19121052-011-R-Rev0
APPENDIX D
Iluka EMP & IWMP Performance
Report H2 2020

Iluka Resources Limited
Mineral Sands By-Product Disposal
Planning Permit 15-105
Crown Allotments 91, 94, 95, 96
Parish of Telangatuk
Environmental Management Plan and Rehabilitation Performance Report – H2 2020
Iluka Ref: UDOCS 0058-1414587248-1098
Contact: Ian Williams
Environment Superintendent, Murray Basin [email protected]

Iluka Resources Ltd Planning Permit 15-105: Mineral Sands By-Product Disposal (Pit 23)
EMP and Rehabilitation Performance Report – H2 2020 FINAL (Rev 0)
i
Document control
Revision Details of review or changes Prepared by Date created
A Draft S. Alexander 10-03-2021
0 Final S.Alexander
Iluka Resources Ltd Planning Permit 15-105: Mineral Sands By-Product Disposal (Pit 23)
EMP and Rehabilitation Performance Report – H2 2020 FINAL (Rev 0)
ii
Table of contents
1 EXECUTIVE SUMMARY ....................................................................................................... 5
2 INTRODUCTION ................................................................................................................... 6
2.1 PLANNING PERMIT 15-105.......................................................................................................... 6 2.2 COMMENCEMENT OF THE PERMIT .......................................................................................... 6 2.3 ENDORSED PLANS ...................................................................................................................... 9 2.4 PERFORMANCE REPORTING .................................................................................................... 9 2.5 REHABILITATION AND VEGETATION MANAGEMENT PLAN ................................................. 10
3 DELIVERY AND DISPOSAL OF MATERIALS INTO PIT 23 ............................................... 10
4 MONITORING RESULTS .................................................................................................... 10
4.1 GROUNDWATER ........................................................................................................................ 10 4.2 SURFACE WATER QUALITY ..................................................................................................... 36 4.3 NOISE .......................................................................................................................................... 41 4.4 PM10 CONCENTRATIONS IN AIR .............................................................................................. 41 4.5 RADIATION MONITORING – OTHER ........................................................................................ 45
5 MANAGEMENT ACTIONS .................................................................................................. 49
5.1 MONITORING BORE AUDITS .................................................................................................... 49 5.2 GROUNDWATER FLOW PATHS FROM PIT 23 ........................................................................ 49 5.3 GROUNDWATER MODEL REVIEW AND RECALIBRATION .................................................... 51 5.4 MAXIMUM SURFACE LEVEL OF DISPOSED MATERIALS IN PIT 23 ..................................... 51 5.5 NON-COMPLIANCES ................................................................................................................. 51 5.6 COMMENTS AND COMPLAINTS RECEIVED ........................................................................... 51 5.7 H2 2020 COMPLETED ACTIONS ............................................................................................... 51 5.8 H1 2021 PROPOSED ACTIONS ................................................................................................. 52 5.9 OTHER MATTERS ...................................................................................................................... 52
6 REFERENCES .................................................................................................................... 53
7 APPENDICES ...................................................................................................................... 54
APPENDIX A: MONITORING DATA (LAB) – RADIATION – SURFACE WATER ................................ 54 APPENDIX B: MONITORING DATA (LAB) – GROUNDWATER .......................................................... 55 APPENDIX C: MONITORING DATA (FIELD) – GROUNDWATER .................................................... 116 APPENDIX D: MONITORING DATA (LAB) – SURFACE WATER ..................................................... 135 APPENDIX E: MONITORING DATA (FIELD) – SURFACE WATER .................................................. 152
Iluka Resources Ltd Planning Permit 15-105: Mineral Sands By-Product Disposal (Pit 23)
EMP and Rehabilitation Performance Report – H2 2020 FINAL (Rev 0)
iii
List of tables
Table 1: Pit 23 bore status (as at 31/12/2020) ................................................................................................. 10
Table 2: Monitoring bores - standing water Levels (mAHD) ............................................................................ 13
Table 3: Groundwater monitoring locations – ionic ratio balance results ........................................................ 16
Table 4: Groundwater radionuclide concentrations vs. ionic balance ratios, H2 2020 .................................... 23
Table 5: Groundwater quality exceedances vs ionic balance ratios, H2 2020 ................................................ 35
Table 6:Selenium groundwater trigger levels for GW04, H2 2020 .................................................................. 35 Table 7: Surface water monitoring - ionic ratio balance results ....................................................................... 37
Table 8: Monitoring program – radionuclide concentrations in surface water ................................................. 40
Table 9: Elevated PM10 association with Pit 23 matrix ................................................................................... 42
Table 10: PM10 exceedance assessment, H2 2020 ......................................................................................... 43
Table 11: Radon concentrations within Pit 23 for H2 2020 .............................................................................. 46 Table 12: Thoron concentrations within Pit 23 for H2 2020 ............................................................................. 46
Table 13: Gross Alpha radiation in PM10 dust .................................................................................................. 48
List of figures
Figure 1: Douglas Mine and Pit 23 regional location ......................................................................................... 7
Figure 2: Pit 23 location ..................................................................................................................................... 8
Figure 3: Pit 23 updated groundwater monitoring network (as at 31/12/2019) ................................................ 12
Figure 4: Groundwater elevation (mAHD) – bores in predicted flow path ....................................................... 14
Figure 5: Groundwater elevation (mAHD) – bores up-gradient of Pit 23 ......................................................... 14 Figure 6: Groundwater elevation (mAHD) – cross-gradient and background bores ........................................ 15
Figure 7: U-238 and ionic balance trends – up-gradient bores (1 of 2) ........................................................... 31
Figure 8: U-238 and ionic balance trends – up-gradient bores (2 of 2) ........................................................... 31
Figure 9: Ra-228 and ionic balance trends – up-gradient bores (1 of 2)s ....................................................... 31
Figure 10: Ra-228 and ionic balance trends – up-gradient bores (2 of 2) ....................................................... 31
Figure 11: U-238 and ionic balance trends – down-gradient bores (1 of 2) .................................................... 32 Figure 12: U-238 and ionic balance trends – down-gradient bores (2 of 2) .................................................... 32
Figure 13: Ra-228 and ionic balance trends – down-gradient bores (1 of 2) .................................................. 32
Figure 14: Ra-228 and ionic balance trends – down-gradient bores (2 of 2) .................................................. 32
Figure 15: U-238 and ionic balance trends – cross-gradient bores (1 of 2) .................................................... 33
Figure 16: U-238 and ionic balance trends – cross-gradient bores (2 of 2) .................................................... 33 Figure 17: Ra-228 and ionic balance trends – cross-gradient bores (1 of 2) .................................................. 33
Figure 18: Ra-228 and ionic balance trends – cross-gradient bores (2 of 2) .................................................. 33
Figure 19: U-238 and ionic balance trends – bores representing background (1 of 2) ................................... 34
Figure 20: U-238 and ionic balance trends – bores representing background (2 of 2) ................................... 34
Figure 21: Ra-228 and ionic balance trends – bores representing background (1 of 2) ................................. 34
Figure 22: Ra-228 and ionic balance trends – bores representing background (2 of 2) ................................. 34 Figure 23: GW04 - Selenium as compared against ionic balance trends ........................................................ 36
Figure 24: Ra-226 and Ra-228 in surface water .............................................................................................. 40

Iluka Resources Ltd Planning Permit 15-105: Mineral Sands By-Product Disposal (Pit 23)
EMP and Rehabilitation Performance Report – H2 2020 FINAL (Rev 0)
iv
Figure 25: Uranium and U-238 in surface water .............................................................................................. 41
Figure 26: PM10 dust concentrations at neighbouring residences vs. daily rainfall ......................................... 42
Figure 27: Pit 23 air quality (PM10) monitoring locations .................................................................................. 44
Figure 28: Radon and thoron detectors ........................................................................................................... 45 Figure 29: Radon concentration in air, H2 2020 .............................................................................................. 47
Figure 30: Thoron concentration in air, H2 2020 ............................................................................................. 47
Figure 31: Gross Alpha Radiation in PM10 Dust – H2 2020 ........................................................................... 48
Figure 32: 2019 vs 2020 interpreted groundwater contours (EMM 2019; EMM 2020) .................................... 50

Iluka Resources Ltd Planning Permit 15-105: Mineral Sands By-Product Disposal (Pit 23)
EMP and Rehabilitation Performance Report – H2 2020 FINAL (Rev 0)
5
1 Executive Summary
Iluka Resources Limited (Iluka) operates the Pit 23 by-products disposal facility located at the Douglas Mine in the Kanagulk area and within the municipality of the Horsham Rural City.
Pursuant to Planning Permit 15-105 issued by Horsham Rural City Council (HRCC), and the subsidiary Pit 23 Incoming Waste Monitoring Plan (IWMP), the Pit 23 facility is approved for the disposal of mineral separation by-products and used dust filter bags from the Iluka Hamilton Mineral Separation (MSP) which contain or are contaminated with Naturally Occurring Radioactive Material (NORM), and concrete and steel which contains or is contaminated with NORM associated with plant and infrastructure from nominated Iluka sites within Victoria.
Complementing the IWMP are the endorsed Pit 23 Environmental Management Plan (EMP) which addresses the identification, management and monitoring of environmental risks associated with the approved development and use; and the endorsed Rehabilitation and Vegetation Management Plan (R&VMP) which addresses the future rehabilitation of the Pit 23 facility including infrastructure decommissioning, landform reinstatement and end land use.
This report is submitted in accordance with Section 12.2 of the endorsed Iluka Pit 23 EMP and outlines the results of monitoring and management actions undertaken during the period 1st July 2020 to 31st December 2020.
Key commentary on environmental monitoring outcomes and performance against compliance objectives in the Pit EMP for the H2 2020 reporting period:
• There were no exceedances of applicable limits for radionuclides or any other analytes in groundwater in bores down-gradient of Pit 23 attributable to disposal activities;
• There were no surface water discharges from the Pit 23 disturbance area;
• There were no exceedances of applicable limits for radionuclides or any other analytes in groundwater-fed surface water sites down-gradient of Pit 23 attributable to disposal activities;
• No noise complaints were received;
• There were no exceedances of the PM10 limit attributable to Pit 23 operations;
• There were no exceedances of the air concentration limits for radon or thoron;
• Measured concentrations of gross alpha radiation in airborne dust were within the range of historical values; and
• Updated groundwater level contours and flow-paths show no material change from the hydrogeological model contours developed in 2015 by CDM Smith.
Detailed assessment of compliance, key results and management actions are provided in Section 4 and 5 of the enclosed report.

Iluka Resources Ltd Planning Permit 15-105: Mineral Sands By-Product Disposal (Pit 23)
EMP and Rehabilitation Performance Report – H2 2020 FINAL (Rev 0)
6
2 Introduction
Iluka Resources Limited (Iluka) operates the Pit 23 by-products disposal facility located at the Douglas Mine in the Kanagulk area and within the municipality of the Horsham Rural City (Figure 1 and Figure 2).
Pursuant to Planning Permit 15-105 issued by Horsham Rural City Council (HRCC), and the subsidiary Pit 23 Incoming Waste Monitoring Plan (IWMP), the Pit 23 facility is approved for the disposal of mineral separation by-products and used dust filter bags from the Iluka Hamilton Mineral Separation (MSP) which contain or are contaminated with Naturally Occurring Radioactive Material (NORM), and concrete and steel which contains or is contaminated with NORM associated with plant and infrastructure from nominated Iluka sites within Victoria.
2.1 Planning Permit 15-105
Under the Horsham Planning Scheme the subject land is in the Farming Zone and under the provisions of that zone a permit is required for use and development for Industry (Refuse Disposal). On 25th February 2017 Planning Permit 15-105, (the Permit) was issued by the Horsham Rural City Council as the Responsible Authority to allow:
Use and development of the land for the disposal of waste by-products associated with or sourced through mineral sands processing undertaken at the Hamilton Mineral Separation Plant (MSP), including waste by-products and contaminated materials resulting from the processing and transport operations as follows:
o By-products from the processing of heavy mineral concentrate at the Hamilton MSP;
o used dust filter bags from the Hamilton MSP; and
o Other chemically inert material contaminated with naturally occurring radioactive material.
in accordance with the endorsed plans.
2.2 Commencement of the Permit
Condition 1 of the Permit states:
This permit does not come into operation until:
a. Iluka has applied to the Department of Economic Development, Jobs, Transport and Resources to vary the 2003 Work Plan to identify a new endues utilisation of Pit 23 and to vary the rehabilitation plan; and
b. Iluka has applied to the Minister to surrender part of MIN 5367 (Pit 23); and
c. The Department of Economic Development, Jobs, Transport and Resources has approved the Work Plan Variation; and
d. The Minister has registered the partial surrender of MIN 5367.
The permit comes into operation on the same day the Work Plan Variation is approved, and the partial surrender of MIN 5367 is registered.
The Variation to the 2003 Douglas Mine Work Plan was approved on the 13th April 2017, and the partial surrender of MIN5367 was registered on 11th May 2017, this being the date of commencement of the Permit.

FIGURE:(A4)ORIG: DRAWN: SCALE: DATE: DWG No:
!(
!
!
HRCC-PP-15-105 MIN5367
WIMMERA HIGHWAY
NATIM
UK H
AMILT
ON R
OAD
NHILL
HAR
ROW
ROAD
NATIMUK FRANCES ROAD
HARROW CLEAR LAKE ROAD
COLERAINE EDENHOPE ROAD
HORSHAM NORADJUHA ROAD
HARROW BALMORAL ROAD
NATIMUK
JilpangerN.C.R.
BlackRangeStatePark
MITRE
TOOAN
HARROW
DOUGLAS
BROOKSBY
GYMBOWEN
ARAPILESQUANTONG
JALLUMBA
TOOLONDO
NORADJUHA
NURRABIEL
MIGA LAKE
DUFFHOLME
TOOAN EAST
CLEAR LAKE
CONNANGORACH
VECTIS SOUTH
TELANGATUK EAST
560000
560000
580000
580000
5880000 5880000
5900000 5900000
5920000 5920000
N.Travers D.G.S. 1:250,000
DOUGLAS
LOCATION PLAN
!
!
!
!
S.A. N.S.W.
VIC
OUYEN
MILDURA
HAMILTON MELBOURNE
Map Area
0 200 km
N
Map Projection: MGA Zone 54
May 2018 247670 ver.00
0 2.5 5 km
1
LegendDouglas mine
MIN5367 tenement
HRCC-PP-15-105
Pit 23

WA
DE
S R
OA
D
JASPER LANE
EL
LIO
TT
S B
AC
K L
AN
E
ELLIOTTS ROAD
WOMBELANO ROAD
UNNAMED
TU
RR
EL R
OA
D
MC
KE
CH
NIE
S R
OA
D
QU
IGLE
YS
RO
AD
BRANDTS ROAD
HARROW-K
ANAGULK ROAD
RO
BE
RT
SO
NS
RO
AD
JASPER LANE
UN
NAM
ED
UN
NA
ME
D
UN
NA
ME
D
UNNAM
ED
Pit 19
Pit 22
Pit 5
Pit 10
Pit 9Pit 23
Pit 11
Pit 12
Pit 3
Pit 1
Pit 2
Pit 21
Source: Esri, DigitalGlobe, GeoEye, Earthstar Geographics, CNES/Airbus DS, USDA, USGS,
AeroGRID, IGN, and the GIS User Community
2L:\Maps\2018\Unregistered\Douglas\mxd\Pit 23 Annual Report 2017 N. Travers 26/06/2018
N
0 500 1,000 1,500 2,000250MetersLegend
Pit 23 haul road
Mine Access Road
Truck wash circuit
Pit 23 crest
Pit Crests
Roads
LOCATION OF PIT 23
FIGURE:DRAWN: DATE:
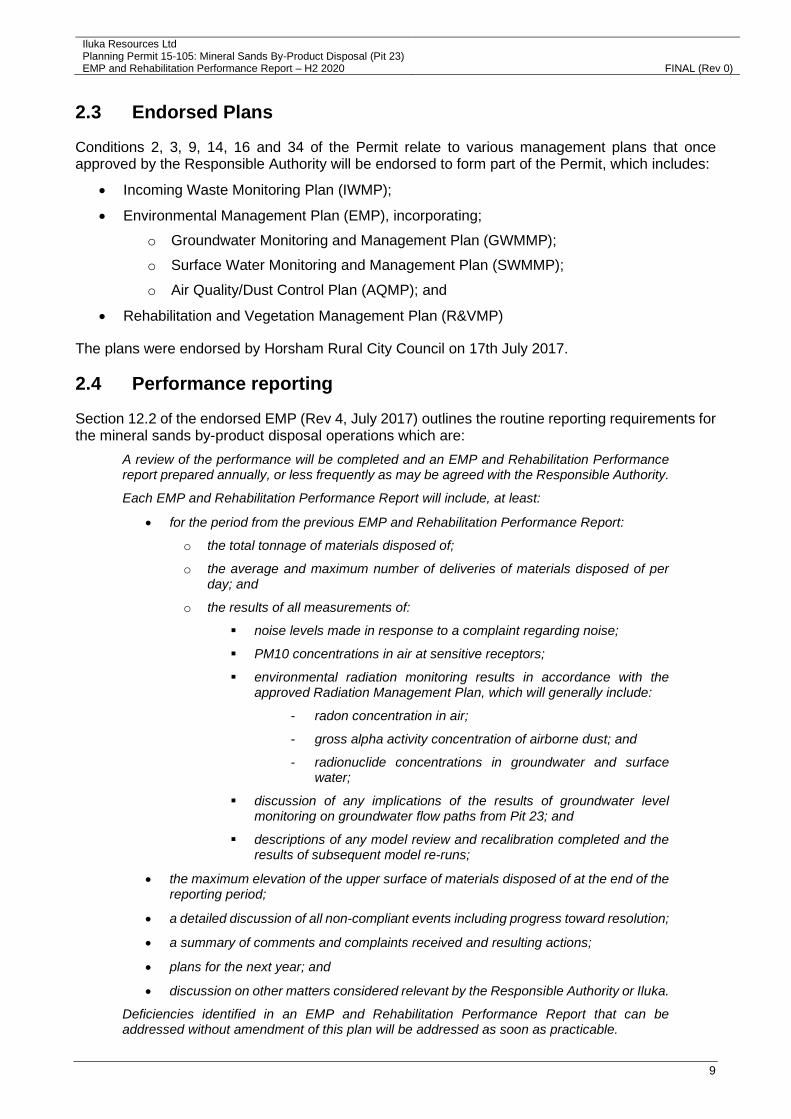
Iluka Resources Ltd Planning Permit 15-105: Mineral Sands By-Product Disposal (Pit 23)
EMP and Rehabilitation Performance Report – H2 2020 FINAL (Rev 0)
9
2.3 Endorsed Plans
Conditions 2, 3, 9, 14, 16 and 34 of the Permit relate to various management plans that once approved by the Responsible Authority will be endorsed to form part of the Permit, which includes:
• Incoming Waste Monitoring Plan (IWMP);
• Environmental Management Plan (EMP), incorporating;
o Groundwater Monitoring and Management Plan (GWMMP);
o Surface Water Monitoring and Management Plan (SWMMP);
o Air Quality/Dust Control Plan (AQMP); and
• Rehabilitation and Vegetation Management Plan (R&VMP)
The plans were endorsed by Horsham Rural City Council on 17th July 2017.
2.4 Performance reporting
Section 12.2 of the endorsed EMP (Rev 4, July 2017) outlines the routine reporting requirements for the mineral sands by-product disposal operations which are:
A review of the performance will be completed and an EMP and Rehabilitation Performance report prepared annually, or less frequently as may be agreed with the Responsible Authority.
Each EMP and Rehabilitation Performance Report will include, at least:
• for the period from the previous EMP and Rehabilitation Performance Report:
o the total tonnage of materials disposed of;
o the average and maximum number of deliveries of materials disposed of per day; and
o the results of all measurements of:
noise levels made in response to a complaint regarding noise;
PM10 concentrations in air at sensitive receptors;
environmental radiation monitoring results in accordance with the approved Radiation Management Plan, which will generally include:
- radon concentration in air;
- gross alpha activity concentration of airborne dust; and
- radionuclide concentrations in groundwater and surface water;
discussion of any implications of the results of groundwater level monitoring on groundwater flow paths from Pit 23; and
descriptions of any model review and recalibration completed and the results of subsequent model re-runs;
• the maximum elevation of the upper surface of materials disposed of at the end of the reporting period;
• a detailed discussion of all non-compliant events including progress toward resolution;
• a summary of comments and complaints received and resulting actions;
• plans for the next year; and
• discussion on other matters considered relevant by the Responsible Authority or Iluka.
Deficiencies identified in an EMP and Rehabilitation Performance Report that can be addressed without amendment of this plan will be addressed as soon as practicable.
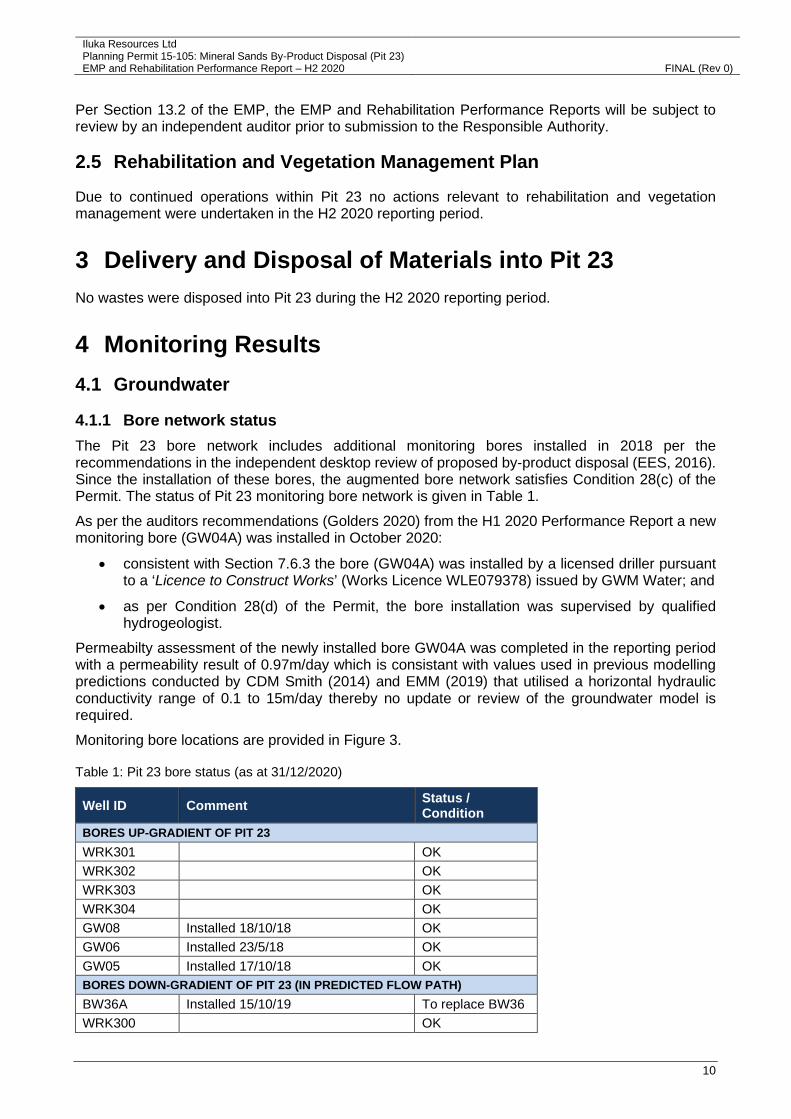
Iluka Resources Ltd Planning Permit 15-105: Mineral Sands By-Product Disposal (Pit 23)
EMP and Rehabilitation Performance Report – H2 2020 FINAL (Rev 0)
10
Per Section 13.2 of the EMP, the EMP and Rehabilitation Performance Reports will be subject to review by an independent auditor prior to submission to the Responsible Authority.
2.5 Rehabilitation and Vegetation Management Plan
Due to continued operations within Pit 23 no actions relevant to rehabilitation and vegetation management were undertaken in the H2 2020 reporting period.
3 Delivery and Disposal of Materials into Pit 23
No wastes were disposed into Pit 23 during the H2 2020 reporting period.
4 Monitoring Results
4.1 Groundwater
4.1.1 Bore network status
The Pit 23 bore network includes additional monitoring bores installed in 2018 per the recommendations in the independent desktop review of proposed by-product disposal (EES, 2016). Since the installation of these bores, the augmented bore network satisfies Condition 28(c) of the Permit. The status of Pit 23 monitoring bore network is given in Table 1.
As per the auditors recommendations (Golders 2020) from the H1 2020 Performance Report a new monitoring bore (GW04A) was installed in October 2020:
• consistent with Section 7.6.3 the bore (GW04A) was installed by a licensed driller pursuant to a ‘Licence to Construct Works’ (Works Licence WLE079378) issued by GWM Water; and
• as per Condition 28(d) of the Permit, the bore installation was supervised by qualified hydrogeologist.
Permeabilty assessment of the newly installed bore GW04A was completed in the reporting period with a permeability result of 0.97m/day which is consistant with values used in previous modelling predictions conducted by CDM Smith (2014) and EMM (2019) that utilised a horizontal hydraulic conductivity range of 0.1 to 15m/day thereby no update or review of the groundwater model is required.
Monitoring bore locations are provided in Figure 3.
Table 1: Pit 23 bore status (as at 31/12/2020)
Well ID Comment Status / Condition
BORES UP-GRADIENT OF PIT 23
WRK301 OK
WRK302 OK
WRK303 OK
WRK304 OK
GW08 Installed 18/10/18 OK
GW06 Installed 23/5/18 OK
GW05 Installed 17/10/18 OK
BORES DOWN-GRADIENT OF PIT 23 (IN PREDICTED FLOW PATH)
BW36A Installed 15/10/19 To replace BW36
WRK300 OK

Iluka Resources Ltd Planning Permit 15-105: Mineral Sands By-Product Disposal (Pit 23)
EMP and Rehabilitation Performance Report – H2 2020 FINAL (Rev 0)
11
Well ID Comment Status / Condition
GW01 Installed 23/5/18 OK
GW02 Installed 17/10/18 OK
GW03 Installed 17/10/18 OK
GW04A Installed 15/10/2020 OK
BW5 In predicted flow path OK
BORES CROSS-GRADIENT TO PIT 23 FLOW PATH
GW04* Installed 18/10/18 OK
GW07 Installed 23/5/18 OK
BW28A * OK
BW45B Installed 18/10/18 – replaced BW45 OK
BORES REPRESENTATIVE OF BACKGROUND
IWB2 Representative of background OK
IWB6 Representative of background OK
BW53 (“Puls”) Representative of background OK * BW28A and GW04 are incorrectly referenced in the current endorsed EMP (Rev 4, July 2017) as being down-gradient of Pit 23. Groundwater modelling per CDM Smith (2014) and EMM (2019) indicate that BW28A and GW04 are cross-gradient to the predicted flow path from Pit 23.

(A3)ORIG: DRAWN: SCALE: DATE: DWG No:
!(
!(
!(
!(
!(
!(
!(
!(!(
!(
!(
!(
!(
!(
!(
!(
!(
!(
!(
!(
Pit 23
!(
McGlashin Swamp
White Lake
Ti Tree Swamp
Bitter Swamp
CARL
INS
ROAD
WOMBELANO ROAD
ELLIOTTS ROAD
WHITE LAKE ROAD
ELLIO
TTS B
ACK
LANE
BRANDTS ROADHARROW -
KANAGULK ROAD
MCKE
CHNI
ESRO
AD
ELLIO
TTS A
ND B
RAND
TSRO
AD
BW5
IWB6
IWB2
GW08
GW07
GW06
GW05
GW04
GW03
GW02
GW01
BW36
BW45B
BW28A
WRK304
WRK303WRK302
WRK301
WRK300BW53 (Puls)
GW04A (New)
3S.Alexander D.G.S. June 2020 257184 ver.011:25,000 FIGURE:
Site photo: 5 Oct. 2018N
0 500 1,000 m
DOUGLAS MINEPIT 23 MONITORING BORE NETWORK &
GROUNDWATER FLOW PATH
Legend
Bore Position/Purpose
Pit 23
Pit 23 Particle Tracks
!( Background
!( Cross-gradient
!( Down-gradient
Up-gradient!(
!(

Iluka Resources Ltd Planning Permit 15-105: Mineral Sands By-Product Disposal (Pit 23)
EMP and Rehabilitation Performance Report – H2 2020 FINAL (Rev 0)
13
4.1.2 Standing water levels
In accordance with Section 7.9.1 of the current endorsed EMP (Rev 4, July 2017) groundwater levels are measured on a monthly basis at bores WRK300 – WRK304 inclusive, GW01 to GW08 inclusive and BW36A and BW45B. All other bores (BW5, BW28A, BW53, IWB2 and IWB6) are measured on a biannual basis.
Groundwater level hydrographs for these bores expressed in groundwater elevation (metres above Australian Height Datum, mAHD) are given in Table 2 and Figure 4 – Figure 6. Data includes that obtained during scheduled events and ad-hoc measurements.
All bores along the predicted flow path (Figure 4) exhibit stable standing water levels in the preceding 24-month period and in comparison to long-term trends; bores up-gradient of Pit 23 (Figure 5) exhibit relatively stable water levels with minor fluctuation.
Table 2: Monitoring bores - standing water Levels (mAHD)
Bore ID Jul-20 Aug-20 Sep-20 Oct-20 Nov-20 Dec-20
BORES UP-GRADIENT OF PIT 23 GW05 178.9 178.9 178.9 178.9 179.0 179.0
GW06 176.2 176.2 176.1 176.2 176.2 176.2
GW08 177.5 177.6 177.4 177.6 177.5 177.5
WRK301 178.2 178.2 178.2 178.2 178.2 178.2
WRK302 176.8 176.7 176.8 176.7 176.8 176.8
WRK303 179.8 179.9 179.9 179.9 179.9 179.9
WRK304 180.4 180.5 180.5 180.4 180.4 180.4
BORES DOWN-GRADIENT OF PIT 23 (IN PREDICTED FLOW PLATH)
BW05 147.4 * * * * *
WRK300 175.1 175.1 175.1 175.2 175.2 175.2
BW36A 174.5 174.4 174.6 174.4 174.5 174.5
GW01 173.5 173.5 173.4 173.4 173.4 173.5
GW02 170.8 170.8 170.7 170.9 170.8 170.8
GW03 162.0 162.1 162.0 162.1 162.0 162.0
GW04A GW04A newly installed Nov 2020 177.0 177.0
BORES CROSS GRADIENT TO PIT 23 FLOW PATH BW28A 152.5 152.5 * * * *
BW45B 177.4 177.4 177.4 177.3 177.4 177.4
GW04 178.1 178.2 178.1 178.2 178.3 178.3
GW07 172.5 172.5 172.5 172.5 172.5 172.5
BORES REPRESENTATIVE OF BACKGROUND IWB2 179.7 179.9 179.7 179.7 179.8 179.7
IWB6 176.9 177.0 176.7 176.8 176.4 176.5
BW53 ("Puls") 175.8 176.3 176.2 176.3 176.2 176.3
Notes
• bores are listed according to their position relative to the Pit 23 groundwater flow path
• bores down-gradient (on predicted flow path) are listed in order of their position along the path of flow
• dates marked with an asterisk (*) indicates no scheduled sampling required
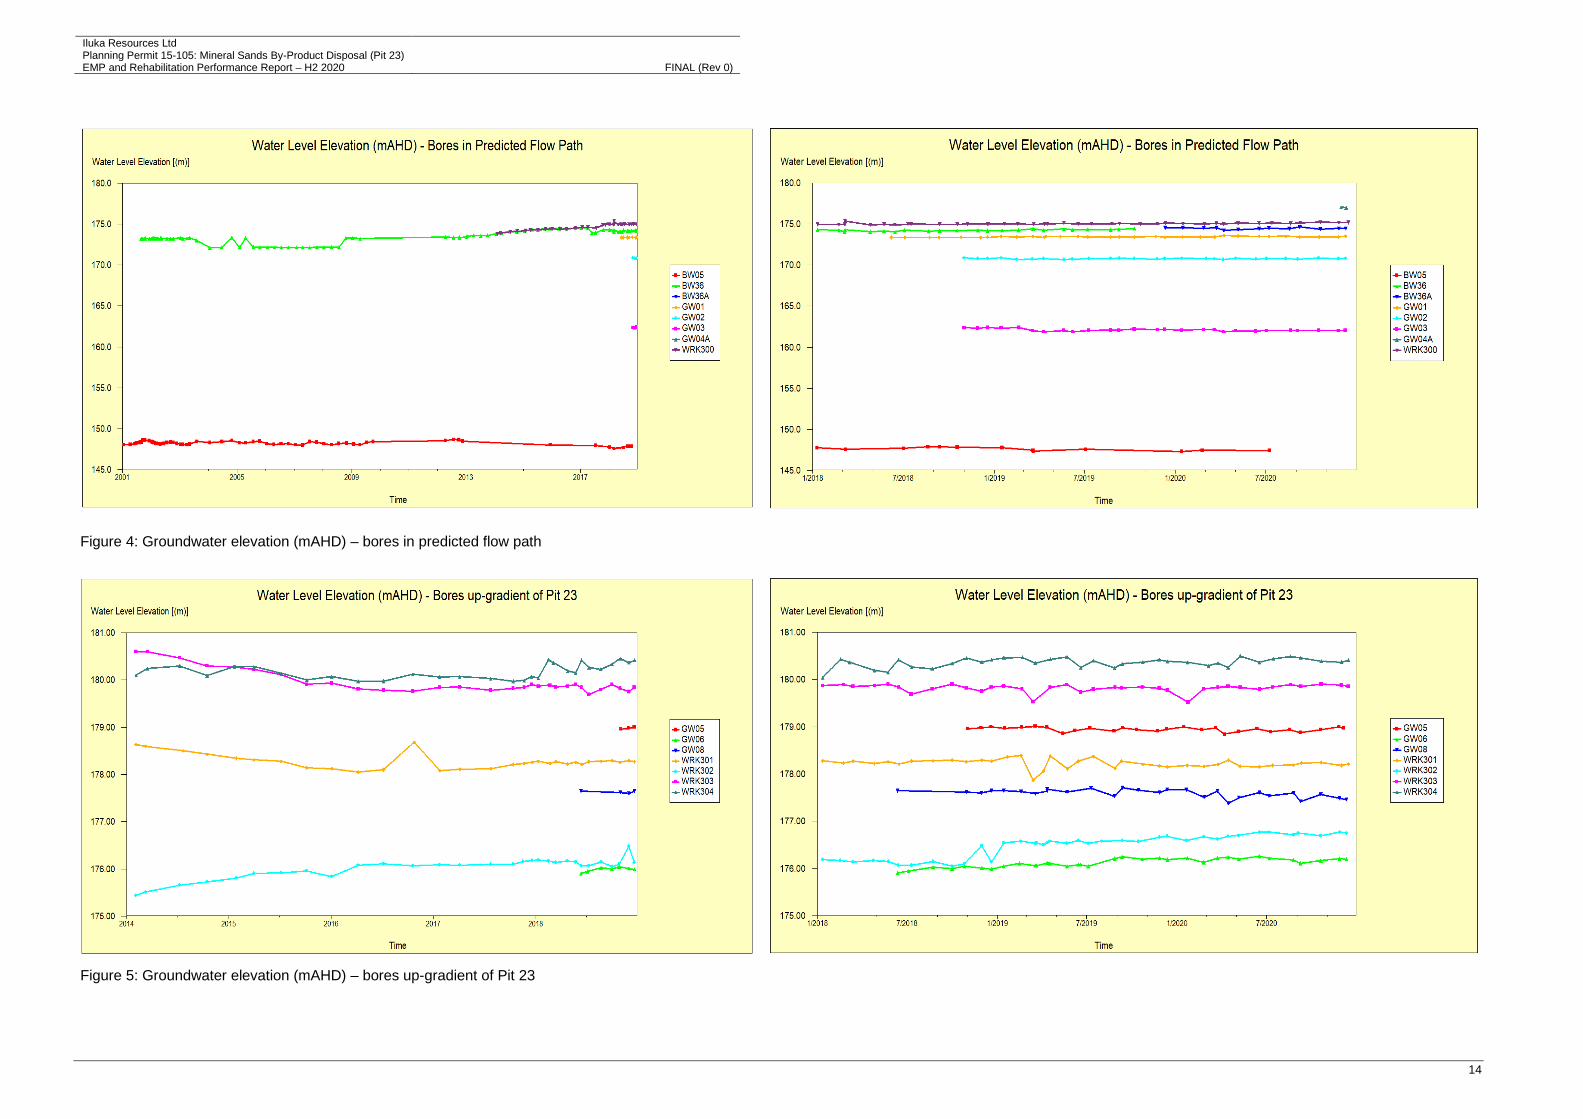
Iluka Resources Ltd Planning Permit 15-105: Mineral Sands By-Product Disposal (Pit 23)
EMP and Rehabilitation Performance Report – H2 2020 FINAL (Rev 0)
14
Figure 4: Groundwater elevation (mAHD) – bores in predicted flow path
Figure 5: Groundwater elevation (mAHD) – bores up-gradient of Pit 23
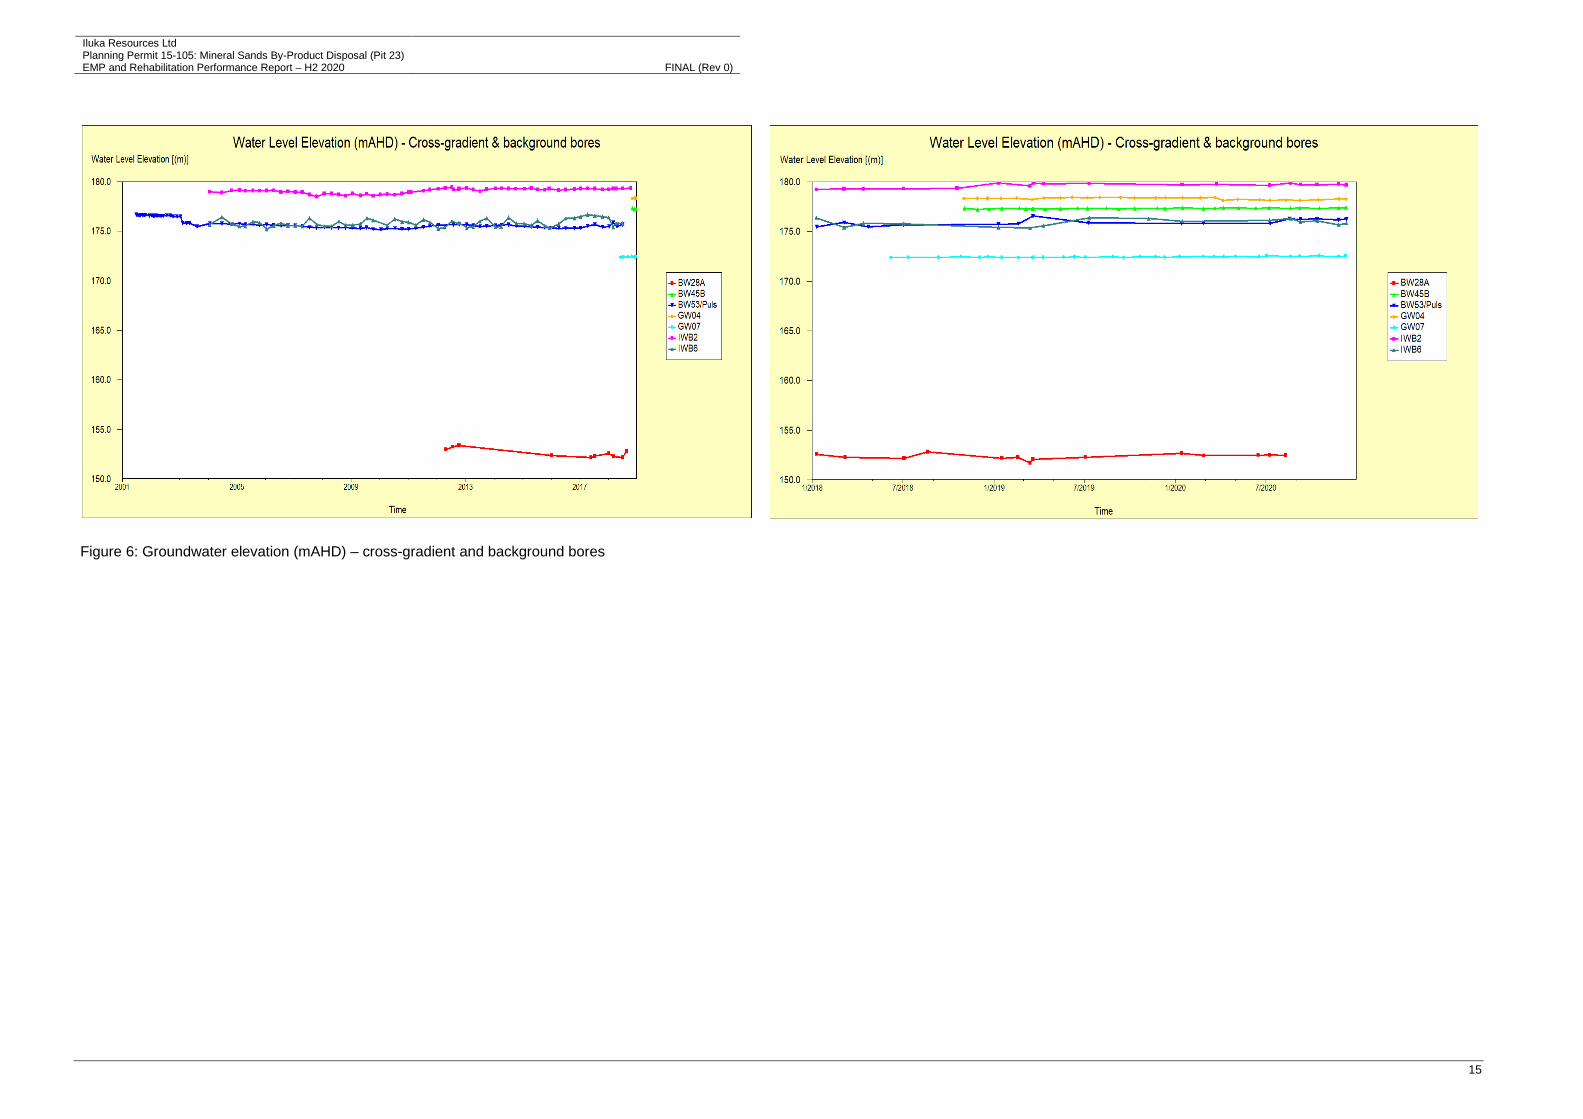
Iluka Resources Ltd Planning Permit 15-105: Mineral Sands By-Product Disposal (Pit 23)
EMP and Rehabilitation Performance Report – H2 2020 FINAL (Rev 0)
15
Figure 6: Groundwater elevation (mAHD) – cross-gradient and background bores

Iluka Resources Ltd Planning Permit 15-105: Mineral Sands By-Product Disposal (Pit 23)
EMP and Rehabilitation Performance Report – H2 2020 FINAL (Rev 0)
16
4.1.3 Groundwater quality
4.1.3.1 Ionic balance ratios
Per Section 7.9.2 of the current endorsed EMP (Revision 4, July 2017) chloride:sulfate (CL:SO4) and sodium:calcium (Na:Ca) ratios in groundwater are assessed from results obtained during scheduled and/or follow-up groundwater sampling events. Per the EMP, a consecutive reduction in either ratio of >10% applies as a potential indicator of seepage from Pit 23 having arrived in a bore and is a trigger for further investigation. Per the EMP, further investigation would include:
• comparing the timing of the consecutive >10% reduction in ionic ratios with the hydrogeological model predictions;
• comparing the timing of the ionic balance trigger with other analytes (e.g. radionuclides, heavy metals) to identify any corresponding exceedances in those analytes in the same rounds of sampling;
• where such a correlation exists completing a detailed investigation of cause and impact, including possible reviews of hydrogeological or solute transport models.
Calculated Cl:SO4 and Na:Ca for the reporting period are given in Table 3. As above, this includes ratios as determined from the results of scheduled and follow-up sampling.
Reductions of >10% in either of the ionic ratios in consecutive and/or follow-up sampling events occurred at three bores (WRK304, BW36A and GW04) during the reporting period one of which (BW36A) is located down-gradient to Pit 23 however there were no corresponding exceedences for other analytes in bore BW36A or WRK304.
As detailed further in Section 4.1.3.3, the ionic balance trigger for GW04 corresponded with elevated Selenium results, however, these results are below the upper trigger limit based on background values which have naturally elevated concentrations at GW04 and are above the standard SEPP WoV objectives. These observations are not considered to be associated with Pit 23.
Table 3: Groundwater monitoring locations – ionic ratio balance results
Bore ID Date Cl
(mg/L) SO4
(mg/L) CL:SO4 (Ratio)
% Red.
Na (mg/L)
Ca (mg/L)
Na:Ca (Ratio)
% Red.
Repeated ratio
exceedance?
BORES UP-GRADIENT OF PIT 23
GW05
28/11/2018 3100 560 5.5 I.D. 1800 170 10.6 I.D. 15/01/2019 3800 790 4.8 13% 2200 200 11 -4% 19/02/2019 3700 740 5 10% 2000 180 11.1 -5%
8/07/2019 3100 660 4.7 2% 1900 140 13.6 -23% 15/01/2020 2600 640 4 14% 1700 81 20.9 -55%
20/02/2020 2800 620 4.5 4% 1900 87 21.8 -61%
9/07/2020 2700 640 4.2 -4% 1900 84 22.6 -8%
17/08/2020 2600 590 4.4 -8% 1700 95 17.9 15%
GW06
12/06/2018 6600 1500 4.4 I.D. 3400 660 5.2 I.D. 14/01/2019 6700 1700 3.9 10% 3400 630 5.4 -5% 21/03/2019 6800 1600 4.3 -8% 3400 620 5.5 -2% 17/04/2019 7000 1500 4.7 -10% 3500 640 5.5 0% 22/05/2019 6800 1400 4.9 -4% 3400 670 5.1 7% 18/06/2019 6800 1500 4.5 7% 3400 580 5.9 -16%
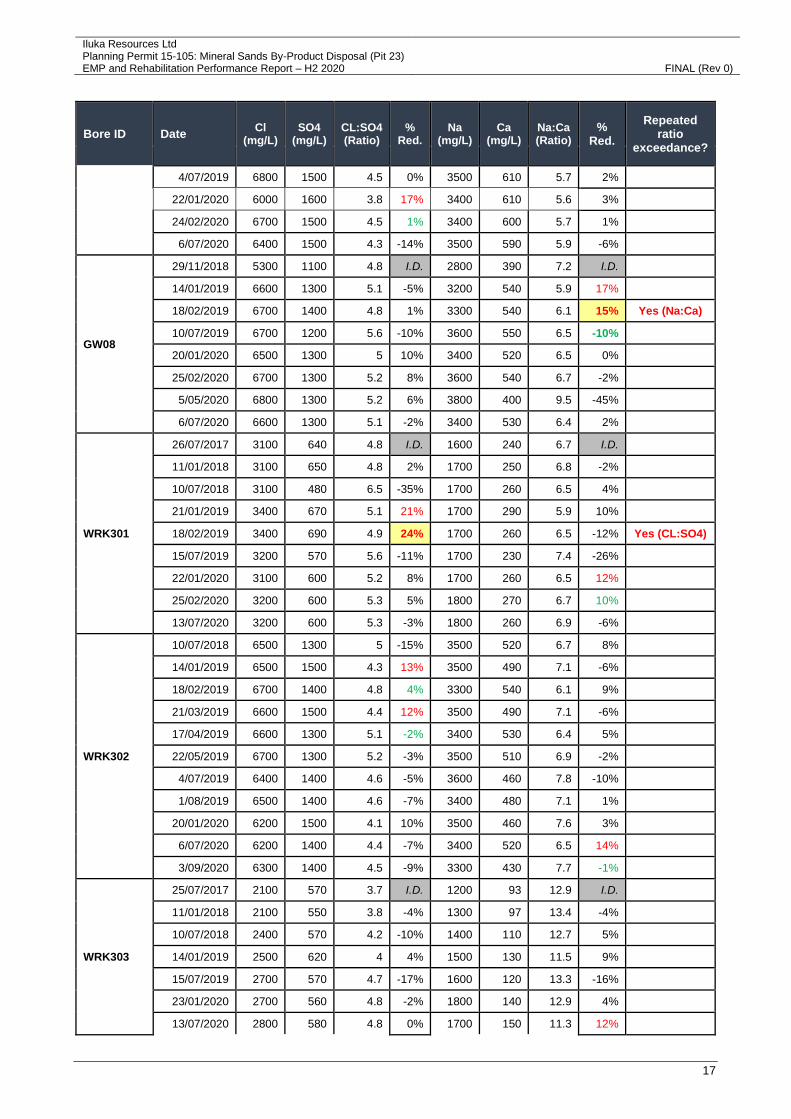
Iluka Resources Ltd Planning Permit 15-105: Mineral Sands By-Product Disposal (Pit 23)
EMP and Rehabilitation Performance Report – H2 2020 FINAL (Rev 0)
17
Bore ID Date Cl
(mg/L) SO4
(mg/L) CL:SO4 (Ratio)
% Red.
Na (mg/L)
Ca (mg/L)
Na:Ca (Ratio)
% Red.
Repeated ratio
exceedance?
4/07/2019 6800 1500 4.5 0% 3500 610 5.7 2% 22/01/2020 6000 1600 3.8 17% 3400 610 5.6 3%
24/02/2020 6700 1500 4.5 1% 3400 600 5.7 1%
6/07/2020 6400 1500 4.3 -14% 3500 590 5.9 -6%
GW08
29/11/2018 5300 1100 4.8 I.D. 2800 390 7.2 I.D. 14/01/2019 6600 1300 5.1 -5% 3200 540 5.9 17% 18/02/2019 6700 1400 4.8 1% 3300 540 6.1 15% Yes (Na:Ca)
10/07/2019 6700 1200 5.6 -10% 3600 550 6.5 -10% 20/01/2020 6500 1300 5 10% 3400 520 6.5 0%
25/02/2020 6700 1300 5.2 8% 3600 540 6.7 -2%
5/05/2020 6800 1300 5.2 6% 3800 400 9.5 -45%
6/07/2020 6600 1300 5.1 -2% 3400 530 6.4 2%
WRK301
26/07/2017 3100 640 4.8 I.D. 1600 240 6.7 I.D. 11/01/2018 3100 650 4.8 2% 1700 250 6.8 -2% 10/07/2018 3100 480 6.5 -35% 1700 260 6.5 4% 21/01/2019 3400 670 5.1 21% 1700 290 5.9 10% 18/02/2019 3400 690 4.9 24% 1700 260 6.5 -12% Yes (CL:SO4)
15/07/2019 3200 570 5.6 -11% 1700 230 7.4 -26% 22/01/2020 3100 600 5.2 8% 1700 260 6.5 12%
25/02/2020 3200 600 5.3 5% 1800 270 6.7 10%
13/07/2020 3200 600 5.3 -3% 1800 260 6.9 -6%
WRK302
10/07/2018 6500 1300 5 -15% 3500 520 6.7 8% 14/01/2019 6500 1500 4.3 13% 3500 490 7.1 -6% 18/02/2019 6700 1400 4.8 4% 3300 540 6.1 9% 21/03/2019 6600 1500 4.4 12% 3500 490 7.1 -6% 17/04/2019 6600 1300 5.1 -2% 3400 530 6.4 5% 22/05/2019 6700 1300 5.2 -3% 3500 510 6.9 -2%
4/07/2019 6400 1400 4.6 -5% 3600 460 7.8 -10% 1/08/2019 6500 1400 4.6 -7% 3400 480 7.1 1%
20/01/2020 6200 1500 4.1 10% 3500 460 7.6 3%
6/07/2020 6200 1400 4.4 -7% 3400 520 6.5 14%
3/09/2020 6300 1400 4.5 -9% 3300 430 7.7 -1%
WRK303
25/07/2017 2100 570 3.7 I.D. 1200 93 12.9 I.D. 11/01/2018 2100 550 3.8 -4% 1300 97 13.4 -4% 10/07/2018 2400 570 4.2 -10% 1400 110 12.7 5% 14/01/2019 2500 620 4 4% 1500 130 11.5 9% 15/07/2019 2700 570 4.7 -17% 1600 120 13.3 -16% 23/01/2020 2700 560 4.8 -2% 1800 140 12.9 4% 13/07/2020 2800 580 4.8 0% 1700 150 11.3 12%

Iluka Resources Ltd Planning Permit 15-105: Mineral Sands By-Product Disposal (Pit 23)
EMP and Rehabilitation Performance Report – H2 2020 FINAL (Rev 0)
18
Bore ID Date Cl
(mg/L) SO4
(mg/L) CL:SO4 (Ratio)
% Red.
Na (mg/L)
Ca (mg/L)
Na:Ca (Ratio)
% Red.
Repeated ratio
exceedance?
19/08/2020 2900 590 4.9 -2% 1600 120 13.3 -4%
WRK304
10/07/2018 2200 640 3.4 0% 1400 93 15.1 -3% 14/01/2019 2200 680 3.2 6% 1400 87 16.1 -7% 15/07/2019 2400 640 3.8 -16% 1500 94 16 1% 22/01/2020 2500 700 3.6 5% 1700 100 17 -7%
5/03/2020 2500 640 3.9 -4% 1600 110 14.5 9%
14/07/2020 2400 650 3.7 -3% 1600 110 14.5 14%
19/08/2020 2500 640 3.9 -9% 1400 110 12.7 25% Yes (Na:Ca)
BORES DOWN-GRADIENT OF PIT 23
BW05
18/10/2018 8800 800 11 23% 4900 260 18.8 -11% 17/01/2019 8300 960 8.6 17% 4500 290 15.5 35% 20/03/2019 8400 890 9.4 10% 4700 260 18.1 24% Yes (Na:Ca)
3/07/2019 8300 860 9.7 -12% 4600 240 19.2 -24% 13/01/2020 7800 870 9 7% 4700 240 19.6 -2%
8/07/2020 7900 880 9 0% 4700 260 18.1 8%
BW36A
12/07/2017 2200 420 5.2 I.D. 1300 74 17.6 I.D. 10/01/2018 2000 360 5.6 -6% 1200 82 14.6 17%
6/03/2018 1900 360 5.3 5% 1100 61 18 -3% Bore blocked - replaced with BW36A in Oct 2019
11/12/2019 1200 160 7.5 I.D. 760 76 10 I.D.
16/01/2020 1200 90 13.33 -78% 770 69 11.2 -12%
7/07/2020 1900 240 7.9 41% 1200 120 10 10%
17/08/2020 2100 220 9.5 28% 1300 110 11.8 -6% Yes (Cl:SO4)
GW01
7/06/2018 930 110 8.5 I.D. 490 82 6 I.D. 15/01/2019 3400 400 8.5 -1% 1800 65 27.7 -363% 20/03/2019 3500 420 8.3 2% 2000 68 29.4 -6% 15/04/2019 3700 370 10 -18% 1900 75 25.3 9% 14/05/2019 3400 360 9.4 -11% 2100 64 32.8 -18% 18/06/2019 3400 420 8.1 5% 1800 56 32.1 -16%
8/07/2019 3400 400 8.5 0% 1900 58 32.8 -18% 15/01/2020 3500 470 7.4 12% 1900 92 20.7 37%
20/02/2020 3400 450 7.6 11% 1900 73 26 21% Yes (Both)
7/07/2020 3300 550 6.6 11% 2000 82 24.4 -18% 10/08/2020 3400 440 7.7 -4% 1800 78 23.1 -12%
GW02
28/11/2018 2100 410 5.1 I.D. 1300 38 34.2 I.D. 15/01/2019 2000 330 6.1 -18% 1200 26 46.2 -35% 10/07/2019 2300 330 7 -15% 1300 21 61.9 -34% 14/01/2020 2100 340 6.2 11% 1200 19 63.2 -2%
3/03/2020 2000 290 6.9 1% 1200 17 70.6 -14%

Iluka Resources Ltd Planning Permit 15-105: Mineral Sands By-Product Disposal (Pit 23)
EMP and Rehabilitation Performance Report – H2 2020 FINAL (Rev 0)
19
Bore ID Date Cl
(mg/L) SO4
(mg/L) CL:SO4 (Ratio)
% Red.
Na (mg/L)
Ca (mg/L)
Na:Ca (Ratio)
% Red.
Repeated ratio
exceedance?
2/07/2020 2100 420 5 19% 1200 21 57.1 10%
10/08/2020 2100 370 5.7 8% 1200 19 63.2 0%
GW03
28/11/2018 2900 510 5.7 I.D. 1800 190 9.5 I.D. 15/01/2019 3100 590 5.3 8% 1900 270 7 26% 19/02/2019 3500 630 5.6 -6% 1800 180 10 -6% 10/07/2019 3400 540 6.3 -20% 1900 170 11.2 -59% 14/01/2020 3300 550 6 5% 1800 160 11.3 -1%
2/07/2020 3300 570 5.8 4% 1900 170 11.2 1%
14/01/2021 3300 630 5.2 10% 2000 180 11.1 1%
GW04A New bore GW04A installed in Oct 2020
30/11/2020 2300 360 6.4 I.D. 1300 120 10.8 I.D.
WRK300
10/01/2018 1700 320 5.3 6% 1000 150 6.7 13% 6/03/2018 1700 330 5.2 3% 920 130 7.1 8%
17/07/2018 1600 290 5.5 -7% 880 140 6.3 11% 18/10/2018 1700 310 5.5 -3% 910 130 7 -5% 21/01/2019 1800 300 6 -9% 910 150 6.1 3% 18/02/2019 1700 330 5.2 7% 910 130 7 -11% 21/03/2019 1800 310 5.8 -5% 1000 180 5.6 12% 17/04/2019 1800 290 6.2 -13% 970 150 6.5 -3% 16/07/2019 1700 300 5.7 6% 990 130 7.6 -26% 16/01/2020 1700 310 5.5 3% 1100 150 7.3 4%
13/07/2020 1700 320 5.3 3% 930 140 6.6 9%
BORES CROSS-GRADIENT OF PIT 23
BW28A *
20/08/2018 7200 870 8.3 -14% 3600 510 7.1 -7% 17/01/2019 7100 1000 7.1 9% 3500 540 6.5 8% 18/02/2019 7200 1100 6.5 16% 3400 490 6.9 -7%
3/07/2019 7100 920 7.7 -9% 3600 500 7.2 -11% 13/01/2020 6900 960 7.2 7% 3400 460 7.4 -3%
26/02/2020 7000 850 8.2 -7% 3600 490 7.3 -2%
8/07/2020 7100 920 7.7 -7% 3500 500 7 5%
10/08/2020 7100 870 8.2 -14% 3200 480 6.7 10%
BW45B
29/11/2018 4800 840 5.7 I.D. 2500 290 8.6 I.D. 17/01/2019 5100 960 5.3 7% 2500 320 7.8 9%
6/03/2019 5100 910 5.6 2% 2500 310 8.1 6% 20/03/2019 5300 960 5.5 3% 2700 320 8.4 2% 15/04/2019 5400 810 6.7 -17% 2600 300 8.7 -1% 14/05/2019 5100 870 5.9 -3% 2900 320 9.1 -5% 18/06/2019 5300 860 6.2 -8% 2700 290 9.3 -8%
8/07/2019 5000 860 5.8 -9% 2800 310 9 -16%
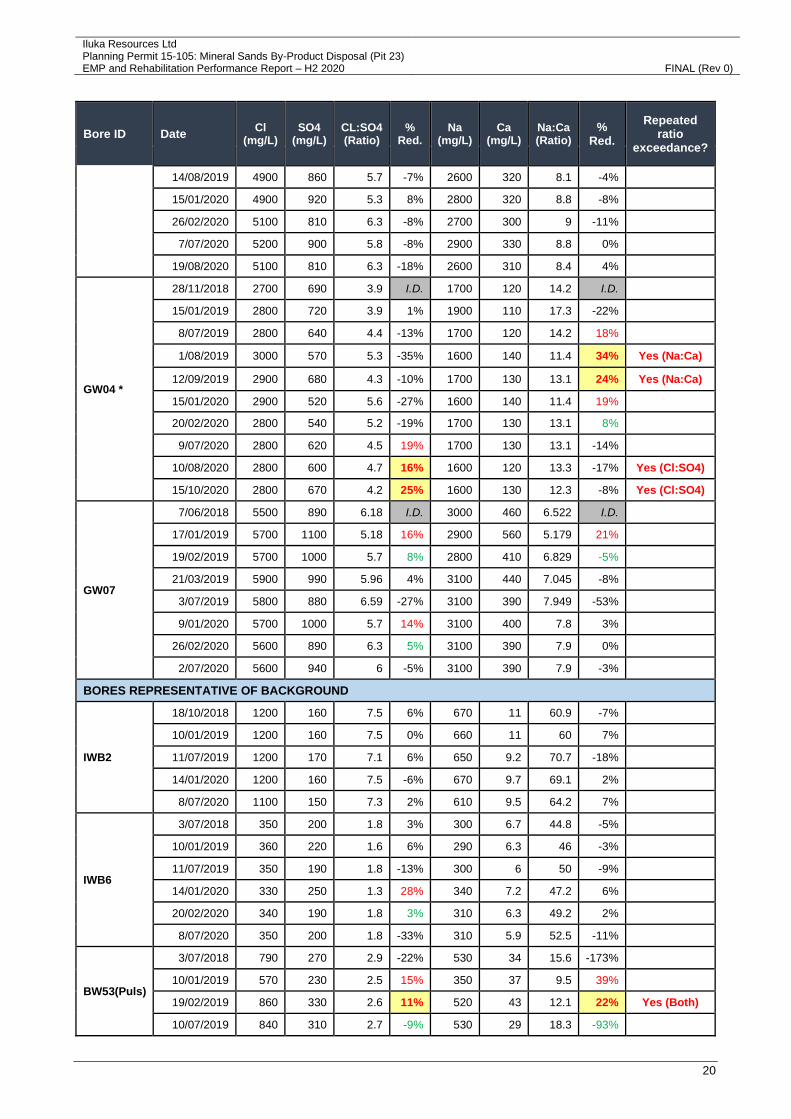
Iluka Resources Ltd Planning Permit 15-105: Mineral Sands By-Product Disposal (Pit 23)
EMP and Rehabilitation Performance Report – H2 2020 FINAL (Rev 0)
20
Bore ID Date Cl
(mg/L) SO4
(mg/L) CL:SO4 (Ratio)
% Red.
Na (mg/L)
Ca (mg/L)
Na:Ca (Ratio)
% Red.
Repeated ratio
exceedance?
14/08/2019 4900 860 5.7 -7% 2600 320 8.1 -4%
15/01/2020 4900 920 5.3 8% 2800 320 8.8 -8%
26/02/2020 5100 810 6.3 -8% 2700 300 9 -11%
7/07/2020 5200 900 5.8 -8% 2900 330 8.8 0%
19/08/2020 5100 810 6.3 -18% 2600 310 8.4 4%
GW04 *
28/11/2018 2700 690 3.9 I.D. 1700 120 14.2 I.D.
15/01/2019 2800 720 3.9 1% 1900 110 17.3 -22%
8/07/2019 2800 640 4.4 -13% 1700 120 14.2 18%
1/08/2019 3000 570 5.3 -35% 1600 140 11.4 34% Yes (Na:Ca)
12/09/2019 2900 680 4.3 -10% 1700 130 13.1 24% Yes (Na:Ca)
15/01/2020 2900 520 5.6 -27% 1600 140 11.4 19%
20/02/2020 2800 540 5.2 -19% 1700 130 13.1 8%
9/07/2020 2800 620 4.5 19% 1700 130 13.1 -14%
10/08/2020 2800 600 4.7 16% 1600 120 13.3 -17% Yes (Cl:SO4)
15/10/2020 2800 670 4.2 25% 1600 130 12.3 -8% Yes (Cl:SO4)
GW07
7/06/2018 5500 890 6.18 I.D. 3000 460 6.522 I.D. 17/01/2019 5700 1100 5.18 16% 2900 560 5.179 21% 19/02/2019 5700 1000 5.7 8% 2800 410 6.829 -5% 21/03/2019 5900 990 5.96 4% 3100 440 7.045 -8%
3/07/2019 5800 880 6.59 -27% 3100 390 7.949 -53% 9/01/2020 5700 1000 5.7 14% 3100 400 7.8 3%
26/02/2020 5600 890 6.3 5% 3100 390 7.9 0%
2/07/2020 5600 940 6 -5% 3100 390 7.9 -3%
BORES REPRESENTATIVE OF BACKGROUND
IWB2
18/10/2018 1200 160 7.5 6% 670 11 60.9 -7% 10/01/2019 1200 160 7.5 0% 660 11 60 7% 11/07/2019 1200 170 7.1 6% 650 9.2 70.7 -18% 14/01/2020 1200 160 7.5 -6% 670 9.7 69.1 2%
8/07/2020 1100 150 7.3 2% 610 9.5 64.2 7%
IWB6
3/07/2018 350 200 1.8 3% 300 6.7 44.8 -5% 10/01/2019 360 220 1.6 6% 290 6.3 46 -3% 11/07/2019 350 190 1.8 -13% 300 6 50 -9% 14/01/2020 330 250 1.3 28% 340 7.2 47.2 6%
20/02/2020 340 190 1.8 3% 310 6.3 49.2 2%
8/07/2020 350 200 1.8 -33% 310 5.9 52.5 -11%
BW53(Puls)
3/07/2018 790 270 2.9 -22% 530 34 15.6 -173% 10/01/2019 570 230 2.5 15% 350 37 9.5 39% 19/02/2019 860 330 2.6 11% 520 43 12.1 22% Yes (Both)
10/07/2019 840 310 2.7 -9% 530 29 18.3 -93%
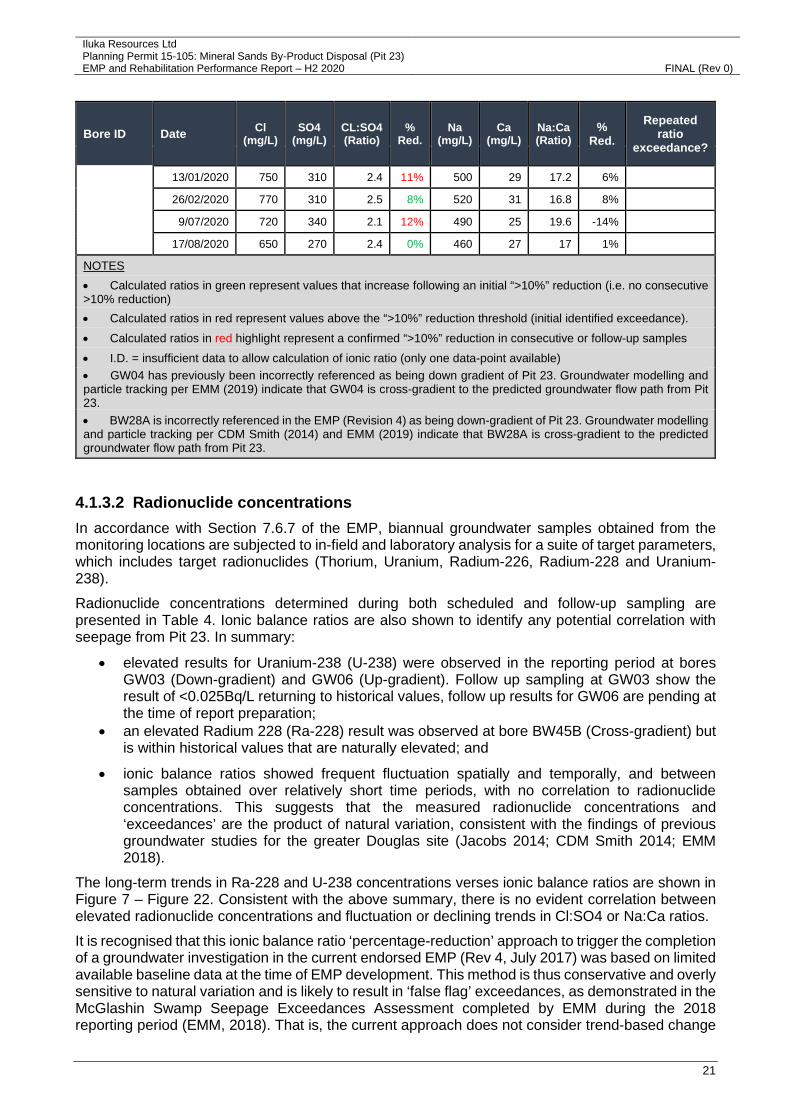
Iluka Resources Ltd Planning Permit 15-105: Mineral Sands By-Product Disposal (Pit 23)
EMP and Rehabilitation Performance Report – H2 2020 FINAL (Rev 0)
21
Bore ID Date Cl
(mg/L) SO4
(mg/L) CL:SO4 (Ratio)
% Red.
Na (mg/L)
Ca (mg/L)
Na:Ca (Ratio)
% Red.
Repeated ratio
exceedance?
13/01/2020 750 310 2.4 11% 500 29 17.2 6%
26/02/2020 770 310 2.5 8% 520 31 16.8 8%
9/07/2020 720 340 2.1 12% 490 25 19.6 -14%
17/08/2020 650 270 2.4 0% 460 27 17 1%
NOTES
• Calculated ratios in green represent values that increase following an initial “>10%” reduction (i.e. no consecutive >10% reduction)
• Calculated ratios in red represent values above the “>10%” reduction threshold (initial identified exceedance).
• Calculated ratios in red highlight represent a confirmed “>10%” reduction in consecutive or follow-up samples
• I.D. = insufficient data to allow calculation of ionic ratio (only one data-point available) • GW04 has previously been incorrectly referenced as being down gradient of Pit 23. Groundwater modelling and particle tracking per EMM (2019) indicate that GW04 is cross-gradient to the predicted groundwater flow path from Pit 23. • BW28A is incorrectly referenced in the EMP (Revision 4) as being down-gradient of Pit 23. Groundwater modelling and particle tracking per CDM Smith (2014) and EMM (2019) indicate that BW28A is cross-gradient to the predicted groundwater flow path from Pit 23.
4.1.3.2 Radionuclide concentrations
In accordance with Section 7.6.7 of the EMP, biannual groundwater samples obtained from the monitoring locations are subjected to in-field and laboratory analysis for a suite of target parameters, which includes target radionuclides (Thorium, Uranium, Radium-226, Radium-228 and Uranium-238).
Radionuclide concentrations determined during both scheduled and follow-up sampling are presented in Table 4. Ionic balance ratios are also shown to identify any potential correlation with seepage from Pit 23. In summary:
• elevated results for Uranium-238 (U-238) were observed in the reporting period at bores GW03 (Down-gradient) and GW06 (Up-gradient). Follow up sampling at GW03 show the result of <0.025Bq/L returning to historical values, follow up results for GW06 are pending at the time of report preparation;
• an elevated Radium 228 (Ra-228) result was observed at bore BW45B (Cross-gradient) but is within historical values that are naturally elevated; and
• ionic balance ratios showed frequent fluctuation spatially and temporally, and between samples obtained over relatively short time periods, with no correlation to radionuclide concentrations. This suggests that the measured radionuclide concentrations and ‘exceedances’ are the product of natural variation, consistent with the findings of previous groundwater studies for the greater Douglas site (Jacobs 2014; CDM Smith 2014; EMM 2018).
The long-term trends in Ra-228 and U-238 concentrations verses ionic balance ratios are shown in Figure 7 – Figure 22. Consistent with the above summary, there is no evident correlation between elevated radionuclide concentrations and fluctuation or declining trends in Cl:SO4 or Na:Ca ratios.
It is recognised that this ionic balance ratio ‘percentage-reduction’ approach to trigger the completion of a groundwater investigation in the current endorsed EMP (Rev 4, July 2017) was based on limited available baseline data at the time of EMP development. This method is thus conservative and overly sensitive to natural variation and is likely to result in ‘false flag’ exceedances, as demonstrated in the McGlashin Swamp Seepage Exceedances Assessment completed by EMM during the 2018 reporting period (EMM, 2018). That is, the current approach does not consider trend-based change

Iluka Resources Ltd Planning Permit 15-105: Mineral Sands By-Product Disposal (Pit 23)
EMP and Rehabilitation Performance Report – H2 2020 FINAL (Rev 0)
22
in groundwater chemistry that accounts for seasonality or other influences on groundwater chemistry over a sufficient period of time. Revised site-specific trigger levels for groundwater quality, developed using the now expanded monitoring dataset and applying a trend-based trigger approach across all target analytes per the ANZECC/ARCMANZ (2000) guidelines, will therefore be implemented in the next revision of the EMP (Revision 5.1).

Iluka Resources Ltd Planning Permit 15-105: Mineral Sands By-Product Disposal (Pit 23)
EMP and Rehabilitation Performance Report – H2 2020 FINAL (Rev 0)
23
Table 4: Groundwater radionuclide concentrations vs. ionic balance ratios, H2 2020
Bore ID Date Thorium Uranium U-238 Ra226 Ra228 CL:SO4 Na:Ca
Groundwater Travel Time
(Years) *
(mg/L) (mg/L) (Bq/L) (Bq/L) (Bq/L) Ratio % Red. Ratio % Red.
Precautionary trigger n/a 0.17 0.17 4.3 1.7 n/a n/a n/a n/a
Upper trigger n/a 0.2 0.2 5 2 n/a n/a n/a n/a
BORES UP-GRADIENT OF PIT 23
GW05
15/11/2018 <0.002 <0.002 <0.025 0.05 0.12 5.5 I.D. 10.6 I.D.
N/A –
bores are up-gradient of Pit
23
Cl:SO4 and Na:Ca ratios
shown to demonstrate
natural variation only
15/01/2019 <0.002 <0.002 <0.025 <0.05 0.09 4.8 13% 11 -4%
19/02/2019 <0.002 <0.002 <0.025 <0.05 <0.08 5 -10% 11.1 -5%
8/07/2019 <0.002 0.001 <0.025 0.02 <0.08 4.7 2% 13.6 -23%
15/01/2020 <0.002 <0.001 <0.025 0.03 0.13 4.1 14% 21.0 -55%
20/02/2020 <0.002 <0.001 <0.025 0.04 0.1 4.5 4% 21.8 -61%
9/07/2020 <0.002 <0.001 <0.025 0.04 0.11 4.2 -4% 22.6 -8%
17/08/2020 <0.002 <0.001 <0.025 0.07 0.16 4.4 -8% 17.9 15%
GW06
12/06/2018 <0.002 0.072 0.037 0.11 0.14 4.4 I.D. 5.1 I.D.
14/01/2019 <0.002 0.105 1.3 0.05 0.22 3.9 10% 5.4 -5%
21/03/2019 <0.002 0.071 0.877 <0.05 0.09 4.2 -8% 5.5 -2%
17/04/2019 <0.002 0.089 1.1 0.06 0.19 4.7 -10% 5.5 0%
22/05/2019 <0.002 0.079 0.975 0.04 0.14 4.9 -4% 5.1 7%
18/06/2019 <0.002 0.003 <0.025 0.04 0.2 4.5 7% 5.9 -16%
4/07/2019 <0.002 0.072 0.889 0.06 0.17 4.5 0% 5.7 2%
22/01/2020 <0.002 0.003 0.025 0.04 0.21 3.8 17% 5.6 3%
24/02/2020 <0.002 0.003 1.33 0.16 0.08 4.5 1% 5.7 1%
6/07/2020 <0.002 0.003 0.667 0.05 0.19 4.3 -14% 5.9 -6%
20/01/2021 <0.002 0.003 Awaiting results 4.1 3% 6.0 -1%
GW08 29/11/2018 <0.002 0.002 0.025 0.09 0.24 4.8 I.D. 7.2 I.D.
14/01/2019 <0.002 0.064 0.79 <0.05 <0.08 5.1 -5% 5.9 17%

Iluka Resources Ltd Planning Permit 15-105: Mineral Sands By-Product Disposal (Pit 23)
EMP and Rehabilitation Performance Report – H2 2020 FINAL (Rev 0)
24
Bore ID Date Thorium Uranium U-238 Ra226 Ra228 CL:SO4 Na:Ca
Groundwater Travel Time
(Years) *
(mg/L) (mg/L) (Bq/L) (Bq/L) (Bq/L) Ratio % Red. Ratio % Red.
Precautionary trigger n/a 0.17 0.17 4.3 1.7 n/a n/a n/a n/a
Upper trigger n/a 0.2 0.2 5 2 n/a n/a n/a n/a
18/02/2019 <0.002 0.009 0.111 0.09 0.12 4.8 1% 6.1 15%
10/07/2019 <0.002 0.024 <0.025 0.04 0.08 5.9 -10% 6.5 -10%
20/01/2020 <0.003 0.001 2.86 0.07 <0.08 5.0 10% 6.5 0%
25/02/2020 <0.004 0.001 1.31 0.07 0.09 5.2 8% 6.7 -2%
5/05/2020 <0.002 <0.001 0.148 0.06 <0.08 5.2 6% 9.5 -45%
6/07/2020 <0.002 0.001 <0.025 0.06 <0.08 5.1 -2% 6.4 2%
WRK301
10/07/2018 <0.002 0.008 0.049 0.14 0.17 6.5 -35% 6.5 4%
21/01/2019 <0.002 0.017 0.21 0.07 0.09 5 21% 5.9 10%
18/02/2019 <0.002 0.005 0.062 0.05 <0.08 4.9 24% 6.5 -12%
15/07/2019 <0.002 0.008 0.037 0.04 0.11 5.6 -11% 7.4 -26%
22/01/2020 0.0024 0.005 0.037 0.06 <0.08 5.2 8% 6.5 12%
25/02/2020 <0.002 0.005 0.395 0.01 <0.08 5.3 5% 6.7 10%
13/07/2020 <0.002 0.006 <0.025 <0.01 <0.08 5.3 -3% 6.9 -4%
WRK302
10/07/2018 <0.002 0.059 0.148 0.19 0.76 5 -15% 6.7 8%
14/01/2019 <0.002 0.048 0.593 0.16 1.01 4.3 13% 7.1 -6%
18/02/2019 <0.002 0.046 0.568 0.31 1.14 4.8 4% 6.1 9%
21/03/2019 <0.002 0.116 1.43 0.27 0.94 4.4 12% 7.1 -6%
17/04/2019 <0.002 0.018 0.222 0.21 1.08 5.1 -2% 6.4 5%
22/05/2019 <0.002 <0.002 <0.025 0.12 0.84 5.1 -3% 6.9 -2%
4/07/2019 <0.002 0.001 0.086 0.24 0.91 4.6 -5% 7.8 -10%
1/08/2019 <0.002 <0.001 0.728 0.22 0.92 4.6 -7% 7.1 1%
20/01/2020 <0.002 <0.001 0.296 0.34 1.02 4.1 10% 7.6 3%
6/07/2020 <0.002 <0.001 0.049 0.18 0.74 4.4 -7% 6.5 14%
3/09/2020 <0.002 <0.001 0.16 0.33 0.91 4.5 -9% 7.7 -1%

Iluka Resources Ltd Planning Permit 15-105: Mineral Sands By-Product Disposal (Pit 23)
EMP and Rehabilitation Performance Report – H2 2020 FINAL (Rev 0)
25
Bore ID Date Thorium Uranium U-238 Ra226 Ra228 CL:SO4 Na:Ca
Groundwater Travel Time
(Years) *
(mg/L) (mg/L) (Bq/L) (Bq/L) (Bq/L) Ratio % Red. Ratio % Red.
Precautionary trigger n/a 0.17 0.17 4.3 1.7 n/a n/a n/a n/a
Upper trigger n/a 0.2 0.2 5 2 n/a n/a n/a n/a
WRK303
10/07/2018 <0.002 <0.002 <0.025 <0.06 <0.09 4.2 -10% 12.7 5%
14/01/2019 <0.002 <0.002 <0.025 <0.05 <0.08 4 4% 11.5 9%
15/07/2019 <0.002 <0.001 <0.025 0.04 <0.08 4.7 -17% 13.3 -16%
23/01/2020 <0.002 <0.001 <0.025 0.03 <0.08 4.8 -2% 12.9 4%
13/07/2020 <0.002 <0.001 <0.025 0.04 0.09 4.8 0% 11.3 12%
19/08/2020 0.006 0.004 <0.025 0.03 <0.08 4.9 -2% 13.3 -4%
WRK304
10/07/2018 <0.002 <0.002 <0.025 <0.05 <0.08 3.4 0% 15.1 -3%
14/01/2019 <0.002 <0.002 <0.025 <0.05 <0.08 3.2 6% 16.1 -7%
15/07/2019 <0.002 <0.001 <0.025 0.02 <0.08 3.8 -16% 16 1%
22/01/2020 <0.002 <0.001 2.7 <0.01 <0.08 3.6 5% 17 -7%
5/03/2020 <0.002 <0.001 <0.025 <0.01 <0.08 3.9 -4% 14.5 9%
14/07/2020 <0.002 <0.001 <0.025 0.02 <0.08 3.7 -3% 14.5 14%
19/08/2020 0.006 0.004 <0.025 0.01 <0.08 3.9 -9% 12.7 25%
BORES DOWN-GRADIENT OF PIT 23 (IN PREDICTED FLOW PATH)
BW36A
11/12/2019 <0.002 0.002 <0.025 0.07 0.17 7.5 I.D. 10 I.D.
16/01/2020 <0.002 <0.001 <0.025 <0.01 <0.08 13.3 -78% 11.2 -12%
7/07/2020 <0.002 <0.001 <0.025 0.06 0.15 7.9 41% 10.0 10%
17/08/2020 <0.002 <0.001 0.037 0.06 0.2 9.5 28% 11.8 -6%
WRK300
18/10/2018 <0.002 <0.001 N.S. N.S. N.S. 5.5 -3% 7 -5%
36 years
21/01/2019 <0.002 <0.002 <0.025 <0.05 <0.08 6 -9% 6.1 3%
18/02/2019 <0.002 <0.002 <0.025 <0.05 <0.08 5.2 7% 7 -11%
21/03/2019 <0.002 0.002 <0.025 <0.05 <0.08 5.8 -5% 5.6 12%
17/04/2019 <0.002 <0.002 <0.025 0.03 0.09 6.2 -13% 6.5 -3%
16/07/2019 <0.002 <0.002 <0.025 0.03 <0.08 5.7 6% 7.6 -26%

Iluka Resources Ltd Planning Permit 15-105: Mineral Sands By-Product Disposal (Pit 23)
EMP and Rehabilitation Performance Report – H2 2020 FINAL (Rev 0)
26
Bore ID Date Thorium Uranium U-238 Ra226 Ra228 CL:SO4 Na:Ca
Groundwater Travel Time
(Years) *
(mg/L) (mg/L) (Bq/L) (Bq/L) (Bq/L) Ratio % Red. Ratio % Red.
Precautionary trigger n/a 0.17 0.17 4.3 1.7 n/a n/a n/a n/a
Upper trigger n/a 0.2 0.2 5 2 n/a n/a n/a n/a
16/01/2020 <0.002 0.001 <0.025 0.02 0.08 5.5 3% 7.3 4%
13/07/2020 <0.002 <0.001 <0.025 0.03 <0.08 5.3 3% 6.6 9%
GW01
7/06/2018 <0.002 <0.001 <0.025 <0.05 <0.08 8.4 I.D. 6 I.D.
88 years
15/01/2019 <0.002 <0.001 <0.025 0.48 1.36 8.5 -1% 27.7 -363%
20/03/2019 <0.002 0.001 <0.025 0.48 0.72 8.3 2% 29.4 -6%
15/04/2019 <0.002 <0.001 <0.025 0.4 1.2 10 -18% 25.3 9%
14/05/2019 0.0095 0.009 <0.025 0.47 1.36 9.4 -11% 32.8 -18%
18/06/2019 <0.002 <0.002 <0.025 0.46 1.29 8 5% 32.1 -16%
8/07/2019 <0.002 0.002 <0.025 0.28 0.77 8.5 0% 32.7 -18%
15/01/2020 <0.002 <0.001 <0.025 0.32 0.81 7.4 12% 20.7 37%
20/02/2020 <0.002 <0.001 <0.025 0.32 0.9 7.6 11% 26.0 21%
7/07/2020 <0.002 <0.001 <0.025 0.24 0.72 6.6 11% 24.4 -18%
10/08/2020 <0.002 <0.001 <0.025 0.13 0.42 7.7 -4% 23.1 -12%
GW02
28/11/2018 <0.002 <0.001 <0.025 0.05 0.11 5.1 I.D. 34.2 I.D.
144 years
15/01/2019 <0.002 <0.001 <0.025 0.05 0.15 6 -18% 46.1 -35%
10/07/2019 <0.002 <0.001 0.296 0.1 0.32 7 -15% 61.9 -34%
14/01/2020 <0.002 <0.001 <0.025 0.05 0.14 6.2 11% 63.2 -2%
3/03/2020 0.004 <0.001 <0.025 0.08 0.27 6.9 1% 70.6 -14%
2/07/2020 <0.002 <0.001 <0.025 0.1 0.33 5.0 19% 57.1 10%
10/08/2020 <0.002 <0.001 <0.025 0.09 0.31 5.7 8% 63.2 0%
GW03
28/11/2018 <0.002 <0.002 0.025 0.07 0.16 5.7 I.D. 9.5 I.D.
176 years 15/01/2019 <0.002 <0.002 <0.025 <0.05 <0.08 5.3 8% 7 26%
19/02/2019 <0.002 <0.002 <0.025 <0.05 <0.08 5.6 -6% 10 -6%
10/07/2019 <0.002 <0.001 <0.025 0.01 <0.08 6.3 -20% 11.2 -59%

Iluka Resources Ltd Planning Permit 15-105: Mineral Sands By-Product Disposal (Pit 23)
EMP and Rehabilitation Performance Report – H2 2020 FINAL (Rev 0)
27
Bore ID Date Thorium Uranium U-238 Ra226 Ra228 CL:SO4 Na:Ca
Groundwater Travel Time
(Years) *
(mg/L) (mg/L) (Bq/L) (Bq/L) (Bq/L) Ratio % Red. Ratio % Red.
Precautionary trigger n/a 0.17 0.17 4.3 1.7 n/a n/a n/a n/a
Upper trigger n/a 0.2 0.2 5 2 n/a n/a n/a n/a
14/01/2020 <0.002 <0.001 <0.025 0.01 <0.08 6 5% 11.3 -1%
2/07/2020 <0.002 <0.001 0.864 0.01 <0.08 5.8 4% 11.2 1%
14/01/2021 0.008 <0.001 <0.025 <0.05 <0.08 5.2 10% 11.1 1%
GW04A New bore installed in Oct 2020
30/11/2020 <0.002 <0.001 <0.025 0.04 0.2 6.4 I.D. 10.8 I.D.
BW05
18/10/2018 <0.002 0.03 <0.025 <0.05 <0.08 11 -23% 18.8 -11%
500+ years
17/01/2019 <0.002 0.004 0.037 <0.05 <0.08 8.6 17% 15.5 35%
20/03/2019 <0.002 0.003 0.049 <0.05 <0.08 9.4 10% 18.1 24%
3/07/2019 <0.002 0.003 <0.025 0.03 <0.08 9.6 -12% 19.2 -24%
13/01/2020 <0.002 0.002 <0.025 <0.01 <0.08 9.0 7% 19.6 -2%
8/07/2020 <0.002 0.004 <0.025 0.03 <0.08 9.0 0% 18.1 8%
BORES CROSS-GRADIENT OF PIT 23
BW28A *
20/08/2018 <0.002 0.005 0.074 0.09 <0.08 8.3 -14% 7 7%
N/A -
Bores not on flow path from
Pit 23
Cl:SO4 and Na:Ca ratios
shown to demonstrate
natural variation only
17/01/2019 <0.002 0.005 1.48 0.13 <0.08 7.1 9% 6.5 2%
18/02/2019 <0.002 0.005 0.173 0.17 <0.08 6.5 16% 6.9 -5%
3/07/2019 <0.002 0.006 0.679 0.13 <0.08 7.7 -9% 7.2 -11%
13/01/2020 <0.002 0.006 2.16 0.1 <0.08 7.2 7% 7.4 -3%
26/02/2020 <0.002 0.007 0.234 0.12 <0.08 8.2 -7% 7.3 -2%
8/07/2020 <0.002 0.007 <0.025 0.11 <0.08 7.7 -7% 7.0 5%
10/08/2020 <0.002 0.007 0.148 0.11 <0.08 8.2 -14% 6.7 10%
BW45B
29/11/2018 <0.002 <0.001 <0.025 0.22 0.86 5.6 I.D. 8.6 I.D.
17/01/2019 <0.002 0.001 <0.025 0.42 2.4 5.3 7% 7.8 9%
6/03/2019 <0.002 0.001 <0.025 0.45 2.6 5.6 2% 8 6%
20/03/2019 <0.002 0.012 0.037 0.83 2.77 5.5 3% 8.4 2%
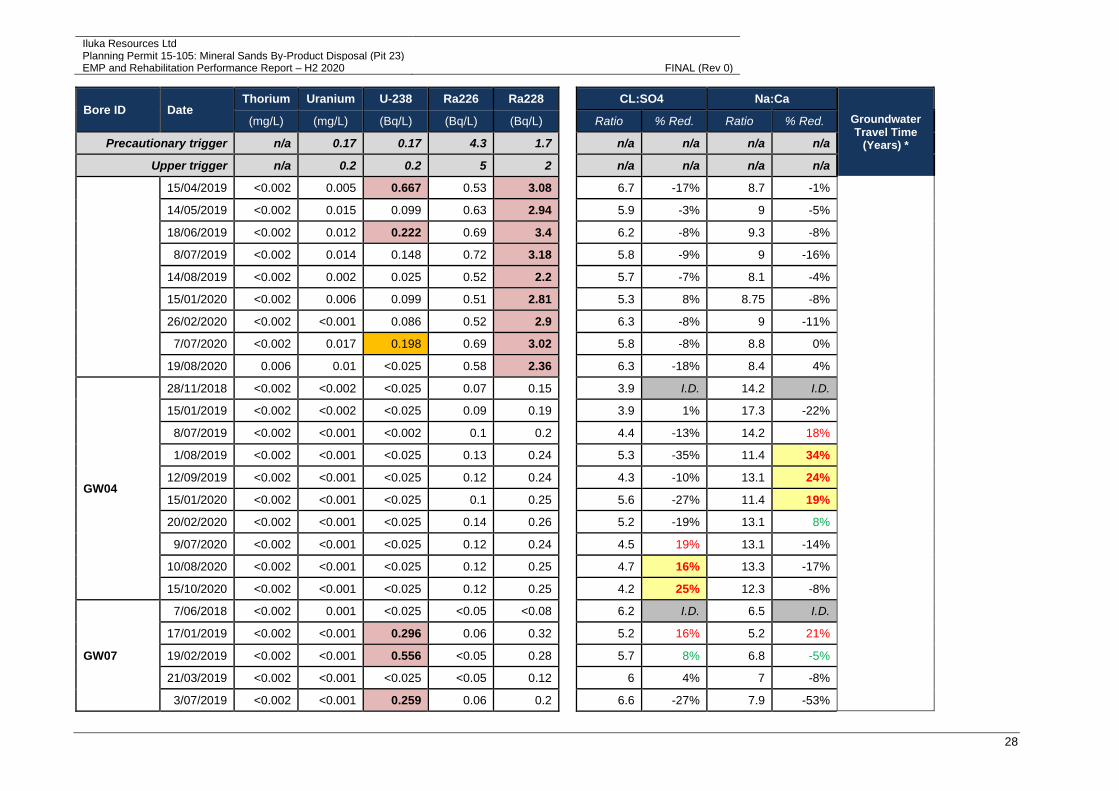
Iluka Resources Ltd Planning Permit 15-105: Mineral Sands By-Product Disposal (Pit 23)
EMP and Rehabilitation Performance Report – H2 2020 FINAL (Rev 0)
28
Bore ID Date Thorium Uranium U-238 Ra226 Ra228 CL:SO4 Na:Ca
Groundwater Travel Time
(Years) *
(mg/L) (mg/L) (Bq/L) (Bq/L) (Bq/L) Ratio % Red. Ratio % Red.
Precautionary trigger n/a 0.17 0.17 4.3 1.7 n/a n/a n/a n/a
Upper trigger n/a 0.2 0.2 5 2 n/a n/a n/a n/a
15/04/2019 <0.002 0.005 0.667 0.53 3.08 6.7 -17% 8.7 -1%
14/05/2019 <0.002 0.015 0.099 0.63 2.94 5.9 -3% 9 -5%
18/06/2019 <0.002 0.012 0.222 0.69 3.4 6.2 -8% 9.3 -8%
8/07/2019 <0.002 0.014 0.148 0.72 3.18 5.8 -9% 9 -16%
14/08/2019 <0.002 0.002 0.025 0.52 2.2 5.7 -7% 8.1 -4%
15/01/2020 <0.002 0.006 0.099 0.51 2.81 5.3 8% 8.75 -8%
26/02/2020 <0.002 <0.001 0.086 0.52 2.9 6.3 -8% 9 -11%
7/07/2020 <0.002 0.017 0.198 0.69 3.02 5.8 -8% 8.8 0%
19/08/2020 0.006 0.01 <0.025 0.58 2.36 6.3 -18% 8.4 4%
GW04
28/11/2018 <0.002 <0.002 <0.025 0.07 0.15 3.9 I.D. 14.2 I.D.
15/01/2019 <0.002 <0.002 <0.025 0.09 0.19 3.9 1% 17.3 -22%
8/07/2019 <0.002 <0.001 <0.002 0.1 0.2 4.4 -13% 14.2 18%
1/08/2019 <0.002 <0.001 <0.025 0.13 0.24 5.3 -35% 11.4 34%
12/09/2019 <0.002 <0.001 <0.025 0.12 0.24 4.3 -10% 13.1 24%
15/01/2020 <0.002 <0.001 <0.025 0.1 0.25 5.6 -27% 11.4 19%
20/02/2020 <0.002 <0.001 <0.025 0.14 0.26 5.2 -19% 13.1 8%
9/07/2020 <0.002 <0.001 <0.025 0.12 0.24 4.5 19% 13.1 -14%
10/08/2020 <0.002 <0.001 <0.025 0.12 0.25 4.7 16% 13.3 -17%
15/10/2020 <0.002 <0.001 <0.025 0.12 0.25 4.2 25% 12.3 -8%
GW07
7/06/2018 <0.002 0.001 <0.025 <0.05 <0.08 6.2 I.D. 6.5 I.D.
17/01/2019 <0.002 <0.001 0.296 0.06 0.32 5.2 16% 5.2 21%
19/02/2019 <0.002 <0.001 0.556 <0.05 0.28 5.7 8% 6.8 -5%
21/03/2019 <0.002 <0.001 <0.025 <0.05 0.12 6 4% 7 -8%
3/07/2019 <0.002 <0.001 0.259 0.06 0.2 6.6 -27% 7.9 -53%

Iluka Resources Ltd Planning Permit 15-105: Mineral Sands By-Product Disposal (Pit 23)
EMP and Rehabilitation Performance Report – H2 2020 FINAL (Rev 0)
29
Bore ID Date Thorium Uranium U-238 Ra226 Ra228 CL:SO4 Na:Ca
Groundwater Travel Time
(Years) *
(mg/L) (mg/L) (Bq/L) (Bq/L) (Bq/L) Ratio % Red. Ratio % Red.
Precautionary trigger n/a 0.17 0.17 4.3 1.7 n/a n/a n/a n/a
Upper trigger n/a 0.2 0.2 5 2 n/a n/a n/a n/a
9/01/2020 <0.002 <0.001 2.04 0.08 0.19 5.7 14% 7.8 3%
26/02/2020 <0.002 <0.001 0.037 0.07 0.24 6.3 5% 7.9 0%
2/07/2020 <0.002 <0.001 0.123 0.07 0.34 6.0 -5% 7.9 -3%
BORES REPRESENTATIVE OF BACKGROUND
IWB2
18/10/2018 <0.002 <0.001 <0.025 0.03 <0.08 7.5 6% 60.9 -7%
N/A - Bores not on flow path from Pit 23
10/01/2019 <0.002 <0.001 <0.025 <0.05 0.08 7.5 0% 60 7%
11/07/2019 <0.002 <0.001 <0.025 0.03 <0.08 7 6% 70.6 -18%
14/01/2020 <0.002 <0.001 <0.025 0.06 0.12 7.5 -6% 69.1 2%
8/07/2020 <0.002 <0.001 <0.025 0.01 <0.08 7.3 2% 64.2 7%
IWB6
3/07/2018 <0.002 <0.001 0.037 <0.05 <0.08 1.7 3% 44.8 -5%
10/01/2019 <0.002 <0.001 <0.025 <0.05 <0.08 1.7 6% 46 -3%
11/07/2019 <0.002 <0.001 <0.025 0.02 <0.08 1.8 -13% 50 -9%
14/01/2020 <0.002 <0.001 <0.025 0.03 <0.08 1.3 28% 47.2 6%
20/02/2020 <0.002 <0.001 <0.025 0.02 <0.08 1.8 3% 49.2 2%
8/07/2020 <0.002 <0.001 <0.025 0.02 <0.08 1.8 -33% 52.5 -11%
BW53 (“Puls”)
3/07/2018 <0.002 <0.001 <0.025 <0.05 0.11 2.9 -22% 15.6 -173%
10/01/2019 <0.002 <0.001 <0.025 <0.05 0.19 2.5 15% 9.6 39%
19/02/2019 <0.002 <0.001 <0.025 <0.05 0.16 2.6 11% 12.1 22%
10/07/2019 <0.002 <0.001 <0.025 0.04 0.11 2.7 -9% 18.3 -93%
13/01/2020 <0.002 <0.002 <0.025 0.04 0.12 2.4 11% 17.2 6%
26/02/2020 <0.002 <0.002 <0.025 0.03 0.17 2.5 8% 16.8 8%
9/07/2020 <0.002 <0.001 <0.025 0.04 0.1 2.1 12% 19.6 -14%
17/08/2020 <0.002 <0.001 0.037 0.03 0.1 2.4 0% 17.0 1%
NOTES

Iluka Resources Ltd Planning Permit 15-105: Mineral Sands By-Product Disposal (Pit 23)
EMP and Rehabilitation Performance Report – H2 2020 FINAL (Rev 0)
30
Bore ID Date Thorium Uranium U-238 Ra226 Ra228 CL:SO4 Na:Ca
Groundwater Travel Time
(Years) *
(mg/L) (mg/L) (Bq/L) (Bq/L) (Bq/L) Ratio % Red. Ratio % Red.
Precautionary trigger n/a 0.17 0.17 4.3 1.7 n/a n/a n/a n/a
Upper trigger n/a 0.2 0.2 5 2 n/a n/a n/a n/a
• < = results below the laboratory limit of detection. These are treated as a negative (-) concentrations in figures presented in this report to allow graphical representation.
• Results highlighted in orange indicate an exceedance of the precautionary trigger
• Results highlighted in pink indicate an exceedance of the upper trigger
• Calculated ratios in green represent values that increase following an initial “>10%” reduction (i.e. no consecutive >10% reduction)
• Calculated ratios in red represent values above the “>10%” reduction threshold (initial identified exceedance).
• Calculated ratios in red highlight represent a confirmed “>10%” reduction in consecutive or follow-up samples
• N.S. = not sampled / analysed
• I.D. = insufficient data to allow calculation of ionic ratio (only one data-point available)
• Groundwater arrival year is based on groundwater model predictions (particle tracking) per CDM Smith (2015) and EMM (2019), and assumes that groundwater flow originates from Pit 23 immediately on commencement of the first by-product disposal to into Pit 23 (December 2011).
• GW04 is incorrectly referenced in the EMP (Revision 4) as being down gradient of Pit 23. Groundwater modelling and particle tracking per EMM (2019) indicate that GW04 is cross-gradient to the predicted groundwater flow path from Pit 23.
• BW28A is incorrectly referenced in the EMP (Revision 4) as being down-gradient of Pit 23. Groundwater modelling and particle tracking per CDM Smith (2014) and EMM (2019) indicate that BW28A is cross-gradient to the predicted groundwater flow path from Pit 23.

Iluka Resources Ltd Planning Permit 15-105: Mineral Sands By-Product Disposal (Pit 23)
EMP and Rehabilitation Performance Report – H2 2020 FINAL (Rev 0)
31
Figure 7: U-238 and ionic balance trends – up-gradient bores (1 of 2)
Figure 8: U-238 and ionic balance trends – up-gradient bores (2 of 2)
Figure 9: Ra-228 and ionic balance trends – up-gradient bores (1 of 2)s Figure 10: Ra-228 and ionic balance trends – up-gradient bores (2 of 2)

Iluka Resources Ltd Planning Permit 15-105: Mineral Sands By-Product Disposal (Pit 23)
EMP and Rehabilitation Performance Report – H2 2020 FINAL (Rev 0)
32
Figure 11: U-238 and ionic balance trends – down-gradient bores (1 of 2)
Figure 12: U-238 and ionic balance trends – down-gradient bores (2 of 2)
Figure 13: Ra-228 and ionic balance trends – down-gradient bores (1 of 2) Figure 14: Ra-228 and ionic balance trends – down-gradient bores (2 of 2)

Iluka Resources Ltd Planning Permit 15-105: Mineral Sands By-Product Disposal (Pit 23)
EMP and Rehabilitation Performance Report – H2 2020 FINAL (Rev 0)
33
Figure 15: U-238 and ionic balance trends – cross-gradient bores (1 of 2)
Figure 16: U-238 and ionic balance trends – cross-gradient bores (2 of 2)
Figure 17: Ra-228 and ionic balance trends – cross-gradient bores (1 of 2) Figure 18: Ra-228 and ionic balance trends – cross-gradient bores (2 of 2)

Iluka Resources Ltd Planning Permit 15-105: Mineral Sands By-Product Disposal (Pit 23)
EMP and Rehabilitation Performance Report – H2 2020 FINAL (Rev 0)
34
Figure 19: U-238 and ionic balance trends – bores representing background (1 of 2)
Figure 20: U-238 and ionic balance trends – bores representing background (2 of 2)
Figure 21: Ra-228 and ionic balance trends – bores representing background (1 of 2) Figure 22: Ra-228 and ionic balance trends – bores representing background (2 of 2)

Iluka Resources Ltd Planning Permit 15-105: Mineral Sands By-Product Disposal (Pit 23)
EMP and Rehabilitation Performance Report – H2 2020 FINAL (Rev 0)
35
4.1.3.3 Other analytes
In accordance with Section 7.6.7 of the EMP, biannual groundwater samples obtained from the monitoring locations are subjected to in-field and laboratory analysis for a suite of target parameters.
Analyte concentrations above trigger limits that coincided with ionic balance ratio triggers are presented in Table 5 & Table 6 and Figure 23. In summary:
• analysis recorded an elevated selenium result at GW04 during August and October as part of the follow up sampling required due to an ionic balance trigger that occurred during July’s scheduled sampling;
• sufficient data is available to determine background concentrations for GW04, which is determined as the 75th percentile value based on the mean and standard deviation of the available data. For GW04, the 75th percentile (background) value is higher than the standard SEPP WoV objectives and therefore applies as the upper trigger (background value); and
• all results are consistent with historical values and do not indicate seepage from Pit 23.
Table 5: Groundwater quality exceedances vs ionic balance ratios, H2 2020
Bore ID Date Se CL:SO4 Na:Ca
(mg/L) Ratio % Red. Ratio % Red. Precautionary trigger 0.017 n/a n/a n/a n/a
Upper trigger 0.02 n/a n/a n/a n/a
GW04 Cross
Gradient
9/07/2020 0.031 4.5 19% 13.1 -14%
10/08/2020 0.029 4.7 16% 13.3 -17%
2 sample av 0.030
10/08/2020 0.029 4.7 16% 13.3 -17%
15/10/2020 0.026 4.2 25% 12.3 -8%
2 sample av 0.028
Table 6:Selenium groundwater trigger levels for GW04, H2 2020
GW04 Se
(mg/L) AVG
Std Dev
Background (av+2SD)
Prec Trigger
(85% of b/g)
Upper Trigger
Ion. Bal. Rep. Exceedance?
2-sample
AVG Comment
28/11/2018 0.029 - - - - -
No - min 5 results reqd for statistical analysis
15/01/2019 0.023 0.026 0.004 0.0345 - -
No 0.026 min 5 results reqd for statistical analysis
8/07/2019 0.025 0.026 0.003 0.0318 - -
YES (Na:Ca) 0.024 min 5 results reqd for statistical analysis
1/08/2019 0.024 0.025 0.003 0.0305 - - YES (Na:Ca) 0.0245 min 5 results reqd for statistical analysis
12/09/2019 0.029 0.026 0.003 0.0317 0.0269 0.0317 YES (Na:Ca) 0.0265 Na:Ca Ratio triggered, Se equal to precautionary trigger
15/01/2020 0.022 0.025 0.003 0.0314 0.0267 0.0314 YES (Na:Ca) 0.0255 Na:Ca Ratio triggered, Se below precautionary trigger
20/02/2020 0.022 0.025 0.003 0.0309 0.0263 0.0309 No 0.0220 No ratio triggerred, Se below precautionary trigger
9/07/2020 0.031 0.026 0.004 0.0327 0.0278 0.0327 YES
(Cl:SO4) 0.0265
Se below precautionary trigger
10/08/2020 0.029 0.026 0.004 0.0330 0.0281 0.0330 YES
(Cl:SO4) 0.0300 Se above precautionary trigger,
below upper trigger
15/10/2020 0.026 0.026 0.003 0.0326 0.0277 0.0326 YES
(Cl:SO4) 0.0275
Se below precautionary trigger

Iluka Resources Ltd Planning Permit 15-105: Mineral Sands By-Product Disposal (Pit 23)
EMP and Rehabilitation Performance Report – H2 2020 FINAL (Rev 0)
36
Figure 23: GW04 - Selenium as compared against ionic balance trends
All groundwater quality monitoring data (laboratory and field data) for the reporting period for all parameters monitored is provided in Appendix B and Appendix C of this report, respectively.
4.2 Surface water quality
4.2.1 Runoff-fed surface water sites
In accordance with Section 8.7.1 of the EMP, surface water samples must be obtained from nominated runoff-fed surface water monitoring points if a discharge of run-off from the disturbed area of Pit 23 and surrounds occurs.
No discharges occurred during the reporting period and subsequently no follow-up monitoring was required.
4.2.2 Groundwater-fed surface water sites
In accordance with Section 8.7.2 of the EMP, quarterly surface water samples obtained from the nominated groundwater-fed surface water monitoring points down-gradient of Pit 23 (i.e. surface water features receiving groundwater base-flow) are analysed for a suite of target parameters to identify the potential expression of Pit 23 groundwater seepage.
Results obtained for specific parameters are summarised in sections 4.2.2.1 - 4.2.2.3 below.
All surface water quality monitoring data for the reporting period and for all parameters monitored (laboratory and field results) is provided in Appendix D and Appendix E of this report.
4.2.2.1 Ionic balance ratios
Assessment of potential Pit 23 seepage and expression into surface waters is based on an analysis of Cl:SO4 and Na:Ca ratios obtained from quarterly monitoring, with a consecutive reduction in either ratio of >10% applied as potential indicator of Pit 23 seepage and expression at surface.
Ionic ratio results for nominated surface water monitoring locations in the H2 2020 reporting period are given in Table 7. The data presented includes results preceding the H2 2020 reporting period to show longer-term trends and to demonstrate the influence of seasonality in both the availability of
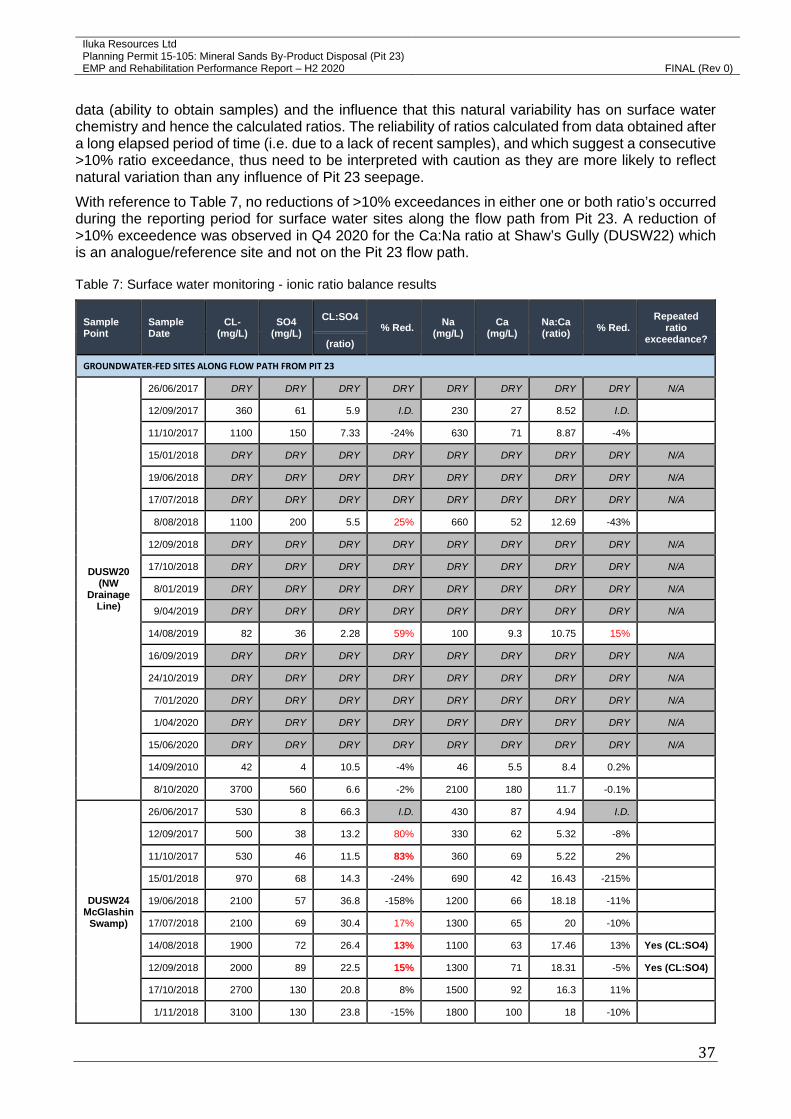
Iluka Resources Ltd Planning Permit 15-105: Mineral Sands By-Product Disposal (Pit 23)
EMP and Rehabilitation Performance Report – H2 2020 FINAL (Rev 0)
37
data (ability to obtain samples) and the influence that this natural variability has on surface water chemistry and hence the calculated ratios. The reliability of ratios calculated from data obtained after a long elapsed period of time (i.e. due to a lack of recent samples), and which suggest a consecutive >10% ratio exceedance, thus need to be interpreted with caution as they are more likely to reflect natural variation than any influence of Pit 23 seepage.
With reference to Table 7, no reductions of >10% exceedances in either one or both ratio’s occurred during the reporting period for surface water sites along the flow path from Pit 23. A reduction of >10% exceedence was observed in Q4 2020 for the Ca:Na ratio at Shaw’s Gully (DUSW22) which is an analogue/reference site and not on the Pit 23 flow path.
Table 7: Surface water monitoring - ionic ratio balance results
Sample Point
Sample Date
CL- (mg/L)
SO4 (mg/L)
CL:SO4 % Red.
Na (mg/L)
Ca (mg/L)
Na:Ca (ratio)
% Red. Repeated
ratio exceedance? (ratio)
GROUNDWATER-FED SITES ALONG FLOW PATH FROM PIT 23
DUSW20 (NW
Drainage Line)
26/06/2017 DRY DRY DRY DRY DRY DRY DRY DRY N/A
12/09/2017 360 61 5.9 I.D. 230 27 8.52 I.D. 11/10/2017 1100 150 7.33 -24% 630 71 8.87 -4% 15/01/2018 DRY DRY DRY DRY DRY DRY DRY DRY N/A
19/06/2018 DRY DRY DRY DRY DRY DRY DRY DRY N/A
17/07/2018 DRY DRY DRY DRY DRY DRY DRY DRY N/A
8/08/2018 1100 200 5.5 25% 660 52 12.69 -43% 12/09/2018 DRY DRY DRY DRY DRY DRY DRY DRY N/A
17/10/2018 DRY DRY DRY DRY DRY DRY DRY DRY N/A
8/01/2019 DRY DRY DRY DRY DRY DRY DRY DRY N/A
9/04/2019 DRY DRY DRY DRY DRY DRY DRY DRY N/A
14/08/2019 82 36 2.28 59% 100 9.3 10.75 15%
16/09/2019 DRY DRY DRY DRY DRY DRY DRY DRY N/A
24/10/2019 DRY DRY DRY DRY DRY DRY DRY DRY N/A
7/01/2020 DRY DRY DRY DRY DRY DRY DRY DRY N/A
1/04/2020 DRY DRY DRY DRY DRY DRY DRY DRY N/A
15/06/2020 DRY DRY DRY DRY DRY DRY DRY DRY N/A
14/09/2010 42 4 10.5 -4% 46 5.5 8.4 0.2% 8/10/2020 3700 560 6.6 -2% 2100 180 11.7 -0.1%
DUSW24 McGlashin
Swamp)
26/06/2017 530 8 66.3 I.D. 430 87 4.94 I.D. 12/09/2017 500 38 13.2 80% 330 62 5.32 -8% 11/10/2017 530 46 11.5 83% 360 69 5.22 2% 15/01/2018 970 68 14.3 -24% 690 42 16.43 -215% 19/06/2018 2100 57 36.8 -158% 1200 66 18.18 -11% 17/07/2018 2100 69 30.4 17% 1300 65 20 -10% 14/08/2018 1900 72 26.4 13% 1100 63 17.46 13% Yes (CL:SO4)
12/09/2018 2000 89 22.5 15% 1300 71 18.31 -5% Yes (CL:SO4)
17/10/2018 2700 130 20.8 8% 1500 92 16.3 11% 1/11/2018 3100 130 23.8 -15% 1800 100 18 -10%
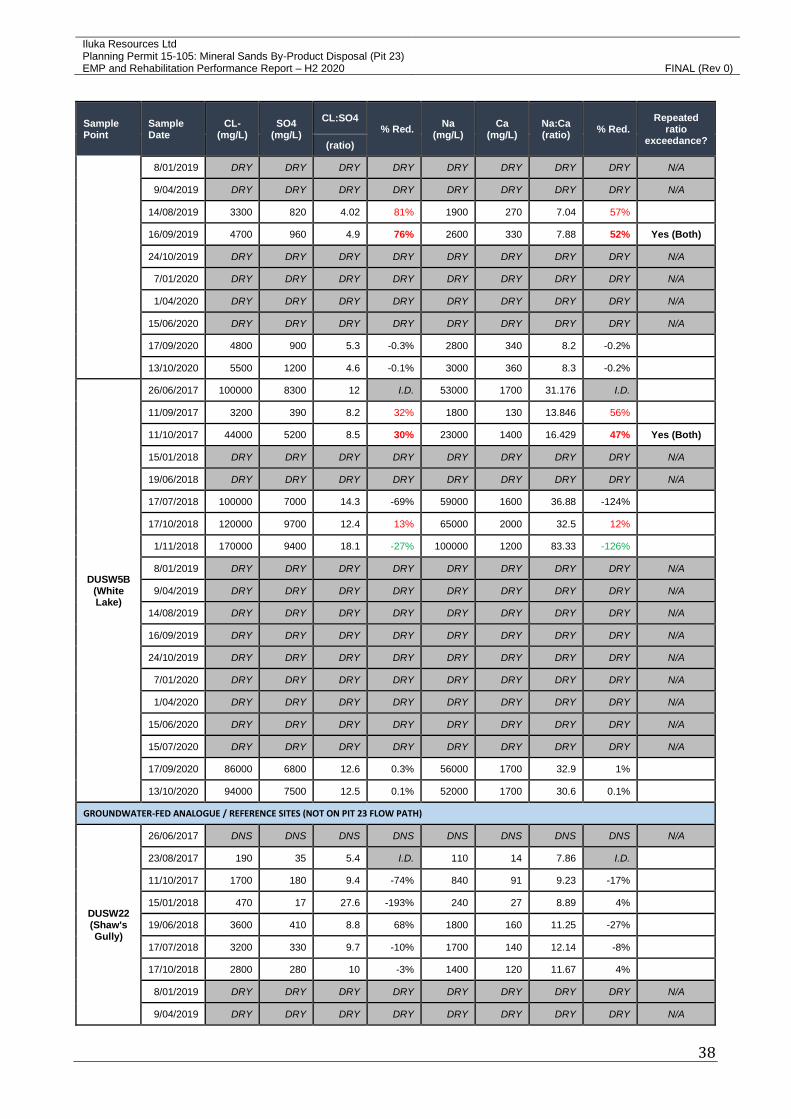
Iluka Resources Ltd Planning Permit 15-105: Mineral Sands By-Product Disposal (Pit 23)
EMP and Rehabilitation Performance Report – H2 2020 FINAL (Rev 0)
38
Sample Point
Sample Date
CL- (mg/L)
SO4 (mg/L)
CL:SO4 % Red.
Na (mg/L)
Ca (mg/L)
Na:Ca (ratio)
% Red. Repeated
ratio exceedance? (ratio)
8/01/2019 DRY DRY DRY DRY DRY DRY DRY DRY N/A
9/04/2019 DRY DRY DRY DRY DRY DRY DRY DRY N/A
14/08/2019 3300 820 4.02 81% 1900 270 7.04 57%
16/09/2019 4700 960 4.9 76% 2600 330 7.88 52% Yes (Both)
24/10/2019 DRY DRY DRY DRY DRY DRY DRY DRY N/A
7/01/2020 DRY DRY DRY DRY DRY DRY DRY DRY N/A
1/04/2020 DRY DRY DRY DRY DRY DRY DRY DRY N/A
15/06/2020 DRY DRY DRY DRY DRY DRY DRY DRY N/A
17/09/2020 4800 900 5.3 -0.3% 2800 340 8.2 -0.2% 13/10/2020 5500 1200 4.6 -0.1% 3000 360 8.3 -0.2%
DUSW5B (White Lake)
26/06/2017 100000 8300 12 I.D. 53000 1700 31.176 I.D. 11/09/2017 3200 390 8.2 32% 1800 130 13.846 56% 11/10/2017 44000 5200 8.5 30% 23000 1400 16.429 47% Yes (Both)
15/01/2018 DRY DRY DRY DRY DRY DRY DRY DRY N/A
19/06/2018 DRY DRY DRY DRY DRY DRY DRY DRY N/A
17/07/2018 100000 7000 14.3 -69% 59000 1600 36.88 -124% 17/10/2018 120000 9700 12.4 13% 65000 2000 32.5 12% 1/11/2018 170000 9400 18.1 -27% 100000 1200 83.33 -126% 8/01/2019 DRY DRY DRY DRY DRY DRY DRY DRY N/A
9/04/2019 DRY DRY DRY DRY DRY DRY DRY DRY N/A
14/08/2019 DRY DRY DRY DRY DRY DRY DRY DRY N/A
16/09/2019 DRY DRY DRY DRY DRY DRY DRY DRY N/A
24/10/2019 DRY DRY DRY DRY DRY DRY DRY DRY N/A
7/01/2020 DRY DRY DRY DRY DRY DRY DRY DRY N/A
1/04/2020 DRY DRY DRY DRY DRY DRY DRY DRY N/A
15/06/2020 DRY DRY DRY DRY DRY DRY DRY DRY N/A
15/07/2020 DRY DRY DRY DRY DRY DRY DRY DRY N/A
17/09/2020 86000 6800 12.6 0.3% 56000 1700 32.9 1%
13/10/2020 94000 7500 12.5 0.1% 52000 1700 30.6 0.1%
GROUNDWATER-FED ANALOGUE / REFERENCE SITES (NOT ON PIT 23 FLOW PATH)
DUSW22 (Shaw's Gully)
26/06/2017 DNS DNS DNS DNS DNS DNS DNS DNS N/A
23/08/2017 190 35 5.4 I.D. 110 14 7.86 I.D. 11/10/2017 1700 180 9.4 -74% 840 91 9.23 -17% 15/01/2018 470 17 27.6 -193% 240 27 8.89 4% 19/06/2018 3600 410 8.8 68% 1800 160 11.25 -27% 17/07/2018 3200 330 9.7 -10% 1700 140 12.14 -8% 17/10/2018 2800 280 10 -3% 1400 120 11.67 4% 8/01/2019 DRY DRY DRY DRY DRY DRY DRY DRY N/A
9/04/2019 DRY DRY DRY DRY DRY DRY DRY DRY N/A
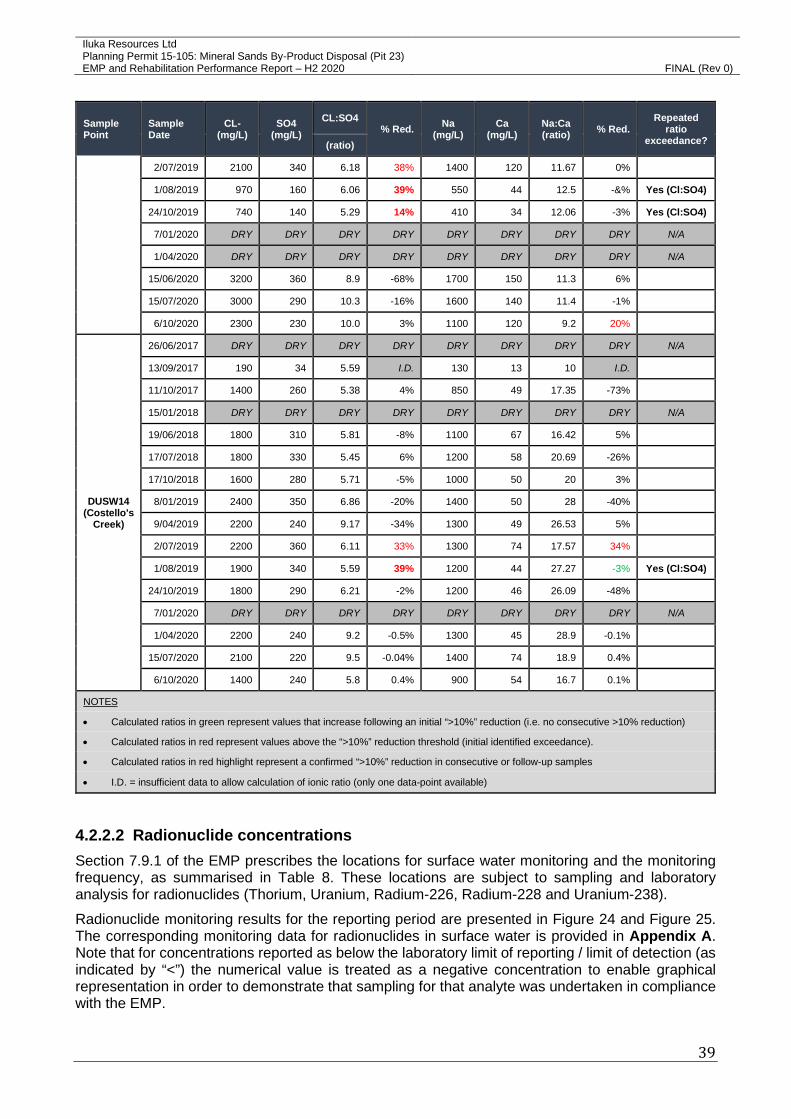
Iluka Resources Ltd Planning Permit 15-105: Mineral Sands By-Product Disposal (Pit 23)
EMP and Rehabilitation Performance Report – H2 2020 FINAL (Rev 0)
39
Sample Point
Sample Date
CL- (mg/L)
SO4 (mg/L)
CL:SO4 % Red.
Na (mg/L)
Ca (mg/L)
Na:Ca (ratio)
% Red. Repeated
ratio exceedance? (ratio)
2/07/2019 2100 340 6.18 38% 1400 120 11.67 0%
1/08/2019 970 160 6.06 39% 550 44 12.5 -&% Yes (Cl:SO4)
24/10/2019 740 140 5.29 14% 410 34 12.06 -3% Yes (Cl:SO4)
7/01/2020 DRY DRY DRY DRY DRY DRY DRY DRY N/A
1/04/2020 DRY DRY DRY DRY DRY DRY DRY DRY N/A
15/06/2020 3200 360 8.9 -68% 1700 150 11.3 6%
15/07/2020 3000 290 10.3 -16% 1600 140 11.4 -1%
6/10/2020 2300 230 10.0 3% 1100 120 9.2 20%
DUSW14 (Costello's
Creek)
26/06/2017 DRY DRY DRY DRY DRY DRY DRY DRY N/A
13/09/2017 190 34 5.59 I.D. 130 13 10 I.D. 11/10/2017 1400 260 5.38 4% 850 49 17.35 -73% 15/01/2018 DRY DRY DRY DRY DRY DRY DRY DRY N/A
19/06/2018 1800 310 5.81 -8% 1100 67 16.42 5% 17/07/2018 1800 330 5.45 6% 1200 58 20.69 -26% 17/10/2018 1600 280 5.71 -5% 1000 50 20 3% 8/01/2019 2400 350 6.86 -20% 1400 50 28 -40% 9/04/2019 2200 240 9.17 -34% 1300 49 26.53 5% 2/07/2019 2200 360 6.11 33% 1300 74 17.57 34%
1/08/2019 1900 340 5.59 39% 1200 44 27.27 -3% Yes (Cl:SO4)
24/10/2019 1800 290 6.21 -2% 1200 46 26.09 -48%
7/01/2020 DRY DRY DRY DRY DRY DRY DRY DRY N/A
1/04/2020 2200 240 9.2 -0.5% 1300 45 28.9 -0.1%
15/07/2020 2100 220 9.5 -0.04% 1400 74 18.9 0.4%
6/10/2020 1400 240 5.8 0.4% 900 54 16.7 0.1%
NOTES
• Calculated ratios in green represent values that increase following an initial “>10%” reduction (i.e. no consecutive >10% reduction)
• Calculated ratios in red represent values above the “>10%” reduction threshold (initial identified exceedance).
• Calculated ratios in red highlight represent a confirmed “>10%” reduction in consecutive or follow-up samples
• I.D. = insufficient data to allow calculation of ionic ratio (only one data-point available)
4.2.2.2 Radionuclide concentrations
Section 7.9.1 of the EMP prescribes the locations for surface water monitoring and the monitoring frequency, as summarised in Table 8. These locations are subject to sampling and laboratory analysis for radionuclides (Thorium, Uranium, Radium-226, Radium-228 and Uranium-238).
Radionuclide monitoring results for the reporting period are presented in Figure 24 and Figure 25. The corresponding monitoring data for radionuclides in surface water is provided in Appendix A. Note that for concentrations reported as below the laboratory limit of reporting / limit of detection (as indicated by “<”) the numerical value is treated as a negative concentration to enable graphical representation in order to demonstrate that sampling for that analyte was undertaken in compliance with the EMP.

Iluka Resources Ltd Planning Permit 15-105: Mineral Sands By-Product Disposal (Pit 23)
EMP and Rehabilitation Performance Report – H2 2020 FINAL (Rev 0)
40
The monitoring results for radionuclides in surface water obtained during the reporting period confirm nil exceedances of any precautionary or upper trigger. Further, no off-site discharges from the confines of Pit 23 or immediate area occurred.
Note that long-term data for these surface water points is available and the data presented in Figure 24 and Figure 25 represents all current data for these points.
Table 8: Monitoring program – radionuclide concentrations in surface water
Surface water monitoring locations Frequency
DUSW14 – Costello’s Creek
DUSW5B – White Lake
DUSW24 – McGlashin Swamp
DUSW20 – North-west drainage line
DUSW22 – Southern Drainage Line
• Quarterly; or
• During or following an off-site discharge event (creek and drainage lines only)
Figure 24: Ra-226 and Ra-228 in surface water

Iluka Resources Ltd Planning Permit 15-105: Mineral Sands By-Product Disposal (Pit 23)
EMP and Rehabilitation Performance Report – H2 2020 FINAL (Rev 0)
41
Figure 25: Uranium and U-238 in surface water
4.2.2.3 Other analytes
In accordance with Section 8.7.2 of the EMP, quarterly samples (if available) obtained from the monitoring locations are subjected to in-field and laboratory analysis for a suite of target parameters.
As discussed in Sections 4.2.1 and 4.2.2.1 there have been no runoff or discharges from site throughout the reporting period and no instances where ionic balance ratios were triggered at surface water monitoring locations along the flow path of Pit 23 that may be influenced from groundwater discharge.
4.3 Noise
In accordance with Section 10.1.4 of the endorsed EMP, noise level measurements will be undertaken in the unlikely event that noise complaints are received.
No noise related complaints were received during the reporting period, and hence no noise levels measurements were undertaken.
4.4 PM10 concentrations in air
In accordance with Sections 9.6 and 10.1.4 of the endorsed EMP, the concentration of PM10 dust in air at the Lyon’s and Chadwick’s residences is measured using high volume (‘hi-vol’) air samplers on a one-in-six day monitoring cycle. The location of these hi-vol air samplers relative to Pit 23 are shown in Figure 27.
12-month rolling results for PM10 compared to daily rainfall are shown in Figure 26. Results adhere to the expected year-on-year pattern of lower airborne PM10 concentrations in winter months.

Iluka Resources Ltd Planning Permit 15-105: Mineral Sands By-Product Disposal (Pit 23)
EMP and Rehabilitation Performance Report – H2 2020 FINAL (Rev 0)
42
Figure 26: PM10 dust concentrations at neighbouring residences vs. daily rainfall
Two results above the PM10 concentration limit (0.06 mg/m3) were recorded at the Lyons residence in H2 2020, on the 12th and 30th December 2012.
Per Section 9.6 of the Pit 23 EMP, where an exceedance of a precautionary or upper concentration limit has occurred Iluka is to determine whether the elevated result is associated with Pit 23. This determination requires comparison between measured PM10 concentrations at the Chadwick’s and Lyon’s residences per the method outlined in Table 24 of the EMP, shown below:
Table 9: Elevated PM10 association with Pit 23 matrix
Location If measured concentration is Associated?
Chadwick’s > Trigger Level > Lyon’s Yes
Chadwick’s > Trigger Level < Lyon’s No
Lyon’s > Trigger Level > Chadwick’s No
Lyon’s > Trigger Level < Chadwick’s Yes
Assessment of the two H2 2020 concentration exceedances observed at the Lyon’s residence based on the above protocol is given in Table 10 below.
Based on this assessment, and with reference to field monitoring notes and weather data from the Kanagulk BOM station (Station # 079097) on these dates, neither exceedance was associated with Pit 23.
In both instances the measured PM10 concentrations at the Chadwick’s residence, which is sited upwind of the Lyon’s property and closer to the Pit 23 facility, were lower than those measured at Lyon’s residence and below the precautionary and upper concentration limits at the same point in time. This is supported by field monitoring records and wind data which indicate dust sources un-related to Pit 23 use and development.

Iluka Resources Ltd Planning Permit 15-105: Mineral Sands By-Product Disposal (Pit 23)
EMP and Rehabilitation Performance Report – H2 2020 FINAL (Rev 0)
43
Table 10: PM10 exceedance assessment, H2 2020
Date Measured Concentration (mg/m3)
Associated? Comment
Lyon’s Chadwick’s Rises
12/12/20 0.09 0.023 0.028 No BOM station indicates winds prevailing from the NE during the monitoring event (Pit 23 is sited to the W of Lyon’s residence).
30/12/20 0.22 0.01 0.015 No Sheep activity and third-party harvesting in vicinity of hi-volume air sampler unit during monitoring event. BOM station indicates winds prevailing from the S/SE during the monitoring event (Pit 23 is sited to W of Lyon’s residence).

!?
!?
!?
Lyons
The Rises
Chadwicks
Pit 19
Pit 22
Pit 5
Pit 10
Pit 9Pit 23
Pit 11
Pit 12
Pit 3
Pit 1
Pit 2
Pit 21
Source: Esri, DigitalGlobe, GeoEye, Earthstar Geographics, CNES/Airbus DS, USDA, USGS,
AeroGRID, IGN, and the GIS User Community
27L:\Maps\2018\Unregistered\Douglas\mxd\Pit 23 Annual Report 2017 N. Travers 26/06/2018
N
0 1,000 2,000 3,000 4,000500MetersLegend
!? PM10 monitoring
Pit 23 crest
Pit Crests
FIGURE:DRAWN: DATE:
AIR QUALITY MONITORING LOCATIONS(PM10 - Hi Vols)
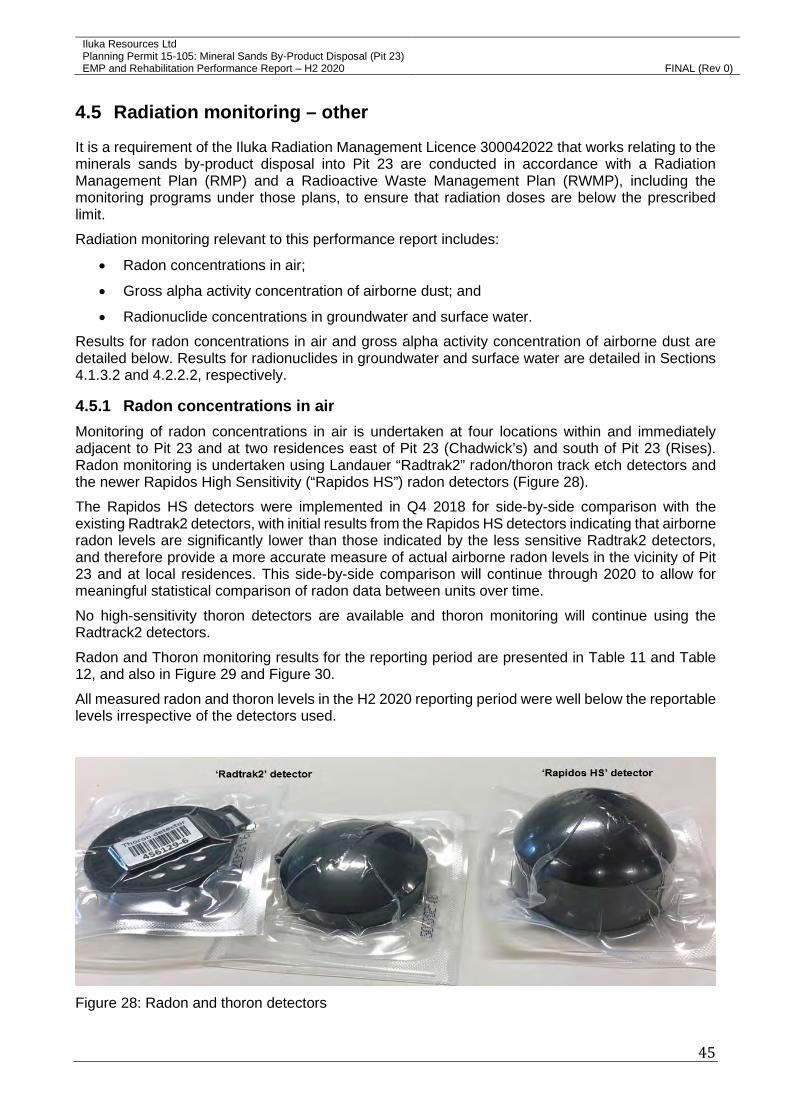
Iluka Resources Ltd Planning Permit 15-105: Mineral Sands By-Product Disposal (Pit 23)
EMP and Rehabilitation Performance Report – H2 2020 FINAL (Rev 0)
45
4.5 Radiation monitoring – other
It is a requirement of the Iluka Radiation Management Licence 300042022 that works relating to the minerals sands by-product disposal into Pit 23 are conducted in accordance with a Radiation Management Plan (RMP) and a Radioactive Waste Management Plan (RWMP), including the monitoring programs under those plans, to ensure that radiation doses are below the prescribed limit.
Radiation monitoring relevant to this performance report includes:
• Radon concentrations in air;
• Gross alpha activity concentration of airborne dust; and
• Radionuclide concentrations in groundwater and surface water.
Results for radon concentrations in air and gross alpha activity concentration of airborne dust are detailed below. Results for radionuclides in groundwater and surface water are detailed in Sections 4.1.3.2 and 4.2.2.2, respectively.
4.5.1 Radon concentrations in air
Monitoring of radon concentrations in air is undertaken at four locations within and immediately adjacent to Pit 23 and at two residences east of Pit 23 (Chadwick’s) and south of Pit 23 (Rises). Radon monitoring is undertaken using Landauer “Radtrak2” radon/thoron track etch detectors and the newer Rapidos High Sensitivity (“Rapidos HS”) radon detectors (Figure 28).
The Rapidos HS detectors were implemented in Q4 2018 for side-by-side comparison with the existing Radtrak2 detectors, with initial results from the Rapidos HS detectors indicating that airborne radon levels are significantly lower than those indicated by the less sensitive Radtrak2 detectors, and therefore provide a more accurate measure of actual airborne radon levels in the vicinity of Pit 23 and at local residences. This side-by-side comparison will continue through 2020 to allow for meaningful statistical comparison of radon data between units over time.
No high-sensitivity thoron detectors are available and thoron monitoring will continue using the Radtrack2 detectors.
Radon and Thoron monitoring results for the reporting period are presented in Table 11 and Table 12, and also in Figure 29 and Figure 30.
All measured radon and thoron levels in the H2 2020 reporting period were well below the reportable levels irrespective of the detectors used.
Figure 28: Radon and thoron detectors

Iluka Resources Ltd Planning Permit 15-105: Mineral Sands By-Product Disposal (Pit 23)
EMP and Rehabilitation Performance Report – H2 2020 FINAL (Rev 0)
46
Table 11: Radon concentrations within Pit 23 for H2 2020
Location
Radon concentration in air (Bq/m3) Rapidos High Sensitivity (Bq/m³)
Reportable level
Jan 20 - Mar 20
Apr 20 - Jun 20
Jul 20 - Sep 20
Oct 20 - Dec 20
Jan 20 - Mar 20
Apr 20 - Jun 20
Jul 20 - Sep 20
Oct 20 - Dec 20
Pit 23 East 100 16 ± 16 <15 <15 23 ± 16 <4 <3 <8 16 ± 8
Pit 23 North 100 <15 <15 <15 15 ± 16 4 ± 3 <3 <8 <10
Pit 23 West 100 <15 <15 31 ± 14 31 ± 16 <4 <3 13 ± 7 <10
Pit 23 South 100 <20 <15 34 ± 16 <15 <3 <3 14 ± 7 <10
Chadwick’s 100 <15 <15 29 ± 12 <15 6 ± 3 <3 <8 16 ± 9
Rises 100 <15 <15 <15 <15 <4 <3 15 ± 7 <10
Table 12: Thoron concentrations within Pit 23 for H2 2020
Location
Thoron concentration in air (Bq/m3) Radtrak2 Detectors
Reportable level
Jan19 To
Apr19
Apr19 To
Jul19
Jul19 To
Sep19
Oct19 To
Dec19
Jan20 To
Mar20
Apr20 To
Jun20
Jul20 To
Sep20
Oct20 To
Dec20
Pit 23 East 1000 67 ± 32 34 ± 20 58 ± 26 100 ± 36 <20 <20 <30 <40
Pit 23 North 1000 42 ± 28 <30 <30 <40 23 ± 12 <20 <30 <40
Pit 23 West 1000 119 ± 32 68 ± 22 66 ± 26 83 ± 40 58 ± 16 <20 <30 87 ± 36
Pit 23 South 1000 - 138 ± 30 115 ± 30 133 ± 38 81 ± 18 <20 <30 101 ± 36
Chadwick’s 1000 <30 <30 <30 <40 <20 <20 <30 <40
Rises 1000 36 ± 28 <30 <30 <40 <20 <20 <30 <40

Iluka Resources Ltd Planning Permit 15-105: Mineral Sands By-Product Disposal (Pit 23)
EMP and Rehabilitation Performance Report – H2 2020 FINAL (Rev 0)
47
Figure 29: Radon concentration in air, H2 2020
Figure 30: Thoron concentration in air, H2 2020

Iluka Resources Ltd Planning Permit 15-105: Mineral Sands By-Product Disposal (Pit 23)
EMP and Rehabilitation Performance Report – H2 2020 FINAL (Rev 0)
48
4.5.2 Gross alpha concentrations in airborne dust
As noted in Section 4.4, sampling for airborne particulates in PM10 dust is conducted using high volume (hi-vol) air samplers located at the Chadwick’s, Lyons and Rises residences (see Figure 27).
On a quarterly basis hi-vol units are run for a continuous 96 hour period for purposes of monitoring gross alpha concentration in air, which represents a total air sample volume of approximately 6,000 m3. The filters are weighed to determine the total dust loading in mg/m3 and then analysed for gross alpha activity expressed as millibequerels/m3 (mBq/m3).
The results for the monitoring period are in line with historical values and are shown in Table 13 and Figure 31.
Table 13: Gross Alpha radiation in PM10 dust
Location Run Date Sample / Filter No. Air Volume (m3) Activity Conc (mBq/m3)
Chadwick’s 07/09/2020 160420GF79 6046 0.228
Lyon’s 13/09/2020 160420GF82 6074 0.101
Rises 01/10/2020 160420GF90 5913 0.194
Chadwick’s 19/10/2020 310820GF2 5988 0.156
Lyon’s 19/10/2020 160420GF100 5961 0.131
Rises 19/10/2020 310820GF1 6044 0.136
Figure 31: Gross Alpha Radiation in PM10 Dust – H2 2020

Iluka Resources Ltd Planning Permit 15-105: Mineral Sands By-Product Disposal (Pit 23)
EMP and Rehabilitation Performance Report – H2 2020 FINAL (Rev 0)
49
5 Management Actions
5.1 Monitoring bore audits
In accordance with Section 7.6.2 of the EMP, audits of the monitoring bore network are undertaken on monthly or bi-annually and outcomes reported annually within this EMP and Rehabilitation Performance Report.
Bore integrity (e.g. physical condition, blocked/dry or poor yield) is assessed as part of the groundwater monitoring program.
As per Section 4.1.1 of this report, all bores are in serviceable condition with the exception of BW36 which is blocked and was replaced with BW36A in October 2019.
5.2 Groundwater flow paths from Pit 23
In accordance with Section 7.9.1 of the EMP, groundwater levels measured at bores WRK300 – WRK304 inclusive, GW1 to GW7 inclusive, GW9, BW36A and BW45B are used to construct groundwater contours in the area of Pit 23 and surrounds and infer groundwater flow paths from Pit 23, with these levels and flow paths compared with the groundwater levels and flow paths predicted by the hydrogeological model.
Groundwater level contours are provided in Figure 32 (EMM 2019; EMM 2020). This compares the 2019 modelled contours per EMM (2019), and interpreted groundwater contours as at June 2020 including standing water level data for new monitoring bores installed in 2018 and 2019. From these June 2020 contours it is confirmed that:
• groundwater contours and flow-paths are consistent with the 2019 modelled contours and prior year contours; and
• groundwater flow from Pit 23 is still to the north and north-west.

Iluka Resources Ltd Planning Permit 15-105: Mineral Sands By-Product Disposal (Pit 23)
EMP and Rehabilitation Performance Report – H2 2020 FINAL (Rev 0)
50
Figure 32: 2019 vs 2020 interpreted groundwater contours (EMM 2019; EMM 2020)

Iluka Resources Ltd Planning Permit 15-105: Mineral Sands By-Product Disposal (Pit 23)
EMP and Rehabilitation Performance Report – H2 2020 FINAL (Rev 0)
51
5.3 Groundwater model review and recalibration
Sections 7.10 and 8.7.2 of the endorsed EMP outlines the circumstances that will trigger a review
and recalibration of the hydrogeological model.
An update of the Douglas Mine (inclusive Pit 23) hydrogeological model was commissioned through
EMM Consulting in December 2018 in response to the potential groundwater seepage impacts
identified during surface water monitoring at McGlashin’s Swamp in the 2017 reporting period. This
also satisfied the commitment for a review of the model within two (2) years of the Planning Permit
being granted.
Whilst complimentary seepage impact investigation (EMM, 2018) determined that the observed
exceedances were associated with natural phenomena and un-related to Pit 23, a review and update
of the groundwater model was required in accordance with the Pit 23 EMP.
Preliminary findings of the 2019 groundwater model update were presented to the Responsible
Authority and Pit 23 Technical Reference Group (TRG) by Iluka and EMM Consulting personnel at
a meeting held at the HRCC Council Chambers on 23rd May 2019. The final modelling report was
completed and provided to the Responsible Authority in Q3 2019.
This modelling will be used to validate existing model predictions on the groundwater flow path and
groundwater flow rates from the Pit 23 facility, and to inform updates to groundwater-related content
with the next iteration of the Pit 23 Environmental Management Plan (EMP, Rev 5.1).
5.4 Maximum surface level of disposed materials in Pit 23
In accordance with Section 7.9.1 of the EMP, the maximum elevation of the upper surface of materials disposed of at the end of the reporting period must be reported.
The Pit 23 void consists of an upper and lower disposal area; no wastes were disposed into Pit 23 during the H2 2020 reporting period.
Accordingly, the survey undertaken on the 8th of December 2017 confirming the upper surface of materials deposited in Pit 23 (i.e. the elevation of capped material in the upper disposal area) remains unchanged at 193 mAHD.
5.5 Non-compliances
There were no non-compliances for the H2 2020 reporting period.
5.6 Comments and complaints received
No complaints or comments were received during the H2 2020 reporting period.
5.7 H2 2020 Completed Actions
The following actions were completed during H2 2020:
• submission of the updated Pit 23 Incoming Waste Monitoring Plan (IWMP) and Environmental Management Plan (EMP) as required by the default two-year review periods stipulated within these plans. The updated EMP (Revision 5.1) included outcomes of the updated groundwater modelling completed by EMM in 2019;
• annual review of the Pit 23 Risk Analysis and Response Plan (RARP) risk register as per Section 6 of the EMP; and

Iluka Resources Ltd Planning Permit 15-105: Mineral Sands By-Product Disposal (Pit 23)
EMP and Rehabilitation Performance Report – H2 2020 FINAL (Rev 0)
52
• Installation of groundwater monitoring bore GW04A located between GW04 and BW36A as previously agreed with Auditor.
5.8 H1 2021 Proposed Actions
The following actions are planned for H1 2021:
• implementation of the ongoing monitoring requirements as per the EMP.
5.9 Other matters
5.9.1 Annual geotechnical audit
In accordance with Section 10.5.2 and 10.5.3 of the EMP, geotechnical audits are completed on an annual basis with the last audit completed in December 2020 (AMC Consultants, 2020).
The next audit is scheduled for November 2021.
5.9.2 Pit 23 Risk Register annual review
Per Section 6 of the EMP, the Pit 23 Risk Analysis and Response Plan (RARP) was developed by AECOM Australia Pty Ltd who recommended that the Pit 23 Risk Register (contained as Appendix A of the RARP) be reviewed annually at the time when EMP and Rehabilitation Performance Reports are developed.
Reviews of the Pit 23 RARP risk register were conducted in December 2018 and presented in the prior 2018 EMP and Rehabilitation Performance Report submitted to the Responsible Authority on 3rd June 2019.
A review of the Pit 23 RARP risk register was undertaken in November 2020 as part of the review and update of the Environmental Management Plan (EMP) and is scheduled to be reviewed in H2 2021.
Iluka Resources Ltd Planning Permit 15-105: Mineral Sands By-Product Disposal (Pit 23)
EMP and Rehabilitation Performance Report – H2 2020 FINAL (Rev 0)
53
6 References
ANZECC/ARMCANZ (2000) National Water Quality Management Strategy: Australian and New Zealand Guidelines for Fresh and Marine Water Quality. Australian and New Zealand Environment and Conservation Council and Agricultural and Resource Management Council of Australia and New Zealand, Canberra, Australian Capital Territory, October 2000. CDM Smith (2014) Douglas Mine Site Hydrogeological Modelling. Completed on behalf of Iluka Resources, November 2014
CDM Smith (2015) Douglas Mine – Particle Tracking of Seepage Water. Completed on behalf of Iluka Resources, February 2015
EMM (2018) Pit 23 Groundwater – Assessment of Seepage Indicator Exceedances, November 2018 (Report S180265, Rev 2 Final), issued for Iluka Resources Ltd
EMM (2019) Groundwater Model Update and Predictive Scenario Modelling – Douglas Mine. Prepared by EMM Consulting for Iluka Resources Ltd, September 2019. EES (2016) Independent Desktop Review For The Continuation Of Mineral By-Products Disposal Into Pit 23 At Iluka’s Douglas Mine Site, Northwest Victoria No. 215071v2 dated April 2016. Prepared by Environmental Earth Sciences, Melbourne, Victoria. (TRIM T18729). AMC Consultants (2021) Douglas Mine Pit 23 Geotechnical Audit & Risk Assessment, 3rd December 2020.

Iluka Resources Ltd Planning Permit 15-105: Mineral Sands By-Product Disposal (Pit 23)
EMP and Rehabilitation Performance Report – H2 2020 FINAL (Rev 0)
54
7 Appendices
Appendix A: Monitoring Data (Lab) – Radiation – Surface Water
Surface water ID
Date Thorium Uranium U238 Ra226 Ra228
(mg/L) (mg/L) (Bq/L) (Bq/L) (Bq/L)
Precautionary trigger n/a 0.17 0.17 4.3 1.7
Upper trigger n/a 0.2 0.2 5 2
Q3 2020 DUSW05B 15/07/2020 DRY DRY DRY DRY DRY DUSW05B 17/09/2020 <0.002 <0.001 NR 0.02 0.13 DUSW14 15/07/2020 <0.002 <0.001 <0.025 <0.01 <0.08 DUSW20 15/07/2020 DRY DRY DRY DRY DRY DUSW20 14/09/2020 0.0038 <0.01 <0.025 <0.01 <0.08 DUSW22 15/07/2020 <0.002 <0.001 <0.025 <0.01 <0.08 DUSW24 15/07/2020 DRY DRY DRY DRY DRY DUSW24 17/09/2020 <0.002 0.007 0.049 0.01 <0.08
Q4 2020 DUSW05B 13/10/2020 <0.002 <0.001 <0.025 0.02 0.11 DUSW14 6/10/2020 <0.002 <0.001 <0.025 <0.01 <0.08 DUSW20 8/10/2020 <0.002 <0.001 <0.025 <0.01 <0.08 DUSW22 6/10/2020 <0.002 <0.001 <0.025 <0.01 <0.08 DUSW24 13/10/2020 <0.002 0.004 <0.025 0.01 <0.08 NR = No Result due to precipitation forming in sample
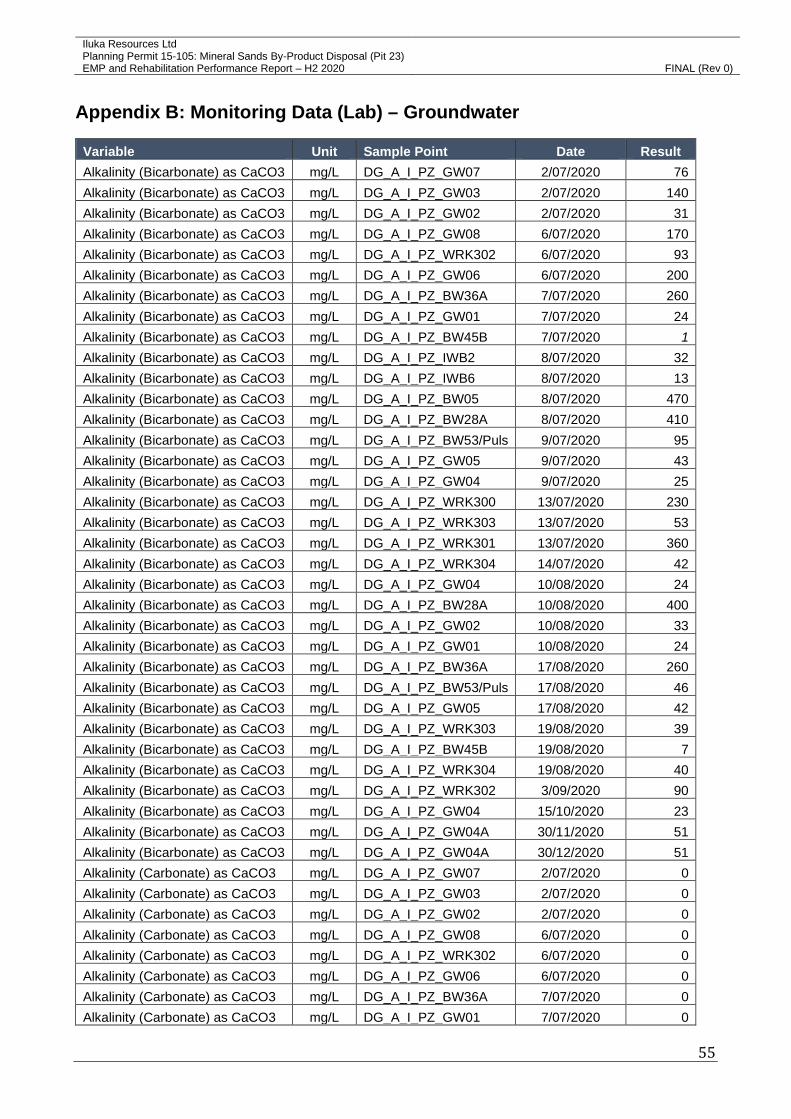
Iluka Resources Ltd Planning Permit 15-105: Mineral Sands By-Product Disposal (Pit 23)
EMP and Rehabilitation Performance Report – H2 2020 FINAL (Rev 0)
55
Appendix B: Monitoring Data (Lab) – Groundwater
Variable Unit Sample Point Date Result
Alkalinity (Bicarbonate) as CaCO3 mg/L DG_A_I_PZ_GW07 2/07/2020 76
Alkalinity (Bicarbonate) as CaCO3 mg/L DG_A_I_PZ_GW03 2/07/2020 140
Alkalinity (Bicarbonate) as CaCO3 mg/L DG_A_I_PZ_GW02 2/07/2020 31
Alkalinity (Bicarbonate) as CaCO3 mg/L DG_A_I_PZ_GW08 6/07/2020 170
Alkalinity (Bicarbonate) as CaCO3 mg/L DG_A_I_PZ_WRK302 6/07/2020 93
Alkalinity (Bicarbonate) as CaCO3 mg/L DG_A_I_PZ_GW06 6/07/2020 200
Alkalinity (Bicarbonate) as CaCO3 mg/L DG_A_I_PZ_BW36A 7/07/2020 260
Alkalinity (Bicarbonate) as CaCO3 mg/L DG_A_I_PZ_GW01 7/07/2020 24
Alkalinity (Bicarbonate) as CaCO3 mg/L DG_A_I_PZ_BW45B 7/07/2020 1 Alkalinity (Bicarbonate) as CaCO3 mg/L DG_A_I_PZ_IWB2 8/07/2020 32
Alkalinity (Bicarbonate) as CaCO3 mg/L DG_A_I_PZ_IWB6 8/07/2020 13
Alkalinity (Bicarbonate) as CaCO3 mg/L DG_A_I_PZ_BW05 8/07/2020 470
Alkalinity (Bicarbonate) as CaCO3 mg/L DG_A_I_PZ_BW28A 8/07/2020 410
Alkalinity (Bicarbonate) as CaCO3 mg/L DG_A_I_PZ_BW53/Puls 9/07/2020 95
Alkalinity (Bicarbonate) as CaCO3 mg/L DG_A_I_PZ_GW05 9/07/2020 43
Alkalinity (Bicarbonate) as CaCO3 mg/L DG_A_I_PZ_GW04 9/07/2020 25
Alkalinity (Bicarbonate) as CaCO3 mg/L DG_A_I_PZ_WRK300 13/07/2020 230
Alkalinity (Bicarbonate) as CaCO3 mg/L DG_A_I_PZ_WRK303 13/07/2020 53
Alkalinity (Bicarbonate) as CaCO3 mg/L DG_A_I_PZ_WRK301 13/07/2020 360
Alkalinity (Bicarbonate) as CaCO3 mg/L DG_A_I_PZ_WRK304 14/07/2020 42
Alkalinity (Bicarbonate) as CaCO3 mg/L DG_A_I_PZ_GW04 10/08/2020 24
Alkalinity (Bicarbonate) as CaCO3 mg/L DG_A_I_PZ_BW28A 10/08/2020 400
Alkalinity (Bicarbonate) as CaCO3 mg/L DG_A_I_PZ_GW02 10/08/2020 33
Alkalinity (Bicarbonate) as CaCO3 mg/L DG_A_I_PZ_GW01 10/08/2020 24
Alkalinity (Bicarbonate) as CaCO3 mg/L DG_A_I_PZ_BW36A 17/08/2020 260
Alkalinity (Bicarbonate) as CaCO3 mg/L DG_A_I_PZ_BW53/Puls 17/08/2020 46
Alkalinity (Bicarbonate) as CaCO3 mg/L DG_A_I_PZ_GW05 17/08/2020 42
Alkalinity (Bicarbonate) as CaCO3 mg/L DG_A_I_PZ_WRK303 19/08/2020 39
Alkalinity (Bicarbonate) as CaCO3 mg/L DG_A_I_PZ_BW45B 19/08/2020 7
Alkalinity (Bicarbonate) as CaCO3 mg/L DG_A_I_PZ_WRK304 19/08/2020 40
Alkalinity (Bicarbonate) as CaCO3 mg/L DG_A_I_PZ_WRK302 3/09/2020 90
Alkalinity (Bicarbonate) as CaCO3 mg/L DG_A_I_PZ_GW04 15/10/2020 23
Alkalinity (Bicarbonate) as CaCO3 mg/L DG_A_I_PZ_GW04A 30/11/2020 51
Alkalinity (Bicarbonate) as CaCO3 mg/L DG_A_I_PZ_GW04A 30/12/2020 51
Alkalinity (Carbonate) as CaCO3 mg/L DG_A_I_PZ_GW07 2/07/2020 0
Alkalinity (Carbonate) as CaCO3 mg/L DG_A_I_PZ_GW03 2/07/2020 0
Alkalinity (Carbonate) as CaCO3 mg/L DG_A_I_PZ_GW02 2/07/2020 0
Alkalinity (Carbonate) as CaCO3 mg/L DG_A_I_PZ_GW08 6/07/2020 0
Alkalinity (Carbonate) as CaCO3 mg/L DG_A_I_PZ_WRK302 6/07/2020 0
Alkalinity (Carbonate) as CaCO3 mg/L DG_A_I_PZ_GW06 6/07/2020 0
Alkalinity (Carbonate) as CaCO3 mg/L DG_A_I_PZ_BW36A 7/07/2020 0
Alkalinity (Carbonate) as CaCO3 mg/L DG_A_I_PZ_GW01 7/07/2020 0

Iluka Resources Ltd Planning Permit 15-105: Mineral Sands By-Product Disposal (Pit 23)
EMP and Rehabilitation Performance Report – H2 2020 FINAL (Rev 0)
56
Variable Unit Sample Point Date Result
Alkalinity (Carbonate) as CaCO3 mg/L DG_A_I_PZ_BW45B 7/07/2020 0
Alkalinity (Carbonate) as CaCO3 mg/L DG_A_I_PZ_IWB2 8/07/2020 0
Alkalinity (Carbonate) as CaCO3 mg/L DG_A_I_PZ_IWB6 8/07/2020 0
Alkalinity (Carbonate) as CaCO3 mg/L DG_A_I_PZ_BW05 8/07/2020 0
Alkalinity (Carbonate) as CaCO3 mg/L DG_A_I_PZ_BW28A 8/07/2020 0
Alkalinity (Carbonate) as CaCO3 mg/L DG_A_I_PZ_BW53/Puls 9/07/2020 0
Alkalinity (Carbonate) as CaCO3 mg/L DG_A_I_PZ_GW05 9/07/2020 0
Alkalinity (Carbonate) as CaCO3 mg/L DG_A_I_PZ_GW04 9/07/2020 0
Alkalinity (Carbonate) as CaCO3 mg/L DG_A_I_PZ_WRK300 13/07/2020 0
Alkalinity (Carbonate) as CaCO3 mg/L DG_A_I_PZ_WRK303 13/07/2020 0
Alkalinity (Carbonate) as CaCO3 mg/L DG_A_I_PZ_WRK301 13/07/2020 0
Alkalinity (Carbonate) as CaCO3 mg/L DG_A_I_PZ_WRK304 14/07/2020 0
Alkalinity (Carbonate) as CaCO3 mg/L DG_A_I_PZ_GW04 10/08/2020 0
Alkalinity (Carbonate) as CaCO3 mg/L DG_A_I_PZ_BW28A 10/08/2020 0
Alkalinity (Carbonate) as CaCO3 mg/L DG_A_I_PZ_GW02 10/08/2020 0
Alkalinity (Carbonate) as CaCO3 mg/L DG_A_I_PZ_GW01 10/08/2020 0
Alkalinity (Carbonate) as CaCO3 mg/L DG_A_I_PZ_BW36A 17/08/2020 0
Alkalinity (Carbonate) as CaCO3 mg/L DG_A_I_PZ_BW53/Puls 17/08/2020 0
Alkalinity (Carbonate) as CaCO3 mg/L DG_A_I_PZ_GW05 17/08/2020 0
Alkalinity (Carbonate) as CaCO3 mg/L DG_A_I_PZ_WRK303 19/08/2020 0
Alkalinity (Carbonate) as CaCO3 mg/L DG_A_I_PZ_BW45B 19/08/2020 0
Alkalinity (Carbonate) as CaCO3 mg/L DG_A_I_PZ_WRK304 19/08/2020 0
Alkalinity (Carbonate) as CaCO3 mg/L DG_A_I_PZ_WRK302 3/09/2020 0
Alkalinity (Carbonate) as CaCO3 mg/L DG_A_I_PZ_GW04 15/10/2020 0
Alkalinity (Carbonate) as CaCO3 mg/L DG_A_I_PZ_GW04A 30/11/2020 0
Alkalinity (Carbonate) as CaCO3 mg/L DG_A_I_PZ_GW04A 30/12/2020 0
Alkalinity (Hydroxide) as CaCO3 mg/L DG_A_I_PZ_GW07 2/07/2020 0
Alkalinity (Hydroxide) as CaCO3 mg/L DG_A_I_PZ_GW03 2/07/2020 0
Alkalinity (Hydroxide) as CaCO3 mg/L DG_A_I_PZ_GW02 2/07/2020 0
Alkalinity (Hydroxide) as CaCO3 mg/L DG_A_I_PZ_GW08 6/07/2020 0
Alkalinity (Hydroxide) as CaCO3 mg/L DG_A_I_PZ_WRK302 6/07/2020 0
Alkalinity (Hydroxide) as CaCO3 mg/L DG_A_I_PZ_GW06 6/07/2020 0
Alkalinity (Hydroxide) as CaCO3 mg/L DG_A_I_PZ_BW36A 7/07/2020 0
Alkalinity (Hydroxide) as CaCO3 mg/L DG_A_I_PZ_GW01 7/07/2020 0
Alkalinity (Hydroxide) as CaCO3 mg/L DG_A_I_PZ_BW45B 7/07/2020 0
Alkalinity (Hydroxide) as CaCO3 mg/L DG_A_I_PZ_IWB2 8/07/2020 0
Alkalinity (Hydroxide) as CaCO3 mg/L DG_A_I_PZ_IWB6 8/07/2020 0
Alkalinity (Hydroxide) as CaCO3 mg/L DG_A_I_PZ_BW05 8/07/2020 0
Alkalinity (Hydroxide) as CaCO3 mg/L DG_A_I_PZ_BW28A 8/07/2020 0
Alkalinity (Hydroxide) as CaCO3 mg/L DG_A_I_PZ_BW53/Puls 9/07/2020 0
Alkalinity (Hydroxide) as CaCO3 mg/L DG_A_I_PZ_GW05 9/07/2020 0
Alkalinity (Hydroxide) as CaCO3 mg/L DG_A_I_PZ_GW04 9/07/2020 0
Alkalinity (Hydroxide) as CaCO3 mg/L DG_A_I_PZ_WRK300 13/07/2020 0
Alkalinity (Hydroxide) as CaCO3 mg/L DG_A_I_PZ_WRK303 13/07/2020 0

Iluka Resources Ltd Planning Permit 15-105: Mineral Sands By-Product Disposal (Pit 23)
EMP and Rehabilitation Performance Report – H2 2020 FINAL (Rev 0)
57
Variable Unit Sample Point Date Result
Alkalinity (Hydroxide) as CaCO3 mg/L DG_A_I_PZ_WRK301 13/07/2020 0
Alkalinity (Hydroxide) as CaCO3 mg/L DG_A_I_PZ_WRK304 14/07/2020 0
Alkalinity (Hydroxide) as CaCO3 mg/L DG_A_I_PZ_GW04 10/08/2020 0
Alkalinity (Hydroxide) as CaCO3 mg/L DG_A_I_PZ_BW28A 10/08/2020 0
Alkalinity (Hydroxide) as CaCO3 mg/L DG_A_I_PZ_GW02 10/08/2020 0
Alkalinity (Hydroxide) as CaCO3 mg/L DG_A_I_PZ_GW01 10/08/2020 0
Alkalinity (Hydroxide) as CaCO3 mg/L DG_A_I_PZ_BW36A 17/08/2020 0
Alkalinity (Hydroxide) as CaCO3 mg/L DG_A_I_PZ_BW53/Puls 17/08/2020 0
Alkalinity (Hydroxide) as CaCO3 mg/L DG_A_I_PZ_GW05 17/08/2020 0
Alkalinity (Hydroxide) as CaCO3 mg/L DG_A_I_PZ_WRK303 19/08/2020 0
Alkalinity (Hydroxide) as CaCO3 mg/L DG_A_I_PZ_BW45B 19/08/2020 0
Alkalinity (Hydroxide) as CaCO3 mg/L DG_A_I_PZ_WRK304 19/08/2020 0
Alkalinity (Hydroxide) as CaCO3 mg/L DG_A_I_PZ_WRK302 3/09/2020 0
Alkalinity (Hydroxide) as CaCO3 mg/L DG_A_I_PZ_GW04 15/10/2020 0
Alkalinity (Hydroxide) as CaCO3 mg/L DG_A_I_PZ_GW04A 30/11/2020 0
Alkalinity (Hydroxide) as CaCO3 mg/L DG_A_I_PZ_GW04A 30/12/2020 0
Alkalinity (Total) as CaCO3 mg/L DG_A_I_PZ_GW07 2/07/2020 76
Alkalinity (Total) as CaCO3 mg/L DG_A_I_PZ_GW03 2/07/2020 140
Alkalinity (Total) as CaCO3 mg/L DG_A_I_PZ_GW02 2/07/2020 31
Alkalinity (Total) as CaCO3 mg/L DG_A_I_PZ_GW08 6/07/2020 170
Alkalinity (Total) as CaCO3 mg/L DG_A_I_PZ_WRK302 6/07/2020 93
Alkalinity (Total) as CaCO3 mg/L DG_A_I_PZ_GW06 6/07/2020 200
Alkalinity (Total) as CaCO3 mg/L DG_A_I_PZ_BW36A 7/07/2020 260
Alkalinity (Total) as CaCO3 mg/L DG_A_I_PZ_GW01 7/07/2020 24
Alkalinity (Total) as CaCO3 mg/L DG_A_I_PZ_BW45B 7/07/2020 1 Alkalinity (Total) as CaCO3 mg/L DG_A_I_PZ_IWB2 8/07/2020 32
Alkalinity (Total) as CaCO3 mg/L DG_A_I_PZ_IWB6 8/07/2020 13
Alkalinity (Total) as CaCO3 mg/L DG_A_I_PZ_BW05 8/07/2020 470
Alkalinity (Total) as CaCO3 mg/L DG_A_I_PZ_BW28A 8/07/2020 410
Alkalinity (Total) as CaCO3 mg/L DG_A_I_PZ_BW53/Puls 9/07/2020 95
Alkalinity (Total) as CaCO3 mg/L DG_A_I_PZ_GW05 9/07/2020 43
Alkalinity (Total) as CaCO3 mg/L DG_A_I_PZ_GW04 9/07/2020 25
Alkalinity (Total) as CaCO3 mg/L DG_A_I_PZ_WRK300 13/07/2020 230
Alkalinity (Total) as CaCO3 mg/L DG_A_I_PZ_WRK303 13/07/2020 53
Alkalinity (Total) as CaCO3 mg/L DG_A_I_PZ_WRK301 13/07/2020 360
Alkalinity (Total) as CaCO3 mg/L DG_A_I_PZ_WRK304 14/07/2020 42
Alkalinity (Total) as CaCO3 mg/L DG_A_I_PZ_GW04 10/08/2020 24
Alkalinity (Total) as CaCO3 mg/L DG_A_I_PZ_BW28A 10/08/2020 400
Alkalinity (Total) as CaCO3 mg/L DG_A_I_PZ_GW02 10/08/2020 33
Alkalinity (Total) as CaCO3 mg/L DG_A_I_PZ_GW01 10/08/2020 24
Alkalinity (Total) as CaCO3 mg/L DG_A_I_PZ_BW36A 17/08/2020 260
Alkalinity (Total) as CaCO3 mg/L DG_A_I_PZ_BW53/Puls 17/08/2020 46
Alkalinity (Total) as CaCO3 mg/L DG_A_I_PZ_GW05 17/08/2020 42
Alkalinity (Total) as CaCO3 mg/L DG_A_I_PZ_WRK303 19/08/2020 39

Iluka Resources Ltd Planning Permit 15-105: Mineral Sands By-Product Disposal (Pit 23)
EMP and Rehabilitation Performance Report – H2 2020 FINAL (Rev 0)
58
Variable Unit Sample Point Date Result
Alkalinity (Total) as CaCO3 mg/L DG_A_I_PZ_BW45B 19/08/2020 7
Alkalinity (Total) as CaCO3 mg/L DG_A_I_PZ_WRK304 19/08/2020 40
Alkalinity (Total) as CaCO3 mg/L DG_A_I_PZ_WRK302 3/09/2020 90
Alkalinity (Total) as CaCO3 mg/L DG_A_I_PZ_GW04 15/10/2020 23
Alkalinity (Total) as CaCO3 mg/L DG_A_I_PZ_GW04A 30/11/2020 51
Alkalinity (Total) as CaCO3 mg/L DG_A_I_PZ_GW04A 30/12/2020 51
Aluminium (Total) mg/L DG_A_I_PZ_GW07 2/07/2020 0.07
Aluminium (Total) mg/L DG_A_I_PZ_GW03 2/07/2020 0.05
Aluminium (Total) mg/L DG_A_I_PZ_GW02 2/07/2020 0.05
Aluminium (Total) mg/L DG_A_I_PZ_GW08 6/07/2020 0.01 Aluminium (Total) mg/L DG_A_I_PZ_WRK302 6/07/2020 0.22
Aluminium (Total) mg/L DG_A_I_PZ_GW06 6/07/2020 0.26
Aluminium (Total) mg/L DG_A_I_PZ_BW36A 7/07/2020 0.02
Aluminium (Total) mg/L DG_A_I_PZ_GW01 7/07/2020 1.1
Aluminium (Total) mg/L DG_A_I_PZ_BW45B 7/07/2020 9.8
Aluminium (Total) mg/L DG_A_I_PZ_IWB2 8/07/2020 0.11
Aluminium (Total) mg/L DG_A_I_PZ_IWB6 8/07/2020 0.12
Aluminium (Total) mg/L DG_A_I_PZ_BW05 8/07/2020 0.1
Aluminium (Total) mg/L DG_A_I_PZ_BW28A 8/07/2020 0.01 Aluminium (Total) mg/L DG_A_I_PZ_BW53/Puls 9/07/2020 0.17
Aluminium (Total) mg/L DG_A_I_PZ_GW05 9/07/2020 0.01 Aluminium (Total) mg/L DG_A_I_PZ_GW04 9/07/2020 0.02
Aluminium (Total) mg/L DG_A_I_PZ_WRK300 13/07/2020 0.02
Aluminium (Total) mg/L DG_A_I_PZ_WRK303 13/07/2020 0.12
Aluminium (Total) mg/L DG_A_I_PZ_WRK301 13/07/2020 0.22
Aluminium (Total) mg/L DG_A_I_PZ_WRK304 14/07/2020 0.04
Aluminium (Total) mg/L DG_A_I_PZ_GW04 10/08/2020 0.02
Aluminium (Total) mg/L DG_A_I_PZ_BW28A 10/08/2020 0.01 Aluminium (Total) mg/L DG_A_I_PZ_GW02 10/08/2020 0.02
Aluminium (Total) mg/L DG_A_I_PZ_GW01 10/08/2020 0.97
Aluminium (Total) mg/L DG_A_I_PZ_BW36A 17/08/2020 0.02
Aluminium (Total) mg/L DG_A_I_PZ_BW53/Puls 17/08/2020 2.7
Aluminium (Total) mg/L DG_A_I_PZ_GW05 17/08/2020 0.01 Aluminium (Total) mg/L DG_A_I_PZ_WRK303 19/08/2020 0.02
Aluminium (Total) mg/L DG_A_I_PZ_BW45B 19/08/2020 0.43
Aluminium (Total) mg/L DG_A_I_PZ_WRK304 19/08/2020 0.1
Aluminium (Total) mg/L DG_A_I_PZ_WRK302 3/09/2020 0.25
Aluminium (Total) mg/L DG_A_I_PZ_GW04 15/10/2020 0.02
Aluminium (Total) mg/L DG_A_I_PZ_GW04A 30/11/2020 0.01 Aluminium (Total) mg/L DG_A_I_PZ_GW04A 30/12/2020 0.01 Ammonia Nitrogen mg/L DG_A_I_PZ_GW07 2/07/2020 0.46
Ammonia Nitrogen mg/L DG_A_I_PZ_GW03 2/07/2020 0.02 Ammonia Nitrogen mg/L DG_A_I_PZ_GW02 2/07/2020 0.02 Ammonia Nitrogen mg/L DG_A_I_PZ_GW08 6/07/2020 0.02

Iluka Resources Ltd Planning Permit 15-105: Mineral Sands By-Product Disposal (Pit 23)
EMP and Rehabilitation Performance Report – H2 2020 FINAL (Rev 0)
59
Variable Unit Sample Point Date Result
Ammonia Nitrogen mg/L DG_A_I_PZ_WRK302 6/07/2020 0.02 Ammonia Nitrogen mg/L DG_A_I_PZ_GW06 6/07/2020 0.02 Ammonia Nitrogen mg/L DG_A_I_PZ_BW36A 7/07/2020 0.054
Ammonia Nitrogen mg/L DG_A_I_PZ_GW01 7/07/2020 0.02 Ammonia Nitrogen mg/L DG_A_I_PZ_BW45B 7/07/2020 0.02 Ammonia Nitrogen mg/L DG_A_I_PZ_IWB2 8/07/2020 0.004 Ammonia Nitrogen mg/L DG_A_I_PZ_IWB6 8/07/2020 0.013
Ammonia Nitrogen mg/L DG_A_I_PZ_BW05 8/07/2020 0.02 Ammonia Nitrogen mg/L DG_A_I_PZ_BW28A 8/07/2020 0.02 Ammonia Nitrogen mg/L DG_A_I_PZ_BW53/Puls 9/07/2020 6.9
Ammonia Nitrogen mg/L DG_A_I_PZ_GW05 9/07/2020 0.02 Ammonia Nitrogen mg/L DG_A_I_PZ_GW04 9/07/2020 0.02 Ammonia Nitrogen mg/L DG_A_I_PZ_WRK300 13/07/2020 0.02 Ammonia Nitrogen mg/L DG_A_I_PZ_WRK303 13/07/2020 0.02 Ammonia Nitrogen mg/L DG_A_I_PZ_WRK301 13/07/2020 0.02 Ammonia Nitrogen mg/L DG_A_I_PZ_WRK304 14/07/2020 0.02 Ammonia Nitrogen mg/L DG_A_I_PZ_GW04 10/08/2020 0.02 Ammonia Nitrogen mg/L DG_A_I_PZ_BW28A 10/08/2020 0.068
Ammonia Nitrogen mg/L DG_A_I_PZ_GW02 10/08/2020 0.045
Ammonia Nitrogen mg/L DG_A_I_PZ_GW01 10/08/2020 0.02 Ammonia Nitrogen mg/L DG_A_I_PZ_BW36A 17/08/2020 1
Ammonia Nitrogen mg/L DG_A_I_PZ_BW53/Puls 17/08/2020 1.2
Ammonia Nitrogen mg/L DG_A_I_PZ_GW05 17/08/2020 0.11
Ammonia Nitrogen mg/L DG_A_I_PZ_WRK303 19/08/2020 0.082
Ammonia Nitrogen mg/L DG_A_I_PZ_BW45B 19/08/2020 0.041
Ammonia Nitrogen mg/L DG_A_I_PZ_WRK304 19/08/2020 0.02 Ammonia Nitrogen mg/L DG_A_I_PZ_WRK302 3/09/2020 0.02 Ammonia Nitrogen mg/L DG_A_I_PZ_GW04 15/10/2020 0.022
Ammonia Nitrogen mg/L DG_A_I_PZ_GW04A 30/11/2020 0.004 Ammonia Nitrogen mg/L DG_A_I_PZ_GW04A 30/12/2020 0.004 Anions (Total) meq/L DG_A_I_PZ_GW07 2/07/2020 180
Anions (Total) meq/L DG_A_I_PZ_GW03 2/07/2020 110
Anions (Total) meq/L DG_A_I_PZ_GW02 2/07/2020 70
Anions (Total) meq/L DG_A_I_PZ_GW08 6/07/2020 220
Anions (Total) meq/L DG_A_I_PZ_WRK302 6/07/2020 210
Anions (Total) meq/L DG_A_I_PZ_GW06 6/07/2020 220
Anions (Total) meq/L DG_A_I_PZ_BW36A 7/07/2020 65
Anions (Total) meq/L DG_A_I_PZ_GW01 7/07/2020 100
Anions (Total) meq/L DG_A_I_PZ_BW45B 7/07/2020 170
Anions (Total) meq/L DG_A_I_PZ_IWB2 8/07/2020 36
Anions (Total) meq/L DG_A_I_PZ_IWB6 8/07/2020 15
Anions (Total) meq/L DG_A_I_PZ_BW05 8/07/2020 250
Anions (Total) meq/L DG_A_I_PZ_BW28A 8/07/2020 230
Anions (Total) meq/L DG_A_I_PZ_BW53/Puls 9/07/2020 30

Iluka Resources Ltd Planning Permit 15-105: Mineral Sands By-Product Disposal (Pit 23)
EMP and Rehabilitation Performance Report – H2 2020 FINAL (Rev 0)
60
Variable Unit Sample Point Date Result
Anions (Total) meq/L DG_A_I_PZ_GW05 9/07/2020 90
Anions (Total) meq/L DG_A_I_PZ_GW04 9/07/2020 93
Anions (Total) meq/L DG_A_I_PZ_WRK300 13/07/2020 59
Anions (Total) meq/L DG_A_I_PZ_WRK303 13/07/2020 92
Anions (Total) meq/L DG_A_I_PZ_WRK301 13/07/2020 110
Anions (Total) meq/L DG_A_I_PZ_WRK304 14/07/2020 83
Anions (Total) meq/L DG_A_I_PZ_GW04 10/08/2020 93
Anions (Total) meq/L DG_A_I_PZ_BW28A 10/08/2020 230
Anions (Total) meq/L DG_A_I_PZ_GW02 10/08/2020 69
Anions (Total) meq/L DG_A_I_PZ_GW01 10/08/2020 100
Anions (Total) meq/L DG_A_I_PZ_BW36A 17/08/2020 70
Anions (Total) meq/L DG_A_I_PZ_BW53/Puls 17/08/2020 25
Anions (Total) meq/L DG_A_I_PZ_GW05 17/08/2020 86
Anions (Total) meq/L DG_A_I_PZ_WRK303 19/08/2020 94
Anions (Total) meq/L DG_A_I_PZ_BW45B 19/08/2020 160
Anions (Total) meq/L DG_A_I_PZ_WRK304 19/08/2020 84
Anions (Total) meq/L DG_A_I_PZ_WRK302 3/09/2020 210
Anions (Total) meq/L DG_A_I_PZ_GW04 15/10/2020 95
Anions (Total) meq/L DG_A_I_PZ_GW04A 30/11/2020 74
Anions (Total) meq/L DG_A_I_PZ_GW04A 30/12/2020 74
Antimony (Total) mg/L DG_A_I_PZ_GW07 2/07/2020 0.001 Antimony (Total) mg/L DG_A_I_PZ_GW03 2/07/2020 0.001 Antimony (Total) mg/L DG_A_I_PZ_GW02 2/07/2020 0.001 Antimony (Total) mg/L DG_A_I_PZ_GW08 6/07/2020 0.001 Antimony (Total) mg/L DG_A_I_PZ_WRK302 6/07/2020 0.001 Antimony (Total) mg/L DG_A_I_PZ_GW06 6/07/2020 0.001 Antimony (Total) mg/L DG_A_I_PZ_BW36A 7/07/2020 0.001 Antimony (Total) mg/L DG_A_I_PZ_GW01 7/07/2020 0.001 Antimony (Total) mg/L DG_A_I_PZ_BW45B 7/07/2020 0.001 Antimony (Total) mg/L DG_A_I_PZ_IWB2 8/07/2020 0.001 Antimony (Total) mg/L DG_A_I_PZ_IWB6 8/07/2020 0.001 Antimony (Total) mg/L DG_A_I_PZ_BW05 8/07/2020 0.001 Antimony (Total) mg/L DG_A_I_PZ_BW28A 8/07/2020 0.001 Antimony (Total) mg/L DG_A_I_PZ_BW53/Puls 9/07/2020 0.001 Antimony (Total) mg/L DG_A_I_PZ_GW05 9/07/2020 0.001 Antimony (Total) mg/L DG_A_I_PZ_GW04 9/07/2020 0.001 Antimony (Total) mg/L DG_A_I_PZ_WRK300 13/07/2020 0.001 Antimony (Total) mg/L DG_A_I_PZ_WRK303 13/07/2020 0.001 Antimony (Total) mg/L DG_A_I_PZ_WRK301 13/07/2020 0.001 Antimony (Total) mg/L DG_A_I_PZ_WRK304 14/07/2020 0.001 Antimony (Total) mg/L DG_A_I_PZ_GW04 10/08/2020 0.001 Antimony (Total) mg/L DG_A_I_PZ_BW28A 10/08/2020 0.001 Antimony (Total) mg/L DG_A_I_PZ_GW02 10/08/2020 0.001 Antimony (Total) mg/L DG_A_I_PZ_GW01 10/08/2020 0.001

Iluka Resources Ltd Planning Permit 15-105: Mineral Sands By-Product Disposal (Pit 23)
EMP and Rehabilitation Performance Report – H2 2020 FINAL (Rev 0)
61
Variable Unit Sample Point Date Result
Antimony (Total) mg/L DG_A_I_PZ_BW36A 17/08/2020 0.001 Antimony (Total) mg/L DG_A_I_PZ_BW53/Puls 17/08/2020 0.001 Antimony (Total) mg/L DG_A_I_PZ_GW05 17/08/2020 0.001 Antimony (Total) mg/L DG_A_I_PZ_WRK303 19/08/2020 0.001 Antimony (Total) mg/L DG_A_I_PZ_BW45B 19/08/2020 0.001 Antimony (Total) mg/L DG_A_I_PZ_WRK304 19/08/2020 0.001 Antimony (Total) mg/L DG_A_I_PZ_WRK302 3/09/2020 0.001 Antimony (Total) mg/L DG_A_I_PZ_GW04 15/10/2020 0.015
Antimony (Total) mg/L DG_A_I_PZ_GW04A 30/11/2020 0.001 Antimony (Total) mg/L DG_A_I_PZ_GW04A 30/12/2020 0.001 Arsenic (Total) mg/L DG_A_I_PZ_GW07 2/07/2020 0.002
Arsenic (Total) mg/L DG_A_I_PZ_GW03 2/07/2020 0.013
Arsenic (Total) mg/L DG_A_I_PZ_GW02 2/07/2020 0.001
Arsenic (Total) mg/L DG_A_I_PZ_GW08 6/07/2020 0.001
Arsenic (Total) mg/L DG_A_I_PZ_WRK302 6/07/2020 0.002
Arsenic (Total) mg/L DG_A_I_PZ_GW06 6/07/2020 0.005
Arsenic (Total) mg/L DG_A_I_PZ_BW36A 7/07/2020 0.14
Arsenic (Total) mg/L DG_A_I_PZ_GW01 7/07/2020 0.007
Arsenic (Total) mg/L DG_A_I_PZ_BW45B 7/07/2020 0.007
Arsenic (Total) mg/L DG_A_I_PZ_IWB2 8/07/2020 0.002
Arsenic (Total) mg/L DG_A_I_PZ_IWB6 8/07/2020 0.011
Arsenic (Total) mg/L DG_A_I_PZ_BW05 8/07/2020 0.01
Arsenic (Total) mg/L DG_A_I_PZ_BW28A 8/07/2020 0.65
Arsenic (Total) mg/L DG_A_I_PZ_BW53/Puls 9/07/2020 0.009
Arsenic (Total) mg/L DG_A_I_PZ_GW05 9/07/2020 0.005
Arsenic (Total) mg/L DG_A_I_PZ_GW04 9/07/2020 0.006
Arsenic (Total) mg/L DG_A_I_PZ_WRK300 13/07/2020 0.002
Arsenic (Total) mg/L DG_A_I_PZ_WRK303 13/07/2020 0.002
Arsenic (Total) mg/L DG_A_I_PZ_WRK301 13/07/2020 0.004
Arsenic (Total) mg/L DG_A_I_PZ_WRK304 14/07/2020 0.01
Arsenic (Total) mg/L DG_A_I_PZ_GW04 10/08/2020 0.007
Arsenic (Total) mg/L DG_A_I_PZ_BW28A 10/08/2020 0.73
Arsenic (Total) mg/L DG_A_I_PZ_GW02 10/08/2020 0.002
Arsenic (Total) mg/L DG_A_I_PZ_GW01 10/08/2020 0.009
Arsenic (Total) mg/L DG_A_I_PZ_BW36A 17/08/2020 0.17
Arsenic (Total) mg/L DG_A_I_PZ_BW53/Puls 17/08/2020 0.008
Arsenic (Total) mg/L DG_A_I_PZ_GW05 17/08/2020 0.004
Arsenic (Total) mg/L DG_A_I_PZ_WRK303 19/08/2020 0.002
Arsenic (Total) mg/L DG_A_I_PZ_BW45B 19/08/2020 0.007
Arsenic (Total) mg/L DG_A_I_PZ_WRK304 19/08/2020 0.008
Arsenic (Total) mg/L DG_A_I_PZ_WRK302 3/09/2020 0.004
Arsenic (Total) mg/L DG_A_I_PZ_GW04 15/10/2020 0.006
Arsenic (Total) mg/L DG_A_I_PZ_GW04A 30/11/2020 0.001
Arsenic (Total) mg/L DG_A_I_PZ_GW04A 30/12/2020 0.001

Iluka Resources Ltd Planning Permit 15-105: Mineral Sands By-Product Disposal (Pit 23)
EMP and Rehabilitation Performance Report – H2 2020 FINAL (Rev 0)
62
Variable Unit Sample Point Date Result
Barium (Total) mg/L DG_A_I_PZ_GW07 2/07/2020 0.025
Barium (Total) mg/L DG_A_I_PZ_GW03 2/07/2020 0.013
Barium (Total) mg/L DG_A_I_PZ_GW02 2/07/2020 0.035
Barium (Total) mg/L DG_A_I_PZ_GW08 6/07/2020 0.005
Barium (Total) mg/L DG_A_I_PZ_WRK302 6/07/2020 0.02
Barium (Total) mg/L DG_A_I_PZ_GW06 6/07/2020 0.02
Barium (Total) mg/L DG_A_I_PZ_BW36A 7/07/2020 0.43
Barium (Total) mg/L DG_A_I_PZ_GW01 7/07/2020 0.045
Barium (Total) mg/L DG_A_I_PZ_BW45B 7/07/2020 0.03
Barium (Total) mg/L DG_A_I_PZ_IWB2 8/07/2020 0.003
Barium (Total) mg/L DG_A_I_PZ_IWB6 8/07/2020 0.026
Barium (Total) mg/L DG_A_I_PZ_BW05 8/07/2020 0.029
Barium (Total) mg/L DG_A_I_PZ_BW28A 8/07/2020 0.076
Barium (Total) mg/L DG_A_I_PZ_BW53/Puls 9/07/2020 0.042
Barium (Total) mg/L DG_A_I_PZ_GW05 9/07/2020 0.018
Barium (Total) mg/L DG_A_I_PZ_GW04 9/07/2020 0.024
Barium (Total) mg/L DG_A_I_PZ_WRK300 13/07/2020 0.021
Barium (Total) mg/L DG_A_I_PZ_WRK303 13/07/2020 0.044
Barium (Total) mg/L DG_A_I_PZ_WRK301 13/07/2020 0.011
Barium (Total) mg/L DG_A_I_PZ_WRK304 14/07/2020 0.035
Barium (Total) mg/L DG_A_I_PZ_GW04 10/08/2020 0.022
Barium (Total) mg/L DG_A_I_PZ_BW28A 10/08/2020 0.079
Barium (Total) mg/L DG_A_I_PZ_GW02 10/08/2020 0.037
Barium (Total) mg/L DG_A_I_PZ_GW01 10/08/2020 0.045
Barium (Total) mg/L DG_A_I_PZ_BW36A 17/08/2020 0.45
Barium (Total) mg/L DG_A_I_PZ_BW53/Puls 17/08/2020 0.035
Barium (Total) mg/L DG_A_I_PZ_GW05 17/08/2020 0.014
Barium (Total) mg/L DG_A_I_PZ_WRK303 19/08/2020 0.044
Barium (Total) mg/L DG_A_I_PZ_BW45B 19/08/2020 0.031
Barium (Total) mg/L DG_A_I_PZ_WRK304 19/08/2020 0.036
Barium (Total) mg/L DG_A_I_PZ_WRK302 3/09/2020 0.022
Barium (Total) mg/L DG_A_I_PZ_GW04 15/10/2020 0.022
Barium (Total) mg/L DG_A_I_PZ_GW04A 30/11/2020 0.072
Barium (Total) mg/L DG_A_I_PZ_GW04A 30/12/2020 0.072
Beryllium (Total) mg/L DG_A_I_PZ_GW07 2/07/2020 0.002
Beryllium (Total) mg/L DG_A_I_PZ_GW03 2/07/2020 0.001 Beryllium (Total) mg/L DG_A_I_PZ_GW02 2/07/2020 0.001 Beryllium (Total) mg/L DG_A_I_PZ_GW08 6/07/2020 0.001 Beryllium (Total) mg/L DG_A_I_PZ_WRK302 6/07/2020 0.001
Beryllium (Total) mg/L DG_A_I_PZ_GW06 6/07/2020 0.001 Beryllium (Total) mg/L DG_A_I_PZ_BW36A 7/07/2020 0.001 Beryllium (Total) mg/L DG_A_I_PZ_GW01 7/07/2020 0.011
Beryllium (Total) mg/L DG_A_I_PZ_BW45B 7/07/2020 0.009
Beryllium (Total) mg/L DG_A_I_PZ_IWB2 8/07/2020 0.001
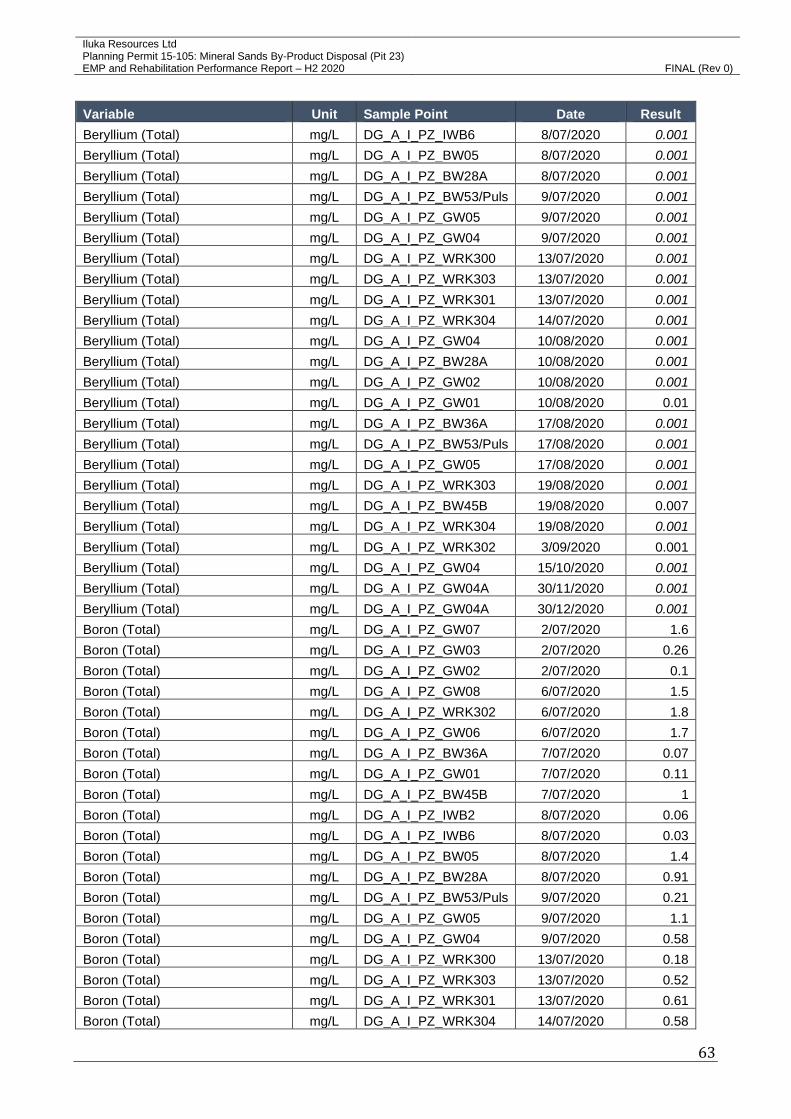
Iluka Resources Ltd Planning Permit 15-105: Mineral Sands By-Product Disposal (Pit 23)
EMP and Rehabilitation Performance Report – H2 2020 FINAL (Rev 0)
63
Variable Unit Sample Point Date Result
Beryllium (Total) mg/L DG_A_I_PZ_IWB6 8/07/2020 0.001 Beryllium (Total) mg/L DG_A_I_PZ_BW05 8/07/2020 0.001 Beryllium (Total) mg/L DG_A_I_PZ_BW28A 8/07/2020 0.001 Beryllium (Total) mg/L DG_A_I_PZ_BW53/Puls 9/07/2020 0.001 Beryllium (Total) mg/L DG_A_I_PZ_GW05 9/07/2020 0.001 Beryllium (Total) mg/L DG_A_I_PZ_GW04 9/07/2020 0.001 Beryllium (Total) mg/L DG_A_I_PZ_WRK300 13/07/2020 0.001 Beryllium (Total) mg/L DG_A_I_PZ_WRK303 13/07/2020 0.001 Beryllium (Total) mg/L DG_A_I_PZ_WRK301 13/07/2020 0.001 Beryllium (Total) mg/L DG_A_I_PZ_WRK304 14/07/2020 0.001 Beryllium (Total) mg/L DG_A_I_PZ_GW04 10/08/2020 0.001 Beryllium (Total) mg/L DG_A_I_PZ_BW28A 10/08/2020 0.001 Beryllium (Total) mg/L DG_A_I_PZ_GW02 10/08/2020 0.001 Beryllium (Total) mg/L DG_A_I_PZ_GW01 10/08/2020 0.01
Beryllium (Total) mg/L DG_A_I_PZ_BW36A 17/08/2020 0.001 Beryllium (Total) mg/L DG_A_I_PZ_BW53/Puls 17/08/2020 0.001 Beryllium (Total) mg/L DG_A_I_PZ_GW05 17/08/2020 0.001 Beryllium (Total) mg/L DG_A_I_PZ_WRK303 19/08/2020 0.001 Beryllium (Total) mg/L DG_A_I_PZ_BW45B 19/08/2020 0.007
Beryllium (Total) mg/L DG_A_I_PZ_WRK304 19/08/2020 0.001 Beryllium (Total) mg/L DG_A_I_PZ_WRK302 3/09/2020 0.001
Beryllium (Total) mg/L DG_A_I_PZ_GW04 15/10/2020 0.001 Beryllium (Total) mg/L DG_A_I_PZ_GW04A 30/11/2020 0.001 Beryllium (Total) mg/L DG_A_I_PZ_GW04A 30/12/2020 0.001 Boron (Total) mg/L DG_A_I_PZ_GW07 2/07/2020 1.6
Boron (Total) mg/L DG_A_I_PZ_GW03 2/07/2020 0.26
Boron (Total) mg/L DG_A_I_PZ_GW02 2/07/2020 0.1
Boron (Total) mg/L DG_A_I_PZ_GW08 6/07/2020 1.5
Boron (Total) mg/L DG_A_I_PZ_WRK302 6/07/2020 1.8
Boron (Total) mg/L DG_A_I_PZ_GW06 6/07/2020 1.7
Boron (Total) mg/L DG_A_I_PZ_BW36A 7/07/2020 0.07
Boron (Total) mg/L DG_A_I_PZ_GW01 7/07/2020 0.11
Boron (Total) mg/L DG_A_I_PZ_BW45B 7/07/2020 1
Boron (Total) mg/L DG_A_I_PZ_IWB2 8/07/2020 0.06
Boron (Total) mg/L DG_A_I_PZ_IWB6 8/07/2020 0.03
Boron (Total) mg/L DG_A_I_PZ_BW05 8/07/2020 1.4
Boron (Total) mg/L DG_A_I_PZ_BW28A 8/07/2020 0.91
Boron (Total) mg/L DG_A_I_PZ_BW53/Puls 9/07/2020 0.21
Boron (Total) mg/L DG_A_I_PZ_GW05 9/07/2020 1.1
Boron (Total) mg/L DG_A_I_PZ_GW04 9/07/2020 0.58
Boron (Total) mg/L DG_A_I_PZ_WRK300 13/07/2020 0.18
Boron (Total) mg/L DG_A_I_PZ_WRK303 13/07/2020 0.52
Boron (Total) mg/L DG_A_I_PZ_WRK301 13/07/2020 0.61
Boron (Total) mg/L DG_A_I_PZ_WRK304 14/07/2020 0.58

Iluka Resources Ltd Planning Permit 15-105: Mineral Sands By-Product Disposal (Pit 23)
EMP and Rehabilitation Performance Report – H2 2020 FINAL (Rev 0)
64
Variable Unit Sample Point Date Result
Boron (Total) mg/L DG_A_I_PZ_GW04 10/08/2020 0.56
Boron (Total) mg/L DG_A_I_PZ_BW28A 10/08/2020 0.87
Boron (Total) mg/L DG_A_I_PZ_GW02 10/08/2020 0.11
Boron (Total) mg/L DG_A_I_PZ_GW01 10/08/2020 0.1
Boron (Total) mg/L DG_A_I_PZ_BW36A 17/08/2020 0.07
Boron (Total) mg/L DG_A_I_PZ_BW53/Puls 17/08/2020 0.18
Boron (Total) mg/L DG_A_I_PZ_GW05 17/08/2020 0.9
Boron (Total) mg/L DG_A_I_PZ_WRK303 19/08/2020 0.56
Boron (Total) mg/L DG_A_I_PZ_BW45B 19/08/2020 1
Boron (Total) mg/L DG_A_I_PZ_WRK304 19/08/2020 0.67
Boron (Total) mg/L DG_A_I_PZ_WRK302 3/09/2020 1.7
Boron (Total) mg/L DG_A_I_PZ_GW04 15/10/2020 0.54
Boron (Total) mg/L DG_A_I_PZ_GW04A 30/11/2020 0.35
Boron (Total) mg/L DG_A_I_PZ_GW04A 30/12/2020 0.35
Cadmium (Total) mg/L DG_A_I_PZ_GW07 2/07/2020 0.0002 Cadmium (Total) mg/L DG_A_I_PZ_GW03 2/07/2020 0.0002 Cadmium (Total) mg/L DG_A_I_PZ_GW02 2/07/2020 0.0002 Cadmium (Total) mg/L DG_A_I_PZ_GW08 6/07/2020 0.0002 Cadmium (Total) mg/L DG_A_I_PZ_WRK302 6/07/2020 0.0002 Cadmium (Total) mg/L DG_A_I_PZ_GW06 6/07/2020 0.0002 Cadmium (Total) mg/L DG_A_I_PZ_BW36A 7/07/2020 0.0002 Cadmium (Total) mg/L DG_A_I_PZ_GW01 7/07/2020 0.0002 Cadmium (Total) mg/L DG_A_I_PZ_BW45B 7/07/2020 0.0002 Cadmium (Total) mg/L DG_A_I_PZ_IWB2 8/07/2020 0.0002 Cadmium (Total) mg/L DG_A_I_PZ_IWB6 8/07/2020 0.0002 Cadmium (Total) mg/L DG_A_I_PZ_BW05 8/07/2020 0.0002 Cadmium (Total) mg/L DG_A_I_PZ_BW28A 8/07/2020 0.0002 Cadmium (Total) mg/L DG_A_I_PZ_BW53/Puls 9/07/2020 0.0002 Cadmium (Total) mg/L DG_A_I_PZ_GW05 9/07/2020 0.0002 Cadmium (Total) mg/L DG_A_I_PZ_GW04 9/07/2020 0.0002 Cadmium (Total) mg/L DG_A_I_PZ_WRK300 13/07/2020 0.0002 Cadmium (Total) mg/L DG_A_I_PZ_WRK303 13/07/2020 0.0002 Cadmium (Total) mg/L DG_A_I_PZ_WRK301 13/07/2020 0.0002 Cadmium (Total) mg/L DG_A_I_PZ_WRK304 14/07/2020 0.0002 Cadmium (Total) mg/L DG_A_I_PZ_GW04 10/08/2020 0.0002 Cadmium (Total) mg/L DG_A_I_PZ_BW28A 10/08/2020 0.0002 Cadmium (Total) mg/L DG_A_I_PZ_GW02 10/08/2020 0.0002 Cadmium (Total) mg/L DG_A_I_PZ_GW01 10/08/2020 0.0002 Cadmium (Total) mg/L DG_A_I_PZ_BW36A 17/08/2020 0.0002 Cadmium (Total) mg/L DG_A_I_PZ_BW53/Puls 17/08/2020 0.0002 Cadmium (Total) mg/L DG_A_I_PZ_GW05 17/08/2020 0.0002 Cadmium (Total) mg/L DG_A_I_PZ_WRK303 19/08/2020 0.0002 Cadmium (Total) mg/L DG_A_I_PZ_BW45B 19/08/2020 0.0002 Cadmium (Total) mg/L DG_A_I_PZ_WRK304 19/08/2020 0.0002

Iluka Resources Ltd Planning Permit 15-105: Mineral Sands By-Product Disposal (Pit 23)
EMP and Rehabilitation Performance Report – H2 2020 FINAL (Rev 0)
65
Variable Unit Sample Point Date Result
Cadmium (Total) mg/L DG_A_I_PZ_WRK302 3/09/2020 0.0002
Cadmium (Total) mg/L DG_A_I_PZ_GW04 15/10/2020 0.0002 Cadmium (Total) mg/L DG_A_I_PZ_GW04A 30/11/2020 0.0002 Cadmium (Total) mg/L DG_A_I_PZ_GW04A 30/12/2020 0.0002 Calcium mg/L DG_A_I_PZ_GW07 2/07/2020 390
Calcium mg/L DG_A_I_PZ_GW03 2/07/2020 170
Calcium mg/L DG_A_I_PZ_GW02 2/07/2020 21
Calcium mg/L DG_A_I_PZ_GW08 6/07/2020 530
Calcium mg/L DG_A_I_PZ_WRK302 6/07/2020 520
Calcium mg/L DG_A_I_PZ_GW06 6/07/2020 590
Calcium mg/L DG_A_I_PZ_BW36A 7/07/2020 120
Calcium mg/L DG_A_I_PZ_GW01 7/07/2020 82
Calcium mg/L DG_A_I_PZ_BW45B 7/07/2020 330
Calcium mg/L DG_A_I_PZ_IWB2 8/07/2020 9.5
Calcium mg/L DG_A_I_PZ_IWB6 8/07/2020 5.9
Calcium mg/L DG_A_I_PZ_BW05 8/07/2020 260
Calcium mg/L DG_A_I_PZ_BW28A 8/07/2020 500
Calcium mg/L DG_A_I_PZ_BW53/Puls 9/07/2020 25
Calcium mg/L DG_A_I_PZ_GW05 9/07/2020 84
Calcium mg/L DG_A_I_PZ_GW04 9/07/2020 130
Calcium mg/L DG_A_I_PZ_WRK300 13/07/2020 140
Calcium mg/L DG_A_I_PZ_WRK303 13/07/2020 150
Calcium mg/L DG_A_I_PZ_WRK301 13/07/2020 260
Calcium mg/L DG_A_I_PZ_WRK304 14/07/2020 110
Calcium mg/L DG_A_I_PZ_GW04 10/08/2020 120
Calcium mg/L DG_A_I_PZ_BW28A 10/08/2020 480
Calcium mg/L DG_A_I_PZ_GW02 10/08/2020 19
Calcium mg/L DG_A_I_PZ_GW01 10/08/2020 78
Calcium mg/L DG_A_I_PZ_BW36A 17/08/2020 110
Calcium mg/L DG_A_I_PZ_BW53/Puls 17/08/2020 27
Calcium mg/L DG_A_I_PZ_GW05 17/08/2020 95
Calcium mg/L DG_A_I_PZ_WRK303 19/08/2020 120
Calcium mg/L DG_A_I_PZ_BW45B 19/08/2020 310
Calcium mg/L DG_A_I_PZ_WRK304 19/08/2020 110
Calcium mg/L DG_A_I_PZ_WRK302 3/09/2020 430
Calcium mg/L DG_A_I_PZ_GW04 15/10/2020 130
Calcium mg/L DG_A_I_PZ_GW04A 30/11/2020 120
Calcium mg/L DG_A_I_PZ_GW04A 30/12/2020 120
Cations (Total) meq/L DG_A_I_PZ_GW07 2/07/2020 180
Cations (Total) meq/L DG_A_I_PZ_GW03 2/07/2020 110
Cations (Total) meq/L DG_A_I_PZ_GW02 2/07/2020 65
Cations (Total) meq/L DG_A_I_PZ_GW08 6/07/2020 220
Cations (Total) meq/L DG_A_I_PZ_WRK302 6/07/2020 210
Cations (Total) meq/L DG_A_I_PZ_GW06 6/07/2020 220
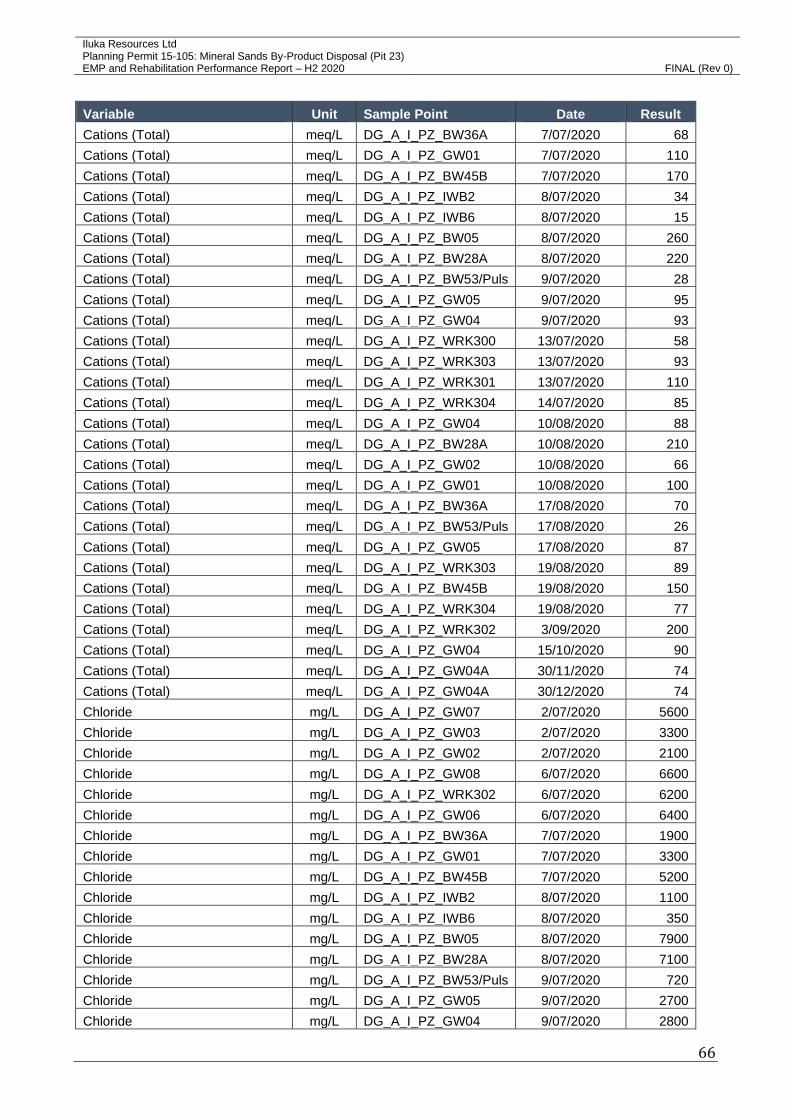
Iluka Resources Ltd Planning Permit 15-105: Mineral Sands By-Product Disposal (Pit 23)
EMP and Rehabilitation Performance Report – H2 2020 FINAL (Rev 0)
66
Variable Unit Sample Point Date Result
Cations (Total) meq/L DG_A_I_PZ_BW36A 7/07/2020 68
Cations (Total) meq/L DG_A_I_PZ_GW01 7/07/2020 110
Cations (Total) meq/L DG_A_I_PZ_BW45B 7/07/2020 170
Cations (Total) meq/L DG_A_I_PZ_IWB2 8/07/2020 34
Cations (Total) meq/L DG_A_I_PZ_IWB6 8/07/2020 15
Cations (Total) meq/L DG_A_I_PZ_BW05 8/07/2020 260
Cations (Total) meq/L DG_A_I_PZ_BW28A 8/07/2020 220
Cations (Total) meq/L DG_A_I_PZ_BW53/Puls 9/07/2020 28
Cations (Total) meq/L DG_A_I_PZ_GW05 9/07/2020 95
Cations (Total) meq/L DG_A_I_PZ_GW04 9/07/2020 93
Cations (Total) meq/L DG_A_I_PZ_WRK300 13/07/2020 58
Cations (Total) meq/L DG_A_I_PZ_WRK303 13/07/2020 93
Cations (Total) meq/L DG_A_I_PZ_WRK301 13/07/2020 110
Cations (Total) meq/L DG_A_I_PZ_WRK304 14/07/2020 85
Cations (Total) meq/L DG_A_I_PZ_GW04 10/08/2020 88
Cations (Total) meq/L DG_A_I_PZ_BW28A 10/08/2020 210
Cations (Total) meq/L DG_A_I_PZ_GW02 10/08/2020 66
Cations (Total) meq/L DG_A_I_PZ_GW01 10/08/2020 100
Cations (Total) meq/L DG_A_I_PZ_BW36A 17/08/2020 70
Cations (Total) meq/L DG_A_I_PZ_BW53/Puls 17/08/2020 26
Cations (Total) meq/L DG_A_I_PZ_GW05 17/08/2020 87
Cations (Total) meq/L DG_A_I_PZ_WRK303 19/08/2020 89
Cations (Total) meq/L DG_A_I_PZ_BW45B 19/08/2020 150
Cations (Total) meq/L DG_A_I_PZ_WRK304 19/08/2020 77
Cations (Total) meq/L DG_A_I_PZ_WRK302 3/09/2020 200
Cations (Total) meq/L DG_A_I_PZ_GW04 15/10/2020 90
Cations (Total) meq/L DG_A_I_PZ_GW04A 30/11/2020 74
Cations (Total) meq/L DG_A_I_PZ_GW04A 30/12/2020 74
Chloride mg/L DG_A_I_PZ_GW07 2/07/2020 5600
Chloride mg/L DG_A_I_PZ_GW03 2/07/2020 3300
Chloride mg/L DG_A_I_PZ_GW02 2/07/2020 2100
Chloride mg/L DG_A_I_PZ_GW08 6/07/2020 6600
Chloride mg/L DG_A_I_PZ_WRK302 6/07/2020 6200
Chloride mg/L DG_A_I_PZ_GW06 6/07/2020 6400
Chloride mg/L DG_A_I_PZ_BW36A 7/07/2020 1900
Chloride mg/L DG_A_I_PZ_GW01 7/07/2020 3300
Chloride mg/L DG_A_I_PZ_BW45B 7/07/2020 5200
Chloride mg/L DG_A_I_PZ_IWB2 8/07/2020 1100
Chloride mg/L DG_A_I_PZ_IWB6 8/07/2020 350
Chloride mg/L DG_A_I_PZ_BW05 8/07/2020 7900
Chloride mg/L DG_A_I_PZ_BW28A 8/07/2020 7100
Chloride mg/L DG_A_I_PZ_BW53/Puls 9/07/2020 720
Chloride mg/L DG_A_I_PZ_GW05 9/07/2020 2700
Chloride mg/L DG_A_I_PZ_GW04 9/07/2020 2800

Iluka Resources Ltd Planning Permit 15-105: Mineral Sands By-Product Disposal (Pit 23)
EMP and Rehabilitation Performance Report – H2 2020 FINAL (Rev 0)
67
Variable Unit Sample Point Date Result
Chloride mg/L DG_A_I_PZ_WRK300 13/07/2020 1700
Chloride mg/L DG_A_I_PZ_WRK303 13/07/2020 2800
Chloride mg/L DG_A_I_PZ_WRK301 13/07/2020 3200
Chloride mg/L DG_A_I_PZ_WRK304 14/07/2020 2400
Chloride mg/L DG_A_I_PZ_GW04 10/08/2020 2800
Chloride mg/L DG_A_I_PZ_BW28A 10/08/2020 7100
Chloride mg/L DG_A_I_PZ_GW02 10/08/2020 2100
Chloride mg/L DG_A_I_PZ_GW01 10/08/2020 3400
Chloride mg/L DG_A_I_PZ_BW36A 17/08/2020 2100
Chloride mg/L DG_A_I_PZ_BW53/Puls 17/08/2020 650
Chloride mg/L DG_A_I_PZ_GW05 17/08/2020 2600
Chloride mg/L DG_A_I_PZ_WRK303 19/08/2020 2900
Chloride mg/L DG_A_I_PZ_BW45B 19/08/2020 5100
Chloride mg/L DG_A_I_PZ_WRK304 19/08/2020 2500
Chloride mg/L DG_A_I_PZ_WRK302 3/09/2020 6300
Chloride mg/L DG_A_I_PZ_GW04 15/10/2020 2800
Chloride mg/L DG_A_I_PZ_GW04A 30/11/2020 2300
Chloride mg/L DG_A_I_PZ_GW04A 30/12/2020 2300
Chloride:Sulfate Ratio DG_A_I_PZ_GW07 2/07/2020 5.96
Chloride:Sulfate Ratio DG_A_I_PZ_GW03 2/07/2020 5.79
Chloride:Sulfate Ratio DG_A_I_PZ_GW02 2/07/2020 5
Chloride:Sulfate Ratio DG_A_I_PZ_GW08 6/07/2020 5.08
Chloride:Sulfate Ratio DG_A_I_PZ_WRK302 6/07/2020 4.43
Chloride:Sulfate Ratio DG_A_I_PZ_GW06 6/07/2020 4.27
Chloride:Sulfate Ratio DG_A_I_PZ_GW01 7/07/2020 6.6
Chloride:Sulfate Ratio DG_A_I_PZ_BW45B 7/07/2020 5.78
Chloride:Sulfate Ratio DG_A_I_PZ_IWB2 8/07/2020 7.33
Chloride:Sulfate Ratio DG_A_I_PZ_IWB6 8/07/2020 1.75
Chloride:Sulfate Ratio DG_A_I_PZ_BW05 8/07/2020 8.98
Chloride:Sulfate Ratio DG_A_I_PZ_BW28A 8/07/2020 7.72
Chloride:Sulfate Ratio DG_A_I_PZ_BW53/Puls 9/07/2020 2.12
Chloride:Sulfate Ratio DG_A_I_PZ_GW05 9/07/2020 4.22
Chloride:Sulfate Ratio DG_A_I_PZ_GW04 9/07/2020 4.52
Chloride:Sulfate Ratio DG_A_I_PZ_WRK300 13/07/2020 5.31
Chloride:Sulfate Ratio DG_A_I_PZ_WRK303 13/07/2020 4.83
Chloride:Sulfate Ratio DG_A_I_PZ_WRK301 13/07/2020 5.33
Chloride:Sulfate Ratio DG_A_I_PZ_WRK304 14/07/2020 3.69
Chloride:Sulfate Ratio DG_A_I_PZ_GW04 10/08/2020 4.67
Chloride:Sulfate Ratio DG_A_I_PZ_BW28A 10/08/2020 8.16
Chloride:Sulfate Ratio DG_A_I_PZ_GW02 10/08/2020 5.68
Chloride:Sulfate Ratio DG_A_I_PZ_GW01 10/08/2020 7.73
Chloride:Sulfate Ratio DG_A_I_PZ_BW53/Puls 17/08/2020 2.41
Chloride:Sulfate Ratio DG_A_I_PZ_GW05 17/08/2020 4.41
Chloride:Sulfate Ratio DG_A_I_PZ_WRK303 19/08/2020 4.92

Iluka Resources Ltd Planning Permit 15-105: Mineral Sands By-Product Disposal (Pit 23)
EMP and Rehabilitation Performance Report – H2 2020 FINAL (Rev 0)
68
Variable Unit Sample Point Date Result
Chloride:Sulfate Ratio DG_A_I_PZ_BW45B 19/08/2020 6.3
Chloride:Sulfate Ratio DG_A_I_PZ_WRK304 19/08/2020 3.91
Chloride:Sulfate Ratio DG_A_I_PZ_WRK302 3/09/2020 4.5
Chloride:Sulfate Ratio DG_A_I_PZ_GW04 15/10/2020 4.18
Chromium (Total) mg/L DG_A_I_PZ_GW07 2/07/2020 0.009
Chromium (Total) mg/L DG_A_I_PZ_GW03 2/07/2020 0.002
Chromium (Total) mg/L DG_A_I_PZ_GW02 2/07/2020 0.002
Chromium (Total) mg/L DG_A_I_PZ_GW08 6/07/2020 0.001 Chromium (Total) mg/L DG_A_I_PZ_WRK302 6/07/2020 0.001 Chromium (Total) mg/L DG_A_I_PZ_GW06 6/07/2020 0.001 Chromium (Total) mg/L DG_A_I_PZ_BW36A 7/07/2020 0.001 Chromium (Total) mg/L DG_A_I_PZ_GW01 7/07/2020 0.005
Chromium (Total) mg/L DG_A_I_PZ_BW45B 7/07/2020 0.002
Chromium (Total) mg/L DG_A_I_PZ_IWB2 8/07/2020 0.001 Chromium (Total) mg/L DG_A_I_PZ_IWB6 8/07/2020 0.003
Chromium (Total) mg/L DG_A_I_PZ_BW05 8/07/2020 0.001 Chromium (Total) mg/L DG_A_I_PZ_BW28A 8/07/2020 0.001 Chromium (Total) mg/L DG_A_I_PZ_BW53/Puls 9/07/2020 0.001 Chromium (Total) mg/L DG_A_I_PZ_GW05 9/07/2020 0.001 Chromium (Total) mg/L DG_A_I_PZ_GW04 9/07/2020 0.001 Chromium (Total) mg/L DG_A_I_PZ_WRK300 13/07/2020 0.001 Chromium (Total) mg/L DG_A_I_PZ_WRK303 13/07/2020 0.001 Chromium (Total) mg/L DG_A_I_PZ_WRK301 13/07/2020 0.001 Chromium (Total) mg/L DG_A_I_PZ_WRK304 14/07/2020 0.026
Chromium (Total) mg/L DG_A_I_PZ_GW04 10/08/2020 0.003
Chromium (Total) mg/L DG_A_I_PZ_BW28A 10/08/2020 0.001 Chromium (Total) mg/L DG_A_I_PZ_GW02 10/08/2020 0.001 Chromium (Total) mg/L DG_A_I_PZ_GW01 10/08/2020 0.006
Chromium (Total) mg/L DG_A_I_PZ_BW36A 17/08/2020 0.001 Chromium (Total) mg/L DG_A_I_PZ_BW53/Puls 17/08/2020 0.003
Chromium (Total) mg/L DG_A_I_PZ_GW05 17/08/2020 0.002
Chromium (Total) mg/L DG_A_I_PZ_WRK303 19/08/2020 0.004
Chromium (Total) mg/L DG_A_I_PZ_BW45B 19/08/2020 0.001 Chromium (Total) mg/L DG_A_I_PZ_WRK304 19/08/2020 0.026
Chromium (Total) mg/L DG_A_I_PZ_WRK302 3/09/2020 0.001 Chromium (Total) mg/L DG_A_I_PZ_GW04 15/10/2020 0.003
Chromium (Total) mg/L DG_A_I_PZ_GW04A 30/11/2020 0.001 Chromium (Total) mg/L DG_A_I_PZ_GW04A 30/12/2020 0.001 Cobalt (Total) mg/L DG_A_I_PZ_GW07 2/07/2020 0.027
Cobalt (Total) mg/L DG_A_I_PZ_GW03 2/07/2020 0.005
Cobalt (Total) mg/L DG_A_I_PZ_GW02 2/07/2020 0.017
Cobalt (Total) mg/L DG_A_I_PZ_GW08 6/07/2020 0.001 Cobalt (Total) mg/L DG_A_I_PZ_WRK302 6/07/2020 0.027
Cobalt (Total) mg/L DG_A_I_PZ_GW06 6/07/2020 0.002
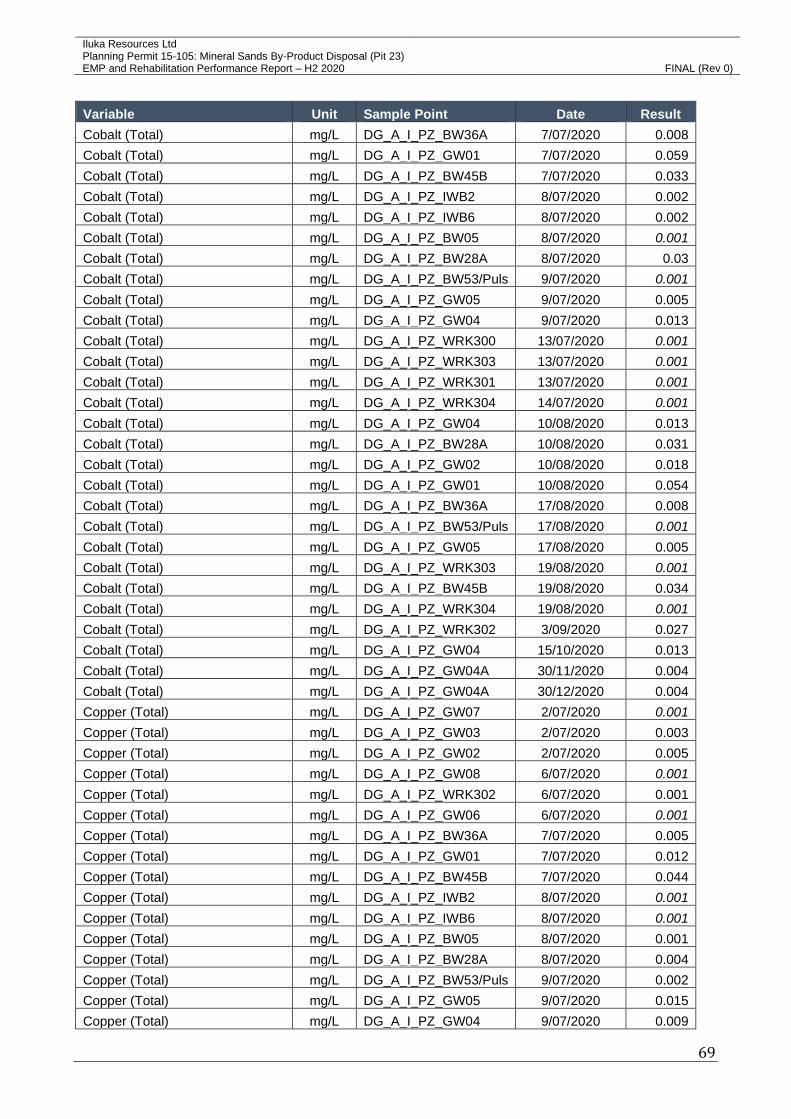
Iluka Resources Ltd Planning Permit 15-105: Mineral Sands By-Product Disposal (Pit 23)
EMP and Rehabilitation Performance Report – H2 2020 FINAL (Rev 0)
69
Variable Unit Sample Point Date Result
Cobalt (Total) mg/L DG_A_I_PZ_BW36A 7/07/2020 0.008
Cobalt (Total) mg/L DG_A_I_PZ_GW01 7/07/2020 0.059
Cobalt (Total) mg/L DG_A_I_PZ_BW45B 7/07/2020 0.033
Cobalt (Total) mg/L DG_A_I_PZ_IWB2 8/07/2020 0.002
Cobalt (Total) mg/L DG_A_I_PZ_IWB6 8/07/2020 0.002
Cobalt (Total) mg/L DG_A_I_PZ_BW05 8/07/2020 0.001 Cobalt (Total) mg/L DG_A_I_PZ_BW28A 8/07/2020 0.03
Cobalt (Total) mg/L DG_A_I_PZ_BW53/Puls 9/07/2020 0.001 Cobalt (Total) mg/L DG_A_I_PZ_GW05 9/07/2020 0.005
Cobalt (Total) mg/L DG_A_I_PZ_GW04 9/07/2020 0.013
Cobalt (Total) mg/L DG_A_I_PZ_WRK300 13/07/2020 0.001 Cobalt (Total) mg/L DG_A_I_PZ_WRK303 13/07/2020 0.001 Cobalt (Total) mg/L DG_A_I_PZ_WRK301 13/07/2020 0.001 Cobalt (Total) mg/L DG_A_I_PZ_WRK304 14/07/2020 0.001 Cobalt (Total) mg/L DG_A_I_PZ_GW04 10/08/2020 0.013
Cobalt (Total) mg/L DG_A_I_PZ_BW28A 10/08/2020 0.031
Cobalt (Total) mg/L DG_A_I_PZ_GW02 10/08/2020 0.018
Cobalt (Total) mg/L DG_A_I_PZ_GW01 10/08/2020 0.054
Cobalt (Total) mg/L DG_A_I_PZ_BW36A 17/08/2020 0.008
Cobalt (Total) mg/L DG_A_I_PZ_BW53/Puls 17/08/2020 0.001 Cobalt (Total) mg/L DG_A_I_PZ_GW05 17/08/2020 0.005
Cobalt (Total) mg/L DG_A_I_PZ_WRK303 19/08/2020 0.001 Cobalt (Total) mg/L DG_A_I_PZ_BW45B 19/08/2020 0.034
Cobalt (Total) mg/L DG_A_I_PZ_WRK304 19/08/2020 0.001 Cobalt (Total) mg/L DG_A_I_PZ_WRK302 3/09/2020 0.027
Cobalt (Total) mg/L DG_A_I_PZ_GW04 15/10/2020 0.013
Cobalt (Total) mg/L DG_A_I_PZ_GW04A 30/11/2020 0.004
Cobalt (Total) mg/L DG_A_I_PZ_GW04A 30/12/2020 0.004
Copper (Total) mg/L DG_A_I_PZ_GW07 2/07/2020 0.001 Copper (Total) mg/L DG_A_I_PZ_GW03 2/07/2020 0.003
Copper (Total) mg/L DG_A_I_PZ_GW02 2/07/2020 0.005
Copper (Total) mg/L DG_A_I_PZ_GW08 6/07/2020 0.001 Copper (Total) mg/L DG_A_I_PZ_WRK302 6/07/2020 0.001
Copper (Total) mg/L DG_A_I_PZ_GW06 6/07/2020 0.001 Copper (Total) mg/L DG_A_I_PZ_BW36A 7/07/2020 0.005
Copper (Total) mg/L DG_A_I_PZ_GW01 7/07/2020 0.012
Copper (Total) mg/L DG_A_I_PZ_BW45B 7/07/2020 0.044
Copper (Total) mg/L DG_A_I_PZ_IWB2 8/07/2020 0.001 Copper (Total) mg/L DG_A_I_PZ_IWB6 8/07/2020 0.001 Copper (Total) mg/L DG_A_I_PZ_BW05 8/07/2020 0.001
Copper (Total) mg/L DG_A_I_PZ_BW28A 8/07/2020 0.004
Copper (Total) mg/L DG_A_I_PZ_BW53/Puls 9/07/2020 0.002
Copper (Total) mg/L DG_A_I_PZ_GW05 9/07/2020 0.015
Copper (Total) mg/L DG_A_I_PZ_GW04 9/07/2020 0.009

Iluka Resources Ltd Planning Permit 15-105: Mineral Sands By-Product Disposal (Pit 23)
EMP and Rehabilitation Performance Report – H2 2020 FINAL (Rev 0)
70
Variable Unit Sample Point Date Result
Copper (Total) mg/L DG_A_I_PZ_WRK300 13/07/2020 0.012
Copper (Total) mg/L DG_A_I_PZ_WRK303 13/07/2020 0.013
Copper (Total) mg/L DG_A_I_PZ_WRK301 13/07/2020 0.006
Copper (Total) mg/L DG_A_I_PZ_WRK304 14/07/2020 0.004
Copper (Total) mg/L DG_A_I_PZ_GW04 10/08/2020 0.011
Copper (Total) mg/L DG_A_I_PZ_BW28A 10/08/2020 0.001 Copper (Total) mg/L DG_A_I_PZ_GW02 10/08/2020 0.002
Copper (Total) mg/L DG_A_I_PZ_GW01 10/08/2020 0.014
Copper (Total) mg/L DG_A_I_PZ_BW36A 17/08/2020 0.006
Copper (Total) mg/L DG_A_I_PZ_BW53/Puls 17/08/2020 0.003
Copper (Total) mg/L DG_A_I_PZ_GW05 17/08/2020 0.016
Copper (Total) mg/L DG_A_I_PZ_WRK303 19/08/2020 0.007
Copper (Total) mg/L DG_A_I_PZ_BW45B 19/08/2020 0.029
Copper (Total) mg/L DG_A_I_PZ_WRK304 19/08/2020 0.004
Copper (Total) mg/L DG_A_I_PZ_WRK302 3/09/2020 0.002
Copper (Total) mg/L DG_A_I_PZ_GW04 15/10/2020 0.008
Copper (Total) mg/L DG_A_I_PZ_GW04A 30/11/2020 0.001 Copper (Total) mg/L DG_A_I_PZ_GW04A 30/12/2020 0.001 Dissolved Oxygen mg/L DG_A_I_PZ_GW07 2/07/2020 9.3
Dissolved Oxygen mg/L DG_A_I_PZ_GW03 2/07/2020 0.1
Dissolved Oxygen mg/L DG_A_I_PZ_GW02 2/07/2020 2.3
Dissolved Oxygen mg/L DG_A_I_PZ_GW08 6/07/2020 5.6
Dissolved Oxygen mg/L DG_A_I_PZ_WRK302 6/07/2020 6.6
Dissolved Oxygen mg/L DG_A_I_PZ_GW06 6/07/2020 8.7
Dissolved Oxygen mg/L DG_A_I_PZ_BW36A 7/07/2020 0.1
Dissolved Oxygen mg/L DG_A_I_PZ_GW01 7/07/2020 4.6
Dissolved Oxygen mg/L DG_A_I_PZ_BW45B 7/07/2020 0.2
Dissolved Oxygen mg/L DG_A_I_PZ_IWB2 8/07/2020 0
Dissolved Oxygen mg/L DG_A_I_PZ_IWB6 8/07/2020 3.3
Dissolved Oxygen mg/L DG_A_I_PZ_BW05 8/07/2020 0
Dissolved Oxygen mg/L DG_A_I_PZ_BW28A 8/07/2020 0
Dissolved Oxygen mg/L DG_A_I_PZ_BW53/Puls 9/07/2020 0.5
Dissolved Oxygen mg/L DG_A_I_PZ_GW05 9/07/2020 0.5
Dissolved Oxygen mg/L DG_A_I_PZ_GW04 9/07/2020 6.4
Dissolved Oxygen mg/L DG_A_I_PZ_WRK300 13/07/2020 1
Dissolved Oxygen mg/L DG_A_I_PZ_WRK303 13/07/2020 7.8
Dissolved Oxygen mg/L DG_A_I_PZ_WRK301 13/07/2020 0.9
Dissolved Oxygen mg/L DG_A_I_PZ_WRK304 14/07/2020 9.6
Dissolved Oxygen mg/L DG_A_I_PZ_BW28A 10/08/2020 0
Dissolved Oxygen mg/L DG_A_I_PZ_GW02 10/08/2020 0.7
Dissolved Oxygen mg/L DG_A_I_PZ_GW01 10/08/2020 4.7
Dissolved Oxygen mg/L DG_A_I_PZ_GW04 10/08/2020 6.3
Dissolved Oxygen mg/L DG_A_I_PZ_BW53/Puls 17/08/2020 0.2
Dissolved Oxygen mg/L DG_A_I_PZ_GW05 17/08/2020 0.3
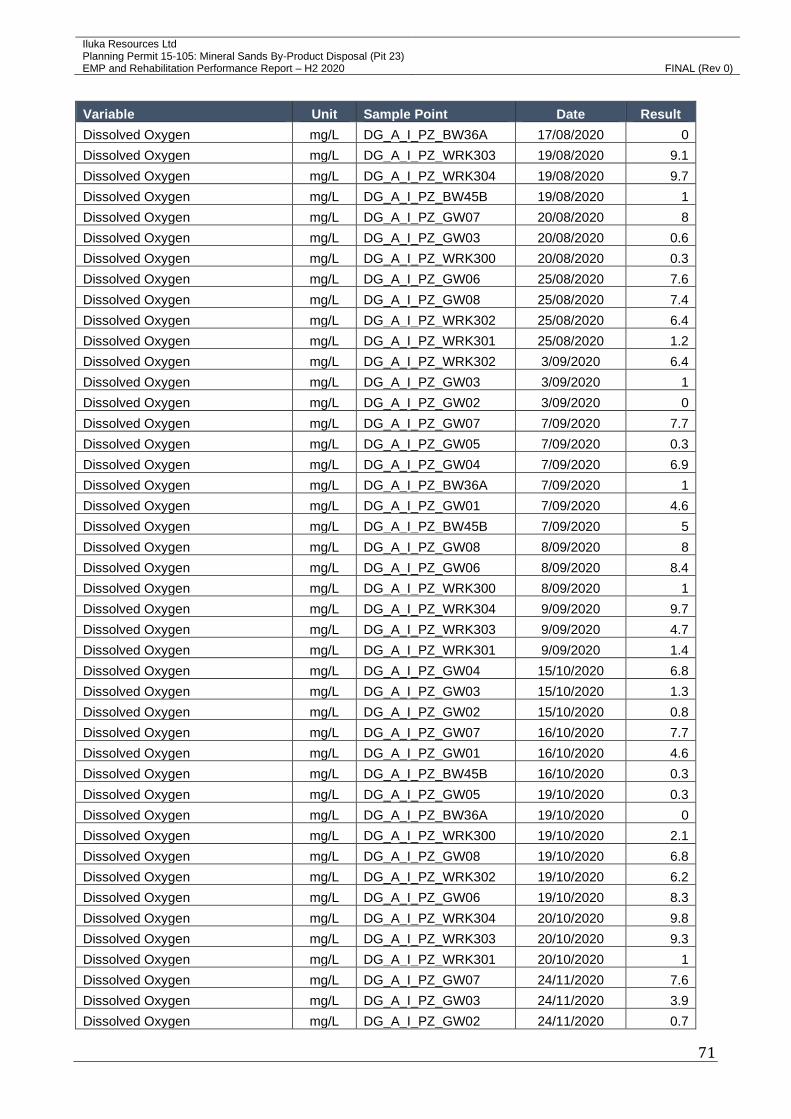
Iluka Resources Ltd Planning Permit 15-105: Mineral Sands By-Product Disposal (Pit 23)
EMP and Rehabilitation Performance Report – H2 2020 FINAL (Rev 0)
71
Variable Unit Sample Point Date Result
Dissolved Oxygen mg/L DG_A_I_PZ_BW36A 17/08/2020 0
Dissolved Oxygen mg/L DG_A_I_PZ_WRK303 19/08/2020 9.1
Dissolved Oxygen mg/L DG_A_I_PZ_WRK304 19/08/2020 9.7
Dissolved Oxygen mg/L DG_A_I_PZ_BW45B 19/08/2020 1
Dissolved Oxygen mg/L DG_A_I_PZ_GW07 20/08/2020 8
Dissolved Oxygen mg/L DG_A_I_PZ_GW03 20/08/2020 0.6
Dissolved Oxygen mg/L DG_A_I_PZ_WRK300 20/08/2020 0.3
Dissolved Oxygen mg/L DG_A_I_PZ_GW06 25/08/2020 7.6
Dissolved Oxygen mg/L DG_A_I_PZ_GW08 25/08/2020 7.4
Dissolved Oxygen mg/L DG_A_I_PZ_WRK302 25/08/2020 6.4
Dissolved Oxygen mg/L DG_A_I_PZ_WRK301 25/08/2020 1.2
Dissolved Oxygen mg/L DG_A_I_PZ_WRK302 3/09/2020 6.4
Dissolved Oxygen mg/L DG_A_I_PZ_GW03 3/09/2020 1
Dissolved Oxygen mg/L DG_A_I_PZ_GW02 3/09/2020 0
Dissolved Oxygen mg/L DG_A_I_PZ_GW07 7/09/2020 7.7
Dissolved Oxygen mg/L DG_A_I_PZ_GW05 7/09/2020 0.3
Dissolved Oxygen mg/L DG_A_I_PZ_GW04 7/09/2020 6.9
Dissolved Oxygen mg/L DG_A_I_PZ_BW36A 7/09/2020 1
Dissolved Oxygen mg/L DG_A_I_PZ_GW01 7/09/2020 4.6
Dissolved Oxygen mg/L DG_A_I_PZ_BW45B 7/09/2020 5
Dissolved Oxygen mg/L DG_A_I_PZ_GW08 8/09/2020 8
Dissolved Oxygen mg/L DG_A_I_PZ_GW06 8/09/2020 8.4
Dissolved Oxygen mg/L DG_A_I_PZ_WRK300 8/09/2020 1
Dissolved Oxygen mg/L DG_A_I_PZ_WRK304 9/09/2020 9.7
Dissolved Oxygen mg/L DG_A_I_PZ_WRK303 9/09/2020 4.7
Dissolved Oxygen mg/L DG_A_I_PZ_WRK301 9/09/2020 1.4
Dissolved Oxygen mg/L DG_A_I_PZ_GW04 15/10/2020 6.8
Dissolved Oxygen mg/L DG_A_I_PZ_GW03 15/10/2020 1.3
Dissolved Oxygen mg/L DG_A_I_PZ_GW02 15/10/2020 0.8
Dissolved Oxygen mg/L DG_A_I_PZ_GW07 16/10/2020 7.7
Dissolved Oxygen mg/L DG_A_I_PZ_GW01 16/10/2020 4.6
Dissolved Oxygen mg/L DG_A_I_PZ_BW45B 16/10/2020 0.3
Dissolved Oxygen mg/L DG_A_I_PZ_GW05 19/10/2020 0.3
Dissolved Oxygen mg/L DG_A_I_PZ_BW36A 19/10/2020 0
Dissolved Oxygen mg/L DG_A_I_PZ_WRK300 19/10/2020 2.1
Dissolved Oxygen mg/L DG_A_I_PZ_GW08 19/10/2020 6.8
Dissolved Oxygen mg/L DG_A_I_PZ_WRK302 19/10/2020 6.2
Dissolved Oxygen mg/L DG_A_I_PZ_GW06 19/10/2020 8.3
Dissolved Oxygen mg/L DG_A_I_PZ_WRK304 20/10/2020 9.8
Dissolved Oxygen mg/L DG_A_I_PZ_WRK303 20/10/2020 9.3
Dissolved Oxygen mg/L DG_A_I_PZ_WRK301 20/10/2020 1
Dissolved Oxygen mg/L DG_A_I_PZ_GW07 24/11/2020 7.6
Dissolved Oxygen mg/L DG_A_I_PZ_GW03 24/11/2020 3.9
Dissolved Oxygen mg/L DG_A_I_PZ_GW02 24/11/2020 0.7

Iluka Resources Ltd Planning Permit 15-105: Mineral Sands By-Product Disposal (Pit 23)
EMP and Rehabilitation Performance Report – H2 2020 FINAL (Rev 0)
72
Variable Unit Sample Point Date Result
Dissolved Oxygen mg/L DG_A_I_PZ_GW01 24/11/2020 5
Dissolved Oxygen mg/L DG_A_I_PZ_BW45B 24/11/2020 1
Dissolved Oxygen mg/L DG_A_I_PZ_GW04 25/11/2020 7
Dissolved Oxygen mg/L DG_A_I_PZ_GW05 25/11/2020 0.7
Dissolved Oxygen mg/L DG_A_I_PZ_BW36A 25/11/2020 1
Dissolved Oxygen mg/L DG_A_I_PZ_WRK300 25/11/2020 1.4
Dissolved Oxygen mg/L DG_A_I_PZ_GW08 26/11/2020 7.2
Dissolved Oxygen mg/L DG_A_I_PZ_WRK302 26/11/2020 6.1
Dissolved Oxygen mg/L DG_A_I_PZ_GW06 26/11/2020 8.3
Dissolved Oxygen mg/L DG_A_I_PZ_GW04A 30/11/2020 4.3
Dissolved Oxygen mg/L DG_A_I_PZ_WRK304 30/11/2020 10.2
Dissolved Oxygen mg/L DG_A_I_PZ_WRK303 30/11/2020 7
Dissolved Oxygen mg/L DG_A_I_PZ_WRK301 30/11/2020 1
Dissolved Oxygen mg/L DG_A_I_PZ_GW05 4/12/2020 0
Dissolved Oxygen mg/L DG_A_I_PZ_GW07 8/12/2020 7.8
Dissolved Oxygen mg/L DG_A_I_PZ_GW03 8/12/2020 4.8
Dissolved Oxygen mg/L DG_A_I_PZ_GW02 8/12/2020 0.6
Dissolved Oxygen mg/L DG_A_I_PZ_BW45B 9/12/2020 1.2
Dissolved Oxygen mg/L DG_A_I_PZ_GW01 9/12/2020 5.4
Dissolved Oxygen mg/L DG_A_I_PZ_GW04 9/12/2020 8
Dissolved Oxygen mg/L DG_A_I_PZ_BW36A 9/12/2020 0
Dissolved Oxygen mg/L DG_A_I_PZ_GW04A 10/12/2020 3
Dissolved Oxygen mg/L DG_A_I_PZ_GW08 10/12/2020 7
Dissolved Oxygen mg/L DG_A_I_PZ_WRK302 10/12/2020 6.8
Dissolved Oxygen mg/L DG_A_I_PZ_GW06 10/12/2020 6.8
Dissolved Oxygen mg/L DG_A_I_PZ_WRK304 14/12/2020 8
Dissolved Oxygen mg/L DG_A_I_PZ_WRK303 14/12/2020 8.1
Dissolved Oxygen mg/L DG_A_I_PZ_WRK301 14/12/2020 6.7
Dissolved Oxygen mg/L DG_A_I_PZ_WRK300 14/12/2020 2.5
Dissolved Oxygen Field % DG_A_I_PZ_GW07 2/07/2020 95
Dissolved Oxygen Field % DG_A_I_PZ_GW03 2/07/2020 9
Dissolved Oxygen Field % DG_A_I_PZ_GW02 2/07/2020 30
Dissolved Oxygen Field % DG_A_I_PZ_GW08 6/07/2020 59
Dissolved Oxygen Field % DG_A_I_PZ_WRK302 6/07/2020 74
Dissolved Oxygen Field % DG_A_I_PZ_GW06 6/07/2020 92
Dissolved Oxygen Field % DG_A_I_PZ_BW36A 7/07/2020 9
Dissolved Oxygen Field % DG_A_I_PZ_GW01 7/07/2020 47
Dissolved Oxygen Field % DG_A_I_PZ_BW45B 7/07/2020 4
Dissolved Oxygen Field % DG_A_I_PZ_IWB2 8/07/2020 0
Dissolved Oxygen Field % DG_A_I_PZ_IWB6 8/07/2020 35
Dissolved Oxygen Field % DG_A_I_PZ_BW05 8/07/2020 0
Dissolved Oxygen Field % DG_A_I_PZ_BW28A 8/07/2020 0
Dissolved Oxygen Field % DG_A_I_PZ_BW53/Puls 9/07/2020 4
Dissolved Oxygen Field % DG_A_I_PZ_GW05 9/07/2020 2
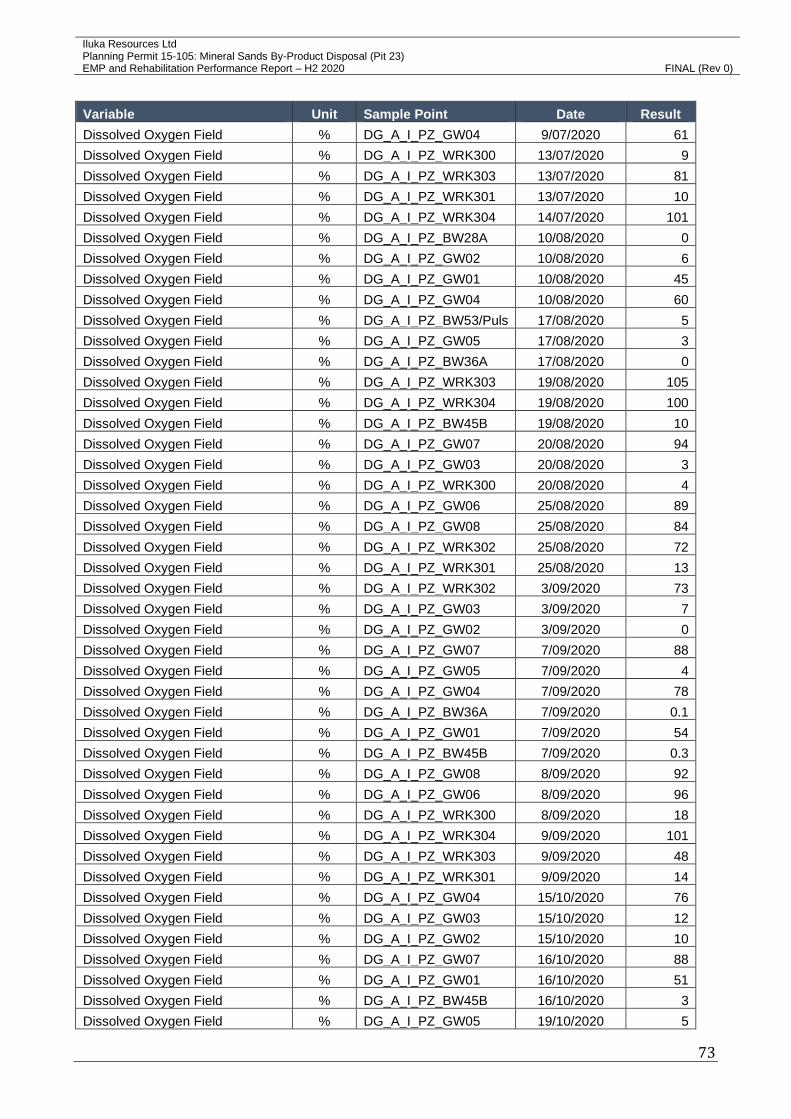
Iluka Resources Ltd Planning Permit 15-105: Mineral Sands By-Product Disposal (Pit 23)
EMP and Rehabilitation Performance Report – H2 2020 FINAL (Rev 0)
73
Variable Unit Sample Point Date Result
Dissolved Oxygen Field % DG_A_I_PZ_GW04 9/07/2020 61
Dissolved Oxygen Field % DG_A_I_PZ_WRK300 13/07/2020 9
Dissolved Oxygen Field % DG_A_I_PZ_WRK303 13/07/2020 81
Dissolved Oxygen Field % DG_A_I_PZ_WRK301 13/07/2020 10
Dissolved Oxygen Field % DG_A_I_PZ_WRK304 14/07/2020 101
Dissolved Oxygen Field % DG_A_I_PZ_BW28A 10/08/2020 0
Dissolved Oxygen Field % DG_A_I_PZ_GW02 10/08/2020 6
Dissolved Oxygen Field % DG_A_I_PZ_GW01 10/08/2020 45
Dissolved Oxygen Field % DG_A_I_PZ_GW04 10/08/2020 60
Dissolved Oxygen Field % DG_A_I_PZ_BW53/Puls 17/08/2020 5
Dissolved Oxygen Field % DG_A_I_PZ_GW05 17/08/2020 3
Dissolved Oxygen Field % DG_A_I_PZ_BW36A 17/08/2020 0
Dissolved Oxygen Field % DG_A_I_PZ_WRK303 19/08/2020 105
Dissolved Oxygen Field % DG_A_I_PZ_WRK304 19/08/2020 100
Dissolved Oxygen Field % DG_A_I_PZ_BW45B 19/08/2020 10
Dissolved Oxygen Field % DG_A_I_PZ_GW07 20/08/2020 94
Dissolved Oxygen Field % DG_A_I_PZ_GW03 20/08/2020 3
Dissolved Oxygen Field % DG_A_I_PZ_WRK300 20/08/2020 4
Dissolved Oxygen Field % DG_A_I_PZ_GW06 25/08/2020 89
Dissolved Oxygen Field % DG_A_I_PZ_GW08 25/08/2020 84
Dissolved Oxygen Field % DG_A_I_PZ_WRK302 25/08/2020 72
Dissolved Oxygen Field % DG_A_I_PZ_WRK301 25/08/2020 13
Dissolved Oxygen Field % DG_A_I_PZ_WRK302 3/09/2020 73
Dissolved Oxygen Field % DG_A_I_PZ_GW03 3/09/2020 7
Dissolved Oxygen Field % DG_A_I_PZ_GW02 3/09/2020 0
Dissolved Oxygen Field % DG_A_I_PZ_GW07 7/09/2020 88
Dissolved Oxygen Field % DG_A_I_PZ_GW05 7/09/2020 4
Dissolved Oxygen Field % DG_A_I_PZ_GW04 7/09/2020 78
Dissolved Oxygen Field % DG_A_I_PZ_BW36A 7/09/2020 0.1
Dissolved Oxygen Field % DG_A_I_PZ_GW01 7/09/2020 54
Dissolved Oxygen Field % DG_A_I_PZ_BW45B 7/09/2020 0.3
Dissolved Oxygen Field % DG_A_I_PZ_GW08 8/09/2020 92
Dissolved Oxygen Field % DG_A_I_PZ_GW06 8/09/2020 96
Dissolved Oxygen Field % DG_A_I_PZ_WRK300 8/09/2020 18
Dissolved Oxygen Field % DG_A_I_PZ_WRK304 9/09/2020 101
Dissolved Oxygen Field % DG_A_I_PZ_WRK303 9/09/2020 48
Dissolved Oxygen Field % DG_A_I_PZ_WRK301 9/09/2020 14
Dissolved Oxygen Field % DG_A_I_PZ_GW04 15/10/2020 76
Dissolved Oxygen Field % DG_A_I_PZ_GW03 15/10/2020 12
Dissolved Oxygen Field % DG_A_I_PZ_GW02 15/10/2020 10
Dissolved Oxygen Field % DG_A_I_PZ_GW07 16/10/2020 88
Dissolved Oxygen Field % DG_A_I_PZ_GW01 16/10/2020 51
Dissolved Oxygen Field % DG_A_I_PZ_BW45B 16/10/2020 3
Dissolved Oxygen Field % DG_A_I_PZ_GW05 19/10/2020 5

Iluka Resources Ltd Planning Permit 15-105: Mineral Sands By-Product Disposal (Pit 23)
EMP and Rehabilitation Performance Report – H2 2020 FINAL (Rev 0)
74
Variable Unit Sample Point Date Result
Dissolved Oxygen Field % DG_A_I_PZ_BW36A 19/10/2020 0
Dissolved Oxygen Field % DG_A_I_PZ_WRK300 19/10/2020 28
Dissolved Oxygen Field % DG_A_I_PZ_GW08 19/10/2020 79
Dissolved Oxygen Field % DG_A_I_PZ_WRK302 19/10/2020 70
Dissolved Oxygen Field % DG_A_I_PZ_GW06 19/10/2020 95
Dissolved Oxygen Field % DG_A_I_PZ_WRK304 20/10/2020 106
Dissolved Oxygen Field % DG_A_I_PZ_WRK303 20/10/2020 106
Dissolved Oxygen Field % DG_A_I_PZ_WRK301 20/10/2020 9
Dissolved Oxygen Field % DG_A_I_PZ_GW07 24/11/2020 88
Dissolved Oxygen Field % DG_A_I_PZ_GW03 24/11/2020 42
Dissolved Oxygen Field % DG_A_I_PZ_GW02 24/11/2020 9
Dissolved Oxygen Field % DG_A_I_PZ_GW01 24/11/2020 59
Dissolved Oxygen Field % DG_A_I_PZ_BW45B 24/11/2020 9
Dissolved Oxygen Field % DG_A_I_PZ_GW04 25/11/2020 86
Dissolved Oxygen Field % DG_A_I_PZ_GW05 25/11/2020 8
Dissolved Oxygen Field % DG_A_I_PZ_BW36A 25/11/2020 0.2
Dissolved Oxygen Field % DG_A_I_PZ_WRK300 25/11/2020 23
Dissolved Oxygen Field % DG_A_I_PZ_GW08 26/11/2020 74
Dissolved Oxygen Field % DG_A_I_PZ_WRK302 26/11/2020 70
Dissolved Oxygen Field % DG_A_I_PZ_GW06 26/11/2020 87
Dissolved Oxygen Field % DG_A_I_PZ_GW04A 30/11/2020 39
Dissolved Oxygen Field % DG_A_I_PZ_WRK304 30/11/2020 115
Dissolved Oxygen Field % DG_A_I_PZ_WRK303 30/11/2020 82
Dissolved Oxygen Field % DG_A_I_PZ_WRK301 30/11/2020 11
Dissolved Oxygen Field % DG_A_I_PZ_GW05 4/12/2020 0
Dissolved Oxygen Field % DG_A_I_PZ_GW07 8/12/2020 102
Dissolved Oxygen Field % DG_A_I_PZ_GW03 8/12/2020 52
Dissolved Oxygen Field % DG_A_I_PZ_GW02 8/12/2020 7
Dissolved Oxygen Field % DG_A_I_PZ_BW45B 9/12/2020 14
Dissolved Oxygen Field % DG_A_I_PZ_GW01 9/12/2020 54
Dissolved Oxygen Field % DG_A_I_PZ_GW04 9/12/2020 95
Dissolved Oxygen Field % DG_A_I_PZ_BW36A 9/12/2020 0
Dissolved Oxygen Field % DG_A_I_PZ_GW04A 10/12/2020 27
Dissolved Oxygen Field % DG_A_I_PZ_GW08 10/12/2020 77
Dissolved Oxygen Field % DG_A_I_PZ_WRK302 10/12/2020 77
Dissolved Oxygen Field % DG_A_I_PZ_GW06 10/12/2020 79
Dissolved Oxygen Field % DG_A_I_PZ_WRK304 14/12/2020 103
Dissolved Oxygen Field % DG_A_I_PZ_WRK303 14/12/2020 78
Dissolved Oxygen Field % DG_A_I_PZ_WRK301 14/12/2020 56
Dissolved Oxygen Field % DG_A_I_PZ_WRK300 14/12/2020 30
Electrical Conductivity µS/cm DG_A_I_PZ_GW07 2/07/2020 17000
Electrical Conductivity µS/cm DG_A_I_PZ_GW07 2/07/2020 17000
Electrical Conductivity µS/cm DG_A_I_PZ_GW03 2/07/2020 11000
Electrical Conductivity µS/cm DG_A_I_PZ_GW03 2/07/2020 11000

Iluka Resources Ltd Planning Permit 15-105: Mineral Sands By-Product Disposal (Pit 23)
EMP and Rehabilitation Performance Report – H2 2020 FINAL (Rev 0)
75
Variable Unit Sample Point Date Result
Electrical Conductivity µS/cm DG_A_I_PZ_GW02 2/07/2020 7300
Electrical Conductivity µS/cm DG_A_I_PZ_GW02 2/07/2020 7300
Electrical Conductivity µS/cm DG_A_I_PZ_GW08 6/07/2020 20000
Electrical Conductivity µS/cm DG_A_I_PZ_GW08 6/07/2020 20000
Electrical Conductivity µS/cm DG_A_I_PZ_WRK302 6/07/2020 20000
Electrical Conductivity µS/cm DG_A_I_PZ_WRK302 6/07/2020 20000
Electrical Conductivity µS/cm DG_A_I_PZ_GW06 6/07/2020 20000
Electrical Conductivity µS/cm DG_A_I_PZ_GW06 6/07/2020 20000
Electrical Conductivity µS/cm DG_A_I_PZ_BW36A 7/07/2020 6900
Electrical Conductivity µS/cm DG_A_I_PZ_BW36A 7/07/2020 6900
Electrical Conductivity µS/cm DG_A_I_PZ_GW01 7/07/2020 11000
Electrical Conductivity µS/cm DG_A_I_PZ_GW01 7/07/2020 11000
Electrical Conductivity µS/cm DG_A_I_PZ_BW45B 7/07/2020 16000
Electrical Conductivity µS/cm DG_A_I_PZ_BW45B 7/07/2020 16000
Electrical Conductivity µS/cm DG_A_I_PZ_IWB2 8/07/2020 4000
Electrical Conductivity µS/cm DG_A_I_PZ_IWB2 8/07/2020 4000
Electrical Conductivity µS/cm DG_A_I_PZ_IWB6 8/07/2020 1700
Electrical Conductivity µS/cm DG_A_I_PZ_IWB6 8/07/2020 1700
Electrical Conductivity µS/cm DG_A_I_PZ_BW05 8/07/2020 23000
Electrical Conductivity µS/cm DG_A_I_PZ_BW05 8/07/2020 23000
Electrical Conductivity µS/cm DG_A_I_PZ_BW28A 8/07/2020 21000
Electrical Conductivity µS/cm DG_A_I_PZ_BW28A 8/07/2020 21000
Electrical Conductivity µS/cm DG_A_I_PZ_BW53/Puls 9/07/2020 3000
Electrical Conductivity µS/cm DG_A_I_PZ_BW53/Puls 9/07/2020 3000
Electrical Conductivity µS/cm DG_A_I_PZ_GW05 9/07/2020 9000
Electrical Conductivity µS/cm DG_A_I_PZ_GW05 9/07/2020 9000
Electrical Conductivity µS/cm DG_A_I_PZ_GW04 9/07/2020 9500
Electrical Conductivity µS/cm DG_A_I_PZ_GW04 9/07/2020 9500
Electrical Conductivity µS/cm DG_A_I_PZ_WRK300 13/07/2020 6100
Electrical Conductivity µS/cm DG_A_I_PZ_WRK300 13/07/2020 6100
Electrical Conductivity µS/cm DG_A_I_PZ_WRK303 13/07/2020 9300
Electrical Conductivity µS/cm DG_A_I_PZ_WRK303 13/07/2020 9300
Electrical Conductivity µS/cm DG_A_I_PZ_WRK301 13/07/2020 11000
Electrical Conductivity µS/cm DG_A_I_PZ_WRK301 13/07/2020 11000
Electrical Conductivity µS/cm DG_A_I_PZ_WRK304 14/07/2020 8700
Electrical Conductivity µS/cm DG_A_I_PZ_WRK304 14/07/2020 8700
Electrical Conductivity µS/cm DG_A_I_PZ_GW04 10/08/2020 9200
Electrical Conductivity µS/cm DG_A_I_PZ_BW28A 10/08/2020 21000
Electrical Conductivity µS/cm DG_A_I_PZ_BW28A 10/08/2020 21000
Electrical Conductivity µS/cm DG_A_I_PZ_GW02 10/08/2020 7300
Electrical Conductivity µS/cm DG_A_I_PZ_GW02 10/08/2020 7300
Electrical Conductivity µS/cm DG_A_I_PZ_GW01 10/08/2020 11000
Electrical Conductivity µS/cm DG_A_I_PZ_GW01 10/08/2020 11000
Electrical Conductivity µS/cm DG_A_I_PZ_GW04 10/08/2020 9200

Iluka Resources Ltd Planning Permit 15-105: Mineral Sands By-Product Disposal (Pit 23)
EMP and Rehabilitation Performance Report – H2 2020 FINAL (Rev 0)
76
Variable Unit Sample Point Date Result
Electrical Conductivity µS/cm DG_A_I_PZ_BW36A 17/08/2020 7000
Electrical Conductivity µS/cm DG_A_I_PZ_BW53/Puls 17/08/2020 2700
Electrical Conductivity µS/cm DG_A_I_PZ_BW53/Puls 17/08/2020 2700
Electrical Conductivity µS/cm DG_A_I_PZ_GW05 17/08/2020 8900
Electrical Conductivity µS/cm DG_A_I_PZ_GW05 17/08/2020 8900
Electrical Conductivity µS/cm DG_A_I_PZ_BW36A 17/08/2020 7000
Electrical Conductivity µS/cm DG_A_I_PZ_WRK303 19/08/2020 9500
Electrical Conductivity µS/cm DG_A_I_PZ_WRK303 19/08/2020 9500
Electrical Conductivity µS/cm DG_A_I_PZ_BW45B 19/08/2020 16000
Electrical Conductivity µS/cm DG_A_I_PZ_WRK304 19/08/2020 8600
Electrical Conductivity µS/cm DG_A_I_PZ_WRK304 19/08/2020 8600
Electrical Conductivity µS/cm DG_A_I_PZ_BW45B 19/08/2020 16000
Electrical Conductivity µS/cm DG_A_I_PZ_GW07 20/08/2020 18888
Electrical Conductivity µS/cm DG_A_I_PZ_GW03 20/08/2020 11713
Electrical Conductivity µS/cm DG_A_I_PZ_WRK300 20/08/2020 6517
Electrical Conductivity µS/cm DG_A_I_PZ_GW06 25/08/2020 21691
Electrical Conductivity µS/cm DG_A_I_PZ_GW08 25/08/2020 21616
Electrical Conductivity µS/cm DG_A_I_PZ_WRK302 25/08/2020 21011
Electrical Conductivity µS/cm DG_A_I_PZ_WRK301 25/08/2020 11417
Electrical Conductivity µS/cm DG_A_I_PZ_WRK302 3/09/2020 20000
Electrical Conductivity µS/cm DG_A_I_PZ_WRK302 3/09/2020 20000
Electrical Conductivity µS/cm DG_A_I_PZ_GW03 3/09/2020 11486
Electrical Conductivity µS/cm DG_A_I_PZ_GW02 3/09/2020 7765
Electrical Conductivity µS/cm DG_A_I_PZ_GW07 7/09/2020 18900
Electrical Conductivity µS/cm DG_A_I_PZ_GW05 7/09/2020 9557
Electrical Conductivity µS/cm DG_A_I_PZ_GW04 7/09/2020 10023
Electrical Conductivity µS/cm DG_A_I_PZ_BW36A 7/09/2020 7812
Electrical Conductivity µS/cm DG_A_I_PZ_GW01 7/09/2020 11659
Electrical Conductivity µS/cm DG_A_I_PZ_BW45B 7/09/2020 17457
Electrical Conductivity µS/cm DG_A_I_PZ_GW08 8/09/2020 21795
Electrical Conductivity µS/cm DG_A_I_PZ_GW06 8/09/2020 21757
Electrical Conductivity µS/cm DG_A_I_PZ_WRK300 8/09/2020 6545
Electrical Conductivity µS/cm DG_A_I_PZ_WRK304 9/09/2020 10383
Electrical Conductivity µS/cm DG_A_I_PZ_WRK303 9/09/2020 9736
Electrical Conductivity µS/cm DG_A_I_PZ_WRK301 9/09/2020 11665
Electrical Conductivity µS/cm DG_A_I_PZ_GW04 15/10/2020 9600
Electrical Conductivity µS/cm DG_A_I_PZ_GW04 15/10/2020 9600
Electrical Conductivity µS/cm DG_A_I_PZ_GW03 15/10/2020 10785
Electrical Conductivity µS/cm DG_A_I_PZ_GW02 15/10/2020 7252
Electrical Conductivity µS/cm DG_A_I_PZ_GW07 16/10/2020 17593
Electrical Conductivity µS/cm DG_A_I_PZ_GW01 16/10/2020 10850
Electrical Conductivity µS/cm DG_A_I_PZ_BW45B 16/10/2020 16373
Electrical Conductivity µS/cm DG_A_I_PZ_GW05 19/10/2020 8917
Electrical Conductivity µS/cm DG_A_I_PZ_BW36A 19/10/2020 7550

Iluka Resources Ltd Planning Permit 15-105: Mineral Sands By-Product Disposal (Pit 23)
EMP and Rehabilitation Performance Report – H2 2020 FINAL (Rev 0)
77
Variable Unit Sample Point Date Result
Electrical Conductivity µS/cm DG_A_I_PZ_WRK300 19/10/2020 5980
Electrical Conductivity µS/cm DG_A_I_PZ_GW08 19/10/2020 20280
Electrical Conductivity µS/cm DG_A_I_PZ_WRK302 19/10/2020 19542
Electrical Conductivity µS/cm DG_A_I_PZ_GW06 19/10/2020 20316
Electrical Conductivity µS/cm DG_A_I_PZ_WRK304 20/10/2020 9239
Electrical Conductivity µS/cm DG_A_I_PZ_WRK303 20/10/2020 9518
Electrical Conductivity µS/cm DG_A_I_PZ_WRK301 20/10/2020 10424
Electrical Conductivity µS/cm DG_A_I_PZ_GW07 24/11/2020 18801
Electrical Conductivity µS/cm DG_A_I_PZ_GW03 24/11/2020 11404
Electrical Conductivity µS/cm DG_A_I_PZ_GW02 24/11/2020 7775
Electrical Conductivity µS/cm DG_A_I_PZ_GW01 24/11/2020 11598
Electrical Conductivity µS/cm DG_A_I_PZ_BW45B 24/11/2020 17600
Electrical Conductivity µS/cm DG_A_I_PZ_GW04 25/11/2020 10037
Electrical Conductivity µS/cm DG_A_I_PZ_GW05 25/11/2020 9663
Electrical Conductivity µS/cm DG_A_I_PZ_BW36A 25/11/2020 8359
Electrical Conductivity µS/cm DG_A_I_PZ_WRK300 25/11/2020 6515
Electrical Conductivity µS/cm DG_A_I_PZ_GW08 26/11/2020 21486
Electrical Conductivity µS/cm DG_A_I_PZ_WRK302 26/11/2020 20873
Electrical Conductivity µS/cm DG_A_I_PZ_GW06 26/11/2020 21679
Electrical Conductivity µS/cm DG_A_I_PZ_GW04A 30/11/2020 8100
Electrical Conductivity µS/cm DG_A_I_PZ_GW04A 30/11/2020 8100
Electrical Conductivity µS/cm DG_A_I_PZ_WRK304 30/11/2020 9412
Electrical Conductivity µS/cm DG_A_I_PZ_WRK303 30/11/2020 10092
Electrical Conductivity µS/cm DG_A_I_PZ_WRK301 30/11/2020 12865
Electrical Conductivity µS/cm DG_A_I_PZ_GW05 4/12/2020 9439
Electrical Conductivity µS/cm DG_A_I_PZ_GW07 8/12/2020 18327
Electrical Conductivity µS/cm DG_A_I_PZ_GW03 8/12/2020 11213
Electrical Conductivity µS/cm DG_A_I_PZ_GW02 8/12/2020 7628
Electrical Conductivity µS/cm DG_A_I_PZ_BW45B 9/12/2020 17042
Electrical Conductivity µS/cm DG_A_I_PZ_GW01 9/12/2020 11241
Electrical Conductivity µS/cm DG_A_I_PZ_GW04 9/12/2020 9756
Electrical Conductivity µS/cm DG_A_I_PZ_BW36A 9/12/2020 8250
Electrical Conductivity µS/cm DG_A_I_PZ_GW04A 10/12/2020 8279
Electrical Conductivity µS/cm DG_A_I_PZ_GW08 10/12/2020 21180
Electrical Conductivity µS/cm DG_A_I_PZ_WRK302 10/12/2020 20254
Electrical Conductivity µS/cm DG_A_I_PZ_GW06 10/12/2020 21063
Electrical Conductivity µS/cm DG_A_I_PZ_WRK304 14/12/2020 9205
Electrical Conductivity µS/cm DG_A_I_PZ_WRK303 14/12/2020 10143
Electrical Conductivity µS/cm DG_A_I_PZ_WRK301 14/12/2020 11410
Electrical Conductivity µS/cm DG_A_I_PZ_WRK300 14/12/2020 6346
Electrical Conductivity µS/cm DG_A_I_PZ_GW04A 30/12/2020 8100
Fluoride mg/L DG_A_I_PZ_GW07 2/07/2020 0.36
Fluoride mg/L DG_A_I_PZ_GW03 2/07/2020 0.24
Fluoride mg/L DG_A_I_PZ_GW02 2/07/2020 0.1
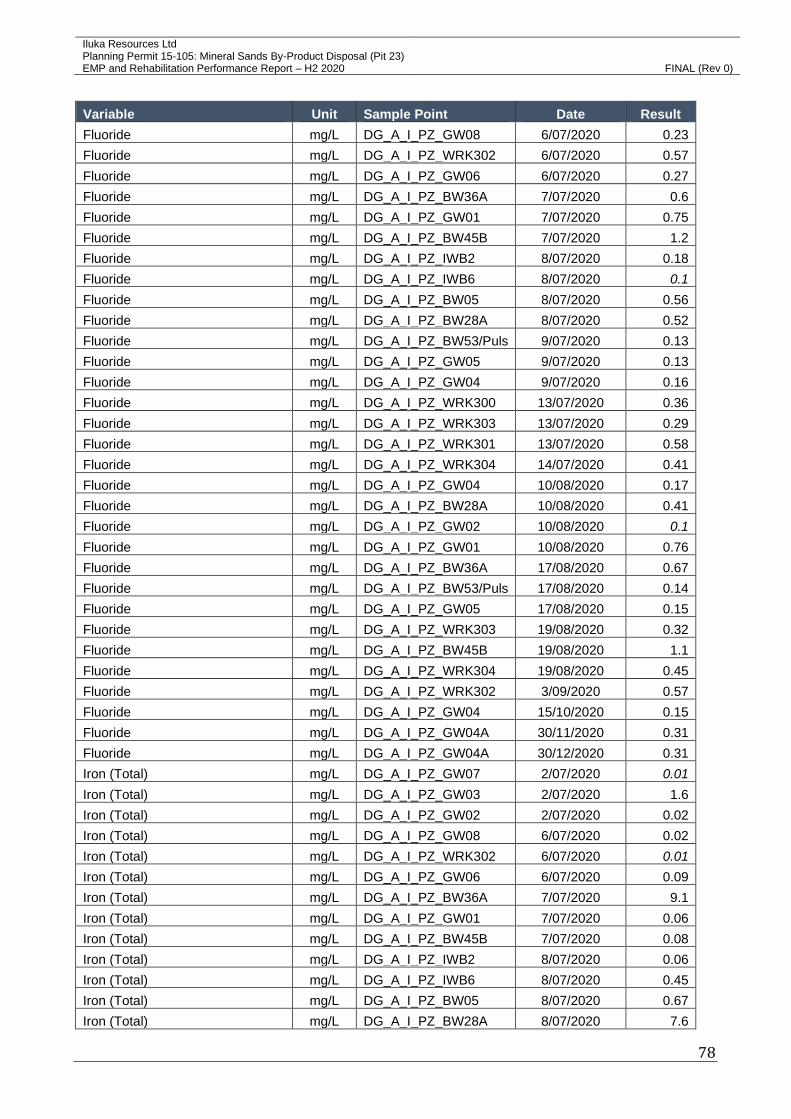
Iluka Resources Ltd Planning Permit 15-105: Mineral Sands By-Product Disposal (Pit 23)
EMP and Rehabilitation Performance Report – H2 2020 FINAL (Rev 0)
78
Variable Unit Sample Point Date Result
Fluoride mg/L DG_A_I_PZ_GW08 6/07/2020 0.23
Fluoride mg/L DG_A_I_PZ_WRK302 6/07/2020 0.57
Fluoride mg/L DG_A_I_PZ_GW06 6/07/2020 0.27
Fluoride mg/L DG_A_I_PZ_BW36A 7/07/2020 0.6
Fluoride mg/L DG_A_I_PZ_GW01 7/07/2020 0.75
Fluoride mg/L DG_A_I_PZ_BW45B 7/07/2020 1.2
Fluoride mg/L DG_A_I_PZ_IWB2 8/07/2020 0.18
Fluoride mg/L DG_A_I_PZ_IWB6 8/07/2020 0.1 Fluoride mg/L DG_A_I_PZ_BW05 8/07/2020 0.56
Fluoride mg/L DG_A_I_PZ_BW28A 8/07/2020 0.52
Fluoride mg/L DG_A_I_PZ_BW53/Puls 9/07/2020 0.13
Fluoride mg/L DG_A_I_PZ_GW05 9/07/2020 0.13
Fluoride mg/L DG_A_I_PZ_GW04 9/07/2020 0.16
Fluoride mg/L DG_A_I_PZ_WRK300 13/07/2020 0.36
Fluoride mg/L DG_A_I_PZ_WRK303 13/07/2020 0.29
Fluoride mg/L DG_A_I_PZ_WRK301 13/07/2020 0.58
Fluoride mg/L DG_A_I_PZ_WRK304 14/07/2020 0.41
Fluoride mg/L DG_A_I_PZ_GW04 10/08/2020 0.17
Fluoride mg/L DG_A_I_PZ_BW28A 10/08/2020 0.41
Fluoride mg/L DG_A_I_PZ_GW02 10/08/2020 0.1 Fluoride mg/L DG_A_I_PZ_GW01 10/08/2020 0.76
Fluoride mg/L DG_A_I_PZ_BW36A 17/08/2020 0.67
Fluoride mg/L DG_A_I_PZ_BW53/Puls 17/08/2020 0.14
Fluoride mg/L DG_A_I_PZ_GW05 17/08/2020 0.15
Fluoride mg/L DG_A_I_PZ_WRK303 19/08/2020 0.32
Fluoride mg/L DG_A_I_PZ_BW45B 19/08/2020 1.1
Fluoride mg/L DG_A_I_PZ_WRK304 19/08/2020 0.45
Fluoride mg/L DG_A_I_PZ_WRK302 3/09/2020 0.57
Fluoride mg/L DG_A_I_PZ_GW04 15/10/2020 0.15
Fluoride mg/L DG_A_I_PZ_GW04A 30/11/2020 0.31
Fluoride mg/L DG_A_I_PZ_GW04A 30/12/2020 0.31
Iron (Total) mg/L DG_A_I_PZ_GW07 2/07/2020 0.01 Iron (Total) mg/L DG_A_I_PZ_GW03 2/07/2020 1.6
Iron (Total) mg/L DG_A_I_PZ_GW02 2/07/2020 0.02
Iron (Total) mg/L DG_A_I_PZ_GW08 6/07/2020 0.02
Iron (Total) mg/L DG_A_I_PZ_WRK302 6/07/2020 0.01 Iron (Total) mg/L DG_A_I_PZ_GW06 6/07/2020 0.09
Iron (Total) mg/L DG_A_I_PZ_BW36A 7/07/2020 9.1
Iron (Total) mg/L DG_A_I_PZ_GW01 7/07/2020 0.06
Iron (Total) mg/L DG_A_I_PZ_BW45B 7/07/2020 0.08
Iron (Total) mg/L DG_A_I_PZ_IWB2 8/07/2020 0.06
Iron (Total) mg/L DG_A_I_PZ_IWB6 8/07/2020 0.45
Iron (Total) mg/L DG_A_I_PZ_BW05 8/07/2020 0.67
Iron (Total) mg/L DG_A_I_PZ_BW28A 8/07/2020 7.6

Iluka Resources Ltd Planning Permit 15-105: Mineral Sands By-Product Disposal (Pit 23)
EMP and Rehabilitation Performance Report – H2 2020 FINAL (Rev 0)
79
Variable Unit Sample Point Date Result
Iron (Total) mg/L DG_A_I_PZ_BW53/Puls 9/07/2020 0.45
Iron (Total) mg/L DG_A_I_PZ_GW05 9/07/2020 0.01 Iron (Total) mg/L DG_A_I_PZ_GW04 9/07/2020 0.01 Iron (Total) mg/L DG_A_I_PZ_WRK300 13/07/2020 0.01 Iron (Total) mg/L DG_A_I_PZ_WRK303 13/07/2020 0.02
Iron (Total) mg/L DG_A_I_PZ_WRK301 13/07/2020 0.04
Iron (Total) mg/L DG_A_I_PZ_WRK304 14/07/2020 0.06
Iron (Total) mg/L DG_A_I_PZ_GW04 10/08/2020 0.01 Iron (Total) mg/L DG_A_I_PZ_BW28A 10/08/2020 5.4
Iron (Total) mg/L DG_A_I_PZ_GW02 10/08/2020 0.04
Iron (Total) mg/L DG_A_I_PZ_GW01 10/08/2020 0.05
Iron (Total) mg/L DG_A_I_PZ_BW36A 17/08/2020 11
Iron (Total) mg/L DG_A_I_PZ_BW53/Puls 17/08/2020 0.53
Iron (Total) mg/L DG_A_I_PZ_GW05 17/08/2020 0.01
Iron (Total) mg/L DG_A_I_PZ_WRK303 19/08/2020 0.01 Iron (Total) mg/L DG_A_I_PZ_BW45B 19/08/2020 0.05
Iron (Total) mg/L DG_A_I_PZ_WRK304 19/08/2020 0.11
Iron (Total) mg/L DG_A_I_PZ_WRK302 3/09/2020 0.01
Iron (Total) mg/L DG_A_I_PZ_GW04 15/10/2020 0.01
Iron (Total) mg/L DG_A_I_PZ_GW04A 30/11/2020 0.01
Iron (Total) mg/L DG_A_I_PZ_GW04A 30/12/2020 0.01
Lead (Total) mg/L DG_A_I_PZ_GW07 2/07/2020 0.001 Lead (Total) mg/L DG_A_I_PZ_GW03 2/07/2020 0.001 Lead (Total) mg/L DG_A_I_PZ_GW02 2/07/2020 0.001 Lead (Total) mg/L DG_A_I_PZ_GW08 6/07/2020 0.001 Lead (Total) mg/L DG_A_I_PZ_WRK302 6/07/2020 0.005
Lead (Total) mg/L DG_A_I_PZ_GW06 6/07/2020 0.001 Lead (Total) mg/L DG_A_I_PZ_BW36A 7/07/2020 0.001
Lead (Total) mg/L DG_A_I_PZ_GW01 7/07/2020 0.002
Lead (Total) mg/L DG_A_I_PZ_BW45B 7/07/2020 0.025
Lead (Total) mg/L DG_A_I_PZ_IWB2 8/07/2020 0.001 Lead (Total) mg/L DG_A_I_PZ_IWB6 8/07/2020 0.001 Lead (Total) mg/L DG_A_I_PZ_BW05 8/07/2020 0.001 Lead (Total) mg/L DG_A_I_PZ_BW28A 8/07/2020 0.001 Lead (Total) mg/L DG_A_I_PZ_BW53/Puls 9/07/2020 0.001 Lead (Total) mg/L DG_A_I_PZ_GW05 9/07/2020 0.001 Lead (Total) mg/L DG_A_I_PZ_GW04 9/07/2020 0.001 Lead (Total) mg/L DG_A_I_PZ_WRK300 13/07/2020 0.001 Lead (Total) mg/L DG_A_I_PZ_WRK303 13/07/2020 0.001 Lead (Total) mg/L DG_A_I_PZ_WRK301 13/07/2020 0.001 Lead (Total) mg/L DG_A_I_PZ_WRK304 14/07/2020 0.001 Lead (Total) mg/L DG_A_I_PZ_GW04 10/08/2020 0.001 Lead (Total) mg/L DG_A_I_PZ_BW28A 10/08/2020 0.001 Lead (Total) mg/L DG_A_I_PZ_GW02 10/08/2020 0.001
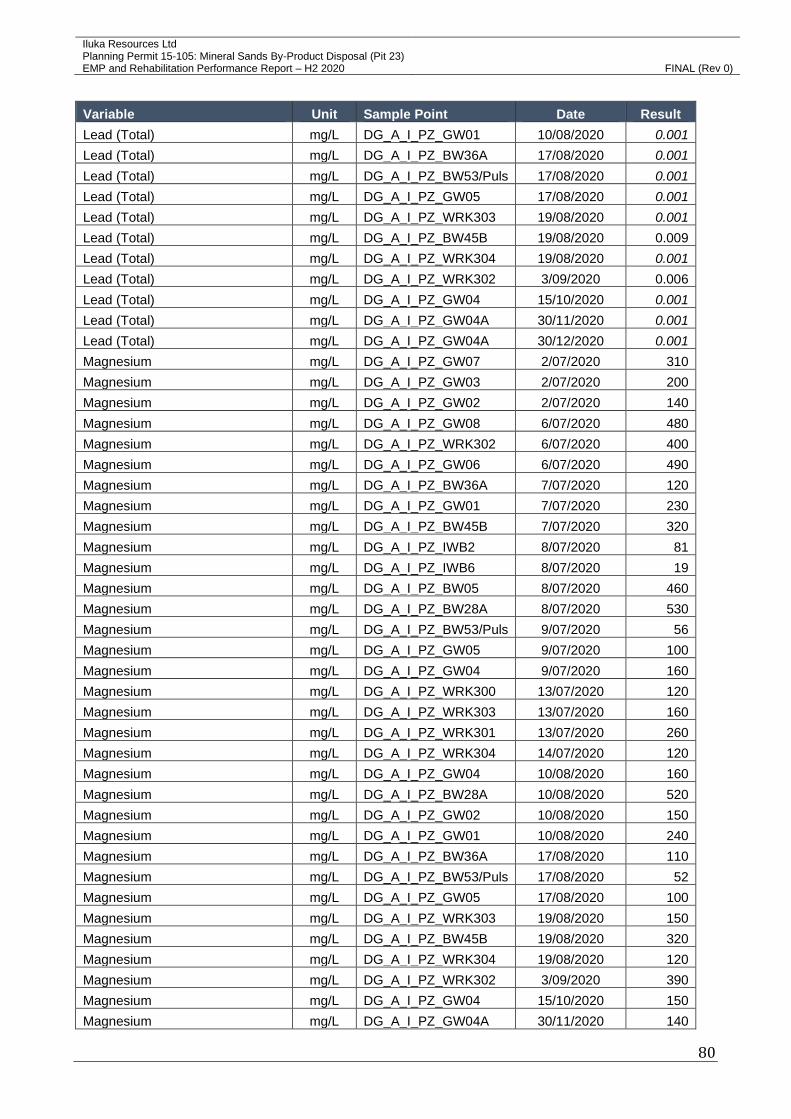
Iluka Resources Ltd Planning Permit 15-105: Mineral Sands By-Product Disposal (Pit 23)
EMP and Rehabilitation Performance Report – H2 2020 FINAL (Rev 0)
80
Variable Unit Sample Point Date Result
Lead (Total) mg/L DG_A_I_PZ_GW01 10/08/2020 0.001 Lead (Total) mg/L DG_A_I_PZ_BW36A 17/08/2020 0.001 Lead (Total) mg/L DG_A_I_PZ_BW53/Puls 17/08/2020 0.001 Lead (Total) mg/L DG_A_I_PZ_GW05 17/08/2020 0.001 Lead (Total) mg/L DG_A_I_PZ_WRK303 19/08/2020 0.001 Lead (Total) mg/L DG_A_I_PZ_BW45B 19/08/2020 0.009
Lead (Total) mg/L DG_A_I_PZ_WRK304 19/08/2020 0.001 Lead (Total) mg/L DG_A_I_PZ_WRK302 3/09/2020 0.006
Lead (Total) mg/L DG_A_I_PZ_GW04 15/10/2020 0.001 Lead (Total) mg/L DG_A_I_PZ_GW04A 30/11/2020 0.001 Lead (Total) mg/L DG_A_I_PZ_GW04A 30/12/2020 0.001 Magnesium mg/L DG_A_I_PZ_GW07 2/07/2020 310
Magnesium mg/L DG_A_I_PZ_GW03 2/07/2020 200
Magnesium mg/L DG_A_I_PZ_GW02 2/07/2020 140
Magnesium mg/L DG_A_I_PZ_GW08 6/07/2020 480
Magnesium mg/L DG_A_I_PZ_WRK302 6/07/2020 400
Magnesium mg/L DG_A_I_PZ_GW06 6/07/2020 490
Magnesium mg/L DG_A_I_PZ_BW36A 7/07/2020 120
Magnesium mg/L DG_A_I_PZ_GW01 7/07/2020 230
Magnesium mg/L DG_A_I_PZ_BW45B 7/07/2020 320
Magnesium mg/L DG_A_I_PZ_IWB2 8/07/2020 81
Magnesium mg/L DG_A_I_PZ_IWB6 8/07/2020 19
Magnesium mg/L DG_A_I_PZ_BW05 8/07/2020 460
Magnesium mg/L DG_A_I_PZ_BW28A 8/07/2020 530
Magnesium mg/L DG_A_I_PZ_BW53/Puls 9/07/2020 56
Magnesium mg/L DG_A_I_PZ_GW05 9/07/2020 100
Magnesium mg/L DG_A_I_PZ_GW04 9/07/2020 160
Magnesium mg/L DG_A_I_PZ_WRK300 13/07/2020 120
Magnesium mg/L DG_A_I_PZ_WRK303 13/07/2020 160
Magnesium mg/L DG_A_I_PZ_WRK301 13/07/2020 260
Magnesium mg/L DG_A_I_PZ_WRK304 14/07/2020 120
Magnesium mg/L DG_A_I_PZ_GW04 10/08/2020 160
Magnesium mg/L DG_A_I_PZ_BW28A 10/08/2020 520
Magnesium mg/L DG_A_I_PZ_GW02 10/08/2020 150
Magnesium mg/L DG_A_I_PZ_GW01 10/08/2020 240
Magnesium mg/L DG_A_I_PZ_BW36A 17/08/2020 110
Magnesium mg/L DG_A_I_PZ_BW53/Puls 17/08/2020 52
Magnesium mg/L DG_A_I_PZ_GW05 17/08/2020 100
Magnesium mg/L DG_A_I_PZ_WRK303 19/08/2020 150
Magnesium mg/L DG_A_I_PZ_BW45B 19/08/2020 320
Magnesium mg/L DG_A_I_PZ_WRK304 19/08/2020 120
Magnesium mg/L DG_A_I_PZ_WRK302 3/09/2020 390
Magnesium mg/L DG_A_I_PZ_GW04 15/10/2020 150
Magnesium mg/L DG_A_I_PZ_GW04A 30/11/2020 140

Iluka Resources Ltd Planning Permit 15-105: Mineral Sands By-Product Disposal (Pit 23)
EMP and Rehabilitation Performance Report – H2 2020 FINAL (Rev 0)
81
Variable Unit Sample Point Date Result
Magnesium mg/L DG_A_I_PZ_GW04A 30/12/2020 140
Manganese (Total) mg/L DG_A_I_PZ_GW07 2/07/2020 0.006
Manganese (Total) mg/L DG_A_I_PZ_GW03 2/07/2020 0.74
Manganese (Total) mg/L DG_A_I_PZ_GW02 2/07/2020 0.48
Manganese (Total) mg/L DG_A_I_PZ_GW08 6/07/2020 0.004
Manganese (Total) mg/L DG_A_I_PZ_WRK302 6/07/2020 0.015
Manganese (Total) mg/L DG_A_I_PZ_GW06 6/07/2020 0.017
Manganese (Total) mg/L DG_A_I_PZ_BW36A 7/07/2020 4
Manganese (Total) mg/L DG_A_I_PZ_GW01 7/07/2020 0.011
Manganese (Total) mg/L DG_A_I_PZ_BW45B 7/07/2020 0.052
Manganese (Total) mg/L DG_A_I_PZ_IWB2 8/07/2020 0.008
Manganese (Total) mg/L DG_A_I_PZ_IWB6 8/07/2020 0.011
Manganese (Total) mg/L DG_A_I_PZ_BW05 8/07/2020 0.12
Manganese (Total) mg/L DG_A_I_PZ_BW28A 8/07/2020 1.5
Manganese (Total) mg/L DG_A_I_PZ_BW53/Puls 9/07/2020 0.04
Manganese (Total) mg/L DG_A_I_PZ_GW05 9/07/2020 0.018
Manganese (Total) mg/L DG_A_I_PZ_GW04 9/07/2020 0.037
Manganese (Total) mg/L DG_A_I_PZ_WRK300 13/07/2020 0.047
Manganese (Total) mg/L DG_A_I_PZ_WRK303 13/07/2020 0.057
Manganese (Total) mg/L DG_A_I_PZ_WRK301 13/07/2020 0.015
Manganese (Total) mg/L DG_A_I_PZ_WRK304 14/07/2020 0.006
Manganese (Total) mg/L DG_A_I_PZ_GW04 10/08/2020 0.034
Manganese (Total) mg/L DG_A_I_PZ_BW28A 10/08/2020 1.6
Manganese (Total) mg/L DG_A_I_PZ_GW02 10/08/2020 0.53
Manganese (Total) mg/L DG_A_I_PZ_GW01 10/08/2020 0.007
Manganese (Total) mg/L DG_A_I_PZ_BW36A 17/08/2020 4.3
Manganese (Total) mg/L DG_A_I_PZ_BW53/Puls 17/08/2020 0.03
Manganese (Total) mg/L DG_A_I_PZ_GW05 17/08/2020 0.015
Manganese (Total) mg/L DG_A_I_PZ_WRK303 19/08/2020 0.004
Manganese (Total) mg/L DG_A_I_PZ_BW45B 19/08/2020 0.058
Manganese (Total) mg/L DG_A_I_PZ_WRK304 19/08/2020 0.007
Manganese (Total) mg/L DG_A_I_PZ_WRK302 3/09/2020 0.018
Manganese (Total) mg/L DG_A_I_PZ_GW04 15/10/2020 0.033
Manganese (Total) mg/L DG_A_I_PZ_GW04A 30/11/2020 0.056
Manganese (Total) mg/L DG_A_I_PZ_GW04A 30/12/2020 0.056
Mercury (Total) mg/L DG_A_I_PZ_GW07 2/07/2020 0.0002
Mercury (Total) mg/L DG_A_I_PZ_GW03 2/07/2020 0.0001
Mercury (Total) mg/L DG_A_I_PZ_GW02 2/07/2020 0.0001 Mercury (Total) mg/L DG_A_I_PZ_GW08 6/07/2020 0.0001 Mercury (Total) mg/L DG_A_I_PZ_WRK302 6/07/2020 0.0001 Mercury (Total) mg/L DG_A_I_PZ_GW06 6/07/2020 0.0001 Mercury (Total) mg/L DG_A_I_PZ_BW36A 7/07/2020 0.0001 Mercury (Total) mg/L DG_A_I_PZ_GW01 7/07/2020 0.0001 Mercury (Total) mg/L DG_A_I_PZ_BW45B 7/07/2020 0.0001
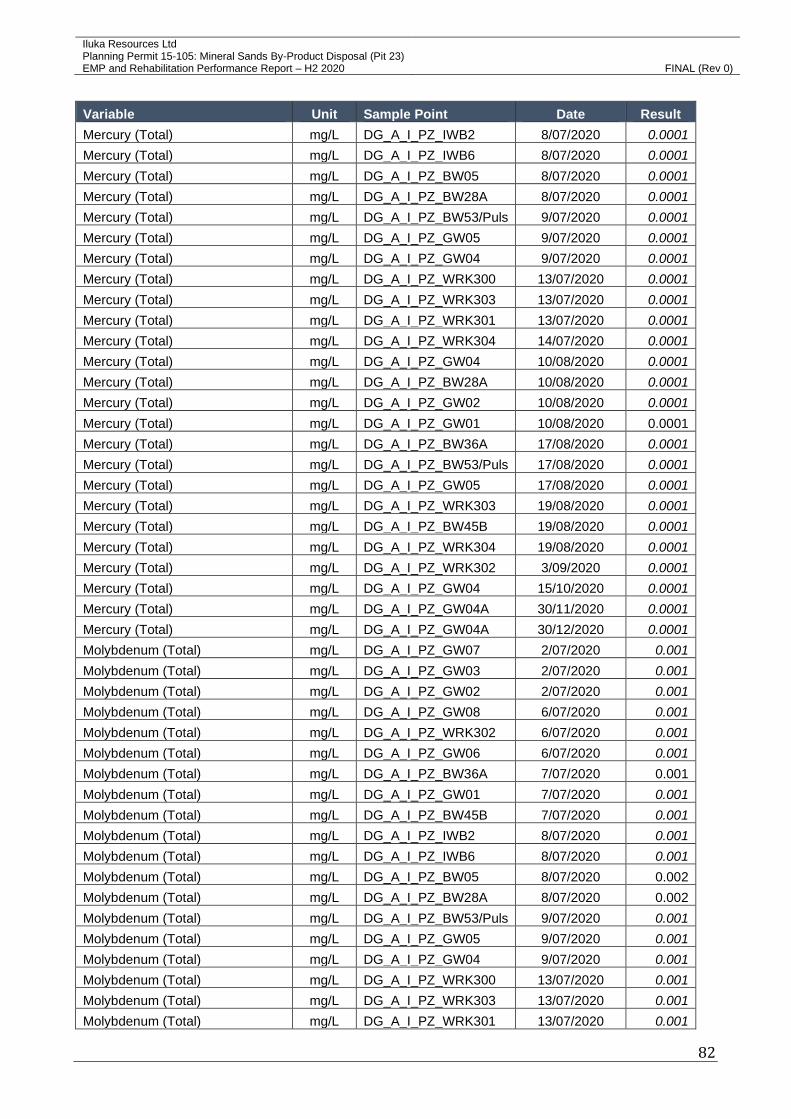
Iluka Resources Ltd Planning Permit 15-105: Mineral Sands By-Product Disposal (Pit 23)
EMP and Rehabilitation Performance Report – H2 2020 FINAL (Rev 0)
82
Variable Unit Sample Point Date Result
Mercury (Total) mg/L DG_A_I_PZ_IWB2 8/07/2020 0.0001 Mercury (Total) mg/L DG_A_I_PZ_IWB6 8/07/2020 0.0001 Mercury (Total) mg/L DG_A_I_PZ_BW05 8/07/2020 0.0001 Mercury (Total) mg/L DG_A_I_PZ_BW28A 8/07/2020 0.0001 Mercury (Total) mg/L DG_A_I_PZ_BW53/Puls 9/07/2020 0.0001 Mercury (Total) mg/L DG_A_I_PZ_GW05 9/07/2020 0.0001 Mercury (Total) mg/L DG_A_I_PZ_GW04 9/07/2020 0.0001 Mercury (Total) mg/L DG_A_I_PZ_WRK300 13/07/2020 0.0001 Mercury (Total) mg/L DG_A_I_PZ_WRK303 13/07/2020 0.0001 Mercury (Total) mg/L DG_A_I_PZ_WRK301 13/07/2020 0.0001 Mercury (Total) mg/L DG_A_I_PZ_WRK304 14/07/2020 0.0001 Mercury (Total) mg/L DG_A_I_PZ_GW04 10/08/2020 0.0001 Mercury (Total) mg/L DG_A_I_PZ_BW28A 10/08/2020 0.0001 Mercury (Total) mg/L DG_A_I_PZ_GW02 10/08/2020 0.0001 Mercury (Total) mg/L DG_A_I_PZ_GW01 10/08/2020 0.0001
Mercury (Total) mg/L DG_A_I_PZ_BW36A 17/08/2020 0.0001 Mercury (Total) mg/L DG_A_I_PZ_BW53/Puls 17/08/2020 0.0001 Mercury (Total) mg/L DG_A_I_PZ_GW05 17/08/2020 0.0001 Mercury (Total) mg/L DG_A_I_PZ_WRK303 19/08/2020 0.0001 Mercury (Total) mg/L DG_A_I_PZ_BW45B 19/08/2020 0.0001 Mercury (Total) mg/L DG_A_I_PZ_WRK304 19/08/2020 0.0001 Mercury (Total) mg/L DG_A_I_PZ_WRK302 3/09/2020 0.0001 Mercury (Total) mg/L DG_A_I_PZ_GW04 15/10/2020 0.0001 Mercury (Total) mg/L DG_A_I_PZ_GW04A 30/11/2020 0.0001 Mercury (Total) mg/L DG_A_I_PZ_GW04A 30/12/2020 0.0001 Molybdenum (Total) mg/L DG_A_I_PZ_GW07 2/07/2020 0.001 Molybdenum (Total) mg/L DG_A_I_PZ_GW03 2/07/2020 0.001 Molybdenum (Total) mg/L DG_A_I_PZ_GW02 2/07/2020 0.001 Molybdenum (Total) mg/L DG_A_I_PZ_GW08 6/07/2020 0.001 Molybdenum (Total) mg/L DG_A_I_PZ_WRK302 6/07/2020 0.001 Molybdenum (Total) mg/L DG_A_I_PZ_GW06 6/07/2020 0.001 Molybdenum (Total) mg/L DG_A_I_PZ_BW36A 7/07/2020 0.001
Molybdenum (Total) mg/L DG_A_I_PZ_GW01 7/07/2020 0.001 Molybdenum (Total) mg/L DG_A_I_PZ_BW45B 7/07/2020 0.001 Molybdenum (Total) mg/L DG_A_I_PZ_IWB2 8/07/2020 0.001 Molybdenum (Total) mg/L DG_A_I_PZ_IWB6 8/07/2020 0.001 Molybdenum (Total) mg/L DG_A_I_PZ_BW05 8/07/2020 0.002
Molybdenum (Total) mg/L DG_A_I_PZ_BW28A 8/07/2020 0.002
Molybdenum (Total) mg/L DG_A_I_PZ_BW53/Puls 9/07/2020 0.001 Molybdenum (Total) mg/L DG_A_I_PZ_GW05 9/07/2020 0.001 Molybdenum (Total) mg/L DG_A_I_PZ_GW04 9/07/2020 0.001 Molybdenum (Total) mg/L DG_A_I_PZ_WRK300 13/07/2020 0.001 Molybdenum (Total) mg/L DG_A_I_PZ_WRK303 13/07/2020 0.001 Molybdenum (Total) mg/L DG_A_I_PZ_WRK301 13/07/2020 0.001

Iluka Resources Ltd Planning Permit 15-105: Mineral Sands By-Product Disposal (Pit 23)
EMP and Rehabilitation Performance Report – H2 2020 FINAL (Rev 0)
83
Variable Unit Sample Point Date Result
Molybdenum (Total) mg/L DG_A_I_PZ_WRK304 14/07/2020 0.001 Molybdenum (Total) mg/L DG_A_I_PZ_GW04 10/08/2020 0.001 Molybdenum (Total) mg/L DG_A_I_PZ_BW28A 10/08/2020 0.002
Molybdenum (Total) mg/L DG_A_I_PZ_GW02 10/08/2020 0.001 Molybdenum (Total) mg/L DG_A_I_PZ_GW01 10/08/2020 0.001 Molybdenum (Total) mg/L DG_A_I_PZ_BW36A 17/08/2020 0.001 Molybdenum (Total) mg/L DG_A_I_PZ_BW53/Puls 17/08/2020 0.001 Molybdenum (Total) mg/L DG_A_I_PZ_GW05 17/08/2020 0.001 Molybdenum (Total) mg/L DG_A_I_PZ_WRK303 19/08/2020 0.001 Molybdenum (Total) mg/L DG_A_I_PZ_BW45B 19/08/2020 0.001 Molybdenum (Total) mg/L DG_A_I_PZ_WRK304 19/08/2020 0.001 Molybdenum (Total) mg/L DG_A_I_PZ_WRK302 3/09/2020 0.001 Molybdenum (Total) mg/L DG_A_I_PZ_GW04 15/10/2020 0.001 Molybdenum (Total) mg/L DG_A_I_PZ_GW04A 30/11/2020 0.001 Molybdenum (Total) mg/L DG_A_I_PZ_GW04A 30/12/2020 0.001 Nickel (Total) mg/L DG_A_I_PZ_GW07 2/07/2020 0.026
Nickel (Total) mg/L DG_A_I_PZ_GW03 2/07/2020 0.005
Nickel (Total) mg/L DG_A_I_PZ_GW02 2/07/2020 0.006
Nickel (Total) mg/L DG_A_I_PZ_GW08 6/07/2020 0.009
Nickel (Total) mg/L DG_A_I_PZ_WRK302 6/07/2020 0.02
Nickel (Total) mg/L DG_A_I_PZ_GW06 6/07/2020 0.015
Nickel (Total) mg/L DG_A_I_PZ_BW36A 7/07/2020 0.012
Nickel (Total) mg/L DG_A_I_PZ_GW01 7/07/2020 0.033
Nickel (Total) mg/L DG_A_I_PZ_BW45B 7/07/2020 0.058
Nickel (Total) mg/L DG_A_I_PZ_IWB2 8/07/2020 0.003
Nickel (Total) mg/L DG_A_I_PZ_IWB6 8/07/2020 0.002
Nickel (Total) mg/L DG_A_I_PZ_BW05 8/07/2020 0.001 Nickel (Total) mg/L DG_A_I_PZ_BW28A 8/07/2020 0.013
Nickel (Total) mg/L DG_A_I_PZ_BW53/Puls 9/07/2020 0.001 Nickel (Total) mg/L DG_A_I_PZ_GW05 9/07/2020 0.004
Nickel (Total) mg/L DG_A_I_PZ_GW04 9/07/2020 0.01
Nickel (Total) mg/L DG_A_I_PZ_WRK300 13/07/2020 0.002
Nickel (Total) mg/L DG_A_I_PZ_WRK303 13/07/2020 0.005
Nickel (Total) mg/L DG_A_I_PZ_WRK301 13/07/2020 0.002
Nickel (Total) mg/L DG_A_I_PZ_WRK304 14/07/2020 0.004
Nickel (Total) mg/L DG_A_I_PZ_GW04 10/08/2020 0.01
Nickel (Total) mg/L DG_A_I_PZ_BW28A 10/08/2020 0.014
Nickel (Total) mg/L DG_A_I_PZ_GW02 10/08/2020 0.006
Nickel (Total) mg/L DG_A_I_PZ_GW01 10/08/2020 0.029
Nickel (Total) mg/L DG_A_I_PZ_BW36A 17/08/2020 0.013
Nickel (Total) mg/L DG_A_I_PZ_BW53/Puls 17/08/2020 0.003
Nickel (Total) mg/L DG_A_I_PZ_GW05 17/08/2020 0.004
Nickel (Total) mg/L DG_A_I_PZ_WRK303 19/08/2020 0.004
Nickel (Total) mg/L DG_A_I_PZ_BW45B 19/08/2020 0.05

Iluka Resources Ltd Planning Permit 15-105: Mineral Sands By-Product Disposal (Pit 23)
EMP and Rehabilitation Performance Report – H2 2020 FINAL (Rev 0)
84
Variable Unit Sample Point Date Result
Nickel (Total) mg/L DG_A_I_PZ_WRK304 19/08/2020 0.003
Nickel (Total) mg/L DG_A_I_PZ_WRK302 3/09/2020 0.02
Nickel (Total) mg/L DG_A_I_PZ_GW04 15/10/2020 0.01
Nickel (Total) mg/L DG_A_I_PZ_GW04A 30/11/2020 0.005
Nickel (Total) mg/L DG_A_I_PZ_GW04A 30/12/2020 0.005
Nitrate-Nitrogen mg/L DG_A_I_PZ_GW07 2/07/2020 0.6
Nitrate-Nitrogen mg/L DG_A_I_PZ_GW03 2/07/2020 2
Nitrate-Nitrogen mg/L DG_A_I_PZ_GW02 2/07/2020 7.8
Nitrate-Nitrogen mg/L DG_A_I_PZ_GW08 6/07/2020 0.32
Nitrate-Nitrogen mg/L DG_A_I_PZ_WRK302 6/07/2020 0.34
Nitrate-Nitrogen mg/L DG_A_I_PZ_GW06 6/07/2020 0.13
Nitrate-Nitrogen mg/L DG_A_I_PZ_BW36A 7/07/2020 0.12
Nitrate-Nitrogen mg/L DG_A_I_PZ_GW01 7/07/2020 1.5
Nitrate-Nitrogen mg/L DG_A_I_PZ_BW45B 7/07/2020 0.15
Nitrate-Nitrogen mg/L DG_A_I_PZ_IWB2 8/07/2020 4
Nitrate-Nitrogen mg/L DG_A_I_PZ_IWB6 8/07/2020 8.2
Nitrate-Nitrogen mg/L DG_A_I_PZ_BW05 8/07/2020 1
Nitrate-Nitrogen mg/L DG_A_I_PZ_BW28A 8/07/2020 0.2
Nitrate-Nitrogen mg/L DG_A_I_PZ_BW53/Puls 9/07/2020 2.7
Nitrate-Nitrogen mg/L DG_A_I_PZ_GW05 9/07/2020 4
Nitrate-Nitrogen mg/L DG_A_I_PZ_GW04 9/07/2020 3.3
Nitrate-Nitrogen mg/L DG_A_I_PZ_WRK300 13/07/2020 1.2
Nitrate-Nitrogen mg/L DG_A_I_PZ_WRK303 13/07/2020 1.2
Nitrate-Nitrogen mg/L DG_A_I_PZ_WRK301 13/07/2020 0.18
Nitrate-Nitrogen mg/L DG_A_I_PZ_WRK304 14/07/2020 2.1
Nitrate-Nitrogen mg/L DG_A_I_PZ_GW04 10/08/2020 3.5
Nitrate-Nitrogen mg/L DG_A_I_PZ_BW28A 10/08/2020 0.29
Nitrate-Nitrogen mg/L DG_A_I_PZ_GW02 10/08/2020 7.1
Nitrate-Nitrogen mg/L DG_A_I_PZ_GW01 10/08/2020 1.4
Nitrate-Nitrogen mg/L DG_A_I_PZ_BW36A 17/08/2020 0.02
Nitrate-Nitrogen mg/L DG_A_I_PZ_BW53/Puls 17/08/2020 3.8
Nitrate-Nitrogen mg/L DG_A_I_PZ_GW05 17/08/2020 4.5
Nitrate-Nitrogen mg/L DG_A_I_PZ_WRK303 19/08/2020 2.6
Nitrate-Nitrogen mg/L DG_A_I_PZ_BW45B 19/08/2020 0.18
Nitrate-Nitrogen mg/L DG_A_I_PZ_WRK304 19/08/2020 2.2
Nitrate-Nitrogen mg/L DG_A_I_PZ_WRK302 3/09/2020 0.31
Nitrate-Nitrogen mg/L DG_A_I_PZ_GW04 15/10/2020 3.6
Nitrate-Nitrogen mg/L DG_A_I_PZ_GW04A 30/11/2020 4
Nitrate-Nitrogen mg/L DG_A_I_PZ_GW04A 30/12/2020 4
Nitrite (Total) mg/L DG_A_I_PZ_GW07 2/07/2020 0.0033
Nitrite (Total) mg/L DG_A_I_PZ_GW03 2/07/2020 0.0395
Nitrite (Total) mg/L DG_A_I_PZ_GW02 2/07/2020 0.0823
Nitrite (Total) mg/L DG_A_I_PZ_GW08 6/07/2020 0.0033
Nitrite (Total) mg/L DG_A_I_PZ_WRK302 6/07/2020 0.0033

Iluka Resources Ltd Planning Permit 15-105: Mineral Sands By-Product Disposal (Pit 23)
EMP and Rehabilitation Performance Report – H2 2020 FINAL (Rev 0)
85
Variable Unit Sample Point Date Result
Nitrite (Total) mg/L DG_A_I_PZ_GW06 6/07/2020 0.0033
Nitrite (Total) mg/L DG_A_I_PZ_GW01 7/07/2020 0.0033
Nitrite (Total) mg/L DG_A_I_PZ_BW45B 7/07/2020 0.0263
Nitrite (Total) mg/L DG_A_I_PZ_IWB2 8/07/2020 0.0066
Nitrite (Total) mg/L DG_A_I_PZ_IWB6 8/07/2020 0.0132
Nitrite (Total) mg/L DG_A_I_PZ_BW05 8/07/2020 0.0033
Nitrite (Total) mg/L DG_A_I_PZ_BW28A 8/07/2020 0.0428
Nitrite (Total) mg/L DG_A_I_PZ_BW53/Puls 9/07/2020 0.0263
Nitrite (Total) mg/L DG_A_I_PZ_GW05 9/07/2020 0.3224
Nitrite (Total) mg/L DG_A_I_PZ_GW04 9/07/2020 0.0428
Nitrite (Total) mg/L DG_A_I_PZ_WRK300 13/07/2020 0.1711
Nitrite (Total) mg/L DG_A_I_PZ_WRK303 13/07/2020 0.0033
Nitrite (Total) mg/L DG_A_I_PZ_WRK301 13/07/2020 0.0066
Nitrite (Total) mg/L DG_A_I_PZ_WRK304 14/07/2020 0.0033
Nitrite (Total) mg/L DG_A_I_PZ_GW04 10/08/2020 0.0461
Nitrite (Total) mg/L DG_A_I_PZ_BW28A 10/08/2020 0.0197
Nitrite (Total) mg/L DG_A_I_PZ_GW02 10/08/2020 0.0954
Nitrite (Total) mg/L DG_A_I_PZ_GW01 10/08/2020 0.0132
Nitrite (Total) mg/L DG_A_I_PZ_BW53/Puls 17/08/2020 0.1481
Nitrite (Total) mg/L DG_A_I_PZ_GW05 17/08/2020 0.3158
Nitrite (Total) mg/L DG_A_I_PZ_WRK303 19/08/2020 0.0033
Nitrite (Total) mg/L DG_A_I_PZ_BW45B 19/08/2020 0.0559
Nitrite (Total) mg/L DG_A_I_PZ_WRK304 19/08/2020 0.0066
Nitrite (Total) mg/L DG_A_I_PZ_WRK302 3/09/2020 0.0033
Nitrite (Total) mg/L DG_A_I_PZ_GW04 15/10/2020 0.0296
Nitrite-Nitrogen mg/L DG_A_I_PZ_GW07 2/07/2020 0.001 Nitrite-Nitrogen mg/L DG_A_I_PZ_GW03 2/07/2020 0.012
Nitrite-Nitrogen mg/L DG_A_I_PZ_GW02 2/07/2020 0.025
Nitrite-Nitrogen mg/L DG_A_I_PZ_GW08 6/07/2020 0.001 Nitrite-Nitrogen mg/L DG_A_I_PZ_WRK302 6/07/2020 0.001 Nitrite-Nitrogen mg/L DG_A_I_PZ_GW06 6/07/2020 0.001 Nitrite-Nitrogen mg/L DG_A_I_PZ_BW36A 7/07/2020 0.007
Nitrite-Nitrogen mg/L DG_A_I_PZ_GW01 7/07/2020 0.001 Nitrite-Nitrogen mg/L DG_A_I_PZ_BW45B 7/07/2020 0.008
Nitrite-Nitrogen mg/L DG_A_I_PZ_IWB2 8/07/2020 0.002
Nitrite-Nitrogen mg/L DG_A_I_PZ_IWB6 8/07/2020 0.004
Nitrite-Nitrogen mg/L DG_A_I_PZ_BW05 8/07/2020 0.001 Nitrite-Nitrogen mg/L DG_A_I_PZ_BW28A 8/07/2020 0.013
Nitrite-Nitrogen mg/L DG_A_I_PZ_BW53/Puls 9/07/2020 0.008
Nitrite-Nitrogen mg/L DG_A_I_PZ_GW05 9/07/2020 0.098
Nitrite-Nitrogen mg/L DG_A_I_PZ_GW04 9/07/2020 0.013
Nitrite-Nitrogen mg/L DG_A_I_PZ_WRK300 13/07/2020 0.052
Nitrite-Nitrogen mg/L DG_A_I_PZ_WRK303 13/07/2020 0.001
Nitrite-Nitrogen mg/L DG_A_I_PZ_WRK301 13/07/2020 0.002

Iluka Resources Ltd Planning Permit 15-105: Mineral Sands By-Product Disposal (Pit 23)
EMP and Rehabilitation Performance Report – H2 2020 FINAL (Rev 0)
86
Variable Unit Sample Point Date Result
Nitrite-Nitrogen mg/L DG_A_I_PZ_WRK304 14/07/2020 0.001 Nitrite-Nitrogen mg/L DG_A_I_PZ_GW04 10/08/2020 0.014
Nitrite-Nitrogen mg/L DG_A_I_PZ_BW28A 10/08/2020 0.006
Nitrite-Nitrogen mg/L DG_A_I_PZ_GW02 10/08/2020 0.029
Nitrite-Nitrogen mg/L DG_A_I_PZ_GW01 10/08/2020 0.004
Nitrite-Nitrogen mg/L DG_A_I_PZ_BW36A 17/08/2020 0.005
Nitrite-Nitrogen mg/L DG_A_I_PZ_BW53/Puls 17/08/2020 0.045
Nitrite-Nitrogen mg/L DG_A_I_PZ_GW05 17/08/2020 0.096
Nitrite-Nitrogen mg/L DG_A_I_PZ_WRK303 19/08/2020 0.001
Nitrite-Nitrogen mg/L DG_A_I_PZ_BW45B 19/08/2020 0.017
Nitrite-Nitrogen mg/L DG_A_I_PZ_WRK304 19/08/2020 0.002
Nitrite-Nitrogen mg/L DG_A_I_PZ_WRK302 3/09/2020 0.001 Nitrite-Nitrogen mg/L DG_A_I_PZ_GW04 15/10/2020 0.009
Nitrite-Nitrogen mg/L DG_A_I_PZ_GW04A 30/11/2020 0.12
Nitrite-Nitrogen mg/L DG_A_I_PZ_GW04A 30/12/2020 0.12
pH pH units DG_A_I_PZ_GW07 2/07/2020 6.4
pH pH units DG_A_I_PZ_GW07 2/07/2020 6.37
pH pH units DG_A_I_PZ_GW03 2/07/2020 6.4
pH pH units DG_A_I_PZ_GW03 2/07/2020 6.13
pH pH units DG_A_I_PZ_GW02 2/07/2020 5.6
pH pH units DG_A_I_PZ_GW02 2/07/2020 5.46
pH pH units DG_A_I_PZ_GW08 6/07/2020 6.4
pH pH units DG_A_I_PZ_GW08 6/07/2020 6.27
pH pH units DG_A_I_PZ_WRK302 6/07/2020 6.1
pH pH units DG_A_I_PZ_WRK302 6/07/2020 5.98
pH pH units DG_A_I_PZ_GW06 6/07/2020 6.7
pH pH units DG_A_I_PZ_GW06 6/07/2020 6.56
pH pH units DG_A_I_PZ_BW36A 7/07/2020 6.8
pH pH units DG_A_I_PZ_BW36A 7/07/2020 6.78
pH pH units DG_A_I_PZ_GW01 7/07/2020 5.5
pH pH units DG_A_I_PZ_GW01 7/07/2020 5.35
pH pH units DG_A_I_PZ_BW45B 7/07/2020 4.4
pH pH units DG_A_I_PZ_BW45B 7/07/2020 4.43
pH pH units DG_A_I_PZ_IWB2 8/07/2020 5.6
pH pH units DG_A_I_PZ_IWB2 8/07/2020 5.43
pH pH units DG_A_I_PZ_IWB6 8/07/2020 5.19
pH pH units DG_A_I_PZ_IWB6 8/07/2020 5.5
pH pH units DG_A_I_PZ_BW05 8/07/2020 7.2
pH pH units DG_A_I_PZ_BW05 8/07/2020 7
pH pH units DG_A_I_PZ_BW28A 8/07/2020 6.5
pH pH units DG_A_I_PZ_BW28A 8/07/2020 6.55
pH pH units DG_A_I_PZ_BW53/Puls 9/07/2020 6.9
pH pH units DG_A_I_PZ_BW53/Puls 9/07/2020 6.86
pH pH units DG_A_I_PZ_GW05 9/07/2020 6

Iluka Resources Ltd Planning Permit 15-105: Mineral Sands By-Product Disposal (Pit 23)
EMP and Rehabilitation Performance Report – H2 2020 FINAL (Rev 0)
87
Variable Unit Sample Point Date Result
pH pH units DG_A_I_PZ_GW05 9/07/2020 6
pH pH units DG_A_I_PZ_GW04 9/07/2020 5.8
pH pH units DG_A_I_PZ_GW04 9/07/2020 5.66
pH pH units DG_A_I_PZ_WRK300 13/07/2020 7
pH pH units DG_A_I_PZ_WRK300 13/07/2020 6.75
pH pH units DG_A_I_PZ_WRK303 13/07/2020 6.4
pH pH units DG_A_I_PZ_WRK303 13/07/2020 6.04
pH pH units DG_A_I_PZ_WRK301 13/07/2020 7.3
pH pH units DG_A_I_PZ_WRK301 13/07/2020 7.04
pH pH units DG_A_I_PZ_WRK304 14/07/2020 6.2
pH pH units DG_A_I_PZ_WRK304 14/07/2020 6.11
pH pH units DG_A_I_PZ_GW04 10/08/2020 5.6
pH pH units DG_A_I_PZ_BW28A 10/08/2020 6.6
pH pH units DG_A_I_PZ_BW28A 10/08/2020 6.58
pH pH units DG_A_I_PZ_GW02 10/08/2020 5.6
pH pH units DG_A_I_PZ_GW02 10/08/2020 5.51
pH pH units DG_A_I_PZ_GW01 10/08/2020 5.4
pH pH units DG_A_I_PZ_GW01 10/08/2020 5.55
pH pH units DG_A_I_PZ_GW04 10/08/2020 5.67
pH pH units DG_A_I_PZ_BW36A 17/08/2020 6.7
pH pH units DG_A_I_PZ_BW53/Puls 17/08/2020 6.7
pH pH units DG_A_I_PZ_BW53/Puls 17/08/2020 6.42
pH pH units DG_A_I_PZ_GW05 17/08/2020 6
pH pH units DG_A_I_PZ_GW05 17/08/2020 6.03
pH pH units DG_A_I_PZ_BW36A 17/08/2020 6.77
pH pH units DG_A_I_PZ_WRK303 19/08/2020 6
pH pH units DG_A_I_PZ_WRK303 19/08/2020 5.83
pH pH units DG_A_I_PZ_BW45B 19/08/2020 4.8
pH pH units DG_A_I_PZ_WRK304 19/08/2020 6.2
pH pH units DG_A_I_PZ_WRK304 19/08/2020 6.06
pH pH units DG_A_I_PZ_BW45B 19/08/2020 4.77
pH pH units DG_A_I_PZ_GW07 20/08/2020 6.27
pH pH units DG_A_I_PZ_GW03 20/08/2020 6.12
pH pH units DG_A_I_PZ_WRK300 20/08/2020 6.65
pH pH units DG_A_I_PZ_GW06 25/08/2020 6.53
pH pH units DG_A_I_PZ_GW08 25/08/2020 6.23
pH pH units DG_A_I_PZ_WRK302 25/08/2020 5.92
pH pH units DG_A_I_PZ_WRK301 25/08/2020 7
pH pH units DG_A_I_PZ_WRK302 3/09/2020 6
pH pH units DG_A_I_PZ_WRK302 3/09/2020 5.93
pH pH units DG_A_I_PZ_GW03 3/09/2020 6.11
pH pH units DG_A_I_PZ_GW02 3/09/2020 5.47
pH pH units DG_A_I_PZ_GW07 7/09/2020 6.36
pH pH units DG_A_I_PZ_GW05 7/09/2020 5.96
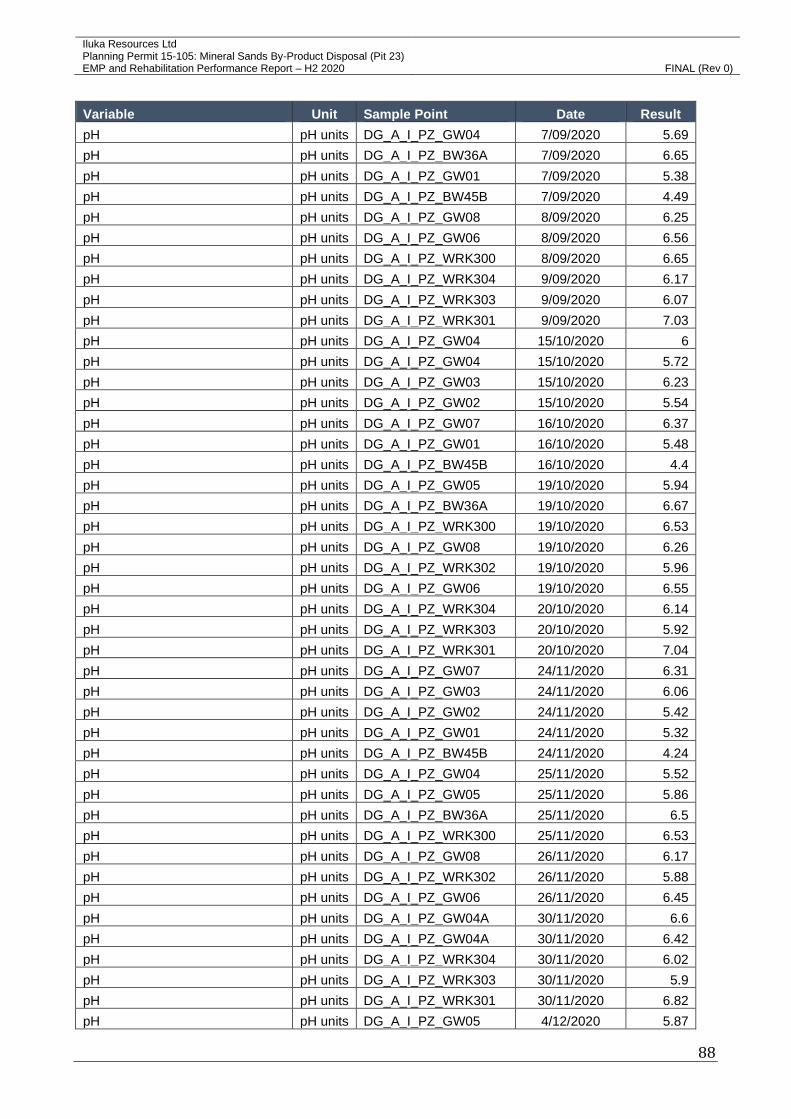
Iluka Resources Ltd Planning Permit 15-105: Mineral Sands By-Product Disposal (Pit 23)
EMP and Rehabilitation Performance Report – H2 2020 FINAL (Rev 0)
88
Variable Unit Sample Point Date Result
pH pH units DG_A_I_PZ_GW04 7/09/2020 5.69
pH pH units DG_A_I_PZ_BW36A 7/09/2020 6.65
pH pH units DG_A_I_PZ_GW01 7/09/2020 5.38
pH pH units DG_A_I_PZ_BW45B 7/09/2020 4.49
pH pH units DG_A_I_PZ_GW08 8/09/2020 6.25
pH pH units DG_A_I_PZ_GW06 8/09/2020 6.56
pH pH units DG_A_I_PZ_WRK300 8/09/2020 6.65
pH pH units DG_A_I_PZ_WRK304 9/09/2020 6.17
pH pH units DG_A_I_PZ_WRK303 9/09/2020 6.07
pH pH units DG_A_I_PZ_WRK301 9/09/2020 7.03
pH pH units DG_A_I_PZ_GW04 15/10/2020 6
pH pH units DG_A_I_PZ_GW04 15/10/2020 5.72
pH pH units DG_A_I_PZ_GW03 15/10/2020 6.23
pH pH units DG_A_I_PZ_GW02 15/10/2020 5.54
pH pH units DG_A_I_PZ_GW07 16/10/2020 6.37
pH pH units DG_A_I_PZ_GW01 16/10/2020 5.48
pH pH units DG_A_I_PZ_BW45B 16/10/2020 4.4
pH pH units DG_A_I_PZ_GW05 19/10/2020 5.94
pH pH units DG_A_I_PZ_BW36A 19/10/2020 6.67
pH pH units DG_A_I_PZ_WRK300 19/10/2020 6.53
pH pH units DG_A_I_PZ_GW08 19/10/2020 6.26
pH pH units DG_A_I_PZ_WRK302 19/10/2020 5.96
pH pH units DG_A_I_PZ_GW06 19/10/2020 6.55
pH pH units DG_A_I_PZ_WRK304 20/10/2020 6.14
pH pH units DG_A_I_PZ_WRK303 20/10/2020 5.92
pH pH units DG_A_I_PZ_WRK301 20/10/2020 7.04
pH pH units DG_A_I_PZ_GW07 24/11/2020 6.31
pH pH units DG_A_I_PZ_GW03 24/11/2020 6.06
pH pH units DG_A_I_PZ_GW02 24/11/2020 5.42
pH pH units DG_A_I_PZ_GW01 24/11/2020 5.32
pH pH units DG_A_I_PZ_BW45B 24/11/2020 4.24
pH pH units DG_A_I_PZ_GW04 25/11/2020 5.52
pH pH units DG_A_I_PZ_GW05 25/11/2020 5.86
pH pH units DG_A_I_PZ_BW36A 25/11/2020 6.5
pH pH units DG_A_I_PZ_WRK300 25/11/2020 6.53
pH pH units DG_A_I_PZ_GW08 26/11/2020 6.17
pH pH units DG_A_I_PZ_WRK302 26/11/2020 5.88
pH pH units DG_A_I_PZ_GW06 26/11/2020 6.45
pH pH units DG_A_I_PZ_GW04A 30/11/2020 6.6
pH pH units DG_A_I_PZ_GW04A 30/11/2020 6.42
pH pH units DG_A_I_PZ_WRK304 30/11/2020 6.02
pH pH units DG_A_I_PZ_WRK303 30/11/2020 5.9
pH pH units DG_A_I_PZ_WRK301 30/11/2020 6.82
pH pH units DG_A_I_PZ_GW05 4/12/2020 5.87

Iluka Resources Ltd Planning Permit 15-105: Mineral Sands By-Product Disposal (Pit 23)
EMP and Rehabilitation Performance Report – H2 2020 FINAL (Rev 0)
89
Variable Unit Sample Point Date Result
pH pH units DG_A_I_PZ_GW07 8/12/2020 6.31
pH pH units DG_A_I_PZ_GW03 8/12/2020 6.05
pH pH units DG_A_I_PZ_GW02 8/12/2020 5.37
pH pH units DG_A_I_PZ_BW45B 9/12/2020 4.3
pH pH units DG_A_I_PZ_GW01 9/12/2020 5.26
pH pH units DG_A_I_PZ_GW04 9/12/2020 5.53
pH pH units DG_A_I_PZ_BW36A 9/12/2020 6.55
pH pH units DG_A_I_PZ_GW04A 10/12/2020 6.17
pH pH units DG_A_I_PZ_GW08 10/12/2020 6.25
pH pH units DG_A_I_PZ_WRK302 10/12/2020 5.98
pH pH units DG_A_I_PZ_GW06 10/12/2020 6.59
pH pH units DG_A_I_PZ_WRK304 14/12/2020 5.91
pH pH units DG_A_I_PZ_WRK303 14/12/2020 5.76
pH pH units DG_A_I_PZ_WRK301 14/12/2020 6.84
pH pH units DG_A_I_PZ_WRK300 14/12/2020 6.28
pH pH units DG_A_I_PZ_GW04A 30/12/2020 6.6
Phosphorus (Ortho) mg/L DG_A_I_PZ_GW07 2/07/2020 0.004 Phosphorus (Ortho) mg/L DG_A_I_PZ_GW03 2/07/2020 0.004 Phosphorus (Ortho) mg/L DG_A_I_PZ_GW02 2/07/2020 0.004 Phosphorus (Ortho) mg/L DG_A_I_PZ_GW08 6/07/2020 0.004 Phosphorus (Ortho) mg/L DG_A_I_PZ_WRK302 6/07/2020 0.004 Phosphorus (Ortho) mg/L DG_A_I_PZ_GW06 6/07/2020 0.009
Phosphorus (Ortho) mg/L DG_A_I_PZ_BW36A 7/07/2020 0.058
Phosphorus (Ortho) mg/L DG_A_I_PZ_GW01 7/07/2020 0.004 Phosphorus (Ortho) mg/L DG_A_I_PZ_BW45B 7/07/2020 0.004 Phosphorus (Ortho) mg/L DG_A_I_PZ_IWB2 8/07/2020 0.077
Phosphorus (Ortho) mg/L DG_A_I_PZ_IWB6 8/07/2020 0.004 Phosphorus (Ortho) mg/L DG_A_I_PZ_BW05 8/07/2020 0.004 Phosphorus (Ortho) mg/L DG_A_I_PZ_BW28A 8/07/2020 0.063
Phosphorus (Ortho) mg/L DG_A_I_PZ_BW53/Puls 9/07/2020 0.96
Phosphorus (Ortho) mg/L DG_A_I_PZ_GW05 9/07/2020 0.006
Phosphorus (Ortho) mg/L DG_A_I_PZ_GW04 9/07/2020 0.004
Phosphorus (Ortho) mg/L DG_A_I_PZ_WRK300 13/07/2020 0.004
Phosphorus (Ortho) mg/L DG_A_I_PZ_WRK303 13/07/2020 0.006
Phosphorus (Ortho) mg/L DG_A_I_PZ_WRK301 13/07/2020 0.007
Phosphorus (Ortho) mg/L DG_A_I_PZ_WRK304 14/07/2020 0.014
Phosphorus (Ortho) mg/L DG_A_I_PZ_GW04 10/08/2020 0.008
Phosphorus (Ortho) mg/L DG_A_I_PZ_BW28A 10/08/2020 0.047
Phosphorus (Ortho) mg/L DG_A_I_PZ_GW02 10/08/2020 0.004 Phosphorus (Ortho) mg/L DG_A_I_PZ_GW01 10/08/2020 0.004 Phosphorus (Ortho) mg/L DG_A_I_PZ_BW36A 17/08/2020 0.043
Phosphorus (Ortho) mg/L DG_A_I_PZ_BW53/Puls 17/08/2020 0.28
Phosphorus (Ortho) mg/L DG_A_I_PZ_GW05 17/08/2020 0.005
Phosphorus (Ortho) mg/L DG_A_I_PZ_WRK303 19/08/2020 0.009

Iluka Resources Ltd Planning Permit 15-105: Mineral Sands By-Product Disposal (Pit 23)
EMP and Rehabilitation Performance Report – H2 2020 FINAL (Rev 0)
90
Variable Unit Sample Point Date Result
Phosphorus (Ortho) mg/L DG_A_I_PZ_BW45B 19/08/2020 0.004 Phosphorus (Ortho) mg/L DG_A_I_PZ_WRK304 19/08/2020 0.016
Phosphorus (Ortho) mg/L DG_A_I_PZ_WRK302 3/09/2020 0.004 Phosphorus (Ortho) mg/L DG_A_I_PZ_GW04 15/10/2020 0.011
Phosphorus (Ortho) mg/L DG_A_I_PZ_GW04A 30/11/2020 0.004 Phosphorus (Ortho) mg/L DG_A_I_PZ_GW04A 30/12/2020 0.004 Potassium mg/L DG_A_I_PZ_GW07 2/07/2020 16
Potassium mg/L DG_A_I_PZ_GW03 2/07/2020 29
Potassium mg/L DG_A_I_PZ_GW02 2/07/2020 26
Potassium mg/L DG_A_I_PZ_GW08 6/07/2020 19
Potassium mg/L DG_A_I_PZ_WRK302 6/07/2020 26
Potassium mg/L DG_A_I_PZ_GW06 6/07/2020 21
Potassium mg/L DG_A_I_PZ_BW36A 7/07/2020 15
Potassium mg/L DG_A_I_PZ_GW01 7/07/2020 17
Potassium mg/L DG_A_I_PZ_BW45B 7/07/2020 19
Potassium mg/L DG_A_I_PZ_IWB2 8/07/2020 5
Potassium mg/L DG_A_I_PZ_IWB6 8/07/2020 1.5
Potassium mg/L DG_A_I_PZ_BW05 8/07/2020 81
Potassium mg/L DG_A_I_PZ_BW28A 8/07/2020 43
Potassium mg/L DG_A_I_PZ_BW53/Puls 9/07/2020 9.8
Potassium mg/L DG_A_I_PZ_GW05 9/07/2020 16
Potassium mg/L DG_A_I_PZ_GW04 9/07/2020 15
Potassium mg/L DG_A_I_PZ_WRK300 13/07/2020 14
Potassium mg/L DG_A_I_PZ_WRK303 13/07/2020 15
Potassium mg/L DG_A_I_PZ_WRK301 13/07/2020 25
Potassium mg/L DG_A_I_PZ_WRK304 14/07/2020 22
Potassium mg/L DG_A_I_PZ_GW04 10/08/2020 16
Potassium mg/L DG_A_I_PZ_BW28A 10/08/2020 42
Potassium mg/L DG_A_I_PZ_GW02 10/08/2020 26
Potassium mg/L DG_A_I_PZ_GW01 10/08/2020 17
Potassium mg/L DG_A_I_PZ_BW36A 17/08/2020 15
Potassium mg/L DG_A_I_PZ_BW53/Puls 17/08/2020 9.8
Potassium mg/L DG_A_I_PZ_GW05 17/08/2020 14
Potassium mg/L DG_A_I_PZ_WRK303 19/08/2020 13
Potassium mg/L DG_A_I_PZ_BW45B 19/08/2020 18
Potassium mg/L DG_A_I_PZ_WRK304 19/08/2020 20
Potassium mg/L DG_A_I_PZ_WRK302 3/09/2020 24
Potassium mg/L DG_A_I_PZ_GW04 15/10/2020 16
Potassium mg/L DG_A_I_PZ_GW04A 30/11/2020 13
Potassium mg/L DG_A_I_PZ_GW04A 30/12/2020 13
Radium 226 Bq/L DG_A_I_PZ_GW07 2/07/2020 0.07
Radium 226 Bq/L DG_A_I_PZ_GW03 2/07/2020 0.01
Radium 226 Bq/L DG_A_I_PZ_GW02 2/07/2020 0.1
Radium 226 Bq/L DG_A_I_PZ_GW08 6/07/2020 0.06

Iluka Resources Ltd Planning Permit 15-105: Mineral Sands By-Product Disposal (Pit 23)
EMP and Rehabilitation Performance Report – H2 2020 FINAL (Rev 0)
91
Variable Unit Sample Point Date Result
Radium 226 Bq/L DG_A_I_PZ_WRK302 6/07/2020 0.18
Radium 226 Bq/L DG_A_I_PZ_GW06 6/07/2020 0.05
Radium 226 Bq/L DG_A_I_PZ_BW36A 7/07/2020 0.06
Radium 226 Bq/L DG_A_I_PZ_GW01 7/07/2020 0.24
Radium 226 Bq/L DG_A_I_PZ_BW45B 7/07/2020 0.69
Radium 226 Bq/L DG_A_I_PZ_IWB2 8/07/2020 0.01
Radium 226 Bq/L DG_A_I_PZ_IWB6 8/07/2020 0.02
Radium 226 Bq/L DG_A_I_PZ_BW05 8/07/2020 0.03
Radium 226 Bq/L DG_A_I_PZ_BW28A 8/07/2020 0.11
Radium 226 Bq/L DG_A_I_PZ_BW53/Puls 9/07/2020 0.04
Radium 226 Bq/L DG_A_I_PZ_GW05 9/07/2020 0.04
Radium 226 Bq/L DG_A_I_PZ_GW04 9/07/2020 0.12
Radium 226 Bq/L DG_A_I_PZ_WRK300 13/07/2020 0.03
Radium 226 Bq/L DG_A_I_PZ_WRK303 13/07/2020 0.04
Radium 226 Bq/L DG_A_I_PZ_WRK301 13/07/2020 0.01 Radium 226 Bq/L DG_A_I_PZ_WRK304 14/07/2020 0.02
Radium 226 Bq/L DG_A_I_PZ_BW28A 10/08/2020 0.11
Radium 226 Bq/L DG_A_I_PZ_GW02 10/08/2020 0.09
Radium 226 Bq/L DG_A_I_PZ_GW01 10/08/2020 0.13
Radium 226 Bq/L DG_A_I_PZ_GW04 10/08/2020 0.12
Radium 226 Bq/L DG_A_I_PZ_BW53/Puls 17/08/2020 0.03
Radium 226 Bq/L DG_A_I_PZ_GW05 17/08/2020 0.07
Radium 226 Bq/L DG_A_I_PZ_BW36A 17/08/2020 0.06
Radium 226 Bq/L DG_A_I_PZ_WRK303 19/08/2020 0.03
Radium 226 Bq/L DG_A_I_PZ_WRK304 19/08/2020 0.01
Radium 226 Bq/L DG_A_I_PZ_BW45B 19/08/2020 0.58
Radium 226 Bq/L DG_A_I_PZ_WRK302 3/09/2020 0.33
Radium 226 Bq/L DG_A_I_PZ_GW04 15/10/2020 0.12
Radium 226 Bq/L DG_A_I_PZ_GW04A 30/11/2020 0.04
Radium 228 Bq/L DG_A_I_PZ_GW07 2/07/2020 0.34
Radium 228 Bq/L DG_A_I_PZ_GW03 2/07/2020 0.08 Radium 228 Bq/L DG_A_I_PZ_GW02 2/07/2020 0.33
Radium 228 Bq/L DG_A_I_PZ_GW08 6/07/2020 0.08 Radium 228 Bq/L DG_A_I_PZ_WRK302 6/07/2020 0.74
Radium 228 Bq/L DG_A_I_PZ_GW06 6/07/2020 0.19
Radium 228 Bq/L DG_A_I_PZ_BW36A 7/07/2020 0.15
Radium 228 Bq/L DG_A_I_PZ_GW01 7/07/2020 0.72
Radium 228 Bq/L DG_A_I_PZ_BW45B 7/07/2020 3.02
Radium 228 Bq/L DG_A_I_PZ_IWB2 8/07/2020 0.08 Radium 228 Bq/L DG_A_I_PZ_IWB6 8/07/2020 0.08 Radium 228 Bq/L DG_A_I_PZ_BW05 8/07/2020 0.08 Radium 228 Bq/L DG_A_I_PZ_BW28A 8/07/2020 0.08 Radium 228 Bq/L DG_A_I_PZ_BW53/Puls 9/07/2020 0.1
Radium 228 Bq/L DG_A_I_PZ_GW05 9/07/2020 0.11

Iluka Resources Ltd Planning Permit 15-105: Mineral Sands By-Product Disposal (Pit 23)
EMP and Rehabilitation Performance Report – H2 2020 FINAL (Rev 0)
92
Variable Unit Sample Point Date Result
Radium 228 Bq/L DG_A_I_PZ_GW04 9/07/2020 0.24
Radium 228 Bq/L DG_A_I_PZ_WRK300 13/07/2020 0.08 Radium 228 Bq/L DG_A_I_PZ_WRK303 13/07/2020 0.09
Radium 228 Bq/L DG_A_I_PZ_WRK301 13/07/2020 0.08 Radium 228 Bq/L DG_A_I_PZ_WRK304 14/07/2020 0.08 Radium 228 Bq/L DG_A_I_PZ_BW28A 10/08/2020 0.08 Radium 228 Bq/L DG_A_I_PZ_GW02 10/08/2020 0.31
Radium 228 Bq/L DG_A_I_PZ_GW01 10/08/2020 0.42
Radium 228 Bq/L DG_A_I_PZ_GW04 10/08/2020 0.25
Radium 228 Bq/L DG_A_I_PZ_BW53/Puls 17/08/2020 0.1
Radium 228 Bq/L DG_A_I_PZ_GW05 17/08/2020 0.16
Radium 228 Bq/L DG_A_I_PZ_BW36A 17/08/2020 0.2
Radium 228 Bq/L DG_A_I_PZ_WRK303 19/08/2020 0.08 Radium 228 Bq/L DG_A_I_PZ_WRK304 19/08/2020 0.08 Radium 228 Bq/L DG_A_I_PZ_BW45B 19/08/2020 2.36
Radium 228 Bq/L DG_A_I_PZ_WRK302 3/09/2020 0.91
Radium 228 Bq/L DG_A_I_PZ_GW04 15/10/2020 0.25
Radium 228 Bq/L DG_A_I_PZ_GW04A 30/11/2020 0.2
Redox Potential (Eh) mV DG_A_I_PZ_GW07 2/07/2020 210
Redox Potential (Eh) mV DG_A_I_PZ_GW03 2/07/2020 35
Redox Potential (Eh) mV DG_A_I_PZ_GW02 2/07/2020 234
Redox Potential (Eh) mV DG_A_I_PZ_GW08 6/07/2020 173
Redox Potential (Eh) mV DG_A_I_PZ_WRK302 6/07/2020 182
Redox Potential (Eh) mV DG_A_I_PZ_GW06 6/07/2020 164
Redox Potential (Eh) mV DG_A_I_PZ_BW36A 7/07/2020 -41
Redox Potential (Eh) mV DG_A_I_PZ_GW01 7/07/2020 228
Redox Potential (Eh) mV DG_A_I_PZ_BW45B 7/07/2020 283
Redox Potential (Eh) mV DG_A_I_PZ_IWB2 8/07/2020 315
Redox Potential (Eh) mV DG_A_I_PZ_IWB6 8/07/2020 346
Redox Potential (Eh) mV DG_A_I_PZ_BW05 8/07/2020 -10
Redox Potential (Eh) mV DG_A_I_PZ_BW28A 8/07/2020 -16
Redox Potential (Eh) mV DG_A_I_PZ_BW53/Puls 9/07/2020 -130
Redox Potential (Eh) mV DG_A_I_PZ_GW05 9/07/2020 134
Redox Potential (Eh) mV DG_A_I_PZ_GW04 9/07/2020 156
Redox Potential (Eh) mV DG_A_I_PZ_WRK300 13/07/2020 138
Redox Potential (Eh) mV DG_A_I_PZ_WRK303 13/07/2020 209
Redox Potential (Eh) mV DG_A_I_PZ_WRK301 13/07/2020 147
Redox Potential (Eh) mV DG_A_I_PZ_WRK304 14/07/2020 221
Redox Potential (Eh) mV DG_A_I_PZ_BW28A 10/08/2020 -10
Redox Potential (Eh) mV DG_A_I_PZ_GW02 10/08/2020 309
Redox Potential (Eh) mV DG_A_I_PZ_GW01 10/08/2020 489
Redox Potential (Eh) mV DG_A_I_PZ_GW04 10/08/2020 380
Redox Potential (Eh) mV DG_A_I_PZ_BW53/Puls 17/08/2020 -6
Redox Potential (Eh) mV DG_A_I_PZ_GW05 17/08/2020 384

Iluka Resources Ltd Planning Permit 15-105: Mineral Sands By-Product Disposal (Pit 23)
EMP and Rehabilitation Performance Report – H2 2020 FINAL (Rev 0)
93
Variable Unit Sample Point Date Result
Redox Potential (Eh) mV DG_A_I_PZ_BW36A 17/08/2020 9
Redox Potential (Eh) mV DG_A_I_PZ_WRK303 19/08/2020 244
Redox Potential (Eh) mV DG_A_I_PZ_WRK304 19/08/2020 215
Redox Potential (Eh) mV DG_A_I_PZ_BW45B 19/08/2020 273
Redox Potential (Eh) mV DG_A_I_PZ_GW07 20/08/2020 222
Redox Potential (Eh) mV DG_A_I_PZ_GW03 20/08/2020 71
Redox Potential (Eh) mV DG_A_I_PZ_WRK300 20/08/2020 139
Redox Potential (Eh) mV DG_A_I_PZ_GW06 25/08/2020 165
Redox Potential (Eh) mV DG_A_I_PZ_GW08 25/08/2020 191
Redox Potential (Eh) mV DG_A_I_PZ_WRK302 25/08/2020 185
Redox Potential (Eh) mV DG_A_I_PZ_WRK301 25/08/2020 86
Redox Potential (Eh) mV DG_A_I_PZ_WRK302 3/09/2020 235
Redox Potential (Eh) mV DG_A_I_PZ_GW03 3/09/2020 115
Redox Potential (Eh) mV DG_A_I_PZ_GW02 3/09/2020 315
Redox Potential (Eh) mV DG_A_I_PZ_GW07 7/09/2020 252
Redox Potential (Eh) mV DG_A_I_PZ_GW05 7/09/2020 302
Redox Potential (Eh) mV DG_A_I_PZ_GW04 7/09/2020 340
Redox Potential (Eh) mV DG_A_I_PZ_BW36A 7/09/2020 -72
Redox Potential (Eh) mV DG_A_I_PZ_GW01 7/09/2020 172
Redox Potential (Eh) mV DG_A_I_PZ_BW45B 7/09/2020 234
Redox Potential (Eh) mV DG_A_I_PZ_GW08 8/09/2020 235
Redox Potential (Eh) mV DG_A_I_PZ_GW06 8/09/2020 252
Redox Potential (Eh) mV DG_A_I_PZ_WRK300 8/09/2020 229
Redox Potential (Eh) mV DG_A_I_PZ_WRK304 9/09/2020 547
Redox Potential (Eh) mV DG_A_I_PZ_WRK303 9/09/2020 200
Redox Potential (Eh) mV DG_A_I_PZ_WRK301 9/09/2020 261
Redox Potential (Eh) mV DG_A_I_PZ_GW04 15/10/2020 279
Redox Potential (Eh) mV DG_A_I_PZ_GW03 15/10/2020 88
Redox Potential (Eh) mV DG_A_I_PZ_GW02 15/10/2020 286
Redox Potential (Eh) mV DG_A_I_PZ_GW07 16/10/2020 210
Redox Potential (Eh) mV DG_A_I_PZ_GW01 16/10/2020 261
Redox Potential (Eh) mV DG_A_I_PZ_BW45B 16/10/2020 310
Redox Potential (Eh) mV DG_A_I_PZ_GW05 19/10/2020 222
Redox Potential (Eh) mV DG_A_I_PZ_BW36A 19/10/2020 -66
Redox Potential (Eh) mV DG_A_I_PZ_WRK300 19/10/2020 162
Redox Potential (Eh) mV DG_A_I_PZ_GW08 19/10/2020 215
Redox Potential (Eh) mV DG_A_I_PZ_WRK302 19/10/2020 240
Redox Potential (Eh) mV DG_A_I_PZ_GW06 19/10/2020 218
Redox Potential (Eh) mV DG_A_I_PZ_WRK304 20/10/2020 212
Redox Potential (Eh) mV DG_A_I_PZ_WRK303 20/10/2020 210
Redox Potential (Eh) mV DG_A_I_PZ_WRK301 20/10/2020 90
Redox Potential (Eh) mV DG_A_I_PZ_GW07 24/11/2020 155
Redox Potential (Eh) mV DG_A_I_PZ_GW03 24/11/2020 63
Redox Potential (Eh) mV DG_A_I_PZ_GW02 24/11/2020 177

Iluka Resources Ltd Planning Permit 15-105: Mineral Sands By-Product Disposal (Pit 23)
EMP and Rehabilitation Performance Report – H2 2020 FINAL (Rev 0)
94
Variable Unit Sample Point Date Result
Redox Potential (Eh) mV DG_A_I_PZ_GW01 24/11/2020 199
Redox Potential (Eh) mV DG_A_I_PZ_BW45B 24/11/2020 286
Redox Potential (Eh) mV DG_A_I_PZ_GW04 25/11/2020 293
Redox Potential (Eh) mV DG_A_I_PZ_GW05 25/11/2020 260
Redox Potential (Eh) mV DG_A_I_PZ_BW36A 25/11/2020 -100
Redox Potential (Eh) mV DG_A_I_PZ_WRK300 25/11/2020 101
Redox Potential (Eh) mV DG_A_I_PZ_GW08 26/11/2020 203
Redox Potential (Eh) mV DG_A_I_PZ_WRK302 26/11/2020 236
Redox Potential (Eh) mV DG_A_I_PZ_GW06 26/11/2020 284
Redox Potential (Eh) mV DG_A_I_PZ_GW04A 30/11/2020 647
Redox Potential (Eh) mV DG_A_I_PZ_WRK304 30/11/2020 200
Redox Potential (Eh) mV DG_A_I_PZ_WRK303 30/11/2020 220
Redox Potential (Eh) mV DG_A_I_PZ_WRK301 30/11/2020 91
Redox Potential (Eh) mV DG_A_I_PZ_GW05 4/12/2020 190
Redox Potential (Eh) mV DG_A_I_PZ_GW07 8/12/2020 191
Redox Potential (Eh) mV DG_A_I_PZ_GW03 8/12/2020 107
Redox Potential (Eh) mV DG_A_I_PZ_GW02 8/12/2020 135
Redox Potential (Eh) mV DG_A_I_PZ_BW45B 9/12/2020 240
Redox Potential (Eh) mV DG_A_I_PZ_GW01 9/12/2020 216
Redox Potential (Eh) mV DG_A_I_PZ_GW04 9/12/2020 202
Redox Potential (Eh) mV DG_A_I_PZ_BW36A 9/12/2020 -54
Redox Potential (Eh) mV DG_A_I_PZ_GW04A 10/12/2020 160
Redox Potential (Eh) mV DG_A_I_PZ_GW08 10/12/2020 185
Redox Potential (Eh) mV DG_A_I_PZ_WRK302 10/12/2020 191
Redox Potential (Eh) mV DG_A_I_PZ_GW06 10/12/2020 184
Redox Potential (Eh) mV DG_A_I_PZ_WRK304 14/12/2020 186
Redox Potential (Eh) mV DG_A_I_PZ_WRK303 14/12/2020 169
Redox Potential (Eh) mV DG_A_I_PZ_WRK301 14/12/2020 76
Redox Potential (Eh) mV DG_A_I_PZ_WRK300 14/12/2020 88
Selenium (Total) mg/L DG_A_I_PZ_GW07 2/07/2020 0.008
Selenium (Total) mg/L DG_A_I_PZ_GW03 2/07/2020 0.001 Selenium (Total) mg/L DG_A_I_PZ_GW02 2/07/2020 0.003
Selenium (Total) mg/L DG_A_I_PZ_GW08 6/07/2020 0.015
Selenium (Total) mg/L DG_A_I_PZ_WRK302 6/07/2020 0.011
Selenium (Total) mg/L DG_A_I_PZ_GW06 6/07/2020 0.007
Selenium (Total) mg/L DG_A_I_PZ_BW36A 7/07/2020 0.003
Selenium (Total) mg/L DG_A_I_PZ_GW01 7/07/2020 0.024
Selenium (Total) mg/L DG_A_I_PZ_BW45B 7/07/2020 0.022
Selenium (Total) mg/L DG_A_I_PZ_IWB2 8/07/2020 0.001 Selenium (Total) mg/L DG_A_I_PZ_IWB6 8/07/2020 0.002
Selenium (Total) mg/L DG_A_I_PZ_BW05 8/07/2020 0.015
Selenium (Total) mg/L DG_A_I_PZ_BW28A 8/07/2020 0.013
Selenium (Total) mg/L DG_A_I_PZ_BW53/Puls 9/07/2020 0.003
Selenium (Total) mg/L DG_A_I_PZ_GW05 9/07/2020 0.033

Iluka Resources Ltd Planning Permit 15-105: Mineral Sands By-Product Disposal (Pit 23)
EMP and Rehabilitation Performance Report – H2 2020 FINAL (Rev 0)
95
Variable Unit Sample Point Date Result
Selenium (Total) mg/L DG_A_I_PZ_GW04 9/07/2020 0.031
Selenium (Total) mg/L DG_A_I_PZ_WRK300 13/07/2020 0.002
Selenium (Total) mg/L DG_A_I_PZ_WRK303 13/07/2020 0.016
Selenium (Total) mg/L DG_A_I_PZ_WRK301 13/07/2020 0.007
Selenium (Total) mg/L DG_A_I_PZ_WRK304 14/07/2020 0.017
Selenium (Total) mg/L DG_A_I_PZ_GW04 10/08/2020 0.029
Selenium (Total) mg/L DG_A_I_PZ_BW28A 10/08/2020 0.014
Selenium (Total) mg/L DG_A_I_PZ_GW02 10/08/2020 0.004
Selenium (Total) mg/L DG_A_I_PZ_GW01 10/08/2020 0.033
Selenium (Total) mg/L DG_A_I_PZ_BW36A 17/08/2020 0.002
Selenium (Total) mg/L DG_A_I_PZ_BW53/Puls 17/08/2020 0.001 Selenium (Total) mg/L DG_A_I_PZ_GW05 17/08/2020 0.037
Selenium (Total) mg/L DG_A_I_PZ_WRK303 19/08/2020 0.028
Selenium (Total) mg/L DG_A_I_PZ_BW45B 19/08/2020 0.034
Selenium (Total) mg/L DG_A_I_PZ_WRK304 19/08/2020 0.013
Selenium (Total) mg/L DG_A_I_PZ_WRK302 3/09/2020 0.01
Selenium (Total) mg/L DG_A_I_PZ_GW04 15/10/2020 0.026
Selenium (Total) mg/L DG_A_I_PZ_GW04A 30/11/2020 0.011
Selenium (Total) mg/L DG_A_I_PZ_GW04A 30/12/2020 0.011
Silver (Total) mg/L DG_A_I_PZ_GW07 2/07/2020 0.001 Silver (Total) mg/L DG_A_I_PZ_GW03 2/07/2020 0.001 Silver (Total) mg/L DG_A_I_PZ_GW02 2/07/2020 0.001 Silver (Total) mg/L DG_A_I_PZ_GW08 6/07/2020 0.001 Silver (Total) mg/L DG_A_I_PZ_WRK302 6/07/2020 0.001 Silver (Total) mg/L DG_A_I_PZ_GW06 6/07/2020 0.001 Silver (Total) mg/L DG_A_I_PZ_BW36A 7/07/2020 0.001 Silver (Total) mg/L DG_A_I_PZ_GW01 7/07/2020 0.001 Silver (Total) mg/L DG_A_I_PZ_BW45B 7/07/2020 0.001 Silver (Total) mg/L DG_A_I_PZ_IWB2 8/07/2020 0.001 Silver (Total) mg/L DG_A_I_PZ_IWB6 8/07/2020 0.001 Silver (Total) mg/L DG_A_I_PZ_BW05 8/07/2020 0.001 Silver (Total) mg/L DG_A_I_PZ_BW28A 8/07/2020 0.001 Silver (Total) mg/L DG_A_I_PZ_BW53/Puls 9/07/2020 0.001 Silver (Total) mg/L DG_A_I_PZ_GW05 9/07/2020 0.001 Silver (Total) mg/L DG_A_I_PZ_GW04 9/07/2020 0.001 Silver (Total) mg/L DG_A_I_PZ_WRK300 13/07/2020 0.001 Silver (Total) mg/L DG_A_I_PZ_WRK303 13/07/2020 0.001 Silver (Total) mg/L DG_A_I_PZ_WRK301 13/07/2020 0.001 Silver (Total) mg/L DG_A_I_PZ_WRK304 14/07/2020 0.001 Silver (Total) mg/L DG_A_I_PZ_GW04 10/08/2020 0.001 Silver (Total) mg/L DG_A_I_PZ_BW28A 10/08/2020 0.001 Silver (Total) mg/L DG_A_I_PZ_GW02 10/08/2020 0.001 Silver (Total) mg/L DG_A_I_PZ_GW01 10/08/2020 0.001 Silver (Total) mg/L DG_A_I_PZ_BW36A 17/08/2020 0.001

Iluka Resources Ltd Planning Permit 15-105: Mineral Sands By-Product Disposal (Pit 23)
EMP and Rehabilitation Performance Report – H2 2020 FINAL (Rev 0)
96
Variable Unit Sample Point Date Result
Silver (Total) mg/L DG_A_I_PZ_BW53/Puls 17/08/2020 0.001 Silver (Total) mg/L DG_A_I_PZ_GW05 17/08/2020 0.001 Silver (Total) mg/L DG_A_I_PZ_WRK303 19/08/2020 0.001 Silver (Total) mg/L DG_A_I_PZ_BW45B 19/08/2020 0.001 Silver (Total) mg/L DG_A_I_PZ_WRK304 19/08/2020 0.001 Silver (Total) mg/L DG_A_I_PZ_WRK302 3/09/2020 0.001 Silver (Total) mg/L DG_A_I_PZ_GW04 15/10/2020 0.003
Silver (Total) mg/L DG_A_I_PZ_GW04A 30/11/2020 0.001 Silver (Total) mg/L DG_A_I_PZ_GW04A 30/12/2020 0.001 Sodium mg/L DG_A_I_PZ_GW07 2/07/2020 3100
Sodium mg/L DG_A_I_PZ_GW03 2/07/2020 1900
Sodium mg/L DG_A_I_PZ_GW02 2/07/2020 1200
Sodium mg/L DG_A_I_PZ_GW08 6/07/2020 3400
Sodium mg/L DG_A_I_PZ_WRK302 6/07/2020 3400
Sodium mg/L DG_A_I_PZ_GW06 6/07/2020 3500
Sodium mg/L DG_A_I_PZ_BW36A 7/07/2020 1200
Sodium mg/L DG_A_I_PZ_GW01 7/07/2020 2000
Sodium mg/L DG_A_I_PZ_BW45B 7/07/2020 2900
Sodium mg/L DG_A_I_PZ_IWB2 8/07/2020 610
Sodium mg/L DG_A_I_PZ_IWB6 8/07/2020 310
Sodium mg/L DG_A_I_PZ_BW05 8/07/2020 4700
Sodium mg/L DG_A_I_PZ_BW28A 8/07/2020 3500
Sodium mg/L DG_A_I_PZ_BW53/Puls 9/07/2020 490
Sodium mg/L DG_A_I_PZ_GW05 9/07/2020 1900
Sodium mg/L DG_A_I_PZ_GW04 9/07/2020 1700
Sodium mg/L DG_A_I_PZ_WRK300 13/07/2020 930
Sodium mg/L DG_A_I_PZ_WRK303 13/07/2020 1700
Sodium mg/L DG_A_I_PZ_WRK301 13/07/2020 1800
Sodium mg/L DG_A_I_PZ_WRK304 14/07/2020 1600
Sodium mg/L DG_A_I_PZ_GW04 10/08/2020 1600
Sodium mg/L DG_A_I_PZ_BW28A 10/08/2020 3200
Sodium mg/L DG_A_I_PZ_GW02 10/08/2020 1200
Sodium mg/L DG_A_I_PZ_GW01 10/08/2020 1800
Sodium mg/L DG_A_I_PZ_BW36A 17/08/2020 1300
Sodium mg/L DG_A_I_PZ_BW53/Puls 17/08/2020 460
Sodium mg/L DG_A_I_PZ_GW05 17/08/2020 1700
Sodium mg/L DG_A_I_PZ_WRK303 19/08/2020 1600
Sodium mg/L DG_A_I_PZ_BW45B 19/08/2020 2600
Sodium mg/L DG_A_I_PZ_WRK304 19/08/2020 1400
Sodium mg/L DG_A_I_PZ_WRK302 3/09/2020 3300
Sodium mg/L DG_A_I_PZ_GW04 15/10/2020 1600
Sodium mg/L DG_A_I_PZ_GW04A 30/11/2020 1300
Sodium mg/L DG_A_I_PZ_GW04A 30/12/2020 1300
Standing Water Level mAHD DG_A_I_PZ_GW07 2/07/2020 172.536

Iluka Resources Ltd Planning Permit 15-105: Mineral Sands By-Product Disposal (Pit 23)
EMP and Rehabilitation Performance Report – H2 2020 FINAL (Rev 0)
97
Variable Unit Sample Point Date Result
Standing Water Level mAHD DG_A_I_PZ_GW03 2/07/2020 162.02
Standing Water Level mAHD DG_A_I_PZ_GW02 2/07/2020 170.77
Standing Water Level mAHD DG_A_I_PZ_GW08 6/07/2020 177.53
Standing Water Level mAHD DG_A_I_PZ_WRK302 6/07/2020 176.77
Standing Water Level mAHD DG_A_I_PZ_GW06 6/07/2020 176.224
Standing Water Level mAHD DG_A_I_PZ_BW36A 7/07/2020 174.475
Standing Water Level mAHD DG_A_I_PZ_GW01 7/07/2020 173.475
Standing Water Level mAHD DG_A_I_PZ_BW45B 7/07/2020 177.37
Standing Water Level mAHD DG_A_I_PZ_IWB2 8/07/2020 179.656
Standing Water Level mAHD DG_A_I_PZ_IWB6 8/07/2020 176.85
Standing Water Level mAHD DG_A_I_PZ_BW05 8/07/2020 147.439
Standing Water Level mAHD DG_A_I_PZ_BW28A 8/07/2020 152.5
Standing Water Level mAHD DG_A_I_PZ_BW53/Puls 9/07/2020 175.81
Standing Water Level mAHD DG_A_I_PZ_GW05 9/07/2020 178.89
Standing Water Level mAHD DG_A_I_PZ_GW04 9/07/2020 178.13
Standing Water Level mAHD DG_A_I_PZ_WRK300 13/07/2020 175.11
Standing Water Level mAHD DG_A_I_PZ_WRK303 13/07/2020 179.84
Standing Water Level mAHD DG_A_I_PZ_WRK301 13/07/2020 178.18
Standing Water Level mAHD DG_A_I_PZ_WRK304 14/07/2020 180.44
Standing Water Level mAHD DG_A_I_PZ_BW28A 10/08/2020 152.48
Standing Water Level mAHD DG_A_I_PZ_GW02 10/08/2020 170.78
Standing Water Level mAHD DG_A_I_PZ_GW01 10/08/2020 173.515
Standing Water Level mAHD DG_A_I_PZ_GW04 10/08/2020 178.17
Standing Water Level mAHD DG_A_I_PZ_BW53/Puls 17/08/2020 176.29
Standing Water Level mAHD DG_A_I_PZ_GW05 17/08/2020 178.94
Standing Water Level mAHD DG_A_I_PZ_BW36A 17/08/2020 174.425
Standing Water Level mAHD DG_A_I_PZ_WRK303 19/08/2020 179.89
Standing Water Level mAHD DG_A_I_PZ_WRK304 19/08/2020 180.49
Standing Water Level mAHD DG_A_I_PZ_BW45B 19/08/2020 177.35
Standing Water Level mAHD DG_A_I_PZ_GW07 20/08/2020 172.476
Standing Water Level mAHD DG_A_I_PZ_GW03 20/08/2020 162.05
Standing Water Level mAHD DG_A_I_PZ_WRK300 20/08/2020 175.07
Standing Water Level mAHD DG_A_I_PZ_IWB2 20/08/2020 179.876
Standing Water Level mAHD DG_A_I_PZ_IWB6 20/08/2020 177
Standing Water Level mAHD DG_A_I_PZ_GW06 25/08/2020 176.184
Standing Water Level mAHD DG_A_I_PZ_GW08 25/08/2020 177.59
Standing Water Level mAHD DG_A_I_PZ_WRK302 25/08/2020 176.71
Standing Water Level mAHD DG_A_I_PZ_WRK301 25/08/2020 178.19
Standing Water Level mAHD DG_A_I_PZ_WRK302 3/09/2020 176.75
Standing Water Level mAHD DG_A_I_PZ_GW03 3/09/2020 162.01
Standing Water Level mAHD DG_A_I_PZ_GW02 3/09/2020 170.72
Standing Water Level mAHD DG_A_I_PZ_GW07 7/09/2020 172.516
Standing Water Level mAHD DG_A_I_PZ_GW05 7/09/2020 178.88
Standing Water Level mAHD DG_A_I_PZ_GW04 7/09/2020 178.13
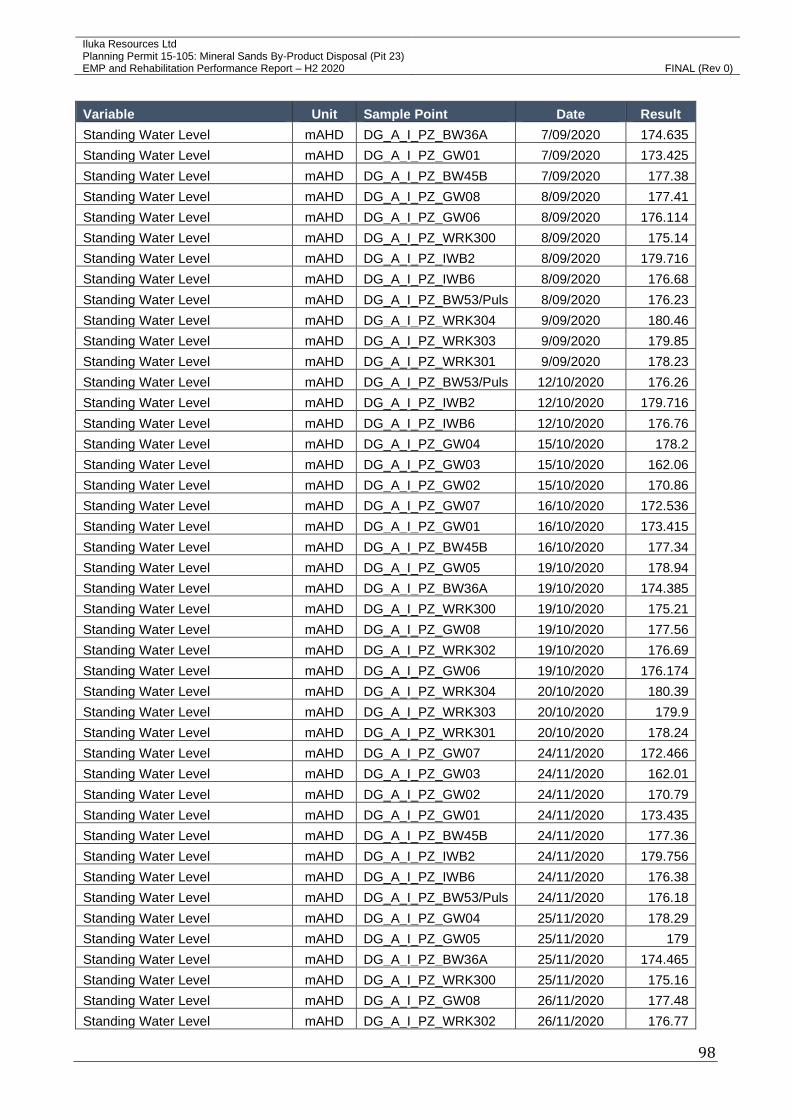
Iluka Resources Ltd Planning Permit 15-105: Mineral Sands By-Product Disposal (Pit 23)
EMP and Rehabilitation Performance Report – H2 2020 FINAL (Rev 0)
98
Variable Unit Sample Point Date Result
Standing Water Level mAHD DG_A_I_PZ_BW36A 7/09/2020 174.635
Standing Water Level mAHD DG_A_I_PZ_GW01 7/09/2020 173.425
Standing Water Level mAHD DG_A_I_PZ_BW45B 7/09/2020 177.38
Standing Water Level mAHD DG_A_I_PZ_GW08 8/09/2020 177.41
Standing Water Level mAHD DG_A_I_PZ_GW06 8/09/2020 176.114
Standing Water Level mAHD DG_A_I_PZ_WRK300 8/09/2020 175.14
Standing Water Level mAHD DG_A_I_PZ_IWB2 8/09/2020 179.716
Standing Water Level mAHD DG_A_I_PZ_IWB6 8/09/2020 176.68
Standing Water Level mAHD DG_A_I_PZ_BW53/Puls 8/09/2020 176.23
Standing Water Level mAHD DG_A_I_PZ_WRK304 9/09/2020 180.46
Standing Water Level mAHD DG_A_I_PZ_WRK303 9/09/2020 179.85
Standing Water Level mAHD DG_A_I_PZ_WRK301 9/09/2020 178.23
Standing Water Level mAHD DG_A_I_PZ_BW53/Puls 12/10/2020 176.26
Standing Water Level mAHD DG_A_I_PZ_IWB2 12/10/2020 179.716
Standing Water Level mAHD DG_A_I_PZ_IWB6 12/10/2020 176.76
Standing Water Level mAHD DG_A_I_PZ_GW04 15/10/2020 178.2
Standing Water Level mAHD DG_A_I_PZ_GW03 15/10/2020 162.06
Standing Water Level mAHD DG_A_I_PZ_GW02 15/10/2020 170.86
Standing Water Level mAHD DG_A_I_PZ_GW07 16/10/2020 172.536
Standing Water Level mAHD DG_A_I_PZ_GW01 16/10/2020 173.415
Standing Water Level mAHD DG_A_I_PZ_BW45B 16/10/2020 177.34
Standing Water Level mAHD DG_A_I_PZ_GW05 19/10/2020 178.94
Standing Water Level mAHD DG_A_I_PZ_BW36A 19/10/2020 174.385
Standing Water Level mAHD DG_A_I_PZ_WRK300 19/10/2020 175.21
Standing Water Level mAHD DG_A_I_PZ_GW08 19/10/2020 177.56
Standing Water Level mAHD DG_A_I_PZ_WRK302 19/10/2020 176.69
Standing Water Level mAHD DG_A_I_PZ_GW06 19/10/2020 176.174
Standing Water Level mAHD DG_A_I_PZ_WRK304 20/10/2020 180.39
Standing Water Level mAHD DG_A_I_PZ_WRK303 20/10/2020 179.9
Standing Water Level mAHD DG_A_I_PZ_WRK301 20/10/2020 178.24
Standing Water Level mAHD DG_A_I_PZ_GW07 24/11/2020 172.466
Standing Water Level mAHD DG_A_I_PZ_GW03 24/11/2020 162.01
Standing Water Level mAHD DG_A_I_PZ_GW02 24/11/2020 170.79
Standing Water Level mAHD DG_A_I_PZ_GW01 24/11/2020 173.435
Standing Water Level mAHD DG_A_I_PZ_BW45B 24/11/2020 177.36
Standing Water Level mAHD DG_A_I_PZ_IWB2 24/11/2020 179.756
Standing Water Level mAHD DG_A_I_PZ_IWB6 24/11/2020 176.38
Standing Water Level mAHD DG_A_I_PZ_BW53/Puls 24/11/2020 176.18
Standing Water Level mAHD DG_A_I_PZ_GW04 25/11/2020 178.29
Standing Water Level mAHD DG_A_I_PZ_GW05 25/11/2020 179
Standing Water Level mAHD DG_A_I_PZ_BW36A 25/11/2020 174.465
Standing Water Level mAHD DG_A_I_PZ_WRK300 25/11/2020 175.16
Standing Water Level mAHD DG_A_I_PZ_GW08 26/11/2020 177.48
Standing Water Level mAHD DG_A_I_PZ_WRK302 26/11/2020 176.77

Iluka Resources Ltd Planning Permit 15-105: Mineral Sands By-Product Disposal (Pit 23)
EMP and Rehabilitation Performance Report – H2 2020 FINAL (Rev 0)
99
Variable Unit Sample Point Date Result
Standing Water Level mAHD DG_A_I_PZ_GW06 26/11/2020 176.214
Standing Water Level mAHD DG_A_I_PZ_WRK304 30/11/2020 180.37
Standing Water Level mAHD DG_A_I_PZ_WRK303 30/11/2020 179.88
Standing Water Level mAHD DG_A_I_PZ_WRK301 30/11/2020 178.18
Standing Water Level mAHD DG_A_I_PZ_GW05 4/12/2020 178.97
Standing Water Level mAHD DG_A_I_PZ_GW07 8/12/2020 172.536
Standing Water Level mAHD DG_A_I_PZ_GW03 8/12/2020 162.04
Standing Water Level mAHD DG_A_I_PZ_GW02 8/12/2020 170.8
Standing Water Level mAHD DG_A_I_PZ_BW45B 9/12/2020 177.4
Standing Water Level mAHD DG_A_I_PZ_GW01 9/12/2020 173.515
Standing Water Level mAHD DG_A_I_PZ_GW04 9/12/2020 178.27
Standing Water Level mAHD DG_A_I_PZ_BW36A 9/12/2020 174.465
Standing Water Level mAHD DG_A_I_PZ_GW04A 10/12/2020 -24.48
Standing Water Level mAHD DG_A_I_PZ_GW08 10/12/2020 177.45
Standing Water Level mAHD DG_A_I_PZ_WRK302 10/12/2020 176.75
Standing Water Level mAHD DG_A_I_PZ_GW06 10/12/2020 176.204
Standing Water Level mAHD DG_A_I_PZ_BW53/Puls 10/12/2020 176.25
Standing Water Level mAHD DG_A_I_PZ_IWB2 10/12/2020 179.696
Standing Water Level mAHD DG_A_I_PZ_IWB6 10/12/2020 176.54
Standing Water Level mAHD DG_A_I_PZ_WRK304 14/12/2020 180.41
Standing Water Level mAHD DG_A_I_PZ_WRK303 14/12/2020 179.85
Standing Water Level mAHD DG_A_I_PZ_WRK301 14/12/2020 178.21
Standing Water Level mAHD DG_A_I_PZ_WRK300 14/12/2020 175.18
Standing Water Level (mBTOC) m DG_A_I_PZ_GW07 2/07/2020 16.31
Standing Water Level (mBTOC) m DG_A_I_PZ_GW03 2/07/2020 10.4
Standing Water Level (mBTOC) m DG_A_I_PZ_GW02 2/07/2020 15.61
Standing Water Level (mBTOC) m DG_A_I_PZ_GW08 6/07/2020 13.44
Standing Water Level (mBTOC) m DG_A_I_PZ_WRK302 6/07/2020 13.51
Standing Water Level (mBTOC) m DG_A_I_PZ_GW06 6/07/2020 13.29
Standing Water Level (mBTOC) m DG_A_I_PZ_BW36A 7/07/2020 26.26
Standing Water Level (mBTOC) m DG_A_I_PZ_GW01 7/07/2020 19.04
Standing Water Level (mBTOC) m DG_A_I_PZ_BW45B 7/07/2020 19.88
Standing Water Level (mBTOC) m DG_A_I_PZ_IWB2 8/07/2020 12.26
Standing Water Level (mBTOC) m DG_A_I_PZ_IWB6 8/07/2020 1.85
Standing Water Level (mBTOC) m DG_A_I_PZ_BW05 8/07/2020 5.33
Standing Water Level (mBTOC) m DG_A_I_PZ_BW28A 8/07/2020 4.19
Standing Water Level (mBTOC) m DG_A_I_PZ_BW53/Puls 9/07/2020 10.32
Standing Water Level (mBTOC) m DG_A_I_PZ_GW05 9/07/2020 21.41
Standing Water Level (mBTOC) m DG_A_I_PZ_GW04 9/07/2020 24.11
Standing Water Level (mBTOC) m DG_A_I_PZ_WRK300 13/07/2020 24.51
Standing Water Level (mBTOC) m DG_A_I_PZ_WRK303 13/07/2020 20.56
Standing Water Level (mBTOC) m DG_A_I_PZ_WRK301 13/07/2020 18.6
Standing Water Level (mBTOC) m DG_A_I_PZ_WRK304 14/07/2020 18.63
Standing Water Level (mBTOC) m DG_A_I_PZ_BW28A 10/08/2020 4.21

Iluka Resources Ltd Planning Permit 15-105: Mineral Sands By-Product Disposal (Pit 23)
EMP and Rehabilitation Performance Report – H2 2020 FINAL (Rev 0)
100
Variable Unit Sample Point Date Result
Standing Water Level (mBTOC) m DG_A_I_PZ_GW02 10/08/2020 15.6
Standing Water Level (mBTOC) m DG_A_I_PZ_GW01 10/08/2020 19
Standing Water Level (mBTOC) m DG_A_I_PZ_GW04 10/08/2020 24.07
Standing Water Level (mBTOC) m DG_A_I_PZ_BW53/Puls 17/08/2020 9.84
Standing Water Level (mBTOC) m DG_A_I_PZ_GW05 17/08/2020 21.36
Standing Water Level (mBTOC) m DG_A_I_PZ_BW36A 17/08/2020 26.31
Standing Water Level (mBTOC) m DG_A_I_PZ_WRK303 19/08/2020 20.51
Standing Water Level (mBTOC) m DG_A_I_PZ_WRK304 19/08/2020 18.58
Standing Water Level (mBTOC) m DG_A_I_PZ_BW45B 19/08/2020 19.9
Standing Water Level (mBTOC) m DG_A_I_PZ_GW07 20/08/2020 16.37
Standing Water Level (mBTOC) m DG_A_I_PZ_GW03 20/08/2020 10.37
Standing Water Level (mBTOC) m DG_A_I_PZ_WRK300 20/08/2020 24.55
Standing Water Level (mBTOC) m DG_A_I_PZ_IWB2 20/08/2020 12.04
Standing Water Level (mBTOC) m DG_A_I_PZ_IWB6 20/08/2020 1.7
Standing Water Level (mBTOC) m DG_A_I_PZ_GW06 25/08/2020 13.33
Standing Water Level (mBTOC) m DG_A_I_PZ_GW08 25/08/2020 13.38
Standing Water Level (mBTOC) m DG_A_I_PZ_WRK302 25/08/2020 13.57
Standing Water Level (mBTOC) m DG_A_I_PZ_WRK301 25/08/2020 18.59
Standing Water Level (mBTOC) m DG_A_I_PZ_WRK302 3/09/2020 13.53
Standing Water Level (mBTOC) m DG_A_I_PZ_GW03 3/09/2020 10.41
Standing Water Level (mBTOC) m DG_A_I_PZ_GW02 3/09/2020 15.66
Standing Water Level (mBTOC) m DG_A_I_PZ_GW07 7/09/2020 16.33
Standing Water Level (mBTOC) m DG_A_I_PZ_GW05 7/09/2020 21.42
Standing Water Level (mBTOC) m DG_A_I_PZ_GW04 7/09/2020 24.11
Standing Water Level (mBTOC) m DG_A_I_PZ_BW36A 7/09/2020 26.1
Standing Water Level (mBTOC) m DG_A_I_PZ_GW01 7/09/2020 19.09
Standing Water Level (mBTOC) m DG_A_I_PZ_BW45B 7/09/2020 19.87
Standing Water Level (mBTOC) m DG_A_I_PZ_GW08 8/09/2020 13.56
Standing Water Level (mBTOC) m DG_A_I_PZ_GW06 8/09/2020 13.4
Standing Water Level (mBTOC) m DG_A_I_PZ_WRK300 8/09/2020 24.48
Standing Water Level (mBTOC) m DG_A_I_PZ_IWB2 8/09/2020 12.2
Standing Water Level (mBTOC) m DG_A_I_PZ_IWB6 8/09/2020 2.02
Standing Water Level (mBTOC) m DG_A_I_PZ_BW53/Puls 8/09/2020 9.9
Standing Water Level (mBTOC) m DG_A_I_PZ_WRK304 9/09/2020 18.61
Standing Water Level (mBTOC) m DG_A_I_PZ_WRK303 9/09/2020 20.55
Standing Water Level (mBTOC) m DG_A_I_PZ_WRK301 9/09/2020 18.55
Standing Water Level (mBTOC) m DG_A_I_PZ_BW53/Puls 12/10/2020 9.87
Standing Water Level (mBTOC) m DG_A_I_PZ_IWB2 12/10/2020 12.2
Standing Water Level (mBTOC) m DG_A_I_PZ_IWB6 12/10/2020 1.94
Standing Water Level (mBTOC) m DG_A_I_PZ_GW04 15/10/2020 24.04
Standing Water Level (mBTOC) m DG_A_I_PZ_GW03 15/10/2020 10.36
Standing Water Level (mBTOC) m DG_A_I_PZ_GW02 15/10/2020 15.52
Standing Water Level (mBTOC) m DG_A_I_PZ_GW07 16/10/2020 16.31
Standing Water Level (mBTOC) m DG_A_I_PZ_GW01 16/10/2020 19.1

Iluka Resources Ltd Planning Permit 15-105: Mineral Sands By-Product Disposal (Pit 23)
EMP and Rehabilitation Performance Report – H2 2020 FINAL (Rev 0)
101
Variable Unit Sample Point Date Result
Standing Water Level (mBTOC) m DG_A_I_PZ_BW45B 16/10/2020 19.91
Standing Water Level (mBTOC) m DG_A_I_PZ_GW05 19/10/2020 21.36
Standing Water Level (mBTOC) m DG_A_I_PZ_BW36A 19/10/2020 26.35
Standing Water Level (mBTOC) m DG_A_I_PZ_WRK300 19/10/2020 24.41
Standing Water Level (mBTOC) m DG_A_I_PZ_GW08 19/10/2020 13.41
Standing Water Level (mBTOC) m DG_A_I_PZ_WRK302 19/10/2020 13.59
Standing Water Level (mBTOC) m DG_A_I_PZ_GW06 19/10/2020 13.34
Standing Water Level (mBTOC) m DG_A_I_PZ_WRK304 20/10/2020 18.68
Standing Water Level (mBTOC) m DG_A_I_PZ_WRK303 20/10/2020 20.5
Standing Water Level (mBTOC) m DG_A_I_PZ_WRK301 20/10/2020 18.54
Standing Water Level (mBTOC) m DG_A_I_PZ_GW07 24/11/2020 16.38
Standing Water Level (mBTOC) m DG_A_I_PZ_GW03 24/11/2020 10.41
Standing Water Level (mBTOC) m DG_A_I_PZ_GW02 24/11/2020 15.59
Standing Water Level (mBTOC) m DG_A_I_PZ_GW01 24/11/2020 19.08
Standing Water Level (mBTOC) m DG_A_I_PZ_BW45B 24/11/2020 19.89
Standing Water Level (mBTOC) m DG_A_I_PZ_IWB2 24/11/2020 12.16
Standing Water Level (mBTOC) m DG_A_I_PZ_IWB6 24/11/2020 2.32
Standing Water Level (mBTOC) m DG_A_I_PZ_BW53/Puls 24/11/2020 9.95
Standing Water Level (mBTOC) m DG_A_I_PZ_GW04 25/11/2020 23.95
Standing Water Level (mBTOC) m DG_A_I_PZ_GW05 25/11/2020 21.3
Standing Water Level (mBTOC) m DG_A_I_PZ_BW36A 25/11/2020 26.27
Standing Water Level (mBTOC) m DG_A_I_PZ_WRK300 25/11/2020 24.46
Standing Water Level (mBTOC) m DG_A_I_PZ_GW08 26/11/2020 13.49
Standing Water Level (mBTOC) m DG_A_I_PZ_WRK302 26/11/2020 13.51
Standing Water Level (mBTOC) m DG_A_I_PZ_GW06 26/11/2020 13.3
Standing Water Level (mBTOC) m DG_A_I_PZ_GW04A 30/11/2020 24.42
Standing Water Level (mBTOC) m DG_A_I_PZ_WRK304 30/11/2020 18.7
Standing Water Level (mBTOC) m DG_A_I_PZ_WRK303 30/11/2020 20.52
Standing Water Level (mBTOC) m DG_A_I_PZ_WRK301 30/11/2020 18.6
Standing Water Level (mBTOC) m DG_A_I_PZ_GW05 4/12/2020 21.33
Standing Water Level (mBTOC) m DG_A_I_PZ_GW07 8/12/2020 16.31
Standing Water Level (mBTOC) m DG_A_I_PZ_GW03 8/12/2020 10.38
Standing Water Level (mBTOC) m DG_A_I_PZ_GW02 8/12/2020 15.58
Standing Water Level (mBTOC) m DG_A_I_PZ_BW45B 9/12/2020 19.85
Standing Water Level (mBTOC) m DG_A_I_PZ_GW01 9/12/2020 19
Standing Water Level (mBTOC) m DG_A_I_PZ_GW04 9/12/2020 23.97
Standing Water Level (mBTOC) m DG_A_I_PZ_BW36A 9/12/2020 26.27
Standing Water Level (mBTOC) m DG_A_I_PZ_GW04A 10/12/2020 24.48
Standing Water Level (mBTOC) m DG_A_I_PZ_GW08 10/12/2020 13.52
Standing Water Level (mBTOC) m DG_A_I_PZ_WRK302 10/12/2020 13.53
Standing Water Level (mBTOC) m DG_A_I_PZ_GW06 10/12/2020 13.31
Standing Water Level (mBTOC) m DG_A_I_PZ_BW53/Puls 10/12/2020 9.88
Standing Water Level (mBTOC) m DG_A_I_PZ_IWB2 10/12/2020 12.22
Standing Water Level (mBTOC) m DG_A_I_PZ_IWB6 10/12/2020 2.16

Iluka Resources Ltd Planning Permit 15-105: Mineral Sands By-Product Disposal (Pit 23)
EMP and Rehabilitation Performance Report – H2 2020 FINAL (Rev 0)
102
Variable Unit Sample Point Date Result
Standing Water Level (mBTOC) m DG_A_I_PZ_WRK304 14/12/2020 18.66
Standing Water Level (mBTOC) m DG_A_I_PZ_WRK303 14/12/2020 20.55
Standing Water Level (mBTOC) m DG_A_I_PZ_WRK301 14/12/2020 18.57
Standing Water Level (mBTOC) m DG_A_I_PZ_WRK300 14/12/2020 24.44
Strontium (Total) mg/L DG_A_I_PZ_GW07 2/07/2020 5.5
Strontium (Total) mg/L DG_A_I_PZ_GW03 2/07/2020 2
Strontium (Total) mg/L DG_A_I_PZ_GW02 2/07/2020 0.53
Strontium (Total) mg/L DG_A_I_PZ_GW08 6/07/2020 5.8
Strontium (Total) mg/L DG_A_I_PZ_WRK302 6/07/2020 6.2
Strontium (Total) mg/L DG_A_I_PZ_GW06 6/07/2020 9.1
Strontium (Total) mg/L DG_A_I_PZ_BW36A 7/07/2020 1.1
Strontium (Total) mg/L DG_A_I_PZ_GW01 7/07/2020 1.2
Strontium (Total) mg/L DG_A_I_PZ_BW45B 7/07/2020 4
Strontium (Total) mg/L DG_A_I_PZ_IWB2 8/07/2020 0.3
Strontium (Total) mg/L DG_A_I_PZ_IWB6 8/07/2020 0.05
Strontium (Total) mg/L DG_A_I_PZ_BW05 8/07/2020 7.3
Strontium (Total) mg/L DG_A_I_PZ_BW28A 8/07/2020 7.6
Strontium (Total) mg/L DG_A_I_PZ_BW53/Puls 9/07/2020 0.42
Strontium (Total) mg/L DG_A_I_PZ_GW05 9/07/2020 1.3
Strontium (Total) mg/L DG_A_I_PZ_GW04 9/07/2020 1.7
Strontium (Total) mg/L DG_A_I_PZ_WRK300 13/07/2020 1.3
Strontium (Total) mg/L DG_A_I_PZ_WRK303 13/07/2020 1.8
Strontium (Total) mg/L DG_A_I_PZ_WRK301 13/07/2020 3.6
Strontium (Total) mg/L DG_A_I_PZ_WRK304 14/07/2020 1.5
Strontium (Total) mg/L DG_A_I_PZ_GW04 10/08/2020 2.1
Strontium (Total) mg/L DG_A_I_PZ_BW28A 10/08/2020 9.2
Strontium (Total) mg/L DG_A_I_PZ_GW02 10/08/2020 0.66
Strontium (Total) mg/L DG_A_I_PZ_GW01 10/08/2020 2
Strontium (Total) mg/L DG_A_I_PZ_BW36A 17/08/2020 1.2
Strontium (Total) mg/L DG_A_I_PZ_BW53/Puls 17/08/2020 0.38
Strontium (Total) mg/L DG_A_I_PZ_GW05 17/08/2020 1.4
Strontium (Total) mg/L DG_A_I_PZ_WRK303 19/08/2020 1.7
Strontium (Total) mg/L DG_A_I_PZ_BW45B 19/08/2020 4.2
Strontium (Total) mg/L DG_A_I_PZ_WRK304 19/08/2020 1.3
Strontium (Total) mg/L DG_A_I_PZ_WRK302 3/09/2020 6.1
Strontium (Total) mg/L DG_A_I_PZ_GW04 15/10/2020 1.7
Strontium (Total) mg/L DG_A_I_PZ_GW04A 30/11/2020 1.4
Strontium (Total) mg/L DG_A_I_PZ_GW04A 30/12/2020 1.4
Sulfate mg/L DG_A_I_PZ_GW07 2/07/2020 940
Sulfate mg/L DG_A_I_PZ_GW03 2/07/2020 570
Sulfate mg/L DG_A_I_PZ_GW02 2/07/2020 420
Sulfate mg/L DG_A_I_PZ_GW08 6/07/2020 1300
Sulfate mg/L DG_A_I_PZ_WRK302 6/07/2020 1400
Sulfate mg/L DG_A_I_PZ_GW06 6/07/2020 1500

Iluka Resources Ltd Planning Permit 15-105: Mineral Sands By-Product Disposal (Pit 23)
EMP and Rehabilitation Performance Report – H2 2020 FINAL (Rev 0)
103
Variable Unit Sample Point Date Result
Sulfate mg/L DG_A_I_PZ_BW36A 7/07/2020 240
Sulfate mg/L DG_A_I_PZ_GW01 7/07/2020 500
Sulfate mg/L DG_A_I_PZ_BW45B 7/07/2020 900
Sulfate mg/L DG_A_I_PZ_IWB2 8/07/2020 150
Sulfate mg/L DG_A_I_PZ_IWB6 8/07/2020 200
Sulfate mg/L DG_A_I_PZ_BW05 8/07/2020 880
Sulfate mg/L DG_A_I_PZ_BW28A 8/07/2020 920
Sulfate mg/L DG_A_I_PZ_BW53/Puls 9/07/2020 340
Sulfate mg/L DG_A_I_PZ_GW05 9/07/2020 640
Sulfate mg/L DG_A_I_PZ_GW04 9/07/2020 620
Sulfate mg/L DG_A_I_PZ_WRK300 13/07/2020 320
Sulfate mg/L DG_A_I_PZ_WRK303 13/07/2020 580
Sulfate mg/L DG_A_I_PZ_WRK301 13/07/2020 600
Sulfate mg/L DG_A_I_PZ_WRK304 14/07/2020 650
Sulfate mg/L DG_A_I_PZ_GW04 10/08/2020 600
Sulfate mg/L DG_A_I_PZ_BW28A 10/08/2020 870
Sulfate mg/L DG_A_I_PZ_GW02 10/08/2020 370
Sulfate mg/L DG_A_I_PZ_GW01 10/08/2020 440
Sulfate mg/L DG_A_I_PZ_BW36A 17/08/2020 220
Sulfate mg/L DG_A_I_PZ_BW53/Puls 17/08/2020 270
Sulfate mg/L DG_A_I_PZ_GW05 17/08/2020 590
Sulfate mg/L DG_A_I_PZ_WRK303 19/08/2020 590
Sulfate mg/L DG_A_I_PZ_BW45B 19/08/2020 810
Sulfate mg/L DG_A_I_PZ_WRK304 19/08/2020 640
Sulfate mg/L DG_A_I_PZ_WRK302 3/09/2020 1400
Sulfate mg/L DG_A_I_PZ_GW04 15/10/2020 670
Sulfate mg/L DG_A_I_PZ_GW04A 30/11/2020 360
Sulfate mg/L DG_A_I_PZ_GW04A 30/12/2020 360
Temperature °C DG_A_I_PZ_GW07 2/07/2020 17.9
Temperature °C DG_A_I_PZ_GW03 2/07/2020 18
Temperature °C DG_A_I_PZ_GW02 2/07/2020 17.7
Temperature °C DG_A_I_PZ_GW08 6/07/2020 17.7
Temperature °C DG_A_I_PZ_WRK302 6/07/2020 17.2
Temperature °C DG_A_I_PZ_GW06 6/07/2020 17.6
Temperature °C DG_A_I_PZ_BW36A 7/07/2020 14.9
Temperature °C DG_A_I_PZ_GW01 7/07/2020 15.6
Temperature °C DG_A_I_PZ_BW45B 7/07/2020 14.9
Temperature °C DG_A_I_PZ_IWB2 8/07/2020 17.7
Temperature °C DG_A_I_PZ_IWB6 8/07/2020 16.9
Temperature °C DG_A_I_PZ_BW05 8/07/2020 17.2
Temperature °C DG_A_I_PZ_BW28A 8/07/2020 17.5
Temperature °C DG_A_I_PZ_BW53/Puls 9/07/2020 15.1
Temperature °C DG_A_I_PZ_GW05 9/07/2020 14.6
Temperature °C DG_A_I_PZ_GW04 9/07/2020 15.1

Iluka Resources Ltd Planning Permit 15-105: Mineral Sands By-Product Disposal (Pit 23)
EMP and Rehabilitation Performance Report – H2 2020 FINAL (Rev 0)
104
Variable Unit Sample Point Date Result
Temperature °C DG_A_I_PZ_WRK300 13/07/2020 14.1
Temperature °C DG_A_I_PZ_WRK303 13/07/2020 17.5
Temperature °C DG_A_I_PZ_WRK301 13/07/2020 17.4
Temperature °C DG_A_I_PZ_WRK304 14/07/2020 17
Temperature °C DG_A_I_PZ_BW28A 10/08/2020 17.5
Temperature °C DG_A_I_PZ_GW02 10/08/2020 17.7
Temperature °C DG_A_I_PZ_GW01 10/08/2020 16.5
Temperature °C DG_A_I_PZ_GW04 10/08/2020 18
Temperature °C DG_A_I_PZ_BW53/Puls 17/08/2020 15.5
Temperature °C DG_A_I_PZ_GW05 17/08/2020 16.5
Temperature °C DG_A_I_PZ_BW36A 17/08/2020 16.3
Temperature °C DG_A_I_PZ_WRK303 19/08/2020 15
Temperature °C DG_A_I_PZ_WRK304 19/08/2020 15.2
Temperature °C DG_A_I_PZ_BW45B 19/08/2020 13.2
Temperature °C DG_A_I_PZ_GW07 20/08/2020 18.3
Temperature °C DG_A_I_PZ_GW03 20/08/2020 17.3
Temperature °C DG_A_I_PZ_WRK300 20/08/2020 14
Temperature °C DG_A_I_PZ_GW06 25/08/2020 17.5
Temperature °C DG_A_I_PZ_GW08 25/08/2020 17.4
Temperature °C DG_A_I_PZ_WRK302 25/08/2020 17.1
Temperature °C DG_A_I_PZ_WRK301 25/08/2020 17.6
Temperature °C DG_A_I_PZ_WRK302 3/09/2020 17.2
Temperature °C DG_A_I_PZ_GW03 3/09/2020 17.9
Temperature °C DG_A_I_PZ_GW02 3/09/2020 17.6
Temperature °C DG_A_I_PZ_GW07 7/09/2020 18.1
Temperature °C DG_A_I_PZ_GW05 7/09/2020 18.2
Temperature °C DG_A_I_PZ_GW04 7/09/2020 21
Temperature °C DG_A_I_PZ_BW36A 7/09/2020 21
Temperature °C DG_A_I_PZ_GW01 7/09/2020 20
Temperature °C DG_A_I_PZ_BW45B 7/09/2020 20.5
Temperature °C DG_A_I_PZ_GW08 8/09/2020 17.7
Temperature °C DG_A_I_PZ_GW06 8/09/2020 17.7
Temperature °C DG_A_I_PZ_WRK300 8/09/2020 16.1
Temperature °C DG_A_I_PZ_WRK304 9/09/2020 17
Temperature °C DG_A_I_PZ_WRK303 9/09/2020 17.1
Temperature °C DG_A_I_PZ_WRK301 9/09/2020 17.3
Temperature °C DG_A_I_PZ_GW04 15/10/2020 18
Temperature °C DG_A_I_PZ_GW03 15/10/2020 18.3
Temperature °C DG_A_I_PZ_GW02 15/10/2020 17.8
Temperature °C DG_A_I_PZ_GW07 16/10/2020 18.1
Temperature °C DG_A_I_PZ_GW01 16/10/2020 16.5
Temperature °C DG_A_I_PZ_BW45B 16/10/2020 16.3
Temperature °C DG_A_I_PZ_GW05 19/10/2020 16.8
Temperature °C DG_A_I_PZ_BW36A 19/10/2020 16.5

Iluka Resources Ltd Planning Permit 15-105: Mineral Sands By-Product Disposal (Pit 23)
EMP and Rehabilitation Performance Report – H2 2020 FINAL (Rev 0)
105
Variable Unit Sample Point Date Result
Temperature °C DG_A_I_PZ_WRK300 19/10/2020 16.6
Temperature °C DG_A_I_PZ_GW08 19/10/2020 17.7
Temperature °C DG_A_I_PZ_WRK302 19/10/2020 17.2
Temperature °C DG_A_I_PZ_GW06 19/10/2020 17.7
Temperature °C DG_A_I_PZ_WRK304 20/10/2020 16.9
Temperature °C DG_A_I_PZ_WRK303 20/10/2020 18.8
Temperature °C DG_A_I_PZ_WRK301 20/10/2020 18.5
Temperature °C DG_A_I_PZ_GW07 24/11/2020 18.1
Temperature °C DG_A_I_PZ_GW03 24/11/2020 19.8
Temperature °C DG_A_I_PZ_GW02 24/11/2020 17.8
Temperature °C DG_A_I_PZ_GW01 24/11/2020 20.7
Temperature °C DG_A_I_PZ_BW45B 24/11/2020 21.4
Temperature °C DG_A_I_PZ_GW04 25/11/2020 22.7
Temperature °C DG_A_I_PZ_GW05 25/11/2020 22.4
Temperature °C DG_A_I_PZ_BW36A 25/11/2020 25
Temperature °C DG_A_I_PZ_WRK300 25/11/2020 23.9
Temperature °C DG_A_I_PZ_GW08 26/11/2020 18.1
Temperature °C DG_A_I_PZ_WRK302 26/11/2020 17.3
Temperature °C DG_A_I_PZ_GW06 26/11/2020 17.5
Temperature °C DG_A_I_PZ_GW04A 30/11/2020 18.4
Temperature °C DG_A_I_PZ_WRK304 30/11/2020 17.8
Temperature °C DG_A_I_PZ_WRK303 30/11/2020 18.3
Temperature °C DG_A_I_PZ_WRK301 30/11/2020 22
Temperature °C DG_A_I_PZ_GW05 4/12/2020 19.3
Temperature °C DG_A_I_PZ_GW07 8/12/2020 18
Temperature °C DG_A_I_PZ_GW03 8/12/2020 18.8
Temperature °C DG_A_I_PZ_GW02 8/12/2020 17.5
Temperature °C DG_A_I_PZ_BW45B 9/12/2020 17
Temperature °C DG_A_I_PZ_GW01 9/12/2020 17
Temperature °C DG_A_I_PZ_GW04 9/12/2020 19.9
Temperature °C DG_A_I_PZ_BW36A 9/12/2020 21.3
Temperature °C DG_A_I_PZ_GW04A 10/12/2020 17.7
Temperature °C DG_A_I_PZ_GW08 10/12/2020 17.8
Temperature °C DG_A_I_PZ_WRK302 10/12/2020 17.8
Temperature °C DG_A_I_PZ_GW06 10/12/2020 17.9
Temperature °C DG_A_I_PZ_WRK304 14/12/2020 17.7
Temperature °C DG_A_I_PZ_WRK303 14/12/2020 18.2
Temperature °C DG_A_I_PZ_WRK301 14/12/2020 25.2
Temperature °C DG_A_I_PZ_WRK300 14/12/2020 27.4
Thallium (Total) mg/L DG_A_I_PZ_GW07 2/07/2020 0.001 Thallium (Total) mg/L DG_A_I_PZ_GW03 2/07/2020 0.001 Thallium (Total) mg/L DG_A_I_PZ_GW02 2/07/2020 0.001 Thallium (Total) mg/L DG_A_I_PZ_GW08 6/07/2020 0.001 Thallium (Total) mg/L DG_A_I_PZ_WRK302 6/07/2020 0.001
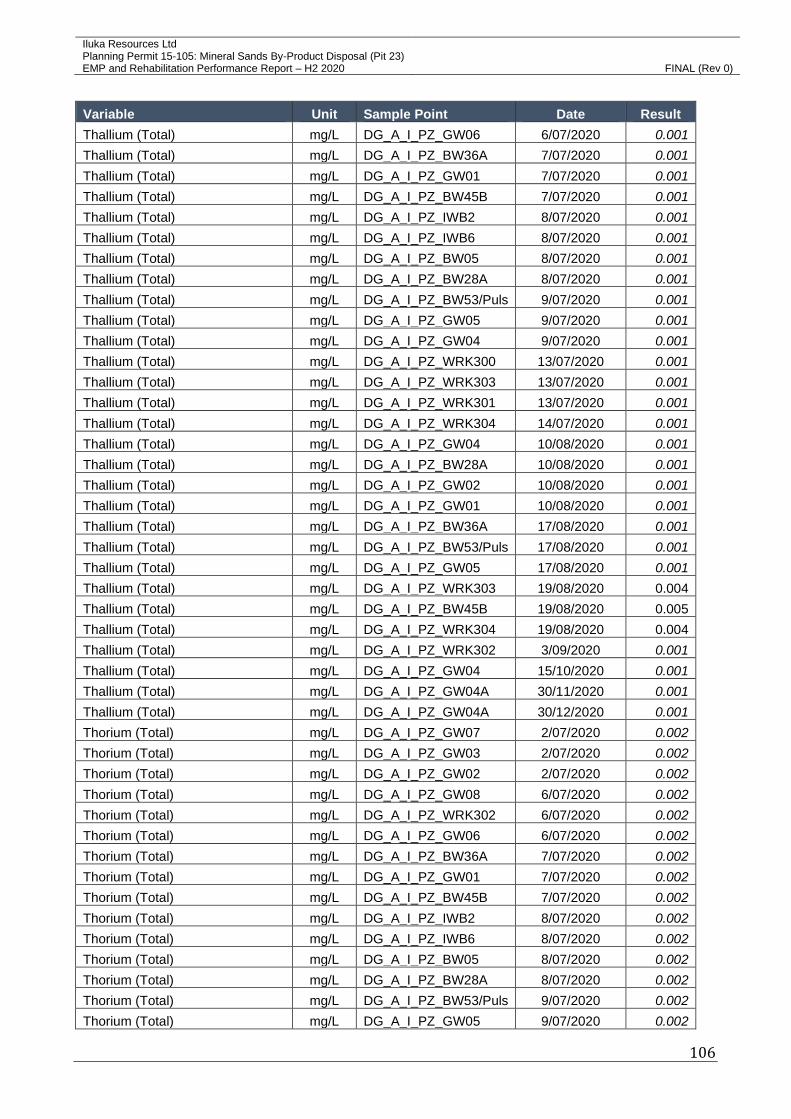
Iluka Resources Ltd Planning Permit 15-105: Mineral Sands By-Product Disposal (Pit 23)
EMP and Rehabilitation Performance Report – H2 2020 FINAL (Rev 0)
106
Variable Unit Sample Point Date Result
Thallium (Total) mg/L DG_A_I_PZ_GW06 6/07/2020 0.001 Thallium (Total) mg/L DG_A_I_PZ_BW36A 7/07/2020 0.001 Thallium (Total) mg/L DG_A_I_PZ_GW01 7/07/2020 0.001 Thallium (Total) mg/L DG_A_I_PZ_BW45B 7/07/2020 0.001 Thallium (Total) mg/L DG_A_I_PZ_IWB2 8/07/2020 0.001 Thallium (Total) mg/L DG_A_I_PZ_IWB6 8/07/2020 0.001 Thallium (Total) mg/L DG_A_I_PZ_BW05 8/07/2020 0.001 Thallium (Total) mg/L DG_A_I_PZ_BW28A 8/07/2020 0.001 Thallium (Total) mg/L DG_A_I_PZ_BW53/Puls 9/07/2020 0.001 Thallium (Total) mg/L DG_A_I_PZ_GW05 9/07/2020 0.001 Thallium (Total) mg/L DG_A_I_PZ_GW04 9/07/2020 0.001 Thallium (Total) mg/L DG_A_I_PZ_WRK300 13/07/2020 0.001 Thallium (Total) mg/L DG_A_I_PZ_WRK303 13/07/2020 0.001 Thallium (Total) mg/L DG_A_I_PZ_WRK301 13/07/2020 0.001 Thallium (Total) mg/L DG_A_I_PZ_WRK304 14/07/2020 0.001 Thallium (Total) mg/L DG_A_I_PZ_GW04 10/08/2020 0.001 Thallium (Total) mg/L DG_A_I_PZ_BW28A 10/08/2020 0.001 Thallium (Total) mg/L DG_A_I_PZ_GW02 10/08/2020 0.001 Thallium (Total) mg/L DG_A_I_PZ_GW01 10/08/2020 0.001 Thallium (Total) mg/L DG_A_I_PZ_BW36A 17/08/2020 0.001 Thallium (Total) mg/L DG_A_I_PZ_BW53/Puls 17/08/2020 0.001 Thallium (Total) mg/L DG_A_I_PZ_GW05 17/08/2020 0.001 Thallium (Total) mg/L DG_A_I_PZ_WRK303 19/08/2020 0.004
Thallium (Total) mg/L DG_A_I_PZ_BW45B 19/08/2020 0.005
Thallium (Total) mg/L DG_A_I_PZ_WRK304 19/08/2020 0.004
Thallium (Total) mg/L DG_A_I_PZ_WRK302 3/09/2020 0.001 Thallium (Total) mg/L DG_A_I_PZ_GW04 15/10/2020 0.001 Thallium (Total) mg/L DG_A_I_PZ_GW04A 30/11/2020 0.001 Thallium (Total) mg/L DG_A_I_PZ_GW04A 30/12/2020 0.001 Thorium (Total) mg/L DG_A_I_PZ_GW07 2/07/2020 0.002 Thorium (Total) mg/L DG_A_I_PZ_GW03 2/07/2020 0.002 Thorium (Total) mg/L DG_A_I_PZ_GW02 2/07/2020 0.002 Thorium (Total) mg/L DG_A_I_PZ_GW08 6/07/2020 0.002 Thorium (Total) mg/L DG_A_I_PZ_WRK302 6/07/2020 0.002 Thorium (Total) mg/L DG_A_I_PZ_GW06 6/07/2020 0.002 Thorium (Total) mg/L DG_A_I_PZ_BW36A 7/07/2020 0.002 Thorium (Total) mg/L DG_A_I_PZ_GW01 7/07/2020 0.002 Thorium (Total) mg/L DG_A_I_PZ_BW45B 7/07/2020 0.002 Thorium (Total) mg/L DG_A_I_PZ_IWB2 8/07/2020 0.002 Thorium (Total) mg/L DG_A_I_PZ_IWB6 8/07/2020 0.002 Thorium (Total) mg/L DG_A_I_PZ_BW05 8/07/2020 0.002 Thorium (Total) mg/L DG_A_I_PZ_BW28A 8/07/2020 0.002 Thorium (Total) mg/L DG_A_I_PZ_BW53/Puls 9/07/2020 0.002 Thorium (Total) mg/L DG_A_I_PZ_GW05 9/07/2020 0.002

Iluka Resources Ltd Planning Permit 15-105: Mineral Sands By-Product Disposal (Pit 23)
EMP and Rehabilitation Performance Report – H2 2020 FINAL (Rev 0)
107
Variable Unit Sample Point Date Result
Thorium (Total) mg/L DG_A_I_PZ_GW04 9/07/2020 0.002 Thorium (Total) mg/L DG_A_I_PZ_WRK300 13/07/2020 0.002 Thorium (Total) mg/L DG_A_I_PZ_WRK303 13/07/2020 0.002 Thorium (Total) mg/L DG_A_I_PZ_WRK301 13/07/2020 0.002 Thorium (Total) mg/L DG_A_I_PZ_WRK304 14/07/2020 0.002 Thorium (Total) mg/L DG_A_I_PZ_GW04 10/08/2020 0.002 Thorium (Total) mg/L DG_A_I_PZ_BW28A 10/08/2020 0.002 Thorium (Total) mg/L DG_A_I_PZ_GW02 10/08/2020 0.002 Thorium (Total) mg/L DG_A_I_PZ_GW01 10/08/2020 0.002 Thorium (Total) mg/L DG_A_I_PZ_BW36A 17/08/2020 0.002 Thorium (Total) mg/L DG_A_I_PZ_BW53/Puls 17/08/2020 0.002 Thorium (Total) mg/L DG_A_I_PZ_GW05 17/08/2020 0.002 Thorium (Total) mg/L DG_A_I_PZ_WRK303 19/08/2020 0.006
Thorium (Total) mg/L DG_A_I_PZ_BW45B 19/08/2020 0.006
Thorium (Total) mg/L DG_A_I_PZ_WRK304 19/08/2020 0.006
Thorium (Total) mg/L DG_A_I_PZ_WRK302 3/09/2020 0.002 Thorium (Total) mg/L DG_A_I_PZ_GW04 15/10/2020 0.002 Thorium (Total) mg/L DG_A_I_PZ_GW04A 30/11/2020 0.002 Thorium (Total) mg/L DG_A_I_PZ_GW04A 30/12/2020 0.002 Tin (Total) mg/L DG_A_I_PZ_GW07 2/07/2020 0.001 Tin (Total) mg/L DG_A_I_PZ_GW03 2/07/2020 0.001 Tin (Total) mg/L DG_A_I_PZ_GW02 2/07/2020 0.001 Tin (Total) mg/L DG_A_I_PZ_GW08 6/07/2020 0.001 Tin (Total) mg/L DG_A_I_PZ_WRK302 6/07/2020 0.001 Tin (Total) mg/L DG_A_I_PZ_GW06 6/07/2020 0.001 Tin (Total) mg/L DG_A_I_PZ_BW36A 7/07/2020 0.001 Tin (Total) mg/L DG_A_I_PZ_GW01 7/07/2020 0.001 Tin (Total) mg/L DG_A_I_PZ_BW45B 7/07/2020 0.001 Tin (Total) mg/L DG_A_I_PZ_IWB2 8/07/2020 0.001 Tin (Total) mg/L DG_A_I_PZ_IWB6 8/07/2020 0.001 Tin (Total) mg/L DG_A_I_PZ_BW05 8/07/2020 0.001 Tin (Total) mg/L DG_A_I_PZ_BW28A 8/07/2020 0.001 Tin (Total) mg/L DG_A_I_PZ_BW53/Puls 9/07/2020 0.001 Tin (Total) mg/L DG_A_I_PZ_GW05 9/07/2020 0.001 Tin (Total) mg/L DG_A_I_PZ_GW04 9/07/2020 0.001 Tin (Total) mg/L DG_A_I_PZ_WRK300 13/07/2020 0.001 Tin (Total) mg/L DG_A_I_PZ_WRK303 13/07/2020 0.001 Tin (Total) mg/L DG_A_I_PZ_WRK301 13/07/2020 0.001 Tin (Total) mg/L DG_A_I_PZ_WRK304 14/07/2020 0.001 Tin (Total) mg/L DG_A_I_PZ_GW04 10/08/2020 0.001 Tin (Total) mg/L DG_A_I_PZ_BW28A 10/08/2020 0.001 Tin (Total) mg/L DG_A_I_PZ_GW02 10/08/2020 0.001 Tin (Total) mg/L DG_A_I_PZ_GW01 10/08/2020 0.001 Tin (Total) mg/L DG_A_I_PZ_BW36A 17/08/2020 0.001

Iluka Resources Ltd Planning Permit 15-105: Mineral Sands By-Product Disposal (Pit 23)
EMP and Rehabilitation Performance Report – H2 2020 FINAL (Rev 0)
108
Variable Unit Sample Point Date Result
Tin (Total) mg/L DG_A_I_PZ_BW53/Puls 17/08/2020 0.001
Tin (Total) mg/L DG_A_I_PZ_GW05 17/08/2020 0.001 Tin (Total) mg/L DG_A_I_PZ_WRK303 19/08/2020 0.001 Tin (Total) mg/L DG_A_I_PZ_BW45B 19/08/2020 0.001 Tin (Total) mg/L DG_A_I_PZ_WRK304 19/08/2020 0.001 Tin (Total) mg/L DG_A_I_PZ_WRK302 3/09/2020 0.001 Tin (Total) mg/L DG_A_I_PZ_GW04 15/10/2020 0.001 Tin (Total) mg/L DG_A_I_PZ_GW04A 30/11/2020 0.001
Tin (Total) mg/L DG_A_I_PZ_GW04A 30/12/2020 0.001
Titanium (Total) mg/L DG_A_I_PZ_GW07 2/07/2020 0.001 Titanium (Total) mg/L DG_A_I_PZ_GW03 2/07/2020 0.001 Titanium (Total) mg/L DG_A_I_PZ_GW02 2/07/2020 0.001 Titanium (Total) mg/L DG_A_I_PZ_GW08 6/07/2020 0.001 Titanium (Total) mg/L DG_A_I_PZ_WRK302 6/07/2020 0.001 Titanium (Total) mg/L DG_A_I_PZ_GW06 6/07/2020 0.009
Titanium (Total) mg/L DG_A_I_PZ_BW36A 7/07/2020 0.001
Titanium (Total) mg/L DG_A_I_PZ_GW01 7/07/2020 0.002
Titanium (Total) mg/L DG_A_I_PZ_BW45B 7/07/2020 0.001 Titanium (Total) mg/L DG_A_I_PZ_IWB2 8/07/2020 0.004
Titanium (Total) mg/L DG_A_I_PZ_IWB6 8/07/2020 0.001
Titanium (Total) mg/L DG_A_I_PZ_BW05 8/07/2020 0.001 Titanium (Total) mg/L DG_A_I_PZ_BW28A 8/07/2020 0.001 Titanium (Total) mg/L DG_A_I_PZ_BW53/Puls 9/07/2020 0.003
Titanium (Total) mg/L DG_A_I_PZ_GW05 9/07/2020 0.001
Titanium (Total) mg/L DG_A_I_PZ_GW04 9/07/2020 0.001
Titanium (Total) mg/L DG_A_I_PZ_WRK300 13/07/2020 0.001 Titanium (Total) mg/L DG_A_I_PZ_WRK303 13/07/2020 0.003
Titanium (Total) mg/L DG_A_I_PZ_WRK301 13/07/2020 0.004
Titanium (Total) mg/L DG_A_I_PZ_WRK304 14/07/2020 0.002
Titanium (Total) mg/L DG_A_I_PZ_GW04 10/08/2020 0.001 Titanium (Total) mg/L DG_A_I_PZ_BW28A 10/08/2020 0.001 Titanium (Total) mg/L DG_A_I_PZ_GW02 10/08/2020 0.001 Titanium (Total) mg/L DG_A_I_PZ_GW01 10/08/2020 0.002
Titanium (Total) mg/L DG_A_I_PZ_BW36A 17/08/2020 0.001 Titanium (Total) mg/L DG_A_I_PZ_BW53/Puls 17/08/2020 0.074
Titanium (Total) mg/L DG_A_I_PZ_GW05 17/08/2020 0.001 Titanium (Total) mg/L DG_A_I_PZ_WRK303 19/08/2020 0.001 Titanium (Total) mg/L DG_A_I_PZ_BW45B 19/08/2020 0.001 Titanium (Total) mg/L DG_A_I_PZ_WRK304 19/08/2020 0.002
Titanium (Total) mg/L DG_A_I_PZ_WRK302 3/09/2020 0.001 Titanium (Total) mg/L DG_A_I_PZ_GW04 15/10/2020 0.001 Titanium (Total) mg/L DG_A_I_PZ_GW04A 30/11/2020 0.001 Titanium (Total) mg/L DG_A_I_PZ_GW04A 30/12/2020 0.001 Total Dissolved Solids mg/L DG_A_I_PZ_GW07 2/07/2020 11390
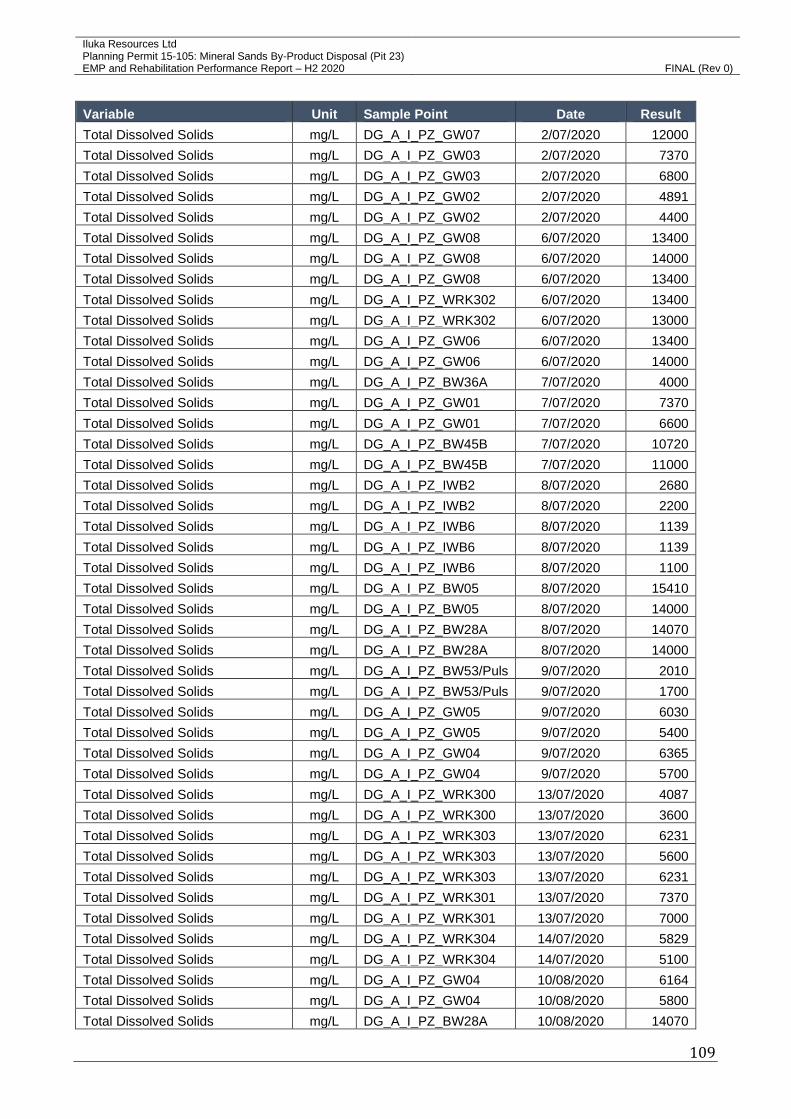
Iluka Resources Ltd Planning Permit 15-105: Mineral Sands By-Product Disposal (Pit 23)
EMP and Rehabilitation Performance Report – H2 2020 FINAL (Rev 0)
109
Variable Unit Sample Point Date Result
Total Dissolved Solids mg/L DG_A_I_PZ_GW07 2/07/2020 12000
Total Dissolved Solids mg/L DG_A_I_PZ_GW03 2/07/2020 7370
Total Dissolved Solids mg/L DG_A_I_PZ_GW03 2/07/2020 6800
Total Dissolved Solids mg/L DG_A_I_PZ_GW02 2/07/2020 4891
Total Dissolved Solids mg/L DG_A_I_PZ_GW02 2/07/2020 4400
Total Dissolved Solids mg/L DG_A_I_PZ_GW08 6/07/2020 13400
Total Dissolved Solids mg/L DG_A_I_PZ_GW08 6/07/2020 14000
Total Dissolved Solids mg/L DG_A_I_PZ_GW08 6/07/2020 13400
Total Dissolved Solids mg/L DG_A_I_PZ_WRK302 6/07/2020 13400
Total Dissolved Solids mg/L DG_A_I_PZ_WRK302 6/07/2020 13000
Total Dissolved Solids mg/L DG_A_I_PZ_GW06 6/07/2020 13400
Total Dissolved Solids mg/L DG_A_I_PZ_GW06 6/07/2020 14000
Total Dissolved Solids mg/L DG_A_I_PZ_BW36A 7/07/2020 4000
Total Dissolved Solids mg/L DG_A_I_PZ_GW01 7/07/2020 7370
Total Dissolved Solids mg/L DG_A_I_PZ_GW01 7/07/2020 6600
Total Dissolved Solids mg/L DG_A_I_PZ_BW45B 7/07/2020 10720
Total Dissolved Solids mg/L DG_A_I_PZ_BW45B 7/07/2020 11000
Total Dissolved Solids mg/L DG_A_I_PZ_IWB2 8/07/2020 2680
Total Dissolved Solids mg/L DG_A_I_PZ_IWB2 8/07/2020 2200
Total Dissolved Solids mg/L DG_A_I_PZ_IWB6 8/07/2020 1139
Total Dissolved Solids mg/L DG_A_I_PZ_IWB6 8/07/2020 1139
Total Dissolved Solids mg/L DG_A_I_PZ_IWB6 8/07/2020 1100
Total Dissolved Solids mg/L DG_A_I_PZ_BW05 8/07/2020 15410
Total Dissolved Solids mg/L DG_A_I_PZ_BW05 8/07/2020 14000
Total Dissolved Solids mg/L DG_A_I_PZ_BW28A 8/07/2020 14070
Total Dissolved Solids mg/L DG_A_I_PZ_BW28A 8/07/2020 14000
Total Dissolved Solids mg/L DG_A_I_PZ_BW53/Puls 9/07/2020 2010
Total Dissolved Solids mg/L DG_A_I_PZ_BW53/Puls 9/07/2020 1700
Total Dissolved Solids mg/L DG_A_I_PZ_GW05 9/07/2020 6030
Total Dissolved Solids mg/L DG_A_I_PZ_GW05 9/07/2020 5400
Total Dissolved Solids mg/L DG_A_I_PZ_GW04 9/07/2020 6365
Total Dissolved Solids mg/L DG_A_I_PZ_GW04 9/07/2020 5700
Total Dissolved Solids mg/L DG_A_I_PZ_WRK300 13/07/2020 4087
Total Dissolved Solids mg/L DG_A_I_PZ_WRK300 13/07/2020 3600
Total Dissolved Solids mg/L DG_A_I_PZ_WRK303 13/07/2020 6231
Total Dissolved Solids mg/L DG_A_I_PZ_WRK303 13/07/2020 5600
Total Dissolved Solids mg/L DG_A_I_PZ_WRK303 13/07/2020 6231
Total Dissolved Solids mg/L DG_A_I_PZ_WRK301 13/07/2020 7370
Total Dissolved Solids mg/L DG_A_I_PZ_WRK301 13/07/2020 7000
Total Dissolved Solids mg/L DG_A_I_PZ_WRK304 14/07/2020 5829
Total Dissolved Solids mg/L DG_A_I_PZ_WRK304 14/07/2020 5100
Total Dissolved Solids mg/L DG_A_I_PZ_GW04 10/08/2020 6164
Total Dissolved Solids mg/L DG_A_I_PZ_GW04 10/08/2020 5800
Total Dissolved Solids mg/L DG_A_I_PZ_BW28A 10/08/2020 14070

Iluka Resources Ltd Planning Permit 15-105: Mineral Sands By-Product Disposal (Pit 23)
EMP and Rehabilitation Performance Report – H2 2020 FINAL (Rev 0)
110
Variable Unit Sample Point Date Result
Total Dissolved Solids mg/L DG_A_I_PZ_BW28A 10/08/2020 14000
Total Dissolved Solids mg/L DG_A_I_PZ_GW02 10/08/2020 4891
Total Dissolved Solids mg/L DG_A_I_PZ_GW02 10/08/2020 4500
Total Dissolved Solids mg/L DG_A_I_PZ_GW01 10/08/2020 7370
Total Dissolved Solids mg/L DG_A_I_PZ_GW01 10/08/2020 6800
Total Dissolved Solids mg/L DG_A_I_PZ_GW04 10/08/2020 6164
Total Dissolved Solids mg/L DG_A_I_PZ_BW36A 17/08/2020 3500
Total Dissolved Solids mg/L DG_A_I_PZ_BW53/Puls 17/08/2020 1809
Total Dissolved Solids mg/L DG_A_I_PZ_BW53/Puls 17/08/2020 1600
Total Dissolved Solids mg/L DG_A_I_PZ_GW05 17/08/2020 5963
Total Dissolved Solids mg/L DG_A_I_PZ_GW05 17/08/2020 5200
Total Dissolved Solids mg/L DG_A_I_PZ_WRK303 19/08/2020 6365
Total Dissolved Solids mg/L DG_A_I_PZ_WRK303 19/08/2020 5600
Total Dissolved Solids mg/L DG_A_I_PZ_BW45B 19/08/2020 10720
Total Dissolved Solids mg/L DG_A_I_PZ_BW45B 19/08/2020 9900
Total Dissolved Solids mg/L DG_A_I_PZ_WRK304 19/08/2020 5762
Total Dissolved Solids mg/L DG_A_I_PZ_WRK304 19/08/2020 5000
Total Dissolved Solids mg/L DG_A_I_PZ_BW45B 19/08/2020 10720
Total Dissolved Solids mg/L DG_A_I_PZ_GW07 20/08/2020 12654.96
Total Dissolved Solids mg/L DG_A_I_PZ_GW03 20/08/2020 7847.71
Total Dissolved Solids mg/L DG_A_I_PZ_WRK300 20/08/2020 4366.39
Total Dissolved Solids mg/L DG_A_I_PZ_GW06 25/08/2020 14532.97
Total Dissolved Solids mg/L DG_A_I_PZ_GW08 25/08/2020 14482.72
Total Dissolved Solids mg/L DG_A_I_PZ_WRK302 25/08/2020 14077.37
Total Dissolved Solids mg/L DG_A_I_PZ_WRK301 25/08/2020 7649.39
Total Dissolved Solids mg/L DG_A_I_PZ_WRK302 3/09/2020 13400
Total Dissolved Solids mg/L DG_A_I_PZ_WRK302 3/09/2020 13000
Total Dissolved Solids mg/L DG_A_I_PZ_GW03 3/09/2020 7695.62
Total Dissolved Solids mg/L DG_A_I_PZ_GW02 3/09/2020 5202.55
Total Dissolved Solids mg/L DG_A_I_PZ_GW07 7/09/2020 12663
Total Dissolved Solids mg/L DG_A_I_PZ_GW05 7/09/2020 6403.19
Total Dissolved Solids mg/L DG_A_I_PZ_GW04 7/09/2020 6715.41
Total Dissolved Solids mg/L DG_A_I_PZ_GW01 7/09/2020 7811.53
Total Dissolved Solids mg/L DG_A_I_PZ_BW45B 7/09/2020 11696.19
Total Dissolved Solids mg/L DG_A_I_PZ_GW08 8/09/2020 14602.65
Total Dissolved Solids mg/L DG_A_I_PZ_GW06 8/09/2020 14577.19
Total Dissolved Solids mg/L DG_A_I_PZ_WRK300 8/09/2020 4385.15
Total Dissolved Solids mg/L DG_A_I_PZ_WRK304 9/09/2020 6956.61
Total Dissolved Solids mg/L DG_A_I_PZ_WRK303 9/09/2020 6523.12
Total Dissolved Solids mg/L DG_A_I_PZ_WRK301 9/09/2020 7815.55
Total Dissolved Solids mg/L DG_A_I_PZ_GW04 15/10/2020 6432
Total Dissolved Solids mg/L DG_A_I_PZ_GW04 15/10/2020 5600
Total Dissolved Solids mg/L DG_A_I_PZ_GW03 15/10/2020 7225.95
Total Dissolved Solids mg/L DG_A_I_PZ_GW02 15/10/2020 4858.84

Iluka Resources Ltd Planning Permit 15-105: Mineral Sands By-Product Disposal (Pit 23)
EMP and Rehabilitation Performance Report – H2 2020 FINAL (Rev 0)
111
Variable Unit Sample Point Date Result
Total Dissolved Solids mg/L DG_A_I_PZ_GW07 16/10/2020 11787.31
Total Dissolved Solids mg/L DG_A_I_PZ_GW01 16/10/2020 7269.5
Total Dissolved Solids mg/L DG_A_I_PZ_BW45B 16/10/2020 10969.91
Total Dissolved Solids mg/L DG_A_I_PZ_GW05 19/10/2020 5974.39
Total Dissolved Solids mg/L DG_A_I_PZ_WRK300 19/10/2020 4006.6
Total Dissolved Solids mg/L DG_A_I_PZ_GW08 19/10/2020 13587.6
Total Dissolved Solids mg/L DG_A_I_PZ_WRK302 19/10/2020 13093.14
Total Dissolved Solids mg/L DG_A_I_PZ_GW06 19/10/2020 13611.72
Total Dissolved Solids mg/L DG_A_I_PZ_WRK304 20/10/2020 6190.13
Total Dissolved Solids mg/L DG_A_I_PZ_WRK303 20/10/2020 6377.06
Total Dissolved Solids mg/L DG_A_I_PZ_WRK301 20/10/2020 6984.08
Total Dissolved Solids mg/L DG_A_I_PZ_GW07 24/11/2020 12596.67
Total Dissolved Solids mg/L DG_A_I_PZ_GW03 24/11/2020 7640.68
Total Dissolved Solids mg/L DG_A_I_PZ_GW02 24/11/2020 5209.25
Total Dissolved Solids mg/L DG_A_I_PZ_GW01 24/11/2020 7770.66
Total Dissolved Solids mg/L DG_A_I_PZ_BW45B 24/11/2020 11792
Total Dissolved Solids mg/L DG_A_I_PZ_GW04 25/11/2020 6724.79
Total Dissolved Solids mg/L DG_A_I_PZ_GW05 25/11/2020 6474.21
Total Dissolved Solids mg/L DG_A_I_PZ_WRK300 25/11/2020 4365.05
Total Dissolved Solids mg/L DG_A_I_PZ_GW08 26/11/2020 14395.62
Total Dissolved Solids mg/L DG_A_I_PZ_WRK302 26/11/2020 13984.91
Total Dissolved Solids mg/L DG_A_I_PZ_GW06 26/11/2020 14524.93
Total Dissolved Solids mg/L DG_A_I_PZ_GW04A 30/11/2020 4600
Total Dissolved Solids mg/L DG_A_I_PZ_WRK304 30/11/2020 6306.04
Total Dissolved Solids mg/L DG_A_I_PZ_WRK303 30/11/2020 6761.64
Total Dissolved Solids mg/L DG_A_I_PZ_WRK301 30/11/2020 8619.55
Total Dissolved Solids mg/L DG_A_I_PZ_GW05 4/12/2020 6324.13
Total Dissolved Solids mg/L DG_A_I_PZ_GW07 8/12/2020 12279.09
Total Dissolved Solids mg/L DG_A_I_PZ_GW03 8/12/2020 7512.71
Total Dissolved Solids mg/L DG_A_I_PZ_GW02 8/12/2020 5110.76
Total Dissolved Solids mg/L DG_A_I_PZ_BW45B 9/12/2020 11418.14
Total Dissolved Solids mg/L DG_A_I_PZ_GW01 9/12/2020 7531.47
Total Dissolved Solids mg/L DG_A_I_PZ_GW04 9/12/2020 6536.52
Total Dissolved Solids mg/L DG_A_I_PZ_GW08 10/12/2020 14190.6
Total Dissolved Solids mg/L DG_A_I_PZ_WRK302 10/12/2020 13570.18
Total Dissolved Solids mg/L DG_A_I_PZ_GW06 10/12/2020 14112.21
Total Dissolved Solids mg/L DG_A_I_PZ_WRK304 14/12/2020 6167.35
Total Dissolved Solids mg/L DG_A_I_PZ_WRK303 14/12/2020 6795.81
Total Dissolved Solids mg/L DG_A_I_PZ_WRK301 14/12/2020 7644.7
Total Dissolved Solids mg/L DG_A_I_PZ_WRK300 14/12/2020 4251.82
Total Dissolved Solids mg/L DG_A_I_PZ_GW04A 30/12/2020 4600
Uranium (Total) mg/L DG_A_I_PZ_GW07 2/07/2020 0.001 Uranium (Total) mg/L DG_A_I_PZ_GW03 2/07/2020 0.001 Uranium (Total) mg/L DG_A_I_PZ_GW02 2/07/2020 0.001

Iluka Resources Ltd Planning Permit 15-105: Mineral Sands By-Product Disposal (Pit 23)
EMP and Rehabilitation Performance Report – H2 2020 FINAL (Rev 0)
112
Variable Unit Sample Point Date Result
Uranium (Total) mg/L DG_A_I_PZ_GW08 6/07/2020 0.001
Uranium (Total) mg/L DG_A_I_PZ_WRK302 6/07/2020 0.001 Uranium (Total) mg/L DG_A_I_PZ_GW06 6/07/2020 0.003
Uranium (Total) mg/L DG_A_I_PZ_BW36A 7/07/2020 0.001 Uranium (Total) mg/L DG_A_I_PZ_GW01 7/07/2020 0.001 Uranium (Total) mg/L DG_A_I_PZ_BW45B 7/07/2020 0.017
Uranium (Total) mg/L DG_A_I_PZ_IWB2 8/07/2020 0.001 Uranium (Total) mg/L DG_A_I_PZ_IWB6 8/07/2020 0.001 Uranium (Total) mg/L DG_A_I_PZ_BW05 8/07/2020 0.004
Uranium (Total) mg/L DG_A_I_PZ_BW28A 8/07/2020 0.007
Uranium (Total) mg/L DG_A_I_PZ_BW53/Puls 9/07/2020 0.001 Uranium (Total) mg/L DG_A_I_PZ_GW05 9/07/2020 0.001 Uranium (Total) mg/L DG_A_I_PZ_GW04 9/07/2020 0.001 Uranium (Total) mg/L DG_A_I_PZ_WRK300 13/07/2020 0.001 Uranium (Total) mg/L DG_A_I_PZ_WRK303 13/07/2020 0.001 Uranium (Total) mg/L DG_A_I_PZ_WRK301 13/07/2020 0.006
Uranium (Total) mg/L DG_A_I_PZ_WRK304 14/07/2020 0.001 Uranium (Total) mg/L DG_A_I_PZ_GW04 10/08/2020 0.001 Uranium (Total) mg/L DG_A_I_PZ_BW28A 10/08/2020 0.007
Uranium (Total) mg/L DG_A_I_PZ_GW02 10/08/2020 0.001 Uranium (Total) mg/L DG_A_I_PZ_GW01 10/08/2020 0.001 Uranium (Total) mg/L DG_A_I_PZ_BW36A 17/08/2020 0.001 Uranium (Total) mg/L DG_A_I_PZ_BW53/Puls 17/08/2020 0.001 Uranium (Total) mg/L DG_A_I_PZ_GW05 17/08/2020 0.001 Uranium (Total) mg/L DG_A_I_PZ_WRK303 19/08/2020 0.004
Uranium (Total) mg/L DG_A_I_PZ_BW45B 19/08/2020 0.01
Uranium (Total) mg/L DG_A_I_PZ_WRK304 19/08/2020 0.004
Uranium (Total) mg/L DG_A_I_PZ_WRK302 3/09/2020 0.001 Uranium (Total) mg/L DG_A_I_PZ_GW04 15/10/2020 0.001 Uranium (Total) mg/L DG_A_I_PZ_GW04A 30/11/2020 0.001 Uranium (Total) mg/L DG_A_I_PZ_GW04A 30/12/2020 0.001 Uranium 238 Bq/L DG_A_I_PZ_GW07 2/07/2020 0.123
Uranium 238 Bq/L DG_A_I_PZ_GW03 2/07/2020 0.864
Uranium 238 Bq/L DG_A_I_PZ_GW02 2/07/2020 0.025 Uranium 238 Bq/L DG_A_I_PZ_GW08 6/07/2020 0.025 Uranium 238 Bq/L DG_A_I_PZ_WRK302 6/07/2020 0.049
Uranium 238 Bq/L DG_A_I_PZ_GW06 6/07/2020 0.667
Uranium 238 Bq/L DG_A_I_PZ_BW36A 7/07/2020 0.025 Uranium 238 Bq/L DG_A_I_PZ_GW01 7/07/2020 0.025 Uranium 238 Bq/L DG_A_I_PZ_BW45B 7/07/2020 0.198
Uranium 238 Bq/L DG_A_I_PZ_IWB2 8/07/2020 0.025 Uranium 238 Bq/L DG_A_I_PZ_IWB6 8/07/2020 0.025 Uranium 238 Bq/L DG_A_I_PZ_BW05 8/07/2020 0.025 Uranium 238 Bq/L DG_A_I_PZ_BW28A 8/07/2020 0.025
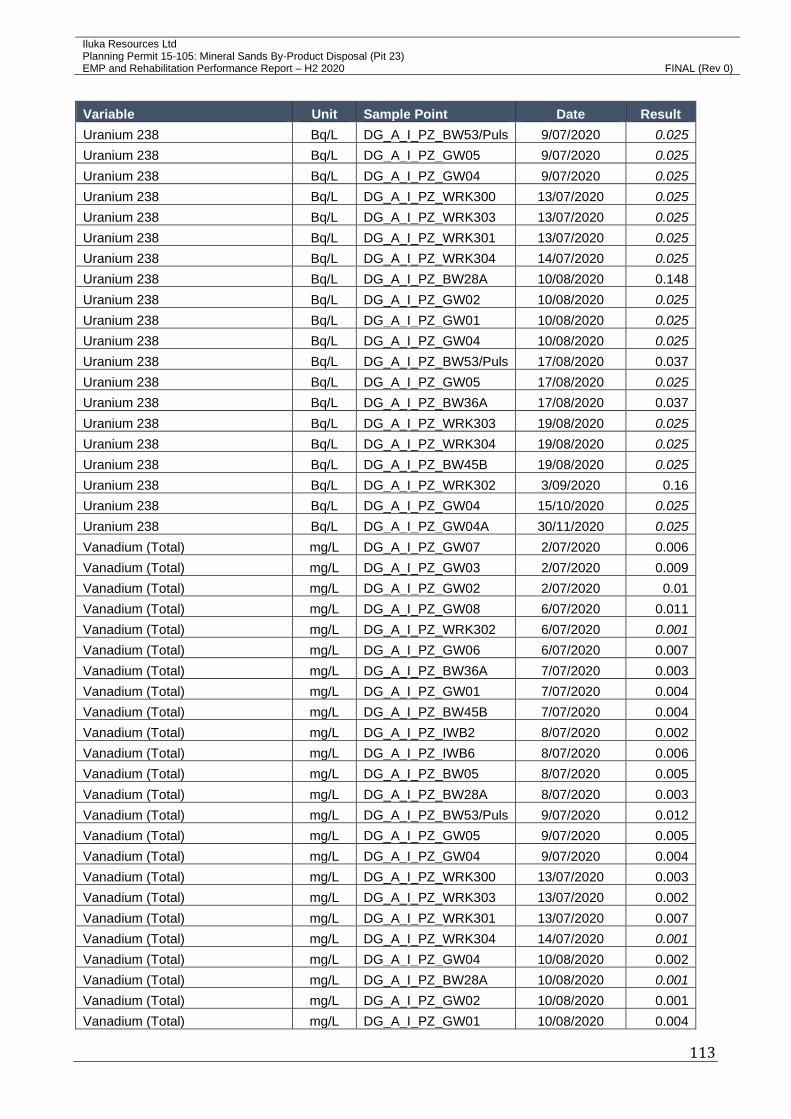
Iluka Resources Ltd Planning Permit 15-105: Mineral Sands By-Product Disposal (Pit 23)
EMP and Rehabilitation Performance Report – H2 2020 FINAL (Rev 0)
113
Variable Unit Sample Point Date Result
Uranium 238 Bq/L DG_A_I_PZ_BW53/Puls 9/07/2020 0.025 Uranium 238 Bq/L DG_A_I_PZ_GW05 9/07/2020 0.025 Uranium 238 Bq/L DG_A_I_PZ_GW04 9/07/2020 0.025 Uranium 238 Bq/L DG_A_I_PZ_WRK300 13/07/2020 0.025 Uranium 238 Bq/L DG_A_I_PZ_WRK303 13/07/2020 0.025 Uranium 238 Bq/L DG_A_I_PZ_WRK301 13/07/2020 0.025 Uranium 238 Bq/L DG_A_I_PZ_WRK304 14/07/2020 0.025 Uranium 238 Bq/L DG_A_I_PZ_BW28A 10/08/2020 0.148
Uranium 238 Bq/L DG_A_I_PZ_GW02 10/08/2020 0.025 Uranium 238 Bq/L DG_A_I_PZ_GW01 10/08/2020 0.025 Uranium 238 Bq/L DG_A_I_PZ_GW04 10/08/2020 0.025 Uranium 238 Bq/L DG_A_I_PZ_BW53/Puls 17/08/2020 0.037
Uranium 238 Bq/L DG_A_I_PZ_GW05 17/08/2020 0.025 Uranium 238 Bq/L DG_A_I_PZ_BW36A 17/08/2020 0.037
Uranium 238 Bq/L DG_A_I_PZ_WRK303 19/08/2020 0.025 Uranium 238 Bq/L DG_A_I_PZ_WRK304 19/08/2020 0.025 Uranium 238 Bq/L DG_A_I_PZ_BW45B 19/08/2020 0.025 Uranium 238 Bq/L DG_A_I_PZ_WRK302 3/09/2020 0.16
Uranium 238 Bq/L DG_A_I_PZ_GW04 15/10/2020 0.025 Uranium 238 Bq/L DG_A_I_PZ_GW04A 30/11/2020 0.025 Vanadium (Total) mg/L DG_A_I_PZ_GW07 2/07/2020 0.006
Vanadium (Total) mg/L DG_A_I_PZ_GW03 2/07/2020 0.009
Vanadium (Total) mg/L DG_A_I_PZ_GW02 2/07/2020 0.01
Vanadium (Total) mg/L DG_A_I_PZ_GW08 6/07/2020 0.011
Vanadium (Total) mg/L DG_A_I_PZ_WRK302 6/07/2020 0.001 Vanadium (Total) mg/L DG_A_I_PZ_GW06 6/07/2020 0.007
Vanadium (Total) mg/L DG_A_I_PZ_BW36A 7/07/2020 0.003
Vanadium (Total) mg/L DG_A_I_PZ_GW01 7/07/2020 0.004
Vanadium (Total) mg/L DG_A_I_PZ_BW45B 7/07/2020 0.004
Vanadium (Total) mg/L DG_A_I_PZ_IWB2 8/07/2020 0.002
Vanadium (Total) mg/L DG_A_I_PZ_IWB6 8/07/2020 0.006
Vanadium (Total) mg/L DG_A_I_PZ_BW05 8/07/2020 0.005
Vanadium (Total) mg/L DG_A_I_PZ_BW28A 8/07/2020 0.003
Vanadium (Total) mg/L DG_A_I_PZ_BW53/Puls 9/07/2020 0.012
Vanadium (Total) mg/L DG_A_I_PZ_GW05 9/07/2020 0.005
Vanadium (Total) mg/L DG_A_I_PZ_GW04 9/07/2020 0.004
Vanadium (Total) mg/L DG_A_I_PZ_WRK300 13/07/2020 0.003
Vanadium (Total) mg/L DG_A_I_PZ_WRK303 13/07/2020 0.002
Vanadium (Total) mg/L DG_A_I_PZ_WRK301 13/07/2020 0.007
Vanadium (Total) mg/L DG_A_I_PZ_WRK304 14/07/2020 0.001 Vanadium (Total) mg/L DG_A_I_PZ_GW04 10/08/2020 0.002
Vanadium (Total) mg/L DG_A_I_PZ_BW28A 10/08/2020 0.001 Vanadium (Total) mg/L DG_A_I_PZ_GW02 10/08/2020 0.001
Vanadium (Total) mg/L DG_A_I_PZ_GW01 10/08/2020 0.004

Iluka Resources Ltd Planning Permit 15-105: Mineral Sands By-Product Disposal (Pit 23)
EMP and Rehabilitation Performance Report – H2 2020 FINAL (Rev 0)
114
Variable Unit Sample Point Date Result
Vanadium (Total) mg/L DG_A_I_PZ_BW36A 17/08/2020 0.002
Vanadium (Total) mg/L DG_A_I_PZ_BW53/Puls 17/08/2020 0.015
Vanadium (Total) mg/L DG_A_I_PZ_GW05 17/08/2020 0.003
Vanadium (Total) mg/L DG_A_I_PZ_WRK303 19/08/2020 0.001 Vanadium (Total) mg/L DG_A_I_PZ_BW45B 19/08/2020 0.001 Vanadium (Total) mg/L DG_A_I_PZ_WRK304 19/08/2020 0.002
Vanadium (Total) mg/L DG_A_I_PZ_WRK302 3/09/2020 0.001 Vanadium (Total) mg/L DG_A_I_PZ_GW04 15/10/2020 0.001
Vanadium (Total) mg/L DG_A_I_PZ_GW04A 30/11/2020 0.003
Vanadium (Total) mg/L DG_A_I_PZ_GW04A 30/12/2020 0.003
Zinc (Total) mg/L DG_A_I_PZ_GW07 2/07/2020 0.011
Zinc (Total) mg/L DG_A_I_PZ_GW03 2/07/2020 0.039
Zinc (Total) mg/L DG_A_I_PZ_GW02 2/07/2020 0.016
Zinc (Total) mg/L DG_A_I_PZ_GW08 6/07/2020 0.013
Zinc (Total) mg/L DG_A_I_PZ_WRK302 6/07/2020 0.003
Zinc (Total) mg/L DG_A_I_PZ_GW06 6/07/2020 0.001 Zinc (Total) mg/L DG_A_I_PZ_BW36A 7/07/2020 0.013
Zinc (Total) mg/L DG_A_I_PZ_GW01 7/07/2020 0.034
Zinc (Total) mg/L DG_A_I_PZ_BW45B 7/07/2020 0.047
Zinc (Total) mg/L DG_A_I_PZ_IWB2 8/07/2020 0.005
Zinc (Total) mg/L DG_A_I_PZ_IWB6 8/07/2020 0.004
Zinc (Total) mg/L DG_A_I_PZ_BW05 8/07/2020 0.009
Zinc (Total) mg/L DG_A_I_PZ_BW28A 8/07/2020 0.016
Zinc (Total) mg/L DG_A_I_PZ_BW53/Puls 9/07/2020 0.014
Zinc (Total) mg/L DG_A_I_PZ_GW05 9/07/2020 0.028
Zinc (Total) mg/L DG_A_I_PZ_GW04 9/07/2020 0.022
Zinc (Total) mg/L DG_A_I_PZ_WRK300 13/07/2020 0.015
Zinc (Total) mg/L DG_A_I_PZ_WRK303 13/07/2020 0.015
Zinc (Total) mg/L DG_A_I_PZ_WRK301 13/07/2020 0.012
Zinc (Total) mg/L DG_A_I_PZ_WRK304 14/07/2020 0.013
Zinc (Total) mg/L DG_A_I_PZ_GW04 10/08/2020 0.014
Zinc (Total) mg/L DG_A_I_PZ_BW28A 10/08/2020 0.012
Zinc (Total) mg/L DG_A_I_PZ_GW02 10/08/2020 0.014
Zinc (Total) mg/L DG_A_I_PZ_GW01 10/08/2020 0.019
Zinc (Total) mg/L DG_A_I_PZ_BW36A 17/08/2020 0.011
Zinc (Total) mg/L DG_A_I_PZ_BW53/Puls 17/08/2020 0.039
Zinc (Total) mg/L DG_A_I_PZ_GW05 17/08/2020 0.018
Zinc (Total) mg/L DG_A_I_PZ_WRK303 19/08/2020 0.011
Zinc (Total) mg/L DG_A_I_PZ_BW45B 19/08/2020 0.037
Zinc (Total) mg/L DG_A_I_PZ_WRK304 19/08/2020 0.012
Zinc (Total) mg/L DG_A_I_PZ_WRK302 3/09/2020 0.012
Zinc (Total) mg/L DG_A_I_PZ_GW04 15/10/2020 0.029
Zinc (Total) mg/L DG_A_I_PZ_GW04A 30/11/2020 0.016
Zinc (Total) mg/L DG_A_I_PZ_GW04A 30/12/2020 0.016

Iluka Resources Ltd Planning Permit 15-105: Mineral Sands By-Product Disposal (Pit 23)
EMP and Rehabilitation Performance Report – H2 2020 FINAL (Rev 0)
115

Iluka Resources Ltd Planning Permit 15-105: Mineral Sands By-Product Disposal (Pit 23)
EMP and Rehabilitation Performance Report – H2 2020 FINAL (Rev 0)
116
Appendix C: Monitoring Data (Field) – Groundwater
Variable Unit Sample Point Date Result
Dissolved Oxygen mg/L DG_A_I_PZ_BW28A 8/07/2020 0
Dissolved Oxygen mg/L DG_A_I_PZ_BW28A 10/08/2020 0
Dissolved Oxygen mg/L DG_A_I_PZ_BW53/Puls 9/07/2020 0.5
Dissolved Oxygen mg/L DG_A_I_PZ_BW53/Puls 17/08/2020 0.2
Dissolved Oxygen mg/L DG_A_I_PZ_BW05 8/07/2020 0
Dissolved Oxygen mg/L DG_A_I_PZ_IWB2 8/07/2020 0
Dissolved Oxygen mg/L DG_A_I_PZ_IWB6 8/07/2020 3.3
Dissolved Oxygen mg/L DG_A_I_PZ_WRK300 13/07/2020 1
Dissolved Oxygen mg/L DG_A_I_PZ_WRK300 20/08/2020 0.3
Dissolved Oxygen mg/L DG_A_I_PZ_WRK300 8/09/2020 1
Dissolved Oxygen mg/L DG_A_I_PZ_WRK300 19/10/2020 2.1
Dissolved Oxygen mg/L DG_A_I_PZ_WRK300 25/11/2020 1.4
Dissolved Oxygen mg/L DG_A_I_PZ_WRK300 14/12/2020 2.5
Dissolved Oxygen mg/L DG_A_I_PZ_WRK301 13/07/2020 0.9
Dissolved Oxygen mg/L DG_A_I_PZ_WRK301 25/08/2020 1.2
Dissolved Oxygen mg/L DG_A_I_PZ_WRK301 9/09/2020 1.4
Dissolved Oxygen mg/L DG_A_I_PZ_WRK301 20/10/2020 1
Dissolved Oxygen mg/L DG_A_I_PZ_WRK301 30/11/2020 1
Dissolved Oxygen mg/L DG_A_I_PZ_WRK301 14/12/2020 6.7
Dissolved Oxygen mg/L DG_A_I_PZ_WRK302 6/07/2020 6.6
Dissolved Oxygen mg/L DG_A_I_PZ_WRK302 25/08/2020 6.4
Dissolved Oxygen mg/L DG_A_I_PZ_WRK302 3/09/2020 6.4
Dissolved Oxygen mg/L DG_A_I_PZ_WRK302 19/10/2020 6.2
Dissolved Oxygen mg/L DG_A_I_PZ_WRK302 26/11/2020 6.1
Dissolved Oxygen mg/L DG_A_I_PZ_WRK302 10/12/2020 6.8
Dissolved Oxygen mg/L DG_A_I_PZ_WRK303 13/07/2020 7.8
Dissolved Oxygen mg/L DG_A_I_PZ_WRK303 19/08/2020 9.1
Dissolved Oxygen mg/L DG_A_I_PZ_WRK303 9/09/2020 4.7
Dissolved Oxygen mg/L DG_A_I_PZ_WRK303 20/10/2020 9.3
Dissolved Oxygen mg/L DG_A_I_PZ_WRK303 30/11/2020 7
Dissolved Oxygen mg/L DG_A_I_PZ_WRK303 14/12/2020 8.1
Dissolved Oxygen mg/L DG_A_I_PZ_WRK304 14/07/2020 9.6
Dissolved Oxygen mg/L DG_A_I_PZ_WRK304 19/08/2020 9.7
Dissolved Oxygen mg/L DG_A_I_PZ_WRK304 9/09/2020 9.7
Dissolved Oxygen mg/L DG_A_I_PZ_WRK304 20/10/2020 9.8
Dissolved Oxygen mg/L DG_A_I_PZ_WRK304 30/11/2020 10.2
Dissolved Oxygen mg/L DG_A_I_PZ_WRK304 14/12/2020 8
Dissolved Oxygen mg/L DG_A_I_PZ_GW01 7/07/2020 4.6
Dissolved Oxygen mg/L DG_A_I_PZ_GW01 10/08/2020 4.7
Dissolved Oxygen mg/L DG_A_I_PZ_GW01 7/09/2020 4.6
Dissolved Oxygen mg/L DG_A_I_PZ_GW01 16/10/2020 4.6
Dissolved Oxygen mg/L DG_A_I_PZ_GW01 24/11/2020 5

Iluka Resources Ltd Planning Permit 15-105: Mineral Sands By-Product Disposal (Pit 23)
EMP and Rehabilitation Performance Report – H2 2020 FINAL (Rev 0)
117
Variable Unit Sample Point Date Result
Dissolved Oxygen mg/L DG_A_I_PZ_GW01 9/12/2020 5.4
Dissolved Oxygen mg/L DG_A_I_PZ_GW06 6/07/2020 8.7
Dissolved Oxygen mg/L DG_A_I_PZ_GW06 25/08/2020 7.6
Dissolved Oxygen mg/L DG_A_I_PZ_GW06 8/09/2020 8.4
Dissolved Oxygen mg/L DG_A_I_PZ_GW06 19/10/2020 8.3
Dissolved Oxygen mg/L DG_A_I_PZ_GW06 26/11/2020 8.3
Dissolved Oxygen mg/L DG_A_I_PZ_GW06 10/12/2020 6.8
Dissolved Oxygen mg/L DG_A_I_PZ_GW07 2/07/2020 9.3
Dissolved Oxygen mg/L DG_A_I_PZ_GW07 20/08/2020 8
Dissolved Oxygen mg/L DG_A_I_PZ_GW07 7/09/2020 7.7
Dissolved Oxygen mg/L DG_A_I_PZ_GW07 16/10/2020 7.7
Dissolved Oxygen mg/L DG_A_I_PZ_GW07 24/11/2020 7.6
Dissolved Oxygen mg/L DG_A_I_PZ_GW07 8/12/2020 7.8
Dissolved Oxygen mg/L DG_A_I_PZ_BW45B 7/07/2020 0.2
Dissolved Oxygen mg/L DG_A_I_PZ_BW45B 19/08/2020 1
Dissolved Oxygen mg/L DG_A_I_PZ_BW45B 7/09/2020 5
Dissolved Oxygen mg/L DG_A_I_PZ_BW45B 16/10/2020 0.3
Dissolved Oxygen mg/L DG_A_I_PZ_BW45B 24/11/2020 1
Dissolved Oxygen mg/L DG_A_I_PZ_BW45B 9/12/2020 1.2
Dissolved Oxygen mg/L DG_A_I_PZ_GW02 2/07/2020 2.3
Dissolved Oxygen mg/L DG_A_I_PZ_GW02 10/08/2020 0.7
Dissolved Oxygen mg/L DG_A_I_PZ_GW02 3/09/2020 0
Dissolved Oxygen mg/L DG_A_I_PZ_GW02 15/10/2020 0.8
Dissolved Oxygen mg/L DG_A_I_PZ_GW02 24/11/2020 0.7
Dissolved Oxygen mg/L DG_A_I_PZ_GW02 8/12/2020 0.6
Dissolved Oxygen mg/L DG_A_I_PZ_GW03 2/07/2020 0.1
Dissolved Oxygen mg/L DG_A_I_PZ_GW03 20/08/2020 0.6
Dissolved Oxygen mg/L DG_A_I_PZ_GW03 3/09/2020 1
Dissolved Oxygen mg/L DG_A_I_PZ_GW03 15/10/2020 1.3
Dissolved Oxygen mg/L DG_A_I_PZ_GW03 24/11/2020 3.9
Dissolved Oxygen mg/L DG_A_I_PZ_GW03 8/12/2020 4.8
Dissolved Oxygen mg/L DG_A_I_PZ_GW04 9/07/2020 6.4
Dissolved Oxygen mg/L DG_A_I_PZ_GW04 10/08/2020 6.3
Dissolved Oxygen mg/L DG_A_I_PZ_GW04 7/09/2020 6.9
Dissolved Oxygen mg/L DG_A_I_PZ_GW04 15/10/2020 6.8
Dissolved Oxygen mg/L DG_A_I_PZ_GW04 25/11/2020 7
Dissolved Oxygen mg/L DG_A_I_PZ_GW04 9/12/2020 8
Dissolved Oxygen mg/L DG_A_I_PZ_GW05 9/07/2020 0.5
Dissolved Oxygen mg/L DG_A_I_PZ_GW05 17/08/2020 0.3
Dissolved Oxygen mg/L DG_A_I_PZ_GW05 7/09/2020 0.3
Dissolved Oxygen mg/L DG_A_I_PZ_GW05 19/10/2020 0.3
Dissolved Oxygen mg/L DG_A_I_PZ_GW05 25/11/2020 0.7
Dissolved Oxygen mg/L DG_A_I_PZ_GW05 4/12/2020 0
Dissolved Oxygen mg/L DG_A_I_PZ_GW08 6/07/2020 5.6
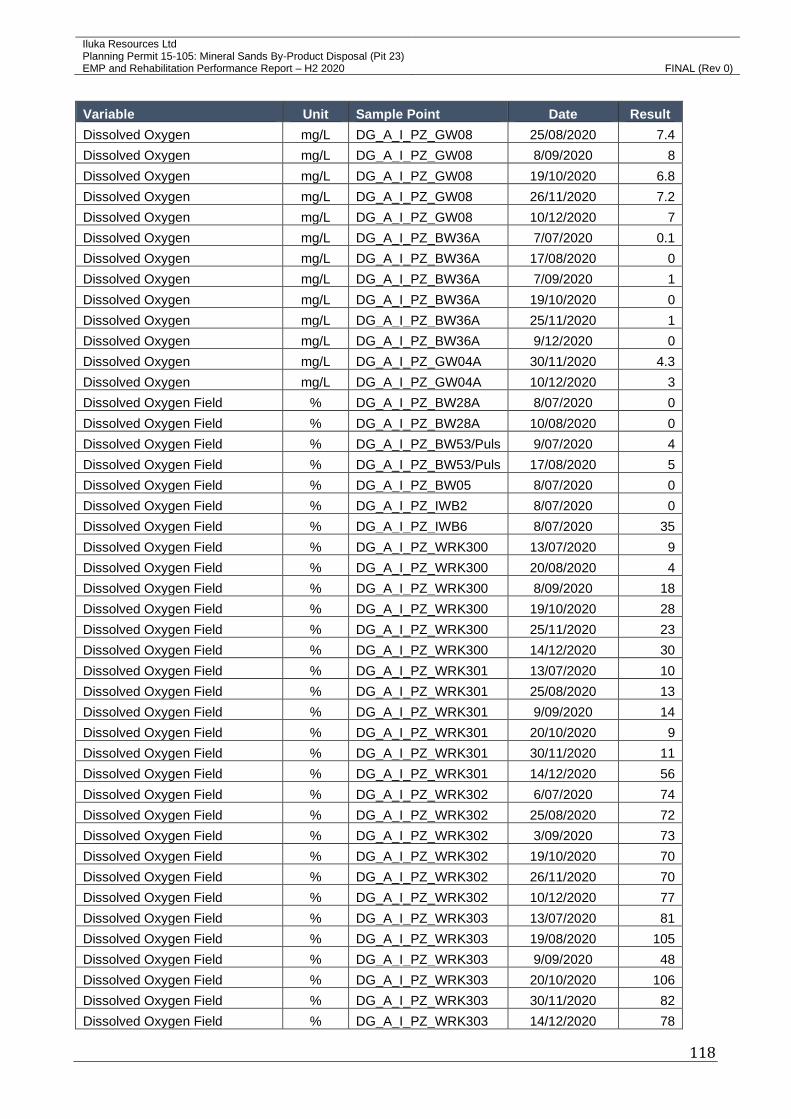
Iluka Resources Ltd Planning Permit 15-105: Mineral Sands By-Product Disposal (Pit 23)
EMP and Rehabilitation Performance Report – H2 2020 FINAL (Rev 0)
118
Variable Unit Sample Point Date Result
Dissolved Oxygen mg/L DG_A_I_PZ_GW08 25/08/2020 7.4
Dissolved Oxygen mg/L DG_A_I_PZ_GW08 8/09/2020 8
Dissolved Oxygen mg/L DG_A_I_PZ_GW08 19/10/2020 6.8
Dissolved Oxygen mg/L DG_A_I_PZ_GW08 26/11/2020 7.2
Dissolved Oxygen mg/L DG_A_I_PZ_GW08 10/12/2020 7
Dissolved Oxygen mg/L DG_A_I_PZ_BW36A 7/07/2020 0.1
Dissolved Oxygen mg/L DG_A_I_PZ_BW36A 17/08/2020 0
Dissolved Oxygen mg/L DG_A_I_PZ_BW36A 7/09/2020 1
Dissolved Oxygen mg/L DG_A_I_PZ_BW36A 19/10/2020 0
Dissolved Oxygen mg/L DG_A_I_PZ_BW36A 25/11/2020 1
Dissolved Oxygen mg/L DG_A_I_PZ_BW36A 9/12/2020 0
Dissolved Oxygen mg/L DG_A_I_PZ_GW04A 30/11/2020 4.3
Dissolved Oxygen mg/L DG_A_I_PZ_GW04A 10/12/2020 3
Dissolved Oxygen Field % DG_A_I_PZ_BW28A 8/07/2020 0
Dissolved Oxygen Field % DG_A_I_PZ_BW28A 10/08/2020 0
Dissolved Oxygen Field % DG_A_I_PZ_BW53/Puls 9/07/2020 4
Dissolved Oxygen Field % DG_A_I_PZ_BW53/Puls 17/08/2020 5
Dissolved Oxygen Field % DG_A_I_PZ_BW05 8/07/2020 0
Dissolved Oxygen Field % DG_A_I_PZ_IWB2 8/07/2020 0
Dissolved Oxygen Field % DG_A_I_PZ_IWB6 8/07/2020 35
Dissolved Oxygen Field % DG_A_I_PZ_WRK300 13/07/2020 9
Dissolved Oxygen Field % DG_A_I_PZ_WRK300 20/08/2020 4
Dissolved Oxygen Field % DG_A_I_PZ_WRK300 8/09/2020 18
Dissolved Oxygen Field % DG_A_I_PZ_WRK300 19/10/2020 28
Dissolved Oxygen Field % DG_A_I_PZ_WRK300 25/11/2020 23
Dissolved Oxygen Field % DG_A_I_PZ_WRK300 14/12/2020 30
Dissolved Oxygen Field % DG_A_I_PZ_WRK301 13/07/2020 10
Dissolved Oxygen Field % DG_A_I_PZ_WRK301 25/08/2020 13
Dissolved Oxygen Field % DG_A_I_PZ_WRK301 9/09/2020 14
Dissolved Oxygen Field % DG_A_I_PZ_WRK301 20/10/2020 9
Dissolved Oxygen Field % DG_A_I_PZ_WRK301 30/11/2020 11
Dissolved Oxygen Field % DG_A_I_PZ_WRK301 14/12/2020 56
Dissolved Oxygen Field % DG_A_I_PZ_WRK302 6/07/2020 74
Dissolved Oxygen Field % DG_A_I_PZ_WRK302 25/08/2020 72
Dissolved Oxygen Field % DG_A_I_PZ_WRK302 3/09/2020 73
Dissolved Oxygen Field % DG_A_I_PZ_WRK302 19/10/2020 70
Dissolved Oxygen Field % DG_A_I_PZ_WRK302 26/11/2020 70
Dissolved Oxygen Field % DG_A_I_PZ_WRK302 10/12/2020 77
Dissolved Oxygen Field % DG_A_I_PZ_WRK303 13/07/2020 81
Dissolved Oxygen Field % DG_A_I_PZ_WRK303 19/08/2020 105
Dissolved Oxygen Field % DG_A_I_PZ_WRK303 9/09/2020 48
Dissolved Oxygen Field % DG_A_I_PZ_WRK303 20/10/2020 106
Dissolved Oxygen Field % DG_A_I_PZ_WRK303 30/11/2020 82
Dissolved Oxygen Field % DG_A_I_PZ_WRK303 14/12/2020 78
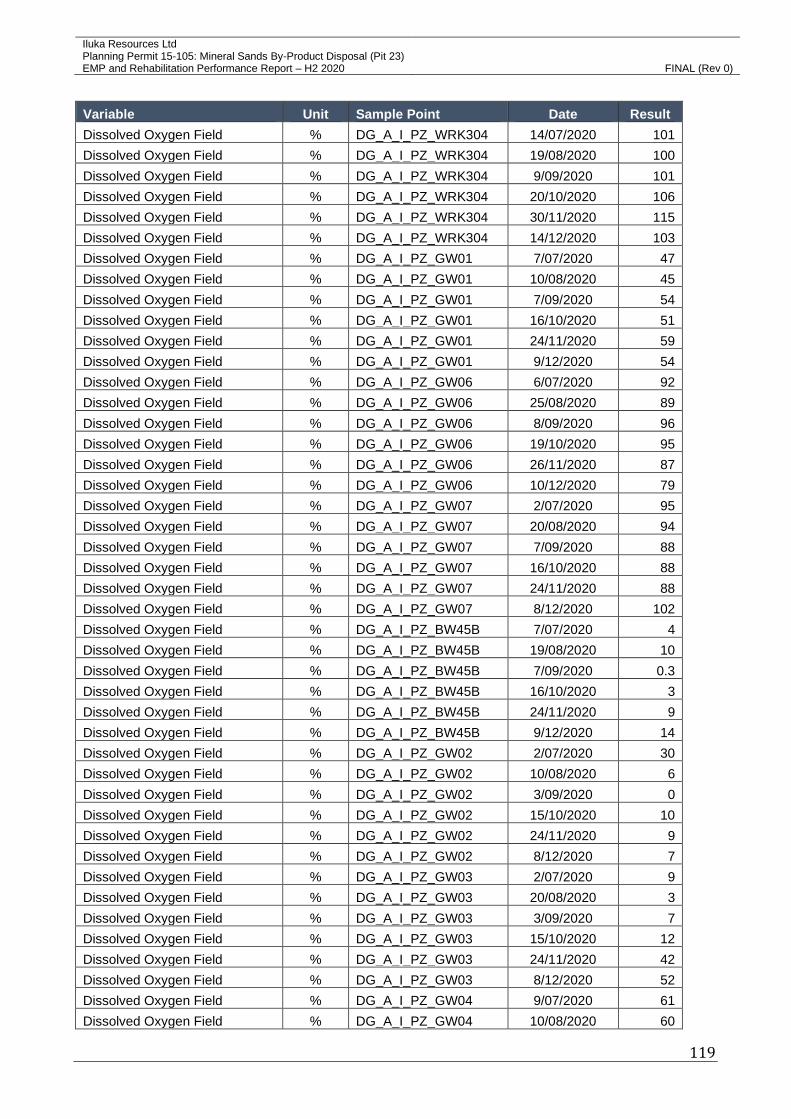
Iluka Resources Ltd Planning Permit 15-105: Mineral Sands By-Product Disposal (Pit 23)
EMP and Rehabilitation Performance Report – H2 2020 FINAL (Rev 0)
119
Variable Unit Sample Point Date Result
Dissolved Oxygen Field % DG_A_I_PZ_WRK304 14/07/2020 101
Dissolved Oxygen Field % DG_A_I_PZ_WRK304 19/08/2020 100
Dissolved Oxygen Field % DG_A_I_PZ_WRK304 9/09/2020 101
Dissolved Oxygen Field % DG_A_I_PZ_WRK304 20/10/2020 106
Dissolved Oxygen Field % DG_A_I_PZ_WRK304 30/11/2020 115
Dissolved Oxygen Field % DG_A_I_PZ_WRK304 14/12/2020 103
Dissolved Oxygen Field % DG_A_I_PZ_GW01 7/07/2020 47
Dissolved Oxygen Field % DG_A_I_PZ_GW01 10/08/2020 45
Dissolved Oxygen Field % DG_A_I_PZ_GW01 7/09/2020 54
Dissolved Oxygen Field % DG_A_I_PZ_GW01 16/10/2020 51
Dissolved Oxygen Field % DG_A_I_PZ_GW01 24/11/2020 59
Dissolved Oxygen Field % DG_A_I_PZ_GW01 9/12/2020 54
Dissolved Oxygen Field % DG_A_I_PZ_GW06 6/07/2020 92
Dissolved Oxygen Field % DG_A_I_PZ_GW06 25/08/2020 89
Dissolved Oxygen Field % DG_A_I_PZ_GW06 8/09/2020 96
Dissolved Oxygen Field % DG_A_I_PZ_GW06 19/10/2020 95
Dissolved Oxygen Field % DG_A_I_PZ_GW06 26/11/2020 87
Dissolved Oxygen Field % DG_A_I_PZ_GW06 10/12/2020 79
Dissolved Oxygen Field % DG_A_I_PZ_GW07 2/07/2020 95
Dissolved Oxygen Field % DG_A_I_PZ_GW07 20/08/2020 94
Dissolved Oxygen Field % DG_A_I_PZ_GW07 7/09/2020 88
Dissolved Oxygen Field % DG_A_I_PZ_GW07 16/10/2020 88
Dissolved Oxygen Field % DG_A_I_PZ_GW07 24/11/2020 88
Dissolved Oxygen Field % DG_A_I_PZ_GW07 8/12/2020 102
Dissolved Oxygen Field % DG_A_I_PZ_BW45B 7/07/2020 4
Dissolved Oxygen Field % DG_A_I_PZ_BW45B 19/08/2020 10
Dissolved Oxygen Field % DG_A_I_PZ_BW45B 7/09/2020 0.3
Dissolved Oxygen Field % DG_A_I_PZ_BW45B 16/10/2020 3
Dissolved Oxygen Field % DG_A_I_PZ_BW45B 24/11/2020 9
Dissolved Oxygen Field % DG_A_I_PZ_BW45B 9/12/2020 14
Dissolved Oxygen Field % DG_A_I_PZ_GW02 2/07/2020 30
Dissolved Oxygen Field % DG_A_I_PZ_GW02 10/08/2020 6
Dissolved Oxygen Field % DG_A_I_PZ_GW02 3/09/2020 0
Dissolved Oxygen Field % DG_A_I_PZ_GW02 15/10/2020 10
Dissolved Oxygen Field % DG_A_I_PZ_GW02 24/11/2020 9
Dissolved Oxygen Field % DG_A_I_PZ_GW02 8/12/2020 7
Dissolved Oxygen Field % DG_A_I_PZ_GW03 2/07/2020 9
Dissolved Oxygen Field % DG_A_I_PZ_GW03 20/08/2020 3
Dissolved Oxygen Field % DG_A_I_PZ_GW03 3/09/2020 7
Dissolved Oxygen Field % DG_A_I_PZ_GW03 15/10/2020 12
Dissolved Oxygen Field % DG_A_I_PZ_GW03 24/11/2020 42
Dissolved Oxygen Field % DG_A_I_PZ_GW03 8/12/2020 52
Dissolved Oxygen Field % DG_A_I_PZ_GW04 9/07/2020 61
Dissolved Oxygen Field % DG_A_I_PZ_GW04 10/08/2020 60

Iluka Resources Ltd Planning Permit 15-105: Mineral Sands By-Product Disposal (Pit 23)
EMP and Rehabilitation Performance Report – H2 2020 FINAL (Rev 0)
120
Variable Unit Sample Point Date Result
Dissolved Oxygen Field % DG_A_I_PZ_GW04 7/09/2020 78
Dissolved Oxygen Field % DG_A_I_PZ_GW04 15/10/2020 76
Dissolved Oxygen Field % DG_A_I_PZ_GW04 25/11/2020 86
Dissolved Oxygen Field % DG_A_I_PZ_GW04 9/12/2020 95
Dissolved Oxygen Field % DG_A_I_PZ_GW05 9/07/2020 2
Dissolved Oxygen Field % DG_A_I_PZ_GW05 17/08/2020 3
Dissolved Oxygen Field % DG_A_I_PZ_GW05 7/09/2020 4
Dissolved Oxygen Field % DG_A_I_PZ_GW05 19/10/2020 5
Dissolved Oxygen Field % DG_A_I_PZ_GW05 25/11/2020 8
Dissolved Oxygen Field % DG_A_I_PZ_GW05 4/12/2020 0
Dissolved Oxygen Field % DG_A_I_PZ_GW08 6/07/2020 59
Dissolved Oxygen Field % DG_A_I_PZ_GW08 25/08/2020 84
Dissolved Oxygen Field % DG_A_I_PZ_GW08 8/09/2020 92
Dissolved Oxygen Field % DG_A_I_PZ_GW08 19/10/2020 79
Dissolved Oxygen Field % DG_A_I_PZ_GW08 26/11/2020 74
Dissolved Oxygen Field % DG_A_I_PZ_GW08 10/12/2020 77
Dissolved Oxygen Field % DG_A_I_PZ_BW36A 7/07/2020 9
Dissolved Oxygen Field % DG_A_I_PZ_BW36A 17/08/2020 0
Dissolved Oxygen Field % DG_A_I_PZ_BW36A 7/09/2020 0.1
Dissolved Oxygen Field % DG_A_I_PZ_BW36A 19/10/2020 0
Dissolved Oxygen Field % DG_A_I_PZ_BW36A 25/11/2020 0.2
Dissolved Oxygen Field % DG_A_I_PZ_BW36A 9/12/2020 0
Dissolved Oxygen Field % DG_A_I_PZ_GW04A 30/11/2020 39
Dissolved Oxygen Field % DG_A_I_PZ_GW04A 10/12/2020 27
Electrical Conductivity µS/cm DG_A_I_PZ_BW28A 8/07/2020 21000
Electrical Conductivity µS/cm DG_A_I_PZ_BW28A 10/08/2020 21000
Electrical Conductivity µS/cm DG_A_I_PZ_BW53/Puls 9/07/2020 3000
Electrical Conductivity µS/cm DG_A_I_PZ_BW53/Puls 17/08/2020 2700
Electrical Conductivity µS/cm DG_A_I_PZ_BW05 8/07/2020 23000
Electrical Conductivity µS/cm DG_A_I_PZ_IWB2 8/07/2020 4000
Electrical Conductivity µS/cm DG_A_I_PZ_IWB6 8/07/2020 1700
Electrical Conductivity µS/cm DG_A_I_PZ_WRK300 13/07/2020 6100
Electrical Conductivity µS/cm DG_A_I_PZ_WRK300 20/08/2020 6517
Electrical Conductivity µS/cm DG_A_I_PZ_WRK300 8/09/2020 6545
Electrical Conductivity µS/cm DG_A_I_PZ_WRK300 19/10/2020 5980
Electrical Conductivity µS/cm DG_A_I_PZ_WRK300 25/11/2020 6515
Electrical Conductivity µS/cm DG_A_I_PZ_WRK300 14/12/2020 6346
Electrical Conductivity µS/cm DG_A_I_PZ_WRK301 13/07/2020 11000
Electrical Conductivity µS/cm DG_A_I_PZ_WRK301 25/08/2020 11417
Electrical Conductivity µS/cm DG_A_I_PZ_WRK301 9/09/2020 11665
Electrical Conductivity µS/cm DG_A_I_PZ_WRK301 20/10/2020 10424
Electrical Conductivity µS/cm DG_A_I_PZ_WRK301 30/11/2020 12865
Electrical Conductivity µS/cm DG_A_I_PZ_WRK301 14/12/2020 11410
Electrical Conductivity µS/cm DG_A_I_PZ_WRK302 6/07/2020 20000
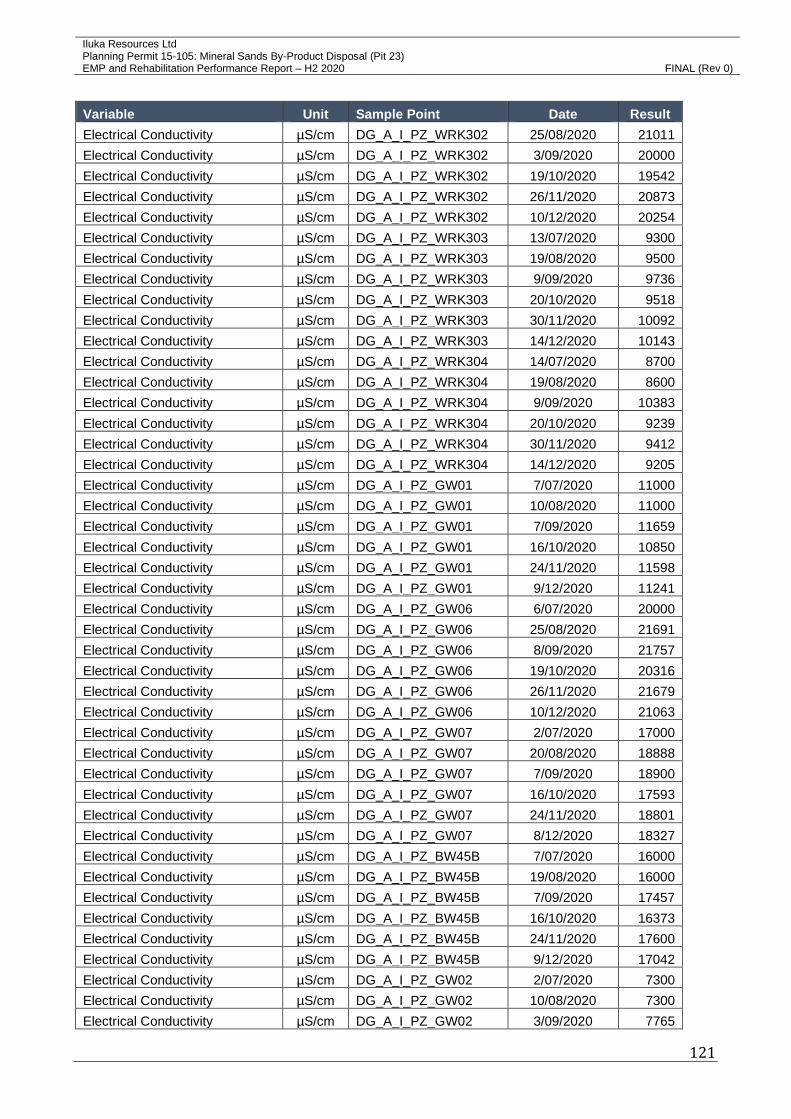
Iluka Resources Ltd Planning Permit 15-105: Mineral Sands By-Product Disposal (Pit 23)
EMP and Rehabilitation Performance Report – H2 2020 FINAL (Rev 0)
121
Variable Unit Sample Point Date Result
Electrical Conductivity µS/cm DG_A_I_PZ_WRK302 25/08/2020 21011
Electrical Conductivity µS/cm DG_A_I_PZ_WRK302 3/09/2020 20000
Electrical Conductivity µS/cm DG_A_I_PZ_WRK302 19/10/2020 19542
Electrical Conductivity µS/cm DG_A_I_PZ_WRK302 26/11/2020 20873
Electrical Conductivity µS/cm DG_A_I_PZ_WRK302 10/12/2020 20254
Electrical Conductivity µS/cm DG_A_I_PZ_WRK303 13/07/2020 9300
Electrical Conductivity µS/cm DG_A_I_PZ_WRK303 19/08/2020 9500
Electrical Conductivity µS/cm DG_A_I_PZ_WRK303 9/09/2020 9736
Electrical Conductivity µS/cm DG_A_I_PZ_WRK303 20/10/2020 9518
Electrical Conductivity µS/cm DG_A_I_PZ_WRK303 30/11/2020 10092
Electrical Conductivity µS/cm DG_A_I_PZ_WRK303 14/12/2020 10143
Electrical Conductivity µS/cm DG_A_I_PZ_WRK304 14/07/2020 8700
Electrical Conductivity µS/cm DG_A_I_PZ_WRK304 19/08/2020 8600
Electrical Conductivity µS/cm DG_A_I_PZ_WRK304 9/09/2020 10383
Electrical Conductivity µS/cm DG_A_I_PZ_WRK304 20/10/2020 9239
Electrical Conductivity µS/cm DG_A_I_PZ_WRK304 30/11/2020 9412
Electrical Conductivity µS/cm DG_A_I_PZ_WRK304 14/12/2020 9205
Electrical Conductivity µS/cm DG_A_I_PZ_GW01 7/07/2020 11000
Electrical Conductivity µS/cm DG_A_I_PZ_GW01 10/08/2020 11000
Electrical Conductivity µS/cm DG_A_I_PZ_GW01 7/09/2020 11659
Electrical Conductivity µS/cm DG_A_I_PZ_GW01 16/10/2020 10850
Electrical Conductivity µS/cm DG_A_I_PZ_GW01 24/11/2020 11598
Electrical Conductivity µS/cm DG_A_I_PZ_GW01 9/12/2020 11241
Electrical Conductivity µS/cm DG_A_I_PZ_GW06 6/07/2020 20000
Electrical Conductivity µS/cm DG_A_I_PZ_GW06 25/08/2020 21691
Electrical Conductivity µS/cm DG_A_I_PZ_GW06 8/09/2020 21757
Electrical Conductivity µS/cm DG_A_I_PZ_GW06 19/10/2020 20316
Electrical Conductivity µS/cm DG_A_I_PZ_GW06 26/11/2020 21679
Electrical Conductivity µS/cm DG_A_I_PZ_GW06 10/12/2020 21063
Electrical Conductivity µS/cm DG_A_I_PZ_GW07 2/07/2020 17000
Electrical Conductivity µS/cm DG_A_I_PZ_GW07 20/08/2020 18888
Electrical Conductivity µS/cm DG_A_I_PZ_GW07 7/09/2020 18900
Electrical Conductivity µS/cm DG_A_I_PZ_GW07 16/10/2020 17593
Electrical Conductivity µS/cm DG_A_I_PZ_GW07 24/11/2020 18801
Electrical Conductivity µS/cm DG_A_I_PZ_GW07 8/12/2020 18327
Electrical Conductivity µS/cm DG_A_I_PZ_BW45B 7/07/2020 16000
Electrical Conductivity µS/cm DG_A_I_PZ_BW45B 19/08/2020 16000
Electrical Conductivity µS/cm DG_A_I_PZ_BW45B 7/09/2020 17457
Electrical Conductivity µS/cm DG_A_I_PZ_BW45B 16/10/2020 16373
Electrical Conductivity µS/cm DG_A_I_PZ_BW45B 24/11/2020 17600
Electrical Conductivity µS/cm DG_A_I_PZ_BW45B 9/12/2020 17042
Electrical Conductivity µS/cm DG_A_I_PZ_GW02 2/07/2020 7300
Electrical Conductivity µS/cm DG_A_I_PZ_GW02 10/08/2020 7300
Electrical Conductivity µS/cm DG_A_I_PZ_GW02 3/09/2020 7765
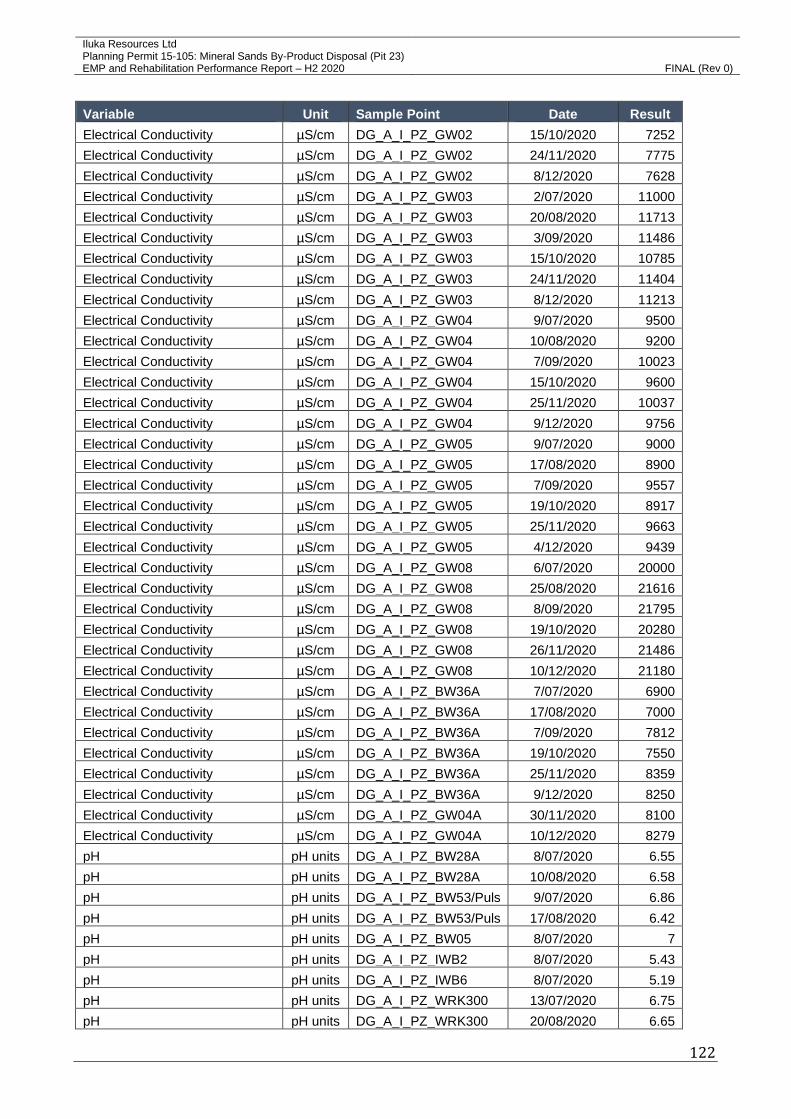
Iluka Resources Ltd Planning Permit 15-105: Mineral Sands By-Product Disposal (Pit 23)
EMP and Rehabilitation Performance Report – H2 2020 FINAL (Rev 0)
122
Variable Unit Sample Point Date Result
Electrical Conductivity µS/cm DG_A_I_PZ_GW02 15/10/2020 7252
Electrical Conductivity µS/cm DG_A_I_PZ_GW02 24/11/2020 7775
Electrical Conductivity µS/cm DG_A_I_PZ_GW02 8/12/2020 7628
Electrical Conductivity µS/cm DG_A_I_PZ_GW03 2/07/2020 11000
Electrical Conductivity µS/cm DG_A_I_PZ_GW03 20/08/2020 11713
Electrical Conductivity µS/cm DG_A_I_PZ_GW03 3/09/2020 11486
Electrical Conductivity µS/cm DG_A_I_PZ_GW03 15/10/2020 10785
Electrical Conductivity µS/cm DG_A_I_PZ_GW03 24/11/2020 11404
Electrical Conductivity µS/cm DG_A_I_PZ_GW03 8/12/2020 11213
Electrical Conductivity µS/cm DG_A_I_PZ_GW04 9/07/2020 9500
Electrical Conductivity µS/cm DG_A_I_PZ_GW04 10/08/2020 9200
Electrical Conductivity µS/cm DG_A_I_PZ_GW04 7/09/2020 10023
Electrical Conductivity µS/cm DG_A_I_PZ_GW04 15/10/2020 9600
Electrical Conductivity µS/cm DG_A_I_PZ_GW04 25/11/2020 10037
Electrical Conductivity µS/cm DG_A_I_PZ_GW04 9/12/2020 9756
Electrical Conductivity µS/cm DG_A_I_PZ_GW05 9/07/2020 9000
Electrical Conductivity µS/cm DG_A_I_PZ_GW05 17/08/2020 8900
Electrical Conductivity µS/cm DG_A_I_PZ_GW05 7/09/2020 9557
Electrical Conductivity µS/cm DG_A_I_PZ_GW05 19/10/2020 8917
Electrical Conductivity µS/cm DG_A_I_PZ_GW05 25/11/2020 9663
Electrical Conductivity µS/cm DG_A_I_PZ_GW05 4/12/2020 9439
Electrical Conductivity µS/cm DG_A_I_PZ_GW08 6/07/2020 20000
Electrical Conductivity µS/cm DG_A_I_PZ_GW08 25/08/2020 21616
Electrical Conductivity µS/cm DG_A_I_PZ_GW08 8/09/2020 21795
Electrical Conductivity µS/cm DG_A_I_PZ_GW08 19/10/2020 20280
Electrical Conductivity µS/cm DG_A_I_PZ_GW08 26/11/2020 21486
Electrical Conductivity µS/cm DG_A_I_PZ_GW08 10/12/2020 21180
Electrical Conductivity µS/cm DG_A_I_PZ_BW36A 7/07/2020 6900
Electrical Conductivity µS/cm DG_A_I_PZ_BW36A 17/08/2020 7000
Electrical Conductivity µS/cm DG_A_I_PZ_BW36A 7/09/2020 7812
Electrical Conductivity µS/cm DG_A_I_PZ_BW36A 19/10/2020 7550
Electrical Conductivity µS/cm DG_A_I_PZ_BW36A 25/11/2020 8359
Electrical Conductivity µS/cm DG_A_I_PZ_BW36A 9/12/2020 8250
Electrical Conductivity µS/cm DG_A_I_PZ_GW04A 30/11/2020 8100
Electrical Conductivity µS/cm DG_A_I_PZ_GW04A 10/12/2020 8279
pH pH units DG_A_I_PZ_BW28A 8/07/2020 6.55
pH pH units DG_A_I_PZ_BW28A 10/08/2020 6.58
pH pH units DG_A_I_PZ_BW53/Puls 9/07/2020 6.86
pH pH units DG_A_I_PZ_BW53/Puls 17/08/2020 6.42
pH pH units DG_A_I_PZ_BW05 8/07/2020 7
pH pH units DG_A_I_PZ_IWB2 8/07/2020 5.43
pH pH units DG_A_I_PZ_IWB6 8/07/2020 5.19
pH pH units DG_A_I_PZ_WRK300 13/07/2020 6.75
pH pH units DG_A_I_PZ_WRK300 20/08/2020 6.65

Iluka Resources Ltd Planning Permit 15-105: Mineral Sands By-Product Disposal (Pit 23)
EMP and Rehabilitation Performance Report – H2 2020 FINAL (Rev 0)
123
Variable Unit Sample Point Date Result
pH pH units DG_A_I_PZ_WRK300 8/09/2020 6.65
pH pH units DG_A_I_PZ_WRK300 19/10/2020 6.53
pH pH units DG_A_I_PZ_WRK300 25/11/2020 6.53
pH pH units DG_A_I_PZ_WRK300 14/12/2020 6.28
pH pH units DG_A_I_PZ_WRK301 13/07/2020 7.04
pH pH units DG_A_I_PZ_WRK301 25/08/2020 7
pH pH units DG_A_I_PZ_WRK301 9/09/2020 7.03
pH pH units DG_A_I_PZ_WRK301 20/10/2020 7.04
pH pH units DG_A_I_PZ_WRK301 30/11/2020 6.82
pH pH units DG_A_I_PZ_WRK301 14/12/2020 6.84
pH pH units DG_A_I_PZ_WRK302 6/07/2020 5.98
pH pH units DG_A_I_PZ_WRK302 25/08/2020 5.92
pH pH units DG_A_I_PZ_WRK302 3/09/2020 5.93
pH pH units DG_A_I_PZ_WRK302 19/10/2020 5.96
pH pH units DG_A_I_PZ_WRK302 26/11/2020 5.88
pH pH units DG_A_I_PZ_WRK302 10/12/2020 5.98
pH pH units DG_A_I_PZ_WRK303 13/07/2020 6.04
pH pH units DG_A_I_PZ_WRK303 19/08/2020 5.83
pH pH units DG_A_I_PZ_WRK303 9/09/2020 6.07
pH pH units DG_A_I_PZ_WRK303 20/10/2020 5.92
pH pH units DG_A_I_PZ_WRK303 30/11/2020 5.9
pH pH units DG_A_I_PZ_WRK303 14/12/2020 5.76
pH pH units DG_A_I_PZ_WRK304 14/07/2020 6.11
pH pH units DG_A_I_PZ_WRK304 19/08/2020 6.06
pH pH units DG_A_I_PZ_WRK304 9/09/2020 6.17
pH pH units DG_A_I_PZ_WRK304 20/10/2020 6.14
pH pH units DG_A_I_PZ_WRK304 30/11/2020 6.02
pH pH units DG_A_I_PZ_WRK304 14/12/2020 5.91
pH pH units DG_A_I_PZ_GW01 7/07/2020 5.35
pH pH units DG_A_I_PZ_GW01 10/08/2020 5.55
pH pH units DG_A_I_PZ_GW01 7/09/2020 5.38
pH pH units DG_A_I_PZ_GW01 16/10/2020 5.48
pH pH units DG_A_I_PZ_GW01 24/11/2020 5.32
pH pH units DG_A_I_PZ_GW01 9/12/2020 5.26
pH pH units DG_A_I_PZ_GW06 6/07/2020 6.56
pH pH units DG_A_I_PZ_GW06 25/08/2020 6.53
pH pH units DG_A_I_PZ_GW06 8/09/2020 6.56
pH pH units DG_A_I_PZ_GW06 19/10/2020 6.55
pH pH units DG_A_I_PZ_GW06 26/11/2020 6.45
pH pH units DG_A_I_PZ_GW06 10/12/2020 6.59
pH pH units DG_A_I_PZ_GW07 2/07/2020 6.37
pH pH units DG_A_I_PZ_GW07 20/08/2020 6.27
pH pH units DG_A_I_PZ_GW07 7/09/2020 6.36
pH pH units DG_A_I_PZ_GW07 16/10/2020 6.37

Iluka Resources Ltd Planning Permit 15-105: Mineral Sands By-Product Disposal (Pit 23)
EMP and Rehabilitation Performance Report – H2 2020 FINAL (Rev 0)
124
Variable Unit Sample Point Date Result
pH pH units DG_A_I_PZ_GW07 24/11/2020 6.31
pH pH units DG_A_I_PZ_GW07 8/12/2020 6.31
pH pH units DG_A_I_PZ_BW45B 7/07/2020 4.43
pH pH units DG_A_I_PZ_BW45B 19/08/2020 4.77
pH pH units DG_A_I_PZ_BW45B 7/09/2020 4.49
pH pH units DG_A_I_PZ_BW45B 16/10/2020 4.4
pH pH units DG_A_I_PZ_BW45B 24/11/2020 4.24
pH pH units DG_A_I_PZ_BW45B 9/12/2020 4.3
pH pH units DG_A_I_PZ_GW02 2/07/2020 5.46
pH pH units DG_A_I_PZ_GW02 10/08/2020 5.51
pH pH units DG_A_I_PZ_GW02 3/09/2020 5.47
pH pH units DG_A_I_PZ_GW02 15/10/2020 5.54
pH pH units DG_A_I_PZ_GW02 24/11/2020 5.42
pH pH units DG_A_I_PZ_GW02 8/12/2020 5.37
pH pH units DG_A_I_PZ_GW03 2/07/2020 6.13
pH pH units DG_A_I_PZ_GW03 20/08/2020 6.12
pH pH units DG_A_I_PZ_GW03 3/09/2020 6.11
pH pH units DG_A_I_PZ_GW03 15/10/2020 6.23
pH pH units DG_A_I_PZ_GW03 24/11/2020 6.06
pH pH units DG_A_I_PZ_GW03 8/12/2020 6.05
pH pH units DG_A_I_PZ_GW04 9/07/2020 5.66
pH pH units DG_A_I_PZ_GW04 10/08/2020 5.67
pH pH units DG_A_I_PZ_GW04 7/09/2020 5.69
pH pH units DG_A_I_PZ_GW04 15/10/2020 5.72
pH pH units DG_A_I_PZ_GW04 25/11/2020 5.52
pH pH units DG_A_I_PZ_GW04 9/12/2020 5.53
pH pH units DG_A_I_PZ_GW05 9/07/2020 6
pH pH units DG_A_I_PZ_GW05 17/08/2020 6.03
pH pH units DG_A_I_PZ_GW05 7/09/2020 5.96
pH pH units DG_A_I_PZ_GW05 19/10/2020 5.94
pH pH units DG_A_I_PZ_GW05 25/11/2020 5.86
pH pH units DG_A_I_PZ_GW05 4/12/2020 5.87
pH pH units DG_A_I_PZ_GW08 6/07/2020 6.27
pH pH units DG_A_I_PZ_GW08 25/08/2020 6.23
pH pH units DG_A_I_PZ_GW08 8/09/2020 6.25
pH pH units DG_A_I_PZ_GW08 19/10/2020 6.26
pH pH units DG_A_I_PZ_GW08 26/11/2020 6.17
pH pH units DG_A_I_PZ_GW08 10/12/2020 6.25
pH pH units DG_A_I_PZ_BW36A 7/07/2020 6.78
pH pH units DG_A_I_PZ_BW36A 17/08/2020 6.77
pH pH units DG_A_I_PZ_BW36A 7/09/2020 6.65
pH pH units DG_A_I_PZ_BW36A 19/10/2020 6.67
pH pH units DG_A_I_PZ_BW36A 25/11/2020 6.5
pH pH units DG_A_I_PZ_BW36A 9/12/2020 6.55
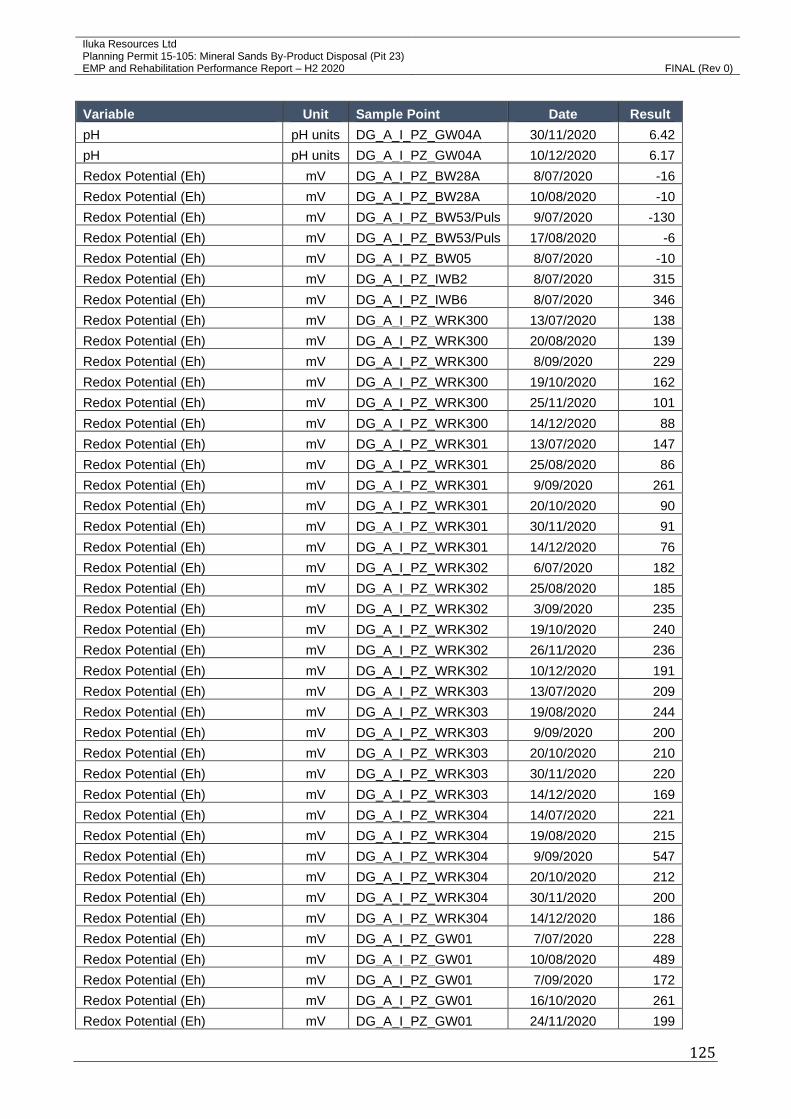
Iluka Resources Ltd Planning Permit 15-105: Mineral Sands By-Product Disposal (Pit 23)
EMP and Rehabilitation Performance Report – H2 2020 FINAL (Rev 0)
125
Variable Unit Sample Point Date Result
pH pH units DG_A_I_PZ_GW04A 30/11/2020 6.42
pH pH units DG_A_I_PZ_GW04A 10/12/2020 6.17
Redox Potential (Eh) mV DG_A_I_PZ_BW28A 8/07/2020 -16
Redox Potential (Eh) mV DG_A_I_PZ_BW28A 10/08/2020 -10
Redox Potential (Eh) mV DG_A_I_PZ_BW53/Puls 9/07/2020 -130
Redox Potential (Eh) mV DG_A_I_PZ_BW53/Puls 17/08/2020 -6
Redox Potential (Eh) mV DG_A_I_PZ_BW05 8/07/2020 -10
Redox Potential (Eh) mV DG_A_I_PZ_IWB2 8/07/2020 315
Redox Potential (Eh) mV DG_A_I_PZ_IWB6 8/07/2020 346
Redox Potential (Eh) mV DG_A_I_PZ_WRK300 13/07/2020 138
Redox Potential (Eh) mV DG_A_I_PZ_WRK300 20/08/2020 139
Redox Potential (Eh) mV DG_A_I_PZ_WRK300 8/09/2020 229
Redox Potential (Eh) mV DG_A_I_PZ_WRK300 19/10/2020 162
Redox Potential (Eh) mV DG_A_I_PZ_WRK300 25/11/2020 101
Redox Potential (Eh) mV DG_A_I_PZ_WRK300 14/12/2020 88
Redox Potential (Eh) mV DG_A_I_PZ_WRK301 13/07/2020 147
Redox Potential (Eh) mV DG_A_I_PZ_WRK301 25/08/2020 86
Redox Potential (Eh) mV DG_A_I_PZ_WRK301 9/09/2020 261
Redox Potential (Eh) mV DG_A_I_PZ_WRK301 20/10/2020 90
Redox Potential (Eh) mV DG_A_I_PZ_WRK301 30/11/2020 91
Redox Potential (Eh) mV DG_A_I_PZ_WRK301 14/12/2020 76
Redox Potential (Eh) mV DG_A_I_PZ_WRK302 6/07/2020 182
Redox Potential (Eh) mV DG_A_I_PZ_WRK302 25/08/2020 185
Redox Potential (Eh) mV DG_A_I_PZ_WRK302 3/09/2020 235
Redox Potential (Eh) mV DG_A_I_PZ_WRK302 19/10/2020 240
Redox Potential (Eh) mV DG_A_I_PZ_WRK302 26/11/2020 236
Redox Potential (Eh) mV DG_A_I_PZ_WRK302 10/12/2020 191
Redox Potential (Eh) mV DG_A_I_PZ_WRK303 13/07/2020 209
Redox Potential (Eh) mV DG_A_I_PZ_WRK303 19/08/2020 244
Redox Potential (Eh) mV DG_A_I_PZ_WRK303 9/09/2020 200
Redox Potential (Eh) mV DG_A_I_PZ_WRK303 20/10/2020 210
Redox Potential (Eh) mV DG_A_I_PZ_WRK303 30/11/2020 220
Redox Potential (Eh) mV DG_A_I_PZ_WRK303 14/12/2020 169
Redox Potential (Eh) mV DG_A_I_PZ_WRK304 14/07/2020 221
Redox Potential (Eh) mV DG_A_I_PZ_WRK304 19/08/2020 215
Redox Potential (Eh) mV DG_A_I_PZ_WRK304 9/09/2020 547
Redox Potential (Eh) mV DG_A_I_PZ_WRK304 20/10/2020 212
Redox Potential (Eh) mV DG_A_I_PZ_WRK304 30/11/2020 200
Redox Potential (Eh) mV DG_A_I_PZ_WRK304 14/12/2020 186
Redox Potential (Eh) mV DG_A_I_PZ_GW01 7/07/2020 228
Redox Potential (Eh) mV DG_A_I_PZ_GW01 10/08/2020 489
Redox Potential (Eh) mV DG_A_I_PZ_GW01 7/09/2020 172
Redox Potential (Eh) mV DG_A_I_PZ_GW01 16/10/2020 261
Redox Potential (Eh) mV DG_A_I_PZ_GW01 24/11/2020 199

Iluka Resources Ltd Planning Permit 15-105: Mineral Sands By-Product Disposal (Pit 23)
EMP and Rehabilitation Performance Report – H2 2020 FINAL (Rev 0)
126
Variable Unit Sample Point Date Result
Redox Potential (Eh) mV DG_A_I_PZ_GW01 9/12/2020 216
Redox Potential (Eh) mV DG_A_I_PZ_GW06 6/07/2020 164
Redox Potential (Eh) mV DG_A_I_PZ_GW06 25/08/2020 165
Redox Potential (Eh) mV DG_A_I_PZ_GW06 8/09/2020 252
Redox Potential (Eh) mV DG_A_I_PZ_GW06 19/10/2020 218
Redox Potential (Eh) mV DG_A_I_PZ_GW06 26/11/2020 284
Redox Potential (Eh) mV DG_A_I_PZ_GW06 10/12/2020 184
Redox Potential (Eh) mV DG_A_I_PZ_GW07 2/07/2020 210
Redox Potential (Eh) mV DG_A_I_PZ_GW07 20/08/2020 222
Redox Potential (Eh) mV DG_A_I_PZ_GW07 7/09/2020 252
Redox Potential (Eh) mV DG_A_I_PZ_GW07 16/10/2020 210
Redox Potential (Eh) mV DG_A_I_PZ_GW07 24/11/2020 155
Redox Potential (Eh) mV DG_A_I_PZ_GW07 8/12/2020 191
Redox Potential (Eh) mV DG_A_I_PZ_BW45B 7/07/2020 283
Redox Potential (Eh) mV DG_A_I_PZ_BW45B 19/08/2020 273
Redox Potential (Eh) mV DG_A_I_PZ_BW45B 7/09/2020 234
Redox Potential (Eh) mV DG_A_I_PZ_BW45B 16/10/2020 310
Redox Potential (Eh) mV DG_A_I_PZ_BW45B 24/11/2020 286
Redox Potential (Eh) mV DG_A_I_PZ_BW45B 9/12/2020 240
Redox Potential (Eh) mV DG_A_I_PZ_GW02 2/07/2020 234
Redox Potential (Eh) mV DG_A_I_PZ_GW02 10/08/2020 309
Redox Potential (Eh) mV DG_A_I_PZ_GW02 3/09/2020 315
Redox Potential (Eh) mV DG_A_I_PZ_GW02 15/10/2020 286
Redox Potential (Eh) mV DG_A_I_PZ_GW02 24/11/2020 177
Redox Potential (Eh) mV DG_A_I_PZ_GW02 8/12/2020 135
Redox Potential (Eh) mV DG_A_I_PZ_GW03 2/07/2020 35
Redox Potential (Eh) mV DG_A_I_PZ_GW03 20/08/2020 71
Redox Potential (Eh) mV DG_A_I_PZ_GW03 3/09/2020 115
Redox Potential (Eh) mV DG_A_I_PZ_GW03 15/10/2020 88
Redox Potential (Eh) mV DG_A_I_PZ_GW03 24/11/2020 63
Redox Potential (Eh) mV DG_A_I_PZ_GW03 8/12/2020 107
Redox Potential (Eh) mV DG_A_I_PZ_GW04 9/07/2020 156
Redox Potential (Eh) mV DG_A_I_PZ_GW04 10/08/2020 380
Redox Potential (Eh) mV DG_A_I_PZ_GW04 7/09/2020 340
Redox Potential (Eh) mV DG_A_I_PZ_GW04 15/10/2020 279
Redox Potential (Eh) mV DG_A_I_PZ_GW04 25/11/2020 293
Redox Potential (Eh) mV DG_A_I_PZ_GW04 9/12/2020 202
Redox Potential (Eh) mV DG_A_I_PZ_GW05 9/07/2020 134
Redox Potential (Eh) mV DG_A_I_PZ_GW05 17/08/2020 384
Redox Potential (Eh) mV DG_A_I_PZ_GW05 7/09/2020 302
Redox Potential (Eh) mV DG_A_I_PZ_GW05 19/10/2020 222
Redox Potential (Eh) mV DG_A_I_PZ_GW05 25/11/2020 260
Redox Potential (Eh) mV DG_A_I_PZ_GW05 4/12/2020 190
Redox Potential (Eh) mV DG_A_I_PZ_GW08 6/07/2020 173
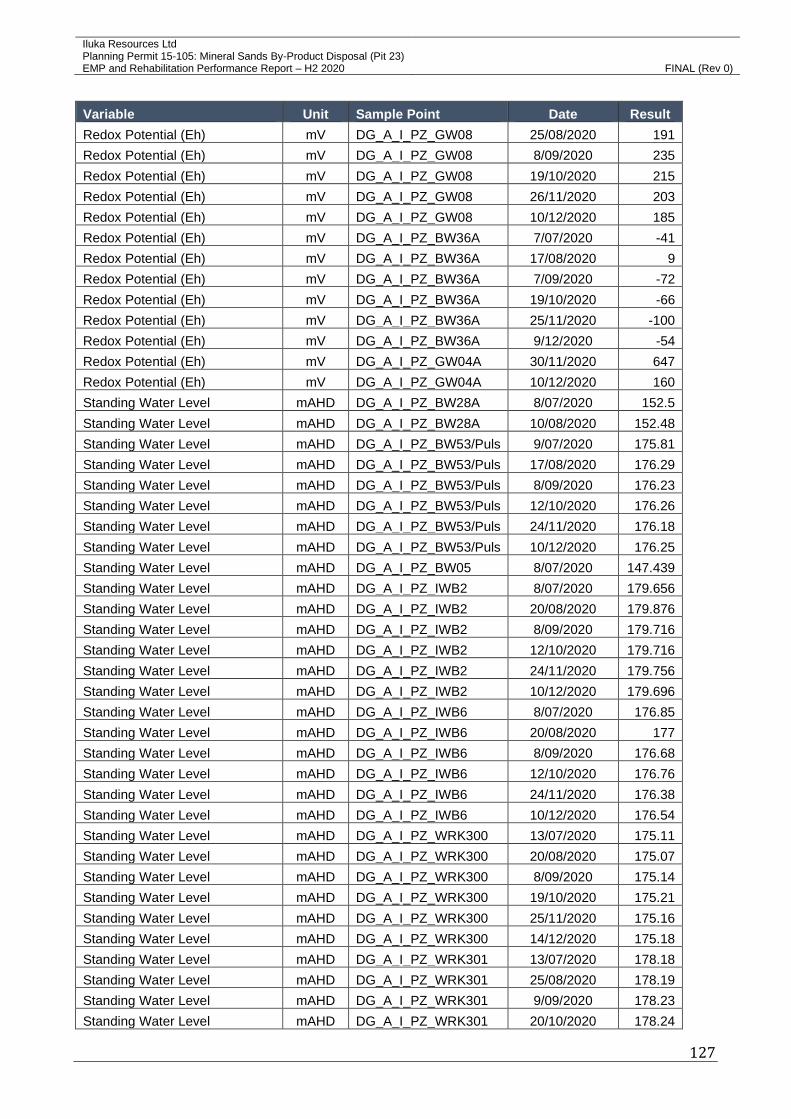
Iluka Resources Ltd Planning Permit 15-105: Mineral Sands By-Product Disposal (Pit 23)
EMP and Rehabilitation Performance Report – H2 2020 FINAL (Rev 0)
127
Variable Unit Sample Point Date Result
Redox Potential (Eh) mV DG_A_I_PZ_GW08 25/08/2020 191
Redox Potential (Eh) mV DG_A_I_PZ_GW08 8/09/2020 235
Redox Potential (Eh) mV DG_A_I_PZ_GW08 19/10/2020 215
Redox Potential (Eh) mV DG_A_I_PZ_GW08 26/11/2020 203
Redox Potential (Eh) mV DG_A_I_PZ_GW08 10/12/2020 185
Redox Potential (Eh) mV DG_A_I_PZ_BW36A 7/07/2020 -41
Redox Potential (Eh) mV DG_A_I_PZ_BW36A 17/08/2020 9
Redox Potential (Eh) mV DG_A_I_PZ_BW36A 7/09/2020 -72
Redox Potential (Eh) mV DG_A_I_PZ_BW36A 19/10/2020 -66
Redox Potential (Eh) mV DG_A_I_PZ_BW36A 25/11/2020 -100
Redox Potential (Eh) mV DG_A_I_PZ_BW36A 9/12/2020 -54
Redox Potential (Eh) mV DG_A_I_PZ_GW04A 30/11/2020 647
Redox Potential (Eh) mV DG_A_I_PZ_GW04A 10/12/2020 160
Standing Water Level mAHD DG_A_I_PZ_BW28A 8/07/2020 152.5
Standing Water Level mAHD DG_A_I_PZ_BW28A 10/08/2020 152.48
Standing Water Level mAHD DG_A_I_PZ_BW53/Puls 9/07/2020 175.81
Standing Water Level mAHD DG_A_I_PZ_BW53/Puls 17/08/2020 176.29
Standing Water Level mAHD DG_A_I_PZ_BW53/Puls 8/09/2020 176.23
Standing Water Level mAHD DG_A_I_PZ_BW53/Puls 12/10/2020 176.26
Standing Water Level mAHD DG_A_I_PZ_BW53/Puls 24/11/2020 176.18
Standing Water Level mAHD DG_A_I_PZ_BW53/Puls 10/12/2020 176.25
Standing Water Level mAHD DG_A_I_PZ_BW05 8/07/2020 147.439
Standing Water Level mAHD DG_A_I_PZ_IWB2 8/07/2020 179.656
Standing Water Level mAHD DG_A_I_PZ_IWB2 20/08/2020 179.876
Standing Water Level mAHD DG_A_I_PZ_IWB2 8/09/2020 179.716
Standing Water Level mAHD DG_A_I_PZ_IWB2 12/10/2020 179.716
Standing Water Level mAHD DG_A_I_PZ_IWB2 24/11/2020 179.756
Standing Water Level mAHD DG_A_I_PZ_IWB2 10/12/2020 179.696
Standing Water Level mAHD DG_A_I_PZ_IWB6 8/07/2020 176.85
Standing Water Level mAHD DG_A_I_PZ_IWB6 20/08/2020 177
Standing Water Level mAHD DG_A_I_PZ_IWB6 8/09/2020 176.68
Standing Water Level mAHD DG_A_I_PZ_IWB6 12/10/2020 176.76
Standing Water Level mAHD DG_A_I_PZ_IWB6 24/11/2020 176.38
Standing Water Level mAHD DG_A_I_PZ_IWB6 10/12/2020 176.54
Standing Water Level mAHD DG_A_I_PZ_WRK300 13/07/2020 175.11
Standing Water Level mAHD DG_A_I_PZ_WRK300 20/08/2020 175.07
Standing Water Level mAHD DG_A_I_PZ_WRK300 8/09/2020 175.14
Standing Water Level mAHD DG_A_I_PZ_WRK300 19/10/2020 175.21
Standing Water Level mAHD DG_A_I_PZ_WRK300 25/11/2020 175.16
Standing Water Level mAHD DG_A_I_PZ_WRK300 14/12/2020 175.18
Standing Water Level mAHD DG_A_I_PZ_WRK301 13/07/2020 178.18
Standing Water Level mAHD DG_A_I_PZ_WRK301 25/08/2020 178.19
Standing Water Level mAHD DG_A_I_PZ_WRK301 9/09/2020 178.23
Standing Water Level mAHD DG_A_I_PZ_WRK301 20/10/2020 178.24

Iluka Resources Ltd Planning Permit 15-105: Mineral Sands By-Product Disposal (Pit 23)
EMP and Rehabilitation Performance Report – H2 2020 FINAL (Rev 0)
128
Variable Unit Sample Point Date Result
Standing Water Level mAHD DG_A_I_PZ_WRK301 30/11/2020 178.18
Standing Water Level mAHD DG_A_I_PZ_WRK301 14/12/2020 178.21
Standing Water Level mAHD DG_A_I_PZ_WRK302 6/07/2020 176.77
Standing Water Level mAHD DG_A_I_PZ_WRK302 25/08/2020 176.71
Standing Water Level mAHD DG_A_I_PZ_WRK302 3/09/2020 176.75
Standing Water Level mAHD DG_A_I_PZ_WRK302 19/10/2020 176.69
Standing Water Level mAHD DG_A_I_PZ_WRK302 26/11/2020 176.77
Standing Water Level mAHD DG_A_I_PZ_WRK302 10/12/2020 176.75
Standing Water Level mAHD DG_A_I_PZ_WRK303 13/07/2020 179.84
Standing Water Level mAHD DG_A_I_PZ_WRK303 19/08/2020 179.89
Standing Water Level mAHD DG_A_I_PZ_WRK303 9/09/2020 179.85
Standing Water Level mAHD DG_A_I_PZ_WRK303 20/10/2020 179.9
Standing Water Level mAHD DG_A_I_PZ_WRK303 30/11/2020 179.88
Standing Water Level mAHD DG_A_I_PZ_WRK303 14/12/2020 179.85
Standing Water Level mAHD DG_A_I_PZ_WRK304 14/07/2020 180.44
Standing Water Level mAHD DG_A_I_PZ_WRK304 19/08/2020 180.49
Standing Water Level mAHD DG_A_I_PZ_WRK304 9/09/2020 180.46
Standing Water Level mAHD DG_A_I_PZ_WRK304 20/10/2020 180.39
Standing Water Level mAHD DG_A_I_PZ_WRK304 30/11/2020 180.37
Standing Water Level mAHD DG_A_I_PZ_WRK304 14/12/2020 180.41
Standing Water Level mAHD DG_A_I_PZ_GW01 7/07/2020 173.475
Standing Water Level mAHD DG_A_I_PZ_GW01 10/08/2020 173.515
Standing Water Level mAHD DG_A_I_PZ_GW01 7/09/2020 173.425
Standing Water Level mAHD DG_A_I_PZ_GW01 16/10/2020 173.415
Standing Water Level mAHD DG_A_I_PZ_GW01 24/11/2020 173.435
Standing Water Level mAHD DG_A_I_PZ_GW01 9/12/2020 173.515
Standing Water Level mAHD DG_A_I_PZ_GW06 6/07/2020 176.224
Standing Water Level mAHD DG_A_I_PZ_GW06 25/08/2020 176.184
Standing Water Level mAHD DG_A_I_PZ_GW06 8/09/2020 176.114
Standing Water Level mAHD DG_A_I_PZ_GW06 19/10/2020 176.174
Standing Water Level mAHD DG_A_I_PZ_GW06 26/11/2020 176.214
Standing Water Level mAHD DG_A_I_PZ_GW06 10/12/2020 176.204
Standing Water Level mAHD DG_A_I_PZ_GW07 2/07/2020 172.536
Standing Water Level mAHD DG_A_I_PZ_GW07 20/08/2020 172.476
Standing Water Level mAHD DG_A_I_PZ_GW07 7/09/2020 172.516
Standing Water Level mAHD DG_A_I_PZ_GW07 16/10/2020 172.536
Standing Water Level mAHD DG_A_I_PZ_GW07 24/11/2020 172.466
Standing Water Level mAHD DG_A_I_PZ_GW07 8/12/2020 172.536
Standing Water Level mAHD DG_A_I_PZ_BW45B 7/07/2020 177.37
Standing Water Level mAHD DG_A_I_PZ_BW45B 19/08/2020 177.35
Standing Water Level mAHD DG_A_I_PZ_BW45B 7/09/2020 177.38
Standing Water Level mAHD DG_A_I_PZ_BW45B 16/10/2020 177.34
Standing Water Level mAHD DG_A_I_PZ_BW45B 24/11/2020 177.36
Standing Water Level mAHD DG_A_I_PZ_BW45B 9/12/2020 177.4
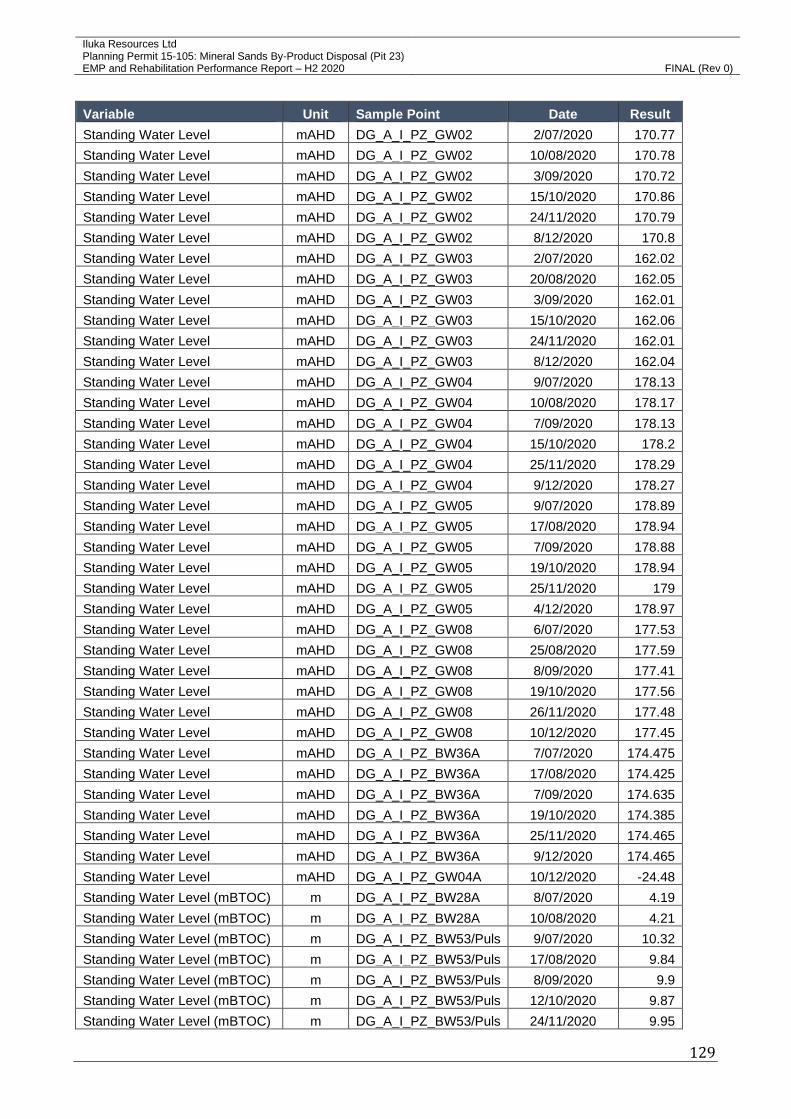
Iluka Resources Ltd Planning Permit 15-105: Mineral Sands By-Product Disposal (Pit 23)
EMP and Rehabilitation Performance Report – H2 2020 FINAL (Rev 0)
129
Variable Unit Sample Point Date Result
Standing Water Level mAHD DG_A_I_PZ_GW02 2/07/2020 170.77
Standing Water Level mAHD DG_A_I_PZ_GW02 10/08/2020 170.78
Standing Water Level mAHD DG_A_I_PZ_GW02 3/09/2020 170.72
Standing Water Level mAHD DG_A_I_PZ_GW02 15/10/2020 170.86
Standing Water Level mAHD DG_A_I_PZ_GW02 24/11/2020 170.79
Standing Water Level mAHD DG_A_I_PZ_GW02 8/12/2020 170.8
Standing Water Level mAHD DG_A_I_PZ_GW03 2/07/2020 162.02
Standing Water Level mAHD DG_A_I_PZ_GW03 20/08/2020 162.05
Standing Water Level mAHD DG_A_I_PZ_GW03 3/09/2020 162.01
Standing Water Level mAHD DG_A_I_PZ_GW03 15/10/2020 162.06
Standing Water Level mAHD DG_A_I_PZ_GW03 24/11/2020 162.01
Standing Water Level mAHD DG_A_I_PZ_GW03 8/12/2020 162.04
Standing Water Level mAHD DG_A_I_PZ_GW04 9/07/2020 178.13
Standing Water Level mAHD DG_A_I_PZ_GW04 10/08/2020 178.17
Standing Water Level mAHD DG_A_I_PZ_GW04 7/09/2020 178.13
Standing Water Level mAHD DG_A_I_PZ_GW04 15/10/2020 178.2
Standing Water Level mAHD DG_A_I_PZ_GW04 25/11/2020 178.29
Standing Water Level mAHD DG_A_I_PZ_GW04 9/12/2020 178.27
Standing Water Level mAHD DG_A_I_PZ_GW05 9/07/2020 178.89
Standing Water Level mAHD DG_A_I_PZ_GW05 17/08/2020 178.94
Standing Water Level mAHD DG_A_I_PZ_GW05 7/09/2020 178.88
Standing Water Level mAHD DG_A_I_PZ_GW05 19/10/2020 178.94
Standing Water Level mAHD DG_A_I_PZ_GW05 25/11/2020 179
Standing Water Level mAHD DG_A_I_PZ_GW05 4/12/2020 178.97
Standing Water Level mAHD DG_A_I_PZ_GW08 6/07/2020 177.53
Standing Water Level mAHD DG_A_I_PZ_GW08 25/08/2020 177.59
Standing Water Level mAHD DG_A_I_PZ_GW08 8/09/2020 177.41
Standing Water Level mAHD DG_A_I_PZ_GW08 19/10/2020 177.56
Standing Water Level mAHD DG_A_I_PZ_GW08 26/11/2020 177.48
Standing Water Level mAHD DG_A_I_PZ_GW08 10/12/2020 177.45
Standing Water Level mAHD DG_A_I_PZ_BW36A 7/07/2020 174.475
Standing Water Level mAHD DG_A_I_PZ_BW36A 17/08/2020 174.425
Standing Water Level mAHD DG_A_I_PZ_BW36A 7/09/2020 174.635
Standing Water Level mAHD DG_A_I_PZ_BW36A 19/10/2020 174.385
Standing Water Level mAHD DG_A_I_PZ_BW36A 25/11/2020 174.465
Standing Water Level mAHD DG_A_I_PZ_BW36A 9/12/2020 174.465
Standing Water Level mAHD DG_A_I_PZ_GW04A 10/12/2020 -24.48
Standing Water Level (mBTOC) m DG_A_I_PZ_BW28A 8/07/2020 4.19
Standing Water Level (mBTOC) m DG_A_I_PZ_BW28A 10/08/2020 4.21
Standing Water Level (mBTOC) m DG_A_I_PZ_BW53/Puls 9/07/2020 10.32
Standing Water Level (mBTOC) m DG_A_I_PZ_BW53/Puls 17/08/2020 9.84
Standing Water Level (mBTOC) m DG_A_I_PZ_BW53/Puls 8/09/2020 9.9
Standing Water Level (mBTOC) m DG_A_I_PZ_BW53/Puls 12/10/2020 9.87
Standing Water Level (mBTOC) m DG_A_I_PZ_BW53/Puls 24/11/2020 9.95

Iluka Resources Ltd Planning Permit 15-105: Mineral Sands By-Product Disposal (Pit 23)
EMP and Rehabilitation Performance Report – H2 2020 FINAL (Rev 0)
130
Variable Unit Sample Point Date Result
Standing Water Level (mBTOC) m DG_A_I_PZ_BW53/Puls 10/12/2020 9.88
Standing Water Level (mBTOC) m DG_A_I_PZ_BW05 8/07/2020 5.33
Standing Water Level (mBTOC) m DG_A_I_PZ_IWB2 8/07/2020 12.26
Standing Water Level (mBTOC) m DG_A_I_PZ_IWB2 20/08/2020 12.04
Standing Water Level (mBTOC) m DG_A_I_PZ_IWB2 8/09/2020 12.2
Standing Water Level (mBTOC) m DG_A_I_PZ_IWB2 12/10/2020 12.2
Standing Water Level (mBTOC) m DG_A_I_PZ_IWB2 24/11/2020 12.16
Standing Water Level (mBTOC) m DG_A_I_PZ_IWB2 10/12/2020 12.22
Standing Water Level (mBTOC) m DG_A_I_PZ_IWB6 8/07/2020 1.85
Standing Water Level (mBTOC) m DG_A_I_PZ_IWB6 20/08/2020 1.7
Standing Water Level (mBTOC) m DG_A_I_PZ_IWB6 8/09/2020 2.02
Standing Water Level (mBTOC) m DG_A_I_PZ_IWB6 12/10/2020 1.94
Standing Water Level (mBTOC) m DG_A_I_PZ_IWB6 24/11/2020 2.32
Standing Water Level (mBTOC) m DG_A_I_PZ_IWB6 10/12/2020 2.16
Standing Water Level (mBTOC) m DG_A_I_PZ_WRK300 13/07/2020 24.51
Standing Water Level (mBTOC) m DG_A_I_PZ_WRK300 20/08/2020 24.55
Standing Water Level (mBTOC) m DG_A_I_PZ_WRK300 8/09/2020 24.48
Standing Water Level (mBTOC) m DG_A_I_PZ_WRK300 19/10/2020 24.41
Standing Water Level (mBTOC) m DG_A_I_PZ_WRK300 25/11/2020 24.46
Standing Water Level (mBTOC) m DG_A_I_PZ_WRK300 14/12/2020 24.44
Standing Water Level (mBTOC) m DG_A_I_PZ_WRK301 13/07/2020 18.6
Standing Water Level (mBTOC) m DG_A_I_PZ_WRK301 25/08/2020 18.59
Standing Water Level (mBTOC) m DG_A_I_PZ_WRK301 9/09/2020 18.55
Standing Water Level (mBTOC) m DG_A_I_PZ_WRK301 20/10/2020 18.54
Standing Water Level (mBTOC) m DG_A_I_PZ_WRK301 30/11/2020 18.6
Standing Water Level (mBTOC) m DG_A_I_PZ_WRK301 14/12/2020 18.57
Standing Water Level (mBTOC) m DG_A_I_PZ_WRK302 6/07/2020 13.51
Standing Water Level (mBTOC) m DG_A_I_PZ_WRK302 25/08/2020 13.57
Standing Water Level (mBTOC) m DG_A_I_PZ_WRK302 3/09/2020 13.53
Standing Water Level (mBTOC) m DG_A_I_PZ_WRK302 19/10/2020 13.59
Standing Water Level (mBTOC) m DG_A_I_PZ_WRK302 26/11/2020 13.51
Standing Water Level (mBTOC) m DG_A_I_PZ_WRK302 10/12/2020 13.53
Standing Water Level (mBTOC) m DG_A_I_PZ_WRK303 13/07/2020 20.56
Standing Water Level (mBTOC) m DG_A_I_PZ_WRK303 19/08/2020 20.51
Standing Water Level (mBTOC) m DG_A_I_PZ_WRK303 9/09/2020 20.55
Standing Water Level (mBTOC) m DG_A_I_PZ_WRK303 20/10/2020 20.5
Standing Water Level (mBTOC) m DG_A_I_PZ_WRK303 30/11/2020 20.52
Standing Water Level (mBTOC) m DG_A_I_PZ_WRK303 14/12/2020 20.55
Standing Water Level (mBTOC) m DG_A_I_PZ_WRK304 14/07/2020 18.63
Standing Water Level (mBTOC) m DG_A_I_PZ_WRK304 19/08/2020 18.58
Standing Water Level (mBTOC) m DG_A_I_PZ_WRK304 9/09/2020 18.61
Standing Water Level (mBTOC) m DG_A_I_PZ_WRK304 20/10/2020 18.68
Standing Water Level (mBTOC) m DG_A_I_PZ_WRK304 30/11/2020 18.7
Standing Water Level (mBTOC) m DG_A_I_PZ_WRK304 14/12/2020 18.66

Iluka Resources Ltd Planning Permit 15-105: Mineral Sands By-Product Disposal (Pit 23)
EMP and Rehabilitation Performance Report – H2 2020 FINAL (Rev 0)
131
Variable Unit Sample Point Date Result
Standing Water Level (mBTOC) m DG_A_I_PZ_GW01 7/07/2020 19.04
Standing Water Level (mBTOC) m DG_A_I_PZ_GW01 10/08/2020 19
Standing Water Level (mBTOC) m DG_A_I_PZ_GW01 7/09/2020 19.09
Standing Water Level (mBTOC) m DG_A_I_PZ_GW01 16/10/2020 19.1
Standing Water Level (mBTOC) m DG_A_I_PZ_GW01 24/11/2020 19.08
Standing Water Level (mBTOC) m DG_A_I_PZ_GW01 9/12/2020 19
Standing Water Level (mBTOC) m DG_A_I_PZ_GW06 6/07/2020 13.29
Standing Water Level (mBTOC) m DG_A_I_PZ_GW06 25/08/2020 13.33
Standing Water Level (mBTOC) m DG_A_I_PZ_GW06 8/09/2020 13.4
Standing Water Level (mBTOC) m DG_A_I_PZ_GW06 19/10/2020 13.34
Standing Water Level (mBTOC) m DG_A_I_PZ_GW06 26/11/2020 13.3
Standing Water Level (mBTOC) m DG_A_I_PZ_GW06 10/12/2020 13.31
Standing Water Level (mBTOC) m DG_A_I_PZ_GW07 2/07/2020 16.31
Standing Water Level (mBTOC) m DG_A_I_PZ_GW07 20/08/2020 16.37
Standing Water Level (mBTOC) m DG_A_I_PZ_GW07 7/09/2020 16.33
Standing Water Level (mBTOC) m DG_A_I_PZ_GW07 16/10/2020 16.31
Standing Water Level (mBTOC) m DG_A_I_PZ_GW07 24/11/2020 16.38
Standing Water Level (mBTOC) m DG_A_I_PZ_GW07 8/12/2020 16.31
Standing Water Level (mBTOC) m DG_A_I_PZ_BW45B 7/07/2020 19.88
Standing Water Level (mBTOC) m DG_A_I_PZ_BW45B 19/08/2020 19.9
Standing Water Level (mBTOC) m DG_A_I_PZ_BW45B 7/09/2020 19.87
Standing Water Level (mBTOC) m DG_A_I_PZ_BW45B 16/10/2020 19.91
Standing Water Level (mBTOC) m DG_A_I_PZ_BW45B 24/11/2020 19.89
Standing Water Level (mBTOC) m DG_A_I_PZ_BW45B 9/12/2020 19.85
Standing Water Level (mBTOC) m DG_A_I_PZ_GW02 2/07/2020 15.61
Standing Water Level (mBTOC) m DG_A_I_PZ_GW02 10/08/2020 15.6
Standing Water Level (mBTOC) m DG_A_I_PZ_GW02 3/09/2020 15.66
Standing Water Level (mBTOC) m DG_A_I_PZ_GW02 15/10/2020 15.52
Standing Water Level (mBTOC) m DG_A_I_PZ_GW02 24/11/2020 15.59
Standing Water Level (mBTOC) m DG_A_I_PZ_GW02 8/12/2020 15.58
Standing Water Level (mBTOC) m DG_A_I_PZ_GW03 2/07/2020 10.4
Standing Water Level (mBTOC) m DG_A_I_PZ_GW03 20/08/2020 10.37
Standing Water Level (mBTOC) m DG_A_I_PZ_GW03 3/09/2020 10.41
Standing Water Level (mBTOC) m DG_A_I_PZ_GW03 15/10/2020 10.36
Standing Water Level (mBTOC) m DG_A_I_PZ_GW03 24/11/2020 10.41
Standing Water Level (mBTOC) m DG_A_I_PZ_GW03 8/12/2020 10.38
Standing Water Level (mBTOC) m DG_A_I_PZ_GW04 9/07/2020 24.11
Standing Water Level (mBTOC) m DG_A_I_PZ_GW04 10/08/2020 24.07
Standing Water Level (mBTOC) m DG_A_I_PZ_GW04 7/09/2020 24.11
Standing Water Level (mBTOC) m DG_A_I_PZ_GW04 15/10/2020 24.04
Standing Water Level (mBTOC) m DG_A_I_PZ_GW04 25/11/2020 23.95
Standing Water Level (mBTOC) m DG_A_I_PZ_GW04 9/12/2020 23.97
Standing Water Level (mBTOC) m DG_A_I_PZ_GW05 9/07/2020 21.41
Standing Water Level (mBTOC) m DG_A_I_PZ_GW05 17/08/2020 21.36
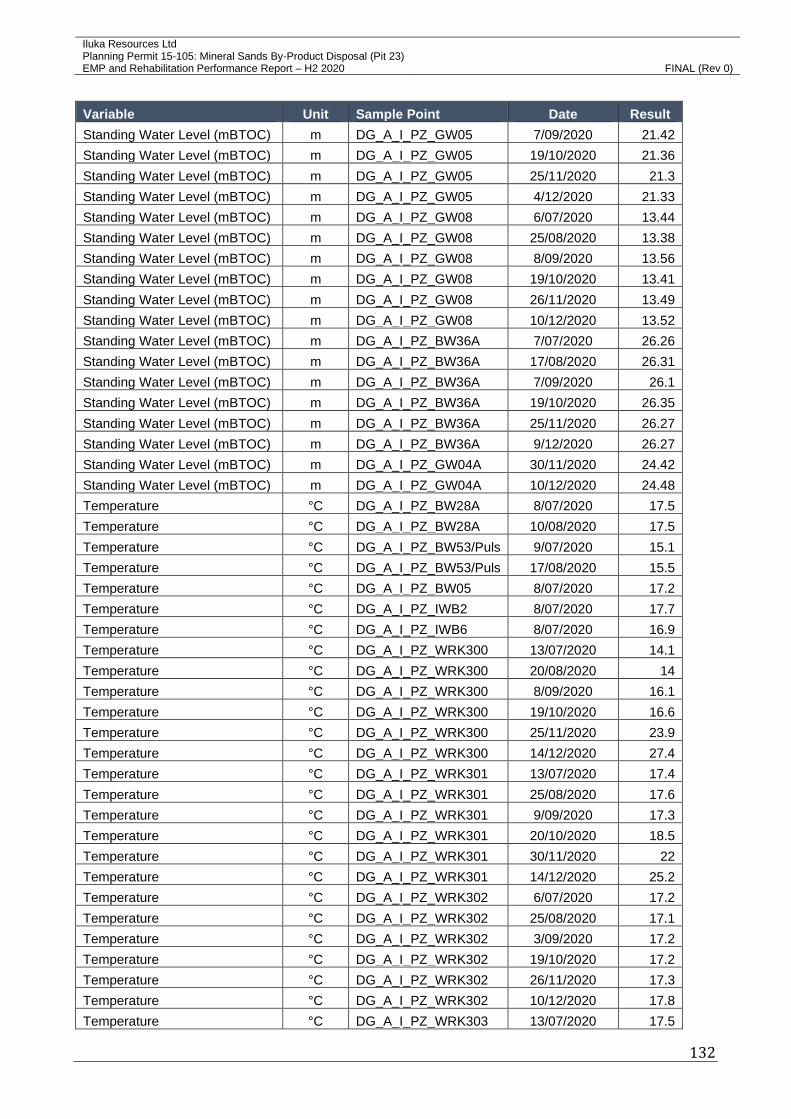
Iluka Resources Ltd Planning Permit 15-105: Mineral Sands By-Product Disposal (Pit 23)
EMP and Rehabilitation Performance Report – H2 2020 FINAL (Rev 0)
132
Variable Unit Sample Point Date Result
Standing Water Level (mBTOC) m DG_A_I_PZ_GW05 7/09/2020 21.42
Standing Water Level (mBTOC) m DG_A_I_PZ_GW05 19/10/2020 21.36
Standing Water Level (mBTOC) m DG_A_I_PZ_GW05 25/11/2020 21.3
Standing Water Level (mBTOC) m DG_A_I_PZ_GW05 4/12/2020 21.33
Standing Water Level (mBTOC) m DG_A_I_PZ_GW08 6/07/2020 13.44
Standing Water Level (mBTOC) m DG_A_I_PZ_GW08 25/08/2020 13.38
Standing Water Level (mBTOC) m DG_A_I_PZ_GW08 8/09/2020 13.56
Standing Water Level (mBTOC) m DG_A_I_PZ_GW08 19/10/2020 13.41
Standing Water Level (mBTOC) m DG_A_I_PZ_GW08 26/11/2020 13.49
Standing Water Level (mBTOC) m DG_A_I_PZ_GW08 10/12/2020 13.52
Standing Water Level (mBTOC) m DG_A_I_PZ_BW36A 7/07/2020 26.26
Standing Water Level (mBTOC) m DG_A_I_PZ_BW36A 17/08/2020 26.31
Standing Water Level (mBTOC) m DG_A_I_PZ_BW36A 7/09/2020 26.1
Standing Water Level (mBTOC) m DG_A_I_PZ_BW36A 19/10/2020 26.35
Standing Water Level (mBTOC) m DG_A_I_PZ_BW36A 25/11/2020 26.27
Standing Water Level (mBTOC) m DG_A_I_PZ_BW36A 9/12/2020 26.27
Standing Water Level (mBTOC) m DG_A_I_PZ_GW04A 30/11/2020 24.42
Standing Water Level (mBTOC) m DG_A_I_PZ_GW04A 10/12/2020 24.48
Temperature °C DG_A_I_PZ_BW28A 8/07/2020 17.5
Temperature °C DG_A_I_PZ_BW28A 10/08/2020 17.5
Temperature °C DG_A_I_PZ_BW53/Puls 9/07/2020 15.1
Temperature °C DG_A_I_PZ_BW53/Puls 17/08/2020 15.5
Temperature °C DG_A_I_PZ_BW05 8/07/2020 17.2
Temperature °C DG_A_I_PZ_IWB2 8/07/2020 17.7
Temperature °C DG_A_I_PZ_IWB6 8/07/2020 16.9
Temperature °C DG_A_I_PZ_WRK300 13/07/2020 14.1
Temperature °C DG_A_I_PZ_WRK300 20/08/2020 14
Temperature °C DG_A_I_PZ_WRK300 8/09/2020 16.1
Temperature °C DG_A_I_PZ_WRK300 19/10/2020 16.6
Temperature °C DG_A_I_PZ_WRK300 25/11/2020 23.9
Temperature °C DG_A_I_PZ_WRK300 14/12/2020 27.4
Temperature °C DG_A_I_PZ_WRK301 13/07/2020 17.4
Temperature °C DG_A_I_PZ_WRK301 25/08/2020 17.6
Temperature °C DG_A_I_PZ_WRK301 9/09/2020 17.3
Temperature °C DG_A_I_PZ_WRK301 20/10/2020 18.5
Temperature °C DG_A_I_PZ_WRK301 30/11/2020 22
Temperature °C DG_A_I_PZ_WRK301 14/12/2020 25.2
Temperature °C DG_A_I_PZ_WRK302 6/07/2020 17.2
Temperature °C DG_A_I_PZ_WRK302 25/08/2020 17.1
Temperature °C DG_A_I_PZ_WRK302 3/09/2020 17.2
Temperature °C DG_A_I_PZ_WRK302 19/10/2020 17.2
Temperature °C DG_A_I_PZ_WRK302 26/11/2020 17.3
Temperature °C DG_A_I_PZ_WRK302 10/12/2020 17.8
Temperature °C DG_A_I_PZ_WRK303 13/07/2020 17.5

Iluka Resources Ltd Planning Permit 15-105: Mineral Sands By-Product Disposal (Pit 23)
EMP and Rehabilitation Performance Report – H2 2020 FINAL (Rev 0)
133
Variable Unit Sample Point Date Result
Temperature °C DG_A_I_PZ_WRK303 19/08/2020 15
Temperature °C DG_A_I_PZ_WRK303 9/09/2020 17.1
Temperature °C DG_A_I_PZ_WRK303 20/10/2020 18.8
Temperature °C DG_A_I_PZ_WRK303 30/11/2020 18.3
Temperature °C DG_A_I_PZ_WRK303 14/12/2020 18.2
Temperature °C DG_A_I_PZ_WRK304 14/07/2020 17
Temperature °C DG_A_I_PZ_WRK304 19/08/2020 15.2
Temperature °C DG_A_I_PZ_WRK304 9/09/2020 17
Temperature °C DG_A_I_PZ_WRK304 20/10/2020 16.9
Temperature °C DG_A_I_PZ_WRK304 30/11/2020 17.8
Temperature °C DG_A_I_PZ_WRK304 14/12/2020 17.7
Temperature °C DG_A_I_PZ_GW01 7/07/2020 15.6
Temperature °C DG_A_I_PZ_GW01 10/08/2020 16.5
Temperature °C DG_A_I_PZ_GW01 7/09/2020 20
Temperature °C DG_A_I_PZ_GW01 16/10/2020 16.5
Temperature °C DG_A_I_PZ_GW01 24/11/2020 20.7
Temperature °C DG_A_I_PZ_GW01 9/12/2020 17
Temperature °C DG_A_I_PZ_GW06 6/07/2020 17.6
Temperature °C DG_A_I_PZ_GW06 25/08/2020 17.5
Temperature °C DG_A_I_PZ_GW06 8/09/2020 17.7
Temperature °C DG_A_I_PZ_GW06 19/10/2020 17.7
Temperature °C DG_A_I_PZ_GW06 26/11/2020 17.5
Temperature °C DG_A_I_PZ_GW06 10/12/2020 17.9
Temperature °C DG_A_I_PZ_GW07 2/07/2020 17.9
Temperature °C DG_A_I_PZ_GW07 20/08/2020 18.3
Temperature °C DG_A_I_PZ_GW07 7/09/2020 18.1
Temperature °C DG_A_I_PZ_GW07 16/10/2020 18.1
Temperature °C DG_A_I_PZ_GW07 24/11/2020 18.1
Temperature °C DG_A_I_PZ_GW07 8/12/2020 18
Temperature °C DG_A_I_PZ_BW45B 7/07/2020 14.9
Temperature °C DG_A_I_PZ_BW45B 19/08/2020 13.2
Temperature °C DG_A_I_PZ_BW45B 7/09/2020 20.5
Temperature °C DG_A_I_PZ_BW45B 16/10/2020 16.3
Temperature °C DG_A_I_PZ_BW45B 24/11/2020 21.4
Temperature °C DG_A_I_PZ_BW45B 9/12/2020 17
Temperature °C DG_A_I_PZ_GW02 2/07/2020 17.7
Temperature °C DG_A_I_PZ_GW02 10/08/2020 17.7
Temperature °C DG_A_I_PZ_GW02 3/09/2020 17.6
Temperature °C DG_A_I_PZ_GW02 15/10/2020 17.8
Temperature °C DG_A_I_PZ_GW02 24/11/2020 17.8
Temperature °C DG_A_I_PZ_GW02 8/12/2020 17.5
Temperature °C DG_A_I_PZ_GW03 2/07/2020 18
Temperature °C DG_A_I_PZ_GW03 20/08/2020 17.3
Temperature °C DG_A_I_PZ_GW03 3/09/2020 17.9

Iluka Resources Ltd Planning Permit 15-105: Mineral Sands By-Product Disposal (Pit 23)
EMP and Rehabilitation Performance Report – H2 2020 FINAL (Rev 0)
134
Variable Unit Sample Point Date Result
Temperature °C DG_A_I_PZ_GW03 15/10/2020 18.3
Temperature °C DG_A_I_PZ_GW03 24/11/2020 19.8
Temperature °C DG_A_I_PZ_GW03 8/12/2020 18.8
Temperature °C DG_A_I_PZ_GW04 9/07/2020 15.1
Temperature °C DG_A_I_PZ_GW04 10/08/2020 18
Temperature °C DG_A_I_PZ_GW04 7/09/2020 21
Temperature °C DG_A_I_PZ_GW04 15/10/2020 18
Temperature °C DG_A_I_PZ_GW04 25/11/2020 22.7
Temperature °C DG_A_I_PZ_GW04 9/12/2020 19.9
Temperature °C DG_A_I_PZ_GW05 9/07/2020 14.6
Temperature °C DG_A_I_PZ_GW05 17/08/2020 16.5
Temperature °C DG_A_I_PZ_GW05 7/09/2020 18.2
Temperature °C DG_A_I_PZ_GW05 19/10/2020 16.8
Temperature °C DG_A_I_PZ_GW05 25/11/2020 22.4
Temperature °C DG_A_I_PZ_GW05 4/12/2020 19.3
Temperature °C DG_A_I_PZ_GW08 6/07/2020 17.7
Temperature °C DG_A_I_PZ_GW08 25/08/2020 17.4
Temperature °C DG_A_I_PZ_GW08 8/09/2020 17.7
Temperature °C DG_A_I_PZ_GW08 19/10/2020 17.7
Temperature °C DG_A_I_PZ_GW08 26/11/2020 18.1
Temperature °C DG_A_I_PZ_GW08 10/12/2020 17.8
Temperature °C DG_A_I_PZ_BW36A 7/07/2020 14.9
Temperature °C DG_A_I_PZ_BW36A 17/08/2020 16.3
Temperature °C DG_A_I_PZ_BW36A 7/09/2020 21
Temperature °C DG_A_I_PZ_BW36A 19/10/2020 16.5
Temperature °C DG_A_I_PZ_BW36A 25/11/2020 25
Temperature °C DG_A_I_PZ_BW36A 9/12/2020 21.3
Temperature °C DG_A_I_PZ_GW04A 30/11/2020 18.4
Temperature °C DG_A_I_PZ_GW04A 10/12/2020 17.7

Iluka Resources Ltd Planning Permit 15-105: Mineral Sands By-Product Disposal (Pit 23)
EMP and Rehabilitation Performance Report – H2 2020 FINAL (Rev 0)
135
Appendix D: Monitoring Data (Lab) – Surface water
Variable Unit Sample Point Date Result
Alkalinity (Bicarbonate) as CaCO3 mg/L DG_A_I_SW_DUSW05B 17/09/2020 21.000
Alkalinity (Bicarbonate) as CaCO3 mg/L DG_A_I_SW_DUSW05B 13/10/2020 48.000
Alkalinity (Bicarbonate) as CaCO3 mg/L DG_A_I_SW_DUSW14 15/07/2020 160.000
Alkalinity (Bicarbonate) as CaCO3 mg/L DG_A_I_SW_DUSW14 6/10/2020 180.000
Alkalinity (Bicarbonate) as CaCO3 mg/L DG_A_I_SW_DUSW19 26/11/2020 64.000
Alkalinity (Bicarbonate) as CaCO3 mg/L DG_A_I_SW_DUSW20 14/09/2020 41.000
Alkalinity (Bicarbonate) as CaCO3 mg/L DG_A_I_SW_DUSW20 8/10/2020 220.000
Alkalinity (Bicarbonate) as CaCO3 mg/L DG_A_I_SW_DUSW22 15/07/2020 120.000
Alkalinity (Bicarbonate) as CaCO3 mg/L DG_A_I_SW_DUSW22 6/10/2020 150.000
Alkalinity (Bicarbonate) as CaCO3 mg/L DG_A_I_SW_DUSW24 17/09/2020 51.000
Alkalinity (Bicarbonate) as CaCO3 mg/L DG_A_I_SW_DUSW24 13/10/2020 120.000
Alkalinity (Carbonate) as CaCO3 mg/L DG_A_I_SW_DUSW05B 17/09/2020 52.000
Alkalinity (Carbonate) as CaCO3 mg/L DG_A_I_SW_DUSW05B 13/10/2020 60.000
Alkalinity (Carbonate) as CaCO3 mg/L DG_A_I_SW_DUSW14 15/07/2020 0.000
Alkalinity (Carbonate) as CaCO3 mg/L DG_A_I_SW_DUSW14 6/10/2020 0.000
Alkalinity (Carbonate) as CaCO3 mg/L DG_A_I_SW_DUSW19 26/11/2020 0.000
Alkalinity (Carbonate) as CaCO3 mg/L DG_A_I_SW_DUSW20 14/09/2020 0.000
Alkalinity (Carbonate) as CaCO3 mg/L DG_A_I_SW_DUSW20 8/10/2020 14.000
Alkalinity (Carbonate) as CaCO3 mg/L DG_A_I_SW_DUSW22 15/07/2020 0.000
Alkalinity (Carbonate) as CaCO3 mg/L DG_A_I_SW_DUSW22 6/10/2020 0.000
Alkalinity (Carbonate) as CaCO3 mg/L DG_A_I_SW_DUSW24 17/09/2020 20.000
Alkalinity (Carbonate) as CaCO3 mg/L DG_A_I_SW_DUSW24 13/10/2020 31.000
Alkalinity (Hydroxide) as CaCO3 mg/L DG_A_I_SW_DUSW05B 13/10/2020 0.000
Alkalinity (Hydroxide) as CaCO3 mg/L DG_A_I_SW_DUSW19 26/11/2020 0.000
Alkalinity (Hydroxide) as CaCO3 mg/L DG_A_I_SW_DUSW24 13/10/2020 0.000
Alkalinity (Hydroxide) as OH mg/L DG_A_I_SW_DUSW05B 17/09/2020 0.000
Alkalinity (Hydroxide) as OH mg/L DG_A_I_SW_DUSW14 15/07/2020 0.000
Alkalinity (Hydroxide) as OH mg/L DG_A_I_SW_DUSW14 6/10/2020 0.000
Alkalinity (Hydroxide) as OH mg/L DG_A_I_SW_DUSW20 14/09/2020 0.000
Alkalinity (Hydroxide) as OH mg/L DG_A_I_SW_DUSW20 8/10/2020 0.000
Alkalinity (Hydroxide) as OH mg/L DG_A_I_SW_DUSW22 15/07/2020 0.000
Alkalinity (Hydroxide) as OH mg/L DG_A_I_SW_DUSW22 6/10/2020 0.000
Alkalinity (Hydroxide) as OH mg/L DG_A_I_SW_DUSW24 17/09/2020 0.000
Alkalinity (Total) as CaCO3 mg/L DG_A_I_SW_DUSW05B 13/10/2020 110.000
Alkalinity (Total) as CaCO3 mg/L DG_A_I_SW_DUSW19 26/11/2020 64.000
Alkalinity (Total) as CaCO3 mg/L DG_A_I_SW_DUSW24 13/10/2020 150.000
Aluminium (Total) mg/L DG_A_I_SW_DUSW05B 17/09/2020 0.010 Aluminium (Total) mg/L DG_A_I_SW_DUSW05B 13/10/2020 3.200
Aluminium (Total) mg/L DG_A_I_SW_DUSW11 8/10/2020 7.800
Aluminium (Total) mg/L DG_A_I_SW_DUSW14 15/07/2020 0.320
Aluminium (Total) mg/L DG_A_I_SW_DUSW14 6/10/2020 2.100
Aluminium (Total) mg/L DG_A_I_SW_DUSW19 26/11/2020 0.860
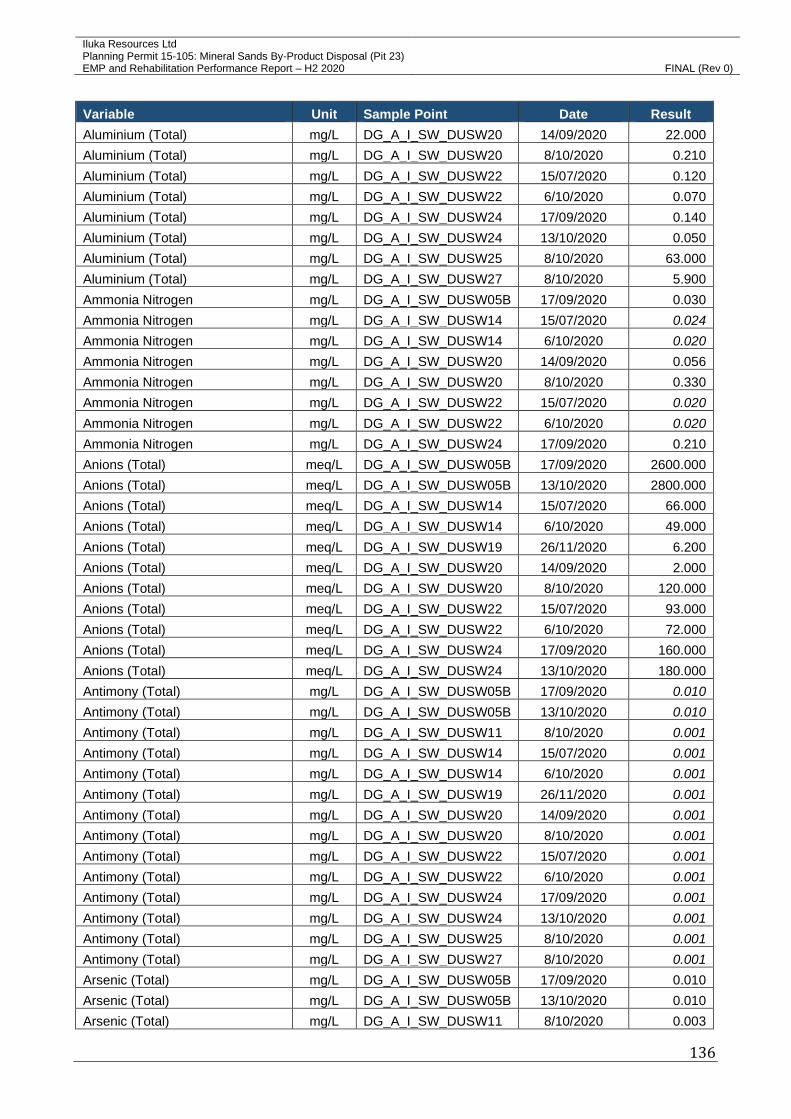
Iluka Resources Ltd Planning Permit 15-105: Mineral Sands By-Product Disposal (Pit 23)
EMP and Rehabilitation Performance Report – H2 2020 FINAL (Rev 0)
136
Variable Unit Sample Point Date Result
Aluminium (Total) mg/L DG_A_I_SW_DUSW20 14/09/2020 22.000
Aluminium (Total) mg/L DG_A_I_SW_DUSW20 8/10/2020 0.210
Aluminium (Total) mg/L DG_A_I_SW_DUSW22 15/07/2020 0.120
Aluminium (Total) mg/L DG_A_I_SW_DUSW22 6/10/2020 0.070
Aluminium (Total) mg/L DG_A_I_SW_DUSW24 17/09/2020 0.140
Aluminium (Total) mg/L DG_A_I_SW_DUSW24 13/10/2020 0.050
Aluminium (Total) mg/L DG_A_I_SW_DUSW25 8/10/2020 63.000
Aluminium (Total) mg/L DG_A_I_SW_DUSW27 8/10/2020 5.900
Ammonia Nitrogen mg/L DG_A_I_SW_DUSW05B 17/09/2020 0.030
Ammonia Nitrogen mg/L DG_A_I_SW_DUSW14 15/07/2020 0.024 Ammonia Nitrogen mg/L DG_A_I_SW_DUSW14 6/10/2020 0.020 Ammonia Nitrogen mg/L DG_A_I_SW_DUSW20 14/09/2020 0.056
Ammonia Nitrogen mg/L DG_A_I_SW_DUSW20 8/10/2020 0.330
Ammonia Nitrogen mg/L DG_A_I_SW_DUSW22 15/07/2020 0.020 Ammonia Nitrogen mg/L DG_A_I_SW_DUSW22 6/10/2020 0.020 Ammonia Nitrogen mg/L DG_A_I_SW_DUSW24 17/09/2020 0.210
Anions (Total) meq/L DG_A_I_SW_DUSW05B 17/09/2020 2600.000
Anions (Total) meq/L DG_A_I_SW_DUSW05B 13/10/2020 2800.000
Anions (Total) meq/L DG_A_I_SW_DUSW14 15/07/2020 66.000
Anions (Total) meq/L DG_A_I_SW_DUSW14 6/10/2020 49.000
Anions (Total) meq/L DG_A_I_SW_DUSW19 26/11/2020 6.200
Anions (Total) meq/L DG_A_I_SW_DUSW20 14/09/2020 2.000
Anions (Total) meq/L DG_A_I_SW_DUSW20 8/10/2020 120.000
Anions (Total) meq/L DG_A_I_SW_DUSW22 15/07/2020 93.000
Anions (Total) meq/L DG_A_I_SW_DUSW22 6/10/2020 72.000
Anions (Total) meq/L DG_A_I_SW_DUSW24 17/09/2020 160.000
Anions (Total) meq/L DG_A_I_SW_DUSW24 13/10/2020 180.000
Antimony (Total) mg/L DG_A_I_SW_DUSW05B 17/09/2020 0.010 Antimony (Total) mg/L DG_A_I_SW_DUSW05B 13/10/2020 0.010 Antimony (Total) mg/L DG_A_I_SW_DUSW11 8/10/2020 0.001 Antimony (Total) mg/L DG_A_I_SW_DUSW14 15/07/2020 0.001 Antimony (Total) mg/L DG_A_I_SW_DUSW14 6/10/2020 0.001 Antimony (Total) mg/L DG_A_I_SW_DUSW19 26/11/2020 0.001 Antimony (Total) mg/L DG_A_I_SW_DUSW20 14/09/2020 0.001 Antimony (Total) mg/L DG_A_I_SW_DUSW20 8/10/2020 0.001 Antimony (Total) mg/L DG_A_I_SW_DUSW22 15/07/2020 0.001 Antimony (Total) mg/L DG_A_I_SW_DUSW22 6/10/2020 0.001 Antimony (Total) mg/L DG_A_I_SW_DUSW24 17/09/2020 0.001 Antimony (Total) mg/L DG_A_I_SW_DUSW24 13/10/2020 0.001 Antimony (Total) mg/L DG_A_I_SW_DUSW25 8/10/2020 0.001 Antimony (Total) mg/L DG_A_I_SW_DUSW27 8/10/2020 0.001 Arsenic (Total) mg/L DG_A_I_SW_DUSW05B 17/09/2020 0.010
Arsenic (Total) mg/L DG_A_I_SW_DUSW05B 13/10/2020 0.010
Arsenic (Total) mg/L DG_A_I_SW_DUSW11 8/10/2020 0.003
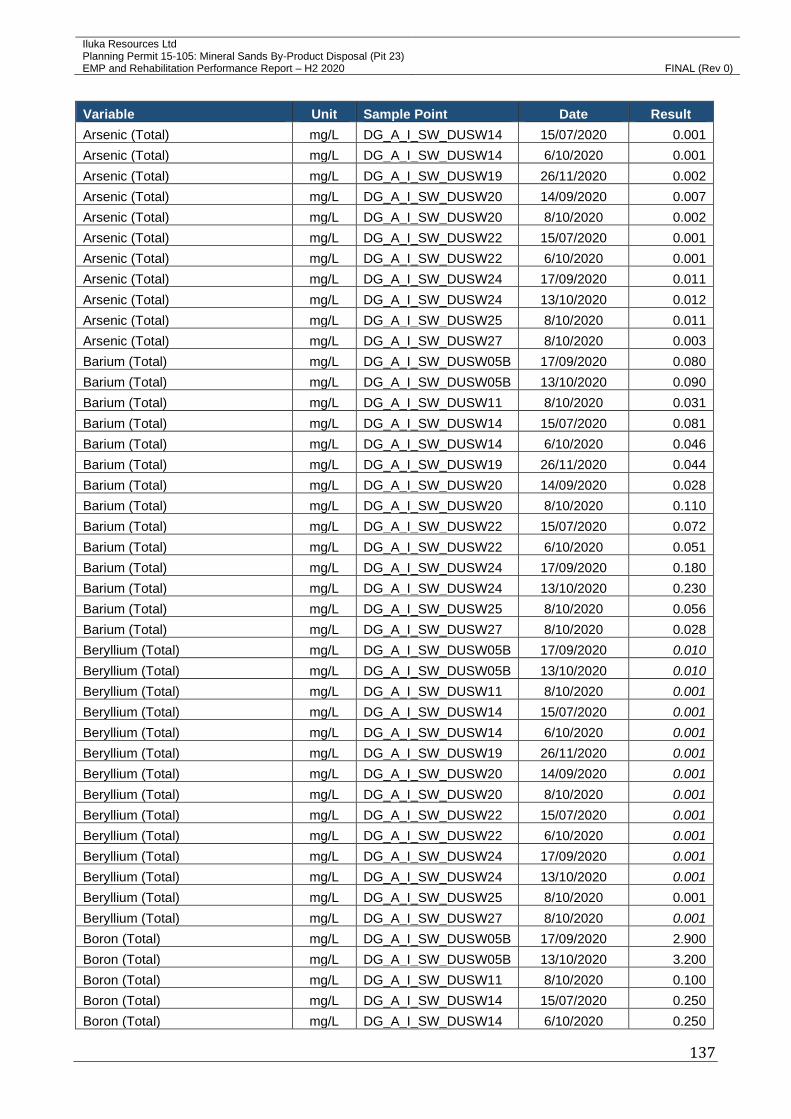
Iluka Resources Ltd Planning Permit 15-105: Mineral Sands By-Product Disposal (Pit 23)
EMP and Rehabilitation Performance Report – H2 2020 FINAL (Rev 0)
137
Variable Unit Sample Point Date Result
Arsenic (Total) mg/L DG_A_I_SW_DUSW14 15/07/2020 0.001
Arsenic (Total) mg/L DG_A_I_SW_DUSW14 6/10/2020 0.001
Arsenic (Total) mg/L DG_A_I_SW_DUSW19 26/11/2020 0.002
Arsenic (Total) mg/L DG_A_I_SW_DUSW20 14/09/2020 0.007
Arsenic (Total) mg/L DG_A_I_SW_DUSW20 8/10/2020 0.002
Arsenic (Total) mg/L DG_A_I_SW_DUSW22 15/07/2020 0.001
Arsenic (Total) mg/L DG_A_I_SW_DUSW22 6/10/2020 0.001
Arsenic (Total) mg/L DG_A_I_SW_DUSW24 17/09/2020 0.011
Arsenic (Total) mg/L DG_A_I_SW_DUSW24 13/10/2020 0.012
Arsenic (Total) mg/L DG_A_I_SW_DUSW25 8/10/2020 0.011
Arsenic (Total) mg/L DG_A_I_SW_DUSW27 8/10/2020 0.003
Barium (Total) mg/L DG_A_I_SW_DUSW05B 17/09/2020 0.080
Barium (Total) mg/L DG_A_I_SW_DUSW05B 13/10/2020 0.090
Barium (Total) mg/L DG_A_I_SW_DUSW11 8/10/2020 0.031
Barium (Total) mg/L DG_A_I_SW_DUSW14 15/07/2020 0.081
Barium (Total) mg/L DG_A_I_SW_DUSW14 6/10/2020 0.046
Barium (Total) mg/L DG_A_I_SW_DUSW19 26/11/2020 0.044
Barium (Total) mg/L DG_A_I_SW_DUSW20 14/09/2020 0.028
Barium (Total) mg/L DG_A_I_SW_DUSW20 8/10/2020 0.110
Barium (Total) mg/L DG_A_I_SW_DUSW22 15/07/2020 0.072
Barium (Total) mg/L DG_A_I_SW_DUSW22 6/10/2020 0.051
Barium (Total) mg/L DG_A_I_SW_DUSW24 17/09/2020 0.180
Barium (Total) mg/L DG_A_I_SW_DUSW24 13/10/2020 0.230
Barium (Total) mg/L DG_A_I_SW_DUSW25 8/10/2020 0.056
Barium (Total) mg/L DG_A_I_SW_DUSW27 8/10/2020 0.028
Beryllium (Total) mg/L DG_A_I_SW_DUSW05B 17/09/2020 0.010 Beryllium (Total) mg/L DG_A_I_SW_DUSW05B 13/10/2020 0.010 Beryllium (Total) mg/L DG_A_I_SW_DUSW11 8/10/2020 0.001 Beryllium (Total) mg/L DG_A_I_SW_DUSW14 15/07/2020 0.001 Beryllium (Total) mg/L DG_A_I_SW_DUSW14 6/10/2020 0.001 Beryllium (Total) mg/L DG_A_I_SW_DUSW19 26/11/2020 0.001 Beryllium (Total) mg/L DG_A_I_SW_DUSW20 14/09/2020 0.001 Beryllium (Total) mg/L DG_A_I_SW_DUSW20 8/10/2020 0.001 Beryllium (Total) mg/L DG_A_I_SW_DUSW22 15/07/2020 0.001 Beryllium (Total) mg/L DG_A_I_SW_DUSW22 6/10/2020 0.001 Beryllium (Total) mg/L DG_A_I_SW_DUSW24 17/09/2020 0.001 Beryllium (Total) mg/L DG_A_I_SW_DUSW24 13/10/2020 0.001 Beryllium (Total) mg/L DG_A_I_SW_DUSW25 8/10/2020 0.001
Beryllium (Total) mg/L DG_A_I_SW_DUSW27 8/10/2020 0.001 Boron (Total) mg/L DG_A_I_SW_DUSW05B 17/09/2020 2.900
Boron (Total) mg/L DG_A_I_SW_DUSW05B 13/10/2020 3.200
Boron (Total) mg/L DG_A_I_SW_DUSW11 8/10/2020 0.100
Boron (Total) mg/L DG_A_I_SW_DUSW14 15/07/2020 0.250
Boron (Total) mg/L DG_A_I_SW_DUSW14 6/10/2020 0.250

Iluka Resources Ltd Planning Permit 15-105: Mineral Sands By-Product Disposal (Pit 23)
EMP and Rehabilitation Performance Report – H2 2020 FINAL (Rev 0)
138
Variable Unit Sample Point Date Result
Boron (Total) mg/L DG_A_I_SW_DUSW19 26/11/2020 0.140
Boron (Total) mg/L DG_A_I_SW_DUSW20 14/09/2020 0.110
Boron (Total) mg/L DG_A_I_SW_DUSW20 8/10/2020 0.320
Boron (Total) mg/L DG_A_I_SW_DUSW22 15/07/2020 0.140
Boron (Total) mg/L DG_A_I_SW_DUSW22 6/10/2020 0.140
Boron (Total) mg/L DG_A_I_SW_DUSW24 17/09/2020 2.400
Boron (Total) mg/L DG_A_I_SW_DUSW24 13/10/2020 2.800
Boron (Total) mg/L DG_A_I_SW_DUSW25 8/10/2020 0.080
Boron (Total) mg/L DG_A_I_SW_DUSW27 8/10/2020 0.090
Cadmium (Total) mg/L DG_A_I_SW_DUSW05B 17/09/2020 0.002 Cadmium (Total) mg/L DG_A_I_SW_DUSW05B 13/10/2020 0.002 Cadmium (Total) mg/L DG_A_I_SW_DUSW11 8/10/2020 0.000 Cadmium (Total) mg/L DG_A_I_SW_DUSW14 15/07/2020 0.000 Cadmium (Total) mg/L DG_A_I_SW_DUSW14 6/10/2020 0.000 Cadmium (Total) mg/L DG_A_I_SW_DUSW19 26/11/2020 0.000 Cadmium (Total) mg/L DG_A_I_SW_DUSW20 14/09/2020 0.000 Cadmium (Total) mg/L DG_A_I_SW_DUSW20 8/10/2020 0.000 Cadmium (Total) mg/L DG_A_I_SW_DUSW22 15/07/2020 0.000 Cadmium (Total) mg/L DG_A_I_SW_DUSW22 6/10/2020 0.000 Cadmium (Total) mg/L DG_A_I_SW_DUSW24 17/09/2020 0.000 Cadmium (Total) mg/L DG_A_I_SW_DUSW24 13/10/2020 0.000 Cadmium (Total) mg/L DG_A_I_SW_DUSW25 8/10/2020 0.000 Cadmium (Total) mg/L DG_A_I_SW_DUSW27 8/10/2020 0.000 Calcium mg/L DG_A_I_SW_DUSW05B 17/09/2020 1700.000
Calcium mg/L DG_A_I_SW_DUSW05B 13/10/2020 1700.000
Calcium mg/L DG_A_I_SW_DUSW14 15/07/2020 74.000
Calcium mg/L DG_A_I_SW_DUSW14 6/10/2020 54.000
Calcium mg/L DG_A_I_SW_DUSW19 26/11/2020 13.000
Calcium mg/L DG_A_I_SW_DUSW20 14/09/2020 5.500
Calcium mg/L DG_A_I_SW_DUSW20 8/10/2020 180.000
Calcium mg/L DG_A_I_SW_DUSW22 15/07/2020 140.000
Calcium mg/L DG_A_I_SW_DUSW22 6/10/2020 120.000
Calcium mg/L DG_A_I_SW_DUSW24 17/09/2020 340.000
Calcium mg/L DG_A_I_SW_DUSW24 13/10/2020 360.000
Cations (Total) meq/L DG_A_I_SW_DUSW05B 17/09/2020 2800.000
Cations (Total) meq/L DG_A_I_SW_DUSW05B 13/10/2020 2700.000
Cations (Total) meq/L DG_A_I_SW_DUSW14 15/07/2020 73.000
Cations (Total) meq/L DG_A_I_SW_DUSW14 6/10/2020 49.000
Cations (Total) meq/L DG_A_I_SW_DUSW19 26/11/2020 7.000
Cations (Total) meq/L DG_A_I_SW_DUSW20 14/09/2020 2.900
Cations (Total) meq/L DG_A_I_SW_DUSW20 8/10/2020 120.000
Cations (Total) meq/L DG_A_I_SW_DUSW22 15/07/2020 98.000
Cations (Total) meq/L DG_A_I_SW_DUSW22 6/10/2020 70.000
Cations (Total) meq/L DG_A_I_SW_DUSW24 17/09/2020 160.000

Iluka Resources Ltd Planning Permit 15-105: Mineral Sands By-Product Disposal (Pit 23)
EMP and Rehabilitation Performance Report – H2 2020 FINAL (Rev 0)
139
Variable Unit Sample Point Date Result
Cations (Total) meq/L DG_A_I_SW_DUSW24 13/10/2020 170.000
Chloride mg/L DG_A_I_SW_DUSW05B 17/09/2020 86000.000
Chloride mg/L DG_A_I_SW_DUSW05B 13/10/2020 94000.000
Chloride mg/L DG_A_I_SW_DUSW14 15/07/2020 2100.000
Chloride mg/L DG_A_I_SW_DUSW14 6/10/2020 1400.000
Chloride mg/L DG_A_I_SW_DUSW19 26/11/2020 110.000
Chloride mg/L DG_A_I_SW_DUSW20 14/09/2020 42.000
Chloride mg/L DG_A_I_SW_DUSW20 8/10/2020 3700.000
Chloride mg/L DG_A_I_SW_DUSW22 15/07/2020 3000.000
Chloride mg/L DG_A_I_SW_DUSW22 6/10/2020 2300.000
Chloride mg/L DG_A_I_SW_DUSW24 17/09/2020 4800.000
Chloride mg/L DG_A_I_SW_DUSW24 13/10/2020 5500.000
Chromium (Total) mg/L DG_A_I_SW_DUSW05B 17/09/2020 0.010 Chromium (Total) mg/L DG_A_I_SW_DUSW05B 13/10/2020 0.010 Chromium (Total) mg/L DG_A_I_SW_DUSW11 8/10/2020 0.007
Chromium (Total) mg/L DG_A_I_SW_DUSW14 15/07/2020 0.001 Chromium (Total) mg/L DG_A_I_SW_DUSW14 6/10/2020 0.002
Chromium (Total) mg/L DG_A_I_SW_DUSW19 26/11/2020 0.001
Chromium (Total) mg/L DG_A_I_SW_DUSW20 14/09/2020 0.021
Chromium (Total) mg/L DG_A_I_SW_DUSW20 8/10/2020 0.001 Chromium (Total) mg/L DG_A_I_SW_DUSW22 15/07/2020 0.001 Chromium (Total) mg/L DG_A_I_SW_DUSW22 6/10/2020 0.001 Chromium (Total) mg/L DG_A_I_SW_DUSW24 17/09/2020 0.001 Chromium (Total) mg/L DG_A_I_SW_DUSW24 13/10/2020 0.002
Chromium (Total) mg/L DG_A_I_SW_DUSW25 8/10/2020 0.062
Chromium (Total) mg/L DG_A_I_SW_DUSW27 8/10/2020 0.005
Cobalt (Total) mg/L DG_A_I_SW_DUSW05B 17/09/2020 0.010 Cobalt (Total) mg/L DG_A_I_SW_DUSW05B 13/10/2020 0.010 Cobalt (Total) mg/L DG_A_I_SW_DUSW11 8/10/2020 0.002
Cobalt (Total) mg/L DG_A_I_SW_DUSW14 15/07/2020 0.001 Cobalt (Total) mg/L DG_A_I_SW_DUSW14 6/10/2020 0.001 Cobalt (Total) mg/L DG_A_I_SW_DUSW19 26/11/2020 0.001 Cobalt (Total) mg/L DG_A_I_SW_DUSW20 14/09/2020 0.003
Cobalt (Total) mg/L DG_A_I_SW_DUSW20 8/10/2020 0.001
Cobalt (Total) mg/L DG_A_I_SW_DUSW22 15/07/2020 0.001 Cobalt (Total) mg/L DG_A_I_SW_DUSW22 6/10/2020 0.001 Cobalt (Total) mg/L DG_A_I_SW_DUSW24 17/09/2020 0.001 Cobalt (Total) mg/L DG_A_I_SW_DUSW24 13/10/2020 0.001 Cobalt (Total) mg/L DG_A_I_SW_DUSW25 8/10/2020 0.006
Cobalt (Total) mg/L DG_A_I_SW_DUSW27 8/10/2020 0.002
Copper (Total) mg/L DG_A_I_SW_DUSW05B 17/09/2020 0.010 Copper (Total) mg/L DG_A_I_SW_DUSW05B 13/10/2020 0.010 Copper (Total) mg/L DG_A_I_SW_DUSW11 8/10/2020 0.010
Copper (Total) mg/L DG_A_I_SW_DUSW14 15/07/2020 0.001
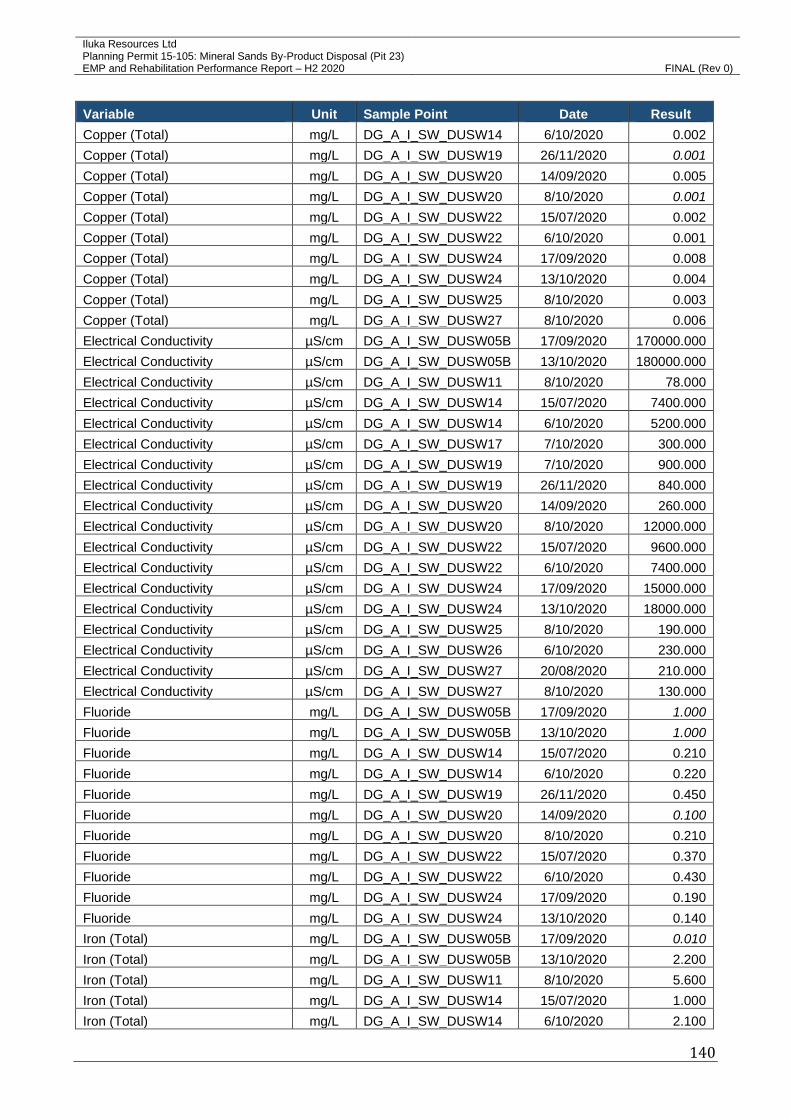
Iluka Resources Ltd Planning Permit 15-105: Mineral Sands By-Product Disposal (Pit 23)
EMP and Rehabilitation Performance Report – H2 2020 FINAL (Rev 0)
140
Variable Unit Sample Point Date Result
Copper (Total) mg/L DG_A_I_SW_DUSW14 6/10/2020 0.002
Copper (Total) mg/L DG_A_I_SW_DUSW19 26/11/2020 0.001 Copper (Total) mg/L DG_A_I_SW_DUSW20 14/09/2020 0.005
Copper (Total) mg/L DG_A_I_SW_DUSW20 8/10/2020 0.001 Copper (Total) mg/L DG_A_I_SW_DUSW22 15/07/2020 0.002
Copper (Total) mg/L DG_A_I_SW_DUSW22 6/10/2020 0.001
Copper (Total) mg/L DG_A_I_SW_DUSW24 17/09/2020 0.008
Copper (Total) mg/L DG_A_I_SW_DUSW24 13/10/2020 0.004
Copper (Total) mg/L DG_A_I_SW_DUSW25 8/10/2020 0.003
Copper (Total) mg/L DG_A_I_SW_DUSW27 8/10/2020 0.006
Electrical Conductivity µS/cm DG_A_I_SW_DUSW05B 17/09/2020 170000.000
Electrical Conductivity µS/cm DG_A_I_SW_DUSW05B 13/10/2020 180000.000
Electrical Conductivity µS/cm DG_A_I_SW_DUSW11 8/10/2020 78.000
Electrical Conductivity µS/cm DG_A_I_SW_DUSW14 15/07/2020 7400.000
Electrical Conductivity µS/cm DG_A_I_SW_DUSW14 6/10/2020 5200.000
Electrical Conductivity µS/cm DG_A_I_SW_DUSW17 7/10/2020 300.000
Electrical Conductivity µS/cm DG_A_I_SW_DUSW19 7/10/2020 900.000
Electrical Conductivity µS/cm DG_A_I_SW_DUSW19 26/11/2020 840.000
Electrical Conductivity µS/cm DG_A_I_SW_DUSW20 14/09/2020 260.000
Electrical Conductivity µS/cm DG_A_I_SW_DUSW20 8/10/2020 12000.000
Electrical Conductivity µS/cm DG_A_I_SW_DUSW22 15/07/2020 9600.000
Electrical Conductivity µS/cm DG_A_I_SW_DUSW22 6/10/2020 7400.000
Electrical Conductivity µS/cm DG_A_I_SW_DUSW24 17/09/2020 15000.000
Electrical Conductivity µS/cm DG_A_I_SW_DUSW24 13/10/2020 18000.000
Electrical Conductivity µS/cm DG_A_I_SW_DUSW25 8/10/2020 190.000
Electrical Conductivity µS/cm DG_A_I_SW_DUSW26 6/10/2020 230.000
Electrical Conductivity µS/cm DG_A_I_SW_DUSW27 20/08/2020 210.000
Electrical Conductivity µS/cm DG_A_I_SW_DUSW27 8/10/2020 130.000
Fluoride mg/L DG_A_I_SW_DUSW05B 17/09/2020 1.000 Fluoride mg/L DG_A_I_SW_DUSW05B 13/10/2020 1.000 Fluoride mg/L DG_A_I_SW_DUSW14 15/07/2020 0.210
Fluoride mg/L DG_A_I_SW_DUSW14 6/10/2020 0.220
Fluoride mg/L DG_A_I_SW_DUSW19 26/11/2020 0.450
Fluoride mg/L DG_A_I_SW_DUSW20 14/09/2020 0.100 Fluoride mg/L DG_A_I_SW_DUSW20 8/10/2020 0.210
Fluoride mg/L DG_A_I_SW_DUSW22 15/07/2020 0.370
Fluoride mg/L DG_A_I_SW_DUSW22 6/10/2020 0.430
Fluoride mg/L DG_A_I_SW_DUSW24 17/09/2020 0.190
Fluoride mg/L DG_A_I_SW_DUSW24 13/10/2020 0.140
Iron (Total) mg/L DG_A_I_SW_DUSW05B 17/09/2020 0.010 Iron (Total) mg/L DG_A_I_SW_DUSW05B 13/10/2020 2.200
Iron (Total) mg/L DG_A_I_SW_DUSW11 8/10/2020 5.600
Iron (Total) mg/L DG_A_I_SW_DUSW14 15/07/2020 1.000
Iron (Total) mg/L DG_A_I_SW_DUSW14 6/10/2020 2.100

Iluka Resources Ltd Planning Permit 15-105: Mineral Sands By-Product Disposal (Pit 23)
EMP and Rehabilitation Performance Report – H2 2020 FINAL (Rev 0)
141
Variable Unit Sample Point Date Result
Iron (Total) mg/L DG_A_I_SW_DUSW19 26/11/2020 0.970
Iron (Total) mg/L DG_A_I_SW_DUSW20 14/09/2020 14.000
Iron (Total) mg/L DG_A_I_SW_DUSW20 8/10/2020 0.200
Iron (Total) mg/L DG_A_I_SW_DUSW22 15/07/2020 0.320
Iron (Total) mg/L DG_A_I_SW_DUSW22 6/10/2020 0.380
Iron (Total) mg/L DG_A_I_SW_DUSW24 17/09/2020 0.140
Iron (Total) mg/L DG_A_I_SW_DUSW24 13/10/2020 0.050
Iron (Total) mg/L DG_A_I_SW_DUSW25 8/10/2020 37.000
Iron (Total) mg/L DG_A_I_SW_DUSW27 8/10/2020 4.600
Lead (Total) mg/L DG_A_I_SW_DUSW05B 17/09/2020 0.010 Lead (Total) mg/L DG_A_I_SW_DUSW05B 13/10/2020 0.010 Lead (Total) mg/L DG_A_I_SW_DUSW11 8/10/2020 0.003
Lead (Total) mg/L DG_A_I_SW_DUSW14 15/07/2020 0.001 Lead (Total) mg/L DG_A_I_SW_DUSW14 6/10/2020 0.001 Lead (Total) mg/L DG_A_I_SW_DUSW19 26/11/2020 0.001 Lead (Total) mg/L DG_A_I_SW_DUSW20 14/09/2020 0.008
Lead (Total) mg/L DG_A_I_SW_DUSW20 8/10/2020 0.001 Lead (Total) mg/L DG_A_I_SW_DUSW22 15/07/2020 0.001 Lead (Total) mg/L DG_A_I_SW_DUSW22 6/10/2020 0.001 Lead (Total) mg/L DG_A_I_SW_DUSW24 17/09/2020 0.004
Lead (Total) mg/L DG_A_I_SW_DUSW24 13/10/2020 0.001 Lead (Total) mg/L DG_A_I_SW_DUSW25 8/10/2020 0.014
Lead (Total) mg/L DG_A_I_SW_DUSW27 8/10/2020 0.002
Magnesium mg/L DG_A_I_SW_DUSW05B 17/09/2020 3700.000
Magnesium mg/L DG_A_I_SW_DUSW05B 13/10/2020 4000.000
Magnesium mg/L DG_A_I_SW_DUSW14 15/07/2020 120.000
Magnesium mg/L DG_A_I_SW_DUSW14 6/10/2020 82.000
Magnesium mg/L DG_A_I_SW_DUSW19 26/11/2020 10.000
Magnesium mg/L DG_A_I_SW_DUSW20 14/09/2020 5.100
Magnesium mg/L DG_A_I_SW_DUSW20 8/10/2020 210.000
Magnesium mg/L DG_A_I_SW_DUSW22 15/07/2020 240.000
Magnesium mg/L DG_A_I_SW_DUSW22 6/10/2020 170.000
Magnesium mg/L DG_A_I_SW_DUSW24 17/09/2020 230.000
Magnesium mg/L DG_A_I_SW_DUSW24 13/10/2020 260.000
Manganese (Total) mg/L DG_A_I_SW_DUSW05B 17/09/2020 0.010 Manganese (Total) mg/L DG_A_I_SW_DUSW05B 13/10/2020 0.130
Manganese (Total) mg/L DG_A_I_SW_DUSW11 8/10/2020 0.027
Manganese (Total) mg/L DG_A_I_SW_DUSW14 15/07/2020 0.160
Manganese (Total) mg/L DG_A_I_SW_DUSW14 6/10/2020 0.057
Manganese (Total) mg/L DG_A_I_SW_DUSW19 26/11/2020 0.022
Manganese (Total) mg/L DG_A_I_SW_DUSW20 14/09/2020 0.070
Manganese (Total) mg/L DG_A_I_SW_DUSW20 8/10/2020 0.072
Manganese (Total) mg/L DG_A_I_SW_DUSW22 15/07/2020 0.027
Manganese (Total) mg/L DG_A_I_SW_DUSW22 6/10/2020 0.030
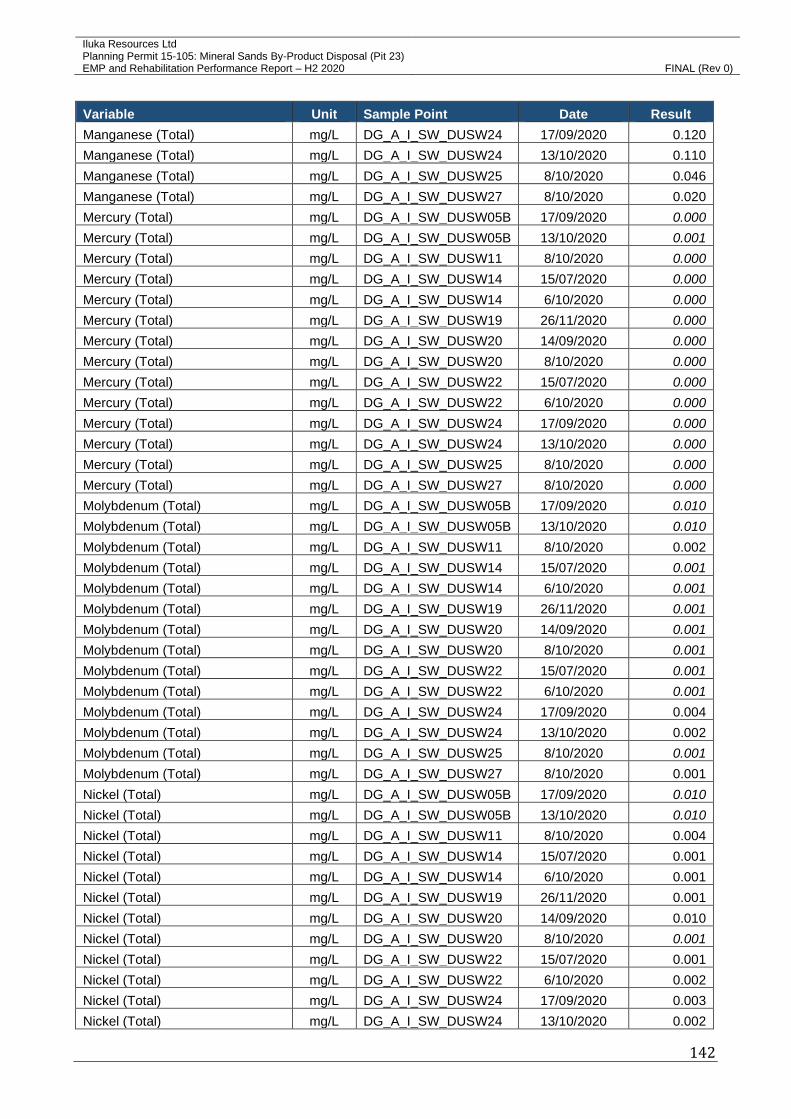
Iluka Resources Ltd Planning Permit 15-105: Mineral Sands By-Product Disposal (Pit 23)
EMP and Rehabilitation Performance Report – H2 2020 FINAL (Rev 0)
142
Variable Unit Sample Point Date Result
Manganese (Total) mg/L DG_A_I_SW_DUSW24 17/09/2020 0.120
Manganese (Total) mg/L DG_A_I_SW_DUSW24 13/10/2020 0.110
Manganese (Total) mg/L DG_A_I_SW_DUSW25 8/10/2020 0.046
Manganese (Total) mg/L DG_A_I_SW_DUSW27 8/10/2020 0.020
Mercury (Total) mg/L DG_A_I_SW_DUSW05B 17/09/2020 0.000 Mercury (Total) mg/L DG_A_I_SW_DUSW05B 13/10/2020 0.001 Mercury (Total) mg/L DG_A_I_SW_DUSW11 8/10/2020 0.000 Mercury (Total) mg/L DG_A_I_SW_DUSW14 15/07/2020 0.000 Mercury (Total) mg/L DG_A_I_SW_DUSW14 6/10/2020 0.000 Mercury (Total) mg/L DG_A_I_SW_DUSW19 26/11/2020 0.000 Mercury (Total) mg/L DG_A_I_SW_DUSW20 14/09/2020 0.000 Mercury (Total) mg/L DG_A_I_SW_DUSW20 8/10/2020 0.000 Mercury (Total) mg/L DG_A_I_SW_DUSW22 15/07/2020 0.000 Mercury (Total) mg/L DG_A_I_SW_DUSW22 6/10/2020 0.000 Mercury (Total) mg/L DG_A_I_SW_DUSW24 17/09/2020 0.000 Mercury (Total) mg/L DG_A_I_SW_DUSW24 13/10/2020 0.000 Mercury (Total) mg/L DG_A_I_SW_DUSW25 8/10/2020 0.000 Mercury (Total) mg/L DG_A_I_SW_DUSW27 8/10/2020 0.000 Molybdenum (Total) mg/L DG_A_I_SW_DUSW05B 17/09/2020 0.010 Molybdenum (Total) mg/L DG_A_I_SW_DUSW05B 13/10/2020 0.010 Molybdenum (Total) mg/L DG_A_I_SW_DUSW11 8/10/2020 0.002
Molybdenum (Total) mg/L DG_A_I_SW_DUSW14 15/07/2020 0.001 Molybdenum (Total) mg/L DG_A_I_SW_DUSW14 6/10/2020 0.001 Molybdenum (Total) mg/L DG_A_I_SW_DUSW19 26/11/2020 0.001 Molybdenum (Total) mg/L DG_A_I_SW_DUSW20 14/09/2020 0.001 Molybdenum (Total) mg/L DG_A_I_SW_DUSW20 8/10/2020 0.001 Molybdenum (Total) mg/L DG_A_I_SW_DUSW22 15/07/2020 0.001 Molybdenum (Total) mg/L DG_A_I_SW_DUSW22 6/10/2020 0.001 Molybdenum (Total) mg/L DG_A_I_SW_DUSW24 17/09/2020 0.004
Molybdenum (Total) mg/L DG_A_I_SW_DUSW24 13/10/2020 0.002
Molybdenum (Total) mg/L DG_A_I_SW_DUSW25 8/10/2020 0.001 Molybdenum (Total) mg/L DG_A_I_SW_DUSW27 8/10/2020 0.001
Nickel (Total) mg/L DG_A_I_SW_DUSW05B 17/09/2020 0.010 Nickel (Total) mg/L DG_A_I_SW_DUSW05B 13/10/2020 0.010 Nickel (Total) mg/L DG_A_I_SW_DUSW11 8/10/2020 0.004
Nickel (Total) mg/L DG_A_I_SW_DUSW14 15/07/2020 0.001
Nickel (Total) mg/L DG_A_I_SW_DUSW14 6/10/2020 0.001
Nickel (Total) mg/L DG_A_I_SW_DUSW19 26/11/2020 0.001
Nickel (Total) mg/L DG_A_I_SW_DUSW20 14/09/2020 0.010
Nickel (Total) mg/L DG_A_I_SW_DUSW20 8/10/2020 0.001 Nickel (Total) mg/L DG_A_I_SW_DUSW22 15/07/2020 0.001
Nickel (Total) mg/L DG_A_I_SW_DUSW22 6/10/2020 0.002
Nickel (Total) mg/L DG_A_I_SW_DUSW24 17/09/2020 0.003
Nickel (Total) mg/L DG_A_I_SW_DUSW24 13/10/2020 0.002

Iluka Resources Ltd Planning Permit 15-105: Mineral Sands By-Product Disposal (Pit 23)
EMP and Rehabilitation Performance Report – H2 2020 FINAL (Rev 0)
143
Variable Unit Sample Point Date Result
Nickel (Total) mg/L DG_A_I_SW_DUSW25 8/10/2020 0.015
Nickel (Total) mg/L DG_A_I_SW_DUSW27 8/10/2020 0.003
Nitrate-Nitrogen mg/L DG_A_I_SW_DUSW05B 17/09/2020 0.005 Nitrate-Nitrogen mg/L DG_A_I_SW_DUSW05B 13/10/2020 0.005 Nitrate-Nitrogen mg/L DG_A_I_SW_DUSW11 8/10/2020 0.470
Nitrate-Nitrogen mg/L DG_A_I_SW_DUSW14 15/07/2020 0.045
Nitrate-Nitrogen mg/L DG_A_I_SW_DUSW14 6/10/2020 0.005 Nitrate-Nitrogen mg/L DG_A_I_SW_DUSW17 7/10/2020 0.580
Nitrate-Nitrogen mg/L DG_A_I_SW_DUSW19 7/10/2020 0.035
Nitrate-Nitrogen mg/L DG_A_I_SW_DUSW19 26/11/2020 0.013
Nitrate-Nitrogen mg/L DG_A_I_SW_DUSW20 14/09/2020 0.005 Nitrate-Nitrogen mg/L DG_A_I_SW_DUSW20 8/10/2020 0.005 Nitrate-Nitrogen mg/L DG_A_I_SW_DUSW22 15/07/2020 0.005 Nitrate-Nitrogen mg/L DG_A_I_SW_DUSW22 6/10/2020 0.005 Nitrate-Nitrogen mg/L DG_A_I_SW_DUSW24 17/09/2020 0.005 Nitrate-Nitrogen mg/L DG_A_I_SW_DUSW24 13/10/2020 0.082
Nitrate-Nitrogen mg/L DG_A_I_SW_DUSW25 8/10/2020 0.250
Nitrate-Nitrogen mg/L DG_A_I_SW_DUSW26 6/10/2020 0.580
Nitrate-Nitrogen mg/L DG_A_I_SW_DUSW27 20/08/2020 0.240
Nitrate-Nitrogen mg/L DG_A_I_SW_DUSW27 8/10/2020 0.130
Nitrite-Nitrogen mg/L DG_A_I_SW_DUSW05B 17/09/2020 0.100 Nitrite-Nitrogen mg/L DG_A_I_SW_DUSW05B 13/10/2020 0.001 Nitrite-Nitrogen mg/L DG_A_I_SW_DUSW11 8/10/2020 0.010
Nitrite-Nitrogen mg/L DG_A_I_SW_DUSW14 15/07/2020 0.003
Nitrite-Nitrogen mg/L DG_A_I_SW_DUSW14 6/10/2020 0.001 Nitrite-Nitrogen mg/L DG_A_I_SW_DUSW17 7/10/2020 0.036
Nitrite-Nitrogen mg/L DG_A_I_SW_DUSW19 7/10/2020 0.005
Nitrite-Nitrogen mg/L DG_A_I_SW_DUSW19 26/11/2020 0.006
Nitrite-Nitrogen mg/L DG_A_I_SW_DUSW20 14/09/2020 0.010
Nitrite-Nitrogen mg/L DG_A_I_SW_DUSW20 8/10/2020 0.001
Nitrite-Nitrogen mg/L DG_A_I_SW_DUSW22 15/07/2020 0.001 Nitrite-Nitrogen mg/L DG_A_I_SW_DUSW22 6/10/2020 0.001 Nitrite-Nitrogen mg/L DG_A_I_SW_DUSW24 17/09/2020 0.001 Nitrite-Nitrogen mg/L DG_A_I_SW_DUSW24 13/10/2020 0.004
Nitrite-Nitrogen mg/L DG_A_I_SW_DUSW25 8/10/2020 0.024
Nitrite-Nitrogen mg/L DG_A_I_SW_DUSW26 6/10/2020 0.028
Nitrite-Nitrogen mg/L DG_A_I_SW_DUSW27 20/08/2020 0.016
Nitrite-Nitrogen mg/L DG_A_I_SW_DUSW27 8/10/2020 0.012
Nitrogen (Total) mg/L DG_A_I_SW_DUSW05B 17/09/2020 1.000
Nitrogen (Total) mg/L DG_A_I_SW_DUSW05B 13/10/2020 1.400
Nitrogen (Total) mg/L DG_A_I_SW_DUSW11 8/10/2020 2.800
Nitrogen (Total) mg/L DG_A_I_SW_DUSW14 15/07/2020 0.840
Nitrogen (Total) mg/L DG_A_I_SW_DUSW14 6/10/2020 0.770
Nitrogen (Total) mg/L DG_A_I_SW_DUSW17 7/10/2020 2.600

Iluka Resources Ltd Planning Permit 15-105: Mineral Sands By-Product Disposal (Pit 23)
EMP and Rehabilitation Performance Report – H2 2020 FINAL (Rev 0)
144
Variable Unit Sample Point Date Result
Nitrogen (Total) mg/L DG_A_I_SW_DUSW19 7/10/2020 0.770
Nitrogen (Total) mg/L DG_A_I_SW_DUSW19 26/11/2020 0.780
Nitrogen (Total) mg/L DG_A_I_SW_DUSW20 14/09/2020 2.700
Nitrogen (Total) mg/L DG_A_I_SW_DUSW20 8/10/2020 1.500
Nitrogen (Total) mg/L DG_A_I_SW_DUSW22 15/07/2020 0.320
Nitrogen (Total) mg/L DG_A_I_SW_DUSW22 6/10/2020 0.370
Nitrogen (Total) mg/L DG_A_I_SW_DUSW23 15/07/2020 2.400
Nitrogen (Total) mg/L DG_A_I_SW_DUSW24 17/09/2020 6.600
Nitrogen (Total) mg/L DG_A_I_SW_DUSW24 13/10/2020 5.900
Nitrogen (Total) mg/L DG_A_I_SW_DUSW25 8/10/2020 2.000
Nitrogen (Total) mg/L DG_A_I_SW_DUSW26 6/10/2020 0.610
Nitrogen (Total) mg/L DG_A_I_SW_DUSW27 20/08/2020 4.200
Nitrogen (Total) mg/L DG_A_I_SW_DUSW27 8/10/2020 3.300
pH pH units DG_A_I_SW_DUSW05B 17/09/2020 8.400
pH pH units DG_A_I_SW_DUSW05B 13/10/2020 8.500
pH pH units DG_A_I_SW_DUSW11 8/10/2020 7.300
pH pH units DG_A_I_SW_DUSW14 15/07/2020 7.500
pH pH units DG_A_I_SW_DUSW14 6/10/2020 7.500
pH pH units DG_A_I_SW_DUSW17 7/10/2020 7.700
pH pH units DG_A_I_SW_DUSW19 7/10/2020 7.800
pH pH units DG_A_I_SW_DUSW19 26/11/2020 7.900
pH pH units DG_A_I_SW_DUSW20 14/09/2020 7.300
pH pH units DG_A_I_SW_DUSW20 8/10/2020 7.900
pH pH units DG_A_I_SW_DUSW22 15/07/2020 7.600
pH pH units DG_A_I_SW_DUSW22 6/10/2020 7.800
pH pH units DG_A_I_SW_DUSW24 17/09/2020 9.000
pH pH units DG_A_I_SW_DUSW24 13/10/2020 8.600
pH pH units DG_A_I_SW_DUSW25 8/10/2020 7.000
pH pH units DG_A_I_SW_DUSW26 6/10/2020 8.000
pH pH units DG_A_I_SW_DUSW27 20/08/2020 7.300
pH pH units DG_A_I_SW_DUSW27 8/10/2020 7.000
Phosphorus (Ortho) mg/L DG_A_I_SW_DUSW05B 17/09/2020 0.004 Phosphorus (Ortho) mg/L DG_A_I_SW_DUSW05B 13/10/2020 0.004 Phosphorus (Ortho) mg/L DG_A_I_SW_DUSW11 8/10/2020 0.015
Phosphorus (Ortho) mg/L DG_A_I_SW_DUSW14 15/07/2020 0.004 Phosphorus (Ortho) mg/L DG_A_I_SW_DUSW14 6/10/2020 0.004 Phosphorus (Ortho) mg/L DG_A_I_SW_DUSW19 26/11/2020 0.004 Phosphorus (Ortho) mg/L DG_A_I_SW_DUSW20 14/09/2020 0.057
Phosphorus (Ortho) mg/L DG_A_I_SW_DUSW20 8/10/2020 0.004 Phosphorus (Ortho) mg/L DG_A_I_SW_DUSW22 15/07/2020 0.004 Phosphorus (Ortho) mg/L DG_A_I_SW_DUSW22 6/10/2020 0.007
Phosphorus (Ortho) mg/L DG_A_I_SW_DUSW24 17/09/2020 0.007
Phosphorus (Ortho) mg/L DG_A_I_SW_DUSW24 13/10/2020 0.025
Phosphorus (Ortho) mg/L DG_A_I_SW_DUSW25 8/10/2020 0.004

Iluka Resources Ltd Planning Permit 15-105: Mineral Sands By-Product Disposal (Pit 23)
EMP and Rehabilitation Performance Report – H2 2020 FINAL (Rev 0)
145
Variable Unit Sample Point Date Result
Phosphorus (Ortho) mg/L DG_A_I_SW_DUSW27 8/10/2020 0.054
Phosphorus (Total) mg/L DG_A_I_SW_DUSW05B 17/09/2020 0.340
Phosphorus (Total) mg/L DG_A_I_SW_DUSW05B 13/10/2020 0.360
Phosphorus (Total) mg/L DG_A_I_SW_DUSW11 8/10/2020 0.190
Phosphorus (Total) mg/L DG_A_I_SW_DUSW14 15/07/2020 0.067
Phosphorus (Total) mg/L DG_A_I_SW_DUSW14 6/10/2020 0.039
Phosphorus (Total) mg/L DG_A_I_SW_DUSW17 7/10/2020 0.150
Phosphorus (Total) mg/L DG_A_I_SW_DUSW19 7/10/2020 0.045
Phosphorus (Total) mg/L DG_A_I_SW_DUSW19 26/11/2020 0.021
Phosphorus (Total) mg/L DG_A_I_SW_DUSW20 14/09/2020 0.110
Phosphorus (Total) mg/L DG_A_I_SW_DUSW20 8/10/2020 0.095
Phosphorus (Total) mg/L DG_A_I_SW_DUSW22 15/07/2020 0.009
Phosphorus (Total) mg/L DG_A_I_SW_DUSW22 6/10/2020 0.015
Phosphorus (Total) mg/L DG_A_I_SW_DUSW23 15/07/2020 0.050
Phosphorus (Total) mg/L DG_A_I_SW_DUSW24 17/09/2020 0.160
Phosphorus (Total) mg/L DG_A_I_SW_DUSW24 13/10/2020 0.210
Phosphorus (Total) mg/L DG_A_I_SW_DUSW25 8/10/2020 0.018
Phosphorus (Total) mg/L DG_A_I_SW_DUSW26 6/10/2020 0.051
Phosphorus (Total) mg/L DG_A_I_SW_DUSW27 20/08/2020 0.320
Phosphorus (Total) mg/L DG_A_I_SW_DUSW27 8/10/2020 0.270
Potassium mg/L DG_A_I_SW_DUSW05B 17/09/2020 530.000
Potassium mg/L DG_A_I_SW_DUSW05B 13/10/2020 530.000
Potassium mg/L DG_A_I_SW_DUSW14 15/07/2020 6.700
Potassium mg/L DG_A_I_SW_DUSW14 6/10/2020 6.700
Potassium mg/L DG_A_I_SW_DUSW19 26/11/2020 4.800
Potassium mg/L DG_A_I_SW_DUSW20 14/09/2020 6.400
Potassium mg/L DG_A_I_SW_DUSW20 8/10/2020 13.000
Potassium mg/L DG_A_I_SW_DUSW22 15/07/2020 11.000
Potassium mg/L DG_A_I_SW_DUSW22 6/10/2020 10.000
Potassium mg/L DG_A_I_SW_DUSW24 17/09/2020 130.000
Potassium mg/L DG_A_I_SW_DUSW24 13/10/2020 140.000
Radium 226 Bq/L DG_A_I_SW_DUSW05B 17/09/2020 0.020
Radium 226 Bq/L DG_A_I_SW_DUSW05B 13/10/2020 0.020
Radium 226 Bq/L DG_A_I_SW_DUSW14 15/07/2020 0.010
Radium 226 Bq/L DG_A_I_SW_DUSW14 6/10/2020 0.010 Radium 226 Bq/L DG_A_I_SW_DUSW19 26/11/2020 0.010 Radium 226 Bq/L DG_A_I_SW_DUSW20 14/09/2020 0.010 Radium 226 Bq/L DG_A_I_SW_DUSW20 8/10/2020 0.010 Radium 226 Bq/L DG_A_I_SW_DUSW22 15/07/2020 0.010
Radium 226 Bq/L DG_A_I_SW_DUSW22 6/10/2020 0.010 Radium 226 Bq/L DG_A_I_SW_DUSW24 17/09/2020 0.010
Radium 226 Bq/L DG_A_I_SW_DUSW24 13/10/2020 0.010
Radium 228 Bq/L DG_A_I_SW_DUSW05B 17/09/2020 0.130
Radium 228 Bq/L DG_A_I_SW_DUSW05B 13/10/2020 0.110

Iluka Resources Ltd Planning Permit 15-105: Mineral Sands By-Product Disposal (Pit 23)
EMP and Rehabilitation Performance Report – H2 2020 FINAL (Rev 0)
146
Variable Unit Sample Point Date Result
Radium 228 Bq/L DG_A_I_SW_DUSW14 15/07/2020 0.080 Radium 228 Bq/L DG_A_I_SW_DUSW14 6/10/2020 0.080 Radium 228 Bq/L DG_A_I_SW_DUSW19 26/11/2020 0.080 Radium 228 Bq/L DG_A_I_SW_DUSW20 14/09/2020 0.080 Radium 228 Bq/L DG_A_I_SW_DUSW20 8/10/2020 0.080 Radium 228 Bq/L DG_A_I_SW_DUSW22 15/07/2020 0.080 Radium 228 Bq/L DG_A_I_SW_DUSW22 6/10/2020 0.080 Radium 228 Bq/L DG_A_I_SW_DUSW24 17/09/2020 0.080 Radium 228 Bq/L DG_A_I_SW_DUSW24 13/10/2020 0.080 Selenium (Total) mg/L DG_A_I_SW_DUSW05B 17/09/2020 0.010 Selenium (Total) mg/L DG_A_I_SW_DUSW05B 13/10/2020 0.010 Selenium (Total) mg/L DG_A_I_SW_DUSW11 8/10/2020 0.001 Selenium (Total) mg/L DG_A_I_SW_DUSW14 15/07/2020 0.001 Selenium (Total) mg/L DG_A_I_SW_DUSW14 6/10/2020 0.001 Selenium (Total) mg/L DG_A_I_SW_DUSW19 26/11/2020 0.001 Selenium (Total) mg/L DG_A_I_SW_DUSW20 14/09/2020 0.001 Selenium (Total) mg/L DG_A_I_SW_DUSW20 8/10/2020 0.001 Selenium (Total) mg/L DG_A_I_SW_DUSW22 15/07/2020 0.001 Selenium (Total) mg/L DG_A_I_SW_DUSW22 6/10/2020 0.001 Selenium (Total) mg/L DG_A_I_SW_DUSW24 17/09/2020 0.001 Selenium (Total) mg/L DG_A_I_SW_DUSW24 13/10/2020 0.001 Selenium (Total) mg/L DG_A_I_SW_DUSW25 8/10/2020 0.001 Selenium (Total) mg/L DG_A_I_SW_DUSW27 8/10/2020 0.001 Silver (Total) mg/L DG_A_I_SW_DUSW05B 17/09/2020 0.010 Silver (Total) mg/L DG_A_I_SW_DUSW05B 13/10/2020 0.010 Silver (Total) mg/L DG_A_I_SW_DUSW11 8/10/2020 0.001 Silver (Total) mg/L DG_A_I_SW_DUSW14 15/07/2020 0.001 Silver (Total) mg/L DG_A_I_SW_DUSW14 6/10/2020 0.001 Silver (Total) mg/L DG_A_I_SW_DUSW19 26/11/2020 0.001 Silver (Total) mg/L DG_A_I_SW_DUSW20 14/09/2020 0.001 Silver (Total) mg/L DG_A_I_SW_DUSW20 8/10/2020 0.001 Silver (Total) mg/L DG_A_I_SW_DUSW22 15/07/2020 0.001 Silver (Total) mg/L DG_A_I_SW_DUSW22 6/10/2020 0.001 Silver (Total) mg/L DG_A_I_SW_DUSW24 17/09/2020 0.001 Silver (Total) mg/L DG_A_I_SW_DUSW24 13/10/2020 0.001 Silver (Total) mg/L DG_A_I_SW_DUSW25 8/10/2020 0.001 Silver (Total) mg/L DG_A_I_SW_DUSW27 8/10/2020 0.001 Sodium mg/L DG_A_I_SW_DUSW05B 17/09/2020 56000.000
Sodium mg/L DG_A_I_SW_DUSW05B 13/10/2020 52000.000
Sodium mg/L DG_A_I_SW_DUSW14 15/07/2020 1400.000
Sodium mg/L DG_A_I_SW_DUSW14 6/10/2020 900.000
Sodium mg/L DG_A_I_SW_DUSW19 26/11/2020 120.000
Sodium mg/L DG_A_I_SW_DUSW20 14/09/2020 46.000
Sodium mg/L DG_A_I_SW_DUSW20 8/10/2020 2100.000
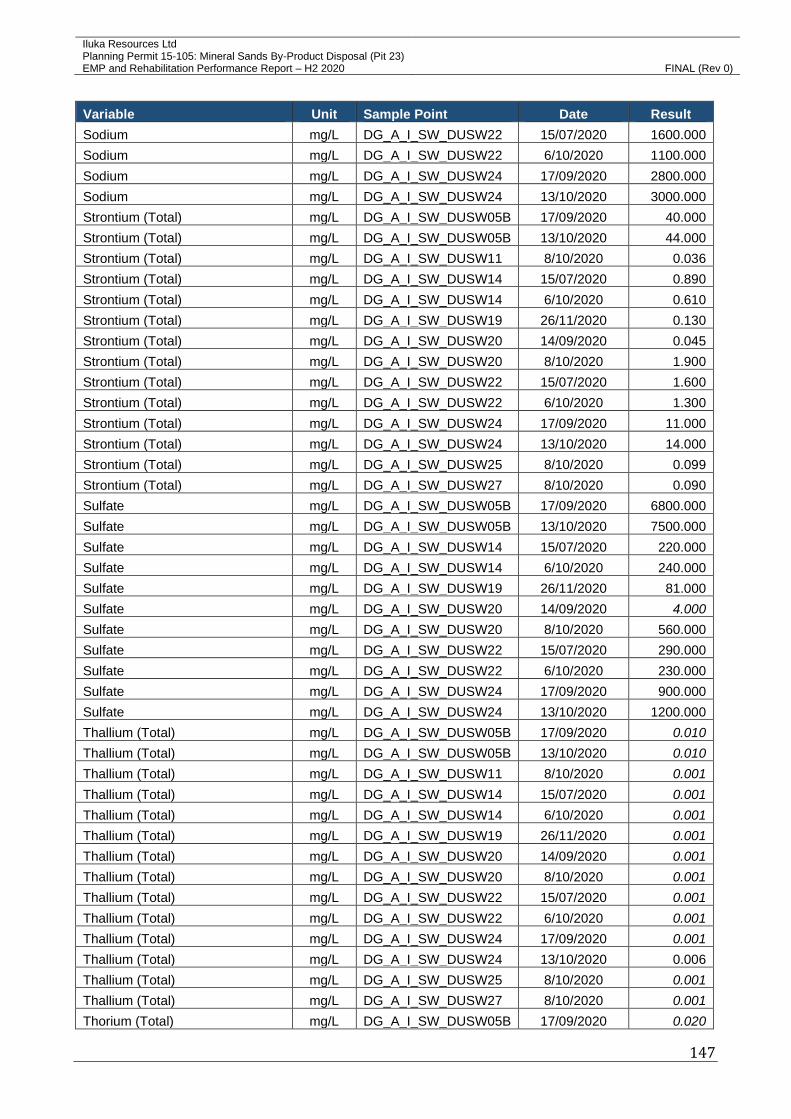
Iluka Resources Ltd Planning Permit 15-105: Mineral Sands By-Product Disposal (Pit 23)
EMP and Rehabilitation Performance Report – H2 2020 FINAL (Rev 0)
147
Variable Unit Sample Point Date Result
Sodium mg/L DG_A_I_SW_DUSW22 15/07/2020 1600.000
Sodium mg/L DG_A_I_SW_DUSW22 6/10/2020 1100.000
Sodium mg/L DG_A_I_SW_DUSW24 17/09/2020 2800.000
Sodium mg/L DG_A_I_SW_DUSW24 13/10/2020 3000.000
Strontium (Total) mg/L DG_A_I_SW_DUSW05B 17/09/2020 40.000
Strontium (Total) mg/L DG_A_I_SW_DUSW05B 13/10/2020 44.000
Strontium (Total) mg/L DG_A_I_SW_DUSW11 8/10/2020 0.036
Strontium (Total) mg/L DG_A_I_SW_DUSW14 15/07/2020 0.890
Strontium (Total) mg/L DG_A_I_SW_DUSW14 6/10/2020 0.610
Strontium (Total) mg/L DG_A_I_SW_DUSW19 26/11/2020 0.130
Strontium (Total) mg/L DG_A_I_SW_DUSW20 14/09/2020 0.045
Strontium (Total) mg/L DG_A_I_SW_DUSW20 8/10/2020 1.900
Strontium (Total) mg/L DG_A_I_SW_DUSW22 15/07/2020 1.600
Strontium (Total) mg/L DG_A_I_SW_DUSW22 6/10/2020 1.300
Strontium (Total) mg/L DG_A_I_SW_DUSW24 17/09/2020 11.000
Strontium (Total) mg/L DG_A_I_SW_DUSW24 13/10/2020 14.000
Strontium (Total) mg/L DG_A_I_SW_DUSW25 8/10/2020 0.099
Strontium (Total) mg/L DG_A_I_SW_DUSW27 8/10/2020 0.090
Sulfate mg/L DG_A_I_SW_DUSW05B 17/09/2020 6800.000
Sulfate mg/L DG_A_I_SW_DUSW05B 13/10/2020 7500.000
Sulfate mg/L DG_A_I_SW_DUSW14 15/07/2020 220.000
Sulfate mg/L DG_A_I_SW_DUSW14 6/10/2020 240.000
Sulfate mg/L DG_A_I_SW_DUSW19 26/11/2020 81.000
Sulfate mg/L DG_A_I_SW_DUSW20 14/09/2020 4.000 Sulfate mg/L DG_A_I_SW_DUSW20 8/10/2020 560.000
Sulfate mg/L DG_A_I_SW_DUSW22 15/07/2020 290.000
Sulfate mg/L DG_A_I_SW_DUSW22 6/10/2020 230.000
Sulfate mg/L DG_A_I_SW_DUSW24 17/09/2020 900.000
Sulfate mg/L DG_A_I_SW_DUSW24 13/10/2020 1200.000
Thallium (Total) mg/L DG_A_I_SW_DUSW05B 17/09/2020 0.010 Thallium (Total) mg/L DG_A_I_SW_DUSW05B 13/10/2020 0.010 Thallium (Total) mg/L DG_A_I_SW_DUSW11 8/10/2020 0.001 Thallium (Total) mg/L DG_A_I_SW_DUSW14 15/07/2020 0.001 Thallium (Total) mg/L DG_A_I_SW_DUSW14 6/10/2020 0.001 Thallium (Total) mg/L DG_A_I_SW_DUSW19 26/11/2020 0.001 Thallium (Total) mg/L DG_A_I_SW_DUSW20 14/09/2020 0.001 Thallium (Total) mg/L DG_A_I_SW_DUSW20 8/10/2020 0.001 Thallium (Total) mg/L DG_A_I_SW_DUSW22 15/07/2020 0.001 Thallium (Total) mg/L DG_A_I_SW_DUSW22 6/10/2020 0.001 Thallium (Total) mg/L DG_A_I_SW_DUSW24 17/09/2020 0.001 Thallium (Total) mg/L DG_A_I_SW_DUSW24 13/10/2020 0.006
Thallium (Total) mg/L DG_A_I_SW_DUSW25 8/10/2020 0.001 Thallium (Total) mg/L DG_A_I_SW_DUSW27 8/10/2020 0.001 Thorium (Total) mg/L DG_A_I_SW_DUSW05B 17/09/2020 0.020

Iluka Resources Ltd Planning Permit 15-105: Mineral Sands By-Product Disposal (Pit 23)
EMP and Rehabilitation Performance Report – H2 2020 FINAL (Rev 0)
148
Variable Unit Sample Point Date Result
Thorium (Total) mg/L DG_A_I_SW_DUSW05B 13/10/2020 0.020 Thorium (Total) mg/L DG_A_I_SW_DUSW11 8/10/2020 0.002 Thorium (Total) mg/L DG_A_I_SW_DUSW14 15/07/2020 0.002 Thorium (Total) mg/L DG_A_I_SW_DUSW14 6/10/2020 0.002 Thorium (Total) mg/L DG_A_I_SW_DUSW19 26/11/2020 0.002 Thorium (Total) mg/L DG_A_I_SW_DUSW20 14/09/2020 0.004
Thorium (Total) mg/L DG_A_I_SW_DUSW20 8/10/2020 0.002 Thorium (Total) mg/L DG_A_I_SW_DUSW22 15/07/2020 0.002 Thorium (Total) mg/L DG_A_I_SW_DUSW22 6/10/2020 0.002 Thorium (Total) mg/L DG_A_I_SW_DUSW24 17/09/2020 0.002 Thorium (Total) mg/L DG_A_I_SW_DUSW24 13/10/2020 0.002 Thorium (Total) mg/L DG_A_I_SW_DUSW25 8/10/2020 0.009
Thorium (Total) mg/L DG_A_I_SW_DUSW27 8/10/2020 0.002 Tin (Total) mg/L DG_A_I_SW_DUSW05B 17/09/2020 0.010 Tin (Total) mg/L DG_A_I_SW_DUSW05B 13/10/2020 0.010 Tin (Total) mg/L DG_A_I_SW_DUSW11 8/10/2020 0.001 Tin (Total) mg/L DG_A_I_SW_DUSW14 15/07/2020 0.001 Tin (Total) mg/L DG_A_I_SW_DUSW14 6/10/2020 0.001 Tin (Total) mg/L DG_A_I_SW_DUSW19 26/11/2020 0.001 Tin (Total) mg/L DG_A_I_SW_DUSW20 14/09/2020 0.001
Tin (Total) mg/L DG_A_I_SW_DUSW20 8/10/2020 0.001 Tin (Total) mg/L DG_A_I_SW_DUSW22 15/07/2020 0.001 Tin (Total) mg/L DG_A_I_SW_DUSW22 6/10/2020 0.001 Tin (Total) mg/L DG_A_I_SW_DUSW24 17/09/2020 0.001 Tin (Total) mg/L DG_A_I_SW_DUSW24 13/10/2020 0.001 Tin (Total) mg/L DG_A_I_SW_DUSW25 8/10/2020 0.002
Tin (Total) mg/L DG_A_I_SW_DUSW27 8/10/2020 0.001 Titanium (Total) mg/L DG_A_I_SW_DUSW05B 17/09/2020 0.010 Titanium (Total) mg/L DG_A_I_SW_DUSW05B 13/10/2020 0.020
Titanium (Total) mg/L DG_A_I_SW_DUSW11 8/10/2020 0.340
Titanium (Total) mg/L DG_A_I_SW_DUSW14 15/07/2020 0.010
Titanium (Total) mg/L DG_A_I_SW_DUSW14 6/10/2020 0.080
Titanium (Total) mg/L DG_A_I_SW_DUSW19 26/11/2020 0.003
Titanium (Total) mg/L DG_A_I_SW_DUSW20 14/09/2020 0.570
Titanium (Total) mg/L DG_A_I_SW_DUSW20 8/10/2020 0.010
Titanium (Total) mg/L DG_A_I_SW_DUSW22 15/07/2020 0.003
Titanium (Total) mg/L DG_A_I_SW_DUSW22 6/10/2020 0.002
Titanium (Total) mg/L DG_A_I_SW_DUSW24 17/09/2020 0.001
Titanium (Total) mg/L DG_A_I_SW_DUSW24 13/10/2020 0.001 Titanium (Total) mg/L DG_A_I_SW_DUSW25 8/10/2020 1.900
Titanium (Total) mg/L DG_A_I_SW_DUSW27 8/10/2020 0.190
Total Dissolved Solids mg/L DG_A_I_SW_DUSW05B 17/09/2020 170000.000
Total Dissolved Solids mg/L DG_A_I_SW_DUSW05B 13/10/2020 160000.000
Total Dissolved Solids mg/L DG_A_I_SW_DUSW11 8/10/2020 170.000

Iluka Resources Ltd Planning Permit 15-105: Mineral Sands By-Product Disposal (Pit 23)
EMP and Rehabilitation Performance Report – H2 2020 FINAL (Rev 0)
149
Variable Unit Sample Point Date Result
Total Dissolved Solids mg/L DG_A_I_SW_DUSW14 15/07/2020 4400.000
Total Dissolved Solids mg/L DG_A_I_SW_DUSW14 6/10/2020 3000.000
Total Dissolved Solids mg/L DG_A_I_SW_DUSW17 7/10/2020 3400.000
Total Dissolved Solids mg/L DG_A_I_SW_DUSW19 7/10/2020 590.000
Total Dissolved Solids mg/L DG_A_I_SW_DUSW19 26/11/2020 490.000
Total Dissolved Solids mg/L DG_A_I_SW_DUSW20 14/09/2020 460.000
Total Dissolved Solids mg/L DG_A_I_SW_DUSW20 8/10/2020 7700.000
Total Dissolved Solids mg/L DG_A_I_SW_DUSW22 15/07/2020 6300.000
Total Dissolved Solids mg/L DG_A_I_SW_DUSW22 6/10/2020 4900.000
Total Dissolved Solids mg/L DG_A_I_SW_DUSW24 17/09/2020 9900.000
Total Dissolved Solids mg/L DG_A_I_SW_DUSW24 13/10/2020 12000.000
Total Dissolved Solids mg/L DG_A_I_SW_DUSW25 8/10/2020 860.000
Total Dissolved Solids mg/L DG_A_I_SW_DUSW26 6/10/2020 2900.000
Total Dissolved Solids mg/L DG_A_I_SW_DUSW27 20/08/2020 370.000
Total Dissolved Solids mg/L DG_A_I_SW_DUSW27 8/10/2020 220.000
Total Kjeldahl Nitrogen mg/L DG_A_I_SW_DUSW05B 17/09/2020 1.000
Total Kjeldahl Nitrogen mg/L DG_A_I_SW_DUSW05B 13/10/2020 1.400
Total Kjeldahl Nitrogen mg/L DG_A_I_SW_DUSW11 8/10/2020 2.300
Total Kjeldahl Nitrogen mg/L DG_A_I_SW_DUSW14 15/07/2020 0.790
Total Kjeldahl Nitrogen mg/L DG_A_I_SW_DUSW14 6/10/2020 0.770
Total Kjeldahl Nitrogen mg/L DG_A_I_SW_DUSW17 7/10/2020 2.000
Total Kjeldahl Nitrogen mg/L DG_A_I_SW_DUSW19 7/10/2020 0.730
Total Kjeldahl Nitrogen mg/L DG_A_I_SW_DUSW19 26/11/2020 0.760
Total Kjeldahl Nitrogen mg/L DG_A_I_SW_DUSW20 14/09/2020 2.700
Total Kjeldahl Nitrogen mg/L DG_A_I_SW_DUSW20 8/10/2020 1.500
Total Kjeldahl Nitrogen mg/L DG_A_I_SW_DUSW22 15/07/2020 0.320
Total Kjeldahl Nitrogen mg/L DG_A_I_SW_DUSW22 6/10/2020 0.370
Total Kjeldahl Nitrogen mg/L DG_A_I_SW_DUSW24 17/09/2020 6.600
Total Kjeldahl Nitrogen mg/L DG_A_I_SW_DUSW24 13/10/2020 5.800
Total Kjeldahl Nitrogen mg/L DG_A_I_SW_DUSW25 8/10/2020 1.700
Total Kjeldahl Nitrogen mg/L DG_A_I_SW_DUSW26 6/10/2020 0.020 Total Kjeldahl Nitrogen mg/L DG_A_I_SW_DUSW27 20/08/2020 3.900
Total Kjeldahl Nitrogen mg/L DG_A_I_SW_DUSW27 8/10/2020 3.200
Total Oxidised Nitrogen as N mg/L DG_A_I_SW_DUSW05B 17/09/2020 0.100 Total Oxidised Nitrogen as N mg/L DG_A_I_SW_DUSW05B 13/10/2020 0.006 Total Oxidised Nitrogen as N mg/L DG_A_I_SW_DUSW14 15/07/2020 0.048
Total Oxidised Nitrogen as N mg/L DG_A_I_SW_DUSW14 6/10/2020 0.006 Total Oxidised Nitrogen as N mg/L DG_A_I_SW_DUSW19 26/11/2020 0.019
Total Oxidised Nitrogen as N mg/L DG_A_I_SW_DUSW20 14/09/2020 0.020 Total Oxidised Nitrogen as N mg/L DG_A_I_SW_DUSW20 8/10/2020 0.006 Total Oxidised Nitrogen as N mg/L DG_A_I_SW_DUSW22 15/07/2020 0.006 Total Oxidised Nitrogen as N mg/L DG_A_I_SW_DUSW22 6/10/2020 0.006 Total Oxidised Nitrogen as N mg/L DG_A_I_SW_DUSW24 17/09/2020 0.010 Total Oxidised Nitrogen as N mg/L DG_A_I_SW_DUSW24 13/10/2020 0.086

Iluka Resources Ltd Planning Permit 15-105: Mineral Sands By-Product Disposal (Pit 23)
EMP and Rehabilitation Performance Report – H2 2020 FINAL (Rev 0)
150
Variable Unit Sample Point Date Result
Total Suspended Solids mg/L DG_A_I_SW_DUSW05B 17/09/2020 280.000
Total Suspended Solids mg/L DG_A_I_SW_DUSW05B 13/10/2020 610.000
Total Suspended Solids mg/L DG_A_I_SW_DUSW11 8/10/2020 52.000
Total Suspended Solids mg/L DG_A_I_SW_DUSW14 15/07/2020 10.000
Total Suspended Solids mg/L DG_A_I_SW_DUSW14 6/10/2020 16.000
Total Suspended Solids mg/L DG_A_I_SW_DUSW17 7/10/2020 190.000
Total Suspended Solids mg/L DG_A_I_SW_DUSW19 7/10/2020 7.000
Total Suspended Solids mg/L DG_A_I_SW_DUSW19 26/11/2020 12.000
Total Suspended Solids mg/L DG_A_I_SW_DUSW20 14/09/2020 180.000
Total Suspended Solids mg/L DG_A_I_SW_DUSW20 8/10/2020 2.000
Total Suspended Solids mg/L DG_A_I_SW_DUSW22 15/07/2020 4.000
Total Suspended Solids mg/L DG_A_I_SW_DUSW22 6/10/2020 1.000 Total Suspended Solids mg/L DG_A_I_SW_DUSW23 15/07/2020 54.000
Total Suspended Solids mg/L DG_A_I_SW_DUSW24 17/09/2020 10.000
Total Suspended Solids mg/L DG_A_I_SW_DUSW24 13/10/2020 24.000
Total Suspended Solids mg/L DG_A_I_SW_DUSW25 8/10/2020 250.000
Total Suspended Solids mg/L DG_A_I_SW_DUSW26 6/10/2020 36.000
Total Suspended Solids mg/L DG_A_I_SW_DUSW27 20/08/2020 32.000
Total Suspended Solids mg/L DG_A_I_SW_DUSW27 8/10/2020 43.000
Turbidity NTU DG_A_I_SW_DUSW17 7/10/2020 2700.000
Turbidity NTU DG_A_I_SW_DUSW19 7/10/2020 81.000
Turbidity NTU DG_A_I_SW_DUSW26 6/10/2020 2200.000
Turbidity NTU DG_A_I_SW_DUSW27 20/08/2020 180.000
Uranium (Total) mg/L DG_A_I_SW_DUSW05B 17/09/2020 0.010 Uranium (Total) mg/L DG_A_I_SW_DUSW05B 13/10/2020 0.002 Uranium (Total) mg/L DG_A_I_SW_DUSW05B 13/10/2020 0.010 Uranium (Total) mg/L DG_A_I_SW_DUSW11 8/10/2020 0.001 Uranium (Total) mg/L DG_A_I_SW_DUSW14 15/07/2020 0.002 Uranium (Total) mg/L DG_A_I_SW_DUSW14 15/07/2020 0.001 Uranium (Total) mg/L DG_A_I_SW_DUSW14 6/10/2020 0.002 Uranium (Total) mg/L DG_A_I_SW_DUSW14 6/10/2020 0.001 Uranium (Total) mg/L DG_A_I_SW_DUSW19 26/11/2020 0.002 Uranium (Total) mg/L DG_A_I_SW_DUSW19 26/11/2020 0.001 Uranium (Total) mg/L DG_A_I_SW_DUSW20 14/09/2020 0.001 Uranium (Total) mg/L DG_A_I_SW_DUSW20 8/10/2020 0.002 Uranium (Total) mg/L DG_A_I_SW_DUSW20 8/10/2020 0.001 Uranium (Total) mg/L DG_A_I_SW_DUSW22 15/07/2020 0.002 Uranium (Total) mg/L DG_A_I_SW_DUSW22 15/07/2020 0.001 Uranium (Total) mg/L DG_A_I_SW_DUSW22 6/10/2020 0.002 Uranium (Total) mg/L DG_A_I_SW_DUSW22 6/10/2020 0.001 Uranium (Total) mg/L DG_A_I_SW_DUSW24 17/09/2020 0.004
Uranium (Total) mg/L DG_A_I_SW_DUSW24 17/09/2020 0.007
Uranium (Total) mg/L DG_A_I_SW_DUSW24 13/10/2020 0.002 Uranium (Total) mg/L DG_A_I_SW_DUSW24 13/10/2020 0.004

Iluka Resources Ltd Planning Permit 15-105: Mineral Sands By-Product Disposal (Pit 23)
EMP and Rehabilitation Performance Report – H2 2020 FINAL (Rev 0)
151
Variable Unit Sample Point Date Result
Uranium (Total) mg/L DG_A_I_SW_DUSW25 8/10/2020 0.002
Uranium (Total) mg/L DG_A_I_SW_DUSW27 8/10/2020 0.001 Uranium 238 Bq/L DG_A_I_SW_DUSW05B 13/10/2020 0.025 Uranium 238 Bq/L DG_A_I_SW_DUSW14 15/07/2020 0.025 Uranium 238 Bq/L DG_A_I_SW_DUSW14 6/10/2020 0.025 Uranium 238 Bq/L DG_A_I_SW_DUSW19 26/11/2020 0.025 Uranium 238 Bq/L DG_A_I_SW_DUSW20 14/09/2020 0.025 Uranium 238 Bq/L DG_A_I_SW_DUSW20 8/10/2020 0.025 Uranium 238 Bq/L DG_A_I_SW_DUSW22 15/07/2020 0.025 Uranium 238 Bq/L DG_A_I_SW_DUSW22 6/10/2020 0.025 Uranium 238 Bq/L DG_A_I_SW_DUSW24 17/09/2020 0.049
Uranium 238 Bq/L DG_A_I_SW_DUSW24 13/10/2020 0.025 Vanadium (Total) mg/L DG_A_I_SW_DUSW05B 17/09/2020 0.010 Vanadium (Total) mg/L DG_A_I_SW_DUSW05B 13/10/2020 0.020
Vanadium (Total) mg/L DG_A_I_SW_DUSW11 8/10/2020 0.013
Vanadium (Total) mg/L DG_A_I_SW_DUSW14 15/07/2020 0.001 Vanadium (Total) mg/L DG_A_I_SW_DUSW14 6/10/2020 0.003
Vanadium (Total) mg/L DG_A_I_SW_DUSW19 26/11/2020 0.002
Vanadium (Total) mg/L DG_A_I_SW_DUSW20 14/09/2020 0.029
Vanadium (Total) mg/L DG_A_I_SW_DUSW20 8/10/2020 0.001
Vanadium (Total) mg/L DG_A_I_SW_DUSW22 15/07/2020 0.001 Vanadium (Total) mg/L DG_A_I_SW_DUSW22 6/10/2020 0.001 Vanadium (Total) mg/L DG_A_I_SW_DUSW24 17/09/2020 0.007
Vanadium (Total) mg/L DG_A_I_SW_DUSW24 13/10/2020 0.003
Vanadium (Total) mg/L DG_A_I_SW_DUSW25 8/10/2020 0.082
Vanadium (Total) mg/L DG_A_I_SW_DUSW27 8/10/2020 0.010
Zinc (Total) mg/L DG_A_I_SW_DUSW05B 17/09/2020 0.010 Zinc (Total) mg/L DG_A_I_SW_DUSW05B 13/10/2020 0.010 Zinc (Total) mg/L DG_A_I_SW_DUSW11 8/10/2020 0.022
Zinc (Total) mg/L DG_A_I_SW_DUSW14 15/07/2020 0.004
Zinc (Total) mg/L DG_A_I_SW_DUSW14 6/10/2020 0.006
Zinc (Total) mg/L DG_A_I_SW_DUSW19 26/11/2020 0.002
Zinc (Total) mg/L DG_A_I_SW_DUSW20 14/09/2020 0.120
Zinc (Total) mg/L DG_A_I_SW_DUSW20 8/10/2020 0.039
Zinc (Total) mg/L DG_A_I_SW_DUSW22 15/07/2020 0.007
Zinc (Total) mg/L DG_A_I_SW_DUSW22 6/10/2020 0.009
Zinc (Total) mg/L DG_A_I_SW_DUSW24 17/09/2020 0.007
Zinc (Total) mg/L DG_A_I_SW_DUSW24 13/10/2020 0.003
Zinc (Total) mg/L DG_A_I_SW_DUSW25 8/10/2020 0.029
Zinc (Total) mg/L DG_A_I_SW_DUSW27 8/10/2020 0.023
Results that are italicised represent less than values i.e. 0.001 = <0.001
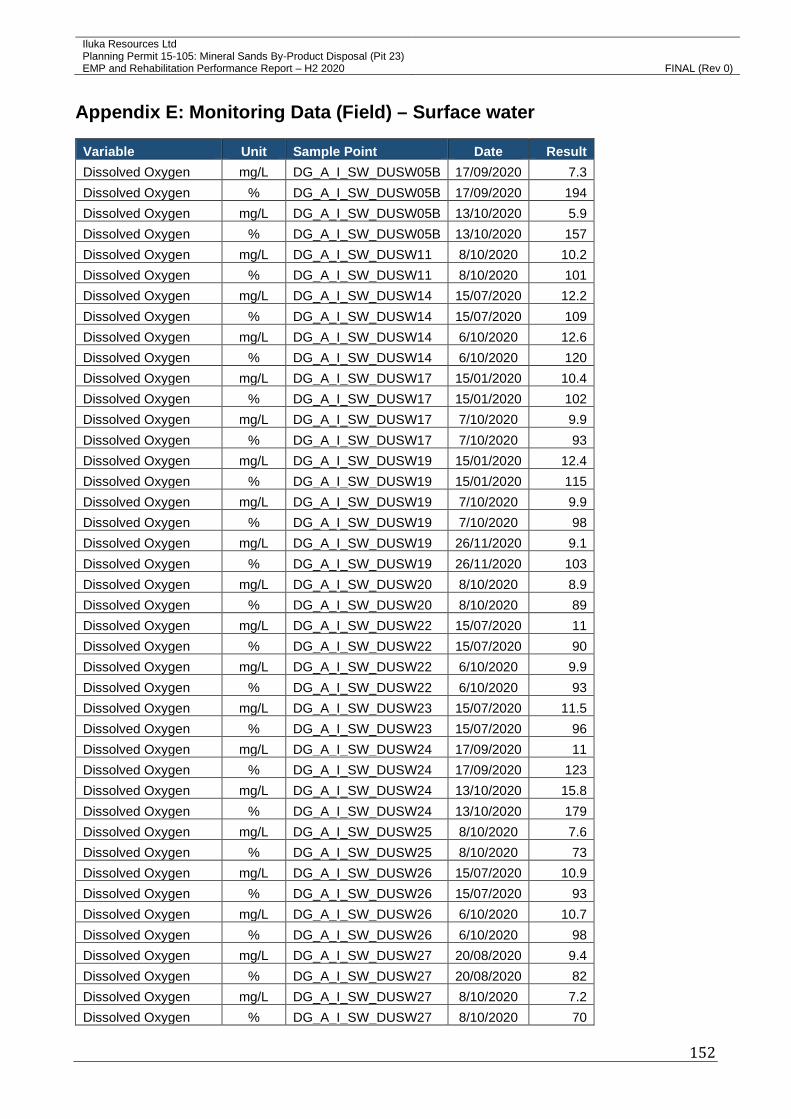
Iluka Resources Ltd Planning Permit 15-105: Mineral Sands By-Product Disposal (Pit 23)
EMP and Rehabilitation Performance Report – H2 2020 FINAL (Rev 0)
152
Appendix E: Monitoring Data (Field) – Surface water
Variable Unit Sample Point Date Result
Dissolved Oxygen mg/L DG_A_I_SW_DUSW05B 17/09/2020 7.3
Dissolved Oxygen % DG_A_I_SW_DUSW05B 17/09/2020 194
Dissolved Oxygen mg/L DG_A_I_SW_DUSW05B 13/10/2020 5.9
Dissolved Oxygen % DG_A_I_SW_DUSW05B 13/10/2020 157
Dissolved Oxygen mg/L DG_A_I_SW_DUSW11 8/10/2020 10.2
Dissolved Oxygen % DG_A_I_SW_DUSW11 8/10/2020 101
Dissolved Oxygen mg/L DG_A_I_SW_DUSW14 15/07/2020 12.2
Dissolved Oxygen % DG_A_I_SW_DUSW14 15/07/2020 109
Dissolved Oxygen mg/L DG_A_I_SW_DUSW14 6/10/2020 12.6
Dissolved Oxygen % DG_A_I_SW_DUSW14 6/10/2020 120
Dissolved Oxygen mg/L DG_A_I_SW_DUSW17 15/01/2020 10.4
Dissolved Oxygen % DG_A_I_SW_DUSW17 15/01/2020 102
Dissolved Oxygen mg/L DG_A_I_SW_DUSW17 7/10/2020 9.9
Dissolved Oxygen % DG_A_I_SW_DUSW17 7/10/2020 93
Dissolved Oxygen mg/L DG_A_I_SW_DUSW19 15/01/2020 12.4
Dissolved Oxygen % DG_A_I_SW_DUSW19 15/01/2020 115
Dissolved Oxygen mg/L DG_A_I_SW_DUSW19 7/10/2020 9.9
Dissolved Oxygen % DG_A_I_SW_DUSW19 7/10/2020 98
Dissolved Oxygen mg/L DG_A_I_SW_DUSW19 26/11/2020 9.1
Dissolved Oxygen % DG_A_I_SW_DUSW19 26/11/2020 103
Dissolved Oxygen mg/L DG_A_I_SW_DUSW20 8/10/2020 8.9
Dissolved Oxygen % DG_A_I_SW_DUSW20 8/10/2020 89
Dissolved Oxygen mg/L DG_A_I_SW_DUSW22 15/07/2020 11
Dissolved Oxygen % DG_A_I_SW_DUSW22 15/07/2020 90
Dissolved Oxygen mg/L DG_A_I_SW_DUSW22 6/10/2020 9.9
Dissolved Oxygen % DG_A_I_SW_DUSW22 6/10/2020 93
Dissolved Oxygen mg/L DG_A_I_SW_DUSW23 15/07/2020 11.5
Dissolved Oxygen % DG_A_I_SW_DUSW23 15/07/2020 96
Dissolved Oxygen mg/L DG_A_I_SW_DUSW24 17/09/2020 11
Dissolved Oxygen % DG_A_I_SW_DUSW24 17/09/2020 123
Dissolved Oxygen mg/L DG_A_I_SW_DUSW24 13/10/2020 15.8
Dissolved Oxygen % DG_A_I_SW_DUSW24 13/10/2020 179
Dissolved Oxygen mg/L DG_A_I_SW_DUSW25 8/10/2020 7.6
Dissolved Oxygen % DG_A_I_SW_DUSW25 8/10/2020 73
Dissolved Oxygen mg/L DG_A_I_SW_DUSW26 15/07/2020 10.9
Dissolved Oxygen % DG_A_I_SW_DUSW26 15/07/2020 93
Dissolved Oxygen mg/L DG_A_I_SW_DUSW26 6/10/2020 10.7
Dissolved Oxygen % DG_A_I_SW_DUSW26 6/10/2020 98
Dissolved Oxygen mg/L DG_A_I_SW_DUSW27 20/08/2020 9.4
Dissolved Oxygen % DG_A_I_SW_DUSW27 20/08/2020 82
Dissolved Oxygen mg/L DG_A_I_SW_DUSW27 8/10/2020 7.2
Dissolved Oxygen % DG_A_I_SW_DUSW27 8/10/2020 70
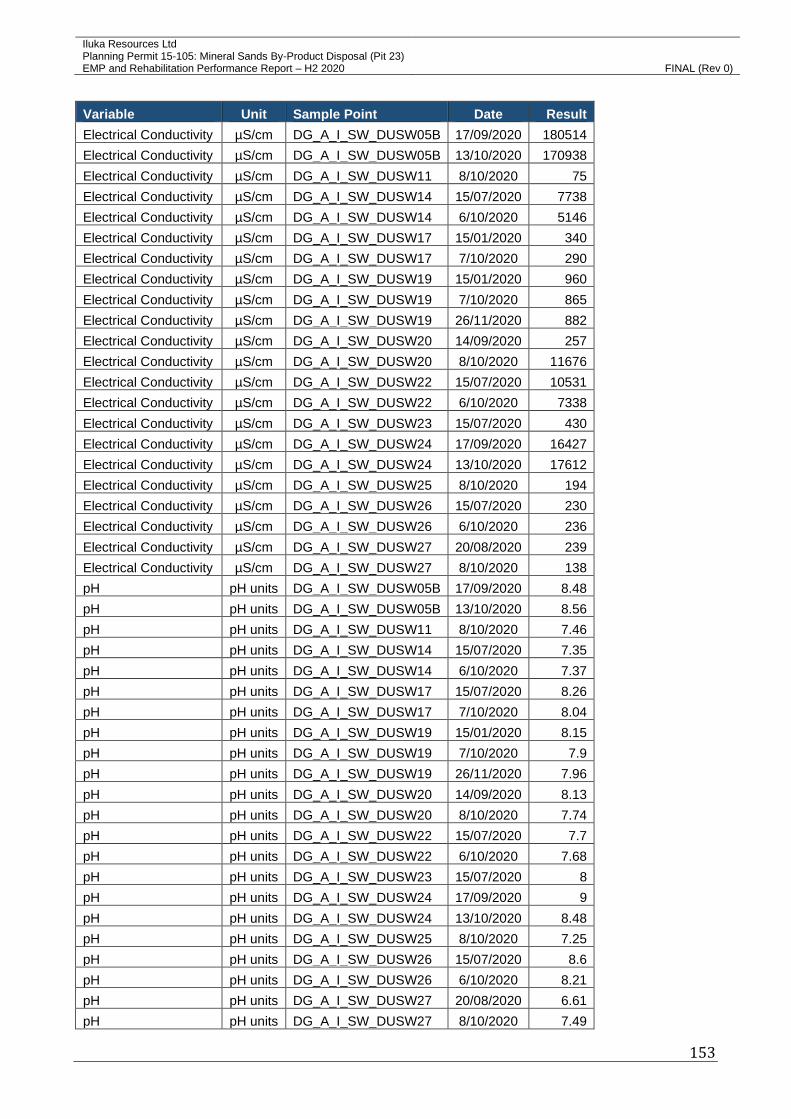
Iluka Resources Ltd Planning Permit 15-105: Mineral Sands By-Product Disposal (Pit 23)
EMP and Rehabilitation Performance Report – H2 2020 FINAL (Rev 0)
153
Variable Unit Sample Point Date Result
Electrical Conductivity µS/cm DG_A_I_SW_DUSW05B 17/09/2020 180514
Electrical Conductivity µS/cm DG_A_I_SW_DUSW05B 13/10/2020 170938
Electrical Conductivity µS/cm DG_A_I_SW_DUSW11 8/10/2020 75
Electrical Conductivity µS/cm DG_A_I_SW_DUSW14 15/07/2020 7738
Electrical Conductivity µS/cm DG_A_I_SW_DUSW14 6/10/2020 5146
Electrical Conductivity µS/cm DG_A_I_SW_DUSW17 15/01/2020 340
Electrical Conductivity µS/cm DG_A_I_SW_DUSW17 7/10/2020 290
Electrical Conductivity µS/cm DG_A_I_SW_DUSW19 15/01/2020 960
Electrical Conductivity µS/cm DG_A_I_SW_DUSW19 7/10/2020 865
Electrical Conductivity µS/cm DG_A_I_SW_DUSW19 26/11/2020 882
Electrical Conductivity µS/cm DG_A_I_SW_DUSW20 14/09/2020 257
Electrical Conductivity µS/cm DG_A_I_SW_DUSW20 8/10/2020 11676
Electrical Conductivity µS/cm DG_A_I_SW_DUSW22 15/07/2020 10531
Electrical Conductivity µS/cm DG_A_I_SW_DUSW22 6/10/2020 7338
Electrical Conductivity µS/cm DG_A_I_SW_DUSW23 15/07/2020 430
Electrical Conductivity µS/cm DG_A_I_SW_DUSW24 17/09/2020 16427
Electrical Conductivity µS/cm DG_A_I_SW_DUSW24 13/10/2020 17612
Electrical Conductivity µS/cm DG_A_I_SW_DUSW25 8/10/2020 194
Electrical Conductivity µS/cm DG_A_I_SW_DUSW26 15/07/2020 230
Electrical Conductivity µS/cm DG_A_I_SW_DUSW26 6/10/2020 236
Electrical Conductivity µS/cm DG_A_I_SW_DUSW27 20/08/2020 239
Electrical Conductivity µS/cm DG_A_I_SW_DUSW27 8/10/2020 138
pH pH units DG_A_I_SW_DUSW05B 17/09/2020 8.48
pH pH units DG_A_I_SW_DUSW05B 13/10/2020 8.56
pH pH units DG_A_I_SW_DUSW11 8/10/2020 7.46
pH pH units DG_A_I_SW_DUSW14 15/07/2020 7.35
pH pH units DG_A_I_SW_DUSW14 6/10/2020 7.37
pH pH units DG_A_I_SW_DUSW17 15/07/2020 8.26
pH pH units DG_A_I_SW_DUSW17 7/10/2020 8.04
pH pH units DG_A_I_SW_DUSW19 15/01/2020 8.15
pH pH units DG_A_I_SW_DUSW19 7/10/2020 7.9
pH pH units DG_A_I_SW_DUSW19 26/11/2020 7.96
pH pH units DG_A_I_SW_DUSW20 14/09/2020 8.13
pH pH units DG_A_I_SW_DUSW20 8/10/2020 7.74
pH pH units DG_A_I_SW_DUSW22 15/07/2020 7.7
pH pH units DG_A_I_SW_DUSW22 6/10/2020 7.68
pH pH units DG_A_I_SW_DUSW23 15/07/2020 8
pH pH units DG_A_I_SW_DUSW24 17/09/2020 9
pH pH units DG_A_I_SW_DUSW24 13/10/2020 8.48
pH pH units DG_A_I_SW_DUSW25 8/10/2020 7.25
pH pH units DG_A_I_SW_DUSW26 15/07/2020 8.6
pH pH units DG_A_I_SW_DUSW26 6/10/2020 8.21
pH pH units DG_A_I_SW_DUSW27 20/08/2020 6.61
pH pH units DG_A_I_SW_DUSW27 8/10/2020 7.49

Iluka Resources Ltd Planning Permit 15-105: Mineral Sands By-Product Disposal (Pit 23)
EMP and Rehabilitation Performance Report – H2 2020 FINAL (Rev 0)
154
Variable Unit Sample Point Date Result
Redox Potential (Eh) mV DG_A_I_SW_DUSW05B 17/09/2020 210
Redox Potential (Eh) mV DG_A_I_SW_DUSW05B 13/10/2020 211
Redox Potential (Eh) mV DG_A_I_SW_DUSW11 8/10/2020 244
Redox Potential (Eh) mV DG_A_I_SW_DUSW14 15/07/2020 180
Redox Potential (Eh) mV DG_A_I_SW_DUSW14 6/10/2020 162
Redox Potential (Eh) mV DG_A_I_SW_DUSW17 15/01/2020 258
Redox Potential (Eh) mV DG_A_I_SW_DUSW17 7/10/2020 203
Redox Potential (Eh) mV DG_A_I_SW_DUSW19 15/01/2020 221
Redox Potential (Eh) mV DG_A_I_SW_DUSW19 7/10/2020 185
Redox Potential (Eh) mV DG_A_I_SW_DUSW19 26/11/2020 121
Redox Potential (Eh) mV DG_A_I_SW_DUSW20 14/09/2020 246
Redox Potential (Eh) mV DG_A_I_SW_DUSW20 8/10/2020 186
Redox Potential (Eh) mV DG_A_I_SW_DUSW22 15/07/2020 76
Redox Potential (Eh) mV DG_A_I_SW_DUSW22 6/10/2020 178
Redox Potential (Eh) mV DG_A_I_SW_DUSW23 15/07/2020 186
Redox Potential (Eh) mV DG_A_I_SW_DUSW24 17/09/2020 125
Redox Potential (Eh) mV DG_A_I_SW_DUSW24 13/10/2020 166
Redox Potential (Eh) mV DG_A_I_SW_DUSW25 8/10/2020 217
Redox Potential (Eh) mV DG_A_I_SW_DUSW26 15/07/2020 134
Redox Potential (Eh) mV DG_A_I_SW_DUSW26 6/10/2020 200
Redox Potential (Eh) mV DG_A_I_SW_DUSW27 20/08/2020 211
Redox Potential (Eh) mV DG_A_I_SW_DUSW27 8/10/2020 192
Temperature (Water) °C DG_A_I_SW_DUSW05B 17/09/2020 17.5
Temperature (Water) °C DG_A_I_SW_DUSW05B 13/10/2020 21.4
Temperature (Water) °C DG_A_I_SW_DUSW11 8/10/2020 13.3
Temperature (Water) °C DG_A_I_SW_DUSW14 15/07/2020 8.9
Temperature (Water) °C DG_A_I_SW_DUSW14 6/10/2020 11.8
Temperature (Water) °C DG_A_I_SW_DUSW17 15/01/2020 11.7
Temperature (Water) °C DG_A_I_SW_DUSW17 7/10/2020 11.9
Temperature (Water) °C DG_A_I_SW_DUSW19 15/01/2020 11.2
Temperature (Water) °C DG_A_I_SW_DUSW19 7/10/2020 13.7
Temperature (Water) °C DG_A_I_SW_DUSW19 26/11/2020 20.6
Temperature (Water) °C DG_A_I_SW_DUSW20 14/09/2020 12.2
Temperature (Water) °C DG_A_I_SW_DUSW20 8/10/2020 12.1
Temperature (Water) °C DG_A_I_SW_DUSW22 15/07/2020 4.8
Temperature (Water) °C DG_A_I_SW_DUSW22 6/10/2020 11.5
Temperature (Water) °C DG_A_I_SW_DUSW23 15/07/2020 6.9
Temperature (Water) °C DG_A_I_SW_DUSW24 17/09/2020 13.7
Temperature (Water) °C DG_A_I_SW_DUSW24 13/10/2020 17.9
Temperature (Water) °C DG_A_I_SW_DUSW25 8/10/2020 11.4
Temperature (Water) °C DG_A_I_SW_DUSW26 15/07/2020 7.5
Temperature (Water) °C DG_A_I_SW_DUSW26 6/10/2020 11
Temperature (Water) °C DG_A_I_SW_DUSW27 20/08/2020 8.1
Temperature (Water) °C DG_A_I_SW_DUSW27 8/10/2020 11.8

Iluka Resources Ltd Planning Permit 15-105: Mineral Sands By-Product Disposal (Pit 23)
EMP and Rehabilitation Performance Report – H2 2020 FINAL (Rev 0)
155
Variable Unit Sample Point Date Result
Turbidity NTU DG_A_I_SW_DUSW05B 17/09/2020 102
Turbidity NTU DG_A_I_SW_DUSW05B 13/10/2020 174
Turbidity NTU DG_A_I_SW_DUSW11 8/10/2020 136
Turbidity NTU DG_A_I_SW_DUSW14 15/07/2020 38.8
Turbidity NTU DG_A_I_SW_DUSW14 6/10/2020 42.6
Turbidity NTU DG_A_I_SW_DUSW17 15/07/2020 2600
Turbidity NTU DG_A_I_SW_DUSW17 7/10/2020 2700
Turbidity NTU DG_A_I_SW_DUSW19 15/01/2020 24.9
Turbidity NTU DG_A_I_SW_DUSW19 7/10/2020 75
Turbidity NTU DG_A_I_SW_DUSW19 26/11/2020 26.1
Turbidity NTU DG_A_I_SW_DUSW20 14/09/2020 164
Turbidity NTU DG_A_I_SW_DUSW20 8/10/2020 59.2
Turbidity NTU DG_A_I_SW_DUSW22 15/07/2020 5.8
Turbidity NTU DG_A_I_SW_DUSW22 6/10/2020 5.4
Turbidity NTU DG_A_I_SW_DUSW23 15/07/2020 566
Turbidity NTU DG_A_I_SW_DUSW24 17/09/2020 6.6
Turbidity NTU DG_A_I_SW_DUSW24 13/10/2020 6.1
Turbidity NTU DG_A_I_SW_DUSW25 8/10/2020 781
Turbidity NTU DG_A_I_SW_DUSW26 15/07/2020 897
Turbidity NTU DG_A_I_SW_DUSW26 6/10/2020 867
Turbidity NTU DG_A_I_SW_DUSW27 8/10/2020 208
September 2021 19121052-011-R-Rev0
APPENDIX E
Important Information

GOLDER ASSOCIATES PTY LTD IMPORTANT INFORMATION RELATING TO THIS REPORT
Error! Unknown document property name.Page 1 of 1 GAP Form No. LEG04 RL2
May 2021
The document (“Report”) to which this page is attached and which this page forms a part of, has been issued
by Golder Associates Pty Ltd (“Golder”) subject to the important limitations and other qualifications set out below.
This Report constitutes or is part of services (“Services”) provided by Golder to its client (“Client”) under and subject
to a contract between Golder and its Client (“Contract”). The contents of this page are not intended to and do not
alter Golder’s obligations (including any limits on those obligations) to its Client under the Contract.
This Report is provided for use solely by Golder’s Client and persons acting on the Client’s behalf, such as its
professional advisers. Golder is responsible only to its Client for this Report. Golder has no responsibility to any other
person who relies or makes decisions based upon this Report or who makes any other use of this Report. Golder
accepts no responsibility for any loss or damage suffered by any person other than its Client as a result of any
reliance upon any part of this Report, decisions made based upon this Report or any other use of it.
This Report has been prepared in the context of the circumstances and purposes referred to in, or derived from,
the Contract and Golder accepts no responsibility for use of the Report, in whole or in part, in any other context
or circumstance or for any other purpose.
The scope of Golder’s Services and the period of time they relate to are determined by the Contract and are subject to restrictions and limitations set out in the Contract. If a service or other work is not expressly referred to in this Report, do not assume that it has been provided or performed. If a matter is not addressed in this Report, do not assume that any determination has been made by Golder in regards to it.
At any location relevant to the Services conditions may exist which were not detected by Golder, in particular due to
the specific scope of the investigation Golder has been engaged to undertake. Conditions can only be verified at the
exact location of any tests undertaken. Variations in conditions may occur between tested locations and there may
be conditions which have not been revealed by the investigation and which have not therefore been taken into account
in this Report.
Golder accepts no responsibility for and makes no representation as to the accuracy or completeness of the
information provided to it by or on behalf of the Client or sourced from any third party. Golder has assumed that such
information is correct unless otherwise stated and no responsibility is accepted by Golder for incomplete or
inaccurate data supplied by its Client or any other person for whom Golder is not responsible. Golder has not taken
account of matters that may have existed when the Report was prepared but which were only later disclosed to
Golder.
Having regard to the matters referred to in the previous paragraphs on this page in particular, carrying out the
Services has allowed Golder to form no more than an opinion as to the actual conditions at any relevant location.
That opinion is necessarily constrained by the extent of the information collected by Golder or otherwise made
available to Golder. Further, the passage of time may affect the accuracy, applicability or usefulness of the opinions,
assessments or other information in this Report. This Report is based upon the information and other circumstances
that existed and were known to Golder when the Services were performed and this Report was prepared.
Golder has not considered the effect of any possible future developments including physical changes to any
relevant location or changes to any laws or regulations relevant to such location.
Where permitted by the Contract, Golder may have retained subconsultants affiliated with Golder to provide some or all of the Services. However, it is Golder which remains solely responsible for the Services and there is no legal recourse against any of Golder’s affiliated companies or the employees, officers or directors of any of them.
By date, or revision, the Report supersedes any prior report or other document issued by Golder dealing with any
matter that is addressed in the Report.
Any uncertainty as to the extent to which this Report can be used or relied upon in any respect should be
referred to Golder for clarification

golder.com