Embed Size (px)
Citation preview
1
ECONOMICS
Student Learning
Assessment
Report:
Spring 2016
2
Contents Spring 2016 Student Learning Assessment Report: BS in Economics ...................................................................................................................................................................... 3
Spring 2016 Student Learning Assessment Report: MS in Economics ................................................................................................................................................................... 13
3
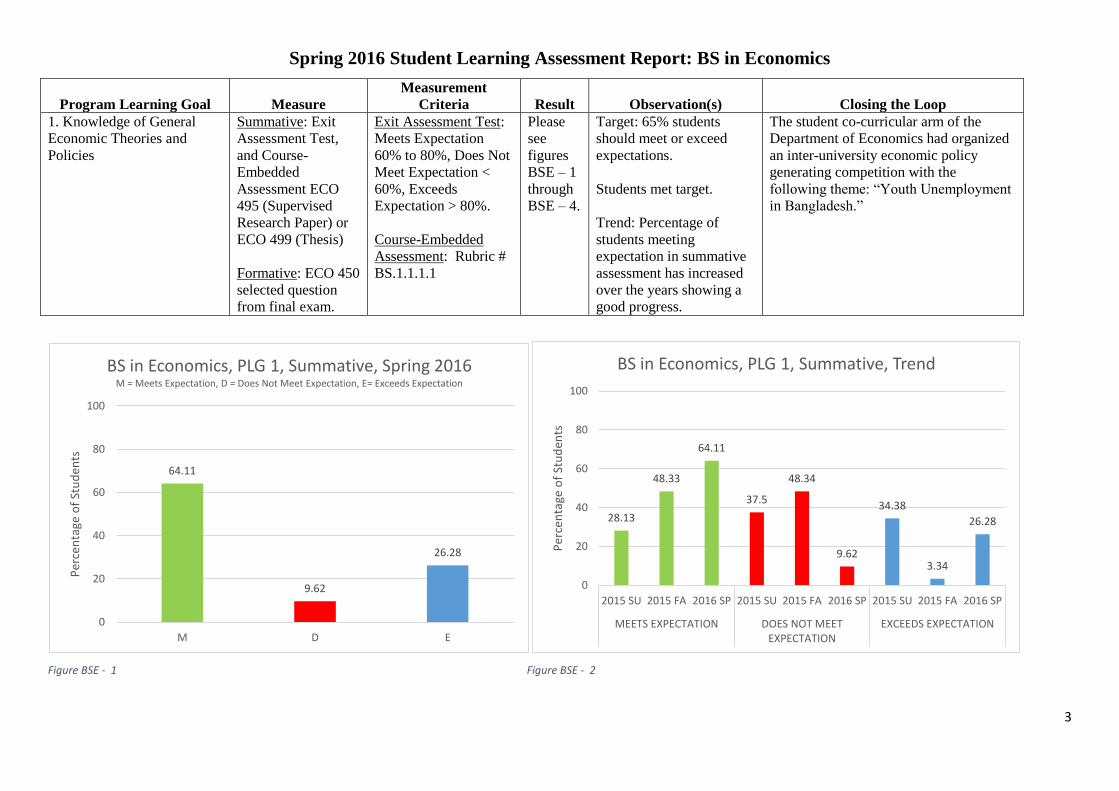
Spring 2016 Student Learning Assessment Report: BS in Economics
Program Learning Goal Measure
Measurement
Criteria Result Observation(s) Closing the Loop
1. Knowledge of General
Economic Theories and
Policies
Summative: Exit
Assessment Test,
and Course-
Embedded
Assessment ECO
495 (Supervised
Research Paper) or
ECO 499 (Thesis)
Formative: ECO 450
selected question
from final exam.
Exit Assessment Test:
Meets Expectation
60% to 80%, Does Not
Meet Expectation <
60%, Exceeds
Expectation > 80%.
Course-Embedded
Assessment: Rubric #
BS.1.1.1.1
Please
see
figures
BSE – 1
through
BSE – 4.
Target: 65% students
should meet or exceed
expectations.
Students met target.
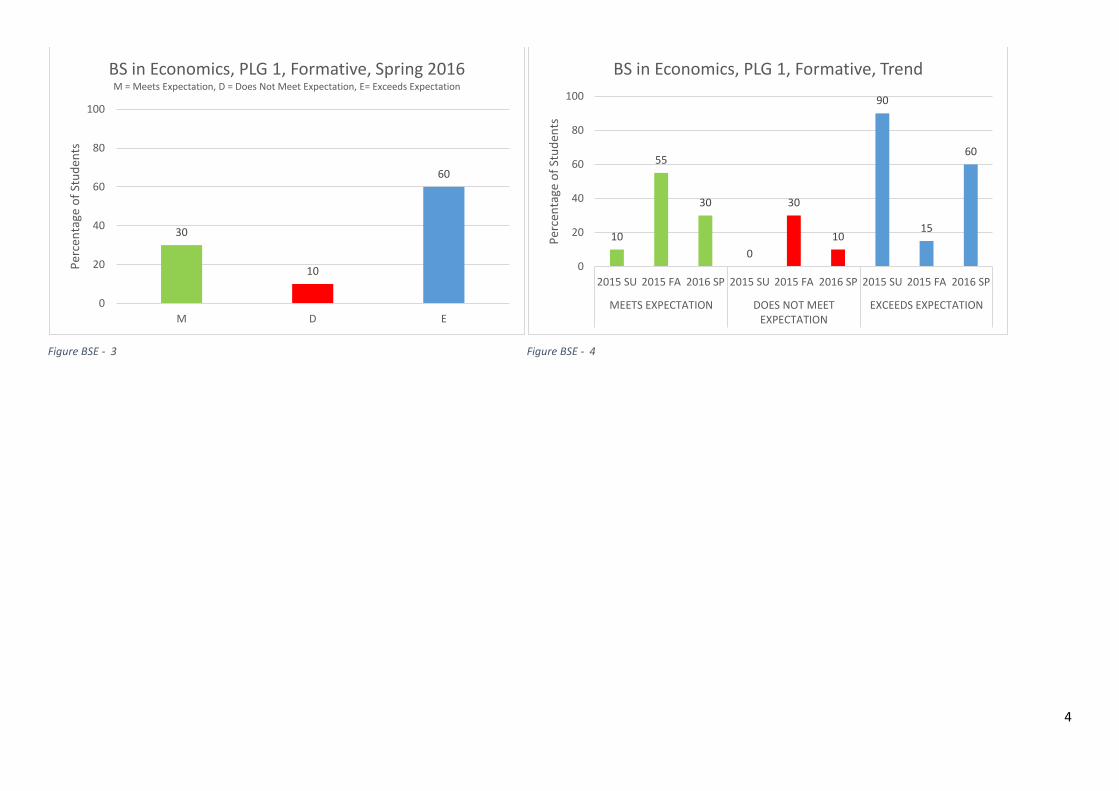
Trend: Percentage of
students meeting
expectation in summative
assessment has increased
over the years showing a
good progress.
The student co-curricular arm of the
Department of Economics had organized
an inter-university economic policy
generating competition with the
following theme: “Youth Unemployment
in Bangladesh.”
Figure BSE - 1 Figure BSE - 2
64.11
9.62
26.28
0
20
40
60
80
100
M D E
Per
cen
tage
of
Stu
den
ts
BS in Economics, PLG 1, Summative, Spring 2016M = Meets Expectation, D = Does Not Meet Expectation, E= Exceeds Expectation
28.13
48.33
64.11
37.5
48.34
9.62
34.38
3.34
26.28
0
20
40
60
80
100
2015 SU 2015 FA 2016 SP 2015 SU 2015 FA 2016 SP 2015 SU 2015 FA 2016 SP
MEETS EXPECTATION DOES NOT MEETEXPECTATION
EXCEEDS EXPECTATION
Per
cen
tage
of
Stu
den
ts
BS in Economics, PLG 1, Summative, Trend
4
Figure BSE - 3 Figure BSE - 4
30
10
60
0
20
40
60
80
100
M D E
Per
cen
tage
of
Stu
den
tsBS in Economics, PLG 1, Formative, Spring 2016M = Meets Expectation, D = Does Not Meet Expectation, E= Exceeds Expectation
10
55
30
0
30
10
90
15
60
0
20
40
60
80
100
2015 SU 2015 FA 2016 SP 2015 SU 2015 FA 2016 SP 2015 SU 2015 FA 2016 SP
MEETS EXPECTATION DOES NOT MEETEXPECTATION
EXCEEDS EXPECTATION
Per
cen
tage
of
Stu
den
ts
BS in Economics, PLG 1, Formative, Trend
5
Program Learning Goal Measure
Measurement
Criteria Result Observation(s) Closing the Loop
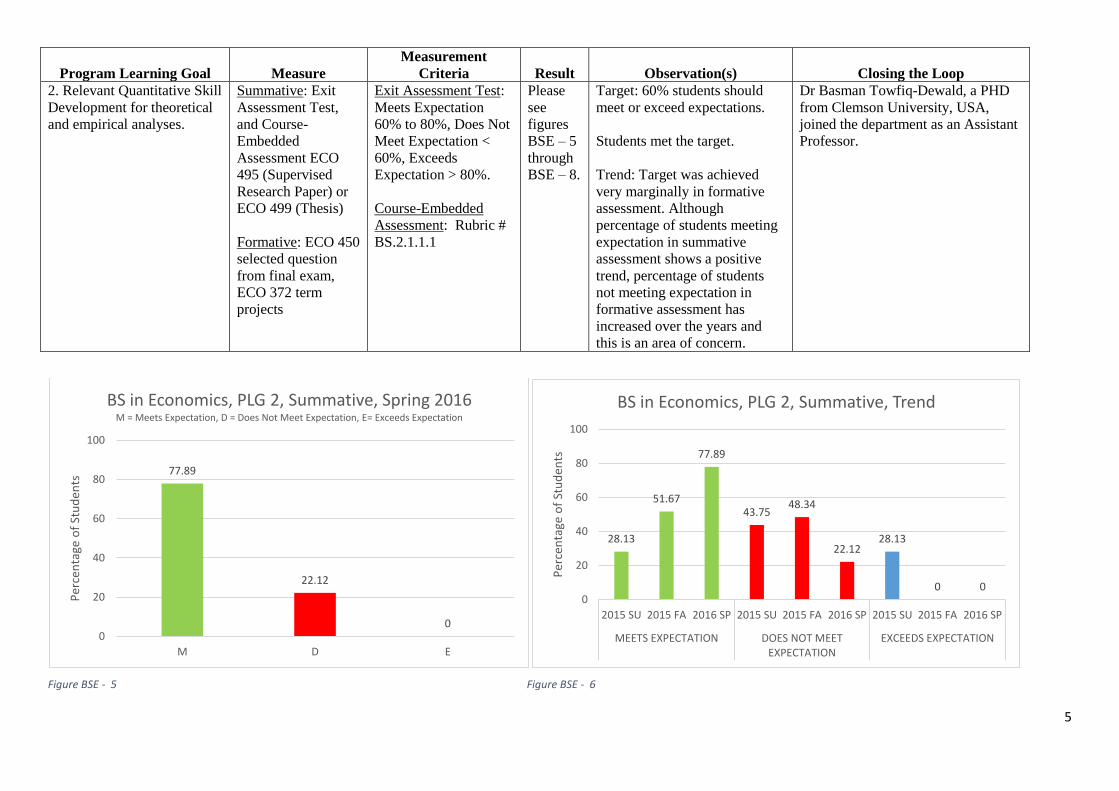
2. Relevant Quantitative Skill
Development for theoretical
and empirical analyses.
Summative: Exit
Assessment Test,
and Course-
Embedded
Assessment ECO
495 (Supervised
Research Paper) or
ECO 499 (Thesis)
Formative: ECO 450
selected question
from final exam,
ECO 372 term
projects
Exit Assessment Test:
Meets Expectation
60% to 80%, Does Not
Meet Expectation <
60%, Exceeds
Expectation > 80%.
Course-Embedded
Assessment: Rubric #
BS.2.1.1.1
Please
see
figures
BSE – 5
through
BSE – 8.
Target: 60% students should
meet or exceed expectations.
Students met the target.
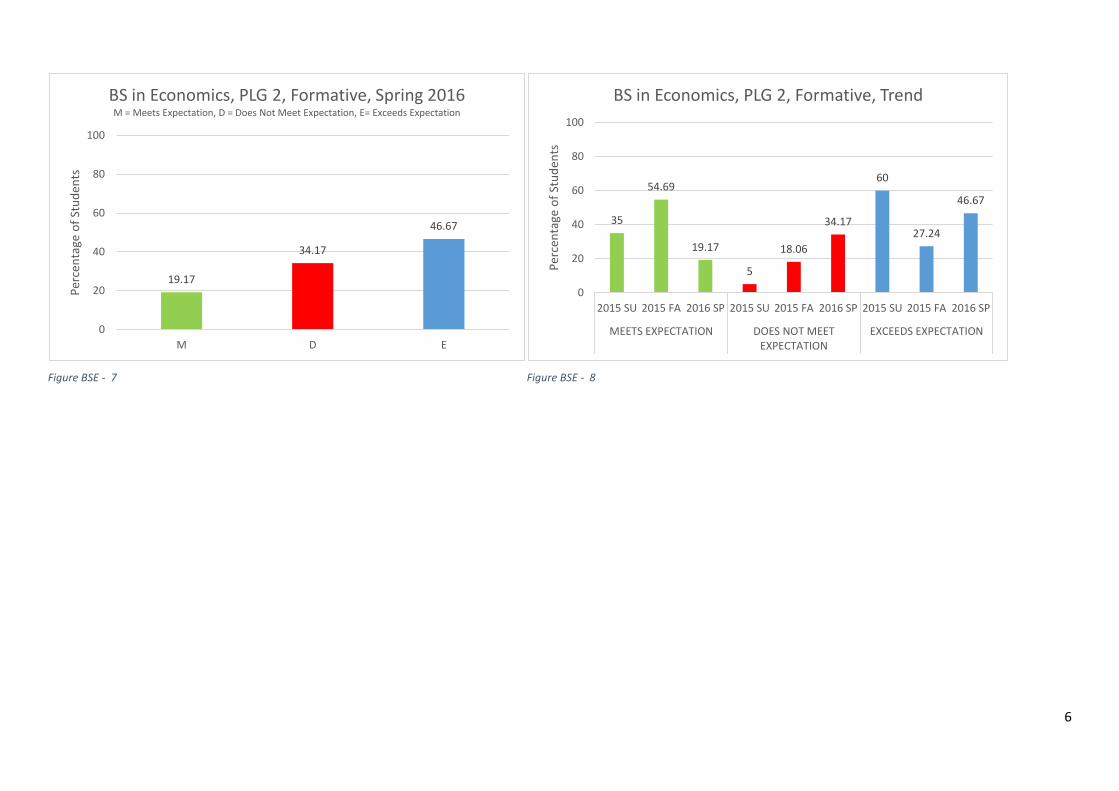
Trend: Target was achieved
very marginally in formative
assessment. Although
percentage of students meeting
expectation in summative
assessment shows a positive
trend, percentage of students
not meeting expectation in
formative assessment has
increased over the years and
this is an area of concern.
Dr Basman Towfiq-Dewald, a PHD
from Clemson University, USA,
joined the department as an Assistant
Professor.
Figure BSE - 5 Figure BSE - 6
77.89
22.12
00
20
40
60
80
100
M D E
Per
cen
tage
of
Stu
den
ts
BS in Economics, PLG 2, Summative, Spring 2016M = Meets Expectation, D = Does Not Meet Expectation, E= Exceeds Expectation
28.13
51.67
77.89
43.7548.34
22.1228.13
0 00
20
40
60
80
100
2015 SU 2015 FA 2016 SP 2015 SU 2015 FA 2016 SP 2015 SU 2015 FA 2016 SP
MEETS EXPECTATION DOES NOT MEETEXPECTATION
EXCEEDS EXPECTATION
Per
cen
tage
of
Stu
den
ts
BS in Economics, PLG 2, Summative, Trend
6
Figure BSE - 7 Figure BSE - 8
19.17
34.17
46.67
0
20
40
60
80
100
M D E
Per
cen
tage
of
Stu
den
ts
BS in Economics, PLG 2, Formative, Spring 2016M = Meets Expectation, D = Does Not Meet Expectation, E= Exceeds Expectation
35
54.69
19.17
5
18.06
34.17
60
27.24
46.67
0
20
40
60
80
100
2015 SU 2015 FA 2016 SP 2015 SU 2015 FA 2016 SP 2015 SU 2015 FA 2016 SP
MEETS EXPECTATION DOES NOT MEETEXPECTATION
EXCEEDS EXPECTATION
Per
cen
tage
of
Stu
den
ts
BS in Economics, PLG 2, Formative, Trend
7
Program Learning Goal Measure
Measurement
Criteria Result Observation(s) Closing the Loop
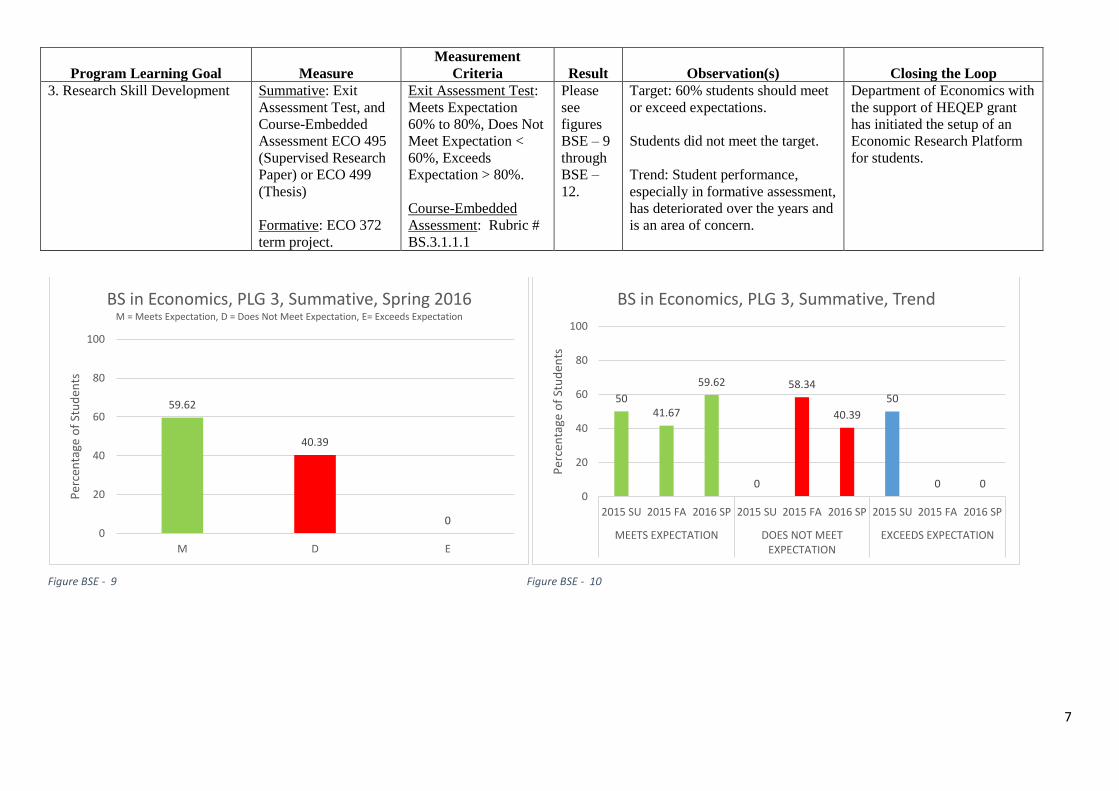
3. Research Skill Development Summative: Exit
Assessment Test, and
Course-Embedded
Assessment ECO 495
(Supervised Research
Paper) or ECO 499
(Thesis)
Formative: ECO 372
term project.
Exit Assessment Test:
Meets Expectation
60% to 80%, Does Not
Meet Expectation <
60%, Exceeds
Expectation > 80%.
Course-Embedded
Assessment: Rubric #
BS.3.1.1.1
Please
see
figures
BSE – 9
through
BSE –
12.
Target: 60% students should meet
or exceed expectations.
Students did not meet the target.
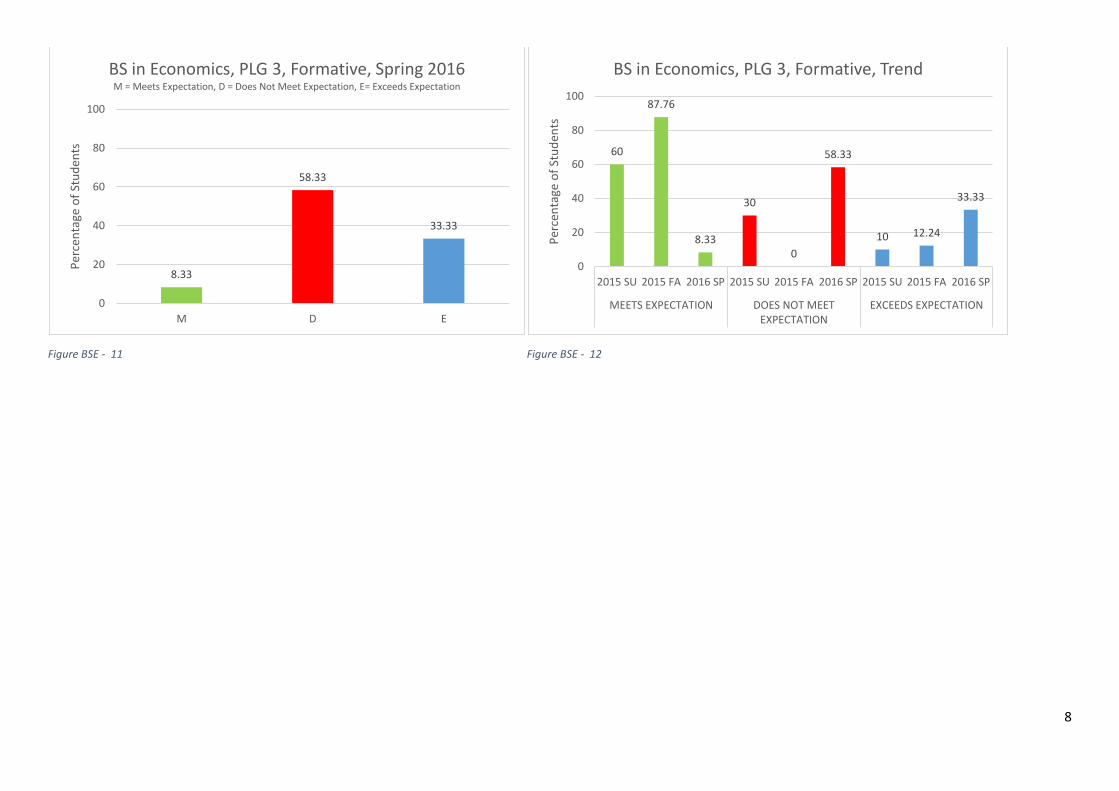
Trend: Student performance,
especially in formative assessment,
has deteriorated over the years and
is an area of concern.
Department of Economics with
the support of HEQEP grant
has initiated the setup of an
Economic Research Platform
for students.
Figure BSE - 9 Figure BSE - 10
59.62
40.39
00
20
40
60
80
100
M D E
Per
cen
tage
of
Stu
den
ts
BS in Economics, PLG 3, Summative, Spring 2016M = Meets Expectation, D = Does Not Meet Expectation, E= Exceeds Expectation
5041.67
59.62
0
58.34
40.39
50
0 00
20
40
60
80
100
2015 SU 2015 FA 2016 SP 2015 SU 2015 FA 2016 SP 2015 SU 2015 FA 2016 SP
MEETS EXPECTATION DOES NOT MEETEXPECTATION
EXCEEDS EXPECTATION
Per
cen
tage
of
Stu
den
ts
BS in Economics, PLG 3, Summative, Trend
8
Figure BSE - 11 Figure BSE - 12
8.33
58.33
33.33
0
20
40
60
80
100
M D E
Per
cen
tage
of
Stu
den
tsBS in Economics, PLG 3, Formative, Spring 2016M = Meets Expectation, D = Does Not Meet Expectation, E= Exceeds Expectation
60
87.76
8.33
30
0
58.33
10 12.24
33.33
0
20
40
60
80
100
2015 SU 2015 FA 2016 SP 2015 SU 2015 FA 2016 SP 2015 SU 2015 FA 2016 SP
MEETS EXPECTATION DOES NOT MEETEXPECTATION
EXCEEDS EXPECTATION
Per
cen
tage
of
Stu
den
ts
BS in Economics, PLG 3, Formative, Trend
9
Program Learning Goal Measure
Measurement
Criteria Result Observation(s) Closing the Loop
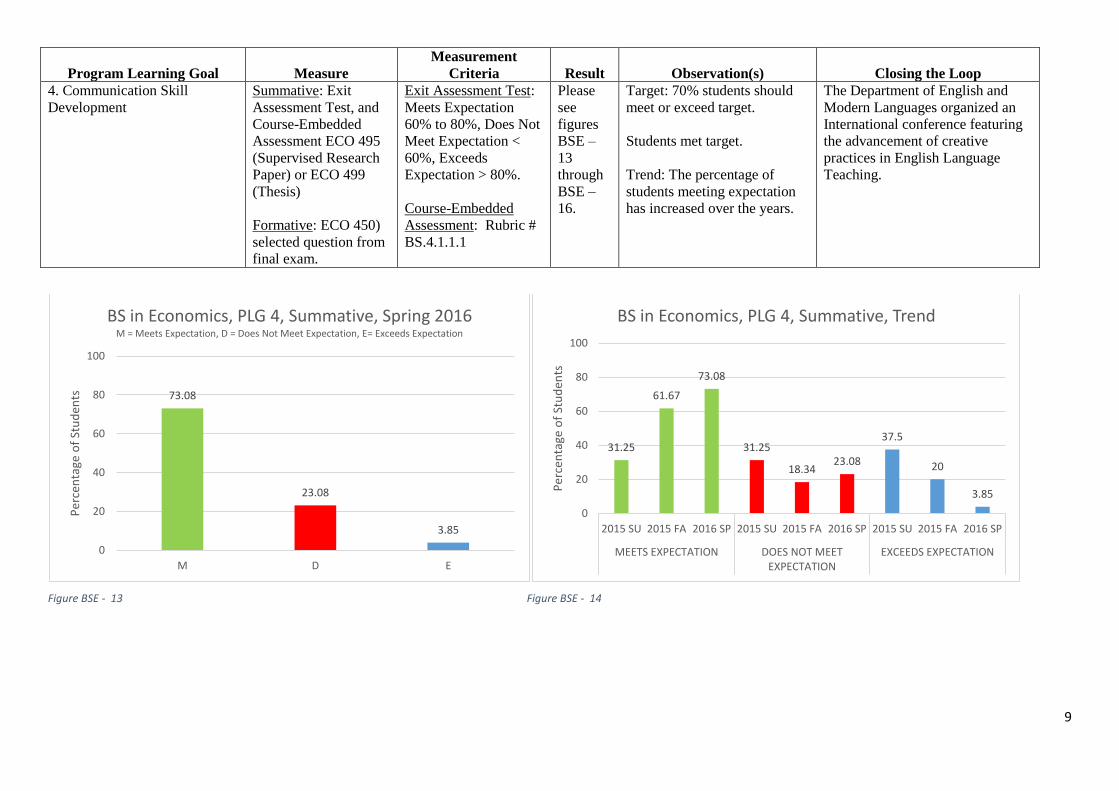
4. Communication Skill
Development
Summative: Exit
Assessment Test, and
Course-Embedded
Assessment ECO 495
(Supervised Research
Paper) or ECO 499
(Thesis)
Formative: ECO 450)
selected question from
final exam.
Exit Assessment Test:
Meets Expectation
60% to 80%, Does Not
Meet Expectation <
60%, Exceeds
Expectation > 80%.
Course-Embedded
Assessment: Rubric #
BS.4.1.1.1
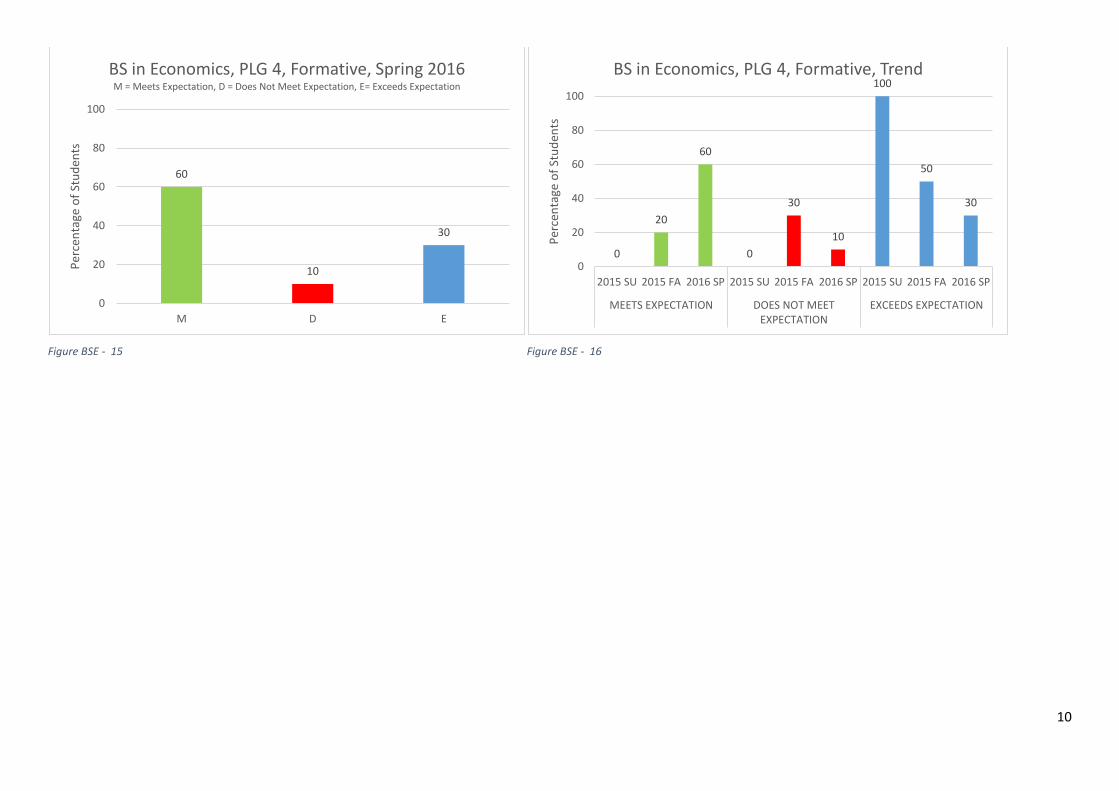
Please
see
figures
BSE –
13
through
BSE –
16.
Target: 70% students should
meet or exceed target.
Students met target.
Trend: The percentage of
students meeting expectation
has increased over the years.
The Department of English and
Modern Languages organized an
International conference featuring
the advancement of creative
practices in English Language
Teaching.
Figure BSE - 13 Figure BSE - 14
73.08
23.08
3.85
0
20
40
60
80
100
M D E
Per
cen
tage
of
Stu
den
ts
BS in Economics, PLG 4, Summative, Spring 2016M = Meets Expectation, D = Does Not Meet Expectation, E= Exceeds Expectation
31.25
61.67
73.08
31.25
18.3423.08
37.5
20
3.85
0
20
40
60
80
100
2015 SU 2015 FA 2016 SP 2015 SU 2015 FA 2016 SP 2015 SU 2015 FA 2016 SP
MEETS EXPECTATION DOES NOT MEETEXPECTATION
EXCEEDS EXPECTATIONP
erce
nta
ge o
f St
ud
ents
BS in Economics, PLG 4, Summative, Trend
10
Figure BSE - 15 Figure BSE - 16
60
10
30
0
20
40
60
80
100
M D E
Per
cen
tage
of
Stu
den
tsBS in Economics, PLG 4, Formative, Spring 2016M = Meets Expectation, D = Does Not Meet Expectation, E= Exceeds Expectation
0
20
60
0
30
10
100
50
30
0
20
40
60
80
100
2015 SU 2015 FA 2016 SP 2015 SU 2015 FA 2016 SP 2015 SU 2015 FA 2016 SP
MEETS EXPECTATION DOES NOT MEETEXPECTATION
EXCEEDS EXPECTATION
Per
cen
tage
of
Stu
den
ts
BS in Economics, PLG 4, Formative, Trend
11
Program Learning Goal Measure
Measurement
Criteria Result Observation(s) Closing the Loop
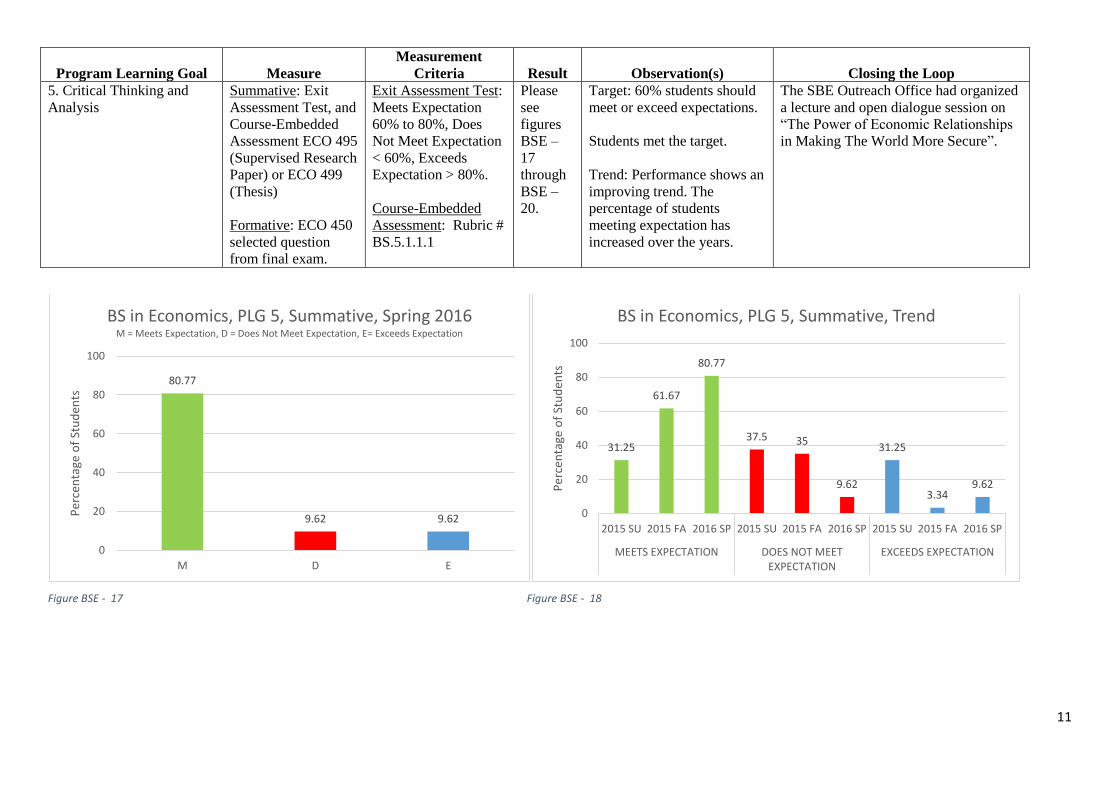
5. Critical Thinking and
Analysis
Summative: Exit
Assessment Test, and
Course-Embedded
Assessment ECO 495
(Supervised Research
Paper) or ECO 499
(Thesis)
Formative: ECO 450
selected question
from final exam.
Exit Assessment Test:
Meets Expectation
60% to 80%, Does
Not Meet Expectation
< 60%, Exceeds
Expectation > 80%.
Course-Embedded
Assessment: Rubric #
BS.5.1.1.1
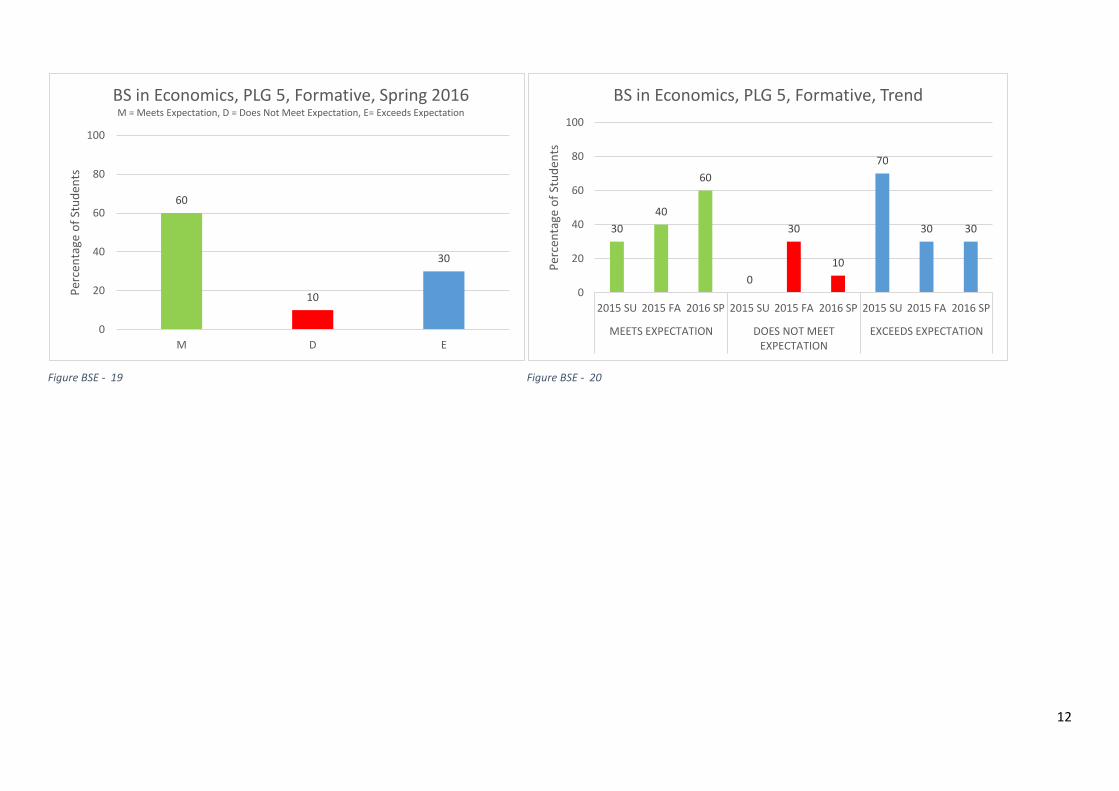
Please
see
figures
BSE –
17
through
BSE –
20.
Target: 60% students should
meet or exceed expectations.
Students met the target.
Trend: Performance shows an
improving trend. The
percentage of students
meeting expectation has
increased over the years.
The SBE Outreach Office had organized
a lecture and open dialogue session on
“The Power of Economic Relationships
in Making The World More Secure”.
Figure BSE - 17 Figure BSE - 18
80.77
9.62 9.62
0
20
40
60
80
100
M D E
Per
cen
tage
of
Stu
den
ts
BS in Economics, PLG 5, Summative, Spring 2016M = Meets Expectation, D = Does Not Meet Expectation, E= Exceeds Expectation
31.25
61.67
80.77
37.5 35
9.62
31.25
3.349.62
0
20
40
60
80
100
2015 SU 2015 FA 2016 SP 2015 SU 2015 FA 2016 SP 2015 SU 2015 FA 2016 SP
MEETS EXPECTATION DOES NOT MEETEXPECTATION
EXCEEDS EXPECTATIONP
erce
nta
ge o
f St
ud
ents
BS in Economics, PLG 5, Summative, Trend
12
Figure BSE - 19 Figure BSE - 20
60
10
30
0
20
40
60
80
100
M D E
Per
cen
tage
of
Stu
den
ts
BS in Economics, PLG 5, Formative, Spring 2016M = Meets Expectation, D = Does Not Meet Expectation, E= Exceeds Expectation
30
40
60
0
30
10
70
30 30
0
20
40
60
80
100
2015 SU 2015 FA 2016 SP 2015 SU 2015 FA 2016 SP 2015 SU 2015 FA 2016 SP
MEETS EXPECTATION DOES NOT MEETEXPECTATION
EXCEEDS EXPECTATION
Per
cen
tage
of
Stu
den
ts
BS in Economics, PLG 5, Formative, Trend
13
Spring 2016 Student Learning Assessment Report: MS in Economics
Program
Learning Goal
Student
Learning
Outcome Measure
Measurement
Criteria Result Observation(s) Closing the Loop
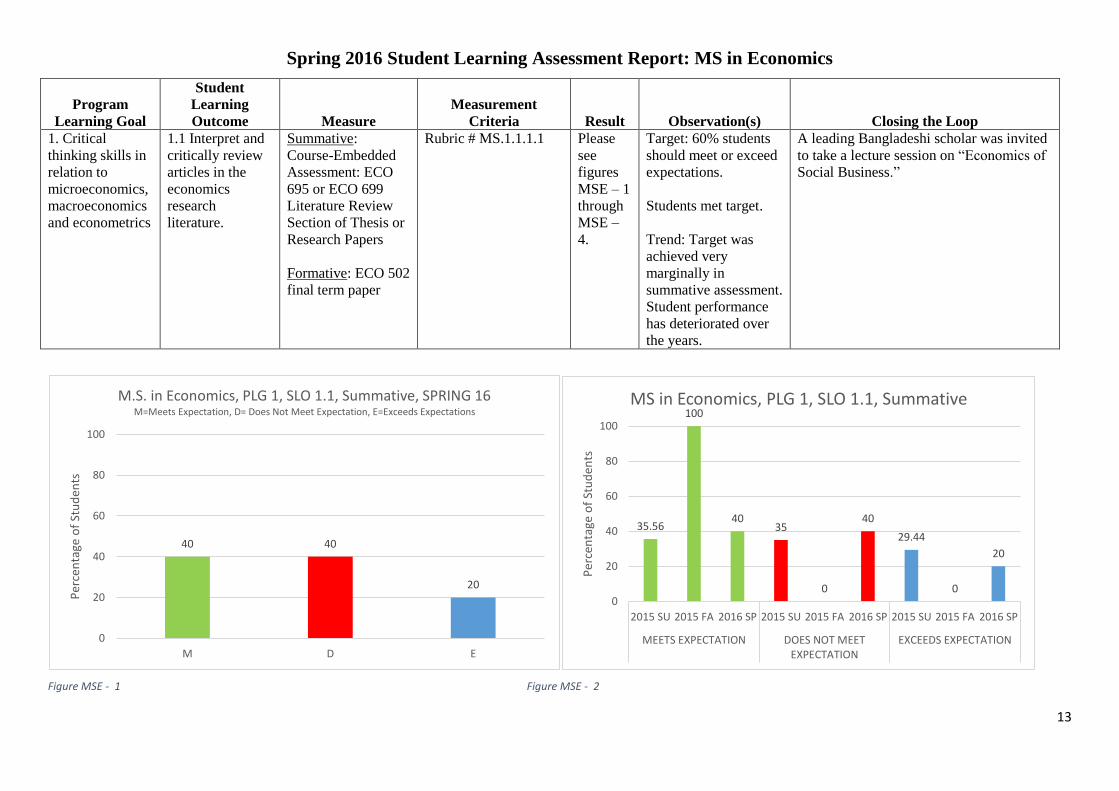
1. Critical
thinking skills in
relation to
microeconomics,
macroeconomics
and econometrics
1.1 Interpret and
critically review
articles in the
economics
research
literature.
Summative:
Course-Embedded
Assessment: ECO
695 or ECO 699
Literature Review
Section of Thesis or
Research Papers
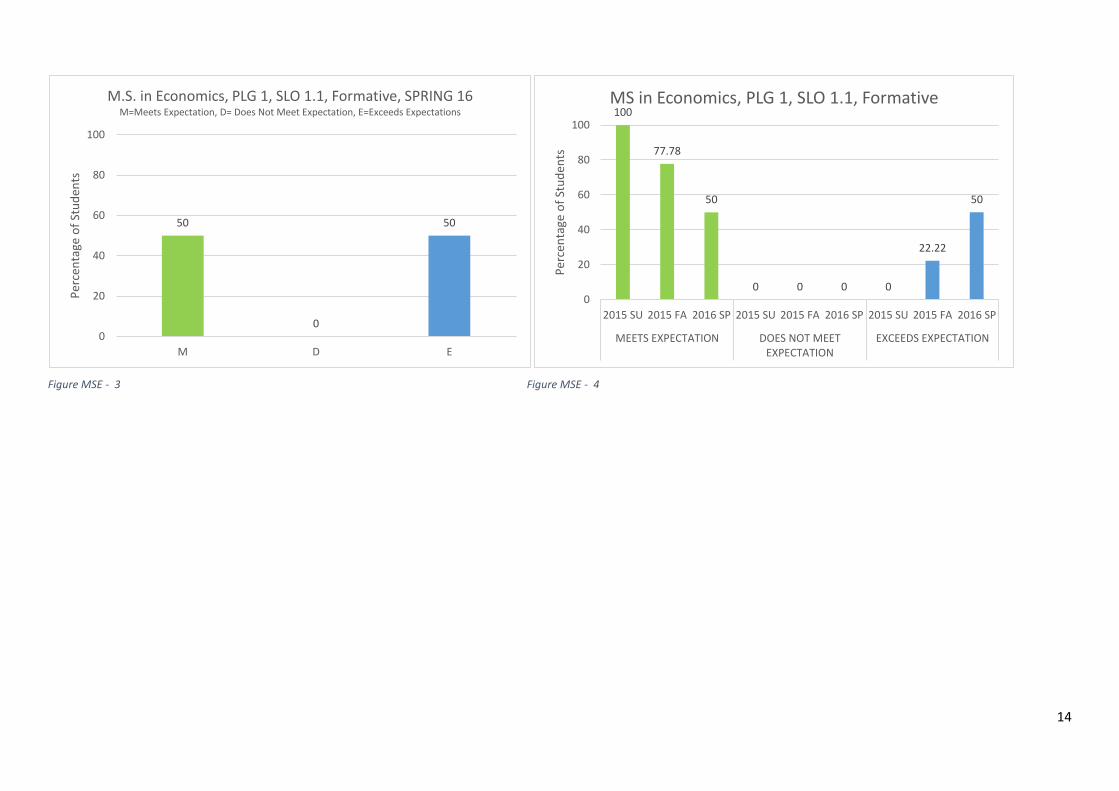
Formative: ECO 502
final term paper
Rubric # MS.1.1.1.1 Please
see
figures
MSE – 1
through
MSE –
4.
Target: 60% students
should meet or exceed
expectations.
Students met target.
Trend: Target was
achieved very
marginally in
summative assessment.
Student performance
has deteriorated over
the years.
A leading Bangladeshi scholar was invited
to take a lecture session on “Economics of
Social Business.”
Figure MSE - 1 Figure MSE - 2
40 40
20
0
20
40
60
80
100
M D E
Per
cen
tage
of
Stu
den
ts
M.S. in Economics, PLG 1, SLO 1.1, Summative, SPRING 16 M=Meets Expectation, D= Does Not Meet Expectation, E=Exceeds Expectations
35.56
100
4035
0
40
29.44
0
20
0
20
40
60
80
100
2015 SU 2015 FA 2016 SP 2015 SU 2015 FA 2016 SP 2015 SU 2015 FA 2016 SP
MEETS EXPECTATION DOES NOT MEETEXPECTATION
EXCEEDS EXPECTATION
Per
cen
tage
of
Stu
den
ts
MS in Economics, PLG 1, SLO 1.1, Summative
14
Figure MSE - 3 Figure MSE - 4
50
0
50
0
20
40
60
80
100
M D E
Per
cen
tage
of
Stu
den
ts
M.S. in Economics, PLG 1, SLO 1.1, Formative, SPRING 16 M=Meets Expectation, D= Does Not Meet Expectation, E=Exceeds Expectations 100
77.78
50
0 0 0 0
22.22
50
0
20
40
60
80
100
2015 SU 2015 FA 2016 SP 2015 SU 2015 FA 2016 SP 2015 SU 2015 FA 2016 SP
MEETS EXPECTATION DOES NOT MEETEXPECTATION
EXCEEDS EXPECTATION
Per
cen
tage
of
Stu
den
ts
MS in Economics, PLG 1, SLO 1.1, Formative
15
Program
Learning Goal
Student
Learning
Outcome Measure
Measurement
Criteria Result Observation(s) Closing the Loop
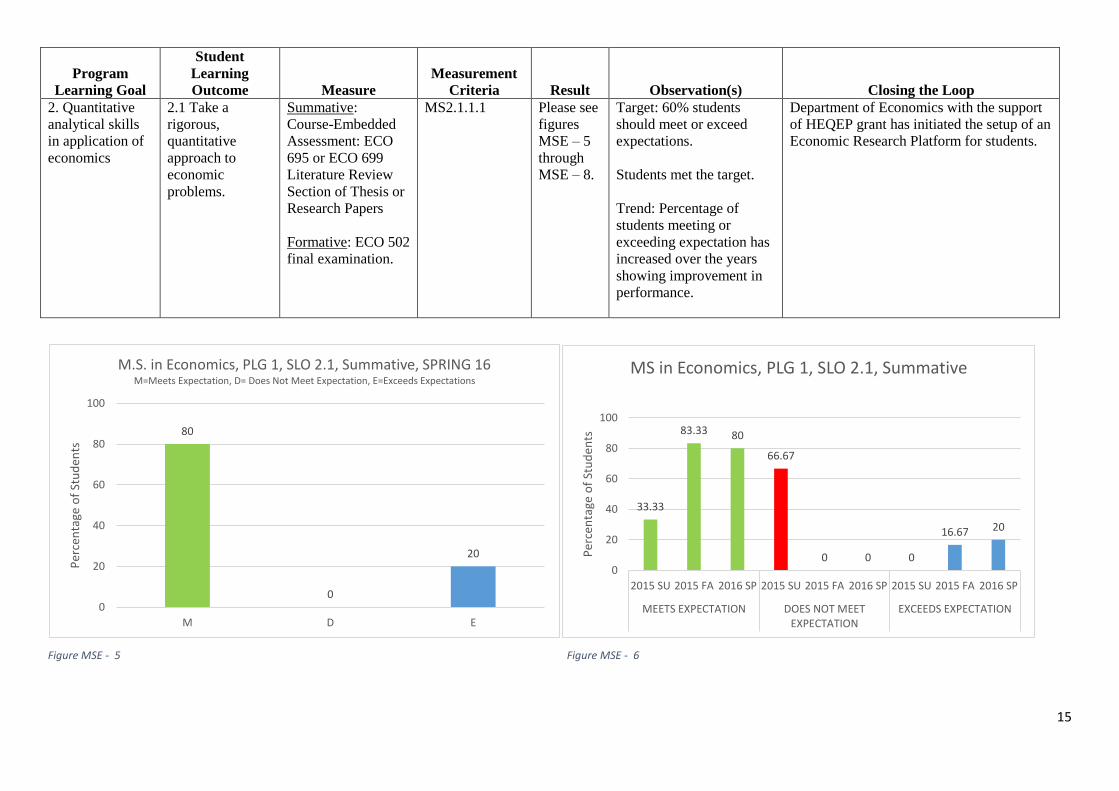
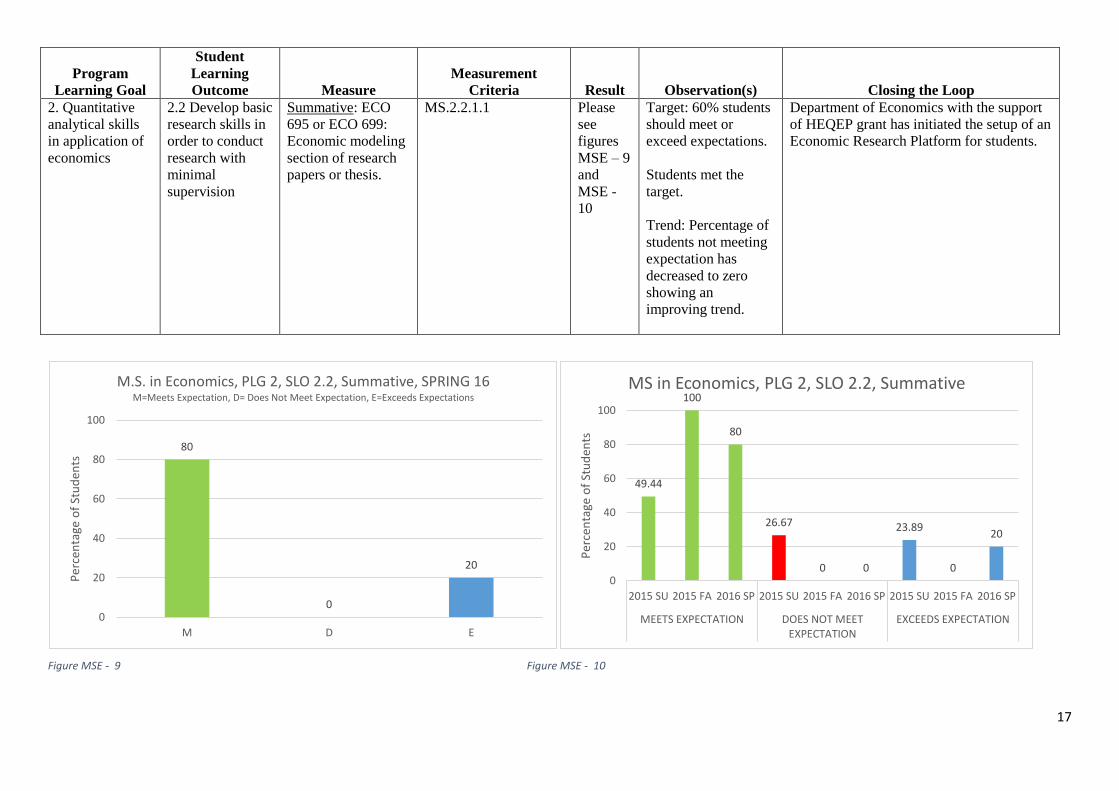
2. Quantitative
analytical skills
in application of
economics
2.1 Take a
rigorous,
quantitative
approach to
economic
problems.
Summative:
Course-Embedded
Assessment: ECO
695 or ECO 699
Literature Review
Section of Thesis or
Research Papers
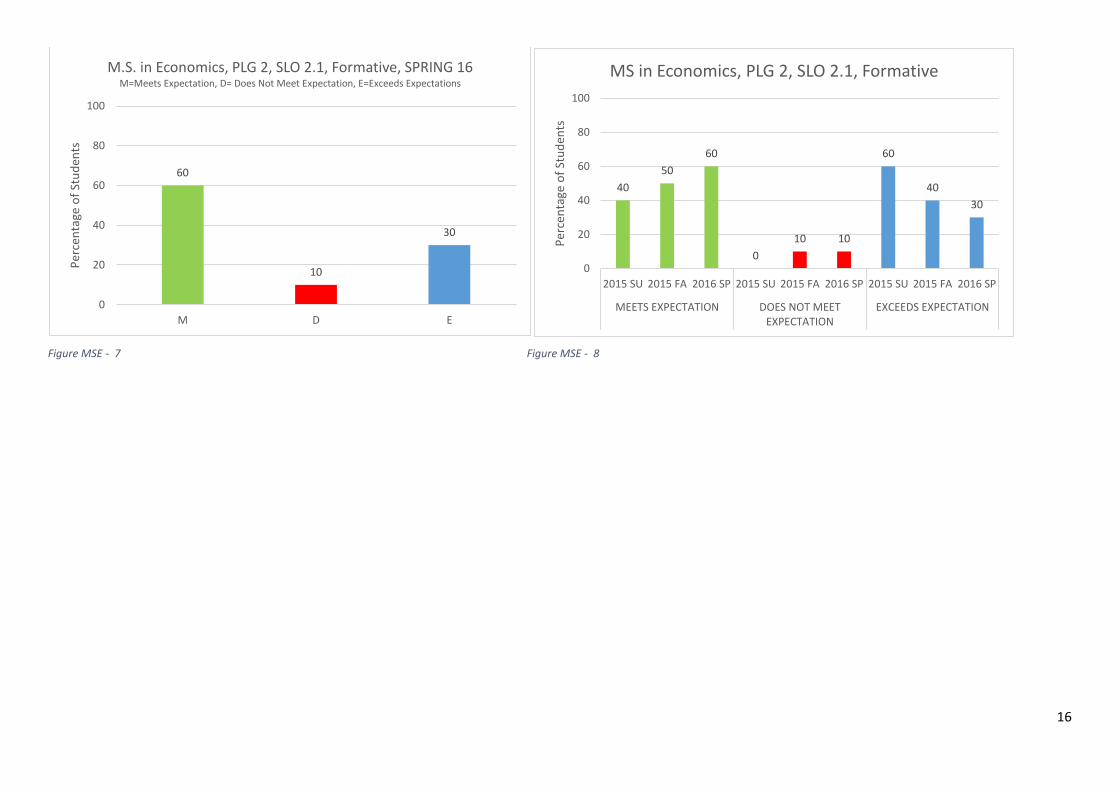
Formative: ECO 502
final examination.
MS2.1.1.1 Please see
figures
MSE – 5
through
MSE – 8.
Target: 60% students
should meet or exceed
expectations.
Students met the target.
Trend: Percentage of
students meeting or
exceeding expectation has
increased over the years
showing improvement in
performance.
Department of Economics with the support
of HEQEP grant has initiated the setup of an
Economic Research Platform for students.
Figure MSE - 5 Figure MSE - 6
80
0
20
0
20
40
60
80
100
M D E
Per
cen
tage
of
Stu
den
ts
M.S. in Economics, PLG 1, SLO 2.1, Summative, SPRING 16 M=Meets Expectation, D= Does Not Meet Expectation, E=Exceeds Expectations
33.33
83.33 80
66.67
0 0 0
16.67 20
0
20
40
60
80
100
2015 SU 2015 FA 2016 SP 2015 SU 2015 FA 2016 SP 2015 SU 2015 FA 2016 SP
MEETS EXPECTATION DOES NOT MEETEXPECTATION
EXCEEDS EXPECTATION
Per
cen
tage
of
Stu
den
ts
MS in Economics, PLG 1, SLO 2.1, Summative
16
Figure MSE - 7 Figure MSE - 8
60
10
30
0
20
40
60
80
100
M D E
Per
cen
tage
of
Stu
den
tsM.S. in Economics, PLG 2, SLO 2.1, Formative, SPRING 16
M=Meets Expectation, D= Does Not Meet Expectation, E=Exceeds Expectations
40
50
60
0
10 10
60
40
30
0
20
40
60
80
100
2015 SU 2015 FA 2016 SP 2015 SU 2015 FA 2016 SP 2015 SU 2015 FA 2016 SP
MEETS EXPECTATION DOES NOT MEETEXPECTATION
EXCEEDS EXPECTATION
Per
cen
tage
of
Stu
den
ts
MS in Economics, PLG 2, SLO 2.1, Formative
17
Program
Learning Goal
Student
Learning
Outcome Measure
Measurement
Criteria Result Observation(s) Closing the Loop
2. Quantitative
analytical skills
in application of
economics
2.2 Develop basic
research skills in
order to conduct
research with
minimal
supervision
Summative: ECO
695 or ECO 699:
Economic modeling
section of research
papers or thesis.
MS.2.2.1.1 Please
see
figures
MSE – 9
and
MSE -
10
Target: 60% students
should meet or
exceed expectations.
Students met the
target.
Trend: Percentage of
students not meeting
expectation has
decreased to zero
showing an
improving trend.
Department of Economics with the support
of HEQEP grant has initiated the setup of an
Economic Research Platform for students.
Figure MSE - 9 Figure MSE - 10
80
0
20
0
20
40
60
80
100
M D E
Per
cen
tage
of
Stu
den
ts
M.S. in Economics, PLG 2, SLO 2.2, Summative, SPRING 16 M=Meets Expectation, D= Does Not Meet Expectation, E=Exceeds Expectations
49.44
100
80
26.67
0 0
23.89
0
20
0
20
40
60
80
100
2015 SU 2015 FA 2016 SP 2015 SU 2015 FA 2016 SP 2015 SU 2015 FA 2016 SP
MEETS EXPECTATION DOES NOT MEETEXPECTATION
EXCEEDS EXPECTATION
Per
cen
tage
of
Stu
den
ts
MS in Economics, PLG 2, SLO 2.2, Summative
18
Program
Learning Goal
Student
Learning
Outcome Measure
Measurement
Criteria Result Observation(s) Closing the Loop
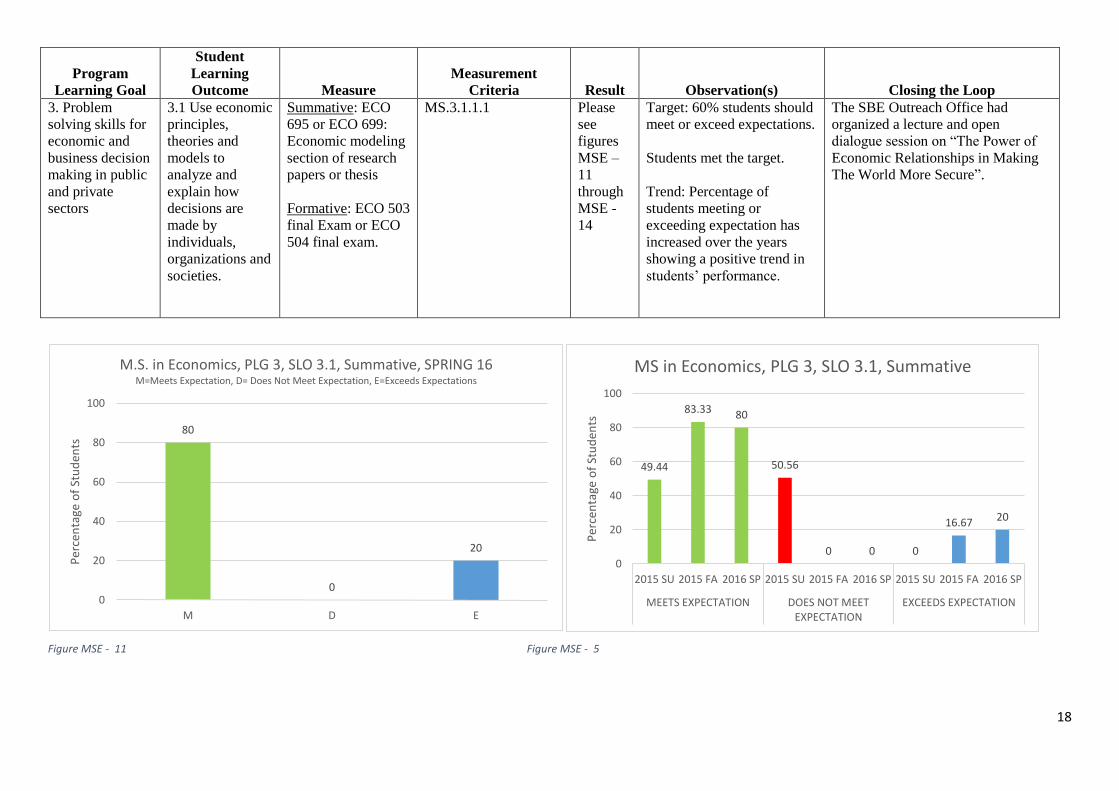
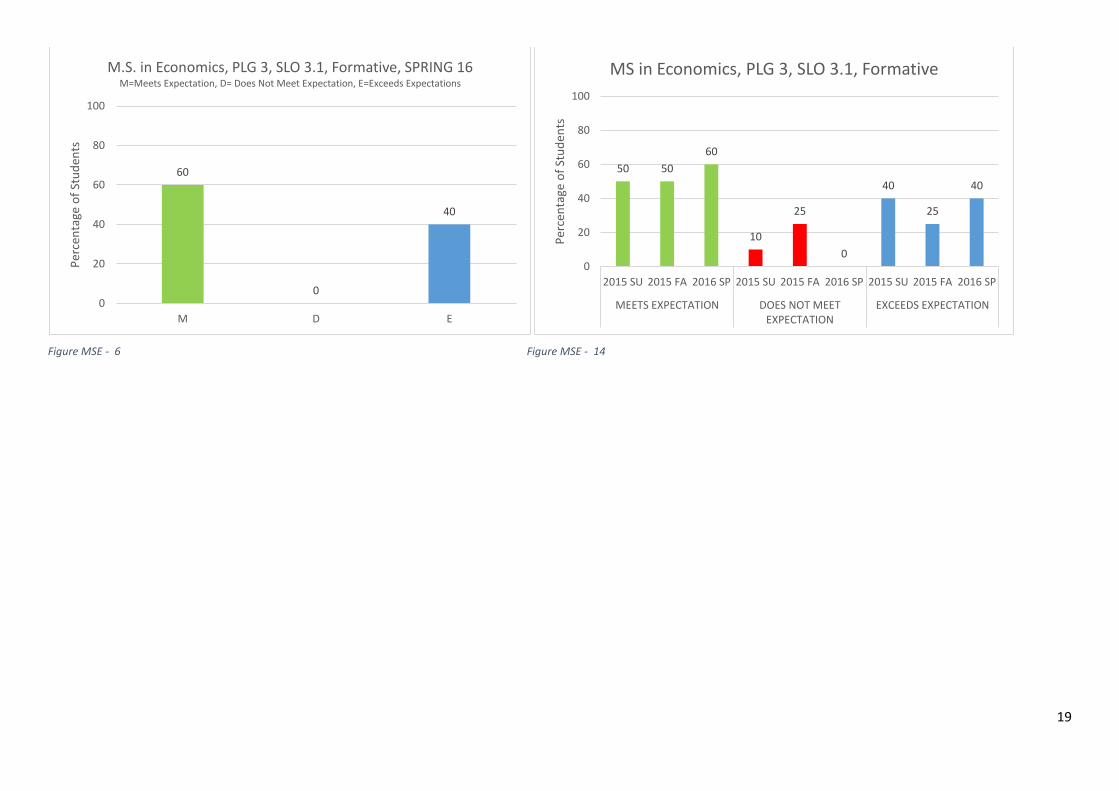
3. Problem
solving skills for
economic and
business decision
making in public
and private
sectors
3.1 Use economic
principles,
theories and
models to
analyze and
explain how
decisions are
made by
individuals,
organizations and
societies.
Summative: ECO
695 or ECO 699:
Economic modeling
section of research
papers or thesis
Formative: ECO 503
final Exam or ECO
504 final exam.
MS.3.1.1.1 Please
see
figures
MSE –
11
through
MSE -
14
Target: 60% students should
meet or exceed expectations.
Students met the target.
Trend: Percentage of
students meeting or
exceeding expectation has
increased over the years
showing a positive trend in
students’ performance.
The SBE Outreach Office had
organized a lecture and open
dialogue session on “The Power of
Economic Relationships in Making
The World More Secure”.
Figure MSE - 11 Figure MSE - 5
80
0
20
0
20
40
60
80
100
M D E
Per
cen
tage
of
Stu
den
ts
M.S. in Economics, PLG 3, SLO 3.1, Summative, SPRING 16 M=Meets Expectation, D= Does Not Meet Expectation, E=Exceeds Expectations
49.44
83.33 80
50.56
0 0 0
16.67 20
0
20
40
60
80
100
2015 SU 2015 FA 2016 SP 2015 SU 2015 FA 2016 SP 2015 SU 2015 FA 2016 SP
MEETS EXPECTATION DOES NOT MEETEXPECTATION
EXCEEDS EXPECTATIONP
erce
nta
ge o
f St
ud
ents
MS in Economics, PLG 3, SLO 3.1, Summative
19
Figure MSE - 6 Figure MSE - 14
60
0
40
0
20
40
60
80
100
M D E
Per
cen
tage
of
Stu
den
tsM.S. in Economics, PLG 3, SLO 3.1, Formative, SPRING 16
M=Meets Expectation, D= Does Not Meet Expectation, E=Exceeds Expectations
50 50
60
10
25
0
40
25
40
0
20
40
60
80
100
2015 SU 2015 FA 2016 SP 2015 SU 2015 FA 2016 SP 2015 SU 2015 FA 2016 SP
MEETS EXPECTATION DOES NOT MEETEXPECTATION
EXCEEDS EXPECTATION
Per
cen
tage
of
Stu
den
ts
MS in Economics, PLG 3, SLO 3.1, Formative
20