Embed Size (px)
Citation preview
Fiscal year ended March 31, 2018
ANNUALREPORT 2018
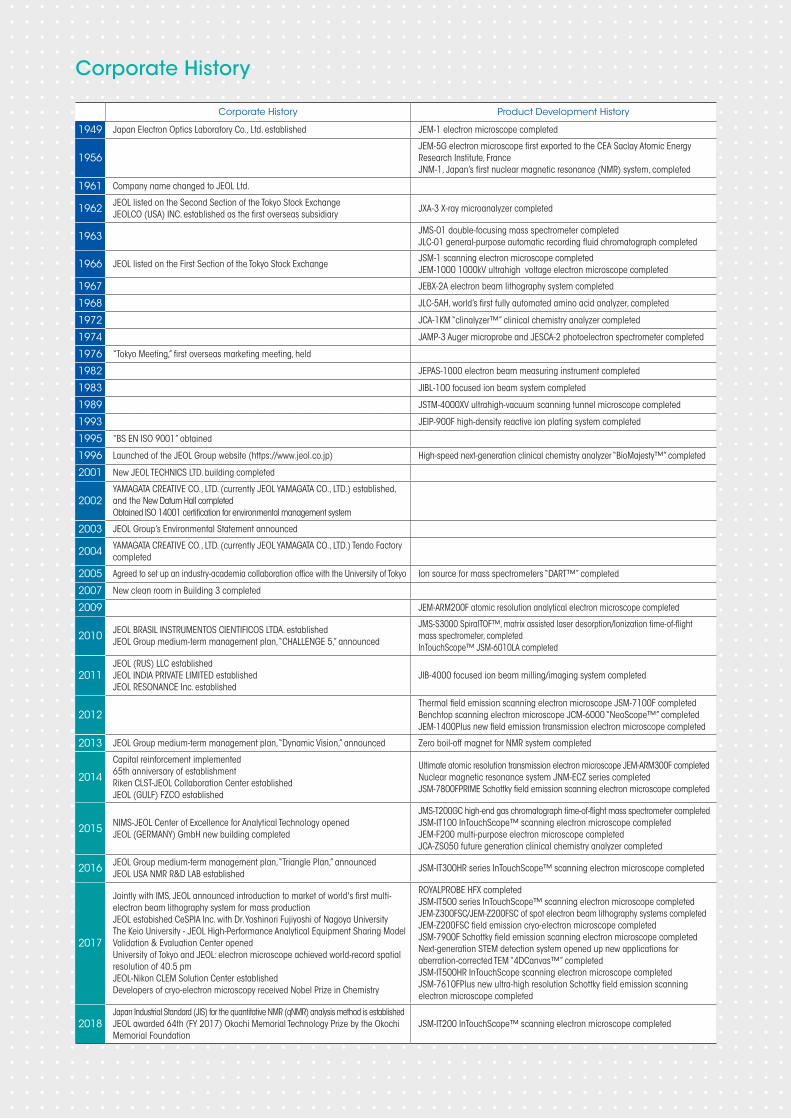
Corporate History Product Development History
1949 Japan Electron Optics Laboratory Co., Ltd. established JEM-1 electron microscope completed
1956JEM-5G electron microscope first exported to the CEA Saclay Atomic Energy Research Institute, FranceJNM-1, Japan’s first nuclear magnetic resonance (NMR) system, completed
1961 Company name changed to JEOL Ltd.
1962 JEOL listed on the Second Section of the Tokyo Stock ExchangeJEOLCO (USA) INC. established as the first overseas subsidiary
JXA-3 X-ray microanalyzer completed
1963 JMS-01 double-focusing mass spectrometer completedJLC-01 general-purpose automatic recording fluid chromatograph completed
1966 JEOL listed on the First Section of the Tokyo Stock ExchangeJSM-1 scanning electron microscope completedJEM-1000 1000kV ultrahigh voltage electron microscope completed
1967 JEBX-2A electron beam lithography system completed
1968 JLC-5AH, world’s first fully automated amino acid analyzer, completed
1972 JCA-1KM “clinalyzer™” clinical chemistry analyzer completed
1974 JAMP-3 Auger microprobe and JESCA-2 photoelectron spectrometer completed
1976 “Tokyo Meeting,” first overseas marketing meeting, held
1982 JEPAS-1000 electron beam measuring instrument completed
1983 JIBL-100 focused ion beam system completed
1989 JSTM-4000XV ultrahigh-vacuum scanning tunnel microscope completed
1993 JEIP-900F high-density reactive ion plating system completed
1995 “BS EN ISO 9001” obtained
1996 Launched of the JEOL Group website (https://www.jeol.co.jp) High-speed next-generation clinical chemistry analyzer “BioMajesty™” completed
2001 New JEOL TECHNICS LTD. building completed
2002YAMAGATA CREATIVE CO., LTD. (currently JEOL YAMAGATA CO., LTD.) established, and the New Datum Hall completedObtained ISO 14001 certification for environmental management system
2003 JEOL Group’s Environmental Statement announced
2004 YAMAGATA CREATIVE CO., LTD. (currently JEOL YAMAGATA CO., LTD.) Tendo Factory completed
2005 Agreed to set up an industry-academia collaboration office with the University of Tokyo Ion source for mass spectrometers “DART™” completed
2007 New clean room in Building 3 completed
2009 JEM-ARM200F atomic resolution analytical electron microscope completed
2010 JEOL BRASIL INSTRUMENTOS CIENTIFICOS LTDA. establishedJEOL Group medium-term management plan, “CHALLENGE 5,” announced
JMS-S3000 SpiralTOF™, matrix assisted laser desorption/Ionization time-of-flight mass spectrometer, completedInTouchScope™ JSM-6010LA completed
2011JEOL (RUS) LLC establishedJEOL INDIA PRIVATE LIMITED establishedJEOL RESONANCE Inc. established
JIB-4000 focused ion beam milling/imaging system completed
2012Thermal field emission scanning electron microscope JSM-7100F completedBenchtop scanning electron microscope JCM-6000 “NeoScope™” completedJEM-1400Plus new field emission transmission electron microscope completed
2013 JEOL Group medium-term management plan, “Dynamic Vision,” announced Zero boil-off magnet for NMR system completed
2014
Capital reinforcement implemented65th anniversary of establishmentRiken CLST-JEOL Collaboration Center establishedJEOL (GULF) FZCO established
Ultimate atomic resolution transmission electron microscope JEM-ARM300F completedNuclear magnetic resonance system JNM-ECZ series completedJSM-7800FPRIME Schottky field emission scanning electron microscope completed
2015 NIMS-JEOL Center of Excellence for Analytical Technology openedJEOL (GERMANY) GmbH new building completed
JMS-T200GC high-end gas chromatograph time-of-flight mass spectrometer completedJSM-IT100 InTouchScope™ scanning electron microscope completedJEM-F200 multi-purpose electron microscope completedJCA-ZS050 future generation clinical chemistry analyzer completed
2016 JEOL Group medium-term management plan, “Triangle Plan,” announced JEOL USA NMR R&D LAB established
JSM-IT300HR series InTouchScope™ scanning electron microscope completed
2017
Jointly with IMS, JEOL announced introduction to market of world's first multi-electron beam lithography system for mass productionJEOL estabished CeSPIA Inc. with Dr. Yoshinori Fujiyoshi of Nagoya UniversityThe Keio University - JEOL High-Performance Analytical Equipment Sharing Model Validation & Evaluation Center openedUniversity of Tokyo and JEOL: electron microscope achieved world-record spatial resolution of 40.5 pmJEOL-Nikon CLEM Solution Center establishedDevelopers of cryo-electron microscopy received Nobel Prize in Chemistry
ROYALPROBE HFX completedJSM-IT500 series InTouchScope™ scanning electron microscope completedJEM-Z300FSC/JEM-Z200FSC of spot electron beam lithography systems completedJEM-Z200FSC field emission cryo-electron microscope completedJSM-7900F Schottky field emission scanning electron microscope completedNext-generation STEM detection system opened up new applications for aberration-corrected TEM “4DCanvas™” completedJSM-IT500HR InTouchScope scanning electron microscope completedJSM-7610FPlus new ultra-high resolution Schottky field emission scanning electron microscope completed
2018Japan Industrial Standard (JIS) for the quantitative NMR (qNMR) analysis method is establishedJEOL awarded 64th (FY 2017) Okochi Memorial Technology Prize by the Okochi Memorial Foundation
JSM-IT200 InTouchScope™ scanning electron microscope completed
Corporate History
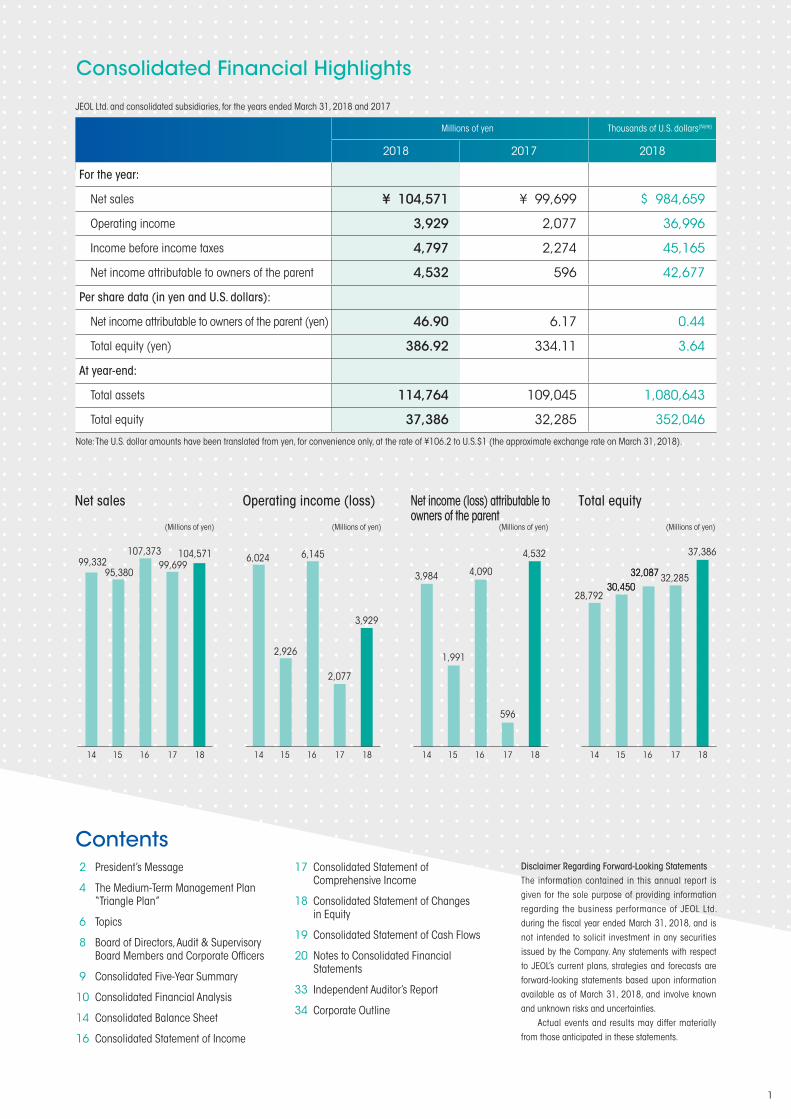
JEOL Ltd. and consolidated subsidiaries, for the years ended March 31, 2018 and 2017
Millions of yen Thousands of U.S. dollars(Note)
2018 2017 2018
For the year:
Net sales ¥ 104,571 ¥ 99,699 $ 984,659
Operating income 3,929 2,077 36,996
Income before income taxes 4,797 2,274 45,165
Net income attributable to owners of the parent 4,532 596 42,677
Per share data (in yen and U.S. dollars):
Net income attributable to owners of the parent (yen) 46.90 6.17 0.44
Total equity (yen) 386.92 334.11 3.64
At year-end:
Total assets 114,764 109,045 1,080,643
Total equity 37,386 32,285 352,046
Note: The U.S. dollar amounts have been translated from yen, for convenience only, at the rate of ¥106.2 to U.S.$1 (the approximate exchange rate on March 31, 2018).
99,332107,373 6,145
(Millions of yen)
Net sales
(Millions of yen)
Operating income (loss)
(Millions of yen)
Net income (loss) attributable to owners of the parent
(Millions of yen)
Total equity
14 15 16 17 18 14 15 16 17 18 14 15 16 17 1814 15 16 17 18
99,699104,571
95,3806,024
2,926
4,090
4,532
1,991
3,984 32,08732,08730,45030,450
28,792
2,077
3,929
596
37,386
32,285
Disclaimer Regarding Forward-Looking StatementsThe information contained in this annual report is given for the sole purpose of providing information regarding the business performance of JEOL Ltd. during the fiscal year ended March 31, 2018, and is not intended to solicit investment in any securities issued by the Company. Any statements with respect to JEOL’s current plans, strategies and forecasts are forward-looking statements based upon information available as of March 31, 2018, and involve known and unknown risks and uncertainties. Actual events and results may differ materially from those anticipated in these statements.
Consolidated Financial Highlights
Contents2
4
6
8
9
10
14
16
President’s Message
The Medium-Term Management Plan “Triangle Plan”
Topics
Board of Directors, Audit & Supervisory Board Members and Corporate Officers
Consolidated Five-Year Summary
Consolidated Financial Analysis
Consolidated Balance Sheet
Consolidated Statement of Income
17
18
19
20
33
34
Consolidated Statement of Comprehensive Income
Consolidated Statement of Changes in Equity
Consolidated Statement of Cash Flows
Notes to Consolidated Financial Statements
Independent Auditor’s Report
Corporate Outline
1
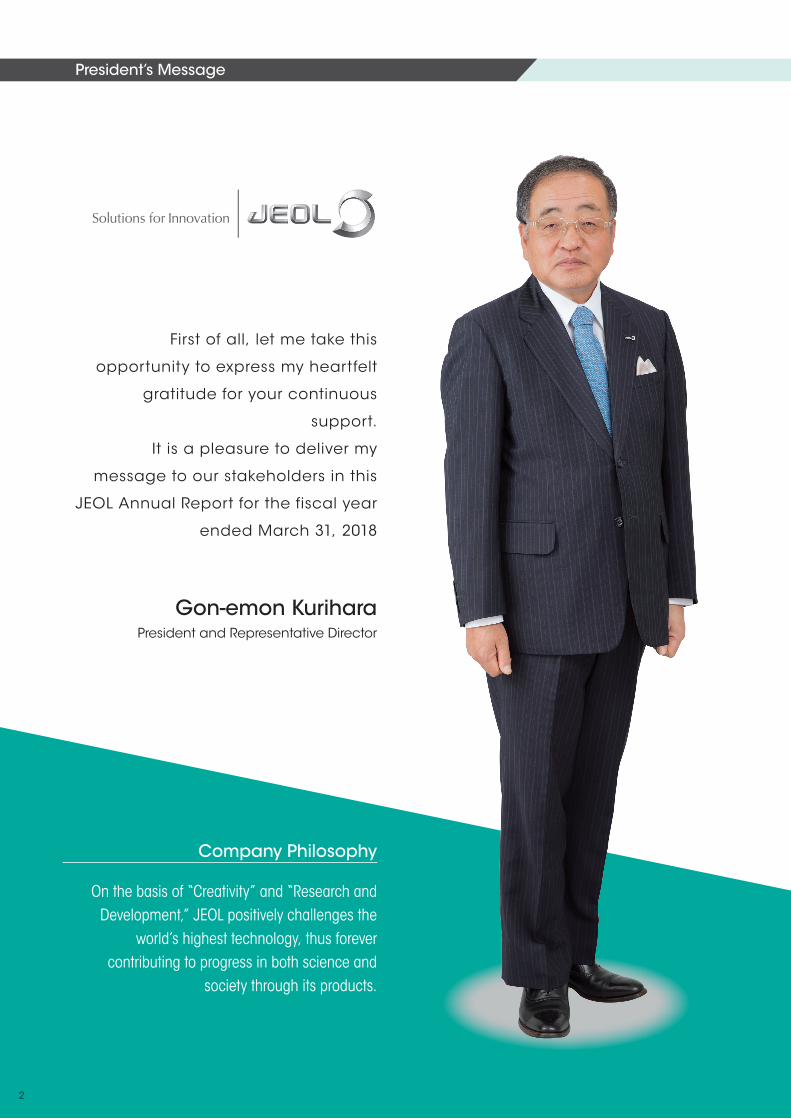
First of all, let me take this
opportunity to express my heartfelt
gratitude for your continuous
support.
It is a pleasure to deliver my
message to our stakeholders in this
JEOL Annual Report for the fiscal year
ended March 31, 2018
Company Philosophy
On the basis of “Creativity” and “Research and Development,” JEOL positively challenges the
world’s highest technology, thus forever contributing to progress in both science and
society through its products.
President’s Message
Gon-emon KuriharaPresident and Representative Director
2
“Dynamic Vision” (the medium-term management plan
for FY 2013 to FY 2015). While continuing the
YOKOGUSHI Strategy (cross-sectional collaboration
strategy) implemented in the previous management
plans, we wil l pursue “speed,” “difference,” and
“change” as a new set of keywords to deepen and
materialize our growth strategy. Based on these visions
and strategies, we will strive to transform the Company
into a highly profitable, medium-sized enterprise that
continuously generates solid profits.
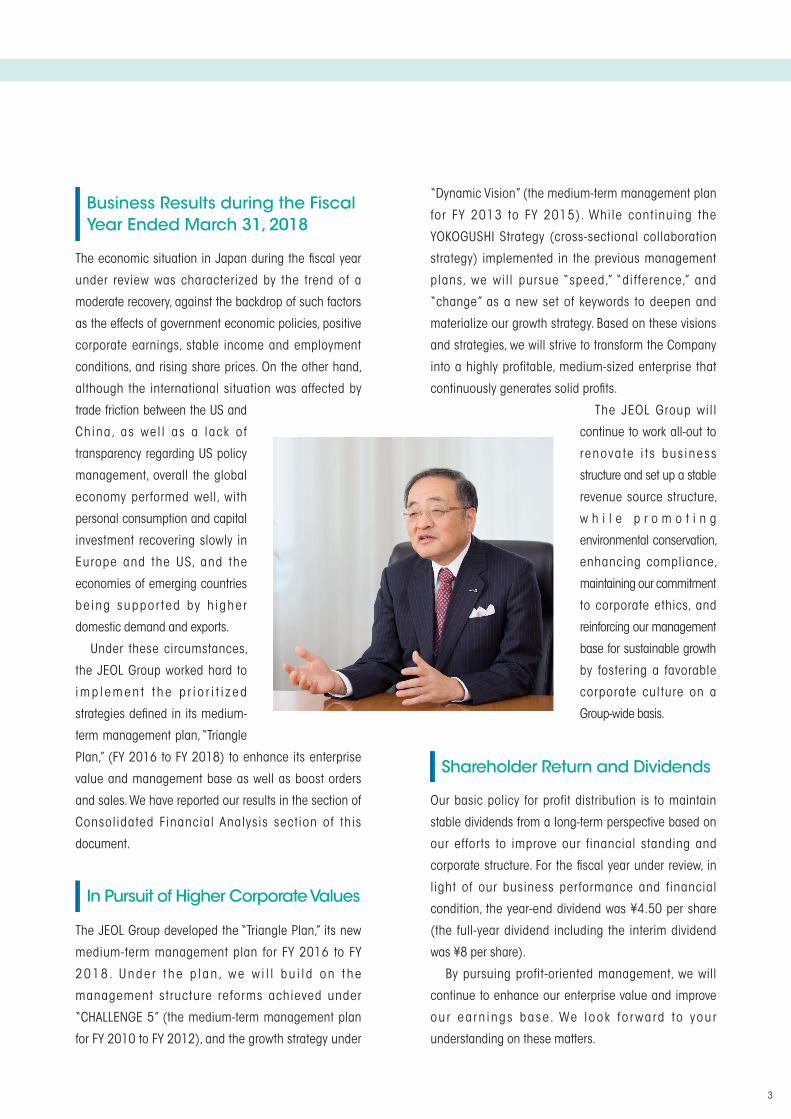
The JEOL Group will
continue to work all-out to
renova te i t s bus iness
structure and set up a stable
revenue source structure,
w h i l e p r o m o t i n g
environmental conservation,
enhancing compliance,
maintaining our commitment
to corporate ethics, and
reinforcing our management
base for sustainable growth
by fostering a favorable
corporate culture on a
Group-wide basis.
Our basic policy for profit distribution is to maintain
stable dividends from a long-term perspective based on
our efforts to improve our financial standing and
corporate structure. For the fiscal year under review, in
light of our business performance and financial
condition, the year-end dividend was ¥4.50 per share
(the full-year dividend including the interim dividend
was ¥8 per share).
By pursuing profit-oriented management, we will
continue to enhance our enterprise value and improve
ou r ea rn ings base. We look fo r wa rd to you r
understanding on these matters.
The economic situation in Japan during the fiscal year
under review was characterized by the trend of a
moderate recovery, against the backdrop of such factors
as the effects of government economic policies, positive
corporate earnings, stable income and employment
conditions, and rising share prices. On the other hand,
although the international situation was affected by
trade friction between the US and
China, as wel l as a lack o f
transparency regarding US policy
management, overall the global
economy performed well, with
personal consumption and capital
investment recovering slowly in
Europe and the US, and the
economies of emerging countries
be ing suppor ted by h igher
domestic demand and exports.
Under these circumstances,
the JEOL Group worked hard to
i m p l e m e n t t h e p r i o r i t i z e d
strategies defined in its medium-
term management plan, “Triangle
Plan,” (FY 2016 to FY 2018) to enhance its enterprise
value and management base as well as boost orders
and sales. We have reported our results in the section of
Consolidated Financial Analysis section of this
document.
The JEOL Group developed the “Triangle Plan,” its new
medium-term management plan for FY 2016 to FY
2 0 1 8 . U n d e r t h e p l a n , we w i l l b u i l d o n t h e
management structure reforms achieved under
“CHALLENGE 5” (the medium-term management plan
for FY 2010 to FY 2012), and the growth strategy under
Business Results during the Fiscal Year Ended March 31, 2018
In Pursuit of Higher Corporate Values
Shareholder Return and Dividends
3
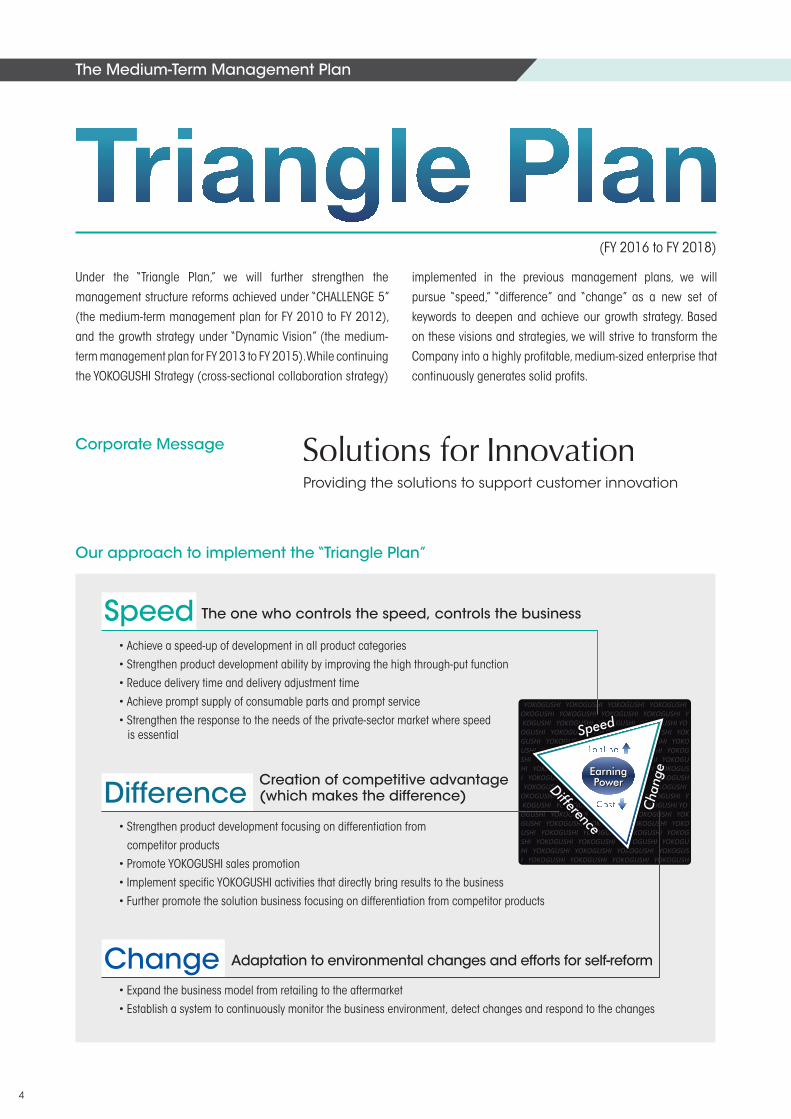
The one who controls the speed, controls the business
• Achieve a speed-up of development in all product categories
• Strengthen product development ability by improving the high through-put function
• Reduce delivery time and delivery adjustment time
• Achieve prompt supply of consumable parts and prompt service
• Strengthen the response to the needs of the private-sector market where speed is essential
Creation of competitive advantage (which makes the difference)
• Strengthen product development focusing on differentiation from
competitor products
• Promote YOKOGUSHI sales promotion
• Implement specific YOKOGUSHI activities that directly bring results to the business
• Further promote the solution business focusing on differentiation from competitor products
Adaptation to environmental changes and efforts for self-reform
• Expand the business model from retailing to the aftermarket
• Establish a system to continuously monitor the business environment, detect changes and respond to the changes
Speed
Difference
Change
(FY 2016 to FY 2018)
Under the “Triangle Plan,” we will further strengthen the
management structure reforms achieved under “CHALLENGE 5”
(the medium-term management plan for FY 2010 to FY 2012),
and the growth strategy under “Dynamic Vision” (the medium-
term management plan for FY 2013 to FY 2015). While continuing
the YOKOGUSHI Strategy (cross-sectional collaboration strategy)
implemented in the previous management plans, we will
pursue “speed,” “difference” and “change” as a new set of
keywords to deepen and achieve our growth strategy. Based
on these visions and strategies, we will strive to transform the
Company into a highly profitable, medium-sized enterprise that
continuously generates solid profits.
Corporate Message
Our approach to implement the “Triangle Plan”
Providing the solutions to support customer innovation
The Medium-Term Management Plan
4
*CLEM: correlative light-electron microscopy
Establishment of JEOL-Nikon CLEM Solution Center
All eyes on cryo-electron microscopesAwarded 2017 Nobel Prize in Chemistry
The 2017 Nobel Prize in Chemistry was awarded to the three developers of cryo-electron microscopy: Professor Dr. Jacques Dubochet of the University of Lausanne in Switzerland, Professor Joachim Frank of Columbia University in the United States, and Richard Henderson, Programme Leader at the MRC Laboratory of Molecular Biology in the UK. JEOL's �eld emission cryo-electron microscopes JEM-Z200FSC and JEM-Z300FSC, which went on sale th is �scal year, are cut t ing-edge cryo-electron microscopes based on the super-low electron microscopy technology expertise that the Company has been nurturing for over 30 years. It is expected that these models will play a central role in new drug developments and in clarifying biological processes.
Launched JEM-Z300FSC �eld emission cryo-electron microscope
Structure analysis of viruses and p ro te i n s u s i n g c r yo - e l e c t ro n microscopes is approaching the atomic level. The requirement for unprecedented stability in both h a r d w a r e a n d s o f t w a r e h a s developed hand in hand with this trend. In response to these requirements, and following on from the launch in April of the CRYO ARM™ 200, in June the Company began sales of the CRYO ARM™ 300, the current ultimate in resolution and stability.
JEOL and Nikon Corporation have jointly established the JEOL-Nikon CLEM* Solution Center, with the aim of providing the opportunity to experience cutting-edge CLEM solutions and for disseminating technical information.
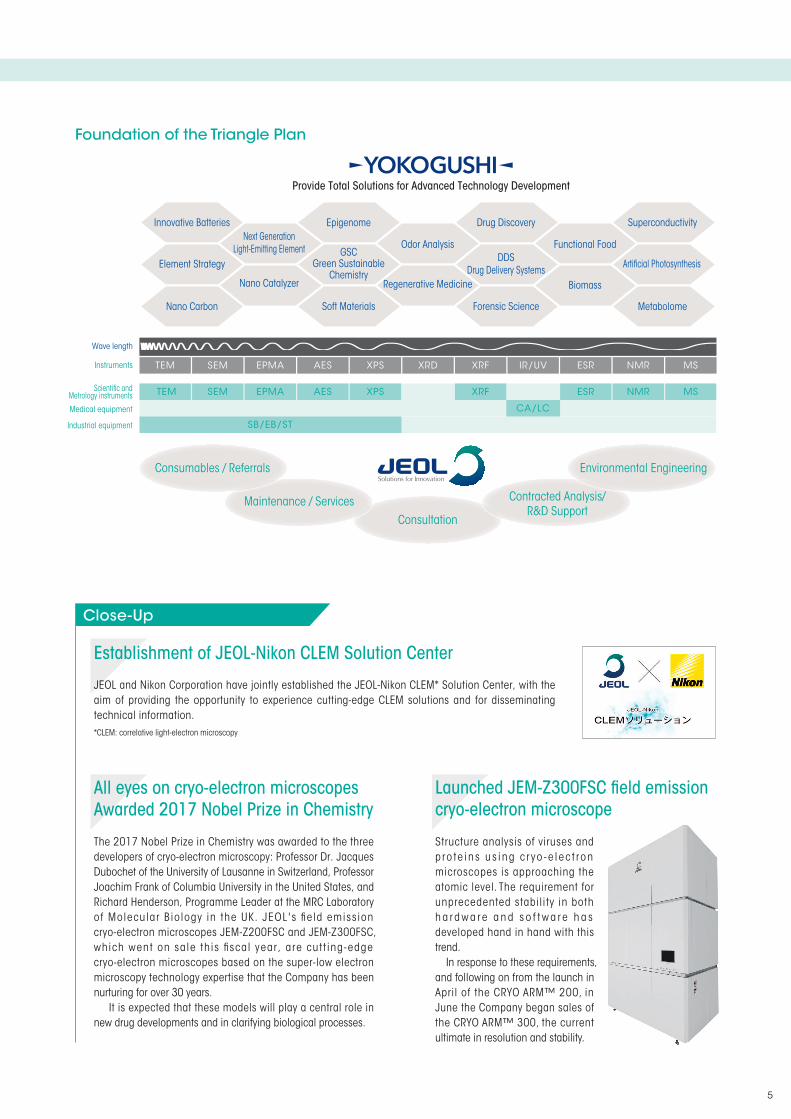
TEM SEM EPMA AES XPS XRD XRF IR/UV ESR NMR MS
TEM SEM EPMA AES XPS XRF
CA/LC
ESR NMR MS
SB/EB/ST
Provide Total Solutions for Advanced Technology Development
Innovative Batteries Superconductivity
Arti�cial Photosynthesis
Metabolome
Biomass
Functional Food
Forensic Science
DDSDrug Delivery Systems
Drug Discovery
Regenerative Medicine
Odor Analysis
Soft Materials
GSCGreen Sustainable
Chemistry
Epigenome
Nano Catalyzer
Next GenerationLight-Emitting Element
Nano Carbon
Element Strategy
Wave length
Instruments
Scienti�c andMetrology instruments
Industrial equipment
Medical equipment
Consumables / Referrals Environmental Engineering
Contracted Analysis/R&D Support
Maintenance / ServicesConsultation
Foundation of the Triangle Plan
Close-Up
5
Topics
JGMS basic policyUnder the Company philosophy, the JEOL Group strives to provide total solutions that meet the needs of customers and markets and contribute to the realization of a sustainable recycling society, by providing services and products that include the latest scientific a n d m e t r o l o g y i n s t r u m e n t s , semiconductor-related equipment, industrial equipment, medical equipment and other types of equipment.
Providing products that take the environment into accountRegulations restricting substances used in products, including the EU’s RoHS Directive, are already in force and the use of similar regulations is expanding to other countries. Going forward, in addition to complying with legal requirements, and with the aim of considering everything from procurement to disposal, and of responding to requests both in Japan and from overseas, we will proactively work on the development, production and supply of environmentally friendly and environmentally aware products. On our “Environment Activities” website (www.jeol.
Environmental Activities co.jp/en/corporate/envi/report/), we have made available information regarding our environmental initiatives.
Participation in a Network of Enterprises That Consider the Environment in Akishima CityBased on the concept of contribution from the regional level to the global environment, we have actively participated from the beginning in the “Network of Enterprises That Consider the Environment in Akishima City,” which was set up in April 2005 and which invo l ves Ak i sh ima C i t y i n the Tokyo metropolitan area and enterprises in Akishima.
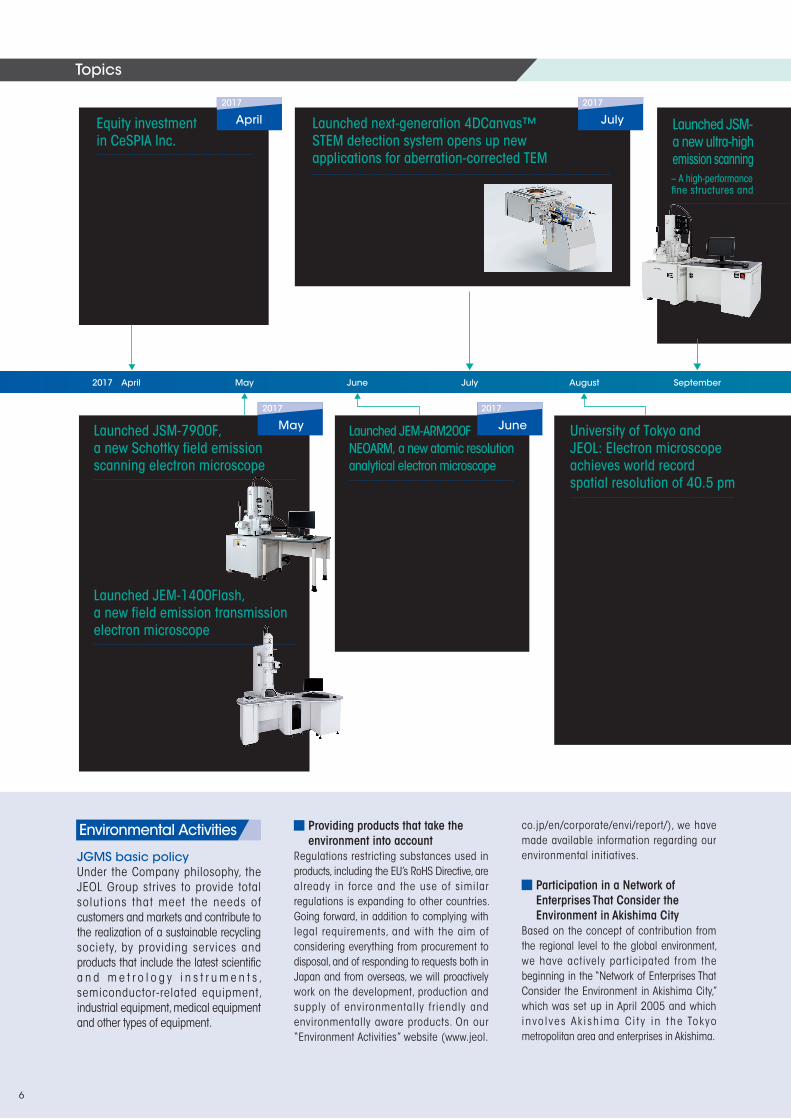
Equity investment in CeSPIA Inc.
In a joint equit y investment with Nagoya University’ s Visiting Professor Dr. Yoshinori Fujiyoshi the Company established CeSPIA Inc. CeSPIA Inc. provides contract services for analyz-ing protein structures based on mem-brane protein structure methods using cryo-electron microscopes which has been developed and evolved by Dr. Fujiyoshi.
2017 May June January February MarchJuly August October November DecemberSeptember
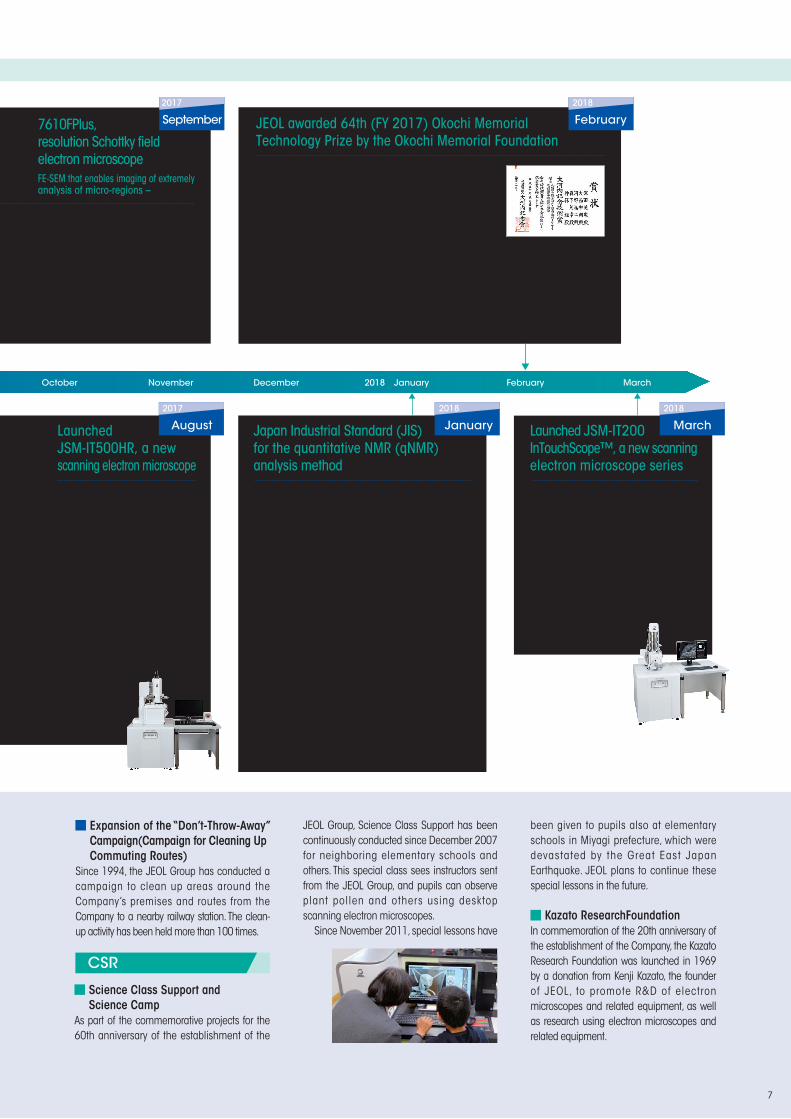
JEOL awarded 64th (FY 2017) Okochi Memorial Technology Prize by the Okochi Memorial Foundation
JEOL has been awarded the 64th (FY 2017) Okochi Memorial Technology Prize by the Okochi Memorial Foundation(Japan), for “Development of a Transmission Electron Microscope with Automatic Aberration Correction and Super High Resolution.” The Okochi Memorial Foundation, established in 1954, commemorates achievements by academia and industry, and is named for the late, distinguished scientist Masatoshi Okochi. Since 1954, with the objective of “promoting science and technology for manufacturing” in accordance with his legacy, award ceremonies have been held for Okochi Prizes, now prestigious prizes with a tradition of being presented for signi�cant achievements.
Launched JSM-IT500HR, a new scanning electron microscope
We added a high-br ightness electron gun to our InTouchScope™ series to overturn the conven-tional wisdom for standard SEMs, and have begun selling the result as an SEM that allows high-quality imaging and is able to quickly carry out high spatial resolution analysis. By harmonizing and improving both performance and ease of use, we were able to realize a 40% improvement in work ef�ciency (compared with o u r p r e v i o u s products).
University of Tokyo and JEOL: Electron microscope achieves world record spatial resolution of 40.5 pm
Professors Yuichi Ikuhara and Naoya Shibata, and Assistant Professor Ryo Ishikawa of the Institute of Engineering Innovation, School of Engineering, the University of Tokyo, in collaboration with the JEOL research group, have achieved a world record for spatial resolution of 40.5 pm. They used a scanning transmission electron micro-scope with an accelerating voltage of 300 kV made by JEOL. Installed at University of Tokyo, this equipment is equipped with a system, developed by JEOL, that is able to correct high-order aberrations.
Launched next-generation 4DCanvas™ STEM detection system opens up new applications for aberration-corrected TEM
JEOL has developed the 4DCanvas™ pixelated STEM detector, a new type of detector that captures all the elec-trons that have passed through a s a m p l e a s a t w o - d i m e n s i o n a l pattern.
Launched JSM-7900F, a new Schottky field emission scanning electron microscope
JSM-7900F achieves a combina-tion of ultra-high resolution obser-vation and superior operability. It delivers high performance at all times, without being dependent on the skill of the operator.
This is a new type of electron microscope that is equipped with a high-sensitivity sCMOS camera, an ult ra -wide area montage system, and a system that can link images from an optical microscope.
Launched JEM-ARM200F NEOARM, a new atomic resolution analytical electron microscope
This device is equipped with a cold �eld-emission gun (Cold-FEG) devel-oped using the Company's proprietary technology, as well as a new Cs corrector (ASCOR) that compensates for higher order aberrations. And is capable of atomic-resolution imaging not only at high accelerating voltages of 200 kV, but also at the low accelerating voltage of 30 kV.
Launched JEM-1400Flash, a new field emission transmission electron microscope
Japan Industrial Standard (JIS)for the quantitative NMR (qNMR) analysis method
Based on METI's the Standardization System for Cultivating New Markets, JEOL and FUJIFILM Wako Pure Chemical Corporation have been working on the standardization of the quantitative NMR (qNMR) analysis method since 2016. The draft they created has been examined by the Japan Industrial Standards (JIS) Committee, and published as “general rules for quantitative nuclear magnetic resonance spectroscopy K0138.” The quantitative NMR analysis method has already appeared as a test methodology in the Japanese Pharmacopoeia, the quality standards publication for pharmaceuticals. In addition, for certain food additives it has been adopted as a standard for reference materials, and it is becoming widely used for organic compounds, typi�ed by pharmaceuticals and chemical reagents. That it has become a set of general rules for JIS means that, in Japan, quantitative analysis methods using quantitative NMR analysis methods have been recognized in a broader range as a national standard.
The JSM-IT200, with more simple and easy-to-use operability launched which mounted as same function as JSM-IT500, the Company's higher model InTouchScope™ series. As same as JSM-IT500 series, routine analyses are even faster and easier to carryout, and throughput is approx imately 35% higher than previous models (JSM-IT100 series.)
Through a combination of a semi-in lens type objective lens and an in lens Schottky �eld emission electron gun capable of providing a large probe current with high stability, we w e r e a b l e t o a c h i e v e b o t h ultra-high-resolution imaging and high-spatial resolution analysis.
2017
April
2017
May2017
June2017
August2018
January2018
March
2017
July2017
September2018
February
2018April
Launched JSM- 7610FPlus,a new ultra-high resolution Schottky fieldemission scanning electron microscope – A high-performance FE-SEM that enables imaging of extremely�ne structures and analysis of micro-regions –
Launched JSM-IT200InTouchScope™, a new scanning electron microscope series
6
Expansion of the “Don’t-Throw-Away” Campaign(Campaign for Cleaning Up Commuting Routes)Since 1994, the JEOL Group has conducted a campaign to clean up areas around the Company’s premises and routes from the Company to a nearby railway station. The clean-up activity has been held more than 100 times.
JEOL Group, Science Class Support has been continuously conducted since December 2007 for neighboring elementary schools and others. This special class sees instructors sent from the JEOL Group, and pupils can observe plant pollen and others using desktop scanning electron microscopes.
Since November 2011, special lessons have
Science Class Support and Science CampAs part of the commemorative projects for the 60th anniversary of the establishment of the
CSR
Equity investment in CeSPIA Inc.
In a joint equit y investment with Nagoya University’ s Visiting Professor Dr. Yoshinori Fujiyoshi the Company established CeSPIA Inc. CeSPIA Inc. provides contract services for analyz-ing protein structures based on mem-brane protein structure methods using cryo-electron microscopes which has been developed and evolved by Dr. Fujiyoshi.
2017 May June January February MarchJuly August October November DecemberSeptember
JEOL awarded 64th (FY 2017) Okochi Memorial Technology Prize by the Okochi Memorial Foundation
JEOL has been awarded the 64th (FY 2017) Okochi Memorial Technology Prize by the Okochi Memorial Foundation(Japan), for “Development of a Transmission Electron Microscope with Automatic Aberration Correction and Super High Resolution.” The Okochi Memorial Foundation, established in 1954, commemorates achievements by academia and industry, and is named for the late, distinguished scientist Masatoshi Okochi. Since 1954, with the objective of “promoting science and technology for manufacturing” in accordance with his legacy, award ceremonies have been held for Okochi Prizes, now prestigious prizes with a tradition of being presented for signi�cant achievements.
Launched JSM-IT500HR, a new scanning electron microscope
We added a high-br ightness electron gun to our InTouchScope™ series to overturn the conven-tional wisdom for standard SEMs, and have begun selling the result as an SEM that allows high-quality imaging and is able to quickly carry out high spatial resolution analysis. By harmonizing and improving both performance and ease of use, we were able to realize a 40% improvement in work ef�ciency (compared with o u r p r e v i o u s products).
University of Tokyo and JEOL: Electron microscope achieves world record spatial resolution of 40.5 pm
Professors Yuichi Ikuhara and Naoya Shibata, and Assistant Professor Ryo Ishikawa of the Institute of Engineering Innovation, School of Engineering, the University of Tokyo, in collaboration with the JEOL research group, have achieved a world record for spatial resolution of 40.5 pm. They used a scanning transmission electron micro-scope with an accelerating voltage of 300 kV made by JEOL. Installed at University of Tokyo, this equipment is equipped with a system, developed by JEOL, that is able to correct high-order aberrations.
Launched next-generation 4DCanvas™ STEM detection system opens up new applications for aberration-corrected TEM
JEOL has developed the 4DCanvas™ pixelated STEM detector, a new type of detector that captures all the elec-trons that have passed through a s a m p l e a s a t w o - d i m e n s i o n a l pattern.
Launched JSM-7900F, a new Schottky field emission scanning electron microscope
JSM-7900F achieves a combina-tion of ultra-high resolution obser-vation and superior operability. It delivers high performance at all times, without being dependent on the skill of the operator.
This is a new type of electron microscope that is equipped with a high-sensitivity sCMOS camera, an ult ra -wide area montage system, and a system that can link images from an optical microscope.
Launched JEM-ARM200F NEOARM, a new atomic resolution analytical electron microscope
This device is equipped with a cold �eld-emission gun (Cold-FEG) devel-oped using the Company's proprietary technology, as well as a new Cs corrector (ASCOR) that compensates for higher order aberrations. And is capable of atomic-resolution imaging not only at high accelerating voltages of 200 kV, but also at the low accelerating voltage of 30 kV.
Launched JEM-1400Flash, a new field emission transmission electron microscope
Japan Industrial Standard (JIS)for the quantitative NMR (qNMR) analysis method
Based on METI's the Standardization System for Cultivating New Markets, JEOL and FUJIFILM Wako Pure Chemical Corporation have been working on the standardization of the quantitative NMR (qNMR) analysis method since 2016. The draft they created has been examined by the Japan Industrial Standards (JIS) Committee, and published as “general rules for quantitative nuclear magnetic resonance spectroscopy K0138.” The quantitative NMR analysis method has already appeared as a test methodology in the Japanese Pharmacopoeia, the quality standards publication for pharmaceuticals. In addition, for certain food additives it has been adopted as a standard for reference materials, and it is becoming widely used for organic compounds, typi�ed by pharmaceuticals and chemical reagents. That it has become a set of general rules for JIS means that, in Japan, quantitative analysis methods using quantitative NMR analysis methods have been recognized in a broader range as a national standard.
The JSM-IT200, with more simple and easy-to-use operability launched which mounted as same function as JSM-IT500, the Company's higher model InTouchScope™ series. As same as JSM-IT500 series, routine analyses are even faster and easier to carryout, and throughput is approx imately 35% higher than previous models (JSM-IT100 series.)
Through a combination of a semi-in lens type objective lens and an in lens Schottky �eld emission electron gun capable of providing a large probe current with high stability, we w e r e a b l e t o a c h i e v e b o t h ultra-high-resolution imaging and high-spatial resolution analysis.
2017
April
2017
May2017
June2017
August2018
January2018
March
2017
July2017
September2018
February
2018April
Launched JSM- 7610FPlus,a new ultra-high resolution Schottky fieldemission scanning electron microscope – A high-performance FE-SEM that enables imaging of extremely�ne structures and analysis of micro-regions –
Launched JSM-IT200InTouchScope™, a new scanning electron microscope series
been given to pupils also at elementary schools in Miyagi prefecture, which were devastated by the Great East Japan Earthquake. JEOL plans to continue these special lessons in the future.
Kazato ResearchFoundationIn commemoration of the 20th anniversary of the establishment of the Company, the Kazato Research Foundation was launched in 1969 by a donation from Kenji Kazato, the founder of JEOL, to promote R&D of electron microscopes and related equipment, as well as research using electron microscopes and related equipment.
7
Shin Saito
Katsumoto Yaguchi
Yoshihiro Ohkura
Peter Genovese
Mitsuru Takahashi
Akihiro Kobayashi
Hiroaki Fukuda
Yasuo Hijikata
Tadashi Komagata
Tadashi Okubo
Shintaro Yazuka
Kiyotaka Fujino
Toshikatsu Kaneyama
Osamu Wakimoto
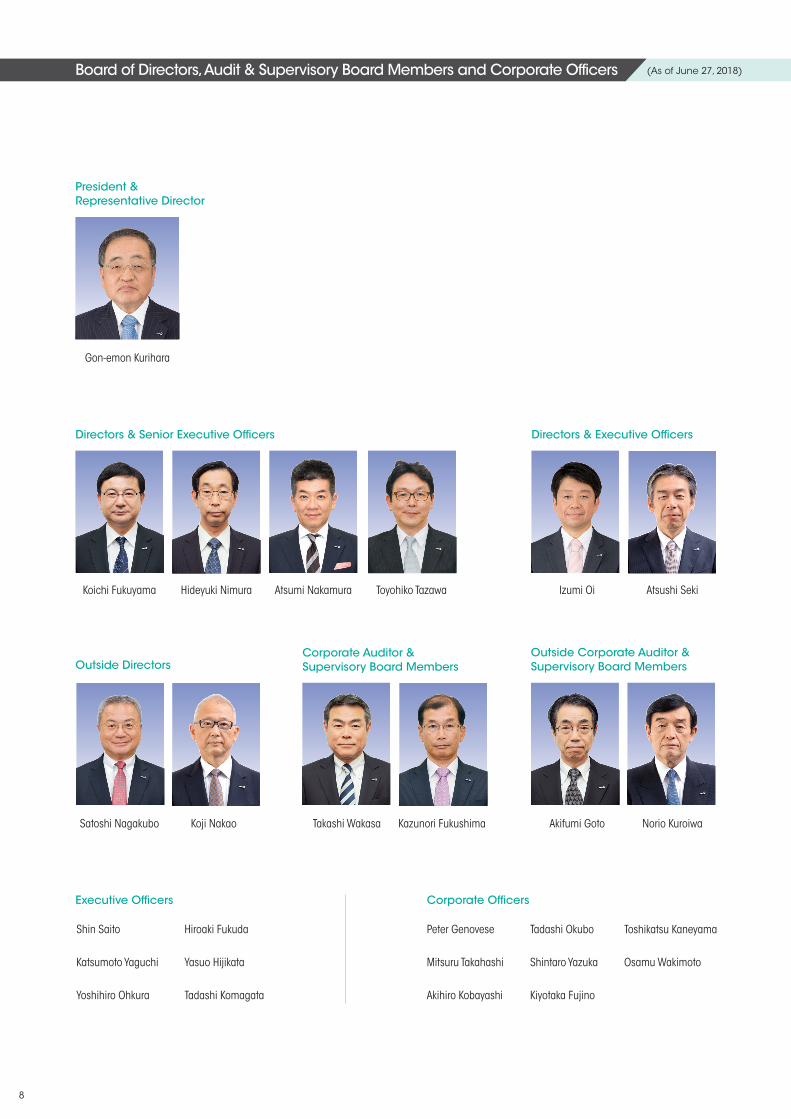
Gon-emon Kurihara
Koichi Fukuyama
Satoshi Nagakubo Takashi WakasaKoji Nakao Kazunori Fukushima
Hideyuki Nimura Atsumi Nakamura Izumi Oi
Akifumi Goto
Toyohiko Tazawa Atsushi Seki
Norio Kuroiwa
President & Representative Director
Directors & Senior Executive Officers
Outside DirectorsCorporate Auditor & Supervisory Board Members
Outside Corporate Auditor & Supervisory Board Members
Directors & Executive Officers
Executive Officers Corporate Officers
Board of Directors, Audit & Supervisory Board Members and Corporate Officers (As of June 27, 2018)
8
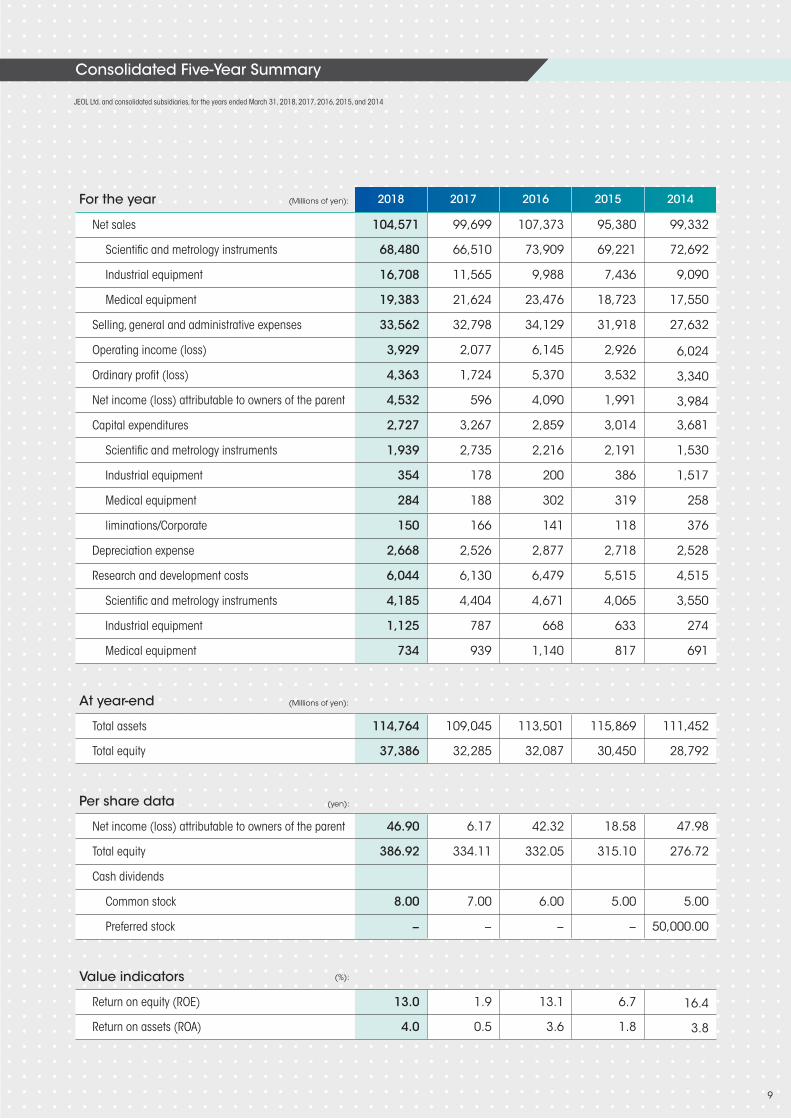
JEOL Ltd. and consolidated subsidiaries, for the years ended March 31, 2018, 2017, 2016, 2015, and 2014
For the year 2018 2017 2016 2015 2014
Net sales 104,571 99,699 107,373 95,380 99,332
Scientific and metrology instruments 68,480 66,510 73,909 69,221 72,692
Industrial equipment 16,708 11,565 9,988 7,436 9,090
Medical equipment 19,383 21,624 23,476 18,723 17,550
Selling, general and administrative expenses 33,562 32,798 34,129 31,918 27,632
Operating income (loss) 3,929 2,077 6,145 2,926 6,024
Ordinary profit (loss) 4,363 1,724 5,370 3,532 3,340
Net income (loss) attributable to owners of the parent 4,532 596 4,090 1,991 3,984
Capital expenditures 2,727 3,267 2,859 3,014 3,681
Scientific and metrology instruments 1,939 2,735 2,216 2,191 1,530
Industrial equipment 354 178 200 386 1,517
Medical equipment 284 188 302 319 258
liminations/Corporate 150 166 141 118 376
Depreciation expense 2,668 2,526 2,877 2,718 2,528
Research and development costs 6,044 6,130 6,479 5,515 4,515
Scientific and metrology instruments 4,185 4,404 4,671 4,065 3,550
Industrial equipment 1,125 787 668 633 274
Medical equipment 734 939 1,140 817 691
At year-end
Total assets 114,764 109,045 113,501 115,869 111,452
Total equity 37,386 32,285 32,087 30,450 28,792
Per share data
Net income (loss) attributable to owners of the parent 46.90 6.17 42.32 18.58 47.98
Total equity 386.92 334.11 332.05 315.10 276.72
Cash dividends
Common stock 8.00 7.00 6.00 5.00 5.00
Preferred stock − − − − 50,000.00
Value indicators
Return on equity (ROE) 13.0 1.9 13.1 6.7 16.4
Return on assets (ROA) 4.0 0.5 3.6 1.8 3.8
Consolidated Five-Year Summary
(Millions of yen):
(Millions of yen):
(yen):
(%):
9
The economic situation in Japan during the fiscal year under
review was characterized by the trend of a moderate
recovery, against the backdrop of such factors as the effects
of government economic policies, positive corporate
earnings, stable income and employment conditions, and
rising share prices. On the other hand, although the
international situation was affected by trade friction between
the US and China, as well as a lack of transparency regarding
US policy management, overall the global economy
performed well, with personal consumption and capital
investment recovering slowly in Europe and the US, and the
economies of emerging countries being supported by higher
domestic demand and exports.
Under these circumstances, the JEOL Group worked hard
to implement the prioritized strategies defined in its medium-
term management plan, “Triangle Plan,” (FY 2016 to FY
2018) to enhance its enterprise value and management
base as well as boost orders and sales. We have reported
our results in the section of Consolidated Financial Analysis
section of this document.
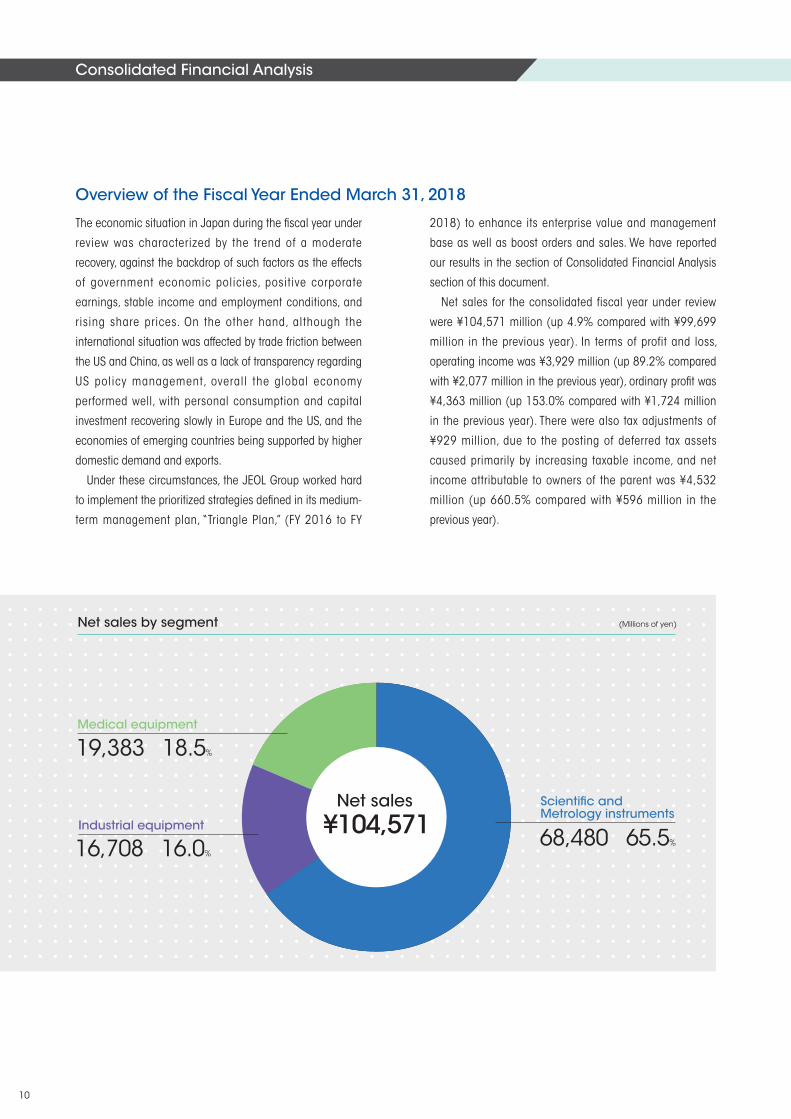
Net sales for the consolidated fiscal year under review
were ¥104,571 million (up 4.9% compared with ¥99,699
million in the previous year). In terms of profit and loss,
operating income was ¥3,929 million (up 89.2% compared
with ¥2,077 million in the previous year), ordinary profit was
¥4,363 million (up 153.0% compared with ¥1,724 million
in the previous year). There were also tax adjustments of
¥929 million, due to the posting of deferred tax assets
caused primarily by increasing taxable income, and net
income attributable to owners of the parent was ¥4,532
million (up 660.5% compared with ¥596 million in the
previous year).
Overview of the Fiscal Year Ended March 31, 2018
Net sales by segment (Millions of yen)
Scienti�c and Metrology instruments
Industrial equipment
16,708 16.0%
Medical equipment
19,383 18.5%
Net sales
¥104,571 68,480 65.5%
Consolidated Financial Analysis
10
Information by Business Segment
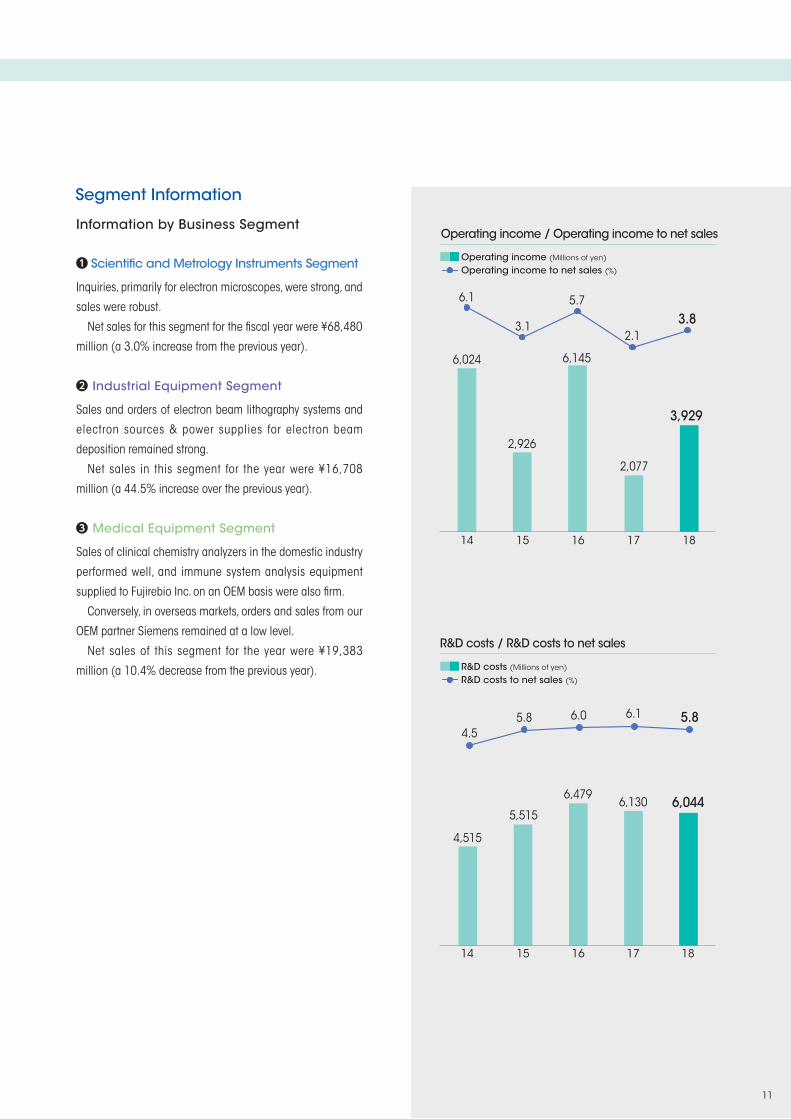
Scientific and Metrology Instruments Segment
Inquiries, primarily for electron microscopes, were strong, and
sales were robust.
Net sales for this segment for the fiscal year were ¥68,480
million (a 3.0% increase from the previous year).
Industrial Equipment Segment
Sales and orders of electron beam lithography systems and
electron sources & power supplies for electron beam
deposition remained strong.
Net sales in this segment for the year were ¥16,708
million (a 44.5% increase over the previous year).
Medical Equipment Segment
Sales of clinical chemistry analyzers in the domestic industry
performed well, and immune system analysis equipment
supplied to Fujirebio Inc. on an OEM basis were also firm.
Conversely, in overseas markets, orders and sales from our
OEM partner Siemens remained at a low level.
Net sales of this segment for the year were ¥19,383
million (a 10.4% decrease from the previous year).
Segment Information
1514
Operating income / Operating income to net sales
Operating income (Millions of yen)
Operating income to net sales (%)
R&D costs (Millions of yen)
R&D costs to net sales (%)
R&D costs / R&D costs to net sales
2,077
2.13.8
6,4796,130
16 17 18
16
6,044
17 18
6.1
6,024
3.1
2,926
6,145
5.7
3,929
4.55.8 6.0 6.1 5.8
4,515
5,515
14 15
11
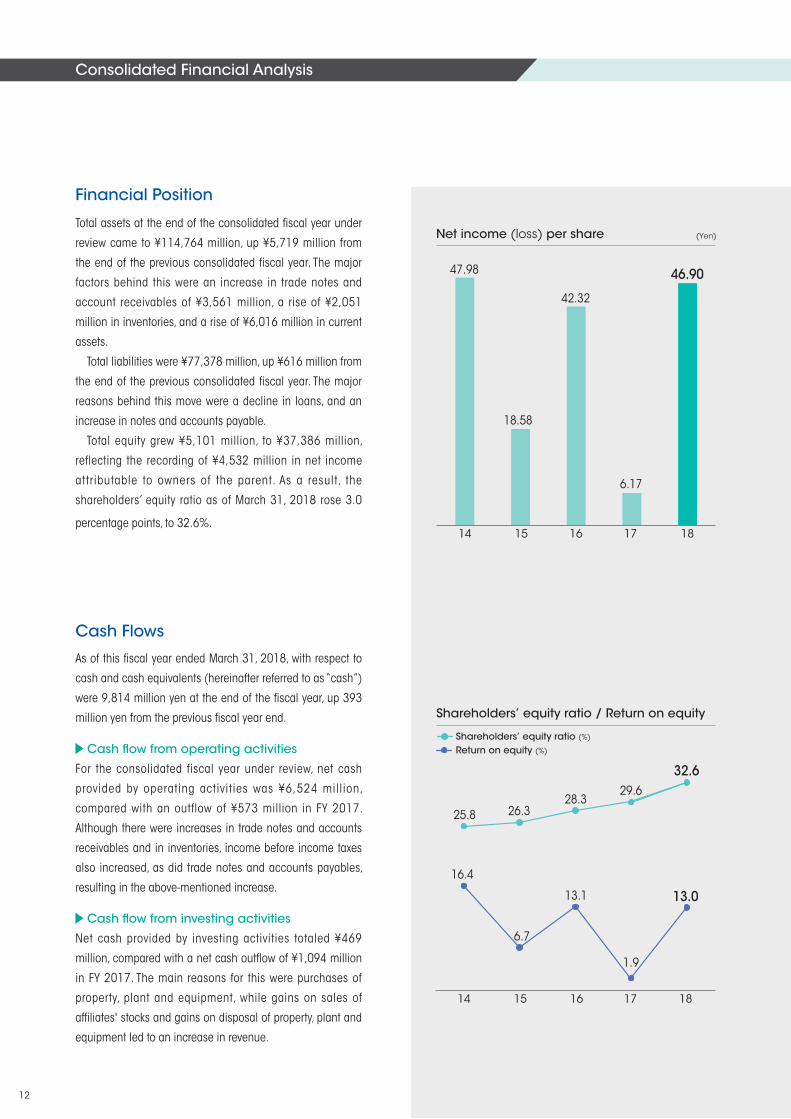
Total assets at the end of the consolidated fiscal year under
review came to ¥114,764 million, up ¥5,719 million from
the end of the previous consolidated fiscal year. The major
factors behind this were an increase in trade notes and
account receivables of ¥3,561 million, a rise of ¥2,051
million in inventories, and a rise of ¥6,016 million in current
assets.
Total liabilities were ¥77,378 million, up ¥616 million from
the end of the previous consolidated fiscal year. The major
reasons behind this move were a decline in loans, and an
increase in notes and accounts payable.
Total equity grew ¥5,101 million, to ¥37,386 million,
reflecting the recording of ¥4,532 million in net income
attributable to owners of the parent. As a result, the
shareholders’ equity ratio as of March 31, 2018 rose 3.0
percentage points, to 32.6%.
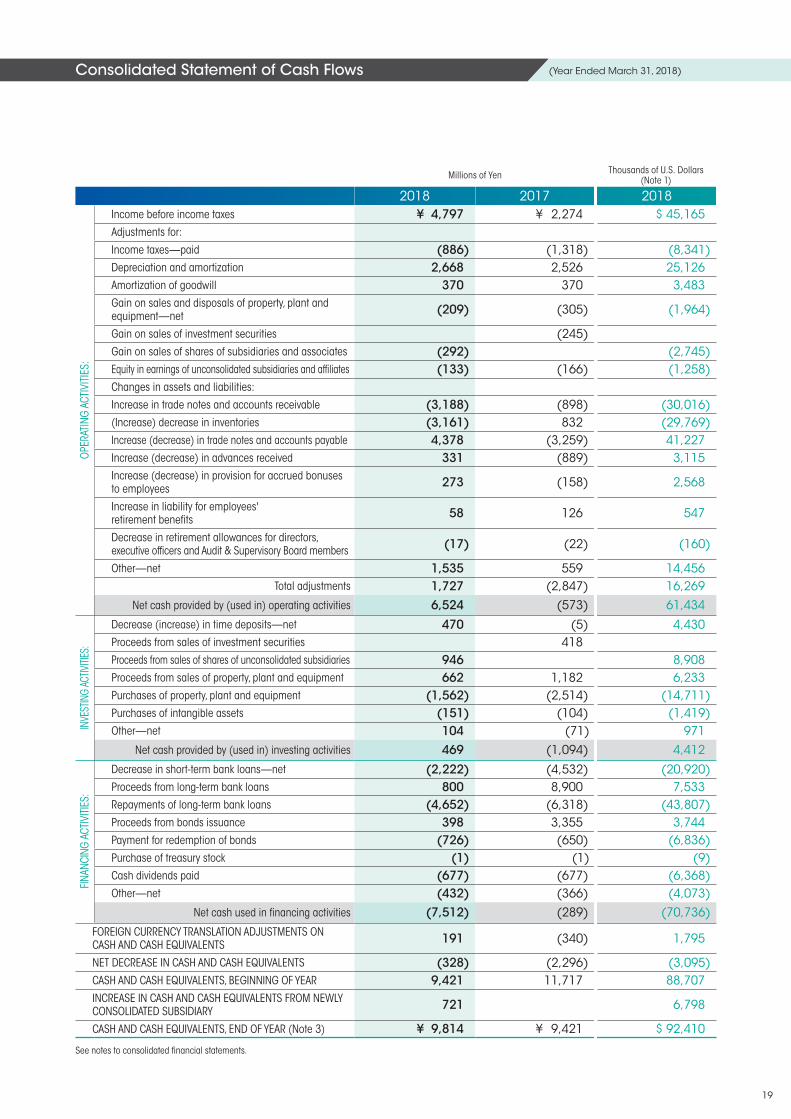
As of this fiscal year ended March 31, 2018, with respect to
cash and cash equivalents (hereinafter referred to as “cash”)
were 9,814 million yen at the end of the fiscal year, up 393
million yen from the previous fiscal year end.
Cash flow from operating activities
For the consolidated fiscal year under review, net cash
provided by operating activities was ¥6,524 million,
compared with an outflow of ¥573 million in FY 2017.
Although there were increases in trade notes and accounts
receivables and in inventories, income before income taxes
also increased, as did trade notes and accounts payables,
resulting in the above-mentioned increase.
Cash flow from investing activities
Net cash provided by investing activities totaled ¥469
million, compared with a net cash outflow of ¥1,094 million
in FY 2017. The main reasons for this were purchases of
property, plant and equipment, while gains on sales of
affiliates' stocks and gains on disposal of property, plant and
equipment led to an increase in revenue.
Financial Position
Cash Flows
Net income (loss) per share
18.58
14 15 16 17 18
(Yen)
47.98
42.32
6.17
46.90
Shareholders’ equity ratio / Return on equity
Shareholders’ equity ratio (%)
Return on equity (%)
14 15 16 17 18
16.4
25.8
6.7
26.3
13.1
28.329.6
1.9
32.6
13.0
Consolidated Financial Analysis
12
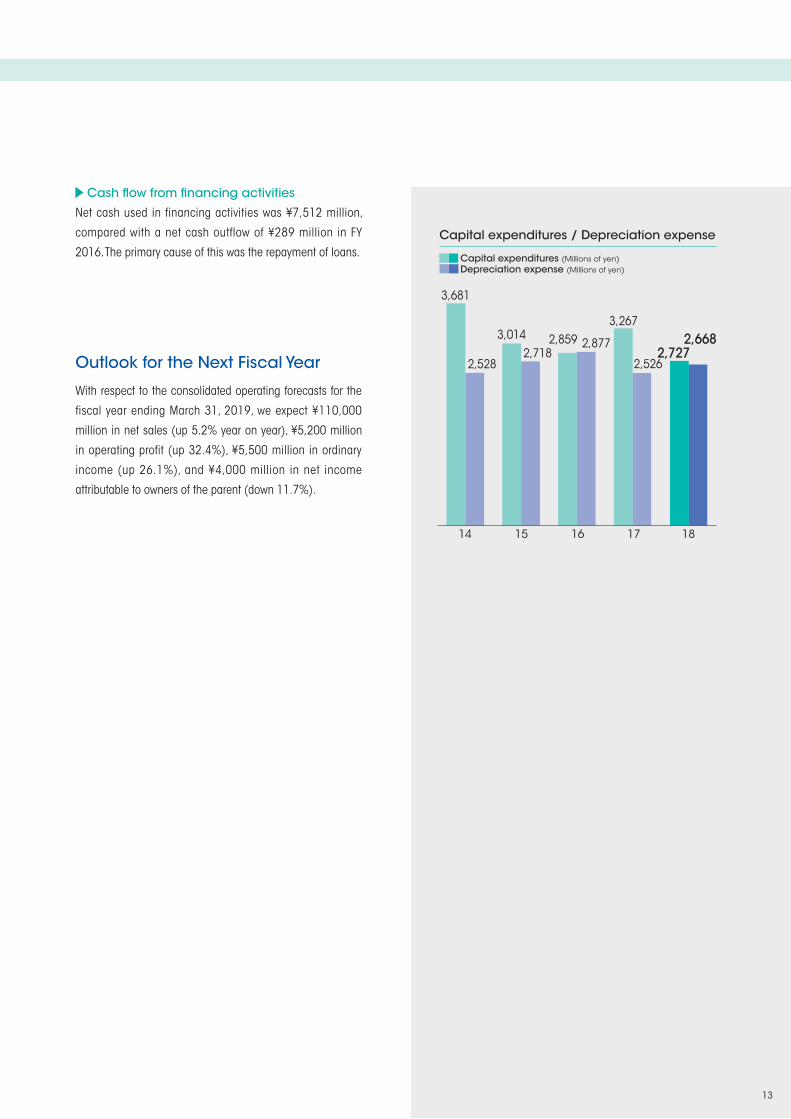
Cash flow from financing activities
Net cash used in financing activities was ¥7,512 million,
compared with a net cash outflow of ¥289 million in FY
2016. The primary cause of this was the repayment of loans.
With respect to the consolidated operating forecasts for the
fiscal year ending March 31, 2019, we expect ¥110,000
million in net sales (up 5.2% year on year), ¥5,200 million
in operating profit (up 32.4%), ¥5,500 million in ordinary
income (up 26.1%), and ¥4,000 million in net income
attributable to owners of the parent (down 11.7%).
Outlook for the Next Fiscal Year
Capital expenditures / Depreciation expense
2,8772,859
2,526
3,267
14 15 16
2,6682,727
17 18
3,681
2,5282,718
3,014
Capital expenditures (Millions of yen)Depreciation expense (Millions of yen)
13
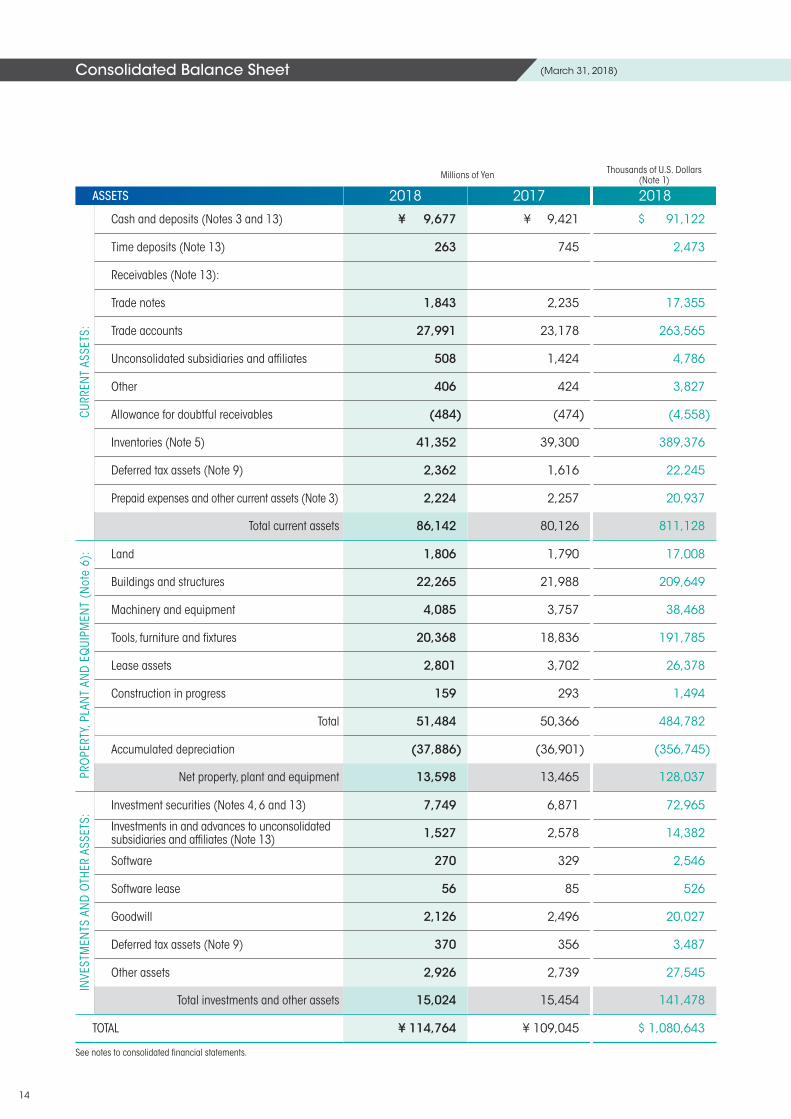
Consolidated Balance Sheet
Millions of Yen Thousands of U.S. Dollars (Note 1)
ASSETS 2018 2017 2018
CURR
ENT
ASSE
TS:
Cash and deposits (Notes 3 and 13) ¥ 9,677 ¥ 9,421 $ 91,122
Time deposits (Note 13) 263 745 2,473
Receivables (Note 13):
Trade notes 1,843 2,235 17,355
Trade accounts 27,991 23,178 263,565
Unconsolidated subsidiaries and affiliates 508 1,424 4,786
Other 406 424 3,827
Allowance for doubtful receivables (484) (474) (4,558)
Inventories (Note 5) 41,352 39,300 389,376
Deferred tax assets (Note 9) 2,362 1,616 22,245
Prepaid expenses and other current assets (Note 3) 2,224 2,257 20,937
Total current assets 86,142 80,126 811,128
PRO
PERT
Y, PL
ANT
AND
EQ
UIPM
ENT
(Not
e 6)
: Land 1,806 1,790 17,008
Buildings and structures 22,265 21,988 209,649
Machinery and equipment 4,085 3,757 38,468
Tools, furniture and fixtures 20,368 18,836 191,785
Lease assets 2,801 3,702 26,378
Construction in progress 159 293 1,494
Total 51,484 50,366 484,782
Accumulated depreciation (37,886) (36,901) (356,745)
Net property, plant and equipment 13,598 13,465 128,037
INVE
STM
ENTS
AN
D O
THER
ASS
ETS:
Investment securities (Notes 4, 6 and 13) 7,749 6,871 72,965
Investments in and advances to unconsolidated subsidiaries and affiliates (Note 13) 1,527 2,578 14,382
Software 270 329 2,546
Software lease 56 85 526
Goodwill 2,126 2,496 20,027
Deferred tax assets (Note 9) 370 356 3,487
Other assets 2,926 2,739 27,545
Total investments and other assets 15,024 15,454 141,478
TOTAL ¥ 114,764 ¥ 109,045 $ 1,080,643
See notes to consolidated financial statements.
(March 31, 2018)
14
Millions of Yen Thousands of U.S. Dollars (Note 1)
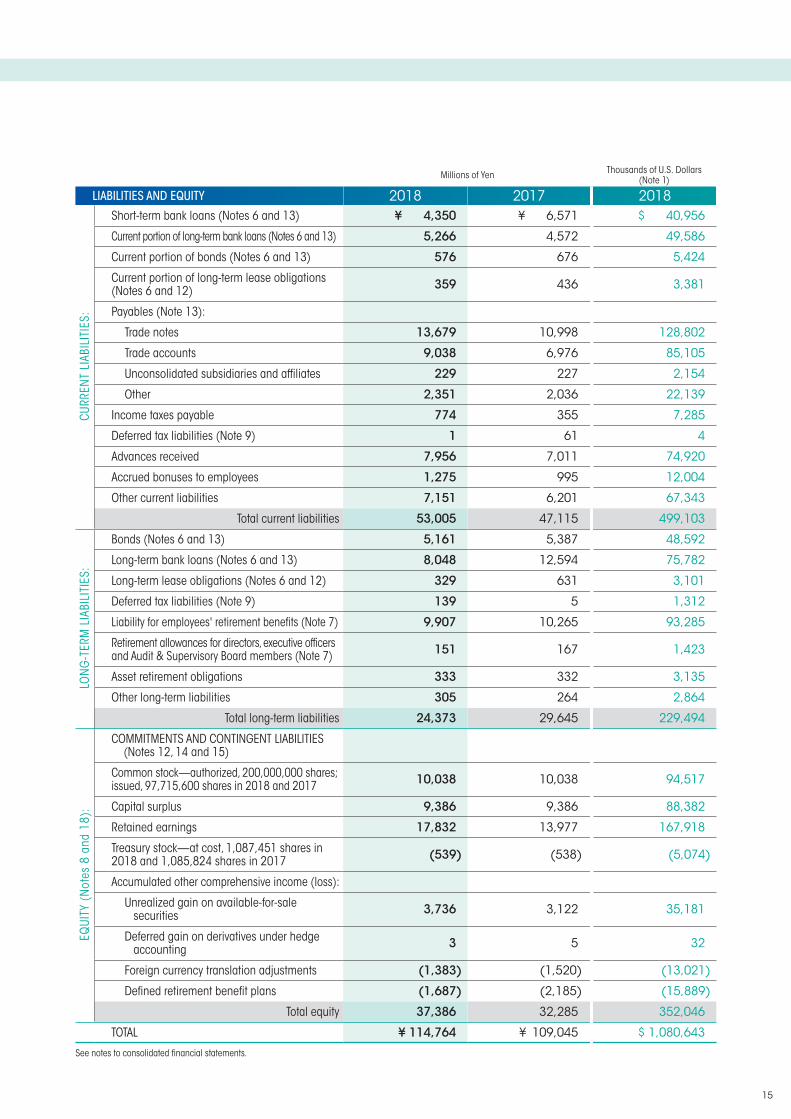
LIABILITIES AND EQUITY 2018 2017 2018
CURR
ENT
LIAB
ILIT
IES:
Short-term bank loans (Notes 6 and 13) ¥ 4,350 ¥ 6,571 $ 40,956
Current portion of long-term bank loans (Notes 6 and 13) 5,266 4,572 49,586
Current portion of bonds (Notes 6 and 13) 576 676 5,424
Current portion of long-term lease obligations (Notes 6 and 12) 359 436 3,381
Payables (Note 13):
Trade notes 13,679 10,998 128,802
Trade accounts 9,038 6,976 85,105
Unconsolidated subsidiaries and affiliates 229 227 2,154
Other 2,351 2,036 22,139
Income taxes payable 774 355 7,285
Deferred tax liabilities (Note 9) 1 61 4
Advances received 7,956 7,011 74,920
Accrued bonuses to employees 1,275 995 12,004
Other current liabilities 7,151 6,201 67,343
Total current liabilities 53,005 47,115 499,103
LON
G-T
ERM
LIA
BILI
TIES
:
Bonds (Notes 6 and 13) 5,161 5,387 48,592
Long-term bank loans (Notes 6 and 13) 8,048 12,594 75,782
Long-term lease obligations (Notes 6 and 12) 329 631 3,101
Deferred tax liabilities (Note 9) 139 5 1,312
Liability for employees' retirement benefits (Note 7) 9,907 10,265 93,285
Retirement allowances for directors, executive officers and Audit & Supervisory Board members (Note 7) 151 167 1,423
Asset retirement obligations 333 332 3,135
Other long-term liabilities 305 264 2,864
Total long-term liabilities 24,373 29,645 229,494
EQUI
TY (
Not
es 8
and
18)
:
COMMITMENTS AND CONTINGENT LIABILITIES (Notes 12, 14 and 15)
Common stock—authorized, 200,000,000 shares; issued, 97,715,600 shares in 2018 and 2017 10,038 10,038 94,517
Capital surplus 9,386 9,386 88,382
Retained earnings 17,832 13,977 167,918
Treasury stock—at cost, 1,087,451 shares in 2018 and 1,085,824 shares in 2017 (539) (538) (5,074)
Accumulated other comprehensive income (loss):
Unrealized gain on available-for-sale securities 3,736 3,122 35,181
Deferred gain on derivatives under hedge accounting 3 5 32
Foreign currency translation adjustments (1,383) (1,520) (13,021)
Defined retirement benefit plans (1,687) (2,185) (15,889)
Total equity 37,386 32,285 352,046
TOTAL ¥ 114,764 ¥ 109,045 $ 1,080,643
See notes to consolidated financial statements.
15
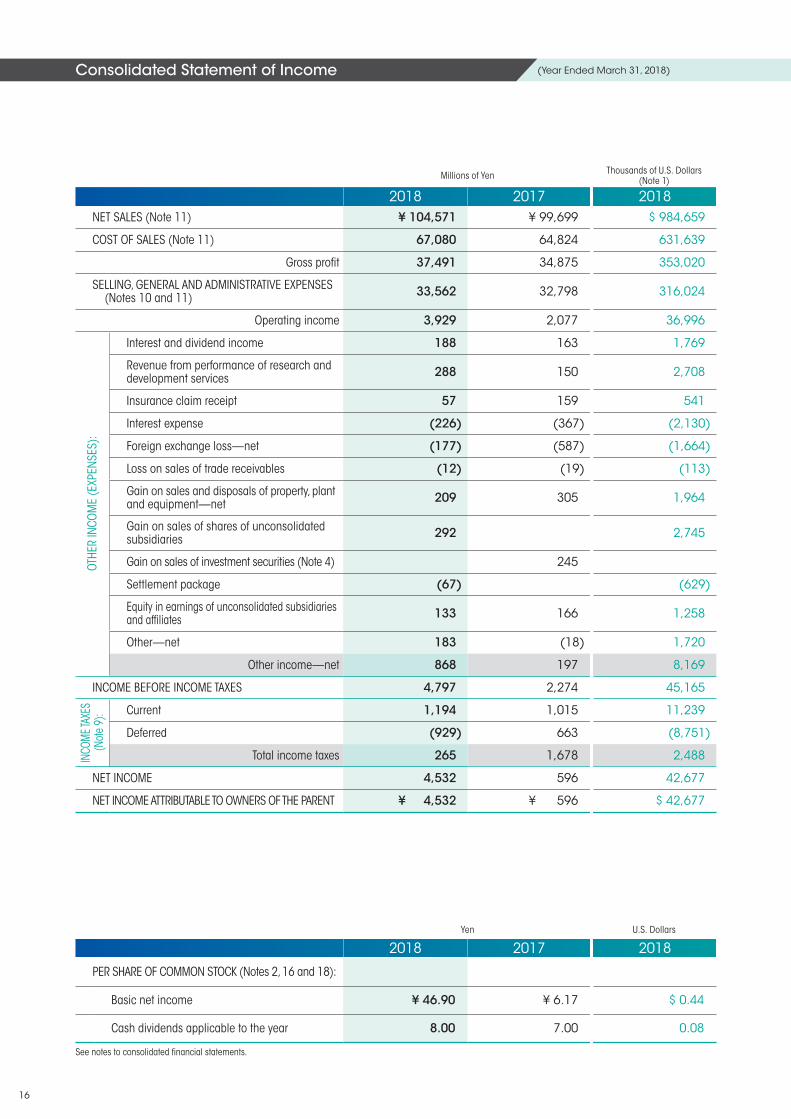
Consolidated Statement of Income (Year Ended March 31, 2018)
Millions of Yen Thousands of U.S. Dollars (Note 1)
2018 2017 2018NET SALES (Note 11) ¥ 104,571 ¥ 99,699 $ 984,659
COST OF SALES (Note 11) 67,080 64,824 631,639
Gross profit 37,491 34,875 353,020
SELLING, GENERAL AND ADMINISTRATIVE EXPENSES (Notes 10 and 11) 33,562 32,798 316,024
Operating income 3,929 2,077 36,996
OTHE
R IN
COM
E (E
XPEN
SES)
:
Interest and dividend income 188 163 1,769
Revenue from performance of research and development services 288 150 2,708
Insurance claim receipt 57 159 541
Interest expense (226) (367) (2,130)
Foreign exchange loss—net (177) (587) (1,664)
Loss on sales of trade receivables (12) (19) (113)
Gain on sales and disposals of property, plant and equipment—net 209 305 1,964
Gain on sales of shares of unconsolidated subsidiaries 292 2,745
Gain on sales of investment securities (Note 4) 245
Settlement package (67) (629)
Equity in earnings of unconsolidated subsidiaries and affiliates 133 166 1,258
Other—net 183 (18) 1,720
Other income—net 868 197 8,169
INCOME BEFORE INCOME TAXES 4,797 2,274 45,165
INCO
ME T
AXES
(N
ote
9): Current 1,194 1,015 11,239
Deferred (929) 663 (8,751)
Total income taxes 265 1,678 2,488
NET INCOME 4,532 596 42,677
NET INCOME ATTRIBUTABLE TO OWNERS OF THE PARENT ¥ 4,532 ¥ 596 $ 42,677
Yen U.S. Dollars
2018 2017 2018
PER SHARE OF COMMON STOCK (Notes 2, 16 and 18):
Basic net income ¥ 46.90 ¥ 6.17 $ 0.44
Cash dividends applicable to the year 8.00 7.00 0.08
See notes to consolidated financial statements.
16
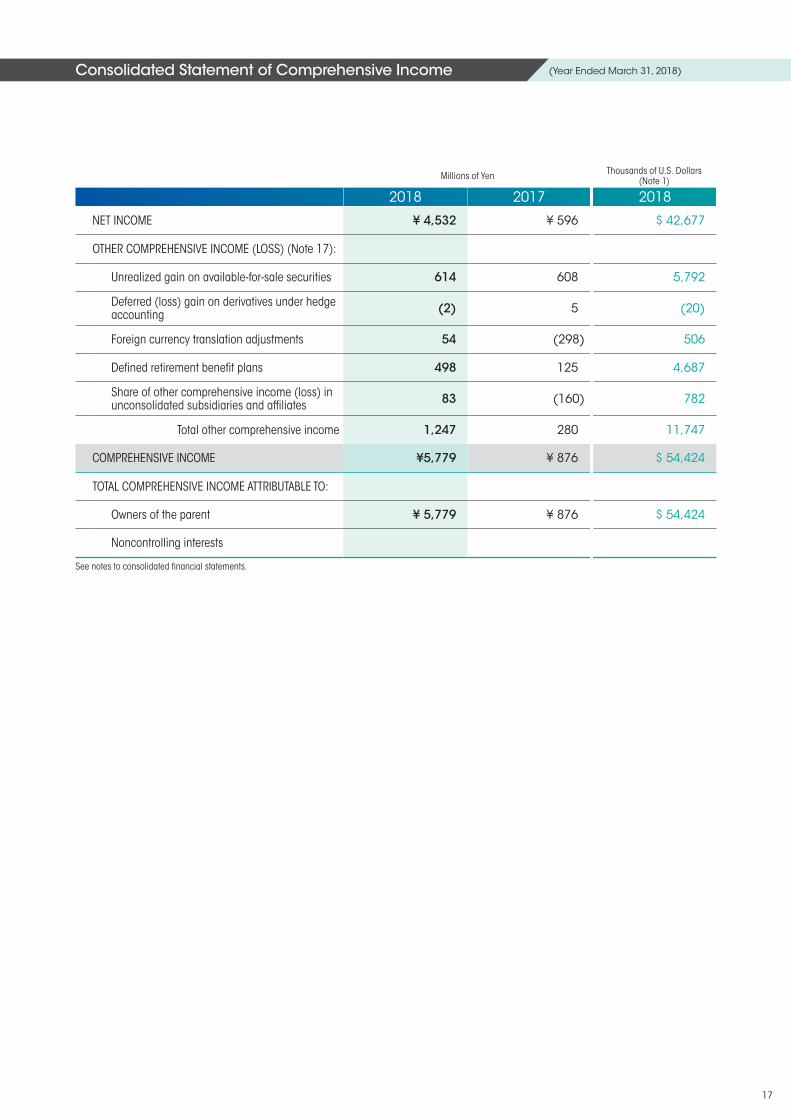
Consolidated Statement of Comprehensive Income (Year Ended March 31, 2018)
Millions of Yen Thousands of U.S. Dollars (Note 1)
2018 2017 2018
NET INCOME ¥ 4,532 ¥ 596 $ 42,677
OTHER COMPREHENSIVE INCOME (LOSS) (Note 17):
Unrealized gain on available-for-sale securities 614 608 5,792
Deferred (loss) gain on derivatives under hedge accounting (2) 5 (20)
Foreign currency translation adjustments 54 (298) 506
Defined retirement benefit plans 498 125 4,687
Share of other comprehensive income (loss) in unconsolidated subsidiaries and affiliates 83 (160) 782
Total other comprehensive income 1,247 280 11,747
COMPREHENSIVE INCOME ¥5,779 ¥ 876 $ 54,424
TOTAL COMPREHENSIVE INCOME ATTRIBUTABLE TO:
Owners of the parent ¥ 5,779 ¥ 876 $ 54,424
Noncontrolling interests
See notes to consolidated financial statements.
17
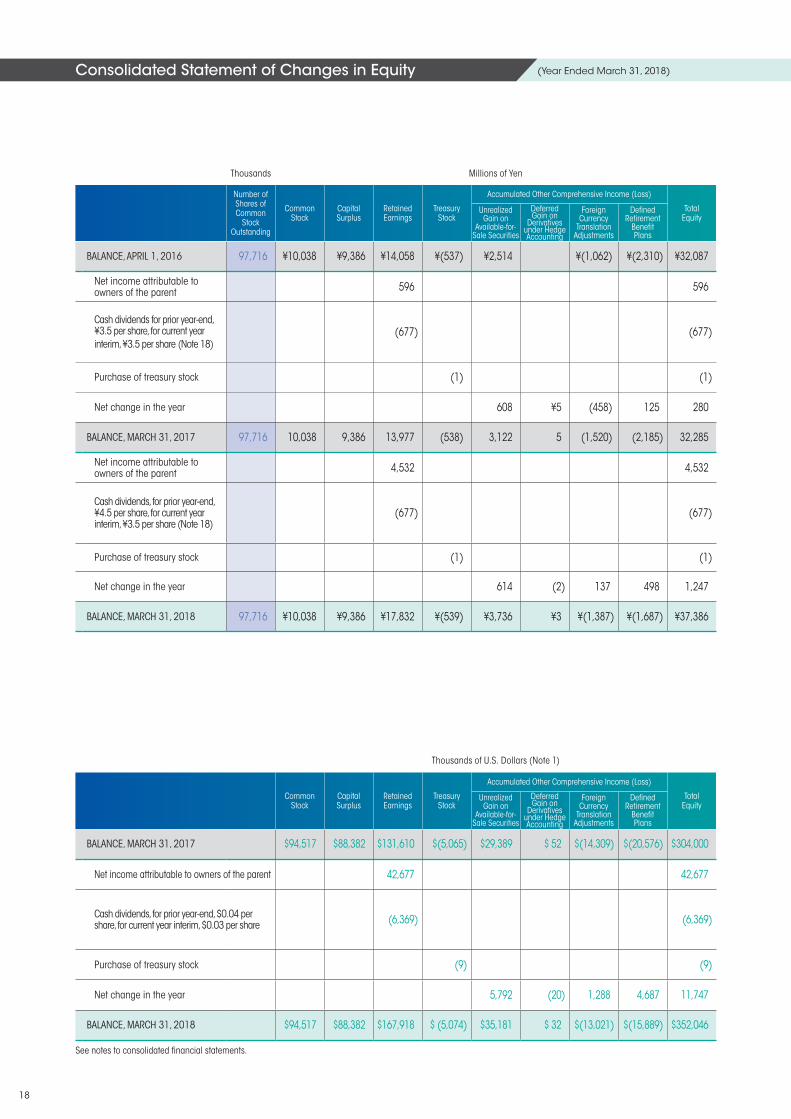
Thousands Millions of Yen
Number of Shares of Common
Stock Outstanding
Common Stock
CapitalSurplus
RetainedEarnings
Treasury Stock
Accumulated Other Comprehensive Income (Loss)
TotalEquity
Unrealized Gain on
Available-for-Sale Securities
Deferred Gain on
Derivatives under Hedge Accounting
ForeignCurrency
Translation Adjustments
Defined Retirement
Benefit Plans
BALANCE, APRIL 1, 2016 97,716 ¥10,038 ¥9,386 ¥14,058 ¥(537) ¥2,514 ¥(1,062) ¥(2,310) ¥32,087
Net income attributable to owners of the parent 596 596
Cash dividends for prior year-end, ¥3.5 per share, for current year interim, ¥3.5 per share (Note 18)
(677) (677)
Purchase of treasury stock (1) (1)
Net change in the year 608 ¥5 (458) 125 280
BALANCE, MARCH 31, 2017 97,716 10,038 9,386 13,977 (538) 3,122 5 (1,520) (2,185) 32,285
Net income attributable to owners of the parent 4,532 4,532
Cash dividends, for prior year-end, ¥4.5 per share, for current year interim, ¥3.5 per share (Note 18)
(677) (677)
Purchase of treasury stock (1) (1)
Net change in the year 614 (2) 137 498 1,247
BALANCE, MARCH 31, 2018 97,716 ¥10,038 ¥9,386 ¥17,832 ¥(539) ¥3,736 ¥3 ¥(1,387) ¥(1,687) ¥37,386
Thousands of U.S. Dollars (Note 1)
Common Stock
CapitalSurplus
RetainedEarnings
Treasury Stock
Accumulated Other Comprehensive Income (Loss)
TotalEquity
Unrealized Gain on
Available-for-Sale Securities
Deferred Gain on
Derivatives under Hedge Accounting
ForeignCurrency
Translation Adjustments
Defined Retirement
Benefit Plans
BALANCE, MARCH 31, 2017 $94,517 $88,382 $131,610 $(5,065) $29,389 $ 52 $(14,309) $(20,576) $304,000
Net income attributable to owners of the parent 42,677 42,677
Cash dividends, for prior year-end, $0.04 per share, for current year interim, $0.03 per share (6,369) (6,369)
Purchase of treasury stock (9) (9)
Net change in the year 5,792 (20) 1,288 4,687 11,747
BALANCE, MARCH 31, 2018 $94,517 $88,382 $167,918 $ (5,074) $35,181 $ 32 $(13,021) $(15,889) $352,046
See notes to consolidated financial statements.
Consolidated Statement of Changes in Equity (Year Ended March 31, 2018)
18
Millions of Yen Thousands of U.S. Dollars (Note 1)
2018 2017 2018
OPER
ATIN
G AC
TIVI
TIES
:
Income before income taxes ¥ 4,797 ¥ 2,274 $ 45,165Adjustments for:
Income taxes—paid (886) (1,318) (8,341)Depreciation and amortization 2,668 2,526 25,126Amortization of goodwill 370 370 3,483Gain on sales and disposals of property, plant and equipment—net (209) (305) (1,964)
Gain on sales of investment securities (245)Gain on sales of shares of subsidiaries and associates (292) (2,745) Equity in earnings of unconsolidated subsidiaries and affiliates (133) (166) (1,258)Changes in assets and liabilities:
Increase in trade notes and accounts receivable (3,188) (898) (30,016)(Increase) decrease in inventories (3,161) 832 (29,769)Increase (decrease) in trade notes and accounts payable 4,378 (3,259) 41,227Increase (decrease) in advances received 331 (889) 3,115Increase (decrease) in provision for accrued bonuses to employees 273 (158) 2,568
Increase in liability for employees' retirement benefits 58 126 547
Decrease in retirement allowances for directors, executive officers and Audit & Supervisory Board members (17) (22) (160)
Other—net 1,535 559 14,456Total adjustments 1,727 (2,847) 16,269
Net cash provided by (used in) operating activities 6,524 (573) 61,434
INVE
STIN
G AC
TIVITI
ES:
Decrease (increase) in time deposits—net 470 (5) 4,430Proceeds from sales of investment securities 418Proceeds from sales of shares of unconsolidated subsidiaries 946 8,908Proceeds from sales of property, plant and equipment 662 1,182 6,233Purchases of property, plant and equipment (1,562) (2,514) (14,711)Purchases of intangible assets (151) (104) (1,419)Other—net 104 (71) 971
Net cash provided by (used in) investing activities 469 (1,094) 4,412
FINAN
CING
ACT
IVITI
ES:
Decrease in short-term bank loans—net (2,222) (4,532) (20,920)Proceeds from long-term bank loans 800 8,900 7,533Repayments of long-term bank loans (4,652) (6,318) (43,807)Proceeds from bonds issuance 398 3,355 3,744Payment for redemption of bonds (726) (650) (6,836)Purchase of treasury stock (1) (1) (9)Cash dividends paid (677) (677) (6,368)Other—net (432) (366) (4,073)
Net cash used in financing activities (7,512) (289) (70,736)
FOREIGN CURRENCY TRANSLATION ADJUSTMENTS ON CASH AND CASH EQUIVALENTS 191 (340) 1,795
NET DECREASE IN CASH AND CASH EQUIVALENTS (328) (2,296) (3,095)CASH AND CASH EQUIVALENTS, BEGINNING OF YEAR 9,421 11,717 88,707INCREASE IN CASH AND CASH EQUIVALENTS FROM NEWLY CONSOLIDATED SUBSIDIARY 721 6,798
CASH AND CASH EQUIVALENTS, END OF YEAR (Note 3) ¥ 9,814 ¥ 9,421 $ 92,410
See notes to consolidated financial statements.
Consolidated Statement of Cash Flows (Year Ended March 31, 2018)
19
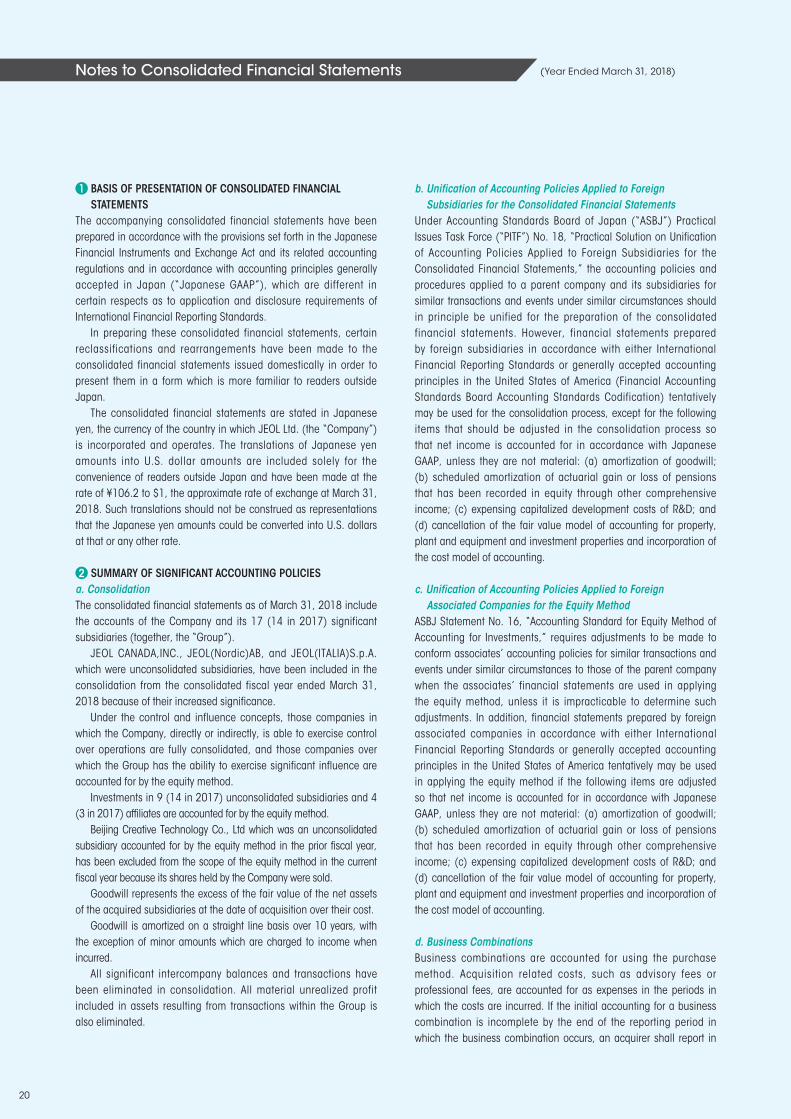
1 BASIS OF PRESENTATION OF CONSOLIDATED FINANCIAL STATEMENTS
The accompanying consolidated financial statements have been prepared in accordance with the provisions set forth in the Japanese Financial Instruments and Exchange Act and its related accounting regulations and in accordance with accounting principles generally accepted in Japan (“Japanese GAAP”), which are different in certain respects as to application and disclosure requirements of International Financial Reporting Standards.
In preparing these consolidated financial statements, certain reclassifications and rearrangements have been made to the consolidated financial statements issued domestically in order to present them in a form which is more familiar to readers outside Japan.
The consolidated financial statements are stated in Japanese yen, the currency of the country in which JEOL Ltd. (the “Company”) is incorporated and operates. The translations of Japanese yen amounts into U.S. dollar amounts are included solely for the convenience of readers outside Japan and have been made at the rate of ¥106.2 to $1, the approximate rate of exchange at March 31, 2018. Such translations should not be construed as representations that the Japanese yen amounts could be converted into U.S. dollars at that or any other rate.
2 SUMMARY OF SIGNIFICANT ACCOUNTING POLICIESa. ConsolidationThe consolidated financial statements as of March 31, 2018 include the accounts of the Company and its 17 (14 in 2017) significant subsidiaries (together, the “Group”).
JEOL CANADA,INC., JEOL(Nordic)AB, and JEOL(ITALIA)S.p.A. which were unconsolidated subsidiaries, have been included in the consolidation from the consolidated fiscal year ended March 31, 2018 because of their increased significance.
Under the control and influence concepts, those companies in which the Company, directly or indirectly, is able to exercise control over operations are fully consolidated, and those companies over which the Group has the ability to exercise significant influence are accounted for by the equity method.
Investments in 9 (14 in 2017) unconsolidated subsidiaries and 4 (3 in 2017) affiliates are accounted for by the equity method.
Beijing Creative Technology Co., Ltd which was an unconsolidated subsidiary accounted for by the equity method in the prior fiscal year, has been excluded from the scope of the equity method in the current fiscal year because its shares held by the Company were sold.
Goodwill represents the excess of the fair value of the net assets of the acquired subsidiaries at the date of acquisition over their cost.
Goodwill is amortized on a straight line basis over 10 years, with the exception of minor amounts which are charged to income when incurred.
All significant intercompany balances and transactions have been eliminated in consolidation. All material unrealized profit included in assets resulting from transactions within the Group is also eliminated.
b. Unification of Accounting Policies Applied to Foreign Subsidiaries for the Consolidated Financial Statements
Under Accounting Standards Board of Japan (“ASBJ”) Practical Issues Task Force (“PITF”) No. 18, “Practical Solution on Unification of Accounting Policies Applied to Foreign Subsidiaries for the Consolidated Financial Statements,” the accounting policies and procedures applied to a parent company and its subsidiaries for similar transactions and events under similar circumstances should in principle be unified for the preparation of the consolidated financial statements. However, financial statements prepared by foreign subsidiaries in accordance with either International Financial Reporting Standards or generally accepted accounting principles in the United States of America (Financial Accounting Standards Board Accounting Standards Codification) tentatively may be used for the consolidation process, except for the following items that should be adjusted in the consolidation process so that net income is accounted for in accordance with Japanese GAAP, unless they are not material: (a) amortization of goodwill; (b) scheduled amortization of actuarial gain or loss of pensions that has been recorded in equity through other comprehensive income; (c) expensing capitalized development costs of R&D; and (d) cancellation of the fair value model of accounting for property, plant and equipment and investment properties and incorporation of the cost model of accounting.
c. Unification of Accounting Policies Applied to Foreign Associated Companies for the Equity Method
ASBJ Statement No. 16, “Accounting Standard for Equity Method of Accounting for Investments,” requires adjustments to be made to conform associates’ accounting policies for similar transactions and events under similar circumstances to those of the parent company when the associates’ financial statements are used in applying the equity method, unless it is impracticable to determine such adjustments. In addition, financial statements prepared by foreign associated companies in accordance with either International Financial Reporting Standards or generally accepted accounting principles in the United States of America tentatively may be used in applying the equity method if the following items are adjusted so that net income is accounted for in accordance with Japanese GAAP, unless they are not material: (a) amortization of goodwill; (b) scheduled amortization of actuarial gain or loss of pensions that has been recorded in equity through other comprehensive income; (c) expensing capitalized development costs of R&D; and (d) cancellation of the fair value model of accounting for property, plant and equipment and investment properties and incorporation of the cost model of accounting.
d. Business CombinationsBusiness combinations are accounted for using the purchase method. Acquisition related costs, such as advisory fees or professional fees, are accounted for as expenses in the periods in which the costs are incurred. If the initial accounting for a business combination is incomplete by the end of the reporting period in which the business combination occurs, an acquirer shall report in
Notes to Consolidated Financial Statements (Year Ended March 31, 2018)
20
its financial statements provisional amounts for the items for which the accounting is incomplete. During the measurement period, which shall not exceed one year from the acquisition, the acquirer shall retrospectively adjust the provisional amounts recognized at the acquisition date to reflect new information obtained about facts and circumstances that existed as of the acquisition date and that would have affected the measurement of the amounts recognized as of that date. Such adjustments shall be recognized as if the accounting for the business combination had been completed at the acquisition date. The acquirer recognizes any bargain purchase gain in profit or loss immediately on the acquisition date after reassessing and confirming that all of the assets acquired and all of the liabilities assumed have been identified after a review of the procedures used in the purchase price allocation. A parent’s ownership interest in a subsidiary might change if the parent purchases or sells ownership interests in its subsidiary. The carrying amount of noncontrolling interest is adjusted to reflect the change in the parent’s ownership interest in its subsidiary while the parent retains its controlling interest. Any difference between the fair value of the consideration received or paid and the amount by which the noncontrolling interest is adjusted is accounted for as capital surplus as long as the parent retains control over its subsidiary.
e. Cash EquivalentCash equivalents are short term investments that are readily convertible into cash and exposed to insignificant risk of changes in value.
Cash equivalents include time deposits and securities which mature or become due within three months of the date of acquisition. Such securities are included in prepaid expenses and other current assets.
f. InventoriesFinished products are mainly stated at the lower of cost, determined Finished products are mainly stated at the lower of cost, determined by the moving average cost method, or net selling value. Finished products of consolidated foreign subsidiaries are stated at the lower of cost, determined by the specific identification method. Work in process is mainly stated at the lower of cost, determined by the specific identification method, or net selling value.
Raw materials and supplies are stated at cost, determined by the moving average cost method, or net selling value.
g. Investment SecuritiesAll securities are classified as available for sale securities and are reported at fair value, with unrealized gains and losses, net of applicable taxes, reported in a separate component of equity. The cost of securities sold is determined based on the moving average method.
Nonmarketable available for sale securities are stated at cost determined by the moving average method. For other than temporary declines in fair value, investment securities are reduced to net realizable value by a charge to income.
h. Property, Plant and EquipmentProperty, plant and equipment are stated at cost. Depreciation of property, plant and equipment of the Company and its consolidated domestic subsidiaries is computed by the declining balance method based on the estimated useful lives of the assets, while the straight line method is applied to all property, plant and equipment of consolidated foreign subsidiaries. The range of useful lives is from 7 to 65 years for buildings and structures and from 2 to 15 years for tools, furniture and fixtures.
Lease assets are depreciated by the straight line method over their respective lease periods. The useful lives for lease assets are the terms of the respective leases.
i. Long Lived AssetsThe Group reviews its long lived assets for impairment whenever events or changes in circumstance indicate the carrying amount of an asset or asset group may not be recoverable. An impairment loss is recognized if the carrying amount of an asset or asset group exceeds the sum of the undiscounted future cash flows expected to result from the continued use and eventual disposition of the asset or asset group. The impairment loss would be measured as the amount by which the carrying amount of the asset exceeds its recoverable amount, which is the higher of the discounted cash flows from the continued use and eventual disposition of the asset or the net selling price at disposition.
Accumulated depreciation includes the accumulated amounts of impairment losses.
j. SoftwareSoftware development costs for internal use are deferred at cost less accumulated amortization, which is calculated by the straight line method over the estimated useful lives (five years).
k. Bond Issue CostsBond issue costs incurred on or after May 1, 2006, are amortized by the straight line method over the bond term in accordance with ASBJ PITF No. 19, “Tentative Solution on Accounting for Deferred Assets,” which was issued by the ASBJ on August 11, 2006, and is effective for fiscal years ending on or after May 1, 2006.
l. Retirement and Pension PlansEmployees of the Company and certain consolidated subsidiaries who retire at or after the age of 60 are entitled to approximately 60% of their benefits in the form of an annuity. The funds for the annuity payments are entrusted to an outside trustee.
The Company accounts for the liability for retirement benefits based on the projected benefit obligations and plan assets at the balance sheet date. The projected benefit obligations are attributed to periods on a benefit formula basis. Actuarial gains and losses and past service costs that are yet to be recognized in profit or loss are recognized within equity (accumulated other comprehensive income), after adjusting for tax effects and are recognized in profit or loss over 12 years and 11 to 12 years, respectively, no longer
21
than the expected average remaining service period of the employees. The discount rate is determined using a single weighted average discount rate reflecting the estimated timing and amount of benefit payment.
m. Asset Retirement ObligationsAn asset retirement obligation is recorded for a legal obligation imposed either by law or contract that results from the acquisition, construction, development and normal operation of a tangible fixed asset and is associated with the retirement of such tangible fixed asset. The asset retirement obligation is recognized as the sum of the discounted cash flows required for the future asset retirement and is recorded in the period in which the obligation is incurred if a reasonable estimate can be made. If a reasonable estimate of the asset retirement obligation cannot be made in the period the asset retirement obligation is incurred, the liability should be recognized when a reasonable estimate of the asset retirement obligation can be made. Upon initial recognition of a liability for an asset retirement obligation, an asset retirement cost is capitalized by increasing the carrying amount of the related fixed asset by the amount of the liability. The asset retirement cost is subsequently allocated to expense through depreciation over the remaining useful life of the asset. Over time, the liability is accreted to its present value each period. Any subsequent revisions to the timing or the amount of the original estimate of undiscounted cash flows are reflected as an adjustment to the carrying amount of the liability and the capitalized amount of the related asset retirement cost.
n. Research and Development CostsResearch and development costs are charged to income as incurred.
o. LeasesFinance lease transactions are capitalized to recognize lease assets and lease obligations in the balance sheet. In March 2007, the ASBJ issued ASBJ Statement No. 13, “Accounting Standard for Lease Transactions,” which revised the previous accounting standard for lease transactions. Under the previous accounting standard, finance leases that were deemed to transfer ownership of the leased property to the lessee were capitalized. However, other finance leases were permitted to be accounted for as operating lease transactions if certain “as if capitalized” information was disclosed in the notes to the lessee’s financial statements. The revised accounting standard permits leases that existed at the transition date and that do not transfer ownership of the leased property to the lessee to continue to be accounted for as operating lease transactions.
The Company applied the revised accounting standard effective April 1, 2008. In addition, the Company continues to account for leases that existed at the transition date and do not transfer ownership of the leased property to the lessee as operating lease transactions.
All other leases are accounted for as operating leases.
p. Income TaxesThe provision for income taxes is computed based on the pretax income included in the consolidated statement of income. The asset and liability approach is used to recognize deferred tax assets and liabilities for the expected future tax consequences of temporary differences between the carrying amounts and the tax bases of
assets and liabilities. Deferred taxes are measured by applying currently enacted income tax rates to the temporary differences.
The Company applied ASBJ Guidance No. 26, “Guidance on Recoverability of Deferred Tax Assets,” effective April 1, 2016.There was no impact from this for the year ended March 31, 2017.
q. Foreign Currency TransactionsAll short term and long term monetary receivables and payables denominated in foreign currencies are translated into Japanese yen at the exchange rates at the balance sheet date. The foreign exchange gains and losses from translation are recognized in the consolidated statement of income to the extent that they are not hedged by forward exchange contracts.
r. Foreign Currency Financial StatementsThe balance sheet accounts of the consolidated foreign subsidiaries are translated into Japanese yen at the current exchange rate as of the balance sheet date except for equity, which is translated at the historical rate. Differences arising from such translation are shown as “Foreign currency translation adjustments” under accumulated other comprehensive income in a separate component of equity. Revenue and expense accounts of consolidated foreign subsidiaries are translated into yen at the average exchange rate.
s. Derivatives and Hedging ActivitiesThe Group uses derivative financial instruments to manage its exposures to fluctuations in foreign exchange and interest rates. Foreign exchange forward contracts and interest rate swaps are utilized by the Group to reduce foreign currency exchange and interest rate risks. The Group does not enter into derivatives for trading or speculative purposes.
Gains or losses on derivatives used for hedging purposes, if qualified for hedge accounting because of a high correlation and effectiveness between the hedging instruments and the hedged items, are deferred until maturity of the hedged transactions.
Forward contracts applied to forecasted (or committed) transactions are also measured at fair value but the unrealized gains/losses are deferred until the underlying transactions are completed.
Interest rate swaps which qualify for hedge accounting and meet specific matching criteria are not remeasured at market value but the differential paid or received under the swap agreements is recognized and included in interest expense.
t. Per Share InformationBasic net income per share is computed by dividing net income attributable to common shareholders by the weighted average number of common shares outstanding for the period.
For the years ended March 31, 2018 and 2017, diluted net income per share is not disclosed because the Company no longer has convertible securities.
Cash dividends per share presented in the accompanying consolidated statement of income are dividends applicable to the respective fiscal years, including dividends to be paid after the end of the year.
u. Accounting Changes and Error CorrectionsUnder ASBJ Statement No. 24, “Accounting Standard for Accounting Changes and Error Corrections,” and ASBJ Guidance No. 24, “Guidance on Accounting Standard for Accounting Changes and
22
Error Corrections,” accounting treatments are required as follows: (1) Changes in Accounting Policies—When a new accounting policy is applied following revision of an accounting standard, the new policy is applied retrospectively unless the revised accounting standard includes specific transitional provisions, in which case the entity shall comply with the specific transitional provisions. (2) Changes in Presentation—When the presentation of financial statements is changed, prior period financial statements are reclassified in accordance with the new presentation. (3) Changes in Accounting Estimates—A change in an accounting estimate is accounted for in the period of the change if the change affects that period only, and is accounted for prospectively if the change affects both the period of the change and future periods. (4) Corrections of Prior Period Errors—When an error in prior period financial statements is discovered, those statements are restated.
v. New Accounting Pronouncements1.JEOL Ltd. and domestic subsidiaries and affiliatesOn March 30, 2018, the ASBJ issued ASBJ Statement No. 29, “Accounting Standard for Revenue Recognition,” and ASBJ Guidance No. 30, “Implementation Guidance on Accounting Standard for Revenue Recognition.” The core principle of the standard and guidance is that an entity should recognize revenue to depict the transfer of promised goods or services to customers in an amount that reflects the consideration to which the entity expects to be entitled in exchange for those goods or services. An entity should recognize revenue in accordance with that core principle by applying the following steps:
Step1: Identify the contract(s) with a customerStep2: Identify the performance obligations in the contractStep3: Determine the transaction priceStep4: Allocate the transaction price to the performance
obligations in the contract Step5: Recognize revenue when (or as) the entity satisfies a
performance obligationThe accounting standard and guidance are effective for annual periods beginning on or after April 1, 2021. Earlier application is permitted for annual periods beginning on or after April 1, 2018.
The Company expects to apply the accounting standard and guidance for annual periods beginning on or after April 1, 2021, and is in the process of measuring the effects of applying the accounting standard and guidance in future applicable periods.
2.Foreign subsidiaries and affiliatesIFRS 15, “Revenue from Contracts with Customers”
IFRS 15 requires an entity to recognize revenue to depict the transfer of promised goods or services to customers in an amount that reflects the consideration to which the entity expects to be entitled in exchange for those goods or services. Compared with the current standards, the new standards require more steps of judgments and estimates. Those judgments and estimates include an identification of performance obligation in contracts, an estimation of variable consideration included in transaction price and an allocation of the transaction price to each performance obligation.
Scheduled Date of AdoptionTo be applied from the fiscal year ending March 2019.
Effect of AdoptionThe effect of adoption of the aforementioned standards on the Company’s consolidated financial statements is under evaluation.
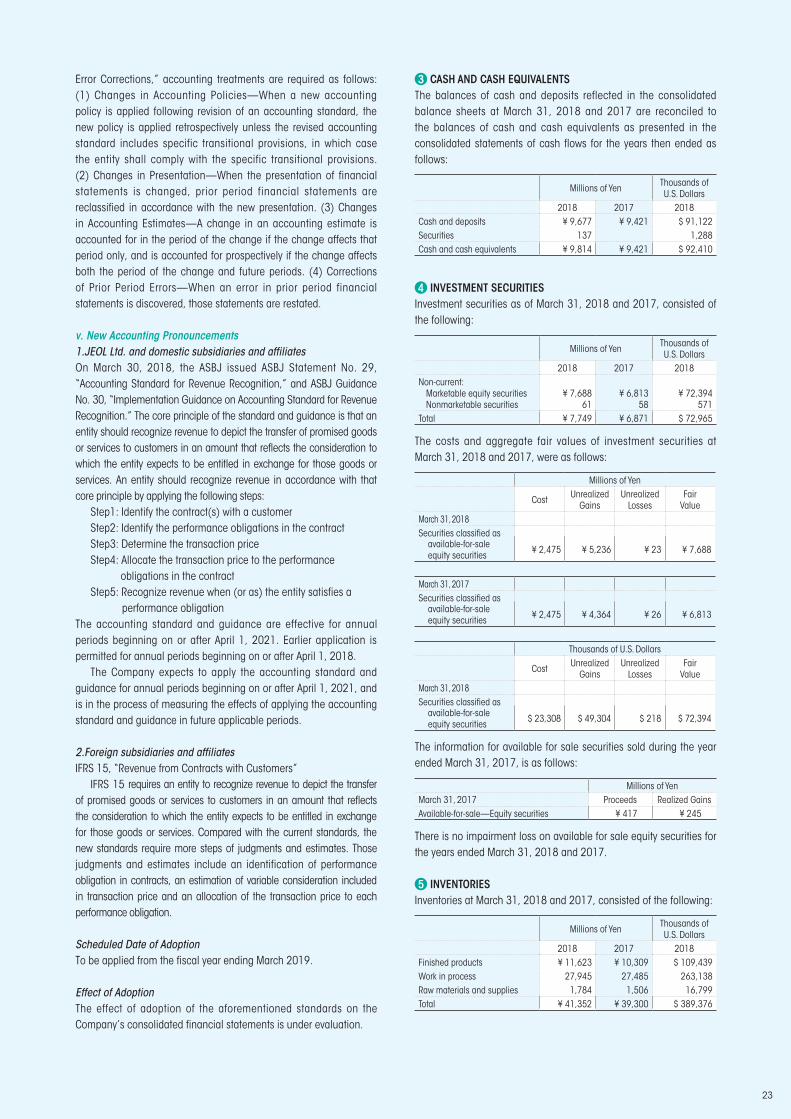
3 CASH AND CASH EQUIVALENTSThe balances of cash and deposits reflected in the consolidated balance sheets at March 31, 2018 and 2017 are reconciled to the balances of cash and cash equivalents as presented in the consolidated statements of cash flows for the years then ended as follows:
Millions of Yen Thousands ofU.S. Dollars
2018 2017 2018Cash and deposits ¥ 9,677 ¥ 9,421 $ 91,122Securities 137 1,288Cash and cash equivalents ¥ 9,814 ¥ 9,421 $ 92,410
4 INVESTMENT SECURITIES Investment securities as of March 31, 2018 and 2017, consisted of the following:
Millions of Yen Thousands ofU.S. Dollars
2018 2017 2018Non-current:
Marketable equity securitiesNonmarketable securities
¥ 7,68861
¥ 6,81358
¥ 72,394571
Total ¥ 7,749 ¥ 6,871 $ 72,965
The costs and aggregate fair values of investment securities at March 31, 2018 and 2017, were as follows:
Millions of Yen
Cost UnrealizedGains
UnrealizedLosses
Fair Value
March 31, 2018Securities classified as
available-for-sale equity securities ¥ 2,475 ¥ 5,236 ¥ 23 ¥ 7,688
March 31, 2017Securities classified as
available-for-sale equity securities ¥ 2,475 ¥ 4,364 ¥ 26 ¥ 6,813
Thousands of U.S. Dollars
Cost UnrealizedGains
UnrealizedLosses
Fair Value
March 31, 2018Securities classified as
available-for-sale equity securities $ 23,308 $ 49,304 $ 218 $ 72,394
The information for available for sale securities sold during the year ended March 31, 2017, is as follows:
Millions of YenMarch 31, 2017 Proceeds Realized GainsAvailable-for-sale—Equity securities ¥ 417 ¥ 245
There is no impairment loss on available for sale equity securities for the years ended March 31, 2018 and 2017.
5 INVENTORIESInventories at March 31, 2018 and 2017, consisted of the following:
Millions of Yen Thousands ofU.S. Dollars
2018 2017 2018Finished products ¥ 11,623 ¥ 10,309 $ 109,439Work in process 27,945 27,485 263,138Raw materials and supplies 1,784 1,506 16,799Total ¥ 41,352 ¥ 39,300 $ 389,376
23
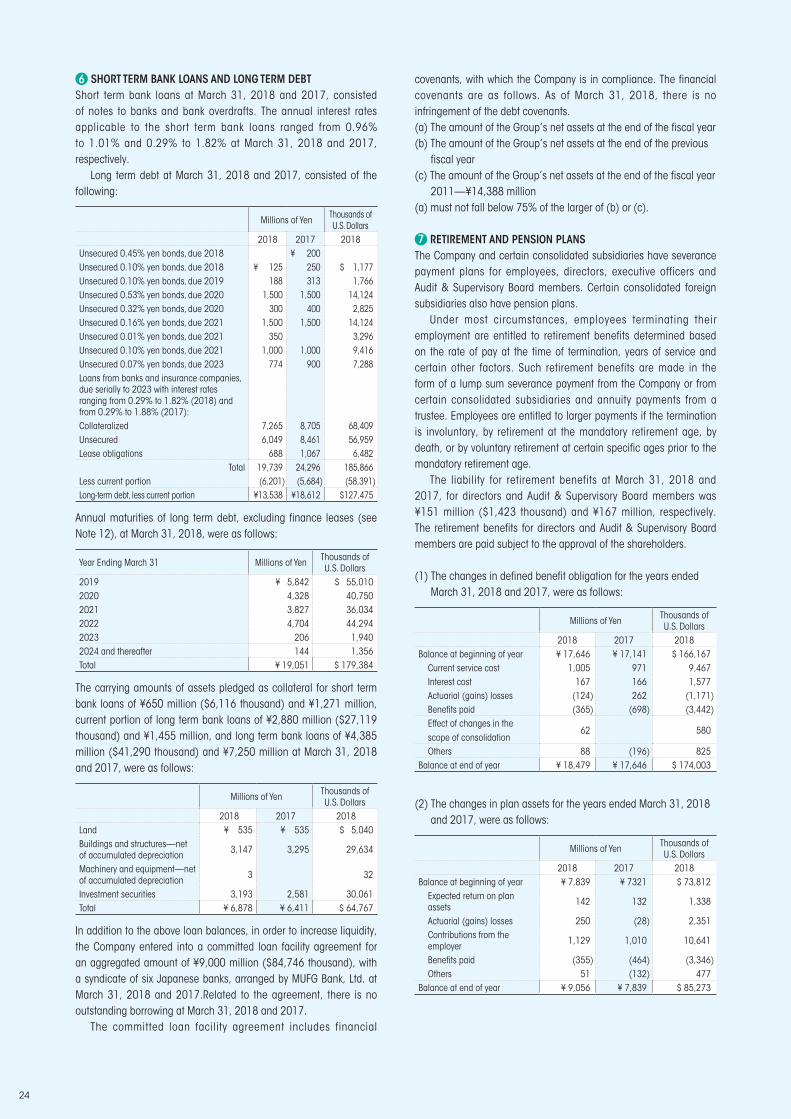
6 SHORT TERM BANK LOANS AND LONG TERM DEBTShort term bank loans at March 31, 2018 and 2017, consisted of notes to banks and bank overdrafts. The annual interest rates applicable to the short term bank loans ranged from 0.96% to 1.01% and 0.29% to 1.82% at March 31, 2018 and 2017, respectively.
Long term debt at March 31, 2018 and 2017, consisted of the following:
Millions of Yen Thousands ofU.S. Dollars
2018 2017 2018Unsecured 0.45% yen bonds, due 2018 ¥ 200Unsecured 0.10% yen bonds, due 2018 ¥ 125 250 $ 1,177Unsecured 0.10% yen bonds, due 2019 188 313 1,766Unsecured 0.53% yen bonds, due 2020 1,500 1,500 14,124Unsecured 0.32% yen bonds, due 2020 300 400 2,825Unsecured 0.16% yen bonds, due 2021 1,500 1,500 14,124Unsecured 0.01% yen bonds, due 2021 350 3,296Unsecured 0.10% yen bonds, due 2021 1,000 1,000 9,416Unsecured 0.07% yen bonds, due 2023 774 900 7,288Loans from banks and insurance companies,due serially to 2023 with interest ratesranging from 0.29% to 1.82% (2018) andfrom 0.29% to 1.88% (2017):Collateralized 7,265 8,705 68,409Unsecured 6,049 8,461 56,959Lease obligations 688 1,067 6,482
Total 19,739 24,296 185,866Less current portion (6,201) (5,684) (58,391)Long-term debt, less current portion ¥13,538 ¥18,612 $127,475
Annual maturities of long term debt, excluding finance leases (see Note 12), at March 31, 2018, were as follows:
Year Ending March 31 Millions of Yen Thousands ofU.S. Dollars
2019 ¥ 5,842 $ 55,0102020 4,328 40,7502021 3,827 36,0342022 4,704 44,2942023 206 1,9402024 and thereafter 144 1,356Total ¥ 19,051 $ 179,384
The carrying amounts of assets pledged as collateral for short term bank loans of ¥650 million ($6,116 thousand) and ¥1,271 million, current portion of long term bank loans of ¥2,880 million ($27,119 thousand) and ¥1,455 million, and long term bank loans of ¥4,385 million ($41,290 thousand) and ¥7,250 million at March 31, 2018 and 2017, were as follows:
Millions of Yen Thousands of U.S. Dollars
2018 2017 2018Land ¥ 535 ¥ 535 $ 5,040Buildings and structures—net of accumulated depreciation 3,147 3,295 29,634
Machinery and equipment—net of accumulated depreciation 3 32
Investment securities 3,193 2,581 30,061Total ¥ 6,878 ¥ 6,411 $ 64,767
In addition to the above loan balances, in order to increase liquidity, the Company entered into a committed loan facility agreement for an aggregated amount of ¥9,000 million ($84,746 thousand), with a syndicate of six Japanese banks, arranged by MUFG Bank, Ltd. at March 31, 2018 and 2017.Related to the agreement, there is no outstanding borrowing at March 31, 2018 and 2017.
The committed loan facility agreement includes financial
covenants, with which the Company is in compliance. The financial covenants are as follows. As of March 31, 2018, there is no infringement of the debt covenants.(a) The amount of the Group’s net assets at the end of the fiscal year(b) The amount of the Group’s net assets at the end of the previous fiscal year(c) The amount of the Group’s net assets at the end of the fiscal year 2011—¥14,388 million(a) must not fall below 75% of the larger of (b) or (c).
7 RETIREMENT AND PENSION PLANSThe Company and certain consolidated subsidiaries have severance payment plans for employees, directors, executive officers and Audit & Supervisory Board members. Certain consolidated foreign subsidiaries also have pension plans.
Under most circumstances, employees terminating their employment are entitled to retirement benefits determined based on the rate of pay at the time of termination, years of service and certain other factors. Such retirement benefits are made in the form of a lump sum severance payment from the Company or from certain consolidated subsidiaries and annuity payments from a trustee. Employees are entitled to larger payments if the termination is involuntary, by retirement at the mandatory retirement age, by death, or by voluntary retirement at certain specific ages prior to the mandatory retirement age.
The liability for retirement benefits at March 31, 2018 and 2017, for directors and Audit & Supervisory Board members was ¥151 million ($1,423 thousand) and ¥167 million, respectively. The retirement benefits for directors and Audit & Supervisory Board members are paid subject to the approval of the shareholders.
(1) The changes in defined benefit obligation for the years ended March 31, 2018 and 2017, were as follows:
Millions of Yen Thousands of U.S. Dollars
2018 2017 2018Balance at beginning of year ¥ 17,646 ¥ 17,141 $ 166,167
Current service cost 1,005 971 9,467Interest cost 167 166 1,577Actuarial (gains) losses (124) 262 (1,171)Benefits paid (365) (698) (3,442)Effect of changes in the scope of consolidation
62 580
Others 88 (196) 825Balance at end of year ¥ 18,479 ¥ 17,646 $ 174,003
(2) The changes in plan assets for the years ended March 31, 2018 and 2017, were as follows:
Millions of Yen Thousands of U.S. Dollars
2018 2017 2018Balance at beginning of year ¥ 7,839 ¥ 7321 $ 73,812
Expected return on plan assets 142 132 1,338
Actuarial (gains) losses 250 (28) 2,351Contributions from the employer 1,129 1,010 10,641
Benefits paid (355) (464) (3,346)Others 51 (132) 477
Balance at end of year ¥ 9,056 ¥ 7,839 $ 85,273
24
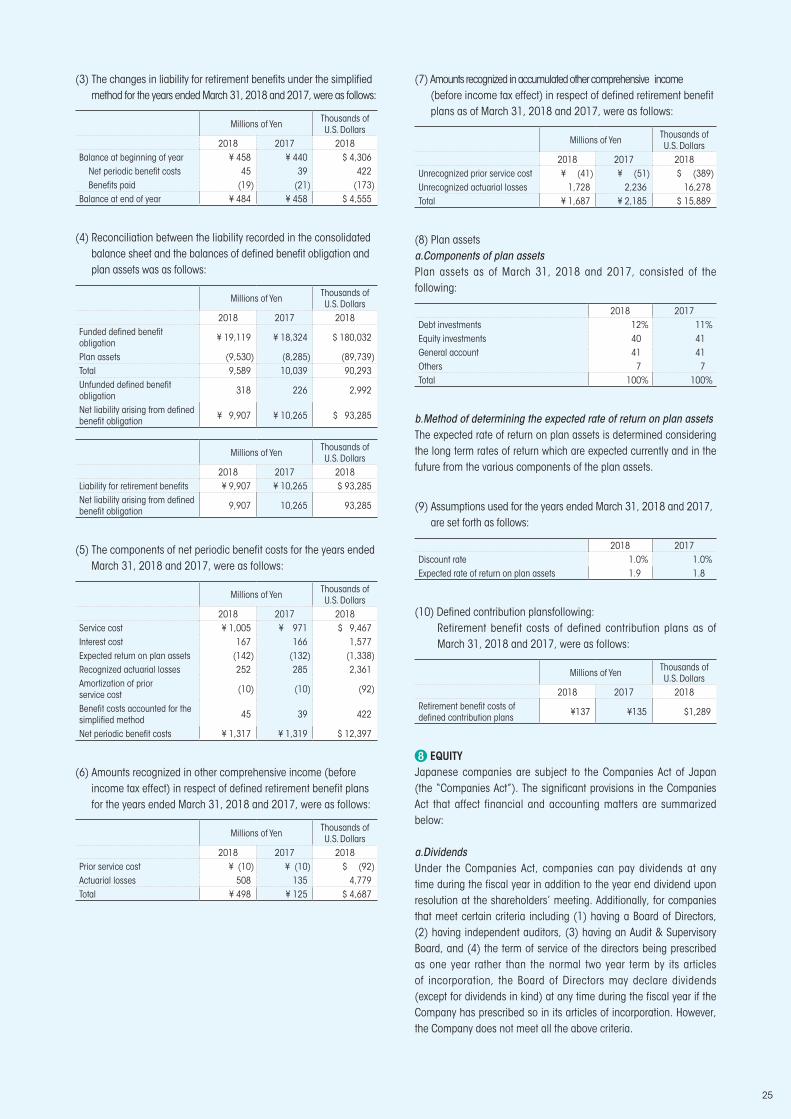
(3) The changes in liability for retirement benefits under the simplified method for the years ended March 31, 2018 and 2017, were as follows:
Millions of Yen Thousands of U.S. Dollars
2018 2017 2018Balance at beginning of year ¥ 458 ¥ 440 $ 4,306
Net periodic benefit costs 45 39 422Benefits paid (19) (21) (173)
Balance at end of year ¥ 484 ¥ 458 $ 4,555
(4) Reconciliation between the liability recorded in the consolidated balance sheet and the balances of defined benefit obligation and plan assets was as follows:
Millions of Yen Thousands of U.S. Dollars
2018 2017 2018Funded defined benefit obligation ¥ 19,119 ¥ 18,324 $ 180,032
Plan assets (9,530) (8,285) (89,739)Total 9,589 10,039 90,293Unfunded defined benefit obligation 318 226 2,992
Net liability arising from defined benefit obligation ¥ 9,907 ¥ 10,265 $ 93,285
Millions of Yen Thousands of U.S. Dollars
2018 2017 2018Liability for retirement benefits ¥ 9,907 ¥ 10,265 $ 93,285Net liability arising from defined benefit obligation 9,907 10,265 93,285
(5) The components of net periodic benefit costs for the years ended March 31, 2018 and 2017, were as follows:
Millions of Yen Thousands of U.S. Dollars
2018 2017 2018Service cost ¥ 1,005 ¥ 971 $ 9,467Interest cost 167 166 1,577Expected return on plan assets (142) (132) (1,338)Recognized actuarial losses 252 285 2,361Amortization of prior service cost (10) (10) (92)
Benefit costs accounted for the simplified method 45 39 422
Net periodic benefit costs ¥ 1,317 ¥ 1,319 $ 12,397
(6) Amounts recognized in other comprehensive income (before income tax effect) in respect of defined retirement benefit plans for the years ended March 31, 2018 and 2017, were as follows:
Millions of Yen Thousands of U.S. Dollars
2018 2017 2018Prior service cost ¥ (10) ¥ (10) $ (92)Actuarial losses 508 135 4,779Total ¥ 498 ¥ 125 $ 4,687
(7) Amounts recognized in accumulated other comprehensive income (before income tax effect) in respect of defined retirement benefit plans as of March 31, 2018 and 2017, were as follows:
Millions of Yen Thousands of U.S. Dollars
2018 2017 2018Unrecognized prior service cost ¥ (41) ¥ (51) $ (389)Unrecognized actuarial losses 1,728 2,236 16,278Total ¥ 1,687 ¥ 2,185 $ 15,889
(8) Plan assetsa.Components of plan assetsPlan assets as of March 31, 2018 and 2017, consisted of the following:
2018 2017Debt investments 12% 11%Equity investments 40 41General account 41 41Others 7 7Total 100% 100%
b.Method of determining the expected rate of return on plan assetsThe expected rate of return on plan assets is determined considering the long term rates of return which are expected currently and in the future from the various components of the plan assets.
(9) Assumptions used for the years ended March 31, 2018 and 2017, are set forth as follows:
2018 2017Discount rate 1.0% 1.0%Expected rate of return on plan assets 1.9 1.8
(10) Defined contribution plansfollowing:Retirement benefit costs of defined contribution plans as of March 31, 2018 and 2017, were as follows:
Millions of Yen Thousands of U.S. Dollars
2018 2017 2018Retirement benefit costs of defined contribution plans ¥137 ¥135 $1,289
8 EQUITYJapanese companies are subject to the Companies Act of Japan (the “Companies Act”). The significant provisions in the Companies Act that affect financial and accounting matters are summarized below:
a.DividendsUnder the Companies Act, companies can pay dividends at any time during the fiscal year in addition to the year end dividend upon resolution at the shareholders’ meeting. Additionally, for companies that meet certain criteria including (1) having a Board of Directors, (2) having independent auditors, (3) having an Audit & Supervisory Board, and (4) the term of service of the directors being prescribed as one year rather than the normal two year term by its articles of incorporation, the Board of Directors may declare dividends (except for dividends in kind) at any time during the fiscal year if the Company has prescribed so in its articles of incorporation. However, the Company does not meet all the above criteria.
25
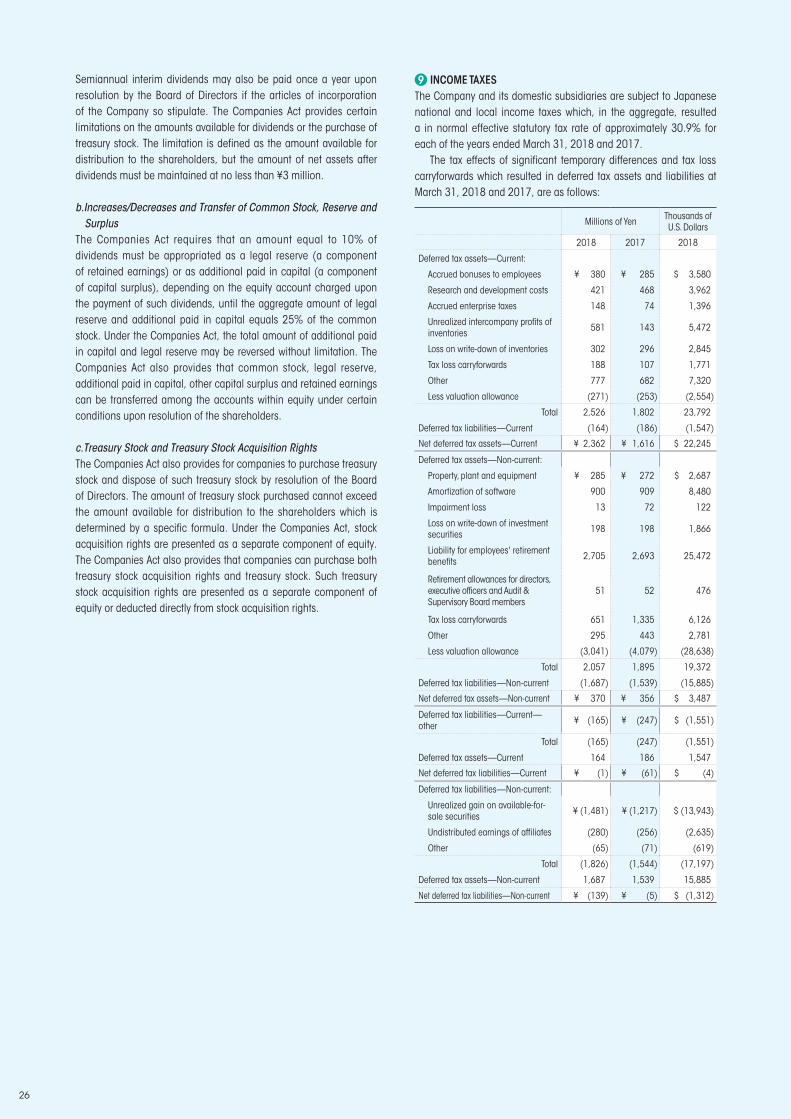
Semiannual interim dividends may also be paid once a year upon resolution by the Board of Directors if the articles of incorporation of the Company so stipulate. The Companies Act provides certain limitations on the amounts available for dividends or the purchase of treasury stock. The limitation is defined as the amount available for distribution to the shareholders, but the amount of net assets after dividends must be maintained at no less than ¥3 million.
b.Increases/Decreases and Transfer of Common Stock, Reserve andSurplus
The Companies Act requires that an amount equal to 10% of dividends must be appropriated as a legal reserve (a component of retained earnings) or as additional paid in capital (a component of capital surplus), depending on the equity account charged upon the payment of such dividends, until the aggregate amount of legal reserve and additional paid in capital equals 25% of the common stock. Under the Companies Act, the total amount of additional paid in capital and legal reserve may be reversed without limitation. The Companies Act also provides that common stock, legal reserve, additional paid in capital, other capital surplus and retained earnings can be transferred among the accounts within equity under certain conditions upon resolution of the shareholders.
c.Treasury Stock and Treasury Stock Acquisition RightsThe Companies Act also provides for companies to purchase treasury stock and dispose of such treasury stock by resolution of the Board of Directors. The amount of treasury stock purchased cannot exceed the amount available for distribution to the shareholders which is determined by a specific formula. Under the Companies Act, stock acquisition rights are presented as a separate component of equity. The Companies Act also provides that companies can purchase both treasury stock acquisition rights and treasury stock. Such treasury stock acquisition rights are presented as a separate component of equity or deducted directly from stock acquisition rights.
9 INCOME TAXES The Company and its domestic subsidiaries are subject to Japanese national and local income taxes which, in the aggregate, resulted a in normal effective statutory tax rate of approximately 30.9% for each of the years ended March 31, 2018 and 2017.
The tax effects of significant temporary differences and tax loss carryforwards which resulted in deferred tax assets and liabilities at March 31, 2018 and 2017, are as follows:
Millions of Yen Thousands ofU.S. Dollars
2018 2017 2018
Deferred tax assets—Current:
Accrued bonuses to employees ¥ 380 ¥ 285 $ 3,580
Research and development costs 421 468 3,962
Accrued enterprise taxes 148 74 1,396
Unrealized intercompany profits of inventories 581 143 5,472
Loss on write-down of inventories 302 296 2,845
Tax loss carryforwards 188 107 1,771
Other 777 682 7,320
Less valuation allowance (271) (253) (2,554)
Total 2,526 1,802 23,792
Deferred tax liabilities—Current (164) (186) (1,547)
Net deferred tax assets—Current ¥ 2,362 ¥ 1,616 $ 22,245
Deferred tax assets—Non-current:
Property, plant and equipment ¥ 285 ¥ 272 $ 2,687
Amortization of software 900 909 8,480
Impairment loss 13 72 122
Loss on write-down of investment securities 198 198 1,866
Liability for employees' retirement benefits 2,705 2,693 25,472
Retirement allowances for directors, executive officers and Audit & Supervisory Board members
51 52 476
Tax loss carryforwards 651 1,335 6,126
Other 295 443 2,781
Less valuation allowance (3,041) (4,079) (28,638)
Total 2,057 1,895 19,372
Deferred tax liabilities—Non-current (1,687) (1,539) (15,885)
Net deferred tax assets—Non-current ¥ 370 ¥ 356 $ 3,487
Deferred tax liabilities—Current—other ¥ (165) ¥ (247) $ (1,551)
Total (165) (247) (1,551)
Deferred tax assets—Current 164 186 1,547
Net deferred tax liabilities—Current ¥ (1) ¥ (61) $ (4)
Deferred tax liabilities—Non-current:
Unrealized gain on available-for-sale securities ¥ (1,481) ¥ (1,217) $ (13,943)
Undistributed earnings of affiliates (280) (256) (2,635)
Other (65) (71) (619)
Total (1,826) (1,544) (17,197)
Deferred tax assets—Non-current 1,687 1,539 15,885
Net deferred tax liabilities—Non-current ¥ (139) ¥ (5) $ (1,312)
26
A reconciliation between the normal effective statutory tax rates and the actual effective tax rates reflected in the accompanying consolidated statement of income for the year ended March 31, 2018, with the corresponding figures for 2017, is as follows:
2018 2017Normal effective statutory tax rate 30.9% 30.9%Expenses not deductible for income tax purposes 2.0 3.0
Inhabitant tax on per capita basis 0.9 1.9Unrealized intercompany profits (4.9) 9.0Difference in tax rates of foreign subsidiaries 0.9 2.6Foreign tax credit 1.1 3.0Less valuation allowance (21.3) 18.2Adjustment on deferred tax assets due to change in income tax rate 0.9
Other—net (5.0) 5.2Actual effective tax rate 5.5% 73.8%
At March 31, 2018, the Company has tax loss carryforwards aggregating approximately ¥2,925 million ($27,535 thousand) which are available to be offset against taxable income of such subsidiaries in future years. These tax loss carryforwards, if not utilized, will expire as follows:
Year Ending March 31 Millions of Yen Thousands of U.S. Dollars
2021 ¥ 1,351 $ 12,7172022 386 3,6322024 and thereafter 1,188 11,186Total ¥ 2,925 $ 27,535
10 SELLING, GENERAL AND ADMINISTRATIVE EXPENSESDepreciation and amortization, research and development costs, net periodic retirement benefit costs and amortization of goodwill for the years ended March 31, 2018 and 2017, were as follows:
Millions of Yen Thousands of U.S. Dollars
2018 2017 2018
Depreciation and amortization ¥ 736 ¥ 837 $ 6,932Research and development costs 6,044 6,130 56,913
Net periodic retirement benefit costs 509 512 4,793
Amortization of goodwill 370 370 3,483
11 RELATED PARTY DISCLOSURESTransactions of the Group with unconsolidated subsidiaries and affiliates for the years ended March 31, 2018 and 2017, were as follows:
Millions of Yen Thousands of U.S. Dollars
2018 2017 2018Sales ¥ 4,265 ¥ 4,906 $ 40,158Purchases 1,582 1,132 14,896Selling, general and administrative expenses 1,223 1,206 11,516
12 LEASESThe Group leases certain machinery, computer equipment, office space and other assets.
Total rental expenses including lease payments under finance leases for the years ended March 31, 2018 and 2017 were ¥1,763 million ($16,600 thousand) and ¥1,641 million, respectively.
Obligations under finance leases and future minimum payments under noncancelable operating leases were as follows:
Millions of Yen Thousands of U.S. Dollars
2018 2017 2018Finance Leases
Operating Leases
Finance Leases
Operating Leases
Finance Leases
Operating Leases
Due within one year ¥ 359 ¥ 162 ¥ 436 ¥ 178 $ 3,381 $ 1,525
Due after one year 329 225 631 284 3,101 2,121
Total ¥ 688 ¥ 387 ¥ 1,067 ¥ 462 $ 6,482 $ 3,646
Pro forma Information of Leased Property Whose Lease Inception Was before March 31, 2008ASBJ Statement No. 13, “Accounting Standard for Lease Transactions,” requires that all finance lease transactions be capitalized to recognize lease assets and lease obligations in the balance sheet. However, ASBJ Statement No. 13 permits leases without ownership transfer of the leased property to the lessee and whose lease inception was before March 31, 2008, to continue to be accounted for as operating lease transactions if certain “as if capitalized” information is disclosed in the notes to the financial statements. The Company applied ASBJ Statement No. 13 effective April 1, 2008, and accounted for such leases as operating lease transactions. Pro forma information of leased property whose lease inception was before March 31, 2008, was as follows:
Millions of Yen2018
Machinery and Equipment TotalAcquisition cost ¥ 41 ¥ 41Accumulated depreciation 38 38Net leased property ¥ 3 ¥ 3
Millions of Yen2017
Machinery and Equipment TotalAcquisition cost ¥ 41 ¥ 41Accumulated depreciation 34 34Net leased property ¥ 7 ¥ 7
Thousands of U.S. Dollars2018
Machinery and Equipment TotalAcquisition cost $ 385 $ 385Accumulated depreciation 353 353Net leased property $ 32 $ 32
Obligations under finance leases:
Millions of Yen Thousands of U.S. Dollars
2018 2017 2018Due within one year ¥ 4 ¥ 4 $ 39Due after one year 4Total ¥ 4 ¥ 8 $ 39
Depreciation expense, interest expense and other information under finance leases:
Millions of Yen Thousands of U.S. Dollars
2018 2017 2018Depreciation expense ¥ 4 ¥ 4 $ 35Interest expense 1 1 3Total ¥ 5 ¥ 5 $ 38Lease payments ¥ 5 ¥ 5 $ 44
27
Depreciation expense and interest expense, which are not reflected in the accompanying consolidated statement of income, are computed by the declining balance method and the interest method, respectively.
13 FINANCIAL INSTRUMENTS AND RELATED DISCLOSURES(1) Group Policy for Financial InstrumentsThe Group uses financial instruments, mainly long term debt including bank loans and bonds to finance capital investment for scientific instruments and industrial equipment. Cash surpluses, if any, are invested in low-risk financial assets. Bank loans are used to fund the Company’s ongoing operations. Derivatives are not used for speculative purposes, but to manage exposure to financial risks as described in (2) below.
(2) Nature, Extent of Risks and Risk Management for Financial InstrumentsReceivables, such as trade notes and trade accounts, are exposed to customer credit risk. Although receivables in foreign currencies are exposed to the market risk of fluctuation in foreign currency exchange rates, the position, net of payables in foreign currencies, is hedged by using forward foreign currency contracts. Investment securities, mainly equity instruments of customers and suppliers of the Group, are exposed to the risk of market price fluctuations.
Payment terms of payables, such as trade notes and trade accounts, are less than one year.
Maturities of bank loans, bonds and lease obligations are less than seven years after the consolidated balance sheet date. Although a part of such bank loans and bonds are exposed to market risks from changes in variable interest rates, those risks are mitigated by using derivatives of interest rate swaps.
Derivatives mainly include forward foreign currency contracts and interest rate swaps, which are used to manage exposure to market risks from changes in foreign currency exchange rates of receivables, and from changes in interest rates of bank loans and bonds.
Derivative transactions entered into by the Group have been made in accordance with internal policies which regulate the authorization and credit limit amount. Please see Note 14 for more details about derivatives.
(3) Fair Values of Financial InstrumentsFair values of financial instruments are based on quoted prices in active markets. If a quoted price is not available, another rational valuation technique is used instead. The results of valuation may differ in assumptions because the rational valuation techniques include variable factors. Also, please see Note 14 for the details of fair value for derivatives.
(a) Fair value of financial instruments
Millions of Yen
March 31, 2018 Carrying Amount Fair Value Unrealized Gain/Loss
Cash and deposits ¥ 9,677 ¥ 9,677Time deposits 263 263Receivables 30,264 30,264Investment securities 7,688 7,688Total ¥ 47,892 ¥ 47,892Short-term bank loans ¥ 4,350 ¥ 4,350Payables 25,297 25,297Long-term debt 19,051 19,096 ¥ 45Total ¥ 48,698 ¥ 48,743 ¥ 45
Millions of Yen
March 31, 2017 Carrying Amount Fair Value Unrealized Gain/Loss
Cash and deposits ¥ 9,421 ¥ 9,421Time deposits 745 745Receivables 26,787 26,787Investment securities 6,813 6,813Total ¥ 43,766 ¥ 43,766Short-term bank loans ¥ 6,571 ¥ 6,571Payables 20,237 20,237Long-term debt 23,229 23,309 ¥ 80Total ¥ 50,037 ¥ 50,117 ¥ 80
Thousands of U.S. Dollars
March 31, 2018 Carrying Amount Fair Value Unrealized Gain/Loss
Cash and deposits $ 91,122 $ 91,122Time deposits 2,473 2,473Receivables 284,975 284,975Investment securities 72,394 72,394Total $ 450,964 $ 450,964Short-term bank loans $ 40,956 $ 40,956Payables 238,200 238,200Long-term debt 179,384 179,810 $ 426Total $ 458,540 $ 458,966 $ 426
Cash and Deposits and Time DepositsThe carrying values of cash and deposits and time deposits approximate fair value because of their short maturities.
Investment SecuritiesThe fair values of investment securities are measured at the quoted market price of the stock exchange for the equity instruments, and at the quoted price obtained from the financial institution for certain debt instruments. Fair value information for investment securities by classification is included in Note 4.
Receivables, Payables and Short Term Bank LoansThe fair values of receivables, payables and short term bank loans are measured at the amount to be received or paid at maturity discounted at the Group’s assumed corporate discount rate.
Long Term DebtThe fair value of long term debt is determined by discounting the cash flows related to the debt at the Group’s assumed corporate borrowing rate.
DerivativesFair value information for derivatives is included in Note 14.
28
(b) Carrying amount of financial instruments whose fair values annot be reliably determined
Millions of Yen Thousands of U.S. Dollars
2018 2017 2018Investments in equity instruments that do not have a quoted market price in an active market
¥ 1,588 ¥ 2,366 $ 14,953
(4) Maturity Analysis for Financial Assets and Securities withContractual Maturities
Millions of YenMarch 31, 2018 Due in 1 Year or LessCash and cash equivalents ¥ 9,677Time deposits 263Receivables 30,264Total ¥ 40,204
Millions of YenMarch 31, 2017 Due in 1 Year or LessCash and cash equivalents ¥ 9,421Time deposits 745Receivables 26,787Total ¥ 36,953
Thousands of U.S. DollarsMarch 31, 2018 Due in 1 Year or LessCash and cash equivalents $ 91,122Time deposits 2,473Receivables 284,975Total $ 378,570
Please see Note 6 for annual maturities of long term debt and Note 12 for obligations under finance leases.
14 DERIVATIVESThe Group enters into foreign currency forward contracts to hedge exchange rate risk associated with certain assets denominated in foreign currencies. The Group also enters into interest rate swap contracts to manage its interest rate exposures on certain liabilities.
All derivative transactions are entered into to hedge interest and foreign currency exchange rate risk exposures arising from the Group’s ordinary business activities.
Because the counterparties to these derivatives are limited to major international financial institutions, the Group does not anticipate any losses arising from credit risk.
With respect to derivative transactions, basic policies are decided by the Board of Directors. Derivative transactions are executed within the necessary range and managed by the financial affairs division.
Derivative Transactions to Which Hedge Accounting Is Applied
Millions of Yen
March 31, 2018
Hedged Item
Contract Amount
Contract Amount
Due after One
Year
Fair Value
Foreign currency forward contracts—Selling U.S.$ Receivables ¥ 1,380 ¥ 4
Interest rate swaps (fixed rate payment, floating rate receipt)
Long-term debt 4,335 ¥ 1,230
Millions of Yen
March 31, 2017
Hedged Item
Contract Amount
Contract Amount
Due after One
Year
Fair Value
Foreign currency forward contracts—Selling U.S.$ Receivables ¥ 1,015 ¥ 8
Interest rate swaps (fixed rate payment, floating rate receipt)
Long-term debt 6,455 ¥ 4,245
Thousands of U.S. Dollars
March 31, 2018
Hedged Item
Contract Amount
Contract Amount
Due after One
Year
Fair Value
Foreign currency forward contracts—Selling U.S.$ Receivables $ 12,999 $ 46
Interest rate swaps (fixed rate payment, floating rate receipt)
Long-term debt 40,819 $ 11,582
The fair value of derivative transactions is measured at the quoted price obtained from the financial institution.
The above interest rate swaps which qualify for hedge accounting and meet specific matching criteria are not remeasured at market value, but the differential paid or received under the swap agreements is recognized and included in interest expense or income. In addition, the fair value of such interest rate swaps is included in that of hedged items (i.e., long term debt).
15 CONTINGENT LIABILITIESAt March 31, 2018 and 2017, the Group had the following contingent liabilities:
Millions of Yen Thousands of U.S. Dollars
2018 2017 2018Guarantees of advance received and bank loans of unconsolidated subsidiary
¥ 485 ¥ 500 $ 4,572
29
16 NET INCOME PER SHAREReconciliation of the differences between basic and diluted net income per share (“EPS”) for the years ended March 31, 2018 and 2017, is as follows:
Millions of Yen
Thousands of Shares Yen U.S.
DollarsNet Income
Attributable to Owners of the
Parent
Weighted-AverageShares
EPS
Year Ended March 31, 2018Basic EPS—Net income available to common shareholders
¥ 4,532 96,629 ¥ 46.90 $ 0.44
Year Ended March 31, 2017Basic EPS—Net income available to common shareholders
¥ 596 96,631 ¥ 6.17
For the years ended March 31, 2018 and 2017, diluted EPS is not disclosed because the Company no longer has convertible securities.
On June 27, 2018, a one-for-two “reverse stock split” is preferred was approved at the Company’s 71st ordinary general meeting of shareholders (the “Ordinary General Meeting of Shareholders”) to be effected on October 1, 2018. See Note 18 for details.
17 OTHER COMPREHENSIVE INCOME (LOSS)The components of other comprehensive income (loss) for the years ended March 31, 2018 and 2017, were as follows:
Millions of Yen Thousands ofU.S. Dollars
2018 2017 2018Unrealized gain (loss) on available-for-sale securities:
Gains arising during the year ¥ 874 ¥ 976 $ 8,241Reclassification adjustments to profit or loss (245)
Amount before income tax effect 874 731 8,241
Income tax effect (260) (123) (2,449)Total ¥ 614 ¥ 608 $ 5,792
Deferred gain (loss) on derivatives under hedge accounting:
Losses arising during the year ¥ (130) ¥ (258) $ (1,225)Reclassification adjustments to profit or loss 127 265 1,196
Amount before income tax effect (3) 7 (29)
Income tax effect 1 (2) 9Total ¥ (2) ¥ 5 $ (20)
Foreign currency translation adjustments ¥ 54 ¥ (298) $ 506
Defined retirement benefit plans: Adjustments arising during the year ¥ 374 ¥ (290) $ 3,522
Reclassification adjustments to profit or loss 124 415 1,165
Amount before income tax effect 498 125 1,117
Total ¥ 498 ¥ 125 $ 4,687Share of other comprehensive income (loss) in unconsolidated subsidiaries and affiliates— Losses arising during the year
¥ 83 ¥ (160) $ 782
Total other comprehensive income ¥ 1,247 ¥ 280 $ 11,747
18 SUBSEQUENT EVENTSShare Consolidation and Change in the Number of Shares Constituting one Share UnitAt the Board of Directors meeting held on May 15, 2018, JEOL
Ltd. resolved to submit a proposal for the reverse stock split is preferred same comment to the just of the financials to its 71st ordinary general meeting of shareholders held on June 27, 2018 (the “Ordinary General Meeting of Shareholders”).
At the same time, JEOL Ltd. resolved at the Board of Director’s meeting a change in the number of shares constituting one share unit contingent on the approval of the proposal regarding the share consolidation at the Ordinary General Meeting of Shareholders.
The proposal regarding the share consolidation was approved at the Ordinary General Meeting of Shareholders.
Details are as follows:
(1) Reason for the share consolidation and the change in thenumber of shares constituting one share unit
Japanese stock exchanges have announced the “Action Plan for Consolidating Trading Units”, aiming to unify the trading unit of common stock of domestic companies listed on Japanese stock exchanges to 100 shares by October 1, 2018.
As a company listed on the Tokyo Stock Exchange, JEOL Ltd., respecting this intention, has decided to change its number of shares constituting one share unit from 1,000 shares to 100 shares as of October 1, 2018.
Also, JEOL Ltd. will carry out a share consolidation (every two shares will be consolidated into one share) with a view to adjusting the investment unit to an appropriate level.
(2) Details of the share consolidation(a) Type of shares subject to the share consolidation:
Common shares(b) Method and ratio of the share consolidation:
Consolidation to be executed on October 1, 2018 at a ratio of one share for each two shares owned by shareholders of record in the latest shareholder register as of September 30, 2018.(c) Share reduction resulting from the share consolidation:
SharesNumber of shares of common stock outstanding before share consolidation (as of March 31, 2018) 97,715,600
Number of share decrease due to share consolidation 48,857,800Number of shares of common stock outstanding after share consolidation 48,857,800
Note“Number of share decrease due to the consolidation” and “Number of shares of common stock outstanding before share consolidation” are a theoretical value calculated based on multiplying the total number of outstanding shares before the consolidation by the share consolidation ratio.
(d) Treatment when less than one share arises:If a fractional number of shares of less than one share arises as a result of the share consolidation, all such fractional numbers of shares shall be subject to a bulk sale by JEOL Ltd. in accordance with provisions of the Companies Act. The proceeds of the said sale shall be distributed to the shareholders who resulted in owning fractional shares in proportion to their respective fractional shareholdings.
(e) Total number of authorized shares as of the effective date:In conjunction with the reduction of total number of the outstanding shares as a result of the share consolidation, in order to adjust the total number of authorized shares to an appropriate level, the total number of authorized shares shall be reduced in accordance with the share consolidation ratio (one-half) as of the effective date (October 1, 2018).
30
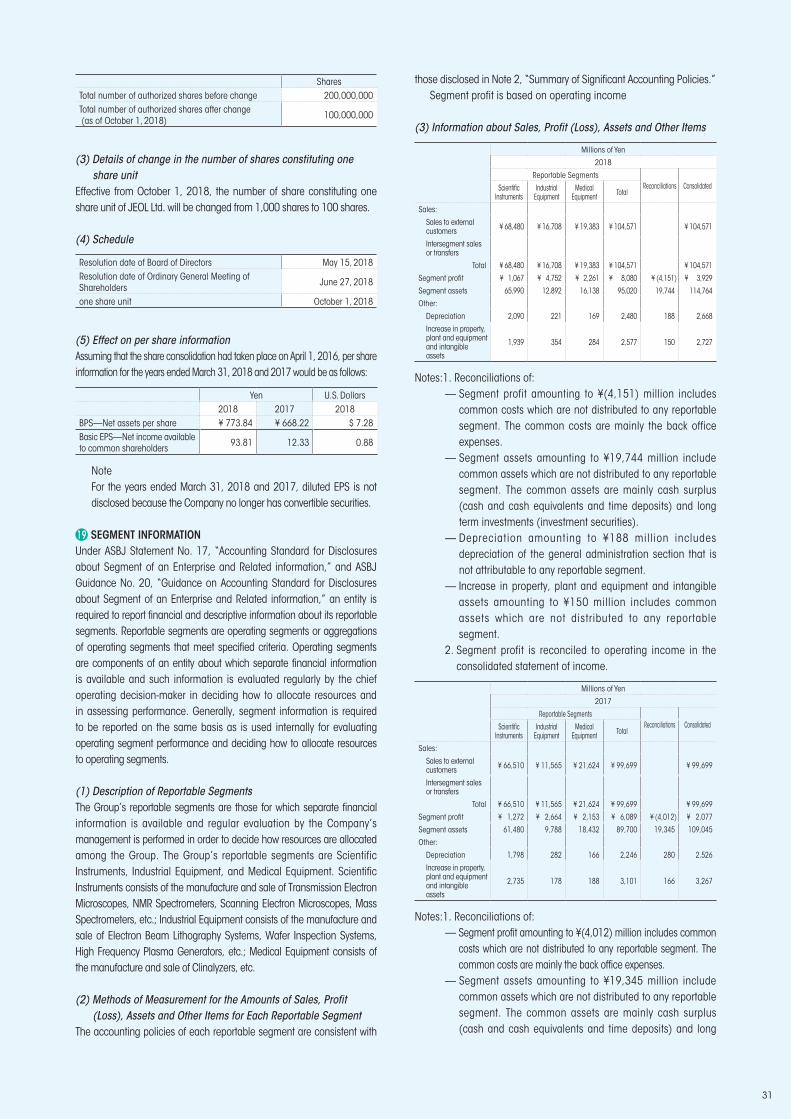
SharesTotal number of authorized shares before change 200,000,000Total number of authorized shares after change (as of October 1, 2018) 100,000,000
(3) Details of change in the number of shares constituting one share unit
Effective from October 1, 2018, the number of share constituting one share unit of JEOL Ltd. will be changed from 1,000 shares to 100 shares.
(4) Schedule
Resolution date of Board of Directors May 15, 2018Resolution date of Ordinary General Meeting of Shareholders June 27, 2018
one share unit October 1, 2018
(5) Effect on per share informationAssuming that the share consolidation had taken place on April 1, 2016, per share information for the years ended March 31, 2018 and 2017 would be as follows:
Yen U.S. Dollars2018 2017 2018
BPS—Net assets per share ¥ 773.84 ¥ 668.22 $ 7.28Basic EPS—Net income available to common shareholders 93.81 12.33 0.88
NoteFor the years ended March 31, 2018 and 2017, diluted EPS is not disclosed because the Company no longer has convertible securities.
19 SEGMENT INFORMATIONUnder ASBJ Statement No. 17, “Accounting Standard for Disclosures about Segment of an Enterprise and Related information,” and ASBJ Guidance No. 20, “Guidance on Accounting Standard for Disclosures about Segment of an Enterprise and Related information,” an entity is required to report financial and descriptive information about its reportable segments. Reportable segments are operating segments or aggregations of operating segments that meet specified criteria. Operating segments are components of an entity about which separate financial information is available and such information is evaluated regularly by the chief operating decision-maker in deciding how to allocate resources and in assessing performance. Generally, segment information is required to be reported on the same basis as is used internally for evaluating operating segment performance and deciding how to allocate resources to operating segments.
(1) Description of Reportable SegmentsThe Group’s reportable segments are those for which separate financial information is available and regular evaluation by the Company’s management is performed in order to decide how resources are allocated among the Group. The Group’s reportable segments are Scientific Instruments, Industrial Equipment, and Medical Equipment. Scientific Instruments consists of the manufacture and sale of Transmission Electron Microscopes, NMR Spectrometers, Scanning Electron Microscopes, Mass Spectrometers, etc.; Industrial Equipment consists of the manufacture and sale of Electron Beam Lithography Systems, Wafer Inspection Systems, High Frequency Plasma Generators, etc.; Medical Equipment consists of the manufacture and sale of Clinalyzers, etc.
(2) Methods of Measurement for the Amounts of Sales, Profit(Loss), Assets and Other Items for Each Reportable Segment
The accounting policies of each reportable segment are consistent with
those disclosed in Note 2, “Summary of Significant Accounting Policies.”Segment profit is based on operating income
(3) Information about Sales, Profit (Loss), Assets and Other Items
Millions of Yen
2018
Reportable SegmentsReconciliations ConsolidatedScientific
InstrumentsIndustrial
EquipmentMedical
Equipment Total
Sales:
Sales to external customers ¥ 68,480 ¥ 16,708 ¥ 19,383 ¥ 104,571 ¥ 104,571
Intersegment sales or transfers
Total ¥ 68,480 ¥ 16,708 ¥ 19,383 ¥ 104,571 ¥ 104,571
Segment profit ¥ 1,067 ¥ 4,752 ¥ 2,261 ¥ 8,080 ¥ (4,151) ¥ 3,929
Segment assets 65,990 12,892 16,138 95,020 19,744 114,764
Other:
Depreciation 2,090 221 169 2,480 188 2,668
Increase in property, plant and equipment and intangible assets
1,939 354 284 2,577 150 2,727
Notes:1. Reconciliations of:— Segment profit amounting to ¥(4,151) million includes
common costs which are not distributed to any reportable segment. The common costs are mainly the back office expenses.
— Segment assets amounting to ¥19,744 million include common assets which are not distributed to any reportable segment. The common assets are mainly cash surplus (cash and cash equivalents and time deposits) and long term investments (investment securities).
— Depreciation amounting to ¥188 million includes depreciation of the general administration section that is not attributable to any reportable segment.
— Increase in property, plant and equipment and intangible assets amounting to ¥150 million includes common assets which are not distributed to any reportable segment.
2. Segment profit is reconciled to operating income in the consolidated statement of income.
Millions of Yen
2017
Reportable SegmentsReconciliations ConsolidatedScientific
InstrumentsIndustrial
EquipmentMedical
Equipment Total
Sales:
Sales to external customers ¥ 66,510 ¥ 11,565 ¥ 21,624 ¥ 99,699 ¥ 99,699
Intersegment sales or transfers
Total ¥ 66,510 ¥ 11,565 ¥ 21,624 ¥ 99,699 ¥ 99,699
Segment profit ¥ 1,272 ¥ 2,664 ¥ 2,153 ¥ 6,089 ¥ (4,012) ¥ 2,077
Segment assets 61,480 9,788 18,432 89,700 19,345 109,045
Other:
Depreciation 1,798 282 166 2,246 280 2,526
Increase in property, plant and equipment and intangible assets
2,735 178 188 3,101 166 3,267
Notes:1. Reconciliations of:— Segment profit amounting to ¥(4,012) million includes common
costs which are not distributed to any reportable segment. The common costs are mainly the back office expenses.
— Segment assets amounting to ¥19,345 million include common assets which are not distributed to any reportable segment. The common assets are mainly cash surplus (cash and cash equivalents and time deposits) and long
31
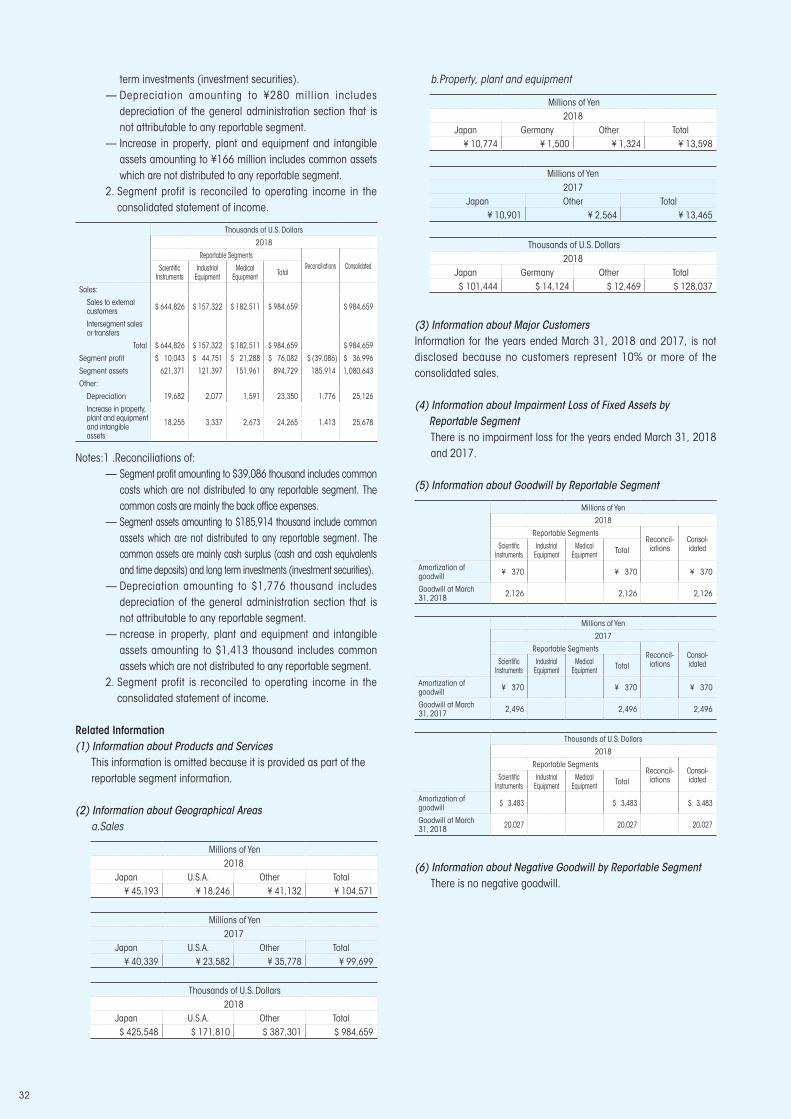
term investments (investment securities).— Depreciation amounting to ¥280 million includes
depreciation of the general administration section that is not attributable to any reportable segment.
— Increase in property, plant and equipment and intangible assets amounting to ¥166 million includes common assets which are not distributed to any reportable segment.
2. Segment profit is reconciled to operating income in the consolidated statement of income.
Thousands of U.S. Dollars
2018
Reportable SegmentsReconciliations ConsolidatedScientific
InstrumentsIndustrial
EquipmentMedical
Equipment Total
Sales:
Sales to external customers $ 644,826 $ 157,322 $ 182,511 $ 984,659 $ 984,659
Intersegment sales or transfers
Total $ 644,826 $ 157,322 $ 182,511 $ 984,659 $ 984,659
Segment profit $ 10,043 $ 44,751 $ 21,288 $ 76,082 $ (39,086) $ 36,996
Segment assets 621,371 121,397 151,961 894,729 185,914 1,080,643
Other:
Depreciation 19,682 2,077 1,591 23,350 1,776 25,126
Increase in property, plant and equipment and intangible assets
18,255 3,337 2,673 24,265 1,413 25,678
Notes:1 .Reconciliations of:— Segment profit amounting to $39,086 thousand includes common
costs which are not distributed to any reportable segment. The common costs are mainly the back office expenses.
— Segment assets amounting to $185,914 thousand include common assets which are not distributed to any reportable segment. The common assets are mainly cash surplus (cash and cash equivalents and time deposits) and long term investments (investment securities).
— Depreciation amounting to $1,776 thousand includes depreciation of the general administration section that is not attributable to any reportable segment.
— ncrease in property, plant and equipment and intangible assets amounting to $1,413 thousand includes common assets which are not distributed to any reportable segment.
2. Segment profit is reconciled to operating income in the consolidated statement of income.
Related Information(1) Information about Products and Services
This information is omitted because it is provided as part of the reportable segment information.
(2) Information about Geographical Areasa.Sales
Millions of Yen2018
Japan U.S.A. Other Total¥ 45,193 ¥ 18,246 ¥ 41,132 ¥ 104,571
Millions of Yen2017
Japan U.S.A. Other Total¥ 40,339 ¥ 23,582 ¥ 35,778 ¥ 99,699
Thousands of U.S. Dollars2018
Japan U.S.A. Other Total$ 425,548 $ 171,810 $ 387,301 $ 984,659
b.Property, plant and equipment
Millions of Yen2018
Japan Germany Other Total¥ 10,774 ¥ 1,500 ¥ 1,324 ¥ 13,598
Millions of Yen2017
Japan Other Total¥ 10,901 ¥ 2,564 ¥ 13,465
Thousands of U.S. Dollars2018
Japan Germany Other Total$ 101,444 $ 14,124 $ 12,469 $ 128,037
(3) Information about Major CustomersInformation for the years ended March 31, 2018 and 2017, is not disclosed because no customers represent 10% or more of the consolidated sales.
(4) Information about Impairment Loss of Fixed Assets by Reportable Segment
There is no impairment loss for the years ended March 31, 2018 and 2017.
(5) Information about Goodwill by Reportable Segment
Millions of Yen
2018
Reportable SegmentsReconcil-
iationsConsol-idatedScientific
InstrumentsIndustrial
EquipmentMedical
Equipment Total
Amortization of goodwill ¥ 370 ¥ 370 ¥ 370
Goodwill at March 31, 2018 2,126 2,126 2,126
Millions of Yen
2017
Reportable SegmentsReconcil-
iationsConsol-idatedScientific
InstrumentsIndustrial
EquipmentMedical
Equipment Total
Amortization of goodwill ¥ 370 ¥ 370 ¥ 370
Goodwill at March 31, 2017 2,496 2,496 2,496
Thousands of U.S. Dollars
2018
Reportable SegmentsReconcil-
iationsConsol-idatedScientific
InstrumentsIndustrial
EquipmentMedical
Equipment Total
Amortization of goodwill $ 3,483 $ 3,483 $ 3,483
Goodwill at March 31, 2018 20,027 20,027 20,027
(6) Information about Negative Goodwill by Reportable SegmentThere is no negative goodwill.
32
Independent Auditor’s Report
33
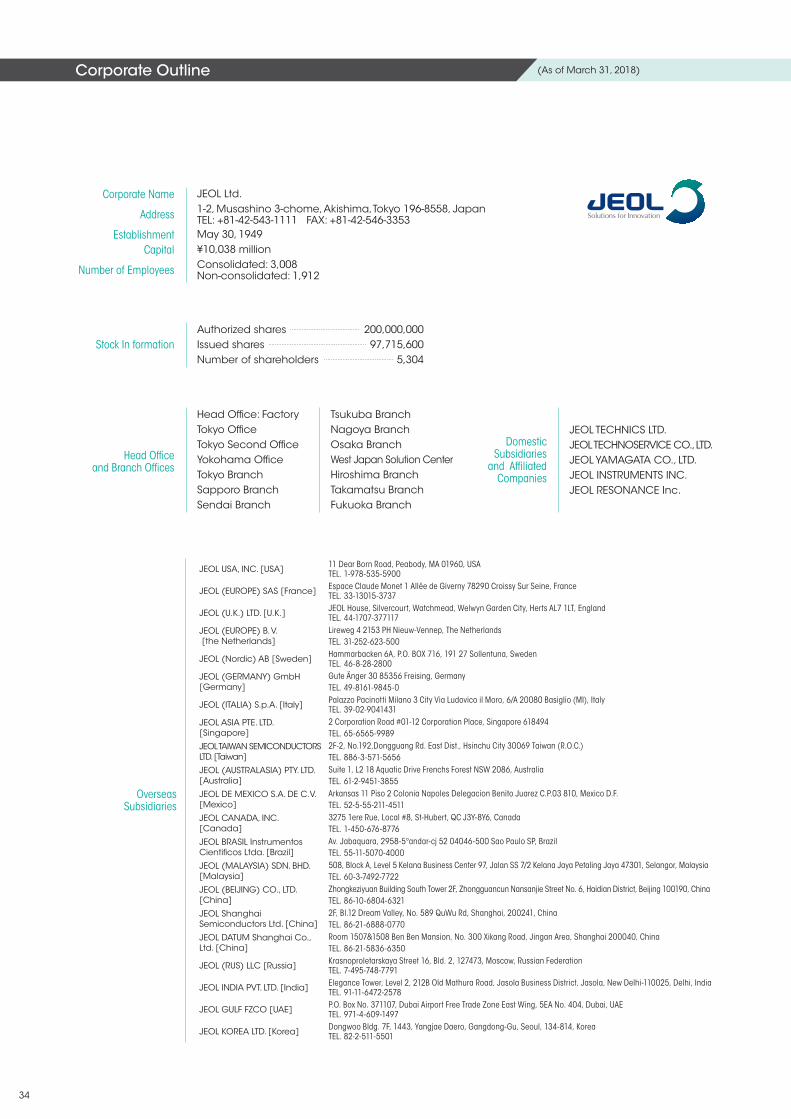
Corporate Outline
Overseas Subsidiaries
JEOL USA, INC. [USA] 11 Dear Born Road, Peabody, MA 01960, USATEL. 1-978-535-5900
JEOL (EUROPE) SAS [France] Espace Claude Monet 1 Allée de Giverny 78290 Croissy Sur Seine, France TEL. 33-13015-3737
JEOL (U.K.) LTD. [U.K.] JEOL House, Silvercourt, Watchmead, Welwyn Garden City, Herts AL7 1LT, England TEL. 44-1707-377117
JEOL (EUROPE) B. V. [the Netherlands]
Lireweg 4 2153 PH Nieuw-Vennep, The NetherlandsTEL. 31-252-623-500
JEOL (Nordic) AB [Sweden] Hammarbacken 6A, P.O. BOX 716, 191 27 Sollentuna, Sweden TEL. 46-8-28-2800
JEOL (GERMANY) GmbH [Germany]
Gute Änger 30 85356 Freising, Germany TEL. 49-8161-9845-0
JEOL (ITALIA) S.p.A. [Italy] Palazzo Pacinotti Milano 3 City Via Ludovico il Moro, 6/A 20080 Basiglio (MI), Italy TEL. 39-02-9041431
JEOL ASIA PTE. LTD. [Singapore]
2 Corporation Road #01-12 Corporation Place, Singapore 618494 TEL. 65-6565-9989
JEOL TAIWAN SEMICONDUCTORS LTD. [Taiwan]
2F-2, No.192,Dongguang Rd. East Dist., Hsinchu City 30069 Taiwan (R.O.C.)TEL. 886-3-571-5656
JEOL (AUSTRALASIA) PTY. LTD. [Australia]
Suite 1, L2 18 Aquatic Drive Frenchs Forest NSW 2086, Australia TEL. 61-2-9451-3855
JEOL DE MEXICO S.A. DE C.V. [Mexico]
Arkansas 11 Piso 2 Colonia Napoles Delegacion Benito Juarez C.P.03 810, Mexico D.F. TEL. 52-5-55-211-4511
JEOL CANADA, INC. [Canada]
3275 1ere Rue, Local #8, St-Hubert, QC J3Y-8Y6, CanadaTEL. 1-450-676-8776
JEOL BRASIL Instrumentos Cientificos Ltda. [Brazil]
Av. Jabaquara, 2958-5°andar-cj 52 04046-500 Sao Paulo SP, Brazil TEL. 55-11-5070-4000
JEOL (MALAYSIA) SDN. BHD. [Malaysia]
508, Block A, Level 5 Kelana Business Center 97, Jalan SS 7/2 Kelana Jaya Petaling Jaya 47301, Selangor, Malaysia TEL. 60-3-7492-7722
JEOL (BEIJING) CO., LTD. [China]
Zhongkeziyuan Building South Tower 2F, Zhongguancun Nansanjie Street No. 6, Haidian District, Beijing 100190, China TEL. 86-10-6804-6321
JEOL Shanghai Semiconductors Ltd. [China]
2F, Bl.12 Dream Valley, No. 589 QuWu Rd, Shanghai, 200241, ChinaTEL. 86-21-6888-0770
JEOL DATUM Shanghai Co., Ltd. [China]
Room 1507&1508 Ben Ben Mansion, No. 300 Xikang Road, Jingan Area, Shanghai 200040, China TEL. 86-21-5836-6350
JEOL (RUS) LLC [Russia] Krasnoproletarskaya Street 16, Bld. 2, 127473, Moscow, Russian Federation TEL. 7-495-748-7791
JEOL INDIA PVT. LTD. [India] Elegance Tower, Level 2, 212B Old Mathura Road, Jasola Business District, Jasola, New Delhi-110025, Delhi, IndiaTEL. 91-11-6472-2578
JEOL GULF FZCO [UAE] P.O. Box No. 371107, Dubai Airport Free Trade Zone East Wing, 5EA No. 404, Dubai, UAETEL. 971-4-609-1497
JEOL KOREA LTD. [Korea] Dongwoo Bldg. 7F, 1443, Yangjae Daero, Gangdong-Gu, Seoul, 134-814, KoreaTEL. 82-2-511-5501
Corporate Name JEOL Ltd.
Address 1-2, Musashino 3-chome, Akishima, Tokyo 196-8558, JapanTEL: +81-42-543-1111 FAX: +81-42-546-3353
Establishment May 30, 1949Capital ¥10,038 million
Number of Employees Consolidated: 3,008Non-consolidated: 1,912
Stock In formationAuthorized sharesIssued sharesNumber of shareholders
200,000,00097,715,600
5,304
Head Office and Branch Offices
Head Office: FactoryTokyo OfficeTokyo Second OfficeYokohama OfficeTokyo Branch Sapporo Branch Sendai Branch
Tsukuba BranchNagoya Branch Osaka Branch West Japan Solution CenterHiroshima Branch Takamatsu Branch Fukuoka Branch
Domestic Subsidiaries
and Affiliated Companies
JEOL TECHNICS LTD.JEOL TECHNOSERVICE CO., LTD.JEOL YAMAGATA CO., LTD.JEOL INSTRUMENTS INC.JEOL RESONANCE Inc.
(As of March 31, 2018)
34

1-2,Musashino 3-chome, Akishima, Tokyo 196-8558, JapanTEL: +81-42-543-1111 FAX: +81-42-546-3353https://www.jeol.co.jp/