Embed Size (px)
Citation preview
REPORT AND ACCOUNTS 31 MARCH 2018

REPORT AND ACCOUNTS 31 March 2018
INDEX
PART I – REPORT OF THE BOARD OF DIRECTORS
PART II – CONSOLIDATED FINANCIAL STATEMENTS
PART III – SEPARATED FINANCIAL STATEMENTS
Page 2
REPORT AND ACCOUNTS 31 March 2018
PART I
REPORT OF THE BOARD OF DIRECTORS 31 MARCH 2018

REPORT AND ACCOUNTS – MARCH 2018 Report of the Board of Directors
1. CEO MESSAGE & MAIN HIGHLIGHTS
"During the first quarter of the year we remained focused implementing the defined strategy, namely in what concerns the:
Improvement of the Business Units’ competitive position, visible in the Top Line 31.0% growth;
In the integration of the investments made over the last months, being of particular relevance (i) the contribution, in the Energy segment, of the operations acquired in the 2Q2017; and (ii) in 1Q2018, the contribution of PUMP, in the Fitness segment, to the sustainability and stability of the Group's results. In the case of Adira, a new business, we are still investing for growth, providing the company with adequate resources to implement the defined growth strategy;
Alongside with the improvement of the competitive position, both organically and through acquisition, it is worth to point out the profitability improvement visible in the Business Units' EBITDA margin YoY growth of 2.1pp;
We’ve also continued to focus on the sale of real estate assets: (i) in Troia, the value of deeds already signed and the amounts we still have in Reserves and PPSAs, totals 9.0M€; and (ii) on the other real estate assets, the value of the deeds carried out and the amount of PPSAs in the portfolio amounts to 5.3M€. Taking into account the assets portfolio and the favorable environment, important steps have been taken to achieve relevant sales during the year, a mandatory condition to continue implementing the defined corporate strategy.”
Cláudia Azevedo, CEO
1Q18 MAIN HIGHLIGHTS
Strong growth in the Business Units’ Turnover (+31.0%), particularly in the Fitness
(+52.1%) and Energy (+21.6%) segments;
Completion of the acquisition and integration of the PUMP Fitness chain, which
operates seven clubs in Lisbon and one in Algarve, contributing to the significant
improvement of the segment's competitive position;
The contribution, in 1Q18, of the operations acquired (Energy and Fitness) amounts to
5.49M€ and 1.37M€ in consolidated Turnover and Ebitda, corresponding to 53% and
83% of its growth, respectively;
In 1Q18, 6 deeds of residential touristic units in Troia were signed, corresponding to
2.4M€. Additionally, as of the date of this report, another deed has already been
signed and there are still 15 contracts in Reserve / PPSA, for a total amount of 6.6M€;
Promissory Purchase and Sale Agreements (PPSA) in Real Estate Assets (excluding
Troia units) amounted to 4.5M€ in addition to the 0.78M€ deeds signed in 1Q18;
Net Debt increased by 15.9M€ compared to the end of 2017, strongly influenced by
the investments in the PUMP Fitness clubs acquisition and the beginning of the
investment in the Biomass project, which will only start to generate returns in the
second half of 2019. Net Debt remains under control and is adequate to the type of
business and assets held by the Group: LTV of 18.3% and Net Debt/Ebitda of 2.70x;
1Q18 Consolidated Net Results are penalized on a non-recurrent way with,
approximately, 3.0M€ of costs driven, mainly, to the recognition of the most recent
estimated total cost concerning the discontinuation of the Brazilian RACE operation,
amounting to 2.0M€.
Page 4

REPORT AND ACCOUNTS – MARCH 2018 Report of the Board of Directors
2. OVERALL PERFORMANCE
The Group's consolidated Turnover
amounted to 42.32M€ in 1Q18. Ebitda
reached 2.08M€, generating a 4.9%
margin, an evolution of 3.7pp over the
same period of the previous year. It
should be noted the significant
evolution of Business Units’ profitability of + 125%.
2.1. BUSINESS UNITS
Business Units’ Turnover in the quarter
amounted to 39.06M€, a 31.0%
increase over the same period last
year. Ebitda more than doubled to
1.99M€, generating a 5.1% margin and
an improvement of 2.1pp compared to
the margin recorded in 1Q17.
In relation to the Business Units’
performance, it should be highlighted:
The Energy segment continued to
present increases in both Turnover
(+21.6%) and, mainly, EBITDA
(+51.5%), to 11.90M€ and 3.18M€,
respectively. The operations
acquired in 2017 were the main
contributors to the significant
performance improvement;
The Industrial Engineering segment, namely Adira, continues to carry out the integration in the
Group's processes in parallel with the investment that is being done in providing the company
with the adequate resources to implement in an effective way the defined growth strategy;
Sustained growth in the Fitness segment Top Line (+52.1%), due to the continued growth in the
number of active members and the expansion plan that is being implemented, including the
acquisition of the PUMP Fitness clubs and the opening of two Solinca clubs in the period, which
produced a positive impact at Ebitda level (+30.5%);
The Hospitality segment continues to deliver a positive performance showing improvements in
the main indicators, particularly RevPAR (+17.2%). Top Line and Ebitda registered a growth of
3.5% and 3.6% respectively;
The Ref. & HVAC segment recorded a positive evolution of 5.5% in Turnover which was not
convoyed with the correspondent operating results that were penalized by a deterioration in
operating margins in some specific works that have not proceed as forecasted;
Finally, regarding Troia Resort Operations, efficiency and profitability measures continue to be
implemented.
Page 5
REPORT AND ACCOUNTS – MARCH 2018 Report of the Board of Directors
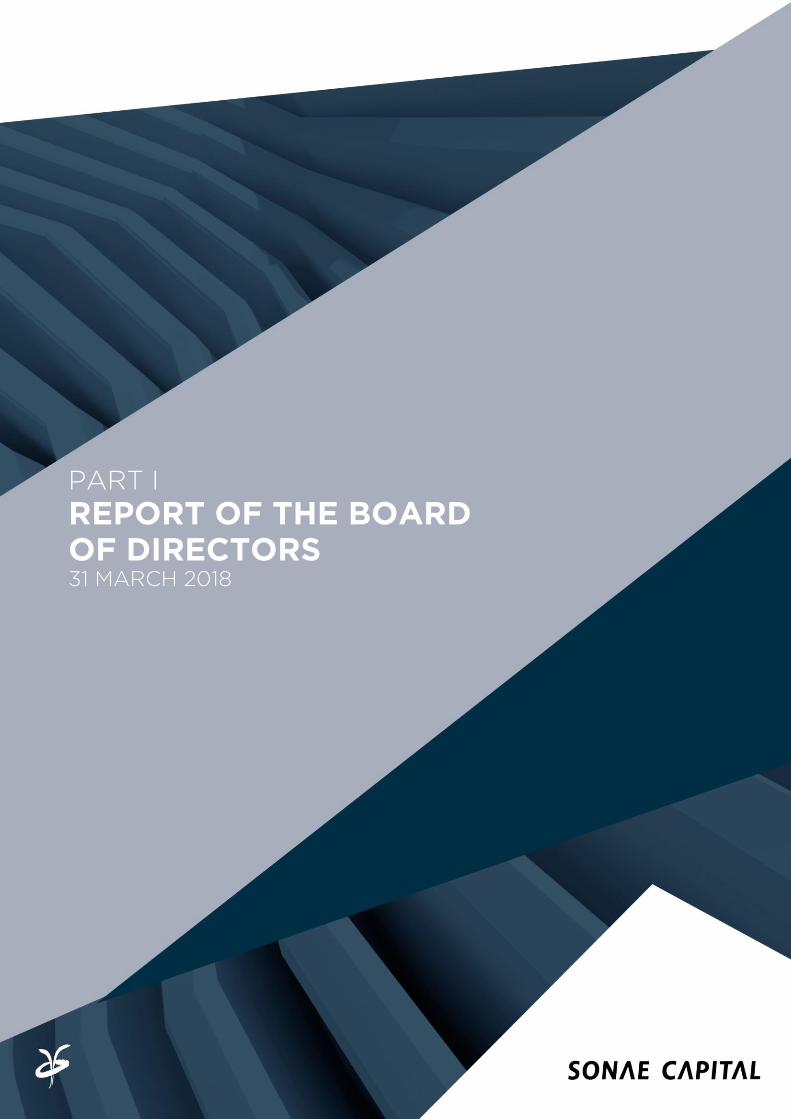
2.2. REAL ESTATE ASSETS
In 1Q18, Troia Resort recorded 6 deeds signings an increase of 4 deeds compared to the same
period last year, correspondent to 2.38M€. As of the date of this report, one additional deed has
already been signed, and there are still 15 promissory purchase and sale agreements and reserves,
corresponding to a total amount of 6.6M€. A significant part of these contracts is foreseen to be
signed over the next quarters;
In relation to other Real Estate Assets, a set of sales deeds were signed regarding several assets
totalling 0.78M€. It should be noted that remain in stock a set of PPSAs over a diverse real estate
assets, totalling 4.5M€.
2.3. CONSOLIDATED NET RESULTS & CAPITAL STRUCTURE
Consolidated Net Results (continued operations) were 5.83M€ negative, representing a decrease of
1M€ compared to the same period of the previous year, which, despite the improvement in Ebitda
(+1.7M€), was mainly affected by: (i) higher Amortization & Depreciations (+1.7M€), mainly due to
the recent acquisitions in the Energy segment; and (ii) Non-Recurring Costs of 0.68M€, which
include staff restructuring costs and an Impairment related to a business made through RACE
Brazil. Altogether, the remaining items, namely, Financial Results, Investment Results and Taxes, do
not show any evolution compared to the previous year.
It should be highlighted the costs recognized with the discontinuation of RACE’s Brazilian
operation, in the amount of 2.0M€. This cost recognition results from the accounting, in 1Q18, of the
forecasted total cost related to the operation closing process which includes, besides the declining
on-going activity, the most recent estimate of (i) current works operational margins; (ii) severance
costs; and (iii) all the contingencies that a process of this nature on this geography conveys.
Following the above mentioned, Consolidated Net Results in 1Q18 stood at 7.86M€ negative, 3.0M€
down from the same period last year, mostly due to the closing process of RACE in Brazil.
Capex in the period amounted to
16.2M€, an increase of 11M€
compared to the previous year,
mainly as a result of investments
made in the PUMP Fitness clubs
acquisition (8.4M€) and in the
beginning of the biomass-fueled
cogeneration project
development (5.0M€), in the
energy segment.
Levered Free Cash Flow, at the end of March, stood at 15.8M€ negative, mainly due to the above-
mentioned Investments.
Page 6

REPORT AND ACCOUNTS – MARCH 2018 Report of the Board of Directors
Due to the Investments previously detailed,
Net Debt registered an increase when
compared to the end of 2017 to 125.3M€.
However the capital structure maintains an
adequate level regarding the Group’s
portfolio: Loan To Value (LTV) of 18.3% and
Net Debt/Ebitda of non Real Estate
businesses of 2.70x.
Net Capital Employed increased 1.0% when
compared to the end of 2017, to 404.6M€,
driven by the increase of Fixed Assets
under management.
Due to the increase in net debt above
mentioned, Debt to Equity ratio reached
44.9%, +7.3pp compared to YE2017.
3. BUSINESS UNITS
3.1. ENERGY
Turnover in the Energy segment
amounted to 11.90M€, an increase of
21.6% over the previous year, mainly due
to the operations acquired during 2017,
with an impact of around 2M€. These
acquisitions contribute to the total
65MW owned or operated capacity.
As a result of the positive Turnover
performance, Ebitda amounted to
3.18M€, a strong increase of 51.5% over
the previous year, translated into a 26.7%
margin (+5.3pp), reinforcing the
continuous improvement of the
previously verified performance.
The contribution of the acquired operations was critical for the 1Q18 results performance,
amounting to 2.0M€ and 1.16M€ in Turnover and Ebitda, respectively.
It should be noted that, despite the Ebitda improvement, Ebit registered a decreased of 16.2%,
due to the 1.3M€ Depreciations & Amortizations increase driven by the operations acquired
during 2017 (which are being accounted for on a linear basis whilst the solar resource is well
asymmetric over the year).
Capex amounted to 5.58M€ and represents the beginning of the development of the new
biomass-fueled cogeneration power plant announced in the last quarter of 2017 and expected to
be operational in the second half of 2019.
Page 7

REPORT AND ACCOUNTS – MARCH 2018 Report of the Board of Directors
3.2. INDUSTRIAL ENGINEERING
During 1Q18, we continued focused on
investing in providing the company
with adequate and sufficient resources
to successfully implement the defined
growth strategy, namely in what
concerns the Commercial team
restructuring plan that is being
implemented.
42 machines were produced during the
1Q18. It should be highlighted the
progresses in the number of machines
delivered on-time, a crucial aspect in
current Adira's strategy (100% of
Standard machines delivered on-time).
This segment's contribution to the Group's consolidated results in the quarter was, 3.32M€ and -
0.22M€ at Turnover and Ebitda, respectively.
Due to its importance, it should be highlighted the restructuring plan being implemented and
the reinforcement of the Commercial Team, including the Agents network. In fact, since the
acquisition, ADIRA’s headcount has already grown by 15 employees (11 in 1Q18) mainly to
reinforce the Commercial, Customer Service and Engineering Teams.
3.3. FITNESS
Fitness segment continues to deliver
positive performances strengthening its
competitive position, reflected, on the
one hand, on an increase in the number
of active members (+23% like-for-like)
and average monthly fees (+2% like-for-
like) when compared to the same period
last year and, on the other hand, the
activity's expansion with the acquisition
of the PUMP fitness clubs.
As a result, Turnover in the period
registered a significant increase of 52.1%
over the same period last year.
The performance verified at the Turnover level is also reflected in the Ebitda performance, which
increased by 30.5% in the comparable quarter, generating a 13.1% margin which, being below
1Q17, is above the last three quarters and FY2017.
It should be noted that the PUMP Fitness chain, acquired at the beginning of 1Q18, accounted for
1.74M€ and 0.43M€ at the Turnover and Ebitda level, respectively, recording a margin of 24.7%.
In 2018, the Management Team will continue to focus on improving its competitive position,
materializing expansion oportunities as the acquisition of eight PUMP fitness clubs proves. The
investment in opening new clubs, following a capital light approach, allowed the Fitness
segment to close 1Q18 with 28 clubs in operation: two new openings in the quarter - "Loures"
and "Lumiar" - and the discontinuation of the Crossfit operation, in “Cascais”, whose profitability
was not meeting expectations (it should be noted that this discontinuation implied an
impairment loss of 0.26M€ penalizing EBIT's evolution).
Page 8

REPORT AND ACCOUNTS – MARCH 2018 Report of the Board of Directors
3.4. HOSPITALITY
The main operational indicators in the
Hospitality segment (including Troia
Residence operation) continue to show
favorable evolutions, especially RevPAR
which showed a YoY performance
improvement of 17.2% in 1Q18.
It should be highlighted the positive
performance achieved in the period,
both at the Turnover and Ebitda levels,
increasing by 3.5% and 3.6%
respectively. However, there was a
slowdown in Q1 YoY growth to which
the adverse climacteric conditions
during the 1Q18, particularly in Tróia,
played an important role. A recover in
growth is foreseen for the next quarters.
Excluding rents, it should be noted that EBITDAR in the Hospitality segment amounted to
negative 0.40M€, a slight improvement of 0.3% over the same period last year. It should be
noted that, due to the typical seasonality of this business segment, the first and fourth quarters
usually record negative EBITDAR which are more than offset by the positive value observed in
the second and mainly third quarters.
Capex remained at a reduced level of 0.15M€, 31.9% lower than in the same period of the
previous year, allowing for an improvement, together with the Ebitda performance, of 7.2% in
Ebitda-Capex figure.
3.5. REFRIGERATION & HVAC
Turnover in 1Q18 increased 5.5% to
10.79M€ compared to the same period
last year. The volume of contracts/works
in Portugal at the end of the period
amounted to 19.2M€, representing
approximately 5 months of activity.
Ebitda in 1Q18 decreased 0.34M€ to
negative 0.07M€, impacting the Ebitda
margin by 3.3pp due to the recognition of
a set of operating costs and potential
contingencies in order to limit the losses
to be recognized in the future in specific
works that were not running according to
the initial plan
Page 9

REPORT AND ACCOUNTS – MARCH 2018 Report of the Board of Directors
3.6. TROIA RESORT - OPERATIONS
Turnover from Troia Resort operations,
excluding real estate, amounted to 1.25M€ in
1Q18, an increase of 8.0% over the previous
year. All the operations posted positive
performances being worth to highlight the
volume increase in the Atlantic Ferries river
transport operation and also the greater
activity in the "Marina de Troia".
Capex remained at controlled levels and was
mainly due to investments of renovation /
improvements in the marine and river
transport operation.
4. REAL ESTATE ASSETS
4.1. TROIA RESORT The Real Estate Assets Unit of Troia Resort registered a turnover of 2.87M€, due to the following
contributions:
Signing of 6 deeds of touristic real estate units, corresponding to 2.38M€, compared to 2
deeds and 0.8M€ recorded in the same period last year. Five of the six deeds signed were
made under the guaranteed income product.
It should be noted that already in the 2Q and up to this report's date, an additional deed
was signed and 15 Promissory Purchase and Sale Agreements and Reserves are still in stock,
for a total amount of 6.6M€.
Rents related to the operations of assets held (Hotels, Troia Shopping, Parking lots, Touristic
Units in operation) amounted to 0.4M€, in line with the previous year.
4.2. OTHER REAL ESTATE ASSETS
Within the Group's current real estate portfolio there are diversified assets with different licensing
and construction stages, including land plots with and without construction viability, residential
units, construction projects, offices, industrial premises and commercial areas, with wide
geographical dispersion.
This block considers all the real estate assets of the Sonae Capital Group, except the units already
developed and in commercialization in the Troia Resort and the assets held by the WTC Fund.
Page 10
REPORT AND ACCOUNTS – MARCH 2018 Report of the Board of Directors
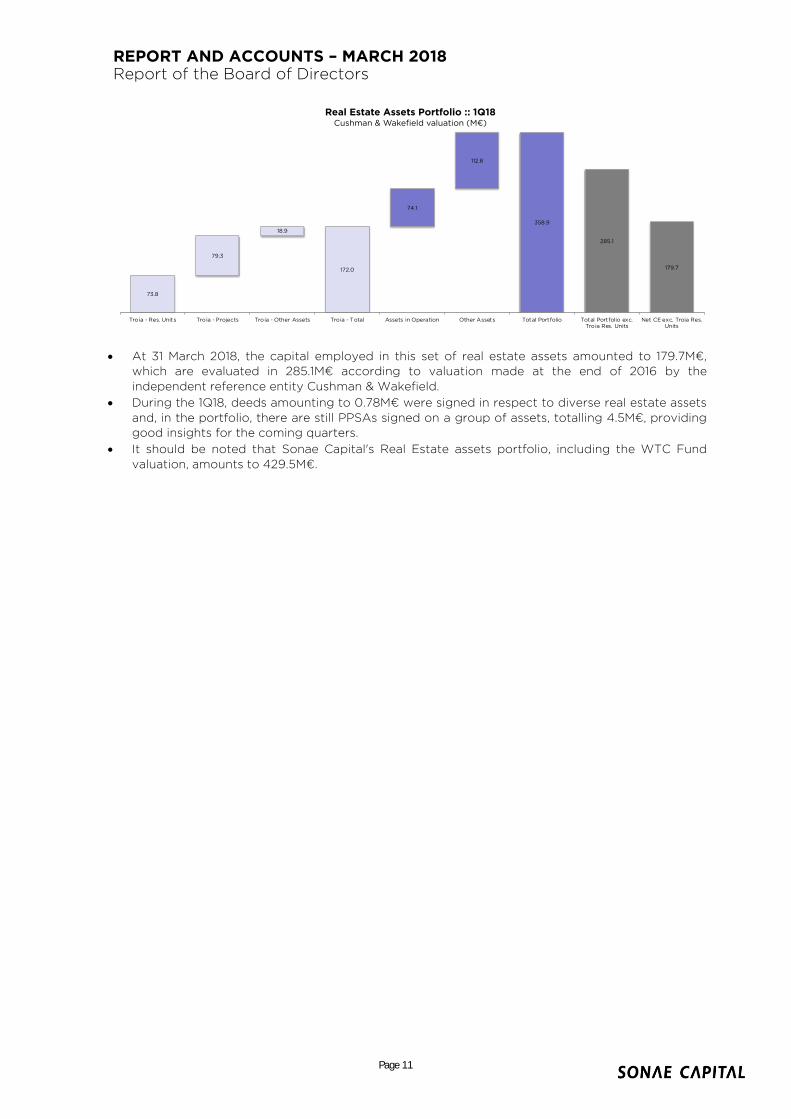
At 31 March 2018, the capital employed in this set of real estate assets amounted to 179.7M€,
which are evaluated in 285.1M€ according to valuation made at the end of 2016 by the
independent reference entity Cushman & Wakefield.
During the 1Q18, deeds amounting to 0.78M€ were signed in respect to diverse real estate assets
and, in the portfolio, there are still PPSAs signed on a group of assets, totalling 4.5M€, providing
good insights for the coming quarters.
It should be noted that Sonae Capital's Real Estate assets portfolio, including the WTC Fund
valuation, amounts to 429.5M€.
73.8
79.3
18.9
172.0
74.1
112.8
358.9
285.1
179.7
Troia - Res. Units Troia - Projects Troia - Other Assets Troia - Total Assets in Operation Other Assets Total Portfolio Total Portfolio exc.Troia Res. Units
Net CE exc. Troia Res.Units
Real Estate Assets Portfolio :: 1Q18Cushman & Wakefield valuation (M€)
Page 11

REPORT AND ACCOUNTS – MARCH 2018 Report of the Board of Directors
5. CORPORATE INFORMATION
5.1. CORPORATE INFORMATION 1Q18 There were no corporate events to register.
5.2. SUBSEQUENT CORPORATE EVENTS On 3 May 2018, the Shareholders' General Meeting of Sonae Capital, SGPS, SA was held at the
company's headquarters. Among the proposals presented, a dividend payment to the
shareholders was approved in the amount of 0.06€ per share.
Page 12

REPORT AND ACCOUNTS – MARCH 2018 Report of the Board of Directors
6. METHODOLOGICAL NOTES
The quarterly consolidated financial information presented in this report is non-audited and has
been prepared in accordance with the International Financial Reporting Standards ("IAS / IFRS"),
issued by the International Accounting Standards Board ("IASB"), as adopted by the European
Union.
With the aim of continuing to provide the best financial information not only at the Consolidated
level, but also, at each Business Unit level and aligning with the best market practices, the
international operations (Mozambique and Brazil) of the Refrigeration & HVAC segment are
considered as assets held for sale and therefore their contribution to the consolidated results is
recognized as discontinued operations.
GLOSSARY
HVAC = Heating, Ventilation and Air Conditioning.
Operational Cash Flow = EBITDA - Capex.
PPSA = Promissory Purchase and Sale Agreement.
Net Debt = Non-Current Loans + Current Loans – Cash and Cash Equivalents – Current
Investments.
EBITDA = Operational Profit (EBIT) + Amortization and Depreciation + Provisions and
Impairment Losses + Impairment Losses of Real Estate Assets in Stocks (included in Costs
of Goods Sold) – Reversal of Impairment Losses and Provisions (including in Other
Operation Income).
EBITDA, excluding Guaranteed Income Provisions = EBITDA + Provisions related to the
estimated present value of potential costs for the full period of the Guaranteed Income from
real estate sales at Troia Resort.
EBITDAR = EBITDA + Building Rents.
Capex = Investment in Tangible and Intangible Assets.
Loan to Value = Net Debt of real estate assets / Real estate assets Valuation.
Gearing: Debt to Equity = Net Debt / Equity.
RevPAR = Revenue Per Available Room.
Page 13

REPORT AND ACCOUNTS – MARCH 2018 Consolidated Financial Statements
PART II
CONSOLIDATED FINANCIAL STATEMENTS 31 MARCH 2018

REPORT AND ACCOUNTS – MARCH 2018 Consolidated Financial Statements
SONAE CAPITAL, SGPS, SA
CONSOLIDATED BALANCE SHEET AS AT 31 MARCH 2018 AND 31 DECEMBER 2017
(Amounts expressed in euro)
ASSETS Notes 31/03/2018 31/12/2017
NON-CURRENT ASSETS:
- -
Tangible assets 8 270 620 247
265 431 974
Intangible assets 8 9 664 824
9 822 521
Goodwill 9 52 091 158
47 376 371
Investments in associated companies and joint ventures 5 1 694 096
1 419 028
Other investments 6 632 974
578 430
Deferred tax assets 13 27 667 900
27 774 060
Other non-current debtors 10 6 554 325
6 601 994
Total non-current assets
368 925 524
359 004 378
CURRENT ASSETS:
Inventories 11 92 655 944
94 396 634
Trade account receivables and other current assets 12 48 760 954
53 002 698
Cash and cash equivalents 14 4 041 166
7 307 069
Total Current Assets
145 458 064
154 706 401
Assets held for sale
2 181 523
2 415 830
TOTAL ASSETS 516 565 111
516 126 609
EQUITY AND LIABILITIES
EQUITY:
Share capital 15 250 000 000
250 000 000
Own Shares 15 (1 192 808)
(1 305 839)
Reserves and retained earnings 15 28 294 591
38 273 437
Profit/(Loss) for the year attributable to the equity holders of Sonae Capital
(7 466 372)
(6 513 485)
Equity attributable to the equity holders of Sonae Capital
269 635 411
280 454 113
Equity attributable to non-controlling interests 16 9 646 405
10 915 176
Total Equity
279 281 816
291 369 289
NON-CURRENT LIABILITIES:
Loans 17 105 810 452
88 468 498
Other non-current creditors 18 2 799 701
3 015 213
Deferred tax liabilities 13 21 619 549
21 638 983
Provisions 21 3 079 824
3 079 824
Total Non-Current Liabilities
133 309 526
116 202 517
CURRENT LIABILITIES:
Loans 17 23 569 546
28 211 633
Trade creditors and other current liabilities 20 70 159 357
71 146 195
Provisions 21 4 324 111
4 403 401
Total Current Liabilities
98 053 014
103 761 230
-
-
TOTAL LIABILITIES
231 362 540
219 963 747
Liabilities associated with assets held for sale
5 920 755
4 793 573
TOTAL EQUITY AND LIABILITIES 516 565 111
516 126 609
The accompanying notes are part of these financial statements.
Page 15

REPORT AND ACCOUNTS – MARCH 2018 Consolidated Financial Statements
SONAE CAPITAL, SGPS, SA
CONSOLIDATED INCOME STATEMENTS BY NATURE
FOR THE THREE MONTHS ENDED 31 MARCH 2018 AND 2017
(Amounts expressed in euro)
Notes 31/03/2018 31/03/2017 Restated
Sales 24 533 422 12 563 763
Services rendered 15 739 681 18 989 222
Other operating income 22 1 320 944 823 383
Cost of sales (12 590 750) (10 982 080)
Changes in stocks of finished goods and work in progress (1 774 072) (593 871)
External supplies and services (13 975 953) (11 494 693)
Staff costs (10 222 681) (8 122 369)
Depreciation and amortisation (5 812 621) (4 070 622)
Provisions and impairment losses (Increases)/Decreases (514 845) 200 708
Other operating expenses (1 254 974) (944 217)
Operational profit/(loss) (4 551 849) (3 630 776)
Financial Expenses 50 570 57 617
Financial Income (1 156 846) (1 047 230)
Net financial income / (expenses) (1 106 276) (989 613)
Profit/(Loss) in associated and jointly controlled companies measured using the equity method 5 193 402 47 098
Investment income 24 4 816 27 596
Profit/(Loss) before taxation (5 459 907) (4 545 695)
taxation 25 370 463 279 044
Profit/(Loss) for the year - continued operations (5 830 370) (4 824 739)
Profit/(Loss) for the year - discontinued operations (2 027 527) (23 503)
Profit/(Loss) for the year 26 (7 857 897)
(4 848 242)
Attributable to:
Equity holders of Sonae Capital (7 466 372) (5 049 378)
Non-controlling interests 16 (391 525) 201 136
Profit/(Loss) per share - continued operations
Basic 28 (0,021923)
(0,020330)
Diluted 28 (0,021923)
(0,020330)
Profit/(Loss) per share - discontinued operations
Basic 28
(0,008173)
(0,000095)
Diluted 28 (0,008173)
(0,000095)
The accompanying notes are part of these financial statements.
Page 16

REPORT AND ACCOUNTS – MARCH 2018 Consolidated Financial Statements
SONAE CAPITAL, SGPS, SA
CONSOLIDATED STATEMENT OF COMPREHENSIVE INCOME
FOR THE THREE MONTHS ENDED 31 MARCH 2018 AND 2017
(Amounts expressed in euro)
31/03/2018 31/03/2017
Consolidated net profit/(loss) for the period
(7 857 897)
(4 848 242)
Items that may be reclassified subsequently to net profit / (loss):
Changes in the currency translation differences
23 591
(5 575)
Share of other comprehensive income of associates and joint ventures accounted for by the equity method (Note 5)
-
-
Change in the fair value of assets available for sale
-
Change in the fair value of cash flow hedging derivatives
-
1 366
Tax related to other comprehensive income captions
-
-
Other comprehensive income for the period - continued operations
-
(4.209)
Other comprehensive income for the period - discontinued operations
23 591
(63.916)
Total comprehensive income for the period
(7 834 306)
(4.916.367)
Attributable to:
Equity holders of Sonae Capital
(7 442 781)
(5 095 167)
Non-controlling interests
(391 525)
178 800
The accompanying notes are part of these financial statements.
Page 17

REPORT AND ACCOUNTS – MARCH 2018 Consolidated Financial Statements
Pag. 6
SONAE CAPITAL, SGPS, SA
CONSOLIDATED STATEMENTS OF CHANGES IN EQUITY
FOR THE THREE MONTHS ENDED 31 MARCH 2018 AND 2017
(Amounts expressed in euro)
Attributable to Equity Holders of Sonae Capital
Share Capital
Own Shares
Demerger Reserve (Note 15)
Translation Reserves
Fair Value
Reserves
Hedging Reserves
Others Reserves
Subtotal
Net Profit/(Loss)
Total
Non-Controlling Interests
Total Equity
Balance as at 1 January 2017 250 000 000
(1 404 226)
132 638 253 12 876 - 5 004 (88 414 342) 44 241 791
17 594 199
310 431 764
9 925 965
320 357 729
-
-
- - - - - -
-
-
-
-
Total consolidated comprehensive income for the period -
-
- (47 155) - 1 366 - (45 789)
(5 049 378)
(5 095 167)
178 800
(4 916 367)
Appropriation of profit of 2016: -
-
- - - - - -
-
-
-
-
Transfer to legal reserves and retained earnings -
-
- - - - 17 594 199 17 594 199
(17 594 199)
-
-
-
Dividends paid -
-
- - - - - -
-
-
-
-
(Acquisition)/Sales of own shares -
64 609
- - - - - -
-
64 609
-
64 609
Changes in the percentage of capital held in affiliated companies -
-
- - - - - -
-
-
-
-
Other changes -
-
- - - - 337 874 337 874
-
337 874
-
337 874
Balance as at 30 March 2017 250 000 000 (1 339 617) 132 638 253 (34 279) - 6 370 (70 482 269) 62 128 075 (5 049 378) 305 739 080 10 104 765 315 843 845
Balance as at 1 January 2018 250 000 000
(1 305 839)
132 638 253 146 352 - 6 370 (94 517 538) 38 273 437
(6 513 485)
280 454 113
10 915 176
291 369 289
-
-
- - - - - -
-
-
-
-
Total consolidated comprehensive income for the period -
-
- 23 591 - - - 23 591
(7 466 372)
(7 442 781)
(391 525)
(7 834 306)
Appropriation of profit of 2017: -
-
- - - - - -
-
-
-
-
Transfer to legal reserves and retained earnings -
-
- - - - (6 513 485) (6 513 485)
6 513 485
-
-
-
Dividends paid -
-
- - - - - -
-
-
(339 504)
(339 504)
(Acquisition)/Sales of own shares -
113 031
- - - - - -
-
113 031
-
113 031
Changes in the percentage of capital held in affiliated companies -
-
- - - - (4 116 071) (4 116 071)
-
(4 116 071)
(537 742)
(4 653 813)
Other changes -
-
- - - - 627 119 627 119
-
627 119
-
627 119
Balance as at 30 March 2018 250 000 000 (1 192 808) 132 638 253 169 943 - 6 370 (104 519 975) 28 294 591 (7 466 372) 269 635 411 9 646 405 279 281 816
The accompanying notes are part of these financial statements. The Board of Directors
Page 18

REPORT AND ACCOUNTS – MARCH 2018 Consolidated Financial Statements
SONAE CAPITAL, SGPS, SA
CONSOLIDATED STATEMENTS OF CASH FLOWS
FOR THE THREE MONTHS ENDED 31 MARCH 2018 AND 2017
(Amounts expressed in euro)
Notes 31/03/2018 1
31/03/2017 1 Restated
OPERATING ACTIVITIES:
Cash receipts from trade debtors
43 840 868
30 779 075
Cash receipts from trade creditors
(30 894 801)
(22 668 640)
Cash paid to employees
(9 941 566)
(8 417 756)
Cash flow generated by operations
3 004 501
(307 321)
Income taxes (paid) / received
(565 100)
(156 591)
Other cash receipts and (payments) relating to operating activities
(2 533 361)
(1 419 905)
Discontinued operations
(938 383)
(11 866)
Net cash from operating activities (1)
844 423
(1 871 951)
INVESTMENT ACTIVITIES:
Cash receipts arising from:
Investments
74 899
79 960
Tangible assets
2 572 535
409 013
Subsidies
-
11
Interest and similar income
43 177
60 525
Dividends
-
73 578
Others
-
1 448
Changes in consolidation perimeter (companies in)
81 143
-
2 771 754
624 535
Cash Payments arising from:
Investments
(8 274 667)
(1 672 703)
Tangible assets
(8 337 265)
(1 512 407)
Intangible assets
(232 351)
(324 080)
Loans granted
-
(30 042)
(16 844 283)
(3 539 232)
Discontinued operations
(28 749)
1 634
Net cash used in investment activities (2)
(14 043 780)
(2 916 331)
FINANCING ACTIVITIES:
Cash receipts arising from:
Loans obtained
21 120 666
2 212 125
21 120 666
2 212 125
Cash Payments arising from:
Loans obtained
(9 105 205)
(22 152 811)
Interest and similar charges
(870 911)
(811 080)
Dividends
(339 504)
-
(10 315 620)
(22 963 891)
Discontinued operations
896 689
(20 501)
Net cash used in financing activities (3)
9 908 357
(20 731 265)
Net increase in cash and cash equivalents (4) = (1) + (2) + (3)
(3 291 000)
(25 519 548)
Effect of foreign exchange rate
-
6 361
Cash and cash equivalents at the beginning of the period 14 7 233 498
32 219 850
Cash and cash equivalents at the end of the period 14 3 942 498
6 693 941
The accompanying notes are part of these financial statements.
1 Prepared in accordance with IAS 34 - Interim Financial Reporting and unaudited
Page 19

REPORT AND ACCOUNTS – MARCH 2018 Consolidated Financial Statements
SONAE CAPITAL, SGPS, SA
NOTES TO THE CONSOLIDATED FINANCIAL STATEMENTS
FOR THE THREE MONTHS ENDED 31 MARCH 2018 AND 2017
(Translation from the Portuguese Original)
(Amounts expressed in euro)
1. INTRODUCTION
SONAE CAPITAL, SGPS, SA (“Company”, "Group" or “Sonae Capital”) whose head-office
is at Lugar do Espido, Via Norte, Apartado 3053, 4471-907 Maia, Portugal, is the parent
company of a group of companies, as detailed in Notes 4 to 6 (“Sonae Capital Group”)
and was set up on 14 December 2007 as a result of the demerger of the shareholding in
SC, SGPS, SA (previously named Sonae Capital, SGPS, SA) from Sonae, SGPS, SA, which
was approved by the Board of Directors on 8 November 2007 and by the Shareholder's
General Meeting held on 14 December 2007.
Reflecting the current management structure, the reporting segments were revised,
addressing the strategic business areas identified in the Group:
Troia Resort Operations; Hospitality; Fitness; Energy; Refrigeration & HVAC; Real Estate; Industrial Engineering Other Assets.
The non-strategic assets are included in the segment Other assets.
2. MAIN ACCOUNTING POLICIES
The main accounting policies adopted are consistent with those used in the financial statements presented for the year ended 31 December 2017.
Basis of preparation
Interim financial statements were presented quarterly, in accordance with IAS 34 –
“Interim Financial Reporting”.
The accompanying consolidated financial statements have been prepared from the
books and accounting records of the Company and of its affiliated undertakings (Notes 4
and 6), on a going concern basis and under the historical cost convention, except for
derivative financial instruments which are stated at fair value.
3. CHANGES IN ACCOUNTING POLICIES
Changes to international accounting standards that came into force on or after 1 January
2018, did not have material impacts in the financial statements as at 31 March 2018.
Page 20
REPORT AND ACCOUNTS – MARCH 2018 Consolidated Financial Statements
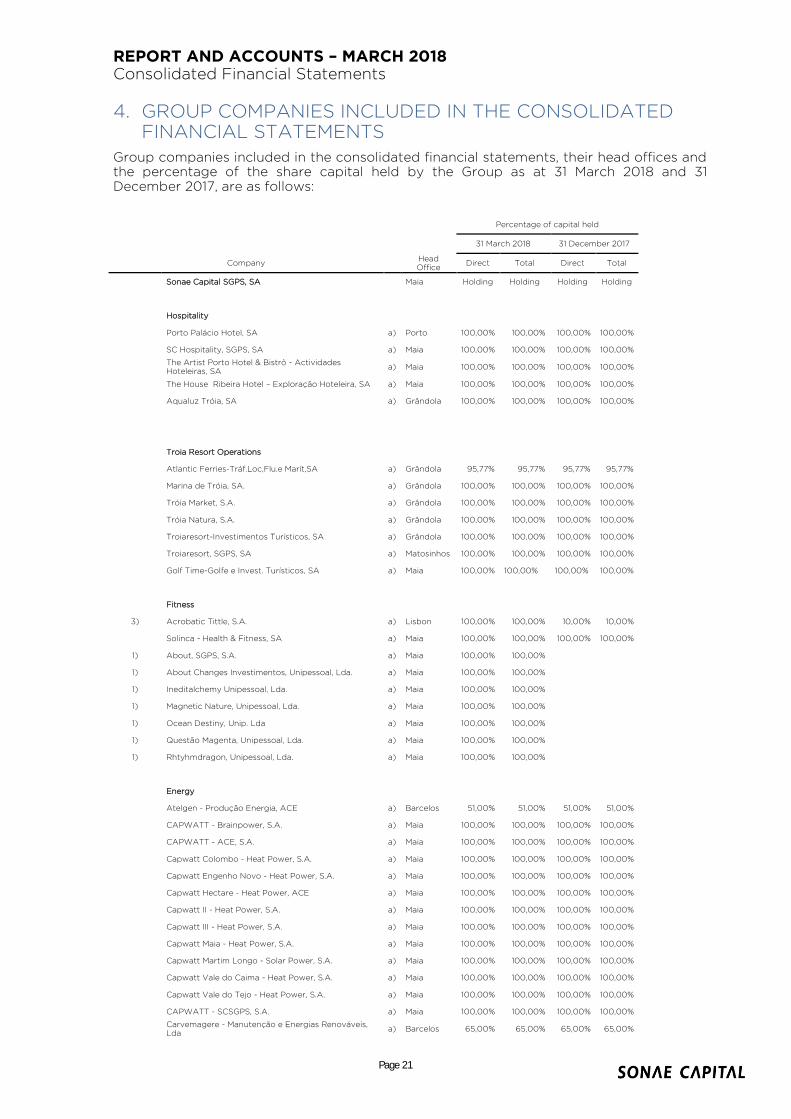
4. GROUP COMPANIES INCLUDED IN THE CONSOLIDATED FINANCIAL STATEMENTS
Group companies included in the consolidated financial statements, their head offices and the percentage of the share capital held by the Group as at 31 March 2018 and 31 December 2017, are as follows:
Percentage of capital held
31 March 2018 31 December 2017
Company Head Office
Direct Total Direct Total
Sonae Capital SGPS, SA
Maia Holding Holding Holding Holding
Hospitality
Porto Palácio Hotel, SA a) Porto 100,00% 100,00% 100,00% 100,00%
SC Hospitality, SGPS, SA a) Maia 100,00% 100,00% 100,00% 100,00%
The Artist Porto Hotel & Bistrô - Actividades Hoteleiras, SA
a) Maia 100,00% 100,00% 100,00% 100,00%
The House Ribeira Hotel – Exploração Hoteleira, SA a) Maia 100,00% 100,00% 100,00% 100,00%
Aqualuz Tróia, SA a) Grândola 100,00% 100,00% 100,00% 100,00%
Troia Resort Operations
Atlantic Ferries-Tráf.Loc,Flu.e Marít,SA a) Grândola 95,77% 95,77% 95,77% 95,77%
Marina de Tróia, SA. a) Grândola 100,00% 100,00% 100,00% 100,00%
Tróia Market, S.A. a) Grândola 100,00% 100,00% 100,00% 100,00%
Tróia Natura, S.A. a) Grândola 100,00% 100,00% 100,00% 100,00%
Troiaresort-Investimentos Turísticos, SA a) Grândola 100,00% 100,00% 100,00% 100,00%
Troiaresort, SGPS, SA a) Matosinhos 100,00% 100,00% 100,00% 100,00%
Golf Time-Golfe e Invest. Turísticos, SA a) Maia 100,00% 100,00% 100,00% 100,00%
Fitness
3) Acrobatic Tittle, S.A. a) Lisbon 100,00% 100,00% 10,00% 10,00%
Solinca - Health & Fitness, SA a) Maia 100,00% 100,00% 100,00% 100,00%
1) About, SGPS, S.A. a) Maia 100,00% 100,00%
1) About Changes Investimentos, Unipessoal, Lda. a) Maia 100,00% 100,00%
1) Ineditalchemy Unipessoal, Lda. a) Maia 100,00% 100,00%
1) Magnetic Nature, Unipessoal, Lda. a) Maia 100,00% 100,00%
1) Ocean Destiny, Unip. Lda a) Maia 100,00% 100,00%
1) Questão Magenta, Unipessoal, Lda. a) Maia 100,00% 100,00%
1) Rhtyhmdragon, Unipessoal, Lda. a) Maia 100,00% 100,00%
Energy
Atelgen - Produção Energia, ACE a) Barcelos 51,00% 51,00% 51,00% 51,00%
CAPWATT - Brainpower, S.A. a) Maia 100,00% 100,00% 100,00% 100,00%
CAPWATT - ACE, S.A. a) Maia 100,00% 100,00% 100,00% 100,00%
Capwatt Colombo - Heat Power, S.A. a) Maia 100,00% 100,00% 100,00% 100,00%
Capwatt Engenho Novo - Heat Power, S.A. a) Maia 100,00% 100,00% 100,00% 100,00%
Capwatt Hectare - Heat Power, ACE a) Maia 100,00% 100,00% 100,00% 100,00%
Capwatt II - Heat Power, S.A. a) Maia 100,00% 100,00% 100,00% 100,00%
Capwatt III - Heat Power, S.A. a) Maia 100,00% 100,00% 100,00% 100,00%
Capwatt Maia - Heat Power, S.A. a) Maia 100,00% 100,00% 100,00% 100,00%
Capwatt Martim Longo - Solar Power, S.A. a) Maia 100,00% 100,00% 100,00% 100,00%
Capwatt Vale do Caima - Heat Power, S.A. a) Maia 100,00% 100,00% 100,00% 100,00%
Capwatt Vale do Tejo - Heat Power, S.A. a) Maia 100,00% 100,00% 100,00% 100,00%
CAPWATT - SCSGPS, S.A. a) Maia 100,00% 100,00% 100,00% 100,00%
Carvemagere - Manutenção e Energias Renováveis, Lda
a) Barcelos 65,00% 65,00% 65,00% 65,00%
Page 21

REPORT AND ACCOUNTS – MARCH 2018 Consolidated Financial Statements
Companhia Térmica SERRADO, ACE a) Maia 70,00% 70,00% 70,00% 70,00%
Companhia Térmica Tagol, Lda. a) Oeiras 100,00% 100,00% 100,00% 100,00%
CTE - Central Termoeléctrica do Estuário, Lda a) Maia 100,00% 100,00% 100,00% 100,00%
Enerlousado - Recursos Energéticos, Lda. a) Maia 100,00% 100,00% 100,00% 100,00%
Ronfegen - Recursos Energéticos, Lda. a) Maia 100,00% 100,00% 100,00% 100,00%
Lusobrisa - Produção de Energia Eléctrica, S.A. a) Maia 100,00% 100,00% 100,00% 100,00%
Gasflow. Unipessoal, Lda a) Maia 100,00% 100,00% 100,00% 100,00%
Soternix - Produção de Energia, ACE a) Barcelos 51,00% 51,00% 51,00% 51,00%
Suncoutim - Solar Energy, SA a) Faro 85,00% 85,00% 85,00% 85,00%
Ventos da Serra - Produção de Energia S.A. a) Maia 100,00% 100,00% 100,00% 100,00%
Sociedade de Iniciativa e Aproveitamentos Florestais - Energia, S.A.
a) Mangualde 90,00% 90,00% 90,00% 90,00%
Refrigeration and HVAC
QCE - Desenvolvimento e fabrico de Equipamentos, SA
a) Matosinhos 100,00% 70,00% 100,00% 70,00%
6) RACE - Refrigeration & Air Conditioning Engineering, S.A.
a) Matosinhos 100,00% 70,00% 100,00% 70,00%
5) RACE. SGPS, SA a) Matosinhos 70,00% 70,00% 70,00% 70,00%
2) Sistavac Sistemas HVAC-R do Brasil, Ltda a) São Paulo 100,00% 70,00% 100,00% 70,00%
Sopair, S.A. a) Madrid 100,00% 70,00% 100,00% 70,00%
2) Spinarq Moçambique, Lda a) Maputo 70,00% 70,00% 70,00% 70,00%
Real Estate
Bloco Q-Soc.Imobil.SA a) Maia 100,00% 100,00% 100,00% 100,00%
Casa da Ribeira-Sociedade Imobiliária, S.A. a) Maia 100,00% 100,00% 100,00% 100,00%
Centro Residencial da Maia,Urban.,SA a) Maia 100,00% 100,00% 100,00% 100,00%
Cinclus Imobiliária,SA a) Maia 100,00% 100,00% 100,00% 100,00%
Contry Club da Maia-Imobiliaria,SA a) Maia 100,00% 100,00% 100,00% 100,00%
Empreend.Imob.Quinta da Azenha,SA a) Maia 100,00% 100,00% 100,00% 100,00%
Fundo Esp.Inv.Imo.Fec. WTC a) Maia 99,00% 99,00% 99,00% 99,00%
Imoclub-Serviços Imobilários,SA a) Maia 100,00% 100,00% 100,00% 100,00%
Imodivor - Sociedade Imobiliária, S.A. a) Maia 100,00% 100,00% 100,00% 100,00%
Imohotel-Emp.Turist.Imobiliários,SA a) Maia 100,00% 100,00% 100,00% 100,00%
Imoponte - Sociedade Imobiliária, SA a) Maia 100,00% 100,00% 100,00% 100,00%
Imosedas-Imobiliária e Seviços,SA a) Maia 100,00% 100,00% 100,00% 100,00%
Implantação - Imobiliária, S.A. a) Maia 100,00% 100,00% 100,00% 100,00%
Porturbe-Edifícios e Urbanizações,SA a) Maia 100,00% 100,00% 100,00% 100,00%
Praedium II-Imobiliária,SA a) Maia 100,00% 100,00% 100,00% 100,00%
Prédios Privados Imobiliária,SA a) Maia 100,00% 100,00% 100,00% 100,00%
Predisedas-Predial das Sedas,SA a) Maia 100,00% 100,00% 100,00% 100,00%
Promessa Sociedade Imobiliária, S.A. a) Maia 100,00% 100,00% 100,00% 100,00%
SC Assets, SGPS, SA a) Maia 100,00% 100,00% 100,00% 100,00%
Sete e Meio Herdades-Inv. Agr. e Tur.,SA a) Grândola 100,00% 100,00% 100,00% 100,00%
Soira - Soc. Imobiliária de Ramalde, SA a) Maia 100,00% 100,00% 100,00% 100,00%
Sótaqua - Soc. de Empreend. Turisticos a) Maia 100,00% 100,00% 100,00% 100,00%
Spinveste - Promoção Imobiliária, SA a) Maia 100,00% 100,00% 100,00% 100,00%
Spinveste-Gestão Imobiliária SGII,SA a) Maia 100,00% 100,00% 100,00% 100,00%
Urbisedas-Imobiliária das Sedas, SA a) Maia 100,00% 100,00% 100,00% 100,00%
Vistas do Freixo-Emp.Tur.Imobiliários,SA a) Maia 100,00% 100,00% 100,00% 100,00%
Soltroia-Imob.de Urb.Turismo de Tróia,SA a) Lisbon 100,00% 100,00% 100,00% 100,00%
SII - Soberana Invest. Imobiliários, SA a) Grândola 100,00% 100,00% 100,00% 100,00%
Tulipamar-Expl.Hoteleira Imob.,SA a) Grândola 100,00% 100,00% 100,00% 100,00%
Marmagno-Expl.Hoteleira Imob.,SA a) Grândola 100,00% 100,00% 100,00% 100,00%
Imopenínsula - Sociedade Imobiliária, SA a) Grândola 100,00% 100,00% 100,00% 100,00%
Imoresort - Sociedade Imobiliária, S.A. a) Grândola 100,00% 100,00% 100,00% 100,00%
Marvero-Expl.Hotel.Im.,SA a) Grândola 100,00% 100,00% 100,00% 100,00%
Page 22

REPORT AND ACCOUNTS – MARCH 2018 Consolidated Financial Statements
Industrial Engeneering
4) 7) SC, INDUSTRIALS, SGPS, S.A. a) Maia 100,00% 100,00% 100,00% 100,00%
Adira - Metal Forming Solutions, S.A. a) Porto 100,00% 100,00% 100,00% 100,00%
Guimadira - Máquinas e Ferramentas, Lda. a)
Vila Nova 100,00% 100,00% 100,00% 100,00%
de Gaia
Others
Imobeauty, S.A. a) Maia 100,00% 100,00% 100,00% 100,00%
SC - Sociedade de Consultadoria, SA a) Maia 100,00% 100,00% 100,00% 100,00%
SC Finance BV a) Amsterdam 100,00% 100,00% 100,00% 100,00%
SC For - Ser.Formação e Desenvolv.Recursos Humanos, SA
a) Maia 100,00% 100,00% 100,00% 100,00%
UP Invest, SGPS, SA a) Maia 100,00% 100,00% 100,00% 100,00%
SC, SGPS, SA a) Maia 100,00% 100,00% 100,00% 100,00%
Solinfitness - Club Málaga, S.L. a) Málaga 100,00% 100,00% 100,00% 100,00%
Praedium - Serviços, SA a) Maia 100,00% 100,00% 100,00% 100,00%
Contacto Concessões, SGPS, S.A. a) Maia 100,00% 100,00% 100,00% 100,00%
Inparvi SGPS, SA a) Maia 100,00% 100,00% 100,00% 100,00%
Interlog-SGPS,SA a) Lisbon 98,98% 98,98% 98,98% 98,98%
Société de Tranchage Isoroy SAS. a) Honfleur 100,00% 100,00% 100,00% 100,00%
1) Company acquired in the year.
2) Discontinued operations
3) Aquisition of 90% participation in the year.
4) Transfer of Other Assets;
5) Ex- Sistavac SGPS SA;
6) Ex- Sistavac, SA;
7) Ex – SC Eng.e Promoção Imobiliária SGPS, SA.
a) Majority of voting rights
These group companies are consolidated using the full consolidation method.
Page 23

REPORT AND ACCOUNTS – MARCH 2018 Consolidated Financial Statements
5. INVESTMENTS IN ASSOCIATED AND JOINTLY CONTROLLED COMPANIES
Associated and jointly controlled companies included in the consolidated financial statements, their head offices and the percentage of share capital held by the Group as at 31 March 2018 and 31 December 2017, are as follows:
31 March 2018
Percentage of Capital
Held
C ompany name Head Office Direct Total Total Assets Total
Liabilities Total Costs
Total incomes
Shared Capital
Net income
Balance Value
Jointly Controlled Companies
Other Assets
Andar - Sociedade Imobiliária, SA Maia 50,00% 50,00% 16 583 031 16 885 950 7 991 - (302 919) (7 991) -
1) Sociedade de Construções do Chile, SA Maia 100,00% 50,00% 16 454 890 242 561 9 918 - 16 212 328 (9 918) -
1) Vastgoed One - Sociedade Imobiliária, SA Maia 100,00% 50,00% 12 037 794 1 251 337 - 12 036 543 (337) -
1) Vastgoed Sun - Sociedade Imobiliária, SA Maia 100,00% 50,00% 12 042 478 1 251 337 - 12 041 227 (337) -
Associated Companies
Other Assets
Lidergraf - Artes Gráficas, Lda
Vila do Conde
24,50% 24,50% 17 469 928 9 631 481 4 761 483 4 787 615 7 838 447 26 133 1 516 523
Energy
2) Feneralt - Produção de Energia, ACE Barcelos 25,00% 25,00% 818 220 167 923 1 407 770 2 053 857 650 297 646 087 177 573
0 0 0 0 0 0 0 0 0 0 0
75 406 341 26 930 417 6 187 836 6 841 472 48 475 923 653 637 1 694 096
31 December 2017
Percentage of Capital
Held
C ompany name Head Office Direct Total Total Assets
Total Liabilities
Total Costs Total
incomes Shared Capital
Net income Balance Value
Jointly Controlled Companies
Other Assets
Andar - Sociedade Imobiliária, SA Maia 50,00% 50,00% 16 583 257 16 878 185 123 856 1 102 (294 928) (122 754) -
1) Sociedade de Construções do Chile, SA Maia 100,00% 50,00% 16 548 484 326 238 110 974 2 423 166 16 222 246 2 312 192 -
1) Vastgoed One - Sociedade Imobiliária, SA Maia 100,00% 50,00% 12 037 856 976 1 084 - 12 036 880 (1 084) -
1) Vastgoed Sun - Sociedade Imobiliária, SA Maia 100,00% 50,00% 12 042 540 976 1 079 - 12 041 564 (1 079) -
Associated Companies
Other Assets
Lidergraf - Artes Gráficas, Lda
Vila do Conde
24,50% 24,50% 18 533 396 10 335 157 20 515 836 21 812 819 8 198 240 1 296 983 1 276 788
Energy
0,00% 0,00% - - - - - - -
Feneralt - Produção de Energia, ACE Barcelos 25,00% 25,00% 818 220 167 923 1 407 770 2 053 857 650 297 646 087 142 240
0 0 0 0
76 563 753 27 709 455 22 160 599 26 290 944 48 854 299 4 130 345 1 419 028
1) Null investment values result from the adoption of the equity method in Andar – Sociedade Imobiliária, SA, holder of all of these
investments;
2) Values for the period ended December 2017.
Associated and jointly controlled companies are consolidated using the equity method.
Page 24

REPORT AND ACCOUNTS – MARCH 2018 Consolidated Financial Statements
The balance values of zero result from the reduction in the acquisition cost by application of the equity method, discontinuing the recognition of its part of additional losses under the terms of IAS 28.
During the periods ended 31 March 2018 and December 2017, movements in investments
of associated and jointly controlled companies may be summarized as follows:
31 March 2018
31 December 2017
Opening balance as at 1 January 1 419 028
1 266 842
Disposals in the period -
(31 948)
Equity method 275 068
391 017
Dividends received -
(206 883)
Closing balance as at 31 March 1 694 096
1 419 028
Accumulated impairment losses (Note 22) -
-
1 694 096
1 419 028
The use of the equity method had the following impacts: 275,068€ recorded on share of
results of associated undertakings (391,017€ at 31 December 2017).
6. OTHER INVESTMENTS
Group companies, jointly controlled companies and associated companies excluded from consolidation, their head offices, the percentage of share capital held and book value as at 31 March 2018 and 31 December 2017 are as follows:
Percentage of capital held
31 March 2018 31 December 2017 Book value
Company Head Office Direct Total Direct Total 31 March
2018
31 December 2017
Troia Resort Operations
Infratróia - Infraestruras de Tróia, E.M. Grândola 25,90% 25,90% 25,90% 25,90% 64 747 64 747
Other Assets
Fundo de Investimento Imobiliário Imosonae Dois Maia - - 0,06% 0,06% - -
Net, SA Lisbon 0,98% 0,98% 0,98% 0,98% 23 034 23 034
Fundo de Capital de Risco F-HITEC Lisbon 6,48% 6,48% 6,48% 6,48% 250 950 250 950
Outros Investimentos
0,00% 0,00% 0,00% 0,00% 294 243 239 699
Total
632 974
578 430
As at 31 March 2018 and 31 December 2017, movements in investments were as follows:
31 March 2018
31 December 2017
Non-current Current
Non-current
Current
Investments at acquisition cost
Opening balance as at 1 January 870 268 -
770 693
-
Acquisitions in the period 97 420 -
71 601
-
Disposals in the period (52 528) -
(66 213)
-
Changes in consolidation perimeter 9 652 -
94 187
-
Closing balance as at 31 March 924 812 -
870 268
-
Accumulated impairment losses (Note 22) (291 838) -
(291 838)
-
632 974 -
578 430
-
Other Investments 632 974 -
578 430
-
Page 25

REPORT AND ACCOUNTS – MARCH 2018 Consolidated Financial Statements
7. CHANGES TO THE CONSOLIDATION PERIMETER
During the period ended 31 March 2018 the following companies were acquired:
Percentage of capital held
Company Head Office
Direct Total
About, SGPS, S.A. Maia 100,00% 100,00%
About Changes Investimentos, Unipessoal, Lda. Maia 100,00% 100,00%
Ineditalchemy Unipessoal, Lda. Maia 100,00% 100,00%
Magnetic Nature, Unipessoal, Lda. Maia 100,00% 100,00%
Ocean Destiny, Unip. Lda Maia 100,00% 100,00%
Questão Magenta, Unipessoal, Lda. Maia 100,00% 100,00%
Rhtyhmdragon, Unipessoal, Lda. Maia 100,00% 100,00%
Impacts in the consolidated financial statements at the inclusion date were as follows:
Acquisition date
31 March 2018
Net assets acquired
Tangible and intangible assets (Notes 10 and 11)
5 246 221
5 019 564
Financial investments
20 371
10 918
Other assets
288.742
443 640
Cash and cash equivalents
81.143
148 554
Other liabilities
(3 946 802)
(3 877 400)
1 689 675
1 745 276
Total equity
1 689 675
Income statements from the acquired companies
Acquisition date
31 March 2018
Cost of sales
-
13 114
External supplies and services
-
858 752
Staff costs
-
418 838
Depreciation and amortisation
-
208 619
Provisions and impairment losses
-
-
Other operating expenses
-
159 075
Operational expenses
-
1 658 398
Sales
-
42 993
Services rendered
-
1 693 374
Other operating income
-
47 657
Operational income
-
1 784 024
Operational profit/(loss)
-
125 626
Financial income
-
8 017
Financial expenses
-
25 927
Net financial income / (expenses)
-
(17 910)
Investment income
-
-
Investment income
-
-
Profit/(Loss) before taxation
-
107 716
Taxation
-
(52 117)
Profit/(Loss) for the year
-
55 599
Gain/(Loss) on acquisition (Note 41)
-
Acquisition price
6 404 462
Payments made
1 919 735
Net cash flow from the acquisition
Payments made
8 324 197
Cash and equivalents acquired
(81 144)
8 243.053
Page 26

REPORT AND ACCOUNTS – MARCH 2018 Consolidated Financial Statements
8. TANGIBLE ASSETS AND INTANGIBLE ASSETS
During the three-month period ended 31 March 2018, movements in tangible and intangible fixed assets as well as in amortisation and accumulated impairment losses, are made up as follows:
Tangible Assets
Land and Natural Resources
Buildings and Other
Constructions
Plant and Machinery
Vehicles
Fixtures and Fittings
Others
Tangible Assets in progress
Total Tangible Assets
Gross Cost:
Opening balance as at 1 January 2018
49 859 173
155 688 594
285 701 503
1 244 107
4 055 064
4 795 793
6 548 831
507 893 064
Changes in consolidation perimeter (companies in)
-
5 299 212
1 380 771
77 390
270 461
61 567
48 505
7 137 906
Discontinued operations
-
-
-
-
-
-
-
-
Capital expenditure
27 816
60 820
626 351
-
-
62 061
6 781 286
7 558 335
Disposals
(453 318)
(1 160 154)
(1 869 423)
(73 000)
(494)
(5 204)
-
(3 561 593)
Transfers
16 433
5 764
2 241 113
(0)
79 196
31 157
(2 433 912)
(60 248)
Closing balance as at 31 March 2018
49 450 105
159 894 237
288 080 315
1 248 497
4 404 227
4 945 374
10 944 710
518 967 464
-
Accumulated depreciation
Opening balance as at 1 January 2018
-
43 580 976
157 597 181
1 070 247
3 303 302
2 274 539
-
207 826 244
Changes in consolidation perimeter (companies in)
-
1 309 434
429 468
11 869
135 484
18 624
-
1 904 879
Discontinued operations
-
-
-
-
-
-
-
-
Charges for the period
-
808 117
4 583 930
10 796
67 508
22 747
-
5 493 098
Disposals
-
(200 898)
(1 038 947)
(9 125)
(1 283)
(5 204)
-
(1 255 457)
Transfers
-
5 764
(3 952)
(0)
531
(92)
-
2 252
Closing balance as at 31 March 2018
-
45 503 394
161 567 680
1 083 787
3 505 542
2 310 861
-
213 971 262
Accumulated impairment losses
Opening balance as at 1 January 2018
6 000 391
23 414 766
5 219 689
-
-
-
-
34 634 846
Changes in consolidation perimeter (companies in)
-
-
-
-
-
-
-
-
Changes in consolidation perimeter (companies out) - Note 8
-
-
-
-
-
-
-
-
Charges for the period
-
-
-
-
-
-
-
-
Closing balance as at 31 March 2018
5 832 918
23 333 217
5 210 065
-
-
-
-
34 376 200
Carrying amount
As at 1 January 2018 43 858 783 88 692 851 122 884 633 173 860 751 762 2 521 253 6 548 831 265 431 974
As at 31 March 2018 43 617 187 91 057 626 121 302 570 164 710 898 685 2 634 513 10 944 710 270 620 002
Page 27

REPORT AND ACCOUNTS – MARCH 2018 Consolidated Financial Statements
Major amounts included in the caption Tangible assets in progress, refer to the following
projects:
31 March 2018
31 March 2018
Troiaresort
1 672 473
1 671 835
Industrial plants re-construction/remodeling and project management
6 830 434 2 240 148
Remodeling / New Health Clubs´s Openings
553 597
1 280 759
Industrial EngIneering
1 133 515
1 112 976
Others
754 691
243 112
10 944 710
6 548 830
During the three-month period ended 31 March 2018, intangible fixed assets as well as in amortisation and accumulated impairment losses, are made up as follows:
Intangible Assets
Patents and other similar
rights
Software
Others
Intangible Assets in progress
Total Intangible
Assets
Gross Cost:
Opening balance as at 1 January 2018
9 336 173
4 819 214
4 004 093
1 519 682
19 679 162
Changes in consolidation perimeter (companies in)
-
-
19 790
-
19 790
Capital expenditure
-
-
-
223 292
223 292
Disposals
(162 029)
-
-
-
(162 029)
Transfers
2 941
117 623
-
(85 019)
35 545
Closing balance as at 31 March 2018
9 177 086
4 936 836
4 023 883
1 657 956
19 795 760
Accumulated amortization
Opening balance as at 1 January 2018
2 656 361
3 681 794
2 828 951
-
9 167 106
Changes in consolidation perimeter (companies in)
-
-
6 596
-
6 596
Changes in consolidation perimeter (companies out)
-
-
-
-
-
Charges for the period
101 933
161 806
55 784
-
319 523
Disposals
(55 237)
-
-
-
(55 237)
Transfers
2 941
472
-
-
3 413
Closing balance as at 31 March 2018
2 705 998
3 844 071
2 891 330
-
9 441 400
Carrying amount
As at 1 January 2018 6 679 812 1 137 420 1 175 142 1 519 682 10 512 056
As at 31 March 2018 6 471 087 1 092 764 1 132 552 1 657 956 10 354 360
As at 31 March 2018 the net assets of Marina de Troia in Patents and other similar rights,
amounts to 5,066,469€ (5,261,284€ at 31 December 2017).
Page 28

REPORT AND ACCOUNTS – MARCH 2018 Consolidated Financial Statements
9. GOODWILL
During the periods ended 31 March 2018 and 31 December 2017, movements in goodwill,
as well as in corresponding impairment losses, are as follows:
31 March 2018
31 December 2017
Gross amount:
Opening balance 72 080 082
62 194 124
Increases - acquisition of affiliated companies 4 714 787
10 449 890
Decreases - disposals of affiliated companies -
563 932
Closing balance 76 794 869 72 080 082
Accumulated impairment losses:
Opening balance 24 703 711
24 353 034
Increases -
350 677
Closing balance 24 703 711
24 703 711
Total 52 091 158
47 376 371
10. OTHER NON-CURRENT DEBTORS
As at 31 March 2018 and 31 December 2017, other non-current debtors are detailed as
follows:
31 March 2018
31 December 2017
Loans granted to related parties
Others 907 655
907 655
907 655
907 655
Impairment losses (Note 22) (34 916)
(34 916)
872 739
872 739
Trade accounts receivable and other debtors
Sale of financial investments 505 000
505 000
Others 4 947 707
4 947 709
Impairment losses (Note 22) -
-
5 452 707
5 452 709
Deferred costs
Financing charges 228 880
276 547
228 880
276 547
Total financial instruments 6 554 325
6 601 994
Other non-current debtors 6 554 325
6 601 994
Page 29

REPORT AND ACCOUNTS – MARCH 2018 Consolidated Financial Statements
11. INVENTORIES
Inventories as at 31 March 2018 and 31 December 2017 can be detailed as follows,
highlighting the value attributable to real estate developments:
31 March 2018
31 December 2017
Total
of which Real Estate
Developments
Total of which Real
Estate Developments
Raw materials, by-products and consumables 4 850 740 -
4 677 862
-
Goods for sale 14 561 968 13 045 999
14 767 604
13 282 113
Finished goods 13 122 277 12 386 606
13 281 182
12 613 221
Work in progress 65 823 655 62 725 919
67 372 682
62 728 774
Payments on account - -
-
-
98 358 640 88 158 524
100 099 331
88 624 108
Accumulated impairment losses on stocks (Note 22) (5 702 697) (5 240 945)
(5 702 697)
(5 240 945)
Total Operations 92 655 944 82 917 579
94 396 634
83 383 163
12. TRADE ACCOUNTS RECEIVABLE AND OTHER CURRENT ASSETS
As at 31 March 2018 and 31 December 2017, trade accounts receivable and other current assets are detailed as follows:
31 March 2018 31 December 2017
Trade accounts receivable 27 840 151
31 008 486
Accumulated impairment losses on trade debtors (Note 22) (6 521 056)
(6 208 847)
21 319 096
24 799 640
Taxes recoverable 9 356 529
8 828 905
Loans granted to and other amounts to be received from related parties 86 980
38 897
Other current assets
Suppliers with a debtor balance 2 663 929
1 153 208
Other debtors 4 921 666
5 129 832
Accounts receivable from the sale of financial investments 2 802 915
2 862 642
Accounts receivable from the sale of tangible assets 2 838 255
2 859 253
Interest receivable 7 548
15 434
Deferred costs - Rents 1 057 949
627 096
Deferred costs - External supplies and services 1 535 269
1 382 160
Other current assets 4 166 743
7 301 557
19 994 275 21 331 182
Accumulated impairment losses on other current assets (Note 22) (1 995 925)
(1 995 925)
Trade accounts receivable and other current assets 48 760 954
53 002 698
The caption "Other current assets" includes accruals related with works in progress at the end of the year in the Refrigeration and HVAC segment.
Page 30

REPORT AND ACCOUNTS – MARCH 2018 Consolidated Financial Statements
13. DEFERRED TAXES
Deferred tax assets and liabilities as at 31 March 2018 and 31 December 2017 can be detailed as follows, splitted between the different types of temporary differences:
Deferred tax assets
Deferred tax liabilities
31 March 2017
31 December 2016
31 March 2017
31 December 2016
Amortisation and Depreciation harmonisation adjustments 564,988
566,662
4,196,166
4,068,443
Provisions and impairment losses of non-tax deductible 5,286,204
5,320,494
-
-
Write off of tangible and intangible assets
71,250
71,250
-
-
Write off of accruals
-
-
-
-
Revaluation of tangible assets
-
-
93,738
93,307
Tax losses carried forward
21,376,816
21,414,207
-
-
Financial instruments
-
-
-
-
Write off of stocks
-
-
407,314
462,815
Taxable temporary differences arising from the fair value of non-current liabilities
-
-
6,532,976
6,529,266
Others
63,501
7,644
8,481,457
8,481,456
27,362,760
27,380,258
19,711,651
19,635,287
In accordance with the tax statements presented by companies that recorded deferred
tax assets arising from tax losses carried forward, as at 31 March 2018 and 31 December
2017, and using exchange rates effective at that time, tax losses carried forward can be
summarized as follows:
31 March 2018
31 December 2017
Tax losses carried forward
Deferred tax assets
Time limit
Tax losses carried forward
Deferred tax assets
Time limit
With limited time use
Generated in 2013
18 852 311
3 958 985
2018
18 852 311
3 958 985
2018
Generated in 2014
13 536 168
2 842 595
2026
13 536 168
2 842 595
2026
Generated in 2015
45 035 288
9 457 411
2027
45 035 288
9 457 411
2027
Generated in 2016
12 025 566
2 525 369
2028
12 025 566
2 525 369
2028
Generated in 2017
9 173 702
1 926 477
2022
9 173 702
1 926 477
2022
Generated in 2018
-
-
2023
2023
98 623 036
20 710 838
98 623 036
20 710 838
With a time limit different from the above mentioned
-
-
-
-
98 623 036
20 710 838
98 623 036
20 710 838
An analysis was made on the relevance of the recognition of deferred taxes, taking into
account the possibility of them to be recovered in accordance with the medium and long
term prospects of the Group.
Deferred tax assets arising from tax losses have been recorded only when it is likely to
occur taxable income in the future.
As at 31 March 2018, tax losses carried forward amounting to 47,487,798€ (43,912,619€ as
at 31 December 2017), have not originated deferred tax assets for prudential reasons and
are detailed as follows:
Page 31
REPORT AND ACCOUNTS – MARCH 2018 Consolidated Financial Statements
31 March 2018
31 December 2017
Tax losses carried forward
Tax Credit
Time limit
Tax losses carried forward
Tax Credit
Time limit
With limited time use
Generated in 2013
25 043 382
5 259 110
2018
25 043 382
5 259 110
2018
Generated in 2014
49 633
10 423
2026
49 633
10 423
2026
Generated in 2015
14 778
3 103
2027
4 751
998
2027
Generated in 2016
19 292
4 051
2028
19 292
4 051
2028
Generated in 2017
6 368 844
1 337 457
2022
6 368 844
1 337 457
2022
Generated in 2018
3 485 227
731 897
2023
2023
34 981 156
7 346 042
31 485 902
6 612 039
Without limited time use
12 080 998
3 020 250
12 001 155
3 000 289
With a time limit different from the above mentioned
425 644
95 274
425 562
95 258
12 506 642
3 115 524
12 426 717
3 095 547
47 487 798
10 461 566
43 912 619
9 707 586
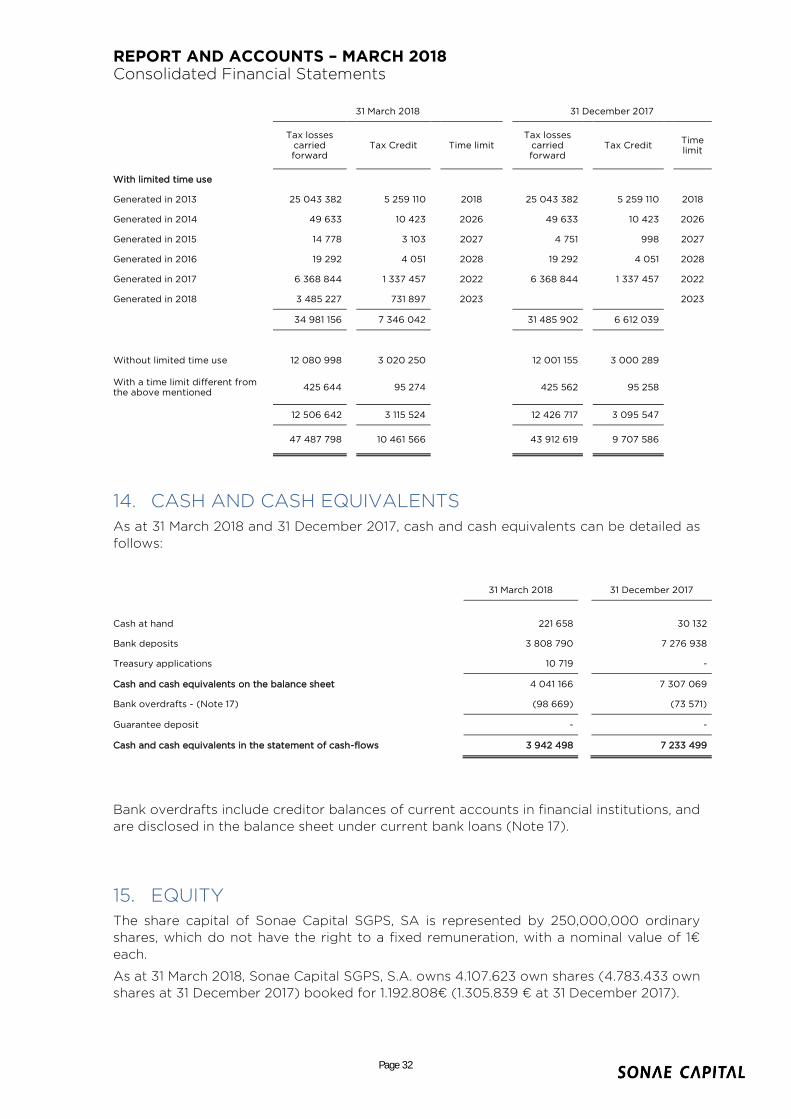
14. CASH AND CASH EQUIVALENTS
As at 31 March 2018 and 31 December 2017, cash and cash equivalents can be detailed as
follows:
31 March 2018 31 December 2017
Cash at hand 221 658 30 132
Bank deposits 3 808 790 7 276 938
Treasury applications 10 719 -
Cash and cash equivalents on the balance sheet 4 041 166 7 307 069
Bank overdrafts - (Note 17) (98 669) (73 571)
Guarantee deposit - -
Cash and cash equivalents in the statement of cash-flows 3 942 498
7 233 499
Bank overdrafts include creditor balances of current accounts in financial institutions, and
are disclosed in the balance sheet under current bank loans (Note 17).
15. EQUITY
The share capital of Sonae Capital SGPS, SA is represented by 250,000,000 ordinary
shares, which do not have the right to a fixed remuneration, with a nominal value of 1€
each.
As at 31 March 2018, Sonae Capital SGPS, S.A. owns 4.107.623 own shares (4.783.433 own
shares at 31 December 2017) booked for 1.192.808€ (1.305.839 € at 31 December 2017).
Page 32

REPORT AND ACCOUNTS – MARCH 2018 Consolidated Financial Statements
Other reserves includes amounts equal to the value of own shares held by the Group's
parent company. This reserve should be unavailable while these shares are kept by the
company.
The Reserves and retained earnings of Sonae Capital Group in the periods ended 31
March 2018 and 31 December 2017 are as follows:
31 March 2018
31 December 2017
Demerger reserve 132 638 253
132 638 253
Translation reserves 169 943
146 352
Fair value reserves -
-
Hedging reserves 6 370
6 370
Others (104 519 975)
(94 517 536)
-
-
Other reserves and retained earnings 28 294 591
38 273 439
Demerger reserve The demerger originated a reserve in the amount of 132,638,253€, which has a treatment similar to that of a Legal Reserve. according to the Code of Commercial Companies, it cannot be distributed to shareholders, unless the company is liquidated, but can be used to absorb losses related to prior years, once other reserves have been fully used, or for capital increases. Translation reserves These reserves are comprised by the conversion of the financial statements of the subsidiaries that have other functional currencies into euro. Hedging Reserve This caption is comprised by the fair value of hedging derivatives and the accrued interest of that derivative. The amounts in this reserve are transferred to the income statement when subsidiaries are sold or liquidated.
16. NON-CONTROLLING INTERESTS
Movements in non-controlling interests in the periods ended 31 March 2018 and 31 December 2017 are as follows:
31 March 2018
31 December 2017
Opening balance as at 1 January 10 915 176
9 925 965
Changes in hedging reserves -
-
Changes in the percentage of capital held in affiliated companies -
776 824
Changes resulting from currency translation -
27 009
Dividends paid (339 504)
(926 710)
Others -
-
Changes in consolidation perimeter (537 742)
-
Profit for the period attributable to minority interests (391 525)
1 112 088
Closing balance 9 646 405
10 915 176
The non-controlling interests are primarily from companies in the Refrigeration and
HVAC segment.
Page 33

REPORT AND ACCOUNTS – MARCH 2018 Consolidated Financial Statements
17. BORROWINGS
As at 31 March 2018 and 31 December 2017, Borrowings are made up as follows:
31 March 2018
31 December 2017
Outstanding amount
Outstanding amount
Repayable on
Current
Non-Current
Current
Non-Current
Bank loans
Sonae Capital SGPS - commercial paper a)
-
-
4 500 000
-
Jun/2021
Sonae Capital SGPS - commercial paper b)
-
22 000 000
-
4 000 000
Oct/2021
Sonae Capital SGPS - commercial paper c)
2 000 000
-
3 200 000
-
Mar/2018
Sonae Capital SGPS - commercial paper d)
10 000 000
-
10 000 000
-
Jun/2018
Sonae Capital SGPS e)
-
10 000 000
-
10 000 000
Feb/2023
Sonae Capital SGPS - commercial paper f)
6 000 000
-
5 000 000
-
Dec/2018
Up-front fees
-
(14 102)
-
(16 867)
Others
1 913 925
2 832 213
1 966 697
3 235 083
19 913 925
34 818 112
24 666 697
17 218 215
Bank overdrafts (Note 14)
98 669
-
73 571
-
Bank loans
20 012 594
34 818 112
24 740 268
17 218 215
Bond Loans
Sonae Capital 2016/2021 Bonds g)
-
15 000 000
-
15 000 000
Jul/2021
Sonae Capital 2014/2019 Bonds h)
-
42 500 000
-
42 500 000
May/2019
Up-front fees
-
(197 815)
-
(254 190)
Bond Loans
-
57 302 185
-
57 245 810
Other loans
48 788
393 625
48 788
197 389
Derivatives (Note 18)
-
-
-
-
Obligations under finance leases
3 303 462
13 556 136
3 422 578
13 867 519
Up-front fees on finance leases
-
(54 903)
-
(60 437)
23 364 844
106 015 154
28 211 633
88 468 497
a) Commercial paper programme, with subscription guarantee, issued on 31 December 2013 with
automatic annual renewal until a maximum of seven years and six months, unless denounced by either
part.
b) Commercial paper programme, with subscription guarantee, issued on 29 September 2017 and valid
until October 2021.
c) Short term commercial paper programme, launched on 28 March 2008 and valid until 28 March 2018,
with the option of prolonging the duration on initiative of Sonae Capital. Placement with investors or
financial institutions and guaranteed by committed credit lines with duration between six months and
a year, contracted through relationship banks.
d) Commercial paper programme, with subscription guarantee, issued on 30 June 2017 with annual
renewal, unless denounced by either part.
e) Commercial paper programme, with subscription guarantee, issued on 24 February 2017 valid until
February 2023 with amortizations every six months beginning 2019.
f) Commercial paper programme, without subscription guarantee, issued on 20 December 2017 with
annual renewal for issues placed with investors.
g) Sonae Capital, SGPS, SA, 2016/2021 bond loan in the amount of 15,000,000€, 5 years until maturity and a sole reimbursement on 29 July 2021, except if the Issuer exercise the Call Option. This bond loan bears interest every six months.
h) Sonae Capital, SGPS, SA, 2014/2019 bond loan in the amount of 42,500,000€, 5 years until maturity and a sole reimbursement on 28 May 2019. This bond loan bears interest every six months.
Page 34

REPORT AND ACCOUNTS – MARCH 2018 Consolidated Financial Statements
The interest rate on bonds and bank loans in force on 31 March 2018 was on average
2.09% (2.27% in December 2017).
Bank loans pay interest rates that are indexed to the Euribor market rates of the period,
and its fair value is considered close to its book value.
In the case that any financial institution or investor holding commercial paper opt to not
renew on any given maturity date, the Group has credit lines at its disposal to cover this
situation.
There does not exist derivative instruments.
The repayment schedule of the nominal value of borrowings may be summarised as
follows:
31 March 2018
31 December 2017
Nominal value
Interest
Nominal value
Interest
N+1
23 569 546 2 410 273
28 211 633 2 437 850
N+2
50 485 855
1 465 742
57 664 567
1 493 224
N+3
8 260 218
581 491
4 359 194
586 376
N+4
40 560 037
326 586
22 329 433
497 625
N+5
5 871 517
72 679
3 373 693
85 336
After N+5
899 645
21 813
1 073 103
26 328
129 646 817
4 878 586
117 011 623
5 126 740
Discontinued Operations
-
-
(17 368 656)
2 047 475
Total
129 646 817
4 878 586
99 642 967
7 174 215
18. OTHER NON-CURRENT CREDITORS
As at 31 March 2018 and 31 December 2017 other non-current creditors can be detailed as
follows:
31 March 2018
31 December 2017
Loans and other amounts payable to related parties
Plaza Mayor Parque de Ocio, SA (Note 28) 1 678 500
1 739 399
Others 232 513
203 172
1 911 013
1 942 571
Other creditors
Creditors in the restructuring process of Torralta 661 284
650 478
Fixed assets suppliers
-
Others 0
5 349
661 284
655 827
Deferred income
Investment aid -
-
Obligations by share-based payments (Note 20) 227 405
416 815
Others
227 405
416 814
Other non-current creditors 2 799 701
3 015 213
Page 35

REPORT AND ACCOUNTS – MARCH 2018 Consolidated Financial Statements
19. SHARE-BASED PAYMENTS
Sonae Capital Group granted deferred performance bonuses to employees, based on
shares of Sonae Capital SGPS, SA to be acquired, three years after they were attributed
to the employee. The acquisition can be exercised during the period commencing on the
third anniversary of the grant date and the end of that year. The company has the option
to settle in cash instead of shares. The option can only be exercised if the employee still
works for the Sonae Capital Group on the vesting date.
As at 31 March 2018 and 31 December 2017, the market value of total liabilities arising
from share-based payments, which have not yet vested, may be summarised as follows:
Year of grant
Vesting year
Number of participants
Fair Value
31 March 2018
31 December 2017
Shares
2015
2018
5
-
569 471
2016
2019
5
463 911
415 708
2017
2020
12
460 231
419 031
2018
2021
13
409 306
-
Total
1 333 448
1 404 211
As at 31 March 2018 and 31 December 2017, the financial statements include the following
amounts corresponding to the period elapsed between the date of granting and those
dates for each deferred bonus plan, which have not yet vested:
31 March 2018
31 December 2017
Other non-current creditors (Note 19)
227 405
416 815
Other current creditors
345 173
569 471
Reserves
(416 815)
(277 619)
Staff Costs
155 763
708 667
Page 36

REPORT AND ACCOUNTS – MARCH 2018 Consolidated Financial Statements
20. TRADE ACCOUNTS PAYABLE
As at 31 March 2018 and 31 December 2017 trade accounts payable can be detailed as
follows:
31 March 2018
31 December 2017
Trade creditors 18 693 297
25 369 800
Loans granted by and other payables to related parties 641 124
608 120
Other current liabilities
Fixed assets suppliers 1 972 965
2 392 508
Advances from customers and down payments 2 903 538
1 881 047
Other creditors 17 295 575
12 743 820
Taxes and contributions payable 4 858 605
4 469 392
Accrued staff costs 7 353 500
7 590 826
Amounts invoiced for works not yet completed 3 298 973
3 640 702
Accrued expenses with purchases - Energy Segment 517 964
397 691
Interest payable 660 584
354 584
Investment aid 102 810
126 309
Other liabilities 11 860 421
11 571 394
50 824 935
45 168 275
Trade accounts payable and other current liabilities 70 159 357
71 146 195
21. PROVISIONS AND ACUMULATED IMPAIRMENT LOSSES
Movements in provisions and accumulated impairment losses over the period ended 31
March 2018 were as follows:
Captions Balance as at
1 January 2018 Increases Decreases Utilisations
Balance as at 31 March 2018
Accumulated impairment losses on:
Tangible Assets (Note 8) 34 634 847
-
(258 645)
-
34 376 202
Intangible Assets 689 536
-
-
-
689 536
Goodwill (Note 9) 24 703 711
-
-
-
24 703 711
Other Investments 291 838
-
-
-
291 838
Other non-current assets (Note 10) 34 916
-
-
-
34 916
Trade accounts receivable (Note 12) 6 208 847
642 826
(330 618)
-
6 521 056
Other current assets (Note 12) 1 995 925
-
-
-
1 995 925
Stocks (Note 11) 5 702 697
-
-
-
5 702 697
Non-current provisions 3 079 824
-
-
-
3 079 824
Current provisions 4 403 401
1 163 331
(1 041 107)
(201 514)
4 324 111
Total 81 745 545 1 806 157 (1 630 370) (201 514) 81 719 815
As at 31 March 2018 and 31 December 2017 detail of other provisions was as follows:
Page 37

REPORT AND ACCOUNTS – MARCH 2018 Consolidated Financial Statements
31 March 2018
31 December 2017
Judicial claims 2 031 044
2 225 121
Provision for secured income 1 573 503
1 451 279
Others 3 799 389
3 806 826
Total 7 403 936
7 483 226
The amount in provision for guaranteed income is the estimate of the difference between
the amount to be charged through the properties sold in “Tróia” and the guaranteed
income to property owners. The amount to be charged through the operation of these
assets is estimated based on the average of the values obtained in previous years.
22. OTHER OPERATIONAL INCOME
Other operational income for the period ended 31 March 2018 and 2017 was as follows:
31 March 2018
31 March 2017
Own work capitalised 98 652
35 119
Gains on sales of assets 599 230
125 548
Supplementary income 136 711
109 696
Others 486 352
553 020
Continued Operations 1 320 944
823 383
Discontinued Operations -
1 163
Total 1 320 944
824 546
The amount included in Other Operational Income includes, in the year ended on 31
March 2018, are related to: (i) recognition of operating subsidies (23,500 euros); (ii)
Compensation receivable, related to operating losses (209,460 euros); and other non-
recurring gains related to the disposal of assets (45,000 euros).
The amount in gains on sales of assets for the year ended on 31 March 2018 includes
gains realized on the sale of real estate assets located in Tróia.
Page 38

REPORT AND ACCOUNTS – MARCH 2018 Consolidated Financial Statements
23. CONTINGENT ASSETS AND LIABILITIES
As at 31 March 2018 and 31 December 2017 the most important contingent liabilities
referred to guarantees given and were made up as follows:
31 March 2018
31 December 2017
Guarantees given:
on VAT reimbursements 5 199 346
5 199 346
on tax claims 17 608 327
15 163 918
on municipal claims 1 134 224
1 134 224
guarantees given on rental contracts 17 980 341
16 466 333
Others 31 861 039
9 574 135
Others include the following guarantees:
5,235,287€ as at 31 March 2018 (4,222,349€ as at 31 December 2017) of guarantees
on construction works given to clients;
3,766,391€ as at 31 March 2018 (3,766,391€ as at 31 December 2017) of guarantees
given concerning building permits in the Resorts segments.
20,070,000€ as at 31 de March 2018 of guarantees given concerning building
permits in the Energy segments.
The Group has not registered provisions for the events/disagreements for which these
guarantees were given since its board of Directors believes that the above mentioned
events will not result in a loss for the Group.
24. INVESTMENT INCOME
As at 31 March 2018 and 2017, Investment income was made up as follows:
31 March 2018
31 March 2017
Dividends -
-
Adjustment to the liquidation price of "Sodesa" 4 816
Adjustment to the selling price of "Box Lines Navegação" -
-
Gains on disposal of investments in group companies
4 816
27 598
Others
-
(2)
Investment Income - 4 816
- 27 596
Page 39

REPORT AND ACCOUNTS – MARCH 2018 Consolidated Financial Statements
25. TAXATION
As at 31 March 2018 and 2017, Taxation was made up as follows:
31 March 2018
31 March 2017
Current tax 284 093 129 634
Deferred tax 86 371 149 409
Taxation 370 463 279 044
26. RECONCILIATION OF CONSOLIDATED NET PROFIT
As at 31 March 2018 and 2017, the reconciliation of consolidated net profit can be
analysed as follows:
31 March 2018
31 March 2017
Aggregate net profit - continued operations (4 442 433) (4 409 232)
Aggregate net profit - discontinued operations (2 157 979) (123 953)
Harmonisation adjustments (306 719) (362 153)
Elimination of intragroup dividends (1 688 496) -
Share of gains/(losses) of associated undertakings 193 402 47 098
Elimination of intragroup capital gains/(losses) 570 262 -
Reclassification of discontinued operations 5 752
Elimination of intragroup impairment -
-
Adjustments of gains/(losses) on assets disposals -
-
Adjustments of gains/(losses) of financial shareholdings sale -
-
Others (31 686)
(2)
Consolidated net profit for the year - continued operations (5 830 370)
(4 824 739)
Consolidated net profit for the year - discontinued operations (2 027 527)
(23 503)
Consolidated net profit for the year (7 857 897)
(4 848 242)
27. RELATED PARTIES
Balances and transactions with related parties are detailed as follows:
March 2018 March 2017
Sales and services rendered
Purchases and services obtained
Sales and services
rendered Purchases and services
obtained
Transactions
Parent company
Associated companies
6 507 765 6 853 (1 903)
- - - -
Feneralt - Produção de Energia, ACE
3 937 (3 855) 3 937 (6 424)
Lidergraf - Artes Gráficas, Lda
2 570 4 620 2 916 4 521
- - - -
Other partners and Group companies
7 675 096 1 301 375
7 908 122 1 207 049
Page 40

REPORT AND ACCOUNTS – MARCH 2018 Consolidated Financial Statements
- -
- -
8ª Avenida - Centro Comercial, SA
6 412 -
- -
Águas Furtadas - Soc. Agricola, SA
648 - 626 -
Algarveshopping- Centro Comercial, S.A.
(4 443) -
- -
Alpêssego - Sociedade Agrícola, SA
629 -
609 -
Casa Agrícola de Ambrães, S.A.
431 - 1 147 -
Aqualuz - Turismo e Lazer, Lda
241 851 731 220 549 1 021
BB Food Service, SA
68 254 (1 874) 135 437 (1 759)
BOM MOMENTO - Comércio Retalhista, SA
37 849 (1 199)
26 405 -
Prod. Agric.Biológica, S.A.
81 633 (164) - -
Cascaishopping- Centro Comercial, S.A.
- - 367 403 (5)
Centro Colombo- Centro Comercial, S.A.
83 459 317 960 142 026 56 560
Continente Hipermercados, S.A.
655 258 (59 561) 202 301 6 151
Contimobe-Imobil.Castelo Paiva,SA
- 1 211 - 1 606
Digitmarket-Sistemas de Informação,SA
- 77 900 - 67 536
Discovery Sports, SA
- - 648 -
Efanor Investimentos, SGPS, S.A.
13 - - -
Efanor Serviços de Apoio à Gestão, S.A.
17 024 - 16 841 -
Euroresinas-Indústrias Quimicas,SA
- 147 - (2 820)
Fashion Division, S.A.
82 - 1 312 -
Herco Consul.Riscos Corret.Seguros, Ltda
- - 2 704 443
Iberosegur - Sociedade Ibérica de Mediação de Seguros, Lda 476 - 236 -
Fundo de Invest. Imobiliário Imosede
11 433 140 894 7 850 142 522
Imosistema-Sociedade Imobiliária,SA
- - (5 592) -
Fundo Invest. Imobiliário Imosonae Dois
- - 77 215 -
Infofield-Informática,SA
- - 41 -
Inovretail, S.A.
1 357 - - -
Insco Insular de Hipermercados, S.A.
408 811 (5 841) 62 234 (4)
LCC LeiriaShopping Centro Comercial SA
140 - (2 276) -
Loureshopping-Centro Comercial, S.A.
- 1 437 - -
NOS Sistemas S.A.
- 151 331 21 082 277 032
Modelo - Dist.de Mat. de Construção,S.A.
39 054 - 488 -
Modelo Continente Hipermercados,SA
4 714 677 83 848 4 413 344 (38 422)
Modelo Continente Hipermercados, Suc.
- 2 550 - 3 150
Modelo Hipermercados Trading, S.A.
1 726 - - -
MDS Corretor de Seguros, SA
88 602 (2 503) 85 131 (1 829)
MDS Africa SGPS, S.A.
275 - 80 -
MDS Auto - Mediação de Seguros, SA
476 - 423 -
MDS Consulting, SA
2 785 1 450 - -
MDS, SGPS, SA
- - 311 -
Modalfa-Comércio e Serviços,SA
66 - 11 797 -
MODALLOOP - Vestuário e Calçado, SA
224 - 375 -
Modelo Hiper Imobiliária,SA
(42) - - -
Movelpartes-Comp.para Ind.Mobiliária,SA
197 - - -
Norteshopping-Centro Comercial, S.A.
4 534 117 504 17 000 -
Paracentro - Gest.de Galerias Com., S.A.
- - 46 009 2 300
Parklake Shopping, S.A.
- - 1 470 034 -
PHARMACONTINENTE - Saúde e Higiene, S.A.
29 - 340 149
Prosa - Produtos e Serviços Agrícolas,S.A.
7 428 471 8 411 (505)
Público-Comunicação Social,SA
900 - 62 2 857
QCE - Desenvolvimento e Fabrico de Equipamentos, S.A. - (172 870) - (131 282)
Saphety Level - Trusted Services S.A.
- 34 942 - 31 179
SONAESR - Serviços e logistica, S.A.
6 837 - 2 348 -
SFS - Serviços de Gestão e Marketing, S.A.
- 858 - -
Sonae Financial Services, S.A.
- 378 - -
Sondis Imobiliária,SA
22 378 - - -
Sonae Indústria-SGPS,SA
- - 654 -
Sonae Arauco Portugal, S.A.
449 854 233 081 17 670 (70)
Sonae Industria de Revestimentos,SA
107 088 116 525 119 841 100 742
SIRS-Soc.Ind.Radiodifusão Sonora,SA
- 4 217 - 6 843
Page 41
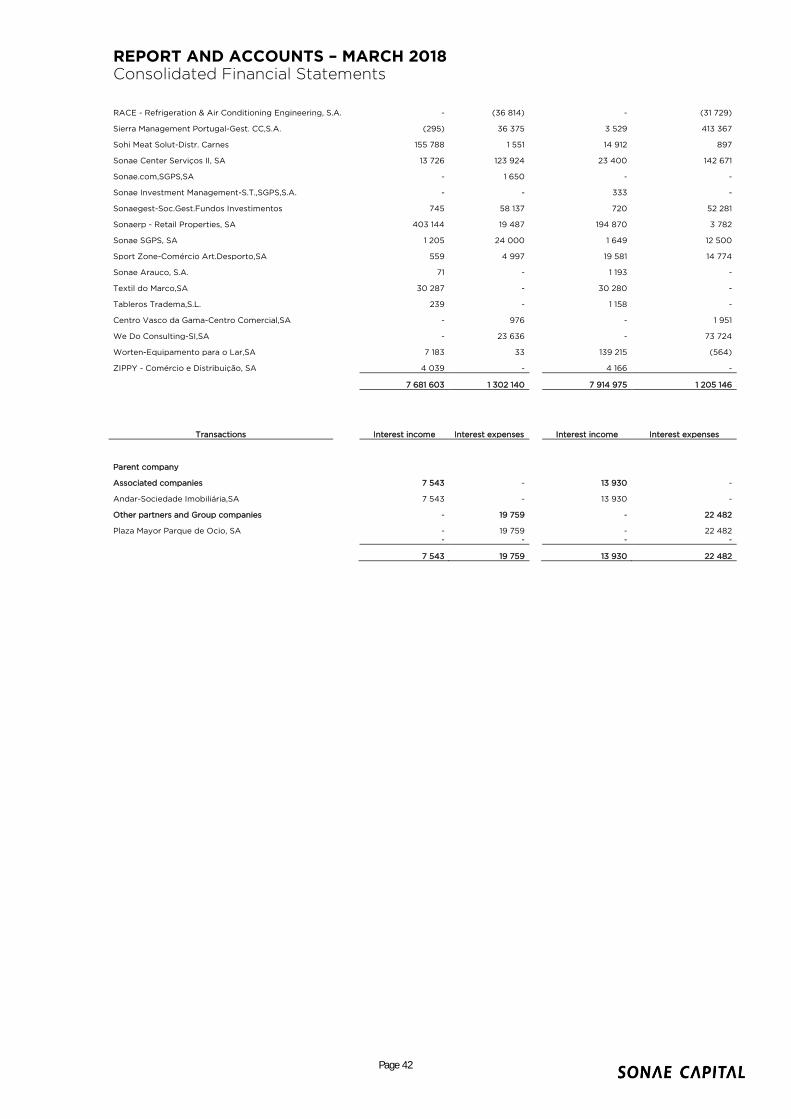
REPORT AND ACCOUNTS – MARCH 2018 Consolidated Financial Statements
RACE - Refrigeration & Air Conditioning Engineering, S.A. - (36 814) - (31 729)
Sierra Management Portugal-Gest. CC,S.A.
(295) 36 375 3 529 413 367
Sohi Meat Solut-Distr. Carnes
155 788 1 551 14 912 897
Sonae Center Serviços II, SA
13 726 123 924 23 400 142 671
Sonae.com,SGPS,SA
- 1 650 - -
Sonae Investment Management-S.T.,SGPS,S.A.
- - 333 -
Sonaegest-Soc.Gest.Fundos Investimentos
745 58 137 720 52 281
Sonaerp - Retail Properties, SA
403 144 19 487 194 870 3 782
Sonae SGPS, SA
1 205 24 000 1 649 12 500
Sport Zone-Comércio Art.Desporto,SA
559 4 997 19 581 14 774
Sonae Arauco, S.A.
71 - 1 193 -
Textil do Marco,SA
30 287 - 30 280 -
Tableros Tradema,S.L.
239 - 1 158 -
Centro Vasco da Gama-Centro Comercial,SA
- 976 - 1 951
We Do Consulting-SI,SA
- 23 636 - 73 724
Worten-Equipamento para o Lar,SA
7 183 33 139 215 (564)
ZIPPY - Comércio e Distribuição, SA
4 039 - 4 166 -
7 681 603 1 302 140
7 914 975 1 205 146
Transactions
Interest income Interest expenses Interest income Interest expenses
Parent company
Associated companies
7 543 -
13 930 -
Andar-Sociedade Imobiliária,SA
7 543 -
13 930 -
Other partners and Group companies
- 19 759 - 22 482
Plaza Mayor Parque de Ocio, SA
- 19 759 - 22 482
- - - -
7 543 19 759 13 930 22 482
Page 42

REPORT AND ACCOUNTS – MARCH 2018 Consolidated Financial Statements
March 2018 December 2017
Balances
Accounts receivable Accounts payable Accounts receivable Accounts payable
Parent company
Associated companies
32 995 1 709 34 294 17 105
- - - -
Andar-Sociedade Imobiliária,SA
23 624 - 16 054 -
Feneralt - Produção de Energia, ACE
6 175 - 9 333 -
Lidergraf - Artes Gráficas, Lda
3 196 1 709 8 907 17 105
- - - -
Other partners and Group companies
6 295 998 2 230 278
7 586 105 2 117 281
- -
- -
8ª Avenida - Centro Comercial, SA
7 886 -
- -
Águas Furtadas - Soc. Agricola, SA
281 -
257 -
Algarveshopping- Centro Comercial, S.A.
16 479 -
21 943 -
Alpêssego - Sociedade Agrícola, SA
2 874 -
2 866 -
Asprela - Sociedade Imobiliária, S.A.
- -
1 513 -
Aqualuz - Turismo e Lazer, Lda
330 337 143 190
85 036 53 327
BB Food Service, SA
57 972 (5 098)
101 974 1 783
BOM MOMENTO - Comércio Retalhista, SA
67 787 -
157 504 -
Casa Agrícola de Ambrães, S.A.
177 -
171 -
Cascaishopping- Centro Comercial, S.A.
100 212 -
163 696 -
Centro Colombo- Centro Comercial, S.A.
116 249 98 453
75 232 199 160
Centro Vasco da Gama-Centro Comercial,SA
1 200 -
- -
Contimobe-Imobil.Castelo Paiva,SA
404 993
404 993
Continente Hipermercados, S.A.
544 312 5 512
1 630 860 10 144
Digitmarket-Sistemas de Informação,SA
95 498 2 869
133 948 39 418
Efanor Investimentos, SGPS, S.A.
- -
280 -
Efanor Serviços de Apoio à Gestão, S.A.
7 662 5 512
2 709 5 512
Sonaerp - Retail Properties, SA
65 872 46 739
390 668 34 839
Euroresinas-Indústrias Quimicas,SA
- 882
- 10 160
Fashion Division, S.A.
425 -
1 364 -
Fundo de Invest. Imobiliário Imosede
12 436 32 259
13 502 6 410
Gaiashopping II- Centro Comercial, S.A.
(163) (163)
- 163
Go Well, S.A.
- 3
- 635
Guimarãeshopping- Centro Comercial, S.A.
- -
163 -
Infofield-Informática,SA
1 683 -
1 683 -
Inovretail, S.A.
1 610 -
- -
Insco Insular de Hipermercados, S.A.
509 034 -
523 525 -
LCC LeiriaShopping Centro Comercial SA
- -
9 372 -
Loureshopping-Centro Comercial, S.A.
- -
1 768 -
MDS Africa SGPS, S.A.
- -
170 -
MDS Consulting, SA
(12) 1 550
- 1 918
MDS Corretor de Seguros, SA
15 930 410 184
17 948 106 257
MDS RE-Mediador de Resseguros, S.G.P.S., S.A. (838) -
(838) -
Modalfa-Comércio e Serviços,SA
1 259 -
68 245 -
MODALLOOP - Vestuário e Calçado, SA
6 235 6 235
6 241 6 235
Modelo - Dist.de Mat. de Construção,S.A.
36 984 -
989 -
Modelo Continente Hipermercados, Suc.
- -
160 -
Modelo Continente Hipermercados,SA
3 139 238 353 581
3 550 053 311 852
Modelo Hiper Imobiliária,SA
- -
52 -
Modelo Hipermercados Trading, S.A.
1 080 -
- -
Movelpartes-Comp.para Ind.Mobiliária,SA
- -
494 -
Norteshopping-Centro Comercial, S.A.
22 031 322 653
21 699 347 635
NOS Sistemas S.A.
223 153 499
- 90 938
Paracentro - Gest.de Galerias Com., S.A.
- 4 000
- 4 000
Parklake Shopping, S.A.
471 318 -
- 117 207
PHARMACONTINENTE - Saúde e Higiene, S.A.
36 -
1 841 -
Plaza Mayor Parque de Ocio,SA
- 40 300
- 40 300
Page 43

REPORT AND ACCOUNTS – MARCH 2018 Consolidated Financial Statements
Prod. Agric.Biológica, S.A.
81 633 -
19 818 -
Prosa - Produtos e Serviços Agrícolas,S.A.
3 308 471
28 772 3 740
Público-Comunicação Social,SA
886 446
- 1 047
Rio Sul - Centro Comercial, SA
6 334 -
6 334 -
Saphety Level - Trusted Services S.A.
- 24 472
- 53 466
SEKIWI, SGPS., S.A.
25 -
273 -
SFS - Serviços de Gestão e Marketing, S.A.
302 102 839
235 146 825
Sierra Management Portugal-Gest. CC,S.A.
1 111 17 139
5 357 29 276
SIRS-Soc.Ind.Radiodifusão Sonora,SA
- 7 417
- 7 824
Sohi Meat Solut-Distr. Carnes
(7 124) (25 919)
119 910 27 332
Sonae Arauco Netherlands B.V.
- 538
- -
Sonae Arauco Portugal, S.A.
350 312 247 754
19 861 10 890
Sonae Arauco, S.A.
300 -
544 -
Sonae Center Serviços II, SA
39 908 80 737
52 498 183 618
Sonae Industria de Revestimentos,SA
133 874 85 163
185 960 83 380
Sonae Indústria-SGPS,SA
- 3 187
830 -
Sonae Investment Management-S.T.,SGPS,S.A.
- -
208 -
Sonae SGPS, SA
6 047 15 375
5 341 50 000
Sonae UK,Ltd.
- 269
- -
Sonae.com,SGPS,SA
- -
- 4 059
Sonaecom - Serviços Partilhados, S.A
- -
25 460 -
Sonaegest-Soc.Gest.Fundos Investimentos
916 16 698
- 16 849
SONAESR - Serviços e logistica, S.A.
14 358 -
10 289 -
Sport Zone-Comércio Art.Desporto,SA
2 178 2 218
2 178 14 337
Tableros Tradema,S.L.
385 -
215 -
Textil do Marco,SA
13 101 119
9 101 119
We Do Consulting-SI,SA
- 19 022
20 191 86 412
Worten-Equipamento para o Lar,SA
14 410 9 180
79 431 9 221
ZIPPY - Comércio e Distribuição, SA
23 -
5 807 -
6 328 993 2 231 987
7 620 399 2 134 386
Balances
Loans obtained Loans granted Loans obtained Loans granted
Parent company
Associated companies
- 872 739
- 872 739
Andar-Sociedade Imobiliária,SA
- 872 739
- 872 739
Other partners and Group companies
1 678 500 -
1 710 059 -
Plaza Mayor Parque de Ocio, SA
1 678 500 -
1 710 059 -
1 678 500 872 739
1 710 059 872 739
Page 44

REPORT AND ACCOUNTS – MARCH 2018 Consolidated Financial Statements
28. EARNINGS PER SHARE
Earnings per share for the periods ended 31 March 2018 and 2017 were calculated taking
into consideration the following amounts:
31 March 2018
31 March 2017
Net profit
Net profit taken into consideration to calculate basic earnings per share (Net profit for the period )
(7 466 372)
(5 049 378)
Effect of dilutive potential shares - -
Interest related to convertible bonds (net of tax) - -
Net profit taken into consideration to calculate diluted earnings per share (7 466 372)
(5 049 378)
Number of shares
Weighted average number of shares used to calculated basic earnings per share 248 085 190
247 218 671
-
-
Effect of dilutive potential ordinary shares from convertible bonds -
-
Weighted average number of shares used to calculated diluted earnings per share
248 085 190
247 218 671
Earnings per share (basic and diluted) - Continued operations (0,021923)
(0,020330)
Earnings per share (basic and diluted) - Discontinued operations (0,008173)
(0,000095)
Earnings per share (basic and diluted) (0,030096)
(0,020425)
There are no convertible instruments included in the shares of Sonae Capital, SGPS, SA,
hence there is no dilutive effect.
Page 45

REPORT AND ACCOUNTS – MARCH 2018 Consolidated Financial Statements
29. SEGMENTS INFORMATION
In 31 March 2018 and 31 December 2017, the following were identified as segments:
Troia Resort Operations; Hospitality; Fitness; Energy; Refrigeration & HVAC; Real Estate; Industrial Engineering Other Assets.
The contribution of the business segments to the income statement of the periods ended
31 March 2018 and 2017 can be detailed as follows:
31 March 2018
Profit and Loss
Account
Troia Resort Operations
Hospitality Fitness Energy Refrigeration and
HVAC Industrial
Engineering Other Assets
Intersegment Adjustments
Consolidated
Turnover
1 217 866 2 857 739 8 940 449 11 903 228 10 785 448 3 324 301 2 438 243 (2 843 150) 40 273 102
Other operational income
192 068 122 128 146 435 256 978 23 497 123 315 765 154 (309 035) 1 320 944
Total operational income
1 409 934 2 979 867 9 086 884 12 160 206 10 808 945 3 447 616 3 203 397 (3 152 185) 41 594 046
Operational cash-flow (EBITDA)
(602 402) (1 449 613) 1 092 065 3 228 670 (411 352) (218 375) 599 548 (124 735) 1 399 621
31 March 2017
Profit and Loss
Account
Troia Resort Operations
Hospitality Fitness Energy Refrigeration and
HVAC Industrial
Engineering Other Assets
Intersegment Adjustments
Consolidated
Turnover
1 737 638 2 668 642 5 879 167 9 790 207 10 220 758 - 2 395 323 (852 552) 33 244 348
Other operational income
470 396 120 722 103 296 146 420 228 818 - 70 445 (327 839) 824 546
Total operational income
2 208 033 2 789 365 5 982 463 9 936 627 10 449 576 - 2 465 768 (1 180 391) 34 068 894
Operational cash-flow (EBITDA)
(970 875) (1 553 675) 900 434 2 101 440 31 781 - 575 799 122 790 289 984
Page 46

REPORT AND ACCOUNTS – MARCH 2018 Consolidated Financial Statements
The contribution of the business segments to the Balance sheets as at 31 March 2018 and
31 December 2017 can be detailed as follows:
31 March 2018
Balance Sheet
Resorts Hotels Fitness Energy Refrigeration and
HVAC Industrial
Engineering Other Assets
Intersegment Adjustments
Consolidated
Fixed Assets Tangible, Intangible and Goodwill
69 431 442 12 798 620 20 522 603 70 711 306 9 822 883 17 095 257 993 032 (3 365 423) 332 376 228
Investments
153 771 317 10 932 664 40 920 208 616 17 544 50 498 450 031 297 (618 882 888) 2 327 070
Other Assets
81 971 101 5 530 893 3 766 811 11 956 114 39 746 680 16 822 463 410 069 684 (482 298 827) 181 861 813
Total Assets
305 173 860 29 262 177 24 330 334 82 876 036 49 587 107 33 968 218 861 094 013 (1 104 547 138) 516 565 111
Total Liabilities
181 861 027 26 800 598 24 429 699 75 241 517 13 614 710 11 480 950 146 498 564 (484 372 563) 231 362 544
Technical investment
359 219 147 166 1 155 151 5 582 444 101 206 245 875 92 153 (2 025) 7 781 627
Gross Debt
9 457 283 - 1 567 465 7 198 467 - 3 854 598 107 302 185 - 129 379 998
Net Debt
9 256 960 (187 565) 1 290 384 7 028 635 (816 019) 3 793 555 107 197 198 - 125 338 832
31 December 2017
Balance Sheet
Resorts Hotels Fitness Energy Refrigeration and
HVAC Industrial
Engineering Other Assets
Intersegment Adjustments
Consolidated
Fixed Assets Tangible, Intangible and Goodwill
71 505 248 12 618 277 10 476 681 67 475 147 9 763 348 - 1 018 191 (2 598 001) 322 630 866
Investments
153 770 439 10 849 159 25 662 172 389 15 484 - 449 240 469 (620 145 656) 1 997 458
Other Assets
81 279 867 5 694 754 2 287 983 12 812 445 49 257 629 - 396 404 923 (380 364 104) 191 498 283
Total Assets
306 555 555 29 162 190 12 790 326 80 459 981 59 306 461 - 846 663 583 (1 003 377 762) 516 126 607
Total Liabilities
181 173 050 25 962 972 9 029 069 72 862 309 21 196 764 - 132 520 962 (465 020 715) 224 757 320
Technical investment
1 827 798 954 495 3 232 316 4 666 123 102 031 - 474 430 (22 575) 12 723 301
Gross Debt
9 886 023 - 964 151 7 582 867 73 571 - 93 945 810 (0) 116 680 131
Net Debt
9 348 956 (334 502) 838 451 7 373 986 (2 590 142) - 93 729 788 0 109 373 062
Page 47

REPORT AND ACCOUNTS – MARCH 2018 Consolidated Financial Statements
30. SUBSEQUENT EVENTS
No significant events, requiring further disclosure, have occurred after 31 March 2018.
31. APPROVAL OF THE FINANCIAL STATEMENTS
These consolidated financial statements were approved by the Board of Directors and
authorized for issue on 22 May 2018.
The Board of Directors
Page 48

REPORT AND ACCOUNTS - MARCH 2018 Separated Financial Statements
PART III
SEPARATED FINANCIAL STATEMENTS 31 MARCH 2018

REPORT AND ACCOUNTS - MARCH 2018 Separated Financial Statements
SONAE CAPITAL, SGPS, SA
BALANCE SHEET AS AT 31 MARCH 2018 AND 31 DECEMBER 2017
(Amounts expressed in euro)
ASSETS Notes 31/03/2018 31/12/2017
NON-CURRENT ASSETS:
Tangible assets
27 222
27 721
Investments 4 301 550 125
300 257 447
Investments in associated companies and joint ventures 4 1 125 301
1 125 301
Other investments 4 275 185
275 185
Deferred tax assets 7 16 764 699
16 764 699
Other non-current debtors 5 314 082 495
314 130 162
Total non-current assets
633 825 027
632 580 515
CURRENT ASSETS:
Other debtors 6 78 043 359
61 331 400
Income tax 6 1 873 050
1 639 593
Other current assets 6 2 534 839
4 316 836
Cash and cash equivalents 8 68 303
171 848
Total Current Assets
82 519 551
67 459 677
TOTAL ASSETS 716 344 578
700 040 192
EQUITY AND LIABILITIES
EQUITY:
Share capital 9 250 000 000
250 000 000
Own Shares 9 (1 192 808)
(1 305 839)
Reserves 10 302 145 038
301 630 917
Retained earnings
5 589 342
-
Profit/(Loss) for the year
1 643 923
5 589 342
Total Equity
558 185 495
555 914 420
NON-CURRENT LIABILITIES:
Bank Loans 11 32 000 000
14 000 000
Bonds 11 57 302 185
57 245 810
Other non-current liabilities 13 131 698
287 354
Total Non-Current Liabilities
89 433 883
71 533 164
CURRENT LIABILITIES:
Bank Loans 11 18 000 000
22 700 000
Trade creditors 13 112 882
137 599
Other creditors 12 49 268 318
48 568 841
Other taxes payable 13 41 221
50 069
Other current liabilities 13 1 302 779
1 136 099
Provisions
-
-
Total Current Liabilities
68 725 200
72 592 608
TOTAL LIABILITIES
158 159 083
144 125 772
TOTAL EQUITY AND LIABILITIES 716 344 578
700 040 192
The accompanying notes are part of these financial statements.
The Board of Directors
Page 50

REPORT AND ACCOUNTS - MARCH 2018 Separated Financial Statements
SONAE CAPITAL, SGPS, SA
INDIVIDUAL STATEMENT OF COMPREHENSIVE INCOME
FOR THE THREE MONTHS ENDED 31 MARCH 2018 AND 2017
(Amounts expressed in euro)
31/03/2018 31/03/2017
Consolidated net profit/(loss) for the period
1 643 923
1 186 212
Items that may be reclassified subsequently to net profit / (loss):
Changes in the currency translation differences
-
-
Change in the fair value of assets available for sale
Change in the fair value of cash flow hedging derivatives
-
-
Tax related to other comprehensive income items
-
-
Total comprehensive income for the period
1 643 923
1 186 212
The accompanying notes are part of these financial statements.
The Board of Directors
Page 51

REPORT AND ACCOUNTS - MARCH 2018 Separated Financial Statements
SONAE CAPITAL, SGPS, SA
INDIVIDUAL STATEMENTS OF CHANGES IN EQUITY
FOR THE THREE MONTHS ENDED 31 MARCH 2018 AND 2017
(Amounts expressed in euro)
Attributable to Equity Holders of Sonae Capital
Share
Capital (Note 9)
Own Shares
(Note 9)
Legal Reserve (Note 9)
Other Reserves (Note 9)
Retained Earnings
Subtotal
Net Profit/(Loss)
Total Equity
Balance as at 1 January 2017 250 000 000
(1 404 226)
10 073 164 306 815 095 - 316 888 259
8 738 316
574 222 348
-
-
- - - -
-
-
Total comprehensive income for the period -
-
- - - -
1 186 212
1 186 212
Appropriation of profit of 2016: -
-
- - - -
-
-
Transfer to legal reserves and retained earnings -
-
- - 8 738 316 8 738 316
(8 738 316)
-
Dividends paid -
-
- - - -
-
-
(Acquisition)/Sales of own shares -
64 609
- 338 303 - 338 303
-
402 912
Changes in the percentage of capital held in affiliated companies -
-
- - - -
-
-
Other changes -
-
- - - -
-
-
Balance as at 31 March 2017 250 000 000 (1 339 617) 10 073 164 307 153 398 8 738 316 325 964 878 1 186 212 575 811 472
Balance as at 1 January 2018 250 000 000
(1 305 839)
10 073 164 291 557 752 - 301 630 916
5 589 342
555 914 420
-
-
- - - -
-
-
Total comprehensive income for the period -
-
- - - -
1 643 923
1 643 923
Appropriation of profit of 2017: -
-
- - - -
-
-
Transfer to legal reserves and retained earnings -
-
- - 5 589 342 5 589 342
(5 589 342)
-
Dividends paid -
-
- - - -
-
-
(Acquisition)/Sales of own shares -
113 031
514 121 - - 514 121
-
627 152
Changes in the percentage of capital held in affiliated companies -
-
- - - -
-
-
Other changes -
-
- - - -
-
-
Balance as at 31 March 2018 250 000 000 (1 192 808) 10 587 285 291 557 752 5 589 342 307 734 380 1 643 923 558 185 495 The accompanying notes are part of these financial statements.
The Board of Directors
Page 52

REPORT AND ACCOUNTS – MARCH 2018 Separated Financial Statements
SONAE CAPITAL, SGPS, SA
INDIVIDUAL STATEMENTS OF CASH FLOWS
FOR THE THREE MONTHS ENDED 31 MARCH 2018 AND 2017
(Amounts expressed in euro)
Notes 31/03/2018 31/03/2017
OPERATING ACTIVITIES:
Cash receipts from trade debtors
-
-
Cash receipts from trade creditors
420 943
235 368
Cash paid to employees
174 023
245 251
Cash flow generated by operations
(594 966)
(480 619)
Income taxes (paid) / received
204 693
(4 014)
Other cash receipts and (payments) relating to operating activities
77 733
(1 489 940)
Net cash from operating activities (1)
(721 926)
(1 966 545)
INVESTMENT ACTIVITIES:
Cash receipts arising from:
Investments 22 -
-
Tangible assets
-
-
Interest and similar income
3 941 621
8 450 547
Loans granted 6 -
411 222
Dividends 16 -
-
Others
898 085
-
4 839 706
8 861 769
Cash Payments arising from:
Investments 22 1 292 678
-
Tangible assets
-
-
Loans granted 6 16 156 864
12 185 236
17 449 542
12 185 236
Net cash used in investment activities (2)
(12 609 836)
(3 323 467)
FINANCING ACTIVITIES:
Cash receipts arising from:
Loans obtained 11 18 000 000
2 200 000
Sale of own shares
-
-
18 000 000
2 200 000
Cash Payments arising from:
Loans obtained 11 4 124 400
23 913 700
Interest and similar charges
647 383
629 723
Dividends
-
-
Purchase of own shares
-
-
4 771 783
24 543 423
Net cash used in financing activities (3)
13 228 217
(22 343 423)
Net increase in cash and cash equivalents (4) = (1) + (2) + (3)
(103 545)
(27 633 435)
Cash and cash equivalents at the beginning of the period 14 171 848
27 861 181
Cash and cash equivalents at the end of the period 14 68 303
227 746
The accompanying notes are part of these financial statements.
1 Prepared in accordance with IAS 34 - Interim Financial Reporting and unaudited
The Board of Directors
Page 53

REPORT AND ACCOUNTS – MARCH 2018 Separated Financial Statements
SONAE CAPITAL, SGPS, SA
NOTES TO THE INDIVIDUAL FINANCIAL STATEMENTS
FOR THE THREE MONTHS ENDED 31 MARCH 2018
(Translation from the Portuguese Original)
(Amounts expressed in Euro)
1. INTRODUCTION
Sonae Capital, SGPS, SA (“the Company" or “Sonae Capital”) whose registered office is at Lugar do Espido, Via Norte, Apartado 3053, 4471-907 Maia, Portugal, was set up on 14 December 2007 by public deed, following the demerger from Sonae, SGPS, SA of the whole of the shareholding in the company formerly named Sonae Capital, SGPS, SA, now named SC, SGPS, SA, in compliance with paragraph a) of Article 118 of the Code of Commercial Companies. The Company’s financial statements are presented as required by the Code of Commercial Companies. According to Decree-Law 158/2009 of 13 July of 2009, the Company’s financial statements have been prepared in accordance with International Financial Reporting Standards.
2. MAIN ACCOUNTING POLICIES
The main accounting policies adopted in preparing the accompanying individual financial statements are consisting with those used in the financial statements presented for the year ended 31 December 2017.
a. Basis of preparation
Interim financial statements are presented quarterly, in accordance with IAS 34 – “Interim Financial Reporting”.
The accompanying financial statements have been prepared from the books and accounting records on a going concern basis and under the historical cost convention, except for financial instruments, which are stated at fair value.
3. CHANGES IN ACCOUNTING POLICIES
During the period, there were no changes in accounting policies or prior period errors.
Page 54

REPORT AND ACCOUNTS – MARCH 2018 Separated Financial Statements
4. FINANCIAL INVESTMENTS
As at 31 March 2018 and 31 December 2017, Investments are detailed as follows:
31 March 2018
31 December 2017
Investments in affiliated and associated undertakings 350 487 407
349 194 729
Investments in other companies
Sonae RE - (0,04%) 1 200
1 200
Fundo Invest. Imob. Imosonae Dois - (0,001%) -
-
Matadouro Alto Alentejo, SA - (0,89%) 1
1
NET Novas Tecnologias, SA - (0,98%) 23 034
23 034
Fundo F HITEC - (6,48%) 250 950
250 950
350 762 592
349 469 914
Impairment (47 811 981)
(47 811 981)
302 950 611
301 657 933
4.1 Investments in affiliated and associated undertakings
As at 31 March 2018 and 31 December 2017, the detail of Investments in Affiliated and Associated Companies is as shown in the table below:
31.03.2018
Sociedade % Held Book Value Equity Profit /
(Loss) for the period
CAPWATT, S.G.P.S., S.A. 100,00% 2 725 000 5 119 588 (12 658)
Fundo Esp de Invest. Imob Fechado WTC 59,87% 42 271 519 71 562 431 851 617
Troiaresort, SGPS, S.A. 100,00% 167 132 793 78 502 554 (247 618)
Interlog - SGPS, S.A. 98,94% 21 658 210 21 856 033 (2 020)
Lidergraf - Artes Gráficas, SA. 24,50% 1 125 301 7 838 447 26 133
SC Assets S.G.P.S., SA 100,00% 25 577 659 12 968 621 (538 758)
SC Hospitality, S.G.P.S., S.A. 100,00% 5 857 175 6 272 267 509
SC Finance B.V. 100,00% 263 698 (4 849 528) (35 442)
SC-Industrials, S.G.P.S., S.A. 100,00% 34 575 100 23 915 349 (564 452)
Race, SGPS, S.A. 70,00% 32 492 436 40 902 939 (144)
Solinca - Health & Fitness, S.A. 100,00% 15 515 838 1 145 038 (75 407)
Contacto Concessões SGPS 100,00% 1 292 678 1 289 464 (3 214)
Total 350 487 407
Impairment
SC Assets S.G.P.S., SA
25 577 659
Interlog - SGPS,S.A.
36 864
Troiaresort, SGPS, S.A.
11 140 826
SC Finance BV
263 698
SC, Industrials, SGPS, S.A.
10 792 934
Total 47 811 981
Page 55

REPORT AND ACCOUNTS – MARCH 2018 Separated Financial Statements
31.12.2017
Sociedade % Held Book Value Equity Profit /
(Loss) for the period
CAPWATT, S.G.P.S., S.A. 100,00% 2 725 000 5 132 247 2 139 631
Fundo Esp de Invest. Imob Fechado WTC 59,87% 42 271 519 72 210 814 4 081 698
Troiaresort, SGPS, S.A. 100,00% 167 132 793 78 750 172 (793 608)
Interlog - SGPS, S.A. 98,94% 21 658 210 21 858 053 5 065
Lidergraf - Artes Gráficas, SA. 24,50% 1 125 301 8 198 240 1 296 983
SC Assets S.G.P.S., SA 100,00% 25 577 659 13 507 379 (314 576)
SC Hospitality, S.G.P.S., S.A. 100,00% 5 857 175 6 272 267 (169 017)
SC Finance B.V. 100,00% 263 698 (4 814 085) 6 022 698
SC-Industrials, S.G.P.S., S.A. 100,00% 34 575 100 24 479 800 23 279 800
Race, SGPS, S.A. 70,00% 32 492 436 40 903 083 252 350
Solinca - Health & Fitness, S.A. 100,00% 15 515 838 1 075 719 (144 724)
Contacto Concessões SGPS 100,00% - - -
Total 349 194 729
Impairment
SC Assets S.G.P.S., SA
25 577 659
Interlog - SGPS,S.A.
36 864
Troiaresort, SGPS, S.A.
11 140 826
SC Finance BV
263 698
SC, Industrials, SGPS, S.A.
10 792 934
Total
47 811 981
Investments carried at cost correspond to those in unlisted companies and for which a fair value cannot be reliably estimated.
Impairment tests on financial investments were performed in 2017, based on external valuations of the real estate of group companies or DCF methodology, to assess the fair value of such investments.
These assessments use discount rates that correspond to the weighted average rates of the cost of capital (WACC), calculated on the basis of the business type in which they operate and s target capital structures, and are in the range [7.1% - 10.1%]. 5 years projections were considered and growth rates in perpetuity were considered void.
As a result of these impairment tests as at 31 March 2018 and 31 December 2017, the detail of Impairments on Investments in Affiliated and Associated Companies is as shown in the table below:
31 March 2018
31 December 2017
Variation
Spred, SGPS, SA -
-
-
Interlog - SGPS,S.A. (36 864)
(36 864)
-
Troiaresort, SGPS, S.A. (11 140 826)
(11 140 826)
-
SC Assets, SGPS, SA (25 577 659)
(25 577 659)
-
SC Finance BV (263 698)
(263 698)
-
SC, Industrials, SGPS, S.A. (10 792 934)
(10 792 934)
-
(47 811 981)
(47 811 981)
-
Page 56

REPORT AND ACCOUNTS – MARCH 2018 Separated Financial Statements
5. OTHER NON-CURRENT ASSETS
As at 31 March 2018 and 31 December 2017, other non-current assets are detailed as follows:
31 March 2018
31 December 2017
Loans granted to group companies:
SC Assets, SGPS, SA 174 450 597
174 450 597
Troiaresort, S.G.P.S., SA 138 805 637
138 805 637
SC Finance BV 5 885 000
5 885 000
Solinca - Health & Fitness, SA -
-
SC Hospitality SGPS SA 6 155 000
6 155 000
SC Engª. Promoção Imobiliária, SA 661 000
661 000
325 957 234
325 957 234
Impairment
SC Assets, SGPS, SA (Note 17) (11 640 970)
(11 640 970)
SC Finance BV (Not3 17) (462 649)
(462 649)
(12 103 619)
(12 103 619)
Up-front fees not yet charged to income statement 228 880
276 547
314 082 495
314 130 162
Loans to group companies interest at market rates and are repayable within a period exceeding one year. The interest rate as at 31 March 2018 stood, in average, at approximately 2.349%. The deferred costs relate to the deferral of the financial charges associated with the bank loans obtained, by their due dates.
6. OTHER CURRENT ASSETS AND INCOME TAX
As at 31 March 2018 and 31 December 2017, Other current assets and Income tax are made up as follows:
31 March 2018
31 December 2017
Trade debtors -
-
Other debtors - Group (Note 21) 1 808 170
1 447 535
Loans granted 74 864 665
58 707 800
Other debtors 1 370 525
1 176 066
78 043 359
61 331 400
Accrued income 2 224 351
4 094 304
Deferred costs 310 488
222 532
2 534 839
4 316 836
Income tax withheld 1 873 050
1 639 593
82 451 249
67 287 829
Page 57

REPORT AND ACCOUNTS – MARCH 2018 Separated Financial Statements
The balance registered at Other debtors - Group is related to the values transferred from subsidiaries under the IRC regime (RETGS).
As at 31 March 2018 and 31 December 2017, the item Loans Granted is related to financial operations with the following subsidiaries:
31 March 2018
31 December 2017
Loans granted (Note 21)
SC Assets, SGPS, SA 1 518 770
73 000
SC Hospitality, SGPS, SA 901 415
454 000
CAPWATT, SGPS, S.A. 43 437 300
41 175 000
Inparvi, SGPS, SA 57 441
69 000
SC, SGPS, S.A. 14 439 855
14 269 500
Solinca - Health & Fitness, SA 10 664 000
1 186 300
Spred, SGPS SA -
-
Troiaresort, S.G.P.S., SA 3 845 883
1 481 000
74 864 665
58 707 800
Loans to group companies interest at market rates and are repayable within a period inferior to one year. The interest rate as at 31 March 2018 stood, in average, at approximately 1.36%.
The item Other Debtors includes as at 31 March 2018 the amount 1,353,187€ related to the settlement of the sale price of the stake in the company, Box Lines Navegação SA, in previous years.
The amount recorded in the accrued income includes 2,199,656€ relating to interest on loans granted to subsidiaries as well as 24,694€ relating to commissions of guarantees given to subsidiaries.
Deferred costs include 273,935€ relating to bank charges, which are deferred over the loan period.
Income Tax
Under current legislation, tax returns are subject to review and correction by the tax authorities for a period of four years (five years for Social Security), except if there have been tax losses or tax benefits, or ongoing tax inspections or claims. In these cases, and depending on the circumstances, the time limits are extended or suspended. In this way the Company tax return, from the years 2015 to 2018, could still be subject to review. However, in the opinion of the Company's Board of Directors, it is not expected that any correction relating to the said financial years will be significant for the consolidated financial statements as at 31 March 2018. The Company is subject to the special regime for the taxation of groups of companies (RETGS) provided for in Article 69 and following of the IRC Code, integrating the taxation group, which is the mother company. In the fiscal year 2018, the Company is subject to taxation on Corporate Income Tax at the normal rate of 21%, plus municipal taxes at a maximum rate of 1.5%. In addition, on the part of the taxable profit of more than 1,500,000€ subject to and not exempt from Corporate Income Tax, the following state levy fees are levied: 3% over 1,500,000€ and less than 7,500,000€; 5% on the upper part to 7,500,000€ and up to 35,000,000€; and 7% that is levied on the part of the taxable income that exceeds 35,000,000€.
Page 58

REPORT AND ACCOUNTS – MARCH 2018 Separated Financial Statements
Under the terms of Article 88 of the Portuguese Income Tax Code, the company is also subject to autonomous taxation on a set of charges at the rates provided for in the mentioned Article. As at 31 March 2018 and 31 December 2017, the item Income tax is made up as follows:
31 March 2018
31 December 2017
Income tax withheld 1 074 971
849 047
Income tax (advanced payment) 863 935
760 611
Income tax (65 856)
29 935
1 873 050
1 639 593
7. DEFERRED TAXES
Deferred tax assets and liabilities as at 31 March 2018 and 31 December 2017 can be detailed as follows, split between the different types of temporary differences:
Deferred tax assets
31 March 2018 31 December 2017
Tax losses carried forward 16 764 699 16 764 699
Others - -
The movements in deferred tax assets and liabilities for the periods ended 31 March 2018 and 31 December 2017 were as follows:
Deferred tax assets
Deferred tax liabilities
31 March 2018 31 December 2017
31 March 2018 31 December 2017
Opening balance 16 764 699 14 314 699
- -
Effect in results
Tax losses carried forward - 2 450 000
- -
Others - -
- -
16 764 699 16 764 699
- -
Effect in reserves: - -
- -
Closing balance 16 764 699 16 764 699
- -
In accordance with the tax statements presented by companies that recorded deferred tax assets arising from tax losses carried forward, as at 31 March 2018 and 31 December 2017, tax losses carried forward can be summarized as follows:
Page 59

REPORT AND ACCOUNTS – MARCH 2018 Separated Financial Statements
31 March 2018
31 December 2017
Tax losses
Deferred tax assets
To be used until
Tax losses
Deferred tax assets
To be used until
Generated in 2013 61 175 12 847 2018
61 175 12 847 2018
Generated in 2014 13 536 168 2 842 595 2026
13 536 168 2 842 595 2026
Generated in 2015 45 035 288 9 457 411 2027
45 035 288 9 457 411 2027
Generated in 2016 12 025 566 2 525 369 2028
12 025 566 2 525 369 2028
Generated in 2017 9 173 702 1 926 477 2022
9 173 702 1 926 477 2022
Generated in 2018 - - 2023
- - 2023
79 831 899 16 764 699
79 831 899 16 764 699
The constitution of deferred tax assets was based on the analysis of the relevance of its recognition, notably as regards the possibility of their recovered, given the prospects for medium and long term of the company. The deferred tax assets recognized resulting from fiscal losses are recorded to the extent that it is probable that taxable profit will occur in the future. The valuation of deferred tax assets is based on the business plans of the Group companies, periodically reviewed and updated. Since fiscal year 2014, most of the Group's subsidiaries, based in Portugal, are part of the perimeter of the taxed Corporate Group in accordance with the Special Taxation Regime for Company Groups (RETGS), whose parent company is the Sonae Capital, SGPS, SA. Gains generated by the application of this tax regime are allocated to Sonae Capital SGPS. The analysis carried out on 31 March 2018, resulted that there is reasonable expectation of recovery of deferred tax assets recorded before their date of expiry.
8. CASH AND CASH EQUIVALENTS
As at 31 March 2018 and 31 December 2017, cash and cash equivalents can be detailed as follows:
31 March 2018
31 December 2017
Cash -
-
Bank deposits 68 303
171 848
Cash and cash equivalents in the balance sheet 68 303
171 848
Bank overdrafts
-
-
Cash and cash equivalents in the cash flow statement 68 303 171 848
9. EQUITY
The share capital of Sonae Capital SGPS, SA both in March 2018 and December 2017 is represented by 250,000,000 ordinary shares, which do not have the right to a fixed remuneration, with a nominal value of 1€ each.
Page 60

REPORT AND ACCOUNTS – MARCH 2018 Separated Financial Statements
As at 31 March 2018, Sonae Capital SGPS, SA holds 4,107,623 own shares representing 1.643% of the share capital (4,783,433 shares at 31 December 2017), recorded by 1,192,808€ (1,305,839€ at 31 December 2017) (Note 10).
10. RESERVES
As at 31 March 2018 and 31 December 2017 the item Other Reserves can be detailed as follows:
31 March 2018
31 December 2017
Legal reserves 10 510 080
10 510 080
Free reserves 157 803 897
157 176 745
Demerger reserve 132 638 253
132 638 253
Own shares reserve 1 192 808
1 305 839
302 145 038
301 630 917
Free Reserves: These reserves result from the transfer of the positive results obtained in retained earnings and can be distributed to shareholders provided they are not required to cover losses. The overall value of the demerger reserve (Note 1), represents the difference between the book value of the stake in SC, SGPS, SA (382,638,253€) and the share capital of Sonae, SGPS, SA (250,000,000€), which is comparable to the Legal Reserve, according to the Code of Commercial Companies, may not be distributed to the shareholders except in the event of liquidation of the Company, but may be used to absorb accumulated losses, after other reserves are exhausted, or can be incorporated into capital. Legal Reserve: Under the law, at least 5% of annual net profit, should be allocated to the Legal Reserve until it represents 20% of the share capital. This reserve is not distributable except in the event of liquidation of the company, but can be used to absorb losses after the other reserves, or increase capital. On 31 March 2018 the value of this item amounts to 10,510,080€ (December 2017: 10,510,080€). Reserve own shares: This reserve, established in accordance with Article 342 of the CSC, is the same amount of the own shares value held by the company. This reserve is unavailable while the own shares are in possession of the company.
Page 61
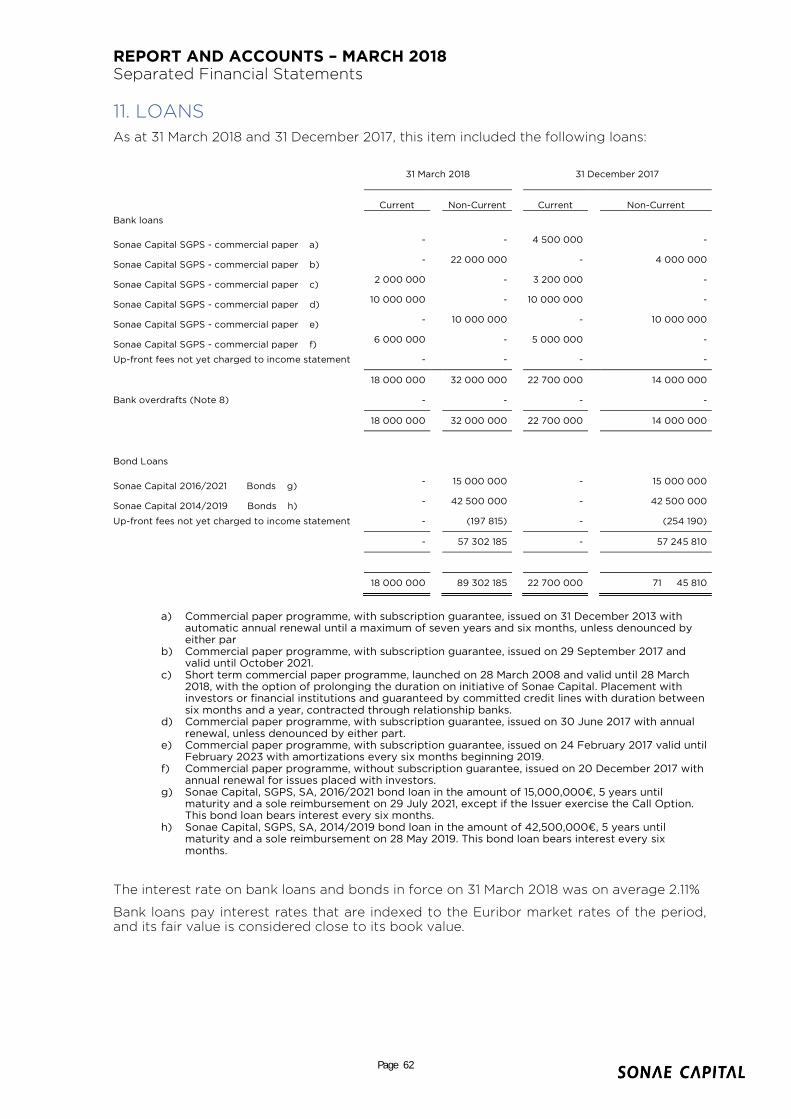
REPORT AND ACCOUNTS – MARCH 2018 Separated Financial Statements
11. LOANS
As at 31 March 2018 and 31 December 2017, this item included the following loans:
31 March 2018
31 December 2017
Current
Non-Current
Current
Non-Current
Bank loans
Sonae Capital SGPS - commercial paper a) -
-
4 500 000
-
Sonae Capital SGPS - commercial paper b) -
22 000 000
-
4 000 000
Sonae Capital SGPS - commercial paper c) 2 000 000
-
3 200 000
-
Sonae Capital SGPS - commercial paper d) 10 000 000
-
10 000 000
-
Sonae Capital SGPS - commercial paper e) -
10 000 000
-
10 000 000
Sonae Capital SGPS - commercial paper f) 6 000 000
-
5 000 000
-
Up-front fees not yet charged to income statement -
-
-
-
18 000 000
32 000 000
22 700 000
14 000 000
Bank overdrafts (Note 8) -
-
-
-
18 000 000
32 000 000
22 700 000
14 000 000
Bond Loans
Sonae Capital 2016/2021 Bonds g)
-
15 000 000
-
15 000 000
Sonae Capital 2014/2019 Bonds h) -
42 500 000
-
42 500 000
Up-front fees not yet charged to income statement -
(197 815)
-
(254 190)
-
57 302 185
-
57 245 810
18 000 000
89 302 185
22 700 000
71 45 810
a) Commercial paper programme, with subscription guarantee, issued on 31 December 2013 with
automatic annual renewal until a maximum of seven years and six months, unless denounced by either par
b) Commercial paper programme, with subscription guarantee, issued on 29 September 2017 and valid until October 2021.
c) Short term commercial paper programme, launched on 28 March 2008 and valid until 28 March 2018, with the option of prolonging the duration on initiative of Sonae Capital. Placement with investors or financial institutions and guaranteed by committed credit lines with duration between six months and a year, contracted through relationship banks.
d) Commercial paper programme, with subscription guarantee, issued on 30 June 2017 with annual renewal, unless denounced by either part.
e) Commercial paper programme, with subscription guarantee, issued on 24 February 2017 valid until February 2023 with amortizations every six months beginning 2019.
f) Commercial paper programme, without subscription guarantee, issued on 20 December 2017 with annual renewal for issues placed with investors.
g) Sonae Capital, SGPS, SA, 2016/2021 bond loan in the amount of 15,000,000€, 5 years until maturity and a sole reimbursement on 29 July 2021, except if the Issuer exercise the Call Option. This bond loan bears interest every six months.
h) Sonae Capital, SGPS, SA, 2014/2019 bond loan in the amount of 42,500,000€, 5 years until maturity and a sole reimbursement on 28 May 2019. This bond loan bears interest every six months.
The interest rate on bank loans and bonds in force on 31 March 2018 was on average 2.11%
Bank loans pay interest rates that are indexed to the Euribor market rates of the period, and its fair value is considered close to its book value.
Page 62

REPORT AND ACCOUNTS – MARCH 2018 Separated Financial Statements
The nominal value of the loans have the following maturity dates:
31 March 2018
31 December 2017
Capital Interest
Capital Interest
N+1 18 000 000 (2 063 883)
22 700 000 (2 112 847)
N+2 45 500 000 (1 226 289)
52 500 000 (1 255 768)
N+3 4 000 000 (430 625)
- (427 135)
N+4 37 000 000 (242 604)
19 000 000 (410 573)
N+5 3 000 000 (35 000)
- (46 667)
After N+5 - -
- (2 917)
107 500 000 (3 998 401)
94 200 000 (4 255 906)
12. OTHER CREDITORS
As at 31 March 2018 and 31 December 2017, other creditors can be detailed as follows:
31 March 2018
31 December 2017
Other creditors
Group companies - Short term loans 48 424 600
47 849 000
Other creditors 843 718
719 841
49 268 318
48 568 841
As at 31 March 2018 and 31 December 2017 the item loans granted is relative to financial operations granted to the following subsidiaries:
31 March 2018
31 December 2017
Group companies - Short term loans: (Note 21)
Interlog-SGPS,SA 21 867 500
21 858 000
SC Industrials,SGPS,S.A. 8 876 500
9 347 000
SC For - Serv.de For.e Des. de Rec. Hum., Unip., Lda 4 000
11 000
Sistavac, SGPS, S.A. 16 389 600
16 613 000
SC Hospitality SGPS SA 1 287 000
-
Solinca - Health & Fitness, S.A. -
20 000
48 424 600
47 849 000
Loans obtained from group companies bear interest at market rates and are repayable within one year. The interest rate as at 31 March 2018 was, in average, approximately 0.050%.
The item Other Creditors - other, there are included 821,807,51€ regarding transfers from subsidiaries of tax estimates under the special regime RETGS.
Page 63

REPORT AND ACCOUNTS – MARCH 2018 Separated Financial Statements
13. SUPLIERS, TAXES, OTHER NON CURRENT AND CURRENT LIABILITIES
As at 31 March 2018 and 31 December 2017, these items were as follows:
31 March 2018
31 December 2017
Current
Non-Current
Current
Non-Current
Trade creditors 112 882
-
137 599
-
Taxes payable - other taxes 41 221
-
50 069
-
Other current liabilities
Accruals:
Staff costs 595 030
131 698
750 007
287 354
Interest payable 624 509
-
308 166
-
Other accruals 79 834
-
73 158
-
Deferred income 3 406
-
4 769
-
1 302 779
131 698
1 136 100
287 354
As at 31 March 2018 and 31 December 2017, interest payable can be detailed as follows:
31 March 2018
31 December 2017
Interest payable
Bank Loans 616 029
305 672
Group companies loans (Note 21) 8 480
2 494
624 509
308 166
As at 31 March 2018 and 31 December 2017, the Income tax and Other taxes can be detailed as follows:
31 March 2018
31 December 2017
Taxes payable - income taxes
Income taxes -
-
Taxes payable - other taxes
Income taxation - amounts withheld 20 765
27 300
VAT 69
69
Social security contributions 20 387
22 700
Stamp duty -
-
41 221
50 069
Page 64

REPORT AND ACCOUNTS – MARCH 2018 Separated Financial Statements
14. EXTERNAL SUPPLIES AND SERVICES
As at 31 March 2018 and 2017, External Supplies and services can be detailed as follows:
31 March 2018
31 December 2017
Operational rents (19 104)
(8 092)
Insurance costs (10 709)
(10 073)
Travelling expenses (9 804)
(19 767)
Services obtained (302 169)
(293 454)
Other services (14 689)
(15 243)
(356 475)
(346 629)
In services obtained, stands out the amounts related to fees from shared services, of 47,449€ (2017: 46,003€) and the item Holding costs with the amount of 171,403€ (2017: 165,831€), invoiced by subsidiary SC Consultancy Company, SA.
15. STAFF COSTS
As at 31 March 2018 and 2017, staff costs were made up as follows:
31 March 2018
31 December 2017
Governing bodies' remunerations (283 410)
(379 411)
Staff and other sectors remunerations -
(67 801)
Social security contributions (36 780)
(48 550)
Other staff costs (4 583)
(5 076)
(324 772)
(500 838)
In 2018 the average number of employees was 0 (zero) (2017: 1).
Page 65

REPORT AND ACCOUNTS – MARCH 2018 Separated Financial Statements
16. NET FINANCIAL EXPENSES AND INVESTMENT INCOME
As at 31 March 2018 and 31 March 2017, Net Financial Expenses and Investment Income can be detailed as follows:
31 March 2018
31 March 2017
Interest payable and similar expenses
Interest arising from:
Bank loans (85 777)
(70 142)
Bonds (480 475)
(486 106)
Other (6 188)
(15 540)
Other financial expenses (444 539)
(369 317)
(1 016 979)
(941 105)
Interest receivable and similar income
Interest income 2 160 960
2 719 727
2 160 960
2 719 727
Net financial expenses 1 143 982
1 778 622
Reversal of /and Impairment losses (Note 4.1)
-
-
Dividends received -
-
Losses on financial investments -
-
Other income 902 901
21 424
Investment income 902 901
21 424
As at 31 March 2018, the amount mentioned in “Interest arising from other” refers in its entirety to interest on current loans obtained from group companies.
As at 31 March 2018, the amount mentioned in “Interest receivable and similar income” includes interest on loans granted to group companies amounting to 2,160,960€.
As at 31 March 2018, the amount mentioned in “Other financial expenses” refers to commissions incurred with the assembly and management of bank loans and bonds.
As at 31 March 2018, the amount mentioned in “Other income” refers to the debt update on the sale of the stake in the company, Box Lines Navegação SA (4,000 euros), in previous years and income from participation in Real Estate Hedge Fund WTC (898,000 euros).
Page 66

REPORT AND ACCOUNTS – MARCH 2018 Separated Financial Statements
17. OTHER OPERATIONAL PROFIT AND OTHER OPERATIONAL EXPENSES
As at 31 March 2018 and 2017, the items Other operational profit and expenses were as follows:
31 March 2018
31 December 2017
Other operating income
Other supplementary income - Comissions (Note 21) 29 244
23 393
Other -
426
29 244
23 819
Other operating expenses
Taxes (15 299)
(8 771)
Other (1)
-
(15 301)
(8 771)
18. TAXATION
As at 31 March 2018 and 2017, Taxation was made up as follows:
31 March 2018
31 December 2017
Current tax (Note 6) 264 844
219 055
Deferred tax (Note 7) -
-
264 844
219 055
As stated in Note 6, the Company is taxable according to the RETGS.
19. EARNINGS PER SHARE
Earnings per share for the periods ended 31 March 2018 and 2017 were calculated taking into consideration the following amounts:
31 March 2018
31 December 2017
Net profit
Net profit taken into consideration to calculate basic
earnings per share (Net profit for the period ) 1 643 923
1 186 212
Effect of dilutive potential shares -
-
Net profit taken into consideration to calculate
diluted earnings per share 1 643 923
1 186 212
Number of shares
Weighted average number of shares used to calculate
basic earnings per share
248 085 190
247 218 671
Weighted average number of shares used to calculate
Earnings per share (basic and diluted) 0,006626
0,004798
Page 67
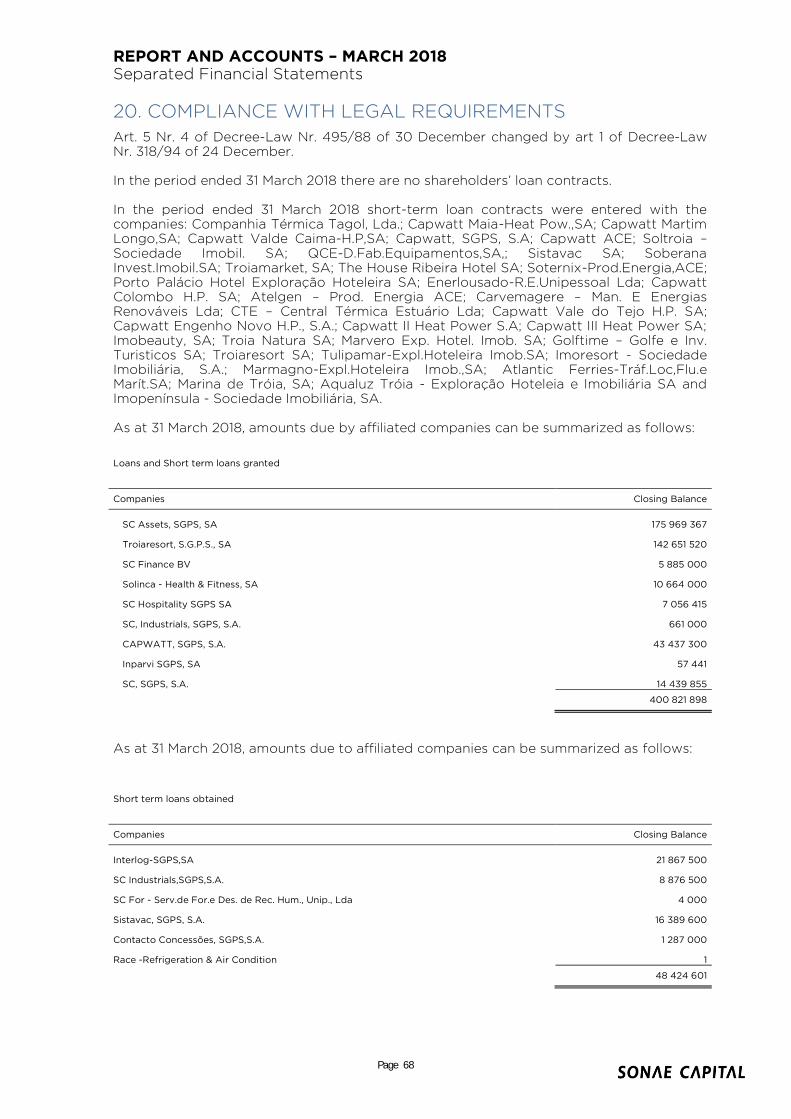
REPORT AND ACCOUNTS – MARCH 2018 Separated Financial Statements
20. COMPLIANCE WITH LEGAL REQUIREMENTS
Art. 5 Nr. 4 of Decree-Law Nr. 495/88 of 30 December changed by art 1 of Decree-Law Nr. 318/94 of 24 December. In the period ended 31 March 2018 there are no shareholders’ loan contracts. In the period ended 31 March 2018 short-term loan contracts were entered with the companies: Companhia Térmica Tagol, Lda.; Capwatt Maia-Heat Pow.,SA; Capwatt Martim Longo,SA; Capwatt Valde Caima-H.P,SA; Capwatt, SGPS, S.A; Capwatt ACE; Soltroia – Sociedade Imobil. SA; QCE-D.Fab.Equipamentos,SA,; Sistavac SA; Soberana Invest.Imobil.SA; Troiamarket, SA; The House Ribeira Hotel SA; Soternix-Prod.Energia,ACE; Porto Palácio Hotel Exploração Hoteleira SA; Enerlousado-R.E.Unipessoal Lda; Capwatt Colombo H.P. SA; Atelgen – Prod. Energia ACE; Carvemagere – Man. E Energias Renováveis Lda; CTE – Central Térmica Estuário Lda; Capwatt Vale do Tejo H.P. SA; Capwatt Engenho Novo H.P., S.A.; Capwatt II Heat Power S.A; Capwatt III Heat Power SA; Imobeauty, SA; Troia Natura SA; Marvero Exp. Hotel. Imob. SA; Golftime – Golfe e Inv. Turisticos SA; Troiaresort SA; Tulipamar-Expl.Hoteleira Imob.SA; Imoresort - Sociedade Imobiliária, S.A.; Marmagno-Expl.Hoteleira Imob.,SA; Atlantic Ferries-Tráf.Loc,Flu.e Marít.SA; Marina de Tróia, SA; Aqualuz Tróia - Exploração Hoteleia e Imobiliária SA and Imopenínsula - Sociedade Imobiliária, SA. As at 31 March 2018, amounts due by affiliated companies can be summarized as follows:
Loans and Short term loans granted
Companies Closing Balance
SC Assets, SGPS, SA 175 969 367
Troiaresort, S.G.P.S., SA 142 651 520
SC Finance BV 5 885 000
Solinca - Health & Fitness, SA 10 664 000
SC Hospitality SGPS SA 7 056 415
SC, Industrials, SGPS, S.A. 661 000
CAPWATT, SGPS, S.A. 43 437 300
Inparvi SGPS, SA 57 441
SC, SGPS, S.A. 14 439 855
400 821 898
As at 31 March 2018, amounts due to affiliated companies can be summarized as follows:
Short term loans obtained
Companies Closing Balance
Interlog-SGPS,SA 21 867 500
SC Industrials,SGPS,S.A. 8 876 500
SC For - Serv.de For.e Des. de Rec. Hum., Unip., Lda 4 000
Sistavac, SGPS, S.A. 16 389 600
Contacto Concessões, SGPS,S.A. 1 287 000
Race -Refrigeration & Air Condition 1
48 424 601
Page 68

REPORT AND ACCOUNTS – MARCH 2018 Separated Financial Statements
21. SUBSEQUENT EVENTS
No significant events, requiring further disclosure, have occurred after 31 March 2018.
22. APPROVAL OF THE FINANCIAL STATEMENTS
These financial statements were approved by the Board of Directors and authorized for issue on 22 May 2018. Board of Directors
Page 69
![Introduction - Microsoft · Web view2016-09-29 · [MS-PPSAS]: PerformancePoint Services Authoring Service Protocol. Intellectual Property Rights Notice for Open Specifications](https://img.pdfslide.us/doc/110x75/5e29481a10c1207e697dd906/introduction-microsoft-web-view-2016-09-29-ms-ppsas-performancepoint-services.jpg)
![Introduction - interoperability.blob.core.windows.netinteroperability.blob.core.windows.net/.../MS-PPSAS/[M… · Web view[MS-PPSAS]: PerformancePoint Services Authoring Service](https://img.pdfslide.us/doc/110x75/5a7823a67f8b9aa3688e7b5a/introduction-m-doc-file-web-viewms-ppsas-performancepoint-services.jpg)


![Introduction - interoperability.blob.core.windows.netMS-PPSAS]-180724.docx · Web viewversion of this technology, there are risks in relying on this preliminary documentation. To](https://img.pdfslide.us/doc/110x75/5d52129388c993a73d8b7132/introduction-ms-ppsas-180724docx-web-viewversion-of-this-technology-there.jpg)
![[MS-PPSAS]: PerformancePoint Services Authoring Service ...... · [MS-PPSAS] — v20140721 ... 12/17/2010 1.05 No change No changes to the meaning, language, or formatting of the](https://img.pdfslide.us/doc/110x75/5e7d269ff3c1037d532e30e4/ms-ppsas-performancepoint-services-authoring-service-ms-ppsas-a.jpg)
![Introduction · Web view2016-10-17 · [MS-PPSAS]: PerformancePoint Services Authoring Service Protocol. Intellectual Property Rights Notice for Open Specifications Documentation](https://img.pdfslide.us/doc/110x75/5e6c163843eb0a2ece4d7033/introduction-web-view-2016-10-17-ms-ppsas-performancepoint-services-authoring.jpg)


![[MS PPSAS]: PerformancePoint Services Authoring Service … · 2016-05-11 · PPSAS]: PerformancePoint Services Authoring Service Protocol Specification. Intellectual Property Rights](https://img.pdfslide.us/doc/110x75/5e9193e44339ee3be509fd2c/ms-ppsas-performancepoint-services-authoring-service-2016-05-11-ppsas-performancepoint.jpg)


![interoperability.blob.core.windows.net · Web view[MS-PPSAS]: PerformancePoint Services Authoring Service Protocol. Intellectual Property Rights Notice for Open Specifications Documentation](https://img.pdfslide.us/doc/110x75/5f0b8e877e708231d43119a7/web-view-ms-ppsas-performancepoint-services-authoring-service-protocol-intellectual.jpg)


![[MS-PPSAS]: PerformancePoint Services Authoring Service ...MS-PP… · [MS-PPSAS]: PerformancePoint Services Authoring Service Protocol Intellectual Property Rights Notice for Open](https://img.pdfslide.us/doc/110x75/5eacf9b078c24c2e2237061f/ms-ppsas-performancepoint-services-authoring-service-ms-pp-ms-ppsas.jpg)
![[MS-PPSAS]: PerformancePoint Services Authoring Service](https://img.pdfslide.us/doc/110x75/616a68d411a7b741a3522f86/ms-ppsas-performancepoint-services-authoring-service-.jpg)