Embed Size (px)
Citation preview
Report into a nosocomial outbreak of
coronavirus disease 2019 (COVID‐19) at
Netcare St. Augustine’s Hospital
15 May 2020
Dr Richard Lessells
Prof Yunus Moosa
Prof Tulio de Oliveira
i
Dr Richard Lessells BSc(MedSci), MB ChB, MRCP(UK), DTM&H, DipHIVMed, PhD
Infectious Diseases Specialist
KwaZulu‐Natal Research Innovation & Sequencing Platform
Nelson R Mandela School of Medicine
University of KwaZulu‐Natal
Prof Mahomed Yunus Suleman Moosa MB ChB, FCP (SA), PhD
Head of Department of Infectious Diseases
Nelson R Mandela School of Medicine
University of KwaZulu‐Natal
Prof Tulio de Oliveira BSc (Hons), PhD
Director, KwaZulu‐Natal Research Innovation & Sequencing Platform
Nelson R Mandela School of Medicine
University of KwaZulu‐Natal
Disclaimer
The three authors report no conflict of interest with Netcare or any other private or public
organization. They have not received any payment or reimbursement and all the costs of generating
the data used in the report and producing the report were borne by the University of KwaZulu‐Natal
and the KwaZulu‐Natal Research Innovation and Sequencing Platform (KRISP). The authors produced
this report in good faith as a response to the call of the Chair of the South African Ministerial
Advisory Committee (MAC) to support the national response to COVID‐19.
Note
This is the final report on the outbreak investigation at St. Augustine’s Hospital. It contains additional
and updated information to that in the interim report released on 30 April, in particular updated
number of cases and deaths. It has also been corrected for a small number of factual and
typographical errors that were in the interim report.
ii
Executive summary
This report presents the findings and recommendations of an investigation into a nosocomial
outbreak of coronavirus disease 2019 (COVID‐19) at St. Augustine’s Hospital in Durban, South Africa.
The investigation began on 4 April after the identification of a number of confirmed COVID‐19 cases
and three deaths at the hospital. Investigation methods included medical record reviews, ward visits,
and interviews with health care workers and management. A detailed timeline of patient cases was
constructed to generate hypotheses as to the spread of infection through the hospital. In addition,
DNA sequencing of severe acute respiratory syndrome‐related coronavirus 2 (SARS‐CoV‐2) nucleic
acid extracted from nasopharyngeal and oropharyngeal swab samples was performed and
phylogenetic analysis was conducted.
Between 9 March and 30 April 2020, 119 confirmed cases were identified at St. Augustine’s Hospital
(39 patients and 80 staff). The 80 staff represent approximately 5% of all staff tested for SARS‐CoV‐2.
The most plausible hypothesis is that there was a single introduction of SARS‐CoV‐2 to the hospital
on 9 March, most likely as a result of transmission from a patient attending the Emergency
Department for investigation of COVID‐19 to another patient present in the ED at the same time
who was then admitted to the cardiac intensive care unit with a suspected stroke. The infection then
spread rapidly through the hospital, involving patients on at least five wards. The spread through the
hospital was facilitated by the frequent movement of patients between and within wards. The
evidence suggests that indirect contact and fomite transmission were likely to be the predominant
modes of patient to patient transmission. We hypothesize that the main outbreak also seeded
smaller outbreaks at a local nursing home (four additional cases) and at the National Renal Care
outpatient dialysis unit on the hospital campus (nine additional patient cases and eight additional
staff cases). Overall, we estimate that up to 135 infections may have been nosocomially acquired as
a result of the single introduction of the virus to the hospital, accounting for about 14% of all cases in
KwaZulu‐Natal reported by 30 April. Phylogenetic analysis supports the main hypothesis of a unique
introduction followed by widespread transmission in the hospital. All of the 18 SARS‐CoV‐2 genomes
produced (nine from patients and nine from health care workers) clustered together with limited
genetic diversity. All of the sequences belong to the A2a clade associated with infections from
Europe.
Fifteen of the 39 patients infected with SARS‐CoV‐2 in the main outbreak died (case fatality rate
38.5%). Most of the deaths were in elderly patients with multimorbidity. In most cases, a medical
decision was taken not to intubate and ventilate because of the comorbidities and poor prognosis.
There was no evidence that, once these patients had been infected with SARS‐CoV‐2, any specific
intervention would have prevented their death.
With the benefit of hindsight, there were a number of opportunities where earlier problem
recognition and earlier intervention might have limited the extent of the outbreak. The first
opportunity was with the unexplained fever of a 81‐year‐old female on 13 March following a
transient ischaemic attack; the second was when a 46‐year‐old female was readmitted with an acute
respiratory illness on 21 March; the third was when the 81‐year‐old female was readmitted with
severe pneumonia on 22 March; and the fourth was with the first confirmed case in a health care
worker (a nurse from cardiac ICU), reported on 23 March. Earlier recognition of possible COVID‐19
infection in the patients, leading to earlier isolation, tracing of potential sources of infection, and
appropriate management of exposed contacts could potentially have averted infections and limited
onward transmission. Earlier investigation of the first health care worker case to identify potential
sources of infection within the hospital could also have uncovered the problem at an earlier stage.
iii
This outbreak highlights how easily and rapidly SARS‐CoV‐2 can spread through a hospital, exposing
weaknesses in respiratory virus infection prevention and control (IPC). It underlines that personal
protective equipment (PPE) is only one component of a comprehensive approach to IPC and does
not replace the need for good IPC systems and practices. The extent of the outbreak underlines the
potential for nosocomial transmission to be a major amplifier of transmission in South Africa. There
is no reason to believe that a similar outbreak cannot and will not happen in other hospitals and
institutions in South Africa, in both the private and public sector.
To reduce the risk of similar outbreaks, we need to strengthen infection prevention and control
systems and practices throughout our hospitals. Management must promote a culture that IPC is
everyone’s responsibility and that everyone has a role to play. Hospitals need to establish separate
zones (and separate entry points) for people who might have COVID‐19 and people who are unlikely
to have COVID‐19. There needs to be vigilance throughout the hospital for acute respiratory illness,
especially in green zones where patients considered low risk for COVID‐19 have been admitted.
Training on COVID‐19, especially on infection prevention & control, should be mandatory for all staff
and implementation of IPC practices should be monitored closely. The importance of hand hygiene
needs to be continually emphasised and hand hygiene practices need to be monitored.
Environmental cleaning practices need to be aligned with the national COVID‐19 IPC guidelines and
the national IPC framework manual. Cleaning should be monitored closely using visual inspection
and fluorescent markers. The importance of regular cleaning of surfaces and of medical equipment
between patient contacts to reduce fomite transmission should be highlighted to all staff. Physical
distancing within the hospital should be promoted through the use of floor markings and prominent
signage. Consideration should be given to weekly PCR testing of all frontline staff and the early use
of DNA sequencing and phylogenetic analysis to investigate potential nosocomial transmission.
The COVID‐19 epidemic is an unprecedented challenge for the health system and the community in
South Africa. We hope that lessons learnt from this nosocomial outbreak can be used to highlight
areas that can be strengthened across the private and public health system, so as to prevent
nosocomial outbreaks becoming a major amplifier of COVID‐19 transmission.
iv
Table of contents
Executive summary ............................................................................................................................. ii
Introduction .................................................................................................................................... ‐ 1 ‐
Background ..................................................................................................................................... ‐ 1 ‐
Investigation methods .................................................................................................................... ‐ 4 ‐
Results ............................................................................................................................................. ‐ 5 ‐
Epidemiological curve ................................................................................................................. ‐ 5 ‐
Timeline of inpatient cases ......................................................................................................... ‐ 6 ‐
Postulated introduction of SARS‐CoV‐2 to the hospital (transmission P1 to P3) ....................... ‐ 9 ‐
Patient journey for P3 ................................................................................................................. ‐ 9 ‐
Chains of transmissions ............................................................................................................ ‐ 10 ‐
Recalled patients ....................................................................................................................... ‐ 14 ‐
Deaths ....................................................................................................................................... ‐ 14 ‐
Health care worker infections ................................................................................................... ‐ 16 ‐
Linked outbreaks in other institutions ...................................................................................... ‐ 16 ‐
DNA sequencing and phylogenetic analysis .............................................................................. ‐ 18 ‐
Discussion...................................................................................................................................... ‐ 19 ‐
Main hypothesis for introduction and spread of SARS‐CoV‐2 .................................................. ‐ 19 ‐
Likely mode of transmission and factors contributing to outbreak ......................................... ‐ 20 ‐
Factors associated with patient deaths .................................................................................... ‐ 22 ‐
Missed opportunities for earlier action .................................................................................... ‐ 22 ‐
Limitations................................................................................................................................. ‐ 23 ‐
Action taken in response to the outbreak ................................................................................ ‐ 24 ‐
Lessons learnt ........................................................................................................................... ‐ 26 ‐
Recommendations .................................................................................................................... ‐ 27 ‐
Appendix A. Full patient timeline (up to 6 May) ........................................................................... ‐ 30 ‐
v
List of Figures
Figure 1 Cumulative and daily counts of confirmed COVID‐19 cases for South Africa (data up to 29
April) .................................................................................................................................................... ‐ 1 ‐
Figure 2 Confirmed COVID‐19 cases across provinces in South Africa (data up to 30 April) ............. ‐ 2 ‐
Figure 3 Epidemiological curve for outbreak of COVID‐19 at St. Augustine's Hospital March ‐ April
2020 .................................................................................................................................................... ‐ 6 ‐
Figure 4 Timeline of COVID‐19 cases at St. Augustine's Hospital (up to 14 April) showing patient
location over time ............................................................................................................................... ‐ 7 ‐
Figure 5 Hypothesis showing putative waves of COVID‐19 transmission centred on different wards
and showing spread to nursing home and dialysis unit ...................................................................... ‐ 8 ‐
Figure 6 Summary of events in emergency department, St. Augustine's Hospital, 9 March ............. ‐ 9 ‐
Figure 7 Specific timeline and ward layout showing infectious case and exposed individuals on
medical ward 1 from 13 March onwards .......................................................................................... ‐ 10 ‐
Figure 8 Specific timeline and ward layout showing infectious case and exposed individuals on
neurology ward from 21 March onwards ......................................................................................... ‐ 11 ‐
Figure 9 Specific timeline and ward layout showing infectious case and exposed individuals on
medical ICU from 22 March onwards ............................................................................................... ‐ 12 ‐
Figure 10 Specific timeline and ward layout showing infectious case and exposed individuals on
medical ward 1 from 27 March onwards .......................................................................................... ‐ 12 ‐
Figure 11 Specific timeline showing infectious case and exposed individuals on surgical ward 1 from
28 March onwards ............................................................................................................................ ‐ 13 ‐
Figure 12 Specific timeline and ward layout showing infectious case and exposed individuals on
surgical ICU from 31 March onwards ............................................................................................... ‐ 13 ‐
Figure 13 Epidemiological curve for outbreak of COVID‐19 in National Renal Care Berea dialysis unit
April 2020 .......................................................................................................................................... ‐ 17 ‐
Figure 14 Phylogenetic tree showing 18 closely related SARS‐CoV‐2 sequences from St. Augustine’s
outbreak and five other sequences from eThekwini ........................................................................ ‐ 19 ‐
List of Tables
Table 1 Current staff complement at Netcare St. Augustine's Hospital ............................................. ‐ 4 ‐
Table 2 Admission details for recalled patients testing positive for SARS‐CoV‐2 ............................. ‐ 14 ‐
Table 3 Details of COVID‐19 cases resulting in death, St. Augustine's Hospital, March ‐ May 2020 ‐ 15 ‐
Table 4 Cadre of staff testing positive for SARS‐CoV‐2 ..................................................................... ‐ 16 ‐
Table 5 Primary ward for nursing staff (and nursing students) testing positive for SARS‐CoV‐2 ..... ‐ 16 ‐
vi
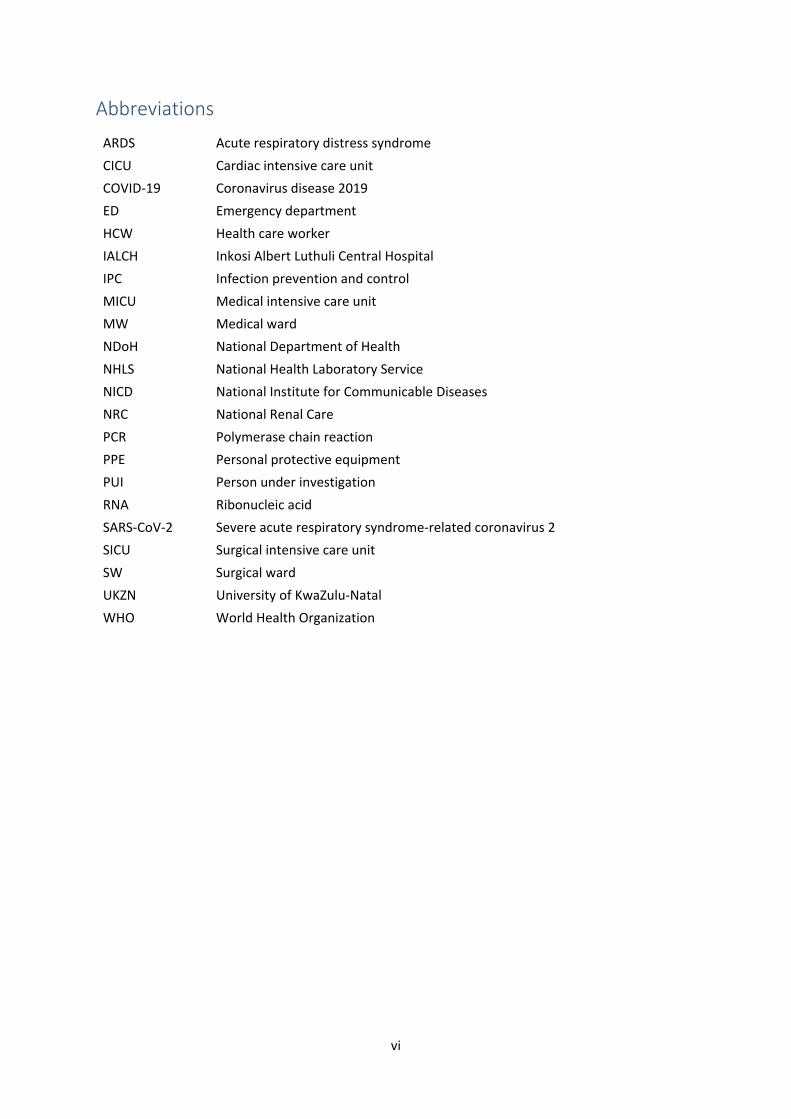
Abbreviations
ARDS Acute respiratory distress syndrome
CICU Cardiac intensive care unit
COVID‐19 Coronavirus disease 2019
ED Emergency department
HCW Health care worker
IALCH Inkosi Albert Luthuli Central Hospital
IPC Infection prevention and control
MICU Medical intensive care unit
MW Medical ward
NDoH National Department of Health
NHLS National Health Laboratory Service
NICD National Institute for Communicable Diseases
NRC National Renal Care
PCR Polymerase chain reaction
PPE Personal protective equipment
PUI Person under investigation
RNA Ribonucleic acid
SARS‐CoV‐2 Severe acute respiratory syndrome‐related coronavirus 2
SICU Surgical intensive care unit
SW Surgical ward
UKZN University of KwaZulu‐Natal
WHO World Health Organization
‐ 1 ‐
Introduction
On Saturday 4 April, at the request of Dr Anban Pillay (Acting Director General, National Department
of Health), Professor Salim Abdool Karim convened a team to investigate an outbreak of coronavirus
disease 2019 (COVID‐19) at St. Augustine’s Hospital. Professor Abdool Karim is the Director of the
Centre for the AIDS Programme of Research in South Africa (CAPRISA) and is currently serving as the
Chair of the Ministerial Advisory Committee on COVID‐19 in South Africa. The outbreak investigation
team consisted of scientists and clinicians from the University of KwaZulu‐Natal: Dr Richard Lessells,
Infectious Diseases Specialist at the KwaZulu‐Natal Research Innovation & Sequencing Plaform
(KRISP); Professor Tulio de Oliveira, Research Professor and Director of KRISP; and Professor Yunus
Moosa, Head of Department of Infectious Diseases.
The investigation was requested following reporting of 13 cases of COVID‐19 in inpatients and health
care workers at St. Augustine’s Hospital, three of which had resulted in death.
Background
The global epidemic of coronavirus disease Coronavirus disease 2019 (COVID‐19) is an infectious disease caused by the severe acute respiratory
syndrome‐related coronavirus 2 (SARS‐CoV‐2). COVID‐19 is predominantly a respiratory disease,
which presents most commonly with fever and dry cough, and which in more severe cases can
progress to viral pneumonia and acute respiratory distress syndrome (ARDS). At present, the case
fatality rate is estimated to be 1‐3%, although this varies considerably by setting. The disease was
first identified in Wuhan, China in December 2019 and has subsequently spread to 188 countries
around the world. As of 30 April, there were over 3 million confirmed cases and over 200 000 deaths
related to COVID‐19.
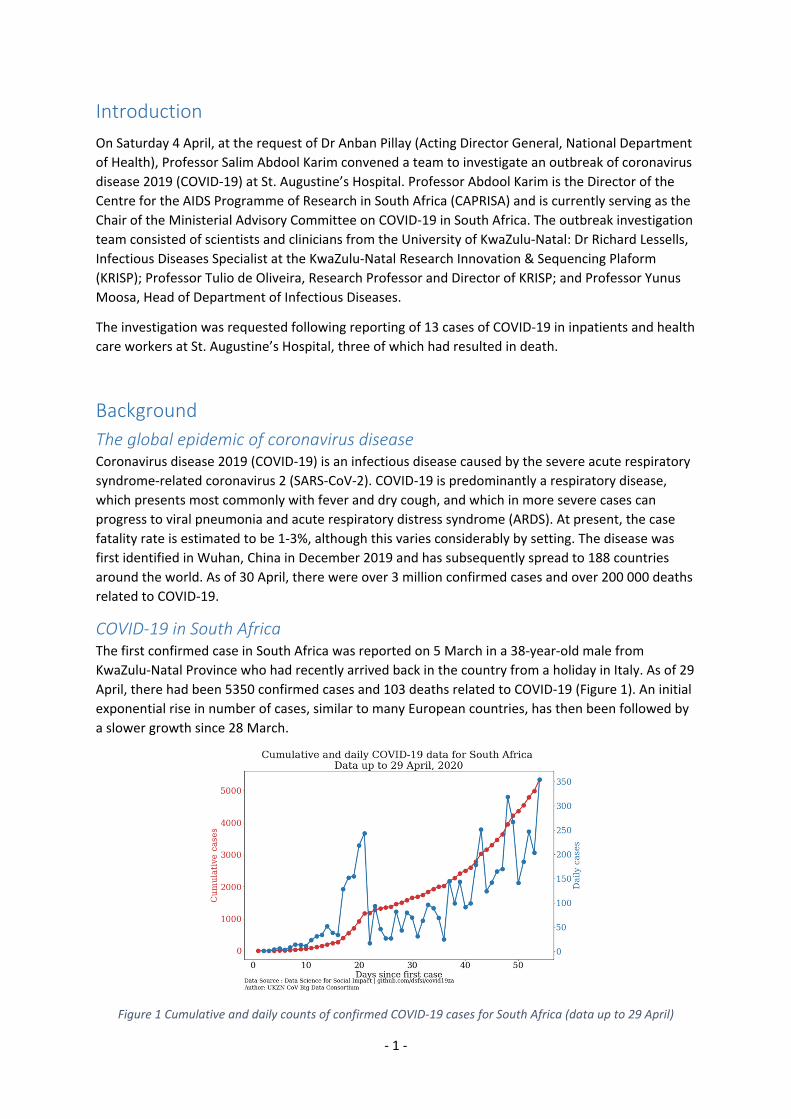
COVID‐19 in South Africa The first confirmed case in South Africa was reported on 5 March in a 38‐year‐old male from
KwaZulu‐Natal Province who had recently arrived back in the country from a holiday in Italy. As of 29
April, there had been 5350 confirmed cases and 103 deaths related to COVID‐19 (Figure 1). An initial
exponential rise in number of cases, similar to many European countries, has then been followed by
a slower growth since 28 March.
Figure 1 Cumulative and daily counts of confirmed COVID‐19 cases for South Africa (data up to 29 April)
‐ 2 ‐
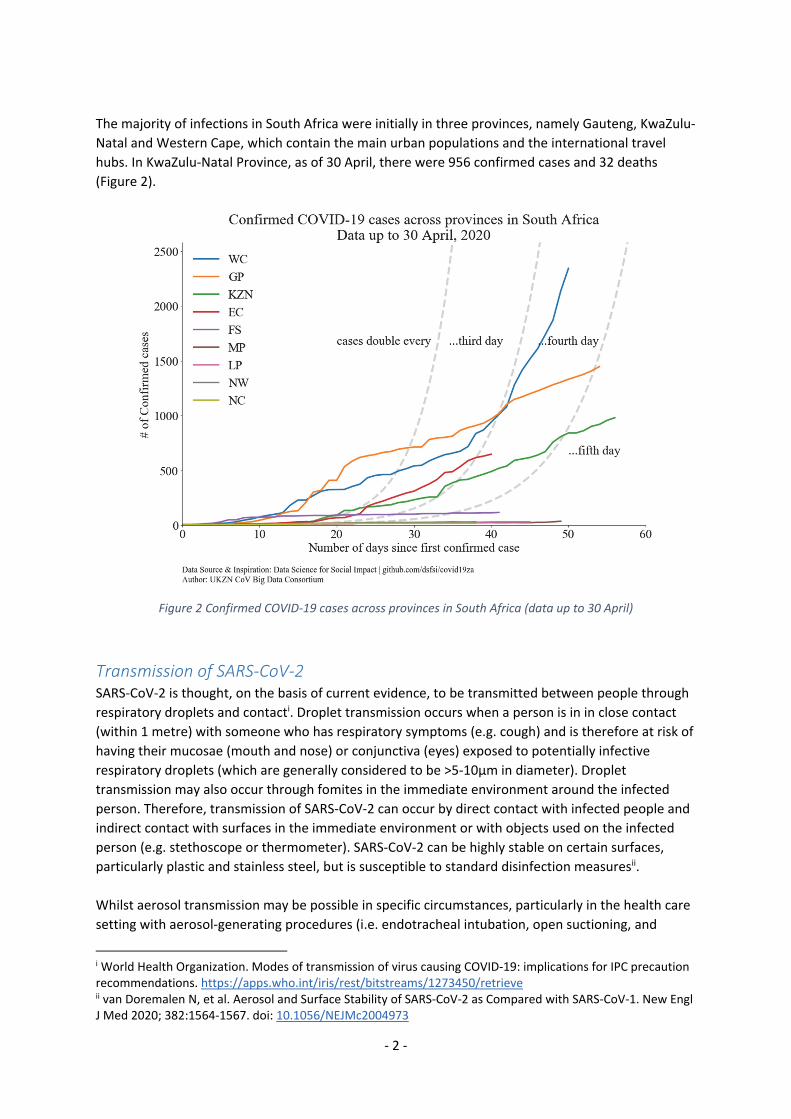
The majority of infections in South Africa were initially in three provinces, namely Gauteng, KwaZulu‐
Natal and Western Cape, which contain the main urban populations and the international travel
hubs. In KwaZulu‐Natal Province, as of 30 April, there were 956 confirmed cases and 32 deaths
(Figure 2).
Figure 2 Confirmed COVID‐19 cases across provinces in South Africa (data up to 30 April)
Transmission of SARS‐CoV‐2 SARS‐CoV‐2 is thought, on the basis of current evidence, to be transmitted between people through
respiratory droplets and contacti. Droplet transmission occurs when a person is in in close contact
(within 1 metre) with someone who has respiratory symptoms (e.g. cough) and is therefore at risk of
having their mucosae (mouth and nose) or conjunctiva (eyes) exposed to potentially infective
respiratory droplets (which are generally considered to be >5‐10μm in diameter). Droplet
transmission may also occur through fomites in the immediate environment around the infected
person. Therefore, transmission of SARS‐CoV‐2 can occur by direct contact with infected people and
indirect contact with surfaces in the immediate environment or with objects used on the infected
person (e.g. stethoscope or thermometer). SARS‐CoV‐2 can be highly stable on certain surfaces,
particularly plastic and stainless steel, but is susceptible to standard disinfection measuresii.
Whilst aerosol transmission may be possible in specific circumstances, particularly in the health care
setting with aerosol‐generating procedures (i.e. endotracheal intubation, open suctioning, and
i World Health Organization. Modes of transmission of virus causing COVID‐19: implications for IPC precaution recommendations. https://apps.who.int/iris/rest/bitstreams/1273450/retrieve ii van Doremalen N, et al. Aerosol and Surface Stability of SARS‐CoV‐2 as Compared with SARS‐CoV‐1. New Engl J Med 2020; 382:1564‐1567. doi: 10.1056/NEJMc2004973
‐ 3 ‐
manual ventilation before intubation), there is currently no evidence that aerosol transmission is an
important mode of transmission more generally1.
Based on current evidence, transmission of SARS‐CoV‐2 is thought to be predominantly driven by
symptomatic individuals, who may be most infectious around the time of symptom onset. However,
there is increasing evidence that SARS‐CoV‐2 is detectable in the upper respiratory tract from 1‐3
days prior to symptomsi, and modelling suggests that presymptomatic transmission may be an
important contributor to the spread of the infection. Recent estimates have suggested that around
40% of transmission may occur in this presymptomatic phaseii. Whilst it is recognized that some
people have true asymptomatic infection (i.e. never develop symptoms), we still do not know how
frequent this is and we do not know to what extent this contributes to transmission.
Nosocomial transmission of SARS‐CoV‐2 In the early phases of the epidemic in China, the risks of nosocomial transmission of SARS‐CoV‐2
became apparent. In one case series of 138 consecutive hospitalized patients with confirmed COVID‐
19 at a university hospital in Wuhan, 57 (41%) cases were presumed to have been infected in
hospital. This included 17 patients hospitalized for other reasons and 40 health care workers, and
there was presumed patient‐to‐patient transmission as well as patient‐to‐health care worker
transmissioniii. The WHO‐China Joint Mission on COVID‐19 reported that, as of 20 February 2020
there had been 2055 confirmed cases in health care workers across 476 hospital in China (at that
time, this was approximately 3% of all confirmed cases in the country)iv. The report noted that many
of the health care workers may have been infected within their households rather than the health
care facility. As a result, they surmised that nosocomial transmission had not been a major amplifier
of transmission. In Italy, around one in ten confirmed cases have been in health care workers and
entire hospitals have been closed because of the infection circulating among doctors and nursesv. In
a recent report from the United States of America, almost one in five confirmed cases were health
care workersvi.
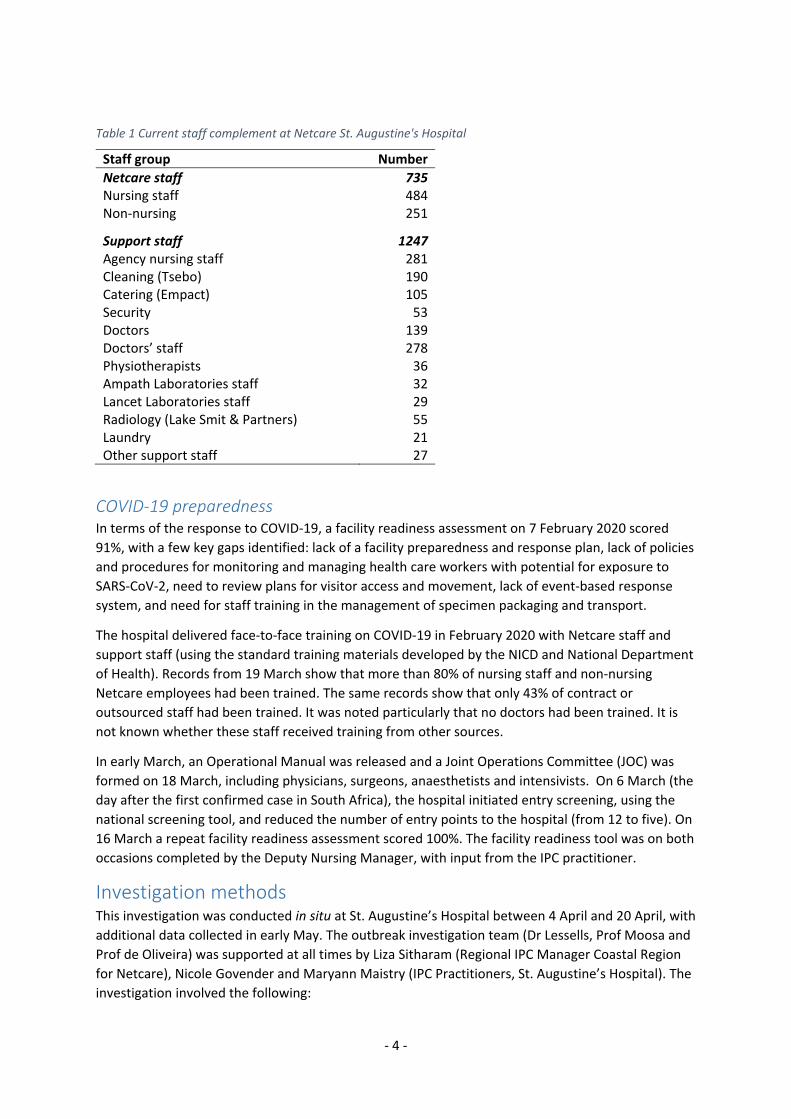
Netcare St. Augustine’s Hospital Netcare St. Augustine’s Hospital is a 469‐bed hospital situated on the Berea in Durban. It has 18
wards, including six intensive care units providing a total of 88 ICU beds. The hospital employs 735
staff (484 nursing and 251 non‐nursing), and has another 1247 support staff. The breakdown of the
staff complement by group is shown in Table 1. In Feb and March 2020, agency nurses covered 32%
of nursing shifts. The hospital has two Infection Prevention & Control (IPC) Practitioners at the
hospital with a Regional IPC Manager to cover all Netcare hospitals in the Coastal Region.
i Kimball A, et al. Asymptomatic and Presymptomatic SARS‐CoV‐2 Infections in Residents of a Long‐Term Care Skilled Nursing Facility — King County, Washington, March 2020. MMWR Morb Mortal Wkly Rep 2020; 69: 377–381. doi: 10.15585/mmwr.mm6913e1 ii He X, et al. Temporal dynamics in viral shedding and transmissibility of COVID‐19. Nature Med 2020 April 15. doi: 10.1038/s41591‐020‐0869‐5 iii Wang D, et al. Clinical Characteristics of 138 Hospitalized Patients With 2019 Novel Coronavirus–Infected Pneumonia in Wuhan, China. JAMA 2020 Feb 7. doi: 10.1001/jama.2020.1585 iv World Health Organization. Report of the WHO‐China Joint Mission on Coronavirus Disease 2019 (COVID‐19). https://www.who.int/docs/default‐source/coronaviruse/who‐china‐joint‐mission‐on‐covid‐19‐final‐report.pdf v The Pansurg Collaborative Group. The three vital lessons Italian hospitals have learned in fighting covid‐19. https://www.hsj.co.uk/emergency‐care/exclusive‐the‐three‐vital‐lessons‐italian‐hospitals‐have‐learned‐in‐fighting‐covid‐19/7027220.article vi CDC COVID‐19 Response Team. Characteristics of Health Care Personnel with COVID‐19 — United States, February 12–April 9, 2020. MMWR 2020; 2020 Apr 17; 69(15): 477‐481. doi: 10.15585/mmwr.mm6915e6
‐ 4 ‐
Table 1 Current staff complement at Netcare St. Augustine's Hospital
Staff group Number
Netcare staff 735 Nursing staff 484 Non‐nursing 251
Support staff 1247 Agency nursing staff 281 Cleaning (Tsebo) 190 Catering (Empact) 105 Security 53 Doctors 139 Doctors’ staff 278 Physiotherapists 36 Ampath Laboratories staff 32 Lancet Laboratories staff 29 Radiology (Lake Smit & Partners) 55 Laundry 21 Other support staff 27
COVID‐19 preparedness In terms of the response to COVID‐19, a facility readiness assessment on 7 February 2020 scored
91%, with a few key gaps identified: lack of a facility preparedness and response plan, lack of policies
and procedures for monitoring and managing health care workers with potential for exposure to
SARS‐CoV‐2, need to review plans for visitor access and movement, lack of event‐based response
system, and need for staff training in the management of specimen packaging and transport.
The hospital delivered face‐to‐face training on COVID‐19 in February 2020 with Netcare staff and
support staff (using the standard training materials developed by the NICD and National Department
of Health). Records from 19 March show that more than 80% of nursing staff and non‐nursing
Netcare employees had been trained. The same records show that only 43% of contract or
outsourced staff had been trained. It was noted particularly that no doctors had been trained. It is
not known whether these staff received training from other sources.
In early March, an Operational Manual was released and a Joint Operations Committee (JOC) was
formed on 18 March, including physicians, surgeons, anaesthetists and intensivists. On 6 March (the
day after the first confirmed case in South Africa), the hospital initiated entry screening, using the
national screening tool, and reduced the number of entry points to the hospital (from 12 to five). On
16 March a repeat facility readiness assessment scored 100%. The facility readiness tool was on both
occasions completed by the Deputy Nursing Manager, with input from the IPC practitioner.
Investigation methods This investigation was conducted in situ at St. Augustine’s Hospital between 4 April and 20 April, with
additional data collected in early May. The outbreak investigation team (Dr Lessells, Prof Moosa and
Prof de Oliveira) was supported at all times by Liza Sitharam (Regional IPC Manager Coastal Region
for Netcare), Nicole Govender and Maryann Maistry (IPC Practitioners, St. Augustine’s Hospital). The
investigation involved the following:
‐ 5 ‐
Review of medical files, laboratory records, and radiological images of confirmed cases
Review of inpatient electronic tracking system to determine the movement of cases within
and between wards and to identify the exact location of beds occupied
Scrutiny of staff records to understand work areas and shift patterns of infected staff
Walk through the emergency department to understand patient flow and to critically review
the COVID‐19 isolation/triage area
Tour of all affected inpatient wards to understand patient and staff movement and bed
distribution within the wards
Desktop review of Netcare COVID‐19 Operational Manual and hospital protocols
Telephone interview with doctors involved in the care of affected patients
Discussions with the IPC Practitioners and Manager
To complement the core investigation, we received samples positive for SARS‐CoV‐2 from the
outbreak. The samples arrived in batches at different times. We managed to generate whole SARS‐
CoV‐2 genomes from 18 samples (eight from St. Augustine’s patients, nine from health care workers,
and one from a local nursing home). We also sequenced whole viral genomes of five randomly
selected samples from eThekwini that were provided to us by the NICD.
In short, this process involves the generation of whole genome sequences of SARS‐CoV‐2, which
contains 29,500 nucleotides. We used the ARTIC network protocol to amplify the genome of the
virusi. The genome was sequenced using the Illumina Miseq platform. The ARTIC protocol and the
Illumina sequencing platform are considered to be the gold standard of the field, i.e. the most
accurate system to generate whole genome sequences of SARS‐CoV‐2. The sequences were
assembled using Genome Detectiveii and all of the mutations were carefully evaluated using the bam
files (i.e. deep coverage) in Geneious R8 software applicationiii.
Results
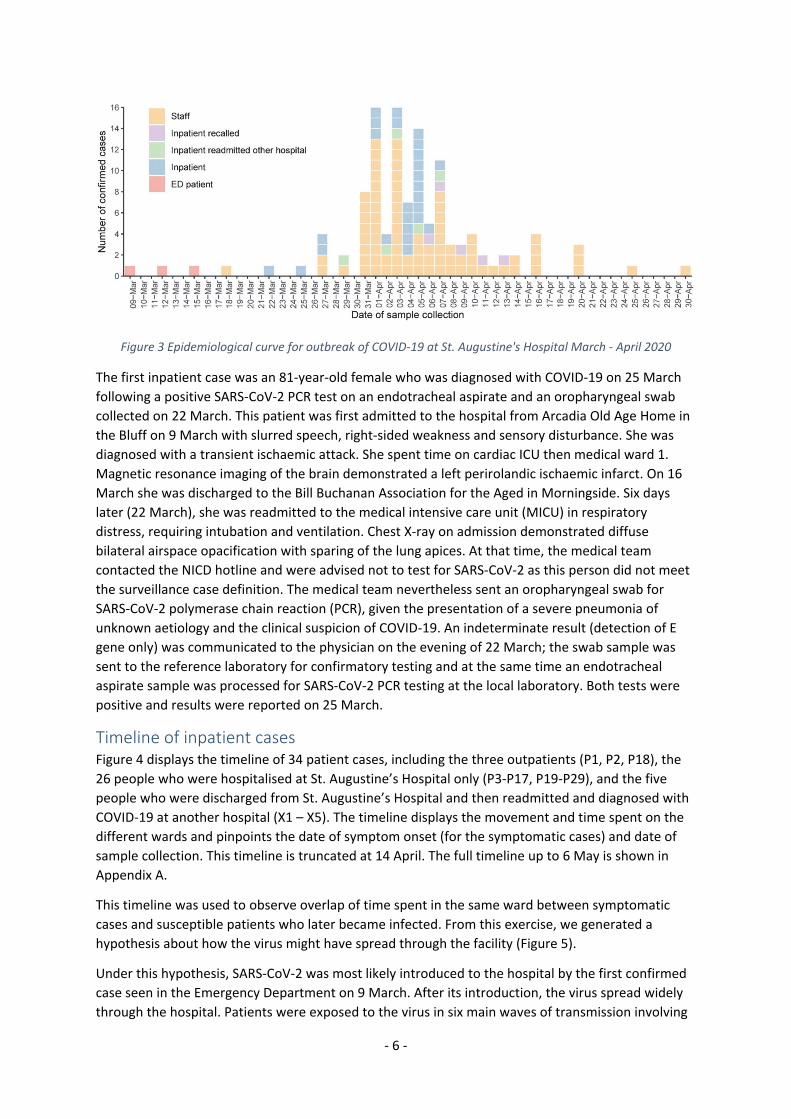
Epidemiological curve Between 9 March and 30 April, there were 119 confirmed COVID‐19 cases in patients and staff at St.
Augustine’s Hospital, comprising 39 patients and 80 staff members. The patients include three
outpatients seen only in the emergency department, 26 hospitalised patients diagnosed at St.
Augustine’s, five patients hospitalised at St. Augustine’s in March/April but then readmitted and
diagnosed with COVID‐19 at other hospitals, and five patients hospitalised at St. Augustine’s in
March then diagnosed with COVID‐19 during a recall screening & testing process. The
epidemiological curve is shown in Figure 3.
The first three cases at the hospital were people who attended the Emergency Department for
assessment, triage and sample collection but were not admitted. The first two (sampled on 9 March
and 12 March respectively) had recently returned from Europe; the third case sampled on 15 March
was a local resident with no travel history and no definite contact with a confirmed case, but who
had contact with many international travellers through her work.
i Quick J. nCoV‐2019 sequencing protocol. https://www.protocols.io/view/ncov‐2019‐sequencing‐protocol‐bbmuik6w ii Cleemput S, et al. Genome Detective Coronavirus Typing Tool for rapid identification and characterization of novel coronavirus genomes. Bioinformatics 2020 Feb 28. pii: btaa145. doi: 10.1093/bioinformatics/btaa145 iii Geneious R8 (https://www.geneious.com)
‐ 6 ‐
Figure 3 Epidemiological curve for outbreak of COVID‐19 at St. Augustine's Hospital March ‐ April 2020
The first inpatient case was an 81‐year‐old female who was diagnosed with COVID‐19 on 25 March
following a positive SARS‐CoV‐2 PCR test on an endotracheal aspirate and an oropharyngeal swab
collected on 22 March. This patient was first admitted to the hospital from Arcadia Old Age Home in
the Bluff on 9 March with slurred speech, right‐sided weakness and sensory disturbance. She was
diagnosed with a transient ischaemic attack. She spent time on cardiac ICU then medical ward 1.
Magnetic resonance imaging of the brain demonstrated a left perirolandic ischaemic infarct. On 16
March she was discharged to the Bill Buchanan Association for the Aged in Morningside. Six days
later (22 March), she was readmitted to the medical intensive care unit (MICU) in respiratory
distress, requiring intubation and ventilation. Chest X‐ray on admission demonstrated diffuse
bilateral airspace opacification with sparing of the lung apices. At that time, the medical team
contacted the NICD hotline and were advised not to test for SARS‐CoV‐2 as this person did not meet
the surveillance case definition. The medical team nevertheless sent an oropharyngeal swab for
SARS‐CoV‐2 polymerase chain reaction (PCR), given the presentation of a severe pneumonia of
unknown aetiology and the clinical suspicion of COVID‐19. An indeterminate result (detection of E
gene only) was communicated to the physician on the evening of 22 March; the swab sample was
sent to the reference laboratory for confirmatory testing and at the same time an endotracheal
aspirate sample was processed for SARS‐CoV‐2 PCR testing at the local laboratory. Both tests were
positive and results were reported on 25 March.
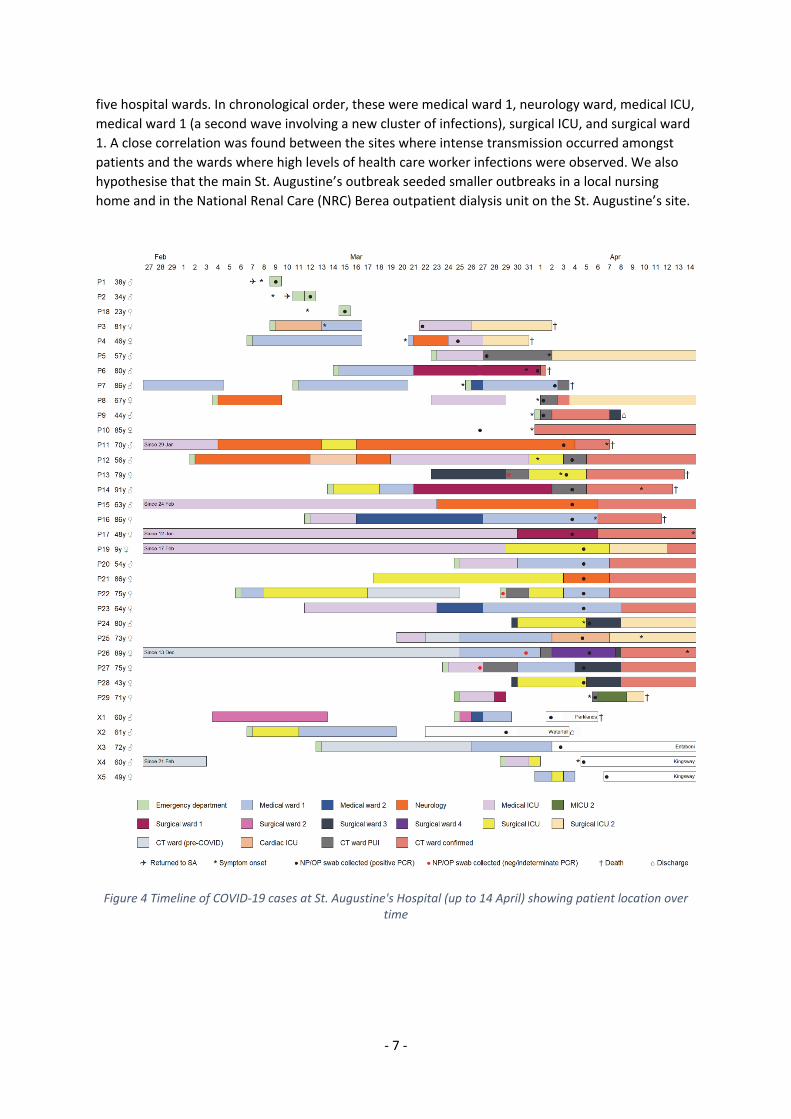
Timeline of inpatient cases Figure 4 displays the timeline of 34 patient cases, including the three outpatients (P1, P2, P18), the
26 people who were hospitalised at St. Augustine’s Hospital only (P3‐P17, P19‐P29), and the five
people who were discharged from St. Augustine’s Hospital and then readmitted and diagnosed with
COVID‐19 at another hospital (X1 – X5). The timeline displays the movement and time spent on the
different wards and pinpoints the date of symptom onset (for the symptomatic cases) and date of
sample collection. This timeline is truncated at 14 April. The full timeline up to 6 May is shown in
Appendix A.
This timeline was used to observe overlap of time spent in the same ward between symptomatic
cases and susceptible patients who later became infected. From this exercise, we generated a
hypothesis about how the virus might have spread through the facility (Figure 5).
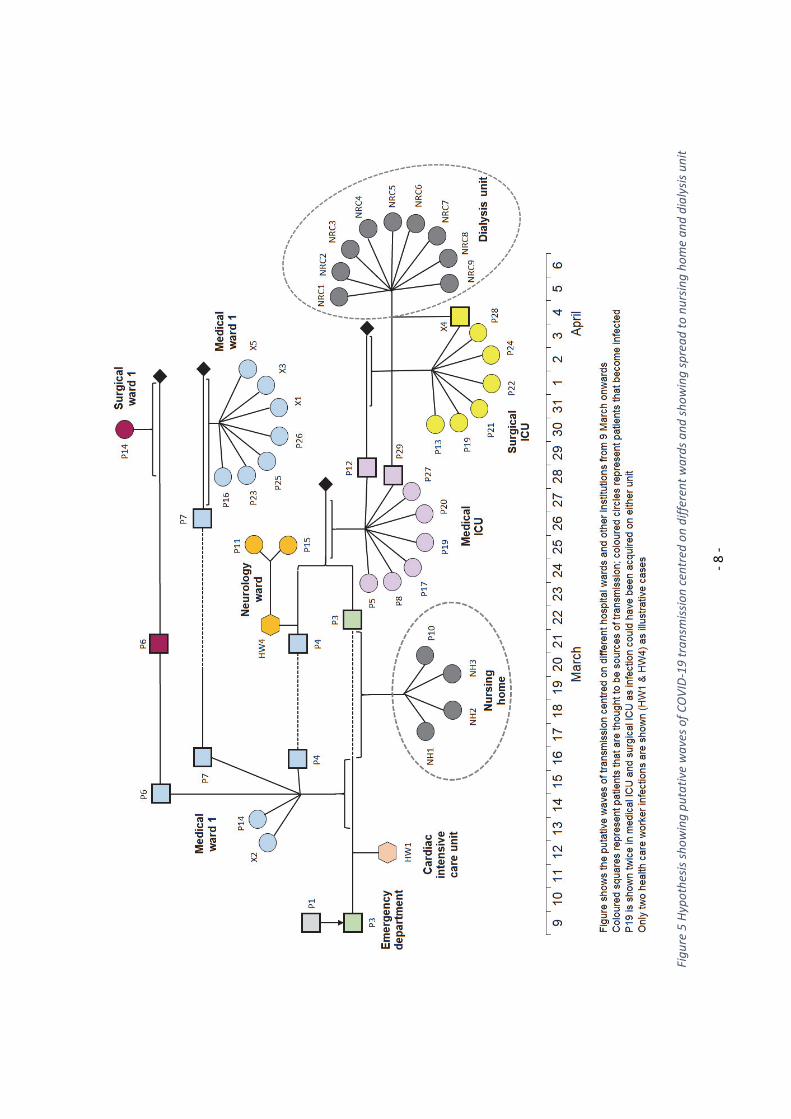
Under this hypothesis, SARS‐CoV‐2 was most likely introduced to the hospital by the first confirmed
case seen in the Emergency Department on 9 March. After its introduction, the virus spread widely
through the hospital. Patients were exposed to the virus in six main waves of transmission involving
‐ 7 ‐
five hospital wards. In chronological order, these were medical ward 1, neurology ward, medical ICU,
medical ward 1 (a second wave involving a new cluster of infections), surgical ICU, and surgical ward
1. A close correlation was found between the sites where intense transmission occurred amongst
patients and the wards where high levels of health care worker infections were observed. We also
hypothesise that the main St. Augustine’s outbreak seeded smaller outbreaks in a local nursing
home and in the National Renal Care (NRC) Berea outpatient dialysis unit on the St. Augustine’s site.
Figure 4 Timeline of COVID‐19 cases at St. Augustine's Hospital (up to 14 April) showing patient location over time
‐ 8 ‐
Figure 5 Hypothesis showing putative waves of COVID‐19 transm
ission centred
on different wards and showing spread to nursing home and dialysis unit
‐ 9 ‐
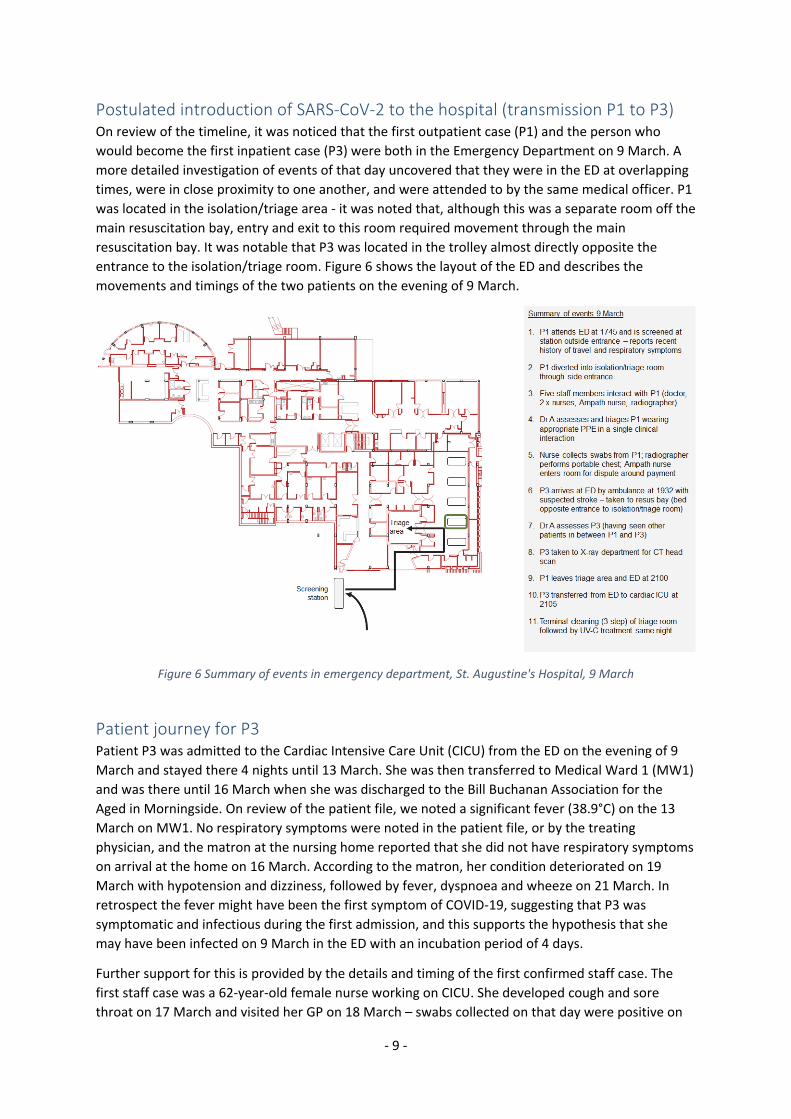
Postulated introduction of SARS‐CoV‐2 to the hospital (transmission P1 to P3) On review of the timeline, it was noticed that the first outpatient case (P1) and the person who
would become the first inpatient case (P3) were both in the Emergency Department on 9 March. A
more detailed investigation of events of that day uncovered that they were in the ED at overlapping
times, were in close proximity to one another, and were attended to by the same medical officer. P1
was located in the isolation/triage area ‐ it was noted that, although this was a separate room off the
main resuscitation bay, entry and exit to this room required movement through the main
resuscitation bay. It was notable that P3 was located in the trolley almost directly opposite the
entrance to the isolation/triage room. Figure 6 shows the layout of the ED and describes the
movements and timings of the two patients on the evening of 9 March.
Figure 6 Summary of events in emergency department, St. Augustine's Hospital, 9 March
Patient journey for P3 Patient P3 was admitted to the Cardiac Intensive Care Unit (CICU) from the ED on the evening of 9
March and stayed there 4 nights until 13 March. She was then transferred to Medical Ward 1 (MW1)
and was there until 16 March when she was discharged to the Bill Buchanan Association for the
Aged in Morningside. On review of the patient file, we noted a significant fever (38.9°C) on the 13
March on MW1. No respiratory symptoms were noted in the patient file, or by the treating
physician, and the matron at the nursing home reported that she did not have respiratory symptoms
on arrival at the home on 16 March. According to the matron, her condition deteriorated on 19
March with hypotension and dizziness, followed by fever, dyspnoea and wheeze on 21 March. In
retrospect the fever might have been the first symptom of COVID‐19, suggesting that P3 was
symptomatic and infectious during the first admission, and this supports the hypothesis that she
may have been infected on 9 March in the ED with an incubation period of 4 days.
Further support for this is provided by the details and timing of the first confirmed staff case. The
first staff case was a 62‐year‐old female nurse working on CICU. She developed cough and sore
throat on 17 March and visited her GP on 18 March – swabs collected on that day were positive on
‐ 10 ‐
PCR for SARS‐CoV‐2 (result received on 23 March). On review of her shift patterns and patient
allocation, it was noted that she was directly responsible for the care of P3 in CICU on the night shift
of 12 Mar‐13 March. Based on the understanding that people can be infectious 1‐3 days prior to
symptom onset, this link provides strong circumstantial evidence that P3 was infectious at this time
and transmitted to the CICU nurse.
Chains of transmissions
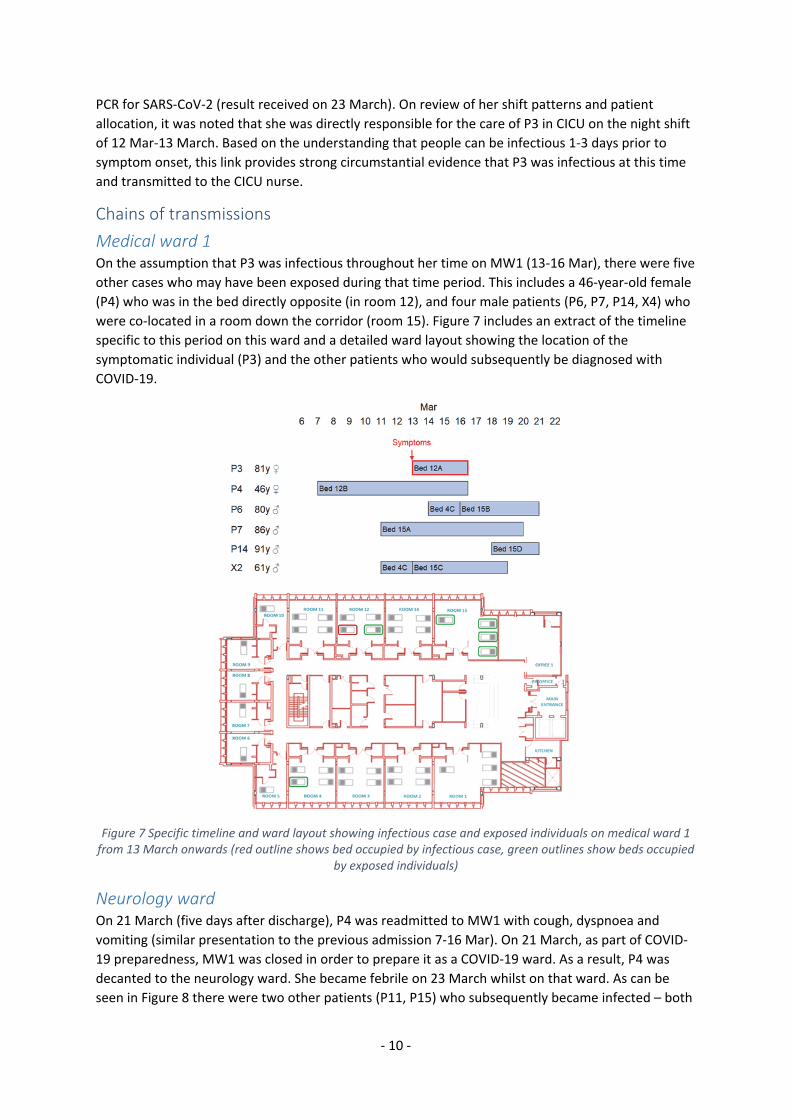
Medical ward 1 On the assumption that P3 was infectious throughout her time on MW1 (13‐16 Mar), there were five
other cases who may have been exposed during that time period. This includes a 46‐year‐old female
(P4) who was in the bed directly opposite (in room 12), and four male patients (P6, P7, P14, X4) who
were co‐located in a room down the corridor (room 15). Figure 7 includes an extract of the timeline
specific to this period on this ward and a detailed ward layout showing the location of the
symptomatic individual (P3) and the other patients who would subsequently be diagnosed with
COVID‐19.
Figure 7 Specific timeline and ward layout showing infectious case and exposed individuals on medical ward 1 from 13 March onwards (red outline shows bed occupied by infectious case, green outlines show beds occupied
by exposed individuals)
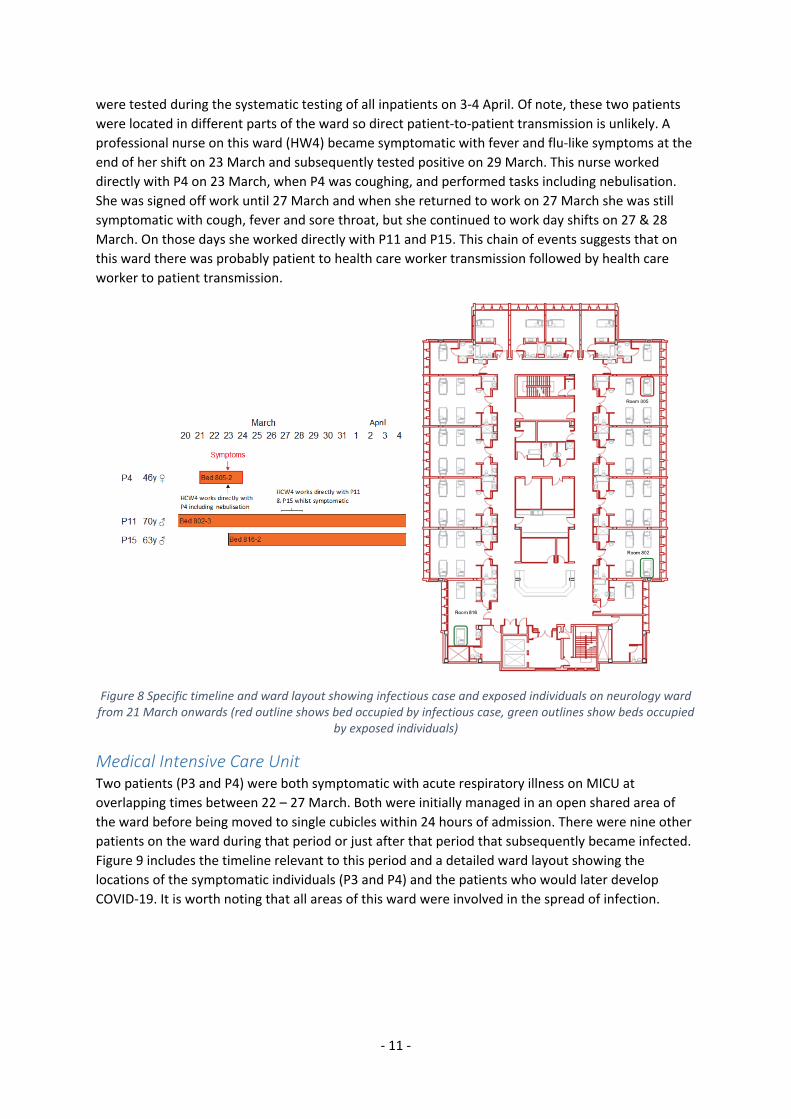
Neurology ward On 21 March (five days after discharge), P4 was readmitted to MW1 with cough, dyspnoea and
vomiting (similar presentation to the previous admission 7‐16 Mar). On 21 March, as part of COVID‐
19 preparedness, MW1 was closed in order to prepare it as a COVID‐19 ward. As a result, P4 was
decanted to the neurology ward. She became febrile on 23 March whilst on that ward. As can be
seen in Figure 8 there were two other patients (P11, P15) who subsequently became infected – both
‐ 11 ‐
were tested during the systematic testing of all inpatients on 3‐4 April. Of note, these two patients
were located in different parts of the ward so direct patient‐to‐patient transmission is unlikely. A
professional nurse on this ward (HW4) became symptomatic with fever and flu‐like symptoms at the
end of her shift on 23 March and subsequently tested positive on 29 March. This nurse worked
directly with P4 on 23 March, when P4 was coughing, and performed tasks including nebulisation.
She was signed off work until 27 March and when she returned to work on 27 March she was still
symptomatic with cough, fever and sore throat, but she continued to work day shifts on 27 & 28
March. On those days she worked directly with P11 and P15. This chain of events suggests that on
this ward there was probably patient to health care worker transmission followed by health care
worker to patient transmission.
Figure 8 Specific timeline and ward layout showing infectious case and exposed individuals on neurology ward from 21 March onwards (red outline shows bed occupied by infectious case, green outlines show beds occupied
by exposed individuals)
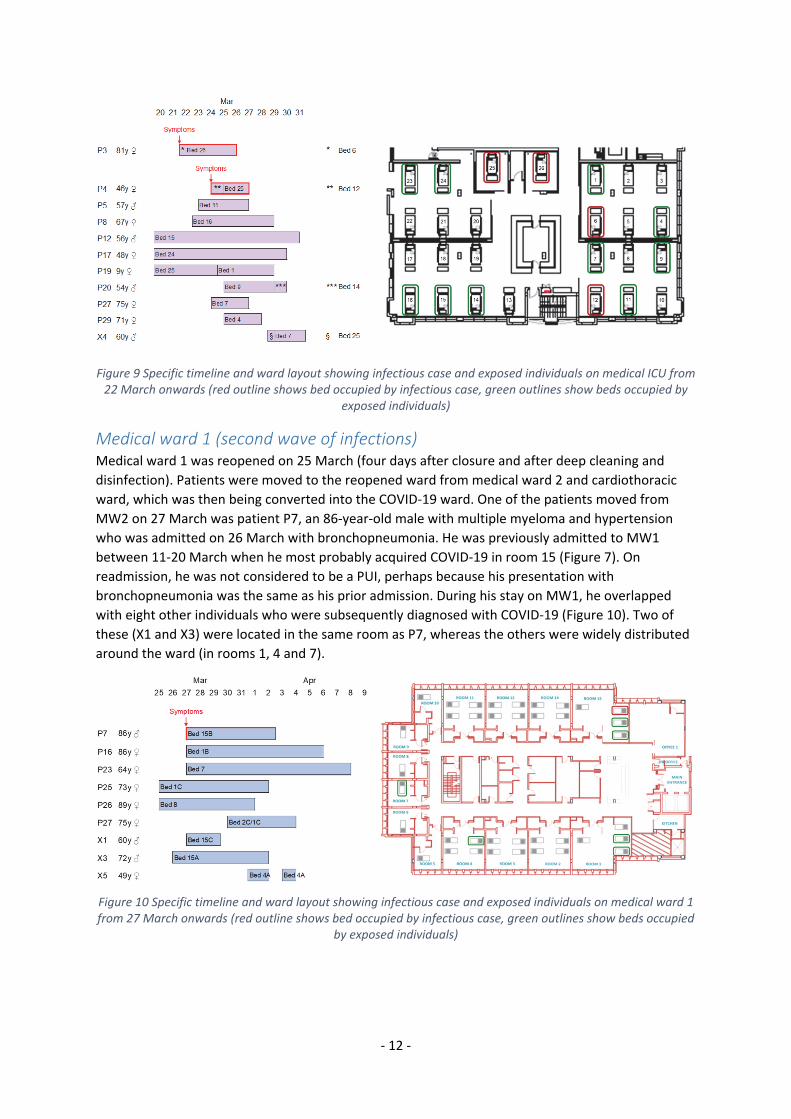
Medical Intensive Care Unit Two patients (P3 and P4) were both symptomatic with acute respiratory illness on MICU at
overlapping times between 22 – 27 March. Both were initially managed in an open shared area of
the ward before being moved to single cubicles within 24 hours of admission. There were nine other
patients on the ward during that period or just after that period that subsequently became infected.
Figure 9 includes the timeline relevant to this period and a detailed ward layout showing the
locations of the symptomatic individuals (P3 and P4) and the patients who would later develop
COVID‐19. It is worth noting that all areas of this ward were involved in the spread of infection.
‐ 12 ‐
Figure 9 Specific timeline and ward layout showing infectious case and exposed individuals on medical ICU from 22 March onwards (red outline shows bed occupied by infectious case, green outlines show beds occupied by
exposed individuals)
Medical ward 1 (second wave of infections) Medical ward 1 was reopened on 25 March (four days after closure and after deep cleaning and
disinfection). Patients were moved to the reopened ward from medical ward 2 and cardiothoracic
ward, which was then being converted into the COVID‐19 ward. One of the patients moved from
MW2 on 27 March was patient P7, an 86‐year‐old male with multiple myeloma and hypertension
who was admitted on 26 March with bronchopneumonia. He was previously admitted to MW1
between 11‐20 March when he most probably acquired COVID‐19 in room 15 (Figure 7). On
readmission, he was not considered to be a PUI, perhaps because his presentation with
bronchopneumonia was the same as his prior admission. During his stay on MW1, he overlapped
with eight other individuals who were subsequently diagnosed with COVID‐19 (Figure 10). Two of
these (X1 and X3) were located in the same room as P7, whereas the others were widely distributed
around the ward (in rooms 1, 4 and 7).
Figure 10 Specific timeline and ward layout showing infectious case and exposed individuals on medical ward 1 from 27 March onwards (red outline shows bed occupied by infectious case, green outlines show beds occupied
by exposed individuals)
‐ 13 ‐
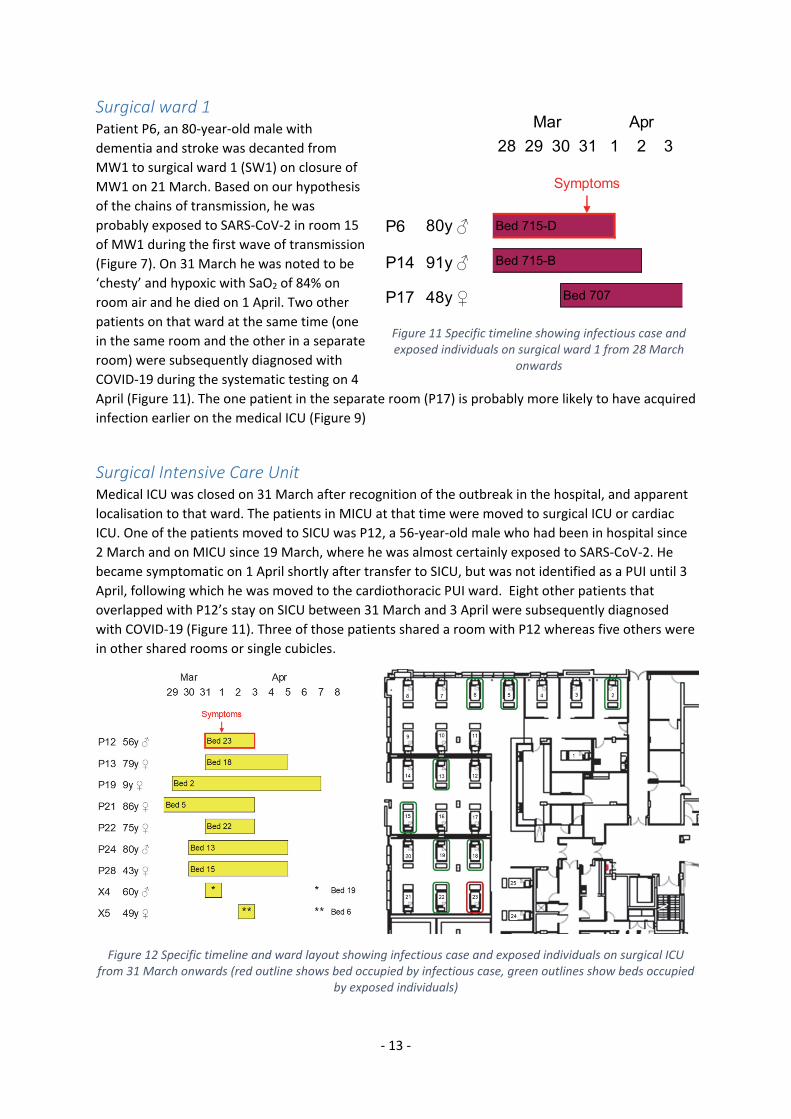
Surgical ward 1 Patient P6, an 80‐year‐old male with
dementia and stroke was decanted from
MW1 to surgical ward 1 (SW1) on closure of
MW1 on 21 March. Based on our hypothesis
of the chains of transmission, he was
probably exposed to SARS‐CoV‐2 in room 15
of MW1 during the first wave of transmission
(Figure 7). On 31 March he was noted to be
‘chesty’ and hypoxic with SaO2 of 84% on
room air and he died on 1 April. Two other
patients on that ward at the same time (one
in the same room and the other in a separate
room) were subsequently diagnosed with
COVID‐19 during the systematic testing on 4
April (Figure 11). The one patient in the separate room (P17) is probably more likely to have acquired
infection earlier on the medical ICU (Figure 9)
Surgical Intensive Care Unit Medical ICU was closed on 31 March after recognition of the outbreak in the hospital, and apparent
localisation to that ward. The patients in MICU at that time were moved to surgical ICU or cardiac
ICU. One of the patients moved to SICU was P12, a 56‐year‐old male who had been in hospital since
2 March and on MICU since 19 March, where he was almost certainly exposed to SARS‐CoV‐2. He
became symptomatic on 1 April shortly after transfer to SICU, but was not identified as a PUI until 3
April, following which he was moved to the cardiothoracic PUI ward. Eight other patients that
overlapped with P12’s stay on SICU between 31 March and 3 April were subsequently diagnosed
with COVID‐19 (Figure 11). Three of those patients shared a room with P12 whereas five others were
in other shared rooms or single cubicles.
Figure 12 Specific timeline and ward layout showing infectious case and exposed individuals on surgical ICU from 31 March onwards (red outline shows bed occupied by infectious case, green outlines show beds occupied
by exposed individuals)
P6 80y ♂ Bed 715-D
P14 91y ♂ Bed 715-B
P17 48y ♀ Bed 707
328
Mar Apr
29 30 31 1 2
Symptoms
Figure 11 Specific timeline showing infectious case and exposed individuals on surgical ward 1 from 28 March
onwards
‐ 14 ‐
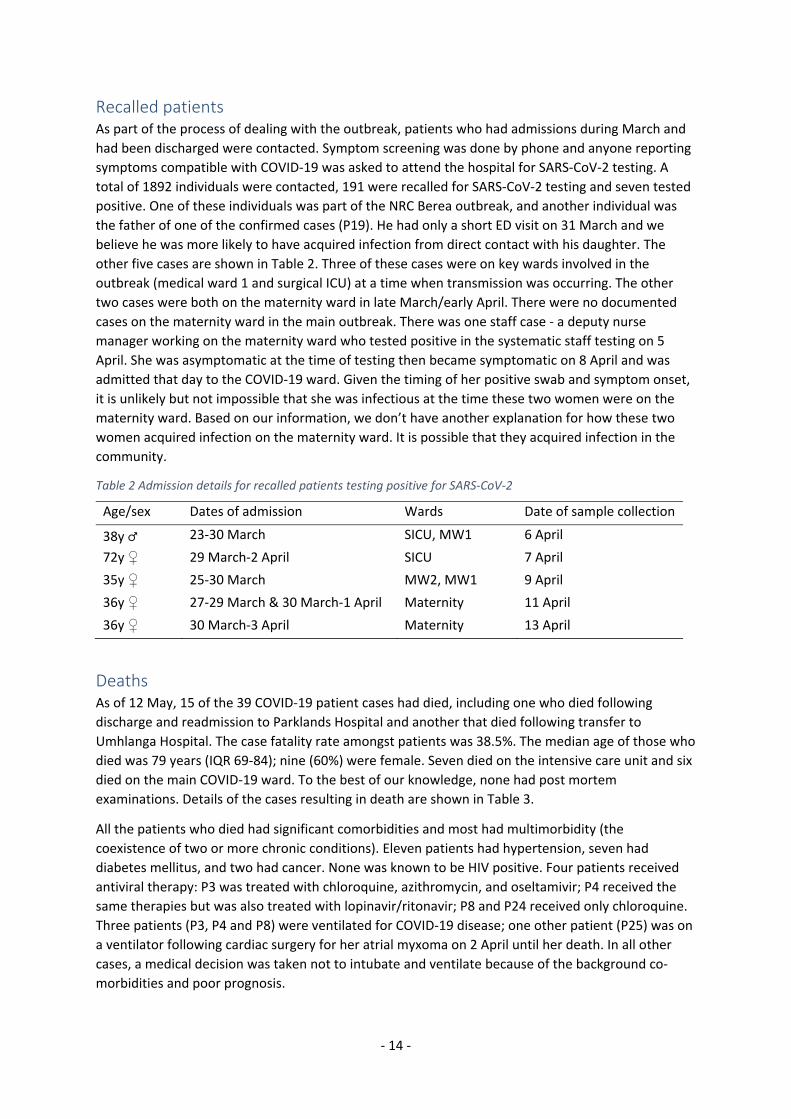
Recalled patients As part of the process of dealing with the outbreak, patients who had admissions during March and
had been discharged were contacted. Symptom screening was done by phone and anyone reporting
symptoms compatible with COVID‐19 was asked to attend the hospital for SARS‐CoV‐2 testing. A
total of 1892 individuals were contacted, 191 were recalled for SARS‐CoV‐2 testing and seven tested
positive. One of these individuals was part of the NRC Berea outbreak, and another individual was
the father of one of the confirmed cases (P19). He had only a short ED visit on 31 March and we
believe he was more likely to have acquired infection from direct contact with his daughter. The
other five cases are shown in Table 2. Three of these cases were on key wards involved in the
outbreak (medical ward 1 and surgical ICU) at a time when transmission was occurring. The other
two cases were both on the maternity ward in late March/early April. There were no documented
cases on the maternity ward in the main outbreak. There was one staff case ‐ a deputy nurse
manager working on the maternity ward who tested positive in the systematic staff testing on 5
April. She was asymptomatic at the time of testing then became symptomatic on 8 April and was
admitted that day to the COVID‐19 ward. Given the timing of her positive swab and symptom onset,
it is unlikely but not impossible that she was infectious at the time these two women were on the
maternity ward. Based on our information, we don’t have another explanation for how these two
women acquired infection on the maternity ward. It is possible that they acquired infection in the
community.
Table 2 Admission details for recalled patients testing positive for SARS‐CoV‐2
Age/sex Dates of admission Wards Date of sample collection
38y ♂ 23‐30 March SICU, MW1 6 April
72y ♀ 29 March‐2 April SICU 7 April
35y ♀ 25‐30 March MW2, MW1 9 April
36y ♀ 27‐29 March & 30 March‐1 April Maternity 11 April
36y ♀ 30 March‐3 April Maternity 13 April
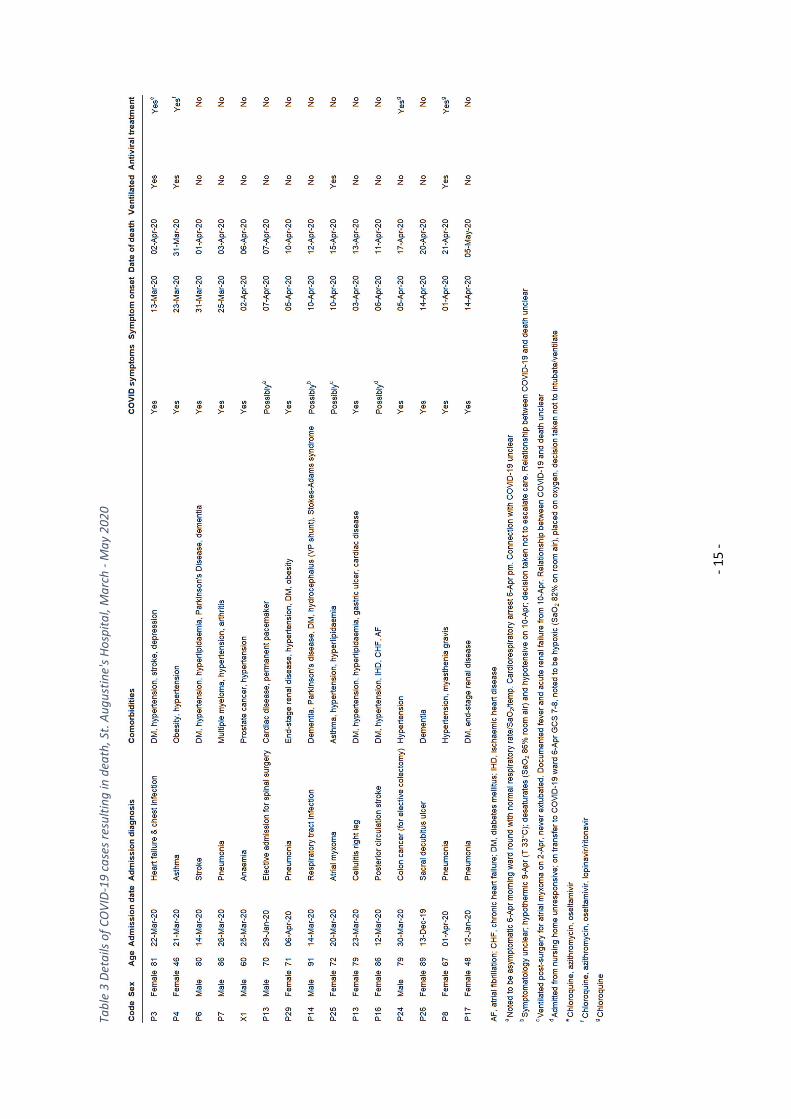
Deaths As of 12 May, 15 of the 39 COVID‐19 patient cases had died, including one who died following
discharge and readmission to Parklands Hospital and another that died following transfer to
Umhlanga Hospital. The case fatality rate amongst patients was 38.5%. The median age of those who
died was 79 years (IQR 69‐84); nine (60%) were female. Seven died on the intensive care unit and six
died on the main COVID‐19 ward. To the best of our knowledge, none had post mortem
examinations. Details of the cases resulting in death are shown in Table 3.
All the patients who died had significant comorbidities and most had multimorbidity (the
coexistence of two or more chronic conditions). Eleven patients had hypertension, seven had
diabetes mellitus, and two had cancer. None was known to be HIV positive. Four patients received
antiviral therapy: P3 was treated with chloroquine, azithromycin, and oseltamivir; P4 received the
same therapies but was also treated with lopinavir/ritonavir; P8 and P24 received only chloroquine.
Three patients (P3, P4 and P8) were ventilated for COVID‐19 disease; one other patient (P25) was on
a ventilator following cardiac surgery for her atrial myxoma on 2 April until her death. In all other
cases, a medical decision was taken not to intubate and ventilate because of the background co‐
morbidities and poor prognosis.
‐ 15 ‐
Table 3 Details of COVID‐19 cases resulting in death, St. Augustine's Hospital, March ‐ M
ay 2020
‐ 16 ‐
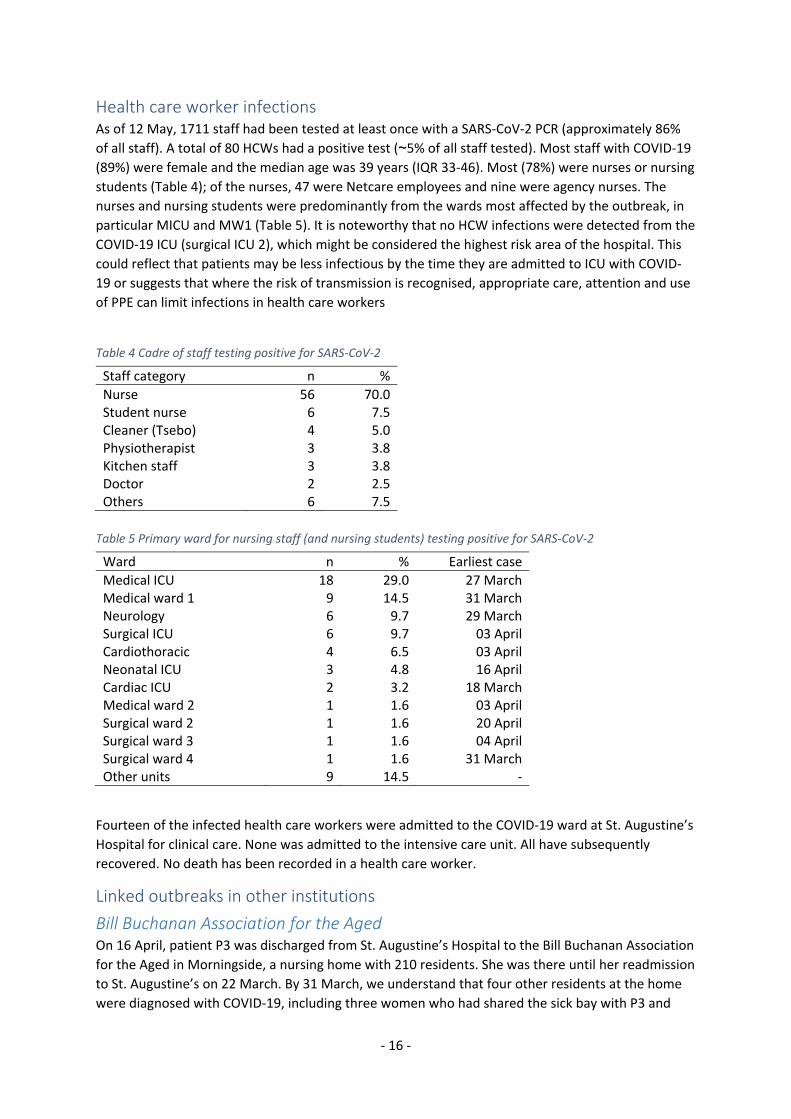
Health care worker infections As of 12 May, 1711 staff had been tested at least once with a SARS‐CoV‐2 PCR (approximately 86%
of all staff). A total of 80 HCWs had a positive test (~5% of all staff tested). Most staff with COVID‐19
(89%) were female and the median age was 39 years (IQR 33‐46). Most (78%) were nurses or nursing
students (Table 4); of the nurses, 47 were Netcare employees and nine were agency nurses. The
nurses and nursing students were predominantly from the wards most affected by the outbreak, in
particular MICU and MW1 (Table 5). It is noteworthy that no HCW infections were detected from the
COVID‐19 ICU (surgical ICU 2), which might be considered the highest risk area of the hospital. This
could reflect that patients may be less infectious by the time they are admitted to ICU with COVID‐
19 or suggests that where the risk of transmission is recognised, appropriate care, attention and use
of PPE can limit infections in health care workers
Table 4 Cadre of staff testing positive for SARS‐CoV‐2
Staff category n %
Nurse 56 70.0 Student nurse 6 7.5 Cleaner (Tsebo) 4 5.0 Physiotherapist 3 3.8 Kitchen staff 3 3.8 Doctor 2 2.5 Others 6 7.5
Table 5 Primary ward for nursing staff (and nursing students) testing positive for SARS‐CoV‐2
Ward n % Earliest case
Medical ICU 18 29.0 27 March Medical ward 1 9 14.5 31 March Neurology 6 9.7 29 March Surgical ICU 6 9.7 03 April Cardiothoracic 4 6.5 03 April Neonatal ICU 3 4.8 16 April Cardiac ICU 2 3.2 18 March Medical ward 2 1 1.6 03 April Surgical ward 2 1 1.6 20 April Surgical ward 3 1 1.6 04 April Surgical ward 4 1 1.6 31 March Other units 9 14.5 ‐
Fourteen of the infected health care workers were admitted to the COVID‐19 ward at St. Augustine’s
Hospital for clinical care. None was admitted to the intensive care unit. All have subsequently
recovered. No death has been recorded in a health care worker.
Linked outbreaks in other institutions
Bill Buchanan Association for the Aged On 16 April, patient P3 was discharged from St. Augustine’s Hospital to the Bill Buchanan Association
for the Aged in Morningside, a nursing home with 210 residents. She was there until her readmission
to St. Augustine’s on 22 March. By 31 March, we understand that four other residents at the home
were diagnosed with COVID‐19, including three women who had shared the sick bay with P3 and
‐ 17 ‐
one woman who stayed in a separate unit and only visited P3 (as they were friends from their
residential home). One of the cases from the sick bay was admitted to St. Augustine’s on 31 March
(patient P10) ‐ she completed 14 days of isolation, had a negative follow‐up SARS‐CoV‐2 PCR and
was discharged back to the home on 15 April. The nursing home managed to isolate the other cases
in a separate building and no staff members at the home tested positive. We hypothesise that P3
introduced the infection into the nursing home and the virus was transmitted to the four other
residents.
National Renal Care dialysis unit National Renal Care operates a 39‐bed outpatient dialysis unit (NRC Berea) on the St. Augustine’s
Hospital campus. NRC also through a separate team provides inpatient dialysis services for St.
Augustine’s Hospital. A total of 19 confirmed cases (11 patients and eight staff) have been identified
within the NRC outpatient dialysis services. We hypothesise that two patients (P29, X4) acquired
COVID‐19 infection whilst they were inpatients on MICU in late March (Figure 9) and then, on
resuming outpatient dialysis care, introduced the infection into the outpatient dialysis unit on either
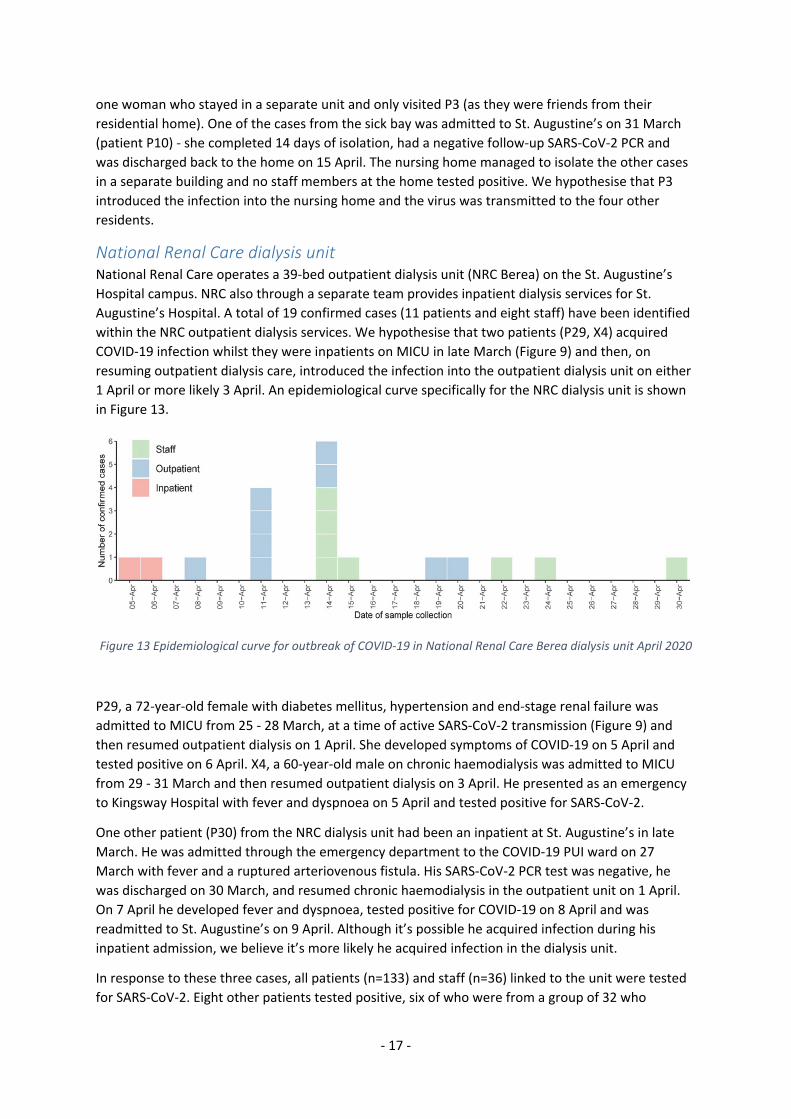
1 April or more likely 3 April. An epidemiological curve specifically for the NRC dialysis unit is shown
in Figure 13.
Figure 13 Epidemiological curve for outbreak of COVID‐19 in National Renal Care Berea dialysis unit April 2020
P29, a 72‐year‐old female with diabetes mellitus, hypertension and end‐stage renal failure was
admitted to MICU from 25 ‐ 28 March, at a time of active SARS‐CoV‐2 transmission (Figure 9) and
then resumed outpatient dialysis on 1 April. She developed symptoms of COVID‐19 on 5 April and
tested positive on 6 April. X4, a 60‐year‐old male on chronic haemodialysis was admitted to MICU
from 29 ‐ 31 March and then resumed outpatient dialysis on 3 April. He presented as an emergency
to Kingsway Hospital with fever and dyspnoea on 5 April and tested positive for SARS‐CoV‐2.
One other patient (P30) from the NRC dialysis unit had been an inpatient at St. Augustine’s in late
March. He was admitted through the emergency department to the COVID‐19 PUI ward on 27
March with fever and a ruptured arteriovenous fistula. His SARS‐CoV‐2 PCR test was negative, he
was discharged on 30 March, and resumed chronic haemodialysis in the outpatient unit on 1 April.
On 7 April he developed fever and dyspnoea, tested positive for COVID‐19 on 8 April and was
readmitted to St. Augustine’s on 9 April. Although it’s possible he acquired infection during his
inpatient admission, we believe it’s more likely he acquired infection in the dialysis unit.
In response to these three cases, all patients (n=133) and staff (n=36) linked to the unit were tested
for SARS‐CoV‐2. Eight other patients tested positive, six of who were from a group of 32 who
‐ 18 ‐
underwent routine haemodialysis at the same sessions as P29 on 1 April and P29 & X4 on 3 April.
Four of these were admitted to hospital with COVID‐19 symptoms. As of 12 May, five of the eleven
patient cases linked to the dialysis unit had died (case fatality rate 45.5%).
Eight staff members tested positive for SARS‐CoV‐2 (22% of those tested). All but one of the staff
cases had symptoms at the time of testing or developed symptoms after testing. Two were admitted
to hospital. None has died.
DNA sequencing and phylogenetic analysis As of 20 April, we have sequenced SARS‐CoV‐2 RNA extracted from 18 samples retrieved from
Ampath Laboratories and the IALCH NHLS Laboratory, using the Illumina platform. This includes
eight samples from inpatients (P3, P5, P6, P7, P11, P12, P13 & P14), one sample from one of the
nursing home residents (NH1) and nine from health care workers (HW4, HW5, HW9, HW11, HW13,
HW30, HW32, HW33 & HW49). Health care workers’ codes were based on a numerical sequence
according to the date of sample collection. In addition, we sequenced SARS‐CoV‐2 RNA from five
other samples from confirmed COVID‐19 cases in eThekwini not known to be linked to the St.
Augustine’s outbreak.
The 23 SARS‐CoV‐2 genome sequences were analysed in a phylogenetic framework on the
NextStrain platform (https://nextstrain.org), to ascertain their genetic relatedness with one another
and with other sequences from around the world. In short, NextStrain allows for the analysis of
pathogen whole genome sequences – like SARS‐CoV‐2 – along with available clinical, demographic
and geographic data. The underlying methods applied include: 1) sequence alignment, 2) tree and
molecular clock inference, 3) ancestral state reconstruction and 4) tree annotation. We selected 32
reference sequences from the GISAID SARS‐CoV‐2 sequence repository (https://www.gisaid.org) to
analyse alongside our sequences. These reference sequences includes the two genomes derived
from the earliest samples in Wuhan, China, as well as 30 sequences representing the major lineages
of SARS‐CoV‐2.
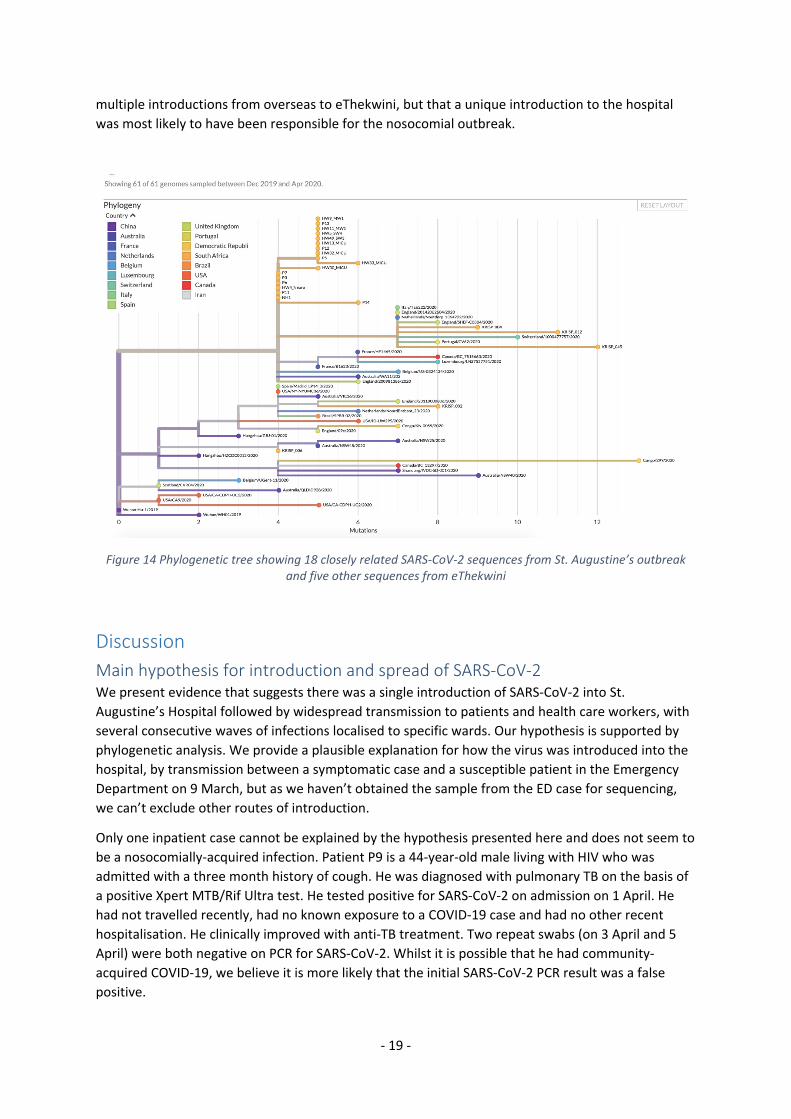
A phylogenetic tree is shown in Figure 14. All of the 18 sequences of the patients and health care
workers clustered closely together in the A2a clade, which has been identified in cases from Europe
or people that have travelled from Europe. These sequences were highly identical, i.e. >99.99%. Six
sequences (including the sequence from P3) were basal in the phylogenetic tree, consistent with
those patients acquiring infection early in the outbreak. There were one or two additional mutations
in the sequences from the other four patients and eight health care workers, consistent with them
being in the later wave of infections on MICU and MW1. The appearance of one to two mutations is
consistent with a month‐long nosocomial outbreak as the virus mutation rate in the population is
approximately two mutations per month (1.8 x 10‐3 substitutions per site in the genome per year)i.
The phylogenetic tree also shows that the all of the five control sequences from eThekwini
(KRISP_002, KRISP_004, KRISP_006 and KRISP_012 & KRISP_045) did not cluster with the hospital
infections. For example, the KRISP_004, KRISP_012 and KRISP_045 sequences clustered with other
European sequences in the A2a European clade, suggesting a distinct introduction of SARS‐CoV‐2 to
eThekwini from Europe. The KRISP_002 sequence clustered with a sequence from New York and the
KRISP_006 sequence clustered with two Australian sequences. This suggests that there were
i Li X, et al. Transmission dynamics and evolutionary history of 2019‐nCoV. J Med Virol 2020; 92(5): 501‐511. doi: 10.1002/jmv.25701
‐ 19 ‐
multiple introductions from overseas to eThekwini, but that a unique introduction to the hospital
was most likely to have been responsible for the nosocomial outbreak.
Figure 14 Phylogenetic tree showing 18 closely related SARS‐CoV‐2 sequences from St. Augustine’s outbreak and five other sequences from eThekwini
Discussion
Main hypothesis for introduction and spread of SARS‐CoV‐2 We present evidence that suggests there was a single introduction of SARS‐CoV‐2 into St.
Augustine’s Hospital followed by widespread transmission to patients and health care workers, with
several consecutive waves of infections localised to specific wards. Our hypothesis is supported by
phylogenetic analysis. We provide a plausible explanation for how the virus was introduced into the
hospital, by transmission between a symptomatic case and a susceptible patient in the Emergency
Department on 9 March, but as we haven’t obtained the sample from the ED case for sequencing,
we can’t exclude other routes of introduction.
Only one inpatient case cannot be explained by the hypothesis presented here and does not seem to
be a nosocomially‐acquired infection. Patient P9 is a 44‐year‐old male living with HIV who was
admitted with a three month history of cough. He was diagnosed with pulmonary TB on the basis of
a positive Xpert MTB/Rif Ultra test. He tested positive for SARS‐CoV‐2 on admission on 1 April. He
had not travelled recently, had no known exposure to a COVID‐19 case and had no other recent
hospitalisation. He clinically improved with anti‐TB treatment. Two repeat swabs (on 3 April and 5
April) were both negative on PCR for SARS‐CoV‐2. Whilst it is possible that he had community‐
acquired COVID‐19, we believe it is more likely that the initial SARS‐CoV‐2 PCR result was a false
positive.
‐ 20 ‐
Other than that case and P10, who we believe acquired infection in the nursing home, there is
strong evidence that all other cases in the St. Augustine’s Hospital inpatients in March and April
were nosocomially acquired infections. Excluding P9, P10 and the three ED cases, the number of
nosocomially acquired infections in hospitalised individuals would therefore be 34. With the four
cases acquired in the nursing home and nine cases acquired in the outpatient dialysis unit, 47 cases
in total were linked to the nosocomial outbreak. In addition, up to 88 infections in staff (80 St.
Augustine’s staff and eight NRC Berea staff) may have been nosocomially acquired during this
outbreak. This total of up to 135 cases associated with the outbreak would represent approximately
14% of all cases reported in KwaZulu‐Natal up to 30 April.
We provide a plausible explanation for how the infection entered the hospital, by transmission
between two patients (P1 and P3) in the Emergency Department. We cannot exclude the possibility
that patient P3 acquired COVID‐19 in the community prior to the initial admission on 9 March. We
found no evidence that she had been in contact with anyone with COVID‐19 or with anyone that had
recently travelled. All three confirmed cases in the country prior to this date were imported
infections; in fact, the first case of local transmission in South Africa was not reported until 13
March, four days after her admission. Therefore, we consider the likelihood of her having been
exposed to SARS‐CoV‐2 prior to her admission on 9 March to be extremely low.
We considered whether the CICU nurse (first staff case) could have been the source of infection for
P3. However, the nurse’s symptoms started five days after last contact with P3 (and four days after
the onset of fever in P3). The timings of symptom onset therefore make this direction of
transmission implausible.
We considered whether P3 could have acquired COVID‐19 in the Bill Buchanan Association for the
Aged in the period between the first and second admission (16‐22 March). However, if that were the
case, we have no plausible explanation for the first health care worker infection (CICU nurse), no
other clear source of the first wave of infections on MW1, and the timing would mean an extremely
rapid incubation period and disease progression (maximum six days from exposure until severe
pneumonia requiring intubation and ventilation). Putting all those together, we therefore believe
this explanation to be extremely unlikely.
We also considered the possibility that patient P4 acquired COVID‐19 in the community and brought
the infection into the hospital on her first admission on 7 March, and that the virus was then
transmitted to P3 and to the other patients on MW1. Again, however, we believe this to be
implausible given that prior to 7 March there were only two reported cases in the country and there
was no documented local transmission of SARS‐CoV‐2. This would also leave the source of the first
health care worker’s infection (CICU nurse) unexplained.
Likely mode of transmission and factors contributing to outbreak According to current evidence, SARS‐CoV‐2 is transmitted between people through respiratory
droplets and contact routesi. Droplet transmission may also occur through fomites so transmission
of the virus can occur by direct contact with an infected person or indirect contact with surfaces in
the immediate environment of that person or with objects used on the infected person (e.g.
stethoscope or thermometer). The spatial distribution of cases and exposed individuals who became
infected on the wards suggests that indirect contact via health care workers or fomite transmission
were the predominant modes of transmission between patients in this outbreak. Direct droplet or
i World Health Organization. Modes of transmission of virus causing COVID‐19: implications for IPC precaution recommendations. https://apps.who.int/iris/rest/bitstreams/1273450/retrieve
‐ 21 ‐
contact transmission would be plausible where the people that were exposed were located in close
proximity to an infectious case, e.g. P4 in the bed directly opposite P3 on MW1 between 13 ‐ 16
March (Figure 7); or X1 and X3 sharing a four‐bedded bay with P7 on MW1 between 27 March ‐ 2
April (Figure 10). However, in other examples the exposed individuals were located in different
rooms and different areas of the ward, making indirect contact via health care workers or fomite
transmission more plausible. We also present evidence suggestive of direct droplet transmission
from a symptomatic health care worker to two patients on the neurology ward.
There continues to be debate around whether aerosol transmission is important in the spread of
SARS‐CoV‐2. Aerosol transmission may be possible in specific circumstances and settings in which
aerosol‐generating procedures are performed (e.g. endotracheal intubation and manual ventilation
before intubation). There is no evidence to suggest aerosol transmission contributed to the outbreak
at St. Augustine’s Hospital. In fact we were struck by the observation that a rushed intubation and
ventilation of P3 on 22 March where several health care workers were not wearing appropriate PPE,
and therefore a high risk exposure, did not result in any health care worker infections (all HCWs
involved did not develop symptoms and had at least one negative SARS‐CoV‐2 PCR). We therefore
believe that the current PPE recommendations for health care workers caring for people with
COVID‐19 are appropriate.
Under our hypothesis, there may have been two transmission events suggestive of presymptomatic
transmission. The transmission from P3 to HCW1 occurred on 12 March in CICU the day before the
onset of fever in P3. Similarly the transmission from P29 and/or X4 in the outpatient dialysis unit
seemed to occur prior to the onset of symptoms in either case. Whilst all the other patient infections
can be explained by exposure to a symptomatic individual, we cannot exclude the possibility that
other transmissions occurred in the presymptomatic phase.
One of the striking observations when reviewing the timeline of cases was the frequent movement
of patients between and within wards. It seems this partly reflects the timing as the hospital was
preparing for COVID‐19 (i.e. emptying wards to repurpose them as COVID‐19 wards) and then
responding to the outbreak as it evolved. It seems likely that this movement of patients around the
hospital facilitated the spread of the virus by bringing unsuspected cases into contact with new
groups of susceptible patients and health care workers. One such example was the closure of MW1
on 21 March to prepare that ward as a COVID PUI ward. On closure, P4 was decanted to the
neurology ward and may have exposed two other people on that ward whilst she was symptomatic
and infectious. Another example was the closure of MICU on 31 March in response to the outbreak,
where P12 was moved to SICU, developed symptoms and may have exposed up to eight other
people on that ward.
Of all the infections in nursing staff (including nursing students), 63% (39/62) were working on
medical ICU, medical ward 1, neurology ward or surgical ICU. These four wards were the wards
where unsuspected cases were managed and where the majority of patients acquired infection. On
those general wards at those times standard precautions were being used. This was consistent with
guidelines from National Department of Health and NICD at the time, and remains consistent with
current guidelinesi. As patients such as P3 and P4 were not initially recognised as high risk for COVID‐
i National Department of Health. COVID‐19 Disease: Infection Prevention and Control Guidelines Version 1, April 2020. http://www.health.gov.za/index.php/component/phocadownload/category/626‐infection‐control‐material?download=4100:covid‐19‐disease‐infection‐prevention‐and‐control‐guidelines‐version‐1‐april‐2020
‐ 22 ‐
19, it seems that isolation was delayed and droplet and contact precautions were not instituted until
there may have been significant numbers of exposures amongst patients and health care workers.
Factors associated with patient deaths A detailed analysis of the factors contributing to death is beyond the scope of this report. It is clear
that deaths occurred predominantly in elderly inpatients with significant comorbidities. Some
patients had complex medical problems and had been in hospital for a prolonged period of time
before acquiring SARS‐CoV‐2 infection. It was noted that experimental therapies including
chloroquine, azithromycin and lopinavir/ritonavir were given to some cases but no conclusions can
be drawn as to whether these had any effect on the outcomes. It is worth noting that there is
currently no evidence to support any specific therapy for COVID‐19i. Based on review of the medical
records, the decisions not to intubate and ventilate some of the affected individuals was
appropriate.
Missed opportunities for earlier action By the time the first inpatient COVID‐19 infection was confirmed in P3 on 25 March, the outbreak
was already at an advanced stage with up to 16 patients already exposed to SARS‐CoV‐2. With the
benefit of hindsight, there are a number of points at which different actions could potentially have
influenced the progression of the outbreak.
1. On the 13 March, patient P3 developed a fever that in retrospect may have been the first
symptom of COVID‐19. Our understanding from review of the medical records and
discussion with the physician is that no specific cause for that fever was identified. If the
possibility of COVID‐19 had been considered at that time, then investigation might have
uncovered the potential exposure to P1 in the ED on 9 March and might have led to SARS‐
CoV‐2 PCR testing. However, the fever was present only on 13 March and did not persist on
14‐16 March, and no respiratory symptoms were documented at that time. The patient
would not have met the criteria for PUI given the apparent lack of contact history. It should
also be noted that fever post‐stroke is common and can have many causes.
2. On 21 March P4 was readmitted to MW1 with an acute respiratory illness five days after
discharge from the same ward. It seems that the presentation on both admissions was
similar with cough and dyspnoea and this was attributed on both admissions to an acute
exacerbation of asthma. Fever was not present on admission and developed later on 23
March. It seems that a chest X‐ray was not performed immediately on readmission and
actually was not done until 25 March, at which time it showed diffuse bilateral air space
opacification. If chest X‐ray had been done at the time of readmission and had been
abnormal then there might have been a higher index of suspicion of COVID‐19. This case
could then have been confirmed and isolated earlier and investigation of the potential
sources of the infection and tracing of potentially exposed patients and staff members could
have begun sooner.
3. On 22 March P3 was readmitted from the nursing home to medical ICU acutely unwell with
clinical and radiological signs of severe pneumonia. There was then a high index of suspicion
of COVID‐19 and swabs were appropriately sent for SARS‐CoV‐2 PCR testing (despite the
advice from the NICD hotline being that she did not meet the criteria for investigation and
should not be tested). Due to the initial indeterminate PCR result (on oropharyngeal swab)
i National Department of Health & National Institute of Communicable Disease. Clinical management of suspected or confirmed COVID‐19 disease, Version 3, 27 March 2020. https://www.nicd.ac.za/wp‐content/uploads/2020/03/Clinical‐Management‐of‐COVID‐19‐disease_Version‐3_27March2020.pdf
‐ 23 ‐
and the need for the sample to be sent for confirmatory testing and for an endotracheal
aspirate sample to be processed for testing, it was three days until the positive result was
received. In those three days, although she was considered highly likely to have COVID‐19
and was managed accordingly, there was no thorough investigation to review the first
admission, to identify potential sources of infection, and to identify people who might have
been exposed to her whilst she was infectious. This action did not happen until after the
positive result was received on 25 March.
4. On 23 March the first staff case was confirmed (symptom onset 17 March, swabs collected
18 March). This staff member had accessed testing through their GP, but reported the
positive test result appropriately to her unit manager on 23 March. The unit manager then
communicated the result to the occupational health nurse and to the nursing manager on
the same day (23 March). It seems that this first documented infection in a staff member did
not trigger any specific investigation or action. If that case had been recognised as important
at the time then a thorough investigation could have been performed to uncover possible
sources of infection within the hospital. This would have uncovered the link to P3 on the
night shift of 12‐13 March and, given that by 23 March P3 had been readmitted with a
severe pneumonia this could have raised the suspicion of nosocomial SARS‐CoV‐2
transmission.
The main underlying issue that runs through all these points is that the first inpatient cases of
COVID‐19 were not suspected to have COVID‐19 as they did not fit the typical profile of the cases
being detected in the country at that time, and had no clear risk factors for community‐acquired
infection. As there were no COVID‐19 patients being treated in the hospital, the risk of nosocomial
acquisition of COVID‐19 would understandably have been considered to be very low. Consequently
the index of suspicion for COVID‐19 in these first cases was low and this contributed to the delayed
diagnosis and delayed recognition of the outbreak.
In terms of the NRC outpatient dialysis unit, the outbreak there highlights the importance of being
proactive rather than reactive when the risk of COVID‐19 being introduced is apparent. By 1 April
when P29 resumed attendance for outpatient dialysis, and certainly by 3 April when X4 also resumed
outpatient dialysis, the outbreak in the main hospital was well established and it was particularly
apparent that MICU had been a hotspot of transmission. Both patients should therefore have been
considered to have had high risk exposures and strategies could have been put in place to minimise
the risk of transmission within the dialysis unit. This could have involved physical separation of P29
and X4 from other patients (possibly using temporary home dialysis care), and appropriate use of
PPE by health care workers attending to those patients.
Limitations We have presented basic information on the infections in health care workers and other staff, and
have shown that the spatial distribution of HCW infections correlates with the wards where most
patient infections were acquired. We obtained detailed information on some of the first staff cases
to help us understand the chains of transmission. However, we have not been able to interrogate all
the health care worker data fully to understand where precisely people worked on specific wards,
whether there was any direct contact with cases, and whether people were symptomatic (or
presymptomatic) whilst working. We also don’t know exactly how much movement there was of
health care workers between different wards during this period. This means that at present we don’t
know to what extent direct health care worker to patient transmission contributed to the outbreak
and to what extent redeployment of HCWs to different wards might have facilitated the spread
through the hospital. Similarly we don’t know to what extent transmission occurred between staff,
‐ 24 ‐
either in the workplace or outside in shared transport and accommodation. We don’t know if some
of the infections in staff may have been acquired in the household or community. Although this is
less likely for the earlier infections, it would be plausible for some of the later infections that were
acquired once there was established community transmission in the local area.
We haven’t followed up the health care worker testing information to explore the outcomes of
contact tracing and identify how many secondary infections can be linked to the hospital outbreak,
as this was not within our remit. The contact tracing has been coordinated by the Communicable
Disease Control Programme of the KwaZulu‐Natal Department of Health. Clearly this information is
important to understand to what extent the nosocomial transmission may have been an amplifier of
transmission in the province. The other specific issue that there is real concern about in terms of
contact tracing is the issue of nurses employed in the Department of Health who do agency work at
St. Augustine’s Hospital. The concern relates to the possibility that they become infected and then
could transmit the virus to patients and colleagues at the Department of Health facility. Although
eight agency nurses tested positive, we don’t have full details of those cases and have not been able
to ascertain whether there has been any risk of spreading the infection to other health facilities.
We did not have the opportunity to review the results of PCR testing of environmental samples from
the hospital. Environmental sampling was done late in the outbreak and was done in a limited
number of areas and was not systematic so it’s not clear how helpful this information would have
been. We also haven’t fully interrogated the cleaning and disinfection records to understand
whether there were gaps and weaknesses in environmental cleaning that may have contributed to
transmission on specific wards.
We have not yet obtained sequences from all the samples related to the outbreak. We have
received additional samples from Ampath and IALCH NHLS Laboratory and further sequencing will be
done.
Action taken in response to the outbreak Since recognising the outbreak, the hospital implemented a number of measures to contain the
outbreak, limit the spread of infection into the community and get the hospital prepared for
reopening. Some of the key steps taken are detailed below:
EThekwini Department of Health were notified of the first confirmed case on 25 March. The
Chief Director visited the hospital on the evening of 25 March and then again with a
delegation on 27 March. A process of contact tracing and staff screening and testing began
on 27 March, initially focused on medical ICU
On confirmation of the second case on 26 March, the Nursing Manager contacted the
Netcare Group Medical Director and Netcare’s National Joint Operations Command (JOC) in
Johannesburg. The Group Medical Director immediately informed the NICD and sought the
advice and guidance of Dr Kerrigan McCarthy, Pathologist: Division of Public Health
Surveillance and Response at the NICD. The advice received was:
The patients who had shared a room with the COVID‐19 positive patients were not
considered contacts as they were more than 1m away from the patients in question
Nurses and doctors who performed aerosolizing procedures but who had worn
adequate PPE were required to self‐monitor and only those who had not worn adequate
PPE were required to home quarantine. All exposed healthcare workers were advised to
only be tested should symptoms develop
The ED visit of both confirmed cases had to be scrutinized to understand the origin of
the COVID‐19 inoculation into the hospital
‐ 25 ‐
On 27 March, the cardiothoracic ward was repurposed as a COVID‐19 ward, with separate
sections for PUIs and confirmed cases. At the same time, the surgical ICU 2 was designated
as the COVID‐19 ICU
The hospitals’ emergency department was closed on the night of 2 April and from 3 April at
midday all doctors’ rooms were closed and no further admissions were taken to the hospital.
Theatre cases were cancelled as of 3 April
Screening of all people (including staff) entering the facility on a daily basis was instituted,
and any person reporting symptoms is sent immediately for testing
All persons entering the facility must wear a surgical mask
Testing of all staff (both Netcare and support staff) regardless of symptoms began on 2 April.
As of 12 May, 1711 staff members had been tested at least once
All staff testing positive and requiring admission were admitted to the COVID‐19 ward at the
hospital. Those not requiring admission were allowed to self‐isolate at home but if their
home circumstances were not suitable for self‐isolation they were admitted to dedicated
isolation facilities
A process to completely decontaminate and disinfect the entire hospital through deep
cleaning began on 2 April. As an additional precaution terminal cleaning using a high dosage
of chlorine, followed by disinfection with the aid of ultraviolet‐C (UV‐C) disinfection robots
was performed
All patients who were treated at the emergency department or admitted into the hospital as
from 1 March were contacted and screened for symptoms – anyone reporting symptoms
was recalled for SARS‐CoV‐2 PCR testing. Attempts were made to contact 3516 individuals
and 1892 (54%) were successfully contacted. Of those, 191 were recalled for testing and
seven tested positive.
The hospital has been split into red zones (patients with confirmed COVID‐19), yellow zones
(persons under investigation) and green zones (low risk patients)
A new plan has been developed for a separate triage and admission area for the red and
yellow zones. These individuals will be directed to a separate hospital entrance and PUI will
be triaged in an appropriate isolation area.
As of 30 April, the hospital was completely closed. All remaining inpatients (including COVID‐19
cases) were transferred to other hospitals.
The NRC outpatient dialysis unit has also taken specific measures in response to the outbreak. As
soon as it was realised that the dialysis unit had become involved in the hospital outbreak, the
chronic haemodialysis patients were cohorted into three groups:
Group 1 ‐ All patients on chronic HD that were admitted to St. Augustine’s at any time from
1 ‐ 31 March. These were considered patients with potential exposure.
Group 2 ‐ All patients dialyzed at the same sessions as P29 and X4 on 1 and 3 April
Group 3 ‐ All patients with confirmed COVID‐19
Group 4 ‐ All other patients that don’t belong to group 1, 2 or 3
Each group is now being dialyzed at different times with appropriate environmental cleaning
between dialysis shifts. Patients in group 3 have either been admitted to hospital to receive
inpatient dialysis services or are self‐isolating at home and receiving home dialysis care.
‐ 26 ‐
Lessons learnt The primary lesson learnt from this outbreak is that SARS‐CoV‐2 can spread very rapidly in the
hospital environment, highlighting the need for strong infection prevention and control systems and
practices throughout the hospital. Presymptomatic transmission of SARS‐CoV‐2 presents a particular
challenge in the hospital setting and means that the safest approach is for health care workers to
assume that all patients are potentially infectious with COVID‐19 and to take appropriate
precautions on that basis.
Early recognition and isolation of patients with suspected COVID‐19 is essential to prevent or limit
transmission in healthcare settings. This outbreak highlights the consequences of delayed
recognition in hospital inpatients. All health care workers should have a high index of suspicion and
now that there is more widespread community transmission and the PUI criteria have been
simplified, all patients with an acute respiratory illness should be suspected to have COVID‐19 and
investigated accordingly. Health care workers should be alert to symptoms developing in people
already in hospital, and should be particularly vigilant in green zones where people thought to be at
low risk of COVID‐19 are.
The different cadres of staff who were infected highlights that all staff working in hospitals are at risk
of infection, even if not involved in frontline patient care. Whilst we cannot be sure that all staff
were infected in the hospital and not in the community, this emphasises the importance of general
measures such as hand hygiene and physical distancing for all staff in the hospital environment.
The hypothesis around the initial transmission event in the emergency department emphasises the
need for the COVID‐19 isolation and triage area to be completely separate from other patient care
areas (with a separate entrance and exit) to limit the potential for transmission. This also allows for a
rethink around the organisation of the hospital and an opportunity to follow best practice from
other settingsi.
There is no evidence that aerosol transmission contributed to this nosocomial outbreak. Current PPE
guidance therefore remains appropriate, particularly around the use of masksii. Health care workers
performing an aerosol‐generating procedure on a COVID‐19 suspect or case should wear N95 masks.
The focus on type of masks provided to health care workers and the anxiety around mask use
detracts from the importance of good mask etiquette, particularly not touching the front of the
mask, and from all other components of IPC.
Hand hygiene remains the most important intervention to prevent transmission of SARS‐CoV‐2
inside and outside hospitals. The pattern of spread within units in this outbreak suggest that contact
and fomite transmission may have been the most common modes of transmission. It has to be
emphasised at all times that hand hygiene is more important than wearing gloves.
Environmental hygiene is also critical. The evidence suggests that the SARS‐CoV‐2 can survive for
hours or even days on different surfaces, so it’s very likely that the environment around a patient
with COVID‐19 will be contaminated. This emphasises the need for regular cleaning and disinfection,
especially of high contact surfaces. If cleaning is not appropriately checked and validated by
i Schwartz J, et al. Protecting Healthcare Workers During the Coronavirus Disease 2019 (COVID‐19) Outbreak: Lessons From Taiwan’s Severe Acute Respiratory Syndrome Response. Clin Infect Dis 2020 Mar 12. doi: 10.1093/cid/ciaa255 ii National Department of Health. COVID‐19 Disease: Infection Prevention and Control Guidelines Version 1, April 2020. http://www.health.gov.za/index.php/component/phocadownload/category/626‐infection‐control‐material?download=4100:covid‐19‐disease‐infection‐prevention‐and‐control‐guidelines‐version‐1‐april‐2020
‐ 27 ‐
supervisors then there is a high likelihood that cleaning efforts will be insufficient, which will then
allow continued virus transmission. An additional concern, although we have no evidence to support
this, is that the over reliance on the UV‐C robots could reduce the quality of the initial cleaning and
disinfection.
Given the potential role of fomite transmission in hospitals, particular attention needs to be paid to
cleaning and disinfection of medical equipment such as stethoscopes, thermometers and other
patient care itemsi.
Recommendations We have a number of recommendations for the hospital and for Netcare to consider in preparation
for reopening of the hospital and to reduce the risk of further outbreaks of COVID‐19 or of other
respiratory virus infections. Many of the recommendations come back to good infection prevention
and control practiceii,iii, and some have already been put in place or are currently in development.
These recommendations also have broader applicability to other private and public health facilities
in South Africa:
The management should promote a culture where infection prevention and control is
everyone’s responsibility and make clear that everyone has an important role to play. This
must include all Netcare employees, doctors and other support staff working in the facility
Training or re‐training on COVID‐19, with a specific focus on infection prevention and
control, should be mandatory for all staff, both Netcare employees, doctors and support
staff working in the facility. There should be documentation that all staff have completed
training before reopening of the hospital.
Outdoor screening stations should continue to operate at all entry points to the hospital
Continue with the practice of all persons inside the hospital building wearing a surgical mask.
Ensure daily reminders to all staff and patients around mask etiquette
The hospital should be separated into red zones (for confirmed COVID‐19 cases), yellow
zones (for persons under investigation) and green zones (for people at low risk of COVID‐19).
These zones must be clearly marked with signage. Each transition point between zones must
also be clearly delineated using signage, doors and floor markings. Each transition zone
should include prominently posted descriptions of the steps to be taken when in that zoneiv.
If at all possible, separate routes through the hospital to the red and yellow zones need to
be delineated so as to avoid contact with the green zones
Separate Emergency Department entrances leading to i) the green zones and ii) the red and
yellow zones need to be constructed, with easy access to appropriate assessment and triage
areas
i Kanamori H, et al. The Role of Patient Care Items as a Fomite in Healthcare‐Associated Outbreaks and Infection Prevention. Clin Infect Dis 2017; 65(8): 1412–9. 10.1093/cid/cix462 ii National Department of Health. COVID‐19 Disease: Infection Prevention and Control Guidelines Version 1, April 2020. http://www.health.gov.za/index.php/component/phocadownload/category/626‐infection‐control‐material?download=4100:covid‐19‐disease‐infection‐prevention‐and‐control‐guidelines‐version‐1‐april‐2020 iii National Department of Health. Practical Manual for Implementation of the National Infection Prevention and Control Strategic Framework; March 2020. http://www.health.gov.za/index.php/component/phocadownload/category/626‐infection‐control‐material?download=3970:practical‐manual‐for‐implementation‐of‐the‐national‐ipc‐strategic‐framework‐march‐2020 iv Schwartz J, et al. Protecting Healthcare Workers During the Coronavirus Disease 2019 (COVID‐19) Outbreak: Lessons From Taiwan’s Severe Acute Respiratory Syndrome Response. Clin Infect Dis 2020 Mar 12. doi: 10.1093/cid/ciaa255
‐ 28 ‐
Reorganise shared rooms in green zones to ensure physical distancing – beds should be
more than 2 metres apart and consider installing partitions
Limit movement of patients between different wards for non‐clinical reasons
Limit non‐essential movement of staff between different units
Systematic daily symptom screening of inpatients in green zones should be instituted – any
patient with documented fever (>38.0°C) or reporting cough, sore throat, or dyspnoea
should be tested for SARS‐CoV‐2.
If rapid PCR testing is provided on site (e.g. Xpert Xpress SARS‐CoV‐2), samples from
inpatients on green zones should be prioritised for testing with rapid turnaround
Consider establishing routine weekly SARS‐CoV‐2 PCR testing of staff, regardless of
symptomsi
Promote physical distancing for patients and staff throughout the hospital. This can be
promoted by floor markings, markings on seats, reorganisation of common areas etc.ii
Encourage physical distancing of staff outside work – consider providing or incentivising safe
means of travel to and from work to limit time in overcrowded transport
Continually reinforce messages around good hand hygiene based on the WHO ‘My 5
Moments for Hand Hygiene’iii
Disseminate clear, simple messages about infection prevention and control to all staff
through multiple channels (e.g. posters on wards, daily text message reminders)
Each ward should appoint a hand hygiene champion, who should be the role model and
should monitor hand hygiene practices on that wardiv
Encourage all staff to monitor each other for improper use of PPE, hand hygiene etc.
All frontline staff should be reminded of the potential role of fomite transmission and should
be reminded to clean and disinfect surfaces regularly, and to clean and disinfect medical
equipment and patient care items between patients
Engage with management of contract cleaning company to ensure that environmental
cleaning practices align with COVID‐19 IPC guidelines and national IPC strategy manuali,v
Institute regular systematic checking and validation of cleaning through visual inspection and
fluorescent markerii
i Black JRM, et al. COVID‐19: the case for health‐care worker screening to prevent hospital transmission. Lancet 2020 Apr 16. doi: 10.1016/S0140‐6736(20)30917‐X ii Wee LE, et al. Minimising intra‐hospital transmission of COVID‐19: the role of social distancing. J Hosp Infect 2020 Apr 12. doi: 10.1016%2Fj.jhin.2020.04.016 iii World Health Organization. WHO guidelines on hand hygiene in health care; 2009. https://apps.who.int/iris/bitstream/handle/10665/44102/9789241597906_eng.pdf?sequence=1&isAllowed=y&ua=1 iv National Department of Health. Practical Manual for Implementation of the National Infection Prevention and Control Strategic Framework; March 2020. http://www.health.gov.za/index.php/component/phocadownload/category/626‐infection‐control‐material?download=3970:practical‐manual‐for‐implementation‐of‐the‐national‐ipc‐strategic‐framework‐march‐2020 v National Department of Health. COVID‐19 Disease: Infection Prevention and Control Guidelines Version 1, April 2020. http://www.health.gov.za/index.php/component/phocadownload/category/626‐infection‐control‐material?download=4100:covid‐19‐disease‐infection‐prevention‐and‐control‐guidelines‐version‐1‐april‐2020
‐ 29 ‐
In terms of the NRC outpatient dialysis unit, we recommend that patients be reorganised into three
groups, although this will need to be reviewed if there is evidence to suggest ongoing transmission in
the unit:
1. Red: Confirmed COVID‐19 cases: All patients currently in group 3 are red. These patients
should be managed separately, and either receive dialysis as an inpatient or dialysis at
home. The criteria to move out of the red category are as follows: If the patient has had mild
disease then such patients are considered non‐infectious two weeks following onset of
symptoms and can then be moved into the green group. If the patient had severe disease
then the patient can be considered non‐infectious two weeks following stabilization of
clinical condition (e.g. no requirement for oxygen) and then can be moved into the green
group.
2. Yellow: Possible exposure to COVID‐19: Patient had a negative SARS‐CoV‐2 PCR,
asymptomatic, but last had contact with a potentially positive patient less than 14 days ago.
Patients currently in group 2 are yellow. This group was last exposed to a confirmed COVID‐
19 case on 14 April. This group will need to be monitored for a further seven days and if no
new infected patients are uncovered then they can be transferred to the green group.
However, if a case is uncovered then that case is moved to red group and the rest of the
yellow group needs to be monitored for a further 14 days before they can be transferred to
green.
3. Green: Low risk of COVID‐19: Patient had at least one negative SARS‐CoV‐2 PCR, last had
contact with a confirmed or suspected case more than 14 days ago, and asymptomatic for
the preceding two weeks. At this point in time all of patients in group 1 and group 4 can be
considered green‐ all have tested negative, none have symptoms and their last encounter
with a potential case of COVID was more than 14 days ago (31 March).
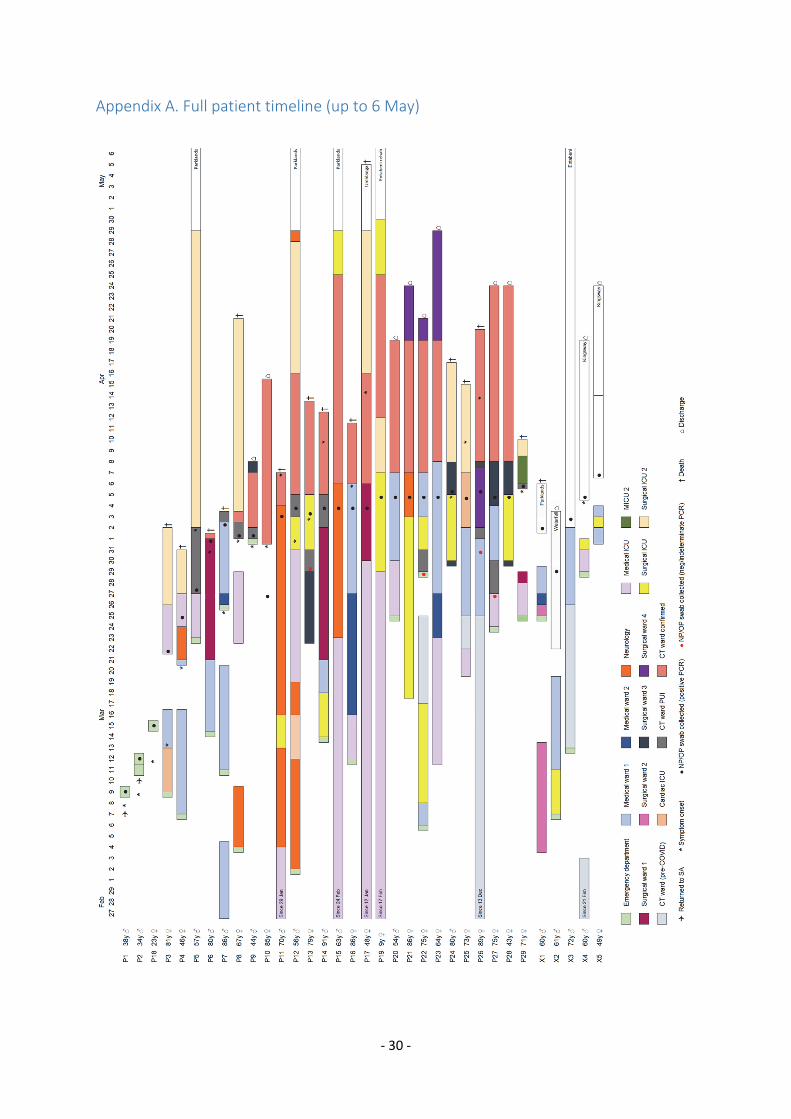
‐ 30 ‐
Appendix A. Full patient timeline (up to 6 May)


![COVID-19 Outbreak in [Location]](https://img.pdfslide.us/doc/110x75/6247c6216176fa3708143446/covid-19-outbreak-in-location.jpg)


![COVID-19 IMPACT SURVEYS...[op1] Percent of firms confirmed permanently closed since COVID-19 outbreak.....10 [op17] Percent of firms likely permanently closed since COVID-19 outbreak.....11](https://img.pdfslide.us/doc/110x75/60c3ed3c25377e5a4e2d292c/covid-19-impact-surveys-op1-percent-of-firms-confirmed-permanently-closed.jpg)