Embed Size (px)
Citation preview

LINKÖPING 2003
STATENS GEOTEKNISKA INSTITUTSWEDISH GEOTECHNICAL INSTITUTE
Repor
t 61
Long-term effects of excavationsat crests of slopesPore pressure distribution – Shear strengthproperties – Stability – Environment
ROLF LARSSON
HELEN ÅHNBERG


STATENS GEOTEKNISKA INSTITUTSWEDISH GEOTECHNICAL INSTITUTE
RapportReport No 61
LINKÖPING 2003
Long-term effects of excavationsat crests of slopesPore pressure distribution – Shear strengthproperties – Stability – Environment
ROLF LARSSON
HELEN ÅHNBERG

SGI Report No 612
Swedish Geotechnical InstituteSE–581 93 Linköping
SGI Literature serviceTel: +46 13 20 18 04Fax: +46 13 20 19 09E-mail: [email protected]: http://www.swedgeo.se
0348-0755SGI-R--03/61--SE
115491-9909-548
Swedish Geotechnical Institute
Rapport/Report
Order
ISSNISRN
Project number SGIDnr SGI
©

3Long-term effects of excavations at crests of slopes
Preface
This report presents the results of a research project concerning the long-termeffects of excavations performed at crests of clay slopes in order to increase thestability. Three slopes in which such excavations were made more than ten yearsago have been investigated with respect to their present conditions. The studieshave concerned the pore pressure distribution and the shear strength of the soil,whether the intended stabilising effect has been achieved and general aspects of theenvironment in the area.
The report is intended for those who plan and design measures to increase thestability of clay slopes and for those who plan the use of land in stabilised areas. Itis thus intended for practising geotechnical engineers, the Swedish Rescue ServicesAgency, the Swedish Rail and Road Administrations, other similar private andnational agencies, landowners and municipal and regional offices for physical andenvironmental planning.
Besides elucidating the questions already mentioned, the results of the project haveled to new recommendations for shear strength testing by field vane tests. Thesehave been presented separately in SGI Varia No. 509 and a paper in Väg- ochVattenbyggaren, No. 4, 2001. The results have also led to revised methods forevaluation of field vane tests, CPT tests and dilatometer tests in overconsolidatedclay. Furthermore, the project has contributed to the initiation of a study concerningthe possibility of improving slope stability investigations by implementinggeophysical test methods among the ordinary geotechnical tests. The results of thisstudy have been presented in SGI Report No. 62.
The project has been supported by grants from the Swedish Rescue ServicesAgency and the Swedish National Rail Administration and by internal researchfunds at the Swedish Geotechnical Institute.
A large number of colleagues and companies have contributed to the special studiesmentioned above, whereas SGI personnel has performed all the work presented in

SGI Report No 614
this report. The implementation of the project has relied on good co-operation withthe involved landowners. The authors wish to express their gratitude to all privatelandowners and municipalities who have put the land at our disposal and contributeddifferent types of information.
Linköping, March 2003
The authors

5Long-term effects of excavations at crests of slopes
Contents
Preface
Notations and symbols ....................................................................... 8
Summary ........................................................................................... 10
1. Introduction ........................................................................................ 12Background of the project ...................................................................... 12Purpose of the study ............................................................................... 14Scope of the investigations ..................................................................... 15
2. Torp, Munkedal .................................................................................. 192.1 Description of the area ................................................................. 192.2 Geology ........................................................................................ 232.3 Previous investigations and stability assessments ....................... 252.4 Stabilising measures..................................................................... 272.5 Restoration of the vegetation ....................................................... 282.6 New investigations ....................................................................... 30
2.6.1 Location ............................................................................. 302.6.2 Observations from an inspection of the area ..................... 322.6.3 Field tests ........................................................................... 372.6.4 Sampling ............................................................................ 632.6.5 Laboratory tests ................................................................. 64
2.7 Test results ................................................................................... 652.7.1 Soil conditions – variations in plan and profile ................. 652.7.2 Pore pressure conditions and variations ............................ 742.7.3 Stress history and stress conditions ................................... 822.7.4 Shear strength .................................................................... 90
2.8 Changes in shear strength .......................................................... 1142.9 Stability calculations .................................................................. 118
2.9.1 Previous calculations ....................................................... 1182.9.2 New calculations.............................................................. 119
SGI Report No 616
3. Strandbacken, Lilla Edet ................................................................ 1313.1 Description of the area ............................................................... 1313.2 Geology ...................................................................................... 1353.3 The Göta-älv Committee ........................................................... 1383.4 Previous investigations .............................................................. 1393.5 Variations in soil conditions and properties .............................. 1423.6 Stabilising measures................................................................... 1563.7 New investigations ..................................................................... 157
3.7.1 Observations .................................................................... 1573.7.2 Location of the new investigations .................................. 1723.7.3 Field tests ......................................................................... 1803.7.4 Surveying and levelling ................................................... 1913.7.5 Sampling .......................................................................... 1923.7.6 Laboratory tests ............................................................... 192
3.8 Test results ................................................................................. 1923.8.1 Soil conditions – stratigraphy and variations over the area . 1923.8.2 Permeability and pore water pressures ............................ 1993.8.3 Stress history and current stress conditions ..................... 2043.8.4 Shear strength .................................................................. 214
3.9 Changes in shear strength due to unloading .............................. 2223.10 Stability calculations .................................................................. 222
3.10.1Previous callations ........................................................... 2223.10.2Conditions in the new calculations .................................. 2233.10.3Results from the calculations ........................................... 225
4. Sundholmen ...................................................................................... 2314.1 Description of the area and its geology ..................................... 231
4.1.1 Description of the area..................................................... 2314.1.2 Geology ........................................................................... 236
4.2 Previous investigations and stability assessments ..................... 2374.2.1 The investigation by SGI in 1957 .................................... 2374.2.2 The investigation by GF in 1989 ..................................... 240
4.3 Stabilising measures................................................................... 2454.4 New investigations ..................................................................... 248
4.4.1 Observations .................................................................... 2484.4.2 Location of the new investigations .................................. 2504.4.3 Field tests ......................................................................... 2514.4.4 Sampling .......................................................................... 2614.4.5 Laboratory tests ............................................................... 261
7Long-term effects of excavations at crests of slopes
4.5 Test results ................................................................................. 2624.5.1 Soil conditions – variations in plan and profile ............... 2624.5.2 Pore pressure conditions and variations .......................... 2654.5.3 Stress history and stress conditions ................................. 2684.5.4 Shear strength .................................................................. 272
4.6 Changes in shear strength .......................................................... 2774.7 Stability calculations .................................................................. 280
4.7.1 Before the excavation ...................................................... 2824.7.2 After excavation .............................................................. 2824.7.3 Comments on the results of the calculations ................... 286
5. Modelling of pore water pressure ............................................... 2875.1 General ....................................................................................... 2875.2 Modelling of pore pressure conditions in Section A in Torp .... 2895.3 Modelling of pore pressure conditions in Section C in Torp ..... 2945.4 Modelling of pore pressure conditions in Strandbacken ........... 3015.5 Modelling of pore pressure conditions in Sundholmen ............. 308
6. Experience from and comments on the resultsof the investigations ........................................................................ 3136.1 Investigation methods ................................................................ 313
6.1.1 Determination of stratification and depth to firm bottom .. 3136.1.2 Determination of shear strength ...................................... 3166.1.3 Determination of other properties ................................... 3456.1.4 Pore pressure measurements and modelling of
pore pressure distribution ............................................... 3466.2 Environment after excavation of slope crests ............................ 3486.3 Soil deposition and stress history............................................... 3496.4 Variations in soil conditions ...................................................... 3506.5 Effect of unloading on the shear strength .................................. 3536.6 Stability after excavation of the slope crest ............................... 3546.7 Achieved increase in stability in relation to expected results .... 354
7. Recommendations .......................................................................... 356Investigation methods .......................................................................... 356Calculation methods ............................................................................. 358Design of excavations for increase of slope stability ........................... 359
8 Need for further research and development ............................ 361
References ......................................................................................... 363
SGI Report No 618
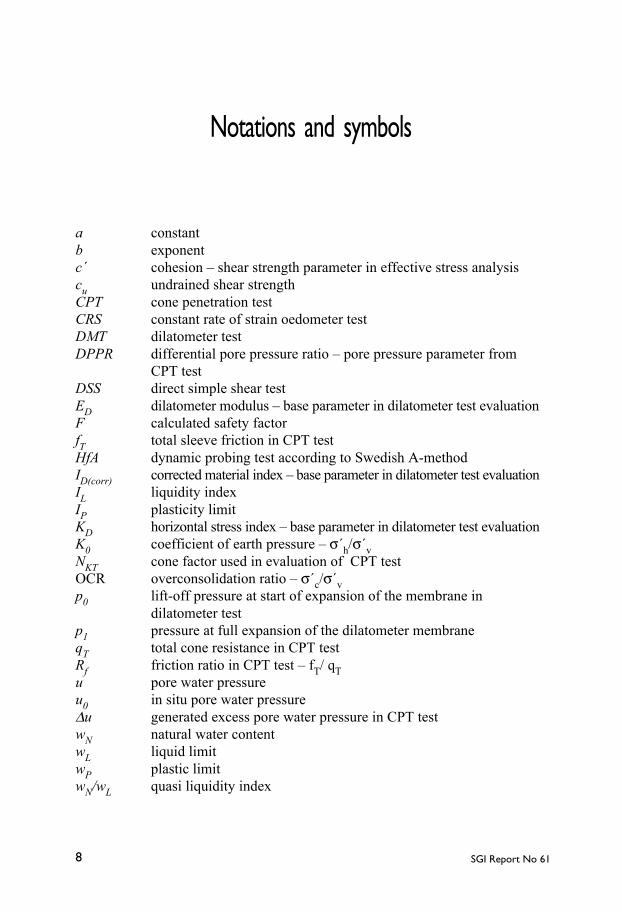
Notations and symbols
a constantb exponentc´ cohesion – shear strength parameter in effective stress analysiscu undrained shear strengthCPT cone penetration testCRS constant rate of strain oedometer testDMT dilatometer testDPPR differential pore pressure ratio – pore pressure parameter from
CPT testDSS direct simple shear testED dilatometer modulus – base parameter in dilatometer test evaluationF calculated safety factorfT total sleeve friction in CPT testHfA dynamic probing test according to Swedish A-methodID(corr) corrected material index – base parameter in dilatometer test evaluationIL liquidity indexIP plasticity limitKD horizontal stress index – base parameter in dilatometer test evaluationK0 coefficient of earth pressure – σ´h/σ´vNKT cone factor used in evaluation of CPT testOCR overconsolidation ratio – σ´c/σ´vp0 lift-off pressure at start of expansion of the membrane in
dilatometer testp1 pressure at full expansion of the dilatometer membraneqT total cone resistance in CPT testRf friction ratio in CPT test – fT/ qTu pore water pressureu0 in situ pore water pressure∆u generated excess pore water pressure in CPT testwN natural water contentwL liquid limitwP plastic limitwN/wL quasi liquidity index

9Long-term effects of excavations at crests of slopes
φ´ friction angle – shear strength parameter in effective stress analysisµ correction factor for field vane testµOCR correction factor for field vane test with respect to
overconsolidation ratioµWL correction factor for field vane test with respect to liquid limitσ´c preconsolidation pressureσ´h effective horizontal pressureσh0 total horizontal pressure in situσv0 total vertical pressure in situσ´v0 effective vertical pressure in situσ´v alt σ´0 effective vertical pressureτfu undrained shear strengthτfu ACTIVE undrained shear strength in active shearτfu PASSIVE undrained shear strength in passive shearτv uncorrected shear strength value from field vane test
Notations and symbols on plan drawings
Static sounding test
Dynamic probing test
Pore pressure measurement station with closed system
Pore pressure measurement station with open system
Undisturbed sampling
Field vane test
Dilatometer test
CPT test
SGI Report No 6110
Summary
In this project, the result of stabilising measures in terms of excavations at the crestof slopes has been studied at three places in western Sweden. At one of these places,two separate areas have been investigated and the study thus includes four differentslopes. The crests of all these slopes were excavated 10 – 15 years before theinvestigations in this project.
The study has comprised mapping of the areas and their geological history, anexamination of previous geotechnical investigations and the basis for the design ofthe stabilising measures performed as well as possible observations or measurestaken thereafter. New investigations have then been performed in order to establishthe present conditions in the slopes regarding the pore pressure distribution, shearstrength and stability situation. The investigations have been aimed at establishingthe present stability conditions and both quantifying the improvement in stabilityand detecting changes in the soil properties because of the unloading. The areashave also been inspected with respect to the conditions of the present slopes anderosion protections, the condition of the ground surfaces within the excavated partsand the vegetation that has been established. The results of the investigations havebeen presented in detail in three separate chapters.
The results that appeared during the course of the investigations have initiated twonew studies. The first of these studies concerned the influence of the type ofequipment and the vane dimensions on the results from field vane tests, and thesecond the possibilities of rationalising slope stability investigations by usinggeophysical methods as supplements to the ordinary geotechnical methods. Thedetailed results of these studies have been reported separately in SGI Varia No. 509and SGI Report No. 62 respectively.
The investigations have led to a number of conclusions and recommendationsregarding the design of excavations at crests of slopes and the concomitant stabilitycalculations. They have also led to recommendations as to how slope stabilityinvestigations should be performed and what methods should be used. Methods for
11Long-term effects of excavations at crests of slopes
prognostication of pore pressure distribution and changes in shear strength after anexcavation have been tried out and as far as possible compared to the real outcome.
The results of the study have called into question the way in which the design ofexcavations at slope crests has hitherto normally been carried out. This concernsboth the resulting stability conditions and the environment in the area. Furthermore,the results have raised serious questions regarding the methods normally used forevaluation of shear strength in overconsolidated soil in general and in slopescreated by excavation and erosion in particular. This has led to recommendationsfor revised evaluation methods for field vane tests, CPT tests and dilatometer testsin overconsolidated soils.
The results of the investigations illustrate how the properties in different parts ina soil mass depend on the geological history of the site and how a detailed modelcan be built up with the aid of this.
The accumulated results have been synthesised and discussed in a separate chapter.Thereafter, more concise recommendations are given regarding investigationtechniques, calculation methods and design of excavations at slope crests in orderto increase the stability. Finally, comments are given on the need for furtherresearch in this area.

SGI Report No 6112
Chapter1.
Introduction
Background to the project
Slips and slides are common occurrences in natural clay slopes in Sweden. Theyare usually results of the ongoing geological process with isostatic uplift of the landand erosion, which creates high and steep slopes, primarily towards watercourses.When this process proceeds, slides normally occur sooner or later when theavailable shear strength is exceeded. Different kinds of human activities can affectthe process and speed it up or alternatively retard it. The slides can be small andsuperficial slips and then only constitute a minor adjustment, resulting in a newtemporarily stable condition for the slope. They can also be dramatic landslides,particularly in quick clays, causing entire basins of fine-grained sediments to flowout and a radical change of the landscape. All forms in between these limits alsoexist.
On account of natural causes, there are thus a large number of slopes withunsatisfactory stability, which pose risks for existing or planned buildings andother constructions in the area. If there are such constructions of importance,stabilising measures for the slope have to be taken in order to achieve an acceptablerisk level. The ongoing erosion process also has to be stopped in order to avoid arenewed worsening of the situation.
Stabilising measures can be of many different types, which in principle can bedivided into geometrical flattening of the slope by earth-moving and soil-reinforcement methods. The latter involve different construction elements beinginstalled into the soil mass, such as sheet pile walls, soil-nails, retaining walls, pilesor columns with reinforced soil. They are all generally more expensive thanflattening by earth moving and are therefore primarily used when the availablespace is limited or when valuable existing constructions have to be preserved.
Different types of drainage systems can also be regarded as soil-reinforcementmethods. These are primarily effective in parts of the soil mass with overconsolidatedmaterial where the drained shear strength is governing the stability.

13Long-term effects of excavations at crests of slopes
Flattening of slopes can be done by excavation at the slope crest, filling at the toeof the slope or a combination of both these actions. The intended result is that theaverage inclination of the slope is reduced and/or that the height of the steepest partis reduced and that the degree of mobilisation of the shear strength in the slope isthereby reduced. A larger fill at the toe of the slope often involves existingwatercourses having to be moved or put in conduits. Besides costs and practicalproblems, this also brings drawbacks for water transport and any fish life andshipping. The hitherto most commonly used method has therefore been to excavateat the crest of the slope and thereby reduce the height of the steepest part and alsothe average inclination of the slope as a whole. For practical reasons, and also tolimit the width of the excavated area and thereby the influence on existing gardens,buildings and other constructions, the excavation has mostly been performed as asingle terrace with a horizontal surface and a steep slope at the back.
The fact that the measured increase in shear strength with depth has been very smallor non-existent has often been a problem in the design of stabilising measures inareas with very thick deposits of “normally consolidated” clay. This is contrary tothe established models for the general behaviour of clays, according to which theshear strength should increase more or less continuously with depth. To what extentthis lack of shear strength increase can be attributed to the methods employed formeasuring the shear strength, usually field vane tests, cannot be readily estimated.However, it has in many cases resulted in very extensive excavations.
Until the end of the 1980s, stabilising measures in terms of flattening of clay slopeswere designed almost solely based on undrained total stress analyses, with theassumption that the shear strength remained unchanged after an unloading.According to this type of analysis, the normal type of excavation described aboveis very effective. The general validity of the method of analysis started to beseriously questioned in the middle of the 1980s, (e.g. Leroueil et al. 1983, Larsson1983 and 1984). However, new rules for design only came into general use in 1995when the guidelines and recommendations for slope stability investigations andstabilising measures were published by the Swedish Commission on Slope Stability,(Commission on Slope Stability 1995 and 1996, a and b). Since then, both drainedand combined analyses are used together with undrained analyses in all clay slopes.According to these analyses, the use of excavations at the crest of the slope in theusual manner is not very effective in all circumstances. The result depends greatly,among other things, upon the resulting pore pressure distribution in the ground.This was not at all considered in the undrained analyses. Furthermore, it has to be
SGI Report No 6114
expected that the undrained shear strength will also be changed as a result of theexcavation. It is thus very uncertain whether the intended stabilisation really hasbeen achieved by the measures taken.
The recommendations of the Commission of Slope Stability were partly based ontheoretical calculations and apprehended reductions in shear strength, whereasthere was a general lack of well-documented observations from real cases. Therecommendations also hinted that the limitations for the common method ofexcavation mainly referred to overconsolidated soil. However, all soils becomeoverconsolidated after removal of overburden load by excavation or naturalerosion. The limitations may therefore be considered to be generally applicable.
Purpose of the study
The purpose of the project was to obtain answers to the uncertainties regarding theeffectiveness of the method of excavation at the crest of clay slopes. One goal wasthus to study how the pore pressure distribution in slopes adapts with time to thenew situation after an excavation and how it then varies seasonally. Another goalwas to find out to what extent the shear strength in the soil has changed when it hasadapted after a long time to the new stress situation after an excavation. A furthergoal has been to investigate in more detail the increase in shear strength with depthin deep clay profiles.
These results of these investigations should provide a better basis for new stabilityanalyses using all types of analyses and thereby a calculation of the increase instability that has in reality been achieved by the measures taken. A more detaileddetermination of the shear strength properties in the soil should also show to whatextent effects of shear strength anisotropy in the clays compensate for a lowerstability according to these calculations. Such effects were not included in theprevious analyses either.
Beside this specific check of what stabilising effects had really been achieved, theproject was also intended to provide better knowledge about the general behaviourand properties of clay soils under different conditions.
The project did not aim at providing a basis for assessments of what use of the landand what activities could be allowed and performed in the specific investigatedstabilised areas in the future. However, several general conclusions regarding thedesign of excavations at slope crests with regard to environmental aspects have alsoemerged during inspection of the areas and the course of the investigations.

15Long-term effects of excavations at crests of slopes
Furthermore, new aspects have emerged on the determination of the geometricalextent of the soft soil layers and on the execution and evaluation of differentmethods of determination of shear strength in situ. This was not part of the originalpurpose either, but became essential for the implementation of the project and forthe conclusions and assessments that could be made.
Scope of the investigations
The investigations have been performed at three places in western Sweden withdifferent geometrical conditions. The first area, Torp, is located at the southern endof the municipality of Munkedal and has a slope about 20 m high down to the riverÖrekilsälven caused by erosion. The crest of this slope has been excavated over astretch of several hundred metres. The depth of the excavation varies between 4 and9 metres and its width varies between 30 and 70 metres. The deepest excavationhere has been performed as two terraces. In this area, two sections about 200 metresapart and with very different geometries have been studied.
The second area has a slope about 10 m high down to the river Göta älv. It is locatedat Strandbacken in the municipality of Lilla Edet. Here, an excavation about 200 mlong and about 50 m wide with a depth of about 4 m has been performed at the crest.A section located approximately at the centre of this area has been studied.
The third area is located in the village of Sundholmen and has a slope about 5 m highdown to the small river Viskan. In this area too, an excavation about 200 m longhas been performed at the crest of the slope. Its depth is only about 2 m and its widthabout 20 m. The size of the excavation was limited by the risk of flooding at extremehighwaters and the requirement that existing buildings should remain. The excavatedarea is mainly used as gardens, and certain measures have been taken to providesurface drainage.
All of the areas are located in valleys with thick deposits of clay in which a largerwatercourse has eroded its channel down through the loose upper soil layers. Theslopes are thus caused by erosion and end in watercourses at their toes. This is thenormal case for slopes in which excavations have been performed at the crests inorder to increase the stability. In all of the investigated areas, the geological processhas also involved the clay layers in the central parts of the valleys being overlaidby coarser lateral fluvial sediments and delta sediments. These sediments have laterbeen eroded away in the channels for the watercourses. The superficial layers at thecrests and in the vicinity behind these thus consist of coarser and more permeablesoil. The excavations performed have mainly been made in this type of soil.
SGI Report No 6116
For all cases, the excavations have been supplemented with a construction of anerosion protection at the toes of the slopes. The measures were taken at the end ofthe 1980s and it may be assumed that a sufficiently long time has now elapsed forthe soils to adapt to the new stress conditions.
In the different areas, an inventory has been made of existing investigations, testsand calculations before the excavations and the results have been put together. Theareas have been inspected and the ground conditions and environments have beendocumented. New geotechnical investigations have then been performed includingpenetration tests, other in situ tests, pore pressure measurements, samplings andlaboratory tests. These investigations have been made comprehensive enough toclarify the conditions in all parts of the slopes. At location of the investigatedsections and boreholes, attempts have been made to place them close to previousinvestigation points to enable a direct comparison between the conditions beforeand after the excavations.
The investigations have involved undisturbed sampling and field vane tests to atleast the same depths as in the previous investigations. This has enabled comparisonof results obtained by the same test methods before and after the excavations. Thepenetration test methods used in the previous investigations were too coarse tomake a comparison between penetration resistances meaningful. In the newinvestigations, CPT tests of the highest class of accuracy have been used, i.e. ClassCPT-3 according to the designation by the Swedish Geotechnical Society. Thesetests have provided both a more detailed picture of the stratifications andsupplementary measures of the undrained shear strength and its variation withdepth. Dilatometer tests have also been performed at some investigation points.The results of these tests have often been found to be less sensitive to disturbanceswhen penetrating layered soils, and they also provide a measure of the horizontalstress conditions in the soil. All field tests have been performed in accordance withthe recommended standards of the Swedish Geotechnical Society, SGF (1993–1996).
The routine tests in the laboratory have been supplemented with a large number ofdirect simple shear tests, which have given an alternative measure of the undrainedshear strength. The results of these tests provide a control and local calibration ofthe empirical factors that are used for correction of results from field vane tests andfall-cone tests, the empirical cone factors used in evaluation of CPT tests and theempirical relations used for evaluation of dilatometer tests. Series of direct simpleshear tests have also been run for determination of the factors required to expressthe relation between undrained shear strength, preconsolidation pressure and

17Long-term effects of excavations at crests of slopes
current effective overburden pressure for the particular soils in the slopes. Anumber of active and passive triaxial tests have also been performed in order tocheck the applicability of the empirical relations that are normally used to estimatethe undrained shear strength anisotropy and the effective strength parameters.
The stress history of the soils and its variation in different parts of the slopes hasbeen investigated by a large number of oedometer tests in the laboratory. Theseresults have also been linked to the results of the CPT and dilatometer tests, whichenabled a control and revision of the methods for evaluation of preconsolidationpressure and overconsolidation ratio from these tests.
All laboratory tests have been performed in accordance with existing Swedishstandards. A few test methods for which there is no such standard have beenperformed according to the guidelines of the Laboratory Committee of the SwedishGeotechnical Society or some other well-established procedure.
The permeability of the soils has been determined in the oedometer tests, whichwere run as “constant rate of strain” tests. In one of the slopes, this has beencombined with permeability measurements in situ by “falling head” tests in openpore pressure measurement systems installed in the ground.
The current pore pressure distributions have been modelled using an advancednumerical calculation method with support from the pore pressure measurementsperformed. The possibility of making a reasonably accurate prognosis beforehandof the pore pressure distribution in a slope resulting from an excavation at the cresthas also been assessed. The factors of safety for the slopes against failure before andafter the excavations have been calculated using undrained, drained and combinedanalyses with and without taking effects of anisotropy into account. The improvementof the stability achieved because of the excavations has then been analysed.
Due to the results that have come forward during the course of the project, a numberof extra investigations have been added. The results obtained from the field vanetests, particularly in Torp, led to a larger study regarding the influence of differentfactors on these results. That study eventually came to comprise results from manymore places than those involved in this report, and its results have been presentedseparately (Åhnberg et al. 2001). Because of shortcomings in the traditionalgeotechnical investigation methods that were found in Torp, among other places,a project was started to elucidate the usefulness of geophysical methods as aids inslope stability investigations. The results of this project, together with guidelinesfor how such methods can be implemented at various stages of the investigations,
SGI Report No 6118
have been presented by Dahlin et al. (2001). The results of the first pore pressuremeasurements led to a comparative study of the pore pressure variations measuredby open systems with inner hoses and closed systems installed in a thick clay layer.The results of this study are shown in this report. Finally, the investigationsperformed have offered a unique opportunity to study the influence ofoverconsolidation ratio on the results of different test methods. Together withresults obtained in a previous investigation in clay till (Larsson 2000), this has ledto a revision of the evaluation of field vane tests, CPT tests and dilatometer tests inoverconsolidated soil. The new interpretation methods are presented in this report.
19Long-term effects of excavations at crests of slopes
Kapitel 2.
Torp, Munkedal
2.1 DESCRIPTION OF THE AREA
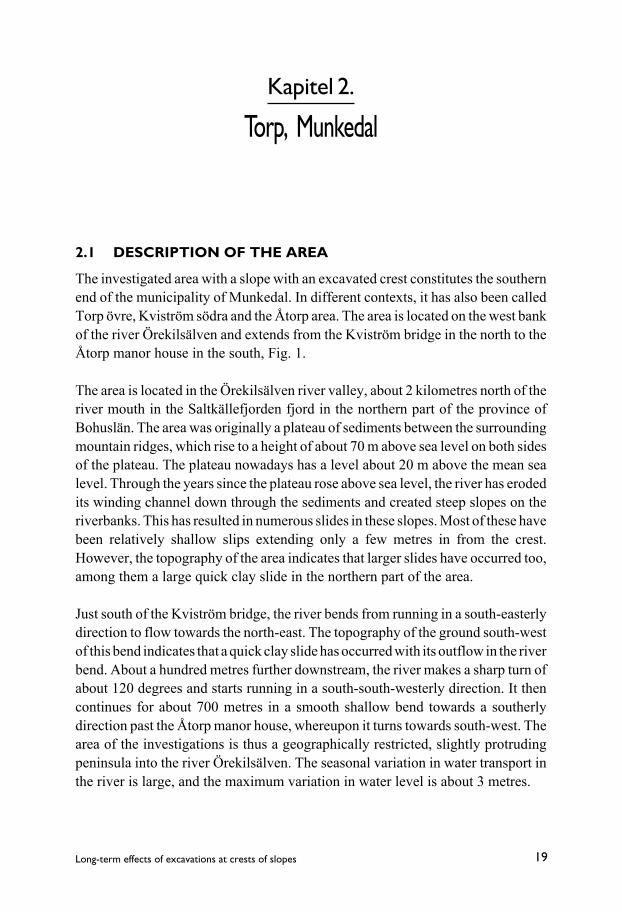
The investigated area with a slope with an excavated crest constitutes the southernend of the municipality of Munkedal. In different contexts, it has also been calledTorp övre, Kviström södra and the Åtorp area. The area is located on the west bankof the river Örekilsälven and extends from the Kviström bridge in the north to theÅtorp manor house in the south, Fig. 1.
The area is located in the Örekilsälven river valley, about 2 kilometres north of theriver mouth in the Saltkällefjorden fjord in the northern part of the province ofBohuslän. The area was originally a plateau of sediments between the surroundingmountain ridges, which rise to a height of about 70 m above sea level on both sidesof the plateau. The plateau nowadays has a level about 20 m above the mean sealevel. Through the years since the plateau rose above sea level, the river has erodedits winding channel down through the sediments and created steep slopes on theriverbanks. This has resulted in numerous slides in these slopes. Most of these havebeen relatively shallow slips extending only a few metres in from the crest.However, the topography of the area indicates that larger slides have occurred too,among them a large quick clay slide in the northern part of the area.
Just south of the Kviström bridge, the river bends from running in a south-easterlydirection to flow towards the north-east. The topography of the ground south-westof this bend indicates that a quick clay slide has occurred with its outflow in the riverbend. About a hundred metres further downstream, the river makes a sharp turn ofabout 120 degrees and starts running in a south-south-westerly direction. It thencontinues for about 700 metres in a smooth shallow bend towards a southerlydirection past the Åtorp manor house, whereupon it turns towards south-west. Thearea of the investigations is thus a geographically restricted, slightly protrudingpeninsula into the river Örekilsälven. The seasonal variation in water transport inthe river is large, and the maximum variation in water level is about 3 metres.
SGI Report No 6120
Fig. 1. Map of the investigated area in southern Munkedal from 1978. In thismap, the river Örekilsälven is designated as Kviströmsälven.Copyright Lantmäteriverket 2003. From The Property Map reference no. M2003/5268.Valid to 2007–09–30.

21Long-term effects of excavations at crests of slopes
The Bohusbanan railway line runs on the western side of the plateau, about 200–300 metres behind the location of the slope crest before the excavation. On the otherside of the valley runs the main road between Göteborg and Oslo, the Europeanhighway E6. The buildings on the plateau today consist of the Åtorp manor house,which is a hotel and conference centre, a carpentry factory and a few dwellinghouses. In earlier times, as shown in the map, there was also a cement works anda larger number of dwelling-houses, but the works has been closed since theexcavation took place and the houses were demolished in connection with thestabilising measures.
The stability in the area has been investigated to a limited extent in connection withdifferent extensions of primarily the industrial premises and Åtorp manor house.It has then been pointed out that the stability of the slopes was low and, already inthe 1950s, an investigation by Caldenius suggested that no buildings should beplaced closer than 100 metres to the crest for safety reasons. In that investigation,it was also proposed that the whole stretch along the river should be supplied witherosion protection to stop the ongoing erosion process. Later investigations citedand repeated these proposals, but nothing happened until a slide occurred in theslope directly beneath the main building of Åtorp manor house in 1980. Thisprompted an investigation that was carried out by Bohusgeo AB, which showedthat the stability was clearly unsatisfactory in this part of the area. It was alsopointed out that there were many sections in the area with more unfavourablegeometrical conditions than in the investigated part. It was therefore apprehendedthat the stability was very low in other parts of the slope along the river as well.
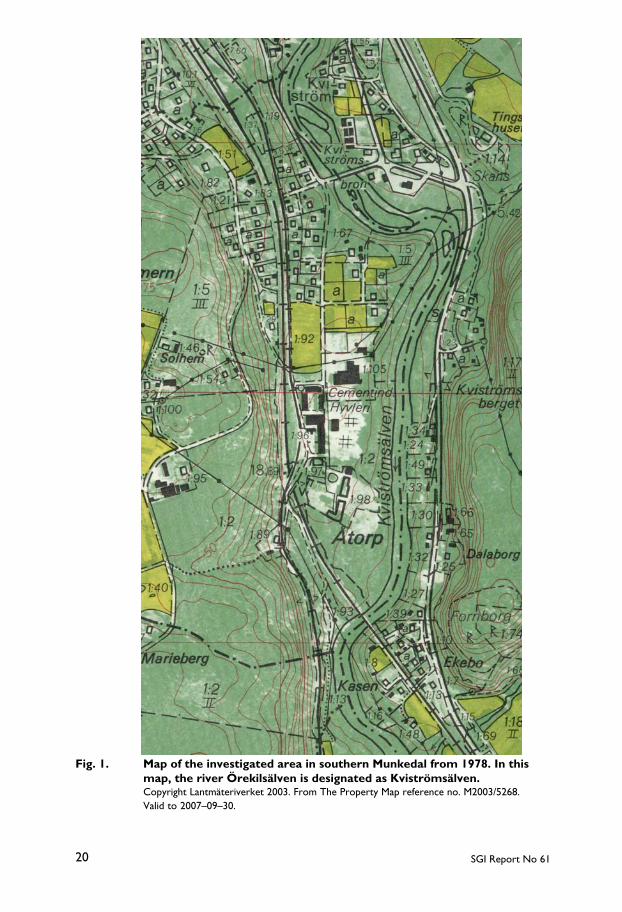
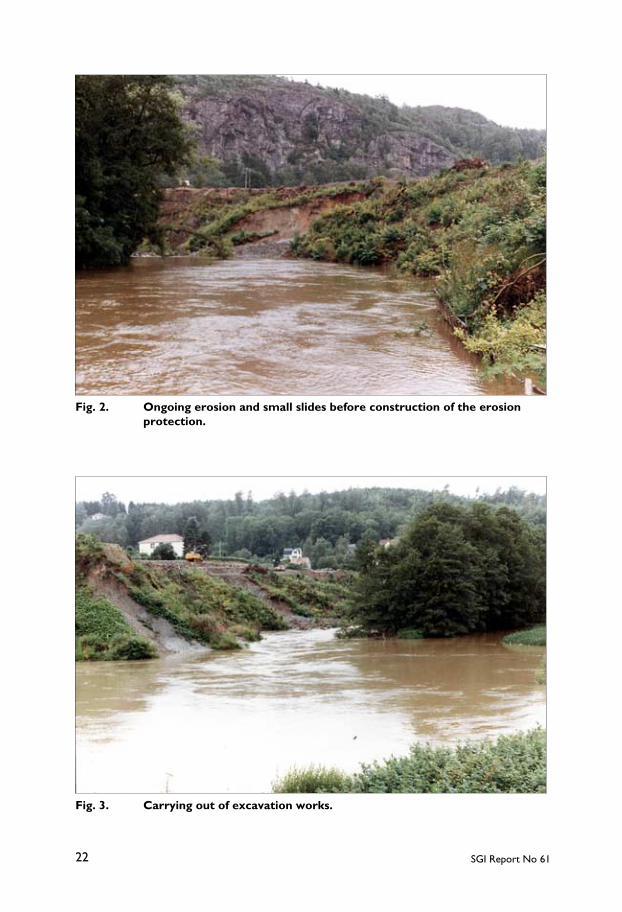
This led to further investigations, which were carried out in co-operation betweenSGI and Bohusgeo AB (Swedish Geotechnical Institute 1985). Eventually, theresults led to an investigation of the entire length of the slope towards the river inthis area and also in a large area in the central parts of the municipality. The outcomeof the investigations led to an intervention by the Swedish Rescue Service Agencyin order to secure the safety in all of this extended area. The so-called “Munkedalworks” comprised large excavations and earthmoving operations in the central partof Munkedal, where the whole river channel was moved (SVT 1985, NCC 1985).They also comprised large excavations and construction of erosion protection onthe riverbanks in the area of the present investigation, Figs. 2 and 3. The slopedirectly beneath the Åtorp manor house was reshaped and flattened by a combinationof excavation and filling. In connection with these works, a number of landedproperties were bought up and the buildings on these were demolished. The size ofthe excavations was partly limited by the existing cement works, which at that time
SGI Report No 6122
Fig. 2. Ongoing erosion and small slides before construction of the erosionprotection.
Fig. 3. Carrying out of excavation works.

23Long-term effects of excavations at crests of slopes
was still in operation. This industry has later been closed and these buildings havealso been demolished.
In the southern part of the Torp area, there was a small wood of beech trees growingin the slope and the area just behind the crest. The wood was protected by anenvironmental decree but it became necessary to cut it down in order to enable theimplementation of the stabilising measures. A plan for replanting was created inorder to re-establish the character of the area with a leafy wood consisting primarilyof beech trees. The plan sought to take into account both environmental interestsof re-establishing the vegetation and geotechnical interests of avoiding treescatching a great deal of wind being placed at unsuitable locations in the area withregard to local stability.
2.2 GEOLOGY
No thorough geological investigation, like e.g. those in the Göta-älv valley and atTuve (SGI Report No 11b), has been made in the Munkedal area. Nor is the areaincluded in any recent geological mapping with an accompanying description ofthe area. It is only briefly mentioned in an old survey by Lindström (1902).However, the general outline of the geological history is the same as for the Göta-älv valley and other valleys with marine clay deposits in the Göteborg and Bohuslänarea.
The area was covered by inland ice during the last glaciation and the deposition ofsediments started when the retreating ice front passed the area. This occurred about12,400 years ago. Fine-grained particles in the melt-water then started to accumulateby sedimentation on top of the bedrock or on top of a layer of till which had beendeposited below the ice cover. The soundings in the Torp area that have reachedfirm bottom layers indicate a layer of till on top of the bedrock, and the pore pressuremeasurements in the same section indicate that the layer is continuous. This section,designated Section A, is located in the northern part of the area, see Fig. 4. The firmbottom in this section slopes down towards the location of the river channel, andthe maximum thickness of the sediments is here about 60 metres. In a sectionlocated 200 metres further south, none of the penetration tests has reached firmbottom and the maximum thickness of the sediments here can only be estimated tomore than 70 metres. Later geophysical investigations have confirmed that thebedrock surface slopes downwards towards the south and have indicated that thethickness of the till layer varies from a metre or so to about 10 metres.
SGI Report No 6124
The sediments were precipitated in sea water, whose salt content and temperaturevaried with depth and the distance to the ice front. Normally, the soils in the lowestlayers are coarser with infusions of silt and sand layers, but the clay content thenstarts to increase continuously upwards in the profile. The lowest layers alsonormally contain sulphides in sufficient quantities for the clay to be significantlybanded, striped or flamed by black sulphide colour. At the start of the deposition,the sea level was more than a hundred metres above its present level in relation tothe bedrock, but the depths gradually became shallower as the ice front movedaway and the isostatic uplift of the land progressed. Postglacial sediments thenstarted to overlay the glacial deposits. When the area had become even shallower,the river had been created in the higher areas to the north and the eroded particlestransported by this started to deposit at and some distance away from the rivermouth. The very fine-grained sediments then started to be overlain by newsediments, which became coarser and coarser as the shoreline and river mouthapproached the present area. When these passed the area, a delta was probablycreated, similar to that which can be seen today at the outlet of the river into the fjordabout 2 kilometres downstream. Varying water transports and water levels resultedin different kinds of lateral fluvial sediments being deposited over the area aroundthe river mouth. The thickness and grain sizes of these sediments were in principlelargest around the main river channel and decreasing sideways, but large variationsoccurred due to the shape of the delta and its variation during the time of depositionof delta and lateral fluvial sediments in the area. From a certain level, the clay inthe deposits thus started to become gradually coarser upwards. They were thenoverlain by silt and sand and in some spots even by gravel. These upper depositsare normally layered. Deposits of silt and sand at the top with a thickness of morethan 10 metres have been found within the investigated area. The normal picturebefore the excavation was that these deposits had a thickness of about 6 metres atthe crest of the slopes and then gradually became thinner towards the valley sides.However, large variations have been found between the two sections in thisinvestigation and also in the different previous investigations. The delta and lateralfluvial sediments also contain varying amounts of organic material.
In this type of deposits, it is common that seams and layers of coarser wave-washedmaterial are found embedded in the fine-grained material along the valley sides asa result of changes in climate and sea level during the period of deposition. This hasnot been reported in this particular area, which may be due to the fact that noinvestigations have been performed close to the valley side. However, in thesouthernmost section in this investigation, a continuous layer of coarser soil wasfound at a depth of 50–55 m below the original ground surface. This layer may be

25Long-term effects of excavations at crests of slopes
assumed to be a result of a temporary re-advance of the ice front during theprotracted period of deglaciation, as described by Stevens (1987).
Since the area rose above sea level, the river has eroded its channel down throughthe sediments and the river bottom now lies more than 20 metres below the levelof the plateau behind the slope crest. A number of slides have occurred in the slopescreated during this process. The slide debris has mainly been eroded away by theriver and has not significantly affected the soil stratification. During the same time,leaching has gradually reduced the salt content in the pore water in the soil. Thisprocess is most pronounced for clay layers in which the distance to a draining layeris relatively short. The process has thus advanced furthest at the valley sideswhereas the original salt content is better preserved in the thicker clay layers.Leaching may entail that the shear strength becomes reduced, but primarily that itssensitivity to disturbance increases and that the remoulded shear strength decreases.Quick clay has thus been found in parts of the Torp area where the clay layers arethinner, which here occur only at a certain distance from the river. However, theriver runs very close to the valley side in the northern part of the area, and this iswhere indications of an old quick clay slide are found.
2.3 PREVIOUS INVESTIGATIONS ANDSTABILITY ASSESSMENTS
The investigations concerning the slope stability that were performed during theearly 1980s, and which are relevant for the excavated area, were primarily locatedin four sections designated as 22-23, A, B and C. The location of the sections canbe seen in Fig. 4. (Section B is not shown in the figure, but lies midway betweensections A and C). The investigations were primarily made by Bohusgeo AB bytotal pressure soundings and field vane tests, and samples were taken by screwauger in the upper silt and sand layers and with the Swedish standard piston samplerin the underlying clay. A few soundings were also made as weight sounding testswith machine-driven rotation. The total pressure soundings and field vane testswere performed using light-weight Geotech equipment. This type of total pressuresounding can apply a maximum push force of 10 kN. The soundings were stoppedwhen this force was reached and the stop level was designated as “stone, boulderor rock”. This was done without any check whether the sounding could be drivenfurther by use of rotation. However, the few weight sounding tests that wereperformed generally reached deeper levels than the total pressure soundings(Swedish Geotechnical Institute 1985).

SGI Report No 6126
The shear strength determinations by field vane tests generally showed a relativelysmall increase in shear strength with depth. A closer study of the results shows thatwhen the measured shear strength value had reached 55–60 kPa, there was a suddendecrease in the measured shear strengths. This limiting value approximatelycorresponds to the maximum shear strength value that can be measured with theequipment used and the normal size of the vane. When this value is reached, thenormal vane therefore has to be replaced with a vane of a smaller size. Normally,this change is not expected to cause any change in the measured shear strength, buta closer study of the results clearly indicates that this happened in this soil.However, this was not revealed until the present investigation and comparisons,which in turn led to a special study of the influence of the vane size and type ofequipment on the results (Åhnberg et al. 2001).
The pore water pressures were measured at one point located some distance awayfrom the crest in Section A using a piezometer installed in the upper part of the claylayer below the overlying silt and sand layers and an open pipe driven down to theassumed firm bottom. The results showed that the free groundwater level waslocated somewhere in the silt and sand layers and that there was a downwardgradient towards considerably lower pressure heads in the bottom layers.
The soil samples were investigated in the laboratory concerning classification,density, water content, undrained shear strength determined by fall-cone tests andsensitivity. Oedometer tests were also performed for determination ofpreconsolidation pressures. The results showed a stratified composition of theupper soil layers with gravel, sand and silt with organic matter gradually changingto clayey silt and silty clay with depth. The clay below was first medium-plastic andthen became high-plastic with black spots from sulphide colour. In a borehole takenrelatively close to the crest in Section A, the water content was generally equal toor lower than the liquid limit and the clay was medium-sensitive. This is normal forclays in western Sweden. In borehole 22, which is located further away from theriver channel and the thickest clay layers, the water content was generally equal toor higher than the liquid limit and the clay was highly sensitive at many levels atthis point. That the clay was highly sensitive and sometimes quick at points locatedcloser to the valley side had also been observed in earlier investigations for otherpurposes. The undrained shear strengths measured by fall-cone tests in samplestaken from greater depths were generally lower than those measured by field vanetests, which is normal. The results of the oedometer tests showed that the clay inthe area behind the crest was normally consolidated or only slightly overconsolidatedin relation to the prevailing overburden pressure.

27Long-term effects of excavations at crests of slopes
The stability calculations using total stress analyses and isotropic undrained shearstrength generally showed safety factors between 0.8 and 0.9 for the most criticalslip surfaces calculated in this way. These slip surfaces extended 10 to 20 metresbehind the crest and deeper than the bottom of the river. In some sections, theassumed firm bottom restricted the depth of the critical slip surfaces. The lowerends of the critical slip surfaces coincided with the submerged toes of the slope atthe river bottom. The discrepancy between the calculated safety factors and thetheoretical minimum value of 1.0 was assumed to be due to the fact that the shearstrength anisotropy had not been taken into account. However, no attempt wasmade to quantify this effect. This was not considered to be necessary since it wasobvious that the safety factor was close to 1.0 and that the stability was highlyunsatisfactory.
A calculated safety factor of at least 1.3 to 1.5 is normally desired in built-up areas,depending on what restrictions are applied for construction and use of the land inthe area. In designing stabilising measures for slopes with a calculated safety factorof 1.0 or below, this means a required increase in calculated safety factor by 30 or50 % respectively. Proposals for designs fulfilling the two different requirementswere drawn up. The final extent of the stabilisation appears to vary between theseproposals, probably as a compromise governed by small variations in the groundlevel, variations in the slope and crest, what landed property was decided to bebought up and the continued operation of the cement works. In principle, thedemands for a calculated safety factor were set to 1.5 for remaining dwelling housesand to 1.3 for the other ground and the cement works (Bergdahl 2002).
2.4 STABILISING MEASURES
The extensive excavations at the slope crest in the Torp area in order to ensuresatisfactory safety against slope failure were performed in 1985. At the same time,an erosion protection of blasted rock-fill was constructed on the riverbanks for theentire roughly 600 metre long distance between the first river bend just south of theKviström bridge, around the protruding point of land and southwards down toÅtorp manor house. The major part of the excavation was made about 5.5 metresdeep. The excavation depth varies somewhat and is smallest in the northern part ofthe area and then gradually increases towards the south. This roughly correspondsto the difference in slope height even though this, and thereby also the excavationdepth, varied somewhat locally. The width of the excavation varies with the earliertopography and contour of the crest line. It is mainly between 25 and 50 metres.Within a small slightly elevated area located directly behind the new upper crest,
SGI Report No 6128
the ground was also scraped off and lowered about a metre to become level withthe surrounding ground.
Over a somewhat more than 100 metre long distance in the southern part of the areathe excavation was increased and became a width of totally about 70 metresincluding the upper slopes. It was here performed in two terraces, an upper one witha width of about 40 metres and an excavation depth of about 5.5 metres and a lowerone about 20 metres wide and an excavation about 4 metres deeper. The slopes fromthe new crests down to the terraces were given inclinations of about 1:2. Theexcavated terraces in the eastern part of the area were given inclinations of only1:50 and thereby became almost horizontal planes. The terrace in the northern partof the excavated area was given a roughly twice as large inclination, but the groundsurface still gives the impression of being almost horizontal.
Directly in front of the Åtorp manor house, there was a steep, almost 10 metre highslope towards the south-east, which then flattened out in its further run towards theriver. The stability problem here was limited to the upper slope. The stability of thisslope was secured by an earth fill spread over a larger area at the toe of the upperslope. The average thickness of this fill was about 2 metres.
An erosion protection was constructed on the riverbanks. First a fill of stone andfiner soils was laid out at the toe of the slope until the shore line was evened out andan inclination of 1:2 was obtained from the river bottom to a level about 3 metresabove the mean water level. The outside of the fill was covered by a 0.7 meter thickshield of rock-fill and its top surface was covered by a 0.3 metres thick fill of clayeysoil.
2.5 RESTORATION OF THE VEGETATION
Almost all trees in the area were cut down in connection with the stabilisationworks. This was also done to a large extent in the remaining lower parts of the slopessince this was necessary to allow the construction of the erosion protection. Manylarge trees were also considered to constitute stability problems because of theirlarge surfaces exposed to winds, which can be very strong seasonally along the westcoast of Sweden.
For environmental reasons and to avoid surface erosion, it was consideredimportant to rapidly re-establish a cover of vegetation. In the southern part, theprotected wood of beech trees had been cut down and it was considered to be veryimportant to replace this and to recreate the character of a leafy wood in the area.
29Long-term effects of excavations at crests of slopes
A comprehensive plan for replanting of the area was therefore designed. The steepexcavation slopes were sowed by spraying grass seed in the same way as isrecommended by the Swedish Road Administration (1984) for excavated slopesalong roads. The mixture of grass seed was supplemented with lupin seeds. Largeparts of the terraces were sown in this way as well. On the terraces were also plantedgroups and groves of different kinds of bushes and leafy trees, which were intendedto grow and through time reach different heights. A cover of topsoil was laid outon these special areas before planting. Osier bushes, which become about waist-high and grow even in very wet conditions, were planted on the small terracescaused by the fills on the riverbanks. In the remaining slope, the original vegetationconsisting of beech trees and other plants was expected to re-establish itself throughall sprouts that were left after the felling of the trees. Supplementary planting ofbeech trees was also to be undertaken in the southern part of the area.
Records from the time for the planting operations and minutes of a meetingconcerning the vegetation a year later show that serious problems had beenencountered. It had not been possible to carry out the planting in those areas thathad the smallest inclinations because of marshy ground conditions, and a largenumber of plants among those that had been placed in other areas had died. Someplants had also been swept down with superficial slips in the slopes that had beenlaid bare. An unexpected amount of thicket and other unwanted growth had alsobeen established on the excavated slopes. Clearing up, resowing and extensive re-planting was therefore planned.
The use and nature of the upper terrace in the southern part of the area had also beenaltered from intended woodland to a parking area during the stabilisation works.During the excavation work, a large flow of water started out of the upper excavatedslope and the upper terrace became exceedingly wet. The upper excavation slopetherefore had to be equipped with a material separation filter and a cover of rock-fill in order to prevent internal erosion. The upper terrace was first lowered about0.9 metres further than originally intended and then supplied with a 0.6 metre thickbase for the parking area. Rock-fill was used as base material because of the wetconditions. A thin cover of mixed coarse and medium-grained soil was then appliedas pavement.
What has happened thereafter with the revegetation programme and any changesin use of the land cannot be seen in the available records.

SGI Report No 6130
2.6 NEW INVESTIGATIONS
2.6.1 Location
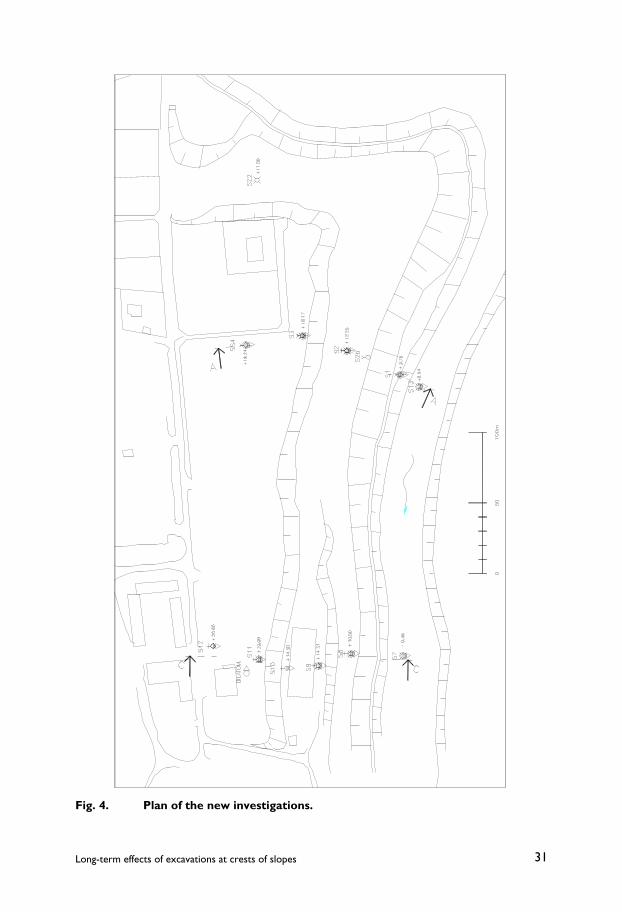
The new investigations have been made with the purpose of studying in detail theeffects of the excavation in terms of changes in pore pressure conditions and shearstrength and the related development of the stability situation. Other possibleaspects of the design and the results of this type of stabilising measures should alsobe looked into. The investigations were therefore located in those sections and testpoints in the excavated area where the situation before the excavation had beeninvestigated in most detail. The previous investigations in this area by BohusgeoAB had been located in Sections A, B and C, where total pressure sounding, fieldvane tests by lightweight Geotech equipment and piston sampling had been carriedout. In Section B, only total pressure sounding had been performed. The porepressure had been measured at two levels in one point in Section A. Supplementaryinvestigation had been performed by SGI in the northern part of the area after theplanned excavation had been extended to include the slope towards the north aswell. Both field vane tests using SGI-type equipment and piston sampling had beenperformed in point 22 within this part of the excavated area (Swedish GeotechnicalInstitute 1985).
The new investigations were therefore performed in Sections A and C withsupplementation of new field vane tests at point 22. Section A is locatedapproximately in the middle of the eastern part of the excavated area and SectionC is located in the south-eastern part where the excavation was performed with twoterraces at different levels. The distance between the two sections is about 200metres. The points for the new investigations were as far as possible located closeto the previous investigation points. The number of investigation points was alsoextended in order to allow comparisons between the conditions in natural groundbehind the excavated area with those in the slope. Investigations were alsoperformed below the river bottom to enable a similar comparison with theconditions in those parts of the area where the geological process had brought thelargest unloading, Fig. 4. In order to differentiate between old and new investigationpoints, the letter S has been added to the designations of the latter.
The field investigations were performed in two stages. The first round of fieldinvestigations and sampling was performed in the autumn of 1996 and comprisedinvestigations in Section A and point 7 in Section C. The latter point is locatedbelow the river and was investigated in this round because the rented raft was thenin place.
31Long-term effects of excavations at crests of slopes
Fig. 4. Plan of the new investigations.
SGI Report No 6132
The second round of investigations took place in the autumn of 1999. It comprisedthe rest of the investigations in Section C and supplementary investigations inSection A, which in the meantime had been found to be required. Field vane testswere then also performed in point 22.
Pore pressure measurements have been performed in a large number of points anddepths in both sections, enabling a study of the pore pressure distribution in thewhole soil mass. Observations have been performed regularly for several years tostudy seasonal variations as well.
2.6.2 Observations from an inspection of the area
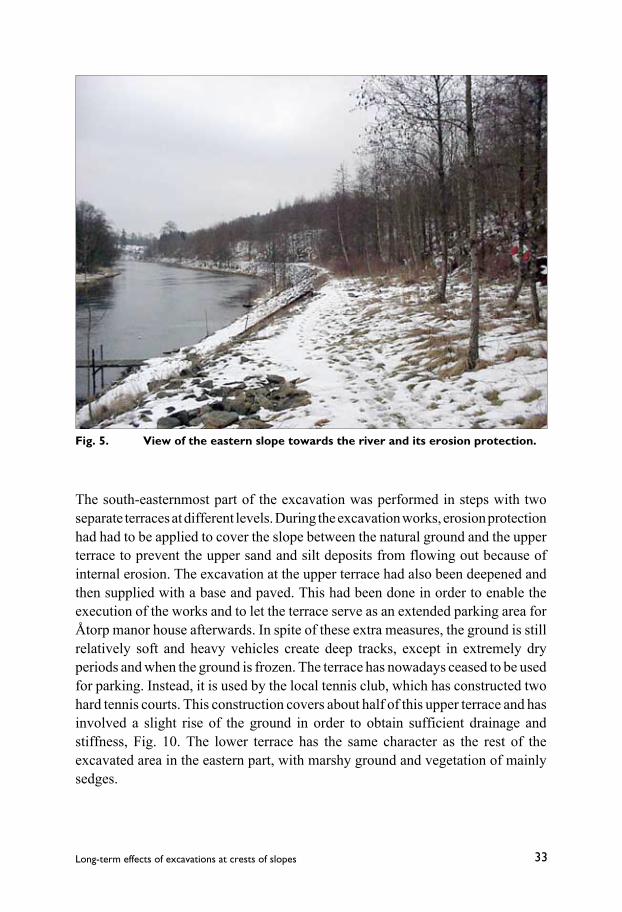
The visual inspection of the area showed that the constructed erosion protection hasfunctioned well. The water transport in the river varies heavily in spite of beingpartly regulated, and can seasonally be very high. The current is then very strongand the water level reaches almost up to the crest of the erosion protection.However, no damage to this or minor slides or slips along the riverbanks can beobserved. The vegetation is fairly abundant in most of the remaining natural slopebelow the eastern part of the excavated area. It partly originates here from the timebefore the excavation because the stabilisation works affected parts of this slopeonly to a limited extent. The clumps of trees consist mainly of birches and alders,Fig. 5.
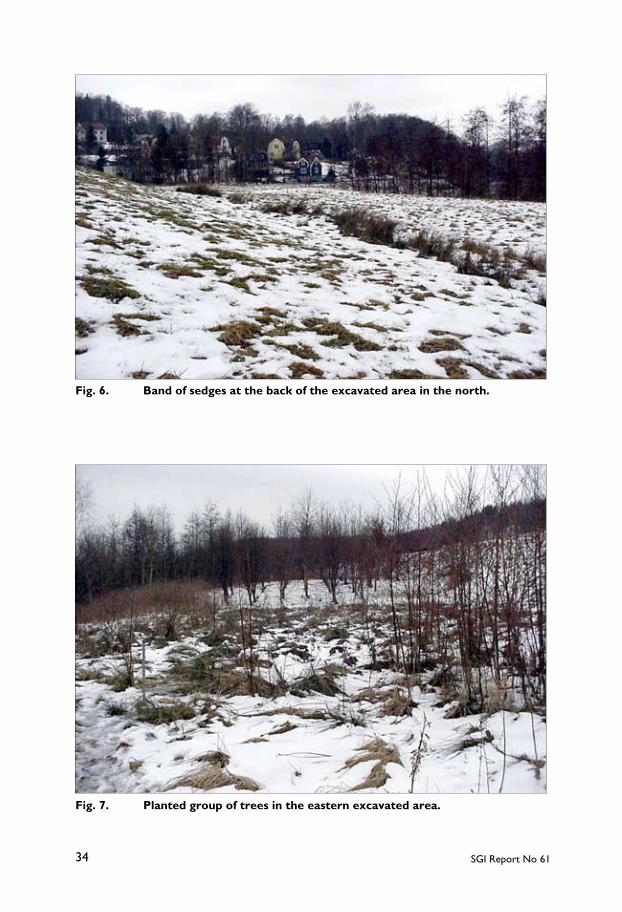
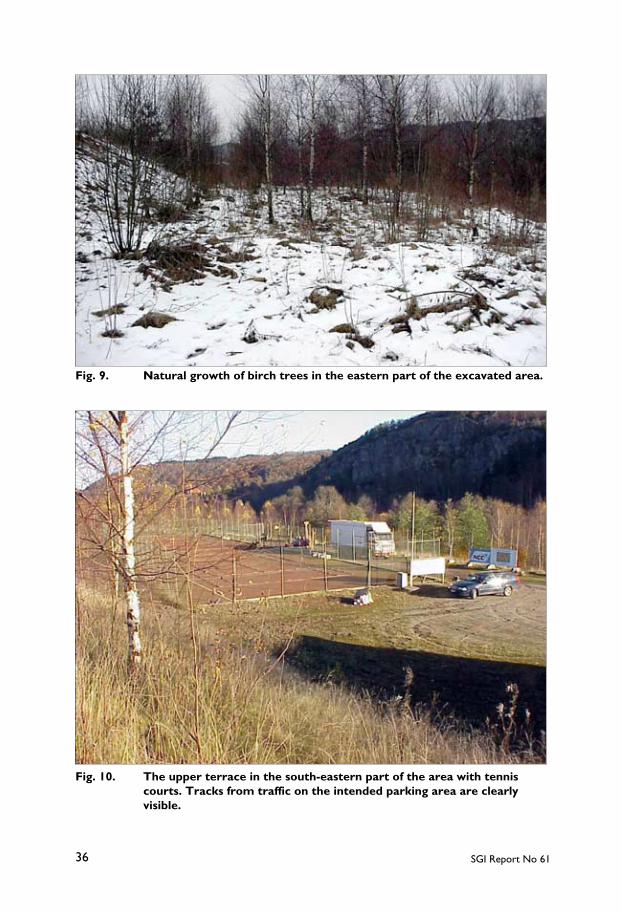
The vegetation on the excavated areas consists mainly of grass and different kindsof sedges. The ground is generally marshy and for most of the time there is freewater or ice at the back of these areas. The excavated areas on the eastern slope weregiven a very small inclination and here the major part of the vegetation is of the typegrowing in marshes and fens. The excavation towards the north was given asomewhat larger inclination and most of this area is covered by grass. However, theconditions are wet at the intersection between the excavated area and the excavationslope at its back because of water seeping out of the slope. This is clearly indicatedalso by a band of sedges growing along this intersection, Fig. 6. That planting oftrees has been performed can only be observed in a few isolated groups of trees.There is one on the eastern excavated area at a point where the ground is slightlyelevated and the conditions thereby somewhat drier. There are also a couple on thenorthern area in points where the ground is similarly elevated or close to the crestof the slope towards the river and consequently relatively dry. A few smaller groupsof birch trees have also been established on the excavated area and in the excavationslopes. However, these are not planted but from natural growth, Figs. 7 – 9.
33Long-term effects of excavations at crests of slopes
The south-easternmost part of the excavation was performed in steps with twoseparate terraces at different levels. During the excavation works, erosion protectionhad had to be applied to cover the slope between the natural ground and the upperterrace to prevent the upper sand and silt deposits from flowing out because ofinternal erosion. The excavation at the upper terrace had also been deepened andthen supplied with a base and paved. This had been done in order to enable theexecution of the works and to let the terrace serve as an extended parking area forÅtorp manor house afterwards. In spite of these extra measures, the ground is stillrelatively soft and heavy vehicles create deep tracks, except in extremely dryperiods and when the ground is frozen. The terrace has nowadays ceased to be usedfor parking. Instead, it is used by the local tennis club, which has constructed twohard tennis courts. This construction covers about half of this upper terrace and hasinvolved a slight rise of the ground in order to obtain sufficient drainage andstiffness, Fig. 10. The lower terrace has the same character as the rest of theexcavated area in the eastern part, with marshy ground and vegetation of mainlysedges.
Fig. 5. View of the eastern slope towards the river and its erosion protection.
SGI Report No 6134
Fig. 6. Band of sedges at the back of the excavated area in the north.
Fig. 7. Planted group of trees in the eastern excavated area.

35Long-term effects of excavations at crests of slopes
a)
b)
Figs. 8 a and b. Groups of planted trees close to the crest of the northern slope andin the north-east corner. In Fig. 8b, the European main highway E6 canbe seen running on the other side of the river behind the excavated area.
SGI Report No 6136
Fig. 9. Natural growth of birch trees in the eastern part of the excavated area.
Fig. 10. The upper terrace in the south-eastern part of the area with tenniscourts. Tracks from traffic on the intended parking area are clearlyvisible.

37Long-term effects of excavations at crests of slopes
The ground surface behind the upper crest is mainly horizontal. Of the formerhouses on the eastern side of the road leading to Åtorp manor house, only a singledwelling house remains in the northern part of the area. The other houses and thecement works have been demolished and the bought-up estates are mostly coveredby grass. A few paved areas remain at the location of the cement works, but no otherinstallations. In the south-eastern part, a small warehouse for the carpentry factoryremains. The ground around this is paved with sand and gravel for transports ofwood to and from the warehouse. No signs of superficial slides or cracks can beobserved and have not, as far as is known, been reported apart from a few smallslides in the northern slope during and shortly after the execution of the stabilisingworks.
2.6.3 Field tests
Penetration tests
In Section A, tests have been performed at five points numbered S4, S3, S2, S1 andS13. Point S4 is located about 50 metres behind the upper crest, Point S3 about 5meters behind this crest, Point S2 at the centre of the excavated area and Point S1just behind the erosion protection at the toe of the slope down at the river. Point S13is located in the deepest part of the river channel about 12 metres outside theshoreline at mean water level, see Figs. 4 and 11. Section A is not in a straight linebut bends at Point S3 in order to locate Point S4 in meadowland instead of in a pavedarea in the straight section.
CPT tests were performed in all points. The results of these tests showed that theupper layer of sand and silt is about 5 metres thick at Point S3, 5 metres behind theupper crest, and that it had thinned out to be about 2 metres thick 50 metres behindthe crest. No silt or sand was found at Point S2, where about 5.5 metres of soil hadbeen excavated. An original thickness of about 5 metres can thus be assumed to berepresentative of the upper layer over the whole distance from the present uppercrest to the river channel. This assumption is supported by the results of the previousinvestigations, which indicate that the thickness of the upper layer was about1.5 metres far behind the present upper crest and about 5 metres at this. However,at one point located in the excavated area those results indicate a 6 metre thick sandand silt layer.
The CPT tests have better ability to penetrate than the previously used total pressuresoundings and the very first new investigations with CPT tests in Section A wentconsiderably deeper in several points. At Points S4 and S3, the stop in the

SGI Report No 6138
Fig
. 11.
Sec
tio
n A
.
-40
-30
-20
-10+0+10
+20
SE
CTI
ON
A-A
CPT
+18.
24H
fA+1
8.17
S3
84/1
31
02
54
Con
e re
sist
ance
(M
Pa)
20
14
35
q c
02
13
45
qC
one
resi
stan
ce
(
MPa
)c
qC
one
resi
stan
ce
(
MP
a)c
qC
one
resi
stan
ce
(
MPa
)c
1002
00bl
ows/
0.20
m
Con
e re
sist
ance
(M
Pa)
01
23
45
q c
HfA
CPT
+12.
25
-20
-30
-40
+20
+10 +0 -10
S2
HfA 10
020
0bl
ows/
0.20
m
50/3
+3.7
0
S1 CP
T
10
23
45
S4
CP
T+0
.54
W
.L.
S13
39Long-term effects of excavations at crests of slopes
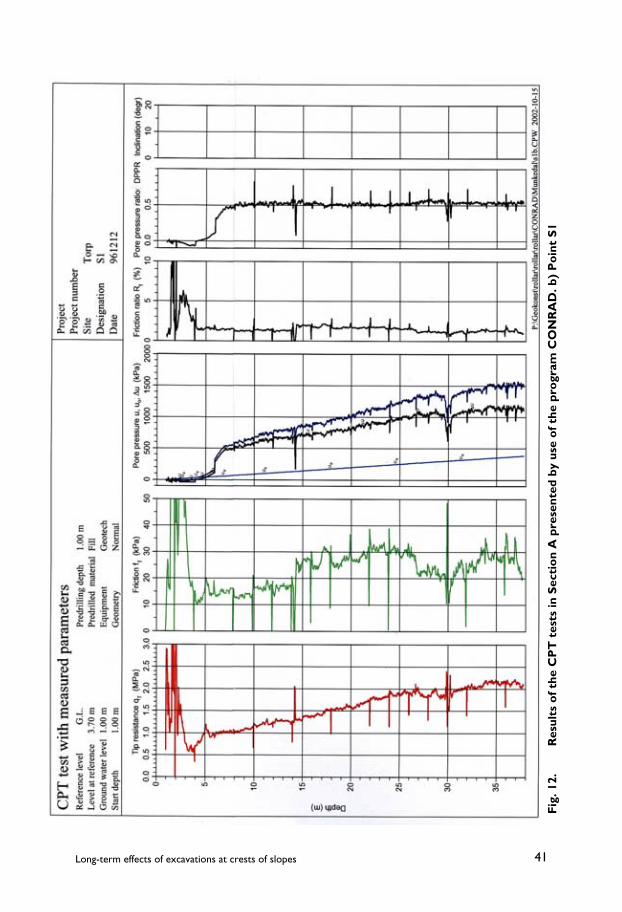
penetration corresponded fairly well with the previously assumed level of the firmbottom. However, at Point S2 the penetration went 13 metres deeper than theassumed firm bottom and at Point S1 the assumed depth was exceeded by 18 metreswithout reaching a distinct stop. The CPT test at this point was terminated when themaximum penetration force was reached at a penetration depth of 37 metres. Theresults also showed that the clay layer continued down to the depths reached. Nostop in penetration was obtained in the test below the river either, but the test wasterminated because the maximum penetration force that could be applied by thedrill rig standing on the raft was reached, Fig. 12.
The increased penetration depths were somewhat alarming because the previousstops in penetration had been designated as “stop against bedrock or other firmobject” and had been assumed to be lower limits for possible slip surfaces. In somecases, the calculated critical slip surfaces had reached and been restricted by thesedepths.
At those points in Section A where stop in penetration against firm bottom had beenreached, the tests were ended by a study of the dissipation of the generated excesspore pressure after stop. These studies indicated that fairly permeable layers hadbeen reached. A few similar studies in the overlying clay showed that this had a verylow permeability.
Since the depths to firm bottom are very important, particularly below the slope,the stop levels in Points S2 and S1 were controlled by dynamic probing tests of typeHfA. These tests penetrated some metres further and indicated that the stops in thecone penetration tests were obtained at the top of a layer of dense coarse soilbetween the clay and the bedrock.
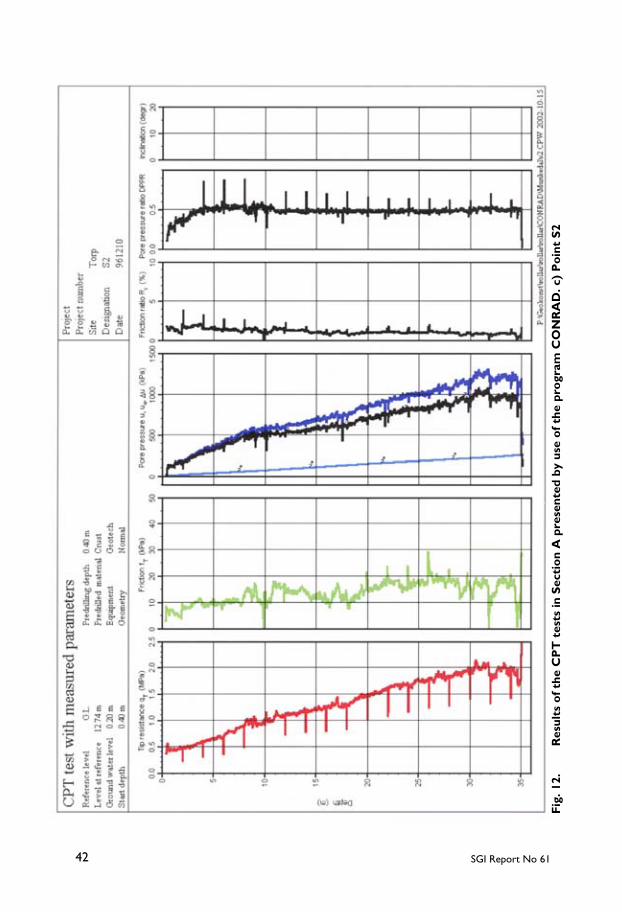
The new investigations in Section C were performed at six points numbered S7, S8,S9, S10, S11 and S12. The reason for the larger number of investigation points inthis section is that the excavation here was made in two steps with two terraces.Point S7 is located below the river and was investigated already in the first round.Point S8 is located at the centre of the lower terrace and Point S9 is located about5 metres behind the crest above the lower terrace. From the investigation point ofview, it would have been desirable to place Point 9 at the centre of the upper terrace,but this would have interfered with the tennis courts in this location. Since it wouldbe impossible to make investigations here without causing considerable damage,the investigations were performed as far in on the terrace as possible withoutcausing negative effects to the courts. Penetration tests, field vane tests and

SGI Report No 6140
Fig
. 12.
Res
ults
of t
he C
PT
tes
ts in
Sec
tio
n A
pre
sent
ed b
y us
e o
f the
pro
gram
CO
NR
AD
. a)
Po
int
S13
41Long-term effects of excavations at crests of slopes
Fig
. 12.
Res
ults
of t
he C
PT
tes
ts in
Sec
tio
n A
pre
sent
ed b
y us
e o
f the
pro
gram
CO
NR
AD
. b)
Po
int
S1
SGI Report No 6142
Fig
. 12.
Res
ults
of t
he C
PT
tes
ts in
Sec
tio
n A
pre
sent
ed b
y us
e o
f the
pro
gram
CO
NR
AD
. c)
Po
int
S2

43Long-term effects of excavations at crests of slopes
Fig
. 12.
Res
ults
of t
he C
PT
tes
ts in
Sec
tio
n A
pre
sent
ed b
y us
e o
f the
pro
gram
CO
NR
AD
. d)
Po
int
S3

SGI Report No 6144
Fig
. 12.
Res
ults
of t
he C
PT
tes
ts in
Sec
tio
n A
pre
sent
ed b
y us
e o
f the
pro
gram
CO
NR
AD
. e)
Po
int
S4

45Long-term effects of excavations at crests of slopes
sampling were performed at the given distance from the crest, whereas the systemsfor pore pressure measurements were placed directly at the crest. At this place, theycould be out of the way for all traffic on the terrace during the observation period.Point S10 is located at the back of the upper terrace, just outside the toe of the slopeup to the natural ground level. Point S11 is then located about 5 metres behind theupper crest. The pore pressure systems were placed directly at the crest in this pointtoo in order to be away from traffic to the warehouse. Point S12, finally, is locatedabout 35 metres behind the upper crest and here the pore pressure measurementsystems were moved a few metres extra inwards to be out of the way. The pointsin the new Section C are in principle located a few metres beside the section andpoints for the previous investigation. They are not exactly in line, however, buthave been moved a few metres further at some locations to avoid making holes inasphalted surfaces or felling growing trees, Figs. 4 and 13.
There is no investigation point down at the riverbank in Section C. The reasons forthis are that there are no reference values from any previous investigations in thislocation, except from a total pressure sounding, and that it would have requiredextensive work and felling of trees to reach this point.
CPT tests have been performed at all investigation points. They all reached largedepths without approaching the maximum tip resistance and firm bottom. Insteadthey had to be terminated when the maximum penetration force was reached. Thisforce was limited by the capacity of the drill rig and the penetration rods or, at thetest from a raft in the river, by the available counterweight. No friction reducingequipment was used since the need for this had not been anticipated. At one point,the penetration had to be terminated because the available length of drilling rodsof 60 metres had been used up. Most of the stop depths also approximatelycoincided with the limit for the acoustic signal transfer system, since no amplifierwas used.
The CPT tests could have been driven deeper if special precautions had been takenfor reduction of rod friction and signal amplification and if more rods had beenbrought to the site. However, the plan for the investigations and the selection ofequipment was based on the results of the previous investigations and nothing inthose indicated depths of the size that was found. No dynamic probing test wasperformed to investigate the depth to firm bottom at the time of the investigationsince the available drill rods would not suffice. These findings contributed to theinitiation of a new project in which the possible gain in including geophysicalmethods in the geotechnical investigations in similar geological conditions was tobe illustrated (Dahlin et al. 2001).

SGI Report No 6146
Fig
. 13.
Sec
tio
n C
.

47Long-term effects of excavations at crests of slopes
The CPT tests thus reached considerably deeper than the previous penetration testsat all points. At point S12, the CPT test reached a depth of 44 metres below theground surface, which is 10 metres deeper than before. At Points S10 and S11, thetests reached a depth below the original ground level of 55 metres, which is about25 metres deeper than before. At Points S8 and S9, finally, the tests reached about63 metres below the original ground level, which is here about 35 metres deeperthan before. The test from the raft in the river only reached 14 metres below the riverbottom because of lack of counterweight for the penetration force. The differencesin penetration depths in Section C were very serious for the estimation of thestability situation since the assumed firm bottom and an elevation of its level closeto the river was shown to be non-existent. The previously calculated critical slipsurfaces in Sections C and B were both limited by this assumed “firm bottom”.
The results of the CPT tests showed that the upper sand and silt layers are about10 metres thick at the back of the investigated area. This has decreased to about8 metres at the new upper crest and it is not found in the other investigation points.The results of investigations before the excavation indicate that the upper layer hada thickness of about 6 metres within the excavated area, and the whole layer hadthus been taken away in this area. The fine-grained soil below this upper layerchanges in character with depth from clayey silt to high-plastic clay and thenbecomes siltier again at great depth. However, this gradual change cannot bereadily observed in the test results, Fig. 14.
The CPT tests in the clay were performed using a very sensitive probe adapted fortests in clay. The tests through the upper sand and silt layers in the area behind theupper crest were performed with an ordinary 5-tonne cone in order not to damagethe sensitive probe. When the clay layer was reached, the more robust probe waswithdrawn. The hole was then expanded by use of a mandrel whereupon the testwas resumed with the more sensitive probe. In the paved areas in Section C, thepavements and bases with gravel and cobbles were pre-drilled and the holes werecased down to the natural soil. Guiding tubes were used in the tests from the raftin the river to prevent the drill rods from buckling before they got enough lateralsupport from surrounding soil.
No stops against firm bottom were received in the penetration tests. However, theresults indicated a coarser soil layer between the levels –31 and –34 metres, whichis about 50 to 55 metres below the original ground surface. The penetration testswere stopped temporarily in this layer at all points where it was reached and thedissipation of excess pore pressure with time was studied. The results indicated thatthe layer had a relatively high permeability and this was later confirmed by the pore
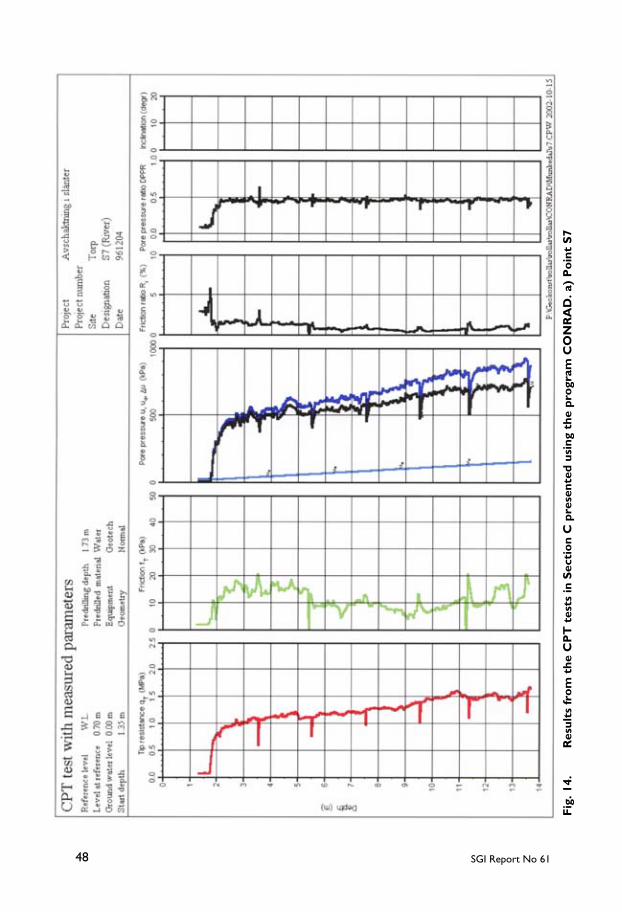
SGI Report No 6148
Fig
. 14.
Res
ults
fro
m t
he C
PT
tes
ts in
Sec
tio
n C
pre
sent
ed u
sing
the
pro
gram
CO
NR
AD
. a)
Po
int
S7

49Long-term effects of excavations at crests of slopes
Fig
. 14.
Res
ults
fro
m t
he C
PT
tes
ts in
Sec
tio
n C
pre
sent
ed u
sing
the
pro
gram
CO
NR
AD
. b)
Po
int
S8

SGI Report No 6150
Fig
. 14.
Res
ults
fro
m t
he C
PT
tes
ts in
Sec
tio
n C
pre
sent
ed u
sing
the
pro
gram
CO
NR
AD
. c)
Po
int
S9

51Long-term effects of excavations at crests of slopes
Fig
. 14.
Res
ults
fro
m t
he C
PT
tes
ts in
Sec
tio
n C
pre
sent
ed u
sing
the
pro
gram
CO
NR
AD
. d)
Po
int
S10
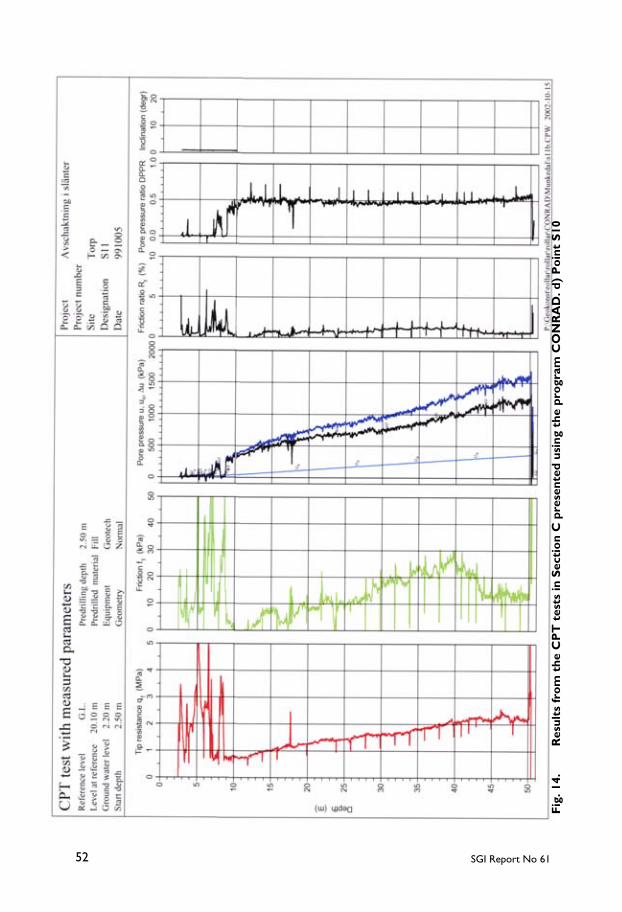
SGI Report No 6152
Fig
. 14.
Res
ults
fro
m t
he C
PT
tes
ts in
Sec
tio
n C
pre
sent
ed u
sing
the
pro
gram
CO
NR
AD
. d)
Po
int
S10

53Long-term effects of excavations at crests of slopes
Fig
. 14.
Res
ults
fro
m t
he C
PT
tes
ts in
Sec
tio
n C
pre
sent
ed u
sing
the
pro
gram
CO
NR
AD
. f)
Po
int
S12
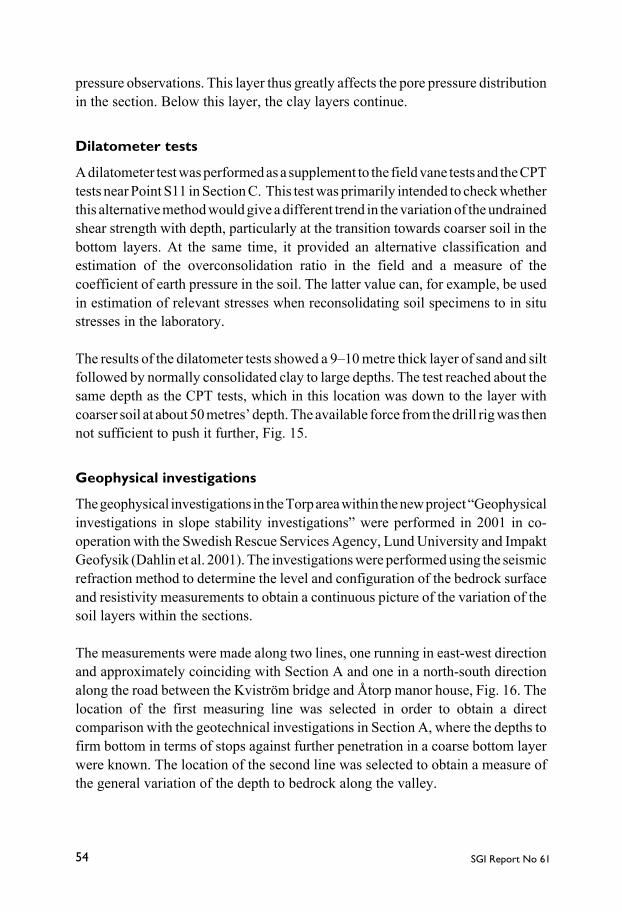
SGI Report No 6154
pressure observations. This layer thus greatly affects the pore pressure distributionin the section. Below this layer, the clay layers continue.
Dilatometer tests
A dilatometer test was performed as a supplement to the field vane tests and the CPTtests near Point S11 in Section C. This test was primarily intended to check whetherthis alternative method would give a different trend in the variation of the undrainedshear strength with depth, particularly at the transition towards coarser soil in thebottom layers. At the same time, it provided an alternative classification andestimation of the overconsolidation ratio in the field and a measure of thecoefficient of earth pressure in the soil. The latter value can, for example, be usedin estimation of relevant stresses when reconsolidating soil specimens to in situstresses in the laboratory.
The results of the dilatometer tests showed a 9–10 metre thick layer of sand and siltfollowed by normally consolidated clay to large depths. The test reached about thesame depth as the CPT tests, which in this location was down to the layer withcoarser soil at about 50 metres’ depth. The available force from the drill rig was thennot sufficient to push it further, Fig. 15.
Geophysical investigations
The geophysical investigations in the Torp area within the new project “Geophysicalinvestigations in slope stability investigations” were performed in 2001 in co-operation with the Swedish Rescue Services Agency, Lund University and ImpaktGeofysik (Dahlin et al. 2001). The investigations were performed using the seismicrefraction method to determine the level and configuration of the bedrock surfaceand resistivity measurements to obtain a continuous picture of the variation of thesoil layers within the sections.
The measurements were made along two lines, one running in east-west directionand approximately coinciding with Section A and one in a north-south directionalong the road between the Kviström bridge and Åtorp manor house, Fig. 16. Thelocation of the first measuring line was selected in order to obtain a directcomparison with the geotechnical investigations in Section A, where the depths tofirm bottom in terms of stops against further penetration in a coarse bottom layerwere known. The location of the second line was selected to obtain a measure ofthe general variation of the depth to bedrock along the valley.
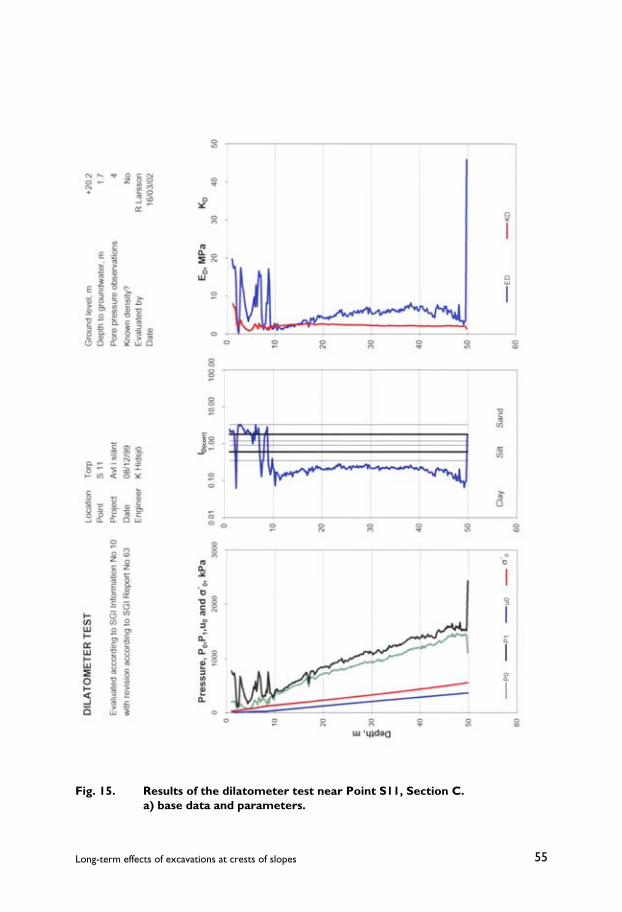
55Long-term effects of excavations at crests of slopes
Fig. 15. Results of the dilatometer test near Point S11, Section C.a) base data and parameters.
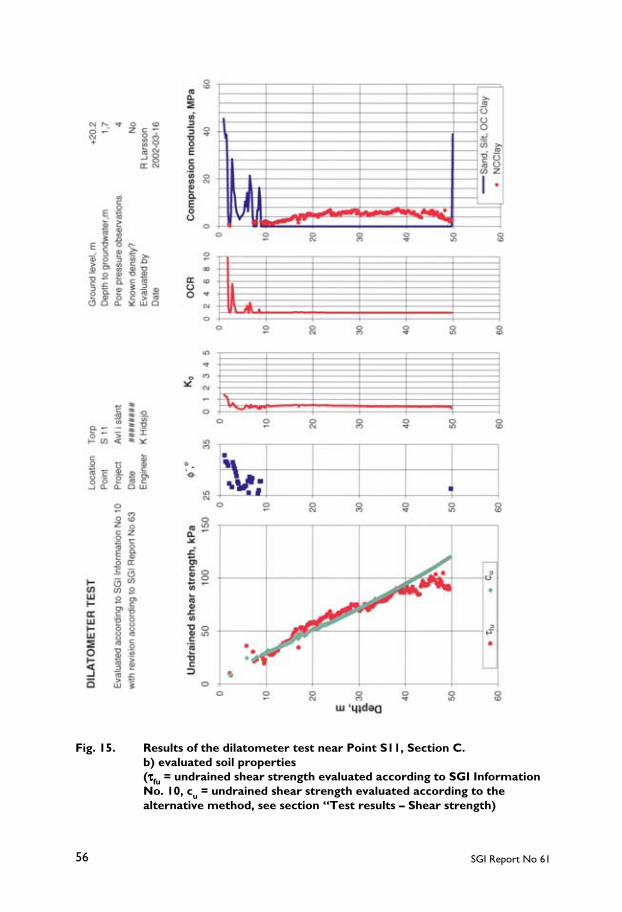
SGI Report No 6156
Fig. 15. Results of the dilatometer test near Point S11, Section C.b) evaluated soil properties(τττττfu = undrained shear strength evaluated according to SGI InformationNo. 10, cu = undrained shear strength evaluated according to thealternative method, see section “Test results – Shear strength)
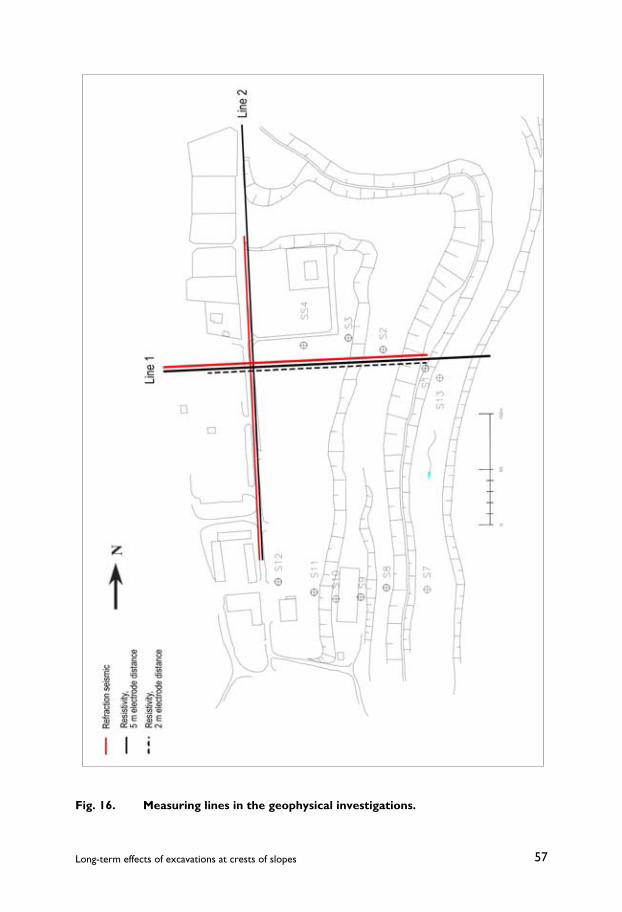
57Long-term effects of excavations at crests of slopes
Fig. 16. Measuring lines in the geophysical investigations.

SGI Report No 6158
The results obtained by the refraction method showed two distinct refractors, thefirst being the border between what may be assumed to be not fully saturated andsaturated soil in the upper sand and silt layers, and the second being the borderbetween soil and rock. The second refractor shows that the contour of the bedrockin Section A has a similar variation as the assumed firm bottom and that thethickness of the coarse soil layer between the clay and bedrock has a thickness thatvaries between one or two metres and more than ten metres, Fig. 17a. The resultsof the measuring line in the north-south direction show that the level of the bedrockvaries somewhat locally but in general slopes downward from north to south. Thelevel of the bedrock in the measuring line is thus more than 20 metres deeper inSection C than in Section A, Fig. 17b.
The resistivity measurements showed that variations in resistivity that can berelated to variations in salt content often have a larger influence on the results thanthe composition of the soil in other respects. The results provide a good picture ofthe variation of the upper sand and silt layers in Section A. The resistivity in theselayers is high, Fig. 18. Similar high values are also measured in the superficiallayers in the outer slope where the soil is coarser and probably not fully saturated.The variation in resistivity in the underlying clay is assumed to be related mainlyto variations in salt content. The clay below the excavated area mainly has a verylow resistivity and thereby a high salt content, whereas the clay behind the uppercrest has a higher resistivity and can thus be assumed to be more leached. Acoupling to the sensitivity of the clay can be observed in such a manner that quickclay may be found in parts of the clay mass where the resistivity is higher than 7Ωm but does not exist in parts with a lower resistivity.
Field vane tests
Field vane tests were performed to determine the undrained shear strength and itsvariation in the section and to measure whether this had changed since the timebefore the excavation. Tests were thus performed in locations in natural groundbehind the excavation, in the excavated areas and below the river bottom in eachsection. Since there were two separate excavated terraces in Section C, tests wereperformed in both of these terraces. Field vane tests were thus performed at PointsS1, S2 and S3 in Section A and Points S7, S8, S9 and S11 in Section C.

59Long-term effects of excavations at crests of slopes
Fig
. 17.
Res
ults
of d
iffer
ent
dete
rmin
atio
ns o
f fir
m b
ott
om
and
bed
rock
.a)
Est
imat
ed le
vels
for
firm
bo
tto
m a
nd b
edro
ck in
Sec
tio
n A
.(A
rro
ws
belo
w t
he p
enet
rati
on
dept
hs in
dica
te t
hat
no fi
rm b
ott
om
has
bee
n re
ache
d)
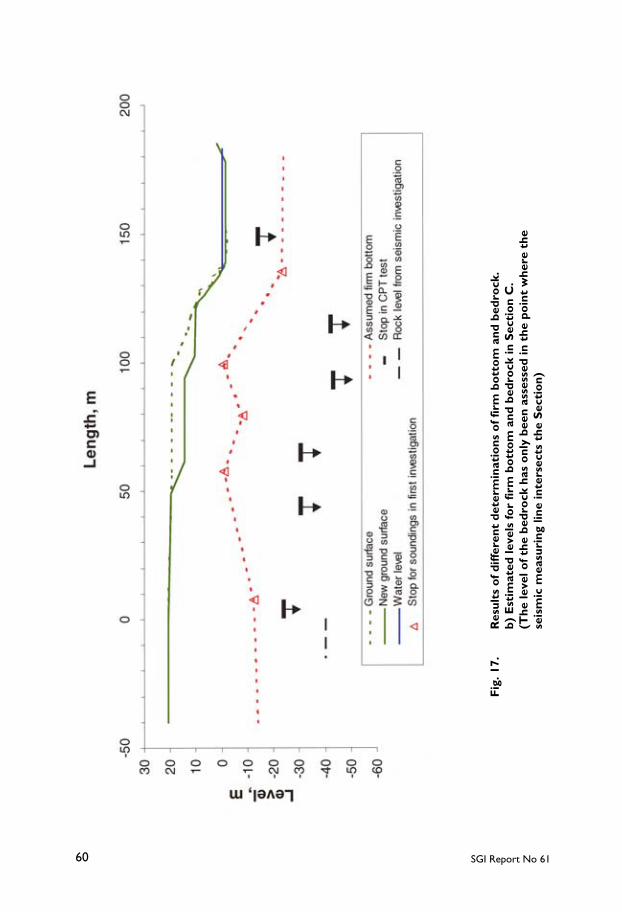
SGI Report No 6160
Fig
. 17.
Res
ults
of d
iffer
ent
dete
rmin
atio
ns o
f fir
m b
ott
om
and
bed
rock
.b)
Est
imat
ed le
vels
for
firm
bo
tto
m a
nd b
edro
ck in
Sec
tio
n C
.(T
he le
vel o
f the
bed
rock
has
onl
y be
en a
sses
sed
in t
he p
oin
t w
here
the
seis
mic
mea
suri
ng li
ne in
ters
ects
the
Sec
tio
n)
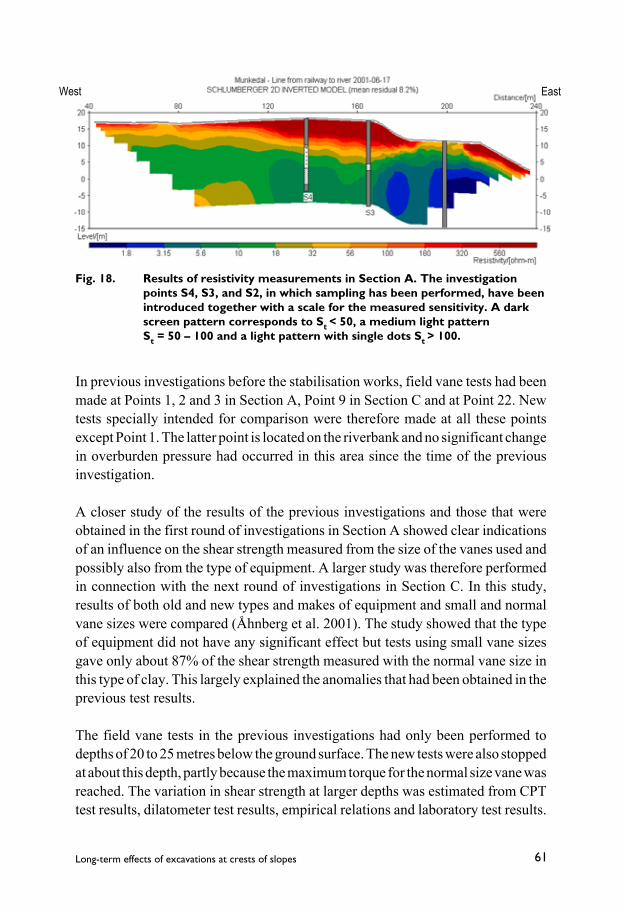
61Long-term effects of excavations at crests of slopes
West East
In previous investigations before the stabilisation works, field vane tests had beenmade at Points 1, 2 and 3 in Section A, Point 9 in Section C and at Point 22. Newtests specially intended for comparison were therefore made at all these pointsexcept Point 1. The latter point is located on the riverbank and no significant changein overburden pressure had occurred in this area since the time of the previousinvestigation.
A closer study of the results of the previous investigations and those that wereobtained in the first round of investigations in Section A showed clear indicationsof an influence on the shear strength measured from the size of the vanes used andpossibly also from the type of equipment. A larger study was therefore performedin connection with the next round of investigations in Section C. In this study,results of both old and new types and makes of equipment and small and normalvane sizes were compared (Åhnberg et al. 2001). The study showed that the typeof equipment did not have any significant effect but tests using small vane sizesgave only about 87% of the shear strength measured with the normal vane size inthis type of clay. This largely explained the anomalies that had been obtained in theprevious test results.
The field vane tests in the previous investigations had only been performed todepths of 20 to 25 metres below the ground surface. The new tests were also stoppedat about this depth, partly because the maximum torque for the normal size vane wasreached. The variation in shear strength at larger depths was estimated from CPTtest results, dilatometer test results, empirical relations and laboratory test results.
Fig. 18. Results of resistivity measurements in Section A. The investigationpoints S4, S3, and S2, in which sampling has been performed, have beenintroduced together with a scale for the measured sensitivity. A darkscreen pattern corresponds to St < 50, a medium light patternSt = 50 – 100 and a light pattern with single dots St > 100.

SGI Report No 6162
Pore pressure measurements
The pore pressure has been measured in a number of measuring stations in SectionsA and C. Previous pore pressure measurements had only been made at two levelsin a location near Point 2 in Section A. Four new stations were installed in SectionA; one behind the erosion protection at the riverbank, one at the centre of theexcavated area, one directly behind the upper crest and one about 50 metres behindthis crest, i.e. at Points S1, S2, S3 and S4. The number of measuring levels in thedifferent points were 3, 5, 6 and 3 respectively and they were distributed with depthin such a way that complete pore pressure profiles could be obtained.
The pore pressure measurement systems in this section consisted of open tubes withinner hoses of 8 mm inner diameter. The stabilisation of the water levels in thesehoses was very slow and the measurements showed that it took several months untilthose systems that had their filter tips placed in the central parts of the clay layerreached stable conditions. The subsequently measured seasonal variation in porepressure was very small. The function of these systems was checked after about ayear by filling up the hoses with water and measuring the equalisation processes.Again, these processes proved to be very slow and afterwards the water levels inthe hoses were stabilised at approximately the same levels as before. Anysignificant variations were only measured in tips located in superficial layers andin tips in or near the coarser soil layers at the bottom. From these results, it wasconcluded that this type of system probably had too slow a response to fully registerthe seasonal variations.
One system was replaced in connection with the function control and a new tip wasalso installed near the crest of the lower slope from the excavated area to theriverbank. This point was designated S2b. One of the pipes and its hose at Point S1on the riverbank has later been lengthened with raised tops because the artesianwater pressures in the bottom layers caused overflow in the hose.
As a consequence of the results in Section A, only closed pore pressure measurementsystems were installed in Section C. Systems of the BAT type were used. They wereinstalled in five stations at Points S8, S9, S10, S11 and S12, i.e. at the centre of thelower excavated terrace, at the crest at the front of the upper excavated terrace, atthe back of this terrace, directly behind the upper crest and about 35 metres behindthis crest. In the various stations, filter tips were placed at 4, 4, 3, 4 and 3 levelsrespectively. Their distribution with depth was selected on the basis of the resultsfrom the CPT tests in order to clarify the pore pressure distribution in the wholeprofile. In three stations, filter tips were installed in the assumedly permeable layer
63Long-term effects of excavations at crests of slopes
located 50 to 55 metres below the original ground surface. The pore pressures havebeen read off regularly for more than a year in order to study the seasonal variations.
The pressures in the closed systems stabilised within a week and appear to reactfaster to seasonal variations. However, with time problems have developed withformation of gas in several of the filter tips. This makes the readings very time-consuming because the gas in the tips has to be evacuated and time given for thepressures to re-stabilise at each reading.
In connection with the second round of field investigations, two BAT tips were alsoinstalled adjacent to and at the same levels as two open systems at Point S2 inSection A. The purpose of this installation was to obtain a direct comparisonbetween the measured variations with the two systems and a better estimate of thereal pore pressure variations in this section.
2.6.4 Sampling
Sampling has been performed in four points distributed from the river channel tothe area behind the excavation in each section. The sampling has been performedwith a Swedish standard piston sampler type St II using the utmost care when takingand transporting the samples. Judging by the results from the fall-cone tests and theoedometer tests in the laboratory, the taking of undisturbed samples succeededfairly well.
In the first round of investigations in Section A, sampling was performed only atPoints S13, S2 and S4. However, a close study of the results of the field tests andthe subsequent laboratory tests showed that the soil conditions vary considerablywith distance from the river. Supplementary sampling was therefore performed atPoint S3 in the second round of investigations.
In Section C, sampling has been performed at Points S7, S8, S9, and S11. Withregard to the great depths, the sampling has in most points been limited to the uppersoil layers of primary interest, but at Point S9 it has been continued down to57 metres depth, i.e. 63 metres below the original ground surface. The purpose ofthis deep sampling was to determine the character of the clay at large depths andto study the composition of the soil in the coarser layers that were indicated at about50 metres depth by the CPT tests.
SGI Report No 6164
2.6.5 Laboratory tests
Routine tests
The samples have been investigated according to Swedish practice by routine testsof density, water content, fall-cone liquid limit and undrained shear strength andsensitivity according to fall-cone tests. Special attention has also been paid toocular inspection and classification of the upper sand and silt layers and theembedded layers found at great depth in Section C.
Oedometer tests
A large number of CRS oedometer tests have been performed in order to determinethe preconsolidation pressure and its variation within the sections. The permeabilityof the soil and its variation has also been determined by these tests.
Triaxial tests
Undrained active and passive triaxial tests have been performed on selectedsamples. The tests have been performed in order to enable the shear strengthanisotropy to be taken into account in the stability calculations and to verify theapplicability of the empirical estimate of the anisotropy that is normally made. Thisverification is required if the effects of the anisotropy are to be taken into accountaccording to the guidelines of the Commission on Slope Stability (1995). A numberof drained triaxial tests have also been performed in order to determine the drainedshear strength parameters and in a corresponding way verify the empiricallyestimated parameters. All triaxial tests have been performed on specimens whichhave been consolidated for stresses just below the estimated preconsolidationstresses at the particular levels and have then been unloaded and adapted to thecorresponding in situ stresses.
Direct simple shear tests
Undrained simple shear tests have been performed for two purposes. The firstpurpose was to check the shear strength determinations that had been made withfield vane tests, CPT tests and dilatometer tests. The evaluation methods for allthese tests use empirical factors in the calculations and the scatter in these factorscan be considerable. It has also been found that the results of the different testmethods differ particularly greatly in investigations of slopes and that the relationsvary between different parts of the slopes. Research concerning the reason for this
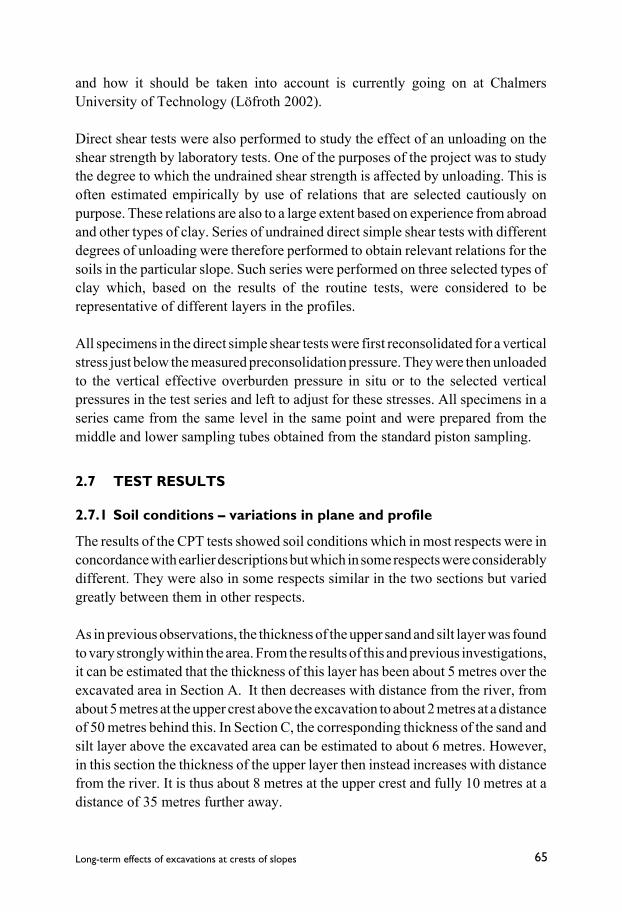
65Long-term effects of excavations at crests of slopes
and how it should be taken into account is currently going on at ChalmersUniversity of Technology (Löfroth 2002).
Direct shear tests were also performed to study the effect of an unloading on theshear strength by laboratory tests. One of the purposes of the project was to studythe degree to which the undrained shear strength is affected by unloading. This isoften estimated empirically by use of relations that are selected cautiously onpurpose. These relations are also to a large extent based on experience from abroadand other types of clay. Series of undrained direct simple shear tests with differentdegrees of unloading were therefore performed to obtain relevant relations for thesoils in the particular slope. Such series were performed on three selected types ofclay which, based on the results of the routine tests, were considered to berepresentative of different layers in the profiles.
All specimens in the direct simple shear tests were first reconsolidated for a verticalstress just below the measured preconsolidation pressure. They were then unloadedto the vertical effective overburden pressure in situ or to the selected verticalpressures in the test series and left to adjust for these stresses. All specimens in aseries came from the same level in the same point and were prepared from themiddle and lower sampling tubes obtained from the standard piston sampling.
2.7 TEST RESULTS
2.7.1 Soil conditions – variations in plane and profile
The results of the CPT tests showed soil conditions which in most respects were inconcordance with earlier descriptions but which in some respects were considerablydifferent. They were also in some respects similar in the two sections but variedgreatly between them in other respects.
As in previous observations, the thickness of the upper sand and silt layer was foundto vary strongly within the area. From the results of this and previous investigations,it can be estimated that the thickness of this layer has been about 5 metres over theexcavated area in Section A. It then decreases with distance from the river, fromabout 5 metres at the upper crest above the excavation to about 2 metres at a distanceof 50 metres behind this. In Section C, the corresponding thickness of the sand andsilt layer above the excavated area can be estimated to about 6 metres. However,in this section the thickness of the upper layer then instead increases with distancefrom the river. It is thus about 8 metres at the upper crest and fully 10 metres at adistance of 35 metres further away.
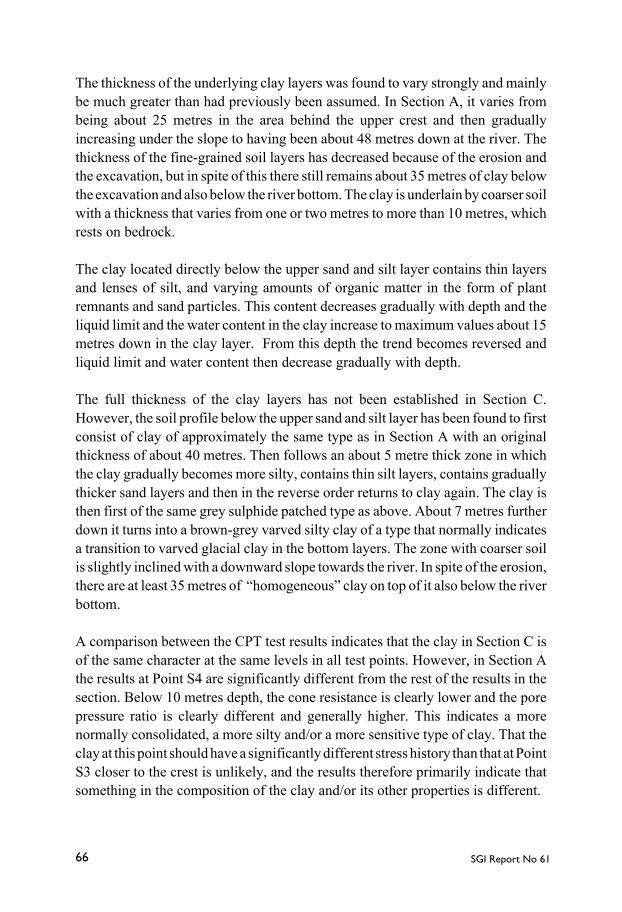
SGI Report No 6166
The thickness of the underlying clay layers was found to vary strongly and mainlybe much greater than had previously been assumed. In Section A, it varies frombeing about 25 metres in the area behind the upper crest and then graduallyincreasing under the slope to having been about 48 metres down at the river. Thethickness of the fine-grained soil layers has decreased because of the erosion andthe excavation, but in spite of this there still remains about 35 metres of clay belowthe excavation and also below the river bottom. The clay is underlain by coarser soilwith a thickness that varies from one or two metres to more than 10 metres, whichrests on bedrock.
The clay located directly below the upper sand and silt layer contains thin layersand lenses of silt, and varying amounts of organic matter in the form of plantremnants and sand particles. This content decreases gradually with depth and theliquid limit and the water content in the clay increase to maximum values about 15metres down in the clay layer. From this depth the trend becomes reversed andliquid limit and water content then decrease gradually with depth.
The full thickness of the clay layers has not been established in Section C.However, the soil profile below the upper sand and silt layer has been found to firstconsist of clay of approximately the same type as in Section A with an originalthickness of about 40 metres. Then follows an about 5 metre thick zone in whichthe clay gradually becomes more silty, contains thin silt layers, contains graduallythicker sand layers and then in the reverse order returns to clay again. The clay isthen first of the same grey sulphide patched type as above. About 7 metres furtherdown it turns into a brown-grey varved silty clay of a type that normally indicatesa transition to varved glacial clay in the bottom layers. The zone with coarser soilis slightly inclined with a downward slope towards the river. In spite of the erosion,there are at least 35 metres of “homogeneous” clay on top of it also below the riverbottom.
A comparison between the CPT test results indicates that the clay in Section C isof the same character at the same levels in all test points. However, in Section Athe results at Point S4 are significantly different from the rest of the results in thesection. Below 10 metres depth, the cone resistance is clearly lower and the porepressure ratio is clearly different and generally higher. This indicates a morenormally consolidated, a more silty and/or a more sensitive type of clay. That theclay at this point should have a significantly different stress history than that at PointS3 closer to the crest is unlikely, and the results therefore primarily indicate thatsomething in the composition of the clay and/or its other properties is different.

67Long-term effects of excavations at crests of slopes
The results of the routine investigations in the laboratory show that the upper sandand silt layer has a density of about 1.9 t/m3. It consists mainly of sand with anorganic content. A few sample tubes with very even-grained material and incompletesaturation and/or large amounts of organic material showed lower values, particularlyin Section A. The density in the silty clay directly below is about the same as in thewater-saturated sand and silt layer. In Section C, the density then graduallydecreases with depth as the silt content in the clay decreases and the water contentincreases. It reaches a minimum of about 1.65 t/m3 at a level of –5 metres, whichis 25 metres below the original ground surface. From this level it graduallyincreases again to become about 1.85 t/m3 at a level of –45 metres. The density issignificantly higher within the zone with infusions and layers of coarser soil wherea maximum value of 2.16 t/m3 has been measured, Fig. 19.
The density in Section A in general follows the same trend, but here the differencesare considerably greater between the sampling points, Fig. 20. The results indicatethat the inclined contour of the firm bottom also has created inclined clay layers.However, the variation in other parameters such as liquid limit and sensitivityindicates that the composition and properties of the clay also vary somewhat. Thevalues that differ most from the general trends in the latter respect are found at PointS4, which is located 50 metres behind the upper crest.
The uniformity of the soil conditions in Section C is illustrated further when thenatural water content and the liquid limit in the various boreholes are plotted versusthe sampling level, Fig. 21. The different curves then overlap without anysignificant difference in values or trends except for a certain normal scatter.
A similar uniformity is not found in Section A. Instead the values vary between thesampling points, Fig. 22. Water contents and liquid limits of the same sizes as thoseon the same levels in Section C are measured at Point S2 below the excavation andat Point S13 below the river bottom. The values are lower at Point S3 just behindthe upper crest and at Point S4 50 metres further away the liquid limit is much lower.The variation in water content generally follows the variation in liquid limit exceptfor the central parts of the clay layer at Point S4, where the water content isconsiderably higher than the liquid limit. The measured variations in water contentscorrespond to the measured variations in density.
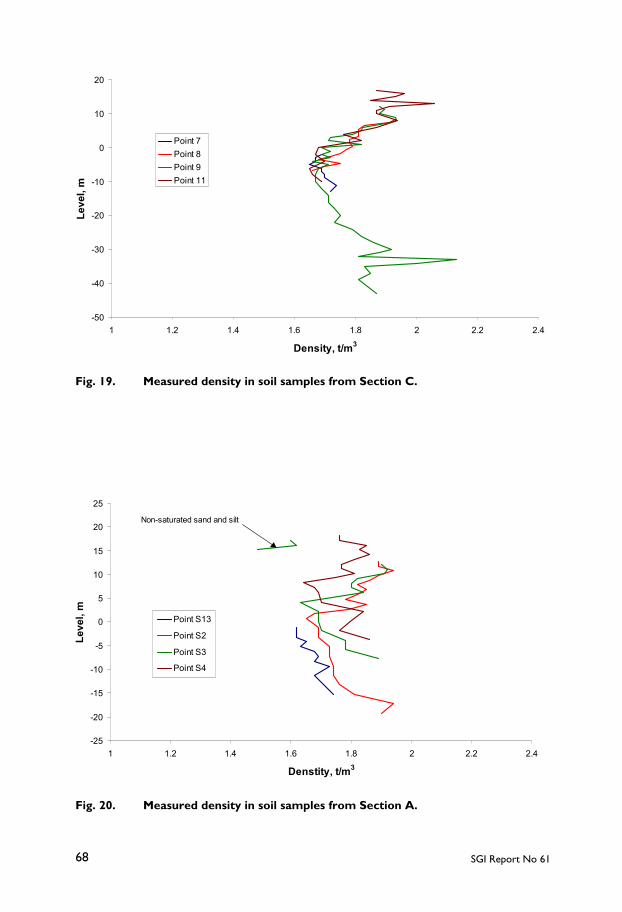
SGI Report No 6168
Fig. 19. Measured density in soil samples from Section C.
Fig. 20. Measured density in soil samples from Section A.
-50
-40
-30
-20
-10
0
10
20
1 1.2 1.4 1.6 1.8 2 2.2 2.4
Density, t/m3
Leve
l, m
Point 7Point 8Point 9Point 11
-25
-20
-15
-10
-5
0
5
10
15
20
25
1 1.2 1.4 1.6 1.8 2 2.2 2.4
Denstity, t/m3
Leve
l, m
Point S13
Point S2
Point S3
Point S4
Non-saturated sand and silt

69Long-term effects of excavations at crests of slopes
-50
-40
-30
-20
-10
0
10
20
0 10 20 30 40 50 60 70 80Water content, %
Leve
l, m
Point 7Point 8Point 9Point 11
-50
-40
-30
-20
-10
0
10
20
0 10 20 30 40 50 60 70 80
Liquid limit, %
Leve
l, m
Point 7Point 8Point 9Point 11
a)
b)
Fig. 21. Measured water contents and liquid limits in Section C.a) water contentb) liquid limit
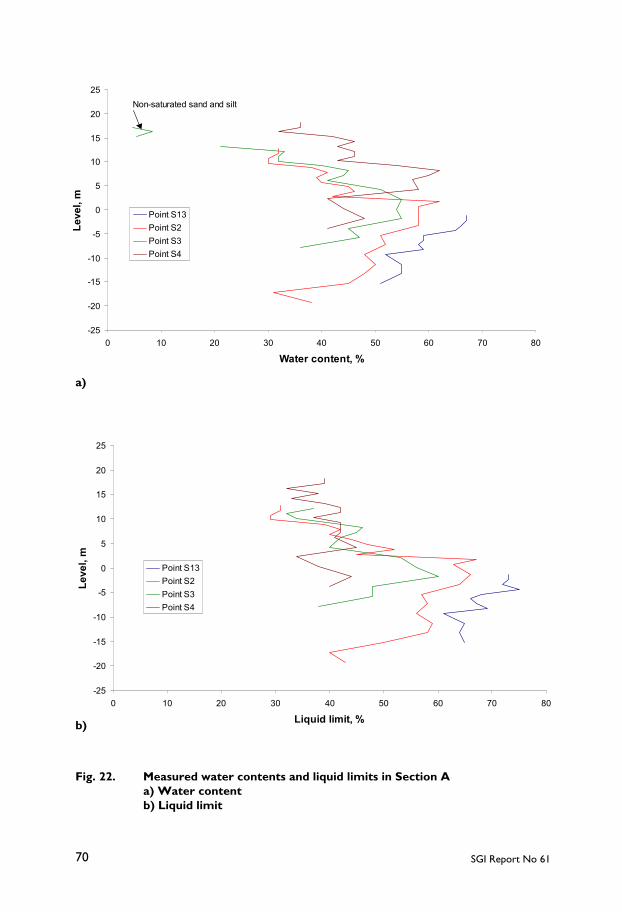
SGI Report No 6170
-25
-20
-15
-10
-5
0
5
10
15
20
25
0 10 20 30 40 50 60 70 80
Water content, %
Leve
l, m
Point S13Point S2Point S3Point S4
Non-saturated sand and silt
-25
-20
-15
-10
-5
0
5
10
15
20
25
0 10 20 30 40 50 60 70 80
Liquid limit, %
Leve
l, m
Point S13Point S2Point S3Point S4
a)
b)
Fig. 22. Measured water contents and liquid limits in Section Aa) Water contentb) Liquid limit
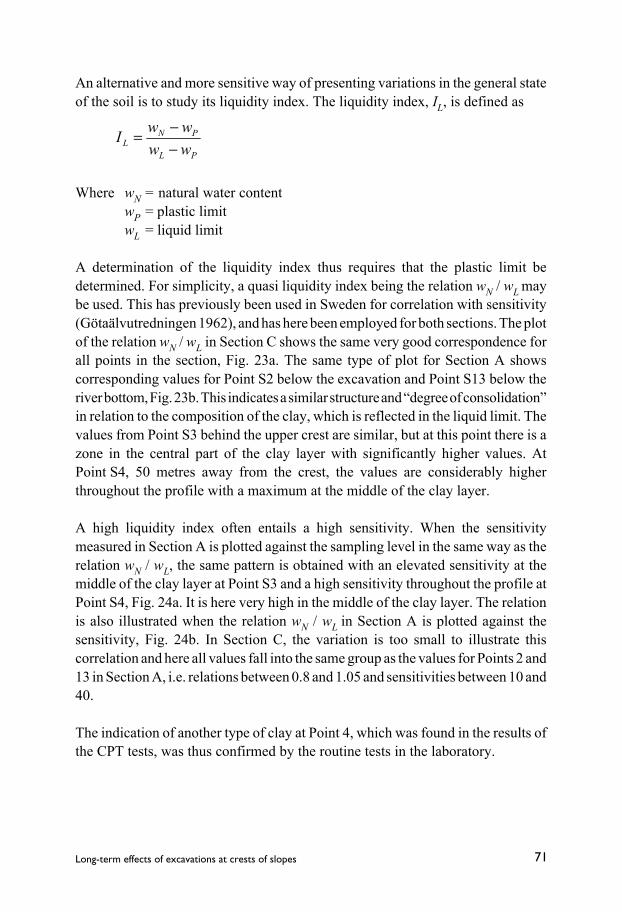
71Long-term effects of excavations at crests of slopes
An alternative and more sensitive way of presenting variations in the general stateof the soil is to study its liquidity index. The liquidity index, IL, is defined as
PL
PNL ww
wwI−−=
Where wN = natural water contentwP = plastic limitwL = liquid limit
A determination of the liquidity index thus requires that the plastic limit bedetermined. For simplicity, a quasi liquidity index being the relation wN / wL maybe used. This has previously been used in Sweden for correlation with sensitivity(Götaälvutredningen 1962), and has here been employed for both sections. The plotof the relation wN / wL in Section C shows the same very good correspondence forall points in the section, Fig. 23a. The same type of plot for Section A showscorresponding values for Point S2 below the excavation and Point S13 below theriver bottom, Fig. 23b. This indicates a similar structure and “degree of consolidation”in relation to the composition of the clay, which is reflected in the liquid limit. Thevalues from Point S3 behind the upper crest are similar, but at this point there is azone in the central part of the clay layer with significantly higher values. AtPoint S4, 50 metres away from the crest, the values are considerably higherthroughout the profile with a maximum at the middle of the clay layer.
A high liquidity index often entails a high sensitivity. When the sensitivitymeasured in Section A is plotted against the sampling level in the same way as therelation wN / wL, the same pattern is obtained with an elevated sensitivity at themiddle of the clay layer at Point S3 and a high sensitivity throughout the profile atPoint S4, Fig. 24a. It is here very high in the middle of the clay layer. The relationis also illustrated when the relation wN / wL in Section A is plotted against thesensitivity, Fig. 24b. In Section C, the variation is too small to illustrate thiscorrelation and here all values fall into the same group as the values for Points 2 and13 in Section A, i.e. relations between 0.8 and 1.05 and sensitivities between 10 and40.
The indication of another type of clay at Point 4, which was found in the results ofthe CPT tests, was thus confirmed by the routine tests in the laboratory.

SGI Report No 6172
a)
b)
Fig. 23. The relation water content/liquid limit in the different sampling pointsin the Torp area.a) Section Cb) Section A
-50
-40
-30
-20
-10
0
10
20
0.6 0.65 0.7 0.75 0.8 0.85 0.9 0.95 1 1.05 1.1
wN/wL
Leve
l, m
Point 7Point 8Point 9Point 11
-25
-20
-15
-10
-5
0
5
10
15
20
0.6 0.7 0.8 0.9 1 1.1 1.2 1.3 1.4 1.5 1.6
wN/wL
Leve
l, m
Point S13Point S2Point S3Point S4

73Long-term effects of excavations at crests of slopes
-25
-20
-15
-10
-5
0
5
10
15
20
0 50 100 150 200 250 300
Sensitivity
Leve
l, m
Point S13Point S2Point S3Point S4
a)
b)
Fig. 24. Sensitivity of the clay in Section A.a) Sensitivity versus levelb) Relation wN/wL versus sensitivity
1
10
100
1000
0.6 0.7 0.8 0.9 1 1.1 1.2 1.3 1.4 1.5 1.6
wN/wL
Sens
itivi
ty
Point S13Point S2Point S3Point S4

SGI Report No 6174
2.7.2 Pore pressure conditions and variations
The pore water pressure in the clay can be assumed to be affected by infiltrationfrom the ground surface through the more permeable sand and silt layers. It is alsoaffected by seepage out through the slope and by the pressure levels in the river andin the coarser soil below the clay. In Section C, it can be assumed to be affected bythe more permeable zone about 50–55 metres below the original ground surface,which can be assumed to be in contact with water transporting layers on the valleysides. The clay layer has a very low permeability. Determinations of the permeabilityby the oedometer tests and by “falling head” tests in filter tips in situ show that thepermeability is about 2·10-10 m/s in the silty clay directly below the upper sand andsilt layers. It then gradually increases to about 4×10⁻¹⁰ m/s within the level interval+2 to –6 metres where the natural water content and the porosity also reachmaximum values. The permeability then gradually decreases with depth alongwith a decreasing water content and denser soil structure and returns to about2·10-10 m/s at greater depths, Fig. 25.
A certain time lag can be expected before changes in the water pressures at theboundaries fully affect the pore pressures in central parts of the clay layer becauseof the low permeability. This also entails that seasonal variations at the boundariescannot be expected to fully affect the pore pressures in central parts of thick claylayers since their duration is too short (e.g. Berntson 1983).
The pore pressure measuring systems in Section A were installed at the end of 1996and the readings started shortly thereafter. The readings during the first six monthsshowed irregular and shifting values in that the readings in some systems becamestable and then showed only little variation whereas the readings in other systemskept changing in different trends without obviously approaching stabilised values,Figs. 26a and b. A year after installation, a function control was thereforeperformed and a renewed pore pressure observation started. This was done in suchway that the inner hoses in the systems were filled up with water and the new porepressure dissipation process was studied. At the same time, a few systems werereplaced and a completely new system was installed in Point S2b located on theexcavated surface close to the lower crest. Once again, it proved to take very longtime for the pressures in the systems to stabilise, in many cases up to six months andin some case even longer than that. Thereafter, the pressures have mainly remainedstable. A certain seasonal variation has been measured, primarily in systems placedin superficial layers and systems installed close to the draining bottom layer. A fewreadings indicating larger variations, which are not in agreement with the generalpattern, are assumed to be erroneous.
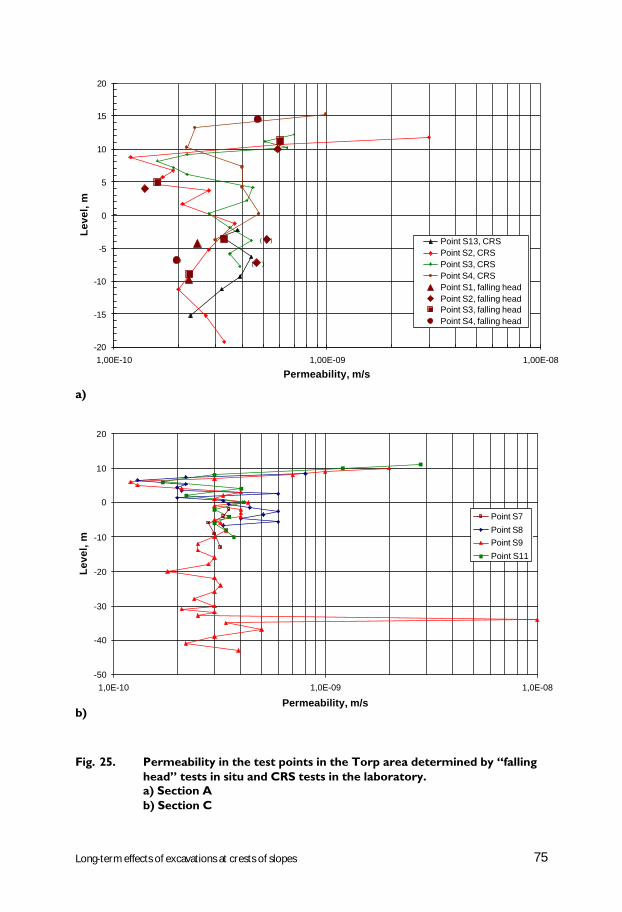
75Long-term effects of excavations at crests of slopes
a)
b)
Fig. 25. Permeability in the test points in the Torp area determined by “fallinghead” tests in situ and CRS tests in the laboratory.a) Section Ab) Section C
-20
-15
-10
-5
0
5
10
15
20
1,00E-10 1,00E-09 1,00E-08
Permeability, m/s
Lev
el, m
Point S13, CRSPoint S2, CRSPoint S3, CRSPoint S4, CRSPoint S1, falling headPoint S2, falling headPoint S3, falling headPoint S4, falling head
( )
( )
-50
-40
-30
-20
-10
0
10
20
1,0E-10 1,0E-09 1,0E-08
Permeability, m/s
Lev
el, m
Point S7
Point S8Point S9
Point S11
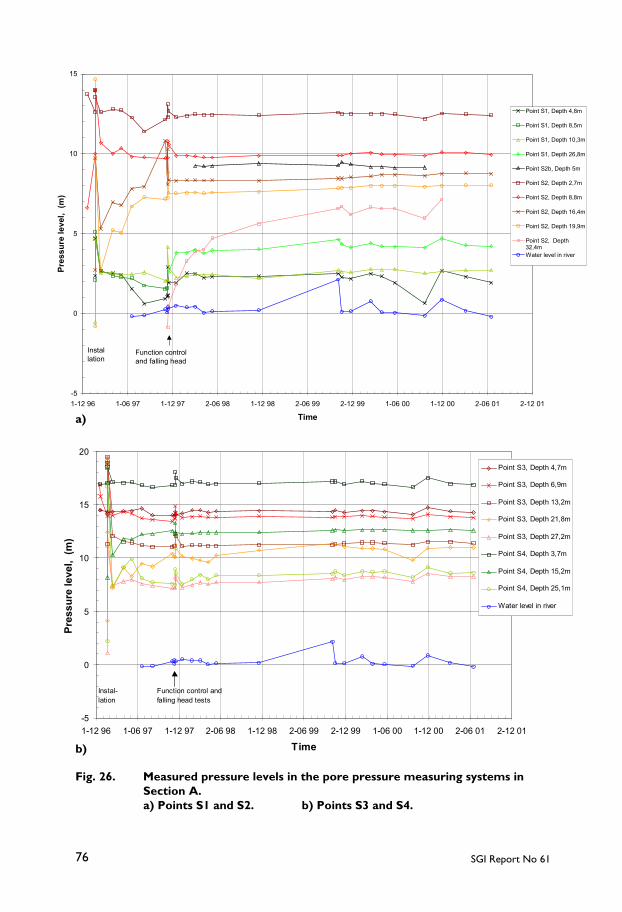
SGI Report No 6176
-5
0
5
10
15
20
1-12 96 1-06 97 1-12 97 2-06 98 1-12 98 2-06 99 2-12 99 1-06 00 1-12 00 2-06 01 2-12 01
Time
Pres
sure
leve
l, (m
)
Point S3, Depth 4,7m
Point S3, Depth 6,9m
Point S3, Depth 13,2m
Point S3, Depth 21,8m
Point S3, Depth 27,2m
Point S4, Depth 3,7m
Point S4, Depth 15,2m
Point S4, Depth 25,1m
Water level in river
Instal-lation
Function control and falling head tests
a)
b)
Fig. 26. Measured pressure levels in the pore pressure measuring systems inSection A.a) Points S1 and S2. b) Points S3 and S4.
-5
0
5
10
15
1-12 96 1-06 97 1-12 97 2-06 98 1-12 98 2-06 99 2-12 99 1-06 00 1-12 00 2-06 01 2-12 01
Time
Pres
sure
leve
l, (m
)
Point S1, Depth 4,8m
Point S1, Depth 8,5m
Point S1, Depth 10,3m
Point S1, Depth 26,8m
Point S2b, Depth 5m
Point S2, Depth 2,7m
Point S2, Depth 8,8m
Point S2, Depth 16,4m
Point S2, Depth 19,9m
Point S2, Depth32,4mWater level in river
Instal-lation
Function control and falling head t t

77Long-term effects of excavations at crests of slopes
The precision in the readings appears to have improved with time. This may bebecause the systems have become fully stabilised for installation effects. It mayalso be due to the fact that problems related to reading off the systems have beenobserved and amended and that the same person, who has been aware of thesepossible problems, has conducted the measurements. A certain regularity in thesmall variations has thereby been observed. The variations in general follow thevariation in external water supply. This is in turn reflected in the water transport andwater level in the river, the latter of which has been monitored simultaneously.
The principle for the reading of the open systems is very simple. It uses an electricalcoaxial cable which is inserted into the inner hose until it reaches the water surfacein the hose. The electrical conduit in the cable is then short-circuited, which isregistered by an ampere-meter on the ground. The length of the inserted cable isthen measured using markers on the cable and a carpenter’s rule. In spite of thesimplicity, measuring errors may occur because of condensed water on the innerwalls of the hose, contact problems at the end of the cable or in the portableinstrument, general problems with moisture or simply errors in measuring theinserted cable length.
The variations measured in pore pressure during the last years generally lie within10 kPa. A somewhat larger variation has been measured at the upper measuringlevel at Point S1, which may be assumed to be in relatively good contact with thewater level in the river, whereas lower variations are measured in the central partsof the clay layer. The pore pressure distributions at the different points areapproximately linear from free groundwater levels in or slightly below the groundsurfaces to a pressure level in the permeable bottom layers, which below the riverand its banks is at about +7 metres. This means that the pressure level in thepermeable bottom layer here is about 7 metres above the mean water level in theriver. Further up in the slope and in the area behind this, the pressure level in thebottom layers increases to +8.5 metres as a maximum. This indicates a certainresistance towards water flow in the bottom layers as well. The pore pressuresbelow the excavated area show a certain influence from higher ground in the areabehind and a certain extra pressure elevation can thus be seen in the upper layers.The pore pressures have a downward gradient in the upper area and below theexcavated part, whereas there are artesian water pressures at the toe of the slope andbelow the river, Fig. 27.
Compared to the values that were measured near Point S2 before the excavation,the pore pressures have been lowered both below the excavation and close to theupper crest. The effect is evident through most of the clay layer. Before the

SGI Report No 6178
-30
-25
-20
-15
-10
-5
0
5
10
15
20
25
0 50 100 150 200 250 300 350
Pore pressure, kPa
Leve
l, m
Point S1
-"-
Point S2
-"-
Ground level at point S2
Point 2 before excavation
-"-
Point S2b
Point S3
-"-
Ground level at point S3
Point S4
-"-
Ground level at point S4
Hydrostatic pressure from level+ 7.5 m
Hydrostatic pressure from mean water level in river
Fig. 27. Pore pressure distribution and measured variations in Section A.
excavation, the pore pressures in locations at various distances from the old crestseem to have been similar to those that are measured today at correspondingdistances behind the new upper crest. This appears to have been the case in spiteof the fact that the upper sand and silt layers were considerably thicker close to theold crest than those that are found behind the new crest.
As mentioned above, the variations in pore pressure that were measured with opensystems in the middle of the clay layer were very small. The later installed closedsystems showed variations that were considerably larger in a relative sense. Thesecomparison systems were installed at Point 2, i.e. under the excavated area, at 8.8and 16.4 metres depth. The maximum measured variations increased from about 3kPa in the open systems to about 20 kPa in the closed ones. The trends in thevariations generally agree with the net supply of water to the area. The highest porepressures are thus measured during late autumn and early spring, whereas thelowest ones are measured at the end of summer and early autumn. This is alsoreflected by the water level in the river, even if the groundwater conditions in thepart of the slope where these pore pressure measuring systems were installed is notdirectly affected by this level, Fig. 28. The water level in the river is also not entirelyrelated to precipitation and snow melting in the catchment area of the river but tosome extent also to the regulation of its water transport.

79Long-term effects of excavations at crests of slopes
The closed pore pressure systems in Section C were installed during October 1999and the measurements started one week after installation. The installation effectswere then evened out and the pore pressures had stabilised. The pore pressureconditions in this section are primarily affected by infiltration of water from theground surface and the water pressure in the permeable zone at great depth. No porepressure systems have been installed on the riverbank, but the pore pressureconditions in the upper layers here can be assumed to be affected by the water levelin the river in the same way as in Section A.
The infiltration from the ground surface is strongly affected by the catchment areabehind the slope, where water infiltrates through the permeable sand and silt layersand then flows towards the slope on top of the underlying less permeable layers.The up to 10 metres thick sand and silt layer is stratified and contains a relativelyimpermeable layer, and two separate aquifers with different pressure levels aretherefore found within the layer. The seasonal variation of these two pressure levelsis about 0.5 metres at a distance of 35 metres from the upper crest. At the crest,where the pressures are lower because of the seepage of water out of the slopebelow, this variation has practically ceased.
-20
0
20
40
60
80
100
120
140
2-06 99 1-12 99 1-06 00 1-12 00 1-06 01 1-12 01 2-06 02
Time
Pore
pre
ssur
e, k
Pa
BAT-tip, 8.8m
BAT-tip, 16.4 m
Open system, 8.8m
Open system, 16.4 m
Water pressure at thezero level in the river
Fig. 28. Pore pressure variations in the clay layer in Section A measured withopen and closed systems.

SGI Report No 6180
Thirty-five metres behind the crest, the free groundwater levels corresponding tothe pressure levels are located about 3 and 6 metres below the ground surface. Atthe crest, where the ground level is 0.5 metres lower, the corresponding depths are4 and 6 metres. The water seeping out of the upper slope continues to flow on topof the fine-grained soil below the erosion protection in the upper slope and thecoarse base on the upper excavated terrace. Because of this continuous watersupply and the limited possibility for evaporation, the variation in the uppergroundwater level should be very small in these parts. The water is then streamingdown to the lower excavated terrace and in principle follows this surface to thelower crest of the slope down to the river. The ground surface of the lower terraceis very marshy and no significant seasonal drying has been observed. The upperfree groundwater level in the slope is thereby almost stationary and significantvariations are only found far behind the upper crest and down at the river. Theabsence of measured variations can to some extent be due to the relatively wetsummers during the observation period.
The absence of variations on the upper groundwater level is also reflected in thepore pressures measured in the underlying soil layers. A variation of only a few kPahas been measured in the upper clay layers. However, the variation increases closeto the permeable layers at large depths and here a variation of about 10 kPa has beenmeasured, Fig. 29. The pore pressure variation in these layers appears to be largestin the area behind the slope, which is closer to the valley sides, and to decreasetowards the river.
Like the conditions in Section A, the pore pressure distribution is approximatelylinear between the upper free groundwater level and the more permeable zone,Fig. 30. The pressure in the latter zone corresponds approximately to a hydrostaticpressure from a level of +7 metres, which is about the same as for the bottom layersbelow the river in Section A. As with the conditions in Section A, there is also acertain deviation from the general pattern in the pore pressures in the upper claylayers under the excavated areas, which can be assumed to be due to an influencefrom the surrounding parts of the slope. The measured gradients are downward inthe upper parts of the slope but at the toe of the slope and below the river thepressures are artesian.
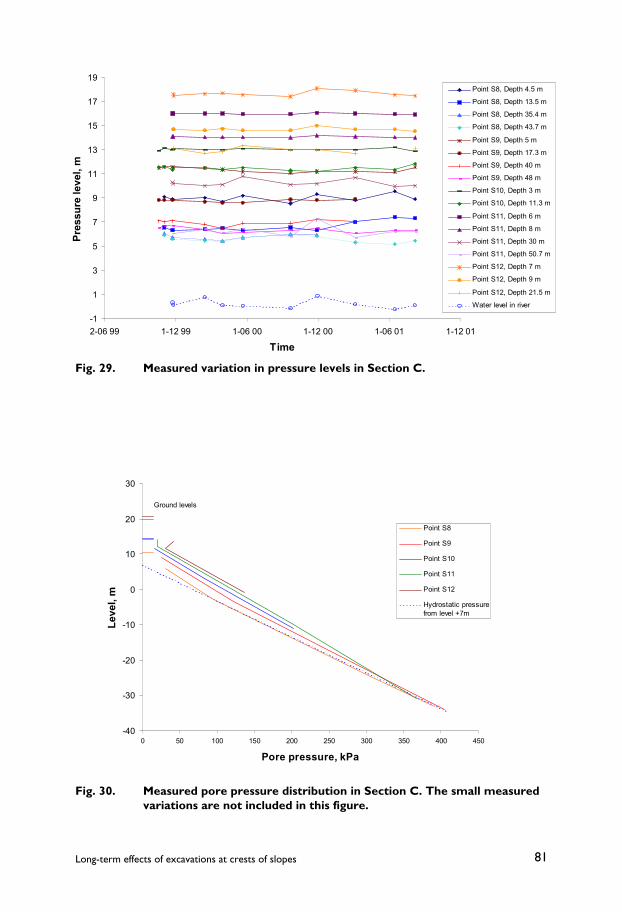
81Long-term effects of excavations at crests of slopes
-1
1
3
5
7
9
11
13
15
17
19
2-06 99 1-12 99 1-06 00 1-12 00 1-06 01 1-12 01
Time
Pres
sure
leve
l, m
Point S8, Depth 4.5 m
Point S8, Depth 13.5 m
Point S8, Depth 35.4 m
Point S8, Depth 43.7 m
Point S9, Depth 5 m
Point S9, Depth 17.3 m
Point S9, Depth 40 m
Point S9, Depth 48 m
Point S10, Depth 3 m
Point S10, Depth 11.3 m
Point S11, Depth 6 m
Point S11, Depth 8 m
Point S11, Depth 30 m
Point S11, Depth 50.7 m
Point S12, Depth 7 m
Point S12, Depth 9 m
Point S12, Depth 21.5 m
Water level in river
-40
-30
-20
-10
0
10
20
30
0 50 100 150 200 250 300 350 400 450
Pore pressure, kPa
Leve
l, m
Point S8
Point S9
Point S10
Point S11
Point S12
Hydrostatic pressurefrom level +7mS i 3
Ground levels
Fig. 29. Measured variation in pressure levels in Section C.
Fig. 30. Measured pore pressure distribution in Section C. The small measuredvariations are not included in this figure.
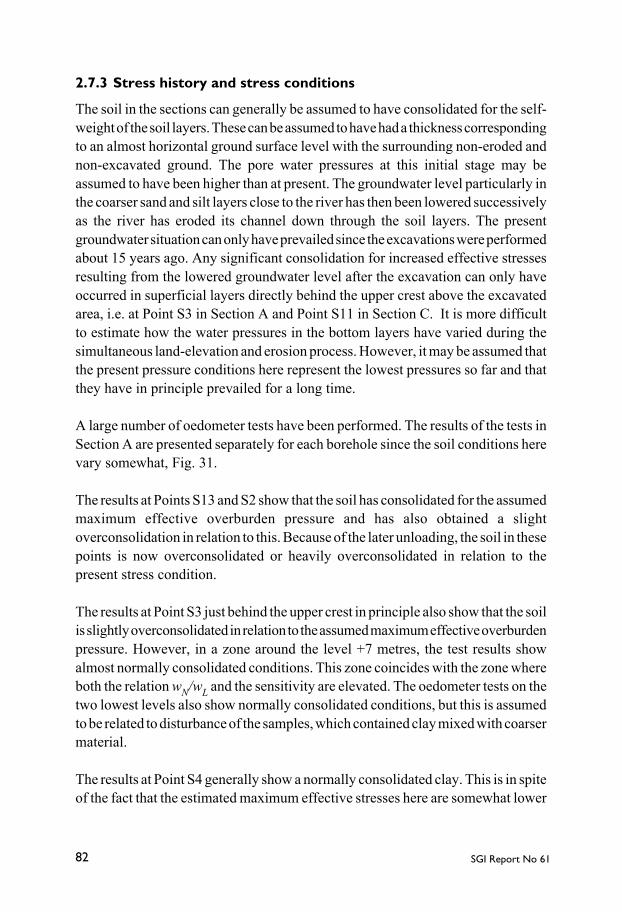
SGI Report No 6182
2.7.3 Stress history and stress conditions
The soil in the sections can generally be assumed to have consolidated for the self-weight of the soil layers. These can be assumed to have had a thickness correspondingto an almost horizontal ground surface level with the surrounding non-eroded andnon-excavated ground. The pore water pressures at this initial stage may beassumed to have been higher than at present. The groundwater level particularly inthe coarser sand and silt layers close to the river has then been lowered successivelyas the river has eroded its channel down through the soil layers. The presentgroundwater situation can only have prevailed since the excavations were performedabout 15 years ago. Any significant consolidation for increased effective stressesresulting from the lowered groundwater level after the excavation can only haveoccurred in superficial layers directly behind the upper crest above the excavatedarea, i.e. at Point S3 in Section A and Point S11 in Section C. It is more difficultto estimate how the water pressures in the bottom layers have varied during thesimultaneous land-elevation and erosion process. However, it may be assumed thatthe present pressure conditions here represent the lowest pressures so far and thatthey have in principle prevailed for a long time.
A large number of oedometer tests have been performed. The results of the tests inSection A are presented separately for each borehole since the soil conditions herevary somewhat, Fig. 31.
The results at Points S13 and S2 show that the soil has consolidated for the assumedmaximum effective overburden pressure and has also obtained a slightoverconsolidation in relation to this. Because of the later unloading, the soil in thesepoints is now overconsolidated or heavily overconsolidated in relation to thepresent stress condition.
The results at Point S3 just behind the upper crest in principle also show that the soilis slightly overconsolidated in relation to the assumed maximum effective overburdenpressure. However, in a zone around the level +7 metres, the test results showalmost normally consolidated conditions. This zone coincides with the zone whereboth the relation wN/wL and the sensitivity are elevated. The oedometer tests on thetwo lowest levels also show normally consolidated conditions, but this is assumedto be related to disturbance of the samples, which contained clay mixed with coarsermaterial.
The results at Point S4 generally show a normally consolidated clay. This is in spiteof the fact that the estimated maximum effective stresses here are somewhat lower

83Long-term effects of excavations at crests of slopes
-20
-15
-10
-5
0
5
10
15
20
0 50 100 150 200 250 300 350 400 450
Effective vertical stress, kPa
Leve
l, m
Preconsolidation pressure
Present effective overburden pressure
Estimated maximum effective verticalstress
-20
-15
-10
-5
0
5
10
15
20
0 50 100 150 200 250 300 350 400 450
Effective vertical stress, kPa
Leve
l, m
Preconsolidation pressure, presentinvestigationPresent effective overburden pressure
Effective overburden pressure beforeexcavation
a)
b)
Fig. 31. Evaluated preconsolidation pressures compared to assumed maximumeffective overburden pressure in Section A.a) Point S13 below the riverb) Point S2 in the excavated area

SGI Report No 6184
-20
-15
-10
-5
0
5
10
15
20
0 50 100 150 200 250 300 350 400 450
Effective vertical stress, kPa
Leve
l, m
Preconsolidation pressure
Present effective overburden pressure
Estimated effective overburdenpressure before excavation
-20
-15
-10
-5
0
5
10
15
20
0 50 100 150 200 250 300 350 400 450
Effective vertical stress, kPa
Leve
l, m
Preconsolidation pressure
Present effective overburden pressure =estimated effectice overburden pressurebefore excavation
c)
d)
Fig. 31. Evaluated preconsolidation pressures compared to assumed maximumeffective overburden pressure in Section A.c) Point S3 behind the upper crestd) Point S4, 50 metres behind the crest

85Long-term effects of excavations at crests of slopes
because of a thinner sand and silt layer and higher pore pressures. The clay at thispoint is different from that at the other points in other respects too and has aconsiderably higher sensitivity and wN /wL relation.
A compilation of all results shows that the preconsolidation in the main part of theinvestigated soil mass is similar and corresponds to an overconsolidation ratio ofabout 1.15 in relation to the assumed previous maximum effective overburdenpressures, Fig. 32. Exceptions are Point S4 and a small depth interval at Point S3,which show normally consolidated conditions for the prevailing stresses. It ispossible that a small previous overconsolidation here has been broken down bydifferent circumstances, such as leaching.
The results of the CPT tests also show that the soil behind the excavated area isalmost normally consolidated for the assumed maximum previous effectiveoverburden pressure and that the values at Point S4 are lower than at the otherpoints. The results also show that the evaluation method that was proposed in SGIInformation No. 15 (Larsson 1991), strongly overestimates the preconsolidation inhomogeneous overconsolidated soil and that this increases with increasingoverconsolidation ratio.
-20
-15
-10
-5
0
5
10
15
20
0 50 100 150 200 250 300 350 400 450
Effective vertical stress, kPa
Leve
l, m
Point S13
Point S2
Point S3
Point S4
Maximum previous effective overburdenpressure in points S2, S3 and S13 - " - -"- in point S4
OCR = 1.15
Fig. 32. Compilation of evaluated preconsolidation pressures from CRS testsin Section A.

SGI Report No 6186
In the evaluation method proposed in SGI Information No. 15, the evaluatedpreconsolidation pressure is corrected with respect to the overconsolidation ratio.The method was proposed on the basis of the investigations in Swedish clays madeby Larsson and Mulabdic (1991) combined with results from Norway and theUnited Kingdom presented in literature. According to that compilation, thepreconsolidation pressure could be evaluated from
)log54.007.1)(4.421.1(´ 0
OCRwq
L
vTc −+
−= σσ
where σ´c = preconsolidation pressureqT = total tip resistanceσv0 = total overburden pressurewL = liquid limitOCR= overconsolidation ratio
However, the Swedish investigations in principle comprised normally consolidatedand only slightly overconsolidated clays with an average overconsolidation ratioof about 1.3, and there was no national experience of overconsolidated soils. Thecorrection for overconsolidation was introduced mainly to take the fissured natureof the overconsolidated dry crusts into account. Later investigations in clay till haveshown that this method strongly overestimates the preconsolidation pressure in thistype of soil (Larsson 2000). New experience from Canadian clays also shows thatno correction should be made for overconsolidation in the evaluation ofpreconsolidation pressure in this way (Demers and Leroueil 2002). Withoutcorrection for overconsolidation the evaluation is simplified to
L
vTc w
q4.421.1
´ 0
+−= σσ
When the results in Section A in Torp are evaluated in this way, a relatively goodcorrelation is obtained with the results from the oedometer tests regardless of wherein the slope the borehole is located and what overconsolidation ratio the clay has,Fig. 33. No correction for overconsolidation ratio should thus be made in thishomogeneous type of clay in which the state of consolidation varies from normallyconsolidated to heavily overconsolidated and the overconsolidation is a result of areal unloading.
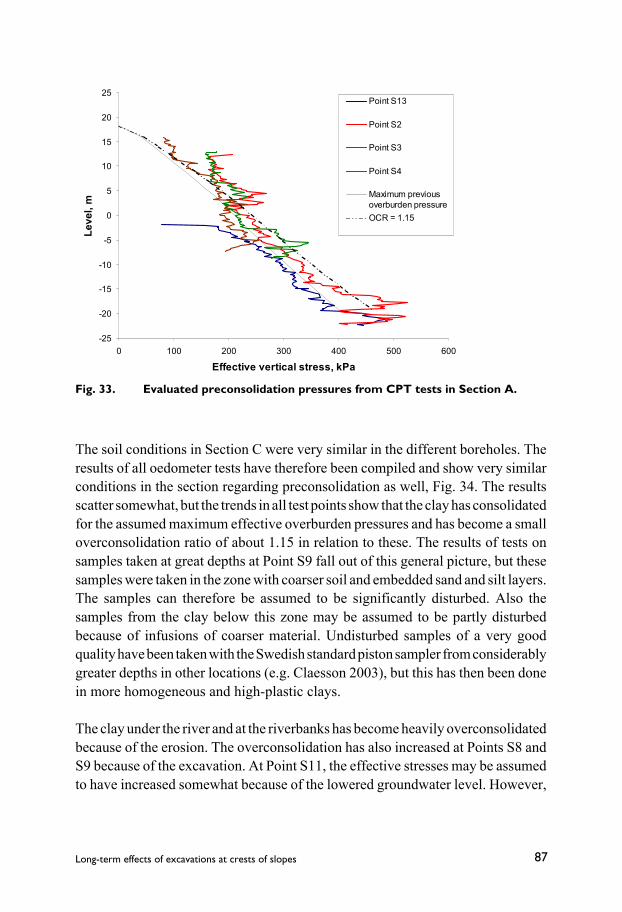
87Long-term effects of excavations at crests of slopes
The soil conditions in Section C were very similar in the different boreholes. Theresults of all oedometer tests have therefore been compiled and show very similarconditions in the section regarding preconsolidation as well, Fig. 34. The resultsscatter somewhat, but the trends in all test points show that the clay has consolidatedfor the assumed maximum effective overburden pressures and has become a smalloverconsolidation ratio of about 1.15 in relation to these. The results of tests onsamples taken at great depths at Point S9 fall out of this general picture, but thesesamples were taken in the zone with coarser soil and embedded sand and silt layers.The samples can therefore be assumed to be significantly disturbed. Also thesamples from the clay below this zone may be assumed to be partly disturbedbecause of infusions of coarser material. Undisturbed samples of a very goodquality have been taken with the Swedish standard piston sampler from considerablygreater depths in other locations (e.g. Claesson 2003), but this has then been donein more homogeneous and high-plastic clays.
The clay under the river and at the riverbanks has become heavily overconsolidatedbecause of the erosion. The overconsolidation has also increased at Points S8 andS9 because of the excavation. At Point S11, the effective stresses may be assumedto have increased somewhat because of the lowered groundwater level. However,
-25
-20
-15
-10
-5
0
5
10
15
20
25
0 100 200 300 400 500 600
Effective vertical stress, kPa
Leve
l, m
Point S13
Point S2
Point S3
Point S4
Maximum previousoverburden pressureOCR = 1.15
Fig. 33. Evaluated preconsolidation pressures from CPT tests in Section A.

SGI Report No 6188
-50
-40
-30
-20
-10
0
10
20
0 100 200 300 400 500 600 700 800
Preconsolidation pressure, kPa
Leve
l, m
Point S7
Point S8
Point S9
Point S11
Maximum previous effectiveoverburden pressureOCR=1,15
Fig. 34. Evaluated preconsolidation pressures from CRS test in Section C.
this has not entailed that the preconsolidation pressure has been exceeded. Whetheror not the stress increase has nevertheless brought any extra consolidation andincrease in preconsolidation pressure because of creep effects cannot be inferredfrom the test results.
The stress and consolidation conditions are thus similar along the investigated areaexcept for the part behind the upper crest in Section A where the clay has obtaineddifferent properties, which are probably a result of leaching.
Similar preconsolidation pressures to those evaluated from the oedometer testswere evaluated from the results of the dilatometer test. More strictly, it is theoverconsolidation ratio that is evaluated from the dilatometer tests and in theevaluation method employed this ratio can never be less than 1.0 (Larsson 1989).This limitation is to some extent reflected in the results from greater depths, Fig. 35.A partly revised method for the evaluation of the overconsolidation ratio fordilatometer tests in overconsolidated soil is presented further on in the report(Chapter 3.8), but this does not affect the evaluation in the normally or only slightlyoverconsolidated soil at Point S11.
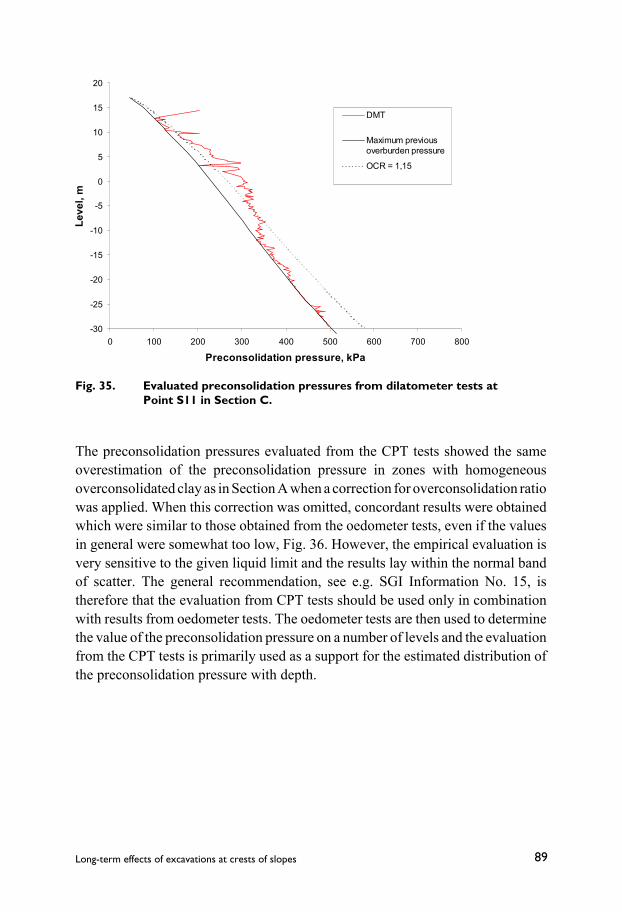
89Long-term effects of excavations at crests of slopes
The preconsolidation pressures evaluated from the CPT tests showed the sameoverestimation of the preconsolidation pressure in zones with homogeneousoverconsolidated clay as in Section A when a correction for overconsolidation ratiowas applied. When this correction was omitted, concordant results were obtainedwhich were similar to those obtained from the oedometer tests, even if the valuesin general were somewhat too low, Fig. 36. However, the empirical evaluation isvery sensitive to the given liquid limit and the results lay within the normal bandof scatter. The general recommendation, see e.g. SGI Information No. 15, istherefore that the evaluation from CPT tests should be used only in combinationwith results from oedometer tests. The oedometer tests are then used to determinethe value of the preconsolidation pressure on a number of levels and the evaluationfrom the CPT tests is primarily used as a support for the estimated distribution ofthe preconsolidation pressure with depth.
-30
-25
-20
-15
-10
-5
0
5
10
15
20
0 100 200 300 400 500 600 700 800
Preconsolidation pressure, kPa
Leve
l, m
DMT
Maximum previousoverburden pressure
OCR = 1,15
Fig. 35. Evaluated preconsolidation pressures from dilatometer tests atPoint S11 in Section C.

SGI Report No 6190
-50
-40
-30
-20
-10
0
10
20
0 100 200 300 400 500 600 700
Preconsolidation pressure, kPa
Leve
l, m
CPT Point S7
CPT Point S8
CPT Point S9
CPT Point S10
CPT Point S11
CPT Point S12
Maximum previouseffective overburdenpressure
Coarser layer
Fig. 36. Evaluated preconsolidation pressures from the CPT tests in Section C.
2.7.4 Shear strength
General
The undrained shear strength normally varies with effective overburden pressure,overconsolidation ratio and liquid limit (or plasticity index). According to empiricalexperience from direct simple shear tests and triaxial tests, the undrained shearstrength can be evaluated from
1´´ −=⋅⋅= bcu
bvu OCRacorOCRac σσ
where cu = undrained shear strengthσ´v = effective vertical pressureOCR = overconsolidation ratio, σ´c /σ´vσ´c = preconsolidation pressure
(Ladd et al. 1977, Jamiolkowski et a.l 1985)

91Long-term effects of excavations at crests of slopes
a and b are material constants. a varies with the mode of loading. In active triaxialtests, it is generally found to be around 0.33 in Swedish clays. In direct simple sheartests, the factor has been found to vary somewhat with the liquid limit and in passivetriaxial tests this variation is more pronounced (Larsson 1980). There may also bea small variation with the plasticity for the active triaxial tests (Westerberg 1999).In direct simple shear tests, which also approximately represent the average shearstrengths, the factor a has an average value for clays of 0.22, but it is normally lowerfor low-plastic clays and higher for high-plastic and organic clays. The factor bnormally varies between 0.75 and 0.85.
Series of undrained direct simple shear tests have been performed on clay fromthree levels in Munkedal. In these series, specimens from the same sample tube, orfrom the middle and lower sample tubes from the same point and level, have beenconsolidated for an effective vertical stress just below the preconsolidationpressure and then unloaded to different overconsolidation ratios. After adjustmentto the new vertical stresses, the undrained shear strength has been measured. Theseseries have been performed on samples from level +7 metre at Point S2 in SectionA and on levels +2 and –8 metres at Point S9 in Section C. The liquid limits variedfrom 42 % to 69% between the samples, i.e. within a fairly limited range. Theresults from the test series coincided with the general picture and the evaluatedfactors a and b ranged from 0.21 to 0.23 and 0.77 to 0.85 respectively, Fig. 37. Noparticular trend for variation of the factors with liquid limit could be observed fromthese results.
Apart from these tests, a number of ordinary direct simple shear tests have beenperformed. In these tests, the specimen are first consolidated for stresses just belowthe preconsolidation pressure and then unloaded to the in situ effective verticalstress. Thereafter the specimens are sheared to failure in undrained conditions. Theresults of these tests have been plotted together with the results from the special testseries, Fig. 38. The compilation shows that the undrained shear strength in directsimple shear in the investigated soil in the Torp area with a good approximation canbe expressed with the general equation and the factors a = 0.22 and b = 0.8.
All relations between consistency limits and other soil properties are here using theliquid limit in accordance with Swedish practice. For inorganic clays, an approximatetranslation to plasticity index can be made using the relation IP ≈ 0.8(wL – 0.18)
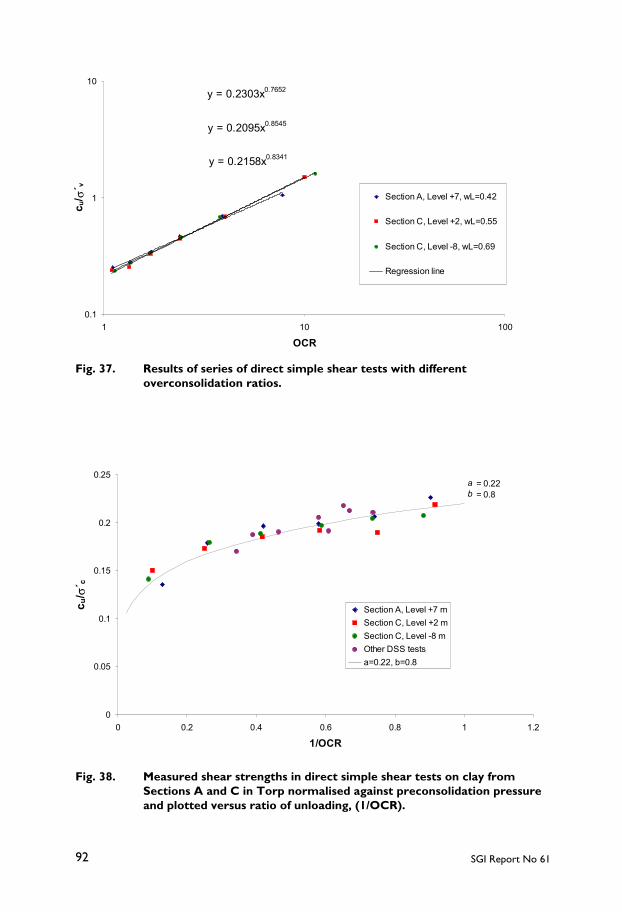
SGI Report No 6192
Fig. 37. Results of series of direct simple shear tests with differentoverconsolidation ratios.
Fig. 38. Measured shear strengths in direct simple shear tests on clay fromSections A and C in Torp normalised against preconsolidation pressureand plotted versus ratio of unloading, (1/OCR).
y = 0.2303x0.7652
y = 0.2095x0.8545
y = 0.2158x0.8341
0.1
1
10
1 10 100
OCR
c u/ σ
´ v
Section A, Level +7, wL=0.42
Section C, Level +2, wL=0.55
Section C, Level -8, wL=0.69
Regression line
0
0.05
0.1
0.15
0.2
0.25
0 0.2 0.4 0.6 0.8 1 1.2
1/OCR
c u/ σ
´ c
Section A, Level +7 mSection C, Level +2 mSection C, Level -8 mOther DSS testsa=0.22, b=0.8
a = 0.22b = 0.8

93Long-term effects of excavations at crests of slopes
Shear strength determinations in Section A
The undrained shear strength in Section A has been determined by field vane tests,CPT tests, fall-cone tests on undisturbed samples and supplementary direct simpleshear tests and triaxial tests on reconsolidated specimens in the laboratory.
Evaluation of the undrained shear strength from CPT tests is normally made by theequation
KT
vTu N
qc 0σ−=
where the cone factor NKT varies depending on what shear strength is referred to,i.e. active shear strength, shear strength at direct simple shear or some other case.For the case of direct simple shear, which normally also corresponds to thecorrected shear strength from field vane tests, it has empirically been found that NKTfor Swedish slightly overconsolidated clays, OCR ≈ 1.3, can be written
LKT wN 65.64.13 += (Larsson and Mulabdic 1990)
where wL is the liquid limit in decimal number.
The relation cu = a·σ´v·OCRb is well established and is incorporated in most basicmodels for the shear strength of clays, e.g. SHANSSEP (Ladd and Foott 1974) andCritical State Soil Mechanics (Schofield and Wroth 1968, Wood 1991). However,the preconsolidation pressure is also evaluated from the net cone resistance(qT –σv0) from the CPT test divided by an empirical cone factor. This means thateither the evaluated shear strength or the preconsolidation pressure, or both, shouldbe corrected for the overconsolidation ratio. In the previously mentioned evaluationaccording to the guidelines in SGI Information No. 15, the evaluated preconsolidationpressure was corrected. Since it has now been shown that no such correction shouldbe made, it follows that the evaluated undrained shear strength should be correctedinstead. No rules for how this should be done have been found in previous literature,but in order to be consistent and compatible it should follow the same principles asin the other shear strength determinations and established soil models. In accordancewith this, the evaluation equation can be rewritten as

SGI Report No 6194
1
0
0
´3.1´
−
⋅−=
b
v
c
KT
vTu N
qcσ
σσ
where qT = total tip resistanceσv0 = total overburden pressureNKT = cone factor = 13.4 + 6.65wLwL = liquid limit in decimal numberσ´v0 = effective overburden pressureσ´c = preconsolidation pressure (can be evaluated from the same
CPT test as described in the previous section with therestriction that OCR = σ´c/σ´v0 ≥ 1)
1.3 = the overconsolidation ratio for which NKT is empiricallydetermined
b = material constant, set to 0.8 from empirical experience orcalibrated through laboratory tests
The correction entails that significantly lower undrained shear strengths areevaluated in heavily overconsolidated clays whereas marginally higher values areevaluated in clays with unusually low overconsolidation ratios, i.e. OCR < 1.3.However, for most “normally consolidated or slightly overconsolidated” clays thecorrection does not entail any significant difference.
In the evaluations made in this project, the material constant b has been set to 0.8unless some other value has been specified in the text.
Field vane tests were performed at Points S13, S2 and S3 and were doubled at thetwo last points. No field vane tests have been performed at Point S4, but only fall-cone tests at the routine testing in the laboratory and a CPT test. These tests gavegenerally lower values of the undrained shear strength than those at correspondinglevels in the other test points did.
Vane tests had been performed adjacent to Point S1 in a previous investigation and,since the stress conditions had not changed much since then, no new tests wereperformed here.
A comparison between the different shear strength determinations in each pointshows that a fairly good agreement between the different methods was obtained atPoint S3 behind the upper crest, Fig. 39. The field vane tests and the fall-cone tests

95Long-term effects of excavations at crests of slopes
0
5
10
15
20
25
30
0 10 20 30 40 50 60 70 80
Undrained shear strength, kPa
Dep
th, m
Field vane 1
Field vane 2
CPT
CPT corr OCR
DSS test
DSS empirical relation
Fall cone test
Fig. 39. Results of shear strength determinations at Point S3 behind theupper crest.
gave higher values than the CPT test and empirical values for direct simple sheardown to a depth of about 9 metres. This may be related to the presence of silt layers,coarser particles and organic matter that may have affected the results. At largerdepths, the agreement is relatively good apart from a few odd values. At greaterdepths the fall-cone tests gave lower strength values, but this is a normal effect ofthe stress relief at sampling. At this point, the soil is only slightly overconsolidatedand the correction of the CPT evaluation for overconsolidation ratio had a verysmall effect.
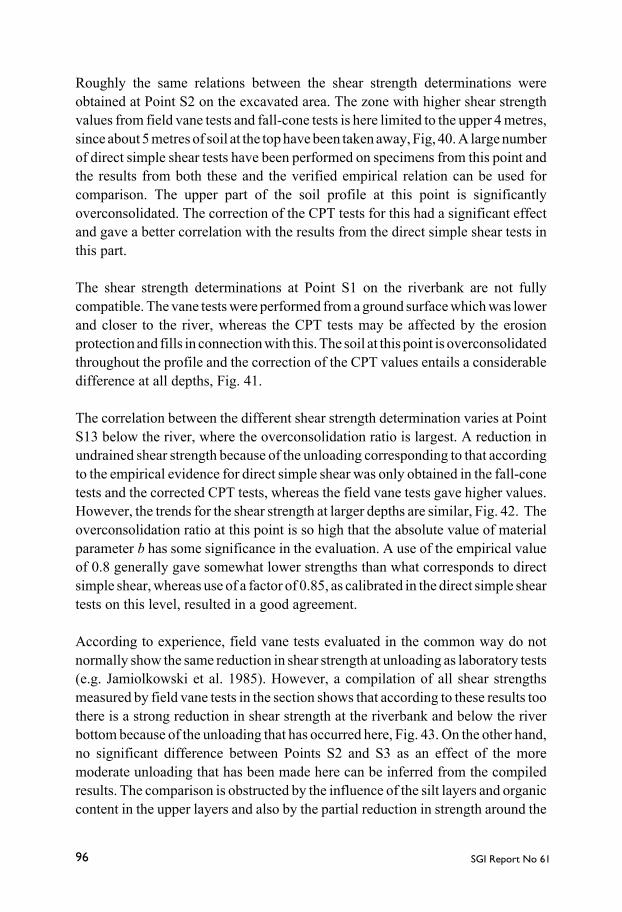
SGI Report No 6196
Roughly the same relations between the shear strength determinations wereobtained at Point S2 on the excavated area. The zone with higher shear strengthvalues from field vane tests and fall-cone tests is here limited to the upper 4 metres,since about 5 metres of soil at the top have been taken away, Fig, 40. A large numberof direct simple shear tests have been performed on specimens from this point andthe results from both these and the verified empirical relation can be used forcomparison. The upper part of the soil profile at this point is significantlyoverconsolidated. The correction of the CPT tests for this had a significant effectand gave a better correlation with the results from the direct simple shear tests inthis part.
The shear strength determinations at Point S1 on the riverbank are not fullycompatible. The vane tests were performed from a ground surface which was lowerand closer to the river, whereas the CPT tests may be affected by the erosionprotection and fills in connection with this. The soil at this point is overconsolidatedthroughout the profile and the correction of the CPT values entails a considerabledifference at all depths, Fig. 41.
The correlation between the different shear strength determination varies at PointS13 below the river, where the overconsolidation ratio is largest. A reduction inundrained shear strength because of the unloading corresponding to that accordingto the empirical evidence for direct simple shear was only obtained in the fall-conetests and the corrected CPT tests, whereas the field vane tests gave higher values.However, the trends for the shear strength at larger depths are similar, Fig. 42. Theoverconsolidation ratio at this point is so high that the absolute value of materialparameter b has some significance in the evaluation. A use of the empirical valueof 0.8 generally gave somewhat lower strengths than what corresponds to directsimple shear, whereas use of a factor of 0.85, as calibrated in the direct simple sheartests on this level, resulted in a good agreement.
According to experience, field vane tests evaluated in the common way do notnormally show the same reduction in shear strength at unloading as laboratory tests(e.g. Jamiolkowski et al. 1985). However, a compilation of all shear strengthsmeasured by field vane tests in the section shows that according to these results toothere is a strong reduction in shear strength at the riverbank and below the riverbottom because of the unloading that has occurred here, Fig. 43. On the other hand,no significant difference between Points S2 and S3 as an effect of the moremoderate unloading that has been made here can be inferred from the compiledresults. The comparison is obstructed by the influence of the silt layers and organiccontent in the upper layers and also by the partial reduction in strength around the

97Long-term effects of excavations at crests of slopes
0
5
10
15
20
25
30
35
40
0 20 40 60 80 100 120
Undrained shear strength, kPa
Dep
th, m
Vane test 1
Vane test 2
CPT
CPT corr OCR
DSS test
DSS, empiricalrelationFall cone test
på
level +7 metres at Point S3 that is indicated by the results of the oedometer tests.A detailed comparison is also rendered difficult by the fact that the liquid limit atthe same levels varies somewhat between the test points. According to empiricalexperience, the shear strength before unloading should thereby have been somewhatlarger in the lower parts of the slope and have decreased gradually with distancefrom the river. However, even if an effect of the unloading on the evaluated shearstrengths from the field vane tests can be observed, it is generally much smaller thanwhat could be expected from the common soil models.
Fig. 40. Results of shear strength determinations in Point S2 in the excavatedarea.

SGI Report No 6198
0
5
10
15
20
25
30
35
40
0 20 40 60 80 100
Undrained shear strength, kPa
Dep
th, m
Field vane
CPT
CPT corr OCR
Fig. 41. Results of shear strength determinations at Point S1 on the riverbank.
A compilation of the results from the CPT tests show that the shear strength farbehind the upper crest is lower than at the crest, Fig. 44. No significant effect of theunloading can be detected when no correction is made for the overconsolidationratio. The effect of the unloading can then only be seen in the uppermost couple ofmetres below the river bottom. The scatter in the results is relatively large and thepossible evaluated effects of the unloading are far lower than those expected fromthe empirical evidence. When the results are corrected for the overconsolidationratio, a considerable effect of the unloading is obtained, particularly below the riverand the riverbank but also in the superficial layers below the excavation. Thepicture is disturbed by the significantly lower values at Point S4, where the clay has
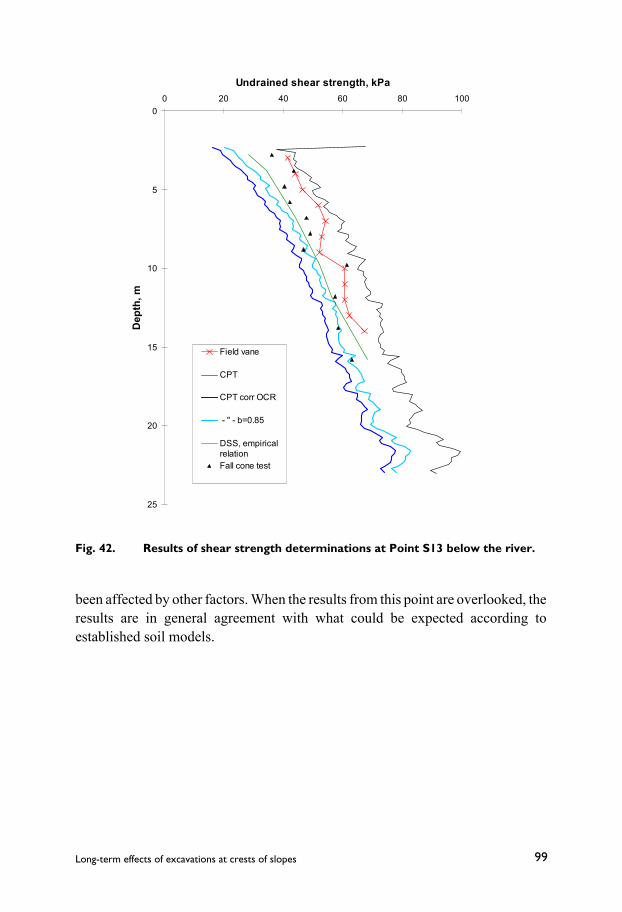
99Long-term effects of excavations at crests of slopes
0
5
10
15
20
25
0 20 40 60 80 100
Undrained shear strength, kPa
Dep
th, m
Field vane
CPT
CPT corr OCR
- " - b=0.85
DSS, empiricalrelationFall cone test
Fig. 42. Results of shear strength determinations at Point S13 below the river.
been affected by other factors. When the results from this point are overlooked, theresults are in general agreement with what could be expected according toestablished soil models.

SGI Report No 61100
-15
-10
-5
0
5
10
150 20 40 60 80 100
Undrained shear strength, kPa
Leve
l, m
Point S13
Point 1
Point S2
- " -
Point S3
- " -
Fig. 43. Compilation of the shear strengths determined by field vane tests inSection A. (The values in Point 1 come from a previous investigation.)

101Long-term effects of excavations at crests of slopes
-20
-15
-10
-5
0
5
10
15
200 10 20 30 40 50 60 70 80 90 100 110
Undrained shear strength, kPa
Leve
l, m
Point S13
Point S1
Point S2
Point S3
Point S4
Fig. 44. Compilation of shear strengths evaluated from CPT tests in Section A.a) without correction for overconsolidation ratio
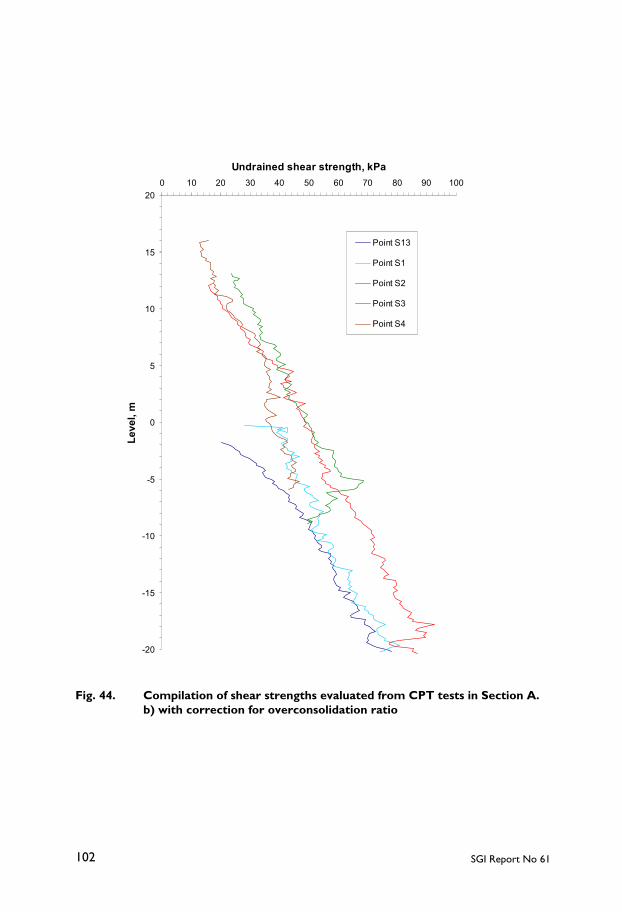
SGI Report No 61102
-20
-15
-10
-5
0
5
10
15
200 10 20 30 40 50 60 70 80 90 100
Undrained shear strength, kPa
Leve
l, m
Point S13
Point S1
Point S2
Point S3
Point S4
Fig. 44. Compilation of shear strengths evaluated from CPT tests in Section A.b) with correction for overconsolidation ratio

103Long-term effects of excavations at crests of slopes
Anisotropy
The anisotropy of the shear strength often plays a significant role in assessmentsof slope stability. It is often estimated empirically, but has to be verified beforebeing used in the final assessment. A number of active undrained triaxial tests havetherefore been performed on specimens from different depths in Point S2 in SectionA. The specimens were reconsolidated at stresses just below the preconsolidationstresses and then allowed to adjust for the in situ stress conditions before theundrained strength tests were performed.
The active undrained shear strength of clay is estimated empirically in the sameway as the shear strength at direct simple shear but with a factor a of 0.33. Theactive shear strength in Munkedal is thus estimated as
8,033.0 OCRc vuACTIVE⋅⋅= σ
A comparison between the measured shear strength values in the triaxial tests andempirically estimated values is shown in Fig. 45. The agreement is good and thevalidity of the empirical relation can be considered as confirmed.
0
5
10
15
20
25
30
35
0 20 40 60 80 100 120 140 160
Undrained shear strength, kPa
Dep
th, m
Triaxial test
Empiricalrelation
Fig. 45. Active undrained shear strength at Point S2, Section A.

SGI Report No 61104
Effective shear strength parameters
The effective shear strength parameters c´ and φ´ have been evaluated from theeffective stress paths in the undrained tests. The value of φ´ is normally assumedto be 30° and c´ is estimated as c´ ≈ 0.1τfu or c´ ≈ 0.03σ´c from empirical relationsfor Swedish clays. The triaxial tests were performed on specimens from differentlevels and the evaluated values varied correspondingly. The stress paths correspondedwell to a friction angle of 30° and a c´ value of about 6 kPa for a depth of 10–11 metres and about 9 kPa for the depth interval 18–26 metres. The correspondingvalues from the empirical relations are 5–6 kPa and 7–10.5 kPa respectively.
Undrained tests on water-saturated specimens are performed with the restrictionthat the volume is constant and the evaluated friction angle corresponds to φ´cv,(cv – constant volume). The mobilised shear strength measured in drained testscorresponds to the friction angle at constant volume plus the effects that developbecause of the change in volume of the specimen during shear. At low stresses, i.e.below the preconsolidation pressure, the soil will dilate (increase its volume). Thiseffect is positive for the shear strength and can be expressed as a c´ value in additionto the friction at constant volume. The influence of the dilatancy (or contractancy)that occurs under drained conditions can thus not be measured directly in undrainedtests. A number of drained tests with different stress paths have therefore beenperformed on specimens from depths of 14 to 22 metres at Point S2. The stress pathshave been selected in such a way that the effective stresses at failure have notexceeded the preconsolidation stresses and have varied in such way that theinfluence of the stress level within this range could be studied. Within this stressrange, the value of c´ was found to vary between about zero just at the preconsolidationpressure and 14 kPa at very low stresses. The relation between c´ and the stress levelis curved. Within the stress region in which the drained shear strength is lower thanthe undrained shear strength, and thereby may be the governing strength, the c´values from the drained tests were equal to or somewhat larger than the valuesevaluated from the stress paths in the undrained tests.
The empirical relations that are normally used for Swedish clays were thus foundto be applicable also to this type of clay.
Shear strength determinations in Section C
The undrained shear strength in Section C has been determined in a correspondingway by field vane tests and CPT tests in the field and fall-cone tests, direct simpleshear tests and triaxial tests in the laboratory. The shear strength has also been

105Long-term effects of excavations at crests of slopes
evaluated from the dilatometer tests at Point 11. According to the recommendationsin SGI Information No. 10 (Larsson 1989), the undrained shear strength, τfu, isevaluated from dilatometer tests as
3.1001 h
fup στ −=
where p1 = expansion pressure in the dilatometer testσh0 = the horizontal earth pressure at rest (calculated from the test
results)10.3= empirical factor for clay (9.0 for gyttja)
In international practice, the evaluation of undrained shear strength from dilatometertests is normally made using the general equation for how the undrained shearstrength varies with effective overburden pressure and overconsolidation ratio(Marchetti 1980). The empirical values a = 0.22 and b = 0.8 are then normally usedand the undrained shear strength is calculated as
8.00´22.0 OCRc vu σ=
The effective overburden pressure is estimated from the results of the dilatometertest or is calculated using measured densities and pore pressures. Theoverconsolidation ratio is evaluated from the dilatometer test results. As for theestimation of preconsolidation pressure, it is then important to use a relevantmethod for the estimation of the overconsolidation ratio. In this report, bothmethods of estimation of the undrained shear strength have been used, and it hasbecome evident that only the latter method estimates a reduction because ofunloading corresponding to the effect that is indicated by the general equation.
Field vane tests have been performed at Points S7, S8, S9 and S11 and CPT testsat Points S7, S8, S9, S10, S11 and S12. The aforementioned larger investigationwith comparison of different field vane equipment and vane sizes was alsoperformed at Point S9.
The shear strength values evaluated at Point S7 below the river have about the samesizes and relations between the different methods as was found at Point S13 withthe corresponding location in Section A, Fig. 46. A strong reduction in shearstrength in relation to what would be obtained in normally consolidated clay withthe same preconsolidation pressure was found here too. The effect of the unloadingis thus strong and the CPT tests and the fall-cone tests yielded values corresponding
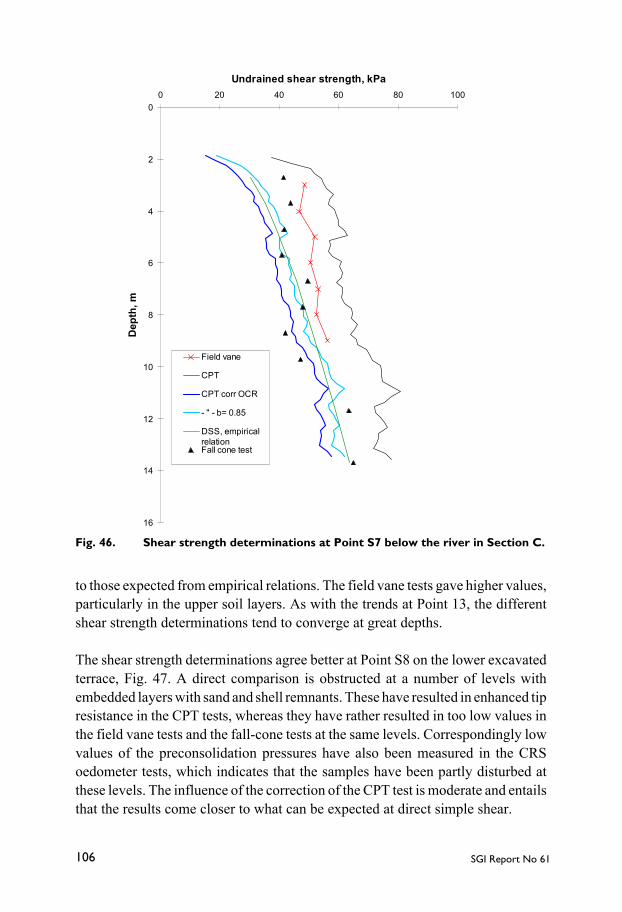
SGI Report No 61106
0
2
4
6
8
10
12
14
16
0 20 40 60 80 100
Undrained shear strength, kPa
Dep
th, m
Field vane
CPT
CPT corr OCR
- " - b= 0.85
DSS, empiricalrelationFall cone test
to those expected from empirical relations. The field vane tests gave higher values,particularly in the upper soil layers. As with the trends at Point 13, the differentshear strength determinations tend to converge at great depths.
The shear strength determinations agree better at Point S8 on the lower excavatedterrace, Fig. 47. A direct comparison is obstructed at a number of levels withembedded layers with sand and shell remnants. These have resulted in enhanced tipresistance in the CPT tests, whereas they have rather resulted in too low values inthe field vane tests and the fall-cone tests at the same levels. Correspondingly lowvalues of the preconsolidation pressures have also been measured in the CRSoedometer tests, which indicates that the samples have been partly disturbed atthese levels. The influence of the correction of the CPT test is moderate and entailsthat the results come closer to what can be expected at direct simple shear.
Fig. 46. Shear strength determinations at Point S7 below the river in Section C.

107Long-term effects of excavations at crests of slopes
0
10
20
30
40
50
60
0 20 40 60 80 100 120 140
Undrained shear strength, kPa
Dep
th, m
Field vane 1
Field vane 2
CPT
CPT corr OCR
Fall cone test
DSS, empiricalrelation - " -
Point S9 is located on the upper excavated terrace. A number of direct simple sheartests and triaxial tests have been performed here, apart from the usual tests. At thispoint, the determined shear strength values vary in relation to each other dependingon depth and type of soil, Fig. 48. In the upper 7 metres or so, the field vane testsyield considerably higher values than can be expected from empirical data. The soilin this depth interval consists mainly of clayey silt with infusions of sand. Belowthis follows about 6 metres of silty clay with a relatively high density and low watercontent and liquid limit. In this layer, the field vane tests and the direct simple sheartests agree well, whereas the CPT tests yield somewhat higher values. At a depthof about 13 metres, there is a pronounced change in the character of the soil to amore high-plastic clay and below this depth the shear strength values determinedby the different methods agree well. The values from fall-cone tests are generally
Fig. 47. Shear strength determinations at Point S8 on the lower excavatedterrace in Section C.

SGI Report No 61108
0
10
20
30
40
50
60
0 50 100 150 200
Undrained shear strength, kPa
Dep
th, m
Field vane, mean value
DSS test
CPT
CPT corr OCR
DSS, empirical relation
Active triaxial test
Empirical active shear strength
Passive triaxial test
Empirical passive shear strength
Fall cone test
lower from about 13 metres’ depth, which is normal. The pattern is similar to thatfound at Point S8, but there were no embedded sand layers at Point S9. The vanetests have been stopped at 25 metres’ depth, but the CPT test and the sampling hasbeen continued to almost 60 metres’ depth. The corrected results from the CPT testand the direct simple shear tests agree well throughout the profile, except for thealready mentioned discrepancy in one of the upper soil layers. The correction foroverconsolidation ratio in the CPT tests has a significant effect in the upper soillayers and generally entails a better correspondence with the results from the directsimple shear tests.
Fig. 48. Shear strength determinations at Point S9 on the upper excavatedterrace in Section C.
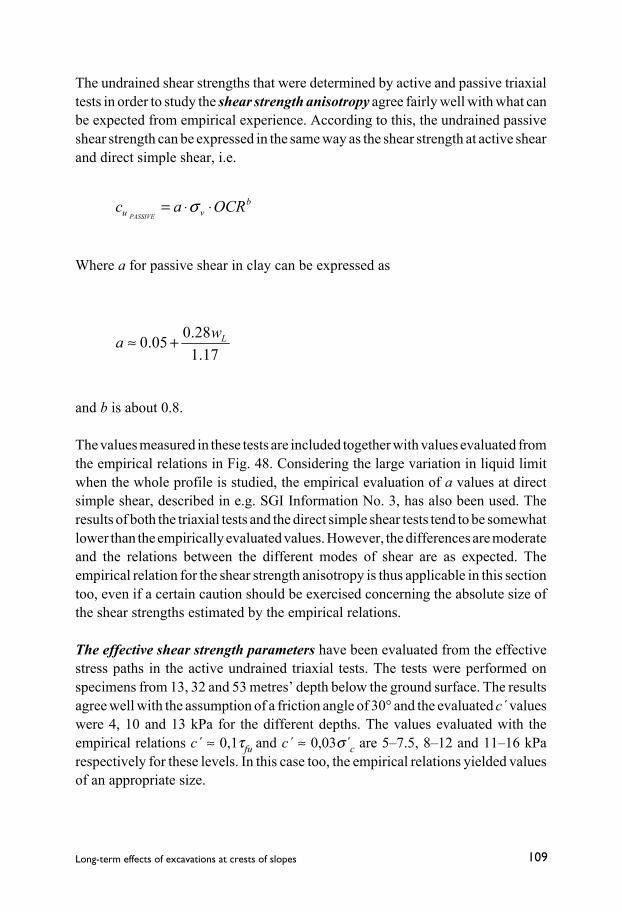
109Long-term effects of excavations at crests of slopes
The undrained shear strengths that were determined by active and passive triaxialtests in order to study the shear strength anisotropy agree fairly well with what canbe expected from empirical experience. According to this, the undrained passiveshear strength can be expressed in the same way as the shear strength at active shearand direct simple shear, i.e.
bvu OCRac
PASSIVE⋅⋅= σ
Where a for passive shear in clay can be expressed as
17.128.005.0 Lwa +≈
and b is about 0.8.
The values measured in these tests are included together with values evaluated fromthe empirical relations in Fig. 48. Considering the large variation in liquid limitwhen the whole profile is studied, the empirical evaluation of a values at directsimple shear, described in e.g. SGI Information No. 3, has also been used. Theresults of both the triaxial tests and the direct simple shear tests tend to be somewhatlower than the empirically evaluated values. However, the differences are moderateand the relations between the different modes of shear are as expected. Theempirical relation for the shear strength anisotropy is thus applicable in this sectiontoo, even if a certain caution should be exercised concerning the absolute size ofthe shear strengths estimated by the empirical relations.
The effective shear strength parameters have been evaluated from the effectivestress paths in the active undrained triaxial tests. The tests were performed onspecimens from 13, 32 and 53 metres’ depth below the ground surface. The resultsagree well with the assumption of a friction angle of 30° and the evaluated c´ valueswere 4, 10 and 13 kPa for the different depths. The values evaluated with theempirical relations c´ ≈ 0,1τfu and c´ ≈ 0,03σ´c are 5–7.5, 8–12 and 11–16 kParespectively for these levels. In this case too, the empirical relations yielded valuesof an appropriate size.

SGI Report No 61110
Point S11 is located just behind the crest of the upper slope. Apart from the usualfield tests, a dilatometer test has also been performed near this point. The patternwith higher strength values from field vane tests and fall-cone tests in the clayeysilt was found once again, in this case down to a depth of 14 metres, Fig. 49. Belowthis depth the results coincide fairly well, except for the usual lower values fromthe fall-cone tests below a certain depth. In the upper soil layers, the dilatometertests evaluated according to SGI Information No. 10 yield significantly lowervalues. However, it is well known that this evaluation method elaborated for clayis not valid for silt where it gives too low values. At larger depths, higher values aregenerally obtained by the alternative method of evaluation even if the trend fordevelopment of shear strength with depth is similar. The soil below the upper sandand silt layers is here classified as normally consolidated or only slightlyoverconsolidated throughout the profile, and the correction of the CPT test resultshas only a marginal effect.
Fig. 49. Shear strength determinations at Point S11 behind the upper crestin Section C.
0
5
10
15
20
25
30
35
40
45
50
0 20 40 60 80 100 120
Undrained shear strength, kPa
Dep
th, m
Field vane
CPT
CPT corr OCR
Dilatometer
- " - alternative interpretation
DSS, empirical relation
Fall cone test

111Long-term effects of excavations at crests of slopes
A compilation of the results of the field vane tests in the different test points inSection C shows that the shear strength is very similar at the same level in the upperpart of the slope, Fig. 50. On the other hand, the effect of the unloading because ofthe erosion is obvious at the toe of the slope below the river where the shear strengthis considerably lower. It is more difficult to trace an effect of the excavations in thiscompilation. This may to some extent be due to the fact that the upper layers, inwhich an effect could be expected, consist mainly of clayey silt with infusions ofsand. The shear strength values from the field vane scattered in this layer and didnot follow the normal pattern for clay soils. A certain effect, which reaches downto a maximum depth of 7 metres (level +3.5 metre), may possibly be seen in thevalues from Point S8. The shear strength values from the field vane tests in this point
-15
-10
-5
0
5
10
150 20 40 60 80
Undrained shear strength, kPa
Leve
l, m
Point S7
Point S8
Point S9
Point S11
Fig. 50. Compilation of shear strength values from the field vane testsin Section C.
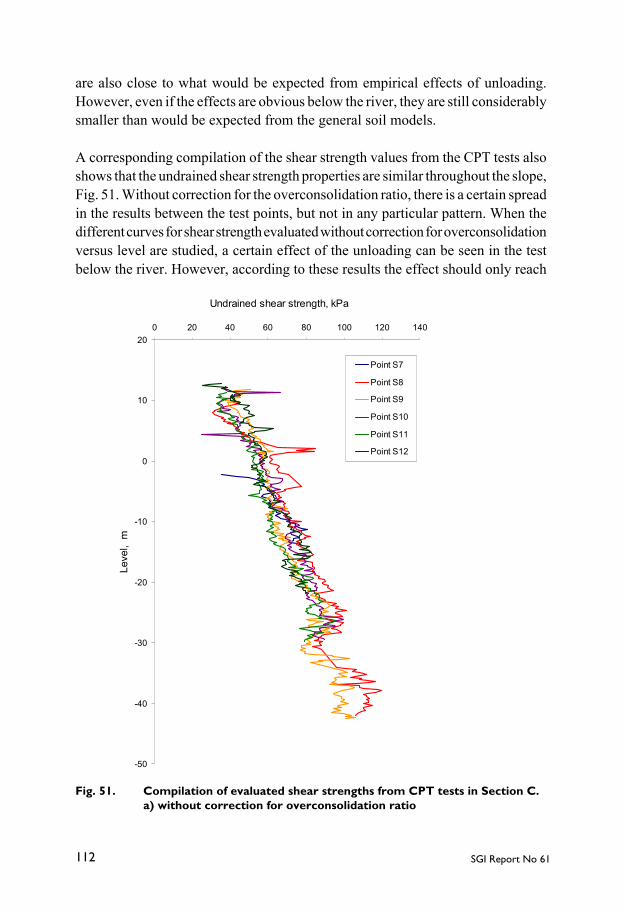
SGI Report No 61112
-50
-40
-30
-20
-10
0
10
200 20 40 60 80 100 120 140
Undrained shear strength, kPa
Leve
l, m
Point S7
Point S8
Point S9
Point S10
Point S11
Point S12
are also close to what would be expected from empirical effects of unloading.However, even if the effects are obvious below the river, they are still considerablysmaller than would be expected from the general soil models.
A corresponding compilation of the shear strength values from the CPT tests alsoshows that the undrained shear strength properties are similar throughout the slope,Fig. 51. Without correction for the overconsolidation ratio, there is a certain spreadin the results between the test points, but not in any particular pattern. When thedifferent curves for shear strength evaluated without correction for overconsolidationversus level are studied, a certain effect of the unloading can be seen in the testbelow the river. However, according to these results the effect should only reach
Fig. 51. Compilation of evaluated shear strengths from CPT tests in Section C.a) without correction for overconsolidation ratio

113Long-term effects of excavations at crests of slopes
-50
-40
-30
-20
-10
0
10
200 20 40 60 80 100 120 140
Undrained shear strength, kPa
Leve
l, m
Point S7
Point S8
Point S9
Point S10
Point S11
Point S12
Fig. 51. Compilation of evaluated shear strengths from CPT tests in Section C.b) with correction for overconsolidation ratio
some metre below the river bottom. After correction of the results, the expectedpattern appears with a considerable reduction of the shear strength at Point S7below the river and reductions also in the upper soil layers below the excavatedterraces at Points S8, S9 and S10. The results at Point S11 directly behind the uppercrest may likewise be marginally affected by the unloading.
The results show that in this type of clay an unloading has only a moderate effecton the undrained shear strength measured by field vane tests. The effect is almostnon-existent for the shear strengths evaluated from CPT tests unless these arecorrected for overconsolidation ratio.

SGI Report No 61114
2.8 CHANGES IN SHEAR STRENGTH
An attempt was made to trace possible changes in the undrained shear strengthbecause of the excavations by performing new field vane tests in those points wheresuch tests had been performed in the investigations prior to the stabilisation works.This was done at Points 2 and 3 in Section A, Point 9 in Section C and Point 22 inthe northern part of the area.
Point S2 is located on the excavated terrace in Section A where about 5.5 metresof soil have been removed. A comparison between the tests before and after theexcavation shows a certain decrease in shear strength down to a depth of about5 metres below the present ground level, Fig. 52. The values are then about equalat greater depths. Below the level 0 metres, the values from the previous investigationsare considerably lower. This is probably a result of a change to a smaller vane size.When the values are corrected for the effect of a such change, which was measuredin the special project concerning these effects, the values from the two investigationsbecome about equal also below this level.
The corresponding comparison at Point 3 behind the upper crest in the same sectionshows very small changes, Fig. 53. The possible changes in this point are in theopposite way and the measured shear strength rather tends to increase after theperformed actions. This is not quite impossible since the groundwater level hasbeen somewhat lowered at this point, resulting in an increased effective overburdenpressure, but the possible effect should be marginal.
An additional comparison was made in Section A. Field vane tests had previouslybeen performed at the riverbank close to Point S1. In the new investigation, fieldvane tests were performed below the river bottom where another about 2 metres oferosion has occurred. The comparison shows marginally higher strength valuesbelow the riverbank, Fig. 54. However, the tests below the river bottom have beenperformed from a floating raft. The test levels are therefore not quite exact and aminor adjustment of the curves level-wise would bring them to almost coincide.
Point S22 in the northern part of the area is compatible with Point S2 since it islocated on the excavated terrace and the thickness of the excavated soil layer wasabout the same. At this point, SGI had performed investigations before theexcavation including field vane tests. Here, almost identical results were obtainedin the new field vane tests, Fig. 55.

115Long-term effects of excavations at crests of slopes
Fig. 52. Comparison between shear strength values measured by field vanetests before and after excavation at Point 2 in Section A.
-10
-5
0
5
10
150 10 20 30 40 50 60 70 80 90
Shear strength value, kPa
Leve
l, m
Before excavation
Corrected for vanesize
After excavation
- " -
Probable change in vane size
Fig. 53. Comparison between shear strength values measured by field vanetests before and after excavation at Point 3 in Section A.
-10
-5
0
5
10
150 10 20 30 40 50 60 70 80 90 100
Shear strength value, kPa
Leve
l, m
Before excavation and lowering of groundwater tableAfter excavation and lowering of groundwater table - " - - " -

SGI Report No 61116
Fig. 55. Comparison between shear strength values measured by field vanetests before and after excavation at Point 22 in the northern part ofthe area.
-15
-10
-5
0
5
10
15
200 10 20 30 40 50 60 70
Shear strength value, kPa
Leve
l, m
Before excavation
After excavation
Fig. 54. Comparison between shear strength values measured by field vanetests below the riverbank and the river bottom in Section A.
-16
-14
-12
-10
-8
-6
-4
-2
00 10 20 30 40 50 60 70 80 90
Shear strength value, kPa
Leve
l, m
2m up on land, ground level +0.8 m
Below river bottom, bottom level ca -1.3 m
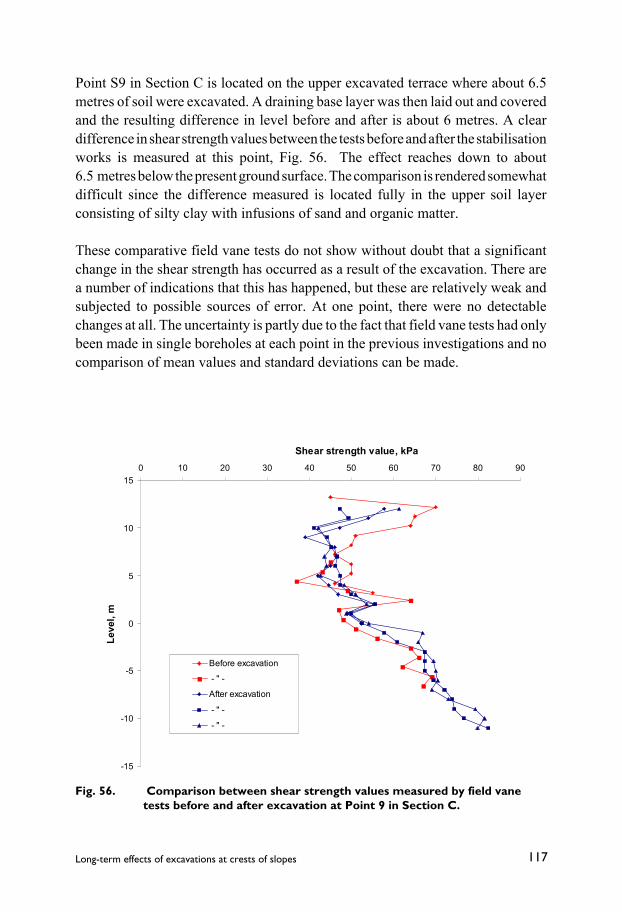
117Long-term effects of excavations at crests of slopes
-15
-10
-5
0
5
10
150 10 20 30 40 50 60 70 80 90
Shear strength value, kPa
Leve
l, m
Before excavation
- " -
After excavation
- " -
- " -
Fig. 56. Comparison between shear strength values measured by field vanetests before and after excavation at Point 9 in Section C.
Point S9 in Section C is located on the upper excavated terrace where about 6.5metres of soil were excavated. A draining base layer was then laid out and coveredand the resulting difference in level before and after is about 6 metres. A cleardifference in shear strength values between the tests before and after the stabilisationworks is measured at this point, Fig. 56. The effect reaches down to about6.5 metres below the present ground surface. The comparison is rendered somewhatdifficult since the difference measured is located fully in the upper soil layerconsisting of silty clay with infusions of sand and organic matter.
These comparative field vane tests do not show without doubt that a significantchange in the shear strength has occurred as a result of the excavation. There area number of indications that this has happened, but these are relatively weak andsubjected to possible sources of error. At one point, there were no detectablechanges at all. The uncertainty is partly due to the fact that field vane tests had onlybeen made in single boreholes at each point in the previous investigations and nocomparison of mean values and standard deviations can be made.

SGI Report No 61118
The excavations were fairly large, but the depth interval within which a measurableeffect can be expected is still limited, among other things because of the adjoininglowering of the groundwater level. The soil also consists mainly of clayey silt andvery silty clay with different kinds of infusions on those levels where a significantchange ought to have occurred, which makes the interpretation more difficult.However, together with all other comparisons between measured shear strengthsat different points in the slope and with different methods, it can be consideredestablished that a reduction in shear strength occurs when the soil is unloaded,particularly in superficial layers. The size of the measured reduction depends onwhat test method and what interpretation is used. The reason why different shearstrengths are measured by different methods, particularly in the lower parts ofslopes, is being investigated at present in a separate joint research project betweenthe Swedish Rescue Services Agency, Chalmers University of Technology andSGI (Löfroth 2002).
2.9 STABILITY CALCULATIONS
2.9.1 Previous calculations
The stability calculations before the excavations had resulted in minimum safetyfactors varying between 0.86 and 0.78 for Sections A and C respectively. Thecalculations were made with assumptions of drained shear strength in the uppersand layers and undrained shear strength in the silt and clay below. The critical slipsurfaces calculated in this way started 10 to 15 metres behind the crest and endedat the toe of the slope. Almost all soil masses involved were located above the riverbottom. There were therefore no large passive zones, but the major part of the slipsurfaces were located in relatively steep active zones. The assumption that thecalculated safety factor would be about 1.0 if the shear strength anisotropy wastaken into account is thus reasonable.
Two alternatives were given for the stabilising measures, one for a 30 % increasein calculated safety factor and one for a 50 % increase. In both cases, thecalculations were made with the same assumptions of drained shear strength in theupper sand layer and isotropic shear strength in the silt and clay. No possiblereduction in shear strength because of the unloading was considered.
In Section A, the first alternative required an excavation down to the level +15metres, i.e. a lowering of the ground surface by 3–4 metres, within a distance of 30metres from the crest. The second alternative required an excavation down to thelevel +11 metres within 50 metres of the crest. In Section C, where the excavation
119Long-term effects of excavations at crests of slopes
was to be made in two steps, the first alternative entailed excavations down to thelevels +11 and +15 metres for the two terraces. These levels had to be lowered to+9.5 and +13 metres in the second alternative. The real excavations fell somewherebetween these two alternatives except in Section B, located about midway betweenthe investigated sections. The operation of the then existing cement works entailedthat the stabilising measures here were limited to a 30% increase in stability. It wasthen considered that the industry was only in operation during the daytime(Bergdahl 2002).
The calculated safety factors after the final design of the excavations using the sameassumptions as before and without considering shear strength anisotropy wereabout 1.3. This value was found both for slip surfaces with the same form andlocation as the previously calculated slip surfaces and for deeper slip surfaces,which reached behind the new upper crest and thus involved larger soil masses. Thelatter slip surfaces were restricted in all sections by the assumed firm bottom.
2.9.2 New calculations
New calculations have been performed in order to study the influences of the newand more comprehensive shear strength determinations, the shear strength anisotropyin real calculations, the use of combined analyses in which parts of the silt and claylayers can also behave in a drained manner and the real contour of the firm bottombeing different from what was previously assumed. The calculations have beenmade using both a “self-seeking” programme for circular sip surfaces and Janbu’sgeneral procedure of slices for slip surfaces of arbitrary shapes (Janbu 1954).
The first type of calculation has been made with the computer program SLOPE/W,(Geo-Slope International 1994) using Spencer’s method for a rigorous analysis(Spencer 1967). The shear strength in the sand and the coarser silt has been assumedas drained with a friction angle of 32°. These calculations have been made usingboth combined and undrained analyses and with the assumption of isotropic shearstrength in the clay. The shear strength in the silt has mainly been modelled for acombined analysis, but in some calculations it has been restricted to undrainedshear strength in order to facilitate studies of possible critical slip surfaces locatedat greater depths.
Approximately the same critical slip surface and safety factor as in the previouscalculations were obtained in the new calculations using isotropic undrained shearstrength for the conditions before the excavation in Section A, Fig. 57.

SGI Report No 61120
Insertion of a roughly modelled anisotropic shear strength increased the calculatedsafety factor to somewhat over 1.0. On the other hand, a control calculation withcombined analyses showed that the critical clip surface moved out towards theslope and became shallower and that the drained shear strength in general becamedimensioning. The calculated safety factor thereby became very close to 1.0 again,Fig. 58.
Control calculations for deeper slip surfaces showed that the most critical slipsurfaces involving large soil volumes went deeper than the previously assumedcontour of the firm bottom.
The possibility of a detailed modelling of the soil properties is generally limited inthe “self-seeking” programmes. Supplementary calculations were thereforeperformed with Janbu’s general procedure of slices in which the modelling of soilproperties and shapes of slip surfaces is unrestricted. The search for the critical slipsurfaces was started by the former calculations. The shape of the slip surface wasthen modified to follow possible weaker planes and layers and to be morekinematically correct considering a drained failure mode at its ends.
The calculations for a superficial slip surface similar to the critical surface obtainedin the SLOPE/W calculations also resulted in a safety factor of 1.0. The differencebetween the calculations was primarily that the shear strength anisotropy could bebetter modelled in the latter calculations. However, this was of little importancesince the drained shear strength was lower and governing along most of thisslip surface.
A larger slip surface involving a large soil volume was also modelled. This slipsurface was given a shape that started as an active failure zone in its upper part. Itthen connected to a straight part following the contour of the firm bottom butlocated a couple of meters up in the clay. About midway under the steep lower partof the slope it transformed to a passive failure zone ending up below the river. It isfairly common that a lower shear strength is measured in the transition zonebetween clay and firmer soil layers below. This was also the case in this section.Whether this reflects a real weaker zone or is a result of an increased disturbancein the normally silty and layered transition zones is difficult to estimate, but in thisway the possibility of such a weaker zone could be taken into account. Thecalculated safety factor for this large slip surface was 1.17 with a combined analysisand isotropic shear strength. It increased to 1.25 when the anisotropy of theundrained shear strength was considered.
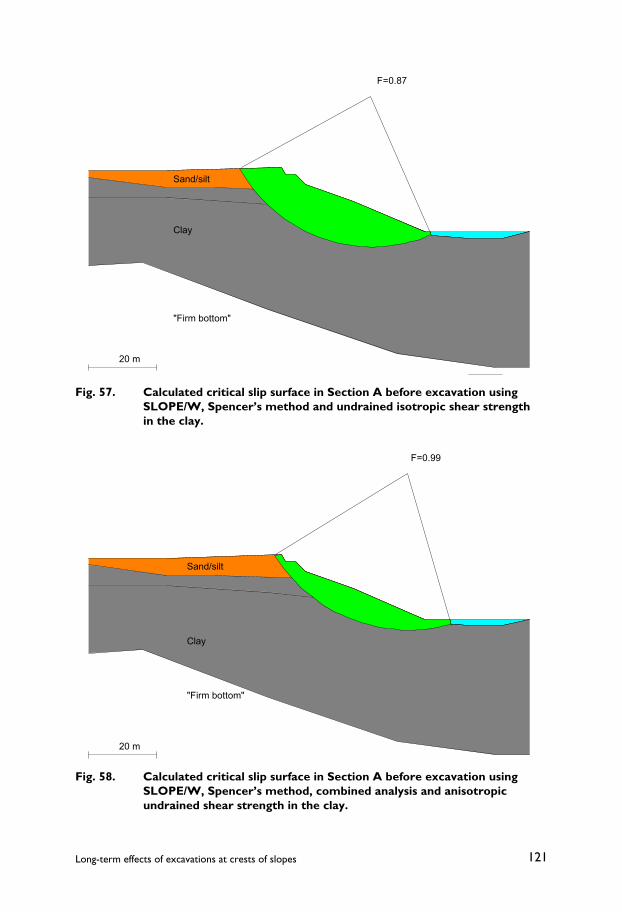
121Long-term effects of excavations at crests of slopes
Fig. 57. Calculated critical slip surface in Section A before excavation usingSLOPE/W, Spencer’s method and undrained isotropic shear strengthin the clay.
Fig. 58. Calculated critical slip surface in Section A before excavation usingSLOPE/W, Spencer’s method, combined analysis and anisotropicundrained shear strength in the clay.
F=0.99
Sand/silt
Clay
20 m
"Firm bottom"
F=0.87
Sand/silt
Clay
"Firm bottom"
20 m

SGI Report No 61122
The safety factor in Section A before the stabilisation works can thus be estimatedto have been close to 1.0 for relatively shallow slip surfaces close to the slope andgradually have increased to about 1.25 for very large slip surfaces reaching morethan 50 metres behind the crest at that time and down to the transition zone betweenclay and firm coarse soil on top of the bedrock.
Calculations for the conditions after the excavation show that the safety factorshave increased, but not in all respects as much as intended. The first calculationsusing SLOPE/W and isotropic undrained shear strength resulted in a lowestcalculated safety factor around 1.4. The location of this calculated critical slipsurface depends to some extent on what is assumed about the distribution of theshear strength. The field vane tests showed somewhat higher shear strength insuperficial layers but lower shear strength increase with depth than the othermethods. Use of the shear strength values from the field vane tests thereby resultedin a calculated critical slip surface reaching far behind the crest and in principlecomprising the whole soil volume down to firm bottom. Use of the shear strengthobtained by the other methods resulted in a slip surface comprising about half ofthe excavated area and reaching a limited depth, Fig. 59.
The corresponding calculations with combined analyses resulted in shallower slipsurfaces with safety factors of about 1.1 (1.06 to 1.12 depending on the isotropicundrained shear strength determination that was used), Fig. 60.
The succeeding calculations using the general procedure of slices and anisotropicundrained shear strength increased the calculated safety for a large slip surfacereaching behind the excavated area to 1.5. The calculated safety factor withcombined analyses for slip surfaces starting on the excavated area was increasedto 1.16 when the anisotropy was taken into account. At the same time, the criticalslip surface was moved somewhat further out towards the slope and thus becomeshallower and the drained shear strength had become governing to a higher degreethan when isotropic shear strength was used.
The excavation has thus resulted in an increased calculated safety factor for largeslip surfaces up to about 1.5. However, the safety factor decreases gradually forsmaller slip surfaces and is only about 1.16 for relatively shallow slip surfaces,although these may involve about one third of the excavated area. In these moresuperficial slip surfaces, the drained shear strength is largely governing and theincrease in safely factor is primarily related to the decrease in average slopeinclination resulting from removal of the very steep upper part of the previous slopeand the construction of the erosion protection at the toe of the slope.
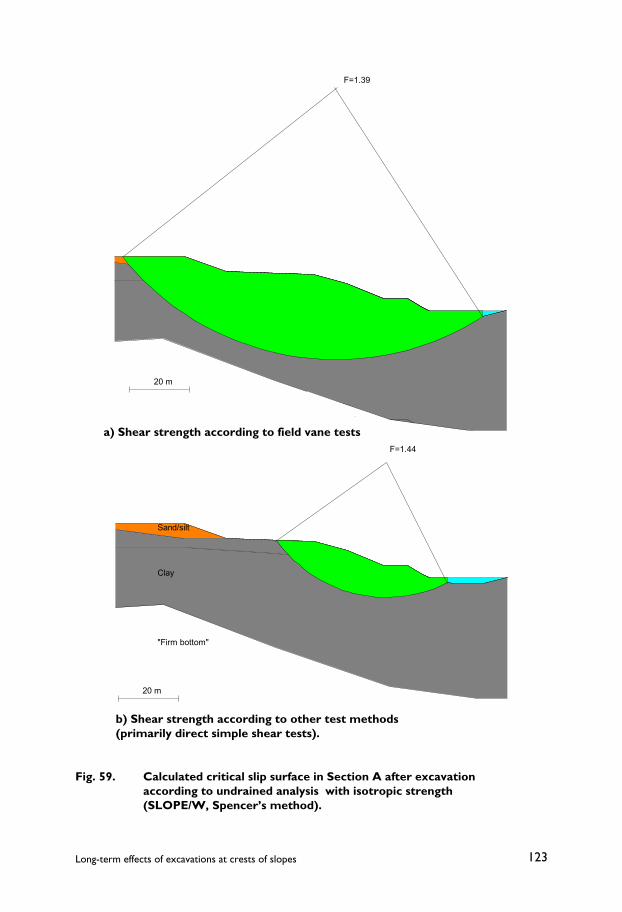
123Long-term effects of excavations at crests of slopes
F=1.39
20 m
F=1.44
Sand/silt
Clay
"Firm bottom"
20 m
Fig. 59. Calculated critical slip surface in Section A after excavationaccording to undrained analysis with isotropic strength(SLOPE/W, Spencer’s method).
b) Shear strength according to other test methods(primarily direct simple shear tests).
a) Shear strength according to field vane tests

SGI Report No 61124
F=1.12 (1.16)
Sand/silt
Clay
"Firm bottom"
20 m
Fig. 60. Calculated critical slip surface in Section A after excavation accordingto combined analysis and isotropic shear strength (SLOPE/W,Spencer’s method).(Values in brackets refer to safety factors calculated with combinedanalyses, anisotropic undrained shear strength and Janbu’s generalprocedure of slices.)

125Long-term effects of excavations at crests of slopes
The assessment of the stability conditions is influenced by the fact that the requiredsafety factor for combined analyses is lower than for undrained analyses. It is alsoinfluenced by the fact that if a slide occurs in a relatively small and shallow slipsurface and the masses end up in the river and are transported away by this, thena large part of the stabilising forces for larger slip surfaces is also taken away. Thesafety of these larger slip surfaces is thus not necessarily greater than that of theshallow slip surfaces.
In Section C, the lower slope towards the river was very steep, with an averageinclination of just over 30°. The erosion process had also created a small cavity atthe toe of the slope. At this state, the superficial part of the slope was barely stableaccording to a drained analysis. Very small increases in the assumed pore pressureswould lower the calculated safety factor to values below 1.0, and it may be assumedthat effects of the vegetation in the slope had contributed and enabled the slope tostand in this way.
An undrained analysis results in a critical slip surface with approximately the sameshape and location as in the previous section. It thus starts 10–15 metres in behindthe crest and ends at the toe of the slope. Without consideration for the shearstrength anisotropy it becomes about 0.81, which is very close to the previousestimate made before the excavation, Fig. 61. Control calculations with the generalprocedure of slices using anisotropic shear strength and combined analyses showthat the safety factor is close to 1.0 for all of the outer part of the slope and that thedrained shear strength is governing for all parts of the shallow slip surfaces.
The calculated safety factors increased for larger slip surfaces. For very large suchsurfaces reaching 20 metres behind the area involved in the subsequent excavation,the calculated safety factor taking anisotropy into account becomes about 1.2. Thisslip surface reached a depth of about 40 metres below the original ground surface.A control of even larger slip surfaces involving parts of the carpentry factory andreaching down to the coarser draining layer, where a possible weaker zone isindicated by the CPT test results, gives a safety factor of 1.26 increasing to 1.39when the shear strength anisotropy is considered, Fig. 62.
The excavation and the other stabilising measures brought moderate changes in theouter slope. The erosion cavity at the toe of the slope was filled in and then coveredby the erosion protection. A minor excavation of sand and silt was also performedabove the steepest part, but the major part of the steep lower slope remainedunchanged. The resulting increase in calculated safety factor according to a drained

SGI Report No 61126
Fig. 62. Calculated safety factor for a selected slip surface reaching down to thecoarser soil layer at great depth. (Combined analysis, isotropic shearstrength, SLOPE/W, Spencer’s method.)(Values in brackets refer to safety factors calculated with combinedanalyses, anisotropic undrained shear strength and Janbu’s generalprocedure of slices.)
Fig. 61. Calculated critical slip surface in Section C before the excavationaccording to undrained analysis with isotropic shear strength, SLOPE/W, Spencer’s method.(Values in brackets refer to safety factors calculated with combinedanalyses, anisotropic undrained shear strength and Janbu’s generalprocedure of slices.)
F=0.81 (1.0)
Sand/silt
Clay
Coarser layer
Clay
20 m
Sa/Si
Clay
Coarser layer
Clay
F=1.26 (1.39)

127Long-term effects of excavations at crests of slopes
analysis is only about 15 % for superficial slip surfaces, Fig. 63. However, for thecritical slip surface according to undrained analysis before the excavation thecalculated safety factor has increased much more. This slip surface now starts about10 metres in on the upper excavated terrace and the calculated safety factor is 1.32.
The stabilising effect decreases for larger slip surfaces since the stabilising forcesfor these have also been reduced because of the excavation. It is thus found that thecalculated safety factor for the large slip surface reaching 20 metres behind theupper crest has only increased to about 1.3, i.e. an increase by only about 8 %, andthat this surface is now the critical slip surface according to undrained analysis. Forthe very large slip surface reaching down to the possible weaker zone, thecalculated safety factor has been reduced from 1.39 to 1. 36, Fig. 63. The valuesgiven are based on control calculations using the general procedure of slices withmodified slip surfaces and more detailed descriptions of the shear strength.
The effect of the excavation and the construction of the erosion protection inSection C has thus been that the calculated safety factor has increased to about 1.15for shallow slip surfaces in which the drained shear strength is governing. Thiscalculated safety factor is very sensitive to what is assumed about the pore pressureconditions in this part, which have not been examined in detail. For slip surfacesreaching further into the slope, the calculated safety factor fairly rapidly rises toabout 1.3 and then remains about constant independent of the size of the slipsurface. In these larger slip surfaces, the undrained shear strength in the claygoverns the size of the calculated safety factor.
As in Section A, the stability of large slip surfaces is dependent on the outer massesin the slope remaining stable in their current state. If a slide occurred in the outerpart and the soil masses were swept away from the toe of the slope, then the safetyfactor for the next slip surface in the slope would be lowered. If this part failed too,the stability for the next slip surface would be jeopardised, and so on. How far sucha successive development could reach can only be speculated on. Fortunately, thereis no quick clay right beside the possible initial slides, so a rapid and dramaticdevelopment is not plausible.
The excavations performed have entailed that in both sections the calculated safetyfactors have fulfilled the demands for what is classified as “uninhabited area withless important constructions”, which corresponds to the affected areas afterdemolition of the dwelling houses and closure of the cement works. The present andprevious topography shows that previous slides along this part of the river havebeen relatively shallow, even if the deepest scar reaches about 30 metres in from
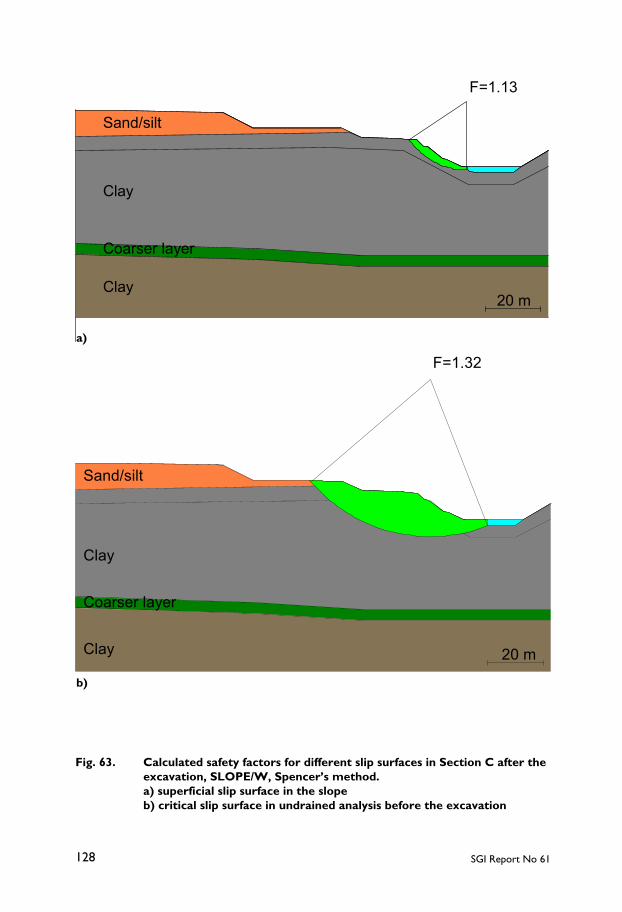
SGI Report No 61128
Fig. 63. Calculated safety factors for different slip surfaces in Section C after theexcavation, SLOPE/W, Spencer’s method.a) superficial slip surface in the slopeb) critical slip surface in undrained analysis before the excavation
F=1.13
Sand/silt
Clay
Clay
Coarser layer
20 m
F=1.32
Sand/silt
Clay
Clay
Coarser layer
20 m
a)
b)
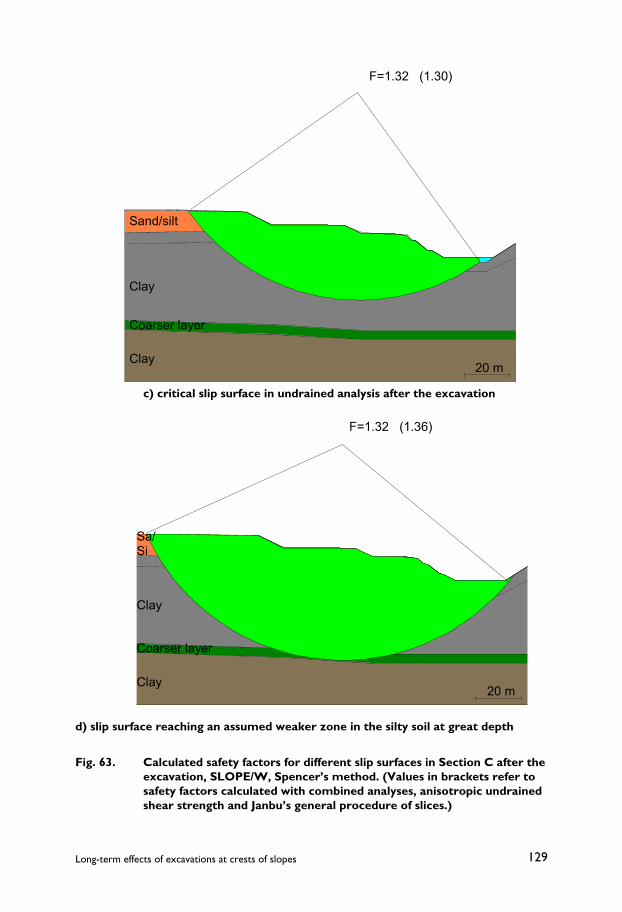
129Long-term effects of excavations at crests of slopes
F=1.32 (1.30)
Sand/silt
Clay
Clay
Coarser layer
20 m
Fig. 63. Calculated safety factors for different slip surfaces in Section C after theexcavation, SLOPE/W, Spencer’s method. (Values in brackets refer tosafety factors calculated with combined analyses, anisotropic undrainedshear strength and Janbu’s general procedure of slices.)
F=1.32 (1.36)
Sa/Si
Clay
Clay
Coarser layer
20 m
d) slip surface reaching an assumed weaker zone in the silty soil at great depth
c) critical slip surface in undrained analysis after the excavation
SGI Report No 61130
the previous crest. It is not known whether this slide has developed as a single slideor a number of retrogressive slides. In spite of its depth, there is still a fairly longdistance between the backscarp of the largest slide and the area with quick clay. Theprobability of a development that would rapidly reach into quick clay and result ina major landslide is therefore small.
According to common rules and recommendations, the current buildings andactivities in the area could remain provided that they are not extended and that noactions are taken which make the stability conditions worse. This was also the goalof the stabilising measures performed. The remaining insecurity is mainly relatedto the stability of the outer parts of the slope down towards the river. According tothe calculations, this is low and very sensitive to assumptions about the porepressure conditions. On the other hand, the stability conditions have been improvedby the excavation and particularly by the construction of the erosion protection andthe accompanying fill at the toe of the slope. Provided that no great changes occur,such as undermining and deterioration of the erosion protection or forest fire orother destruction of existing vegetation, the risk of a slide in the outer part of theslope should thereby be small.
Further considerations regarding the required safety factor and use of the area areoutside the scope of this project.
131Long-term effects of excavations at crests of slopes
Chapter 3.
Strandbacken, Lilla Edet
3.1 DESCRIPTION OF THE AREA
The Strandbacken area in the municipality of Lilla Edet is located on the westernside of the river Göta-älv about 1 km south of the locks at Ström and the Lilla Edethydroelectric power plant, Fig. 64. The buildings in the area today comprise aboutten single-family houses located between the river and the main road between LillaEdet and the city of Kungälv, which runs parallel to the river at a distance of about250 metres. The area was previously built up with a larger number of houses locatedalmost all the way out to the then existing crest of the steep slope towards the river.The old houses close to the river in the now excavated area were demolished inconnection with the stabilisation works, and the closest building is now locatedabout 100 metres from the river.
The built-up area on this side of the main road lies as an isolated enclave surroundedby farmland. However, new houses have recently been built on the other side of theroad all the way up to the rocky hills behind. Erosion ravines created by smallbrooks running towards the river border the area to the north and to the south. Thereis also a small ravine at the centre of the area. This is partly created by humanactivity and has through the years, among other things, been used as an access roadfor the local fire brigade to fetch water from the river. On the riverbank there havealso been constructions in the form of small landing-stages and piers. These havelater been replaced by an erosion protection of rock-fill.
A first excavation of the slope crest was made in 1959 in order to counteract anestimated risk of imminent slope failure. This excavation had a limited size andreached only about 10 metres behind the crest at the most. No buildings weredemolished at this stage, but the design of the excavation was adjusted in order tolet them remain, Fig. 65. The then existing erosion protection was also extendedfurther southwards. However, the calculated stability was still low for the wholearea and the requirements for minimum safety factors that have been establishedlater were far from fulfilled. After an investigation in 1988, it was therefore decidedto ensure the stability of the area by a large excavation over a length of about 250

SGI Report No 61132
Fig. 64. Strandbacken at Lilla Edet. Map from 1977. Copyright Lantmäteriverket 2003.From The Property Map reference no. M2003/5268. Valid to 2007-09-30.

133Long-term effects of excavations at crests of slopes
Fig. 65. Strandbacken after the first excavation.a) Photo of the excavation from 1962 taken by Å. Paulsson.

SGI Report No 61134
Fig. 65. Strandbacken after the first excavation.b) Map of the area from the investigation by SGI in 1988.
135Long-term effects of excavations at crests of slopes
metres, i.e. the whole distance between the surrounding ravines, reaching 50 metresbehind the original crest. All buildings within this area were bought up anddemolished. The excavated area in front of the remaining buildings has thereafteronly been used for walks and airing of domestic dogs. The slope has been stable,but smaller slope failures have occurred in recent times both to the north and to thesouth of the excavated area. However, these slides have not affected any buildingsor constructions.
3.2 GEOLOGY
A comprehensive investigation concerning the geology of the Göta-älv valley wasmade in connection with the large Göta-älv investigation (SOU 1962:48). Somemodifications of the general geological description have been made thereafter,mainly concerning the detailed dating of different geological phases. The descriptiongiven below is mainly taken from the Göta-älv investigation but has been modifiedaccording to the chronology given in the National Atlas of Sweden – Geology(Fredén 1994).
Thick deposits of clay started to be deposited in the Göta-älv valley in connectionwith the melting of the inland ice. The retreating ice front passed the Lilla Edet areaabout 12,000 years ago. Fine-grained particles in the meltwater then started tosediment directly on top of the bedrock or on a layer of till which had been depositedbelow the ice cover. The sea level in the area at that time was about 125 metreshigher in relation to the bedrock than today, and only a few peaks protruded asrocky islets. When the ice had retreated further, the area at first constituted a branchof the sea connecting it to the basin of Vänern. Later on, when the ice front passedthe province of Närke, the ice dam that until then had locked in the present BalticSea ceased to exist. The previously trapped water masses could then flow out intothe sea together with the fine-grained soil particles they brought. Because of theland-elevation, the sound at Närke was again shut off about 9,000 years ago and theVänern basin returned to be a bay. Since then, the area has successively becomeshallower and with time turned into dry land.
The clay layers in the area were deposited in seawater in which the salt content hasvaried during different periods, both with depth and with distance from thecoastline. The glacial clay gradually becomes more fine-grained upwards in the soilprofile. The late-glacial layers have contents of ironsulphide, which can occur asdistinct black-coloured bands or as a blotchy sulphide colouring. In this clay, tracesof earlier organisms that have lived in the mud on the sea bottom are also found.These traces are similar to worm holes. Thick deposits of post-glacial clay have

SGI Report No 61136
been deposited on top of the glacial layers. At the end of the period during whichthe Lilla Edet area was submerged, a river had already been created in the area tothe north. The river brought sand and silt particles that were deposited at theriveroutlet into the shallow water, which probably had the shape of a delta. In thisway, the clay in the central parts of the valley was overlain by mixed layers of clayand silt, which gradually turned into silt and loose sand towards the ground surface.These layers contain a considerable amount of organic matter that mainly originatesfrom reeds and other plants growing at the bottom of the shallow bay. The thicknessof the upper sand and silt layers amounted to about 7 metres in the investigatedsection in the excavated area at Strandbacken. However, it varies considerablyalong and perpendicular to the river and rapidly becomes thinner behind theexcavated area in the investigated section. The exact thickness is also difficult todetermine because of the gradual transition to more fine-grained soil. Since the landrose above sea level, the river has eroded its channel down through the soil layers.The location of the channel is probably governed by the more easily eroded sandand silt layers. Also the locations of the brook ravines to the north and south of thearea may be governed by local variations in the composition of the upper soil layers.
Anomalies and variations in the soil layering are common in the Göta-älv valley.The retreat of the ice front was not a continuous process; several momentary stopsand retreats occurred. The latter sometimes entailed that coarser layers werecreated within the clay deposits (Stevens 1987). Such layers have been found atseveral locations in and around the Göta-älv valley, and a probable layer of this kindis also found in the Strandbacken area at a depth of 36 metres below the originalground surface. Both during the periods of deposition and in later times, a largenumber of slides have occurred, which have created remoulding and irregularstratification. There is also a certain variation in grain size distribution within theseparate soil layers between the soil near the valley sides and that in the central partsof the valley. The borders between the different layers are generally somewhatinclined. This is partly attributed to the fact that, even if the borders have once beenhorizontal, the subsequent consolidation has meant that the total compression hasbeen largest in the parts where the clay layers are thickest. The borders between thelayers have then become inclined in a manner that reflects the underlying contourof the bedrock of firm bottom layers. The location of the thickest layers does notnecessarily coincide with the location of the river channel.
The sediments in the Göta-älv valley are mainly deposited in seawater. During thetime thereafter a considerable leaching of the salt in the pore water has occurred,particularly in the northern part of the valley. This has had the result that the liquidlimit of the clay, and sometimes also its remoulded shear strength, has been

137Long-term effects of excavations at crests of slopes
considerably reduced in many places and quick clay is often found. The claydeposits to the north of Lilla Edet are generally completely leached. South of thecentral parts of the municipality, the degree of leaching varies across the valley insuch way that the clay close to the valley sides in general is more leached than theclay at the centre of the valley. The Strandbacken area is located close to this border.Only about 700 metres to the north there are profiles that have been classified ascompletely leached, whereas considerable salt contents remain in the vicinity of theriver at Strandbacken. In this area, it is mainly superficial layers and layers closeto draining layers that have been substantially leached. The degree of leachingincreases further away towards the valley side and becomes almost total at adistance of about 300 metres from the river. The clays at Lilla Edet in sections somedistance to the north of Strandbacken and at the same and larger distances from theriver are known as extreme quick clays and have been used for research anddemonstration purposes on several occasions.
The natural ground level at Strandbacken is today located about 10 metres abovethe mean water level in the river. Within the river channel, the erosion has entailedthat the water depth gradually increases to about 5 metres over a varying distancefrom the riverbank. The depth then rapidly increases to about 10 metres in the deepnavigable channel, which is the fairway between Lake Vänern and the sea. Theshallower inclined terrace is triangular in shape and reaches almost out to themiddle of the river (about 50 metres), in the southern part but only about 10 metresin the northern part where the fairway leads in towards the lock on the western sideof the river.
The erosion conditions have been altered during the last century because of theconstruction of the Lilla Edet hydroelectric power plant and the lock at Ström andalso because of the increased ship traffic. The raised water level above the lock andthe power plant has meant increased erosion at the riverbanks, which has beenremedied by erosion protection structures. On the other hand, the bottom erosionhas practically ceased in these parts. The water level south of the lock has not beengreatly affected. Erosion protection has been constructed along the riverbanks andno significant shore erosion is going on, except possibly in the side ravines. Howthe increased ship traffic and the forceful and altered water streams from the outletof the power plant have affected the bottom erosion is more uncertain. The riverappears to have eroded through the clay layers from the lock down to a distance ofabout 600 metres to the north of Strandbacken. The bottom here consists of firm till.South of this point, the bottom consists of medium-stiff, very fine-grained clay,which by common criteria should be considered as very resistant against erosion.In earlier times, there was continuous erosion, which created a natural compensation
SGI Report No 61138
for the ongoing land-elevation, but the latter has practically ceased in the area.Whether any significant bottom erosion has to be anticipated is thus uncertain, andno regular inspection has been performed, except for the regular check that thewater depth in the fairway is sufficient for the ship traffic.
3.3 THE GÖTA-ÄLV COMMITTEE
The low stability at Strandbacken was observed already in 1951, when SGIinvestigated the stability of the area along the western side of Göta-älv south of thelock at Ström on the commission of the Inland paper-mill. The stability was thenfound to be low all along the investigated 1 500 metre long distance and anexcavation at the slope crest was recommended. This was considered to beparticularly important at Strandbacken, where there were buildings located near thecrest. The question was circulated between different departments and authorities,but none of these was willing to cover the costs.
After the major landslides at Surte and Göta, the Göta-älv Committee wascommissioned by the Swedish government in 1958 to investigate the stabilityconditions along the Göta-älv valley (SOU 1962:48) and the question was broughtup again. This new investigation found that the previous assessment of low stabilityin the Strandbacken area and the recommendation of an immediate excavation atthe crest remained valid. The question once again went through protracted anddifficult negotiations between different authorities until the situation became acutein February 1959, when cracks indicating an imminent failure were observed. Thespeed of the negotiations rapidly increased until the government (the King inCouncil), in May decided that the stabilisation work should be carried out and paidfor by the Crown. This was then done during the summer and early autumn. Thisexcavation only comprised a fairly narrow strip along the crest and the existingbuildings could thereby remain. The extent of the measure was enough to remedythe risk of imminent failure but not the long-term stability problems.
The Göta-älv investigation showed that the stability was very unsatisfactory alsoin other parts of the area south of the lock at Ström and recommendations were madefor excavations in other locations here. These measures were not considered acutein the same way and their execution was delayed. New investigations have thenbeen made in different contexts, mainly in connection with development andconstruction in the area. These have given the same results and excavations havesuccessively been performed in other parts along the river. In 1988, SGI wascommissioned by the municipality of Lilla Edet to reinvestigate the Strandbackenarea. The stability was once again found to be clearly unsatisfactory (Fc = 1.0–1.1),
139Long-term effects of excavations at crests of slopes
and a combination of a fill at the toe of the slope in the river and an enlargedexcavation at the crest was recommended. The buildings near the crest of the slopewere evacuated directly after the stability calculations had been performed. TheVattenfall Company was opposed to a fill in the river since this would be made ashort distance downstream from the Lilla Edet hydroelectric power plant and affectthe power production. The stabilising measures were therefore confined to anexcavation at the crest of the slope, which became all the more extensive. Anexcavation with a lowering of the ground surface by about 4 metres over a widthof about 50 metres along a distance of over 200 metres was therefore performedduring 1990–1991 after the evacuated buildings had been bought up and demolished.The stated dimensions of the excavation include the first excavation performed in1959.
3.4 PREVIOUS INVESTIGATIONS
The work by the Göta-älv Committee was very comprehensive, and no less than 18sections were investigated within the distance from the lock at Ström to the end ofthe Strandbacken area alone, Fig. 66. The investigations were made with theequipment available and according to the practice at that time. Some new equipmentwas also introduced and tested during the course of the investigation. Theinvestigations comprised field vane tests, iskymeter tests, A-sounding tests, weightsounding tests, machine sounding tests, soundings with the salt probe and samplingand laboratory tests. Undisturbed samples were taken by piston sampler and theSwedish sampler for continuous cores encased in metal foils. The pore waterpressure was also measured at a number of points. The investigations wereperformed in sections with boreholes distributed from locations out in the river tofar up towards the side or the valley.
Many of the investigation methods employed have later been abandoned andinterpretations of their results are uncertain. Of the field test methods, only the fieldvane test and the weight sounding test remain unaltered. Sampling is performed bya piston sampler today as well, but it is uncertain whether the same type of samplerwas used in all or part of the Göta-älv investigation. This investigation started in1957 and ended in 1961, and the piston sampler used in Sweden today did notbecome standard until 1961.
The reliability of the results of the laboratory tests thereby varies depending on howsensitive the measured property is to the sample quality. The testing routines andinterpretation methods were also partly different from those employed today. Thecorrection factors for the undrained shear strengths determined by field vane tests
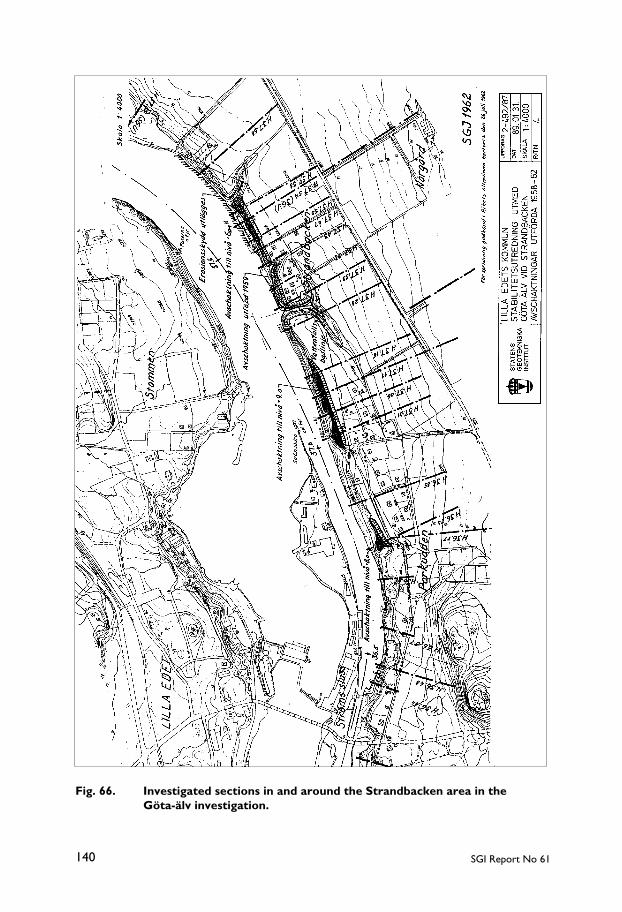
SGI Report No 61140
Fig. 66. Investigated sections in and around the Strandbacken area in theGöta-älv investigation.
141Long-term effects of excavations at crests of slopes
and fall-cone tests were also different from those that are used nowadays. Theinvestigations were therefore not coupled in such way that field vane tests andsampling were performed at the same test points; instead the different investigationswere spread out along the sections with relatively long distances between the testpoints. No samples at all were taken in the investigations from a raft out in the river.This entails that the interpretation of these tests is somewhat uncertain and that acompilation of the results taking the local variations in soil composition intoaccount cannot be made.
In the investigation by SGI in 1988–1989, the previous investigations in theStrandbacken area were supplemented by an ocular inspection and investigationsin two boreholes in Section 37.33, which is located close to the ravine at thenorthern end of the area, Figs. 65b and 66. Two pore pressure measuring systemswere also installed in a station located 10 metres behind the new upper crest sincethe excavation in 1959 and the pore pressure variations were observed for sometime.
The ocular inspection revealed clear indications of ongoing movements in theslope. These indications consisted of leaning and bent trees in the slope, a leaningboat-shed at the toe of the slope and rolls and patches with bare soil on the surfaceof the slope. The 10–12 metre high slope had an average inclination of about 1:3.However, the inclination varied with steeper parts at the erosion protection, in thelower slope up to the excavated area and in the excavated slope up to natural groundlevel. More level parts were found on the excavated terrace and on top of the erosionprotection. The river bottom was sounded by the fairway authority, Kanalverket,and was in this section found have a shallow inclination from about 2 metres’ depthat the toe of the erosion protection to about 4 metres’ depth about 15 metres furtherout. The depth rapidly increased to about 8 metres and then remained fairly constantto a distance of 40 metres from the riverbank, from which it slowly increased to adepth of 9–10 metres in the fairway. All depths refer to the lowest water level in theriver.
The investigations consisted of CPT tests, field vane tests and standard pistonsampling. The CPT tests were stopped at 20–25 metres’ depth and field vane testsand sampling were performed at every third or fourth metre depth down tosomewhat deeper levels. The purpose of these tests was only to confirm theprevious results from the Göta-älv investigation, and to make possible a correctionof the field vane test results with compatible liquid limits. A few oedometer testswere also performed in order to check the assumed stress history.
SGI Report No 61142
3.5 VARIATIONS IN SOIL CONDITIONS AND PROPERTIES
The results of the previous investigations showed that the slope towards the riverwas fairly steep and about 10 metres high within a distance of 1500 metressouthwards from the lock at Ström. In the Strandbacken area, i.e. between sections37.01 and 37.68, the slope was between 8 and 13 metres high, with the lowestheights in the southern end. Within the area that was involved in the last excavation,the slope was between 10 and 12 metres high, with an average value of just over10 metres. The ground behind the crest rose gradually with a very small inclinationtowards the side of the valley. The soil consisted of clay with varying thicknessunderlain by sandy, gravelly material which was assumed to rest on till. The claywas covered by a layer of sand and silt with an estimated thickness of 2 to 5 metres.Thicker layers of sand and silt have been found in the present investigation. Thedifference may be due to the fact that the layer according to the old classificationsystem was designated as sand and “mo”, (coarse silt), whereas the “mjäla” (finesilt), was probably regarded as part of the clay layer. In the supplementaryinvestigations in 1988, it was also found that the upper layers had significantorganic contents down to about the zero-level, i.e. down to about 10 metres’ depth.The zero-level roughly corresponds to the water level in the river when no wateris let out through the power plant. The thickness of the soft soil layers was estimatedto vary from a few metres at the lock to almost 50 metres at the southern end of theinvestigated area. Erosion protection had been constructed for the larger part of thedistance but not in the southern part where erosion was going on and superficialslides occurred from time to time.
Within the area in and close to Strandbacken, the weight sounding tests had beenstopped at levels of mainly –25 to –30 metres at the deepest. A few deeper levelswere reached in the tests furthest to the south. In all cases, the weight sounding testswere stopped after a very large and gradually increasing amount of rotation hadbeen required for penetration over a fairly large depth interval. The so-calledmachine soundings penetrated a few metres further and stopped at a level of about–35 metres, i.e. about 45 metres below the original ground surface. This stop levelis fairly constant within a wide strip from the slope to about a hundred metres behindit. At larger distances from the river, the stop depths first increase somewhat andthen decrease towards the valley side. The stop levels below the river are somewhathigher than on land. The clay was reported to contain some layers or infusions ofsand and shells. However, these did not appear to be continuous but to have limitedextents or occur as lenses. From the test results it is difficult to estimate exactlywhere the border between clay and underlying coarser soil lies. Samplings andfield vane tests have generally been stopped somewhat above the stop levels for the
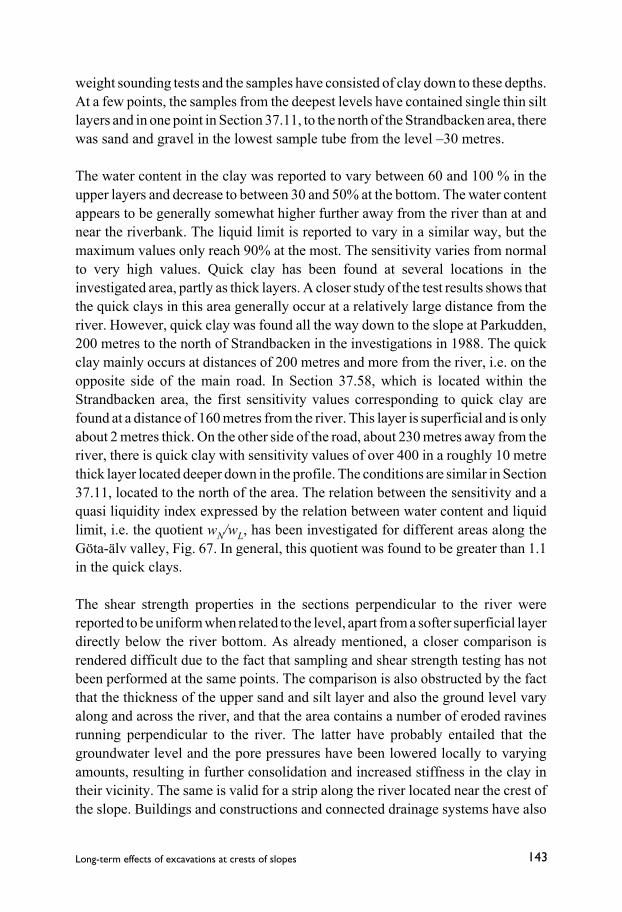
143Long-term effects of excavations at crests of slopes
weight sounding tests and the samples have consisted of clay down to these depths.At a few points, the samples from the deepest levels have contained single thin siltlayers and in one point in Section 37.11, to the north of the Strandbacken area, therewas sand and gravel in the lowest sample tube from the level –30 metres.
The water content in the clay was reported to vary between 60 and 100 % in theupper layers and decrease to between 30 and 50% at the bottom. The water contentappears to be generally somewhat higher further away from the river than at andnear the riverbank. The liquid limit is reported to vary in a similar way, but themaximum values only reach 90% at the most. The sensitivity varies from normalto very high values. Quick clay has been found at several locations in theinvestigated area, partly as thick layers. A closer study of the test results shows thatthe quick clays in this area generally occur at a relatively large distance from theriver. However, quick clay was found all the way down to the slope at Parkudden,200 metres to the north of Strandbacken in the investigations in 1988. The quickclay mainly occurs at distances of 200 metres and more from the river, i.e. on theopposite side of the main road. In Section 37.58, which is located within theStrandbacken area, the first sensitivity values corresponding to quick clay arefound at a distance of 160 metres from the river. This layer is superficial and is onlyabout 2 metres thick. On the other side of the road, about 230 metres away from theriver, there is quick clay with sensitivity values of over 400 in a roughly 10 metrethick layer located deeper down in the profile. The conditions are similar in Section37.11, located to the north of the area. The relation between the sensitivity and aquasi liquidity index expressed by the relation between water content and liquidlimit, i.e. the quotient wN/wL, has been investigated for different areas along theGöta-älv valley, Fig. 67. In general, this quotient was found to be greater than 1.1in the quick clays.
The shear strength properties in the sections perpendicular to the river werereported to be uniform when related to the level, apart from a softer superficial layerdirectly below the river bottom. As already mentioned, a closer comparison isrendered difficult due to the fact that sampling and shear strength testing has notbeen performed at the same points. The comparison is also obstructed by the factthat the thickness of the upper sand and silt layer and also the ground level varyalong and across the river, and that the area contains a number of eroded ravinesrunning perpendicular to the river. The latter have probably entailed that thegroundwater level and the pore pressures have been lowered locally to varyingamounts, resulting in further consolidation and increased stiffness in the clay intheir vicinity. The same is valid for a strip along the river located near the crest ofthe slope. Buildings and constructions and connected drainage systems have also
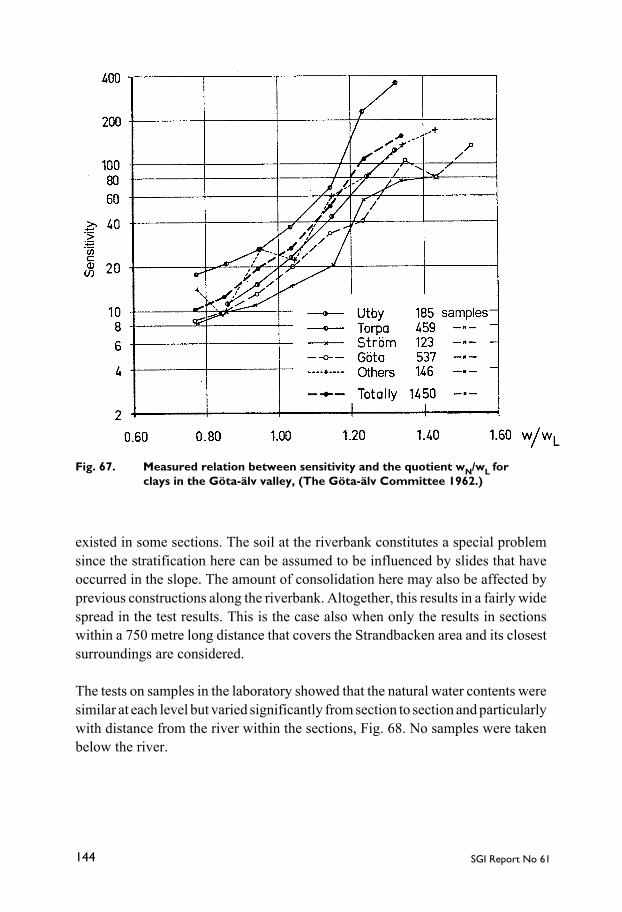
SGI Report No 61144
existed in some sections. The soil at the riverbank constitutes a special problemsince the stratification here can be assumed to be influenced by slides that haveoccurred in the slope. The amount of consolidation here may also be affected byprevious constructions along the riverbank. Altogether, this results in a fairly widespread in the test results. This is the case also when only the results in sectionswithin a 750 metre long distance that covers the Strandbacken area and its closestsurroundings are considered.
The tests on samples in the laboratory showed that the natural water contents weresimilar at each level but varied significantly from section to section and particularlywith distance from the river within the sections, Fig. 68. No samples were takenbelow the river.
Fig. 67. Measured relation between sensitivity and the quotient wN/wL forclays in the Göta-älv valley, (The Göta-älv Committee 1962.)

145Long-term effects of excavations at crests of slopes
-35
-30
-25
-20
-15
-10
-5
0
5
10
15
0 10 20 30 40 50 60 70 80 90 100
Water content, %
Leve
l,m3768,crest3758, 8m behind crest3758, 68m behind crest3750, 39m behind crest3743, in slope3743, 40m behind crest3733, at shoreline3733,crest3733, 51.5m behind crest3728, in slope3728, 42 m behind crestt3716, crest3711, in slope3711, 25m behind crest3711, 98m behind crest3706, in slope3701, in slope3701,crest3701, 97m behind crest3685, 51m behind crest
The spread in results is considerably reduced when the area is limited further andwhen the part close to the river is separated from the part far away from the river,Figs. 69a and b. It is then clear that the properties at the same distances from the riverare more similar and that the water content is generally higher far away from theriver. It can also be inferred that the maximum water content is found at a higherlevel at greater distance from the river.
The determinations of the consistency limits are fewer. A compilation of alldeterminations of liquid limit shows that it varies in approximately the same wayas the natural water content and that the spread between different points is about thesame. However, it is not possible to make the same separation of the data as for thewater content and study the variation in different parts of the area. There is possiblyan indication of higher liquid limits at some distance from the river, Fig. 70.
Fig. 68. Compilation of measured natural water contents in and aroundthe Strandbacken area.

SGI Report No 61146
-35
-30
-25
-20
-15
-10
-5
0
5
10
15
0 10 20 30 40 50 60 70 80 90
Water content, %
Leve
l, m
3768, crest
3758, 8m behind crest
3733,crest
3716, crest
-35
-30
-25
-20
-15
-10
-5
0
5
10
15
0 10 20 30 40 50 60 70 80 90
Water content, %
Leve
l,m
3758, 68m behind crest
3711, 98m behind crest
3701, 97m behind crest
a)
b)
Fig. 69. Variation in natural water content in the soil profiles in theStrandbacken area.a) Close to the crestb) At large distances from the river
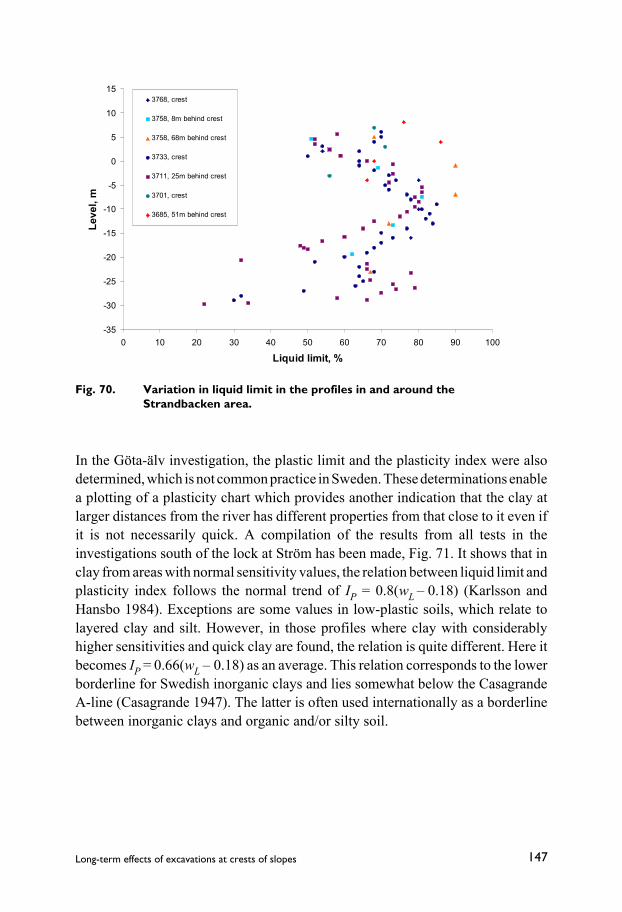
147Long-term effects of excavations at crests of slopes
-35
-30
-25
-20
-15
-10
-5
0
5
10
15
0 10 20 30 40 50 60 70 80 90 100
Liquid limit, %
Leve
l, m
3768, crest
3758, 8m behind crest
3758, 68m behind crest
3733, crest
3711, 25m behind crest
3701, crest
3685, 51m behind crest
In the Göta-älv investigation, the plastic limit and the plasticity index were alsodetermined, which is not common practice in Sweden. These determinations enablea plotting of a plasticity chart which provides another indication that the clay atlarger distances from the river has different properties from that close to it even ifit is not necessarily quick. A compilation of the results from all tests in theinvestigations south of the lock at Ström has been made, Fig. 71. It shows that inclay from areas with normal sensitivity values, the relation between liquid limit andplasticity index follows the normal trend of IP = 0.8(wL – 0.18) (Karlsson andHansbo 1984). Exceptions are some values in low-plastic soils, which relate tolayered clay and silt. However, in those profiles where clay with considerablyhigher sensitivities and quick clay are found, the relation is quite different. Here itbecomes IP = 0.66(wL – 0.18) as an average. This relation corresponds to the lowerborderline for Swedish inorganic clays and lies somewhat below the CasagrandeA-line (Casagrande 1947). The latter is often used internationally as a borderlinebetween inorganic clays and organic and/or silty soil.
Fig. 70. Variation in liquid limit in the profiles in and around theStrandbacken area.
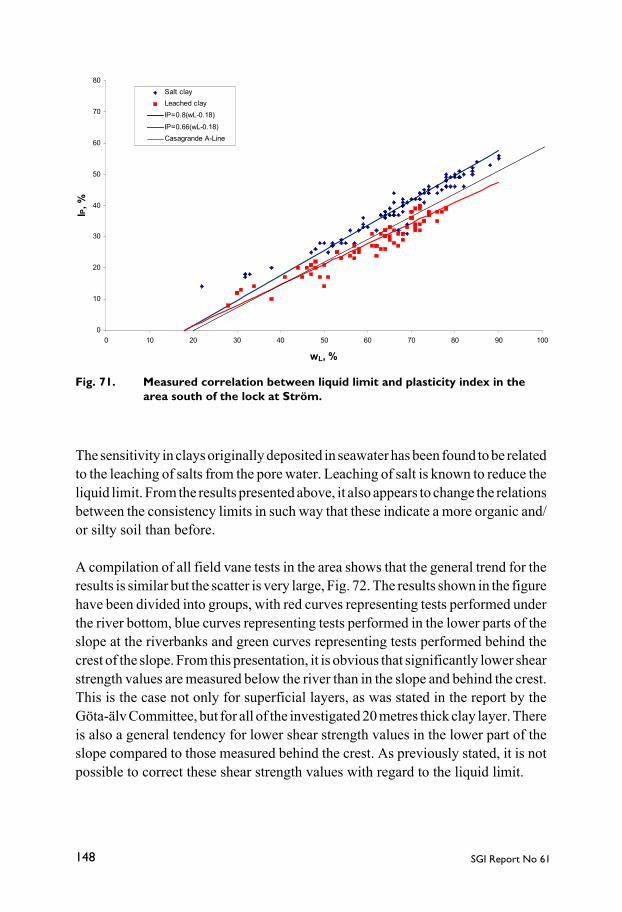
SGI Report No 61148
0
10
20
30
40
50
60
70
80
0 10 20 30 40 50 60 70 80 90 100
wL, %
IP, %
Salt clayLeached clayIP=0.8(wL-0.18)
IP=0.66(wL-0.18)Casagrande A-Line
The sensitivity in clays originally deposited in seawater has been found to be relatedto the leaching of salts from the pore water. Leaching of salt is known to reduce theliquid limit. From the results presented above, it also appears to change the relationsbetween the consistency limits in such way that these indicate a more organic and/or silty soil than before.
A compilation of all field vane tests in the area shows that the general trend for theresults is similar but the scatter is very large, Fig. 72. The results shown in the figurehave been divided into groups, with red curves representing tests performed underthe river bottom, blue curves representing tests performed in the lower parts of theslope at the riverbanks and green curves representing tests performed behind thecrest of the slope. From this presentation, it is obvious that significantly lower shearstrength values are measured below the river than in the slope and behind the crest.This is the case not only for superficial layers, as was stated in the report by theGöta-älv Committee, but for all of the investigated 20 metres thick clay layer. Thereis also a general tendency for lower shear strength values in the lower part of theslope compared to those measured behind the crest. As previously stated, it is notpossible to correct these shear strength values with regard to the liquid limit.
Fig. 71. Measured correlation between liquid limit and plasticity index in thearea south of the lock at Ström.
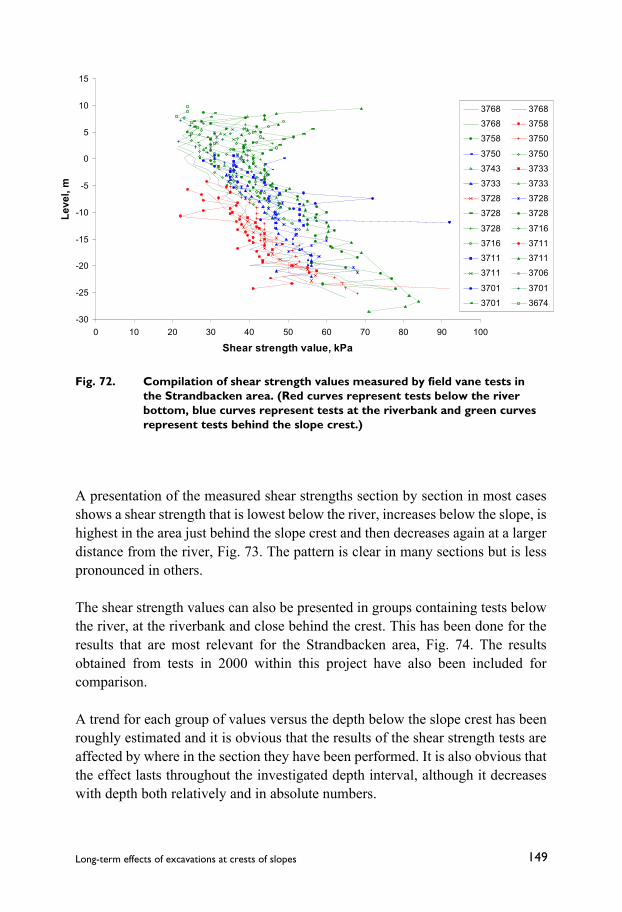
149Long-term effects of excavations at crests of slopes
-30
-25
-20
-15
-10
-5
0
5
10
15
0 10 20 30 40 50 60 70 80 90 100
Shear strength value, kPa
Leve
l, m
3768 3768
3768 3758
3758 3750
3750 3750
3743 3733
3733 3733
3728 3728
3728 3728
3728 3716
3716 3711
3711 3711
3711 3706
3701 3701
3701 3674
A presentation of the measured shear strengths section by section in most casesshows a shear strength that is lowest below the river, increases below the slope, ishighest in the area just behind the slope crest and then decreases again at a largerdistance from the river, Fig. 73. The pattern is clear in many sections but is lesspronounced in others.
The shear strength values can also be presented in groups containing tests belowthe river, at the riverbank and close behind the crest. This has been done for theresults that are most relevant for the Strandbacken area, Fig. 74. The resultsobtained from tests in 2000 within this project have also been included forcomparison.
A trend for each group of values versus the depth below the slope crest has beenroughly estimated and it is obvious that the results of the shear strength tests areaffected by where in the section they have been performed. It is also obvious thatthe effect lasts throughout the investigated depth interval, although it decreaseswith depth both relatively and in absolute numbers.
Fig. 72. Compilation of shear strength values measured by field vane tests inthe Strandbacken area. (Red curves represent tests below the riverbottom, blue curves represent tests at the riverbank and green curvesrepresent tests behind the slope crest.)
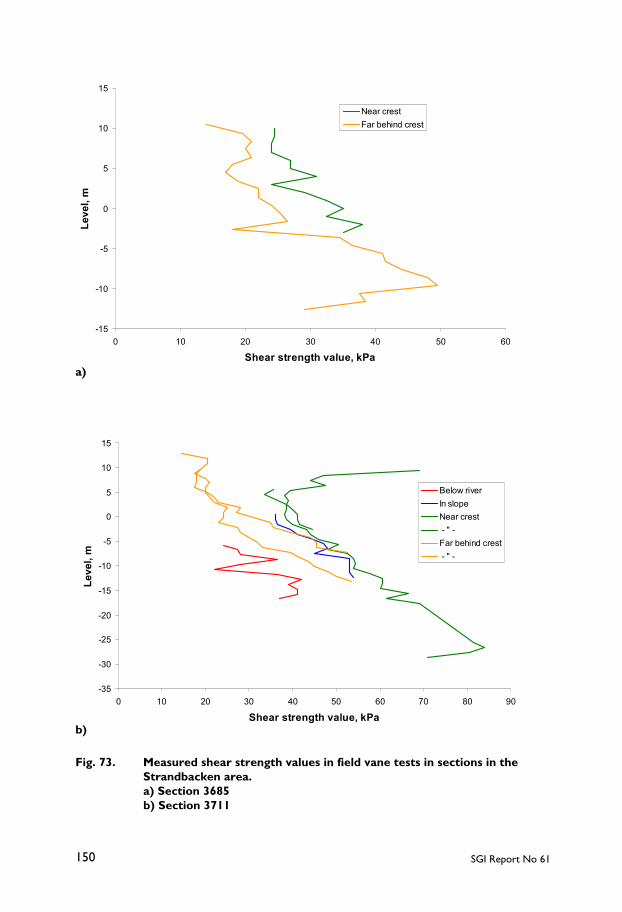
SGI Report No 61150
-15
-10
-5
0
5
10
15
0 10 20 30 40 50 60
Shear strength value, kPa
Leve
l, m
Near crestFar behind crest
-35
-30
-25
-20
-15
-10
-5
0
5
10
15
0 10 20 30 40 50 60 70 80 90
Shear strength value, kPa
Leve
l, m
Below riverIn slopeNear crest - " -Far behind crest - " -
a)
b)
Fig. 73. Measured shear strength values in field vane tests in sections in theStrandbacken area.a) Section 3685b) Section 3711

151Long-term effects of excavations at crests of slopes
-25
-20
-15
-10
-5
0
5
10
0 10 20 30 40 50 60 70 80
Shear strength value, kPa
Leve
l, m
Below riverIn slopeNear crest - " - - " -
-25
-20
-15
-10
-5
0
5
10
0 10 20 30 40 50 60 70
Shear strength value, kPa
Leve
l, m
Below river
In slope
Near crest
c)
d)
Fig. 73. Measured shear strength values in field vane tests in sections in theStrandbacken area.c) Section 3728d) Section 3733

SGI Report No 61152
-30
-25
-20
-15
-10
-5
0
5
10
0 10 20 30 40 50 60 70 80
Shear strength value, kPa
Leve
l, m
Below riverIn slopeNear crest - " -
-30
-25
-20
-15
-10
-5
0
5
10
15
0 10 20 30 40 50 60 70 80 90
Shear strength value, kPa
Leve
l, m
Below riverNear crest
e)
f)
Fig. 73. Measured shear strength values in field vane tests in sections in theStrandbacken area.e) Section 3750f) Section 3758

153Long-term effects of excavations at crests of slopes
-30
-25
-20
-15
-10
-5
0
5
10
0 10 20 30 40 50 60 70 80 90 100
Shear strength value, kPa
Leve
l, m
Below riverIn slopeNear crest
0
5
10
15
20
25
30
35
40
45
0 10 20 30 40 50 60 70 80 90
Shear strength value, kPa
Dep
th b
elow
cre
st, m
3768
3758
3750
3733
3728
3711
Point1
Trend belowriverTrend in slope
Trend nearcrest
g)
a)
Fig. 73. Measured shear strength values in field vane tests in sections in theStrandbacken area.g) Section 3768
Fig. 74. Shear strength values obtained by field vane tests in different parts ofsections perpendicular to the river in the Strandbacken area.a) below the river
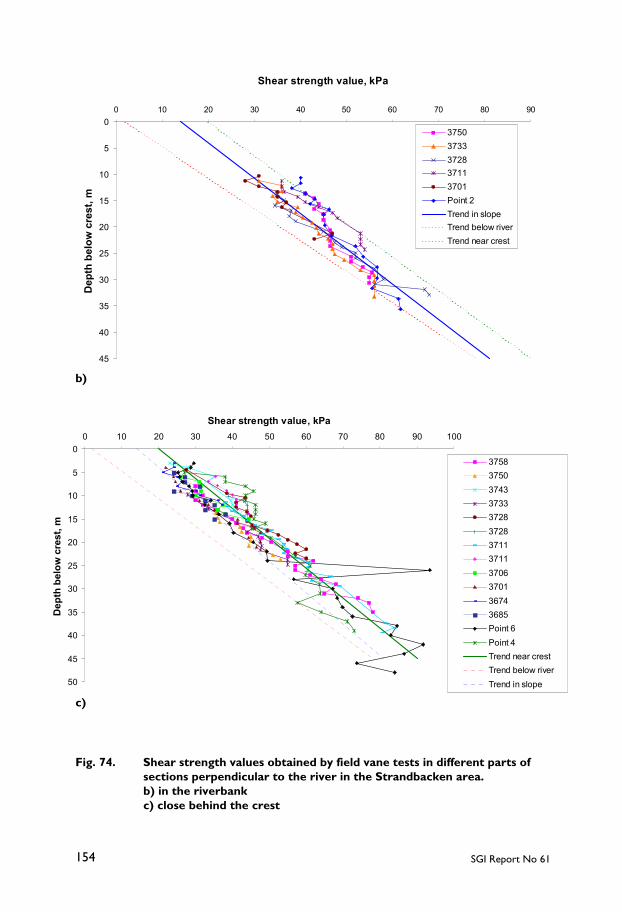
SGI Report No 61154
0
5
10
15
20
25
30
35
40
45
0 10 20 30 40 50 60 70 80 90
Shear strength value, kPaD
epth
bel
ow c
rest
, m
37503733372837113701Point 2Trend in slopeTrend below riverTrend near crest
0
5
10
15
20
25
30
35
40
45
50
0 10 20 30 40 50 60 70 80 90 100
Shear strength value, kPa
Dep
th b
elow
cre
st, m
375837503743373337283728371137113706370136743685Point 6 Point 4Trend near crestTrend below riverTrend in slope
b)
c)
Fig. 74. Shear strength values obtained by field vane tests in different parts ofsections perpendicular to the river in the Strandbacken area.b) in the riverbankc) close behind the crest

155Long-term effects of excavations at crests of slopes
The pore water pressures were measured in open systems in two sections in andadjacent to the Strandbacken area during the Göta-älv investigation. In systems thatwere installed far behind the slope crest, the pressure level in superficially locatedfilter tips was found to be just below the ground surface and there was then adownward hydraulic gradient. In systems located at medium distances from thecrest, the pressure levels in superficial filter tips were still just below the groundsurface, which was here at a level a few metres lower. The pressures at depth herewere described as almost hydrostatic from the upper groundwater level. Close tothe crest, the pore pressures were lower in the upper soil layers and the free groundwater level here was located a few metres below the ground surface, depending onthe thickness of the upper sand and silt layers. The ground surface was alsogenerally at a somewhat lower level than further away from the slope. The porepressure gradient here had shifted to become slightly upward. The pore pressuresdown at the riverbank were described as slightly artesian. The majority of theobservations were made during July 1961, which can be assumed to correspond toa relatively dry period.
The pore pressure measurements during the later investigation in 1988-89 weremade in a point located about 10 metres behind the upper crest behind the terraceof the first excavation. One filter tip here was installed close to the lower boundaryof the upper sand and silt layer and another tip was placed in the clay 11 metresfurther down. A longer observation period showed that the pore pressures in theupper layer varied a lot and corresponded to a free groundwater level from a halfto about three and a half metres below the ground surface. The measured porepressures in the clay varied in the same way but with a smaller amplitude.
The measured pore pressures are plotted versus level in Fig. 75. A direct comparisonis obstructed by the fact that the ground level and the thickness of the sand and siltlayer vary somewhat between the measuring sections, which is probably also thecase for the underlying bottom layers of coarser and permeable soil. The trend lineshave been drawn using guidance also from the observations of the pore pressuresin the bottom layers in the present investigation.
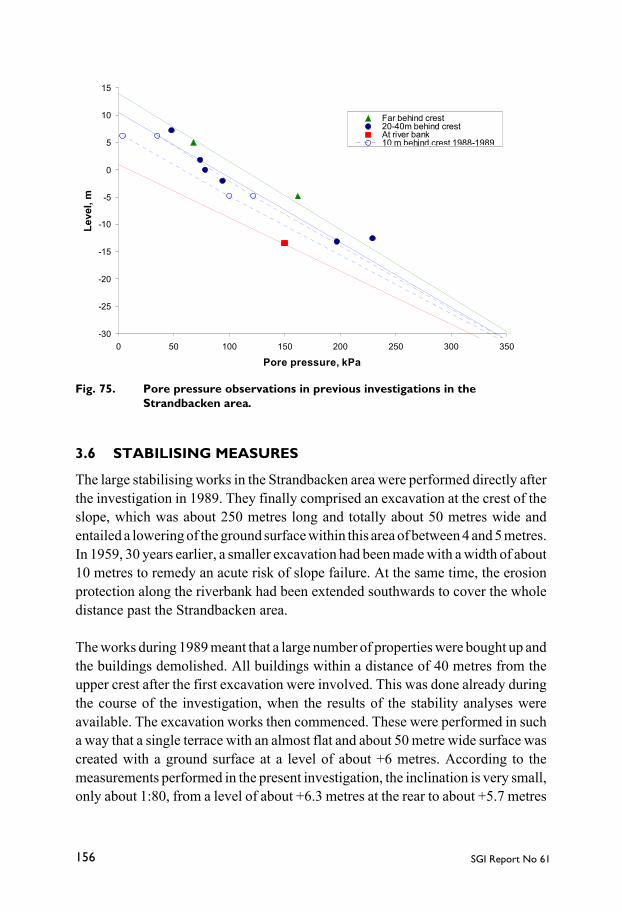
SGI Report No 61156
-30
-25
-20
-15
-10
-5
0
5
10
15
0 50 100 150 200 250 300 350
Pore pressure, kPa
Leve
l, m
Far behind crest20-40m behind crestAt river bank10 m behind crest 1988-1989
Fig. 75. Pore pressure observations in previous investigations in theStrandbacken area.
3.6 STABILISING MEASURES
The large stabilising works in the Strandbacken area were performed directly afterthe investigation in 1989. They finally comprised an excavation at the crest of theslope, which was about 250 metres long and totally about 50 metres wide andentailed a lowering of the ground surface within this area of between 4 and 5 metres.In 1959, 30 years earlier, a smaller excavation had been made with a width of about10 metres to remedy an acute risk of slope failure. At the same time, the erosionprotection along the riverbank had been extended southwards to cover the wholedistance past the Strandbacken area.
The works during 1989 meant that a large number of properties were bought up andthe buildings demolished. All buildings within a distance of 40 metres from theupper crest after the first excavation were involved. This was done already duringthe course of the investigation, when the results of the stability analyses wereavailable. The excavation works then commenced. These were performed in sucha way that a single terrace with an almost flat and about 50 metre wide surface wascreated with a ground surface at a level of about +6 metres. According to themeasurements performed in the present investigation, the inclination is very small,only about 1:80, from a level of about +6.3 metres at the rear to about +5.7 metres
157Long-term effects of excavations at crests of slopes
at the crest of the slope down to the river. This is even less than the already smallinclination of 1:50 that was proposed in the report from 1989. The excavation wasmade in the upper sand and silt layer. Most of this was taken away, but part of it stillremains. No replanting of the area has been mentioned and none seems to have beenattempted.
The excavation was designed with the aim that the factor of safety according to anundrained analysis should be at least 1.5 for the remaining built-up areas. This wasalso the aim for smaller potential slip surfaces in the outer slope. For larger slipsurfaces in areas where no buildings were involved, a safety factor of 1.3 accordingto undrained analysis was aimed for.
3.7 NEW INVESTIGATIONS
3.7.1 Observations
An ocular inspection of the area was made before the new field tests started and thecondition of the area was documented by photographs. Further observations havebeen made during the course of the investigations. The area is large and a full viewcan only be obtained from the other side of the river. From this side and frompassing ships in the river, at normal water levels one can mainly see a solid erosionprotection structure of rock-fill at the riverbank and the lower slope, which isovergrown by trees and bushes. The front of the built-up area has been moved fromjust behind the riverbank to a distance of about 80 metres away from the river. Fromthis side the houses as well as the excavated terrace and the upper slope at its rearcan mainly be seen during wintertime. In summertime they are largely obscured bythe trees in the lower slope and at its crest, Fig. 76.
The erosion protection constructed of rock-fill starts some distance out in the waterand then covers the riverbank to a height of about 2 metres above the zero level,Fig. 77. Scattered stones are also found all over the bottom shelf that slopes gentlyfrom about a metre or so depth at the riverbank to 4–5 metres’ depth before it getsa steeper inclination down to the deep channel in the fairway. The fairway and thechannel into the lock should have a minimum depth of 5.95 metres at the lowestwater level in the river. This is regularly checked. The depth in the fairway in theriver is generally larger, but the information is somewhat uncertain. In the sectionsin the Göta-älv investigation 1962, this depth varied mainly between 8 and11 metres, and measurements in the northern part of the Strandbacken area showeddepths between 8 and 10 metres. However, according to the map from the fairwayauthorities based on soundings in 1975, the water depths in the fairway in the area

SGI Report No 61158
a)
b)
Fig. 76. The Strandbacken area seen from the opposite side of the river in lateOctober 2000.a) The visible part of the area. The river and a landing pier on itseastern side are seen in the foreground. The erosion protection and thelower part of the slope can be clearly observed, the excavated terracecan be discerned and the remaining buildings can be seen in the back-ground.b) A close-up of a section where the different levels can be betterobserved.

159Long-term effects of excavations at crests of slopes
Fig
. 77.
Riv
erba
nk a
nd e
rosi
on
pro
tect
ion.
a) T
he r
iver
bank
to
war
ds t
he s
out
h. A
bo
llard
can
see
n in
the
riv
er w
ith
a m
arke
r fo
r th
e w
este
rn s
ide
of t
he fa
irw
ay.

SGI Report No 61160
Fig
. 77.
Riv
erba
nk a
nd e
rosi
on
pro
tect
ion.
b) T
he r
iver
bank
to
war
ds t
he n
ort
h. T
he p
rotr
udin
g po
int
at t
he o
ld a
cces
s ro
ad t
o t
he r
iver
bank
obs
cure
spa
rts
of t
he b
ank.
The
bri
dge
at L
illa
Ede
t, t
he e
ntra
nce
to t
he lo
ck a
t S
trö
m, t
he I
nlan
d pa
per
mill
and
the
hydr
oel
ectr
ic p
ow
er p
lant
at
Lill
a E
det
can
be s
een
in t
he b
ackg
roun
d.

161Long-term effects of excavations at crests of slopes
mainly vary between 6 and 8 metres, with a deeper part with a bottom level at about–8.2 metres at Strandbacken.
The lowest water level in the river is given as –0.25 metres. The water level in theriver varies strongly also during the day. It is somewhat affected by the tide and thewind direction since there are no further locks downstream towards the sea, but itis mainly influenced by the power production and outlet of water at the power plant1.5 kilometres upstream. It normally appears to vary between the levels 0 and+1.4 metres. However, during the extremely wet winter in 2000–2001, when theareas around Lake Vänern became flooded and emergency tapping of waterthrough the river was necessary, the water level was constantly close to the top ofthe erosion protection, i.e. at about +2 metres.
The variations can be illustrated by the measurements of water level and wateroutlet performed by the fairway authorities during year 2000. The variations inwater level and water flow during one of the first days in each month are shown inFig. 78. It can here be seen how the water level, like the tide, varies regularly withtwo peaks and two lows each day. The water flows during the same periods werealmost constant and thus cannot have affected the variation except for the selectedday in July. On that day, the water outlet increased significantly after about half theday, which directly affected the water level in the river. The average water levelsduring the selected days can also be seen to be related to the corresponding waterflows.
The effect of the water flow is also illustrated in Fig. 79, where total water flow andmean water level for each day during the year are plotted. Apart from raising thewater level, an increased water flow also entails that the width and section area ofthe river and the rate of the water flow in it increase. The cubic root of the waterflow has therefore been selected as a relevant value for comparison with the waterlevel in the river. The figure shows clearly that the water flow is the main factor thataffects the water level in the river and that the water level decreases rapidly whenthe power production is reduced during long holidays and the vacation period or forsome other reason. The effect of the emergency tapping at the end of the year toreduce the effects of the flooding around Lake Vänern is also clearly illustrated.
At the riverbank in the Strandbacken area, there is a small hut above the erosionprotection, which is used by the local fishermen. A few simple wooden jetties havealso been constructed along the riverbank.
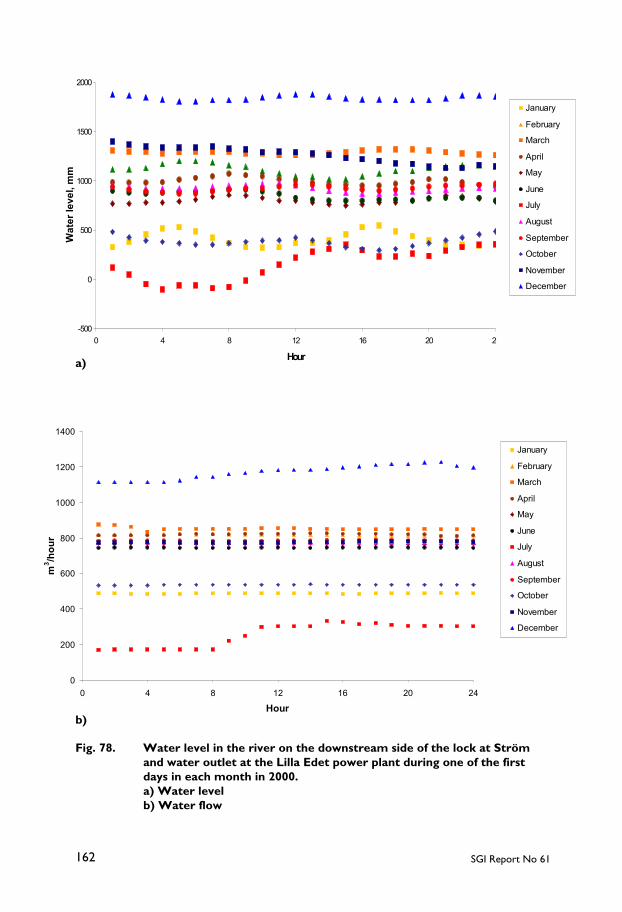
SGI Report No 61162
0
200
400
600
800
1000
1200
1400
0 4 8 12 16 20 24
Hour
m3 /h
our
January
February
March
April
May
June
July
August
September
October
November
December
b)
a)
January
February
March
April
May
June
July
August
September
October
November
December
-500
0
500
1000
1500
2000
0 4 8 12 16 20 24
Hour
Wat
er le
vel,
mm
Fig. 78. Water level in the river on the downstream side of the lock at Strömand water outlet at the Lilla Edet power plant during one of the firstdays in each month in 2000.a) Water levelb) Water flow
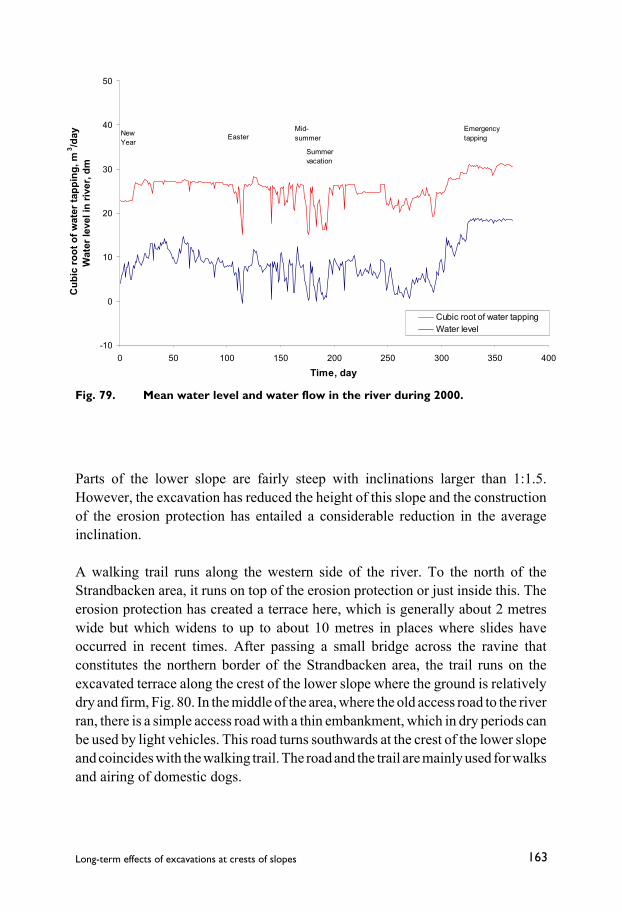
163Long-term effects of excavations at crests of slopes
-10
0
10
20
30
40
50
0 50 100 150 200 250 300 350 400
Time, day
Cub
ic ro
ot o
f wat
er ta
ppin
g, m
3 /day
Wat
er le
vel i
n riv
er, d
m
Cubic root of water tappingWater level
New Year
EasterMid-summer
Summer vacation
Emergency tapping
Fig. 79. Mean water level and water flow in the river during 2000.
Parts of the lower slope are fairly steep with inclinations larger than 1:1.5.However, the excavation has reduced the height of this slope and the constructionof the erosion protection has entailed a considerable reduction in the averageinclination.
A walking trail runs along the western side of the river. To the north of theStrandbacken area, it runs on top of the erosion protection or just inside this. Theerosion protection has created a terrace here, which is generally about 2 metreswide but which widens to up to about 10 metres in places where slides haveoccurred in recent times. After passing a small bridge across the ravine thatconstitutes the northern border of the Strandbacken area, the trail runs on theexcavated terrace along the crest of the lower slope where the ground is relativelydry and firm, Fig. 80. In the middle of the area, where the old access road to the riverran, there is a simple access road with a thin embankment, which in dry periods canbe used by light vehicles. This road turns southwards at the crest of the lower slopeand coincides with the walking trail. The road and the trail are mainly used for walksand airing of domestic dogs.

SGI Report No 61164
The most significant feature of the excavated terrace is its marshy nature. Theground surface is normally very wet. This is the case throughout the year at the rearend of the terrace and for most of the year in all other parts except for a strip closeto the lower crest. The vegetation consists mainly of reeds, which grow in largeclumps, sedges and a few birch trees. In large spots there is no vegetation at all. Herethe grey sandy silt lies open and no vegetation has managed to become rootedduring the more than 10 years that have elapsed since the excavation works. Birchesgrow at the edges of the terrace towards the ravine in the north and the slope towardsthe river, where the ground conditions are drier, Fig. 81.
The area is somewhat drier and the vegetation is somewhat lusher in summertime,but the marshy nature is still evident, Fig. 82.
At the rear end of the excavated terrace, the groundwater level is located at theground surface all year through since water is seeping out of the upper excavatedslope in which the soil consists of sand and silt. As a result of this seepage, internalerosion occurs at places in this slope, Fig. 83.
The remaining buildings are located behind the upper slope. Some property reachesall the way to the crest of this slope, but the nearest building is located about10 metres away from this, Fig. 84.
Fig. 80. The trail along the lower crest in the southern part of the area where itcan also be used by light vehicles.
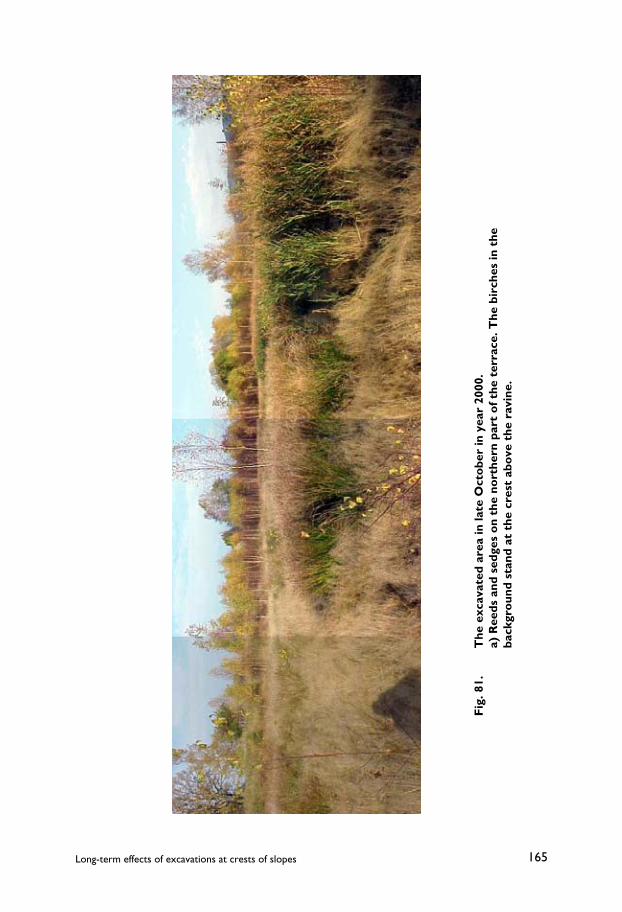
165Long-term effects of excavations at crests of slopes
Fig
. 81.
The
exc
avat
ed a
rea
in la
te O
cto
ber
in y
ear
2000
.a)
Ree
ds a
nd s
edge
s o
n th
e no
rthe
rn p
art
of t
he t
erra
ce. T
he b
irch
es in
the
back
gro
und
stan
d at
the
cre
st a
bove
the
rav
ine.

SGI Report No 61166
Fig
. 81.
The
exc
avat
ed a
rea
in la
te O
cto
ber
in y
ear
2000
.b)
Bir
ches
at
the
cres
t o
f the
slo
pe t
ow
ards
the
riv
er a
nd r
eeds
on
the
sout
hern
par
to
f th
e ex
cava
ted
terr
ace.

167Long-term effects of excavations at crests of slopes
Fig
. 81.
The
exc
avat
ed a
rea
in la
te O
cto
ber
in y
ear
2000
.c)
The
so
uthe
rn p
art
of t
he e
xcav
ated
ter
race
wit
h re
eds
and
sedg
es a
nd a
larg
e sp
ot
wit
hba
re s
and
and
silt
. The
upp
er e
xcav
ated
slo
pe is
see
n in
the
bac
kgro
und
toge
ther
wit
hbi
rche
s gr
ow
ing
on
this
slo
pe t
oo
.
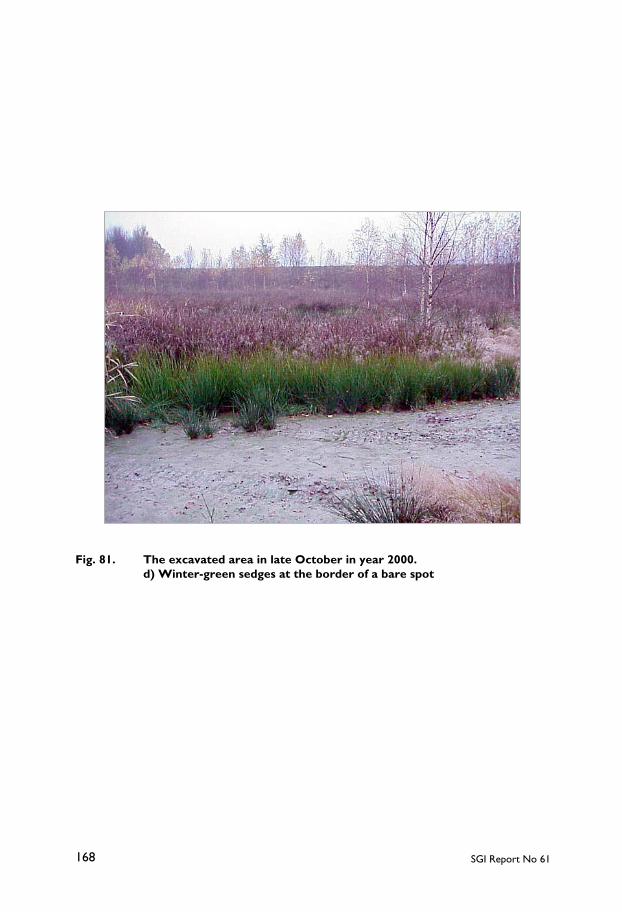
SGI Report No 61168
Fig. 81. The excavated area in late October in year 2000.d) Winter-green sedges at the border of a bare spot

169Long-term effects of excavations at crests of slopes
Fig
. 81.
The
exc
avat
ed a
rea
in la
te O
cto
ber
in y
ear
2000
.e)
Vie
w o
f mo
st o
f the
exc
avat
ed a
rea
loo
king
to
war
ds t
he n
ort
h w
ith
the
rive
r an
d th
e bu
ilt-
up c
entr
e o
f Lill
a E
det
in t
he b
ackg
roun
d. B
are
spo
ts w
ith
sand
and
silt
can
be
seen
thr
oug
hth
e tr
ees.

SGI Report No 61170
a)
b)
Fig. 82. The excavated terrace in June 2001.a) View of the northern part from the upper crestb) Nature in the southern part.
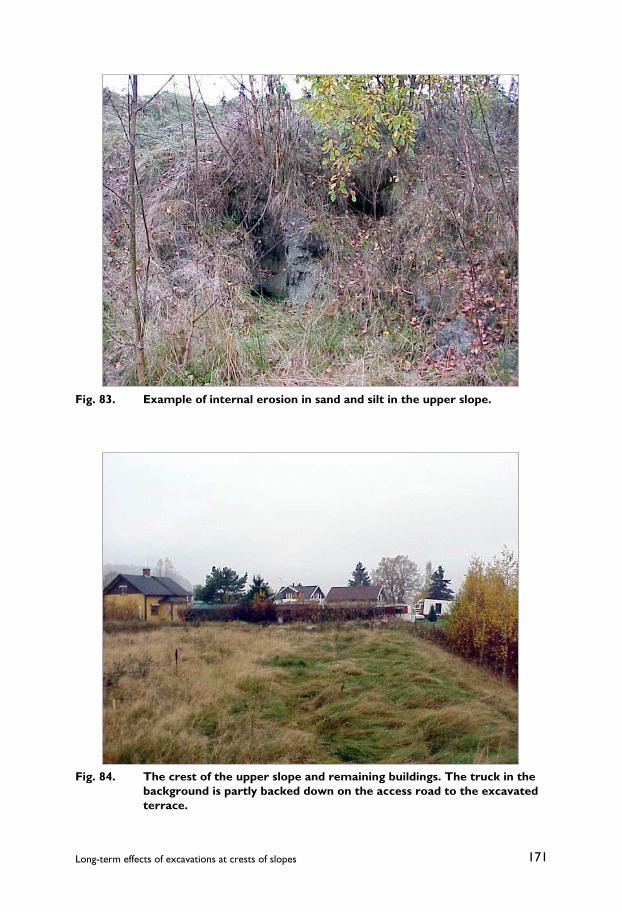
171Long-term effects of excavations at crests of slopes
Fig. 83. Example of internal erosion in sand and silt in the upper slope.
Fig. 84. The crest of the upper slope and remaining buildings. The truck in thebackground is partly backed down on the access road to the excavatedterrace.

SGI Report No 61172
North and south of the remaining buildings in the area there is open farmland upto the main road. Behind this, there are new buildings reaching all the way up to therocky hills at the border of the valley, Fig. 85.
Requests for permission to build on the land between the upper crest and the mainroad have been made. However, the authorities have been restrictive and suchrequests have only been granted in areas very close to the main road.
3.7.2 Location of the new investigations
The new investigations in this project have been located in a section through thecentral parts of the excavated area. They have been performed at six points, at fourof which detailed investigations with field tests and sampling were performedwhereas only pore pressures were measured at two. The four points with detailedinvestigations were placed in such way that one is located between 20 and 25 metresout in the river, one is located in the riverbank, one is located at the centre of theexcavated terrace and one is located in original ground about 25 metres behind thenew upper crest. The desire was to find points with as well defined conditions aspossible, which at the same time were easily accessible and did not require intrusionon private properties or obstruction to the ship traffic in the fairway. It was thereforenot possible to place the points in a straight line perpendicular to the river. Instead,the points on land were placed in a line with an oblique angle towards the river. Atthe riverbank, this line bent backwards about 90° towards the investigation pointin the river, Fig. 86.
The points were numbered from 1 to 6. Point 1 is in reality a short line about 20–25 metres out in the river. A raft was borrowed from the fairway authorities and wasmoved along this line in such way that it did not interfere with the fairway in thedeep channel. The raft was fixed in position along the river using cramp irons in theprotruding point of the erosion protection at the old access road and the bollardholding the marker for the side of the deep channel. A large number of bottomanchors and ropes to firm objects ashore were also used to fix the raft sideways,Fig. 87.
Point 2 is located slightly inside the erosion protection at the former access road,which has been mentioned earlier. The shoreline here protrudes into a small capeand the point is located approximately in the line of a straightened-out riverbank,Fig. 88. All test holes at this point had to be pre-drilled about 2 metres to ensure thatno stones or old fill material would damage the test and sampling equipment.
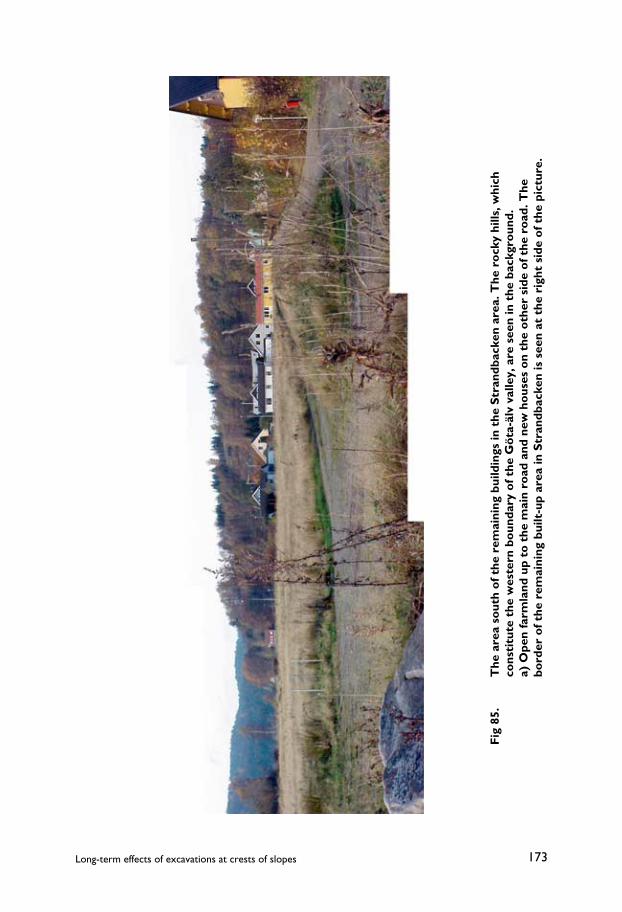
173Long-term effects of excavations at crests of slopes
Fig
85.
The
are
a so
uth
of t
he r
emai
ning
bui
ldin
gs in
the
Str
andb
acke
n ar
ea. T
he r
ock
y hi
lls, w
hich
cons
titu
te t
he w
este
rn b
oun
dary
of t
he G
öta
-älv
val
ley,
are
see
n in
the
bac
kgro
und.
a) O
pen
farm
land
up
to t
he m
ain
road
and
new
ho
uses
on
the
oth
er s
ide
of t
he r
oad
. The
bord
er o
f the
rem
aini
ng b
uilt
-up
area
in S
tran
dbac
ken
is s
een
at t
he r
ight
sid
e o
f the
pic
ture
.
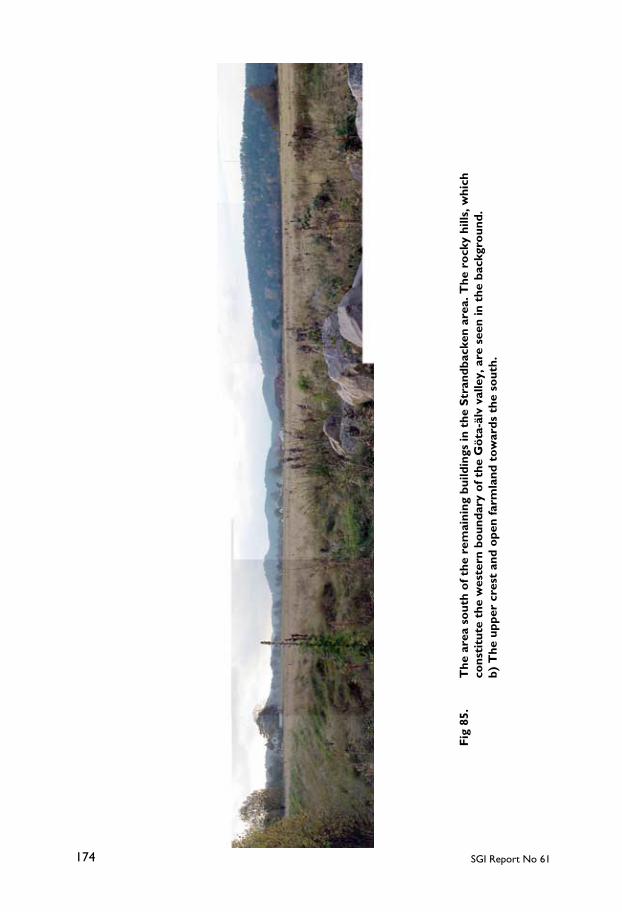
SGI Report No 61174
Fig
85.
The
are
a so
uth
of t
he r
emai
ning
bui
ldin
gs in
the
Str
andb
acke
n ar
ea. T
he r
ock
y hi
lls, w
hich
cons
titu
te t
he w
este
rn b
oun
dary
of t
he G
öta
-älv
val
ley,
are
see
n in
the
bac
kgro
und.
b) T
he u
pper
cre
st a
nd o
pen
farm
land
to
war
ds t
he s
out
h.
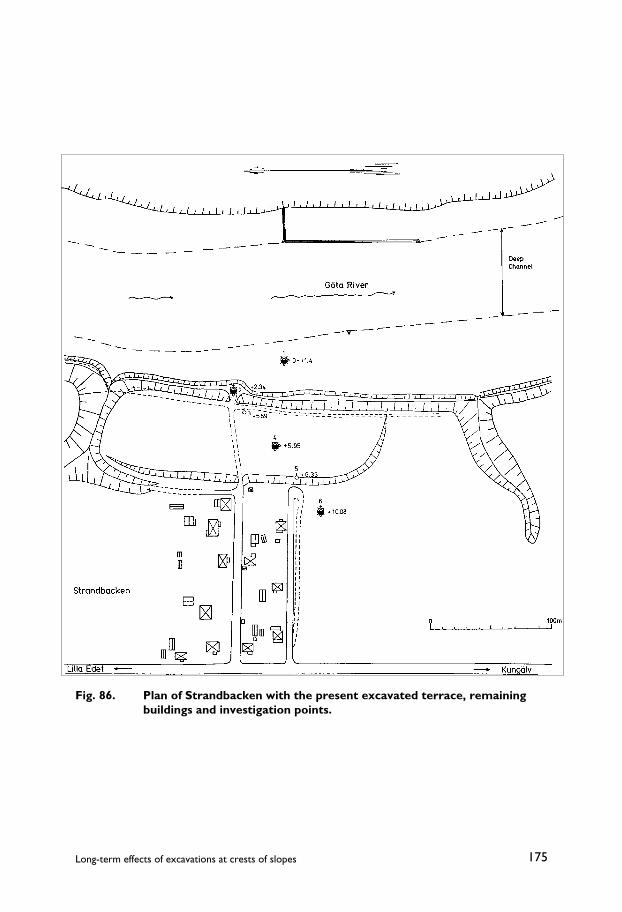
175Long-term effects of excavations at crests of slopes
Fig. 86. Plan of Strandbacken with the present excavated terrace, remainingbuildings and investigation points.
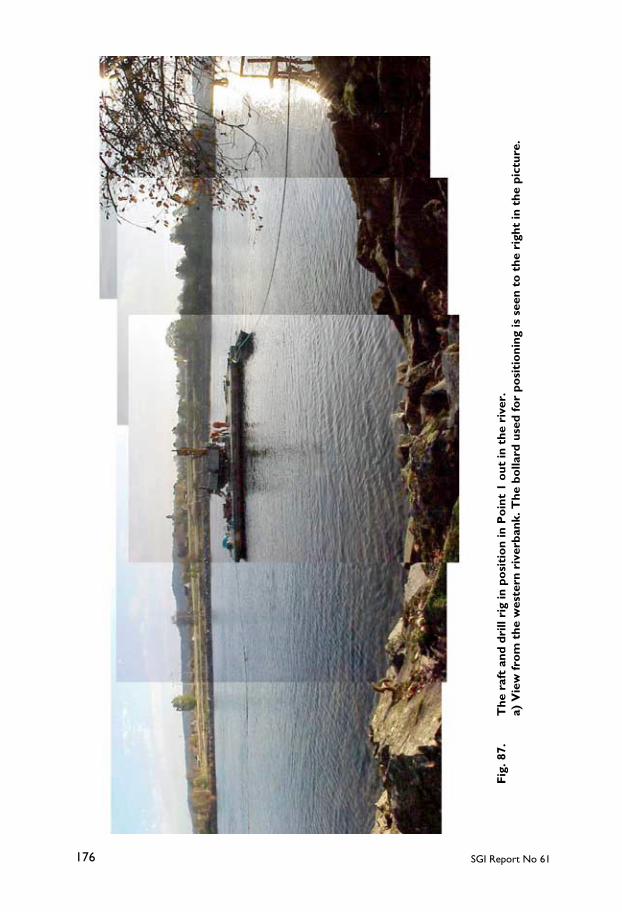
SGI Report No 61176
Fig
. 87.
The
raf
t an
d dr
ill r
ig in
po
siti
on
in P
oin
t 1
out
in t
he r
iver
.a)
Vie
w fr
om
the
wes
tern
riv
erba
nk. T
he b
olla
rd u
sed
for
posi
tio
ning
is s
een
to t
he r
ight
in t
he p
ictu
re.
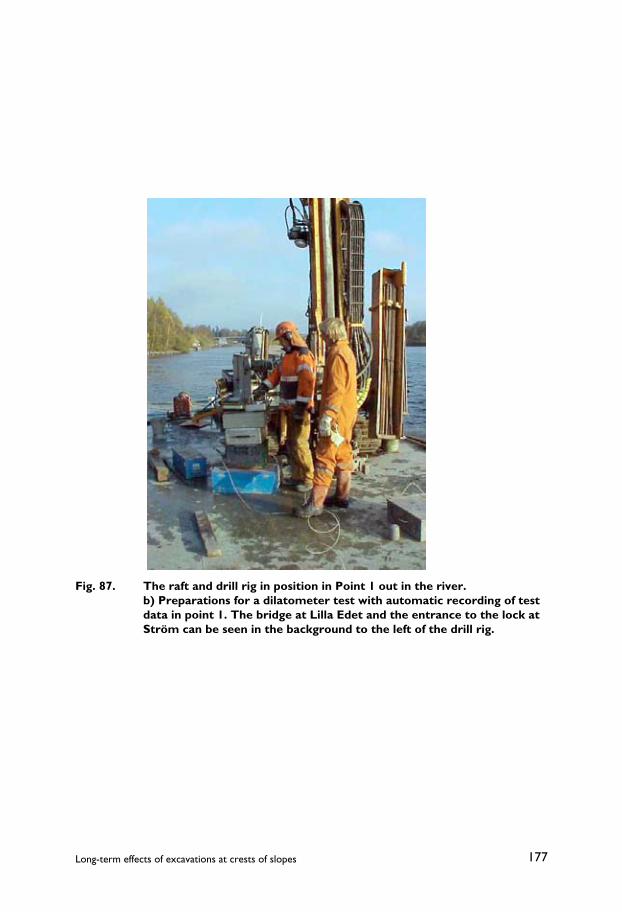
177Long-term effects of excavations at crests of slopes
Fig. 87. The raft and drill rig in position in Point 1 out in the river.b) Preparations for a dilatometer test with automatic recording of testdata in point 1. The bridge at Lilla Edet and the entrance to the lock atStröm can be seen in the background to the left of the drill rig.
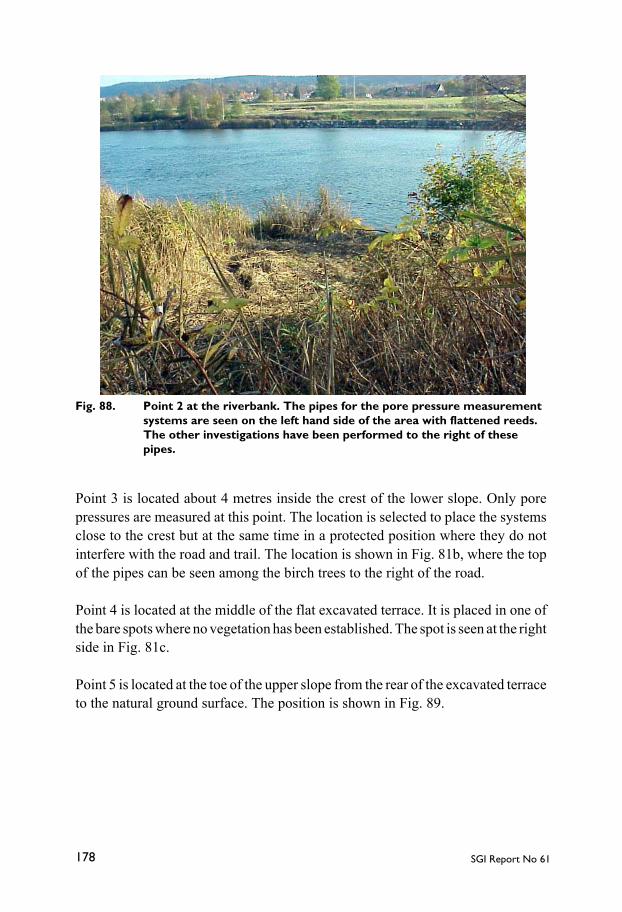
SGI Report No 61178
Fig. 88. Point 2 at the riverbank. The pipes for the pore pressure measurementsystems are seen on the left hand side of the area with flattened reeds.The other investigations have been performed to the right of thesepipes.
Point 3 is located about 4 metres inside the crest of the lower slope. Only porepressures are measured at this point. The location is selected to place the systemsclose to the crest but at the same time in a protected position where they do notinterfere with the road and trail. The location is shown in Fig. 81b, where the topof the pipes can be seen among the birch trees to the right of the road.
Point 4 is located at the middle of the flat excavated terrace. It is placed in one ofthe bare spots where no vegetation has been established. The spot is seen at the rightside in Fig. 81c.
Point 5 is located at the toe of the upper slope from the rear of the excavated terraceto the natural ground surface. The position is shown in Fig. 89.
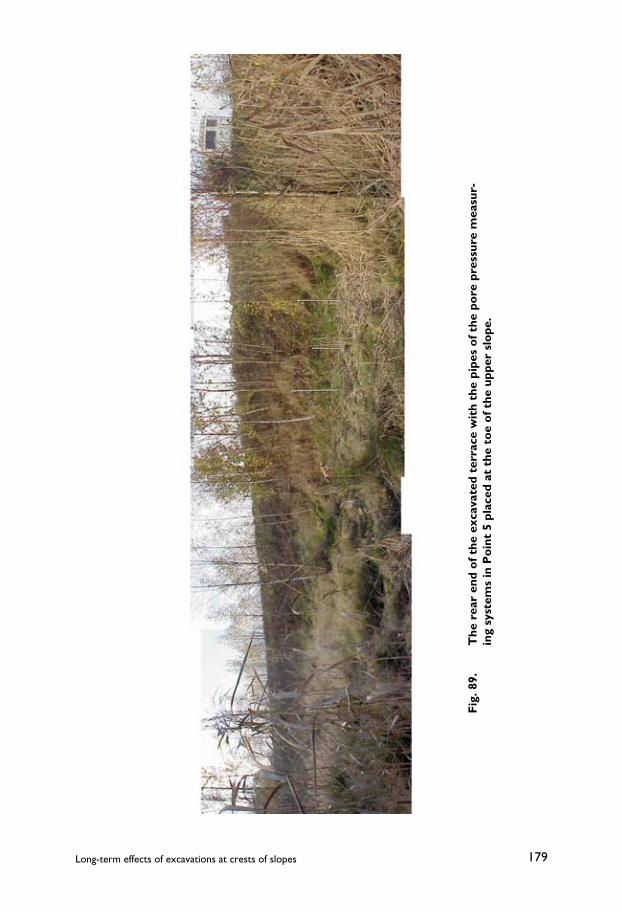
179Long-term effects of excavations at crests of slopes
Fig
. 89.
The
rea
r en
d o
f the
exc
avat
ed t
erra
ce w
ith
the
pipe
s o
f the
po
re p
ress
ure
mea
sur-
ing
syst
ems
in P
oin
t 5
plac
ed a
t th
e to
e o
f the
upp
er s
lope
.

SGI Report No 61180
Point 6, finally, is located about 25 metres behind the crest of the upper slope inwhat until recently has been cultivated farmland. The only change that has occurredin this area is that a contractor has bought the land and that a few decimetres oftopsoil have been scraped off and sold to gardeners. The pipes for the pore pressuremeasuring systems are seen in Fig. 85a near the side of the road, where they are outof the way. The other investigations at this point were carried out further out on theopen field.
The points in this section are located between sections 37.43 and 37.50 in the Göta-älv investigation.
3.7.3 Field tests
CPT tests
CPT tests have been performed at Points 1, 2, 4 and 6 in the new investigation. Thetests were performed with a clay probe, which is a probe with a high sensitivity andresolution but a load capacity limited to 5 MPa in cone resistance. Pre-drilling hastherefore been performed through any upper layers of fill or dry crust. No suchlayers existed at Point 1 and at Points 4 and 6 the crust effects and stiffer upper layerswere limited to about 1 metre. At Point 2, which was located at the erosionprotection and old access road, pre-drilling down to 2.9 metres had to be done toensure that all coarse cobbles, stones and remains of old fills had been passed.
The drill rig was anchored by screw augers in the tests on land. The tests here werestopped when the maximum load capacity of the probe was reached in stiff bottomlayers. In the test below the river, the drill rig could not be anchored. This test wasstopped when the front of the drill rig lifted, which almost coincided with reachingthe maximum probe capacity. The stop levels are deeper than those reached in theweight sounding tests and correspond approximately to those reached in “machinesounding tests” in the previous investigations. It is thus unlikely that significantlygreater depths would have been reached if a coarser probe and more penetrationforce had been used.
The results indicate that the soil below the upper layers of sand and silt or fillmaterial consists of relatively homogeneous clay. However, according to the trendsin pore pressure generation and tip resistance with depth, which show a number ofsignificant breaks, the character of the clay varies with depth. At greater depths,there appears to be a certain content of shells or other coarser material, andindications of coarse objects or layers are also found. A rather thin embedded stiffer

181Long-term effects of excavations at crests of slopes
layer is found at a relatively great depth at all points. The layer is located at a levelof –27 metres at Points 4 and 6, and below the slope and under the river it rises toa level of about –22 metres.
The pore pressure registrations indicate that this layer may be draining. The CPTtests have passed through the layer and below there is another layer of stiff clay witha somewhat different character. Further down, stop in penetration occurs in coarsepermeable soil, Fig. 90.
The tip resistance in Point 6 was found to be rather low in relation to the overburdenpressure and the results at the other points. The test was therefore repeated, but theresults of the two tests at this point proved to be almost identical, Fig. 91.
Dilatometer tests
Dilatometer tests were performed at Point 1 out in the river and Point 4 on theexcavated terrace. The purpose of these tests was to obtain a supplementaryclassification, alternative determinations of the undrained shear strength and theoverconsolidation ratio and an estimate of the in situ horizontal stresses. The testfrom the raft in the river reached a depth of only about 19 metres below the waterlevel before the front of the drill rig lifted. This is 8 metres less than the CPT testand is probably a result of the side friction against the coarser drill rods in the stiffclay. The test at Point 4 reached 39 metres depth, which is the same as for the CPTtest.
The results from the dilatometer tests confirmed the information obtained from theCPT tests, but fewer details of layers could be observed, Fig. 92.
Field vane tests
Field vane tests were performed at Points 1, 2, 4 and 6 using equipment type SGIand the normal vane size. The test depths were selected with guidance from the CPTtest results and in general comprised the whole profile. The exception was the testsfrom the raft in the river, where friction against the large protecting tubes incombination with the unanchored drill rig meant that the tests had to be stopped atthe same level as the dilatometer tests.

SGI Report No 61182
Fig
. 90.
Res
ults
of t
he C
PT
tes
t in
Str
andb
acke
n pr
esen
ted
usin
g th
e pr
ogr
am C
ON
RA
D. a
) P
oin
t1

183Long-term effects of excavations at crests of slopes
Fig
. 90.
Res
ults
of t
he C
PT
tes
t in
Str
andb
acke
n pr
esen
ted
usin
g th
e pr
ogr
am C
ON
RA
D. b
) P
oin
t 2

SGI Report No 61184
Fig
. 90.
Res
ults
of t
he C
PT
tes
t in
Str
andb
acke
n pr
esen
ted
usin
g th
e pr
ogr
am C
ON
RA
D. c
) P
oin
t 4
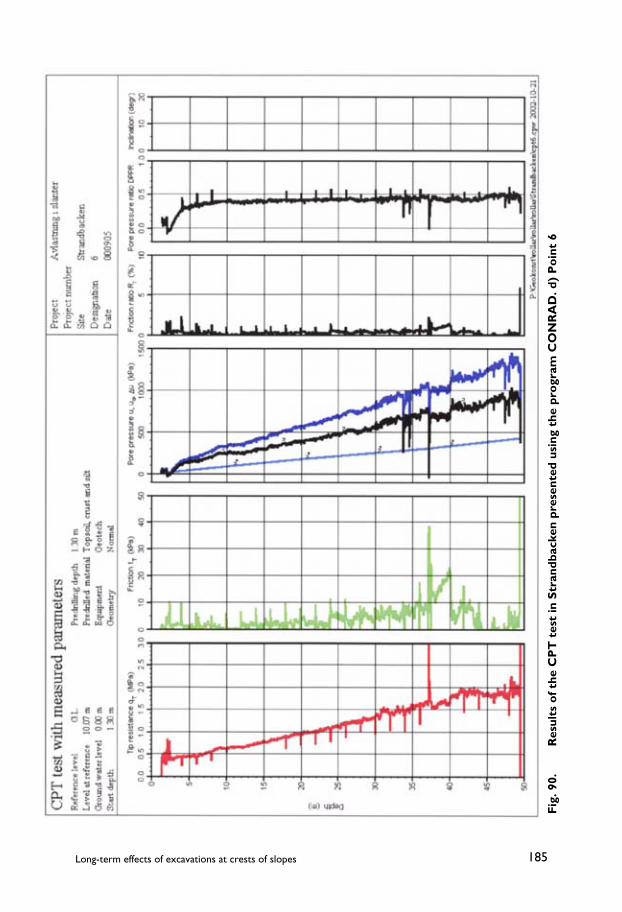
185Long-term effects of excavations at crests of slopes
Fig
. 90.
Res
ults
of t
he C
PT
tes
t in
Str
andb
acke
n pr
esen
ted
usin
g th
e pr
ogr
am C
ON
RA
D. d
) P
oin
t 6

SGI Report No 61186
Fig. 91. Comparison between the results of the parallel CPT tests at Point 6.

187Long-term effects of excavations at crests of slopes
Fig. 92. Results of the dilatometer tests in Strandbacken.a) Results of dilatometer tests at Point 1, base data
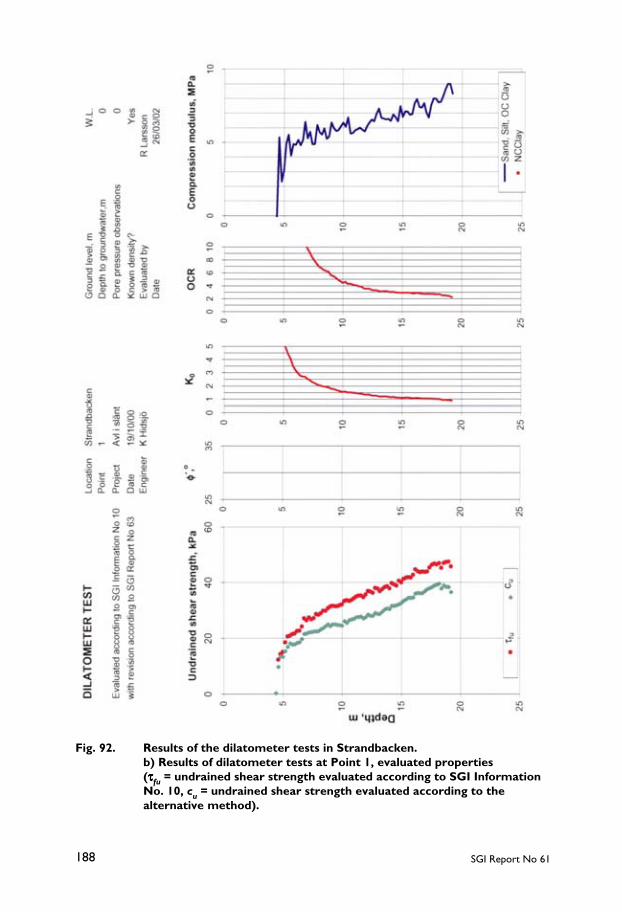
SGI Report No 61188
Fig. 92. Results of the dilatometer tests in Strandbacken.b) Results of dilatometer tests at Point 1, evaluated properties(τττττfu = undrained shear strength evaluated according to SGI InformationNo. 10, cu = undrained shear strength evaluated according to thealternative method).

189Long-term effects of excavations at crests of slopes
Fig. 92. Results of the dilatometer tests in Strandbacken.c) Results of dilatometer tests at Point 4, base data

SGI Report No 61190
Fig. 92. Results of the dilatometer tests in Strandbacken.d) Results of dilatometer tests at Point 4, evaluated properties(τττττfu = undrained shear strength evaluated according to SGI InformationNo. 10, cu = undrained shear strength evaluated according to thealternative method).

191Long-term effects of excavations at crests of slopes
The field vane tests produced fairly even results although the curves versus depthare slightly serrated because of the content of shells and other coarse material in theclay. The tests in Point 4 were doubled in other to check the repeatability of theresults. The test series in each point was started with tests at every metre depth. Thesequence was then thinned out to tests at every second metre at larger depths. In thedoubled test series in Point 4, the deeper test levels were selected in such way thatone test series was performed at every second even metre depth and the other atevery second odd metre. In this way a more continuous profile was obtained.
Pore pressure measurements
Closed pore pressure measuring systems of BAT type were installed at Points 2, 3,5 and 6. The stabilised pore pressures in the bottom layers were also read off in theCPT tests. Three systems were placed in each station. The filter tips in each stationwere placed in such a way that the uppermost tip was located fairly close to theground surface but safely below the upper free groundwater level. This wasintended to enable a monitoring of the variation of this groundwater level. Thelowest tips at Points 5 and 6 were placed at a level of about –27 metres, whereaccording to the CPT test results there might be a continuous permeable layer. Thelowest tips at Points 2 and 3 were placed at the same level, which here correspondsto the transition between the lower clay layer and the coarse and firm soil below.The third tip in each station was placed in the central part of the upper clay layerat levels selected from indications in changes in soil properties from the CPT tests.
The pore pressure measuring systems have been read off more or less regularly withthe purpose of monitoring seasonal variation and catching extreme values duringwet and dry seasons. During the course of the measurements, problems withdevelopment of gas have been encountered in some of the tips. These tips have thenhad to be re-saturated at each measurement after the problem started.
3.7.4 Sampling
Undisturbed samples have been taken with Swedish standard piston sampler typeSt II at Points 1, 2, 4 and 6. The sampling levels have been selected with guidancefrom the results of the CPT tests and have in principle comprised the wholepenetrated profiles. The material brought up in the cutting edges and spacers hasbeen examined in the field in order to obtain as detailed information about thestratification as possible. Extreme care has been taken when taking, transportingand handling the samples. Disturbed sampling has also been performed to shallow

SGI Report No 61192
depths at a point at the crest of the lower slope in order to investigate the thicknessof the remaining sand and silt layer at this point.
3.7.5 Surveying and levelling
The investigated part of the area has been surveyed and the investigation pointshave been introduced in the coordinate system used by Lilla Edet municipality. Allinvestigation points and all points where the inclination of the ground surfacechanges have been levelled in relation to a reference point provided by themunicipality. A reference point for the water level in the river has also been selectedand levelled.
3.7.6 Laboratory tests
The soil samples have been investigated by routine tests comprising classification,density, water content, liquid limit and undrained shear strength and sensitivityaccording to fall-cone tests. A large number of CRS oedometer tests have also beenperformed in order to determine the preconsolidation pressure and the permeabilityof the soil.
Supplementary determinations of the undrained shear strength have then beenmade by direct simple shear tests on specimen from selected levels at all samplingpoints. For two levels at Point 4, test series on specimens with different degrees ofunloading have also been performed in order to study how an unloading affects theundrained shear strength according to this type of test.
A number of triaxial tests have also been performed in order to check the validityof the empirical relations for shear strength in clay for this particular soil and todetermine the shear strength parameters in the upper sand and silt layer.
3.8 TEST RESULTS
3.8.1 Soil conditions – stratigraphy and variations over the area
The results of the field and laboratory tests showed that the soil conditions withinthe investigated area at Strandbacken varied with depth and in certain respects alsoacross the area, i.e. perpendicular to the river. The upper soil layers below theoriginal ground surface have consisted in a thin layer of topsoil overlying sand andsilt. At Point 6, about 25 metres behind the upper crest, these upper layers reach onlyabout 2.5 metres below the ground surface. At the upper slope, this thickness has
193Long-term effects of excavations at crests of slopes
increased to at least 4 metres and the entire upper slope consists of this type of soil.The thickness has increased further at the centre of the excavated terrace where theupper 3 metres of the remaining soil is classified as silt. This means that the sandand silt layer here had a thickness of about 7 metres before the excavation. Thedisturbed samples taken at the crest of the lower slope indicate similar conditionsat this point. However, it is not a straightforward task to determine the exactthickness of these layers since the transitions from sand to silt and silty clay witha decreasing silt content are gradual and thin layers of coarser material are foundembedded in the clay, particularly in the uppermost part. The soil properties are alsoaffected by the organic content, which is found in the form of embedded plantremains, thin layers of plant remains and more evenly distributed finer particles.The upper soil layers are thereby designated as organic. The organic content issignificant within a relatively large depth interval, and infusions of visible plantremains have been found down to 12 metres' depth below the original groundsurface. The organic content varies between 2.2 and 3 % within the whole layer ofclayey silt and silty clay down to this depth. The upper soil layers also containvarious amounts of shells.
At about the same level, about 12 metres below the original ground surface, thecharacter of the soil changes according to both field and laboratory tests. Thegeneration of tip resistance and pore pressure in the CPT tests and the evaluatedmaterial index in the dilatometer test indicate that more homogeneous clay isencountered. According to the laboratory tests, it is a high-plastic sulphide spottedclay with some content of shells, which are absent in certain depth intervals and atcertain levels form thin layers or lenses of shells. At greater depth, about 30 metresbelow the original ground surface, the soil becomes coarser and lenses and thinlayers of coarse soil start to appear. At the level of about –27 metres, i.e. 37 metresbelow the original ground surface, an apparently continuous layer of coarser soilis found. At Points 1 and 2, this layer is found at a level of about –22 metres. Thetests have penetrated further in all points and samples have also been taken at deeperlevels. At those points where the sampling operations have caught the embeddedlayer, it has been found to consist of a number of alternating thin layers of fine sandand plant remnants.
Below this layer, the clay continues for a number of metres before stop in thesoundings is obtained in sand or coarser soil. This clay at the bottom of the profileis coarser and contains single small channels, which have been stated to originatefrom small organisms that once lived in the bottom mud in the sea. In the deepestclay layers, there is a transition from grey, sulphide spotted clay to brown-grey
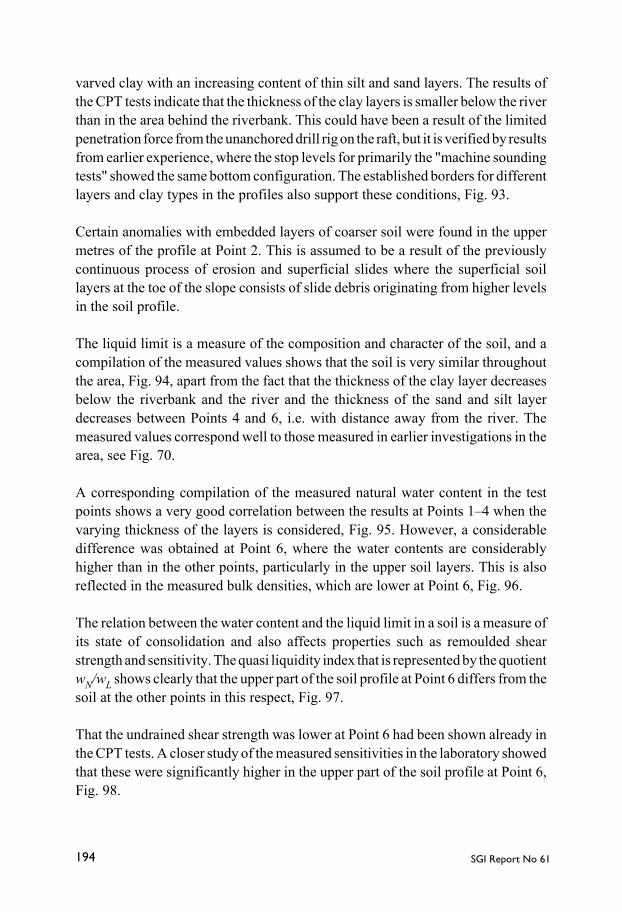
SGI Report No 61194
varved clay with an increasing content of thin silt and sand layers. The results ofthe CPT tests indicate that the thickness of the clay layers is smaller below the riverthan in the area behind the riverbank. This could have been a result of the limitedpenetration force from the unanchored drill rig on the raft, but it is verified by resultsfrom earlier experience, where the stop levels for primarily the "machine soundingtests" showed the same bottom configuration. The established borders for differentlayers and clay types in the profiles also support these conditions, Fig. 93.
Certain anomalies with embedded layers of coarser soil were found in the uppermetres of the profile at Point 2. This is assumed to be a result of the previouslycontinuous process of erosion and superficial slides where the superficial soillayers at the toe of the slope consists of slide debris originating from higher levelsin the soil profile.
The liquid limit is a measure of the composition and character of the soil, and acompilation of the measured values shows that the soil is very similar throughoutthe area, Fig. 94, apart from the fact that the thickness of the clay layer decreasesbelow the riverbank and the river and the thickness of the sand and silt layerdecreases between Points 4 and 6, i.e. with distance away from the river. Themeasured values correspond well to those measured in earlier investigations in thearea, see Fig. 70.
A corresponding compilation of the measured natural water content in the testpoints shows a very good correlation between the results at Points 1–4 when thevarying thickness of the layers is considered, Fig. 95. However, a considerabledifference was obtained at Point 6, where the water contents are considerablyhigher than in the other points, particularly in the upper soil layers. This is alsoreflected in the measured bulk densities, which are lower at Point 6, Fig. 96.
The relation between the water content and the liquid limit in a soil is a measure ofits state of consolidation and also affects properties such as remoulded shearstrength and sensitivity. The quasi liquidity index that is represented by the quotientwN/wL shows clearly that the upper part of the soil profile at Point 6 differs from thesoil at the other points in this respect, Fig. 97.
That the undrained shear strength was lower at Point 6 had been shown already inthe CPT tests. A closer study of the measured sensitivities in the laboratory showedthat these were significantly higher in the upper part of the soil profile at Point 6,Fig. 98.

195Long-term effects of excavations at crests of slopes
Fig. 93. Variation in stratigraphy at Strandbacken with distance from the river.(The different layers are described in more detail in the text. Differentcolours have been used in the upper layers of topsoil, sand and silt toillustrate the extent of the excavation.)

SGI Report No 61196
-45
-40
-35
-30
-25
-20
-15
-10
-5
0
5
10
0 10 20 30 40 50 60 70 80 90
Liquid limit, %
Leve
l, m
Point 1Point 2Point 4Point 6
-45
-40
-35
-30
-25
-20
-15
-10
-5
0
5
10
0 10 20 30 40 50 60 70 80 90
Water content, %
Leve
l, m
Point 1Point 2Point 4Point 6
Fig. 94. Compilation of measured liquid limits in the new test pointsat Strandbacken.
Fig. 95. Compilation of measured water contents at the new test pointsat Strandbacken.
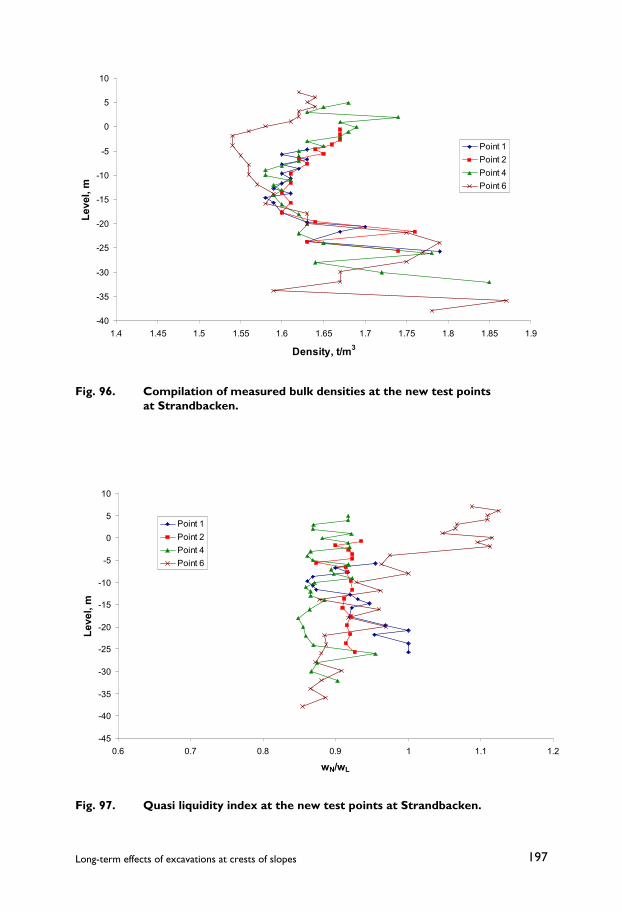
197Long-term effects of excavations at crests of slopes
Fig. 96. Compilation of measured bulk densities at the new test pointsat Strandbacken.
Fig. 97. Quasi liquidity index at the new test points at Strandbacken.
-40
-35
-30
-25
-20
-15
-10
-5
0
5
10
1.4 1.45 1.5 1.55 1.6 1.65 1.7 1.75 1.8 1.85 1.9
Density, t/m3
Leve
l, m
Point 1Point 2Point 4Point 6
-45
-40
-35
-30
-25
-20
-15
-10
-5
0
5
10
0.6 0.7 0.8 0.9 1 1.1 1.2
wN/wL
Leve
l, m
Point 1Point 2Point 4Point 6
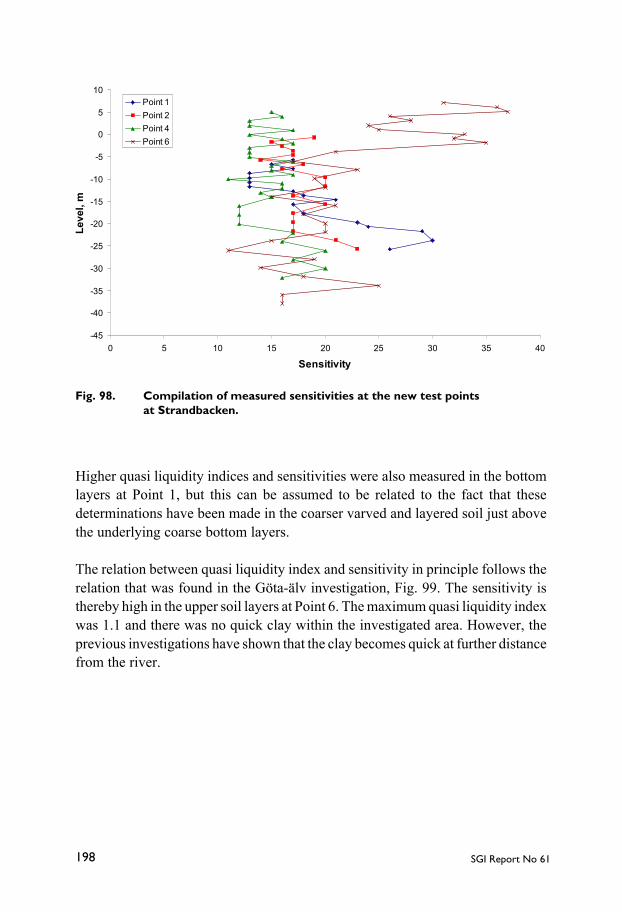
SGI Report No 61198
Higher quasi liquidity indices and sensitivities were also measured in the bottomlayers at Point 1, but this can be assumed to be related to the fact that thesedeterminations have been made in the coarser varved and layered soil just abovethe underlying coarse bottom layers.
The relation between quasi liquidity index and sensitivity in principle follows therelation that was found in the Göta-älv investigation, Fig. 99. The sensitivity isthereby high in the upper soil layers at Point 6. The maximum quasi liquidity indexwas 1.1 and there was no quick clay within the investigated area. However, theprevious investigations have shown that the clay becomes quick at further distancefrom the river.
-45
-40
-35
-30
-25
-20
-15
-10
-5
0
5
10
0 5 10 15 20 25 30 35 40
Sensitivity
Leve
l, m
Point 1Point 2Point 4Point 6
Fig. 98. Compilation of measured sensitivities at the new test pointsat Strandbacken.
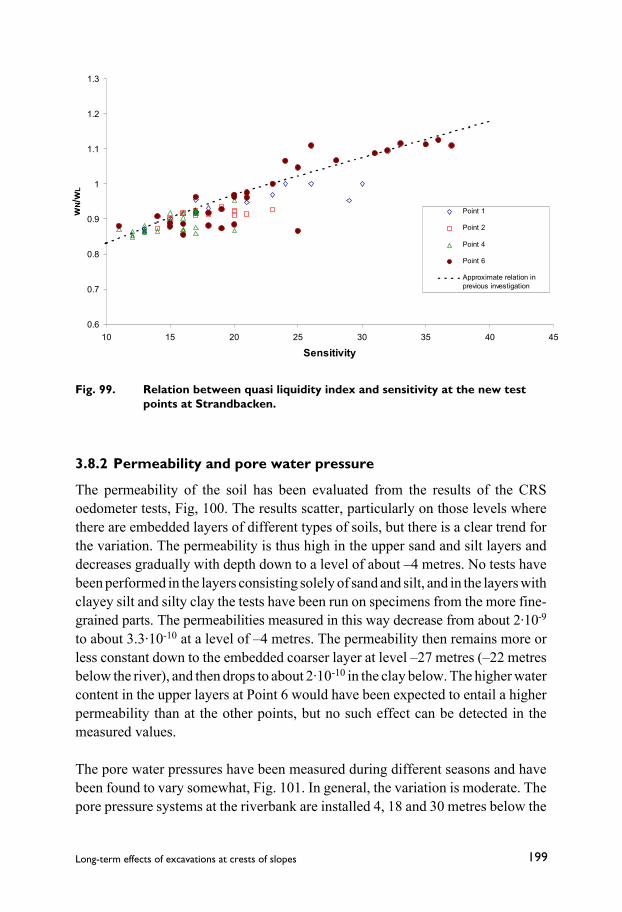
199Long-term effects of excavations at crests of slopes
Fig. 99. Relation between quasi liquidity index and sensitivity at the new testpoints at Strandbacken.
3.8.2 Permeability and pore water pressure
The permeability of the soil has been evaluated from the results of the CRSoedometer tests, Fig, 100. The results scatter, particularly on those levels wherethere are embedded layers of different types of soils, but there is a clear trend forthe variation. The permeability is thus high in the upper sand and silt layers anddecreases gradually with depth down to a level of about –4 metres. No tests havebeen performed in the layers consisting solely of sand and silt, and in the layers withclayey silt and silty clay the tests have been run on specimens from the more fine-grained parts. The permeabilities measured in this way decrease from about 2·10-9
to about 3.3·10-10 at a level of –4 metres. The permeability then remains more orless constant down to the embedded coarser layer at level –27 metres (–22 metresbelow the river), and then drops to about 2·10-10 in the clay below. The higher watercontent in the upper layers at Point 6 would have been expected to entail a higherpermeability than at the other points, but no such effect can be detected in themeasured values.
The pore water pressures have been measured during different seasons and havebeen found to vary somewhat, Fig. 101. In general, the variation is moderate. Thepore pressure systems at the riverbank are installed 4, 18 and 30 metres below the
0.6
0.7
0.8
0.9
1
1.1
1.2
1.3
10 15 20 25 30 35 40 45
Sensitivity
wN/w
L
Point 1
Point 2
Point 4
Point 6
Approximate relation inprevious investigation
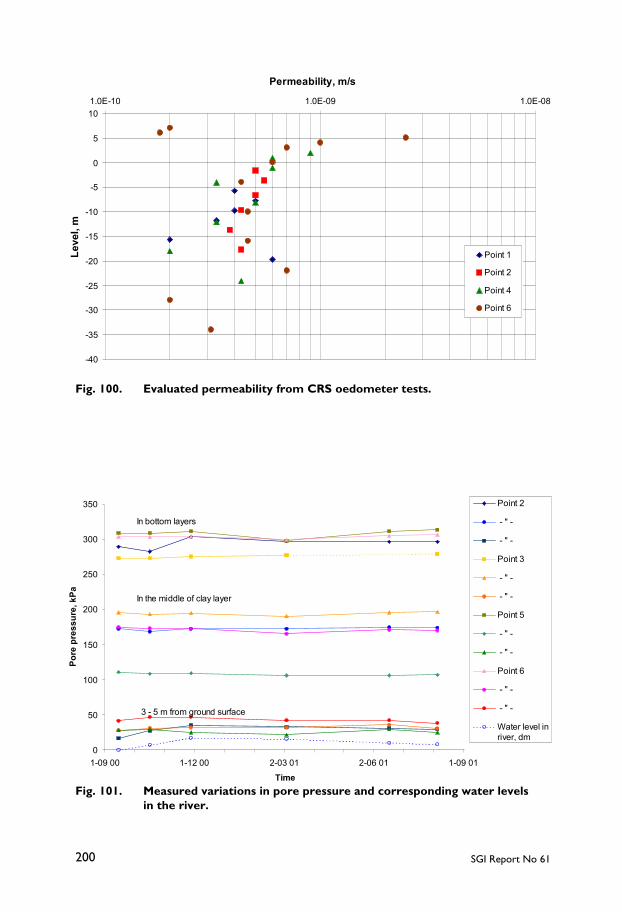
SGI Report No 61200
0
50
100
150
200
250
300
350
1-09 00 1-12 00 2-03 01 2-06 01 1-09 01
Time
Pore
pre
ssur
e, k
Pa
Point 2
- " -
- " -
Point 3
- " -
- " -
Point 5
- " -
- " -
Point 6
- " -
- " -
Water level inriver, dm
In bottom layers
In the middle of clay layer
3 - 5 m from ground surface
Fig. 100. Evaluated permeability from CRS oedometer tests.
Fig. 101. Measured variations in pore pressure and corresponding water levelsin the river.
-40
-35
-30
-25
-20
-15
-10
-5
0
5
101.0E-10 1.0E-09 1.0E-08
Permeability, m/sLe
vel,
m
Point 1
Point 2
Point 4
Point 6
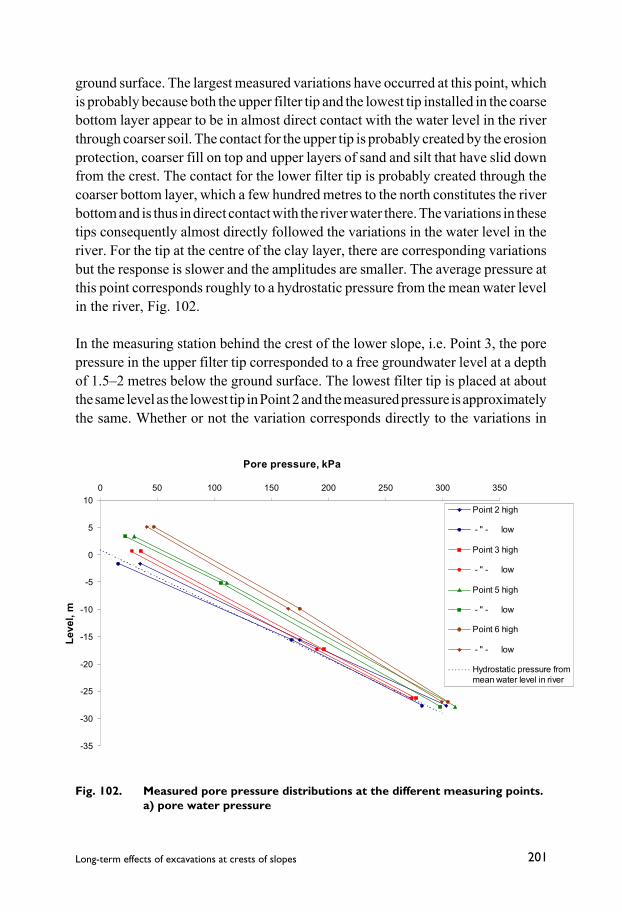
201Long-term effects of excavations at crests of slopes
-35
-30
-25
-20
-15
-10
-5
0
5
100 50 100 150 200 250 300 350
Pore pressure, kPa
Leve
l, m
Point 2 high
- " - low
Point 3 high
- " - low
Point 5 high
- " - low
Point 6 high
- " - low
Hydrostatic pressure frommean water level in river
ground surface. The largest measured variations have occurred at this point, whichis probably because both the upper filter tip and the lowest tip installed in the coarsebottom layer appear to be in almost direct contact with the water level in the riverthrough coarser soil. The contact for the upper tip is probably created by the erosionprotection, coarser fill on top and upper layers of sand and silt that have slid downfrom the crest. The contact for the lower filter tip is probably created through thecoarser bottom layer, which a few hundred metres to the north constitutes the riverbottom and is thus in direct contact with the river water there. The variations in thesetips consequently almost directly followed the variations in the water level in theriver. For the tip at the centre of the clay layer, there are corresponding variationsbut the response is slower and the amplitudes are smaller. The average pressure atthis point corresponds roughly to a hydrostatic pressure from the mean water levelin the river, Fig. 102.
In the measuring station behind the crest of the lower slope, i.e. Point 3, the porepressure in the upper filter tip corresponded to a free groundwater level at a depthof 1.5–2 metres below the ground surface. The lowest filter tip is placed at aboutthe same level as the lowest tip in Point 2 and the measured pressure is approximatelythe same. Whether or not the variation corresponds directly to the variations in
Fig. 102. Measured pore pressure distributions at the different measuring points.a) pore water pressure

SGI Report No 61202
-30
-25
-20
-15
-10
-5
0
5
10-2 0 2 4 6 8 10 12
Pressure level, mPi
ezom
eter
leve
l, m
Point 2 - " -Point 3 - " -Point 5 - " -Point 6 - " -
Fig. 102. Measured pore pressure distributions at the different measuring points.b) pressure levels
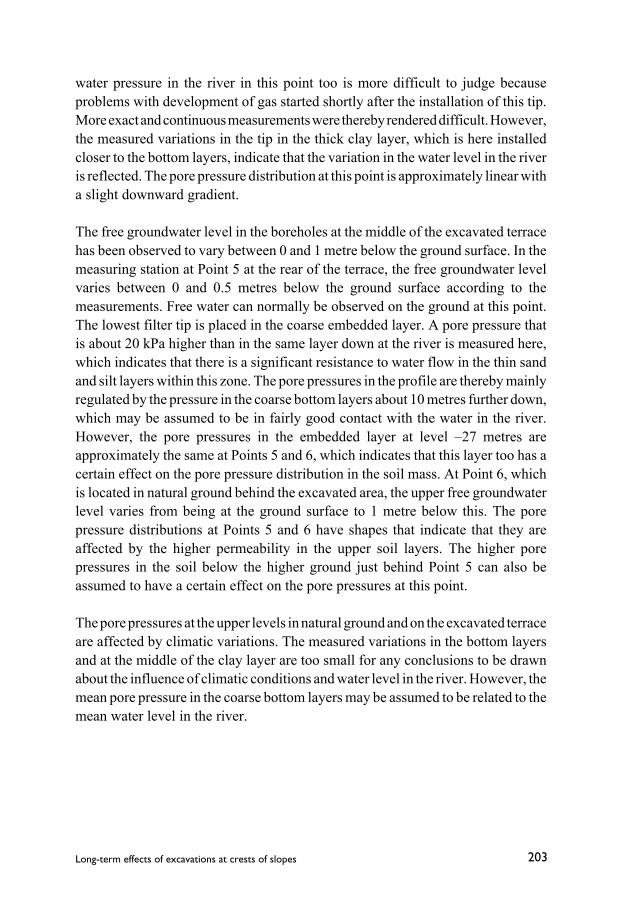
203Long-term effects of excavations at crests of slopes
water pressure in the river in this point too is more difficult to judge becauseproblems with development of gas started shortly after the installation of this tip.More exact and continuous measurements were thereby rendered difficult. However,the measured variations in the tip in the thick clay layer, which is here installedcloser to the bottom layers, indicate that the variation in the water level in the riveris reflected. The pore pressure distribution at this point is approximately linear witha slight downward gradient.
The free groundwater level in the boreholes at the middle of the excavated terracehas been observed to vary between 0 and 1 metre below the ground surface. In themeasuring station at Point 5 at the rear of the terrace, the free groundwater levelvaries between 0 and 0.5 metres below the ground surface according to themeasurements. Free water can normally be observed on the ground at this point.The lowest filter tip is placed in the coarse embedded layer. A pore pressure thatis about 20 kPa higher than in the same layer down at the river is measured here,which indicates that there is a significant resistance to water flow in the thin sandand silt layers within this zone. The pore pressures in the profile are thereby mainlyregulated by the pressure in the coarse bottom layers about 10 metres further down,which may be assumed to be in fairly good contact with the water in the river.However, the pore pressures in the embedded layer at level –27 metres areapproximately the same at Points 5 and 6, which indicates that this layer too has acertain effect on the pore pressure distribution in the soil mass. At Point 6, whichis located in natural ground behind the excavated area, the upper free groundwaterlevel varies from being at the ground surface to 1 metre below this. The porepressure distributions at Points 5 and 6 have shapes that indicate that they areaffected by the higher permeability in the upper soil layers. The higher porepressures in the soil below the higher ground just behind Point 5 can also beassumed to have a certain effect on the pore pressures at this point.
The pore pressures at the upper levels in natural ground and on the excavated terraceare affected by climatic variations. The measured variations in the bottom layersand at the middle of the clay layer are too small for any conclusions to be drawnabout the influence of climatic conditions and water level in the river. However, themean pore pressure in the coarse bottom layers may be assumed to be related to themean water level in the river.

SGI Report No 61204
3.8.3 Stress history and current stress conditions
The stress history of the soil has been estimated from what is known about thegeological history of the area and from evaluated preconsolidation pressures froma large number of CRS oedometer tests on specimens from all test points wheresampling has been performed. From the geological history, it may be assumed thatthe area was once very flat with a groundwater level located at the ground surface.The soil has then consolidated for the self-weight of the overlying soil masses andpossibly also obtained a small overconsolidation because of creep effects. Thereafter,the erosion process has been going on, involving a decrease in overburden pressureunder the river and the eroded slopes. At the same time, the effective stresses haveincreased behind the crests of the slopes because of the lowered groundwater levelsand the lowered water level in the river, which has brought lower pore pressuresthroughout the profiles. The largest increases in effective stress may be assumedto have occurred in those areas where the sand and silt layers are thick and thedistances to the crest also have been short and the lowering of the groundwater levelconsequently has been large. In the Strandbacken area, this corresponds to the nowexcavated area. It should be borne in mind that this process has been gradual,starting with a very narrow and shallow river-course, which has become successivelywider and deeper. It is difficult to estimate whether the previous development of thearea with small buildings and accompanying drainage systems has had any effecton the remaining soil masses, but this is probably negligible.
The excavation performed has entailed that the vertical stresses have decreased andprobably that any ongoing creep processes have been stopped or retarded. It isuncertain whether the pore pressures below the excavated terrace have beensignificantly affected since it was mainly sand and coarse silt that was taken away.Most of the previous pore pressure observations were made in open systems duringa short period of time and their accuracy is uncertain. Some of the observations ofupward gradients that were made seem very questionable in the light of what haslater been measured. The excavation can with certainty be expected to have broughta slight lowering of the pore pressures in the area directly behind the upperexcavated slope. This has entailed a corresponding increase in effective overburdenpressure, for which only very little adaptation in terms of consolidation andfollowing creep can have occurred.
From the geological perspective, it can thus be assumed that the soil below thecentre of the river-course has consolidated for stresses corresponding to the sameground level as in the surrounding areas above the eroded slopes, the samestratigraphy and a groundwater level approximately at this ground surface. The soil

205Long-term effects of excavations at crests of slopes
closer to the riverbank can be expected to have consolidated for somewhat higherstresses since the groundwater level and the pore pressures may be expected to havebecome somewhat lower before the approaching erosion slope entailed that theoverburden pressure decreased. The corresponding or somewhat enhancedpreconsolidation pressures may be expected behind the crest of the slope since theeffective stresses here have increased because of even lower pore pressures and thatthe stresses have been applied for a longer period of time. The groundwater levelin this area can be expected to have been close to the lower boundary of the layerscontaining only sand and silt. Further away from the river, the soil can be expectedto have consolidated for the current stresses. In the area just behind the upper slopeabove the excavated terrace, the effective stresses have recently increased somewhatas a result of a lowered groundwater table and the overconsolidation due to creepeffects that is normally found therefore does not necessarily exist.
The results of the oedometer tests generally support this picture. The evaluatedpreconsolidation pressures below the river bed at Point 1 show that the soil hasconsolidated for the assumed maximum effective stresses at the centre of the riverbed and has an overconsolidation ratio of about 1.2 in relation to these, Fig. 103.On the other hand, the preconsolidation pressures are still lower than the assumedmaximum stresses behind the former crest of the slope. The unloading due to theerosion has entailed that the soil below the river bed is heavily overconsolidated inrelation to the stresses that prevail today.
The evaluated preconsolidation pressures at Point 2 at the riverbank are somewhathigher than at Point 1, Fig. 104. They correspond approximately to the assumedmaximum effective stresses behind the former crest without any significantoverconsolidation. Due to the erosion, the soil is overconsolidated at this point.
The measured preconsolidation pressures at Point 4 at the middle of the excavatedterrace correspond to the assumed maximum effective stresses with a certainoverconsolidation in relation to these, Fig. 105. The overconsolidation ratio issomewhat lower than would be expected from empirical experience (Larsson andSällfors 1995). This may be due to an assumption of a too low ground water leveland/or that the period of time during which these maximum stresses have acted isrelatively short from a geological perspective. The present effective stresses afterthe excavation are so low that the overconsolidation ratio has become sufficientlylarge for any ongoing creep settlements to stop according to empirical experience.

SGI Report No 61206
-40
-35
-30
-25
-20
-15
-10
-5
0
5
10
0 50 100 150 200 250 300 350 400Effective vertical stress, kPa
Leve
l, m
Preconsolidation pressure
Present effective overburden pressure
Assumed maximum effective stress under water
Assumed maximum effective stress behind crest
-40
-35
-30
-25
-20
-15
-10
-5
0
5
10
0 50 100 150 200 250 300 350 400
Effective vertical stress, kPa
Leve
l, m
Preconsolidation pressure
Present effective overburden pressure
Assumed maximum effective stress under water
Assumed maximum effective stress behind crest
Fig. 103. Preconsolidation pressure from CRS oedometer tests and assumedmaximum stresses at Point 1 below the river.
Fig. 104. Preconsolidation pressure from CRS oedometer tests and assumedmaximum stresses in Point 2 at the riverbank.

207Long-term effects of excavations at crests of slopes
-40
-35
-30
-25
-20
-15
-10
-5
0
5
10
0 50 100 150 200 250 300 350 400
Effective vertical stress, kPa
Leve
l, m
Preconsolidation pressure
Present effective overburden pressure
Assumed maximum effective stress behind crest
Preconsolidation pressure at a correspondinglocation in 1989
Fig. 105. Preconsolidation pressure from CRS oedometer tests and assumedmaximum stresses at Point 4 below the excavated terrace.
Finally, at Point 6 behind the upper crest the preconsolidation pressures are lowerthan the assumed maximum stresses behind the former crest, where the upper sandand silt layers were considerably thicker and the ground water level was lower,Fig. 106. The measured preconsolidation pressures are only marginally higher thanthe current effective vertical stresses. The samples from the levels –22 and–28 metres may have been somewhat disturbed because of embedded layers andcoarser particles. If these results are neglected, the overconsolidation ratio is about1.1, which is less than would have been expected from empirical experience. Thismay be related to the fact that the current stresses have only acted during a relativelyshort period of time from a geological point of view. This in turn is related to thefact that the water level in the river and the pore pressure in the bottom layers havebeen lowered gradually in relation to the surrounding ground and possibly to thefact that the upper groundwater level has been somewhat lowered after theexcavation. Significant changes in properties because of leaching or other changesin the pore water chemistry are unlikely since no indications of this can be observedin the determined liquid limits.

SGI Report No 61208
-40
-35
-30
-25
-20
-15
-10
-5
0
5
10
0 50 100 150 200 250 300 350 400
Effective vertical stress, kPa
Leve
l, m
Preconsolidation pressure
Present effective overburden pressure
Assumed maximum effective stress behind crest
The results of the oedometer tests thus provided a consistent picture, and thevariations that were found between the different points are logical and can beexplained by local differences in the stress history and variations in the thicknessof the upper sand and silt layers.
A measure of the preconsolidation pressure is also obtained from the results ofdilatometer tests and CPT tests. The method of evaluation of preconsolidationpressures from dilatometer tests in clay that has hitherto been commonly used inSweden is based on results from normally consolidated and only slightlyoverconsolidated clays, with the assumption that more overconsolidated claysconsist of fissured crusts (Larsson and Eskilsson 1988).
The equation used with these assumptions is
)5.2(16.010 −= DKOCR
Where KD = horizontal stress index – a base parameter evaluated from thedilatometer test results.
Fig. 106. Preconsolidation pressures from CRS oedometer tests and assumedmaximum stresses at Point 6 behind the upper crest.

209Long-term effects of excavations at crests of slopes
These assumptions are not valid in soils that have been unloaded, for example byerosion or excavation. For non-fissured overconsolidated British clays, Powell andUglow (1988) proposed an evaluation of the preconsolidation pressure accordingto
32.124.0 DKOCR =
This equation has previously been found to give reasonable estimates also inheavily overconsolidated clay till in Sweden (Larsson 2001). However, it does notwork for normally consolidated and only slightly overconsolidated Swedish clays,in which the overconsolidation ratio becomes underestimated. Based on the resultsin this and other recent projects, it is therefore proposed to use a hybrid of theseformulas with a gradual transition from the first to the second according to
5.724.0
5.75)5(368.051.2510
32.1
)5,2(16.0
>=
≥>−+=≤= −
DD
DD
DK
KKOCR
KKOCRKOCR D
The overconsolidation ratios estimated in this way are shown in Fig. 107, where thedecreasing effects with depth of the erosion and the excavation are illustrated.
The evaluated overconsolidation ratios can be used to calculate the preconsolidationpressures. This method provides a good estimate of the preconsolidation pressuresboth for the heavily overconsolidated clay below the river bottom and for the onlyslightly overconsolidated clay below the excavated terrace, Figs. 108a and c. Useof only the first equation would have resulted in much too high values in the heavilyoverconsolidated clay whereas use of only the last equation would have shownunderconsolidated clay at larger depths at Point 4.
An evaluation of the preconsolidation pressure from the CPT tests is somewhatmore uncertain because of the sensitivity of the method to the type of soilrepresented by the liquid limit. As with the findings in Munkedal, much too highvalues were evaluated by the previous method with correction for theoverconsolidation ratio. More relevant results, but with a somewhat larger scatterthan for the dilatometer tests, were obtained when this correction was omitted,Figs. 108 a-d.

SGI Report No 61210
Overconsolidation ratio, OCR, from dilatometer tests
-35
-30
-25
-20
-15
-10
-5
0
5
100 2 4 6 8 10 12 14
Leve
l, m
Point 1
Point 4
Fig. 107. Evaluated overconsolidation ratio from dilatometer testsin Points 1 and 4.
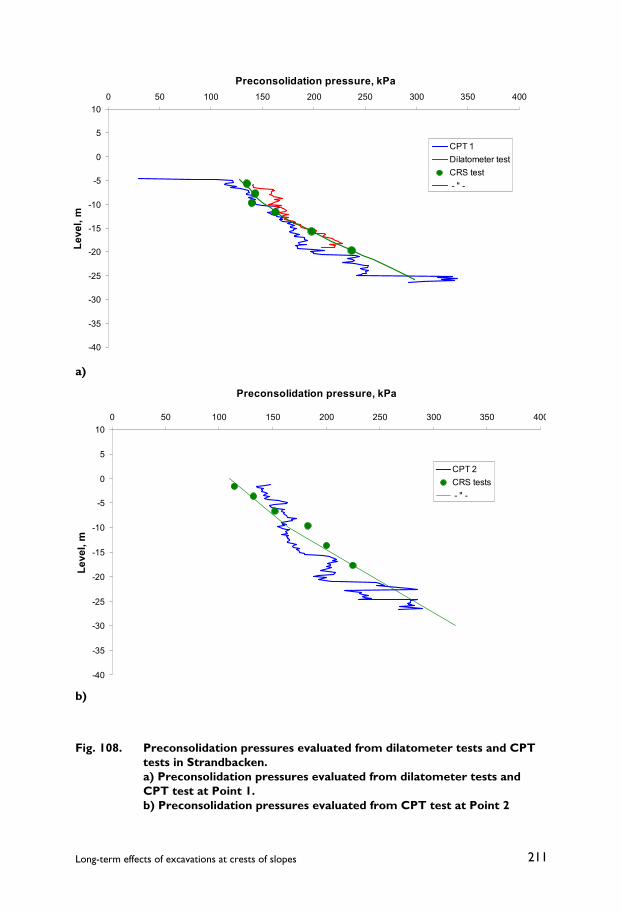
211Long-term effects of excavations at crests of slopes
-40
-35
-30
-25
-20
-15
-10
-5
0
5
100 50 100 150 200 250 300 350 400
Preconsolidation pressure, kPaLe
vel,
m
CPT 1Dilatometer testCRS test - " -
-40
-35
-30
-25
-20
-15
-10
-5
0
5
100 50 100 150 200 250 300 350 400
Preconsolidation pressure, kPa
Leve
l, m
CPT 2CRS tests - " -
a)
b)
Fig. 108. Preconsolidation pressures evaluated from dilatometer tests and CPTtests in Strandbacken.a) Preconsolidation pressures evaluated from dilatometer tests andCPT test at Point 1.b) Preconsolidation pressures evaluated from CPT test at Point 2

SGI Report No 61212
-40
-35
-30
-25
-20
-15
-10
-5
0
5
100 50 100 150 200 250 300 350 400
Preconsolidation pressure, kPaLe
vel,
m
CPT 4Dilatometer testCRS test - " -
-40
-35
-30
-25
-20
-15
-10
-5
0
5
100 50 100 150 200 250 300 350 400
Preconsolidation pressure, kPa
Leve
l, m
CPT6:1
CPT6:2
CRS tests
- " -
c)
d)
Fig. 108. Preconsolidation pressures evaluated from dilatometer tests and CPTtests in Strandbacken.c) Preconsolidation pressures evaluated from dilatometer tests andCPT test at Point 4d) Preconsolidation pressures evaluated from CPT test at Point 6.

213Long-term effects of excavations at crests of slopes
Fig. 109. Evaluated coefficient of earth pressure from dilatometer tests atPoints 1 and 4.
The coefficient of earth pressure, K0, is also evaluated from the dilatometer tests.Fig. 109 shows how this evaluated coefficient decreases with depth in the profilesfrom maximum values around 4 in the superficial heavily overconsolidated soillayers to approach values around 0.5 in the deepest soil layers below the excavatedterrace. The latter value is fairly typical of normally consolidated clay. The K0values in Point 1 are probably also affected by the fact that this point is located ina passive zone where the horizontal pressures are elevated more than results fromthe overconsolidation only. However, as may also be expected, the calculatedhorizontal stresses below the river are still smaller than those at the same levelsbelow the excavated terrace are, Fig. 110.
Coefficient of earth pressure, K0, evaluated from dilatometer tests
-35
-30
-25
-20
-15
-10
-5
0
5
100 0.5 1 1.5 2 2.5 3 3.5 4 4.5
Leve
l, m
Point 1
Point 4
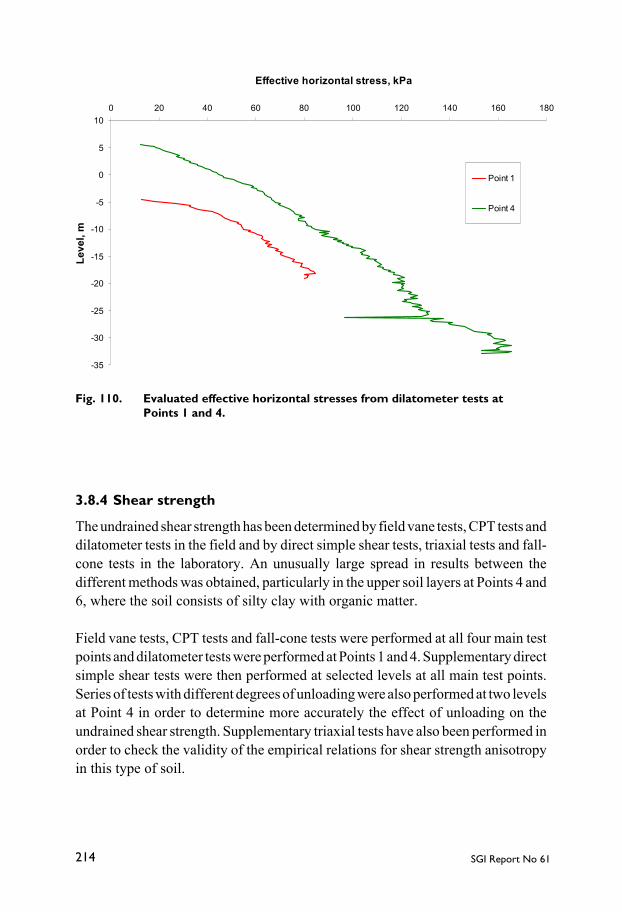
SGI Report No 61214
Effective horizontal stress, kPa
-35
-30
-25
-20
-15
-10
-5
0
5
100 20 40 60 80 100 120 140 160 180
Leve
l, m
Point 1
Point 4
3.8.4 Shear strength
The undrained shear strength has been determined by field vane tests, CPT tests anddilatometer tests in the field and by direct simple shear tests, triaxial tests and fall-cone tests in the laboratory. An unusually large spread in results between thedifferent methods was obtained, particularly in the upper soil layers at Points 4 and6, where the soil consists of silty clay with organic matter.
Field vane tests, CPT tests and fall-cone tests were performed at all four main testpoints and dilatometer tests were performed at Points 1 and 4. Supplementary directsimple shear tests were then performed at selected levels at all main test points.Series of tests with different degrees of unloading were also performed at two levelsat Point 4 in order to determine more accurately the effect of unloading on theundrained shear strength. Supplementary triaxial tests have also been performed inorder to check the validity of the empirical relations for shear strength anisotropyin this type of soil.
Fig. 110. Evaluated effective horizontal stresses from dilatometer tests atPoints 1 and 4.

215Long-term effects of excavations at crests of slopes
The test series with different degrees of unloading were performed on specimensfrom 7 and 16 metres depth in Point 4. The results showed a normal effect of theunloading and that the undrained shear strength could be expressed as
8.00´23.0 OCRcu ⋅≈ σ
The value of factor a = 0.23 is somewhat low in relation to what might be expectedfrom empirical experience for a relatively high-plastic clay. The results have beensummarised together with the other direct simple shear test results in the section inFig. 111.
Fig. 111. Compilation of all undrained shear strengths determined by directsimple shear test on clay from Strandbacken. The results have beennormalised against preconsolidation pressure and plotted against theinverse of the overconsolidation ratio.
0
0.05
0.1
0.15
0.2
0.25
0.3
0 0.1 0.2 0.3 0.4 0.5 0.6 0.7 0.8 0.9 1
1/OCR
c u/ σσ σσ
´ c
Point1Point2Point4Point6a=0.23, b=0.8
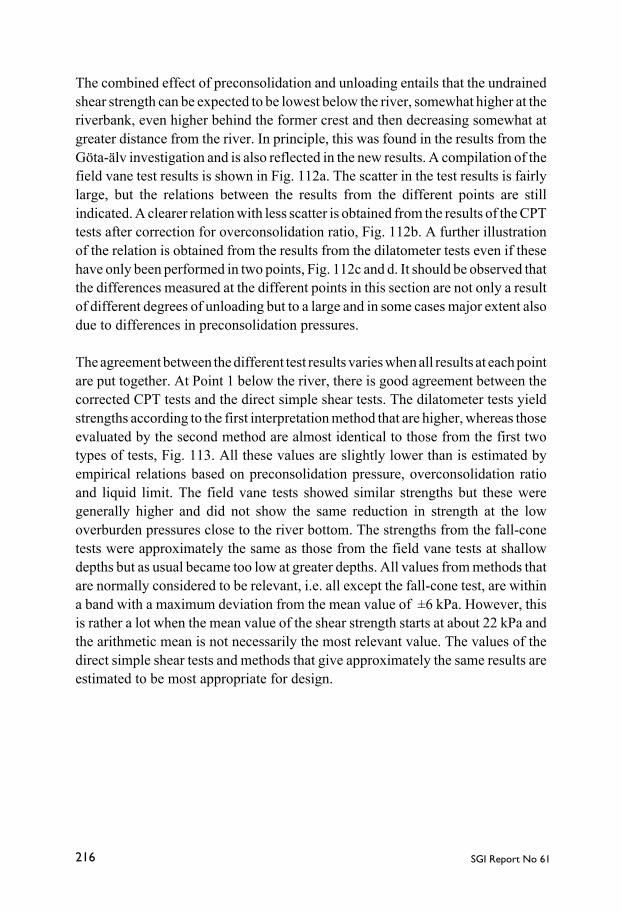
SGI Report No 61216
The combined effect of preconsolidation and unloading entails that the undrainedshear strength can be expected to be lowest below the river, somewhat higher at theriverbank, even higher behind the former crest and then decreasing somewhat atgreater distance from the river. In principle, this was found in the results from theGöta-älv investigation and is also reflected in the new results. A compilation of thefield vane test results is shown in Fig. 112a. The scatter in the test results is fairlylarge, but the relations between the results from the different points are stillindicated. A clearer relation with less scatter is obtained from the results of the CPTtests after correction for overconsolidation ratio, Fig. 112b. A further illustrationof the relation is obtained from the results from the dilatometer tests even if thesehave only been performed in two points, Fig. 112c and d. It should be observed thatthe differences measured at the different points in this section are not only a resultof different degrees of unloading but to a large and in some cases major extent alsodue to differences in preconsolidation pressures.
The agreement between the different test results varies when all results at each pointare put together. At Point 1 below the river, there is good agreement between thecorrected CPT tests and the direct simple shear tests. The dilatometer tests yieldstrengths according to the first interpretation method that are higher, whereas thoseevaluated by the second method are almost identical to those from the first twotypes of tests, Fig. 113. All these values are slightly lower than is estimated byempirical relations based on preconsolidation pressure, overconsolidation ratioand liquid limit. The field vane tests showed similar strengths but these weregenerally higher and did not show the same reduction in strength at the lowoverburden pressures close to the river bottom. The strengths from the fall-conetests were approximately the same as those from the field vane tests at shallowdepths but as usual became too low at greater depths. All values from methods thatare normally considered to be relevant, i.e. all except the fall-cone test, are withina band with a maximum deviation from the mean value of ±6 kPa. However, thisis rather a lot when the mean value of the shear strength starts at about 22 kPa andthe arithmetic mean is not necessarily the most relevant value. The values of thedirect simple shear tests and methods that give approximately the same results areestimated to be most appropriate for design.
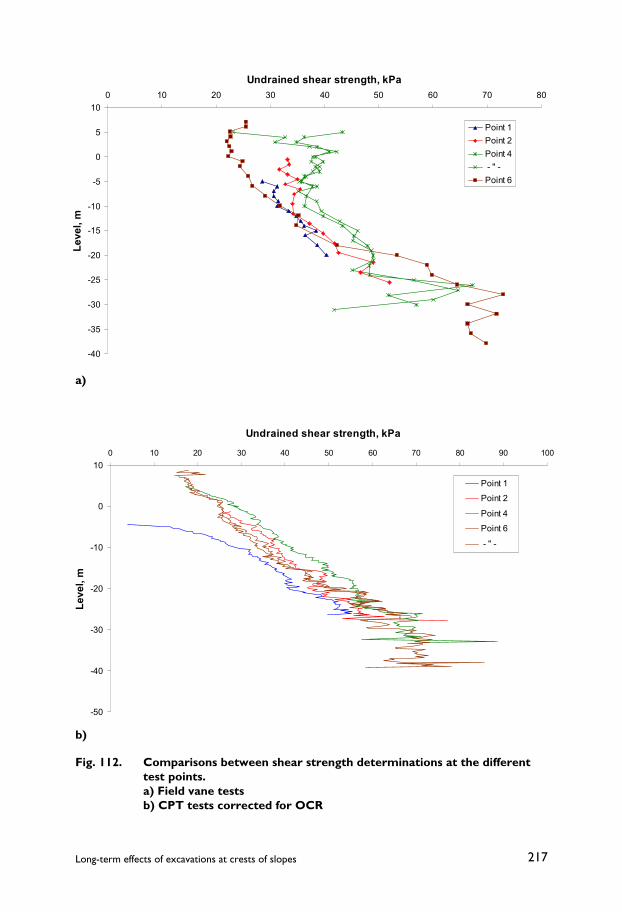
217Long-term effects of excavations at crests of slopes
-40
-35
-30
-25
-20
-15
-10
-5
0
5
100 10 20 30 40 50 60 70 80
Undrained shear strength, kPaLe
vel,
m
Point 1Point 2Point 4 - " -Point 6
-50
-40
-30
-20
-10
0
100 10 20 30 40 50 60 70 80 90 100
Undrained shear strength, kPa
Leve
l, m
Point 1
Point 2
Point 4
Point 6
- " -
a)
b)
Fig. 112. Comparisons between shear strength determinations at the differenttest points.a) Field vane testsb) CPT tests corrected for OCR

SGI Report No 61218
-35
-30
-25
-20
-15
-10
-5
0
5
100 10 20 30 40 50 60 70 80
Undrained shear strength, kPaLe
vel,
m
Point 1
Point 4
-35
-30
-25
-20
-15
-10
-5
0
5
100 10 20 30 40 50 60 70 80
Undrained shear strength, kPa
Leve
l, m
Point 1
Point 4
c)
d)
Fig. 112. Comparisons between shear strength determinations at the differenttest points.c) Dilatometer tests evaluated according to SGI Information No. 10.d) Dilatometer tests evaluated according to the alternative methodusing normalised shear strength.
219Long-term effects of excavations at crests of slopes
Similar relations were obtained at Point 2. The strengths of the corrected CPT testsare again similar to the results of the direct simple shear tests, although they aresomewhat higher at this point, Fig. 114. The direct simple shear test results weresomewhat lower than is estimated from empirical experience and the strengthsevaluated from the field vane tests are higher in the upper part of the profile. Thefield vane test thus do not show the same reduction in shear strength at lowoverburden pressures, but correspond well to the results from the direct simpleshear test at larger depths. The results of the fall-cone tests are of the right size inthe upper part of the profile but too low at greater depths. All relevant values arewithin a band with a maximum deviation from the mean value of ±4 kPa. Since theshear strength is somewhat higher at this point, the relative spread in results is alsolower.
The difference between the shear strengths determined by different methods islarger at Point 4, particularly in the upper 10 metres or so of the profile, where thesoil mainly consists of clayey silt and silty clay with plant remnants, other organicmatter and shells, Fig. 115. In this material, the direct simple shear tests, thedilatometer tests and the corrected CPT test give very similar results, even thoughthe alternative method of evaluation of the dilatometer tests yields somewhat toolow values. The concordance also encompasses the empirically estimated shear
Fig. 113. Compilation of undrained shear strength determinations at Point 1.
0
5
10
15
20
25
30
0 10 20 30 40 50 60 70 80 90
Undrained shear strength, kPaD
epth
, m
CPT testCPT test corr OCRField vane testDilatometer test - " - alternative interpretationDSS testDSS, local empirical relationEmpirical DSS using liquid limitFall-cone test

SGI Report No 61220
0
5
10
15
20
25
30
35
40
0 20 40 60 80 100 120
Undrained shear strength, kPa
Dep
th, m
CPT test
CPT test corr OCR
Field vane test
- " -
Dilatometer test
- " - alternative interpretation
DSS test
DSS, local empirical relation
Empirical DSS using liquid limit
Active triaxial test
Empirical active strength
Fall-cone test
0
5
10
15
20
25
30
35
0 10 20 30 40 50 60 70 80 90
Undrained shear strength, kPaD
epth
, m
CPT testCPT test corr OCRField vane testDSS testDSS, local empirical relationEmpirical DSS using liquid limitFall-cone test
Fig. 114. Compilation of undrained shear strength determinations in Point 2.
Fig. 115. Compilation of undrained shear strength determinations at Point 4.
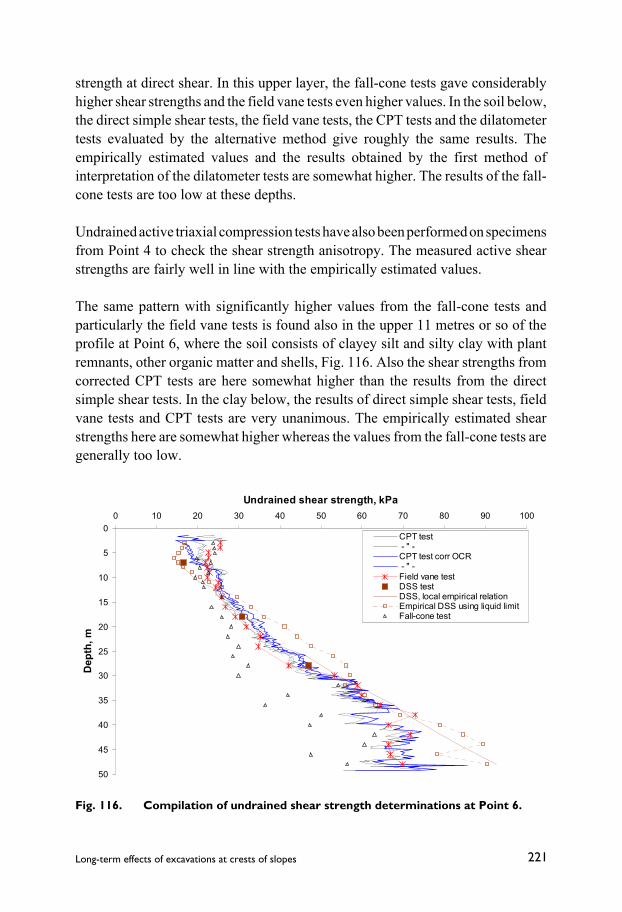
221Long-term effects of excavations at crests of slopes
strength at direct shear. In this upper layer, the fall-cone tests gave considerablyhigher shear strengths and the field vane tests even higher values. In the soil below,the direct simple shear tests, the field vane tests, the CPT tests and the dilatometertests evaluated by the alternative method give roughly the same results. Theempirically estimated values and the results obtained by the first method ofinterpretation of the dilatometer tests are somewhat higher. The results of the fall-cone tests are too low at these depths.
Undrained active triaxial compression tests have also been performed on specimensfrom Point 4 to check the shear strength anisotropy. The measured active shearstrengths are fairly well in line with the empirically estimated values.
The same pattern with significantly higher values from the fall-cone tests andparticularly the field vane tests is found also in the upper 11 metres or so of theprofile at Point 6, where the soil consists of clayey silt and silty clay with plantremnants, other organic matter and shells, Fig. 116. Also the shear strengths fromcorrected CPT tests are here somewhat higher than the results from the directsimple shear tests. In the clay below, the results of direct simple shear tests, fieldvane tests and CPT tests are very unanimous. The empirically estimated shearstrengths here are somewhat higher whereas the values from the fall-cone tests aregenerally too low.
Fig. 116. Compilation of undrained shear strength determinations at Point 6.
0
5
10
15
20
25
30
35
40
45
50
0 10 20 30 40 50 60 70 80 90 100
Undrained shear strength, kPa
Dep
th, m
CPT test - " -CPT test corr OCR - " -Field vane testDSS testDSS, local empirical relationEmpirical DSS using liquid limitFall-cone test
SGI Report No 61222
When comparing the different test results, it should be remembered that field vanetests and CPT tests uncorrected for overconsolidation gave higher values in theoverconsolidated clay in Torp as well. This appears to be related to the testconditions and measuring principles, which is currently studied in detail in anotherproject (Löfroth 2002). In a comparison between the results in the organic clayeysilt and silty clay, it should be observed that all the test methods, except directsimple shear tests and dilatometer tests, use empirical factors based on the liquidlimit in evaluation of the results. The empirical basis for these factors does notcontain any large number of soils of this type and composition. The relevance ofthe factors for this particular type of soil is thereby uncertain.
The drained shear strength parameters have been checked in a few triaxial tests onspecimen from Point 4 and were found to be well in line with the empirical estimatesthat are normally used (Larsson et al. 1983).
3.9 CHANGES IN SHEAR STRENGTH DUE TO UNLOADING
That unloading affects the undrained shear strength has been shown by thecomparisons that have been performed between the shear strengths measured byfield vane tests at different points located below the river, at the riverbank andbehind the crest of the slope(s). This has also been shown in the direct simple sheartests. It would have been desirable to make a direct comparison between thestrength before and after excavation of the new terrace. However, the scatter in theresults of the previous investigations is too large to allow this, particularly since theunloading is relatively moderate and it mainly affected those upper layers in whichthe soil consists of clayey silt and silty clay with plant remnants, other organicmatter and shells and in which the results are particularly difficult to interpret. Theindirect comparison, which on the other hand is rather comprehensive, willtherefore have to suffice in this area.
3.10 STABILITY CALCULATIONS
3.10.1 Previous calculations
The stability of the slope at Strandbacken has been calculated many times from theinvestigation by SGI in 1951 to the present project. In the large Göta-älv investigation,the safety factor was found to be between 1.0 and 1.2 depending on what sectionwas calculated, what method was used and what shear strength parameters wereassumed. Calculated safety factors lower than unity have then probably been set to1.0.

223Long-term effects of excavations at crests of slopes
The limited excavation that was performed in 1959 in connection with an observedcrack and an assessment that a slide was imminent was, as far as is known, not basedon a criterion for a minimum required safety factor. Instead, it appears to have beendesigned to eliminate the immediate danger at a minimum of cost and interferencewith the existing built-up area.
Fairly large changes have occurred since the days of the Göta-älv investigation inhow shear strength in clays is looked upon and how it is determined and evaluated.The shear strength values obtained in field vane tests and fall-cone tests havegenerally been corrected since 1969 and the correction factors were revised in1984. Other types of tests have come into use, the loading history of the soil hascome into consideration to a much larger extent and in new ways, and nowadaysthe shear strength anisotropy is also considered. The drained shear strengthparameters are determined and considered in new ways and the combined analysishas come into use.
Much of this was taken into account in the investigation that was performed by SGIin 1988–89, which led to the large excavation works afterwards. The stability wasthen once more found to be close to 1.0. The excavation was designed to givecalculated safety factors in undrained analyses of at least 1.5 for all potential slipsurfaces reaching the remaining buildings in the area. However, the presentguidelines of the Commission on Slope Stability were not issued until 1995 andcould thus not be followed in all details.
3.10.2 Conditions in the new calculations
The new calculations that have been performed in this project concerning theconditions after the excavation have been based on the actual measurements of porewater pressures and shear strengths that have now been made. The calculationshave also followed the new guidelines of the Committee on Slope Stability (1995).
The undrained shear strength in these calculations is largely based on the results ofthe direct simple shear tests and the local experience that has been created by these.These shear strength values differ from and are lower than those determined byfield vane tests in the upper organic and silty soil layer directly below the superficiallayers of sand and silt. At larger depths and for the major part of the clay deposits,the agreement between the direct simple shear tests and the field vane tests is fairlygood, with a small tendency to higher values from the direct simple shear tests. Theinfluence of the choice of shear strength in the upper layer is moderate since itsthickness is limited and it does not exist at the riverbank or further out below the

SGI Report No 61224
river. The difference in calculated safety factor for large slip surfaces is therebymarginal. For more superficial slip surfaces closer to the lower slope towards theriver, a choice of a higher undrained shear strength mainly entails that the drainedshear strength becomes governing for a larger part of the slip surface and that aslight displacement of the location of the most critical slip surface occurs.
Because of the location of the organic and silty layer in the section, it also mainlyconstitutes a zone with active shear in all slip surfaces. Its shear strength in moreelaborate calculations is therefore mainly based on results of active triaxial tests.
The drained shear strength is based on empirically estimated values, whoserelevance has been checked by triaxial tests on the particular type of soil.
The calculations have been performed with assumptions about the lowest waterlevel in the river combined with the highest prognosticated pore water pressures inthe soil. This condition is fully realistic. The water level in the river is regulated bythe outlet of water through the power plant and can be lowered very rapidly. On theother hand, the pore pressures in the soil mass and particularly in its upper levelsare regulated by climatic conditions. In the calculations for the section before theexcavation, an estimation has been made of the groundwater level in the upper sandand silt layer and the pore pressures in the soil below. This has been based on theprevious measurements of pore pressures in the area and assumptions about porepressures corresponding to the mean water level in the river in the coarse bottomlayers. The estimations about the pore pressures have been aided by calculationswith the computer program SEEP/W, see Chapter 5.
The calculations mainly refer to the investigated section. The geometrical variationsalong the river are mainly related to the position and depth of the fairway in theriver, but other variations in the bottom contour exist. No detailed measurementsof the bottom contour have been performed lately but the assumptions are primarilybased on observations in the area around Point 1 in the river, the charts of thefairway provided by the fairway authorities and data from sections in previousinvestigations. An erosion protection structure for the riverbanks has been in effectsince these investigations were made but changes in the contour of the river bottomcan possibly have occurred. A new detailed investigation of the bottom topographyalong a large part of Göta-älv is planned.
The basic section in the calculations has a bottom contour in the river in which thewater depth increases gradually over a shallow shelf from 1 metre at the riverbankto 5 metres at the border of the fairway and then rapidly increases to full depth in

225Long-term effects of excavations at crests of slopes
the fairway. The depth in the fairway is set to 8 metres in accordance with the depthsat this section in the chart of the fairway. All depths given in this paragraph are givenin relation to the lowest water level in the river.
The minimum depth in the fairway should be 6 metres, but it has been found to beup to 12 metres in previously measured sections in the northern part of the area. Thewidth of the shallow shelf varies from being practically non-existent close to thelock at Ström, where the fairway runs along the western side of the river, to morethan 50 metres in the southern part of the area from the bollard and further on. Thewidth has been set to 30 metres in the basic section, but the influence of the widthof the shelf and the depth in the fairway has been analysed by varying theseparameters in the calculations.
Only two-dimensional aspects have been considered because of the length of theexcavated area and the similar and only gradually changing conditions along thisdistance. There are thus no significant end effects to take into account in theconsidered sections.
The first calculations have been made using the self-seeking program SLOPE/Wand rigorous analyses according to the Spencer method. The shear strengthanisotropy was not considered in these calculations. Some of the critical slipsurfaces that were found in these calculations have then been modified and controlcalculations have been performed with Janbu's general procedure of slices usingmore elaborated shear strength parameters.
3.10.3 Results from the calculations
The calculations for the original section before the excavation without considerationof shear strength anisotropy gave a safety factor of 0.83 for relatively shallow slipsurfaces comprising the outer part of the slope, Fig. 117a. In these initial calculations,drained shear strength was assumed in the sand and silt layer and undrained shearstrength was used in the gyttja and clay layers. The calculated factor of safetyincreases to 1.0 (1.03) in a combined analysis where the shear strength anisotropyis considered. The critical slip surface is then shallower and drained shear strengthis governing along a larger part of it. The calculated safety factor in a fully drainedanalysis becomes approximately the same (1.05), but the critical slip surface is theneven shallower, Fig. 117b.

SGI Report No 61226
F=0.83 (1.03)Sand/siltGyttjaClay
"Firm bottom"
Water
60 m
F=1.05
b)
a)
Fig. 117. Calculated safety factor for the original section (SLOPE/W, Spencer'smethod).a) Undrained isotropic shear strength in the clay. (Values in bracketsrefer to combined analysis with anisotropic shear strength and Janbu'sgeneral procedure of slices.)b) Drained analysis.
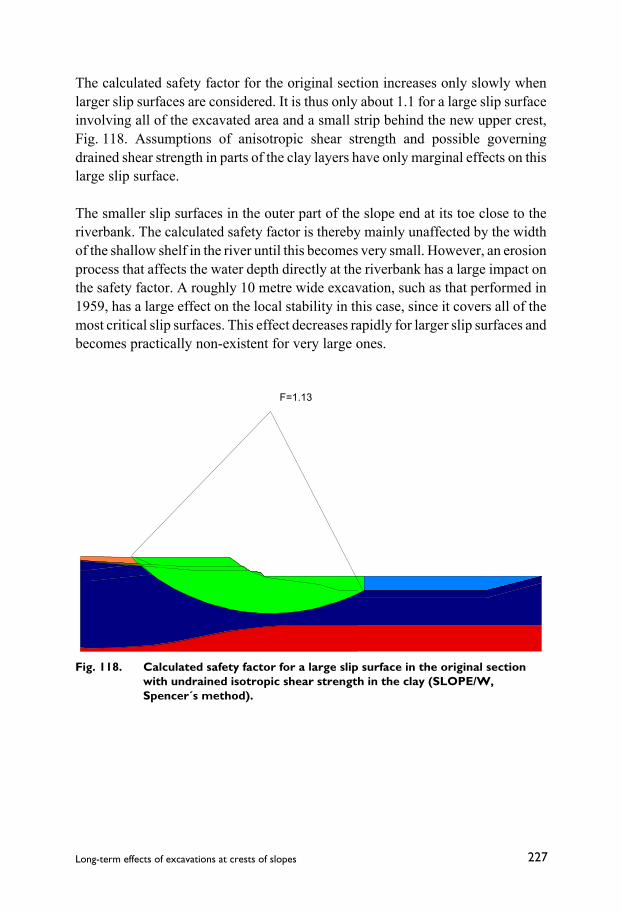
227Long-term effects of excavations at crests of slopes
F=1.13
The calculated safety factor for the original section increases only slowly whenlarger slip surfaces are considered. It is thus only about 1.1 for a large slip surfaceinvolving all of the excavated area and a small strip behind the new upper crest,Fig. 118. Assumptions of anisotropic shear strength and possible governingdrained shear strength in parts of the clay layers have only marginal effects on thislarge slip surface.
The smaller slip surfaces in the outer part of the slope end at its toe close to theriverbank. The calculated safety factor is thereby mainly unaffected by the widthof the shallow shelf in the river until this becomes very small. However, an erosionprocess that affects the water depth directly at the riverbank has a large impact onthe safety factor. A roughly 10 metre wide excavation, such as that performed in1959, has a large effect on the local stability in this case, since it covers all of themost critical slip surfaces. This effect decreases rapidly for larger slip surfaces andbecomes practically non-existent for very large ones.
Fig. 118. Calculated safety factor for a large slip surface in the original sectionwith undrained isotropic shear strength in the clay (SLOPE/W,Spencer´s method).

SGI Report No 61228
The calculations for the present conditions after adaptation to the effects of the largeexcavation resulted in safety factors that had increased to 1.45 for the large slipsurfaces and 1.3 for more local slip surfaces at the lower slope towards the river,Fig. 119. These factors were calculated with assumptions of isotropic undrainedshear strength in the clay and drained shear strength in the sand and silt layers. Theyrepresent local minimum values, and the calculated safety factors for slip surfaces
F=1.45 (1.52)
F=1.31 (1.26)
a)
b)
Fig. 119. Calculated safety factor in the present section using undrained isotropicshear strength in the clay (SLOPE/W, Spencer's method).(Values in brackets refer to combined analysis with anisotropic shearstrength and Janbu's general procedure of slices.)a) large slip surfaceb) local slip surface at the lower slope
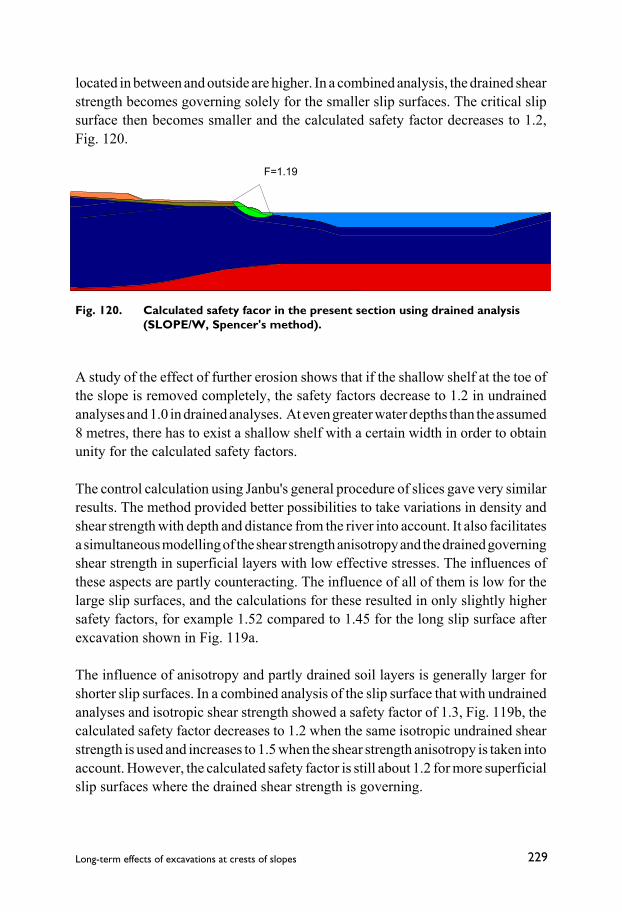
229Long-term effects of excavations at crests of slopes
F=1.19
Fig. 120. Calculated safety facor in the present section using drained analysis(SLOPE/W, Spencer's method).
located in between and outside are higher. In a combined analysis, the drained shearstrength becomes governing solely for the smaller slip surfaces. The critical slipsurface then becomes smaller and the calculated safety factor decreases to 1.2,Fig. 120.
A study of the effect of further erosion shows that if the shallow shelf at the toe ofthe slope is removed completely, the safety factors decrease to 1.2 in undrainedanalyses and 1.0 in drained analyses. At even greater water depths than the assumed8 metres, there has to exist a shallow shelf with a certain width in order to obtainunity for the calculated safety factors.
The control calculation using Janbu's general procedure of slices gave very similarresults. The method provided better possibilities to take variations in density andshear strength with depth and distance from the river into account. It also facilitatesa simultaneous modelling of the shear strength anisotropy and the drained governingshear strength in superficial layers with low effective stresses. The influences ofthese aspects are partly counteracting. The influence of all of them is low for thelarge slip surfaces, and the calculations for these resulted in only slightly highersafety factors, for example 1.52 compared to 1.45 for the long slip surface afterexcavation shown in Fig. 119a.
The influence of anisotropy and partly drained soil layers is generally larger forshorter slip surfaces. In a combined analysis of the slip surface that with undrainedanalyses and isotropic shear strength showed a safety factor of 1.3, Fig. 119b, thecalculated safety factor decreases to 1.2 when the same isotropic undrained shearstrength is used and increases to 1.5 when the shear strength anisotropy is taken intoaccount. However, the calculated safety factor is still about 1.2 for more superficialslip surfaces where the drained shear strength is governing.
SGI Report No 61230
The excavation performed has thus resulted in an increase in calculated safetyfactor according to undrained analyses to about 1.5 for the whole area, which wasthe aim of the design. Only superficial slip surfaces at the lower slope have lowercalculated safety factors. These factors are around 1.2 and the drained shearstrength is then solely governing. The requirement for calculated safety factors forthe areas and the remaining buildings and constructions according to the directionsfrom the Commission on Slope Stability is thus fulfilled. However, the safety factorfor the lower slope depends on the contour of the bottom in the river, and erosionthat results in increasing water depths at the riverbank would entail deterioratingstability conditions.

231Long-term effects of excavations at crests of slopes
Chapter 4.
Sundholmen
4.1 DESCRIPTION OF THE AREA AND ITS GEOLOGY
4.1.1 Description of the area
Sundholmen is a small village with about thirty dwelling houses located on bothsides of the small river Viskan. Highway number 41 between the cities of Borås andVarberg runs parallel to the river, which flows in a valley from north-east to south-west. The distance to Borås is about 50 km and to Varberg about 40 km. At thecentre of the village, there is a side-road towards Öxnevalla to the south-east, whichcrosses the Viskan on a bridge, Fig. 121.
Sundholmen lies just south of a point where the topography changes from a roughly700 metres wide valley to a plain about 2 km wide. The village is surrounded byfarmland. The ground surface in the valley and on the plain is very flat and is onlybroken through by the river-course and smaller ravines along its tributaries in theform of small streams and brooks. The distance from the centre of the village to thesurrounding rocky ridges is about 400 metres towards the north-west and 600metres towards the north-east. In the south-easterly direction, hills can only be seenat a great distance.
The private grounds and gardens along the river reach all the way to its banks butthe buildings are located at distances of at least 30 metres from them. Only a fewsheds lie closer. Correspondingly, the highway and the parallel local road on theother side of the river run at distances of at least 50 metres from it.
Small slips and slides are very common along the river, and many shallow slipscarps can be observed when travelling along it. These slips are normally veryshallow and then only comprise one or a few metres of the riverbank, but sometimesalso larger slides occur. One such slide occurred in Sundholmen in 1956 in frontof the Brosätter nursing home, which is located on the eastern riverbank on theground directly to the north of the bridge. This slide extended about 5 metres intothe ground. Later on, cracks were observed at the opposite riverbank as well and

SGI Report No 61232
Fig. 121. Map of Sundholmen, (Mark municipality).
233Long-term effects of excavations at crests of slopes
a geotechnical investigation was performed by SGI during 1957. The report of thisinvestigation recommended that an excavation should be made behind the crest ofthe slope to the river, partly to ensure the stability of the nursing home and adjacentgrounds and partly to eliminate the risk that slides would affect the bridge and itsabutments. However, this excavation was not performed.
Two new slides occurred in the eastern riverbank in June and July 1989, one to thesouth and downstream of the bridge and one upstream in the ground to the north ofthe nursing home. These slides had larger extents and reached about 10 metres infrom the former crest at the riverbank. As an immediate result, some grounds wereroped-off and a new geotechnical investigation was started. This comprised theentire eastern riverbank from about 100 metres upstream from the bridge to about150 metres downstream. It was conducted by the consulting company GF, whichrecommended that an excavation with a depth of 1 to 2 metres should be made fromthe crest almost up to the existing buildings, i.e. with a width of about 25 metres.This excavation was performed during 1990, but its shape and extent was alteredsomewhat in accordance with the desires of the landowners. The excavation wascarried out with a certain inclination of the terraces down towards the river anddrainage systems were also installed to facilitate the restoration of lawns andgardens, Fig. 122. Smaller excavations were also performed on the opposite sideof the river.
The water level in the river varies strongly. It varies with season and can also varyrelatively much within shorter periods depending on regulations and generation ofpower for industries further up along the river and its main tributaries. The normalvariation between the highest and lowest water levels is about 3.5 metres, but thelevel can rise another metre at exceptional water flows. This entailed, among otherthings, a limitation for the possible depth of the excavations.
The present bridge over the Viskan is a modern construction in concrete. However,there have been a number of older constructions of stone at the same point, whichhave successively replaced each other. The remnants of these constructions haveformed a barrier resulting in a deeper hollow at the river bottom to the north thereofand a strong torrent starting below the bridge and continuing for some distance tothe south. Erosion protection was constructed on both sides of the river inconnection with the excavation works. At the torrent, there is also a stronger erosionprotection structure in the form of a wall built of stone blocks on the western sideof the river, Fig. 123.

SGI Report No 61234
Fig. 122. The river Viskan to the north of the bridge in Sundholmen. The whiteplastic tubes that protrude from the slope are parts of the drainagesystem for the excavated terrace behind.

235Long-term effects of excavations at crests of slopes
Fig. 123. The bridge over the Viskan in Sundholmen.
c) The river south ofthe bridge with thetorrent and erosionprotection.
a) The bridge seenfrom the north withthe barrier of stoneblocks.
b) The bridge seenfrom the east with
the torrent anderosion protection
downstream.
SGI Report No 61236
4.1.2 Geology
No detailed geological survey has been made of the area. In general, the geologicalhistory is the same as for the previously described areas in Munkedal and Lilla Edet.The main differences are that the soft clay deposits started to be formed a fewhundred years earlier because the area is located further to the south and that thethickness of the clay deposits is even greater than at the other places. There are nosoundings or sampling operations to the full depth but there are a number of deepwells in the village where the depths to the aquifers with coarser soil below the clayare reported to be between 86 and 93 metres.
In this area too, the sediments were deposited in salt water. Samples have only beentaken to a depth of 25 metres below the ground surface, but the results of the CPTtests show that there are a number of clay layers of different characters below thisdepth. Distinct borders between different layers are thus found at depths of about40 and 48 metres below the ground surface. The upper clay layer down to 25 metres'depth consists of grey, sulphide-spotted clay. When the water depths had becomeshallow at the end of the deposition period, organic material also started to bedeposited. There is thus a transition zone with an organic content between 6 and 7metres depth and the soil above this zone is significantly more organic. When theland-elevation had proceeded so far that the shoreline passed the area, delta andlateral fluvial sediments were deposited at the river mouth. These sediments consistof silt and sand with organic matter.
The upper layers vary across the valley. The delta and lateral fluvial sediments arefound in the superficial layers at the centre of the valley over about half of its width.In the outer parts, they consist of silt and an upper sand layer is found only withinnarrow strips on each side of the river. The upper soil layers on the eastern side ofthe river consist of about 1 metre of sand on top of about 1.5–2 metres of silt withthin sand layers and then organic clay down to 6 metres' depth. The silt layer isthicker on the western side, and in SGI's investigation in 1957 the soil was heredesignated as clayey silt without any significant organic content down to thetransition to the sulphide-spotted clay, which was found at the same level as on theother side.
The river has later eroded its course through the more easily eroded sand and siltlayers and the organic clay. Its bottom lies about 8 metres below the surroundingground in the investigated area north of the bridge. However, the depth varies withshallower and deeper patches and the deep channel, which runs in the eastern partof the course, is up to half a metre deeper. The level of the surrounding ground is
237Long-term effects of excavations at crests of slopes
at +15 metres and the bottom level in the river is at about +7 metres. The lowestwater level is given as + 9 metres and the highest as +12.5 metres. The water depthin the river thus normally varies between 2 and 5.5 metres and the water surface isonly 2.5 metres below the surrounding ground at the highest water level. Theexcavation has entailed that only about half a metre then remains before theexcavated terrace becomes flooded. This may happen occasionally since the waterlevel can rise about 1 metre further at exceptional water flows, but this is rare andthen only temporary.
The groundwater level in the surrounding ground is located about 1 metre belowthe ground surface. It varies somewhat with distance from the river because acertain drainage and water flow towards the river occurs in the vicinity of this. Itmay also vary due to drainage systems around the buildings and along the roads.However, in general the free groundwater level can be assumed to be located at thegiven level and the groundwater pressure to be hydrostatic from this. Thegroundwater pressures in the upper soil layers in the vicinity of the river are lowerwith a gradual adaptation to the water level in the river. The excavation performedand the drainage system installed below this may have entailed that this zone withlower pore pressures has become somewhat enlarged.
4.2 PREVIOUS INVESTIGATIONS AND STABILITYASSESSMENTS
4.2.1 The investigation by SGI in 1957
The first investigation of the stability of the slopes towards the Viskan inSundholmen was performed by SGI in 1957. In was induced by a slide that occurredin October 1956 in the eastern riverbank in front of the Brosätter nursing homenorth of the bridge. The slide was about 35 metres long and reached about 5 metresin behind the old crest. Cracks were also observed on the opposite western side ofthe river in 1957. Investigations were therefore made in three sections within adistance of 70 metres to the north of the bridge. They comprised weight soundingtests, field vane tests and sampling with piston sampler on both sides of the riverin each section.
In the weight sounding tests, turning of the equipment was started at a depth ofabout 13 metres below the surface of the surrounding ground, which was used asa reference level, and the number of half turns per 0.2 metres of penetration thenincreased gradually with depth. The deepest penetrations were stopped at a depthof about 30 metres below the reference level without reaching any stop or finding

SGI Report No 61238
any significantly stiffer layer. The field vane tests were stopped about 20 metresbelow the reference level after having shown a continuously increasing strengthwith depth. The piston sampling was at most performed to 15 metres below thereference level.
The soil samples were investigated in the laboratory regarding classification,density and undrained shear strength by both fall-cone tests and unconfinedcompression tests, which was the standard procedure at SGI at that time. Theinvestigations showed that the conditions were very similar on each side along theriver but that the upper soil layers differed between the two sides. On the easternside, where the Brosätter nursing home is located, there was about 3 metres ofcoarse silt on top of about 3 metres of organic clay in the upper layers. The groundsurface on the western side was about 1 metre lower and the upper soil hereconsisted of about 5 metres of clayey silt without any observed organic content.Below these upper layers, the soil consisted of similar clay on both sides of the river.
The difference in constituents in the upper soil layers was reflected in the density,which in the upper soil layers was significantly higher in the clayey silt on thewestern side than in the even-graded coarse silt and the organic silt on the easternside, Fig. 124..
Fig. 124. Densities on each side of the river measured by SGI in the investigationin 1957.
-2
0
2
4
6
8
10
12
14
1 1.2 1.4 1.6 1.8 2 2.2 2.4
Density, t/m3
Leve
l, m
Blue lines = east side (Nursing-home side)
Red lines = west side

239Long-term effects of excavations at crests of slopes
-2
0
2
4
6
8
10
12
14
0 10 20 30 40 50 60 70 80 90
Shear strength value, kPa
Leve
l, m
Blue lines = east side (Nursing-home side)
Red lines = west side
The differences are also reflected in the shear strength values from the fall-conetests, where considerably higher values were obtained in the clayey silt from thewestern side than in the organic clay from the eastern side. However, no significantdifference between the two sides was obtained in the clays at larger depths,Fig. 125.
Fig. 125. Shear strength values from fall-cone tests in 1957.
The unconfined compression tests showed strengths that in general were only abouttwo-thirds of those obtained in the fall-cone tests. The latter should be correctedwith respect to the liquid limit, which at that time was only done for organic soil(gyttja). However, even after a correction of the fall-cone test such as that usedtoday the values obtained by the unconfined compression tests remain considerablylower. This has been a general finding and, since the values of the unconfinedcompression tests were found to be unrealistically low, the method has later beenabandoned in Swedish practice for testing of natural clays.
The results of the field vane tests in general showed the same relations between thetwo sides as the fall-cone tests, Fig. 126. The results of the field vane tests and thefall-cone tests are also numerically similar down to a depth of about 10 metres,whereupon the values from the fall-cone tests become lower.
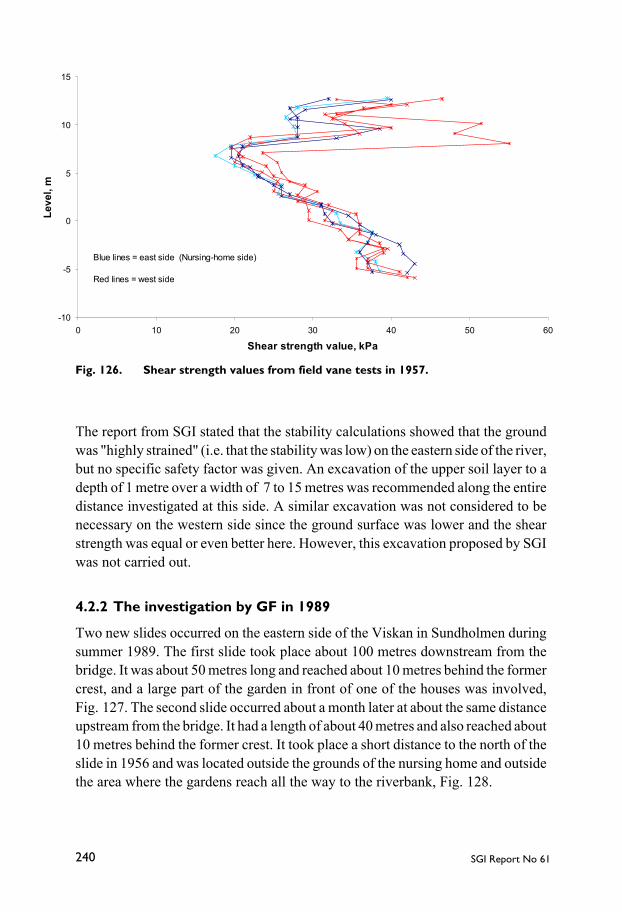
SGI Report No 61240
-10
-5
0
5
10
15
0 10 20 30 40 50 60
Shear strength value, kPa
Leve
l, m
Blue lines = east side (Nursing-home side)
Red lines = west side
The report from SGI stated that the stability calculations showed that the groundwas "highly strained" (i.e. that the stability was low) on the eastern side of the river,but no specific safety factor was given. An excavation of the upper soil layer to adepth of 1 metre over a width of 7 to 15 metres was recommended along the entiredistance investigated at this side. A similar excavation was not considered to benecessary on the western side since the ground surface was lower and the shearstrength was equal or even better here. However, this excavation proposed by SGIwas not carried out.
4.2.2 The investigation by GF in 1989
Two new slides occurred on the eastern side of the Viskan in Sundholmen duringsummer 1989. The first slide took place about 100 metres downstream from thebridge. It was about 50 metres long and reached about 10 metres behind the formercrest, and a large part of the garden in front of one of the houses was involved,Fig. 127. The second slide occurred about a month later at about the same distanceupstream from the bridge. It had a length of about 40 metres and also reached about10 metres behind the former crest. It took place a short distance to the north of theslide in 1956 and was located outside the grounds of the nursing home and outsidethe area where the gardens reach all the way to the riverbank, Fig. 128.
Fig. 126. Shear strength values from field vane tests in 1957.

241Long-term effects of excavations at crests of slopes
Fig. 127. The slide downstream from the bridge in Sundholmen in 1989 with theback scarp running through the landowner's potato-patch.Photo Å. Johansson.
Fig. 128. Location of the slides, investigations and proposed remedial measuresin 1989 (GF 1989).

SGI Report No 61242
The consulting company GF now performed a new geotechnical investigation. Thiscomprised the whole distance along the eastern riverbank where dwelling housesare located in the vicinity of the river, both upstream and downstream from thebridge. The field investigations comprised total pressure soundings at five points,field vane tests at three points, undisturbed sampling by the standard piston samplerin two points supplemented by disturbed sampling in superficial layers at four morepoints and pore pressure measurements at one point. A detailed survey andlevelling of the area was also made.
The penetration tests were stopped at a level of about –10 metres, i.e. about 25metres below the level of the ground surface in the surrounding area and at aboutthe same level where the previous weight sounding tests had been stopped. Theresults down to this depth indicated that the soil below the upper layers of sand, siltand organic soil consisted of homogeneous clay with a stiffness gradually increasingwith depth. No significant differences could be observed between the results fromthe different test points. The field vane tests were performed down to the samedepths as the penetration tests, whereas the sampling operations were stopped about5 metres further up.
The inspection of the soil samples and the results of the routine tests in thelaboratory showed that the conditions were very even throughout the investigatedarea. They were also consistent with the results obtained in the previous investigationby SGI. A minor difference can be related to the change in classification system thathad been made in Sweden between the two investigations. The upper layer that hadpreviously been designated as ”mo” was now classified as sand turning to silt withdepth and the previously designated organic clay was now classified with a moregradual change from silty gyttja to clayey gyttja.
The measured densities were very similar in the investigated area and in bothinvestigations, Fig. 129. Values of the liquid limit were only reported in the latterinvestigation but were here very unanimous in spite of a distance of about 200metres between the sampling points, Fig. 130. This means that they could be usedfor correction of the older strength determinations and that the same correctionsshould be applicable for all values from field vane tests and fall-cone tests at therespective levels on the eastern side of the river.
In the report by GF it was observed that the consistency in the results from the fieldvane tests was ”almost improbably good”. This is valid also when the results of theprevious investigation by SGI are included in the comparison, Fig. 131. For thisreason, the area was included among the sites in a special study where comparative
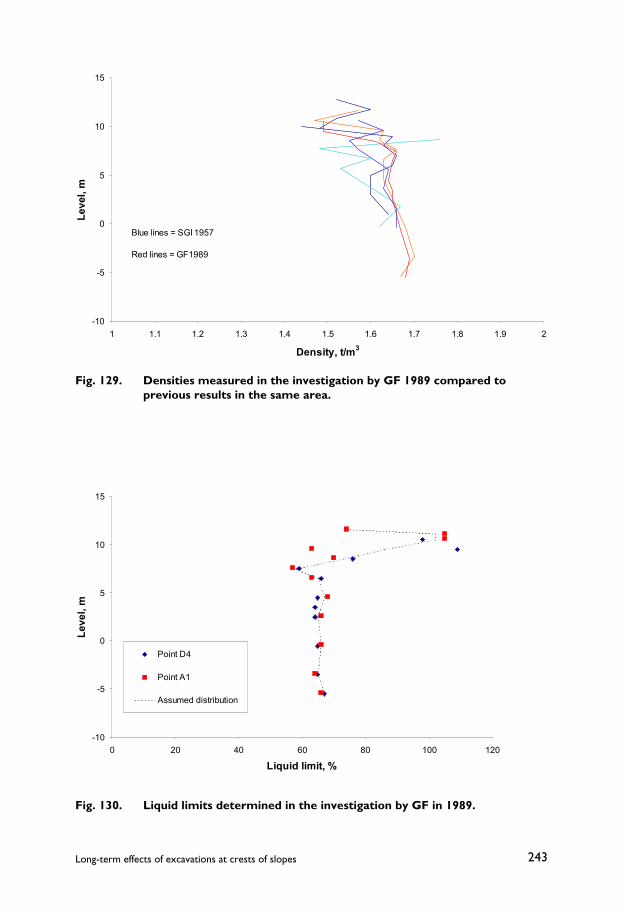
243Long-term effects of excavations at crests of slopes
-10
-5
0
5
10
15
0 20 40 60 80 100 120
Liquid limit, %
Leve
l, m
Point D4
Point A1
Assumed distribution
Fig. 129. Densities measured in the investigation by GF 1989 compared toprevious results in the same area.
Fig. 130. Liquid limits determined in the investigation by GF in 1989.
-10
-5
0
5
10
15
1 1.1 1.2 1.3 1.4 1.5 1.6 1.7 1.8 1.9 2
Density, t/m3
Leve
l, m
Blue lines = SGI 1957
Red lines = GF1989
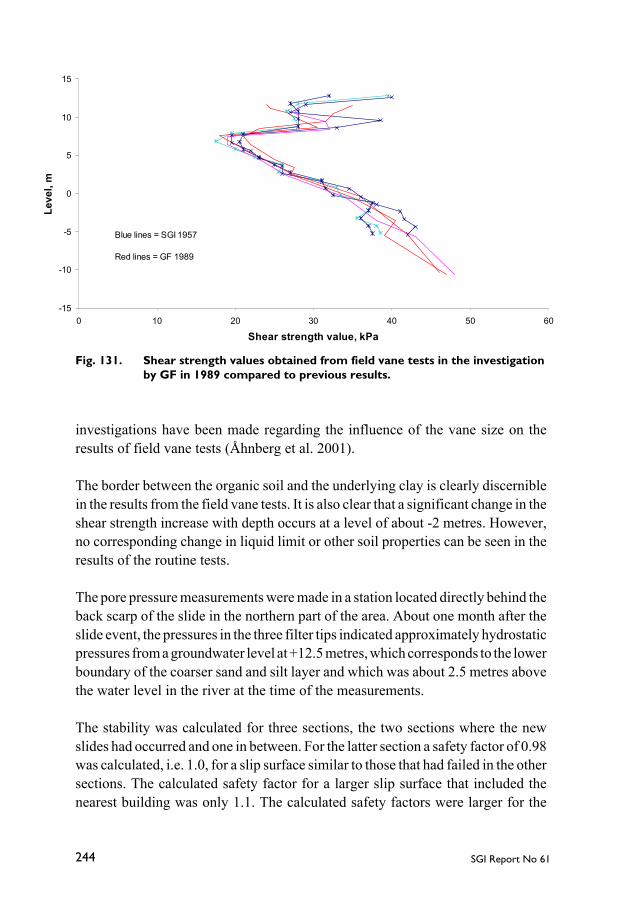
SGI Report No 61244
-15
-10
-5
0
5
10
15
0 10 20 30 40 50 60
Shear strength value, kPa
Leve
l, m
Blue lines = SGI 1957
Red lines = GF 1989
investigations have been made regarding the influence of the vane size on theresults of field vane tests (Åhnberg et al. 2001).
The border between the organic soil and the underlying clay is clearly discerniblein the results from the field vane tests. It is also clear that a significant change in theshear strength increase with depth occurs at a level of about -2 metres. However,no corresponding change in liquid limit or other soil properties can be seen in theresults of the routine tests.
The pore pressure measurements were made in a station located directly behind theback scarp of the slide in the northern part of the area. About one month after theslide event, the pressures in the three filter tips indicated approximately hydrostaticpressures from a groundwater level at +12.5 metres, which corresponds to the lowerboundary of the coarser sand and silt layer and which was about 2.5 metres abovethe water level in the river at the time of the measurements.
The stability was calculated for three sections, the two sections where the newslides had occurred and one in between. For the latter section a safety factor of 0.98was calculated, i.e. 1.0, for a slip surface similar to those that had failed in the othersections. The calculated safety factor for a larger slip surface that included thenearest building was only 1.1. The calculated safety factors were larger for the
Fig. 131. Shear strength values obtained from field vane tests in the investigationby GF in 1989 compared to previous results.

245Long-term effects of excavations at crests of slopes
sections where slides had occurred, and the steepest parts towards the river therebyhad been flattened out. In spite of this, the safety factor for a new slip surfaceencompassing the nearest house in the southern slide area was calculated as only1.2. All stability calculations were performed as undrained analyses.
4.3 STABILISING MEASURES
The recommendation by GF was that an excavation of the ground surface shouldbe made to a depth of 1 to 2 metres over the whole area between the riverbank andthe buildings. GF also recommended constructing erosion protection along theriverbank over the whole distance. The extent of the excavation was a compromisebetween what was desired from a stability point of view and what desirable andpossible from other aspects. From stability aspects, it would have been desirable toreach a calculated safety factor of 1.5 for slip surfaces involving a house. Thecorresponding requirement for other potential slip surfaces would have been safetyfactors of 1.3. On the other hand, the excavations could not be made so deep thatthe ground surface would be flooded at high water levels in the river or entail otherproblems for the future use of the land.
The recommendation was followed in principle but the design was varied somewhatin concord with the wishes of the landowners. The excavation at the Brosätternursing home was thus modelled in such way that the main building stands on aslightly protruding spit of land with excavations reaching further in on the groundat both sides. On this lot, there were also some installations that were not easy tomove and reconstruct at short notice. These were therefore left as small hillocks onthe excavated terrace, Fig. 132.
Other examples of excavations in accordance with the landowner´s desires areshown in Fig. 133b. The excavation in Fig. 133b, for example, was staged in severalsmall terraces. Since the excavated areas were to continue to be used as gardens,drainage systems were installed to lead off the water in the superficial layers to theriver. This was done over the whole area except for the lot furthest to the north,where no garden extends down to the river.
The recommended erosion protection was constructed by rock-fill. It was alsoextended to encompass both sides of the river, and a smaller excavation was alsoperformed on the western side of the river, Fig. 134.

SGI Report No 61246
a)
b)
Fig. 132. The excavated area at the Brosätter nursing homea) protruding spit of land on the terrace with the main buildingb) hillocks with remaining installations in the form of a deep well and atank for treatment of waste water

247Long-term effects of excavations at crests of slopes
b)
a)
Fig. 133. Excavated areas on the eastern side of the river south of the bridge.a) the ground closest to the bridgeb) excavation in the form of several terraces furthest to the south.

SGI Report No 61248
Fig. 134. Erosion protection and excavated area on the west side of the rivernorth of the bridge.
4.4 NEW INVESTIGATIONS
4.4.1 Observations
The inspection in connection with the present investigation revealed that theerosion protection was intact. However, it was to a large extent overgrown by grassand bushes. Several trees, some of them apparently older than the erosionprotection, were also found down at the toe of the riverbank. The lawns and gardenshad been re-established on the excavated terraces and the ground in general gavea very neat impression. The exception is the northernmost part of the excavation,which is not used as a garden. No drainage system was installed here, which issomething that the landowner regrets today, and the ground has a marshy character,Fig. 135.
When the new investigation started in March 2001, the surface of the excavatedterrace in front of the nursing home was fairly soft and the free groundwater level
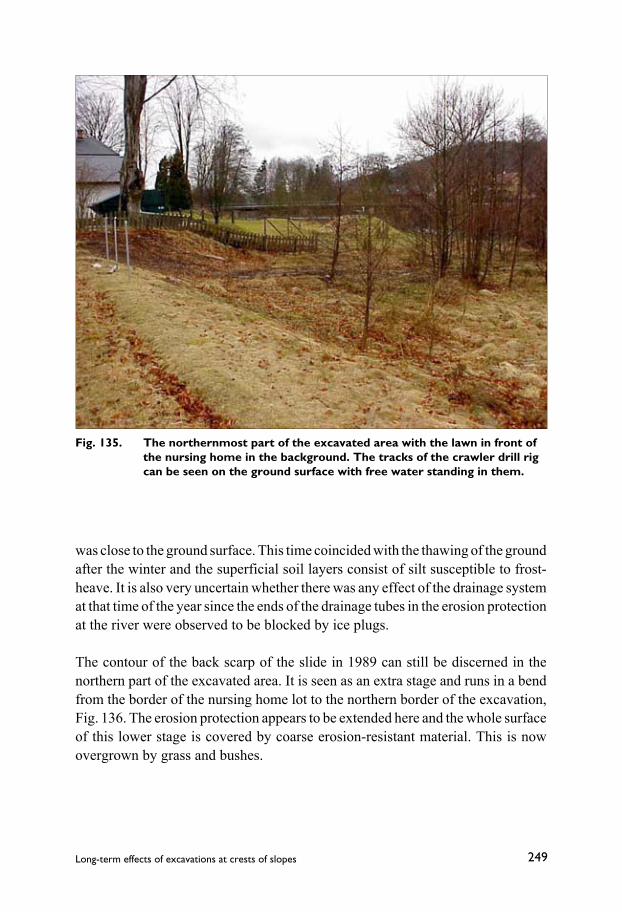
249Long-term effects of excavations at crests of slopes
Fig. 135. The northernmost part of the excavated area with the lawn in front ofthe nursing home in the background. The tracks of the crawler drill rigcan be seen on the ground surface with free water standing in them.
was close to the ground surface. This time coincided with the thawing of the groundafter the winter and the superficial soil layers consist of silt susceptible to frost-heave. It is also very uncertain whether there was any effect of the drainage systemat that time of the year since the ends of the drainage tubes in the erosion protectionat the river were observed to be blocked by ice plugs.
The contour of the back scarp of the slide in 1989 can still be discerned in thenorthern part of the excavated area. It is seen as an extra stage and runs in a bendfrom the border of the nursing home lot to the northern border of the excavation,Fig. 136. The erosion protection appears to be extended here and the whole surfaceof this lower stage is covered by coarse erosion-resistant material. This is nowovergrown by grass and bushes.
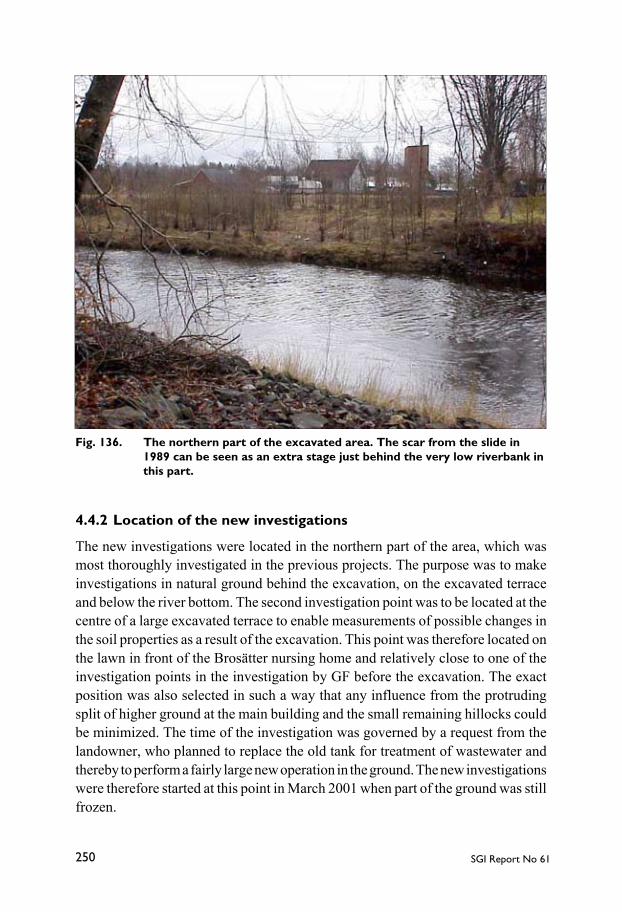
SGI Report No 61250
4.4.2 Location of the new investigations
The new investigations were located in the northern part of the area, which wasmost thoroughly investigated in the previous projects. The purpose was to makeinvestigations in natural ground behind the excavation, on the excavated terraceand below the river bottom. The second investigation point was to be located at thecentre of a large excavated terrace to enable measurements of possible changes inthe soil properties as a result of the excavation. This point was therefore located onthe lawn in front of the Brosätter nursing home and relatively close to one of theinvestigation points in the investigation by GF before the excavation. The exactposition was also selected in such a way that any influence from the protrudingsplit of higher ground at the main building and the small remaining hillocks couldbe minimized. The time of the investigation was governed by a request from thelandowner, who planned to replace the old tank for treatment of wastewater andthereby to perform a fairly large new operation in the ground. The new investigationswere therefore started at this point in March 2001 when part of the ground was stillfrozen.
Fig. 136. The northern part of the excavated area. The scar from the slide in1989 can be seen as an extra stage just behind the very low riverbank inthis part.
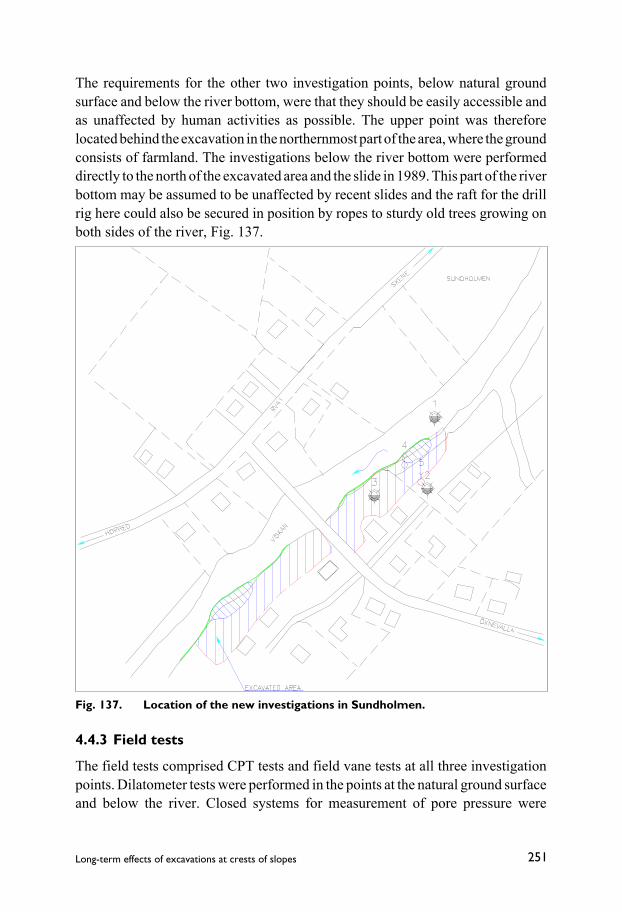
251Long-term effects of excavations at crests of slopes
The requirements for the other two investigation points, below natural groundsurface and below the river bottom, were that they should be easily accessible andas unaffected by human activities as possible. The upper point was thereforelocated behind the excavation in the northernmost part of the area, where the groundconsists of farmland. The investigations below the river bottom were performeddirectly to the north of the excavated area and the slide in 1989. This part of the riverbottom may be assumed to be unaffected by recent slides and the raft for the drillrig here could also be secured in position by ropes to sturdy old trees growing onboth sides of the river, Fig. 137.
Fig. 137. Location of the new investigations in Sundholmen.
4.4.3 Field tests
The field tests comprised CPT tests and field vane tests at all three investigationpoints. Dilatometer tests were performed in the points at the natural ground surfaceand below the river. Closed systems for measurement of pore pressure were
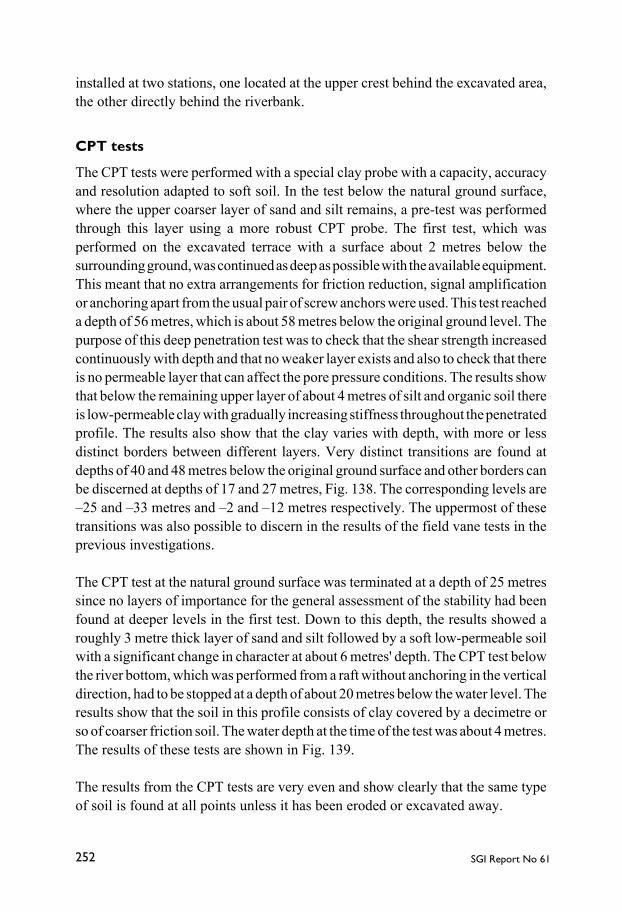
SGI Report No 61252
installed at two stations, one located at the upper crest behind the excavated area,the other directly behind the riverbank.
CPT tests
The CPT tests were performed with a special clay probe with a capacity, accuracyand resolution adapted to soft soil. In the test below the natural ground surface,where the upper coarser layer of sand and silt remains, a pre-test was performedthrough this layer using a more robust CPT probe. The first test, which wasperformed on the excavated terrace with a surface about 2 metres below thesurrounding ground, was continued as deep as possible with the available equipment.This meant that no extra arrangements for friction reduction, signal amplificationor anchoring apart from the usual pair of screw anchors were used. This test reacheda depth of 56 metres, which is about 58 metres below the original ground level. Thepurpose of this deep penetration test was to check that the shear strength increasedcontinuously with depth and that no weaker layer exists and also to check that thereis no permeable layer that can affect the pore pressure conditions. The results showthat below the remaining upper layer of about 4 metres of silt and organic soil thereis low-permeable clay with gradually increasing stiffness throughout the penetratedprofile. The results also show that the clay varies with depth, with more or lessdistinct borders between different layers. Very distinct transitions are found atdepths of 40 and 48 metres below the original ground surface and other borders canbe discerned at depths of 17 and 27 metres, Fig. 138. The corresponding levels are–25 and –33 metres and –2 and –12 metres respectively. The uppermost of thesetransitions was also possible to discern in the results of the field vane tests in theprevious investigations.
The CPT test at the natural ground surface was terminated at a depth of 25 metressince no layers of importance for the general assessment of the stability had beenfound at deeper levels in the first test. Down to this depth, the results showed aroughly 3 metre thick layer of sand and silt followed by a soft low-permeable soilwith a significant change in character at about 6 metres' depth. The CPT test belowthe river bottom, which was performed from a raft without anchoring in the verticaldirection, had to be stopped at a depth of about 20 metres below the water level. Theresults show that the soil in this profile consists of clay covered by a decimetre orso of coarser friction soil. The water depth at the time of the test was about 4 metres.The results of these tests are shown in Fig. 139.
The results from the CPT tests are very even and show clearly that the same typeof soil is found at all points unless it has been eroded or excavated away.

253Long-term effects of excavations at crests of slopes
Fig
. 138
.R
esul
ts o
f th
e de
ep C
PT
tes
t o
n th
e ex
cava
ted
terr
ace.

SGI Report No 61254
Fig
. 139
.R
esul
ts o
f the
CP
T t
ests
bel
ow
nat
ural
gro
und
surf
ace
and
the
rive
r bo
tto
m.
a) b
elo
w n
atur
al g
roun
d su
rfac
e

255Long-term effects of excavations at crests of slopes
Fig
. 139
.R
esul
ts o
f the
CP
T t
ests
bel
ow
nat
ural
gro
und
surf
ace
and
the
rive
r bo
tto
m.
b) b
elo
w t
he r
iver
bo
tto
m

SGI Report No 61256
Dilatometer tests
The dilatometer tests in the test point on the natural ground surface were alsoterminated at 25 metres' depth. The results show little less than 3 metres of sand andsilt followed by partly organic cohesive soil down to about 6 metres' depth. Belowthis, the results indicate normally consolidated or only slightly overconsolidatedclay throughout the investigated depth, Fig. 140.
The tests below the river had to be terminated 21 metres below the water level. Theresults indicate overconsolidated clay, which is heavily overconsolidated in theuppermost layers, Fig. 141.
Field vane tests
Field vane tests were performed at all points down to a level of -10 metres, that is,25 metres below the ground level in the surrounding area. The tests were repeatedat an adjacent point at all three test locations. However, this doubling of the testswas not performed to the full depth at all points.
The tests were performed with the SGI equipment and a vane of normal size. Aspecial study belonging to the afore-mentioned project concerning the influence ofthe vane size was also conducted below the natural ground surface at the upper testlocation. There are thus even more results available from this point.
Pore pressure measurements
Closed systems for measurement of pore pressures were installed in two stationsin the investigated area. They were placed in the northern part of the area justoutside the garden of the nursing home. One station here was placed directly behindthe upper crest above the excavation and one down at the riverbank directly behindits crest. Three systems were installed in each station: one at a level of about–10 metres, one at a relatively shallow depth which was still assumed to be safelybelow the free groundwater level and one approximately midway between these.The closed systems are of the BAT type. Readings of the pore pressures have beenmade on a number of occasions during a period of about one year. The location ofthe systems can be seen in Figs. 135 and 136.

257Long-term effects of excavations at crests of slopes
Fig
. 140
.R
esul
ts o
f dila
tom
eter
tes
ts b
elo
w t
he n
atur
al g
roun
d su
rfac
e in
Sun
dho
lmen
.a)
bas
e da
ta
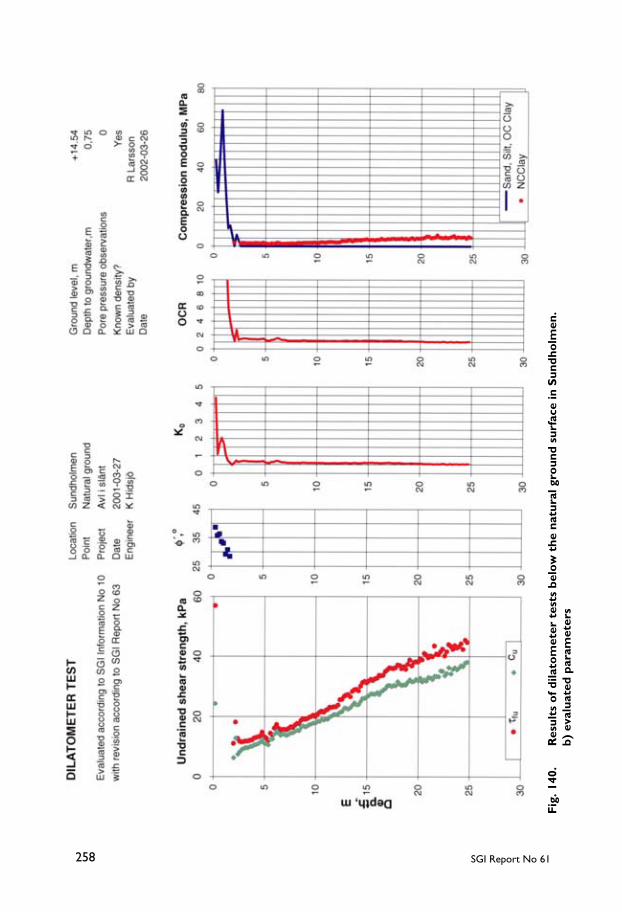
SGI Report No 61258
Fig
. 140
.R
esul
ts o
f dila
tom
eter
tes
ts b
elo
w t
he n
atur
al g
roun
d su
rfac
e in
Sun
dho
lmen
.b)
eva
luat
ed p
aram
eter
s
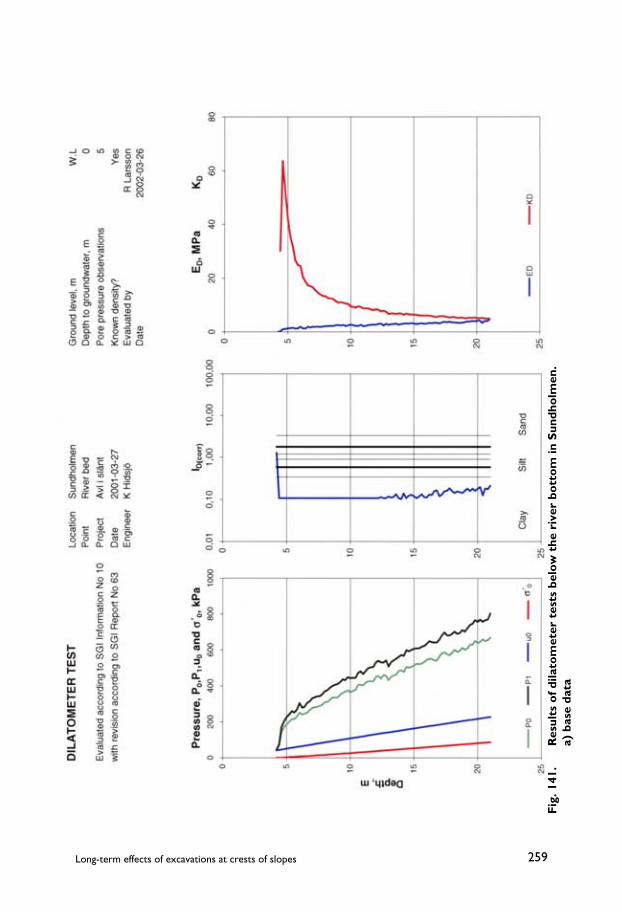
259Long-term effects of excavations at crests of slopes
Fig
. 141
.R
esul
ts o
f dila
tom
eter
tes
ts b
elo
w t
he r
iver
bo
tto
m in
Sun
dho
lmen
.a)
bas
e da
ta

SGI Report No 61260
Fig
. 141
.R
esul
ts o
f dila
tom
eter
tes
ts b
elo
w t
he r
iver
bo
tto
m in
Sun
dho
lmen
.b)
eva
luat
ed p
aram
eter
s
261Long-term effects of excavations at crests of slopes
4.4.4 Sampling
Undisturbed sampling has been performed with standard piston sampler type St IIat all three test points. Samples have been taken at depths every metre down to10 metres below the ground surface and the river bottom, and then at every secondmetre. This sequence was followed down to 20 metres' depth below the naturalground surface in the upper test location, whereupon an additional samplingoperation was performed at 25 metres' depth. Below the excavated terrace, thedeepest samples were taken at 18 metres' depth. The sampling below the river wasstopped at 21 metres' depth below the water level, which corresponds approximatelyto the deepest sampling level below the natural ground surface.
4.4.5 Laboratory tests
All samples have been investigated in the laboratory regarding classification,density, water content, liquid limit, undrained shear strength according to fall-conetests and sensitivity. The organic content was also determined in samples from theupper part of the profile in order to verify the classification. CRS oedometer testswere performed on a large number of specimens in order to determine thedistributions of preconsolidation pressure and permeability, and undrained directsimple shear tests have been performed in order to supplement the shear strengthdeterminations in the field tests.
The undrained direct simple shear tests have been performed on a large number ofspecimens from the clay layers in the different boreholes. The results have beencompiled and normalised with respect to preconsolidation and overconsolidationratio and in this way local empirical relations have been created. A number of directsimple shear tests have also been performed on specimens from the overlying layerof silty and organic soil.
A few triaxial tests have also been performed in order to verify the applicability ofthe common empirical relations for shear strength anisotropy and effective shearstrength parameters.
SGI Report No 61262
4.5 TEST RESULTS
4.5.1 Soil conditions - variations in plan and profile
The results of all investigations have shown that the soil conditions are veryhomogeneous on the eastern side of the Viskan in Sundholmen. This applies bothalong the river and within the about 50 metre wide strip from the centre of the riverto about 10 metres behind the excavated area that has been investigated. The soilbelow the natural ground surface behind the excavated area consists of a roughly3 metre thick layer of sand and silt which has an organic content in its lower parts.This layer is followed by about 3 metres of organic soil (gyttja) and organic clay.The organic content in this part varies between 7.5 and 3.5 % and decreases withdepth. Below this, there is normally consolidated or only slightly overconsolidatedclay. The clay layer extends to more than 58 metres' depth according to the deepestCPT test and probably to 80 – 90 metres' depth according to observations inconnection with installation of deep wells in the area.
According to the results of the CPT tests, field vane tests and dilatometer tests, theclay is divided into relatively thick layers with somewhat different properties. Thiscan be observed from different trends in shear strength increase with depth anddifferent values or trends for the pore pressure parameters DPPR and Bq in the CPTtests and for the material index ID in the dilatometer tests. The cause of thesevariations is difficult to judge because sampling has only been done down to a depthof 25 metres, which is the interval of interest for the stability. However, thedifferences are probably caused by variations in the grain size distribution in thesoil resulting from different conditions during the time when the soil was deposited.Within the investigated depth, there is a point at a level of about –2 metres wherethe shear strength increase with depth is significantly altered. From the results ofthe routine investigations in the laboratory, this can be related to the fact that fromthe top of the clay layer down to this level there is a steady gradual increase in liquidlimit, a decrease in water content and an increase in density. Below the level of thechange, these parameters are more constant or possibly have slightly oppositetrends.
The density in the upper sand and silt layer is between 1.7 and 2.0 t/m3. It decreasesto about 1.5 t/m3 in the organic soil and then increases to an average value of1.64 t/m3 in the clay below. However, a certain regular variation between valuesof 1.61 – 1.69 t/m3 can be observed in the clay, Fig. 142.

263Long-term effects of excavations at crests of slopes
Fig. 142. Measured densities in Sundholmen.
The water content and liquid limit vary with values of 20 – 50% in the sand and siltlayer increasing to 80 – 100% in the organic soil and then dropping to being mainlybetween 60 and 70 % in the clay, Fig. 143. The water content is mainly somewhatlower than the liquid limit and the clay has a normal sensitivity with values between10 and 20.
-15
-10
-5
0
5
10
15
1 1.2 1.4 1.6 1.8 2 2.2
Density, t/m3
Leve
l, m
Natural groundExcavated areaRiver bedGF 1989 - " -

SGI Report No 61264
-15
-10
-5
0
5
10
15
0 10 20 30 40 50 60 70 80 90 100
Natural water content, %
Leve
l, m
Below natural groundBelow excavated areaBelow river bed
-15
-10
-5
0
5
10
15
0 20 40 60 80 100 120
Liquid limit, %
Leve
l, m
Natural groundExcavated areaRiver bedGF 1989
a)
b)
Fig. 143. Measured water contents and liquid limits in Sundholmen.a) water contentb) liquid limit

265Long-term effects of excavations at crests of slopes
4.5.2 Pore pressure conditions and variations
The pore pressures have been measured on a number of occasions and show acertain seasonal variation. Below higher ground in the area, they are mainlyaffected by climatic variations whereas the pore pressures in the vicinity of the riverare affected by the water level in this. Below the natural ground surface behind theexcavated terrace, the pore pressure in deeper layers corresponds to a pressure levellocated about 1 metre below the ground surface. This pressure level can probablyvary in the upper layers and in very dry periods go down to the lower part of thesand and silt layer. However, no such occasion with very dry conditions hasoccurred during the period of the measurements. At the back of the excavatedterrace, groundwater tends to seep out at the toe of the excavated slope except fordry periods. In the gardens, this water is led off by the drainage systems and the freegroundwater level is here normally located up to a metre or so below the excavatedterraces. However, the drainage tubes may be frozen during wintertime and thegroundwater level may then be located close to the ground surface over most of theexcavated area. No drainage system was installed in the northernmost part of theexcavated area, and here the ground surface is normally wet over about half of itswidth except for very dry periods. The part of this area closest to the riverconstitutes the extra stage created by the previous slide. The lower lying groundsurface in this part is covered by coarser erosion-resistant material, and any surfacewater here runs down to the lower boundary of this cover.
In the vicinity of the river, the pore pressures in the upper soil layers are affectedby the water level in the watercourse. The influence of this water level ispronounced in the uppermost layers. No extreme water levels have been prevailingat the measuring times, but the variations in water level have then been within 0.8metres, which also corresponds to the maximum variations in pore pressure thathave been registered in the upper soil layers. At greater depths in the vicinity of theriver, the pore pressures are more related to the mean water level in the river. Thereis thus a depression in the pressure levels around the river with lower pressures thanat the same levels in the surrounding areas. The lowering of the pressure levelincreases as the river is approached, and a minimum should occur below the centreof the river bed. The influence of this depression decreases with depth and itbecomes insignificant at very large depths. The thickness of the clay layers inSundholmen is so large that any possible variation in the water pressures in thecoarser soil below are unimportant and no permanent lower or artesian waterpressure of a size that would affect the pore pressure gradient appear to exist. Themeasured pore pressures in Sundholmen are shown in Fig. 144.
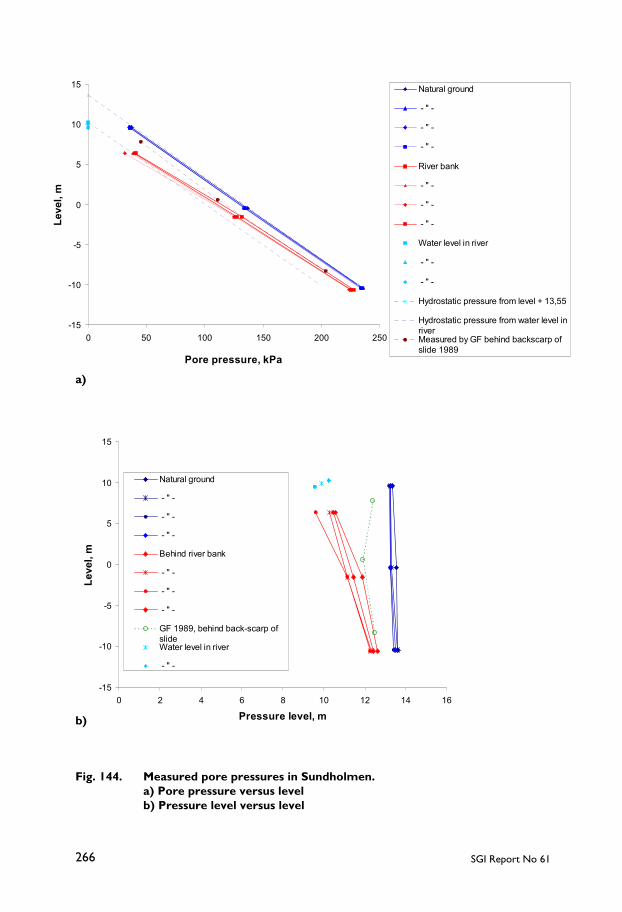
SGI Report No 61266
-15
-10
-5
0
5
10
15
0 50 100 150 200 250
Pore pressure, kPa
Leve
l, m
Natural ground
- " -
- " -
- " -
River bank
- " -
- " -
- " -
Water level in river
- " -
- " -
Hydrostatic pressure from level + 13,55
Hydrostatic pressure from water level inriver Measured by GF behind backscarp ofslide 1989
-15
-10
-5
0
5
10
15
0 2 4 6 8 10 12 14 16
Pressure level, m
Leve
l, m
Natural ground
- " -
- " -
- " -
Behind river bank
- " -
- " -
- " -
GF 1989, behind back-scarp ofslideWater level in river
- " -
a)
b)
Fig. 144. Measured pore pressures in Sundholmen.a) Pore pressure versus levelb) Pressure level versus level

267Long-term effects of excavations at crests of slopes
0
50
100
150
200
250
1-3 01 1-5 01 1-7 01 1-9 01 1-11 01 2-1 02
Date
Pore
pre
ssur
e, k
PaW
ater
leve
l in
river
, dm
Natural ground - " - - " -River bank - " - - " -Water level in river
Fig. 144. Measured pore pressures in Sundholmen.c) Measured pore pressure variation
The permeability of the soil has been evaluated from the results of the CRSoedometer tests in the laboratory. It is about 1·10-9 m/s in the upper organic clay andthen gradually decreases to become about 2.5·10-10 m/s at a level of about –5 metres.It then remains fairly constant or possibly appears to increase somewhat with depth,Fig. 145. However, in homogeneous clay, it would rather be expected to find aslight decrease in permeability with depth because of the higher overburdenpressures and the accompanying compression of the soil. The variation inpermeability reflects the variation in water content and thereby also the variationin void ratio in the soil. The permeability of the overlying sand and silt layer isconsiderably higher.
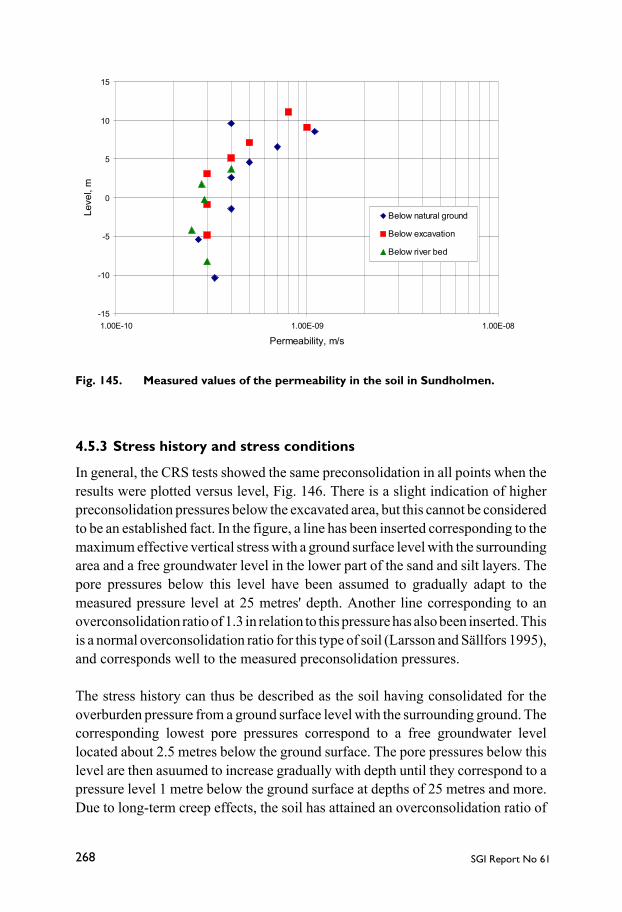
SGI Report No 61268
Fig. 145. Measured values of the permeability in the soil in Sundholmen.
4.5.3 Stress history and stress conditions
In general, the CRS tests showed the same preconsolidation in all points when theresults were plotted versus level, Fig. 146. There is a slight indication of higherpreconsolidation pressures below the excavated area, but this cannot be consideredto be an established fact. In the figure, a line has been inserted corresponding to themaximum effective vertical stress with a ground surface level with the surroundingarea and a free groundwater level in the lower part of the sand and silt layers. Thepore pressures below this level have been assumed to gradually adapt to themeasured pressure level at 25 metres' depth. Another line corresponding to anoverconsolidation ratio of 1.3 in relation to this pressure has also been inserted. Thisis a normal overconsolidation ratio for this type of soil (Larsson and Sällfors 1995),and corresponds well to the measured preconsolidation pressures.
The stress history can thus be described as the soil having consolidated for theoverburden pressure from a ground surface level with the surrounding ground. Thecorresponding lowest pore pressures correspond to a free groundwater levellocated about 2.5 metres below the ground surface. The pore pressures below thislevel are then asuumed to increase gradually with depth until they correspond to apressure level 1 metre below the ground surface at depths of 25 metres and more.Due to long-term creep effects, the soil has attained an overconsolidation ratio of
-15
-10
-5
0
5
10
15
1.00E-10 1.00E-09 1.00E-08
Permeability, m/s
Leve
l, m
Below natural ground
Below excavation
Below river bed
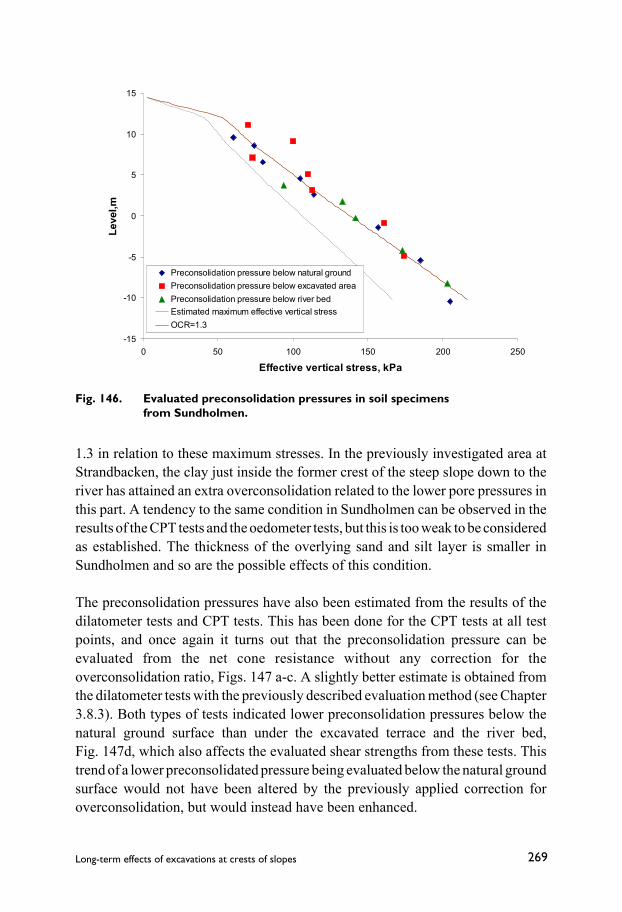
269Long-term effects of excavations at crests of slopes
1.3 in relation to these maximum stresses. In the previously investigated area atStrandbacken, the clay just inside the former crest of the steep slope down to theriver has attained an extra overconsolidation related to the lower pore pressures inthis part. A tendency to the same condition in Sundholmen can be observed in theresults of the CPT tests and the oedometer tests, but this is too weak to be consideredas established. The thickness of the overlying sand and silt layer is smaller inSundholmen and so are the possible effects of this condition.
The preconsolidation pressures have also been estimated from the results of thedilatometer tests and CPT tests. This has been done for the CPT tests at all testpoints, and once again it turns out that the preconsolidation pressure can beevaluated from the net cone resistance without any correction for theoverconsolidation ratio, Figs. 147 a-c. A slightly better estimate is obtained fromthe dilatometer tests with the previously described evaluation method (see Chapter3.8.3). Both types of tests indicated lower preconsolidation pressures below thenatural ground surface than under the excavated terrace and the river bed,Fig. 147d, which also affects the evaluated shear strengths from these tests. Thistrend of a lower preconsolidated pressure being evaluated below the natural groundsurface would not have been altered by the previously applied correction foroverconsolidation, but would instead have been enhanced.
-15
-10
-5
0
5
10
15
0 50 100 150 200 250
Effective vertical stress, kPa
Leve
l,m
Preconsolidation pressure below natural groundPreconsolidation pressure below excavated areaPreconsolidation pressure below river bedEstimated maximum effective vertical stressOCR=1.3
Fig. 146. Evaluated preconsolidation pressures in soil specimensfrom Sundholmen.

SGI Report No 61270
0
5
10
15
20
25
30
0 50 100 150 200 250 300
Preconsolidation pressure, kPaD
epth
, m
Effective overburden pressureDilatometer testCPT testCRS oedometer test
0
5
10
15
20
25
30
0 50 100 150 200 250 300
Preconsolidation pressure, kPa
Dep
th, m
Effective overburden pressureCPT testCRS oedometer test
a)
b)
Fig. 147. Evaluated preconsolidation pressures from CPT tests and dilatometertests.a) below natural ground surfaceb) below the excavated terrace

271Long-term effects of excavations at crests of slopes
0
5
10
15
20
25
0 50 100 150 200 250 300
Preconsolidation pressure, kPaD
epth
, m
Effective overburden pressure
Dilatometer test
CPT test
CRS oedometer test
-15
-10
-5
0
5
10
15
20
0 50 100 150 200 250 300
Preconsolidation pressure, kPa
Leve
l, m
Max effective overburden pressure
OCR=1.3
Dilatometer, natural ground
Dilatometer, river bed
CPT , natural ground
CPT, excavated area
CPT, river bed
CRS oedometer test
c)
d)
Fig. 147. Evaluated preconsolidation pressures from CPT tests and dilatometertests.c) below the river bedd) compilation of the evaluated values from the field tests versus testlevel
SGI Report No 61272
One problem involved in drawing detailed conclusions about the relations betweenthe evaluated preconsolidation pressures and undrained shear strengths is that thevertical stress is involved in the evaluation. The excavated area and the river-courseare fairly narrow and the distance from the test point in the natural soil to the crestabove the excavation is small. The influence of the conditions in the other parts ofthe slope can thus be significant, particularly at greater depths. This should, forexample, mean that the net cone resistance from CPT test and the evaluatedpreconsolidation pressures and shear strengths below the river would be somewhatoverestimated, whereas they would be somewhat underestimated below the naturalground. The influence on the results obtained below the excavated area is evenmore difficult to estimate.
4.5.4 Shear strength
The undrained shear strength was measured by field vane tests, which wererepeated at the three test points. The tests were performed down to levels of about–10 metres, which is 25 metres below the surrounding ground surface. The resultsfrom all field vane tests are very similar when plotted versus the test level, Fig. 148.An effect of the unloading can only be seen at the most superficial test level belowthe river bottom. The results also agree very well with the results of previousinvestigations on this side of the river, Fig. 149.
In the laboratory, the undrained shear strength has been determined by fall-conetests in the routine investigations and a number of direct simple shear tests. Thelatter tests have been divided into two groups: tests on the clay and tests on theoverlying gyttja. The results from each group have been compiled and normalisedversus effective overburden pressure and overconsolidation ratio. According tothese compilations, the undrained shear strength in the clay can be expressed by
86.0´205.0 OCRc vu σ=
, Fig. 150.
The corresponding equation for the gyttja is
86.0´3.0 OCRc vu σ≈
The relation for the gyttja is more approximate since it is based on only 4 tests.However, it fits well into previous experience from this type of soil (Larsson 1990).

273Long-term effects of excavations at crests of slopes
-15
-10
-5
0
5
10
15
0 5 10 15 20 25 30 35 40 45
Undrained shear strength, kPa
Leve
l, m
Natural ground - " -Excavated area - " -River bed - " -
-15
-10
-5
0
5
10
15
0 10 20 30 40 50 60
Uncorrected shear strength value, kPa
Leve
l, m
SGI 2001
SGI 2001
SGI 2001
SGI 2001
SGI 1957
SGI 1957
SGI 1957
GF 1989
GF 1889
GF 1989
Fig. 148. Results of field vane tests in the present investigation in Sundholmen.
Fig. 149. Results of field vane tests in all investigations on the eastern side of theriver in Sundholmen.

SGI Report No 61274
Fig. 150. Normalised undrained shear strength in the clay in Sundholmen deter-mined by direct simple shear tests.
These two equations constitute a local empirical relation for how the undrainedshear strength varies with effective overburden pressure and overconsolidationratio.
The undrained shear strength has also been evaluated from the CPT tests anddilatometer tests. The agreement with the other test results is generally good, butcertain significant discrepancies are also observed. In the test point at naturalground surface, the soil is mainly normally consolidated and only slightlyoverconsolidated. Here a very good correlation is obtained in the clay between fieldvane tests, CPT tests, dilatometer tests with the alternative evaluation, fall-conetests and direct simple shear tests, Fig. 151. Only the results of the dilatometer testsusing the first evaluation method and the values estimated by the general empiricismbased on preconsolidation pressure and liquid limit give somewhat higher values.In the overlying gyttja and organic silt, the field vane tests and the fall-cone testsgive significantly higher values than the other methods whereas the alternativeevaluation of the dilatometer tests gives lower values when the normal a-factor of0.22 is used in the evaluation.
Approximately the same relations are obtained in the tests at the excavated terrace,apart from a somewhat higher scatter and the fact that no dilatometer tests wereperformed here, Fig. 152.
y = 0,2047x0,8629
0,1
1
10
1 10Overconsolidation ratio, OCR
Nor
mal
ised
she
ar s
tren
gth,
c u
/ σ´ v

275Long-term effects of excavations at crests of slopes
0
5
10
15
20
25
30
0 10 20 30 40 50 60
Undrained shear strength, kPaD
epth
, m
Dilatometer
- " - alternative interpretation
CPT test
CPT test corr OCR
Field vane test
Fall-cone test
DSS, local empirical relation
DSS, empirical using liquid limit
DSS test
Fig. 151. Measured values of undrained shear strength in the upper test point onthe natural ground surface in Sundholmen.
Fig. 152. Measured values of undrained shear strength below the excavatedterrace in Sundholmen.
0
5
10
15
20
25
0 10 20 30 40 50 60
Undrained shear strength, kPa
Dep
th, m
CPT testCPT test corr OCRField vane testFall-cone testDSS, local empirical relationDSS, empirical using liquid limitDSS test
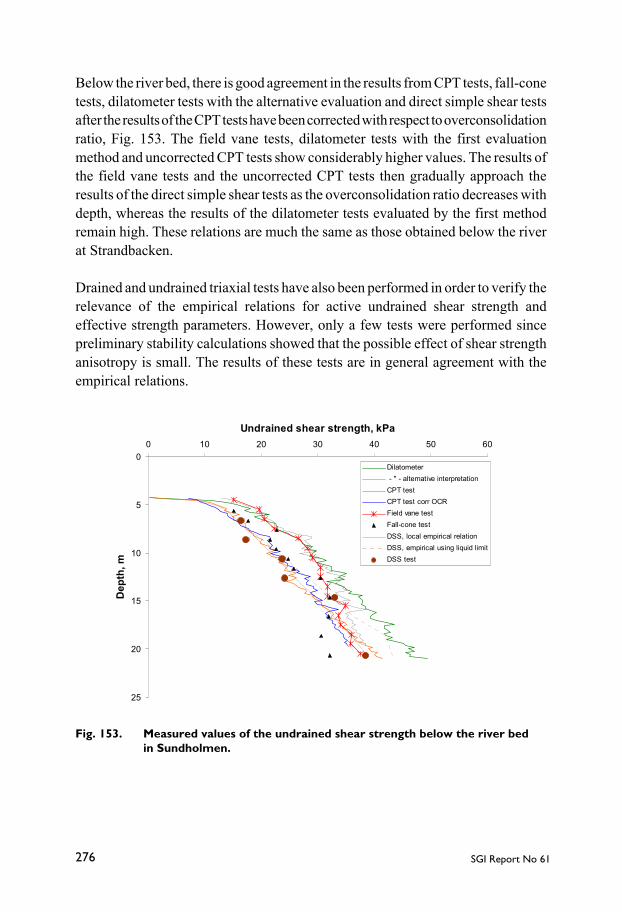
SGI Report No 61276
0
5
10
15
20
25
0 10 20 30 40 50 60
Undrained shear strength, kPa
Dep
th, m
Dilatometer - " - alternative interpretationCPT testCPT test corr OCRField vane testFall-cone testDSS, local empirical relationDSS, empirical using liquid limitDSS test
Below the river bed, there is good agreement in the results from CPT tests, fall-conetests, dilatometer tests with the alternative evaluation and direct simple shear testsafter the results of the CPT tests have been corrected with respect to overconsolidationratio, Fig. 153. The field vane tests, dilatometer tests with the first evaluationmethod and uncorrected CPT tests show considerably higher values. The results ofthe field vane tests and the uncorrected CPT tests then gradually approach theresults of the direct simple shear tests as the overconsolidation ratio decreases withdepth, whereas the results of the dilatometer tests evaluated by the first methodremain high. These relations are much the same as those obtained below the riverat Strandbacken.
Drained and undrained triaxial tests have also been performed in order to verify therelevance of the empirical relations for active undrained shear strength andeffective strength parameters. However, only a few tests were performed sincepreliminary stability calculations showed that the possible effect of shear strengthanisotropy is small. The results of these tests are in general agreement with theempirical relations.
Fig. 153. Measured values of the undrained shear strength below the river bedin Sundholmen.
277Long-term effects of excavations at crests of slopes
4.6 CHANGES IN SHEAR STRENGTH
As has already been shown, the results of the field vane tests are very similarregardless of whether they were obtained below the river, below the excavatedterrace or below the natural ground surface when plotted versus level, Fig. 148. Thepreconsolidation pressures are also similar over the area when plotted versus level.No significant effect of the unloading can thus be observed in these results eitheras an effect of the natural erosion process or the man-made excavation. An effectcan only be discerned at the uppermost test point below the river bottom.
A more direct comparison of the effect of the unloading can be made for the resultsfrom the field vane tests below the excavated terrace because tests were performedat adjacent points in both investigations in 1959 and 1989. This comparisonindicates a marginal effect, but this is too small to be considered as a fact, Fig. 154.
The first method of evaluation of the dilatometer tests likewise did not show anysignificant effect of the natural unloading. Apart from the uppermost 3 – 4 metresbelow the river bottom, the results from this point and those from the point at naturalground surface are almost identical when plotted against level, Fig. 155a. However,it should be observed that the evaluated preconsolidation pressures from thedilatometer tests are higher below the river than below the natural ground surfaceand that the general stiffness estimated from these tests follows the same relation.A somewhat higher effect of the unloading is obtained when using the alternativeevaluation method, Fig. 155b, but this relation is also affected by the difference inevaluated preconsolidation pressures, and the evaluated decrease in shear strengthbelow the river bottom is thereby less than would have been expected.
The shear strength evaluated from the CPT tests show a clear trend of an effect ofthe natural unloading on the undrained shear strength, Fig. 156. This, however, issolely an effect of the correction performed for the overconsolidation ratio. Theaccumulated results also clearly show the effect of the lower evaluatedpreconsolidation pressures below the natural ground surface, and without thecorrection the relations would be largely reversed. Because of the low tip resistancemeasured at larger depths below the natural ground surface, the evaluated shearstrength here also becomes lower than under the excavated terrace. In the upperlevels, where a reduction should have been expected below the excavation, a smallsuch reduction is also evaluated.

SGI Report No 61278
-15
-10
-5
0
5
10
15
0 10 20 30 40 50 60
Shear strength value, kPa
Leve
l, m
Blue lines = Before excavation
Red lines = After excavation
Fig. 154. Results of field vane tests below the excavated terrace before and afterthe excavation.

279Long-term effects of excavations at crests of slopes
-15
-10
-5
0
5
10
15
0 10 20 30 40 50 60
Undrained shear strength, kPa
Leve
l, m
Natural groundRiver bed
-15
-10
-5
0
5
10
15
0 5 10 15 20 25 30 35 40 45
Undrained shear strength, kPa
Leve
l, m
Natural groundRiver bed
a)
b)
Fig. 155. Evaluated undrained shear strength from dilatometer tests in Sundhol-men.a) Evaluation according to the first methodb) Evaluation according to the alternative method

SGI Report No 61280
-15
-10
-5
0
5
10
150 5 10 15 20 25 30 35 40 45 50
Undrained shear strength, kPaLe
vel,
m
Natural groundExcavated areaRiver bed
The results obtained provide unusually weak and uncertain indications of an effectof the unloading on the undrained shear strength, except for the laboratory tests andevaluations of CPT tests and dilatometer tests, which implicitly assumes that thereis such an effect. In this case, the differences in level between the natural groundsurface, the excavated terrace and the river bottom are considerably smaller thanin the other investigated areas. The fact that the results from both the CPT test andthe dilatometer test in the test point located on natural ground behind the excavationshow unusually low values in relation both to the preconsolidation pressure and tothe results in the other points is probably also a strongly contributing factor to thisresult.
4.7 STABILITY CALCULATIONS
Stability calculations in this project have been performed for the area in front of theBrosätter nursing home. The topography of the section that was measured in detailin the GF investigation in 1989 and the lowest water level in the river given in theprevious investigations have been used to describe the conditions before theexcavation. For the conditions afterwards, a typical section based on a survey of theground in this investigation has been used.
Fig. 156. Evaluated undrained shear strength from the CPT tests in Sundholmen.

281Long-term effects of excavations at crests of slopes
It is somewhat difficult to draw a representative section for the conditions after theexcavation, since the excavation has been adapted to existing buildings andconstructions and particularly its width can vary strongly within short distancesalong the river. Furthermore, some existing wells and tanks have been left stickingup as small hillocks on the excavated terrace at the time of the investigation. Oneof these hillocks is now removed since the waste water system has been reconstructed.An average width has been used for the excavated terrace in the type section. Thisshould be fairly relevant since the width varies within short distances and three-dimensional end-effects should help to smooth out the stability. The small hillockshave been disregarded for similar reasons. The erosion protection has beenassumed to be 0.7 metres thick and cover the slope down to the river bottom. Apartfrom this, the bottom profile in the river has been assumed to be unchanged since1989.
The undrained shear strength in the calculations has been based on the determinationsperformed. In cases where these differ, the main stress has been put on the resultsfrom the direct simple shear tests. The shear strength in the upper sand and silt layerhas been assumed to be drained and when the ground water level has been locatedbelow the ground surface, negative pore pressures have been assumed in theoverlying silt because of its capillarity. The effect of the latter assumption is verysmall except for very shallow slips in the riverbank because the free groundwaterlevel is high and in large parts even lies in the ground surface after the excavation.
A modelling of the groundwater level is rendered more difficult since a number ofdrainage tubes have been installed below the excavated terrace and end in theerosion protection at the riverbank. The exact positions and the function of thesetubes are uncertain. In connection with the inspection and investigations, it couldbe observed that the free groundwater level at the back and the middle of theexcavated area seasonally lies in or very close to the ground surface and that iceplugs may block the drainage tubes. Any effects of the drainage tubes havetherefore been disregarded in the modelling of the groundwater pressures.
Calculations of the stability with undrained and drained analyses and circular slipsurfaces have been performed with the computer program SLOPE/W. The Spencermethod of calculation has been used in all of these calculations. Calculations of slipsurfaces with more varied shapes, more varied shear strength parameters andcombined analyses have then been performed using Janbu's general procedure ofslices.

SGI Report No 61282
4.7.1 Before the excavation
The initial calculations showed that the calculated factor of safety before theexcavation is about 1.0 for both undrained and drained analyses. The undrainedanalysis results in critical slip surfaces reaching 5 to 10 metres in behind the crestand ending at the toe of the slope at the river bottom, whereas the drained analysisshows lowest values for superficial slips in the riverbank, Fig. 157.
The calculated safety factor increases with distance from the river and approachesa value of 1.3 when the starting point of the slip surface reaches the nearestbuildings.
The initial calculations used fairly simple soil models which were based onaverages of the values of the shear strengths measured below the later excavatedarea and the river for short slip surfaces and the measured shear strength below thenatural ground surface for longer slip surfaces.
The subsequent calculations using the Janbu method resulted in a safety factor of1.03 for an undrained analysis with isotropic shear strength. The critical slip surfaceis approximately the same as that obtained in the initial calculations. This safetyfactor rises to about 1.12 when the anisotropy is taken into account. A combinedanalysis on the other hand lowers the calculated safety factor to 0.95, whichincreases to 1.02 when the shear strength anisotropy is also considered. The drainedsafety factor also became of the same size as in the previous calculation, i.e. closeto 1.0.
The safety factors in the latter calculations became somewhat lower than in the firstones for longer slip surfaces that reach the buildings. This is mainly a result of amore detailed modelling of the strength variation. The safety factor in an undrainedanalysis thereby became about 1.18. When anisotropy is considered it increases to1.23. It decreases to 1.16 in a combined analysis and again increases to 1.18 whenthe anisotropy is also taken into account.
4.7.2 After excavation
The calculations for the situation after the excavation have been made for twoconditions: with and without the erosion protection. This has been done to illustratethe effects of the two stabilising measures, excavation and the weight of the erosionprotection, on the calculated stability separately.
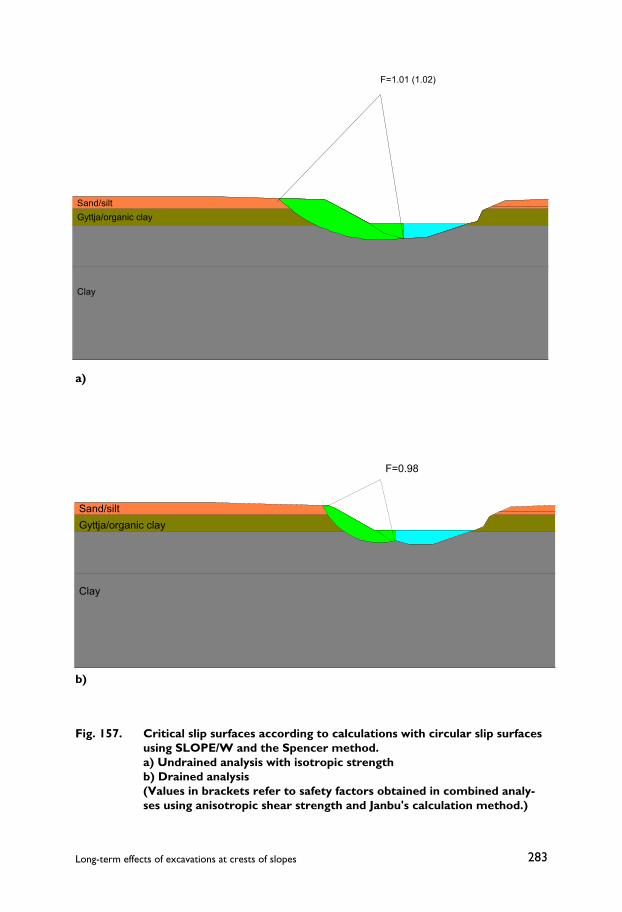
283Long-term effects of excavations at crests of slopes
F=1.01 (1.02)
Sand/siltGyttja/organic clay
Clay
Sand/siltGyttja/organic clay
Clay
F=0.98
a)
b)
Fig. 157. Critical slip surfaces according to calculations with circular slip surfacesusing SLOPE/W and the Spencer method.a) Undrained analysis with isotropic strengthb) Drained analysis(Values in brackets refer to safety factors obtained in combined analy-ses using anisotropic shear strength and Janbu's calculation method.)

SGI Report No 61284
The initial calculations with undrained analyses and simplified assumptions aboutthe shear strength distribution resulted in a critical shear surface that had movedinwards across the excavated area to encompass part of the nearest building witha safety factor of 1.33, Fig. 158. The erosion protection has no significant effect onthis large slip surface. Calculations with the same assumptions give a strongincrease in calculated safety factor for slip surfaces reaching about halfway in overthe excavated terrace. The calculated safety factor in an undrained analysis for asuch surface then amounts to about 1.48 without consideration of the erosionprotection and is reduced to about 1.42 when the weight of this is taken into account.The safety factor in drained analyses for relatively shallow slips is stronglydependent on the exact design of the erosion protection and the pore pressuredistribution close to the riverbank but can still be assumed to be very low, i.e. closeto 1.0.
In the subsequent calculations with the Janbu method and a more detailedmodelling of the shear strength properties, the same safety factor of 1.33 wasobtained in undrained analyses for slip surfaces reaching in behind the excavatedterrace and in below the nearest buildings. This factor increases to 1.36 when theanisotropy is considered, and a combined analysis for a similar slip surface givessafety factors of 1.31 regardless of whether the anisotropy is considered or not.
The safety factor in an undrained analysis for slip surfaces comprising about halfthe excavated terrace becomes 1.35 increasing to 1.48 if the anisotropy is considered.These factors apply to the case when the erosion protection is not considered. Whenthis is taken into account the calculated safety factors in undrained analyses for slipsurfaces of this extent decrease to 1.28 and 1.40 respectively. However, in acombined analysis the increase in safety factor because of the excavation is not thatlarge. Because it was the upper coarser sand and silt layers that were removed, therewas no corresponding decrease in pore pressures and the drained shear strengththereby becomes governing to a higher degree. The calculated safety factor for thesame slip surface thereby becomes about 1.10 for the first case without consideringthe erosion protection, and increasing to 1.14 when anisotropy is considered. Theeffective stress level increases proportionally more than the shear stresses when theerosion protection is considered and the calculated safety factors for this slipsurface thereby increase to 1.15 and 1.18 respectively.
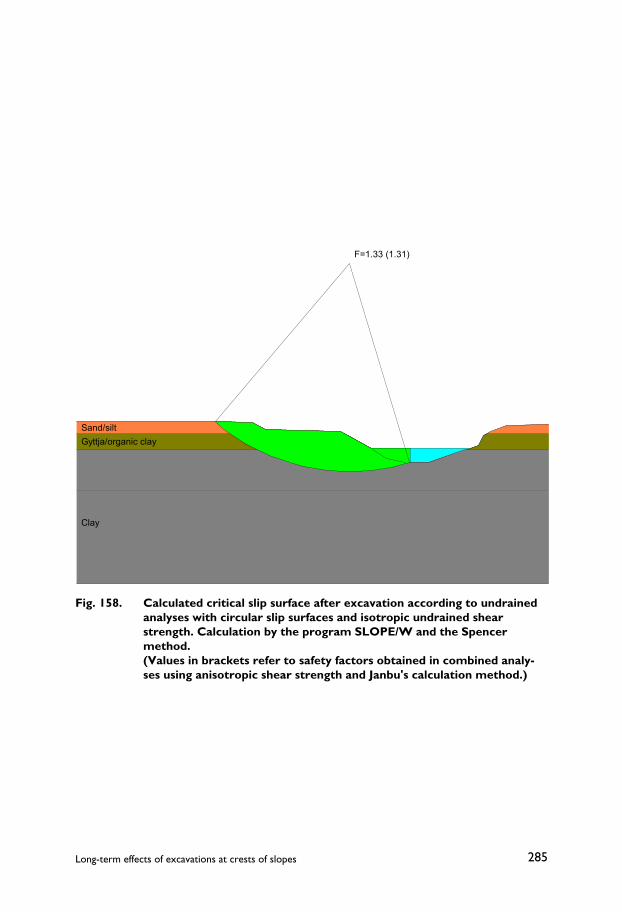
285Long-term effects of excavations at crests of slopes
Sand/siltGyttja/organic clay
Clay
F=1.33 (1.31)
Fig. 158. Calculated critical slip surface after excavation according to undrainedanalyses with circular slip surfaces and isotropic undrained shearstrength. Calculation by the program SLOPE/W and the Spencermethod.(Values in brackets refer to safety factors obtained in combined analy-ses using anisotropic shear strength and Janbu's calculation method.)
SGI Report No 61286
4.7.3 Comments on the results of the calculations
The results of the calculations show that the safety factors required for remainingbuildings according to the guidelines of the Swedish Commission on SlopeStability (1995) have barely been reached and that the stability of the outer part ofthe excavated terrace close to the river is still very low. This is not unexpected sincethe possible stabilising measures were limited by the risk of flooding at high waterlevels in the river and the existing buildings, and the measures had been adapted tothis. This is particularly the case for the nursing home lot, which is located upstreamfrom the bridge with the highest risk of flooding and where the existing buildingslay closest to the river. The measures taken were therefore less than would havebeen desirable from a stability point of view alone.
The calculations also show that the works performed primarily have an effect onthe stability of slip surfaces with a limited extent behind the riverbank. For such slipsurfaces, the excavation has a large effect according to undrained analyses but aconsiderably more limited effect according to the combined and drained analyses.The latter finding is partly due to the fact that the excavation is not associated witha corresponding lowering of the pore pressures in this particular type of soil profile.The calculations also show that the erosion protection, apart from ensuring thelong-term stability, lowers the safety factor in undrained analyses but increases itin the more critical combined analyses.
The effect of the installed drainage system is obviously good from an environmentalpoint of view. The contrast between the lawns on the drained excavated terraces andthe marshy ground to the north of them is striking. The effect from a stability pointof view is more uncertain since the free groundwater level at times can be observedto be located at or very close to the ground surface over large parts of the terraceand the drainage tubes are seasonally blocked by ice plugs. This means that thecalculated safety factor for shallow slips at the riverbank is very low and uncertain.Apart from the pore pressures, it also depends strongly on the exact design of theerosion protection both above and below the water level. This aspect has not beena primary factor for the present project and has therefore not been investigated indetail. The stability of the riverbank is probably also significantly affected by rootsystems of the rich vegetation with bushes and trees that grow here.
The relatively steep part of the riverbank in front of the nursing home, where thelocal stability is most uncertain, is closed off by a high fence running parallel to theriverbank a metre or two from the crest. The risk related to a local slip at theriverbank is thereby limited. As a rule, the slope at the riverbank is flatter in theother parts in the area.
287Long-term effects of excavations at crests of slopes
Chapter 5.
Modelling of pore water pressure
5.1 GENERAL
The pore water pressures have been modelled with aid of the computer programSEEP/W from GEO-SLOPE International (1994). The purpose for this modellingis normally to connect those pressures that have been measured at single points andthe boundary conditions into a complete model of the pore pressure conditionswithin the slope. This model can then be used in the stability calculations. Anotherpurpose would in this case have been to investigate to what extent the measuredpore pressure conditions before the excavations could have been used to predict thepresent pore pressure conditions after adaptation for the new geometries.
However, it is not possible to make a direct such evaluation since the pore pressureobservations in the previous investigations were very limited. It is only theconditions afterwards that are known in more detail. The modelling of both thecurrent and the previous conditions has therefore been done under the assumptionthat the boundary conditions in terms of pore pressures in the bottom layers andpore pressure profiles at larger distances from the excavations have remainedunchanged and thus were the same as those measured today. The permeability ofthe different soil layers has also been assumed to have remained the same. Thecalculations have then in principle been performed without support from measuredpore pressures within the clay profiles; instead the calculated pore pressuredistributions have been compared to the measured ones. However, some details inthe modelling have been affected by the measured values. It has thus, for example,been necessary to model a highly permeable soil layer on top of the excavatedterraces, in which the water that in some cases seeps out at the toe of the excavatedslope can flow out over the terrace. It has also been necessary to use the real porepressure observations as support for the modelling of the two separate aquifers thatwere found in the sand with embedded clay layers behind the excavation in SectionC in Torp.
It has proved to be difficult to model the pore pressure conditions in the superficialparts of the steep lower parts of the slopes. The calculated pore pressures here are
SGI Report No 61288
highly influenced by assumptions of the permeability in the surface layers withfissures, roots and dry crust effects. They are also strongly influenced by assumptionsabout the infiltration and surface runoff of water on the ground surface. The generalpicture of the pore pressure can be modelled fairly well but some details areconsiderably more difficult to reproduce. This is a serious weakness in themodelling since the pore pressure conditions in the outer parts of the slope are oftenof major importance for the stability. This can be remedied by closely spaced porepressure observation points and a more manual estimation in these parts.
The pore pressures in a slope are influenced by precipitation and evaporation. Allof the investigated slopes have had delta and lateral fluvial sediments overlying theclay. This has in most cases entailed that in normal conditions water seeps out atthe toes of the excavated slopes at the rear of the terraces and flows out over theirsurfaces. The groundwater level is thereby located in or close to these surfaces andcannot be significantly affected by heavier rainfalls or snow-melting. Only theareas behind the excavations are significantly affected, unless the surface waterhere is prevented from infiltrating into the ground and raising the groundwaterlevels by paved surfaces and drainage systems. For the conditions before theexcavations, on the other hand, the precipitation can be assumed to have had asignificant impact unless drainage systems had been installed in the ground.
It is problematic to simulate the effect of rainfall since the infiltration depends onthe condition of the ground surface and its inclination and also on the intensity andduration of the rainfall. However, the calculations show that fairly soon a limit isreached for how much water can be infiltrated without causing the calculations torun away and yield unreasonable results. This limit is far lower than the amount ofprecipitation that falls during wet periods and also lower that the amounts that aregiven as guiding values for infiltration capacity in other contexts (Svenska Vatten-och Avloppsföreningen 1983). Larger amounts than the limits found in thecalculation may therefore be assumed to run off as surface discharge.
The pore pressure levels are lowered somewhat during dry periods, particularly inthe superficial layers because of evaporation and the water take-up by the roots ofthe vegetation. However, there are no detailed guidelines for this that take intoaccount the particular ground conditions and vegetation. This seasonal groundwaterlowering in the upper layers has therefore not been modelled except for anillustration in the slope at Strandbacken. Neither has it any significant importancefor the assessment of the stability conditions for which the maximum pore pressuresare of primary interest. However, it has a certain importance for the comparisonbetween measured and calculated pore pressures in the upper soil layers.

289Long-term effects of excavations at crests of slopes
5.2 MODELLING OF PORE PRESSURE CONDITIONSIN SECTION A IN TORP
The soil conditions and the permeability values that have been measured in thedifferent investigations were used in the modelling of the conditions in Section A.There is some uncertainty about how the thickness of the upper sand and silt layervaries in the area between the upper crest and the test point located 50 metres behindthis. This layer is about 5 metres thick at the crest and less than 2 metres far behind,and the exact variation has some importance for the calculated pore pressures in thispart of the slope. However, some guidance about this variation is obtained from theresults of the geophysical resistivity measurements. In the model, the excavatedterrace has been supplied with an upper 0.5 metre thick layer with the samepermeability as the sand in order to allow a simulation of the outflow of seepagewater over the terrace.
The basic model uses the mean water level in the river, the measured pressure levelsin the coarse bottom layers and the measured free groundwater level far behind thecrest as boundary conditions. It has also been assumed that no horizontal water flowoccurs at the vertical boundary far behind the crest or at the vertical boundary at thecentre of the river bed. The model created thus and the calculated pore pressuredistribution are shown in Fig. 159.
A comparison between calculated and measured pore pressures shows a generallygood agreement, Fig. 160. Only very small variations have been measured becauseof the slow response in the open pore pressure systems used in this section, and themeasured values can be assumed to correspond to the modelled normal conditions.Only the most superficial pore pressure measuring system at the river bank, whichcan be assumed to have some contact with the water in the river, and the twosubsequently installed closed systems show any significant variations.
In evaluation of the comparison, it should be remembered that the pore pressuresin the bottom layers are calculated using the pressure levels measured in filter tipsin these layers, and the correlation is therefore of necessity good here. Allcalculated pore pressures in the lower layers are also affected by this fact, whereasthey are fairly insensitive to assumptions regarding the top layers.
For the situation before the excavation, it has been assumed that all excavatedmaterial has had the same permeability as the remaining sand and silt layers and thatthe same boundary conditions as for the present conditions apply. These assumptionsentail that the groundwater level is raised about 1 metre at the centre of the now

SGI Report No 61290
Fig
. 159
.C
alcu
lati
on
mo
del a
nd c
alcu
late
d po
re p
ress
ure
dist
ribu
tio
n in
Sec
tio
n A
in T
orp
aft
er e
xcav
atio
n.a)
Cal
cula
tio
n m
ode
l

291Long-term effects of excavations at crests of slopes
Fig
. 159
.C
alcu
lati
on
mo
del a
nd c
alcu
late
d po
re p
ress
ure
dist
ribu
tio
n in
Sec
tio
n A
in T
orp
aft
er e
xcav
atio
n.b)
Cal
cula
ted
pore
pre
ssur
e di
stri
buti
on. P
ress
ure
lines
for
ever
y 10
kP
a.
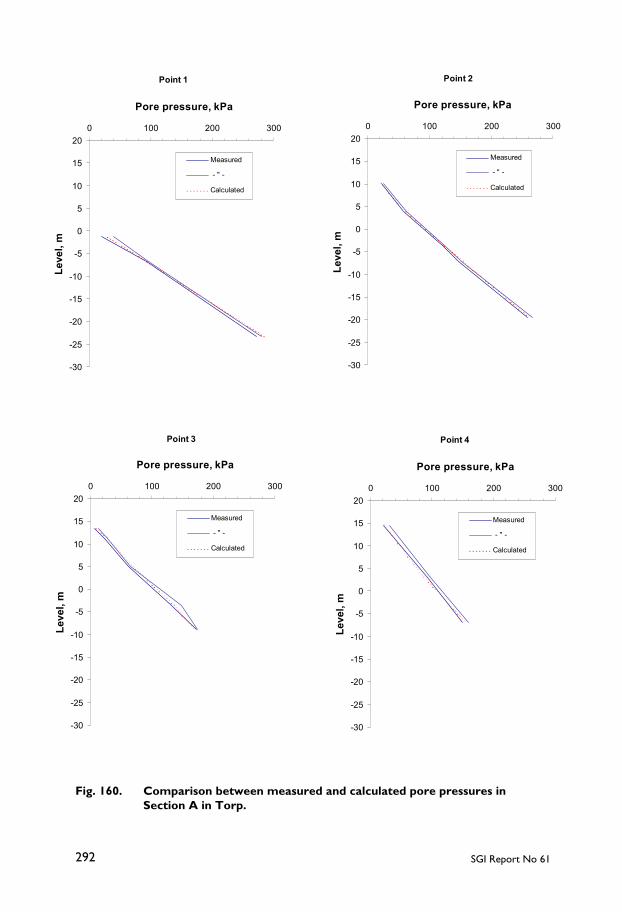
SGI Report No 61292
Point 1
-30
-25
-20
-15
-10
-5
0
5
10
15
200 100 200 300
Pore pressure, kPa
Leve
l, m
Measured
- " -
Calculated
Point 2
-30
-25
-20
-15
-10
-5
0
5
10
15
200 100 200 300
Pore pressure, kPa
Leve
l, m
Measured
- " -
Calculated
Point 3
-30
-25
-20
-15
-10
-5
0
5
10
15
200 100 200 300
Pore pressure, kPa
Leve
l, m
Measured
- " -
Calculated
Point 4
-30
-25
-20
-15
-10
-5
0
5
10
15
200 100 200 300
Pore pressure, kPa
Leve
l, m
Measured
- " -
Calculated
Fig. 160. Comparison between measured and calculated pore pressures inSection A in Torp.
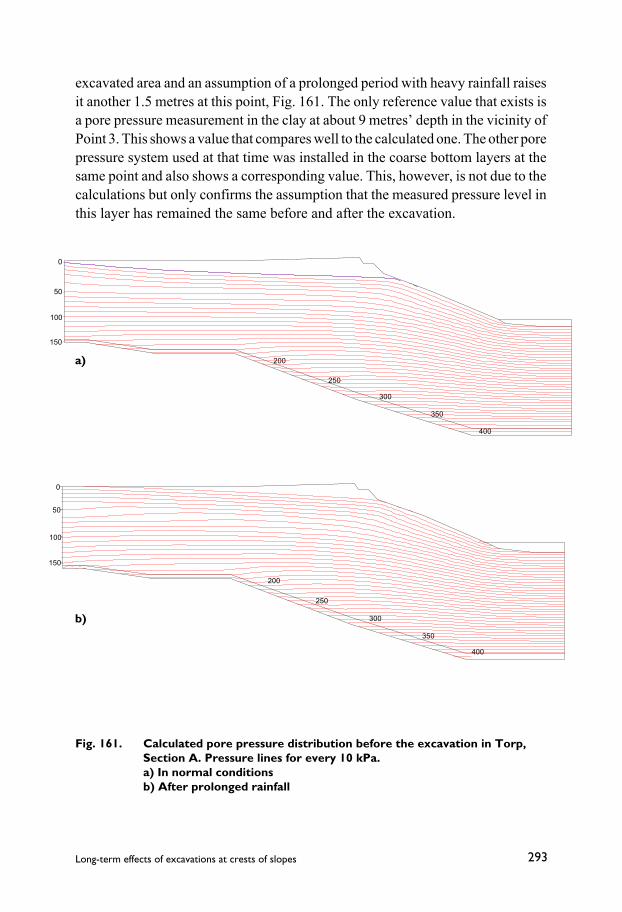
293Long-term effects of excavations at crests of slopes
excavated area and an assumption of a prolonged period with heavy rainfall raisesit another 1.5 metres at this point, Fig. 161. The only reference value that exists isa pore pressure measurement in the clay at about 9 metres’ depth in the vicinity ofPoint 3. This shows a value that compares well to the calculated one. The other porepressure system used at that time was installed in the coarse bottom layers at thesame point and also shows a corresponding value. This, however, is not due to thecalculations but only confirms the assumption that the measured pressure level inthis layer has remained the same before and after the excavation.
Fig. 161. Calculated pore pressure distribution before the excavation in Torp,Section A. Pressure lines for every 10 kPa.a) In normal conditionsb) After prolonged rainfall
0
50
100
150
200
250
300
350
400
0
50
100
150
200
250
300
350
400
b)
a)

SGI Report No 61294
5.3 MODELLING OF PORE PRESSURE CONDITIONSIN SECTION C IN TORP
The excavation in Section C was performed with two terraces. The ground surfaceat the upper terrace was first lowered by an extra amount and then supplied with abase of rock-fill covered by a pavement of more fine-grained material. The upperexcavated slope is also covered by coarse friction material serving as protectionagainst inner erosion. These parts are thus supplied with coarse surface layers thattransport any water coming out of the upper slope. No such layer exists on the lowerterrace, but a fictitious layer of sand has been applied in the model to let waterstreaming out from the upper parts of the slope spread out over the surface.
The results of the pore pressure measurements indicated that the embedded coarserlayer at a level of about –30 metres is continuous and free-draining. The modeltherefore stops at the lower boundary of this layer and the measured pressure levelis used as a boundary condition. Like the model for Section A, a vertical boundaryhas been located at the centre of the river-course with the boundary condition thatno horizontal water flow occurs. The rear vertical boundary is located just behindPoint 12. It is here assumed that no horizontal water flow occurs in the clay layersand that the water pressure in the uppermost sand layer corresponds to the measuredfree groundwater level. A clay layer that separates two sand layers in the uppersediments was found in the CPT tests. This layer was found in both Point 11 andPoint 12 and it has been assumed to be continuous between these points withconsideration given to the measured pore pressures. It cannot be estimated whetherit also has reached further out towards the river and then been removed by theexcavation. This model entails that the water pressure in the superficial sand layerin the area behind the excavation is affected by the upper groundwater level farbehind the excavation, whereas the pore water pressure in the lower sand layer andthe clay below is also affected by the groundwater level at the rear of the upperexcavated terrace. This modelling can be made with the answer at hand, but wouldhardly have been possible on the basis of investigations with normal extent beforethe excavation. The model and the calculated pore pressure distribution are shownin Fig. 162.
As with the conditions in Section A, the groundwater levels here are located veryclose to the ground surface and rainfall can thereby only have a marginal influence.The measured pore pressure variations in this section are also very small in spiteof the fact that closed systems were used. The calculated pore pressures in thebottom layers are governed by the assumed pressure level, which in turn correspondsto the pressures measured in these layers. The correspondence between measured
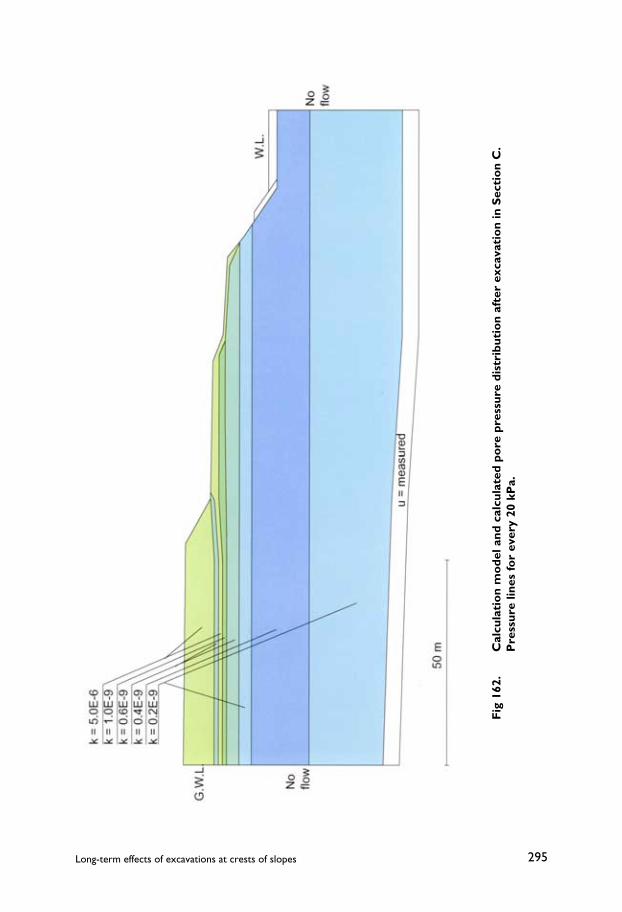
295Long-term effects of excavations at crests of slopes
Fig
162
.C
alcu
lati
on
mo
del a
nd c
alcu
late
d po
re p
ress
ure
dist
ribu
tio
n af
ter
exca
vati
on
in S
ecti
on
C.
Pre
ssur
e lin
es fo
r ev
ery
20 k
Pa.

SGI Report No 61296
Fig
162
.C
alcu
lati
on
mo
del a
nd c
alcu
late
d po
re p
ress
ure
dist
ribu
tio
n af
ter
exca
vati
on
in S
ecti
on
C.
Pre
ssur
e lin
es fo
r ev
ery
20 k
Pa.

297Long-term effects of excavations at crests of slopes
and calculated pore pressure at greater depths is thereby of necessity good. Thegeneral concordance is also good between measured values and those calculatedwith the assumptions described in the model, Fig. 163.
The results of a calculation of the conditions before the excavations are shown inFig. 164. In this model, the excavated masses have mainly been assumed to consistof sand and silt with the same properties as the remaining layers behind theexcavation. The embedded clay layer has not been assumed to continue into theexcavated area. The boundary conditions have been assumed to be unchanged, butprolonged rainfall has also been modelled. The groundwater level in the upper sandlayer has then not been allowed to rise at the rear boundary since the latter coincideswith the road to the Åtorp manor house and the drainage system below this. On theother hand, the water level in the river has been raised and the pore pressures at thelower boundary have been increased. In this way, groundwater levels are calculated,which at both centres of the now excavated terraces lie about 1.5 metre higher innormal conditions and about 3 metres higher after heavy rainfall than after theexcavation respectively. There are no reference values from pore pressuremeasurements before the excavation in this section.

SGI Report No 61298
Point 8
-35
-30
-25
-20
-15
-10
-5
0
5
10
15
200 100 200 300 400 500
Pore pressure, kPa
Leve
l, m
Measured
- " -
Calculated
Point 9
-35
-30
-25
-20
-15
-10
-5
0
5
10
15
200 100 200 300 400 500
Pore pressure, kPa
Leve
l, m
Measured
- " -
Calculated
Point 10
-35
-30
-25
-20
-15
-10
-5
0
5
10
15
200 100 200 300 400 500
Pore pressure, kPa
Leve
l, m
Measured
- " -
Calculated
Fig. 163. Measured and calculated pore pressures in Section C.
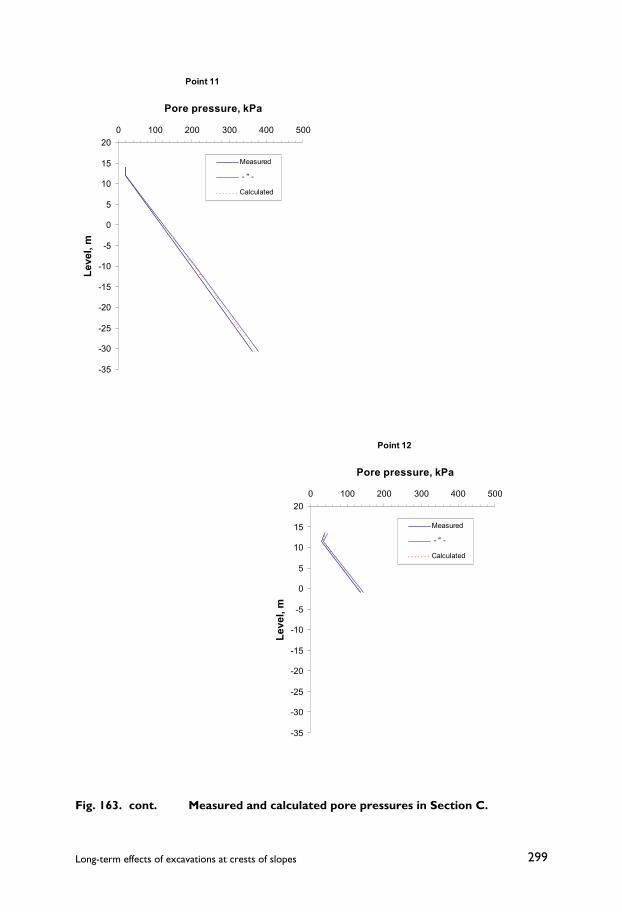
299Long-term effects of excavations at crests of slopes
Point 11
-35
-30
-25
-20
-15
-10
-5
0
5
10
15
200 100 200 300 400 500
Pore pressure, kPa
Leve
l, m
Measured
- " -
Calculated
Point 12
-35
-30
-25
-20
-15
-10
-5
0
5
10
15
200 100 200 300 400 500
Pore pressure, kPa
Leve
l, m
Measured
- " -
Calculated
Fig. 163. cont. Measured and calculated pore pressures in Section C.
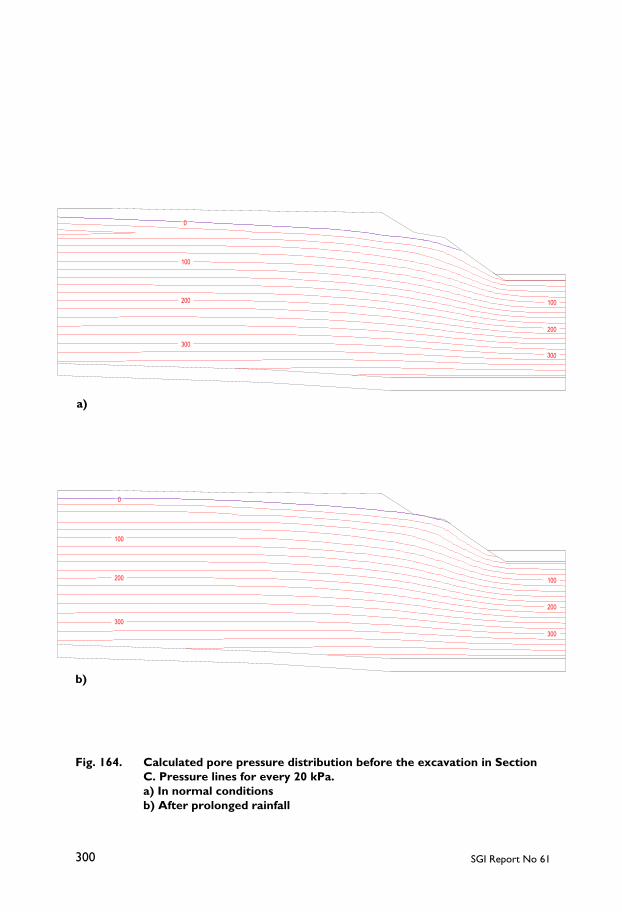
SGI Report No 61300
0
100
100 200
200
300
300
0
100
100 200
200
300 300
Fig. 164. Calculated pore pressure distribution before the excavation in SectionC. Pressure lines for every 20 kPa.a) In normal conditionsb) After prolonged rainfall
a)
b)
301Long-term effects of excavations at crests of slopes
5.4 MODELLING OF PORE PRESSURE CONDITIONSAT STRANDBACKEN
The slope at Strandbacken has been modelled with the geometry, stratification andpermeability properties that have been measured without any extra considerations,Fig. 165. In this case, the excavation has been performed solely in the upper layerwith coarser sediments and about 1 metre of silt remains as a top layer on theexcavated terrace. The modelling has been done with a lower boundary correspondingto the measured transition to the coarse bottom layers. The water level in the riverhas been varied between the levels 0 and +2 metres in accordance with the measuredvalues and the pressure level in the bottom layers has correspondingly been variedbetween +1 and +3 metres. A vertical boundary has been placed at the centre of thedeep channel in the river and a condition of no horizontal water flow has beenapplied at this. The other end of the model has been located just behind Point 6 about30 metres behind the upper crest of the slope. The upper groundwater level here hasbeen varied within the measured limits and a condition with no horizontal waterflow through the clay at the boundary has been applied.
The modelling after the excavation does not take rainfall into account becausewater seeps out of the upper slope and the ground water level is very close to theground surface over almost all of the terrace even in normal conditions. On the otherhand, a simulation has been made of the possible effects of evaporation during drierperiods. Empirical guiding values for the monthly evaporation in a relatively neararea in western Sweden (Bergsten 1950) have been used for this purpose.
The calculated pore pressure distributions at high and low water levels and in dryperiods are shown in Fig. 166a–c.
The calculated pore pressures have been compared to the measured values,Fig. 167. The correlation has to be good in the lower parts of the clay layers sincethe water pressures at the lower boundary in the model are based on measured porewater pressures in the bottom layers. The results show that an effect of theevaporation also has to be modelled to enable a calculation of the measuredvariations in pore pressure below the excavated terrace. However, the calculatedvariations are somewhat larger than those measured in the central parts of the clayprofiles. This is probably a result of the calculations having been made for steadystates without time limits for the boundary conditions, whereas both wet and dryseasons are limited in time. These periods have thus not been prolonged enough tolet the calculated effects fully affect the central parts of the clay layers.

SGI Report No 61302
Fig
. 165
.M
ode
l fo
r ca
lcul
atio
n o
f po
re p
ress
ure
dist
ribu
tio
n at
Str
andb
acke
n in
pres
ent
cond
itio
ns a
fter
the
larg
e ex
cava
tio
n.
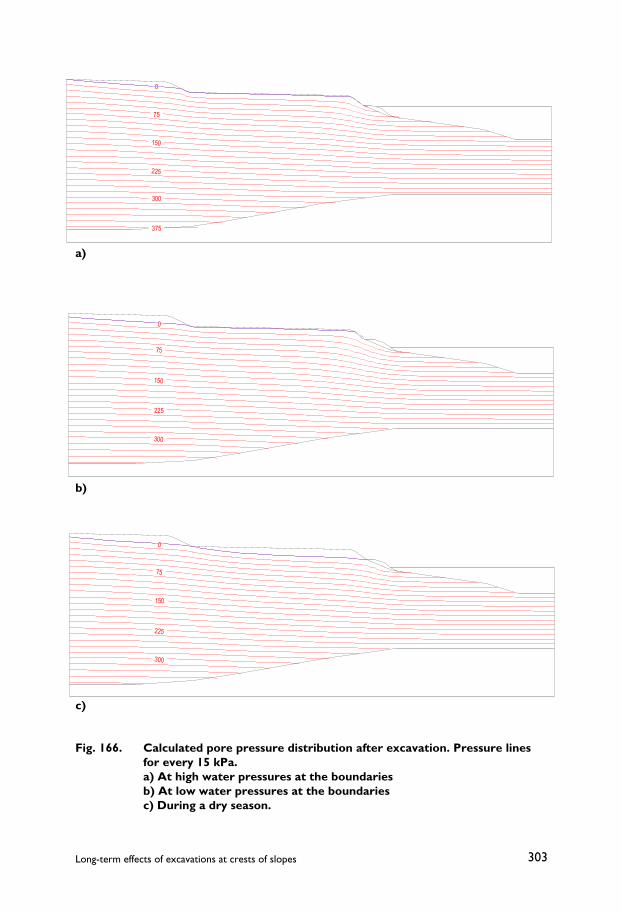
303Long-term effects of excavations at crests of slopes
0
75
150
225
300
375
0
75
150
225
300
0
75
150
225
300
a)
b)
c)
Fig. 166. Calculated pore pressure distribution after excavation. Pressure linesfor every 15 kPa.a) At high water pressures at the boundariesb) At low water pressures at the boundariesc) During a dry season.

SGI Report No 61304
Point 2
-30
-25
-20
-15
-10
-5
0
5
100 100 200 300 400
Pore pressure, kPa
Leve
l, m
Measured - " -Calculated - " -
Point 3
-30
-25
-20
-15
-10
-5
0
5
100 100 200 300 400
Pore pressure, kPa
Leve
l, m
Measured - " -Calculated - " -
Point 5
-30
-25
-20
-15
-10
-5
0
5
100 100 200 300 400
Pore pressure, kPa
Leve
l, m
Measured - " -Calculated - " -
Point 6
-30
-25
-20
-15
-10
-5
0
5
100 100 200 300 400
Pore pressure, kPa
Leve
l, m
Measured - " -Calculated - " -
Fig. 167. Comparison between measured and calculated pore pressures after theexcavation at Strandbacken. The span between the calculated porepressures refers to variation between the cases of high water pressuresat the boundaries and a dry season.

305Long-term effects of excavations at crests of slopes
The previous conditions have been modelled for two cases, both before anyexcavation was made and after the first limited excavation. The calculations areschematic since the sections within the excavated area have varied somewhat andpart of the area has been built-up with accompanying drainage systems. Thecalculations have been made for a “normal” condition with relatively low waterpressures at the boundaries and a condition with prolonged rainfall. The results ofthese calculations are shown in Figs. 168a and b and 169a and b.
From the results it can be seen that the calculated groundwater level has beenlocated at a much higher level than at present, particularly during wet periods, andthat the first excavation should have brought a fairly small lowering of thegroundwater level.
There are a few pore pressure observations made before the excavations, which canbe compared, to the calculated values. In the Göta-älv investigation, pore pressureobservations were made in open systems at a few points in the area between the lockat Ström and Strandbacken. These observations were made for a limited period oftime and it cannot be estimated whether the read-off pressures were fully stabilised.All of these systems were not installed in or even close to the Strandbacken area andthe sections and ground levels have varied. Six points with distances to the originalcrest of 20 to 40 metres have been selected for comparison. The ground level at oneof these points differed by more than 2 metres in relation to the calculation sectionand the level for this value been adjusted accordingly when plotted for comparison.
In the investigation by SGI in 1988, two closed pore pressure measuring systemswere installed in the clay and these were monitored for a relatively long period oftime. They were placed about 10 metres behind the new upper crest after the firstlimited excavation that had been performed in 1959.
The comparison between the measured and calculated values is shown in Fig. 170.According to this comparison, the calculated values are of approximately the rightsize. However, the values from the Göta-älv investigation are mostly somewhathigher, possibly because the measured pore pressures have not been fully stabilised.The values measured by the investigation in 1988 show a larger variation than thecalculated one, both upwards and downwards. This is plausible for the lower valuessince no dry season has been simulated. However, the highest measured values atthis relatively close distance to the crest are difficult to fully explain and simulate.

SGI Report No 61306
0
75
150
225
300
0
75
150
225
300
a)
b)
Fig. 168. Calculated pore pressure distribution before any excavation. Pressurelines for every 15 kPa.a) normal conditionsb) wet period

307Long-term effects of excavations at crests of slopes
0
75
150
225
300
0
75
150
225
300
Fig. 169. Calculated pore pressure distribution after the first excavation. Pressu-re lines for every 15 kPa.a) normal conditionsb) wet period
a)
b)
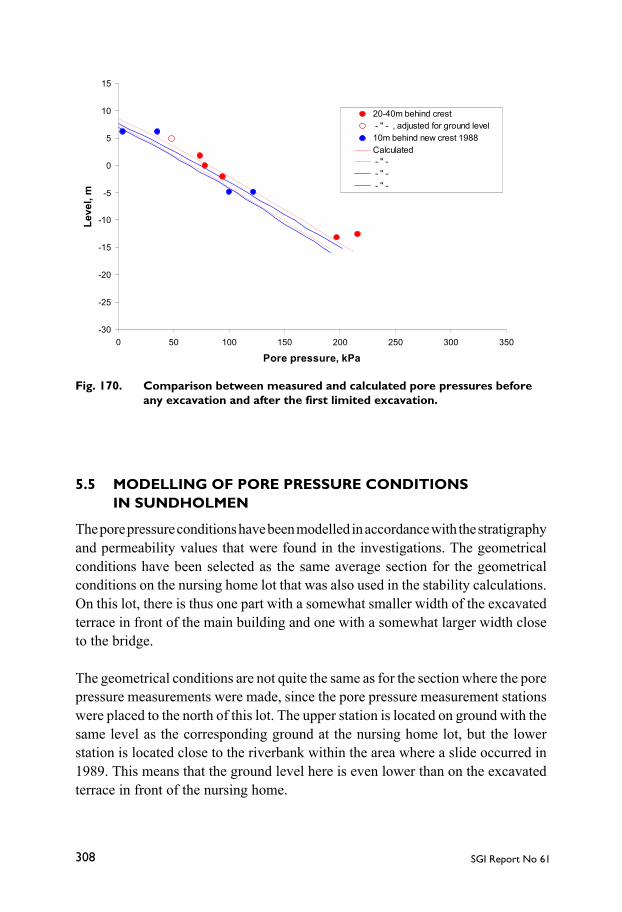
SGI Report No 61308
-30
-25
-20
-15
-10
-5
0
5
10
15
0 50 100 150 200 250 300 350
Pore pressure, kPa
Leve
l, m
20-40m behind crest - " - , adjusted for ground level10m behind new crest 1988Calculated - " - - " - - " -
5.5 MODELLING OF PORE PRESSURE CONDITIONSIN SUNDHOLMEN
The pore pressure conditions have been modelled in accordance with the stratigraphyand permeability values that were found in the investigations. The geometricalconditions have been selected as the same average section for the geometricalconditions on the nursing home lot that was also used in the stability calculations.On this lot, there is thus one part with a somewhat smaller width of the excavatedterrace in front of the main building and one with a somewhat larger width closeto the bridge.
The geometrical conditions are not quite the same as for the section where the porepressure measurements were made, since the pore pressure measurement stationswere placed to the north of this lot. The upper station is located on ground with thesame level as the corresponding ground at the nursing home lot, but the lowerstation is located close to the riverbank within the area where a slide occurred in1989. This means that the ground level here is even lower than on the excavatedterrace in front of the nursing home.
Fig. 170. Comparison between measured and calculated pore pressures beforeany excavation and after the first limited excavation.

309Long-term effects of excavations at crests of slopes
The calculation model has been given an extent that reaches between the two roadsrunning parallel to and on each side of the river. The given boundary conditions inthese two vertical boundaries are that the groundwater level in the upper layer islocated 1 metre below the ground surface and that the pore pressures in theunderlying clay along these boundaries are hydrostatic from this level. Theassumed groundwater level coincides with what has been observed in theinvestigations below the natural ground surface and is also natural with regard tothe drainage systems along the roads. The lower boundary of the model has beenplaced at a level of –70 metres, i.e. 85 metres below the natural ground surface, inaccordance with the information from the deep wells in the area. The pressure levelat this boundary is also assumed to be at 1 metre below the natural ground surfacewhich corresponds to hydrostatic water pressure from the assumed groundwaterlevel at the boundaries. The excavation has been performed solely in the upper deltaand lateral fluvial sediments and a layer of sand and silt still covers the excavatedterrace. No effect of the installed drainage system has been taken into account. Thecalculations have been made for a mean water level in the river.
According to the results of the calculations, the upper ground water level barelytouches the toe of the excavated slope both before and after the excavation,Fig. 171. This means that all of the excavated masses should have been locatedabove the free groundwater level and that the latter has not been altered by theexcavation works.
No influence of rainfall has been modelled. The area between the excavated terraceand the road consists of a built-up ground with accompanying paved surfaces anddrainage systems. The infiltration of rain and melt-water should thus be verylimited in this area. After the excavation, the groundwater level at the terrace is veryclose to the ground surface and the possible effect of infiltration is thereby verylimited.
Heavy rainfall could have significantly affected the conditions in front of the built-up part of the lot before the excavation and thereby affected the stability of the steepriverbank. However, it is not known whether there was any effective drainagesystem at that time or not. High water levels in the river also affect the groundwaterlevel and the pore pressures but do not constitute a stability problem except duringvery rapid drawdowns afterwards. The pore water pressures in the upper soil layersdecrease during dry periods because of evaporation. This effect can be assumed toreach deeper after the excavation. The installed drainage system should also havebrought a certain lowering of the groundwater level during those periods when itis functioning. According to the calculations, the excavation has not brought any
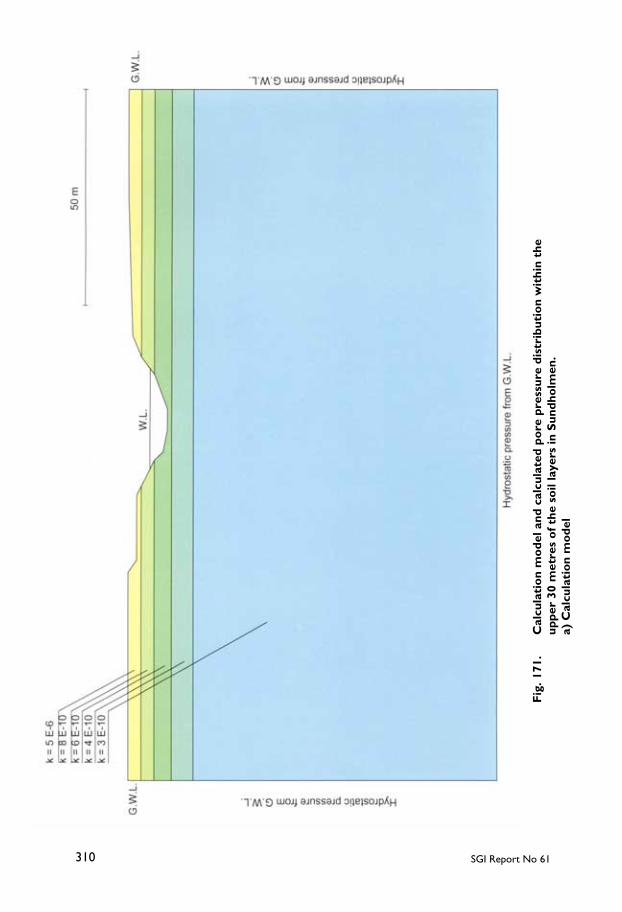
SGI Report No 61310
Fig
. 171
.C
alcu
lati
on
mo
del a
nd c
alcu
late
d po
re p
ress
ure
dist
ribu
tio
n w
ithi
n th
eup
per
30 m
etre
s o
f the
so
il la
yers
in S
undh
olm
en.
a) C
alcu
lati
on
mo
del
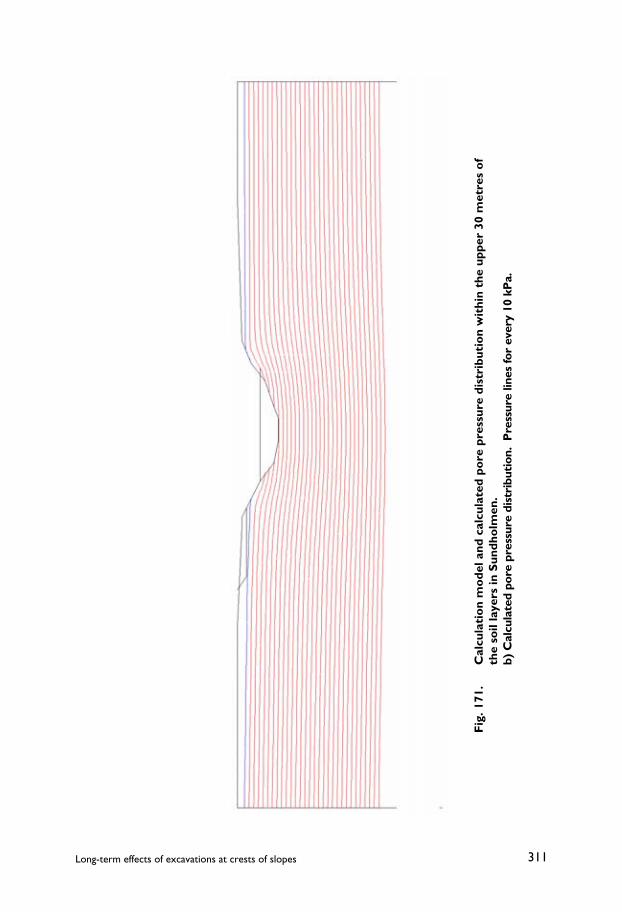
311Long-term effects of excavations at crests of slopes
Fig
. 171
.C
alcu
lati
on
mo
del a
nd c
alcu
late
d po
re p
ress
ure
dist
ribu
tio
n w
ithi
n th
e up
per
30 m
etre
s o
fth
e so
il la
yers
in S
undh
olm
en.
b) C
alcu
late
d po
re p
ress
ure
dist
ribu
tion
. P
ress
ure
lines
for
ever
y 10
kP
a.

SGI Report No 61312
significant changes to the pore pressure conditions apart from the aspects mentionedabove, which are more difficult to simulate.
The calculated depression in pore pressures around and below the river fits verywell with the picture obtained from the measurements. Considering the relativelysimple soil and boundary conditions that prevail in this section, it is plausible thata good prognosis could have been made based on conditions known before theexcavation. However, this does not apply to the effects of the installed drainagesystem.
313Long-term effects of excavations at crests of slopes
Chapter 6.
Experience from and commentson the results of the investigations
6.1 INVESTIGATION METHODS
6.1.1 Determination of stratification and depth to firm bottom
The soil layers and stratification can be highly variable also in areas that in a generaloverview are characterised as clay areas. The thickness of the deposits of soft soilscan also vary greatly. The clay layers are in many areas covered by coarser soils,and layers of coarser soil are also often found embedded in the clay layers. Theshear strength in these layers differs from that in the surrounding clay and can beboth higher and lower. If these layers are thick enough and continuous, they alsobecome water transporting and affect the groundwater pressures in the entire soilmass. It is thus very important to use investigation methods that enable in a rationalway the detection and mapping of such variations in the soil profiles. Among thevarious equipment used in current practice, only CPT tests and dilatometer testsfulfil this requirement.
The depths to “firm bottom” and to bedrock can vary strongly both sideways andalong the investigated area. The depth to firm bottom has to be established since itconstitutes the lower limit for possible slip surfaces. The firm bottom is also inmany cases made up of friction soil or fissured rock that is permeable and therebyaffects the pore pressure conditions in the overlying soil mass. The depth to firmbottom and its variation also affect the homogeneity of the overlying soil massesacross and along the area. A strongly inclined firm bottom often means that theoverlying soil layers are inclined and vary in thickness. The varying conditions forpercolation of water and diffusion also entail that different parts of the soil massmay have been subjected to different degrees of chemical changes, such as leachingof salts and/or introduction of dispersive agents, and that the character andproperties of the soil thereby vary.
The depth to firm bottom should preferably be known roughly before the detailedgeotechnical investigations start. This facilitates a selection of proper equipmentand a rational methodology for the investigations. General information about what

SGI Report No 61314
type of soil layers can be found and what depths to firm bottom can be expected isoften obtained by the initial “inspection” which should be performed according tothe guidelines for slope stability investigations given by the Swedish Commissionon Slope Stability (1995). This inspection comprises, among other things, studiesof previous geotechnical investigations in the area, the geological map and theaccompanying geological descriptions of the area. Great caution has to be observedwhen interpreting old investigations, because these were often performed withsimpler equipment with less resolution in the results and ability to penetrate the soillayers. If the available information is insufficient, an initial geophysical investigationshould be considered for clarification of the thickness of the soil layers in the area.Recommendations for when geophysical investigations should be performed andwhat methods should be used for different soil conditions and at different stages ina slope stability investigation have been given in SGI Report No. 62 (Dahlin et al.2001).
The depths to firm bottom vary between the different investigated areas, eventhough they are fairly large in all cases, from about 20 to about 85 metres. In theStrandbacken area, there was a large amount of information available fromprevious investigations and also a detailed geological description of the area.Different investigation methods had been used and some of these could withconfidence be assumed to have penetrated down to firm bottom. The maximumdepths to firm bottom, about 40 metres, the main stratification and undrained shearstrength of the soil were thereby largely known. The investigations could therebybe planned with already known requirements for penetration force, amount ofequipment and its sensitivity and resolution. The purpose for the new investigationswas thereby mainly limited to supplementing the known picture of stratificationand soil properties in the area with more accurate results with higher degrees ofdetail and resolution.
In Sundholmen, the approximate depth to firm bottom was known from informationfrom several deep wells in the area. It could thereby be estimated at about 85 metres,and there was no significant variation in the reported depths. The previousgeotechnical investigations showed that the upper soil layers were also fairlyhomogeneous regarding thickness and properties. Because of the limited depth andwidth of the river-course, only the properties in the upper soil layers affect thestability unless any significantly weaker layer exists at greater depth. As in theprevious investigations, the new ones were therefore concentrated in the upper25 metres. However, one CPT test was continued to more than twice this depth inorder to ascertain that the above-mentioned condition was fulfilled.
315Long-term effects of excavations at crests of slopes
In the Torp area, there were also previous investigations available. However, thesehad mainly been performed with equipment with limited ability to penetrate and theachieved penetration depths had erroneously been designated as stops at firmbottom. This meant that the thickness of the soft soil deposits was underestimatedbefore the new investigations and the preparations and equipment first brought tothe site were insufficient. Supplementary investigations therefore had to be madein several stages and the investigations in the deepest profile were finally stoppedat depths of 50 to 60 metres without having reached firm bottom. This could be donebecause it was estimated from control calculations that the then remainingunderlying soil could not affect the stability. In this case, the investigation couldhave been made in a much more rational way if the later geophysical investigationhad been performed prior to the geotechnical investigations.
CPT tests and dilatometer tests provide similar and often more or less equally goodpictures of the stratification and classification of the soil layers. However, the CPTtest is more cost-effective and yields a fully continuous profile. The dilatometer testis normally used only as a supplement and when some special property is to bemeasured. Both methods yield a coarse classification whereby significantlydifferent soil types such as sand, silt and clay normally can be distinguished withfairly good accuracy. The CPT test can also be used for estimation of whetherdifferent layers can be considered as free-draining or not by studying the dissipationof the generated excess pore pressure during short stops in penetration in theselayers. This should always be done at stops against presumed firm bottom layersto check whether these consist of free-draining coarse soil or fissured rock. Ameasure of the stabilised water pressure at these levels is then also obtained. Thepossibility to classify and differentiate between more similar soil types, such asorganic clay, clay, silty clay and clayey silt is limited. Boundaries or transitionzones between different types of soil are often clearly observed in the results of CPTtests in terms of changes in friction ratio, pore pressure ratio and development oftip resistance and generated excess pore pressure with depth. In the dilatometertests this can be seen in the trends for measured pressures and evaluated materialindex. However, samples of the soil have to be taken and classified in the laboratoryto enable a determination of the causes of these changes. The results of suchclassifications and the belonging routine tests are also required for making anoptimal evaluation of properties in the soil from the field tests. The results of theCPT tests in this project illustrated these possibilities and limitations. All significantlayers, both thin and thick, were registered, but an exact classification required thatsamples should be taken in all of these layers.

SGI Report No 61316
The investigations should therefore start with CPT tests and the sampling levelsshould be selected from these results in such way that all significant soil layers areincluded in the sampling. On the other hand, the amount of sampling in thickhomogeneous layers can in the same way be reduced in many cases.
Static penetration tests, such as the CPT test, stop in very dense coarse soil. Theytherefore cannot be used to measure the thickness of underlying layers of densefriction soils. Also dynamic penetration tests usually stop somewhere within suchlayers, unless they are thin. Geophysical investigations provide a contour of thebedrock surface. The accuracy of this determination is often sufficient, but themeasurement is not exact. In order to determine the bedrock surface more exactly,and if required obtain a better calibration of the geophysical measurements, soil-rock drilling with multi-channel registration of the drilling parameters should beperformed, preferably by the Jb-3 method (SGF 1999). For an estimation of thedrainage properties at the firm bottom, it is normally sufficient to study theequalised pore pressures at the stops of a large enough number of CPT tests in thearea. This picture will also be clarified further when the results of the pore pressuremeasurements in piezometers become available.
6.1.2 Determination of shear strength
General
The field vane test is the traditional method of determining undrained shear strengthin Sweden. Fall-cone tests are also performed as part of the routine testing ofundisturbed soil samples in the laboratory. The results of the fall-cone tests oftenbecome of the same size as those of the field vane tests down to depths of 10 to 15metres. At larger depths, they generally become lower, which is assumed to be aresult of the large unloading that occurs in samples from great depths. The latterresults are thus considered to be less relevant. This applies to homogeneous clay.In clay with numerous thin silt layers or with infusions of other coarser particles,the fall-cone test can give higher values because these objects stop the conepenetration. The fall-cone test should therefore not be used in such soils. Thegeneral picture with similar values from field vane tests and fall-cone tests downto 10 to 15 metres' depth and lower values from the fall-cone test below that wasmainly obtained also in the present investigation. The exceptions were theinvestigations performed below the river beds, where the results of the fall-conetests became lower throughout the profiles.
317Long-term effects of excavations at crests of slopes
The results of field vane tests often indicate an improbably low increase in shearstrength with depth. Among other things, this can be a result of the amounts of siltparticles and thin silt layers increasing with depth, which entails an increased riskthat the soil will be excessively disturbed when the vane is inserted at the test level.It is recommended that test equipment with protective rods and a vane casing beused in such soils, since this type of equipment has been found to cause lessdisturbance here. In this project, and in the special study of the field vane test thatwas performed in connection with it, it has also been found that a change from thenormal vane size to a smaller one may result in a smaller shear strength value beingmeasured (Åhnberg et al. 2001). Such a change is made when the maximum torquefor the vane and/or the measuring instrument is reached. In soils that are easilydisturbed, there is thus an obvious risk that there will be a jump in the measuredshear strength at the level where the change is made and that the increase in shearstrength then becomes lower at greater depths. This is a further reason to useequipment with casing since most of the rod friction, which otherwise constitutesa large part of the torque resistance, is thereby eliminated. The normal vane size canthen often be used to considerably greater depths. These aspects were illustrated bythe results from the Torp area in this investigation. Larger vanes than the normalare sometimes used in very soft soils. This can also affect the measured shearstrength in some types of soils, as was shown in the special study of the field vanetest that was initiated by the results from Torp (Åhnberg et al. 2001).
A further aspect that may influence the measured increase in shear strength withdepth in field vane tests is that the overconsolidation ratio in the soil often varieswith depth. How the overconsolidation ratio affects the results will be discussedfurther on in this Chapter.
The field vane test is a relatively time-consuming and costly method for determinationof the undrained shear strength in situ. The CPT test is a considerably more rationalmethod and it is therefore recommended that this test be used to a relatively largeextent also for determination of the undrained shear strength, provided that theequipment is accurate enough. The results from initial CPT tests can then be usedfor rough calculations to estimate whether there is a possible stability problem andin that case how far the potential slip surfaces extend. The following field vane testscan then be concentrated in this zone where, apart from being a supplement to theCPT tests, they also constitute a local calibration of the latter against a better triedout method. However, the evaluation of both field vane tests and CPT test rely onempirical factors and both may need a calibration against, for example, directsimple shear tests, as has been shown in this project.

SGI Report No 61318
The shear strength can also be evaluated from dilatometer tests. These tests arenormally only performed in order to determine some other parameter(s), as forexample the coefficient of earth pressure. However, in some cases they may be usedas supplements to estimate the shear strength in soils that are very easily disturbedand in which both field vane tests and CPT tests may be assumed to cause excessivedisturbance and in which taking of undisturbed samples is extra difficult. In suchsoils, the dilatometer test has often proved to be the method whose results in termsof evaluated undrained shear strength have been least affected by the disturbanceduring penetration. In the investigations in this project, the shear strength evaluatedfrom dilatometer tests often differed more than is normal from the results of theother methods in homogeneous clay layers. This applies primarily to the evaluationmethod proposed by Larsson (1989). Rankka (1994) has previously obtainedsimilar results at investigations in slopes. The difference may be related, amongother things, to the special stress conditions in a slope. In that case, such factors asthe orientation of the dilatometer blade in relation to the direction of the slope couldalso influence the results. The internationally more commonly used method, whichemploys the evaluated overconsolidation ratio, the effective overburden pressureand empirical relations between these and the undrained shear strength, in mostcases gave results in better agreement with the other test methods. However, thisis provided that the evaluation method for the overconsolidation ratio that has beenpresented in this report is used.
Shear strength values obtained by field vane tests and fall-cone tests are correctedby empirical correction factors. In Sweden, these factors are related to the liquidlimit of the soil (Larsson et al. 1983). The normal evaluation of undrained shearstrength from CPT tests is also based on an empirical cone factor, which should bemodified with respect to the liquid limit of the soil (Larsson and Mulabdic1991).An evaluation of the shear strength from field vane tests and fall-cone tests therebyrequires that the liquid limit on the test level at the test point be determined. Thishas to be done on samples brought into the laboratory. A more qualified evaluationof the undrained shear strength from CPT test results also requires that the variationin liquid limit with depth in the test point be determined. Dilatometer tests are alsoevaluated by use of empirical correlations, However, the normally used evaluationmethods do not require any other parameter than those determined in the test, apartfrom an estimate of the pore pressure distribution.
The basis for all empirical relations contains scatter, and a condition for therelevance of the evaluated shear strengths is that the tests have been performedaccording to established methods, i.e. according to the recommendations of theSwedish Geotechnical Society. Another condition is that the disturbance of the soil
319Long-term effects of excavations at crests of slopes
at the test is within normal limits for the particular test method in a soil with acorresponding composition and that all other factors have also been “normal”.However, the only measure of the composition of the soil that is normally used isits liquid limit. Smaller or larger deviations are therefore often obtained in theresults from some and sometimes for all of the methods mentioned above. In the soilprofiles in the present investigation, the largest differences were obtained in theorganic, silty and sandy delta and lateral fluvial sediments, whose compositionsalso differ from those soils on which the empirical factors are based.
A first way of checking whether the measured shear strength values are reasonableis to use empirical relations for how the shear strength normally varies withpreconsolidation pressure, overconsolidation ratio and liquid limit (Larsson et al.1983). This requires that undisturbed samples have been taken and that thevariation in preconsolidation pressure with depth has been determined by oedometertests. The empirical relations can be used to sort out obviously impossible valuesthat are due to excessive disturbance during the test, improper execution of the test,measuring errors, damaged equipment, etc. However, also the empirical relationscontain considerable scatter and they can only be used in this way and as supportfor measured values and trends.
A more direct calibration of the measured shear strength values can be made byperforming undrained direct simple shear tests on samples of high quality, whichhave first been reconsolidated with guidance from measured preconsolidationpressures and then been allowed to adapt to the in situ effective overburdenpressure. The results of such tests are not corrected but are used as direct shearstrength determinations. They can thereby also be used for a local calibration of allthe empirical factors and correlations mentioned above.
The shear strength anisotropy can be estimated roughly with the use of empiricalrelations (Larsson et al. 1983). However, the shear strength estimated in this wayis only used in coarser estimates. Before being used in a final estimate of thestability, it has to be verified by active triaxial tests and when appropriate also bypassive triaxial tests. These tests can be performed in a limited series that primarilyaims at verifying that the existing empirical relations are also applicable in thespecific case. If any significant deviations from these are measured in the tests, thetest series has to be extended.
The effective shear strength parameters in clay are also normally estimatedaccording to an empirical pattern (Larsson et al. 1983). The applicability of thispattern should be verified by a number of drained triaxial tests in all cases where

SGI Report No 61320
the absolute values have a significant importance for the estimated stability. Acontrol can also be made by studying the effective stress-paths in undrained triaxialtests. The test series should be expanded if any significant deviations from theempirical pattern are measured. Effective shear strength parameters in possibleoverlying or embedded silt and sand layers are normally estimated from empiricalrelations and results of CPT tests (e.g. Knutsson et al. 1998).
Examples of how the different determinations scatter, how empirical relations cansupport different trends and how the evaluation can be improved by local calibrationsare found in the presentations of the test results from the different test areas. Thisalso applies to the performed verifications of shear strength anisotropy andeffective shear strength parameters.
The descriptions given above for how the shear strength can be determined are inprinciple in line with the recommendations for determination of shear strength instability investigations given by the Swedish Committee on Slope Stability (1995).However, some additions and modifications have been made with regard toexperience and results obtained in the present and other mentioned researchprojects carried out since then. Further aspects of the determination of shearstrength in overconsolidated soil will be discussed in the next section.
Special effects in overconsolidated soils and slopes
The stress conditions in overconsolidated soils and slopes are different from thosein normally consolidated soils under flat ground. The horizontal stresses have notdecreased in the same degree as the vertical overburden pressure in overconsolidatedsoils in which the overconsolidation is due to a real unloading. When the unloadingbecomes large enough, a reversed situation with larger horizontal stresses than theoverburden pressure will occur.
In natural slopes, the stress conditions will differ in different parts of the slope(e.g. Rankka 1994). The stress conditions far behind the crest of the slope are inprinciple the same as below ordinary flat ground and the soil is here often “normallyconsolidated or only slightly overconsolidated”. The horizontal stresses in the soilhere correspond to the earth pressure at rest. The soil closer to the crest is still oftenonly slightly overconsolidated but often for slightly higher effective verticalstresses since the groundwater level is somewhat lower due to the seepage of watertowards the lower lying parts of the slope. At the same time, the horizontal stressesare lower here towards the slope since the corresponding counteracting soil massesare less in this direction. The horizontal pressures here thereby correspond to values
321Long-term effects of excavations at crests of slopes
between earth pressure at rest and active earth pressure. The stress conditions belowthe slope then gradually change to the situation down at the toe of the slope, wherethe vertical stresses are low and the overconsolidation is correspondingly high. Thecoefficient of earth pressure is high because of both the overconsolidation ratio andthe excess pressures transmitted from the overlying sloping ground, and thehorizontal stresses lie somewhere between earth pressure at rest and passive earthpressure. The differences in stress conditions between normally consolidated soilsand overconsolidated soils are thus enhanced in a slope.
Most of the test methods used in situ are sensitive to the acting horizontal stress.This has been shown for the case of field vane tests below embankments on clay(Law 1979 and 1985), and for CPT tests in sand (e.g. Schmertmann 1972). Thedilatometer measures pressures in a horizontal direction and should thereby besensitive to the in situ horizontal stress in that direction. The common evaluationmethods are generally tried out for normal cases with normally consolidated tomoderately overconsolidated soils and relatively flat ground and are therefore notnecessarily valid for significantly different stress conditions. The influence of thehorizontal stresses on the results of field vane tests and CPT tests in different partsof a clay slope is currently being investigated in a separate research project in co-operation between the Swedish Rescue Services Agency, Chalmers University ofTechnology and SGI (Löfroth 2002).
In most general models of how the undrained shear strength varies withpreconsolidation pressure and overconsolidation ratio the shear strength is directlyor indirectly described by the equation
1´.´ −== bcu
bvu OCRacaltOCRac σσ
(e.g. Ladd and Foott 1974, Jamiolkowski et al. 1985, Schofield and Wroth 1968,Roscoe and Burland 1968, Wood 1991)
These relations are obtained in both direct simple shear tests and triaxial tests in thelaboratory. Results presented by e.g. Larsson (1980), Jamiolkowski et al. (1985)and Mayne (1988) show that the factor a is about 0.33 for active triaxial tests on clayand up to 0.5 in the same type of test on organic soils, (Larsson 1986). For the casesof direct simple shear tests and passive triaxial tests, the factor a has been found tovary with the liquid limit (or plasticity index). An average value of 0.22 is oftenused for the case of direct simple shear, whereas considerably higher values shouldbe used in organic soils. There may also be a possible slight variation in the a-factor
SGI Report No 61322
in triaxial tests on clay with the plasticity of the soil (e.g. Westerberg 1999), but thisis normally not taken into consideration.
The b-factor is normally between 0.75 and 0.85 in both triaxial tests and directsimple shear tests (e.g. Jamiolkowski et al. 1985 and Mayne 1988). It is normallyset to 0.8 according to the empirical pattern (or more cautiously to 0.75). The valuesthat have been measured in this investigation have been within the normal band.This means that a large unloading results in a considerable decrease in theundrained shear strength.
However, a corresponding reduction is not measured by field vane tests in situ. Insuch tests the measured reduction is far less, if any (e.g. Jamiolkowski et al. 1985).According to Swedish experience (Hansbo 1957), the preconsolidation pressure inclay can be estimated directly from the measured shear strength values in field vanetests by the equation
L
vc w45.0' τσ =
where τv = measured uncorrected shear strength value from the field vane testwL = liquid limit
A corresponding relation expressed as a function of the plasticity index has beenfound for other clays by Mayne and Mitchell (1988). These correlations imply thatno reduction in the measured shear strength value from field vane tests as a resultof unloading can be expected.
The fact that a certain effect of the unloading and overconsolidation can beobserved in the results of the field vane tests means that a certain modification ofthe Hansbo relation ought to be made in overconsolidated soil. However thismodification is small. The results of this investigation have given the relation
11,1
'45,0
=
vL
v
wOCR
στ
where OCR = overconsolidation ratio evaluated from preconsolidation pressuresdetermined by oedometer tests
σ'v = effective overburden pressure
323Long-term effects of excavations at crests of slopes
An old rule of thumb for field vane tests below eroded water courses is that areduction in the shear strength in relation to the measured values at the same levelsin the surrounding ground can be detected within the uppermost 5 to 10 metresbelow the river bottom, but not further down in the profiles (Bergdahl 2002).Corresponding results were largely obtained in the present investigations and thisalso applied to the CPT tests according to the common methods of interpretation.It is hoped that the aforementioned ongoing project (Löfroth 2002) will show if, andto what extent, this is related to the stress conditions with relatively high remaininghorizontal stresses in the unloaded areas at the toes of the slopes.
According to the accumulated values presented by Jamiolkowski et al. (1985),there is generally a small effect of an unloading on the shear strength values inuncemented clays which can be expressed with a b-value of about 0.95. This entailsa certain but small reduction in measured undrained shear strength because ofunloading. The results from the field vane tests in the present investigation havealso been gathered for evaluation of the b-factor. However, it is not quitestraightforward to obtain a correct value of this factor in a natural soil mass sincenot only the overconsolidation ratio but also the liquid limit (or plasticity index)vary. The relations between the effective overburden pressures and the measuredshear strength values are thereby affected in more than one way and a certain scattercan be expected also after correction with respect to the liquid limit. The resultsfrom the different slopes have therefore been put together in different ways, bothas a bulk and as results from a selected soil layer with relatively homogeneousproperties in terms of plasticity, Fig. 172. In Sundholmen, only the results from therelatively homogeneous clay below the delta and lateral fluvial sediments havebeen incorporated.
As can be seen in the figure, b-values between mainly 0.89 and 1.04 could beevaluated from the different compilations with an average value of 0.97. This isapproximately the same range and average value as those presented for similarclays by Jamiolkowski et al. (1985).
The Swedish experience, which forms the basis for the normally employedcorrection factors for field vane tests, is based on normally consolidated and onlyslightly overconsolidated soils. A certain caution is therefore called for whenapplying the results of field vane tests in more overconsolidated soils, for exampleat the toes and under the rivers in slope stability investigations of eroded watercourses.A correction in heavily overconsolidated soil is obtained automatically when acombined analyses is used since the drained shear strength becomes governing athigh overconsolidation ratios. However, there is a certain span with over
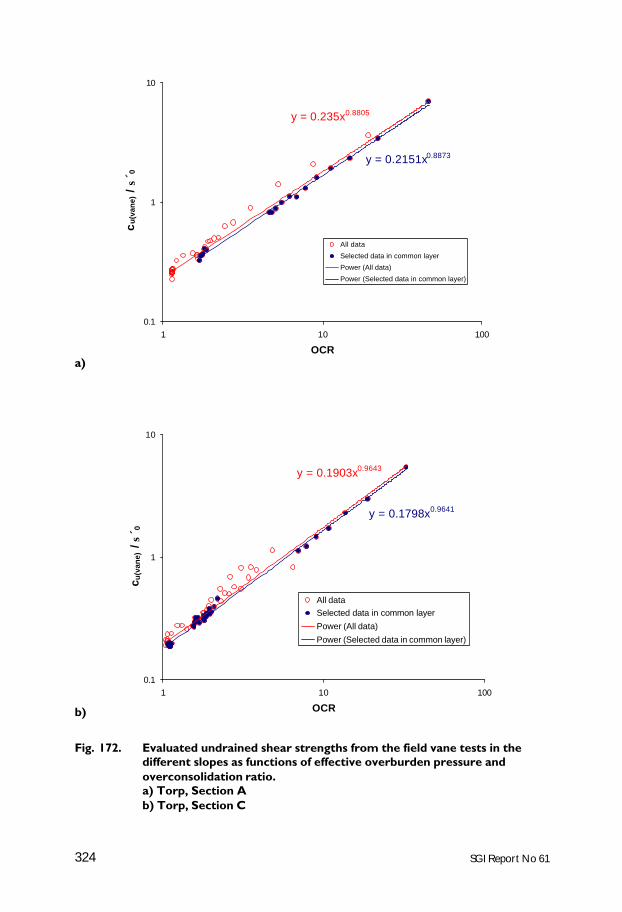
SGI Report No 61324
a)
b)
Fig. 172. Evaluated undrained shear strengths from the field vane tests in thedifferent slopes as functions of effective overburden pressure andoverconsolidation ratio.a) Torp, Section Ab) Torp, Section C
y = 0.235x0.8805
y = 0.2151x0.8873
0.1
1
10
1 10 100
OCR
cu
(van
e) /
σ´ 0
All data
Selected data in common layer
Power (All data)
Power (Selected data in common layer)
y = 0.1903x0.9643
y = 0.1798x0.9641
0.1
1
10
1 10 100
OCR
cu
(van
e) /
σ´ 0
All dataSelected data in common layer
Power (All data)
Power (Selected data in common layer)
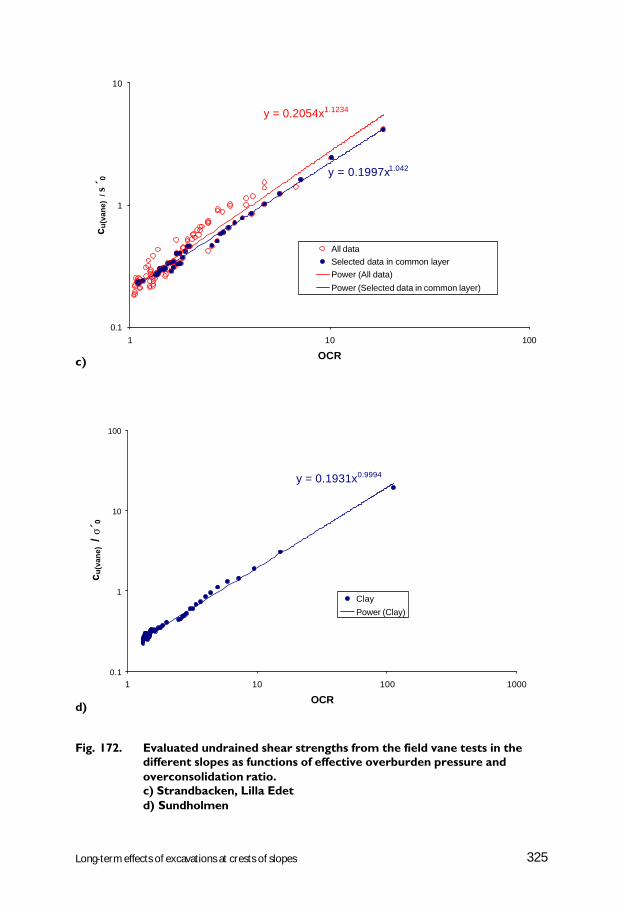
325Long-term effects of excavations at crests of slopes
c)
d)
Fig. 172. Evaluated undrained shear strengths from the field vane tests in thedifferent slopes as functions of effective overburden pressure andoverconsolidation ratio.c) Strandbacken, Lilla Edetd) Sundholmen
y = 0.2054x1.1234
y = 0.1997x1.042
0.1
1
10
1 10 100
OCR
c u(v
ane)
/ σ
´ 0
All dataSelected data in common layerPower (All data)
Power (Selected data in common layer)
y = 0.1931x0.9994
0.1
1
10
100
1 10 100 1000
OCR
c u(v
ane)
/ σ´
0
Clay
Power (Clay)

SGI Report No 61326
consolidation ratios that are higher than normal, for which the correction factorshave been determined, but lower than the level at which the drained shear strengthbecomes governing. This means that an extra correction should be required in thisinterval also when combined analyses are used.
The need for a correction of the undrained shear strengths measured by field vanetests for overconsolidation has been mentioned only sparsely in the literature. Thefirst observation about this, to the authors' knowledge, was made by Leroueil et al.(1983). They pointed out that the shear strength values measured by field vane testswould require a correction factor of about 1/(0.9 OCR) to correspond to the back-calculated shear strength at slides in overconsolidated Champlain clay. However,this was not intended as a real proposal for a correction factor but rather intendedto illustrate that the field vane tests, which had been found to be a useful tool innormally or only slightly overconsolidated Scandinavian clays, was less suited foroverconsolidated Canadian clays where use of effective stress parameters andanalyses was considered more appropriate.
Fig. 172. Evaluated undrained shear strengths from the field vane tests in thedifferent slopes as functions of effective overburden pressure andoverconsolidation ratio.e) All data
y = 0.2083x0.9752
R2 = 0.9488
0.1
1
10
100
1 10 100 1000
OCR
cu
(van
e) /
σ´ 0
All dataPower (All data)

327Long-term effects of excavations at crests of slopes
The first and, to the authors' knowledge, hitherto only real proposal for a correctionof the results of field vane tests for overconsolidation was presented by Aas et al.(1986). In this proposal, the soil is divided into the three categories “Young, Agedand Overconsolidated”. “Young” here stands for normally consolidated soils and“Aged” represents soils which with time have attained a certain overconsolidationbecause of creep effects and possibly other processes without having beensubjected to a corresponding load. These two categories are merged into a soilgroup designated “normally consolidated, NC”, which corresponds to what in theSwedish classification system would be designated “normally consolidated or onlyslightly overconsolidated soil”. In order to separate these soils from overconsolidatedsoils, “OC”, the quotient between the measured shear strength value and theeffective overburden pressure in relation to the plasticity index is studied, Fig. 173.
From the given chart, it can be concluded that “normally consolidated, NC, clays”refers to clays with an overconsolidation ratio less than about 1.5. The correctionfactors, µ, for the two types of soil are then determined from the curves in Fig. 174on the basis of the quotient between the measured shear strength value and theeffective overburden pressure. No guidance for a possible interpolation betweenthe two curves is given, but the full correction for overconsolidation is to be appliedto all soils that are classified as overconsolidated in the first chart.
The correction factors that are determined in this way for normally consolidatedclay are usually very similar to those obtained according to the rules for correctionfactors used in Sweden (Larsson et al. 1984). This is to be expected since bothmethods are based on much of the same data. However, they differ for very high-plastic soils because the Norwegian database for such soils includes results fromSouth-east Asia whereas the Swedish database relates to the types of organic clay,gyttja and highly decomposed peat that are found in Sweden and Finland.
The correction factors differ in overconsolidated soils since the Swedish databaseonly includes normally consolidated and only slightly overconsolidated soils,whereas the Norwegian database includes also overconsolidated soils. No correctionof the results from field vane tests for overconsolidation has hitherto been made inSweden except for that which is made indirectly when using a combined analysis.In principle, it therefore appears that for evaluation of a relevant undrained shearstrength an extra correction, µOCR, should be applied in addition to that which inSweden is made on the basis of the liquid limit of the soil. According to theempirical values for how the results of field vane test are affected byoverconsolidation, this correction should be approximately
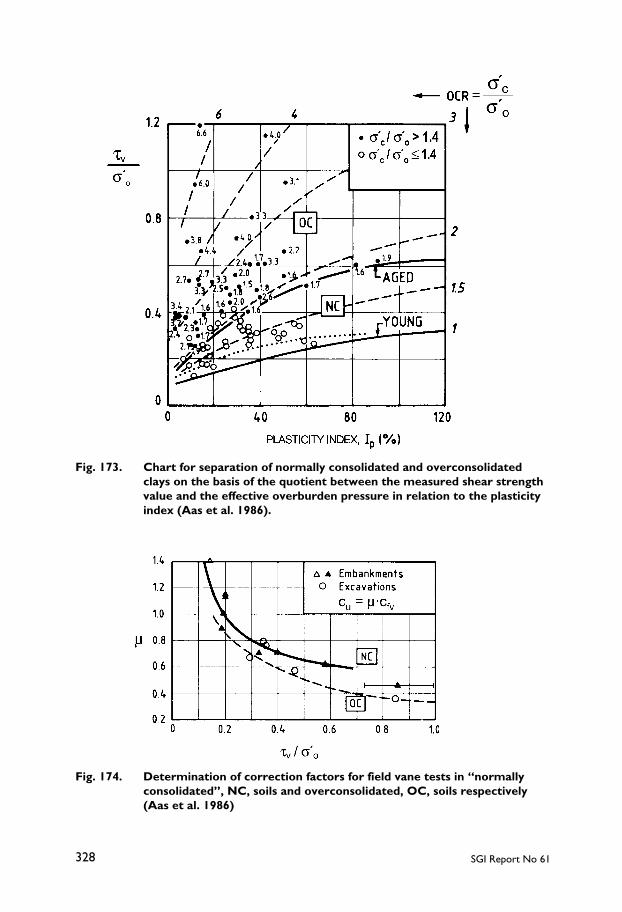
SGI Report No 61328
Fig. 174. Determination of correction factors for field vane tests in “normallyconsolidated”, NC, soils and overconsolidated, OC, soils respectively(Aas et al. 1986)
Fig. 173. Chart for separation of normally consolidated and overconsolidatedclays on the basis of the quotient between the measured shear strengthvalue and the effective overburden pressure in relation to the plasticityindex (Aas et al. 1986).
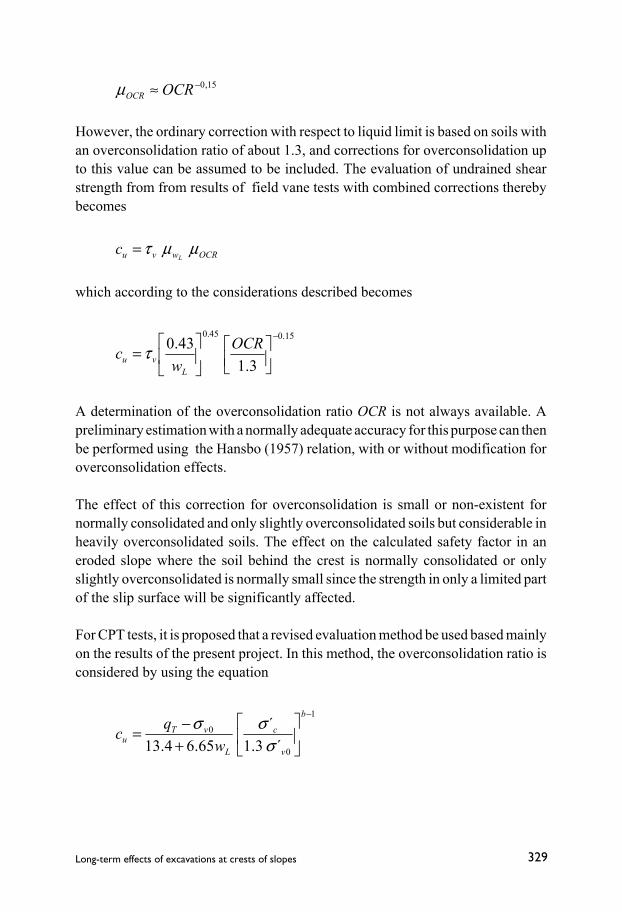
329Long-term effects of excavations at crests of slopes
15,0−≈ OCROCRµ
However, the ordinary correction with respect to liquid limit is based on soils withan overconsolidation ratio of about 1.3, and corrections for overconsolidation upto this value can be assumed to be included. The evaluation of undrained shearstrength from from results of field vane tests with combined corrections therebybecomes
OCRwvu Lc µµτ=
which according to the considerations described becomes
15.045.0
3.143.0 −
= OCR
wc
Lvu τ
A determination of the overconsolidation ratio OCR is not always available. Apreliminary estimation with a normally adequate accuracy for this purpose can thenbe performed using the Hansbo (1957) relation, with or without modification foroverconsolidation effects.
The effect of this correction for overconsolidation is small or non-existent fornormally consolidated and only slightly overconsolidated soils but considerable inheavily overconsolidated soils. The effect on the calculated safety factor in aneroded slope where the soil behind the crest is normally consolidated or onlyslightly overconsolidated is normally small since the strength in only a limited partof the slip surface will be significantly affected.
For CPT tests, it is proposed that a revised evaluation method be used based mainlyon the results of the present project. In this method, the overconsolidation ratio isconsidered by using the equation
1
0
0
´3.1´
65.64.13
−
+−=
b
v
c
L
vTu w
qcσ
σσ

SGI Report No 61330
No directly corresponding proposal for correction of the evaluated shear strengthfrom CPT-tests for overconsolidation has been found in the literature. However,proposals have been made for a varying of the cone factor with respect to the porepressure parameter Bq in such a way that a lower Bq-value should correspond toa higher cone factor and thereby a lower evaluated undrained shear strength (e.g.Karlsrud et al. 1996). Since a lower Bq-value indicates a higher overconsolidationratio (e.g. Robertson et al. 1986, Mayne and Holtz 1988, Larsson and Mulabdic1991), this entails an indirect correction for overconsolidation ratio. A general useof the proposed method is therefore to be recommended.
A correspondingly limited effect of unloading on the evaluated undrained shearstrength is found in the results of dilatometer tests if the evaluation methodrecommended in SGI Information No. 10 (Larsson 1989) is used. Internationally,the general equation for the variation of the undrained shear strength with effectiveoverburden pressure and overconsolidation is more commonly used. In thisevaluation, the values a = 0.22 and b = 0.8 taken from empirical pattern for claysare normally used and the equation thus becomes
8.00´22.0 OCRc vu σ=
This evaluation is indirect and uses the overconsolidation ratio that is evaluatedfrom the dilatometer test results together with the in situ effective overburdenpressure (Marchetti 1980). The equation implies that the expected effect of anoverconsolidation is evaluated. A condition for the applicability of the method isthat a relevant method for evaluation of the overconsolidation ratio is used. ForSwedish conditions, it should thus only be used in connection with the method forthe latter evaluation that is proposed in this report (see next section “Determinationof other properties”). The factor a = 0.22 is an average value for clays. Thecorresponding factor for organic soils is generally higher, which means that theundrained shear strength in organic soils is underestimated by this method. Analternative generally applicable factor for organic soil is difficult to give since it hasbeen found to vary between 0.22 and 0.45 depending on the type of organic soil andthe organic content (Larsson 1990). In the examples given in this report, thisevaluation method thus generally provides fairly good estimates of the undrainedshear strength in the clays in the soil profiles, whereas it generally underestimatesthe shear strength in the upper layers containing organic matter unless an a-factorwhich has been determined by direct simple shear tests is used.

331Long-term effects of excavations at crests of slopes
The new evaluation methods are intended to provide more relevant shear strengthdeterminations, which should also bring the results from the different test methodsinto better concordance. This improved concordance is illustrated when theundrained shear strengths determined by direct simple shear tests and CPT tests,field vane tests and dilatometer tests evaluated by the new methods are showntogether in those investigation points where such results are available, Figs. 175-178. In these presentations, the results are much closer than before in all parts wherethe soil is overconsolidated (compared with the previously presented test resultsfrom each investigated slope). However, certain significant differences still remain.This in particular relates to the field vane tests and the dilatometer tests in the uppersandy, silty and organic delta and lateral fluvial sediments, even when these resultshave also been brought into better concordance with the others by the newevaluation methods. This is related to the fact that other factors in the evaluations,such as the correction factor with respect to the liquid limit and the a-factor, are notrelevant for this type of soil. For the dilatometer tests in Sundholmen, this wasremedied by inserting the a-factor determined by direct simple shear tests in theevaluation. Significant scatter in the test results, particularly for field vane tests, canoccur in layers where the clay contains layers of coarser material of embeddedcoarser objects, such as e.g. shells and gravel particles.

SGI Report No 61332
0
5
10
15
20
25
0 20 40 60 80 100
Undrained shear strength, kPa
Dep
th, m
Field vane test
CPT test
DSS, empiricalrelation
Fig. 175. Evaluated undrained shear strengths after correction for overconsolida-tion ratio in Torp, Section A.a) Point S13 below the river
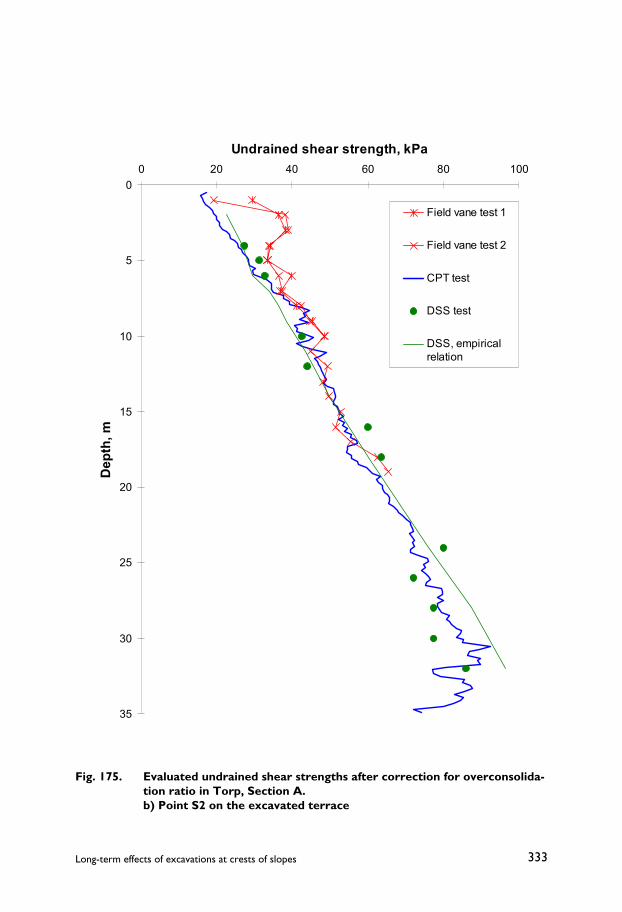
333Long-term effects of excavations at crests of slopes
0
5
10
15
20
25
30
35
0 20 40 60 80 100
Undrained shear strength, kPa
Dep
th, m
Field vane test 1
Field vane test 2
CPT test
DSS test
DSS, empiricalrelation
Fig. 175. Evaluated undrained shear strengths after correction for overconsolida-tion ratio in Torp, Section A.b) Point S2 on the excavated terrace
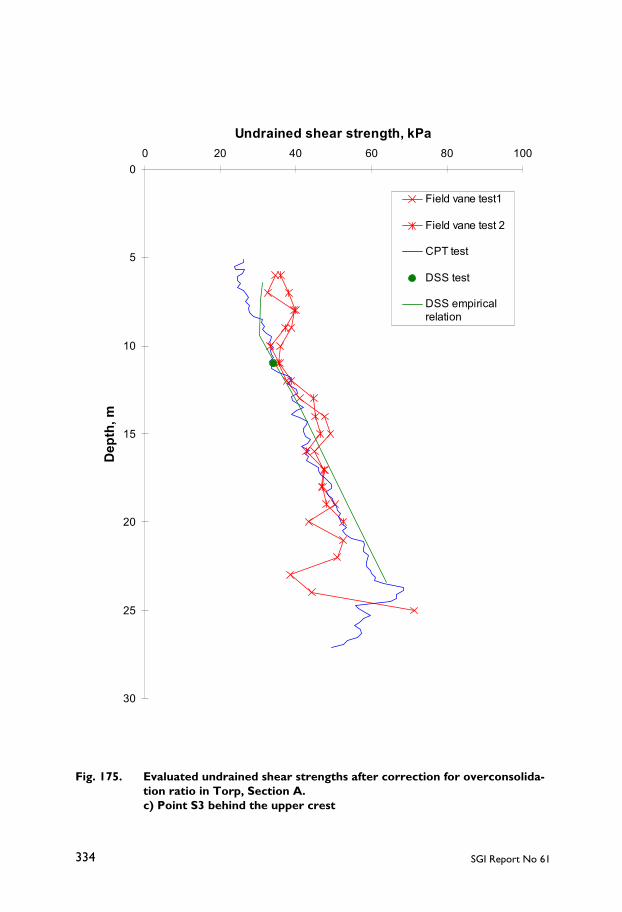
SGI Report No 61334
0
5
10
15
20
25
30
0 20 40 60 80 100
Undrained shear strength, kPa
Dep
th, m
Field vane test1
Field vane test 2
CPT test
DSS test
DSS empiricalrelation
Fig. 175. Evaluated undrained shear strengths after correction for overconsolida-tion ratio in Torp, Section A.c) Point S3 behind the upper crest
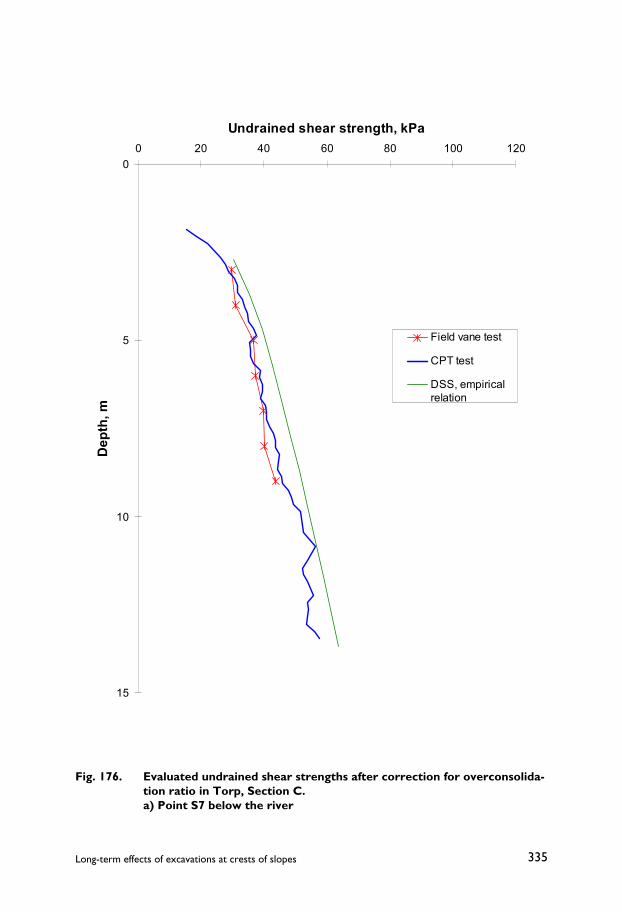
335Long-term effects of excavations at crests of slopes
0
5
10
15
0 20 40 60 80 100 120
Undrained shear strength, kPa
Dep
th, m
Field vane test
CPT test
DSS, empiricalrelation
Fig. 176. Evaluated undrained shear strengths after correction for overconsolida-tion ratio in Torp, Section C.a) Point S7 below the river
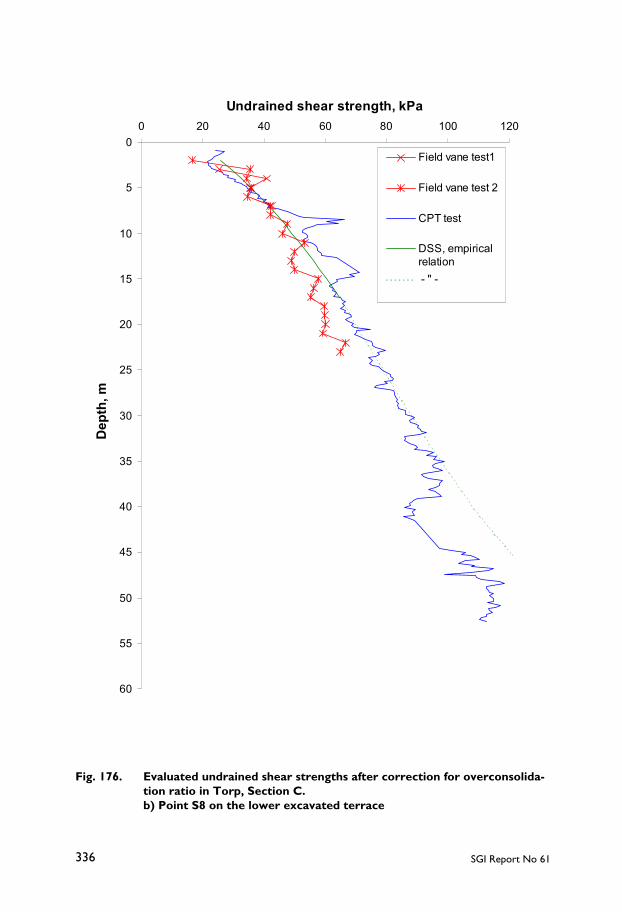
SGI Report No 61336
0
5
10
15
20
25
30
35
40
45
50
55
60
0 20 40 60 80 100 120
Undrained shear strength, kPaD
epth
, m
Field vane test1
Field vane test 2
CPT test
DSS, empiricalrelation - " -
Fig. 176. Evaluated undrained shear strengths after correction for overconsolida-tion ratio in Torp, Section C.b) Point S8 on the lower excavated terrace
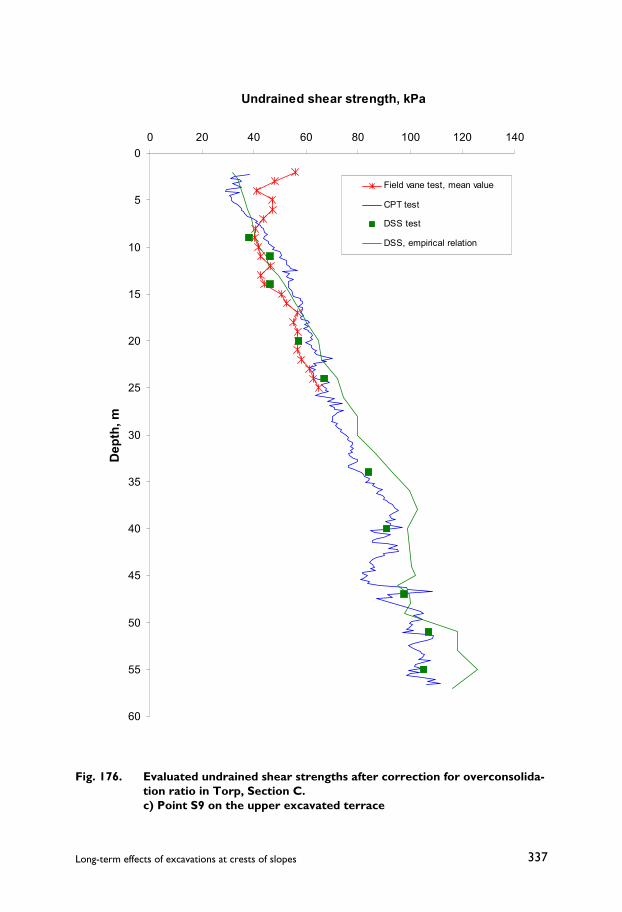
337Long-term effects of excavations at crests of slopes
0
5
10
15
20
25
30
35
40
45
50
55
60
0 20 40 60 80 100 120 140
Undrained shear strength, kPaD
epth
, m
Field vane test, mean value
CPT test
DSS test
DSS, empirical relation
Fig. 176. Evaluated undrained shear strengths after correction for overconsolida-tion ratio in Torp, Section C.c) Point S9 on the upper excavated terrace
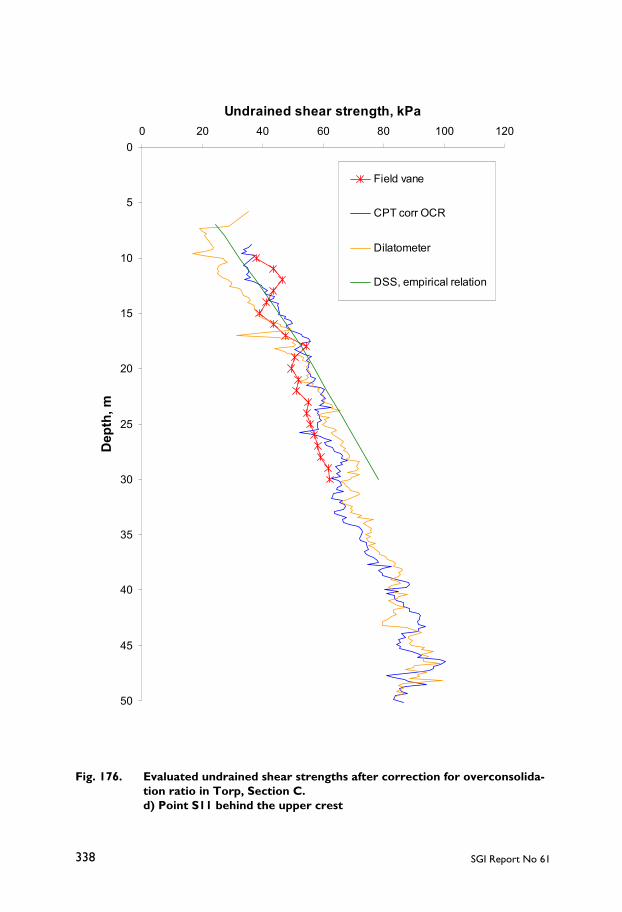
SGI Report No 61338
0
5
10
15
20
25
30
35
40
45
50
0 20 40 60 80 100 120
Undrained shear strength, kPaD
epth
, m
Field vane
CPT corr OCR
Dilatometer
DSS, empirical relation
Fig. 176. Evaluated undrained shear strengths after correction for overconsolida-tion ratio in Torp, Section C.d) Point S11 behind the upper crest

339Long-term effects of excavations at crests of slopes
a)
b)
0
5
10
15
20
25
30
0 10 20 30 40 50 60 70
Undrained shear strength, kPaD
epth
, m
Field vane testCPT test Dilatometer testDSS testDSS, local empirical relation
0
5
10
15
20
25
30
35
0 10 20 30 40 50 60 70 80 90
Undrained shear strength, kPa
Dep
th, m
Field vane test
CPT test
DSS test
DSS, local empirical relation
Fig. 177. Evaluated undrained shear strengths after correction for overconsolida-tion ratio in Strandbacken.a) Point 1 below the riverb) Point 2 on the riverbank
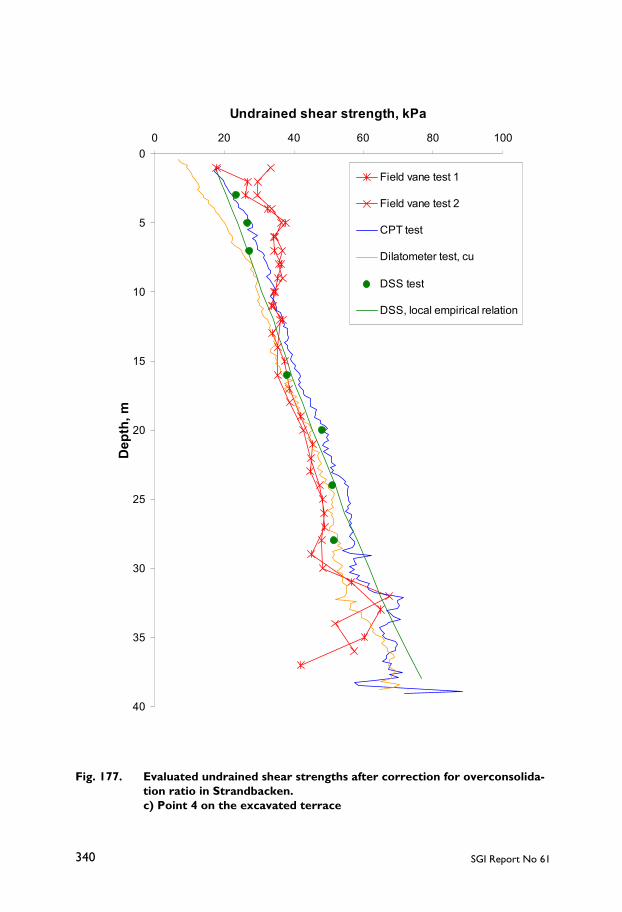
SGI Report No 61340
0
5
10
15
20
25
30
35
40
0 20 40 60 80 100
Undrained shear strength, kPaD
epth
, m
Field vane test 1
Field vane test 2
CPT test
Dilatometer test, cu
DSS test
DSS, local empirical relation
Fig. 177. Evaluated undrained shear strengths after correction for overconsolida-tion ratio in Strandbacken.c) Point 4 on the excavated terrace

341Long-term effects of excavations at crests of slopes
0
5
10
15
20
25
30
35
40
45
50
0 20 40 60 80 100
Undrained shear strength, kPaD
epth
, m
Field vane test
CPT test
- " -
DSS test
DSS, local empirical relation
Fig. 177. Evaluated undrained shear strengths after correction for overconsolida-tion ratio in Strandbacken.d) Point 6 behind the upper crest
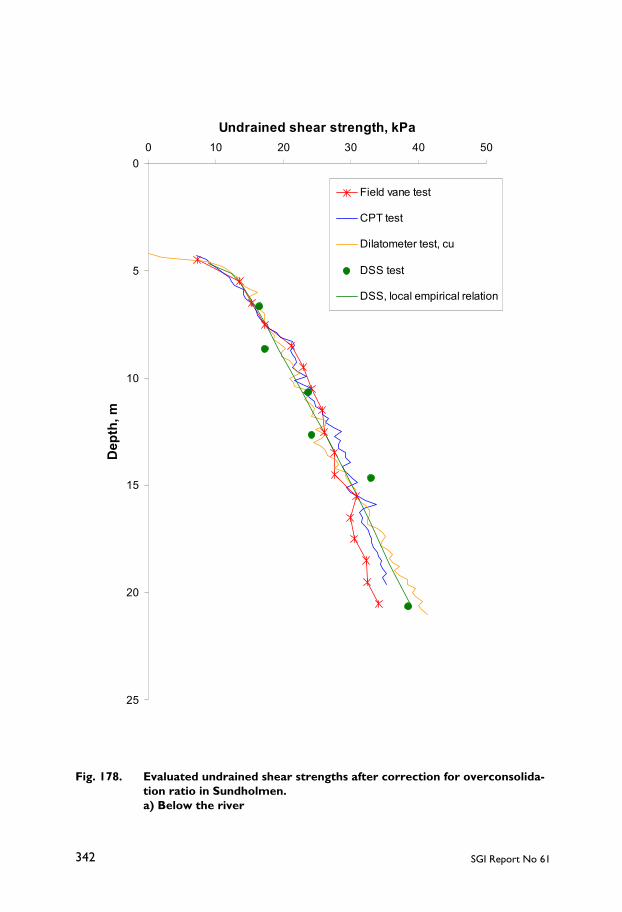
SGI Report No 61342
0
5
10
15
20
25
0 10 20 30 40 50
Undrained shear strength, kPaD
epth
, m
Field vane test
CPT test
Dilatometer test, cu
DSS test
DSS, local empirical relation
Fig. 178. Evaluated undrained shear strengths after correction for overconsolida-tion ratio in Sundholmen.a) Below the river
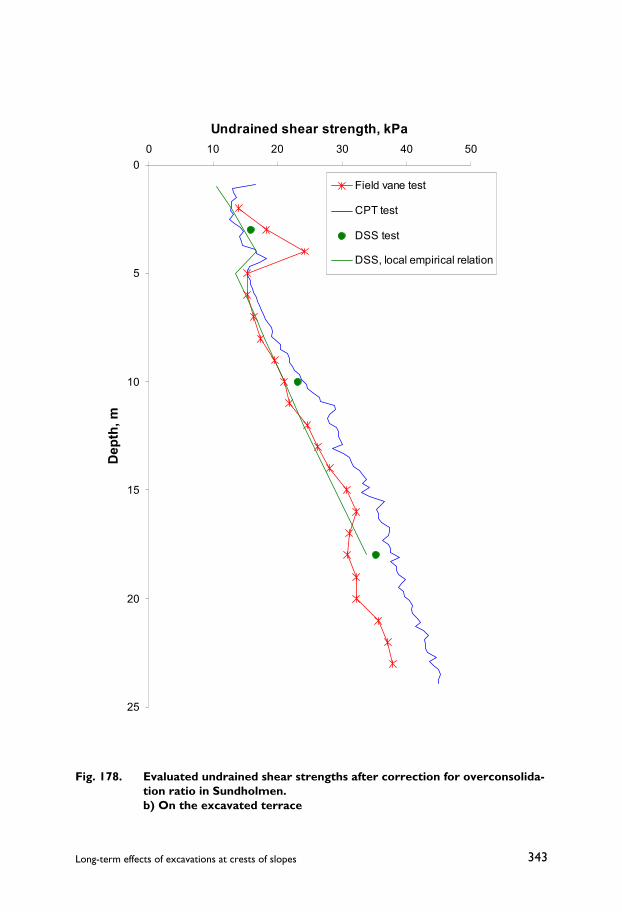
343Long-term effects of excavations at crests of slopes
0
5
10
15
20
25
0 10 20 30 40 50
Undrained shear strength, kPaD
epth
, m
Field vane test
CPT test
DSS test
DSS, local empirical relation
Fig. 178. Evaluated undrained shear strengths after correction for overconsolida-tion ratio in Sundholmen.b) On the excavated terrace

SGI Report No 61344
0
5
10
15
20
25
30
0 10 20 30 40 50
Undrained shear strength, kPa
Dep
th, m
Field vane test
CPT test
Dilatometer test, cu
DSS, local empirical relation
DSS test
Fig. 178. Evaluated undrained shear strengths after correction for overconsolida-tion ratio in Sundholmen.c) On natural ground behind the upper crest

345Long-term effects of excavations at crests of slopes
6.1.3 Determination of other properties
The soil properties in terms of density, natural water content, liquid limit andsensitivity are determined in routine tests in the laboratory.
The approximate determination of the bulk density, which is obtained from CPTtests and dilatometer tests, is often adequate for a preliminary evaluation of thesetests but not for estimation of the self-weight of the soil in calculation of slopestability. For the latter purpose, the density should be determined on undisturbedsamples in the laboratory. This is also valid for the density in all thicker layers ofsilty and sandy soil.
The natural water content and the liquid limit in clay can be determined on bothdisturbed and undisturbed samples, but a closed sampler should be used. Adetermination of the sensitivity normally requires undisturbed samples but canalternatively be done using undisturbed shear strength from field tests andremoulded shear strength determined on disturbed samples. In the investigatedslopes, which are all located in western Sweden, it was found that the value of 1.1for the quotient between natural water content and liquid limit proposed by theGöta-älv Committee (1962) as a lower limit for the possible occurrence ofquick clay was applicable. The results of the geophysical investigation, which wascarried out in the Torp area, also indicate that the lower limit for the resistivity of5–10 Ωm for a possible occurrence of quick clay reported by Söderblom (1969) isalso applicable. The corresponding limit in Torp was about 7 Ωm. The limits canbe used to exclude the possibility of quick clays within those parts of the soil massesthat fall outside the limiting values. However, a possible occurrence of quick clayin areas within the limits always has to be verified by sampling.
The presence of quick clays normally results in enhanced pore pressure ratios andvery low friction ratios in CPT tests. This can be used as support for the estimationof the extent of the quick clay formation, but the occurrence of the quick clay, likeall other more detailed soil classifications of different soil layers, must always beverified by sampling.
The most rational way of determining the permeability of the soil is by CRSoedometer tests on undisturbed samples in the laboratory. The preconsolidationpressure of the soil is also determined by these tests. CRS tests that are performedin slope stability investigations normally only aim at determining these twoparameters. They can therefore be stopped after a shorter time than is required fordetermination of all compressibility parameters and require less evaluation.

SGI Report No 61346
The preconsolidation pressure in the soil can be estimated fairly well by CPT testsand dilatometer tests. This has been shown by the test results presented. However,conditions for this are in both cases that the presented evaluation methods areemployed. This means that the preconsolidation pressure is evaluated from CPTtests using the equation
L
vTc w
q4.421.1
´ 0
+−= σσ
The overconsolidation ratio is evaluated from the dilatometer tests by the equations
5.724.0
5.75)5(368.051.2510
32.1
)5.2(16.0
>=
≤>−+=≤= −
DD
DD
DK
KKOCR
KKOCRKOCR D
whereupon the preconsolidation pressure can be calculated with knowledge of theeffective overburden pressure.
The preconsolidation pressures evaluated from CPT tests and dilatometer testshave to be verified by oedometer tests, but the number of oedometer tests can bereduced in relation to the case when the former data are missing. The results of thefield tests are a very useful guidance for estimation of the trends with depth andwhen connecting the oedometer data to a profile with depth, even if there may besome discrepancies in absolute values between the field and laboratory tests.
6.1.4 Pore pressure measurements and modelling ofpore pressure distribution
All pore pressure measurements in fine-grained soils should be performed withclosed systems. The material in the systems and all connecting tubes, pipes and rodsshould be selected carefully in order to avoid as far as possible evolution of gas.However, equipment for removal of gas and saturation of the systems shouldalways be at hand to enable control and remedy of possible gas formation. Thelocation of the pore pressure systems should be selected with guidance from theCPT test results. Systems should be placed in all presumed water transmittinglayers in such way that the continuity and possible pressure differences along thelayers can be observed. A reference system should also be installed to monitor the
347Long-term effects of excavations at crests of slopes
water levels in any connecting watercourses.
These data together provide the boundary conditions required for a calculation ofthe groundwater seepage and for outlining a model of the pore pressure distributionin the slope. The pore pressure systems and the water levels should be recorded overa sufficient time to allow a study of the natural variations and how these occurwithin different parts of the slope and affect each other. A prognosis of themaximum variations should be made, and the risk of possible remaining high porepressures within the soil mass in the event of rapid lowering of the water levels inthe watercourses should also be estimated.
The results of this project indicate that fairly good general models can be createdfor the pore pressure distribution and variation in the soil masses within a slopeprovided that the soil profiles are not too complicated. They also indicate that areasonably accurate prognosis can be made for the changes in pore pressureconditions after a stabilising measure that changes the geometry of the slope. Somedetails can be difficult to model, such as the effects of precipitation and particularlyevaporation. These effects would need further studies to provide better guidelines.However, it is normally the maximum pore pressures that are of chief interest forthe stability. If the maximum infiltration in the calculation models is exaggerated,this often becomes obvious from improbable effects in the calculation results. Theresults of the calculations therefore have to be carefully scrutinised. Depending onhow the calculation model is designed, fictitious surface layers may have to beintroduced in order to model seepage water streaming out at some parts in the slopeand then being re-infiltrated in other parts. The use of different calculationprograms is thus often not quite straightforward but requires a certain experience.A detailed modelling of all different conditions with different intensity andduration of precipitation, evaporation, water levels in watercourses under differentcircumstances etc. would also be very laborious.
Whether or not the effect of different drainage systems can also be adequatelymodelled cannot be judged from the results of this investigation. This has not beentested since such measures were only made to a limited and unspecified extent inone of the investigated slopes.
Some additional pore pressure systems installed at the centre of thick clay layersmay be required to verify the calculated model. However, supplementary porepressure systems are primarily required in those parts of the slope where the createdmodel and the measured shear strength properties show that the drained shearstrength may be dimensioning. This normally applies to the outer parts of the slope

SGI Report No 61348
where the overburden pressures are relatively low. A detailed knowledge of theproperties of the superficial soil layers is required to accurately model the porepressure situation in this part of the slope. This is often difficult to obtain becauselarge parts of this soil volume are often heterogeneous with a character of a dry crustwith cracks and fissures, root systems of trees and other plants etc. For this reason,it is often more rational to install a larger number of pore pressure systems withinthis zone and to make a cautious manual estimate of the most critical pore pressureconditions.
The results of this project show clearly that the pore pressures are of greatimportance also in areas with "soft normally consolidated" clay, particularly forshallower slip surfaces in the outer parts of the slopes.
6.2 ENVIRONMENT AFTER EXCAVATION OF SLOPE CRESTS
The observations within the three areas show that the environment after anexcavation according to the hitherto most commonly used method for excavationsat slope crests is often not quite like what would have been desirable. Suchexcavations are mostly performed within or near built-up areas and there is oftena strong demand to use the excavated areas for gardens, parks or other recreationpurposes. Their common location above watercourses with a natural view overthese means that they have very good preconditions to become nice environmentsfor many forms of human recreation. However, this purpose requires that they areprovided with sufficient inclinations and drainage systems to lead off both surfacewater and any water seeping out from the rear excavation slope and to prevent anywaterlogged areas from occurring. This requirement is valid both if open areas aredesired and if it is desired that any other growth should be established than thatwhich occurs naturally in marshy areas.
This was clearly illustrated in the investigated areas, and the contrast between theenvironments on the drained lots in Sundholmen and the undrained areas there andin the other areas is striking. This is in spite of the fact that the drainage systems inSundholmen are fairly shallow and not quite functioning all the year around.
The designs of the excavations have also entailed that the increase in the stabilityof the outer parts of the slopes has not been quite as large as would have beendesirable. The improvement that has been achieved is also not primarily due to theexcavations but to the fact that erosion protection structures have been constructedat the toes and decreased the average inclinations of the remaining slopes. Theoverall stability together with the environment would benefit if the design of the

349Long-term effects of excavations at crests of slopes
excavation involves a larger and preferably also varied inclination and if aneffective drainage system is installed to permanently lower the groundwater levelbelow the excavated areas.
The erosion protection structures, apart from contributing to the improved stability,have entailed that the previously ongoing erosion processes have stopped. This inturn has meant that the previous scars in the slopes from superficial slips havehealed and at the same time that the littery impression created by trees that hadfallen in the slopes or slid out into the watercourses has ceased. The constructionof the erosion protection in Torp and Strandbacken has also had the result thatshelves have been created above the highest water level, which constitute walkingpaths along the river and which can be used by fishermen. These are benefits forboth the environment and for the possibility to use the areas for recreation.
6.3 SOIL DEPOSITION AND STRESS HISTORY
All the investigated areas are located in western Sweden and the loose soil layershave mainly been deposited in connection with the melting of the inland ice and thesedimentation that occurred in the sea outside the front of the retreating ice. Theareas are located in valleys with surrounding ridges of rocky hills and they haverisen above the sea because of the land-elevation. After the areas emerged abovethe sea level, rivers were formed and have eroded their courses down throughpreviously deposited sediments, which have then been redeposited outside the newcoastline. Coarser sediments have been deposited as delta or lateral fluvialsediments close to the river mouths and have in turn successively been eroded andredeposited when the coastline has moved out towards the present coastline.
It can be assumed that the areas were rather flat and horizontal just as the coastlinepassed over them and that the groundwater level was then located at the groundsurface. All soil layers in the area can be assumed to have consolidated for the stressconditions prevailing at that time. Thereafter, the rivers have eroded their coursesdown through the upper soil layers and the overburden pressures below them havethereby decreased. This has been a very slow process that still continues. Also thesoils below the watercourses may therefore have attained a certain overconsolidationin relation to the maximum effective overburden pressures because of creepprocesses at times when the stresses still were high. Such an effect appears to bedetected in most of the investigated areas, but the exact size is more difficult tojudge since the previous stress history can only be assumed.

SGI Report No 61350
The erosion process and the consequent successive lowering of the water level inthe created river-course have entailed that the groundwater level has been loweredin the adjacent ground. This has resulted in increased effective stresses and the soilhas consolidated for these at the same time as creep processes have brought a furtherincrease in preconsolidation. The largest groundwater lowering in the areas outsidethe slopes has occurred close to their crests. As the watercourses have eroded downthrough the sediments, they have also been widened because of erosion and slidesin the slopes and a successively larger volume of soil has thereby become unloadedand overconsolidated. All soil masses below the watercourses and their slopes arethus overconsolidated because of the stress history. This also means that the highestpreconsolidation pressures, and thereby also the highest shear strengths, arenormally found just behind the natural crests of the slopes. The groundwaterlowering is normally less far behind the crests and the preconsolidation pressuresand shear strengths are thereby somewhat lower.
The differences in stress history for the soil masses behind the slope crests whichare related to the distance from this can be marginal or highly significant dependingon the size of the groundwater lowering, how long the different stress conditionshave prevailed etc. They have been clearly traceable in many cases in the presentproject.
A further change in properties can occur when clay which has been deposited in saltwater is leached. This may mean that preconsolidation effects created by previousstresses and creep effects over a long time are broken down and the soil turns intoa state that is more normally consolidated in relation to the current stresses. Therebythe undrained shear strength also decreases. Such effects are indicated by the testresults in points far behind the crests in both Torp and Strandbacken.
The stress history outlined above is common in western Sweden, but can of coursevary because of anomalies during the deposition, larger landslides that haveoccurred during the time from deposition to the present day, human activities etc.In the investigated areas, the stress history could be inferred from the test resultsand provided a logical explanation for the observed variations in these. It was alsoa support for the creation of overall models for the variation of the strength withinthe areas.
A plausible model for deposition and stress history is a prerequisite for the creationof a reliable model for the shear strength properties. Even if the stress history mayvary between different areas, it is reflected in the test results and can normally be

351Long-term effects of excavations at crests of slopes
described with support from knowledge of the geological history of the area and thetest results. The variation of the preconsolidation in the area is most rationallymapped by performing CPT tests with a sufficient accuracy and a verification andcalibration of the results by an adequate number of oedometer tests.
6.4 VARIATIONS IN SOIL CONDITIONS
As a rule, there is a certain variation in the soil profiles also in areas with so-called"homogeneous" soil conditions. A relatively large variation could thus be observedin the upper layers consisting of delta and lateral fluvial sediments with sand, siltand organic material in the three areas that have been studied. The thickness of theselayers varied from one or two metres to about 10 metres and the variation was notnecessarily regular but could vary pretty much at random. This in turn can be relatedto the varying shape of the delta during the period of deposition. Nor is thecomposition of these upper sediments uniform; it varies with different grain sizedistributions and organic contents. These variations may be gradual and relativelysmall, but can also, for example, constitute embedded clay layers creating separateground water aquifers with different groundwater heads, as in Section C in Torp,or different soil layering in different parts in the area, as in Sundholmen, where athree metre thick gyttja layer was found on one side of the river but not on the other.These anomalies could likewise be related to the varying geometry and currents inthe previous river deltas.
The thickness of the underlying clay layers may vary as well, partly related to thevarying thickness of the fluvial sediments under the mainly flat ground surface,partly related to the variation in the underlying firm bottom. This was mostsignificant in Section A in Torp, where the depth to firm bottom was smallest andwhere the latter was heavily inclined. On the other hand, no variation was observedin the clay layers in Sundholmen where no significant variation in the thickness ofthe upper sediments was measured and the depth to firm bottom was very largewithin all the investigated area.
The natural water content related to the level varies depending on the thickness ofthe clay layers within the area. It may to some extent be related to differences inpreconsolidation pressure at different distances from the watercourses, but this isof marginal importance in the studied areas. If large areas are studied, like the1.5 km long distance south of the Ström lock in Lilla Edet that was studied in theGöta-älv investigation in 1962, there will usually be fairly large variations. Thisdepends, among other things, on differences in grain size distributions, use of the
SGI Report No 61352
land and topographical variations. As a result, the larger the studied area is, thelarger will the scatter be in different compilations of parameter data and the greaterwill the uncertainties be about the relevance for the specific area of interest.
The clays in the areas were deposited in salt seawater and have then been leachedto varying extents. This has in some areas entailed that quick clay has been createdin some parts. A low salt content does not automatically mean that the clay becomesquick, but that the salt content becomes lower than a certain limit is a prerequisitefor this to happen (e.g. Söderblom 1969). Besides leaching there are a number ofother factors that affect this process such as void ratio, oxidation, weathering, ionprecipitation, ion composition, other chemical substances in the pore water etc.Leaching can occur both by percolation (water seepage through the soil) anddiffusion (equalisation of chemical concentrations by ion migration). In both cases,this is facilitated if the thicknesses of the clay layers are small and if these areunderlain by water transporting coarse layers. Quick clay was found in Section Ain Torp within parts where the thickness of the clay layer was moderate but notwhere they were thick. High sensitivity-values were also found at the test pointlocated furthest away from the river in Strandbacken, although no quick clay wasfound within the area now investigated. However, further up towards the valleysides where the thickness of the clay layers decreases, there are large areas withquick clay according to the previous investigations.
Leaching normally entails that the liquid limit of the clay is reduced. It can alsomean that the structure of the soil becomes weaker and that both the preconsolidationpressure and the undrained shear strength thereby become reduced. Indications ofthis could be observed in both Torp and Strandbacken within those parts where thesensitivity was enhanced.
There can thus be considerable variations in soil properties due to chemical changesthat have occurred during the time after the deposition also when the soil layershave the same history of deposition and stresses.
Modelling of the soil properties within an area is usually made with reference todepth below the ground surface or to the level. For areas with watercourses thathave eroded down from an originally approximately flat ground surface, themethod of presenting properties versus level gives the best model.

353Long-term effects of excavations at crests of slopes
6.5 EFFECT OF UNLOADING ON THE SHEAR STRENGTH
That an unloading affects the undrained shear strength in such way that it decreasesafter the soil has been given time to swell and adapt to the new stress condition canbe regarded as an established fact. This is also clearly illustrated by the results inTorp and Strandbacken, where erosion has brought very large unloading below thewatercourses.
However, the measured reduction varied depending on what method was used forthe measurement when the hitherto commonly used evaluation methods wereapplied. The reduction that was measured in more advanced laboratory tests, suchas direct simple shear tests, corresponded fully to the reduction that is normallyestimated from the soil models that have been elaborated by primarily advancedlaboratory testing in triaxial and direct simple shear apparatuses. The reduction thatwas measured by field vane tests was considerably smaller. This is also in line withprevious Swedish experience. The same was found for the results of CPT tests anddilatometer tests. However, the evaluation methods that have hitherto been used forfield vane tests and CPT tests in Sweden are mainly based on experience fromnormally consolidated and only slightly overconsolidated soils. When using therevised evaluation methods that have been presented earlier in this chapter, thecorresponding shear strength reductions are obtained as in the advanced laboratorytests. The same reduction was obtained with the revised method for dilatometertests that has also been presented here.
The evaluation methods for the field tests are empirical and no theoreticalframework for the response of the various methods and the necessary correctionsin overconsolidated soils has been elaborated.
The excavations varied in size from fairly large, up to 9 metres deep, to fairlymoderate, 1 to 2 metres deep. The excavation work was mainly performed withinthe upper delta and lateral fluvial sediments and, in most cases, such sediments orcoarser silty clay constituted the upper soil layers after the excavation as well. Forthis reason and because of the test methods employed, the changes measured afterthe excavations were very moderate. However, the only available values from theconditions before the excavations to compare with had been obtained by field vanetests. Considering the experience of how the results of this type of test are affectedby an unloading, there is nothing in these results to disprove that the expectedreduction in shear strength really has occurred.
SGI Report No 61354
Experience from other types of excavations in clay has shown that it can take verylong time, sometimes several decades, before the full shear strength reduction hasevolved (e.g. Skempton 1964). In the studied cases, where free water has keptstreaming out on the excavated terraces, the 10 to 15 years that have elapsed shouldbe a sufficient time for all major changes to occur.
Another aspect of how unloading affects the shear strength is that the load reductionand the pore pressure equalisation entail that the effective stresses decrease in allof the unloaded soil volume. As a result, the drained shear strength becomes lowerthan the undrained shear strength and thereby governing in a successively largerpart of the soil volume. This means that the reduction in available shear strengthbecomes larger than is the case for the undrained shear strength alone, and this oftenbecomes the dominating factor.
6.6 STABILITY AFTER EXCAVATION OF THE SLOPE CREST
The calculated stability factors after the excavations in principle reach the valuesthat are required according to the guidelines of the Swedish Commission on SlopeStability (1965) for the current use of the land. All potential slip surfaces whichaffect existing buildings have calculated safety factors of at least 1.3 and thecalculated critical slip surfaces in what is classified as “other ground” haveminimum safety factors of mainly 1.2 according to combined analyses. The onlyexception is the outermost strip in front of the Brosätter nursing home, where thecalculations still show very low stability. This strip is fenced off and is normallynot entered. There is also no obvious risk that a local slide in this riverbank willcontinue backwards within a short time after a such event. The requirements set bythe guidelines for existing buildings and current land use can thereby be consideredto be met.
The achieved result is not solely an effect of the excavations but for shallower slipsurfaces the constructed erosion protections have also provided a considerableimprovement of the calculated stability.
6.7 ACHIEVED INCREASE IN STABILITY IN RELATION TOEXPECTED RESULTS
The excavations had in all cases been designed to provide a certain minimumcalculated safety factor for the remaining buildings according to undrainedanalyses. However, the ambitions differed between the different cases. InStrandbacken the aim was to reach a calculated safety factor of 1.5. In the Torp area,

355Long-term effects of excavations at crests of slopes
designs were made for two alternatives, one with 30% increase in calculatedstability and one with a 50 % increase. The safety factor before the excavation wasin this case assumed to be 1.0. The calculations without consideration for anisotropyshowed lower safety factors, but in reality these cannot be lower than unity. Thefinal design of the excavation and the calculated safety factors varied for differentreasons, among them a desire to preserve the existing cement works and varyinggeometrical conditions along the roughly 600 metre long distance. The variation incalculated safety factor mainly remained within the two given alternatives. InSundholmen, a lowest calculated safety factor of 1.3 for slip surfaces reaching theexisting buildings was aimed for. However, certain compromises had to be madewith consideration for the risk of flooding and the requirement that the excavatedground should be possible to use as gardens also after the excavation.
The demands thus set have in principle been fulfilled. The main discrepancies referto the stability of the excavated areas and shallower slip surfaces at the outer slopefrom the excavated terraces down to the watercourses. The calculated safety factorsare lower in these parts than was assumed in the designs. However, this mainlyrefers to calculated safety factors in combined analyses, for which lower requirementsof their sizes are generally set. The general assessment of the stability of large andmedium size slip surfaces is thereby not significantly affected.
However, the excavations performed have only entailed minor improvements inthe stability of shallow slip surfaces in the outer slope from the excavated area downto the watercourses. The calculated safety factors in these parts are mainlygoverned by the drained shear strength. The lowering of the pore water pressuresafter the excavations is very limited, whereas the steep slopes remain after thisoperation and the increase in calculated safety factor is thereby very limited. Insome cases, the stabilising works also entailed that the vegetation in the slopes hadto be cut down, which resulted in stability problems in steeper parts. A number ofsuperficial slides are thus reported to have occurred in the upper parts of theremaining steep outer slopes shortly after the excavation works, which among otherthings brought down some of the replanted trees. However, the erosion protectionstructures have normally entailed that also the outer slopes have become more leveland in some cases they also constitute counterweights for the shallow slip surfaces.The exception is the riverbank in Sundholmen, which has been commented uponabove. The combined effects mean that the calculation factors normally reachacceptable levels. However, as stated before, this is not primarily a result of theexcavation, and the effects of the erosion protection structures were not consideredin the designs.
SGI Report No 61356
Investigation methods
On the basis of the results of this project and previous experience it is recommendedthat a slope stability investigation should be started with a thorough study ofexisting geotechnical investigations and geological information and otherobservations that can be used for estimation of the layering and depths of the soildeposits in the area. This is prescribed in the guidelines of the Swedish Commissionon Slope Stability (1995) and is here called ”Geotechnical inspection and roughestimations”. If the existing information is insufficient for an estimate of thethickness of the soil layers, a geophysical survey should be considered. Thegeophysical methods that are most likely to be used at this stage are refraction- orreflection- seismic surveys.
The subsequent geotechnical investigations can then be performed in a mostrational way and it can be assured that the best-suited and adequate equipment isbrought and used in the field. All soundings that are aimed at detailed mapping ofthe soil layering and measuring properties in the soft or medium-stiff soil layers thatare of primary interest should be performed as CPT tests. The pore pressures shouldbe measured during the tests and the most accurate equipment should preferably beused, i.e. Class CPT-3 according to the standard recommended in Sweden(SGF 1993). The tests should be continued to depths well below those that can beinvolved in a potential stability problem. This often entails that they should becontinued to firm bottom. In extremely deep soil profiles, an initial pilot test shouldbe continued to large depths to ascertain that no weaker or water-transportinglayers, which can affect the stability, occur at larger depths. After this has beenensured, the subsequent penetration tests can be stopped at more moderate levelswhere the criteria given above are fulfilled.
In cases where there is a requirement to determine the thickness of underlyingdenser layers of coarse soil and till and the level of the bedrock surface by soundingtests, soil-rock drilling with multi-channel registration of drilling parametersshould be used. This should preferably be performed as Jb-3 sounding accordingto the description of the method by SGF (1999).
Chapter 7.
Recommendations

357Long-term effects of excavations at crests of slopes
After obtaining supplementary data from routine tests on samples in the laboratory,a preliminary estimation of both preconsolidation pressures and shear strengths canbe made from CPT tests performed with high accuracy. This should be madeaccording to the revised methods presented in this report. If the investigations aresupplemented by dilatometer tests, these too should be evaluated according to therevised method presented here. However, in soils with significant organic contents,which are often found behind the crests of the slopes, the previous evaluationmethod should be used unless relevant factors for the new method have beendetermined for the particular soil in the laboratory.
The undrained shear strength is traditionally determined by field vane testsperformed according to the standard recommended by SGF (1993). This shouldnormally be done with the normal-size vane. The tests should be performed withequipment with casings for the vane and rods in soils that are susceptible todisturbance and at large depths, where the rod friction against the turning rodsotherwise becomes too large. The extent of the required field vane testing depends,among other things, on the extent to which high-accuracy CPT tests have beenperformed. The field vane is so far the most well-tried method of determination ofundrained shear strength in the field and can partly serve as a calibration ofdeterminations by CPT tests. The hitherto commonly used evaluation method forthe field vane test appears to yield too high values of the undrained shear strengthin overconsolidated soils, for example, at the toes of slopes and below erodedwatercourses. A reduction for overconsolidation should therefore be made whenthe overconsolidation ratio exceeds 1.3 according to the method for this presentedin this report.
Supplementary direct simple shear tests should be performed whenever theaccuracy of the results and/or the relevance for the test and evaluation method isuncertain and also when the scatter in the test results is large. The results of directsimple shear tests can be used for calibration of undrained shear strengths obtainedfrom both field vane tests and CPT tests provided that the tests have been performedon samples of high quality. This is also stated in the guidelines of the SwedishCommission on Slope Stability and has been exemplified in this report.
The guidelines of the Commission also state that in cases where the shear strengthanisotropy is used and is of significant importance for the assessment of thestability, these effects have to be verified by triaxial tests. This too has beenexemplified in the report.
SGI Report No 61358
The stress history in the area should be clarified to enable a relevant modelling ofthe shear strength properties in the soil mass. This can be achieved by a sufficientnumber of oedometer tests on undisturbed soil samples supported by the results ofthe CPT tests.
Measuring of pore pressure variations in fine-grained soils should only be donewith closed systems. Problems with evolution of gas may occur with time andequipment to remedy this problem should be at hand. The pore pressures in theouter part of a slope, i.e. close to the crest and below the steep slope below this, areoften of great importance. At the same time they are normally most difficult tomodel properly. Several systems for pore pressure measurements should thereforebe placed in these parts.
Calculation methods
The pore pressure conditions in a slope can be modelled fairly accurately withexisting calculation programs. This is provided that the soil layering and itsvariation within the area are not too complicated. The modelling can mainly bedone for the pore pressure conditions at large, whereas important details such as theexact pore pressure distribution in the outer parts of the slope are more difficult tocalculate. The effect of precipitation and evaporation is also difficult to calculateaccurately. With these reservations, it should be possible to make an adequateprognosis beforehand of how the pore pressure conditions will change after achange in the geometry of the slope, such as an excavation of the crest.
A relatively good prognosis for the changes in shear strength after an excavationcan be made on the basis of established soil models and empirical parameters. Thegeneral equation cu= a·σ´0·OCRb is then used. The b-factor is then normally set to0.8 and the a-factor can be calculated from measured undrained shear strength,effective overburden pressure and overconsolidation ratio before the excavation.A more refined analysis can be made if these parameters are calibrated for theparticular soil by direct simple shear tests in the laboratory. Stability calculation inconnection with slope stability analyses and stabilising measures should be madewith “rigorous” analyses. It shall be possible to model in detail the shear strengthof the soil both concerning drained and undrained shear strength, the shear strengthanisotropy and the pore pressure variations in the soil mass, and combined analyseswhich take all these factors into account should be performed. If these requirementsare not fulfilled, there is risk that the necessary stabilising measures become bothunder- and overestimated and that their design will not be suitable in every respect.Different existing calculation programs can handle different parts of these demands,

359Long-term effects of excavations at crests of slopes
but there is so far no really good “self-seeking” program, which can handle all theseaspects in a satisfactory way without compromises or manipulations. One way toovercome this, is to use two programs, one of which is self-seeking, as has beendone in this project.
Design of excavations for increase of slope stability
More aspects than only the calculated factor of safety in undrained analyses haveto be considered in the design of an excavation. From an overall stability point ofview, the stability according to combined analyses, which also include drainedanalyses, also has to be considered. This often has the result that the remaining slopefrom the excavated area down to the toe of the slope also has to be changed in someway.
The stabilising measures in all slopes towards running watercourses should becombined with construction of permanent erosion protection, unless this is alreadyin place. The construction of a substantial erosion protection structure normallyentails that the average inclination of the lower slope is decreased, which improvesthe stability. However, the stability for shallow slips in the upper part of theremaining slope is not necessarily affected by this measure. There is therefore oftencause for a rounding-off of the crest of the slope. This should also be consideredfrom an aesthetic point of view.
The design of the rear excavated slope, or slopes if the excavation is made in stages,should also be considered, particularly when the excavation is performed in silt andfine sand. Slopes that are given normal fairly steep inclinations are often not stablein these types of soil because of high pore pressures and they are often also subjectto internal erosion by the water seeping out through them. This can necessitatefurther remedies, such as the construction of erosion protection already duringexecution of the works, or it can entail a degradation of the slope with time. In thelatter case, cavities and small slips will occur with attendant risks for those who livein or visit the area, and there is also a risk that the slope with time will retrogresstowards gardens, buildings or other constructions behind it. There are also aestheticaspects concerning the design of the rear excavation slope, where a more roundedgeometry is often considered to be more natural and appealing.
The excavated areas should always be given sufficient inclinations to ensureadequate run-off of surface water. This requirement applies both when the area isintended for recreation and when natural or planted vegetation is to be re-established. In many cases deeper drainage systems should also be installed, which

SGI Report No 61360
will lead away any water flowing in from higher elevated ground at the rear of theexcavated area and which will permanently lower the groundwater level below theexcavated area and its outer crest.
361Long-term effects of excavations at crests of slopes
Chapter 8.
Need for further research and development
The investigations in this project have been performed in slopes with somewhatdifferent types of clay and organic soils ranging from low-plastic clay throughhigh-plastic clay, organic clay to gyttja. However, they have been limited to thesame type of stabilising measure at, in principle, the same type of layering and stresshistory in the soil profiles. The main differences between the different slopes havebeen the heights of the slopes and the sizes of the excavations. Similar measureshave been used in other types of soils, such as more overconsolidated clays and claydeposits without overlying delta and lateral fluvial sediments. There may thus befurther aspects of the method and the design of excavations than those put forwardin this report. Furthermore, even if the investigated method is one of the mostcommonly used ones, it is only one of many whose long-term functions have notbeen investigated. There is thus a need for a continuation with studies of the effectsof other methods and in other types of soil.
The results of the investigations, together with previous experience, have raisedserious questions about the previous methods of evaluation of undrained shearstrength in overconsolidated soils in general and in particular in slopes. This refersto all commonly used field methods for this determination. Revised methods forevaluation of the shear strength from field vane tests, CPT tests and dilatometertests have been proposed in this report. However, these methods are based solelyon empirical experience and so far no theoretical basis has been elaborated forthem. Research is currently going on in co-operation between the Swedish RescueServices Agency, Chalmers University of Technology and SGI regarding how thestress conditions in the soil affect what is measured in field vane tests and CPT testsand how this affects the interpretation (Löfroth 2002).
The field vane test is also used in other types of overconsolidated soil such as claytill, both to estimate the undrained shear strength and to estimate the preconsolidationpressure. It is also sometimes used for calibration of other methods as CPT tests(e.g. Foged and Steenfelt 1992, Kammer Mortensen et al. 1991). It is therebynormally not considered that the overconsolidation affects the results of different

SGI Report No 61362
tests in different ways. The results of this investigation and what has been reportedelsewhere about results of field vane tests in overconsolidated soil (e.g. Leroueil etal. 1983, Jamiolkowski et al. 1985, Aas et al. 1986), raise questions regarding thispractice. A review of the experience of all different field methods to determine theproperties in all types of overconsolidated fine-grained soils is therefore required.
The current methods of prognostication of pore pressure variation would also needto be improved. More series of continuous measurements with closed systems ofthe pore pressure variations in soil masses are required. This also applies to how thepore pressures vary in rather short time perspectives with climatic changes in termsof temperature, wind, precipitation, humidity, water levels in adjacent watercoursesand their duration. Better knowledge is also required about how the pore pressuresvary in the outer parts of slopes. Better guidelines are thereafter required for howthe pore pressures in slopes should be modelled when using different calculationprograms.
Finally, new or further developed “self-seeking” calculation programs are needed,which in all repects can take into account all important factors and variations thatshould be consideared according to the guidelines given by the Swedish Commissionon Slope Stability (1995).

363Long-term effects of excavations at crests of slopes
References
Aas, G., Lacasse, S., Lunne, T. and Hoeg, K. (1986). Use of in Situ Tests forFoundation Design on Clay. Proceedings of In Situ ‘86, a Specialty Conference onUse of In Situ Tests in Geotechnical Engineering., Blacksburg, Virginia, pp. 1–30,ASCE, New York.
Åhnberg, H., Larsson, R. and Berglund, C. (2001). Nygamla vingar – stora som små(New and old vanes – large and small). Swedish Geotechnical Institute, Varia No.509, Linköping, (shorter version in Väg- och Vattenbyggaren, No. 4, 2001, pp. 20–24, Stockholm. (In Swedish)
Bergdahl, U. (2002). Personal communication.
Bergsten, F. (1950). Contribution to study of evaporation in Sweden. SwedishMeteorological and Hydrological Institute, Communications, Series D, No. 3,Stockholm.
Berntson, J. (1983). Portrycksvariationer i leror inom Göteborgstrakten (Pore pressurevariation in clays in the Gothenburg area). Swedish Geotechnical Institute, ReportNo. 20, Linköping. (In Swedish)
Casagrande, A. (1947). Classification and Identification of Soils. Proceedings ASCE 73:6,pp. 783–810.
Claesson, P. (2003). Long term settlements in soft clays. Chalmers University of Technology.Department of Geotechnical Engineering. Thesis. 197 + /7/ p
Commission on Slope Stability (1995). Anvisningar för släntstabilitetsutredningar(Guidelines for slope stability investigations). Royal Swedish Academy of EngineeringSciences, Commission on Slope Stability, Report 3:95, Linköping.(In Swedish)
Commission on Slope Stability (1996 a). Förstärkningsåtgärder i silt- och lerslänter– Beskrivning av förekommande metoder och praktiskt genomförande (Stabilisingmeasures in silt and clay slopes – Description of current methods and their executionin practice). Royal Swedish Academy of Engineering Sciences, Commission onSlope Stability, Report 1:96, Linköping. (In Swedish)
Commission on Slope Stability (1996 b). Förstärkningsåtgärder i silt- och lerslänter– Rekommendationer för dimensionering och projektering (Stabilising measures insilt and clay slopes – Recommendations for design and dimensioning). RoyalSwedish Academy of Engineering Sciences, Commission on Slope Stability, Report2:96, Linköping. (In Swedish)
SGI Report No 61364
Dahlin, T., Larsson, R., Leroux, V., Svensson, M. and Wisén, R. (2001). Geofysik isläntstabilitetsutredningar (Geophysical methods in slope stability investigations).Swedish Geotechnical Institute, Report No. 62, Linköping. (In Swedish)
Demers, D. and Leroueil, S. (2002). Evaluation of preconsolidation pressure and theoverconsolidation ratio from piezocone tests of clay deposits in Quebec. CanadianGeotechnical Journal, Vol. 39, No.1, 2002, pp.174–92
Foged, N. and Steenfelt, J. (1992). An engineering approach to preloaded clay tillstrength. Proceedings of NGM-92, Aalborg. DGF-Bulletin No. 9, Vol. 1/3.
Fredén, C. (Editor) (1994). Geology. National Atlas of Sweden. Bra Böcker, Höganäs.Geo-Slope (1994). SEEP/W for finite seepage analysis. GEO-SLOPE International Ltd,
Calgary, Alberta, Canada.Geo-Slope (1995). SLOPE/W for slope stability analysis. GEO-SLOPE International
Ltd, Calgary, Alberta, Canada.Göta-älv Committee (1962). Rasriskerna i Götaälvdalen – Betänkande avgivet av
Götaälvkommittén (The Risks of Landslides in the Göta-älv Valley – Report fromthe Göta-älv Committee). Statens offentliga utredningar, SOU 1962:48. Stockholm.(In Swedish)
Hansbo, S. (1957). A new approach to the determination of the shear strength of clay bythe fall-cone test. Swedish Geotechnical Institute, Proceedings No. 14, Stockholm.
Jamiolkowski, M., Ladd, C.C., Germaine, J.T. and Lancelotta, R. (1985). NewDevelopments in Field and Laboratory Testing of Soils. Theme Lecture.Proceedings 11th International Conference on Soil Mechanics and FoundationEngineering, San Francisco,Vol. 1, pp. 57–153.
Janbu, N. (1954). Stability Analysis of Slopes with Dimensionless Parameters. Thesis,Harvard University, Cambridge, Massachusetts.
Janbu, N. (1973). Slope stability computations. Embankment Dam Engineering –Casagrande Volume. John Wiley & Sons.
Kammer Mortensen, J., Hansen, G. and Sørensen, B. (1991). Correlation of CPT andField Vane Test for Clay Tills. Danish Geotechnical Society, DGF Bulletin No. 7,Copenhagen.
Karlsrud, K., Lunne, T. and Brattelien, K. (1996). Improved CPTU Interpretationsbased on Block Samples. XII Nordic Geotechnical Conference, NGM-96,Reykjavik, Vol. 1, pp. 195–201.
Karlsson, R. and Hansbo, S. (1989). Soil classification and identification. SwedishCouncil for Building Research, D8:1989. Stockholm.
Knutsson, S., Larsson, R., Tremblay, M. and Öberg-Högsta, A.-L. (1998).Siltjordars egenskaper (Properties of Silt). Swedish Geotechnical Institute,Information No. 16, Linköping. (In Swedish)
Konsultföretaget GF (1989). Skredområde i Sundholmen – Geoteknisk undersökningoch PM beträffande stabilitetsförhållanden (Slide area in Sundholmen –Geotechnical investigation and report concerning stability conditions).Konsultföretaget GF, Ref. No. 34307 149 230, Gothenburg. (In Swedish)
365Long-term effects of excavations at crests of slopes
Ladd, C.C. and Foott, R. (1974). New Design Procedure for Stability of Soft Clays.ASCE, Journal of the Geotechnical Engineering Division, Vol. 100, No. GT7.
Ladd, C.C., Foott, R., Ishihara, K., Schlosser, F. and Poulos, H.G. (1977). Stress-Deformation and Strength Characteristics. A State of the Art Review. ProceedingsIXth International Conference on Soil Mechanics and Foundation Engineering,Tokyo, Vol. 2.
Larsson, R. (1980). Undrained shear strength in stability calculation of embankmentsand foundations on soft clays. Canadian Geotechnical Journal, Vol. 17, No. 4, 1980,pp. 591–602.
Larsson, R. (1983). Släntstabilitetsberäkningar i lera – Skall man användatotalspänningsanalys, effektivspänningsanalys eller kombinerad analys? (Calculationof slope stability in clay – Is total stress analysis, effective stress analysis orcombined analysis to be used?). Swedish Geotechnical Institute, Report No. 19,Linköping. (In Swedish)
Larsson, R. (1984). On the Use of Effective Stress Analyses for Slope Stability inClays. Proceedings IV International Symposium on Landslides, Toronto, Volume 2,pp. 277–282.
Larsson, R. (1989). Dilatometerförsök – En in-situ metod för bestämning av lagerföljdoch egenskaper i jord – Utförande och utvärdering (The dilatomemeter test – An insitu method for determination of stratification and properties in soil – Performanceand evaluation). Swedish Geotechnical Institute, Information No. 10, Linköping. (InSwedish)
Larsson, R. (1990). Behaviour of organic clay and gyttja. Swedish GeotechnicalInstitute, Report No. 38, Linköping.
Larsson, R. (1992). The CPT test, equipment-testing-evaluation. Swedish GeotechnicalInstitute, Information No. 15E, Linköping.
Larsson, R. (2001). Investigations and Load Tests in Clay Till. Swedish GeotechnicalInstitute, Report No. 59, Linköping.
Larsson, R., Bergdahl, U. and Eriksson, L. (1983). Evaluation of shear strength incohesive soils with special reference to Swedish practice and experience. SwedishGeotechnical Institute, Information No. 3E. Linköping. (Also in shorter version inASTM Geotechnical Testing Journal, Vol. 10, No. 3, 1987.)
Larsson, R. and Eskilson, S. (1988). Dilatometerförsök i lera (Dilatometer tests inclay). Swedish Geotechnical Institute, Varia No. 243, Linköping. (In Swedish)
Larsson, R. and Mulabdic, M. (1991). Piezocone Tests in Clay. Swedish GeotechnicalInstitute, Report 42, Linköping.
Larsson, R. and Sällfors, G. (1995). Sättningsegenskaper i lös lera på grund avgeologisk avsättning och “åldring” (Consolidation properties in soft clay as a resultof geological deposition and “ageing”). Swedish Geotechnical Institute, Varia No.438, Linköping. Shorter version in Väg- och Vattenbyggaren No. 2, 1995, pp. 33–38. (In Swedish)
Law, K.T. (1979). Triaxial-vane tests on a soft marine clay. Canadian GeotechnicalJournal, Vol. 16, No. 1, pp.11–18.
SGI Report No 61366
Law, K.T. (1985). Use of field vane tests under earth-structures. Proceedings 11thInternational Conference on Soil Mechanics and Foundation Engineering, SanFrancisco, Vol. 2, pp. 893–898.
Leroueil, S., Collins, G. and Tavenas, F. (1983). Total and effective stress analyses ofslopes in Champlain sea clays. Symposium on Slopes on Soft Clays. SwedishGeotechnical Institute, Report No. 17, Linköping.
Lindström, A. (1902). Beskrifning till kartbladet Uddevalla (Description of thegeological map of the Uddevalla area). Swedish Geological Survey, Series Ac, No.3, Stockholm. (In Swedish)
Löfroth, H. (2002). Model and Field Tests to Study Influence of Stress Conditions onMeasured Shear Strength. International Symposium on Identification andDetermination of Soil and Rock Parameters for Geotechnical Design, PARAM 2002,Paris.
Marchetti, S. (1980). In Situ Tests by Flat Dilatometer. ASCE, Journal of theGeotechnical Engineering Division, Vol. 106, No. GT3.
Mayne, P. W. (1988). Determining OCR in Clays from Laboratory Strength.Proceedings ASCE, Journal of Geotechnical Engineering, Vol. 114, No. GT1, Jan.1988, pp. 76–92.
Mayne, P.W. and Holtz, R.D. (1988). Profiling stress history from piezoconesoundings. Soils and Foundations, Vol. 28, No. 1, pp. 16–28.
Mayne, P.W. and Mitchell, J.K. (1988). Profiling of overconsolidation ratio in claysby field vane. Canadian Geotechnical Journal, Vol. 25, No.1, pp. 150–157.
Mesri, G. (1975). Discussion on new design procedure for stability of soft clays. ASCEJournal of the Geotechnical Engineering Division, Vol. 101, No. GT4, pp. 409–412.
NCC (1985). Örekilsälven, Munkedal, Förstärkningsarbeten (Örekilsälven, Munkedal,Stabilization work). Video, NCC, Gothenburg.
Powell, J.J.M. and Uglow, I.M. (1988). The Interpretation of the MarchettiDilatometer in UK Clays. Penetration Testing in the UK. Thomas Telford, London.
Rankka, K. (1994). In situ stress conditions across clay slopes. Thesis. ChalmersUniversity of Technology, Department of Geotechnical Engineering, Gothenburg.
Robertsson, P.K., Campanella, R. G., Gillespie, D. and Grieg, J. (1986). Use ofPiezometer Cone Data. Proceedings of In Situ ‘86, a Specialty Conference on Use ofIn Situ Tests in Geotechnical Engineering, Blacksburg, Virginia, June 23–25, ASCE,New York, pp. 1263–1280.
Roscoe, K.H. and Burland, J.B. (1968). On the generalised stress-strain behaviour of“wet” clay. Symposium on Engineering Plasticity, Cambridge, pp. 535–609.Cambridge University Press.
Schmertmann, J.H. (1972). Effects of in situ lateral stress on friction-conepenetrometer data in sands. Verhandelingen Fugro, Sondeer Symposium Den Haag1972, pp. 37–39.
Schofield, A.N. and Wroth, C.P. (1968). Critical State Soil Mechanics. McGraw-Hill.London.
367Long-term effects of excavations at crests of slopes
SGF (1993). Recommended standard for CPT tests. Swedish Geotechnical Society,Report No. 1:93E, Linköping.
SGF (1993). Recommended standard for field vane tests. Swedish GeotechnicalSociety, Report No. 2:93E, Linköping.
SGF (1995). Recommended standard for dilatometer tests. Swedish GeotechnicalSociety, Report No. 1:95E, Linköping.
SGF (1996). Geoteknisk fälthandbok (Handbook for geotechnical field investigations).Swedish Geotechnical Society, Report No. 1:96, Linköping. (In Swedish)
SGF (1999). Metodbeskrivning for Jord-bergsondering (Description of methods forsoil-rock drilling). Swedish Geotechnical Society, Report No. 2:99, Linköping. (InSwedish)
Skempton, A.W. (1964). Long-term stability of clay slopes. Fourth Rankine Lecture,Geotechnique, Vol. 14, No. 2, pp. 77–101.
Söderblom, R. (1969). Salt in Swedish clays and its importance for quick clayformation. Results from some field and laboratory studies. Swedish GeotechnicalInstitute, Proceedings No. 22, Stockholm.
Spencer, E. (1967). Method of analysis of the stability of embankments assumingparallel inter-slice forces. Geotechnique, Vol. 17, No. 1, pp. 11–26.
Spencer, E. (1970). The analysis of the stability of embankments by the method ofslices. Ph.D. thesis. University of Manchester.
Stevens, R. (1987). Glaciomarine fine sediments in southwestern Sweden: lateWeichselian – Holocene lithostratigraphy, depositional environments and varveformation. Dissertation. Chalmers University of Technology/University ofGothenburg, Department of Geology, Publ. A54, Gothenburg.
Svenska Vatten- och Avloppsföreningen (1983). Lokalt omhändertagande avdagvatten – LOD, Anvisningar och kommentarer (Local infiltration of precipitation– LOD, Guidelines and comments). Svenska Vatten- och Avloppsföreningen,Publikation; VAV P46, Stockholm. (In Swedish)
SVT (1985). Räddningstjänst i Munkedal (Rescue Service in Munkedal). News items onVästnytt 8 January, 27 February, 10 April and 27 Novenber 1985. SverigesTelevision, Västnytt, Gothenburg. (In Swedish)
Swedish Geotechnical Institute (1956). Yttrande över grundförhållandena för Viskansstränder vid Brosäters vårdhem i Sundholmen, Älvsborgs län (Report on the groundconditions in the banks of the Viskan at Brosätter nursing home in Sundholmen,Älvsborg county). Swedish Geotechnical Institute, Uppdrag K5981, Stockholm.(In Swedish)
Swedish Geotechnical Institute (1985). Stabilitetsutredning för västra stranden avÖrekilsälven vid Torp övre (Investigation of the stability of the western bank ofÖrekilsälven at Torp övre). Swedish Geotechnical Institute, Dnr 2-77/85, Linköping.(In Swedish)
SGI Report No 61368
Swedish Geotechnical Institute (1988). Lilla Edet, Strandbacken. Geotekniskaundersökningar och stabilitetsanalys (Lilla Edet, Strandbacken. Geotechnicalinvestigations and stability analyses). Swedish Geotechnical Institute, Dnr2-492/87,Linköping. (In Swedish)
Swedish Road Administration (1984). BYA 84 - Guidelines and general advice atconstruction of roads and streets. Document TU 154, Borlänge. (In Swedish)
Swedish Standard SS 02 71 07 – Geotekniska provningsmetoder – Organisk halt i jord– Kolorimetermetoden (Geotechnical tests – Organic content in soils – Thecolorimetric method) (1990). (In Swedish)
Swedish Standard SS 02 71 14 – Geotekniska provningsmetoder – Skrymdensitet(Geotechnical tests – Bulk density) (1989). (In Swedish)
Swedish Standard SS 02 71 16 – Geotekniska provningsmetoder – Vattenkvot ochvattenmättnadsgrad (Geotechnical tests – Water content and saturation ratio) (1989).(In Swedish)
Swedish Standard SS 02 71 20 – Geotekniska provningsmetoder – Konflytgräns(Geotechnical tests – Fall-cone liquid limit) (1990). (In Swedish)
Swedish Standard SS 02 71 21 – Geotekniska provningsmetoder – Plasticitetsgräns(Geotechnical tests – Plastic limit) (1990). (In Swedish)
Swedish Standard SS 02 71 25 – Geotekniska provningsmetoder – Skjuvhållfasthet– Fallkonförsök (Geotechnical tests – Undrained shear strength – Fall-cone test)(1991). (In Swedish)
Swedish Standard SS 02 71 26 – Geotekniska provningsmetoder –Kompressionsegenskaper – Ödometerförsök – CRS-försök (Geotechnical tests –Compressibility – Oedometer test – CRS test) (1991). (In Swedish)
Swedish Standard SS 02 71 27 – Geotekniska provningsmetoder – Skjuvhållfasthet– Direkta skjuvförsök, (Geotechnical tests – Undrained shear strength – Directsimple shear test) (1991). (In Swedish)
Swedish Standard SS 02 71 29 – Geotekniska provningsmetoder –Kompressionsegenskaper – Ödometerförsök – Stegvis pålastning (Geotechnical tests– Compressibility – Oedometer test – Incrementally loaded test) (1991). (InSwedish)
Westerberg, B. (1999). Behaviour and Modelling of a Natural Soft Clay. Thesis, LuleåUniversity of Technology, Department of Civil and Mining Engineering, Division ofSoil Mechanics and Foundation Engineering, Luleå.
Wood, D.M. (1991). Soil behaviour and critical state soil mechanics. CambridgeUniversity Press.


Statens geotekniska institutSwedish Geotechnical Institute
SE-581 93 Linköping, SwedenTel 013–20 18 00, Int + 46 13 201800Fax 013–20 19 14, Int + 46 13 201914
E-mail: [email protected] Internet: www.swedgeo.se