Embed Size (px)
Citation preview
Project Number: 3-53640.00
Hydrological Modelling Dataset Report 4: Hydro-power Schemes Background and Descriptions 24 May 2021

©WSP New Zealand Limited 2021 i
Contact Details
Dr Jack McConchie
WSP L9 Majestic Centre 100 Willis Street Wellington 6011 +64 4 471 7000 [email protected]
Document Details: Date: 24 May 2021 Reference: 3-53640.00 Status: Final
Prepared by Courtenay Bremner
Lizzie Fox
Reviewed by Deborah Maxwell
Approved for release by Jack McConchie
©WSP New Zealand Limited 2021 1
Document History and Status Revision Date Author Reviewed by Approved by Status
Version 1 7 May 20 Lizzie Fox and Courtenay Bremner
Deborah Maxwell Jack McConchie Final for comment
Version 1.1 24 May 2021 Lizzie Fox Jack McConchie Jack McConchie Final
Revision Details Revision Details
Version 1.1 Updating following feedback from the EA
Disclaimers and Limitations This report (‘Report’) has been prepared by WSP exclusively for the Electricity Authority (‘Client’) in relation to Hydrological Modelling Dataset 2021 Full Update (‘Purpose’) and in accordance with the AoG Consultancy Service Order (CSO) dated 17 March 2021. The findings in this Report are based on and are subject to the assumptions specified in the Report and CSO dated 17 March 2021. WSP accepts no liability whatsoever for any reliance on or use of this Report, in whole or in part, for any use or purpose other than the Purpose or any use or reliance on the Report by any third party.
In preparing the Report, WSP has relied upon data, surveys, analyses, designs, plans and other information (‘Client Data’) provided by or on behalf of the Client. Except as otherwise stated in the Report, WSP has not verified the accuracy or completeness of the Client Data. To the extent that the statements, opinions, facts, information, conclusions and/or recommendations in this Report are based in whole or part on the Client Data, those conclusions are contingent upon the accuracy and completeness of the Client Data. WSP will not be liable in relation to incorrect conclusions or findings in the Report should any Client Data be incorrect or have been concealed, withheld, misrepresented or otherwise not fully disclosed to WSP.

©WSP New Zealand Limited 2021 2
©WSP New Zealand Limited 2021 3
Preface A large proportion of New Zealand’s electricity needs are met by generation from hydro power. Information about the distribution of inflows and the capability of the various hydro systems is necessary to ensure a reliable, competitive and efficient market and electricity system.
The hydrological modelling dataset (HMD) is a dataset of hydrological information made available by the Electricity Authority. The dataset was known as the SPECTRA update until 2010. In 2015 the dataset was revised to become the HMD, a comprehensive dataset that can be relied upon by modellers and analysts to test scenarios, provide commentary and inform decisions.
The HMD is comprised of data provided by hydro generators and supplemented with some from other sources. These parties are acknowledged for their contribution and for making this data available.
The HMD consists of three main components:
1. Infrastructure and hydrological constraint attributes:
This dataset records standing information about the capability of the main hydro schemes.
2. Flows:
This time series dataset records data for inflows for reservoirs and flows at various existing or potential hydro generating sites.
3. Storage and spill:
This time series dataset records storage for the main hydro schemes.
This report provides background information for each of the power schemes and overall datasets in a separate, stand-alone report. It is useful to read this in conjunction with the Flows and Storage and spill reports for further context and detail relating to each dataset.
©WSP New Zealand Limited 2021 4
Contents 1 Introduction ........................................................................................................................................................................................................ 5
2 North Island ........................................................................................................................................................................................................ 6
2.1 Waikato (Arapuni and Karapiro) ......................................................................................................................................... 6
2.2 Tokaanu, Rangipo and Taupo ............................................................................................................................................... 7
2.3 Waikaremoana .................................................................................................................................................................................. 9
2.4 Matahina................................................................................................................................................................................................. 9
2.5 Wheao and Flaxy ............................................................................................................................................................................. 11
2.6 Mangahao ............................................................................................................................................................................................ 12
2.7 Patea ......................................................................................................................................................................................................... 12
2.8 Kaimai ...................................................................................................................................................................................................... 13
2.9 Ngaruroro River, Hawke’s Bay ............................................................................................................................................. 15
2.10 Mohaka River, Hawke’s Bay ................................................................................................................................................... 15
3 South Island....................................................................................................................................................................................................... 17
3.1 Waitaki..................................................................................................................................................................................................... 17
3.2 Manapouri .......................................................................................................................................................................................... 20
3.3 Monowai ................................................................................................................................................................................................ 21
3.4 Clutha ...................................................................................................................................................................................................... 22
3.5 Cobb ......................................................................................................................................................................................................... 24
3.6 Coleridge .............................................................................................................................................................................................. 24
3.7 Highbank .............................................................................................................................................................................................26
3.8 Waipori ...................................................................................................................................................................................................26
3.9 Lake Onslow ...................................................................................................................................................................................... 27
3.10 Grey River .............................................................................................................................................................................................28
3.11 Waiau River, Canterbury..........................................................................................................................................................28
3.12 Wairau River, Marlborough ...................................................................................................................................................29
3.13 Hurunui River, Canterbury .................................................................................................................................................... 30
©WSP New Zealand Limited 2021 5
1 Introduction The Hydrological Modelling Dataset (HMD) flow records have been calculated at several locations throughout New Zealand with perceived hydro-electric power potential. This HMD Interim Update Report 4 was requested by the Electricity Authority. It includes a discussion on the background to the various hydro schemes. It is designed to be read in conjunction with Reports 1, 2, 2a, and 3 where more information is required.
The following power companies have provided data for the Hydrological Modelling Dataset (HMD):
Contact Energy Ltd Genesis Energy Ltd Meridian Energy Ltd Mighty River Power Ltd King Country Energy Pioneer Generation Trustpower
The HMD also relies heavily on data supplied by the National Institute of Water and Atmospheric Research (NIWA) from the Water Resources Archive (and funded by PGSF). Flow series from a few rivers form a fundamental component of the datasets discussed. Their use in this report is consistent with the purpose for which Government funding is provided for their collection.
Additional river flow series were provided by Hawkes Bay Regional Council and Environment Canterbury Regional Council. Their assistance with this project is gratefully acknowledged.
©WSP New Zealand Limited 2021 6
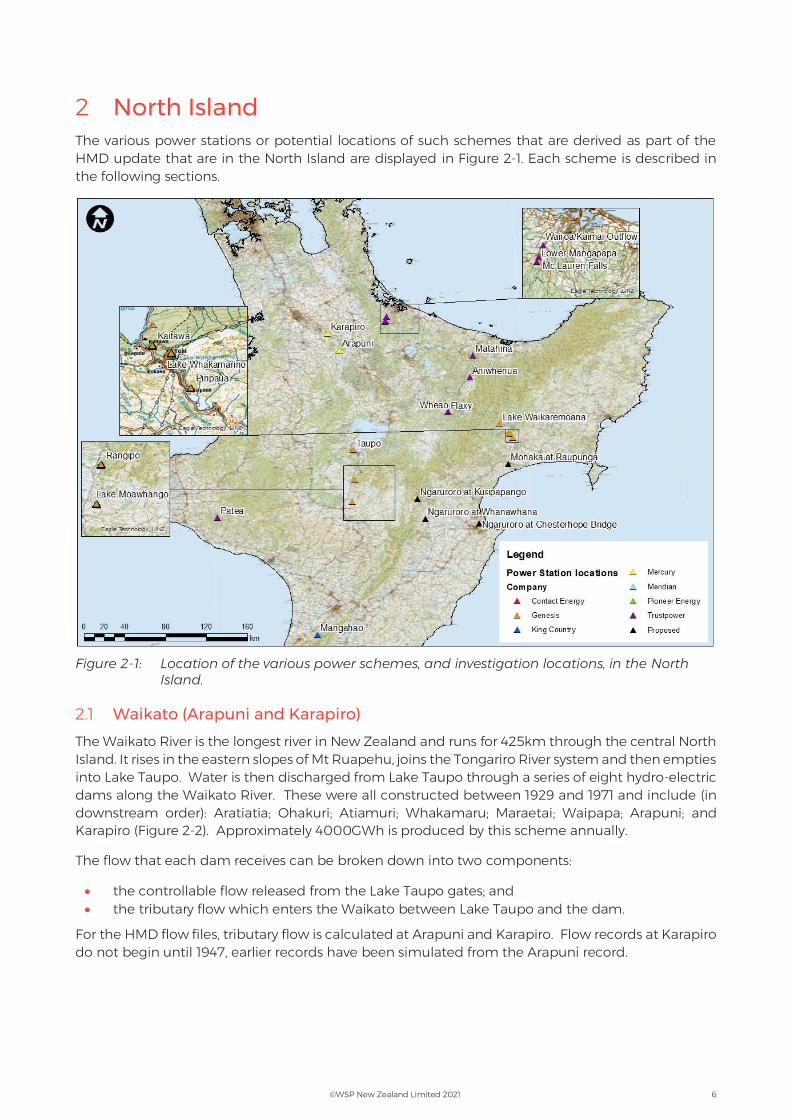
2 North Island The various power stations or potential locations of such schemes that are derived as part of the HMD update that are in the North Island are displayed in Figure 2-1. Each scheme is described in the following sections.
Figure 2-1: Location of the various power schemes, and investigation locations, in the North Island.
2.1 Waikato (Arapuni and Karapiro)
The Waikato River is the longest river in New Zealand and runs for 425km through the central North Island. It rises in the eastern slopes of Mt Ruapehu, joins the Tongariro River system and then empties into Lake Taupo. Water is then discharged from Lake Taupo through a series of eight hydro-electric dams along the Waikato River. These were all constructed between 1929 and 1971 and include (in downstream order): Aratiatia; Ohakuri; Atiamuri; Whakamaru; Maraetai; Waipapa; Arapuni; and Karapiro (Figure 2-2). Approximately 4000GWh is produced by this scheme annually.
The flow that each dam receives can be broken down into two components:
the controllable flow released from the Lake Taupo gates; and the tributary flow which enters the Waikato between Lake Taupo and the dam.
For the HMD flow files, tributary flow is calculated at Arapuni and Karapiro. Flow records at Karapiro do not begin until 1947, earlier records have been simulated from the Arapuni record.
©WSP New Zealand Limited 2021 7
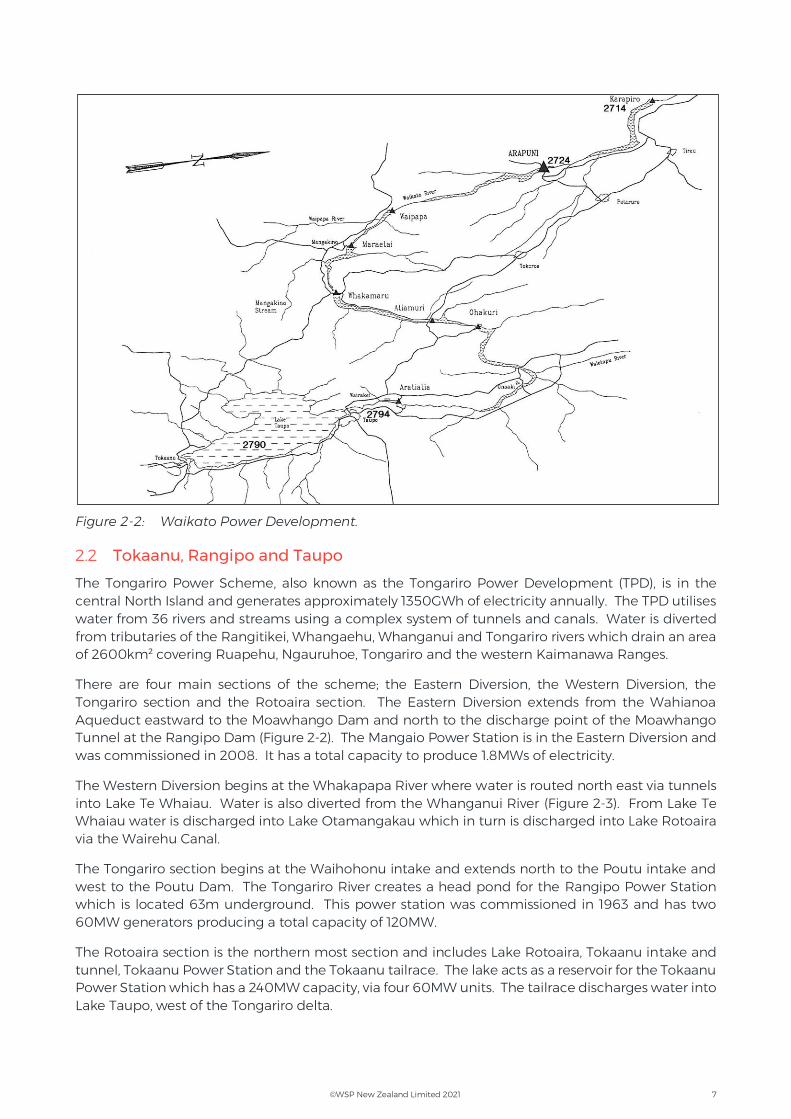
Figure 2-2: Waikato Power Development.
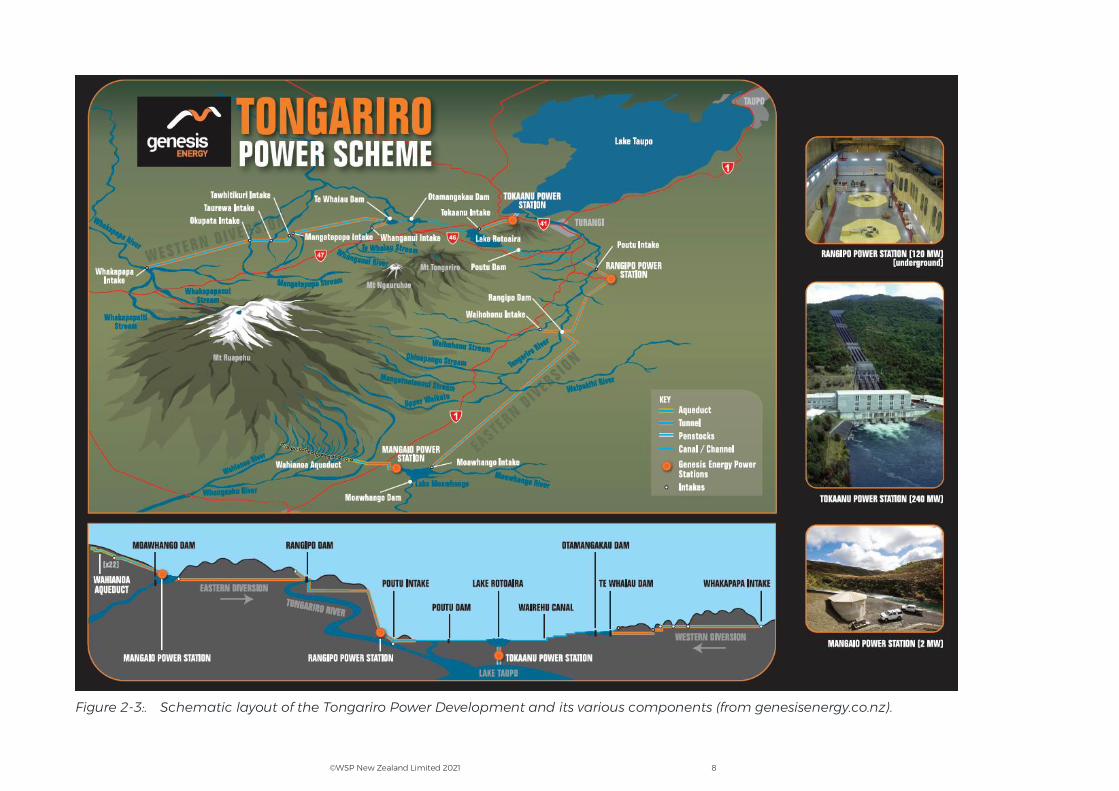
2.2 Tokaanu, Rangipo and Taupo
The Tongariro Power Scheme, also known as the Tongariro Power Development (TPD), is in the central North Island and generates approximately 1350GWh of electricity annually. The TPD utilises water from 36 rivers and streams using a complex system of tunnels and canals. Water is diverted from tributaries of the Rangitikei, Whangaehu, Whanganui and Tongariro rivers which drain an area of 2600km² covering Ruapehu, Ngauruhoe, Tongariro and the western Kaimanawa Ranges.
There are four main sections of the scheme; the Eastern Diversion, the Western Diversion, the Tongariro section and the Rotoaira section. The Eastern Diversion extends from the Wahianoa Aqueduct eastward to the Moawhango Dam and north to the discharge point of the Moawhango Tunnel at the Rangipo Dam (Figure 2-2). The Mangaio Power Station is in the Eastern Diversion and was commissioned in 2008. It has a total capacity to produce 1.8MWs of electricity.
The Western Diversion begins at the Whakapapa River where water is routed north east via tunnels into Lake Te Whaiau. Water is also diverted from the Whanganui River (Figure 2-3). From Lake Te Whaiau water is discharged into Lake Otamangakau which in turn is discharged into Lake Rotoaira via the Wairehu Canal.
The Tongariro section begins at the Waihohonu intake and extends north to the Poutu intake and west to the Poutu Dam. The Tongariro River creates a head pond for the Rangipo Power Station which is located 63m underground. This power station was commissioned in 1963 and has two 60MW generators producing a total capacity of 120MW.
The Rotoaira section is the northern most section and includes Lake Rotoaira, Tokaanu intake and tunnel, Tokaanu Power Station and the Tokaanu tailrace. The lake acts as a reservoir for the Tokaanu Power Station which has a 240MW capacity, via four 60MW units. The tailrace discharges water into Lake Taupo, west of the Tongariro delta.
©WSP New Zealand Limited 2021 8
Figure 2-3:. Schematic layout of the Tongariro Power Development and its various components (from genesisenergy.co.nz).
©WSP New Zealand Limited 2021 9
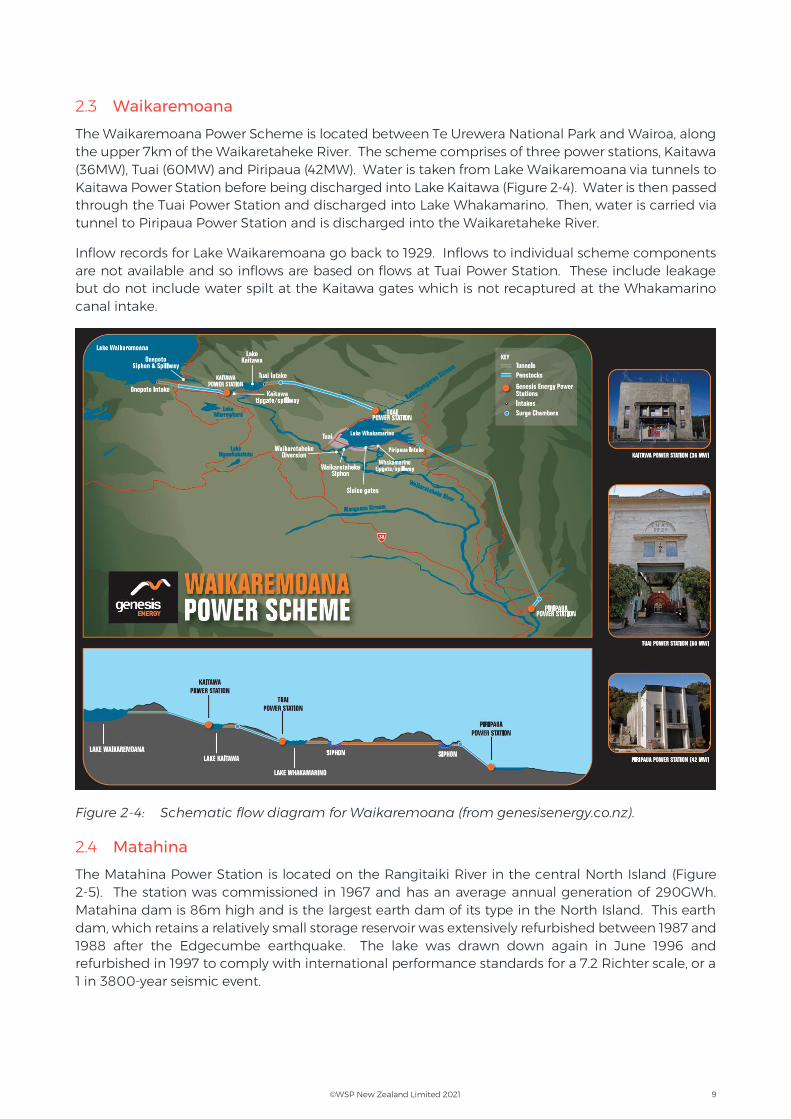
2.3 Waikaremoana
The Waikaremoana Power Scheme is located between Te Urewera National Park and Wairoa, along the upper 7km of the Waikaretaheke River. The scheme comprises of three power stations, Kaitawa (36MW), Tuai (60MW) and Piripaua (42MW). Water is taken from Lake Waikaremoana via tunnels to Kaitawa Power Station before being discharged into Lake Kaitawa (Figure 2-4). Water is then passed through the Tuai Power Station and discharged into Lake Whakamarino. Then, water is carried via tunnel to Piripaua Power Station and is discharged into the Waikaretaheke River.
Inflow records for Lake Waikaremoana go back to 1929. Inflows to individual scheme components are not available and so inflows are based on flows at Tuai Power Station. These include leakage but do not include water spilt at the Kaitawa gates which is not recaptured at the Whakamarino canal intake.
Figure 2-4: Schematic flow diagram for Waikaremoana (from genesisenergy.co.nz).
2.4 Matahina
The Matahina Power Station is located on the Rangitaiki River in the central North Island (Figure 2-5). The station was commissioned in 1967 and has an average annual generation of 290GWh. Matahina dam is 86m high and is the largest earth dam of its type in the North Island. This earth dam, which retains a relatively small storage reservoir was extensively refurbished between 1987 and 1988 after the Edgecumbe earthquake. The lake was drawn down again in June 1996 and refurbished in 1997 to comply with international performance standards for a 7.2 Richter scale, or a 1 in 3800-year seismic event.
©WSP New Zealand Limited 2021 10
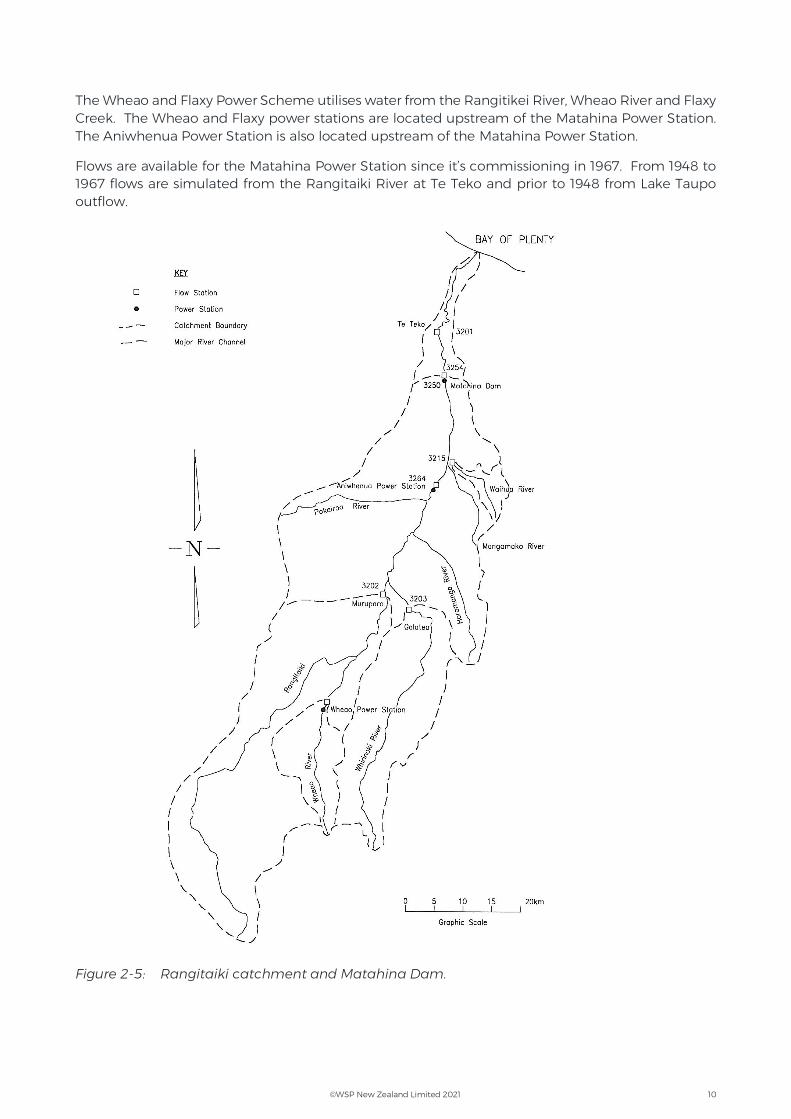
The Wheao and Flaxy Power Scheme utilises water from the Rangitikei River, Wheao River and Flaxy Creek. The Wheao and Flaxy power stations are located upstream of the Matahina Power Station. The Aniwhenua Power Station is also located upstream of the Matahina Power Station.
Flows are available for the Matahina Power Station since it’s commissioning in 1967. From 1948 to 1967 flows are simulated from the Rangitaiki River at Te Teko and prior to 1948 from Lake Taupo outflow.
Figure 2-5: Rangitaiki catchment and Matahina Dam.
©WSP New Zealand Limited 2021 11
2.5 Wheao and Flaxy
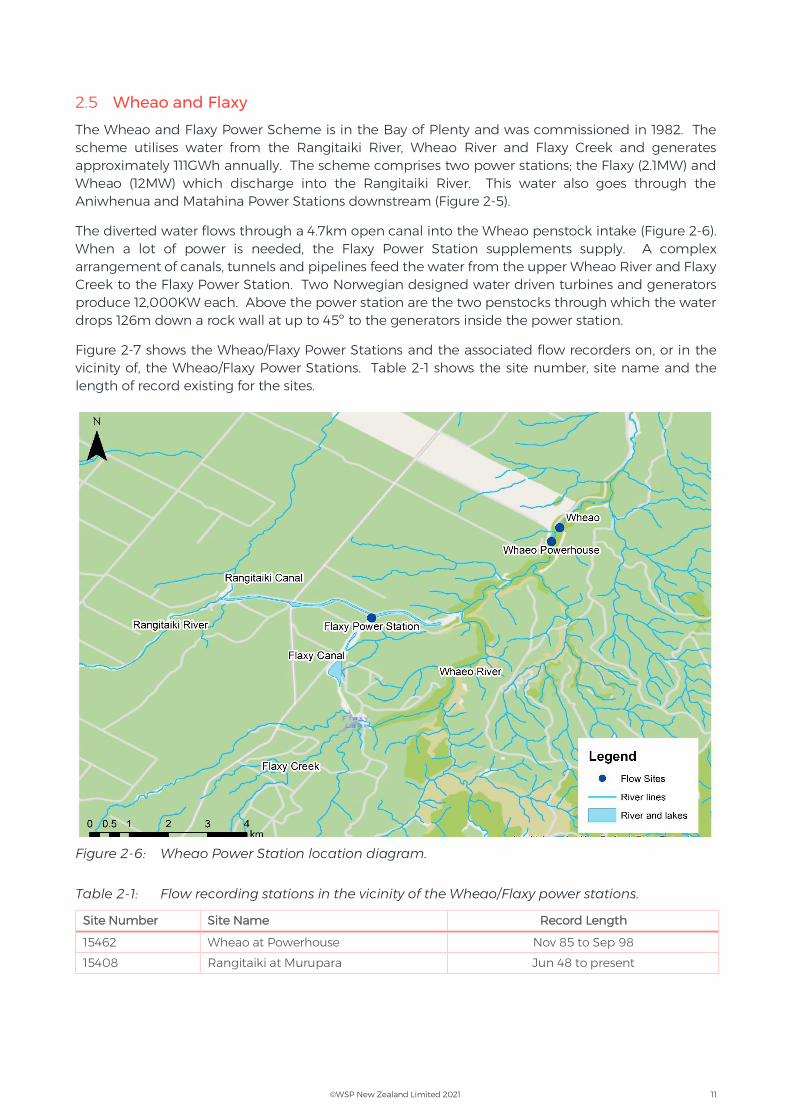
The Wheao and Flaxy Power Scheme is in the Bay of Plenty and was commissioned in 1982. The scheme utilises water from the Rangitaiki River, Wheao River and Flaxy Creek and generates approximately 111GWh annually. The scheme comprises two power stations; the Flaxy (2.1MW) and Wheao (12MW) which discharge into the Rangitaiki River. This water also goes through the Aniwhenua and Matahina Power Stations downstream (Figure 2-5).
The diverted water flows through a 4.7km open canal into the Wheao penstock intake (Figure 2-6). When a lot of power is needed, the Flaxy Power Station supplements supply. A complex arrangement of canals, tunnels and pipelines feed the water from the upper Wheao River and Flaxy Creek to the Flaxy Power Station. Two Norwegian designed water driven turbines and generators produce 12,000KW each. Above the power station are the two penstocks through which the water drops 126m down a rock wall at up to 45º to the generators inside the power station.
Figure 2-7 shows the Wheao/Flaxy Power Stations and the associated flow recorders on, or in the vicinity of, the Wheao/Flaxy Power Stations. Table 2-1 shows the site number, site name and the length of record existing for the sites.
Figure 2-6: Wheao Power Station location diagram.
Table 2-1: Flow recording stations in the vicinity of the Wheao/Flaxy power stations.
Site Number Site Name Record Length
15462 Wheao at Powerhouse Nov 85 to Sep 98
15408 Rangitaiki at Murupara Jun 48 to present
©WSP New Zealand Limited 2021 12
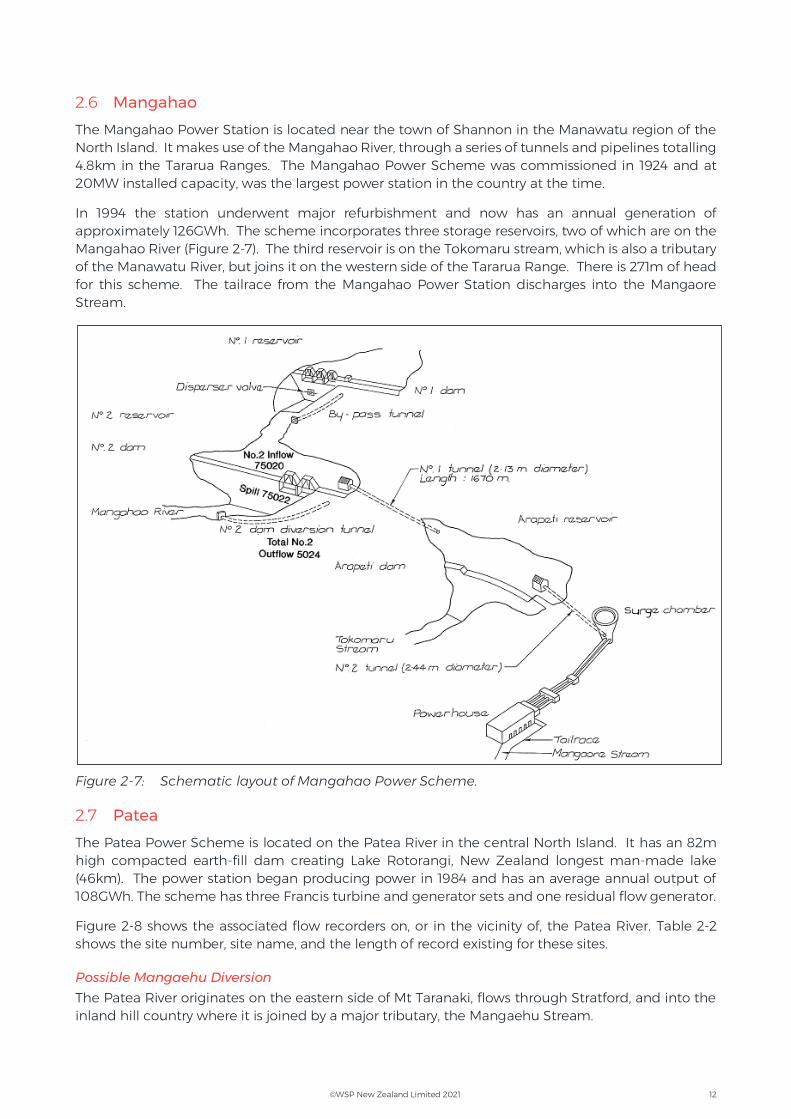
2.6 Mangahao
The Mangahao Power Station is located near the town of Shannon in the Manawatu region of the North Island. It makes use of the Mangahao River, through a series of tunnels and pipelines totalling 4.8km in the Tararua Ranges. The Mangahao Power Scheme was commissioned in 1924 and at 20MW installed capacity, was the largest power station in the country at the time.
In 1994 the station underwent major refurbishment and now has an annual generation of approximately 126GWh. The scheme incorporates three storage reservoirs, two of which are on the Mangahao River (Figure 2-7). The third reservoir is on the Tokomaru stream, which is also a tributary of the Manawatu River, but joins it on the western side of the Tararua Range. There is 271m of head for this scheme. The tailrace from the Mangahao Power Station discharges into the Mangaore Stream.
Figure 2-7: Schematic layout of Mangahao Power Scheme.
2.7 Patea
The Patea Power Scheme is located on the Patea River in the central North Island. It has an 82m high compacted earth-fill dam creating Lake Rotorangi, New Zealand longest man-made lake (46km). The power station began producing power in 1984 and has an average annual output of 108GWh. The scheme has three Francis turbine and generator sets and one residual flow generator.
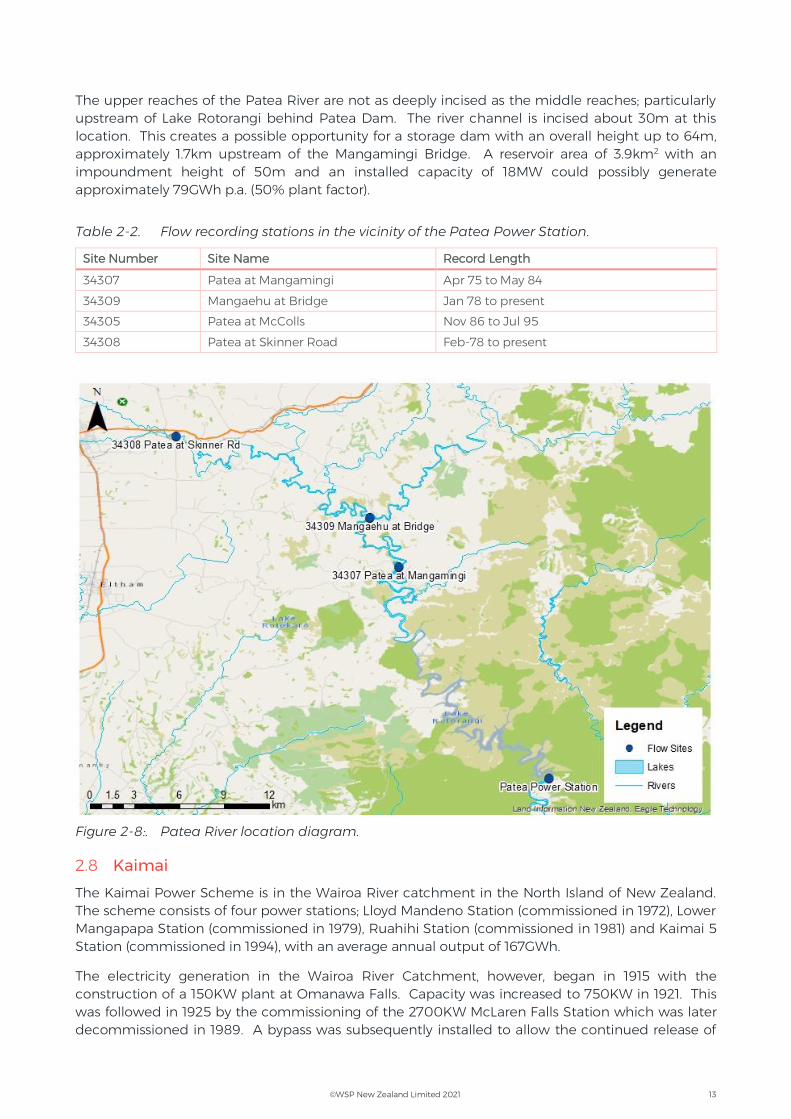
Figure 2-8 shows the associated flow recorders on, or in the vicinity of, the Patea River. Table 2-2 shows the site number, site name, and the length of record existing for these sites.
Possible Mangaehu Diversion
The Patea River originates on the eastern side of Mt Taranaki, flows through Stratford, and into the inland hill country where it is joined by a major tributary, the Mangaehu Stream.
©WSP New Zealand Limited 2021 13
The upper reaches of the Patea River are not as deeply incised as the middle reaches; particularly upstream of Lake Rotorangi behind Patea Dam. The river channel is incised about 30m at this location. This creates a possible opportunity for a storage dam with an overall height up to 64m, approximately 1.7km upstream of the Mangamingi Bridge. A reservoir area of 3.9km2 with an impoundment height of 50m and an installed capacity of 18MW could possibly generate approximately 79GWh p.a. (50% plant factor).
Table 2-2. Flow recording stations in the vicinity of the Patea Power Station.
Site Number Site Name Record Length
34307 Patea at Mangamingi Apr 75 to May 84
34309 Mangaehu at Bridge Jan 78 to present
34305 Patea at McColls Nov 86 to Jul 95
34308 Patea at Skinner Road Feb-78 to present
Figure 2-8:. Patea River location diagram.
2.8 Kaimai
The Kaimai Power Scheme is in the Wairoa River catchment in the North Island of New Zealand. The scheme consists of four power stations; Lloyd Mandeno Station (commissioned in 1972), Lower Mangapapa Station (commissioned in 1979), Ruahihi Station (commissioned in 1981) and Kaimai 5 Station (commissioned in 1994), with an average annual output of 167GWh.
The electricity generation in the Wairoa River Catchment, however, began in 1915 with the construction of a 150KW plant at Omanawa Falls. Capacity was increased to 750KW in 1921. This was followed in 1925 by the commissioning of the 2700KW McLaren Falls Station which was later decommissioned in 1989. A bypass was subsequently installed to allow the continued release of
©WSP New Zealand Limited 2021 14
recreational flows into the Wairoa River on set days each year for activities such as rafting and canoeing.
The Ruahihi Power Station is situated on the Wairoa River adjacent to SH29. Ruahihi was commissioned in 1981 and is the third and largest station in the overall scheme (20MW). Failure of the feed canal later that year required major rebuilding. The station was recommissioned in 1983.
Lake McLaren is the reservoir for this station which is linked to the power station by a canal. Lake McLaren was formed in 1925 by the construction of a 26m high concrete arch dam across the lower Mangapapa River to operate the now decommissioned McLarens Falls Power Station. Water passes through a gated inlet structure into a 2.5km canal. The construction of the canal involved moving 2,400,000m³ of soil at depths up to 46m below original ground level, making it one of the larger canals in New Zealand. The depth of the water in this canal is 6m and the width at normal operating level is 30m. Flow velocities are up to 0.9m per second depending on machine settings and water levels.
Transition from the canal to penstock is a forebay which has screens, a cleaner and control gates. Downstream of the forebay is a 1.6km low pressure conduit leading to twin high-pressure penstock pipes down the escarpment and under State Highway 29 into the powerhouse. There are two generating sets in the station, each producing 10,000KW at 86.4m head of water. Operating speed is 500rpm and the average energy produced is 75.6GWh per annum.
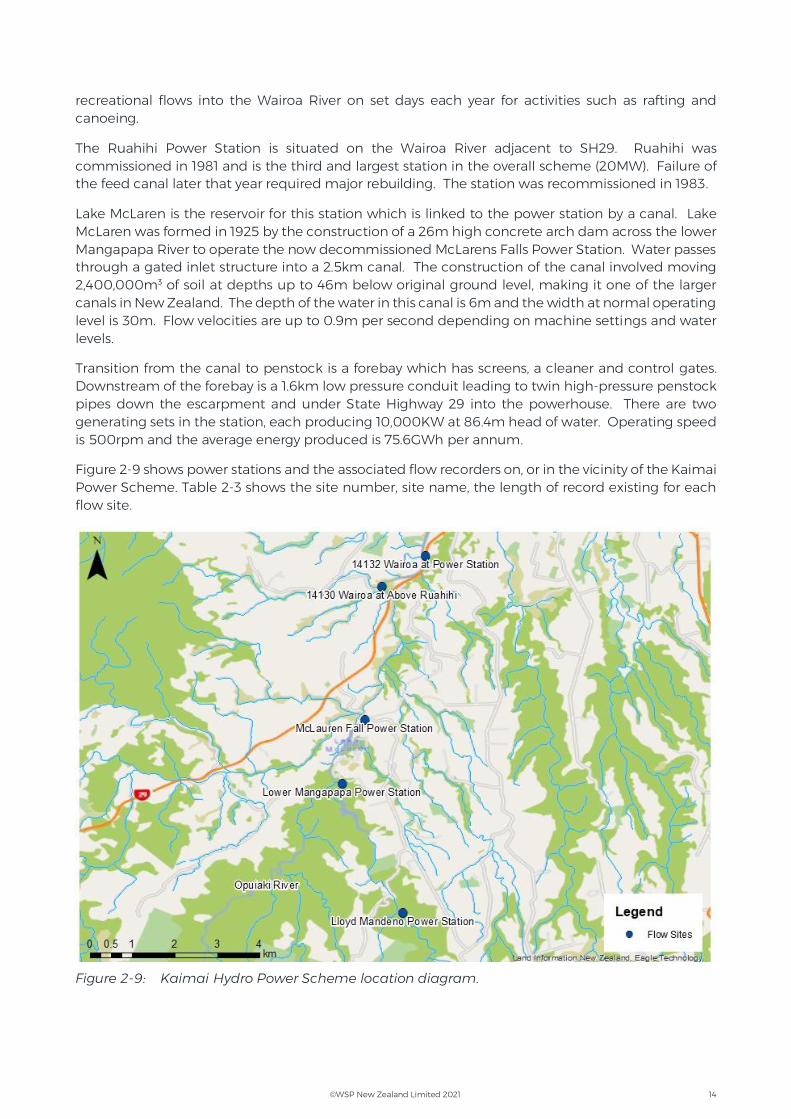
Figure 2-9 shows power stations and the associated flow recorders on, or in the vicinity of the Kaimai Power Scheme. Table 2-3 shows the site number, site name, the length of record existing for each flow site.
Figure 2-9: Kaimai Hydro Power Scheme location diagram.
©WSP New Zealand Limited 2021 15
Table 2-3: Flow recording stations in the vicinity of the power station, including possible power station records.
Site Number Site Name Record Length
14130 Wairoa at Above Ruahihi Sep 90 to present
14132 Wairoa at Power Station Jul 93 to present
2.9 Ngaruroro River, Hawke’s Bay
The Ngaruroro River is in the eastern North Island and runs for a length of 164km. The upper-Ngaruroro drains Kaweka Forest Park and is used for trout fishing, rafting and tramping. The Ngaruroro empties into Hawke’s Bay just north the town of Clive.
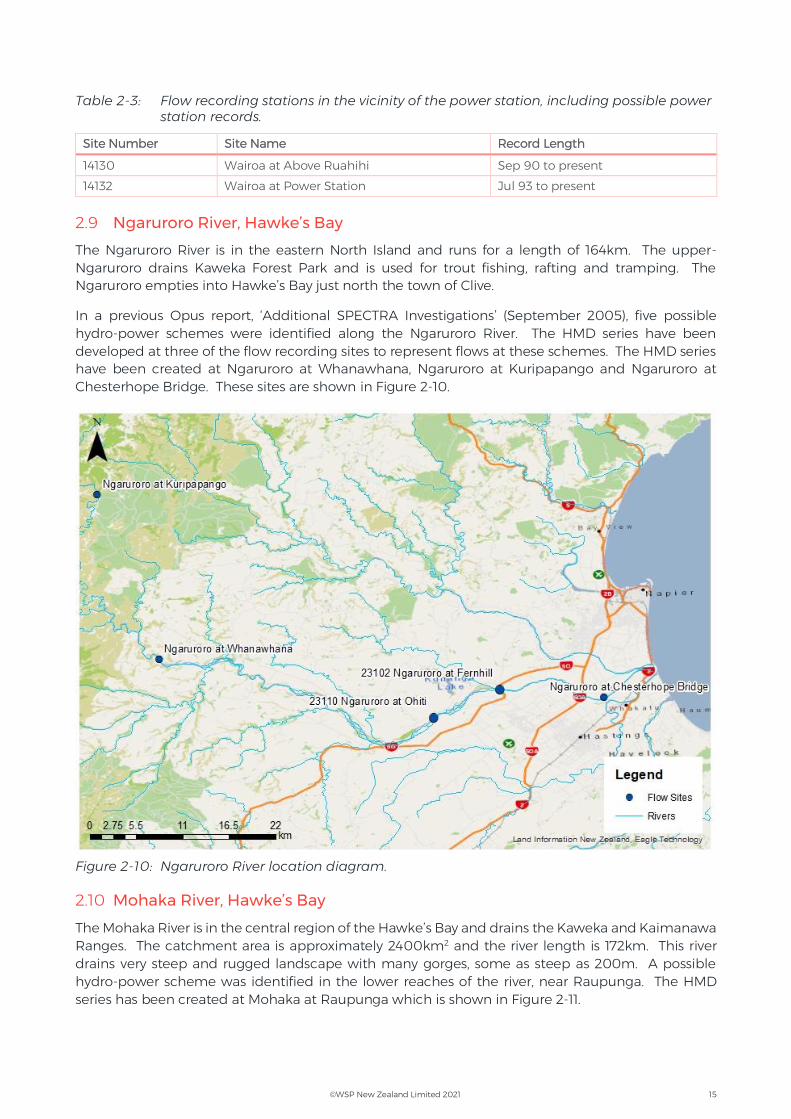
In a previous Opus report, ‘Additional SPECTRA Investigations’ (September 2005), five possible hydro-power schemes were identified along the Ngaruroro River. The HMD series have been developed at three of the flow recording sites to represent flows at these schemes. The HMD series have been created at Ngaruroro at Whanawhana, Ngaruroro at Kuripapango and Ngaruroro at Chesterhope Bridge. These sites are shown in Figure 2-10.
Figure 2-10: Ngaruroro River location diagram.
2.10 Mohaka River, Hawke’s Bay
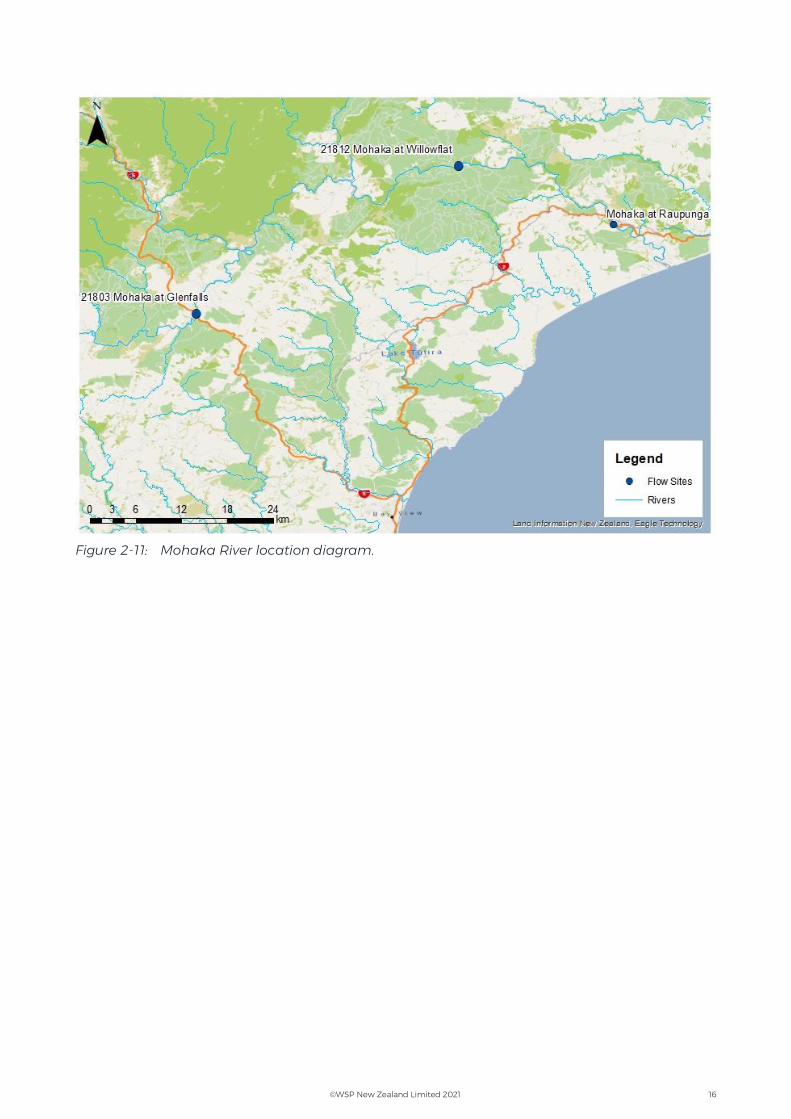
The Mohaka River is in the central region of the Hawke’s Bay and drains the Kaweka and Kaimanawa Ranges. The catchment area is approximately 2400km2 and the river length is 172km. This river drains very steep and rugged landscape with many gorges, some as steep as 200m. A possible hydro-power scheme was identified in the lower reaches of the river, near Raupunga. The HMD series has been created at Mohaka at Raupunga which is shown in Figure 2-11.
©WSP New Zealand Limited 2021 16
Figure 2-11: Mohaka River location diagram.
©WSP New Zealand Limited 2021 17
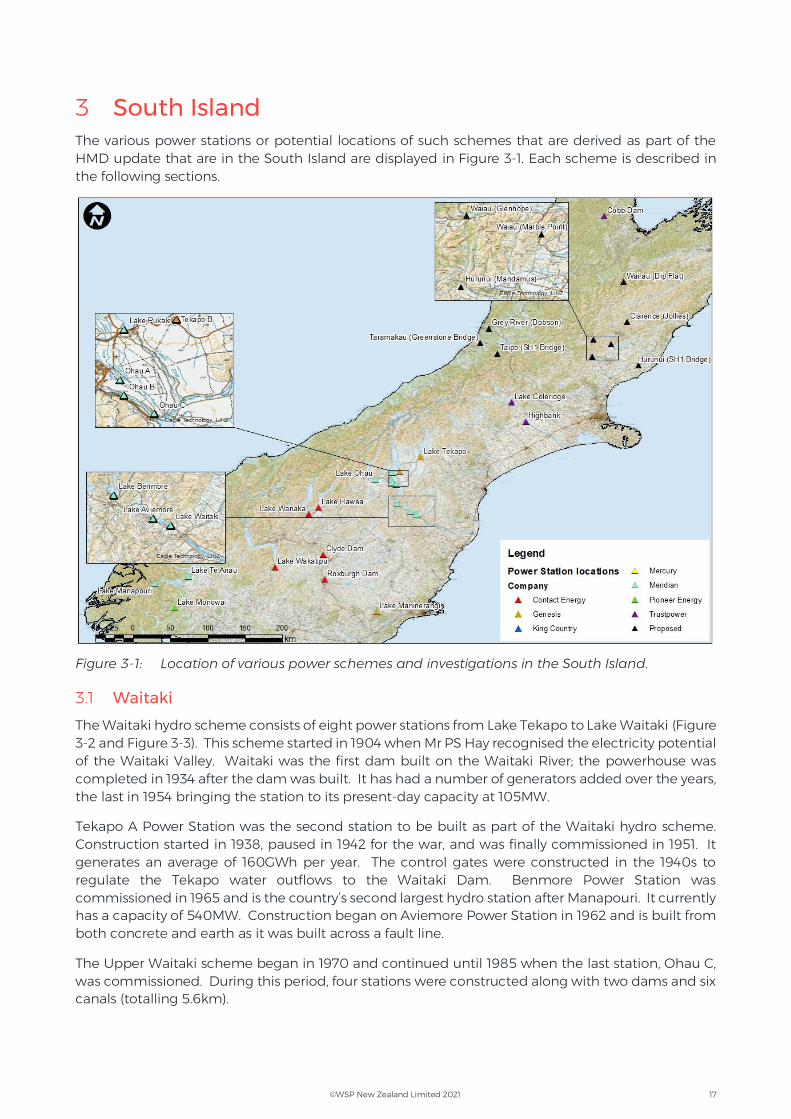
3 South Island The various power stations or potential locations of such schemes that are derived as part of the HMD update that are in the South Island are displayed in Figure 3-1. Each scheme is described in the following sections.
Figure 3-1: Location of various power schemes and investigations in the South Island.
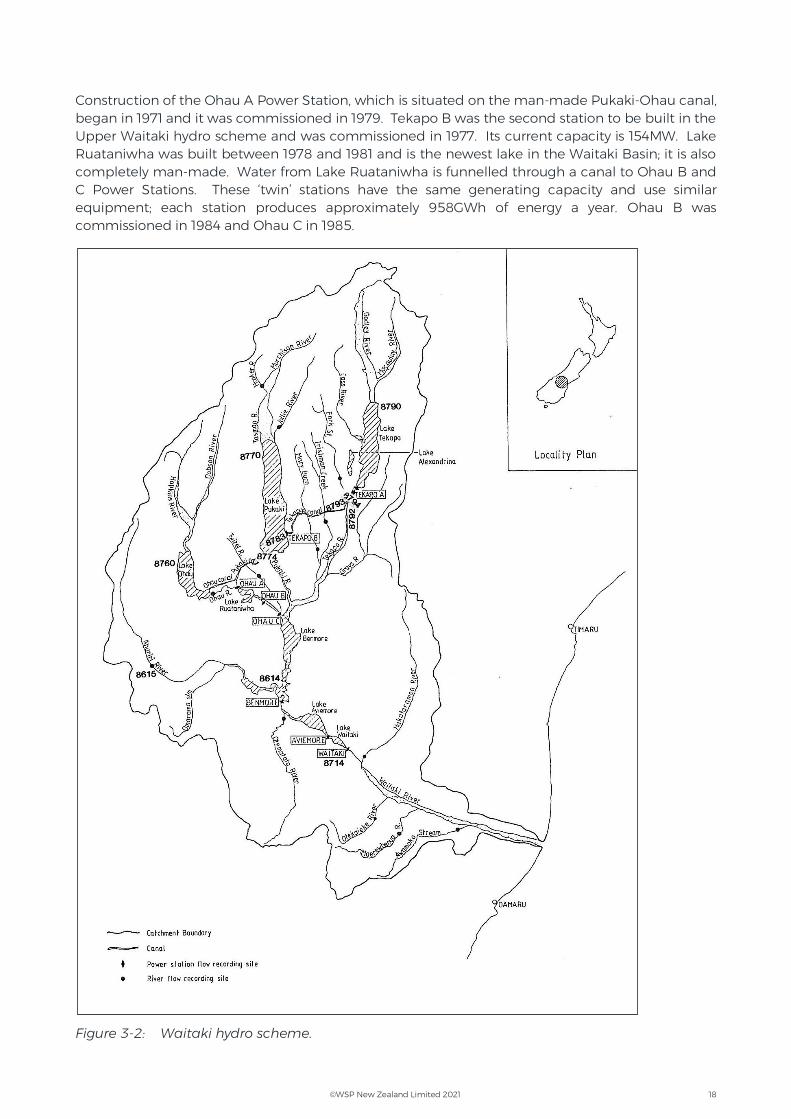
3.1 Waitaki
The Waitaki hydro scheme consists of eight power stations from Lake Tekapo to Lake Waitaki (Figure 3-2 and Figure 3-3). This scheme started in 1904 when Mr PS Hay recognised the electricity potential of the Waitaki Valley. Waitaki was the first dam built on the Waitaki River; the powerhouse was completed in 1934 after the dam was built. It has had a number of generators added over the years, the last in 1954 bringing the station to its present-day capacity at 105MW.
Tekapo A Power Station was the second station to be built as part of the Waitaki hydro scheme. Construction started in 1938, paused in 1942 for the war, and was finally commissioned in 1951. It generates an average of 160GWh per year. The control gates were constructed in the 1940s to regulate the Tekapo water outflows to the Waitaki Dam. Benmore Power Station was commissioned in 1965 and is the country’s second largest hydro station after Manapouri. It currently has a capacity of 540MW. Construction began on Aviemore Power Station in 1962 and is built from both concrete and earth as it was built across a fault line.
The Upper Waitaki scheme began in 1970 and continued until 1985 when the last station, Ohau C, was commissioned. During this period, four stations were constructed along with two dams and six canals (totalling 5.6km).
©WSP New Zealand Limited 2021 18
Construction of the Ohau A Power Station, which is situated on the man-made Pukaki-Ohau canal, began in 1971 and it was commissioned in 1979. Tekapo B was the second station to be built in the Upper Waitaki hydro scheme and was commissioned in 1977. Its current capacity is 154MW. Lake Ruataniwha was built between 1978 and 1981 and is the newest lake in the Waitaki Basin; it is also completely man-made. Water from Lake Ruataniwha is funnelled through a canal to Ohau B and C Power Stations. These ‘twin’ stations have the same generating capacity and use similar equipment; each station produces approximately 958GWh of energy a year. Ohau B was commissioned in 1984 and Ohau C in 1985.
Figure 3-2: Waitaki hydro scheme.
©WSP New Zealand Limited 2021 19
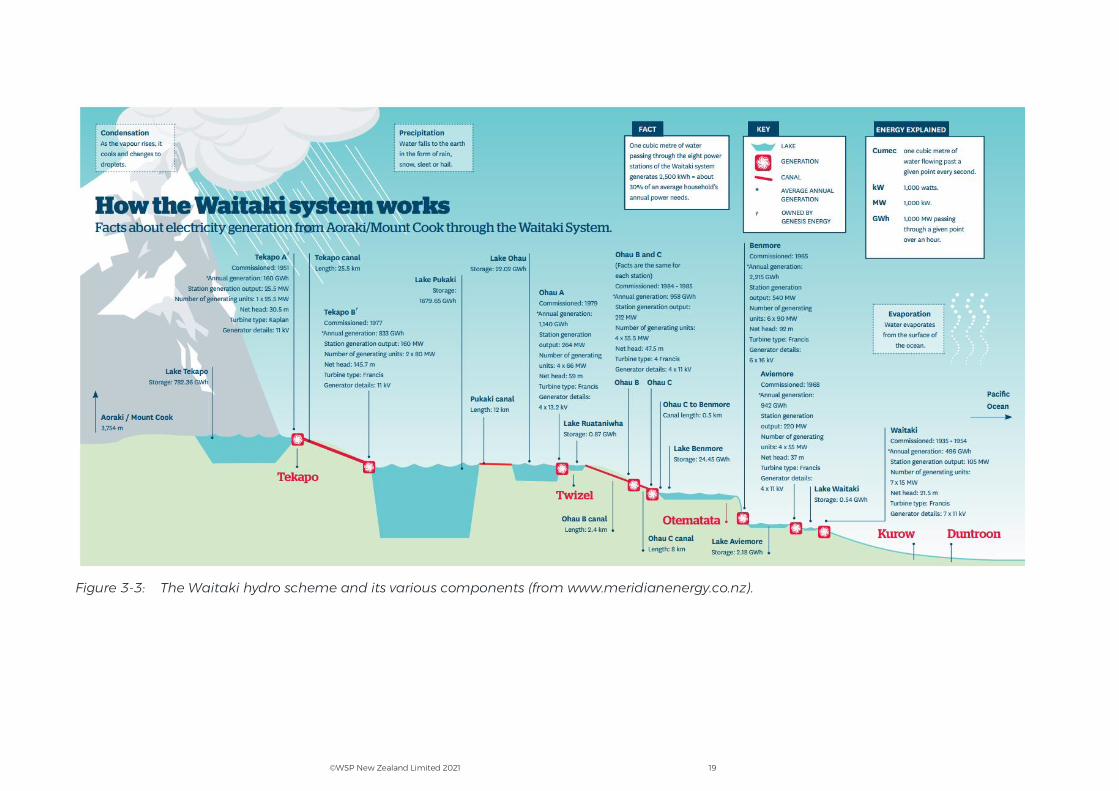
Figure 3-3: The Waitaki hydro scheme and its various components (from www.meridianenergy.co.nz).
©WSP New Zealand Limited 2021 20
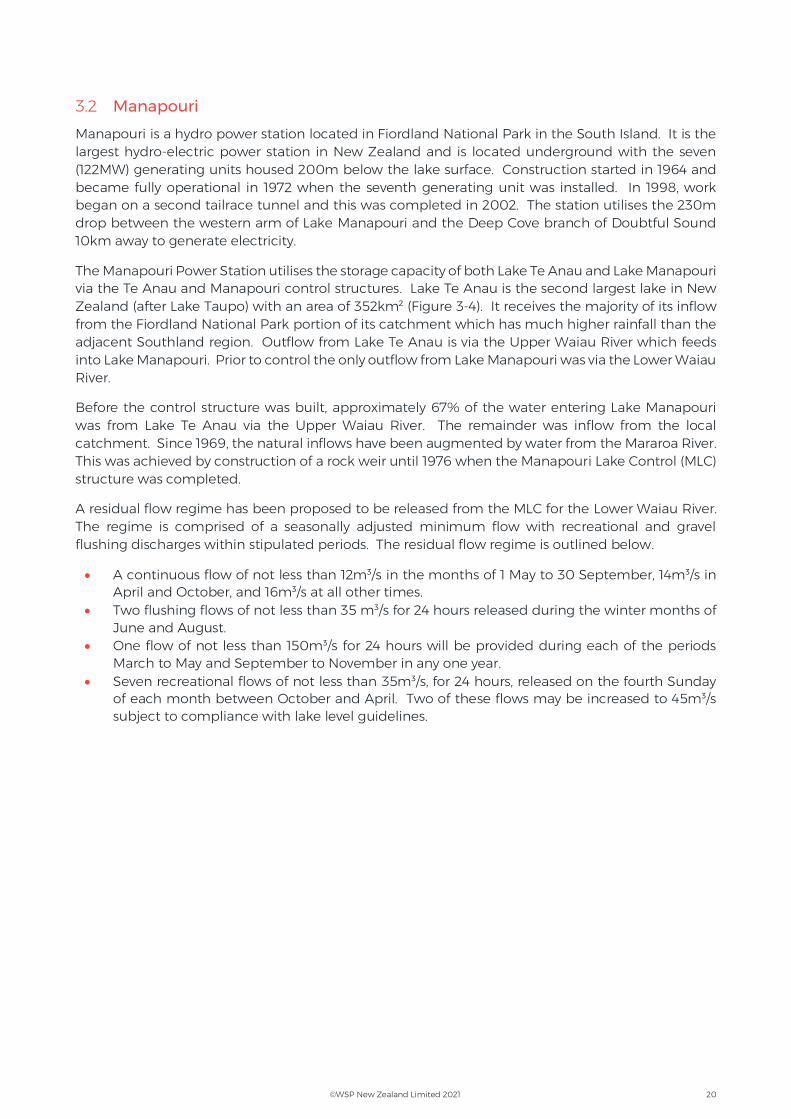
3.2 Manapouri
Manapouri is a hydro power station located in Fiordland National Park in the South Island. It is the largest hydro-electric power station in New Zealand and is located underground with the seven (122MW) generating units housed 200m below the lake surface. Construction started in 1964 and became fully operational in 1972 when the seventh generating unit was installed. In 1998, work began on a second tailrace tunnel and this was completed in 2002. The station utilises the 230m drop between the western arm of Lake Manapouri and the Deep Cove branch of Doubtful Sound 10km away to generate electricity.
The Manapouri Power Station utilises the storage capacity of both Lake Te Anau and Lake Manapouri via the Te Anau and Manapouri control structures. Lake Te Anau is the second largest lake in New Zealand (after Lake Taupo) with an area of 352km² (Figure 3-4). It receives the majority of its inflow from the Fiordland National Park portion of its catchment which has much higher rainfall than the adjacent Southland region. Outflow from Lake Te Anau is via the Upper Waiau River which feeds into Lake Manapouri. Prior to control the only outflow from Lake Manapouri was via the Lower Waiau River.
Before the control structure was built, approximately 67% of the water entering Lake Manapouri was from Lake Te Anau via the Upper Waiau River. The remainder was inflow from the local catchment. Since 1969, the natural inflows have been augmented by water from the Mararoa River. This was achieved by construction of a rock weir until 1976 when the Manapouri Lake Control (MLC) structure was completed.
A residual flow regime has been proposed to be released from the MLC for the Lower Waiau River. The regime is comprised of a seasonally adjusted minimum flow with recreational and gravel flushing discharges within stipulated periods. The residual flow regime is outlined below.
A continuous flow of not less than 12m³/s in the months of 1 May to 30 September, 14m³/s in April and October, and 16m³/s at all other times.
Two flushing flows of not less than 35 m³/s for 24 hours released during the winter months of June and August.
One flow of not less than 150m³/s for 24 hours will be provided during each of the periods March to May and September to November in any one year.
Seven recreational flows of not less than 35m³/s, for 24 hours, released on the fourth Sunday of each month between October and April. Two of these flows may be increased to 45m³/s subject to compliance with lake level guidelines.
©WSP New Zealand Limited 2021 21
Figure 3-4: Schematic layout of the Manapouri Power Development.
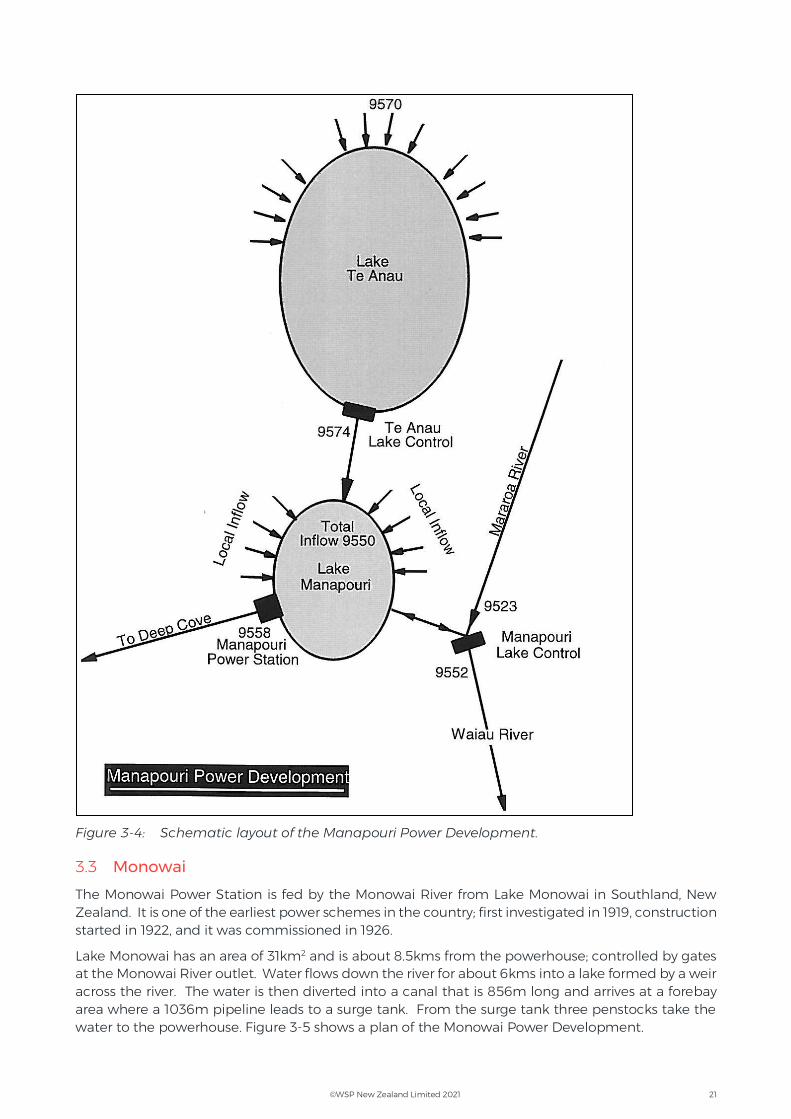
3.3 Monowai
The Monowai Power Station is fed by the Monowai River from Lake Monowai in Southland, New Zealand. It is one of the earliest power schemes in the country; first investigated in 1919, construction started in 1922, and it was commissioned in 1926.
Lake Monowai has an area of 31km2 and is about 8.5kms from the powerhouse; controlled by gates at the Monowai River outlet. Water flows down the river for about 6kms into a lake formed by a weir across the river. The water is then diverted into a canal that is 856m long and arrives at a forebay area where a 1036m pipeline leads to a surge tank. From the surge tank three penstocks take the water to the powerhouse. Figure 3-5 shows a plan of the Monowai Power Development.
©WSP New Zealand Limited 2021 22
Initially there were two machines; a third was added in 1927. It was overhauled in the 2000s and now contains modern turbines and plant although the original buildings are still in use. The generating capacity has now increased to 7.6MW.
Figure 3-5: Monowai Power Development plan (original development).
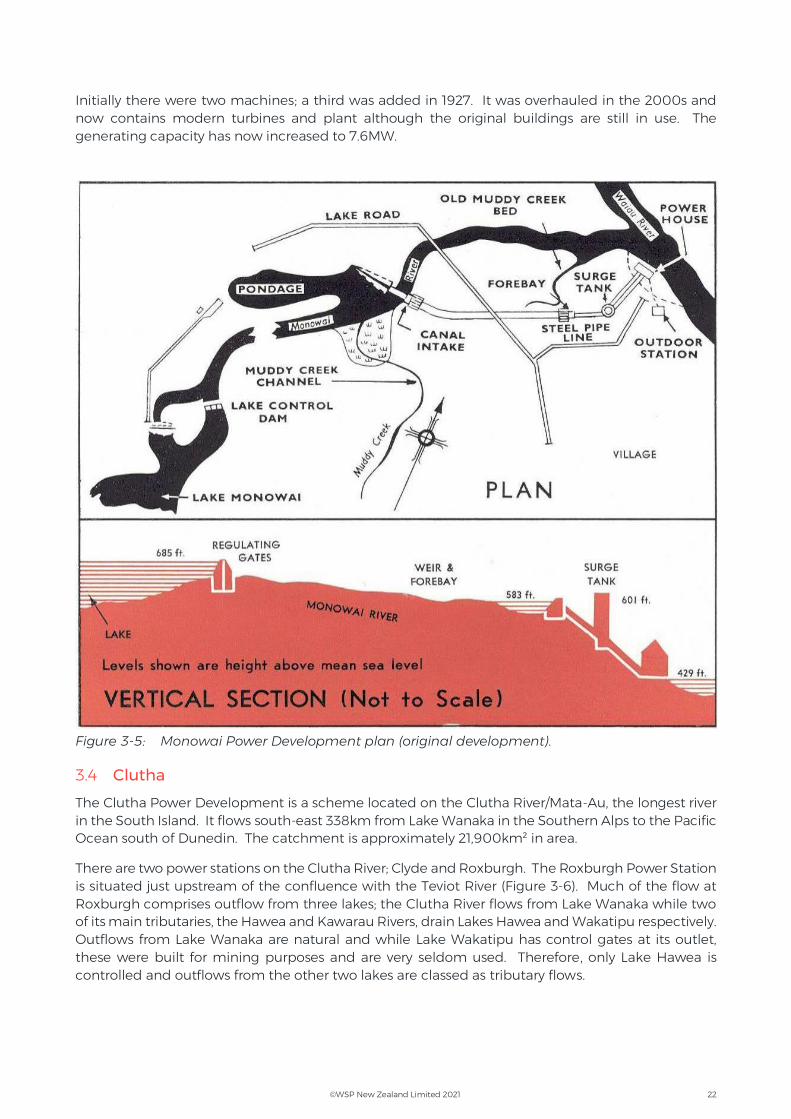
3.4 Clutha
The Clutha Power Development is a scheme located on the Clutha River/Mata-Au, the longest river in the South Island. It flows south-east 338km from Lake Wanaka in the Southern Alps to the Pacific Ocean south of Dunedin. The catchment is approximately 21,900km² in area.
There are two power stations on the Clutha River; Clyde and Roxburgh. The Roxburgh Power Station is situated just upstream of the confluence with the Teviot River (Figure 3-6). Much of the flow at Roxburgh comprises outflow from three lakes; the Clutha River flows from Lake Wanaka while two of its main tributaries, the Hawea and Kawarau Rivers, drain Lakes Hawea and Wakatipu respectively. Outflows from Lake Wanaka are natural and while Lake Wakatipu has control gates at its outlet, these were built for mining purposes and are very seldom used. Therefore, only Lake Hawea is controlled and outflows from the other two lakes are classed as tributary flows.
©WSP New Zealand Limited 2021 23
Figure 3-6: Clutha catchment.
©WSP New Zealand Limited 2021 24
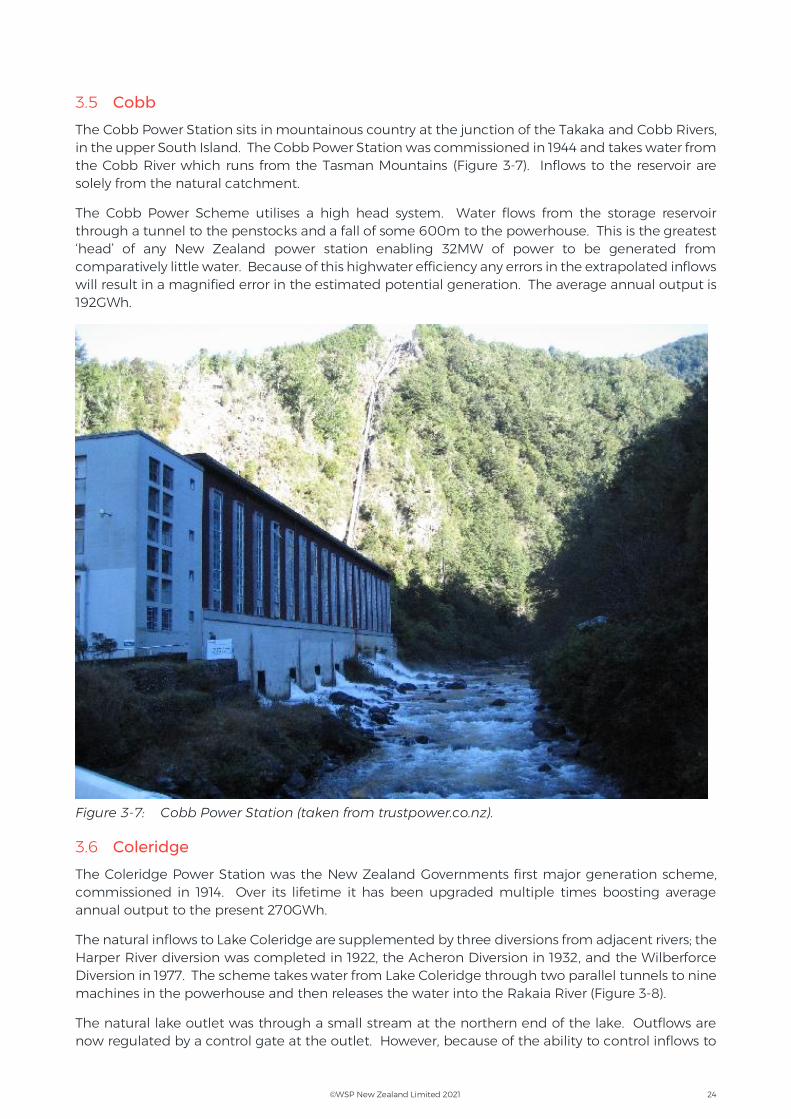
3.5 Cobb
The Cobb Power Station sits in mountainous country at the junction of the Takaka and Cobb Rivers, in the upper South Island. The Cobb Power Station was commissioned in 1944 and takes water from the Cobb River which runs from the Tasman Mountains (Figure 3-7). Inflows to the reservoir are solely from the natural catchment.
The Cobb Power Scheme utilises a high head system. Water flows from the storage reservoir through a tunnel to the penstocks and a fall of some 600m to the powerhouse. This is the greatest ‘head’ of any New Zealand power station enabling 32MW of power to be generated from comparatively little water. Because of this highwater efficiency any errors in the extrapolated inflows will result in a magnified error in the estimated potential generation. The average annual output is 192GWh.
Figure 3-7: Cobb Power Station (taken from trustpower.co.nz).
3.6 Coleridge
The Coleridge Power Station was the New Zealand Governments first major generation scheme, commissioned in 1914. Over its lifetime it has been upgraded multiple times boosting average annual output to the present 270GWh.
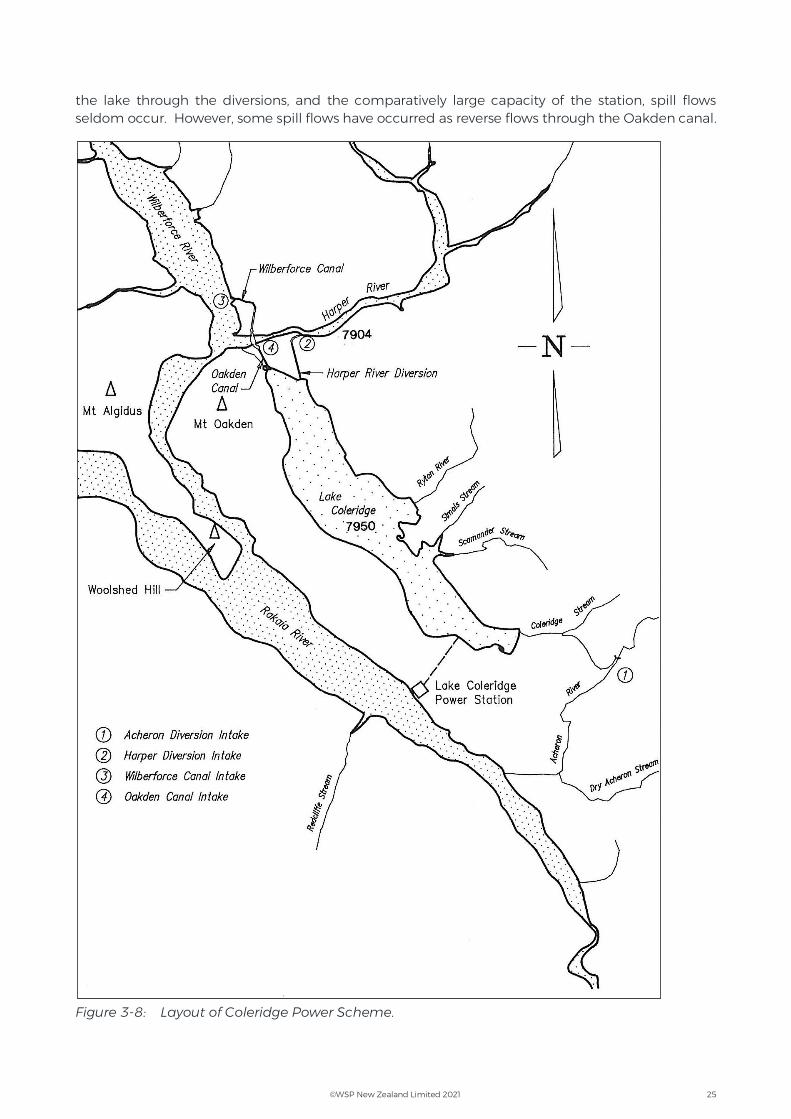
The natural inflows to Lake Coleridge are supplemented by three diversions from adjacent rivers; the Harper River diversion was completed in 1922, the Acheron Diversion in 1932, and the Wilberforce Diversion in 1977. The scheme takes water from Lake Coleridge through two parallel tunnels to nine machines in the powerhouse and then releases the water into the Rakaia River (Figure 3-8).
The natural lake outlet was through a small stream at the northern end of the lake. Outflows are now regulated by a control gate at the outlet. However, because of the ability to control inflows to
©WSP New Zealand Limited 2021 25
the lake through the diversions, and the comparatively large capacity of the station, spill flows seldom occur. However, some spill flows have occurred as reverse flows through the Oakden canal.
Figure 3-8: Layout of Coleridge Power Scheme.
©WSP New Zealand Limited 2021 26
3.7 Highbank
The Highbank/Montalto Power Scheme is in Canterbury in the South Island. The scheme draws from the Rangitata River via the 66km Rangitata diversion race that is used for local irrigation when it is dry. Irrigation takes priority in summer, when demand for electricity is lower; in winter when electricity demand increases, and demand for irrigation water reduces, the water is used for power generation purposes.
The Highbank Power Station was built from 1939-1945 and had a major electrical and ancillary equipment upgrade in 2002. The Montalto Power Station was commissioned in 1982 and utilises the Rangitata diversion race. The combined system of irrigation and generation causes generation volumes to vary but the approximate annual output for both stations is 98GWh.
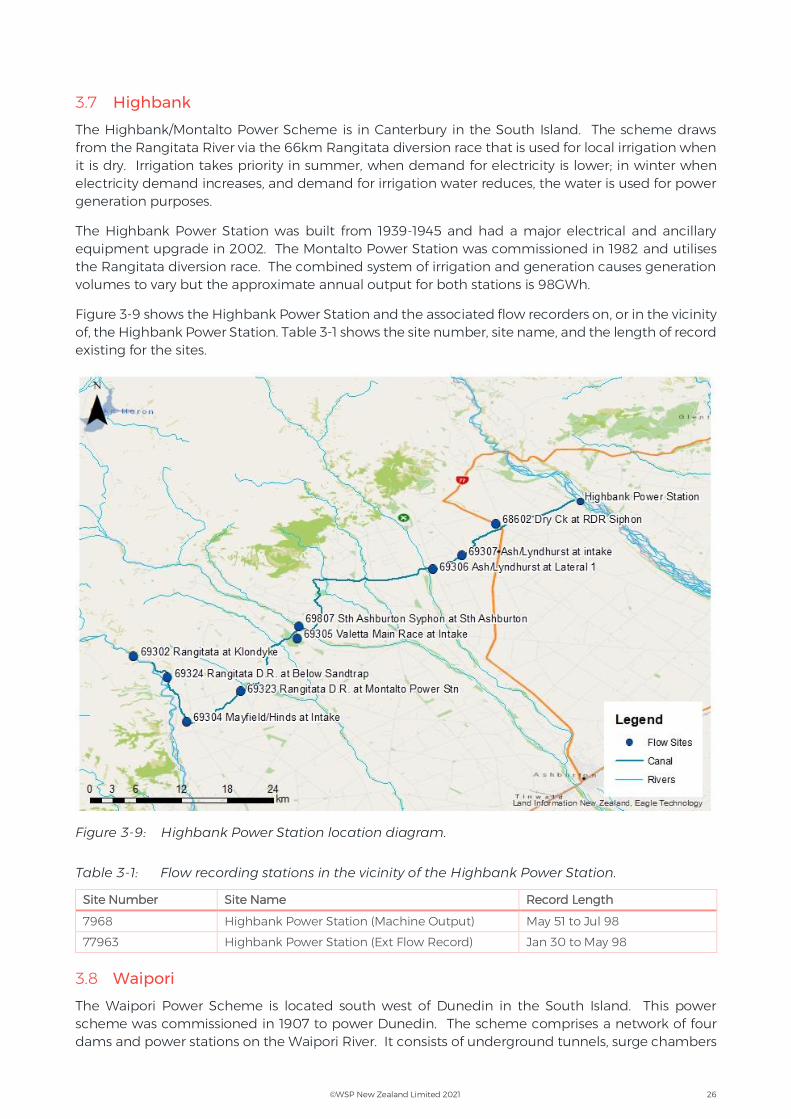
Figure 3-9 shows the Highbank Power Station and the associated flow recorders on, or in the vicinity of, the Highbank Power Station. Table 3-1 shows the site number, site name, and the length of record existing for the sites.
Figure 3-9: Highbank Power Station location diagram.
Table 3-1: Flow recording stations in the vicinity of the Highbank Power Station.
Site Number Site Name Record Length
7968 Highbank Power Station (Machine Output) May 51 to Jul 98
77963 Highbank Power Station (Ext Flow Record) Jan 30 to May 98
3.8 Waipori
The Waipori Power Scheme is located south west of Dunedin in the South Island. This power scheme was commissioned in 1907 to power Dunedin. The scheme comprises a network of four dams and power stations on the Waipori River. It consists of underground tunnels, surge chambers
©WSP New Zealand Limited 2021 27
and an integration of vintage machinery and the latest generation equipment. Lake Mahinerangi is used as the scheme’s reservoir.
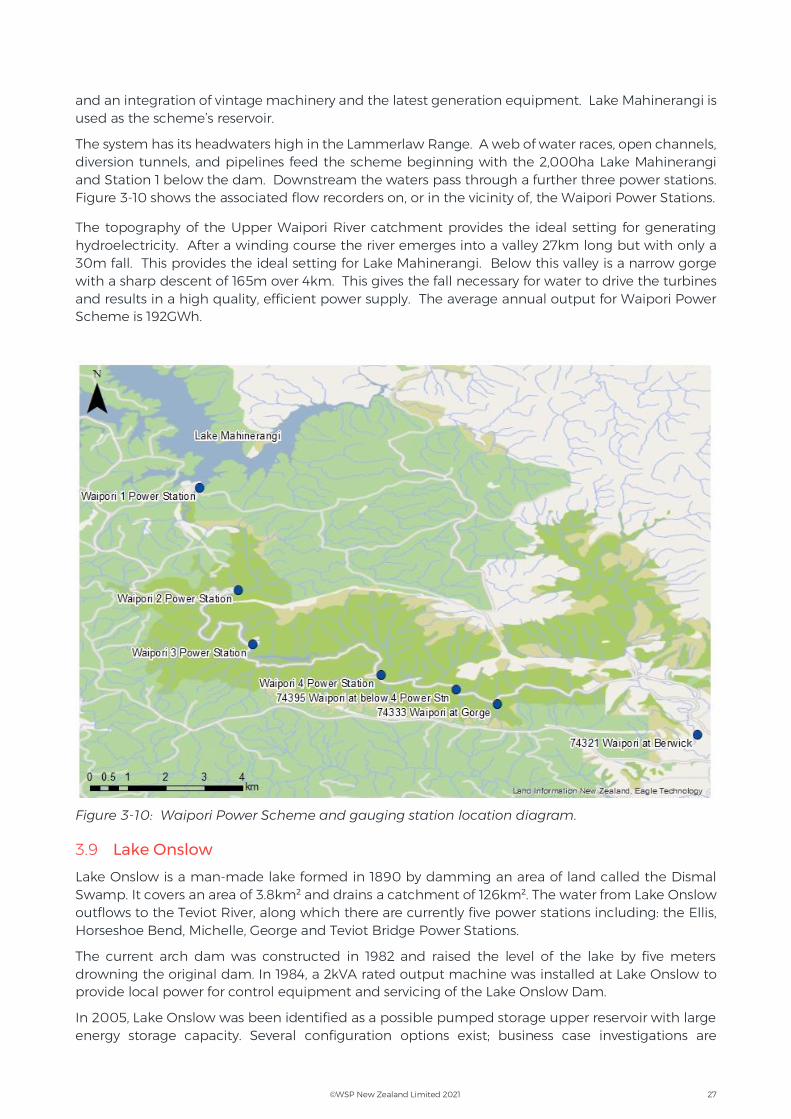
The system has its headwaters high in the Lammerlaw Range. A web of water races, open channels, diversion tunnels, and pipelines feed the scheme beginning with the 2,000ha Lake Mahinerangi and Station 1 below the dam. Downstream the waters pass through a further three power stations. Figure 3-10 shows the associated flow recorders on, or in the vicinity of, the Waipori Power Stations.
The topography of the Upper Waipori River catchment provides the ideal setting for generating hydroelectricity. After a winding course the river emerges into a valley 27km long but with only a 30m fall. This provides the ideal setting for Lake Mahinerangi. Below this valley is a narrow gorge with a sharp descent of 165m over 4km. This gives the fall necessary for water to drive the turbines and results in a high quality, efficient power supply. The average annual output for Waipori Power Scheme is 192GWh.
Figure 3-10: Waipori Power Scheme and gauging station location diagram.
3.9 Lake Onslow
Lake Onslow is a man-made lake formed in 1890 by damming an area of land called the Dismal Swamp. It covers an area of 3.8km² and drains a catchment of 126km². The water from Lake Onslow outflows to the Teviot River, along which there are currently five power stations including: the Ellis, Horseshoe Bend, Michelle, George and Teviot Bridge Power Stations.
The current arch dam was constructed in 1982 and raised the level of the lake by five meters drowning the original dam. In 1984, a 2kVA rated output machine was installed at Lake Onslow to provide local power for control equipment and servicing of the Lake Onslow Dam.
In 2005, Lake Onslow was been identified as a possible pumped storage upper reservoir with large energy storage capacity. Several configuration options exist; business case investigations are
©WSP New Zealand Limited 2021 28
currently underway with a decision due in 2022. For the purposes of the HMD update, the derived flow series used the catchment area described above, of 126km², when correlating a dataset back to 1932 for analysis.
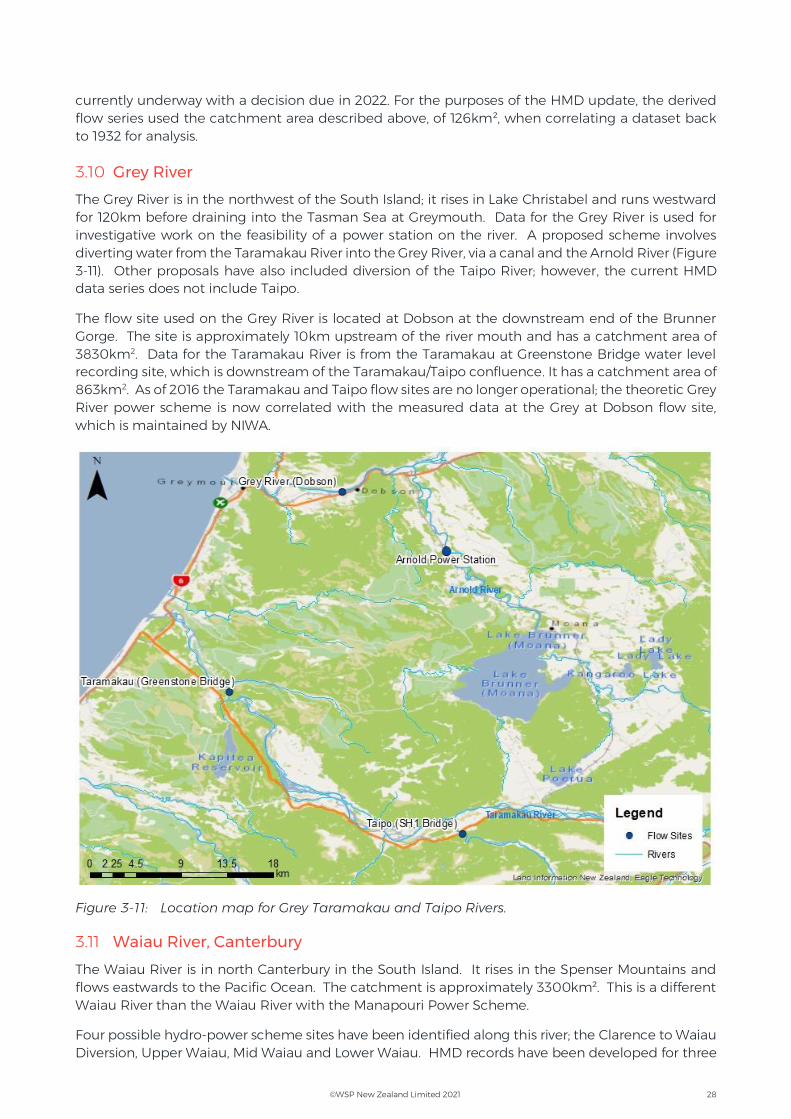
3.10 Grey River
The Grey River is in the northwest of the South Island; it rises in Lake Christabel and runs westward for 120km before draining into the Tasman Sea at Greymouth. Data for the Grey River is used for investigative work on the feasibility of a power station on the river. A proposed scheme involves diverting water from the Taramakau River into the Grey River, via a canal and the Arnold River (Figure 3-11). Other proposals have also included diversion of the Taipo River; however, the current HMD data series does not include Taipo.
The flow site used on the Grey River is located at Dobson at the downstream end of the Brunner Gorge. The site is approximately 10km upstream of the river mouth and has a catchment area of 3830km2. Data for the Taramakau River is from the Taramakau at Greenstone Bridge water level recording site, which is downstream of the Taramakau/Taipo confluence. It has a catchment area of 863km2. As of 2016 the Taramakau and Taipo flow sites are no longer operational; the theoretic Grey River power scheme is now correlated with the measured data at the Grey at Dobson flow site, which is maintained by NIWA.
Figure 3-11: Location map for Grey Taramakau and Taipo Rivers.
3.11 Waiau River, Canterbury
The Waiau River is in north Canterbury in the South Island. It rises in the Spenser Mountains and flows eastwards to the Pacific Ocean. The catchment is approximately 3300km². This is a different Waiau River than the Waiau River with the Manapouri Power Scheme.
Four possible hydro-power scheme sites have been identified along this river; the Clarence to Waiau Diversion, Upper Waiau, Mid Waiau and Lower Waiau. HMD records have been developed for three
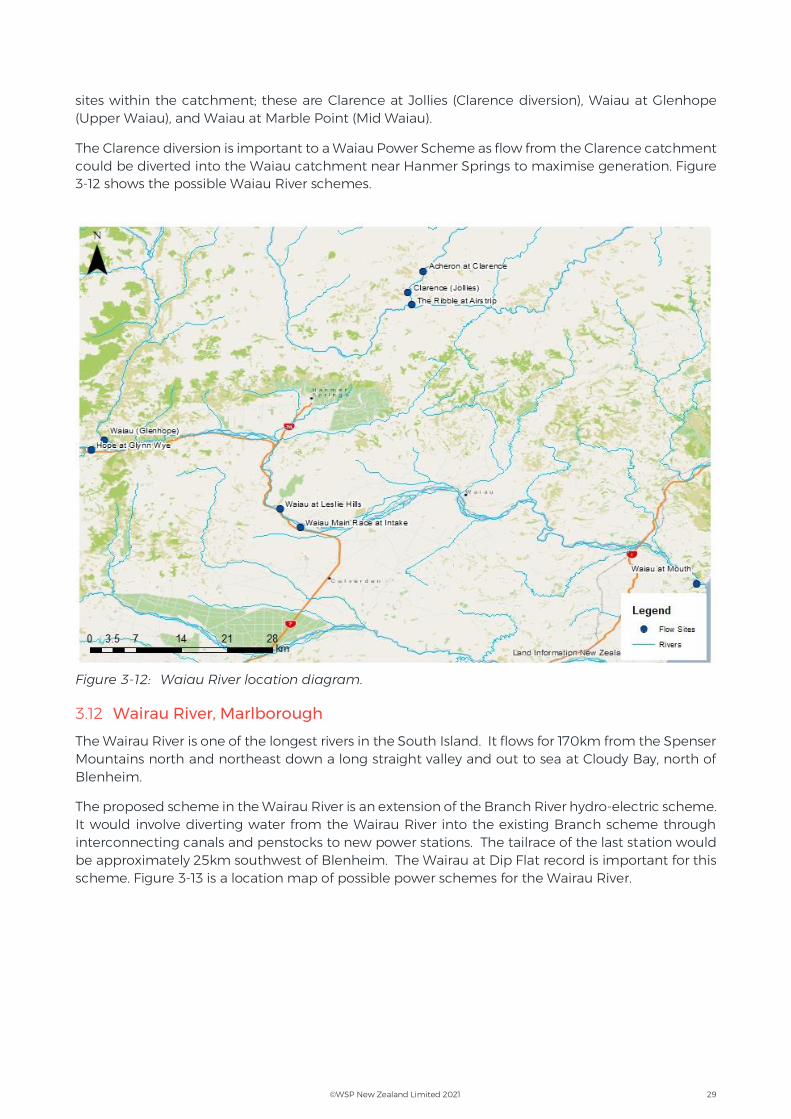
©WSP New Zealand Limited 2021 29
sites within the catchment; these are Clarence at Jollies (Clarence diversion), Waiau at Glenhope (Upper Waiau), and Waiau at Marble Point (Mid Waiau).
The Clarence diversion is important to a Waiau Power Scheme as flow from the Clarence catchment could be diverted into the Waiau catchment near Hanmer Springs to maximise generation. Figure 3-12 shows the possible Waiau River schemes.
Figure 3-12: Waiau River location diagram.
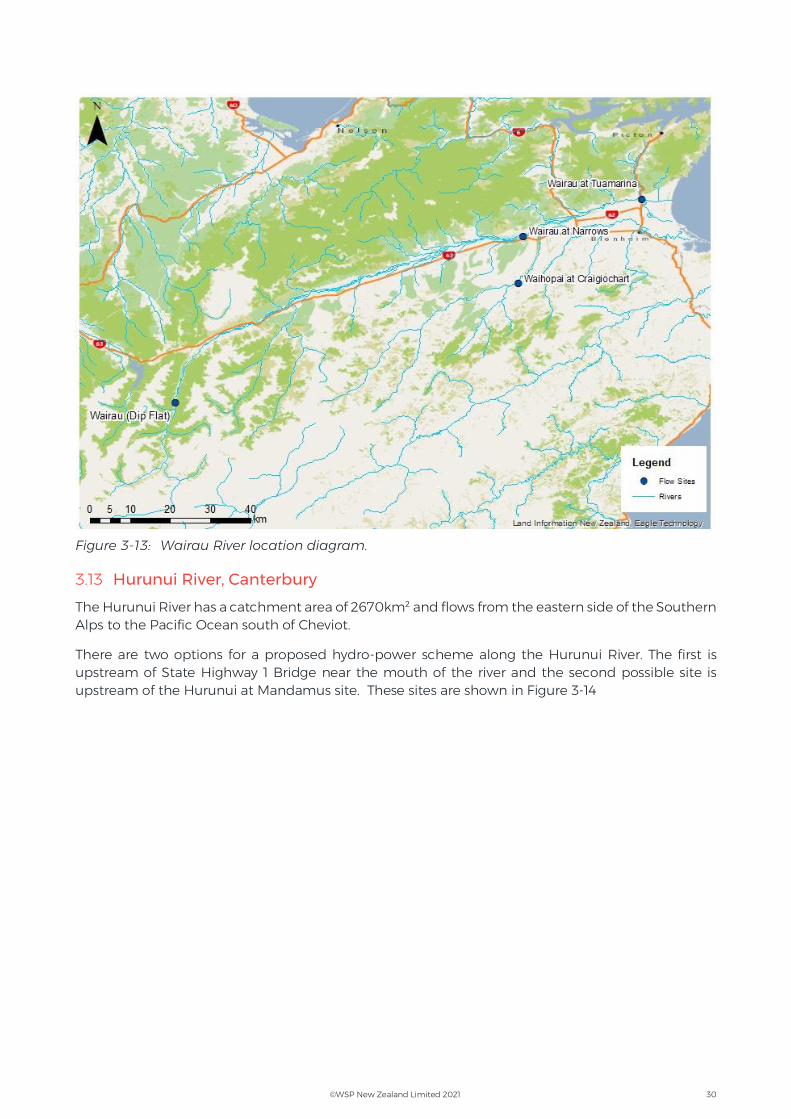
3.12 Wairau River, Marlborough
The Wairau River is one of the longest rivers in the South Island. It flows for 170km from the Spenser Mountains north and northeast down a long straight valley and out to sea at Cloudy Bay, north of Blenheim.
The proposed scheme in the Wairau River is an extension of the Branch River hydro-electric scheme. It would involve diverting water from the Wairau River into the existing Branch scheme through interconnecting canals and penstocks to new power stations. The tailrace of the last station would be approximately 25km southwest of Blenheim. The Wairau at Dip Flat record is important for this scheme. Figure 3-13 is a location map of possible power schemes for the Wairau River.
©WSP New Zealand Limited 2021 30
Figure 3-13: Wairau River location diagram.
3.13 Hurunui River, Canterbury
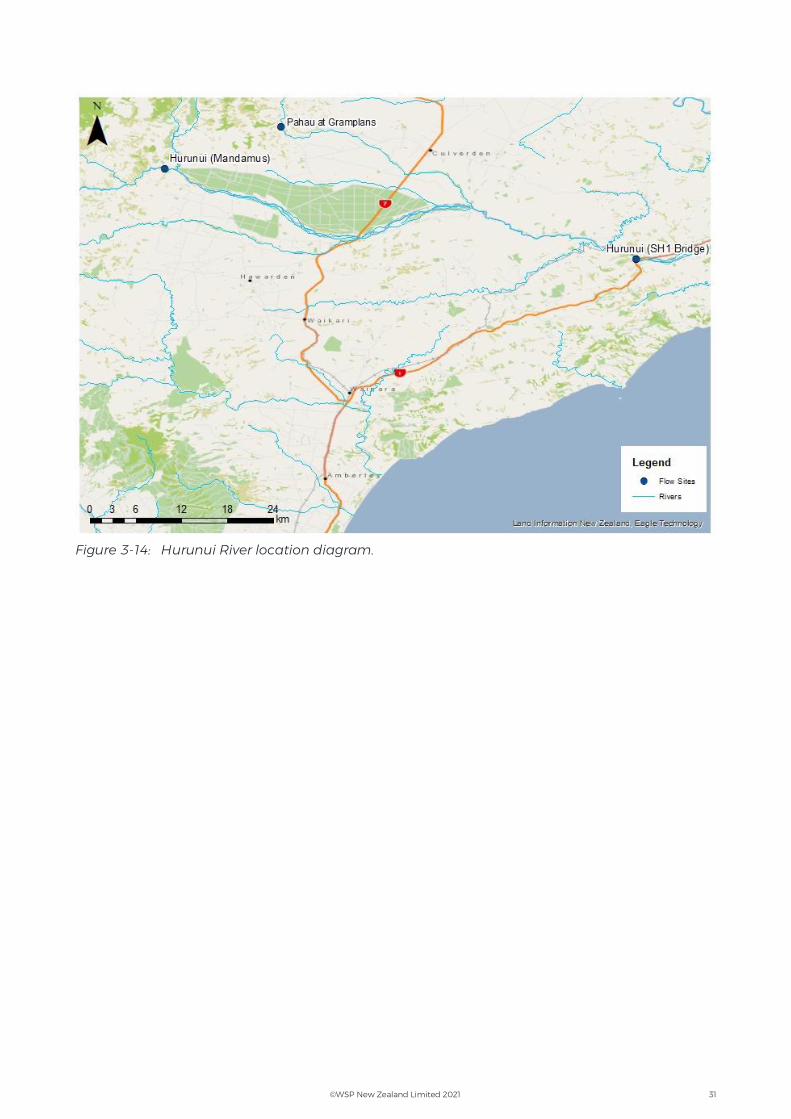
The Hurunui River has a catchment area of 2670km² and flows from the eastern side of the Southern Alps to the Pacific Ocean south of Cheviot.
There are two options for a proposed hydro-power scheme along the Hurunui River. The first is upstream of State Highway 1 Bridge near the mouth of the river and the second possible site is upstream of the Hurunui at Mandamus site. These sites are shown in Figure 3-14
©WSP New Zealand Limited 2021 31
Figure 3-14: Hurunui River location diagram.

wsp.com/nz