Embed Size (px)
Citation preview
TEXAS WATER DEVELOPMENT BOARD
REPORT 307
OCCURRENCE, AVAILABILITY, AND CHEMICAL QUALITY
OF GROUND WATER
IN THE BLOSSOM SAND AQUIFER
By
Celeste McLaurin, Geologist
August 1988
TEXAS WATER DEVELOPMENT BOARD
M . Reginald Arnold II. Executive Administrator
Louie Welch. Chairman Stuart S . Coleman. Vice Chairman Glen E. Roney. Member
Thomas M. Dunning. Member Charles W. Jenness. Member Wesley E. Pittman. Member
A uthorization for use or reproduction of any original material contained in this publication. i. e .• not obtained from other sources. is freely granted. The Board would appreciate acknowledgement.
Published and distributed by the
Texas Water Development Board Post Office Box 13231 Austin. Texas 7B711
ii
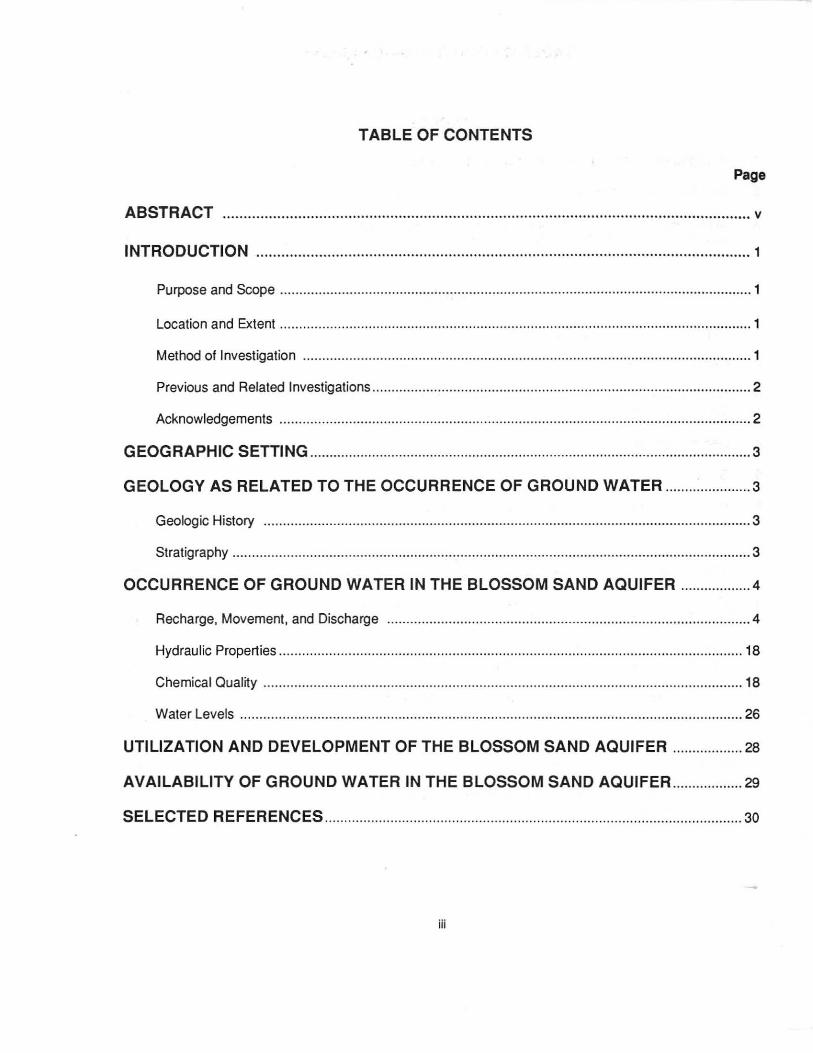
TABLE OF CONTENTS
Page
ABSTRACT .............. ..... .................... .................................... ................. ...... ................... ......... v
INTRODUCTION .......... ............. .. .... ....... .... .......... .................. .................................................. 1
Purpose and Scope ...... ..... ...... .. .. .............................................................. ... ........ ...... .... ........... ....... 1
Location and Extent ..... .. ................... .... .. ...... .... ....... ........ ...... ... .. .. .. ............ ..... .................. ........ .. ..... 1
Method of Investigation .. .............................. ......... ...... ..... ......... ............. ... ......... ....... .... ...... ...... ....... 1
Previous and Related Investigations .. ... .......................................... .... .... ...... ... .... ..... ...... .. .. .. ... ..... ..... 2
Acknowledgements .......... ....... .... ..... .......... ............. .... .......... .......................... ... ..... ..... .. ..... ...... ...... . 2
GEOGRAPHIC SETTING .......... ........ ............................................ .................... ........ .. ......... .. ........... 3
GEOLOGY AS RELATED TO THE OCCURRENCE OF GROUND WATER .............. ........ 3
Geologic History ..... ........ .. .... ...... ........................ ....... .................... .... ...... .... ........ ... .......... ...... ......... 3
Stratigraphy ............. ... .... .... .... .... .. ... ............... ...... .................................... ............. .. ................ ........ . 3
OCCURRENCE OF GROUND WATER IN THE BLOSSOM SAND AQUIFER ............ ..... .4
Recharge, Movement, and Discharge ....... .. .. .............. ..... .... ........ ..... ...... .... .... .... ..... ... ..... ... ...... ....... 4
Hydraulic Properties ......... .......... ......... ... ........................ .. ... ...... .............. ...... ... ............ ...... .. ....... .... 18
Chemical Quality ......... ................................................... .. ........... ... ....... .. ........ ......... ... ..... .... .......... 18
Water Levels ................. ... ...... .... ........... ... .......... .......... ......... .. ......... .... ...... ..... .. ........ ... ..... .. ........... 26
UTILIZATION AND DEVELOPMENT OF THE BLOSSOM SAND AQUIFER .. ...... .......... 28
AVAILABILITY OF GROUND WATER IN THE BLOSSOM SAND AQUIFER .................. 29
SELECTED REFERENCES ... ..... ......... ... .... ................. ........................................... ... ..................... 30
iii
r
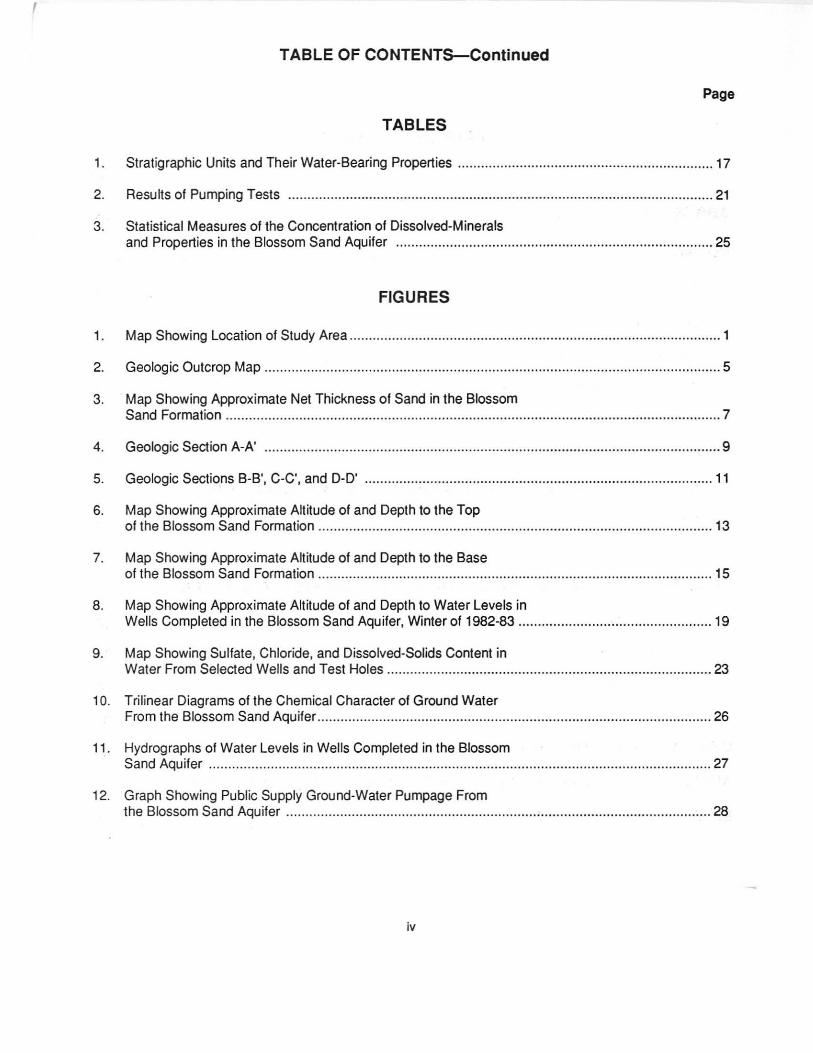
TABLE OF CONTENTS-Continued
Page
TABLES
1. Stratigraphic Units and Their Water-Bearing Properties ....... .... ....... ...... ... ...... ......••••... .. ...... ... ......... 17
2. Resu Its of Pumping Tests .......... ....... ...... .... .... ..... .. ...... .... ....... ............... .......... .. .. ..... ... ... .... ........... 21
3. Statistical Measures of the Concentration of Dissolved·Minerals and Properties in the Blossom Sand Aquifer ....... .. ...... ....... ... ......... .... ........ .... .. .. ... .... ..... ..... ......... .. 25
FIGURES
1. Map Showing Location of Study Area ... ................ ..............•.••........ ..... ........ ..... .. .. ... ..••••••• ......... ... ..... 1
2. Geologic Outcrop Map ... ...... ............... .... ...... ............ ... ....... ........ ... .. .... .... ..... ... ..... ... ..... ...... ..... .. ..... .. 5
3. Map Showing Approximate Net Thickness of Sand in the Blossom Sand Formation .. ... ... .. ...... ... ............ ....... ..... ................. .. .. ........ ..... .... .... .. ...... .... .... .... ...•.•. ... ..... ....... . 7
4. Geologic Section A·A' .. ... .......... .............. .. .. ..... .. ....... ......... ............... ...... ... ........ ... .............. ........ .. ... 9
5. Geologic Sections B-B·. C·C·. and D·O' .. .. ........ .. ............. ...... ............ .... ..... ..... ....... ..... ..... ...... ..... ... 11
6. Map Showing Approximate Altitude of and Depth to the Top of the Blossom Sand Formation .... .... .... .. .................... ... ......... .... ... .•... ......... ... ....... .... ........... ......... . 13
7. Map Showing Approximate Altitude of and Depth to the Base of the Blossom Sand Formation ............ .. .. .. ...... .. .......... .... .... ...... .... ........ .... .. ...... ...... .. .. ........ .. ........ 15
8. Map Showing Approximate Altitude of and Depth to Water Levels in Wells Completed in the Blossom Sand Aquifer. Winter of 1982·83 .......... .. .. ........ .. .. .. .. .... ...... .... .... .. 19
9. Map Showing Sulfate. Chloride. and Dissolved·Solids Content in Water From Selected Wells and Test Holes ...... ...................... .... .. .. ...... .... .. .......... ...... .. ...... ........ .... 23
10. Tril inear Diagrams of the Chemical Character of Ground Water From the Blossom Sand Aquifer ... ...... .. ................... ...... ....... .. ..... .. ......... .... .. .. .............. ... ... ......... ... . 26
11 . Hydrographs of Water Levels in Wells Completed in the Blossom Sand Aquifer .... ........ .. ......................... .. ..... ................. ........... .......................... .. ............. ...... ...... ... 27
12. Graph Showing Public Supply Ground-Water Pumpage From the Blossom Sand Aquifer ........... ...... .... ..... .... .... ...... ........ .. ...... ... ..... ....... .. ..... .......................... ..... . 28
iv
ABSTRACT
The Blossom Sand Formation of Cretaceous age forms a minor aquifer in a narrow east-west band in parts of Bowie, Red River, and Lamar Counties. The formation consists of alternating sequences of fine- to medium-grained sand, shale , clay, marl , and chalk deposited in a marine environment along the northern edge of the East Texas Basin. Formation thickness ranges from 0 to 400 feet with less than 29 percent consisting of sand.
The aquifer yields small to moderate amounts of water over a limited area on and south of the outcrop. Production is greatest in Red River County and decreases westward . Transmissivity, determined from nine pump tests , ranged from 85 to 549 square feet per day. The average annual effective recharge to the aqu ifer which is available for development is estimated to be 811 acre-feet. Water-level declines are occurring in the Clarksville area due to heavy pumpage.
Chemical quality of water available from the Blossom Sand aquifer generally increases rapidly in
v
dissolved-solids content downdip and has a median value of 853 milligrams per liter within the study area. Fresh to slightly saline ground water from the aquifer occurs primarily in wells located on the formation outcrop except for the area around the City of Clarksville. The ground water is generally slightly alkaline, high in sodium and bicarbonate, soft, and is high in iron content in localized areas. The water quality is generally acceptable for most non-industrial uses, except irrigation for which it has high SAR and RSC values.
Most water wells producing from the Blossom Sand Formation are shallow domestic or livestock wells, but are rapidly being abandoned because of greater access ibility to public water supply systems. The City of Clarksville is the largest municipal supplier, producing from two large-capacity wells. The estimated 1982 pumpage for the City of Clarksville was 589 acre-feet. The Red River Water Supply Corporation pumped an additional 224 acre-feet in 1982.

,

OCCURRENCE, AVAILABILITY, AND CHEMICAL QUALITY OF
GROUND WATER IN THE BLOSSOM SAND AQUIFER
INTRODUCTION
Purpose and Scope
The purpose of this study was to describe the ground-water resources of the Blossom Sand aquifer of Cretaceous age. Field investigations were conducted during the period from May 1982 to March 1983.
Included in the scope of the study was the collection and compilation of all available data pertaining to the occurrence, quality, quantity, and availability of ground water in the Blossom Sand aquifer.
Principal object ives of the investigation included the determination of: (a) the location, geographic distribution, and extent of strata containing usable-qual ity water, (b) the quantity and quality of available ground water, (c) the hydrologic characterist ics of the aquifer, and (d) the annual recharge and discharge.
Location and Extent
The study area is within the boundaries of Bowie, Fannin, Lamar, and Red River Counties in northeast Texas (Figure 1). The aquifer is generally restricted to the east-west trending Blossom Sand outcrop except in the vicinity of Clarksville where usable-quality ground water extends downdip to the southern edge of the City. The outcrop area covers approximately 221 square miles and is in the Red and Sulphur River Basins.
Method of Investigation
An inventory of all municipal, industrial , and irrigation wells, along with selected domestic and
livestock wells was begun in May 1982. Of the 139 water wells inventoried, 71 are classified as domestic or livestock, seven as public supply, one as irrigation, and 60 as destroyed or abandoned. Concurrent with the initiation of field work, office work involved gathering data from drillers' water well reports and compiling available surface and subsurface geologic data relating to ground water.
Information on the lithologic character, depth, and thickness of the Blossom Sand Formation was obtained from geophysical and drillers' logs on file with the Texas Water Commission. To aid in the delineation of the aquifer, the Texas Department of Water Resources (a predecessor agency of the Texas Water Development Board) drilled seven test holes. Hydraulic characteristics of the aquifer were determined from pump and recovery tests and laboratory analyses of test hole cores.
The geologic base map for this report was adopted from the Sherman and Texarkana Geologic
Figure 1.-Location of Study Area
, Atlas Sheets published by the University of Texas, Bureau of Economic Geology.
Chemical quality of ground water available from the Blossom Sand was determined by analyzing water quality data from selected wells and test holes. Figure 9 shows the approximate downdip limit of fresh to slightly saline water. For the purpose of this report , usable-quality ground water is considered to be water that contains less than 3,000 mill igrams per liter (mg/I) dissolved solids.
Water-level measurements were taken during November 1982 and January 1983. The few historical water-level records available were used to help determine the effects of pumpage on the aquifer.
Basic data, consisting of well information, chemical analyses of well water, and test hole results , which were gathered during the course of the study, are not included within this report, but are available for public inspection in the files of the Texas Water Development Board.
Previous and Related Investigations
Prior to this report, there has been limited definitive stratigraphic or hydrologic work completed on the Blossom Sand Formation. The available literature often contains disagreement on stratigraphic and facies relationships, as wel l as nomenclature. Although a comprehensive stratigraphic investigation was beyond the scope of this study, an attempt was made to delineate the upper, lower, and lateral boundaries of the sandy facies of the formation.
One of the initial related hydrologic investigations was by A. C. Veatch in 1906 which described the geology and ground-water resources of northern Louisiana and southern Arkansas. Veatch briefly discussed the Cretaceous formations in a small area of Texas and referred to the Blossom Sand as the Sub-Clarksville Sand.
C. H. Gordon is credited with naming the Blossom Sand in 1906 after the town of Blossom in Lamar County, Texas. He also conducted a regional study in 1.911 of the geology and ground water in northeastern Texas. The Blossom Sand was initially assigned to the upper Eagle Ford Group.
Lloyd Stephenson (1918) revised areal distributions and interpreted new stratigraphic and age
- 2 -
relationships for many Gulfian format ions. Most pertinent to this report was the correlation of the Blossom Sand with the Austin Group. Another paper by Stephenson in 1936 was devoted to the stratigraphic relationships of the Austin and Taylor Formations.
Baker and others (1963) conducted an investigation of the ground-water resources of the Red River, Sulphur River, and Cypress Creek Basins in which hydrologic characteristics of the Blossom Sand Formation were estimated.
Stehli and others (1972) interpreted the depositional environments of the Gulfian Cretaceous groups of northeast Texas by using lithologic data to determine sediment sources and dist ribution. A related paleontological study completed by Stehli and Creath (1964) also considered the interpretation of regional environments.
Wood and Guevara (1981) published a report on the regional structure with cross sections and general stratigraphy of the East Texas basin.
Publications containing information relating to the geology and hydrology of the Blossom Sand Formation are included in the selected references of this report.
Acknowledgements
The author appreciates the cooperation of property owners within the study region in supplying information concerning their wells and allowing access to their property; and all water well drillers , city officials, watersuperintendents, and officials of independent water companies for information, assistance, and cooperation rendered throughout the investigation. Cooperation of federal and otherstate agencies is also gratefully appreciated . Special thanks are extended to the State Department of Highways and Public Transportation for the use of highway right-of-way as drilling sites for test holes and particularly to Dave Garrison and Don Otee for the cooperation they rendered throughout the test hole drilling phase of th is investigat ion.
The author also thanks Phillip Nordstrom and John Ashworth fort heir many useful suggestions and for their review and editing of the manuscript. Field inventory of water wells for this investigation was completed by the author and Gerald Adair. General supervision in the preparation of this report was
furnished by Tommy R. Knowles , Chief of the Water Availability Data and Studies Section, and Henry J. Alvarez, Head of the Ground Water Unit.
GEOGRAPHIC SETTING
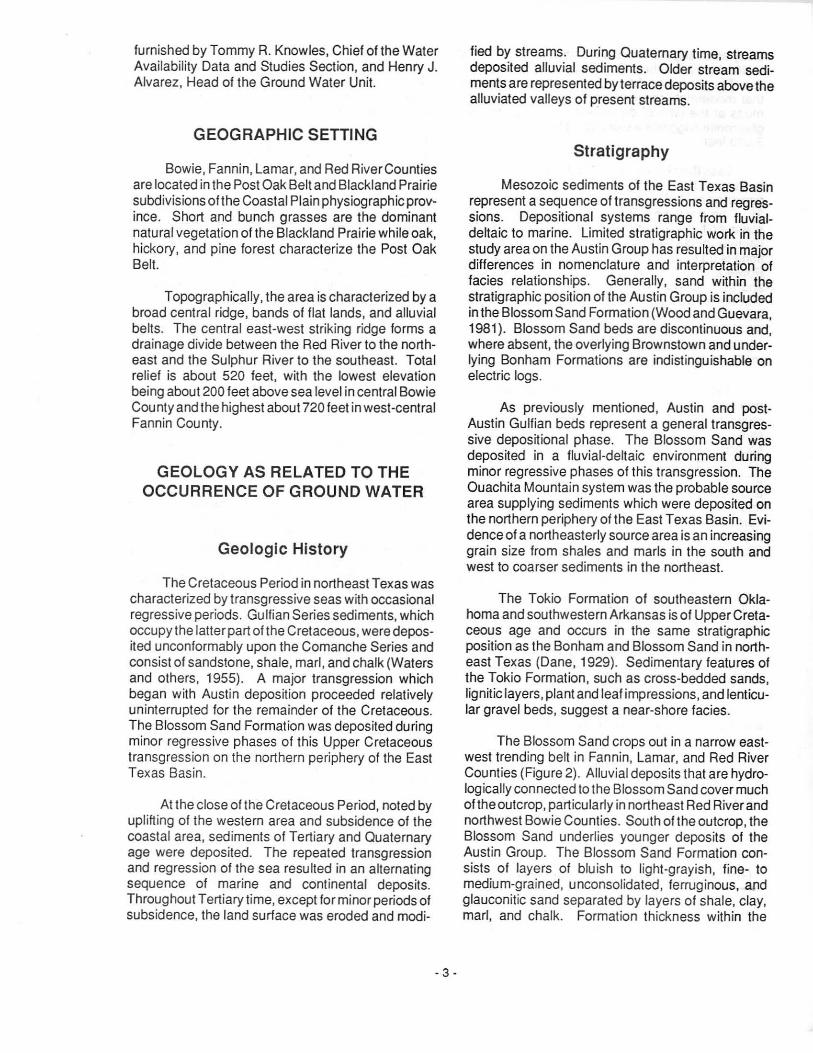
Bowie, Fannin, Lamar, and Red RiverCounties are located in the Post Oak Belt and Blackland Prairie subdivisions of the Coastal Plain physiographic province. Short and bunch grasses are the dominant natural vegetation of the Blackland Prairie while oak, hickory, and pine forest characterize the Post Oak Belt.
Topographically, the area is characterized by a broad central ridge, bands of flat lands, and alluvial belts. The central east-west striking ridge forms a drainage divide between the Red River to the northeast and the Sulphur River to the southeast. Total relief is about 520 feet, with the lowest elevation being about 200 feet above sea level in central Bowie County and the highest about 720 feet in west-central Fannin County.
GEOLOGY AS RELATED TO THE OCCURRENCE OF GROUND WATER
Geologic History
The Cretaceous Period in northeast Texas was characterized by transgressive seas with occasional regressive periods. Gulfian Series sediments, which occupy the latter part ofthe Cretaceous, were deposited unconformably upon the Comanche Series and consist of sandstone, shale, marl , and chalk (Waters and others, 1955). A major transgression which began with Austin deposition proceeded relatively uninterrupted for the remainder of the Cretaceous. The Blossom Sand Formation was deposited during minor regressive phases of th is Upper Cretaceous transgression on the northern periphery of the East Texas Basin.
At the close of the Cretaceous Period, noted by upl ifting of the western area and subsidence of the coastal area, sediments of Tertiary and Quaternary age were deposited. The repeated transgression and regression of the sea resulted in an alternating sequence of marine and continental deposits. Throughout Tertiary time, except for minor periods of subsidence, the land surface was eroded and modi-
- 3 -
fied by streams. During Quaternary time, streams deposited alluvial sediments. Older stream sediments are represented by terrace deposits above the alluviated valleys of present streams.
Stratigraphy
Mesozoic sediments of the East Texas Basin represent a sequence of transgressions and regressions. Depositiona l systems range from fluvialdeltaic to marine. Limited stratigraphic work in the study area on the Austin Group has resulted in major differences in nomenclature and interpretation of facies relationships. Generally, sand within the stratigraphic position of the Austin Group is included inthe Blossom Sand Formation (Wood and Guevara, 1981). Blossom Sand beds are discontinuous and, where absent, the overlying Brownstown and underlying Bonham Formations are indistinguishable on electric logs.
As previously mentioned, Austin and postAustin Gulfian beds represent a general transgressive depositional phase. The Blossom Sand was deposited in a fluvial-deltaic environment during minor regressive phases of this transgression. The Ouachita Mountain system was the probable source area supplying sediments which were deposited on the northern periphery of the East Texas Basin. Evidence of a northeasterly source area is an increasing grain size from shales and marls in the south and west to coarser sediments in the northeast.
The Tokio Formation of southeastern Oklahoma and southwestern Arkansas is of Upper Cretacecus age and occurs in the same stratigraphic position as the Bonham and Blossom Sand in northeast Texas (Dane, 1929). Sedimentary features of the Tokio Formation, such as cross-bedded sands, ligniticlayers, plant and leaf impressions, and lenticular gravel beds, suggest a near-shore facies.
The Blossom Sand crops out in a narrow eastwest trend ing belt in Fannin, Lamar, and Red River Counties (Figure 2) . Alluvial deposits that are hydrologically connected to the Blossom Sand cover much of the outcrop, particularly in northeast Red River and northwest Bowie Counties. South of the outcrop, the Blossom Sand underlies younger deposits of the Austin Group. The Blossom Sand Formation consists of layers of blu ish to light-grayish, fine- to medium-grained, unconsolidated, ferruginous, and glauconitic sand separated by layers of shale, clay, marl , and chalk. Formation th ickness within the

I
study area ranges from zero in central Fannin County to 400 feet in southern Red River and Bowie Counties. The graycolorofthe sands and shales indicates that moderately reducing conditions existed in the muds at the time of deposition. The presence of glauconite suggests water depths between 100 and 3,000 feet.
Less than 29 percent ofthe formation thickness is sand with areas of greatest net sand thickness occurring in Red River and Bowie Counties (Figure 3). The sand beds are generally discontinuous; however, two water-bearing sand units appear to be laterally persistent. The lowest water-producing sand is up to 60 feet thick and is traceable through Bowie and Red River Counties, merging into chalk and marl approximately at the Lamar County line. The upper water-producing sand is generally less than 20 feet thick extending from central through eastern Lamar County. These two sand beds are separated by thick beds of impermeable clay and marl and are not hydrologically connected.
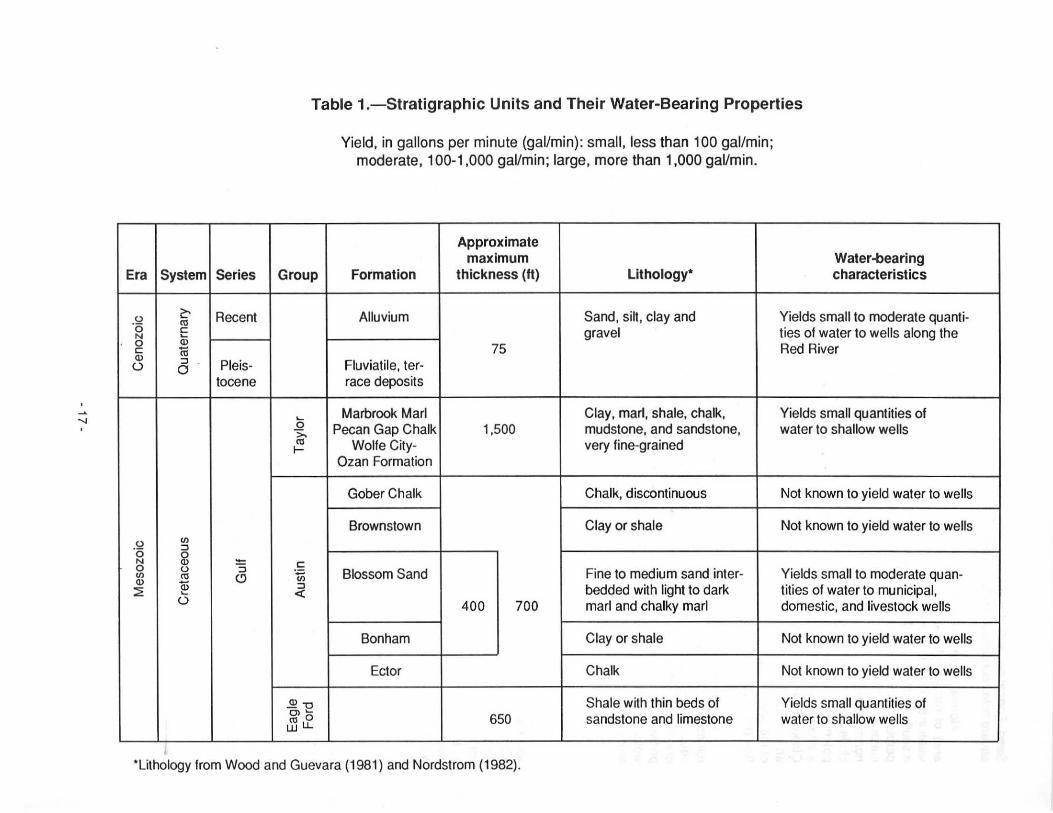
Table 1 shows the approximate maximum thickness, lithologic description, and water-bearing characteristics of the stratigraphic units within the study area. Figures 4 and 5 are geologic cross sections which illustrate the vertical and lateral relationships of structure and stratigraphy. Locations of the cross sections are shown on Figure 2. Figures 6 and 7 are maps showing the approximate altitude of and depth to the top and base of the Blossom Sand Formation. The top and base are mapped on the uppermost and lowermost sands within the Austin Group.
Seven test holes drilled through the Blossom Sand during this investigation resulted in a better delineation of the extent of the formation which contains sufficient quantities of usable-quality ground water. Formation characteristics of the Blossom Sand were evaluated by analyzing cores taken in sandy intervals of test hole WB-16-17-602 in Red River County. Median grain diameter (0
501 ranges
from silt to fine grained sand in size. The average porosity is approximately 37 percent but, due to the small grain size, the specific yield is generally less than seven percent.
OCCURRENCE OF GROUND WATER IN THE BLOSSOM SAND AQUIFER
Recharge, Movement, and Discharge
Recharge is the process by which water is added to an aquifer. It may be absorbed on the
- 4 -
outcrop from precipitation, streams, or lakes either directly into a formation or indirectly by way of another formation. Factors which affect an aquifer's capacity to be recharged are the amount and frequency of precipitation, the areal extent of the outcrop, the topography, the type and amount of vegetation, the type and condition of the soil in the outcrop area, and the capacity of the formation to accept recharge.
Recharge of the Blossom Sand aquifer occurs through infiltration of precipitation on the outcrop. Deep loamy soils overlying most of the Blossom Sand outcrop are derived from clayey sediments and are generally very slowly permeable. Although soils covering the outcrop can inhibit recharge due to a slow rate of water transmission, thin, high-level terrace deposits in places on the outcrop form a good recharge facility to the Blossom Sand aquifer.
The amount of water that enters an aquifer and is available for development is the effective recharge. Annual effective recharge of the Blossom Sand aquifer was determined by applying a value of onehalf of one percent (0.005) of the mean annual precipitation that falls on the sandy rechargeable portion of the formation outcrop and the alluvium that covers the outcrop. This value was assumed based on calculations made by Ashworth (1988), who determined that 0.005 of the mean annual precipitation falling on the Nacatoch outcrop enters the aquifer system as recharge. Analyses of cores taken from test holes in the Nacatoch and Blossom Sand indicate similar lithologies, grain sizes, and cementation. Pump tests indicate similartransmissivities, and both outcrops are partially covered by very slowly permeable soils. Based on these similarities, a value of 0.005 was assumed for the Blossom Sand aquifer which equates to an average annual effective recharge of 811 acre-feet.
Duetothe discontinuity of sands and the impervious nature of the intervening beds, the study area was divided into three recharge zones. Zonal division was based on an average percentage of the total formation thickness which is sandy as estimated from electric logs and on subcrop totally covered by alluvium. In western Bowie County and the eastern one-third of Red River County, the Blossom Sand Formation is totally covered by alluvium. The alluvium recharges readily and probably fi lters water directly into the sandy portions of the underlying Blossom Sand Formation. Approximately 29 percent of the formation outcrop consists of rechargeable sand in the central and western two-thirds of Red River County, while only 15 percent of the formation outcrop is sandy in the eastern half of Lamar County. From central Lamar County westward, most of the formation has merged into marl and therefore does not contribute significantly to the total annual effective recharge. Of the 210 square miles of Blossom
"
Era System Series
u c:- Recent '0 '" c N Q; 0 c (;j OJ :::J Pleis· <..) a
tocene
u U) :::J '0 0
N OJ -0 U :; U) '" CJ OJ Qi ::< ~
<..)
j
Table 1.-Stratigraphic Units and Their Water-Bearing Properties
Group
~
0 >. '" I-
C
en :::J «
.!!!-o O>~
'" 0 LlJl1.
Yield, in gallons per minute (gal/min): small, less than 100 gal/min; moderate, 100-1,000 gal/min; large, more than 1,000 gaVmin.
Approximate maximum
Formation thickness (It) Lithology'
Alluvium Sand, silt, clay and gravel
75 Fluviatile, ter· race deposits
Marbrook Marl Clay, marl, shale, chalk, Pecan Gap Chalk 1,500 mudstone, and sandstone,
Wolfe City· very fine·grained Ozan Formation
Gober Chalk Chalk, discontinuous
Brownstown Clay or shale
Blossom Sand Fine to medium sand inter-bedded with light to dark
400 700 marl and chalky marl
Bonham Clay or shale
Ector Chalk
Shale with thin beds of 650 sandstone and limestone
Water-bearing characteristics
Yields small to moderate quanti· ties of water to wells along the Red River
Yields small qu antities of water to shallow wells
Not known to yield water to wells
Not known to yield water to wells
Yields small to moderate quan· tities of water to municipal, domestic, and livestock wells
Not known to yield water to wells
Not known to yield water to wells
Yields small quantities of water to shallow wells
"Lithology from Wood and Guevara (1981) and Nordstrom (1982).
I

Sand Formation and alluvium outcrop, only 67 square miles consists of rechargeable m'aterial.
Normal movement of ground water is from the area of recharge to points of discharge, Ground water in the Blossom Sand aquifer normally moves in a south-southeasterly direction, down gradient, and perpendicular to the contours of the potentiometric surface (Figure 8), Factors which may alter the normal direction of movement of ground water include variance in lithology and change in slope of the potentiometric surface due to heavy pumpage, Such a change in slope can be seen in the vicinity of Clarksville where continuous pumpage has caused an increase in the hydraulic gradient in the direction of the points of discharge, As a result, a preferred flow path has developed toward those points ,
Discharge is the process by which water is released from storage, It occurs naturally through seeps and springs and artificially through pumpage of wells, Municipal wells in Red River County are the primary means of discharge, although five flowing wells in Lamar County have discharged considerable amounts of water in the past.
Hydraulic Properties
The ability of an aquifer to store and transmit water determines the capacity of that aquifer to yield water to wells, These parameters are dependent on the porosity and hydraulic conductivity of the formations which make up the aquifer and are expressed as the aquifer's coefficient of storage and transmissivity, An average porosity of 37 percent by volume was determined for sand intervals cored in Board test holes,
A determination of the coefficient of storage is important in the calculation of the amount of water stored in an aquifer. A reasonable estimate of artesian coefficient of storage can generally be made by multiplying the aquifer thickness by 1 x1 a's, Two wells belonging to the City of Clarksville have coefficients of storage of 7x1 a·' and 3x10" , respectively (Table 2) , Specific yield is considered to be equivalent to the storage coefficient of a water table (unconfined) aquifer. The specific yield of wells underwatertable conditions ranges from approximately 0,1 to 0,3,
Transmissivity is a measure of an aquifer's ability to transmit water and is important in computing the amount of water available from an aquifer on a
- 18 -
continuous basis, The transmissivity of the Blossom Sand aquifer as determined from nine pump tests (Table 2) ranges from 85 to 549 square feet per day (ft2td),
Hydraulic conductivity of the Blossom Sand aquifer was calculated by dividing transmissivity by contributing sand thickness or by screened interval in a well. In eight pumping tests (Table 2) hydraulic conductivity ranged from 2,7 to 7,1 feet per day,
Chemical Quality
The chemical quality of water available from the Blossom Sand aquifer is variable as depicted on the water-quality map (Figure 9) , Ground water in the Blossom Sand, like all other aquifer waters, contains dissolved minerals , the concentration of which determines its usefulness, The following classification of water by Hem (1970, p, 219) is based on the dissolved-solids concentration in parts per million (ppm),
Description
Fresh Slightly saline Moderately saline Very saline Brine
Dissolved-solids content in ppm
Less than 1 ,000 1,000 to 3,000
3,000 to 10,000 10,000 to 35,000 More than 35,000
The approximate downdip limit of fresh to slightly saline water (3,000 mgtl) (Figure 9) indicates that usable-quality water in the Blossom Sand occurs primarily in wells located on the format ion outcrop except in the vicinity of Clarksville where the line dips approximately six miles to just south of the city, Since laboratory analyzed samples are limited, additional data were considered in order to approximate the downdip limit. A satisfactory relationship between chemical quality and electric log resistivity can be determined when aquifer properties are well known. However the number of wells in the Blossom Sand with analyzed water samples and electric logs are few, As a result , an empirical relationship between electric-log resistivity and dissolved-solids concentration, applicable to sand aquifers generally, was used to approximate the southern limit of fresh to slightly saline water.
The median value and range of the mineral constituents or properties of water from the Blossom

Table 2,-Results of Pumping Tests
Date Screened Coefficient Hydraulic Specific test interval Yield Transmissivity 01 conductivity capacity
Welf began (It) (gal/min) (ft'/d) storage (ft/d) (gal/mlnllt)
LAMAR COUNTY
RT-17-21-710 Aug. 6, 1942 146-168 35 89' 4.0 0.4
711 Aug. 30, 1942 164-190 38 85' 3.3 0.4
RED RIVER COUNTY
W8-16-17-402 July 2, 1965 91-166 10
602 Sept. 2, 1982 25
17-24-801 Oct. 26,1982 450-500 150
803 Dec. 3,1969 465-530 156
32-201 Aug. 9,1960 523-600 630
203 Aug. to, 1960 510-603 630
205 June21 , 1957 585-665 554
"Transmissivity calculated from the Logan formula.
Sand appear in Table 3. The median is a central value characteristic of the data. The range is an indication of the dispersion of the data. These numbers do not include data on water derived from alluvial deposits.
Dissolved-solids content of sampled wells has a median of 853 mg/l and ranges between 56 and 17,090 mg/l. Approximately 33 percent of the wells sampled exceeded 1,000 mg/l. Using the U.S. Geological Survey classification (Hem, 1970, p. 219). water quality ranges from fresh to very saline. Generally, the dissolved-solids content increases rapidly downdip. Also, fresh water flushing is retarded in areas where the sand contains large amounts of silt and clay. Dissolved-solids content of water from selected wells and test holes is shown on Figure 9.
High iron content occurs in the Blossom Sand aquifer in localized areas and is often apparent by the reddish discoloration of material coming in contact with the water. All four samples in Lamar County and two of eight wells sampled in Red River County analyzed for iron exceeded the 0.3 mg/l recommended limit.
- 21 -
235' 3.1 1.0
192
165 3.3 1.0
176 2.7 1.3
549 7xlO-5 7.1
494 3xl0-5 5.3
530' 6.6 2.3
Su lfate content had a median value of 114 mgll and ranged from 2 to 5,239 mg/ l. Six samples in Red RiverCounty, three in Lamar County, and one in Fannin County exceeded the 300 mg/ ilimitation on sulfate. A total of 10 samples exceeded the 300 mg/i limitation on chloride. Chloride content generallyincreaseddowndip. The median value of chloride was 124.5 mg/l; the range was from 1 to 10,282 mg/l. Sulfate and chloride content are also depicted on Figure 9.
A median pH of 8.2 indicates that generally the ground water is slightly alkaline. Deeper wells completed southeast ofthe outcrop show a slightly higher alkalinity than shallower wells completed on the outcrop.
Hardness as calcium carbonate (CaCO,) was determined to be less than 60 mg/l in 56 of the 84 water samples taken from the Blossom Sand aquifer. A hardness value of less than 60 mg/l is considered soft.
Figure 10 displays water-quality data from the Blossom Sand on a Piper trilinear diagram. These diagrams are usefu l in interpreting water analyses

..... ','

Table 3.-Statistical Measures of the Concentration of Dissolved Minerals
and Properties in the Blossom Sand Aquifer (Concentrations in mg/l. except for SAR. RSC. specific conductance. and pH.)
Constituent or property
Silica (SiO,)
Iron (Fe)
Calcium (Ca)
Magnesium (Mg)
Sodium (Na)
Potassium (K)
Bicarbonate (HC03
)
Carbonate (CO,)
Sulfate (SO.)
Ch loride (CI)
Fluoride (F)
Nitrate (N03)
Dissolved solids
Hardness as CaC03
Sodium-adsorption ratio (SAR)
Residual sodium carbonate (RSC)
Specific conductance (micromhos at 25°C)
Hydrogen ion concentration (pH)
- 25-
Median
15
0.1
6
1
322.5
4.0
369
o
114
124.5
0.6
0.4
853
27.5
16.8
2.7
765
8.2
Range
3 - 82
0.0 - 71 .6
1 - 496
0-630
1 - 6.334
1 - 22
0-815
0-42
2 - 5. 239
1-10.282
<0.1-3.1
<0.04 - 45.3
56 - 17.090
4 - 3.830
0.1 - 117.0
0-13.1
41 - 37.000
3.6 - 8.9

and in demonstrating certain relationships among ana lyses (Hem, 1970). Generally, the ionic concentration of sodium and potassium is greater in the Blossom Sand aquifer than calcium and magnesium. Carbonate plus bicarbonate constitute 50 percent or more of the total anion milliequivalents per liter in many of the samples.
Water from the Blossom Sand is generally unsatisfactory for the purpose of irrigation. Fortyseven of the 84 samples collected exceeded a specific conductance of 750 micromhos at 25°C. The sodium adsorption rat io (SAR) in 16 of the samples collected exceeded the recommended upper limit of 60, and over 50 percent of the samples exceeded 2.5 mel l residual sodium carbonate (RSC). Many shallow outcrop wells drilled in the vicinity of Paris are of suitable quality for watering yards and gardens.
Water Levels
Changes in water levels of a water-table aquifer reflect a change in the amount of ground water in storage, and in an artesian aquifer the levels reflect changes both in storage and in artesian pressure. Major factors controlling such changes are the amou nt of recharge to and discharge from an aquifer. Minor fluctuations in water levels are in response to changes in the environment and, most commonly, in atmospheric pressure.
Seasonal fluctuations can be attributed to variations in rainfall and evapotranspiration on the aqui-
fer outcrop. During periods of drought, water is withdrawn from storage without being replaced and the imbalance results in a water-level decline. When rainfal l resumes, the aquifer is recharged and water levels rise.
Pumping wells can also alter the piezometric surface. When a wel l is pumped the water level declines, assuming the shape of an inverted cone with its apex at the pumped well. Expansion of the cone will continue until it intercepts some source of replenishment. Development of cones of depression depend on the aquifer's transmissivity and coefficient of storage, pumping rate, and length of time the well is pumped. Artesian aquifers, like portions of the Blossom Sand, develop cones of depression rapidly over a larger area because of small transmissivity and storage.
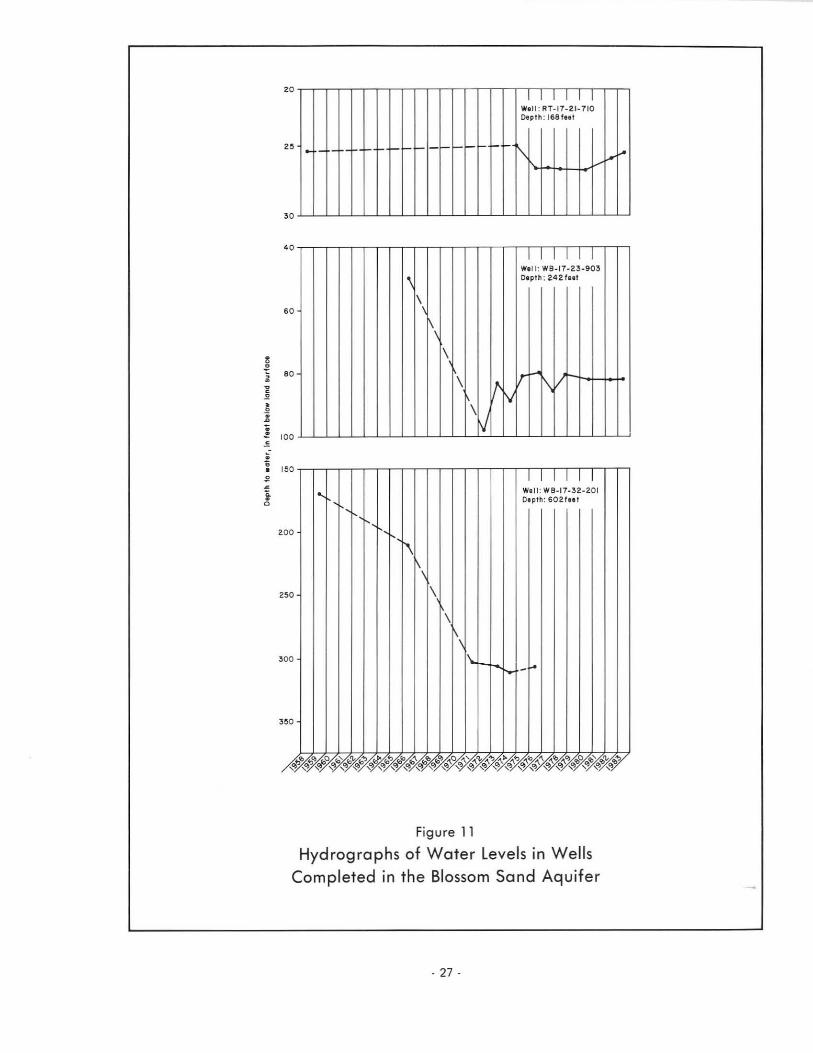
Historical water-level trends in the Blossom Sand aquifer are difficult to trace due to the limited amount of data available. Figure 11 illustrates fluctuations in three municipal wells which have been measured annually as part of the Board's water-level monitoring network. Water-level measurements taken during the winter of 1982-83 are shown on Figure 8.
Heavy pumpage of ground water from municipal wells has resulted in a significant decline of the water level in the vicinity of Clarksville. Factors such as increased municipal demand, close spacing of wells, and limited amount of ground water available from the aquifer are primarily responsible for the rapid water-level decline. In 1982, the pump in well
S''l,
" ., .
" .. Po ,c .. noqts 01 componen1 concenTrolia n. in milli lqu i.allnll pi t lila<.
. ~
"' ~\
o o
LAMAR COUNTY
o o
Cotion. tota llOO puclnt, Clnd on ions IOlai IOO p.teI Rl
./'
0
'00
... .,
"
./' :
° 0
"
... ~ " 0
" RE O RIV ER COUNTY
Figure 10.-Trilinear Diagrams of the Chemical Character of Ground Water From the Blossom Sand Aquifer
- 26 -
"' 0 0
., -bot>
"' 0
" '" " '00
"
I ~ ~ Z · <
" • £ < · 0
' 0
- e- e-- -
' 0
4 0
\
60 \ \
, 8 0 ,
'1/ 100
150
' 00
"0 ,
\
' 00
Figure 11
" V
I I I I I I Well: RT -17- 21_110 Depth : 168t .. ,
1\
I I I I I I Will: We_ 11_Z3 . 90! C, plh ; 242 fut
r ~ V
I I I I I I Wi ll: W8-17-3Z-201 C'pth : 60 21 .. ,
Hydrographs of Water levels in Wells Completed in the Blossom Sand Aquifer
- 27-
.• J.
WB-17-32-205 was lowered 100 feet in response to the declining water level. Pumps in wells WB-17-24-801 and WB-17-24-803, belonging to the Red River Water Supply Corporation, were also recently lowered.
UTILIZATION AND DEVELOPMENT OF THE BLOSSOM SAND AQUIFER
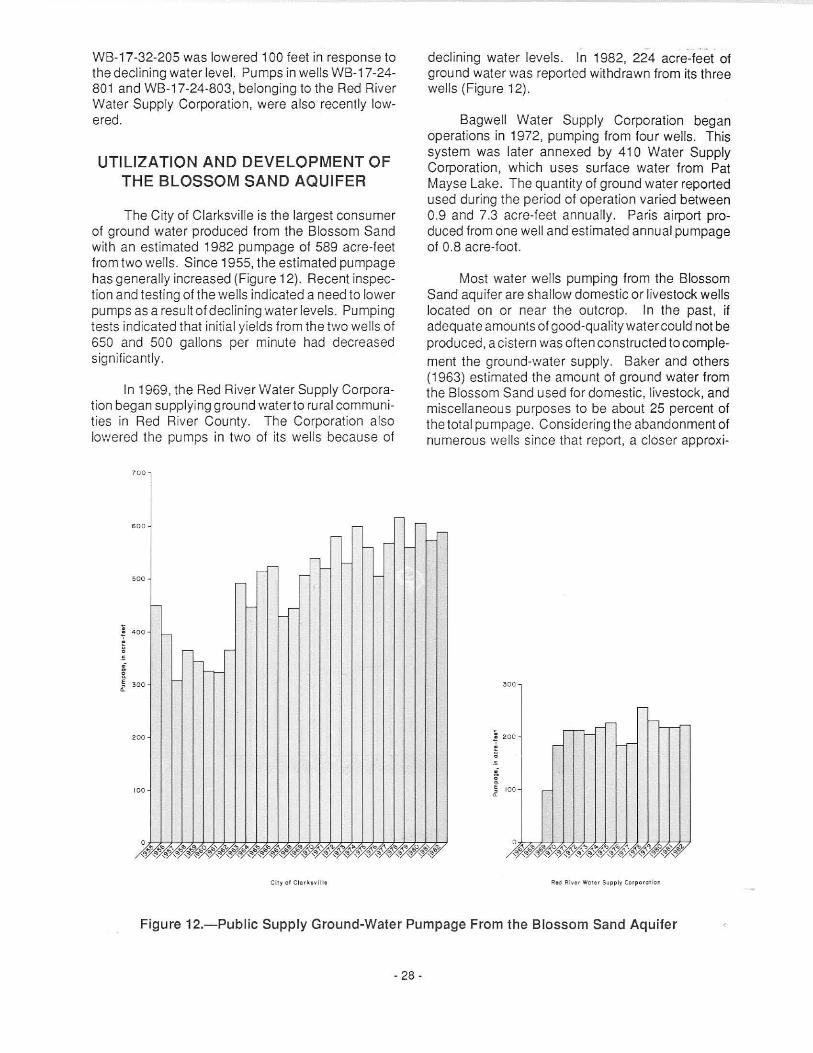
The City of Clarksville is the largest consumer of ground water produced from the Blossom Sand with an estimated 1982 pumpage of 589 acre-feet from two wells. Since 1955, the estimated pumpage has generally increased (Figure 12). Recent inspection and testing of the wells indicated a need to lower pumps as a result of declining water levels. Pumping tests indicated that initial yields from the two wells of 650 and 500 gallons per minute had decreased significantly .
In 1969, the Red River Water Supply Corporation began supplying ground water to rural communities in Red River County. The Corporation also lowered the pumps in two of its wells because of
00
00
'00
declining water levels. In 1982, 224 acre-feet of ground water was reported withdrawn from its three wells (Figure 12).
Bagwell Water Supply Corporation began operations in 1972, pumping from four wells. This system was later annexed by 410 Water Supply Corporation , which uses surface water from Pat Mayse Lake. The quantity of ground water reported used during the period of operation varied between 0.9 and 7.3 acre-feet annually. Paris airport produced from one well and estimated annual pumpage of 0.8 acre-foot.
Most water wells pumping from the Blossom Sand aquifer are shallow domestic or livestock wells located on or near the outcrop. In the past, if adequate amounts of good-quality water could not be produced, a cistern was often constructed tocomplement the ground-water supply. Baker and others (1963) estimated the amount of ground water from the Blossom Sand used for domestic, livestock, and miscellaneous purposes to be about 25 percent of the total pumpage. Considering the abandonment of numerous wells since that report, a closer approxi-
Rt<J Ri . .. WOI.r Suppl y Cor po ra r ion
Figure 12.-Public Supply Ground-Water Pumpage From the Blossom Sand Aquifer
·28·
mation of this pu mpage is probably less than 10 percent. A large percentage ofthe domestic wells in the study area have been abandoned in favor of public water supply systems.
Relatively few acres in the study area are irrigated by water from the Blossom Sand aquifer (Texas Department of Water Resources, 1981). The subhumid climate generally provides a sufficient part of the crop water requirement through precipitation, requiring irrigation only during infrequent, critically dry periods. Even if a greater demand for ground water to be used for irrigation purposes existed, water from the Blossom Sand is generally unsatisfactory to meet this need. The water from shallow wells located on the outcrop is usually chemically suitable for watering gardens and lawns.
At present, no industrial entity pumps independently from the Blossom Sand aquifer. Industrial users of ground water presently obtain water from municipal or water supply corporation sources. The high concentration of sodium, bicarbonate, and dissolved solids makes water from the Blossom Sand aquifer generally undesirable for industrial use.
AVAILABILITY OF GROUND WATER IN THE BLOSSOM SAND AQUIFER
Many factors determine the amount of water available for development from an aquifer. Hydrologic factors include: (1) the rate of recharge to the aquifer, (2) the volume of water in storage, (3) the ability of the formation to transmit water, and (4) the chemical quality of the water. Economic factors include the number and cost of wells required to produce the necessary quantity of water and any type of water treatment that might be necessary.
The amount of fresh to slightly saline water available for development annually from the Blossom Sand aquifer is approximately 811 acre-feet, which is
- 29 -
the approximate average annual recharge. Theoretically, this annual effective recharge can be developed without reducing the quantity of ground water in storage. However, a single well or well field cannot recover the total sustainable annual yield.
Very little water-bearing sand occurs in the Blossom Sand Formation west of central Lamar County (Figure 3) ; therefore, the western boundary ofthe aqu ifer is arbitrarily placed althe western edge ofthe City of Paris. Although a few shallow wells are present in the formation outcrop in Fannin County, the total amount of ground water available in this area is almost negligible and therefore is not included as part of the aquifer.
The most desirable areas for development coincide with areas having the thickest sand beds containing fresh to slightly saline water. The thickest individual beds occur in northwestern Bowie and eastern Red River Counties (Figure 3). In western Red River County, an area of relatively thick net sand occurs which is the sum of several sand beds. Thickness of individual sand beds decreases from east to west. Although the net sand thickness is sufficient in this area, the amount of water available for development which meets usable chemical-quality standards is limited.
Alternative sources of good-quality water exist in the vicinity of the Blossom Sand aquifer. Wells producing from the alluvial deposits along the Red River provide enough water to meet the municipal, domestic, and livestock demands of the local area. The Woodbine aquifer provides fresh to slightly saline water in western Lamar and Fannin Counties where it is not available from the Blossom Sand. At much greater depths the Paluxy-Antlers aquifer produces usable-quality water over most of the study area. Also, the Nacatoch aquifer occurs south of the study area in Bowie and southern Red River Counties. In addition to ground water, large quantities of water are presently being supplied from surface sources.
SELECTED REFERENCES
Agagu, O.K., Guevara, E.H., and Wood, D.H., 1980, Stratigraphic framework and depositional sequences of the East Texas basin, in Geology and geohydrology of the East Texas basin: Univ. Texas at Austin, Bur. Econ. Geology Circ. 80-12, p. 4-10.
Agagu, O.K., McGowen, M.K. , Wood, D.H., Basciano, J.M. , and Harris, D.W., 1980, Regional tectonic framework of the East Texas basin, in Geology and geohydrology of the East Texas basin : Univ. of Texas at Austin, Bur. Econ. Geology, Circ. 80-12, p. 11-19.
Ashworth,J .B., 1988, Ground-waterresourcesofthe Nacatoch aquifer: Texas Water Devel. Board Rept. 305, 151 p.
Baker, E.T., Jr. , Long, A.T., Jr., Reeves, R.D., and Wood, L.A., 1963, Reconnaissance investigation of the ground-water resources of the Red River, Sulphur River, and Cypress Creek basins, Texas : Texas Water Comm. Bull. 6306, 127 p.
Bates, R.L., and Jackson, J.A., ed., 1980, Glossary of geology (2d ed.): Amer. Geologicallnst., 749 p.
Beall, Robert, 1973, Plate tectonics and the origin of the Gulf Coast basin : Gulf Coast Assoc. Geol. Soc. Transactions, v. 23, p. 108-114.
Bentall, Ray, compiler, 1963, Methods of determining permeability, transmissibility and drawdown: U.S. Geol. Survey Water-Supply Paper 1536-1, 341 p.
Bureau of Economic Geology, 1966, Geologic atlas of Texas, Texarkana sheet: Univ. Texas at Austin , Bur. Econ. Geology map.
____ 1967, Geologic atlas of Texas, Sherman sheet: Univ. Texas at Aust in, Bur. Econ. Geology map.
Burke, K., 1976, Development of graben associated with the initial ruptures ofthe Atlantic Ocean, in Boll, M.H.P., ed., Sedimentary basins of continental margins and cratons: Tectonophysics, v. 36, no. 1-3, p. 93-112.
- 30-
Burke, K., and Dewey, J.F., 1973, Plume-generated triple junctions-key indicators in applying tectonics to old rocks: Journal of Geology, v. 81, no. 00, p. 406.
Coleman, J.M., and Prior, D.B., 1982, Deltaic sand bodies: Amer. Assoc. of Petroleum Geologists Education Course Note Series no. 15, 171 p.
Coon, L.A., 1956, Tertiary-Cretaceous growthofthe East Texas basin: Gulf Coast Assoc. Geol. Soc. Transactions , v. 6, p. 85-90.
Counts, H.B., Tait, D.B., Klein, H., and Billingsley, GA, 1955, Ground-water resources in a part of southwestern Arkansas : Arkansas Geological and Conservation Commission Water-Resources Circ. no. 2, p. 9-26.
Dane, C.H., 1929, Upper Cretaceous formations of southwestern Arkansas : Arkansas Geological Survey Bull. 1, 215 p.
Davis, L.V., 1960, Geology and ground-water resources of southern McCurtain County, Oklahoma: Oklahoma Geological Survey Bull. 86, p.l05.
Doll, W.L. , Meyer, Gerald, and Archer, R.J., 1963, Water resources of West Virginia: Dept. of Nat. Resources, Div. of Water Resources, 134 p.
Dolioff, J.H., Rozendal, RA , Siratovich, E.N ., Swain, F.M., and Woncek, J., 1967, Subsurface upper Cretaceous stratigraphy of southwestern Arkansas : Gulf Coast Assoc. Geol. Soc. Transactions, v. 17, p. 76-104.
Drumble, E.T., 1918, The geology of east Texas : Univ. Texas at Austin, Bur. Econ. Geology Bull. 1869, p. 10-27.
Gordon, C.H., 1911, Geology and underground waters of northeastern Texas: U.S. Geol. Survey Water-Supply Paper 276, p. 7-25, 45-61.
Granata, W.H. , 1963, Cretaceous stratigraphy and structural development of the Sabine Uplift area, Texas and Louisiana, in Report on selected North Louisiana and South Arkansas oil
and gas fields and regional geology: Shreveport Geological Society, Reference Volume V, 201 p.
Hall, W.D., 1976, Hydrogeologic significance of depositional systems and facies in lower Cretaceous sandstones, North-central Texas: Univ. Texas at Austin, Bur. Econ. Geology Circ. 76-1,29 p.
Heller, V.G., 1933, The eHect of saline and alkaline waters on domestic animals: Oklahoma A&M College Expt. Station Bull. 217, 23 p.
Hem, J.D., 1970, Study and interpretation of the chemical characteristics of natural water: U.S. Geol. Survey Water-Supply Paper 1473 (2d ed.), 363 p.
Jackson, M.PA, 1981 , Tectonic development during early infilling of the East Texas basin, in Geology and geohydrology of the East Texas basin: Univ. Texas at Austin, Bur. Econ. Geology Circ. 81-7, p: 7-11.
Lyerly, P.J., and Longnecker, D.E., 1957, Salinity control in irrigation agriculture: Texas A&M Univ., Texas Agriculture Extension Service Bull . 876, 20 p.
McGowen, M.K., and Lopez, C.M., 1983, Depositional systems in the Nacatoch Formation (Upper Cretaceous), northeast Texas and southwest Arkansas: Univ. Texas at Austin, Bur. Econ. Geology Rept. of Inv. 137, 59 p.
McKee, J.E., and Wolf, HW., 1963, Water quality criteria: California State Water Quality Control Board Pub. 3-A, 548 p.
Moore, GW., and Del Castillo, Luis, 1974, Tectonic evolution of the southern Gulf of Mexico: Geol. Soc. America Bull. , v. 85, no. 4, p. 607-618.
Murray, G.E., 1961, Geology of the Atlantic and Gulf Coastal Province of North America: New York, Harper's, 692 p.
Nichols, P.H. , 1964, The remaining frontiers for exploration in northeast Texas: Gulf Coast Assoc. Geol. Soc. Transactions, v. 14, p. 7-22.
Nordstrom, PL, 1982, Occurrence, availability, and chemical quality of ground water in the Cretaceous aquifers of north-central Texas: Texas
- 31 -
Dept. of Water Resources Rept. 269, v. 1, 109 p., and v. 2,387 p.
Sellards, E.H., Adkins, W.S., and Plummer, F.B., 1932, The geology ofTexas, v. I, Stratigraphy: Univ. Texas Bull. 3232, 1007 p.
Sellards, E.H., and Baker, C.L. , 1934, The geology of Texas, v. II , Structural and economic geology: Univ. Texas Bull. 3401, 884 p.
Seni, S.J ., and Kreitler, CW., 1981, Evolution of the East Texas basin, in Geology and geohydrology of the East Texas basin: Univ. Texas at Austin, Bur. Econ. Geology Circ. 81-7, p. 12-20.
Stehli, F.G., and Creath, W.B., 1964, Foraminiferal ratio and regional environment: Amer. Assoc. of Petroleum Geologist Bull., v. 48, no. 11, p. 1810-1827.
Stehli, F.G., Creath, W.B., Upshaw, C.F., and Forgotson, J.M., Jr., 1972, Depositional history of Gulfian Cretaceous of East Texas Embayment: Amer. Assoc. of Petroleum Geologists BUll., v. 56, no. 1, p. 27-38.
Stephenson, LW., 1918, A contribution to the geology of northeastern Texas and southern Oklahoma: U.S. Geol. Survey Professional Paper 120,206 p.
1936, Stratigraphic relations of the Austin, Taylor and equivalent formations in Texas: U.S. Geol. Survey Professional Paper 186-G, p. 133-146.
Taylor, H.D., 1976, Water- leve l and water-quality data from observation wells in northeast Texas: Texas Water Devel. Board Rept . 198,294 p.
Texas Department of Health, 1980, Drinking water standards governing drinking water quality and reporting requirements for public water supply systems (Adopted by the Texas Board of Health November 29,1980): 20 p.
Texas Department of Water Resources, 1981, Inventories of irrigation in Texas, 1958, 1964, 1969, 1974, and 1979: Texas Dept. Water Resources Rept. 263, 295 p.
U.S. Soil Conservation Service, 1977, Soi l survey of Red River County, Texas: U.S. Dept. of Agriculture, 94 p.

U.S. Soil Conservation Service, 1979, Soil survey of Lamar and Delta Counties, Texas: U.S. Dept. of Agricu~ure, 148 p.
____ 1980, Soil survey of Bowie County, Texas: U.S. Dept. of Agricu~ure, 128 p.
Veatch, A.C ., 1906, Geology and underground-water resources of northern Louisiana and southern Arkansas: U.S. Geol. Survey Professional Paper no. 46, p. 11-23.
Waters, J.A., McFarland, p.w., and Lea, J.w., 1955, Geologic framework of the Gulf Coastal Plain of Texas: Amer. Assoc. of Geological Societies Bull., v. 39, p. 1821-1850.
- 32-
Wilcox, LV., 1955, Classification and useof irrigation waters: U.S. Dept. Agriculture Circ. 969, 19 p.
Winslow, A. G., and Kister, L.A., 1956, Saline-water resources of Texas: U.S. Geol. Survey WaterSupply Paper 1365, 105 p.
Wood, D.H., and Guevara, E.H., 1981, Regional structural cross sections and general stratigraphy, East Texas basin: Univ. Texas at Austin, Bur. Econ. Geology, 21 p.
Wood, M.L., andWalper, J.L., 1974, The evolution of the Interior Western Basins and the Gulf of Mexico: Gulf Coast Assoc. of Geol. Soc. Transactions, v. 24, p . 31-41.