Embed Size (px)
Citation preview
Q3 REPORT 2015
Q3 REPORT 2015
Pioneer Property Group ASA. Q3/2015 preliminary unaudited IFRS report Page 1
Highlights of the Q3 report
Pioneer Property Group ASA’s (“PPG”) third quarter 2015 financial results represent the full first
operational quarter since the formation of the group 12th May 2015.
Total revenues in the quarter were MNOK 51.1 and with a pre-tax profit of MNOK 18.2.
Revenues and profitability were in line with expectations, and profitability was significantly improved from
the second quarter, which was heavily impacted by IPO-related costs.
On 30th September, PPG paid a dividend to holders of preference shares1 – in total NOK 2.74 per
preference share. From Q4 and onwards, the Company has an ambition of regular dividend payments, in
line with PPG’s articles of association – equivalent to NOK 1.875 per preference share per quarter.
The Company had total assets of MNOK 3,708, where Investment Property (112 preschools) were valued
at MNOK 3,413 and with a cash balance of MNOK 211. Total debt was MNOK 2,097 and total equity of
MNOK 1,610.
Background and strategy
Pioneer Property Group ASA (PPG) is a real estate company focusing on providing high-quality properties
for government-backed care-services. The company’s current portfolio consists of 112 Norwegian
kindergartens centrally located in the largest cities and which house a total of over eleven thousand children.
The properties are leased out on long-term triple-net contracts to large kindergarten operators, including
Norlandia Care Group and Espira.
The company’s property portfolio is a result of the acquisition from several independent preschool operators,
again driven by these companies’ wish to free-up resources and capital to be able to provide the highest
quality possible in their primary focus area – preschool operations. Pioneer Property’s kindergartens have
during the later years played an important role in the improvement of the Norwegian preschool market,
through improved capacity, quality and cost-efficiency.
Going forward the company’s strategy is to expand its reach into care-services property with similar
characteristics as the Norwegian kindergarten market – i.e. long term contracts with solid operators, again
backed by government financing.
PPG’s kindergartens are well located in central areas, including Stavanger, Bergen, Kristiansand, and the
greater Oslo area. The average age of the properties is at a low eight year average, and the quality of the
properties is therefore very high. In total the properties have a capacity in excess of eleven thousand children.
Key material events during the third quarter
The PPG group was established in the preceding quarter (Q2/2015) through the acquisition of four separate
property portfolios, and also issued and listed MNOK 650 in preference shares on the Oslo Axess stock
exchange (details, including prospectus and investor presentation, available via the PPG website). This
quarter, Q3/2015, was therefore the first full operating quarter for the Company – and was uneventful in
comparison to the second quarter, with all operations progressing as expected. Key event was the payment
of the Company’s first dividend to its preference shareholders on 30th September.
Overview of the financial accounts for the third quarter of 2015
Revenues of MNOK 51.1 represent a run-rate of MNOK 17 in monthly rental revenues. Operating costs were
significantly reduced from the second quarter, and pre-tax profit for the second quarter was MNOK 18.2.
The balance sheet as of 30/9 includes Investment Property of MNOK 3,413, and material events took place
that should have impacted this valuation level. In addition the company had MNOK 211 in cash balance at
1 Note that for the current year, «Dividend payments» are technically a repayment of paid in capital.
Pioneer Property Group ASA. Q3/2015 preliminary unaudited IFRS report Page 2
the end of the quarter – higher than required for PPG’s underlying operations, but gives additional security
to the Company’s planned dividend payments to the preference share owners over the next few years. On
the debt side, PPG had a total of MNOK 2,097 in debt, including two separate bond-loans in the subsidiaries
Pioneer Property II AS and Pioneer Property III AS, which are stock exchange listed bonds and report
separate financial reports.
Accounting policies:
The financial statements have been drawn up in accordance with International Standards for Financial
Reporting (IFRS). The consolidated accounts for the third quarter were compiled in accordance with IAS 34
- Interim Financial Reporting. The financial statements of the third quarter is an update on the last report
which is the second quarter, and are therefore intended to be read in conjunction with the report of the second
quarter.
Outlook
No material subsequent events have occurred since the end of the financial quarter which should have an
impact on the outlook for the Company.
Responsibility Statement of the Board of Directors
We confirm, to the best of our knowledge, that the set of financial statements for the period ending 30
September 2015 have been prepared in accordance with IFRS, and gives a true and fair view of the Group's
assets, liabilities, financial position and profit or loss as a whole.
We also confirm, to the best of our knowledge, that the interim management report includes a fair review of
important events that have occurred during the first six months of the financial year and their impact on the
set of financial statements, a description of the principal risks and uncertainties for the remaining three
months of the financial year, and major related parties transactions.
17 November 2015
The Board of Directors
Pioneer Property Group ASA
Roger Adolfsen
Chairman
Sandra Henriette Riise
Board Member
Geir Hjort
Board Member
Even Carlsen
Board Member
Nina Hjørdis Torp Høisæter
Board Member
Runar Rønningen
CEO
Pioneer Property Group ASA. Q3/2015 preliminary unaudited IFRS report Page 3
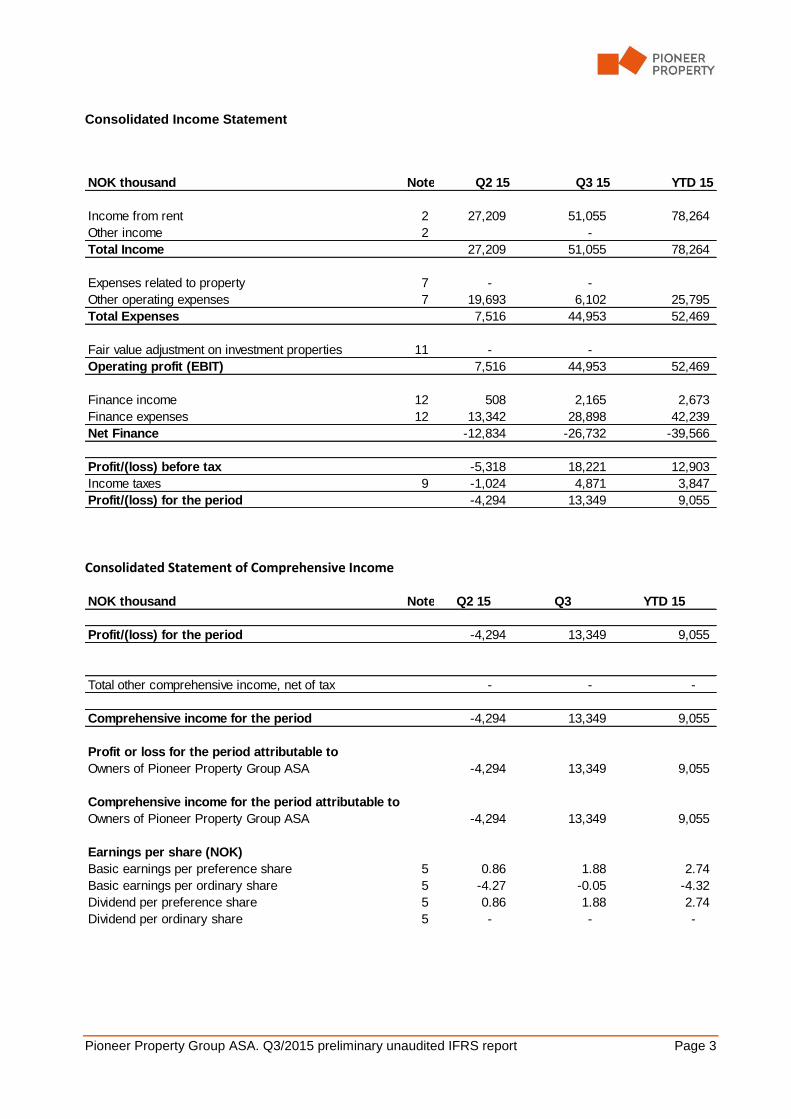
Consolidated Income Statement
Consolidated Statement of Comprehensive Income
NOK thousand Note Q2 15 Q3 15 YTD 15
Income from rent 2 27,209 51,055 78,264
Other income 2 -
Total Income 27,209 51,055 78,264
Expenses related to property 7 - -
Other operating expenses 7 19,693 6,102 25,795
Total Expenses 7,516 44,953 52,469
Fair value adjustment on investment properties 11 - -
Operating profit (EBIT) 7,516 44,953 52,469
Finance income 12 508 2,165 2,673
Finance expenses 12 13,342 28,898 42,239
Net Finance -12,834 -26,732 -39,566
Profit/(loss) before tax -5,318 18,221 12,903
Income taxes 9 -1,024 4,871 3,847
Profit/(loss) for the period -4,294 13,349 9,055
NOK thousand Note Q2 15 Q3 YTD 15
Profit/(loss) for the period -4,294 13,349 9,055
Total other comprehensive income, net of tax - - -
Comprehensive income for the period -4,294 13,349 9,055
Profit or loss for the period attributable to
Owners of Pioneer Property Group ASA -4,294 13,349 9,055
Comprehensive income for the period attributable to
Owners of Pioneer Property Group ASA -4,294 13,349 9,055
Earnings per share (NOK)
Basic earnings per preference share 5 0.86 1.88 2.74
Basic earnings per ordinary share 5 -4.27 -0.05 -4.32
Dividend per preference share 5 0.86 1.88 2.74
Dividend per ordinary share 5 - - -
Pioneer Property Group ASA. Q3/2015 preliminary unaudited IFRS report Page 4
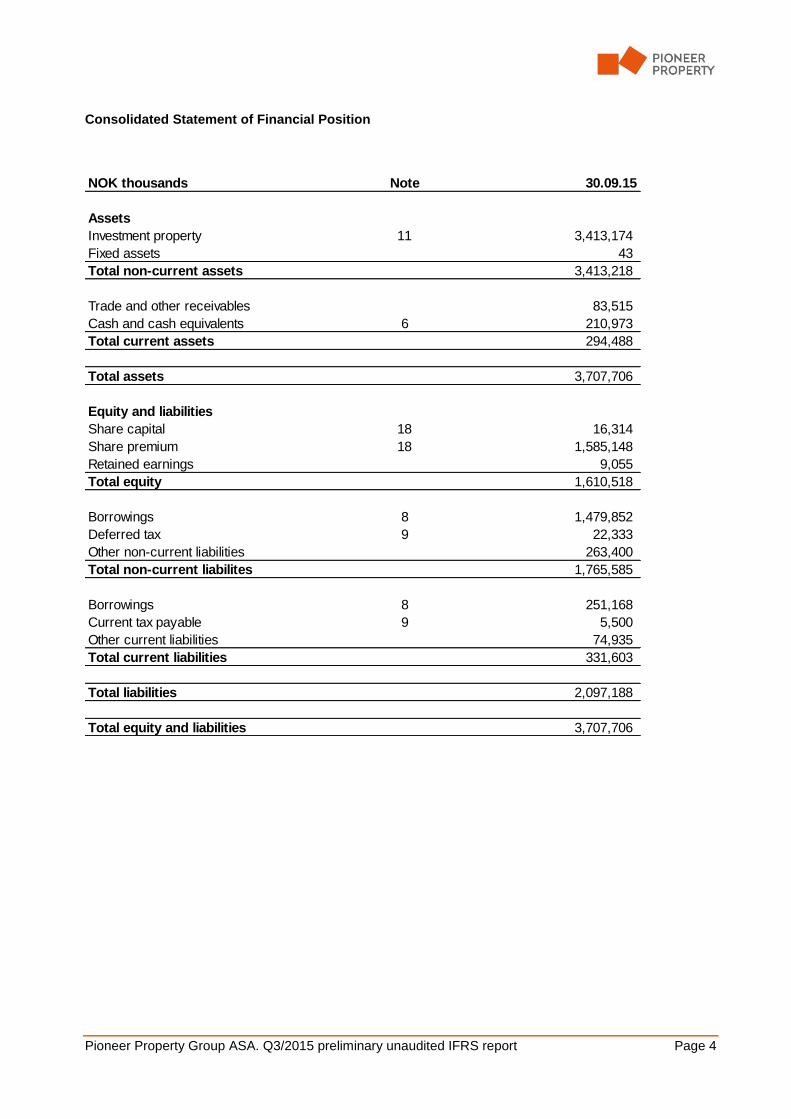
Consolidated Statement of Financial Position
NOK thousands Note 30.09.15
Assets
Investment property 11 3,413,174
Fixed assets 43
Total non-current assets 3,413,218
Trade and other receivables 83,515
Cash and cash equivalents 6 210,973
Total current assets 294,488
Total assets 3,707,706
Equity and liabilities
Share capital 18 16,314
Share premium 18 1,585,148
Retained earnings 9,055
Total equity 1,610,518
Borrowings 8 1,479,852
Deferred tax 9 22,333
Other non-current liabilities 263,400
Total non-current liabilites 1,765,585
Borrowings 8 251,168
Current tax payable 9 5,500
Other current liabilities 74,935
Total current liabilities 331,603
Total liabilities 2,097,188
Total equity and liabilities 3,707,706
Pioneer Property Group ASA. Q3/2015 preliminary unaudited IFRS report Page 5
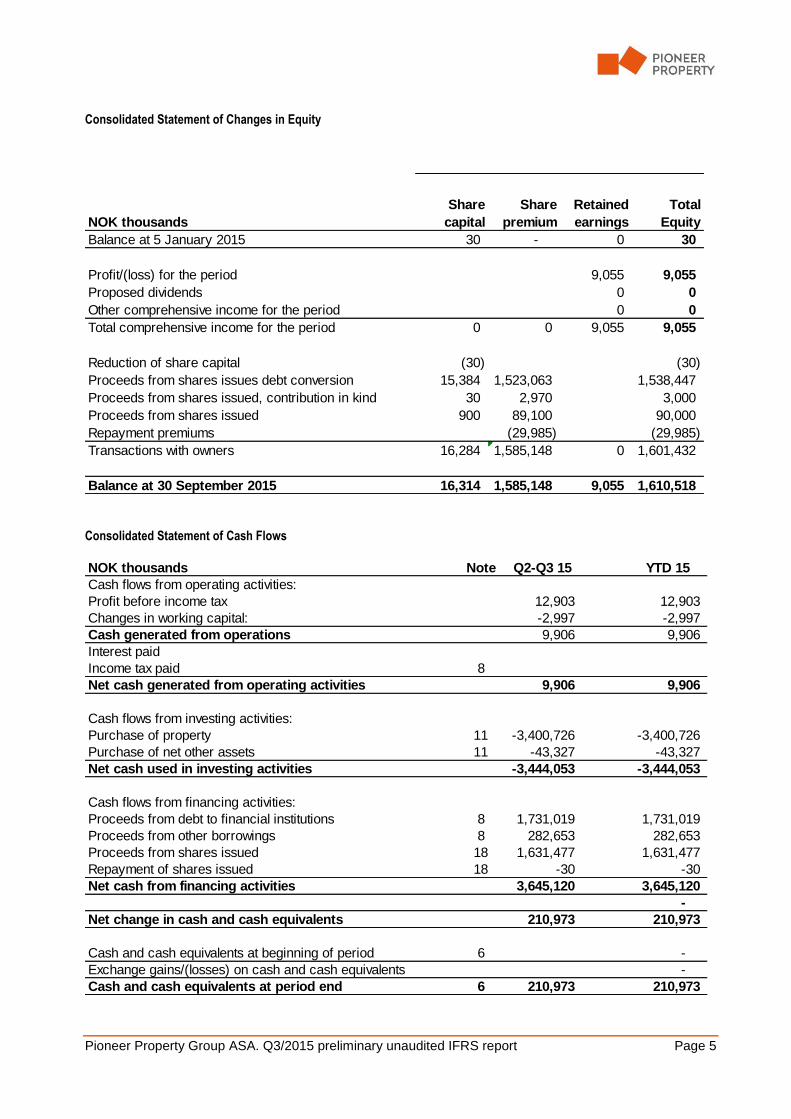
Consolidated Statement of Changes in Equity
Consolidated Statement of Cash Flows
NOK thousands
Share
capital
Share
premium
Retained
earnings
Total
Equity
Balance at 5 January 2015 30 - 0 30
Profit/(loss) for the period 9,055 9,055
Proposed dividends 0 0
Other comprehensive income for the period 0 0
Total comprehensive income for the period 0 0 9,055 9,055
Reduction of share capital (30) (30)
Proceeds from shares issues debt conversion 15,384 1,523,063 1,538,447
Proceeds from shares issued, contribution in kind 30 2,970 3,000
Proceeds from shares issued 900 89,100 90,000
Repayment premiums (29,985) (29,985)
Transactions with owners 16,284 1,585,148 0 1,601,432
Balance at 30 September 2015 16,314 1,585,148 9,055 1,610,518
NOK thousands Note Q2-Q3 15 YTD 15
Cash flows from operating activities:
Profit before income tax 12,903 12,903
Changes in working capital: -2,997 -2,997
Cash generated from operations 9,906 9,906
Interest paid
Income tax paid 8
Net cash generated from operating activities 9,906 9,906
Cash flows from investing activities:
Purchase of property 11 -3,400,726 -3,400,726
Purchase of net other assets 11 -43,327 -43,327
Net cash used in investing activities -3,444,053 -3,444,053
Cash flows from financing activities:
Proceeds from debt to financial institutions 8 1,731,019 1,731,019
Proceeds from other borrowings 8 282,653 282,653
Proceeds from shares issued 18 1,631,477 1,631,477
Repayment of shares issued 18 -30 -30
Net cash from financing activities 3,645,120 3,645,120
-
Net change in cash and cash equivalents 210,973 210,973
Cash and cash equivalents at beginning of period 6 -
Exchange gains/(losses) on cash and cash equivalents -
Cash and cash equivalents at period end 6 210,973 210,973
Pioneer Property Group ASA. Q3/2015 preliminary unaudited IFRS report Page 6
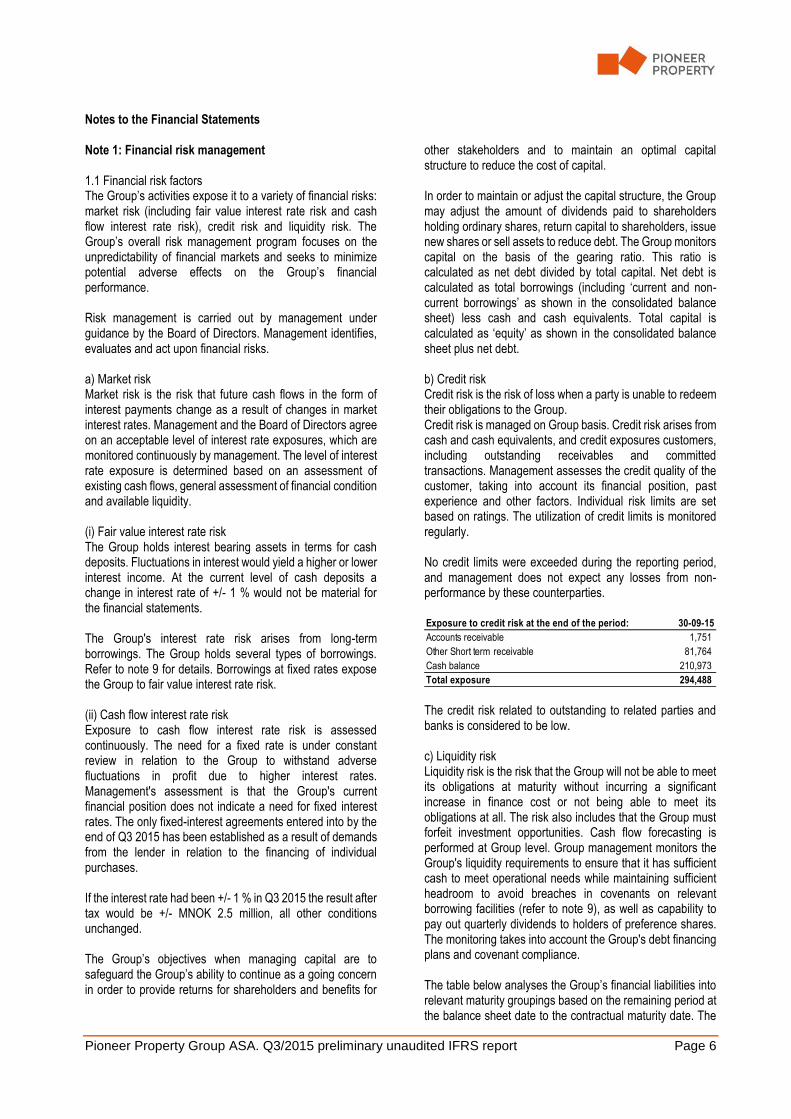
Notes to the Financial Statements
Note 1: Financial risk management 1.1 Financial risk factors The Group’s activities expose it to a variety of financial risks: market risk (including fair value interest rate risk and cash flow interest rate risk), credit risk and liquidity risk. The Group’s overall risk management program focuses on the unpredictability of financial markets and seeks to minimize potential adverse effects on the Group’s financial performance. Risk management is carried out by management under guidance by the Board of Directors. Management identifies, evaluates and act upon financial risks. a) Market risk Market risk is the risk that future cash flows in the form of interest payments change as a result of changes in market interest rates. Management and the Board of Directors agree on an acceptable level of interest rate exposures, which are monitored continuously by management. The level of interest rate exposure is determined based on an assessment of existing cash flows, general assessment of financial condition and available liquidity. (i) Fair value interest rate risk The Group holds interest bearing assets in terms for cash deposits. Fluctuations in interest would yield a higher or lower interest income. At the current level of cash deposits a change in interest rate of +/- 1 % would not be material for the financial statements. The Group's interest rate risk arises from long-term borrowings. The Group holds several types of borrowings. Refer to note 9 for details. Borrowings at fixed rates expose the Group to fair value interest rate risk. (ii) Cash flow interest rate risk Exposure to cash flow interest rate risk is assessed continuously. The need for a fixed rate is under constant review in relation to the Group to withstand adverse fluctuations in profit due to higher interest rates. Management's assessment is that the Group's current financial position does not indicate a need for fixed interest rates. The only fixed-interest agreements entered into by the end of Q3 2015 has been established as a result of demands from the lender in relation to the financing of individual purchases. If the interest rate had been +/- 1 % in Q3 2015 the result after tax would be +/- MNOK 2.5 million, all other conditions unchanged. The Group’s objectives when managing capital are to safeguard the Group’s ability to continue as a going concern in order to provide returns for shareholders and benefits for
other stakeholders and to maintain an optimal capital structure to reduce the cost of capital. In order to maintain or adjust the capital structure, the Group may adjust the amount of dividends paid to shareholders holding ordinary shares, return capital to shareholders, issue new shares or sell assets to reduce debt. The Group monitors capital on the basis of the gearing ratio. This ratio is calculated as net debt divided by total capital. Net debt is calculated as total borrowings (including ‘current and non-current borrowings’ as shown in the consolidated balance sheet) less cash and cash equivalents. Total capital is calculated as ‘equity’ as shown in the consolidated balance sheet plus net debt. b) Credit risk Credit risk is the risk of loss when a party is unable to redeem their obligations to the Group. Credit risk is managed on Group basis. Credit risk arises from cash and cash equivalents, and credit exposures customers, including outstanding receivables and committed transactions. Management assesses the credit quality of the customer, taking into account its financial position, past experience and other factors. Individual risk limits are set based on ratings. The utilization of credit limits is monitored regularly. No credit limits were exceeded during the reporting period, and management does not expect any losses from non-performance by these counterparties.
The credit risk related to outstanding to related parties and banks is considered to be low. c) Liquidity risk Liquidity risk is the risk that the Group will not be able to meet its obligations at maturity without incurring a significant increase in finance cost or not being able to meet its obligations at all. The risk also includes that the Group must forfeit investment opportunities. Cash flow forecasting is performed at Group level. Group management monitors the Group's liquidity requirements to ensure that it has sufficient cash to meet operational needs while maintaining sufficient headroom to avoid breaches in covenants on relevant borrowing facilities (refer to note 9), as well as capability to pay out quarterly dividends to holders of preference shares. The monitoring takes into account the Group's debt financing plans and covenant compliance. The table below analyses the Group’s financial liabilities into relevant maturity groupings based on the remaining period at the balance sheet date to the contractual maturity date. The
Exposure to credit risk at the end of the period: 30-09-15
Accounts receivable 1,751
Other Short term receivable 81,764
Cash balance 210,973
Total exposure 294,488
Pioneer Property Group ASA. Q3/2015 preliminary unaudited IFRS report Page 7
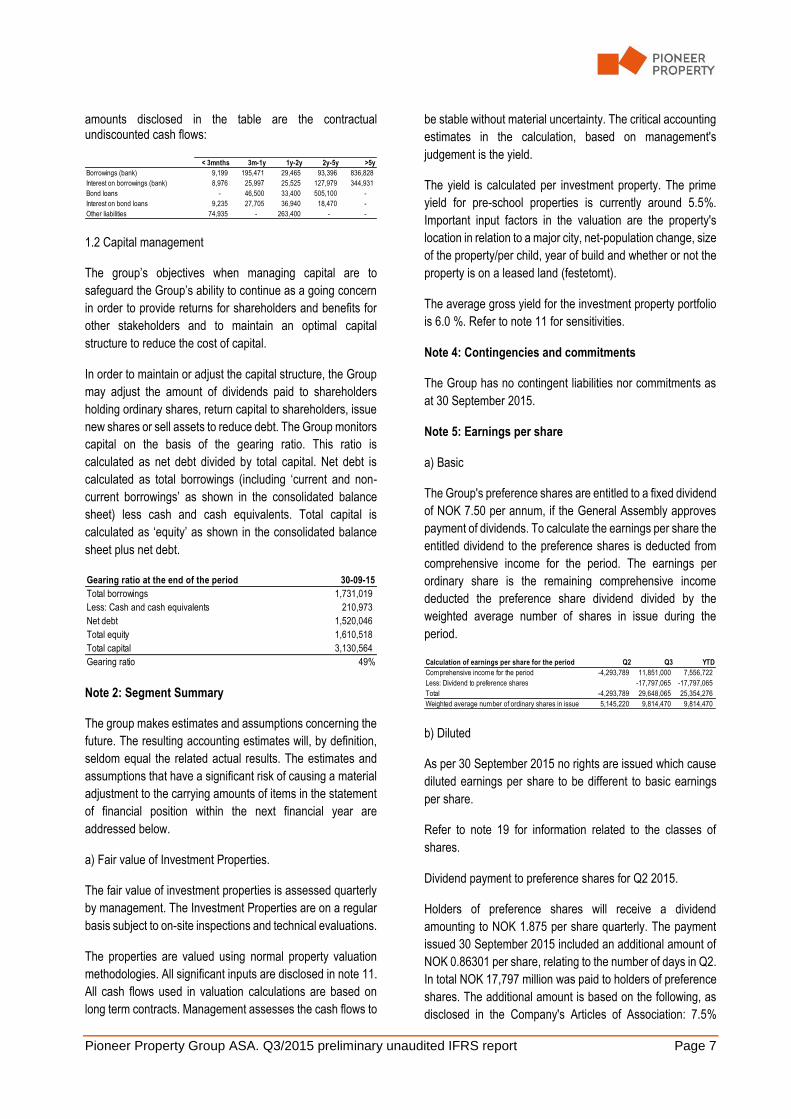
amounts disclosed in the table are the contractual undiscounted cash flows:
1.2 Capital management
The group’s objectives when managing capital are to
safeguard the Group’s ability to continue as a going concern
in order to provide returns for shareholders and benefits for
other stakeholders and to maintain an optimal capital
structure to reduce the cost of capital.
In order to maintain or adjust the capital structure, the Group
may adjust the amount of dividends paid to shareholders
holding ordinary shares, return capital to shareholders, issue
new shares or sell assets to reduce debt. The Group monitors
capital on the basis of the gearing ratio. This ratio is
calculated as net debt divided by total capital. Net debt is
calculated as total borrowings (including ‘current and non-
current borrowings’ as shown in the consolidated balance
sheet) less cash and cash equivalents. Total capital is
calculated as ‘equity’ as shown in the consolidated balance
sheet plus net debt.
Note 2: Segment Summary
The group makes estimates and assumptions concerning the
future. The resulting accounting estimates will, by definition,
seldom equal the related actual results. The estimates and
assumptions that have a significant risk of causing a material
adjustment to the carrying amounts of items in the statement
of financial position within the next financial year are
addressed below.
a) Fair value of Investment Properties.
The fair value of investment properties is assessed quarterly
by management. The Investment Properties are on a regular
basis subject to on-site inspections and technical evaluations.
The properties are valued using normal property valuation
methodologies. All significant inputs are disclosed in note 11.
All cash flows used in valuation calculations are based on
long term contracts. Management assesses the cash flows to
be stable without material uncertainty. The critical accounting
estimates in the calculation, based on management's
judgement is the yield.
The yield is calculated per investment property. The prime
yield for pre-school properties is currently around 5.5%.
Important input factors in the valuation are the property's
location in relation to a major city, net-population change, size
of the property/per child, year of build and whether or not the
property is on a leased land (festetomt).
The average gross yield for the investment property portfolio
is 6.0 %. Refer to note 11 for sensitivities.
Note 4: Contingencies and commitments
The Group has no contingent liabilities nor commitments as
at 30 September 2015.
Note 5: Earnings per share
a) Basic
The Group's preference shares are entitled to a fixed dividend
of NOK 7.50 per annum, if the General Assembly approves
payment of dividends. To calculate the earnings per share the
entitled dividend to the preference shares is deducted from
comprehensive income for the period. The earnings per
ordinary share is the remaining comprehensive income
deducted the preference share dividend divided by the
weighted average number of shares in issue during the
period.
b) Diluted
As per 30 September 2015 no rights are issued which cause
diluted earnings per share to be different to basic earnings
per share.
Refer to note 19 for information related to the classes of
shares.
Dividend payment to preference shares for Q2 2015.
Holders of preference shares will receive a dividend
amounting to NOK 1.875 per share quarterly. The payment
issued 30 September 2015 included an additional amount of
NOK 0.86301 per share, relating to the number of days in Q2.
In total NOK 17,797 million was paid to holders of preference
shares. The additional amount is based on the following, as
disclosed in the Company's Articles of Association: 7.5%
< 3mnths 3m-1y 1y-2y 2y-5y >5y
Borrowings (bank) 9,199 195,471 29,465 93,396 836,828
Interest on borrowings (bank) 8,976 25,997 25,525 127,979 344,931
Bond loans - 46,500 33,400 505,100 -
Interest on bond loans 9,235 27,705 36,940 18,470 -
Other liabilities 74,935 - 263,400 - -
Gearing ratio at the end of the period 30-09-15
Total borrowings 1,731,019
Less: Cash and cash equivalents 210,973
Net debt 1,520,046
Total equity 1,610,518
Total capital 3,130,564
Gearing ratio 49% Calculation of earnings per share for the period Q2 Q3 YTD
Comprehensive income for the period -4,293,789 11,851,000 7,556,722
Less: Dividend to preference shares -17,797,065 -17,797,065
Total -4,293,789 29,648,065 25,354,276
Weighted average number of ordinary shares in issue 5,145,220 9,814,470 9,814,470
Pioneer Property Group ASA. Q3/2015 preliminary unaudited IFRS report Page 8
interest on the IPO subscription rate (NOK 100) adjusted for
number of days from registration of the preference shares in
the Company register (Foretaksregisteret) until 30 June 2015
divided by 365 days per year. The preference shares were
registered 19 May 2015.
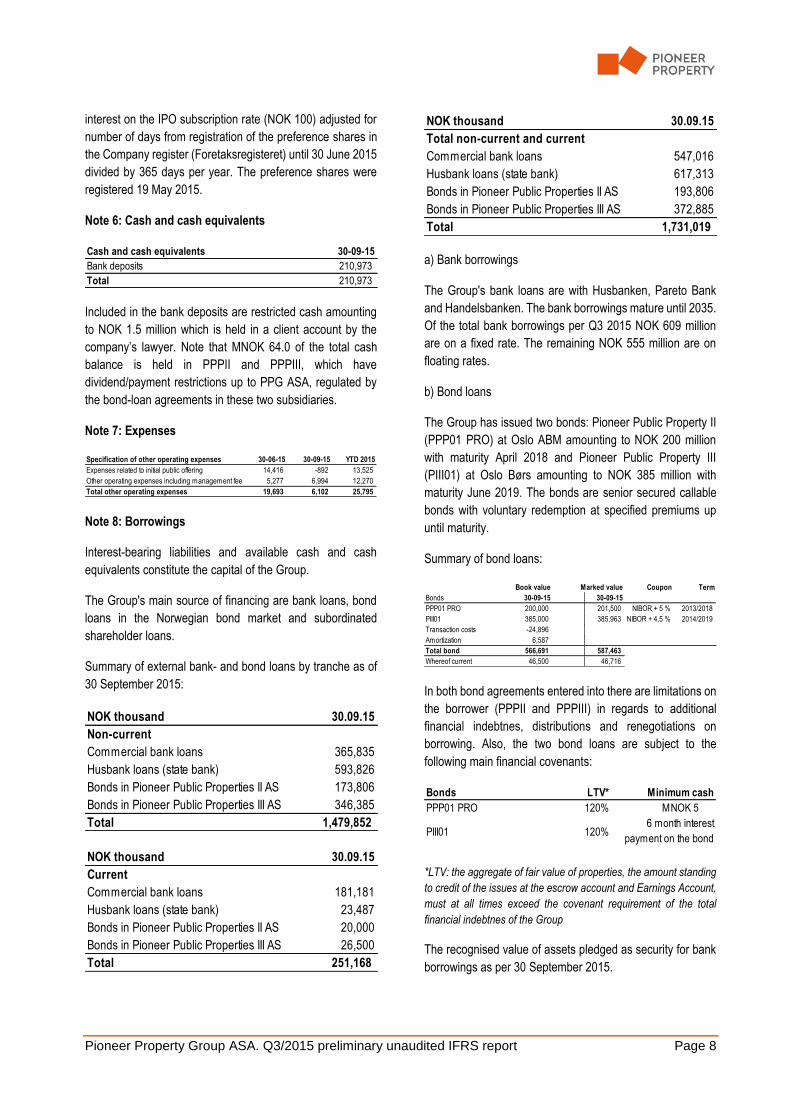
Note 6: Cash and cash equivalents
Included in the bank deposits are restricted cash amounting
to NOK 1.5 million which is held in a client account by the
company’s lawyer. Note that MNOK 64.0 of the total cash
balance is held in PPPII and PPPIII, which have
dividend/payment restrictions up to PPG ASA, regulated by
the bond-loan agreements in these two subsidiaries.
Note 7: Expenses
Note 8: Borrowings
Interest-bearing liabilities and available cash and cash
equivalents constitute the capital of the Group.
The Group's main source of financing are bank loans, bond
loans in the Norwegian bond market and subordinated
shareholder loans.
Summary of external bank- and bond loans by tranche as of
30 September 2015:
a) Bank borrowings
The Group's bank loans are with Husbanken, Pareto Bank
and Handelsbanken. The bank borrowings mature until 2035.
Of the total bank borrowings per Q3 2015 NOK 609 million
are on a fixed rate. The remaining NOK 555 million are on
floating rates.
b) Bond loans
The Group has issued two bonds: Pioneer Public Property II
(PPP01 PRO) at Oslo ABM amounting to NOK 200 million
with maturity April 2018 and Pioneer Public Property III
(PIII01) at Oslo Børs amounting to NOK 385 million with
maturity June 2019. The bonds are senior secured callable
bonds with voluntary redemption at specified premiums up
until maturity.
Summary of bond loans:
In both bond agreements entered into there are limitations on
the borrower (PPPII and PPPIII) in regards to additional
financial indebtnes, distributions and renegotiations on
borrowing. Also, the two bond loans are subject to the
following main financial covenants:
*LTV: the aggregate of fair value of properties, the amount standing
to credit of the issues at the escrow account and Earnings Account,
must at all times exceed the covenant requirement of the total
financial indebtnes of the Group
The recognised value of assets pledged as security for bank
borrowings as per 30 September 2015.
Cash and cash equivalents 30-09-15
Bank deposits 210,973
Total 210,973
Specification of other operating expenses 30-06-15 30-09-15 YTD 2015
Expenses related to initial public offering 14,416 -892 13,525
Other operating expenses including management fee 5,277 6,994 12,270
Total other operating expenses 19,693 6,102 25,795
NOK thousand 30.09.15
Non-current
Commercial bank loans 365,835
Husbank loans (state bank) 593,826
Bonds in Pioneer Public Properties II AS 173,806
Bonds in Pioneer Public Properties III AS 346,385
Total 1,479,852
NOK thousand 30.09.15
Current
Commercial bank loans 181,181
Husbank loans (state bank) 23,487
Bonds in Pioneer Public Properties II AS 20,000
Bonds in Pioneer Public Properties III AS 26,500
Total 251,168
NOK thousand 30.09.15
Total non-current and current
Commercial bank loans 547,016
Husbank loans (state bank) 617,313
Bonds in Pioneer Public Properties II AS 193,806
Bonds in Pioneer Public Properties III AS 372,885
Total 1,731,019
Book value Marked value Coupon Term
Bonds 30-09-15 30-09-15
PPP01 PRO 200,000 201,500 NIBOR + 5 % 2013/2018
PIII01 385,000 385,963 NIBOR + 4,5 % 2014/2019
Transaction costs -24,896
Amortization 6,587
Total bond 566,691 587,463
Whereof current 46,500 46,716
Bonds LTV*
PPP01 PRO 120% MNOK 5
PIII01 120%
Minimum cash
6 month interest
payment on the bond
Pioneer Property Group ASA. Q3/2015 preliminary unaudited IFRS report Page 9
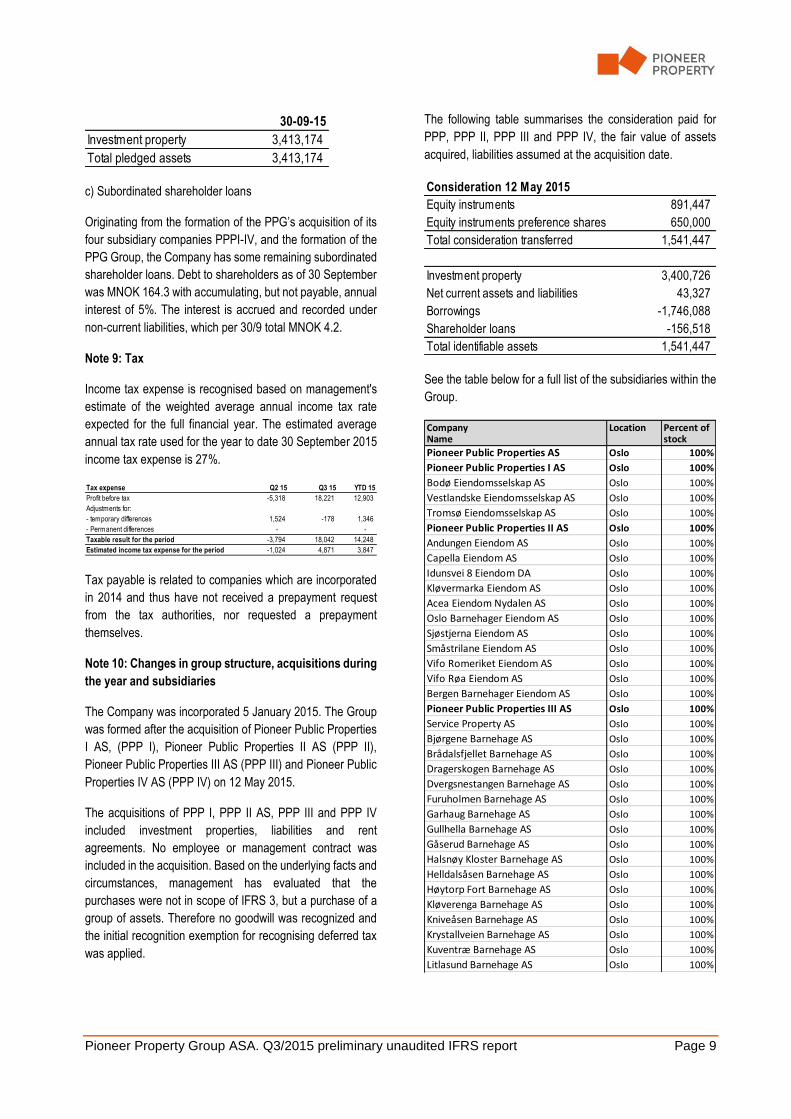
c) Subordinated shareholder loans
Originating from the formation of the PPG’s acquisition of its
four subsidiary companies PPPI-IV, and the formation of the
PPG Group, the Company has some remaining subordinated
shareholder loans. Debt to shareholders as of 30 September
was MNOK 164.3 with accumulating, but not payable, annual
interest of 5%. The interest is accrued and recorded under
non-current liabilities, which per 30/9 total MNOK 4.2.
Note 9: Tax
Income tax expense is recognised based on management's
estimate of the weighted average annual income tax rate
expected for the full financial year. The estimated average
annual tax rate used for the year to date 30 September 2015
income tax expense is 27%.
Tax payable is related to companies which are incorporated
in 2014 and thus have not received a prepayment request
from the tax authorities, nor requested a prepayment
themselves.
Note 10: Changes in group structure, acquisitions during
the year and subsidiaries
The Company was incorporated 5 January 2015. The Group
was formed after the acquisition of Pioneer Public Properties
I AS, (PPP I), Pioneer Public Properties II AS (PPP II),
Pioneer Public Properties III AS (PPP III) and Pioneer Public
Properties IV AS (PPP IV) on 12 May 2015.
The acquisitions of PPP I, PPP II AS, PPP III and PPP IV
included investment properties, liabilities and rent
agreements. No employee or management contract was
included in the acquisition. Based on the underlying facts and
circumstances, management has evaluated that the
purchases were not in scope of IFRS 3, but a purchase of a
group of assets. Therefore no goodwill was recognized and
the initial recognition exemption for recognising deferred tax
was applied.
The following table summarises the consideration paid for
PPP, PPP II, PPP III and PPP IV, the fair value of assets
acquired, liabilities assumed at the acquisition date.
See the table below for a full list of the subsidiaries within the
Group.
30-09-15
Investment property 3,413,174
Total pledged assets 3,413,174
Tax expense Q2 15 Q3 15 YTD 15
Profit before tax -5,318 18,221 12,903
Adjustments for:
- temporary differences 1,524 -178 1,346
- Permanent differences - -
Taxable result for the period -3,794 18,042 14,248
Estimated income tax expense for the period -1,024 4,871 3,847
Consideration 12 May 2015
Equity instruments 891,447
Equity instruments preference shares 650,000
Total consideration transferred 1,541,447
Investment property 3,400,726
Net current assets and liabilities 43,327
Borrowings -1,746,088
Shareholder loans -156,518
Total identifiable assets 1,541,447
Company Location Percent ofName stock
Pioneer Public Properties AS Oslo 100%
Pioneer Public Properties I AS Oslo 100%
Bodø Eiendomsselskap AS Oslo 100%
Vestlandske Eiendomsselskap AS Oslo 100%
Tromsø Eiendomsselskap AS Oslo 100%
Pioneer Public Properties II AS Oslo 100%
Andungen Eiendom AS Oslo 100%
Capella Eiendom AS Oslo 100%
Idunsvei 8 Eiendom DA Oslo 100%
Kløvermarka Eiendom AS Oslo 100%
Acea Eiendom Nydalen AS Oslo 100%
Oslo Barnehager Eiendom AS Oslo 100%
Sjøstjerna Eiendom AS Oslo 100%
Småstrilane Eiendom AS Oslo 100%
Vifo Romeriket Eiendom AS Oslo 100%
Vifo Røa Eiendom AS Oslo 100%
Bergen Barnehager Eiendom AS Oslo 100%
Pioneer Public Properties III AS Oslo 100%
Service Property AS Oslo 100%
Bjørgene Barnehage AS Oslo 100%
Brådalsfjellet Barnehage AS Oslo 100%
Dragerskogen Barnehage AS Oslo 100%
Dvergsnestangen Barnehage AS Oslo 100%
Furuholmen Barnehage AS Oslo 100%
Garhaug Barnehage AS Oslo 100%
Gullhella Barnehage AS Oslo 100%
Gåserud Barnehage AS Oslo 100%
Halsnøy Kloster Barnehage AS Oslo 100%
Helldalsåsen Barnehage AS Oslo 100%
Høytorp Fort Barnehage AS Oslo 100%
Kløverenga Barnehage AS Oslo 100%
Kniveåsen Barnehage AS Oslo 100%
Krystallveien Barnehage AS Oslo 100%
Kuventræ Barnehage AS Oslo 100%
Litlasund Barnehage AS Oslo 100%
Pioneer Property Group ASA. Q3/2015 preliminary unaudited IFRS report Page 10
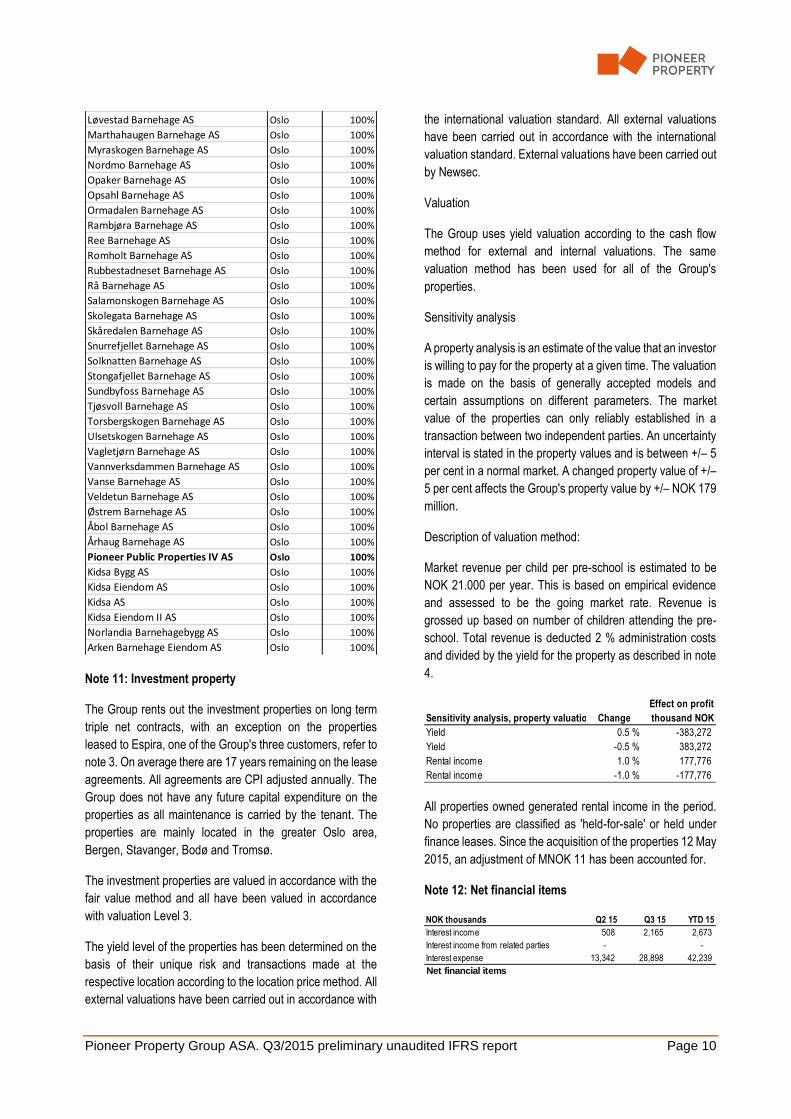
Note 11: Investment property
The Group rents out the investment properties on long term
triple net contracts, with an exception on the properties
leased to Espira, one of the Group's three customers, refer to
note 3. On average there are 17 years remaining on the lease
agreements. All agreements are CPI adjusted annually. The
Group does not have any future capital expenditure on the
properties as all maintenance is carried by the tenant. The
properties are mainly located in the greater Oslo area,
Bergen, Stavanger, Bodø and Tromsø.
The investment properties are valued in accordance with the
fair value method and all have been valued in accordance
with valuation Level 3.
The yield level of the properties has been determined on the
basis of their unique risk and transactions made at the
respective location according to the location price method. All
external valuations have been carried out in accordance with
the international valuation standard. All external valuations
have been carried out in accordance with the international
valuation standard. External valuations have been carried out
by Newsec.
Valuation
The Group uses yield valuation according to the cash flow
method for external and internal valuations. The same
valuation method has been used for all of the Group's
properties.
Sensitivity analysis
A property analysis is an estimate of the value that an investor
is willing to pay for the property at a given time. The valuation
is made on the basis of generally accepted models and
certain assumptions on different parameters. The market
value of the properties can only reliably established in a
transaction between two independent parties. An uncertainty
interval is stated in the property values and is between +/– 5
per cent in a normal market. A changed property value of +/–
5 per cent affects the Group's property value by +/– NOK 179
million.
Description of valuation method:
Market revenue per child per pre-school is estimated to be
NOK 21.000 per year. This is based on empirical evidence
and assessed to be the going market rate. Revenue is
grossed up based on number of children attending the pre-
school. Total revenue is deducted 2 % administration costs
and divided by the yield for the property as described in note
4.
All properties owned generated rental income in the period.
No properties are classified as 'held-for-sale' or held under
finance leases. Since the acquisition of the properties 12 May
2015, an adjustment of MNOK 11 has been accounted for.
Note 12: Net financial items
Løvestad Barnehage AS Oslo 100%
Marthahaugen Barnehage AS Oslo 100%
Myraskogen Barnehage AS Oslo 100%
Nordmo Barnehage AS Oslo 100%
Opaker Barnehage AS Oslo 100%
Opsahl Barnehage AS Oslo 100%
Ormadalen Barnehage AS Oslo 100%
Rambjøra Barnehage AS Oslo 100%
Ree Barnehage AS Oslo 100%
Romholt Barnehage AS Oslo 100%
Rubbestadneset Barnehage AS Oslo 100%
Rå Barnehage AS Oslo 100%
Salamonskogen Barnehage AS Oslo 100%
Skolegata Barnehage AS Oslo 100%
Skåredalen Barnehage AS Oslo 100%
Snurrefjellet Barnehage AS Oslo 100%
Solknatten Barnehage AS Oslo 100%
Stongafjellet Barnehage AS Oslo 100%
Sundbyfoss Barnehage AS Oslo 100%
Tjøsvoll Barnehage AS Oslo 100%
Torsbergskogen Barnehage AS Oslo 100%
Ulsetskogen Barnehage AS Oslo 100%
Vagletjørn Barnehage AS Oslo 100%
Vannverksdammen Barnehage AS Oslo 100%
Vanse Barnehage AS Oslo 100%
Veldetun Barnehage AS Oslo 100%
Østrem Barnehage AS Oslo 100%
Åbol Barnehage AS Oslo 100%
Århaug Barnehage AS Oslo 100%
Pioneer Public Properties IV AS Oslo 100%
Kidsa Bygg AS Oslo 100%
Kidsa Eiendom AS Oslo 100%
Kidsa AS Oslo 100%
Kidsa Eiendom II AS Oslo 100%
Norlandia Barnehagebygg AS Oslo 100%
Arken Barnehage Eiendom AS Oslo 100%
Sensitivity analysis, property valuation Change
Effect on profit
thousand NOK
Yield 0.5 % -383,272
Yield -0.5 % 383,272
Rental income 1.0 % 177,776
Rental income -1.0 % -177,776
NOK thousands Q2 15 Q3 15 YTD 15
Interest income 508 2,165 2,673
Interest income from related parties - -
Interest expense 13,342 28,898 42,239
Net financial items
Pioneer Property Group ASA. Q3/2015 preliminary unaudited IFRS report Page 11
In the third quarter, payable interest expense on bank- and
bond loans totalled MNOK 21.6. Also included in the reported
Interest expense was a calculated, but not payable, interest
expense of MNOK 4.2 relating to the subordinated
shareholder loans – which for Q3 also included MNOK 1.3
originating from the second quarter. Furthermore an
additional MNOK 3.1 in miscellaneous financial costs,
partially relating to sale credit to Kidsa, and also relating to
amortization of bond-related startup expenses according to
IFRS (PPPII and PPPIII).
Note 13: Related-party transactions
Overview over related parties
The Group had the following material transactions with
related parties:
The outstanding balances between the related parties are
unsecured. The interest rate used to calculate interest are
based on current market rates. There are no provisions for
loss on receivables. Transactions made between the related
parties are made on terms equivalent to those that prevail in
the market at arm’s length.
Note 14: Payroll
The company does not have any employees. Refer to Note
14 for information regarding management fee to Pioneer
Management AS, a fully owned subsidiary of Pioneer Capital
Partners AS.
Note 15: Trade receivables
None of the receivables are due.
Note 16: Share capital and shareholder information
The Company have two classes of shares, ordinary shares
and preference shares. The face value per share for both
ordinary and preference shares classes is NOK 1. Share
premium for all shares issued in the period is of NOK 99 per
share.
About the shares: The differences between the share classes
are differing voting rights and differing rights to the
Company’s profit. Besides voting rights, the difference
between the Company's share classes is that the preference
shares entail a preferential right to the Company’s profit
through a preferential right over ordinary shares to dividends.
The regulations on voting rights and dividends are decided
upon by the Shareholders’ Meeting and can be found in the
Articles of Association.
The ordinary shares: The Company's ordinary share confers
one vote unlike the preference shares that confer one-tenth
of a vote.
The preference share: The Company’s preference shares
confer a preferential right over ordinary shares to an annual
dividend of NOK 7.50 per preference share. Dividend
payments are made quarterly with NOK 1.875 per preference
share, if approved by the General Assembly. The preference
share does not otherwise confer a right to dividend. If the
general meeting decided not to pay dividends or to pay
dividends that fall below NOK 1.875 per preference share
during a quarter, the difference between paid dividends and
NOK 1.875 per preference share shall be accumulated and
adjusted upwards with an annual interest rate of 5 per cent
until full dividends have been distributed. No dividends may
be distributed to the ordinary shareholders until the
preference shareholders have received full dividends
including the withheld amount. Any difference between NOK
Related party
Roger Adolfsen Chairman of the Board and owner of Mecca Invest AS
Sandra Henriette Riise Board member
Geir Hjort Board member
Even Carlsen Board member and owner of Grafo AS
Nina Hjørdis Torp Høisæter Board member
Runar Rønningen CEO Pioneer Capital Partners
Pioneer Capital Partners AS Shareholder and deliverer of managment services
Grafo AS Substantial shareholder
Kevenstern AS Substantial shareholder
Mecca Invest AS Substantial shareholder
Norlandia Care Group AS Controlled by substantial shareholders, refer to note 18
Kidprop AS Controlled by substantial shareholders, refer to note 18
Kidsa Drift AS Controlled by substantial shareholders, refer to note 18
Acea Properties AS Controlled by substantial shareholders, refer to note 18
Relation to the Group
Transactions with related parties Q2 15 Q3 15 YTD 15
Rent revenue from Norlandia Care Group AS including subsidiaries 8,449 14,937 23,386
Rent revenue from Kidsa Drift including subsidiaries 4,477 9,539 14,016
Management fee to Pioneer Capital Partners AS including subsidiaries 785 2,800 3,585
Purchase of shares from related parties (refer to note 11) 1,541,447 - 1,541,447
Receivables from related parties 30-09-15
Kidprop AS 7,658
Liabilities to related parties 30-09-15
Pioneer Capital Partners AS 154,362
Norlandia Care Group AS 12,382
Kidsa Drift AS 18,254
Acea Properties AS 14,737
30-09-15
Trade Receivables 1,751
Other Receivables 81,764
Total Receivables 83,515
Number of
shares
Ordinary
shares
Preference
shares Share premium
Total
Proceeds from incorporation 30,000 30,000
Paid out capital -30,000 -30,000
Proceeds from share issue, debt conversion 15,384,470 8,884,470 6,500,000 1,523,062,530 1,538,447,000
Proceeds from share issue, contribution in kind 30,000 30,000 2,970,000 3,000,000
Proceeds from share issue 900,000 900,000 89,100,000 90,000,000
Payment premiums -29,984,589 -29,984,589
At 30 September 2015 16,314,470 9,814,470 6,500,000 1,585,147,941 1,601,462,411
Pioneer Property Group ASA. Q3/2015 preliminary unaudited IFRS report Page 12
1.875 per preference share and the dividend paid per
preference share is accumulated for each quarter.
Detailed information regarding dividends, issues and
redemption can be found in the Company's Articles of
Association, available in the prospectus via the Company’s
website.
Note 17: Operational leases
Properties are leased out on long term triple net contracts to
solid pre-school operators (Espira, Norlandia Preschools and
Kidsa Drift, of which all have lease guarantees from Norlandia
Care Group. Future payments under non-cancellable
operating leases are as follows in nominal amounts excluding
CPI adjustments
Note 18: Subsequent events
No material subsequent events have occurred since the end
of the quarter.
Shareholder Ord shares Pref shars
Norlandia Care Group AS 20.05% 9.37%
Hospitality Invest AS 19.82% 2.46%
HI Capital AS 2.34% 3.41%
Eidissen Consult AS 14.45% 4.22%
Grafo AS 14.45% 4.22%
Klevenstern AS 14.45% 2.85%
Mecca Invest AS 14.45% 2.85%
Acea Properties 0.00% 0.56%
PCP AS 0.00% 2.85%
Other minority shareholders 0.00% 67.21%
Total 100% 100%
30-09-15
Within 1 year 208,114
Between 1 and 5 years 832,458
After 5 years 2,497,374