Embed Size (px)
Citation preview

NEW MEXICO
OKLAHOMA
BOARD OF WATER ENGINEERS
STATE OF TEXAS
SLT OBSERVATION STATIONSSHOWING
ACTIVE, PROPOSED AND DISCONTINUED

STATE OF TEXAS
BOARD OF WATER ENGINEERS
and
UNITED STATES DEPARTMENT OF AGRICULTURE
SOIL CONSERVATION SERVICE
DIVISION OF IRRIGATION AND WATER CONSERVATION
PROGRESS REPORT NO. 10
of
SILT LOAD OF TEXAS STREA1B
(1947-1948)
(The silt data contained in this report were obtained under a cooperative,agreement between the Board of Vfeter Engineers and U. S. Department ofAgriculture, Soil Conservation Service, Division of Irrigation and WaterConservation.)
Austin, TexasAugust, 1949

ORGANIZATION
STATE OF TEXAS
BOARD OF WATER ENGINEERS
E. V. Spence, ChairmanJo Wo Pritchett, MemberH. A. Beckwith, Member
UNITED STATES DEPARTMENT OF AGRICULTURE
SOIL CONSERVATION SERVICE
DIVISION OF IRRIGATION AND WATER CONSERVATION
Cooperating in Studies on Silt of Texas Streams
Ho H. Bennett, Chief of ServiceM. L. Nichols, Chief of ResearchGeo. D. Clyde, Chief, Division of Irrigation

TABLE OF CONTENTS
Page
INTRODUCTION 1
SUMMARIZED SILT DATA 2-7
COOPERATE ON AND ACKNOWLEDGEMENTS 8
SUSPENDED SILT LOAD DETERMINATIONS
Brazos River Watershed
Belton Station (Leon River) 9-10
Easterly Station (Navasota River) 11-12
South Bend Station 13-14
Possum Kingdom Dam Station 15-16
Richmond Station 17-18
Colorado River 'Watershed
Llano Station (Llano River) 19-20
Johnson City Station (Pedernales River) 21-22
San Saba Station ............ 23-24
Inks Dam Station .' • . ........ 25-26
Buchanan Dam Station . 27-28
Austin Station . „ . ..... o ... 29-30
Guadalupe River Watershed
Spring Branch Station 31-32
Victoria Station . 33-34
Lavaca River Watershed
Edna Station 35-36
(continued on next page)

TABLE OF CONTENTS (Cont'd.)
Page
Neches River Watershed
Horger Station (Angelina River) » 37-38
Rockland Station . ..... 39-40
Nueces River Watershed
Cotulla Station ............ 41-42
Three Rivers Station ....... ... . 43-44
Corpus Christi Dam Station » 45-46
Sabine River Watershed
Logansport, La„ Station . 47-48
San Antonio River Watershed
Goliad Station ........... 49-50
San Jacinto River Watershed
Huffman Station ....... 51-52
Humble Station (West Fork San Jacinto River) • . » 53-54
Trinity River Watershed
Romayor Station oo.o.oo.ooo.o 55-56
SUMMARY OF AIL TEXAS SILT STATIONS, ACTIVE AND DISCONTINUED. 57-58

Progress Report No. 10of
THE SILT LOAD OF TEXAS STREAMS, 1947-1948
by
1/Dean W. Bloodgood, Irrigation Engineer
Division of Irrigation ResearchSoil Conservation Service
U. S. Department of Agriculture
INTRODUCTION
The purpose of the silt studies is to make a determination of thecharacteristics of the suspended silt load of Texas streams.
The tenth annual progress report for Silt Load of Texas Streams isone of a series that have been prepared annually since 1939o
The first report contains cooperative and other available data onthe suspended silt load of Texas streams for a period from 1899 to 1939.These data were obtained at 27 stations located on 10 of the watersheds
of Texas and consisted of the amount of silt load in tons and acre feet
for each month and for the year, as well as a summary for the period thestation was in operation. This report also contains a description of theequipment used in obtaining the water samples, the technique used in thelaboratory and computation of data.
The subsequent reports contain a compilation of silt data obtainedduring the water years ending each September 30 and a summary of theyearly silt load up to the time of the present report. Most of thesereports are available for free distribution upon request.
Prior to 1939, 14 silt sampling stations were discontinued, out ofa total of 27, on account of insufficient funds for their operation andmaintenance.
Since 1939 and to September 30, 1948, 18 new silt sampling stationshave been established, and 7 have been discontinued. There are now 24active silt sampling stations located on 10 of the watersheds of Texas.Since 1899 silt data have been obtained at 45 stations. The complete siltprogram calls for studies at 74 stations, which include the 45 that havecontributed data.
The water samples collected for silt determinations were obtained bya simple, inexpensive, and easily operated device known as the Texas orDepartment of Agriculture sampler. This type of sampler has been in continuous use during the past 25 years in obtaining water samples for suspended silt load of Texas streams. During this long period to September30, 1948, a total of 100,508 daily observations have been made with thistype of sampler. Each observation consisted of obtaining one to three
T7 Member of a Sub-committee on Physical Aspects, Joint Committeeon Sedimentation in Reservoirs, American Society of Civil Engineers.
- 1 -

water samples for regular river flows and extra samples during a floodstage of a stream, During the water year 1947-1948, 7,775 daily observations were made at 24 stations, and 11,062 water samples were receivedand silt determinations made at our cooperative silt laboratory.
The Texas or Department of Agriculture silt sampler is not designedor used for collecting water samples containing bed load material. It isused, however, for collecting water samples near the surface of a streamfor suspended silt material. This is the type of material that contributesto most of the sediment deposited in the larger artificial lakes. The bedload material contributes mostly to a river channel and upper portion ofa lake sedimentation.
All silt data compiled for this report have been computed for awater year October 1 to the following September 30. This is a year adoptedby the Surface Water Branch, United States Geological Survey, in all oftheir stream measurements. It is necessary and essential to use river discharge data in connection with any silt determination of Texas streams, sothat period has also been adopted as a year for the silt calculations.
The silt determinations are made by calculating the percentage of drysilt by weight as obtained from a water sample0
For the main purpose of the sedimentation studies of Texas streamsall calculations are based on one cubic foot of silt weighing 70 pounds.
SUMMARIZED SILT DATA
Belton Station, Leon River
The average discharge of the Leon River at the Bel ton Station for a2-year record is 497,780 acre feet, while for the year 1947-1948, it was122,140 acre feet, or 25f. of the average flow. The average silt load forthe same period is 486 acre feet, while for 1947-1948, it was 77 acre feet,or 16% of the average load. The total load for a 3-year period is 1,611,940tons or 18089 acre feet of silt.
South Bend Station, Brazos River
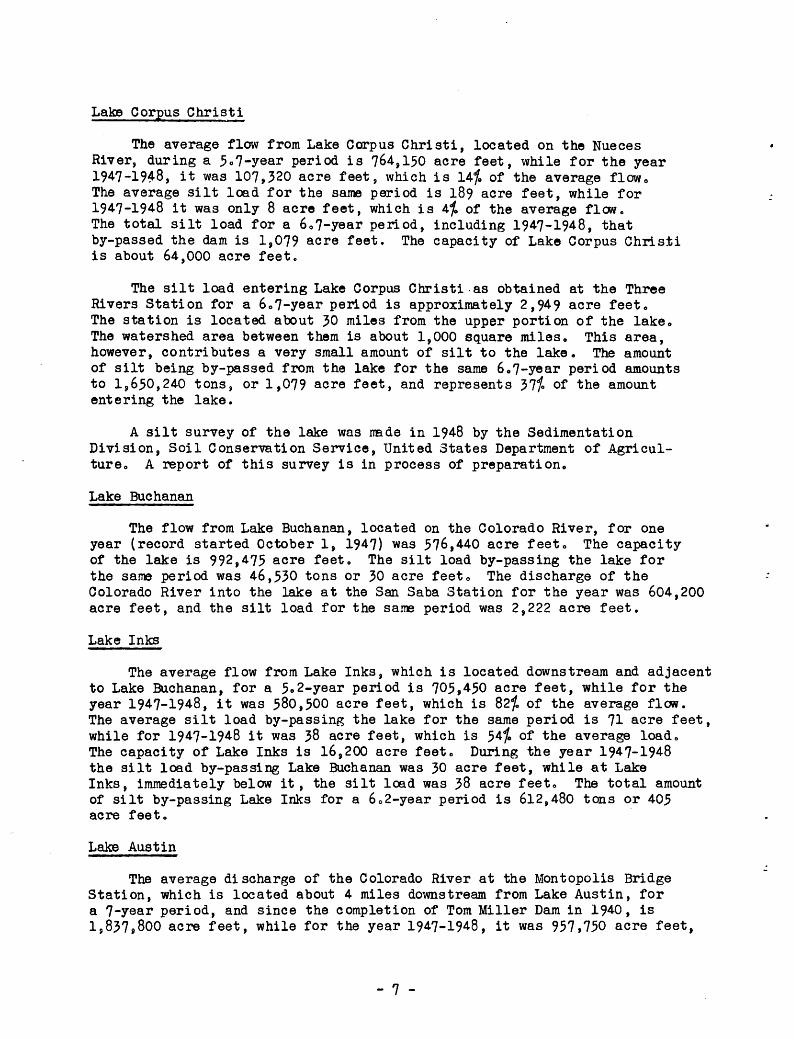
The average discharge of the Brazos River at the South Bend Station(upper portion of xvatershed) for a 5°7-year period is 497,400 acre feet,while for the year 1947-1948, it was 391,140 acre feet, or 79% of the average flow. The average silt load for the same period is 2,216 acre feet,while for the year 1947-1948, it was 1,783 acre feet, or Q0% of the average loadc The total load for the 6.7-year period was 22,007,940 tons, or14,437 acre feet of silt.
Richmond Station, Brazos River
The average discharge of the Brazos River at the Richmond Station(lower portion of the watershed) for a 23o3-year period is 6,023,540 acre

feet, while for the year 1947-1948, it was 1,950,620 acre feet, which is32% of the average flow. The average load for the same period is 24,898acre feet,'while for the year it was 2,591 acre feet, which is 10% of theaverage load. The total load for a 2403-year period is 889,824,770 tonsor 582,870 acre feet of silt. This large quantity of silt is sufficientto have jeopardized the economic life of a water storage reservoir similarto Lake Possum Kingdom located on the same watershed and which has a capacity of 750,000 acre feet of water. The data obtained at the RichmondStation are probably the longest continuous daily silt records in existence(25.1 years to August, 1949).
Easterly Station, Navasota River
The average discharge of the Navasota River (a tributary of the BrazosRiver) at the Easterly Station for a 5»7-year period is 433,650 acre feet,while for the year 1947-1948, it was 99,160 acre feet, which is 23% of theaverage flow. The average silt load for the same period is 275 acre feet,while for 1947-1948, it was 53 acre feet, which is 19% of the average load.The total load for a 6»7-year period is 2,485,660 tons or 1,634 acre feetof silt.
San Saba Station, Colorado River
The average discharge of the Colorado River at the San Saba Station(located a few miles above the upper portion of Lake Buchanan) for a 17-yearperiod is 1,245,570 acre feet, while for the year I947-I948, it was 604,200acre feet, which is 48% of the average flow. The average silt load for thesame period is 3,148 acre feet, while for the year 1947-1948, it was 2,222acre feet, which is 71% of the average load. The total load for an 18-yearperiod is 85,258,480 tons or 55,919 acre feet of silt. The silt recordsobtained at this station are also among the longest daily continuous records(I808 years to August, 1949).
Johnson City Station, Pedernales River
The average discharge of the Pedernales River (a tributary of theColorado River) at the Johnson City Station for a 5.2-year period is131,570 acre feet, while for the year I947-I948, it was 31,690 acre feet,which is 24% of the average flow. The average silt load for the same periodis 180 acre feet, while for the year 1947-1948, it was 27 acre feet, whichis 15% of the average load. The total load for a 602-year period is 1,456,500tons or 957 acre feet of silt.
Llano Station, Llano River
The average discharge of the Llano River (a tributary of the ColoradoRiver and joining it between Lake Buchanan and Lake Travis) at the LlanoStation for a 5.2-year period is 181,690 acre feet, while for the year1947-1948, it was 327,420 acre feet, which is 180% of the average flow.This is one of the few streams that had any excessive flood waters duringthe year. The upper watersheds of this stream are located in areas whereexcessive and very high rainfall occurred during the year, some of which
- 3 -

exceeded all previous records. The rainfall (cloudbursts) on a small areaof the Llano watershed, which contained little moisture and vegetativegrowth (weeds, etcQ) due to drouth, caused the run-off to be extremelyrapid and high0 The rainfall for the storm of June 23-24, 1948, whichoccurred on a small watershed area of one of the tributaries of the Llano
River varied from 8 to 22 inches according to the Weather Bureau records.
The soils of the small watershed area at the time of the storm were
dry and aerated due to the prolonged drouth0 When the hard - cloud-burstproportion - rain fell upon the dry pulverized soil, the erosion was exceedingly great. This erosion caused the Llano River to carry a large siltload with the flood waters.
The average annual silt load of the Llano River is 143 acre feet9while for one month, June, it amounted to 902 acre feet9 For the entireyear it was 965 acre feet, which is 675% of the average loado The totalload for a 602-year period is 2,594,720 tons, or 19702 acre feet of silt.
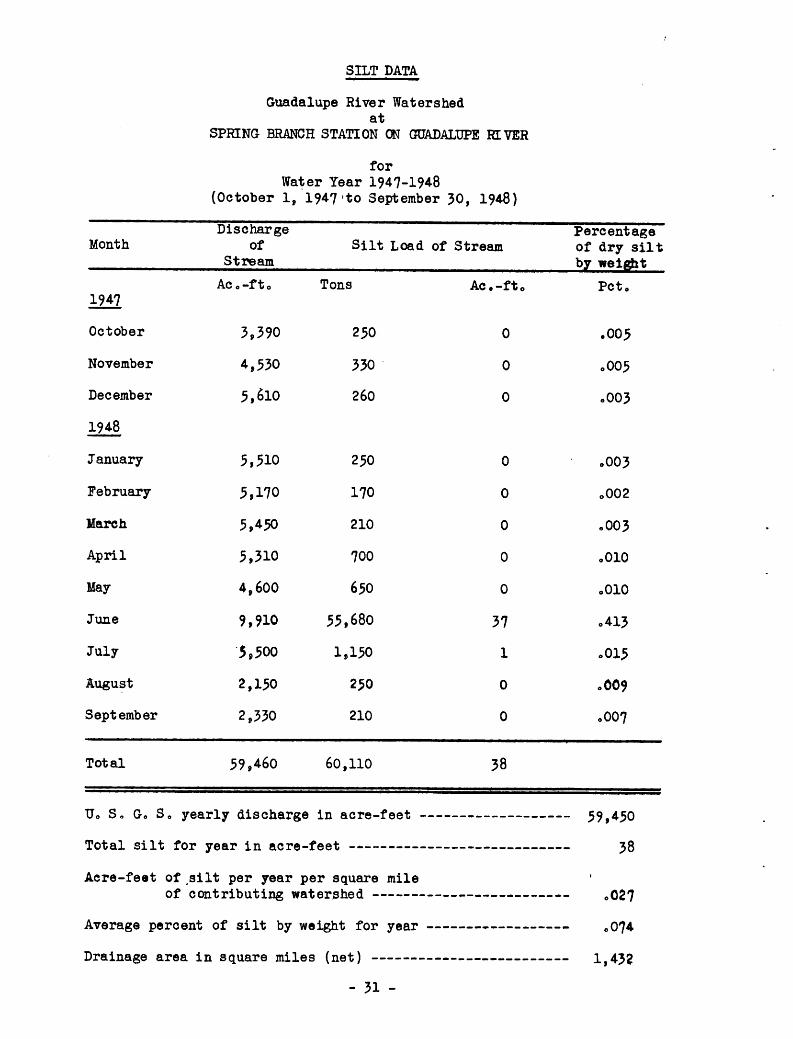
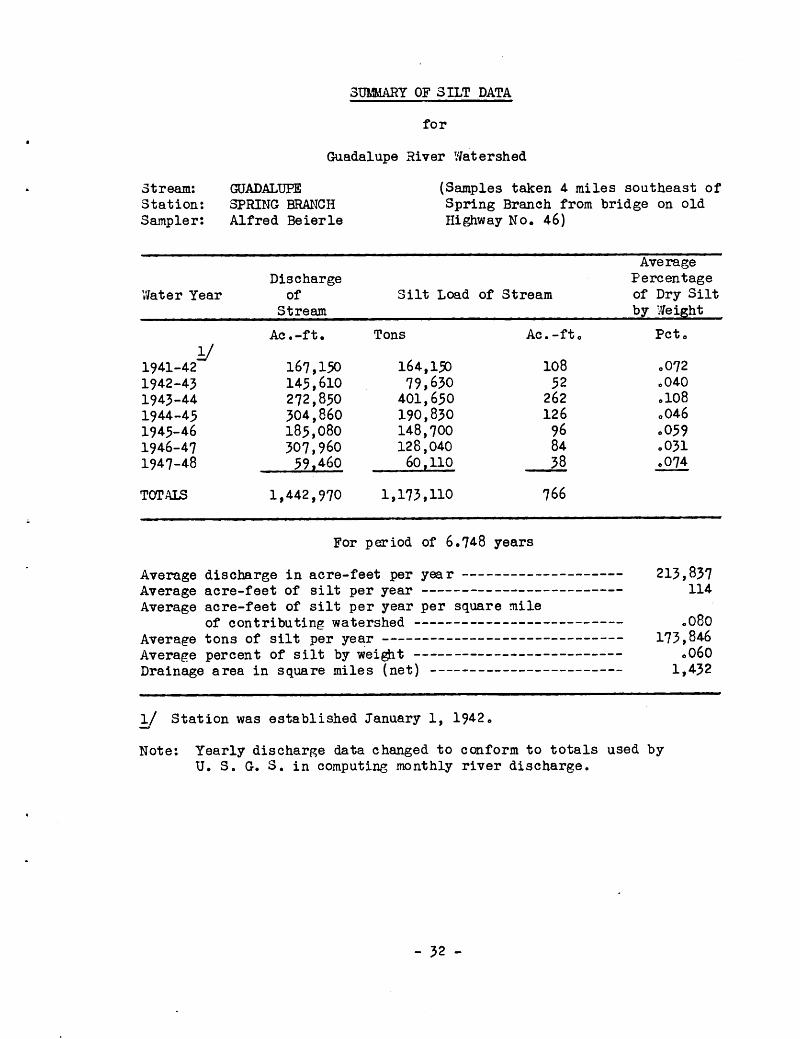
Spring Branch Station, Guadalupe River
The average discharge of the Guadalupe River at the Spring BranchStation (upper portion of the watershed) for a 5<>7-year period is 240,700acre feet, while for the year 1947-1948, it was 59,460 acre feet, whichis 25% of the average flow. The average silt load for the same period is127 acre feet, while for the year 1947-1948, it was 38 acre feet, whichis 30% of the average load.
Practically all of the silt load occurred in one month, June, when itwas 37 acre feet out of a total of 38 acre feet for the entire year. Mostof the discharge of the river also occurred during June and amounted to55,680 acre feet out of a total of 60,110 acre feet for the entire year»
The total load for a 6o7-year period is ls173,110 tons, or 766 acrefeet of silto
Victoria Station, Guadalupe River
The average discharge of the Guadalupe River at the Victoria Station(lower portion of the watershed) for a 201-year period is 1,417,870 acrefeet, while for the year 1947-1948, it was 509,960 acre feet, which is 36%of the average flow. The average silt load for the same period is 551acre feet, while for I947-I948, it was 111 acre feet, which is 20% of theaverage load0 The total load for a 3o1-year period is 1,915,860 tons, or1,259 acre feet of silt.
Edna Station, Lavaca River
The average discharge of the Lavaca River at the Edna Station for a2.1-year period is 248,480 acre feet, while for the year 1947-1948, it was114,240 acre feet, or 46% of the average flow. The average silt load forthe same period is 164 acre feet, while for the year 1947-1948, it was 66acre feet, or 40% of the average loado The total load for a 3o 1-year periodis 618,860 tons, or 407 acre feet of silt.
= 4. -

Rockland Station. Neches River'i * ii.
The average discharge of the Neches River at the Rockland Stationfor a 17«.l-year period is 2,052,740 acre feet, while for the year 1947-1948, it was 1,250,360 acre feet, which is 6l> of the average flow. Theaverage silt load for the same period is 338 acre feet, while for 1947-1948, it was 77 acre feet, which is 23% of the average load. The totalsilt load for an 18.1-year period is 8,953,060 tons, or 5,865 acre feetof silt. This is also one of the stations with a long continuous siltrecord.
Horger Station, Angelina River
The average discharge of the Angelina River, a tributary of theNeches River, at the Horger Station for a 2.1-year period is 3,403,490acre feet, while for the year 1947-1948, it was 1,619,040 acre feet,which is 48% of the average flow. The average silt load is 703 acre feet,while for 1947-1948, it was 149 acre feet, which is 21% of the averageload. The total load for a 3.1-year period is 2,457,670 tons, or 1,613acre feet of silt.
Cotulla Station, Nueces River
The average discharge of the Nueces River at the Cotulla Station fora 5«7-year period is 210,645 acre feet, while for the year 1947-1948, itwas 72,900 acre feet, which is 35% of the average flow. The average siltload is 95 acre feet, while for I947-I948, it was 19 acre feet, which is20% of the average load. The entire discharge and silt load occurred inJune, July, and September. During the other months of the year the riverwas entirely dry at the Cotulla Station. The total load for a 6.7-yearperiod is 860,580 tons, or 564 acre feet of silt.
Three Rivers Station, Nueces River
The average discharge of the Nueces River at the Three Rivers Stationfor a 20-year period is 716,380 acre feet, while for 1947-1948 it was129,330 acre feet, which is 18% of the average flow. The average siltload for the same period is 527 acre feet, while for the year 1947-1948,it was 164 acre feet, which is 31% of the average load. The total siltload for a 21-year period is 16,319,750 tons, or 10,704 acre feet of silt.This is also one of the long continuous silt records.
Logansport, La. Station, Sabine River
The average discharge of the Sabine River at the Logansport, La.Station for a 13.2-year period is 3,040,380 acre feet, while for the year1947-1948 it was 2,820,560 acre feet, which is 93% of the average flow.The average silt load for the same period is 806 acre feet, while for1947-1948, it was 298 acre feet, which is 37% of the average load. Thetotal load for a 14.2-year period is 16,631,910 tons, or 10,904 acre feetof silt.
- 5 -

Goliad Station, San Antonio River
The average discharge of the San Antonio River at the Goliad Stationfor a 5o7-year period is 562,470 acre feet, while for the year 1947-1948,it was 226,510 acre feet, which is 40% of the average flow. The averagesilt load for the same period is 550 acre feet, while for 1947-1948, itwas 155 acre feet or 28% of the average load. The total silt load for a6o7-year period is 5,067,120 tons or 3,321 acre feet of silt.
Huffman Station, San Jacinto River
The average discharge of the San Jacinto River at Huffman (SheldonPumping Plant) Station near the lower end of the river for a 2.1-yearperiod is 2,369,630 acre feet, while for the year 1947-1948, it was 499,740acre feet, which is 21% of the average flow. The average silt load forthe same period is 1,135 acre feet, while for the year 1947-1948, it was70 acre feet, which is 6% of the average load. The total load for the3ol-year period is 3,713,780 tons, or 2,435 acre feet of silt.
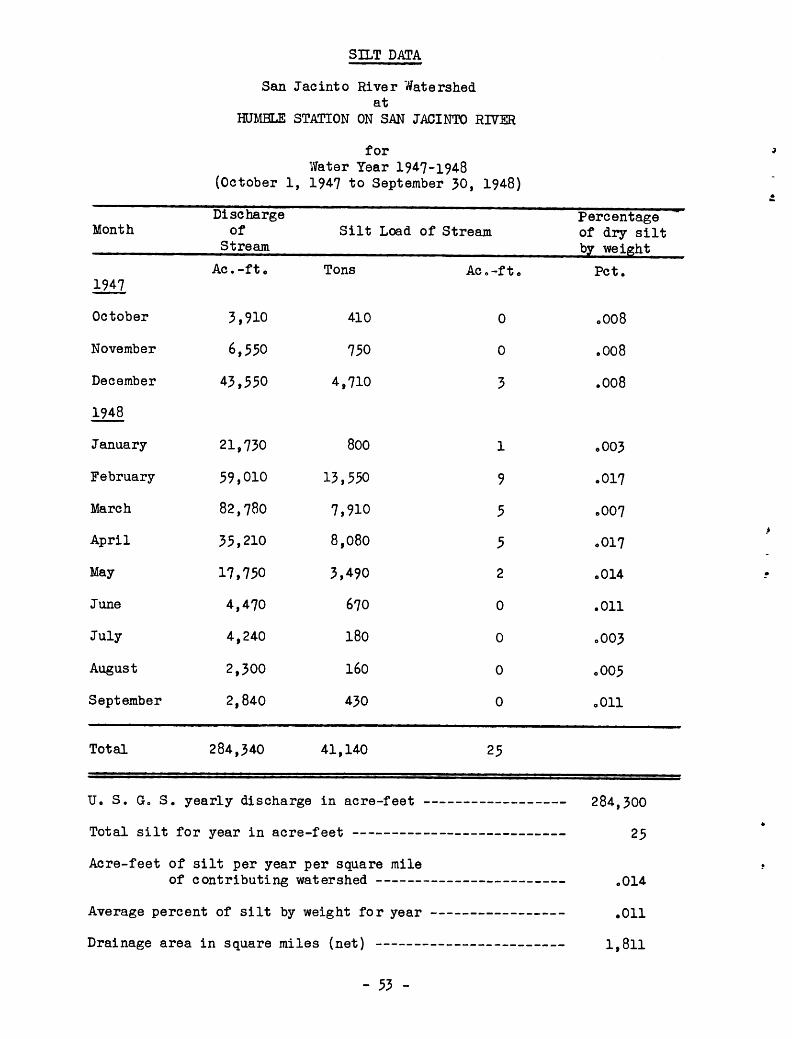
Humble Station, San Jacinto River
The average discharge of the West Fork of the San Jacinto River atthe Humble Station for an 11 »3-year period is 925,490 acre feet, whilefor the year 1947-1948, it was 284,340 acre feet, which is 31% of the average flow0 The average silt load for the same period is 298 acre feet,while for 1947-1948, it was 25 acre feet, which is 8% of the average load.The total silt load for a 12o3-year period is 5,203,760 tons, or 3,408acre feet of silt.
Romayor Station, Trinity River
The average discharge of the Trinity River at the Romayor Stationfor an llol-year period is 6,976,050 acre feet, while for the year 1947-1948, it was 4,476,720 acre feet, which is 64% of the average flow0 Theaverage silt load for the same period is 4,791 acre feet, while for theyear 1947-1948, it was 2,154 acre feet, which is 45% of the average load.The total load for a 12al year period is 84,659,480 tons, or 55,533 acrefeet of silto
Lake Possum Kingdom
The average flow from Lake Possum Kingdom on the upper watershed areaof the Brazos River through the outlet gates and turbines and over thespillway for a 5.7-year period is 702,270 acre feet, while for the year1947-1948, it was 323,380 acre feet, which is 46% of the average flow.The average silt load by-passing the lake for the same period is 108 acrefeet, while for the year 1947-1948, it was 22 acre feet, which is 20% ofthe average load. The total silt load by-passing the dam for a 607-yearperiod is 895,370 tons, or 586 acre feet of silt. The Lake Possum Kingdomhas a capacity of 750,000 acre feet of water. During the 6,,7-year period14,437 acre feet of suspended silt load entered Lake Possum Kingdom at theSouth Bend Station. During the same period 586 acre feet of silt, or 2e3%,by-passed the dam»
6 -
Lake Corpus Christi
The average flow from Lake Corpus Christi, located on the NuecesRiver, during a 5„7-year period is 764,150 acre feet, while for the year1947-1948, it was 107,320 acre feet, which is 14% of the average flow.The average silt load for the same period is 189 acre feet, while for1947-1948 it was only 8 acre feet, which is 4% of the average flow.The total silt load for a 6,7-year period, including 1947-1948, thatby-passed the dam is 1,079 acre feet. The capacity of Lake Corpus Christiis about 64,000 acre feet.
The silt load entering Lake Corpus Christi as obtained at the ThreeRivers Station for a 6o7-year period is approximately 2,949 acre feet.The station is located about 30 miles from the upper portion of the lake.The watershed area between them is about 1,000 square miles. This area,however, contributes a very small amount of silt to the lake. The amountof silt being by-passed from the lake for the same 6.7-year period amountsto 1,650,240 tons, or 1,079 acre feet, and represents 37% of the amountentering the lake.
A silt survey of the lake was made in 1948 by the SedimentationDivision, Soil Conservation Service, United States Department of Agriculture. A report of this survey is in process of preparation.
Lake Buchanan
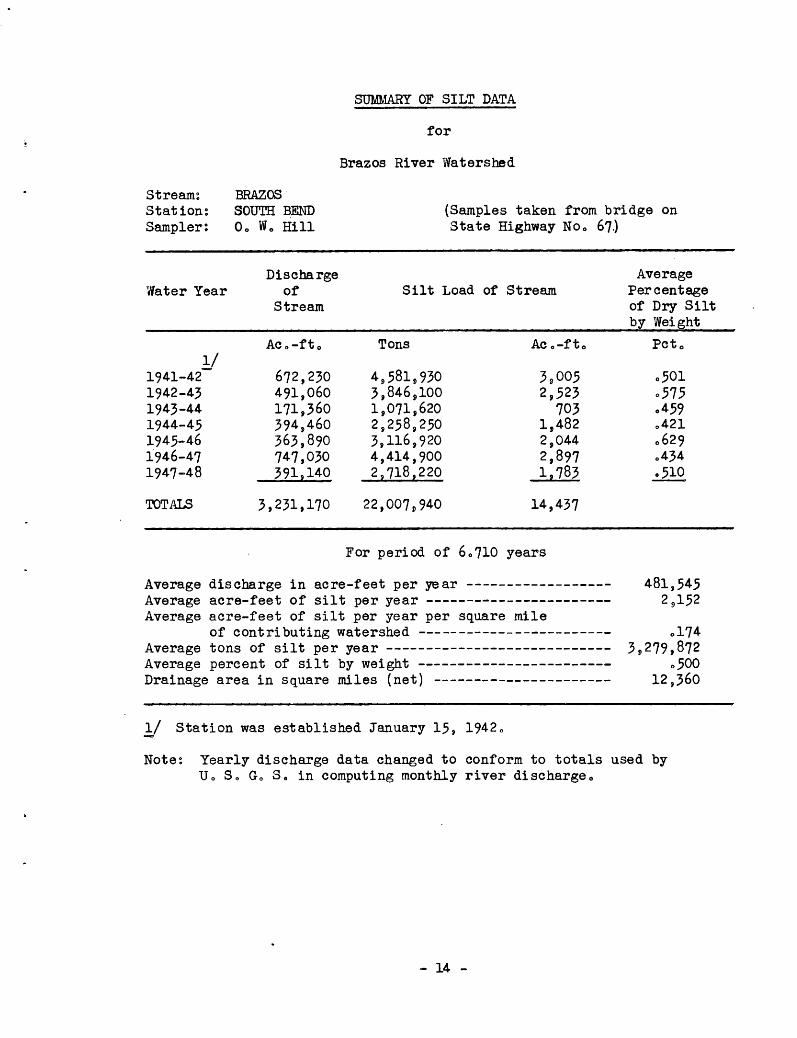
The flow from Lake Buchanan, located on the Colorado River, for oneyear (record started October 1, 1947) was 576,440 acre feet. The capacityof the lake is 992,475 acre feet. The silt load by-passing the lake forthe same period was 46,530 tons or 30 acre feeto The discharge of theColorado River into the lake at the San Saba Station for the year was 604,200acre feet, and the silt load for the same period was 2,222 acre feet.
Lake Inks
The average flow from Lake Inks, which is located downstream and adjacentto Lake Buchanan, for a 5»2-year period is 705,450 acre feet, while for theyear 1947-1948, it was 5§0,500 acre feet, which is 82% of the average flow.The average silt load by-passing the lake for the same period is 71 acre feet,while for 1947-1948 it was 38 acre feet, which is 54% of the average load.The capacity of Lake Inks is 16,200 acre feet. During the year I947-I948the silt load by-passing Lake Buchanan was 30 acre feet, while at LakeInks, immediately below it, the silt load was 38 acre feet. The total amountof silt by-passing Lake Inks for a 602-year period is 612,480 tons or 405acre feet.
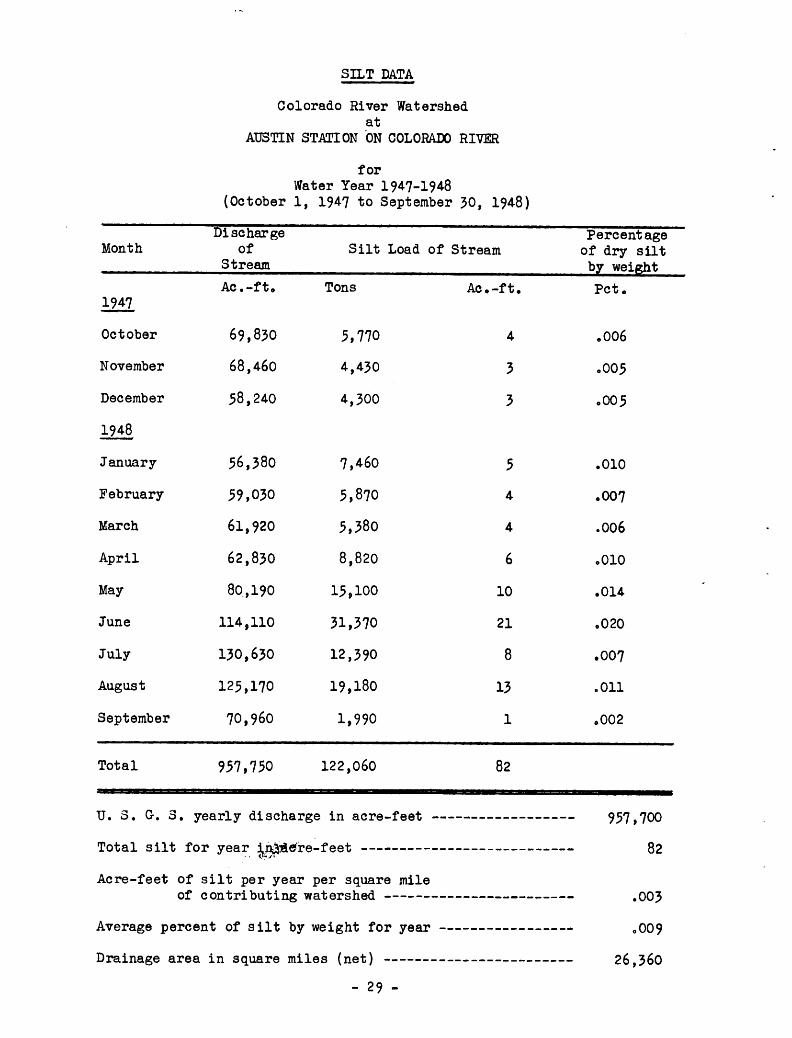
Lake Austin
The average discharge of the Colorado River at the Montopolis BridgeStation, which is located about 4 miles downstream from Lake Austin, fora 7-year period, and since the completion of Tom Miller Dam in 1940, is1,837,800 acre feet, while for the year 1947-1948, it was 957,750 acre feet,
- 7

which is 52% of the average discharge.. This flow was water released atvarious intervals from four lakes above the station, namely, Buchanan,Inks, Mansfield or Travis (Marshall Ford) and Austin. The average siltload by-passing the four lakes for the 7-year period is 239 acre feet,while for the year 1947-1948 it was 82 acre feet, which is 34% of theaverage load.
Cooperation
Some of the silt determinations were made possible through the splendid financial cooperation of several agencies in Texas who are interestedin silt problems. Those cooperating agencies are the Brazos River Conservation and Reclamation District; the Lower Colorado River Authority; andthe Water Departments of the Cities of Houston and Corpus Christi 0 TheWater Resources Branch of the United States Geological Survey has alsooffered helpful and congenial cooperation in furnishing river dischargedata and information.
Acknowledgements
Acknowledgements are due the silt sample collectors, some of whomhave many years of continuous service, for their faithful performance oftheir duties in obtaining water samples every day of the year; to Mr» RayCase for his good work in the cooperative silt laboratory; to Mrs0 VirginiaAdcock for her excellent assistance in the office in computing, checking,compilation, and typing silt data, and to Mr. Ivan Stout for his generalassistance in the silt studies.
8 -

SILT DATA
Brazos River Watershed
at
BELTON STATION ON LEON RIVER
for
Water Year 1947-1948(October 1, 1947 to September 30, 1948)
Discharge PercentageMonth of Silt Load of Stream of dry silt
Stream by weight
ACo-fto Tons ACo-ft. Pet.
1947
October 69O 30 0 .003
November 3,720 540 0 .011
December 8,200 3,480 2 o031
1948
January 3,350 170 0 o004
February 20,090 68,230 45 .249
March 11,420 3,570 2 .023
April 7,630 910 1 .009
May 29,860 8,930 6 o022
June 10,810 3,870 3 .026
July 17,180 19,360 13 0083
August 1,160 290 0 .018
September 8,000 9,140 5 O084
Total 122,110 118,520 77
U. S. Go S„ yearly discharge in acre-feet 122,100
Total silt for year in acre-feet 77
Acre-feet of silt per year per square mileof contributing watershed O022
Average percent of silt by weight for year .071
Drainage area in square miles (net) 3,547
- 9 -

SUMMARY OF SILT DATA
for
Brazos River Watershed
Streams
Station;
Sampler:
LEON
HELTON
No Ho Hander
2/(Samples taken from HighwayBridge on State Hwye 317)
Water Year
Dischargeof
Stream
Silt Load of Stream
AveragePercentageof Dry Silt
by WeightAc 0-ft 0 Tons Ac.-fto PCto
Sept., 19451945-461946-471947-48
10,380663,960362,480122,110
26,320 171,187,070 779
280,030 216118,520 77
0I86
d31o057o071
TOTALS 1,158,930 1,611,940 1,089
For period of 3o083 years
Average discharge in acre-feet per year 375,910Average acre-feet of silt per year 353Average acre-feet of silt per year per square mile
of contributing watershed .100Average tons of silt.per year 522,848Average percent of silt by weight .103Drainage area in square miles (net) 3,547
1/ One month record. Station was established September 1, 1945o"2/ Prior to October 1, 1945 samples were taken from inlet to pumping
plant north of Belton — located about J mile upstream from bridgeon Uo So Highway No. 81.
Note: Yearly discharge data changed to conform to totalsused by U. S„ GD S0 in computing monthly river discharge0
- 10 -

SILT DATA
Brazos River Watershed
at
EASTERLY STATION ON NAVASOTA RIVER
for
Water Year 1947-1948(October 1, 1947 to September 30, I948)
Month
Dischargeof
Stream
Silt Load of StreamPercentage
of dry siltby weight
1947Ac.-ft 0 Tons Ac.'-ft. Pet.
October 200 30 0 oOll
November 320 90 0 .021
December 3,340 1,270 1 .028
1948
January 6,920 4,190 3 O044
February 28,450 16,040 11 .041
March 12,930 5,440 4 o031
April 12,720 11,610 8 .067
May 30,650 38,770 25 o093
June 820 380 0 .034
July 2,620 2,150 1 .060
August 90 10 0 o008
September 100 0 0 0
Total 99,160 79,980 53
U. S. G. S, yearly discharge in acre-feet 99,150
Total silt for year in acre-feet 53
Acre-feet of silt per year per square mileof contributing watershed ,056
Average percent of silt by weight for year e059
Drainage area in square miles (net) 949
- 11 -

SUMMARY OF SILT DATA
for
Brazos River Watershed
Stream: NAVASOTA
Station: EASTERLY
Sampler: GoTee King(Samples taken from bridge onUo So Highway No„ 79
Average
Discharge Percentage
Water Year of Silt Load of Stream of Dry Silt
Stream by Weight
Ac.-ft, Tons
y1941-42 199,750 142,6001942-43 84,820 59,6001943-44 592,670 889,3401944-45 556,120 607,9801945-46 617,980 513,050
1946-47 441,190 193,1101947-48 99,160 79,980
TOTALS 2,591,690 2,485,660
Ac.-ft,
94
39584400
337127
53
1,634
PCto
0O520O52
ollO
0O800O6I,032
.059
For period of 6»748 years
Average discharge in acre-feet per year 384,068Average acre-feet of silt per year 242Average acre-feet of silt per year per square mile
of contributing watershed «255Average tons of silt per year 368,355Average percent of silt by weight .070Drainage area in square miles (net) 949
1/ Station was established January 1, 1942»
Note: Yearly discharge data changed to conform to totals usedby U. S. G. So in computing monthly river discharge.
- 12 -

SILT DATA
Brazos River Watershed
at
SOUTH BEND STATION ON BRAZOS RIVER
for
Water Year 1947-1948(October 1, 1947 to September 30, 1948)
Month
Discharge
of
Stream
Silt Load of Stream
Percentageof dry siltby weight
1947
Ac.-ft. Tons Ac.-ft. Pet.
October 31,120 113,340 74 .267
November 10,190 3,910 3 .028
December 27,370 225,500 148 .605
1948
January 3,800 1,970 1 .038
February 11,060 176,680 116 1.174
March 15,400 122,810 81 .586
April 3,790 1,580 1 .031
May 27,160 86,960 57 .235
June 131,120 826,170 542 .463
July 118,680 1,137,170 746 .704
August 10,440 21,800 14 ol53
September 1,010 330 0 .024
Total 391,140 2,718,220 1,783
U. S. G. 30 yearly discharge in acre-feet 391,200
Total silt for year in acre-feet 1,783
Acre-feet of silt per year per square mileof contributing watershed .144
Average percent of silt by weight for year .510
•Drainage area in square miles (net) 12,360
- 13 -
SUMMARY OF SILT DATA
for
Brazos River Watershed
Stream: BRAZOS
Station: SOUTH BEND (Samples taken from bridge onSampler: 0„ W0 Hill State Highway No0 67.)
Discharge Average
Water Year of
Stream
Silt Load of' Stream Percentage
of Dry Siltby Weight
Ac 0-ft 0 Tons Ac.-fto PCto
1/1941-42 672,230 4,581,930 3,005 .501
1942-43 491,060 3,846,100 2,523 o5751943-44 171,360 1,071,620 703 .4591944-45 394,460 2,258,250 1,482 .421
1945-46 363,890 3,116,920 2,044 06291946-47 747,030 4,414,900 2,897 .434
1947-48 391,140 2,718,220 1,783 .510
TOTALS 3,231,170 22,007P940 14,437
For period of 6.710 years
Average discharge in acre-feet per yearAverage acre-feet of silt per yearAverage acre-feet of silt per year per square mile
of contributing watershedAverage tons of silt per year 3:Average percent of silt by weightDrainage area in square miles (net)
481,5452.152
ol74279^872
»50012,360
1/ Station was established January 15, 19420
Note: Yearly discharge data changed to conform to totals used byUo S. Go S. in computing monthly river discharge0
- 14 -

SILT DATA
Brazos River 7/atershed
at
POSSUM KINGDOM DAM STATION ON BRAZOS RIVER
for
Water Year 1947-1948(October 1, 1947 to September 30, 1948)
Discharge PercentageMonth of Silt Load of Stream of dry silt
Stream by weight
Ac.-ft. Tons Ac.-ft. Pet.
1947
October 17,690 1,690 1 .007
November 11,450 1,470 1 .009
December 18,310 940 1 .004
1948
January 23,720 820 1 .003
February 24,760 3,080 2 .009
March 19,450 1,270 1 .005
April 28,840 4,520 3 .012
May 14,670 1,740 1 .009
June 35,750 2,630 2 .005
July 45,000 7,400 5 .012
August 58,710 4,690 3 .006
September 25,030 810 1 .002
Total 323,380 31,060 22
Yearly discharge in acre-feet 323,380
Total silt for year in acre-feet 22
Acre-feet of silt per year per square mileof contributing watershed
Average percent of silt by weight for year .007
Drainage area in square miles (net)
1/ Discharge figures for this station obtained fromBrazos River Conservation A Reclamation District
- 15 -

SUMMARY OF SILT DATA
for
Brazos River Watershed
Stream:
•
BRAZOS
Station: POSSUM KINGDOM DAM (Samples taken in tiailrace
Sampler: J. P. Cochran and over spillway)
AverageDischarge Percentage
Water Year of
Stream
Silt Load of Stream of Dry Siltby Weight
Ac.-ft 0 Tons Ac.-fto Pet.
1/1941-42 588,030 55,070 36 o007
1942-43 851,290 625,770 410 o054
1943-44 92,040 15,590 10 .012
1944-45 307,410 51,350 32 .012
1945-46 293,110 41,250 27 .010
1946-47 946,860 75,280 49 .006
1947-48 323,380 31,060 22 .007
TOTALS 3,402,120 895,370 586
Average dij
For
scharge in acre-]
period of 60'710 years
507,022Average acre-feet of silt 1Der :irear 87Average acre-feet of silt per year per square mile
of contributing watershedAverage tons of silt per yearAverage percent of silt by weightDrainage area in square miles (net) -•
1/ Station was established January 15, 1942
- 16 -
133,438.019

SILT DATA
Brazos River Watershed
at
RICHMOND STATION ON BRAZOS RIVER
for
Water Year I947-I948(October 1, 1947 to September 30, 1948)
Month
Dischargeof
Stream
Silt Load of Stream
Ac.-ft Tons
1947
October 57,940 6,160
November 91,760 56,050
December 213,940 212,250
1948
January 120,120 34,460
February 257,300 265,920
March 350,020 1,169,300
April 165,500 236,850
May 282,110 1,359,490
June 123,660 245,360
July 184,840 356,780
August 34,960 5,140
September 68,470 2,960
Total 1,950,620 3,950,720
Ac.-ft.
4
37
139
23
174
767
155
892
161
234
3
2
2,591
Percentageof dry silt
by weight
Pet.
.008
.045
.073
.021
.076
0245
.105
o354
.146
.142
.011
.003
U. S. G. 3. yearly discharge in acre-feet 1,951,000
Total silt for year in acre-feet 2,591
Acre-feet of silt per year per square mileof contributing watershed .074
Average percent of silt by weight for year .149
Drainage area in square miles (net) 34,810
- 17 -

SUMMARY OF SILT DATA
for
Brazos River Watershed
Streams BRAZOS
Stati on: RICHMOND (Samples taken from bridge onSamplers S. Jo Butler Uo So Highway No0 90)
Average
Discharge Percentage
Water Year of
Stream
Silt Load of' Stream of Dry Siltby Weight
ACo-fto Tons ACo-fto Pct„
1/1923-24 494,900 714,220 468 0IO6
1924-25 1,237,300 12,676,710 8,314 o7531925-26 8,762,800 44,939,350, 29,476 o3771926-27 5,562,600 34,377,320 21,739 .454
1927-28 3,318,400 28,163,890 18,472 06231928-29 6,000,000 32,284,200 21,174 o395
1929-30 5,218,900 38,686,330 25,373 o545
1930-31 5.639,000 27,766,660 18,212 o362
2-3/r
1931-32 8,041,000 63,649,510 41,749 o582
1932-33 2,563,100 15,175,520 9,954 .435
1933-34 3,372,670 23,318,780 15,294 o508
1934-35 78334,480 63,472,990 41,633 0636
1935-36 6,031,540 40,330.500 26,453 o491
1936-37 5,405,790 25,531,710 16,747 .347
1937-38 7,203,600 55,656,280 36,544 o568
1938-39 1,966,110 14,742,470 9,668 o5511939-40 3,161,120 23,679,220 15,531 o550
1940-41 16,124,370 97,306,510 63,824 .443
1941-42 8,522,910 71.490,110 46,891 0616
1942-43 3,255,310 11,426,360 7,496 02581943-44 7,626,500 46,735,630 30,654 O450
1944-45 9.804,730 57,254,020 37,555 o429
1945-46 7,399,590 35,484,230 23,275 o352
1946-47 6,345,770 21,011,530 13,783 0243
1947-48 1.950,620 3.950,720 2,591 o!49
TOTALS 142,343,110 889,824,770 582,870
For period of 240306 years
Average discharge in acre-feet per year • • 5,856,295Average acre-feet of silt per year • 23,980Average acre-feet of silt per year per square mile
of contributing watershed —•• •—• • 0689Average tons of silt per year 36,609,263Average percent of silt by weight • o459Drainage area in square miles (net) • 34,81017 Station was established at Rosenberg, June 11, 1924e2/ Station was discontinued at Rosenberg, April 12, 1932.3/ Station was established at Richmond, April 13, 1932oNotes Yearly discharge data changed to conform to totals used by
Uo So Go So in computing monthly river discharge«- 18 -

SILT DATA
Colorado River Watershed
at
LLANO STATION ON LLANO RIVER
for
Water Year 1947-1948(October 1, 1947 to September 30, 1948)
Discharge PercentageMonth of Silt Load of Stream of dry silt
Stream by weightAc.-ft. Tons Ac,.-ft. Pet.
1947
October 1,820 160 0 .006
November 3,370 110 0 .002
December 4,680 160 0 .003
1948
January 4,530 210 0 .003
February 7,140 610 0 .006
March 4,870 250 0 .004
April 6,310 1,720 1 * .020
May 13,280 26,170 17 ol45
June 181,890 1,374,580 902 -555
July 76,980 63,570 42 .061
August 8,870 970 1 .008
September 13,680 2,890 2 .016
Total 327,420 1,471,400 965
U. S. G. S. yearly discharge in acre-feet 327,400
Total silt for year in acre-feet 965
Acre-feet of silt per year per square mileof contributing watershed .241
Average percent of silt by weight for year .330
Drainage area in square miles (net) 4,000
- 19 -

SUMMARY OF SILT DATA
for
Colorado River Watershed
Stream: LLANO (Samples were taken at Uo So GagingStation: LLANO Station \ mile downst:ream from
Sampler: Mrs. Tracy M. Ward bridge on State Highway No. 16)
Average
Discharge Percentage
Water Year of Silt Load of Stream of Dry SiltStream by Weight
Ac.-fto Tons Ac.-ft0 PCto
1/1941-42 65,990 252,700 166 .281
1942-43 235,470 381,560 250 .119
1943-44 196,070 120,450 79 .045
1944-45 156,920 90,120 60 .042
1945-46 142,740 249,740 164 ol29
1946-47 141,550 28,750 18 o015
1947-48 327,420 1,471,400 965 .330
T0TAL3 1,266,160 2,594,720 1,702
For period of 6.167 years
Average discharge in acre-feet per year 205,312Average acre-feet of silt per year 276Average acre-feet of silt per year per square mile
of contributing watershed 0O69Average tons of silt per year 420,743Average percent of silt by weight .151Drainage area in square miles (net) 4,000
1/ Station was established August 1, 1942.
Note: Yearly discharge data changed to conform to totals used byU. So G. S. in computing monthly river discharge»
- 20 -

SILT DATA
Colorado River Watershed
at
JOHNSON CITY STATION ON PEDERNALES RIVER
for
Water Year 1947-1948(October 1, 1947 to September 30, 1948)
Month
Dischargeof
Stream
Silt Load of Streamream
Percentageof dry siltby wei^it
Ac.-ft. Pet.
0 .007
0 .005
0 .015
0 .006
0 .007
0 .005
21 «232
3 .066
1 .077
1 .032
0 .025
1 .073
Ac.-ft, Tons
1947
October 620 60
November 1,060 70
December 2,310 480
1948
January 1,400 110
February 1,960 180
March 1,930 120
April 10,140 31,990
May 5,060 4 ,540
June 1,920 2 ,020
July 3,710 1 ,630
August 650 220
September 930 920
Total 31,690 42,340 27
U. S. G. S. yearly discharge in acre-feet 31,630
Total silt for year in acre-feet 27
Acre-feet of silt per year per square mileof contributing watershed .029
Average percent of silt by weight for year .098
Drainage area in square miles (net) 947
- 21 -

SUMMARY OF SILT DATA
for
Colorado River Watershed
Stream:
Station:
Sampler:
PEDERNALES
JOHNSON CITT
John W. Grisham
(Samples were taken from highwaybridge on U.S0 Hwy0 28l, aboutlh miles north of Johnson City)
' Average
Discharge Percentage
Water Year of Silt Load of Stream of Dry Silt
Stream by Weight
Ac.-ft,
1/1941-42 22,6301942-43 79,8501943-44 167,7001944-45 187,0001945-46 94,1401946-47 128,4601947-48 31,690
TOTALS 711,470
Tons
107,030150,740724,550191,740132,430107,67042,340
1,456,500
Ac o-ft,
70
99476126
88
71
27
957
PCto
o347
ol39o317
o075ol030O620O98
For period of 6.167 years
Average discharge in acre-feet per year 115,367Average acre-feet of silt per year 155Average acre-feet of silt per year per square mile
of contributing watershed .164Average tons of silt per year 236,176Average percent of silt by weight o150Drainage area in square miles (net) 947
1
1/ Statioji was established August 1, 1942e
Note: Yearly discharge data changed to conform to totals usedby Uo So G. So in computing monthly river discharge.
- 22 -

SILT DATA
Colorado River Watershed
at
SAN SABA STATION ON COLORADO RIVER
for
Water Year 1947-1948(October 1, 1947 to September 30, 1948)
Month
Dischargeof
Stream
Silt Load of Stream
Percentageof dry siltby weight
1947
Ac.-ft. Tons Ac.-ft. Pet. •
October 36,770 416,290 273 .832
November 10,480 8,310 5 .058
December 38,210 139,850 92 .269
1948
January 7,630 380 0 .004
February 15,550 56,050 37 .264
March 25,340 93,600 61 .271
April 15,250 10,000 7 .048
May 64,680 303,600 199 o345
June 49,300 269,970 177 .402
July 273,940 1,865,240 1,223 .500
August 34,380 111,330 73 .238
September 32,670 114,960 75 .258
Total 604,200 3,389,580 2,222
U. So G. S. yearly discharge in acre-feet 604,200
Total silt for year in acre-feet 2,222
Acre-feet of silt per year per square mileof contributing watershed .118
Average percent of silt by weight for year .412
Drainage area in square miles (net) 18,800
- 23 -

SUMMARY OF SILT DATA
for
Colorado River Watershed
HStream: COLORADO
Station: NEAR SAN SABA
Sampler: Robert A. Broyles
(Samples were taken from Red Bluffbridge about midway between SanSaba and Lometa)
AverageDischarge Percentage
Water Year of
Stream
Silt Load of Stream of Dry Siltby Weight
Ac.-fto Tons Ac.-fto Pdto
1/1929-30 24,000 143,140 94 o4391930-31 1,373,750 5,136,520 3,369 o2751931-32 2,223,900 9,934,850 6,516 .3281932-33 475,300 1,303,620 855 .201
1933-34 504,380 2,121,550 1,391 •3091934-35 2,564,290 14,423,520 9,459 .4131935-36 2,276,400 7,520,550 4,933 02431936-37 1,197,100 2,688,230 1,764 .1651937-38 2,809,340 8,923,940 5,853 »2331938-39 819,430 3,709,100 2,432 .3331939-40 773,690 3,191,810 2,094 o3031940-41 2,052,980 8.613,430 5,650 .3081941-42 1,285,920 4,571,140 2,998 o26l1942-43 475,090 703,520 461 0I091943-44 592,790 2,129,300 1,397 .2641944-45 870,370 2,655,490 1,743 .224
1945-46 416,390 1,511,040 992 o2671946-47 517,540 2,588,150 1,696 o3671947-48 604,200 3,389,580 2,222 0412
TOTAIS 21,856,860 85,258,480 55,919
For period of l8o055 years
Average discharge in acre-feet per year 1,210,571Average acre-feet of silt per year 3,097Average acre-feet of silt per year per square mile
of contributing watershed .165Average tons of silt per year 4,722,153Average percent of silt by weight .287Drainage area in square miles (net) 18,800
1/ Station was established September 11, 19302/ Water samples were discontinued at old Red Bluff bridge and started
one-half mile upstream at the new Red Bluff bridge on May 24, 1940o
Note: Yearly discharge data changed to conform to totals usedby Uo 30 G0 30 in computing monthly river discharge»
- 24 -

SILT DATA
Colorado River Watershed
at
INKS DAM STATION ON COLORADO RIVER
for
Water Year I947-I948(October 1, 1947 to September 30, 1948)
Discharge PercentageMonth of Silt Load of Stream of dry silt
Stream by weightAc.-ft. Tons Ac.-ft. Pet.
1947
October 66,170 8,670 6 . .010
November 59,790 3,980 3 .005
December 45,440 1,590 1 .003
1948
January 34,340 1,060 1 .002
February 50,100 3,090 2 .005
March 47,990 3,600 2 .006
April 44,460 2,700 2 .004
May 31,860 4,060 3 .009
June 43,380 8,790 6 .015
July 54,460 6,570 4 .009
August 55,970 11,240 7 .015
September 46,540 1,350 1 .002
Total 580,500 56,700 38
Yearly discharge in acre-feet 580,500
Total silt for year in acre-feet 38
Acre-feet of silt per year per square mileof contributing watershed
Average percent of silt by v/eight for year .007
Drainage area in square miles (net)
1/ Discharge figures for this station obtained from Lower Colorado Itiver Authority
- 25 -

Stream: COLORADO
Station: INKS DAM
Sampler: Lloyd Myers
SUMMARY OF SILT DATA
for
Colorado River Watershed
(Samples were taken from tailrace)
Averace
Discharge Percentage
Water Year of Silt Load of St:ream of Dry Silt
Stream by Weight
Ac.-ft 0 Tons Ac .-ft. Pet.
1/1941-42 285,200 41,270 27 oOll
1942-43 662,460 67,090 44 o007
1943-44 768,040 127,980 84 .012
1944-45 751,950 157,540 104 0OI5
1945-46 678,460 134,030 88 o015
1946-47 498,980 27,870 20 .004
1947-48 580,500 56,700 38 .007
TOTALS 4,225,590 612,480 405
For period of 6.167 years.
Average discharge in acre-feet per year 685,194Average acre-feet of silt per year 66Average acre-feet of silt per year per square mile
of contributing watershedAverage tons of silt per year 99,316Average percent of silt by weigit .011Drainage area in square miles (net)
1/ Station was established August 1, 1942,
- 26 -

SILT DATA
Colorado River Watershed
at
BUCHANAN DAM STATION ON COLORADO RIVER
for
Water Year 1947-1948(October 1, 1947 to September 30, 1948)
Discharge PercentageMonth of Silt Load of Stream of dry silt
Stream by weightAc.-ft. Tons Ac.-ft. Pet.
1947
October 65,460 8,080 5 .009
November 59,110 4,570 3 .006
December 45,840 1,710 1 .003
1948
January 35,640 1,020 1 .002
February 51,340 3,740 2 .005
March 47,000 2,680 2 .004
April 42,970 3,130 2 .005
May 29,350 1,700 1 .004
June 43,540 6,160 4 .010
July 54,380 8,290 5 .011
August . 54,940 4,180 3 .006
September 46,870 1,270 1 .002
Total 576,440 46,530 JO
1/Yearly discharge in acre-feet 576,440
Total silt for year in acre-feet 30
Acre-feet of silt per year per square mileof contributing watershed
Average percent of silt by weight for year .006
Drainage area in square miles (net)
— Discharge figures for this station obtained from Lower Colorado River •authority.
- 27 -
SUMMARY OF SILT DATA
for
Colorado River Watershed
Stream: COLORADO
Station: BUCHANAN DAM
Sampler: Lloyd Myers
(Samples taken at power house)
'Water Year
1947-48
TOTAIS
1/
Dischargeof
Stream
Ac.-ft.
576,440
576,440
Silt Load of Stream
Tons
46,530
46,530
Ac.-ft.
30
30
Average
Percentageof Dry Siltby Tfeight
Pet
,006
For period of 1.000 year
Average discharge in acre-feet per year 576,440Average acre-feet of silt per year 30Average acre-feet of silt per year per square mile
of contributing watershedAverage tons of silt per year 46,530Average percent of silt by weight .- »006Drainage area in square miles (net)
1/ Station established October 1, I947
- 28 -
SILT DATA
Colorado River Watershed
at
AUSTIN STATION ON COLORADO RIVER
for
Water Year 1947-1948(October 1, 1947 to September 30, 1948)
DischargeMonth of Silt Load of Stream
Stream
Ac.-ft. Tons Ac.-ft.1947
October 69,830 5,770 4
November 68,460 4,430 3
December 58,240 4,300 3
1948
January 56,380 7,460 5
February 59,030 5,870 4
March 61,920 5,380 4
April 62,830 8,820 6
May 80,190 15,100 10
June 114,110 31,370 21
July 130,630 12,390 8
August 125,170 19,180 13
September 70,960 1,990 1
Total 957,750 122,060 82
U. 3. G. 3. yearly discharge in acre-feet
Total silt for year ^n&de're-feet
Acre-feet of silt per year per square mileof contributing watershed
Average percent of silt by weight for year
Drainage area in square miles (net)
- 29 -
Percentageof dry silt
by weight
Pet.
.006
.005
.005
.010
.007
.006
o010
.014
.020
.007
.011
.002
957,700
82
.003
.009
26,360

SUMMARY OF SILT DATA
for
Colorado River Watershed
Stream: COLORADO
Station: AUSTIN (Samples taken from Montopolis
Sampler: Mrs. G. L. Pliler Bridge)
AverageDischarge Percentage
Water Year of
Stream
Silt Load of Stream of Dry Siltby Weight
Ac.-fto Tons Ac 0-ft0 PCto
1/1936-37 48,040 1,830 1 o003
1937-38 *1938-39 y
3,609,570 8,881,220 5,826 .181986,630 735,150 - 481 o055
1939-40 * 1,334,120 906,750 596 o050
1940-41 3,869,250 979,240 642 o0191941-42 986,440 121,570 80 o009
1942-43 1,787,770 328,050 215 o013
1943-44 1,392,380 186,590 122 o010
1944-45 1,750,770 444,540 292 o019
1945-46 1,554,930 256,770 170 o012
1946-47 1,523,070 234,770 155 oOll
1947-48 957,750 122,060 82 0OO9
TOTALS 19,800,720 13,198,540 8,662
For period of 11.164 years
Average discharge in acre-feet per year 1,773,622Average acre-feet of silt per year 776Average acre-feet of silt per year per square mile
of contributing watershed .029Average tons of silt per year 1,182,241Average percent of silt by weight .049Drainage area in square miles (net) 26,360
1/ Station was established August 2, 1937, and samples taken from~" Congress Avenue bridge.2/ Samples taken from Montopolis bridge0
* Rehabilitation of the old Austin Dam (now termed Tom Miller Dam) wasstarted August 1, 1938. This construction at times doubtless distorted the silt load of samples which were taken from 1§ to 4 milesdownstream therefrom. Rehabilitation was completed and the impoundingof water was begun on January 7, 1940.
Note; Yearly discharge data changed to conform to totals used byUo S0 G, S. in computing monthly river dischargeo
- 30 -
SILT DATA
Guadalupe River Watershedat
SPRING BRANCH STATION ON GUADALUPE RIVER
for
Water Year 1947-1948(October 1, 1947 to September 30, 1948)
Discharge PercentageMonth of Silt Load of Stream of dry silt
Stream by weight
Ac.-fto Tons Ac.-fto Pet.1947
October 3,390 250 0 .005
November 4,530 330 0 .005
December 5,6lO 260 0 .003
1948
January 5,510 250 0 .003
February 5,170 170 0 o002
March 5,450 210 0 .003
April 5,310 700 0 .010
May 4,600 650 0 .010
June 9,910 55,680 37 o413
July 5,500 1,150 1 .015
August 2,150 250 0 .009
September 2,330 210 0 .007
Total 59,460 60,110 38
Uo S. Go So yearly discharge in acre-feet 59,450
Total silt for year in acre-feet 38
Acre-feet of silt per year per square mileof contributing watershed .027
Average percent of silt by weight for year O074
Drainage area in square miles (net) 1,43?
- 31 -
Stream:
Station:
Sampler:
SUMMARY OF SILT DATA
for
Guadalupe River Watershed
GUADALUPE
SPRING BRANCH
Alfred Beierle
(Samples taken 4 miles southeast ofSpring Branch from bridge on oldHighway No. 46)
Average
Discharge Percentage
Water Year of Silt Load of Stream of Dry SiltStream by Weight
1/1941-42
1942-431943-44
1944-451945-461946-471947-48
TOTALS
Ac.-ft.
167,150145,610272,850304,860185,080307,960
59,460
Tons
164,15079,630
401,650190,830148,700128,040
60,110
1,442,970 1,173,110
Ac.-ft, Pet,
108 0O72
52 .040
262 .108
126 O046
96 o05984 .031
38 .074
766
For period of 6.748 years
Average discharge in acre-feet per year 213,837Average acre-feet of silt per year 114Average acre-feet of silt per year per square mile
of contributing watershed .080Average tons of silt per year 173,846Average percent of silt by weight 0O6ODrainage area in square miles (net) 1,432
1/ Station was established January 1, 1942.
Note: Yearly discharge data changed to conform to totals used byU. S. G. S. in computing monthly river discharge.
- 32 -

SILT DATA
Guadalupe River Watershedat
VICTORIA STATION ON GUADALUPE RIVER
for
Water Year 1947-1948(October 1, 1947 to September 30, 1948)
Discharge PercentageMonth of Silt Load of Stream of dry silt
Stream by weightAc.-ft. Tons Ac.-ft. Pet.
1947
October 35,860 4,210 3 .009
November 37,940 2,560 2 .005
December 44,240 7,720 5 .013
1948
January 41,160 2,220 1 .004
February 47,390 10,930 7 .017
March 47,240 8,620 6 .013
April 32,860 5,280 3 .012
May 86,920 80,640 53 .068
June 33,380 5,990 4 .013
July 45,770 9,820 6 .016
August 33,680 29,260 19 .064
September 23,520 2,310 2 .007
Total 509,960 169,560 111
U. S„ G. S. yearly discharge in acre-feet 510,000
Total silt for year in acre-feet 111
Acre-feet of silt per year per square mileof contributing watershed .020
Average percent of silt by weight for year .024
Drainage area in square miles (net) 5,676
- 33 -

SUMMARY OF SILT DATA
for
Guadalupe River 'Watershed
Stream: GUADALUPE
Station: VICTORIA
Sampler: A. E. Anders
(Samples taken from bridge onUo 3, Highway No. 59)
DischargeWater Year of Silt Load of Stream
Stream
Ac.-ft. Tons Ac.-fto
1/1944-45 38,430 19,480 13
1945-46 1,319,520 949,130 624
1946-47 1,595,300 777,690 511
1947-48 509,960 169,560 111
TOTALS 3,463,210 1,915,860 1,259
For period of 3.O83 years
Average discharge in acre-feet per yearAverage acre-feet of silt per yearAverage acre-feet of silt per year per square mile
of contributing watershedAverage tons of silt per yearAverage percent of silt by weightDrainage area in square miles (net)
AveragePercentageof Dry Siltby Weight
Pet.
.037
.053
.036
.024
1,123,325408
.072621,427
.041
5,676
1/ Station was established September 1, 1945. Record for one month.
Note: Yearly discharge data changed to conform to totals used byU. S0 Go S. in computing monthly river discharge.
- 34 -

SUMMARY OF SILT DATA
for
Lavaca River Watershed
Stream: LAVACA
Station: EDNA
Sampler: Mrs. Ida Berryhill
(Samples taken from bridge on U.SHigiway No. 59 between Victoriaand Edna)
DischargeWater Year of Silt Load of Stream
Stream
Ac.-ft. Tons Ac.-ft.
1/1944-45"" 980 570 0
1945-46 266,330 327,240 215
1946-47 250,340 192,850 126
1947-48 114,240 98,200 66
TOTALS 631,890 618,860 407
For period of 3.083 years
Average discharge in acre-feet per yearAverage acre-feet of silt per yearAverage acre-feet of silt per year perisquare mile
of contributing watershedAverage tons of silt per yearAverage percent of silt by weightDrainage area in square miles (net)
AveragePercentageof Dry Siltby Weight
Pet.
.090
.057
.063
204,959132
.149200,733
.072887
1/ Station established September 1, 1945.
Note: Yearly discharge data changed to conform to totals usedby U. S. G. S. in computing monthly river discharge.
- 35 -

SILT DATA
Lavaca River Watershed
at
EDNA STATION ON LAVACA RIVER
for
Water Year 1947-1948(October 1, 1947 to September 30, 1948)
Month
Dischargeof
Stream
Silt Load of Stream
Percentageof dry siltby weight
1947
Ac.-ft. Tons Ac.-ft. Pet.
October 1,060 80 0 .006
November 2,080 770 1 .027
December 2,730 1,170 1 .031
1948
January 3,730 2,510 2 .049
February 10,280 7,540 5 .054
March 9,550 8,960 6 .069
April 2,520 860 1 .025
May 73,140 73,580 48 .074
June 4,290 630 0 .011
July 2,980 790 1 .019
August 720 90 0 0OO9
September 1,160 1,220 1 .077
Total 114,240 98,200 66
U. 3. G. 3. yearly discharge in acre-feet 114,300
Total silt for year in acre-feet 66
Acre-feet of silt per year per square mileof contributing watershed O074
Average percent of silt by weight for year .063
Drainage area in square miles (net) 887
- 36 -

Month
SILT DATA
Neches River Watershed
at
HORGER STATION ON ANGELINA RIVER
for
Water Year 1947-1948(October 1, 1947 to September 30, 1948)
Dischargeof
Stream
Ac.-ft.
Silt Load of Stream
Tons Ac.-ft.
Percentageof dry siltby weight
Pet
1947
October 11,460 1,000 1 .006
November 49,960 9,900 6 .015
December 149,550 23,700 16 .012
1948
January 138,900 14,450 9 .008
February 464,330 62,470 41 .010
March 310,770 21,970 14 .005
April 268,110 56,440 37 .015
May 150,090 30,090 20 .015
June 45,780 5,340 4 .009
July 18,070 1,060 1 .004
August 5,900 430 0 .005
September 6,120 220 0 .003
Total 1,619,040 227,070 149
U. 3. G. 3. yearly discharge in acre-feet 1,619,000
Total silt for year in acre-feet 149
Acre-feet of silt per year per square mileof contributing watershed .043
Average percent of silt by weight for year .010
Drainage area in square miles (net) 3,435
- 37 -

SUMMARY OF SILT DATA
for
Neches River Watershed
Stream:
Station:
Sampler:
ANGELINA
HORGER
D. W. Moye
(Samples taken from bridge onState Highway No. 63 betweenZavalla and Jasper)
DischargeWater Year of Silt Load of Stream
Stream
Ac.-fto Tons Ac.-ft,
y1944-45 19,470 11,020 7
1945-46 3,869,300 1,826,050 1,198
1946-47 3,200,750 393,530 259
1947-48 1,619,040 227,070 149
T0TAL3 8,708,560 2,457,670 1,613
For period of 3*083 years
Average discharge in acre-feet per yearAverage acre-feet of silt per year —Average acre-feet of silt per year per square mile
of contributing watershedAverage tons of silt per yearAverage percent of silt by weightDrainage area in square miles (net)
AveragePercentageof Dry Siltby Weight
Pet.
.042
.035
.009
.010
2,824,702523
.152797,168
.021
3,435
1/ Station established September 1, 1945«
Note: Yearly discharge data changed to conform to totals used byU. S. G. S. in computing monthly river discharge.
- 38 -

SILT DATA
Neches River Watershed
at
ROCKLAND STATION ON NECHES RIVER
for
Water Year 1947-I948(October 1, 1947 to September 30, 1948)
Month
Dischargeof
Stream
Silt Load of StreamPercentage
of dry siltby weight
Ac.-ft. Tons
1947
October 8,510 620
November 25,560 4,400
December 91,790 7,410
1948
January 106,670 5,060
February 320,450 29,330
March 265,080 12,360
April 203,490 20,630
May 125,300 25,570
June 77,970 10,880
July 17,880 1,920
August 4,110 300
September 3,550 280
Total 1,250,360 118,760
Ac.-ft Pet.
0 .005
3 .013
5 .006
3 .003
19 .007
8 .003
14 .007
17 .015
7 .010
1 .008
0 .005
0 .006
77
U. S. G. S. yearly discharge in acre-feet 1,250,000
Total silt for year in acre-feet 77
Acre-feet of silt per year per square mileof contributing watershed .022
Average percent of silt by weight for year .007
Drainage area in square miles (net) 3,539
- 39 -

Stream:
Station:
Sampler:
SUMMARY OF SILT DATA
for
Neches River Watershed
NECHES
ROCKLAND
George W. Jones
(Samples were taken from bridge onUo S. Highway 69 between Woodvilleand Lufkin)
Average
Discharge Percentage
Water Year of Silt Load of Stream of Dry Silt
Stream by Weight
ACo-ft, Tons ACo-ft, Pet,
1/1929-30 10,620 290 0 .002
1930-31 1,490,250 229,220 151 .011
1931-32 2,560,930 193,940 128 0OO6
1932-33 1,395,940 144,700 95 .008
1933-34 1,552,630 174,070 112 .008
1934-35 2,601,910 297,100 194 0OO8
1935-36 1,040,600 140,280 91 .010
1936-37 928,420 110,180 71 0OO9
1937-38 1,400,070 225,940 147 .012
1938-39 854,380 140,590 91 o012
1939-40 1,097,590 227,590 149 o0151940-41 3,578,370 586,140 384 .012
1941-42 2,522,390 550,920 361 .016
1942-43 748,520 316,090 207 o0311943-44 3,230,410 1,865,580 1,223 .042
1944-45 3,396,060 1,967,220 1,290 .043
1945-46 3,534,920 1,285,240 845 o027
1946-47 3,255,520 379,210 249 o009
1947-48 1,250,360 118,760 77 .007
TOTALS 36,449,890 8,953,060 5,865
For period of 18.148 years
Average discharge in acre-feet per year 2,008,480Average acre-feet of silt per year 323Average acre-feet of silt per year per square mile
of contributing watershed .091Average tons of silt per year 493,336Average percent of silt by weight o0l8Drainage area in square miles (net) 3,539
1/ Station was established August 8, 1930.
Note: Yearly discharge data changed to conform to totals used byu. 3. G. 3. in computing monthly river discharge0
- 40 -

SILT DATA
Nueces River Watershed
at
COTULLA STATION ON NUECES RIVER
for
Water Year 1947-1948(October 1, 1947 to September 30, 1948)
Discharge PercentageMonth of Silt Load of Stream of dry silt
Stream _____ by weightAc.-ft. Tons Ac.-ft. Pet.
1947
October 0 -
November 0 -
December 0 -
1948
January 0 - -
February 0 -
March 0 -
April 0 -
May 0 - -
June 26,060 17,170 11 .048
July 35,210 11,000 7 .023
August 0 - - -
September 11,630 930 1 .006
Total 72,900 29,100 19
U. S. G. S. yearly discharge in acre-feet 72,900
Total silt for year in acre-feet 19
Acre-feet of silt per year per square mileof contributing watershed .004
Average percent of silt by weight for year .029
Drainage area in square miles (net) 5,260
- 41 -

SUMMARY OF SILT DATA
for
Nueces River Watershed
Stream: NUECES
Station: COTOLLA (Samples taken from highwaySampler: Joe G. Jennings bridge :Ln Cotulla)
Ave rageDischarge Percentage
'Water Year of Silt Load of Stream of Dry SiltStream by Weight
Ac.-ft. Tons Ac.-fto Pet.
1/1941-42 141,380 64,130 42 .0331942-43 64,240 33,270 22 .0381943-44 482,520 367,860 241 .0561944-45 82,440 65,460 43 .0581945-46 347,610 284,210 186 .0601946-47 92,610 16,550 11 .0131947-48 72,900 29,100 • 19 .029
TOTAIS 1,283,700 860,580 564
For period of 6.748 years
Average discharge in acre-feet per year 190,234Average acre-feet of silt per year 84Average acre-feet of silt per year per square mile
of contributing watershed .016Average tons of silt per year 127,531Average percent of silt by weight .049Drainage area in square miles (net) 5,260
1/ Station was established January 1, 1942.
Note: Yearly discharge data changed to conform to totals used byU.S.G.So in computing monthly river discharge.
- 42 -

Month
1947
October
November
December
1948
January
February
March
April
May
June
July
August
September
Total
SILT DATA
Nueces River Watershed
at
THREE RIVERS STATION ON NUECES RIVER
for
Water Year 1947-1948(October 1, 1947 to September 30, 1948)
Dischargeof
Stream
Silt Load of Stream
Ac.-ft. Tons
340 50
7,640 15,290
1,930 600
800 70
1,660 100
1,380 160
600 70
2,300 5,120
2,600 21,620
92,710 169,630
7,870 28,000
8,500 12,690
128,330 253,400
Ac.-ft.
0
10
0
0
0
0
0
3
14
111
18
8
164
Percentageof dry silt
by weight
Pet.
.011
.147
.023
.006
.004
.009
0OO9
.164
.611
.134
.261
.110
U. S. G. S. yearly discharge in acre-feet 128,300
Total silt for year in acre-feet 164
Acre-feet of silt per year per square mileof contributing watershed .011
Average percent of silt by weight for year .145
Drainage area in square miles (net) 15,600
- 43 -

SUMMARY OF SILT DATA
for
Nueces River Watershed
Stream: NUECES
Station: NEAR THREE RIVERS
Sampler: Carl Franze
(Samples were taken 2 miles south ofThree Rivers from railroad bridge,except at extreme low stage whensamples were taken at low dam)
Water Year
-28
-29-30
-31-32
-33-34
-35-36-37-38
-39-40
-41
-42
-43-44
-45-46
-47-48
19271928
19291930
19311932
19331934
19351936193719381939'1940'
1941-1942-
1943-1944-
1945-1946-1947-
TOTALS
1/
Dischargeof
Stream
Silt Load of Stream
AveragePercentage
ream of Dry Siltby Weight
Ac.-fto Pet.
405 .142
855 ol29
473 0O89291 o071381 .042
179 o070
438 ol93
1,565 0O69494 o072
94 a033506 .118
297 .108
679 o091
1,073 .092
648 0O65213 o091
439 .070
387 ol46
744 o090
379 o052
164 .145
ACo-fto
318,930741,300596,510455,880
1,006,200287,120253,800
2,547,150768,200318,050479,730306,600840,190
1,300,8601,107,790260,470700,090297,070927,400810,070128,330
Tons
617,9201,303,600
721,440443,420581,880275,050668,320
2,383,630752,320142,270771,540450,960
1,035,6001,635,320987,340323,990668,660590,010
1,134,770578,310253,400
14,451,740 16,319,750 10,704
For period of 210000 years
Average discharge in acre-feet per year — 688,178Average acre-feet of silt per year 510Average acre-feet of silt per year per square mile
of contributing watershed »033Average tons of silt per year 777,131Average percent of silt by weight .083Drainage area in square miles (net) • 15,600
T7 Station was established October 1, 1927°
Note: Yearly discharge data changed to conform to totals usedby Uo S. G0 So in computing monthly river dischargeo
44 -

SILT DATA
Nueces River 7/atershed
at
CORPUS CHRISTI DAM STATION ON NUECES RIVER
for
Water Year 1947-1948(October 1, 1947 to September 30, 1948)
Silt Load of Stream
Ac.-ft. Tons Ac.-ft
1947
October 5, HO 650 0
November 3,890 310 0
December 2,010 270 0
1948
January 2,440 220 0
February 1,900 210 0
March 1,750 170 0
April 2,210 250 0
May 2,400 300 0
June 2,600 320 0
July 72,170 11,030 7
August 2,820 410 0
September 8,020. 1,030 1
Total 107,320 15,170 8
U. 3. G. S. yearly discharge in acre-feet
Total silt for year in acre-feet
Acre-feet of silt per year per square mileof contributing watershed
Average percent of silt by weight for year
Drainage area in square miles (net)
- 45 -
Discharge Percentage
Month of Silt Load of Stream of dry silt
Stream by weightPet.
.009
.006
.010
.007
.008
.007
.008
.009
.009
.011
.010
.009
107,300
15,170
.010

SUMMARY OF SILT DATA
Stream:
Station:
Sampler:
for
Nueces River Watershed
NUECES
CORPUS CHRISTI DAM (Samples taken belowEddie Wright to outlet gates)
and adjacent
Water Year
Dischargeof
Stream
Silt Load of Stream
Ave ragePercentageof Dry Siltby Weight
1/1941-42
1942-431943-441944-451945-461946-471947-48
TOTALS
Ac.-ft.
1,202,820249,640740,310273,820936,910921,510107,320
4,432,330 1
Tons Ac.-ft 0
546,500 35844,790 29
323,550 212125,070 81350,430 231244,730 16015,170 8
.,650,240 1,079
Pet.
.033
.013
.032
.034
.027
.020
.010
For
Average discharge in acre-feetAverage acre-feet of silt perAverage acre-feet of silt per
of contributing watersAverage tons of silt per yearAverage percent of silt by weiDrainage area in square miles
• period of 6.660 years
665,515162
247,784.027
year per square milehed
r»h+gm» — -- ______ - --
( r\&+ \ —
1/ Station was established February 2, 1942.
Note: Yearly discharge data changed to conform to totals used byU. S. G. S. in computing monthly river discharge.
- 46 -

SILT DATA
Sabine River Watershed
at
LOGANSPORT STATION ON SABINE RIVER
for
Water Year 1947-1948(October 1, 1947 to September 30, 1948)
Discharge PercentageMonth of Silt Load of Stream of dry silt
Stream by weightAc.-ft. Tons Ac.-ft. Pet.
1947
October 12,370 1,460 1 .009
November 68,670 19,510 13 .021
December 331,500 73,980 49 .016
1948
January 421,610 69,200 45 .012
February 580,600 42,180 28 .005
March 583,930 95,680 63 .012
April 201,700 48,240 32 .018
May 419,090 87,000 57 .015
June 157,810 10,520 7 .005
July 26,060 3,450 2 .010
August 11,280 1,010 1 .007
September 5,940 160 0 .002
Total 2,820,560 452,390 298
U. S. G. 3. yearly discharge in acre-feet 2,821,000
Total silt for year in acre-feet 298
Acre-feet of silt per year per square mileof contributing watershed .061
Average percent of silt by weight for year .012
Drainage area in square miles (net) 4,858
- 47 -

SUMMARY OF SILT DATA
for
Sabine River Watershed
Stream: SABINE (Samples were taken from U. So
Station: LOGANSPORT, LA. Highway 84 bridge in downtownSampler: R. E. Davenport Logansport, La. )
AverageDischarge Percentage
Water Year of
Stream
Silt Load of Stream of Dry Silt
by WeightAc.-fto Tons Ac.-ft. Pet.
1/1932-33 2,545,700 503,740 330 o015
2/1933-34 69,200 5,780 4 .006
3/1934-35 13,910 400 0 .002
1935-36 841,410 137,020 89 .012
1936-37 1,689,660 270,430 176 .012
1937-38 3,155,000 537,990 353 o013
1938-39 1,325,580 291,500 190 .016
1939-40 1,302,990 458,990 301 .026
1940-41 4,876,180 825,330 541 .012
1941-42 3,817,160 1,439,880 944 .028
1942-43 1,716,620 999,370 655 .043
1943-44 4,193,070 3,002,050 1,969 o0531944-45 5,996,730 4,502,820 2,953 o0551945-46 5,137,000 2,650,320 1,738 .038
1946-47 3,318,320 553,900 363 .012
1947-48 2,820,560 452,390 298 .012
TOTALS 42,819,090 16,631,910 10,904
For period of 14.156 years
Average discharge in acre-feet per year 3,024,801Average acre-feet of silt per year 770Average acre-feet of silt per year per square mile
of contributing watershed .159Average tons of silt per year 1,174,902Average percent of silt by weight O029Drainage area in square miles (net) 4,858
1/ Station was established December 1, 1932o2/ Station was discontinued December 27, 1933»3/ Station was reestablished September 1, 1935.
Note: Yearly discharge data changed to conform to totals used byU. S. G. S. in computing monthly river discharge.
- 48 -

SILT DATA
San Antonio River Watershed
at
GOLIAD STATION ON SAN ANTONIO RIVER
for
Water Year 1947-1948(October 1, 1947 to September 30, 1948)
Discharge PercentageMonth of Silt Load of Stream of dry silt
Stream by weight
Ac.-fto Tons Ac.-ft. Pet.1947
October 13,820 3,070 2 .016
November 16,340 7,450 5 .033
December 17,490 2,800 2 .012
1948
January 16,040 1,750 1 .008
February 17,320 3,050 2 .013
March 15,640 4,850 3 .023
April 14,200 12,630 8 .065
May 18,970 38,850 25 .150
June 8,120 1,210 1 .011
July 24,510 43,990 29 .132
August 46,930 95,650 63 .150
September 17,130 21,720 14 .093
Total 226,510 237,020 155
U. S. G. S. yearly discharge in acre-feet 226,500
Total silt for year in acre-feet 155
Acre-feet of silt per year per square mileof contributing watershed .040
Average percent of silt by weight for year .077
Drainage area in square miles (net) 3,918
- 49 -

Stream: SAN ANTONIO
Station: GOLIAD
Sampler: Polo Perez
SUMMARY OF SILT DATA
for
San Antonio River Watershed
(Samples were taken near Goliadfrom bridge on State Highway No. 29)
Average
Discharge Percentage
Water Year of Silt Load of Stream of Dry S iltStream by Weight
Ac 0-ft 0 Tons Ac 0 — —U 0 PCto
1/1941-42" 699,580 848,340 556 0O891942-43 453,180 581,740 382 o094
I943-44 365,060 725,630 475 .146
1944-45 352,460 567,440 371 .118
1945-46 663,080 1,387,180 910 .154
1946-47 699,560 719,770 472 0O76
1947-48 226,510 237,020 155 o077
TOTALS 3,459,430 5,067,120 3,321
For period of 6o748 years
Average discharge in acre-feet per year 512,660Average acre-feet of silt per year 492Average acre-feet of silt per year per square mile
of contributing watershed .126Average tons of silt per year 750,907Average percent of silt by weight .108Drainage area in square miles (net) 3,918
1/ Station was established January 1, 19420
Note: Yearly discharge data changed to conform to totals used byUo S. Go S. in computing monthly river dischargeo
- 50 -

SILT DATA
San Jacinto River Watershed
at
HUFFMAN STATION ON SAN JACINTO RIVER
for
Water Year 1947-1948(October 1, 1947 to September 30, 1948)
Discharge PercentageMonth of Silt Load of Stream of dry silt
Stream by weightAc.-ft. Tons Ac.-ft. Pet.
1947
October 8,070 980 0 .009
November 13,500 1,680 1 .009
December 72,110 25,650 17 .026
1948
January 41,700 4,480 3 .008
February 114,720 24,820 16 .016
March 121,860 24,940 16 .015
April 65,710 15,130 10 .017
May 31,780 5,070 3 .012
June 8,970 1,280 1 .010
July 9,580 1,140 1 .009
August 5,320 1,880 1 .026
September 6,420 1,250 1 .014
Total 499,740 108,300 70
— i t ..I- -•. I. 1 . . .
U. S. G. S. yearly discharge in acre-feet 499,7QQ.
Total silt for year in acre-feet 70
Acre-feet of silt per year per square mileof contributing watershed .025
Average percent of silt by weight for year .016
Drainage area in square miles (net) 2,791
- 51 -

SUMMARY OF SILT DATA
for
San Jacinto River Watershed
Stream: SAN JACINTO
Station: HUFFMAN
Sampler: Phil Baker Scott(Samples were taken at SheldonPumping Plant, City of Houston)
'Water Year
Dischargeof
Stream
Silt Load of Stream
AveragePercentage
of Dry Siltby Weight
1/1944-45
Ac.-fto
221,940
Tons
163,730
Ac.-fto
107
PCto
.054
1945-46 2,246,700 1,345,020 881 O044
1946-47 2,466,540 2,096,730 1,377 .062
1947-48 499,740 108,300 70 .016
TOTALS 5,434,920 3,713,780 2,435
For period of 3.083 years
Average discharge in acre-feet per year 1,762,867Average acre-feet of silt per year 790Average acre-feet of silt per year per square mile
of contributing watershed .283Average tons of silt per year • 1,204,599Average percent of silt by wei^it .050Drainage area in square miles (net) 2,791
l/ Station established September 1, 1945°
Note: Yearly discharge data changed to conform to totals used byU. S. G. 3. in computing monthly river discharge.
- 52 -
SILT DATA
San Jacinto River Watershedat
HUMHLE STATION ON SAN JACINTO RIVER
for
Water Year 1947-1948(October 1, 1947 to September 30, 1948)
Month
Dischargeof
Stream
Silt Load of StreamPercentageof dry siltby weight
Pet.Ac.-ft Tons
1947
October 3,910 410
November 6,550 750
December 43,550 4,710
1948
January 21,730 800
February 59,010 13,550
March 82,780 7,910
April 35,210 8,080
May 17,750 3,490
June 4,470 670
July 4,240 180
August 2,300 160
September 2,840 430
Total 284,340 41,140
Ac.-ft
0 .008
0 .008
3 .008
1 .003
9 .017
5 .007
5 .017
2 .014
0 .011
0 .003
0 o005
0 oOll
25
U. S. G. S. yearly discharge in acre-feet 284,300
Total silt for year in acre-feet 25
Acre-feet of silt per year per square mileof contributing watershed .014
Average percent of silt by weight for year .011
Drainage area in square miles (net) 1,811
- 53 -

SUMMARY OF SILT DATA
for
San Jacinto River Watershed
Stream: WEST FORK OF SAN JACINTO
Station: NEAR HOMBLE
Sampler: L. C. Clark(Samples were taken from highwaybridge about 2 mi, north of Humble)
AverageDischarge Percentage
Water Year of Silt Load of Stream of Dry SiltStream by Weight
1932-33
1933-34
1936-371937-381938-391939-401940-411941-42
1942-431943-44
1944-451945-461946-471947-48
TOTALS
1/
£/
3/
Ac.-ft, Tons
253,210 144,800
7,450 520
12,450 1,370491,940 150,650319,500 120,660282,680 162,070
2,566,090 896,050909,180 373,670545,760 290,820881,200 660,570
1,577,380 1,241,4901,320,330 774,8101,325,000 345,140
284,340 41,140
10,776,600 5,203,760
Ac.-ft,
93
0
1
9777
105588245191434
815509228
§2
3.408
Pet.
.042
o005
.008
.022
.028„042
.026
o030
o039
o055.058.043
o019oOll
For period of 12.337 years
Average discharge in acre-feet per year —— 873,519Average acre-feet of silt per year 276Average acre-feet of silt per year per square mile
of contributing watershed .152Average tons of silt per year 421,801Average percent of silt by weight • O035Drainage area in square miles (net) 1,811
1/ Station established December 1, 1932o2/ Station discontinued December 31, 1933<>3/ Station re-established July 1, 1937»
Note: Yearly discharge data changed to conform to totals used byU. S. G. S„ in computing monthly river discharge,,
- 54 -

SILT DATA
Trinity River Watershedat
ROMAYOR STATION ON TRINITY RIVER
for
Water Year 1947-1948(October 1, 1947 to September 30, 1948)
Discharge PercentageMonth of Silt Load of Stream of dry silt
Stream by weightAc.-ft. Tons Ac.-ft. Pet.
1947
October 60,680 10,730 7 »013
November 111,080 55,000 36 .036
December 618,450 404,300 265 .048
1948
January 425,550 425,570 279 .073
February 626,100 323,570 212 .038
March 999,490 578,180 379 .042
April 402,590 301,340 I98 .055
May 807,790 .912,430 598 .083
June 159,340 96,420 63 .044
July 172,270 156,470 103 .067
August 50,230 13,480 9 .020
September 43,150 7,230 5 .012
Total 4,476,720 3,284,720 2,1541 1 ——-—— 1 • __-»----e-ig-8---a ... - 5-agaa 1 1 l 1 1 1 n =»--»= ,i 'B—a
U. 3. G. S. yearly discharge in acre-feet 4,477,000
Total silt for year in acre-feet 2,154
Acre-feet of silt per year per square mileof contributing watershed .125
Average percent of silt by weight for year .054
Drainage area in square miles (net) 17,200
- 35 -

SUMMARY OF SILT DATA
for
Trinity River Watershed
Stream: TRINITY
Station: ROMAYOR (Samples taken from the railroad
Sampler: Claud Allen bridge)
AverageDischarge Percentage
Water Year of Silt Load of Stream of Dry SiltStream by Weight
ACo-ft. Tons AC o"lue PCto
1/1935-36 42,130 5,220 4 o009
1936-37 3,900,920 3,481,600 2,285 .066
1937-38 6,753,160 6,741,220 4,423 .073
1938-39 2,165,150 3,199,280 2,099 .1091939-40 3,218,170 4,999,040 3,280 .114
1940-41 12,258,630 9,657,990 6,335 0O581941-42 9,901,100 9,447,990 6,197 o070
1942-43 4,298,370 4,914,950 3,224 o084
1943-44 7,588,430 11,433,850 7,501 olll
I944-45 12,202,840 13,559,310 8,893 .082
1945-46 8,391,500 8,643,330 5,670 .0761946-47 7,009,180 5,290,980 3,468 «0551947-48 4,476,720 3,284,720 2,154 o054
TOTALS 82,206,300 84,659,480 55,533
For period of 120142 years
Average discharge in acre-Average acre-feet of silt
-feet per ye 6,770,4084,574
Average acre-feet of silt per year per square mile
of contributing watershed .266
Average tons of silt per 3 6,972,449Average percent of silt b: 0O76Drainage area in square miles (net) - 17,200
1/ Station was established August 10, 19360
Note: Yearly discharge data changed to conform to totals usedby U. 30 Go 30 in computing monthly river discharge.
- 56 -

SUMMARY OF SILT DATA FOR SOME OF THE MAJOR TEXAS STREAMS
(For Water Year Ending September 30, 1948)
Water
shed Stream Silt StationYears
SamplesTaken
Total
LengthRecord
AverageRunoff
of
Stream
Average Amountof
Silt
Amt. of
Silt per SiltSq0.Mi, by.
Watershed weight
Brazos
Brazos
Brazos
Brazos
Brazos
Brazos
Brazos
Brazos
Brazos
1 Brazos
vn Brazos
Brazos
Brazos
Brazos
Brazos
Brazos
Colorado
Colorado
Colorado
Colorado
Colorado
Colorado
Colorado
Colorado
GuadalupeGuadalupe
Salt Fork
Salt Fork
Dbl.Mt.Fork
Clear Fork
Clear Fork
Little River
San Gabriel
Leon
Navasota
Brazos
Brazos
Brazos
Brazos
Brazos
Brazos
Brazos
Colorado
Pedernales
Colorado
Colorado
Colorado
Colorado
Colorado
Colorado
GuadalupeGuadalupe
Aspermont 1/ 1924-25Seymour \f~ 1924-30Aspermont 1/ 1924-33Crystal Fallsi/ 1925-29Eliasville 1/ 1924-25Little River 1/ 1924-29Circleville \J 1924-29Belton 1945-48Easterly 1942-48South Bend 1942-48Possum King.Dam 1942-48Mineral Wells 1/ 1924-34Glen Rose 1/ 1924-29Waco 1/ 1924-33Bryan 1/ 1899-02Richmond 1924-48Llano 1942-48Johnson City 1942-48San Saba 1930-48Tow 1/ 1927-32Inks Dam 1942-48Buchanan Dam 2/ 1947-48Austin 1937-48
Columbus-E.Lake 3/ 30-33;37-41Spring Branch 1942-48Victoria 1945-48
arsII
1.2386.107,244
307,244
962,403
,083,748
6.7106.710
10.332
,588,254
,41924.30660I676ol67
I8o0555.1626ol67loOOO
11.164
6o9976.7483.083
ac-ft
111,100337,790135,280214,440177,240419,870110,744373,980384,080481,565507,022953,550
1,181,3701,717,1304,156,7365,855,940
205,320115,370
1,210,0501,245,440685,190576,440
1,773,6503,167,710213,840
1,123,400
ac-ft
2,8185,4502,665568
529752222
353242
2,152
876,5068,378
10,32539,11723,980
276
155
3,0973,360
66
30
7765,898
114
408
* Percent of silt by volume.1/ Silt by months and summary data prior to 1940 contained in progress report No,2/ Station established October 1, 1947«3/ Station discontinued October 31, 1941.
tons
4,2978,3094,062
866
808
1,147339522
368
3,279133
9,920
12,77315,742
36,609420
2364,7225,122
9946
1,1828,991
173621
1.
420
370400
020
630190
590850360870438060
810
010
260
740
180
150520
320
530
240
960850430
ac-ft
1.272
I0O38
1.765ol31o092ol43
.369
.100
c255.174
0468
o537.536
1.340
06890O69.164
0165.174
.029
O202
0O8Oo072
per
cent
,842
,807,206
.297
.335,201
,225,103,070,500
,019,764.794
.673,941*.459.151,150
,287,302,011
,006,049,209,060,041
Net
drainage
area
sq.mi.
2,2165,2501,5104,3205,7405,253
602
3,547949
12,360
13,91015,60019,26029,19034,8104,000
94718,80019,300
26,36029,1401,4325,676

SUMMARY OF SILT DATA (Continued)
Water
shed Stream Silt Station
Amto of
Years Total Average Silt perSamples Length Runoff Average Amount Sq. Mi.Taken Record of Stream of Silt Watershed
years ac-ft. ac-ft. tons
Lavaca Lavaca
Neches AngelinaNeches Neches
Nueces Nueces
Nueces Nueces
Nueces Nueces
Rio Grande Rio Grande
Rio Grande Rio Grande
Red Pease
Red Wichita
Red Red
Sabine Sabine
Sabine Sabine
San Antonio San Antonio
San Antonio San Antonio
San Jacinto West Fork
San Jacinto San Jacinto
Trinity TrinityTrinity Trinity
Edna 1945-48Horger 1945-48Rockland 1930-48Cotulla 1942-48Three Rivers 1927-48Corpus ChroDam 1942-48Eagle Pass 4/ 1934-43Roma 4/# "" 1929-43Crowell j5/ 1942-47Wichita Falls 1/ 1900-02Denison 1/ 30-33536-39Logansport,La. 32-33;35-48Ruliff 6/ 1945-46Falls City 1/ 1927-33Goliad 1942-48Humble 32-33?37-48Huffman 1945-48Rosser 7/ 1938-40Romayor 1936-48
3o0833o083
18.1486.748
21.000
6.6609o068
14„184
5o002
2.014
6.26014.1561.0835»9676.748
12.3373o083lo598
12.142
204,9602,824,6702,008,500
190,234688,380665,515
3,180,0574,166,619
113,411566,420
3,326,7803,024,801
11,408,860127,120512,680873,510
1,763,100760,700
6,770,210
132
523323
84
510162
9,77612,588
9925,516
13,640770
3,124142
492
276790986
. 4,574
* percent of silt by volume.1/ Silt by months and summary data prior to 1940 contained in progress report No. 1,4/ Station discontinued May 31, 1943°5/ Station discontinued June 30, 1947oXj Station established September 1, 1945 and discontinued September 30, 1946.2/ Station discontinued June 27, 1940.
200,730797,170493,340127,531777,130247,784
14,904,54519,192,311
1,512,834
20,793,3801,174,9025,771,404
216,730750,910421,800
1,204,6001,504,9206,972,450
ac-ft.
.149
.1520O9I.016
-033
.078
.080
.412
1.776.415
ol59-331.069.126.152.283,122
.266
Silt
...by..Weight
percent
.072
.021
.018
.049
.083
.027
.344
o338o930
.974*
.459
.029
.037
.125
.108
o035.050
,145.076
Net
drainagearea
sq.mi
8873,4353,5395,260
l.%*oo
125,260157,204
2,4103,105
32,8404,8589,4402,0703,9181,8112,7918,057
IV.200

![[XLS]search-bcarchives.royalbcmuseum.bc.casearch-bcarchives.royalbcmuseum.bc.ca/Document/Finding... · Web view1 1 1 1947 1 1947 1 11 11 1 1947 1 1 1 1 1 1947 1 1947 1 1 1 1 1947](https://img.pdfslide.us/doc/110x75/5af7f4f67f8b9a44658bb89b/xlssearch-view1-1-1-1947-1-1947-1-11-11-1-1947-1-1-1-1-1-1947-1-1947-1-1-1-1.jpg)