Embed Size (px)
Citation preview
REPORT TO THE CONSULTATIVE COMMITTEE OF THE ITC TRUST FUND (1 JANUARY – 31 DECEMBER 2017)
REPORT TO THE
CONSULTATIVE COMMITTEE
OF THE ITC TRUST FUND
(1 January – 31 December 2017)
2
TABLE OF CONTENTS
1. Introduction ................................................................................................................ 4
2. Source of ITC funds ................................................................................................... 4
2.1 Voluntary contributions to the ITC Trust Fund .................................................................. 5
2.2 Breakdown of contributions received for the period Jan - Dec 2017 ................................. 6
2.3 Portion of W1 contributions received in first nine months of the year, 2012-17 ................ 6
3. Use and status of ITC funds: delivery against the 2017 total budget ..................... 7
4. Regular budget overview and delivery ..................................................................... 8
5. Extrabudgetary funds overview and delivery ........................................................ 10
5.1 Extrabudgetary funds overview ....................................................................................... 10
5.2 Total Extrabudgetary delivery ......................................................................................... 11
5.3 Extrabudgetary delivery by focus area ............................................................................ 11
5.4 Extrabudgetary delivery by priority countries .................................................................. 13
5.5 Extrabudgetary delivery by fund category and regions ................................................... 13
5.6 Extrabudgetary delivery by cost categories .................................................................... 15
5.7 ITC cash position ............................................................................................................ 15
6. Programme Support Costs...................................................................................... 16
7. ITC’s performance against the Operational Plan commitments ........................... 17
7.1 ITC’s contribution to the Sustainable Development Goals .............................................. 17
7.2 ITC’s performance against Tier 2 of the Corporate Scorecard ....................................... 21
7.3 Window I contribution to ITC’s corporate results ............................................................. 25
7.4 ITC’s performance against Tier 3 of the Corporate Scorecard ....................................... 27
7.5 Status of Operational Plan 2017 deliverables ................................................................. 28
7.6 Evaluation ..................................................................................................................... 31
7.7 Developing ITC’s risk management framework .............................................................. 32
Annex I List of trade related technical assistance projects per focus area and region............................................................................................................... 33
Annex II Strategic plan 2015-17 milestones status ..................................................... 37
3
List of Figures
Figure 1: Share of 2017 funder contributions to Window I and Window II of the ITC Trust Fund as of
31 December 2017 ................................................................................................................ 6 Figure 2: Percentage of W1 contributions received in first 9 months of the year, 2012-17 ................. 6 Figure 3: ITC delivery pattern from 2008 to 2017, by source of funds, $ million ................................. 7 Figure 4: Delivery of RB by focus area, for the period Jan – Dec 2017, $ million ............................... 8 Figure 5: The UN recosting methodology............................................................................................. 9 Figure 6: XB delivery by focus area and Window, for the period Jan – Dec 2017, $ million ............. 11 Figure 7: 2016-2017 XB delivery by focus area and funding source, $ million .................................. 12 Figure 8: XB delivery delivery by priority countries for years 2016-2017 ........................................... 13 Figure 9: XB delivery by funding category and region FY 2016-2017 ............................................... 13 Figure 10: XB, W1 and W2 region – specific delivery, for years 2016-2017........................................ 14 Figure 11: ITC delivery distribution by SDG for Jan-December 2017, in percentages ........................ 17 Figure 12: Frequency of ITC project linkages to SDG goals and targets ............................................. 19 Figure 13: ITC’s direct contribution to SDG monitoring ........................................................................ 20 Figure 14: ITC’s Risk appetite and tolerance statement ...................................................................... 32
List of tables
Table 1: XB funding received from 1 January to 31 December 2016 and 2017, in $ thousand ......... 5
Table 2: ITC OP budget, RB and XB delivery for the period Jan - Dec 2017, $ million ...................... 7
Table 3: RB delivery by focus area, for the period Jan – Dec 2017, $ million .................................... 8
Table 4: RB delivery by cost category for the period Jan – Dec 2017, $ million................................. 8
Table 5: Biennial RB delivery overview, $ million ............................................................................... 8
Table 6: 2017 XB budget and delivery, for the period Jan – Dec 2017, $ million ............................. 11
Table 7: XB, W1 and W2 budgets and delivery by focus area, Jan – Dec 2017, $ million ............... 12
Table 8: Operational plan and delivery by funding category and region, for Jan-Dec 2017, $ mn .. 14
Table 9: 2016-17 XB delivery by cost category, $ million ................................................................. 15
Table 10: ITC cash position for the period 2016- 2017, $ million ....................................................... 15
Table 11: PSC delivery by cost category, for the period Jan – Dec 2017, US $ million ..................... 16
Table 12: Corporate outcome indicators and progress for the Biennium 2016-2017 ......................... 22
Table 13: Corporate output indicators and progress for the Biennium 2016-2017 ............................. 24
Table 14: Efficiency and effectiveness key performance indicators and progress for the period Jan
2017 – December 2017 ....................................................................................................... 27
Table 15: Strategic milestones for the period Jan 2017 - December 2017: technical assistance ...... 28
Table 16: Strategic milestones for the period Jan 2017 - December 2017: impact, effectiveness and
efficiency ............................................................................................................................. 30
4
1. Introduction
ITC is pleased to submit to the Consultative Committee of the ITC Trust Fund (CCITF) the following
financial report of its budgets, delivery and performance covering the period from 1 January to 31
December 2017.
This report provides information principally in the form of self-explanatory tables that give an overview
of the organization’s activities. It focuses on the analysis of ITC’s extrabudgetary resources, providing
a detailed description of the source of funds, their status and use. It also presents an update on
programme support and regular budget resources and gives an account of ITC’s performance against
the targets set in the Operational Plan 2017. ITC’s Annual Report 2017 complements this CCITF report
with more qualitative information about the work of ITC and the positive changes that the organisation
has achieved for its beneficiaries. In addition, ITC produces the annual audited financial statements,
following the International Public Sector Accounting Standards (IPSAS).
As 2017 was the last year of ITC’s Strategic Plan 2015-17, this report also includes a status overview
of the key deliverables of the Strategic Plan in Annex II.
2. Source of ITC funds
ITC’s work is enabled by two sources of funding: the regular budget (RB) and extrabudgetary funding
(XB), which includes programme support costs (PSC). The RB is approved on a biennial basis by the
United Nations General Assembly and the World Trade Organization (WTO) General Council. 2017 is
the second year of the 2016-2017 biennium.
Extrabudgetary funds are voluntary contributions to the ITC Trust Fund (ITF). This includes two
categories of funds known as windows. Window I (W1) consists of unearmarked and soft-earmarked
contributions from funders, while Window II (W2) is composed of earmarked bilateral contributions for
specific projects and programmes, for Junior Professional Officers (JPOs) and secondees, as well as a
small amount of revenue from the sale of products and services. PSC is earned via a fixed-percentage
charge on all extrabudgetary expenditures.
.
5
Donors Window 1 Window 2 Total Window 1 Window 2 Total
Countries and regional associations 10,776 34,232 45,008 8,930 38,994 47,923
African Guarantee Fund (AGF) - - - - 445 445
Argentina - - - - 20 20
Australia - 1,147 1,147 - 307 307
Canada 730 757 1,487 723 - 723
China 100 400 500 100 400 500
COMESA Clearing House - 254 254 - 122 122
Denmark - - - - 43 43
European Union - 15,503 15,503 - 19,484 19,484
Expertise France - - - - 463 463
FEFAC - - - - 6 6
Finland 3,370 245 3,615 - 136 136
Germany 2,169 699 2,868 2,049 2,212 4,261
Hungary - - - - 180 180
India 50 - 50 50 - 50
Indonesia - - - - 30 30
Ireland 877 - 877 910 - 910
Italy - 139 139 - - -
Japan - 49 49 - 927 927
Kuwait * - - - 145 - 145
Madagascar - 67 67 - - -
Mali - - - - 62 62
Netherlands (the) - 1,735 1,735 - 4,101 4,101
Norway - - - 1,093 - 1,093
Organisation Internationale de la Francophonie - - - - 34 34
Physikalisch-Technische Bundesanstalt (PTB) - - - - 13 13
PromPeru - - - - 20 20
Republic of Korea (the) - 306 306 - 658 658
Saint Vincent and the Grenadines - 43 43 - - -
South Africa - - - - 60 60
Sultanate of Oman - 27 27 - - -
Sweden 3,479 - 3,479 3,859 838 4,698
Switzerland - 2,231 2,231 - 2,543 2,543
Switzerland/EIF - 167 167 - 200 200
UEMOA - - - - 276 276
United Kingdom of Great Britain and Northern Ireland (the) - 10,066 10,066 - 4,653 4,653
USAID - 254 254 - 760 760
Zambia - 145 145 - - -
Associations, banks, companies, non-governmental - 2,636 2,636 - 2,388 2,388
Barbados Investment and Development Cooperation - 54 54 - 82 82
Caribbean Development Bank - 60 60 - 129 129
Costa Rica CINDE - - - - 8 8
DHL - 85 85 - 70 70
International Islamic Trade Finance Corporation - ITFC - 15 15 - 15 15
Islamic Centre for Development of Trade - 25 25 - 40 40
Islamic Development Bank - 800 800 - 1,040 1,040
ITHRAA Oman - - - - 31 31
La Corporacion de Promocion de Exportaciones e Inversiones (CORPEI) de Ecuador - 87 87 - - -
McDonalds Corp. - - - - 25 25
National Graduate Institute for Policy Studies (GRIPS) - 112 112 - 113 113
PepsiCo - 540 540 - 100 100
ProCórdoba Argentina - - - - 20 20
Qatar Development Bank - - - - 81 81
Saint Lucia Trade Export Promotion Agency (TEPA) - 200 200 - 82 82
Stichting IDH Sustainable Trade Initiative - 85 85 - - -
Sustainable Agriculture Initiative (SAI Platform) - 22 22 - 114 114
Swisscontact - - - - 170 170
The Mo Ibrahim Foundation - 114 114 - 114 114
Trademark East Africa - 350 350 - 150 150
Western NIS Enterprise Fund (WNISEF) - 87 87 - 5 5
Intra-organizational arrangements and revolving funds 58 3,457 3,515 60 3,238 3,298
Enhanced Integrated Framework (EIF) - 1,012 1,012 - 1,059 1,059
Food and Agriculture Organization of the United Nations (FAO) - - - - 228 228
Foundation for the Global Compact 58 - 58 60 - 60
ILO - 183 183 - 131 131
One UN Fund - 156 156 - - -
UNCTAD - 368 368 - - -
UNDP - - - - 27 27
UNEP - 105 105 - - -
UNIDO - 88 88 - - -
World Bank - 848 848 - 848 848
WTO-STDF - - - - 462 462
Revolving funds - 698 698 - 484 484
Total 10,834 40,325 51,159 8,990 44,619 53,609
2016 (US$ ‘000) 2017 (US$ ‘000)
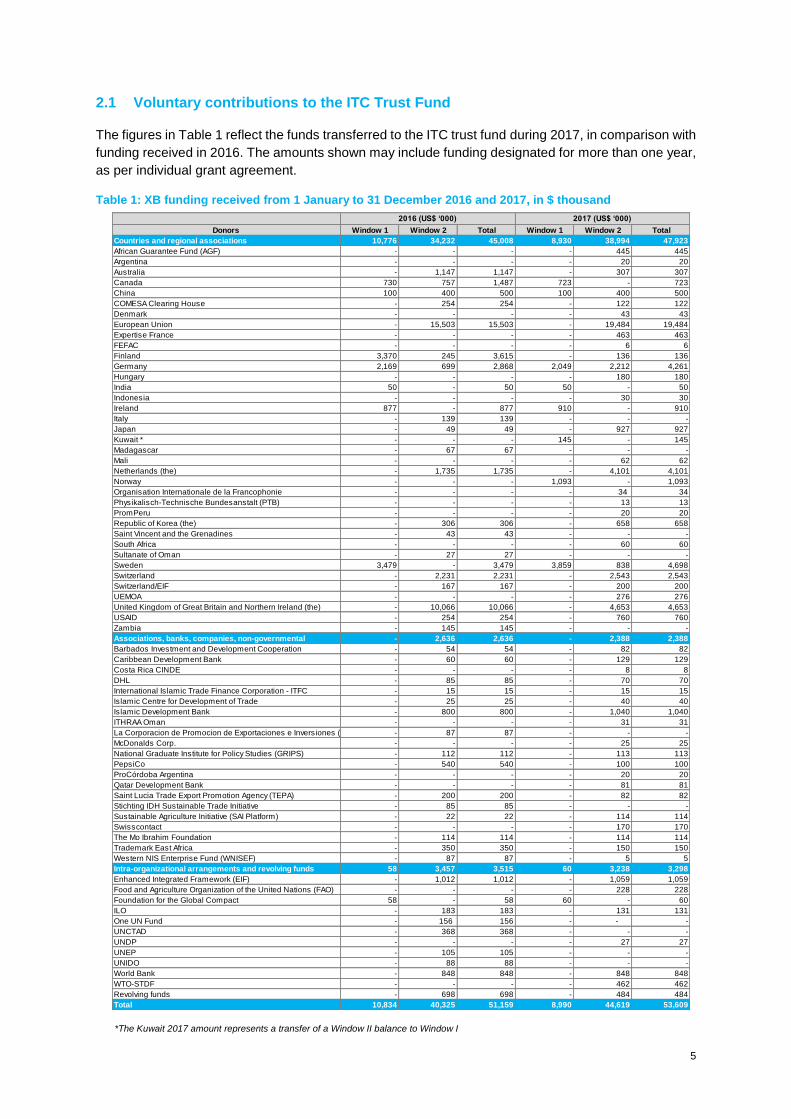
2.1 Voluntary contributions to the ITC Trust Fund
The figures in Table 1 reflect the funds transferred to the ITC trust fund during 2017, in comparison with
funding received in 2016. The amounts shown may include funding designated for more than one year,
as per individual grant agreement.
Table 1: XB funding received from 1 January to 31 December 2016 and 2017, in $ thousand
*The Kuwait 2017 amount represents a transfer of a Window II balance to Window I
6
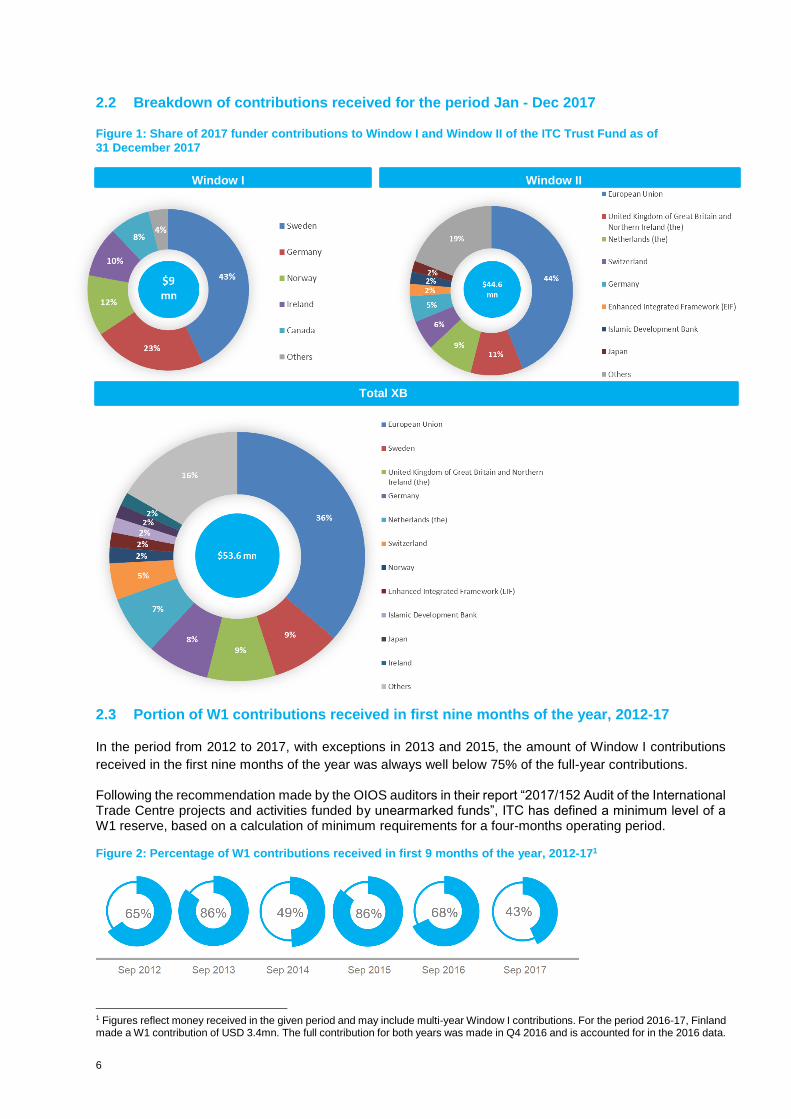
2.2 Breakdown of contributions received for the period Jan - Dec 2017
Figure 1: Share of 2017 funder contributions to Window I and Window II of the ITC Trust Fund as of
31 December 2017
2.3 Portion of W1 contributions received in first nine months of the year, 2012-17
In the period from 2012 to 2017, with exceptions in 2013 and 2015, the amount of Window I contributions
received in the first nine months of the year was always well below 75% of the full-year contributions.
Following the recommendation made by the OIOS auditors in their report “2017/152 Audit of the International Trade Centre projects and activities funded by unearmarked funds”, ITC has defined a minimum level of a W1 reserve, based on a calculation of minimum requirements for a four-months operating period.
Figure 2: Percentage of W1 contributions received in first 9 months of the year, 2012-171
1 Figures reflect money received in the given period and may include multi-year Window I contributions. For the period 2016-17, Finland made a W1 contribution of USD 3.4mn. The full contribution for both years was made in Q4 2016 and is accounted for in the 2016 data.
Window I Window II
Total XB
7
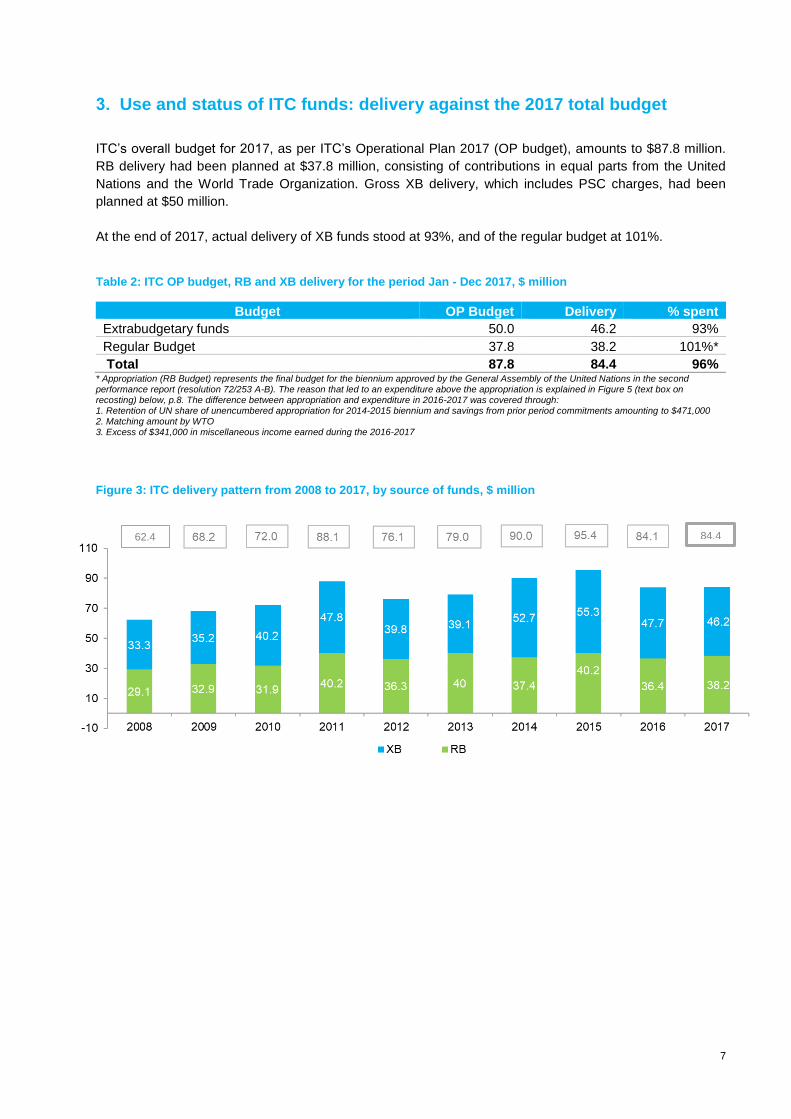
3. Use and status of ITC funds: delivery against the 2017 total budget
ITC’s overall budget for 2017, as per ITC’s Operational Plan 2017 (OP budget), amounts to $87.8 million.
RB delivery had been planned at $37.8 million, consisting of contributions in equal parts from the United
Nations and the World Trade Organization. Gross XB delivery, which includes PSC charges, had been
planned at $50 million.
At the end of 2017, actual delivery of XB funds stood at 93%, and of the regular budget at 101%.
Table 2: ITC OP budget, RB and XB delivery for the period Jan - Dec 2017, $ million
Budget OP Budget Delivery % spent
Extrabudgetary funds 50.0 46.2 93%
Regular Budget 37.8 38.2 101%*
Total 87.8 84.4 96% * Appropriation (RB Budget) represents the final budget for the biennium approved by the General Assembly of the United Nations in the second performance report (resolution 72/253 A-B). The reason that led to an expenditure above the appropriation is explained in Figure 5 (text box on recosting) below, p.8. The difference between appropriation and expenditure in 2016-2017 was covered through: 1. Retention of UN share of unencumbered appropriation for 2014-2015 biennium and savings from prior period commitments amounting to $471,000 2. Matching amount by WTO 3. Excess of $341,000 in miscellaneous income earned during the 2016-2017
Figure 3: ITC delivery pattern from 2008 to 2017, by source of funds, $ million
62.4 84.4
8
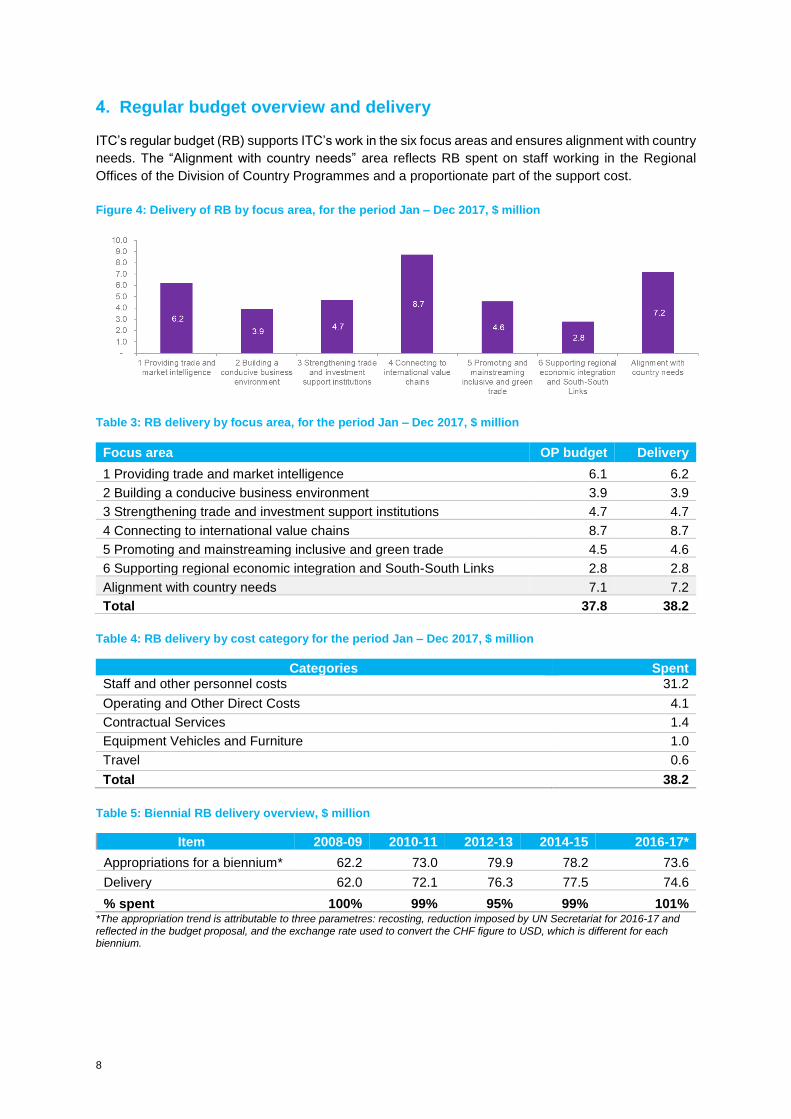
4. Regular budget overview and delivery
ITC’s regular budget (RB) supports ITC’s work in the six focus areas and ensures alignment with country
needs. The “Alignment with country needs” area reflects RB spent on staff working in the Regional
Offices of the Division of Country Programmes and a proportionate part of the support cost.
Figure 4: Delivery of RB by focus area, for the period Jan – Dec 2017, $ million
Table 3: RB delivery by focus area, for the period Jan – Dec 2017, $ million
Focus area OP budget Delivery
1 Providing trade and market intelligence 6.1 6.2
2 Building a conducive business environment 3.9 3.9
3 Strengthening trade and investment support institutions 4.7 4.7
4 Connecting to international value chains 8.7 8.7
5 Promoting and mainstreaming inclusive and green trade 4.5 4.6
6 Supporting regional economic integration and South-South Links 2.8 2.8
Alignment with country needs 7.1 7.2
Total 37.8 38.2
Table 4: RB delivery by cost category for the period Jan – Dec 2017, $ million
Categories Spent Staff and other personnel costs 31.2
Operating and Other Direct Costs 4.1
Contractual Services 1.4
Equipment Vehicles and Furniture 1.0
Travel 0.6
Total 38.2
Table 5: Biennial RB delivery overview, $ million
Item 2008-09 2010-11 2012-13 2014-15 2016-17*
Appropriations for a biennium* 62.2 73.0 79.9 78.2 73.6
Delivery 62.0 72.1 76.3 77.5 74.6
% spent 100% 99% 95% 99% 101% *The appropriation trend is attributable to three parametres: recosting, reduction imposed by UN Secretariat for 2016-17 and reflected in the budget proposal, and the exchange rate used to convert the CHF figure to USD, which is different for each biennium.
9
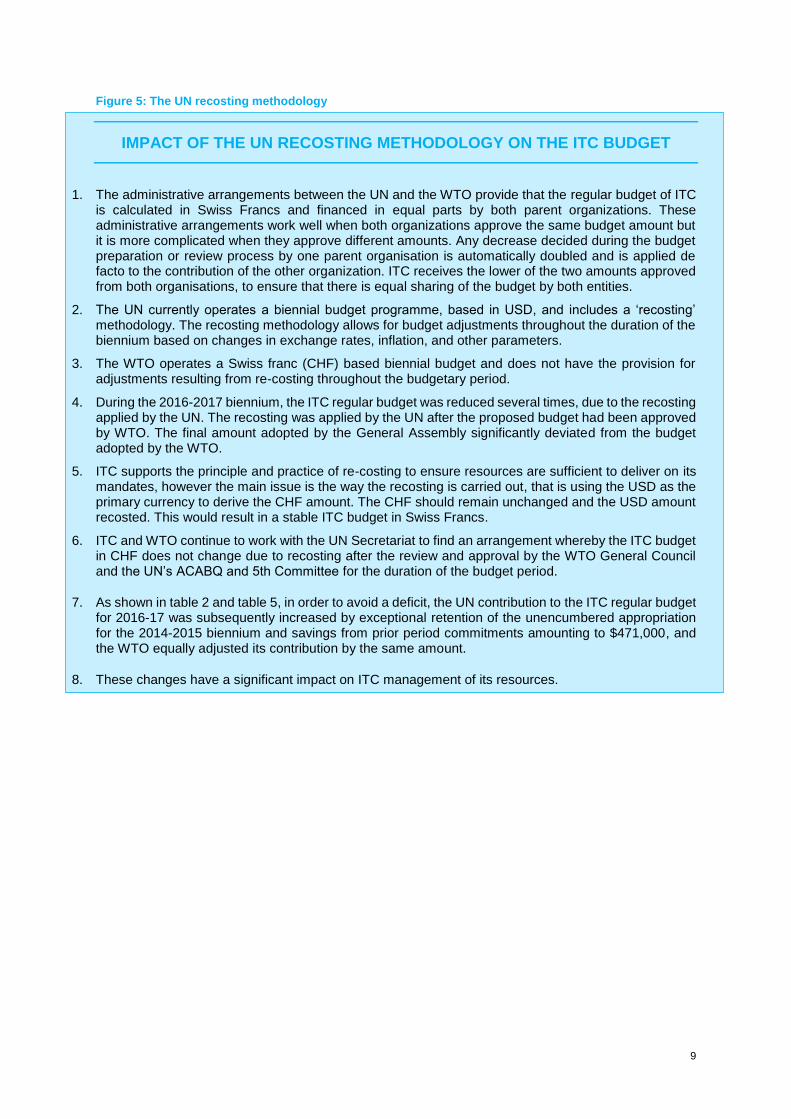
Figure 5: The UN recosting methodology
IMPACT OF THE UN RECOSTING METHODOLOGY ON THE ITC BUDGET
1. The administrative arrangements between the UN and the WTO provide that the regular budget of ITC is calculated in Swiss Francs and financed in equal parts by both parent organizations. These administrative arrangements work well when both organizations approve the same budget amount but it is more complicated when they approve different amounts. Any decrease decided during the budget preparation or review process by one parent organisation is automatically doubled and is applied de facto to the contribution of the other organization. ITC receives the lower of the two amounts approved from both organisations, to ensure that there is equal sharing of the budget by both entities.
2. The UN currently operates a biennial budget programme, based in USD, and includes a ‘recosting’ methodology. The recosting methodology allows for budget adjustments throughout the duration of the biennium based on changes in exchange rates, inflation, and other parameters.
3. The WTO operates a Swiss franc (CHF) based biennial budget and does not have the provision for adjustments resulting from re-costing throughout the budgetary period.
4. During the 2016-2017 biennium, the ITC regular budget was reduced several times, due to the recosting applied by the UN. The recosting was applied by the UN after the proposed budget had been approved by WTO. The final amount adopted by the General Assembly significantly deviated from the budget adopted by the WTO.
5. ITC supports the principle and practice of re-costing to ensure resources are sufficient to deliver on its mandates, however the main issue is the way the recosting is carried out, that is using the USD as the primary currency to derive the CHF amount. The CHF should remain unchanged and the USD amount recosted. This would result in a stable ITC budget in Swiss Francs.
6. ITC and WTO continue to work with the UN Secretariat to find an arrangement whereby the ITC budget in CHF does not change due to recosting after the review and approval by the WTO General Council and the UN’s ACABQ and 5th Committee for the duration of the budget period.
7. As shown in table 2 and table 5, in order to avoid a deficit, the UN contribution to the ITC regular budget for 2016-17 was subsequently increased by exceptional retention of the unencumbered appropriation for the 2014-2015 biennium and savings from prior period commitments amounting to $471,000, and the WTO equally adjusted its contribution by the same amount.
8. These changes have a significant impact on ITC management of its resources.
10
5. Extrabudgetary funds overview and delivery
5.1 Extrabudgetary funds overview
Extrabudgetary funds (XB) are mobilized through the ITC Trust Fund (ITF). ITC works with these funds
in accordance with applicable United Nations regulations, and internal rules and procedures. The
volume of XB funds depends on agreements reached with funders on an ongoing basis, with project
budgets usually covering several years. As explained in Section 2 of this report, the ITF consists of two
categories of funds: Window I comprises un-earmarked and soft-earmarked contributions while Window
II consists of contributions for specific projects, JPOs and secondees, as well as of a small amount of
income channelled through “Revolving Funds”. Governed by specific terms of reference, these funds
enable the delivery of activities which are of a recurring nature and generate financial income on a cost-
recovery basis, e.g. by provision of specific services (trainings, webinars). Planned deliverables funded
from Window II (W2) are more restricted compared with initiatives funded from Window I (W1).
Window I allocations are made by ITC’s Senior Management Committee (SMC) during the preparation of the annual Operational Plan and throughout the year. When deciding on W1 allocations, SMC takes into account the overall purpose of W1 funds: to support expenditures contributing to “preparing the future” of ITC and to finance initiatives which are critical to ITC’s corporate interests and performance in pursuit of export impact for good. SMC also considers the following criteria:
1. Client needs / priorities;
2. Prioritization of initiatives according to the ITC Strategic Plan;
3. Synergies and balance with Window II components of the overall work programme;
4. Performance in the execution of the work programme;
5. Funder preferences;
6. Actual and expected funder contributions.
Within the framework of grant agreements with funders, budgets may be adjusted in the course of the year to reflect changes in the operating environment.
ITC’s management of W1 funds was audited in 2017 by the UN’s Office of Internal Oversight Services (OIOS) as part of their regular audit services.2 The audit aimed to assess the adequacy and effectiveness of governance, risk management and control processes at ITC over the management and use of unearmarked funds (W1). The audit covered the period from January 2015 - June 2017 and included a review of fundraising and relationship with donors, planning and use of W1 funds, and monitoring and reporting. The audit found that there were adequate arrangements for reviewing and approving W1 allocations, and for donor reporting and managing donor relationships. Review of sample expenditures showed adequate support and alignment to approved projects and activities. The audit found that ITC used W1 funds to develop expertise, tools and to demonstrate results in new areas of work for which it had now leveraged earmarked funds.
Based on its findings, OIOS made five recommendations: 1) the evaluation of the current resource mobilization strategy and incorporating lessons learnt in the revised strategy; 2) definition of a minimum level of W1 as a reserve for the following year; 3) operationalization of ITC’s risk management framework; 4) establishment of requirements for justification and approval of budget/actual variances; and finally, 5) (a) establishment of monitoring and reporting of cumulative achievements for long-term W1 initiatives, and (b) a timeline for evaluation of the AIM for Results project to inform its next phase. ITC accepted all recommendations and is addressing them.
Window II allocations follow the grant agreements signed with funders for specific projects. The projects
must fall within the scope of ITC’s Strategic Framework.
The analyses presented in the following sections compare total delivery, as well as W1 and W2 delivery
with the budget allocations reflected in the ITC Operational Plan 2017.
2 OIOS 2017/152; 21/12/2017: Audit of the International Trade Centre projects and activities funded by unearmarked funds. (https://oios.un.org/page?slug=report )
11
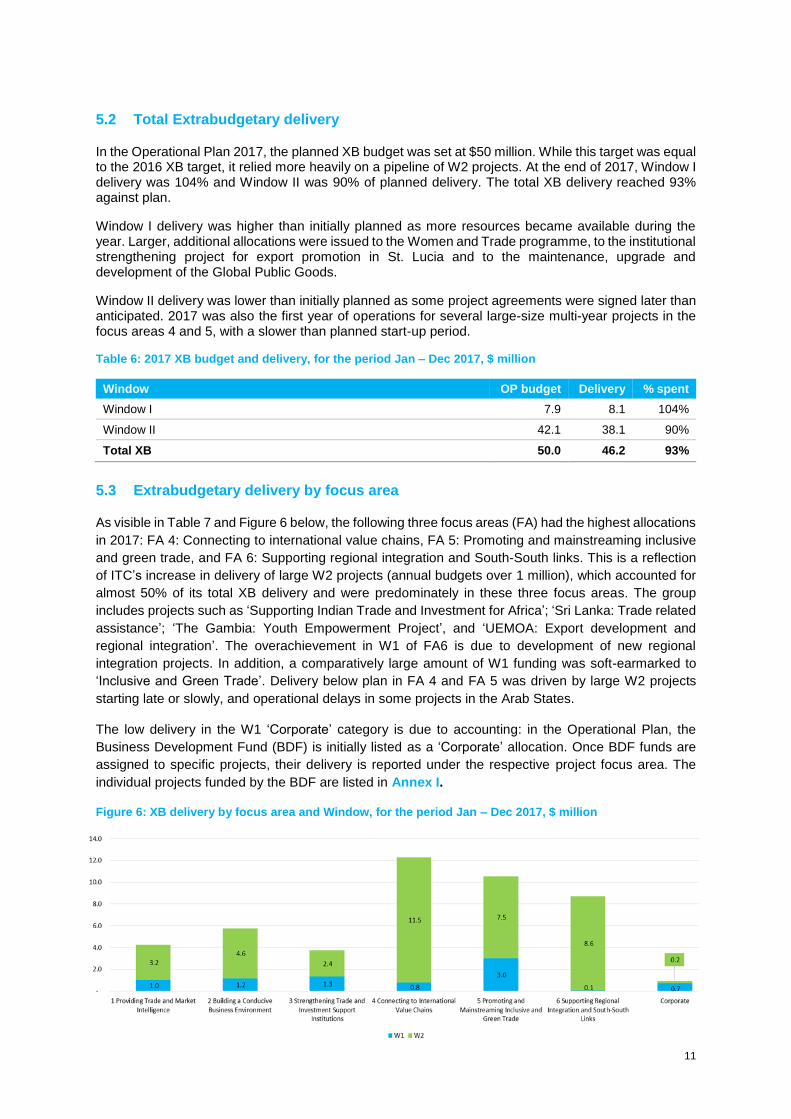
5.2 Total Extrabudgetary delivery
In the Operational Plan 2017, the planned XB budget was set at $50 million. While this target was equal to the 2016 XB target, it relied more heavily on a pipeline of W2 projects. At the end of 2017, Window I delivery was 104% and Window II was 90% of planned delivery. The total XB delivery reached 93% against plan.
Window I delivery was higher than initially planned as more resources became available during the year. Larger, additional allocations were issued to the Women and Trade programme, to the institutional strengthening project for export promotion in St. Lucia and to the maintenance, upgrade and development of the Global Public Goods.
Window II delivery was lower than initially planned as some project agreements were signed later than anticipated. 2017 was also the first year of operations for several large-size multi-year projects in the focus areas 4 and 5, with a slower than planned start-up period.
Table 6: 2017 XB budget and delivery, for the period Jan – Dec 2017, $ million
Window OP budget Delivery % spent
Window I 7.9 8.1 104%
Window II 42.1 38.1 90%
Total XB 50.0 46.2 93%
5.3 Extrabudgetary delivery by focus area
As visible in Table 7 and Figure 6 below, the following three focus areas (FA) had the highest allocations
in 2017: FA 4: Connecting to international value chains, FA 5: Promoting and mainstreaming inclusive
and green trade, and FA 6: Supporting regional integration and South-South links. This is a reflection
of ITC’s increase in delivery of large W2 projects (annual budgets over 1 million), which accounted for
almost 50% of its total XB delivery and were predominately in these three focus areas. The group
includes projects such as ‘Supporting Indian Trade and Investment for Africa’; ‘Sri Lanka: Trade related
assistance’; ‘The Gambia: Youth Empowerment Project’, and ‘UEMOA: Export development and
regional integration’. The overachievement in W1 of FA6 is due to development of new regional
integration projects. In addition, a comparatively large amount of W1 funding was soft-earmarked to
‘Inclusive and Green Trade’. Delivery below plan in FA 4 and FA 5 was driven by large W2 projects
starting late or slowly, and operational delays in some projects in the Arab States.
The low delivery in the W1 ‘Corporate’ category is due to accounting: in the Operational Plan, the
Business Development Fund (BDF) is initially listed as a ‘Corporate’ allocation. Once BDF funds are
assigned to specific projects, their delivery is reported under the respective project focus area. The
individual projects funded by the BDF are listed in Annex I.
Figure 6: XB delivery by focus area and Window, for the period Jan – Dec 2017, $ million
12
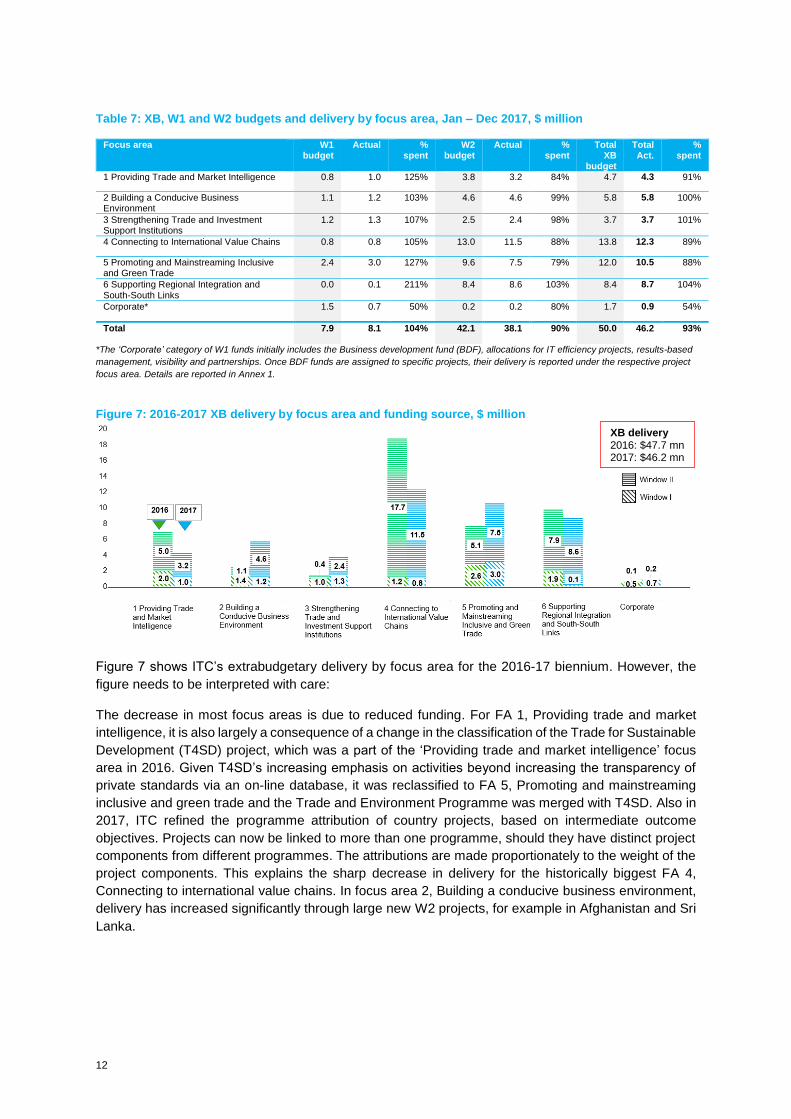
Table 7: XB, W1 and W2 budgets and delivery by focus area, Jan – Dec 2017, $ million
Focus area W1 budget
Actual % spent
W2 budget
Actual % spent
Total XB
budget
Total Act.
% spent
1 Providing Trade and Market Intelligence 0.8 1.0 125% 3.8 3.2 84% 4.7 4.3 91%
2 Building a Conducive Business Environment
1.1 1.2 103% 4.6 4.6 99% 5.8 5.8 100%
3 Strengthening Trade and Investment Support Institutions
1.2 1.3 107% 2.5 2.4 98% 3.7 3.7 101%
4 Connecting to International Value Chains 0.8 0.8 105% 13.0 11.5 88% 13.8 12.3 89%
5 Promoting and Mainstreaming Inclusive and Green Trade
2.4 3.0 127% 9.6 7.5 79% 12.0 10.5 88%
6 Supporting Regional Integration and South-South Links
0.0 0.1 211% 8.4 8.6 103% 8.4 8.7 104%
Corporate* 1.5 0.7 50% 0.2 0.2 80% 1.7 0.9 54%
Total 7.9 8.1 104% 42.1 38.1 90% 50.0 46.2 93%
*The ‘Corporate’ category of W1 funds initially includes the Business development fund (BDF), allocations for IT efficiency projects, results-based
management, visibility and partnerships. Once BDF funds are assigned to specific projects, their delivery is reported under the respective project
focus area. Details are reported in Annex 1.
Figure 7: 2016-2017 XB delivery by focus area and funding source, $ million
Figure 7 shows ITC’s extrabudgetary delivery by focus area for the 2016-17 biennium. However, the
figure needs to be interpreted with care:
The decrease in most focus areas is due to reduced funding. For FA 1, Providing trade and market
intelligence, it is also largely a consequence of a change in the classification of the Trade for Sustainable
Development (T4SD) project, which was a part of the ‘Providing trade and market intelligence’ focus
area in 2016. Given T4SD’s increasing emphasis on activities beyond increasing the transparency of
private standards via an on-line database, it was reclassified to FA 5, Promoting and mainstreaming
inclusive and green trade and the Trade and Environment Programme was merged with T4SD. Also in
2017, ITC refined the programme attribution of country projects, based on intermediate outcome
objectives. Projects can now be linked to more than one programme, should they have distinct project
components from different programmes. The attributions are made proportionately to the weight of the
project components. This explains the sharp decrease in delivery for the historically biggest FA 4,
Connecting to international value chains. In focus area 2, Building a conducive business environment,
delivery has increased significantly through large new W2 projects, for example in Afghanistan and Sri
Lanka.
XB delivery 2016: $47.7 mn 2017: $46.2 mn
13
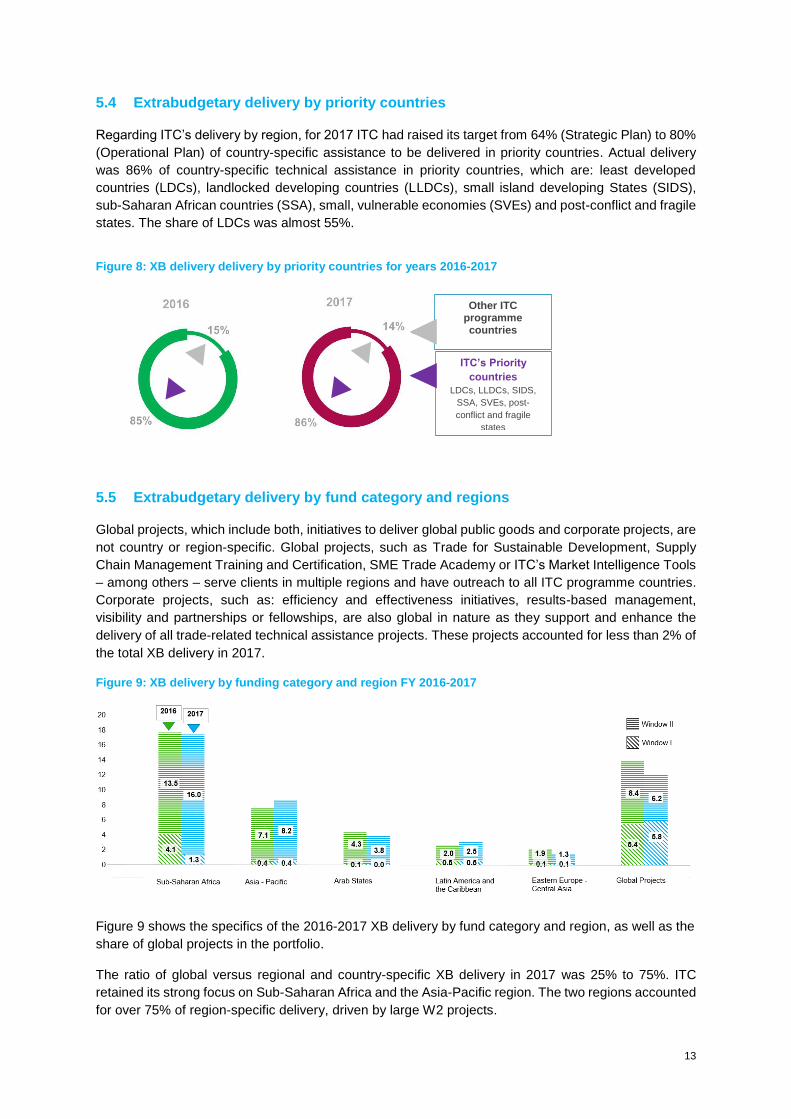
5.4 Extrabudgetary delivery by priority countries
Regarding ITC’s delivery by region, for 2017 ITC had raised its target from 64% (Strategic Plan) to 80%
(Operational Plan) of country-specific assistance to be delivered in priority countries. Actual delivery
was 86% of country-specific technical assistance in priority countries, which are: least developed
countries (LDCs), landlocked developing countries (LLDCs), small island developing States (SIDS),
sub-Saharan African countries (SSA), small, vulnerable economies (SVEs) and post-conflict and fragile
states. The share of LDCs was almost 55%.
Figure 8: XB delivery delivery by priority countries for years 2016-2017
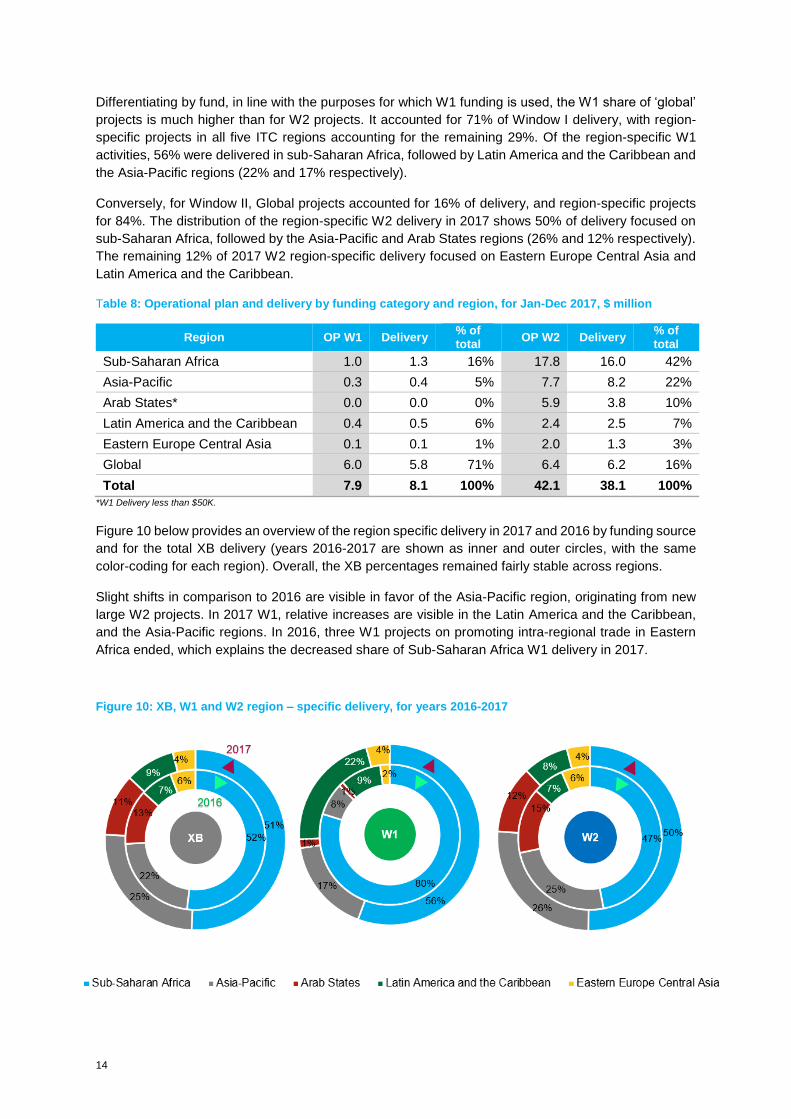
5.5 Extrabudgetary delivery by fund category and regions
Global projects, which include both, initiatives to deliver global public goods and corporate projects, are
not country or region-specific. Global projects, such as Trade for Sustainable Development, Supply
Chain Management Training and Certification, SME Trade Academy or ITC’s Market Intelligence Tools
– among others – serve clients in multiple regions and have outreach to all ITC programme countries.
Corporate projects, such as: efficiency and effectiveness initiatives, results-based management,
visibility and partnerships or fellowships, are also global in nature as they support and enhance the
delivery of all trade-related technical assistance projects. These projects accounted for less than 2% of
the total XB delivery in 2017.
Figure 9: XB delivery by funding category and region FY 2016-2017
Figure 9 shows the specifics of the 2016-2017 XB delivery by fund category and region, as well as the
share of global projects in the portfolio.
The ratio of global versus regional and country-specific XB delivery in 2017 was 25% to 75%. ITC
retained its strong focus on Sub-Saharan Africa and the Asia-Pacific region. The two regions accounted
for over 75% of region-specific delivery, driven by large W2 projects.
ITC’s Priority
countries
LDCs, LLDCs, SIDS,
SSA, SVEs, post-
conflict and fragile
states
Other ITC programme countries
14
Differentiating by fund, in line with the purposes for which W1 funding is used, the W1 share of ‘global’
projects is much higher than for W2 projects. It accounted for 71% of Window I delivery, with region-
specific projects in all five ITC regions accounting for the remaining 29%. Of the region-specific W1
activities, 56% were delivered in sub-Saharan Africa, followed by Latin America and the Caribbean and
the Asia-Pacific regions (22% and 17% respectively).
Conversely, for Window II, Global projects accounted for 16% of delivery, and region-specific projects
for 84%. The distribution of the region-specific W2 delivery in 2017 shows 50% of delivery focused on
sub-Saharan Africa, followed by the Asia-Pacific and Arab States regions (26% and 12% respectively).
The remaining 12% of 2017 W2 region-specific delivery focused on Eastern Europe Central Asia and
Latin America and the Caribbean.
Table 8: Operational plan and delivery by funding category and region, for Jan-Dec 2017, $ million
Region OP W1 Delivery % of total
OP W2 Delivery % of total
Sub-Saharan Africa 1.0 1.3 16% 17.8 16.0 42%
Asia-Pacific 0.3 0.4 5% 7.7 8.2 22%
Arab States* 0.0 0.0 0% 5.9 3.8 10%
Latin America and the Caribbean 0.4 0.5 6% 2.4 2.5 7%
Eastern Europe Central Asia 0.1 0.1 1% 2.0 1.3 3%
Global 6.0 5.8 71% 6.4 6.2 16%
Total 7.9 8.1 100% 42.1 38.1 100%
*W1 Delivery less than $50K.
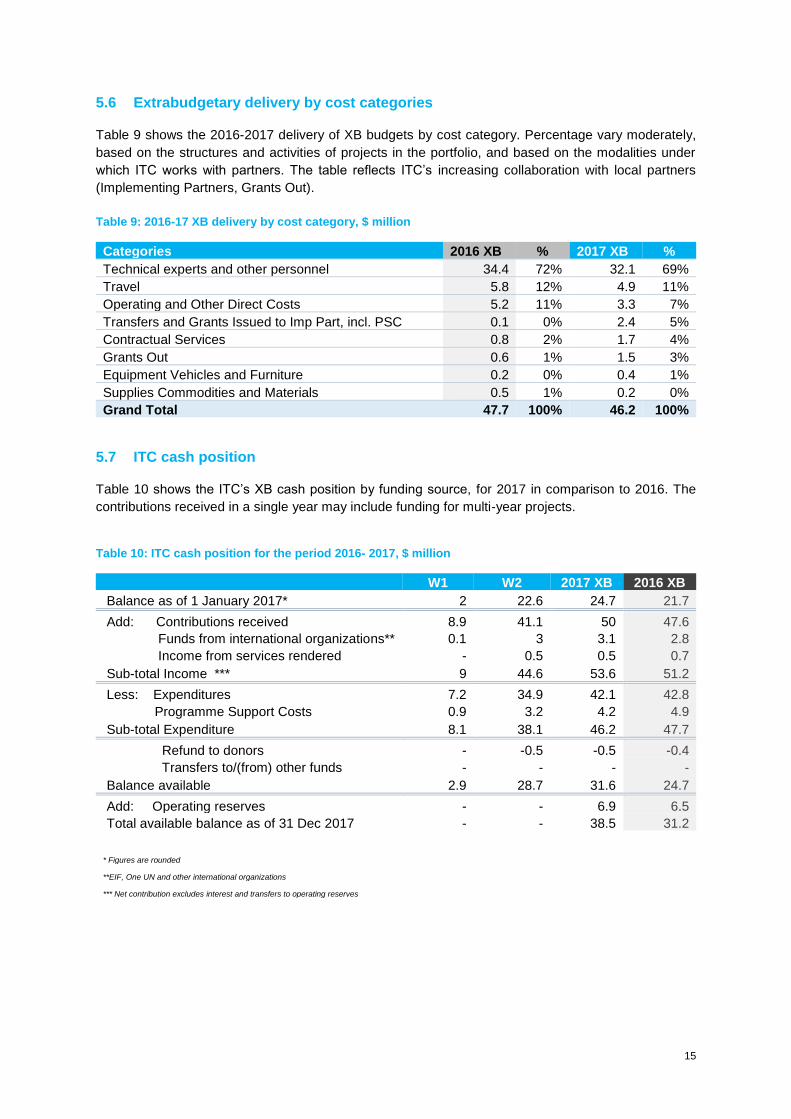
Figure 10 below provides an overview of the region specific delivery in 2017 and 2016 by funding source
and for the total XB delivery (years 2016-2017 are shown as inner and outer circles, with the same
color-coding for each region). Overall, the XB percentages remained fairly stable across regions.
Slight shifts in comparison to 2016 are visible in favor of the Asia-Pacific region, originating from new
large W2 projects. In 2017 W1, relative increases are visible in the Latin America and the Caribbean,
and the Asia-Pacific regions. In 2016, three W1 projects on promoting intra-regional trade in Eastern
Africa ended, which explains the decreased share of Sub-Saharan Africa W1 delivery in 2017.
Figure 10: XB, W1 and W2 region – specific delivery, for years 2016-2017
15
5.6 Extrabudgetary delivery by cost categories
Table 9 shows the 2016-2017 delivery of XB budgets by cost category. Percentage vary moderately,
based on the structures and activities of projects in the portfolio, and based on the modalities under
which ITC works with partners. The table reflects ITC’s increasing collaboration with local partners
(Implementing Partners, Grants Out).
Table 9: 2016-17 XB delivery by cost category, $ million
Categories 2016 XB % 2017 XB %
Technical experts and other personnel 34.4 72% 32.1 69%
Travel 5.8 12% 4.9 11%
Operating and Other Direct Costs 5.2 11% 3.3 7%
Transfers and Grants Issued to Imp Part, incl. PSC 0.1 0% 2.4 5%
Contractual Services 0.8 2% 1.7 4%
Grants Out 0.6 1% 1.5 3%
Equipment Vehicles and Furniture 0.2 0% 0.4 1%
Supplies Commodities and Materials 0.5 1% 0.2 0%
Grand Total 47.7 100% 46.2 100%
5.7 ITC cash position
Table 10 shows the ITC’s XB cash position by funding source, for 2017 in comparison to 2016. The
contributions received in a single year may include funding for multi-year projects.
Table 10: ITC cash position for the period 2016- 2017, $ million
W1 W2 2017 XB 2016 XB
Balance as of 1 January 2017* 2 22.6 24.7 21.7
Add: Contributions received 8.9 41.1 50 47.6
Funds from international organizations** 0.1 3 3.1 2.8
Income from services rendered - 0.5 0.5 0.7
Sub-total Income *** 9 44.6 53.6 51.2
Less: Expenditures 7.2 34.9 42.1 42.8
Programme Support Costs 0.9 3.2 4.2 4.9
Sub-total Expenditure 8.1 38.1 46.2 47.7
Refund to donors - -0.5 -0.5 -0.4
Transfers to/(from) other funds - - - -
Balance available 2.9 28.7 31.6 24.7
Add: Operating reserves - - 6.9 6.5
Total available balance as of 31 Dec 2017 - - 38.5 31.2
* Figures are rounded
**EIF, One UN and other international organizations
*** Net contribution excludes interest and transfers to operating reserves
16
6. Programme Support Costs
The charge collected on trust funds or extrabudgetary expenditures is called Programme Support Costs
(PSC) and is expressed as a percentage of direct costs (expenditure). PSC are charged to recover
incremental indirect costs that are defined as additional costs incurred when supporting activities
financed from extrabudgetary contributions (e.g. indirect costs for the central administration of human,
financial, physical and ICT resources and operating systems, staffing, facilities, equipment, legal costs
and liabilities etc.). The recovery and use of PSC resources are of central importance to the financing
and organization of efficient and effective programme support services.
Table 11: PSC delivery by cost category, for the period Jan – Dec 2017, US $ million
Categories Spent % Contractual Services 0.0 0%
Operating and Other Direct Costs 0.6 11%
Staff and other personnel costs 4.7 89%
Supplies Commodities and Materials 0.0 0%
Total 5.3 100% *Supplies, commodities and materials amount to $4.4 thousands and contractual services amount to 20.4 thousands
17
7. ITC’s performance against the Operational Plan commitments
ITC’s mission is to foster inclusive and sustainable growth and development through trade and
international business development. In its Strategic Plan 2015-17, ITC has set targets in the form of
‘key deliverables’, reflecting how the organisation intends to meet its goal. In each annual Operational
Plan these targets were broken down further, both in form of a Corporate Scorecard, and in form of
transforming the key deliverables into operational milestones. ITC achieved the vast majority of the 44
2015-17 Strategic plan milestones, and remains committed to carry forward the few milestones (6, or
13%) that were still in progress at the end of 2017 (see Annex II: Final review and status of Strategic
plan 2015-17 milestones).
The Corporate Scorecard translates ITC’s strategic objectives into a coherent set of performance
measures, considering ITC’s SDG contributions (Tier 1), ITC’s corporate outcomes and
outputs (Tier 2), and key performance indicators for ITC’s operations (Tier 3). The following sections
present the results achieved in 2017.
7.1 ITC’s contribution to the Sustainable Development Goals
Tier 1 of ITC’s results framework aims to track the organization’s contribution to the 2030 Agenda for
Sustainable Development with its 17 Sustainable Development Goals (SDG). The 2030 Agenda
explicitly identifies international trade as ‘an engine for inclusive economic growth, job creation and
poverty reduction’, and as ’contributing to the promotion of sustainable development.’ The private sector
is a major driver of productivity, inclusive economic growth and job creation.
ITC committed to contribute to 10 SDGs through 23 targets. In 2017, project managers were asked for
the first time to provide a short narrative on their project’s contribution to the SDGs.
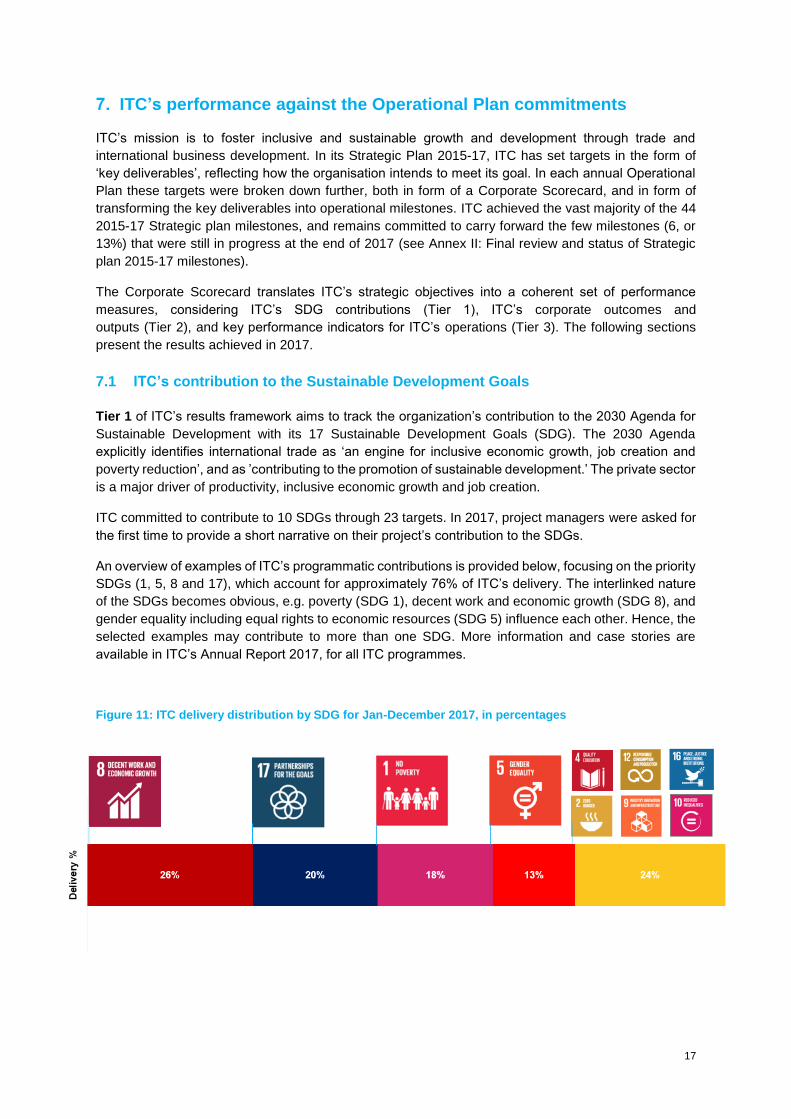
An overview of examples of ITC’s programmatic contributions is provided below, focusing on the priority
SDGs (1, 5, 8 and 17), which account for approximately 76% of ITC’s delivery. The interlinked nature
of the SDGs becomes obvious, e.g. poverty (SDG 1), decent work and economic growth (SDG 8), and
gender equality including equal rights to economic resources (SDG 5) influence each other. Hence, the
selected examples may contribute to more than one SDG. More information and case stories are
available in ITC’s Annual Report 2017, for all ITC programmes.
Figure 11: ITC delivery distribution by SDG for Jan-December 2017, in percentages
18
SDG 8: Promote sustained, inclusive and sustainable economic growth, full and productive employment and decent work for all
ITC addresses four targets under SDG 8: 8.2 Achieve higher levels of economic productivity through
diversification, technological upgrading and innovation; 8.3. (1) Promote policies that support productive
activities, decent job creation, entrepreneurship, creativity and innovation; and (2) Encourage
formalization and growth of micro, small and medium-sized enterprises; 8.9 Implement policies to
promote sustainable tourism that creates jobs and promotes local culture and products and 8.11
Increase Aid for Trade support.
The largest contributions in area of SDGs 8 were achieved in ITC’s Empowering Poor Communities to
Trade Programme that achieved formalization and sustainable income generation of micro-
entrepreneurs in Sub-Saharan African countries. In addition, within the Women and Trade programme,
facilitating growth of women-owned enterprises, and within the Value Added to Trade programme, in
particular in the NTF III interventions in Sub-Saharan Africa, significant enterprise revenue increases
were generated. Investment in technologies and achievement of new business deals within new
markets, as significant drivers of growth, were also recorded with many beneficiaries involved in the
South-South Trade and Investment programme.
SDG 17 Strengthen the means of implementation and revitalize the global partnership for sustainable development
ITC contributes to SDG 17 through 3 targets: 17.10 Ensure a universal, rules-based, open, non-
discriminatory and equitable multilateral trading system under the WTO; 17.11 Support significantly
increased exports of developing countries, doubling the least developed countries’ share of global
exports by 2020 and 17.12: Realize timely implementation of duty-free and quota-free market access
on a lasting basis for all least developed countries, consistent with World Trade Organization decisions,
including by ensuring that preferential rules of origin applicable to imports from least developed
countries are transparent and simple, and contribute to facilitating market access.
Several ITC programmes facilitated the conclusion of significant transactions, deals and leads for
international trade and investment. The ‘South-South Trade and Investment’ programme recorded over
$37 million of trade and investment deals and $95 million under negotiation, followed by the Women
and Trade programme with over $24 million of transacted business and business leads. In both cases,
beneficiary MSMEs were mostly from Sub-Saharan Africa.
Within the ‘Value Added to Trade’ programme, projects have reported over $15 million of signed
contracts and generated sales. The majority of beneficiaries were from LDCs and LLDCs in Eastern
Europe and Central Asia and the Asia-Pacific region.
ITC’s activities in the focus area of ‘Providing trade and market intelligence’ have contributed
significantly to transparency in trade rules, market access requirements and rules of origin.
SDG 1: End poverty in all its forms, everywhere
ITC contributes to SDG 1 through two targets: target 1.2 Reduce the proportion of men, women and
children of all ages living in poverty, and target 1.7(1.b) Create sound policy frameworks based on pro-
poor and gender-sensitive development strategies.
In the programmatic areas “Value Added to Trade”, “Empowering Women to Trade” and “Empowering
Poor Communities to Trade”, significant results were recorded in the textile and agribusiness sectors,
where beneficiaries have formalized their business activities; grouped into cooperatives, sectoral
associations or artisan groups, and have obtained new knowledge and technical know-how, resulting
in employment and income increases.
As an example of impact at the policy level, ITC had a long-term involvement in the Sub-Saharan Africa
cotton sector, assisting in the development of a first Tanzania’s “Cotton-to Clothing (C2C) value chain
19
development strategy 2016-2020”. The strategy represents a framework to deliver a vision of
Tanzania’s National Industrialization Plan (2017-2020), in which the cotton and textiles sector has a
priority development status. This strategy revealed the positive potential impact of inclusion of women
in the organic cotton sector, in terms of socio-economic inclusion, acquisition of skills, health and
income3, and the promising opportunities for wealth and job creation in the cotton sector and related
creative industries for Tanzanian youth. The Textile Development Unit, within the Tanzanian Ministry of
Industry, Trade and Investment, continues to support the National C2C Secretariat, and to provide
policy advice and analysis to the Ministry.4
SDG 5: Achieve gender equality and empower all women and girls
ITC contributes to SDG 5 through three targets: target 5.5 Ensure women’s full and effective
participation in business and trade and equal opportunities for leadership in political, economic and
public life; Target 5.a Support women’s equal rights to economic resources and Target 5.b Enhance
use of enabling technology to promote the empowerment of women.
The most explicit contribution comes through ITC’s Women and Trade (‘SheTrades’) programme, with
significant Window I (W1) funding. For example, ITC’s advocacy was instrumental for the adoption of
the WTO Buenos Aires declaration on Women and Trade at the WTO Ministerial Conference in
December 2017, which was supported by 120 WTO members. SheTrades has used technology to
facilitate the connection of women-owned business enterprises to markets. By 2017, partners had
committed to connecting 980,000 women entrepreneurs to international markets – well ahead of the
initial target of 1 million by 2020. ITC also contributes to SDG 5 by having adopted the target indicator
of at least 40% of female beneficiaries across all ITC projects.
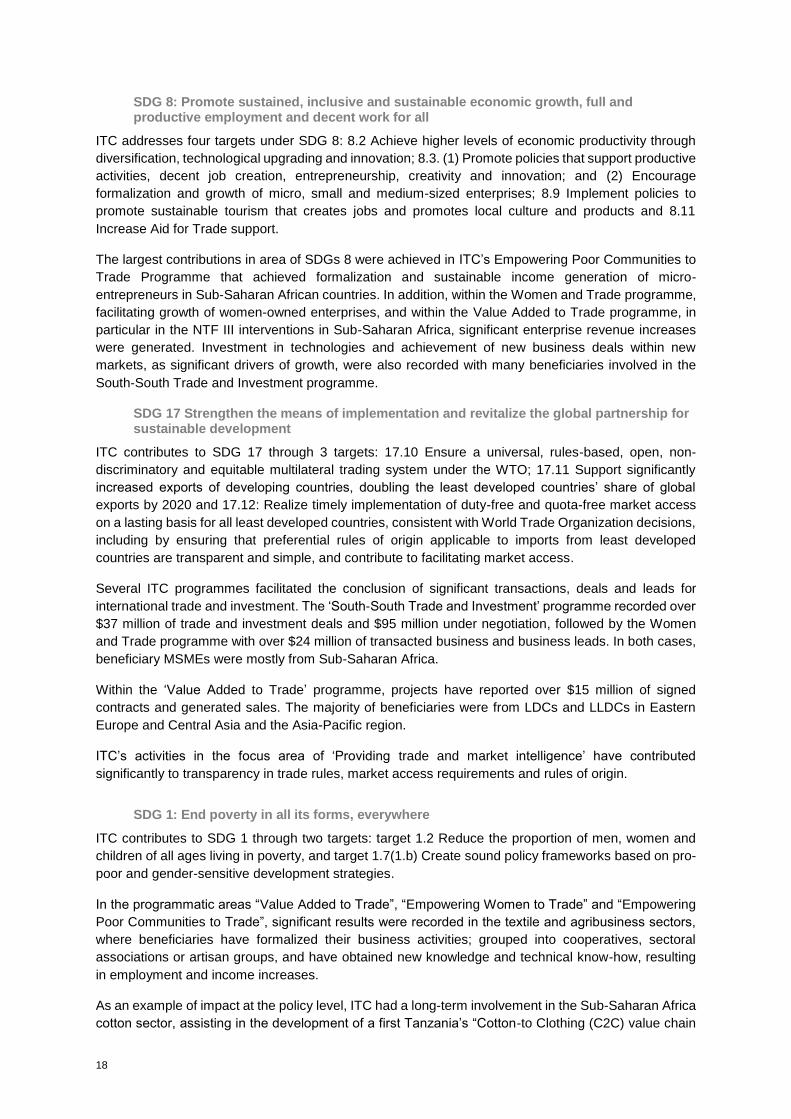
Figure 12 below shows the frequency of project linkages to SDG goals and targets for the year 2017.
The linkages show the mapping of programmatic contributions to individual SDGs
Figure 12: Frequency of ITC project linkages to SDG goals and targets
3 See United Republic of Tanzania Cotton to Clothing Strategy 2016-2020, p.87 4 See more at https://tdu.or.tz/about-the-tdu/
20
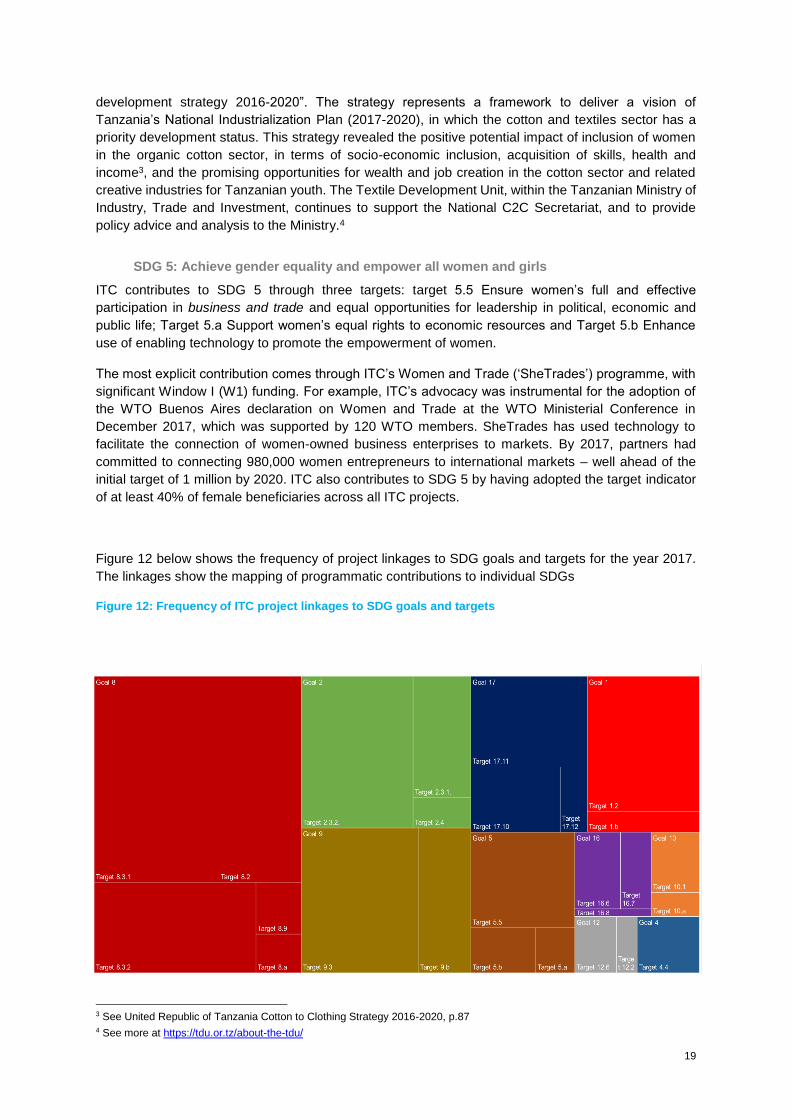
In addition to ITC’s efforts to contribute through its own technical assistance projects to the 2030
Agenda, ITC also contributes to the global effort to track the progress on achieving the SDGs. Together
with WTO and UNCTAD, ITC is the custodian agency for the indicators 10.a, 17.10, 17.11 and 17.12.
Figure 13: ITC’s direct contribution to SDG monitoring
Goal 10: Reduce inequality within and among countries
Target 10.a: Implement the principle of special and differential treatment for developing countries, in
particular least developed countries, in accordance with World Trade Organization agreements
Indicator 10.a.1: Proportion of tariff lines applied to imports from least developed countries and
developing countries with zero-tariff
Goal 17. Strengthen the means of implementation and revitalize the Global Partnership for
Sustainable Development
Target 17.10: Promote a universal, rules-based, open, non-discriminatory and equitable multilateral
trading system under the World Trade Organization, including through the conclusion of negotiations
under its Doha Development Agenda
Indicator 17.10.1: Worldwide weighted tariff-average
Target 17.11: Significantly increase the exports of developing countries, in particular with a view to
doubling the least developed countries' share of global exports by 2020
Indicator 17.11.1: Developing countries' and least developed countries' share of global exports
Target 17.12: Realize timely implementation of duty-free and quota-free market access on a lasting
basis for all least developed countries, consistent with World Trade Organization decisions, including
by ensuring that preferential rules of origin applicable to imports from least developed countries are
transparent and simple, and contribute to facilitating market access
Indicator 17.12.1: Average tariffs faced by developing countries, least developed countries and
small island developing States
21
7.2 ITC’s performance against Tier 2 of the Corporate Scorecard
Corporate Outcomes
ITC’s Tier 2 of the corporate scorecard reflects corporate outcomes and output indicators and their
targets as specified in the 2016-17 Strategic Framework and approved by the UN General Assembly.
The outcome and output indicators are an integral part of ITC’s corporate results framework:
In line with the 2030 agenda and as established through long-term research, ITC’s results framework
(also known as the corporate theory of change) builds on international trade as a lever for inclusive and
sustainable development. Firms connected to international markets are more productive and create
more employment, drive up wages and – because micro, small and medium sized enterprises (MSMEs)
account for the bulk of job creation - make growth more inclusive.
MSME international competitiveness is seen as being contingent on the decisions and actions of four
types of actors: MSMEs, policymakers and regulators, trade and investment support institutions (TISIs),
as well as international market partners such as buyers and investors. ITC seeks to influence these
actors, to change their decision-making in favour of increasing the international competitiveness of
MSMEs. To this end, ITC carries out interventions that expand awareness on factors that are conducive
or obstructive to MSME competitiveness; builds the actors’ skills and knowledge to rectify problems and
to take advantage of opportunities; enables them to formulate and gain consensus on action plans; and
supports them in following-through on these plans.
ITC’s corporate outcome indicators aim to track changes at the level of improved international
competitiveness of MSMEs (Outcome indicator C3 and C4), and at the level of changes in the actions
of the key actors (Outcome indicators C1 and C2; B1 and A2). Given that an increased awareness of
factors surrounding international trade competitiveness is important for a change in actions of all actors
involved in or influencing international trade, one of the corporate indicators also tracks ITC’s results at
this level (A1).
Each ITC project establishes a logframe with results indicators that are customized to the requirements
of the specific project partners. At the same time, each ITC project also follows the logic of the corporate
theory of change and links to one or more of the corporate results indicators. These indicators are
tracked quarterly and reported bi-annually. Table 12 shows targets and actuals for each of the
indicators.
22
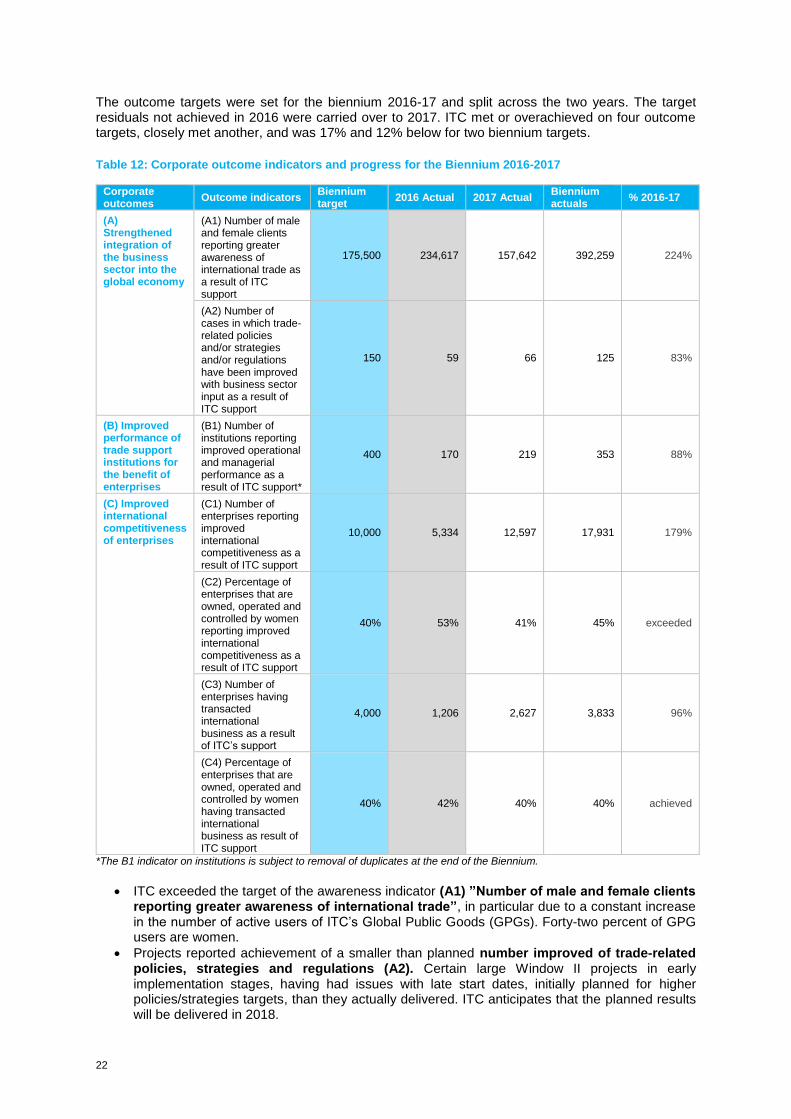
The outcome targets were set for the biennium 2016-17 and split across the two years. The target residuals not achieved in 2016 were carried over to 2017. ITC met or overachieved on four outcome targets, closely met another, and was 17% and 12% below for two biennium targets.
Table 12: Corporate outcome indicators and progress for the Biennium 2016-2017
Corporate outcomes
Outcome indicators Biennium target
2016 Actual 2017 Actual Biennium actuals
% 2016-17
(A) Strengthened integration of the business sector into the global economy
(A1) Number of male and female clients reporting greater awareness of international trade as a result of ITC support
175,500 234,617 157,642 392,259 224%
(A2) Number of cases in which trade-related policies and/or strategies and/or regulations have been improved with business sector input as a result of ITC support
150 59 66 125 83%
(B) Improved performance of trade support institutions for the benefit of enterprises
(B1) Number of institutions reporting improved operational and managerial performance as a result of ITC support*
400 170 219 353 88%
(C) Improved international competitiveness of enterprises
(C1) Number of enterprises reporting improved international competitiveness as a result of ITC support
10,000 5,334 12,597 17,931 179%
(C2) Percentage of enterprises that are owned, operated and controlled by women reporting improved international competitiveness as a result of ITC support
40% 53% 41% 45% exceeded
(C3) Number of enterprises having transacted international business as a result of ITC’s support
4,000 1,206 2,627 3,833 96%
(C4) Percentage of enterprises that are owned, operated and controlled by women having transacted international business as result of ITC support
40% 42% 40% 40% achieved
*The B1 indicator on institutions is subject to removal of duplicates at the end of the Biennium.
ITC exceeded the target of the awareness indicator (A1) ”Number of male and female clients reporting greater awareness of international trade”, in particular due to a constant increase in the number of active users of ITC’s Global Public Goods (GPGs). Forty-two percent of GPG users are women.
Projects reported achievement of a smaller than planned number improved of trade-related policies, strategies and regulations (A2). Certain large Window II projects in early implementation stages, having had issues with late start dates, initially planned for higher policies/strategies targets, than they actually delivered. ITC anticipates that the planned results will be delivered in 2018.
23
ITC reported fewer than planned TISIs having improved their performance (B1). The reason is that, so far, the definition of this indicator counted only unique institutions, thus ITC reported the net figure, removing duplicate entries. In some cases, several projects may intervene with the same institution in different performance areas. The Strenghening Trade and Investment Support Institutions programme was the largest contributor to this indicator having assisted numerous institutions in Morocco, Ghana, the Gambia, Sri Lanka, Kenya and Indonesia. Large contributions also came from projects in Benin, Fiji and the Caribbean. The 2017 Annual Evaluation Synthesis Report indicated the need to provide long term and deep institutional support to TISIs, especially in the areas where their involvement with the business sector is essential. From 2018 onwards, ITC will start monitoring this indicator, capturing more qualitative information, thus allowing to estimate the depth of institutional interventions.
At the MSME level (C1-C4 indicators), ITC has met or exceeded 3 out of 4 targets. The largest contributors to increased MSME competitiveness were project interventions in the coffee sector of Ethiopia and Rwanda; within the fashion and textiles sector in Burkina Faso, Mali, Ethiopia and Kenya; and a project targeting women within the Indian Ocean Rim. The MSMEs have achieved a record number of business transactions in 2017. The beneficiaries in Fiji’s agribusiness sector, under the Empowering Poor Communities to Trade programme, and in the Kenyan avocado sector reported the largest number of business transactions, followed by beneficiary companies of the Supporting Indian Trade and Investment for Africa project. Over 40% of beneficiaries with increased competitiveness and reporting international business transactions were women-owned, operated or controlled MSMEs.
24
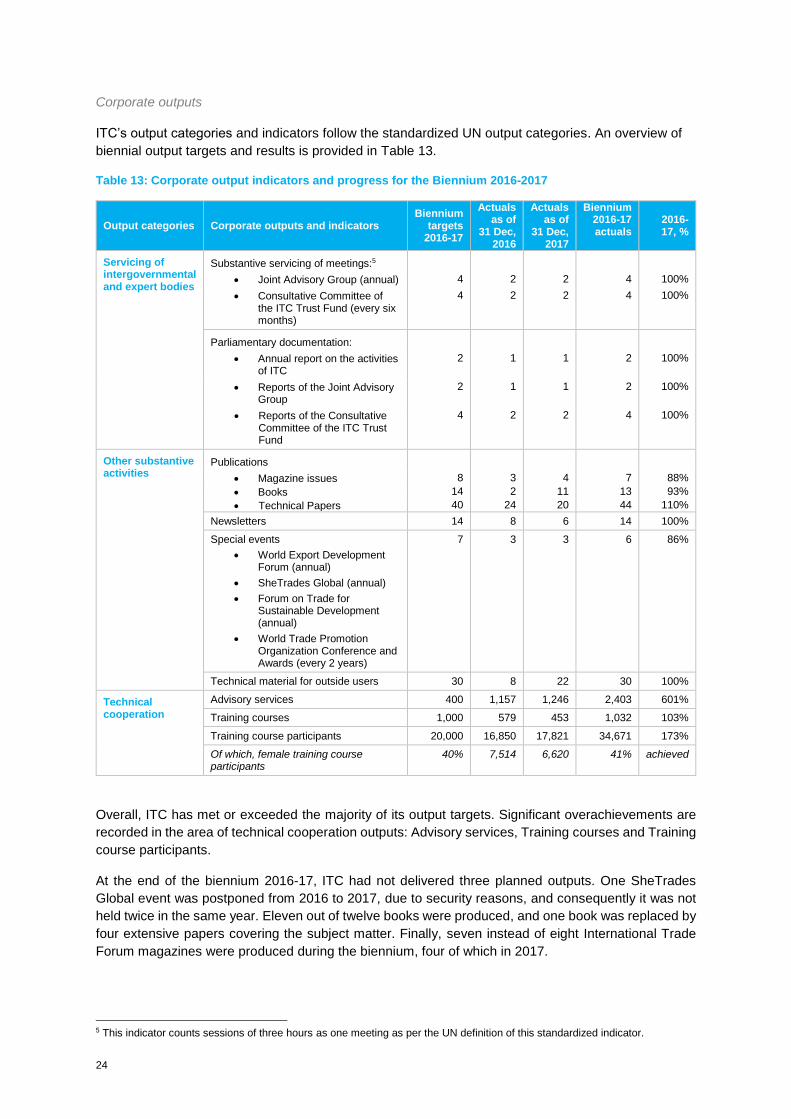
Corporate outputs
ITC’s output categories and indicators follow the standardized UN output categories. An overview of
biennial output targets and results is provided in Table 13.
Table 13: Corporate output indicators and progress for the Biennium 2016-2017
Output categories Corporate outputs and indicators Biennium
targets 2016-17
Actuals as of
31 Dec, 2016
Actuals as of
31 Dec, 2017
Biennium 2016-17 actuals
2016- 17, %
Servicing of intergovernmental and expert bodies
Substantive servicing of meetings:5
Joint Advisory Group (annual) 4 2 2 4 100%
Consultative Committee of the ITC Trust Fund (every six months)
4 2 2 4 100%
Parliamentary documentation:
Annual report on the activities of ITC
2 1 1 2 100%
Reports of the Joint Advisory Group
2 1 1 2 100%
Reports of the Consultative Committee of the ITC Trust Fund
4 2 2 4 100%
Other substantive activities
Publications
Magazine issues 8 3 4 7 88%
Books 14 2 11 13 93%
Technical Papers 40 24 20 44 110%
Newsletters 14 8 6 14 100%
Special events
World Export Development Forum (annual)
SheTrades Global (annual)
Forum on Trade for Sustainable Development (annual)
World Trade Promotion Organization Conference and Awards (every 2 years)
7 3 3 6 86%
Technical material for outside users 30 8 22 30 100%
Technical cooperation
Advisory services 400 1,157 1,246 2,403 601%
Training courses 1,000 579 453 1,032 103%
Training course participants 20,000 16,850 17,821 34,671 173%
Of which, female training course participants
40% 7,514 6,620 41% achieved
Overall, ITC has met or exceeded the majority of its output targets. Significant overachievements are
recorded in the area of technical cooperation outputs: Advisory services, Training courses and Training
course participants.
At the end of the biennium 2016-17, ITC had not delivered three planned outputs. One SheTrades
Global event was postponed from 2016 to 2017, due to security reasons, and consequently it was not
held twice in the same year. Eleven out of twelve books were produced, and one book was replaced by
four extensive papers covering the subject matter. Finally, seven instead of eight International Trade
Forum magazines were produced during the biennium, four of which in 2017.
5 This indicator counts sessions of three hours as one meeting as per the UN definition of this standardized indicator.
25
7.3 Window I contribution to ITC’s corporate results
Window I funding is “core” funding, as it supports the mandate of ITC as an organization. It is by nature
fully aligned with ITC’s programme of work and ITC’s strategic framework. The funders either define
their contribution at the level of ITC’s mandate or soft-earmark at the focus area or programme level.
This enables ITC to respond in the most flexible manner to changing beneficiary needs.
Window I funders can claim very tangible outputs, ranging from new tools, innovative methods, to
impact on the ground.
One of the advantages of Window I funding is its ability to produce multiplier effects, as its immediate
outputs find their application across multiple ITC interventions. Furthermore, the Window I business
development fund mobilizes and leverages additional XB funding (Window II). From 2013 to date, one
dollar invested in W1 Business development fund leveraged on average over $21 of additional
Window II (W2) ITC project funding. There are also funds leveraged in form of activities of other
development actors, as a result of ITC’s interventions. So far, ITC has not systematically tracked the
leverage effect through such additional funding. This will be pursued, starting in 2018.
Window I funding enables ITC to provide solutions for universal obstacles to international trade, across
all six focus areas. The products and services that are developed, maintained or upgraded, contribute
to outcome level results, be it through their application and customization in country and regional
projects or as ‘global public goods’.
Examples in 2017 include ITC’s flagship SME Competitiveness report, awareness-raising tools and
knowledge toolkits for ITC’s beneficiaries:
An innovative database and web application on Rules of Origin was been developed. Rules of
origin cover laws, regulations and administrative determinations of general application applied
by government of importing countries to determine the origin of goods under specific trade
agreements. The database contains 20 trade agreements involving 50 countries and more than
5,000 different rules of origin classified by ITC and provided at the “tariff line” product level. The
database also includes information on origin provision and administrative procedures. It speaks
directly to SDG target 17.12 “Realize timely implementation of duty-free and quota-free market
access on a lasting basis for all least developed countries, consistent with World Trade
Organization decisions, including by ensuring that preferential rules of origin applicable to
imports from least developed countries are transparent and simple, and contribute to facilitating
market access”
ITC launched its third flagship SME Competitiveness Outlook (SMECO) in October 2017,
focusing on regional trade. The findings of the report provide targeted advice for businesses,
policymakers and TISIs. The report sent a strong message that regional trade agreements help
deliver inclusive growth for MSMEs, as they boost value chain activities and narrow the
competitiveness gap between large and small firms. The impact on regional trade is even
stronger when investments are included.
ITC used its highly customizable SME Competitiveness Survey (SMECS), as a preferred tool
for data collection on ITC’s MSME beneficiaries, in ITC’s projects under Value added to Trade,
Youth and Trade and Women and Trade programmes. In 2017 alone, 452 companies from the
Gambia, Kenya, Indonesia, Sri Lanka and Uganda were surveyed through SMECS. The results
of the survey, used as benchmarks and measured over time, will contribute to ITC’s ability to
measure project and programme results.
A consolidated training curriculum on e-Solutions was developed and used to train MSMEs and
TISIs across UEMOA, in Bangladesh, Nepal and other Asian countries. TISIs and other
partners trained provided positive evaluations. Some reported improved performance (B1
outcome), now having the capacity to offer their constituencies services that promote better
access to e-commerce opportunities. By applying ITC’s e-Solutions, MSMEs from Rwanda and
26
Syria have already transacted business. The training materials and approaches were adapted
to a new project in UEMOA countries and within other ITC projects using e-Solutions (C3/C4
outcome).
Examples of results (outcomes) achieved with Window I funding, in 2017 are:
Over 2,500 beneficiaries have improved awareness of non-tariff measures (NTMs), as
measured through NTM publications downloads. Information on non-tariff measures applied by
90 countries remain universally available to beneficiaries as well as the entire suite of ITC’s
Global Public Goods.
Within its Supporting Trade Negotiations programme, ITC supported stakeholders in drafting
the national Trade Policy Framework in Tonga: The policy was endorsed by the line Ministry
and is submitted for final approval.
In 76 cases TISIs improved their performance through programmatic interventions: Supporting
TISI programme, Poor Communities and Trade Programme, Export Strategy Design and
Management programme, Supporting Trade Negotiations programme and through E-solutions
and the SME Competitiveness Outlook projects.
Within the Poor Communities and Trade Programme, over 540 micro-entrepreneurs artisans,
organized in groups, ateliers, or transacting through an enterprise, have transacted business.
The majority of them (450) were women beneficiaries, based in Kenya, Burkina Faso and Mali,
Ethiopia and Haiti.
ITC remains committed to providing maximum visibility to Window I funders in ITC’s reports and events
that are available to the public.
27
7.4 ITC’s performance against Tier 3 of the Corporate Scorecard
This tier of the corporate scorecard measures organisational performance in areas that are critical for
effectiveness and efficiency. The targets were set in the Operational plan 2017.
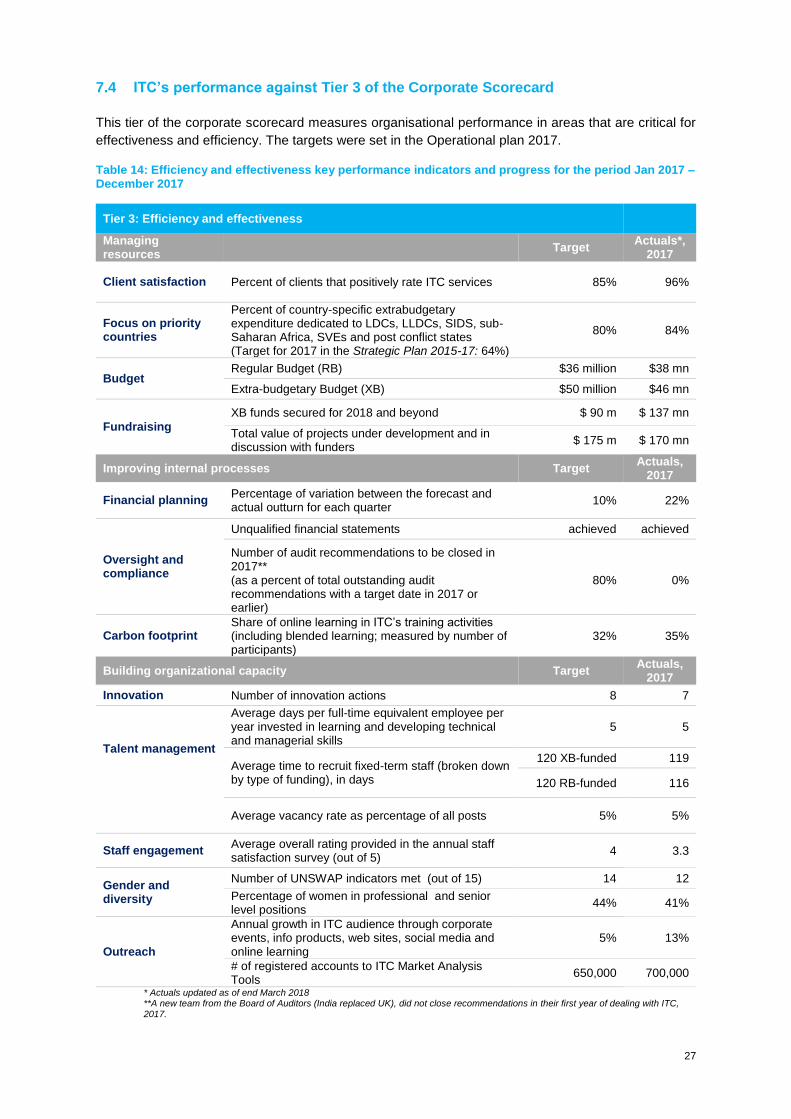
Table 14: Efficiency and effectiveness key performance indicators and progress for the period Jan 2017 – December 2017
Tier 3: Efficiency and effectiveness
Managing resources
Target Actuals*,
2017
Client satisfaction Percent of clients that positively rate ITC services 85% 96%
Focus on priority countries
Percent of country-specific extrabudgetary expenditure dedicated to LDCs, LLDCs, SIDS, sub-Saharan Africa, SVEs and post conflict states (Target for 2017 in the Strategic Plan 2015-17: 64%)
80% 84%
Budget Regular Budget (RB) $36 million $38 mn
Extra-budgetary Budget (XB) $50 million $46 mn
Fundraising
XB funds secured for 2018 and beyond $ 90 m $ 137 mn
Total value of projects under development and in discussion with funders
$ 175 m $ 170 mn
Improving internal processes Target Actuals,
2017
Financial planning Percentage of variation between the forecast and actual outturn for each quarter
10% 22%
Oversight and compliance
Unqualified financial statements achieved achieved
Number of audit recommendations to be closed in 2017** (as a percent of total outstanding audit recommendations with a target date in 2017 or earlier)
80% 0%
Carbon footprint Share of online learning in ITC’s training activities (including blended learning; measured by number of participants)
32% 35%
Building organizational capacity Target Actuals,
2017
Innovation Number of innovation actions 8 7
Talent management
Average days per full-time equivalent employee per year invested in learning and developing technical and managerial skills
5 5
Average time to recruit fixed-term staff (broken down by type of funding), in days
120 XB-funded 119
120 RB-funded 116
Average vacancy rate as percentage of all posts 5% 5%
Staff engagement Average overall rating provided in the annual staff satisfaction survey (out of 5)
4 3.3
Gender and diversity
Number of UNSWAP indicators met (out of 15) 14 12
Percentage of women in professional and senior level positions
44% 41%
Outreach
Annual growth in ITC audience through corporate events, info products, web sites, social media and online learning
5% 13%
# of registered accounts to ITC Market Analysis Tools
650,000 700,000
* Actuals updated as of end March 2018 **A new team from the Board of Auditors (India replaced UK), did not close recommendations in their first year of dealing with ITC, 2017.
28
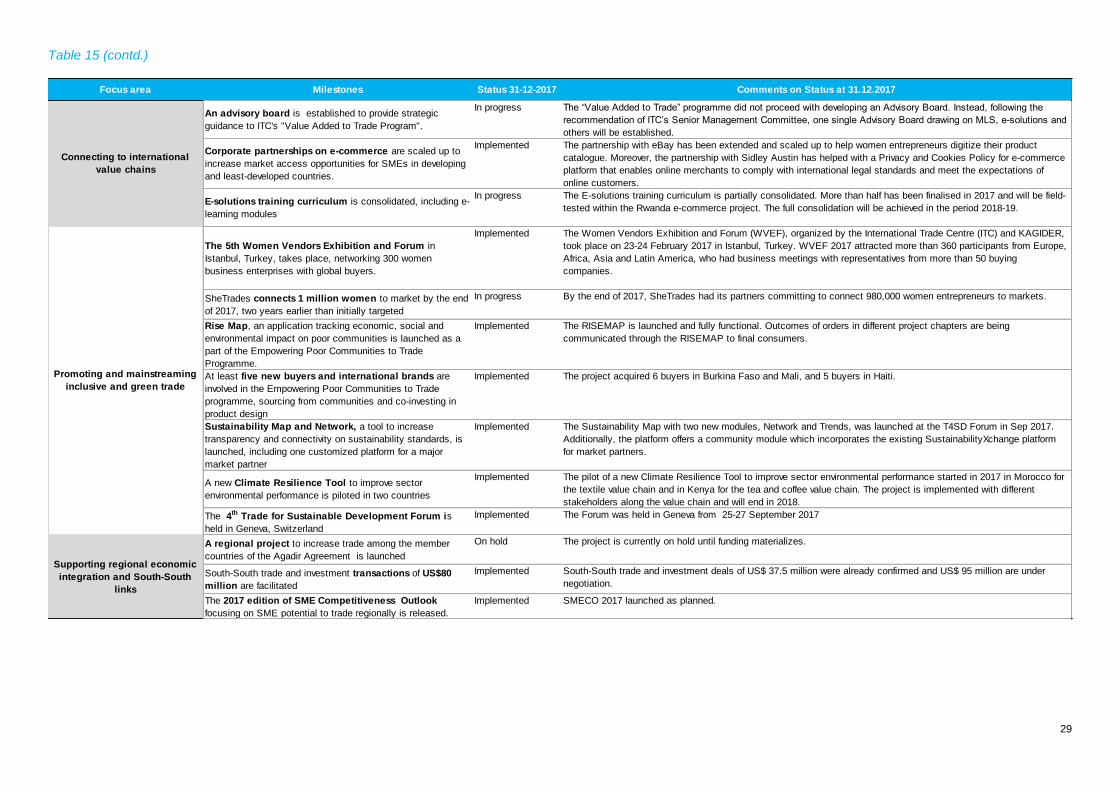
7.5 Status of Operational Plan 2017 deliverables
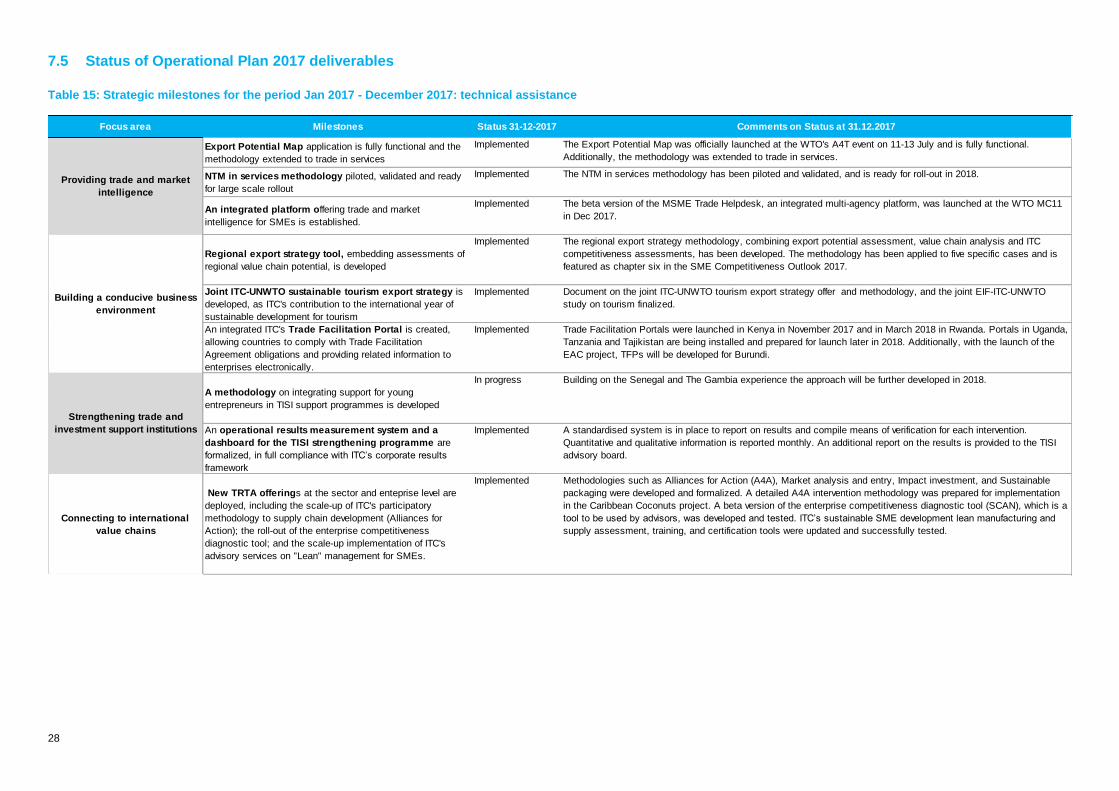
Table 15: Strategic milestones for the period Jan 2017 - December 2017: technical assistance
Focus area Milestones Status 31-12-2017 Comments on Status at 31.12.2017
Export Potential Map application is fully functional and the
methodology extended to trade in services
Implemented The Export Potential Map was officially launched at the WTO's A4T event on 11-13 July and is fully functional.
Additionally, the methodology was extended to trade in services.
NTM in services methodology piloted, validated and ready
for large scale rollout
Implemented The NTM in services methodology has been piloted and validated, and is ready for roll-out in 2018.
An integrated platform offering trade and market
intelligence for SMEs is established.
Implemented The beta version of the MSME Trade Helpdesk, an integrated multi-agency platform, was launched at the WTO MC11
in Dec 2017.
Regional export strategy tool, embedding assessments of
regional value chain potential, is developed
Implemented The regional export strategy methodology, combining export potential assessment, value chain analysis and ITC
competitiveness assessments, has been developed. The methodology has been applied to five specific cases and is
featured as chapter six in the SME Competitiveness Outlook 2017.
Joint ITC-UNWTO sustainable tourism export strategy is
developed, as ITC's contribution to the international year of
sustainable development for tourism
Implemented Document on the joint ITC-UNWTO tourism export strategy offer and methodology, and the joint EIF-ITC-UNWTO
study on tourism finalized.
An integrated ITC's Trade Facilitation Portal is created,
allowing countries to comply with Trade Facilitation
Agreement obligations and providing related information to
enterprises electronically.
Implemented Trade Facilitation Portals were launched in Kenya in November 2017 and in March 2018 in Rwanda. Portals in Uganda,
Tanzania and Tajikistan are being installed and prepared for launch later in 2018. Additionally, with the launch of the
EAC project, TFPs will be developed for Burundi.
A methodology on integrating support for young
entrepreneurs in TISI support programmes is developed
In progress Building on the Senegal and The Gambia experience the approach will be further developed in 2018.
An operational results measurement system and a
dashboard for the TISI strengthening programme are
formalized, in full compliance with ITC’s corporate results
framework
Implemented A standardised system is in place to report on results and compile means of verification for each intervention.
Quantitative and qualitative information is reported monthly. An additional report on the results is provided to the TISI
advisory board.
Connecting to international
value chains
New TRTA offerings at the sector and enteprise level are
deployed, including the scale-up of ITC's participatory
methodology to supply chain development (Alliances for
Action); the roll-out of the enterprise competitiveness
diagnostic tool; and the scale-up implementation of ITC's
advisory services on "Lean" management for SMEs.
Implemented Methodologies such as Alliances for Action (A4A), Market analysis and entry, Impact investment, and Sustainable
packaging were developed and formalized. A detailed A4A intervention methodology was prepared for implementation
in the Caribbean Coconuts project. A beta version of the enterprise competitiveness diagnostic tool (SCAN), which is a
tool to be used by advisors, was developed and tested. ITC’s sustainable SME development lean manufacturing and
supply assessment, training, and certification tools were updated and successfully tested.
Providing trade and market
intelligence
Building a conducive business
environment
Strengthening trade and
investment support institutions
29
Table 15 (contd.)
Focus area Milestones Status 31-12-2017 Comments on Status at 31.12.2017
An advisory board is established to provide strategic
guidance to ITC's "Value Added to Trade Program".
In progress The “Value Added to Trade” programme did not proceed with developing an Advisory Board. Instead, following the
recommendation of ITC’s Senior Management Committee, one single Advisory Board drawing on MLS, e-solutions and
others will be established.
Corporate partnerships on e-commerce are scaled up to
increase market access opportunities for SMEs in developing
and least-developed countries.
Implemented The partnership with eBay has been extended and scaled up to help women entrepreneurs digitize their product
catalogue. Moreover, the partnership with Sidley Austin has helped with a Privacy and Cookies Policy for e-commerce
platform that enables online merchants to comply with international legal standards and meet the expectations of
online customers.
E-solutions training curriculum is consolidated, including e-
learning modules
In progress The E-solutions training curriculum is partially consolidated. More than half has been finalised in 2017 and will be field-
tested within the Rwanda e-commerce project. The full consolidation will be achieved in the period 2018-19.
The 5th Women Vendors Exhibition and Forum in
Istanbul, Turkey, takes place, networking 300 women
business enterprises with global buyers.
Implemented The Women Vendors Exhibition and Forum (WVEF), organized by the International Trade Centre (ITC) and KAGIDER,
took place on 23-24 February 2017 in Istanbul, Turkey. WVEF 2017 attracted more than 360 participants from Europe,
Africa, Asia and Latin America, who had business meetings with representatives from more than 50 buying
companies.
SheTrades connects 1 million women to market by the end
of 2017, two years earlier than initially targeted
In progress By the end of 2017, SheTrades had its partners committing to connect 980,000 women entrepreneurs to markets.
Rise Map, an application tracking economic, social and
environmental impact on poor communities is launched as a
part of the Empowering Poor Communities to Trade
Programme.
Implemented The RISEMAP is launched and fully functional. Outcomes of orders in different project chapters are being
communicated through the RISEMAP to final consumers.
At least five new buyers and international brands are
involved in the Empowering Poor Communities to Trade
programme, sourcing from communities and co-investing in
product design
Implemented The project acquired 6 buyers in Burkina Faso and Mali, and 5 buyers in Haiti.
Sustainability Map and Network, a tool to increase
transparency and connectivity on sustainability standards, is
launched, including one customized platform for a major
market partner
Implemented The Sustainability Map with two new modules, Network and Trends, was launched at the T4SD Forum in Sep 2017.
Additionally, the platform offers a community module which incorporates the existing SustainabilityXchange platform
for market partners.
A new Climate Resilience Tool to improve sector
environmental performance is piloted in two countries
Implemented The pilot of a new Climate Resilience Tool to improve sector environmental performance started in 2017 in Morocco for
the textile value chain and in Kenya for the tea and coffee value chain. The project is implemented with different
stakeholders along the value chain and will end in 2018.
The 4th Trade for Sustainable Development Forum is
held in Geneva, Switzerland
Implemented The Forum was held in Geneva from 25-27 September 2017
A regional project to increase trade among the member
countries of the Agadir Agreement is launched
On hold The project is currently on hold until funding materializes.
South-South trade and investment transactions of US$80
million are facilitated
Implemented South-South trade and investment deals of US$ 37.5 million were already confirmed and US$ 95 million are under
negotiation.
The 2017 edition of SME Competitiveness Outlook
focusing on SME potential to trade regionally is released.
Implemented SMECO 2017 launched as planned.
Connecting to international
value chains
Promoting and mainstreaming
inclusive and green trade
Supporting regional economic
integration and South-South
links
30
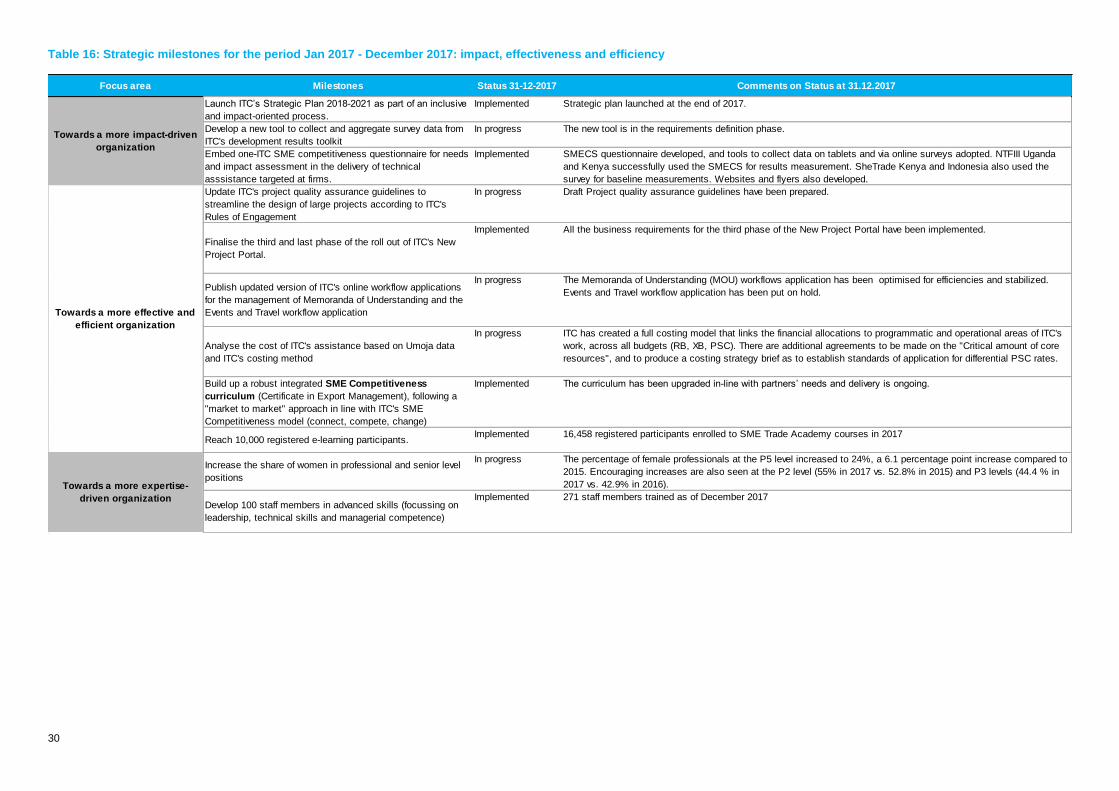
Table 16: Strategic milestones for the period Jan 2017 - December 2017: impact, effectiveness and efficiency
Focus area Milestones Status 31-12-2017 Comments on Status at 31.12.2017
Launch ITC’s Strategic Plan 2018-2021 as part of an inclusive
and impact-oriented process.
Implemented Strategic plan launched at the end of 2017.
Develop a new tool to collect and aggregate survey data from
ITC's development results toolkit
In progress The new tool is in the requirements definition phase.
Embed one-ITC SME competitiveness questionnaire for needs
and impact assessment in the delivery of technical
asssistance targeted at firms.
Implemented SMECS questionnaire developed, and tools to collect data on tablets and via online surveys adopted. NTFIII Uganda
and Kenya successfully used the SMECS for results measurement. SheTrade Kenya and Indonesia also used the
survey for baseline measurements. Websites and flyers also developed.
Update ITC's project quality assurance guidelines to
streamline the design of large projects according to ITC's
Rules of Engagement
In progress Draft Project quality assurance guidelines have been prepared.
Finalise the third and last phase of the roll out of ITC's New
Project Portal.
Implemented All the business requirements for the third phase of the New Project Portal have been implemented.
Publish updated version of ITC's online workflow applications
for the management of Memoranda of Understanding and the
Events and Travel workflow application
In progress The Memoranda of Understanding (MOU) workflows application has been optimised for efficiencies and stabilized.
Events and Travel workflow application has been put on hold.
Analyse the cost of ITC's assistance based on Umoja data
and ITC's costing method
In progress ITC has created a full costing model that links the financial allocations to programmatic and operational areas of ITC's
work, across all budgets (RB, XB, PSC). There are additional agreements to be made on the "Critical amount of core
resources", and to produce a costing strategy brief as to establish standards of application for differential PSC rates.
Build up a robust integrated SME Competitiveness
curriculum (Certificate in Export Management), following a
"market to market" approach in line with ITC's SME
Competitiveness model (connect, compete, change)
Implemented The curriculum has been upgraded in-line with partners’ needs and delivery is ongoing.
Reach 10,000 registered e-learning participants.Implemented 16,458 registered participants enrolled to SME Trade Academy courses in 2017
Increase the share of women in professional and senior level
positions
In progress The percentage of female professionals at the P5 level increased to 24%, a 6.1 percentage point increase compared to
2015. Encouraging increases are also seen at the P2 level (55% in 2017 vs. 52.8% in 2015) and P3 levels (44.4 % in
2017 vs. 42.9% in 2016).
Develop 100 staff members in advanced skills (focussing on
leadership, technical skills and managerial competence)
Implemented 271 staff members trained as of December 2017
Towards a more impact-driven
organization
Towards a more effective and
efficient organization
Towards a more expertise-
driven organization
31
7.6 Evaluation
7.6.1 ITC’s Independent Evaluation Unit
The Independent Evaluation Unit (IEU) implemented its workplan as laid out in the Operational Plan
2017, except for conducting the evaluation of the TISI Strengthening programme. This evaluation was
postponed to 2019 because the Office of Internal Oversight Services (OIOS) had included an audit of
the TISI Strengthening programme in its larger 2017 audit of ITC’s management of unearmarked funds.6
The corporate level ‘Client relationship and networks’ evaluation was focused on ITC’s participation and
performance in the UN Delivering as One (DaO) system and will be concluded in Q2 2018. The choice
to focus on client relationships and networks in the context of UN cooperation at country level was made
in view of the ongoing UN Reform discussions.
The 2017 Annual Evaluation Synthesis Report (AESR), which covered 23 projects and 13 of ITC’s 15
programmes concluded with two main messages:
ITC’s shift since 2014 to rationalize its project portfolio within well-defined programmes is starting to
pay dividends. While ITC’s projects overall have achieved their objectives and contributed to attaining
the Sustainable Development Goals, both internal and donor-led evaluations find that effectiveness and
efficiency ratings are significantly higher for more recent projects that have come under ITC’s
programmatic approach.
The second message in the 2017 AESR was that clients and stakeholders are of the opinion that ITC
has a comparative advantage in providing internationalization support services to micro, small and
medium-sized enterprises (MSMEs), in particular for businesses at the bottom of the socioeconomic
pyramid. In a related finding, the evaluations confirmed that trade and investment support institutions
(TISIs) play a decisive role not just as implementing partners, but in ensuring that the impacts of ITC’s
interventions endure and multiply long after projects are closed. ITC should engage with individual TISIs
over longer project periods, since institutional capacity change, especially in LDCs, is more sustainable
and successful with deeper and longer engagement.
7.6.2 The Office of Internal Oversight Services’ review of the implementation of recommendations on the 2015 programme evaluation of the ITC
In Q4 2017, OIOS conducted a review to determine the extent to which the five recommendations
emanating from the 2015 OIOS programme evaluation of International Trade Centre (ITC) had been
implemented.7 The evaluation had reviewed various aspects of ITC relevance, effectiveness and
efficiency in executing this mandate. In its 2017 review, OIOS found that ITC has taken significant steps
to implement all recommendations. The review determined that four recommendations
(recommendation 1-3 and 5) have been fully implemented, while one recommendation was partially
implemented (recommendation 4).
“Compared to three years prior, ITC was more focussed on core corporate priorities, which were overall
better aligned to client and donor priorities, resulting in specific ITC projects also better aligned with
corporate priorities. Additionally, its core corporate priorities have been institutionalized through the use
of results-based management tools such as logical frameworks and theories of change. The reporting
and evidence generation on results, including higher-level results has improved. ITC had, through its
programmes, advanced the promotion of women, youth and environment in trade.” …..Three important
changes remained to be fully effected; (i) The shift from earmarked to un-earmarked resources, despite
the adoption of a more strategic approach to resource mobilisation, was yet to happen; (ii) a continued
6 OIOS 2017/152; 21/12/2017: Audit of the International Trade Centre projects and activities funded by unearmarked funds. 7 OIOS Triennial review of the implementation of recommendations on the programme evaluation of the International Trade Centre.
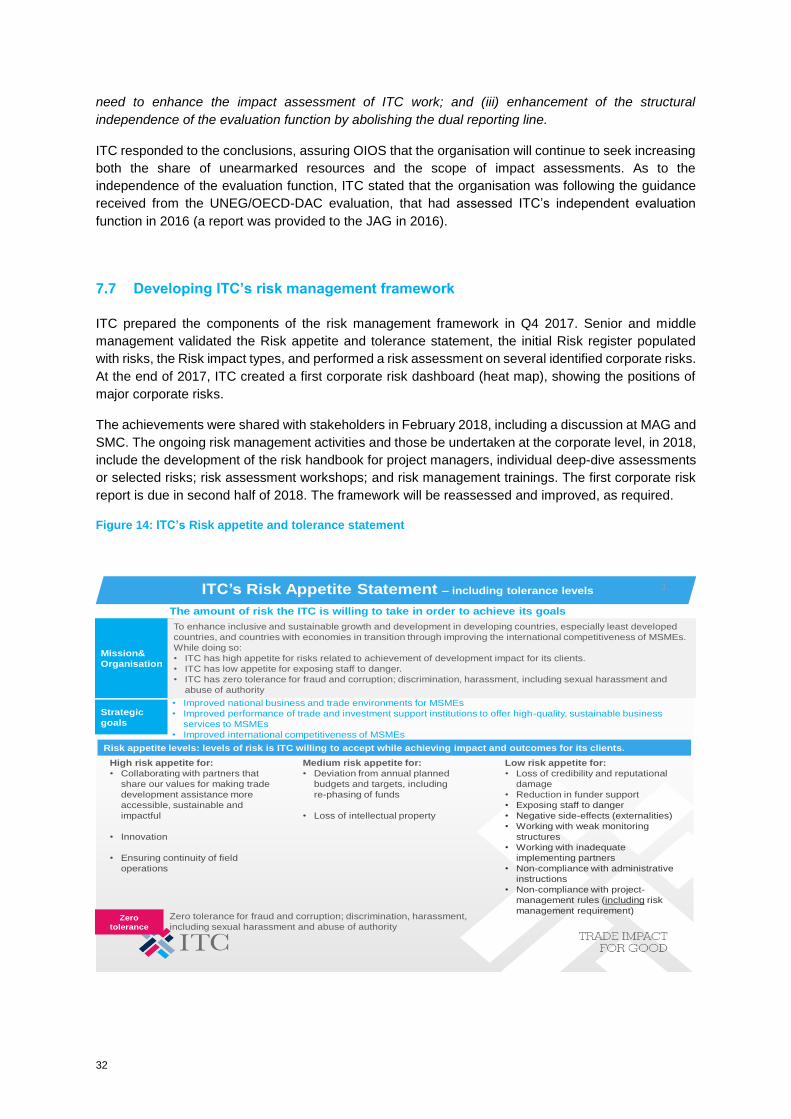
32
need to enhance the impact assessment of ITC work; and (iii) enhancement of the structural
independence of the evaluation function by abolishing the dual reporting line.
ITC responded to the conclusions, assuring OIOS that the organisation will continue to seek increasing
both the share of unearmarked resources and the scope of impact assessments. As to the
independence of the evaluation function, ITC stated that the organisation was following the guidance
received from the UNEG/OECD-DAC evaluation, that had assessed ITC’s independent evaluation
function in 2016 (a report was provided to the JAG in 2016).
7.7 Developing ITC’s risk management framework
ITC prepared the components of the risk management framework in Q4 2017. Senior and middle
management validated the Risk appetite and tolerance statement, the initial Risk register populated
with risks, the Risk impact types, and performed a risk assessment on several identified corporate risks.
At the end of 2017, ITC created a first corporate risk dashboard (heat map), showing the positions of
major corporate risks.
The achievements were shared with stakeholders in February 2018, including a discussion at MAG and
SMC. The ongoing risk management activities and those be undertaken at the corporate level, in 2018,
include the development of the risk handbook for project managers, individual deep-dive assessments
or selected risks; risk assessment workshops; and risk management trainings. The first corporate risk
report is due in second half of 2018. The framework will be reassessed and improved, as required.
Figure 14: ITC’s Risk appetite and tolerance statement
1ITC’s Risk Appetite Statement – including tolerance levels
The amount of risk the ITC is willing to take in order to achieve its goals
Mission&
Organisation
To enhance inclusive and sustainable growth and development in developing countries, especially least developed
countries, and countries with economies in transition through improving the international competitiveness of MSMEs.
While doing so:
• ITC has high appetite for risks related to achievement of development impact for its clients.
• ITC has low appetite for exposing staff to danger.
• ITC has zero tolerance for fraud and corruption; discrimination, harassment, including sexual harassment and
abuse of authority
Strategic
goals
High risk appetite for:
• Collaborating with partners that
share our values for making trade
development assistance more
accessible, sustainable and
impactful
• Innovation
• Ensuring continuity of field
operations
Medium risk appetite for:
• Deviation from annual planned
budgets and targets, including
re-phasing of funds
• Loss of intellectual property
Low risk appetite for:
• Loss of credibility and reputational
damage
• Reduction in funder support
• Exposing staff to danger
• Negative side-effects (externalities)
• Working with weak monitoring
structures
• Working with inadequate
implementing partners
• Non-compliance with administrative
instructions
• Non-compliance with project-
management rules (including risk
management requirement)
Risk appetite levels: levels of risk is ITC willing to accept while achieving impact and outcomes for its clients.
• Improved national business and trade environments for MSMEs
• Improved performance of trade and investment support institutions to offer high-quality, sustainable business
services to MSMEs
• Improved international competitiveness of MSMEs
Zero
tolerance
Zero tolerance for fraud and corruption; discrimination, harassment,
including sexual harassment and abuse of authority
33
Annex I List of trade related technical assistance projects per focus area8 and region
8 ITC’s Focus areas with their respective full titles are listed in Table 7 of this document. For layout reasons they are quoted only with their numbers in this Annex.
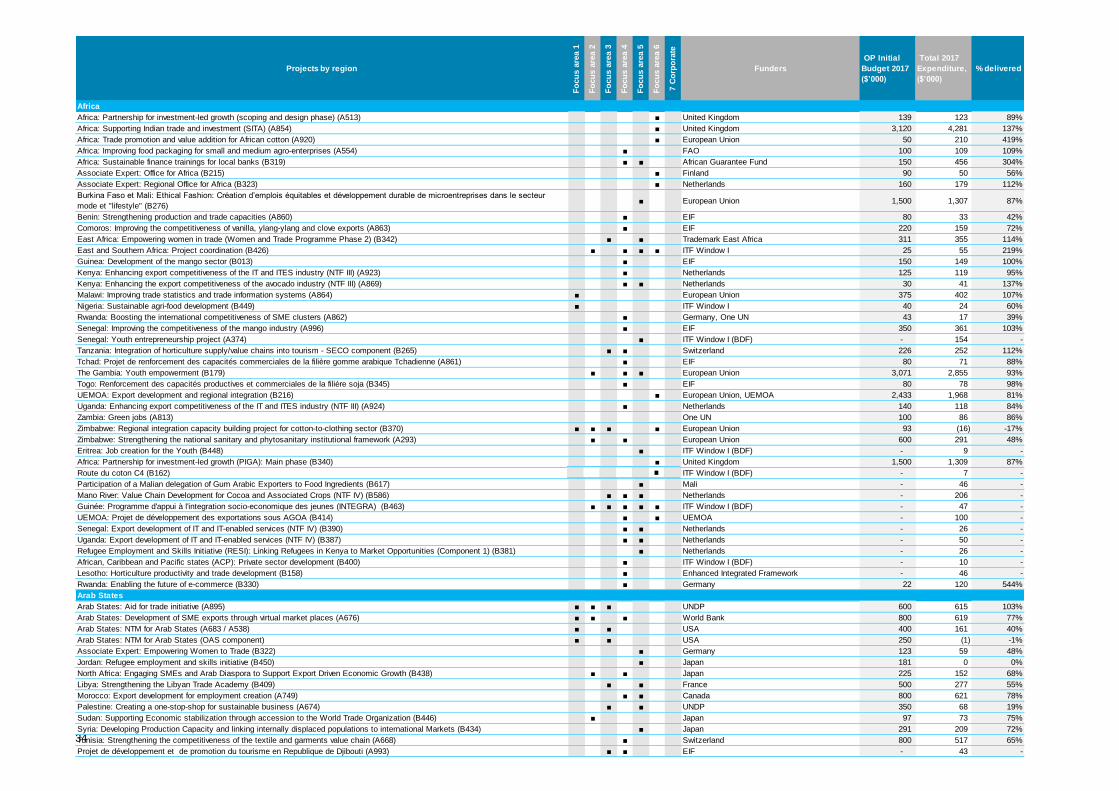
34
Projects by region
Fo
cu
s a
rea 1
Fo
cu
s a
rea 2
Fo
cu
s a
rea 3
Fo
cu
s a
rea 4
Fo
cu
s a
rea 5
Fo
cu
s a
rea 6
7 C
orp
ora
te
Funders
OP Initial
Budget 2017
($’000)
Total 2017
Expenditure,
($’000)
% delivered
Africa
Africa: Partnership for investment-led growth (scoping and design phase) (A513) ■ United Kingdom 139 123 89%
Africa: Supporting Indian trade and investment (SITA) (A854) ■ United Kingdom 3,120 4,281 137%
Africa: Trade promotion and value addition for African cotton (A920) ■ European Union 50 210 419%
Africa: Improving food packaging for small and medium agro-enterprises (A554) ■ FAO 100 109 109%
Africa: Sustainable finance trainings for local banks (B319) ■ ■ African Guarantee Fund 150 456 304%
Associate Expert: Office for Africa (B215) ■ Finland 90 50 56%
Associate Expert: Regional Office for Africa (B323) ■ Netherlands 160 179 112%
Burkina Faso et Mali: Ethical Fashion: Création d’emplois équitables et développement durable de microentreprises dans le secteur
mode et "lifestyle" (B276)■ European Union 1,500 1,307 87%
Benin: Strengthening production and trade capacities (A860) ■ EIF 80 33 42%
Comoros: Improving the competitiveness of vanilla, ylang-ylang and clove exports (A863) ■ EIF 220 159 72%
East Africa: Empowering women in trade (Women and Trade Programme Phase 2) (B342) ■ ■ Trademark East Africa 311 355 114%
East and Southern Africa: Project coordination (B426) ■ ■ ■ ■ ITF Window I 25 55 219%
Guinea: Development of the mango sector (B013) ■ EIF 150 149 100%
Kenya: Enhancing export competitiveness of the IT and ITES industry (NTF III) (A923) ■ Netherlands 125 119 95%
Kenya: Enhancing the export competitiveness of the avocado industry (NTF III) (A869) ■ ■ Netherlands 30 41 137%
Malawi: Improving trade statistics and trade information systems (A864) ■ European Union 375 402 107%
Nigeria: Sustainable agri-food development (B449) ■ ITF Window I 40 24 60%
Rwanda: Boosting the international competitiveness of SME clusters (A862) ■ Germany, One UN 43 17 39%
Senegal: Improving the competitiveness of the mango industry (A996) ■ EIF 350 361 103%
Senegal: Youth entrepreneurship project (A374) ■ ITF Window I (BDF) - 154 -
Tanzania: Integration of horticulture supply/value chains into tourism - SECO component (B265) ■ ■ Switzerland 226 252 112%
Tchad: Projet de renforcement des capacités commerciales de la filière gomme arabique Tchadienne (A861) ■ EIF 80 71 88%
The Gambia: Youth empowerment (B179) ■ ■ ■ European Union 3,071 2,855 93%
Togo: Renforcement des capacités productives et commerciales de la filière soja (B345) ■ EIF 80 78 98%
UEMOA: Export development and regional integration (B216) ■ European Union, UEMOA 2,433 1,968 81%
Uganda: Enhancing export competitiveness of the IT and ITES industry (NTF III) (A924) ■ Netherlands 140 118 84%
Zambia: Green jobs (A813) One UN 100 86 86%
Zimbabwe: Regional integration capacity building project for cotton-to-clothing sector (B370) ■ ■ ■ ■ European Union 93 (16) -17%
Zimbabwe: Strengthening the national sanitary and phytosanitary institutional framework (A293) ■ ■ European Union 600 291 48%
Eritrea: Job creation for the Youth (B448) ■ ITF Window I (BDF) - 9 -
Africa: Partnership for investment-led growth (PIGA): Main phase (B340) ■ United Kingdom 1,500 1,309 87%
Route du coton C4 (B162) ■ ITF Window I (BDF) - 7 -
Participation of a Malian delegation of Gum Arabic Exporters to Food Ingredients (B617) ■ Mali - 46 -
Mano River: Value Chain Development for Cocoa and Associated Crops (NTF IV) (B586) ■ ■ ■ Netherlands - 206 -
Guinée: Programme d'appui à l'integration socio-economique des jeunes (INTEGRA) (B463) ■ ■ ■ ■ ■ ITF Window I (BDF) - 47 -
UEMOA: Projet de développement des exportations sous AGOA (B414) ■ ■ UEMOA - 100 -
Senegal: Export development of IT and IT-enabled services (NTF IV) (B390) ■ ■ Netherlands - 26 -
Uganda: Export development of IT and IT-enabled services (NTF IV) (B387) ■ ■ Netherlands - 50 -
Refugee Employment and Skills Initiative (RESI): Linking Refugees in Kenya to Market Opportunities (Component 1) (B381) ■ Netherlands - 26 -
African, Caribbean and Pacific states (ACP): Private sector development (B400) ■ ITF Window I (BDF) - 10 -
Lesotho: Horticulture productivity and trade development (B158) ■ Enhanced Integrated Framework - 46 -
Rwanda: Enabling the future of e-commerce (B330) ■ Germany 22 120 544%
Arab States
Arab States: Aid for trade initiative (A895) ■ ■ ■ UNDP 600 615 103%
Arab States: Development of SME exports through virtual market places (A676) ■ ■ ■ World Bank 800 619 77%
Arab States: NTM for Arab States (A683 / A538) ■ ■ USA 400 161 40%
Arab States: NTM for Arab States (OAS component) ■ ■ USA 250 (1) -1%
Associate Expert: Empowering Women to Trade (B322) ■ Germany 123 59 48%
Jordan: Refugee employment and skills initiative (B450) ■ Japan 181 0 0%
North Africa: Engaging SMEs and Arab Diaspora to Support Export Driven Economic Growth (B438) ■ ■ Japan 225 152 68%
Libya: Strengthening the Libyan Trade Academy (B409) ■ ■ France 500 277 55%
Morocco: Export development for employment creation (A749) ■ ■ Canada 800 621 78%
Palestine: Creating a one-stop-shop for sustainable business (A674) ■ ■ UNDP 350 68 19%
Sudan: Supporting Economic stabilization through accession to the World Trade Organization (B446) ■ Japan 97 73 75%
Syria: Developing Production Capacity and linking internally displaced populations to international Markets (B434) ■ Japan 291 209 72%
Tunisia: Strengthening the competitiveness of the textile and garments value chain (A668) ■ Switzerland 800 517 65%
Projet de développement et de promotion du tourisme en Republique de Djibouti (A993) ■ ■ EIF - 43 -
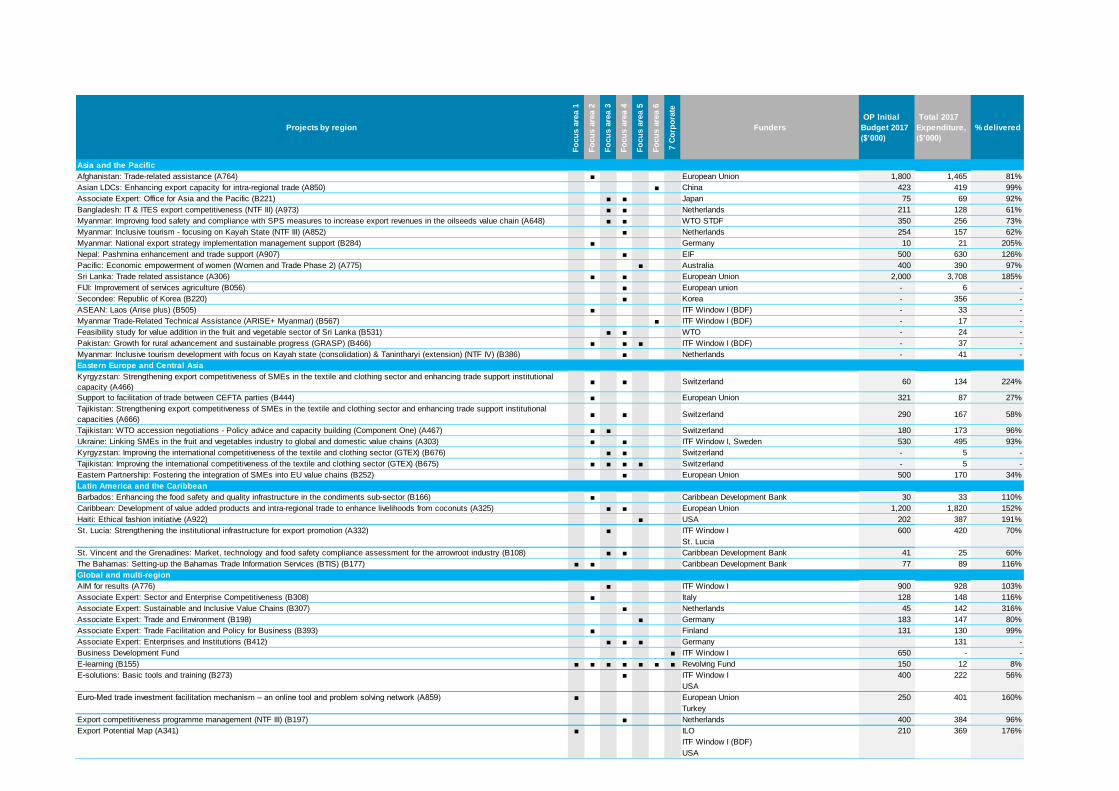
35
Projects by region
Fo
cu
s a
rea 1
Fo
cu
s a
rea 2
Fo
cu
s a
rea 3
Fo
cu
s a
rea 4
Fo
cu
s a
rea 5
Fo
cu
s a
rea 6
7 C
orp
ora
te
Funders
OP Initial
Budget 2017
($’000)
Total 2017
Expenditure,
($’000)
% delivered
Asia and the Pacific
Afghanistan: Trade-related assistance (A764) ■ European Union 1,800 1,465 81%
Asian LDCs: Enhancing export capacity for intra-regional trade (A850) ■ China 423 419 99%
Associate Expert: Office for Asia and the Pacific (B221) ■ ■ Japan 75 69 92%
Bangladesh: IT & ITES export competitiveness (NTF III) (A973) ■ ■ Netherlands 211 128 61%
Myanmar: Improving food safety and compliance with SPS measures to increase export revenues in the oilseeds value chain (A648) ■ ■ WTO STDF 350 256 73%
Myanmar: Inclusive tourism - focusing on Kayah State (NTF III) (A852) ■ Netherlands 254 157 62%
Myanmar: National export strategy implementation management support (B284) ■ Germany 10 21 205%
Nepal: Pashmina enhancement and trade support (A907) ■ EIF 500 630 126%
Pacific: Economic empowerment of women (Women and Trade Phase 2) (A775) ■ Australia 400 390 97%
Sri Lanka: Trade related assistance (A306) ■ ■ European Union 2,000 3,708 185%
FIJI: Improvement of services agriculture (B056) ■ European union - 6 -
Secondee: Republic of Korea (B220) ■ Korea - 356 -
ASEAN: Laos (Arise plus) (B505) ■ ITF Window I (BDF) - 33 -
Myanmar Trade-Related Technical Assistance (ARISE+ Myanmar) (B567) ■ ITF Window I (BDF) - 17 -
Feasibility study for value addition in the fruit and vegetable sector of Sri Lanka (B531) ■ ■ WTO - 24 -
Pakistan: Growth for rural advancement and sustainable progress (GRASP) (B466) ■ ■ ■ ITF Window I (BDF) - 37 -
Myanmar: Inclusive tourism development with focus on Kayah state (consolidation) & Tanintharyi (extension) (NTF IV) (B386) ■ Netherlands - 41 -
Eastern Europe and Central Asia
Kyrgyzstan: Strengthening export competitiveness of SMEs in the textile and clothing sector and enhancing trade support institutional
capacity (A466)■ ■ Switzerland 60 134 224%
Support to facilitation of trade between CEFTA parties (B444) ■ European Union 321 87 27%
Tajikistan: Strengthening export competitiveness of SMEs in the textile and clothing sector and enhancing trade support institutional
capacities (A666)■ ■ Switzerland 290 167 58%
Tajikistan: WTO accession negotiations - Policy advice and capacity building (Component One) (A467) ■ ■ Switzerland 180 173 96%
Ukraine: Linking SMEs in the fruit and vegetables industry to global and domestic value chains (A303) ■ ■ ITF Window I, Sweden 530 495 93%
Kyrgyzstan: Improving the international competitiveness of the textile and clothing sector (GTEX) (B676) ■ ■ Switzerland - 5 -
Tajikistan: Improving the international competitiveness of the textile and clothing sector (GTEX) (B675) ■ ■ ■ ■ Switzerland - 5 -
Eastern Partnership: Fostering the integration of SMEs into EU value chains (B252) ■ European Union 500 170 34%
Latin America and the Caribbean
Barbados: Enhancing the food safety and quality infrastructure in the condiments sub-sector (B166) ■ Caribbean Development Bank 30 33 110%
Caribbean: Development of value added products and intra-regional trade to enhance livelihoods from coconuts (A325) ■ ■ European Union 1,200 1,820 152%
Haiti: Ethical fashion initiative (A922) ■ USA 202 387 191%
St. Lucia: Strengthening the institutional infrastructure for export promotion (A332) ■ ITF Window I 600 420 70%
St. Lucia -
St. Vincent and the Grenadines: Market, technology and food safety compliance assessment for the arrowroot industry (B108) ■ ■ Caribbean Development Bank 41 25 60%
The Bahamas: Setting-up the Bahamas Trade Information Services (BTIS) (B177) ■ ■ Caribbean Development Bank 77 89 116%
Global and multi-region
AIM for results (A776) ■ ITF Window I 900 928 103%
Associate Expert: Sector and Enterprise Competitiveness (B308) ■ Italy 128 148 116%
Associate Expert: Sustainable and Inclusive Value Chains (B307) ■ Netherlands 45 142 316%
Associate Expert: Trade and Environment (B198) ■ Germany 183 147 80%
Associate Expert: Trade Facilitation and Policy for Business (B393) ■ Finland 131 130 99%
Associate Expert: Enterprises and Institutions (B412) ■ ■ ■ Germany 131 -
Business Development Fund ■ ITF Window I 650 - -
E-learning (B155) ■ ■ ■ ■ ■ ■ ■ Revolving Fund 150 12 8%
E-solutions: Basic tools and training (B273) ■ ITF Window I 400 222 56%
USA -
Euro-Med trade investment facilitation mechanism – an online tool and problem solving network (A859) ■ European Union 250 401 160%
Turkey -
Export competitiveness programme management (NTF III) (B197) ■ Netherlands 400 384 96%
Export Potential Map (A341) ■ ILO 210 369 176%
ITF Window I (BDF) -
USA -
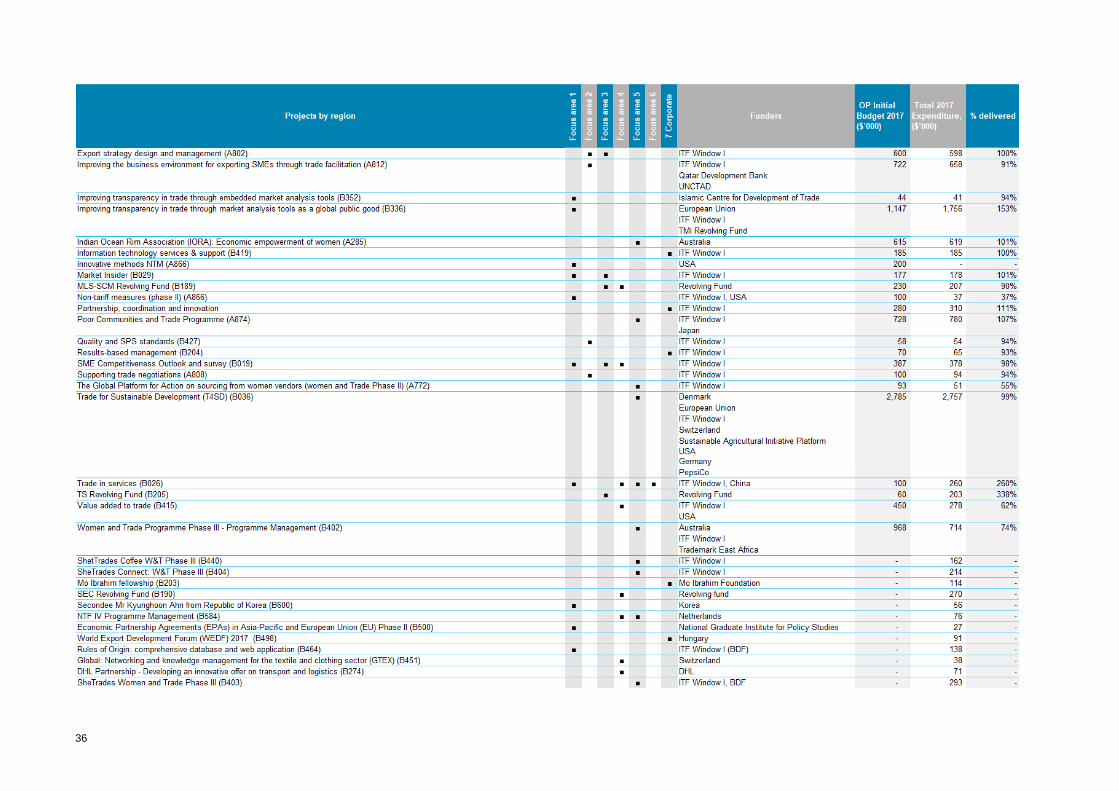
36
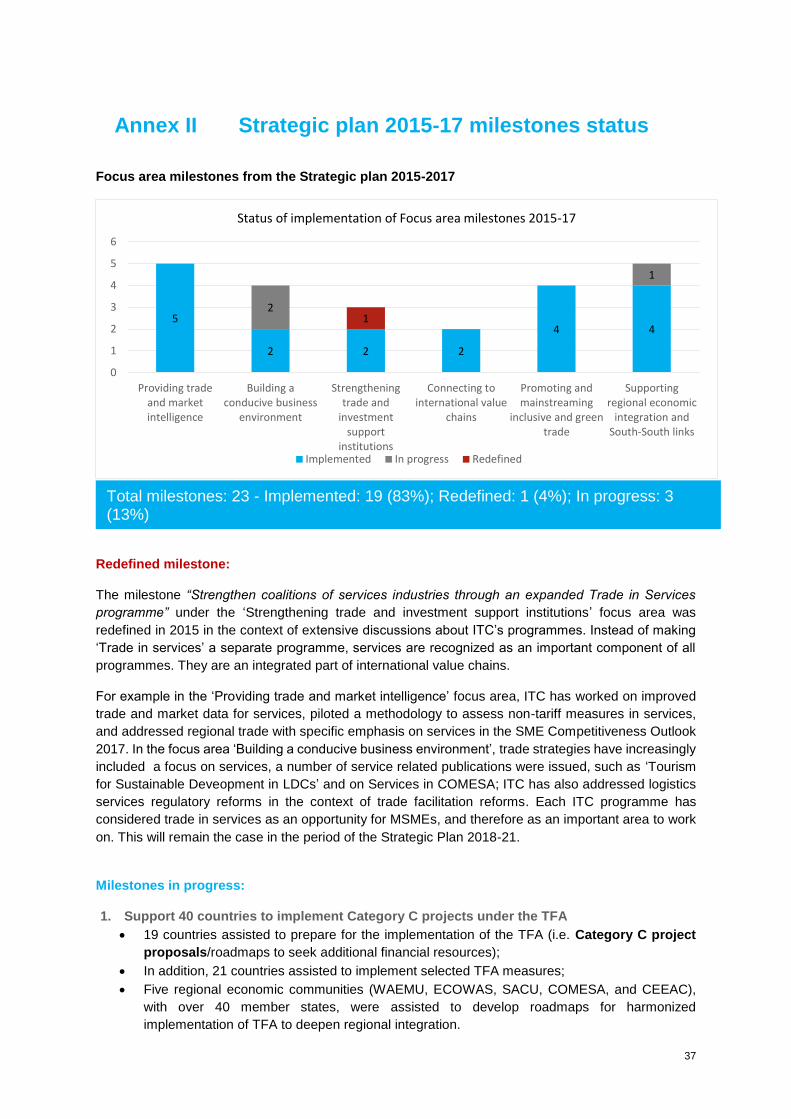
37
Annex II Strategic plan 2015-17 milestones status
Focus area milestones from the Strategic plan 2015-2017
Redefined milestone:
The milestone “Strengthen coalitions of services industries through an expanded Trade in Services
programme” under the ‘Strengthening trade and investment support institutions’ focus area was
redefined in 2015 in the context of extensive discussions about ITC’s programmes. Instead of making
‘Trade in services’ a separate programme, services are recognized as an important component of all
programmes. They are an integrated part of international value chains.
For example in the ‘Providing trade and market intelligence’ focus area, ITC has worked on improved
trade and market data for services, piloted a methodology to assess non-tariff measures in services,
and addressed regional trade with specific emphasis on services in the SME Competitiveness Outlook
2017. In the focus area ‘Building a conducive business environment’, trade strategies have increasingly
included a focus on services, a number of service related publications were issued, such as ‘Tourism
for Sustainable Deveopment in LDCs’ and on Services in COMESA; ITC has also addressed logistics
services regulatory reforms in the context of trade facilitation reforms. Each ITC programme has
considered trade in services as an opportunity for MSMEs, and therefore as an important area to work
on. This will remain the case in the period of the Strategic Plan 2018-21.
Milestones in progress:
1. Support 40 countries to implement Category C projects under the TFA
19 countries assisted to prepare for the implementation of the TFA (i.e. Category C project
proposals/roadmaps to seek additional financial resources);
In addition, 21 countries assisted to implement selected TFA measures;
Five regional economic communities (WAEMU, ECOWAS, SACU, COMESA, and CEEAC),
with over 40 member states, were assisted to develop roadmaps for harmonized
implementation of TFA to deepen regional integration.
5
2 2 2
4 4
2
1
1
0
1
2
3
4
5
6
Providing tradeand marketintelligence
Building aconducive business
environment
Strengtheningtrade and
investmentsupport
institutions
Connecting tointernational value
chains
Promoting andmainstreaming
inclusive and greentrade
Supportingregional economic
integration andSouth-South links
Status of implementation of Focus area milestones 2015-17
Implemented In progress Redefined
Total milestones: 23 - Implemented: 19 (83%); Redefined: 1 (4%); In progress: 3 (13%)
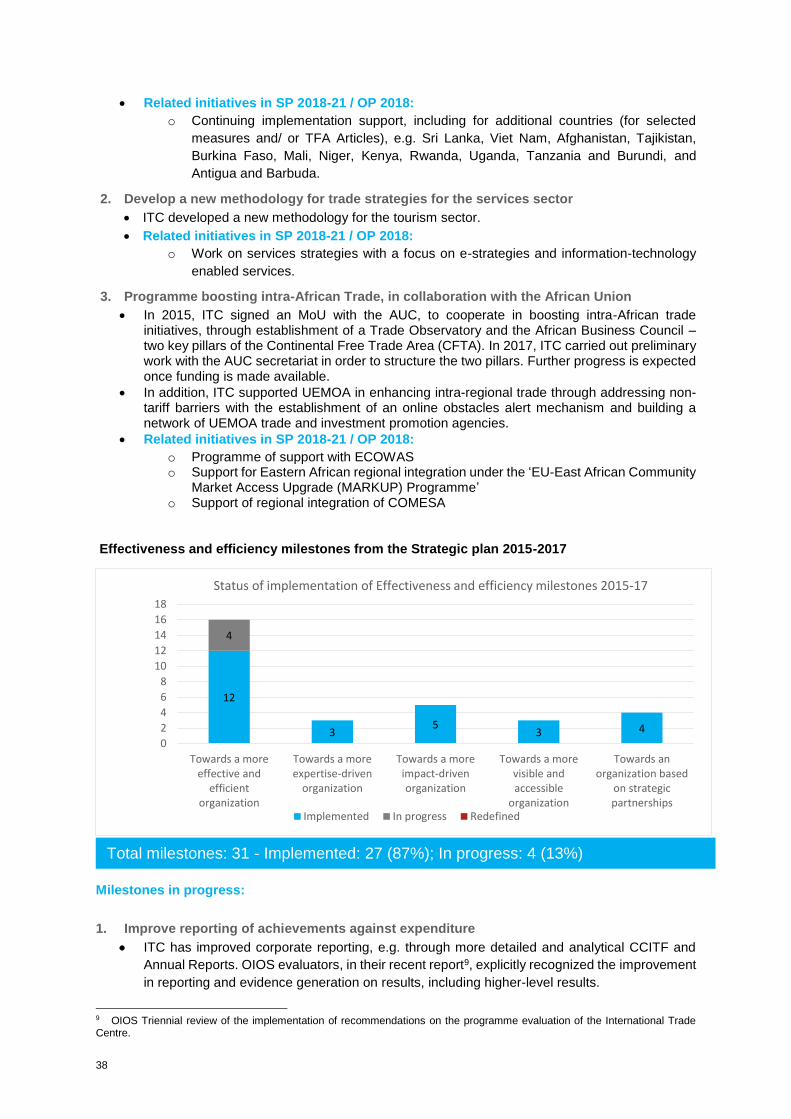
38
Related initiatives in SP 2018-21 / OP 2018:
o Continuing implementation support, including for additional countries (for selected
measures and/ or TFA Articles), e.g. Sri Lanka, Viet Nam, Afghanistan, Tajikistan,
Burkina Faso, Mali, Niger, Kenya, Rwanda, Uganda, Tanzania and Burundi, and
Antigua and Barbuda.
2. Develop a new methodology for trade strategies for the services sector
ITC developed a new methodology for the tourism sector.
Related initiatives in SP 2018-21 / OP 2018:
o Work on services strategies with a focus on e-strategies and information-technology
enabled services.
3. Programme boosting intra-African Trade, in collaboration with the African Union
In 2015, ITC signed an MoU with the AUC, to cooperate in boosting intra-African trade initiatives, through establishment of a Trade Observatory and the African Business Council – two key pillars of the Continental Free Trade Area (CFTA). In 2017, ITC carried out preliminary work with the AUC secretariat in order to structure the two pillars. Further progress is expected once funding is made available.
In addition, ITC supported UEMOA in enhancing intra-regional trade through addressing non-tariff barriers with the establishment of an online obstacles alert mechanism and building a network of UEMOA trade and investment promotion agencies.
Related initiatives in SP 2018-21 / OP 2018:
o Programme of support with ECOWAS o Support for Eastern African regional integration under the ‘EU-East African Community
Market Access Upgrade (MARKUP) Programme’ o Support of regional integration of COMESA
Effectiveness and efficiency milestones from the Strategic plan 2015-2017
Milestones in progress:
1. Improve reporting of achievements against expenditure
ITC has improved corporate reporting, e.g. through more detailed and analytical CCITF and
Annual Reports. OIOS evaluators, in their recent report9, explicitly recognized the improvement
in reporting and evidence generation on results, including higher-level results.
9 OIOS Triennial review of the implementation of recommendations on the programme evaluation of the International Trade Centre.
Total milestones: 31 - Implemented: 27 (87%); In progress: 4 (13%)
12
35
3 4
4
0
2
4
6
8
10
12
14
16
18
Towards a moreeffective and
efficientorganization
Towards a moreexpertise-driven
organization
Towards a moreimpact-drivenorganization
Towards a morevisible andaccessible
organization
Towards anorganization based
on strategicpartnerships
Status of implementation of Effectiveness and efficiency milestones 2015-17
Implemented In progress Redefined
39
ITC has created a pilot full costing model linking the financial allocations to programmatic and
operational areas of ITC’s work under all budgets (RB, PSC, XB).
Related initiatives in SP 2018-21 / OP 2018:
o Further deepen RBM and project management standards as recommended by the
Donor Committee on Enterprise Development (DCED).
o Work towards achieving compliance with the IATI standard.
o Advance methodologies for programme-level costing and results measurement.
2. Accelerate improvements in automation to enhance the quality and sharing of information
and knowledge, and reduce internal transaction costs
ITC developed the new project portal.
ITC developed a database and automated workflow for Memoranda of Understanding (MoU).
The Learning and Development HUB was upgraded.
Project completion reports, including on lessons learnt, have become mandatory for all
projects are published in a uniform format in the project portal.
Related initiatives in SP 2018-21 / OP 2018:
o A new CRM version.
o Development of an integral knowledge management strategy.
3. Map the full cost of its operations and take these into account in resource allocation
decisions
This initiative will inevitably continue in 2018 since it relies on implementation of UMOJA 2.0.
Related initiatives in SP 2018-21 / OP 2018:
o The UN Secretariat will introduce ‘Umoja 2’ for all Umoja users with new modules on
budget planning, reporting, implementing partner management and resource
mobilization.
4. Complete an ITC-wide risk management and accountability framework
ITC has developed and adopted the components of the Risk management framework.
Related initiatives in SP 2018-21 / OP 2018:
o Further implementation support through development of systematic risk management
planning, execution and monitoring.
o Risk trainings and workshops for staff, to educate about structured risk management
and to perform risk assessments.
o ITC will produce the first corporate risk report in 2018.
Street address: ITC 54-56, rue de Montbrillant 1202 Geneva, Switzerland
Postal address: ITC Palais des Nations 1211 Geneva 10, Switzerland
Telephone: +41-22 730 0111
Fax: +41-22 733 4439
E-mail: [email protected]
Internet: http://www.intracen.org
The International Trade Centre (ITC) is the joint agency of the World Trade Organization and the United Nations.