Embed Size (px)
Citation preview

Geophys.J. Int. (2003)***, 000–000
Reply to commentby F.A. Dahlenand G. Nolet on: “On
sensitivity kernelsfor ‘wave-equation’ transmission
tomography”
RobertD. vanderHilst�
andMaartenV. deHoop�����
�Departmentof Earth,Atmospheric,andPlanetarySciences,MassachusettsInstituteof Technology, Rm54-522,
Cambridge, MA 02139,USA.
�Centerfor WavePhenomena,ColoradoSchoolof Mines,Golden,CO80401,USA.
SUMMARY
We thankDahlenandNolet (2005)– hereinafterDN05 – for the commentson our paper
(DeHoopandVanderHilst (2005);hereinafterHH05)andfor giving ustheopportunityto
elaborateour points.In somecaseswe agreewith DN05, but we respectfullycontinueto
differ in opinionon fundamentalaspectsof the finite frequency sensitivity kernelsknown
as‘bananadoughnut’kernels(Dahlenetal.,2000)– hereinafterBDKs,aspertheiroriginal
nomenclature– andonthesignificanceof theireffecton thetomographicmodelspresented
sofar. DN05 dismissHH05’s analysisasa “tale ... full of soundandfury, signifying noth-
ing”. Wearenotsureof themeaningof this in scientificdialog,but thequoteis interesting� ,andwe invite thereaderto ponderits merit in view of theobservationsmadebelow. HH05
� For thoselessfamiliar with Shakespeare’s play ”Macbeth”, the full quoteis: ‘It is a tale told by an idiot, full of soundandfury, signifying
nothing’.Thisspeechwasmadeby Macbethashepreparesfor battleandridiculesthewarningsof impendingdoom.Momentslaterheis told
thatBirnamWoodhasstartedto move andis advancingon his troops.‘Liar andslave!’ hecriesat themessengerwho bringshim this news.
But thesameday, all thepropheciesarefulfilled, andMacbethis defeatedandkilled.
2 R.D.vanderHilst andM.V. deHoop–TRANSMISSION TOMOGRAPHY
donotcommentonthemodelsby Montelli etal. (2004a;2004b),hereinafterM04a,b,but in
responseto DN05,andfor readersinterestedin theimplicationsfor theimages,wetakethis
opportunityto discusssomesalientissuesbeforereturningto the moretechnicalmatters.
Wereferto ray theory(thatis, thehigh frequency approximationandtheuseof ‘ray paths’)
asRT andfinite frequency theory(with BDKs) asFFT andthe Princetonmodels,which
weregracefullymadeavailableto usby RaffaellaMontelli, asPRI-RT/PRI-FFT.
Keywords: transmissiontomography– finite-frequency sensitivity kernels– plumes
1 ARE THE EFFECTS OF BDKS ON THE TOMOGRAPHIC IMA GESSIGNIFICANT?
HH05 remarkthat the effectsof BDKs on global tomographicimagesaresmall comparedto effects
of the damping(regularization)that is neededto mitigateeffectsof uneven datacoverageandquality.
DN05takeissuewith thisandclaimthat(i) “[BDKs] enableimprovedimagingof small-scalewavespeed
anomalies”,suchas ‘plumes’, and (quotingM04a) that (ii) “dependingon the depthand size of the
anomaly, theamplitudesof thevelocity perturbationsin [PRI-FFT] are ���� �� larger thanin [PRI-
RT]”. To demonstratethat theseclaimsof imageimprovementareoverstatedwe comparethe RT and
FFT modelspublishedby M04aandM04b, respectively, andmodelMIT-P05by VanderHilst, Li, and
Karason(in preparation).Thelatteris basedonadatasetthatis comparableto thatusedby M04b,with
thepertinentexceptionthatwedid notusethelongperiod � datafrom BoltonandMasters(2001).
1.1 Resolutionof slabstructure
We first assesstheeffect of FFT on the imagingof mantlestructuresthathave not beendisputed.Fig-
ure1 depictsslabsof subductedlithospherebelow SouthAmericaaccordingto MIT-P05(left), PRI-FFT
(middle),andPRI-RT (right). It appearsthattheRT andFFT imagesarevirtually thesame(despitethe
incorporationof shortperioddatafrom Engdahletal. (1998)in thelatter),but bothlacktheuppermantle
structuresrevealedin MIT-P05.M04bstatethat“slabsarelargefeaturesthatcauselittle or nowavefront
healing”.Thismaybeso,but BDKs arecalculatedin a smoothlyvaryingbackgroundmediumandhave
no knowledgeabouteither the level of wavefront healingin the datato which they areappliedor the
scalesandtypesof heterogeneity(suchas,plumes,slabs)throughwhich they pass.Besides,if thelarge

Geophys.J. Int.: .. 3
FIGURE 1 GOES HERE.
Figure1.
sizeof slabsis usedto explainthatthereis no‘wavefronthealing’,and,by implication,thatthedatahave
not ‘lost’ informationaboutthesestructures,thenwhy arethey not resolvedbetter?
Figure1 suggeststhat (i) the short period datausedin PRI-FFTwere given much lower weight
thanthe long perioddata,that (ii) the long perioddatado not containinformationaboutlengthscales
pertinentto slabstructurein theuppermantle(but, then,how about‘plumes’?),or – mostlikely – that
(iii) the specificmodelparameterizationandregularization(damping)usedby M04a,bdoesnot allow
betterresolutionof slabs.The latter canbe fixed, but it is – in our view – not satisfactory that much
confidenceis placedin the imagesof elusive ‘plumes’ while ratherincontroversial structuressuchas
subductedslabs(which,for severalreasons,shouldbeeasierto image)arenotwell constrained.
1.2 How about plumes?
To staycloserto thetopicof Montelli andco-workers,figure2 illustratestheeffectsof theuseof BDKs
for ‘plume’ structuresin theupperandin thedeepmantle.Sincesmall is in theeye of thebeholderwe
invite thereadersto judgefor themselvesthesignificanceof thedifferences.
For comparison,figure3 depictsthe lateralvariationin P-wavespeedaccordingto MIT-P05.Apart
from differencesin amplitudethat arisefrom differentchoicesof parameterization,damping,anddata
fit criterion(seecaptionto figure1), therearetwo observationsthatarerelevantfor thediscussionhere.
First, comparedto figures2a,b,plume-like structuresin the IndianOceanareconspicuouslyabsentin
figure3a.This doesnot necessarilymeanthat they do not exist. Owing to thedifferentialnatureof the

4 R.D.vanderHilst andM.V. deHoop–TRANSMISSION TOMOGRAPHY
FIGURE 2 GOES HERE.
Figure2.
FIGURE 3 GOES HERE.
Figure3.
dataand the behavior of the sensitivity kernelsof the long period ������� data � the sensitivity to
shallow structurebeneathsourceandreceiver is stronglyreduced,which degradesour ability to resolve
theseuppermantlestructures.This differencebetweenthe modelsis mostlikely dueto the useof the
long-period� databy M04.Second,in supportof M04b’s interpretationin termsof deepmantleplumes,
MIT-P05alsorevealsa low velocity anomalybeneathHawaii (figure3b). In MIT-P05this anomalyis
locatedto thewestof Hawaii andagreeswell with thewesternmostpartof thesplit anomalyin theRT
andFFT models(figures2c,d).
� We alsouse3D kernelsto combinelong period ������� (and ������ �!���#"$� , but that is not of interesthere)with theshortperiod � and
% � data(Engdahlet al., 1998)– seeVanderHilst andKarason(2001)andKarason(2002).They foundthat ‘f at rays’ andBDK-like kernels
producedsimilar images(Karason,2002).
Geophys.J. Int.: .. 5
FIGURE 4 GOES HERE.
Figure4.
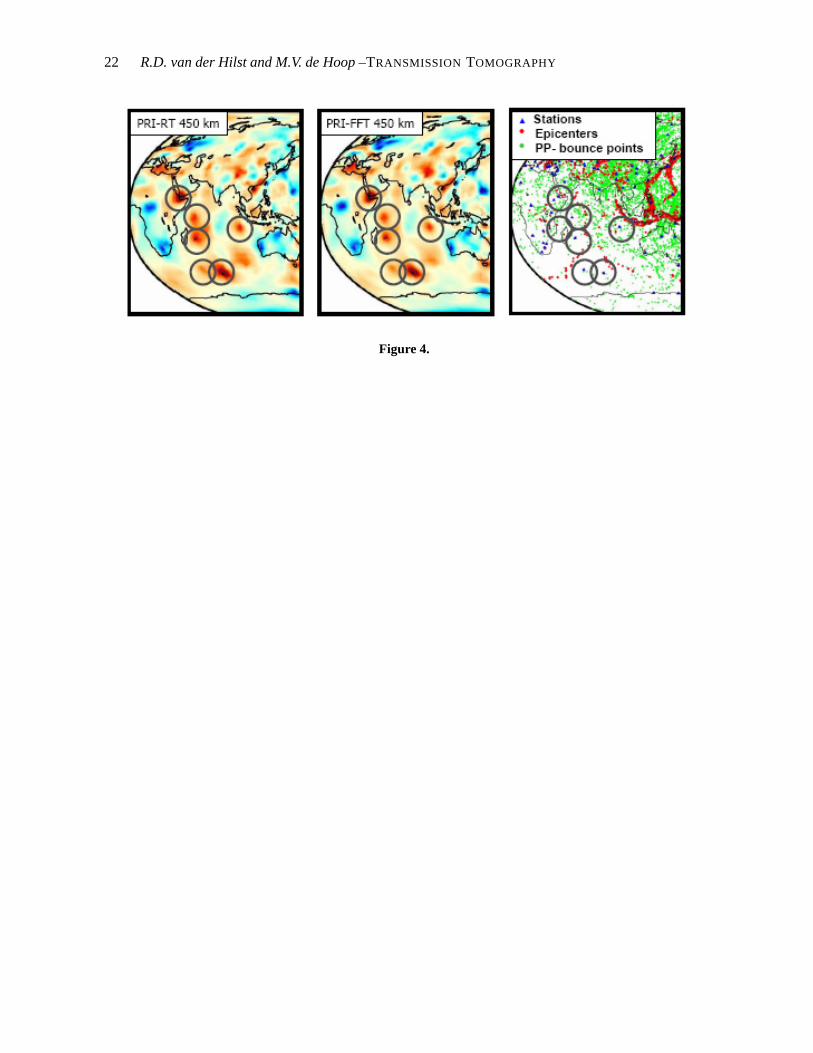
Thesimilarity of theimagesaccordingto PRI-RT (figures2a,c)andPRI-FFT(figures2b,d)suggests
that theplume-like structuresdo not appear(or arebetterimaged)becauseof FFT. By itself, this does
not invalidateM04b’s interpretations.Yet, thereis reasonfor caution.Figure4 suggeststhat, for this
geographicalregion, (i) the plumesignaturesshow up only (always?)below the oceanislandstations
thatcontributeto thesetof longperiod � dataandthat(ii) at 450km depththeimageof these‘plumes’
is virtually thesameasat 150km depth(2a,b).Theseobservationssuggestthat for theseuppermantle
‘plumes’ preferredsamplingalongsteeprays(or BDKs) in poorly sampledregionsis an issue.This is
a classicalresolutionproblem,but theperceptionof continuity in radialdirectionmaybeenhancedby
M04’s useof an isotropicgradientminimization,which may alsoexplain the large thicknessof some
continentalkeels(e.g.,beneathSouthAfrica).
1.3 What about the magnitudeof wavespeedperturbations?
In theexamplesgivenabove, boththespatialpatternandtheamplitudesof theRT andFFT wavespeed
variationsareremarkablysimilar. How canthis bereconciledwith DN05’s claim of a 30-50%increase
in amplituderesultingfrom theuseof BDKs?Theanswermaybesurprisinglysimple.
WeunderstandthatM04a– andDN05– infer theamplitudeincreasefrom histogramsof theratioof
wavespeedvariationsin PRI-FFTandPRI-RT ( &�')(*(�+&�'-,/. ) “for thoseanomaliesthat aresignificantly
differentfrom zero( 0 &1'2+3'/054687:9*� )”. Indeed,M04ausehistogramslike theonereproducedin figure5a
to suggestthat theaverageratio is significantlylarger than1: they report ;7: for the lowermostmantle
and ;7:� nearEarth’s surface(henceanincreaseof 50%and30%,respectively). Of course,takinga bite
out of onesideof a (statistical)distribution biasesthe averagein the oppositedirection.In fact, in a
6 R.D.vanderHilst andM.V. deHoop–TRANSMISSION TOMOGRAPHY
similar fashiononecouldplot theinverseratioto arguethatRT inversionsproducethelargeramplitudes!
Furthermore,themagnitudeof thebiasdependscritically on thevalueof theminimumcut-off andthe
treatmentof (very large)outliers.Clearly, theaverageis anincorrect(andmisleading)measurefor such
distributions.In fact,themodeof <=; suggeststhat &>')(*(?<@&>'-,/. in all examplesshown in M04a.
To shedfurtherlight on this,weperformedasimpleanalysisof theFFTandRT modelsA . Including
all valuesproducesnormaldistributionswith ameanratioof <�; (Figure5b).Excludingthesmallvalues
doesindeedincreasetheaverage&>')(*(B+&>'),*. (by about15%,but theprecisevalueis not important)(5c).
Ironically, this is alsotruefor theratio &�' ,/. +&�' (*( (5d),but wedonotsuggestthatRT amplitudesexceed
thecorrespondingFFTones.Evaluationof therelativebehavior of &>' ,*. and &>' (*( with scatterplots(fig-
ure5e)indicatesthat(i) thecorrelationbetween&�' (*(�. and &�' ,/. is not significantlydifferentfrom one,
that(ii) thelargeanomaliesarewell correlated(andareassociatedwith relatively smallspatialfeatures
becauseregriddingat 0.5 by 0.5 deg would otherwisehave producedmany morepoints),andthat (iii)
large ratiosonly occurcloseto zeroandare thusassociatedwith anomaliesthat could reasonablybe
regardedasin thenoise.Thelatterbecomesevidentwhenwe plot the(RMS) magnitudeof wavespeed
perturbationsasa function of the ratio betweenFFT andRT anomalies(figure 5f): for all depthsthe
strongestanomaliesproduceratioscloseto onewhereasthenegative andlargepositive ratiosareasso-
ciatedwith muchweaker anomalies.We find that in the top < 2,000km theFFT andRT anomaliesare
statisticallysimilar; thediscrepancy is larger in thelowermostmantlebut doesnot exceed10%(thatis,
0.1of perturbationsof theorderof 0.5%).
UnlessM04ausedotherevidence,theamplitudeincreaseresultingfrom theuseof FFT is (much)
smallerthanthey claim.And we arguethatthedifferencesthatdo occurareinsignificant.For instance,
M04auseOccam’srazortoselect‘simple’ models,but anotherperceptionof ‘simple’ mayyielddifferent
amplitudes.Indeed,by adjustingthedampingM04acanproduceRT modelsthatare(alsoin their own
view) similar to the FFT results,but they choseto comparemodelswith the sameCED . In the absence
of preciseknowledgeaboutdataerror the CED -criterion is difficult to implementobjectively, however.
Uncertaintiesaboutdataerroraresubstantial;for example,M04aremove anoff-set in the long period
� travel timesof up to <F s without – by their own admission– knowing theorigin of it. With intrinsic
uncertaintiesthis largethe C D –criterionis no lesssubjective thanregularization(damping).
A TheFFTmodelusedhere– afterM04b– mayslightly differ from theFFTmodelthatwasusedby M04ain thecomparisonswith theirRT re-
sults.Moreover, weusedregriddedmodels.Thismaygiveminordifferencescomparedto resultspresentedby M04a,but thatis inconsequential
for thepointswemake here.

Geophys.J. Int.: .. 7
FIGURE 5 GOES HERE.
Figure5.
1.4 The BananaDoughnut paradox
The above observationssupport– andreinforce– HH05’s remarkthat differencesinducedby BDKs
arenot significantin view of imageuncertaintydueto unevendatacoverage,variabledataquality, and
the effectsof practicalconsiderationsor choiceof differentinversionstrategies.Theseincludeparam-
eterization,damping,normalizatonof sensitivity within projectedkernels,choiceof dataerrorwhena
CED -criterion is usedfor modelselection,andthe weightingof differentdatasets.We notethat similar
conclusionscanbereachedfor surfacewave tomography(Trampert& Spetzler, 2005).
The similarity of the RT andFFT results(illustratedin figures1, 2, 4, or Fig. 9 of M04a, for that
matter)leadsto a paradox:If, on theonehand,theRT inversionmapsanomalieson unperturbedrays
andif, ontheotherhand,BDKs havenegligible sensitivity to anomaliesonthoserays,thenwhy (barring
fortuitoussource-receiverdistributions)doestheFFTinversionreconstruct–within error– heterogeneity
atthesamelocationandwith practicallythesamespatialdimensionsandamplitudesastheRT inversion?
In fact,in mostpartsof themodel,theprojectionof BDKs ontobasisfunctions(blocks,splines,voronoi
cells,...)wouldnotpreserve thedoughnutholebut producea‘f at ray’ kernelwith negativesensitivity on
theray (seeHH05, their Fig. 5a); theeffective kernelsarethenrathersimilar to thekernelsusedin the
RT inversions.Furthermore,thesensitivity on theray is notnegligible for scalesrepresentedin thedata.
Weelaborateandgeneralizethisstatementin thenext section.

8 R.D.vanderHilst andM.V. deHoop–TRANSMISSION TOMOGRAPHY
FIGURE 6 GOES HERE.
Figure6.
2 MULTI-SCALE ASPECTS
We concurwith Dahlenet al. thatfinite-frequency wavessensestructure(also)off thegeometricalray
andthatscatteringmustbeconsideredto imageheterogeneitywith lengthscalesthataresmallcompared
to theseismicwavelengths.Fundamentally, however, data(only) resolve structureat spatialscalesthat
arerepresentedin them.Theultimateconsequencesof thisareimportantandcall for adifferentapproach
towardfinite frequency imagingthandefendedby DN05.
In thelinearizedframework of waveequationtomography, with theGreen’s functionscalculatedin a
smoothbackground,smallstructureswill be‘invisible’ if thedatalack therelevantfrequencies(through
diffraction),andthis is true for anomalieson the ray andaway from it. For structureon the ray this is
consistentwith BDKs for long-perioddata.However, smallanomaliesplacedwithin thehigh-sensitivity
ring aroundthe‘doughnuthole’ shouldnot bevisible eitherif thedatalack therelevant (high) frequen-
cies.Thesubtleimplicationfor tomographyis that,uponback-projectionalonglong-periodBDKs, the
kernelintersectionsmayyield anomaliesthataresmallerin sizethanthescalesrepresentedin thedata.
This small-scalestructureis not (andcannotbe) resolvedby thedataused.(NB in theclassicalRadon
conceptthis paradoxicalsituationdoesnot occurbecausethe intersectionof crossinglines is a point
andinfinite frequency datawill besensitive to that).Furthermore,thesensitivity doesnot vanishon the
unperturbedray for scalesrepresentedin thedata.In a space-scalesensethis is consistentwith the ‘f at
man’notionof Hungetal. (2001)thatif youplacea largeenoughanomalyon theray thedatawouldbe
sensitive to it.
Theseissues(andthebanana-doughnutparadox)signaltheneedfor a basis– or frame– thatprop-
erly matchesthe multi-scaleaspectsof finite frequency wave behavior. HH05 introducedan explicit

Geophys.J. Int.: .. 9
multi-resolutionanalysisbasedoncurvelets, whichprovideaframewith thecorrectpropertiesfor finite-
frequency wave equationtomography. They showed (seefigure 6) that: (1) dataresolve variationsin
structureprimarily in directionsperpendicularto theray; (2) finite bandwidthdataresolve only certain
scales(thatis, thenumberof annuli,or scales,thatcontributeto thesensitivity is limited); (3) sensitivity
on theray is notzerofor scalesrepresentedin data,andthat(4) thehigherthefrequency, thesmallerthe
lengthscaleof thestructuresthatcanberesolved.Figure6 demonstratesthattheresolutionof structure
at a certainscaleis thesamewhetherit is locatedon theunperturbedray (i.e., in the ’doughnuthole’)
or away from it (e.g.,on the BDK ring of maximumsensitivity). In otherwords,waveswith a certain
frequency contentare(in)sensitive to certainscaleswhetherthey occuron the ray or away from it. A
detailedanalysisof themulti-resolutionconceptfor wave equationtomographyis beyondthescopeof
this ”Reply” andwill bepresentedelsewhere(Douma,DeHoop,andVanderHilst, in preparation).
3 MEASUREMENT
We agreewith Dahlenet al. (2000) that the type of measurementshoulddictatewhich approachto
(approximating)propagatingwavesshouldbe used G . We alsoagreethat – in principle – oneshould
not useray theoryto backproject‘finite-frequency travel times’ measuredby time domaincrosscor-
relation.HH05 doesnot, however, statethat the cross-correlationcriterion approachto transmission
tomographyandtheassociatedoptimizationscheme,asusedby Dahlenet al. (2000),areincorrect.The
cross-correlation/optimum criterionis, indeed,a ‘stable’criterionto comparethe‘distance’betweentwo
wavefields.But it is just a criterion,andit is only tied to thenotionof travel time properin theasymp-
totic broad-bandlimit of two deltawaves(possiblyconvolved with a sourceor stationsignature).This
is analyzedin detail in HormannandDe Hoop(2002).Onecangive any nameto themaximumof the
crosscorrelation,suchas‘finite-frequency travel time shift’, but frequency dependenttravel-timeshifts
have little meaningoutsidethecontext of anexplicit multi-resolution,time-frequency analysis.
G In this regardDahlenet al.’s comparisonsof RT andFFT throughresolutiontestswith syntheticdataaresomewhatmisleading.For aproper
discussionof therelative meritsof FFT over RT oneshouldusedataconsistentwith RT in theRT inversionsanddataconsistentwith FFT in
thecaseof BDK inversions.M04atesttheRT inversionsonsyntheticdelaytimesthatareconsistentwith theFFTcrosscorrelation.Thesedata
donot containthescalesassumedin RT. Viceversa,FFT inversionof dataproducedby RT maywell yield resultsthatare(slightly) inferior to
resultsof theRT inversion.

10 R.D.vanderHilst andM.V. deHoop–TRANSMISSION TOMOGRAPHY
4 THEORETICAL CONSIDERATIONS
The basic theoreticalobservationsof HH05 are that (i) the kernelsinducedby the cross-correlation
criterion areoscillatory(no surprise),the precisepatternof their zerocrossingsis determinedby the
backgroundmediumbut doesnotmatter, andazerocrossingneedsnotcoincidewith theunperturbedray
paths,andthat(ii) oneshouldnotview thekernelspoint-wise(Strichartz,2003)but in amulti-resolution
framework (seesection2).
4.1 Ray kernel asan infinite bandwidth realizationof finite frequency(wave) kernel
We assumethat (i) the velocity model is smoothandthat (ii) the sourcescanbe representedby point
sourcesand,hence,thatthewavefield(that is, thedisplacementH at receiver I ) canbewrittenasa time
convolution of a sourcesignatureJLK=MON P with a Green’s function QSR (that is, H5R�TUJLKV�WYXZ QSR ). We do
notclaim thatouranalysisappliesto frequenciesarbitrarilycloseto zero.
The key ingredientin the kernel developmentis the Green’s function in the unperturbedmodel.
The Green’s function canbe representedby oscillatory integrals (OIs) – seeDuistermaat(1996)and
Dencker (1982)for thescalarwave andelasticwave case,respectively. Theleading-orderamplitudein
the OI yields a Maslov (that is, asymptotic)representationof the Green’s function.This is warranted
undera ‘f ar-field’ approximation(NB. theanalysisandargumentspresentedin HH05 hold for general
OIs, but to keepthe expositiontransparentHH05 usedonly the simplestform andleft out the higher
ordercontributions– HH05eq.1 thenreducesto HH05eq.2.)
Startingfrom theGreen’s functionsrepresentationof thekernel,HH05show thatthekerneltendsto
thetravel time tomographykernelasthefrequency (bandwidth)becomesinfinite. Conversely, theband-
limited Maslov representationsof theGreen’s functionsin thekernelcaptureits leadingfinite-frequency
features.In this sense,‘travel time’ and‘wave-equation’tomographydo indeedsharethesamekernel.
This is consistentwith theobservation thatasymptotically(that is, ‘delta waves’) themaximumof the
crosscorrelationyieldsthetravel timeshift. Indeed,in themulti-resolutionsettingmentionedin section2
thebehavior of thekernelcanbedescribedcorrectly– usingthemulti-resolutionrepresentationof the
Green’s functions– all theway from thenarrow-bandsituationto theinfinite bandwidthlimit.
DN05 seemconfusedaboutthenotionof distribution andregularization.Separatingout sourceand
receiver signatures,the exact kernel would be a distribution built from Green’s functions,which are
(Lagrangian)distributions themselves.The approximate,finite bandwidthkernel is a regularizationof
this distribution (throughthe instrumentresponseandsourcesignature);this regularizationis smooth
Geophys.J. Int.: .. 11
but notadistribution itself. Thefull distribution describedby its regularizationshouldnotbeconsidered
point-wise,however (Strichartz,2003).
Finally, thesingularsupportof thekernelcoincideswith theunperturbedray. To analyzewhathap-
penson this ray (for example,uponregularizationwith a sourcesignature)it sufficesto focuson the
mostsingularpart of thekernel,which canbederived from theMaslov representationsof theGreen’s
functions.Thisnotionallows thedevelopmentof fastfinite frequency methods,evenfor complex media.
4.2 Causticsand kernel complexity
Any statementrelatingto thebehavior of akernelof a (locally linearized)inversionprocedureshouldbe
generic.To tie thebehavior of akernelto aparticular, simplemediumis in ouropinionmeaningless.The
breakthroughneededin (finite frequency) tomographyis not thelinearizationwith approximatekernels
calculatedfor quasi-homogeneousmediabut theproperaccountingfor broad-bandwaveinteractionwith
heterogeneityata widerangeof lengthscales.DN05 andHH05concurthatcausticsaffect thelocations
of the zerocrossingsin the point-wiseevaluationof the kernels.What shouldbe realized,however, is
thatcausticsform readilyandubiquitouslydueto smoothheterogeneitiesin themedium(seeWhite; cf.
HH05),andcanthusbeexpectedto occurthroughoutEarth’smantle(bothbetweenthesourceandscatter
pointandbetweenthereceiverandthescatterer).Thefactthatmostarenotobservableatthesurfacedoes
notmeanthatthey canbeignoredin thetheoriesandkernelevaluationsunderconsideration.Accounting
only for the �[� causticis, therefore,not sufficient. In this context we arguethat theuseof BDKs will
merely give a falsesenseof improvementwhen imaging complex media,suchas the uppermantle,
volcanointeriors,the shallow subsurface,etc.,becausecausticswill begaloreandthe actual‘kernels’
maynotevenremotelyresembleBDK features.
4.3 Err ors in sourcesignature
We agreethatthis will bea relatively smalleffect (but we did not ignoretheerrorin origin time: this is
capturedby thedifferencebetweenJ]\ and J]K ). Wealsoagreethat,if the(errorin) sourcesignatureis
known a deconvolution canremove this effect altogether. If theparameter in H5R/_ ^5` would appearboth
in JLK and QSR , thenHH05 eq.(12) wouldchange(usingHH05 eq.(9)) into a form coincidingwith the
leadingtwo termsof DN05eq.(2) with aST@&)J KVbWYXZ Q R or McJ K ��J]\�P Z Q R . With J K MON P!T�J]\�MON�=&�NedfP
thesecondtermdoesindeedreduceto theerrorin origin time.But thelinearizationis notobviousbecause
we do not know how to comparequantitatively the error in shapeof the signaturein &gJ KV�WYXZ Q R , in

12 R.D.vanderHilst andM.V. deHoop–TRANSMISSION TOMOGRAPHY
general,with theerrorin QSR dueto anerrorin velocitymodelin JLKV�WYXZ &gQSR . If thereis noerrorin origin
timebut anerrorin shape,thesecondtermwill not vanish.In principle,onecouldtry a ‘joint inversion’
for signature(source)andvelocities(medium),but thatwasnot thepointwewantedto make.
5 DISCUSSIONAND OUTLOOK
Theuseof finite frequency sensitivity kernelsin (travel-time)tomographyis not new (see,for instance,
Luo andSchuster(1991)andWoodward(1992)for shalow sub-surfaceimagingandLi andRomanow-
icz (1995)for applicationsto global tomography),but thetheoreticalwork of Dahlenet al. andtheap-
plicationby M04bhave broughtit to theattentionof abroadcommunity. EventhoughDN05responded
with significantfury, HH05concurthatnew approachesareneededfor theproperinterpretationof finite
frequency data.Wepointout,however, thattheevaluation- in simplemedia- andinterpretationof theso
calledbananadoughnutkernelshave seriouslimitationsfor broad-bandsignalanalysisandtomography.
Basedon thematerialpresentedhere(andour experiencewith tomography),we alsostandby our view
that thedifferencesproducedby BDKs aresmall (comparedto imageuncertaintydueto, for instance,
unevendatacoverageandquality, modelparameterization,damping)and,by implication,thatM04a,b–
andDN05 – overstatetheir significance.Thatdoesnot meanthatthetomographicmodelsareincorrect,
but theexamplesgivenheremayinspirea re-assessmentof thestructureslabeledasplumes,unclouded
by unwarrantedclaimsaboutBDKs. We hope– andexpect– thatsuchanexercisereinforcesmuchof
theinterpretationsby Montelli et al. (2004b),but somerevisionmaybenecessary.
Wefully agreewith DN05thattheuseof Green’s functionsin transmissiontomographyhasdistinct
advantagesover travel times:if doneproperly, (i) it allows correctjoint interpretationof datameasured
in differentwaysandwith different sensitivities to Earth’s structure,(ii) it enableswave propagation
analysisand kernel evaluationin modelswith more realistic, lesssmoothheterogeneity, (iii) it helps
mitigateeffectsof unevendatacoverage(by exploiting theadditionalscale-orientationinformation– see
section2 – onecanobtaincomparablespatialresolutionwith fewersource-receiver pairs),and,thus,(iv)
it improves local (multi-)parameterestimation.The ultimateobjective is the detection,extraction,and
interpretationof moreinformationfrom thebroadbanddataandto mapcorrectlythescalesrepresented
in them(impliedby frequency range)to thespatialscalesin thephysics(or the‘model’). We arguethat
theuseof individualmeasurementsof ballisticwaves(i.e.,phasearrivals)combinedwith backprojection
alongalinearizedkernel(rays,BDKs,whatever)will notmeetthischallengeandthat,instead,arigorous

Geophys.J. Int.: .. 13
broad-band,multi-scaleanalysisis needed.HH05 andde Hoop andVan der Hilst (underrevision for
GJI) introduceapproachesfor wave equationtransmissionand reflectiontomographybasedon multi
resolutionandadjointstatemethods,andalsofull computationalapproaches(e.g.,Trompet al. (2005))
holdsignificantpromise.
ACKNOWLEDGMENTS
We thankRaffaellaMontelli andGuustNolet (PrincetonUniversity) for makingtheir modelsavailable
andfor theopenexchangeof informationpertainingto their imaging.Discussionswith BradfordHager
(MIT) andRichardO’Connell (Harvard)helpedus improve themanuscript.We thankChangLi (MIT)
for preparingmaterialfor figures1 to 5,andHuubDouma(CSM)for preparingfigures6. Ourresearchis
supportedby theNSFgrantEAR-0409816andaDutchNationalScienceFoundationgrant(NWO:VICI
865.03.007)for Innovative Research.
14 R.D.vanderHilst andM.V. deHoop–TRANSMISSION TOMOGRAPHY
REFERENCES
Bolton,H. & Masters,G.,2001.Travel timesof PandSfrom theglobaldigital seismicnetworks:Implicationsfor
therelativevariationof PandSvelocity in themantle,J. Geophys.Res., 106(B7), 13527–13540.
Dahlen,F. & Nolet, G., 2005.Commenton “on sensitivity kernelsfor wave-equationtransmissiontomography”
by M.V. deHoopandR.D.vanderHilst, Geophys.J. Int., p. in press.
Dahlen,F., Hung,S.-H.,& Nolet,G.,2000.Frechetkernelsfor finite-frequency traveltimes–I.Theory, Geophys.J.
Int., 141, 157–174.
De Hoop,M. & VanderHilst, R., 2005.On sensitivity kernelsfor ‘wave-equation’tomography, Geophys.J. Int.,
160, DOI: 10.1111/j.1365–246X.2004.02509.
Dencker, N., 1982.On thepropagationof polarizationsetsfor systemsof realprincipal type,J. Funct.Anal., 46,
351–372.
Duistermaat,J.,1996.Fourier Integral Operators, Birkhauser, Boston.
Engdahl,E.,VanderHilst, R.,& Buland,R.,1998.Globalteleseismicearthquakerelocationfrom improvedtravel
timesandproceduresfor depthdetermination,BulletinSeismological Societyof America, 88, 722–743.
Hormann,G. & De Hoop, M., 2002.Detectionof wave front setperturbationsvia correlation:Foundationfor
wave-equationtomography, Appl.Anal., 81, 1443–1465.
Hung,S.-H.,Dahlen,F., & Nolet,G., 2001.Wavefronthealing:a banana-doughnutperspective,Geophys.J. Int.,
146, 289–312.
Karason,H., 2002.Constraintson mantleconvectionfrom seismictomographyandflow modeling, Ph.D.thesis,
MassachusettsInstituteof Technology.
Karason,H. & VanderHilst, R., 2001.Tomographicimagingof the lowermostmantlewith differentialtimesof
refractedanddiffractedcorephases(pkp,pdiff), J. Geoph.Res., 106, 6569–6588.
Li, X.-D. & Romanowicz, B., 1995.Comparisonof global waveform inversionswith and without considering
cross-branchmodecoupling,Geophys.J. Int., 121, 695–709.
Luo, Y. & Schuster, G.,1991.Wave-equationtravel time inversion,Geoph., 56, 645–653.
Montelli, R., Nolet,G., Dahlen,F., Masters,G., Engdahl,E., & Hung,S.-H.,2004a.GlobalP andPPtravel time
tomography:raysvs.waves,Geophys.J. Int., 158, 637–654.
Montelli, R.,Nolet,G.,Dahlen,F., Masters,G.,Engdahl,E.,& Hung,S.-H.,2004b. Finite-frequency tomography
revealsa varietyof plumesin themantle,Science, 303, 338–343.
Strichartz,R.,2003.A guideto distributiontheoryandFourier transforms, World ScientificPublishing,Singapore.
Trampert,J.& Spetzler, J.,2005.Surfacewavetomography:finite frequency effectslostin thenull space,Geophys.
J. Int., p. underreview.
Tromp,J., Tape,C., & Liu, Q., 2005.Seismictomography, adjointmethods,time reversalandbanana-doughnut
kernels,Geophys.J. Int., 160, 195–216.
Geophys.J. Int.: .. 15
Woodward,M., 1992.Waveequationtomography, Geoph., 57, 15–26.

16 R.D.vanderHilst andM.V. deHoop–TRANSMISSION TOMOGRAPHY
Figure captions
FIGURE 1. Mantlestructurebeneathsubductionzonesin SouthAmericaaccordingto – from left to
right – MIT-P05,a recentmodelby VanderHilst et al. (in preparation);thePrincetonmodelbasedon
finite frequency theory(PRI-FFT),andaPrincetonmodelbasedonraytheory(PRI-RT). Thecolorscale
is the samefor all models,but the amplitudeof the anomaliesin the modelsby M04a,bis up to 50%
largerthanin MIT-P05sothatsomecolorsaturationoccurs.Basedonthesimilarity of PRI-RT andPRI-
FFT we attribute thedifferencesbetweenMIT-P05andPRI-FFTnot to theuseof BDKs but to theuse
of a differentparameterization,regularization,anddatamisfit criterion. (NB. True amplitudeimaging
remainsa challenge,andtestinversionswith syntheticdatasuggestthatamplitudesareunderestimated
by asignificantfraction.)
FIGURE 2. To illustrateof effectof ‘bananadoughnutkernels’on theimagesof plume-like structures
we show the lateralvariationin P-wave speedat 150 km depthbeneaththe beneaththe Indian Ocean
( h is Kerguelen)andat 1350km depthbeneathHawaii; we displayresultsof inversionsby Montelli et
al. (2004a,b)with classicalray theory– on the left – andwith finite frequency theory(that is, ‘banana
doughnutkernels’)– on theright. Thecolor scalesarethesame.We leave it to thereaderto assessthe
differencesbetweentheRT andFFT results.
FIGURE 3. Lateralvariationin P-wavespeedaccordingto MIT-P05for theregionsanddepthsusedin
figure2.
FIGURE 4. P-wave speedat 450 km depthbeneaththe Indian Oceanaccordingto the RT (left) and
FFT inversions(middle)dueto M04aandM04b, respectively. Figureon theright depictsgeographical
Geophys.J. Int.: .. 17
distribution of sources(reddots),receivers(bluedots),andthePPbouncepoints(greendots).ThePP
bouncepointdistribution is sparsein muchof theIndianOcean.
FIGURE 5. Comparisonof wavespeedperturbations&�' inferred from FFT and RT inversions.We
use &�'-i�i ( &>'-jlk ) to denotethe relative variationin wavespeedaccordingto the FFT (RT) models.(a)
histogramof &�'-i�im+&>'-jlk for depth <�;-n� km and for modelswith C D +)o T ;7p (after Fig. 13 of
M04a). Accordingto M04a the meanof this distribution is around ;7�q . The low countnearzeroand
the skewnessof the main lobe resultfrom omitting low valuesof 0 &�'2+3'*0 from theanalysis.From PRI-
FFT (M04b) and PRI-RT (M04a) we produced(hereshown for <=;2r/ km depth)histogramsof (b)
&�')(*(�+&�'-,/. for all values;(c) &�')(*(s+&�'-,/. for 0 &�'2+3'*0 largerthan0.2%;and(d) &>'-,/.t+&>')(*( , alsofor 0 &�'2+3'*0largerthan0.2%.Notethatthemeanshiftsto valueslargerthan1 becauseof theomissionof theweaker
anomalies.(e)Scatterplot of &>')i�i vs. &�'fjlk (samedepth)(coorelationcoefficient uvTw87:x/9 ; slope(from
bi-variantregression)is 0.96).Thedashedline (slopeof 1.5)markstheexpectationfrom DN05’s claim
of a <� �� amplitudeincrease.(f) (Normalized)Rootmeansquareof wavespeedamplitudeasfunction
of wavespeedratio for six differentdepths.At eachdepth,the anomalieswith the largestwavespeed
valueshave ratios <�; , whereasthenegative or large positive wavespeedratiosinvolve theweakand–
perhaps– poorly resolvedanomalies.
FIGURE 6. This figure illustratesthescaleanddirectionalcontentof a kernel(seeHH05 for a more
detaileddiscussion).Left: spacedomainrepresentation;right: Fourierdomainrepresentation.Thespace
domaindepictsthecontributionsin spaceto the(normalized)sensitivity kernel,whichis projectedontoa
curveletframe.In theFourierdomainrepresentationthelargestlengthscales(i.e.,smallestwavenumbers
y) plot toward the center, andthe direction in which the scaleannuli arefilled mark the directionof
maximumresolution.In this example,the kernel is of ‘bananadoughnut’type and the (background)
mediumis, thus,homogeneous.Thetoprow (sameasFig.8dof HH05)illustratescontributions(right) to

18 R.D.vanderHilst andM.V. deHoop–TRANSMISSION TOMOGRAPHY
thekernelfrom curveletslocatedontheunperturbedrayhalf-waybetweensourceandreceiver(indicated
with acrossin thespacedomainpanel).TheFouriertransformshowsthatdatawith thespecificfrequency
contentusedheredosensestructureon theunpertubedraybut only for certainscales,and(primarily) in
directionsorthogonalto theray. In thebottomrow thespatiallocationof curveletsconsideredis moved
away from the ray to the first ‘optimum’ of the regularizedkernel (lower left). The Fourier domain
representation,andhencethe‘curveletcontent’,is practicallythesameasfor thepoint on theray. This
demonstratesthatdatawith a certainfrequency contentaresensitive to structureat certainlengthscales
(wave numbers)andthatthissensitivity is thesamefor structureon therayandaway from it.

Geophys.J. Int.: .. 19
Figure1.

20 R.D.vanderHilst andM.V. deHoop–TRANSMISSION TOMOGRAPHY
Figure2.

Geophys.J. Int.: .. 21
Figure3.
22 R.D.vanderHilst andM.V. deHoop–TRANSMISSION TOMOGRAPHY
Figure4.

Geophys.J. Int.: .. 23
Figure5.

24 R.D.vanderHilst andM.V. deHoop–TRANSMISSION TOMOGRAPHY
Figure6.