Embed Size (px)
Citation preview
Repeated Measures Designs
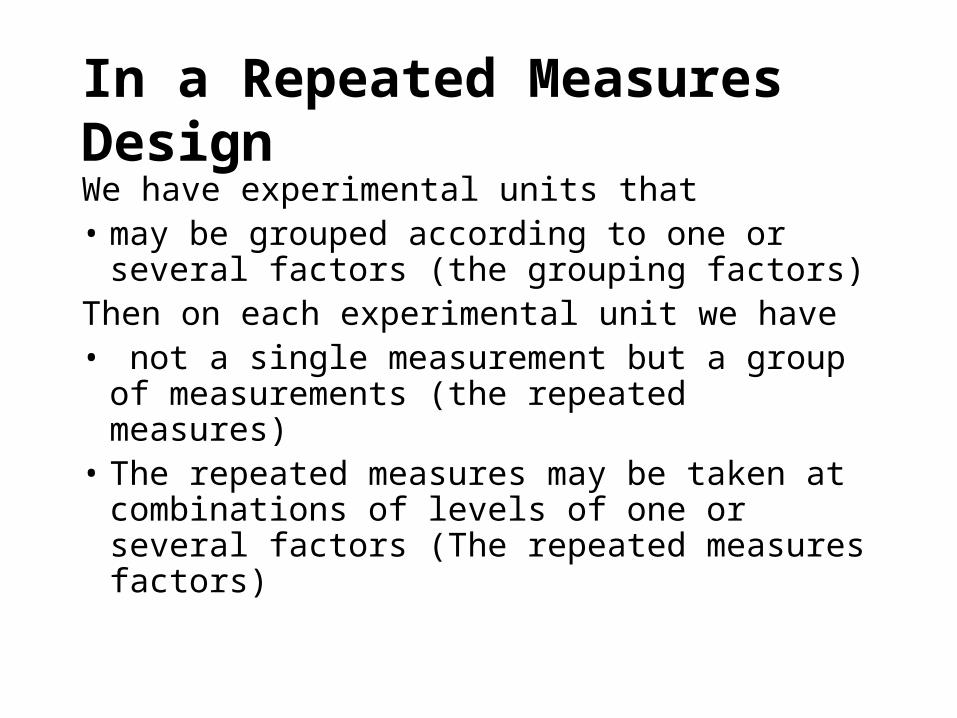
In a Repeated Measures Design
We have experimental units that• may be grouped according to one or several
factors (the grouping factors)Then on each experimental unit we have• not a single measurement but a group of
measurements (the repeated measures)• The repeated measures may be taken at
combinations of levels of one or several factors (The repeated measures factors)
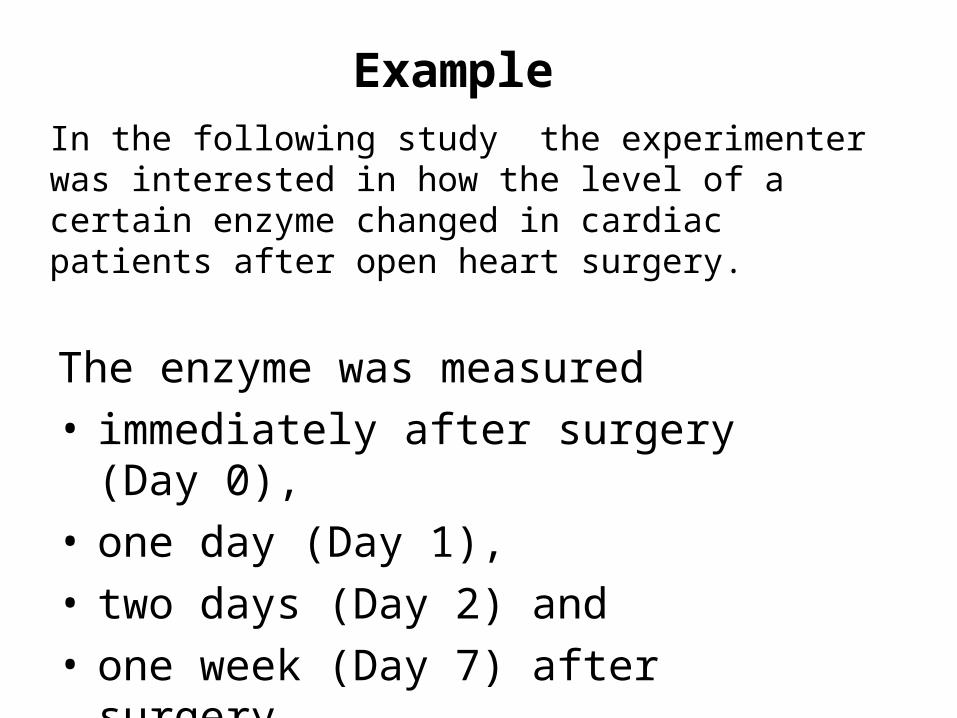
Example In the following study the experimenter was interested in how the level of a certain enzyme changed in cardiac patients after open heart surgery.
The enzyme was measured
• immediately after surgery (Day 0),
• one day (Day 1),
• two days (Day 2) and
• one week (Day 7) after surgery
for n = 15 cardiac surgical patients.
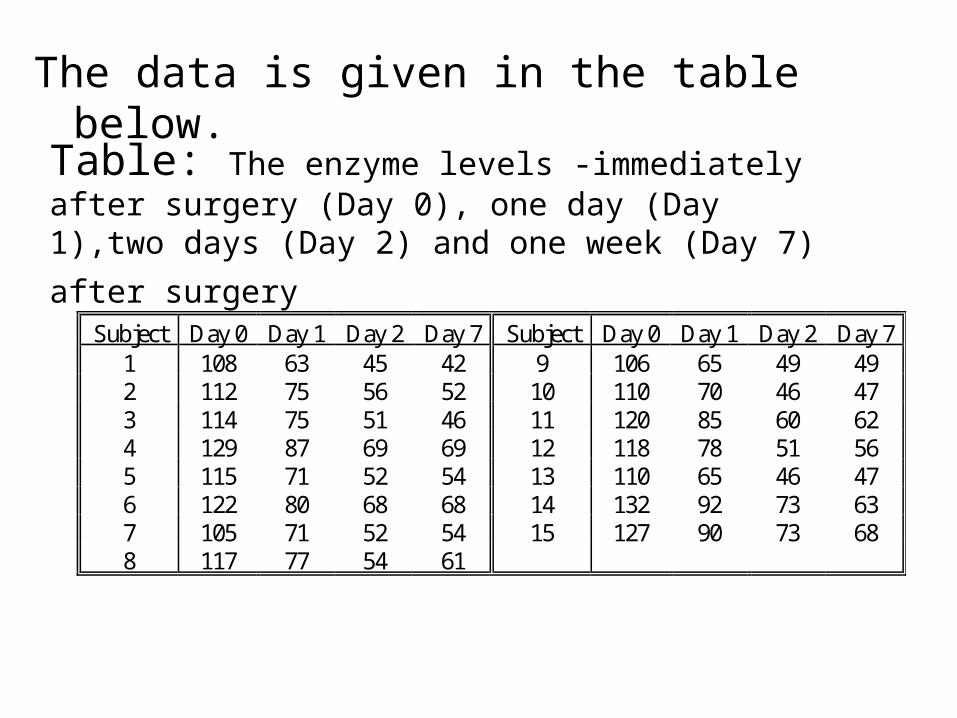
The data is given in the table below.
Subject Day 0 Day 1 Day 2 Day 7 Subject Day 0 Day 1 Day 2 Day 7 1 108 63 45 42 9 106 65 49 49 2 112 75 56 52 10 110 70 46 47 3 114 75 51 46 11 120 85 60 62 4 129 87 69 69 12 118 78 51 56 5 115 71 52 54 13 110 65 46 47 6 122 80 68 68 14 132 92 73 63 7 105 71 52 54 15 127 90 73 68 8 117 77 54 61
Table: The enzyme levels -immediately after surgery (Day 0), one day (Day 1),two days (Day 2) and one week (Day 7)
after surgery
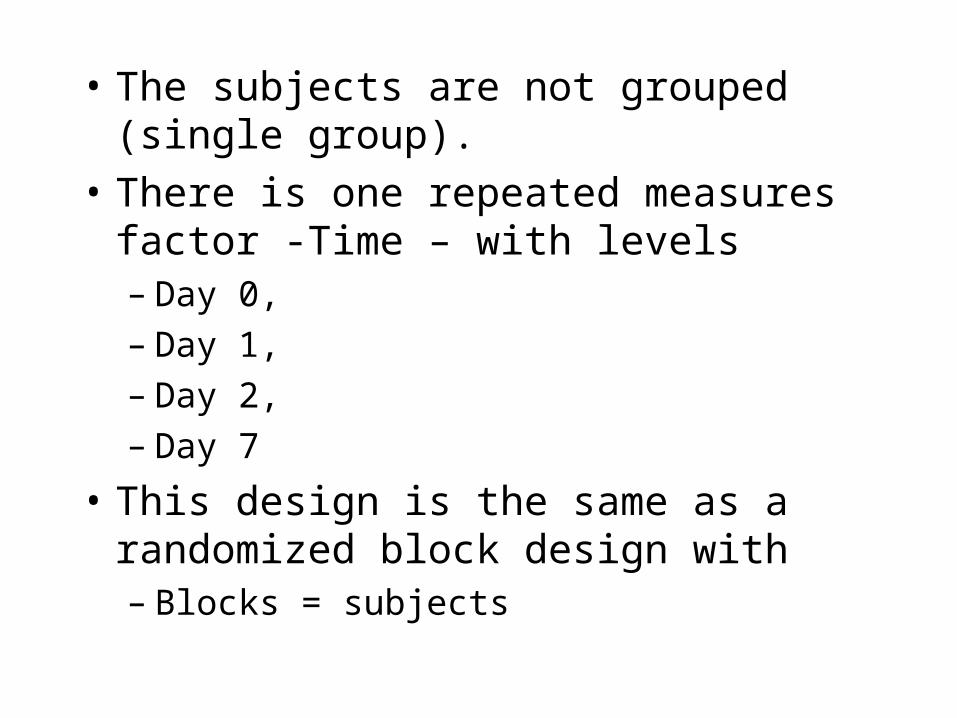
• The subjects are not grouped (single group).
• There is one repeated measures factor -Time – with levels– Day 0, – Day 1, – Day 2, – Day 7
• This design is the same as a randomized block design with – Blocks = subjects
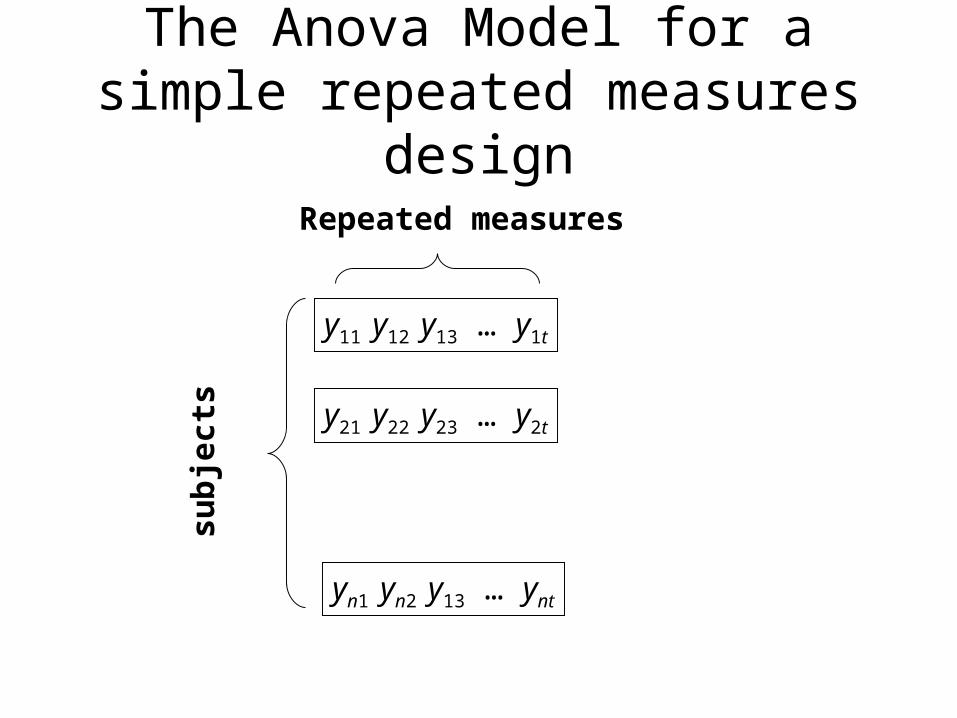
The Anova Model for a simple repeated measures design
y11 y12 y13 … y1t
y21 y22 y23 … y2t
yn1 yn2 y13 … ynt
sub
ject
sRepeated measures
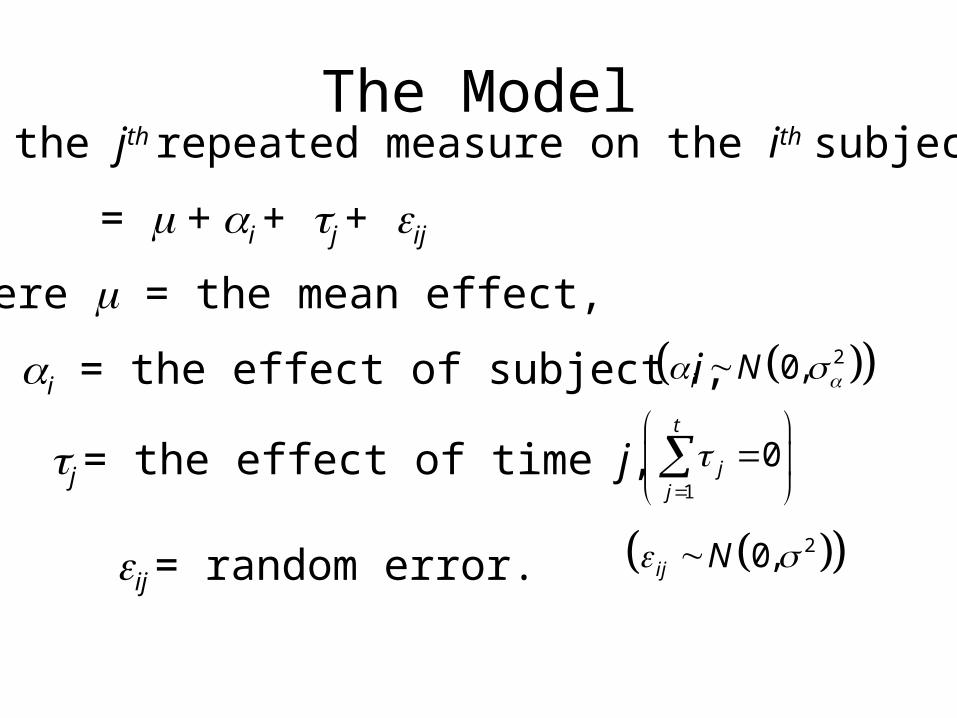
The Modelyij = the jth repeated measure on the ith subject
= + i + j + ij
where = the mean effect,
i = the effect of subject i,
j = the effect of time j,
ij = random error.
20,i N
20,ij N
1
0t
jj
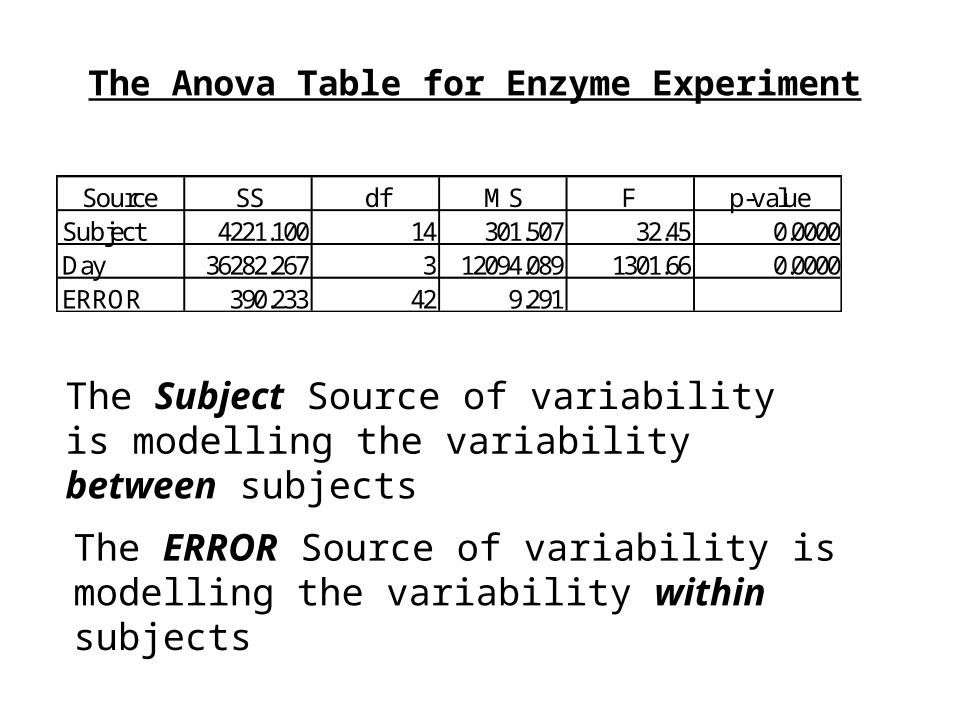
The Anova Table for Enzyme Experiment
Source SS df MS F p-valueSubject 4221.100 14 301.507 32.45 0.0000Day 36282.267 3 12094.089 1301.66 0.0000ERROR 390.233 42 9.291
The Subject Source of variability is modelling the variability between subjects
The ERROR Source of variability is modelling the variability within subjects
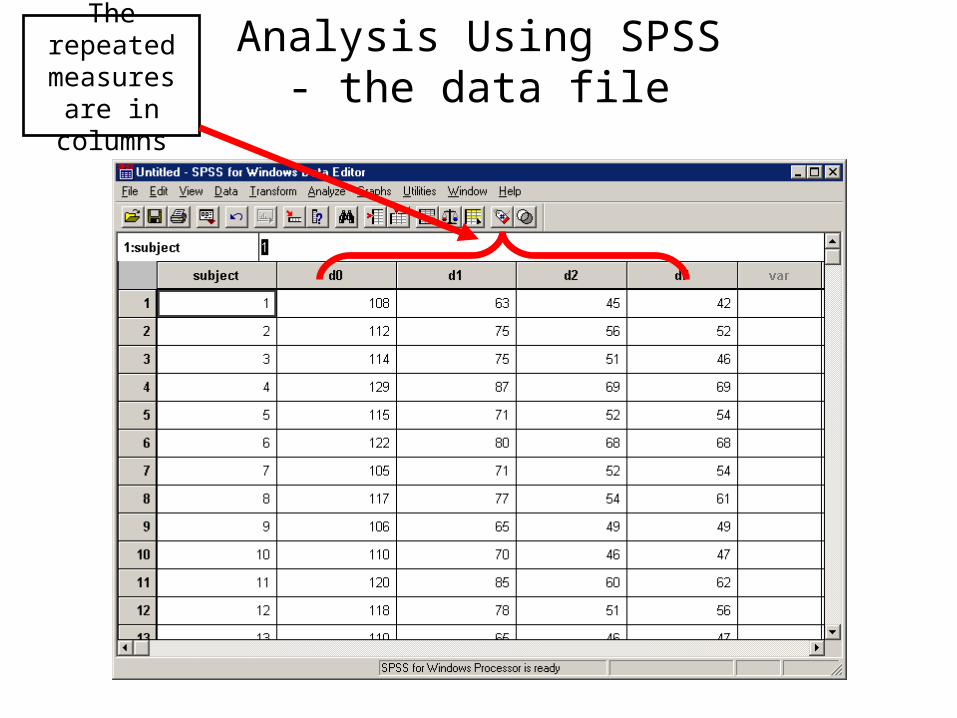
Analysis Using SPSS- the data file
The repeated measures are in columns
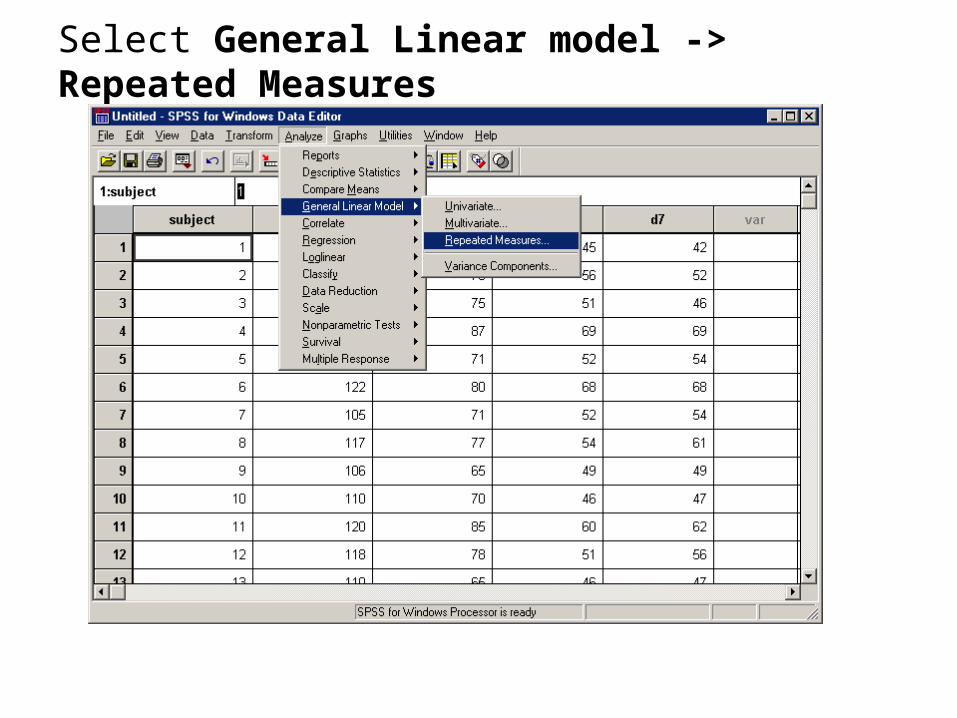
Select General Linear model -> Repeated Measures
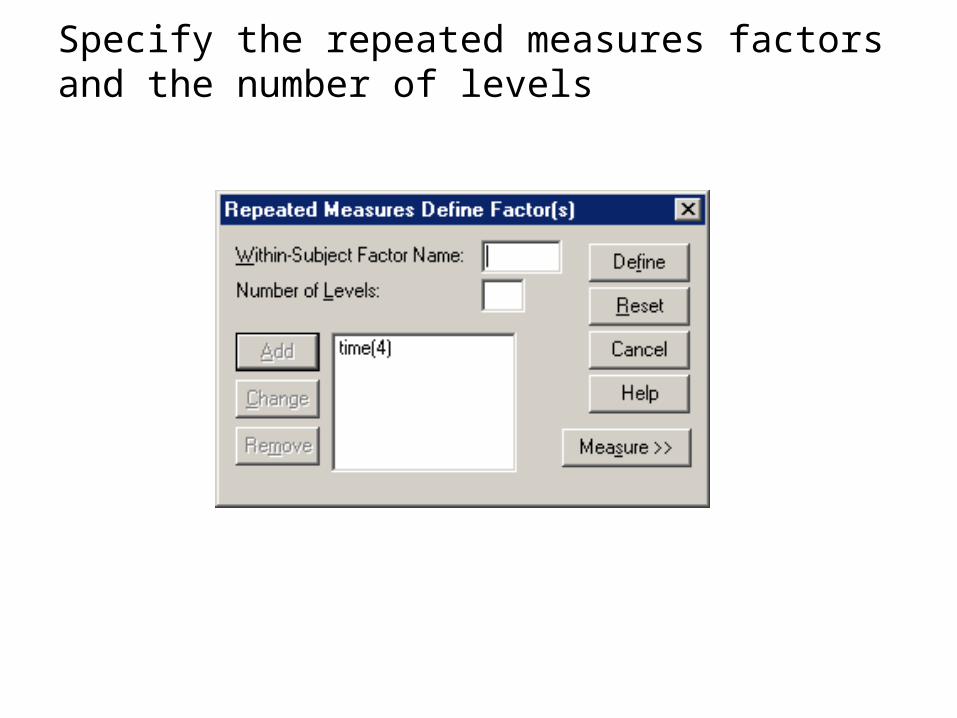
Specify the repeated measures factors and the number of levels
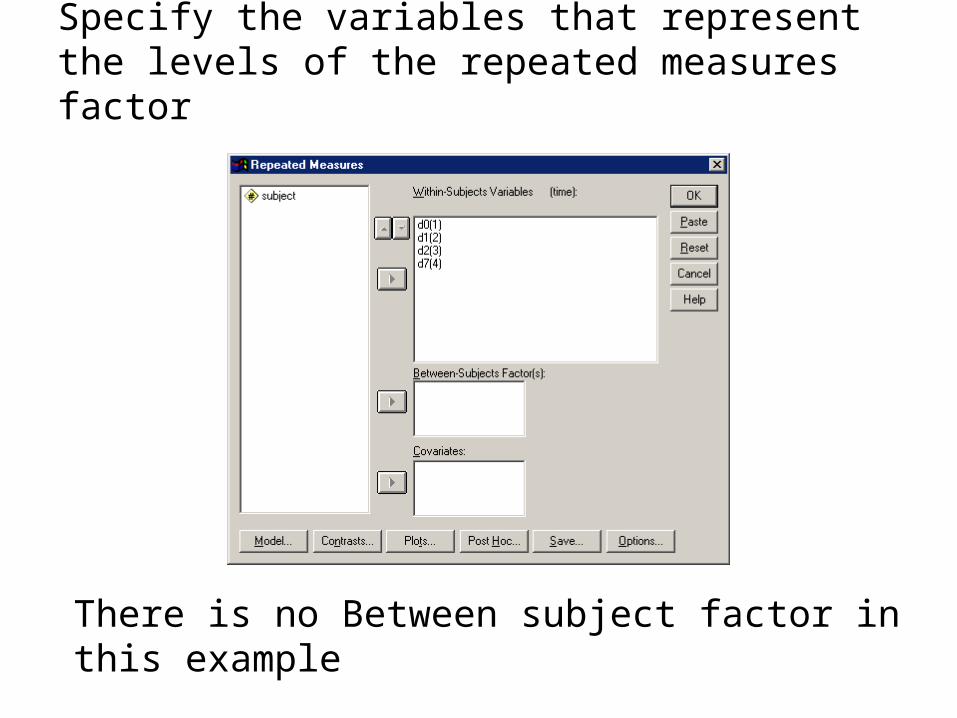
Specify the variables that represent the levels of the repeated measures factor
There is no Between subject factor in this example
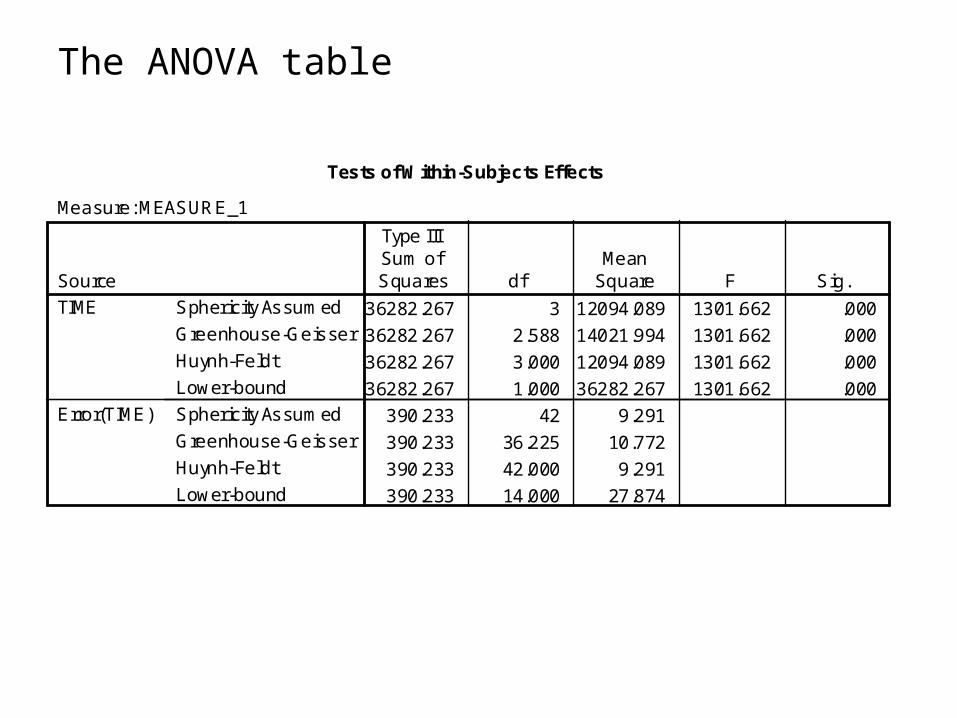
The ANOVA table
Tests of Within-Subjects Effects
Measure: MEASURE_1
36282.267 3 12094.089 1301.662 .000
36282.267 2.588 14021.994 1301.662 .000
36282.267 3.000 12094.089 1301.662 .000
36282.267 1.000 36282.267 1301.662 .000
390.233 42 9.291
390.233 36.225 10.772
390.233 42.000 9.291
390.233 14.000 27.874
Sphericity Assumed
Greenhouse-Geisser
Huynh-Feldt
Lower-bound
Sphericity Assumed
Greenhouse-Geisser
Huynh-Feldt
Lower-bound
SourceTIME
Error(TIME)
Type IIISum of
Squares dfMean
Square F Sig.
The Multivariate Model for a Repeated measures design
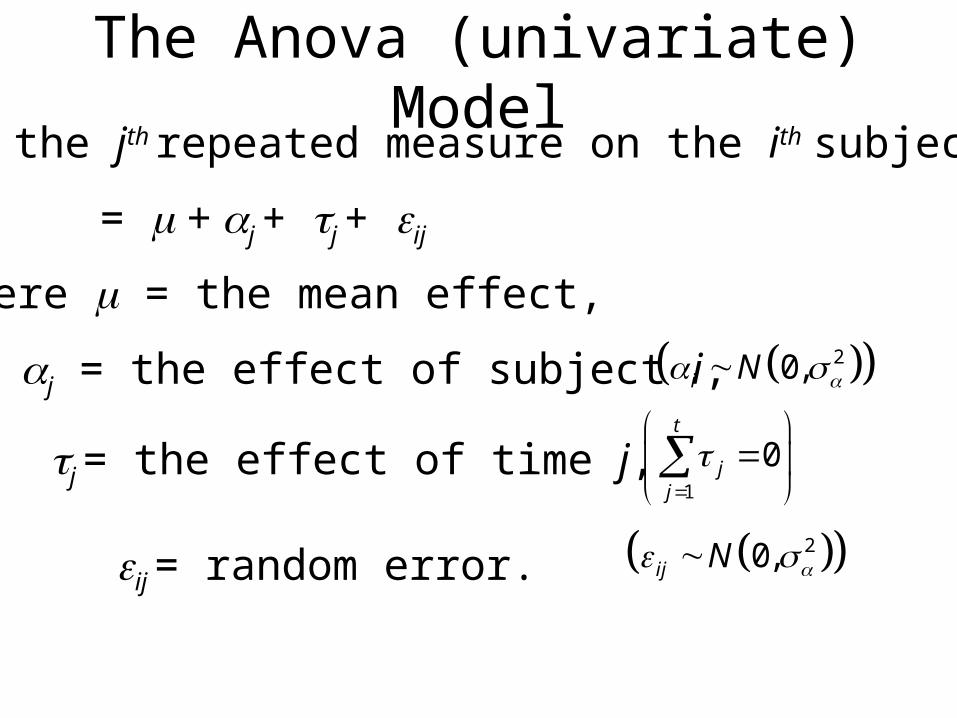
The Anova (univariate) Modelyij = the jth repeated measure on the ith subject
= + j + j + ij
where = the mean effect,
j = the effect of subject i,
j = the effect of time j,
ij = random error.
20,i N
20,ij N
1
0t
jj
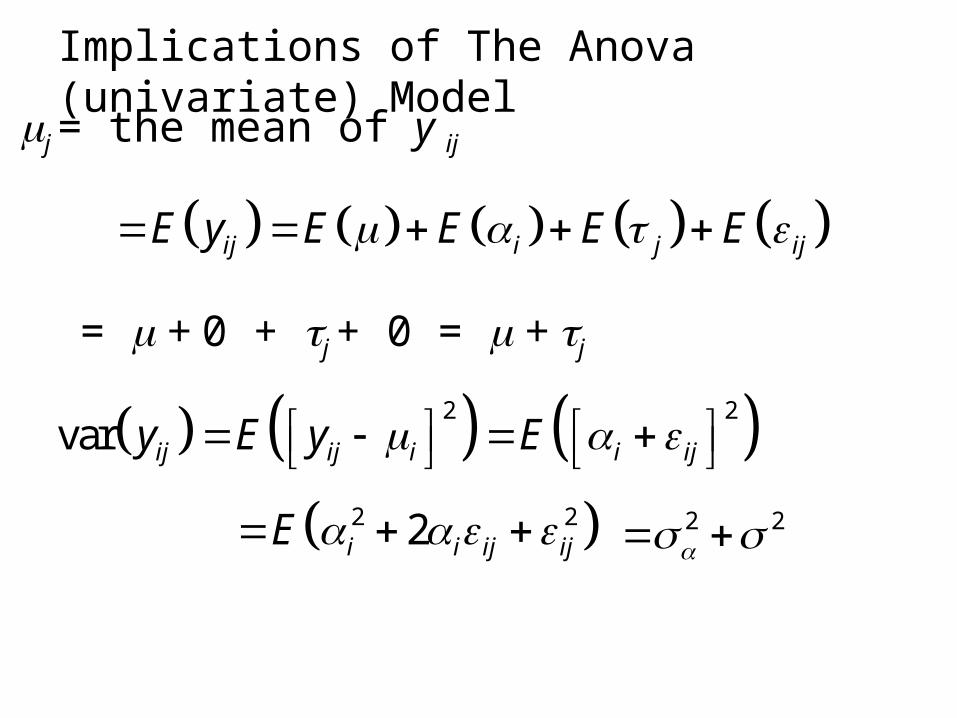
Implications of The Anova (univariate) Modelj = the mean of y ij
= + 0 + j + 0 = + j
ij i j ijE y E E E E
2 2var ij ij i i ijy E y E
2 22i i ij ijE 2 2
2
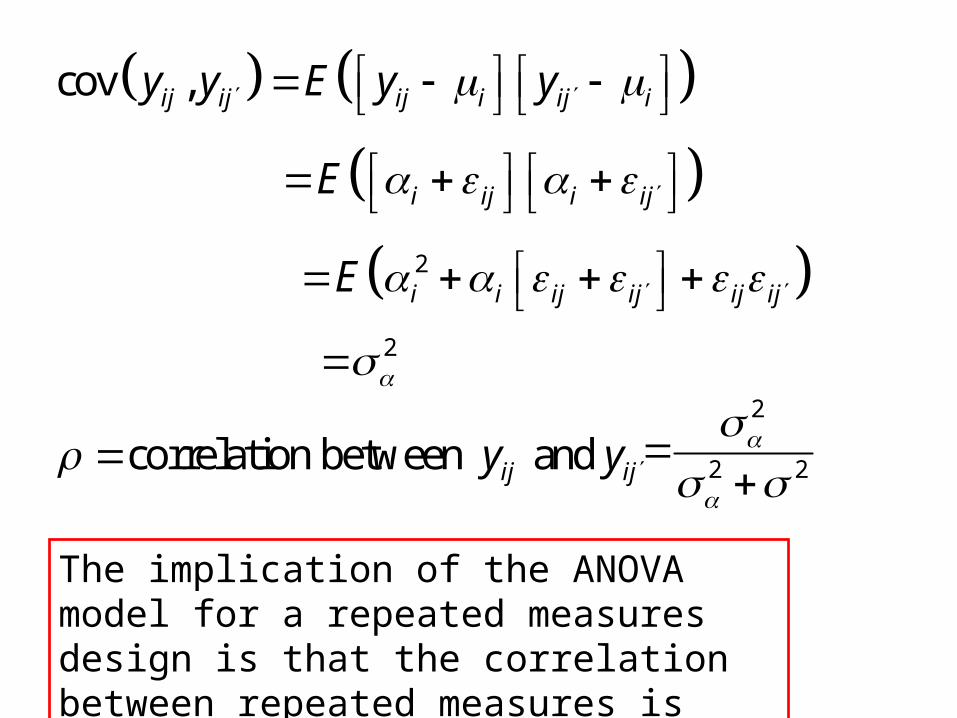
cov ,ij ij ij i ij iy y E y y
i ij i ijE
2i i ij ij ij ijE
correlation between and ij ijy y 2
2 2
The implication of the ANOVA model for a repeated measures design is that the correlation between repeated measures is constant.
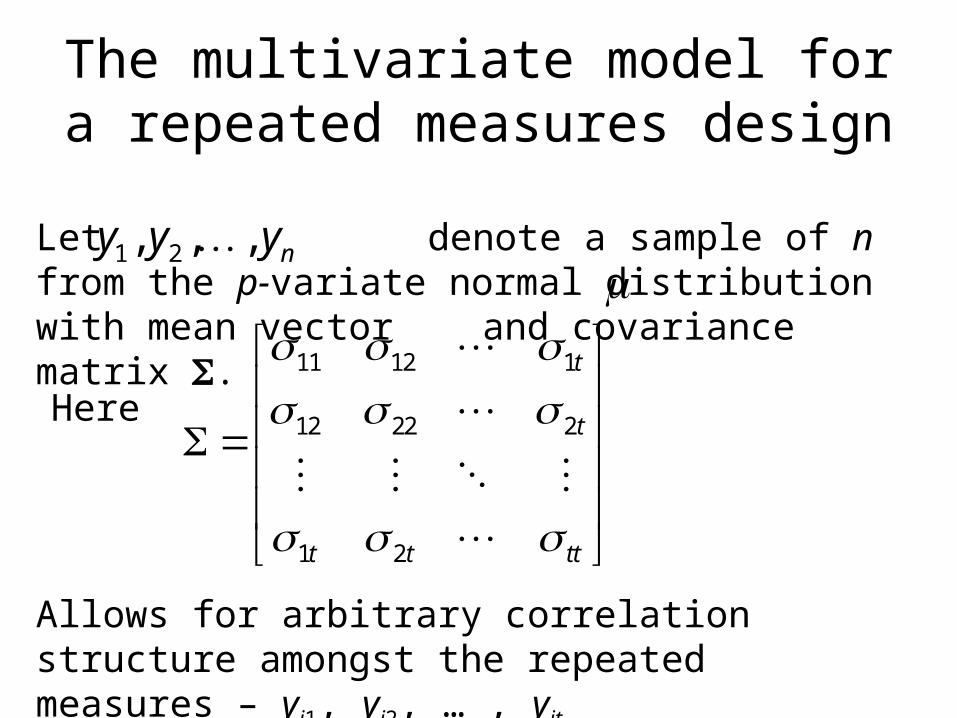
The multivariate model for a repeated measures design
11 12 1
12 22 2
1 2
t
t
t t tt
Here
Let denote a sample of n from the p-variate normal distribution with mean vector and covariance matrix .
1 2, , , ny y y
Allows for arbitrary correlation structure amongst the repeated measures – yi1, yi2, … , yit
Test for equality of repeated measures
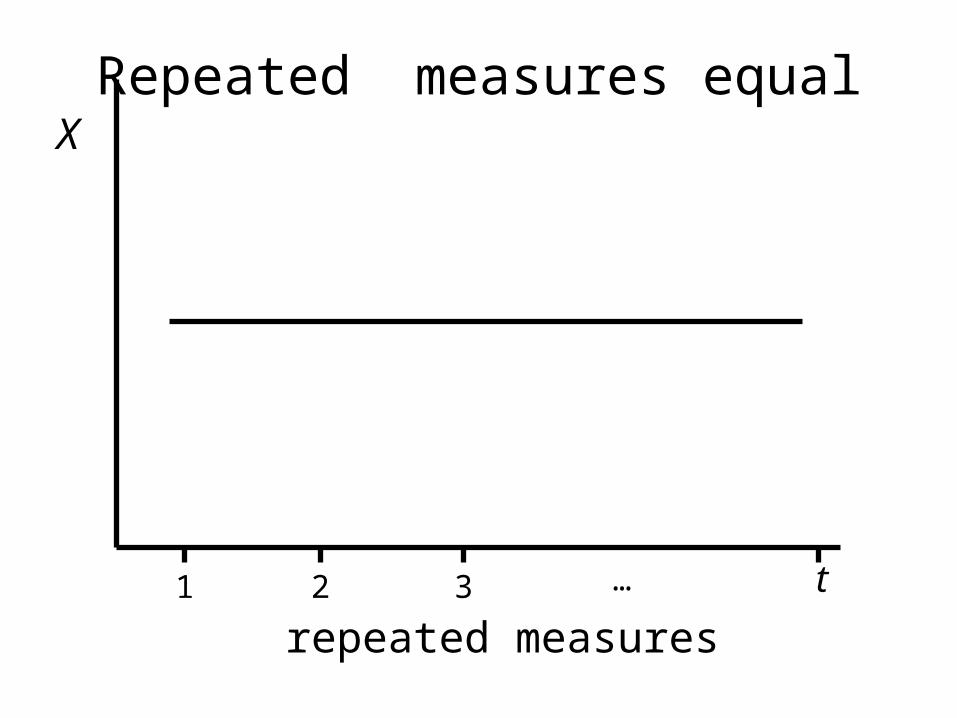
Repeated measures equalX
repeated measures
t1 2 3 …
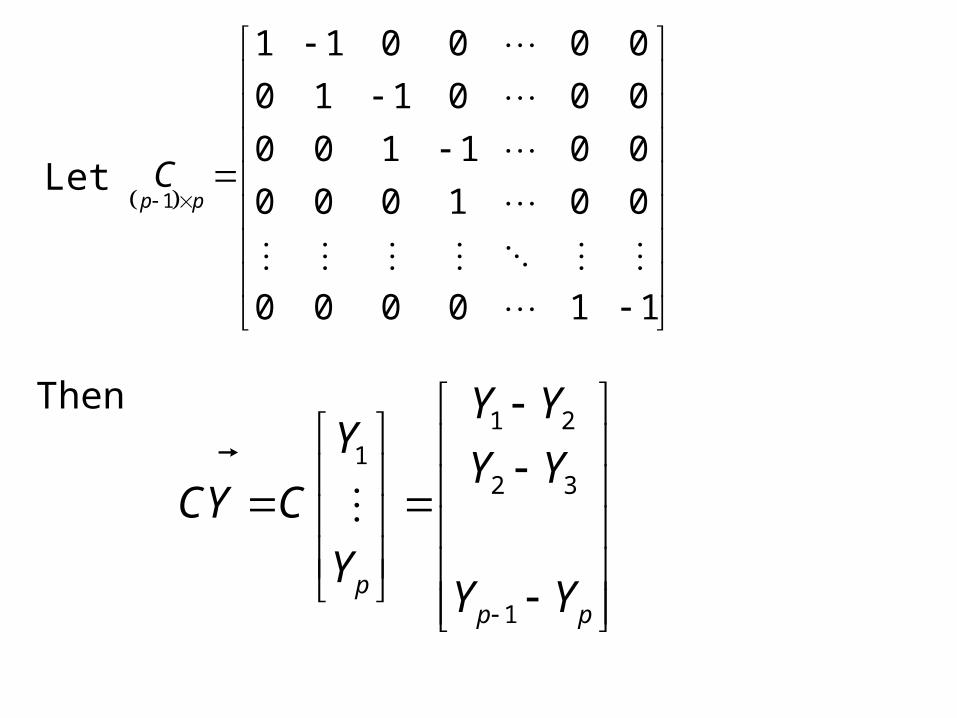
Let 1
1 1 0 0 0 0
0 1 1 0 0 0
0 0 1 1 0 0
0 0 0 1 0 0
0 0 0 0 1 1
p pC
Then1 2
12 3
1p
p p
Y YY
Y YCY C
YY Y
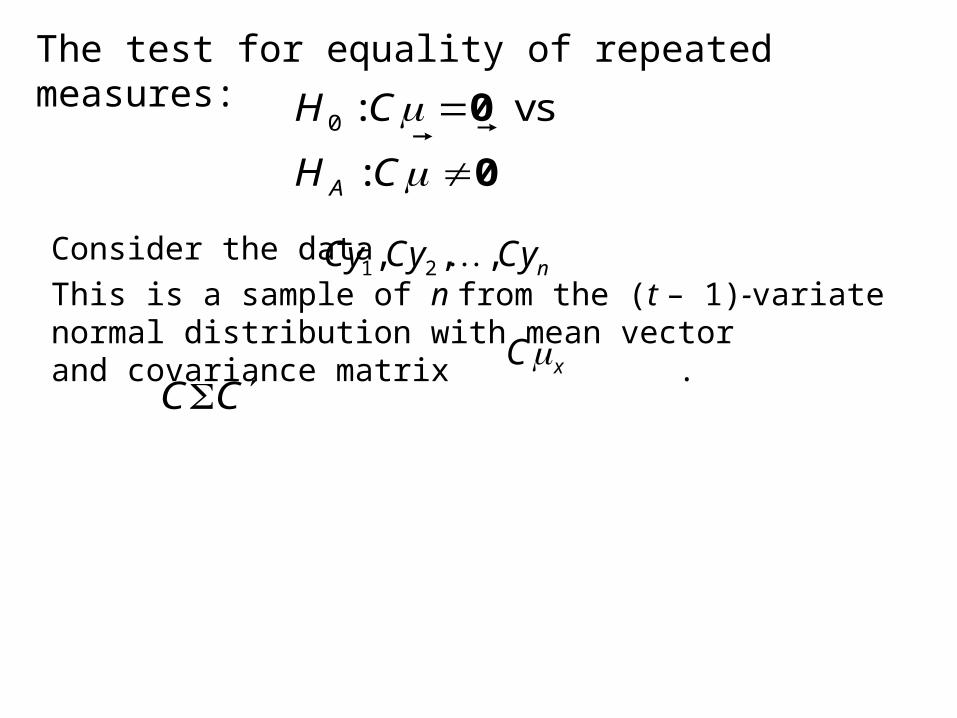
Consider the data
This is a sample of n from the (t – 1)-variate normal distribution with mean vector and covariance matrix .
1 2, , , nCy Cy Cy
xC
0 : vs
:A
H C
H C
0
0
The test for equality of repeated measures:
C C
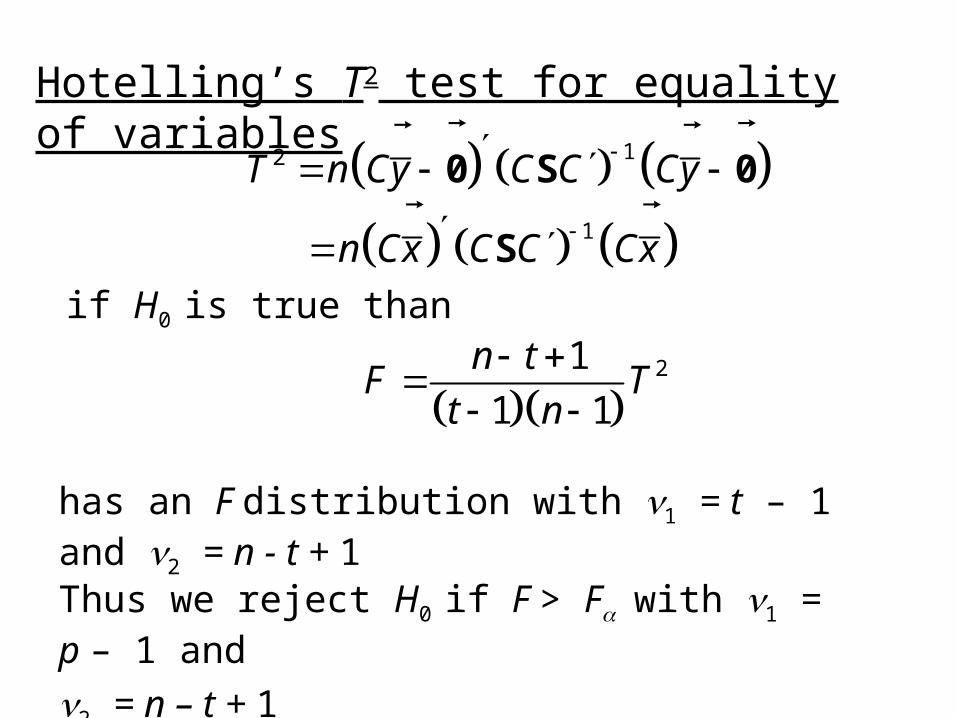
Hotelling’s T2 test for equality of variables
12T n Cy C C Cy 0 S 0
if H0 is true than
Thus we reject H0 if F > Fwith 1 = p – 1 and
2 = n – t + 1
1n Cx C C Cx
S
21
1 1
n tF T
t n
has an F distribution with 1 = t – 1 and 2 = n - t + 1
To perform the test, compute differences of successive variables for each case in the group and perform the one-sample Hotelling’s T2 test for a zero mean vector
Example

Example In the following study the experimenter was interested in how the level of a certain enzyme changed in cardiac patients after open heart surgery.
The enzyme was measured
• immediately after surgery (Day 0),
• one day (Day 1),
• two days (Day 2) and
• one week (Day 7) after surgery
for n = 15 cardiac surgical patients.

The data is given in the table below.
Subject Day 0 Day 1 Day 2 Day 7 Subject Day 0 Day 1 Day 2 Day 7 1 108 63 45 42 9 106 65 49 49 2 112 75 56 52 10 110 70 46 47 3 114 75 51 46 11 120 85 60 62 4 129 87 69 69 12 118 78 51 56 5 115 71 52 54 13 110 65 46 47 6 122 80 68 68 14 132 92 73 63 7 105 71 52 54 15 127 90 73 68 8 117 77 54 61
Table: The enzyme levels -immediately after surgery (Day 0), one day (Day 1),two days (Day 2) and one week (Day 7)
after surgery
Example :
(Repeated Measures Design - Grouping Factor)
• In the following study, similar to example 3, the experimenter was interested in how the level of a certain enzyme changed in cardiac patients after open heart surgery.
• In addition the experimenter was interested in how two drug treatments (A and B) would also effect the level of the enzyme.
• The 24 patients were randomly divided into three groups of n= 8 patients.
• The first group of patients were left untreated as a control group while
• the second and third group were given drug treatments A and B respectively.
• Again the enzyme was measured immediately after surgery (Day 0), one day (Day 1), two days (Day 2) and one week (Day 7) after surgery for each of the cardiac surgical patients in the study.
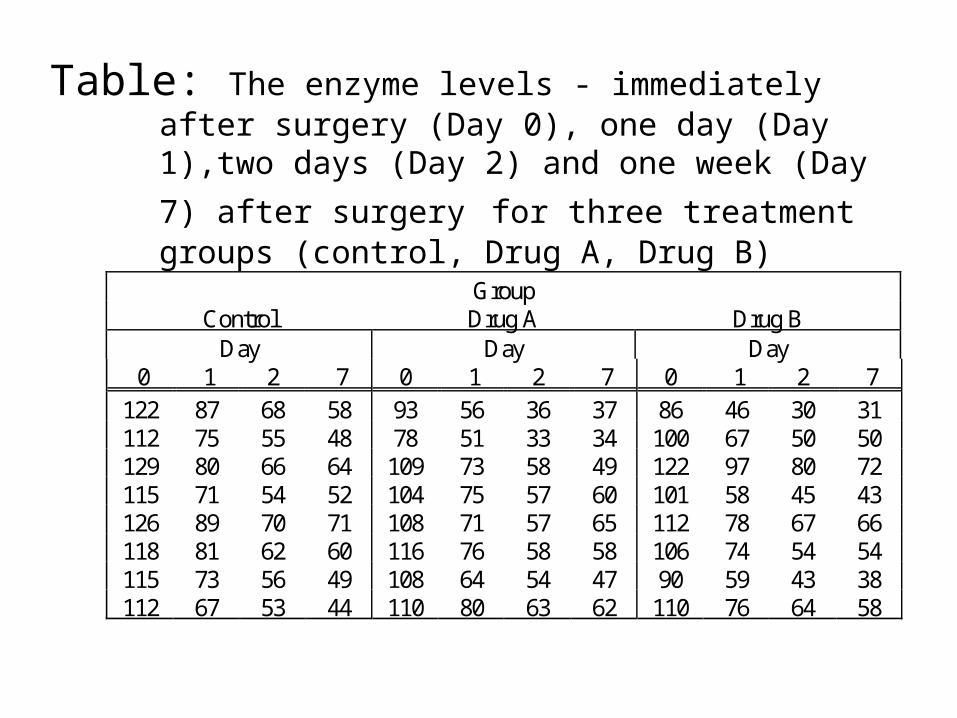
Table: The enzyme levels - immediately after surgery (Day 0), one day (Day 1),two days (Day 2) and one week (Day 7)
after surgery for three treatment groups (control, Drug A, Drug B)
Group Control Drug A Drug B Day Day Day
0 1 2 7 0 1 2 7 0 1 2 7 122 87 68 58 93 56 36 37 86 46 30 31 112 75 55 48 78 51 33 34 100 67 50 50 129 80 66 64 109 73 58 49 122 97 80 72 115 71 54 52 104 75 57 60 101 58 45 43 126 89 70 71 108 71 57 65 112 78 67 66 118 81 62 60 116 76 58 58 106 74 54 54 115 73 56 49 108 64 54 47 90 59 43 38 112 67 53 44 110 80 63 62 110 76 64 58
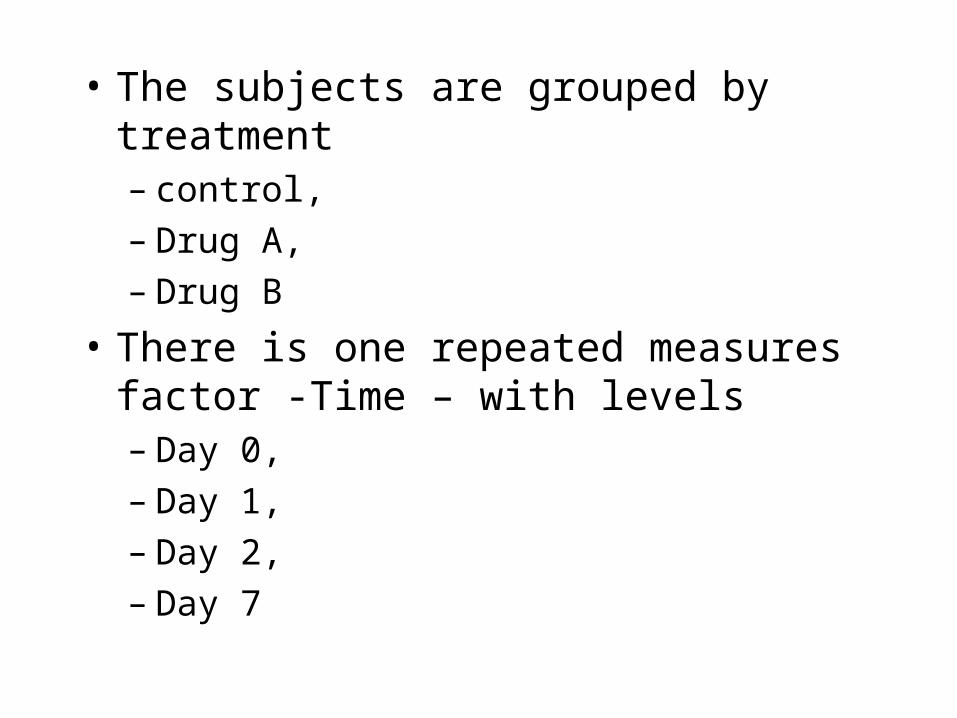
• The subjects are grouped by treatment– control, – Drug A, – Drug B
• There is one repeated measures factor -Time – with levels– Day 0, – Day 1, – Day 2, – Day 7
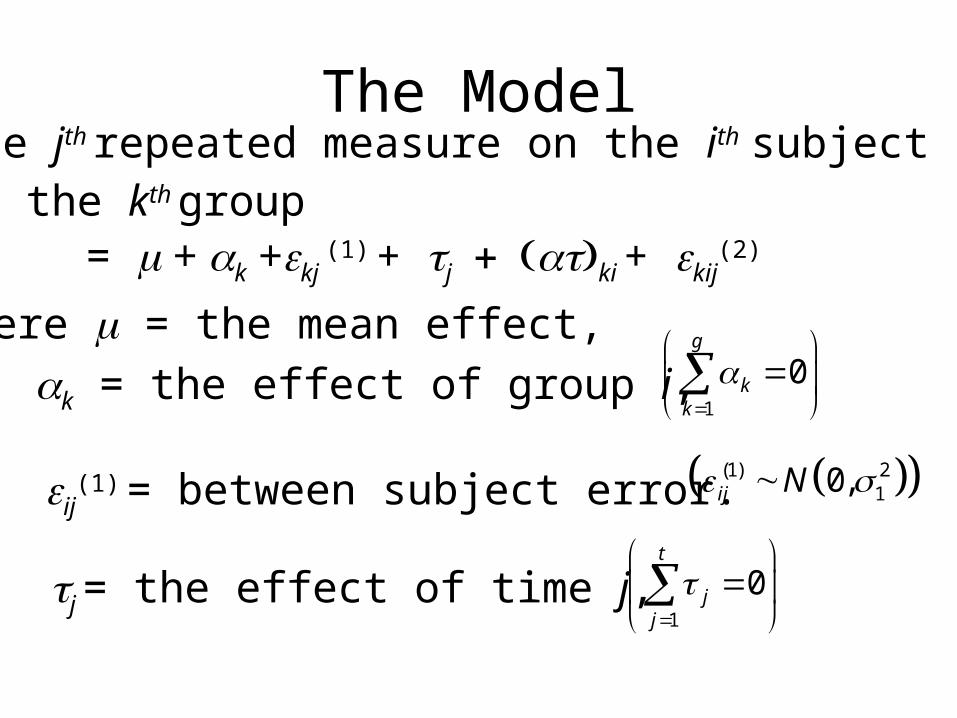
The Modelyikj = the jth repeated measure on the ith subject
in the kth group= + k +kj
(1) + jki + kij
(2)
where = the mean effect,
k = the effect of group i,
j = the effect of time j,
ij(1)
= between subject error. (1) 210,ij N
1
0t
jj
1
0g
kk
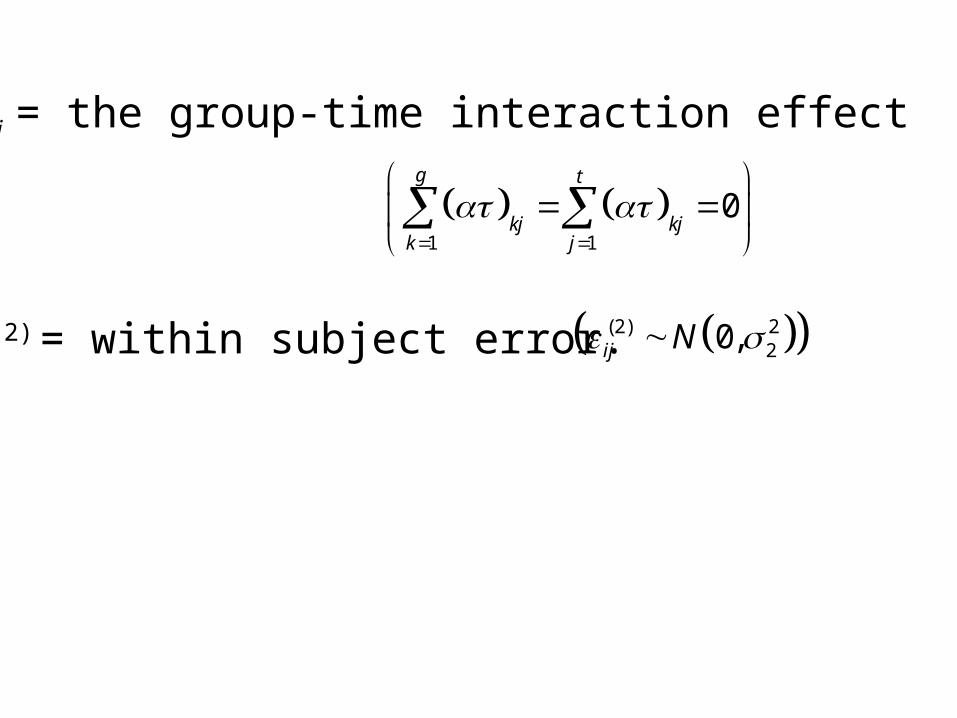
()kj = the group-time interaction effect
ij(2)
= within subject error. (2) 220,ij N
1 1
0g t
kj kjk j
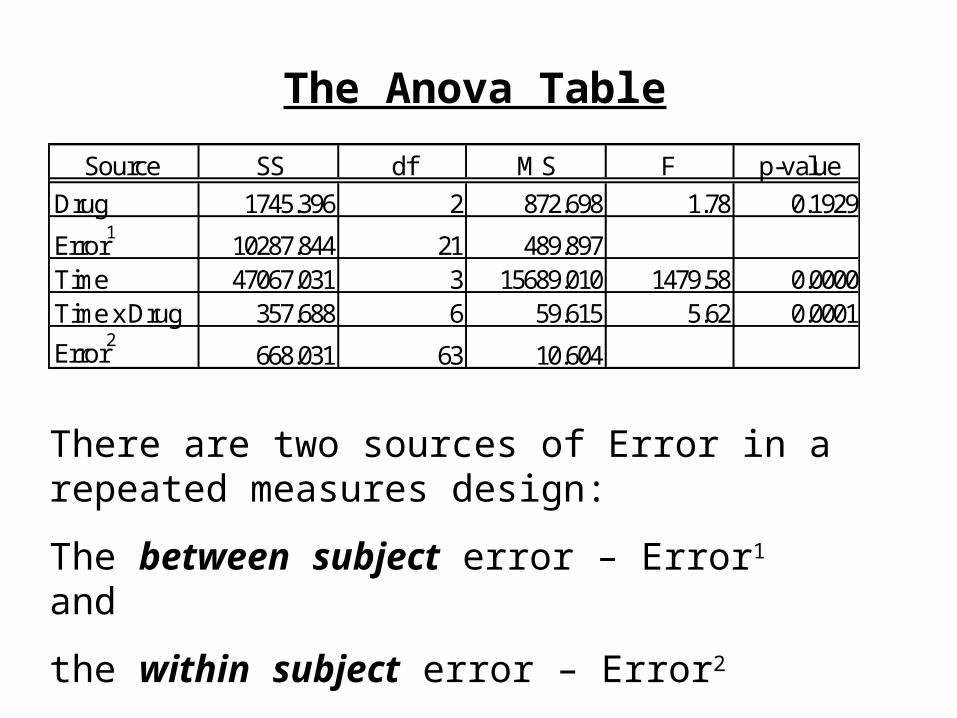
The Anova Table
There are two sources of Error in a repeated measures design:
The between subject error – Error1 and
the within subject error – Error2
Source SS df MS F p-value
Drug 1745.396 2 872.698 1.78 0.1929
Error1
10287.844 21 489.897Time 47067.031 3 15689.010 1479.58 0.0000Time x Drug 357.688 6 59.615 5.62 0.0001
Error2
668.031 63 10.604
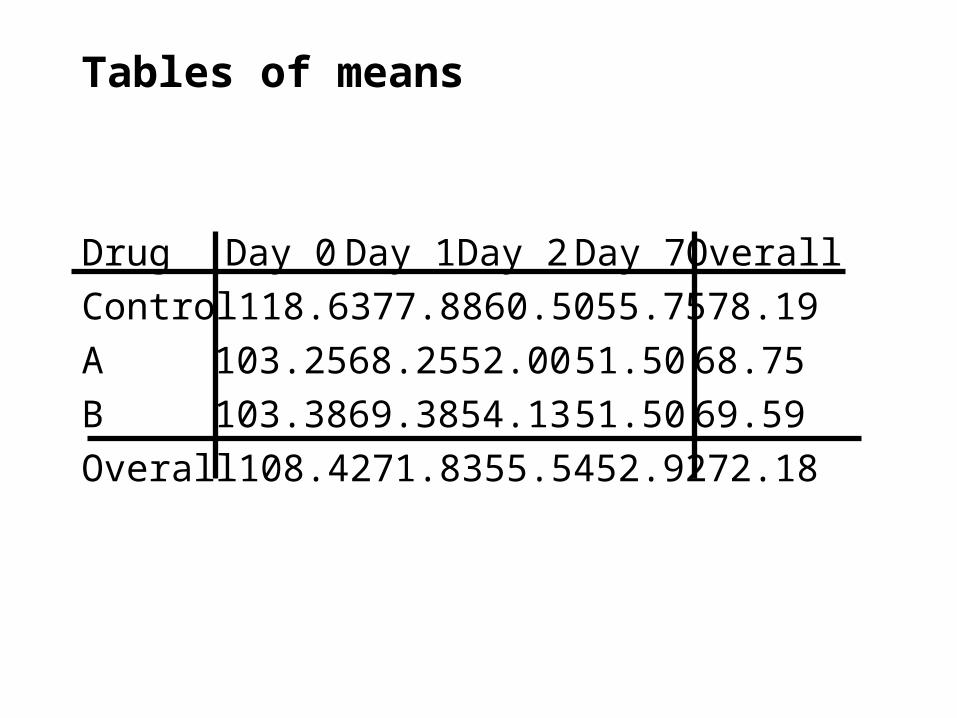
Tables of means
Drug Day 0 Day 1 Day 2 Day 7 Overall
Control 118.63 77.88 60.50 55.75 78.19
A 103.25 68.25 52.00 51.50 68.75
B 103.38 69.38 54.13 51.50 69.59
Overall 108.42 71.83 55.54 52.92 72.18
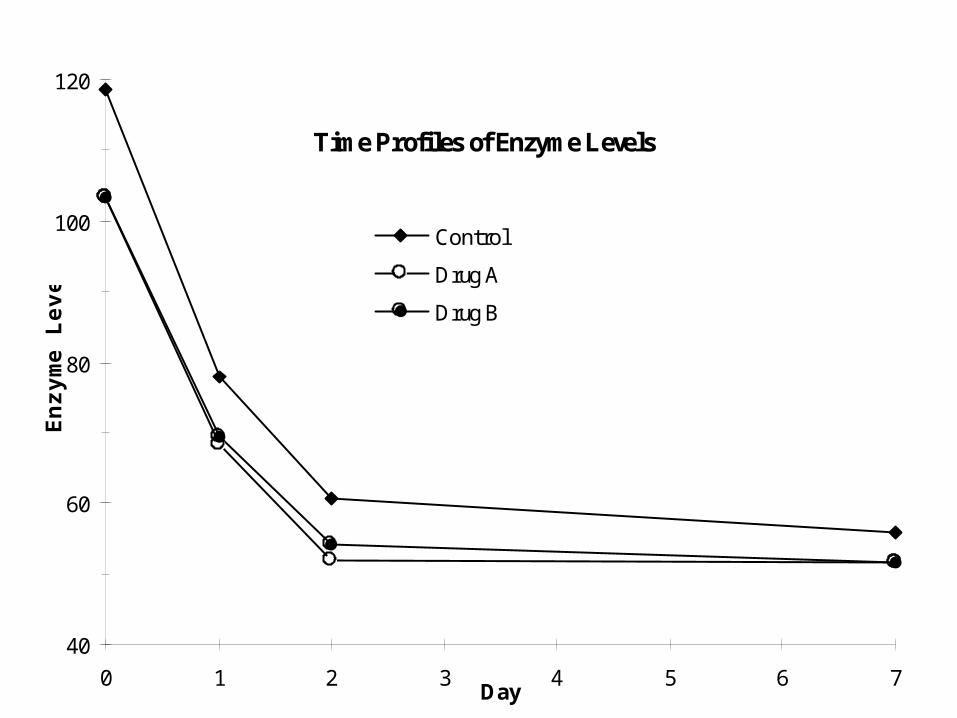
Time Profiles of Enzyme Levels
40
60
80
100
120
0 1 2 3 4 5 6 7Day
Enz
yme
Lev
el
Control
Drug A
Drug B
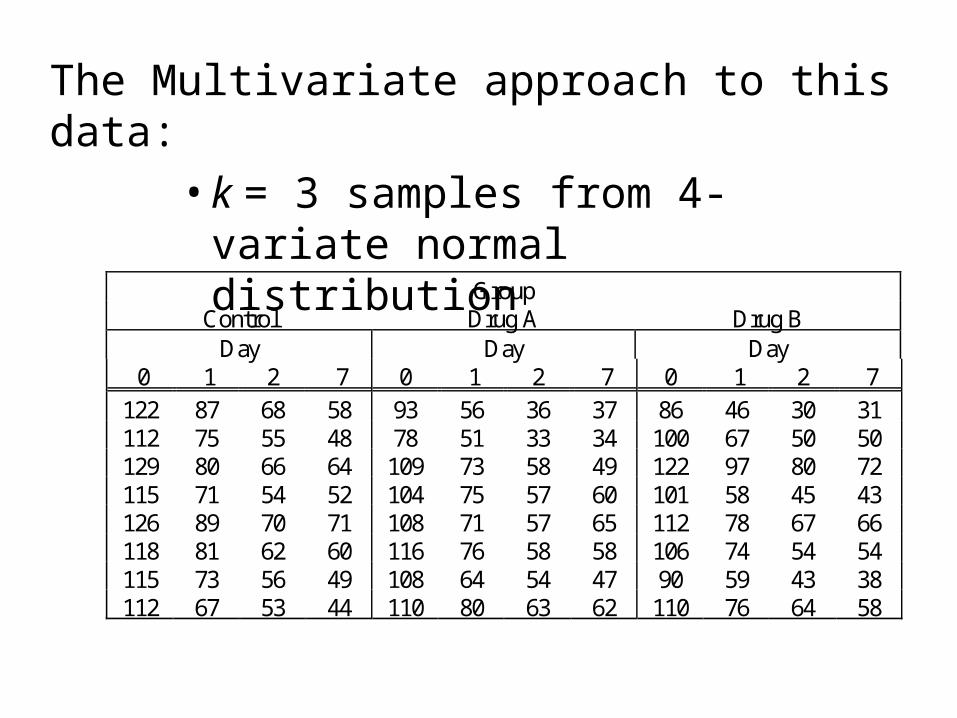
The Multivariate approach to this data:
• k = 3 samples from 4-variate normal distribution
Group Control Drug A Drug B Day Day Day
0 1 2 7 0 1 2 7 0 1 2 7 122 87 68 58 93 56 36 37 86 46 30 31 112 75 55 48 78 51 33 34 100 67 50 50 129 80 66 64 109 73 58 49 122 97 80 72 115 71 54 52 104 75 57 60 101 58 45 43 126 89 70 71 108 71 57 65 112 78 67 66 118 81 62 60 116 76 58 58 106 74 54 54 115 73 56 49 108 64 54 47 90 59 43 38 112 67 53 44 110 80 63 62 110 76 64 58
Analysis
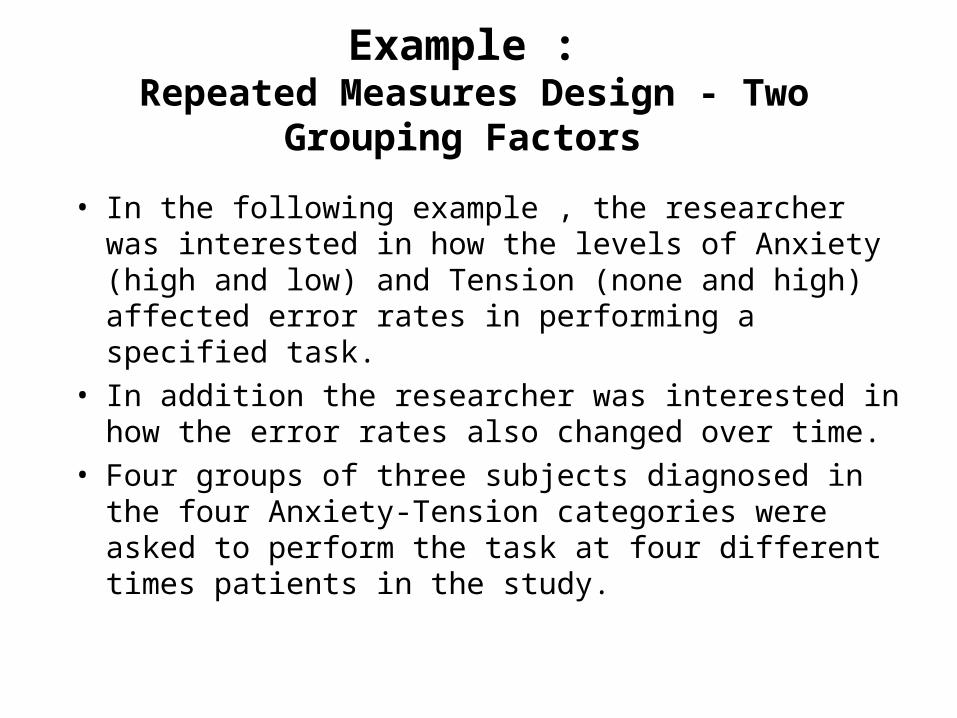
Example : Repeated Measures Design - Two Grouping Factors
• In the following example , the researcher was interested in how the levels of Anxiety (high and low) and Tension (none and high) affected error rates in performing a specified task.
• In addition the researcher was interested in how the error rates also changed over time.
• Four groups of three subjects diagnosed in the four Anxiety-Tension categories were asked to perform the task at four different times patients in the study.
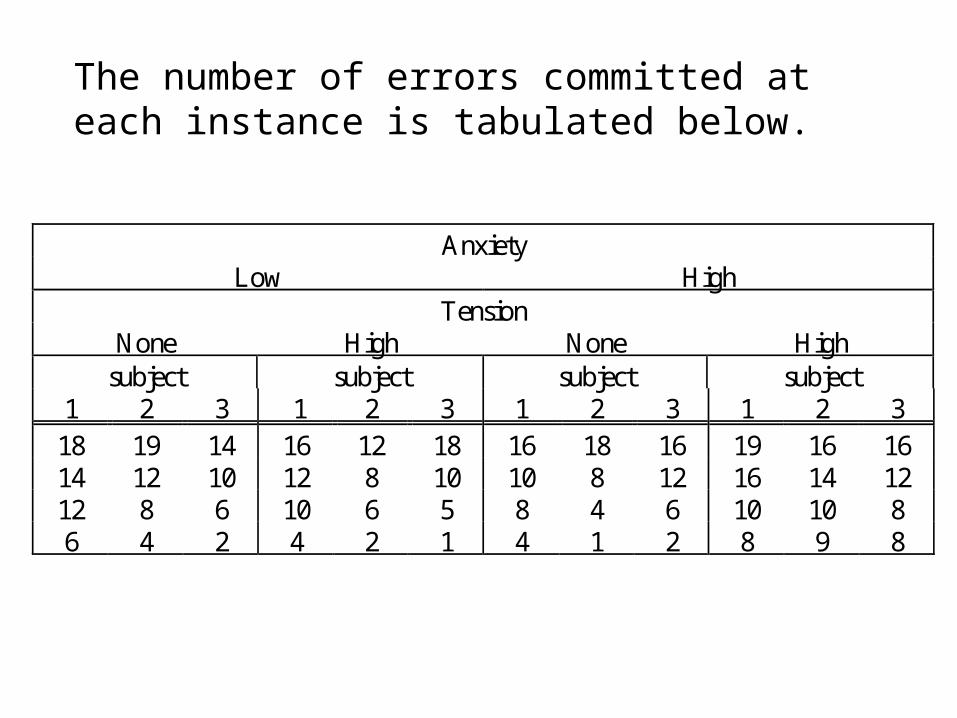
The number of errors committed at each instance is tabulated below.
Anxiety Low High
Tension None High None High
subject subject subject subject 1 2 3 1 2 3 1 2 3 1 2 3
18 19 14 16 12 18 16 18 16 19 16 16 14 12 10 12 8 10 10 8 12 16 14 12 12 8 6 10 6 5 8 4 6 10 10 8 6 4 2 4 2 1 4 1 2 8 9 8
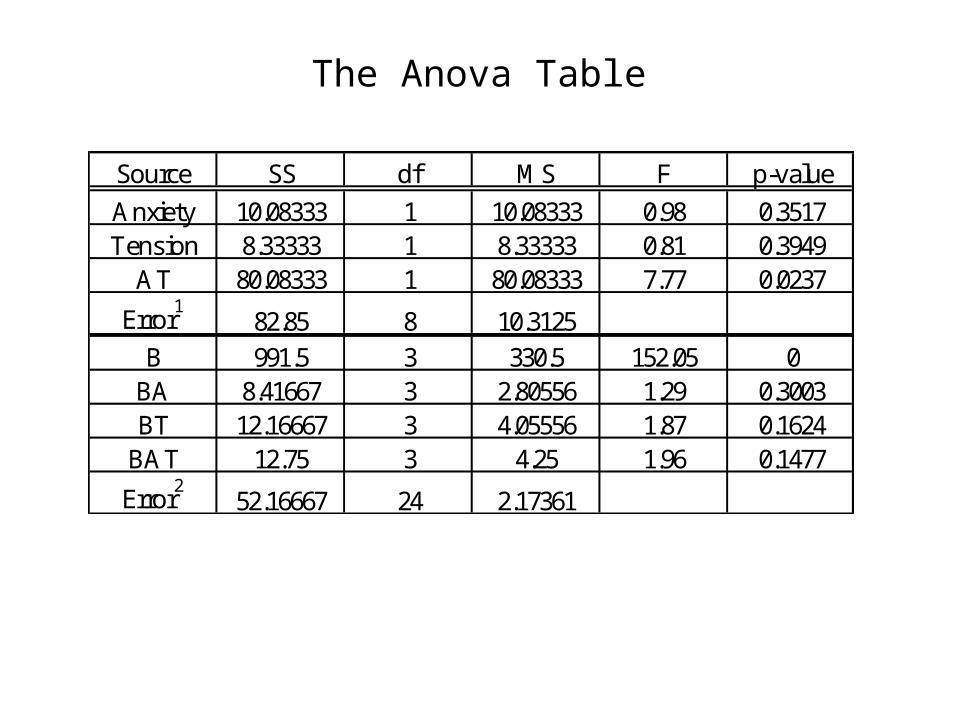
The Anova Table
Source SS df MS F p-value
Anxiety 10.08333 1 10.08333 0.98 0.3517Tension 8.33333 1 8.33333 0.81 0.3949
AT 80.08333 1 80.08333 7.77 0.0237
Error1
82.85 8 10.3125
B 991.5 3 330.5 152.05 0BA 8.41667 3 2.80556 1.29 0.3003BT 12.16667 3 4.05556 1.87 0.1624
BAT 12.75 3 4.25 1.96 0.1477
Error2
52.16667 24 2.17361