Embed Size (px)
Citation preview

REPEATABILITY AtlD COMPARISON OF Tl O I-IAZE TESTS
TO MEASURE LEARNING ABILITY IN HORSES
by
CATHERINE ELIZABETli LOKEY, B.S.
A THESIS
IN
ANIMAL BREEDING
Submitted to the Graduate Faculty of Texas Tech University in Partial Fulfillment of the Requirements for
the Degree of
MASTER OF SCIENCE
Approved
Accepted"
May, 1982
' > /^ . I'- ACKNO\vn:.EDGEMENTS
I would like to thank Dr. James C. Heird for his assistance
with this thesis and my graduate studies. The help received from
Dr. Dennis Cogan and Dr. C. Boyd Ramsey in preparing this thesis
is also appreciated. I am deeply indebted to Mr. Steve Brazier,
Ms. Pam Henderson, Ms. Kelly McHugh, Mr. Wes Newman, Ms. Nancy Smith,
Ms. Melinda Weatherbee and Ms. Denise Williams for their assistance
in collecting the data. The friendship and concern of my fellow
graduate students is gratefully acknowledged. Finally, I would like
to thank my parents for their support and encouragement during my
graduate studies.
11
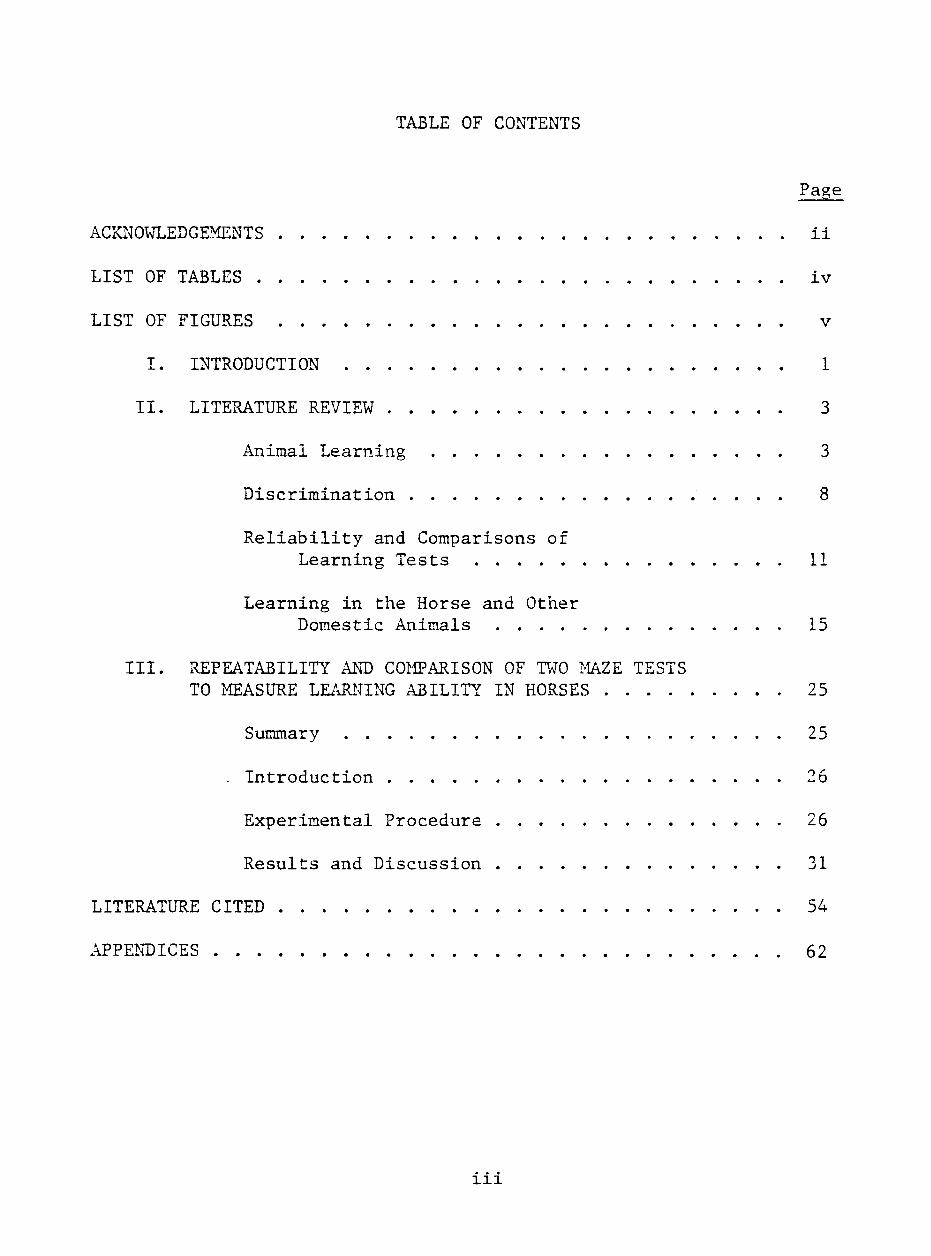
TABLE OF CONTENTS
Page
ACKNOWLEDGEMENTS ii
LIST OF TABLES iv
LIST OF FIGURES v
I. INTRODUCTION 1
II. LITERATURE REVIEW 3
Animal Learning 3
Discrimination 8
Reliability and Comparisons of
Learning Tests 11
Learning in the Horse and Other Domestic Animals 15
III. REPEATABILITY AND COMPARISON OF TWO JMZE TESTS
TO MEASURE LEARITING ABILITY IN HORSES 25
Summary 25
. Introduction 26
Experimental Procedure . . . . . 26
Results and Discussion 31
LITERATURE CITED 54
APPEJTDICES 62
1 1 1
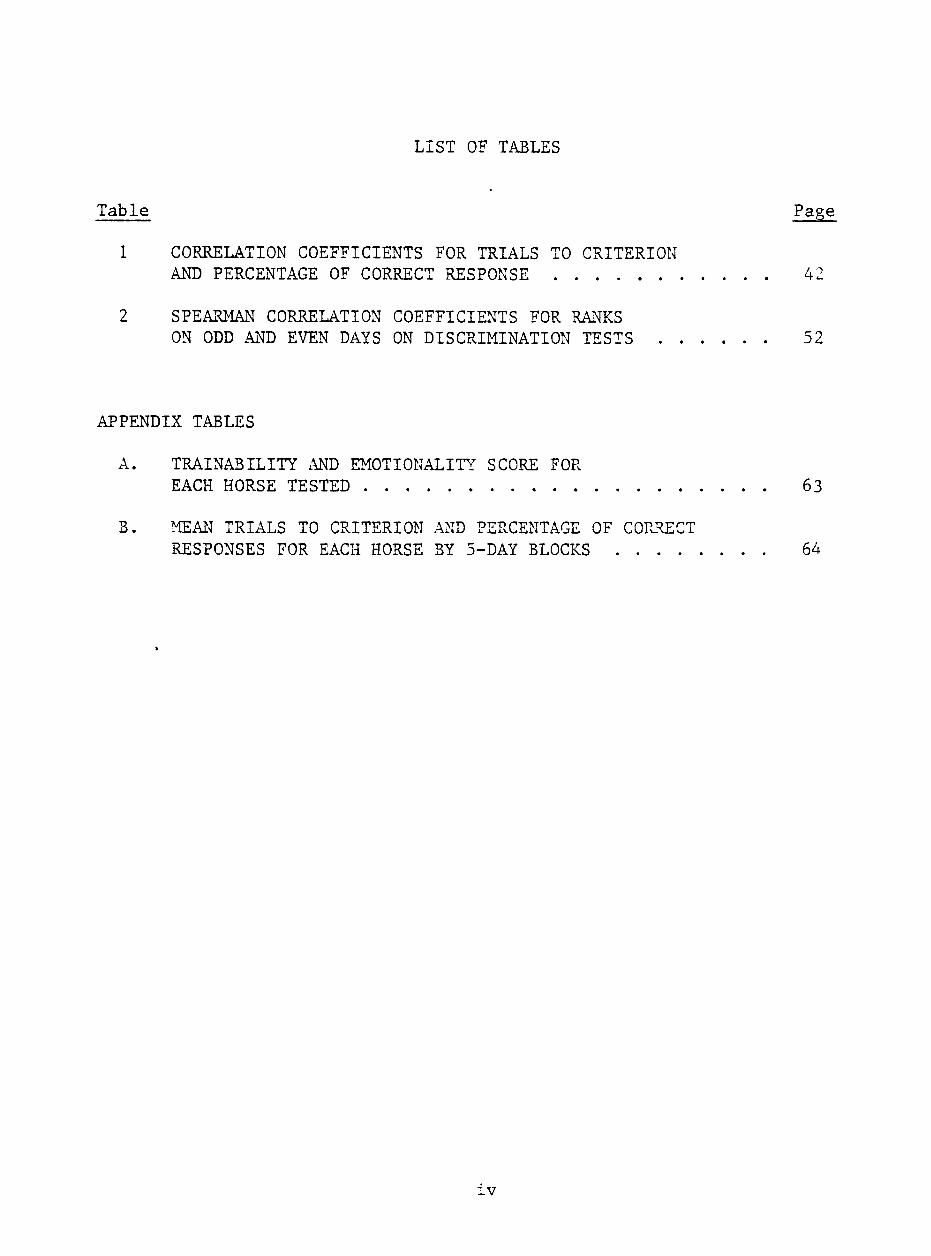
LIST OF TABLES
Table Page
1 CORRELATION COEFFICIENTS FOR TRIALS TO CRITERION AND PERCENTAGE OF CORRECT RESPONSE 42
2 SPEARMAN CORRELATION COEFFICIENTS FOR RANKS ON ODD AND EVEN DAYS ON DISCRIMINATION TESTS 52
APPENDIX TABLES
A. TRAINABILITY M D EMOTIONALITY SCORE FOR EACH HORSE TESTED 63
B. MEAN TRIALS TO CRITERION AND PERCENTAGE OF COPJIECT RESPONSES FOR EACH HORSE BY 5-DAY BLOCKS 64
IV

LIST OF FIGURES
Figure Page
1 MODIFIED T-MAZE 28
2 PERCENTAGE OF CORRECT RESPONSES FOR GROUP 1 BY 5-DAY BLOCKS 34
3 PERCENTAGE OF CORRECT RESPONSES FOR GROUP 2 BY 5-DAY BLOCKS 36
4 NUMBER OF TRIALS TO CRITERION FOR GROUP 1 BY 5-DAY BLOCKS 39
5 NLT ffiER OF TRIALS TO CRITERION FOR GROUP 2 BY 5-DAY BLOCKS 41
6 PERCENTAGE OF CORRECT RESPONSES FOR TRAINABILITY GROUPS BY 5-DAY BLOCKS 44
7 NUMBER OF TRIALS TO CRITERION FOR TRAINABILITY GROUPS BY 5-DAY BLOCKS 45
8 PERCENTAGE OF CORRECT RESPONSES FOR EMOTIONALITY GROUPS BY 5-DAY BLOCKS 48
9 TUMBER OF TRIALS TO CRITERION FOR EMOTIONALITY GROUPS BY 5-DAY BLOCKS 49

CHAPTER I
INTRODUCTION
The horse is unique among livestock species because of the import
ance of its ability to learn. A horse is worthless without training
regardless of its conformation or athletic ability. Unlike other
fields of animal science which are based on production, the horse in
dustry is a hobby industry. The horse's primary function is to pro
vide recreation rather than work or food. In order to perform this
function, the horse must be trainable. For this reason, the study of
learning and behavior is of major economic importance to the horse
industry.
Until recently, most of the research involving horses had concen
trated on nutrition and physiology. In the mid-1970's, the importance
of equine learning research was recognized and increasing numbers of
studies have been conducted.
In most of the research involving learning behavior in horses,
various types of maze tests were used as measures of learning ability.
Existing research has not shox<m whether maze learning ability is
actually related to learning ability in a practical training situation.
One feature of a sound test is reliability. A reliable test is
one that gives consistent results on successive trials. The reli
ability of mazes as tests of learning ability in horses has not
been determined.

The objectives of this study were to: 1) determine if a corre
lation exists between the ranks of the same group of horses given
two types of maze tests - a simple place learning test and a more
difficult discrimination test, 2) compare the repeatability of the
same test using the same group of horses, 3) determine the relation
ship between subjective trainability scores and performance in a maze
learning situation and, 4) determine if a correlation exists between
emotionality scores based on habituation to a novel stimulus and per
formance scores in a maze test.

CHAPTER II
LITERATURE REVIEW
Animal Learning
Tarpy and Mayer (1978) have defined learning as an inferred change
in an organism which results from experience and which influences its
subsequent behavior in a relatively permanent manner. This definition
generally agrees with those given by other psychologists (Kimble, 1961;
Tavolga, 1969; Scott, 1972; Hintzman, 1978).
Although man has observed and recorded the behavior of animals
for centuries, the transition from anecdotalism to experimental studies
did not begin until 1894 when C. Lloyd Morgan's Introduction to Compara
tive Psychology was published (Bitterman, 1979a). Morgan (1894) re
jected the undisciplined anthropomorphism of the anecdotalists and pro
posed that systematic and sustained investigation of animal behavior
should replace the accepted method of simply recording random bits of
apparently intelligent behavior.
E. L. Thorndike and I. P. Pavlov ara generally considered to have
had the most profound influence on subsequent animal learning research
(Bitterman, 1979a; Mackintosh, 1974; Fantino and Logan, 1979; Tarpy and
Mayer, 1978). Both of these experimenters recognized the need for con
trolled objective studies around the turn of the century and each de
veloped experimental methods fulfilling these requirements.
Thorndike's main thesis, which he first presented in his doctoral
dissertation, was zhat animals did not utilize ideas in problem solving
(Thorndike, 1898). He attacked all "mentalistic" explanations of be
havior, even accusing Morgan, who was considered to be the most ob
jective psychologist of the time, of anthropomorphism (Wilcoxin, 1969)
Thorndike later proposed that the behavior of all animals was governed
by what he called the Law of Effect. This principle stated that re
sponses accompanied or closely followed by satisfaction to the animal
would be more firmly connected to the situation so that they would be
more likely to recur, while responses associated with discomfort would
be weakened and become less likely to occur (Thorndike, 1905). Thorn-
dike's experimental method was to place a hungry animal in a box from
which it could escape by performing a simple task such as pulling a
loop or manipulating a lever. Food was placed outside the box as a
.reward. Thorndike advocated this method because it was objective,
quantitative, reproducible, flexible and adaptable to many species
(Bitterman, 1979a).
During the same time period in which Thorndike's methods were
being accepted in western Europe and America, Pavlovian tradition was
being established in Russia (Bitterman, 1979a). Pavlov, a ohysiolo-
gist,. was studying digestive behavior patterns in dogs. He noticed
that previously neutral stimuli acquired the ability to elicit saliv
ation when paired repeatedly with the presentation of food. Pavlov
referred to this phenomenon as a "conditioned reflex." He recognized
the significance of this discovery and decided to direct his efforts
to its investigation. His first approach was introspection but it
soon became apparent that this method was flawed. Pavlov decided that
since the nervous system is a biological system, it should be studied
objectively in controlled experimental settings (Hintzman, 1978).
According to Hintzman (1978), the study of animal learning has
been dominated by the behaviorist viewpoint since about 1930. Although
Pavlov's work on conditioned reflexes was conducted beginning in 1902,
it was not translated into English until 1927. The success of the
behaviorist movement in the United States was largely due to the
efforts of John B. Watson, one of its strongest advocates. Watson
was strongly impressed with Pavlov's work and publicized it. The fail
ings of introspective psychology and the success of Pavlov's work
created a situation in which Watson's philosophies received enthusi
astic support. Behaviorism proposed that unreliable subj.ective methods
of observation used by the introspectionalists be replaced by objec
tive methods and that explanations of behavior alluding to mental
states be banned. Watson (1914) stated that the subject matter of
psychology should be limited to overt behavior which was observable
and measurable. The majority of psychologists today have adopted
Watson's basic philosophy, studying overt behavior in a systematic
and objective manner (Tarpy and Mayer, 1978).
Most subsequent learning research has been designed using the
two basic conditioning models developed by Thorndike and Pavlov. Of
the terms used to distinguish between them, the most widely used and
accepted are instrumental and classical conditioning. The operational
distinction between the two paradigms is whether the presentation of
the stimulus is contingent on the subject's response or vzhether it occurs
regardless of behavior. In classical or Pavlovian conditioning, a con
tingency between the stimulus and the outcome exists, while in instru
mental conditioning reinforcers are response contingent. Four main
types of instrumental conditioning are reward, punishment, avoidance
and omission (Mackintosh, 1974; Tarpy and Mayer, 1978; Bitterman,
1979a). According to Tarpy (1975), reward training is the most conmionly
used type of instrumental conditioning. In this procedure, a subject
receives positive reinforcement for a correct response. Fantino and
Logan (19 79) define reinforcement as any positive or negative event
that increases the probability that the behavior associated with it
will recur in the future. Typical instrumental experiments usually
include a pretraining phase before the instrumental contingency is im
posed. This procedure permits preliminary habituation to the experi
mental apparatus (Mackintosh, 1974). Habituation, which is usually
considered the simplest form of learning, is defined as the decrease of
innate reaction after repeated exposure to a neutral stimulus (Hintz
man, 1978; Craig, 1981). The procedure of eliminating reinforcement
after the response has been established through training and the be
havioral result of that procedure are both called extinction. This
process usually results in a gradual decrease in the learned response
(Tarpy, 1975; Rashotte, 1979).
The only objective measure of learning is performance (Tolman,
1955; Kratzer, 1971; Tarpy, 1975). Tarpy (1975) distinguishes between
the two terms by describing learning as the underlying process deter
mining performance. He also states that performance, and therefore
learning, can be measured by changes in response strength. Indices
of performance frequently used in instrumental learning studies in
clude rate, latency, frequency, duration, vigor, speed, probability
or persistence of the response (Mackintosh, 19 74; Tarpy, 1975; Fantino
and Logan, 1979). Performance can be measured in a series of discrete
trials or the subject may be allowed to respond at its own rate in a
free operant situation. When discrete trials are used, response
strength is measured by latency, speed or probability (Mackintosh,
1974). Probability of responding is most frequently used in situations
involving a choice in which both correct and incorrect responses are
available (Fantino and Logan, 1979). Many different types of apparatus
have been used to study animal learning. Fantino and Logan (1979)
explain that choosing a measure of learning in any particular situation
depends on several factors: 1) the nature of the behavior required,
2) adaptation to the species being studied, and 3) ease with which be
havior may be measured. One of the most popular devices used in animal
learning is the maze, which was first mentioned by Small (1899).
Hintzman (19 78) described several variations of the maze, including a
straight alley maze, T-maze and complex maze. Essentially, all
maze designs include starting areas and one or more goals, linked by
pathways of various complexity. The T-maze, which consists of a
start box and a single choice point branching toward two goals,
is the simplest device for choice situations (Mackintosh, 1974). It
also is considered to be ideally suited to discrimination problems
(Mackintosh, 1974; Hintzman, 1978; Fantino and Logan, 1979). Crespi

8
(1942) stated that motivation is an essential factor in any learning
test. He suggested that food is an appropriate reward for a hungry
animal in a maze test. Rate of learning in a T-raaze usually is re
tarded if the correct alternative is rewarded on less than 100%
of the trials (Hill et al., 1962; Clayton and Koplin, 1964; Sutherland,
1966). Munn (1950) explained that subjects in maze learning studies
usually are trained until they reach a predetermined criterion of per
formance. According to Stone (1951) the results of any learning study
should be analyzed by graphical means.
Discrimination
An animal discriminates when it responds to one situation based
on reward availability but not to another where there is no reward,
less reward or punishment (Tarpy and Mayer, 1978). Sutherland (1964)
has defined discrimination learning as the process by which an animal
learns to give consistently different responses to two or more stimuli.
Mackintosh (19 74) emphasizes that the distinction between single re
sponses, as in a straight alley maze, and simple choice behavior does
not coincide with the distinction between non-discriminative and dis
criminative learning. According to Honig (1969) the primary effect of
discrimination training is the development of differential stimulus
control over behavior by those stimuli involved in the training pro
cedure. In a discrimination test, some distinguishable property of
the situation is varied systematically and with it the consequences
of the response (Bitterman, 1979b). Restle (1955) explained that the

entire stimulus situation facing a subject in a discrimination learn
ing trial is a set of cues. A cue, defined by Sutherland and
Mackintosh (1971), is any dimension of difference that could control
the subject's responses in a choice situation. A cue is relevant if
it can be used by the subject to predict where or how reward is to
be obtained; a cue uncorrelated with reward is irrelevant. In solv
ing a two-choice discrimination problem, the subject learns to relate
its responses currectly to the relevant cues while responding becomes
independent of irrelevant cues (Restle, 1955).
The two methods used to test discriminative learning are simul
taneous and successive discrimination (Macintosh, 1974; Tarpy and Mayer,
1978). A simultaneous discrimination test involves two or more stimuli
presented simultaneously, offering a choice with reinforcement given
to responses to one of the stimuli. In successive discrimination, the
positive (S+) and negative (S-) stimuli are given sequentially requir
ing the subject to learn to respond only to S+.
Several different theories of discrimination learning have been
proposed. The continuity theory, developed from the work of Hull
(1943) and Spence (1936, 1952), xvas probably the earliest accepted
theory (Mackintosh, 1965; Tarpy, 1975; Bitterman, 1979b). This theory
states that responding to discriminative stimuli is a function of
their associative strength, which is an algebraic summation of the
conditioned exitation to S+ on rewarded trials and conditioned inhibi
tion to S- on non-rewarded trials. The continuity theorists believed
that discriminative learning was a gradual process which was continu
ous and cumulative.

10
Observations made by Lashley (1929) and Krechevsky (1932) that
animals learning a simultaneous discrimination usually perform at
chance levels for many trials before shifting abruptly to virtually
errorless performance resulted in a new theory of discrimination.
Lashley (1929) suggested that the direction of attention is the key
to the solution of discrimination problems. Krechevsky (1932, 1938)
proposed that the pre-solution period of discrimination learning
consisted of a series of attempted solutions which he termed hypoth
eses since they seemed to be made systematically. Later studies
(Levine, 1959, 1965) also described discrimination learning in terms
of strategies developed by the animal which, when reinforced, would
account for its ultimate improvement in performance.
Other investigators (Mackintosh, 1965; Sutherland and Mackintosh,
1971) criticized the non-continuity theory, state that it implied
that the subject learned about only one cue at a time and could learn
nothing about the relevant stimulus while attending to irrelevant
stimuli. They developed a modified non-continuity, still emphasiz
ing attention. This theory states that discrimination learning in
volves two discrete processes: 1) strengthening attention to rele
vant stimulus dimensions and 2) attaching a particular response to
the relevant stimuli. Bitterman (1979c) noted that discrimination
can be explained entirely on the basis of attention to positive
stimuli but cited examples of tests using negative stimuli alone or
with novel cues which demonstrated aversion to negative stimuli
(Mandler, 1968; Derdzinski and Warren, 1969).

11
Reliability and Comparisons of Learning Tests
Spence (1932) has defined reliability as the amount of agreement
between results from two or more applications of the same test. He
stated that reliability is determined by the consistency with which
it differentiates between various individuals of a groun on different
occasions. Munn (1950) explained that, if a test of learning measures
the same thing in every animal and measures it uniformly from trial
to trial, animals that make high scores will do so consistently.
Leeper's (1932) concept of reliability is the measure of the extent
to which chance factors have been excluded from obscuring the desired
measurement. Heron (1922) also emphasized the relationship of reli
ability to the predictive value of learning tests.
According to Denenberg and Banks (1962), the importance of
reliability of measurement cannot be overemphasized. They point out
that if behavior is not sufficiently stable to be reproduced, nothing
more than random events has been measured. They also state that re
liability is a more acute problem in behavioral studies compared to
other branches of science because of the d3n:iamic nature of behavior.
A measure of reliability could be had directly if it were possible to
secure completely independent samples of performance using the same
group of subjects (Tolman and Nyswander, 1927; Leeper, 1932; Denenberg
and Banks, 1962).
According to Munn (1950), many early investigators paid little
or no attention to the problem of reliability, assuming that perform
ance on any particular learning problem indicated general learning
12
ability. The first study of reliability of animal behavior was con
ducted by Paterson in 1917 (Leeper, 1932; Munn, 1950). He analyzed
scores on the Watson circular maze and suggested that results from
this test were too unreliable to permit satisfactory measurement of
experimental effects (Paterson, 1917). Numerous studies concerning
reliability of various learning tests were completed in the 1920's
and 30's. Many different methods of testing reliabilitv have been
used but most results have been reported in terms of correlation
coefficients (Munn, 1950).
In a review of reliability tests used prior to 1932, Spence
(1932) listed nine commonly used methods. These included: I) corre
lation between learning and releaming the same maze, 2) correlation
between results on a maze and another learning problem, 3) correla
tion of two series of trials separated by a considerable time inter
val, 4) correlation between scores on various trials, 5) correlations
between scores on different segments of the learning curve, 6) corre
lations between scores of odd and even trials, 7) correlations between
scores on odd and even blinds in a complex maze, 3) correlation be
tween errors on the first half and second half of a test, and
9) correlations between results of two different mazes. Spence con
cluded that the most valid of these methods was a correlation between
two mazes.
Tolman and Nyswander (1927) noted that reliability coefficients
above .60 are rare with results from most studies averaging about .30.
They contend that unless a situation requires accurate ranking of

13
each individual, extremely high reliability coefficients are not
necessary. They suggest that maze tests having relatively low coeffi
cients are useful when one is interested in differences in mean per
formance of very large groups or of individuals at two extremes of
the population. These authors have observed that if a group is
close in ability they will be less likely to maintain their respect
ive ranks consistently. Tolman and Nyswander (1927) disagree with
the results of several studies (Hunter, 1922; Liggett, 1925; Randolph
and Hunter, 1926) which showed relatively low reliability coefficients
and concluded that results from all maze tests should be disregarded.
Several features that Tolman and Nyswander (1927) suggested might be
responsible for low reliability coefficients are: 1) mazes used were
too simple, 2) lack of preliminary training, 3) poor control of moti
vation, and 4) too few trials used to furnish data. Hunter and Randolph
(1924) used the test-retest method to determine coefficients of corre
lation human of learning scores on a stylus maze test. They obtained
higher coefficients of correlation with longer intervals between test
ing and retesting. They also studied rats in a variety of learning
problems, finding the most consistent results with a T-raaze test.
Heron (1930) used the test-retest method in a study of rats in
a multiple T-maze. He found correlations of about .35 between tests.
Heron concluded that animals may forget at different rates between
tests and that keeping all factors constant during two different time
periods is impossible.
14
Validity is another important factor to be considered in the
evaluation of any learning test. A valid test is one that measures
what it is supposed to measure (Hall, 1951; Denenberg and Banks, 1962).
Denenberg and Banks (1962) emphasize the difficulty in evaluating
validity when studying behavior, such as learning or emotionality,
that cannot be directly observed. Hall (1941, 1951) proposed valida
tion of a test by correlating it with a different test assumed to mea
sure the same trait. Commins et al (1932) and Hebb and Williams (1946)
pointed out that the most valid ratings of human intelligence are based
on a large number of tasks while many animal studies have regarded re
sults, from one test as direct indicators of learning ability. Several
authors have suggested that learning ability of animals be evaluated
on several tasks, each requiring a different kind of performance
(Tolman and Nyswander, 1927; Commins et al., 1932; Hebb and Williams,
1946; Kratzer, 1971). Hebb and Williams (1941) note that certain
tests might be measures of motivation or timidity, or a complex of
these factors with intelligence but that they are not interpretable
measures of learning ability in general. Searle (1949) suggested that
"maze bright" animals are not superior in all learning situations but
have traits more adaptable to maze learning. Tolman and Nyswander
(1927) cited the favorable performance of rats compared with humans
to indicate that maze learning is not an index of all types of learn
ing ability.
Commins et al. (1932) proposed several requirements for research
comparing different types of learning tests. These were: 1) the
15
situations should require similar patterns of adjustment not affected
by interference or general activity level of the subject, 2) motiva
tion should be similar, 3) animals should have sufficient heterogeneity
to give a spread of scores, 4) the tests used should be reliable, and
5) the problems should be different enough to give a fair distribu
tion of scores. These requirements were similar to those listed by
Tryon (1931). Commins et al. (1932) compared scores of rats on a Stone
multiple T-maze, Stone light discrimination box, an elevated 12-blind
U-maze and a 20-blind Miles elevated T-maze. They found correlations
between the various mazes, but no relationship was found between per
formance on the discrimination test and the mazes.
Learning Behavior in the Horse and Other Domestic Animals
Until the mid-1970's, research involving equine behavior was un
common. Only recently has the value of such work been recognized.
Early interest in horse behavior was generated by reports of
Clever Hans, a trained horse who demonstrated apparently phenomenal
intelligence. Hans could supposedly read and solve various mathe
matical problems. Controversy between those who believed in the
animal's mental abilities and those who suspected trickery led to
the establishment of an investigative commission in 1911 to settle
the dispute. Pfungst (1965) reported their findings. He reported
that Hans was actually receiving the answers from his handler. When
blindfolded, he correctly answered only 6% of the questions compared
to his previous accuracy of 98%. Pfungst determined that the animal
16
was responding to very slight movements of his handler's head. Karl
Krall who had worked with Hans' ox^er was later able to duplicate
this behavior with Muhamed and Zarif, two Arabians.
Hamilton (1911) compared a horse to humans, monkeys, cats and
dogs in a multiple choice test. Each subject was placed in a com
partment with four exit doors, one of which was unlocked. The same
door was never unlocked on successive trials. The subject received
food after making a correct response. Only human subjects learned not
to try the door which was previously opened. The horse required more
total responses to achieve 100 goals than did the c^her subjects. In
24% of the trials, the horse repeatedly made unsuccessful attempts
to open a locked door without trying another. Hamilton suggested that
the horse's relatively poor performance might be due to the particular
test given being more suited to the other species tested rather than
the horse's lack of ability.
In 1933, Gardner tested 68 horses, ranging in age from 1 to 20
years, by comparing the rate at which they learned to open a covered
feed box. A decrease in time required to solve the problem (from a
mean of 160 sec. to 5 sec.) over four trials indicated that learning had
occurred. Several of the subjects were retested at various intervals
up to 12 months after the original test and demonstrated retention of
learning. The effects of age, sex and breed on learning also were
considered. Horses from 5 to 14 years of age were more successful
than younger and older animals. Geldings learned more quickly
than mares in th - first trial, but no overall differences were
17
noted. Similar results were reported when effects of breed were
studied; draft horses demonstrated better performance than did light
horses in the first trial only. When cows were tested with the same
problem, it was solved more quickly on the first trial, but, by the
fourth trial, scores were the same for both species.
Gardner's next study (1937a,b) involved a discrimination problem
in which 62 horses and 41 cows were tested over 16 trials. The animals
were presented with three covered feed boxes, two of which were empty.
The box containing feed which alternated between trials was designated
by a black cloth draped over it. Total number of errors on each trial
was recorded. Although both species learned the discrimination, the
horses showed a more rapid initial decrease in number of errors which
was attributed to greater adaptability to the test situation. Position
preferences were noted in both species. Although the younger horses
learned more rapidly than older ones, cows showed no age effects on
performance. Pronounced breed differences were observed among the
cows with Guernsey, Brown-Swiss, and Holstein-Friesian animals making
fewer errors than Jerseys, Shorthorns and Ayrshires. In a subsequent
study. Gardner (1937c,d) tested 44 horses and 31 cows which had learn
ed the discrimination problem. The conditions in this test were
identical to those in the previous problem except the position of the
discriminative stimulus was changed. Mean errors of both species
were similar to those on the first discrimination after an initial
increase in errors. Breed, age and sex effects were consistent with
the earlier test in both species.

18
Warren and Warren (1962) tested two horses in a series of dis
crimination reversals combining brightness and spatial cues. Both
animals learned rapidly, averaging two or fewer errors per reversal.
This study showed that the performance of horses on this type of
test was comparable to that of other mammals in previous studies.
Dixon (1966) tested one pony on pattern discrimination, learning
set and memory. The pony reached a 92.5% correct score in the final
test, discriminating between 20 different pairs of patterns. More
rapid learning was observed on each successive pair of patterns. The
pony required 70 sessions to learn the first 10 pairs but only 17
sessions to learn the remaining 10 discriminations. These results
agree with Hebb (1949) who stated that new learning is facilitated
by old. Harlow (1949) explained "learning to learn" by stating that
subjects learn general solutions to frequently encountered problems.
Grizmek (1968) reported handedness in horses. Of the 53 animals
in his study, 77% showed a preference for the foot used in pawing,
67% showed a preference for the foot used to initiate walking, and
23% showed a preference for a lead. Grizmek also, studied the horses'
visual perception by using a goal box based on color. The number of
correct responses varied greatly when different colors were used with
a red goal box resulting in the fewest correct responses. Perform
ance improved with blue and green; the best results were obtained
with yellow. The study concluded that visual activity in horses is
inferior to that of humans.
19
Miller (1974) also studied horses' color perception in a simple
discrimination test in which the animals were allowed to choose
between a pair of colored buckets at a distance of 9.14 m. Feed was
placed in one of the buckets and their position was reversed at ran
dom. He reported that horses could distinguish between the following
pairs of colors: black and white; blue and orange; purple and yellow;
and red and green. In a similar test, symbols including a cross,
square, circle, rectangle and triangle were used as the discrimina
tive stimuli. The symbols were placed on cards in front of the goal
buckets. Miller compared the number of trials required for each
animal to achieve a level of 80% correct responses. He suggested that
such tests might be useful in predicting learning ability in young
horses.
In 1976, Yeates conducted a discrimination test with three half-
sib two-year-old mares. The mares were conditioned to push a flap
for feed reinforcement. No differences were found between animals in
time required to shape the response. After the response had been ac
quired, distinct differences in response rate which were consistent
throughout the study were observed. The subsequent 21 day discrimina
tion test included three periods in which auditory, visual and
tactile stimuli were used with a fixed interval schedule of rein
forcement. Correct responses for the different stimuli were auditory,
69.2%; visual, 56.7%; and tactile, 44%. Higher scores were achieved
when the apparatus was modified to make the test more effortful and
when the animals were put in a free operant situation.

20
Kratzer £t ail (1977) conducted an escape learning test using
37 Quarter Horse yearling geldings in a two-compartment maze. Errors
in making a right hand escape were reduced from 65% to 27% in five
trials. The next phase of the test was a reversal learning which re
quired the horses to learn to go to the left. Performance on this
pattern did not reach the levels achieved in the right-side escane
trials. However, when adverse stimuli were added to the right side,
performance to the left improved rapidly. Errors dropped from 78%
to 16% in 3 trials. Latency of response decreased during the first
phases of testing but increased significantly with the adverse
stimuli.
Fiske and Potter (1979) tested 26 yearling horses in a 20-day
serial reversal learning discrimination test combining spatial and
brightness cues. The learning curves obtained, using linear regres
sion analysis of mean trials and mean errors for all 26 horses show
a reduction of trials and errors over time. However, a great deal
of variation among individuals was noted, with a learning ability
index (LAI = 100/mean trials to criteria/mean errors to criteria)
range from 64.4 to 1.3. Mean trial to criterion scores ranged from
13.05 to 30.00 and mean errors ranged from 1.19 to 24.71. A positive
correlation was reported between maze scores and a subjective train-
ability rating for colts and geldings. No significant correlation
was found between trainability scores and any of the measures of per
formance for fillies. The authors attributed this phenomenon to a
lack of concentration due to estrus behavior.

21
Maze learning, avoidance learning and social dominance were
studied by Haag et al. (1980) using a group of 10 ponies. Rank in the
dominance hierarchy was not correlated with ranks obtained in the
maze and shock avoidance tests. Maze rank was correlated .with three
of the five criteria used to measure avoidance learning. In contrast
to the results of this study, maze and shock avoidance learning were
not found to be correlated in swine (Hammel etal., 1975) or in rats
(Robustelli et al., 1963).
Mader and Price (1980) compared 10 Quarter Horses and 11
Thoroughbreds in a three-choice discrimination test using visual
cues. Quarter Horses learned significantly faster than Thoroughbreds
and performance improved for both breeds in a second discrimination
task. A negative correlation existed between age and rate of learn
ing. Individual emotionality ratings and learning scores were not
correlated, but Quarter Horses as a group were less reactive than
Thoroughbreds. No correlation was found between social dominance
and learning scores.
Rubin et al. (1980) studied the effect of varying the temporal
distribution of conditioning trials on the horse's learning behavior.
Fifteen ponies were first taught to clear a small jump in response
to a buzzer to avoid a shock. All groups received 10 trials per day
but one group was conditioned every day, another twice a week, and
the third only once a week. The animals conditioned once a week
required fewer sessions to learn the response but their elapsed
learning time was greater. The ponies then were assigned to

22
different groups and taught to back in response to a visual cue to
avoid shock. The schedules for the three groups were the same as
the previous test and the results for the two tests were similar.
A Hebb-Williams closed field maze was used by McCall et al
(1981) to study learning ability in 15 yearling horses. A new prob
lem was presented each day with eight trials per problem. Perform
ance was evaluated by the excess entry score method devised by
Pollard and Sampson (1961). The horses made most of their errors
during the first four trials of each problem. The animals were most
successful at solving problems with direct visual solutions. No
significant differences due to sex or prior learning experience were
found. Total excess entry scores and rapidity of learning scores
were not related, suggesting that these criteria measure different
aspects of learning.
Heird (1981) examined the effects of early experience on learn
ing ability in a simple place-learning T-maze test. He divided 24
yearling fillies into three groups based on the amount of handling
they had experienced. The intermediately handled group required
fewest trials to reach criteria and had the highest percent correct
responses. Borh intermediately and extensively handled groups learned,
while the unhandled fillies showed no improvement in performance over
time. Subjective trainability scores tended to predict group learn
ing ability, but trainability and trials to criterion were not signifi
cantly correlated. The author suggested that horses who will later
be exposed to a wide variety of stimuli should be handled more exten
sively than those who will be exposed to limited stimuli.
23
In a related study, Whitaker (1982) divided 40 horses into five
handling groups and tested them on the same place learning test. Train-
ability scores were given prior to testing and during a post-maze test
under saddle. The results showed that performance had reached an
asymptote for all groups by the 10th day of training, but, in the
initial phase of the test performance was superior in the more handled
groups. Pre-test trainability scores and under saddle scores were
positively correlated but were not related to performance in the maze.
A limited amount of research concerned with learning in other
livestock species has been done. These studies may be more relevant
to learning in horses than those involving laboratory animals because
of the similarities between horses and other farm animals. Baryshnikov
and Kokorina (1946) achieved classical conditioning in dairy cattle
with 11.6 pairings of food reward and conditioned stimulus. They also
reported negative relationships between degree of nervousness and
ability to acquire food-conditioned motor reflexes. Nervousness was
negatively correlated to milk production. In contrast to these re
sults, Dickson (1967) found that neither temperament nor dominance
value was correlated with milk production.
Wieckert et al. (1966) used a visual discrimination test in a
modified T-maze to evaluate learning ability in 6-month-old dairy
heifers. A performance level of 80% correct responses was attained
after three sessions of 10 trials each. Using a similar test, Dick
son (1967) reported that calves differed in their ability to remember
and form, visual associations. Albright et al. (1966) used instrumental
24
conditioning to teach cows a homing response with an auditory
stimulus.
Liddell and Anderson (.1931) conditioned sheep and goats to make
reflexive leg movements in response to a metronome paired with elec
trical shock. Liddell (1954) reported differences in maze learning
ability in twin lambs. Cairns (1966) used a U-maze to test strength
of association between lambs housed with dogs and lambs housed with
ewes. All lambs in the study learned the maze quickly and chose the
species of previous association. Sandler et al. (1968) used crossbred
ewes in a detour problem which was quickly solved by all subjects.
In 1915, Yerkes and Cobum reported the first study of condition
ing and learning using pigs. They found that pigs could discriminate
between right-left relationships to obtain food. Curtiss (1937)
trained pigs to open food boxers in response to cessation of a buzzer.
Klopfer (1961) reported that pigs have the capacity to utilize non-
visual cues more readily than visual cues. Wieckert and Barr (1966)
reported significant breed and sex differences in learning ability
of pigs in a T-maze. Instrumental conditioning was used by Baldwin
and Ingram (1967) who placed pigs in a cold environment where they
learned to press a switch to obtain a short burst of heat. Baldwin
(1979) used operant techniques to determine environmental preferences
of both pigs and sheep.
CHAPTER III
REPEATABILITY A JD COMPARISON OF TTTO MAZE TESTS
TO MEASURE LEARNING ABILITY IN HORSES
Summary
Sixteen Quarter Horses were divided into two groups after being
sorted by age and sex. After a 10-day pre-conditioning period, each
animal received emotionality and trainability scores. Each group
then completed a series of four 20-day tests. One group of animals
was initially used in a simple place test in a modified T-maze. Dur
ing the same time period, the other group was involved in a visual
discrimination test. The groups were tested alternately on the two
types of tests in successive test periods with a 10-day extinction
period between each test. A horse that reached a criterion of 11 of
12 correct reponses, with the last eight being consecutive, was re
tired for the day. Otherwise, 20 daily trials were required. The
discrimination test was clearly more difficult than the place test.
Learning occurred abruptly on the discrimination tests compared to
the gradual improvement in performance observed on place tests.
Animals learned more rapidly and reached higher levels of performance
as the series of tests progressed. Trainability and emotionality
scores tended to predict learning ability but were not significantly
correlated with measures of performance. Correlations of ranks with
in groups were higher between tests of the same type than comparisons
made between the place and discrimination tests. Comparisons between
25
26
performance of animals grouped by emotionality or trainability scores
on the last 5 days of each test demonstrated significant differences
between these groups. These results suggest that such scores tend
to predict the final level of learning achieved rather than rate of
learning.
Introduction
Learning is a major factor in the economics of the horse industry
because the horse's value increases with training. In recent years,
increased interest in equine learning ability has resulted in a grow
ing number of learning studies. Many of these tests have used vari
ous types of mazes to measure learning ability. Many of these studies
are based on the assumption that performance on any type of test
indicates general learning ability. If maze tests are to be of value
in equine learning research, their reliability should be determined.
The objective of this study was to determine whether results obtained
from a series of maze tests, using the same horses, would yield
consistent results.
Experimental Procedure
Experimental Animals. Sixteen Quarter Horses were randomly
assigned to one of two groups after being sorted by sex and age.
Eight mares and eight geldings were used in the experiment. The
animals ranged in age from 1 to 15 years. Seven yearlings, three
2-year-olds, three 3-year-olds and three aged horses were in
cluded. Two of the yearling geldings were eliminated from the

experiment due to extremely emotional behavior in the maze. One of
these was removed after the preconditioning period: the other com
pleted Tests 1 and 2 with no evidence of learning. A 6-year-old
mare died during Test 3, leaving the data of 13 animals for analyses.
Test Sequence. After a lO-day preconditioning period, each
animal received subjective emotionality and trainability scores.
Each group then underwent a series of four 20-day tests. One group
of animals was initially used on a simple place test in a modified
T-raaze. During the same time period, the other group was involved
in a discrimination test using the same basic maze with a discrimina
tive stimulus added at the choice point. The groups were tested
alternately on the two types of tests in successive time periods.
Ten-day extinction periods were included between tests.
Maze Design. A modified T-maze was used in both types of tests
(figure 1). The plywood walls were 2.44 m high to reduce visual dis
tractions. The branches of the maze contained feed buckets and were
equipped with exit doors, eliminating the need for the horses to re
trace their paths. The maze was built inside the indoor arena at
the Texas Tech Horse Center so that weather effects and other dis
tractions would be reduced as much as possible. A brightly painted
sliding panel was placed at the choice point as a visual stimulus
for the discrimination tests.
Preconditioning Period. The 10-day preconditioning period
allowed the horses to become accustomed to the maze and the ration to
be used as reinforcement. The feed consisted of 95% whole oats and

28
4.88m
^ FEED TUBS ^
SWINGING DOORS'
•1.83m-
< 2.44m ».
-1.83m-
DISCRIMINATIVE STIMULUS
4.88m
< 2.44m >
START
' * -1 .22m-*
FIGURE 1. MODIFIED T-MAZE
29
5% molasses. Each animal received about 15 minutes of daily handling
during the preconditioning period. Initially, each animal was led
into the maze and allowed to eat from the bucket before being led
through the exit. An effort was made by the handler to spend equal
amounts of time with each horse in each side of the maze and to
choose between sides in a random manner. After an animal learned to
enter the maze independent of its handler, it was allowed to choose
a side on every other trial and led into the opposite side on the
next trial. This procedure reduced the development of position
preferences.
Emotionality and Trainability Scoring. After completion of the
preconditioning period, emotionality and trainability scores were
assigned to each animal. Emotionality scores were based on reaction
to a novel stimulus which was presented to each animal in a uniform
manner. Persistence of the startle response was used to evaluate
emotionality. Emotionality scores ranged from 1 to 4 with 1 denot
ing an extremely emotional individual. Each animal also received
a subjective trainability score which was an average of scores from
three raters who were familiar with the subjects. These scores
ranged from 1 to 4 with 1 being an extremely quick learner.
Maze Procedure. The criterion of success used in both types of
test was 11 of 12 correct responses with the last eight being consecu
tive. Horses who did not reach criterion were retired for the day
after 20 trials. Daily trials were conducted at approximately the
horse's regular feeding time. The horses were tested in a random
order each day (Steel and Torrie, 1980).
30
The score sheet designed for recording each day's results on
the place test is shown in appendix figure A. In this test, feed
was placed in alternate sides of the maze on successive days. Each
horse was brought to the start area and released by the handler.
When the horse had entered a branch of the maze, its response was
recorded as correct or incorrect. The handler then entered the maze,
caught the animal and led it out the exit door. The horses were not
led into the maze or back from the exit doors on the same side each
time.
For the discrimination test:, the daily pattern of correct re
sponses was determined randomly (Steel and Torrie, 1980). The pattern
was recorded on the daily score sheet (appendix figure 1). The same
basic procedure x as used that was used in the place test. The dis
criminative stimulus panel was pulled to the side of the correct
response and the feed was moved when the pattern called for the
correct response to change. The same pattern was used for all horses
on the discrimination test on a given day.
Extinction Procedure. Ten-day extinction periods between tests
were conducted to extinguish behavior learned on previous tests.
All runs through the maze during extinction were unrewarded. The
handler released the horse into the maze on alternate trials. On
trials following "free" responses, the handler led the animal to the
opposite side to reduce position preferences. The discrimination panel
was moved in a random pattern (Steel and Torrie, 1980) for the horses
which had just completed the discrimination test. Each horse completed
31
20 total extinction trails ner day, consisting of 10 "free" and 10
"forced" trials.
Statistical Analysis. Trials to criterion and percentage of cor
rect responses by 5-day groups were analyzed by a completely random
ized design (Barr et al., 1979). Emotionality and trainability were
analyzed by a split-plot design (Barr et al., 1979). Duncan's mul
tiple range test was used for mean separations (Steel and Torrie,
1980). Spearman correlations were calculated for rank analyses (Barr
et al., 1979).
Results and Discussion
Percentage of Correct Responses. The mean percentage of correct
responses for each group was determined for each day, for each 5-day
block and for each test. Group 1 had a mean of 73% correct responses
in the first 20-day place test. This mean is lower than those found
on a similar test by I*/hitaker (1982). His five handling groups had
scores which ranged from 77.7 to 85.6% correct responses. Our scores
also were lower than those observed by Heird et al. (1981) in their
intermediate group which achieved 82% correct responses. These higher
scores probably are due to a greater total number of trials in Heird's
and I^itaker's tests. These tests were identical to the place test
used in this study but both investigators used 30 trials per day.
Nonhandled and most handled groups of Heird et al. obtained a lower
percentage of correct responses than the horses in this study, scor
ing 60 and 67% correct, respectively.
The daily means of Group 1 on Test 1 of this study ranged from
45% correct on day 1 to 91% correct on day 20. These results are

32
consistent with those of the intermediate group of Heird et al. (1981),
which improved from 61% correct on day 3 to 92% correct on day 19.
Although the other groups of Heird et al. (1981) showed some improve
ment in performance, they failed to yield the usual learning curve.
All of Whitaker's (1982) groups demonstrated an increase in percent
age of correct responses as a result of practice. The initial in
crease in percentage of correct responses through day 3, which was
reported by Whitaker (1982) and Fiske and Potter (1979), was not evi
dent in the present study.
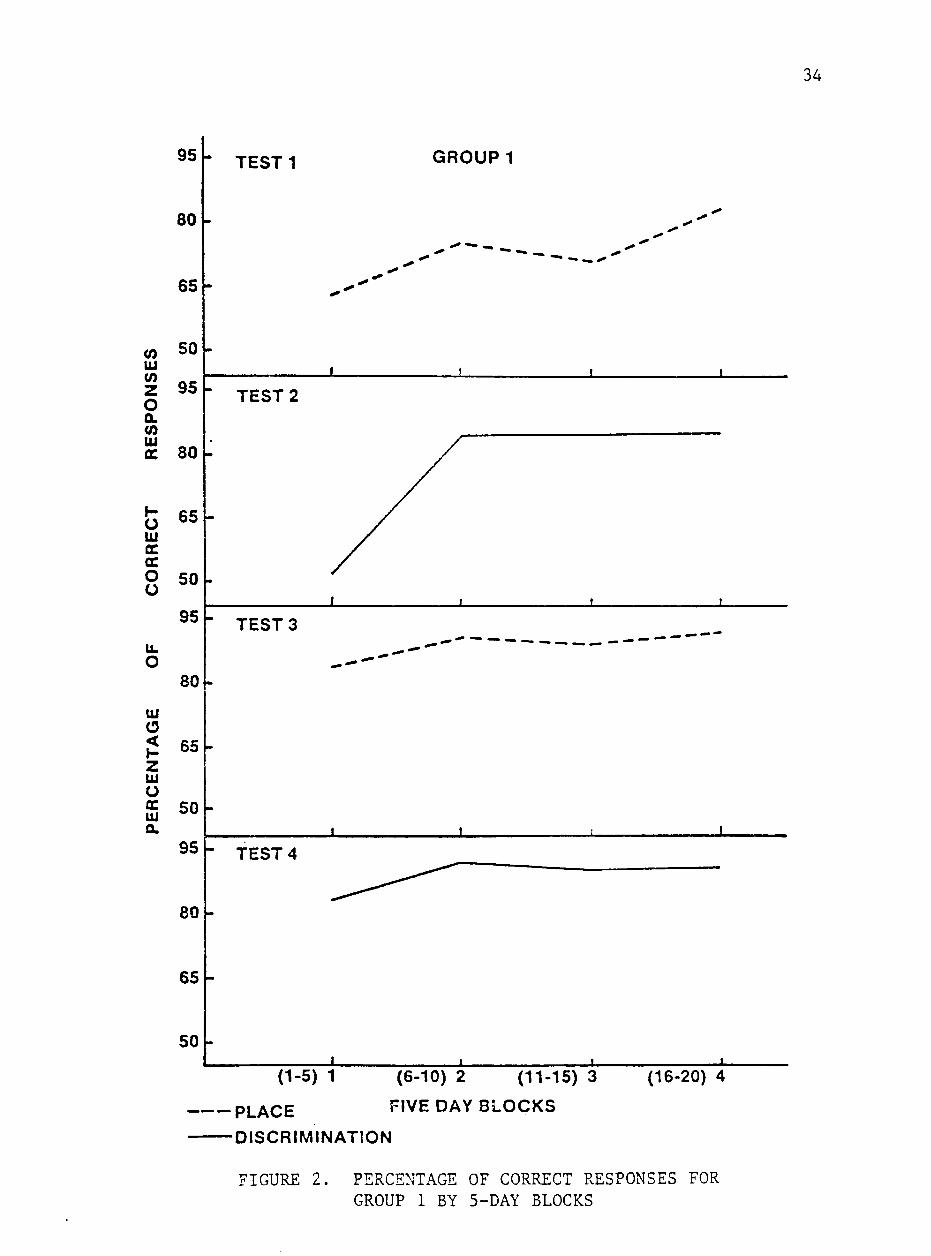
The mean percentages of correct responses by block of Group 1
for each test is shown in figure 2. I^en averaged over 5-day blocks,
percentage of correct responses was lower (P<.05) for block 1 (days
1 to 5) of Test 1 than for block 4 (days 16 to 20), but neither of
these scores differed significantly from those of blocks 2 and 3.
The mean percentage of correct responses for the last block of this
study was 82.9%. These results are comparable to those of I'Jhitaker
(1982) who reported that all of his groups achieved means of 85% or
higher correct responses after day 12.
On Test 2, a discrimination test. Group 1 had a mean of 76.3%
correct responses with mean daily scores ranging from 42% on day 1
to 87.8% on day 17. The mean score for block 1 was significantly
lower than those for blocks 2, 3 and 4 whose mean percentages of
correct responses did not differ (P>.05). These results indicate
that discrimination learning occurs rather abruptly when compared to
the gradual improvement demonstrated on the place test. The horses
33
appeared to hypothesize on the discrimination test. This phenomenon
was first noticed by Lashley (1929) and Krechevsky (1932) and is a
major feature of attention theories of discrimination.
Group 1 achieved a mean of 88.6% correct responses on Test 3,
another place test. Their daily mean scores ranged from 77.5% correct
on day 1 to 94.4% correct on day 20. The mean percentage of correct
responses on block 1 was lower than those for blocks 2, 3 and 4 which
were not different (P>.05).
The early learning in this test compared to the previous two
tests demonstrates the "learning to learn" phenomenon which has also
been reported in horses by Dixon (1966), Fiske and Potter (1979),
and flader and Price (1980) .
Mean percentage of correct responses for Group 1 on their final
test, another discrimination, was 88.7%. Daily mean scores ranged
from 80.8% correct on day 3 to 95.8% correct on day 19, but mean per
centages of correct responses did not differ (P>.05) between 5-day
blocks on this test, indicating that a high level of performance was
maintained throughout this test.
Mean percentages of correct responses for this group did not
differ (P>.05) between Tests 1 and 2. A significantly higher percent
age of correct responses was achieved on Tests 3 and 4 which did not
differ.
Group 2 was started on a discrimination test in which they achieved
a mean of 64.4% correct responses. Yeates (1976) reported a compar
able mean of 56.7% correct in a visual discrimination test under
34
in UJ en z o a. UJ cc
o Ul cc oc o o
u. c
UJ
O < H Z UJ
O oc UJ a.
95
80
65
50
95
80
65
50
95
80
55
50
95
80
65
50
•
-
-
i »
-
-
TEST1
TEST 2
TEST 3
TEST 4
GROUP 1
. - ' - ' '
t i l l
/
/
i 1 t t
^ - - - " ' ' ~ " " "
t i l l
^ ^
—i 1 1 ., 1 . . . (1-5) 1
PLACE
(6-10) 2 (11-15) 3
FIVE DAY BLOCKS
(16-20) 4
•DISCRIMINATION
FIGURE 2. PERCENTAGE OF CORRECT RESPONSES FOR GROUP 1 BY 5-DAY BLOCKS
35
operant conditions. Group 2's score was significantly lower than that
of Group 1 on Test 1, indicating that the discrimination was more
difficult than the place test.
Group 2's mean daily scores ranged from 44.2% correct responses
on day 2 to 90.9% correct responses on day 20. This final score is
consistent with the results of Dixon (1966) whose pony achieved 92.5%
correct responses on the final day of a visual discrimination test
using 20 different pairs of patterns.
When analyzed by 5-day blocks, (figure 3) the 49% correct re
sponses for Group 2 on block 1 of this test was significantly lower
than those on blocks 3 and 4. The mean score of 79.8% correct on
block 4 was higher (P<.05) than those on blocks 1 and 2. Mean scores
on blocks 2 and 3 did not differ. Mader and Price (1980) reported
more rapid learning on a similar test. A criterion of 80% correct
responses on a three choice visual discrimination was reached by
Quarter Horses in 5.4 days and Thoroughbreds in 8.4 days on their
test.
Group 2 reached a mean of 86.4% correct responses on Test 2, a
place test. Mean daily scores on this test ranged from 78% correct
on day 1 to 93% on day 20. These relatively high scores suggest
that previous learning of a more difficult task facilitated learn
ing on the simple place test.
The mean percentage of correct responses for Group 2 on Test 3
was 89.3% with a mean daily of 62% correct on day 1 to 96% on day 11.
The mean percentage of correct responses for block 1 was significantly

36
95
80
65
« 50 UJ 0) Z
o Q. (A UJ OC
u. o
UJ
<
Z UJ
o cc UJ
95
80 -
O 65 UJ cc a. O u
50
95
80
65 -
50 -
TEST1 GROUP 2
TEST 2
TEST 3
95
80
65
50
• •
TEST 4
1
«
1
!
!
•
(
1 (1-5) 1 (6-10) 2 (11-15) 3
PLACE FIVE DAY BLOCKS
DISCRIMINATION
(16-20) 4
FIGURE 3. PERCENTAGES OF CORRECT RESPONSES FOR GROUP 2 BY 5-DAY BLOCKS

37
lower than those on blocks 2, 3 and 4 which did not differ. These
results indicate that learning occurred in the first few days of this
test.
A mean percentage of 86.7% correct responses was achieved on
Test 4 by Group 2. The high score of 94% correct responses was
achieved on day 1 and a low score of 79.2% occurred on day 2 of this
test. No differences (P>.05) were noted between mean scores during the
5-day blocks. A tendency for the percentage of correct responses to
decrease during the 20-day test was noted, perhaps indicating boredom
due to the simple nature of this test.
Group 2 had a significantly lower mean percentage of correct
responses on Test 1 than on the remainder of the tests. Percentage
of correct responses for this group did not differ for Tests 2, 3 and
4. These results, compared with the percentage of correct responses
of Group 1 over the four tests, indicate that learning the more diffi
cult test initially facilitated the animals' ability to learn.
Trials to Criterion. The mean number of trials to criterion for
each group was calculated for each day, for each 5-day block and for
each test. Group 1 averaged 16 trials to criterion for Test 1 with
daily means ranging from 20.0 on day 1 to 12.2 on day 20. This im
provement over time represents learning. Heird et al. (1981) showed
a decrease in trials to criterion with his intermediately handled
group. Fiske and Potter (1979) reported mean numbers of trials to
criterion for individuals ranging from 13.05 to 30.00 on a similar
reversal test. Mean number of trials to criterion by block for Group

38
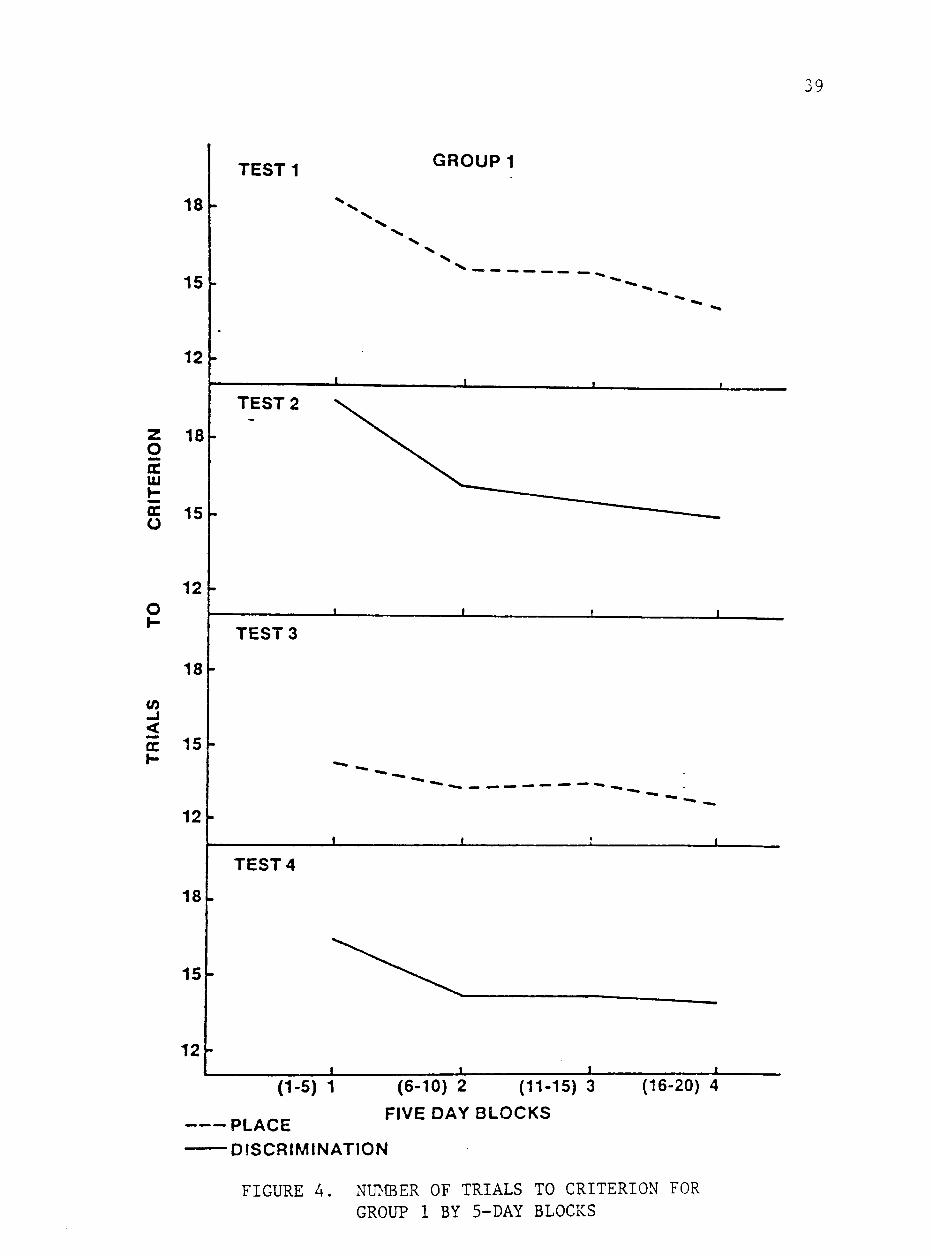
1 on each test is shown in figure 4. Group 1 required more trials
to reach criterion during block 1 (P<.05) than they did in the re
maining 5-day blocks, which did not differ significantly. Whitaker
(1982) reported no improvement in trials to criterion after day 10.
Results from this study and I^itaker's (1982) test suggest that
learning occurs rapidly on the place test.
Daily trials to criterion for Group 1 on Test 2 ranged from 20
on days 1 to 4 to 14.2 on days 12, 17 and 18 with a mean score of 16.6.
More trials were required to reach to criterion on block 1 than blocks
2, 3 and 4, which did not differ significantly. These results indi
cate that learning occurred in the first few days of the study. Since
learning occurred sooner and mean trials to criterion were lower than
in Group 2 on Test 1, it can be concluded that, at least with this
measure, previous experience with the simple maze test facilitated
learning the discrimination test. As indicated earlier, this was not
true for the percent correct measure. Lawrence (1952) stated that
animals trained on an easy problem learned to attend more strongly
to relevant stimuli than those initially given a difficult problem.
On Test 3, Group 1 required a mean of 13.5 trials to reach cri
terion. The mean score for this group on day 18 was 12 trials to cri
terion, a nearly perfect performance. Mean trials to criterion did
not differ among the 5-day blocks which may indicate that learning
was complete at the end of Test 1 and well remembered.
Group 1 reached a mean of 14.7 trials to reach criterion on Test
4 with no differences (P>.05) between 5-day blocks. Mean number of
39
Z g cc UJ cc o
18
15
12
18
15
12 O
18
i/i
< E 15 -
TEST1 GROUP 1
TEST 3 J ,
12
18
15
12
•
TEST 4
-
•
1
•
1
•
•
" " " " - - . . « .
«
. . . . 1 (1-5) 1 (6-10) 2 (11-15) 3
FIVE DAY BLOCKS
(16-20) 4
PLACE DISCRIMINATION
FIGURE 4 . NU>ffiER OF TRIALS TO CRITERION FOR GROUP 1 BY 5-DAY BLOCKS

trials required to reach criterion on Tests 3 and 4 were signifi
cantly lower than the number of trials to criterion for Tests 1 and
2 which did not differ. Test 4 did require more mean trials to
criterion than Test 3 for Group 1, demonstrating the greater diffi
culty of the discrimination task.
Figure 5 shows the mean numbers of trials to criterion by block
for Group 2 on each test. Group 2 shows no improvement in number of
trials to reach criterion during block 1 of Test 1. The mean score
for this entire period was 20, indicating that no individual reached
criterion before day 6 of this test. No significant differences
between mean trials to criterion on blocks 1, 2 and 3 were found.
Number of mean trials required to reach criterion decreased during
days 16 to 20 (P<.05), indicating that learning occurred during this
time period. Fewest mean trials to criterion for this test occurred
on day 20 when the group mean was 12.3.
On Test 2, Group 2 achieved a mean of 14 trials to criterion
with daily means ranging from 16.3 on day 3 to 12.1 on day 7. I'Jhen
analyzed by 5-day blocks, the number of trials required to reach cri
terion was significantly higher for block 1 than for blocks 2 or 4,
which did not differ (P>.05). Mean niiraber of trials to criterion for
block 3 did not differ significantly from any of the other blocks of
days. These results indicate that learning occurred early in this
test.
Rapid learning was also demonstrated by this group on Test 3.
The mean number of trials to criterion on this test was 14.6. Dailv

41
18 -
15 -
12 -
Z 2 18 cc Ul cc o 15 -
12 -O J -
TEST1
^
TEST 2
-
•
TEST 3
-—.^^..^^^ GROUP 2
^ ^ ^ ^
l i l t
" " " ^ ^ ^
, ! t • 1
18 1-
(0
< 15 cc
12
18
15
12
TEST 4
(1-5) 1 (6-10) 2 (11-15) 3
PLACE ^ ' ^ ^ ° ^ ^ BLOCKS
DISCRIMINATION
(16-20) 4
FIGURE 5. NUMBER OF TRIALS TO CRITERION FOR GROUP 2 BY 5-DAY BLOCKS
42
mean trials to criterion improved from 20 on day 1 to 11.9 on day 11,
A significantly greater number of trials to criterion were required
for block 1 than blocks 3 or 4. Mean number of trials to criterion
for block 2 did not differ (P>.05) from any other block of days.
Although the mean number of trials to criterion for Test 4 was
higher during the first few days with a high of 14.9 on day 1, no
significant differences among the 5-day blocks were found for this
test. For Group 2, the mean number of trials to criterion for Test
1 was significantly higher than the values for the remaining tests
which did not differ (P>.05). These results support the idea that
initial learning of a difficult task facilitates later learning.
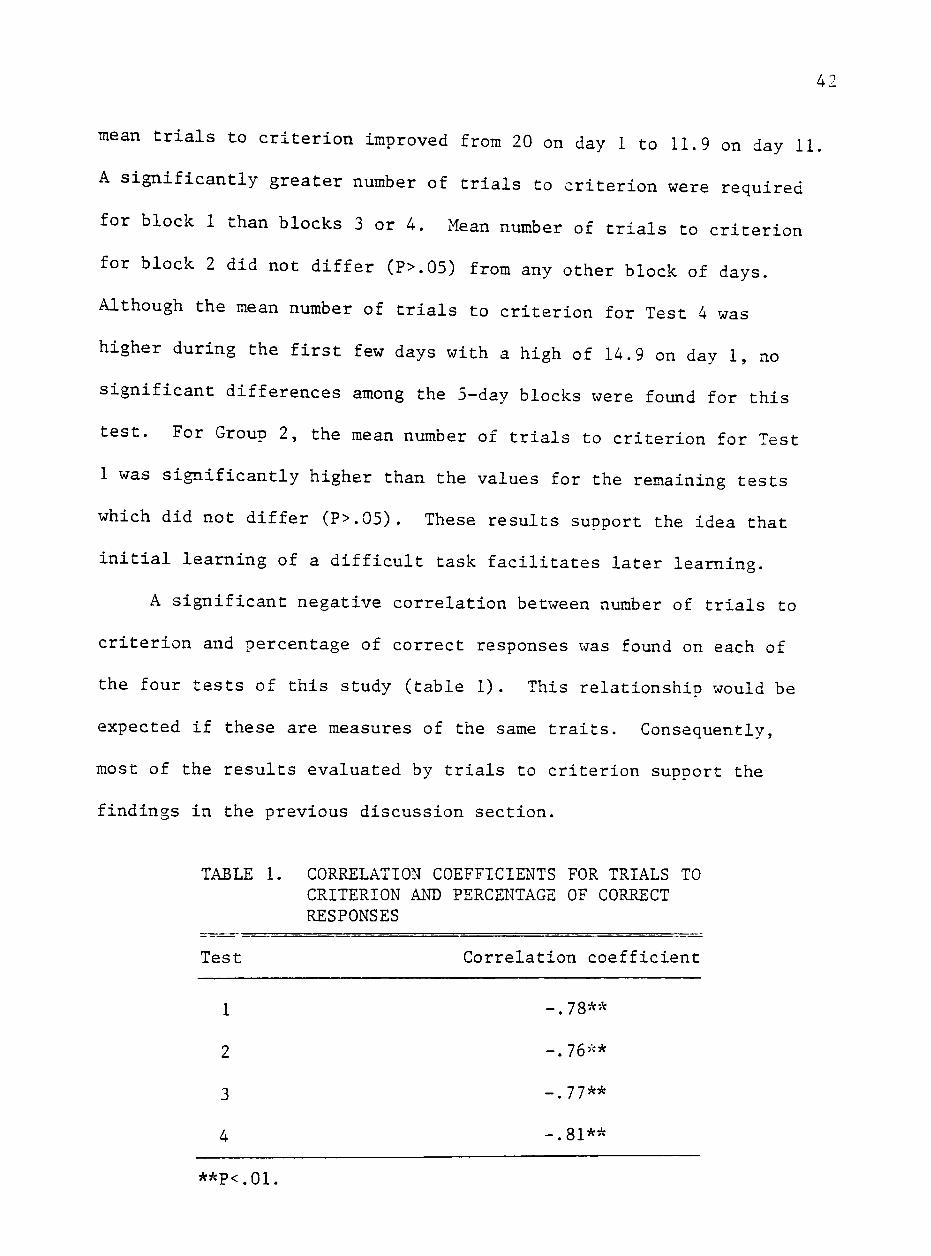
A significant negative correlation between number of trials to
criterion and percentage of correct responses was found on each of
the four tests of this study (table 1). This relationship would be
expected if these are measures of the same traits. Consequently,
most of the results evaluated by trials to criterion support the
findings in the previous discussion section.
TABLE 1. CORRELATION COEFFICIENTS FOR TRIALS TO CRITERION ANT) PERCENTAGE OF CORRECT RESPONSES
Test Correlation coefficient
1 -.78**
2 -.76'^*
3 -.77**
4 -.81**
**P<.01.
43
Trainability Scores. After the pre-conditioning period, each
horse received a trainability score which was an average of sub
jective scores from three raters. Scores ranged from 1 to 4 with
low scores indicating a greater predisposition to learn.
Simple correlation coefficients were calculated between train-
ability scores, number of trials to criterion and percentage of cor
rect responses for each test. No significant correlation
was found between trainability scores and either of the measures of
maze performance. Heird (1981) found no correlation between train-
ability scores and trials to criterion. Fiske and Potter (1979) ob
served negative relationships between trainability scores and both
mean errors and mean trials to criterion for colts and geldings but
not for fillies. They attributed this phenomenon to erratic behavior
during estrus. Whitaker (1982) reported a significant negative corre
lation between group trainability scores and number of trials to
criterion.
The horses were grouped separately for high and low trainability
scores for comparison of mean of number of trials to criterion and
percentage of correct response for 5-day blocks. The mean scores of
high and low trainability groups for percentage or correct responses
and number of trials to criterion by 5-day blocks are shown in figures
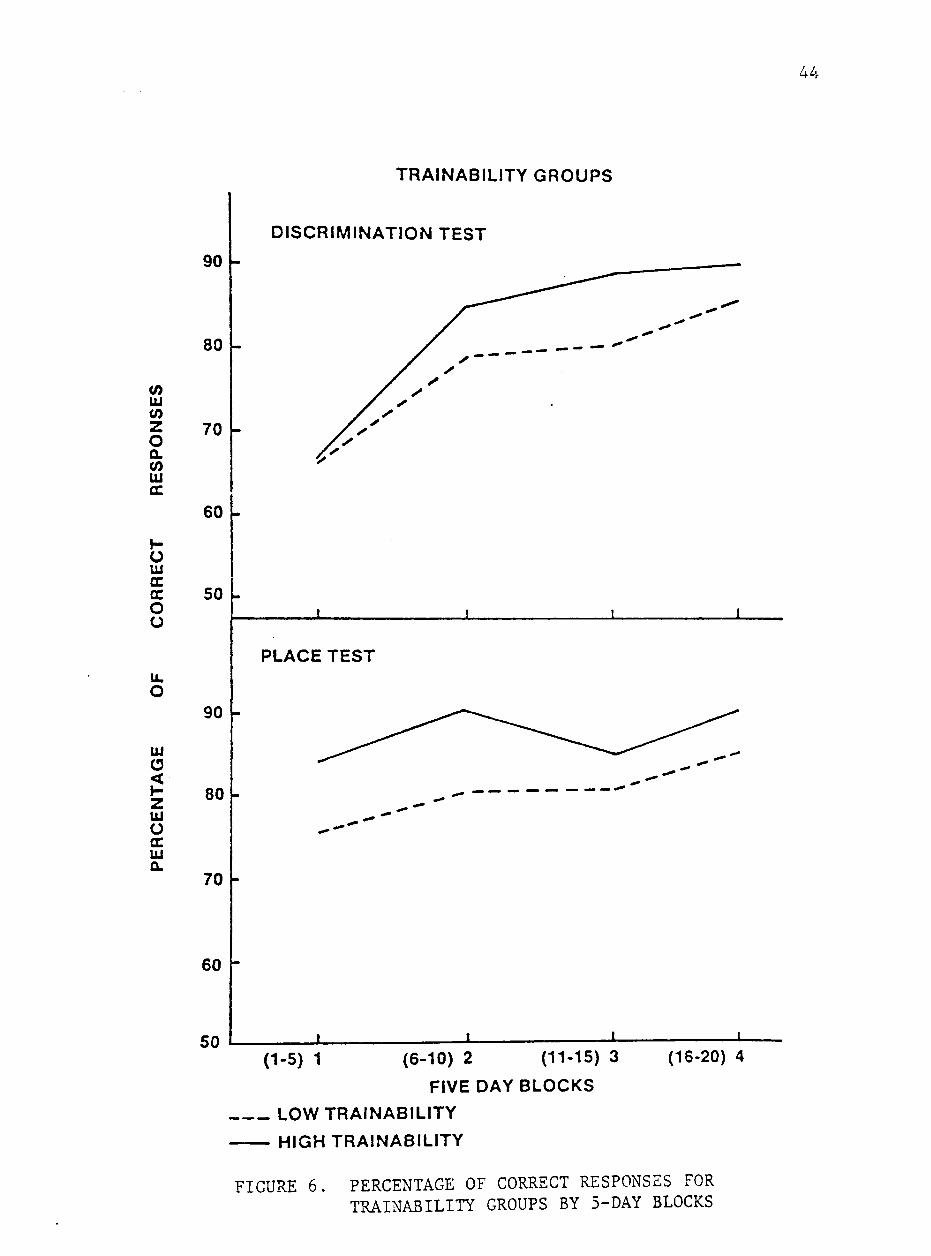
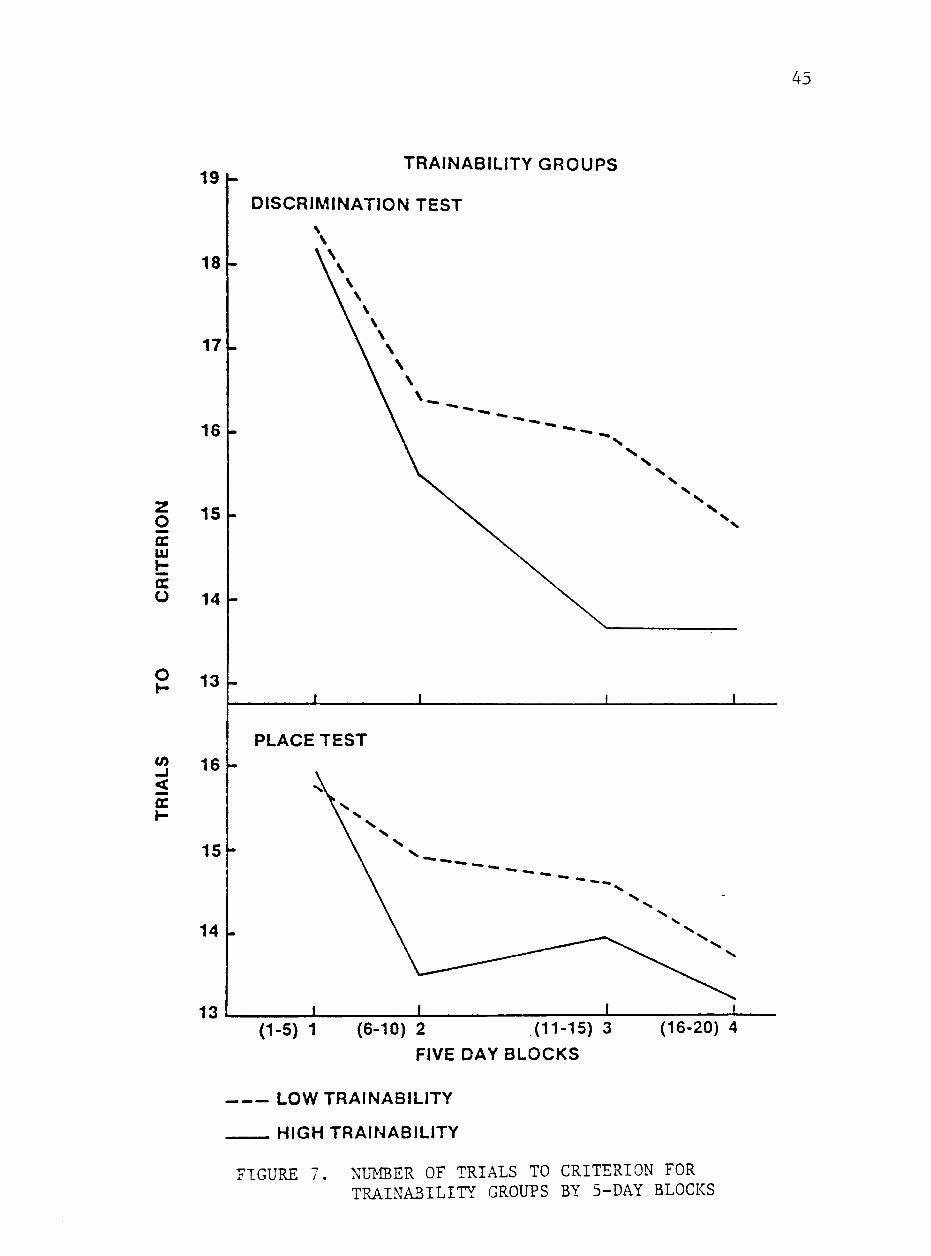
6 and 7. Although differences between groups were not significant,
the animals in the trainable group tended to require fewer trials to
reach criterion and achieve a higher percentage of correct responses
on both types of test. Similar trends were noted by Heird et al. (1981)
44
UJ
Z O Q. cn UJ cc
H O Ul cc cc o o
U. o
UJ o <
z UJ
o flC UJ
a.
TRAINABILITY GROUPS
90
80
70
60
50
90
80
70
60
50
DISCRIMINATION TEST
PLACE TEST
X (1-5) 1 (6-10) 2 (11-15) 3 (16-20) 4
FIVE DAY BLOCKS
LOW TRAINABILITY
HIGH TRAINABILITY
FIGURE 6 . PERCENTAGE OF CORRECT RESPONSES FOR TRAINABILITY GROUPS BY 5-DAY BLOCKS
45
19 TRAINABILITY GROUPS
Z o cc UJ H CC
o
DISCRIMINATION TEST
18
17
16
15
14
13
PLACE TEST
.J < cc
16
15
14
13 (1-5) 1 (6-10) 2 (11-15) 3 (16-20) 4
FIVE DAY BLOCKS
LOW TRAINABILITY
HIGH TRAINABILITY
FIGURE 7. NUMBER OF TRIALS TO CRITERION FOR TRAINABILITY GROUPS BY 5-DAY BLOCKS
/, 6
who suggested that these scores could predict learning over time
rather than individual daily performance.
A higher mean percentage of correct responses (P<.05) was achiev
ed by the trainable group when scores for block 4 were compared.
These animals also tended to require fewer trials to reach criterion
during this block of days. These results indicate that these sub
jective scores predict the level at which an asymtote is reached.
Although trainability scores are not related to rate of learning, they
appear to predict the level of performance ultimately achieved. Simi
lar results of comparisons between performance of horses separated by
emotionality support these conclusions.
Emotionality Score. Several authors (Searle, 1949; Thompson
and Bindra, 1952; Fuller, 1962; Craig, 1981) have suggested that emo
tionality combined with motivational, physical and intellectual char
acteristics, may determine performance in a maze-learning situation.
An emotionality score based on reaction to a novel stimulus was assign
ed to each animal after the pre-conditioning period. Scores ranged
from 1 to 4 with 1 denoting a highly emotional individual.
Simple correlation coefficients were calculated for each test
between emotionality scores, number of trials to reach criterion and
percentage of correct responses. No significant correlation was found
between emotionality scores and maze test performance. A negative
correlation was found between emotionality and trainability scores
(r = -.51, P<.07). \^itaker (1982) reported a negative correlation
(r = -.68, P<.01) between daily emotionality scores and trainability.
4 /
Fiske and Potter (1979) observed a relationship between emotionality
and trainability for colts and geldings but not for fillies. Thomp
son and Bindra (1952) found no significant difference in emotional
ity of "maze bright" and "maze dull" rats.
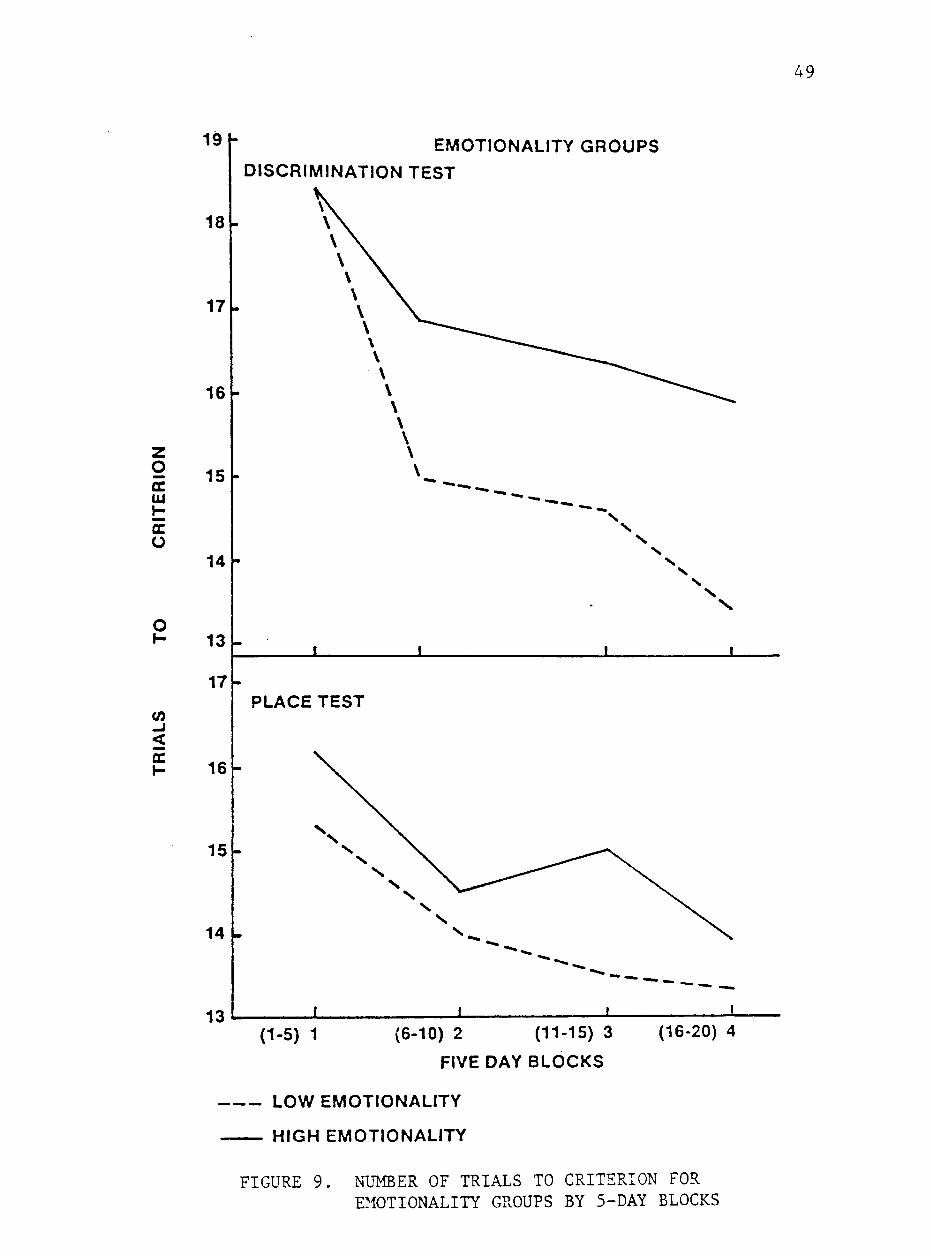
The animals in this study were grouped according to emotional
ity score and their performance on both types of test was compared.
Their mean number of trials to criterion and percentages of correct
responses were calculated for 5-day blocks. These results are shown
in figures 8 and 9. The highly emotional animals required more tials
to reach criterion (P<.05) than did the less emotional group on the
place test. The less emotional group also achieved a higher percent
age of correct responses with the difference approaching significance
(P<.08). On a similar test, Fiske and Potter (1979) found a signifi
cant negative correlation between number of trials to criterion and
emotionality scores for colts and geldings but not for fillies. Al
though TAjhitaker (1982) found no relationship between group emotion
ality scores and number of trials to criterion, he reported a signifi
cant negative correlation between daily individual emotionality scores
and number of trials to criterion.
Although differences between emotionality groups for the discrimi
nation test were not significant, a tendency for the less emotional
animals to require fewer trials to reach criterion and achieve a higher
percentage of correct responses was observed. Mader and Price (1980)
found a similar relationship between emotionality scores and performance
on a similar test. They observed that Quarter Horses learned a three-

UJ
z O Q. V> UJ cc
I -o Ui a. cc o o
u. O
UJ
(5 < Z UJ O CC UJ
a
90
80
70
60
50
90
80
70
60
43
EMOTIONALITY GROUPS
DISCRIMINATION TEST
PLACE TEST
(1-5) 1 X
(6-10) 2 (11-15) 3
FIVE DAY BLOCKS
(16-20) 4
LOW EMOTIONALITY
HIGH EMOTIONALITY
FIGURE 8 . PERCENTAGE OF CORRECT RESPONSES FOR EMOTIONALITY GROUPS BY 5-DAY BLOCKS
49
cc UJ H E o
o
(0
< CC
19 h
18
17
16
15
14
13
17
1 6 -
EMOTIONALITY GROUPS
DISCRIMINATION TEST
\
PLACE TEST
1 5 -
14 -
13
N
J.
(1-5) 1 (6-10) 2 (11-15) 3
FIVE DAY BLOCKS
(16-20) 4
LOW EMOTIONALITY
HIGH EMOTIONALITY
FIGURE 9 . NUMBER OF TRIALS TO CRITERION FOR EMOTIONALITY GROUPS BY 5-DAY BLOCKS

50
choice discrimination significantly faster than Thoroughbreds. The
Quarter Horses tended to be less reactive but no correlation x>ras
found between individual emotionality and learning scores.
Less emotional animals demonstrated superior performance in the
last 5 days of testing. Mean scores for block 4 were different be
tween emotionality groups for both trials to criterion and percent
age of correct responses (P<.001). These results suggest that although
emotionality may not affect rate of learning, less emotional animals
ultimately achieve a higher level of performance on a learning test.
Rank Correlations. Spearman correlation coefficients were calcu
lated between results of each test. The animals were ranked according
to percentage of correct responses. For Group 1, which started on the
place test, ranks on Test 1 were correlated with those on Test 2
(r = .27, P<.001) and Test 3 (r = .33, P<.001). Ranks for Test 2,
a discrimination test, were correlated with those on Test 3 (r = .25,
P<.006) and Test 4 (r = .41, P<.001).
Rank correlations between test and retest for both types of
tests were consistent with figures mentioned by Tolman and Nyswander
(1927). These early experimenters stated that reliability coeffi
cients for rats in maze tests usually ranged from .3 to .6. Tryon
(1931) found much higher correlations between learning and releaming
using rats. His correlations between learning and releaming on
three maze tests averaged .81. The rats used in Tryon's (1931) study
were from strains that had been selectively bred for extremes in
D L
ability. Tolman and Nyswander (1972) noted that such extremes of
ability usually result in abnormally high reliability coefficients.
The highest rank correlation for Group 1 was between Tests 2 and
4, the discrimination tests. These results support Tolman and
Nyswander's (1927) suggestion that higher reliability coefficients
are found with more difficult tests.
For Group 1, significant rank correlations were found for each
possible combination of tests except 1 and 4. When calculated by
type, rank correlations between place and discrimination learning
were found for Group 1 (r = .23, P<.001). Tryon (1931a) found a much
higher correlation between two different T-mazes. Again, this differ
ence probably is due to the extreme nature of his experimental group.
When Spearman correlation coefficients were calculated for Group
2, correlations were found between tests of the same type but no sig
nificant relationship was found between ranks on different types of
tests. These results may be due to some type of order effect; per
haps learning by animals learning the difficult problem first is
task-specific. Correlations were found for Group 2 between discrim
ination tests (r = .33, P<.0001) and between place tests (r = .26,
P<.002).
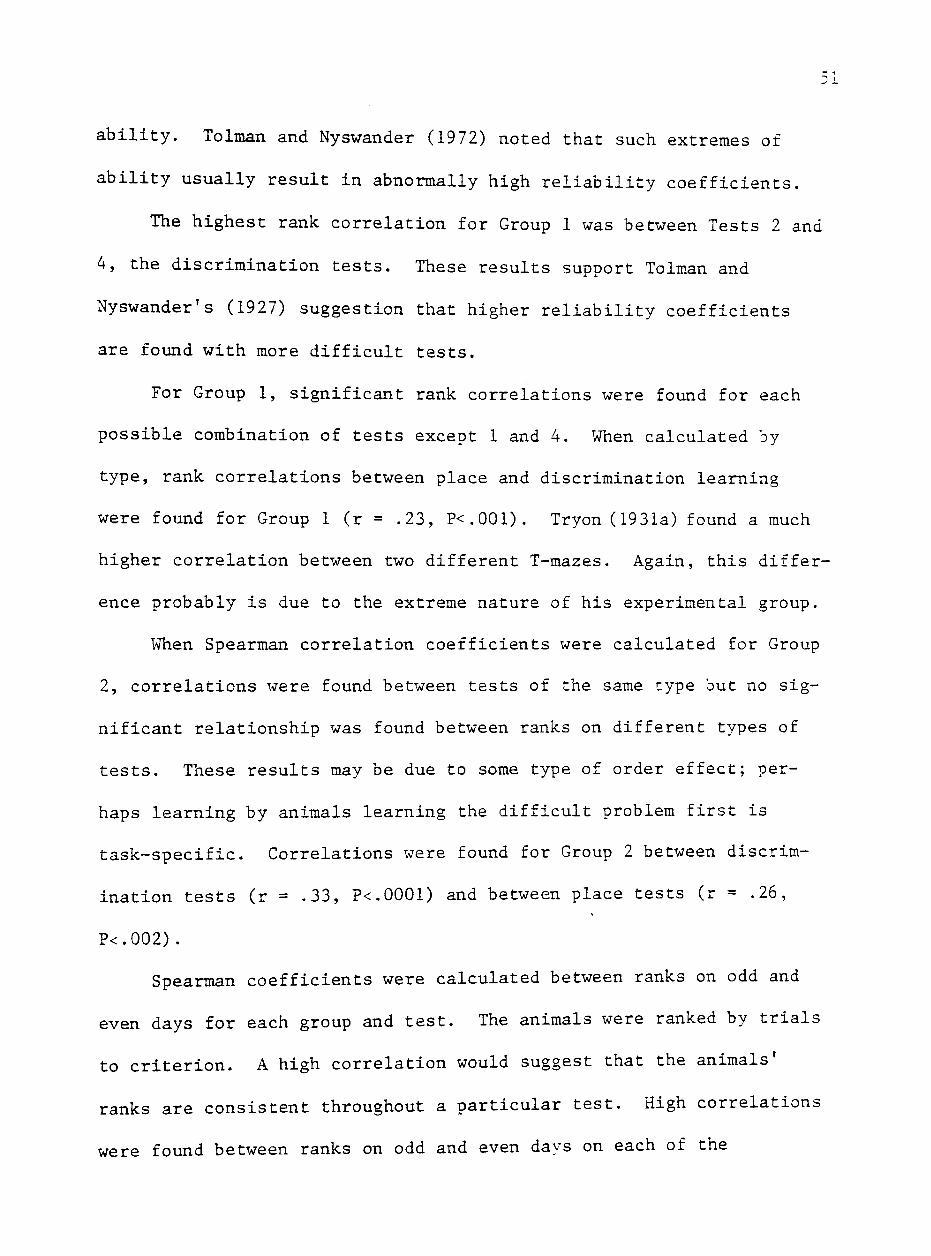
Spearman coefficients were calculated between ranks on odd and
even days for each group and test. The animals were ranked by trials
to criterion. A high correlation would suggest that the animals'
ranks are consistent throughout a particular test. High correlations
were found between ranks on odd and even days on each of the
52
discrimination tests (table 2). No significant correlations were
found for the place test. This difference might be due to the simple
nature of the maze test, the effects of position preferences on the
place test or a combination of these. Heird et al. (1981) reported
that his nonhandled group showed strong position preferences. This
tendency resulted in inconsistent results since an animal who con
sistently went to the same side each x>7ould have extremely high and
low scores on alternate days.
TABLE 2. SPEAR IAN CORRELATION COEFFICIENTS FOR RANKS ON ODD AND EVEN DAYS ON DISCRIMINATION TESTS
Group Test Correlation coefficients
1 2 .62**
1 4 .30**
2 1 .74**
2 3 .45**
**P<.01.
Conclusions. Improvement in performance over time was evident
in both the place and discrimination tests, but the discrimination
was clearly more difficult than the place test. Learning occurred
abruptly on the discrimination tests compared to the gradual improve
ment in performance observed on the place tests. Animals learned
more rapidly and reached higher levels of performance as the series
of tests progressed. Trainability and emotionality scores tended to
predict maze learning ability. Significant differences were
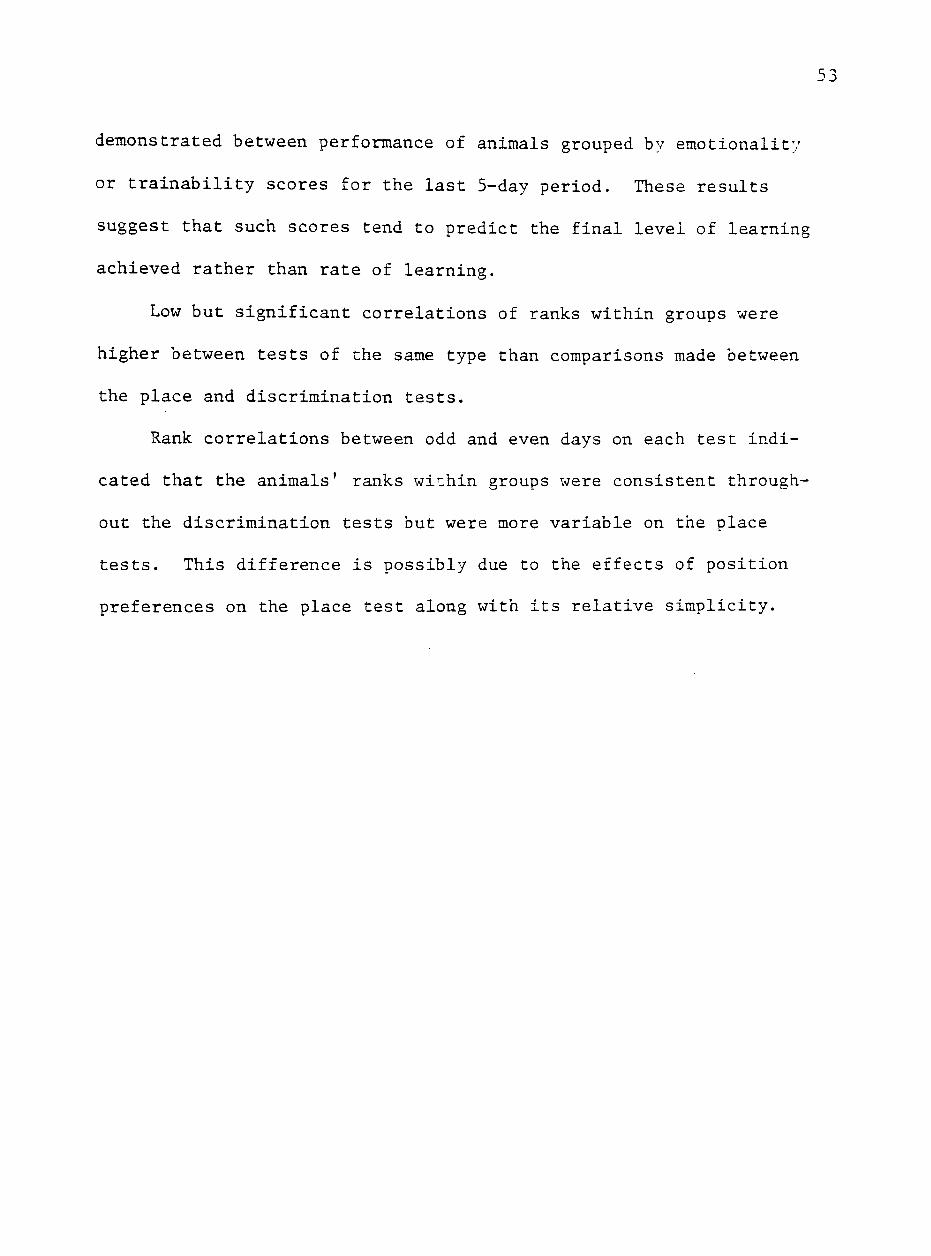
53
demonstrated between performance of animals grouped by emotionality
or trainability scores for the last 5-day period. These results
suggest that such scores tend to predict the final level of learning
achieved rather than rate of learning.
Low but significant correlations of ranks within groups were
higher between tests of the same type than comparisons made between
the place and discrimination tests.
Rank correlations between odd and even days on each test indi
cated that the animals' ranks within groups were consistent through
out the discrimination tests but were more variable on the place
tests. This difference is possibly due to the effects of position
preferences on the place test along with its relative simplicity.

LITERATURE CITED
Albright, J. L., W. P. Gordon, W. C. Black, J. P. Dietrich and W. W. Snyder. 1966. Behavioral responses of cows to auditory training. J. of Dairy Sci. 49:104.
Baldwin, B. A. 1979. Operant studies on the behavior of pigs and sheep in relation to the physical environment. J. Anim. Sci. 49:1125.
Baldwin, B. A. and D. L. Ingram. 196 7. Behavioral thermoregulation in pigs. Physiol. Behav. 2:15.
Barr, A. J., J. H. Goodnight, J. P. Sail, W. H. Blair and D. M. Chilko. 1979. A user's guide to SAS 79. SAS Institute Inc., Gary, N.C.
Baryshnikov, I. A. and E. P. Kokoring. 1964. Higher nervous activity in cattle. Dairy Sci. 26:97.
Bitterman, M. E. 1964. Phyletic differences in learning. Amer. Psychol. 20:396.
Bitterman, M. E. 1979a. Historical introduction. (In) Bitterman, M. E., V. M. Lolordo, J. B. Overmier and M. E. Rashotte. Animal Learning - Survey and Analysis. Plenum Press, New York.
Bitterman, M. E. 1979b. Discrimination. (In) Bitterman, M. E., V. M. Lolordo, J. B. Overmier and M. E. Rashotte. Animal Learning - Survey and Analysis. Plenum Press, New York.
Bitterman, M. E. 1979c. Attention. (In) Bitterman, M. E., V. M. Lolordo, J. B. Overmier and M. S. Rashotte. Animal Learning -Survey and Analysis.
Cairns, R. B. 1966. Development, ra.aintenance and extinction of social attachment behavior in sheep. J. Compar. and Physiol. Psychol. 62:298.
Clayton, K. N. and S. T. Koplin. 1964. T-maze learning as a joint function of probability and magnitude of reward. Psychon. Sci. 1:381.
Commins, W. D., Q. McNemar and C. P. Stone. 1932. Intercorreiations of measures of ability in the rat. J. Compar. Psy. 14:225.
Craig, J. V. 1981. Domestic Animal Behavior. Prentice-Hall, Inc., Englewood Cliffs, N.J.
54
Crespi, L. P. 1942. Quantitative variation of incentive and performance in the white rat. Amer. J. Psychol. 55:467.
Curtiss, Q. F. 1937. Experimental neurosis in the pig. Psychol. Bull. 34:723.
Denenberg, V. H. and E. M. Banks. 1962. Techniques of measurement and evaluation. (In) E. S. Hafez (Ed.) The Behaviour of Domestic Animals. Williams and Wilkins Co., Baltimore.
Derdzinski, D. and J. M. Warren. 1969. Perimeter, complexity and form discrimination learning by cats. J. of Comp. and Phys. Psych. 68:407.
Dickson, D. P. 196 7. A study of social dominance, temperament and learning ability in dairy cattle. Ph.D. Thesis. University of Wisconsin, Madison.
Dixon, J. C. 1966. Pattern discrimination, learning set, and memory in a pony. Paper given at Midwest Psychological Assoc. Convention, Chicago, IL.
Fantino, E. and C. A. Logan. 1979. The Experimental Analysis of Behavior - A Biological Perspective. W. H. Freeman and Co., San Francisco.
Fiske, J. C. and G. D. Potter. 1979. Discrimination reversal learning in yearling horses. J. Anim. Sci. 49:583.
Fuller, J. L. 1962. The genetics of behavior. (In) E. S. Hafez (Ed.) The Behavior of Domestic Animals. Williams and Wilkins Co., Baltimore.
Gardner, L. P. 1933. The responses of horses to the situation of a closed feed box. J. of Comp. Psyc. 15:445.
Gardner, L. B. 1937a. The responses of horses in a discrimination problem. J. of Comp. Psyc. 23:13.
Gardner, L. P. 1937b. The responses of cows in a discrimination problem. J. of Comp. Psyc. 23:35.
Gardner, L. P. 1937c. Responses of horses to the same signal in different positions. J. of Comp. Psyc. 23:305.
Gardner, L. P. 1937d. The responses of cows to the same signal in different positions. J. of Comp. Psyc. 23:333.
Grizmek, B. 1968. On psychology of the horse. In H. Friedrick
(Ed.) Man and Animal: Studies in Behavior. St. Martins Press,
Inc., New York.
56
Haag, E. L., R. Rudman and K. A. Houpt. 1980. Avoidance, maze learning and social dominance in ponies. J. Anim. Sci. 50:329.
Hall, C. S. 1941. Temperament: a survey of animal studies. Psych. Bull. 38:909.
Hall, C. S. 1951. Individual differences In C. P. Stone (Ed.) Comparative Psychology. Prentice-Hall, Inc., Englewood Cliffs, N.J.
Hamilton, G. V. 1911. A study of trial and error reactions in mammals. J. Anim. Behav. 1:33.
Hammell, D. L. , D. D. Kratzer and W. J. Bramble. 1975. Avoidance and maze learning in pigs. J. of Anim. Sci. 40:573.
Harlow, H. F. 1949. The formation of learning sets. Psych. Rev. 56:51.
Hebb, D. 0. 1949. The Organization of Behavior. Wiley Press, New York.
Hebb, D. 0. and K. Williams. 1946. A method of rating animal intelligence. J. of Gen. Psych. 34:59.
Heird, J. C , A. M. Lennon and R. W. Bell. 1981. Effects of early experience on the learning ability of yearling horses. J. Anim. Sci. 53:1204.
Heron, W. T. 1922. The reliability of the inclined plane problem box as a method of measuring the learning ability of the rat. Comp. Psych. Monog. 1:1.
Heron, W. T. 1930. The test-retest reliability of rat learning scores from the multiple T-maze. J. of Genet. Psych. 38:101.
Hill, W. F. , J. W. Cotton and K. M. Clayton. 1962. Effect of reward magnitude, percentage of reinforcement and training method on acquisition and reversal in a T-maze. J. of Exp. Psych. 64:81.
Hintzman, D. L. 19 78. The Psychology of Learning and Memory. W. H. Freeman and Co., San Francisco.
Honig, W. K. 1969. Attentional factors governing the slope of the generalization gradient. (In) R. M. Gilbert and N. S. Sutherland (Eds.) Animal Discrimination Learning. Academic Press, London.
Hull, C. L. 1943. Principles of Behavior. Appleton-Century, New York.
57
Hunter, W. S. 1922. Correlation studies with the maze in rats and humans. Comp. Psych. Monog. 1:37.
Hunter, W. S. and V. Randolph. 1924. Further studies on the reliability of the maze with rats and humans. J. of Como. Psy. 4:431.
Kimble, G. A. 1961. Conditioning and Learning (2nd Ed.). Appleton-Century-Crofts, New York.
Klopfer, F. D. 1961. Early experience and discrimination learning in swine. Amer. Zool. 1:366.
Kratzer, D. D. 19 71. Learning in farm animals. J. of Anim. Sci. 32:1268.
Kratzer, D. D., W. M. Netherland, R. E. Pulse and J. P. Baker. 1977. Maze learning in Quarter horses. J. Anim. Sci. 45:896.
Krechevsky, I. 1932. 'Hypotheses' in rats. Psych. Rev. 39:516.
Krechevsky, I. 1938. A study of the continuity of the problem-solving process. Psych. Rev. 45:107.
Lashley, K. S. 1929. Brain Mechanisms and Intelligence. Univ. of Chicago Press, Chicago, IL.
Lawrence, D. H. 1952. The transfer of a discrimination along a continuum. J. of Comp. and Phys. Psych. 45:511.
Leeper, R. 1932. The reliability and validity of maze experiments with white rats. Gen. Psych. Monog. 11:137.
Levine, M. A. 1959. A model of hypothis behavior in discrimination learning set. Psych. Rev. 66:353.
Levine, M. A. 1965. Hypothesis behavior. ^ A. M. Schrier, H. F. Harlow and F. Stollnitz (Eds.) Behavior of Nonhuman Primates: Modern Research Trends. Academic Press, New York.
Liddel, H. S. 1954. Conditioning and emotions. Scientific Amer. 190:48.
Liddell, H. S. and D. D. Anderson. 1931. A comparative study of the conditioned motor reflex in the rabbit, sheep, goat, and pig. Amer. J. Physiol. 97:339.
Liggett, J. R. 1925. A note on the reliability of the chick's performance in two simple mazes. J. of Genet. Psych. 32:470.

58
Mackintosh, N. J. 1965. Selective attention in animal discrimination learning. Psych. Bull. 64:124.
Mackintosh, N. J. 19 74. The Psychology of Animal Learning. Academic Press, London.
Mader, D. R. and E. D. Price. 1980. Discrimination learning in horses: effects of breed, age, and social dominance. J. Anim. Sci. 50:962.
Mandler, J. M. 1968. The effect of overtraining on the use of positive and negative stimuli in reversal and transfer. J. of Comp. and Phys. Psych. 66:110.
McCall, C. A., G. D. Potter, T. H. Friend and R. S. Ingram. 1981. Learning abilities in yearling horses using the Hebb-Williams closed field maze. J. Anim. Sci. 53:928.
Miller, R. W. 1974. Horse Behavior and Training. Big Sky Books, Bozeman, MT.
Morgan, C. L. 1894. An Introduction to Comparative Psychology. Walter Scott, London.
Munn, N. L. 1950, Handbook of Psychological Research on the Rat. Riverside Press, Cambridge.
Paterson, D. G. 1917. The John Hopkins circular maze studies. Psych. Bull. 13:294.
Pfungst, 0. 1965. Clever Hans. Robert Rosenthal (Ed.) Holt, Rinehart, and Winston, Inc., New York.
Pollard, J. S. and H. Sampson. 1961. Scoring performance in the closed-field test. Australian J. Psychol. 13:92.
Randolph, V. and W. S. Hunter. 1926. A note on the reliability of
the maze as a method of learning in the Angora goat. J. Genet.
Psych. 33:1.
Rashotte, M. E. 1979. Reward training: extinction Bitterman, M 'E V. M. Lolordo, J. B. Overmier and M. E. Rashotte. Animal Learning - Survey and Analysis. Plenum Press, New York.
Restle, F. 1955. A theory of discrimination learning. Psych. Rev.
62:11.
Robustelli, F., J. L. McGough and D. Bouet. 1963. Relationship
between avoidance conditioning and maze learning. Psych. Rep.
13: 103.
59
Rubin, L., C. Oppegard and H. F. Hintz. 1980. The effect of varying the temporal distribution of conditioning trials on equine learning behavior. J. Anim. Sci. 50:1184.
Sandler, B. E., G. A. Van Gelder, W. B. Buck and G. G. Karas. 1968. Effect of dieldrin exposure on detour behavior in sheep. Psychol. Rep. 23:451.
Scott, J. P. 1972. Animal Behavior. The Univ. of Chicago Press, Chicago, IL.
Searle, L. V. 1949. The organization of hereditary maze-brightness and maze-dullness. Genet. Psychol. Monog. 39:279.
Small, W. S. 1899. An experimental study of the mental processes of the rat. Amer. J. Psysiol. 11:133.
Spence, K. W. 1932. The reliability of the maze and methods of its determination. Comp. Psych. Monog. 8:1.
Spence, K. W. 1936. The nature of discrimination learning in animals. Psych. Rev. 43:427.
Spence, K. W. 1952. The nature of the response in discrimination learning. Psych. Rev. 59:89.
Steel, R. G. and J. H. Torrie. 1980. Principles and Procedures of Statistics. McGraw-Hill Book Co., New York.
Stone, C. P. 1927. The reliability of rat learning scores from the multiple T-maze as determined by four different methods. Gen. Psych. Monog. 34:498.
Stone, C. P. (Ed.). 1951. Comparative Psychology. Prentice-Hall, Inc., Englewood Cliffs, N.J.
Sutherland, N. S. 1964. The learning of discrimination by animals. Endeavor. 23:140.
Sutherland, N. S. 1966. Partial reinforcement and breadth of learning. Q. J. Exp. Psych. 18:289.
Sutherland, N. S. and N. J. Mackintosh. 1971. Mechanisms of Animal Discrimination Learning. Academic Press, New York and London.
Tarpy, R. M. 1975. Basic Principles of Learning. Scott, Foresman and Co., Glenview, IL.
Tarpy, R. M. and R. E. Mayer. 1978. Foundations of Learning and Memory. Scott, Foresman and Co., Glenview, IL.
60
Tavolga, W. N. 1969. Principles of Animal Behavior. The Univ. of Chicago Press, Chicago, IL.
Thompson, W. R. and D. Bindra. 1952. Motivational and emotional characteristics of "bright" and "dull" rats. Can. Jour. Psych. 6:116.
Thorndike, E. L. 1898. Animal intelligence: An experimental study of the associative processes in animals. Psychol. Rev. Monog. Suppl. 2:8.
Thorndike, E. L. 1905. The Elements of Psychology. Serler, New York.
Tolman, E. C. and D. B. Nyswander. 1927. The reliability and validity of maze measures for rats. J. Comp. Psych. 7:425.
Tolman, E. C. 1955. Principles of performance. Psych. Rev. 62:315.
Tryon, R. 1926. Effect of the unreliability of measurement on the difference between groups. J. of Comp. Psych. 6:449.
Tryon, R. C. 1931. Studies in individual differences in maze ability. III. The community of function between two maze abilities. Jour. Compar. Psychol. 12:95.
Tryon, R. C. 19 31. Studies in individual differences in maze ability IV. The constancy of individual differences: correlation between learning and releaming. J. Compar. Psy. 12:303.
Warren, J. M. and H. B. Warren. 1962. Reversal learning by horse and raccoon. J. of Genet. Psych. 100:215.
Watson, J. B. 1914. Behavior: An Introduction to Comparative Psychology. Henry Holt and Co., New York.
I^itaker, D. D. 1982. Effects of varying amounts of early handling at weaning and later ages on the subsequent learning ability of two-year-old horses. Ph.D. Dissertation. Texas Tech Univ., Lubbock.
Wieckert, D. A., L. P. Johnson, K. P. Offord and G. R. Barr. 1966. Measuring learning ability in dairy cows. J. Dairy Sci. 49:6 3.
Wieckert, D. A. and G. R. Barr. 1966. Studies of learning ability in young pigs. J. Anim. Sci. 25:1280.
Wilcoxin, H. C. 1969. Historical introduction to the problem of reinforcement. In J. T. Tapp (Ed.) Reinforcement and Behavior. Academic Press, London.

61
Yeates, B. F. 19 76. Discrimination learning in horses. Master's Thesis, Texas A & M Univ., College Station.
Yerkes, R. M. and C. A. Cobum. 1915. A study of the behavior of the pig by the multiple choice method. J. Anim. Behav. 5:185
APPENDIX A
TABLES
62

63
APPENDIX TABLE A. TRAINABILITY AND EMOTIONALITY SCORE FOR EACH HORSE TESTED
Trainability Eraotionalitv Group Horse number score^ score^
4
3
rse number
1
2
3
4
5
6
7
8
9
10
11
12
13
score^
1.3
2.0
3.3
1.7
3.3
3.0
2.3
2.7
2.3
2.7
3.3
1.7
2.3
^Scores ranged from 1 to 4 1 - extremely quick learner, 2 - quick learner, 3 - average learner, 4 - slow learner
Scores ranged from 1 to 4 1 - highly nervous, 2 - nervous, 3 - normal, 4 - quiet
4
4

64
en 00
r-1
o> o ON
o o
M3 00
r vo
LO
o m p~.
00 00
\ 0 CTi
m
W
M en fid O S
ffi CJ < w oi o [ i .
CO
w CO 2 O Pu CO
w pi:
H CJ M Pd f^ O o fe o w o < H 2 W CJ p:i w PH
Q Z < 2: o M f^ w £H M p:; u
o H CO H J
< M ci ^
13 S 2
1
I 1 1 1
1 1
j
1
CO ^ o o 1-4 pq
>-' <:
1 LP)
>^ «
.^ a o
^ PQ
1
1 i
j
i
1
M 1 o 1 0 r H
pq
<^\
CM
O U
m
CN
o CTN
00 00
1-H
CJ> ON ON
1 ^ LPl
CN r^
• ^ 00
CN O
O^ r^
^ ON
CN a\
^ 0 0
0 0 ON
CO
o> LP) ON
vC 00
<i" \o
1—1
O N ON r--
00 vC
1—1
ON r-CO
o 00
CN
v£) in 00
i n 00
vO
• CN
> 0
• <3-
M3
• <r)
CN
CN
VO
1-H
• • CJ H H • U CD 0) H
CO «
<o 1—1
r—1
OJ
• CO 1—t
CN
o •
CO 1—(
CO
CM
• i n ^ H
<r
CN CO
CN VT)
o CN
o CN
CO
• CO
CN
• CO
<r •
\£i
o •
o CN
c CN
o CN
o CO CTN
1—1 CNi
Cvl
CO
o i n
^
o CN
CO
ON i n
cc CO
0 0
. CO 1—1
CO
• CN i - H
CO
. 1—j
1 — 1
o .
i n T — 1
o •
o 1-H
o •
o CNJ
00
• CN 1—1
00
• ^i5
^—
\0
• LO '—1
CO
• <r — <
o CM
CM
CN 00
CO
CM
CM
ro
CO
p-l
CO
e •H
c
CO
e •H c <
CO
e •H <

65
CM
c^ i n ON
CTs CO
CM ON
o ^
0 0 o
^ ON
•v f
r 00 in ON
CM ON
CO ON 0 0
r-. C?N
CN ON
f ^ CJN
o <r
— v£)
CO 00
CO i n
CM r-.
>d-as
CO CO
CN
O O rH
CO
C7N
C3N 00
S3-
o ON
CM ON
in
CO
O o 00 CO in
VC
o ON ON CO
ON CM
<r r
i n •vT
1 — i n
i n r
CM 0 0
cu 3 C •H U C o o
u u o o 5<
p-l PH <:
CO
CM 00
•vO
CN
O
>cr
o CO
MD
-<r
C J
00
CN
CN
•vf
r-~
00
i n
00
CM
CM
CN
•«d-
• CM
<r • CO
o « CN
vO
c J
CN
00
00
< f
^
o
CN
O
1—t
c o CN
^
r—H
o CO 1 — 1
CN
CO
MD CO
00
<r
1—1
~ o CM
^ o in
o o pq
r—1
TT
C:
en
^ •
r—1
r-^
O
20
.
CM
o •
CM 1 — <
CO
vC
ON r—(
<r
•<i-
16
.
<-i
o
o CM
CN
vO
f—^
CO
-
o CN
<r
o
o CV|
-^
vO
00
CN
vO
i n
C"
in vO
cd
e •H c: <1
CO
c
CO
e •H c <

66
ON 0 0 0 0
CO 0 0
ON 00 CTN
00 ON
CT> 0 0
0 0 CO
in 00
CM CTN
O C3N
^ ON 00 0 0 ON
O ON
CO
m CO 0 ^ ON CO
in 00
in ON
ON CO
CN
QJ
C
O a
P3
W
pa < E-i
X (—( Q
CJ O
rH
a o
.—I PQ
5 ^
CO
CM
CM ON
<r ON
m C3N
00
-<r CN CO
CN ON
CO ON
^ 1
.. u u o CJ
in
<r ON 00
CM ON ON in
CO 0 0 C:N
-vT
• CN
CN
• CO
<r •
CO
•<r
. CO
CO
• a\
CO
» —
o *
CN
CM
• ~
CO i n
CO
CO
i n 00
o
CTN
i n 00
^•~i
• • CJ H H' 4J CD (U H
O • o CN
r-1
o •
in r—1
CN
•<f .
CO '-^
CO
CN
. <r r-H
<t
O » o C4
1—1
\£) .
in rH
CN
NO
• r- —'
CO
N C
• CM
"—'
•<r
o • o CN
1—1
CO
• in
'—'
CN
<f
• in " • ^
CO
o ON
ON
CM
CO
CO
• in r — 1
O • <r ^H
o «
CO rH
00
« <3-T—(
o • o CN
<r •
<!• 1 — t
<r .
CN r H
<r • CN
1 — <
CJ
• 00 1—1
M:5
• <r —'
00
• r-H
r—t
O . CO
.—1
CN
ON .-4
O
CN 1 — t
CN
CN 1—1
CM
CO
o c CN
00
1 — <
o CC
CM
o o CM
CN
in
•o
<r oc
CN
0 0 ON
CO
e •H
<
CO
e •H d <
<
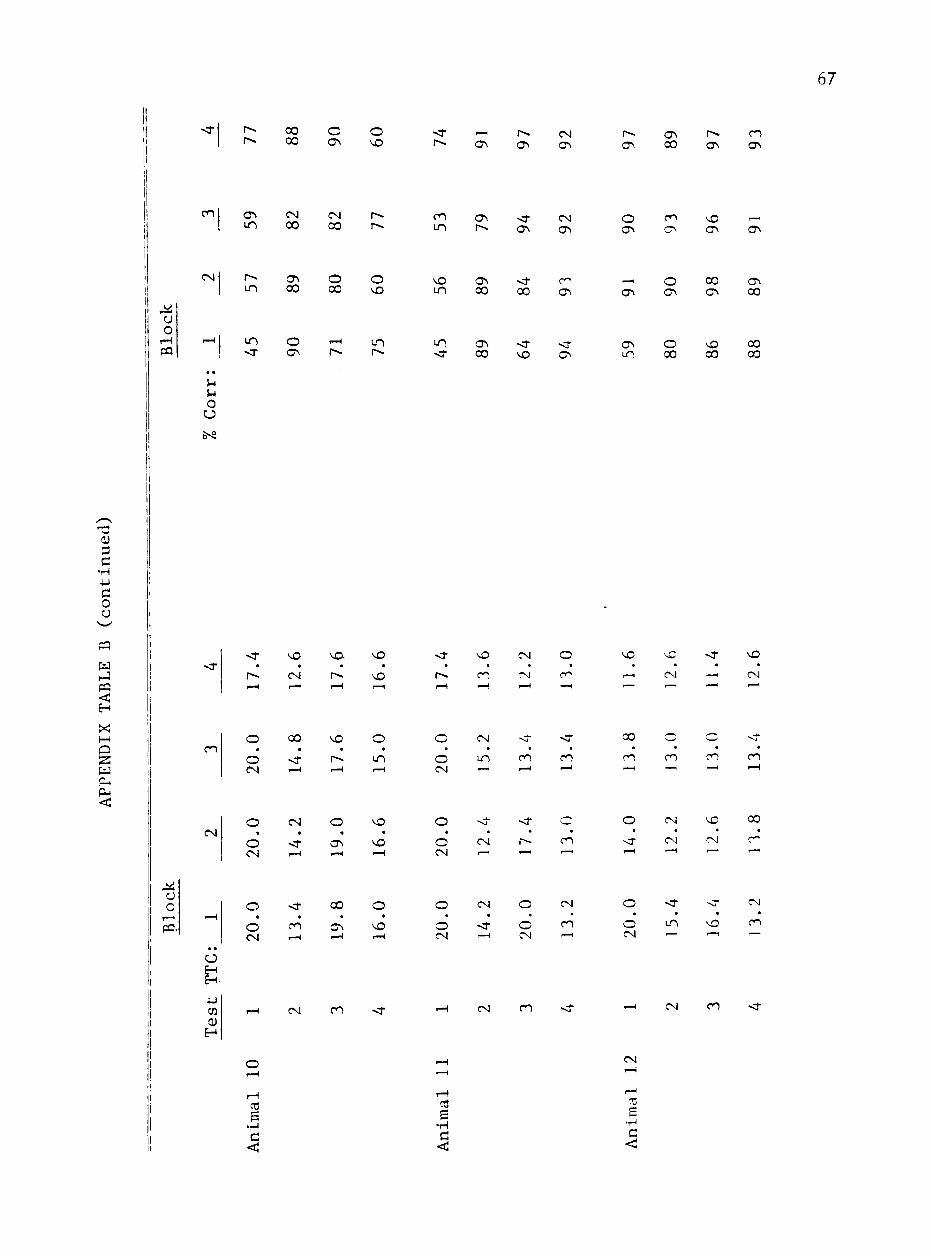
67
r~» i^
00 00
o CTN
o vO
•vT l^
^ ON
r ON
CM ON
r CTN
<o» 00
r ON
CO CTi
CO CTN in
CM 00
CM 00
f^ r«.
CO in
ON r
<r a\
CM ON
o ON
CO ON
vO ON as
CM
u o rH P3,
r-. in
as 00
o 00
o vO
vO in
ON CO
> CO
c^ as
in o as in in cr\
CO ON
cn
ON in
O CTN
o CO
00 CTN
00
as CO
00 00
3
c
o o
u u o CJ
&-9
P3
W 1-3
H
X! M
o w <:
CO
<r • r
NO » CN
vO. .
r
vO •
NO
<f .
r
vO • CO
CM . Cl
o • C^
ock
r — l
PQ.
CN
TT
C:
1
u CD
O
20
.
o
20
.
.—(
CN •
1—1
<r •
CO
CM
O •
ON I—1
00
ON
CO
VO •
VO 1 — *
o •
vO t—(
< •
o
20
.
o
20
.
f—1
• ^
CN
CM
14
.
CN
<r
r—f
o
20
.
CO
CO
CM
CO
NO
O
<3-
O CN
VC
CN
o • o CN
CO • -<r 1 — *
NO . r rH
o •
in • — 1
o • o CM
CM • in
^^
<T . CO
^^
<S' * CO
'—'
00 . CO
r — t
o • CO
—'
c « CO —'
CN
CN
in
rH CM
VO
CM
NO
CO
vO
CM
CO
00
c^
CM
CO
CN
CO
6 •H C <:
CO
e •H c <
CO c
C
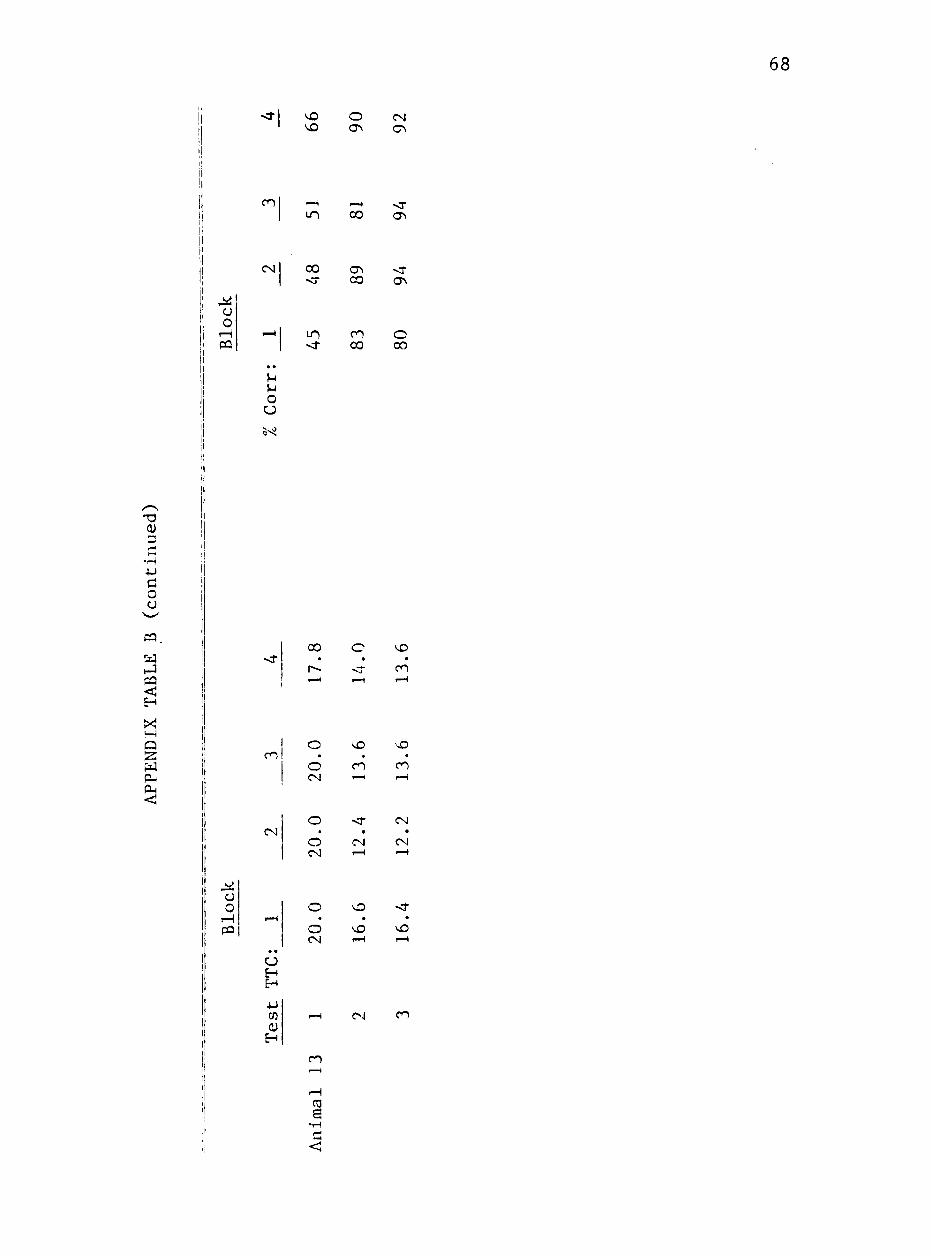
68
T3 0)
NO VO o
CJN
OM cr\
CO —i ^ i n 00 ON
CN
! pq
00
i n
CJN CO
CO 00
ON
o 00
u u o o
a o a
P 5 .
PQ < H X M Q ^2 W PU QH
<1
u o
• H PQ
col
CN
00 vD
CO
o • o CM
o •
o CM
VO •
CO '"'
-d-«
CN 1—1
NO •
CO "—'
CN •
CM ^H
r—t
• •
TTC
T
est
o • o CN
1—1
vO •
vO rH
CM
«cf •
vO 1 — t
CO
ro
CO
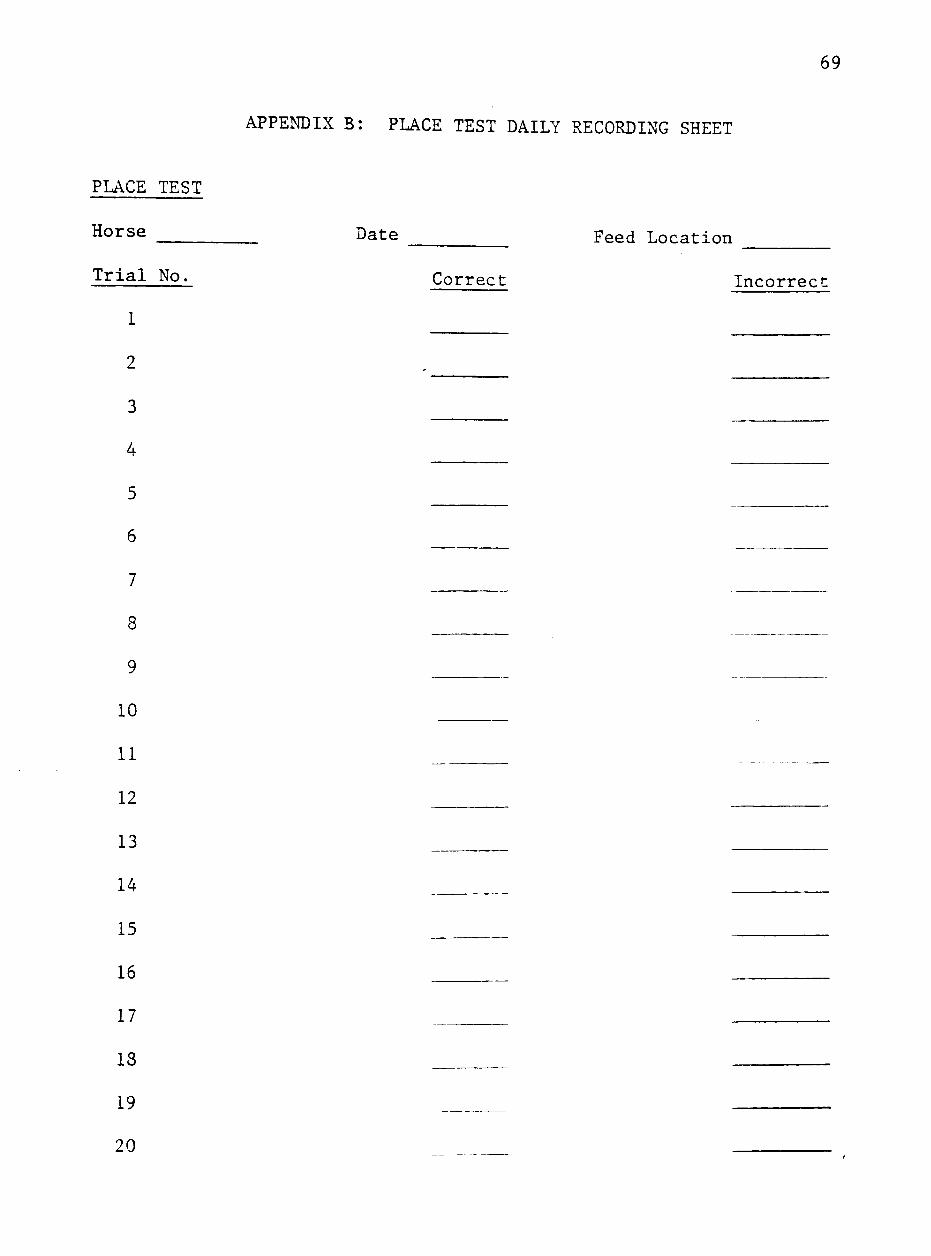
1
2
3
4
5
6
7
8
9
10
11
12
13
14
15
16
17
13
19
20
69
APPENDIX B: PLACE TEST DAILY RECORDING SHEET
PLACE
Horse
Trial
TEST
No.
Date Feed Location
Correct Incorrect
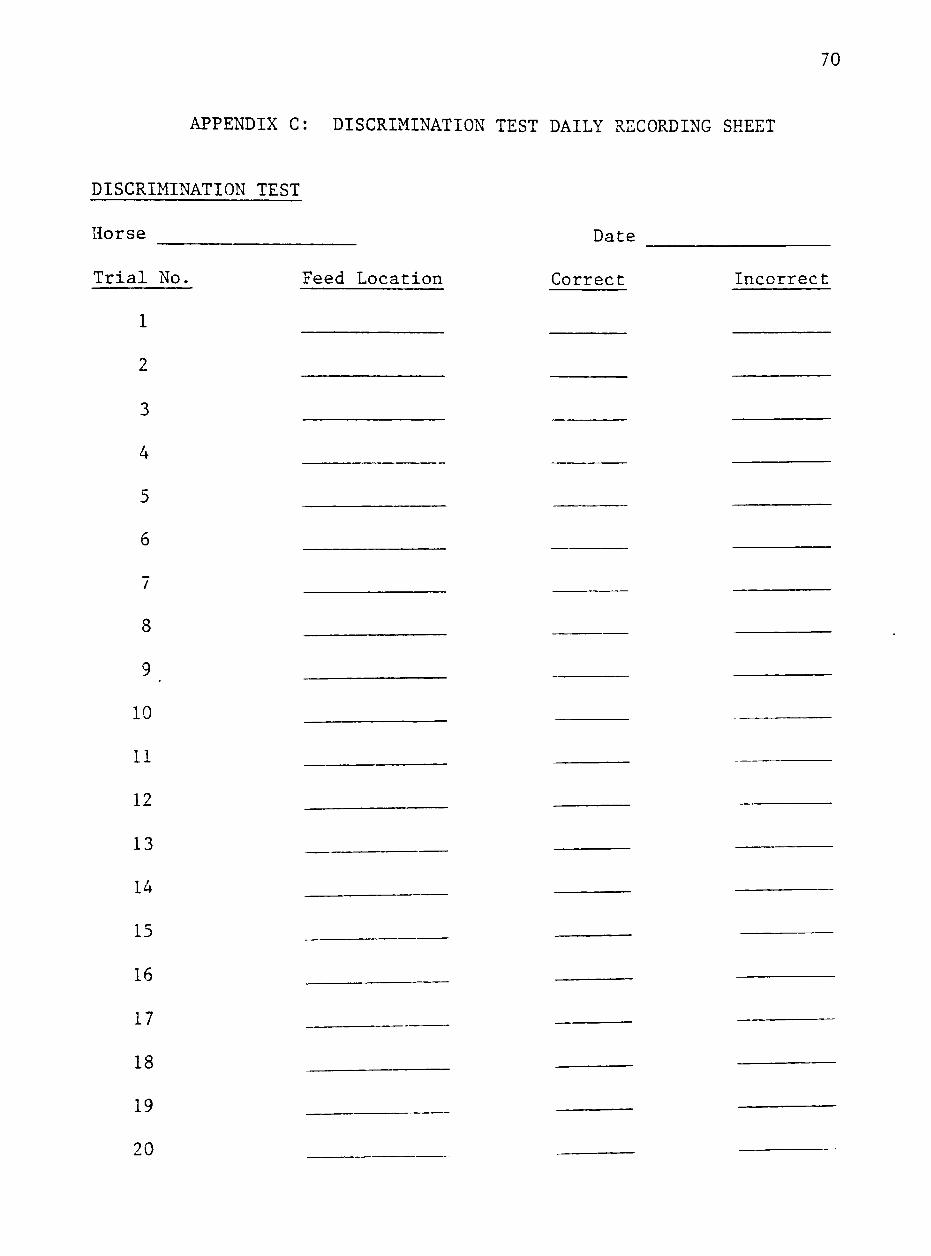
70
APPENDIX C: DISCRIMINATION TEST DAILY RECORDING SHEET
DISCRIMINATION TEST
Horse
Trial No.
1
2
3
4
5
6
Feed Location
Date
Correct Incorrect
8
9
10
11
12
13
14
15
16
17
18
19
20
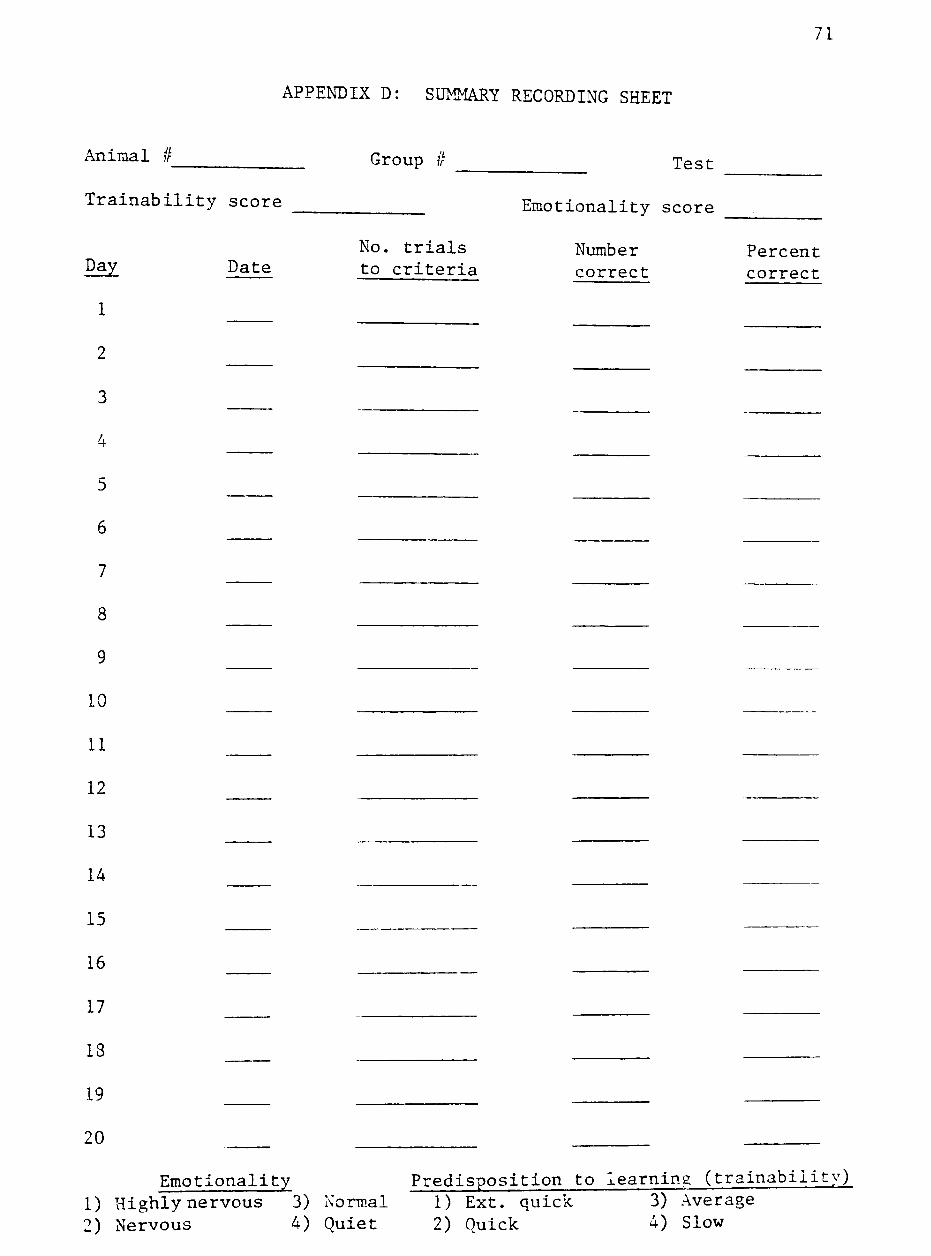
APPENDIX D: SUMMARY RECORDING SHEET
Animal // Group # Test
Trainability score
Day
1
Date No. trials to criteria
Emotionality score
Number correct
71
Percent correct
4
5
6
7
8
9
10
11
12
13
14
15
16
17
13
19
20
Emotionality 1) Highly nervous 3) Normal 2) Nervous 4) Quiet
Predisposition to learning (trainability) 1) Ext. quick 3) Average 2) Quick 4) Slow


![PDF Printing 600 dpi · mzw'aui j u"aZnm~u~iazE]szi~uwaInz~n~sW"au~luzz~u~~n](https://img.pdfslide.us/doc/110x75/5f61ef32fab12d1fff1cd188/pdf-printing-600-mzwaui-j-uaznmuiazesziuwainznswauluzzun.jpg)