Embed Size (px)
Citation preview
Research Report No. 2F for ALDOT Project 930-601
REPAIR OF CRACKED PRESTRESSED CONCRETE GIRDERS, I-565,
HUNTSVILLE, ALABAMA
Submitted to
The Alabama Department of Transportation
Prepared by
Wesley O. Bullock
Robert W. Barnes
Anton K. Schindler
JULY 2011

1. Report No.
FHWA/ALDOT 930-601-2F
2. Government Accession No.
3. Recipient Catalog No.
4 Title and Subtitle
Repair of Cracked Prestressed Concrete Girders, I-565, Huntsville, Alabama
5 Report Date
July 2011
6 Performing Organization Code
7. Author(s)
Wesley O. Bullock, Robert W. Barnes, and Anton K. Schindler
8 Performing Organization Report No.
FHWA/ALDOT 930-601-2F 9 Performing Organization Name and Address
Highway Research Center Department of Civil Engineering 238 Harbert Engineering Center Auburn, AL 36849
10 Work Unit No. (TRAIS)
11 Contract or Grant No.
12 Sponsoring Agency Name and Address
Alabama Department of Transportation 1409 Coliseum Boulevard Montgomery, Alabama 36130-3050
13 Type of Report and Period Covered Technical Report
14 Sponsoring Agency Code
15 Supplementary Notes
Research performed in cooperation with the Alabama Department of Transportation
16 Abstract
Wide cracks were discovered in prestressed concrete bridge girders shortly after their construction in Huntsville, Alabama. Previous investigations of these continuous-for-live-load girders revealed that the cracking resulted from restrained thermal deformations and inadequate reinforcement details, and that the cracking compromised the strength of the girder end regions. A wet-layup fiber-reinforced polymer (FRP) repair system was installed. To assess the efficacy of the FRP repair solution, load testing and finite-element analyses were conducted for pre- and post-repair conditions of two repaired spans.
Post-repair testing included controlled truck loading as well as the monitoring of structural response to diurnal thermal conditions. Results indicate that the girders should be considered simply supported for conservative strength-limit-state design of the FRP repair system. FRP response to thermal conditions was accurately estimated using simplified analysis of restrained temperature gradient effects.
A design procedure was developed for FRP repair of similar structures in accordance with AASHTO LRFD Bridge Design Specifications and the recommendations of ACI 440.2R-08. The reported procedure was formulated to provide the girder end regions with adequate strength for the combined effects of shear and flexure, as well as to provide adequate performance under daily truck loads and temperature variations. 17 Key Words
Bridges, continuity, cracking, damage, fiber-reinforced polymer reinforcement, repair, restraint stresses, strengthening, thermal effects
18 Distribution Statement No restrictions. This document is available to the public through the National Technical Information Service, Springfield, Virginia 22161
19 Security Classification (of this report) Unclassified
20 Security Classification (of this report) Unclassified
21 No. of pages
621
22 Price
_______________________
Research Report FHWA/ALDOT 930-601-2F
REPAIR OF CRACKED PRESTRESSED CONCRETE GIRDERS, I-565,
HUNTSVILLE, ALABAMA
Submitted to
The Alabama Department of Transportation
Prepared by
Wesley O. Bullock
Robert W. Barnes
Anton K. Schindler
JULY 2011
iv
DISCLAIMERS
The contents of this report reflect the views of the authors, who are responsible for the facts and
the accuracy of the data presented herein. The contents do not necessarily reflect the official
views or policies of Auburn University or the Federal Highway Administration. This report does
not constitute a standard, specification, or regulation.
NOT INTENDED FOR CONSTRUCTION, BIDDING, OR PERMIT PURPOSES
Robert W. Barnes, Ph.D., P.E.
Anton K. Schindler, Ph.D., P.E.
Research Supervisors
ACKNOWLEDGEMENTS
Material contained herein was obtained in connection with a research project ALDOT 930-601,
conducted by the Auburn University Highway Research Center. Funding for the project was
provided by the Federal Highway Administration (FHWA) and the Alabama Department of
Transportation (ALDOT). The funding, cooperation, and assistance of many individuals from
each of these organizations are gratefully acknowledged. The authors would like to acknowledge
the various contributions of the following individuals:
George H. Conner, State Maintenance Engineer, ALDOT
Robert King, Structural Engineer, FHWA
Eric Christie, Bridge Maintenance Engineer, ALDOT
W. Sean Butler, First Division, ALDOT
Randall Mullins, Section Supervisor, Bridge Bureau, ALDOT
James F. Boyer, Bridge Rating Engineer, ALDOT
Robert A. Fulton, formerly of Maintenance Bureau, ALDOT
Mark Strickland, Specifications Engineer, ALDOT
Lyndi Blackburn, Assistant Materials and Tests Engineer, ALDOT
v
ABSTRACT
After the construction of elevated portions of I-565 in Huntsville, Alabama, cracks were
discovered in numerous prestressed concrete bulb-tee bridge girders that were constructed to
exhibit continuous behavior in response to post-construction loads. Previous investigations
conducted by Alabama Department of Transportation (ALDOT) and Auburn University Highway
Research Center (AUHRC) personnel resulted in determinations that the cracking was a result of
restrained thermal deformations and inadequate reinforcement details, and that the cracking
compromised the strength of the girder end regions. A wet-layup fiber-reinforced polymer (FRP)
repair scheme was proposed to address the deficiency. To assess the efficacy of the FRP repair
solution, load testing and finite element model (FEM) analyses were conducted for pre- and post-
repair conditions of Northbound Spans 10 and 11. Pre-repair testing was conducted on June 1
and 2, 2005. The FRP reinforcement system was installed in December 2007. Post-repair
testing was conducted on May 25 and 26, 2010.
Post-repair testing included controlled truck loading as well as the monitoring of structural
response to diurnal thermal conditions. Analysis of pre- and post-repair results indicated that the
efficacy of the repair solution could not be assessed with direct comparisons between pre- and
post-repair measurements due to unforeseen unintentional support conditions that were in effect
during the pre-repair testing. Direct analysis of post-repair behavior indicated that the structure
exhibits continuity degradation in response to heavy truck loads and should be considered simply
supported for conservative strength-limit-state design. Analysis of responses to thermal
conditions indicated the FRP reinforcement exhibits behavior that can be accurately estimated
with simplified analysis of linear temperature gradient effects on restrained girders. Based on
conditions observed after more than 2 years in service, the installed FRP reinforcement system
was determined to be performing appropriately.
Based on the experimental observations, a design procedure was developed for FRP
repair of similar structures with damaged regions near continuous ends of prestressed concrete
bridge girders in accordance with AASHTO LRFD Bridge Design Specifications and the
recommendations of ACI 440.2R-08. The design procedure was formulated to provide the girder
end regions with adequate strength-limit-state resistance for the combined effects of shear and
flexure, as well as to provide adequate performance under service loads—including the effects of
daily temperature variations. A design example is presented.
vi
TABLE OF CONTENTS
LIST OF TABLES .......................................................................................................................... xvi LIST OF FIGURES ........................................................................................................................ xx
CHAPTER 1 INTRODUCTION .............................................................................................................................. 1
1.1 Project Overview ............................................................................................................. 1 1.2 Need for Research .......................................................................................................... 3 1.3 Project Objectives ........................................................................................................... 5 1.4 Project Tasks .................................................................................................................. 5
1.4.1 Task 1: Preliminary Engineering for FRP Repair .............................................. 6 1.4.2 Task 2: Literature Review on Current State of the Art ...................................... 6 1.4.3 Task 3: Preliminary Load Testing ..................................................................... 6 1.4.4 Task 4: Construction Monitoring ....................................................................... 6 1.4.5 Task 5: Post-Repair Load Testing .................................................................... 6 1.4.6 Task 6: Performance Monitoring under Traffic Loads ....................................... 7 1.4.7 Task 7: Evaluation of Bridge Performance ....................................................... 7 1.4.8 Task 8: Evaluation of Acoustic Emission Monitoring ........................................ 7 1.4.9 Task 9: Preparation of Final Project Reports .................................................... 7
1.5 Report Organization ........................................................................................................ 7
CHAPTER 2 HISTORY OF THE BRIDGE STRUCTURE AND ASSOCIATED RESEARCH .............................. 9
2.1 Introduction...................................................................................................................... 9 2.2 Bridge Construction ......................................................................................................... 9 2.3 Structural Geometry and Material Properties .................................................................. 9
2.3.1 Spans Investigated ........................................................................................... 10 2.3.2 Girder Types .................................................................................................... 13 2.3.3 Prestressing Strands ........................................................................................ 14 2.3.4 Shear Reinforcement ....................................................................................... 19 2.3.5 Continuity Reinforcement ................................................................................. 23 2.3.6 Bridge Deck ...................................................................................................... 25
2.4 Unexpected Cracking .................................................................................................... 28 2.4.1 Crack Locations ............................................................................................... 28 2.4.2 Previous Repairs and Safety Measures........................................................... 32 2.4.3 Causes for Cracking ......................................................................................... 34
vii
2.4.3.1 Construction Sequence ................................................................. 34 2.4.3.2 Time-Dependent Effects ................................................................ 35 2.4.3.3 Temperature Effects ...................................................................... 35 2.4.3.4 Internal Reinforcement Details ...................................................... 36
2.4.4 Ramifications of Cracking ................................................................................ 37 2.5 Bridge Behavior Analysis .............................................................................................. 38
2.5.1 Behavior Types Considered ............................................................................. 38 2.5.2 Analysis Methods ............................................................................................. 38
2.5.2.1 Elastic Structural Analysis—Unfactored Demands ........................ 39 2.5.2.2 Sectional Model Analysis—Strength Capacities ............................ 39 2.5.2.3 Strut-and-Tie Analysis—Flow of Forces ........................................ 40
2.6 Design of External Fiber-Reinforced Polymer Strengthening System .......................... 43 2.7 Load Tests Prior to FRP Reinforcement Installation ..................................................... 46
2.7.1 Instrumentation for Pre-Repair Load Testing ................................................... 46 2.7.2 Procedures for Pre-Repair Load Testing ......................................................... 47 2.7.3 Results of Pre-Repair Load Testing ................................................................. 47
2.8 Finite-Element Analysis of Bridge Behavior .................................................................. 48 2.8.1 Uncracked Model ............................................................................................. 48 2.8.2 Cracked Model ................................................................................................. 48 2.8.3 Cracked-with-Reinforcement Model ................................................................. 49 2.8.4 Pre-Repair Model ............................................................................................. 49 2.8.5 Post-Repair Model ........................................................................................... 49
2.9 Installation of External FRP Reinforcement .................................................................. 49 2.9.1 Surface Preparation ......................................................................................... 50 2.9.2 Adhesion Testing ............................................................................................. 53 2.9.3 Tensile Testing ................................................................................................. 54 2.9.4 FRP Fabric Installation Procedures ................................................................. 56 2.9.5 FRP Fabric Installation—First Layer ................................................................ 59 2.9.6 FRP Fabric Installation—Second Layer ........................................................... 59 2.9.7 FRP Fabric Installation—Third Layer ............................................................... 60 2.9.8 FRP Fabric Installation—Fourth Layer ............................................................. 60 2.9.9 Painting of Installed FRP Reinforcement ......................................................... 61 2.9.10 FRP Reinforcement Installation Timeline ......................................................... 62
2.9.10.1 December 11, 2007 ....................................................................... 63 2.9.10.2 December 12, 2007 ....................................................................... 63 2.9.10.3 December 13, 2007 ....................................................................... 63 2.9.10.4 December 14, 2007 ....................................................................... 64
viii
2.9.10.5 December 15, 2007 ....................................................................... 64 2.9.10.6 December 16, 2007 ....................................................................... 64 2.9.10.7 December 17, 2007 ....................................................................... 64 2.9.10.8 December 18, 2007 ....................................................................... 64 2.9.10.9 December 19, 2007 ....................................................................... 64 2.9.10.10 After December 19, 2007 ............................................................... 64
2.10 Installation and Testing Concerns ................................................................................. 65 2.10.1 FRP Orientation ............................................................................................... 65 2.10.2 FRP Samples for Tensile Testing .................................................................... 65 2.10.3 FRP Tensile Testing Observation .................................................................... 65 2.10.4 FRP Tensile Test Results ................................................................................ 66
2.11 Current Research .......................................................................................................... 67
CHAPTER 3 BRIDGE INSTRUMENTATION ..................................................................................................... 68
3.1 Introduction.................................................................................................................... 68 3.2 Instrumentation Overview ............................................................................................. 68 3.3 Crack-Opening Displacement Gages ........................................................................... 70
3.3.1 COD Gage Locations ....................................................................................... 72 3.3.2 COD Gage Installation ..................................................................................... 72
3.4 Deflectometers .............................................................................................................. 74 3.4.1 Deflectometer Locations .................................................................................. 75 3.4.2 Deflectometer Installation................................................................................. 78
3.5 Strain Gages ................................................................................................................. 81 3.5.1 Strain Gage Locations...................................................................................... 82
3.5.1.1 Cross Section Locations ................................................................ 91 3.5.1.2 Gage Locations within A Typical Cross Section ............................ 92 3.5.1.3 Discontinued, Additional, and Replacement Gages ...................... 92
3.5.2 Concrete Strain Gages..................................................................................... 93 3.5.3 FRP Strain Gages ............................................................................................ 94 3.5.4 Strain Gage Installation .................................................................................... 95
3.6 Data Acquisition System ............................................................................................. 101 3.7 Sensor Notation .......................................................................................................... 102
ix
CHAPTER 4 BRIDGE TESTING PROCEDURES ............................................................................................ 104
4.1 Introduction.................................................................................................................. 104 4.2 Traffic Control .............................................................................................................. 104 4.3 Load Testing Trucks .................................................................................................... 105
4.3.1 Load Truck Block Configurations ................................................................... 109 4.3.2 Resultant Force Comparisons—Pre- and Post-Repair .................................. 113 4.3.3 Night 1—AE Preloading—LC-6.5 ................................................................... 114 4.3.4 Night 2—AE Loading and Multiposition Load Test—LC-6 ............................. 115 4.3.5 Truck Weight Limits ........................................................................................ 115
4.4 Load Testing Traverse Lanes and Stop Positions ...................................................... 115 4.4.1 Traverse Lanes .............................................................................................. 116 4.4.2 Stop Positions ................................................................................................ 118
4.5 Acoustic Emissions Load Testing ............................................................................... 120 4.6 Bridge Monitoring ........................................................................................................ 122
4.6.1 Weather Conditions during Pre-Repair Testing ............................................. 123 4.6.2 Weather Conditions during Post-Repair Testing ........................................... 123
4.7 Multiposition Load Testing .......................................................................................... 125 4.8 Superposition Testing ................................................................................................. 126 4.9 Data Reduction and Analysis ...................................................................................... 129
CHAPTER 5 RESULTS AND DISCUSSION .................................................................................................... 130
5.1 Introduction.................................................................................................................. 130 5.2 Bearing Pad Effects .................................................................................................... 130 5.3 Bridge Response to Truck Loads—Post-Repair ......................................................... 136
5.3.1 Response to Different Horizontal Truck Alignments ...................................... 136 5.3.2 Indications of Damage to Instrumented Girders ............................................ 141
5.3.2.1 Crack-Opening Displacements .................................................... 141 5.3.2.2 Crack-Opening Displacement Observations ............................... 144 5.3.2.3 Bottom-Fiber Strains .................................................................... 145 5.3.2.4 Bottom-Fiber Strain Observations ............................................... 150 5.3.2.5 COD and Bottom-Fiber Strain Comparisons ............................... 150 5.3.2.6 Damage Indication Conclusions .................................................. 154
5.3.3 Post-Repair Continuity Behavior Assessment ............................................... 154 5.3.3.1 Deflections ................................................................................... 154 5.3.3.2 Bottom-Fiber Strains .................................................................... 159
x
5.3.3.3 Crack Behavior ............................................................................ 170 5.3.3.4 Continuity Behavior Conclusions ................................................. 177
5.3.4 Linear-Elastic Behavior .................................................................................. 178 5.3.4.1 Linear-Elastic Behavior Assessment—Two-Span Structure ....... 178 5.3.4.2 Linear-Elastic Behavior Assessment—Damaged Regions ......... 180 5.3.4.3 Linear-Elastic Behavior Conclusions ........................................... 185
5.3.5 Relationship between Truck Position and FRP Tensile Demand .................. 185 5.4 Bridge Response to Ambient Thermal Conditions ...................................................... 193
5.4.1 Theoretical Response to Ambient Thermal Conditions ................................. 193 5.4.1.1 Structural Analysis ....................................................................... 194 5.4.1.2 Expected Behavior ....................................................................... 198
5.4.2 Measured Responses to Ambient Thermal Conditions ................................. 206 5.4.2.1 Deflections ................................................................................... 207 5.4.2.2 Bottom-Fiber Strains .................................................................... 213 5.4.2.3 Crack-Opening Displacements .................................................... 231
5.5 Performance of FRP Reinforcement ........................................................................... 238 5.6 Conclusions ................................................................................................................. 239
CHAPTER 6 FRP REINFORCEMENT DESIGN ............................................................................................... 241
6.1 Introduction.................................................................................................................. 241 6.2 Necessity of FRP Reinforcement ................................................................................ 241 6.3 FRP Reinforcement Product Selection ....................................................................... 242 6.4 Strength-Limit-State Design ........................................................................................ 243
6.4.1 Critical Cross-Section Locations .................................................................... 244 6.4.2 Critical Load Conditions ................................................................................. 244 6.4.3 Strength-Limit-State Temperature Demands ................................................. 245 6.4.4 Material Properties ......................................................................................... 245
6.4.4.1 Concrete ...................................................................................... 245 6.4.4.2 Steel Reinforcement .................................................................... 246 6.4.4.3 FRP Reinforcement ..................................................................... 246
6.4.5 Dimensional Properties .................................................................................. 247 6.4.5.1 Cross-Section Dimensions .......................................................... 248 6.4.5.2 Reinforcement Dimensions .......................................................... 248
6.4.6 Initial Estimate of Required FRP Layers ........................................................ 250 6.4.7 Vertical Shear Strength Resistance ............................................................... 251
6.4.7.1 Nominal Strength for Bending Moment Resistance ..................... 252
xi
6.4.7.2 Effective Shear Depth .................................................................. 252 6.4.7.3 Net Tension Strain ....................................................................... 253 6.4.7.4 Diagonal Shear Crack Parameters .............................................. 254 6.4.7.5 Components of Vertical Shear Strength ...................................... 255 6.4.7.6 Nominal Vertical Shear Strength ................................................. 256 6.4.7.7 Factored Strength for Resisting Shear Demand .......................... 256
6.4.8 Tensile Strength ............................................................................................. 257 6.4.8.1 Nominal Strength for Resisting Tension ...................................... 257 6.4.8.2 Factored Tension Demand .......................................................... 257
6.4.9 Check Strengths of Each Location with Equal Layers of FRP ....................... 258 6.5 Length of FRP Reinforcement Installation .................................................................. 258 6.6 Anchorage ................................................................................................................... 259 6.7 Service Limit State ...................................................................................................... 261 6.8 Design Summary ......................................................................................................... 262 6.9 Installation Recommendations .................................................................................... 262
6.9.1 Preparing for Installation ................................................................................ 262 6.9.1.1 Adhesion Testing ......................................................................... 262 6.9.1.2 Crack Injection ............................................................................. 263 6.9.1.3 Surface Preparation and Profiling ................................................ 263
6.9.2 FRP Reinforcement Installation ..................................................................... 264 6.9.2.1 Epoxy Saturation.......................................................................... 264 6.9.2.2 Application of FRP Reinforcement ............................................... 265 6.9.2.3 Protective Coating........................................................................ 265 6.9.2.4 Quality Control Testing and Inspection ........................................ 265
CHAPTER 7 SUMMARY AND CONCLUSIONS .............................................................................................. 267
7.1 Project Summary ......................................................................................................... 267 7.2 Conclusions ................................................................................................................. 268
7.2.1 FRP Reinforcement Installation ..................................................................... 269 7.2.2 Observed Responses to Truck Loads ............................................................ 269 7.2.3 Theoretical Responses to Ambient Thermal Conditions ................................ 270 7.2.4 Observed Responses to Ambient Thermal Conditions .................................. 270 7.2.5 Performance of FRP Reinforcement .............................................................. 271 7.2.6 FRP Design Recommendations ..................................................................... 271 7.2.7 FRP Reinforcement Installation Recommendations ...................................... 272
xii
CHAPTER 8 RECOMMENDATIONS ................................................................................................................ 274
8.1 Design of FRP Reinforcement Repair Solutions ......................................................... 274 8.2 Installation of FRP Reinforcement Systems ............................................................... 274 8.3 Northbound Spans 10 and 11 of I-565 ........................................................................ 275 8.4 Recommendations for Further Research .................................................................... 276
8.4.1 In-Service Load Testing ................................................................................. 276 8.4.2 In-Service Bridge Monitoring .......................................................................... 276 8.4.3 Laboratory Testing ......................................................................................... 277
REFERENCES ............................................................................................................................. 278
APPENDIX A ABBREVIATIONS AND NOTATION ........................................................................................... 281
APPENDIX B MULTIPOSITION LOAD TEST—GRAPHICAL RESULTS ........................................................ 285
B.1 Lane A ......................................................................................................................... 286 B.1.1 Crack-Opening Displacements ...................................................................... 286 B.1.2 Deflections ..................................................................................................... 291 B.1.3 Cross-Section Strains .................................................................................... 296
B.1.3.1 Cross-Section Strains—Girder 7 ................................................. 296 B.1.3.2 Cross-Section Strains—Girder 8 ................................................. 316
B.1.4 Bottom-Fiber Strains—Both Girders .............................................................. 336 B.1.4.1 Bottom-Fiber Strains—Girder 7 ................................................... 341 B.1.4.2 Bottom-Fiber Strains—Girder 8 ................................................... 346
B.2 Lane C ......................................................................................................................... 351 B.2.1 Crack-Opening Displacements ...................................................................... 351 B.2.2 Deflections ..................................................................................................... 356 B.2.3 Cross-Section Strains .................................................................................... 361
B.2.3.1 Cross-Section Strains—Girder 7 ................................................. 361 B.2.3.2 Cross-Section Strains—Girder 8 ................................................. 381
B.2.4 Bottom-Fiber Strains—Both Girders .............................................................. 401 B.2.4.1 Bottom-Fiber Strains—Girder 7 ................................................... 406 B.2.4.2 Bottom-Fiber Strains—Girder 8 ................................................... 411
xiii
APPENDIX C MULTIPOSITION LOAD TEST—MEASUREMENTS ................................................................. 416
C.1 Lane A ......................................................................................................................... 417 C.2 Lane C ......................................................................................................................... 427
APPENDIX D BRIDGE MONITORING—GRAPHICAL RESULTS .................................................................... 437
D.1 Crack-Opening Displacements ................................................................................... 438 D.2 Deflections................................................................................................................... 439 D.3 Bottom-Fiber Strains ................................................................................................... 440 D.4 Bottom-Fiber Strains and Crack-Opening Displacements .......................................... 442
APPENDIX E BRIDGE MONITORING MEASUREMENTS ............................................................................... 445
E.1 Crack-Opening Displacements ................................................................................... 446 E.2 Deflections................................................................................................................... 447 E.3 Cross-Section Strains ................................................................................................. 449 E.4 Bottom-Fiber Strains ................................................................................................... 457 E.5 FRP Strains ................................................................................................................. 461
APPENDIX F BRIDGE MONITORING—MEASUREMENT ADJUSTMENTS ................................................... 464
F.1 Inconsistent Measurements ........................................................................................ 465 F.2 Deflectometer Behavior ............................................................................................... 465 F.3 Deflection Adjustments ............................................................................................... 465 F.4 Graphical Presentations of Deflection Adjustments .................................................... 466
F.4.1 Original Deflections—Girders 7 and 8 ........................................................... 466 F.4.2 Adjusted Deflections of Girder 7 in Span 10 .................................................. 467 F.4.3 Adjusted Deflections of Girder 7 in Span 11 .................................................. 470 F.4.4 Adjusted Deflections of Girder 8 in Span 10 .................................................. 473 F.4.5 Adjusted Deflections of Girder 8 in Span 11 .................................................. 476 F.4.6 Final Adjusted Deflections—Girders 7 and 8 ................................................. 479
F.5 Strain Measurement Adjustments ............................................................................... 480
xiv
APPENDIX G SUPERPOSITION—GRAPHICAL RESULTS............................................................................. 482
G.1 Crack-Opening Displacements ................................................................................... 483 G.2 Deflections................................................................................................................... 487 G.3 Bottom-Fiber Strains ................................................................................................... 491
APPENDIX H SUPERPOSITION—MEASUREMENTS ..................................................................................... 495
APPENDIX I AE STATIC POSITIONS—GRAPHICAL RESULTS .................................................................. 500
I.1 Crack-Opening Displacements ................................................................................... 501 I.2 Deflections................................................................................................................... 506 I.3 Bottom-Fiber Strains ................................................................................................... 511
I.3.1 Bottom-Fiber Strains—Girder 7 ..................................................................... 516 I.3.2 Bottom-Fiber Strains—Girder 8 ..................................................................... 521
APPENDIX J AE STATIC POSITIONS—MEASUREMENTS ........................................................................... 526
APPENDIX K FALSE SUPPORT BEARING PAD EFFECTS DURING LOAD TESTING ................................ 539
K.1 Installation of False Supports with Bearing Pads ....................................................... 539 K.2 Pre-Repair Bearing Pad Conditions ............................................................................ 542 K.3 Bearing Pad Removal during FRP Installation............................................................ 543 K.4 Post-Repair Bearing Pad Conditions .......................................................................... 546 K.5 Analysis of Numerical Results..................................................................................... 546
K.5.1 Deflections—Multiposition Load Testing ........................................................ 546 K.5.2 Crack-Opening Displacements—Multiposition Load Testing......................... 551 K.5.3 Surface Strains ............................................................................................... 554 K.5.4 Superposition Deflections .............................................................................. 563
K.6 Bearing Pad Effects .................................................................................................... 565
APPENDIX L DATA ACQUISITION CHANNEL LAYOUT ................................................................................ 566
xv
APPENDIX M STRAIN GAGE INSTALLATION PROCEDURE—FRP REINFORCEMENT ............................. 570
APPENDIX N FRP REINFORCEMENT DESIGN EXAMPLE ............................................................................ 578
N.1 Introduction.................................................................................................................. 578 N.2 Product Selection ........................................................................................................ 578 N.3 Strength-Limit-State Design ........................................................................................ 578
N.3.1 Critical Cross-Section Locations .................................................................... 579 N.3.2 Critical Load Conditions ................................................................................. 584 N.3.3 Material Properties ......................................................................................... 587 N.3.4 Dimensional Properties .................................................................................. 588 N.3.5 Initial Estimate of Required FRP Layers ........................................................ 596 N.3.6 Shear Strength Check—Three Layers ........................................................... 598
N.3.6.1 Limiting Effective FRP Debonding Strain—Three Layers............ 598 N.3.6.2 Effective Shear Depth—Three Layers ......................................... 600 N.3.6.3 Net Longitudinal Tensile Strain—Initial Estimate ......................... 601 N.3.6.4 Layers Required to Satisfy Tensile Strain Demand ..................... 603
N.3.7 Shear Strength—Five Layers ......................................................................... 604 N.3.7.1 Effective FRP Strain—Five Layers .............................................. 605 N.3.7.2 Effective Shear Depth—Five Layers............................................ 606 N.3.7.3 Net Longitudinal Tensile Strain—Five Layers ............................. 606 N.3.7.4 Vertical Shear Strength—Five Layers ......................................... 608 N.3.7.5 Longitudinal Tension Strength Provided—Five Layers ............... 612 N.3.7.6 Longitudinal Tension Strength Required—Five Layers ............... 613 N.3.7.7 Longitudinal Tension Strength Verification—Five Layers ............ 614 N.3.7.8 Strength and Demand Comparisons—Five Layers ..................... 614
N.4 Extent of FRP Installation ............................................................................................ 615 N.5 Anchorage ................................................................................................................... 618 N.6 Service-Limit-State Verification ................................................................................... 618 N.7 Design Summary ......................................................................................................... 619 N.8 Installation Recommendations .................................................................................... 619 N.9 Comparison of Design Recommendation and Previously Installed FRP .................... 619 N.10 Varying Modulus of Elasticity for FRP Reinforcement ................................................ 621
xvi
LIST OF TABLES
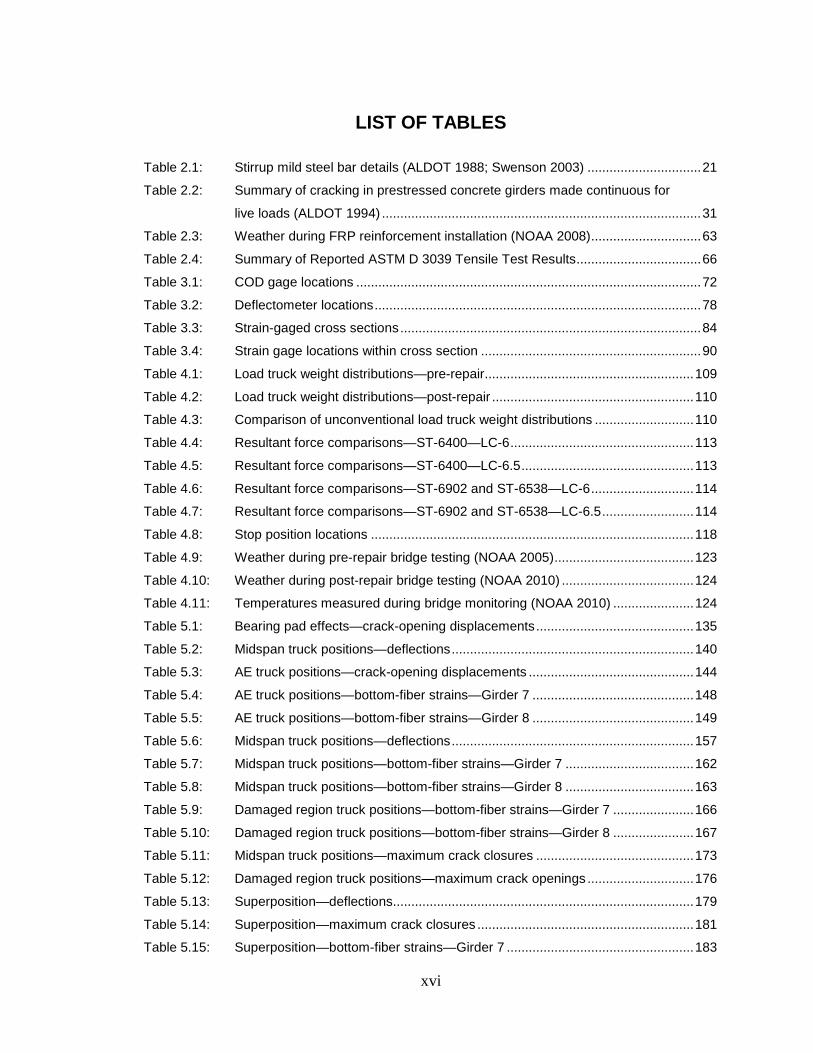
Table 2.1: Stirrup mild steel bar details (ALDOT 1988; Swenson 2003) ............................... 21 Table 2.2: Summary of cracking in prestressed concrete girders made continuous for
live loads (ALDOT 1994) ....................................................................................... 31 Table 2.3: Weather during FRP reinforcement installation (NOAA 2008) .............................. 63 Table 2.4: Summary of Reported ASTM D 3039 Tensile Test Results .................................. 66 Table 3.1: COD gage locations .............................................................................................. 72 Table 3.2: Deflectometer locations ......................................................................................... 78 Table 3.3: Strain-gaged cross sections .................................................................................. 84 Table 3.4: Strain gage locations within cross section ............................................................ 90 Table 4.1: Load truck weight distributions—pre-repair......................................................... 109 Table 4.2: Load truck weight distributions—post-repair ....................................................... 110 Table 4.3: Comparison of unconventional load truck weight distributions ........................... 110 Table 4.4: Resultant force comparisons—ST-6400—LC-6 .................................................. 113 Table 4.5: Resultant force comparisons—ST-6400—LC-6.5 ............................................... 113 Table 4.6: Resultant force comparisons—ST-6902 and ST-6538—LC-6 ............................ 114 Table 4.7: Resultant force comparisons—ST-6902 and ST-6538—LC-6.5 ......................... 114 Table 4.8: Stop position locations ........................................................................................ 118 Table 4.9: Weather during pre-repair bridge testing (NOAA 2005) ...................................... 123 Table 4.10: Weather during post-repair bridge testing (NOAA 2010) .................................... 124 Table 4.11: Temperatures measured during bridge monitoring (NOAA 2010) ...................... 124 Table 5.1: Bearing pad effects—crack-opening displacements ........................................... 135 Table 5.2: Midspan truck positions—deflections .................................................................. 140 Table 5.3: AE truck positions—crack-opening displacements ............................................. 144 Table 5.4: AE truck positions—bottom-fiber strains—Girder 7 ............................................ 148 Table 5.5: AE truck positions—bottom-fiber strains—Girder 8 ............................................ 149 Table 5.6: Midspan truck positions—deflections .................................................................. 157 Table 5.7: Midspan truck positions—bottom-fiber strains—Girder 7 ................................... 162 Table 5.8: Midspan truck positions—bottom-fiber strains—Girder 8 ................................... 163 Table 5.9: Damaged region truck positions—bottom-fiber strains—Girder 7 ...................... 166 Table 5.10: Damaged region truck positions—bottom-fiber strains—Girder 8 ...................... 167 Table 5.11: Midspan truck positions—maximum crack closures ........................................... 173 Table 5.12: Damaged region truck positions—maximum crack openings ............................. 176 Table 5.13: Superposition—deflections.................................................................................. 179 Table 5.14: Superposition—maximum crack closures ........................................................... 181 Table 5.15: Superposition—bottom-fiber strains—Girder 7 ................................................... 183
xvii
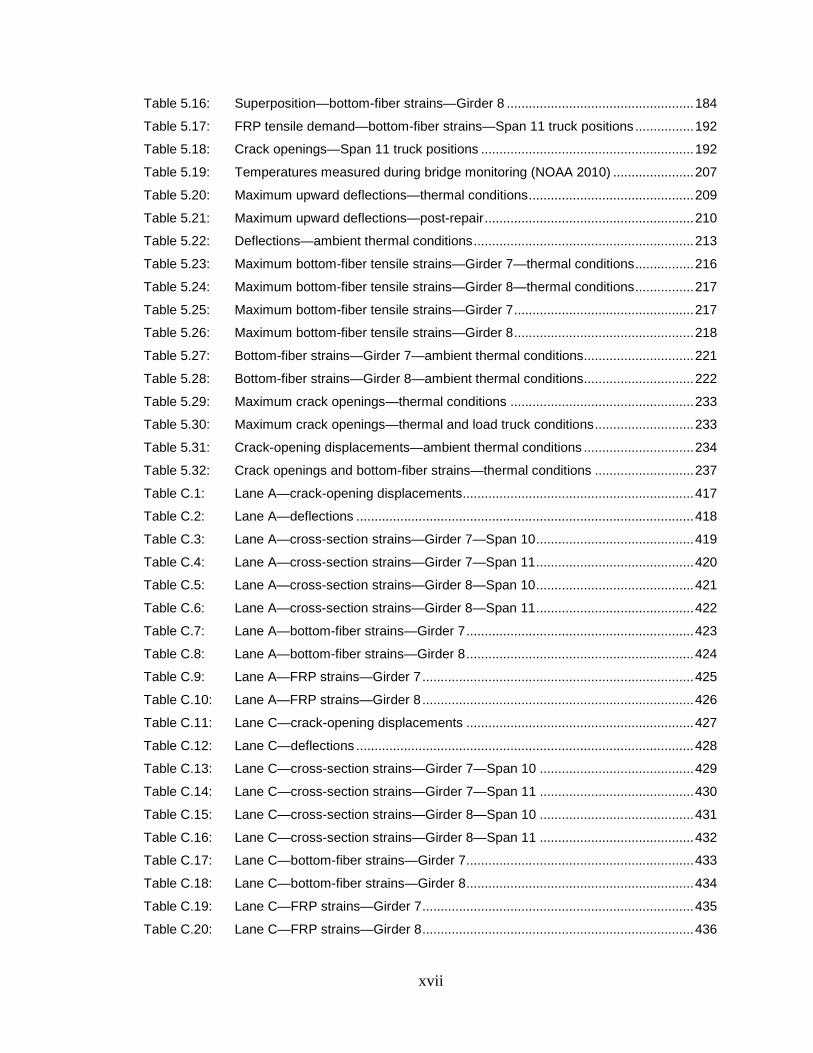
Table 5.16: Superposition—bottom-fiber strains—Girder 8 ................................................... 184 Table 5.17: FRP tensile demand—bottom-fiber strains—Span 11 truck positions ................ 192 Table 5.18: Crack openings—Span 11 truck positions .......................................................... 192 Table 5.19: Temperatures measured during bridge monitoring (NOAA 2010) ...................... 207 Table 5.20: Maximum upward deflections—thermal conditions ............................................. 209 Table 5.21: Maximum upward deflections—post-repair ......................................................... 210 Table 5.22: Deflections—ambient thermal conditions ............................................................ 213 Table 5.23: Maximum bottom-fiber tensile strains—Girder 7—thermal conditions ................ 216 Table 5.24: Maximum bottom-fiber tensile strains—Girder 8—thermal conditions ................ 217 Table 5.25: Maximum bottom-fiber tensile strains—Girder 7 ................................................. 217 Table 5.26: Maximum bottom-fiber tensile strains—Girder 8 ................................................. 218 Table 5.27: Bottom-fiber strains—Girder 7—ambient thermal conditions.............................. 221 Table 5.28: Bottom-fiber strains—Girder 8—ambient thermal conditions.............................. 222 Table 5.29: Maximum crack openings—thermal conditions .................................................. 233 Table 5.30: Maximum crack openings—thermal and load truck conditions ........................... 233 Table 5.31: Crack-opening displacements—ambient thermal conditions .............................. 234 Table 5.32: Crack openings and bottom-fiber strains—thermal conditions ........................... 237 Table C.1: Lane A—crack-opening displacements ............................................................... 417 Table C.2: Lane A—deflections ............................................................................................ 418 Table C.3: Lane A—cross-section strains—Girder 7—Span 10 ........................................... 419 Table C.4: Lane A—cross-section strains—Girder 7—Span 11 ........................................... 420 Table C.5: Lane A—cross-section strains—Girder 8—Span 10 ........................................... 421 Table C.6: Lane A—cross-section strains—Girder 8—Span 11 ........................................... 422 Table C.7: Lane A—bottom-fiber strains—Girder 7 .............................................................. 423 Table C.8: Lane A—bottom-fiber strains—Girder 8 .............................................................. 424 Table C.9: Lane A—FRP strains—Girder 7 .......................................................................... 425 Table C.10: Lane A—FRP strains—Girder 8 .......................................................................... 426 Table C.11: Lane C—crack-opening displacements .............................................................. 427 Table C.12: Lane C—deflections ............................................................................................ 428 Table C.13: Lane C—cross-section strains—Girder 7—Span 10 .......................................... 429 Table C.14: Lane C—cross-section strains—Girder 7—Span 11 .......................................... 430 Table C.15: Lane C—cross-section strains—Girder 8—Span 10 .......................................... 431 Table C.16: Lane C—cross-section strains—Girder 8—Span 11 .......................................... 432 Table C.17: Lane C—bottom-fiber strains—Girder 7 .............................................................. 433 Table C.18: Lane C—bottom-fiber strains—Girder 8 .............................................................. 434 Table C.19: Lane C—FRP strains—Girder 7 .......................................................................... 435 Table C.20: Lane C—FRP strains—Girder 8 .......................................................................... 436
xviii
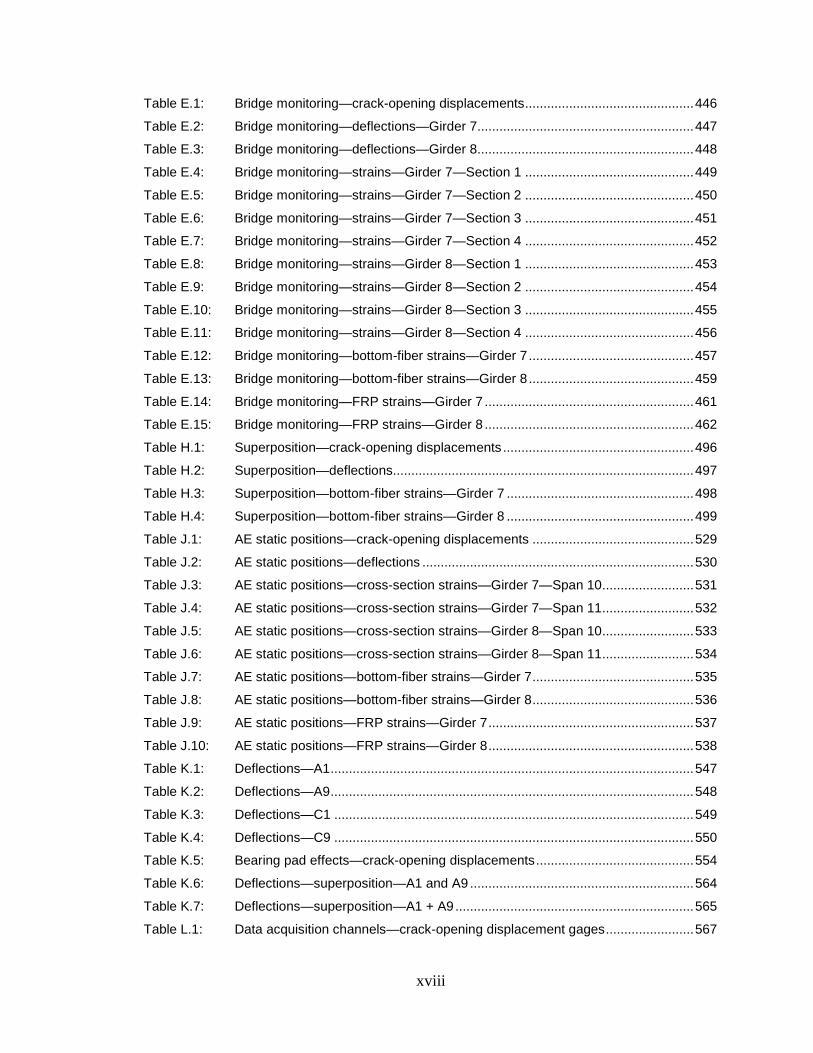
Table E.1: Bridge monitoring—crack-opening displacements .............................................. 446 Table E.2: Bridge monitoring—deflections—Girder 7........................................................... 447 Table E.3: Bridge monitoring—deflections—Girder 8........................................................... 448 Table E.4: Bridge monitoring—strains—Girder 7—Section 1 .............................................. 449 Table E.5: Bridge monitoring—strains—Girder 7—Section 2 .............................................. 450 Table E.6: Bridge monitoring—strains—Girder 7—Section 3 .............................................. 451 Table E.7: Bridge monitoring—strains—Girder 7—Section 4 .............................................. 452 Table E.8: Bridge monitoring—strains—Girder 8—Section 1 .............................................. 453 Table E.9: Bridge monitoring—strains—Girder 8—Section 2 .............................................. 454 Table E.10: Bridge monitoring—strains—Girder 8—Section 3 .............................................. 455 Table E.11: Bridge monitoring—strains—Girder 8—Section 4 .............................................. 456 Table E.12: Bridge monitoring—bottom-fiber strains—Girder 7 ............................................. 457 Table E.13: Bridge monitoring—bottom-fiber strains—Girder 8 ............................................. 459 Table E.14: Bridge monitoring—FRP strains—Girder 7 ......................................................... 461 Table E.15: Bridge monitoring—FRP strains—Girder 8 ......................................................... 462 Table H.1: Superposition—crack-opening displacements .................................................... 496 Table H.2: Superposition—deflections.................................................................................. 497 Table H.3: Superposition—bottom-fiber strains—Girder 7 ................................................... 498 Table H.4: Superposition—bottom-fiber strains—Girder 8 ................................................... 499 Table J.1: AE static positions—crack-opening displacements ............................................ 529 Table J.2: AE static positions—deflections .......................................................................... 530 Table J.3: AE static positions—cross-section strains—Girder 7—Span 10 ......................... 531 Table J.4: AE static positions—cross-section strains—Girder 7—Span 11 ......................... 532 Table J.5: AE static positions—cross-section strains—Girder 8—Span 10 ......................... 533 Table J.6: AE static positions—cross-section strains—Girder 8—Span 11 ......................... 534 Table J.7: AE static positions—bottom-fiber strains—Girder 7 ............................................ 535 Table J.8: AE static positions—bottom-fiber strains—Girder 8 ............................................ 536 Table J.9: AE static positions—FRP strains—Girder 7 ........................................................ 537 Table J.10: AE static positions—FRP strains—Girder 8 ........................................................ 538 Table K.1: Deflections—A1 ................................................................................................... 547 Table K.2: Deflections—A9 ................................................................................................... 548 Table K.3: Deflections—C1 .................................................................................................. 549 Table K.4: Deflections—C9 .................................................................................................. 550 Table K.5: Bearing pad effects—crack-opening displacements ........................................... 554 Table K.6: Deflections—superposition—A1 and A9 ............................................................. 564 Table K.7: Deflections—superposition—A1 + A9 ................................................................. 565 Table L.1: Data acquisition channels—crack-opening displacement gages ........................ 567
xix
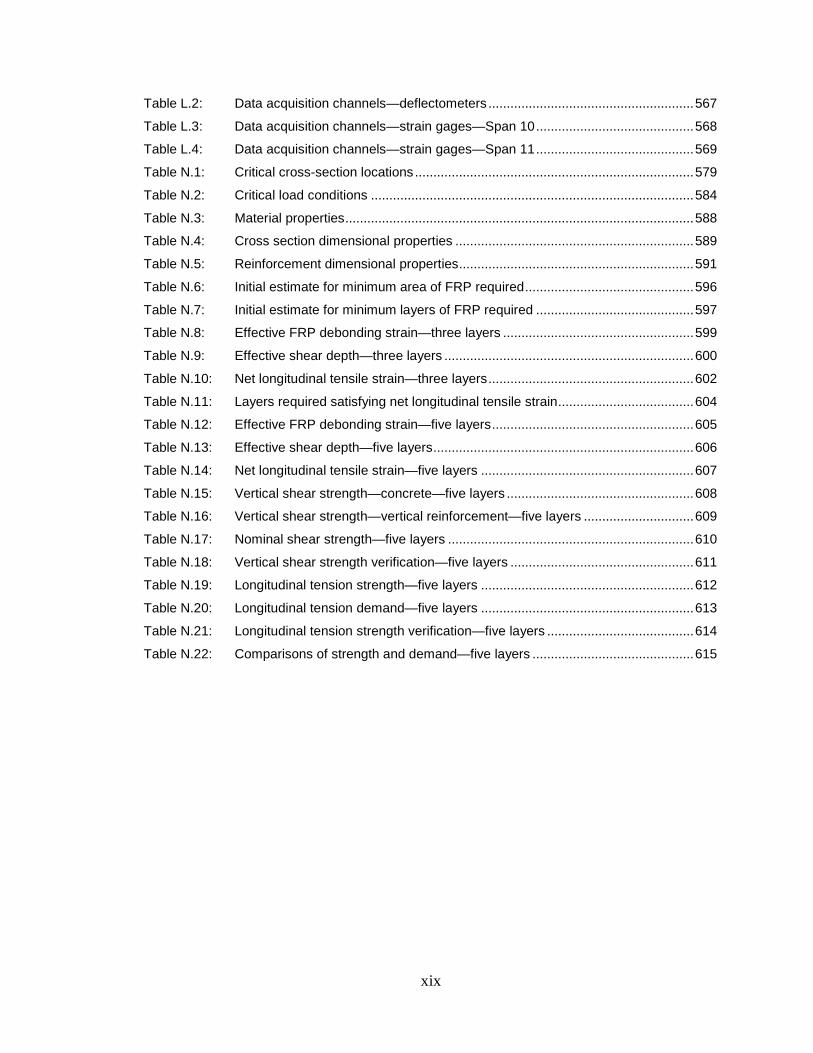
Table L.2: Data acquisition channels—deflectometers ........................................................ 567 Table L.3: Data acquisition channels—strain gages—Span 10 ........................................... 568 Table L.4: Data acquisition channels—strain gages—Span 11 ........................................... 569 Table N.1: Critical cross-section locations ............................................................................ 579 Table N.2: Critical load conditions ........................................................................................ 584 Table N.3: Material properties ............................................................................................... 588 Table N.4: Cross section dimensional properties ................................................................. 589 Table N.5: Reinforcement dimensional properties ................................................................ 591 Table N.6: Initial estimate for minimum area of FRP required .............................................. 596 Table N.7: Initial estimate for minimum layers of FRP required ........................................... 597 Table N.8: Effective FRP debonding strain—three layers .................................................... 599 Table N.9: Effective shear depth—three layers .................................................................... 600 Table N.10: Net longitudinal tensile strain—three layers ........................................................ 602 Table N.11: Layers required satisfying net longitudinal tensile strain ..................................... 604 Table N.12: Effective FRP debonding strain—five layers ....................................................... 605 Table N.13: Effective shear depth—five layers ....................................................................... 606 Table N.14: Net longitudinal tensile strain—five layers .......................................................... 607 Table N.15: Vertical shear strength—concrete—five layers ................................................... 608 Table N.16: Vertical shear strength—vertical reinforcement—five layers .............................. 609 Table N.17: Nominal shear strength—five layers ................................................................... 610 Table N.18: Vertical shear strength verification—five layers .................................................. 611 Table N.19: Longitudinal tension strength—five layers .......................................................... 612 Table N.20: Longitudinal tension demand—five layers .......................................................... 613 Table N.21: Longitudinal tension strength verification—five layers ........................................ 614 Table N.22: Comparisons of strength and demand—five layers ............................................ 615
xx
LIST OF FIGURES
Figure 1.1: Elevated spans of I-565 in Huntsville, Alabama ...................................................... 1 Figure 1.2: Northbound Bent 11 of I-565 in Huntsville, Alabama .............................................. 2 Figure 1.3: Cracked pre-tensioned bulb-tee girders of I-565 (Barnes et al. 2006) .................... 2 Figure 1.4: Girder 9 of Northbound Spans 10 and 11—repaired .............................................. 4 Figure 1.5: Girders 7, 8, and 9 of Northbound Span 10—repaired ........................................... 5 Figure 2.1: Plan view of the two-span continuous unit (ALDOT 1988) ................................... 10 Figure 2.2: Elevation view of the two-span continuous unit (ALDOT 1988) ............................ 11 Figure 2.3: Detailed plan view of the two-span continuous unit (ALDOT 1988) ..................... 12 Figure 2.4: Cross section of a typical BT-54 girder (ALDOT 1988; Swenson 2003) ............... 14 Figure 2.5: Prestressed strand pattern near girder end (ALDOT 1988; Swenson 2003) ........ 15 Figure 2.6: Prestressed strand pattern near girder midpoint
(ALDOT 1988; Swenson 2003) ............................................................................. 16 Figure 2.7: Prestressed strand profile (Swenson 2003) .......................................................... 18 Figure 2.8: Vertical shear reinforcement near girder end
(ALDOT 1988; Swenson 2003) ............................................................................. 19 Figure 2.9: Vertical shear reinforcement near girder midpoint
(ALDOT 1988; Swenson 2003) ............................................................................. 20 Figure 2.10: Location and spacing of vertical shear reinforcement
(ALDOT 1988; Swenson 2003) ............................................................................. 22 Figure 2.11: Continuity reinforcement—continuity diaphragm detail
(ALDOT 1988; Swenson 2003) ............................................................................. 23 Figure 2.12: Continuity reinforcement of a typical BT-54 cross section
(ALDOT 1988; Swenson 2003) ............................................................................. 24 Figure 2.13: Cross section view of deck slab reinforcement over an exterior girder
(ALDOT 1988; Swenson 2003) ............................................................................. 26 Figure 2.14: Cross section view of deck slab reinforcement over an interior girder
(ALDOT 1988; Swenson 2003) ............................................................................. 27 Figure 2.15: Portion of I-565 containing cracked bridge girders (Swenson 2003) .................... 29 Figure 2.16: Cracking pattern in end region of precast girder (Barnes et al. 2006) .................. 29 Figure 2.17: Cracked pre-tensioned bulb-tee girders (Barnes et al. 2006) ............................... 30 Figure 2.18: Typical diaphragm face crack (Swenson 2003) .................................................... 30 Figure 2.19: Typical diaphragm end crack (Swenson 2003) ..................................................... 31 Figure 2.20: Cracks injected with epoxy (Fason 2009) ............................................................. 32 Figure 2.21: Steel frame false supports (Fason 2009) .............................................................. 33 Figure 2.22: False support bearing pad with gap between pad and girder (Fason 2009) ........ 33
xxi
Figure 2.23: False support bearing pad in contact with girder (Fason 2009) ............................ 34 Figure 2.24: Cracked girder with continuity reinforcement details (Barnes et al. 2006) ............ 36 Figure 2.25: Typical strut-and-tie model (Swenson 2003)......................................................... 41 Figure 2.26: Longitudinal configuration profile for FRP (Barnes et al. 2006) ............................ 44 Figure 2.27: Cross-sectional configuration of FRP near diaphragm (Swenson 2003) .............. 45 Figure 2.28: Cross-sectional configuration of FRP beyond bearing pad (Swenson 2003) ....... 45 Figure 2.29: Surface cleaning—final removal of dust and debris .............................................. 50 Figure 2.30: Use of saw for bearing pad removal ..................................................................... 51 Figure 2.31: Use of torch for bearing pad removal .................................................................... 52 Figure 2.32: Successful removal of bearing pad ....................................................................... 52 Figure 2.33: Bearing pad after forceful removal ........................................................................ 53 Figure 2.34: Adhesion test equipment (Swenson 2007) ........................................................... 54 Figure 2.35: Performance of on-site adhesion test ................................................................... 54 Figure 2.36: Preparation of sample for tension testing .............................................................. 55 Figure 2.37: Representative sample for tension testing ............................................................ 56 Figure 2.38: Cutting strips of FRP fabric ................................................................................... 57 Figure 2.39: Epoxy saturation of FRP fabric ............................................................................. 57 Figure 2.40: Applying epoxy to girder surface before FRP fabric installation ........................... 58 Figure 2.41: Installation of first layer of FRP fabric ................................................................... 58 Figure 2.42: Four layers of installed FRP fabric ........................................................................ 59 Figure 2.43: FRP installation sequence–first layer .................................................................... 59 Figure 2.44: FRP installation sequence—second layer ............................................................ 60 Figure 2.45: FRP installation sequence—third layer ................................................................. 60 Figure 2.46: FRP installation sequence—fourth layer ............................................................... 61 Figure 2.47: Painting of FRP reinforcement .............................................................................. 61 Figure 2.48: Painted FRP reinforcement of Span 10 ................................................................ 62 Figure 3.1: Instrumentation overview ...................................................................................... 69 Figure 3.2: Crack-opening displacement gage (TML 2011) .................................................... 71 Figure 3.3: Anchor blocks for COD gage installation (Fason 2009) ........................................ 73 Figure 3.4: COD gage attached to anchor blocks ................................................................... 74 Figure 3.5: Typical deflectometer ............................................................................................ 75 Figure 3.6: Deflectometer locations—Girder Line 7 ................................................................ 77 Figure 3.7: Deflectometer locations—Girder Line 8 ................................................................ 77 Figure 3.8: Girder attachment point for deflectometer wire ..................................................... 79 Figure 3.9: Deflectometer aluminum bar—pre-bent with adjusted turnbuckle ........................ 80 Figure 3.10: Deflectometer area—Span 11 ............................................................................... 81 Figure 3.11: Strain gage cross section locations ....................................................................... 83
xxii
Figure 3.12: Strain gage locations—Girder 7—Section 1 ......................................................... 85 Figure 3.13: Strain gage locations—Girder 7—Section 2 ......................................................... 85 Figure 3.14: Strain gage locations—Girder 7—Section 3 ......................................................... 86 Figure 3.15: Strain gage locations—Girder 7—Section 4 ......................................................... 86 Figure 3.16: Strain gage locations—Girder 8—Section 1 ......................................................... 87 Figure 3.17: Strain gage locations—Girder 8—Section 2 ......................................................... 87 Figure 3.18: Strain gage locations—Girder 8—Section 3 ......................................................... 88 Figure 3.19: Strain gage locations—Girder 8—Section 4 ......................................................... 88 Figure 3.20: Strain gage locations—Girders 7 and 8—Section 5 ............................................. 89 Figure 3.21: Strain gage locations—Girders 7 and 8—Sections 6, 7, and 8............................. 89 Figure 3.22: Strain gage locations—CRACK ............................................................................ 90 Figure 3.23: Surface-mounted strain gage—concrete (Fason 2009) ........................................ 94 Figure 3.24: Surface-mounted strain gage—FRP reinforcement .............................................. 95 Figure 3.25: Strain gage installation—applying degreaser to gage location ............................. 96 Figure 3.26: Strain gage installation—removal of surface irregularities .................................... 96 Figure 3.27: Strain gage installation—initial surface cleaning ................................................... 97 Figure 3.28: Strain gage installation—clean surface prepared for solid epoxy ......................... 97 Figure 3.29: Strain gage installation—application of solid epoxy .............................................. 98 Figure 3.30: Strain gage installation—epoxy surface ................................................................ 98 Figure 3.31: Strain gage installation—gage application with thin epoxy ................................... 99 Figure 3.32: Strain gage installation—gage applied to FRP reinforcement ............................ 100 Figure 3.33: Strain gage installation—rubber coating for moisture protection ........................ 101 Figure 3.34: Strain gage installation—mastic tape for mechanical protection ........................ 101 Figure 3.35: Data acquisition hardware ................................................................................... 102 Figure 4.1: ST-6400 (standard load truck) ............................................................................ 105 Figure 4.2: ST-6902 (pre-repair unconventional truck) ......................................................... 106 Figure 4.3: ST-6538 (post-repair replacement for pre-repair unconventional truck) ............. 106 Figure 4.4: Footprint of ALDOT load testing trucks (ST-6400 and ST-6538) ........................ 107 Figure 4.5: Footprint of ALDOT tool trailer truck (ST-6902) .................................................. 108 Figure 4.6: LC-6.5 block configuration—post-repair ST-6400 ............................................... 111 Figure 4.7: LC-6 block configuration—post-repair ST-6400 .................................................. 111 Figure 4.8: LC-6.5 block configuration—post-repair ST-6538 ............................................... 112 Figure 4.9: LC-6 block configuration—post-repair ST-6538 .................................................. 112 Figure 4.10: Traverse lanes and stop positions—overhead photo .......................................... 116 Figure 4.11: Lane A—Horizontal truck positioning (multiposition test) .................................... 117 Figure 4.12: Lane C—Horizontal truck positioning (multiposition and AE tests) ..................... 117 Figure 4.13: Stop position locations ........................................................................................ 119
xxiii
Figure 4.14: Acoustic emissions test—stop position locations ................................................ 121 Figure 4.15: Superposition test—horizontal lane positioning .................................................. 127 Figure 4.16: Superposition test—stop position locations ........................................................ 128 Figure 5.1: Crack-opening displacements—pre- and post-repair—A4 ................................. 132 Figure 5.2: Crack-opening displacements—pre- and post-repair—A7 ................................. 133 Figure 5.3: Crack-opening displacements—pre- and post-repair—C4 ................................. 133 Figure 5.4: Crack-opening displacements—pre- and post-repair—C7 ................................. 134 Figure 5.5: Lane A—horizontal truck positioning ................................................................... 136 Figure 5.6: Lane C—horizontal truck positioning .................................................................. 137 Figure 5.7: Deflections—A1 ................................................................................................... 137 Figure 5.8: Deflections—A9 ................................................................................................... 138 Figure 5.9: Deflections—C1 .................................................................................................. 138 Figure 5.10: Deflections—C9 .................................................................................................. 139 Figure 5.11: AE Span 10 truck position—crack-opening displacements—LC-6.5 .................. 142 Figure 5.12: AE Span 11 truck position—crack-opening displacements—LC-6.5 .................. 142 Figure 5.13: AE Span 10 truck position—crack-opening displacements—LC-6 ..................... 143 Figure 5.14: AE Span 11 truck position—crack-opening displacements—LC-6 ..................... 143 Figure 5.15: AE Span 10 truck position—bottom-fiber strains—LC-6.5 .................................. 146 Figure 5.16: AE Span 11 truck position—bottom-fiber strains—LC-6.5 .................................. 146 Figure 5.17: AE Span 10 truck position—bottom-fiber strains—LC-6 ..................................... 147 Figure 5.18: AE Span 11 truck position—bottom-fiber strains—LC-6 ..................................... 147 Figure 5.19: COD and bottom-fiber strain comparisons—LC-6.5—AE Span 10 .................... 151 Figure 5.20: COD and bottom-fiber strain comparisons—LC-6.5—AE Span 11 .................... 151 Figure 5.21: COD and bottom-fiber strain comparisons—LC-6—AE Span 10 ....................... 152 Figure 5.22: COD and bottom-fiber strain comparisons—LC-6—AE Span 11 ....................... 152 Figure 5.23: Deflections—A1 ................................................................................................... 155 Figure 5.24: Deflections—A9 ................................................................................................... 155 Figure 5.25: Deflections—C1 .................................................................................................. 156 Figure 5.26: Deflections—C9 .................................................................................................. 156 Figure 5.27: Deflections—post-repair—measurements and predictions—A9......................... 158 Figure 5.28: Deflections—post-repair—measurements and predictions—C9 ........................ 158 Figure 5.29: Bottom-fiber strain—A1 ....................................................................................... 160 Figure 5.30: Bottom-fiber strain—A9 ....................................................................................... 160 Figure 5.31: Bottom-fiber strain—C1 ....................................................................................... 161 Figure 5.32: Bottom-fiber strain—C9 ....................................................................................... 161 Figure 5.33: Bottom-fiber strain—A4 ....................................................................................... 164 Figure 5.34: Bottom-fiber strain—A7 ....................................................................................... 165
xxiv
Figure 5.35: Bottom-fiber strain—C4 ....................................................................................... 165 Figure 5.36: Bottom-fiber strain—C7 ....................................................................................... 166 Figure 5.37: Bottom-fiber strain—post-repair—measurements and predictions—A7 ............. 168 Figure 5.38: Bottom-fiber strain—post-repair—measurements and predictions—A9 ............. 169 Figure 5.39: Bottom-fiber strain—post-repair—measurements and predictions—C7 ............. 169 Figure 5.40: Bottom-fiber strain—post-repair—measurements and predictions—C9 ............. 170 Figure 5.41: Midspan truck positions—crack-opening displacements—A1 ............................ 171 Figure 5.42: Midspan truck positions—crack-opening displacements—A9 ............................ 172 Figure 5.43: Midspan truck positions—crack-opening displacements—C1 ............................ 172 Figure 5.44: Midspan truck positions—crack-opening displacements—C9 ............................ 173 Figure 5.45: Damaged region truck positions—crack-opening displacements—A4 ............... 174 Figure 5.46: Damaged region truck positions—crack-opening displacements—A7 ............... 175 Figure 5.47: Damaged section truck positions—crack-opening displacements—C4 ............. 175 Figure 5.48: Damaged region truck positions—crack-opening displacements—C7 ............... 176 Figure 5.49: Superposition—deflections—predicted and measured ....................................... 179 Figure 5.50: Superposition—crack-opening displacements—predicted and measured ......... 181 Figure 5.51: Superposition—bottom-fiber strains—predicted and measured ......................... 183 Figure 5.52: Longitudinal truck positions—C6 ......................................................................... 186 Figure 5.53: Longitudinal truck positions—AE LC-6 Span 11 and C7 .................................... 187 Figure 5.54: Longitudinal truck positions—C8 ......................................................................... 188 Figure 5.55: Bottom-fiber strains—C6 ..................................................................................... 190 Figure 5.56: Bottom-fiber strains—AE LC-6 Span 11 ............................................................. 190 Figure 5.57: Bottom-fiber strains—C7 ..................................................................................... 191 Figure 5.58: Bottom-fiber strains—C8 ..................................................................................... 191 Figure 5.59: Linear temperature gradient ................................................................................ 194 Figure 5.60: Two-span continuous structure subjected to linear thermal gradient ................. 194 Figure 5.61: Expected deformations—two theoretical load conditions ................................... 195 Figure 5.62: Moment diagrams—two theoretical load conditions ........................................... 196 Figure 5.63: Curvature diagrams—two theoretical load conditions ......................................... 197 Figure 5.64: Curvature due to temperature gradient with restraint ......................................... 200 Figure 5.65: Moment due to temperature gradient with restraint ............................................ 201 Figure 5.66: Shear due to temperature gradient with restraint ................................................ 202 Figure 5.67: Bottom-fiber strain due to temperature gradient with restraint ............................ 203 Figure 5.68: Bottom-fiber stress due to temperature gradient with restraint ........................... 204 Figure 5.69: Deflections due to temperature gradient with restraint ....................................... 206 Figure 5.70: Deflections—normal traffic—twenty-four hours—Girder 7 .................................. 208 Figure 5.71: Deflections—normal traffic—twenty-four hours—Girder 8 .................................. 208
xxv
Figure 5.72: Deflections—8:30 a.m. ........................................................................................ 211 Figure 5.73: Deflections—4:30 p.m. ........................................................................................ 211 Figure 5.74: Deflections—8:30 p.m. ........................................................................................ 212 Figure 5.75: Deflections—2:30 a.m. ........................................................................................ 212 Figure 5.76: Bottom-fiber strains—Girder 7—within 80 in. from diaphragm ........................... 214 Figure 5.77: Bottom-fiber strains—Girder 7—beyond 80 in. from diaphragm ......................... 214 Figure 5.78: Bottom-fiber strains—Girder 8—within 80 in. from diaphragm ........................... 215 Figure 5.79: Bottom-fiber strains—Girder 8—beyond 80 in. from diaphragm ......................... 215 Figure 5.80: Bottom-fiber strains—8:30 a.m. .......................................................................... 219 Figure 5.81: Bottom-fiber strains—4:30 p.m. .......................................................................... 220 Figure 5.82: Bottom-fiber strains—8:30 p.m. .......................................................................... 220 Figure 5.83: Bottom-fiber strains—2:30 a.m. .......................................................................... 221 Figure 5.84: Bottom-fiber strains—concrete—Girder 7—6:30 a.m. ........................................ 223 Figure 5.85: Bottom-fiber strains—concrete—Girder 7—4:30 p.m. ........................................ 223 Figure 5.86: Bottom-fiber strains—concrete—Girder 7—8:30 p.m. ........................................ 224 Figure 5.87: Bottom-fiber strains—concrete—Girder 7—2:30 a.m. ........................................ 224 Figure 5.88: Bottom-fiber strains—concrete—Girder 8—6:30 a.m. ........................................ 225 Figure 5.89: Bottom-fiber strains—concrete—Girder 8—4:30 p.m. ........................................ 225 Figure 5.90: Bottom-fiber strains—concrete—Girder 8—8:30 p.m. ........................................ 226 Figure 5.91: Bottom-fiber strains—concrete—Girder 8—2:30 a.m. ........................................ 226 Figure 5.92: Bottom-fiber strains—damaged region—8:30 a.m. ............................................. 228 Figure 5.93: Bottom-fiber strains—damaged region—4:30 p.m. ............................................. 229 Figure 5.94: Bottom-fiber strains—damaged region—8:30 p.m. ............................................. 229 Figure 5.95: Bottom-fiber strains—damaged region—2:30 a.m. ............................................. 230 Figure 5.96: Crack-opening displacements—normal traffic—twenty-four hours ..................... 232 Figure 5.97: Bottom-fiber strain and COD—thermal conditions—Girder 7—Span 10 ............ 235 Figure 5.98: Bottom-fiber strain and COD—thermal conditions—Girder 7—Span 11 ............ 235 Figure 5.99: Bottom-fiber strain and COD—thermal conditions—Girder 8—Span 10 ............ 236 Figure 5.100: Bottom-fiber strain and COD—thermal conditions—Girder 8—Span 11 ............ 236 Figure 6.1: Cross-sectional configuration of FRP—near diaphragm (Swenson 2003) ......... 249 Figure 6.2: Cross-sectional configuration of FRP—typical (Swenson 2003) ........................ 249 Figure 6.3: Simplified model for initial estimate of FRP requirement .................................... 250 Figure 6.4: FRP fan anchorage system (Niemitz et al. 2010) ............................................... 260 Figure B.1: Crack-opening displacements—A1 ..................................................................... 286 Figure B.2: Crack-opening displacements—A2 ..................................................................... 287 Figure B.3: Crack-opening displacements—A3 ..................................................................... 287 Figure B.4: Crack-opening displacements—A4 ..................................................................... 288
xxvi
Figure B.5: Crack-opening displacements—A5 ..................................................................... 288 Figure B.6: Crack-opening displacements—A6 ..................................................................... 289 Figure B.7: Crack-opening displacements—A7 ..................................................................... 289 Figure B.8: Crack-opening displacements—A8 ..................................................................... 290 Figure B.9: Crack-opening displacements—A9 ..................................................................... 290 Figure B.10: Deflections—A1 ................................................................................................... 291 Figure B.11: Deflections—A2 ................................................................................................... 292 Figure B.12: Deflections—A3 ................................................................................................... 292 Figure B.13: Deflections—A4 ................................................................................................... 293 Figure B.14: Deflections—A5 ................................................................................................... 293 Figure B.15: Deflections—A6 ................................................................................................... 294 Figure B.16: Deflections—A7 ................................................................................................... 294 Figure B.17: Deflections—A8 ................................................................................................... 295 Figure B.18: Deflections—A9 ................................................................................................... 295 Figure B.19: Strains—Girder 7—Section 1—A1 ...................................................................... 296 Figure B.20: Strains—Girder 7—Section 1—A2 ...................................................................... 297 Figure B.21: Strains—Girder 7—Section 1—A3 ...................................................................... 297 Figure B.22: Strains—Girder 7—Section 1—A4 ...................................................................... 298 Figure B.23: Strains—Girder 7—Section 1—A5 ...................................................................... 298 Figure B.24: Strains—Girder 7—Section 1—A6 ...................................................................... 299 Figure B.25: Strains—Girder 7—Section 1—A7 ...................................................................... 299 Figure B.26: Strains—Girder 7—Section 1—A8 ...................................................................... 300 Figure B.27: Strains—Girder 7—Section 1—A9 ...................................................................... 300 Figure B.28: Strains—Girder 7—Section 2—A1 ...................................................................... 301 Figure B.29: Strains—Girder 7—Section 2—A2 ...................................................................... 302 Figure B.30: Strains—Girder 7—Section 2—A3 ...................................................................... 302 Figure B.31: Strains—Girder 7—Section 2—A4 ...................................................................... 303 Figure B.32: Strains—Girder 7—Section 2—A5 ...................................................................... 303 Figure B.33: Strains—Girder 7—Section 2—A6 ...................................................................... 304 Figure B.34: Strains—Girder 7—Section 2—A7 ...................................................................... 304 Figure B.35: Strains—Girder 7—Section 2—A8 ...................................................................... 305 Figure B.36: Strains—Girder 7—Section 2—A9 ...................................................................... 305 Figure B.37: Strains—Girder 7—Section 3—A1 ...................................................................... 306 Figure B.38: Strains—Girder 7—Section 3—A2 ...................................................................... 307 Figure B.39: Strains—Girder 7—Section 3—A3 ...................................................................... 307 Figure B.40: Strains—Girder 7—Section 3—A4 ...................................................................... 308 Figure B.41: Strains—Girder 7—Section 3—A5 ...................................................................... 308
xxvii
Figure B.42: Strains—Girder 7—Section 3—A6 ...................................................................... 309 Figure B.43: Strains—Girder 7—Section 3—A7 ...................................................................... 309 Figure B.44: Strains—Girder 7—Section 3—A8 ...................................................................... 310 Figure B.45: Strains—Girder 7—Section 3—A9 ...................................................................... 310 Figure B.46: Strains—Girder 7—Section 4—A1 ...................................................................... 311 Figure B.47: Strains—Girder 7—Section 4—A2 ...................................................................... 312 Figure B.48: Strains—Girder 7—Section 4—A3 ...................................................................... 312 Figure B.49: Strains—Girder 7—Section 4—A4 ...................................................................... 313 Figure B.50: Strains—Girder 7—Section 4—A5 ...................................................................... 313 Figure B.51: Strains—Girder 7—Section 4—A6 ...................................................................... 314 Figure B.52: Strains—Girder 7—Section 4—A7 ...................................................................... 314 Figure B.53: Strains—Girder 7—Section 4—A8 ...................................................................... 315 Figure B.54: Strains—Girder 7—Section 4—A9 ...................................................................... 315 Figure B.55: Strains—Girder 8—Section 1—A1 ...................................................................... 316 Figure B.56: Strains—Girder 8—Section 1—A2 ...................................................................... 317 Figure B.57: Strains—Girder 8—Section 1—A3 ...................................................................... 317 Figure B.58: Strains—Girder 8—Section 1—A4 ...................................................................... 318 Figure B.59: Strains—Girder 8—Section 1—A5 ...................................................................... 318 Figure B.60: Strains—Girder 8—Section 1—A6 ...................................................................... 319 Figure B.61: Strains—Girder 8—Section 1—A7 ...................................................................... 319 Figure B.62: Strains—Girder 8—Section 1—A8 ...................................................................... 320 Figure B.63: Strains—Girder 8—Section 1—A9 ...................................................................... 320 Figure B.64: Strains—Girder 8—Section 2—A1 ...................................................................... 321 Figure B.65: Strains—Girder 8—Section 2—A2 ...................................................................... 322 Figure B.66: Strains—Girder 8—Section 2—A3 ...................................................................... 322 Figure B.67: Strains—Girder 8—Section 2—A4 ...................................................................... 323 Figure B.68: Strains—Girder 8—Section 2—A5 ...................................................................... 323 Figure B.69: Strains—Girder 8—Section 2—A6 ...................................................................... 324 Figure B.70: Strains—Girder 8—Section 2—A7 ...................................................................... 324 Figure B.71: Strains—Girder 8—Section 2—A8 ...................................................................... 325 Figure B.72: Strains—Girder 8—Section 2—A9 ...................................................................... 325 Figure B.73: Strains—Girder 8—Section 3—A1 ...................................................................... 326 Figure B.74: Strains—Girder 8—Section 3—A2 ...................................................................... 327 Figure B.75: Strains—Girder 8—Section 3—A3 ...................................................................... 327 Figure B.76: Strains—Girder 8—Section 3—A4 ...................................................................... 328 Figure B.77: Strains—Girder 8—Section 3—A5 ...................................................................... 328 Figure B.78: Strains—Girder 8—Section 3—A6 ...................................................................... 329
xxviii
Figure B.79: Strains—Girder 8—Section 3—A7 ...................................................................... 329 Figure B.80: Strains—Girder 8—Section 3—A8 ...................................................................... 330 Figure B.81: Strains—Girder 8—Section 3—A9 ...................................................................... 330 Figure B.82: Strains—Girder 8—Section 4—A1 ...................................................................... 331 Figure B.83: Strains—Girder 8—Section 4—A2 ...................................................................... 332 Figure B.84: Strains—Girder 8—Section 4—A3 ...................................................................... 332 Figure B.85: Strains—Girder 8—Section 4—A4 ...................................................................... 333 Figure B.86: Strains—Girder 8—Section 4—A5 ...................................................................... 333 Figure B.87: Strains—Girder 8—Section 4—A6 ...................................................................... 334 Figure B.88: Strains—Girder 8—Section 4—A7 ...................................................................... 334 Figure B.89: Strains—Girder 8—Section 4—A8 ...................................................................... 335 Figure B.90: Strains—Girder 8—Section 4—A9 ...................................................................... 335 Figure B.91: Bottom-fiber strains—A1 ..................................................................................... 336 Figure B.92: Bottom-fiber strains—A2 ..................................................................................... 337 Figure B.93: Bottom-fiber strains—A3 ..................................................................................... 337 Figure B.94: Bottom-fiber strains—A4 ..................................................................................... 338 Figure B.95: Bottom-fiber strains—A5 ..................................................................................... 338 Figure B.96: Bottom-fiber strains—A6 ..................................................................................... 339 Figure B.97: Bottom-fiber strains—A7 ..................................................................................... 339 Figure B.98: Bottom-fiber strains—A8 ..................................................................................... 340 Figure B.99: Bottom-fiber strains—A9 ..................................................................................... 340 Figure B.100: Bottom-fiber strains—Girder 7—A1 .................................................................... 341 Figure B.101: Bottom-fiber strains—Girder 7—A2 .................................................................... 342 Figure B.102: Bottom-fiber strains—Girder 7—A3 .................................................................... 342 Figure B.103: Bottom-fiber strains—Girder 7—A4 .................................................................... 343 Figure B.104: Bottom-fiber strains—Girder 7—A5 .................................................................... 343 Figure B.105: Bottom-fiber strains—Girder 7—A6 .................................................................... 344 Figure B.106: Bottom-fiber strains—Girder 7—A7 .................................................................... 344 Figure B.107: Bottom-fiber strains—Girder 7—A8 .................................................................... 345 Figure B.108: Bottom-fiber strains—Girder 7—A9 .................................................................... 345 Figure B.109: Bottom-fiber strains—Girder 8—A1 .................................................................... 346 Figure B.110: Bottom-fiber strains—Girder 8—A2 .................................................................... 347 Figure B.111: Bottom-fiber strains—Girder 8—A3 .................................................................... 347 Figure B.112: Bottom-fiber strains—Girder 8—A4 .................................................................... 348 Figure B.113: Bottom-fiber strains—Girder 8—A5 .................................................................... 348 Figure B.114: Bottom-fiber strains—Girder 8—A6 .................................................................... 349 Figure B.115: Bottom-fiber strains—Girder 8—A7 .................................................................... 349
xxix
Figure B.116: Bottom-fiber strains—Girder 8—A8 .................................................................... 350 Figure B.117: Bottom-fiber strains—Girder 8—A9 .................................................................... 350 Figure B.118: Crack-opening displacements—C1 ..................................................................... 351 Figure B.119: Crack-opening displacements—C2 ..................................................................... 352 Figure B.120: Crack-opening displacements—C3 ..................................................................... 352 Figure B.121: Crack-opening displacements—C4 ..................................................................... 353 Figure B.122: Crack-opening displacements—C5 ..................................................................... 353 Figure B.123: Crack-opening displacements—C6 .................................................................... 354 Figure B.124: Crack-opening displacements—C7 ..................................................................... 354 Figure B.125: Crack-opening displacements—C8 ..................................................................... 355 Figure B.126: Crack-opening displacements—C9 ..................................................................... 355 Figure B.127: Deflections—C1 .................................................................................................. 356 Figure B.128: Deflections—C2 .................................................................................................. 357 Figure B.129: Deflections—C3 .................................................................................................. 357 Figure B.130: Deflections—C4 .................................................................................................. 358 Figure B.131: Deflections—C5 .................................................................................................. 358 Figure B.132: Deflections—C6 .................................................................................................. 359 Figure B.133: Deflections—C7 .................................................................................................. 359 Figure B.134: Deflections—C8 .................................................................................................. 360 Figure B.135: Deflections—C9 .................................................................................................. 360 Figure B.136: Strains—Girder 7—Section 1—C1 ...................................................................... 361 Figure B.137: Strains—Girder 7—Section 1—C2 ...................................................................... 362 Figure B.138: Strains—Girder 7—Section 1—C3 ...................................................................... 362 Figure B.139: Strains—Girder 7—Section 1—C4 ...................................................................... 363 Figure B.140: Strains—Girder 7—Section 1—C5 ...................................................................... 363 Figure B.141: Strains—Girder 7—Section 1—C6 ...................................................................... 364 Figure B.142: Strains—Girder 7—Section 1—C7 ...................................................................... 364 Figure B.143: Strains—Girder 7—Section 1—C8 ...................................................................... 365 Figure B.144: Strains—Girder 7—Section 1—C9 ...................................................................... 365 Figure B.145: Strains—Girder 7—Section 2—C1 ...................................................................... 366 Figure B.146: Strains—Girder 7—Section 2—C2 ...................................................................... 367 Figure B.147: Strains—Girder 7—Section 2—C3 ...................................................................... 367 Figure B.148: Strains—Girder 7—Section 2—C4 ...................................................................... 368 Figure B.149: Strains—Girder 7—Section 2—C5 ...................................................................... 368 Figure B.150: Strains—Girder 7—Section 2—C6 ...................................................................... 369 Figure B.151: Strains—Girder 7—Section 2—C7 ...................................................................... 369 Figure B.152: Strains—Girder 7—Section 2—C8 ...................................................................... 370
xxx
Figure B.153: Strains—Girder 7—Section 2—C9 ...................................................................... 370 Figure B.154: Strains—Girder 7—Section 3—C1 ...................................................................... 371 Figure B.155: Strains—Girder 7—Section 3—C2 ...................................................................... 372 Figure B.156: Strains—Girder 7—Section 3—C3 ...................................................................... 372 Figure B.157: Strains—Girder 7—Section 3—C4 ...................................................................... 373 Figure B.158: Strains—Girder 7—Section 3—C5 ...................................................................... 373 Figure B.159: Strains—Girder 7—Section 3—C6 ...................................................................... 374 Figure B.160: Strains—Girder 7—Section 3—C7 ...................................................................... 374 Figure B.161: Strains—Girder 7—Section 3—C8 ...................................................................... 375 Figure B.162: Strains—Girder 7—Section 3—C9 ...................................................................... 375 Figure B.163: Strains—Girder 7—Section 4—C1 ...................................................................... 376 Figure B.164: Strains—Girder 7—Section 4—C2 ...................................................................... 377 Figure B.165: Strains—Girder 7—Section 4—C3 ...................................................................... 377 Figure B.166: Strains—Girder 7—Section 4—C4 ...................................................................... 378 Figure B.167: Strains—Girder 7—Section 4—C5 ...................................................................... 378 Figure B.168: Strains—Girder 7—Section 4—C6 ...................................................................... 379 Figure B.169: Strains—Girder 7—Section 4—C7 ...................................................................... 379 Figure B.170: Strains—Girder 7—Section 4—C8 ...................................................................... 380 Figure B.171: Strains—Girder 7—Section 4—C9 ...................................................................... 380 Figure B.172: Strains—Girder 8—Section 1—C1 ...................................................................... 381 Figure B.173: Strains—Girder 8—Section 1—C2 ...................................................................... 382 Figure B.174: Strains—Girder 8—Section 1—C3 ...................................................................... 382 Figure B.175: Strains—Girder 8—Section 1—C4 ...................................................................... 383 Figure B.176: Strains—Girder8—Section 1—C5 ....................................................................... 383 Figure B.177: Strains—Girder 8—Section 1—C6 ...................................................................... 384 Figure B.178: Strains—Girder 8—Section 1—C7 ...................................................................... 384 Figure B.179: Strains—Girder 8—Section 1—C8 ...................................................................... 385 Figure B.180: Strains—Girder 8—Section 1—C9 ...................................................................... 385 Figure B.181: Strains—Girder 8—Section 2—C1 ...................................................................... 386 Figure B.182: Strains—Girder 8—Section 2—C2 ...................................................................... 387 Figure B.183: Strains—Girder 8—Section 2—C3 ...................................................................... 387 Figure B.184: Strains—Girder 8—Section 2—C4 ...................................................................... 388 Figure B.185: Strains—Girder 8—Section 2—C5 ...................................................................... 388 Figure B.186: Strains—Girder 8—Section 2—C6 ...................................................................... 389 Figure B.187: Strains—Girder 8—Section 2—C7 ...................................................................... 389 Figure B.188: Strains—Girder 8—Section 2—C8 ...................................................................... 390 Figure B.189: Strains—Girder 8—Section 2—C9 ...................................................................... 390
xxxi
Figure B.190: Strains—Girder 8—Section 3—C1 ...................................................................... 391 Figure B.191: Strains—Girder 8—Section 3—C2 ...................................................................... 392 Figure B.192: Strains—Girder 8—Section 3—C3 ...................................................................... 392 Figure B.193: Strains—Girder 8—Section 3—C4 ...................................................................... 393 Figure B.194: Strains—Girder 8—Section 3—C5 ...................................................................... 393 Figure B.195: Strains—Girder 8—Section 3—C6 ...................................................................... 394 Figure B.196: Strains—Girder 8—Section 3—C7 ...................................................................... 394 Figure B.197: Strains—Girder 8—Section 3—C8 ...................................................................... 395 Figure B.198: Strains—Girder 8—Section 3—C9 ...................................................................... 395 Figure B.199: Strains—Girder 8—Section 4—C1 ...................................................................... 396 Figure B.200: Strains—Girder 8—Section 4—C2 ...................................................................... 397 Figure B.201: Strains—Girder 8—Section 4—C3 ...................................................................... 397 Figure B.202: Strains—Girder 8—Section 4—C4 ...................................................................... 398 Figure B.203: Strains—Girder 8—Section 4—C5 ...................................................................... 398 Figure B.204: Strains—Girder 8—Section 4—C6 ...................................................................... 399 Figure B.205: Strains—Girder 8—Section 4—C7 ...................................................................... 399 Figure B.206: Strains—Girder 8—Section 4—C8 ...................................................................... 400 Figure B.207: Strains—Girder 8—Section 4—C9 ...................................................................... 400 Figure B.208: Bottom-fiber strains—C1 ..................................................................................... 401 Figure B.209: Bottom-fiber strains—C2 ..................................................................................... 402 Figure B.210: Bottom-fiber strains—C3 ..................................................................................... 402 Figure B.211: Bottom-fiber strains—C4 ..................................................................................... 403 Figure B.212: Bottom-fiber strains—C5 ..................................................................................... 403 Figure B.213: Bottom-fiber strains—C6 ..................................................................................... 404 Figure B.214: Bottom-fiber strains—C7 ..................................................................................... 404 Figure B.215: Bottom-fiber strains—C8 ..................................................................................... 405 Figure B.216: Bottom-fiber strains—C9 ..................................................................................... 405 Figure B.217: Bottom-fiber strains—Girder 7—C1 .................................................................... 406 Figure B.218: Bottom-fiber strains—Girder 7—C2 .................................................................... 407 Figure B.219: Bottom-fiber strains—Girder 7—C3 .................................................................... 407 Figure B.220: Bottom-fiber strains—Girder 7—C4 .................................................................... 408 Figure B.221: Bottom-fiber strains—Girder 7—C5 .................................................................... 408 Figure B.222: Bottom-fiber strains—Girder 7—C6 .................................................................... 409 Figure B.223: Bottom-fiber strains—Girder 7—C7 .................................................................... 409 Figure B.224: Bottom-fiber strains—Girder 7—C8 .................................................................... 410 Figure B.225: Bottom-fiber strains—Girder 7—C9 .................................................................... 410 Figure B.226: Bottom-fiber strains—Girder 8—C1 .................................................................... 411
xxxii
Figure B.227: Bottom-fiber strains—Girder 8—C2 .................................................................... 412 Figure B.228: Bottom-fiber strains—Girder 8—C3 .................................................................... 412 Figure B.229: Bottom-fiber strains—Girder 8—C4 .................................................................... 413 Figure B.230: Bottom-fiber strains—Girder 8—C5 .................................................................... 413 Figure B.231: Bottom-fiber strains—Girder 8—C6 .................................................................... 414 Figure B.232: Bottom-fiber strains—Girder 8—C7 .................................................................... 414 Figure B.233: Bottom-fiber strains—Girder 8—C8 .................................................................... 415 Figure B.234: Bottom-fiber strains—Girder 8—C9 .................................................................... 415 Figure D.1: Crack-opening displacements—24 hrs ............................................................... 438 Figure D.2: Deflections—24 hrs—Girder 7 ............................................................................ 439 Figure D.3: Deflections—24 hrs—Girder 8 ............................................................................ 439 Figure D.4: Bottom-fiber strains—24 hrs—Girder 7—within 80 in. from diaphragm .............. 440 Figure D.5: Bottom-fiber strains—24 hrs—Girder 7—beyond 80 in. from diaphragm ........... 440 Figure D.6: Bottom-fiber strains—24 hrs—Girder 8—within 80 in. from diaphragm .............. 441 Figure D.7: Bottom-fiber strains—24 hrs—Girder 8—beyond 80 in. from diaphragm ........... 441 Figure D.8: Bottom-fiber strains—24 hrs—FRP near crack locations ................................... 442 Figure D.9: Bottom-fiber strain and COD—24 hrs—Girder 7—Span 10 ............................... 442 Figure D.10: Bottom-fiber strain and COD—24 hrs—Girder 7—Span 11 ............................... 443 Figure D.11: Bottom-fiber strain and COD—24 hrs—Girder 8—Span 10 ............................... 443 Figure D.12: Bottom-fiber strain and COD—24 hrs—Girder 8—Span 11 ............................... 444 Figure F.1: Original deflection results—Girder 7 ................................................................... 466 Figure F.2: Original deflection results—Girder 8 ................................................................... 467 Figure F.3: Original deflection results—Girder 7—Span 10 .................................................. 467 Figure F.4: Adjusted deflection results—D7_10_A ................................................................ 468 Figure F.5: Adjusted deflection results—D7_10_B ................................................................ 468 Figure F.6: Adjusted deflection results—Girder 7—Span 10 ................................................ 469 Figure F.7: Final deflection results—Girder 7—Span 10 ....................................................... 469 Figure F.8: Original deflection results—Girder 7—Span 11 .................................................. 470 Figure F.9: Adjusted deflection results—D7_11_C ............................................................... 470 Figure F.10: Adjusted deflection results—D7_11_D ............................................................... 471 Figure F.11: Adjusted deflection results—D7_11_E ................................................................ 471 Figure F.12: Adjusted deflection results—D7_11_F ................................................................ 472 Figure F.13: Adjusted deflection results—Girder 7—Span 11 ................................................ 472 Figure F.14: Final deflection results—Girder 7—Span 11 ....................................................... 473 Figure F.15: Original deflection results—Girder 8—Span 10 .................................................. 473 Figure F.16: Adjusted deflection results—D8_10_A ................................................................ 474 Figure F.17: Adjusted deflection results—D8_10_B ................................................................ 474
xxxiii
Figure F.18: Adjusted deflection results—Girder 8—Span 10 ................................................ 475 Figure F.19: Final deflection results—Girder 8—Span 10 ....................................................... 475 Figure F.20: Original deflection results—Girder 8—Span 11 .................................................. 476 Figure F.21: Adjusted deflection results—D8_11_C ............................................................... 476 Figure F.22: Adjusted deflection results—D8_11_D ............................................................... 477 Figure F.23: Adjusted deflection results—D8_11_E ................................................................ 477 Figure F.24: Adjusted deflection results—D8_11_F ................................................................ 478 Figure F.25: Adjusted deflection results—Girder 8—Span 11 ................................................ 478 Figure F.26: Final deflection results—Girder 8—Span 11 ....................................................... 479 Figure F.27: Final deflection results—Girder 7 ........................................................................ 479 Figure F.28: Final deflection results—Girder 8 ........................................................................ 480 Figure F.29: Crack location FRP strain measurements—original F8_10_CK ......................... 481 Figure F.30: Crack location FRP strain measurements—adjusted F8_10_CK ....................... 481 Figure G.1: Crack-opening displacements—A1 (east)........................................................... 483 Figure G.2: Crack-opening displacements—A9 (east)........................................................... 484 Figure G.3: Crack-opening displacements—A1 (east) + A9 (east) ........................................ 484 Figure G.4: Crack-opening displacements—superposition—actual and predicted ............... 485 Figure G.5: COD—superposition—actual and predicted—Girder 7 ...................................... 485 Figure G.6: COD—superposition—actual and predicted—Girder 8 ...................................... 486 Figure G.7: Deflections—A1 (east) ........................................................................................ 487 Figure G.8: Deflections—A9 (east) ........................................................................................ 488 Figure G.9: Deflections—A1 (east) + A9 (east)...................................................................... 488 Figure G.10: Deflections—superposition—actual and predicted ............................................. 489 Figure G.11: Deflections—superposition—actual and predicted—Girder 7............................. 489 Figure G.12: Deflections—superposition—actual and predicted—Girder 8............................. 490 Figure G.13: Bottom-fiber strains—A1 (east) ........................................................................... 491 Figure G.14: Bottom-fiber strains—A9 (east) ........................................................................... 492 Figure G.15: Bottom-fiber strains—A1 (east) + A9 (east) ........................................................ 492 Figure G.16: Bottom-fiber strains—superposition—actual and predicted ................................ 493 Figure G.17: Bottom-fiber strains—superposition—actual and predicted—Girder 7 ............... 493 Figure G.18: Bottom-fiber strains—superposition—actual and predicted—Girder 8 ............... 494 Figure I.1: Crack-opening displacements—LC 6.5—AE Span 10 (east) ............................. 501 Figure I.2: Crack-opening displacements—LC 6.5—AE Span 10 (both) ............................. 502 Figure I.3: Crack-opening displacements—LC 6.5—AE Span 11 (east) ............................. 502 Figure I.4: Crack-opening displacements—LC 6.5—AE Span 11 (both) ............................. 503 Figure I.5: Crack-opening displacements—LC 6—AE Span 10 (east) ................................ 503 Figure I.6: Crack-opening displacements—LC 6—AE Span 10 (both) ................................ 504
xxxiv
Figure I.7: Crack-opening displacements—LC 6—AE Span 11 (east) ................................ 504 Figure I.8: Crack-opening displacements—LC 6—AE Span 11 (both) ................................ 505 Figure I.9: Deflections—LC 6.5—AE Span 10 (east) ........................................................... 506 Figure I.10: Deflections—LC 6.5—AE Span 10 (both) ........................................................... 507 Figure I.11: Deflections—LC 6.5—AE Span 11 (east) ........................................................... 507 Figure I.12: Deflections—LC 6.5—AE Span 11 (both) ........................................................... 508 Figure I.13: Deflections—LC 6—AE Span 10 (east) .............................................................. 508 Figure I.14: Deflections—LC 6—AE Span 10 (both) .............................................................. 509 Figure I.15: Deflections—LC 6—AE Span 11 (east) .............................................................. 509 Figure I.16: Deflections—LC 6—AE Span 11 (both) .............................................................. 510 Figure I.17: Bottom-fiber strains—LC 6.5—AE Span 10 (east) .............................................. 511 Figure I.18: Bottom-fiber strains—LC 6.5—AE Span 10 (both) ............................................. 512 Figure I.19: Bottom-fiber strains—LC 6.5—AE Span 11 (east) .............................................. 512 Figure I.20: Bottom-fiber strains—LC 6.5—AE Span 11 (both) ............................................. 513 Figure I.21: Bottom-fiber strains—LC 6—AE Span 10 (east) ................................................. 513 Figure I.22: Bottom-fiber strains—LC 6—AE Span 10 (both) ................................................ 514 Figure I.23: Bottom-fiber strains—LC 6—AE Span 11 (east) ................................................. 514 Figure I.24: Bottom-fiber strains—LC 6—AE Span 11 (both) ................................................ 515 Figure I.25: Bottom-fiber strains—Girder 7—LC 6.5—AE Span 10 (east) ............................. 516 Figure I.26: Bottom-fiber strains—Girder 7—LC 6.5—AE Span 10 (both) ............................. 517 Figure I.27: Bottom-fiber strains—Girder 7—LC 6.5—AE Span 11 (east) ............................. 517 Figure I.28: Bottom-fiber strains—Girder 7—LC 6.5—AE Span 11 (both) ............................. 518 Figure I.29: Bottom-fiber strains—Girder 7—LC 6—AE Span 10 (east) ................................ 518 Figure I.30: Bottom-fiber strains—Girder 7—LC 6—AE Span 10 (both) ................................ 519 Figure I.31: Bottom-fiber strains—Girder 7—LC 6—AE Span 11 (east) ................................ 519 Figure I.32: Bottom-fiber strains—Girder 7—LC 6—AE Span 11 (both) ................................ 520 Figure I.33: Bottom-fiber strains—Girder 8—LC 6.5—AE Span 10 (east) ............................. 521 Figure I.34: Bottom-fiber strains—Girder 8—LC 6.5—AE Span 10 (both) ............................. 522 Figure I.35: Bottom-fiber strains—Girder 8—LC 6.5—AE Span 11 (east) ............................. 522 Figure I.36: Bottom-fiber strains—Girder 8—LC 6.5—AE Span 11 (both) ............................. 523 Figure I.37: Bottom-fiber strains—Girder 8—LC 6—AE Span 10 (east) ................................ 523 Figure I.38: Bottom-fiber strains—Girder 8—LC 6—AE Span 10 (both) ................................ 524 Figure I.39: Bottom-fiber strains—Girder 8—LC 6—AE Span 11 (east) ................................ 524 Figure I.40: Bottom-fiber strains—Girder 8—LC 6—AE Span 11 (both) ................................ 525 Figure J.1: Transverse load position—AE testing—Lane C—east truck .............................. 527 Figure J.2: Transverse load position—AE testing—Lane C—both trucks ............................ 527 Figure J.3: Longitudinal stop positions—AE testing—Spans 10 and 11 ............................... 528
xxxv
Figure K.1: Steel frame false supports................................................................................... 539 Figure K.2: Bearing pad between false support and exterior girder ...................................... 540 Figure K.3: Bearing pad location with space between the bearing pad and girder ............... 541 Figure K.4: Bearing pad location without space between the bearing pad and girder .......... 541 Figure K.5: Bearing pad in contact with girder during pre-repair testing ............................... 542 Figure K.6: Use of reciprocating saw during bearing pad removal ........................................ 543 Figure K.7: Use of propane torch during bearing pad removal .............................................. 544 Figure K.8: Successful removal of bearing pad ..................................................................... 545 Figure K.9: Bearing pad after forceful removal ...................................................................... 545 Figure K.10: Deflections—A1 ................................................................................................... 547 Figure K.11: Deflections—A9 ................................................................................................... 548 Figure K.12: Deflections—C1 .................................................................................................. 549 Figure K.13: Deflections—C9 .................................................................................................. 550 Figure K.14: Crack-opening displacements—pre- and post-repair—A4 ................................. 552 Figure K.15: Crack-opening displacements—pre- and post-repair—A7 ................................. 552 Figure K.16: Crack-opening displacements—pre- and post-repair—C4 ................................. 553 Figure K.17: Crack-opening displacements—pre- and post-repair—C7 ................................. 553 Figure K.18: Bottom-fiber strain—A4 ....................................................................................... 555 Figure K.19: Strain profile—Girder 7—Section 1—A4 ............................................................. 556 Figure K.20: Strain profile—Girder 8—Section 1—A4 ............................................................. 556 Figure K.21: Bottom-fiber strain—C4 ....................................................................................... 557 Figure K.22: Strain profile—Girder 7—Section 1—C4 ............................................................. 558 Figure K.23: Strain profile—Girder 8—Section 1—C4 ............................................................. 558 Figure K.24: Bottom-fiber strain—A7 ....................................................................................... 559 Figure K.25: Strain profile—Girder 7—Section 4—A7 ............................................................. 560 Figure K.26: Strain profile—Girder 8—Section 4—A7 ............................................................. 560 Figure K.27: Bottom-fiber strain—C7 ....................................................................................... 561 Figure K.28: Strain profile—Girder 7—Section 4—C7 ............................................................. 562 Figure K.29: Strain profile—Girder 8—Section 4—C7 ............................................................. 562 Figure K.30: Deflections—superposition—A1 and A9 ............................................................. 563 Figure K.31: Deflections—superposition—A1 + A9 ................................................................. 564 Figure M.1: Strain gage installation—applying degreaser to gage location ........................... 572 Figure M.2: Strain gage installation—removal of surface irregularities .................................. 572 Figure M.3: Strain gage installation—initial surface cleaning ................................................. 573 Figure M.4: Strain gage installation—clean surface prepared for solid epoxy ....................... 573 Figure M.5: Strain gage installation—application of solid epoxy ............................................ 574 Figure M.6: Strain gage installation—epoxy surface .............................................................. 574
xxxvi
Figure M.7: Strain gage installation—rubber coating for moisture protection ........................ 575 Figure M.8: Strain gage installation—mastic tape for mechanical protection ........................ 575 Figure M.9: Strain gage installation—gage application with thin epoxy ................................. 576 Figure M.10: Strain gage installation—gage applied to FRP reinforcement ............................ 576 Figure M.11: Strain gage installation—rubber coating for moisture protection ........................ 577 Figure M.12: Strain gage installation—mastic tape for mechanical protection ........................ 577 Figure N.1: Cracked girder with continuity reinforcement details (Barnes et al. 2006) .......... 580 Figure N.2: Longitudinal configuration profile for FRP (adapted from Barnes et al. 2006) .... 581 Figure N.3: Cross-sectional configuration of FRP—near diaphragm (Swenson 2003) ......... 582 Figure N.4: Cross-sectional configuration of FRP—typical (Swenson 2003) ........................ 583 Figure N.5: Factored shear demand—simply supported (Swenson 2003) ............................ 585 Figure N.6: Factored moment demand—simply supported (Swenson 2003) ........................ 586 Figure N.7: Typical girder-deck composite cross section ...................................................... 590 Figure N.8: Continuity reinforcement—typical BT-54 cross section
(ALDOT 1988; Swenson 2003) ........................................................................... 592 Figure N.9: Cross-sectional configuration of FRP—near diaphragm (Swenson 2003) ......... 593 Figure N.10: Cross-sectional configuration of FRP—typical (Swenson 2003) ........................ 593 Figure N.11: Vertical shear reinforcement—location and spacing
(ALDOT 1988; Swenson 2003) ........................................................................... 595 Figure N.12: Longitudinal configuration profile for five-layer FRP reinforcement system ........ 617
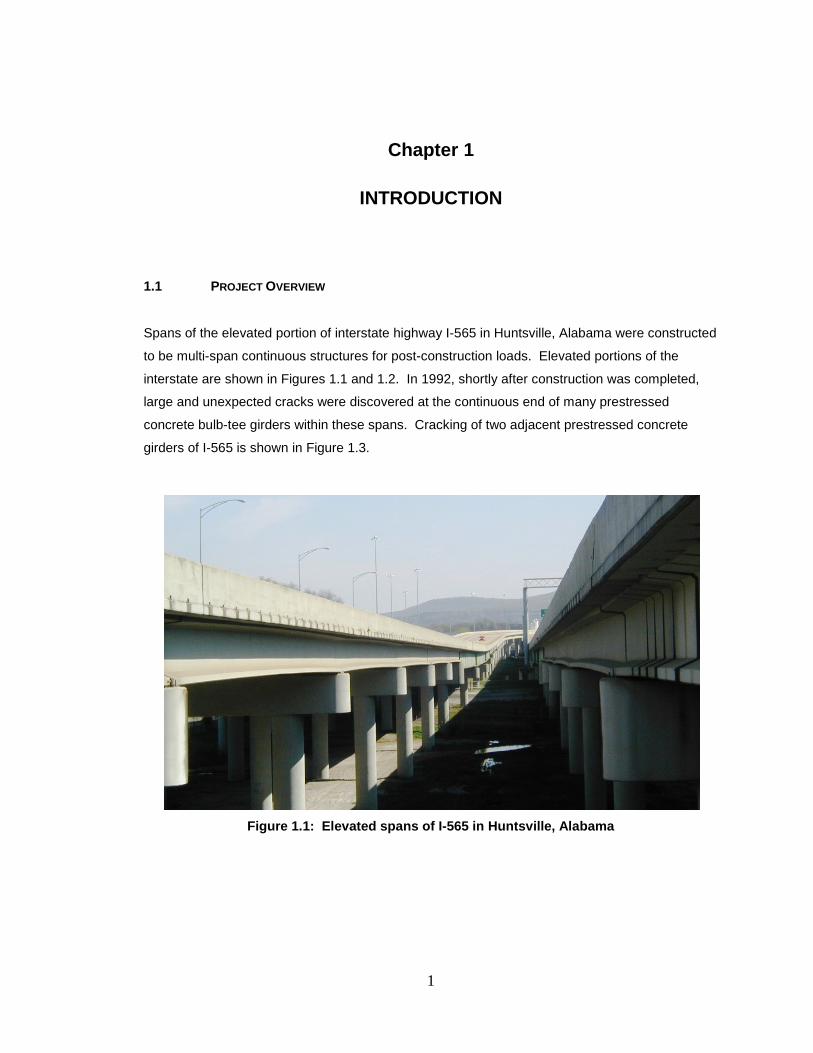
1
Chapter 1
INTRODUCTION
1.1 PROJECT OVERVIEW
Spans of the elevated portion of interstate highway I-565 in Huntsville, Alabama were constructed
to be multi-span continuous structures for post-construction loads. Elevated portions of the
interstate are shown in Figures 1.1 and 1.2. In 1992, shortly after construction was completed,
large and unexpected cracks were discovered at the continuous end of many prestressed
concrete bulb-tee girders within these spans. Cracking of two adjacent prestressed concrete
girders of I-565 is shown in Figure 1.3.
Figure 1.1: Elevated spans of I-565 in Huntsville, Alabama
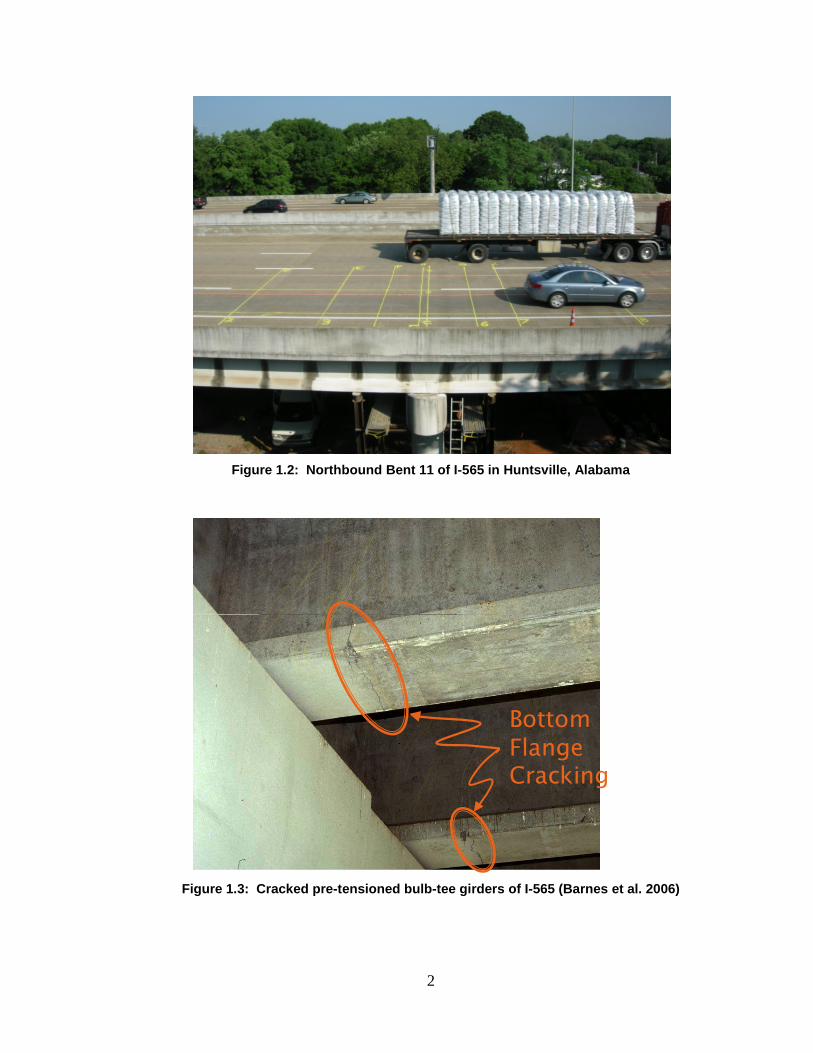
2
Figure 1.2: Northbound Bent 11 of I-565 in Huntsville, Alabama
Figure 1.3: Cracked pre-tensioned bulb-tee girders of I-565 (Barnes et al. 2006)
Bottom Flange Cracking
3
The Alabama Department of Transportation (ALDOT) installed false supports under damaged
girders to safely allow for the investigation of the cause of damage and to determine potential
repair solutions, while preventing catastrophic collapse in case of further deterioration of bridge
girders.
Previous investigations conducted by Alabama Department of Transportation (ALDOT)
and Auburn University Highway Research Center (AUHRC) personnel resulted in determinations
that the cracking was a result of restrained thermal deformations and inadequate reinforcement
details, and that the cracking compromised the strength of the girder end regions (ALDOT 1994;
Gao 2003; Swenson 2003). An externally bonded wet lay-up fiber-reinforced polymer (FRP)
repair scheme was proposed to repair damaged regions and address the perceived strength
deficiency (Swenson 2003). Analysis of pre- and post-repair structural responses to service-level
truck loads was recommended to assess the efficacy of this repair system.
Post-repair bridge testing and resulting conclusions are documented in this report.
Conclusions supported by post-repair bridge testing have been used to evaluate in-service
performance of the FRP reinforcement system and to propose design recommendations for repair
of conditions similar to those of the damaged spans of I-565 using FRP.
1.2 NEED FOR RESEARCH
Many states have bridge structures that contain spans that were constructed to be multi-span
continuous structures for post-construction loads. The National Cooperative Highway Research
Program (NCHRP) published a report titled Connection of Simple-Span Precast Concrete Girders
for Continuity (NCHRP Report 519) that investigated some of the different continuous-for-live-
load connections used in various states (Miller et al. 2004). The damaged girders of I-565 in
Huntsville, Alabama are reviewed within NCHRP Report 519, which states that very few multi-
span continuous bridge structures exhibit significant cracking similar to what was observed on the
Alabama bridge structures. However, NCHRP Report 519 does state that various respondents to
their survey indicated difficulties associated with the positive bending moment continuity
reinforcement during girder fabrication and bridge construction.
Although NCHRP Report 519 suggests that the damage observed in the Alabama bridge
girders is unique, Auburn University researchers have had several conversations with
transportation officials and consulting engineers from around the United States that indicate
otherwise. NCHRP Report 519 also stated that Alabama bridge structures continued to perform
as designed (Miller et al. 2004). However, this continued performance is with respect to service
conditions and not with respect to the strength-limit-state.
Bridge structures exhibiting damage conditions similar to those observed in the damaged
spans of I-565 in Huntsville may adequately resist service loads, but repairs may be necessary to
ensure safety for a design overload event, without requiring complete reconstruction. It is
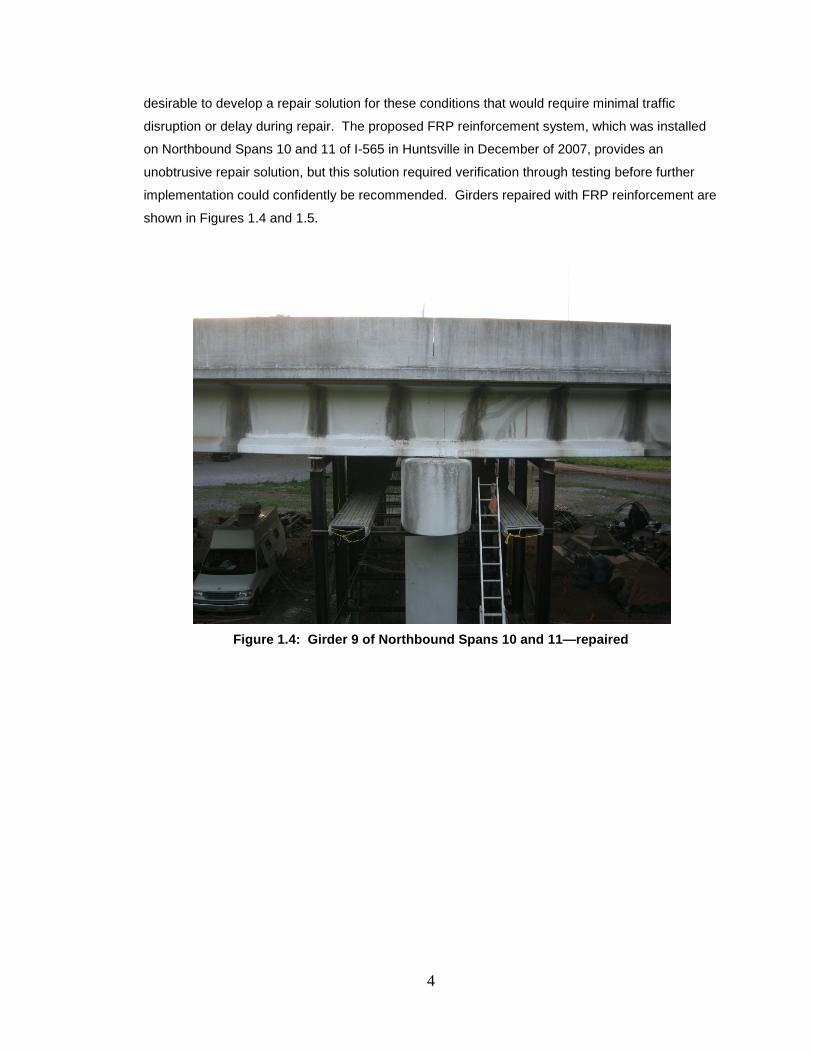
4
desirable to develop a repair solution for these conditions that would require minimal traffic
disruption or delay during repair. The proposed FRP reinforcement system, which was installed
on Northbound Spans 10 and 11 of I-565 in Huntsville in December of 2007, provides an
unobtrusive repair solution, but this solution required verification through testing before further
implementation could confidently be recommended. Girders repaired with FRP reinforcement are
shown in Figures 1.4 and 1.5.
Figure 1.4: Girder 9 of Northbound Spans 10 and 11—repaired
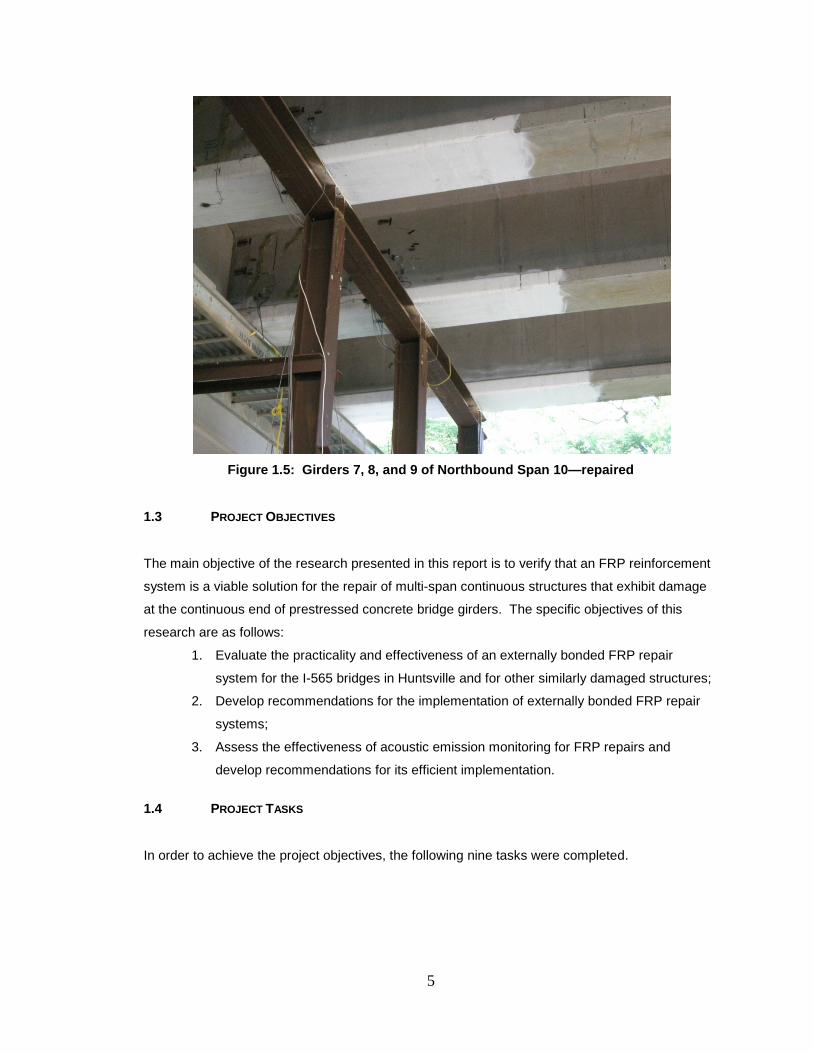
5
Figure 1.5: Girders 7, 8, and 9 of Northbound Span 10—repaired
1.3 PROJECT OBJECTIVES
The main objective of the research presented in this report is to verify that an FRP reinforcement
system is a viable solution for the repair of multi-span continuous structures that exhibit damage
at the continuous end of prestressed concrete bridge girders. The specific objectives of this
research are as follows:
1. Evaluate the practicality and effectiveness of an externally bonded FRP repair
system for the I-565 bridges in Huntsville and for other similarly damaged structures;
2. Develop recommendations for the implementation of externally bonded FRP repair
systems;
3. Assess the effectiveness of acoustic emission monitoring for FRP repairs and
develop recommendations for its efficient implementation.
1.4 PROJECT TASKS
In order to achieve the project objectives, the following nine tasks were completed.
6
1.4.1 Task 1: Preliminary Engineering for FRP Repair
Auburn University investigators cooperated with ALDOT Bridge Bureau personnel to develop
design drawings and specifications for the FRP repair of the I-565 structure. The design
drawings and specifications were translated from an FRP strengthening system proposed during
a previous study conducted by the Auburn University Highway Research Center (AUHRC).
ALDOT and AUHRC personnel cooperated to develop a special provision for the contracting and
construction process of the FRP repair system.
1.4.2 Task 2: Literature Review on Current State of the Art
Literature was reviewed to identify the most effective measurement techniques for assessing the
performance of the I-565 structure before and after the installation of the FRP repair system.
Methods for monitoring deformations that were investigated included the measurement of crack-
opening displacements, girder deflections, and surface strains of concrete and FRP. Methods for
monitoring acoustic emissions (AE) to quantify girder damage were also investigated.
1.4.3 Task 3: Preliminary Load Testing
Preliminary load testing was conducted on June 1 and 2, 2005 to establish benchmark data for
comparison to post-repair structural behavior. Crack-opening displacements, girder deflections,
concrete surface strains, and acoustic emissions were monitored in response to specified
positioning of load-test trucks provided by ALDOT.
1.4.4 Task 4: Construction Monitoring
The FRP reinforcement system was installed on the investigated spans during December, 2007.
An Auburn University researcher documented the installation process.
1.4.5 Task 5: Post-Repair Load Testing
Post-repair load testing was conducted on May 25 and 26, 2010. Additional strain gages were
installed on the FRP surface prior to testing. Structural behavior was monitored in response to
the same truck positions and testing procedures of the preliminary load testing. The post-repair
load testing represented long-term testing of the structure after two years of service. During
those two years, the repaired structure was subjected to thermal variations similar to those that
were the cause of initial cracking.
7
1.4.6 Task 6: Performance Monitoring under Traffic Loads
The bridge structure was also monitored under normal traffic loads during post-repair testing.
Sensors that monitored the structural behavior in response to post-repair load testing were
monitored at fifteen minute intervals for the twenty-four hours between the two nights of load
testing.
1.4.7 Task 7: Evaluation of Bridge Performance
Structural responses measured during preliminary load testing, post-repair load testing, and post-
repair bridge monitoring under normal traffic loads were analyzed by Auburn University
researcher personnel. This task included the determination of pre-repair structural behavior and
an assessment of the post-repair performance of the FRP reinforcement system.
1.4.8 Task 8: Evaluation of Acoustic Emission Monitoring
The overall effectiveness and practicality of using AE monitoring as a tool for the nondestructive
evaluation of concrete bridges was evaluated by Auburn University research personnel.
1.4.9 Task 9: Preparation of Final Project Reports
This report addresses performance of the FRP repair of the I-565 structure. The report includes
further discussion of tasks 1, 3, 4, 5, 6, and 7. Further discussion of tasks 2 and 8, which pertain
to AE testing, has been presented by Hadzor et al. (2011).
1.5 REPORT ORGANIZATION
A summary of the project background and previous research is presented in Chapter 2 of this
report. The project background includes construction details and the cause and location of
damage that was observed soon after the completion of construction. Previous research includes
analyses that assisted with the design of an FRP reinforcement system, analysis of load testing
measurements before the installation of the repair system, and the development of a finite-
element model that was used to analyze modeled bridge behavior before and after the installation
of FRP reinforcement. The chapter concludes with a summary of the FRP reinforcement
installation process.
Chapter 3 contains a discussion of the bridge instrumentation details. This discussion
includes the locations and installation procedures for bridge testing sensors. The sensors
installed include deflectometers, crack-opening displacement gages, and surface-mounted strain
gages.

8
Chapter 4 contains a detailed explanation of bridge testing procedures. The load testing
procedures include truck weights and stop positions. The procedures for monitoring bridge
behavior for a twenty-four hour period are also discussed.
Chapter 5 contains a presentation of the results of analysis following the post-repair
bridge testing. This analysis includes comparisons of pre- and post-repair support conditions and
post-repair behavior. Theoretical analysis of the behavior of a two-span continuous bridge
structure in response to ambient thermal conditions is presented. The measured behavior in
response to thermal conditions observed during bridge monitoring is also presented.
Chapter 6 includes a recommended design procedure for implementation of this repair
solution on similar bridge structures that exhibit similar damage. An example of the design
procedure is presented in Appendix N. The example is a redesign of an FRP reinforcement
system for the investigated bridge structure using the same FRP material that has already been
installed.
Chapter 7 includes a summary of conclusions supported within this report, and Chapter 8
is a discussion of recommendations for further research and the installation of similar repair
systems for similar conditions.
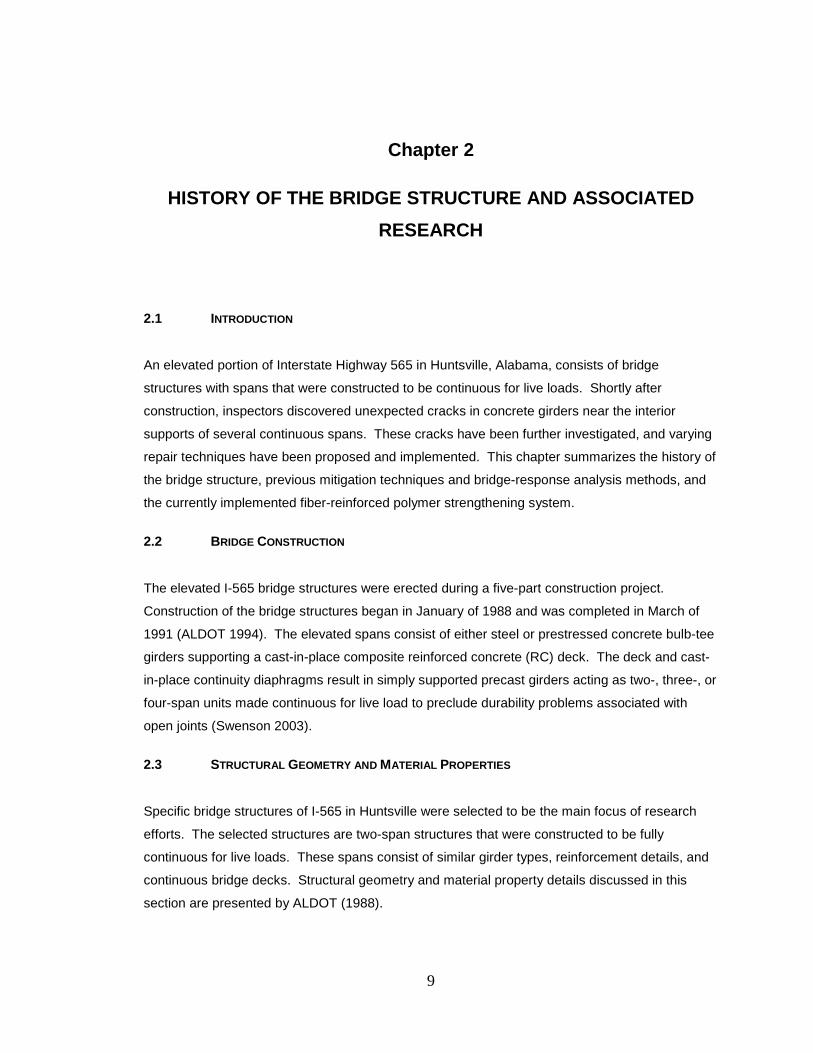
9
Chapter 2
HISTORY OF THE BRIDGE STRUCTURE AND ASSOCIATED RESEARCH
2.1 INTRODUCTION
An elevated portion of Interstate Highway 565 in Huntsville, Alabama, consists of bridge
structures with spans that were constructed to be continuous for live loads. Shortly after
construction, inspectors discovered unexpected cracks in concrete girders near the interior
supports of several continuous spans. These cracks have been further investigated, and varying
repair techniques have been proposed and implemented. This chapter summarizes the history of
the bridge structure, previous mitigation techniques and bridge-response analysis methods, and
the currently implemented fiber-reinforced polymer strengthening system.
2.2 BRIDGE CONSTRUCTION
The elevated I-565 bridge structures were erected during a five-part construction project.
Construction of the bridge structures began in January of 1988 and was completed in March of
1991 (ALDOT 1994). The elevated spans consist of either steel or prestressed concrete bulb-tee
girders supporting a cast-in-place composite reinforced concrete (RC) deck. The deck and cast-
in-place continuity diaphragms result in simply supported precast girders acting as two-, three-, or
four-span units made continuous for live load to preclude durability problems associated with
open joints (Swenson 2003).
2.3 STRUCTURAL GEOMETRY AND MATERIAL PROPERTIES
Specific bridge structures of I-565 in Huntsville were selected to be the main focus of research
efforts. The selected structures are two-span structures that were constructed to be fully
continuous for live loads. These spans consist of similar girder types, reinforcement details, and
continuous bridge decks. Structural geometry and material property details discussed in this
section are presented by ALDOT (1988).
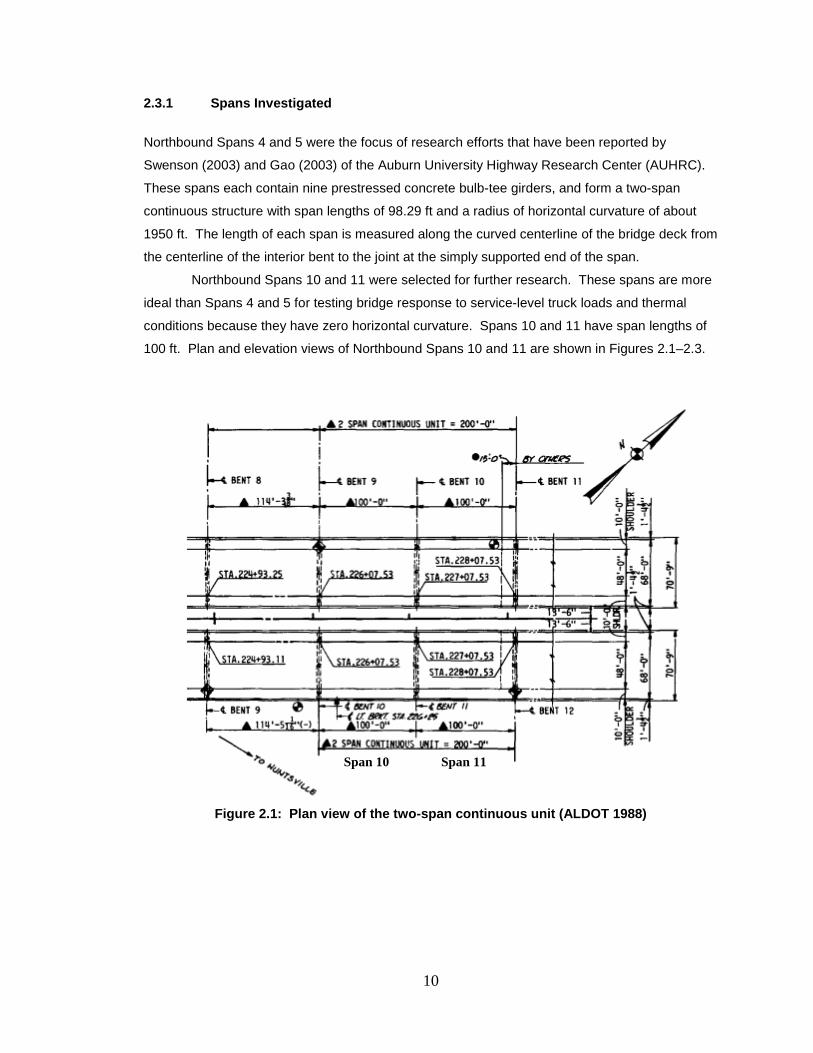
10
2.3.1 Spans Investigated
Northbound Spans 4 and 5 were the focus of research efforts that have been reported by
Swenson (2003) and Gao (2003) of the Auburn University Highway Research Center (AUHRC).
These spans each contain nine prestressed concrete bulb-tee girders, and form a two-span
continuous structure with span lengths of 98.29 ft and a radius of horizontal curvature of about
1950 ft. The length of each span is measured along the curved centerline of the bridge deck from
the centerline of the interior bent to the joint at the simply supported end of the span.
Northbound Spans 10 and 11 were selected for further research. These spans are more
ideal than Spans 4 and 5 for testing bridge response to service-level truck loads and thermal
conditions because they have zero horizontal curvature. Spans 10 and 11 have span lengths of
100 ft. Plan and elevation views of Northbound Spans 10 and 11 are shown in Figures 2.1–2.3.
Figure 2.1: Plan view of the two-span continuous unit (ALDOT 1988)
Span 10 Span 11
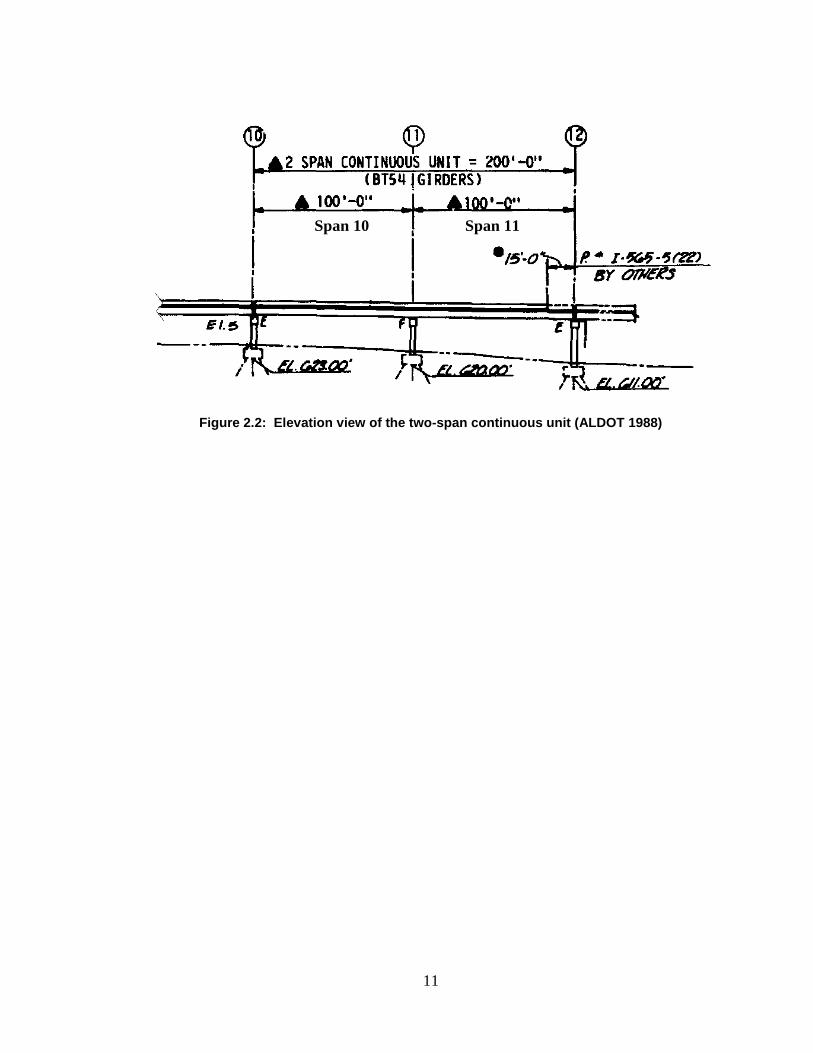
11
Figure 2.2: Elevation view of the two-span continuous unit (ALDOT 1988)
Span 10 Span 11
12
Figure 2.3: Detailed plan view of the two-span continuous unit (ALDOT 1988)
Span 10 Span 11

13
2.3.2 Girder Types
Over the length of the elevated portion of I-565, different prestressed concrete girder types were
used within different spans. These girder types include AASHTO girders (Types I, III, and IV) and
bulb-tee girders (BT-54 and BT-63). The AASHTO girders were prevalent in the original design,
but bulb-tee girders were suggested for a majority of spans during a value engineering redesign
of the bridge structures. The final design consisted of 246 AASHTO girders, 796 BT-63 girders,
and 1292 BT-54 girders (ALDOT 1994). The two-span continuous structure selected for bridge
response testing (Spans 10 and 11) was constructed with BT-54 girders that, over time, exhibited
cracking near their continuous ends. The dimensions of a typical BT-54 girder are shown in
Figure 2.4.
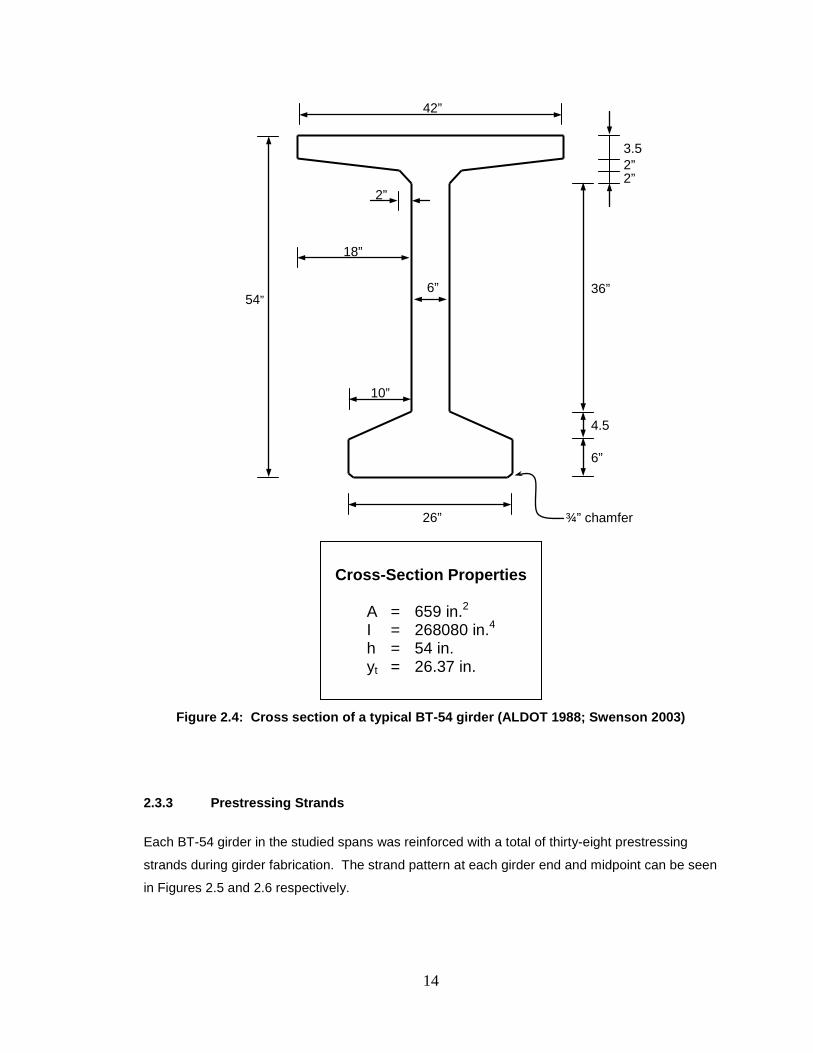
14
Figure 2.4: Cross section of a typical BT-54 girder (ALDOT 1988; Swenson 2003)
2.3.3 Prestressing Strands
Each BT-54 girder in the studied spans was reinforced with a total of thirty-eight prestressing
strands during girder fabrication. The strand pattern at each girder end and midpoint can be seen
in Figures 2.5 and 2.6 respectively.
Cross-Section Properties
A = 659 in.2 I = 268080 in.4 h = 54 in. yt = 26.37 in.
3.5 2”
2”
36”
4.5
6”
26”
42”
18”
10”
2”
¾” chamfer
54” 6”
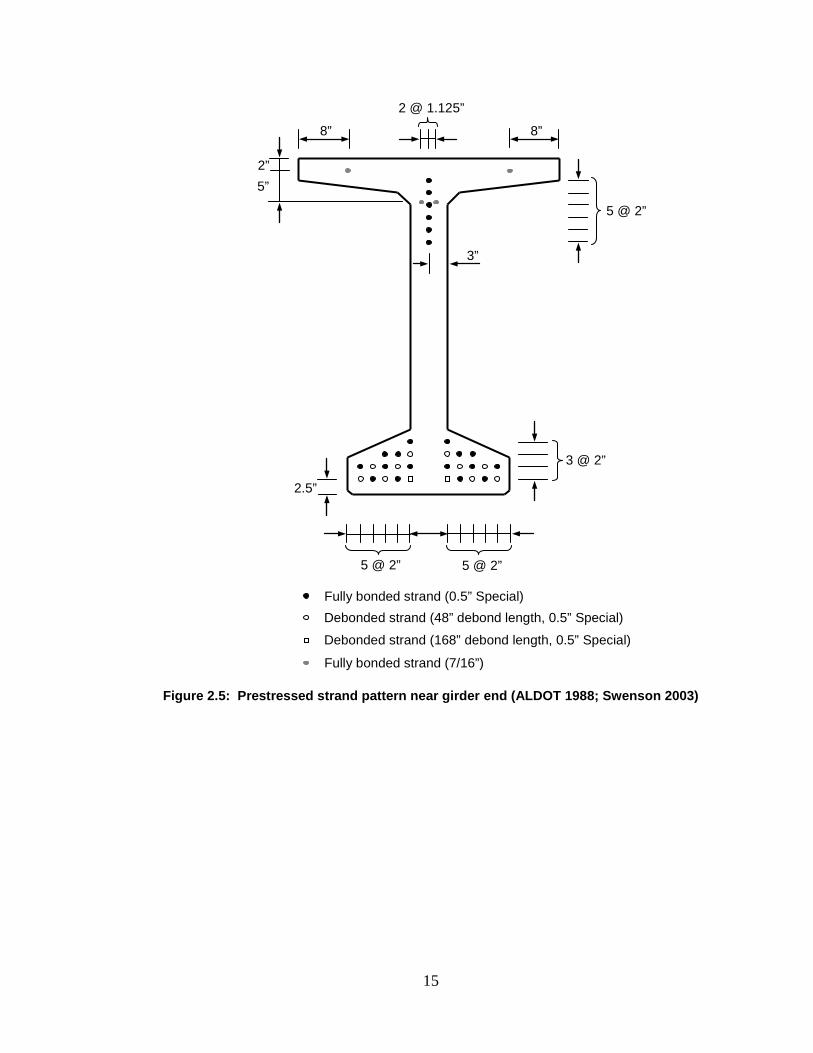
15
Figure 2.5: Prestressed strand pattern near girder end (ALDOT 1988; Swenson 2003)
3 @ 2”
2.5”
5 @ 2” 5 @ 2”
5 @ 2”
2 @ 1.125”
8” 8”
2” 5”
3”
Fully bonded strand (0.5” Special) Debonded strand (48” debond length, 0.5” Special)
Debonded strand (168” debond length, 0.5” Special)
Fully bonded strand (7/16”)
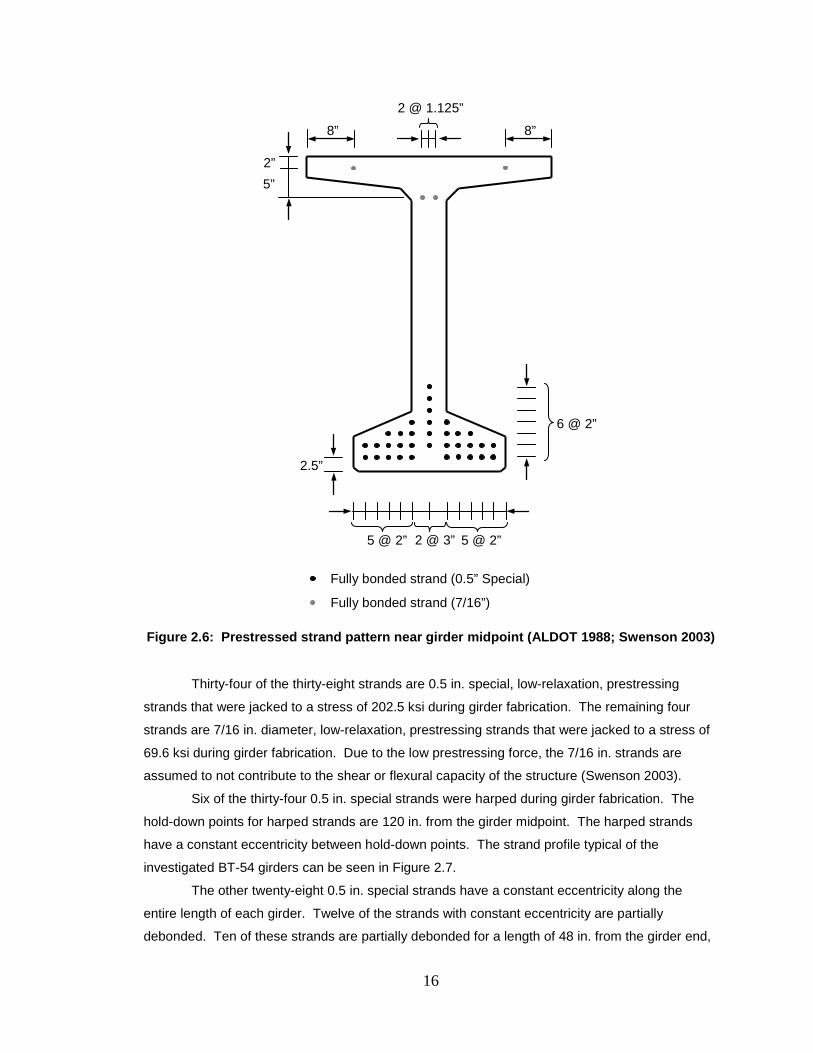
16
Figure 2.6: Prestressed strand pattern near girder midpoint (ALDOT 1988; Swenson 2003)
Thirty-four of the thirty-eight strands are 0.5 in. special, low-relaxation, prestressing
strands that were jacked to a stress of 202.5 ksi during girder fabrication. The remaining four
strands are 7/16 in. diameter, low-relaxation, prestressing strands that were jacked to a stress of
69.6 ksi during girder fabrication. Due to the low prestressing force, the 7/16 in. strands are
assumed to not contribute to the shear or flexural capacity of the structure (Swenson 2003). Six of the thirty-four 0.5 in. special strands were harped during girder fabrication. The
hold-down points for harped strands are 120 in. from the girder midpoint. The harped strands
have a constant eccentricity between hold-down points. The strand profile typical of the
investigated BT-54 girders can be seen in Figure 2.7.
The other twenty-eight 0.5 in. special strands have a constant eccentricity along the
entire length of each girder. Twelve of the strands with constant eccentricity are partially
debonded. Ten of these strands are partially debonded for a length of 48 in. from the girder end,
Fully bonded strand (0.5” Special)
2 @ 1.125”
6 @ 2”
5 @ 2” 5 @ 2” 2 @ 3”
8” 8”
2” 5”
Fully bonded strand (7/16”)
2.5”

17
and the remaining two strands are partially debonded for a length of 168 in. from the girder end
(ALDOT 1988).
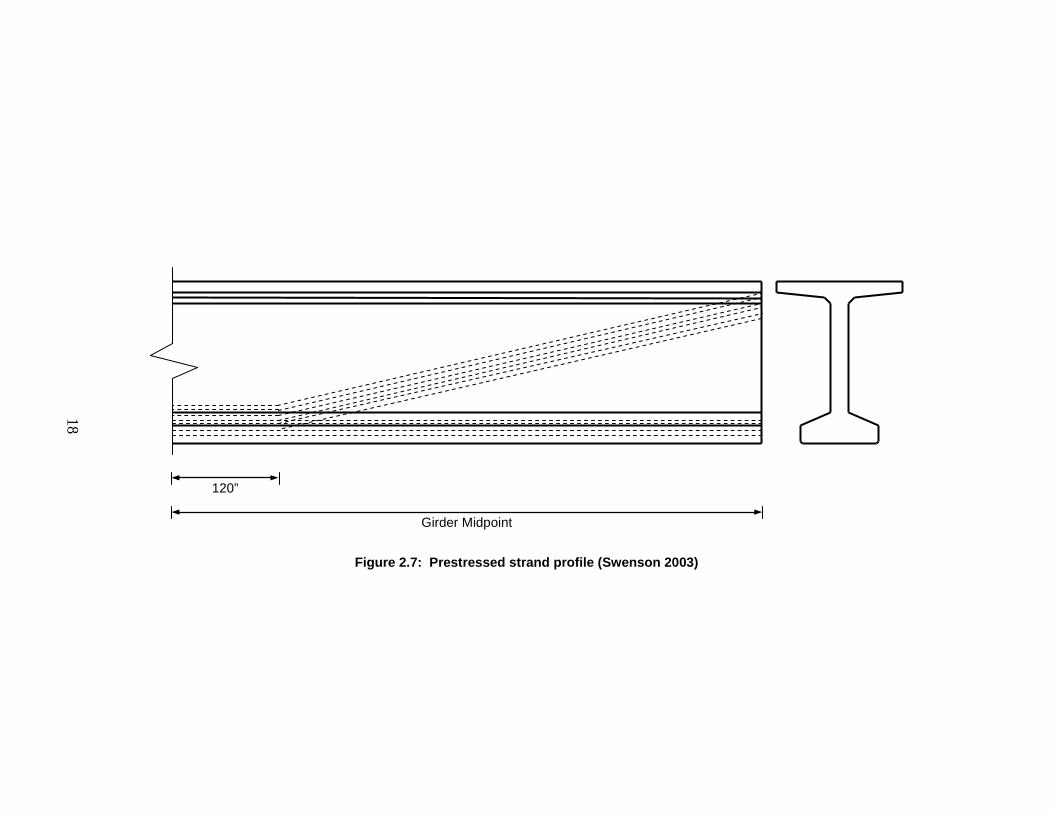
18
Figure 2.7: Prestressed strand profile (Swenson 2003)
120”
Girder Midpoint
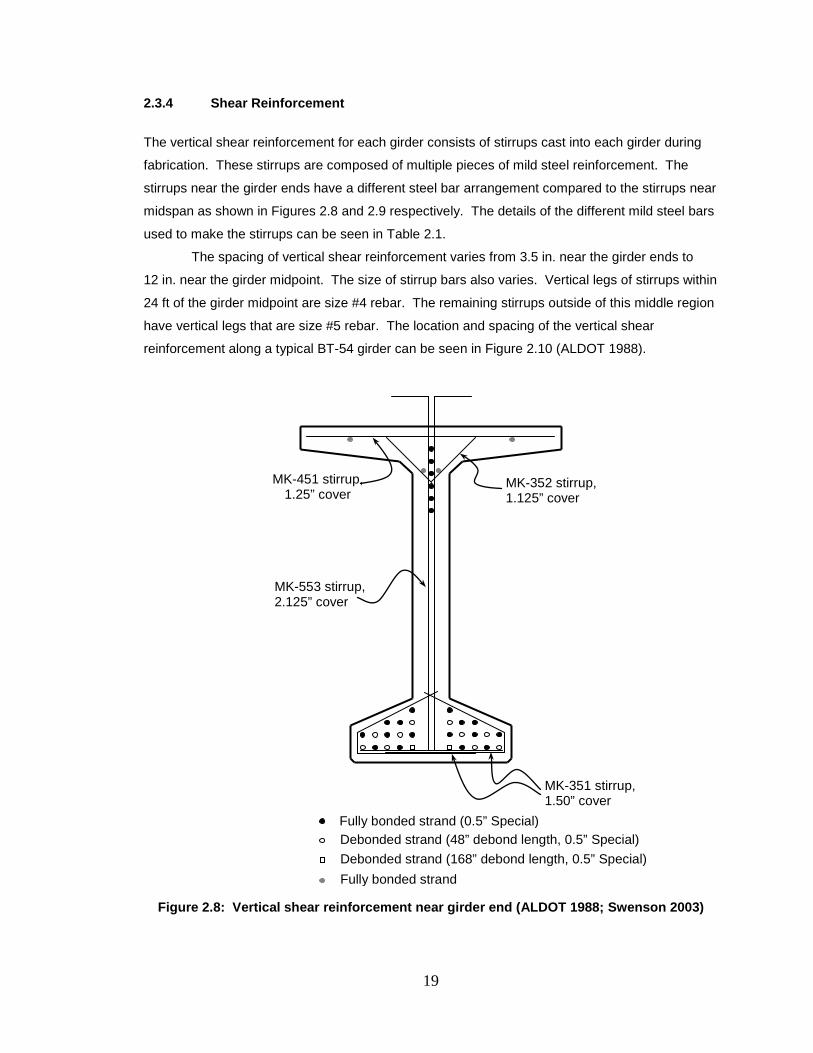
19
2.3.4 Shear Reinforcement
The vertical shear reinforcement for each girder consists of stirrups cast into each girder during
fabrication. These stirrups are composed of multiple pieces of mild steel reinforcement. The
stirrups near the girder ends have a different steel bar arrangement compared to the stirrups near
midspan as shown in Figures 2.8 and 2.9 respectively. The details of the different mild steel bars
used to make the stirrups can be seen in Table 2.1.
The spacing of vertical shear reinforcement varies from 3.5 in. near the girder ends to
12 in. near the girder midpoint. The size of stirrup bars also varies. Vertical legs of stirrups within
24 ft of the girder midpoint are size #4 rebar. The remaining stirrups outside of this middle region
have vertical legs that are size #5 rebar. The location and spacing of the vertical shear
reinforcement along a typical BT-54 girder can be seen in Figure 2.10 (ALDOT 1988).
Figure 2.8: Vertical shear reinforcement near girder end (ALDOT 1988; Swenson 2003)
Fully bonded strand (0.5” Special) Debonded strand (48” debond length, 0.5” Special) Debonded strand (168” debond length, 0.5” Special) Fully bonded strand
MK-351 stirrup, 1.50” cover
MK-553 stirrup, 2.125” cover
MK-451 stirrup, 1.25” cover
MK-352 stirrup, 1.125” cover
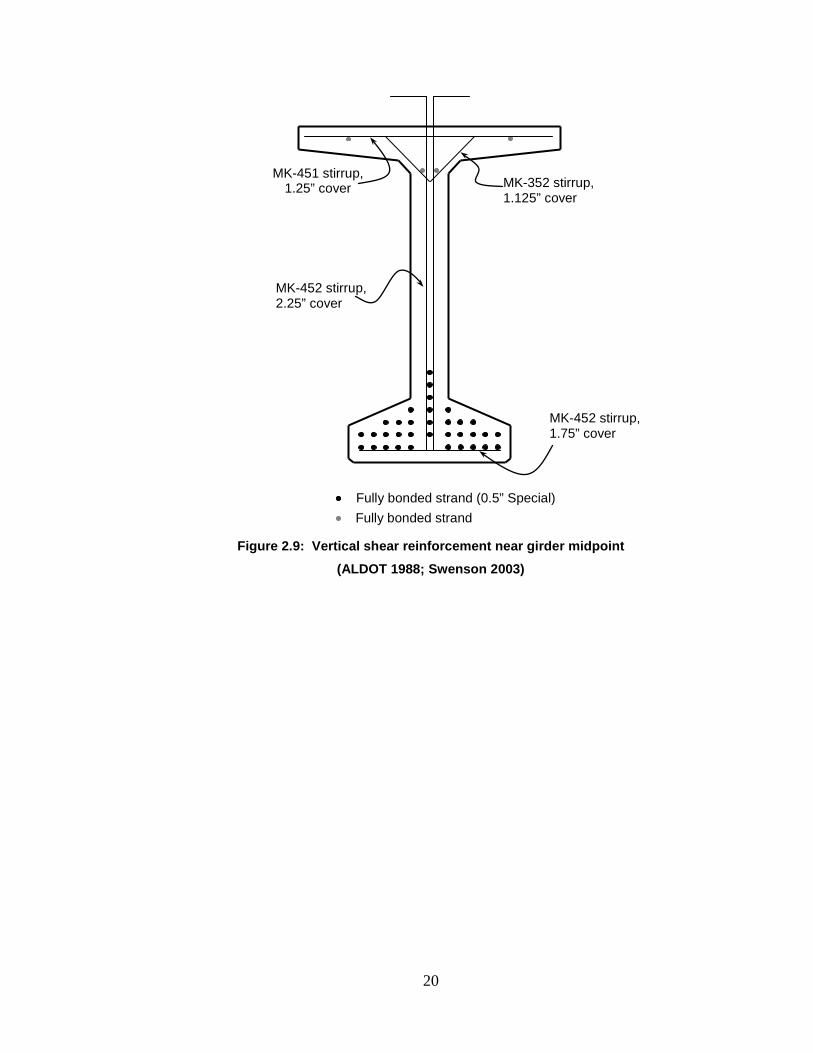
20
Figure 2.9: Vertical shear reinforcement near girder midpoint
(ALDOT 1988; Swenson 2003)
Fully bonded strand
MK-451 stirrup, 1.25” cover MK-352 stirrup,
1.125” cover
MK-452 stirrup, 2.25” cover
MK-452 stirrup, 1.75” cover
Fully bonded strand (0.5” Special)
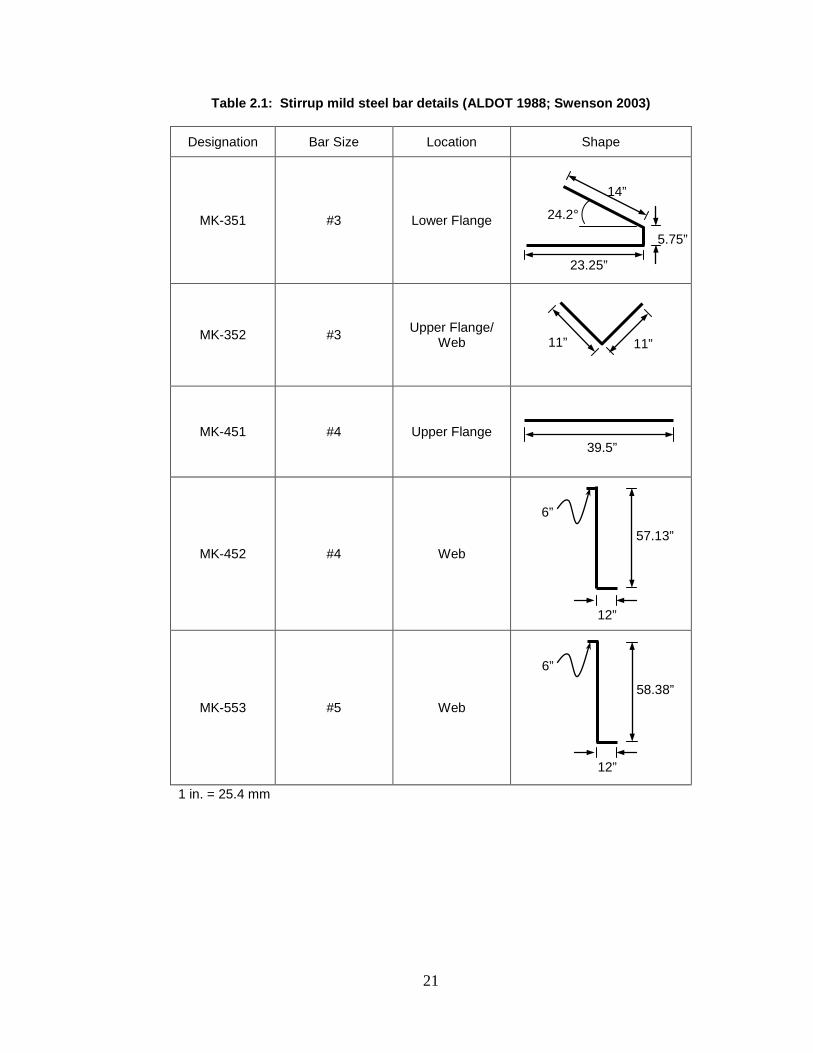
21
Table 2.1: Stirrup mild steel bar details (ALDOT 1988; Swenson 2003)
Designation Bar Size Location Shape
MK-351 #3 Lower Flange
MK-352 #3 Upper Flange/ Web
MK-451 #4 Upper Flange
MK-452 #4 Web
MK-553 #5 Web
1 in. = 25.4 mm
23.25”
11” 11”
39.5”
12”
58.38”
6”
5.75”
14”
24.2°
57.13”
6”
12”
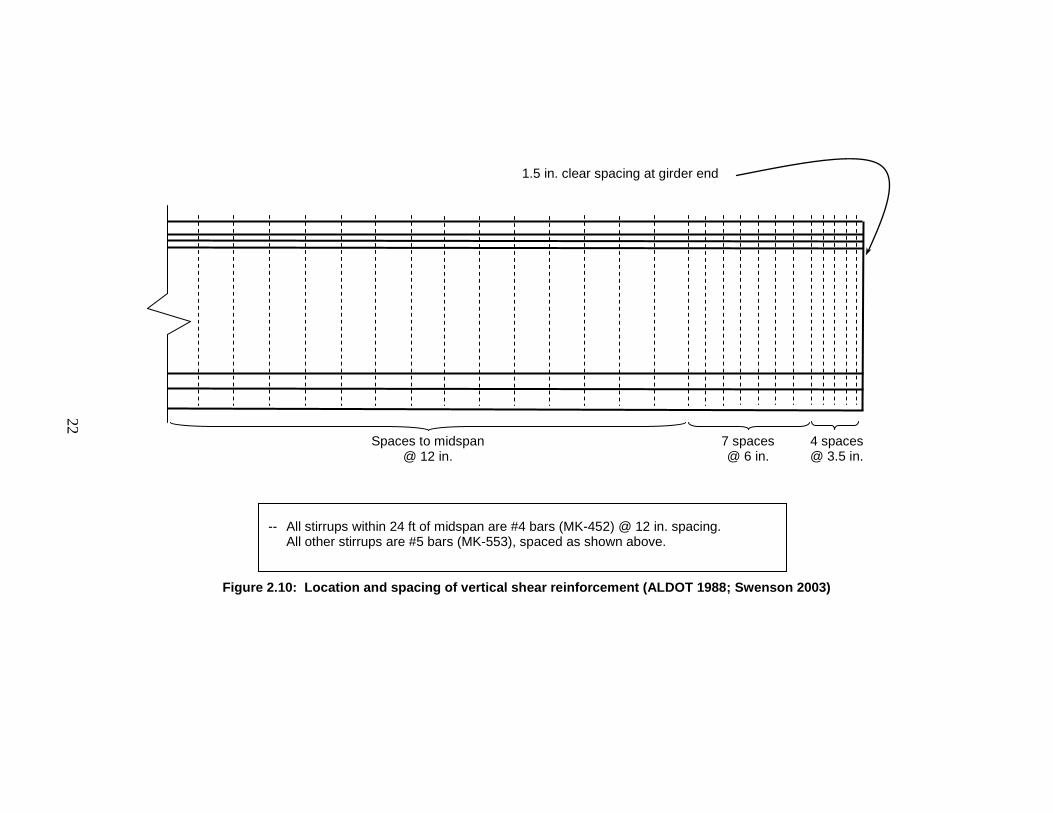
22
Figure 2.10: Location and spacing of vertical shear reinforcement (ALDOT 1988; Swenson 2003)
4 spaces @ 3.5 in.
7 spaces @ 6 in.
Spaces to midspan @ 12 in.
-- All stirrups within 24 ft of midspan are #4 bars (MK-452) @ 12 in. spacing. All other stirrups are #5 bars (MK-553), spaced as shown above.
1.5 in. clear spacing at girder end
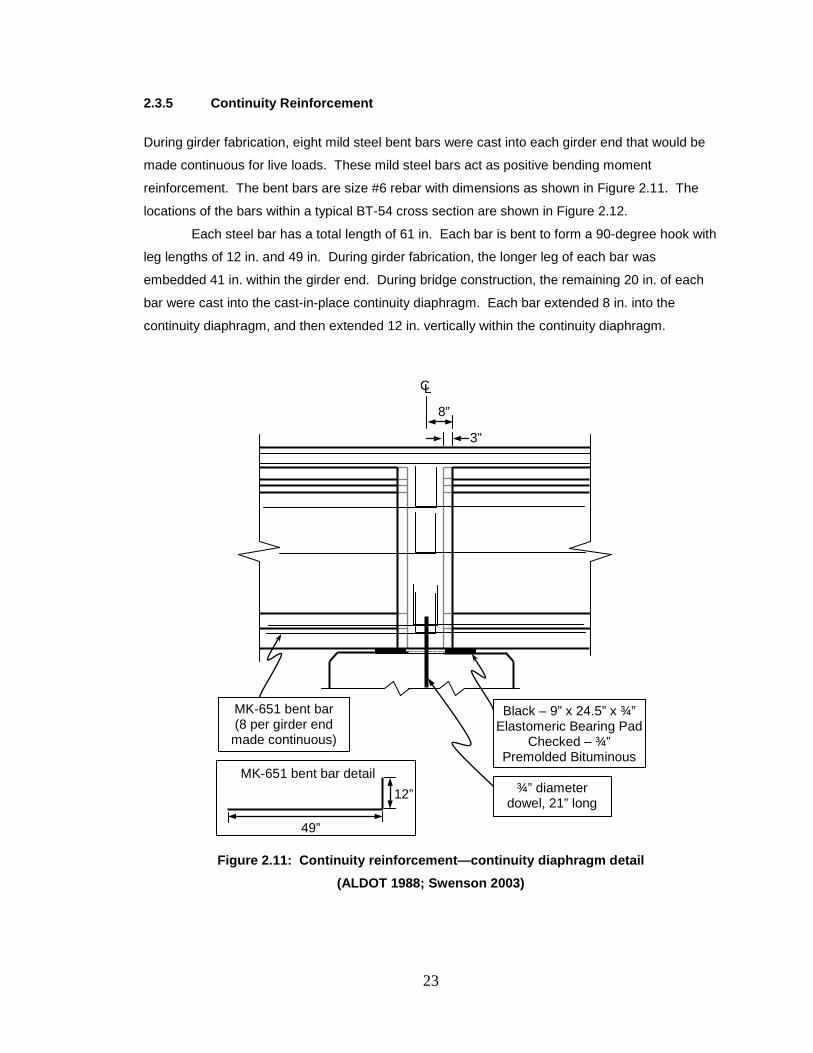
23
2.3.5 Continuity Reinforcement
During girder fabrication, eight mild steel bent bars were cast into each girder end that would be
made continuous for live loads. These mild steel bars act as positive bending moment
reinforcement. The bent bars are size #6 rebar with dimensions as shown in Figure 2.11. The
locations of the bars within a typical BT-54 cross section are shown in Figure 2.12.
Each steel bar has a total length of 61 in. Each bar is bent to form a 90-degree hook with
leg lengths of 12 in. and 49 in. During girder fabrication, the longer leg of each bar was
embedded 41 in. within the girder end. During bridge construction, the remaining 20 in. of each
bar were cast into the cast-in-place continuity diaphragm. Each bar extended 8 in. into the
continuity diaphragm, and then extended 12 in. vertically within the continuity diaphragm.
Figure 2.11: Continuity reinforcement—continuity diaphragm detail
(ALDOT 1988; Swenson 2003)
8”
MK-651 bent bar detail
49”
12”
3”
C L
Black – 9” x 24.5” x ¾” Elastomeric Bearing Pad
Checked – ¾” Premolded Bituminous
¾” diameter
dowel, 21” long
MK-651 bent bar (8 per girder end made continuous)
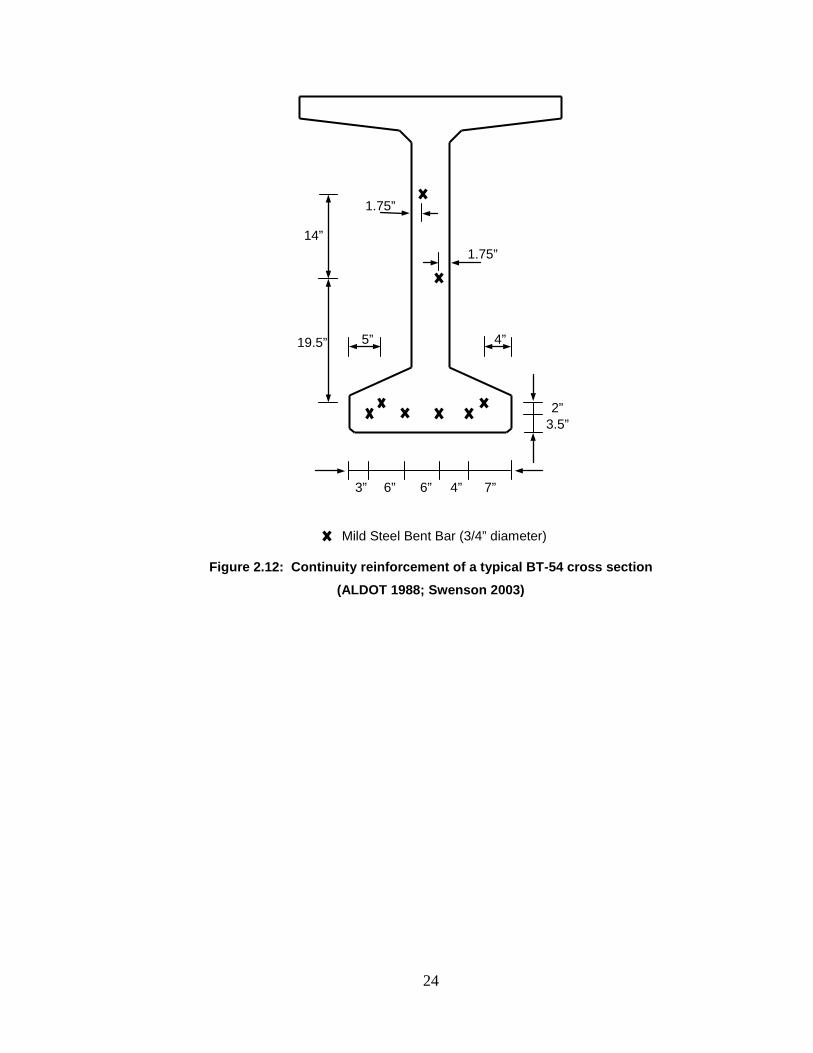
24
Figure 2.12: Continuity reinforcement of a typical BT-54 cross section
(ALDOT 1988; Swenson 2003)
2” 3.5”
5”
1.75”
3” 6” 6” 4” 7”
4” 19.5”
14”
1.75”
Mild Steel Bent Bar (3/4” diameter)
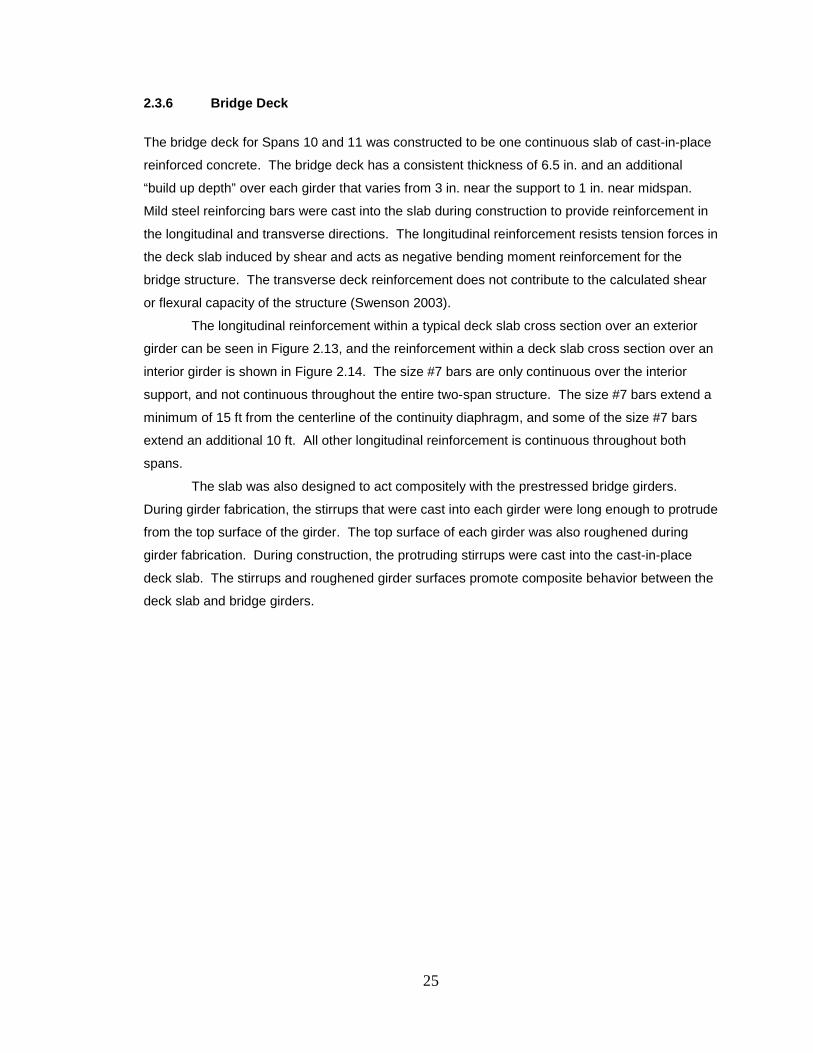
25
2.3.6 Bridge Deck
The bridge deck for Spans 10 and 11 was constructed to be one continuous slab of cast-in-place
reinforced concrete. The bridge deck has a consistent thickness of 6.5 in. and an additional
“build up depth” over each girder that varies from 3 in. near the support to 1 in. near midspan.
Mild steel reinforcing bars were cast into the slab during construction to provide reinforcement in
the longitudinal and transverse directions. The longitudinal reinforcement resists tension forces in
the deck slab induced by shear and acts as negative bending moment reinforcement for the
bridge structure. The transverse deck reinforcement does not contribute to the calculated shear
or flexural capacity of the structure (Swenson 2003).
The longitudinal reinforcement within a typical deck slab cross section over an exterior
girder can be seen in Figure 2.13, and the reinforcement within a deck slab cross section over an
interior girder is shown in Figure 2.14. The size #7 bars are only continuous over the interior
support, and not continuous throughout the entire two-span structure. The size #7 bars extend a
minimum of 15 ft from the centerline of the continuity diaphragm, and some of the size #7 bars
extend an additional 10 ft. All other longitudinal reinforcement is continuous throughout both
spans.
The slab was also designed to act compositely with the prestressed bridge girders.
During girder fabrication, the stirrups that were cast into each girder were long enough to protrude
from the top surface of the girder. The top surface of each girder was also roughened during
girder fabrication. During construction, the protruding stirrups were cast into the cast-in-place
deck slab. The stirrups and roughened girder surfaces promote composite behavior between the
deck slab and bridge girders.
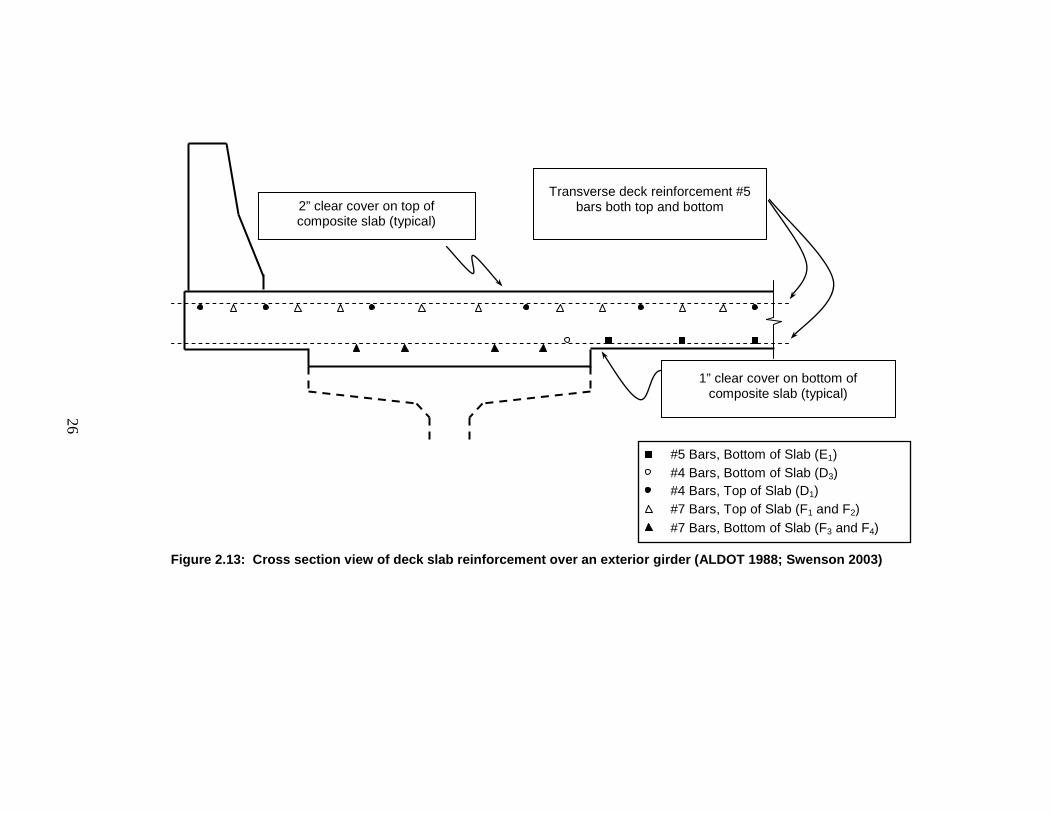
26
Figure 2.13: Cross section view of deck slab reinforcement over an exterior girder (ALDOT 1988; Swenson 2003)
Transverse deck reinforcement #5 bars both top and bottom
1” clear cover on bottom of composite slab (typical)
#5 Bars, Bottom of Slab (E1) #4 Bars, Bottom of Slab (D3) #4 Bars, Top of Slab (D1) #7 Bars, Top of Slab (F1 and F2) #7 Bars, Bottom of Slab (F3 and F4)
2” clear cover on top of composite slab (typical)
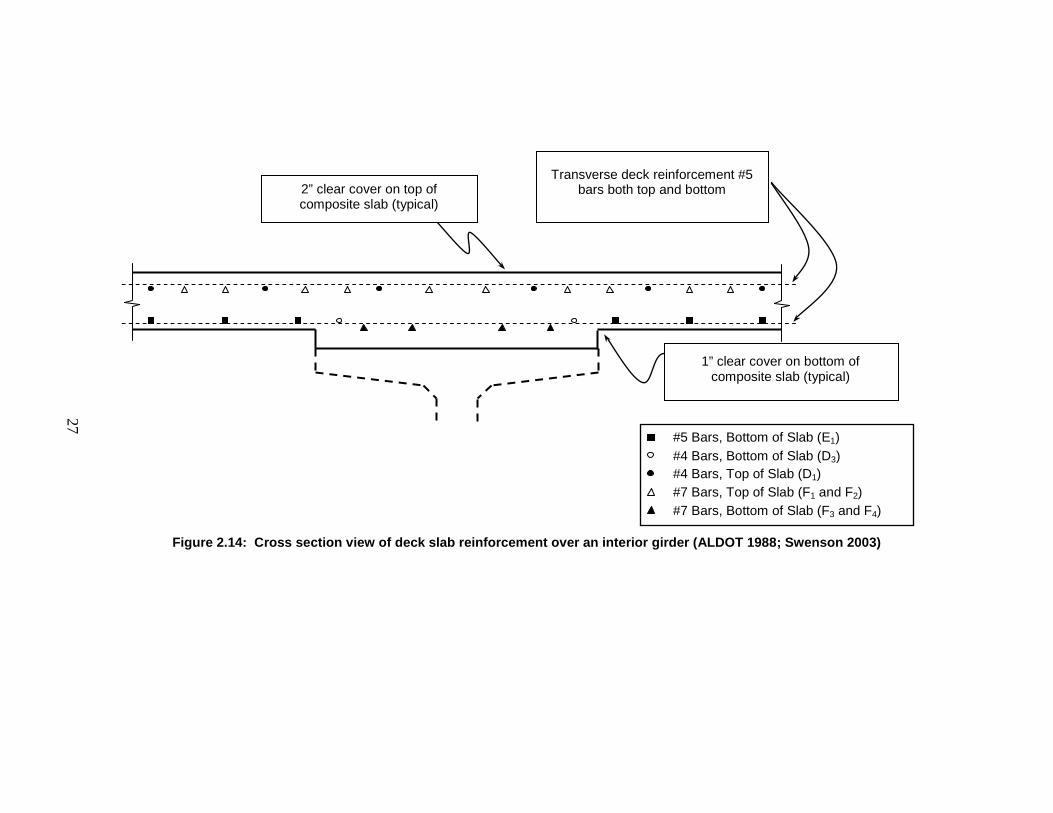
27
Figure 2.14: Cross section view of deck slab reinforcement over an interior girder (ALDOT 1988; Swenson 2003)
Transverse deck reinforcement #5 bars both top and bottom
1” clear cover on bottom of composite slab (typical)
#5 Bars, Bottom of Slab (E1) #4 Bars, Bottom of Slab (D3) #4 Bars, Top of Slab (D1) #7 Bars, Top of Slab (F1 and F2) #7 Bars, Bottom of Slab (F3 and F4)
2” clear cover on top of composite slab (typical)
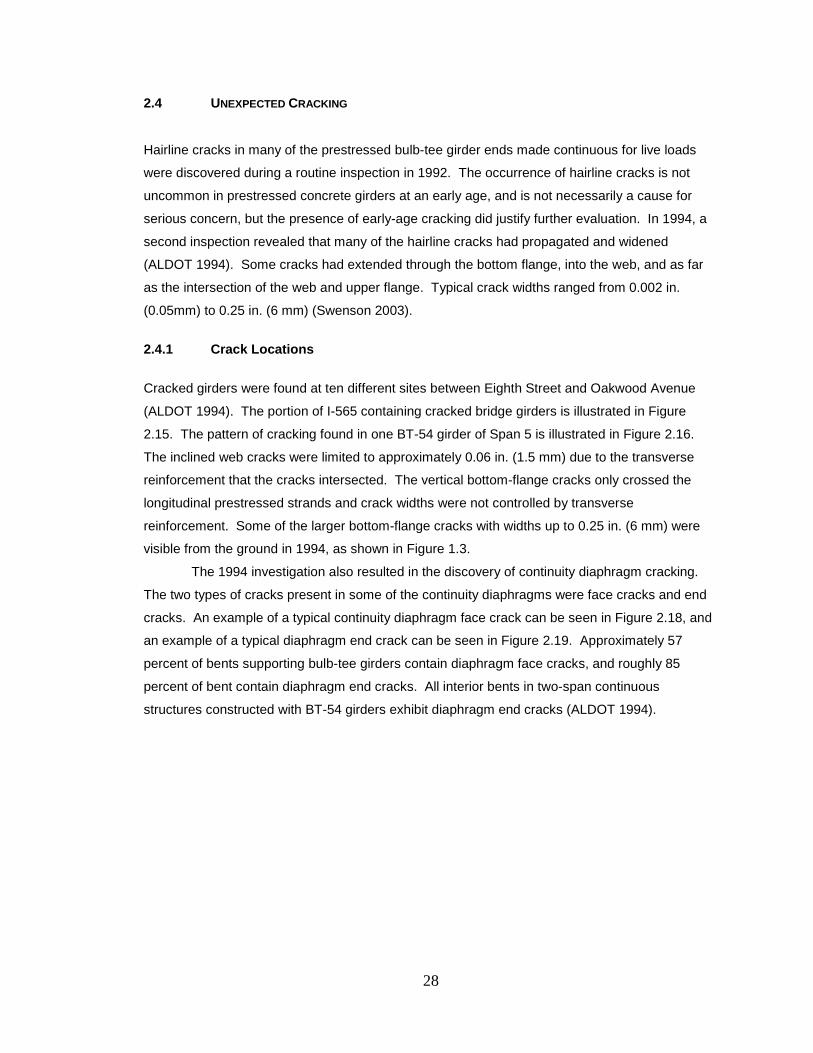
28
2.4 UNEXPECTED CRACKING
Hairline cracks in many of the prestressed bulb-tee girder ends made continuous for live loads
were discovered during a routine inspection in 1992. The occurrence of hairline cracks is not
uncommon in prestressed concrete girders at an early age, and is not necessarily a cause for
serious concern, but the presence of early-age cracking did justify further evaluation. In 1994, a
second inspection revealed that many of the hairline cracks had propagated and widened
(ALDOT 1994). Some cracks had extended through the bottom flange, into the web, and as far
as the intersection of the web and upper flange. Typical crack widths ranged from 0.002 in.
(0.05mm) to 0.25 in. (6 mm) (Swenson 2003).
2.4.1 Crack Locations
Cracked girders were found at ten different sites between Eighth Street and Oakwood Avenue
(ALDOT 1994). The portion of I-565 containing cracked bridge girders is illustrated in Figure
2.15. The pattern of cracking found in one BT-54 girder of Span 5 is illustrated in Figure 2.16.
The inclined web cracks were limited to approximately 0.06 in. (1.5 mm) due to the transverse
reinforcement that the cracks intersected. The vertical bottom-flange cracks only crossed the
longitudinal prestressed strands and crack widths were not controlled by transverse
reinforcement. Some of the larger bottom-flange cracks with widths up to 0.25 in. (6 mm) were
visible from the ground in 1994, as shown in Figure 1.3.
The 1994 investigation also resulted in the discovery of continuity diaphragm cracking.
The two types of cracks present in some of the continuity diaphragms were face cracks and end
cracks. An example of a typical continuity diaphragm face crack can be seen in Figure 2.18, and
an example of a typical diaphragm end crack can be seen in Figure 2.19. Approximately 57
percent of bents supporting bulb-tee girders contain diaphragm face cracks, and roughly 85
percent of bent contain diaphragm end cracks. All interior bents in two-span continuous
structures constructed with BT-54 girders exhibit diaphragm end cracks (ALDOT 1994).
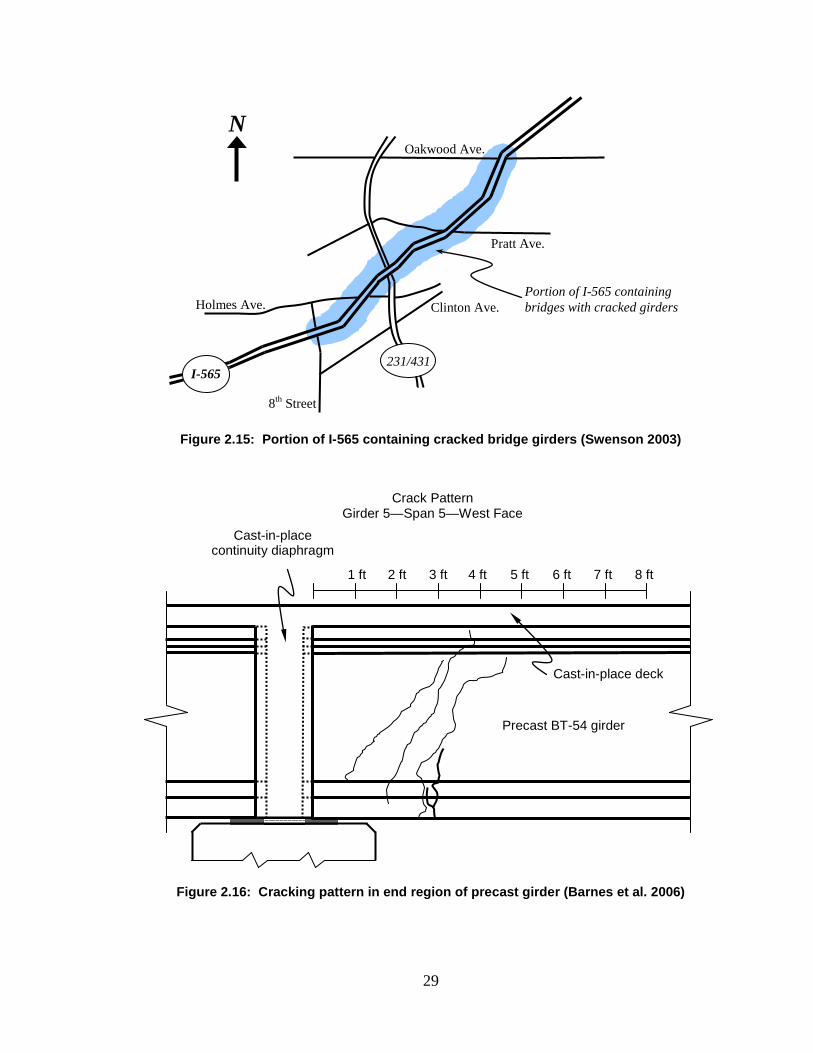
29
Figure 2.15: Portion of I-565 containing cracked bridge girders (Swenson 2003)
Figure 2.16: Cracking pattern in end region of precast girder (Barnes et al. 2006)
Crack Pattern Girder 5—Span 5—West Face
Precast BT-54 girder
Cast-in-place deck
Cast-in-place continuity diaphragm
1 ft 2 ft 3 ft 4 ft 5 ft 6 ft 7 ft 8 ft
Pratt Ave.
Oakwood Ave.
Holmes Ave.
8th Street
Portion of I-565 containing bridges with cracked girders
N
Clinton Ave.
I-565 231/431
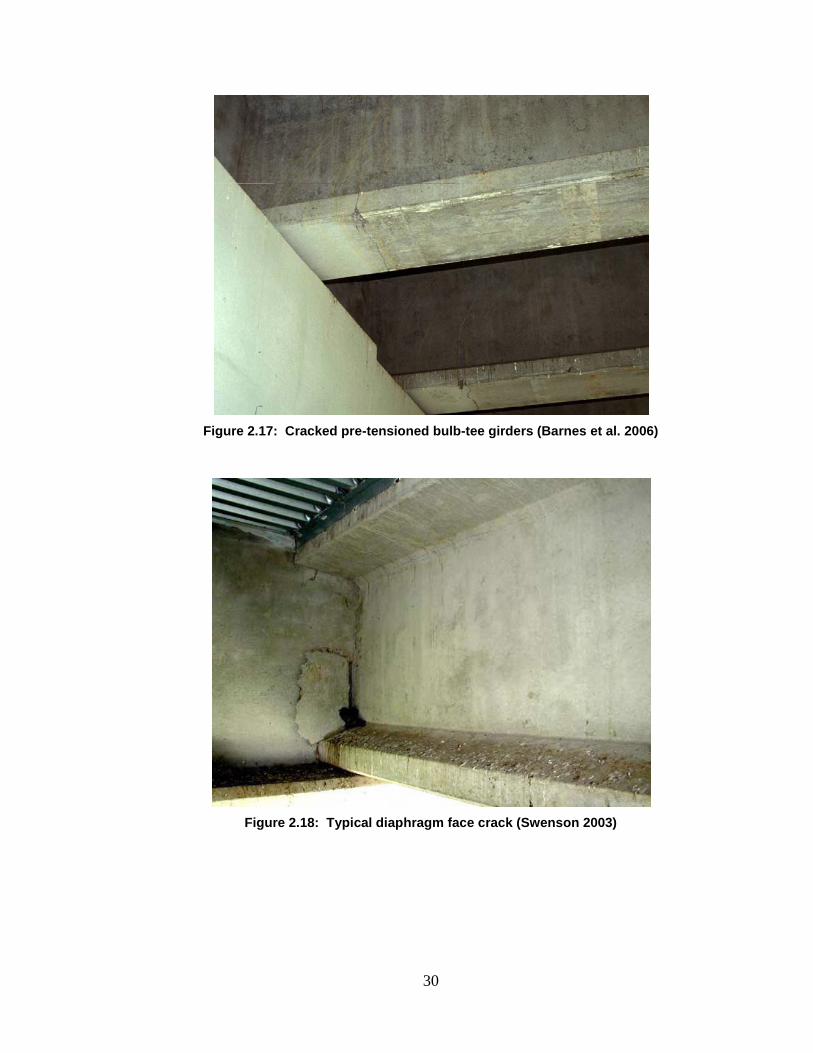
30
Figure 2.17: Cracked pre-tensioned bulb-tee girders (Barnes et al. 2006)
Figure 2.18: Typical diaphragm face crack (Swenson 2003)
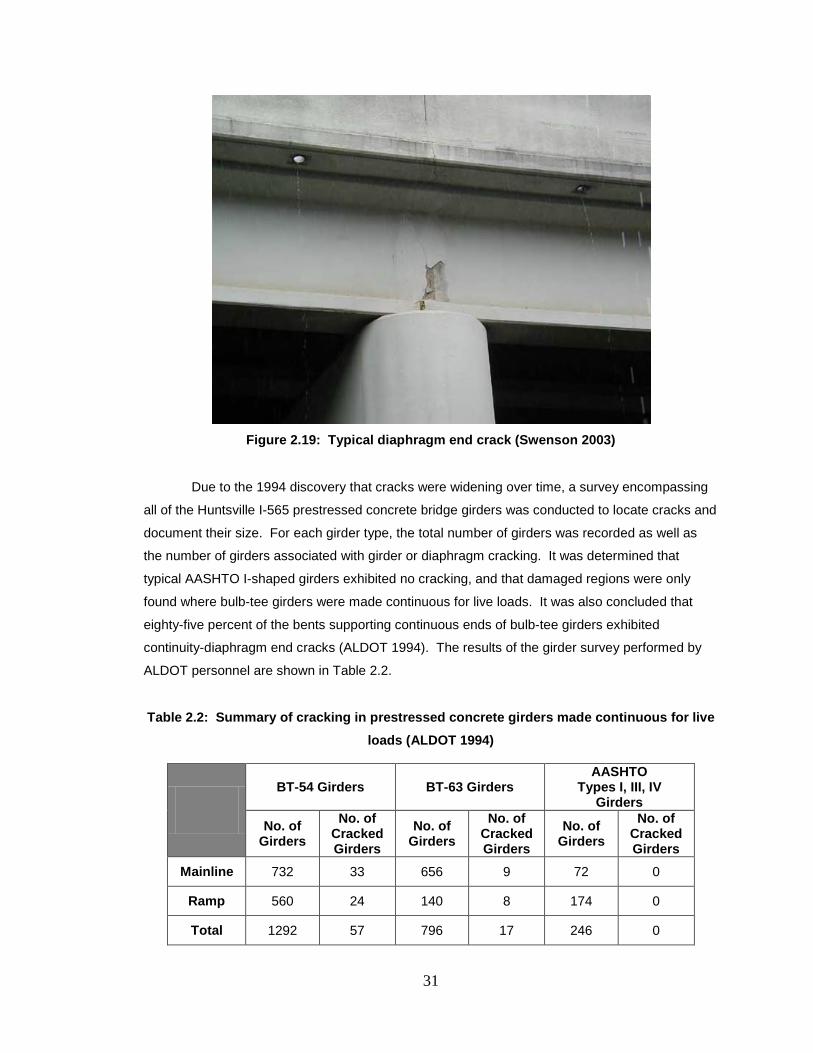
31
Figure 2.19: Typical diaphragm end crack (Swenson 2003)
Due to the 1994 discovery that cracks were widening over time, a survey encompassing
all of the Huntsville I-565 prestressed concrete bridge girders was conducted to locate cracks and
document their size. For each girder type, the total number of girders was recorded as well as
the number of girders associated with girder or diaphragm cracking. It was determined that
typical AASHTO I-shaped girders exhibited no cracking, and that damaged regions were only
found where bulb-tee girders were made continuous for live loads. It was also concluded that
eighty-five percent of the bents supporting continuous ends of bulb-tee girders exhibited
continuity-diaphragm end cracks (ALDOT 1994). The results of the girder survey performed by
ALDOT personnel are shown in Table 2.2.
Table 2.2: Summary of cracking in prestressed concrete girders made continuous for live loads (ALDOT 1994)
BT-54 Girders BT-63 Girders AASHTO
Types I, III, IV Girders
No. of Girders
No. of Cracked Girders
No. of Girders
No. of Cracked Girders
No. of Girders
No. of Cracked Girders
Mainline 732 33 656 9 72 0
Ramp 560 24 140 8 174 0
Total 1292 57 796 17 246 0
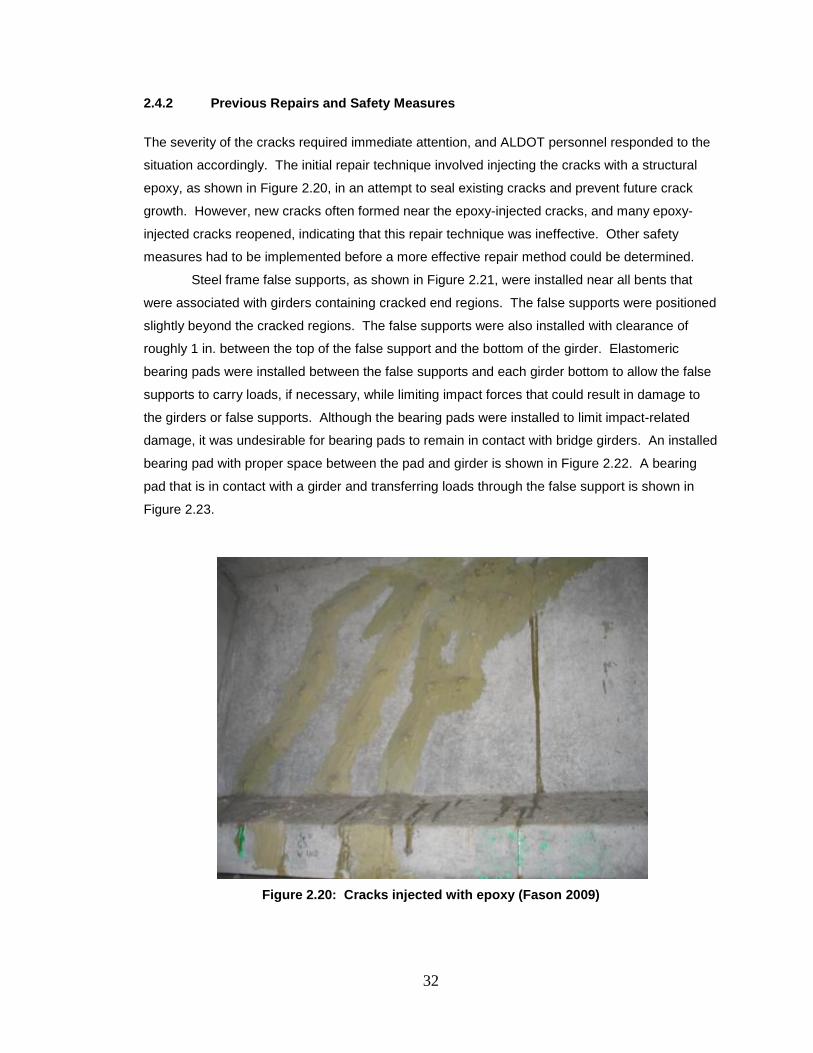
32
2.4.2 Previous Repairs and Safety Measures
The severity of the cracks required immediate attention, and ALDOT personnel responded to the
situation accordingly. The initial repair technique involved injecting the cracks with a structural
epoxy, as shown in Figure 2.20, in an attempt to seal existing cracks and prevent future crack
growth. However, new cracks often formed near the epoxy-injected cracks, and many epoxy-
injected cracks reopened, indicating that this repair technique was ineffective. Other safety
measures had to be implemented before a more effective repair method could be determined.
Steel frame false supports, as shown in Figure 2.21, were installed near all bents that
were associated with girders containing cracked end regions. The false supports were positioned
slightly beyond the cracked regions. The false supports were also installed with clearance of
roughly 1 in. between the top of the false support and the bottom of the girder. Elastomeric
bearing pads were installed between the false supports and each girder bottom to allow the false
supports to carry loads, if necessary, while limiting impact forces that could result in damage to
the girders or false supports. Although the bearing pads were installed to limit impact-related
damage, it was undesirable for bearing pads to remain in contact with bridge girders. An installed
bearing pad with proper space between the pad and girder is shown in Figure 2.22. A bearing
pad that is in contact with a girder and transferring loads through the false support is shown in
Figure 2.23.
Figure 2.20: Cracks injected with epoxy (Fason 2009)
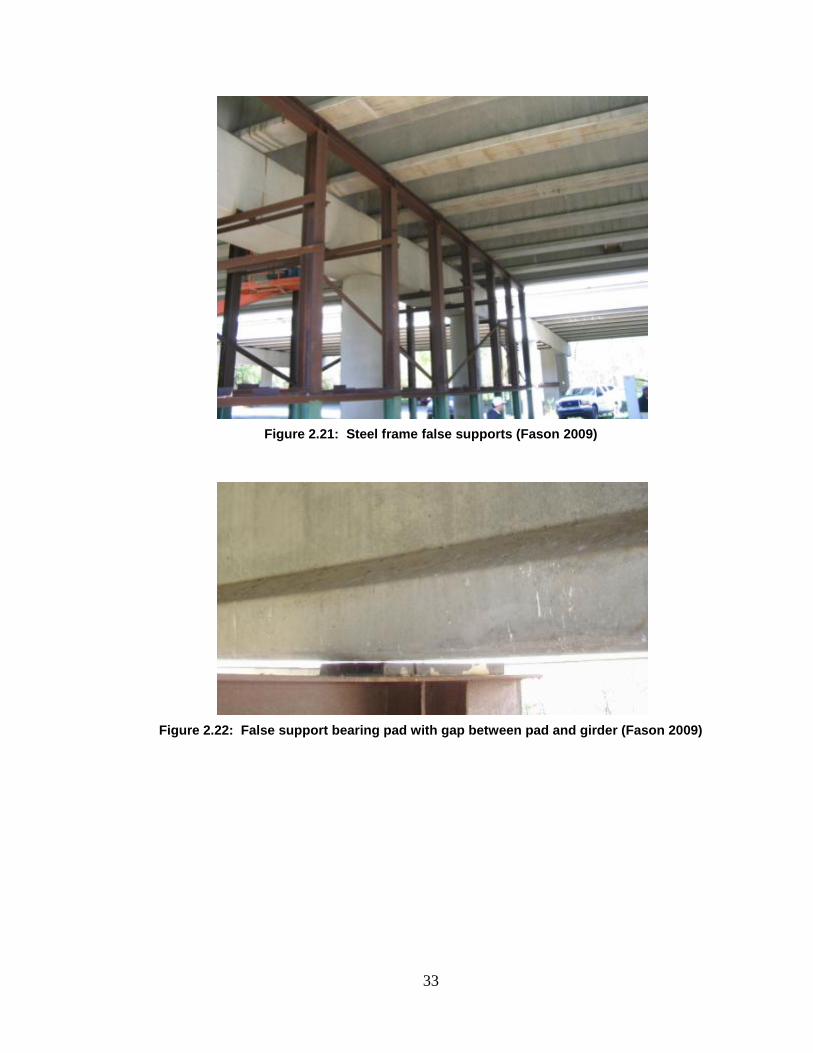
33
Figure 2.21: Steel frame false supports (Fason 2009)
Figure 2.22: False support bearing pad with gap between pad and girder (Fason 2009)
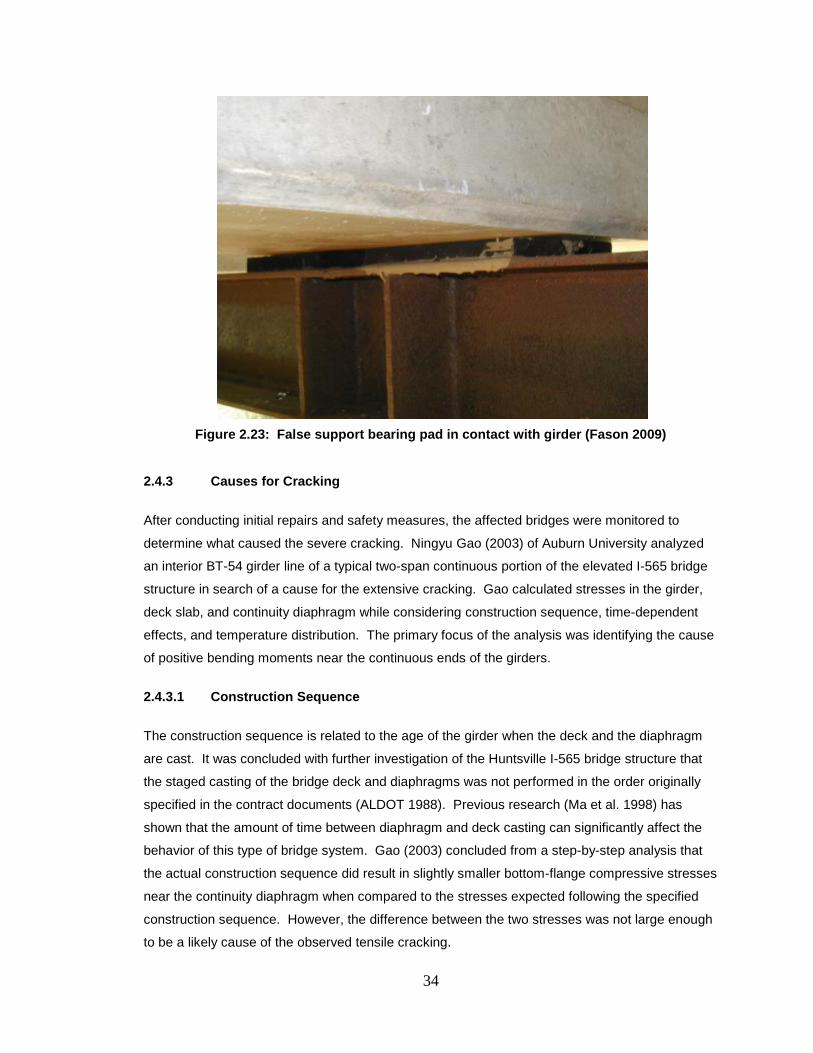
34
Figure 2.23: False support bearing pad in contact with girder (Fason 2009)
2.4.3 Causes for Cracking
After conducting initial repairs and safety measures, the affected bridges were monitored to
determine what caused the severe cracking. Ningyu Gao (2003) of Auburn University analyzed
an interior BT-54 girder line of a typical two-span continuous portion of the elevated I-565 bridge
structure in search of a cause for the extensive cracking. Gao calculated stresses in the girder,
deck slab, and continuity diaphragm while considering construction sequence, time-dependent
effects, and temperature distribution. The primary focus of the analysis was identifying the cause
of positive bending moments near the continuous ends of the girders.
2.4.3.1 Construction Sequence
The construction sequence is related to the age of the girder when the deck and the diaphragm
are cast. It was concluded with further investigation of the Huntsville I-565 bridge structure that
the staged casting of the bridge deck and diaphragms was not performed in the order originally
specified in the contract documents (ALDOT 1988). Previous research (Ma et al. 1998) has
shown that the amount of time between diaphragm and deck casting can significantly affect the
behavior of this type of bridge system. Gao (2003) concluded from a step-by-step analysis that
the actual construction sequence did result in slightly smaller bottom-flange compressive stresses
near the continuity diaphragm when compared to the stresses expected following the specified
construction sequence. However, the difference between the two stresses was not large enough
to be a likely cause of the observed tensile cracking.
35
2.4.3.2 Time-Dependent Effects
Time-dependent effects that could potentially cause cracking in the restrained girder ends include
creep due to prestress forces and concrete shrinkage. The creep and shrinkage could cause
enough of a member length change to induce a positive moment at the restrained girder end.
However, Gao (2003) concluded that time-dependent effects are not large enough to be the
primary cause of cracking—especially considering the early age at which the cracking occurred.
2.4.3.3 Temperature Effects
Ambient thermal conditions can result in temperature variations between the top of the bridge
deck and the bottom of the girders. This temperature distribution can result in an upward
deflection known as “sun cambering” in spans constructed to be continuous for live loads. This
upward deflection due to temperature has the potential to induce bottom-flange tensile stresses
associated with positive bending moments near the continuity diaphragm. It has been concluded
that the relevant design standards used to design the I-565 bridge structures did not supply
sufficient information regarding stresses due to temperature gradients (Barnes et al. 2006).
ALDOT personnel recorded temperature data at several different times during the
investigation. The worst-case temperature gradient recorded occurred at 14:15 CST on May 19,
1994. An ambient temperature of 64.8° F (18.2° C) was reported. The deck surface reportedly
had a temperature of 95.7° F (35.4° C), while the temperature at the bottom of a girder was
52.0° F (11.1° C), which resulted in a temperature difference of 43.7° F (24.3° C) (ALDOT 1994).
Ambient, deck, and girder temperatures were only monitored for a few days, and it is
unlikely that these temperatures represent the worst load scenario related to temperature
distributions that the bridge has experienced in its lifetime. The temperature difference of 43.7° F
(24.3° C) measured for the bridge structure in Huntsville, Alabama is less than the maximum
temperature difference of 48.6° F (27.0° C) calculated by Potgieter and Gamble (1989) for a
bridge structure in Nashville, Tennessee (the city nearest to Huntsville, Alabama within the scope
of their report). It is feasible for the ambient temperature in Huntsville to exceed 100° F (38° C)
during an extreme event on a sunny summer day, which would likely result in a greater
temperature difference than the difference that resulted from the ambient temperature of 64.8° F
(18.2° C) measured on May 19, 1994. Due to direct sun exposure, an increased ambient
temperature will likely have a greater effect on a deck surface than a girder bottom, resulting in an
increased temperature difference that induces tensile stresses of greater magnitude near the
continuity diaphragm (Gao 2003).
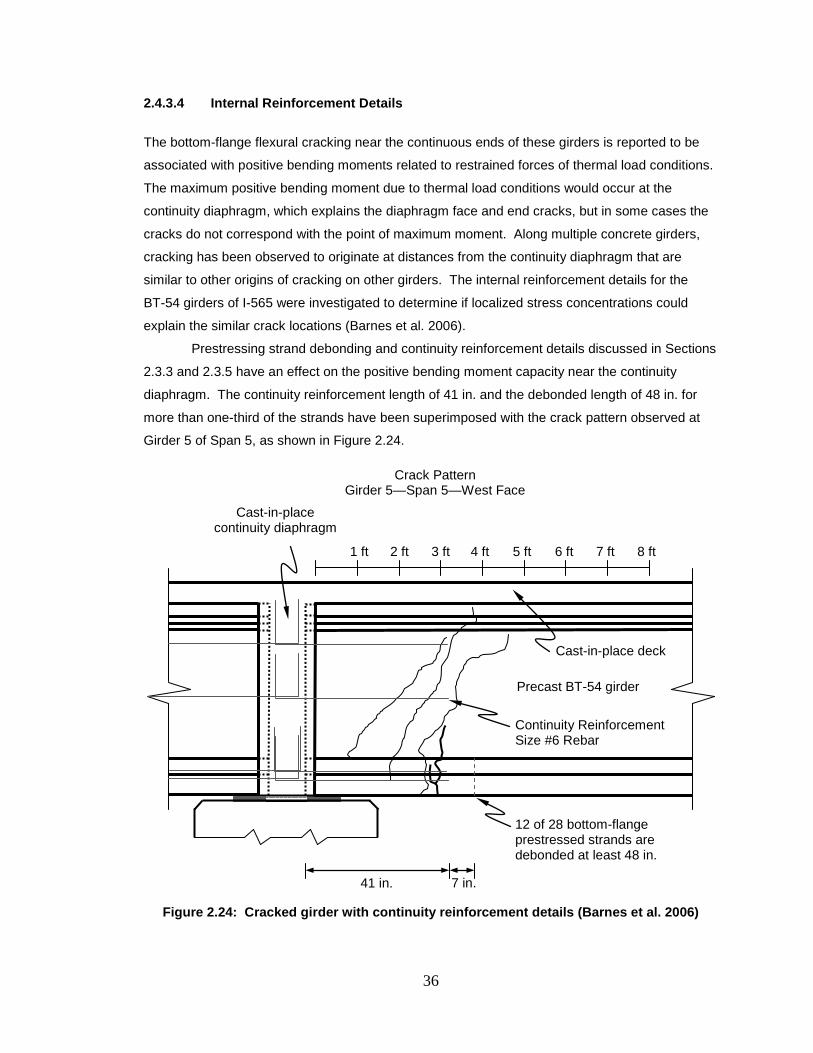
36
2.4.3.4 Internal Reinforcement Details
The bottom-flange flexural cracking near the continuous ends of these girders is reported to be
associated with positive bending moments related to restrained forces of thermal load conditions.
The maximum positive bending moment due to thermal load conditions would occur at the
continuity diaphragm, which explains the diaphragm face and end cracks, but in some cases the
cracks do not correspond with the point of maximum moment. Along multiple concrete girders,
cracking has been observed to originate at distances from the continuity diaphragm that are
similar to other origins of cracking on other girders. The internal reinforcement details for the
BT-54 girders of I-565 were investigated to determine if localized stress concentrations could
explain the similar crack locations (Barnes et al. 2006).
Prestressing strand debonding and continuity reinforcement details discussed in Sections
2.3.3 and 2.3.5 have an effect on the positive bending moment capacity near the continuity
diaphragm. The continuity reinforcement length of 41 in. and the debonded length of 48 in. for
more than one-third of the strands have been superimposed with the crack pattern observed at
Girder 5 of Span 5, as shown in Figure 2.24.
Figure 2.24: Cracked girder with continuity reinforcement details (Barnes et al. 2006)
7 in.
41 in.
Crack Pattern Girder 5—Span 5—West Face
Precast BT-54 girder
Cast-in-place deck
Cast-in-place continuity diaphragm
1 ft 2 ft 3 ft 4 ft 5 ft 6 ft 7 ft 8 ft
Continuity Reinforcement Size #6 Rebar
12 of 28 bottom-flange prestressed strands are debonded at least 48 in.
37
During a critical thermal event, bottom-flange tensile stresses could be induced near the
continuity diaphragm along the girder. The debonded strands result in cross sections with a
relatively weak positive moment bending capacity compared to the midspan cross sections. Due
to relatively weak cross sections for a distance of 48 in. and local stress concentrations that can
occur near the continuity reinforcement termination point at 41 in., cross sections near the
continuity reinforcement termination location are likely points of origin for flexural cracking in
response to positive moment bending.
2.4.4 Ramifications of Cracking
Cracking within the anchorage zone of prestressed strands has the potential to reduce the
effective prestress force, which consequently reduces the shear and flexural capacities of the
girder. Cracks that remain open after the initiating event are an indication of inelastic behavior at
the cracked cross section. This inelastic behavior could be caused by strands either yielding or
slipping at the crack locations.
Yielding of prestressed strands at a crack location is one type of failure that results in a
reduction of effective prestress force. Inelastic behavior caused by strand yielding results in
permanent elongation of the strand, allowing crack widths to remain open after crack inducing
loads are removed. A portion of the strain in the prestressing strand would be lost, which would
result in a reduction of the effective prestressing force transferred to the end region of the girder.
In order for yielding to occur, yield level stresses must be developed in the prestressed
strand at the crack location. This requires that the strands be adequately anchored on both sides
of the crack. Swenson (2003) calculated the development length of a 0.5 in. special prestressing
strand to be 80 in. in accordance with Article 5.11.4.2 of the AASHTO LRFD Bridge Design
Specifications (2002). Swenson also noted that the typical cracking in the I-565 girders occurs
within 41 in. of the continuous girder end. Since the strands are only anchored a distance roughly
half of the full development length before the crack location, development of yielding stresses in
the prestressing strands is not likely.
Slipping of prestressed strands at the crack location also results in the reduction of the
effective prestress force transferred to the end region of a girder. Adequately developed
prestressed strands result in concrete compressive stresses which increase shear capacity.
Strand slip due to a lack of effective anchorage reduces pre-compression effects and may also
result in girders with insufficient resistance to shear forces in the girder end region.
Swenson (2003) determined that the theoretical total slip resulting if all prestressing force
was lost corresponded to the range of crack widths present in the I-565 girders. Swenson
concluded that the prestressing strands slipped as a result of the cracks and that it is appropriate
and conservative to assume that the prestressing force in the strands has been completely lost
between each crack location and girder end. Visual inspection of the girders in 2010 indicated
38
that the girder end regions have experienced much less camber curvature over time than the rest
of the span. This agrees with Swenson’s contention that much of the effective prestress in the
end regions has been lost.
2.5 BRIDGE BEHAVIOR ANALYSIS
Swenson (2003) used analytical methods to determine if the prestressed bulb-tee girders have
strength deficiencies. Different girder behaviors and analysis methods were considered. The
results of this analysis were taken into consideration during the design of an externally bonded
fiber-reinforced polymer (FRP) reinforcement repair method. Bridge behavior analysis from
Swenson (2003) is summarized in this section.
2.5.1 Behavior Types Considered
The two-span structures of I-565 were designed to behave as fully continuous structures for live
loads. However, three possible girder behavior types were considered during analysis. The two-
span structures have been analyzed as behaving as either
• Two simply-supported spans with no continuity at the interior support,
• One fully continuous structure, as originally constructed, or
• A two-span continuous structure with internal hinge behavior at crack locations.
2.5.2 Analysis Methods
The three possible bridge behaviors were evaluated with three analysis methods. The three
analysis methods include
• Elastic structural analysis,
• Sectional model analysis, and
• Strut-and-tie model analysis.
Factored ultimate shear and moment envelopes for both interior and exterior girders were
determined with elastic structural analysis. Shear and moment capacities of a typical cracked
BT-54 girder were determined with sectional model analysis. The calculated capacities were
then compared to the factored ultimate shear and moment envelopes to determine the location
and magnitude of strength deficiencies. The forces transferred through the prestressed strands
and future externally bonded fiber-reinforced polymer (FRP) reinforcement were determined with
strut-and-tie model analysis. An adequate FRP reinforcement design was formulated based on
the resistance force required of the FRP at the crack location.
39
2.5.2.1 Elastic Structural Analysis—Unfactored Demands
Elastic structural analysis of the two-span structure was conducted using structural analysis
software. Shear and bending moment reactions in response to unfactored live loads were
determined for each of the three behavior type models. Analysis of the simply supported model
resulted in
• A maximum positive bending moment of around 26,000 kip-in. at midspan,
• A maximum shear force of roughly 96 kips at the supports, and
• No negative moments.
Analysis of the two-span fully continuous model resulted in
• A maximum shear force of roughly 87 kips at the non-continuous support,
• A maximum shear force of roughly 105 kips at the interior support,
• A maximum positive bending moment of roughly 19,200 kip-in. nearly 500 in.
from the non-continuous end, and
• A maximum negative moment of roughly 22,000 kip-in. at the interior support.
Analysis of the two-span continuous model with an internal hinge resulted in reactions that were
bounded in magnitude by the other two models. These reactions include
a less severe maximum shear force at the interior support compared to both the simply supported
and fully continuous model, less severe maximum positive moment compared to the simply
supported model, and a less severe maximum negative moment at the interior support compared
to the continuous model. Due to distribution factors calculated for the two-span continuous bridge
structure, the live load effects for ultimate shear demand are more severe for interior girders than
exterior, and the live load effects for ultimate moment demand are more severe for exterior
girders.
2.5.2.2 Sectional Model Analysis—Strength Capacities
Strength capacities for a typical cracked BT-54 girder were determined with sectional model
analysis. The strength capacities were compared to the factored ultimate load demands
determined for each type of behavior. The actual behavior may be more similar to the behavior
expected of the continuous model with an internal hinge at the crack location, but the factored
load demands of both the simply-supported and continuous bridge behavior were satisfied when
designing a repair method for the strength deficiencies.
Simply supported behavior was determined to control the factored ultimate shear
demand, exceeding the shear capacity of a typical cracked BT-54 girder by as much as 49 kips
for an interior girder and 4 kips for an exterior girder.
40
Simply supported behavior was determined to control the factored ultimate positive
moment demand, exceeding the positive moment capacity of a typical cracked BT-54 girder for
cross sections located between the cracked cross section and the interior support. Due to the
assumption that the prestressed strands have slipped and the prestress force has been lost, a
strength reduction factor of 0.90 for flexure in non-prestressed concrete members was applied in
accordance with Article 5.5.4.2.1 of the AASHTO LRFD.
Continuous behavior was determined to control the factored ultimate negative moment
demand, exceeding the negative moment capacity of a typical cracked BT-54 girder. The
negative moment capacity at the continuous end of a typical exterior girder was determined to be
deficient for a length of 48 in. from the interior support.
Simply supported behavior was determined to control the longitudinal reinforcement
capacity calculated in accordance with Article 5.8.3.5 of AASHTO LRFD (2002). The longitudinal
reinforcement capacity provided was determined to be unsatisfactory over a length of 14 in. from
the exterior support and over a length of 64 in. from the interior support. The longitudinal
reinforcement at the cracked end was determined to be insufficient for a length of roughly 20 in.
beyond the typical crack location within the two-span bridge structure.
2.5.2.3 Strut-and-Tie Analysis—Flow of Forces
Forces within a BT-54 girder with external reinforcement added to the bottom flange were
determined with strut-and-tie model analysis. A typical strut-and-tie model is presented in
Figure 2.25.
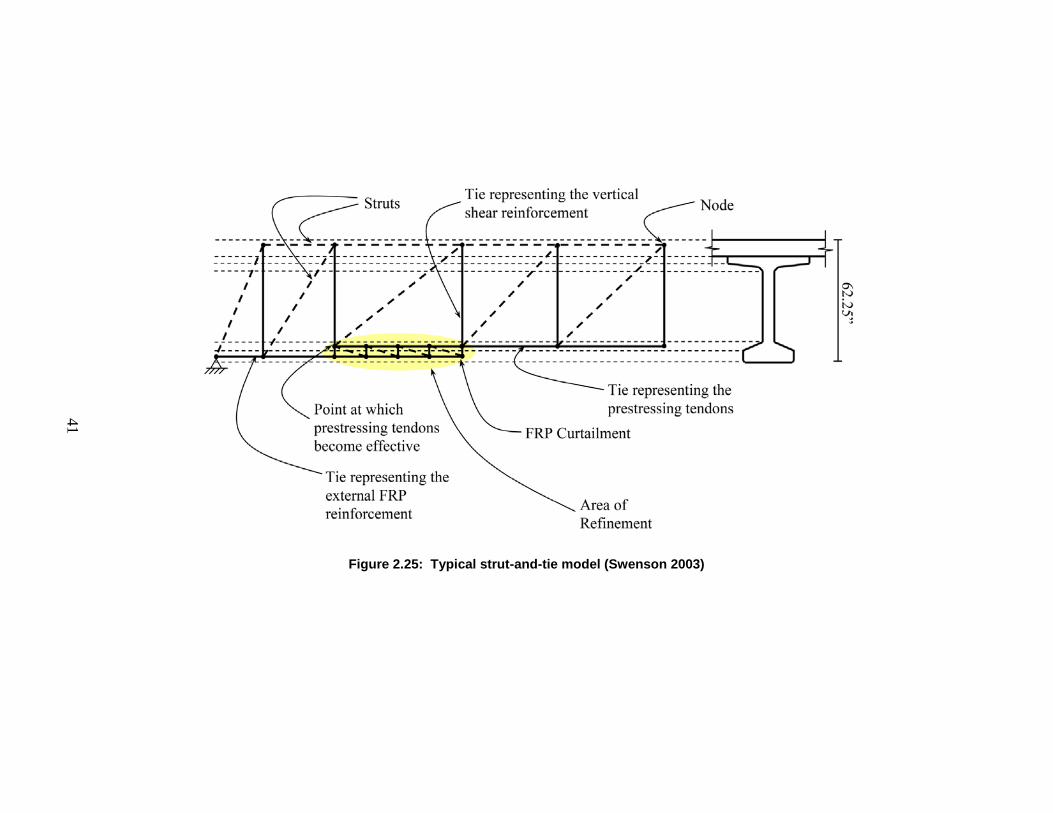
41
Figure 2.25: Typical strut-and-tie model (Swenson 2003)
42
Three separate models (A, B, and C) were produced to analyze the flow of forces within one
girder for each of the three prospective bridge behavior conditions. Specific ties within the strut-
and-tie models represent forces required to be carried by the longitudinal reinforcement. During
the design of an external reinforcement repair method, the tensile capacity of the longitudinal
reinforcement should satisfy the factored ultimate tensile force demand along the entire length of
each tie.
Model A represents a simply supported girder with FRP reinforcement. Load
configurations were examined to produce maximum shear and positive moment effects at the
assumed cracked cross section. The maximum factored ultimate tensile force expected in the
FRP reinforcement was 255 kips and the tensile force expected in prestressing strands at the
same distance from the interior support was 300 kips. As the distance from the interior support
increased, the tensile force expected in the FRP reinforcement decreased and the force expected
in the prestressing strands increased. The element representing the FRP reinforcement furthest
from the interior support expected a factored ultimate tensile force of 62 kips and the element
representing the prestressing strands at that same distance from the interior support expected a
tensile force of 491 kips. The expected factored ultimate tensile force in the element representing
the prestressing strands following the curtailment of the FRP reinforcement was 631 kips.
Model B represents a girder that is part of a two-span structure made fully continuous for
live loads. Load configurations were examined to produce maximum shear effects at the
assumed cracked cross section. The ties representing the longitudinal tensile reinforcement were
primarily in compression near the cracked cross section. None of the ties representing the FRP
reinforcement were expected to be in tension. The element representing the FRP reinforcement
furthest from the interior support expected a factored ultimate compressive force of 9 kips and the
element representing the prestressing strands at that same distance from the interior support
expected a tensile force of 150 kips. The expected factored ultimate tensile force in the element
representing the prestressing strands following the curtailment of the FRP reinforcement was
344 kips.
Model C represents a girder that is part of a two-span structure made continuous for live
loads, but contains an internal hinge representing a cracked cross section. Load configurations
were examined to produce maximum shear effects at the assumed cracked cross section. The
flow of forces in Model C were similar to the simply supported model (Model A), but the tensile
forces expected in the longitudinal reinforcement decreased in magnitude. The maximum
factored ultimate tensile force expected in the FRP reinforcement was 140 kips and the tensile
force expected in prestressing strands at the same distance from the interior support was
189 kips. As the distance from the interior support increased, the tensile force expected in the
FRP reinforcement decreased and the force expected in the prestressing strands increased. The
element representing the FRP reinforcement furthest from the interior support expected a
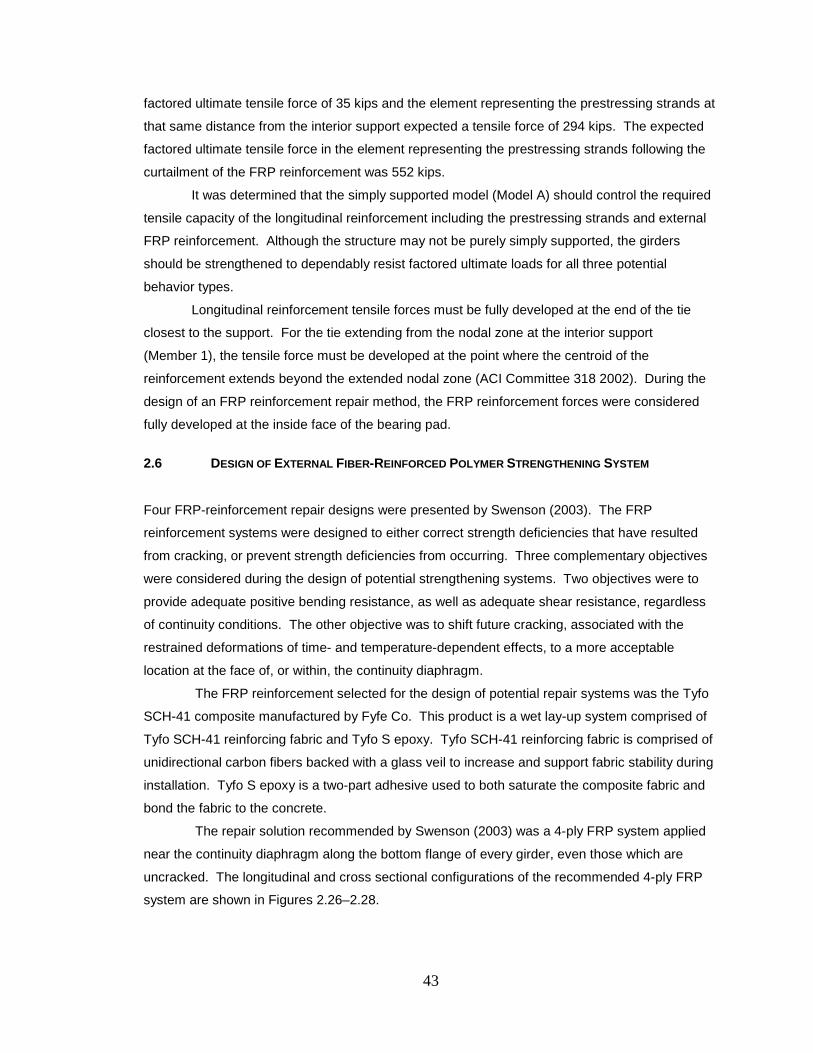
43
factored ultimate tensile force of 35 kips and the element representing the prestressing strands at
that same distance from the interior support expected a tensile force of 294 kips. The expected
factored ultimate tensile force in the element representing the prestressing strands following the
curtailment of the FRP reinforcement was 552 kips.
It was determined that the simply supported model (Model A) should control the required
tensile capacity of the longitudinal reinforcement including the prestressing strands and external
FRP reinforcement. Although the structure may not be purely simply supported, the girders
should be strengthened to dependably resist factored ultimate loads for all three potential
behavior types.
Longitudinal reinforcement tensile forces must be fully developed at the end of the tie
closest to the support. For the tie extending from the nodal zone at the interior support
(Member 1), the tensile force must be developed at the point where the centroid of the
reinforcement extends beyond the extended nodal zone (ACI Committee 318 2002). During the
design of an FRP reinforcement repair method, the FRP reinforcement forces were considered
fully developed at the inside face of the bearing pad.
2.6 DESIGN OF EXTERNAL FIBER-REINFORCED POLYMER STRENGTHENING SYSTEM
Four FRP-reinforcement repair designs were presented by Swenson (2003). The FRP
reinforcement systems were designed to either correct strength deficiencies that have resulted
from cracking, or prevent strength deficiencies from occurring. Three complementary objectives
were considered during the design of potential strengthening systems. Two objectives were to
provide adequate positive bending resistance, as well as adequate shear resistance, regardless
of continuity conditions. The other objective was to shift future cracking, associated with the
restrained deformations of time- and temperature-dependent effects, to a more acceptable
location at the face of, or within, the continuity diaphragm.
The FRP reinforcement selected for the design of potential repair systems was the Tyfo
SCH-41 composite manufactured by Fyfe Co. This product is a wet lay-up system comprised of
Tyfo SCH-41 reinforcing fabric and Tyfo S epoxy. Tyfo SCH-41 reinforcing fabric is comprised of
unidirectional carbon fibers backed with a glass veil to increase and support fabric stability during
installation. Tyfo S epoxy is a two-part adhesive used to both saturate the composite fabric and
bond the fabric to the concrete.
The repair solution recommended by Swenson (2003) was a 4-ply FRP system applied
near the continuity diaphragm along the bottom flange of every girder, even those which are
uncracked. The longitudinal and cross sectional configurations of the recommended 4-ply FRP
system are shown in Figures 2.26–2.28.
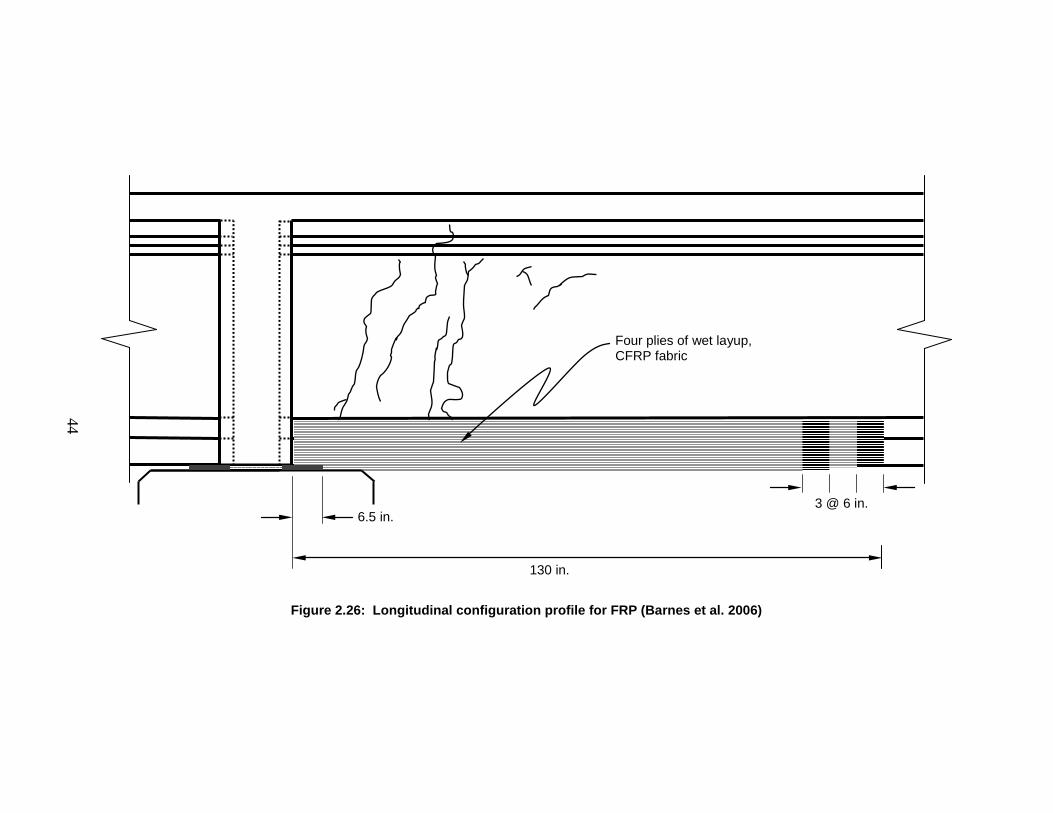
44
Figure 2.26: Longitudinal configuration profile for FRP (Barnes et al. 2006)
6.5 in.
130 in.
3 @ 6 in.
Four plies of wet layup, CFRP fabric
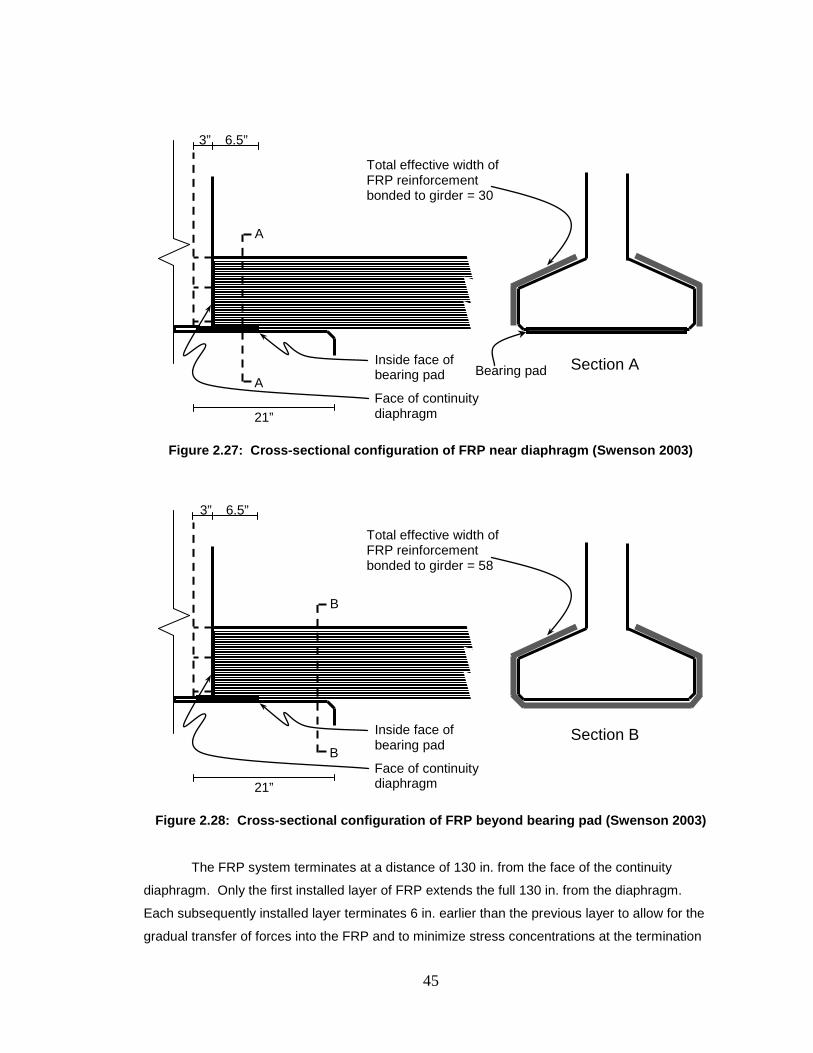
45
Figure 2.27: Cross-sectional configuration of FRP near diaphragm (Swenson 2003)
Figure 2.28: Cross-sectional configuration of FRP beyond bearing pad (Swenson 2003)
The FRP system terminates at a distance of 130 in. from the face of the continuity
diaphragm. Only the first installed layer of FRP extends the full 130 in. from the diaphragm.
Each subsequently installed layer terminates 6 in. earlier than the previous layer to allow for the
gradual transfer of forces into the FRP and to minimize stress concentrations at the termination
6.5”
Inside face of bearing pad
Face of continuity diaphragm
B
B Section B
Total effective width of FRP reinforcement bonded to girder = 58
3”
21”
21”
6.5”
A
A Section A
Total effective width of FRP reinforcement bonded to girder = 30
Bearing pad
3”
Inside face of bearing pad
Face of continuity diaphragm
46
points. FRP applied to the bottom surface of the flange cannot extend to the continuity
diaphragm because of the girder bearing; instead it extends to roughly 10 in. from the face of the
diaphragm, and terminates within 1 in. of the bearing pad.
2.7 LOAD TESTS PRIOR TO FRP REINFORCEMENT INSTALLATION
Load tests scheduled to be performed before and after installation of the FRP system were
planned to quantify the effectiveness of the FRP reinforcement. The pre-repair load tests were
conducted on the nights of May 31, and June 1, 2005. Specific girders were instrumented to
document responses to various load conditions. Two ALDOT load trucks were positioned to
apply loads to the bridge structure at designated locations. General behavior of the damaged
bridge structure was analyzed with measured responses to the pre-repair load tests. Detailed
documentation of the instrumentation, procedures, and results of pre-repair testing has been
reported by Fason (2009) and is summarized in this section.
The instrumentation and procedure of the pre-repair testing were similar to those of the
post-repair testing documented in this report. Specific details regarding the setup and execution
of post-repair testing can be found in Chapters 3 and 4 of this report.
2.7.1 Instrumentation for Pre-Repair Load Testing
Prior to pre-repair testing, Girders 7 and 8 of Northbound Spans 10 and 11were instrumented
with sensors designated to measure girder responses to varying load conditions. The installed
sensors include
• Crack opening displacement (COD) gages,
• Deflectometers, and
• Surface-mounted strain gages.
A total of four COD gages, one per instrumented girder, were installed. Each COD gage was
installed near the continuity diaphragm to span a single crack that extends into the web on each
instrumented girder. A total of twelve deflectometers were positioned underneath the
instrumented girders. A total of fifty-six surface-mounted strain gages were installed on the
concrete surface of the instrumented girders. Eight cross sections contain gages at varying
heights within the cross section, while eight other cross sections have only one concrete gage on
the bottom surface of the bottom flange.
Sensor installation procedures prior to pre-repair testing have been described by Fason
(2009). The majority of these sensors were maintained for post-repair testing, and specific post-
repair sensor instrumentation details from can be found in Chapter 3 of this report.
47
2.7.2 Procedures for Pre-Repair Load Testing
Three distinct horizontal truck alignments represented load truck traverse lanes. Each traverse
lane contained nine stop positions. Load trucks were held at stop positions long enough for
sensors to measure girder response.
The first night of testing was dedicated to acoustic emissions testing. Analysis of the
measurements from the acoustic emissions sensors do not fall within the scope of this report, but
the sensors installed for static load testing did measure girder responses to the static truck
positions of the acoustic emissions test.
The second night of testing included a repeat of the acoustic emissions test followed by
static load testing at all stop positions. Each stop position was recorded three times to allow for
averaging and elimination of outliers. Static load testing concluded with a superposition test.
Pre-repair testing procedures have been reported by Fason (2009). The majority of
these load tests were repeated during post-repair testing, and specific details of post-repair load
testing procedures can be found in Chapter 4 of this report.
2.7.3 Results of Pre-Repair Load Testing
The overall bridge behavior was analyzed following the pre-repair tests. Fason (2009)
determined that the girders were not acting as simply supported girders, which was the worst-
case behavior selected by Swenson for design of the FRP system. It was also determined that,
at the time of the pre-repair load tests, the girders were not behaving as though they were hinged
at the crack locations. It was noted by Fason that crack sizes observed during testing were
visibly not as large as the crack sizes observed during sensor installation.
The superposition test was conducted to assess if the damaged bridge structure
exhibited linear elastic behavior. It was determined that the deflections measured during
superposition testing indicated that the bridge was exhibiting responses similar to linear-elastic
behavior. Although the overall bridge behavior was considered to be linear-elastic, there were
some discrepancies with the localized measurements of the crack-opening devices and strain
gages. The cracks within the girders were observed to be behaving similar to a nonlinear spring,
with the stiffness factor increasing as the deflection increased and crack openings decreased.
The influence of the false supports on bridge behavior during the pre-repair tests was
also reported. A strain gage installed on one column of the false supports measured a small
compressive strain during normal traffic conditions, which indicated that the false supports were
providing some actual support during normal traffic conditions. Strains measured near the bent
during superposition testing were also reportedly affected by the presence of the false supports.
When only one span was loaded, the false supports under that span seemed to carry significant
load, reducing the strain measured at the bent. When both spans were loaded simultaneously,
48
the continuity effects that promote an upward deflection of the opposite span allowed for the false
supports under each span to carry fewer loads individually.
It was concluded by Fason (2009) that direct comparisons between pre- and post-repair
measured responses would not be independently indicative of the effectiveness of the FRP
repair. This was based on the assumption that the weather conditions during post-repair testing
could be more conducive to wider crack openings immediately prior to load testing, and the fact
that the false support bearing pads would be removed during the installation of the FRP
reinforcement.
2.8 FINITE-ELEMENT ANALYSIS OF BRIDGE BEHAVIOR
Shapiro (2007) used ABAQUS/CAE to develop a finite element model (FEM) to represent the
elevated two-span section of I-565 being investigated. Information regarding FEM development
including: element selection, member geometry, material properties, support conditions, member
connections, and load application has been detailed by Shapiro (2007). Once the fundamental
model was created, the model was refined in three stages. Load test results were used to verify
and refine the model as necessary. The final stage of the refinement process became the pre-
repair condition model. Once a pre-repair model was established, the FRP reinforcement was
then added to provide expected results for the post-repair load tests. The unintended support
prvided by the false supports was not considered in the model development. A summary of the
finite-element model analysis presented by Shapiro (2007) is discussed in this section.
2.8.1 Uncracked Model
The first stage of model refinement assumes an ideal scenario of uncracked girders. When
compared to the pre-repair load test results, the Uncracked model results generally exhibit more
compression (or less tension) strain on the bottom surface of the bottom flange than observed
during testing. This discrepancy was even more evident at the cross sections near the cracked
region, especially comparing results associated with midspan loadings. The Uncracked model
overestimates the continuity of the cracked girder-system.
2.8.2 Cracked Model
The second stage of model refinement incorporated ABAQUS seams within the model to
represent existing cracks. The resulting Cracked model represents a worst-case scenario of no
reinforcement contribution at crack locations. The seams cut through the concrete and steel as if
the steel has fractured at the crack locations or the bond between the steel and the concrete has
deteriorated to the extent that no stresses can be transferred from the concrete to the steel. As a
result, the model suggests that no bending moment is developed near the crack locations. The
49
load test results are more complicated and do not reflect the zero strain behavior suggested by
the Cracked model results.
2.8.3 Cracked-with-Reinforcement Model
The Cracked model was refined by accounting for the presence of steel at the cracked cross
sections. A Cracked-with-Reinforcement model was developed by adding two groups of
reinforcing steel to represent the draped and undraped prestressing strands. Although this
reinforcement was added, no attempt was made to apply a prestressing force to the model since
it was considered unlikely that the prestress force would be effective at the cracked sections. The
Cracked-with-Reinforcement model results fell between those of the Uncracked and Cracked
models, better resembling the pre-repair load test results.
2.8.4 Pre-Repair Model
Through further analysis it was suggested that the Cracked-with-Reinforcement model could be
refined by adding seams in the model to represents cracks at the face of the continuity
diaphragm. The addition of seams at the face of the continuity diaphragm yielded results that
best resembled the pre-repair load test results. This refined model became the Pre-Repair model
to officially compare analytical results to experimental load test results. This model was also
refined by modeling the addition of the FRP reinforcement to estimate the post-repair behavior of
the bridge structure.
2.8.5 Post-Repair Model
The wet lay-up FRP reinforcement was modeled to behave as a laminate, or thin plate. The FRP
reinforcement material properties were modeled as both isotropic and laminar. The isotropic
material exhibits the same properties in all directions. The laminar material acts as a simplified
form of an orthotropic material, which differentiates material properties in principal or
perpendicular directions to each other. Shapiro (2007) concluded that the laminar representation
of the FRP material more accurately modeled the orthotropic properties of the FRP reinforcement
selected to be installed. The laminate FRP reinforcement was added to the Pre-Repair model to
create a Post-Repair model for comparison with the results of the post-repair load tests.
2.9 INSTALLATION OF EXTERNAL FRP REINFORCEMENT
FRP reinforcement installation, which took place during December of 2007, was performed in
accordance with the ALDOT Special Provision regarding the use of fiber reinforced polymer for
girder repair. The on-site activities taking place from December 11, through December 19, 2007
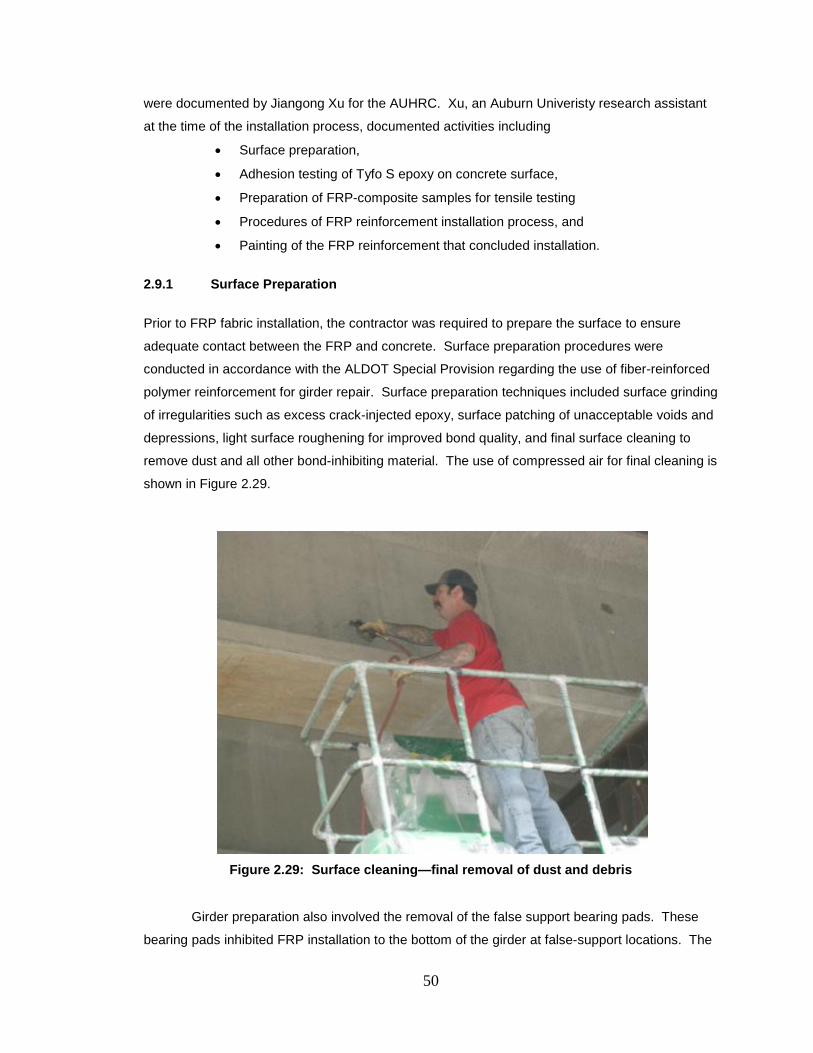
50
were documented by Jiangong Xu for the AUHRC. Xu, an Auburn Univeristy research assistant
at the time of the installation process, documented activities including
• Surface preparation,
• Adhesion testing of Tyfo S epoxy on concrete surface,
• Preparation of FRP-composite samples for tensile testing
• Procedures of FRP reinforcement installation process, and
• Painting of the FRP reinforcement that concluded installation.
2.9.1 Surface Preparation
Prior to FRP fabric installation, the contractor was required to prepare the surface to ensure
adequate contact between the FRP and concrete. Surface preparation procedures were
conducted in accordance with the ALDOT Special Provision regarding the use of fiber-reinforced
polymer reinforcement for girder repair. Surface preparation techniques included surface grinding
of irregularities such as excess crack-injected epoxy, surface patching of unacceptable voids and
depressions, light surface roughening for improved bond quality, and final surface cleaning to
remove dust and all other bond-inhibiting material. The use of compressed air for final cleaning is
shown in Figure 2.29.
Figure 2.29: Surface cleaning—final removal of dust and debris
Girder preparation also involved the removal of the false support bearing pads. These
bearing pads inhibited FRP installation to the bottom of the girder at false-support locations. The
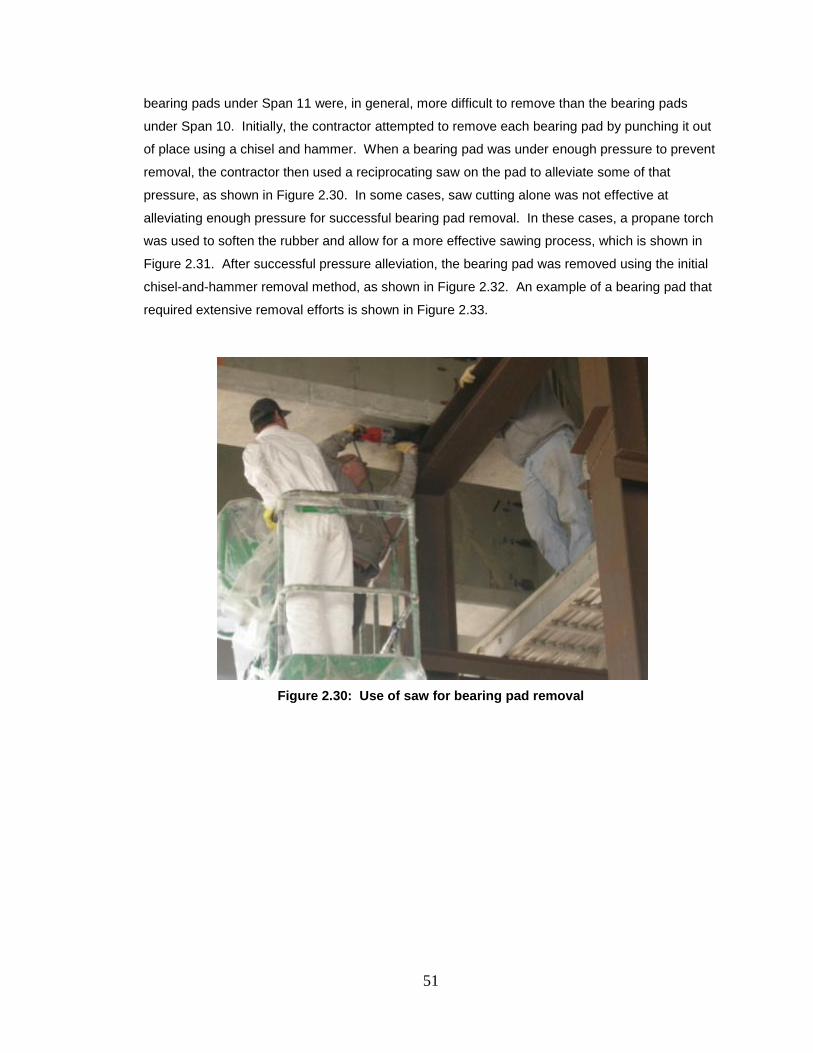
51
bearing pads under Span 11 were, in general, more difficult to remove than the bearing pads
under Span 10. Initially, the contractor attempted to remove each bearing pad by punching it out
of place using a chisel and hammer. When a bearing pad was under enough pressure to prevent
removal, the contractor then used a reciprocating saw on the pad to alleviate some of that
pressure, as shown in Figure 2.30. In some cases, saw cutting alone was not effective at
alleviating enough pressure for successful bearing pad removal. In these cases, a propane torch
was used to soften the rubber and allow for a more effective sawing process, which is shown in
Figure 2.31. After successful pressure alleviation, the bearing pad was removed using the initial
chisel-and-hammer removal method, as shown in Figure 2.32. An example of a bearing pad that
required extensive removal efforts is shown in Figure 2.33.
Figure 2.30: Use of saw for bearing pad removal
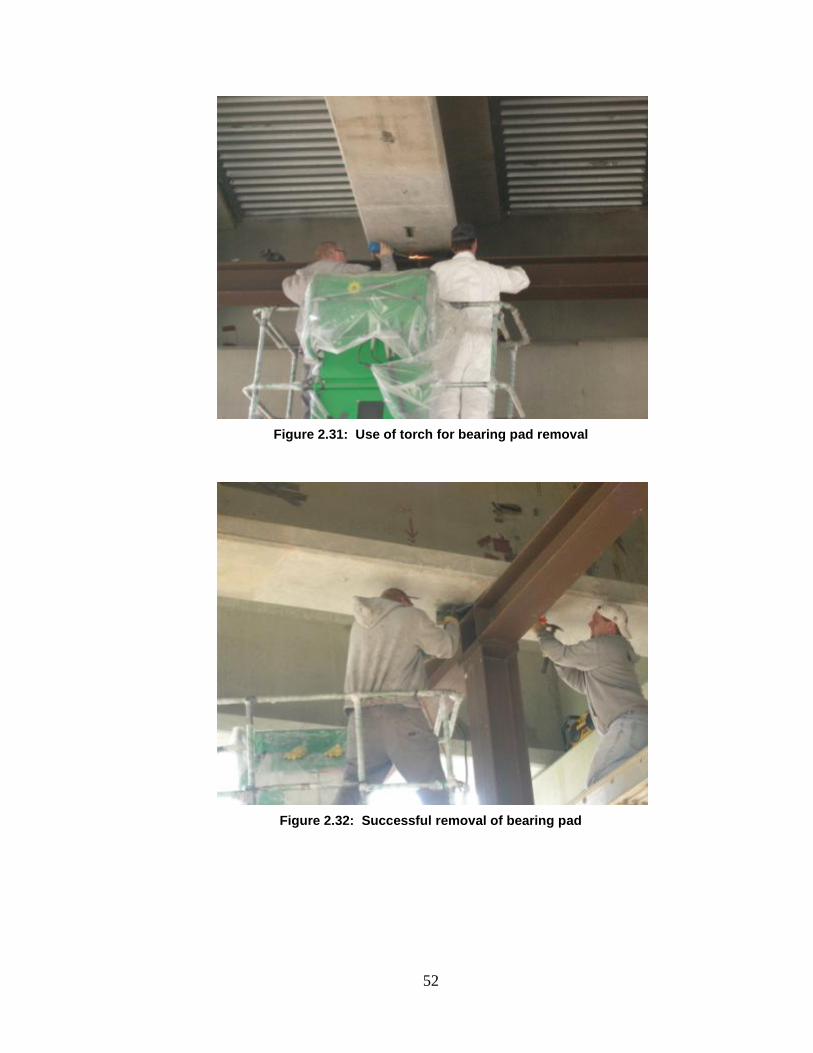
52
Figure 2.31: Use of torch for bearing pad removal
Figure 2.32: Successful removal of bearing pad
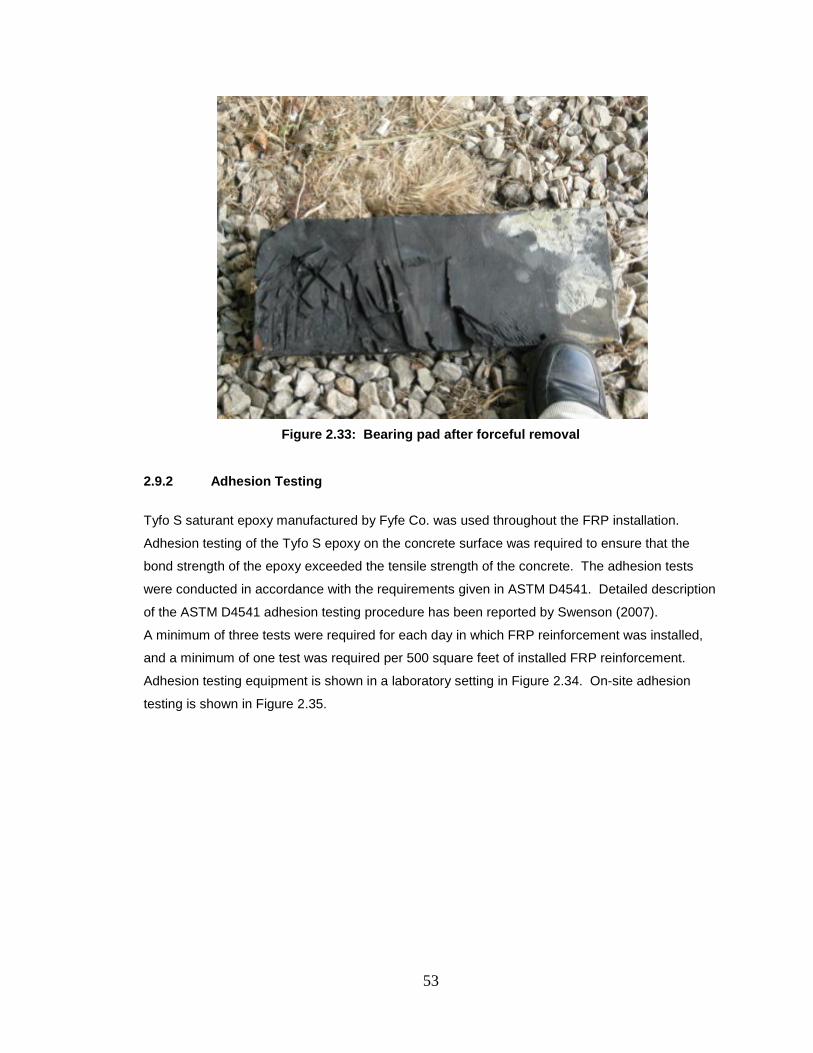
53
Figure 2.33: Bearing pad after forceful removal
2.9.2 Adhesion Testing
Tyfo S saturant epoxy manufactured by Fyfe Co. was used throughout the FRP installation.
Adhesion testing of the Tyfo S epoxy on the concrete surface was required to ensure that the
bond strength of the epoxy exceeded the tensile strength of the concrete. The adhesion tests
were conducted in accordance with the requirements given in ASTM D4541. Detailed description
of the ASTM D4541 adhesion testing procedure has been reported by Swenson (2007).
A minimum of three tests were required for each day in which FRP reinforcement was installed,
and a minimum of one test was required per 500 square feet of installed FRP reinforcement.
Adhesion testing equipment is shown in a laboratory setting in Figure 2.34. On-site adhesion
testing is shown in Figure 2.35.
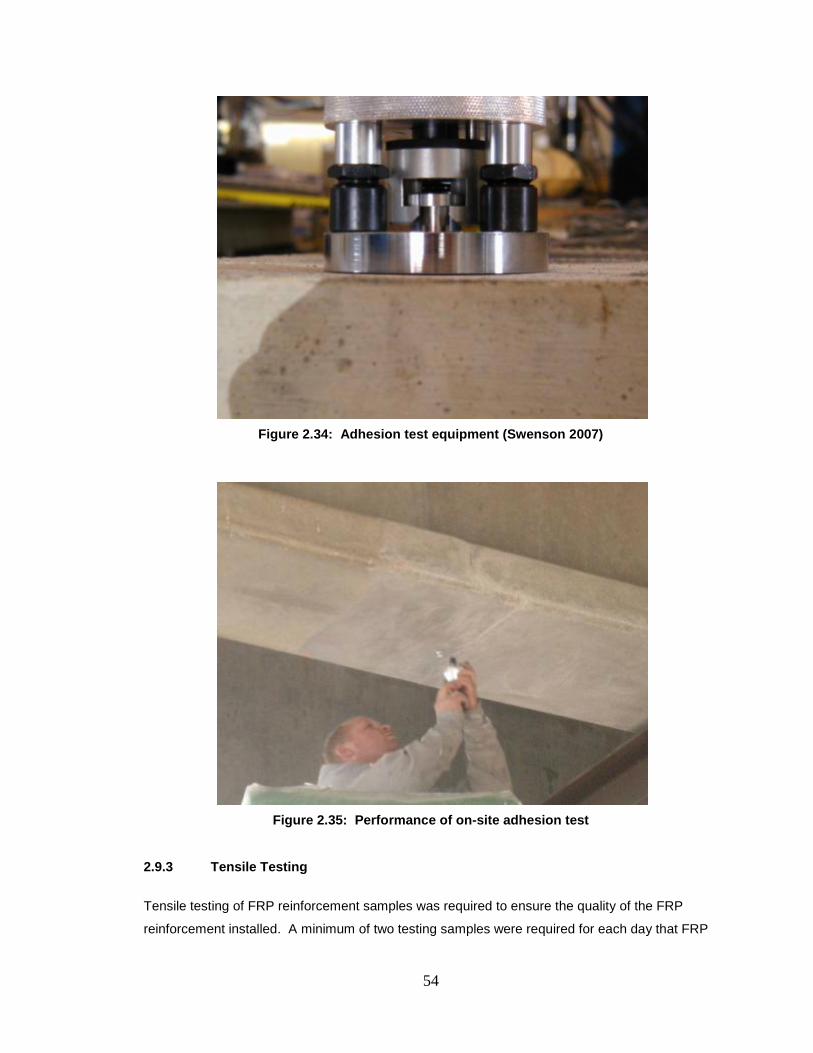
54
Figure 2.34: Adhesion test equipment (Swenson 2007)
Figure 2.35: Performance of on-site adhesion test
2.9.3 Tensile Testing
Tensile testing of FRP reinforcement samples was required to ensure the quality of the FRP
reinforcement installed. A minimum of two testing samples were required for each day that FRP
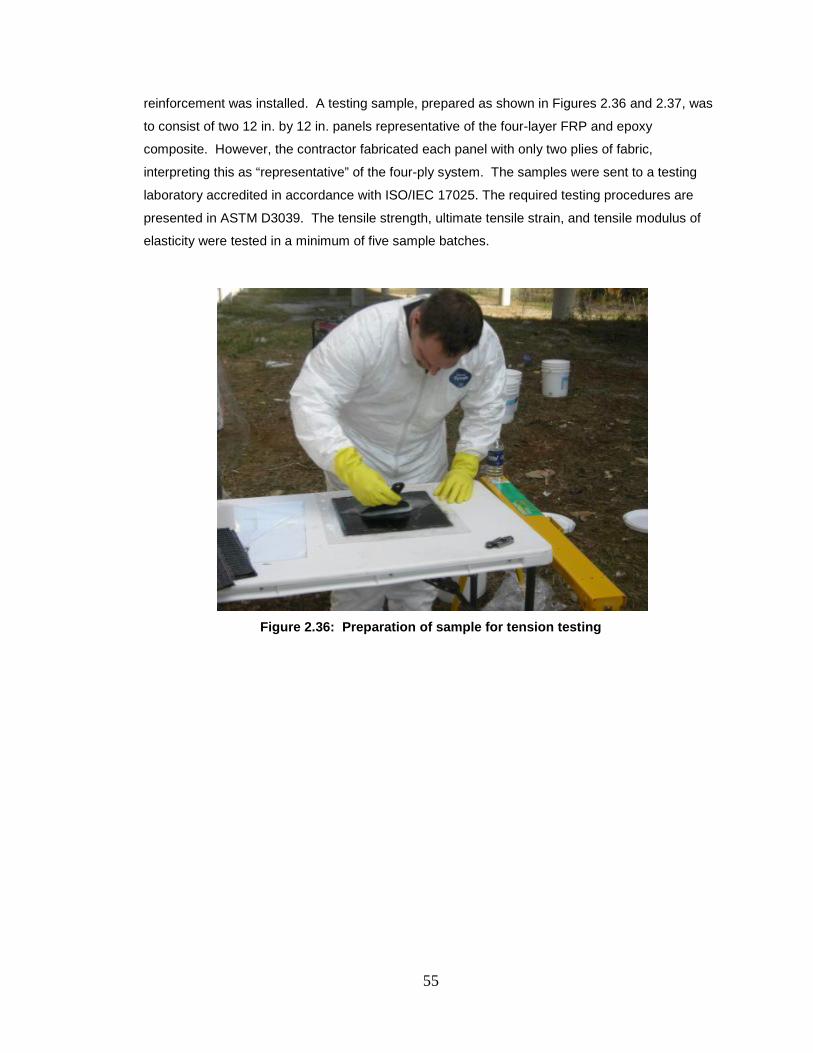
55
reinforcement was installed. A testing sample, prepared as shown in Figures 2.36 and 2.37, was
to consist of two 12 in. by 12 in. panels representative of the four-layer FRP and epoxy
composite. However, the contractor fabricated each panel with only two plies of fabric,
interpreting this as “representative” of the four-ply system. The samples were sent to a testing
laboratory accredited in accordance with ISO/IEC 17025. The required testing procedures are
presented in ASTM D3039. The tensile strength, ultimate tensile strain, and tensile modulus of
elasticity were tested in a minimum of five sample batches.
Figure 2.36: Preparation of sample for tension testing
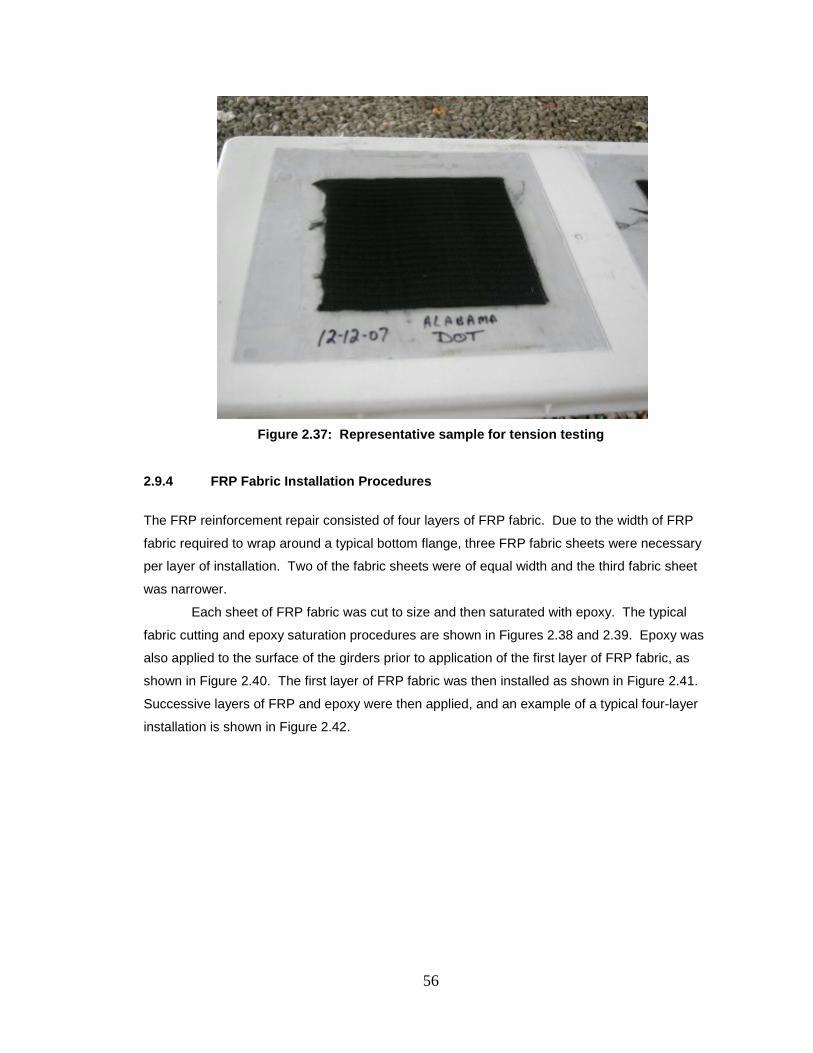
56
Figure 2.37: Representative sample for tension testing
2.9.4 FRP Fabric Installation Procedures
The FRP reinforcement repair consisted of four layers of FRP fabric. Due to the width of FRP
fabric required to wrap around a typical bottom flange, three FRP fabric sheets were necessary
per layer of installation. Two of the fabric sheets were of equal width and the third fabric sheet
was narrower.
Each sheet of FRP fabric was cut to size and then saturated with epoxy. The typical
fabric cutting and epoxy saturation procedures are shown in Figures 2.38 and 2.39. Epoxy was
also applied to the surface of the girders prior to application of the first layer of FRP fabric, as
shown in Figure 2.40. The first layer of FRP fabric was then installed as shown in Figure 2.41.
Successive layers of FRP and epoxy were then applied, and an example of a typical four-layer
installation is shown in Figure 2.42.
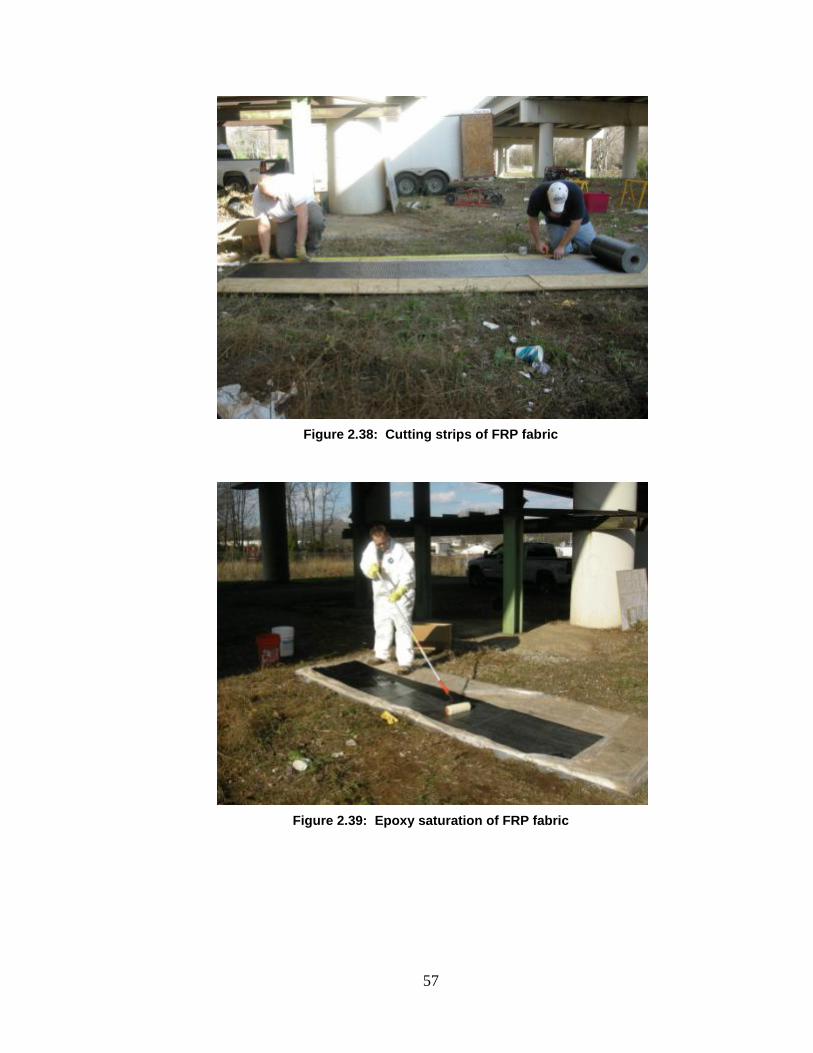
57
Figure 2.38: Cutting strips of FRP fabric
Figure 2.39: Epoxy saturation of FRP fabric
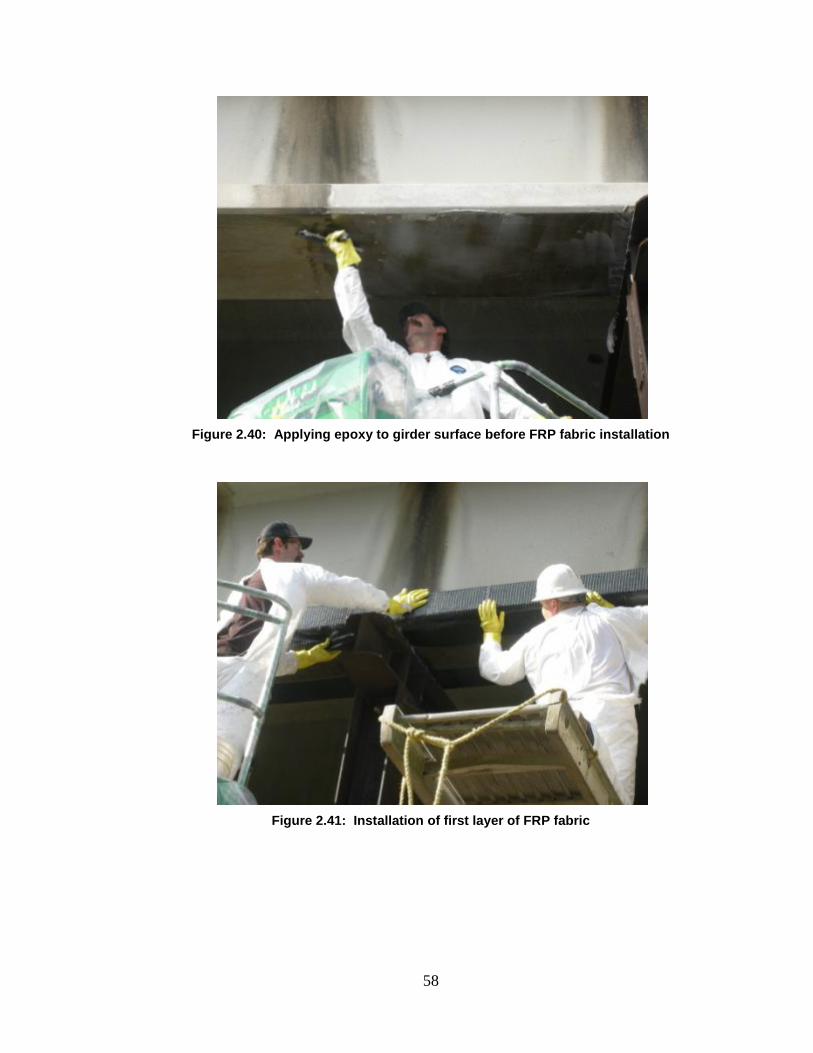
58
Figure 2.40: Applying epoxy to girder surface before FRP fabric installation
Figure 2.41: Installation of first layer of FRP fabric
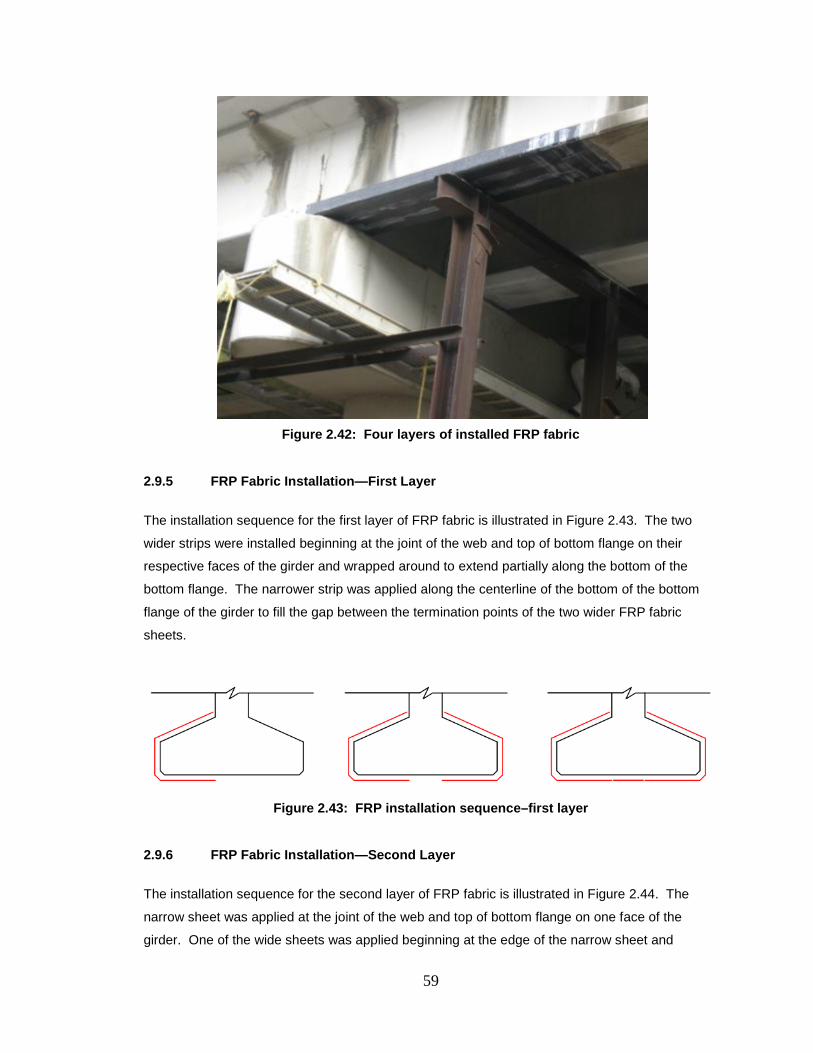
59
Figure 2.42: Four layers of installed FRP fabric
2.9.5 FRP Fabric Installation—First Layer
The installation sequence for the first layer of FRP fabric is illustrated in Figure 2.43. The two
wider strips were installed beginning at the joint of the web and top of bottom flange on their
respective faces of the girder and wrapped around to extend partially along the bottom of the
bottom flange. The narrower strip was applied along the centerline of the bottom of the bottom
flange of the girder to fill the gap between the termination points of the two wider FRP fabric
sheets.
Figure 2.43: FRP installation sequence–first layer
2.9.6 FRP Fabric Installation—Second Layer
The installation sequence for the second layer of FRP fabric is illustrated in Figure 2.44. The
narrow sheet was applied at the joint of the web and top of bottom flange on one face of the
girder. One of the wide sheets was applied beginning at the edge of the narrow sheet and
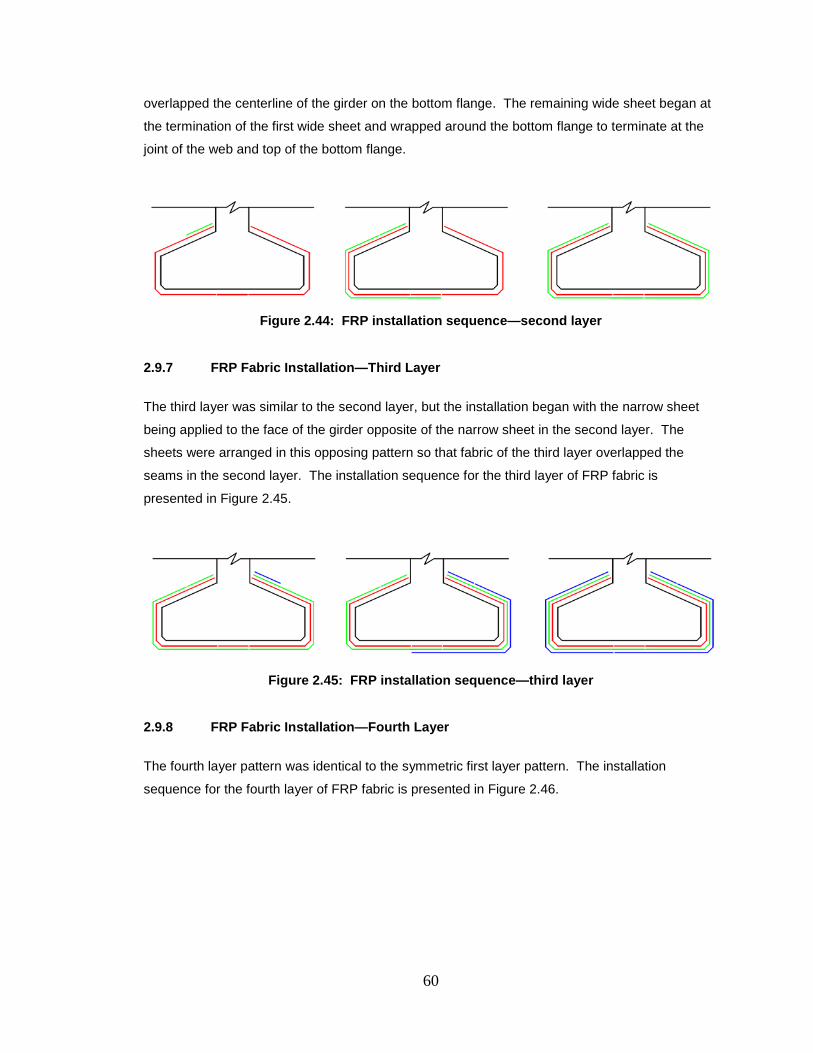
60
overlapped the centerline of the girder on the bottom flange. The remaining wide sheet began at
the termination of the first wide sheet and wrapped around the bottom flange to terminate at the
joint of the web and top of the bottom flange.
Figure 2.44: FRP installation sequence—second layer
2.9.7 FRP Fabric Installation—Third Layer
The third layer was similar to the second layer, but the installation began with the narrow sheet
being applied to the face of the girder opposite of the narrow sheet in the second layer. The
sheets were arranged in this opposing pattern so that fabric of the third layer overlapped the
seams in the second layer. The installation sequence for the third layer of FRP fabric is
presented in Figure 2.45.
Figure 2.45: FRP installation sequence—third layer
2.9.8 FRP Fabric Installation—Fourth Layer
The fourth layer pattern was identical to the symmetric first layer pattern. The installation
sequence for the fourth layer of FRP fabric is presented in Figure 2.46.
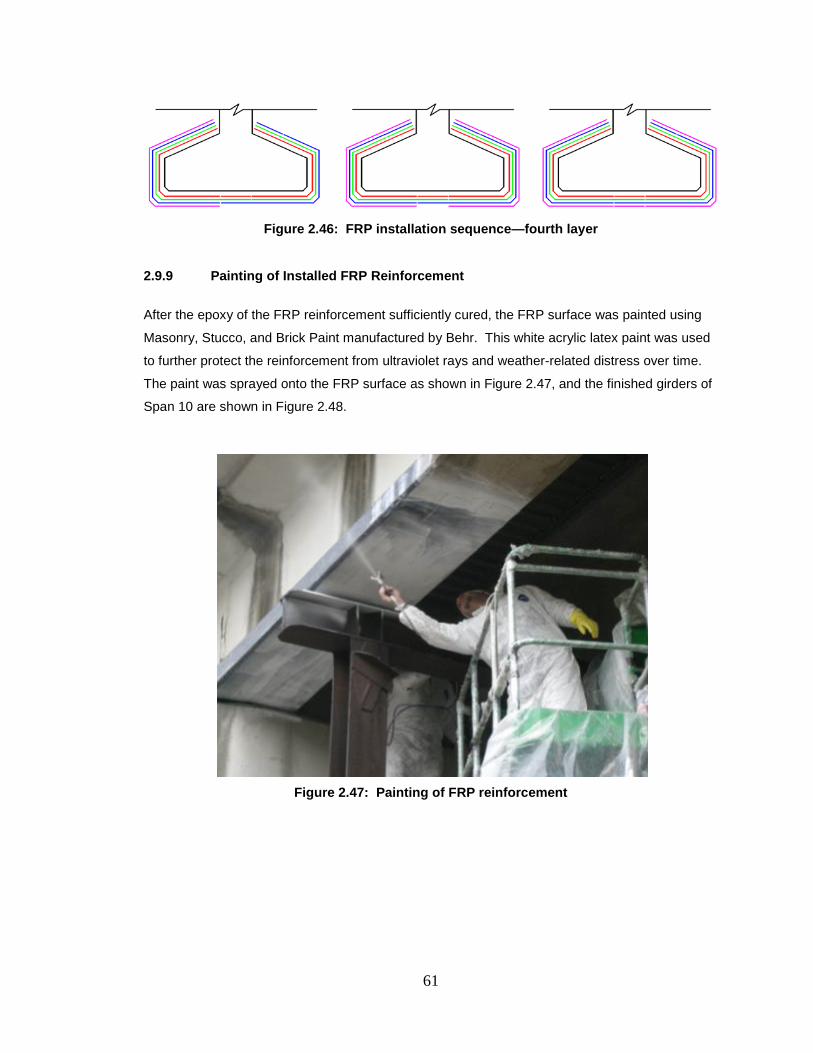
61
Figure 2.46: FRP installation sequence—fourth layer
2.9.9 Painting of Installed FRP Reinforcement
After the epoxy of the FRP reinforcement sufficiently cured, the FRP surface was painted using
Masonry, Stucco, and Brick Paint manufactured by Behr. This white acrylic latex paint was used
to further protect the reinforcement from ultraviolet rays and weather-related distress over time.
The paint was sprayed onto the FRP surface as shown in Figure 2.47, and the finished girders of
Span 10 are shown in Figure 2.48.
Figure 2.47: Painting of FRP reinforcement
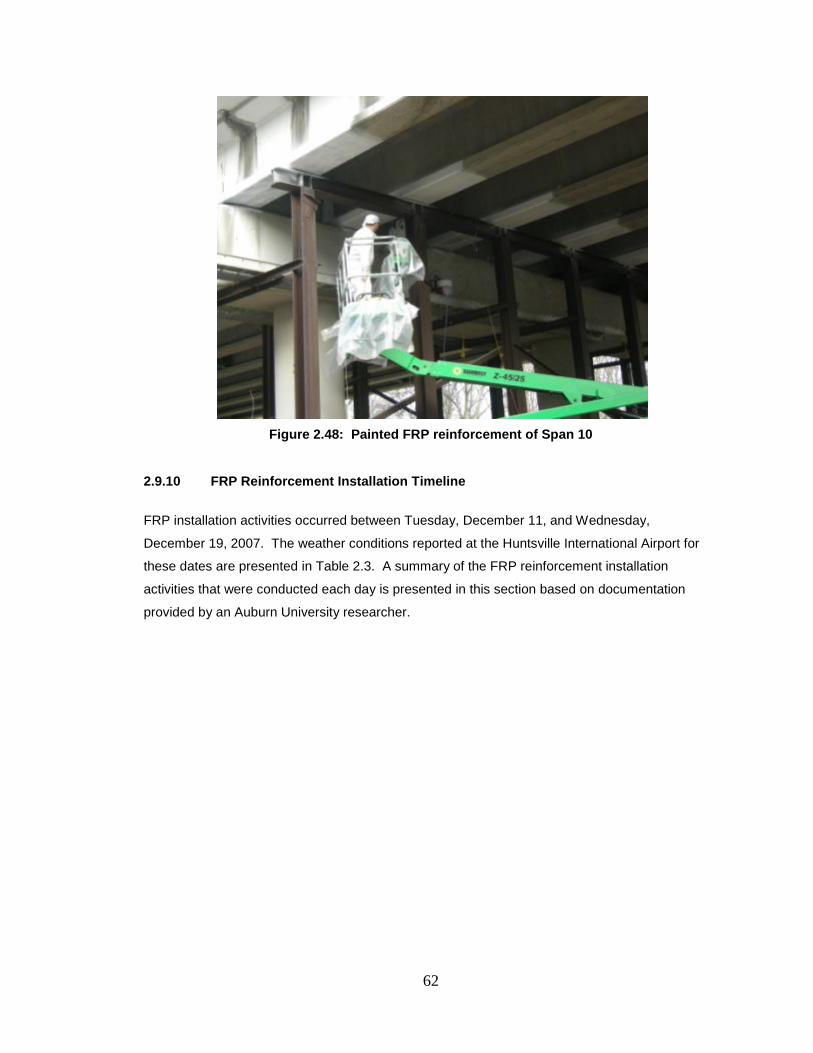
62
Figure 2.48: Painted FRP reinforcement of Span 10
2.9.10 FRP Reinforcement Installation Timeline
FRP installation activities occurred between Tuesday, December 11, and Wednesday,
December 19, 2007. The weather conditions reported at the Huntsville International Airport for
these dates are presented in Table 2.3. A summary of the FRP reinforcement installation
activities that were conducted each day is presented in this section based on documentation
provided by an Auburn University researcher.
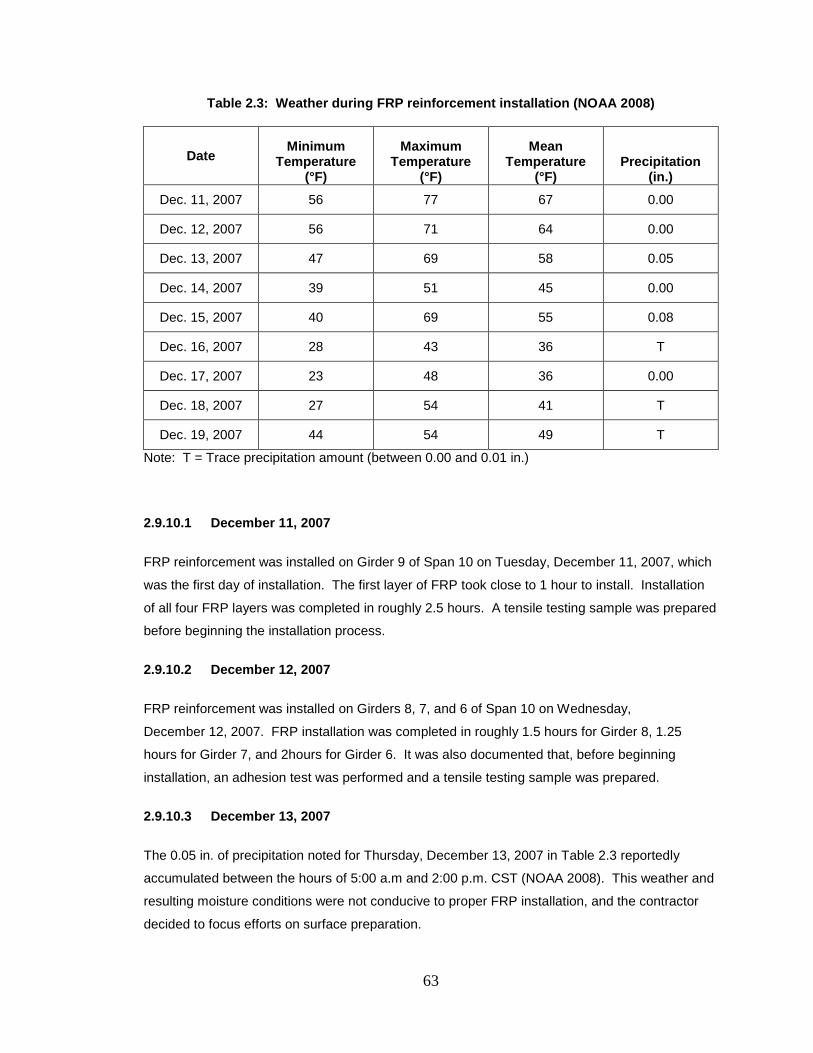
63
Table 2.3: Weather during FRP reinforcement installation (NOAA 2008)
Date Minimum
Temperature (°F)
Maximum Temperature
(°F)
Mean Temperature
(°F) Precipitation
(in.) Dec. 11, 2007 56 77 67 0.00
Dec. 12, 2007 56 71 64 0.00
Dec. 13, 2007 47 69 58 0.05
Dec. 14, 2007 39 51 45 0.00
Dec. 15, 2007 40 69 55 0.08
Dec. 16, 2007 28 43 36 T
Dec. 17, 2007 23 48 36 0.00
Dec. 18, 2007 27 54 41 T
Dec. 19, 2007 44 54 49 T
Note: T = Trace precipitation amount (between 0.00 and 0.01 in.)
2.9.10.1 December 11, 2007
FRP reinforcement was installed on Girder 9 of Span 10 on Tuesday, December 11, 2007, which
was the first day of installation. The first layer of FRP took close to 1 hour to install. Installation
of all four FRP layers was completed in roughly 2.5 hours. A tensile testing sample was prepared
before beginning the installation process.
2.9.10.2 December 12, 2007
FRP reinforcement was installed on Girders 8, 7, and 6 of Span 10 on Wednesday,
December 12, 2007. FRP installation was completed in roughly 1.5 hours for Girder 8, 1.25
hours for Girder 7, and 2hours for Girder 6. It was also documented that, before beginning
installation, an adhesion test was performed and a tensile testing sample was prepared.
2.9.10.3 December 13, 2007
The 0.05 in. of precipitation noted for Thursday, December 13, 2007 in Table 2.3 reportedly
accumulated between the hours of 5:00 a.m and 2:00 p.m. CST (NOAA 2008). This weather and
resulting moisture conditions were not conducive to proper FRP installation, and the contractor
decided to focus efforts on surface preparation.
64
2.9.10.4 December 14, 2007
FRP reinforcement was installed on Girders 5, 4, 3, and 2 of Span 10 on Friday, December 14,
2007. FRP installation was completed in roughly 1 hour for Girder 5, 1 hour for Girder 4, 1.5
hours for Girder 3, and 1 hour for Girder 2. It was again documented that, before beginning
installation, an adhesion test was performed and a tensile testing sample was prepared.
2.9.10.5 December 15, 2007
The forceful removal of Span 11 bearing pads began on Saturday, December 15, 2007.
Complete removal of all Span 11 bearing pads was unsuccessful.
2.9.10.6 December 16, 2007
No work was documented by the AUHRC for Sunday, December 16, 2007
2.9.10.7 December 17, 2007
Span 11 bearing pad removal continued on Monday, December 17, 2007.
2.9.10.8 December 18, 2007
FRP reinforcement was installed on Girders 9, 8, 7, 6, and 5 of Span 11 on Tuesday,
December 18, 2007. FRP installation was completed in roughly 1 hour for Girder 9, 1 hour for
Girder 8, and 2 hours for Girder 7, 1 hour for Girder 6, and 1hour for Girder 5. It was documented
that another tensile testing sample was prepared before beginning installation.
2.9.10.9 December 19, 2007
The contractor began painting installed FRP fabric on Wednesday, December 19, 2007.
Girders 9–2 of Span 10 were painted before beginning other FRP installation. FRP reinforcement
was installed on Girder 1 of Span 10 and Girder 1 of Span 11. FRP installation was completed in
roughly 2 hours for Girder 1 of Span 10 and 1 hour for Girder 1 of Span 11. These girders were
painted immediately following FRP installation. It was also documented that a tensile testing
sample was prepared, before beginning installation.
2.9.10.10 After December 19, 2007
FRP installation activities performed after Wednesday, December 19, 2007 were not documented
by AUHRC personnel. The remaining activities included FRP installation on Girders 4, 3, and 2
of Span 11 and the painting of installed FRP fabric on Girders 9–2 of Span 11.
65
2.10 INSTALLATION AND TESTING CONCERNS
Several issues related to FRP installation and testing were identified during and after the
installation process. These concerns are discussed in this section.
2.10.1 FRP Orientation
AUHRC personnel visited the site on the first day of planned FRP installation and discovered that
the contractor was cutting FRP fabric segments in preparation to install this fabric with the
primary carbon fibers oriented perpendicular to the specified direction. This mistake occurred
despite the primary fiber direction being correctly and explicitly indicated on the FRP installation
plans. The on-site ALDOT inspector—who had no previous experience with FRP installation—
exhibited no comprehension of the importance of the correct FRP orientation. Had the FRP been
installed with the incorrect orientation, none of the required strengthening would have been
achieved. The error was pointed out to the installation contractor and ALDOT personnel prior to
actual installation, and all of the FRP was installed with the correct orientation. It is critical that
design documents clearly show the correct fiber orientation, and that ALDOT inspectors and FRP
installers understand the proper orientation prior to FRP installation.
2.10.2 FRP Samples for Tensile Testing
Panels of cured FRP composite were prepared for ASTM D 3039 tensile testing. The
AUHRC/ALDOT special provision (No. 06-0302, Section 595) for FRP specified that the sample
panels consist of “cured composite that is representative of the installed system.” The original
intention of this specification was that a sample composite panel would consist of four cured
layers of fabric because the installation involved a four-layer FRP system for the I-565 girders.
However, the samples prepared by the contractor and submitted for tensile testing only consisted
of two layers bonded together. Thus, the true mechanical properties of the actual four-layer
system installed are not known, but rather must be inferred from the two-layer tensile test results.
It is not certain that the unit stiffness and ultimate tensile strength remain constant as the number
of layers in the composite increases. The “tensile testing” subsection of the ALDOT special
provision for FRP needs to be modified to clearly state that “all tensile test samples shall consist
of the same number of fabric layers as are installed on the actual concrete structure.”
2.10.3 FRP Tensile Testing Observation
The AUHRC/ALDOT special provision for FRP specified that the contractor notify ALDOT and
AUHRC at least two weeks prior to tensile testing, and that the testing laboratory allow ALDOT
and AUHRC personnel to witness the testing. The contractor did not notify AUHRC researchers
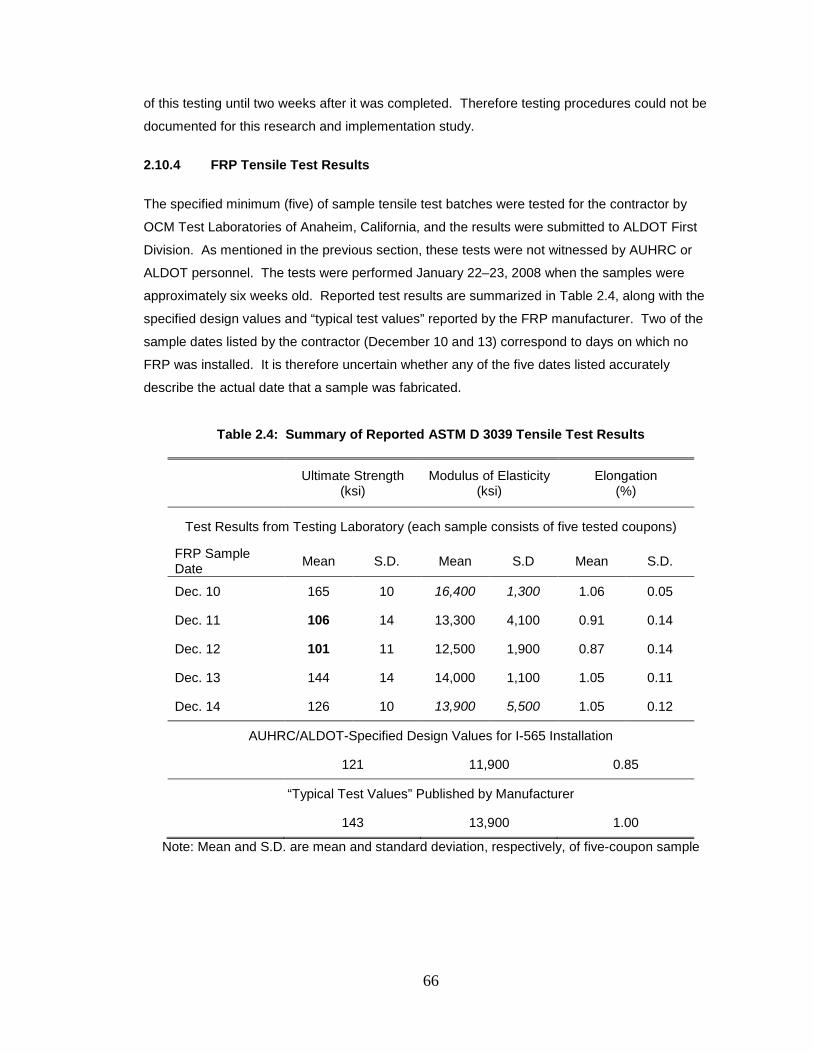
66
of this testing until two weeks after it was completed. Therefore testing procedures could not be
documented for this research and implementation study.
2.10.4 FRP Tensile Test Results
The specified minimum (five) of sample tensile test batches were tested for the contractor by
OCM Test Laboratories of Anaheim, California, and the results were submitted to ALDOT First
Division. As mentioned in the previous section, these tests were not witnessed by AUHRC or
ALDOT personnel. The tests were performed January 22–23, 2008 when the samples were
approximately six weeks old. Reported test results are summarized in Table 2.4, along with the
specified design values and “typical test values” reported by the FRP manufacturer. Two of the
sample dates listed by the contractor (December 10 and 13) correspond to days on which no
FRP was installed. It is therefore uncertain whether any of the five dates listed accurately
describe the actual date that a sample was fabricated.
Table 2.4: Summary of Reported ASTM D 3039 Tensile Test Results
Ultimate Strength (ksi)
Modulus of Elasticity (ksi)
Elongation (%)
Test Results from Testing Laboratory (each sample consists of five tested coupons)
FRP Sample Date Mean S.D. Mean S.D Mean S.D.
Dec. 10 165 10 16,400 1,300 1.06 0.05
Dec. 11 106 14 13,300 4,100 0.91 0.14
Dec. 12 101 11 12,500 1,900 0.87 0.14
Dec. 13 144 14 14,000 1,100 1.05 0.11
Dec. 14 126 10 13,900 5,500 1.05 0.12
AUHRC/ALDOT-Specified Design Values for I-565 Installation
121 11,900 0.85
“Typical Test Values” Published by Manufacturer
143 13,900 1.00
Note: Mean and S.D. are mean and standard deviation, respectively, of five-coupon sample
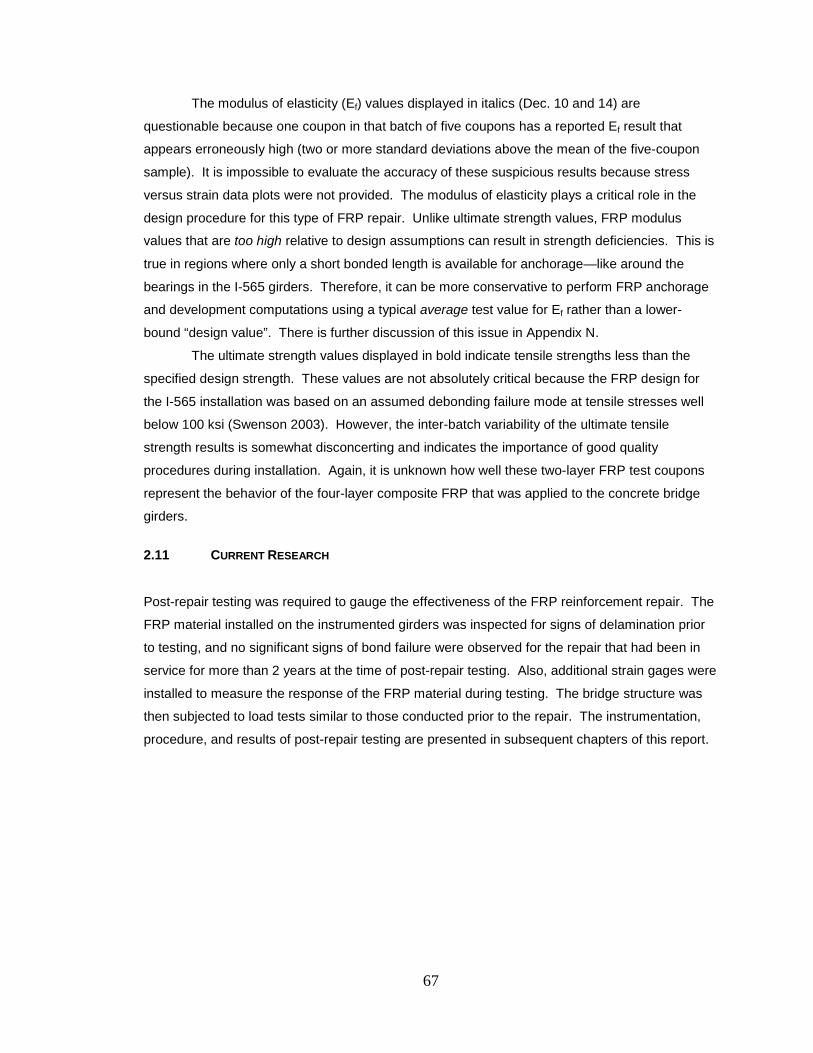
67
The modulus of elasticity (Ef) values displayed in italics (Dec. 10 and 14) are
questionable because one coupon in that batch of five coupons has a reported Ef result that
appears erroneously high (two or more standard deviations above the mean of the five-coupon
sample). It is impossible to evaluate the accuracy of these suspicious results because stress
versus strain data plots were not provided. The modulus of elasticity plays a critical role in the
design procedure for this type of FRP repair. Unlike ultimate strength values, FRP modulus
values that are too high relative to design assumptions can result in strength deficiencies. This is
true in regions where only a short bonded length is available for anchorage—like around the
bearings in the I-565 girders. Therefore, it can be more conservative to perform FRP anchorage
and development computations using a typical average test value for Ef rather than a lower-
bound “design value”. There is further discussion of this issue in Appendix N.
The ultimate strength values displayed in bold indicate tensile strengths less than the
specified design strength. These values are not absolutely critical because the FRP design for
the I-565 installation was based on an assumed debonding failure mode at tensile stresses well
below 100 ksi (Swenson 2003). However, the inter-batch variability of the ultimate tensile
strength results is somewhat disconcerting and indicates the importance of good quality
procedures during installation. Again, it is unknown how well these two-layer FRP test coupons
represent the behavior of the four-layer composite FRP that was applied to the concrete bridge
girders.
2.11 CURRENT RESEARCH
Post-repair testing was required to gauge the effectiveness of the FRP reinforcement repair. The
FRP material installed on the instrumented girders was inspected for signs of delamination prior
to testing, and no significant signs of bond failure were observed for the repair that had been in
service for more than 2 years at the time of post-repair testing. Also, additional strain gages were
installed to measure the response of the FRP material during testing. The bridge structure was
then subjected to load tests similar to those conducted prior to the repair. The instrumentation,
procedure, and results of post-repair testing are presented in subsequent chapters of this report.

68
Chapter 3
BRIDGE INSTRUMENTATION
3.1 INTRODUCTION
Northbound Spans 10 and 11 were instrumented with sensors to quantify bridge behavior and the
response of selected girders during specific loading scenarios. The desired quantifiable
responses included the opening or closing of cracks within a girder web, girder deflections, and
girder surface strains of concrete and FRP reinforcement. Sensor locations and installation
procedures are discussed in this chapter.
3.2 INSTRUMENTATION OVERVIEW
Girders 7 and 8 in Spans 10 and 11 exhibited significant cracking at their continuous ends and
were selected for instrumentation. Two girders per span were heavily instrumented rather than
installing fewer sensors per girder for all nine girders per span. Another factor leading to the
selection of Girders 7 and 8 was the need to keep one lane open to vehicular traffic during load
testing. These girders are the second and third interior girders from the east edge of the bridge,
which allowed the west lane to remain open without significant effect on test results. The exterior
girder (Girder 9) was not chosen because of anticipated analytical complications related to the
proximity of the west barrier rail (Fason 2009).
The instruments installed on each girder included crack-opening displacement (COD)
gages, deflectometers, and surface-mounted strain gages installed on concrete and FRP
reinforcement. A total of seventy-two sensors were installed. Four sensors were COD gages:
each straddled one crack per instrumented girder. Twelve sensors were deflectometers placed
along the ground directly underneath the instrumented girders to measure deflections at
incremental distances from the continuity diaphragm. The remaining fifty-six sensors were
surface-mounted strain gages installed along the instrumented girders. Eight cross sections, four
on each girder line, were instrumented with surface-mounted strain gages at different girder
heights to allow for strain profile analysis. Bottom-fiber strain gages were installed at eight
different locations along each girder line. An overview of the instrumentation locations per girder
line is illustrated in Figure 3.1.
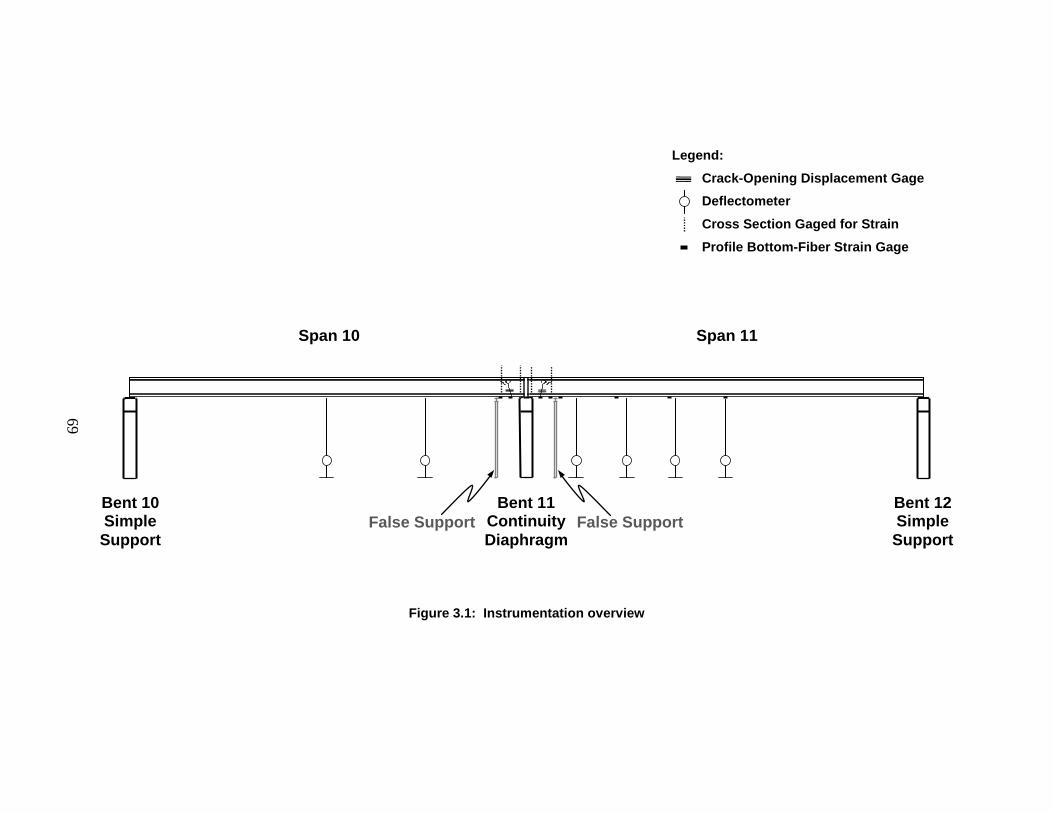
69
Figure 3.1: Instrumentation overview
Legend: Crack-Opening Displacement Gage Deflectometer
Cross Section Gaged for Strain Profile Bottom-Fiber Strain Gage
False Support False Support Bent 10 Simple Support
Span 11
Bent 11
Continuity Diaphragm
Span 10
Bent 12 Simple Support

70
A data acquisition system was used to collect sensor measurements during testing. The
data acquisition system had seventy-two 350-ohm channels available. The COD gages were full-
bridge sensors, and the deflectometers and strain gages were quarter-bridge sensors. Four-wire
configurations were used for the full-bridge sensors. Three-wire configurations were used with
the quarter-bridge sensors to reduce lead-wire temperature effects (Fason 2009).
3.3 CRACK-OPENING DISPLACEMENT GAGES
Crack-opening displacement (COD) gages were installed to measure the opening or closing
deformations of one crack per instrumented girder. Each COD gage was attached to anchor
blocks that were installed on either side of the crack using an epoxy. The type of COD gage
selected for testing is capable of measuring crack openings or closures of up to 2 mm (0.08 in.).
The COD gages are full-bridge instruments that were calibrated prior to testing. A diagram of the
specific model of COD gage used for the pre- and post-repair tests can be seen in Figure 3.2.
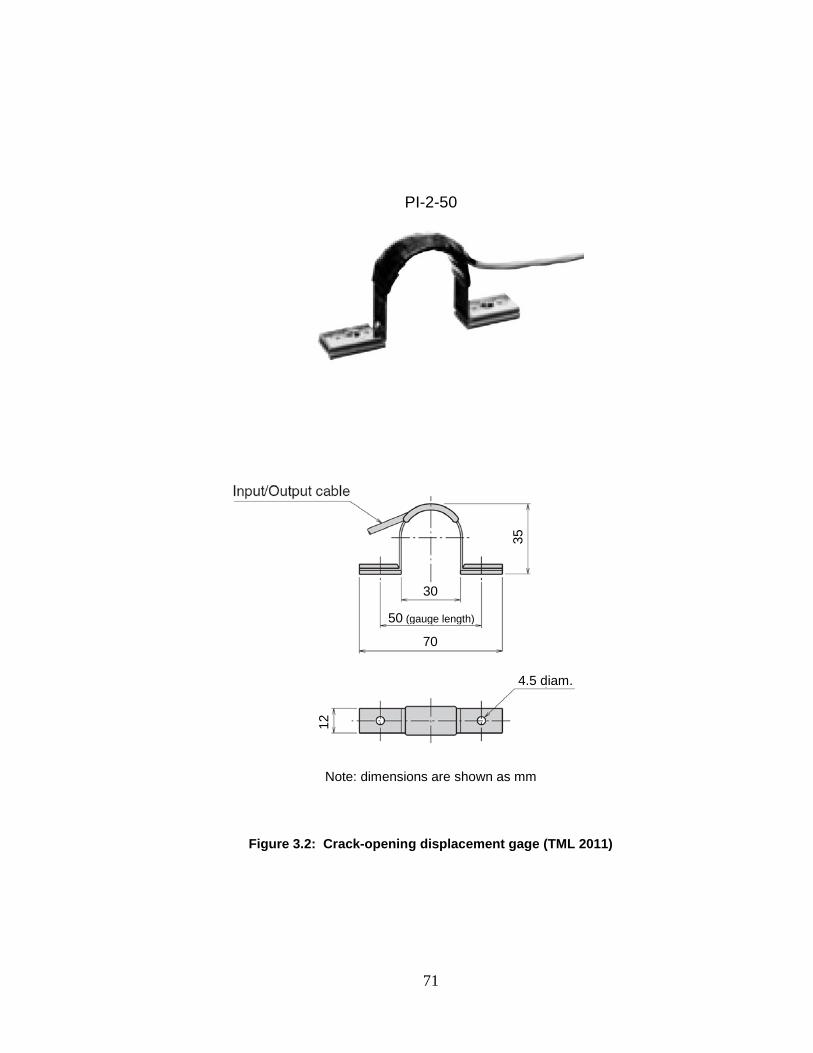
71
Note: dimensions are shown as mm
Figure 3.2: Crack-opening displacement gage (TML 2011)
35
30
70
50 (gauge length)
12
4.5 diam.
PI-2-50
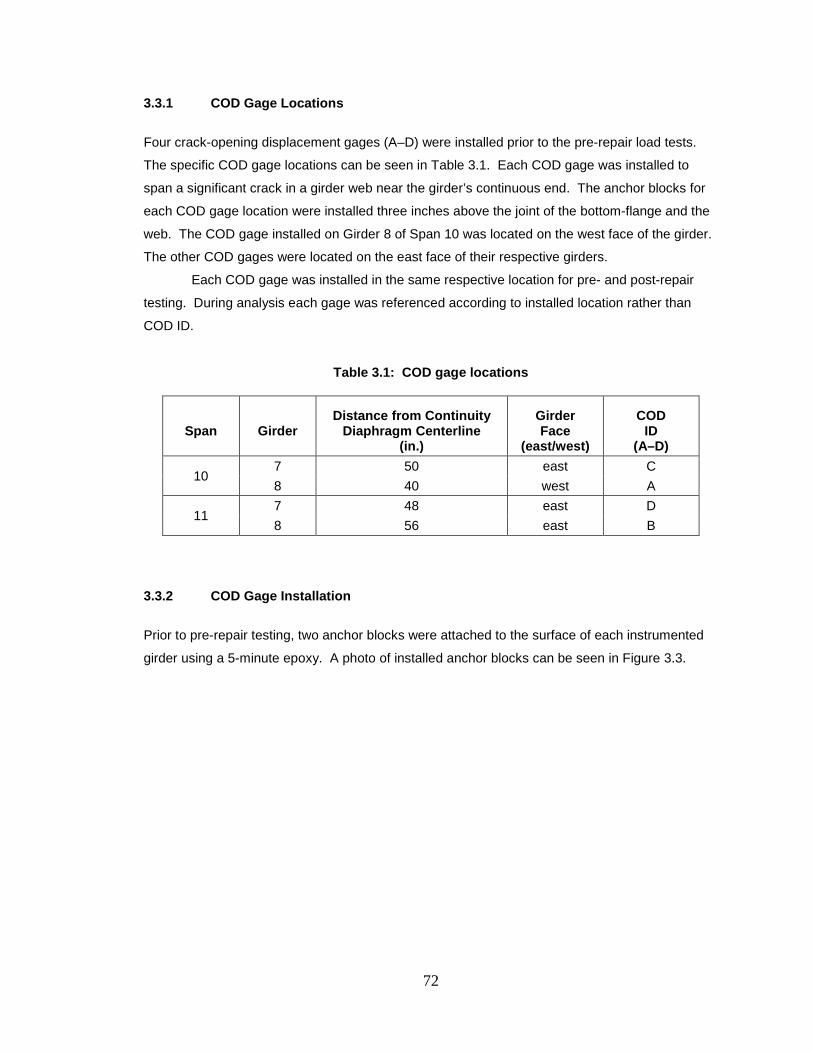
72
3.3.1 COD Gage Locations
Four crack-opening displacement gages (A–D) were installed prior to the pre-repair load tests.
The specific COD gage locations can be seen in Table 3.1. Each COD gage was installed to
span a significant crack in a girder web near the girder’s continuous end. The anchor blocks for
each COD gage location were installed three inches above the joint of the bottom-flange and the
web. The COD gage installed on Girder 8 of Span 10 was located on the west face of the girder.
The other COD gages were located on the east face of their respective girders.
Each COD gage was installed in the same respective location for pre- and post-repair
testing. During analysis each gage was referenced according to installed location rather than
COD ID.
Table 3.1: COD gage locations
Span
Girder
Distance from Continuity Diaphragm Centerline
(in.)
Girder Face
(east/west)
COD ID
(A–D)
10 7 50 east C 8 40 west A
11 7 48 east D 8 56 east B
3.3.2 COD Gage Installation
Prior to pre-repair testing, two anchor blocks were attached to the surface of each instrumented
girder using a 5-minute epoxy. A photo of installed anchor blocks can be seen in Figure 3.3.
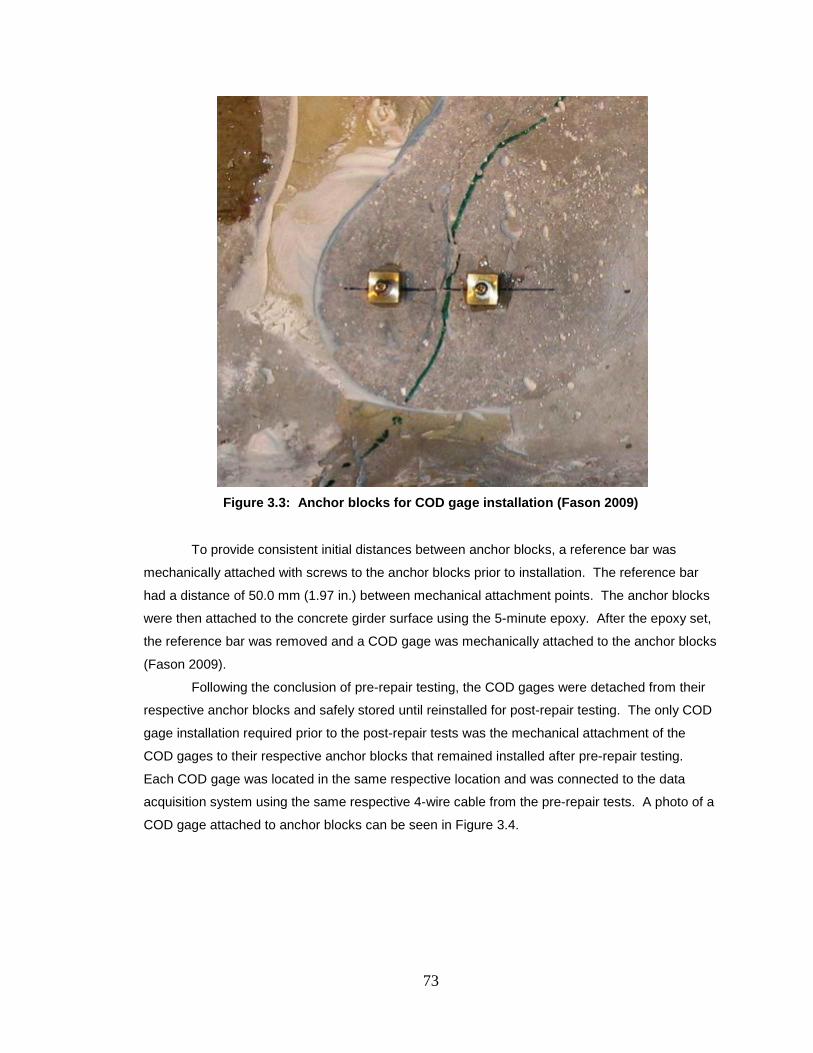
73
Figure 3.3: Anchor blocks for COD gage installation (Fason 2009)
To provide consistent initial distances between anchor blocks, a reference bar was
mechanically attached with screws to the anchor blocks prior to installation. The reference bar
had a distance of 50.0 mm (1.97 in.) between mechanical attachment points. The anchor blocks
were then attached to the concrete girder surface using the 5-minute epoxy. After the epoxy set,
the reference bar was removed and a COD gage was mechanically attached to the anchor blocks
(Fason 2009).
Following the conclusion of pre-repair testing, the COD gages were detached from their
respective anchor blocks and safely stored until reinstalled for post-repair testing. The only COD
gage installation required prior to the post-repair tests was the mechanical attachment of the
COD gages to their respective anchor blocks that remained installed after pre-repair testing.
Each COD gage was located in the same respective location and was connected to the data
acquisition system using the same respective 4-wire cable from the pre-repair tests. A photo of a
COD gage attached to anchor blocks can be seen in Figure 3.4.
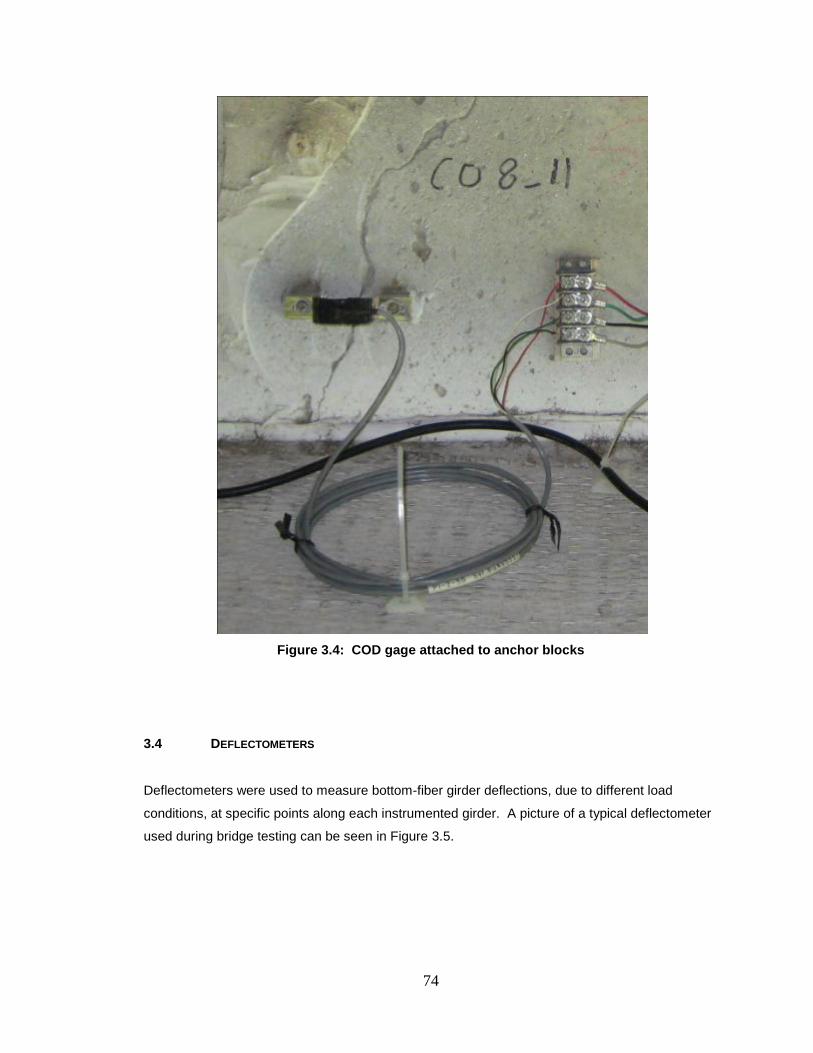
74
Figure 3.4: COD gage attached to anchor blocks
3.4 DEFLECTOMETERS
Deflectometers were used to measure bottom-fiber girder deflections, due to different load
conditions, at specific points along each instrumented girder. A picture of a typical deflectometer
used during bridge testing can be seen in Figure 3.5.
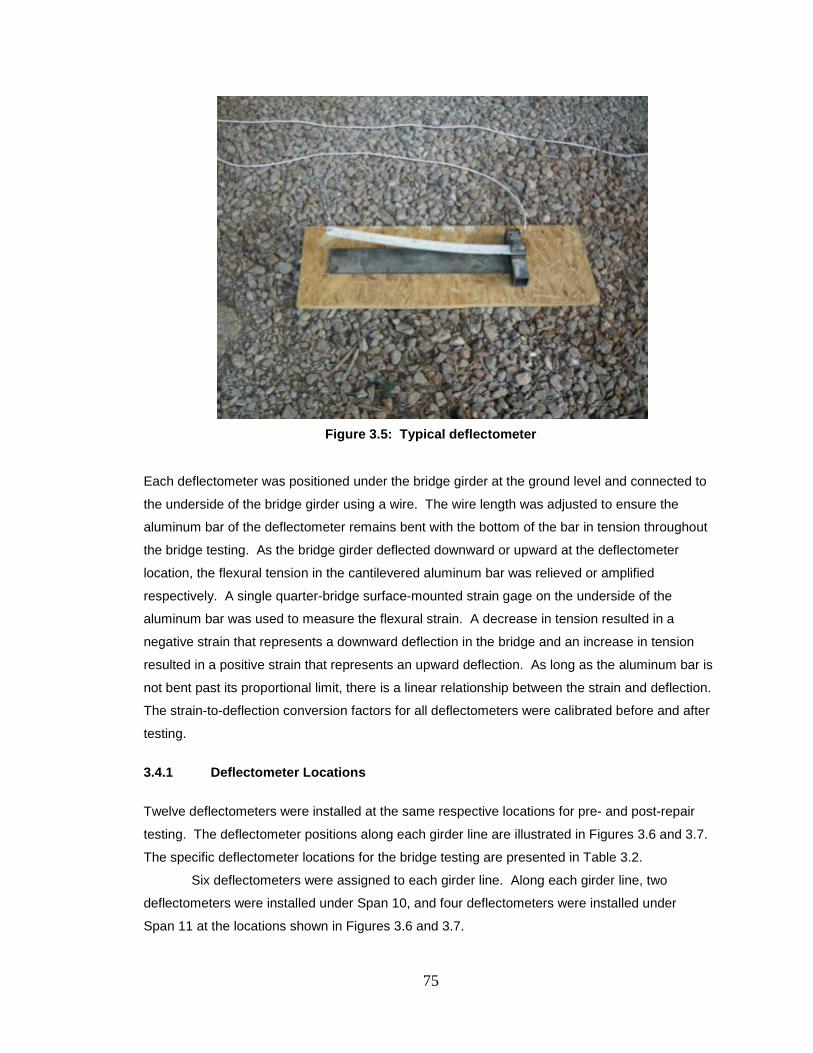
75
Figure 3.5: Typical deflectometer
Each deflectometer was positioned under the bridge girder at the ground level and connected to
the underside of the bridge girder using a wire. The wire length was adjusted to ensure the
aluminum bar of the deflectometer remains bent with the bottom of the bar in tension throughout
the bridge testing. As the bridge girder deflected downward or upward at the deflectometer
location, the flexural tension in the cantilevered aluminum bar was relieved or amplified
respectively. A single quarter-bridge surface-mounted strain gage on the underside of the
aluminum bar was used to measure the flexural strain. A decrease in tension resulted in a
negative strain that represents a downward deflection in the bridge and an increase in tension
resulted in a positive strain that represents an upward deflection. As long as the aluminum bar is
not bent past its proportional limit, there is a linear relationship between the strain and deflection.
The strain-to-deflection conversion factors for all deflectometers were calibrated before and after
testing.
3.4.1 Deflectometer Locations
Twelve deflectometers were installed at the same respective locations for pre- and post-repair
testing. The deflectometer positions along each girder line are illustrated in Figures 3.6 and 3.7.
The specific deflectometer locations for the bridge testing are presented in Table 3.2.
Six deflectometers were assigned to each girder line. Along each girder line, two
deflectometers were installed under Span 10, and four deflectometers were installed under
Span 11 at the locations shown in Figures 3.6 and 3.7.

76
The individual deflectometers have identification labels A–L. However, the notation used
to distinguish between deflectometer locations during analysis and reporting consists of the girder
(7 or 8), span (10 or 11), and girder line location (A–F).
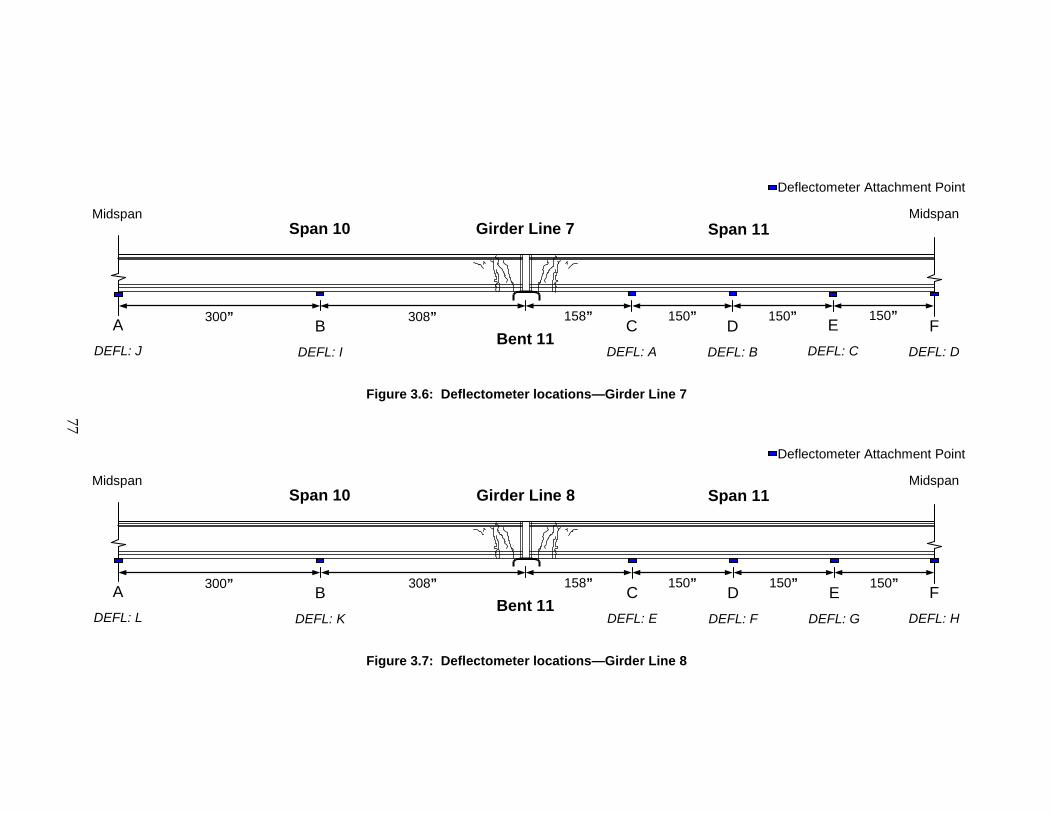
77
Figure 3.6: Deflectometer locations—Girder Line 7
Figure 3.7: Deflectometer locations—Girder Line 8
D
DEFL: F
Midspan
Deflectometer Attachment Point
158”
Midspan
Bent 11 150” 150” 150” 308” 300” A
DEFL: L
B
DEFL: K
C
DEFL: E
E
DEFL: G
F
DEFL: H
Span 11 Span 10
Girder Line 8
D
DEFL: B
Midspan
Deflectometer Attachment Point
158”
Midspan
Bent 11 150” 150” 150” 308” 300” A
DEFL: J
B
DEFL: I
C
DEFL: A
E
DEFL: C
F
DEFL: D
Span 11 Span 10
Girder Line 7
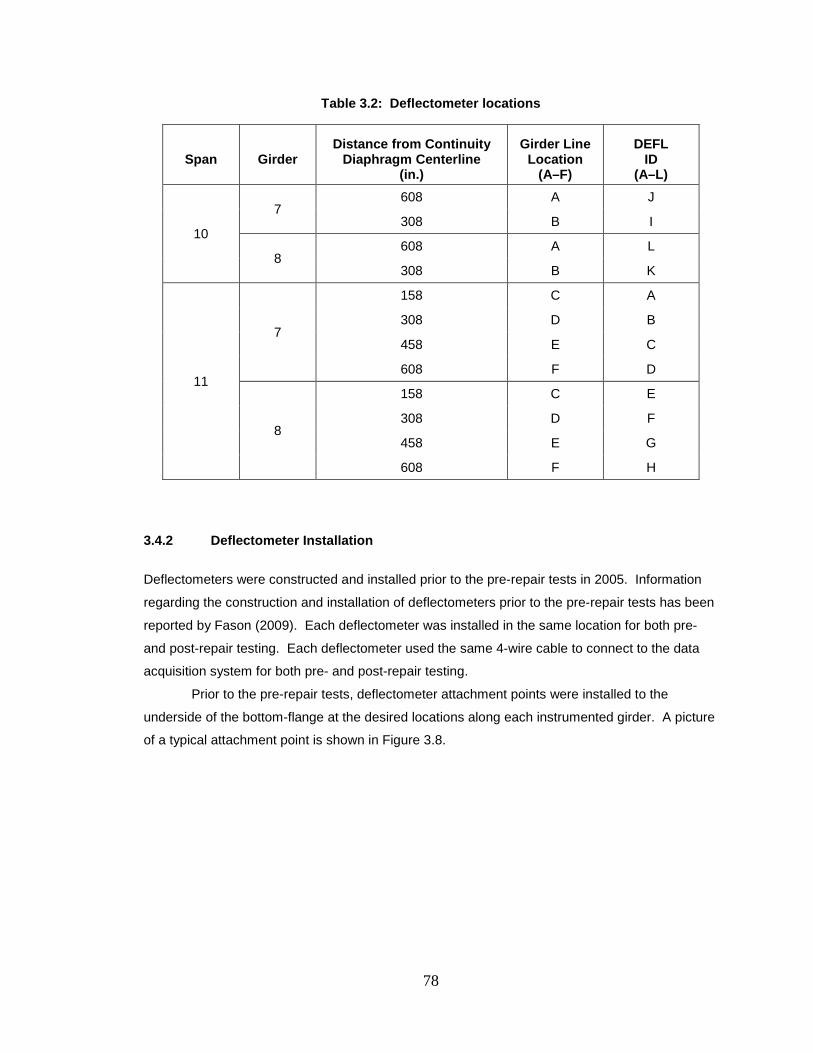
78
Table 3.2: Deflectometer locations
Span
Girder
Distance from Continuity Diaphragm Centerline
(in.)
Girder Line Location
(A–F)
DEFL ID
(A–L)
10
7 608 A J
308 B I
8 608 A L
308 B K
11
7
158 C A
308 D B
458 E C
608 F D
8
158 C E
308 D F
458 E G
608 F H
3.4.2 Deflectometer Installation
Deflectometers were constructed and installed prior to the pre-repair tests in 2005. Information
regarding the construction and installation of deflectometers prior to the pre-repair tests has been
reported by Fason (2009). Each deflectometer was installed in the same location for both pre-
and post-repair testing. Each deflectometer used the same 4-wire cable to connect to the data
acquisition system for both pre- and post-repair testing.
Prior to the pre-repair tests, deflectometer attachment points were installed to the
underside of the bottom-flange at the desired locations along each instrumented girder. A picture
of a typical attachment point is shown in Figure 3.8.
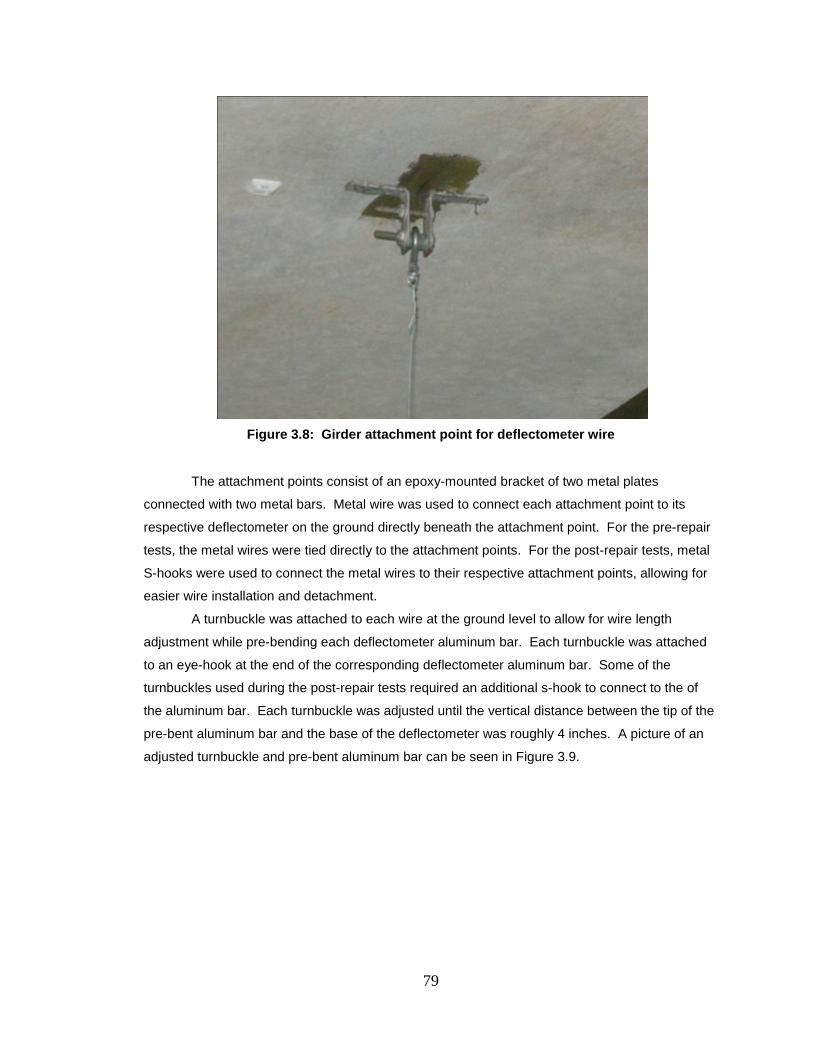
79
Figure 3.8: Girder attachment point for deflectometer wire
The attachment points consist of an epoxy-mounted bracket of two metal plates
connected with two metal bars. Metal wire was used to connect each attachment point to its
respective deflectometer on the ground directly beneath the attachment point. For the pre-repair
tests, the metal wires were tied directly to the attachment points. For the post-repair tests, metal
S-hooks were used to connect the metal wires to their respective attachment points, allowing for
easier wire installation and detachment.
A turnbuckle was attached to each wire at the ground level to allow for wire length
adjustment while pre-bending each deflectometer aluminum bar. Each turnbuckle was attached
to an eye-hook at the end of the corresponding deflectometer aluminum bar. Some of the
turnbuckles used during the post-repair tests required an additional s-hook to connect to the of
the aluminum bar. Each turnbuckle was adjusted until the vertical distance between the tip of the
pre-bent aluminum bar and the base of the deflectometer was roughly 4 inches. A picture of an
adjusted turnbuckle and pre-bent aluminum bar can be seen in Figure 3.9.
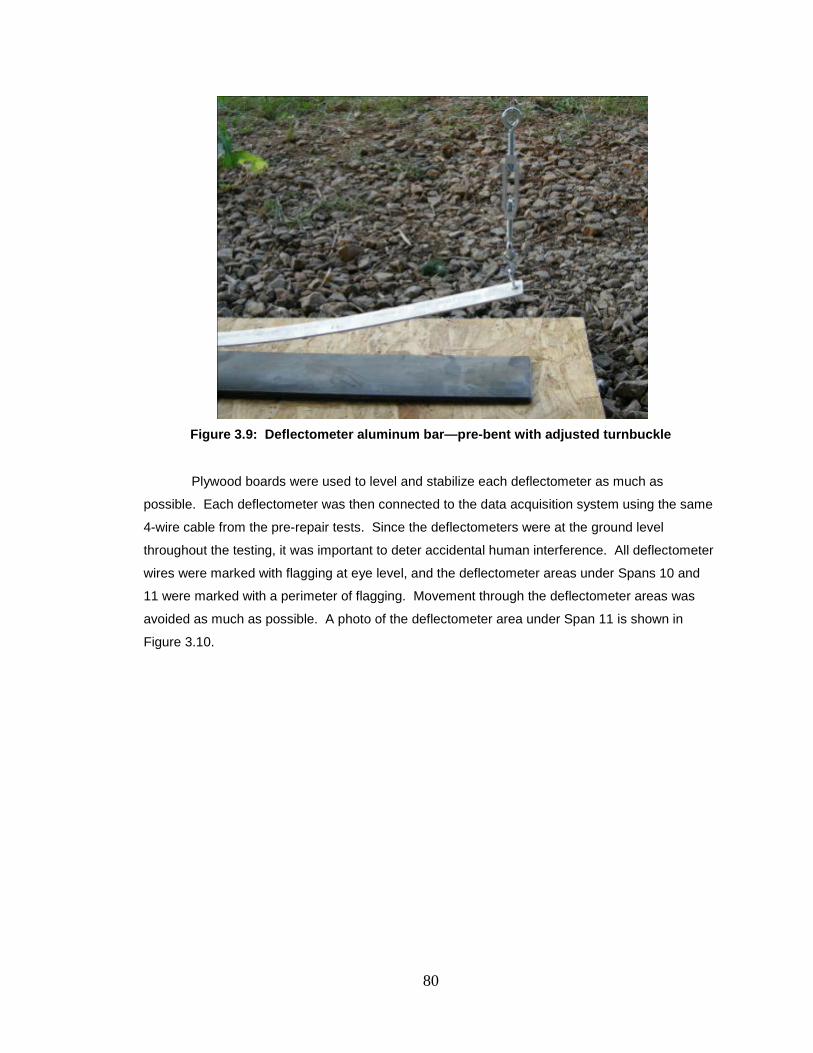
80
Figure 3.9: Deflectometer aluminum bar—pre-bent with adjusted turnbuckle
Plywood boards were used to level and stabilize each deflectometer as much as
possible. Each deflectometer was then connected to the data acquisition system using the same
4-wire cable from the pre-repair tests. Since the deflectometers were at the ground level
throughout the testing, it was important to deter accidental human interference. All deflectometer
wires were marked with flagging at eye level, and the deflectometer areas under Spans 10 and
11 were marked with a perimeter of flagging. Movement through the deflectometer areas was
avoided as much as possible. A photo of the deflectometer area under Span 11 is shown in
Figure 3.10.
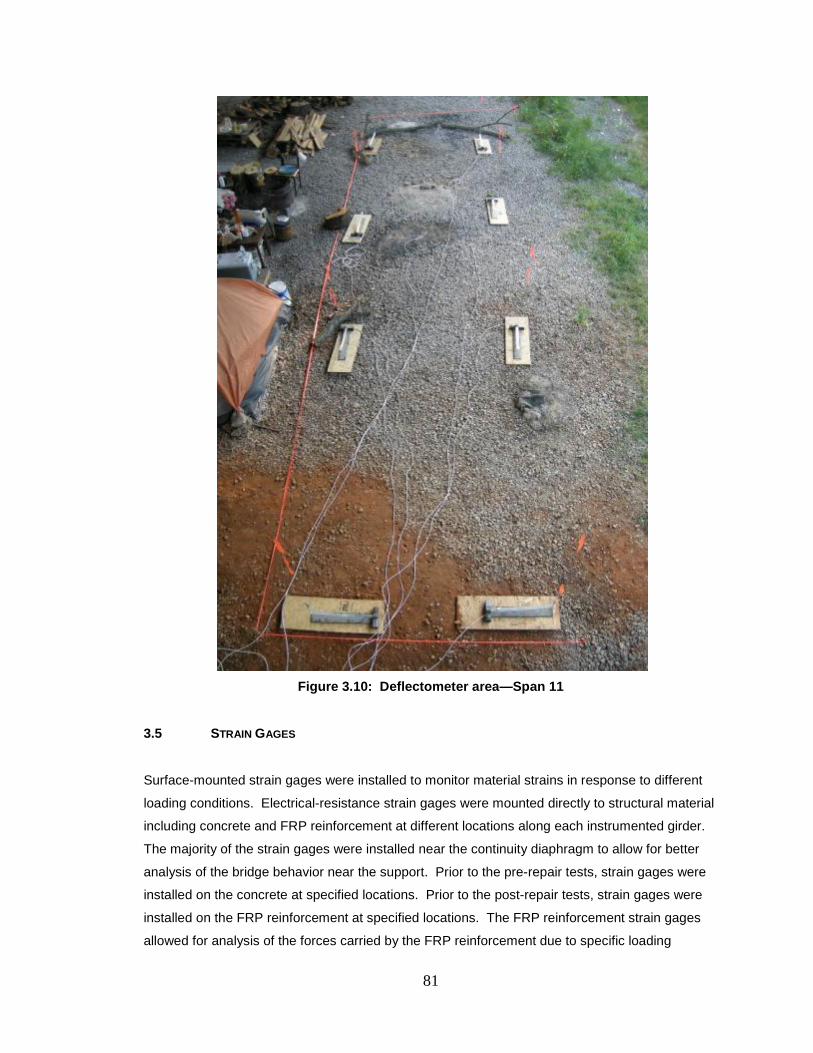
81
Figure 3.10: Deflectometer area—Span 11
3.5 STRAIN GAGES
Surface-mounted strain gages were installed to monitor material strains in response to different
loading conditions. Electrical-resistance strain gages were mounted directly to structural material
including concrete and FRP reinforcement at different locations along each instrumented girder.
The majority of the strain gages were installed near the continuity diaphragm to allow for better
analysis of the bridge behavior near the support. Prior to the pre-repair tests, strain gages were
installed on the concrete at specified locations. Prior to the post-repair tests, strain gages were
installed on the FRP reinforcement at specified locations. The FRP reinforcement strain gages
allowed for analysis of the forces carried by the FRP reinforcement due to specific loading
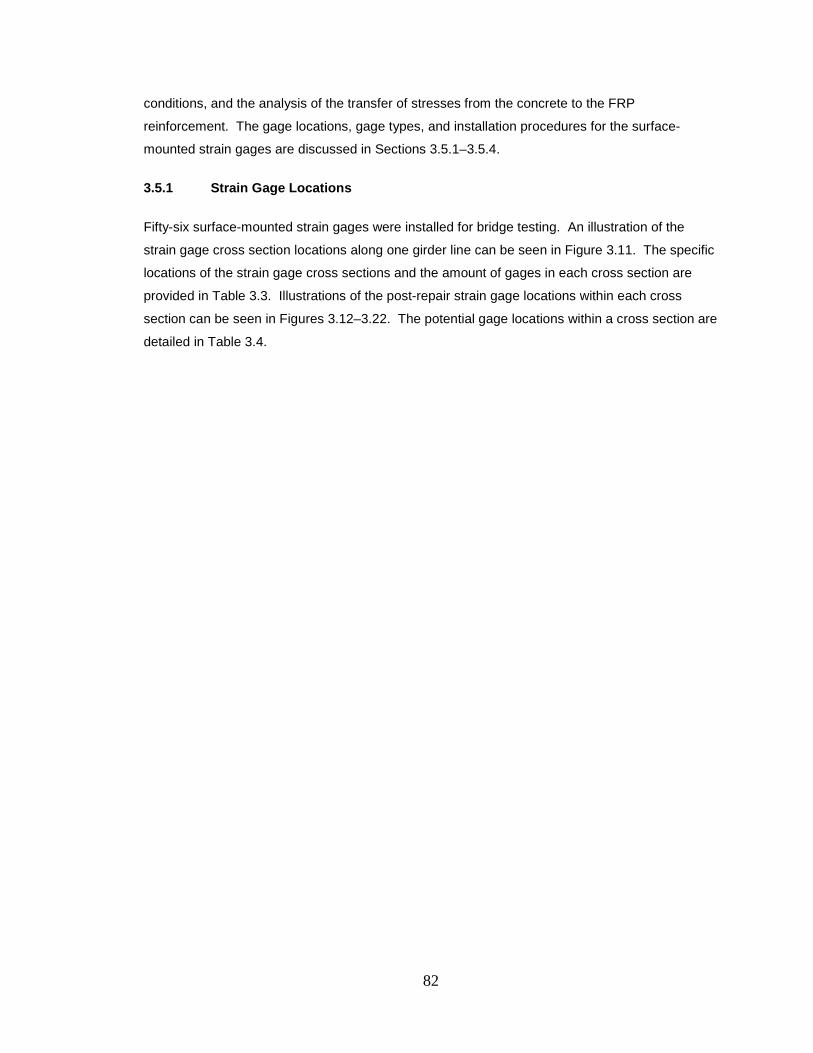
82
conditions, and the analysis of the transfer of stresses from the concrete to the FRP
reinforcement. The gage locations, gage types, and installation procedures for the surface-
mounted strain gages are discussed in Sections 3.5.1–3.5.4.
3.5.1 Strain Gage Locations
Fifty-six surface-mounted strain gages were installed for bridge testing. An illustration of the
strain gage cross section locations along one girder line can be seen in Figure 3.11. The specific
locations of the strain gage cross sections and the amount of gages in each cross section are
provided in Table 3.3. Illustrations of the post-repair strain gage locations within each cross
section can be seen in Figures 3.12–3.22. The potential gage locations within a cross section are
detailed in Table 3.4.
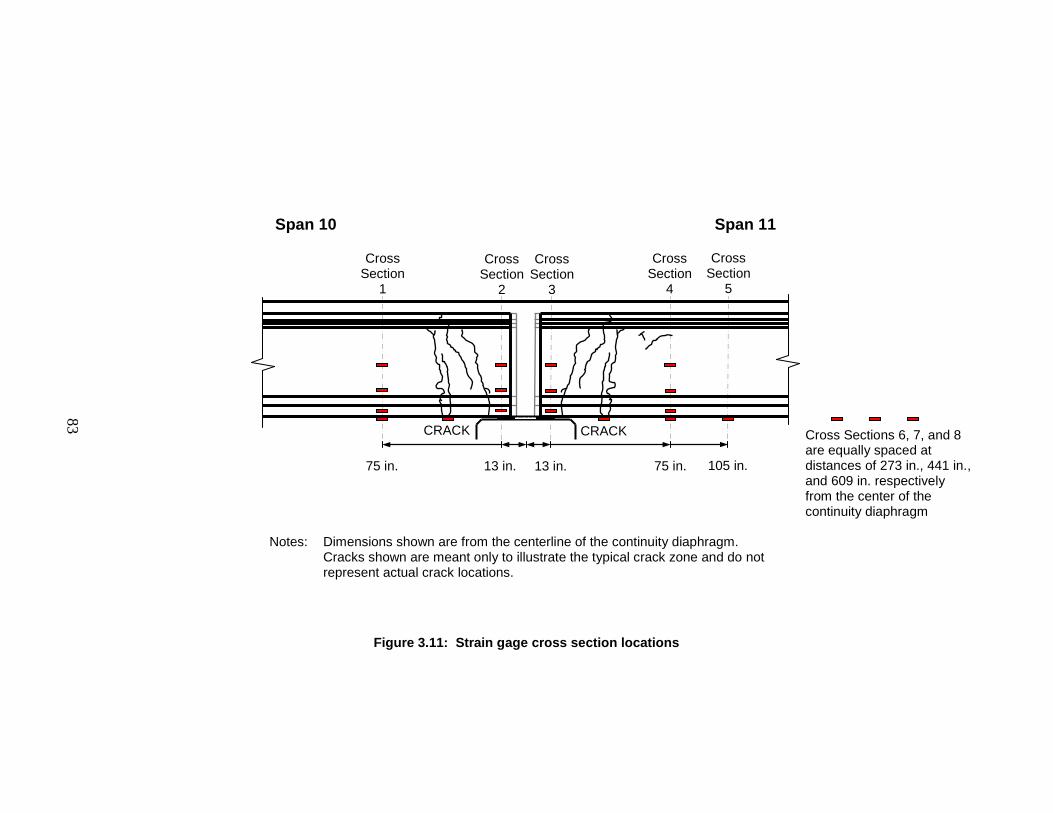
83
Notes: Dimensions shown are from the centerline of the continuity diaphragm. Cracks shown are meant only to illustrate the typical crack zone and do not
represent actual crack locations.
Figure 3.11: Strain gage cross section locations
CRACK CRACK
13 in. 75 in.
75 in. 13 in.
Cross Section
1
Cross Section
2
Cross Section
3
Cross Section
4
Span 10 Span 11
Cross Sections 6, 7, and 8 are equally spaced at distances of 273 in., 441 in., and 609 in. respectively from the center of the continuity diaphragm
105 in.
Cross Section
5
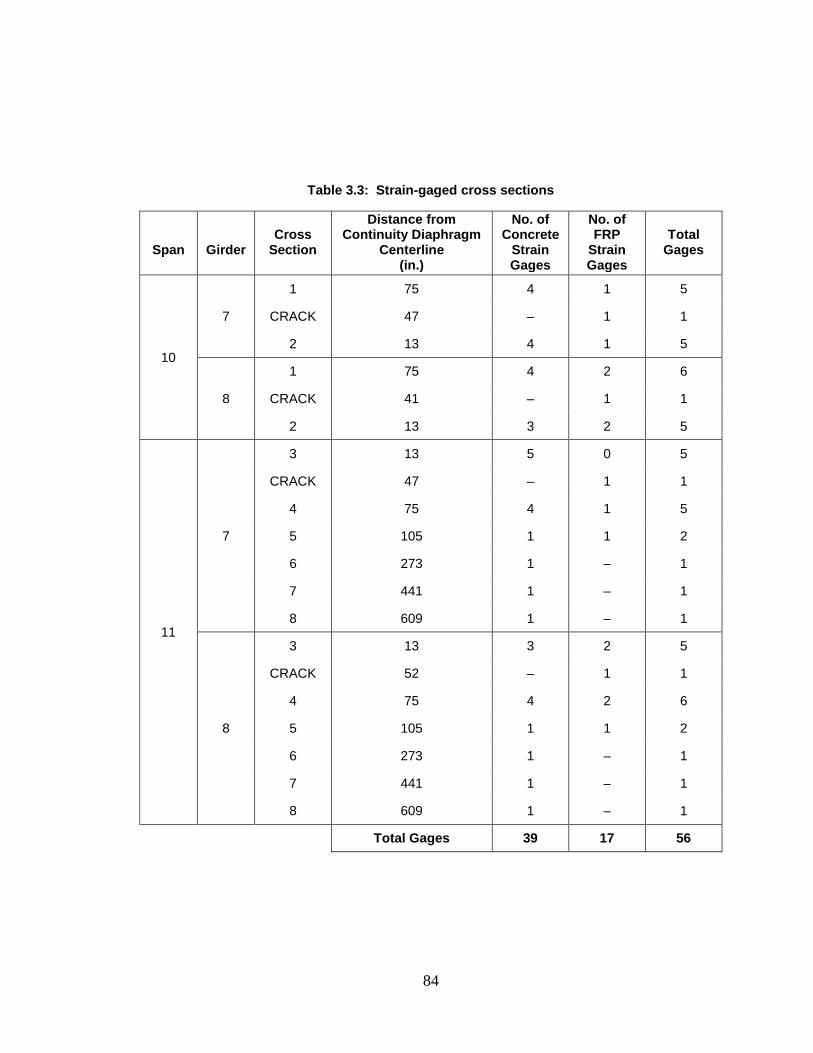
84
Table 3.3: Strain-gaged cross sections
Span
Girder
Cross Section
Distance from Continuity Diaphragm
Centerline (in.)
No. of Concrete
Strain Gages
No. of FRP
Strain Gages
Total Gages
10
7
1 75 4 1 5
CRACK 47 – 1 1
2 13 4 1 5
8
1 75 4 2 6
CRACK 41 – 1 1
2 13 3 2 5
11
7
3 13 5 0 5
CRACK 47 – 1 1
4 75 4 1 5
5 105 1 1 2
6 273 1 – 1
7 441 1 – 1
8 609 1 – 1
8
3 13 3 2 5
CRACK 52 – 1 1
4 75 4 2 6
5 105 1 1 2
6 273 1 – 1
7 441 1 – 1
8 609 1 – 1
Total Gages 39 17 56
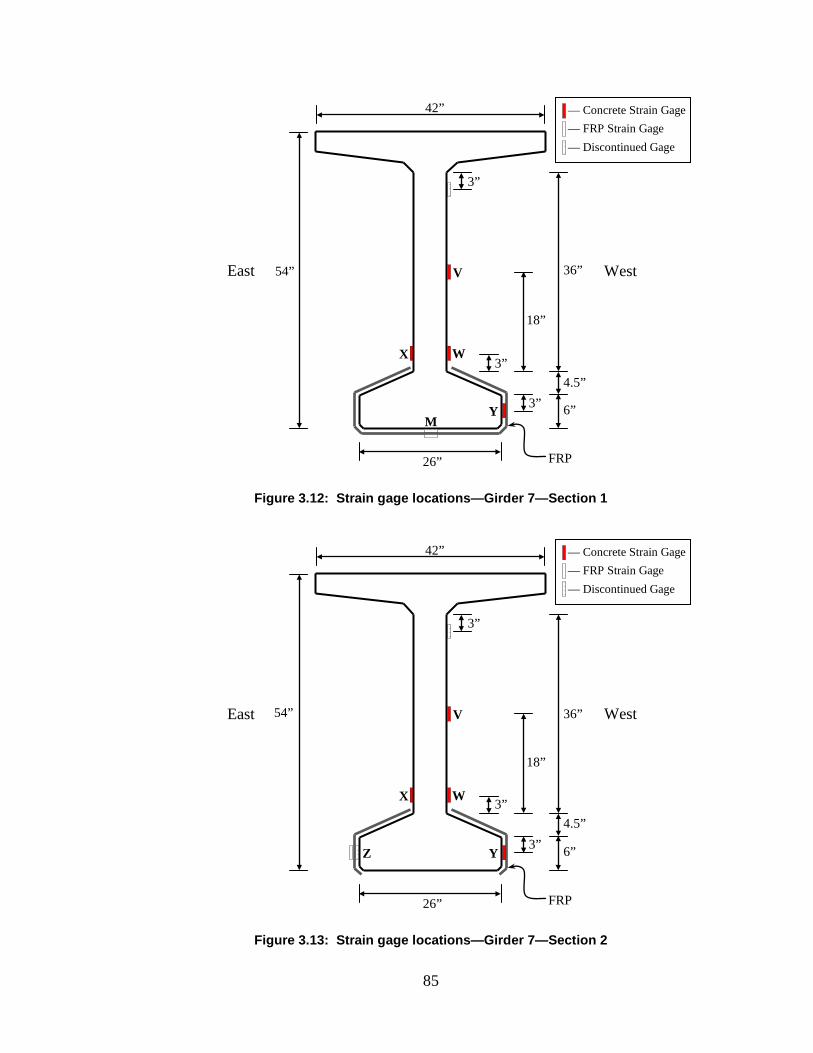
85
Figure 3.12: Strain gage locations—Girder 7—Section 1
Figure 3.13: Strain gage locations—Girder 7—Section 2
4.5”
Z
V
X W
Y
— Concrete Strain Gage
— FRP Strain Gage
— Discontinued Gage
36”
6”
26”
42”
FRP
54”
3”
3”
3”
18”
West East
West East
4.5”
V
X W
Y
— Concrete Strain Gage
— FRP Strain Gage
— Discontinued Gage
36”
6”
26”
42”
FRP
54”
3”
3”
3”
18”
M
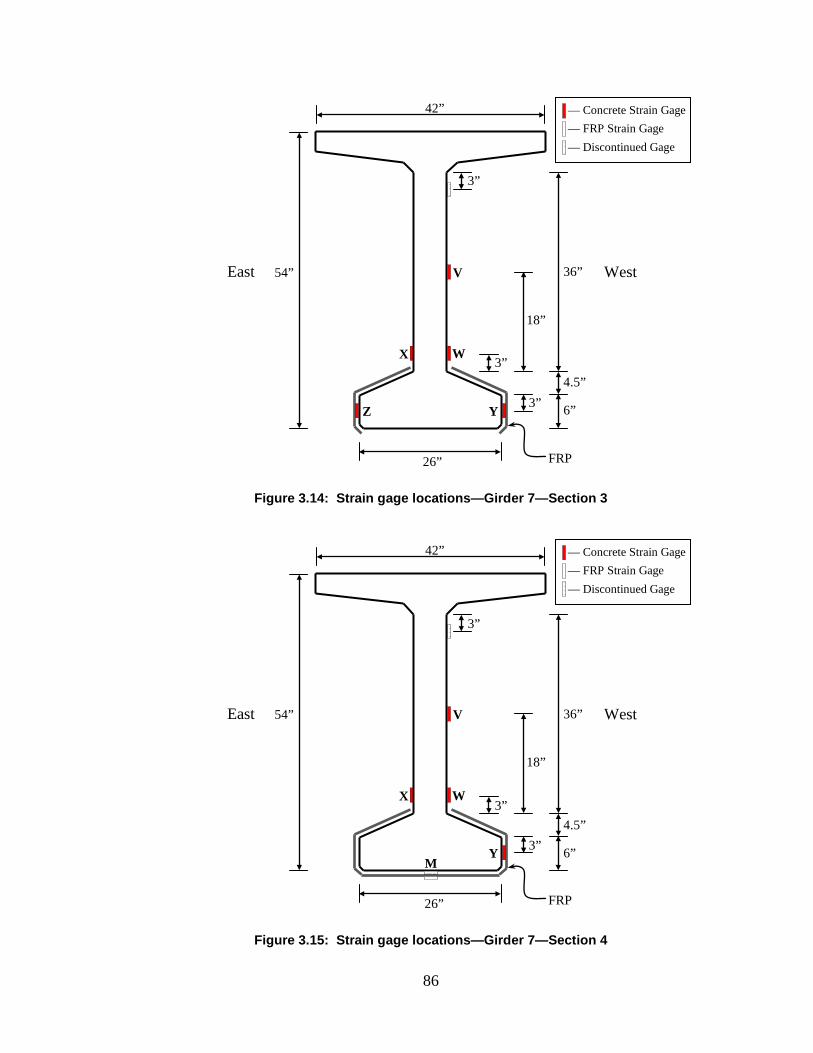
86
Figure 3.14: Strain gage locations—Girder 7—Section 3
Figure 3.15: Strain gage locations—Girder 7—Section 4
4.5”
V
X W
Y
— Concrete Strain Gage
— FRP Strain Gage
— Discontinued Gage
36”
6”
26”
42”
FRP
54”
3”
3”
3”
18”
M
West East
4.5”
Z
V
X W
Y
— Concrete Strain Gage
— FRP Strain Gage
— Discontinued Gage
36”
6”
26”
42”
FRP
54”
3”
3”
3”
18”
West East
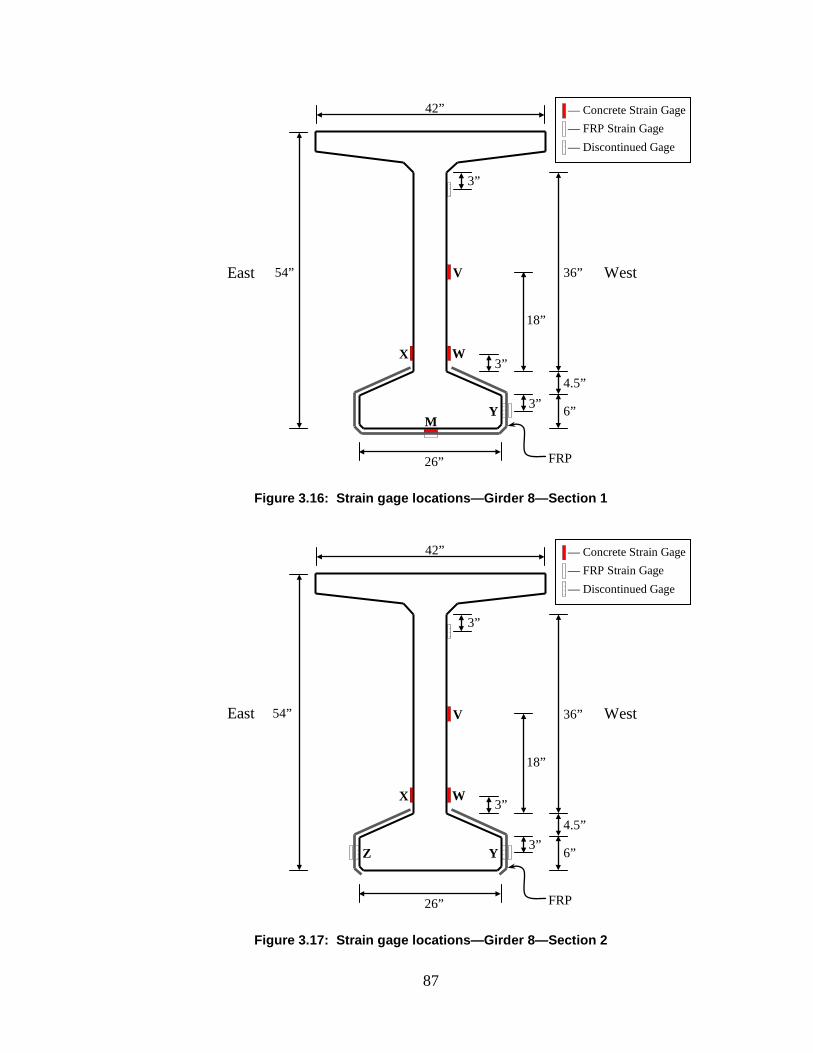
87
Figure 3.16: Strain gage locations—Girder 8—Section 1
Figure 3.17: Strain gage locations—Girder 8—Section 2
4.5”
Z
V
X W
Y
— Concrete Strain Gage
— FRP Strain Gage
— Discontinued Gage
36”
6”
26”
42”
FRP
54”
3”
3”
3”
18”
West East
4.5”
V
X W
Y
— Concrete Strain Gage
— FRP Strain Gage
— Discontinued Gage
36”
6”
26”
42”
FRP
54”
3”
3”
3”
18”
M
West East
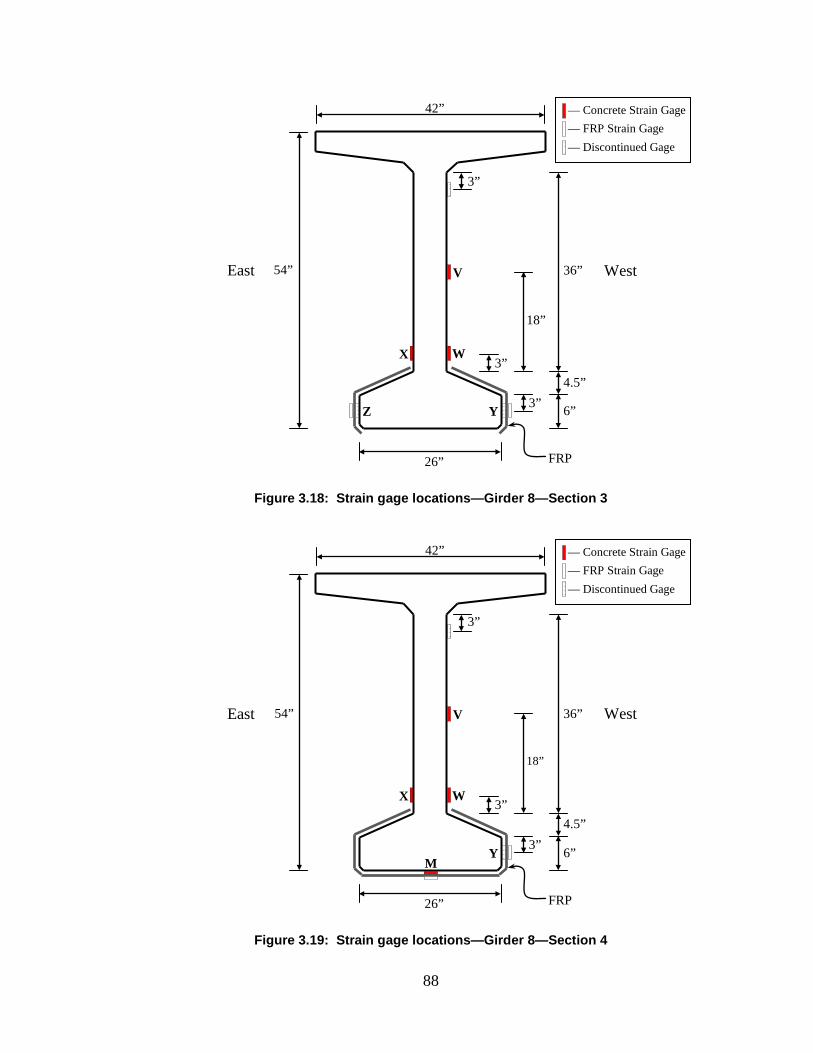
88
Figure 3.18: Strain gage locations—Girder 8—Section 3
Figure 3.19: Strain gage locations—Girder 8—Section 4
4.5”
V
X W
Y
— Concrete Strain Gage
— FRP Strain Gage
— Discontinued Gage
36”
6”
26”
42”
FRP
54”
3”
3”
3”
18”
M
West East
West East
4.5”
Z
V
X W
Y
— Concrete Strain Gage
— FRP Strain Gage
— Discontinued Gage
36”
6”
26”
42”
FRP
54”
3”
3”
3”
18”
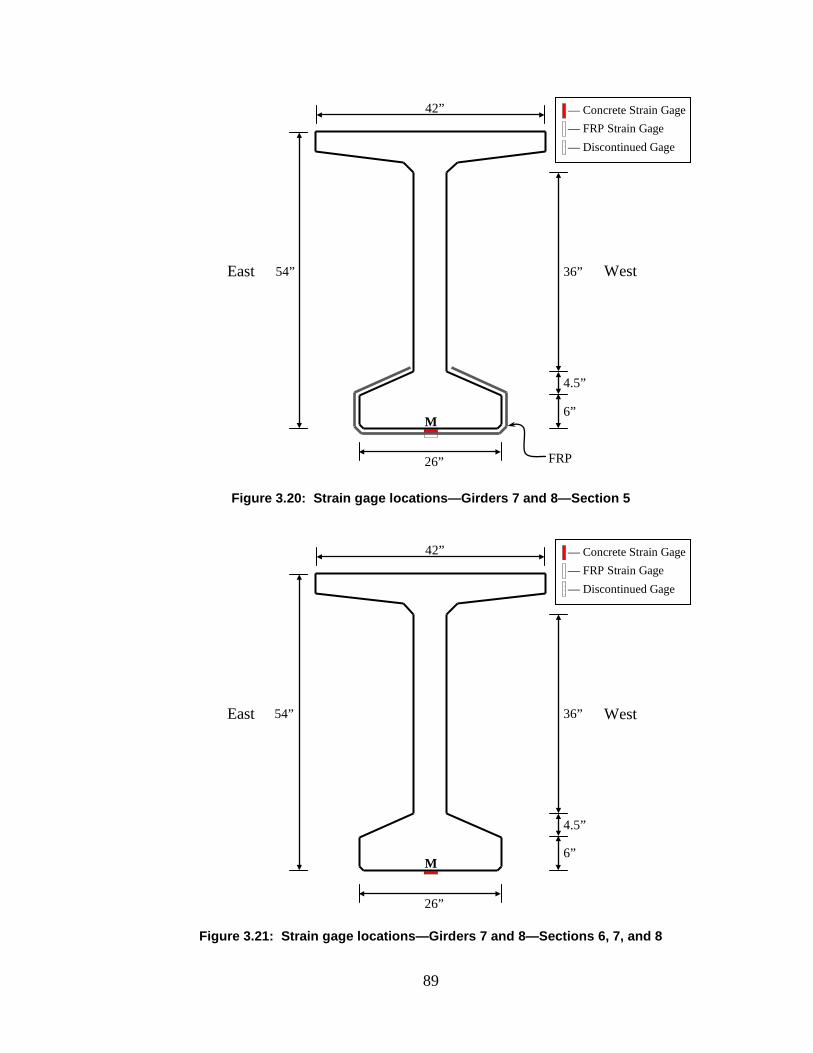
89
Figure 3.20: Strain gage locations—Girders 7 and 8—Section 5
Figure 3.21: Strain gage locations—Girders 7 and 8—Sections 6, 7, and 8
West East
4.5”
— Concrete Strain Gage
— FRP Strain Gage
— Discontinued Gage
36”
6”
26”
42”
54”
M
4.5”
— Concrete Strain Gage
— FRP Strain Gage
— Discontinued Gage
36”
6”
26”
42”
FRP
M
West East 54”
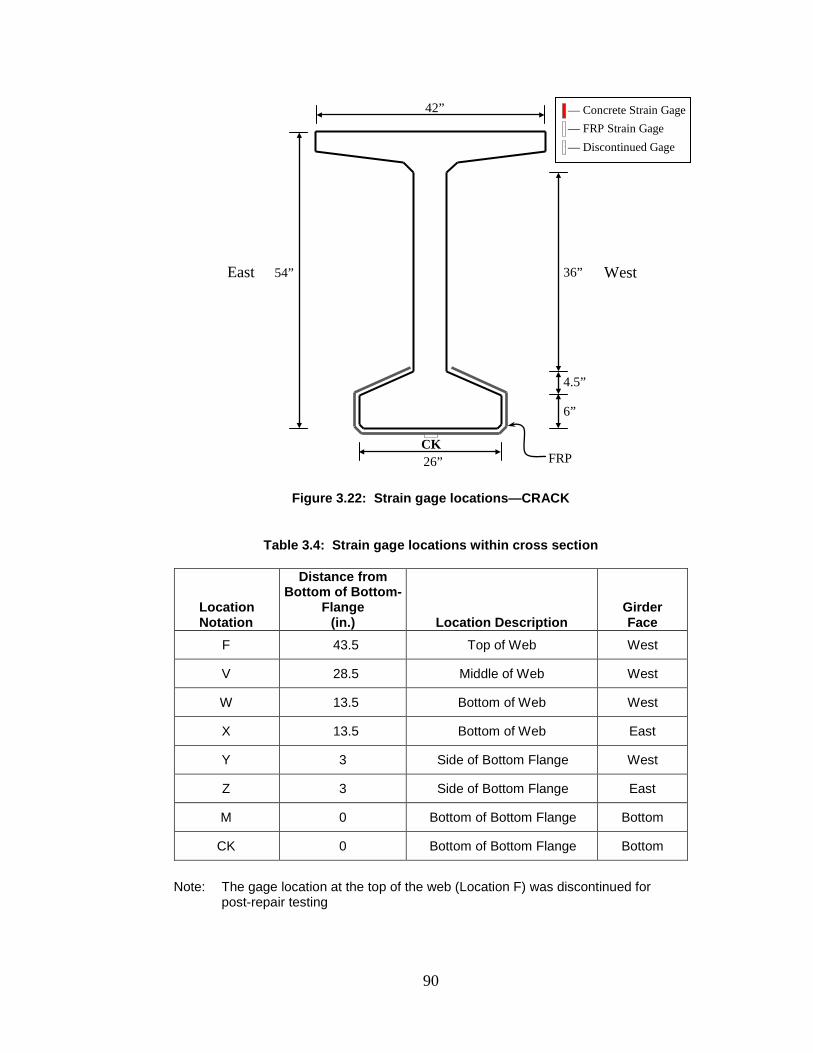
90
Figure 3.22: Strain gage locations—CRACK
Table 3.4: Strain gage locations within cross section
Location Notation
Distance from Bottom of Bottom-
Flange (in.) Location Description
Girder Face
F 43.5 Top of Web West
V 28.5 Middle of Web West
W 13.5 Bottom of Web West
X 13.5 Bottom of Web East
Y 3 Side of Bottom Flange West
Z 3 Side of Bottom Flange East
M 0 Bottom of Bottom Flange Bottom
CK 0 Bottom of Bottom Flange Bottom
Note: The gage location at the top of the web (Location F) was discontinued for
post-repair testing
West East
4.5”
CK
— Concrete Strain Gage
— FRP Strain Gage
— Discontinued Gage
36”
6”
26”
42”
FRP
54”
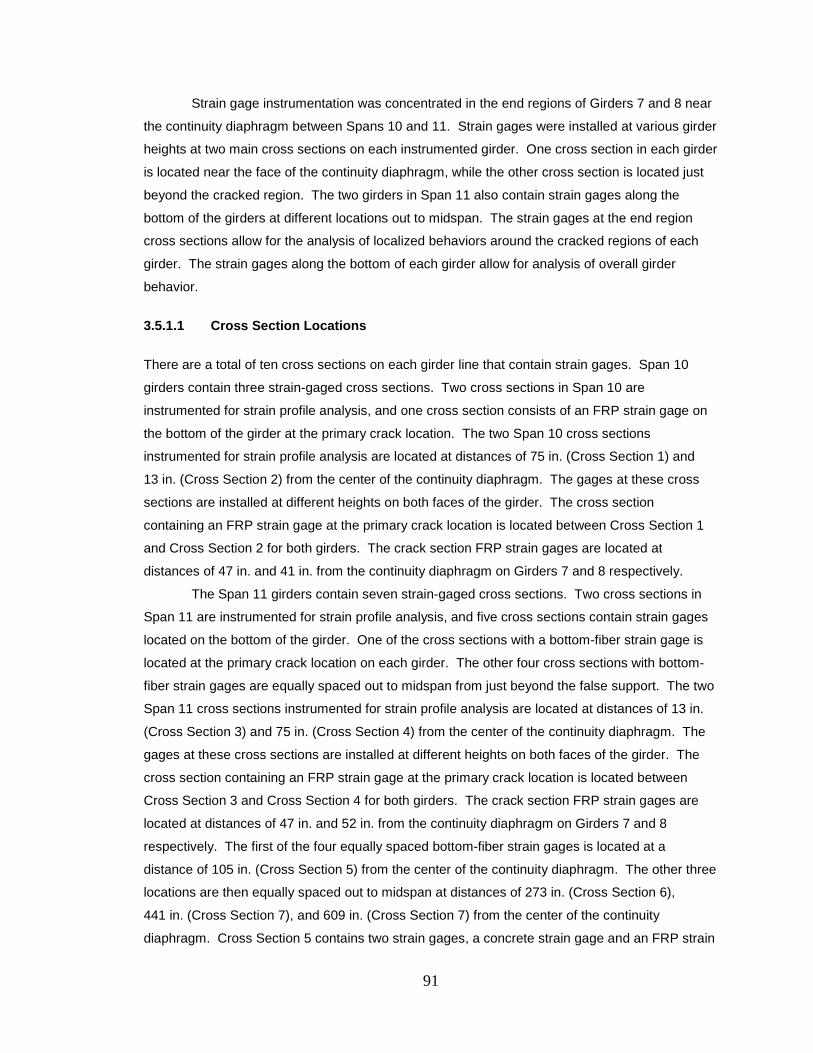
91
Strain gage instrumentation was concentrated in the end regions of Girders 7 and 8 near
the continuity diaphragm between Spans 10 and 11. Strain gages were installed at various girder
heights at two main cross sections on each instrumented girder. One cross section in each girder
is located near the face of the continuity diaphragm, while the other cross section is located just
beyond the cracked region. The two girders in Span 11 also contain strain gages along the
bottom of the girders at different locations out to midspan. The strain gages at the end region
cross sections allow for the analysis of localized behaviors around the cracked regions of each
girder. The strain gages along the bottom of each girder allow for analysis of overall girder
behavior.
3.5.1.1 Cross Section Locations
There are a total of ten cross sections on each girder line that contain strain gages. Span 10
girders contain three strain-gaged cross sections. Two cross sections in Span 10 are
instrumented for strain profile analysis, and one cross section consists of an FRP strain gage on
the bottom of the girder at the primary crack location. The two Span 10 cross sections
instrumented for strain profile analysis are located at distances of 75 in. (Cross Section 1) and
13 in. (Cross Section 2) from the center of the continuity diaphragm. The gages at these cross
sections are installed at different heights on both faces of the girder. The cross section
containing an FRP strain gage at the primary crack location is located between Cross Section 1
and Cross Section 2 for both girders. The crack section FRP strain gages are located at
distances of 47 in. and 41 in. from the continuity diaphragm on Girders 7 and 8 respectively.
The Span 11 girders contain seven strain-gaged cross sections. Two cross sections in
Span 11 are instrumented for strain profile analysis, and five cross sections contain strain gages
located on the bottom of the girder. One of the cross sections with a bottom-fiber strain gage is
located at the primary crack location on each girder. The other four cross sections with bottom-
fiber strain gages are equally spaced out to midspan from just beyond the false support. The two
Span 11 cross sections instrumented for strain profile analysis are located at distances of 13 in.
(Cross Section 3) and 75 in. (Cross Section 4) from the center of the continuity diaphragm. The
gages at these cross sections are installed at different heights on both faces of the girder. The
cross section containing an FRP strain gage at the primary crack location is located between
Cross Section 3 and Cross Section 4 for both girders. The crack section FRP strain gages are
located at distances of 47 in. and 52 in. from the continuity diaphragm on Girders 7 and 8
respectively. The first of the four equally spaced bottom-fiber strain gages is located at a
distance of 105 in. (Cross Section 5) from the center of the continuity diaphragm. The other three
locations are then equally spaced out to midspan at distances of 273 in. (Cross Section 6),
441 in. (Cross Section 7), and 609 in. (Cross Section 7) from the center of the continuity
diaphragm. Cross Section 5 contains two strain gages, a concrete strain gage and an FRP strain
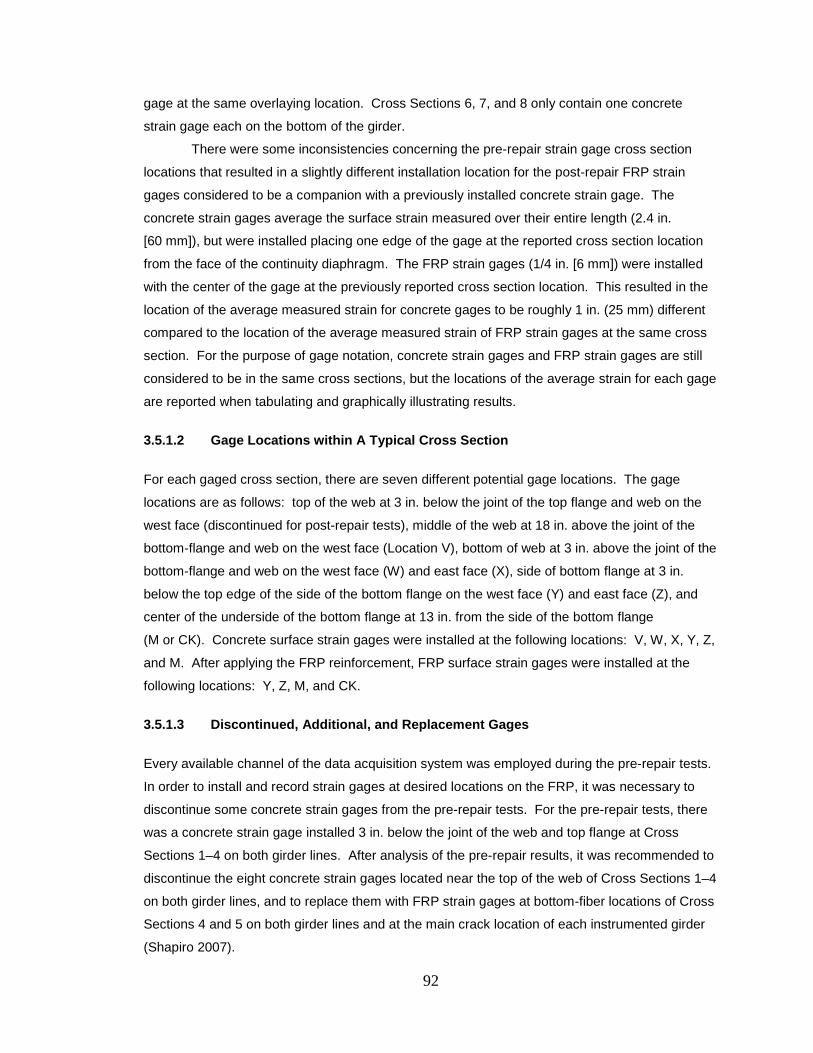
92
gage at the same overlaying location. Cross Sections 6, 7, and 8 only contain one concrete
strain gage each on the bottom of the girder.
There were some inconsistencies concerning the pre-repair strain gage cross section
locations that resulted in a slightly different installation location for the post-repair FRP strain
gages considered to be a companion with a previously installed concrete strain gage. The
concrete strain gages average the surface strain measured over their entire length (2.4 in.
[60 mm]), but were installed placing one edge of the gage at the reported cross section location
from the face of the continuity diaphragm. The FRP strain gages (1/4 in. [6 mm]) were installed
with the center of the gage at the previously reported cross section location. This resulted in the
location of the average measured strain for concrete gages to be roughly 1 in. (25 mm) different
compared to the location of the average measured strain of FRP strain gages at the same cross
section. For the purpose of gage notation, concrete strain gages and FRP strain gages are still
considered to be in the same cross sections, but the locations of the average strain for each gage
are reported when tabulating and graphically illustrating results.
3.5.1.2 Gage Locations within A Typical Cross Section
For each gaged cross section, there are seven different potential gage locations. The gage
locations are as follows: top of the web at 3 in. below the joint of the top flange and web on the
west face (discontinued for post-repair tests), middle of the web at 18 in. above the joint of the
bottom-flange and web on the west face (Location V), bottom of web at 3 in. above the joint of the
bottom-flange and web on the west face (W) and east face (X), side of bottom flange at 3 in.
below the top edge of the side of the bottom flange on the west face (Y) and east face (Z), and
center of the underside of the bottom flange at 13 in. from the side of the bottom flange
(M or CK). Concrete surface strain gages were installed at the following locations: V, W, X, Y, Z,
and M. After applying the FRP reinforcement, FRP surface strain gages were installed at the
following locations: Y, Z, M, and CK.
3.5.1.3 Discontinued, Additional, and Replacement Gages
Every available channel of the data acquisition system was employed during the pre-repair tests.
In order to install and record strain gages at desired locations on the FRP, it was necessary to
discontinue some concrete strain gages from the pre-repair tests. For the pre-repair tests, there
was a concrete strain gage installed 3 in. below the joint of the web and top flange at Cross
Sections 1–4 on both girder lines. After analysis of the pre-repair results, it was recommended to
discontinue the eight concrete strain gages located near the top of the web of Cross Sections 1–4
on both girder lines, and to replace them with FRP strain gages at bottom-fiber locations of Cross
Sections 4 and 5 on both girder lines and at the main crack location of each instrumented girder
(Shapiro 2007).
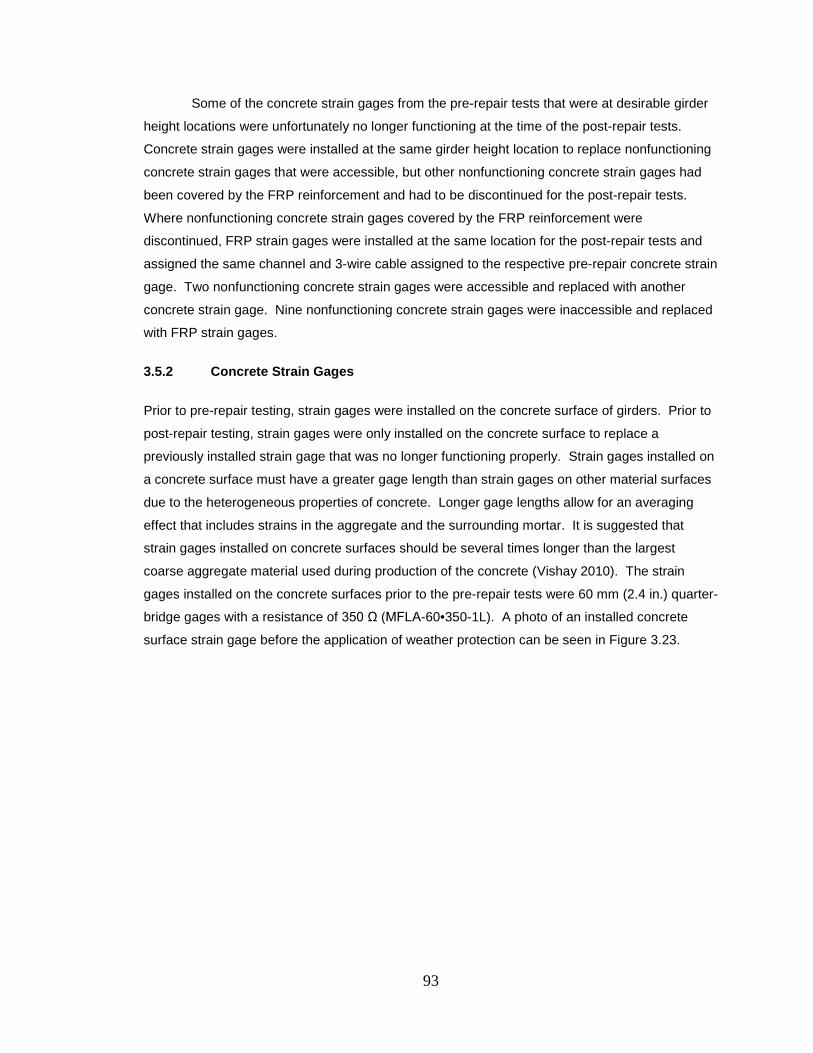
93
Some of the concrete strain gages from the pre-repair tests that were at desirable girder
height locations were unfortunately no longer functioning at the time of the post-repair tests.
Concrete strain gages were installed at the same girder height location to replace nonfunctioning
concrete strain gages that were accessible, but other nonfunctioning concrete strain gages had
been covered by the FRP reinforcement and had to be discontinued for the post-repair tests.
Where nonfunctioning concrete strain gages covered by the FRP reinforcement were
discontinued, FRP strain gages were installed at the same location for the post-repair tests and
assigned the same channel and 3-wire cable assigned to the respective pre-repair concrete strain
gage. Two nonfunctioning concrete strain gages were accessible and replaced with another
concrete strain gage. Nine nonfunctioning concrete strain gages were inaccessible and replaced
with FRP strain gages.
3.5.2 Concrete Strain Gages
Prior to pre-repair testing, strain gages were installed on the concrete surface of girders. Prior to
post-repair testing, strain gages were only installed on the concrete surface to replace a
previously installed strain gage that was no longer functioning properly. Strain gages installed on
a concrete surface must have a greater gage length than strain gages on other material surfaces
due to the heterogeneous properties of concrete. Longer gage lengths allow for an averaging
effect that includes strains in the aggregate and the surrounding mortar. It is suggested that
strain gages installed on concrete surfaces should be several times longer than the largest
coarse aggregate material used during production of the concrete (Vishay 2010). The strain
gages installed on the concrete surfaces prior to the pre-repair tests were 60 mm (2.4 in.) quarter-
bridge gages with a resistance of 350 Ω (MFLA-60•350-1L). A photo of an installed concrete
surface strain gage before the application of weather protection can be seen in Figure 3.23.
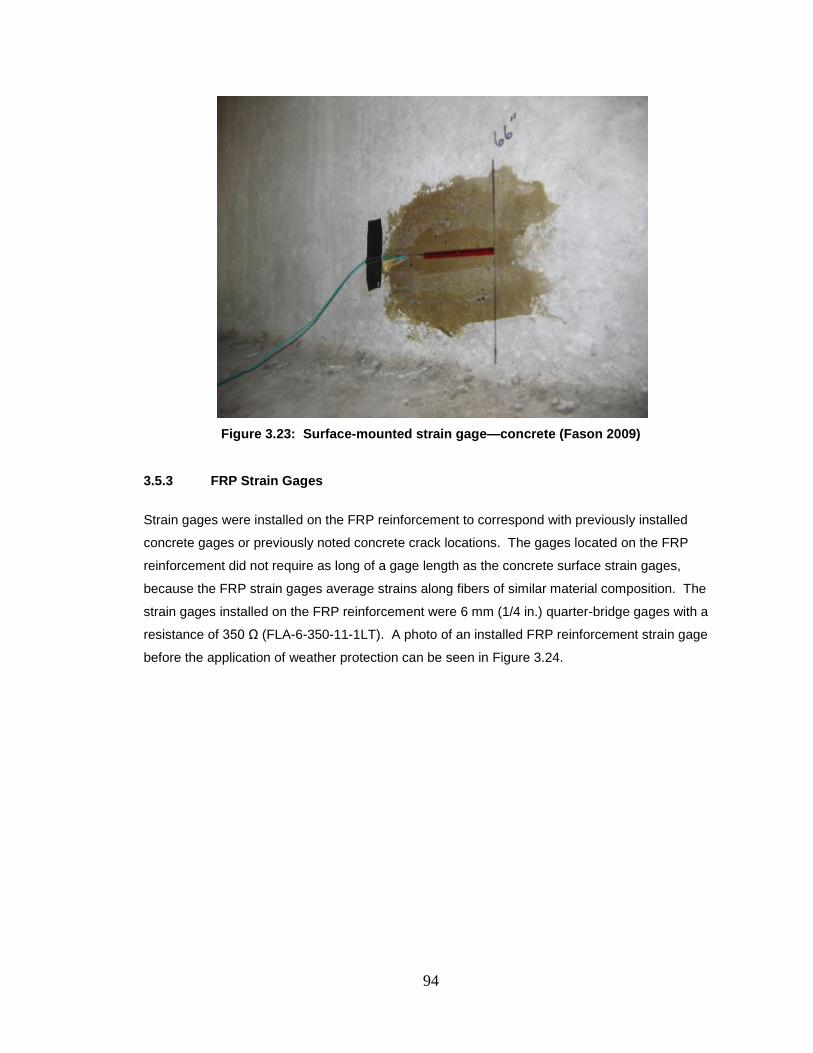
94
Figure 3.23: Surface-mounted strain gage—concrete (Fason 2009)
3.5.3 FRP Strain Gages
Strain gages were installed on the FRP reinforcement to correspond with previously installed
concrete gages or previously noted concrete crack locations. The gages located on the FRP
reinforcement did not require as long of a gage length as the concrete surface strain gages,
because the FRP strain gages average strains along fibers of similar material composition. The
strain gages installed on the FRP reinforcement were 6 mm (1/4 in.) quarter-bridge gages with a
resistance of 350 Ω (FLA-6-350-11-1LT). A photo of an installed FRP reinforcement strain gage
before the application of weather protection can be seen in Figure 3.24.
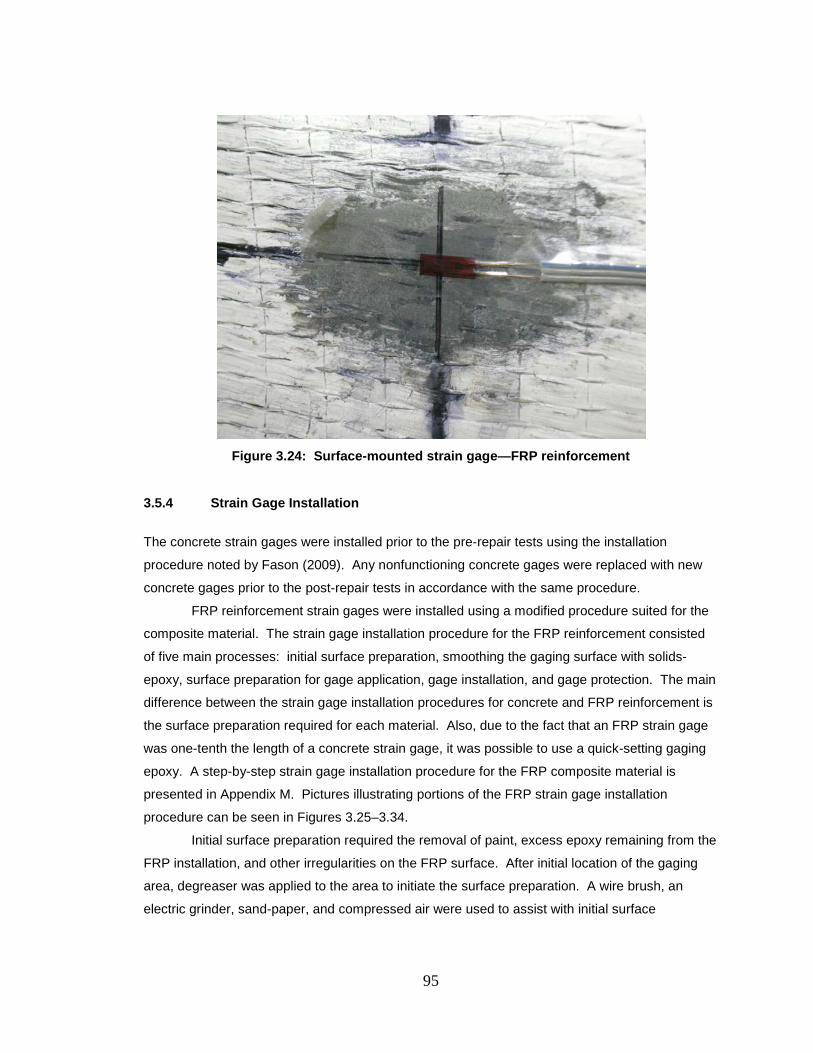
95
Figure 3.24: Surface-mounted strain gage—FRP reinforcement
3.5.4 Strain Gage Installation
The concrete strain gages were installed prior to the pre-repair tests using the installation
procedure noted by Fason (2009). Any nonfunctioning concrete gages were replaced with new
concrete gages prior to the post-repair tests in accordance with the same procedure.
FRP reinforcement strain gages were installed using a modified procedure suited for the
composite material. The strain gage installation procedure for the FRP reinforcement consisted
of five main processes: initial surface preparation, smoothing the gaging surface with solids-
epoxy, surface preparation for gage application, gage installation, and gage protection. The main
difference between the strain gage installation procedures for concrete and FRP reinforcement is
the surface preparation required for each material. Also, due to the fact that an FRP strain gage
was one-tenth the length of a concrete strain gage, it was possible to use a quick-setting gaging
epoxy. A step-by-step strain gage installation procedure for the FRP composite material is
presented in Appendix M. Pictures illustrating portions of the FRP strain gage installation
procedure can be seen in Figures 3.25–3.34.
Initial surface preparation required the removal of paint, excess epoxy remaining from the
FRP installation, and other irregularities on the FRP surface. After initial location of the gaging
area, degreaser was applied to the area to initiate the surface preparation. A wire brush, an
electric grinder, sand-paper, and compressed air were used to assist with initial surface
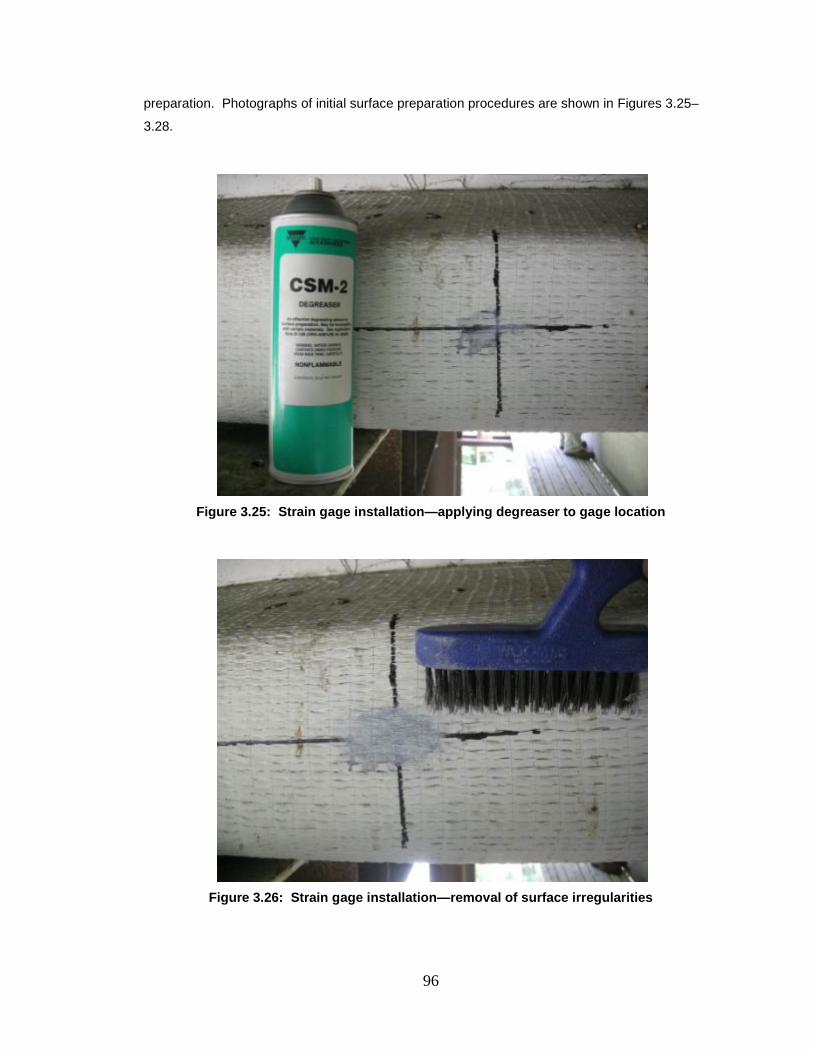
96
preparation. Photographs of initial surface preparation procedures are shown in Figures 3.25–
3.28.
Figure 3.25: Strain gage installation—applying degreaser to gage location
Figure 3.26: Strain gage installation—removal of surface irregularities
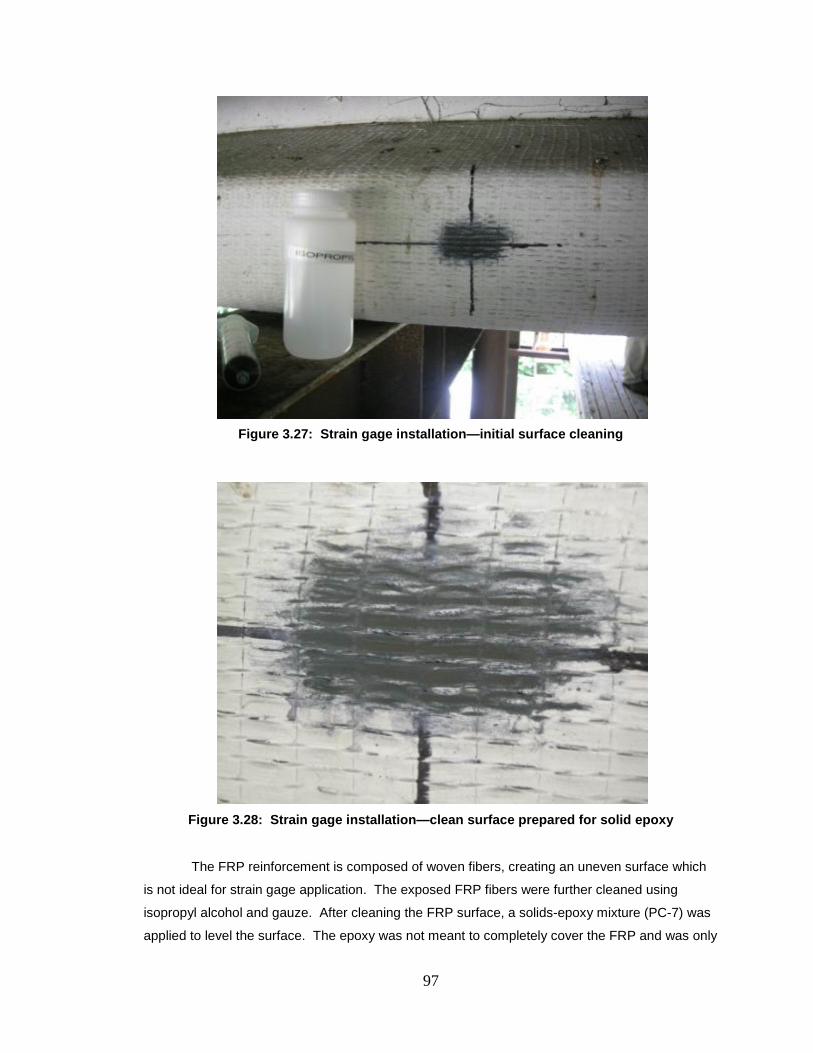
97
Figure 3.27: Strain gage installation—initial surface cleaning
Figure 3.28: Strain gage installation—clean surface prepared for solid epoxy
The FRP reinforcement is composed of woven fibers, creating an uneven surface which
is not ideal for strain gage application. The exposed FRP fibers were further cleaned using
isopropyl alcohol and gauze. After cleaning the FRP surface, a solids-epoxy mixture (PC-7) was
applied to level the surface. The epoxy was not meant to completely cover the FRP and was only
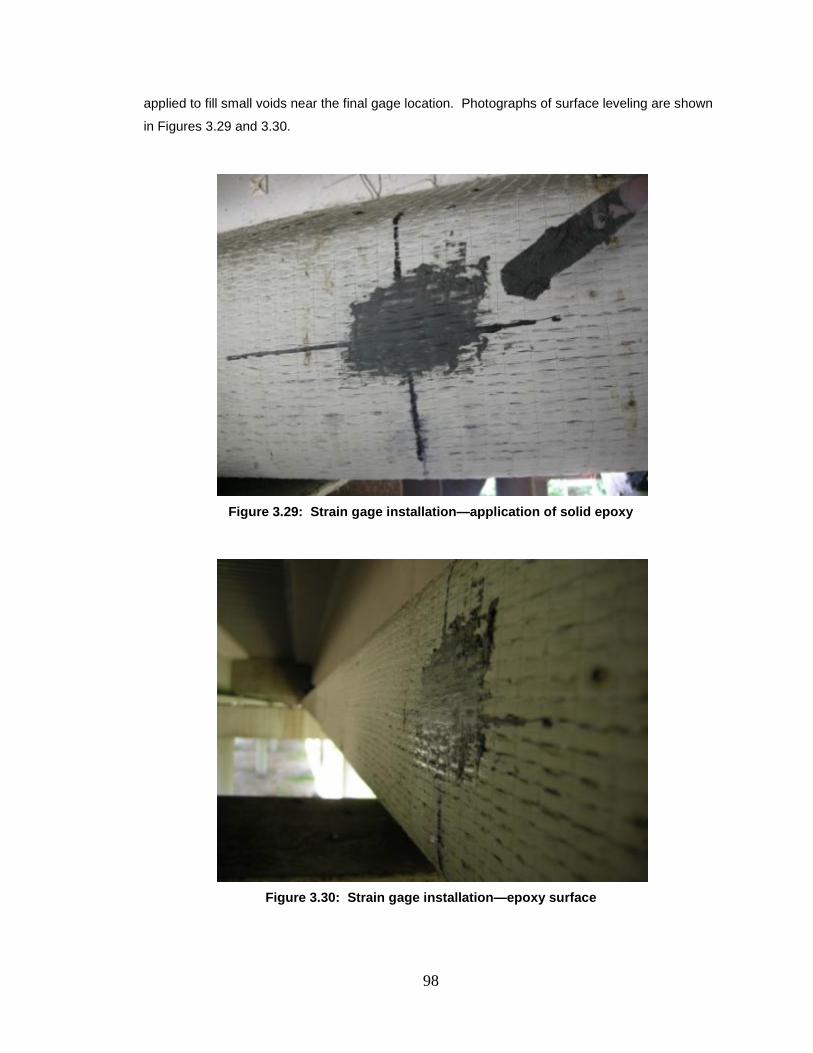
98
applied to fill small voids near the final gage location. Photographs of surface leveling are shown
in Figures 3.29 and 3.30.
Figure 3.29: Strain gage installation—application of solid epoxy
Figure 3.30: Strain gage installation—epoxy surface
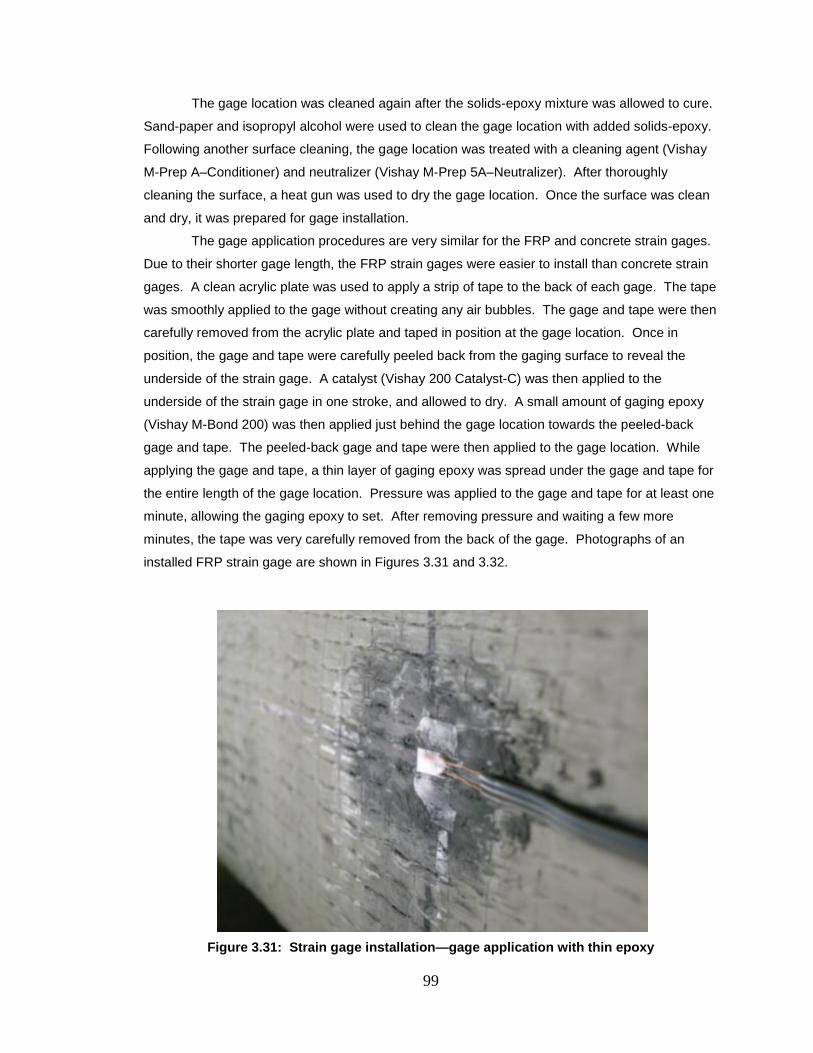
99
The gage location was cleaned again after the solids-epoxy mixture was allowed to cure.
Sand-paper and isopropyl alcohol were used to clean the gage location with added solids-epoxy.
Following another surface cleaning, the gage location was treated with a cleaning agent (Vishay
M-Prep A–Conditioner) and neutralizer (Vishay M-Prep 5A–Neutralizer). After thoroughly
cleaning the surface, a heat gun was used to dry the gage location. Once the surface was clean
and dry, it was prepared for gage installation.
The gage application procedures are very similar for the FRP and concrete strain gages.
Due to their shorter gage length, the FRP strain gages were easier to install than concrete strain
gages. A clean acrylic plate was used to apply a strip of tape to the back of each gage. The tape
was smoothly applied to the gage without creating any air bubbles. The gage and tape were then
carefully removed from the acrylic plate and taped in position at the gage location. Once in
position, the gage and tape were carefully peeled back from the gaging surface to reveal the
underside of the strain gage. A catalyst (Vishay 200 Catalyst-C) was then applied to the
underside of the strain gage in one stroke, and allowed to dry. A small amount of gaging epoxy
(Vishay M-Bond 200) was then applied just behind the gage location towards the peeled-back
gage and tape. The peeled-back gage and tape were then applied to the gage location. While
applying the gage and tape, a thin layer of gaging epoxy was spread under the gage and tape for
the entire length of the gage location. Pressure was applied to the gage and tape for at least one
minute, allowing the gaging epoxy to set. After removing pressure and waiting a few more
minutes, the tape was very carefully removed from the back of the gage. Photographs of an
installed FRP strain gage are shown in Figures 3.31 and 3.32.
Figure 3.31: Strain gage installation—gage application with thin epoxy
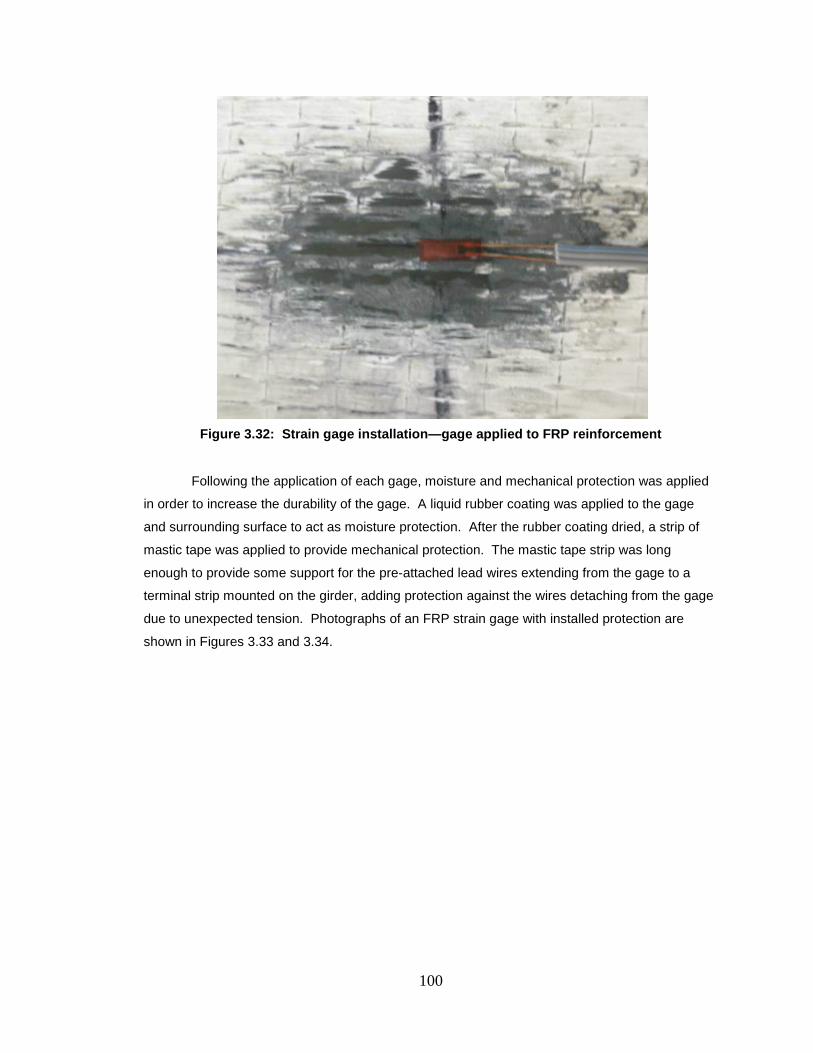
100
Figure 3.32: Strain gage installation—gage applied to FRP reinforcement
Following the application of each gage, moisture and mechanical protection was applied
in order to increase the durability of the gage. A liquid rubber coating was applied to the gage
and surrounding surface to act as moisture protection. After the rubber coating dried, a strip of
mastic tape was applied to provide mechanical protection. The mastic tape strip was long
enough to provide some support for the pre-attached lead wires extending from the gage to a
terminal strip mounted on the girder, adding protection against the wires detaching from the gage
due to unexpected tension. Photographs of an FRP strain gage with installed protection are
shown in Figures 3.33 and 3.34.
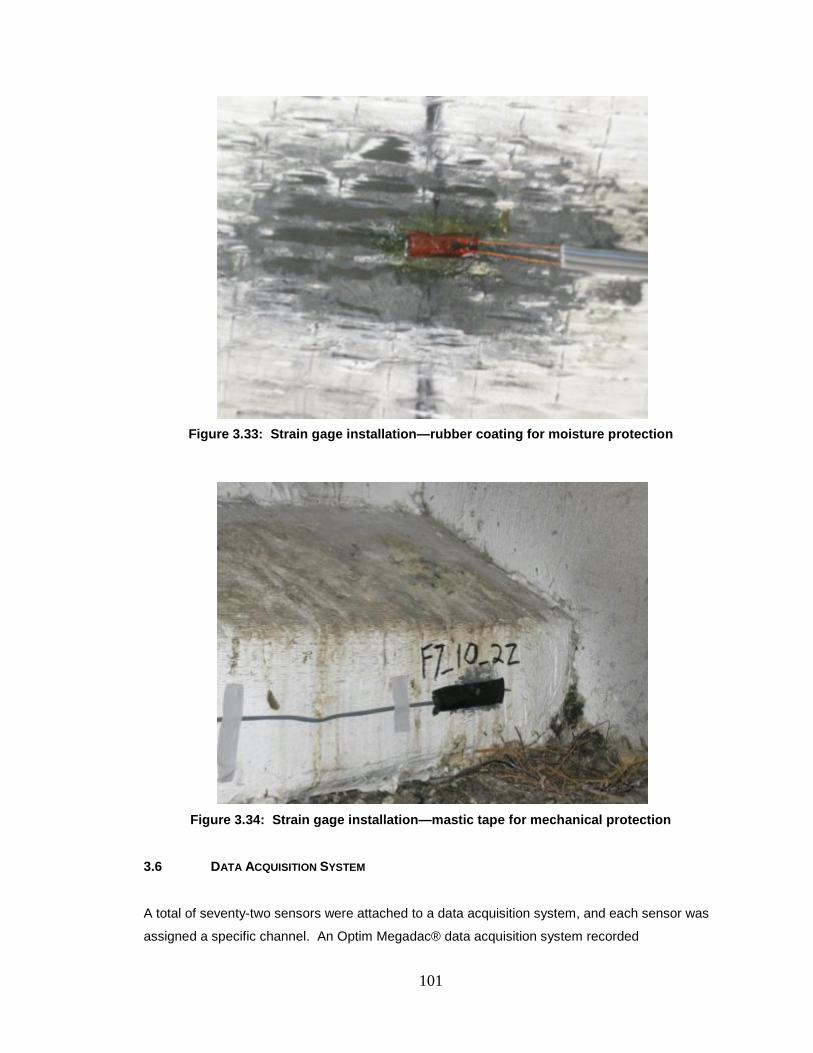
101
Figure 3.33: Strain gage installation—rubber coating for moisture protection
Figure 3.34: Strain gage installation—mastic tape for mechanical protection
3.6 DATA ACQUISITION SYSTEM
A total of seventy-two sensors were attached to a data acquisition system, and each sensor was
assigned a specific channel. An Optim Megadac® data acquisition system recorded
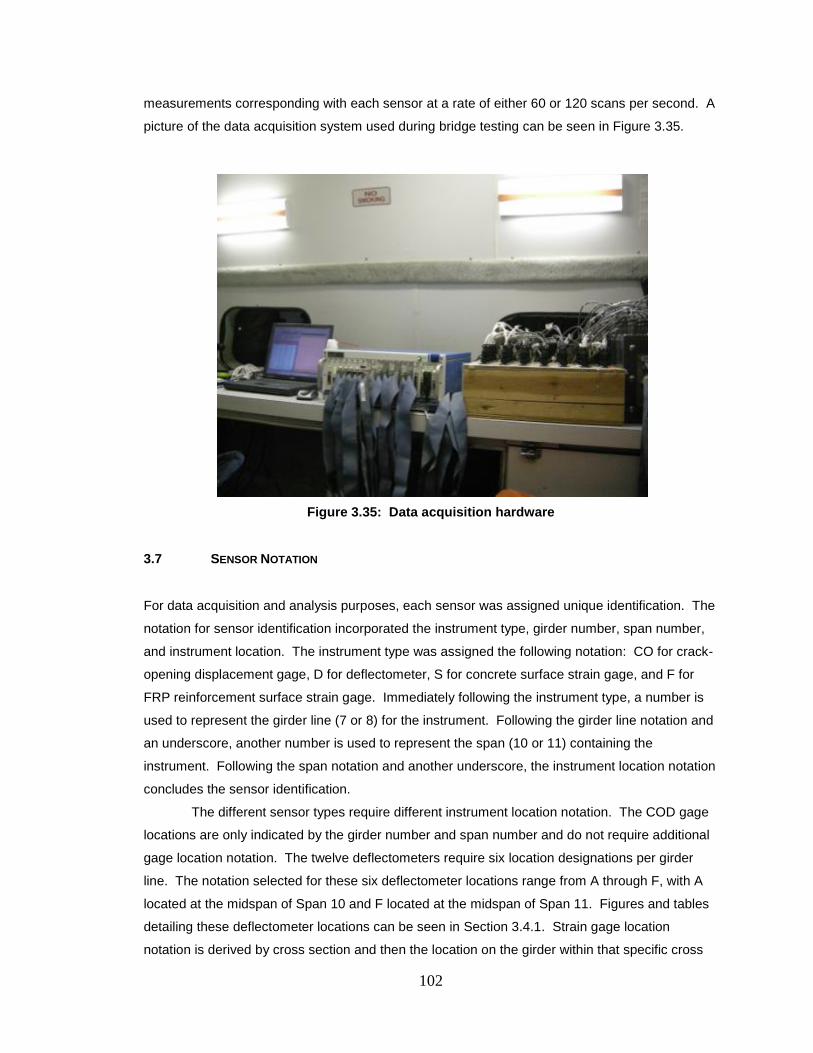
102
measurements corresponding with each sensor at a rate of either 60 or 120 scans per second. A
picture of the data acquisition system used during bridge testing can be seen in Figure 3.35.
Figure 3.35: Data acquisition hardware
3.7 SENSOR NOTATION
For data acquisition and analysis purposes, each sensor was assigned unique identification. The
notation for sensor identification incorporated the instrument type, girder number, span number,
and instrument location. The instrument type was assigned the following notation: CO for crack-
opening displacement gage, D for deflectometer, S for concrete surface strain gage, and F for
FRP reinforcement surface strain gage. Immediately following the instrument type, a number is
used to represent the girder line (7 or 8) for the instrument. Following the girder line notation and
an underscore, another number is used to represent the span (10 or 11) containing the
instrument. Following the span notation and another underscore, the instrument location notation
concludes the sensor identification.
The different sensor types require different instrument location notation. The COD gage
locations are only indicated by the girder number and span number and do not require additional
gage location notation. The twelve deflectometers require six location designations per girder
line. The notation selected for these six deflectometer locations range from A through F, with A
located at the midspan of Span 10 and F located at the midspan of Span 11. Figures and tables
detailing these deflectometer locations can be seen in Section 3.4.1. Strain gage location
notation is derived by cross section and then the location on the girder within that specific cross
103
section. The cross section notation is indicated by a number (1–8). The potential concrete
surface strain gage locations within a cross section are indicated by letters (V, W, X, Y, Z, and M).
Similarly, the potential FRP reinforcement surface strain gage locations within a cross section are
indicated by letters (Y, Z, M, and CK). Figures and tables detailing these strain gage locations
can be seen in Section 3.5.1. The data acquisition channel layout assigned to the seventy-two
sensors can be seen in Appendix L. The following are examples of the data acquisition sensor
identification for each instrument type:
CO8_10 - Crack Opening Displacement Gage Girder Line 8, Span 10
D8_11_F - Deflectometer Girder Line 8, Span 11, Location F
S7_10_1V - Concrete Surface Strain Gage Girder Line 7, Span 10, Cross Section 1, Gage Location V
F7_10_1M - FRP Reinforcement Strain Gage Girder Line 7, Span 10, Cross Section 1, Gage Location M
104
Chapter 4
BRIDGE TESTING PROCEDURES
4.1 INTRODUCTION
Bridge testing was conducted to analyze the behavior of the damaged bridge after installed FRP
reinforcement had been in service for more than 2 years. This testing took place over two nights.
The first night of load testing included the designation of truck traverse lanes and stop positions,
and the completion of the first phase of acoustic emissions (AE) testing. Immediately following
the first night of load testing, sensor measurements were monitored at fifteen-minute intervals
between the two nights of testing to investigate the bridge response to diurnal thermal conditions.
The second night of load testing included the second phase of acoustic emissions testing,
multiposition load testing, and a superposition load test. Details and procedures of the post-
repair bridge testing are discussed within this chapter. Full details of the post-repair acoustic
emissions testing have been reported by Hadzor et al. (2011).
4.2 TRAFFIC CONTROL
The instrumented spans of I-565 in Huntsville support four lanes of northbound traffic. During
pre-repair load testing, it was determined that traffic traveling in the far west lane of the
northbound bridge had a minimal influence on readings taken from the east side of the bridge
(Fason 2009). Girders 7 and 8, the instrumented girders, are located on the east side of the
northbound bridge. It was decided that leaving the west lane of traffic open during testing would
be acceptable as long as measurements were collected during times of minimal traffic
interference. In order to provide a safe working environment during the overnight testing hours,
ALDOT officially closed the three east lanes with standard lane closure procedures including
placement of safety cones and adequate warning signs. The lanes were closed for a distance
long enough to provide the load trucks space with which to maneuver once clear of the spans
being tested, Northbound Spans 10 and 11.
The effect of traffic control on normal traffic flow demands was also considered.
Previously collected traffic volume data was analyzed to determine that the best period for lane
closures was between 11 p.m. and 4 a.m. daily. This time frame also coincides with optimal load
testing circumstances due to relatively steady-state atmospheric conditions. ALDOT began
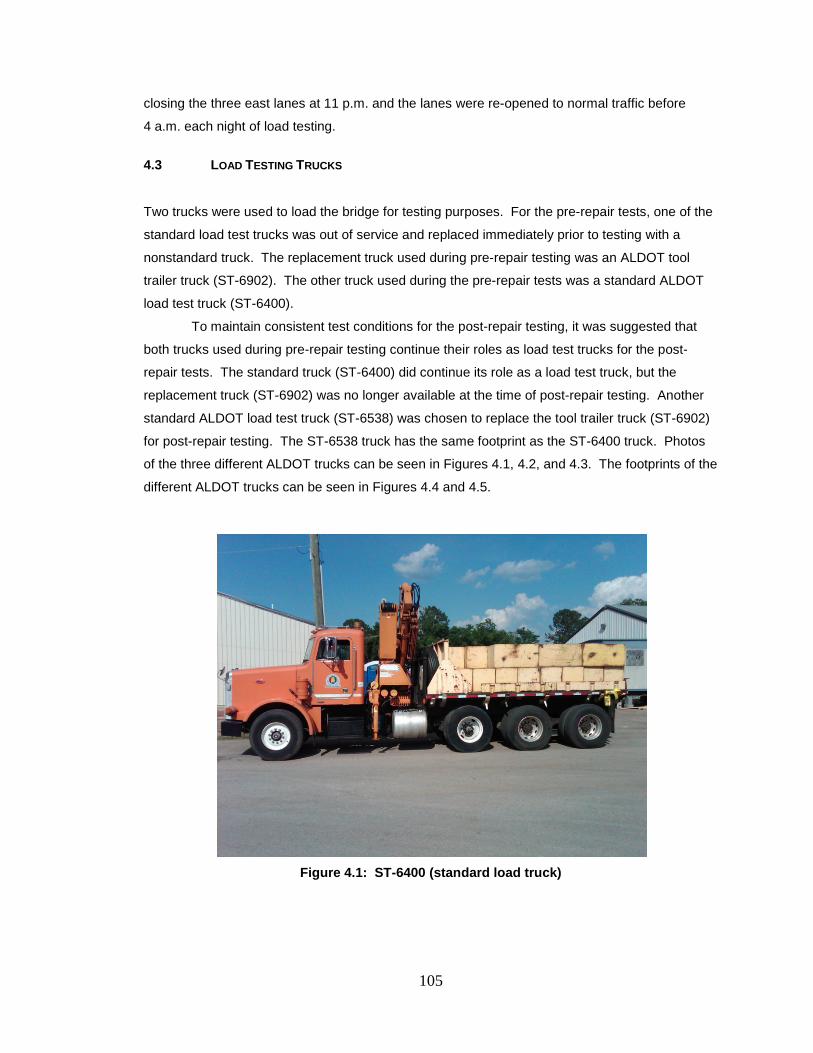
105
closing the three east lanes at 11 p.m. and the lanes were re-opened to normal traffic before
4 a.m. each night of load testing.
4.3 LOAD TESTING TRUCKS
Two trucks were used to load the bridge for testing purposes. For the pre-repair tests, one of the
standard load test trucks was out of service and replaced immediately prior to testing with a
nonstandard truck. The replacement truck used during pre-repair testing was an ALDOT tool
trailer truck (ST-6902). The other truck used during the pre-repair tests was a standard ALDOT
load test truck (ST-6400).
To maintain consistent test conditions for the post-repair testing, it was suggested that
both trucks used during pre-repair testing continue their roles as load test trucks for the post-
repair tests. The standard truck (ST-6400) did continue its role as a load test truck, but the
replacement truck (ST-6902) was no longer available at the time of post-repair testing. Another
standard ALDOT load test truck (ST-6538) was chosen to replace the tool trailer truck (ST-6902)
for post-repair testing. The ST-6538 truck has the same footprint as the ST-6400 truck. Photos
of the three different ALDOT trucks can be seen in Figures 4.1, 4.2, and 4.3. The footprints of the
different ALDOT trucks can be seen in Figures 4.4 and 4.5.
Figure 4.1: ST-6400 (standard load truck)
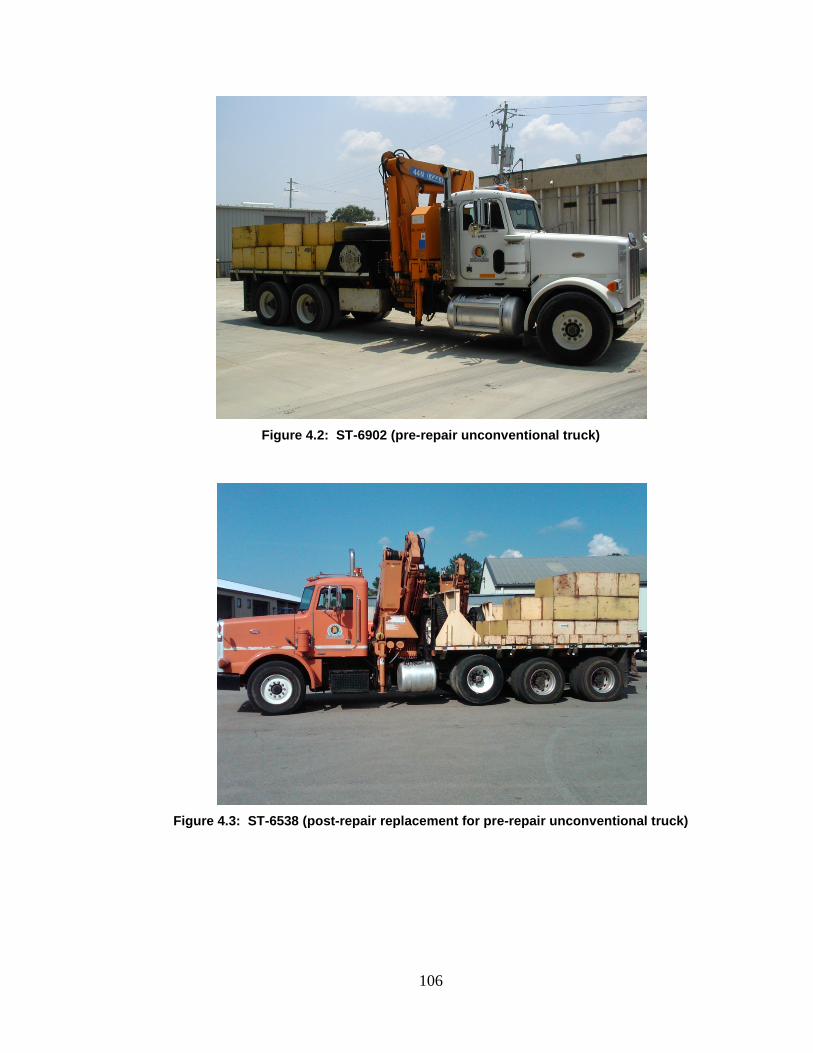
106
Figure 4.2: ST-6902 (pre-repair unconventional truck)
Figure 4.3: ST-6538 (post-repair replacement for pre-repair unconventional truck)
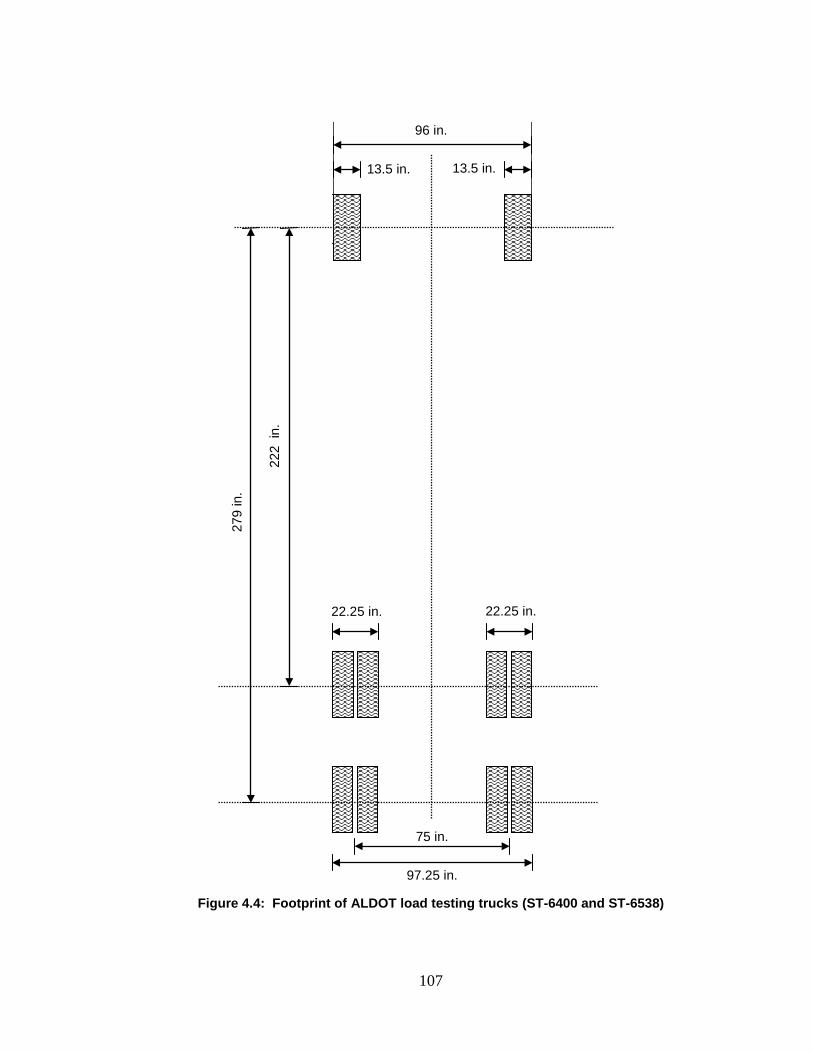
107
Figure 4.4: Footprint of ALDOT load testing trucks (ST-6400 and ST-6538)
97.25 in.
96 in.
13.5 in.
75 in.
279
in.
22.25 in.
222
in.
13.5 in.
22.25 in.
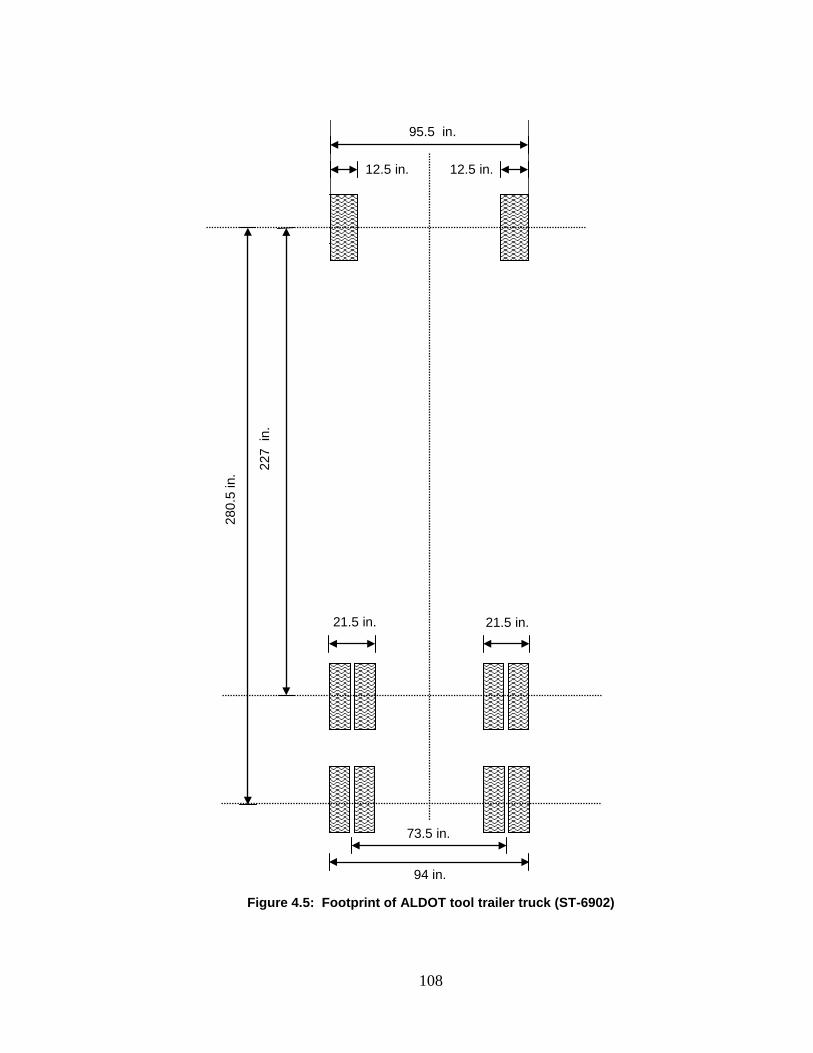
108
Figure 4.5: Footprint of ALDOT tool trailer truck (ST-6902)
21.5 in. 21.5 in.
95.5 in.
12.5 in.
73.5 in.
280.
5 in
. 227
in.
12.5 in.
94 in.
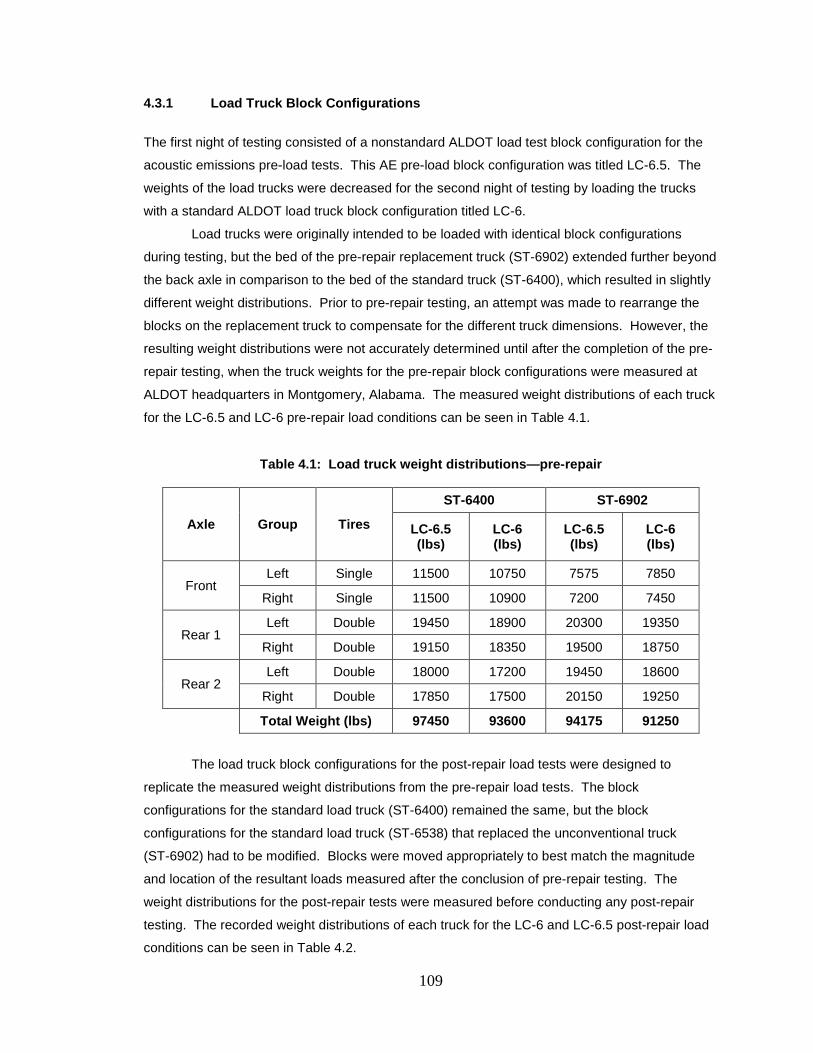
109
4.3.1 Load Truck Block Configurations
The first night of testing consisted of a nonstandard ALDOT load test block configuration for the
acoustic emissions pre-load tests. This AE pre-load block configuration was titled LC-6.5. The
weights of the load trucks were decreased for the second night of testing by loading the trucks
with a standard ALDOT load truck block configuration titled LC-6.
Load trucks were originally intended to be loaded with identical block configurations
during testing, but the bed of the pre-repair replacement truck (ST-6902) extended further beyond
the back axle in comparison to the bed of the standard truck (ST-6400), which resulted in slightly
different weight distributions. Prior to pre-repair testing, an attempt was made to rearrange the
blocks on the replacement truck to compensate for the different truck dimensions. However, the
resulting weight distributions were not accurately determined until after the completion of the pre-
repair testing, when the truck weights for the pre-repair block configurations were measured at
ALDOT headquarters in Montgomery, Alabama. The measured weight distributions of each truck
for the LC-6.5 and LC-6 pre-repair load conditions can be seen in Table 4.1.
Table 4.1: Load truck weight distributions—pre-repair
Axle Group Tires
ST-6400 ST-6902
LC-6.5 (lbs)
LC-6 (lbs)
LC-6.5 (lbs)
LC-6 (lbs)
Front Left Single 11500 10750 7575 7850
Right Single 11500 10900 7200 7450
Rear 1 Left Double 19450 18900 20300 19350
Right Double 19150 18350 19500 18750
Rear 2 Left Double 18000 17200 19450 18600
Right Double 17850 17500 20150 19250
Total Weight (lbs) 97450 93600 94175 91250
The load truck block configurations for the post-repair load tests were designed to
replicate the measured weight distributions from the pre-repair load tests. The block
configurations for the standard load truck (ST-6400) remained the same, but the block
configurations for the standard load truck (ST-6538) that replaced the unconventional truck
(ST-6902) had to be modified. Blocks were moved appropriately to best match the magnitude
and location of the resultant loads measured after the conclusion of pre-repair testing. The
weight distributions for the post-repair tests were measured before conducting any post-repair
testing. The recorded weight distributions of each truck for the LC-6 and LC-6.5 post-repair load
conditions can be seen in Table 4.2.
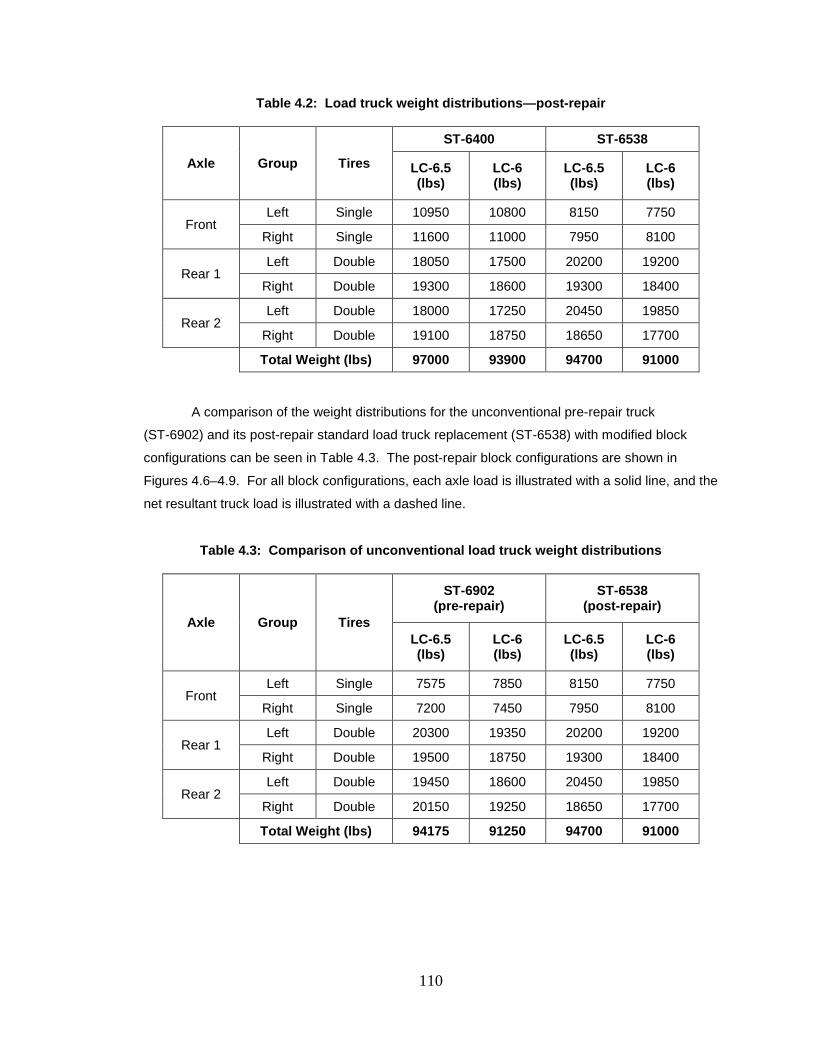
110
Table 4.2: Load truck weight distributions—post-repair
Axle Group Tires
ST-6400 ST-6538
LC-6.5 (lbs)
LC-6 (lbs)
LC-6.5 (lbs)
LC-6 (lbs)
Front Left Single 10950 10800 8150 7750
Right Single 11600 11000 7950 8100
Rear 1 Left Double 18050 17500 20200 19200
Right Double 19300 18600 19300 18400
Rear 2 Left Double 18000 17250 20450 19850
Right Double 19100 18750 18650 17700
Total Weight (lbs) 97000 93900 94700 91000
A comparison of the weight distributions for the unconventional pre-repair truck
(ST-6902) and its post-repair standard load truck replacement (ST-6538) with modified block
configurations can be seen in Table 4.3. The post-repair block configurations are shown in
Figures 4.6–4.9. For all block configurations, each axle load is illustrated with a solid line, and the
net resultant truck load is illustrated with a dashed line.
Table 4.3: Comparison of unconventional load truck weight distributions
Axle Group Tires
ST-6902 (pre-repair)
ST-6538 (post-repair)
LC-6.5 (lbs)
LC-6 (lbs)
LC-6.5 (lbs)
LC-6 (lbs)
Front Left Single 7575 7850 8150 7750
Right Single 7200 7450 7950 8100
Rear 1 Left Double 20300 19350 20200 19200
Right Double 19500 18750 19300 18400
Rear 2 Left Double 19450 18600 20450 19850
Right Double 20150 19250 18650 17700
Total Weight (lbs) 94175 91250 94700 91000
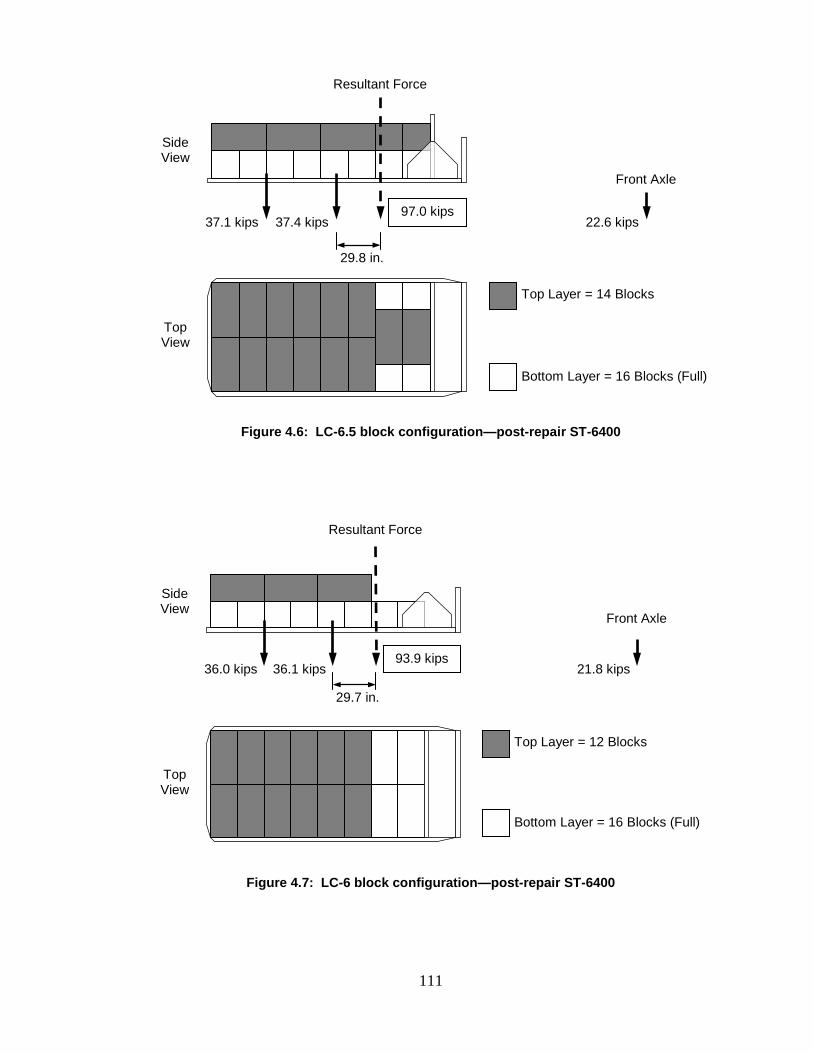
111
Figure 4.6: LC-6.5 block configuration—post-repair ST-6400
Figure 4.7: LC-6 block configuration—post-repair ST-6400
Side View
Top Layer = 12 Blocks
36.0 kips 36.1 kips 21.8 kips 93.9 kips
29.7 in.
Bottom Layer = 16 Blocks (Full)
Top View
Side View
Top Layer = 14 Blocks
37.1 kips 37.4 kips 97.0 kips
22.6 kips
29.8 in.
Bottom Layer = 16 Blocks (Full)
Top View
Front Axle
Resultant Force
Front Axle
Resultant Force
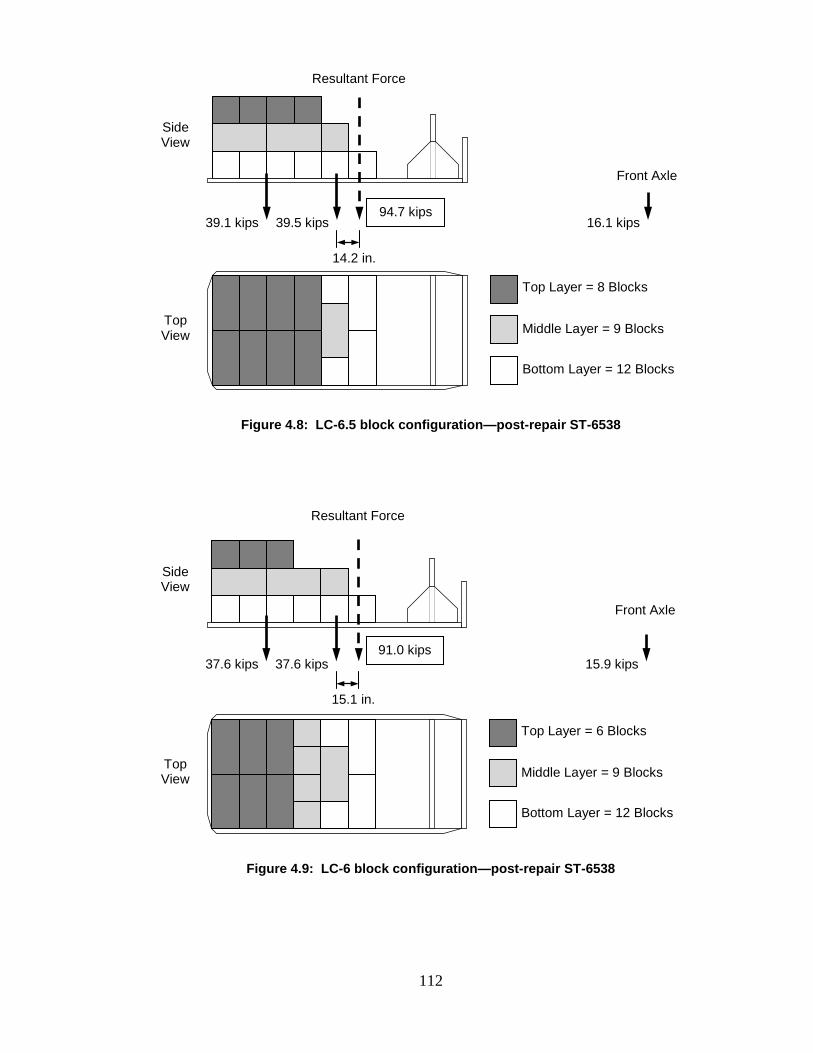
112
Figure 4.8: LC-6.5 block configuration—post-repair ST-6538
Figure 4.9: LC-6 block configuration—post-repair ST-6538
Side View
Top Layer = 6 Blocks
Top View
37.6 kips 37.6 kips 15.9 kips 91.0 kips
15.1 in.
Middle Layer = 9 Blocks
Bottom Layer = 12 Blocks
Side View
Top Layer = 8 Blocks
39.1 kips 39.5 kips 16.1 kips 94.7 kips
14.2 in.
Middle Layer = 9 Blocks
Bottom Layer = 12 Blocks
Top View
Front Axle
Resultant Force
Front Axle
Resultant Force
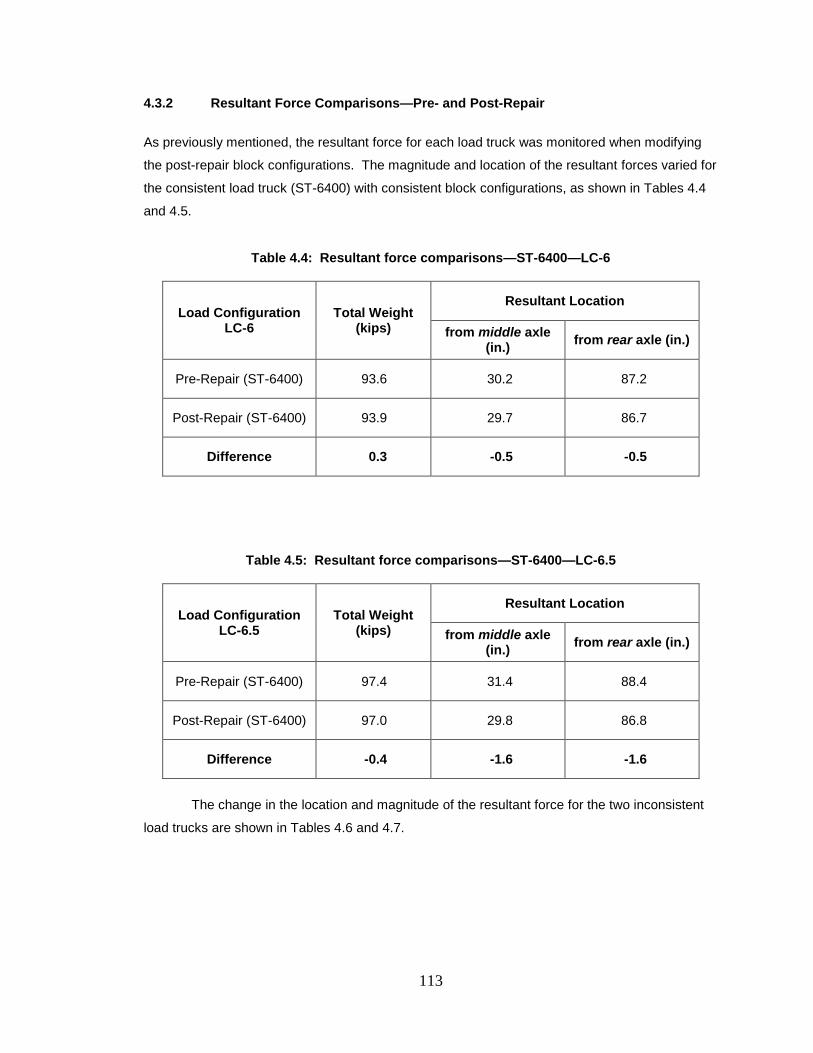
113
4.3.2 Resultant Force Comparisons—Pre- and Post-Repair
As previously mentioned, the resultant force for each load truck was monitored when modifying
the post-repair block configurations. The magnitude and location of the resultant forces varied for
the consistent load truck (ST-6400) with consistent block configurations, as shown in Tables 4.4
and 4.5.
Table 4.4: Resultant force comparisons—ST-6400—LC-6
Load Configuration LC-6
Total Weight (kips)
Resultant Location
from middle axle (in.) from rear axle (in.)
Pre-Repair (ST-6400) 93.6 30.2 87.2
Post-Repair (ST-6400) 93.9 29.7 86.7
Difference 0.3 -0.5 -0.5
Table 4.5: Resultant force comparisons—ST-6400—LC-6.5
Load Configuration LC-6.5
Total Weight (kips)
Resultant Location
from middle axle (in.) from rear axle (in.)
Pre-Repair (ST-6400) 97.4 31.4 88.4
Post-Repair (ST-6400) 97.0 29.8 86.8
Difference -0.4 -1.6 -1.6
The change in the location and magnitude of the resultant force for the two inconsistent
load trucks are shown in Tables 4.6 and 4.7.
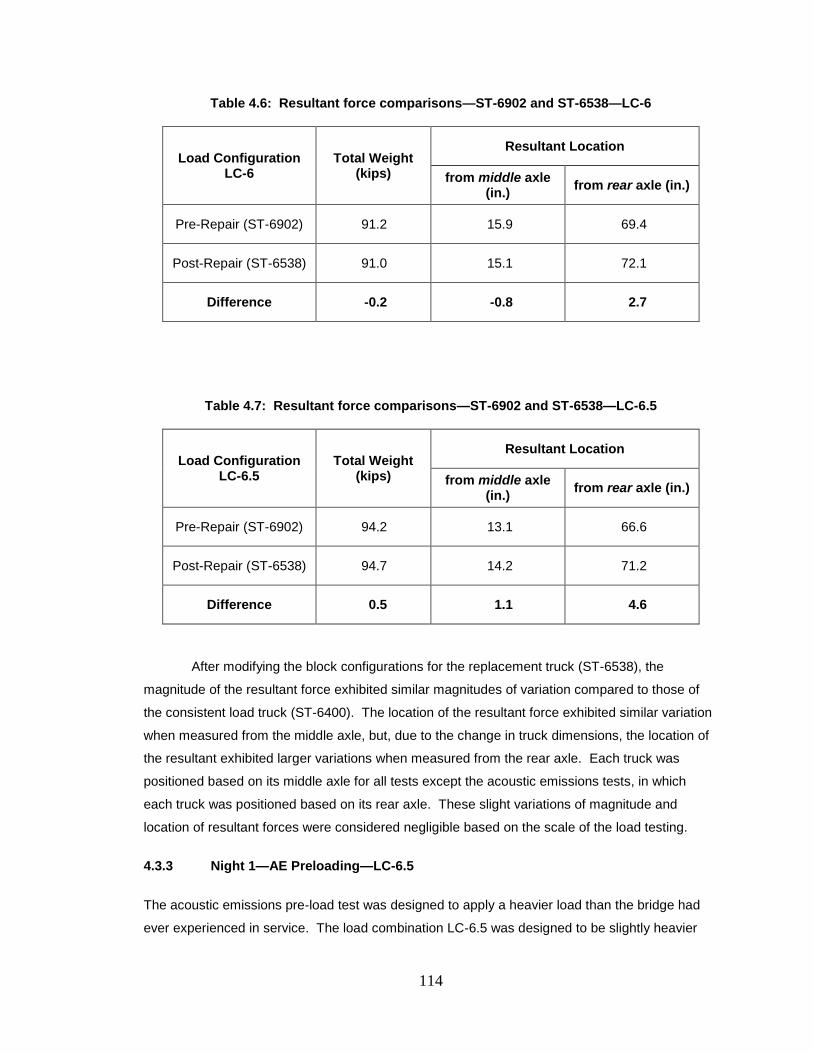
114
Table 4.6: Resultant force comparisons—ST-6902 and ST-6538—LC-6
Load Configuration LC-6
Total Weight (kips)
Resultant Location
from middle axle (in.) from rear axle (in.)
Pre-Repair (ST-6902) 91.2 15.9 69.4
Post-Repair (ST-6538) 91.0 15.1 72.1
Difference -0.2 -0.8 2.7
Table 4.7: Resultant force comparisons—ST-6902 and ST-6538—LC-6.5
Load Configuration LC-6.5
Total Weight (kips)
Resultant Location
from middle axle (in.) from rear axle (in.)
Pre-Repair (ST-6902) 94.2 13.1 66.6
Post-Repair (ST-6538) 94.7 14.2 71.2
Difference 0.5 1.1 4.6
After modifying the block configurations for the replacement truck (ST-6538), the
magnitude of the resultant force exhibited similar magnitudes of variation compared to those of
the consistent load truck (ST-6400). The location of the resultant force exhibited similar variation
when measured from the middle axle, but, due to the change in truck dimensions, the location of
the resultant exhibited larger variations when measured from the rear axle. Each truck was
positioned based on its middle axle for all tests except the acoustic emissions tests, in which
each truck was positioned based on its rear axle. These slight variations of magnitude and
location of resultant forces were considered negligible based on the scale of the load testing.
4.3.3 Night 1—AE Preloading—LC-6.5
The acoustic emissions pre-load test was designed to apply a heavier load than the bridge had
ever experienced in service. The load combination LC-6.5 was designed to be slightly heavier
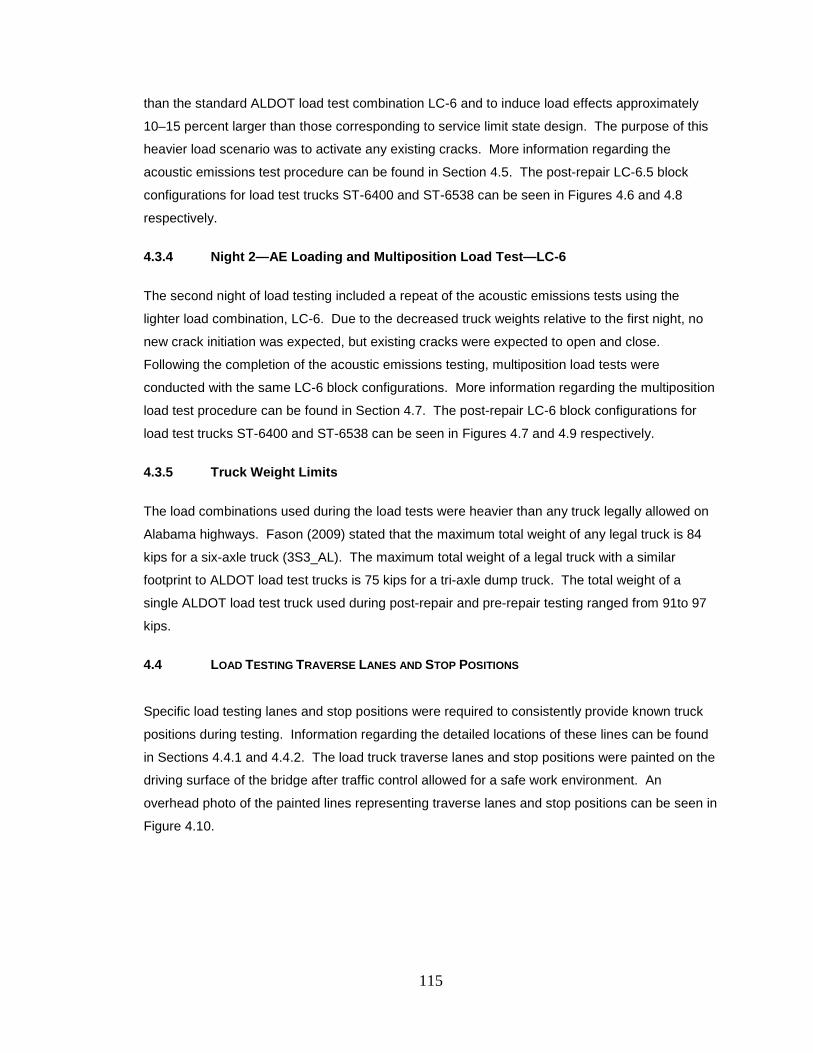
115
than the standard ALDOT load test combination LC-6 and to induce load effects approximately
10–15 percent larger than those corresponding to service limit state design. The purpose of this
heavier load scenario was to activate any existing cracks. More information regarding the
acoustic emissions test procedure can be found in Section 4.5. The post-repair LC-6.5 block
configurations for load test trucks ST-6400 and ST-6538 can be seen in Figures 4.6 and 4.8
respectively.
4.3.4 Night 2—AE Loading and Multiposition Load Test—LC-6
The second night of load testing included a repeat of the acoustic emissions tests using the
lighter load combination, LC-6. Due to the decreased truck weights relative to the first night, no
new crack initiation was expected, but existing cracks were expected to open and close.
Following the completion of the acoustic emissions testing, multiposition load tests were
conducted with the same LC-6 block configurations. More information regarding the multiposition
load test procedure can be found in Section 4.7. The post-repair LC-6 block configurations for
load test trucks ST-6400 and ST-6538 can be seen in Figures 4.7 and 4.9 respectively.
4.3.5 Truck Weight Limits
The load combinations used during the load tests were heavier than any truck legally allowed on
Alabama highways. Fason (2009) stated that the maximum total weight of any legal truck is 84
kips for a six-axle truck (3S3_AL). The maximum total weight of a legal truck with a similar
footprint to ALDOT load test trucks is 75 kips for a tri-axle dump truck. The total weight of a
single ALDOT load test truck used during post-repair and pre-repair testing ranged from 91to 97
kips.
4.4 LOAD TESTING TRAVERSE LANES AND STOP POSITIONS
Specific load testing lanes and stop positions were required to consistently provide known truck
positions during testing. Information regarding the detailed locations of these lines can be found
in Sections 4.4.1 and 4.4.2. The load truck traverse lanes and stop positions were painted on the
driving surface of the bridge after traffic control allowed for a safe work environment. An
overhead photo of the painted lines representing traverse lanes and stop positions can be seen in
Figure 4.10.
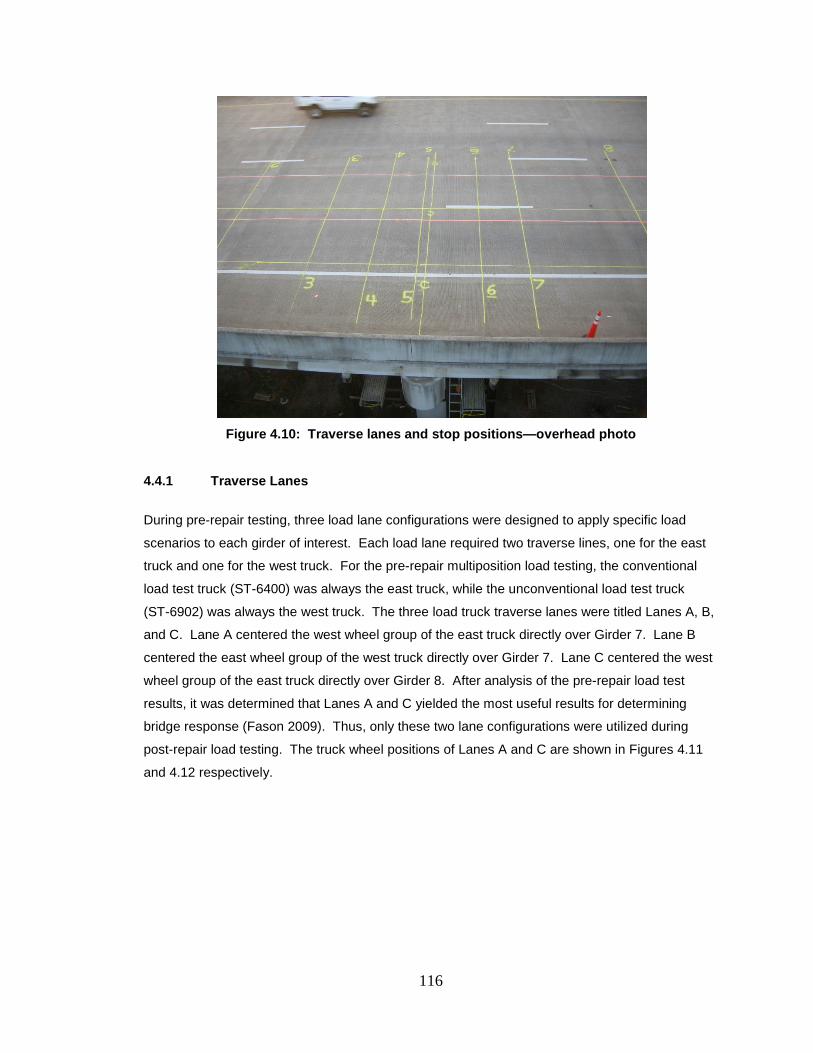
116
Figure 4.10: Traverse lanes and stop positions—overhead photo
4.4.1 Traverse Lanes
During pre-repair testing, three load lane configurations were designed to apply specific load
scenarios to each girder of interest. Each load lane required two traverse lines, one for the east
truck and one for the west truck. For the pre-repair multiposition load testing, the conventional
load test truck (ST-6400) was always the east truck, while the unconventional load test truck
(ST-6902) was always the west truck. The three load truck traverse lanes were titled Lanes A, B,
and C. Lane A centered the west wheel group of the east truck directly over Girder 7. Lane B
centered the east wheel group of the west truck directly over Girder 7. Lane C centered the west
wheel group of the east truck directly over Girder 8. After analysis of the pre-repair load test
results, it was determined that Lanes A and C yielded the most useful results for determining
bridge response (Fason 2009). Thus, only these two lane configurations were utilized during
post-repair load testing. The truck wheel positions of Lanes A and C are shown in Figures 4.11
and 4.12 respectively.
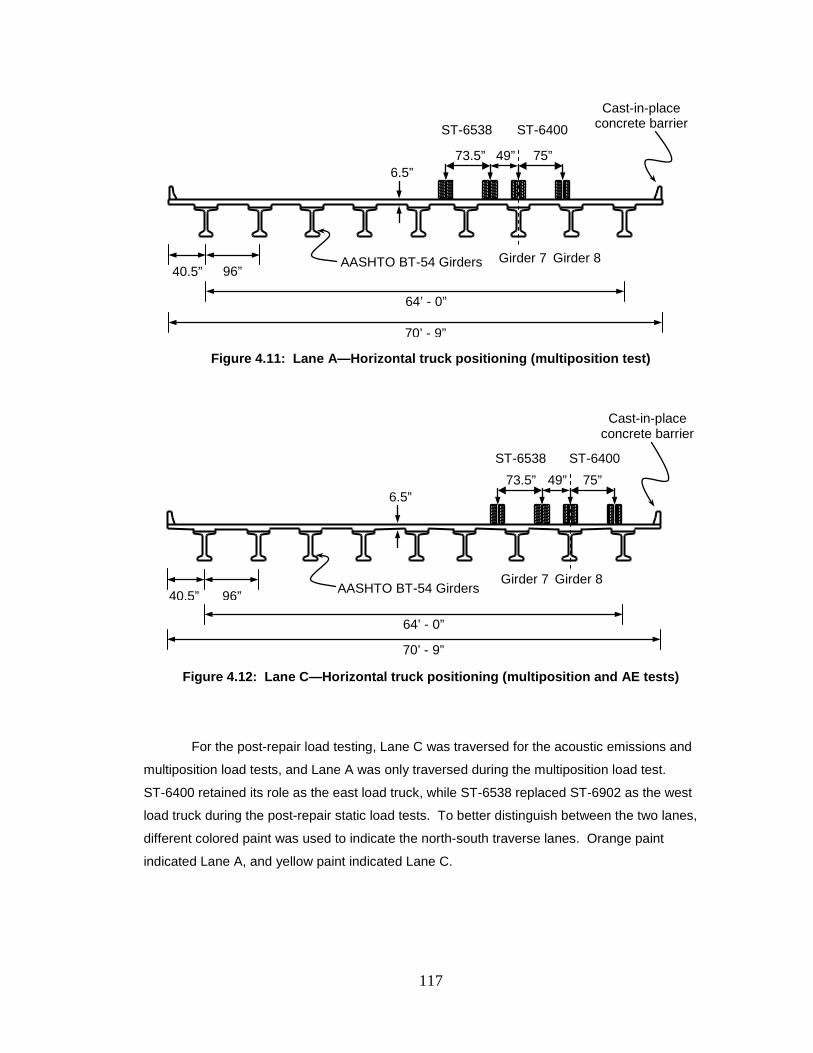
117
Figure 4.11: Lane A—Horizontal truck positioning (multiposition test)
Figure 4.12: Lane C—Horizontal truck positioning (multiposition and AE tests)
For the post-repair load testing, Lane C was traversed for the acoustic emissions and
multiposition load tests, and Lane A was only traversed during the multiposition load test.
ST-6400 retained its role as the east load truck, while ST-6538 replaced ST-6902 as the west
load truck during the post-repair static load tests. To better distinguish between the two lanes,
different colored paint was used to indicate the north-south traverse lanes. Orange paint
indicated Lane A, and yellow paint indicated Lane C.
40.5” 96”
Cast-in-place concrete barrier
64’ - 0”
70’ - 9”
6.5”
Girder 7 Girder 8
73.5” 75” 49” ST-6538 ST-6400
AASHTO BT-54 Girders
40.5” 96” AASHTO BT-54 Girders
Cast-in-place concrete barrier
64’ - 0”
70’ - 9”
6.5”
Girder 7 Girder 8
73.5” 75” 49”
ST-6538 ST-6400
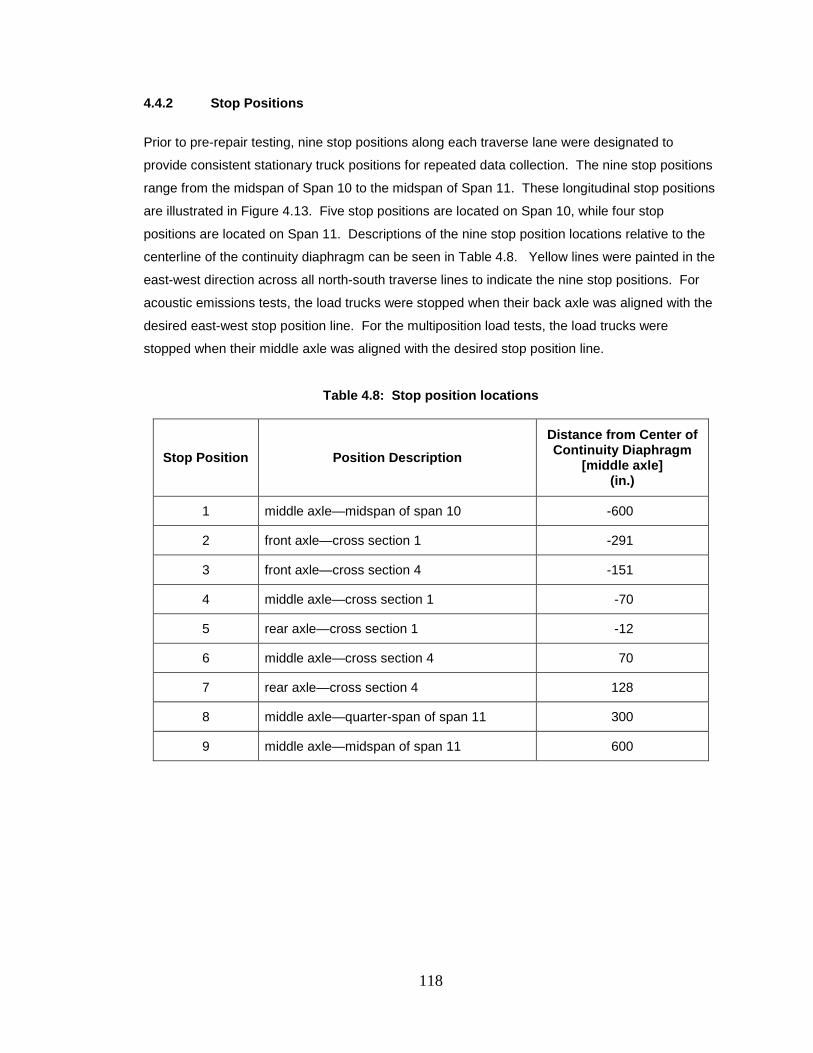
118
4.4.2 Stop Positions
Prior to pre-repair testing, nine stop positions along each traverse lane were designated to
provide consistent stationary truck positions for repeated data collection. The nine stop positions
range from the midspan of Span 10 to the midspan of Span 11. These longitudinal stop positions
are illustrated in Figure 4.13. Five stop positions are located on Span 10, while four stop
positions are located on Span 11. Descriptions of the nine stop position locations relative to the
centerline of the continuity diaphragm can be seen in Table 4.8. Yellow lines were painted in the
east-west direction across all north-south traverse lines to indicate the nine stop positions. For
acoustic emissions tests, the load trucks were stopped when their back axle was aligned with the
desired east-west stop position line. For the multiposition load tests, the load trucks were
stopped when their middle axle was aligned with the desired stop position line.
Table 4.8: Stop position locations
Stop Position Position Description Distance from Center of Continuity Diaphragm
[middle axle] (in.)
1 middle axle—midspan of span 10 -600
2 front axle—cross section 1 -291
3 front axle—cross section 4 -151
4 middle axle—cross section 1 -70
5 rear axle—cross section 1 -12
6 middle axle—cross section 4 70
7 rear axle—cross section 4 128
8 middle axle—quarter-span of span 11 300
9 middle axle—midspan of span 11 600
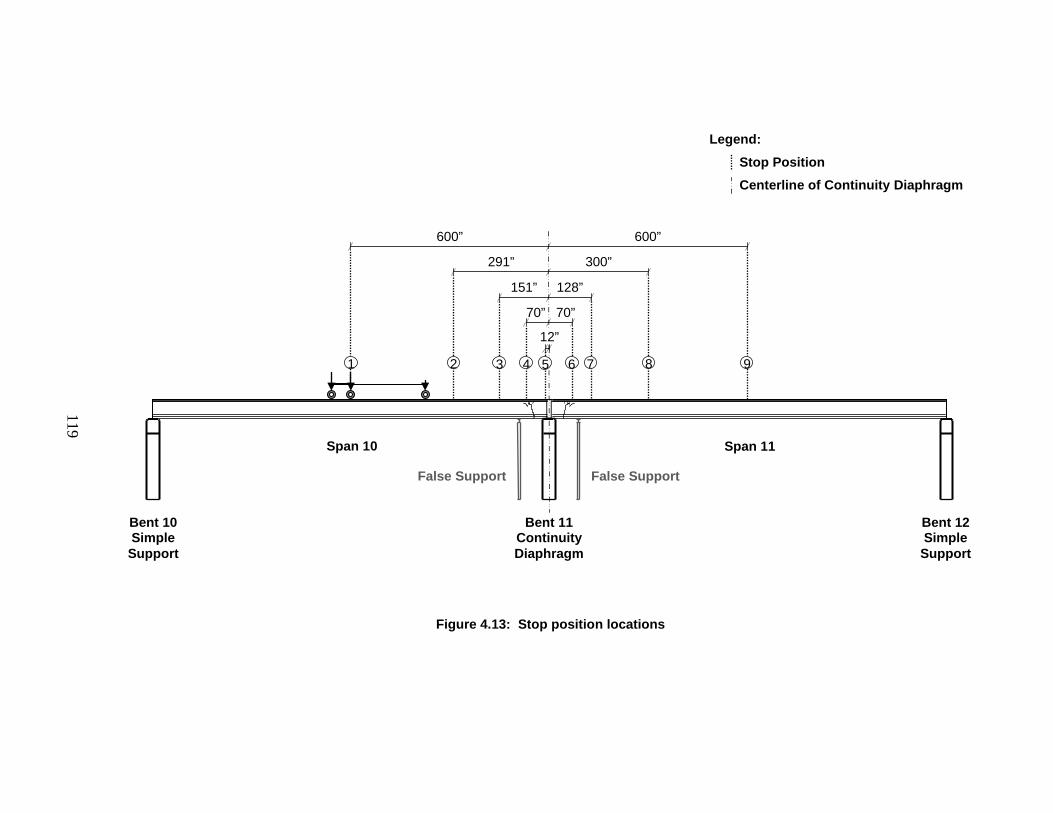
119
Figure 4.13: Stop position locations
Legend: Stop Position Centerline of Continuity Diaphragm
600” 600”
12”
Bent 10 Simple Support
Span 11
Bent 11
Continuity Diaphragm
Span 10
Bent 12 Simple Support
9 8
7 6 5 4 3 2 1
291” 300”
151” 128”
70” 70”
False Support False Support
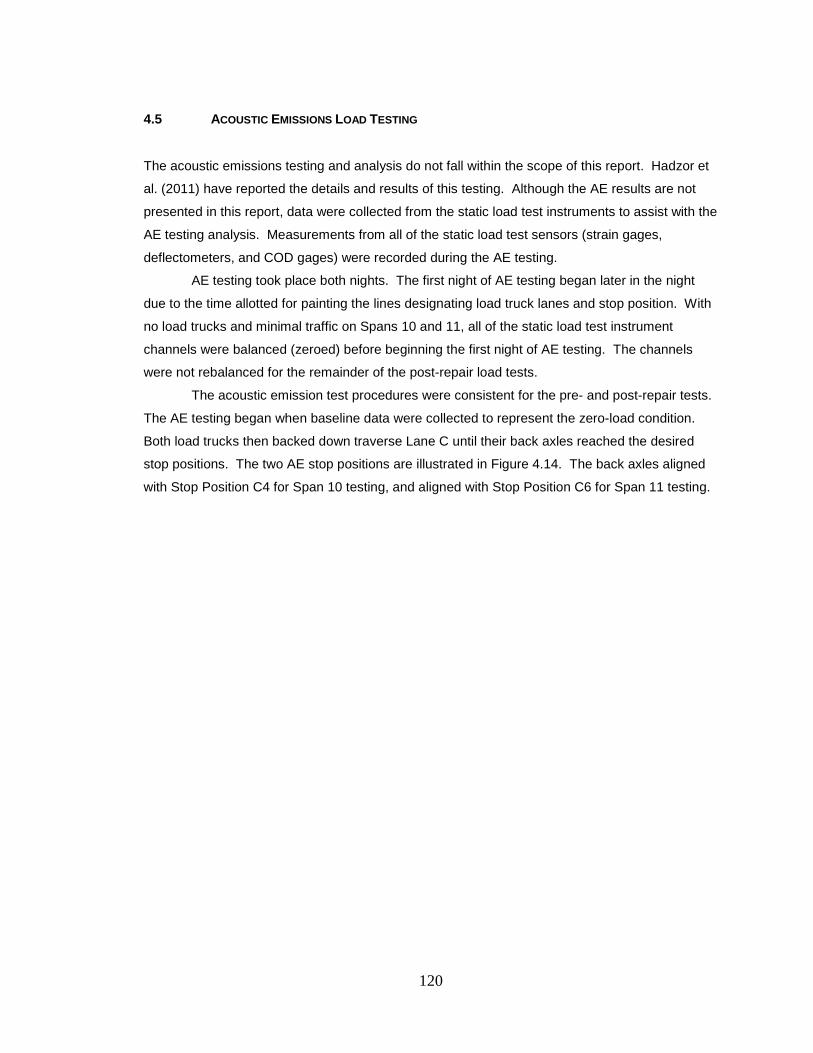
120
4.5 ACOUSTIC EMISSIONS LOAD TESTING
The acoustic emissions testing and analysis do not fall within the scope of this report. Hadzor et
al. (2011) have reported the details and results of this testing. Although the AE results are not
presented in this report, data were collected from the static load test instruments to assist with the
AE testing analysis. Measurements from all of the static load test sensors (strain gages,
deflectometers, and COD gages) were recorded during the AE testing.
AE testing took place both nights. The first night of AE testing began later in the night
due to the time allotted for painting the lines designating load truck lanes and stop position. With
no load trucks and minimal traffic on Spans 10 and 11, all of the static load test instrument
channels were balanced (zeroed) before beginning the first night of AE testing. The channels
were not rebalanced for the remainder of the post-repair load tests.
The acoustic emission test procedures were consistent for the pre- and post-repair tests.
The AE testing began when baseline data were collected to represent the zero-load condition.
Both load trucks then backed down traverse Lane C until their back axles reached the desired
stop positions. The two AE stop positions are illustrated in Figure 4.14. The back axles aligned
with Stop Position C4 for Span 10 testing, and aligned with Stop Position C6 for Span 11 testing.
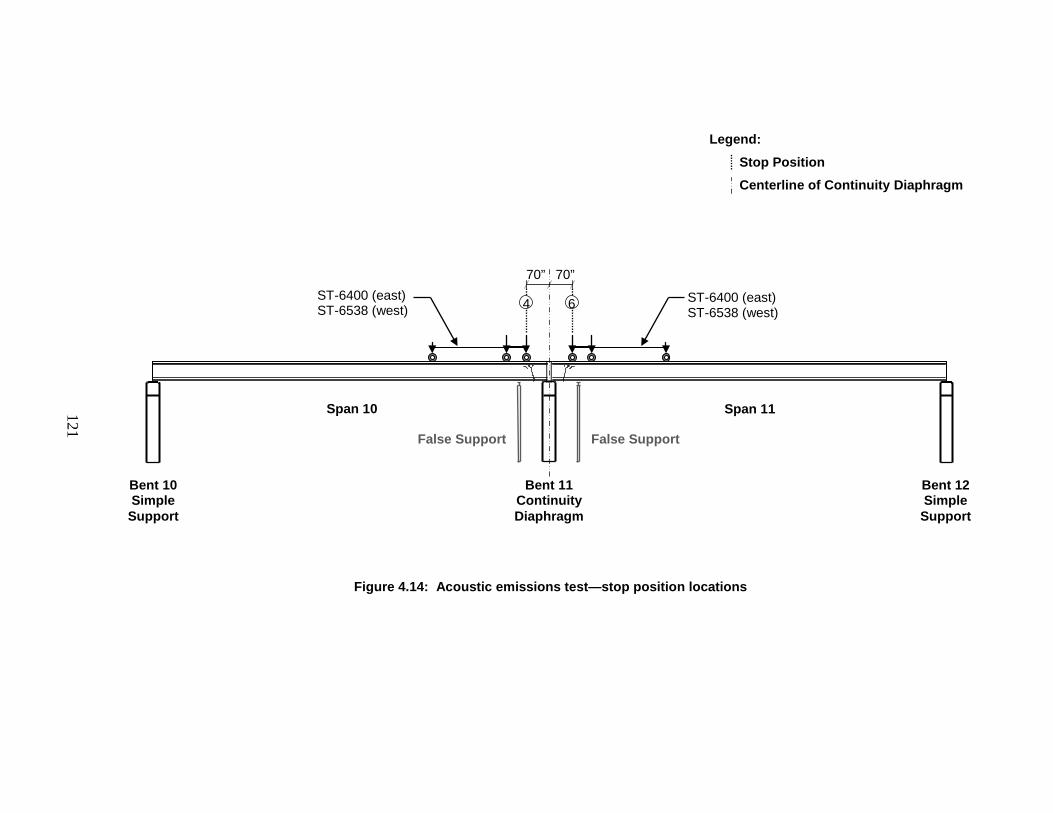
121
Figure 4.14: Acoustic emissions test—stop position locations
70” 70”
Bent 10 Simple Support
Span 11
Bent 11
Continuity Diaphragm
Span 10
Bent 12 Simple Support
6 4
ST-6400 (east) ST-6538 (west)
ST-6400 (east) ST-6538 (west)
Legend: Stop Position Centerline of Continuity Diaphragm
False Support False Support
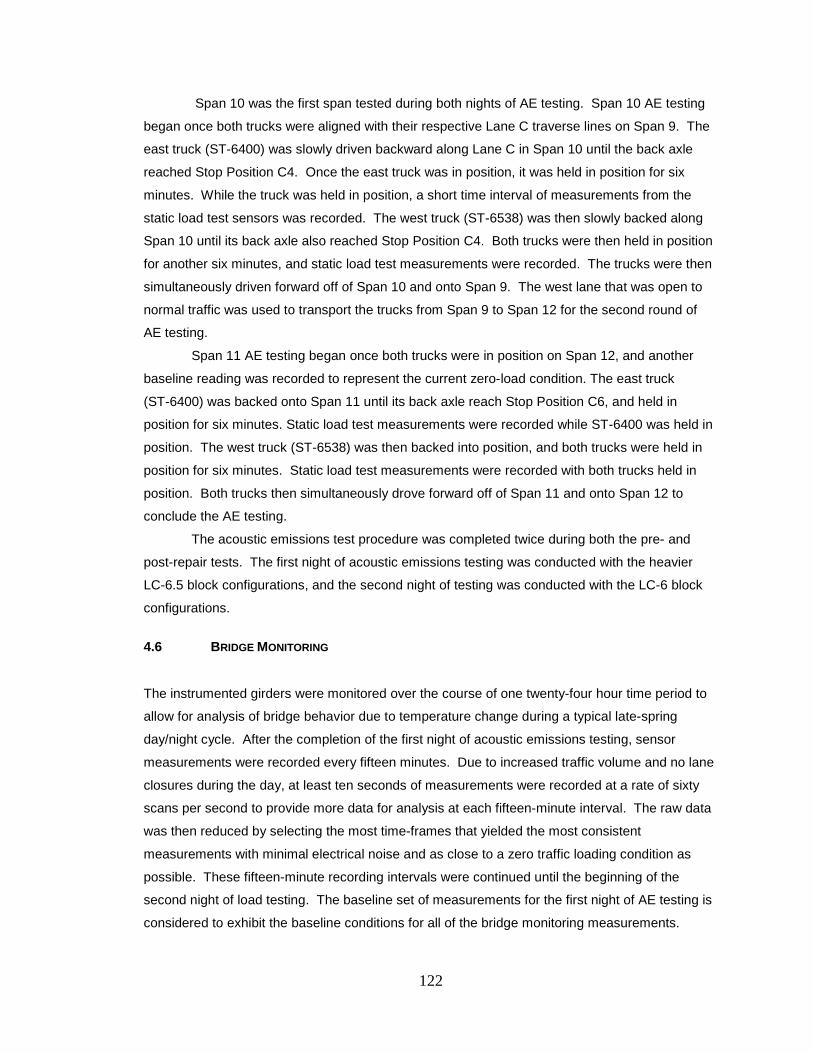
122
Span 10 was the first span tested during both nights of AE testing. Span 10 AE testing
began once both trucks were aligned with their respective Lane C traverse lines on Span 9. The
east truck (ST-6400) was slowly driven backward along Lane C in Span 10 until the back axle
reached Stop Position C4. Once the east truck was in position, it was held in position for six
minutes. While the truck was held in position, a short time interval of measurements from the
static load test sensors was recorded. The west truck (ST-6538) was then slowly backed along
Span 10 until its back axle also reached Stop Position C4. Both trucks were then held in position
for another six minutes, and static load test measurements were recorded. The trucks were then
simultaneously driven forward off of Span 10 and onto Span 9. The west lane that was open to
normal traffic was used to transport the trucks from Span 9 to Span 12 for the second round of
AE testing.
Span 11 AE testing began once both trucks were in position on Span 12, and another
baseline reading was recorded to represent the current zero-load condition. The east truck
(ST-6400) was backed onto Span 11 until its back axle reach Stop Position C6, and held in
position for six minutes. Static load test measurements were recorded while ST-6400 was held in
position. The west truck (ST-6538) was then backed into position, and both trucks were held in
position for six minutes. Static load test measurements were recorded with both trucks held in
position. Both trucks then simultaneously drove forward off of Span 11 and onto Span 12 to
conclude the AE testing.
The acoustic emissions test procedure was completed twice during both the pre- and
post-repair tests. The first night of acoustic emissions testing was conducted with the heavier
LC-6.5 block configurations, and the second night of testing was conducted with the LC-6 block
configurations.
4.6 BRIDGE MONITORING
The instrumented girders were monitored over the course of one twenty-four hour time period to
allow for analysis of bridge behavior due to temperature change during a typical late-spring
day/night cycle. After the completion of the first night of acoustic emissions testing, sensor
measurements were recorded every fifteen minutes. Due to increased traffic volume and no lane
closures during the day, at least ten seconds of measurements were recorded at a rate of sixty
scans per second to provide more data for analysis at each fifteen-minute interval. The raw data
was then reduced by selecting the most time-frames that yielded the most consistent
measurements with minimal electrical noise and as close to a zero traffic loading condition as
possible. These fifteen-minute recording intervals were continued until the beginning of the
second night of load testing. The baseline set of measurements for the first night of AE testing is
considered to exhibit the baseline conditions for all of the bridge monitoring measurements.
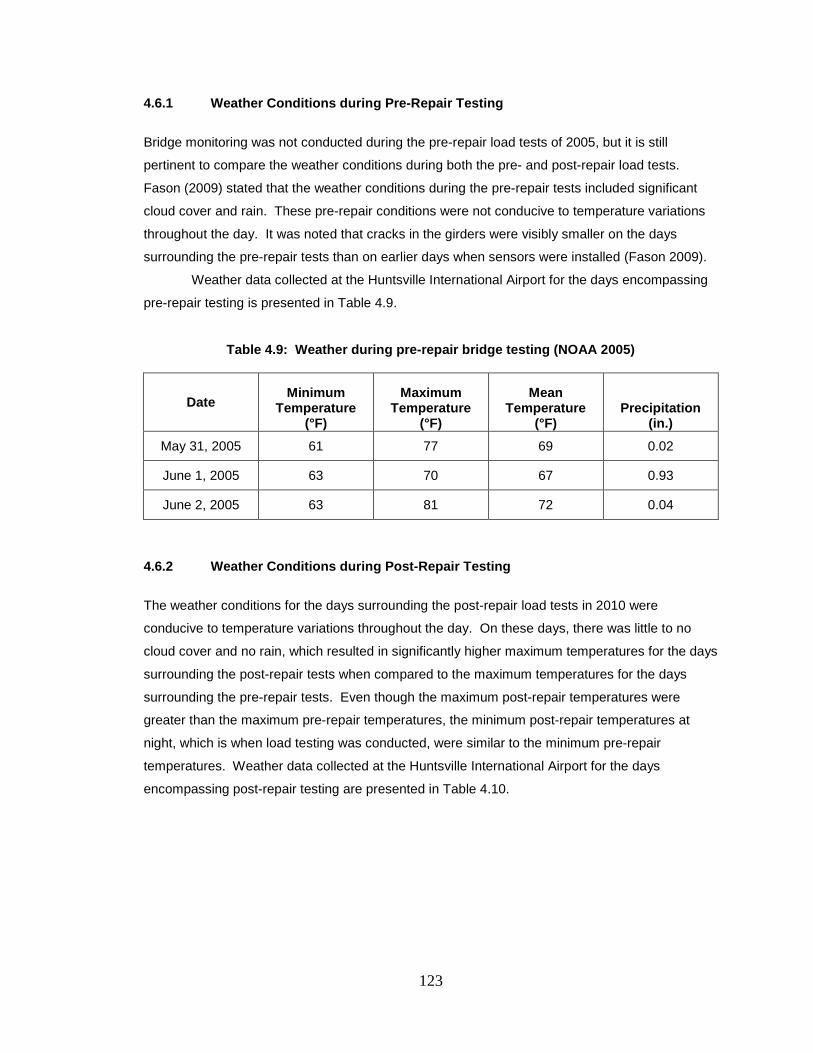
123
4.6.1 Weather Conditions during Pre-Repair Testing
Bridge monitoring was not conducted during the pre-repair load tests of 2005, but it is still
pertinent to compare the weather conditions during both the pre- and post-repair load tests.
Fason (2009) stated that the weather conditions during the pre-repair tests included significant
cloud cover and rain. These pre-repair conditions were not conducive to temperature variations
throughout the day. It was noted that cracks in the girders were visibly smaller on the days
surrounding the pre-repair tests than on earlier days when sensors were installed (Fason 2009).
Weather data collected at the Huntsville International Airport for the days encompassing
pre-repair testing is presented in Table 4.9.
Table 4.9: Weather during pre-repair bridge testing (NOAA 2005)
Date Minimum
Temperature (°F)
Maximum Temperature
(°F)
Mean Temperature
(°F) Precipitation
(in.) May 31, 2005 61 77 69 0.02
June 1, 2005 63 70 67 0.93
June 2, 2005 63 81 72 0.04
4.6.2 Weather Conditions during Post-Repair Testing
The weather conditions for the days surrounding the post-repair load tests in 2010 were
conducive to temperature variations throughout the day. On these days, there was little to no
cloud cover and no rain, which resulted in significantly higher maximum temperatures for the days
surrounding the post-repair tests when compared to the maximum temperatures for the days
surrounding the pre-repair tests. Even though the maximum post-repair temperatures were
greater than the maximum pre-repair temperatures, the minimum post-repair temperatures at
night, which is when load testing was conducted, were similar to the minimum pre-repair
temperatures. Weather data collected at the Huntsville International Airport for the days
encompassing post-repair testing are presented in Table 4.10.
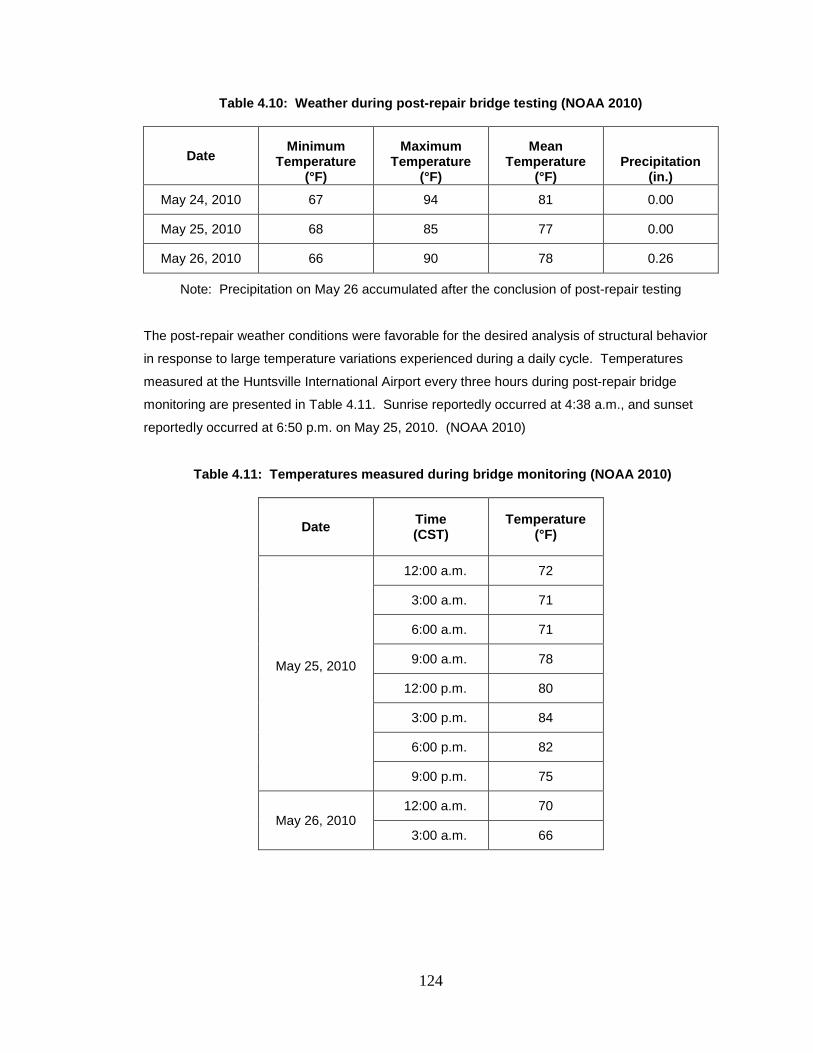
124
Table 4.10: Weather during post-repair bridge testing (NOAA 2010)
Date Minimum
Temperature (°F)
Maximum Temperature
(°F)
Mean Temperature
(°F) Precipitation
(in.) May 24, 2010 67 94 81 0.00
May 25, 2010 68 85 77 0.00
May 26, 2010 66 90 78 0.26
Note: Precipitation on May 26 accumulated after the conclusion of post-repair testing
The post-repair weather conditions were favorable for the desired analysis of structural behavior
in response to large temperature variations experienced during a daily cycle. Temperatures
measured at the Huntsville International Airport every three hours during post-repair bridge
monitoring are presented in Table 4.11. Sunrise reportedly occurred at 4:38 a.m., and sunset
reportedly occurred at 6:50 p.m. on May 25, 2010. (NOAA 2010)
Table 4.11: Temperatures measured during bridge monitoring (NOAA 2010)
Date Time (CST)
Temperature (°F)
May 25, 2010
12:00 a.m. 72
3:00 a.m. 71
6:00 a.m. 71
9:00 a.m. 78
12:00 p.m. 80
3:00 p.m. 84
6:00 p.m. 82
9:00 p.m. 75
May 26, 2010 12:00 a.m. 70
3:00 a.m. 66
125
4.7 MULTIPOSITION LOAD TESTING
Multiposition load tests were conducted for the pre-repair condition on June 2, 2005, and were
repeated for the post-repair condition on May 25, 2010. Lanes A, B, and C were sequentially
traversed during the pre-repair tests, but only Lanes A and C were traversed during the post-
repair tests. Load trucks simultaneously traversed northbound, keeping the driver-side tires
aligned with their respective lane line, and stopped at designated stop positions for a time interval
long enough for steady measurements to be recorded.
A baseline representing the zero-load condition was established by collecting
measurements while no trucks were on the instrumented spans. The trucks stopped at each of
the nine stop positions along each traverse lane long enough to allow for measurements to be
recorded at a rate of 120 scans per second for a minimum of three seconds without traffic
interference. Lane C was traversed three times consecutively, and the trucks stopped at all nine
stop positions during each traverse. This process was then repeated for Lane A.
Every sensor was measured and recorded three times for each stop position. The data
collected were organized according to the traverse lane, stop position, and round of testing, for
example C3—Round 2. The measurements for each sensor from each of the three traverse
rounds were averaged, with the option of eliminating an outlier, to establish one reported
measurement for each sensor with respect to each stop position load condition.
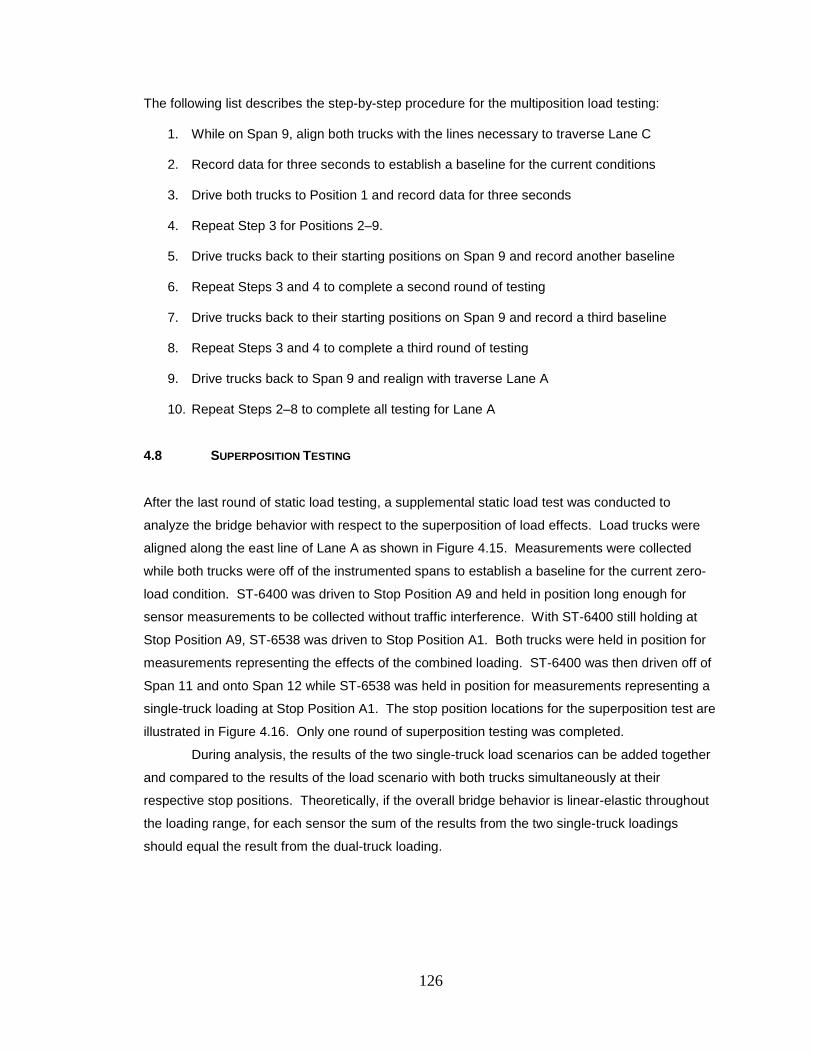
126
The following list describes the step-by-step procedure for the multiposition load testing:
1. While on Span 9, align both trucks with the lines necessary to traverse Lane C
2. Record data for three seconds to establish a baseline for the current conditions
3. Drive both trucks to Position 1 and record data for three seconds
4. Repeat Step 3 for Positions 2–9.
5. Drive trucks back to their starting positions on Span 9 and record another baseline
6. Repeat Steps 3 and 4 to complete a second round of testing
7. Drive trucks back to their starting positions on Span 9 and record a third baseline
8. Repeat Steps 3 and 4 to complete a third round of testing
9. Drive trucks back to Span 9 and realign with traverse Lane A
10. Repeat Steps 2–8 to complete all testing for Lane A
4.8 SUPERPOSITION TESTING
After the last round of static load testing, a supplemental static load test was conducted to
analyze the bridge behavior with respect to the superposition of load effects. Load trucks were
aligned along the east line of Lane A as shown in Figure 4.15. Measurements were collected
while both trucks were off of the instrumented spans to establish a baseline for the current zero-
load condition. ST-6400 was driven to Stop Position A9 and held in position long enough for
sensor measurements to be collected without traffic interference. With ST-6400 still holding at
Stop Position A9, ST-6538 was driven to Stop Position A1. Both trucks were held in position for
measurements representing the effects of the combined loading. ST-6400 was then driven off of
Span 11 and onto Span 12 while ST-6538 was held in position for measurements representing a
single-truck loading at Stop Position A1. The stop position locations for the superposition test are
illustrated in Figure 4.16. Only one round of superposition testing was completed.
During analysis, the results of the two single-truck load scenarios can be added together
and compared to the results of the load scenario with both trucks simultaneously at their
respective stop positions. Theoretically, if the overall bridge behavior is linear-elastic throughout
the loading range, for each sensor the sum of the results from the two single-truck loadings
should equal the result from the dual-truck loading.
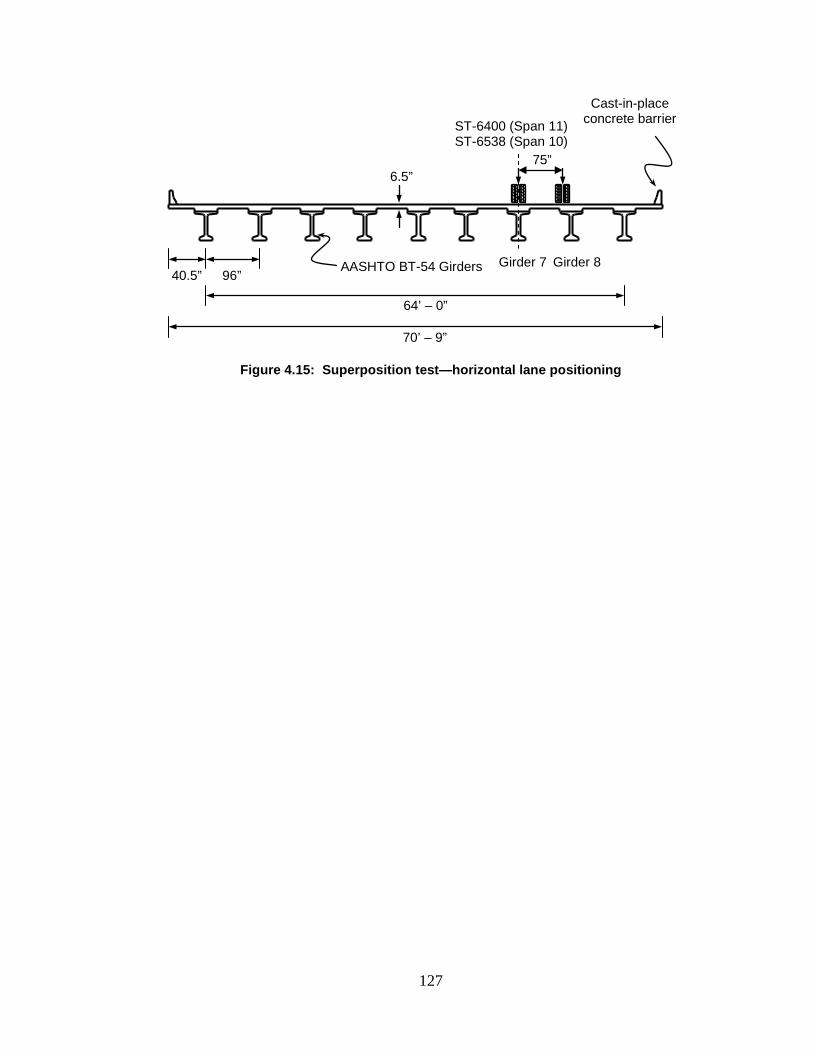
127
Figure 4.15: Superposition test—horizontal lane positioning
40.5” 96” AASHTO BT-54 Girders
Cast-in-place concrete barrier
64’ – 0”
70’ – 9”
6.5”
Girder 7 Girder 8
75”
ST-6400 (Span 11) ST-6538 (Span 10)
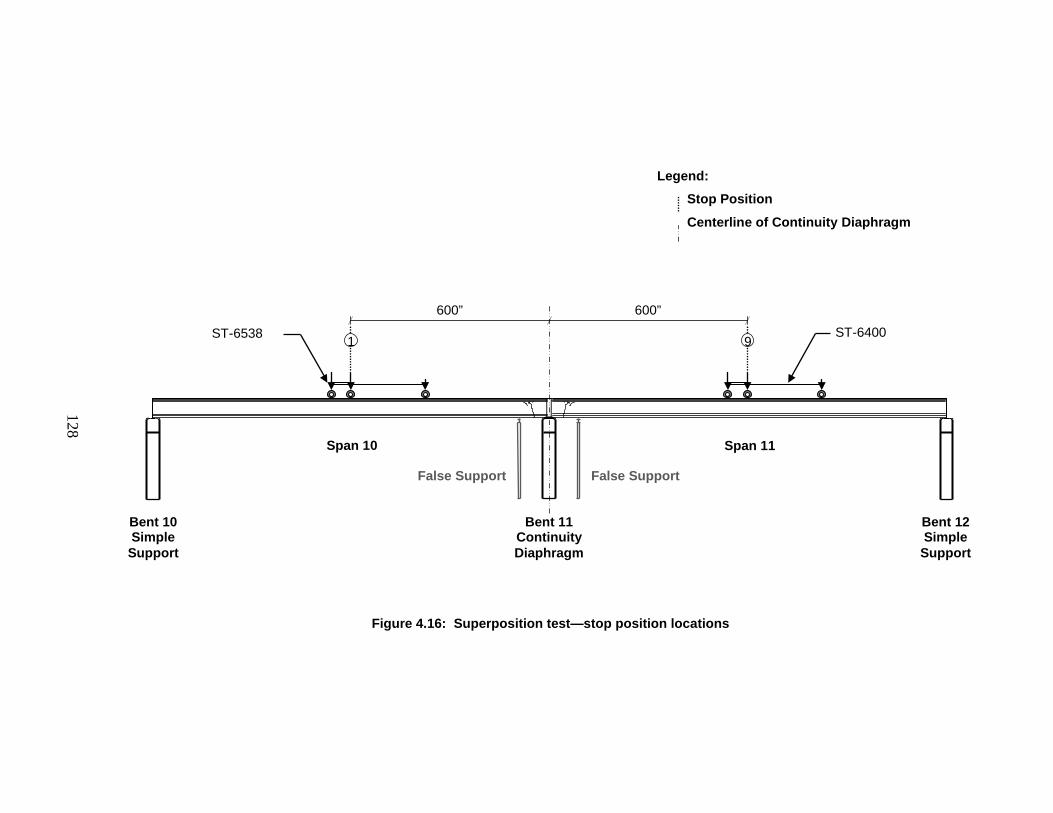
128
Figure 4.16: Superposition test—stop position locations
Bent 10 Simple Support
Span 11
Bent 11
Continuity Diaphragm
Span 10
Bent 12 Simple Support
Legend: Stop Position
Centerline of Continuity Diaphragm
9 1
600” 600” ST-6538
ST-6400
False Support False Support
129
4.9 DATA REDUCTION AND ANALYSIS
For analysis purposes, a single numerical result for each sensor was desired for each recorded
event. Even though data collection occurred during static loading conditions, every sensor
experienced some variance during each recording interval. This variance seems to be mainly
related to electrical noise, but could also be associated with physical effects related to normal
traffic loads or lingering dynamic loads resulting from moving load trucks into position. For the
static load tests, only one lane was open to normal traffic and recorded events were only affected
by electrical noise and potentially the dissipation of dynamic loads associated with moving the
load trucks into position. During bridge monitoring, all lanes were open to normal traffic and
some recorded events correlated with traffic events. Due to increased variable traffic loading,
bridge monitoring data collection required an increased recording window to allow for the
identification of a suitable traffic-free time interval. Selective data reduction was implemented to
reduce effects the inconsistencies might have on the final reported results for all post-repair tests.
During data collection, a separate raw data file was created for each recording interval.
Raw data files were organized according to their respective tests and load conditions. Initial data
analysis included plotting the raw data measurements over time. These raw data plots were
inspected, and reduced time intervals exhibiting relatively consistent behavior were selected for
further data analysis. Each reduced time interval was then plotted for each sensor, and a slightly
more reduced time interval was then selected to represent even more consistent data. The
average numerical result for each sensor over this more consistent time interval was recorded for
further analysis. For each recorded event, average values for up to three consistent time
intervals were recorded for each sensor. These average values were then averaged together to
represent a single numerical result for each sensor relative to each recorded event.
During initial data analysis it was determined that certain sensors were more likely than
others to exhibit inconsistent raw data. Sensors judged to be more vulnerable to inconsistencies
included the following:
• D7_11_F(Deflectometer—Girder 7—Span 11—Location F [Midspan])
• S8_11_3W(Concrete Strain Gage—Girder 8—Span 11—Section 3—Location W)
• F8_11_4M(FRP Strain Gage—Girder 8—Span 11—Section 4—Location M)
For each recorded event, the least consistent sensors were used to efficiently identify the
reduced time intervals to be analyzed for all sensors. The majority of the sensors were consistent
enough that results rounded to an appropriate precision remained constant regardless of the time
intervals selected during data reduction.
130
Chapter 5
RESULTS AND DISCUSSION
5.1 INTRODUCTION
During post-repair testing of Northbound Spans 10 and 11 of I-565 in Huntsville, Alabama,
structural behaviors were measured in response to varying load-truck positions as well as varying
ambient thermal effects during normal traffic conditions. Pre- and post-repair measured
responses to truck loads were analyzed to address the suspicion that contact between girders
and false support bearing pads—which were present during pre-repair testing but removed prior
to FRP installation—had an effect on pre-repair structural behavior, thus making direct
comparison between pre- and post-repair behavior inappropriate for assessing the effectiveness
of the FRP repair (Fason 2009). Post-repair behavioral responses were analyzed independent of
pre-repair measured responses to specifically assess structural behavior observed during post-
repair testing. Post-repair measured responses to service-level truck loads were also compared
to post-repair structural behavior predicted using finite-element modeling (FEM) techniques
(Shapiro 2007). In addition to analyzing behavioral responses to truck loads, theoretical and
measured responses to varying ambient thermal conditions were analyzed to assess the effects
of temperature-induced loading on the instrumented girders.
Measurements from pre-repair testing have been reported by Fason (2009). Predicted
responses to post-repair testing have been reported by Shapiro (2007). Reported post-repair
measurements are presented within the appendices of this report. The analysis of specific
measurements and theoretical behavior predictions is discussed within this chapter.
5.2 BEARING PAD EFFECTS
Inconsistent structural conditions during pre- and post-repair testing could impact the ability to
assess the effectiveness of an installed repair solution using direct comparisons of pre- and post-
repair measured behavior. Variable conditions that could affect the ability to directly relate
behavioral changes measured between pre- and post-repair testing to the performance of a repair
solution include
• Different temperature gradients during pre- and post-repair testing,
131
• Different temperature gradients during pre-repair testing and installation of the
repair,
• Additional damage occurring between pre-repair testing and installation of the
repair, and
• Addition or removal of load-bearing support conditions between pre- and post-
repair testing.
Of these variable conditions, adding or subtracting support conditions would have the most
apparent effect on bridge behavior measured in response to load testing. For this reason, it is
important to determine if the steel false supports installed slightly beyond the damaged regions of
Spans 10 and 11 were acting as load-bearing supports during testing.
Elastomeric bearing pads were located on top of the false supports prior to pre-repair
testing of the bridge structure. These bearing pads were supposed to be removed prior to the
first day of pre-repair testing, but complete removal of all pads was unsuccessful because some
of the girders were in contact with the bearing pads. The bearing pads under Span 10 were
easier to remove than the bearing pads under Span 11. Under Span 10, the bearing pad
corresponding to Girder 8 was completely removed, and the bearing pad corresponding to
Girder 7 was partially removed. The bearing pads corresponding to Girders 7 and 8 of Span 11
could not be removed prior to the pre-repair tests. All of the false-support bearing pads were
finally removed during the FRP installation process, so they were not present during post-repair
testing.
Following pre-repair testing, it was noted by Fason (2009) that the remaining bearing
pads likely allowed some of the load to be transmitted through the false supports rather than
spanning to the bents. Fason also reported that, due to the pre-repair bearing pad effects, direct
comparisons between pre- and post-repair measurements may not be indicative of the
effectiveness of the FRP repair. For this reason, post-repair measurements were analyzed to
check whether these bearing pads had enough of an impact on the pre-repair measurements that
the effectiveness of the repair could not be accurately assessed by direct comparison of
measurements from pre- and post-repair testing.
Multiple comparisons were made to assess the pre-repair bearing pad effects. These
comparisons include deflections, crack-opening displacements, and strains measured in
response to different load-truck positions. A summary of bearing pad conditions and
comparisons of pre-and post-repair measurements are presented in 0 of this report.
The comparison of crack-opening displacements from the pre- and post-repair tests in
response to the same truck positions is one behavior that indicates that the bearing pads had a
significant effect on the pre-repair measurements. Stop positions that resulted in crack openings
were analyzed. Stop position locations are described in Section 4.4 of this report. During both
the pre- and post-repair tests, Stop Position 4 had the greatest effect on the Span 10 crack
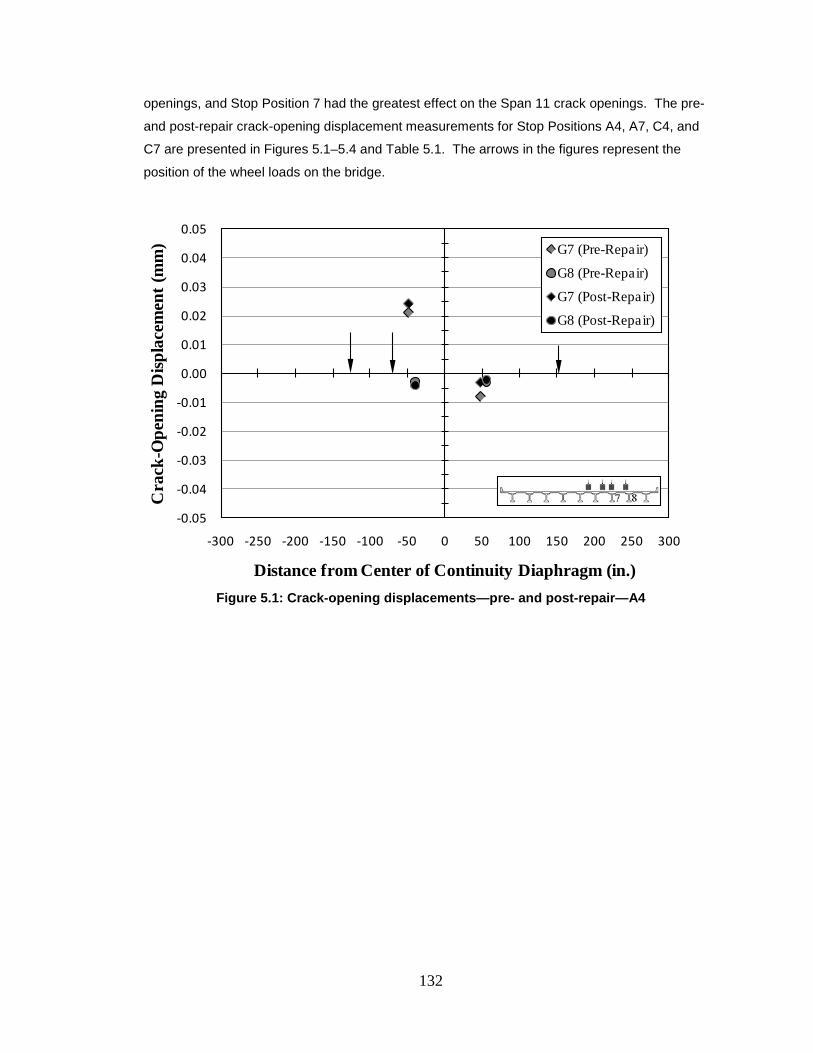
132
openings, and Stop Position 7 had the greatest effect on the Span 11 crack openings. The pre-
and post-repair crack-opening displacement measurements for Stop Positions A4, A7, C4, and
C7 are presented in Figures 5.1–5.4 and Table 5.1. The arrows in the figures represent the
position of the wheel loads on the bridge.
Figure 5.1: Crack-opening displacements—pre- and post-repair—A4
-0.05
-0.04
-0.03
-0.02
-0.01
0.00
0.01
0.02
0.03
0.04
0.05
-300 -250 -200 -150 -100 -50 0 50 100 150 200 250 300
Cra
ck-O
peni
ng D
ispla
cem
ent (
mm
)
Distance from Center of Continuity Diaphragm (in.)
G7 (Pre-Repair)
G8 (Pre-Repair)
G7 (Post-Repair)
G8 (Post-Repair)
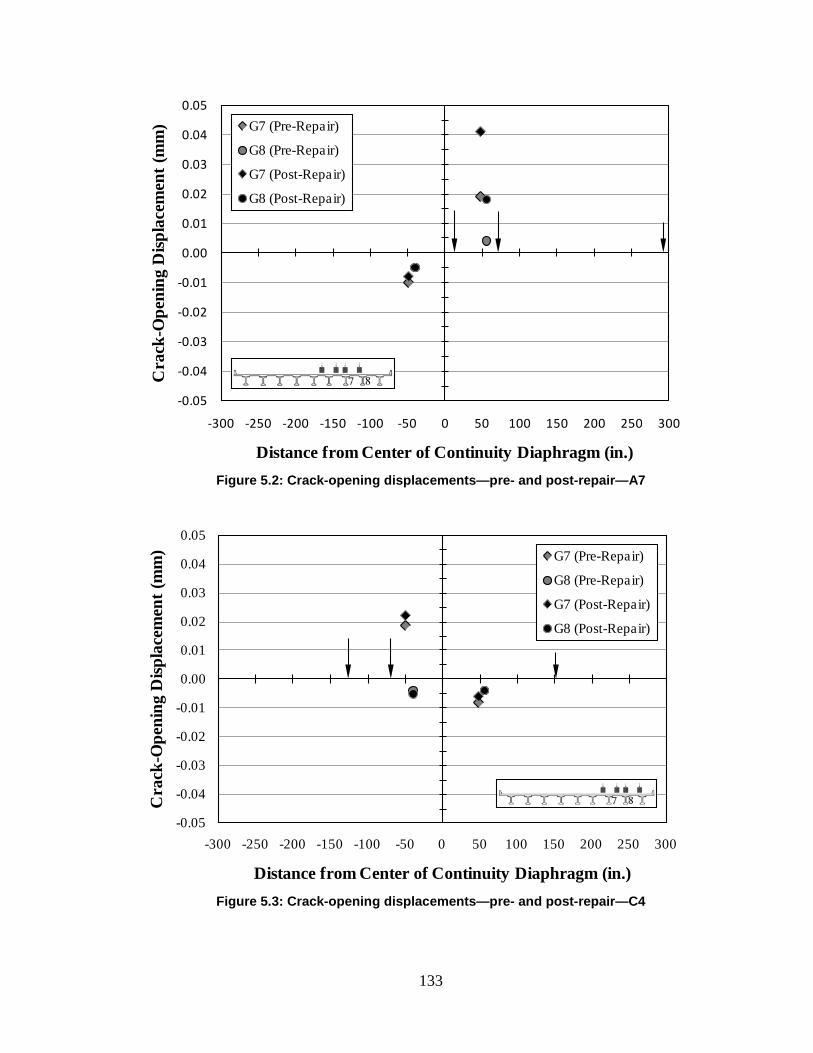
133
Figure 5.2: Crack-opening displacements—pre- and post-repair—A7
Figure 5.3: Crack-opening displacements—pre- and post-repair—C4
-0.05
-0.04
-0.03
-0.02
-0.01
0.00
0.01
0.02
0.03
0.04
0.05
-300 -250 -200 -150 -100 -50 0 50 100 150 200 250 300
Cra
ck-O
peni
ng D
ispla
cem
ent (
mm
)
Distance from Center of Continuity Diaphragm (in.)
G7 (Pre-Repair)
G8 (Pre-Repair)
G7 (Post-Repair)
G8 (Post-Repair)
-0.05
-0.04
-0.03
-0.02
-0.01
0.00
0.01
0.02
0.03
0.04
0.05
-300 -250 -200 -150 -100 -50 0 50 100 150 200 250 300
Cra
ck-O
peni
ng D
ispla
cem
ent (
mm
)
Distance from Center of Continuity Diaphragm (in.)
G7 (Pre-Repair)
G8 (Pre-Repair)
G7 (Post-Repair)
G8 (Post-Repair)
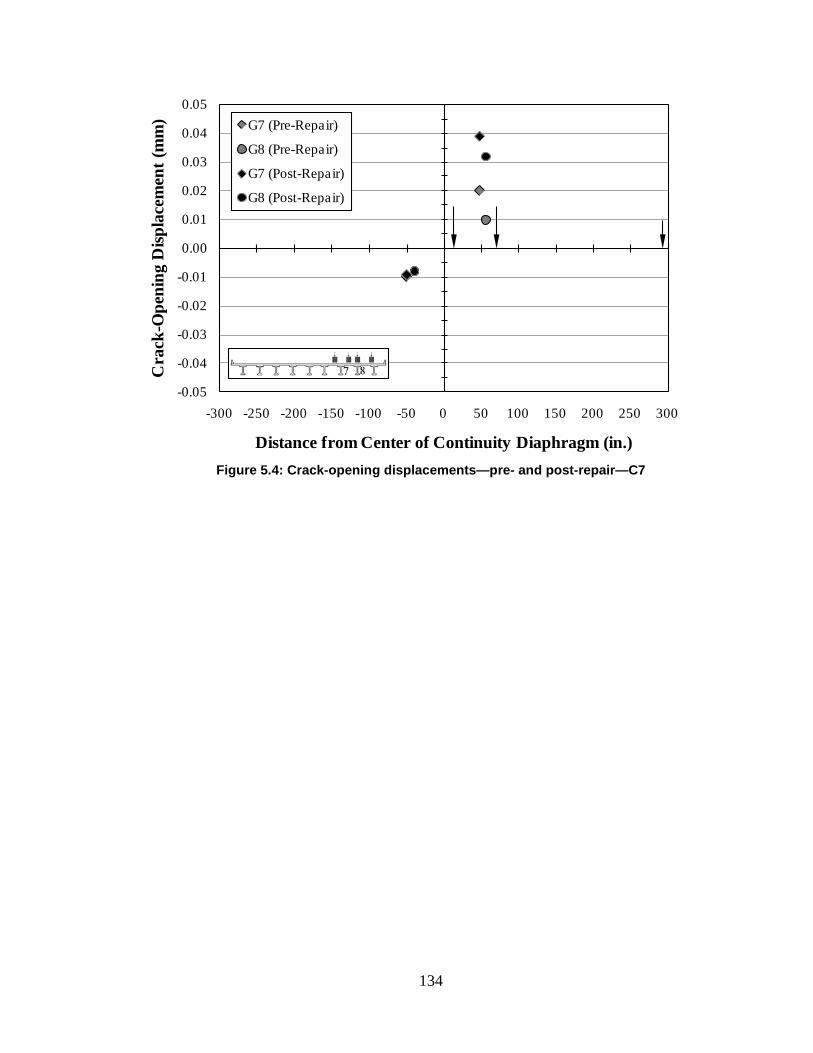
134
Figure 5.4: Crack-opening displacements—pre- and post-repair—C7
-0.05
-0.04
-0.03
-0.02
-0.01
0.00
0.01
0.02
0.03
0.04
0.05
-300 -250 -200 -150 -100 -50 0 50 100 150 200 250 300
Cra
ck-O
peni
ng D
ispla
cem
ent (
mm
)
Distance from Center of Continuity Diaphragm (in.)
G7 (Pre-Repair)
G8 (Pre-Repair)
G7 (Post-Repair)
G8 (Post-Repair)
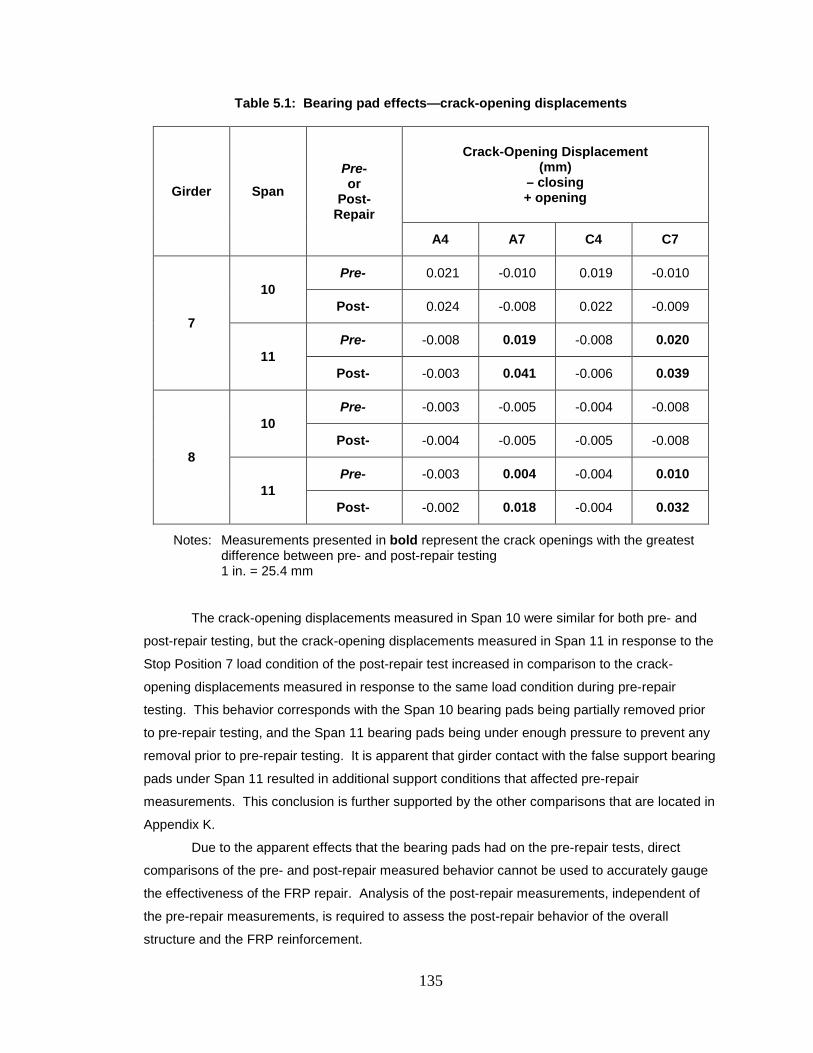
135
Table 5.1: Bearing pad effects—crack-opening displacements
Girder Span Pre- or
Post- Repair
Crack-Opening Displacement (mm)
– closing + opening
A4 A7 C4 C7
7
10 Pre- 0.021 -0.010 0.019 -0.010
Post- 0.024 -0.008 0.022 -0.009
11 Pre- -0.008 0.019 -0.008 0.020
Post- -0.003 0.041 -0.006 0.039
8
10 Pre- -0.003 -0.005 -0.004 -0.008
Post- -0.004 -0.005 -0.005 -0.008
11 Pre- -0.003 0.004 -0.004 0.010
Post- -0.002 0.018 -0.004 0.032
Notes: Measurements presented in bold represent the crack openings with the greatest difference between pre- and post-repair testing
1 in. = 25.4 mm
The crack-opening displacements measured in Span 10 were similar for both pre- and
post-repair testing, but the crack-opening displacements measured in Span 11 in response to the
Stop Position 7 load condition of the post-repair test increased in comparison to the crack-
opening displacements measured in response to the same load condition during pre-repair
testing. This behavior corresponds with the Span 10 bearing pads being partially removed prior
to pre-repair testing, and the Span 11 bearing pads being under enough pressure to prevent any
removal prior to pre-repair testing. It is apparent that girder contact with the false support bearing
pads under Span 11 resulted in additional support conditions that affected pre-repair
measurements. This conclusion is further supported by the other comparisons that are located in
Appendix K.
Due to the apparent effects that the bearing pads had on the pre-repair tests, direct
comparisons of the pre- and post-repair measured behavior cannot be used to accurately gauge
the effectiveness of the FRP repair. Analysis of the post-repair measurements, independent of
the pre-repair measurements, is required to assess the post-repair behavior of the overall
structure and the FRP reinforcement.
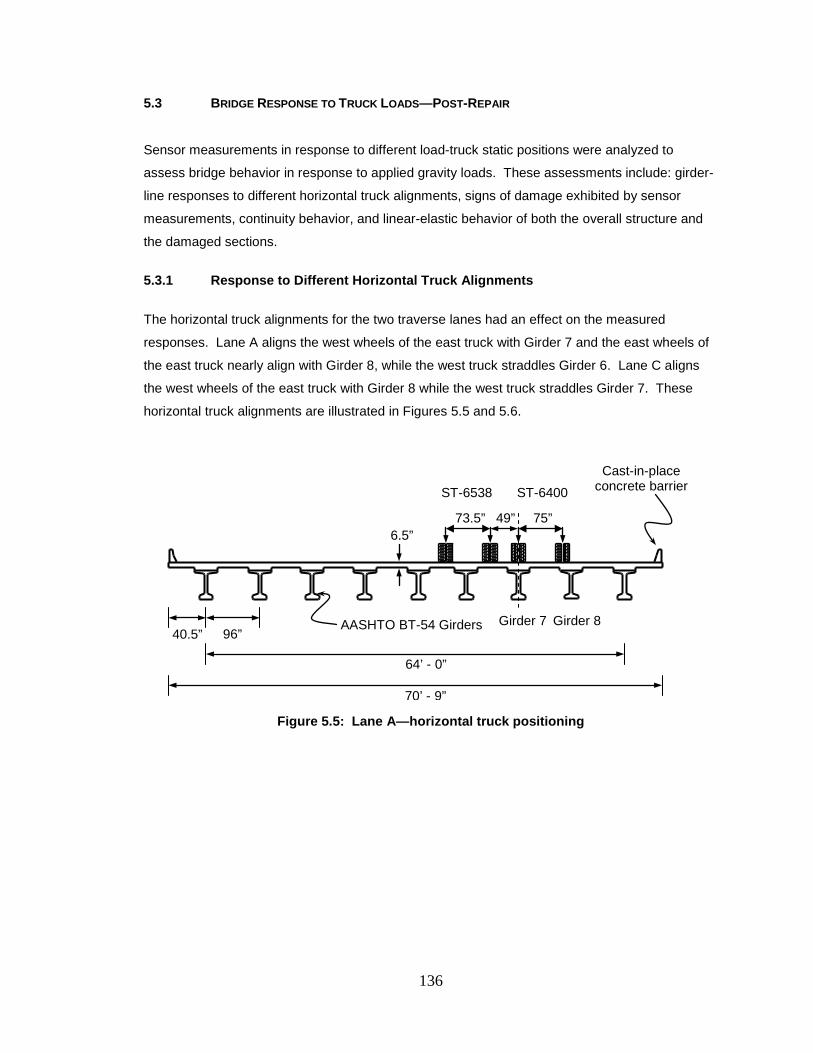
136
5.3 BRIDGE RESPONSE TO TRUCK LOADS—POST-REPAIR
Sensor measurements in response to different load-truck static positions were analyzed to
assess bridge behavior in response to applied gravity loads. These assessments include: girder-
line responses to different horizontal truck alignments, signs of damage exhibited by sensor
measurements, continuity behavior, and linear-elastic behavior of both the overall structure and
the damaged sections.
5.3.1 Response to Different Horizontal Truck Alignments
The horizontal truck alignments for the two traverse lanes had an effect on the measured
responses. Lane A aligns the west wheels of the east truck with Girder 7 and the east wheels of
the east truck nearly align with Girder 8, while the west truck straddles Girder 6. Lane C aligns
the west wheels of the east truck with Girder 8 while the west truck straddles Girder 7. These
horizontal truck alignments are illustrated in Figures 5.5 and 5.6.
Figure 5.5: Lane A—horizontal truck positioning
40.5” 96” AASHTO BT-54 Girders
Cast-in-place concrete barrier
64’ - 0”
70’ - 9”
6.5”
Girder 7 Girder 8
73.5” 75” 49”
ST-6538 ST-6400
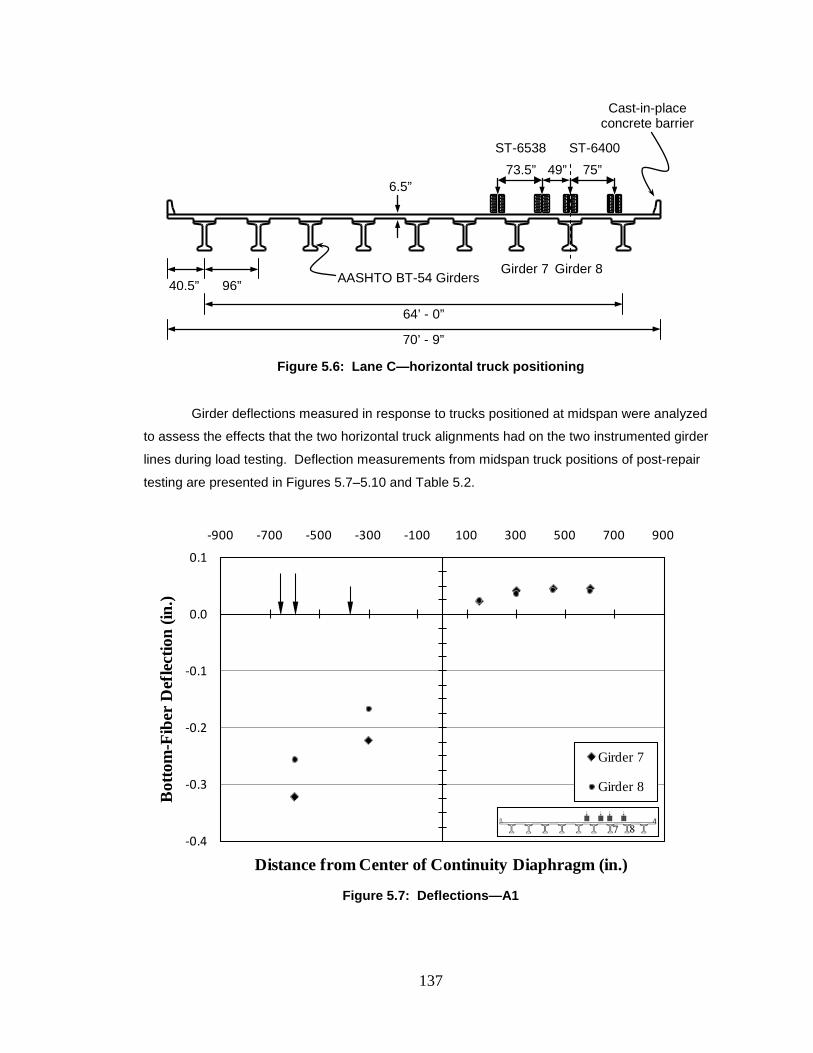
137
Figure 5.6: Lane C—horizontal truck positioning
Girder deflections measured in response to trucks positioned at midspan were analyzed
to assess the effects that the two horizontal truck alignments had on the two instrumented girder
lines during load testing. Deflection measurements from midspan truck positions of post-repair
testing are presented in Figures 5.7–5.10 and Table 5.2.
Figure 5.7: Deflections—A1
-0.4
-0.3
-0.2
-0.1
0.0
0.1
-900 -700 -500 -300 -100 100 300 500 700 900
Bot
tom
-Fib
er D
efle
ctio
n (in
.)
Distance from Center of Continuity Diaphragm (in.)
Girder 7
Girder 8
40.5” 96”
Cast-in-place concrete barrier
64’ - 0”
70’ - 9”
6.5”
Girder 7 Girder 8
73.5” 75” 49” ST-6538 ST-6400
AASHTO BT-54 Girders
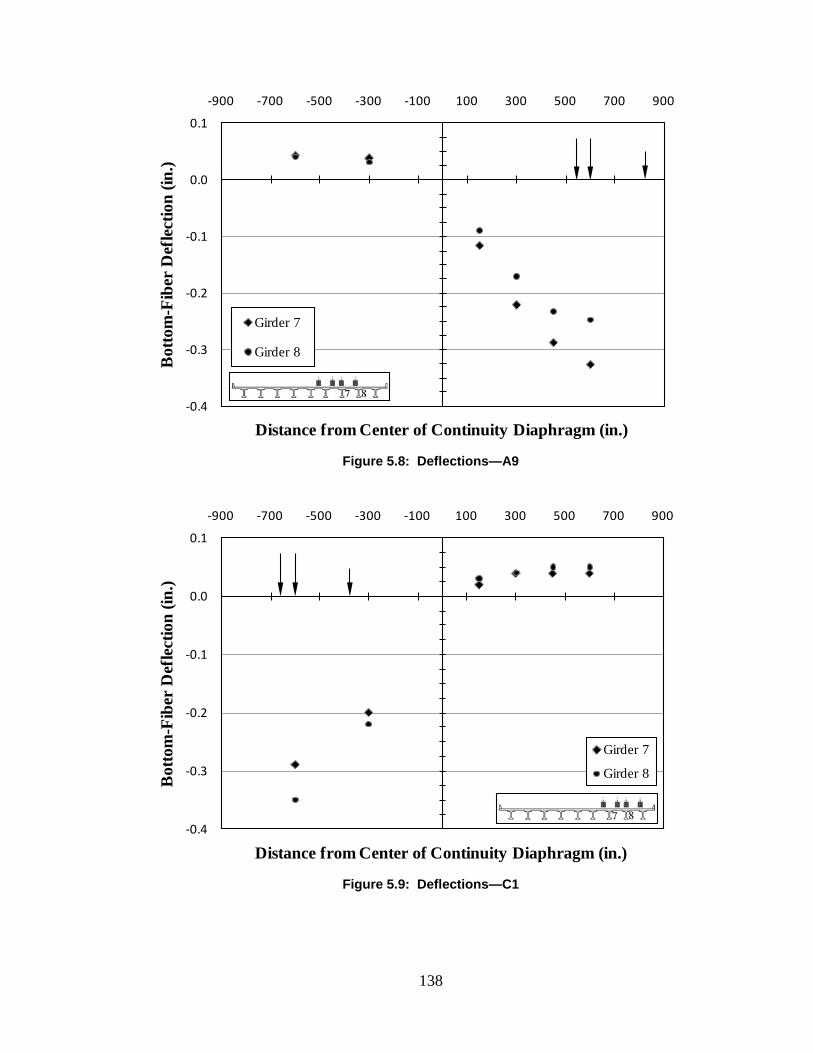
138
Figure 5.8: Deflections—A9
Figure 5.9: Deflections—C1
-0.4
-0.3
-0.2
-0.1
0.0
0.1
-900 -700 -500 -300 -100 100 300 500 700 900
Bot
tom
-Fib
er D
efle
ctio
n (in
.)
Distance from Center of Continuity Diaphragm (in.)
Girder 7
Girder 8
-0.4
-0.3
-0.2
-0.1
0.0
0.1
-900 -700 -500 -300 -100 100 300 500 700 900
Bot
tom
-Fib
er D
efle
ctio
n (in
.)
Distance from Center of Continuity Diaphragm (in.)
Girder 7
Girder 8
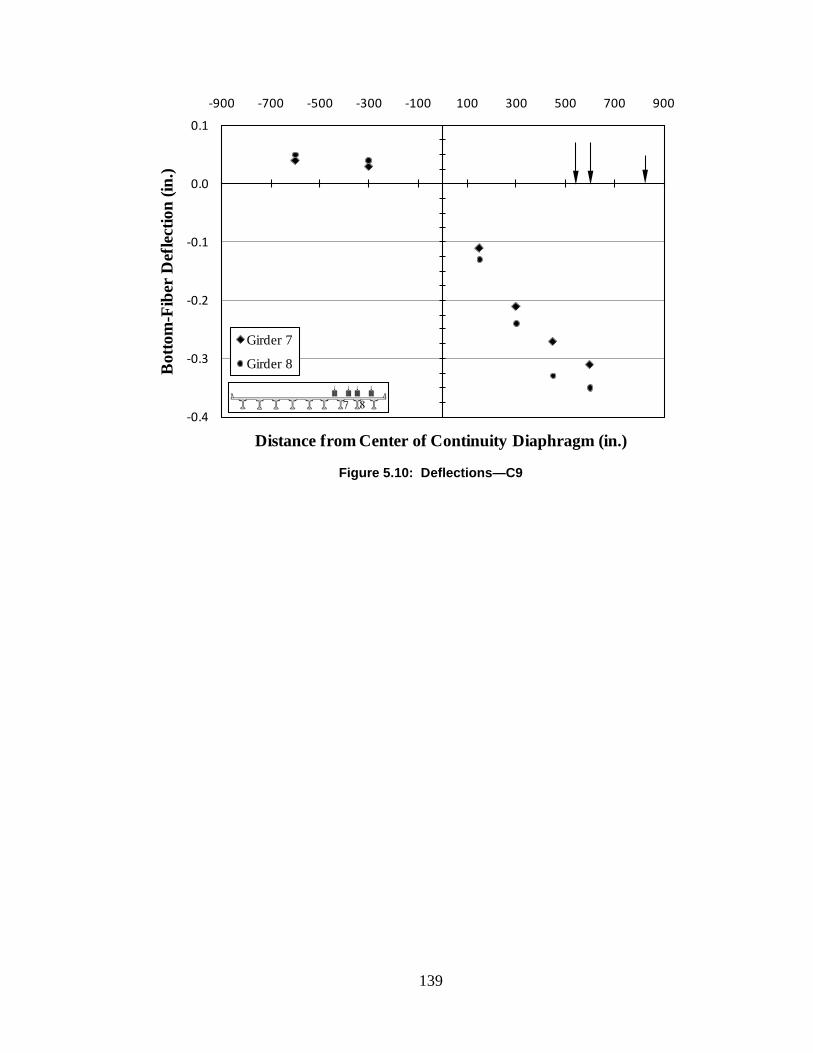
139
Figure 5.10: Deflections—C9
-0.4
-0.3
-0.2
-0.1
0.0
0.1
-900 -700 -500 -300 -100 100 300 500 700 900
Bot
tom
-Fib
er D
efle
ctio
n (in
.)
Distance from Center of Continuity Diaphragm (in.)
Girder 7
Girder 8
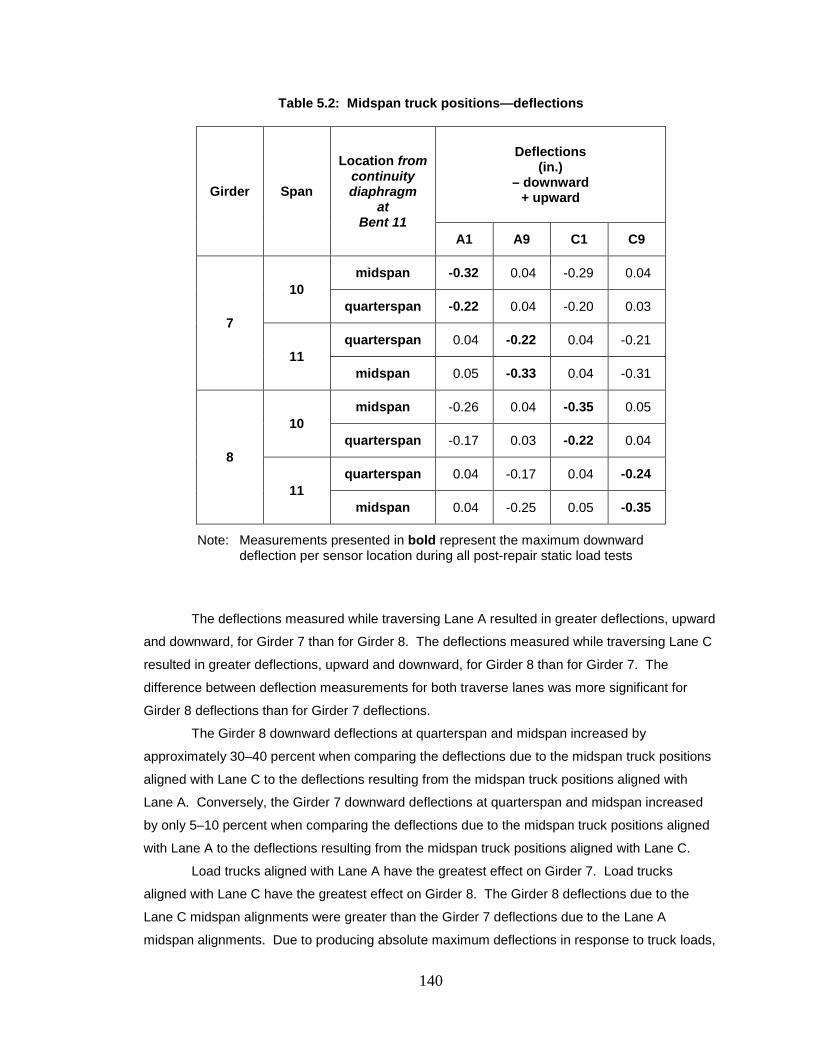
140
Table 5.2: Midspan truck positions—deflections
Girder Span
Location from continuity diaphragm
at Bent 11
Deflections (in.)
– downward + upward
A1 A9 C1 C9
7
10 midspan -0.32 0.04 -0.29 0.04
quarterspan -0.22 0.04 -0.20 0.03
11 quarterspan 0.04 -0.22 0.04 -0.21
midspan 0.05 -0.33 0.04 -0.31
8
10 midspan -0.26 0.04 -0.35 0.05
quarterspan -0.17 0.03 -0.22 0.04
11 quarterspan 0.04 -0.17 0.04 -0.24
midspan 0.04 -0.25 0.05 -0.35
Note: Measurements presented in bold represent the maximum downward deflection per sensor location during all post-repair static load tests
The deflections measured while traversing Lane A resulted in greater deflections, upward
and downward, for Girder 7 than for Girder 8. The deflections measured while traversing Lane C
resulted in greater deflections, upward and downward, for Girder 8 than for Girder 7. The
difference between deflection measurements for both traverse lanes was more significant for
Girder 8 deflections than for Girder 7 deflections.
The Girder 8 downward deflections at quarterspan and midspan increased by
approximately 30–40 percent when comparing the deflections due to the midspan truck positions
aligned with Lane C to the deflections resulting from the midspan truck positions aligned with
Lane A. Conversely, the Girder 7 downward deflections at quarterspan and midspan increased
by only 5–10 percent when comparing the deflections due to the midspan truck positions aligned
with Lane A to the deflections resulting from the midspan truck positions aligned with Lane C.
Load trucks aligned with Lane A have the greatest effect on Girder 7. Load trucks
aligned with Lane C have the greatest effect on Girder 8. The Girder 8 deflections due to the
Lane C midspan alignments were greater than the Girder 7 deflections due to the Lane A
midspan alignments. Due to producing absolute maximum deflections in response to truck loads,
141
the Lane C horizontal truck alignment resulted in better overall results for the analysis of the
behavior of the instrumented girders.
5.3.2 Indications of Damage to Instrumented Girders
Crack-opening displacements and bottom-fiber strains measured during acoustic emissions (AE)
testing were analyzed to assess damage indicated by the two spans when subjected to identical
load conditions mirrored about the centerline of the continuity diaphragm. Information regarding
the procedures and truck positions of the post-repair AE tests is presented in Section 4.5 of this
report.
Analysis of the post-repair acoustic emissions measurements obtained using the AE
sensors is not within the scope of this report. The post-repair AE analysis of the AE sensor
measurements is reported by Hadzor et al. (2011). Crack-opening displacements and surface
strains measured in response to the post-repair AE static positions are presented graphically in
Appendix G and in tabular format in Appendix H of this report.
5.3.2.1 Crack-Opening Displacements
Crack-opening displacement magnitude in response to a specific load can be considered a
measured indication of the relative degree of damage to a specific cross section. Crack-opening
displacement measurements in response to the AE static positions were analyzed to compare the
current amount of damage exhibited by the instrumented girders in response to the identical AE
load conditions applied to both spans. The crack-opening displacement measurements from the
post-repair AE static positions with both trucks in position can be seen in Figures 5.11–5.14 and
Table 5.3.

142
Figure 5.11: AE Span 10 truck position—crack-opening displacements—LC-6.5
Figure 5.12: AE Span 11 truck position—crack-opening displacements—LC-6.5
-0.05
-0.04
-0.03
-0.02
-0.01
0.00
0.01
0.02
0.03
0.04
0.05
-900 -700 -500 -300 -100 100 300 500 700 900
Cra
ck-O
peni
ng D
ispla
cem
ent (
mm
)
Distance from Center of Continuity Diaphragm (in.)
Girder 7
Girder 8
-0.05
-0.04
-0.03
-0.02
-0.01
0.00
0.01
0.02
0.03
0.04
0.05
-900 -700 -500 -300 -100 100 300 500 700 900
Cra
ck-O
peni
ng D
ispla
cem
ent (
mm
)
Distance from Center of Continuity Diaphragm (in.)
Girder 7
Girder 8

143
Figure 5.13: AE Span 10 truck position—crack-opening displacements—LC-6
Figure 5.14: AE Span 11 truck position—crack-opening displacements—LC-6
-0.05
-0.04
-0.03
-0.02
-0.01
0.00
0.01
0.02
0.03
0.04
0.05
-900 -700 -500 -300 -100 100 300 500 700 900
Cra
ck-O
peni
ng D
ispla
cem
ent (
mm
)
Distance from Center of Continuity Diaphragm (in.)
Girder 7
Girder 8
-0.05
-0.04
-0.03
-0.02
-0.01
0.00
0.01
0.02
0.03
0.04
0.05
-900 -700 -500 -300 -100 100 300 500 700 900
Cra
ck-O
peni
ng D
ispla
cem
ent (
mm
)
Distance from Center of Continuity Diaphragm (in.)
Girder 7
Girder 8
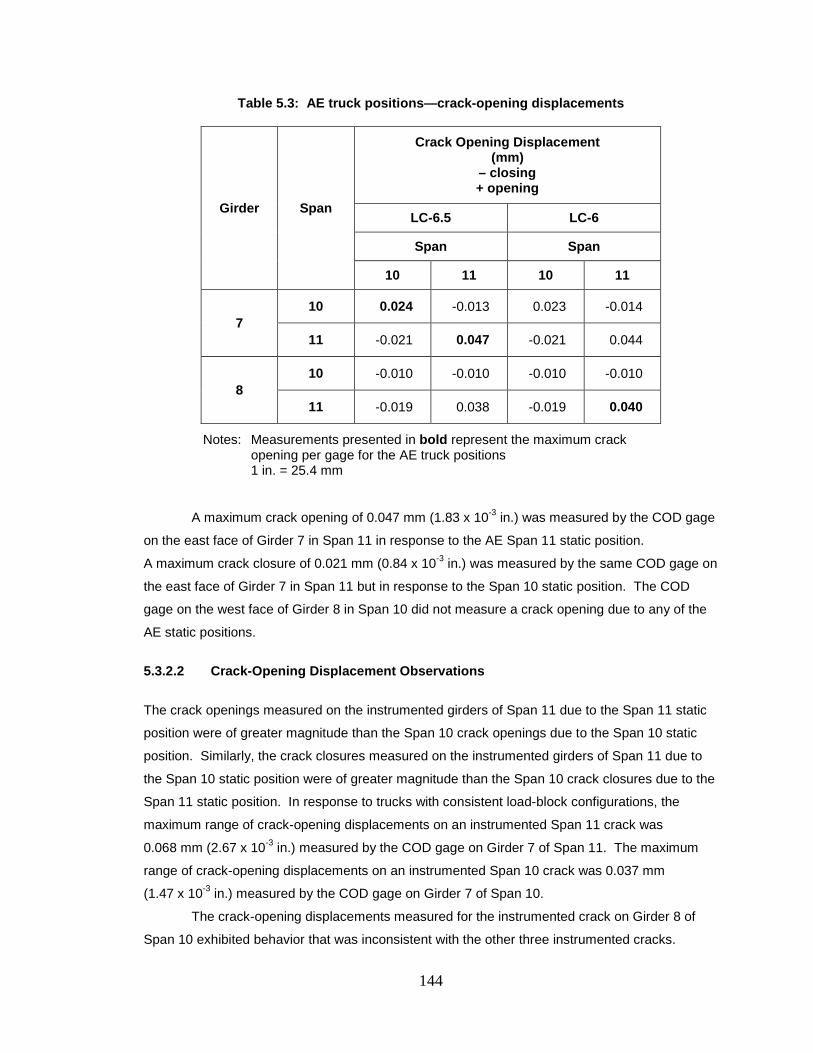
144
Table 5.3: AE truck positions—crack-opening displacements
Girder Span
Crack Opening Displacement (mm)
– closing + opening
LC-6.5 LC-6
Span Span
10 11 10 11
7 10 0.024 -0.013 0.023 -0.014
11 -0.021 0.047 -0.021 0.044
8 10 -0.010 -0.010 -0.010 -0.010
11 -0.019 0.038 -0.019 0.040
Notes: Measurements presented in bold represent the maximum crack opening per gage for the AE truck positions
1 in. = 25.4 mm
A maximum crack opening of 0.047 mm (1.83 x 10⁻³ in.) was measured by the COD gage
on the east face of Girder 7 in Span 11 in response to the AE Span 11 static position.
A maximum crack closure of 0.021 mm (0.84 x 10⁻³ in.) was measured by the same COD gage on
the east face of Girder 7 in Span 11 but in response to the Span 10 static position. The COD
gage on the west face of Girder 8 in Span 10 did not measure a crack opening due to any of the
AE static positions.
5.3.2.2 Crack-Opening Displacement Observations
The crack openings measured on the instrumented girders of Span 11 due to the Span 11 static
position were of greater magnitude than the Span 10 crack openings due to the Span 10 static
position. Similarly, the crack closures measured on the instrumented girders of Span 11 due to
the Span 10 static position were of greater magnitude than the Span 10 crack closures due to the
Span 11 static position. In response to trucks with consistent load-block configurations, the
maximum range of crack-opening displacements on an instrumented Span 11 crack was
0.068 mm (2.67 x 10⁻³ in.) measured by the COD gage on Girder 7 of Span 11. The maximum
range of crack-opening displacements on an instrumented Span 10 crack was 0.037 mm
(1.47 x 10⁻³ in.) measured by the COD gage on Girder 7 of Span 10.
The crack-opening displacements measured for the instrumented crack on Girder 8 of
Span 10 exhibited behavior that was inconsistent with the other three instrumented cracks.
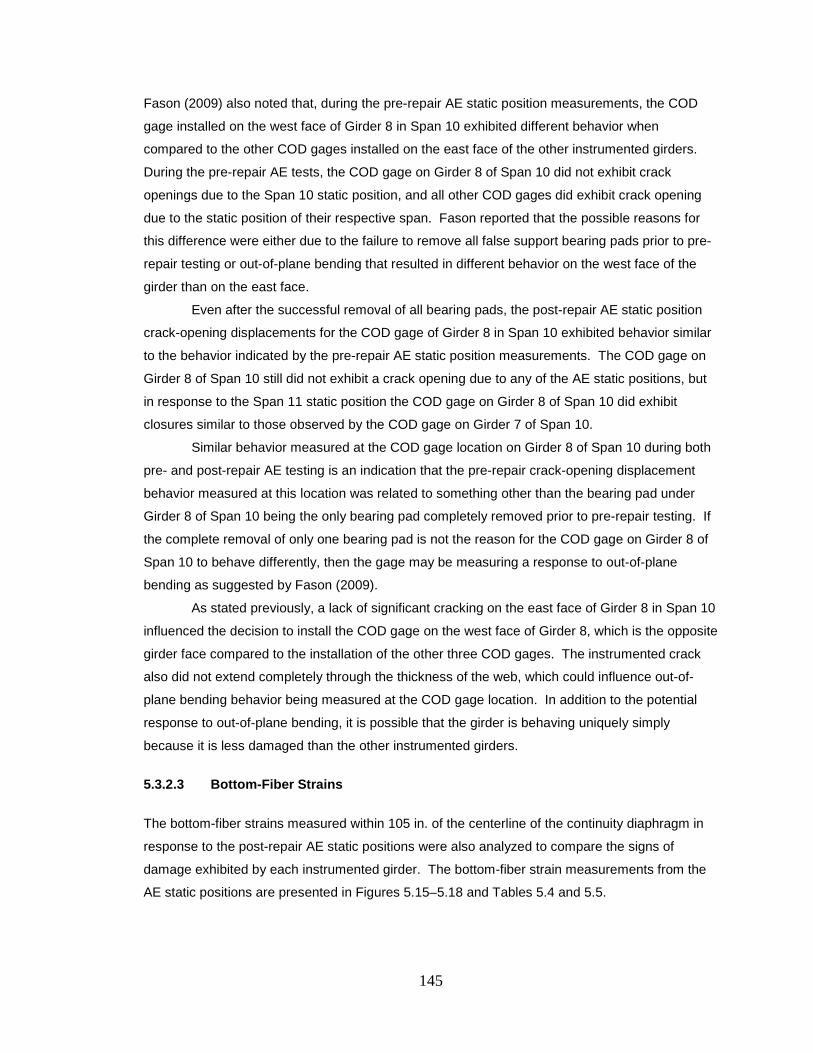
145
Fason (2009) also noted that, during the pre-repair AE static position measurements, the COD
gage installed on the west face of Girder 8 in Span 10 exhibited different behavior when
compared to the other COD gages installed on the east face of the other instrumented girders.
During the pre-repair AE tests, the COD gage on Girder 8 of Span 10 did not exhibit crack
openings due to the Span 10 static position, and all other COD gages did exhibit crack opening
due to the static position of their respective span. Fason reported that the possible reasons for
this difference were either due to the failure to remove all false support bearing pads prior to pre-
repair testing or out-of-plane bending that resulted in different behavior on the west face of the
girder than on the east face.
Even after the successful removal of all bearing pads, the post-repair AE static position
crack-opening displacements for the COD gage of Girder 8 in Span 10 exhibited behavior similar
to the behavior indicated by the pre-repair AE static position measurements. The COD gage on
Girder 8 of Span 10 still did not exhibit a crack opening due to any of the AE static positions, but
in response to the Span 11 static position the COD gage on Girder 8 of Span 10 did exhibit
closures similar to those observed by the COD gage on Girder 7 of Span 10.
Similar behavior measured at the COD gage location on Girder 8 of Span 10 during both
pre- and post-repair AE testing is an indication that the pre-repair crack-opening displacement
behavior measured at this location was related to something other than the bearing pad under
Girder 8 of Span 10 being the only bearing pad completely removed prior to pre-repair testing. If
the complete removal of only one bearing pad is not the reason for the COD gage on Girder 8 of
Span 10 to behave differently, then the gage may be measuring a response to out-of-plane
bending as suggested by Fason (2009).
As stated previously, a lack of significant cracking on the east face of Girder 8 in Span 10
influenced the decision to install the COD gage on the west face of Girder 8, which is the opposite
girder face compared to the installation of the other three COD gages. The instrumented crack
also did not extend completely through the thickness of the web, which could influence out-of-
plane bending behavior being measured at the COD gage location. In addition to the potential
response to out-of-plane bending, it is possible that the girder is behaving uniquely simply
because it is less damaged than the other instrumented girders.
5.3.2.3 Bottom-Fiber Strains
The bottom-fiber strains measured within 105 in. of the centerline of the continuity diaphragm in
response to the post-repair AE static positions were also analyzed to compare the signs of
damage exhibited by each instrumented girder. The bottom-fiber strain measurements from the
AE static positions are presented in Figures 5.15–5.18 and Tables 5.4 and 5.5.
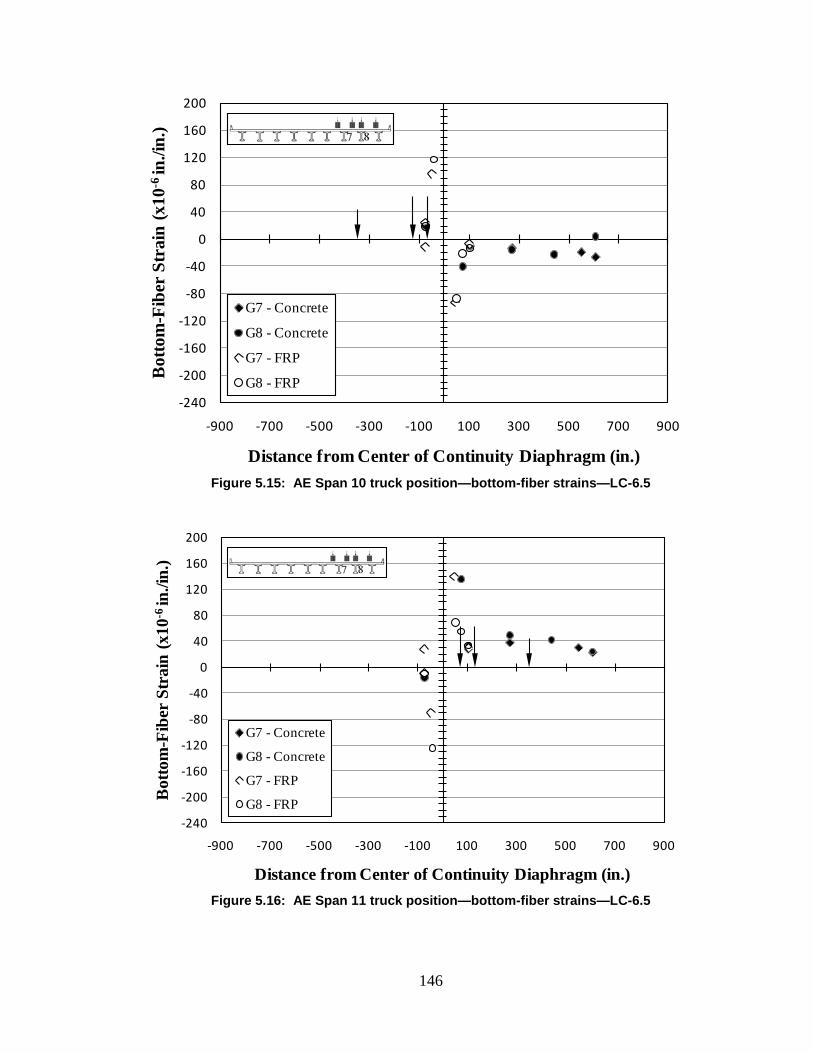
146
Figure 5.15: AE Span 10 truck position—bottom-fiber strains—LC-6.5
Figure 5.16: AE Span 11 truck position—bottom-fiber strains—LC-6.5
-240
-200
-160
-120
-80
-40
0
40
80
120
160
200
-900 -700 -500 -300 -100 100 300 500 700 900
Bot
tom
-Fib
er S
trai
n (x
10-6
in./i
n.)
Distance from Center of Continuity Diaphragm (in.)
G7 - Concrete
G8 - Concrete
G7 - FRP
G8 - FRP
-240
-200
-160
-120
-80
-40
0
40
80
120
160
200
-900 -700 -500 -300 -100 100 300 500 700 900
Bot
tom
-Fib
er S
trai
n (x
10-6
in./i
n.)
Distance from Center of Continuity Diaphragm (in.)
G7 - Concrete
G8 - Concrete
G7 - FRP
G8 - FRP
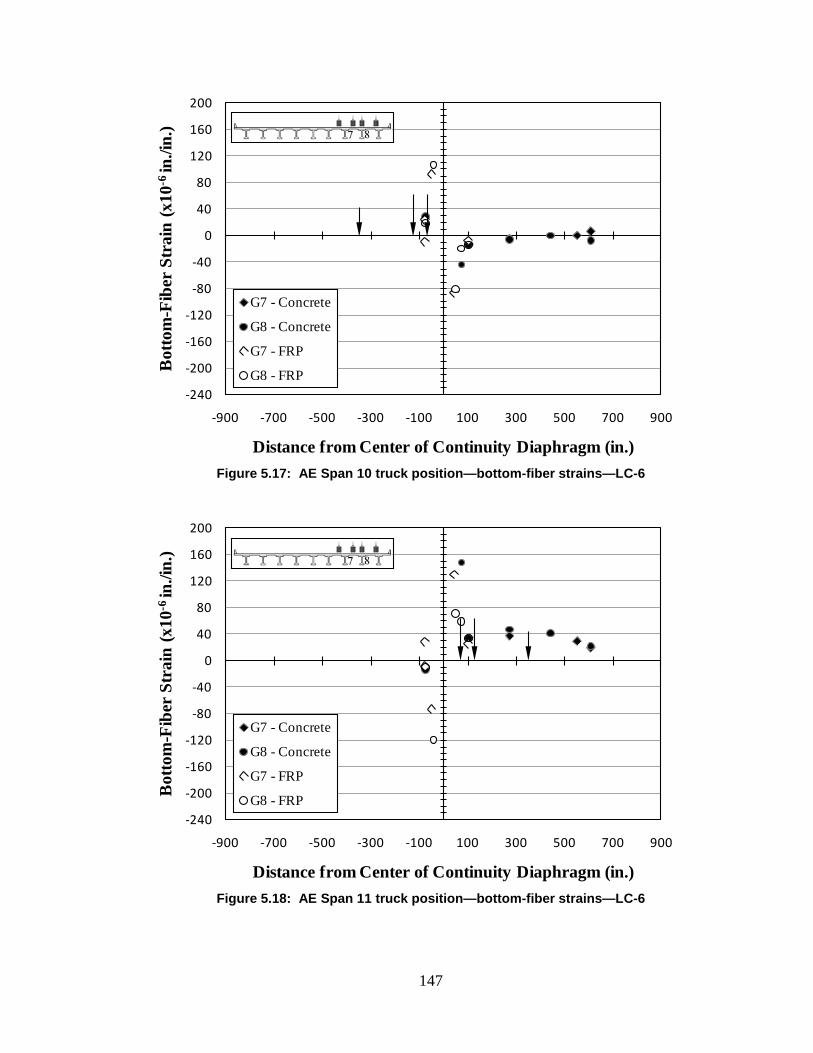
147
Figure 5.17: AE Span 10 truck position—bottom-fiber strains—LC-6
Figure 5.18: AE Span 11 truck position—bottom-fiber strains—LC-6
-240
-200
-160
-120
-80
-40
0
40
80
120
160
200
-900 -700 -500 -300 -100 100 300 500 700 900
Bot
tom
-Fib
er S
trai
n (x
10-6
in./i
n.)
Distance from Center of Continuity Diaphragm (in.)
G7 - Concrete
G8 - Concrete
G7 - FRP
G8 - FRP
-240
-200
-160
-120
-80
-40
0
40
80
120
160
200
-900 -700 -500 -300 -100 100 300 500 700 900
Bot
tom
-Fib
er S
trai
n (x
10-6
in./i
n.)
Distance from Center of Continuity Diaphragm (in.)
G7 - Concrete
G8 - Concrete
G7 - FRP
G8 - FRP
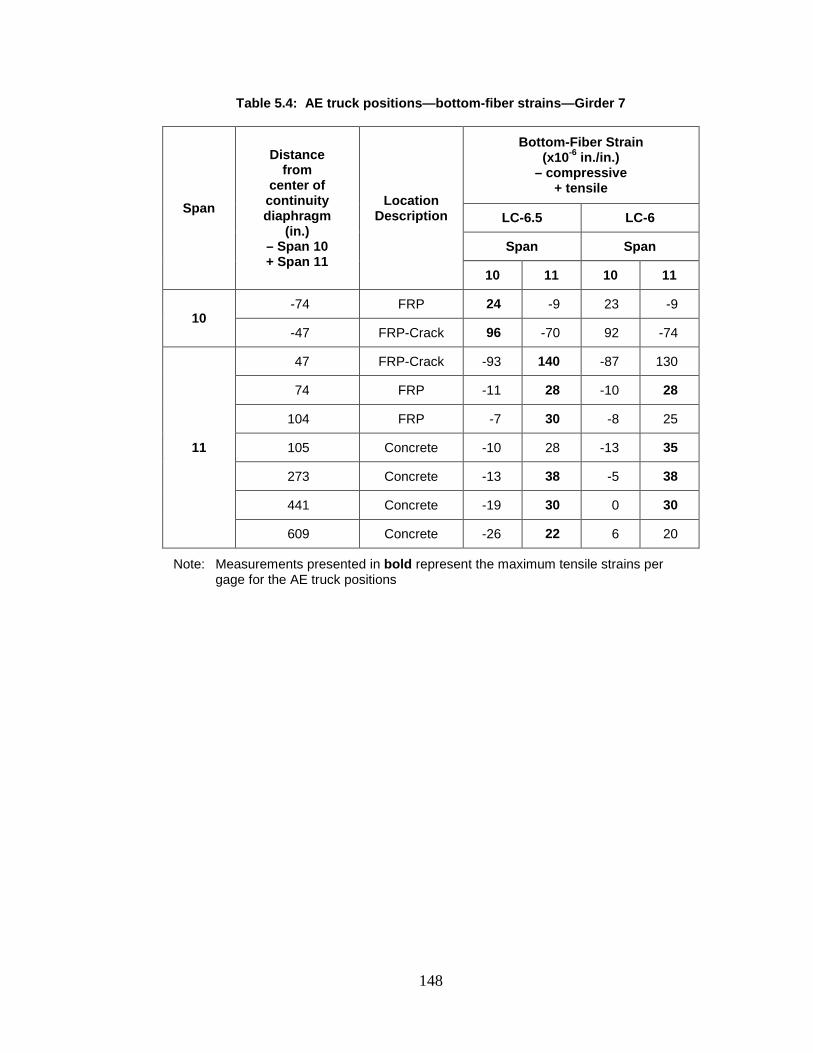
148
Table 5.4: AE truck positions—bottom-fiber strains—Girder 7
Span
Distance from
center of continuity diaphragm
(in.) – Span 10 + Span 11
Location Description
Bottom-Fiber Strain (x10-6 in./in.)
– compressive + tensile
LC-6.5 LC-6
Span Span
10 11 10 11
10 -74 FRP 24 -9 23 -9
-47 FRP-Crack 96 -70 92 -74
11
47 FRP-Crack -93 140 -87 130
74 FRP -11 28 -10 28
104 FRP -7 30 -8 25
105 Concrete -10 28 -13 35
273 Concrete -13 38 -5 38
441 Concrete -19 30 0 30
609 Concrete -26 22 6 20
Note: Measurements presented in bold represent the maximum tensile strains per gage for the AE truck positions
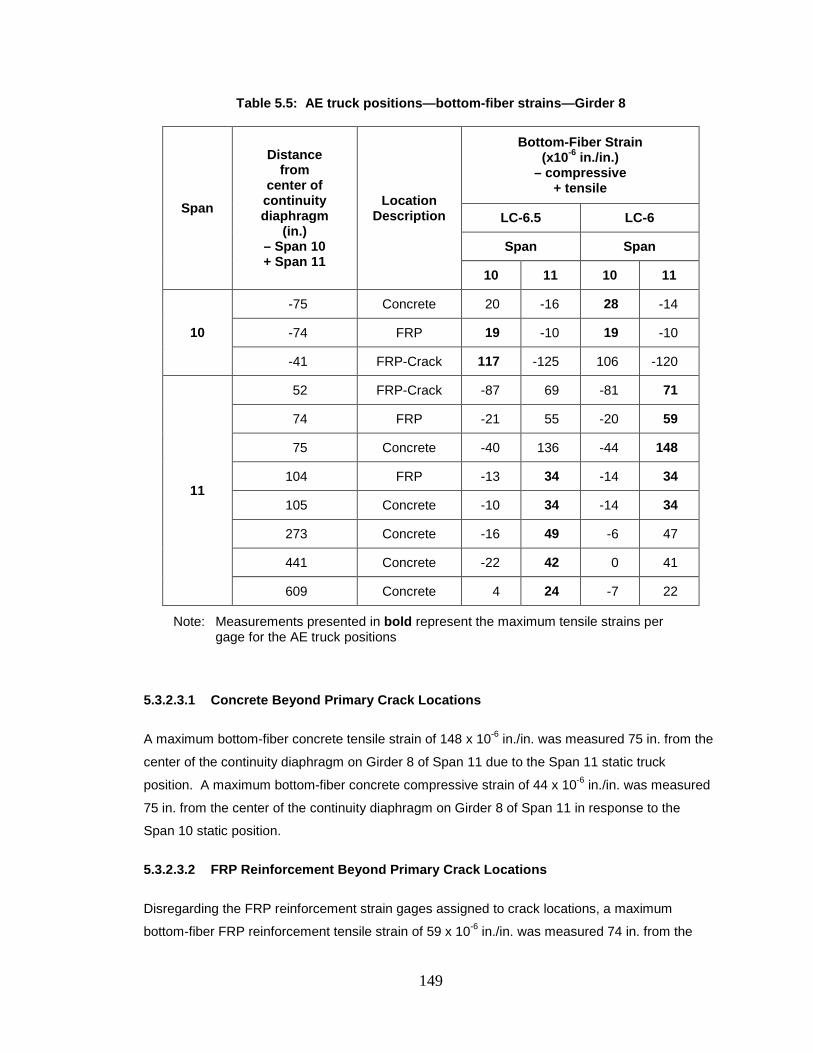
149
Table 5.5: AE truck positions—bottom-fiber strains—Girder 8
Span
Distance from
center of continuity diaphragm
(in.) – Span 10 + Span 11
Location Description
Bottom-Fiber Strain (x10-6 in./in.)
– compressive + tensile
LC-6.5 LC-6
Span Span
10 11 10 11
10
-75 Concrete 20 -16 28 -14
-74 FRP 19 -10 19 -10
-41 FRP-Crack 117 -125 106 -120
11
52 FRP-Crack -87 69 -81 71
74 FRP -21 55 -20 59
75 Concrete -40 136 -44 148
104 FRP -13 34 -14 34
105 Concrete -10 34 -14 34
273 Concrete -16 49 -6 47
441 Concrete -22 42 0 41
609 Concrete 4 24 -7 22
Note: Measurements presented in bold represent the maximum tensile strains per gage for the AE truck positions
5.3.2.3.1 Concrete Beyond Primary Crack Locations
A maximum bottom-fiber concrete tensile strain of 148 x 10-6 in./in. was measured 75 in. from the
center of the continuity diaphragm on Girder 8 of Span 11 due to the Span 11 static truck
position. A maximum bottom-fiber concrete compressive strain of 44 x 10-6 in./in. was measured
75 in. from the center of the continuity diaphragm on Girder 8 of Span 11 in response to the
Span 10 static position.
5.3.2.3.2 FRP Reinforcement Beyond Primary Crack Locations
Disregarding the FRP reinforcement strain gages assigned to crack locations, a maximum
bottom-fiber FRP reinforcement tensile strain of 59 x 10-6 in./in. was measured 74 in. from the
150
center of the continuity diaphragm on Girder 8 of Span 11 in response to the Span 11 static
position. A maximum bottom-fiber FRP reinforcement compressive strain of 21 x 10-6 in./in. was
measured 74 in. from the center of the continuity diaphragm on Girder 8 of Span 11 in response
to the Span 10 static position.
5.3.2.3.3 FRP Reinforcement Near Primary Crack Locations
A maximum bottom-fiber near-crack FRP reinforcement tensile strain of 140 x 10-6 in./in. was
measured 47 in. from the center of the continuity diaphragm at the crack on Girder 7 of Span 11
in response to the Span 11 static position. A maximum bottom-fiber near-crack FRP
reinforcement compressive strain of 125 x 10-6 in./in. was measured 41 in. from the center of the
continuity diaphragm at the crack on Girder 8 of Span 10 in response to the Span 11 static
position.
5.3.2.4 Bottom-Fiber Strain Observations
In response to the AE static positions, the FRP strain gage installed at the crack location of
Girder 7 in Span 11 measured tensile and compressive strains of greater magnitude than the
strains measured at the gage installed at the crack location of Girder 7 in Span 10. The FRP
strain gage installed at the crack location of Girder 8 in Span 10 measured strains of greater
magnitude than the strains measured at the gage installed at the crack location of Girder 8 in
Span 11. The magnitudes of strain measured at the FRP gage corresponding with the crack
location on Girder 8 of Span 11 were not consistent with the magnitudes of strain measured at
the crack locations of the other girders. Also, the concrete strain gage on Girder 8 of Span 11
located 75 in. from the continuity diaphragm measured tensile strains similar to the tensile strains
measured at the FRP corresponding with the crack locations of the other girders.
When considering the FRP strain measurements representing strains measured at the
crack location, it is possible that the FRP strain gages may have been installed at varying
proximities to the actual cracks. This variation is due to the inability to accurately locate each
crack through the FRP reinforcement during strain gage installation. Based on the difference
between the FRP strain measurements at the crack location on Girder 8 of Span 11 and the
measurements at the other crack locations, it is possible that the FRP strain gage at the crack
location on Girder 8 of Span 11 was installed the least accurately with respect to the actual crack
location.
5.3.2.5 COD and Bottom-Fiber Strain Comparisons
Theoretically, the bottom-fiber strain measured at the crack location of a girder should be related
to the crack-opening displacement measured at the instrumented crack of that same girder. The
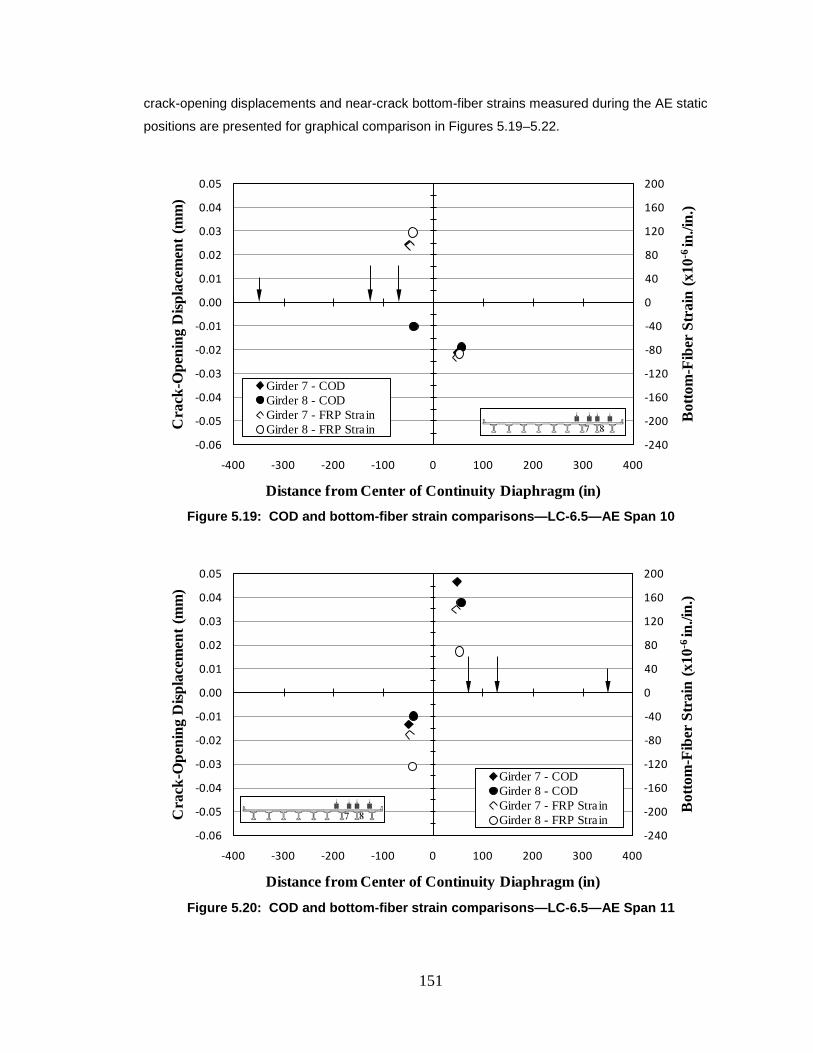
151
crack-opening displacements and near-crack bottom-fiber strains measured during the AE static
positions are presented for graphical comparison in Figures 5.19–5.22.
Figure 5.19: COD and bottom-fiber strain comparisons—LC-6.5—AE Span 10
Figure 5.20: COD and bottom-fiber strain comparisons—LC-6.5—AE Span 11
-240
-200
-160
-120
-80
-40
0
40
80
120
160
200
-0.06
-0.05
-0.04
-0.03
-0.02
-0.01
0.00
0.01
0.02
0.03
0.04
0.05
-400 -300 -200 -100 0 100 200 300 400
Bot
tom
-Fib
er S
trai
n (x
10-6
in./i
n.)
Cra
ck-O
peni
ng D
ispla
cem
ent (
mm
)
Distance from Center of Continuity Diaphragm (in)
Girder 7 - CODGirder 8 - CODGirder 7 - FRP StrainGirder 8 - FRP Strain
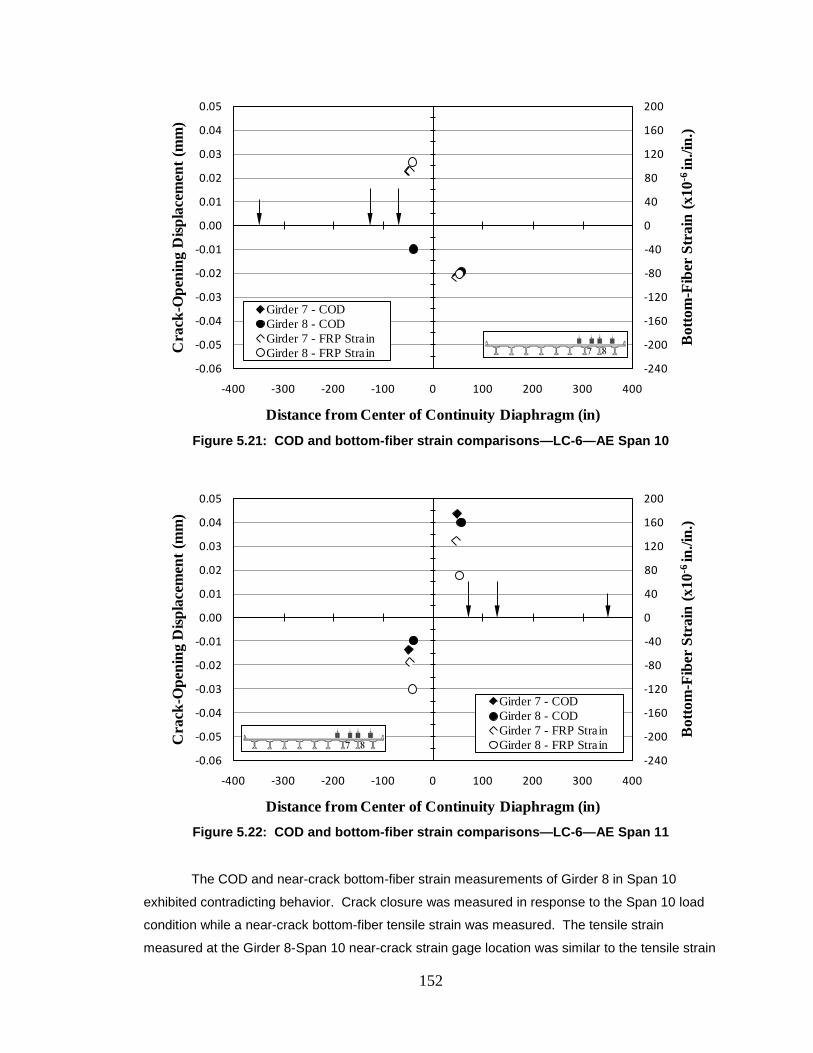
152
Figure 5.21: COD and bottom-fiber strain comparisons—LC-6—AE Span 10
Figure 5.22: COD and bottom-fiber strain comparisons—LC-6—AE Span 11
The COD and near-crack bottom-fiber strain measurements of Girder 8 in Span 10
exhibited contradicting behavior. Crack closure was measured in response to the Span 10 load
condition while a near-crack bottom-fiber tensile strain was measured. The tensile strain
measured at the Girder 8-Span 10 near-crack strain gage location was similar to the tensile strain
-240
-200
-160
-120
-80
-40
0
40
80
120
160
200
-0.06
-0.05
-0.04
-0.03
-0.02
-0.01
0.00
0.01
0.02
0.03
0.04
0.05
-400 -300 -200 -100 0 100 200 300 400
Bot
tom
-Fib
er S
trai
n (x
10-6
in./i
n.)
Cra
ck-O
peni
ng D
ispla
cem
ent (
mm
)
Distance from Center of Continuity Diaphragm (in)
Girder 7 - CODGirder 8 - CODGirder 7 - FRP StrainGirder 8 - FRP Strain
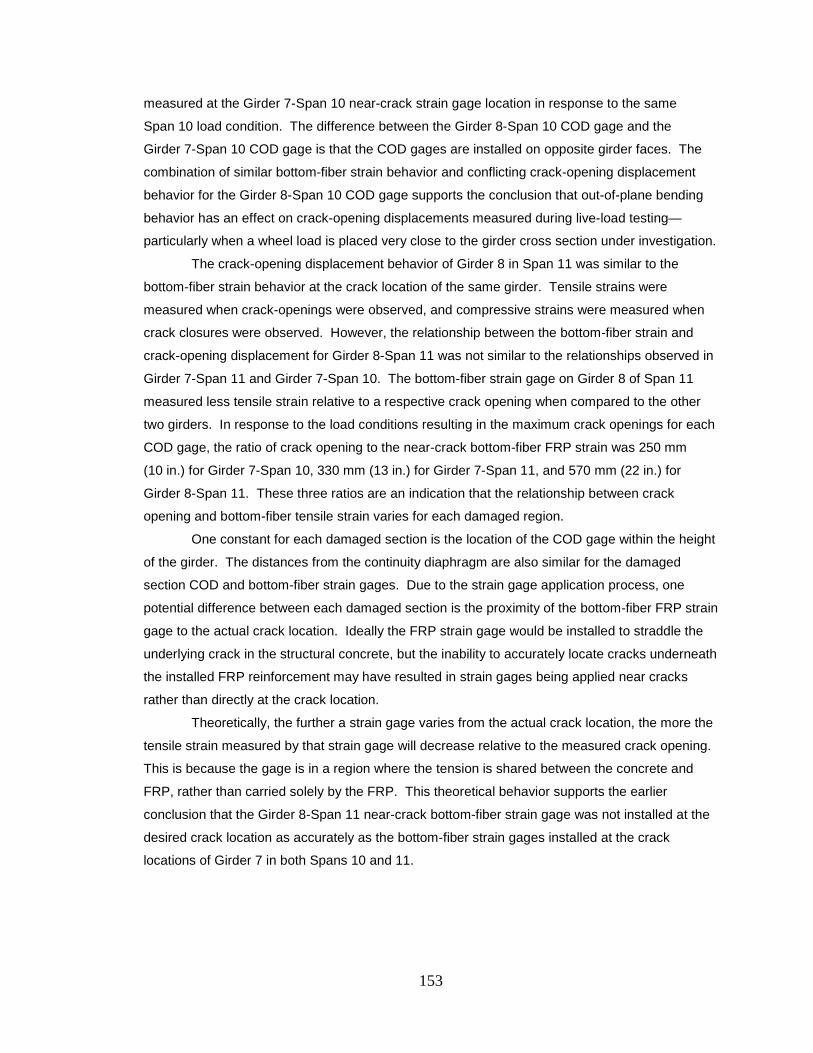
153
measured at the Girder 7-Span 10 near-crack strain gage location in response to the same
Span 10 load condition. The difference between the Girder 8-Span 10 COD gage and the
Girder 7-Span 10 COD gage is that the COD gages are installed on opposite girder faces. The
combination of similar bottom-fiber strain behavior and conflicting crack-opening displacement
behavior for the Girder 8-Span 10 COD gage supports the conclusion that out-of-plane bending
behavior has an effect on crack-opening displacements measured during live-load testing—
particularly when a wheel load is placed very close to the girder cross section under investigation.
The crack-opening displacement behavior of Girder 8 in Span 11 was similar to the
bottom-fiber strain behavior at the crack location of the same girder. Tensile strains were
measured when crack-openings were observed, and compressive strains were measured when
crack closures were observed. However, the relationship between the bottom-fiber strain and
crack-opening displacement for Girder 8-Span 11 was not similar to the relationships observed in
Girder 7-Span 11 and Girder 7-Span 10. The bottom-fiber strain gage on Girder 8 of Span 11
measured less tensile strain relative to a respective crack opening when compared to the other
two girders. In response to the load conditions resulting in the maximum crack openings for each
COD gage, the ratio of crack opening to the near-crack bottom-fiber FRP strain was 250 mm
(10 in.) for Girder 7-Span 10, 330 mm (13 in.) for Girder 7-Span 11, and 570 mm (22 in.) for
Girder 8-Span 11. These three ratios are an indication that the relationship between crack
opening and bottom-fiber tensile strain varies for each damaged region.
One constant for each damaged section is the location of the COD gage within the height
of the girder. The distances from the continuity diaphragm are also similar for the damaged
section COD and bottom-fiber strain gages. Due to the strain gage application process, one
potential difference between each damaged section is the proximity of the bottom-fiber FRP strain
gage to the actual crack location. Ideally the FRP strain gage would be installed to straddle the
underlying crack in the structural concrete, but the inability to accurately locate cracks underneath
the installed FRP reinforcement may have resulted in strain gages being applied near cracks
rather than directly at the crack location.
Theoretically, the further a strain gage varies from the actual crack location, the more the
tensile strain measured by that strain gage will decrease relative to the measured crack opening.
This is because the gage is in a region where the tension is shared between the concrete and
FRP, rather than carried solely by the FRP. This theoretical behavior supports the earlier
conclusion that the Girder 8-Span 11 near-crack bottom-fiber strain gage was not installed at the
desired crack location as accurately as the bottom-fiber strain gages installed at the crack
locations of Girder 7 in both Spans 10 and 11.
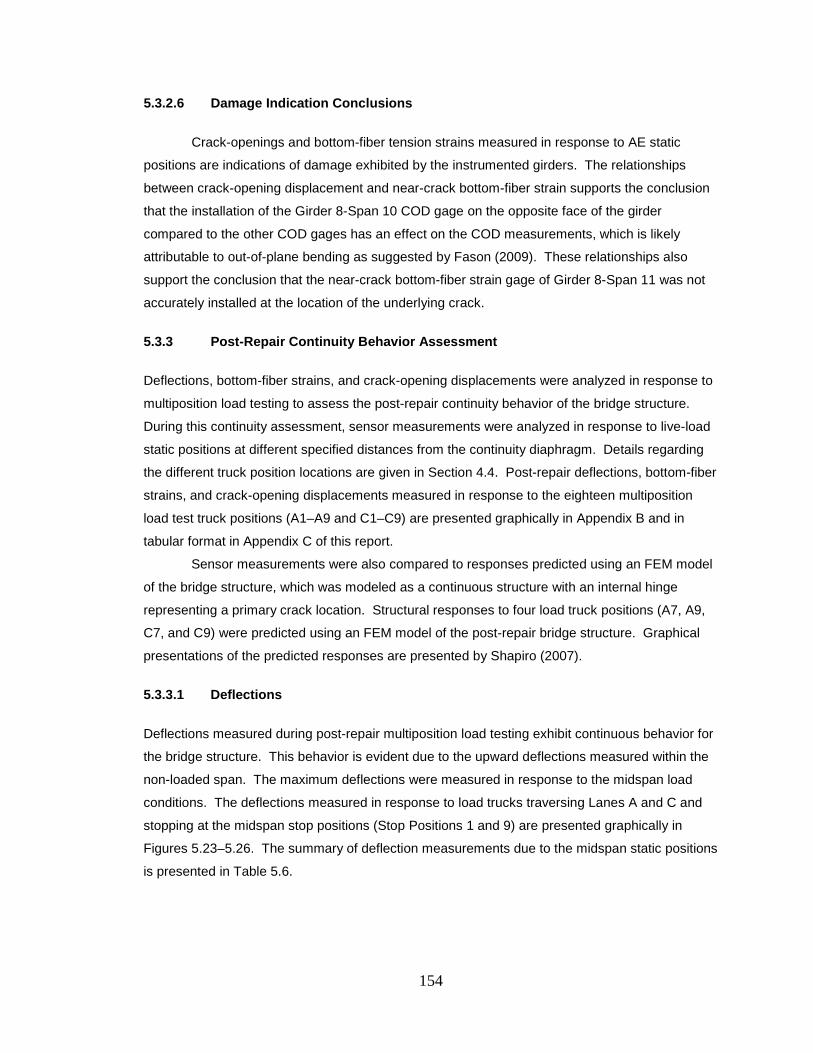
154
5.3.2.6 Damage Indication Conclusions
Crack-openings and bottom-fiber tension strains measured in response to AE static
positions are indications of damage exhibited by the instrumented girders. The relationships
between crack-opening displacement and near-crack bottom-fiber strain supports the conclusion
that the installation of the Girder 8-Span 10 COD gage on the opposite face of the girder
compared to the other COD gages has an effect on the COD measurements, which is likely
attributable to out-of-plane bending as suggested by Fason (2009). These relationships also
support the conclusion that the near-crack bottom-fiber strain gage of Girder 8-Span 11 was not
accurately installed at the location of the underlying crack.
5.3.3 Post-Repair Continuity Behavior Assessment
Deflections, bottom-fiber strains, and crack-opening displacements were analyzed in response to
multiposition load testing to assess the post-repair continuity behavior of the bridge structure.
During this continuity assessment, sensor measurements were analyzed in response to live-load
static positions at different specified distances from the continuity diaphragm. Details regarding
the different truck position locations are given in Section 4.4. Post-repair deflections, bottom-fiber
strains, and crack-opening displacements measured in response to the eighteen multiposition
load test truck positions (A1–A9 and C1–C9) are presented graphically in Appendix B and in
tabular format in Appendix C of this report.
Sensor measurements were also compared to responses predicted using an FEM model
of the bridge structure, which was modeled as a continuous structure with an internal hinge
representing a primary crack location. Structural responses to four load truck positions (A7, A9,
C7, and C9) were predicted using an FEM model of the post-repair bridge structure. Graphical
presentations of the predicted responses are presented by Shapiro (2007).
5.3.3.1 Deflections
Deflections measured during post-repair multiposition load testing exhibit continuous behavior for
the bridge structure. This behavior is evident due to the upward deflections measured within the
non-loaded span. The maximum deflections were measured in response to the midspan load
conditions. The deflections measured in response to load trucks traversing Lanes A and C and
stopping at the midspan stop positions (Stop Positions 1 and 9) are presented graphically in
Figures 5.23–5.26. The summary of deflection measurements due to the midspan static positions
is presented in Table 5.6.
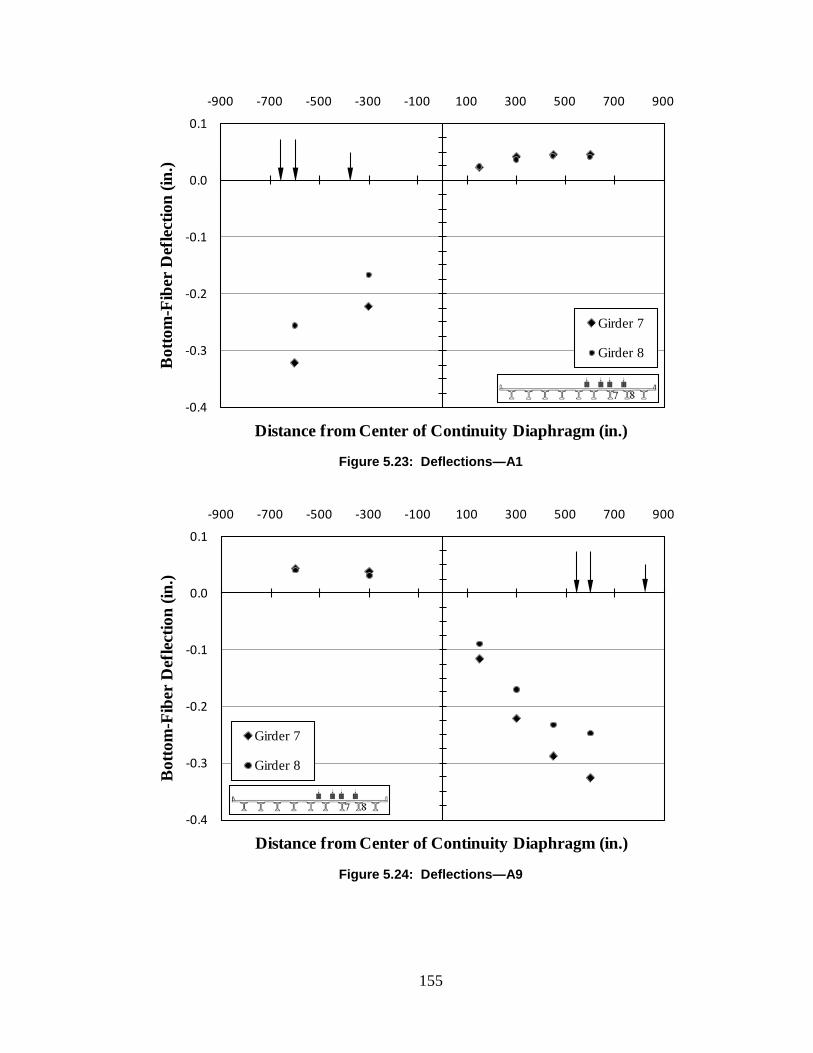
155
Figure 5.23: Deflections—A1
Figure 5.24: Deflections—A9
-0.4
-0.3
-0.2
-0.1
0.0
0.1
-900 -700 -500 -300 -100 100 300 500 700 900
Bot
tom
-Fib
er D
efle
ctio
n (in
.)
Distance from Center of Continuity Diaphragm (in.)
Girder 7
Girder 8
-0.4
-0.3
-0.2
-0.1
0.0
0.1
-900 -700 -500 -300 -100 100 300 500 700 900
Bot
tom
-Fib
er D
efle
ctio
n (in
.)
Distance from Center of Continuity Diaphragm (in.)
Girder 7
Girder 8
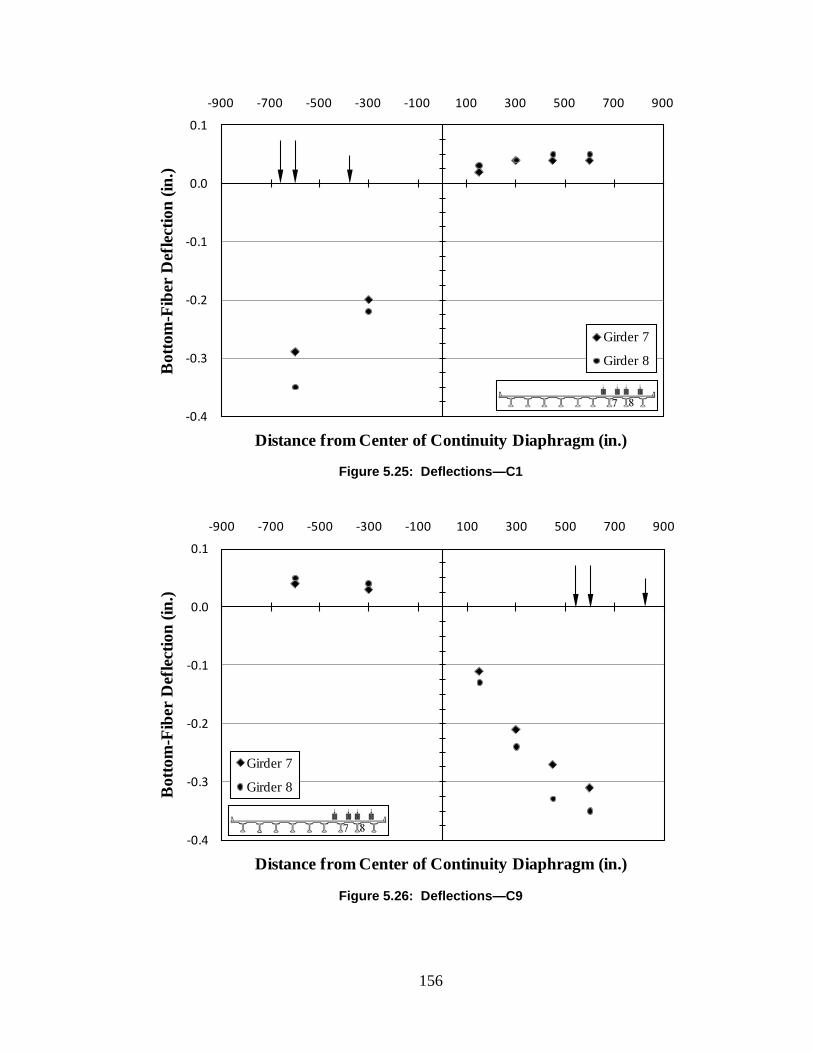
156
Figure 5.25: Deflections—C1
Figure 5.26: Deflections—C9
-0.4
-0.3
-0.2
-0.1
0.0
0.1
-900 -700 -500 -300 -100 100 300 500 700 900
Bot
tom
-Fib
er D
efle
ctio
n (in
.)
Distance from Center of Continuity Diaphragm (in.)
Girder 7
Girder 8
-0.4
-0.3
-0.2
-0.1
0.0
0.1
-900 -700 -500 -300 -100 100 300 500 700 900
Bot
tom
-Fib
er D
efle
ctio
n (in
.)
Distance from Center of Continuity Diaphragm (in.)
Girder 7
Girder 8
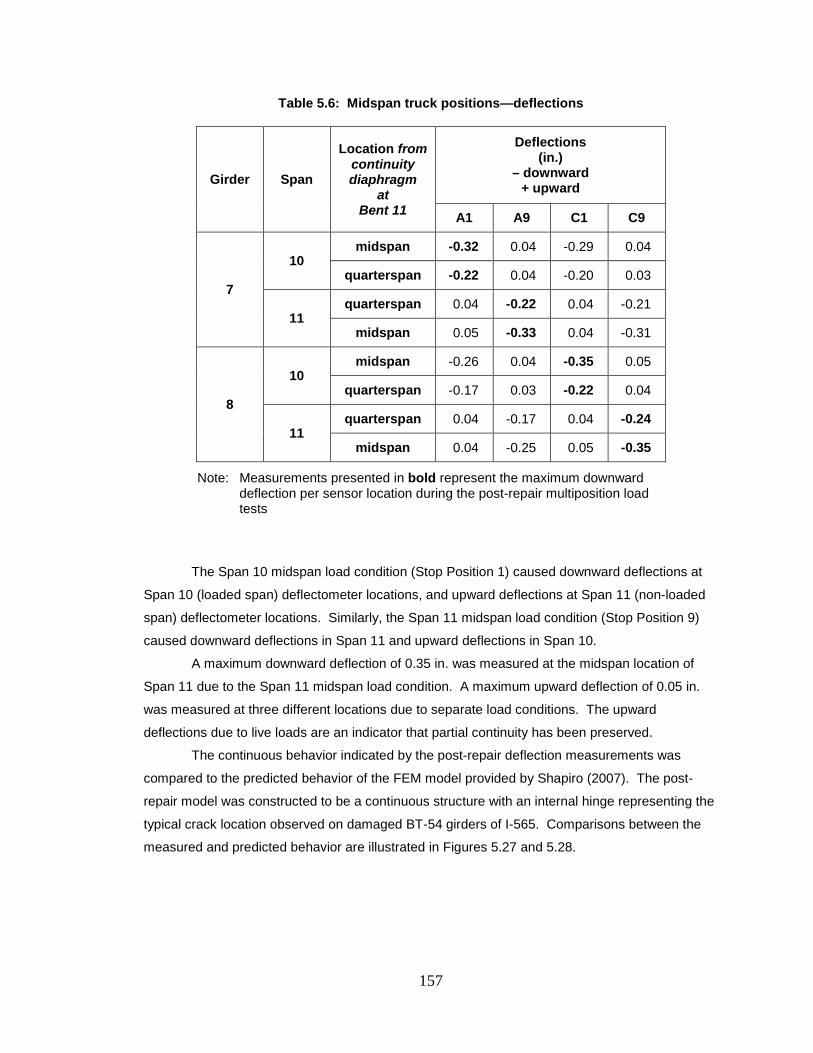
157
Table 5.6: Midspan truck positions—deflections
Girder Span
Location from continuity diaphragm
at Bent 11
Deflections (in.)
– downward + upward
A1 A9 C1 C9
7
10 midspan -0.32 0.04 -0.29 0.04
quarterspan -0.22 0.04 -0.20 0.03
11 quarterspan 0.04 -0.22 0.04 -0.21
midspan 0.05 -0.33 0.04 -0.31
8
10 midspan -0.26 0.04 -0.35 0.05
quarterspan -0.17 0.03 -0.22 0.04
11 quarterspan 0.04 -0.17 0.04 -0.24
midspan 0.04 -0.25 0.05 -0.35
Note: Measurements presented in bold represent the maximum downward deflection per sensor location during the post-repair multiposition load tests
The Span 10 midspan load condition (Stop Position 1) caused downward deflections at
Span 10 (loaded span) deflectometer locations, and upward deflections at Span 11 (non-loaded
span) deflectometer locations. Similarly, the Span 11 midspan load condition (Stop Position 9)
caused downward deflections in Span 11 and upward deflections in Span 10.
A maximum downward deflection of 0.35 in. was measured at the midspan location of
Span 11 due to the Span 11 midspan load condition. A maximum upward deflection of 0.05 in.
was measured at three different locations due to separate load conditions. The upward
deflections due to live loads are an indicator that partial continuity has been preserved.
The continuous behavior indicated by the post-repair deflection measurements was
compared to the predicted behavior of the FEM model provided by Shapiro (2007). The post-
repair model was constructed to be a continuous structure with an internal hinge representing the
typical crack location observed on damaged BT-54 girders of I-565. Comparisons between the
measured and predicted behavior are illustrated in Figures 5.27 and 5.28.
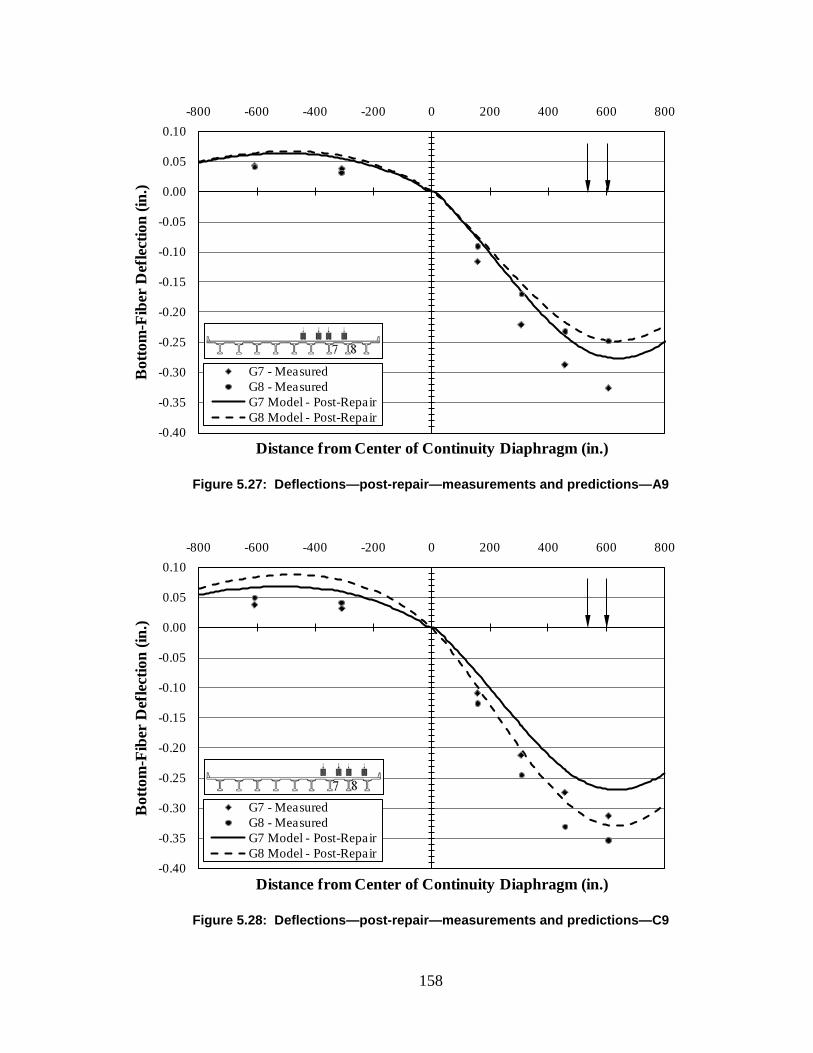
158
Figure 5.27: Deflections—post-repair—measurements and predictions—A9
Figure 5.28: Deflections—post-repair—measurements and predictions—C9
-0.40
-0.35
-0.30
-0.25
-0.20
-0.15
-0.10
-0.05
0.00
0.05
0.10-800 -600 -400 -200 0 200 400 600 800
Bot
tom
-Fib
er D
efle
ctio
n (in
.)
Distance from Center of Continuity Diaphragm (in.)
G7 - MeasuredG8 - MeasuredG7 Model - Post-RepairG8 Model - Post-Repair
-0.40
-0.35
-0.30
-0.25
-0.20
-0.15
-0.10
-0.05
0.00
0.05
0.10-800 -600 -400 -200 0 200 400 600 800
Bot
tom
-Fib
er D
efle
ctio
n (in
.)
Distance from Center of Continuity Diaphragm (in.)
G7 - MeasuredG8 - MeasuredG7 Model - Post-RepairG8 Model - Post-Repair
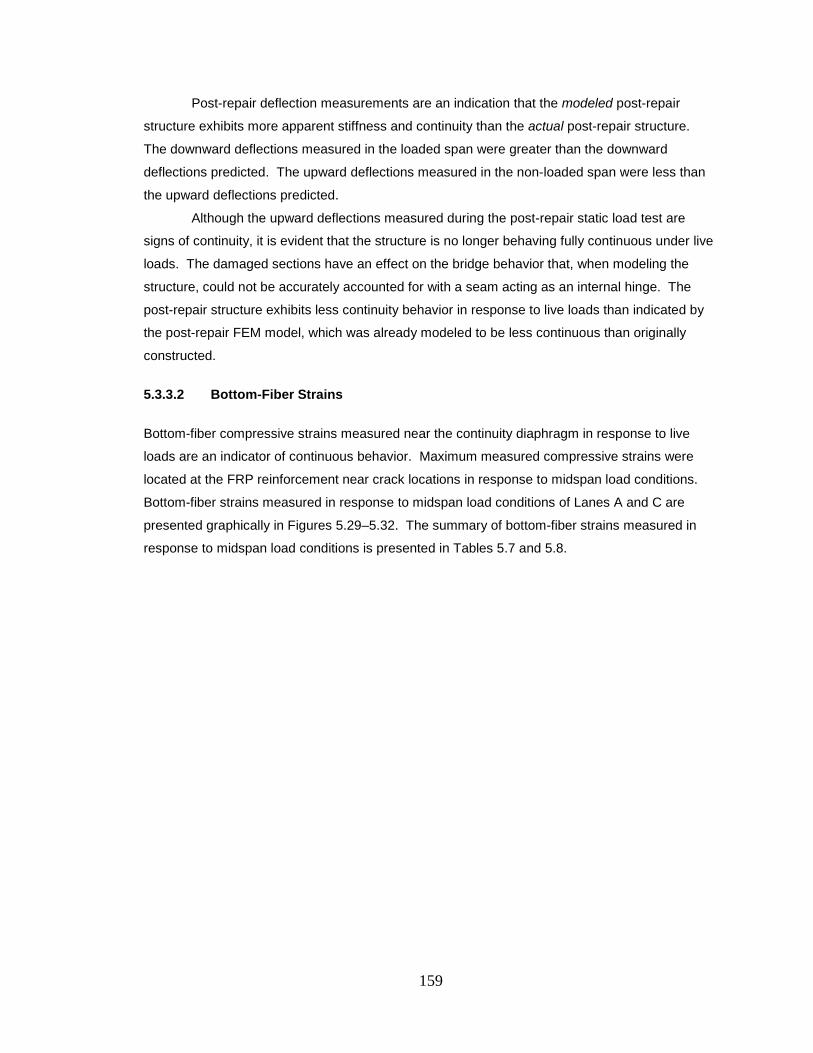
159
Post-repair deflection measurements are an indication that the modeled post-repair
structure exhibits more apparent stiffness and continuity than the actual post-repair structure.
The downward deflections measured in the loaded span were greater than the downward
deflections predicted. The upward deflections measured in the non-loaded span were less than
the upward deflections predicted.
Although the upward deflections measured during the post-repair static load test are
signs of continuity, it is evident that the structure is no longer behaving fully continuous under live
loads. The damaged sections have an effect on the bridge behavior that, when modeling the
structure, could not be accurately accounted for with a seam acting as an internal hinge. The
post-repair structure exhibits less continuity behavior in response to live loads than indicated by
the post-repair FEM model, which was already modeled to be less continuous than originally
constructed.
5.3.3.2 Bottom-Fiber Strains
Bottom-fiber compressive strains measured near the continuity diaphragm in response to live
loads are an indicator of continuous behavior. Maximum measured compressive strains were
located at the FRP reinforcement near crack locations in response to midspan load conditions.
Bottom-fiber strains measured in response to midspan load conditions of Lanes A and C are
presented graphically in Figures 5.29–5.32. The summary of bottom-fiber strains measured in
response to midspan load conditions is presented in Tables 5.7 and 5.8.
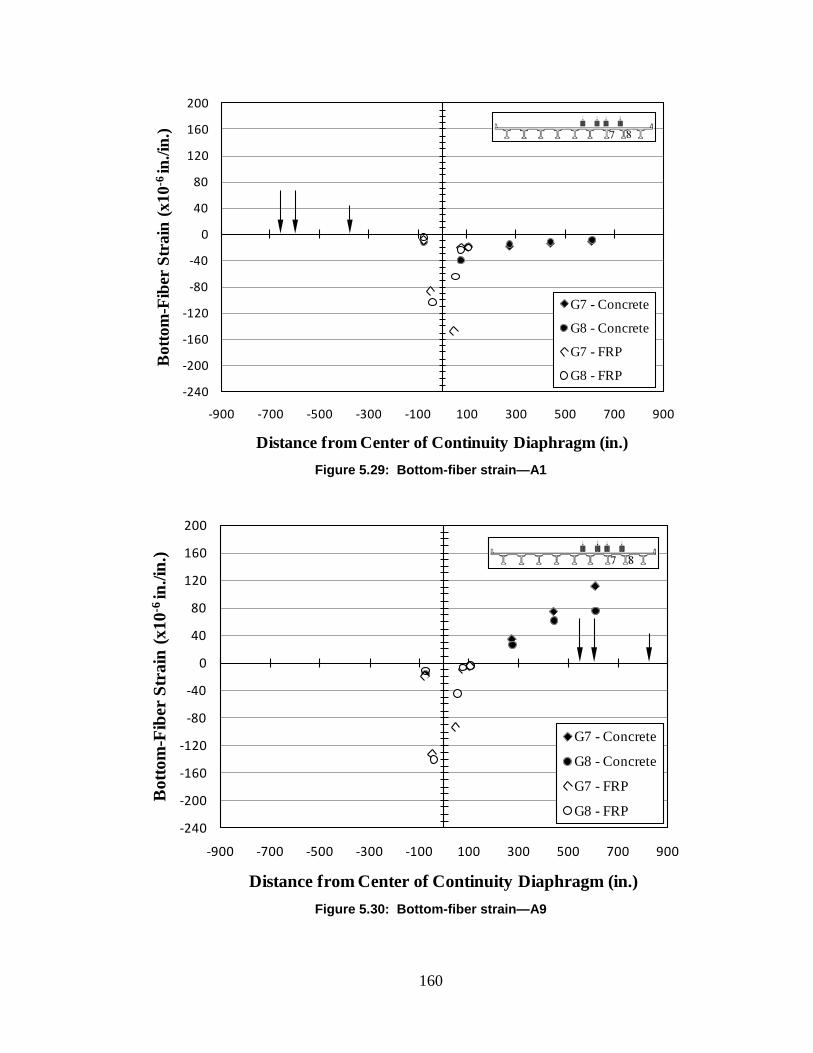
160
Figure 5.29: Bottom-fiber strain—A1
Figure 5.30: Bottom-fiber strain—A9
-240
-200
-160
-120
-80
-40
0
40
80
120
160
200
-900 -700 -500 -300 -100 100 300 500 700 900
Bot
tom
-Fib
er S
trai
n (x
10-6
in./i
n.)
Distance from Center of Continuity Diaphragm (in.)
G7 - Concrete
G8 - Concrete
G7 - FRP
G8 - FRP
-240
-200
-160
-120
-80
-40
0
40
80
120
160
200
-900 -700 -500 -300 -100 100 300 500 700 900
Bot
tom
-Fib
er S
trai
n (x
10-6
in./i
n.)
Distance from Center of Continuity Diaphragm (in.)
G7 - Concrete
G8 - Concrete
G7 - FRP
G8 - FRP
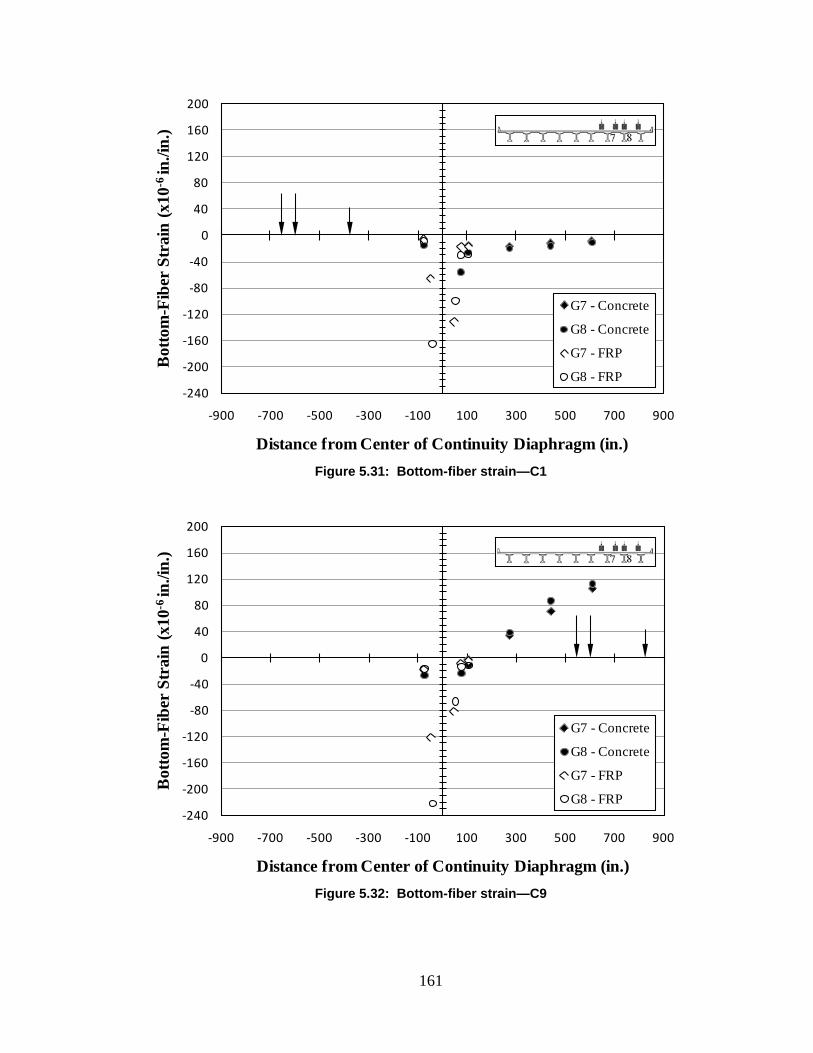
161
Figure 5.31: Bottom-fiber strain—C1
Figure 5.32: Bottom-fiber strain—C9
-240
-200
-160
-120
-80
-40
0
40
80
120
160
200
-900 -700 -500 -300 -100 100 300 500 700 900
Bot
tom
-Fib
er S
trai
n (x
10-6
in./i
n.)
Distance from Center of Continuity Diaphragm (in.)
G7 - Concrete
G8 - Concrete
G7 - FRP
G8 - FRP
-240
-200
-160
-120
-80
-40
0
40
80
120
160
200
-900 -700 -500 -300 -100 100 300 500 700 900
Bot
tom
-Fib
er S
trai
n (x
10-6
in./i
n.)
Distance from Center of Continuity Diaphragm (in.)
G7 - Concrete
G8 - Concrete
G7 - FRP
G8 - FRP
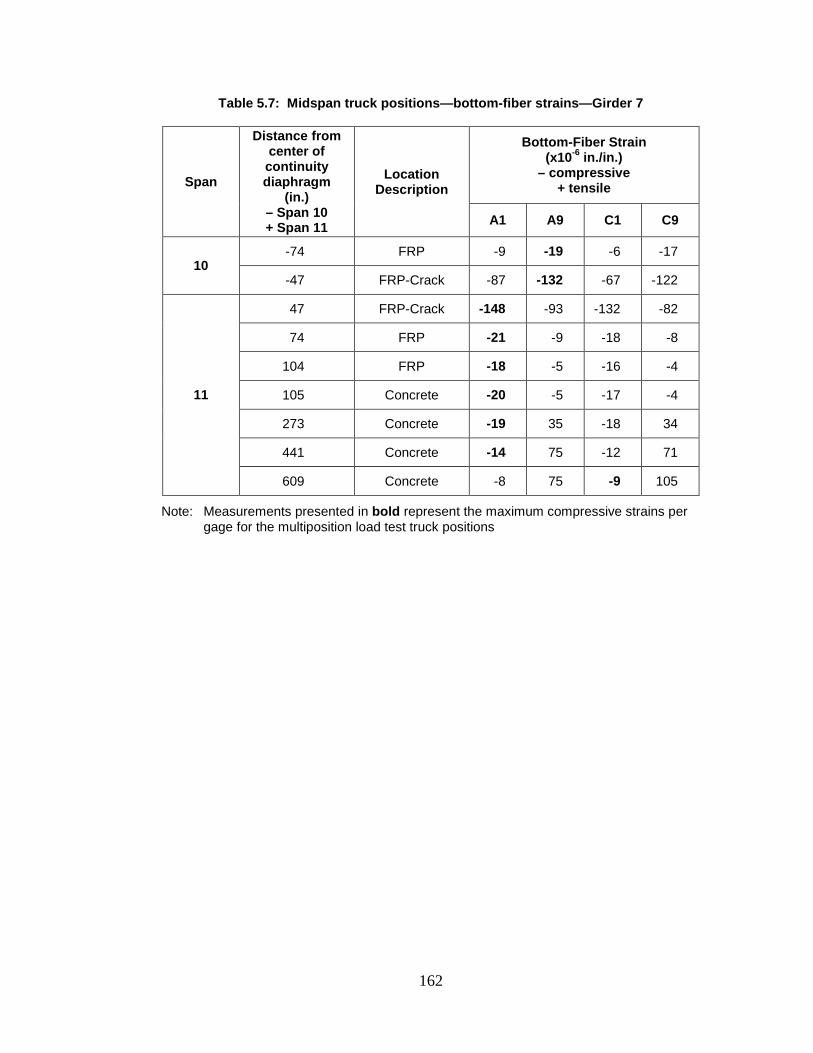
162
Table 5.7: Midspan truck positions—bottom-fiber strains—Girder 7
Span
Distance from center of continuity diaphragm
(in.) – Span 10 + Span 11
Location Description
Bottom-Fiber Strain (x10-6 in./in.)
– compressive + tensile
A1 A9 C1 C9
10 -74 FRP -9 -19 -6 -17
-47 FRP-Crack -87 -132 -67 -122
11
47 FRP-Crack -148 -93 -132 -82
74 FRP -21 -9 -18 -8
104 FRP -18 -5 -16 -4
105 Concrete -20 -5 -17 -4
273 Concrete -19 35 -18 34
441 Concrete -14 75 -12 71
609 Concrete -8 75 -9 105
Note: Measurements presented in bold represent the maximum compressive strains per gage for the multiposition load test truck positions
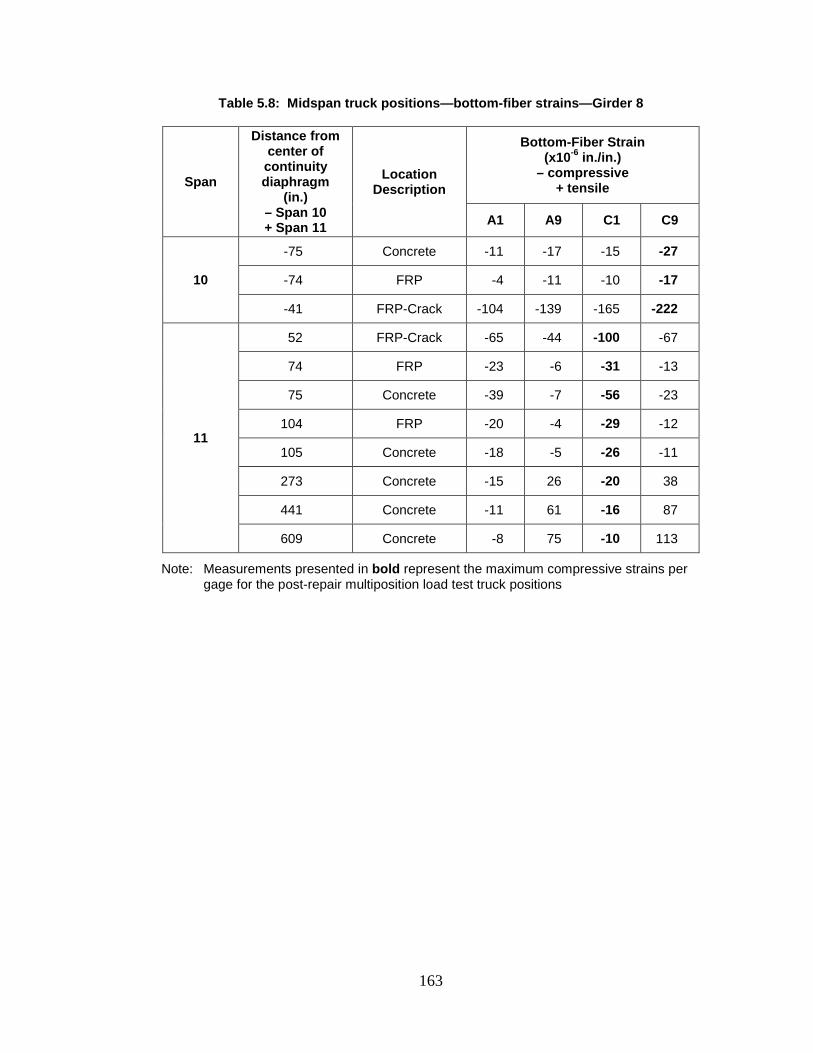
163
Table 5.8: Midspan truck positions—bottom-fiber strains—Girder 8
Span
Distance from center of continuity diaphragm
(in.) – Span 10 + Span 11
Location Description
Bottom-Fiber Strain (x10-6 in./in.)
– compressive + tensile
A1 A9 C1 C9
10
-75 Concrete -11 -17 -15 -27
-74 FRP -4 -11 -10 -17
-41 FRP-Crack -104 -139 -165 -222
11
52 FRP-Crack -65 -44 -100 -67
74 FRP -23 -6 -31 -13
75 Concrete -39 -7 -56 -23
104 FRP -20 -4 -29 -12
105 Concrete -18 -5 -26 -11
273 Concrete -15 26 -20 38
441 Concrete -11 61 -16 87
609 Concrete -8 75 -10 113
Note: Measurements presented in bold represent the maximum compressive strains per gage for the post-repair multiposition load test truck positions
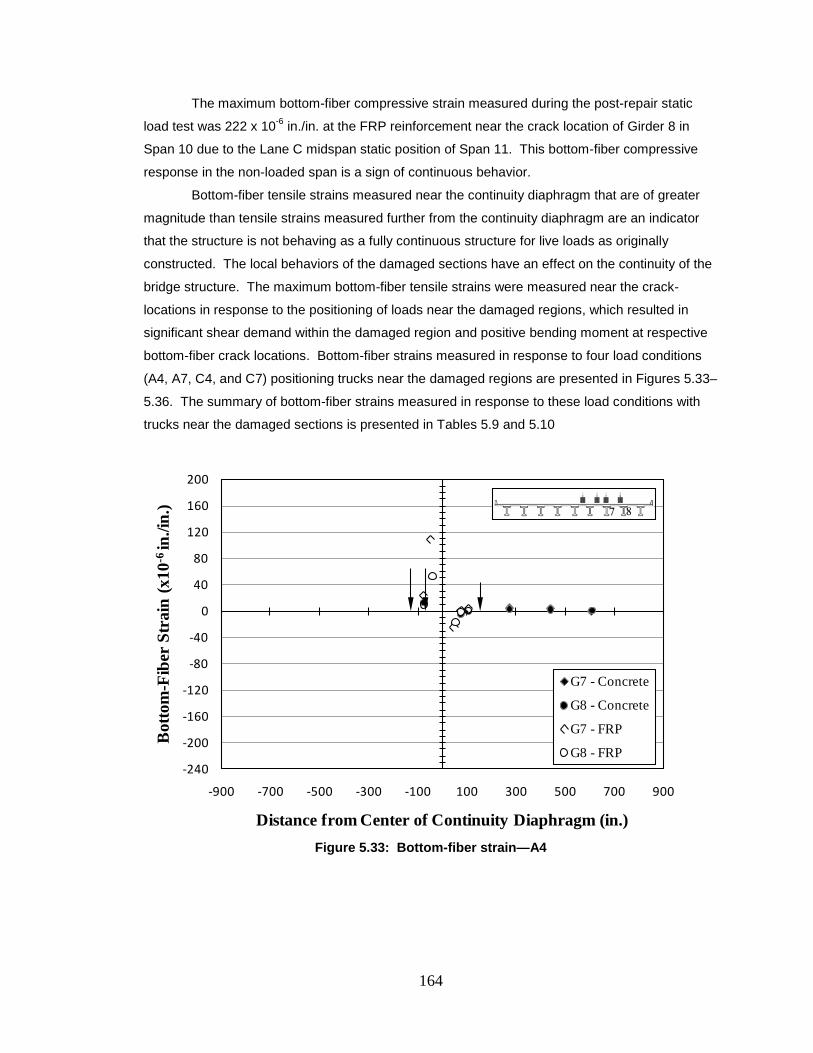
164
The maximum bottom-fiber compressive strain measured during the post-repair static
load test was 222 x 10-6 in./in. at the FRP reinforcement near the crack location of Girder 8 in
Span 10 due to the Lane C midspan static position of Span 11. This bottom-fiber compressive
response in the non-loaded span is a sign of continuous behavior.
Bottom-fiber tensile strains measured near the continuity diaphragm that are of greater
magnitude than tensile strains measured further from the continuity diaphragm are an indicator
that the structure is not behaving as a fully continuous structure for live loads as originally
constructed. The local behaviors of the damaged sections have an effect on the continuity of the
bridge structure. The maximum bottom-fiber tensile strains were measured near the crack-
locations in response to the positioning of loads near the damaged regions, which resulted in
significant shear demand within the damaged region and positive bending moment at respective
bottom-fiber crack locations. Bottom-fiber strains measured in response to four load conditions
(A4, A7, C4, and C7) positioning trucks near the damaged regions are presented in Figures 5.33–
5.36. The summary of bottom-fiber strains measured in response to these load conditions with
trucks near the damaged sections is presented in Tables 5.9 and 5.10
Figure 5.33: Bottom-fiber strain—A4
-240
-200
-160
-120
-80
-40
0
40
80
120
160
200
-900 -700 -500 -300 -100 100 300 500 700 900
Bot
tom
-Fib
er S
trai
n (x
10-6
in./i
n.)
Distance from Center of Continuity Diaphragm (in.)
G7 - Concrete
G8 - Concrete
G7 - FRP
G8 - FRP
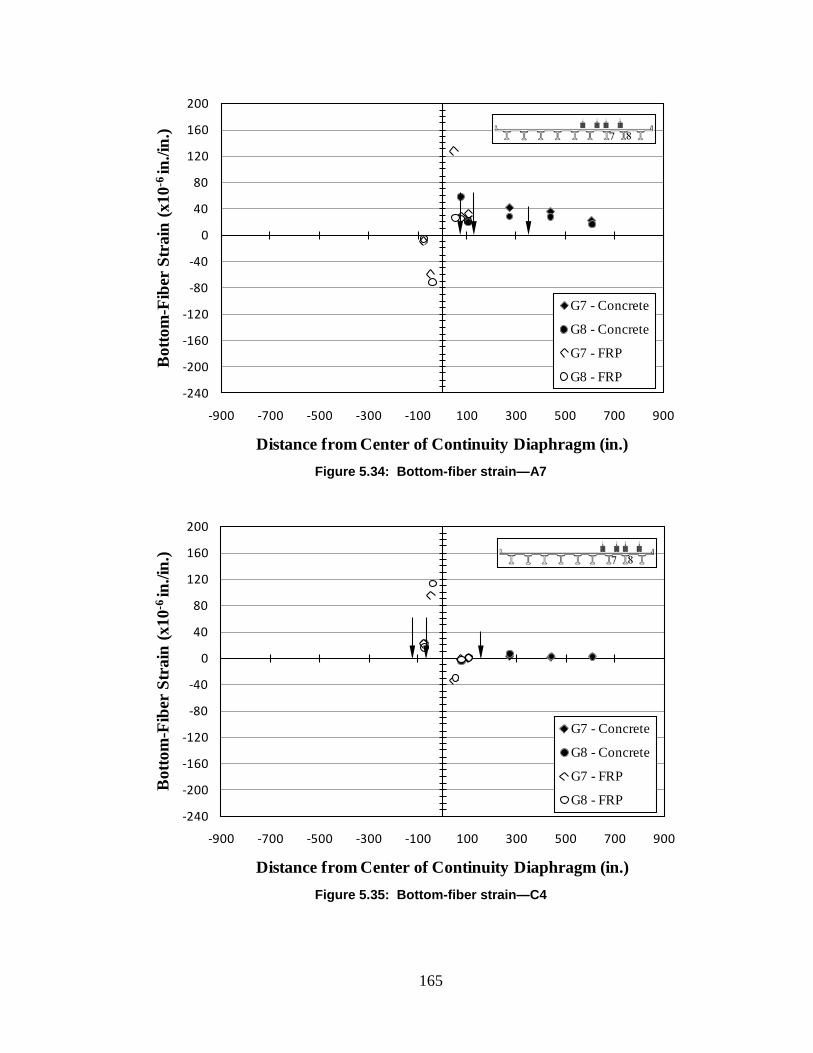
165
Figure 5.34: Bottom-fiber strain—A7
Figure 5.35: Bottom-fiber strain—C4
-240
-200
-160
-120
-80
-40
0
40
80
120
160
200
-900 -700 -500 -300 -100 100 300 500 700 900
Bot
tom
-Fib
er S
trai
n (x
10-6
in./i
n.)
Distance from Center of Continuity Diaphragm (in.)
G7 - Concrete
G8 - Concrete
G7 - FRP
G8 - FRP
-240
-200
-160
-120
-80
-40
0
40
80
120
160
200
-900 -700 -500 -300 -100 100 300 500 700 900
Bot
tom
-Fib
er S
trai
n (x
10-6
in./i
n.)
Distance from Center of Continuity Diaphragm (in.)
G7 - Concrete
G8 - Concrete
G7 - FRP
G8 - FRP
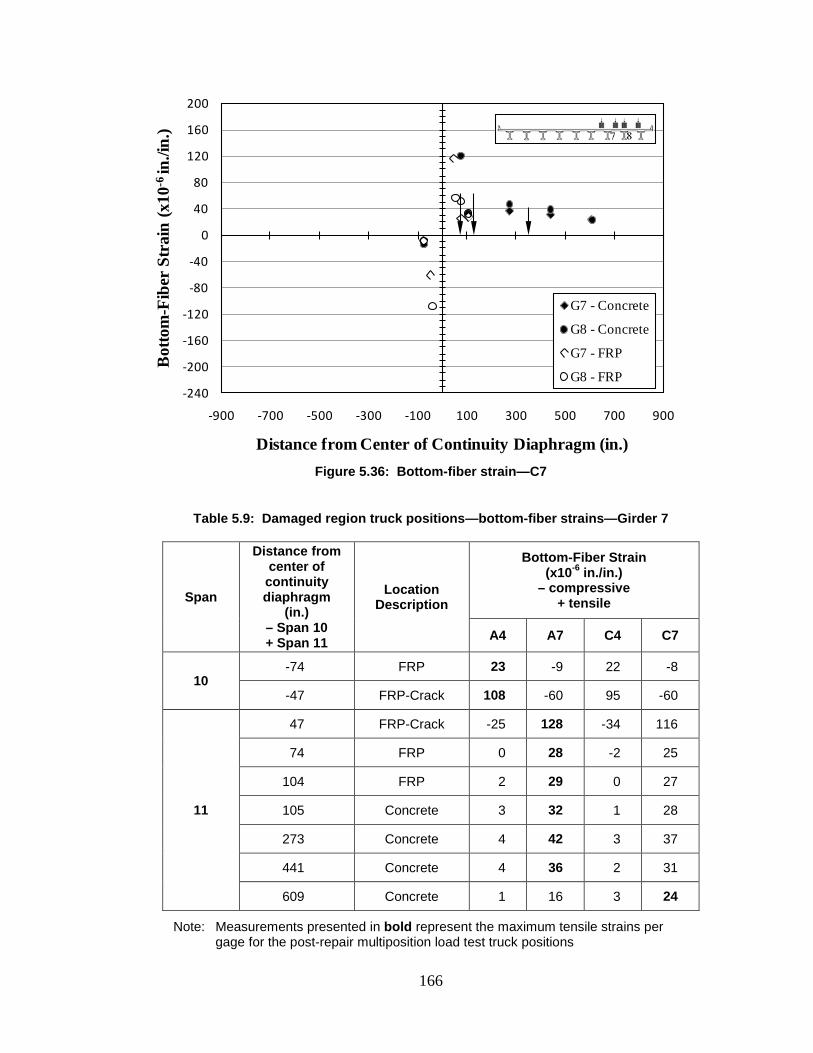
166
Figure 5.36: Bottom-fiber strain—C7
Table 5.9: Damaged region truck positions—bottom-fiber strains—Girder 7
Span
Distance from center of continuity diaphragm
(in.) – Span 10 + Span 11
Location Description
Bottom-Fiber Strain (x10-6 in./in.)
– compressive + tensile
A4 A7 C4 C7
10 -74 FRP 23 -9 22 -8
-47 FRP-Crack 108 -60 95 -60
11
47 FRP-Crack -25 128 -34 116
74 FRP 0 28 -2 25
104 FRP 2 29 0 27
105 Concrete 3 32 1 28
273 Concrete 4 42 3 37
441 Concrete 4 36 2 31
609 Concrete 1 16 3 24
Note: Measurements presented in bold represent the maximum tensile strains per gage for the post-repair multiposition load test truck positions
-240
-200
-160
-120
-80
-40
0
40
80
120
160
200
-900 -700 -500 -300 -100 100 300 500 700 900
Bot
tom
-Fib
er S
trai
n (x
10-6
in./i
n.)
Distance from Center of Continuity Diaphragm (in.)
G7 - Concrete
G8 - Concrete
G7 - FRP
G8 - FRP
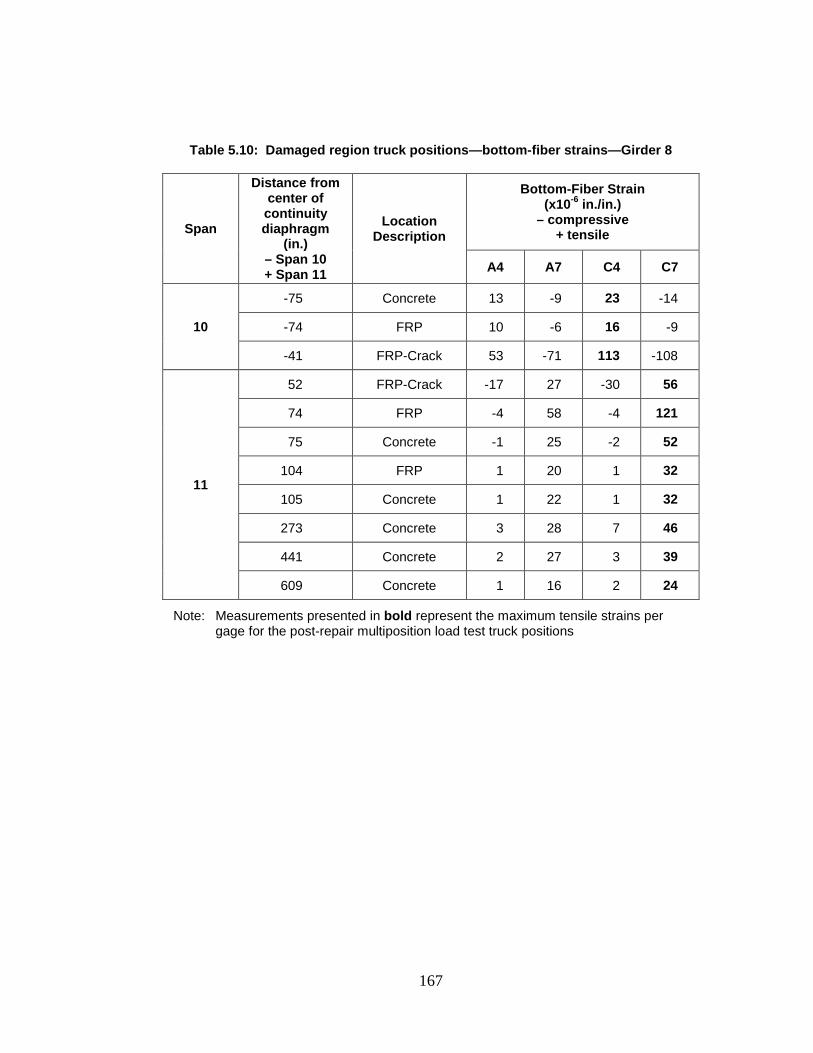
167
Table 5.10: Damaged region truck positions—bottom-fiber strains—Girder 8
Span
Distance from center of continuity diaphragm
(in.) – Span 10 + Span 11
Location Description
Bottom-Fiber Strain (x10-6 in./in.)
– compressive + tensile
A4 A7 C4 C7
10
-75 Concrete 13 -9 23 -14
-74 FRP 10 -6 16 -9
-41 FRP-Crack 53 -71 113 -108
11
52 FRP-Crack -17 27 -30 56
74 FRP -4 58 -4 121
75 Concrete -1 25 -2 52
104 FRP 1 20 1 32
105 Concrete 1 22 1 32
273 Concrete 3 28 7 46
441 Concrete 2 27 3 39
609 Concrete 1 16 2 24
Note: Measurements presented in bold represent the maximum tensile strains per gage for the post-repair multiposition load test truck positions
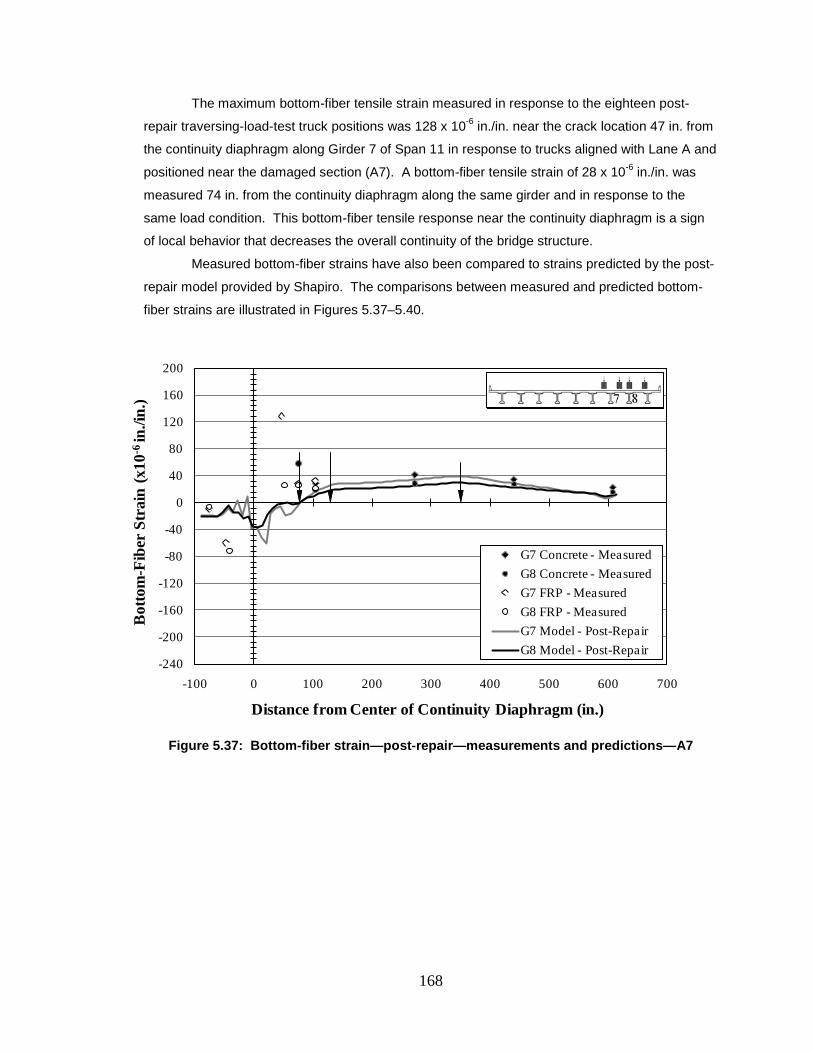
168
The maximum bottom-fiber tensile strain measured in response to the eighteen post-
repair traversing-load-test truck positions was 128 x 10-6 in./in. near the crack location 47 in. from
the continuity diaphragm along Girder 7 of Span 11 in response to trucks aligned with Lane A and
positioned near the damaged section (A7). A bottom-fiber tensile strain of 28 x 10-6 in./in. was
measured 74 in. from the continuity diaphragm along the same girder and in response to the
same load condition. This bottom-fiber tensile response near the continuity diaphragm is a sign
of local behavior that decreases the overall continuity of the bridge structure.
Measured bottom-fiber strains have also been compared to strains predicted by the post-
repair model provided by Shapiro. The comparisons between measured and predicted bottom-
fiber strains are illustrated in Figures 5.37–5.40.
Figure 5.37: Bottom-fiber strain—post-repair—measurements and predictions—A7
-240
-200
-160
-120
-80
-40
0
40
80
120
160
200
-100 0 100 200 300 400 500 600 700
Bot
tom
-Fib
er S
trai
n (x
10-6
in./i
n.)
Distance from Center of Continuity Diaphragm (in.)
G7 Concrete - MeasuredG8 Concrete - MeasuredG7 FRP - MeasuredG8 FRP - MeasuredG7 Model - Post-RepairG8 Model - Post-Repair
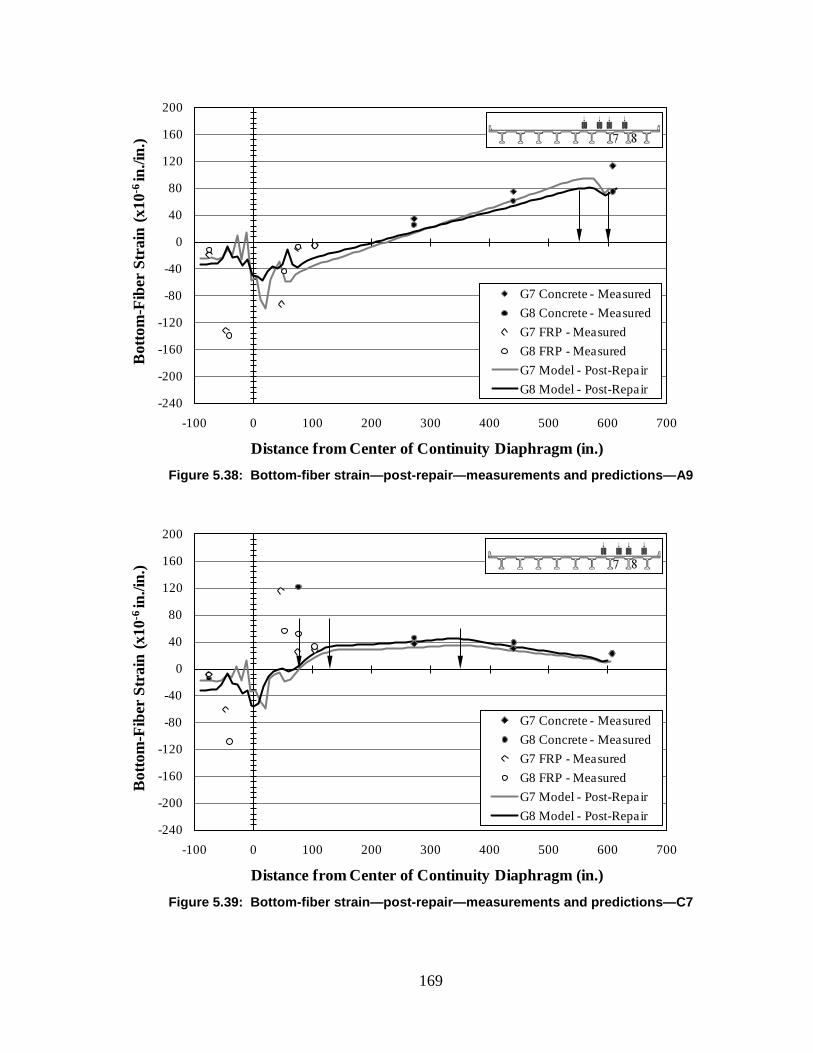
169
Figure 5.38: Bottom-fiber strain—post-repair—measurements and predictions—A9
Figure 5.39: Bottom-fiber strain—post-repair—measurements and predictions—C7
-240
-200
-160
-120
-80
-40
0
40
80
120
160
200
-100 0 100 200 300 400 500 600 700
Bot
tom
-Fib
er S
trai
n (x
10-6
in./i
n.)
Distance from Center of Continuity Diaphragm (in.)
G7 Concrete - MeasuredG8 Concrete - MeasuredG7 FRP - MeasuredG8 FRP - MeasuredG7 Model - Post-RepairG8 Model - Post-Repair
-240
-200
-160
-120
-80
-40
0
40
80
120
160
200
-100 0 100 200 300 400 500 600 700
Bot
tom
-Fib
er S
trai
n (x
10-6
in./i
n.)
Distance from Center of Continuity Diaphragm (in.)
G7 Concrete - MeasuredG8 Concrete - MeasuredG7 FRP - MeasuredG8 FRP - MeasuredG7 Model - Post-RepairG8 Model - Post-Repair
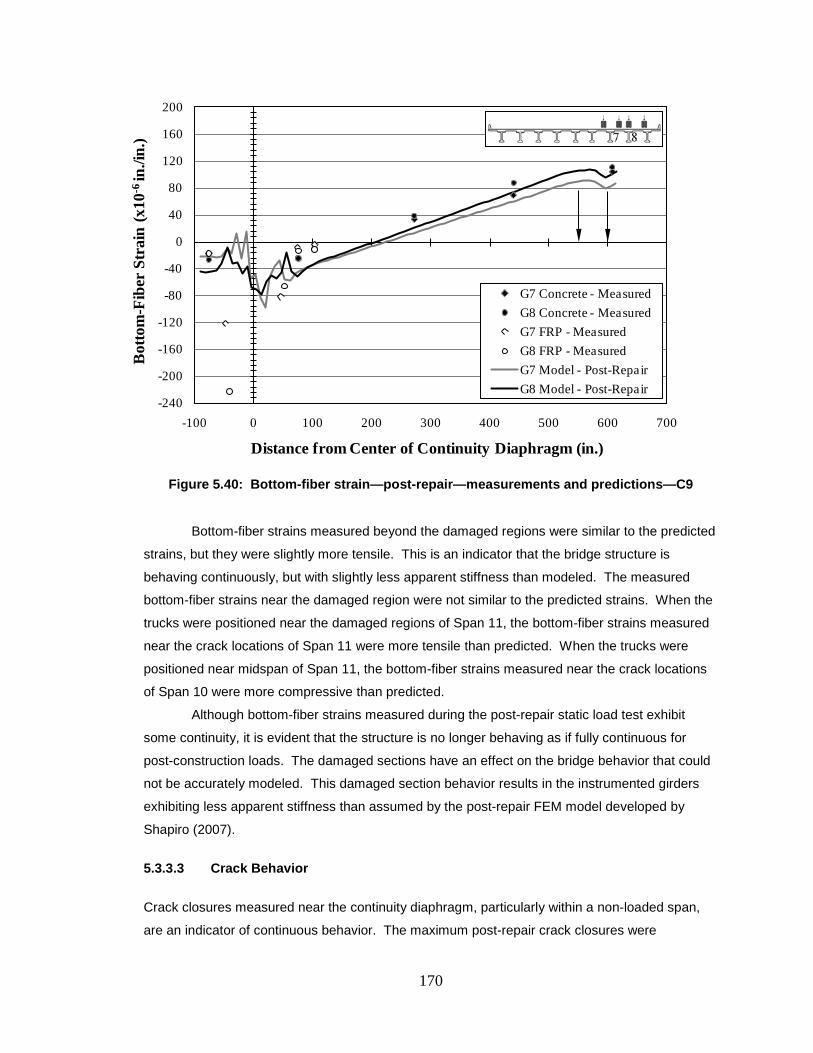
170
Figure 5.40: Bottom-fiber strain—post-repair—measurements and predictions—C9
Bottom-fiber strains measured beyond the damaged regions were similar to the predicted
strains, but they were slightly more tensile. This is an indicator that the bridge structure is
behaving continuously, but with slightly less apparent stiffness than modeled. The measured
bottom-fiber strains near the damaged region were not similar to the predicted strains. When the
trucks were positioned near the damaged regions of Span 11, the bottom-fiber strains measured
near the crack locations of Span 11 were more tensile than predicted. When the trucks were
positioned near midspan of Span 11, the bottom-fiber strains measured near the crack locations
of Span 10 were more compressive than predicted.
Although bottom-fiber strains measured during the post-repair static load test exhibit
some continuity, it is evident that the structure is no longer behaving as if fully continuous for
post-construction loads. The damaged sections have an effect on the bridge behavior that could
not be accurately modeled. This damaged section behavior results in the instrumented girders
exhibiting less apparent stiffness than assumed by the post-repair FEM model developed by
Shapiro (2007).
5.3.3.3 Crack Behavior
Crack closures measured near the continuity diaphragm, particularly within a non-loaded span,
are an indicator of continuous behavior. The maximum post-repair crack closures were
-240
-200
-160
-120
-80
-40
0
40
80
120
160
200
-100 0 100 200 300 400 500 600 700
Bot
tom
-Fib
er S
trai
n (x
10-6
in./i
n.)
Distance from Center of Continuity Diaphragm (in.)
G7 Concrete - MeasuredG8 Concrete - MeasuredG7 FRP - MeasuredG8 FRP - MeasuredG7 Model - Post-RepairG8 Model - Post-Repair
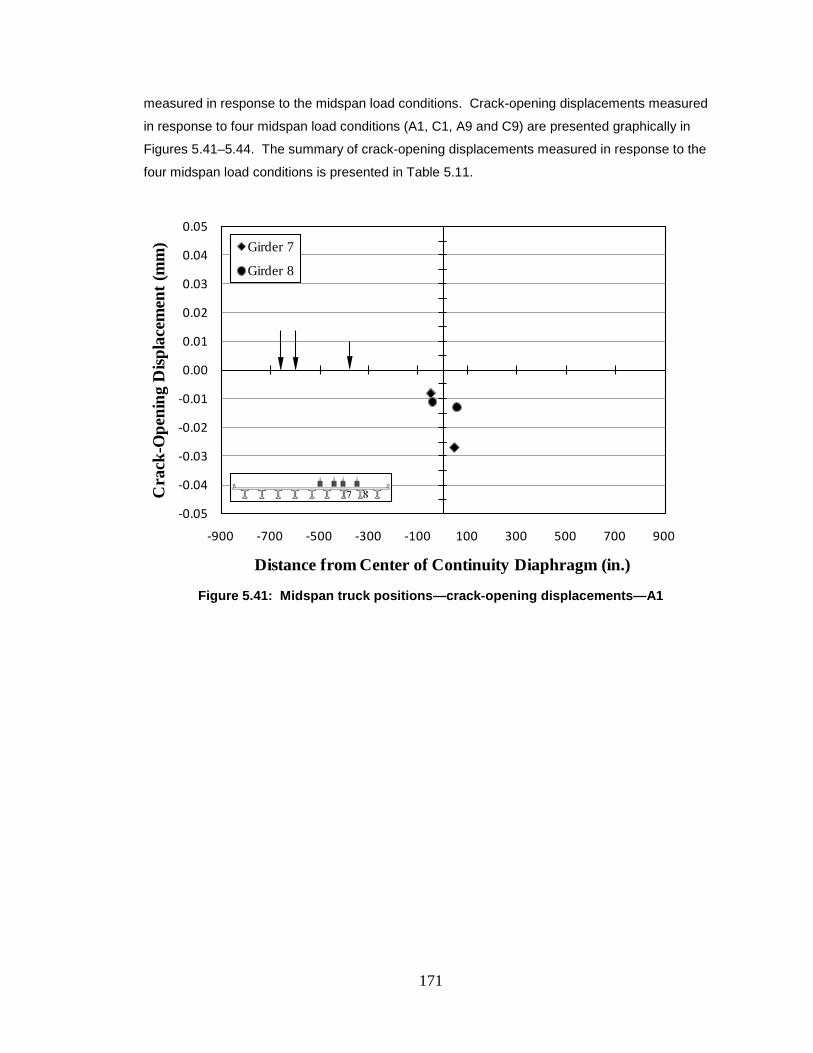
171
measured in response to the midspan load conditions. Crack-opening displacements measured
in response to four midspan load conditions (A1, C1, A9 and C9) are presented graphically in
Figures 5.41–5.44. The summary of crack-opening displacements measured in response to the
four midspan load conditions is presented in Table 5.11.
Figure 5.41: Midspan truck positions—crack-opening displacements—A1
-0.05
-0.04
-0.03
-0.02
-0.01
0.00
0.01
0.02
0.03
0.04
0.05
-900 -700 -500 -300 -100 100 300 500 700 900
Cra
ck-O
peni
ng D
ispla
cem
ent (
mm
)
Distance from Center of Continuity Diaphragm (in.)
Girder 7
Girder 8
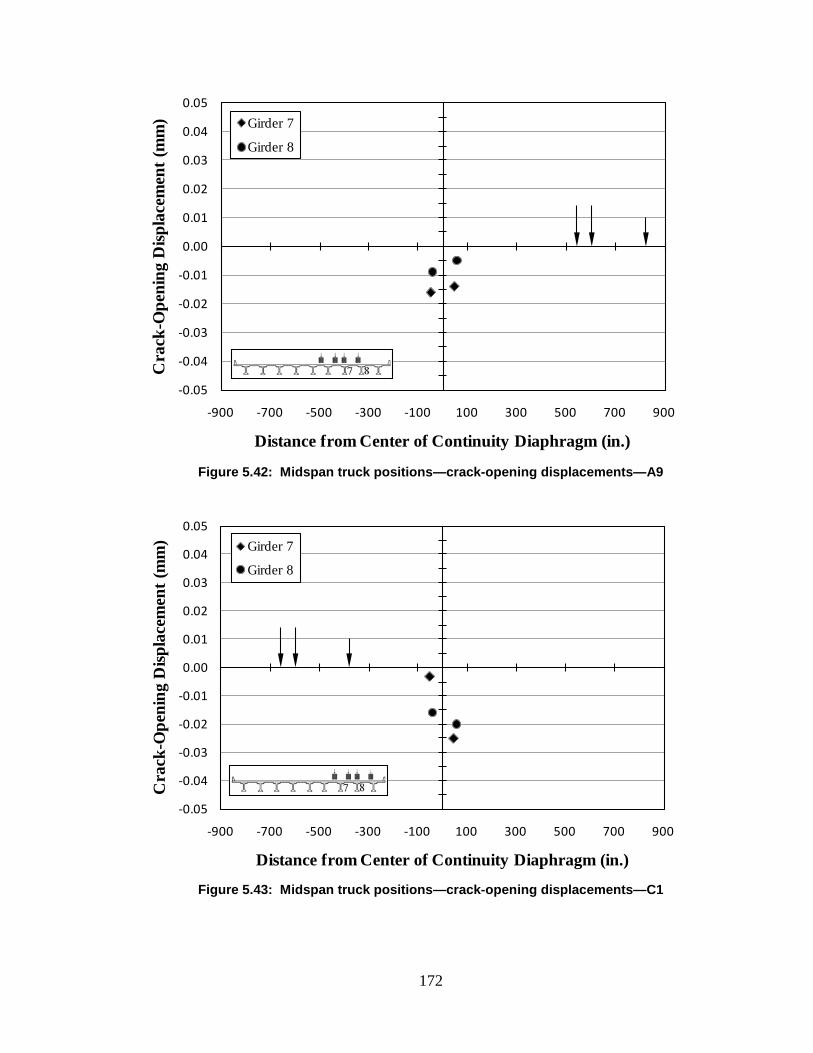
172
Figure 5.42: Midspan truck positions—crack-opening displacements—A9
Figure 5.43: Midspan truck positions—crack-opening displacements—C1
-0.05
-0.04
-0.03
-0.02
-0.01
0.00
0.01
0.02
0.03
0.04
0.05
-900 -700 -500 -300 -100 100 300 500 700 900
Cra
ck-O
peni
ng D
ispla
cem
ent (
mm
)
Distance from Center of Continuity Diaphragm (in.)
Girder 7
Girder 8
-0.05
-0.04
-0.03
-0.02
-0.01
0.00
0.01
0.02
0.03
0.04
0.05
-900 -700 -500 -300 -100 100 300 500 700 900
Cra
ck-O
peni
ng D
ispla
cem
ent (
mm
)
Distance from Center of Continuity Diaphragm (in.)
Girder 7
Girder 8
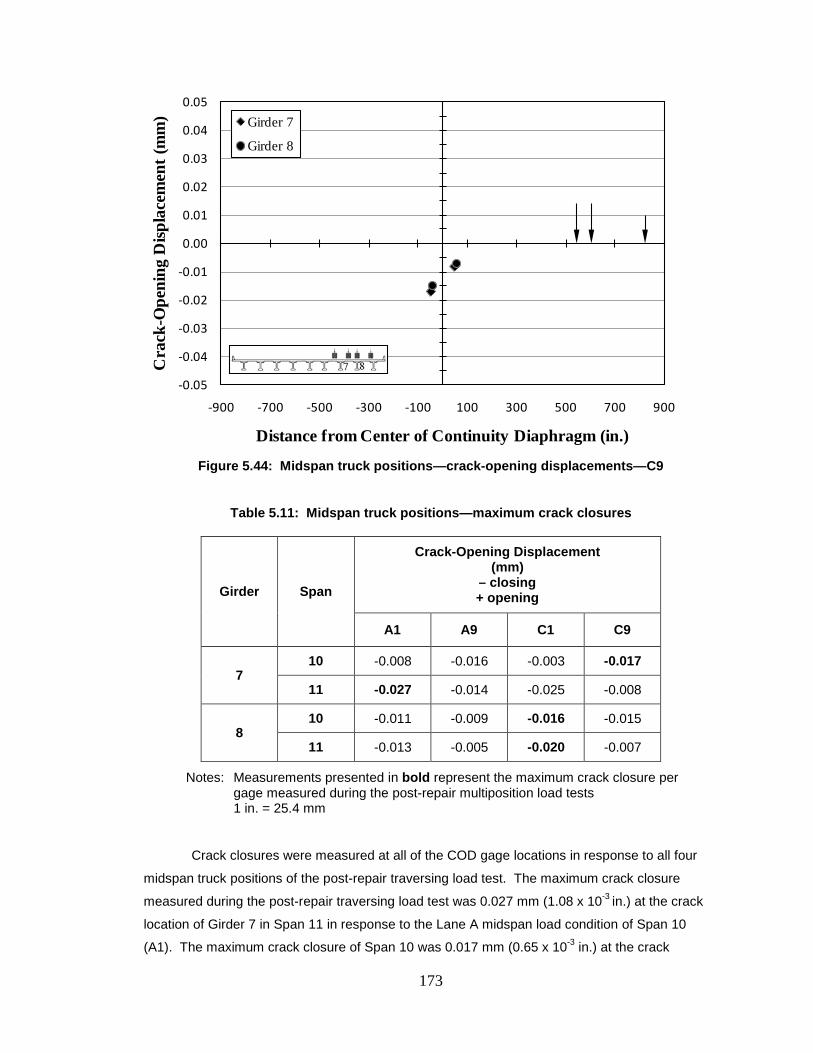
173
Figure 5.44: Midspan truck positions—crack-opening displacements—C9
Table 5.11: Midspan truck positions—maximum crack closures
Girder Span
Crack-Opening Displacement (mm)
– closing + opening
A1 A9 C1 C9
7 10 -0.008 -0.016 -0.003 -0.017
11 -0.027 -0.014 -0.025 -0.008
8 10 -0.011 -0.009 -0.016 -0.015
11 -0.013 -0.005 -0.020 -0.007
Notes: Measurements presented in bold represent the maximum crack closure per gage measured during the post-repair multiposition load tests 1 in. = 25.4 mm
Crack closures were measured at all of the COD gage locations in response to all four
midspan truck positions of the post-repair traversing load test. The maximum crack closure
measured during the post-repair traversing load test was 0.027 mm (1.08 x 10⁻³ in.) at the crack
location of Girder 7 in Span 11 in response to the Lane A midspan load condition of Span 10
(A1). The maximum crack closure of Span 10 was 0.017 mm (0.65 x 10⁻³ in.) at the crack
-0.05
-0.04
-0.03
-0.02
-0.01
0.00
0.01
0.02
0.03
0.04
0.05
-900 -700 -500 -300 -100 100 300 500 700 900
Cra
ck-O
peni
ng D
ispla
cem
ent (
mm
)
Distance from Center of Continuity Diaphragm (in.)
Girder 7
Girder 8
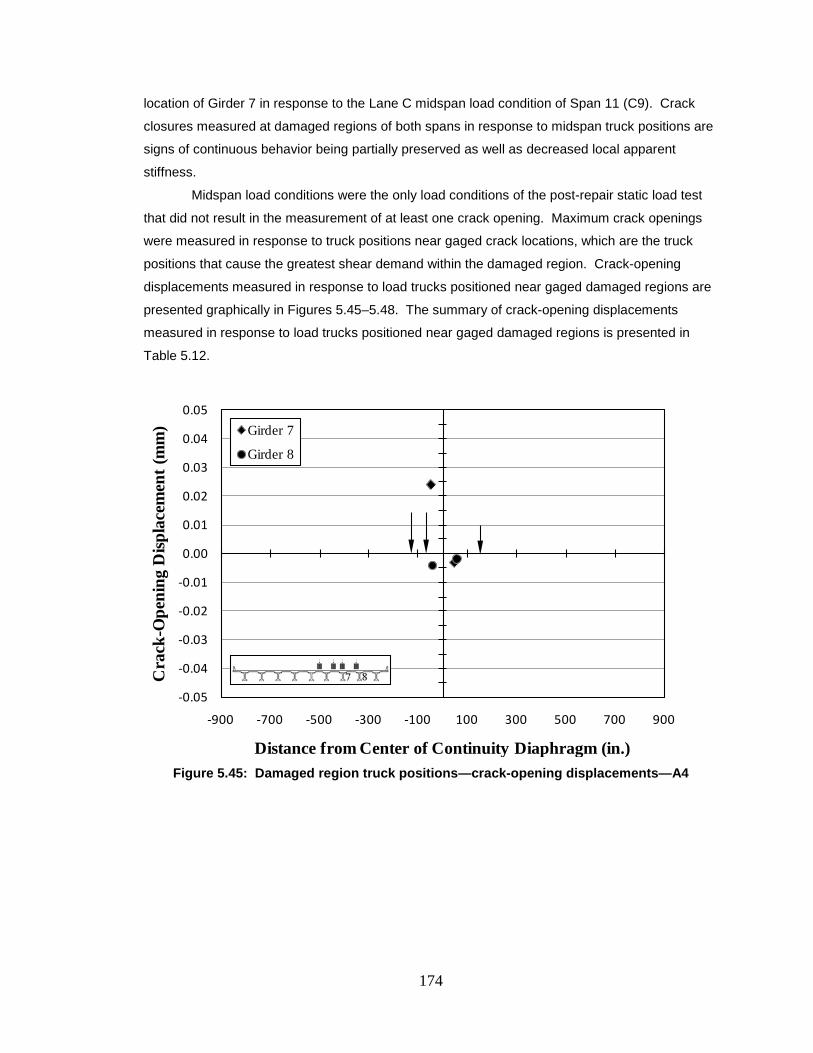
174
location of Girder 7 in response to the Lane C midspan load condition of Span 11 (C9). Crack
closures measured at damaged regions of both spans in response to midspan truck positions are
signs of continuous behavior being partially preserved as well as decreased local apparent
stiffness.
Midspan load conditions were the only load conditions of the post-repair static load test
that did not result in the measurement of at least one crack opening. Maximum crack openings
were measured in response to truck positions near gaged crack locations, which are the truck
positions that cause the greatest shear demand within the damaged region. Crack-opening
displacements measured in response to load trucks positioned near gaged damaged regions are
presented graphically in Figures 5.45–5.48. The summary of crack-opening displacements
measured in response to load trucks positioned near gaged damaged regions is presented in
Table 5.12.
Figure 5.45: Damaged region truck positions—crack-opening displacements—A4
-0.05
-0.04
-0.03
-0.02
-0.01
0.00
0.01
0.02
0.03
0.04
0.05
-900 -700 -500 -300 -100 100 300 500 700 900
Cra
ck-O
peni
ng D
ispla
cem
ent (
mm
)
Distance from Center of Continuity Diaphragm (in.)
Girder 7
Girder 8
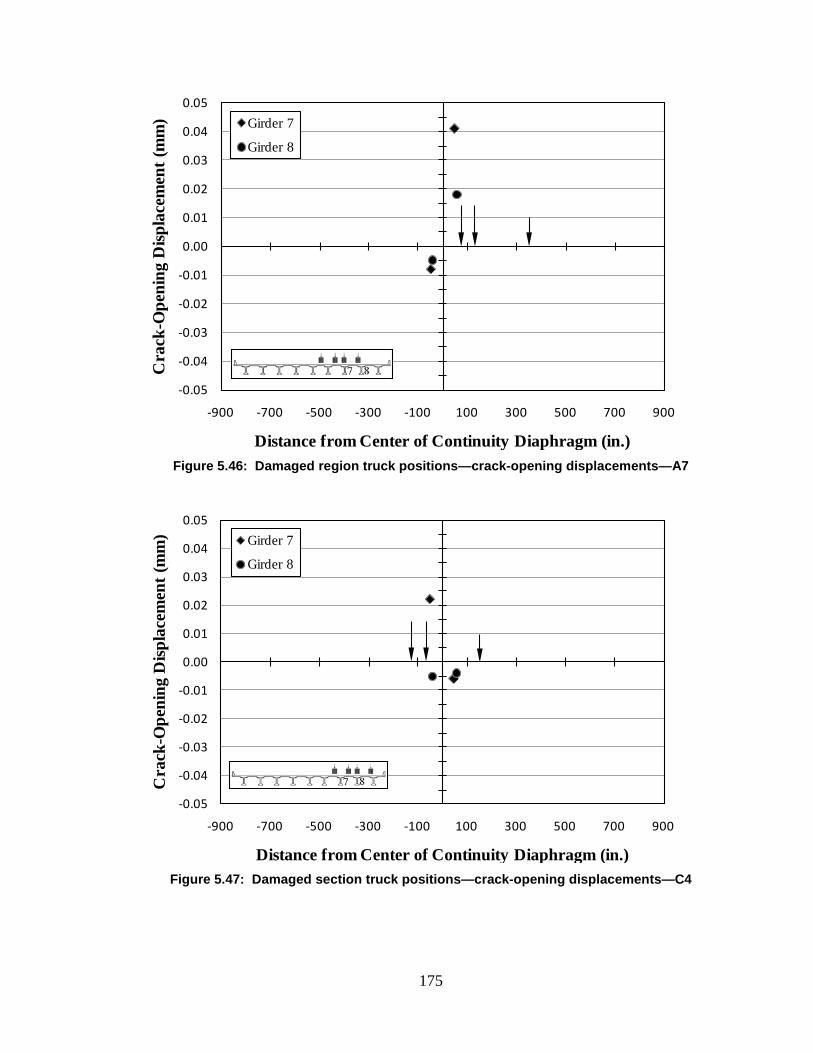
175
Figure 5.46: Damaged region truck positions—crack-opening displacements—A7
Figure 5.47: Damaged section truck positions—crack-opening displacements—C4
-0.05
-0.04
-0.03
-0.02
-0.01
0.00
0.01
0.02
0.03
0.04
0.05
-900 -700 -500 -300 -100 100 300 500 700 900
Cra
ck-O
peni
ng D
ispla
cem
ent (
mm
)
Distance from Center of Continuity Diaphragm (in.)
Girder 7
Girder 8
-0.05
-0.04
-0.03
-0.02
-0.01
0.00
0.01
0.02
0.03
0.04
0.05
-900 -700 -500 -300 -100 100 300 500 700 900
Cra
ck-O
peni
ng D
ispla
cem
ent (
mm
)
Distance from Center of Continuity Diaphragm (in.)
Girder 7
Girder 8
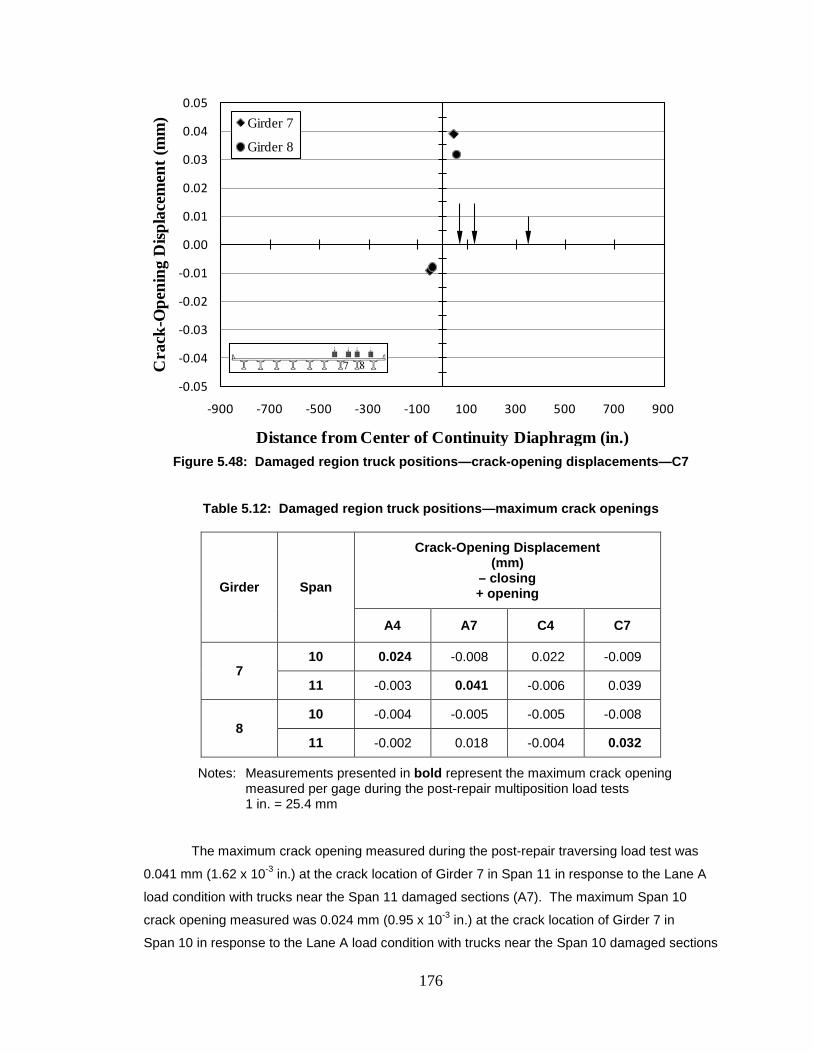
176
Figure 5.48: Damaged region truck positions—crack-opening displacements—C7
Table 5.12: Damaged region truck positions—maximum crack openings
Girder Span
Crack-Opening Displacement (mm)
– closing + opening
A4 A7 C4 C7
7 10 0.024 -0.008 0.022 -0.009
11 -0.003 0.041 -0.006 0.039
8 10 -0.004 -0.005 -0.005 -0.008
11 -0.002 0.018 -0.004 0.032
Notes: Measurements presented in bold represent the maximum crack opening measured per gage during the post-repair multiposition load tests 1 in. = 25.4 mm
The maximum crack opening measured during the post-repair traversing load test was
0.041 mm (1.62 x 10⁻³ in.) at the crack location of Girder 7 in Span 11 in response to the Lane A
load condition with trucks near the Span 11 damaged sections (A7). The maximum Span 10
crack opening measured was 0.024 mm (0.95 x 10⁻³ in.) at the crack location of Girder 7 in
Span 10 in response to the Lane A load condition with trucks near the Span 10 damaged sections
-0.05
-0.04
-0.03
-0.02
-0.01
0.00
0.01
0.02
0.03
0.04
0.05
-900 -700 -500 -300 -100 100 300 500 700 900
Cra
ck-O
peni
ng D
ispla
cem
ent (
mm
)
Distance from Center of Continuity Diaphragm (in.)
Girder 7
Girder 8
177
(A4). Crack openings measured within a loaded span are also signs of decreased apparent
stiffness within damaged regions.
The COD gage installed on the west face of Girder 8 in Span 10 did not measure a crack
opening in response to any of the traversing-load-test stop positions. For the COD gage of
Girder 8 in Span 10, the maximum crack opening (least crack closure) measured during the
traversing load test was a closure of 0.002 mm (0.07 x 10⁻³ in.) in response to trucks being
aligned with Lane C and positioned near the continuity diaphragm (C5).
As stated previously, the COD gage on Girder 8 in Span 10 was installed on the opposite
face of the girder compared to the other COD gages and likely does not accurately represent
behavior similar to what is being measured by the other COD gages. This different behavior for
the crack-opening displacement measurements of Girder 8 in Span 10 is likely due to out-of-
plane bending as noted by Fason (2009).
Regardless of the cause of behavior for the COD gage on Girder 8 of Span 10, the crack-
opening displacements measured at the other three crack locations are indications that the bridge
structure is exhibiting overall continuous behavior that cannot be considered fully continuous for
post-construction loads due to the local behavior of damaged regions.
5.3.3.4 Continuity Behavior Conclusions
Upward deflections of non-loaded spans during post-repair testing are indications that continuity
in response to post-construction loads has been partially preserved for the bridge structure.
However, further analysis of post-repair deflection measurements and model predictions has
provided evidence that the structure is behaving less continuously in response to post-
construction loads than assumed by the post-repair FEM model, which was already modeled to
be less continuous than originally constructed.
Compressive strains measured within non-loaded spans during post-repair testing are
additional indications that continuity is partially preserved for the bridge structure. However,
tensile strains measured near the continuity diaphragm in loaded spans are additional indications
that the structure is not behaving as a fully continuous structure in response to live loads as
originally constructed.
Crack closures measured within non-loaded spans during post-repair testing are
additional indications that continuity has been partially preserved for the bridge structure.
However, crack openings measured within loaded spans are additional indications that the
structure is not behaving as a fully continuous structure in response to live loads as originally
constructed.
Based on the behaviors observed within damaged regions as well as the decrease in
apparent stiffness and continuity compared to the post-repair FEM model, it is appropriate to
assume that increased damage may further reduce the apparent stiffness and continuity behavior
178
of the bridge structure. It is recommended to assume complete degradation of continuity in
response to strength-limit-state demands. Thus, an assumption of simply supported girder
behavior is recommended for the design of repair solutions for bridge structures containing
girders with damage at continuous ends. Decreased continuity behavior will decrease the shear
demand, but will also decrease the shear resistance provided by negative bending moments.
5.3.4 Linear-Elastic Behavior
Superposition test measurements were analyzed to assess if the bridge structure is exhibiting
linear-elastic behavior. During analysis, general behavior of the bridge structure and local
behavior of the damaged sections were considered. Bridge responses were measured while two
load-test trucks were independently positioned at midspan locations of both spans. Bridge
responses were also measured while the load-test trucks were simultaneously positioned at those
same respective locations. More details regarding superposition test procedures are given in
Section 4.8 of this report.
Theoretically, a structure exhibits linear-elastic behavior if the sum of the measured
responses representing both trucks at their respective positions independently is equal to the
actual measured response representing both trucks at their respective positions simultaneously.
The measurements for the post-repair superposition test can be found presented graphically in
Appendix G and in a tabular format in Appendix H of this report.
5.3.4.1 Linear-Elastic Behavior Assessment—Two-Span Structure
Deflections measured during the post-repair superposition test were analyzed to assess the
general behavior of the bridge structure. The predicted and measured superposition deflections
are illustrated in Figure 5.49. The differences between the predicted and measured superposition
deflections are presented in Table 5.13.
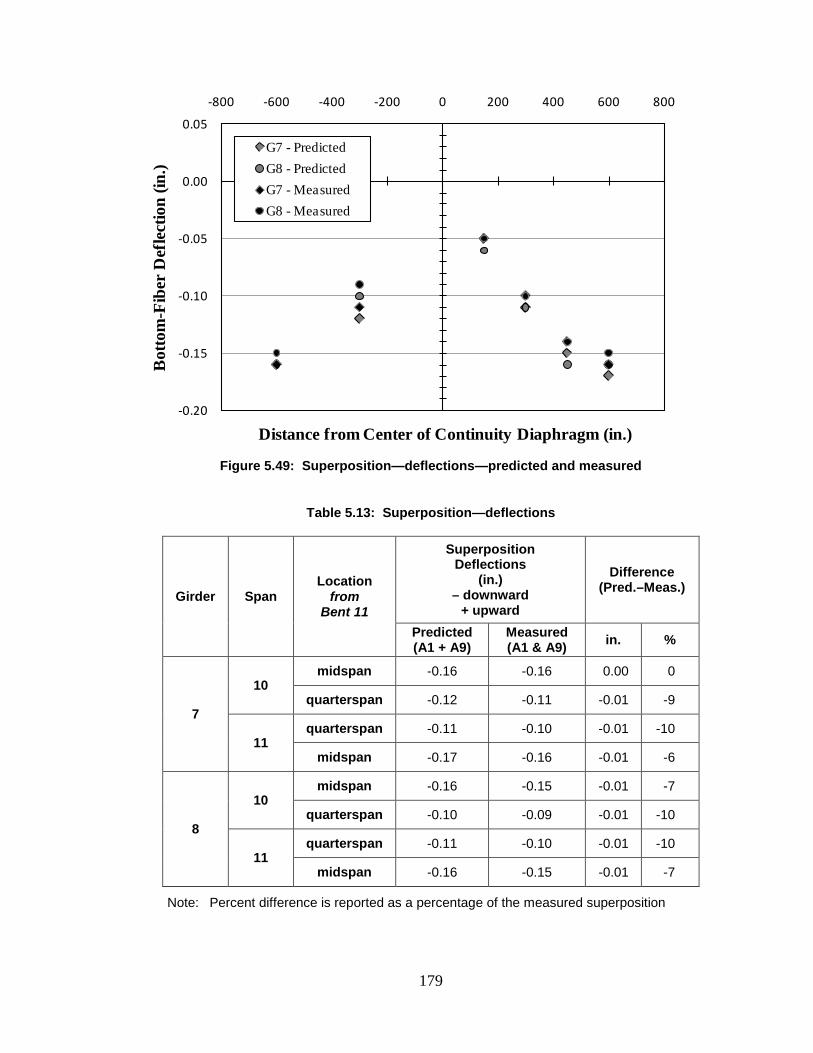
179
Figure 5.49: Superposition—deflections—predicted and measured
Table 5.13: Superposition—deflections
Girder Span Location
from Bent 11
Superposition Deflections
(in.) – downward
+ upward
Difference (Pred.–Meas.)
Predicted (A1 + A9)
Measured (A1 & A9) in. %
7
10 midspan -0.16 -0.16 0.00 0
quarterspan -0.12 -0.11 -0.01 -9
11 quarterspan -0.11 -0.10 -0.01 -10
midspan -0.17 -0.16 -0.01 -6
8
10 midspan -0.16 -0.15 -0.01 -7
quarterspan -0.10 -0.09 -0.01 -10
11 quarterspan -0.11 -0.10 -0.01 -10
midspan -0.16 -0.15 -0.01 -7
Note: Percent difference is reported as a percentage of the measured superposition
-0.20
-0.15
-0.10
-0.05
0.00
0.05
-800 -600 -400 -200 0 200 400 600 800
Bot
tom
-Fib
er D
efle
ctio
n (in
.)
Distance from Center of Continuity Diaphragm (in.)
G7 - PredictedG8 - PredictedG7 - MeasuredG8 - Measured
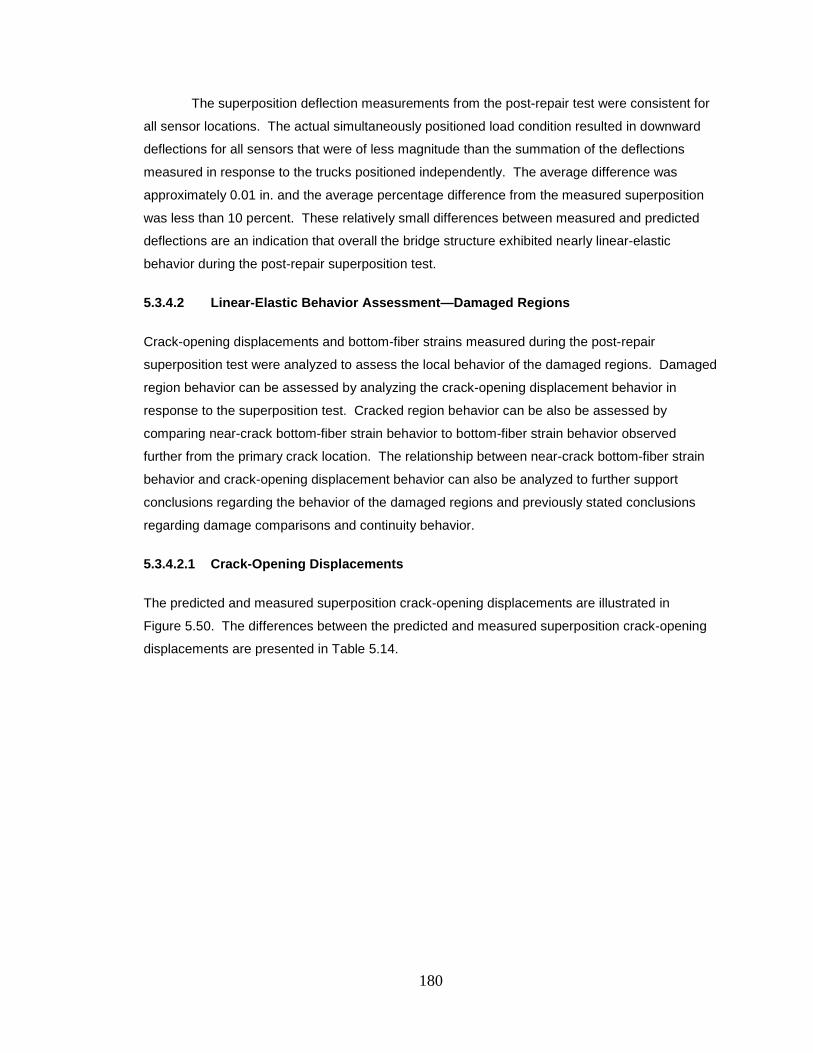
180
The superposition deflection measurements from the post-repair test were consistent for
all sensor locations. The actual simultaneously positioned load condition resulted in downward
deflections for all sensors that were of less magnitude than the summation of the deflections
measured in response to the trucks positioned independently. The average difference was
approximately 0.01 in. and the average percentage difference from the measured superposition
was less than 10 percent. These relatively small differences between measured and predicted
deflections are an indication that overall the bridge structure exhibited nearly linear-elastic
behavior during the post-repair superposition test.
5.3.4.2 Linear-Elastic Behavior Assessment—Damaged Regions
Crack-opening displacements and bottom-fiber strains measured during the post-repair
superposition test were analyzed to assess the local behavior of the damaged regions. Damaged
region behavior can be assessed by analyzing the crack-opening displacement behavior in
response to the superposition test. Cracked region behavior can be also be assessed by
comparing near-crack bottom-fiber strain behavior to bottom-fiber strain behavior observed
further from the primary crack location. The relationship between near-crack bottom-fiber strain
behavior and crack-opening displacement behavior can also be analyzed to further support
conclusions regarding the behavior of the damaged regions and previously stated conclusions
regarding damage comparisons and continuity behavior.
5.3.4.2.1 Crack-Opening Displacements
The predicted and measured superposition crack-opening displacements are illustrated in
Figure 5.50. The differences between the predicted and measured superposition crack-opening
displacements are presented in Table 5.14.
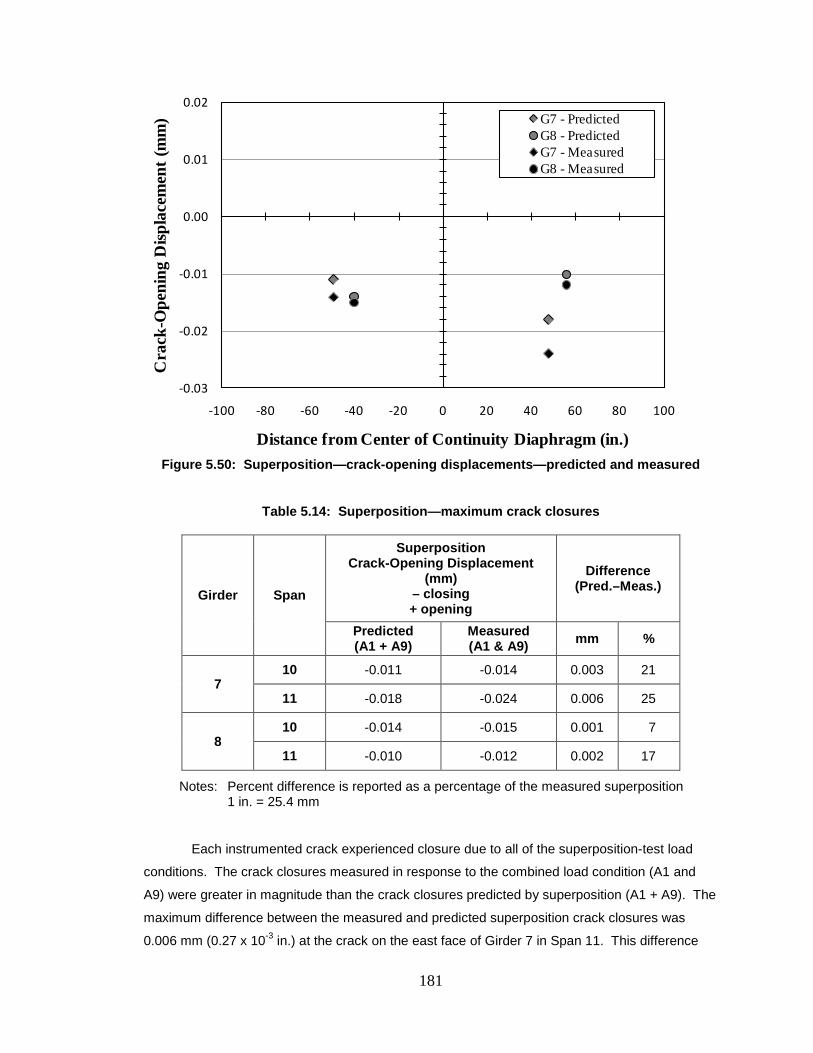
181
Figure 5.50: Superposition—crack-opening displacements—predicted and measured
Table 5.14: Superposition—maximum crack closures
Girder Span
Superposition Crack-Opening Displacement
(mm) – closing + opening
Difference (Pred.–Meas.)
Predicted (A1 + A9)
Measured (A1 & A9) mm %
7 10 -0.011 -0.014 0.003 21
11 -0.018 -0.024 0.006 25
8 10 -0.014 -0.015 0.001 7
11 -0.010 -0.012 0.002 17
Notes: Percent difference is reported as a percentage of the measured superposition 1 in. = 25.4 mm
Each instrumented crack experienced closure due to all of the superposition-test load
conditions. The crack closures measured in response to the combined load condition (A1 and
A9) were greater in magnitude than the crack closures predicted by superposition (A1 + A9). The
maximum difference between the measured and predicted superposition crack closures was
0.006 mm (0.27 x 10⁻³ in.) at the crack on the east face of Girder 7 in Span 11. This difference
-0.03
-0.02
-0.01
0.00
0.01
0.02
-100 -80 -60 -40 -20 0 20 40 60 80 100
Cra
ck-O
peni
ng D
ispla
cem
ent (
mm
)
Distance from Center of Continuity Diaphragm (in.)
G7 - PredictedG8 - PredictedG7 - MeasuredG8 - Measured
182
resulted in a percentage difference from the measured superposition of 25 percent. The average
difference between the measured and predicted crack closures for all four crack locations was
0.003 mm (0.14 x 10⁻³ in.), and the average percentage difference was 18 percent of the
measured result.
The magnitudes of the differences and percentage differences between measured and
predicted crack closures during the post-repair superposition test indicate that the principle of
superposition is not valid in the cracked regions. Therfore, crack locations are exhibiting
nonlinear behavior. As previously noted, the location of the COD gage on Girder 8-Span 10 likely
had an effect on the crack-opening displacement measurements making this gage less reliable
for comparison. The damaged region of Girder 7 in Span 11 exhibited the apparent least linear
behavior. The damaged region of Girder 8 in Span 10 exhibited the most apparent linear
behavior. These varying degrees of linear behavior can be related to varying degrees of damage
within each girder.
Nonlinear behavior exhibited by measured crack closures is possibly associated with the
presence of multiple cracks surrounding the instrumented crack locations. Load conditions that
result in closure of a gaged crack will likely also result in closure of smaller neighboring cracks.
As smaller neighboring cracks close, the local cross-sectional area of the concrete effectively
transmitting compression is increased. Due to the increased local effective compression zone,
the application of additional loads that would result in closure of a gaged crack, if applied
independently, will result in additional crack closure of greater magnitude than the closure in
response to the independent load condition. This neighboring crack closure explanation, as the
possible cause of nonlinear behavior, is supported by the observation that the trucks positioned
simultaneously produced crack closures that were measured to be of greater magnitude than the
summation of the measured crack closures in response to the trucks positioned independently.
5.3.4.2.2 Bottom-Fiber Strains
The predicted and measured superposition bottom-fiber strain measurements are presented in
Figure 5.51. The differences between the predicted and measured superposition bottom-fiber
strain measurements are presented in Tables 5.15 and 5.16.
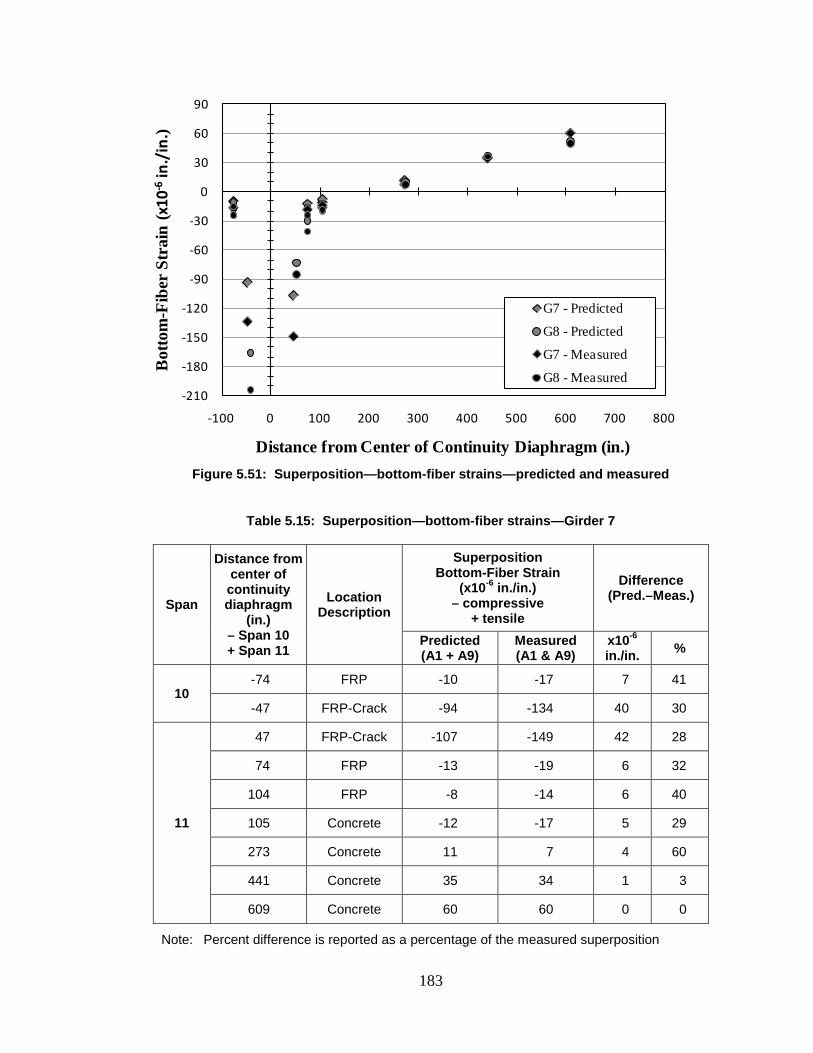
183
Figure 5.51: Superposition—bottom-fiber strains—predicted and measured
Table 5.15: Superposition—bottom-fiber strains—Girder 7
Span
Distance from center of continuity diaphragm
(in.) – Span 10 + Span 11
Location Description
Superposition Bottom-Fiber Strain
(x10-6 in./in.) – compressive
+ tensile
Difference (Pred.–Meas.)
Predicted (A1 + A9)
Measured (A1 & A9)
x10-6
in./in. %
10 -74 FRP -10 -17 7 41
-47 FRP-Crack -94 -134 40 30
11
47 FRP-Crack -107 -149 42 28
74 FRP -13 -19 6 32
104 FRP -8 -14 6 40
105 Concrete -12 -17 5 29
273 Concrete 11 7 4 60
441 Concrete 35 34 1 3
609 Concrete 60 60 0 0
Note: Percent difference is reported as a percentage of the measured superposition
-210
-180
-150
-120
-90
-60
-30
0
30
60
90
-100 0 100 200 300 400 500 600 700 800
Bot
tom
-Fib
er S
trai
n (x
10-6
in./
in.)
Distance from Center of Continuity Diaphragm (in.)
G7 - Predicted
G8 - Predicted
G7 - Measured
G8 - Measured
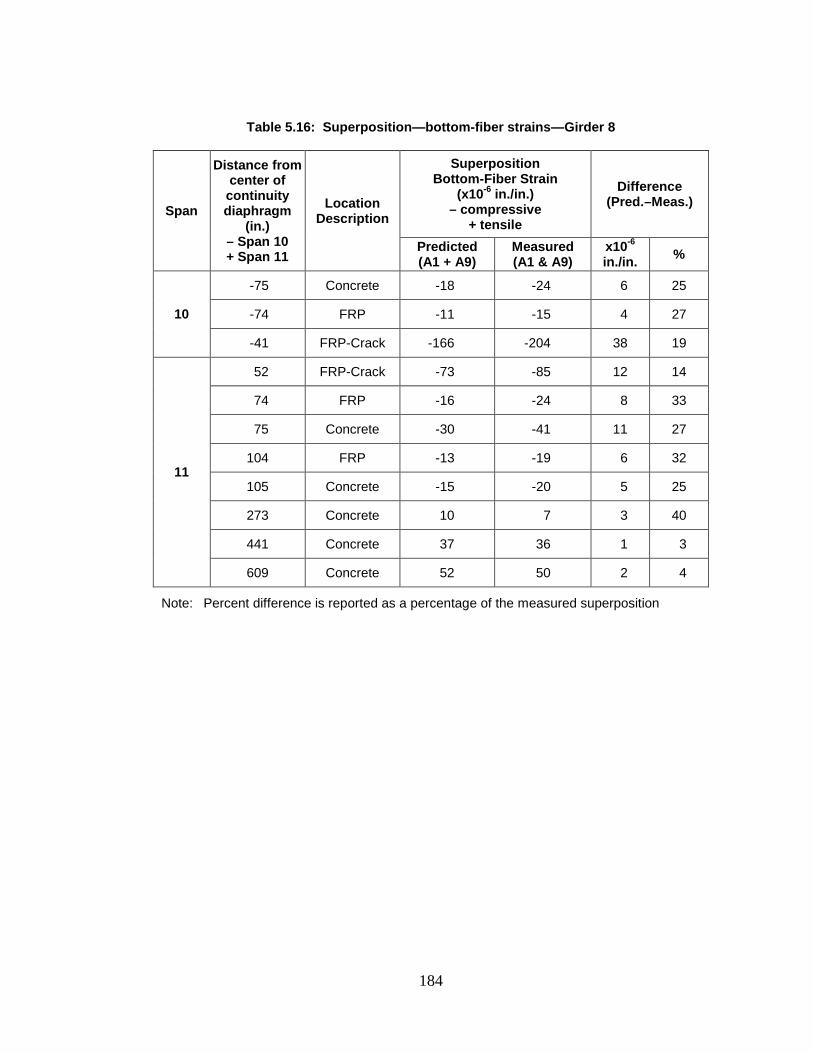
184
Table 5.16: Superposition—bottom-fiber strains—Girder 8
Span
Distance from center of continuity diaphragm
(in.) – Span 10 + Span 11
Location Description
Superposition Bottom-Fiber Strain
(x10-6 in./in.) – compressive
+ tensile
Difference (Pred.–Meas.)
Predicted (A1 + A9)
Measured (A1 & A9)
x10-6
in./in. %
10
-75 Concrete -18 -24 6 25
-74 FRP -11 -15 4 27
-41 FRP-Crack -166 -204 38 19
11
52 FRP-Crack -73 -85 12 14
74 FRP -16 -24 8 33
75 Concrete -30 -41 11 27
104 FRP -13 -19 6 32
105 Concrete -15 -20 5 25
273 Concrete 10 7 3 40
441 Concrete 37 36 1 3
609 Concrete 52 50 2 4
Note: Percent difference is reported as a percentage of the measured superposition
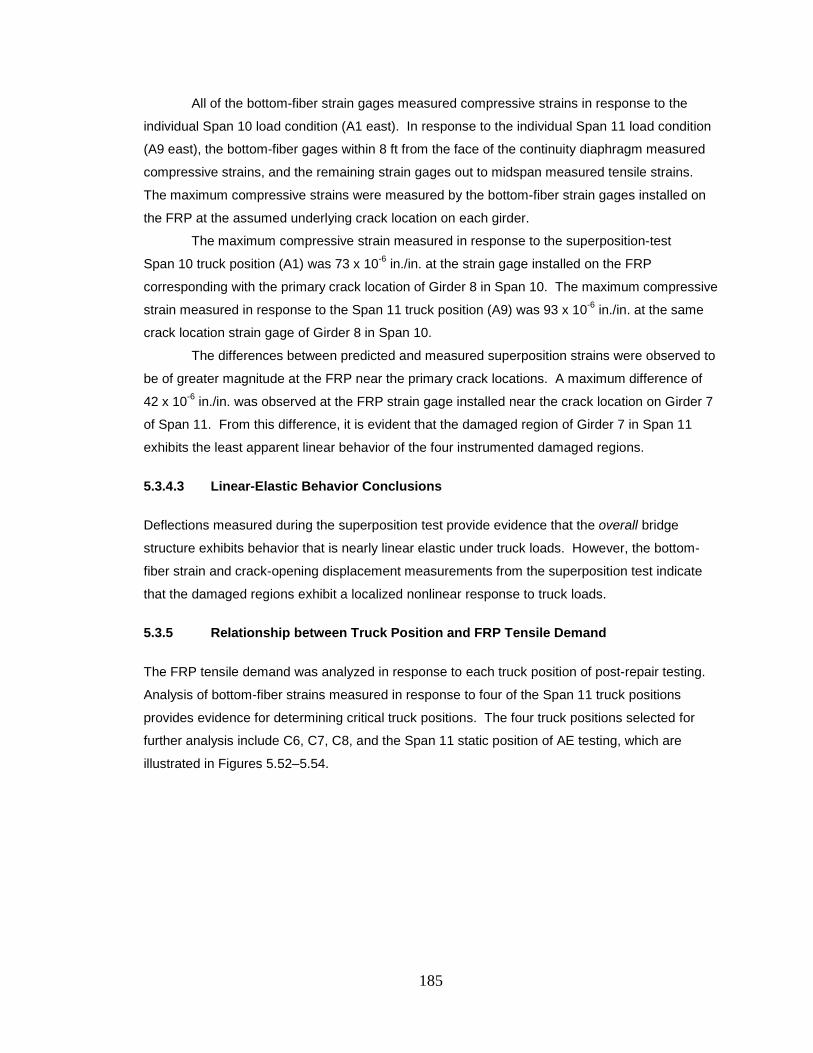
185
All of the bottom-fiber strain gages measured compressive strains in response to the
individual Span 10 load condition (A1 east). In response to the individual Span 11 load condition
(A9 east), the bottom-fiber gages within 8 ft from the face of the continuity diaphragm measured
compressive strains, and the remaining strain gages out to midspan measured tensile strains.
The maximum compressive strains were measured by the bottom-fiber strain gages installed on
the FRP at the assumed underlying crack location on each girder.
The maximum compressive strain measured in response to the superposition-test
Span 10 truck position (A1) was 73 x 10-6 in./in. at the strain gage installed on the FRP
corresponding with the primary crack location of Girder 8 in Span 10. The maximum compressive
strain measured in response to the Span 11 truck position (A9) was 93 x 10-6 in./in. at the same
crack location strain gage of Girder 8 in Span 10.
The differences between predicted and measured superposition strains were observed to
be of greater magnitude at the FRP near the primary crack locations. A maximum difference of
42 x 10-6 in./in. was observed at the FRP strain gage installed near the crack location on Girder 7
of Span 11. From this difference, it is evident that the damaged region of Girder 7 in Span 11
exhibits the least apparent linear behavior of the four instrumented damaged regions.
5.3.4.3 Linear-Elastic Behavior Conclusions
Deflections measured during the superposition test provide evidence that the overall bridge
structure exhibits behavior that is nearly linear elastic under truck loads. However, the bottom-
fiber strain and crack-opening displacement measurements from the superposition test indicate
that the damaged regions exhibit a localized nonlinear response to truck loads.
5.3.5 Relationship between Truck Position and FRP Tensile Demand
The FRP tensile demand was analyzed in response to each truck position of post-repair testing.
Analysis of bottom-fiber strains measured in response to four of the Span 11 truck positions
provides evidence for determining critical truck positions. The four truck positions selected for
further analysis include C6, C7, C8, and the Span 11 static position of AE testing, which are
illustrated in Figures 5.52–5.54.
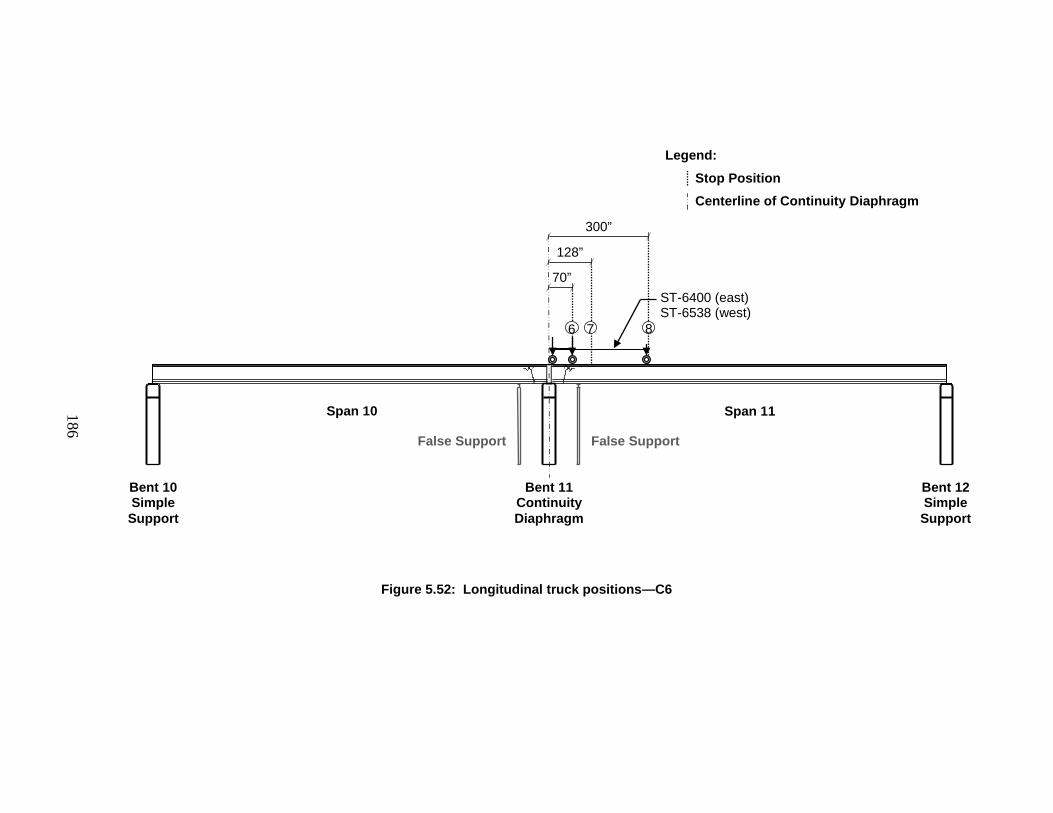
186
Figure 5.52: Longitudinal truck positions—C6
Legend: Stop Position Centerline of Continuity Diaphragm
Bent 10 Simple Support
Span 11
Bent 11
Continuity Diaphragm
Span 10
Bent 12 Simple Support
7 6
128”
70”
False Support False Support
ST-6400 (east) ST-6538 (west)
8
300”
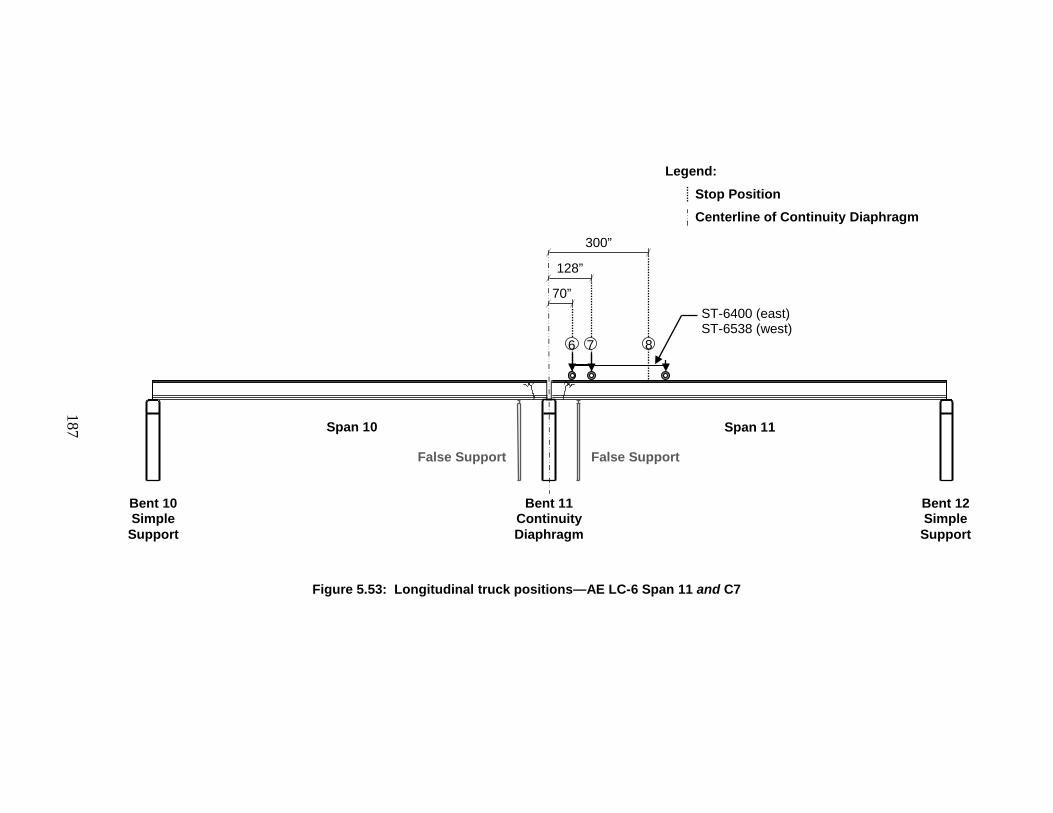
187
Figure 5.53: Longitudinal truck positions—AE LC-6 Span 11 and C7
Legend: Stop Position Centerline of Continuity Diaphragm
Bent 10 Simple Support
Span 11
Bent 11
Continuity Diaphragm
Span 10
Bent 12 Simple Support
7 6
128”
70”
False Support False Support
ST-6400 (east) ST-6538 (west)
8
300”
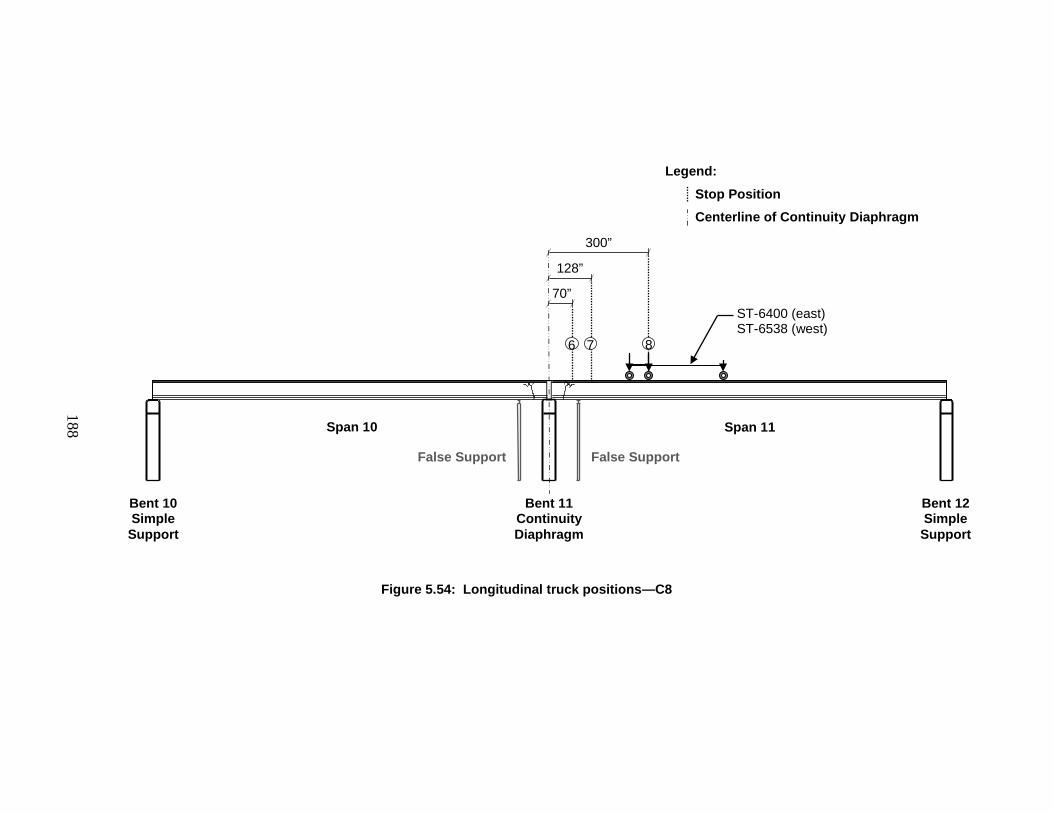
188
Figure 5.54: Longitudinal truck positions—C8
Legend: Stop Position Centerline of Continuity Diaphragm
Bent 10 Simple Support
Span 11
Bent 11
Continuity Diaphragm
Span 10
Bent 12 Simple Support
7 6
128”
70”
False Support False Support
ST-6400 (east) ST-6538 (west)
8
300”
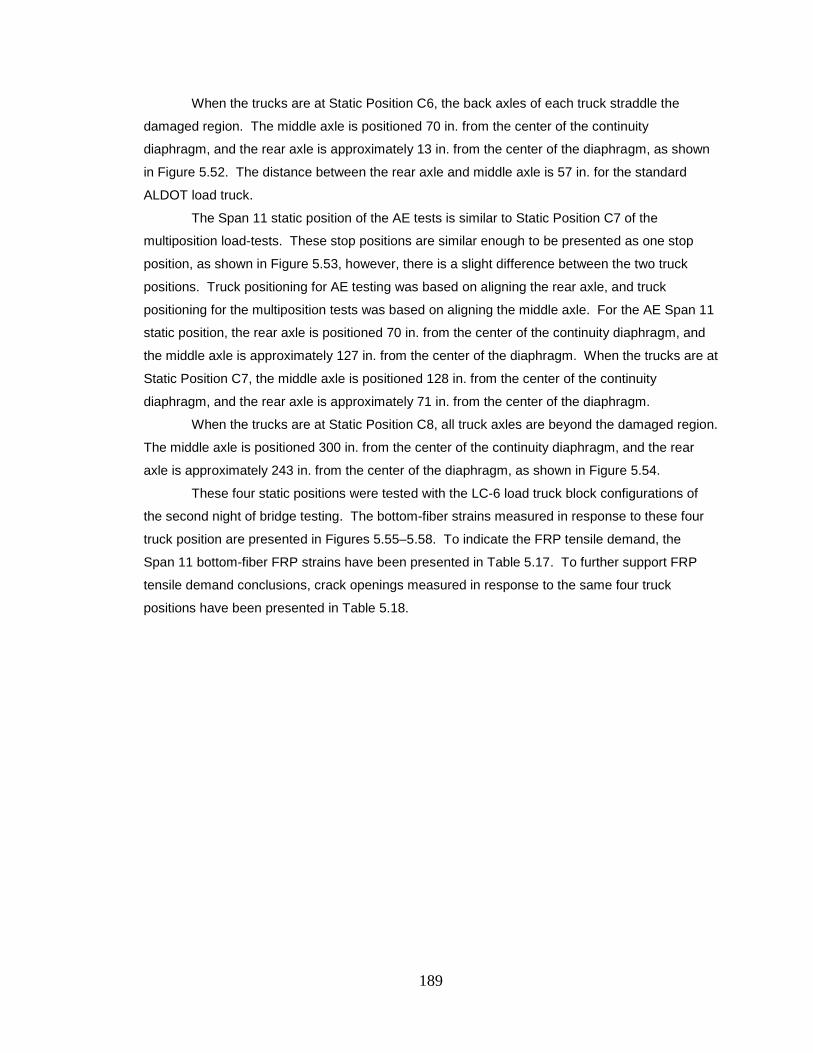
189
When the trucks are at Static Position C6, the back axles of each truck straddle the
damaged region. The middle axle is positioned 70 in. from the center of the continuity
diaphragm, and the rear axle is approximately 13 in. from the center of the diaphragm, as shown
in Figure 5.52. The distance between the rear axle and middle axle is 57 in. for the standard
ALDOT load truck.
The Span 11 static position of the AE tests is similar to Static Position C7 of the
multiposition load-tests. These stop positions are similar enough to be presented as one stop
position, as shown in Figure 5.53, however, there is a slight difference between the two truck
positions. Truck positioning for AE testing was based on aligning the rear axle, and truck
positioning for the multiposition tests was based on aligning the middle axle. For the AE Span 11
static position, the rear axle is positioned 70 in. from the center of the continuity diaphragm, and
the middle axle is approximately 127 in. from the center of the diaphragm. When the trucks are at
Static Position C7, the middle axle is positioned 128 in. from the center of the continuity
diaphragm, and the rear axle is approximately 71 in. from the center of the diaphragm.
When the trucks are at Static Position C8, all truck axles are beyond the damaged region.
The middle axle is positioned 300 in. from the center of the continuity diaphragm, and the rear
axle is approximately 243 in. from the center of the diaphragm, as shown in Figure 5.54.
These four static positions were tested with the LC-6 load truck block configurations of
the second night of bridge testing. The bottom-fiber strains measured in response to these four
truck position are presented in Figures 5.55–5.58. To indicate the FRP tensile demand, the
Span 11 bottom-fiber FRP strains have been presented in Table 5.17. To further support FRP
tensile demand conclusions, crack openings measured in response to the same four truck
positions have been presented in Table 5.18.
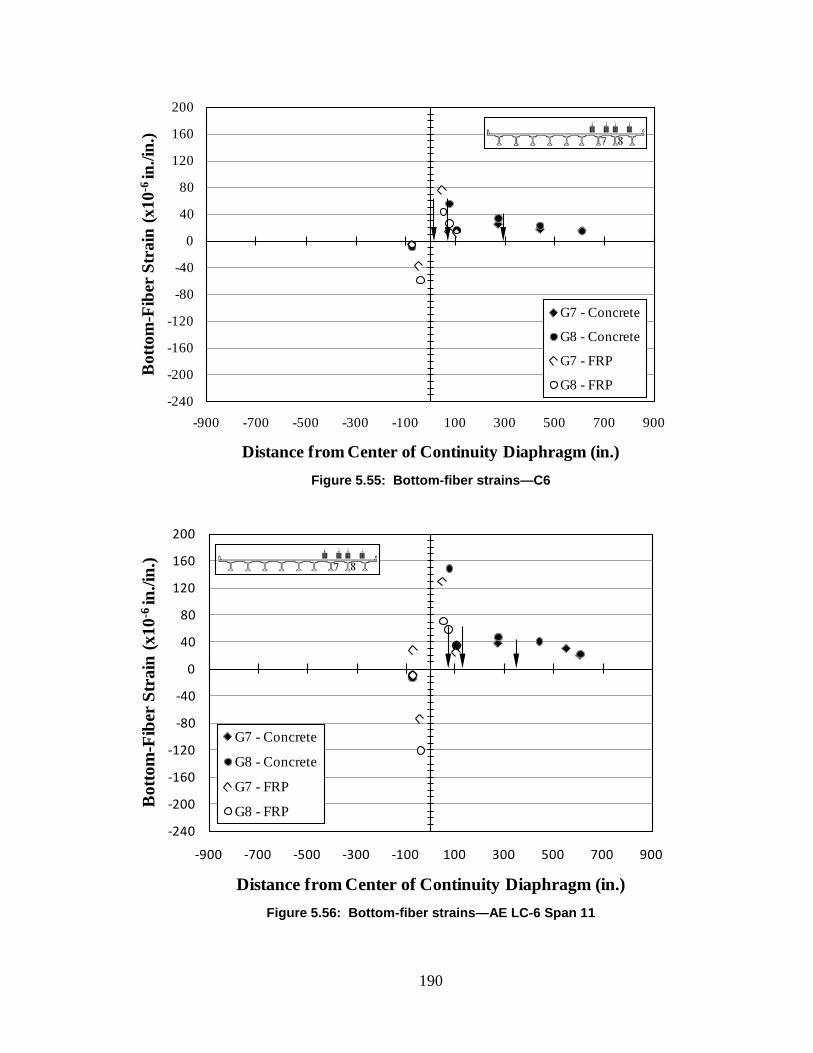
190
Figure 5.55: Bottom-fiber strains—C6
Figure 5.56: Bottom-fiber strains—AE LC-6 Span 11
-240
-200
-160
-120
-80
-40
0
40
80
120
160
200
-900 -700 -500 -300 -100 100 300 500 700 900
Bot
tom
-Fib
er S
trai
n (x
10-6
in./i
n.)
Distance from Center of Continuity Diaphragm (in.)
G7 - Concrete
G8 - Concrete
G7 - FRP
G8 - FRP
-240
-200
-160
-120
-80
-40
0
40
80
120
160
200
-900 -700 -500 -300 -100 100 300 500 700 900
Bot
tom
-Fib
er S
trai
n (x
10-6
in./i
n.)
Distance from Center of Continuity Diaphragm (in.)
G7 - Concrete
G8 - Concrete
G7 - FRP
G8 - FRP
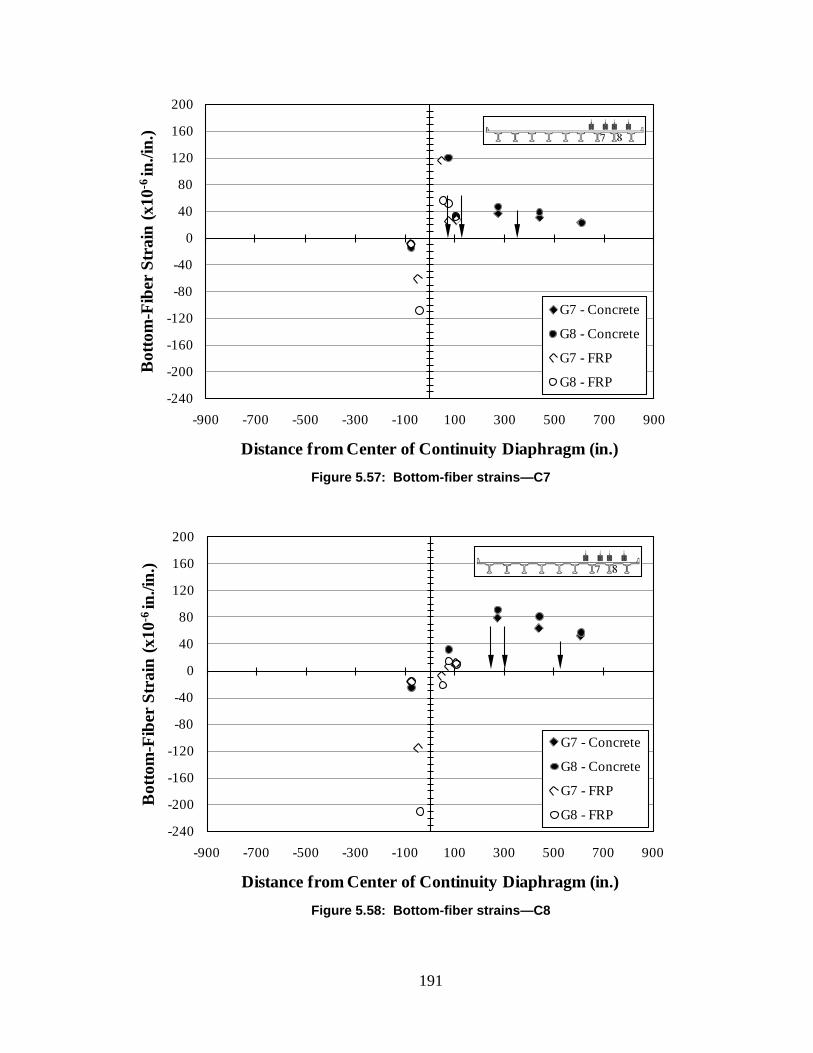
191
Figure 5.57: Bottom-fiber strains—C7
Figure 5.58: Bottom-fiber strains—C8
-240
-200
-160
-120
-80
-40
0
40
80
120
160
200
-900 -700 -500 -300 -100 100 300 500 700 900
Bot
tom
-Fib
er S
trai
n (x
10-6
in./i
n.)
Distance from Center of Continuity Diaphragm (in.)
G7 - Concrete
G8 - Concrete
G7 - FRP
G8 - FRP
-240
-200
-160
-120
-80
-40
0
40
80
120
160
200
-900 -700 -500 -300 -100 100 300 500 700 900
Bot
tom
-Fib
er S
trai
n (x
10-6
in./i
n.)
Distance from Center of Continuity Diaphragm (in.)
G7 - Concrete
G8 - Concrete
G7 - FRP
G8 - FRP
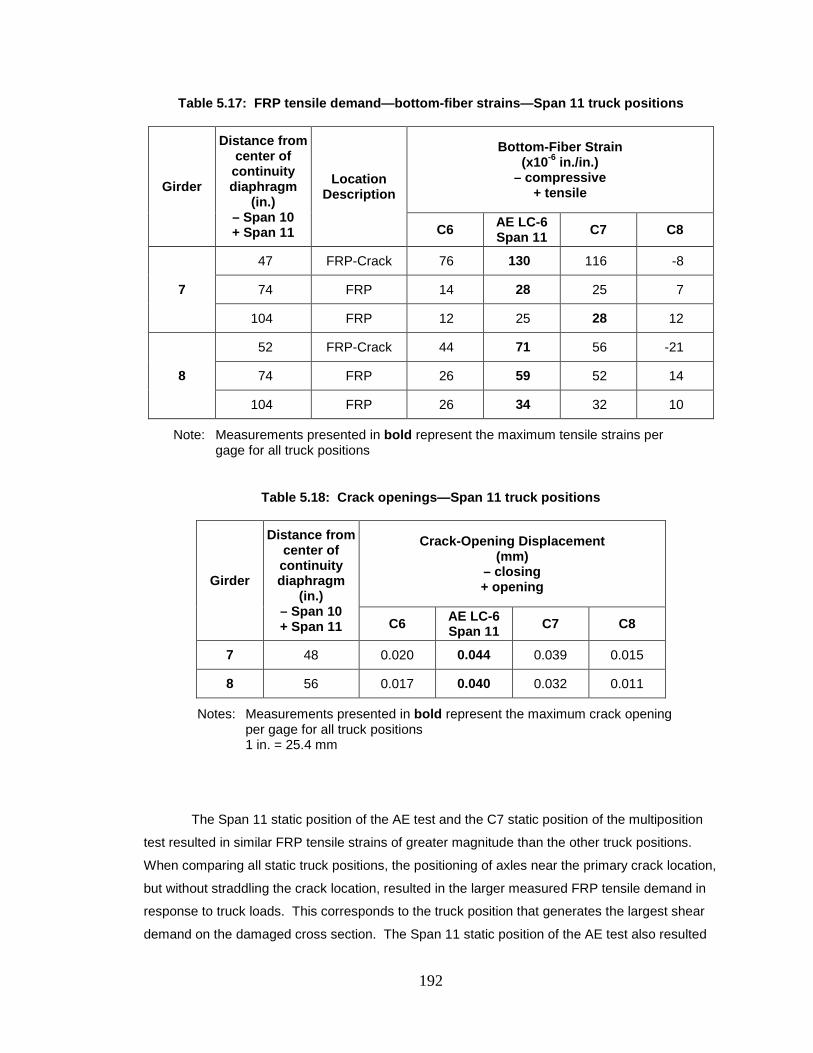
192
Table 5.17: FRP tensile demand—bottom-fiber strains—Span 11 truck positions
Girder
Distance from center of continuity diaphragm
(in.) – Span 10 + Span 11
Location Description
Bottom-Fiber Strain (x10-6 in./in.)
– compressive + tensile
C6 AE LC-6 Span 11 C7 C8
7
47 FRP-Crack 76 130 116 -8
74 FRP 14 28 25 7
104 FRP 12 25 28 12
8
52 FRP-Crack 44 71 56 -21
74 FRP 26 59 52 14
104 FRP 26 34 32 10
Note: Measurements presented in bold represent the maximum tensile strains per gage for all truck positions
Table 5.18: Crack openings—Span 11 truck positions
Girder
Distance from center of continuity diaphragm
(in.) – Span 10 + Span 11
Crack-Opening Displacement (mm)
– closing + opening
C6 AE LC-6 Span 11 C7 C8
7 48 0.020 0.044 0.039 0.015
8 56 0.017 0.040 0.032 0.011
Notes: Measurements presented in bold represent the maximum crack opening per gage for all truck positions 1 in. = 25.4 mm
The Span 11 static position of the AE test and the C7 static position of the multiposition
test resulted in similar FRP tensile strains of greater magnitude than the other truck positions.
When comparing all static truck positions, the positioning of axles near the primary crack location,
but without straddling the crack location, resulted in the larger measured FRP tensile demand in
response to truck loads. This corresponds to the truck position that generates the largest shear
demand on the damaged cross section. The Span 11 static position of the AE test also resulted
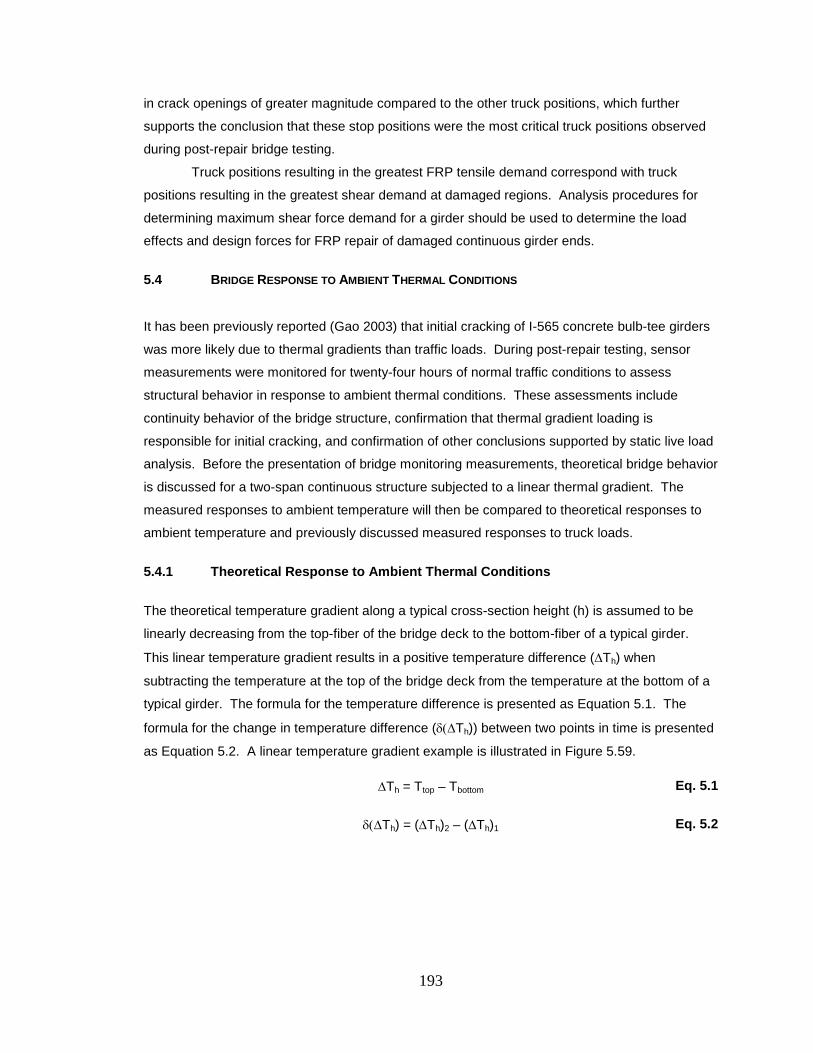
193
in crack openings of greater magnitude compared to the other truck positions, which further
supports the conclusion that these stop positions were the most critical truck positions observed
during post-repair bridge testing.
Truck positions resulting in the greatest FRP tensile demand correspond with truck
positions resulting in the greatest shear demand at damaged regions. Analysis procedures for
determining maximum shear force demand for a girder should be used to determine the load
effects and design forces for FRP repair of damaged continuous girder ends.
5.4 BRIDGE RESPONSE TO AMBIENT THERMAL CONDITIONS
It has been previously reported (Gao 2003) that initial cracking of I-565 concrete bulb-tee girders
was more likely due to thermal gradients than traffic loads. During post-repair testing, sensor
measurements were monitored for twenty-four hours of normal traffic conditions to assess
structural behavior in response to ambient thermal conditions. These assessments include
continuity behavior of the bridge structure, confirmation that thermal gradient loading is
responsible for initial cracking, and confirmation of other conclusions supported by static live load
analysis. Before the presentation of bridge monitoring measurements, theoretical bridge behavior
is discussed for a two-span continuous structure subjected to a linear thermal gradient. The
measured responses to ambient temperature will then be compared to theoretical responses to
ambient temperature and previously discussed measured responses to truck loads.
5.4.1 Theoretical Response to Ambient Thermal Conditions
The theoretical temperature gradient along a typical cross-section height (h) is assumed to be
linearly decreasing from the top-fiber of the bridge deck to the bottom-fiber of a typical girder.
This linear temperature gradient results in a positive temperature difference (∆Th) when
subtracting the temperature at the top of the bridge deck from the temperature at the bottom of a
typical girder. The formula for the temperature difference is presented as Equation 5.1. The
formula for the change in temperature difference (δ(∆Th)) between two points in time is presented
as Equation 5.2. A linear temperature gradient example is illustrated in Figure 5.59.
∆Th = Ttop – Tbottom Eq. 5.1
δ(∆Th) = (∆Th)2 – (∆Th)1 Eq. 5.2
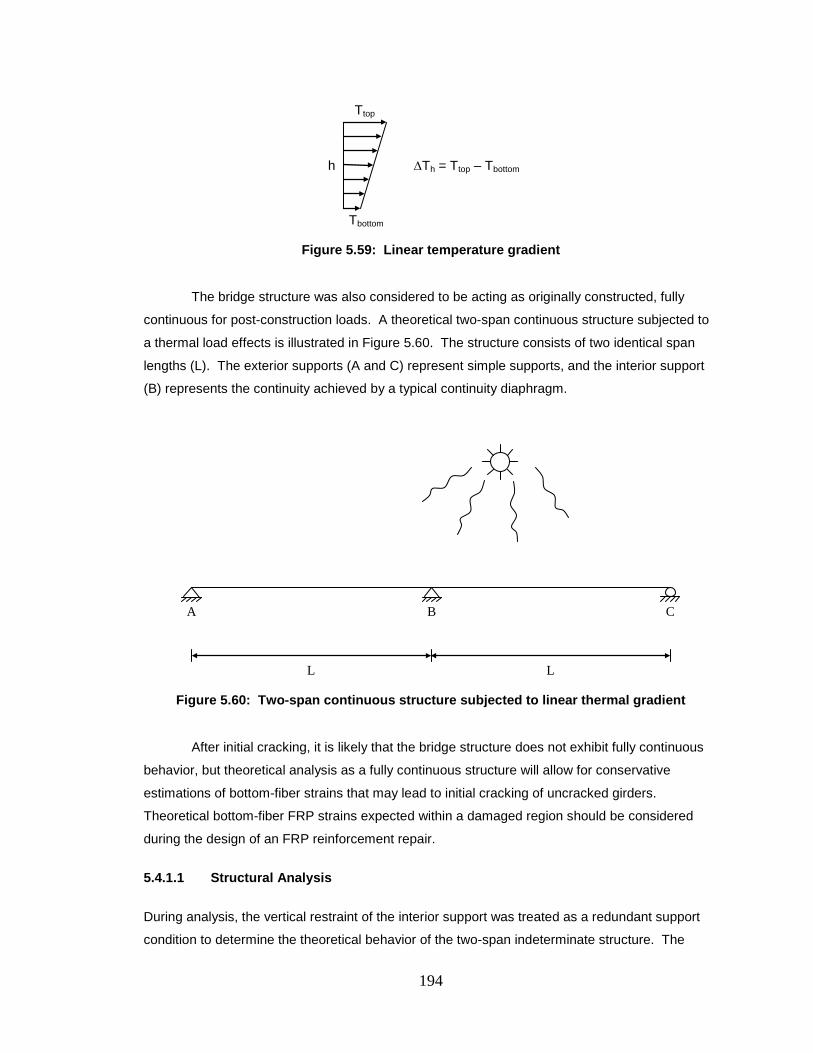
194
Figure 5.59: Linear temperature gradient
The bridge structure was also considered to be acting as originally constructed, fully
continuous for post-construction loads. A theoretical two-span continuous structure subjected to
a thermal load effects is illustrated in Figure 5.60. The structure consists of two identical span
lengths (L). The exterior supports (A and C) represent simple supports, and the interior support
(B) represents the continuity achieved by a typical continuity diaphragm.
Figure 5.60: Two-span continuous structure subjected to linear thermal gradient
After initial cracking, it is likely that the bridge structure does not exhibit fully continuous
behavior, but theoretical analysis as a fully continuous structure will allow for conservative
estimations of bottom-fiber strains that may lead to initial cracking of uncracked girders.
Theoretical bottom-fiber FRP strains expected within a damaged region should be considered
during the design of an FRP reinforcement repair.
5.4.1.1 Structural Analysis
During analysis, the vertical restraint of the interior support was treated as a redundant support
condition to determine the theoretical behavior of the two-span indeterminate structure. The
L L
A C B
h
Tbottom
Ttop
∆Th = Ttop – Tbottom
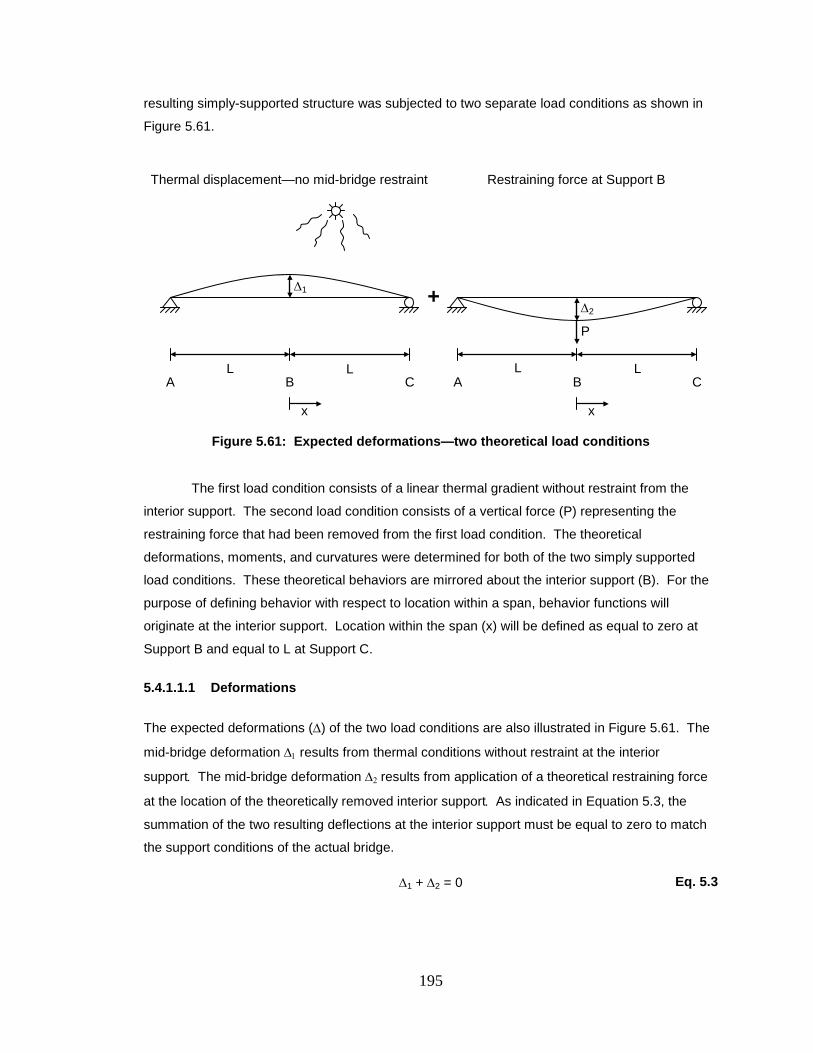
195
resulting simply-supported structure was subjected to two separate load conditions as shown in
Figure 5.61.
Figure 5.61: Expected deformations—two theoretical load conditions
The first load condition consists of a linear thermal gradient without restraint from the
interior support. The second load condition consists of a vertical force (P) representing the
restraining force that had been removed from the first load condition. The theoretical
deformations, moments, and curvatures were determined for both of the two simply supported
load conditions. These theoretical behaviors are mirrored about the interior support (B). For the
purpose of defining behavior with respect to location within a span, behavior functions will
originate at the interior support. Location within the span (x) will be defined as equal to zero at
Support B and equal to L at Support C.
5.4.1.1.1 Deformations
The expected deformations (∆) of the two load conditions are also illustrated in Figure 5.61. The
mid-bridge deformation ∆1 results from thermal conditions without restraint at the interior
support. The mid-bridge deformation ∆2 results from application of a theoretical restraining force
at the location of the theoretically removed interior support. As indicated in Equation 5.3, the
summation of the two resulting deflections at the interior support must be equal to zero to match
the support conditions of the actual bridge.
∆1 + ∆2 = 0 Eq. 5.3
x
+
L L L
P
∆2
∆1
L
Thermal displacement—no mid-bridge restraint Restraining force at Support B
A C B A C B
x
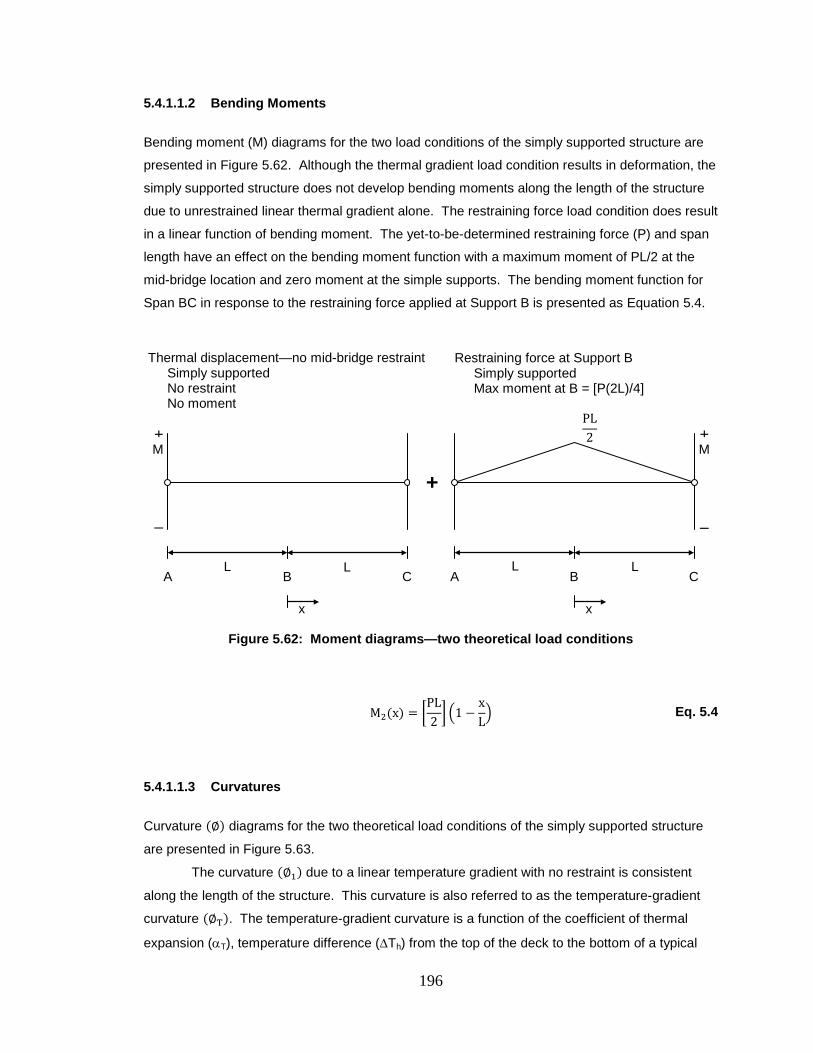
196
5.4.1.1.2 Bending Moments
Bending moment (M) diagrams for the two load conditions of the simply supported structure are
presented in Figure 5.62. Although the thermal gradient load condition results in deformation, the
simply supported structure does not develop bending moments along the length of the structure
due to unrestrained linear thermal gradient alone. The restraining force load condition does result
in a linear function of bending moment. The yet-to-be-determined restraining force (P) and span
length have an effect on the bending moment function with a maximum moment of PL/2 at the
mid-bridge location and zero moment at the simple supports. The bending moment function for
Span BC in response to the restraining force applied at Support B is presented as Equation 5.4.
Figure 5.62: Moment diagrams—two theoretical load conditions
M2(x) = �PL2� �1 −
xL� Eq. 5.4
5.4.1.1.3 Curvatures
Curvature (∅) diagrams for the two theoretical load conditions of the simply supported structure
are presented in Figure 5.63.
The curvature (∅1) due to a linear temperature gradient with no restraint is consistent
along the length of the structure. This curvature is also referred to as the temperature-gradient
curvature (∅T). The temperature-gradient curvature is a function of the coefficient of thermal
expansion (αT), temperature difference (∆Th) from the top of the deck to the bottom of a typical
+
M +
M
– –
Restraining force at Support B Simply supported Max moment at B = [P(2L)/4]
PL2
L L L L
+
Thermal displacement—no mid-bridge restraint Simply supported No restraint No moment
A C B A C B
x x
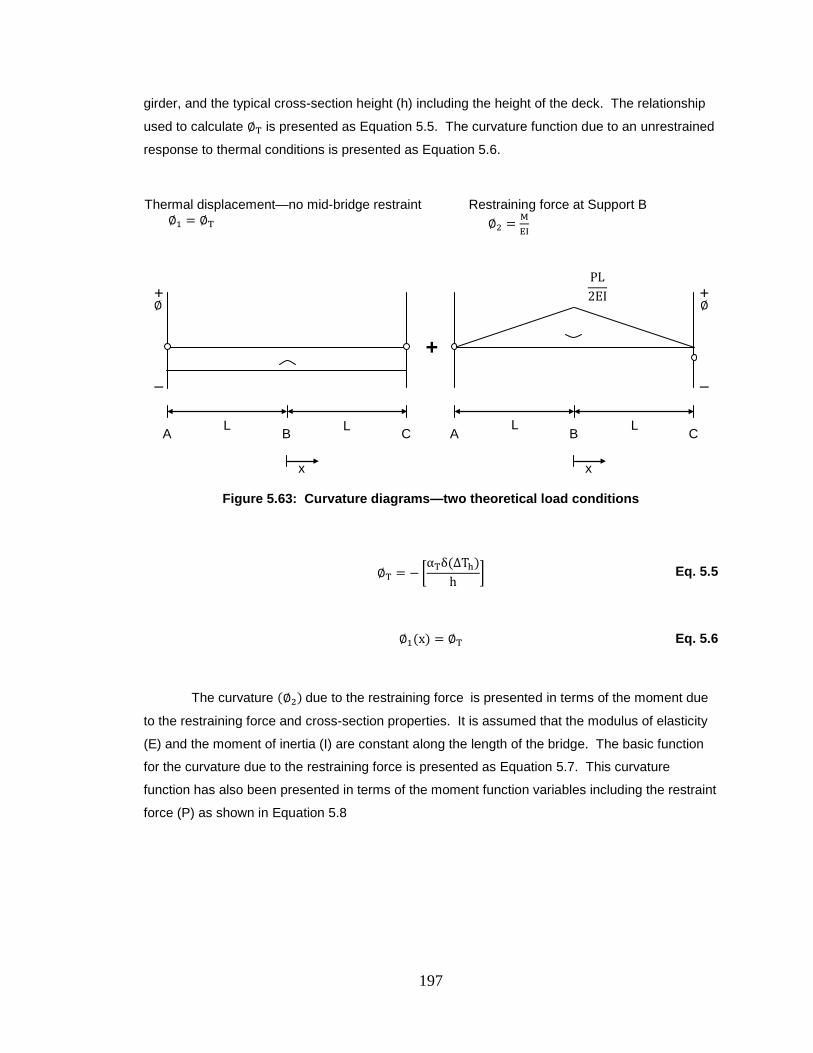
197
girder, and the typical cross-section height (h) including the height of the deck. The relationship
used to calculate ∅T is presented as Equation 5.5. The curvature function due to an unrestrained
response to thermal conditions is presented as Equation 5.6.
Figure 5.63: Curvature diagrams—two theoretical load conditions
∅T = −�αTδ(∆Th)
h� Eq. 5.5
∅1(x) = ∅T Eq. 5.6
The curvature (∅2) due to the restraining force is presented in terms of the moment due
to the restraining force and cross-section properties. It is assumed that the modulus of elasticity
(E) and the moment of inertia (I) are constant along the length of the bridge. The basic function
for the curvature due to the restraining force is presented as Equation 5.7. This curvature
function has also been presented in terms of the moment function variables including the restraint
force (P) as shown in Equation 5.8
+
∅ +
∅
– –
Restraining force at Support B ∅2 = M
EI
PL2EI
L L L L
+
Thermal displacement—no mid-bridge restraint ∅1 = ∅T
A C B A C B
x x
198
∅2(x) =M2(x)
EI Eq. 5.7
∅2(x) =PL2EI
�1 −xL� Eq. 5.8
5.4.1.1.4 Restraint Force at Interior Support
The theory of consistent deformations was used to determine the theoretical restraint force at B.
The theoretical mid-bridge deformations were determined in terms of variables within the
curvature and moment functions. The formulas for the theoretical mid-bridge deflections ∆1 and
∆2 are shown as Equations 5.9 and 5.10 respectively.
∆1=αTδ(∆Th)L2
2h Eq. 5.9
∆2=−PL3
6EI Eq. 5.10
The restraint force is a function of the same properties used to define the moments and
curvatures resulting from the two theoretical load conditions. The deflections ∆1 and ∆2 were
substituted into the consistent deformations relationship presented as Equation 5.3, and the
resulting formula is shown as Equation 5.11. This formula was then manipulated to solve for the
restraint force P in terms of the other variables as shown in Equation 5.12.
αTδ(∆Th)L2
2h−
PL3
6EI= 0 Eq. 5.11
P =3αTδ(∆Th)EI
hL Eq. 5.12
5.4.1.2 Expected Behavior
The expected behavior of the two-span continuous structure can be determined by
superimposing the behaviors of the simply supported structure resulting from the temperature
gradient and restraint force load conditions. The expected response characteristics are
presented as functions of the distance (x) from the interior support. The behaviors presented
199
include the net curvature (∅), bending moment (M), shear force (V), bottom-fiber strain (ε), and
bottom-fiber stress (𝑓). The bottom-fiber strains are computed from the curvatures, and the shear
forces and bottom-fiber stresses are derived from the bending moments. The bottom-fiber strains
and stresses are also a function of the distance (ybot) from the cross section centroid to the
bottom fiber.
5.4.1.2.1 Curvature
The formula for the expected net curvature presented as Equation 5.13 is derived by
superimposing the previously defined curvature functions of the two theoretical load conditions.
The curvature (∅1) due to a temperature gradient without restraint is presented as Equation 5.14.
The restraint force variable (P) within the curvature function presented as Equation 5.8, which
represents the curvature due to the restraint force associated with temperature effects that
restrained at the interior support, can be substituted with the restraint force formula defined as
Equation 5.12. The resulting curvature (∅2) due to the restraint force is presented as
Equation 5.15.
∅(x) = ∅1(x) + ∅2(x) Eq. 5.13
∅1(x) = −�αTδ(∆Th)
h� Eq. 5.14
∅2(x) =PL2EI
�1 −xL�
P =3αTδ(∆Th)EI
hL
∅2(x) =32�αTδ(∆Th)
h� �1 −
xL� Eq. 5.15
The curvature functions defined in Equations 5.14 and 5.15 can be superimposed to
determine the expected net curvature function due to a linear temperature gradient with restraint
at the interior support, which is presented as Equation 5.16.
∅(x) =12�αT∆T
h� �1 − 3 �
xL�� Eq. 5.16
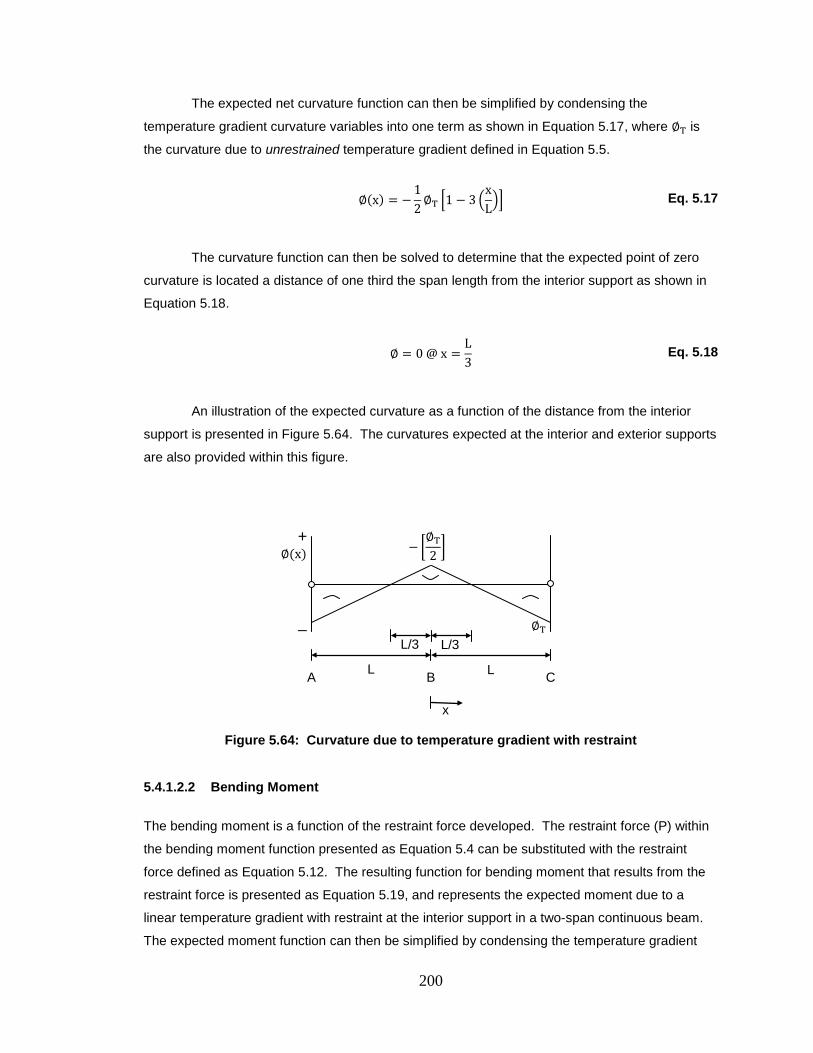
200
The expected net curvature function can then be simplified by condensing the
temperature gradient curvature variables into one term as shown in Equation 5.17, where ∅T is
the curvature due to unrestrained temperature gradient defined in Equation 5.5.
∅(x) = −12∅T �1 − 3 �
xL�� Eq. 5.17
The curvature function can then be solved to determine that the expected point of zero
curvature is located a distance of one third the span length from the interior support as shown in
Equation 5.18.
∅ = 0 @ x =L3
Eq. 5.18
An illustration of the expected curvature as a function of the distance from the interior
support is presented in Figure 5.64. The curvatures expected at the interior and exterior supports
are also provided within this figure.
Figure 5.64: Curvature due to temperature gradient with restraint
5.4.1.2.2 Bending Moment
The bending moment is a function of the restraint force developed. The restraint force (P) within
the bending moment function presented as Equation 5.4 can be substituted with the restraint
force defined as Equation 5.12. The resulting function for bending moment that results from the
restraint force is presented as Equation 5.19, and represents the expected moment due to a
linear temperature gradient with restraint at the interior support in a two-span continuous beam.
The expected moment function can then be simplified by condensing the temperature gradient
+
∅(x)
L/3 L/3 ∅T
−�∅T2�
–
L L
A C B
x
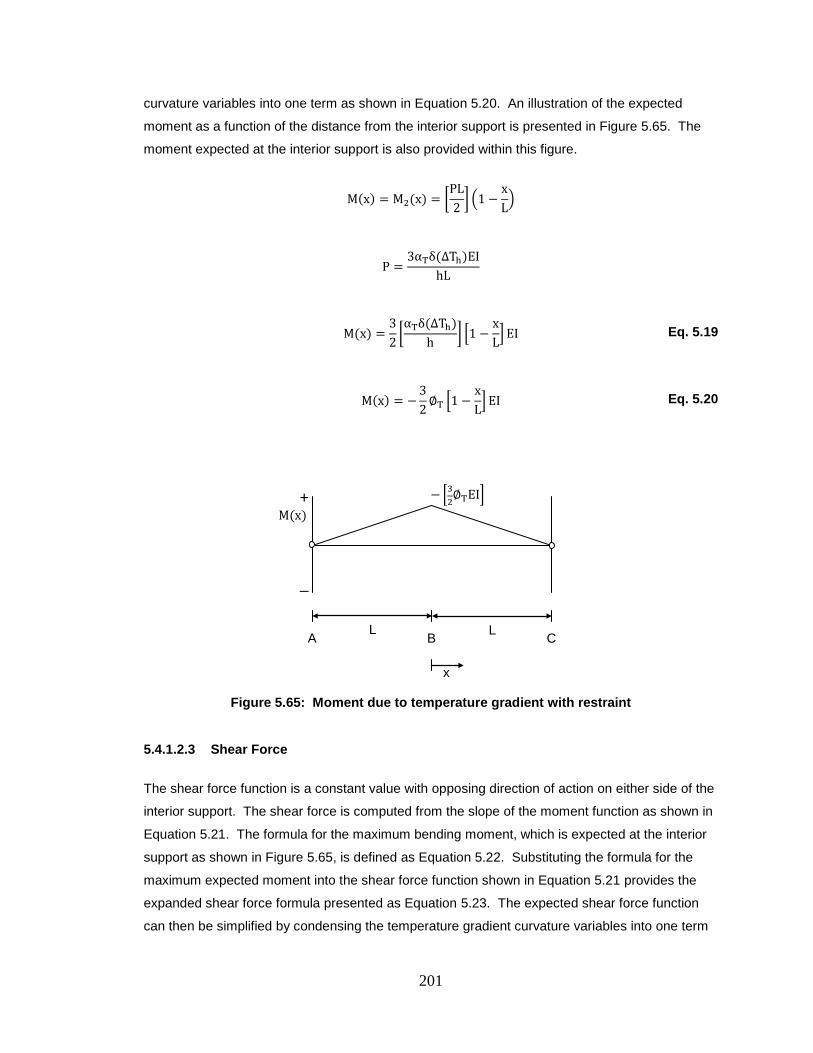
201
curvature variables into one term as shown in Equation 5.20. An illustration of the expected
moment as a function of the distance from the interior support is presented in Figure 5.65. The
moment expected at the interior support is also provided within this figure.
M(x) = M2(x) = �PL2� �1 −
xL�
P =3αTδ(∆Th)EI
hL
M(x) =32�αTδ(∆Th)
h� �1 −
xL�EI Eq. 5.19
M(x) = −32∅T �1 −
xL�EI Eq. 5.20
Figure 5.65: Moment due to temperature gradient with restraint
5.4.1.2.3 Shear Force
The shear force function is a constant value with opposing direction of action on either side of the
interior support. The shear force is computed from the slope of the moment function as shown in
Equation 5.21. The formula for the maximum bending moment, which is expected at the interior
support as shown in Figure 5.65, is defined as Equation 5.22. Substituting the formula for the
maximum expected moment into the shear force function shown in Equation 5.21 provides the
expanded shear force formula presented as Equation 5.23. The expected shear force function
can then be simplified by condensing the temperature gradient curvature variables into one term
+
M(x)
–
− �32∅TEI�
L L
A C B
x
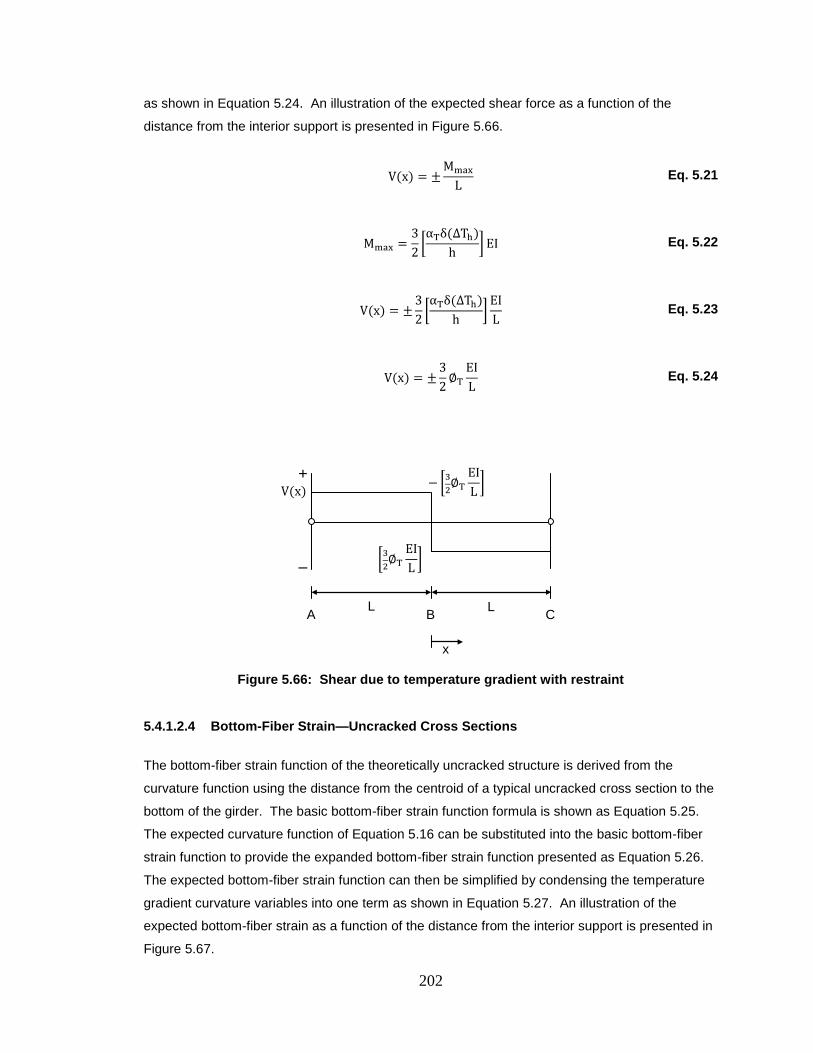
202
as shown in Equation 5.24. An illustration of the expected shear force as a function of the
distance from the interior support is presented in Figure 5.66.
V(x) = ±Mmax
L Eq. 5.21
Mmax =32�αTδ(∆Th)
h� EI Eq. 5.22
V(x) = ±32�αTδ(∆Th)
h�
EIL
Eq. 5.23
V(x) = ±32∅T
EIL
Eq. 5.24
Figure 5.66: Shear due to temperature gradient with restraint
5.4.1.2.4 Bottom-Fiber Strain—Uncracked Cross Sections
The bottom-fiber strain function of the theoretically uncracked structure is derived from the
curvature function using the distance from the centroid of a typical uncracked cross section to the
bottom of the girder. The basic bottom-fiber strain function formula is shown as Equation 5.25.
The expected curvature function of Equation 5.16 can be substituted into the basic bottom-fiber
strain function to provide the expanded bottom-fiber strain function presented as Equation 5.26.
The expected bottom-fiber strain function can then be simplified by condensing the temperature
gradient curvature variables into one term as shown in Equation 5.27. An illustration of the
expected bottom-fiber strain as a function of the distance from the interior support is presented in
Figure 5.67.
+
V(x)
�32∅T
EIL�
−�32∅T
EIL�
–
L L
A C B
x
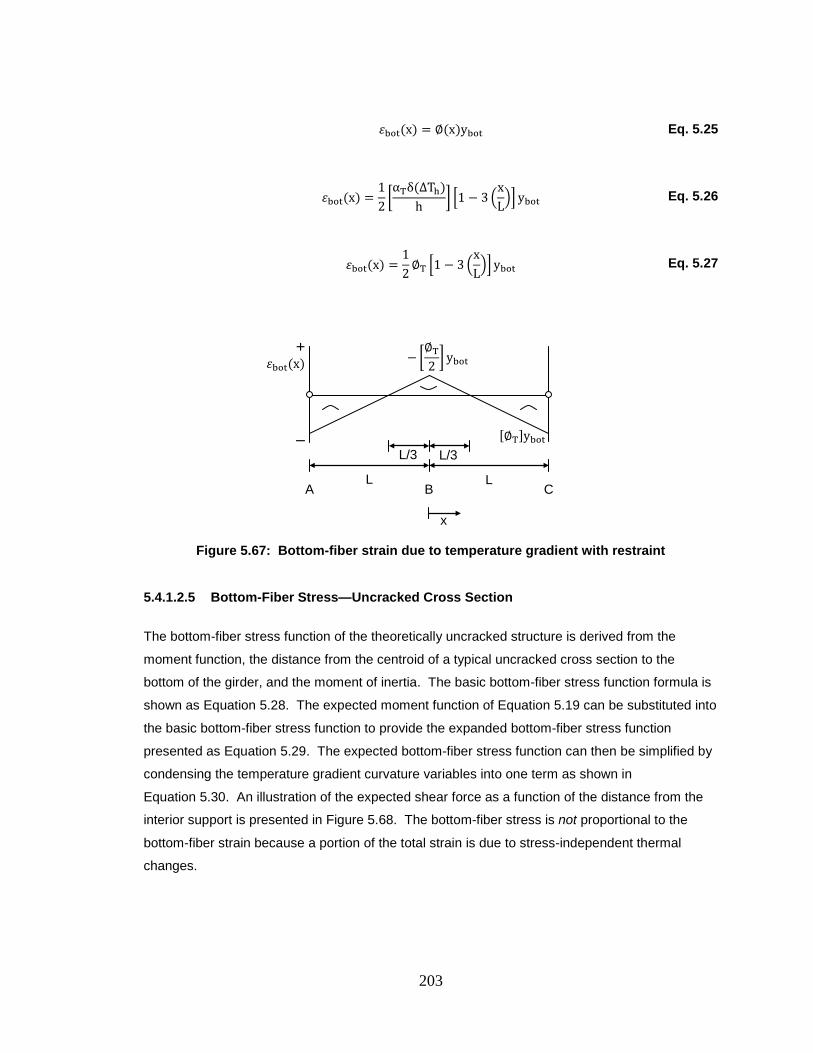
203
𝜀bot(x) = ∅(x)ybot Eq. 5.25
𝜀bot(x) =12�αTδ(∆Th)
h� �1 − 3 �
xL�� ybot Eq. 5.26
𝜀bot(x) =12∅T �1 − 3 �
xL�� ybot Eq. 5.27
Figure 5.67: Bottom-fiber strain due to temperature gradient with restraint
5.4.1.2.5 Bottom-Fiber Stress—Uncracked Cross Section
The bottom-fiber stress function of the theoretically uncracked structure is derived from the
moment function, the distance from the centroid of a typical uncracked cross section to the
bottom of the girder, and the moment of inertia. The basic bottom-fiber stress function formula is
shown as Equation 5.28. The expected moment function of Equation 5.19 can be substituted into
the basic bottom-fiber stress function to provide the expanded bottom-fiber stress function
presented as Equation 5.29. The expected bottom-fiber stress function can then be simplified by
condensing the temperature gradient curvature variables into one term as shown in
Equation 5.30. An illustration of the expected shear force as a function of the distance from the
interior support is presented in Figure 5.68. The bottom-fiber stress is not proportional to the
bottom-fiber strain because a portion of the total strain is due to stress-independent thermal
changes.
+
𝜀bot(x)
L/3 L/3 [∅T]ybot
−�∅T2� ybot
–
L L
A C B
x
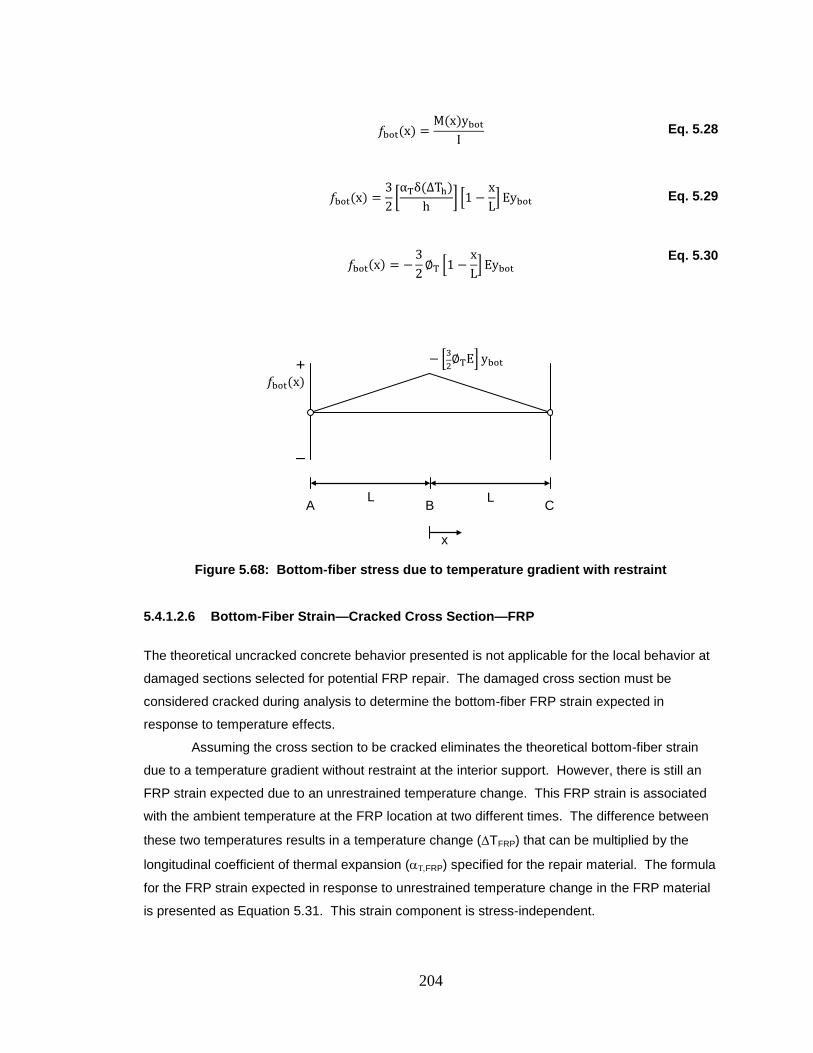
204
𝑓bot(x) =M(x)ybot
I Eq. 5.28
𝑓bot(x) =32�αTδ(∆Th)
h� �1 −
xL�Eybot Eq. 5.29
𝑓bot(x) = −32∅T �1 −
xL�Eybot
Eq. 5.30
Figure 5.68: Bottom-fiber stress due to temperature gradient with restraint
5.4.1.2.6 Bottom-Fiber Strain—Cracked Cross Section—FRP
The theoretical uncracked concrete behavior presented is not applicable for the local behavior at
damaged sections selected for potential FRP repair. The damaged cross section must be
considered cracked during analysis to determine the bottom-fiber FRP strain expected in
response to temperature effects.
Assuming the cross section to be cracked eliminates the theoretical bottom-fiber strain
due to a temperature gradient without restraint at the interior support. However, there is still an
FRP strain expected due to an unrestrained temperature change. This FRP strain is associated
with the ambient temperature at the FRP location at two different times. The difference between
these two temperatures results in a temperature change (∆TFRP) that can be multiplied by the
longitudinal coefficient of thermal expansion (αΤ,FRP) specified for the repair material. The formula
for the FRP strain expected in response to unrestrained temperature change in the FRP material
is presented as Equation 5.31. This strain component is stress-independent.
+
𝑓bot(x)
–
− �32∅TE� ybot
L L
A C B
x
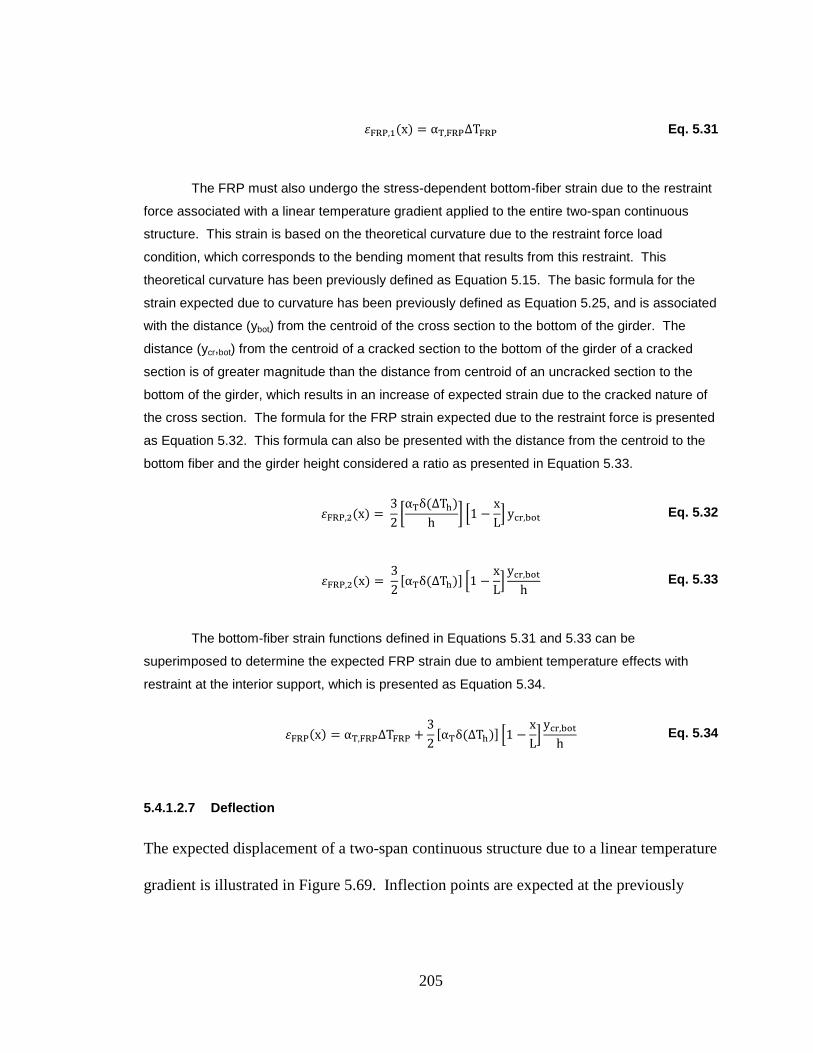
205
𝜀FRP,1(x) = αT,FRP∆TFRP Eq. 5.31
The FRP must also undergo the stress-dependent bottom-fiber strain due to the restraint
force associated with a linear temperature gradient applied to the entire two-span continuous
structure. This strain is based on the theoretical curvature due to the restraint force load
condition, which corresponds to the bending moment that results from this restraint. This
theoretical curvature has been previously defined as Equation 5.15. The basic formula for the
strain expected due to curvature has been previously defined as Equation 5.25, and is associated
with the distance (ybot) from the centroid of the cross section to the bottom of the girder. The
distance (ycr,bot) from the centroid of a cracked section to the bottom of the girder of a cracked
section is of greater magnitude than the distance from centroid of an uncracked section to the
bottom of the girder, which results in an increase of expected strain due to the cracked nature of
the cross section. The formula for the FRP strain expected due to the restraint force is presented
as Equation 5.32. This formula can also be presented with the distance from the centroid to the
bottom fiber and the girder height considered a ratio as presented in Equation 5.33.
𝜀FRP,2(x) = 32�αTδ(∆Th)
h� �1 −
xL� ycr,bot Eq. 5.32
𝜀FRP,2(x) = 32
[αTδ(∆Th)] �1 −xL�
ycr,bot
h Eq. 5.33
The bottom-fiber strain functions defined in Equations 5.31 and 5.33 can be
superimposed to determine the expected FRP strain due to ambient temperature effects with
restraint at the interior support, which is presented as Equation 5.34.
𝜀FRP(x) = αT,FRP∆TFRP +32
[αTδ(∆Th)] �1 −xL�
ycr,bot
h Eq. 5.34
5.4.1.2.7 Deflection
The expected displacement of a two-span continuous structure due to a linear temperature
gradient is illustrated in Figure 5.69. Inflection points are expected at the previously
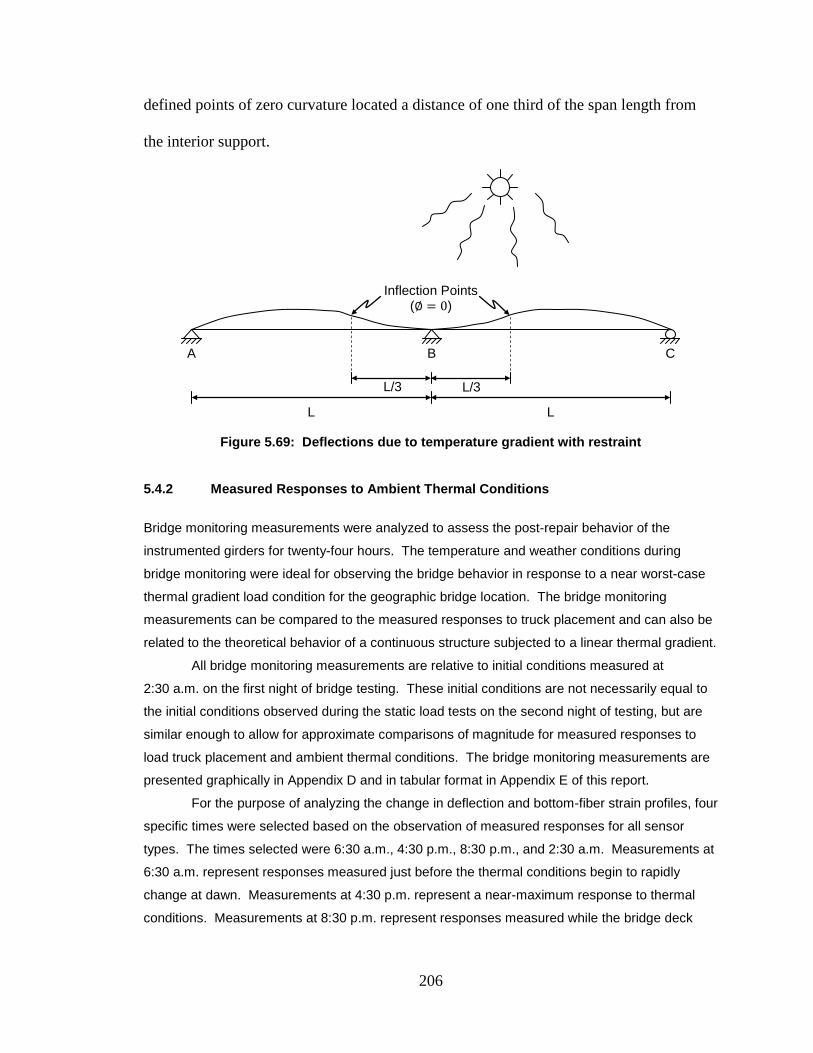
206
defined points of zero curvature located a distance of one third of the span length from
the interior support.
Figure 5.69: Deflections due to temperature gradient with restraint
5.4.2 Measured Responses to Ambient Thermal Conditions
Bridge monitoring measurements were analyzed to assess the post-repair behavior of the
instrumented girders for twenty-four hours. The temperature and weather conditions during
bridge monitoring were ideal for observing the bridge behavior in response to a near worst-case
thermal gradient load condition for the geographic bridge location. The bridge monitoring
measurements can be compared to the measured responses to truck placement and can also be
related to the theoretical behavior of a continuous structure subjected to a linear thermal gradient.
All bridge monitoring measurements are relative to initial conditions measured at
2:30 a.m. on the first night of bridge testing. These initial conditions are not necessarily equal to
the initial conditions observed during the static load tests on the second night of testing, but are
similar enough to allow for approximate comparisons of magnitude for measured responses to
load truck placement and ambient thermal conditions. The bridge monitoring measurements are
presented graphically in Appendix D and in tabular format in Appendix E of this report.
For the purpose of analyzing the change in deflection and bottom-fiber strain profiles, four
specific times were selected based on the observation of measured responses for all sensor
types. The times selected were 6:30 a.m., 4:30 p.m., 8:30 p.m., and 2:30 a.m. Measurements at
6:30 a.m. represent responses measured just before the thermal conditions begin to rapidly
change at dawn. Measurements at 4:30 p.m. represent a near-maximum response to thermal
conditions. Measurements at 8:30 p.m. represent responses measured while the bridge deck
Inflection Points (∅ = 0)
L/3 L/3
L L
A C B
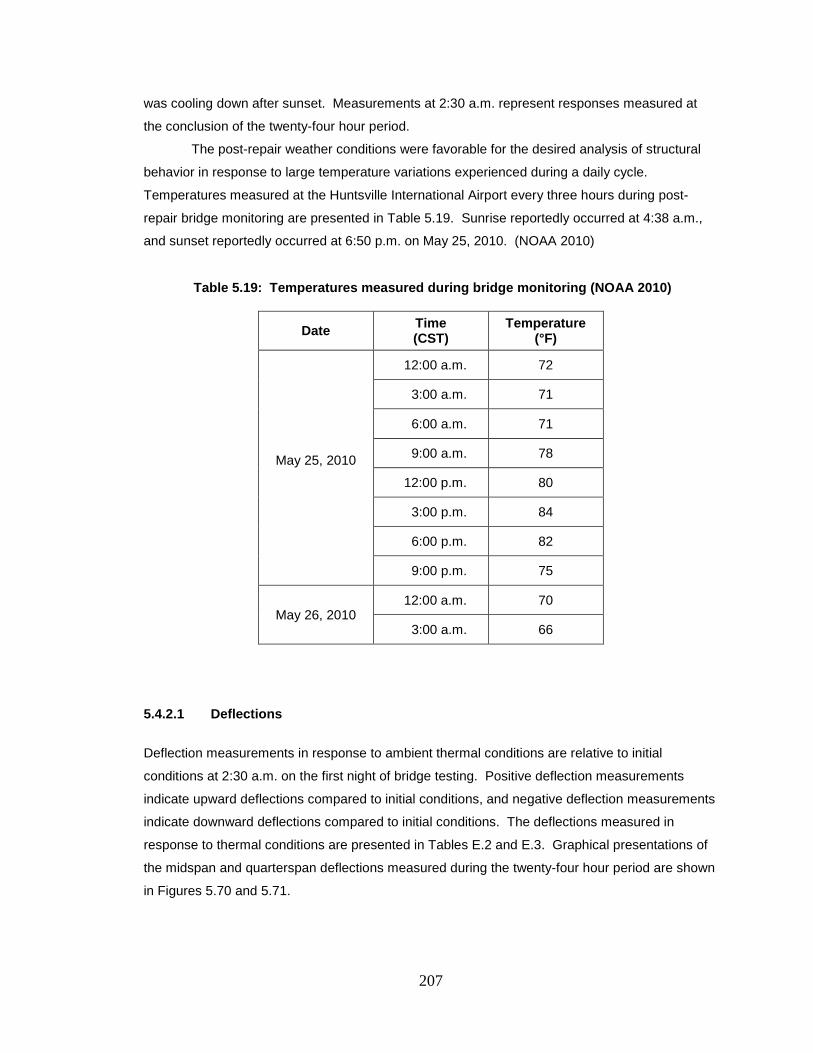
207
was cooling down after sunset. Measurements at 2:30 a.m. represent responses measured at
the conclusion of the twenty-four hour period.
The post-repair weather conditions were favorable for the desired analysis of structural
behavior in response to large temperature variations experienced during a daily cycle.
Temperatures measured at the Huntsville International Airport every three hours during post-
repair bridge monitoring are presented in Table 5.19. Sunrise reportedly occurred at 4:38 a.m.,
and sunset reportedly occurred at 6:50 p.m. on May 25, 2010. (NOAA 2010)
Table 5.19: Temperatures measured during bridge monitoring (NOAA 2010)
Date Time (CST)
Temperature (°F)
May 25, 2010
12:00 a.m. 72
3:00 a.m. 71
6:00 a.m. 71
9:00 a.m. 78
12:00 p.m. 80
3:00 p.m. 84
6:00 p.m. 82
9:00 p.m. 75
May 26, 2010 12:00 a.m. 70
3:00 a.m. 66
5.4.2.1 Deflections
Deflection measurements in response to ambient thermal conditions are relative to initial
conditions at 2:30 a.m. on the first night of bridge testing. Positive deflection measurements
indicate upward deflections compared to initial conditions, and negative deflection measurements
indicate downward deflections compared to initial conditions. The deflections measured in
response to thermal conditions are presented in Tables E.2 and E.3. Graphical presentations of
the midspan and quarterspan deflections measured during the twenty-four hour period are shown
in Figures 5.70 and 5.71.
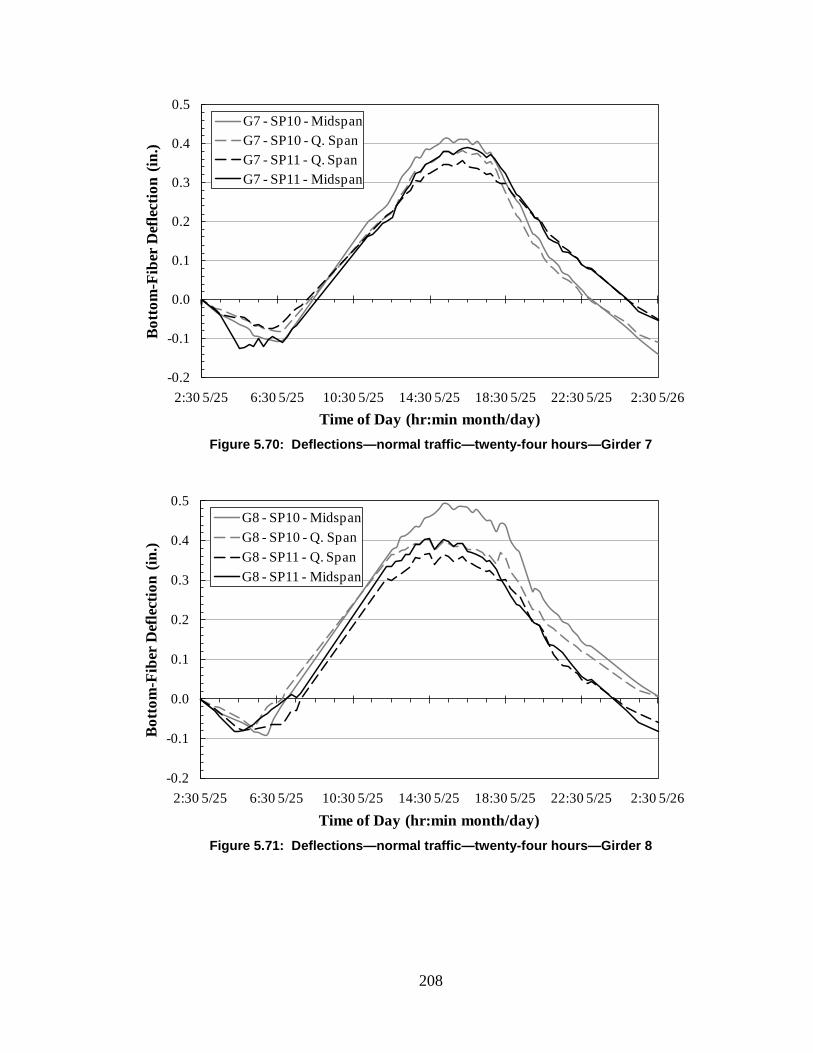
208
Figure 5.70: Deflections—normal traffic—twenty-four hours—Girder 7
Figure 5.71: Deflections—normal traffic—twenty-four hours—Girder 8
-0.2
-0.1
0.0
0.1
0.2
0.3
0.4
0.5
2:30 5/25 6:30 5/25 10:30 5/25 14:30 5/25 18:30 5/25 22:30 5/25 2:30 5/26
Bot
tom
-Fib
er D
efle
ctio
n (in
.)
Time of Day (hr:min month/day)
G7 - SP10 - MidspanG7 - SP10 - Q. SpanG7 - SP11 - Q. SpanG7 - SP11 - Midspan
-0.2
-0.1
0.0
0.1
0.2
0.3
0.4
0.5
2:30 5/25 6:30 5/25 10:30 5/25 14:30 5/25 18:30 5/25 22:30 5/25 2:30 5/26
Bot
tom
-Fib
er D
efle
ctio
n (in
.)
Time of Day (hr:min month/day)
G8 - SP10 - MidspanG8 - SP10 - Q. SpanG8 - SP11 - Q. SpanG8 - SP11 - Midspan
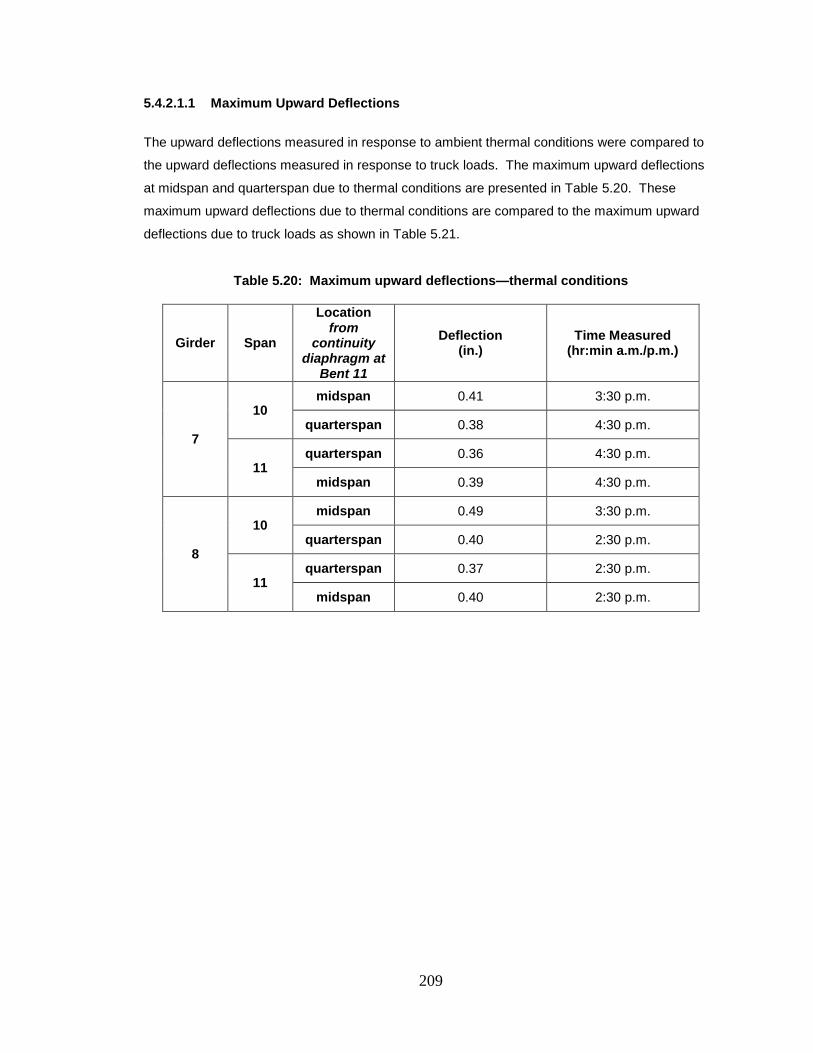
209
5.4.2.1.1 Maximum Upward Deflections
The upward deflections measured in response to ambient thermal conditions were compared to
the upward deflections measured in response to truck loads. The maximum upward deflections
at midspan and quarterspan due to thermal conditions are presented in Table 5.20. These
maximum upward deflections due to thermal conditions are compared to the maximum upward
deflections due to truck loads as shown in Table 5.21.
Table 5.20: Maximum upward deflections—thermal conditions
Girder Span
Location from
continuity diaphragm at
Bent 11
Deflection (in.)
Time Measured (hr:min a.m./p.m.)
7
10 midspan 0.41 3:30 p.m.
quarterspan 0.38 4:30 p.m.
11 quarterspan 0.36 4:30 p.m.
midspan 0.39 4:30 p.m.
8
10 midspan 0.49 3:30 p.m.
quarterspan 0.40 2:30 p.m.
11 quarterspan 0.37 2:30 p.m.
midspan 0.40 2:30 p.m.
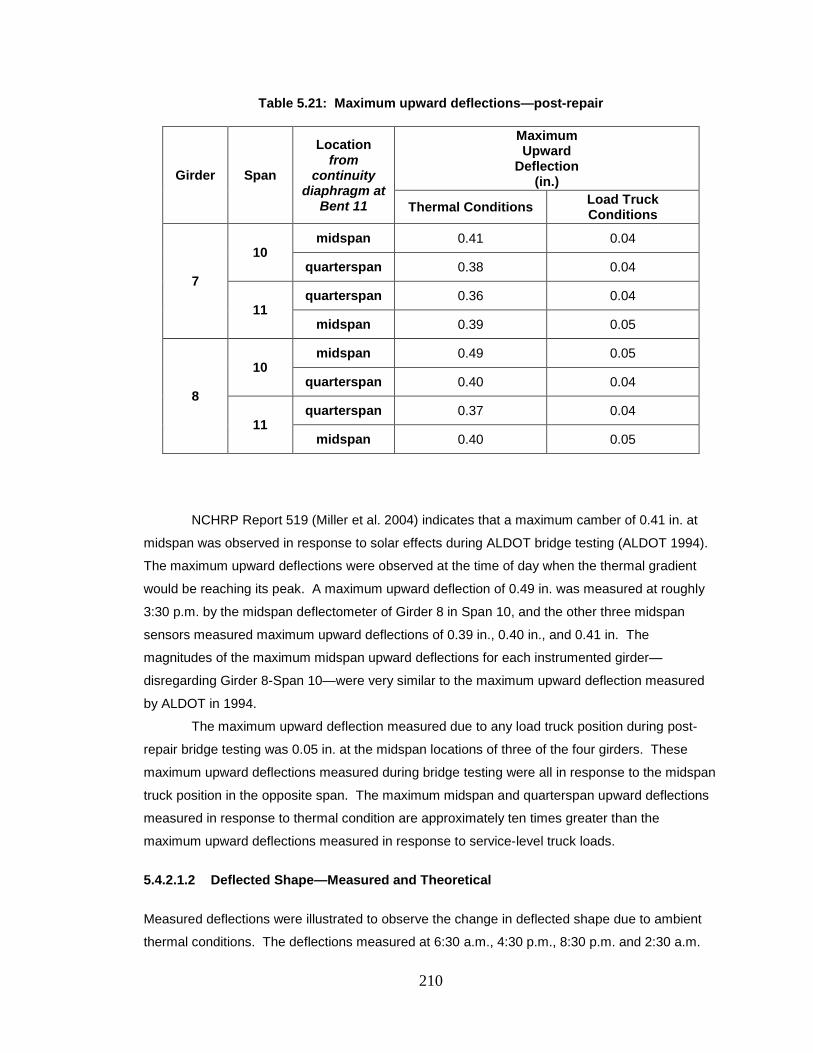
210
Table 5.21: Maximum upward deflections—post-repair
Girder Span
Location from
continuity diaphragm at
Bent 11
Maximum Upward
Deflection (in.)
Thermal Conditions Load Truck Conditions
7
10 midspan 0.41 0.04
quarterspan 0.38 0.04
11 quarterspan 0.36 0.04
midspan 0.39 0.05
8
10 midspan 0.49 0.05
quarterspan 0.40 0.04
11 quarterspan 0.37 0.04
midspan 0.40 0.05
NCHRP Report 519 (Miller et al. 2004) indicates that a maximum camber of 0.41 in. at
midspan was observed in response to solar effects during ALDOT bridge testing (ALDOT 1994).
The maximum upward deflections were observed at the time of day when the thermal gradient
would be reaching its peak. A maximum upward deflection of 0.49 in. was measured at roughly
3:30 p.m. by the midspan deflectometer of Girder 8 in Span 10, and the other three midspan
sensors measured maximum upward deflections of 0.39 in., 0.40 in., and 0.41 in. The
magnitudes of the maximum midspan upward deflections for each instrumented girder—
disregarding Girder 8-Span 10—were very similar to the maximum upward deflection measured
by ALDOT in 1994.
The maximum upward deflection measured due to any load truck position during post-
repair bridge testing was 0.05 in. at the midspan locations of three of the four girders. These
maximum upward deflections measured during bridge testing were all in response to the midspan
truck position in the opposite span. The maximum midspan and quarterspan upward deflections
measured in response to thermal condition are approximately ten times greater than the
maximum upward deflections measured in response to service-level truck loads.
5.4.2.1.2 Deflected Shape—Measured and Theoretical
Measured deflections were illustrated to observe the change in deflected shape due to ambient
thermal conditions. The deflections measured at 6:30 a.m., 4:30 p.m., 8:30 p.m. and 2:30 a.m.
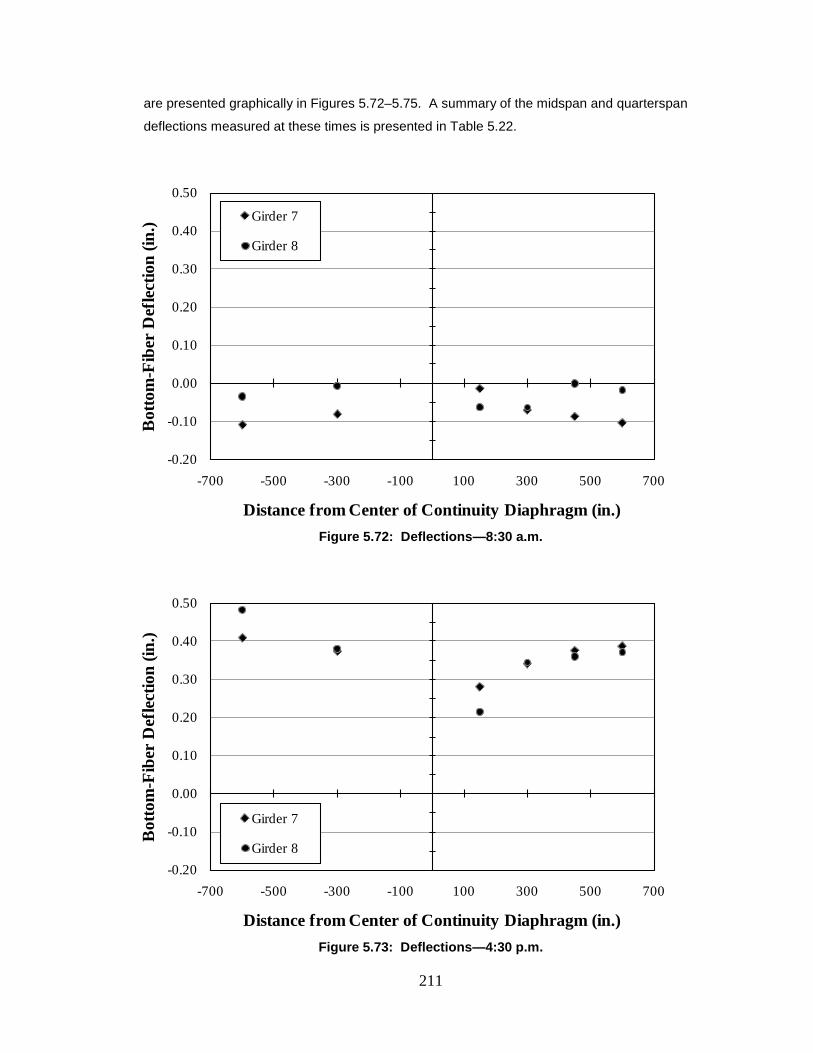
211
are presented graphically in Figures 5.72–5.75. A summary of the midspan and quarterspan
deflections measured at these times is presented in Table 5.22.
Figure 5.72: Deflections—8:30 a.m.
Figure 5.73: Deflections—4:30 p.m.
-0.20
-0.10
0.00
0.10
0.20
0.30
0.40
0.50
-700 -500 -300 -100 100 300 500 700
Bot
tom
-Fib
er D
efle
ctio
n (in
.)
Distance from Center of Continuity Diaphragm (in.)
Girder 7
Girder 8
-0.20
-0.10
0.00
0.10
0.20
0.30
0.40
0.50
-700 -500 -300 -100 100 300 500 700
Bot
tom
-Fib
er D
efle
ctio
n (in
.)
Distance from Center of Continuity Diaphragm (in.)
Girder 7
Girder 8
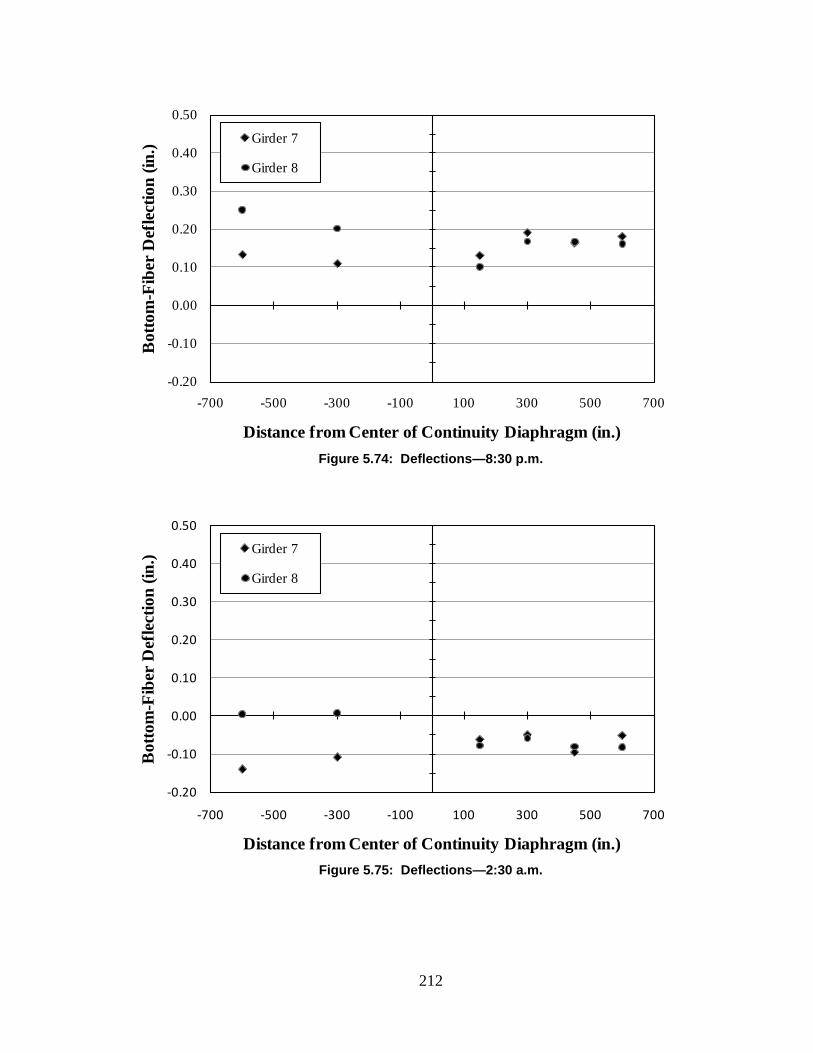
212
Figure 5.74: Deflections—8:30 p.m.
Figure 5.75: Deflections—2:30 a.m.
-0.20
-0.10
0.00
0.10
0.20
0.30
0.40
0.50
-700 -500 -300 -100 100 300 500 700
Bot
tom
-Fib
er D
efle
ctio
n (in
.)
Distance from Center of Continuity Diaphragm (in.)
Girder 7
Girder 8
-0.20
-0.10
0.00
0.10
0.20
0.30
0.40
0.50
-700 -500 -300 -100 100 300 500 700
Bot
tom
-Fib
er D
efle
ctio
n (in
.)
Distance from Center of Continuity Diaphragm (in.)
Girder 7
Girder 8
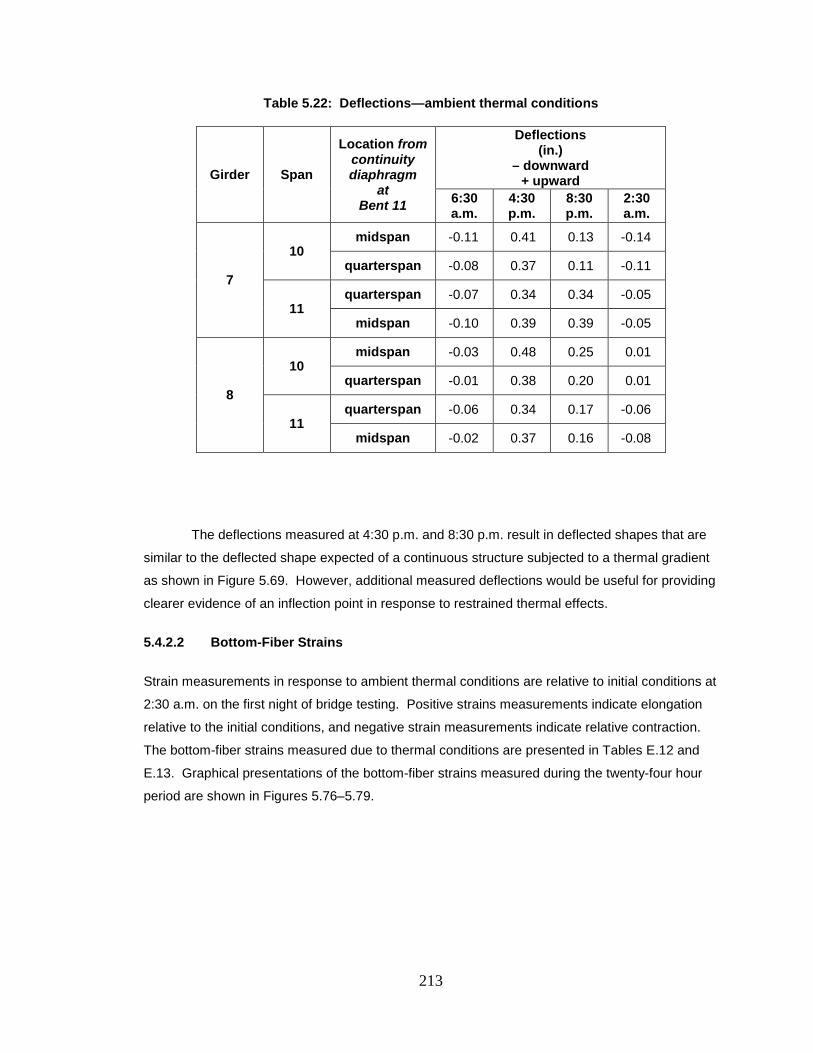
213
Table 5.22: Deflections—ambient thermal conditions
Girder Span
Location from continuity diaphragm
at Bent 11
Deflections (in.)
– downward + upward
6:30 a.m.
4:30 p.m.
8:30 p.m.
2:30 a.m.
7
10 midspan -0.11 0.41 0.13 -0.14
quarterspan -0.08 0.37 0.11 -0.11
11 quarterspan -0.07 0.34 0.34 -0.05
midspan -0.10 0.39 0.39 -0.05
8
10 midspan -0.03 0.48 0.25 0.01
quarterspan -0.01 0.38 0.20 0.01
11 quarterspan -0.06 0.34 0.17 -0.06
midspan -0.02 0.37 0.16 -0.08
The deflections measured at 4:30 p.m. and 8:30 p.m. result in deflected shapes that are
similar to the deflected shape expected of a continuous structure subjected to a thermal gradient
as shown in Figure 5.69. However, additional measured deflections would be useful for providing
clearer evidence of an inflection point in response to restrained thermal effects.
5.4.2.2 Bottom-Fiber Strains
Strain measurements in response to ambient thermal conditions are relative to initial conditions at
2:30 a.m. on the first night of bridge testing. Positive strains measurements indicate elongation
relative to the initial conditions, and negative strain measurements indicate relative contraction.
The bottom-fiber strains measured due to thermal conditions are presented in Tables E.12 and
E.13. Graphical presentations of the bottom-fiber strains measured during the twenty-four hour
period are shown in Figures 5.76–5.79.
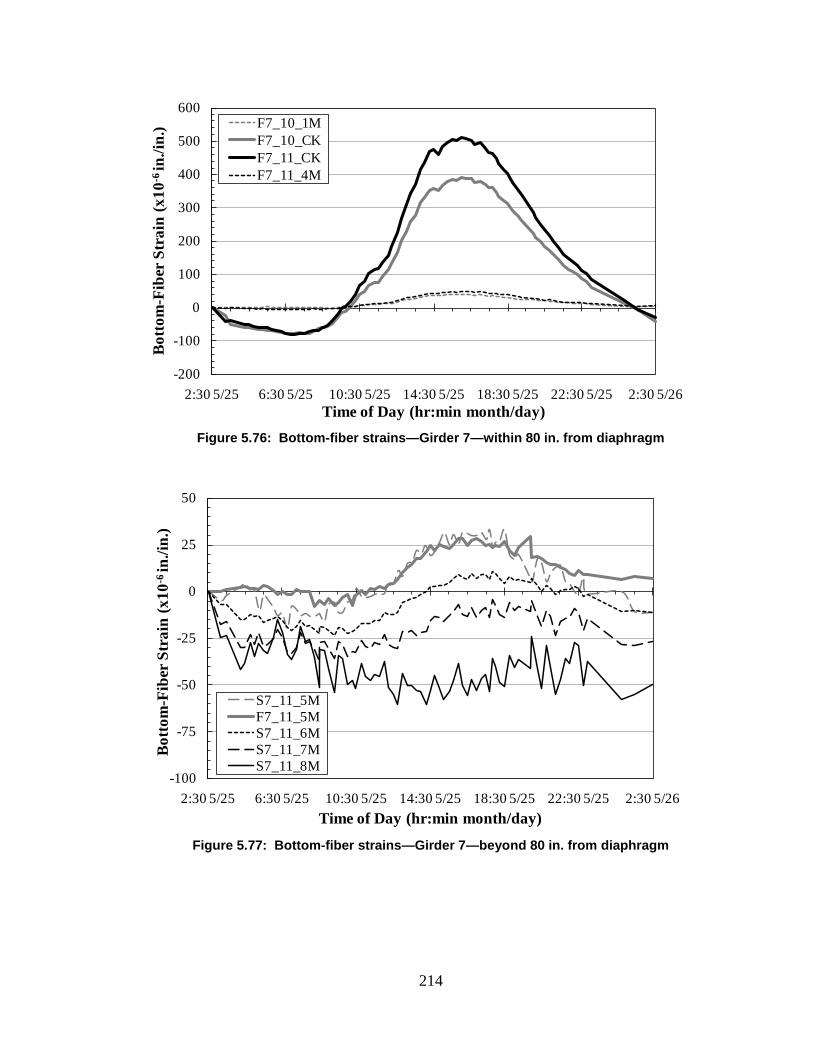
214
Figure 5.76: Bottom-fiber strains—Girder 7—within 80 in. from diaphragm
Figure 5.77: Bottom-fiber strains—Girder 7—beyond 80 in. from diaphragm
-200
-100
0
100
200
300
400
500
600
2:30 5/25 6:30 5/25 10:30 5/25 14:30 5/25 18:30 5/25 22:30 5/25 2:30 5/26
Bot
tom
-Fib
er S
trai
n (x
10-6
in./i
n.)
Time of Day (hr:min month/day)
F7_10_1MF7_10_CKF7_11_CKF7_11_4M
-100
-75
-50
-25
0
25
50
2:30 5/25 6:30 5/25 10:30 5/25 14:30 5/25 18:30 5/25 22:30 5/25 2:30 5/26
Bot
tom
-Fib
er S
trai
n (x
10-6
in./i
n.)
Time of Day (hr:min month/day)
S7_11_5MF7_11_5MS7_11_6MS7_11_7MS7_11_8M
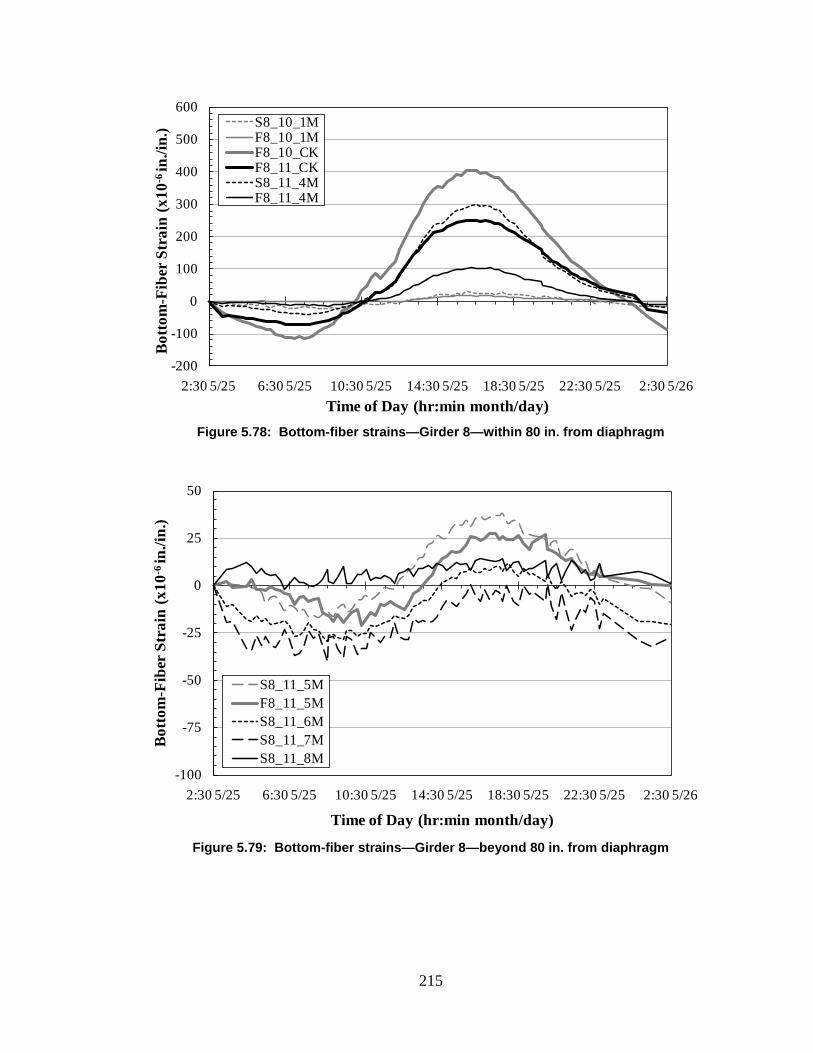
215
Figure 5.78: Bottom-fiber strains—Girder 8—within 80 in. from diaphragm
Figure 5.79: Bottom-fiber strains—Girder 8—beyond 80 in. from diaphragm
-200
-100
0
100
200
300
400
500
600
2:30 5/25 6:30 5/25 10:30 5/25 14:30 5/25 18:30 5/25 22:30 5/25 2:30 5/26
Bot
tom
-Fib
er S
trai
n (x
10-6
in./i
n.)
Time of Day (hr:min month/day)
S8_10_1MF8_10_1MF8_10_CKF8_11_CKS8_11_4MF8_11_4M
-100
-75
-50
-25
0
25
50
2:30 5/25 6:30 5/25 10:30 5/25 14:30 5/25 18:30 5/25 22:30 5/25 2:30 5/26
Bot
tom
-Fib
er S
trai
n (x
10-6
in./i
n.)
Time of Day (hr:min month/day)
S8_11_5MF8_11_5MS8_11_6MS8_11_7MS8_11_8M
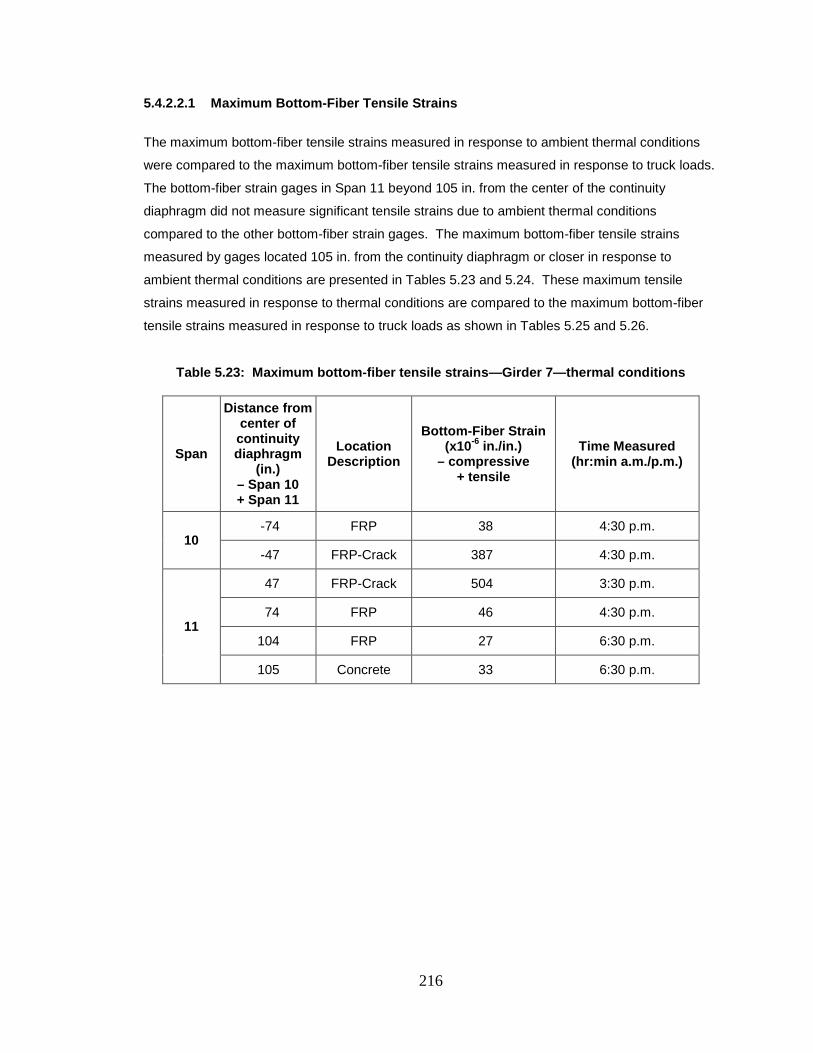
216
5.4.2.2.1 Maximum Bottom-Fiber Tensile Strains
The maximum bottom-fiber tensile strains measured in response to ambient thermal conditions
were compared to the maximum bottom-fiber tensile strains measured in response to truck loads.
The bottom-fiber strain gages in Span 11 beyond 105 in. from the center of the continuity
diaphragm did not measure significant tensile strains due to ambient thermal conditions
compared to the other bottom-fiber strain gages. The maximum bottom-fiber tensile strains
measured by gages located 105 in. from the continuity diaphragm or closer in response to
ambient thermal conditions are presented in Tables 5.23 and 5.24. These maximum tensile
strains measured in response to thermal conditions are compared to the maximum bottom-fiber
tensile strains measured in response to truck loads as shown in Tables 5.25 and 5.26.
Table 5.23: Maximum bottom-fiber tensile strains—Girder 7—thermal conditions
Span
Distance from center of continuity diaphragm
(in.) – Span 10 + Span 11
Location Description
Bottom-Fiber Strain (x10-6 in./in.)
– compressive + tensile
Time Measured (hr:min a.m./p.m.)
10 -74 FRP 38 4:30 p.m.
-47 FRP-Crack 387 4:30 p.m.
11
47 FRP-Crack 504 3:30 p.m.
74 FRP 46 4:30 p.m.
104 FRP 27 6:30 p.m.
105 Concrete 33 6:30 p.m.
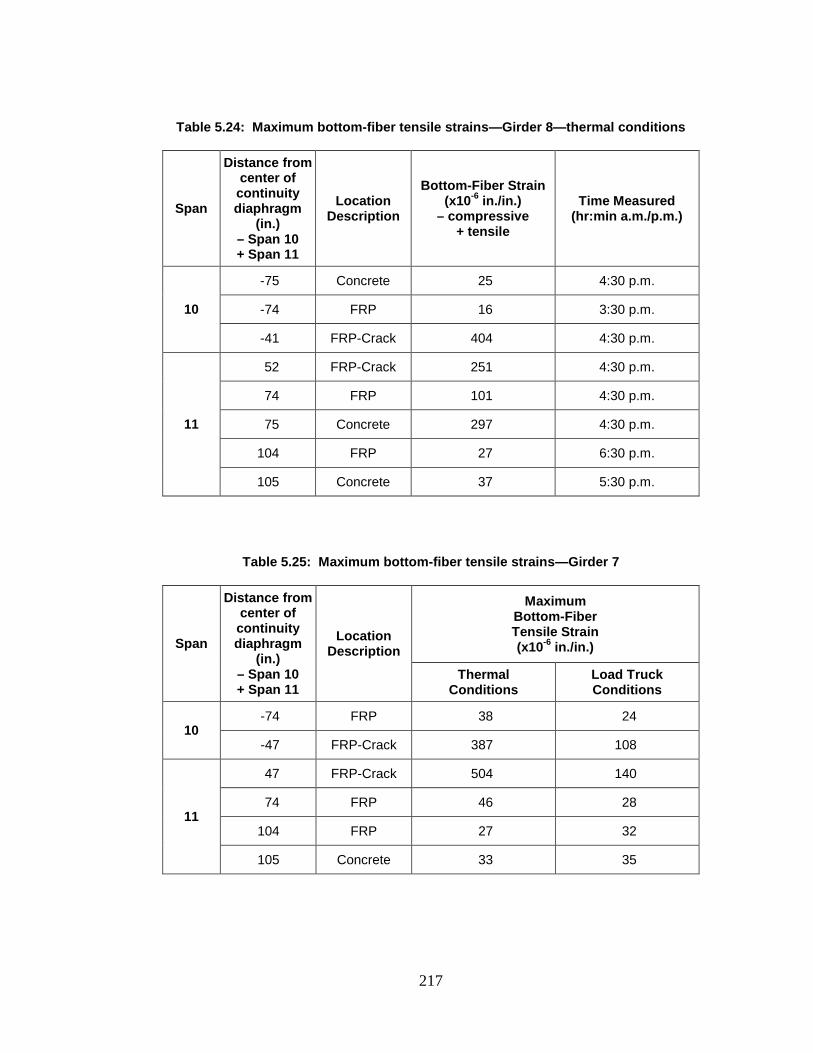
217
Table 5.24: Maximum bottom-fiber tensile strains—Girder 8—thermal conditions
Span
Distance from center of continuity diaphragm
(in.) – Span 10 + Span 11
Location Description
Bottom-Fiber Strain (x10-6 in./in.)
– compressive + tensile
Time Measured (hr:min a.m./p.m.)
10
-75 Concrete 25 4:30 p.m.
-74 FRP 16 3:30 p.m.
-41 FRP-Crack 404 4:30 p.m.
11
52 FRP-Crack 251 4:30 p.m.
74 FRP 101 4:30 p.m.
75 Concrete 297 4:30 p.m.
104 FRP 27 6:30 p.m.
105 Concrete 37 5:30 p.m.
Table 5.25: Maximum bottom-fiber tensile strains—Girder 7
Span
Distance from center of continuity diaphragm
(in.) – Span 10 + Span 11
Location Description
Maximum Bottom-Fiber Tensile Strain (x10-6 in./in.)
Thermal Conditions
Load Truck Conditions
10 -74 FRP 38 24
-47 FRP-Crack 387 108
11
47 FRP-Crack 504 140
74 FRP 46 28
104 FRP 27 32
105 Concrete 33 35
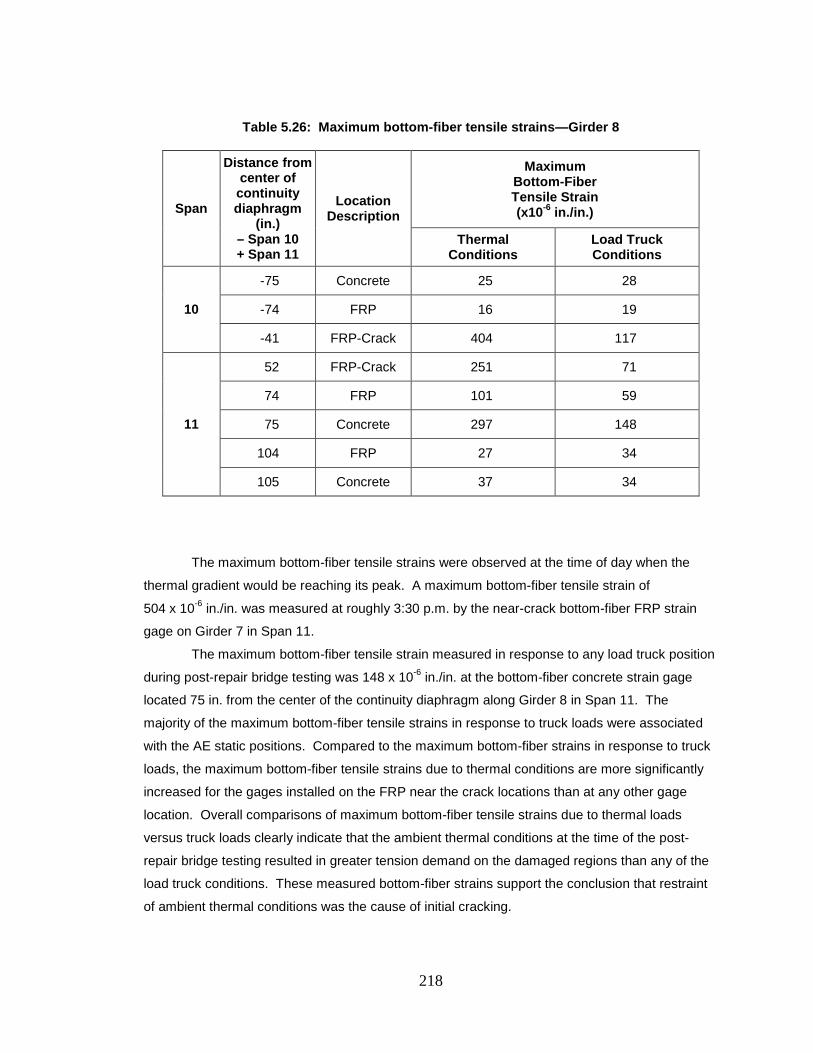
218
Table 5.26: Maximum bottom-fiber tensile strains—Girder 8
Span
Distance from center of continuity diaphragm
(in.) – Span 10 + Span 11
Location Description
Maximum Bottom-Fiber Tensile Strain (x10-6 in./in.)
Thermal Conditions
Load Truck Conditions
10
-75 Concrete 25 28
-74 FRP 16 19
-41 FRP-Crack 404 117
11
52 FRP-Crack 251 71
74 FRP 101 59
75 Concrete 297 148
104 FRP 27 34
105 Concrete 37 34
The maximum bottom-fiber tensile strains were observed at the time of day when the
thermal gradient would be reaching its peak. A maximum bottom-fiber tensile strain of
504 x 10-6 in./in. was measured at roughly 3:30 p.m. by the near-crack bottom-fiber FRP strain
gage on Girder 7 in Span 11.
The maximum bottom-fiber tensile strain measured in response to any load truck position
during post-repair bridge testing was 148 x 10-6 in./in. at the bottom-fiber concrete strain gage
located 75 in. from the center of the continuity diaphragm along Girder 8 in Span 11. The
majority of the maximum bottom-fiber tensile strains in response to truck loads were associated
with the AE static positions. Compared to the maximum bottom-fiber strains in response to truck
loads, the maximum bottom-fiber tensile strains due to thermal conditions are more significantly
increased for the gages installed on the FRP near the crack locations than at any other gage
location. Overall comparisons of maximum bottom-fiber tensile strains due to thermal loads
versus truck loads clearly indicate that the ambient thermal conditions at the time of the post-
repair bridge testing resulted in greater tension demand on the damaged regions than any of the
load truck conditions. These measured bottom-fiber strains support the conclusion that restraint
of ambient thermal conditions was the cause of initial cracking.
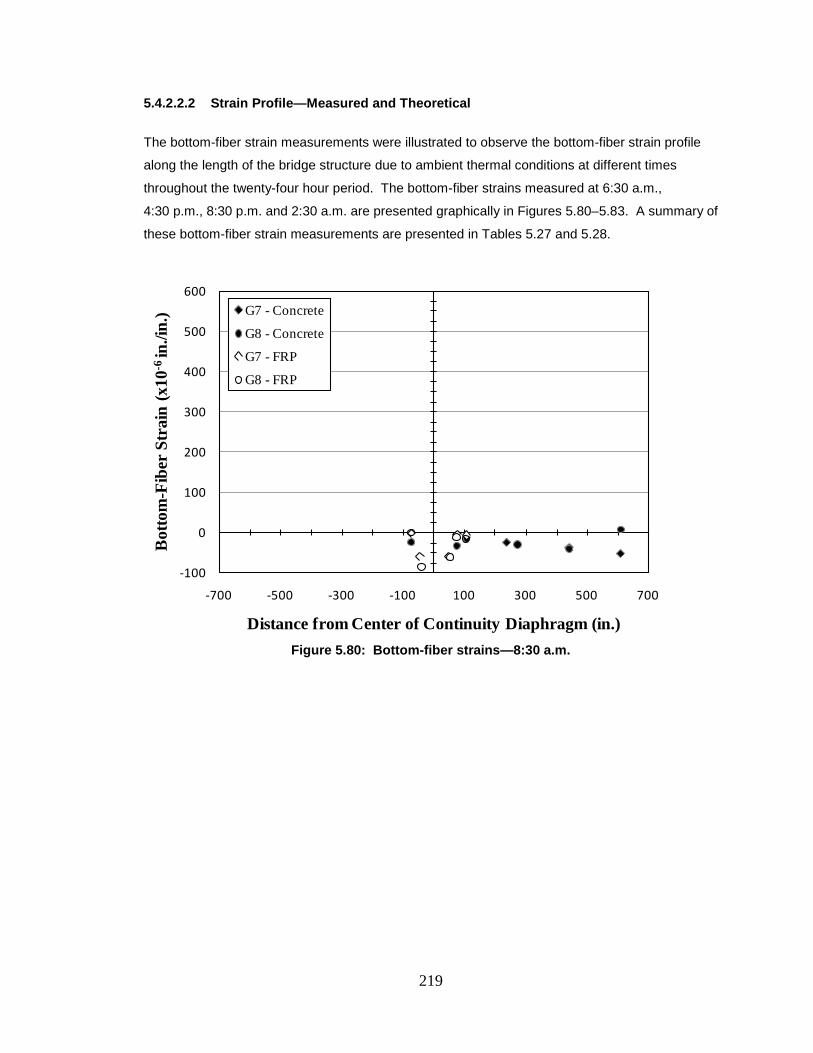
219
5.4.2.2.2 Strain Profile—Measured and Theoretical
The bottom-fiber strain measurements were illustrated to observe the bottom-fiber strain profile
along the length of the bridge structure due to ambient thermal conditions at different times
throughout the twenty-four hour period. The bottom-fiber strains measured at 6:30 a.m.,
4:30 p.m., 8:30 p.m. and 2:30 a.m. are presented graphically in Figures 5.80–5.83. A summary of
these bottom-fiber strain measurements are presented in Tables 5.27 and 5.28.
Figure 5.80: Bottom-fiber strains—8:30 a.m.
-100
0
100
200
300
400
500
600
-700 -500 -300 -100 100 300 500 700
Bot
tom
-Fib
er S
trai
n (x
10-6
in./i
n.)
Distance from Center of Continuity Diaphragm (in.)
G7 - Concrete
G8 - Concrete
G7 - FRP
G8 - FRP
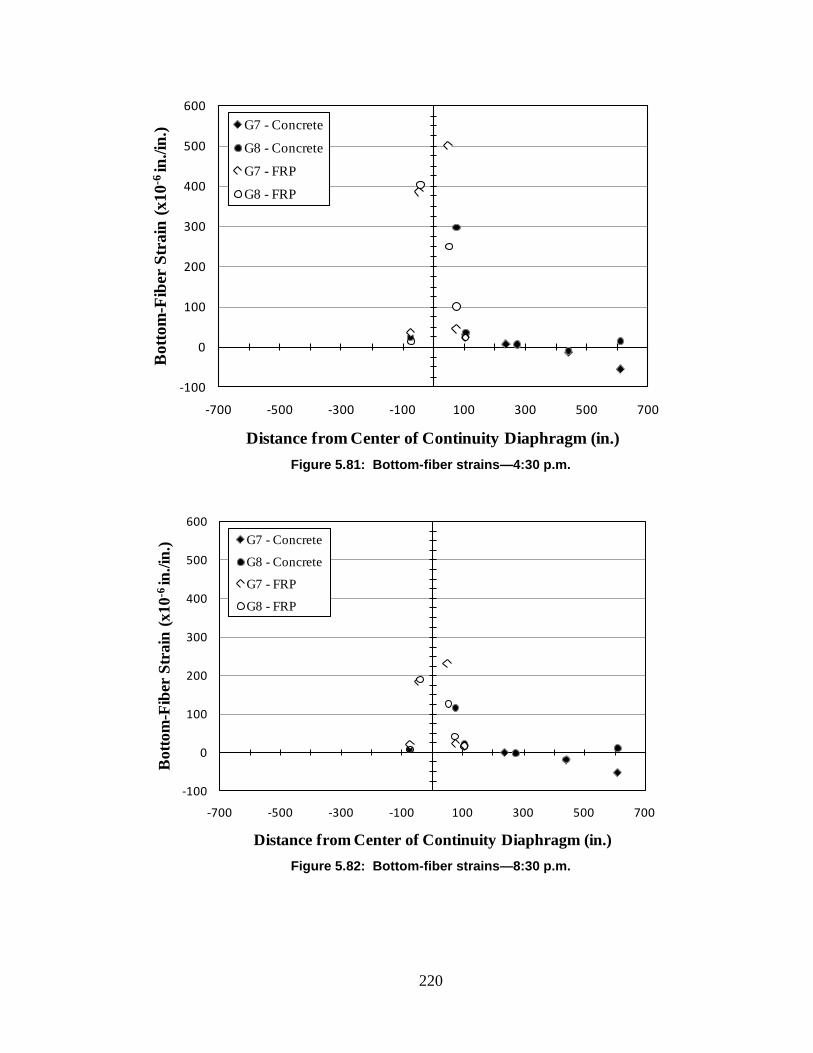
220
Figure 5.81: Bottom-fiber strains—4:30 p.m.
Figure 5.82: Bottom-fiber strains—8:30 p.m.
-100
0
100
200
300
400
500
600
-700 -500 -300 -100 100 300 500 700
Bot
tom
-Fib
er S
trai
n (x
10-6
in./i
n.)
Distance from Center of Continuity Diaphragm (in.)
G7 - Concrete
G8 - Concrete
G7 - FRP
G8 - FRP
-100
0
100
200
300
400
500
600
-700 -500 -300 -100 100 300 500 700
Bot
tom
-Fib
er S
trai
n (x
10-6
in./i
n.)
Distance from Center of Continuity Diaphragm (in.)
G7 - Concrete
G8 - Concrete
G7 - FRP
G8 - FRP
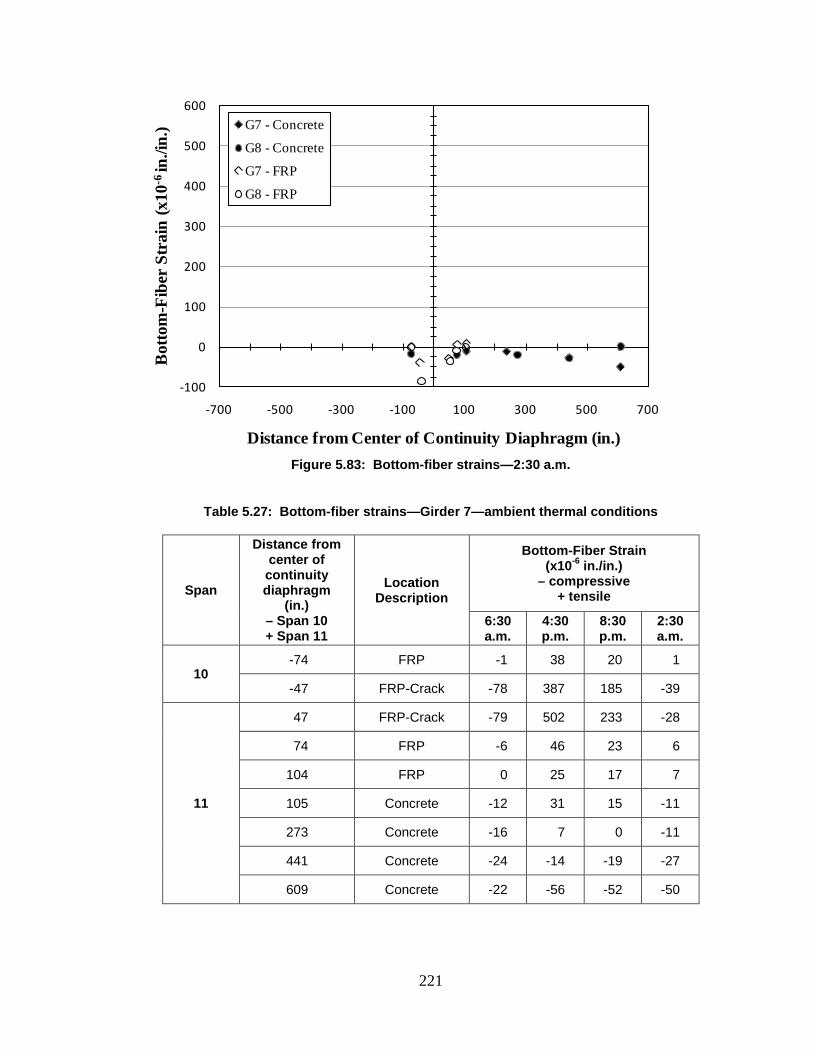
221
Figure 5.83: Bottom-fiber strains—2:30 a.m.
Table 5.27: Bottom-fiber strains—Girder 7—ambient thermal conditions
Span
Distance from center of continuity diaphragm
(in.) – Span 10 + Span 11
Location Description
Bottom-Fiber Strain (x10-6 in./in.)
– compressive + tensile
6:30 a.m.
4:30 p.m.
8:30 p.m.
2:30 a.m.
10 -74 FRP -1 38 20 1
-47 FRP-Crack -78 387 185 -39
11
47 FRP-Crack -79 502 233 -28
74 FRP -6 46 23 6
104 FRP 0 25 17 7
105 Concrete -12 31 15 -11
273 Concrete -16 7 0 -11
441 Concrete -24 -14 -19 -27
609 Concrete -22 -56 -52 -50
-100
0
100
200
300
400
500
600
-700 -500 -300 -100 100 300 500 700
Bot
tom
-Fib
er S
trai
n (x
10-6
in./i
n.)
Distance from Center of Continuity Diaphragm (in.)
G7 - Concrete
G8 - Concrete
G7 - FRP
G8 - FRP
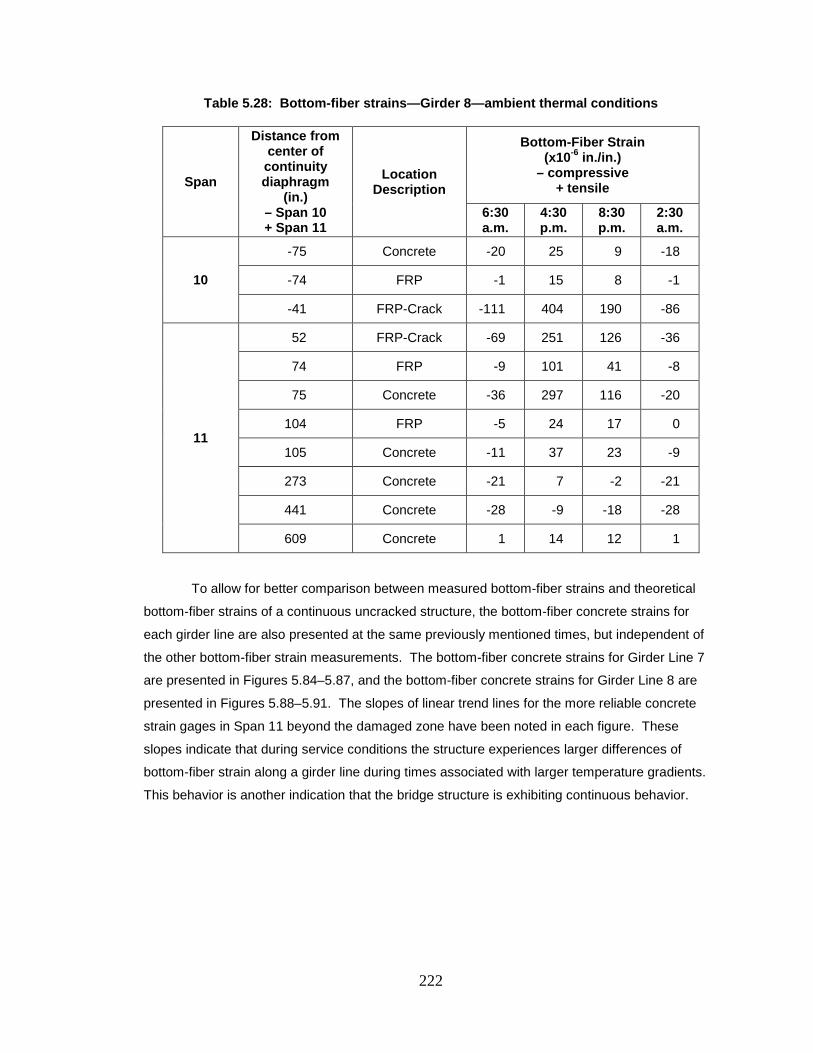
222
Table 5.28: Bottom-fiber strains—Girder 8—ambient thermal conditions
Span
Distance from center of continuity diaphragm
(in.) – Span 10 + Span 11
Location Description
Bottom-Fiber Strain (x10-6 in./in.)
– compressive + tensile
6:30 a.m.
4:30 p.m.
8:30 p.m.
2:30 a.m.
10
-75 Concrete -20 25 9 -18
-74 FRP -1 15 8 -1
-41 FRP-Crack -111 404 190 -86
11
52 FRP-Crack -69 251 126 -36
74 FRP -9 101 41 -8
75 Concrete -36 297 116 -20
104 FRP -5 24 17 0
105 Concrete -11 37 23 -9
273 Concrete -21 7 -2 -21
441 Concrete -28 -9 -18 -28
609 Concrete 1 14 12 1
To allow for better comparison between measured bottom-fiber strains and theoretical
bottom-fiber strains of a continuous uncracked structure, the bottom-fiber concrete strains for
each girder line are also presented at the same previously mentioned times, but independent of
the other bottom-fiber strain measurements. The bottom-fiber concrete strains for Girder Line 7
are presented in Figures 5.84–5.87, and the bottom-fiber concrete strains for Girder Line 8 are
presented in Figures 5.88–5.91. The slopes of linear trend lines for the more reliable concrete
strain gages in Span 11 beyond the damaged zone have been noted in each figure. These
slopes indicate that during service conditions the structure experiences larger differences of
bottom-fiber strain along a girder line during times associated with larger temperature gradients.
This behavior is another indication that the bridge structure is exhibiting continuous behavior.
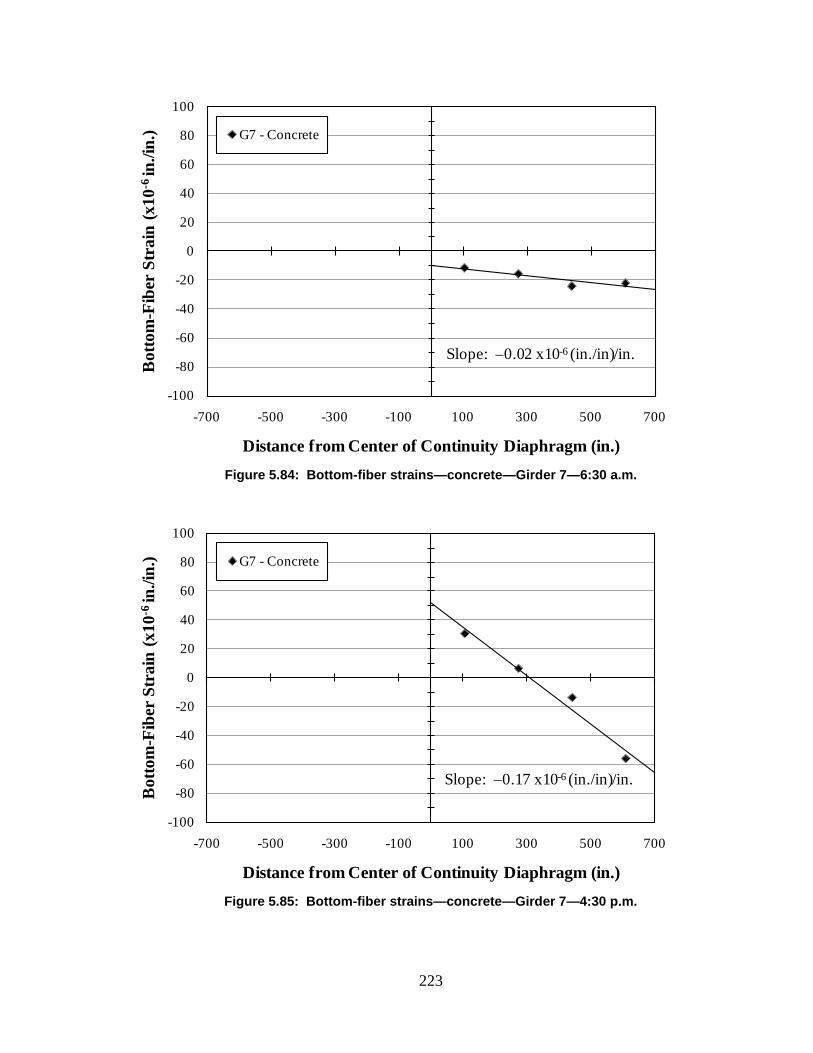
223
Figure 5.84: Bottom-fiber strains—concrete—Girder 7—6:30 a.m.
Figure 5.85: Bottom-fiber strains—concrete—Girder 7—4:30 p.m.
-100
-80
-60
-40
-20
0
20
40
60
80
100
-700 -500 -300 -100 100 300 500 700
Bot
tom
-Fib
er S
trai
n (x
10-6
in./i
n.)
Distance from Center of Continuity Diaphragm (in.)
G7 - Concrete
Slope: –0.02 x10⁻⁶ (in./in)/in.
-100
-80
-60
-40
-20
0
20
40
60
80
100
-700 -500 -300 -100 100 300 500 700
Bot
tom
-Fib
er S
trai
n (x
10-6
in./i
n.)
Distance from Center of Continuity Diaphragm (in.)
G7 - Concrete
Slope: –0.17 x10⁻⁶ (in./in)/in.
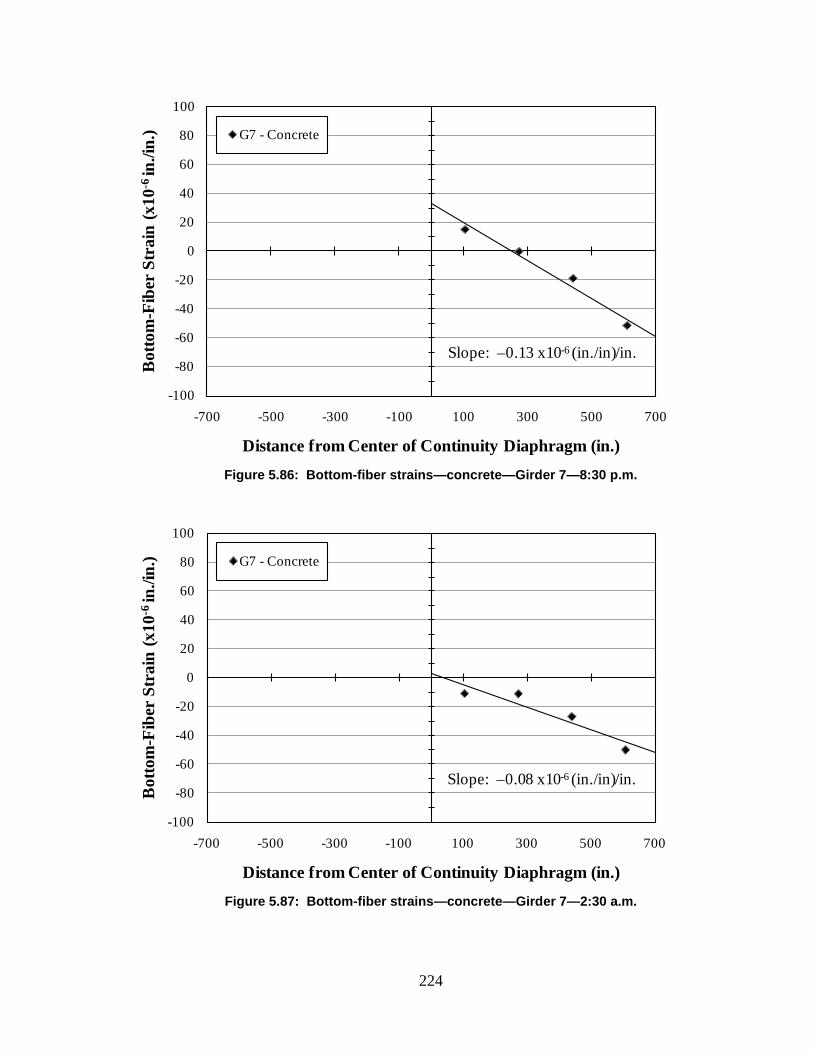
224
Figure 5.86: Bottom-fiber strains—concrete—Girder 7—8:30 p.m.
Figure 5.87: Bottom-fiber strains—concrete—Girder 7—2:30 a.m.
-100
-80
-60
-40
-20
0
20
40
60
80
100
-700 -500 -300 -100 100 300 500 700
Bot
tom
-Fib
er S
trai
n (x
10-6
in./i
n.)
Distance from Center of Continuity Diaphragm (in.)
G7 - Concrete
Slope: –0.13 x10⁻⁶ (in./in)/in.
-100
-80
-60
-40
-20
0
20
40
60
80
100
-700 -500 -300 -100 100 300 500 700
Bot
tom
-Fib
er S
trai
n (x
10-6
in./i
n.)
Distance from Center of Continuity Diaphragm (in.)
G7 - Concrete
Slope: –0.08 x10⁻⁶ (in./in)/in.
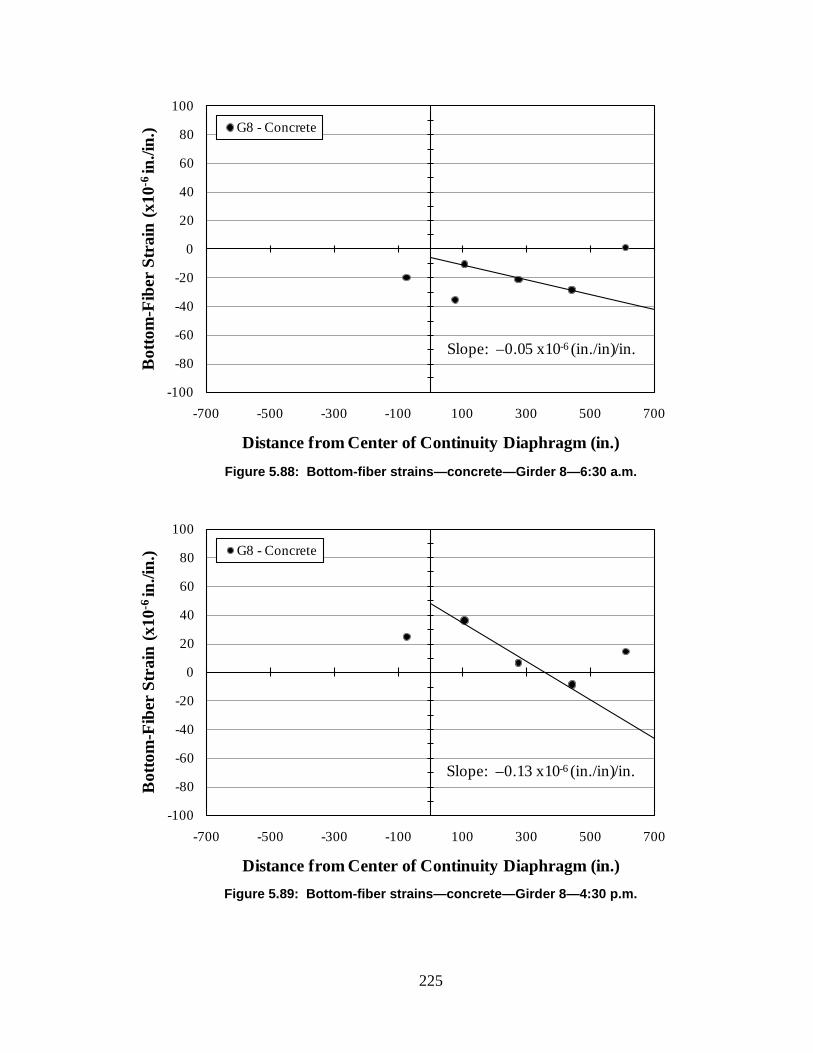
225
Figure 5.88: Bottom-fiber strains—concrete—Girder 8—6:30 a.m.
Figure 5.89: Bottom-fiber strains—concrete—Girder 8—4:30 p.m.
-100
-80
-60
-40
-20
0
20
40
60
80
100
-700 -500 -300 -100 100 300 500 700
Bot
tom
-Fib
er S
trai
n (x
10-6
in./i
n.)
Distance from Center of Continuity Diaphragm (in.)
G8 - Concrete
Slope: –0.05 x10⁻⁶ (in./in)/in.
-100
-80
-60
-40
-20
0
20
40
60
80
100
-700 -500 -300 -100 100 300 500 700
Bot
tom
-Fib
er S
trai
n (x
10-6
in./i
n.)
Distance from Center of Continuity Diaphragm (in.)
G8 - Concrete
Slope: –0.13 x10⁻⁶ (in./in)/in.
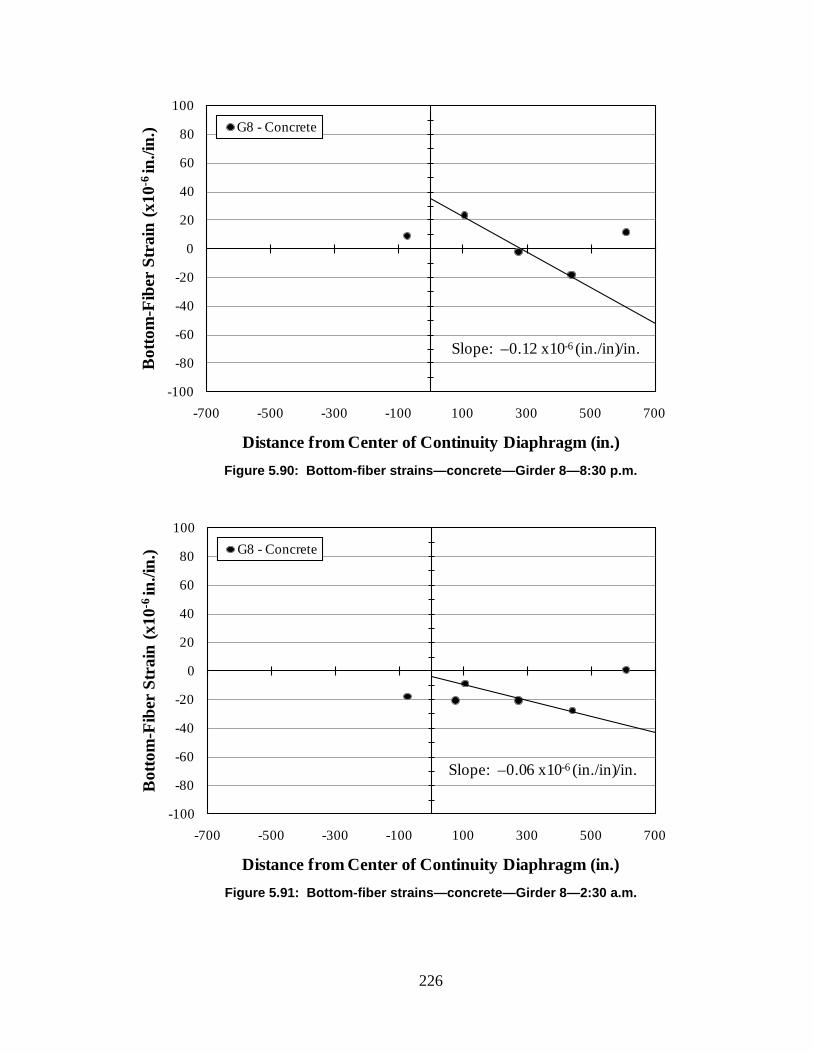
226
Figure 5.90: Bottom-fiber strains—concrete—Girder 8—8:30 p.m.
Figure 5.91: Bottom-fiber strains—concrete—Girder 8—2:30 a.m.
-100
-80
-60
-40
-20
0
20
40
60
80
100
-700 -500 -300 -100 100 300 500 700
Bot
tom
-Fib
er S
trai
n (x
10-6
in./i
n.)
Distance from Center of Continuity Diaphragm (in.)
G8 - Concrete
Slope: –0.12 x10⁻⁶ (in./in)/in.
-100
-80
-60
-40
-20
0
20
40
60
80
100
-700 -500 -300 -100 100 300 500 700
Bot
tom
-Fib
er S
trai
n (x
10-6
in./i
n.)
Distance from Center of Continuity Diaphragm (in.)
G8 - Concrete
Slope: –0.06 x10⁻⁶ (in./in)/in.
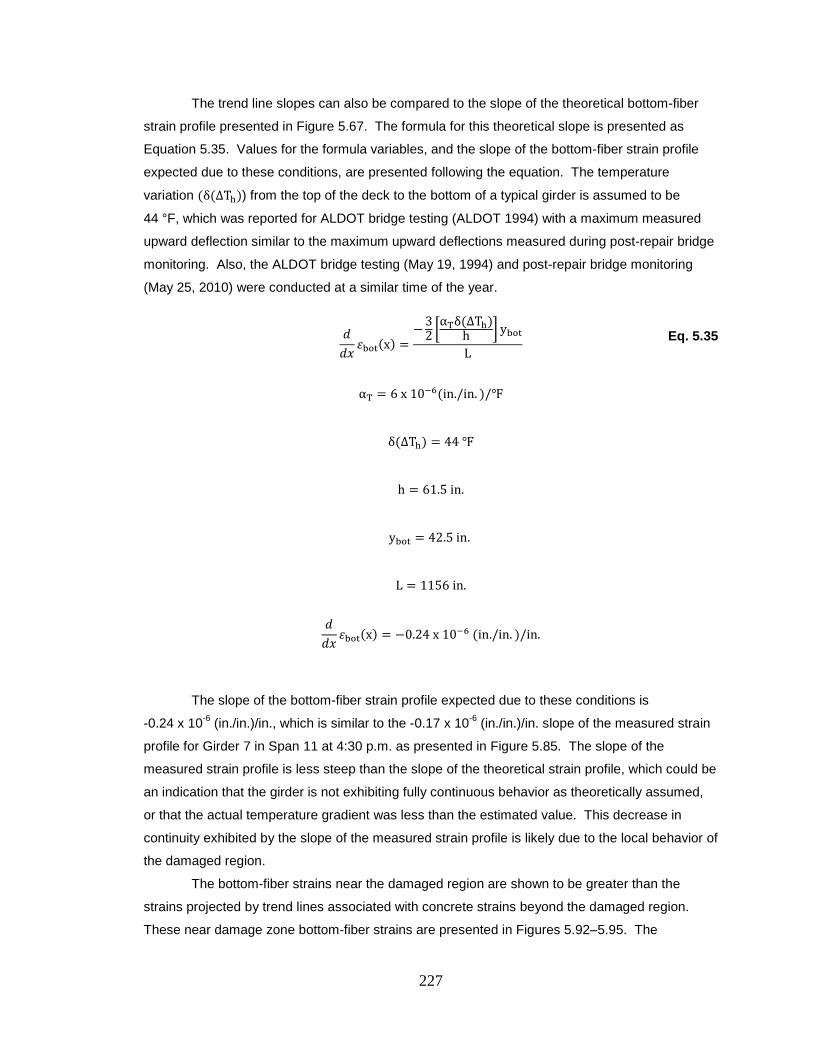
227
The trend line slopes can also be compared to the slope of the theoretical bottom-fiber
strain profile presented in Figure 5.67. The formula for this theoretical slope is presented as
Equation 5.35. Values for the formula variables, and the slope of the bottom-fiber strain profile
expected due to these conditions, are presented following the equation. The temperature
variation (δ(∆Th)) from the top of the deck to the bottom of a typical girder is assumed to be
44 °F, which was reported for ALDOT bridge testing (ALDOT 1994) with a maximum measured
upward deflection similar to the maximum upward deflections measured during post-repair bridge
monitoring. Also, the ALDOT bridge testing (May 19, 1994) and post-repair bridge monitoring
(May 25, 2010) were conducted at a similar time of the year.
𝑑𝑑𝑥
𝜀bot(x) =− 3
2 �αTδ(∆Th)
h � ybotL
Eq. 5.35
αT = 6 x 10⁻⁶(in./in. )/℉
δ(∆Th) = 44 ℉
h = 61.5 in.
ybot = 42.5 in.
L = 1156 in.
𝑑𝑑𝑥
𝜀bot(x) = −0.24 x 10⁻⁶ (in./in. )/in.
The slope of the bottom-fiber strain profile expected due to these conditions is
-0.24 x 10⁻⁶ (in./in.)/in., which is similar to the -0.17 x 10⁻⁶ (in./in.)/in. slope of the measured strain
profile for Girder 7 in Span 11 at 4:30 p.m. as presented in Figure 5.85. The slope of the
measured strain profile is less steep than the slope of the theoretical strain profile, which could be
an indication that the girder is not exhibiting fully continuous behavior as theoretically assumed,
or that the actual temperature gradient was less than the estimated value. This decrease in
continuity exhibited by the slope of the measured strain profile is likely due to the local behavior of
the damaged region.
The bottom-fiber strains near the damaged region are shown to be greater than the
strains projected by trend lines associated with concrete strains beyond the damaged region.
These near damage zone bottom-fiber strains are presented in Figures 5.92–5.95. The
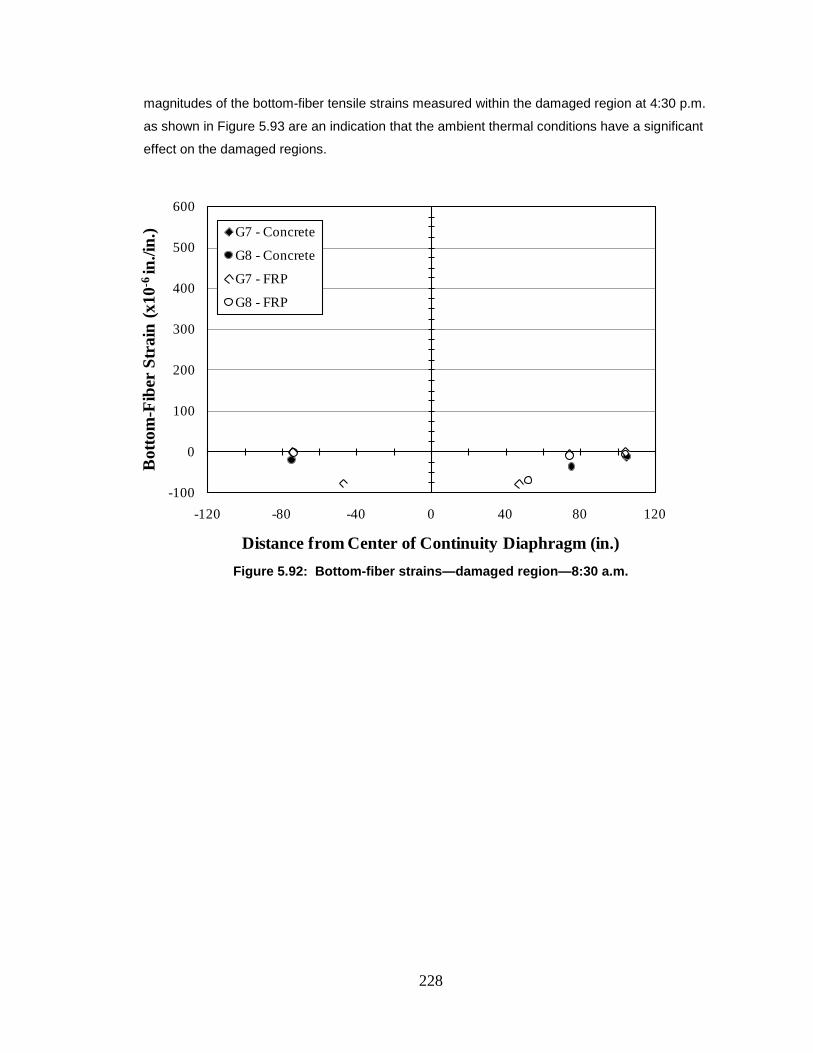
228
magnitudes of the bottom-fiber tensile strains measured within the damaged region at 4:30 p.m.
as shown in Figure 5.93 are an indication that the ambient thermal conditions have a significant
effect on the damaged regions.
Figure 5.92: Bottom-fiber strains—damaged region—8:30 a.m.
-100
0
100
200
300
400
500
600
-120 -80 -40 0 40 80 120
Bot
tom
-Fib
er S
trai
n (x
10-6
in./i
n.)
Distance from Center of Continuity Diaphragm (in.)
G7 - Concrete
G8 - Concrete
G7 - FRP
G8 - FRP
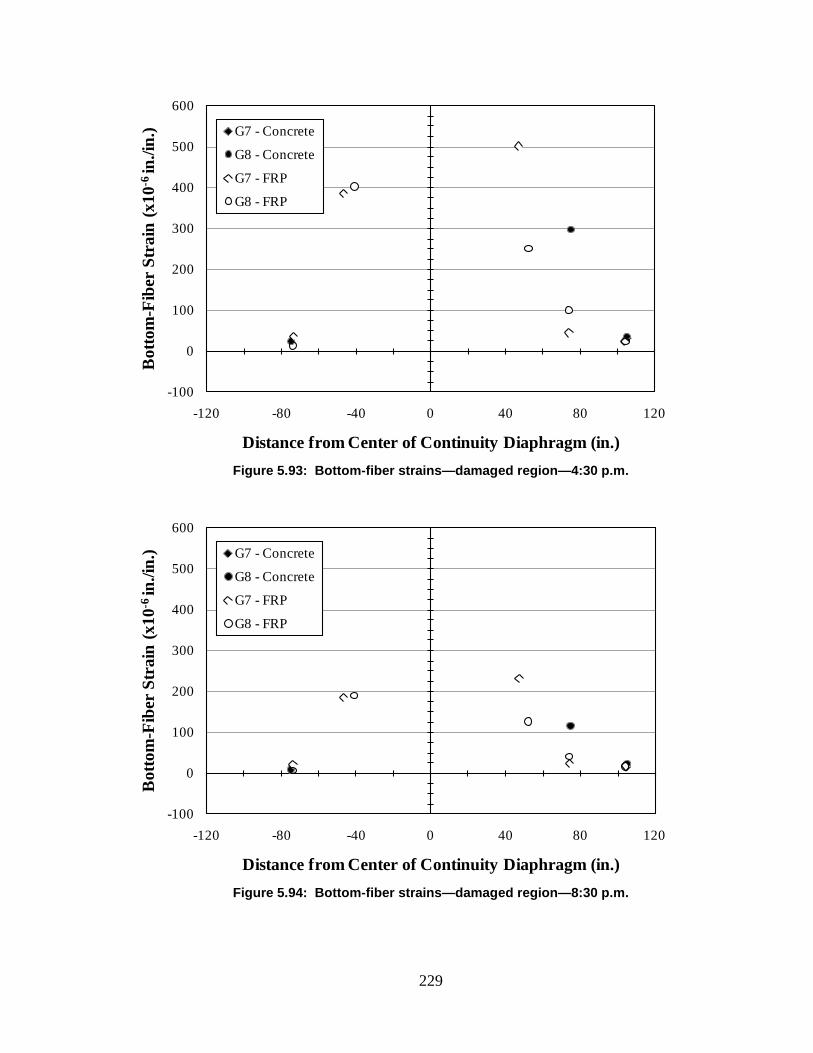
229
Figure 5.93: Bottom-fiber strains—damaged region—4:30 p.m.
Figure 5.94: Bottom-fiber strains—damaged region—8:30 p.m.
-100
0
100
200
300
400
500
600
-120 -80 -40 0 40 80 120
Bot
tom
-Fib
er S
trai
n (x
10-6
in./i
n.)
Distance from Center of Continuity Diaphragm (in.)
G7 - Concrete
G8 - Concrete
G7 - FRP
G8 - FRP
-100
0
100
200
300
400
500
600
-120 -80 -40 0 40 80 120
Bot
tom
-Fib
er S
trai
n (x
10-6
in./i
n.)
Distance from Center of Continuity Diaphragm (in.)
G7 - Concrete
G8 - Concrete
G7 - FRP
G8 - FRP
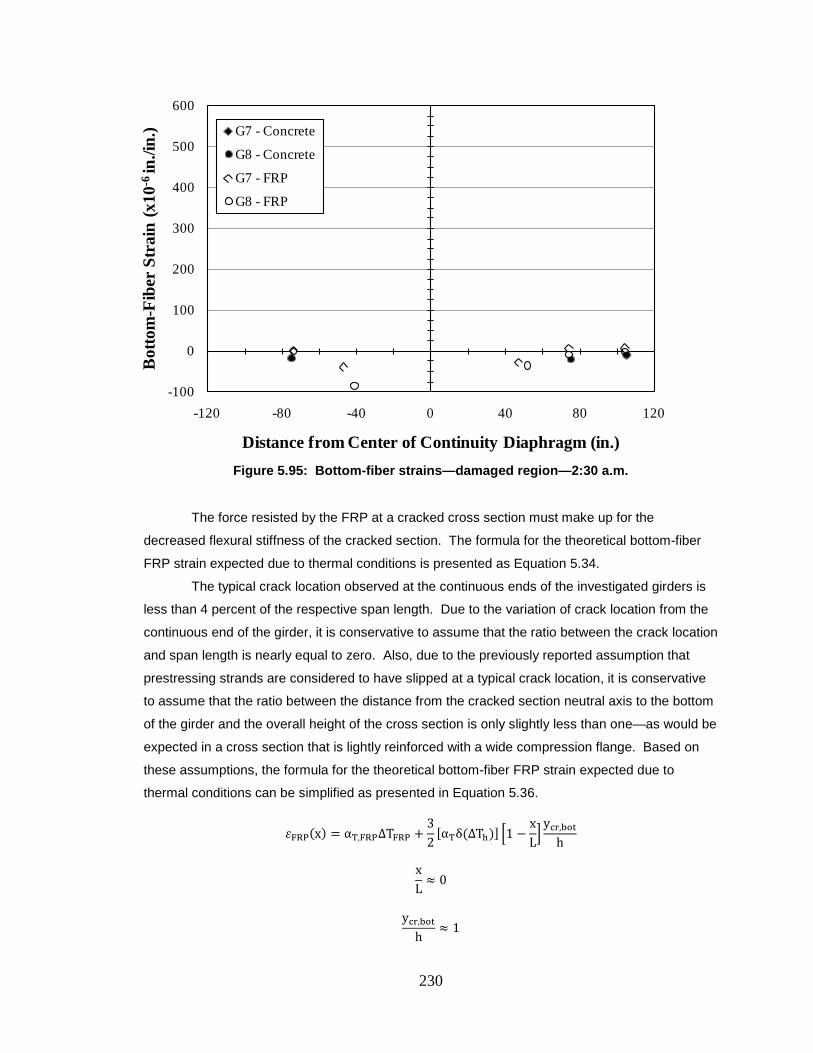
230
Figure 5.95: Bottom-fiber strains—damaged region—2:30 a.m.
The force resisted by the FRP at a cracked cross section must make up for the
decreased flexural stiffness of the cracked section. The formula for the theoretical bottom-fiber
FRP strain expected due to thermal conditions is presented as Equation 5.34.
The typical crack location observed at the continuous ends of the investigated girders is
less than 4 percent of the respective span length. Due to the variation of crack location from the
continuous end of the girder, it is conservative to assume that the ratio between the crack location
and span length is nearly equal to zero. Also, due to the previously reported assumption that
prestressing strands are considered to have slipped at a typical crack location, it is conservative
to assume that the ratio between the distance from the cracked section neutral axis to the bottom
of the girder and the overall height of the cross section is only slightly less than one—as would be
expected in a cross section that is lightly reinforced with a wide compression flange. Based on
these assumptions, the formula for the theoretical bottom-fiber FRP strain expected due to
thermal conditions can be simplified as presented in Equation 5.36.
𝜀FRP(x) = αT,FRP∆TFRP +32
[αTδ(∆Th)] �1 −xL�
ycr,bot
h
xL≈ 0
ycr,bot
h≈ 1
-100
0
100
200
300
400
500
600
-120 -80 -40 0 40 80 120
Bot
tom
-Fib
er S
trai
n (x
10-6
in./i
n.)
Distance from Center of Continuity Diaphragm (in.)
G7 - Concrete
G8 - Concrete
G7 - FRP
G8 - FRP
231
𝜀FRP(x) ≈ αT,FRP∆TFRP +32
[αTδ(∆Th)] Eq. 5.36
Values for the formula variables, and the bottom-fiber strain expected due to these
conditions, are presented following this paragraph. The concrete thermal properties remain the
same as previously presented. The longitudinal coefficient of thermal expansion of the FRP
(αFRP) is approximately 3.6 x 10⁻⁶ (in./in.)/°F according to the manufacturer (Fyfe 2010). An FRP
temperature variation (∆TFRP) of 30 °F is assumed based on the range of maximum and minimum
ambient temperatures reported for the days encompassing post-repair testing (NOAA 2010).
𝜀FRP(x) ≈ αT,FRP∆TFRP +32
[αTδ(∆Th)]
αT,FRP = 3.6 x 10⁻⁶ (in./in. )/in.
∆TFRP = 30 ℉
αT = 6 x 10⁻⁶ (in./in. )/℉
δ(∆Th) = 44 ℉
𝜀FRP(x) ≈ 110 x 10−6 in./in. + 400 x 10−6 in./in.
𝜀FRP(x) ≈ 510 x 10−6 in./in.
The bottom-fiber FRP strain expected due to these conditions is a tensile strain of
510 x 10-6 in./in., which is similar to the maximum tensile strains measured at the crack locations
as presented in Tables 5.23 and 5.24. These similar tensile strains support the conclusion that
this simplified analysis of structural response to a linear temperature gradient can be used to
establish the tensile strain that must be resisted on a regular basis by an FRP repair system.
5.4.2.3 Crack-Opening Displacements
Crack-opening displacements in response to ambient thermal conditions are relative to initial
conditions at 2:30 a.m. on the first night of bridge testing. Positive crack-opening displacement
measurements indicate crack openings compared to the initial conditions, and negative crack-
opening displacement measurements indicate crack closures compared to the initial conditions.
The crack-opening displacements measured in response to ambient thermal conditions are
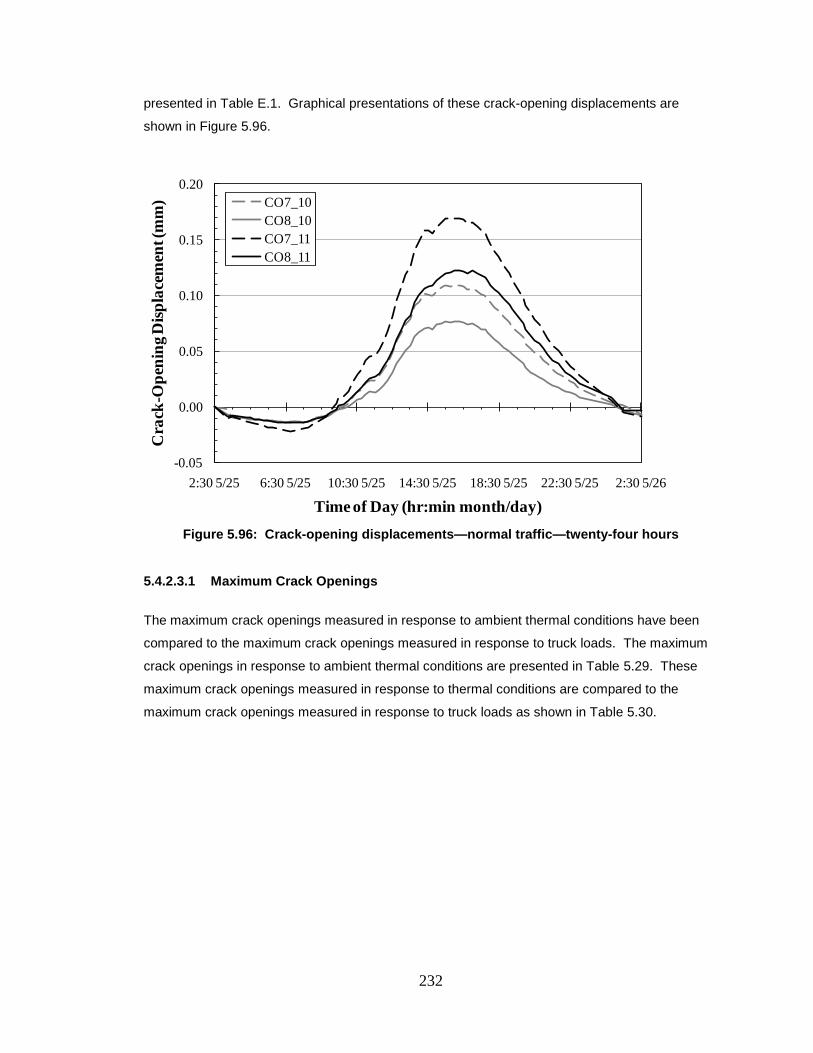
232
presented in Table E.1. Graphical presentations of these crack-opening displacements are
shown in Figure 5.96.
Figure 5.96: Crack-opening displacements—normal traffic—twenty-four hours
5.4.2.3.1 Maximum Crack Openings
The maximum crack openings measured in response to ambient thermal conditions have been
compared to the maximum crack openings measured in response to truck loads. The maximum
crack openings in response to ambient thermal conditions are presented in Table 5.29. These
maximum crack openings measured in response to thermal conditions are compared to the
maximum crack openings measured in response to truck loads as shown in Table 5.30.
-0.05
0.00
0.05
0.10
0.15
0.20
2:30 5/25 6:30 5/25 10:30 5/25 14:30 5/25 18:30 5/25 22:30 5/25 2:30 5/26
Cra
ck-O
peni
ng D
ispla
cem
ent (
mm
)
Time of Day (hr:min month/day)
CO7_10CO8_10CO7_11CO8_11
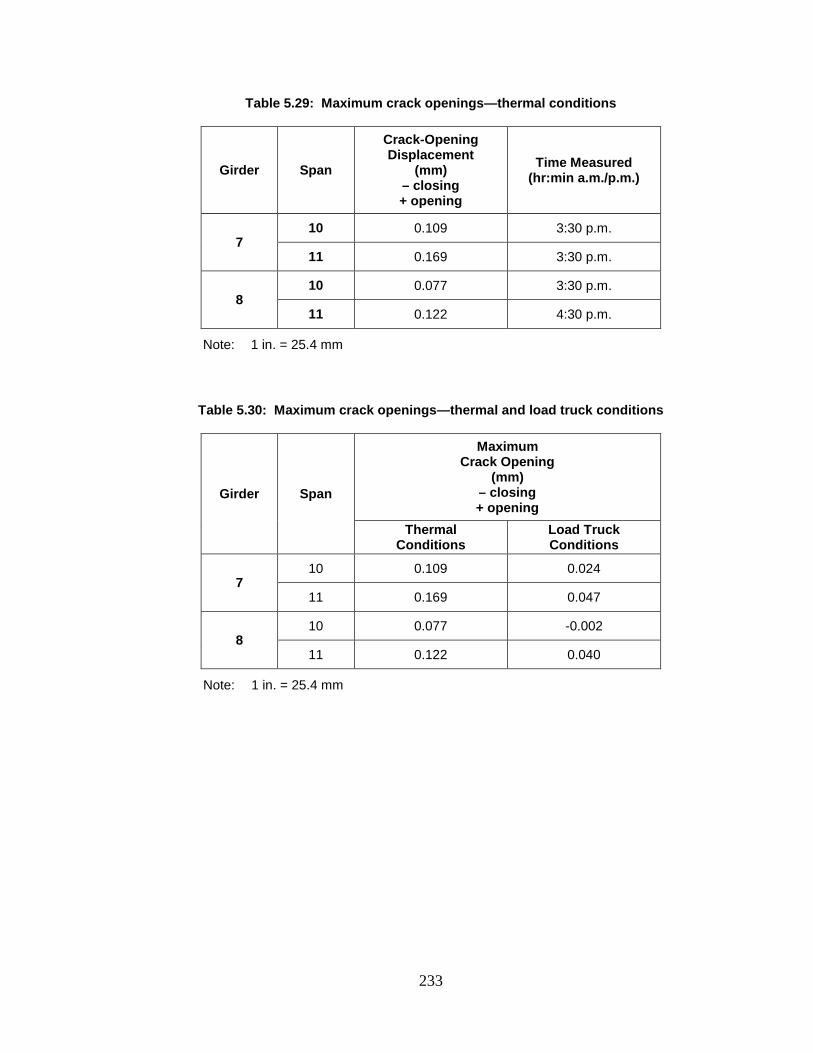
233
Table 5.29: Maximum crack openings—thermal conditions
Girder Span
Crack-Opening Displacement
(mm) – closing + opening
Time Measured (hr:min a.m./p.m.)
7 10 0.109 3:30 p.m.
11 0.169 3:30 p.m.
8 10 0.077 3:30 p.m.
11 0.122 4:30 p.m.
Note: 1 in. = 25.4 mm
Table 5.30: Maximum crack openings—thermal and load truck conditions
Girder Span
Maximum Crack Opening
(mm) – closing + opening
Thermal Conditions
Load Truck Conditions
7 10 0.109 0.024
11 0.169 0.047
8 10 0.077 -0.002
11 0.122 0.040
Note: 1 in. = 25.4 mm
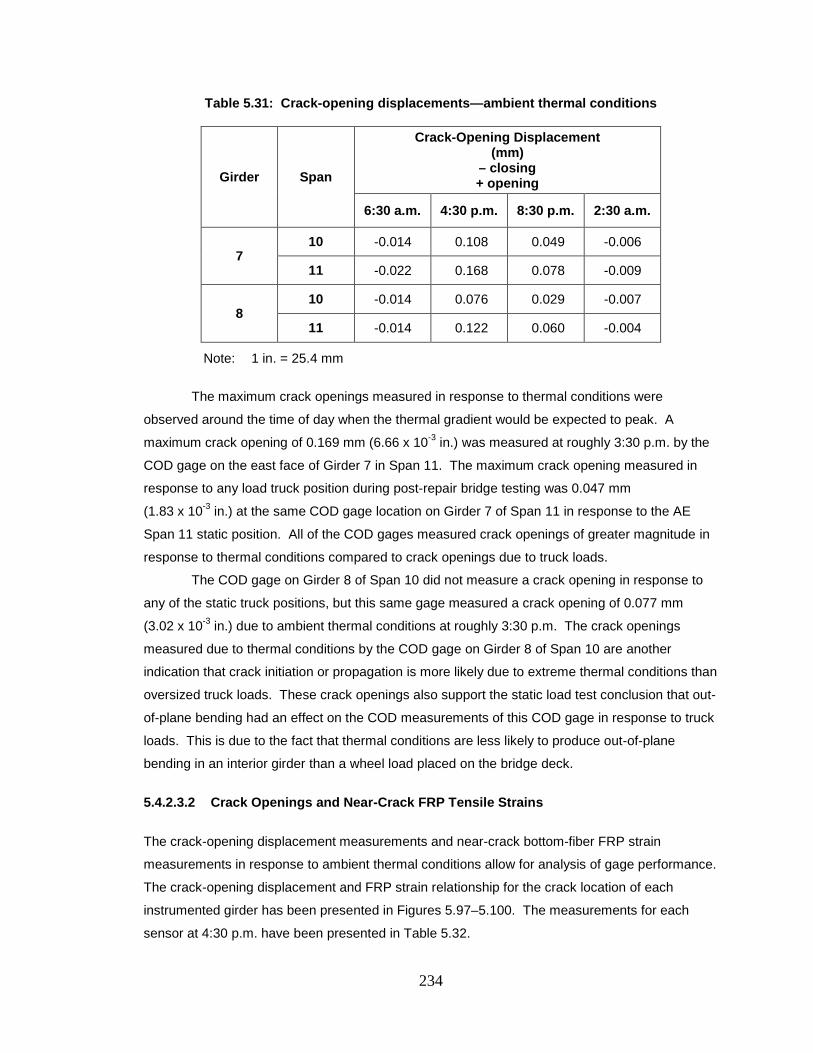
234
Table 5.31: Crack-opening displacements—ambient thermal conditions
Girder Span
Crack-Opening Displacement (mm)
– closing + opening
6:30 a.m. 4:30 p.m. 8:30 p.m. 2:30 a.m.
7 10 -0.014 0.108 0.049 -0.006
11 -0.022 0.168 0.078 -0.009
8 10 -0.014 0.076 0.029 -0.007
11 -0.014 0.122 0.060 -0.004
Note: 1 in. = 25.4 mm
The maximum crack openings measured in response to thermal conditions were
observed around the time of day when the thermal gradient would be expected to peak. A
maximum crack opening of 0.169 mm (6.66 x 10⁻³ in.) was measured at roughly 3:30 p.m. by the
COD gage on the east face of Girder 7 in Span 11. The maximum crack opening measured in
response to any load truck position during post-repair bridge testing was 0.047 mm
(1.83 x 10⁻³ in.) at the same COD gage location on Girder 7 of Span 11 in response to the AE
Span 11 static position. All of the COD gages measured crack openings of greater magnitude in
response to thermal conditions compared to crack openings due to truck loads.
The COD gage on Girder 8 of Span 10 did not measure a crack opening in response to
any of the static truck positions, but this same gage measured a crack opening of 0.077 mm
(3.02 x 10⁻³ in.) due to ambient thermal conditions at roughly 3:30 p.m. The crack openings
measured due to thermal conditions by the COD gage on Girder 8 of Span 10 are another
indication that crack initiation or propagation is more likely due to extreme thermal conditions than
oversized truck loads. These crack openings also support the static load test conclusion that out-
of-plane bending had an effect on the COD measurements of this COD gage in response to truck
loads. This is due to the fact that thermal conditions are less likely to produce out-of-plane
bending in an interior girder than a wheel load placed on the bridge deck.
5.4.2.3.2 Crack Openings and Near-Crack FRP Tensile Strains
The crack-opening displacement measurements and near-crack bottom-fiber FRP strain
measurements in response to ambient thermal conditions allow for analysis of gage performance.
The crack-opening displacement and FRP strain relationship for the crack location of each
instrumented girder has been presented in Figures 5.97–5.100. The measurements for each
sensor at 4:30 p.m. have been presented in Table 5.32.
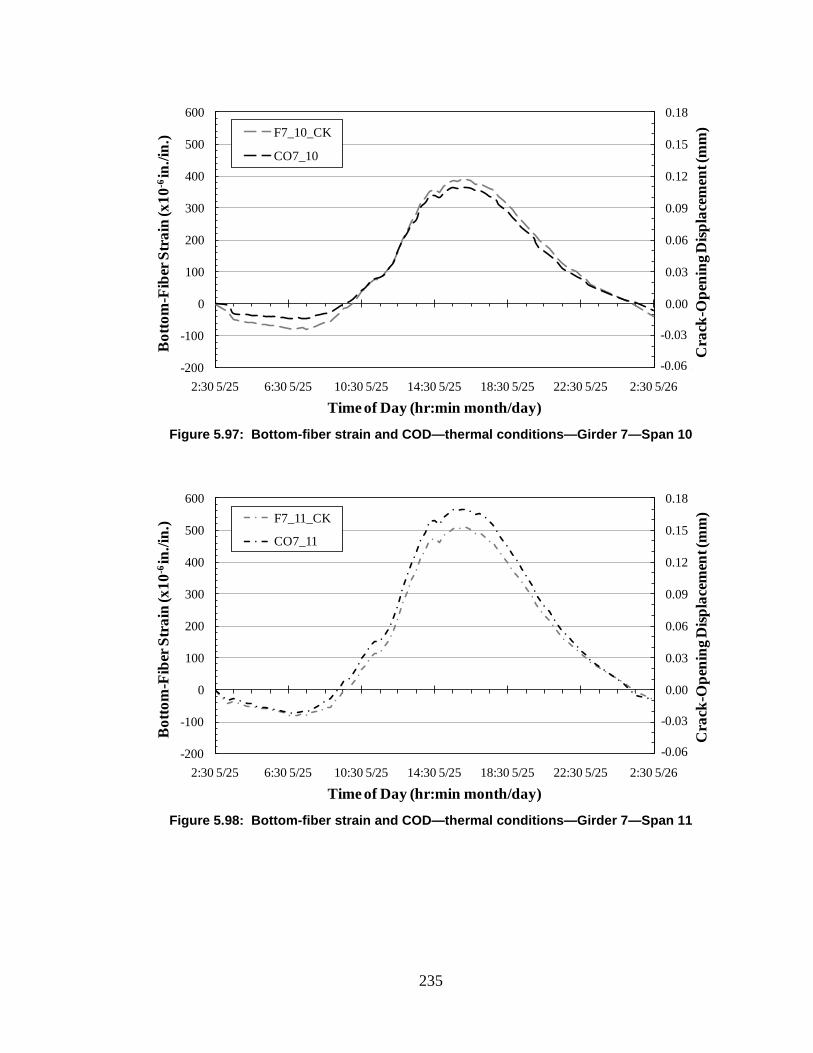
235
Figure 5.97: Bottom-fiber strain and COD—thermal conditions—Girder 7—Span 10
Figure 5.98: Bottom-fiber strain and COD—thermal conditions—Girder 7—Span 11
-0.06
-0.03
0.00
0.03
0.06
0.09
0.12
0.15
0.18
-200
-100
0
100
200
300
400
500
600
2:30 5/25 6:30 5/25 10:30 5/25 14:30 5/25 18:30 5/25 22:30 5/25 2:30 5/26
Cra
ck-O
peni
ng D
ispla
cem
ent (
mm
)
Bot
tom
-Fib
er S
trai
n (x
10-6
in./i
n.)
Time of Day (hr:min month/day)
F7_10_CK
CO7_10
-0.03
-0.06
-0.06
-0.03
0.00
0.03
0.06
0.09
0.12
0.15
0.18
-200
-100
0
100
200
300
400
500
600
2:30 5/25 6:30 5/25 10:30 5/25 14:30 5/25 18:30 5/25 22:30 5/25 2:30 5/26
Cra
ck-O
peni
ng D
ispla
cem
ent (
mm
)
Bot
tom
-Fib
er S
trai
n (x
10-6
in./i
n.)
Time of Day (hr:min month/day)
F7_11_CK
CO7_11
-0.03
-0.06
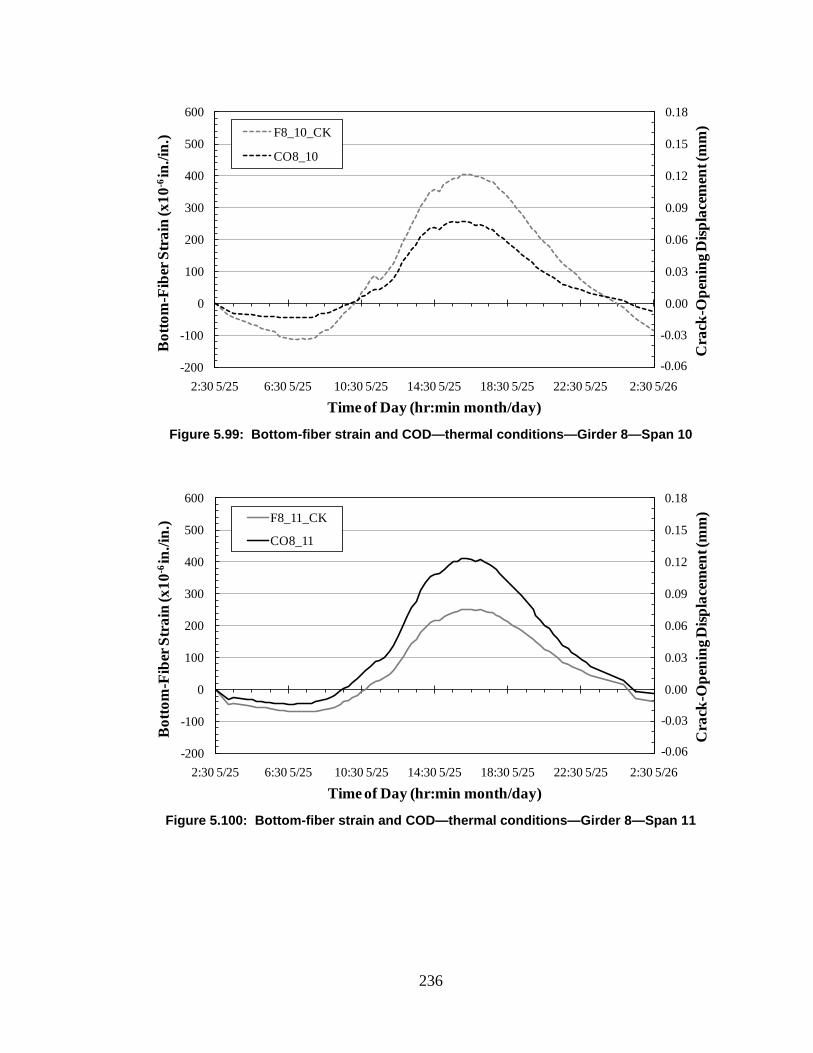
236
Figure 5.99: Bottom-fiber strain and COD—thermal conditions—Girder 8—Span 10
Figure 5.100: Bottom-fiber strain and COD—thermal conditions—Girder 8—Span 11
-0.06
-0.03
0.00
0.03
0.06
0.09
0.12
0.15
0.18
-200
-100
0
100
200
300
400
500
600
2:30 5/25 6:30 5/25 10:30 5/25 14:30 5/25 18:30 5/25 22:30 5/25 2:30 5/26
Cra
ck-O
peni
ng D
ispla
cem
ent (
mm
)
Bot
tom
-Fib
er S
trai
n (x
10-6
in./i
n.)
Time of Day (hr:min month/day)
F8_10_CK
CO8_10
-0.03
-0.06
-0.06
-0.03
0.00
0.03
0.06
0.09
0.12
0.15
0.18
-200
-100
0
100
200
300
400
500
600
2:30 5/25 6:30 5/25 10:30 5/25 14:30 5/25 18:30 5/25 22:30 5/25 2:30 5/26
Cra
ck-O
peni
ng D
ispla
cem
ent (
mm
)
Bot
tom
-Fib
er S
trai
n (x
10-6
in./i
n.)
Time of Day (hr:min month/day)
F8_11_CK
CO8_11
-0.03
-0.06
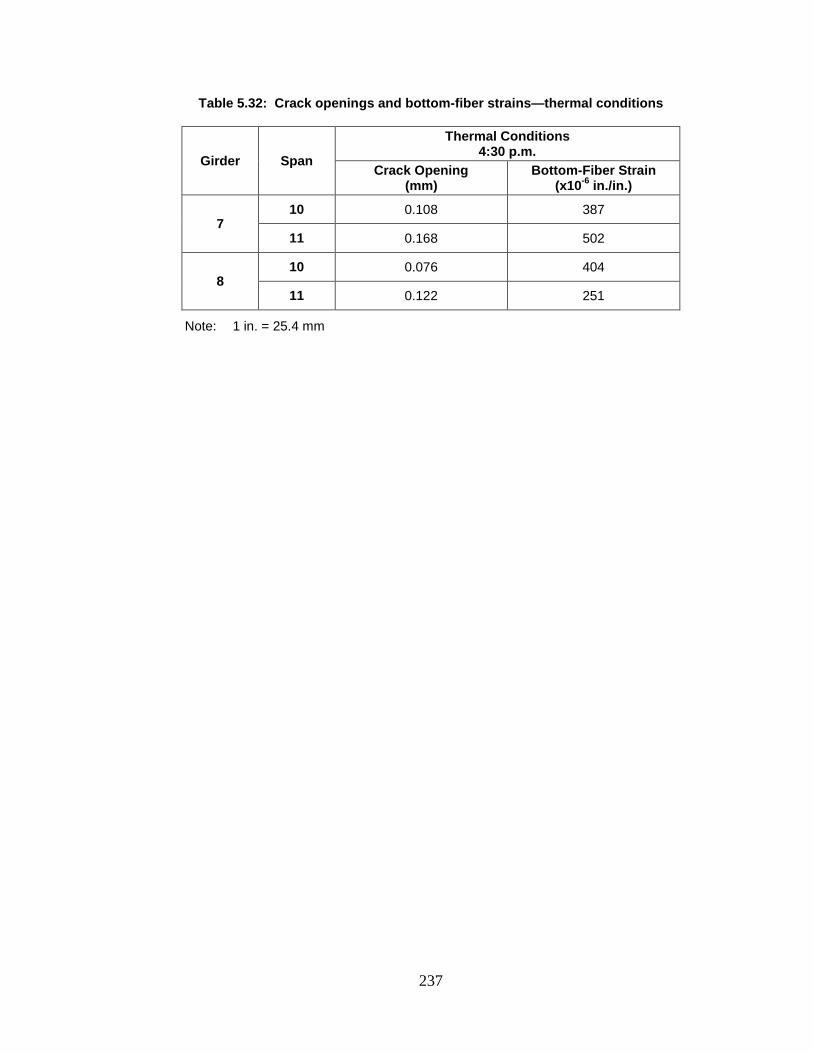
237
Table 5.32: Crack openings and bottom-fiber strains—thermal conditions
Girder Span
Thermal Conditions 4:30 p.m.
Crack Opening (mm)
Bottom-Fiber Strain (x10-6 in./in.)
7 10 0.108 387
11 0.168 502
8 10 0.076 404
11 0.122 251
Note: 1 in. = 25.4 mm

238
Due to the previous conclusion that Girder 7 sensors provide the most reliable
measurements, the crack-opening displacements and FRP strains have been presented using
scales that provided the best graphical comparisons between the Girder 7 sensors.
As previously discussed, the Girder 8-Span 10 COD gage measured crack openings in
response to ambient thermal conditions but not in response to truck loads. Although the
measured behavior at this gage location is more similar to the other gages in response to ambient
temperature than it was in response to truck loads, the COD and FRP strain relationship is not
similar to the relationships observed at the Girder 7 crack locations of both instrumented spans.
The FRP strain measurements for Girder 8 of Span 10 were similar to the FRP strain
measurements for Girder 7 of Span 10, but the COD measurements for the two girders were not
similar under the same conditions. The smaller magnitude of the Girder 8-Span 10 COD
measurements can be associated with the fact that cracks within the girder web are only present
on the west face. The relationship observed in Figure 5.99 supports the previous conclusions
that the performance of the COD gage on Girder 8 of Span 10 has been affected by the presence
of cracks only on the west face of the girder web resulting in different cross sectional behavior
compared to the other instrumented damaged regions and also requiring that the COD gage be
installed on an opposite girder face compared to the other COD gages.
The FRP strains measured at the crack location of Girder 8 in Span 11 were consistently
the least tensile of the four instrumented girders. This behavior is not consistent with the crack-
opening displacements measured by the COD gage on the same girder. The relationship shown
in Figure 5.100 between the COD measurements and the bottom-fiber FRP strain measurements
at the crack location of Girder 8-Span 11 supports the previous conclusion that the bottom-fiber
FRP strain gage assigned to that crack location was not accurately installed as close to the actual
underlying crack location as the other FRP strain gages assigned to their respective crack
locations.
5.5 PERFORMANCE OF FRP REINFORCEMENT
At the time of post-repair testing in May 2010, the FRP reinforcement installed in December 2007
had been in service for more than 2 years. Most importantly, the FRP reinforcement system had
been subjected to two summer cycles and likely experienced varying temperature gradients
similar to the thermal conditions that reportedly caused initial cracking. At the time of post-repair
testing, the bridge structure did not exhibit additional severe cracking of structural concrete or
debonding/deterioration of FRP reinforcement bonded to the concrete surface. During post-repair
testing, stress-induced tensile strains were measured on the surface of the FRP reinforcement in
response to truck loads and daily temperature variations. The FRP reinforcement was installed to
provide tension resistance to limit additional damage without debonding and becoming
ineffective. It is apparent that the FRP installed on Northbound Spans 10 and 11 of I-565 is
239
providing tension resistance without debonding, and that it would be appropriate to recommend a
design procedure for the repair of prestressed bridge girders that exhibit damage near continuous
ends using FRP reinforcement.
5.6 CONCLUSIONS
Analysis of the post-repair measurements in response to truck loads confirmed that contact
between false support bearing pads and bridge girders during pre-repair testing resulted in
additional load-bearing support conditions that affected behavior observed during pre-repair
testing. It is evident that comparisons between pre- and post-repair structural behavior measured
during testing are not useful for assessing the efficacy of the FRP reinforcement repair.
Post-repair measurements in response to truck loads confirmed that, although extensive
cracking near the continuous ends of girders has occurred, the bridge structure exhibits
continuous behavior. However, it is also evident that damaged regions exhibit local nonlinear
behavior preventing the bridge structure from behaving as a fully continuous two-span structure
under live loads as originally constructed. When designing similar FRP repair systems, the
bridge should be considered to consist of simply-supported girders with complete loss of
continuity at the interior support in response to strength-limit-state demands.
Post-repair measurements in response to various truck positions confirmed that the most
critical load conditions for crack openings and FRP tensile demand were those that correspond
with the greatest shear demand within the damaged region. Design-critical loading configurations
for the damaged regions coincide with truck positions that result in the maximum shear force at
the most damaged regions. Analysis procedures for determining the maximum shear force
demand for a simply girder should be used to determine the load effects and design forces for
FRP repair of girders with damaged continuous ends.
Analysis of the post-repair measurements in response to ambient thermal conditions
supports the previously documented conclusion that restraint of temperature-induced
deformations was the cause of initial cracking near the continuous ends of the I-565 bridge
girders. Upward deflections measured in response to ambient thermal conditions during post-
repair bridge monitoring were similar to upward deflections measured in response to solar effects
during an ALDOT investigation of the same spans in 1994.
Linear profiles of bottom-fiber concrete strains measured beyond the primary crack
location of damaged regions were similar to the theoretical linear profiles expected of a fully
continuous structure in response to the restraint of thermal deformations. The slope of the
bottom-fiber strain profiles were less than theoretically expected of a fully continuous structure
subjected to a linear temperature gradient similar to the gradient measured by ALDOT in 1994,
which is an indication that either the structure is not exhibiting fully continuous behavior or the
temperature gradient was less than theoretically assumed.

240
Post-repair measurements in response to thermal conditions also provide evidence that
the typical daily strain range experienced by the FRP reinforcement at a primary crack location is
similar to the theoretical behavior expected in response to a linear temperature gradient similar to
the gradient measured by ALDOT in 1994.
Simplified linear temperature gradient analysis can be used to effectively estimate the
tensile strain that an FRP repair system must resist due to daily temperature variations. This
theoretical strain behavior in response to thermal conditions should be considered when selecting
a specific FRP reinforcement system for repair.
After more than 2 years of service, the repaired bridge structure did not exhibit additional
severe cracking of structural concrete or debonding/deterioration of FRP reinforcement bonded to
the concrete surface. It is apparent that the FRP installed on Northbound Spans 10 and 11 of
I-565 is providing tension resistance without debonding, and that it would be appropriate to
recommend a design procedure for the repair of prestressed bridge girders that exhibit damage
near continuous ends using FRP reinforcement.

241
Chapter 6
FRP REINFORCEMENT DESIGN
6.1 INTRODUCTION
Behavioral observations from bridge testing were used to formulate FRP reinforcement design
recommendations for repairing damaged regions similar to the continuous ends of girders in
Northbound Spans 10 and 11 of I-565 in Huntsville, Alabama. These recommendations include
parameters for selecting appropriate FRP reinforcement products, determining critical cross-
section locations and critical load conditions, determining an amount of reinforcement required to
satisfy strength-limit-state demands, and, if necessary, selecting appropriate solutions for
providing supplementary anchorage. Design recommendations for an FRP reinforcement
solution (similar to the repair system discussed in this report) intended for the repair of damaged
multi-span bridge structures constructed to be continuous for post-construction loads (similar to
the bridge structure discussed in this report) are presented in this chapter. An example of the
design procedure, considering the investigated I-565 bridge structure and FRP reinforcement
product selected by the Auburn University Highway Research Center (AUHRC), is presented in
Appendix N of this report.
6.2 NECESSITY OF FRP REINFORCEMENT
The conditions investigated within the scope of this report include girder cracking at the
continuous ends of bridge structures that were constructed to be continuous for post-construction
loads. As discussed in Chapter 2 of this report, this cracking is attributable to inadequate
detailing of reinforcement to account for positive bending moment demands associated with
ambient temperature conditions (Gao 2003). The primary inadequate detail is the premature
termination of positive bending moment continuity reinforcement within the girder. If large cracks
have been observed to intersect prestressed strands, it has been determined that it is no longer
appropriate to assume that these strands provide significant precompression stresses or act as
effective longitudinal reinforcement for positive bending moment resistance between the crack
location and the face of the continuity diaphragm—particularly under strength-limit-state
demands. Thus, additional longitudinal reinforcement is required to satisfy shear- and flexure-
242
dependent ultimate strength demands that were previously dependent upon the performance of
these prestressed strands.
6.3 FRP REINFORCEMENT PRODUCT SELECTION
A manufacturer of FRP reinforcement must be able to confidently recommend the selected FRP
product for bridge girder reinforcement. Recommendations for determining qualifying FRP
reinforcement products are presented by the American Concrete Institute (ACI) Committee
440.2R-08 Guide for the Design and Construction of Externally Bonded FRP Systems for
Strengthening Concrete Structures (ACI Committee 440 2008), referred to as ACI 440.2R-08
from this point forward. Product selection recommendations are also presented by the National
Cooperative Highway Research Program (NCHRP) Report 655 Recommended Guide
Specification for the Design of Externally Bonded FRP Systems for the Repair and Strengthening
of Concrete Bridge Elements (Zureick et al. 2010), referred to as NCHRP Report 655 from this
point forward.
Material properties should be reported for the cured composite material of FRP fibers and
adhesive. The tension failure strain (εfu) and Young’s modulus of elasticity (Ef) should be
reported by the manufacturer as determined in accordance with ASTM D3039. The glass
transition temperature (Tg) should be reported in accordance with ASTM D4065.
For design purposes, these properties should take into account material degradation due
to prolonged environmental exposure. It is recommended that the durability of an FRP product
be tested for conditions that are consistent with the environment of the installation location.
Conditions that could have an effect on durability include
• Freeze-thaw cycling,
• Hot-wet cycling,
• Alkaline immersion,
• Ultraviolet exposure,
• Dry heat, and
• Salt water exposure.
If the material properties documented by the manufacturer do not account for durability effects,
then an environmental reduction factor (CE) must be applied in accordance with ACI 440.2R-08.
To account for fatigue associated with service life environmental exposure, tensile
properties reported by the manufacturer should be adjusted in accordance with provisions
presented in Section 9.4 of ACI 440.2R-08. Young’s modulus of elasticity is typically unaffected
by environmental conditions, because the design tensile strength and design rupture strain are
both modified by the same reduction coefficient for environmental exposure (ACI Committee 440
2008).
243
According to ACI 440.2R-08, of all types of FRP composites for infrastructure
applications, carbon FRP (CFRP) is the least prone to fatigue failure. The fatigue strength at
ultimate strength is relatively unaffected by environmental conditions, unless the resin or
fiber/resin interface is substantially degraded by environmental exposure.
According to NCHRP Report 655, the tension failure strain should be documented at
greater than 0.85 percent after environmental effects. NCHRP Report 655 also recommends that
the glass transition temperature should represent a temperature more than 40 °F warmer than
the maximum design temperature (Tmax,design) expected at the geographic location of the bridge
structure. This maximum design temperature is defined in Article 3.12.2.2 of the American
Association of State Highway and Transportation Officials LRFD Bridge Design Specification
(AASHTO 2010), referred to as AASHTO LRFD from this point forward.
To assess the feasibility of an FRP repair system, it is recommended to assume FRP
material properties similar to those of the FRP material installed on the girders of Northbound
Spans 10 and 11 of I-565. However, it is permissible to design a repair system with other FRP
products that are recommended by the manufacturer for the reinforcement of bridge girders.
Potential FRP reinforcement products must have documented material properties obtained
through testing. Additional testing may be required to verify these documented properties if the
designer or bridge owner is unfamiliar with the product.
6.4 STRENGTH-LIMIT-STATE DESIGN
After selecting an FRP reinforcement product with confirmed acceptable material properties, the
amount of reinforcement required to satisfy strength-limit-state demands can be determined. For
the purpose of this discussion, strength-limit-state capacities and demands are determined in
accordance with AASHTO LRFD; however, another framework of consistent analysis and design
procedures could be utilized at the discretion of the bridge owner—as long as each of the
relevant failure modes are adequately addressed.
Strength-limit-state capacities must be modified to include the effects of longitudinal FRP
reinforcement. Limiting behavior expected of FRP reinforcement is determined in accordance
with provisions presented by ACI 440.2R-08.
FRP reinforcement design requirements are determined according to the minimum
tensile capacity required of the net flexural reinforcement in response to strength-limit-state
demands. Strength-limit-state design includes the determination of
• Critical cross-section locations,
• Critical load conditions for those locations,
• Material properties of the existing structure and FRP reinforcement,
• Cross-section dimensions,
244
• Reinforcement dimensions at each critical location,
• Shear strength after reinforcement,
• Tension strength of longitudinal reinforcement,
• Length of FRP installation, and
• Supplemental anchorage solution necessity.
The subsequent sections of this chapter detail this strength design process. An example
of the FRP reinforcement design process is presented in 0 of this report. This example refers to
the conditions of the investigated bridge structures of Northbound Spans 10 and 11 of I-565 in
Huntsville, Alabama.
6.4.1 Critical Cross-Section Locations
Critical cross-section locations are those that are associated with support conditions or
reinforcement transition points within a damaged or potentially damaged region. Reinforcement
transitions occur where the cross-sectional area of longitudinal reinforcement area changes due
to the addition or termination of reinforcement. Reinforcement details that result in these changes
in reinforcement area include the termination of mild steel reinforcement, partial debonding of
strands during girder fabrication, and changes in FRP widths that can be installed due to
obstructions. Reinforcement transitions also occur where the spacing of vertical reinforcement
changes.
6.4.2 Critical Load Conditions
Load testing has provided evidence that damaged end regions of bridge structures constructed to
be fully continuous for post-construction loads exhibit partially continuous behavior, but not fully
continuous behavior, in response to service-level truck loads. When determining strength-limit-
state demands, it is conservative and appropriate to assume that a multi-span structure
constructed to be continuous for post-construction loads will consist of independent simply
supported spans near failure. This assumption results in a safe estimate of tensile demand in the
bottom flange. As a bridge structure becomes less continuous there is a decrease in tensile
demand associated with shear, but there is also a reduction of tensile resistance provided by
negative bending moments near the interior support.
Load testing has also provided evidence that the most critical load conditions controlling
FRP reinforcement performance are those that correspond to maximum shear demand within the
damaged end regions. The strength limit state for maximum shear demand, along with the
corresponding bending moment demand, at a critical location will control the tension
requirements of an FRP reinforcement repair solution.
245
Strength-limit-state tension demand is determined by assuming the bridge structure
exhibits simply supported behavior near failure and applying a combination of dead- and live-load
effects to the structure. Impact force effects that are normally associated with behavior near open
bridge joints may be appropriately reduced or neglected at the discretion of the bridge owner
when assessing damaged regions located near continuous support conditions (where there is no
open joint). Strength-limit-state demands at critical cross-section locations of the assumed simply
supported bridge structure can be determined in accordance with AASHTO LRFD or another
framework of consistent analysis and design procedures at the discretion of the bridge owner. All
demands associated with simply supported behavior assumption should be satisfied along the
entire length of the girder. This includes shear and bending moment demands at midspan.
6.4.3 Strength-Limit-State Temperature Demands
Temperature demands do not need to be considered in conjunction with other strength-limit-state
demands. The FRP reinforcement repair has been conservatively designed to strengthen girders
that have experienced complete continuity degradation and exhibit simply supported behavior in
response to live loads. After the degradation of continuity behavior, thermal effects are no longer
restrained and do not result in stress-induced strains. If the continuity remains partially effective,
temperature effects will be restrained and result in stress-induced strain, but the tension demands
on the FRP in response to truck loads will be decreased by a greater magnitude than the
additional tension demands related to these stress-induced thermal strains. It is thus appropriate
to disregard thermal effects during strength-limit-state design.
6.4.4 Material Properties
During the design process it is important to know specific material properties. The materials that
will have an effect on the repair system design include the girder concrete, deck concrete,
longitudinal steel continuity reinforcement, vertical steel shear reinforcement (stirrups), and the
selected FRP reinforcement.
6.4.4.1 Concrete
The 28-day design compressive strength (f ’c) of the concrete placed during girder fabrication and
deck placement is required to determine post-repair strength capacities. Due to the thickness
and effective width (b) of the bridge deck, the compression zone for providing nominal bending
moment resistance will be located within the bridge deck. For this reason, the concrete strength
of the bridge deck affects the strength for bending moment resistance—although only slightly for
typical bridge girders. When determining the nominal strength for shear resistance (Vn), the
246
effective concrete is located in the girder web between the compression and tension zones. For
this reason, the concrete strength of the girder controls nominal strength for shear resistance.
For design purposes, the typical concrete strengths are considered to range from 3 ksi to
8 ksi. Although higher strength concretes may be utilized for prestressed girders, it is
recommended that these higher concrete strengths be taken no higher than 8 ksi during the
design of an FRP reinforcement system (Zureick et al. 2010).
6.4.4.2 Steel Reinforcement
The material properties of steel reinforcement installed during girder fabrication are also required
for strength design. It is undesirable for an FRP failure to occur before the steel reinforcement
yields. For this reason, the design yield strength (fy) of both the longitudinal and vertical steel
reinforcement should be known.
6.4.4.3 FRP Reinforcement
The material properties of the FRP composite material (fabric and cured epoxy) also have an
effect on strength design. The tensile modulus of elasticity (Ef) and nominal one-layer laminate
thickness (tf,n) of the composite material are required to be presented in product specifications
provided by the manufacturer.
FRP reinforcement does not exhibit yielding behavior similar to steel, but rather exhibits
brittle failure modes, typically associated with debonding from the concrete. The FRP strain must
be conservatively limited to prevent this failure mode because FRP debonding represents an
undesirable failure of reinforcement instantaneously becoming ineffective at the debonded
location. Thus, the effective debonding strain (εfe) of laminate FRP reinforcement must be limited
during strength design based on the debonding strain (εfd), development length (Ldf), bonded
length provided (Lb), and an appropriate upper limit debonding strain.
The debonding strain (εfd) is contingent upon other material properties including concrete
strength, FRP modulus of elasticity, the thickness of one layer of laminate, and the total number
of layers (n) installed at a specific location. A formula for the strain level at which an FRP
laminate may debond from a concrete substrate—even if ample bonded length is provided on
either side of the critical section—is presented as Equation 6.1, as proposed by ACI 440.2R-08.
εfd = 0.083�fc′
nEftf in. (in.–lb units) Eq. 6.1
The bond capacity of FRP reinforcement is developed over a critical length (Ldf) from
termination points. This development length of the reinforcement has an effect on the expected
debonding strain, and is based on the same material properties of the concrete and FRP
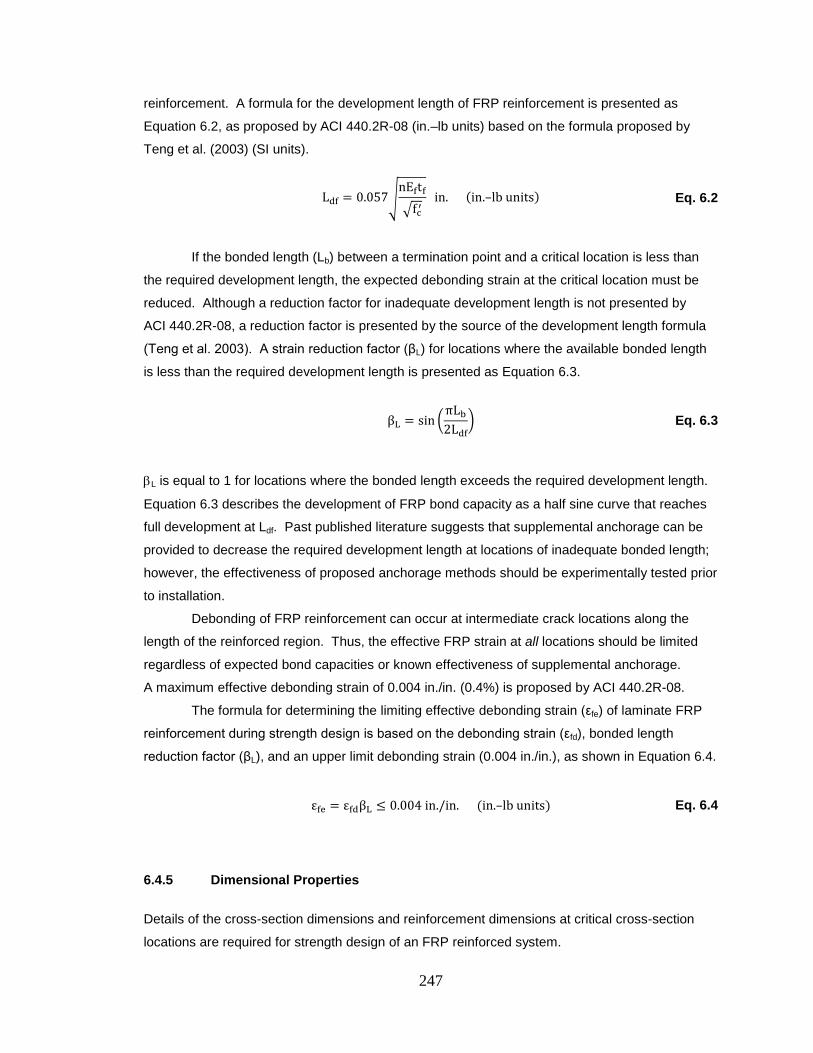
247
reinforcement. A formula for the development length of FRP reinforcement is presented as
Equation 6.2, as proposed by ACI 440.2R-08 (in.–lb units) based on the formula proposed by
Teng et al. (2003) (SI units).
Ldf = 0.057�nEftf�fc′
in. (in.–lb units) Eq. 6.2
If the bonded length (Lb) between a termination point and a critical location is less than
the required development length, the expected debonding strain at the critical location must be
reduced. Although a reduction factor for inadequate development length is not presented by
ACI 440.2R-08, a reduction factor is presented by the source of the development length formula
(Teng et al. 2003). A strain reduction factor (βL) for locations where the available bonded length
is less than the required development length is presented as Equation 6.3.
βL = sin �πLb2Ldf
� Eq. 6.3
βL is equal to 1 for locations where the bonded length exceeds the required development length.
Equation 6.3 describes the development of FRP bond capacity as a half sine curve that reaches
full development at Ldf. Past published literature suggests that supplemental anchorage can be
provided to decrease the required development length at locations of inadequate bonded length;
however, the effectiveness of proposed anchorage methods should be experimentally tested prior
to installation.
Debonding of FRP reinforcement can occur at intermediate crack locations along the
length of the reinforced region. Thus, the effective FRP strain at all locations should be limited
regardless of expected bond capacities or known effectiveness of supplemental anchorage.
A maximum effective debonding strain of 0.004 in./in. (0.4%) is proposed by ACI 440.2R-08.
The formula for determining the limiting effective debonding strain (εfe) of laminate FRP
reinforcement during strength design is based on the debonding strain (εfd), bonded length
reduction factor (βL), and an upper limit debonding strain (0.004 in./in.), as shown in Equation 6.4.
εfe = εfdβL ≤ 0.004 in./in. (in.–lb units) Eq. 6.4
6.4.5 Dimensional Properties
Details of the cross-section dimensions and reinforcement dimensions at critical cross-section
locations are required for strength design of an FRP reinforced system.
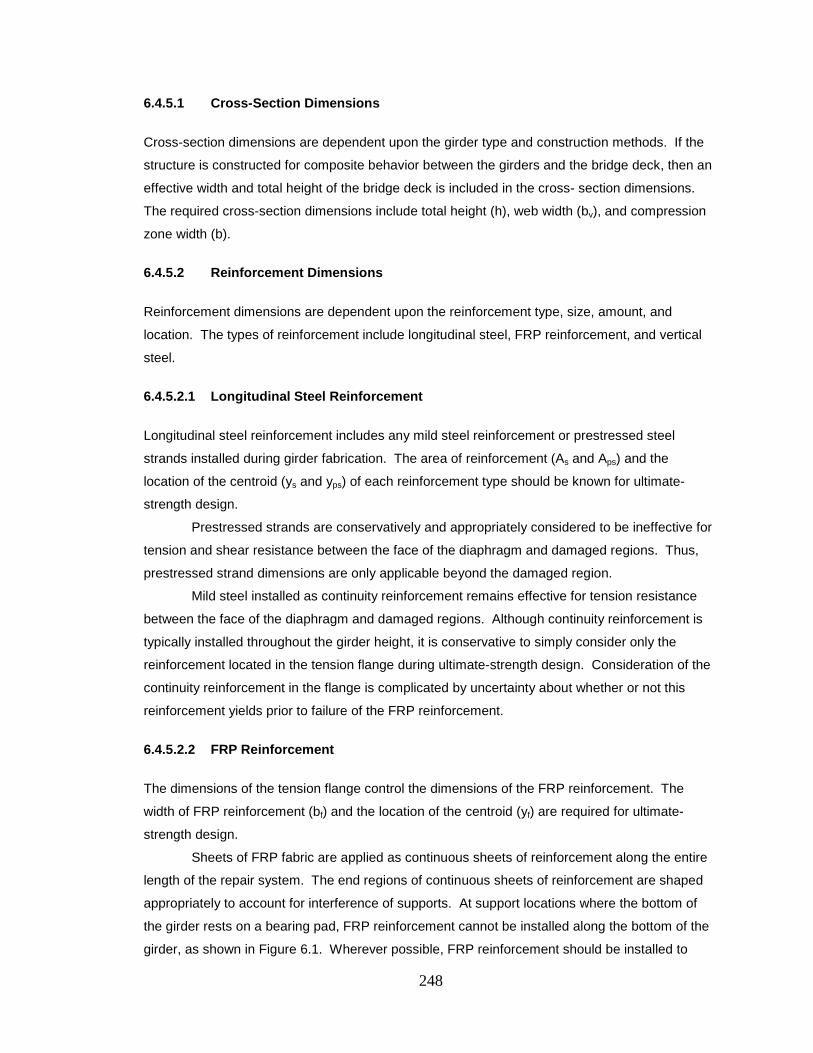
248
6.4.5.1 Cross-Section Dimensions
Cross-section dimensions are dependent upon the girder type and construction methods. If the
structure is constructed for composite behavior between the girders and the bridge deck, then an
effective width and total height of the bridge deck is included in the cross- section dimensions.
The required cross-section dimensions include total height (h), web width (bv), and compression
zone width (b).
6.4.5.2 Reinforcement Dimensions
Reinforcement dimensions are dependent upon the reinforcement type, size, amount, and
location. The types of reinforcement include longitudinal steel, FRP reinforcement, and vertical
steel.
6.4.5.2.1 Longitudinal Steel Reinforcement
Longitudinal steel reinforcement includes any mild steel reinforcement or prestressed steel
strands installed during girder fabrication. The area of reinforcement (As and Aps) and the
location of the centroid (ys and yps) of each reinforcement type should be known for ultimate-
strength design.
Prestressed strands are conservatively and appropriately considered to be ineffective for
tension and shear resistance between the face of the diaphragm and damaged regions. Thus,
prestressed strand dimensions are only applicable beyond the damaged region.
Mild steel installed as continuity reinforcement remains effective for tension resistance
between the face of the diaphragm and damaged regions. Although continuity reinforcement is
typically installed throughout the girder height, it is conservative to simply consider only the
reinforcement located in the tension flange during ultimate-strength design. Consideration of the
continuity reinforcement in the flange is complicated by uncertainty about whether or not this
reinforcement yields prior to failure of the FRP reinforcement.
6.4.5.2.2 FRP Reinforcement
The dimensions of the tension flange control the dimensions of the FRP reinforcement. The
width of FRP reinforcement (bf) and the location of the centroid (yf) are required for ultimate-
strength design.
Sheets of FRP fabric are applied as continuous sheets of reinforcement along the entire
length of the repair system. The end regions of continuous sheets of reinforcement are shaped
appropriately to account for interference of supports. At support locations where the bottom of
the girder rests on a bearing pad, FRP reinforcement cannot be installed along the bottom of the
girder, as shown in Figure 6.1. Wherever possible, FRP reinforcement should be installed to
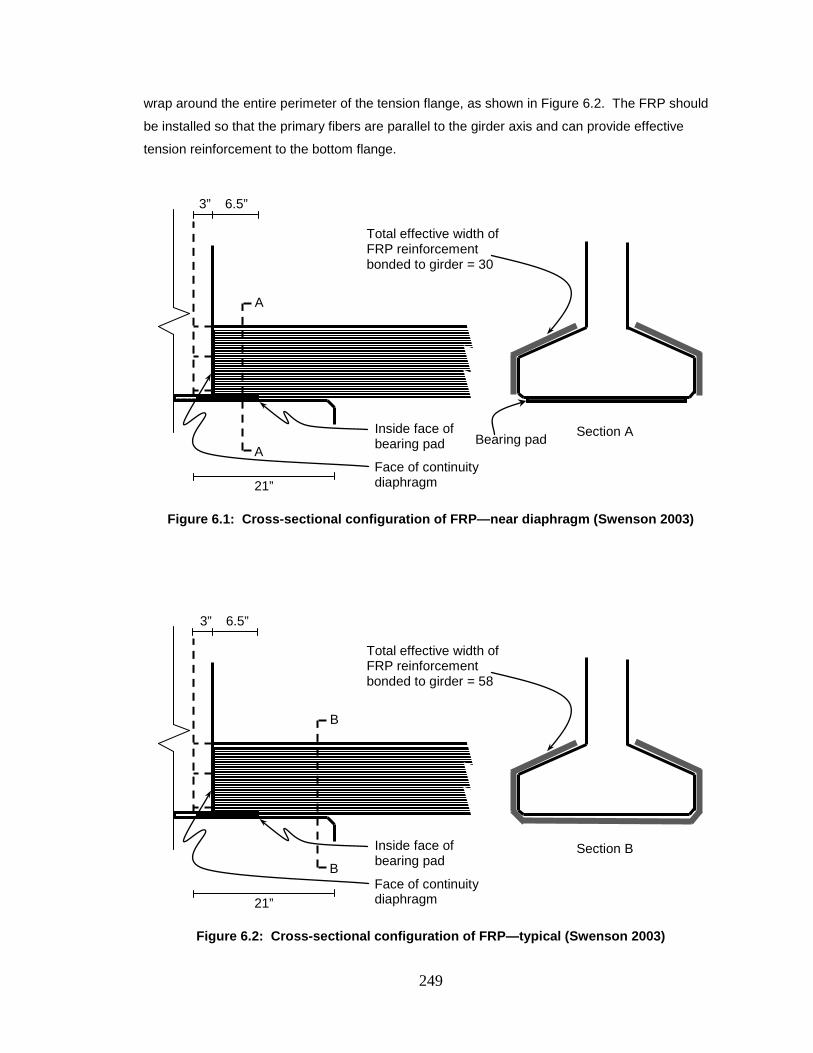
249
wrap around the entire perimeter of the tension flange, as shown in Figure 6.2. The FRP should
be installed so that the primary fibers are parallel to the girder axis and can provide effective
tension reinforcement to the bottom flange.
Figure 6.1: Cross-sectional configuration of FRP—near diaphragm (Swenson 2003)
Figure 6.2: Cross-sectional configuration of FRP—typical (Swenson 2003)
6.5”
Inside face of bearing pad
Face of continuity diaphragm
B
B Section B
Total effective width of FRP reinforcement bonded to girder = 58
3”
21”
21”
6.5”
A
A Section A
Total effective width of FRP reinforcement bonded to girder = 30
Bearing pad
3”
Inside face of bearing pad
Face of continuity diaphragm
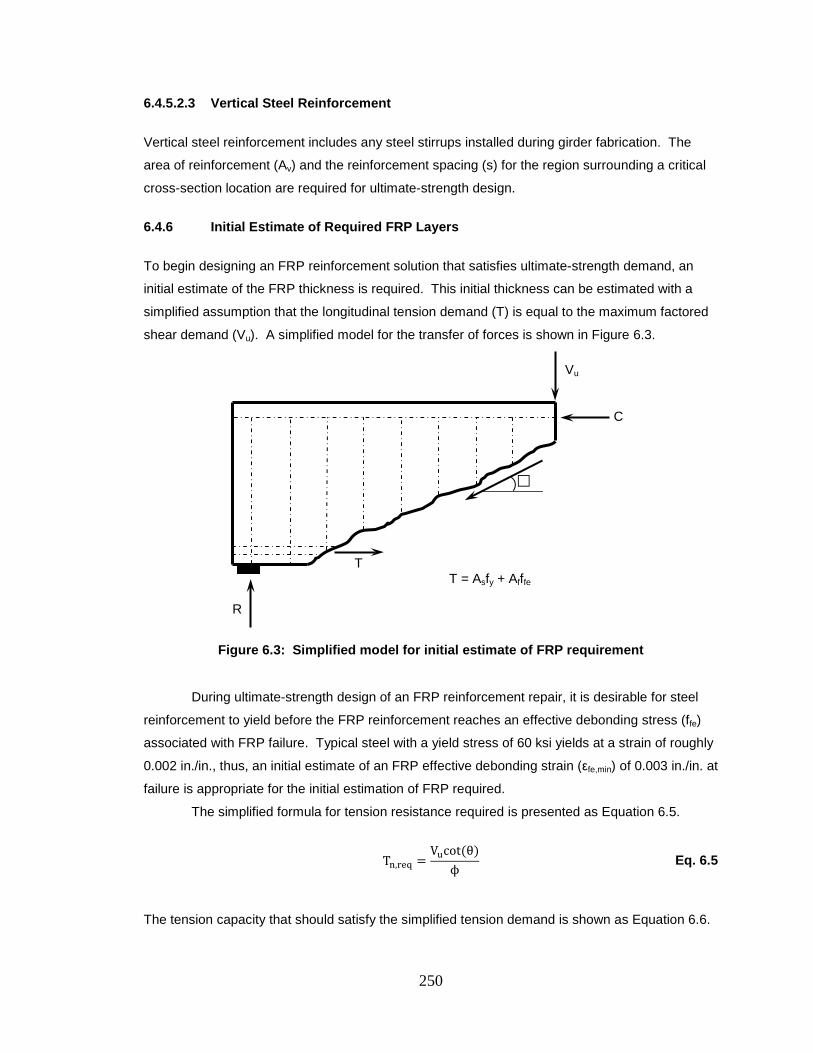
250
6.4.5.2.3 Vertical Steel Reinforcement
Vertical steel reinforcement includes any steel stirrups installed during girder fabrication. The
area of reinforcement (Av) and the reinforcement spacing (s) for the region surrounding a critical
cross-section location are required for ultimate-strength design.
6.4.6 Initial Estimate of Required FRP Layers
To begin designing an FRP reinforcement solution that satisfies ultimate-strength demand, an
initial estimate of the FRP thickness is required. This initial thickness can be estimated with a
simplified assumption that the longitudinal tension demand (T) is equal to the maximum factored
shear demand (Vu). A simplified model for the transfer of forces is shown in Figure 6.3.
Figure 6.3: Simplified model for initial estimate of FRP requirement
During ultimate-strength design of an FRP reinforcement repair, it is desirable for steel
reinforcement to yield before the FRP reinforcement reaches an effective debonding stress (ffe)
associated with FRP failure. Typical steel with a yield stress of 60 ksi yields at a strain of roughly
0.002 in./in., thus, an initial estimate of an FRP effective debonding strain (εfe,min) of 0.003 in./in. at
failure is appropriate for the initial estimation of FRP required.
The simplified formula for tension resistance required is presented as Equation 6.5.
Tn,req =Vucot(θ)
ϕ Eq. 6.5
The tension capacity that should satisfy the simplified tension demand is shown as Equation 6.6.
C
T
R
Vu
T = Asfy + Afffe
251
Tn,prov = Asfy + Afffe,min Eq. 6.6
If there is no steel reinforcement, the FRP thickness must satisfy the entire tension demand for
that cross section. The tension capacity, reduced by an appropriate resistance factor (ϕ) of 0.9,
must be greater than the tension demand, as shown in Equation 6.7.
Tn,prov > Tn,req Eq. 6.7
The formula for the estimated minimum FRP thickness required (tf,req) can then be derived from
Equations 6.5–6.7, which is presented as Equation 6.8.
tf,req =�Vucot (θ)
ϕ − Asfy�
bfffe,min Eq. 6.8
The angle θ is not yet known at this stage of the design process. However, values of
cot(θ) will typically range from 1.0 to 1.5. The designer should begin the process by selecting a
trial value in this range.
The minimum thickness required should be determined for critical cross-section locations.
The greatest required thickness of these locations will control the initial FRP thickness estimated
for the entire reinforcement system. The number of layers (n) of FRP required is determined
based on the manufacturer specified nominal thickness (tf,n) per layer of FRP laminate, as shown
in Equation 6.9.
n =tf,reqtf,n
Eq. 6.9
FRP reinforcement is applied as long continuous sheets of fabric. The number of layers
required to satisfy the maximum thickness requirement of critical locations will control the initially
estimated thickness of reinforcement.
6.4.7 Vertical Shear Strength Resistance
Although longitudinal FRP reinforcement does not directly provide additional vertical strength
resistance, the additional reinforcement does allow for an increase of the vertical shear strength
resistance provided by the concrete and vertical steel reinforcement. The additional
reinforcement results in an increase of the nominal strength for bending moment resistance (Mn),
252
an increase of the effective shear depth (dv) of the cross section, a decrease of the net
longitudinal tensile strain (εs) expected in response to design load conditions, and a decrease of
the expected angle of inclination for shear cracking (θ), which leads to an increase in the nominal
vertical shear strength (Vn) provided by the concrete and vertical steel reinforcement.
6.4.7.1 Nominal Strength for Bending Moment Resistance
The nominal strength for bending moment resistance can be determining in accordance with
typical design provisions. Additional terms may be appropriately included to account for the
effects of the FRP reinforcement. When determining the nominal strength for bending moment
resistance, the standard Whitney uniform compression block theory may not accurately represent
the compression block behavior of the repaired structure. This is due to the failure mode of the
structure being controlled by an FRP debonding failure instead of a concrete crushing failure.
Although the Whitney compression block theory may not accurately represent the actual cross-
section compressive stress distribution, this simplified theory can reasonably be applied for cross
sections with relatively low positive bending moment demands, such as the end regions of bridge
girders. Formulas used to calculate nominal bending moment resistance are presented in
Equations 6.10–6.13.
Mn = Asfy �ds −a2� + AfεfeEfdf −
a2
+ 0.85f′c Eq. 6.10
a =Asfy + AfεfeEf
0.85f′cb Eq. 6.11
ds = h − ys Eq. 6.12
df = h − yf Eq. 6.13
Because the deck provides a very wide compression flange for positive-moment resistance in
bridge girders, the flexural strength is relatively insensitive to the assumed compressive stress
distribution.
6.4.7.2 Effective Shear Depth
The effective shear depth (dv) for each critical cross-section location is the greatest of three
values calculated in accordance with Article 5.8.2.9 of AASHTO LRFD.
253
One effective shear depth value is dependent upon the nominal bending moment
resistance and the tensile forces at failure. It is appropriate to assume that FRP reinforcement
failure occurs due to reaching the FRP effective debonding strain after the steel yields but before
the compression-zone concrete crushes. This effective shear depth is calculated as the distance
between the centroid of the compression zone and the location of the net tensile force, as shown
in Equation 6.14.
dv,1 ≥Mn
Asfy + Afffe Eq. 6.14
The second effective shear depth value is ninety percent of the depth (de) from the top of
the cross section to the location of the net tensile stress, as shown in Equations 6.15 and 6.16.
de =Asfyds + Afffedf
Asfy + Afffe Eq. 6.15
dv,2 ≥ 0.9de Eq. 6.16
The third effective shear depth value is seventy-two-percent of the total height (h) of the
cross section, as shown in Equation 6.17.
dv,3 ≥ 0.72h Eq. 6.17
The maximum of these three effective shear depths controls design in accordance with
AASHTO LRFD provisions. However, the larger of the two values that do not require the
calculation of the nominal bending moment capacity can be used for simplicity if desired.
6.4.7.3 Net Tension Strain
In order to prevent FRP debonding failure under the combined influence of flexure and shear, the
net longitudinal tension strain (εs) corresponding to the nominal strength for shear resistance
must not exceed the effective debonding strain limit for the FRP reinforcement. The net
longitudinal tension strain can be calculated in accordance with Article 5.8.3.4 of AASHTO LRFD,
modified to include FRP effects, as shown in Equation 6.18.
254
εs =
Mudv
+ VuEsAs + EfAf
≤ εfe Eq. 6.18
Terms associated with strength provided by prestressed strands (Vp, Apfpo, and ApsEp) have been
disregarded from the AASHTO formula based on the unknown effectiveness of prestressed
strands within damaged regions.
When determining the net longitudinal tension strain, the factored bending moment
demand corresponding to the maximum factored shear demand must not be taken less than the
theoretical bending moment resulting from the factored shear demand being applied a distance
equal to the effective shear depth from the critical location. The factored bending moment
demand of the net tension strain equation is considered to be the greater of these two bending
moment demands, as shown in Equation 6.19.
Mu ≥ Vudv Eq. 6.19
If the net tension strain calculated in response to the factored demands for shear strength
exceeds the effective debonding strain of the FRP reinforcement, more layers of FRP may be
required to satisfy demand. The effective FRP strain can be substituted into the net tension strain
equation, which can then be rearranged to solve for the number of layers of FRP required to
satisfy the net tension strain demands in response to factored demands for shear strength, as
shown in Equation 6.20.
n =
Mudv
+ Vu − EsAsεfeEfwftf,nεfe
Eq. 6.20
If additional layers are required to satisfy the net tension demand, the net tension strain
must be recalculated with the appropriate number of layers before continuing to check vertical
shear strength.
6.4.7.4 Diagonal Shear Crack Parameters
After determining an appropriate net tension strain in response to factored shear strength
demands, the vertical shear strength can be determined. The net tension strain dictates
parameters associated with diagonal shear cracking, which have an effect on vertical shear
strength provided by concrete and vertical steel reinforcement. These parameters are calculated
in accordance with Article 5.8.3.4 of AASHTO LRFD.
255
The ability of diagonally cracked concrete to transmit tension and shear is related to the
net tension strain. The AASHTO LRFD formula for the factor (β) applied to the concrete shear
strength is presented as Equation 6.21.
β =4.8
1 + 750εs Eq. 6.21
The angle of inclination (θ) of diagonal shear cracking has an effect on the amount of
vertical shear resistance provided by transverse steel reinforcement (stirrups) within a region of
shear cracking. The AASHTO LRFD formula for this angle of inclination is presented as
Equation 6.22.
θ = 29 + 3500εs Eq. 6.22
6.4.7.5 Components of Vertical Shear Strength
The nominal vertical shear strength consists of both concrete and steel components of shear
resistance. These concrete and steel components of vertical shear strength are calculated in
accordance with Article 5.8.3.3 of AASHTO LRFD.
The shear strength (Vc) provided by the concrete is dependent upon the design strength
of the girder concrete (f ’c), the effective shear depth (dv), the width of girder web (bv), and the net
tension strain shear strength factor (β). The formula for the shear strength provided by the
concrete, calculated in accordance with the general procedure of Article 5.8.3.4.2 of AASHTO
LRFD, is presented as Equation 6.23.
Vc = 0.0316β�f′cbvdv (in.–kip units) Eq. 6.23
The shear strength (Vs) provided by the vertical steel reinforcement is dependent upon
the amount of vertical steel reinforcement intersecting a diagonal shear crack. The factors
affecting the shear strength include the effective shear depth (dv), the angle of inclination (θ), the
spacing of reinforcement (s), the area of intersecting reinforcement (Av) within one typical cross
section containing vertical reinforcement, and the assumption that the vertical reinforcement
reaches a yield stress (fy) in response to ultimate strength demands. The formula for the shear
strength provided by vertical steel reinforcement, calculated in accordance with the general
procedure of Article 5.8.3.4.2 of AASHTO LRFD, is presented as Equation 6.24.
256
Vs =Avfydvcot(θ)
s Eq. 6.24
6.4.7.6 Nominal Vertical Shear Strength
The combined shear strengths provided by the concrete and vertical steel reinforcement
represents the nominal vertical shear strength, as shown in Equation 6.25.
Vn = Vc + Vs Eq. 6.25
An upper limit is applied to the nominal vertical shear strength, in accordance with
Article 5.8.3.3 of AASHTO LRFD, to ensure that the vertical steel reinforcement yields prior to
concrete crushing. This upper limit nominal shear strength formula is presented as
Equation 6.26.
Vn,max = 0.25f′cbvdv Eq. 6.26
6.4.7.7 Factored Strength for Resisting Shear Demand
The resistance factor for the shear strength of normal weight reinforced concrete, presented in
Article 5.5.4.2 of AASHTO LRFD, reduces the nominal vertical shear strength to be compared to
the factored shear demand. To satisfy ultimate strength design, the factored shear strength (ϕVn)
must be greater than the factored shear demand (Vu), as shown in Equation 6.27.
ϕVn > Vu Eq. 6.27
Additional longitudinal FRP reinforcement may increase the net tension strength in
response to shear demands, but will not greatly improve the nominal vertical shear strength of
critical cross-section locations. Thus, if the vertical shear strength does not satisfy the vertical
shear demand, an additional repair solution is necessary to provide additional vertical shear
strength. FRP reinforcement solutions for providing additional vertical shear strength have been
proposed by ACI Committee 440 and the NCHRP; however, an additional repair solution for
vertical shear reinforcement is not within the scope of this report.
257
6.4.8 Tensile Strength
The combined demands of flexure and shear induce tension forces that must be resisted by the
flexural tension region of the cross section. It is conservative and appropriate to assume that the
concrete does not provide any tensile strength after cracking, and that all tension demand must
be satisfied with tension capacity provided by longitudinal reinforcement. To determine the
tension strength provided, Article 5.8.3.5 of AASHTO LRFD may be modified with additional
terms that account for resistance capacity provided by externally bonded FRP reinforcement.
6.4.8.1 Nominal Strength for Resisting Tension
The nominal strength for resisting tension is provided by longitudinal reinforcement at the flexural
tension region of the cross section. Based on the typical difference in modulus of elasticity for
steel and laminate FRP, it is appropriate to assume that the steel will yield before the FRP
reaches an effective debonding strain limit. It is also appropriate to assume that the effective
debonding strain limit for the FRP will be reached before concrete crushes. Thus, the nominal
strength for resisting tension (Tn,prov) is limited by the area of longitudinal steel that yields and the
area of FRP that is appropriately assumed to provide tension resistance until reaching the
effective stress limit, as shown in Equation 6.28.
Tn,prov = Asfy + Afffe Eq. 6.28
6.4.8.2 Factored Tension Demand
The factored tension demand (Tn,req) in response to ultimate-strength demand is based on the
maximum factored shear and corresponding bending moment demands at the critical location.
The formula for required tension capacity, presented in Article 5.8.3.5 of AASHTO LRFD, applies
the individual resistance factors for flexure (ϕf) and shear (ϕv), respectively, to compute the
increased demand that corresponds to simultaneous attainment of the nominal strengths in
flexure and shear on the cross section rather than applying a single tension resistance factor to
reduce the computed tensile capacity, as shown in Equation 6.29.
Tn,req = �Mu
dvϕf� + �
Vuϕv
− 0.5Vs� cot (θ) Eq. 6.29
Vertical shear resistance provided by vertical reinforcement reduces the demand on
longitudinal reinforcement due to the diagonal nature of the critical flexure-shear crack. However,
258
AASHTO LRFD limits the contribution of the vertical shear resistance (Vs) to no more than the
factored vertical shear demand, as shown in Equation 6.30.
Vs ≤Vuϕv
Eq. 6.30
Because the shear and flexure resistance factors have already been applied to determine
the required nominal tension capacity, it is appropriate to not apply a reduction factor to the
nominal strength for tension resistance when checking for satisfaction of the nominal tension
capacity, as shown in Equation 6.31.
Tn,prov > Tn,req Eq. 6.31
6.4.9 Check Strengths of Each Location with Equal Layers of FRP
FRP reinforcement systems are installed with continuous sheets of FRP fabric. As the number of
FRP layers increases, the required development length increases and the limiting effective strain
(to prevent debonding) decreases. For this reason, the performance at critical locations must be
checked with the maximum number of layers required of any other location, particularly with
respect to net tension strain in response to shear demands.
6.5 LENGTH OF FRP REINFORCEMENT INSTALLATION
As previously mentioned, the FRP reinforcement is installed as continuous sheets of fabric that
originate at the face of the continuity diaphragm and terminate beyond the damaged region.
When determining the length of reinforcement required, the original reinforcement details of girder
fabrication should be considered. The FRP reinforcement should extend far enough along the
girder so that forces can be transferred through the concrete into the fully developed prestressing
reinforcement beyond the damaged region. For this reason, it is recommended that the FRP
reinforcement extend (a) beyond the debonded length of strands by a minimum distance equal to
the development length of the prestressed strands and (b) beyond any existing bottom flange
cracks by the same minimum distance.
According to AASHTO LRFD design provisions, the development length (d) for the
prestressed strands is dependent upon the stress required to provide the nominal flexural or
tension strength and the effective stress in the strands after accounting for time-dependent
losses. Considering typical values for these parameters, a conservative approximation of the
259
development length being equal to 180 strand diameters is appropriate for determining the length
of FRP reinforcement required. This approximation is presented as Equation 6.32.
d = 180db Eq. 6.32
It is also recommended that the termination of the FRP reinforcement layers be stepped
down to prevent stress concentrations at the reinforcement termination location. ACI 440.2R-08
recommends that each layer be terminated 6 in. earlier than the underlying layer. When
determining the recommended lengths of each layer of FRP reinforcement, the initial (longest)
layer of reinforcement should be designed to extend the recommended distance mentioned
previously.
6.6 ANCHORAGE
The length of adequately bonded reinforcement between a termination location and critical cross-
section location directly affects performance of the reinforcement system. Adequate stress
transfer is required to limit stress concentrations that could result in bond failure of the
reinforcement system. Wherever possible, the FRP reinforcement should (a) extend beyond the
point where it is no longer required for strength and (b) have a bonded length adequate to
develop the effective FRP strain required at each critical section.
Additional anchorage should be considered for regions that do not allow for desired
bonded lengths. There are various methods for providing additional anchorage to increase the
stress capacity at end regions with short bonded lengths; however, more research of anchorage
performance is recommended before selecting a specific anchorage method to be implemented.
Recent research indicates that carbon fiber anchors may be useful for providing
supplemental anchorage at end regions (Ceroni and Pecce 2010; Niemitz et al. 2010; Orton et al.
2008). These anchors, which are depicted in Figure 6.4, include FRP strips that are bundles at
one end and free at the other.
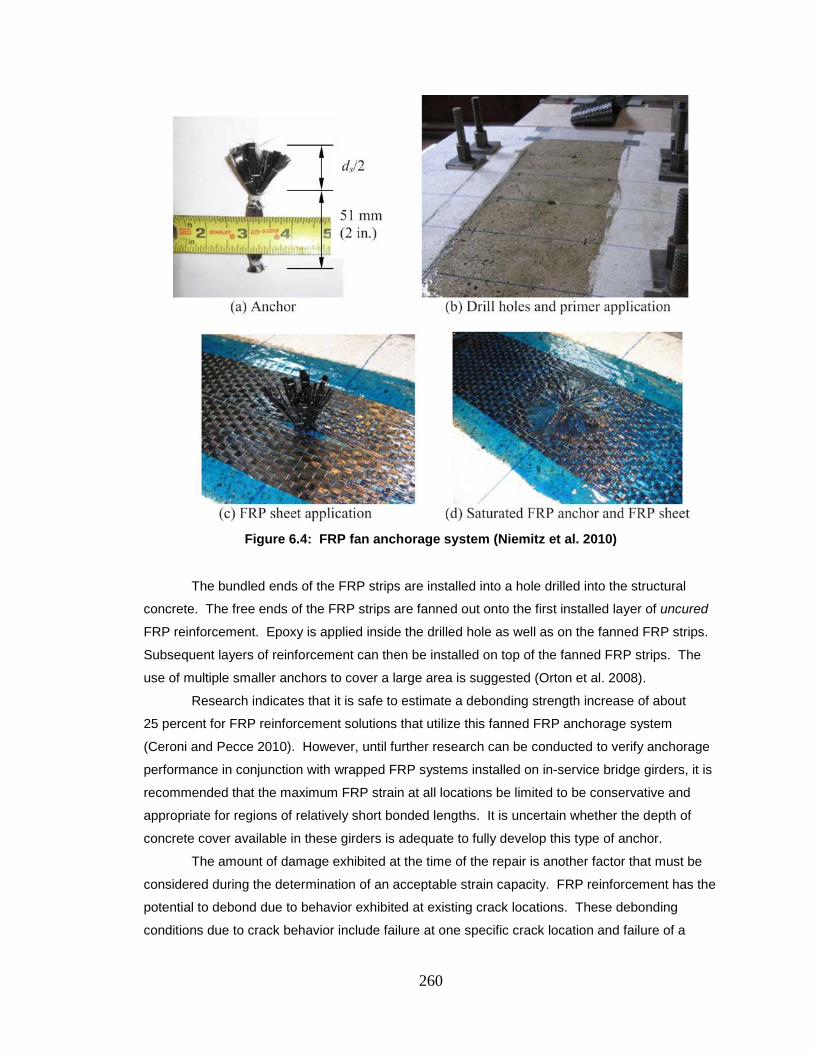
260
Figure 6.4: FRP fan anchorage system (Niemitz et al. 2010)
The bundled ends of the FRP strips are installed into a hole drilled into the structural
concrete. The free ends of the FRP strips are fanned out onto the first installed layer of uncured
FRP reinforcement. Epoxy is applied inside the drilled hole as well as on the fanned FRP strips.
Subsequent layers of reinforcement can then be installed on top of the fanned FRP strips. The
use of multiple smaller anchors to cover a large area is suggested (Orton et al. 2008).
Research indicates that it is safe to estimate a debonding strength increase of about
25 percent for FRP reinforcement solutions that utilize this fanned FRP anchorage system
(Ceroni and Pecce 2010). However, until further research can be conducted to verify anchorage
performance in conjunction with wrapped FRP systems installed on in-service bridge girders, it is
recommended that the maximum FRP strain at all locations be limited to be conservative and
appropriate for regions of relatively short bonded lengths. It is uncertain whether the depth of
concrete cover available in these girders is adequate to fully develop this type of anchor.
The amount of damage exhibited at the time of the repair is another factor that must be
considered during the determination of an acceptable strain capacity. FRP reinforcement has the
potential to debond due to behavior exhibited at existing crack locations. These debonding
conditions due to crack behavior include failure at one specific crack location and failure of a
261
shortened bonded region between two crack locations. Additional anchorage provided by
transverse wrapping of FRP reinforcement around the bottom flange may be beneficial at
locations of excessive cracking that has extended through the bottom chord of the tension flange
prior to repair. Additional testing is required to verify this supplemental anchorage method.
6.7 SERVICE LIMIT STATE
Bridge testing has provided evidence that supports the conclusion that the structure maintains
some continuous behavior for service load conditions. Before any repair methods had been
implemented, a review of the I-565 bridge structures presented in NCHRP Report 519 stated that
the damaged bridge structures continued to perform as designed (Miller et al. 2004). The
strength-limit-state design assumption of simply supported bridge behavior at failure is an even
more conservative assumption for the service limit state. After a bridge structure has been
repaired to satisfy the strength-limit-state demands, assuming simply supported behavior, the
service-limit-state demands should be appropriately satisfied with the same reinforcement,
assuming any partial continuity exists.
During post-repair testing, FRP tensile strains measured in response to ambient thermal
conditions were observed to be of greater magnitude than FRP tensile strains measured in
response to truck loads. The strains measured in response to ambient temperature conditions
were greater than the strains in response to truck loads because of the non-stress-induced strain
exhibited by the FRP material in response to ambient temperature. Only the stress-induced
strain associated with thermal conditions will have an effect on service conditions of the structure.
To determine a critical diurnal strain range, it is conservative and appropriate to assume
that the two-span structure exhibits fully continuous behavior in response to ambient thermal
conditions. The formula for the tension-flange FRP strain expected in response to ambient
thermal conditions is presented as Equation 5.36 in Section 5.4.2.2.2. The strain associated with
the unrestrained expansion of FRP material due to thermal conditions is not considered a stress-
induced strain; however, the strain associated with restraint of the temperature differential
between the top of the deck and bottom of the girder does induce stress-related strain in the FRP
reinforcement. This stress-induced strain, based on a change in temperature differential (δ[∆Th])
and the appropriate concrete coefficient of thermal expansion (αT), represents the FRP strain that
must be accounted for in response to diurnal ambient thermal conditions. The limiting effective
debonding strain (εfe) of the FRP reinforcement shall exceed the stress-induced FRP strain
demand in response to thermal conditions, as shown in Equation 6.33.
𝜀fe >32
[αTδ(∆Th)] Eq. 6.33
262
6.8 DESIGN SUMMARY
An FRP reinforcement system that appropriately satisfies all design requirements may be
summarized after completing the design procedure. The design summary should include the
• Name of the FRP reinforcement product,
• Assumed FRP material properties,
• Fiber orientation in the installed FRP,
• Number of layers required to satisfy ultimate strength demands,
• Distance that each layer must extend,
• Verification that service demands are satisfied, and
• Assessment of supplemental anchorage requirements.
6.9 INSTALLATION RECOMMENDATIONS
An FRP reinforcement system that satisfies design requirements must be appropriately installed
to ensure that the assumed FRP reinforcement conditions remain valid. Installation must be
performed by skilled professionals that have experience following the installation guidelines of the
manufacturer for the selected FRP reinforcement product. Before the FRP reinforcement can be
installed, the structural substrate and surface must be prepared for the installation process. After
the substrate and surface are prepared, the FRP reinforcement can then be appropriately
installed. Specific installation recommendations are presented in this section.
6.9.1 Preparing for Installation
Prior to installation, preparation procedures must be performed in accordance with manufacturer
specifications. In addition to manufacturer guidelines, there are some standard procedures that
must be performed that may not be specifically recommended by the manufacturer. These
procedures include specific details with regard to crack injection and surface preparation.
6.9.1.1 Adhesion Testing
Prior to beginning surface preparation for installation, it is important to test the strength of the
structural concrete that the FRP reinforcement will be bonded to during installation. Adhesion
testing of the FRP reinforcement epoxy on the concrete surface is required to ensure that the
bond strength of the epoxy exceeds the tensile strength of the concrete. Adhesion testing should
be conducted in accordance with the requirements given in ASTM D4541 (2009).
263
6.9.1.2 Crack Injection
Existing cracks should be injected with structural epoxy shortly prior to the installation of FRP
reinforcement. To minimize the possibility of new cracks forming prior to installation, it is
important to schedule the FRP installation for a time of day or year with minimal temperature-
induced stresses that could result in crack re-formation.
Cracks that are 0.01 in. (0.3 mm) and wider can adversely affect FRP reinforcement
performance, as stated by ACI 440.2R-08. The specific concern for this project is the actual
attainment of the computed concrete contribution (Vc) to the vertical shear strength. The
computation of Vc is based on an assumption that shear can be resisted along the diagonal crack
face due to aggregate interlock. This may not be true for overly large crack widths. Thus, it is
recommended that wide cracks be pressure injected with structural epoxy prior to FRP
installation. It is also recommended that smaller cracks be resin injected or sealed to prevent
corrosion of existing steel, especially on exterior girders which are more exposed to aggressive
environmental conditions. All crack injection procedures are recommended to be performed in
accordance with the general procedures for epoxy injection presented by ACI Committee
224.1R-07 Causes, Evaluation, and Repair of Cracks in Concrete Structures, referred to as
ACI 224.1R-07 (ACI Committee 224 2007). The procedures presented by ACI 224.1R-07 include
• Cleaning the crack,
• Sealing the crack to prevent epoxy contained during injection,
• Installation of entry and venting ports,
• Mixing structural epoxy,
• Pressure injecting the epoxy, and
• Removing the surface seals after the epoxy has cured.
6.9.1.3 Surface Preparation and Profiling
After the structural epoxy that has been injected into wide cracks has cured, the surface must be
prepared for installation. FRP installation recommendations of ACI 440.2R-08 state that surfaces
must be prepared for adequate bonding conditions in accordance with the recommendations of
ACI Committee 546 Concrete Repair Guide, referred to as ACI 546R-04 (ACI Committee 546
2004), and International Concrete Repair Institute (ICRI) Committee 310 Guide for Surface
Preparation for the Repair of Deteriorated Concrete Resulting from Reinforcing Steel Corrosion,
referred to as ICRI 310.1R-2008, formerly ICRI 03730 (ICRI Committee 310 2008). Surface
preparation specifications of the NCHRP Report 609 Recommended Construction Specifications
and Process Control Manual for Repair and Retrofit of Concrete Structures Using Bonded FRP
Composites, referred to as NCHRP Report 609, also recommend consulting with ACI 546R-04
and ICRI 310.1R-2008 for assuring proper surface preparation (Mirmiran et al. 2008).
264
General guidelines for surface preparation include the clearing of all irregularities,
unevenness, and sharp protrusions in the surface profile. It is recommended by NCHRP
Report 609 that these obstructions be grinded away to a smooth surface with less than 1/32 in.
deviation. Any excess epoxy or sealer from the crack injection process should also be removed
to provide a smooth surface.
It is recommended by ACI 440.2R-08 that all corners be rounded or chamfered to a
minimum radius of 0.5 in. during surface preparation. The rounding of corners helps to prevent
stress concentrations in the FRP system and voids from forming between the FRP system and
the concrete. This stipulation is not critical for applications such as the damage girders in this
study in which the primary fiber orientation is parallel to the girder corners. It is also
recommended that corners that have been roughened during the rounding process be smoothed
with putty prior to installation.
After the removal of obstructions, the surface must be profiled to remove any remaining
unevenness in the surface. Surface profiling guidelines are presented by ACI 546R-04 and
ICRI 310.1R-2008. It is recommended by NCHRP Report 609 to smooth any remaining bug
holes, depressions, protrusions, and roughened corners using putty made of epoxy resin mortar,
or polymer cement mortar, with a cured strength greater than the strength of the original concrete.
It is also recommended that the patching material be cured for a minimum of 7 days prior to
installation of the FRP reinforcement system.
To complete surface preparation, the bonding surface should be appropriately cleaned.
NCHRP Report 609 states that surface cleaning includes the removal of all bond-inhibiting
material such as dust, curing compounds, or paint coatings.
After completing surface cleaning, the moisture content of the surfaces must be checked.
ACI 440.2R-08 states that the clean bonding surfaces must be as dry as recommended by the
FRP system manufacturer to ensure appropriate resin penetration. The moisture content can be
evaluated in accordance with the requirements of ACI Committee 503 Standard Specifications for
Repairing Concrete with Epoxy Mortars, referred to as ACI 503.4-92 (ACI Committee 503 1992).
6.9.2 FRP Reinforcement Installation
Installation of the FRP reinforcement system should be conducted in accordance with
manufacturer specifications. General guidelines for the installation of FRP reinforcement systems
are also presented by ACI 440.2R-08 and NCHRP Report 609.
6.9.2.1 Epoxy Saturation
Due to the large surface area available for bonding around the perimeter of the girder bottom
flange, a wet-layup FRP reinforcement system is recommended for this application. Wet-layup
systems consist of dry FRP fabrics that are saturated with epoxy during installation. The epoxy of
265
the FRP reinforcement system should be mixed in accordance with manufacturer specifications,
which should include recommended batch sizes, mixture ratios, mixing methods, mixing times,
and pot-life limits (ACI Committee 440 2008). The epoxy should be applied uniformly on the
concrete surface where the FRP is to be installed. The sheets of FRP fabric may also be
saturated prior to installation. Immediately following surface saturation, the first layer of FRP
reinforcement should be installed. Successive layers of epoxy and FRP should be installed
before the previously installed layers have cured (ACI Committee 440 2008).
6.9.2.2 Application of FRP Reinforcement
Prior to epoxy saturation, the sheets of dry FRP fabric should be cut to size, which includes
cutting different lengths for different layers, and modifying one end to appropriately account for
support conditions. FRP fabric materials should be handled in accordance with manufacturer
recommendations. Installers should ensure that the fabric is cut and installed so that the primary
fiber orientation matches the direction stipulated on the contract drawings. Any signs of kinks,
folds, or other forms of severe waviness should be reported appropriately (ACI Committee 440
2008). The sequence of installation should be documented prior to installation. If multiple sheets
are required within each layer, then fabric installation sequences should be designed to prevent
the alignment of seams in successive layers. FRP reinforcement should be applied without
entrapping air between the fabric and concrete surface or successive layers of fabric. Any
entrapped air should be released along the reinforcement in the direction parallel to the fibers,
and should never be rolled perpendicular to the fiber direction (Mirmiran et al. 2008)
6.9.2.3 Protective Coating
Protective coatings should be applied to cured FRP reinforcement systems for improved durability
from environmental conditions, impact, fire, or vandalism. The protective coating must be
approved by the manufacturer and may be a polymer-modified portland cement coating, or a
polymer-based latex coating, with a final appearance that matches, within reason, the color and
texture of the adjacent concrete (Mirmiran et al. 2008).
6.9.2.4 Quality Control Testing and Inspection
The FRP reinforcement system and protective coating should be tested and inspected during and
after FRP installation according to ACI 440.2R-08, NCHRP Report 609, and manufacturer
recommendations. Topics of concern during inspections include
• Representative tensile strength of FRP reinforcement samples,
• Weather conditions such as temperature and humidity,
• Surface temperature of the concrete,
266
• Widths of cracks not injected with epoxy, and the
• Location and size of any delaminations or air voids.
The tensile strength of a representative sample of the installed FRP reinforcement
system should be tested in accordance with the procedures of ASTM D3039 (2008). The
definition of a representative sample of FRP reinforcement for tensile testing should be discussed
and agreed upon prior to installation. The tension modulus of elasticity of the FRP reinforcement
affects the effective debonding strength of the installed repair system. Supplemental anchorage
may be recommended for FRP reinforcement materials that are determined to have a tension
modulus of elasticity greater than assumed during design.
FRP systems should finally be evaluated and accepted based on conformance or
nonconformance with the design drawings and specifications of the designer and manufacturer.
It is recommended that the selected installation contractor be qualified by the FRP and epoxy
manufacturer.
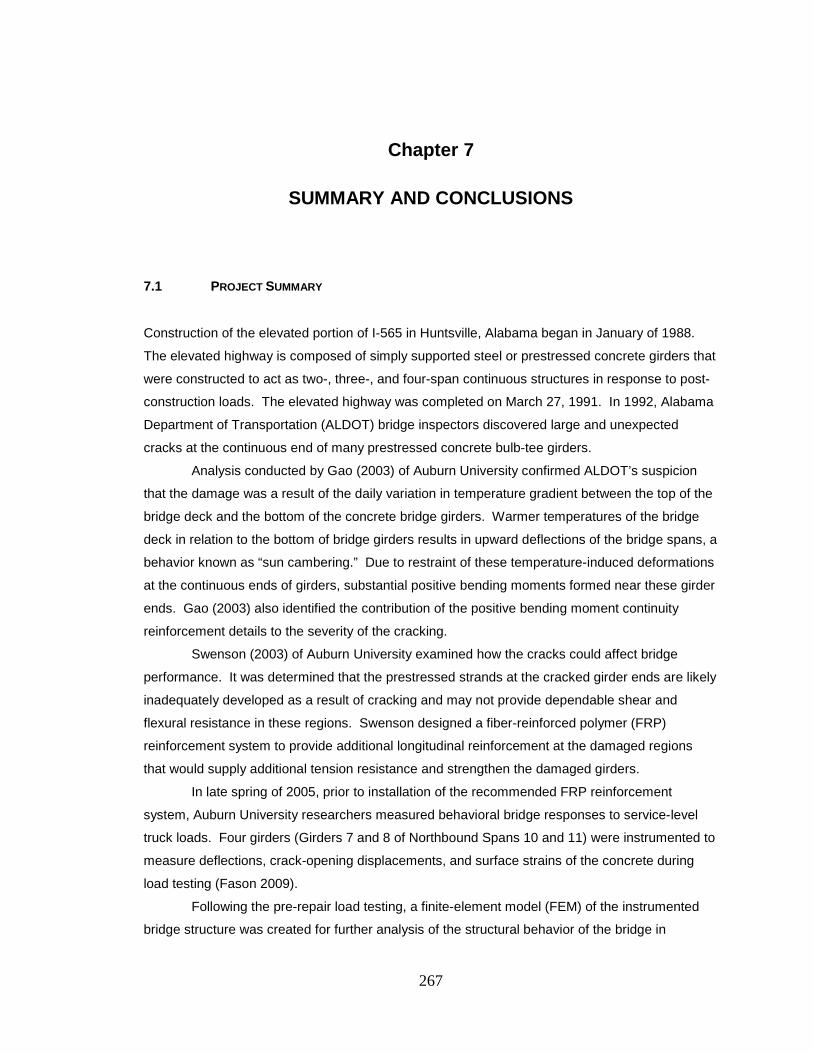
267
Chapter 7
SUMMARY AND CONCLUSIONS
7.1 PROJECT SUMMARY
Construction of the elevated portion of I-565 in Huntsville, Alabama began in January of 1988.
The elevated highway is composed of simply supported steel or prestressed concrete girders that
were constructed to act as two-, three-, and four-span continuous structures in response to post-
construction loads. The elevated highway was completed on March 27, 1991. In 1992, Alabama
Department of Transportation (ALDOT) bridge inspectors discovered large and unexpected
cracks at the continuous end of many prestressed concrete bulb-tee girders.
Analysis conducted by Gao (2003) of Auburn University confirmed ALDOT’s suspicion
that the damage was a result of the daily variation in temperature gradient between the top of the
bridge deck and the bottom of the concrete bridge girders. Warmer temperatures of the bridge
deck in relation to the bottom of bridge girders results in upward deflections of the bridge spans, a
behavior known as “sun cambering.” Due to restraint of these temperature-induced deformations
at the continuous ends of girders, substantial positive bending moments formed near these girder
ends. Gao (2003) also identified the contribution of the positive bending moment continuity
reinforcement details to the severity of the cracking.
Swenson (2003) of Auburn University examined how the cracks could affect bridge
performance. It was determined that the prestressed strands at the cracked girder ends are likely
inadequately developed as a result of cracking and may not provide dependable shear and
flexural resistance in these regions. Swenson designed a fiber-reinforced polymer (FRP)
reinforcement system to provide additional longitudinal reinforcement at the damaged regions
that would supply additional tension resistance and strengthen the damaged girders.
In late spring of 2005, prior to installation of the recommended FRP reinforcement
system, Auburn University researchers measured behavioral bridge responses to service-level
truck loads. Four girders (Girders 7 and 8 of Northbound Spans 10 and 11) were instrumented to
measure deflections, crack-opening displacements, and surface strains of the concrete during
load testing (Fason 2009).
Following the pre-repair load testing, a finite-element model (FEM) of the instrumented
bridge structure was created for further analysis of the structural behavior of the bridge in
268
response to modeled load conditions. Measurements from the pre-repair load tests were used to
refine the pre-repair model. After the pre-repair model was finalized, the recommended FRP
reinforcement system was added to the model to allow for analysis of the predicted post-repair
behavior of the structure (Shapiro 2007).
In December of 2007, the recommended FRP reinforcement system was installed on the
eighteen girders of Northbound Spans 10 and 11. The project plans and specifications were
developed through the collaborative efforts of the Auburn University Highway Research Center
(AUHRC) and ALDOT.
This report includes the details of the post-repair performance monitoring and load testing
of the bridge conducted in the late spring of 2010. The majority of the sensors used during the
pre-repair load tests were maintained for post-repair testing, and additional strain gages were
installed on the surface of the FRP reinforcement. In addition to repeating the pre-repair load
testing procedures, the sensors measuring bridge behavior were also monitored for roughly
24 hours to allow for analysis of the post-repair structure’s behavioral response to a daily cycle in
ambient thermal conditions.
Initially, the post-repair bridge behavior was compared to the behavior observed during
pre-repair testing. It was determined that, due to inconsistent support conditions between pre-
and post-repair testing, comparisons between the pre- and post-repair measurements in
response to truck loads are not appropriate for assessing the efficacy of the repair system. Thus,
the post-repair bridge test results were analyzed independently to gain insight into the post-repair
structural performance.
It was determined that an FRP reinforcement system is an effective repair solution for
damage conditions similar to those observed for the girders of I-565. An updated and simplified
FRP-strengthening design procedure that synthesizes the AASHTO LRFD bridge design
specifications and the FRP-strengthening recommendations of ACI Committee 440 was
developed. This procedure is explained to facilitate application to FRP repair solutions for bridge
structures that exhibit damage at the continuous end of concrete girders. A design example was
developed for the FRP strengthening of girders in Northbound Spans 10 and 11 using the
material properties of the FRP reinforcement used for this project. Recommendations are also
provided for appropriate installation of an FRP reinforcement repair solution.
7.2 CONCLUSIONS
Conclusions stated within this report include AUHRC findings related to:
• The FRP reinforcement installation process that occurred in December 2007,
• Measured responses to service-level truck loads,
• Theoretical responses to ambient thermal conditions,
• Measured responses to ambient thermal conditions,

269
• Performance of FRP reinforcement installed in December 2007, and
• Design recommendations for the repair of other bridge structures exhibiting damaged
regions at the continuous ends of prestressed concrete girders.
7.2.1 FRP Reinforcement Installation
• The installation process in December 2007 indicated that plans and procedures
should be explicitly discussed with the contractor on site before beginning the
reinforcement installation process.
• Proper quality control testing procedures should be discussed and monitored.
• The contractor became noticeably more efficient with the installation process,
consistently installing four layers of FRP reinforcement in roughly one hour during the
repair of the second of the two spans.
7.2.2 Observed Responses to Truck Loads
• Contact between false support bearing pads and bridge girders during pre-repair
testing resulted in additional load-bearing support conditions that affected structural
behavior observed during pre-repair testing.
• Because of differences in support conditions, comparisons between pre- and post-
repair structural behavior measured during testing are not useful for assessing the
efficacy of the FRP reinforcement repair.
• The crack closures measured at the COD gage on Girder 8 of Span 10 during both
pre- and post-repair load testing are an indication of potential out-of-plane bending
behavior in response to truck loads.
• The post-repair structure exhibited an even greater loss of continuity in response to
live loads than indicated by the post-repair FEM model, which was modeled to be
less continuous than the original undamaged structure.
• The overall bridge structure exhibited a nearly linear elastic response to midspan
truck positions during superposition testing.
• The damaged regions of the bridge structure exhibited a localized nonlinear
response to midspan truck positions during superposition testing.
• The magnitude of damage exhibited at a cracked region near the continuous end of a
concrete girder was observed to relate to the degree of continuity degradation
indicated for that girder line in response to live loads.
270
• It is appropriate to assume that the bridge structure would exhibit simply supported
girder behavior in response to strength-limit-state design loads that control the design
of repair solutions.
• Truck positions that induced the greatest shear demand on damaged regions
resulted in greatest measured FRP tensile demands.
• Strength-limit-state demands for damaged regions should be determined in
accordance with AASHTO LRFD or another framework of consistent analysis and
design procedures at the discretion of the bridge owner.
7.2.3 Theoretical Responses to Ambient Thermal Conditions
• For design purposes, it is appropriate to assume that a bridge structure with
damaged continuous girder ends repaired with FRP reinforcement exhibits fully
continuous behavior in response to ambient thermal conditions.
• The stress-induced strain expected in FRP reinforcement installed to repair damaged
continuous ends of multi-span continuous girder systems is primarily a function of the
structural concrete coefficient of thermal expansion, height of the girder-deck
composite cross section, variation of temperature gradient conditions, and distance
from the continuity diaphragm to the damaged region.
• For design purposes, it is conservative and simple to assume that the girder stresses
in the damaged region are approximately the same as the stresses at the adjacent
continuous support.
7.2.4 Observed Responses to Ambient Thermal Conditions
• Upward deflections measured in response to ambient thermal conditions during post-
repair bridge monitoring were similar to upward deflections measured in response to
solar effects during an ALDOT investigation of the same spans in 1994.
• Linear profiles of bottom-fiber concrete strains measured beyond damaged regions
indicate the bridge structure exhibited some preservation of continuous behavior in
response to thermal effects.
• The slope of bottom-fiber concrete strain profiles were less than theoretically
expected of a fully continuous structure subjected to a linear temperature gradient
similar to the gradient measured by ALDOT in 1994, which indicates that either the
structure is not exhibiting fully continuous behavior or the actual temperature gradient
was less than theoretically assumed.

271
• Maximum bottom-fiber FRP strains measured at crack locations in response to
thermal conditions were similar to the bottom-fiber FRP strain estimated in response
to the linear temperature gradient measured by ALDOT in 1994.
• Simplified linear temperature gradient analysis can be used to effectively estimate the
tensile strain that an FRP repair system must resist due to daily temperature
fluctuations.
• Ambient thermal conditions resulted in damaged region crack-opening displacements
and FRP surface strains roughly 3–4.5 times greater than maximum respective
measurements in response to service-level truck loads.
• Comparisons of structural responses to thermal gradient effects and truck loads
support the conclusion that temperature effects caused initial cracking.
7.2.5 Performance of FRP Reinforcement
• The FRP reinforcement was observed to carry tension forces and effectively serve as
additional longitudinal reinforcement to service-level truck loads and ambient thermal
conditions.
• During post-repair testing, the repair system had been in service for more than 2
years without exhibiting signs of debonding or other deterioration.
• No additional signs of severe cracking were observed at the repaired region since the
installation of the FRP reinforcement.
• The installed FRP reinforcement does not satisfy the design procedure presented in
Chapter 6 of this report, but the strength deficiency is less than 5 percent (on the
basis of AASHTO LRFD strength-limit-state design loads).
• The FRP reinforcement that has already been installed is acceptable, but future
design and installation should conform to guidelines and procedures discussed in
Chapter 6 of this report.
7.2.6 FRP Design Recommendations
• FRP reinforcement product can be selected for bridge girder repair using guidelines
presented by ACI 440.2R-08 and NCHRP Report 655.
• FRP reinforcement systems can be designed to resist strength-limit-state demands
determined in accordance with AASHTO LRFD bridge design specifications—or
other strength-limit-state demands at the discretion of the bridge owner.
272
• Designed repair solutions should satisfy strength-limit-state demands at all locations
of (FRP or internal) reinforcement transitions assuming simply supported girder
behavior.
• Debonding failure of FRP reinforcement systems due to tension strains expected in
response to combined shear and bending moment demands has been observed to
control the design of FRP reinforcement repair solutions.
• A simplified formula (d = 180db) for approximating prestressed strand development
lengths that begin at or beyond damaged regions has been proposed as a guideline
for determining the extent of FRP reinforcement.
• FRP anchorage and development computations performed using a typical average
test value for Ef are more conservative than when performed using a lower-bound
“design value.”
• Solutions for providing supplemental anchorage at locations of short available
bonded length require further research before they can be recommended.
• Temperature demands do not need to be considered in conjunction with strength-
limit-state demands because temperature-induced deformations are no longer
restrained once the structure transitions to the simply supported behavior
recommended for strength-limit-state design.
7.2.7 FRP Reinforcement Installation Recommendations
• The contractor should have experience following the guidelines of the manufacturer
for the selected FRP and epoxy reinforcement product.
• Design documents should clearly show the correct fiber orientation, and contractors
and inspectors should demonstrate comprehension of the proper orientation prior to
FRP installation.
• Existing cracks should be injected with structural epoxy prior to installation of FRP
reinforcement.
• Structural substrates should be appropriately prepared for adequate bonding of the
FRP reinforcement to the concrete surface for the entire length installed.
• Protective coatings should be applied to cured FRP reinforcement systems for
improved durability.
• Quality control testing and inspections should be conducted during and following the
installation process to ensure proper installation.

273
• Tensile test samples should consist of the same number of fabric layers as are
installed on the actual structure, and the ALDOT special provision for FRP should be
modified to clearly state this requirement.
274
Chapter 8
RECOMMENDATIONS
8.1 DESIGN OF FRP REINFORCEMENT REPAIR SOLUTIONS
FRP reinforcement can be utilized for the repair of prestressed concrete bridge girders with
damage conditions near continuous ends, similar to the damage observed near the continuous
ends of girders within Northbound Spans 10 and 11 of I-565 in Huntsville, Alabama. The design
procedure presented in Chapter 6 of this report has been formulated in accordance with
specifications of AASHTO LRFD, NCHRP Report 655 (Zureick et al. 2010), and ACI 440.2R-08.
An FRP reinforcement system designed in accordance with the guidelines presented in
this report provides adequate tension reinforcement for the resistance of strength-limit-state
demands of combined shear and flexure. The FRP repair solution also provides resistance to the
tension stresses induced by daily temperature variations on the continuous structure. The design
procedure detailed in this report includes guidelines for the determination of
• An appropriate FRP reinforcement product,
• Critical cross-section locations,
• Critical load conditions for those locations,
• Material and dimensional properties at those locations,
• Layers of FRP reinforcement required to satisfy strength demands, and
• Length of FRP reinforcement required for appropriate development of prestressed
strands.
8.2 INSTALLATION OF FRP REINFORCEMENT SYSTEMS
FRP reinforcement installation procedures should be performed in accordance with the
specifications of the manufacturer. Guidelines presented in Chapter 6 of this report for ensuring
proper FRP reinforcement installation include guidelines that are also presented in NCHRP
Report 609 (Miller et al. 2008) and ACI 440.2R-08. These guidelines include recommended
procedures for:
• Crack injection,
• Surface preparation,
275
• FRP reinforcement installation, and
• Quality control inspection and testing.
8.3 NORTHBOUND SPANS 10 AND 11 OF I-565
The FRP reinforcement system installed on Northbound Spans 10 and 11 of I-565 in
December 2007 was designed by Auburn University researchers (Swenson 2003). The FRP
reinforcement was designed to resist tension forces that were predicted with strut-and-tie models.
The reinforcement system was also designed in accordance with the effective debonding strain
(εfe) specifications presented by ACI 440.2R-02, which have since been updated to reflect the
findings of more recent research as presented by ACI 440.2R-08.
The design procedure presented in Chapter 6 of this report has been formulated in
accordance with AASHTO LRFD specifications (AASHTO 2010) and the updated effective
debonding strain specifications of ACI 440.2R-08. An updated FRP reinforcement system design
example is presented in Appendix N of this report.
The FRP reinforcement systems that were installed on Spans 10 and 11 in
December 2007 do not satisfy the updated design recommendation, but installation of an
additional layer of reinforcement may not be absolutely necessary. The limiting effective
debonding strain (εfe < 0.004 in./in.) controls the recommendation of 5 layers of reinforcement
instead of 4 layers. The current installation of 4 layers satisfies strength requirements at the
interior face of the bearing pad, but results in a strength deficiency of less than 5 percent at the
termination of the continuity reinforcement in response to factored shear demand.
The installed 4 layers of reinforcement nearly satisfy the requirements of the updated
design recommendations of this report. The small computed strength deficiency is based on full
strength-limit-state AASHTO LRFD design loads for new construction in conjunction with the
conservative limiting effective debonding strain of the FRP reinforcement. The length of FRP
reinforcement currently installed allows for adequate development of prestressed strands beyond
the primary crack locations in these particular spans. It is unknown if an additionally installed fifth
layer of reinforcement would perform as expected when bonded to previously installed FRP
reinforcement that has been fully cured. Surface preparation procedures required for proper
installation of additional FRP reinforcement may also be detrimental to the integrity of the existing
FRP reinforcement. Whether or not the computed strength discrepancy justifies the cost, effort,
and uncertainty associated with installation of an additional layer of FRP in Spans 10 and 11 is a
decision best left to the discretion of ALDOT after consideration of these factors in light of the
department’s established maintenance philosophy. On the other hand, FRP reinforcement
configurations for new repairs should be designed to satisfy the design recommendations
proposed within this report.
276
8.4 RECOMMENDATIONS FOR FURTHER RESEARCH
Further research would be beneficial to provide a better understanding of the behavioral
responses observed during the testing of Northbound Spans 10 and 11. Further testing is also
recommended to gain a better understanding of the performance of FRP composite material as a
reinforcement solution.
8.4.1 In-Service Load Testing
Truck positions that resulted in large shear demand at the damaged region resulted in significant
reinforcement tension demand. Future load testing of structures that exhibit damage regions
similar to those of Spans 10 and 11 should focus on these high shear demand truck positions.
Superposition testing should also be conducted with truck positions that result in significant
damaged-region tension demand.
For future pre- and post-repair testing of in-service bridge structures, it is recommended
that variables which may have an effect on bridge behavior during testing be limited to allow for
more appropriate comparisons of pre- and post-repair measured bridge behavior. Variables
observed during the research discussed within this report that had an effect on the ability to
assess the efficacy of the installed FRP reinforcement repair system by directly comparing pre-
and post-repair measurements include
• False supports that were unintentionally load-bearing supports during pre-repair
testing but were not load-bearing supports during post-repair testing,
• Weather conditions that resulted in significantly cooler ambient temperatures during
pre-repair testing compared to the temperatures of post-repair testing,
• Vehicles with different dimensions that required modifications to load block
configurations during both pre- and post-repair testing,
• Time elapsed between pre-repair testing and reinforcement installation, and
• Time elapsed between reinforcement installation and post-repair testing.
8.4.2 In-Service Bridge Monitoring
Bridge monitoring provided information that supports the conclusion that temperature effects are
the primary cause of cracking observed in damaged regions near continuous ends of prestressed
concrete bridge girders. For future in-service load testing of pre- and post-repair conditions of
bridge structures, it is recommended that bridge monitoring be conducted during the days
encompassing both the pre- and post-repair in-service load testing. It is also recommended that
bridge monitoring be conducted for more than one daily cycle during both pre- and post-repair
277
testing. Additionally, it is recommended to measure ambient, deck, and girder temperatures
during future bridge monitoring tests.
8.4.3 Laboratory Testing
The limiting effective debonding strain (εfe < 0.004 in./in.) specified by ACI 440.2R-08 is a
conservative assumption that has been observed to frequently control the amount of FRP
required when executing the design procedure recommended in Chapter 6 of this report. This
conservative assumption is recommended until further testing can validate that higher effective
debonding strains can be achieved consistently and concervatively. Controlled laboratory testing
of longitudinal FRP reinforcement system that wraps around the tension flange at one end of a
simply supported girder could provide insight into the actual performance of this repair system
near failure (strength limit state) conditions. This testing would require that a girder sustain
“controlled” damage near one end of the girder before installing the FRP reinforcement.
Laboratory-controlled testing of solutions for providing additional FRP reinforcement
anchorage for locations of short bonded length between critical cross-section locations and FRP
reinforcement termination is recommended before permitting the installation of FRP
reinforcement systems that require supplemental anchorage.
The design effective debonding strain in areas of short bonded lengths is a function of the
design modulus of elascticity of the composite FRP reinforcement. For design purposes, it is
recommended to assume the design modulus of elasticity of the composite FRP reinforcement
reported by the manufacturer; however, testing of representative samples may indicate that the
installed product exhibits more stiffness than originally assumed during design. To better
understand the ramifications of this issue, laboratory testing is recommended to assess the
effective debonding strain for FRP reinforcement products with varying stiffnesses determined in
accordance with the procedures (ASTM D3039 2008) recommended for testing representative
samples of installed FRP reinforcement systems.
Further testing of FRP reinforcement is recommended to better understand the
performance of this composite material; however, the design procedure recommended in this
report provides appropriately conservative specifications for the design of repair solutions similar
to the reinforcement systems installed to repair the damaged girders of Northbound Spans 10
and 11 of I-565 in Huntsville, Alabama.
278
REFERENCES
AASHTO. 2002. AASHTO LRFD Bridge design specifications: Customary U.S. Units. Second
Edition. Washington, D.C.: American Association of State Highway and Transportation
Officials (AASHTO).
AASHTO. 2010. AASHTO LRFD Bridge design specifications: Customary U.S. Units. Fifth
Edition. Washington, D.C.: American Association of State Highway and Transportation
Officials (AASHTO).
ACI Committee 224. 2007. Causes, evaluation, and repair of cracks in concrete structures
(ACI 224.1R-07). Farmington Hills, MI: American Concrete Institute (ACI).
ACI Committee 318. 2002. Building code requirements for structural concrete and commentary
(ACI 318R-02). Farmington Hills, MI: American Concrete Institute (ACI).
ACI Committee 318. 2008. Building code requirements for structural concrete and commentary
(ACI 318-08). Farmington Hills, MI: American Concrete Institute (ACI).
ACI Committee 440. 2008. Guide for the design and construction of externally bonded FRP
systems for strengthening concrete structures (ACI 440.2R-08). Farmington Hills, MI:
American Concrete Institute (ACI).
ACI Committee 503. 1992. Standard specifications for repairing concrete with epoxy mortars
(ACI 503.4-92). Farmington Hills, MI: American Concrete Institute (ACI).
ACI Committee 546. 2004. Concrete repair guide (ACI 546R-04). Farmington Hills, MI:
American Concrete Institute (ACI).
Alabama Department of Transportation (ALDOT). 1988. Construction plans for
Project ID-565-5(21)358. Montgomery, AL: Alabama Department of Transportation
(ALDOT).
Alabama Department of Transportation (ALDOT). 1994. Cracks in precast prestressed bulb tee
girders on Structure No.’s I-565-45-11.5 A. and B. on I-565 in Huntsville, Alabama. Report
and attachments (A–L). Montgomery, AL: Alabama Department of Transportation
(ALDOT).
ASTM Standard D3039. 2008. Test method for tensile properties of polymer matrix composite
materials (ASTM D3039-08). West Conshohocken, PA: ASTM International.
ASTM Standard D4065. 2006. Practice for plastics: dynamic mechanical properties:
determination and report of procedures (ASTM D4065-06). West Conshohocken, PA:
ASTM International.

279
ASTM Standard D4541. 2009. Standard test method for pull-off strength of coatings using
portable adhesion testers (ASTM D4541-09). West Conshohocken, PA:
ASTM International.
Barnes, R. W., K. S. Swenson, N. Gao, A. K. Schindler, and W. E. Fason. 2006. Cracking and
repair of prestressed concrete bridge girders made continuous for live loads. In the
Proceedings of Structural Faults and Repair, Eleventh International Conference:
Edinburgh, Scotland. 13–15 June 2006.
Ceroni, F. and M. Pecce. 2010. Evaluation of bond strength in concrete elements externally
reinforced with CFRP sheets and anchoring devices. ASCE Journal of Composites for
Construction 14 (5): 521–530.
Fason, W. E. 2009. Static load testing of a damaged, continuous prestressed concrete bridge.
M.S. thesis. Auburn, AL: Auburn University.
Fyfe Co. Tyfo Fiberwrap Systems. 2010. Tyfo SCH-41 Composite using Tyfo S Epoxy data sheet.
San Diego, CA: Fyfe Co. LLC.
Gao, N. 2003. Investigation of cracking in prestressed girders made continuous for live load.
M.S. thesis. Auburn, AL: Auburn University.
Hadzor, T. J., R. W. Barnes, P. H. Ziehl, J. Xu, and A. K. Schindler. 2011. Development of
acoustic emission evaluation method for repaired prestressed concrete bridge girders.
Research Report FHWA/ALDOT 930-601-1. Auburn, Alabama: Auburn University
Highway Research Center.
ICRI Committee 310. 2008. Guide for surface preparation for the repair of deteriorated concrete
resulting from reinforcing steel corrosion (ICRI 310.1R-2008). Farmington Hills, MI:
International Concrete Repair Institute (ICRI).
ISO/IEC Technical Committee. 2005. General requirements for the competence of testing and
calibration laboratories (ISO/IEC 17025). Geneva, Switzerland: International Organization
for Standardization (ISO) and International Electrotechnical Commission (IEC).
Ma, Z., X. Huo, M. K. Tadros, and M. Baishya. 1998. Restraint moments in precast/prestressed
concrete continuous bridges. PCI Journal 43 (6): 40–57.
Miller, R. A., R. Castrodale, A. Mirmiran, and M. Hastak. 2004. Connection of simple-span
precast concrete girders for continuity. NCHRP Report 519. Washington, D.C.:
Transportation Research Board (TRB).
Mirmiran, A., M. Shahawy, A. Nanni, V. Karbhari, and B. Yalim, and A. S. Kalayci. 2008.
Recommended construction specifications and process control manual for repair and
retrofit of concrete structures using bonded FRP composites. NCHRP Report 609.
Washington, D.C.: Transportation Research Board (TRB).
National Oceanic and Atmospheric Administration (NOAA). 2005a. Local Climatological Data:
Huntsville, AL: May 2005. Rocket Center, WV: National Climatic Data Center (NCDC).
280
National Oceanic and Atmospheric Administration (NOAA). 2005b. Local Climatological Data:
Huntsville, AL: June 2005. Rocket Center, WV: National Climatic Data Center (NCDC).
National Oceanic and Atmospheric Administration (NOAA). 2008. Local Climatological Data:
Huntsville, AL: December 2007. Rocket Center, WV: National Climatic Data Center
(NCDC).
National Oceanic and Atmospheric Administration (NOAA). 2010. Local Climatological Data:
Huntsville, AL: May 2010. Rocket Center, WV: National Climatic Data Center (NCDC).
Niemitz, C. W., R. James, and S. F. Breña. 2010. Experimental behavior of carbon fiber-
reinforced polymer (CFRP) sheets attached to concrete surfaces using CRFP anchors.
ASCE Journal of Composites for Construction 14 (2): 185–194.
Orton, S. L., J. O. Jirsa, and O. Bayrak. 2008. Design considerations of carbon fiber anchors.
ASCE Journal of Composites for Construction 12 (6): 608–616.
Potgieter, I. C. and W. L. Gamble. 1989. Nonlinear temperature distributions in bridges at
different locations in the United States. PCI Journal 34 (4): 80–103.
Shapiro, K. A. 2007. Finite-element modeling of a damaged prestressed concrete bridge.
M.S. thesis. Auburn, AL: Auburn University.
Swenson, K. S. 2003. Feasibility of externally bonded FRP reinforcement for repair of cracked
prestressed concrete girders. M.S. thesis. Auburn, AL: Auburn University.
Swenson, K. S. and R. W. Barnes. 2007. Feasibility of externally bonded FRP reinforcement for
repair of cracked prestressed concrete girders, I-565, Huntsville Alabama.
Report IR-07-02. Auburn, AL: Auburn University Highway Research Center (AUHRC).
Teng, J. G., J. F. Chen, S. T. Smith, and L. Lam. 2002. FRP-strengthened RC structures.
Chichester, West Sussex, UK: John Wiley and Sons.
Teng, J. G., S. T. Smith, J. Yao, and J.F. Chen. 2003. Intermediate crack induced debonding in
RC beams and slabs. Construction and Building Materials 17 (6-7): 447–462.
TML. 2011. PI displacement transducer data sheet. TML manual: strain gauge-type transducers.
TML Pam E-701B. Tokyo, Japan: TML Tokyo Sokki Kenkyujo Co., Ltd.
Vishay Precision Group. 2010. Strain gage selection: criteria, procedures, and recommendations.
Tech Note TN-505-4. Raleigh, NC. Vishay Precision Group.
Zureick, A.-H., B. R. Ellingwood, A. S. Nowak, D. R. Mertz, and T. C. Triantafillou. 2010.
Recommended guide specification for the design of externally bonded FRP systems for
repair and strengthening of concrete bridge elements. NCHRP Report 655.
Washington, D.C.: Transportation Research Board (TRB).

281
Appendix A
ABBREVIATIONS AND NOTATION
AASHTO American Association of State Highway and Transportation Officials
ACI American Concrete Institute
AE acoustic emissions
ALDOT Alabama Department of Transportation
ASTM American Society for Testing and Materials
AUHRC Auburn University Highway Research Center
BT bulb-tee
CFRP carbon fiber-reinforced polymer
ERSG electrical-resistance strain gauge
FEM finite-element modeling
FRP fiber-reinforced polymer
I-565 Interstate Highway 565
ICRI International Concrete Repair Institute
IEC International Electrotechnical Commission
ISO International Organization for Standardization
LRFD load and resistance factor design
NCDC National Climatic Data Center
NCHRP National Cooperative Highway Research Program
NOAA National Oceanic and Atmospheric Administration
PCI Precast/Prestressed Concrete Institute
RC reinforced concrete
TRB Transportation Research Board

282
a depth of compression zone
A area
Af area of FRP reinforcement
Aps area of prestressed strand reinforcement
As area of steel reinforcement
Av area of vertical steel reinforcement
b width of compression zone
bf width (perimeter) of FRP reinforcement
bv width of girder web
CE environmental reduction factor for composites
de effective depth from top of cross section
df depth to centroid of FRP reinforcement
ds depth to centroid of longitudinal steel reinforcement
dv effective shear depth
E modulus of elasticity
Ef modulus of elasticity—FRP reinforcement
Ep modulus of elasticity—prestressed strand
Es modulus of elasticity—steel reinforcement
f’c design compressive strength of concrete
fbot stress at the bottom of the cross section
ffe effective debonding stress of FRP reinforcement system
fpo modulus of elasticity of prestressing strands multiplied by the locked-in
difference in strain between the prestressing strands and the surrounding
concrete
fy tension yield strength
h height of the cross section
I moment of inertia of the cross section
L span length
Lb bonded length of FRP reinforcement
d development length of prestressed strand
Lfd development length of FRP reinforcement
M bending moment demand
Mn nominal bending moment capacity
Mu factored bending moment demand
n layers of FRP-epoxy composite
P restraint force due to thermal gradient
s spacing of reinforcement
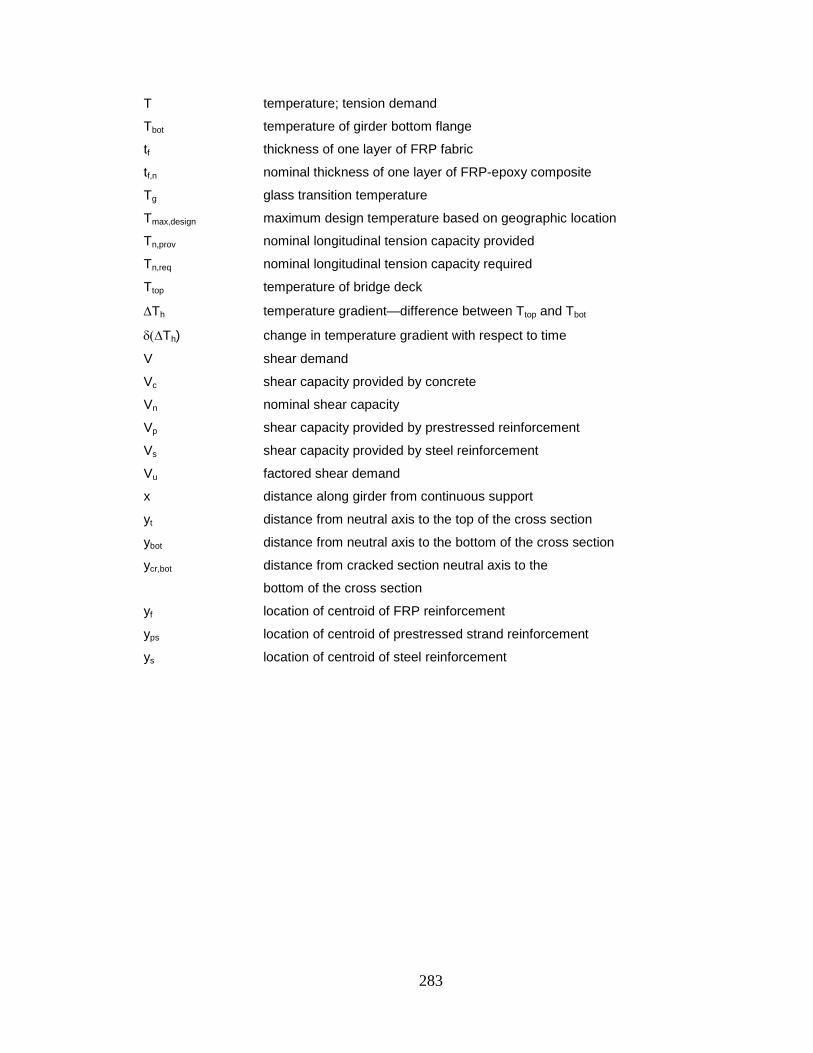
283
T temperature; tension demand
Tbot temperature of girder bottom flange
tf thickness of one layer of FRP fabric
tf,n nominal thickness of one layer of FRP-epoxy composite
Tg glass transition temperature
Tmax,design maximum design temperature based on geographic location
Tn,prov nominal longitudinal tension capacity provided
Tn,req nominal longitudinal tension capacity required
Ttop temperature of bridge deck
∆Th temperature gradient—difference between Ttop and Tbot
δ(∆Th) change in temperature gradient with respect to time
V shear demand
Vc shear capacity provided by concrete
Vn nominal shear capacity
Vp shear capacity provided by prestressed reinforcement
Vs shear capacity provided by steel reinforcement
Vu factored shear demand
x distance along girder from continuous support
yt distance from neutral axis to the top of the cross section
ybot distance from neutral axis to the bottom of the cross section
ycr,bot distance from cracked section neutral axis to the
bottom of the cross section
yf location of centroid of FRP reinforcement
yps location of centroid of prestressed strand reinforcement
ys location of centroid of steel reinforcement
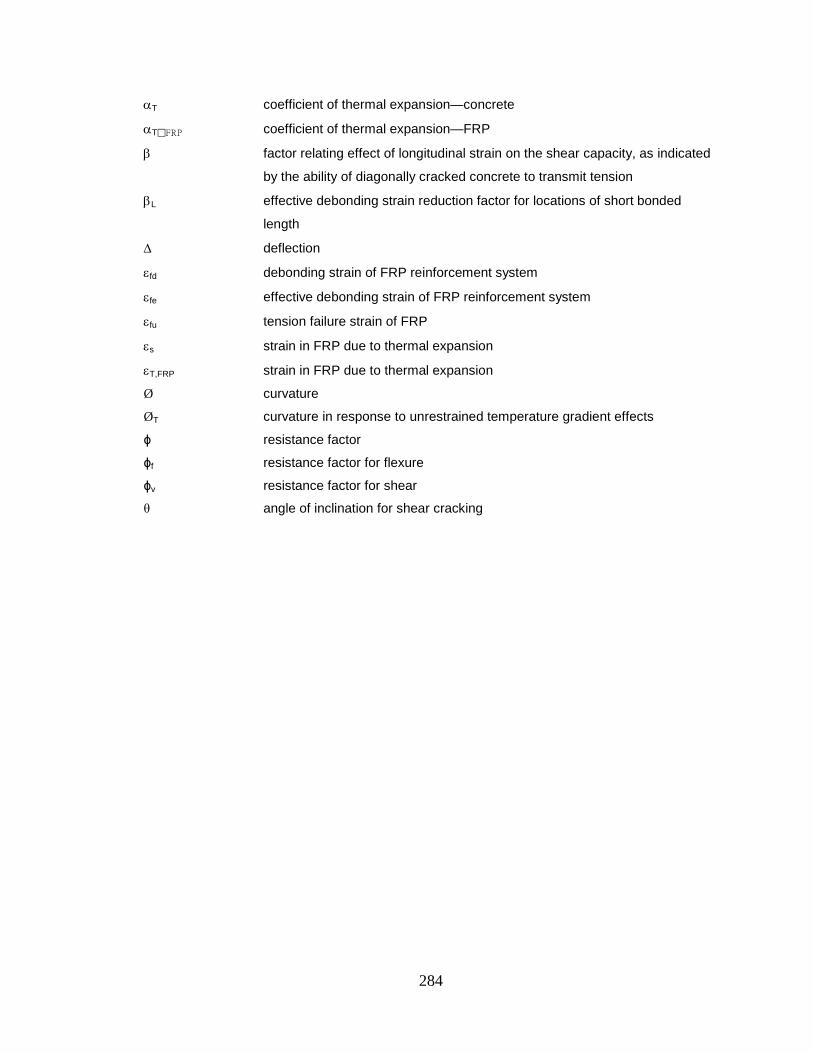
284
αT coefficient of thermal expansion—concrete
αTFRP coefficient of thermal expansion—FRP
β factor relating effect of longitudinal strain on the shear capacity, as indicated
by the ability of diagonally cracked concrete to transmit tension
βL effective debonding strain reduction factor for locations of short bonded
length
∆ deflection
εfd debonding strain of FRP reinforcement system
εfe effective debonding strain of FRP reinforcement system
εfu tension failure strain of FRP
εs strain in FRP due to thermal expansion
εT,FRP strain in FRP due to thermal expansion
Ø curvature
ØT curvature in response to unrestrained temperature gradient effects
ϕ resistance factor
ϕf resistance factor for flexure
ϕv resistance factor for shear
θ angle of inclination for shear cracking

285
Appendix B
MULTIPOSITION LOAD TEST—GRAPHICAL RESULTS
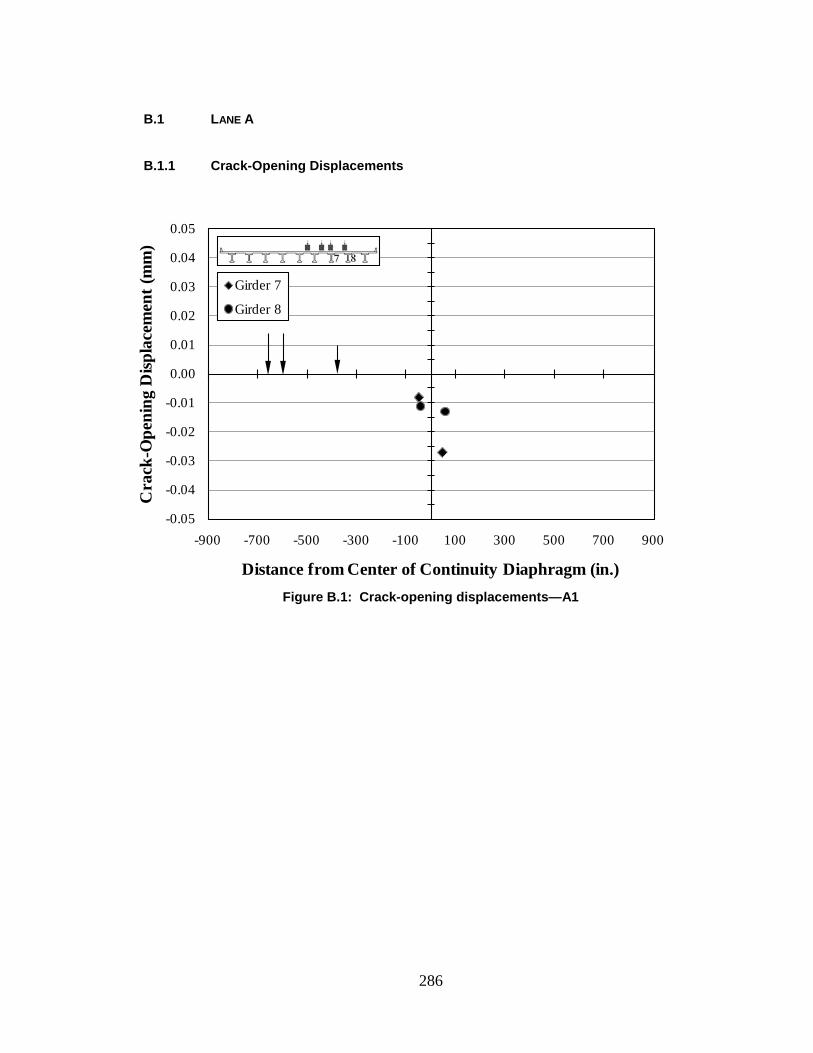
286
B.1 LANE A
B.1.1 Crack-Opening Displacements
Figure B.1: Crack-opening displacements—A1
-0.05
-0.04
-0.03
-0.02
-0.01
0.00
0.01
0.02
0.03
0.04
0.05
-900 -700 -500 -300 -100 100 300 500 700 900
Cra
ck-O
peni
ng D
ispla
cem
ent (
mm
)
Distance from Center of Continuity Diaphragm (in.)
Girder 7
Girder 8
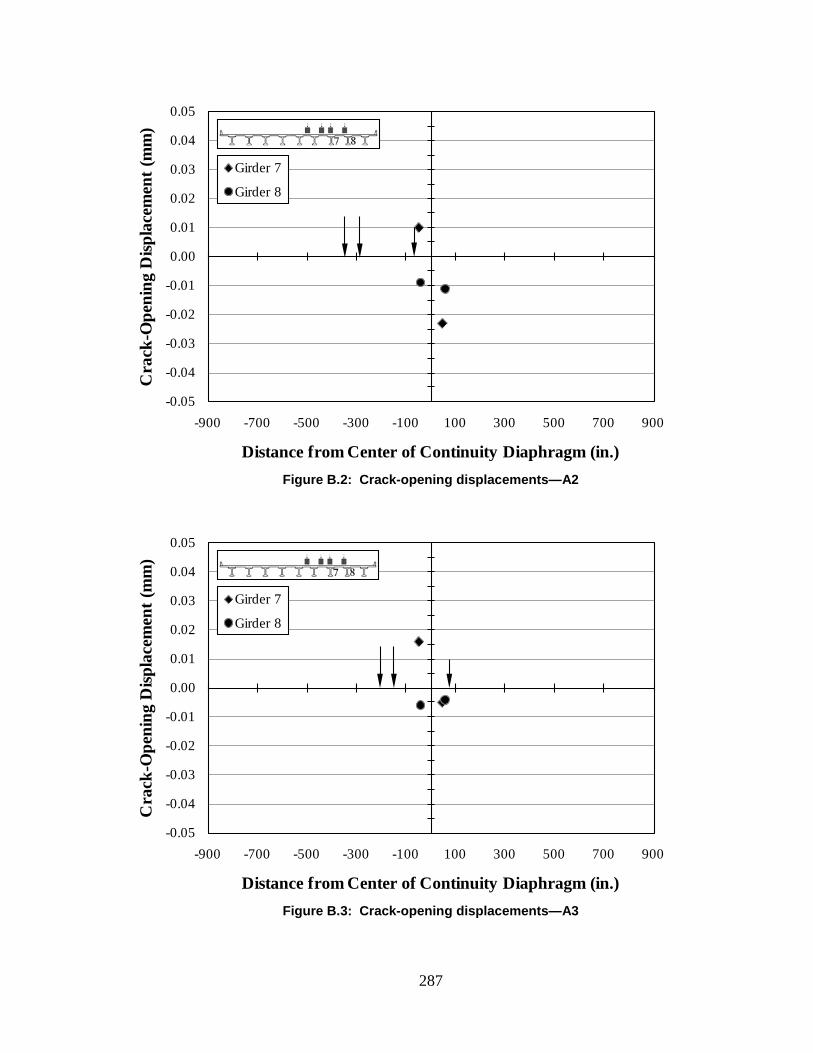
287
Figure B.2: Crack-opening displacements—A2
Figure B.3: Crack-opening displacements—A3
-0.05
-0.04
-0.03
-0.02
-0.01
0.00
0.01
0.02
0.03
0.04
0.05
-900 -700 -500 -300 -100 100 300 500 700 900
Cra
ck-O
peni
ng D
ispla
cem
ent (
mm
)
Distance from Center of Continuity Diaphragm (in.)
Girder 7
Girder 8
-0.05
-0.04
-0.03
-0.02
-0.01
0.00
0.01
0.02
0.03
0.04
0.05
-900 -700 -500 -300 -100 100 300 500 700 900
Cra
ck-O
peni
ng D
ispla
cem
ent (
mm
)
Distance from Center of Continuity Diaphragm (in.)
Girder 7
Girder 8
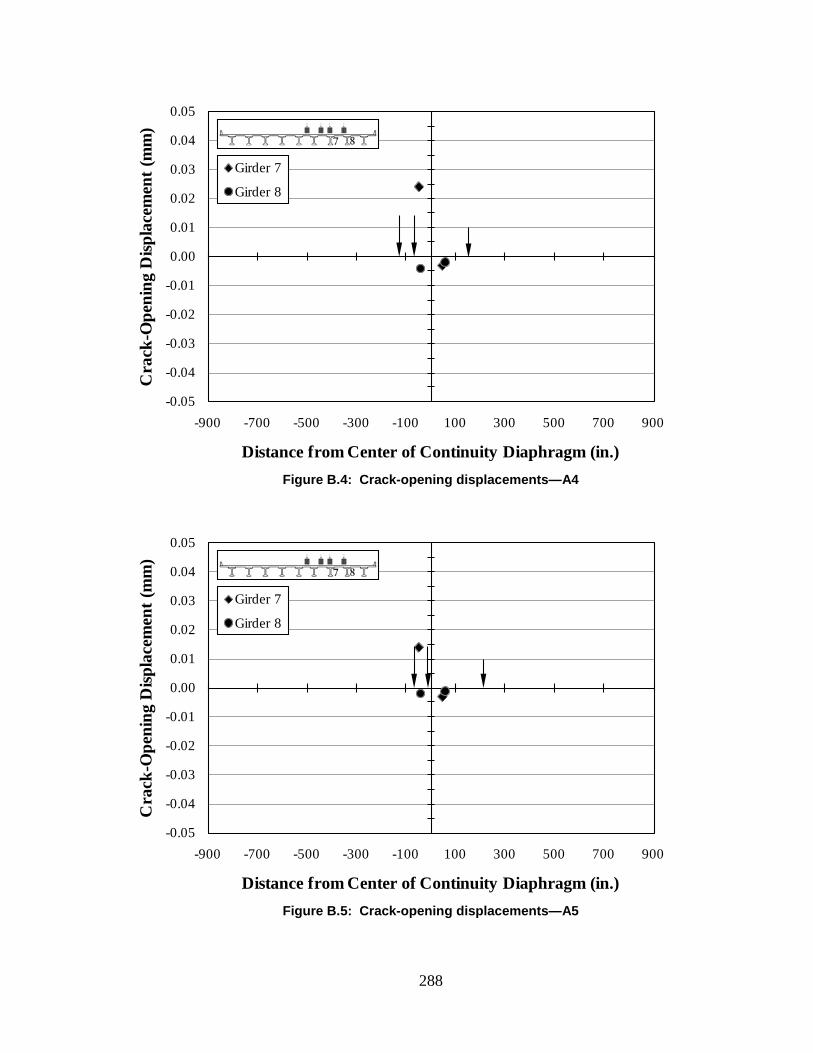
288
Figure B.4: Crack-opening displacements—A4
Figure B.5: Crack-opening displacements—A5
-0.05
-0.04
-0.03
-0.02
-0.01
0.00
0.01
0.02
0.03
0.04
0.05
-900 -700 -500 -300 -100 100 300 500 700 900
Cra
ck-O
peni
ng D
ispla
cem
ent (
mm
)
Distance from Center of Continuity Diaphragm (in.)
Girder 7
Girder 8
-0.05
-0.04
-0.03
-0.02
-0.01
0.00
0.01
0.02
0.03
0.04
0.05
-900 -700 -500 -300 -100 100 300 500 700 900
Cra
ck-O
peni
ng D
ispla
cem
ent (
mm
)
Distance from Center of Continuity Diaphragm (in.)
Girder 7
Girder 8
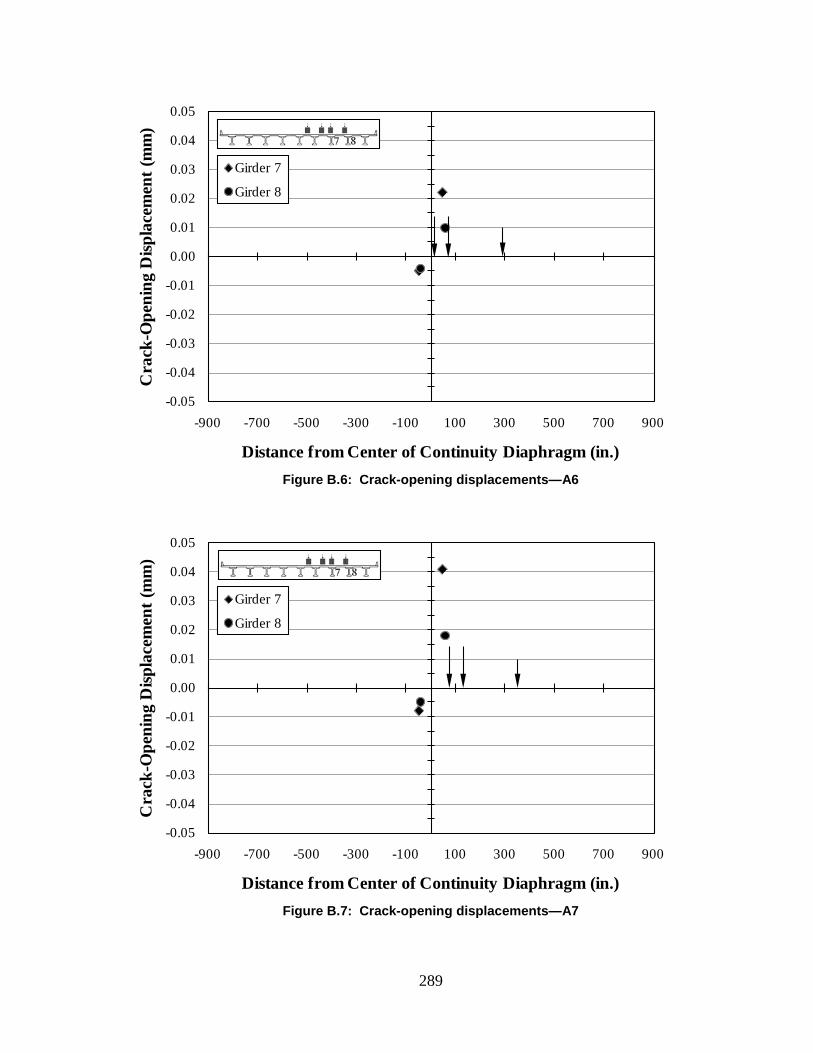
289
Figure B.6: Crack-opening displacements—A6
Figure B.7: Crack-opening displacements—A7
-0.05
-0.04
-0.03
-0.02
-0.01
0.00
0.01
0.02
0.03
0.04
0.05
-900 -700 -500 -300 -100 100 300 500 700 900
Cra
ck-O
peni
ng D
ispla
cem
ent (
mm
)
Distance from Center of Continuity Diaphragm (in.)
Girder 7
Girder 8
-0.05
-0.04
-0.03
-0.02
-0.01
0.00
0.01
0.02
0.03
0.04
0.05
-900 -700 -500 -300 -100 100 300 500 700 900
Cra
ck-O
peni
ng D
ispla
cem
ent (
mm
)
Distance from Center of Continuity Diaphragm (in.)
Girder 7
Girder 8
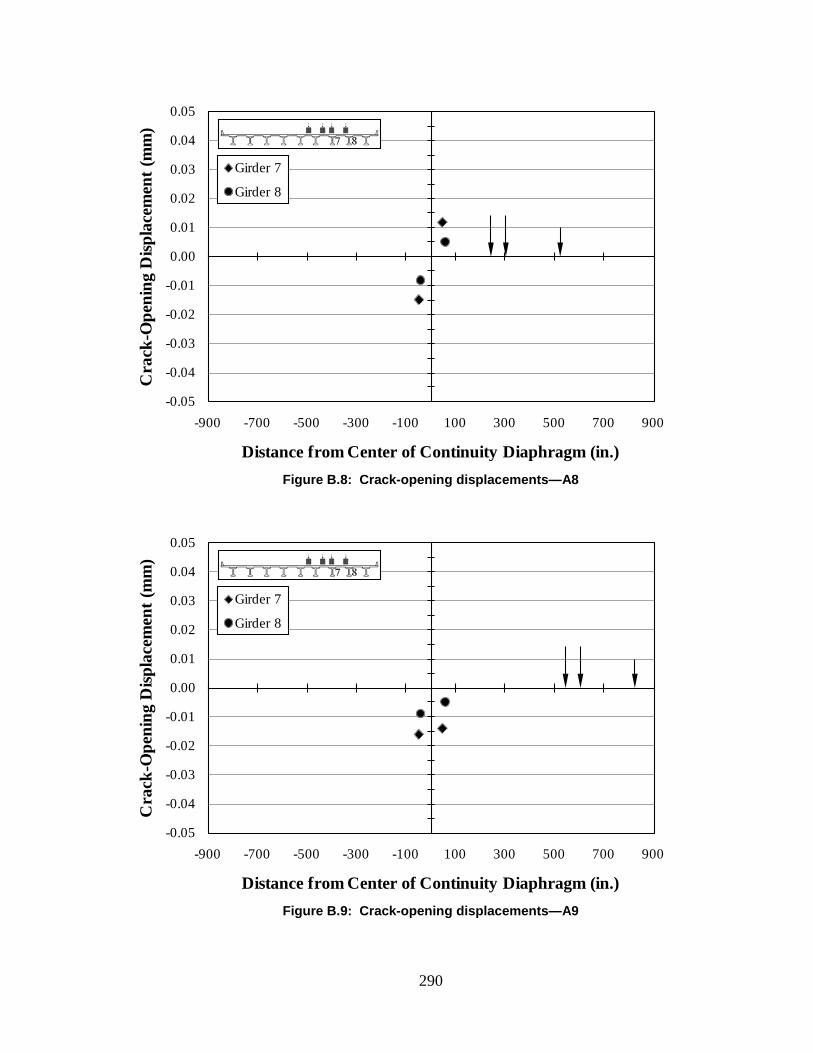
290
Figure B.8: Crack-opening displacements—A8
Figure B.9: Crack-opening displacements—A9
-0.05
-0.04
-0.03
-0.02
-0.01
0.00
0.01
0.02
0.03
0.04
0.05
-900 -700 -500 -300 -100 100 300 500 700 900
Cra
ck-O
peni
ng D
ispla
cem
ent (
mm
)
Distance from Center of Continuity Diaphragm (in.)
Girder 7
Girder 8
-0.05
-0.04
-0.03
-0.02
-0.01
0.00
0.01
0.02
0.03
0.04
0.05
-900 -700 -500 -300 -100 100 300 500 700 900
Cra
ck-O
peni
ng D
ispla
cem
ent (
mm
)
Distance from Center of Continuity Diaphragm (in.)
Girder 7
Girder 8
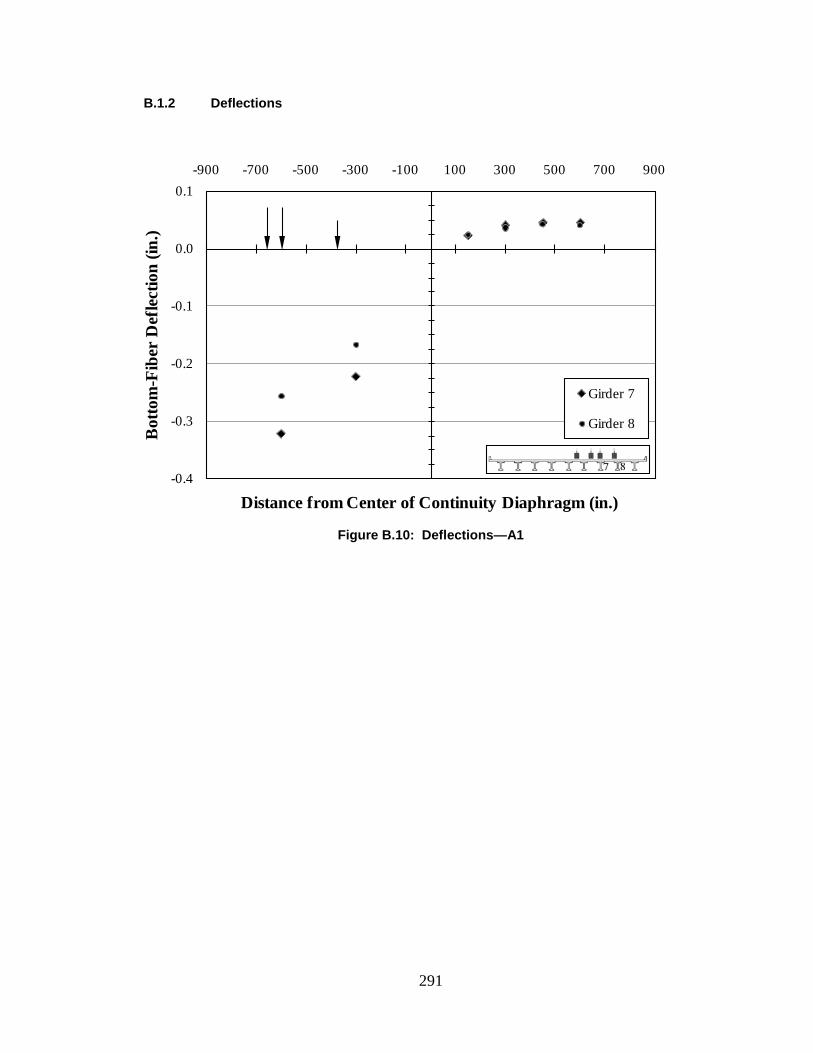
291
B.1.2 Deflections
Figure B.10: Deflections—A1
-0.4
-0.3
-0.2
-0.1
0.0
0.1-900 -700 -500 -300 -100 100 300 500 700 900
Bot
tom
-Fib
er D
efle
ctio
n (in
.)
Distance from Center of Continuity Diaphragm (in.)
Girder 7
Girder 8
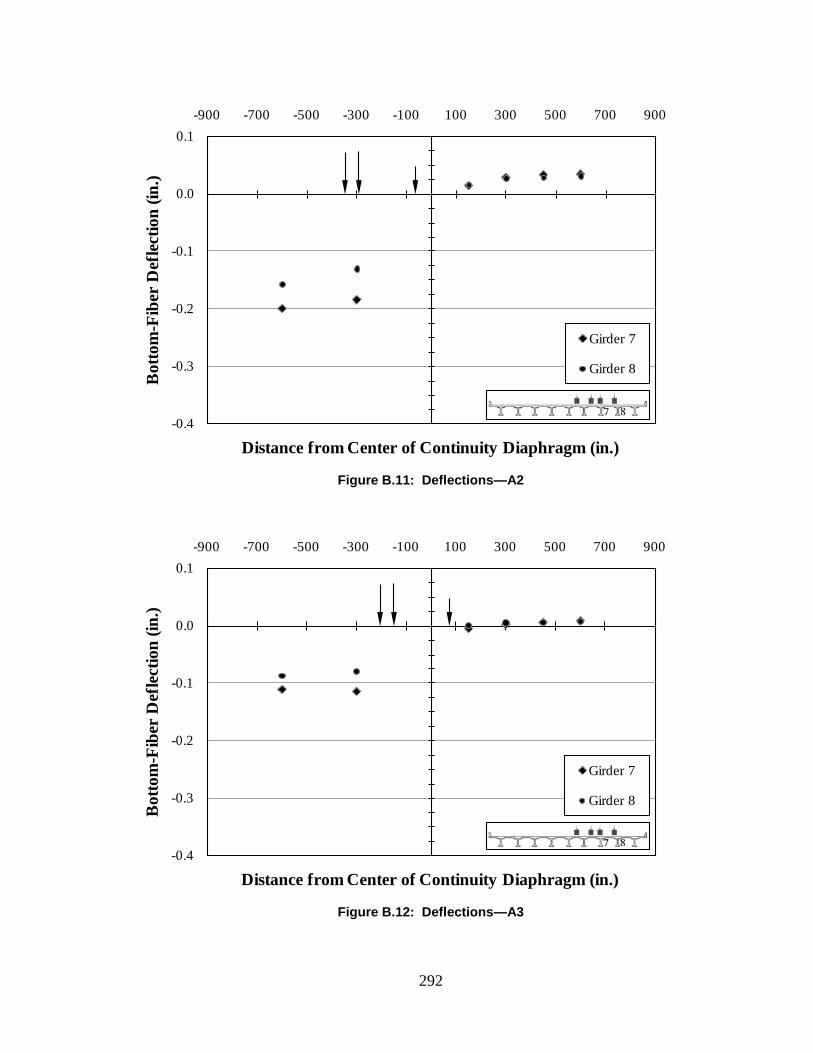
292
Figure B.11: Deflections—A2
Figure B.12: Deflections—A3
-0.4
-0.3
-0.2
-0.1
0.0
0.1-900 -700 -500 -300 -100 100 300 500 700 900
Bot
tom
-Fib
er D
efle
ctio
n (in
.)
Distance from Center of Continuity Diaphragm (in.)
Girder 7
Girder 8
-0.4
-0.3
-0.2
-0.1
0.0
0.1-900 -700 -500 -300 -100 100 300 500 700 900
Bot
tom
-Fib
er D
efle
ctio
n (in
.)
Distance from Center of Continuity Diaphragm (in.)
Girder 7
Girder 8
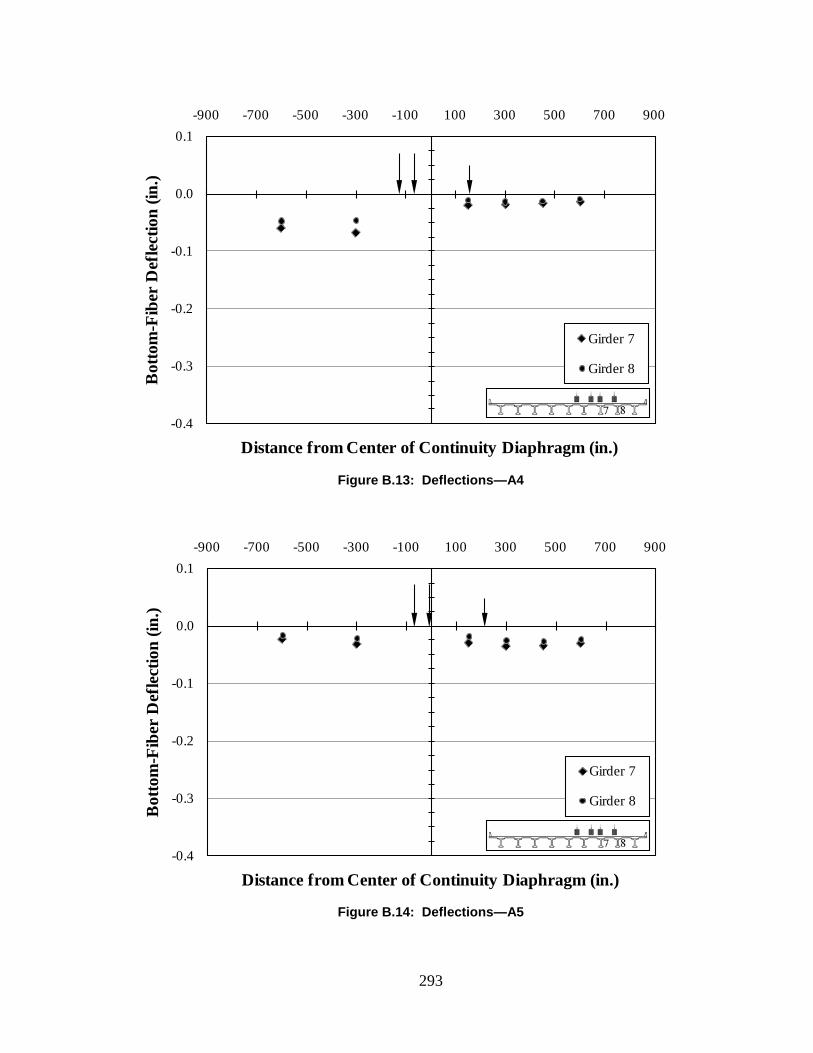
293
Figure B.13: Deflections—A4
Figure B.14: Deflections—A5
-0.4
-0.3
-0.2
-0.1
0.0
0.1-900 -700 -500 -300 -100 100 300 500 700 900
Bot
tom
-Fib
er D
efle
ctio
n (in
.)
Distance from Center of Continuity Diaphragm (in.)
Girder 7
Girder 8
-0.4
-0.3
-0.2
-0.1
0.0
0.1-900 -700 -500 -300 -100 100 300 500 700 900
Bot
tom
-Fib
er D
efle
ctio
n (in
.)
Distance from Center of Continuity Diaphragm (in.)
Girder 7
Girder 8
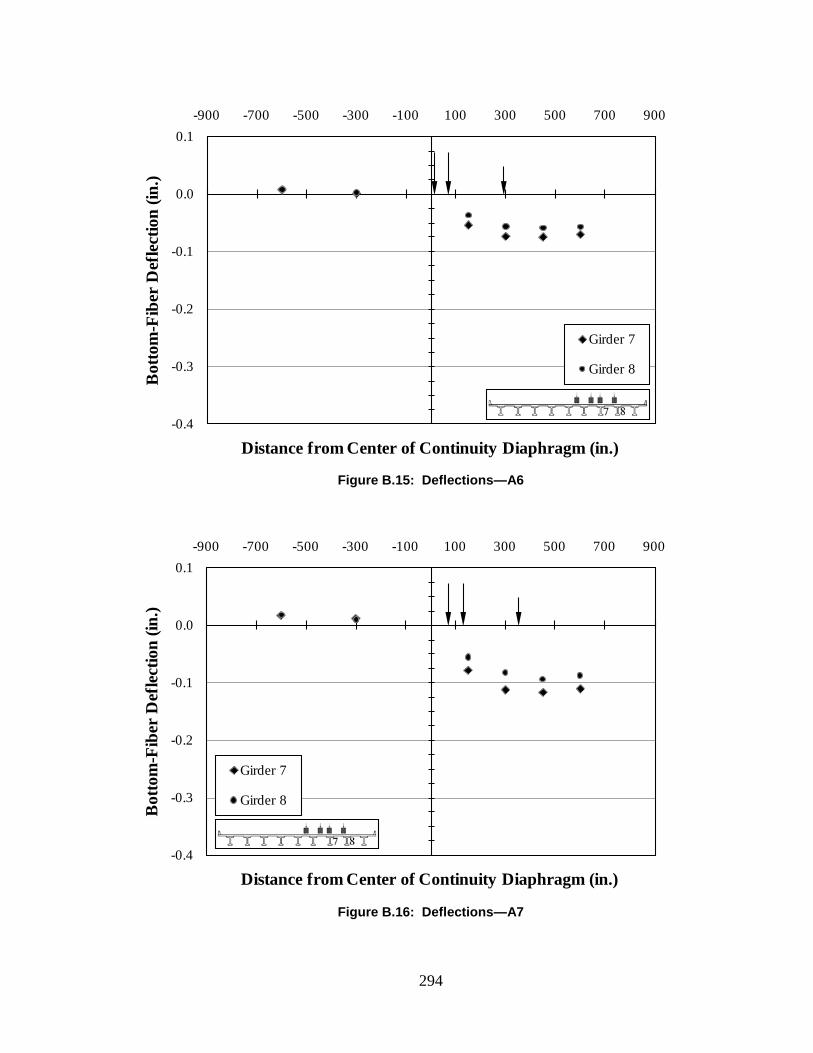
294
Figure B.15: Deflections—A6
Figure B.16: Deflections—A7
-0.4
-0.3
-0.2
-0.1
0.0
0.1-900 -700 -500 -300 -100 100 300 500 700 900
Bot
tom
-Fib
er D
efle
ctio
n (in
.)
Distance from Center of Continuity Diaphragm (in.)
Girder 7
Girder 8
-0.4
-0.3
-0.2
-0.1
0.0
0.1-900 -700 -500 -300 -100 100 300 500 700 900
Bot
tom
-Fib
er D
efle
ctio
n (in
.)
Distance from Center of Continuity Diaphragm (in.)
Girder 7
Girder 8
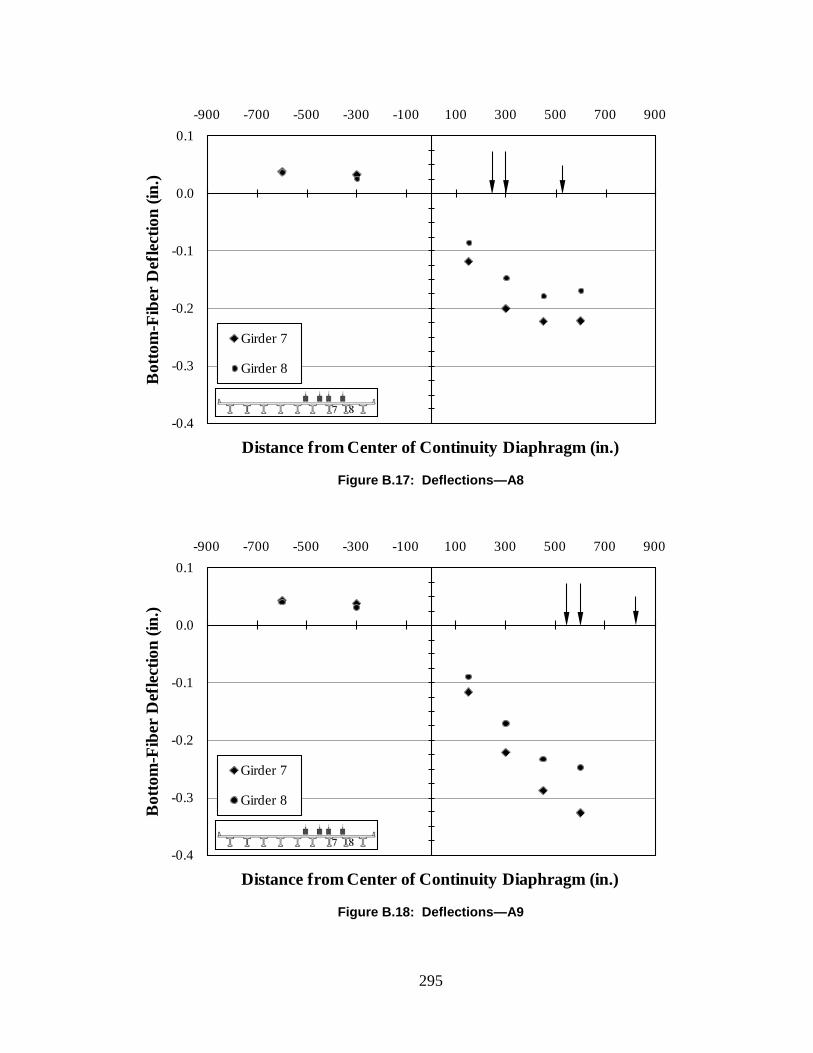
295
Figure B.17: Deflections—A8
Figure B.18: Deflections—A9
-0.4
-0.3
-0.2
-0.1
0.0
0.1-900 -700 -500 -300 -100 100 300 500 700 900
Bot
tom
-Fib
er D
efle
ctio
n (in
.)
Distance from Center of Continuity Diaphragm (in.)
Girder 7
Girder 8
-0.4
-0.3
-0.2
-0.1
0.0
0.1-900 -700 -500 -300 -100 100 300 500 700 900
Bot
tom
-Fib
er D
efle
ctio
n (in
.)
Distance from Center of Continuity Diaphragm (in.)
Girder 7
Girder 8
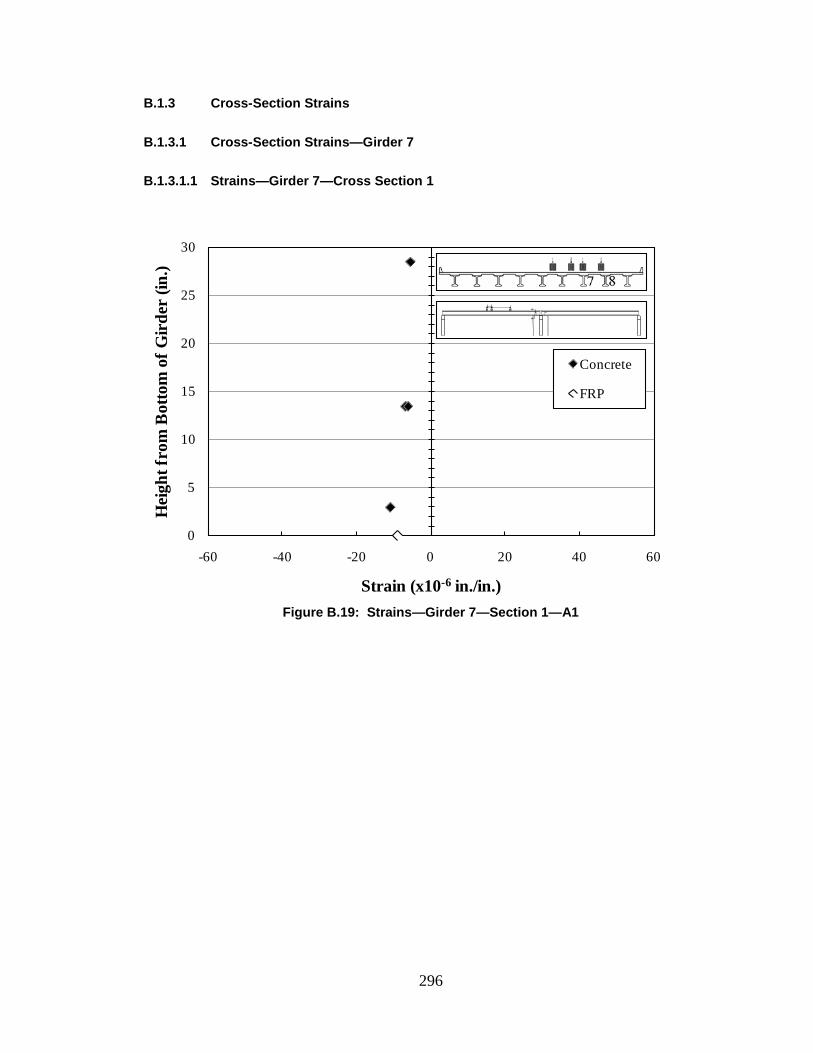
296
B.1.3 Cross-Section Strains
B.1.3.1 Cross-Section Strains—Girder 7
B.1.3.1.1 Strains—Girder 7—Cross Section 1
Figure B.19: Strains—Girder 7—Section 1—A1
0
5
10
15
20
25
30
-60 -40 -20 0 20 40 60
Hei
ght f
rom
Bot
tom
of G
irde
r (in
.)
Strain (x10-6 in./in.)
Concrete
FRP
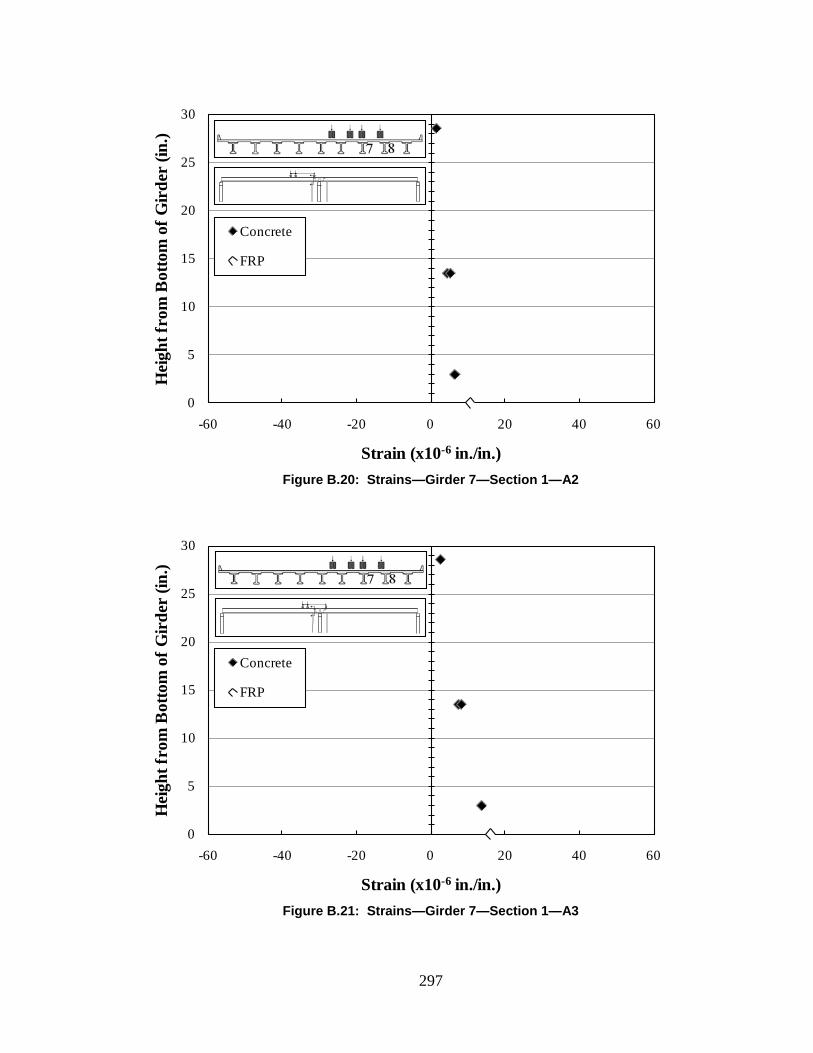
297
Figure B.20: Strains—Girder 7—Section 1—A2
Figure B.21: Strains—Girder 7—Section 1—A3
0
5
10
15
20
25
30
-60 -40 -20 0 20 40 60
Hei
ght f
rom
Bot
tom
of G
irde
r (in
.)
Strain (x10-6 in./in.)
Concrete
FRP
0
5
10
15
20
25
30
-60 -40 -20 0 20 40 60
Hei
ght f
rom
Bot
tom
of G
irde
r (in
.)
Strain (x10-6 in./in.)
Concrete
FRP

298
Figure B.22: Strains—Girder 7—Section 1—A4
Figure B.23: Strains—Girder 7—Section 1—A5
0
5
10
15
20
25
30
-60 -40 -20 0 20 40 60
Hei
ght f
rom
Bot
tom
of G
irde
r (in
.)
Strain (x10-6 in./in.)
Concrete
FRP
0
5
10
15
20
25
30
-60 -40 -20 0 20 40 60
Hei
ght f
rom
Bot
tom
of G
irde
r (in
.)
Strain (x10-6 in./in.)
Concrete
FRP
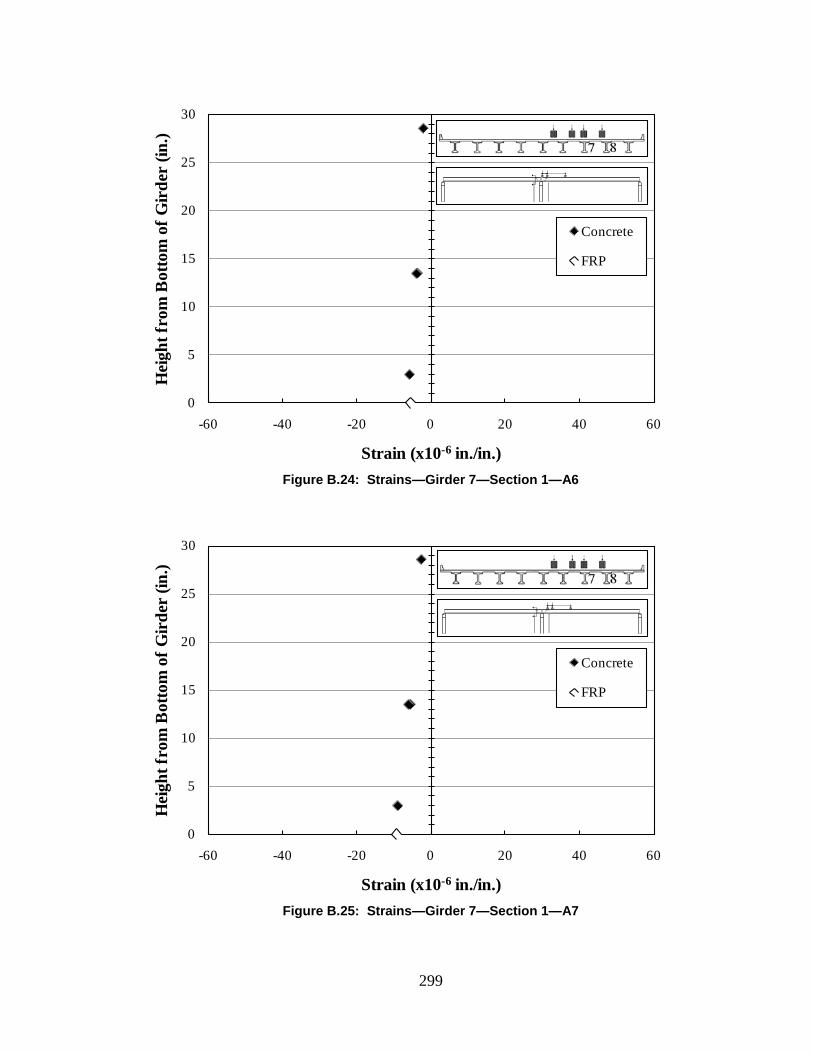
299
Figure B.24: Strains—Girder 7—Section 1—A6
Figure B.25: Strains—Girder 7—Section 1—A7
0
5
10
15
20
25
30
-60 -40 -20 0 20 40 60
Hei
ght f
rom
Bot
tom
of G
irde
r (in
.)
Strain (x10-6 in./in.)
Concrete
FRP
0
5
10
15
20
25
30
-60 -40 -20 0 20 40 60
Hei
ght f
rom
Bot
tom
of G
irde
r (in
.)
Strain (x10-6 in./in.)
Concrete
FRP

300
Figure B.26: Strains—Girder 7—Section 1—A8
Figure B.27: Strains—Girder 7—Section 1—A9
0
5
10
15
20
25
30
-60 -40 -20 0 20 40 60
Hei
ght f
rom
Bot
tom
of G
irde
r (in
.)
Strain (x10-6 in./in.)
Concrete
FRP
0
5
10
15
20
25
30
-60 -40 -20 0 20 40 60
Hei
ght f
rom
Bot
tom
of G
irde
r (in
.)
Strain (x10-6 in./in.)
Concrete
FRP
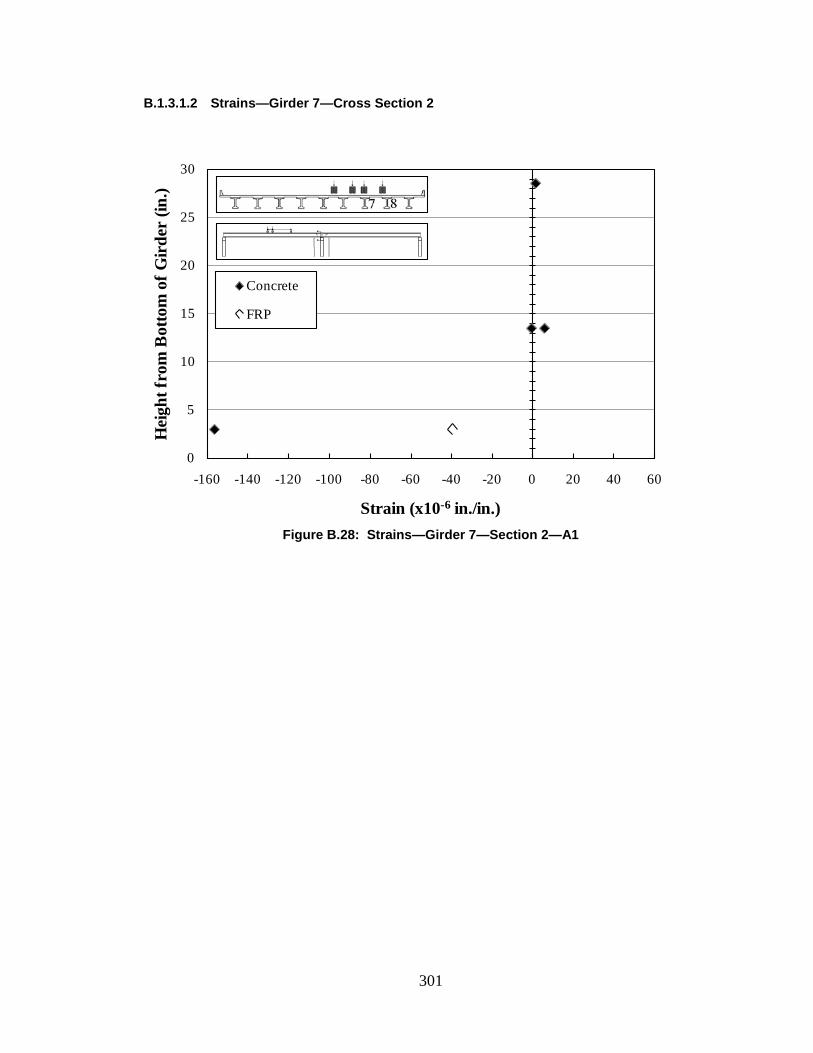
301
B.1.3.1.2 Strains—Girder 7—Cross Section 2
Figure B.28: Strains—Girder 7—Section 2—A1
0
5
10
15
20
25
30
-160 -140 -120 -100 -80 -60 -40 -20 0 20 40 60
Hei
ght f
rom
Bot
tom
of G
irde
r (in
.)
Strain (x10-6 in./in.)
Concrete
FRP

302
Figure B.29: Strains—Girder 7—Section 2—A2
Figure B.30: Strains—Girder 7—Section 2—A3
0
5
10
15
20
25
30
-160 -140 -120 -100 -80 -60 -40 -20 0 20 40 60
Hei
ght f
rom
Bot
tom
of G
irde
r (in
.)
Strain (x10-6 in./in.)
Concrete
FRP
0
5
10
15
20
25
30
-160 -140 -120 -100 -80 -60 -40 -20 0 20 40 60
Hei
ght f
rom
Bot
tom
of G
irde
r (in
.)
Strain (x10-6 in./in.)
Concrete
FRP

303
Figure B.31: Strains—Girder 7—Section 2—A4
Figure B.32: Strains—Girder 7—Section 2—A5
0
5
10
15
20
25
30
-160 -140 -120 -100 -80 -60 -40 -20 0 20 40 60
Hei
ght f
rom
Bot
tom
of G
irde
r (in
.)
Strain (x10-6 in./in.)
Concrete
FRP
0
5
10
15
20
25
30
-160 -140 -120 -100 -80 -60 -40 -20 0 20 40 60
Hei
ght f
rom
Bot
tom
of G
irde
r (in
.)
Strain (x10-6 in./in.)
Concrete
FRP
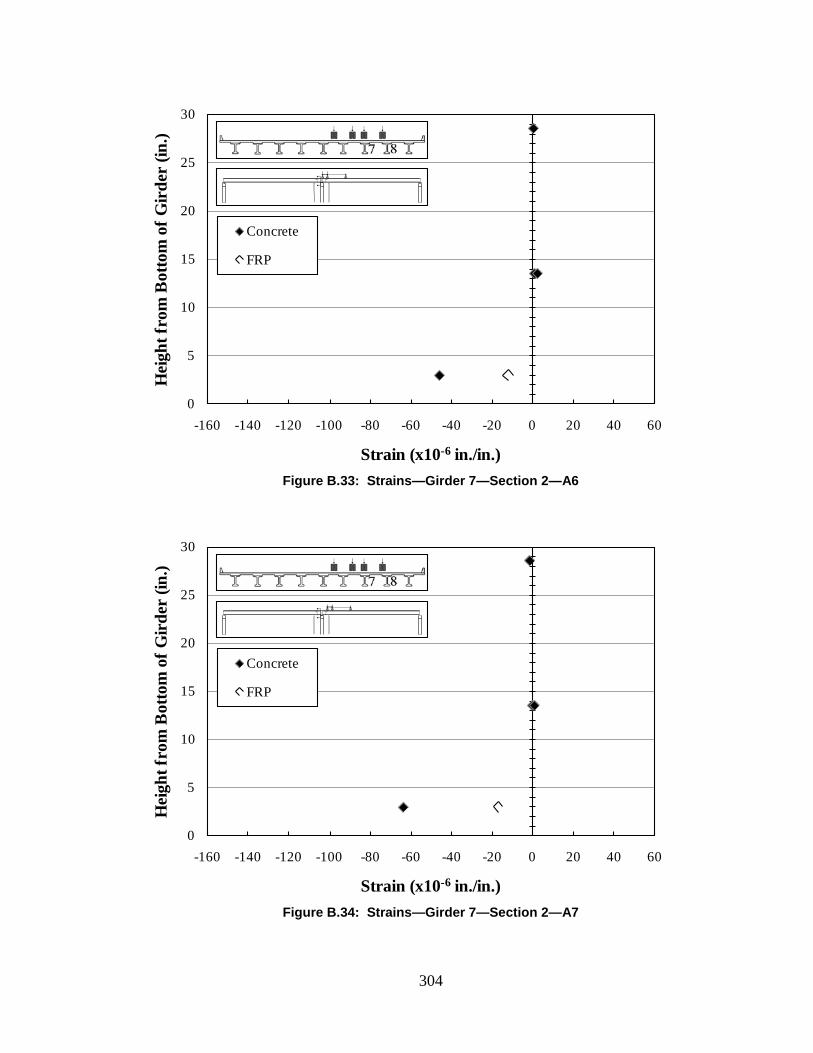
304
Figure B.33: Strains—Girder 7—Section 2—A6
Figure B.34: Strains—Girder 7—Section 2—A7
0
5
10
15
20
25
30
-160 -140 -120 -100 -80 -60 -40 -20 0 20 40 60
Hei
ght f
rom
Bot
tom
of G
irde
r (in
.)
Strain (x10-6 in./in.)
Concrete
FRP
0
5
10
15
20
25
30
-160 -140 -120 -100 -80 -60 -40 -20 0 20 40 60
Hei
ght f
rom
Bot
tom
of G
irde
r (in
.)
Strain (x10-6 in./in.)
Concrete
FRP
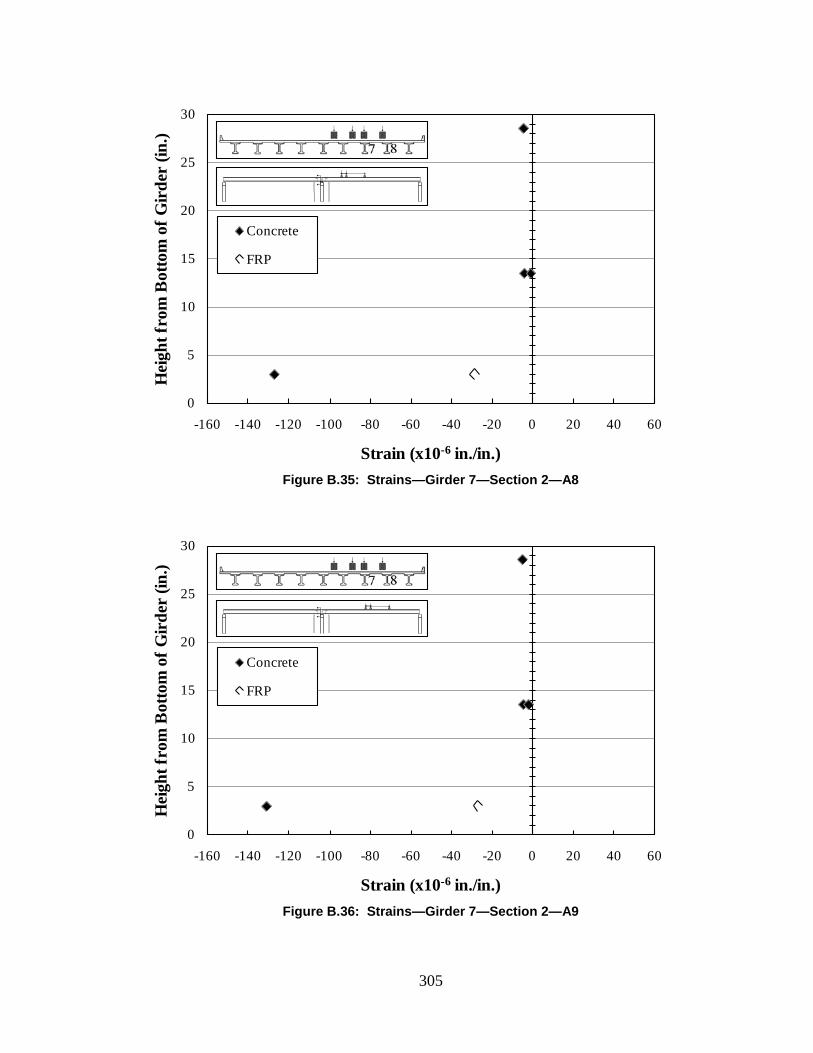
305
Figure B.35: Strains—Girder 7—Section 2—A8
Figure B.36: Strains—Girder 7—Section 2—A9
0
5
10
15
20
25
30
-160 -140 -120 -100 -80 -60 -40 -20 0 20 40 60
Hei
ght f
rom
Bot
tom
of G
irde
r (in
.)
Strain (x10-6 in./in.)
Concrete
FRP
0
5
10
15
20
25
30
-160 -140 -120 -100 -80 -60 -40 -20 0 20 40 60
Hei
ght f
rom
Bot
tom
of G
irde
r (in
.)
Strain (x10-6 in./in.)
Concrete
FRP
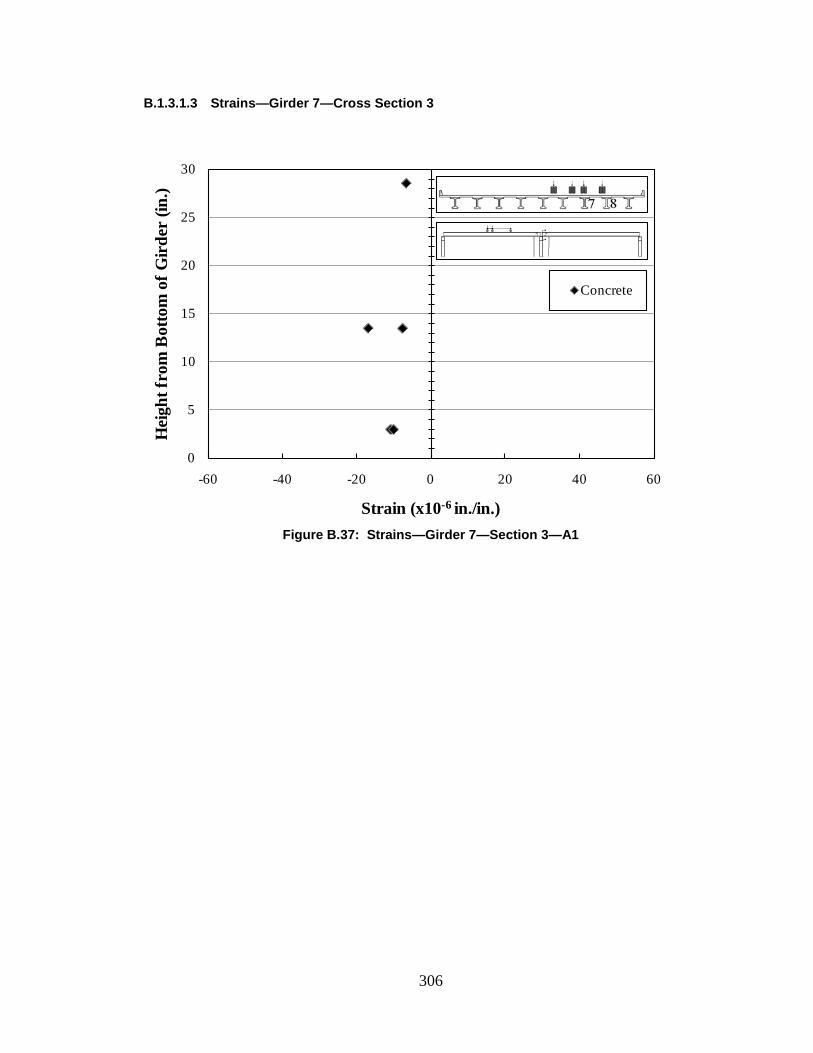
306
B.1.3.1.3 Strains—Girder 7—Cross Section 3
Figure B.37: Strains—Girder 7—Section 3—A1
0
5
10
15
20
25
30
-60 -40 -20 0 20 40 60
Hei
ght f
rom
Bot
tom
of G
irde
r (in
.)
Strain (x10-6 in./in.)
Concrete
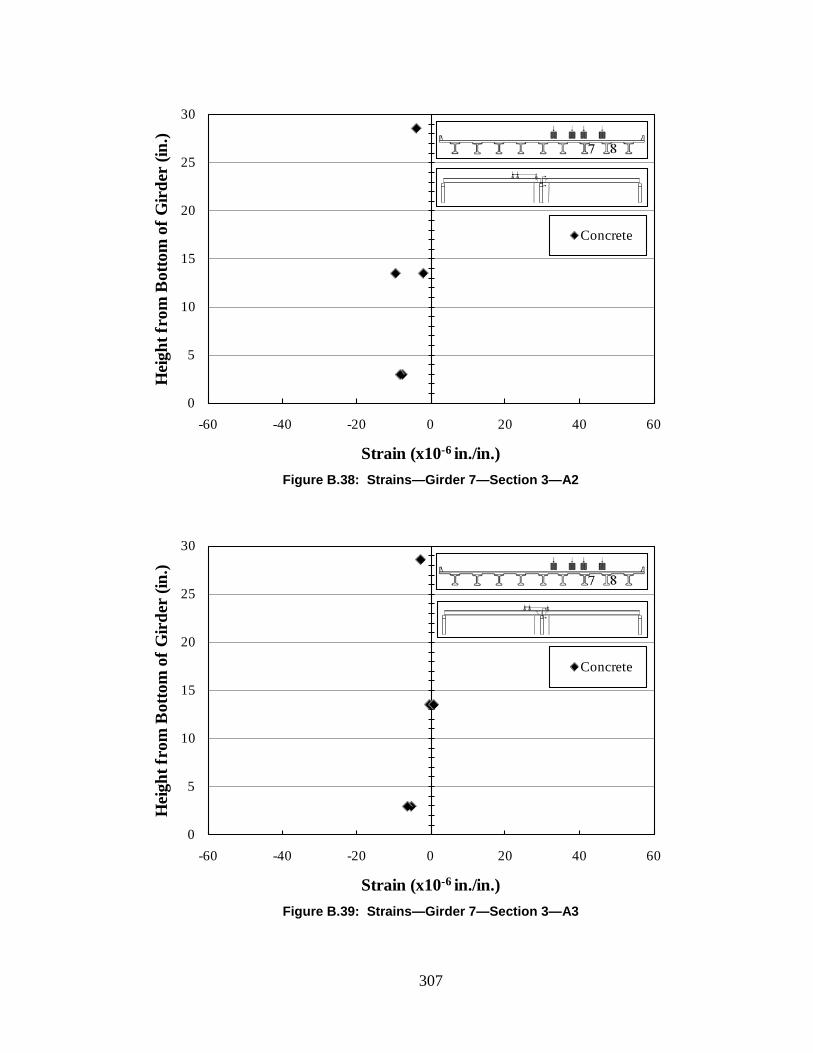
307
Figure B.38: Strains—Girder 7—Section 3—A2
Figure B.39: Strains—Girder 7—Section 3—A3
0
5
10
15
20
25
30
-60 -40 -20 0 20 40 60
Hei
ght f
rom
Bot
tom
of G
irde
r (in
.)
Strain (x10-6 in./in.)
Concrete
0
5
10
15
20
25
30
-60 -40 -20 0 20 40 60
Hei
ght f
rom
Bot
tom
of G
irde
r (in
.)
Strain (x10-6 in./in.)
Concrete

308
Figure B.40: Strains—Girder 7—Section 3—A4
Figure B.41: Strains—Girder 7—Section 3—A5
0
5
10
15
20
25
30
-60 -40 -20 0 20 40 60
Hei
ght f
rom
Bot
tom
of G
irde
r (in
.)
Strain (x10-6 in./in.)
Concrete
0
5
10
15
20
25
30
-60 -40 -20 0 20 40 60
Hei
ght f
rom
Bot
tom
of G
irde
r (in
.)
Strain (x10-6 in./in.)
Concrete

309
Figure B.42: Strains—Girder 7—Section 3—A6
Figure B.43: Strains—Girder 7—Section 3—A7
0
5
10
15
20
25
30
-60 -40 -20 0 20 40 60
Hei
ght f
rom
Bot
tom
of G
irde
r (in
.)
Strain (x10-6 in./in.)
Concrete
0
5
10
15
20
25
30
-60 -40 -20 0 20 40 60
Hei
ght f
rom
Bot
tom
of G
irde
r (in
.)
Strain (x10-6 in./in.)
Concrete

310
Figure B.44: Strains—Girder 7—Section 3—A8
Figure B.45: Strains—Girder 7—Section 3—A9
0
5
10
15
20
25
30
-60 -40 -20 0 20 40 60
Hei
ght f
rom
Bot
tom
of G
irde
r (in
.)
Strain (x10-6 in./in.)
Concrete
0
5
10
15
20
25
30
-60 -40 -20 0 20 40 60
Hei
ght f
rom
Bot
tom
of G
irde
r (in
.)
Strain (x10-6 in./in.)
Concrete

311
B.1.3.1.4 Strains—Girder 7—Cross Section 4
Figure B.46: Strains—Girder 7—Section 4—A1
0
5
10
15
20
25
30
-60 -40 -20 0 20 40 60
Hei
ght f
rom
Bot
tom
of G
irde
r (in
.)
Strain (x10-6 in./in.)
Concrete
FRP

312
Figure B.47: Strains—Girder 7—Section 4—A2
Figure B.48: Strains—Girder 7—Section 4—A3
0
5
10
15
20
25
30
-60 -40 -20 0 20 40 60
Hei
ght f
rom
Bot
tom
of G
irde
r (in
.)
Strain (x10-6 in./in.)
Concrete
FRP
0
5
10
15
20
25
30
-60 -40 -20 0 20 40 60
Hei
ght f
rom
Bot
tom
of G
irde
r (in
.)
Strain (x10-6 in./in.)
Concrete
FRP

313
Figure B.49: Strains—Girder 7—Section 4—A4
Figure B.50: Strains—Girder 7—Section 4—A5
0
5
10
15
20
25
30
-60 -40 -20 0 20 40 60
Hei
ght f
rom
Bot
tom
of G
irde
r (in
.)
Strain (x10-6 in./in.)
Concrete
FRP
0
5
10
15
20
25
30
-60 -40 -20 0 20 40 60
Hei
ght f
rom
Bot
tom
of G
irde
r (in
.)
Strain (x10-6 in./in.)
Concrete
FRP
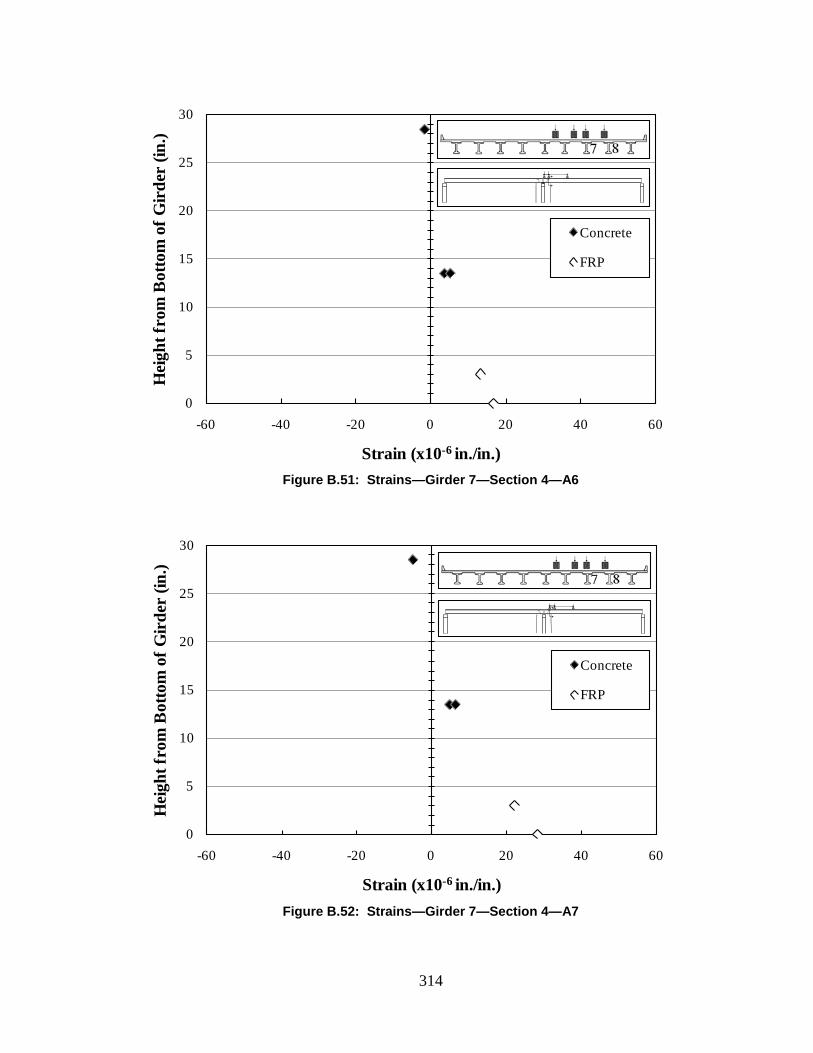
314
Figure B.51: Strains—Girder 7—Section 4—A6
Figure B.52: Strains—Girder 7—Section 4—A7
0
5
10
15
20
25
30
-60 -40 -20 0 20 40 60
Hei
ght f
rom
Bot
tom
of G
irde
r (in
.)
Strain (x10-6 in./in.)
Concrete
FRP
0
5
10
15
20
25
30
-60 -40 -20 0 20 40 60
Hei
ght f
rom
Bot
tom
of G
irde
r (in
.)
Strain (x10-6 in./in.)
Concrete
FRP

315
Figure B.53: Strains—Girder 7—Section 4—A8
Figure B.54: Strains—Girder 7—Section 4—A9
0
5
10
15
20
25
30
-60 -40 -20 0 20 40 60
Hei
ght f
rom
Bot
tom
of G
irde
r (in
.)
Strain (x10-6 in./in.)
Concrete
FRP
0
5
10
15
20
25
30
-60 -40 -20 0 20 40 60
Hei
ght f
rom
Bot
tom
of G
irde
r (in
.)
Strain (x10-6 in./in.)
Concrete
FRP
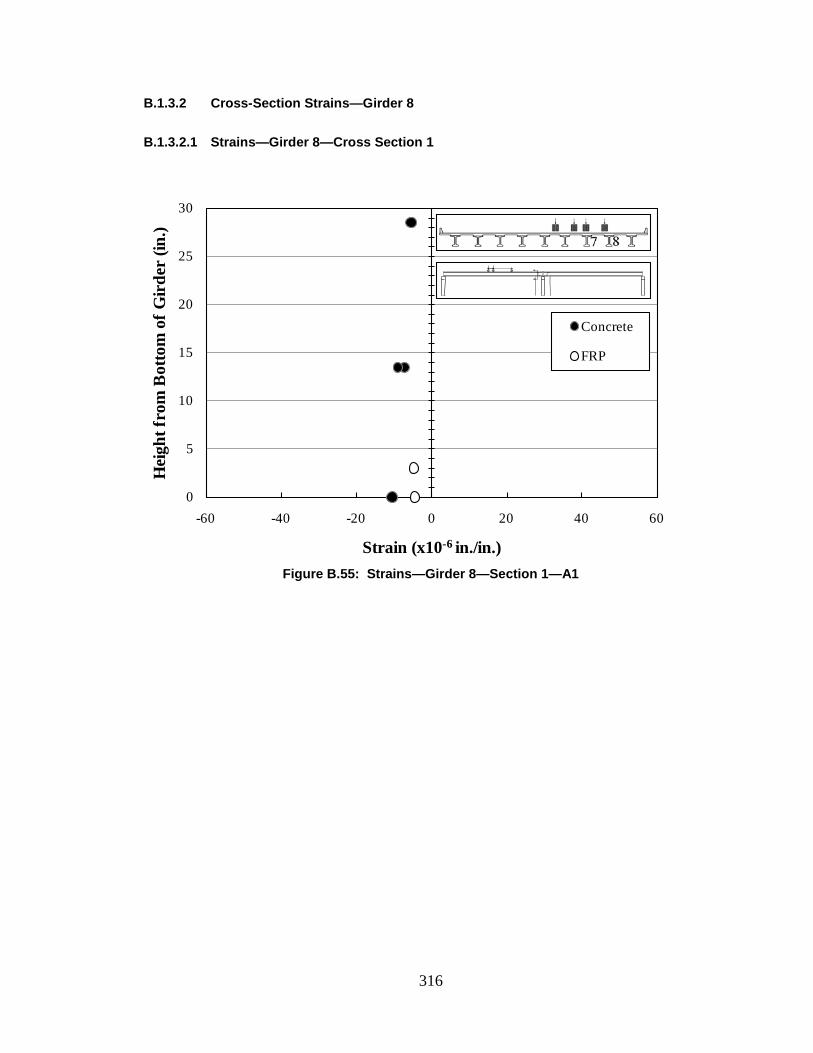
316
B.1.3.2 Cross-Section Strains—Girder 8
B.1.3.2.1 Strains—Girder 8—Cross Section 1
Figure B.55: Strains—Girder 8—Section 1—A1
0
5
10
15
20
25
30
-60 -40 -20 0 20 40 60
Hei
ght f
rom
Bot
tom
of G
irde
r (in
.)
Strain (x10-6 in./in.)
Concrete
FRP

317
Figure B.56: Strains—Girder 8—Section 1—A2
Figure B.57: Strains—Girder 8—Section 1—A3
0
5
10
15
20
25
30
-60 -40 -20 0 20 40 60
Hei
ght f
rom
Bot
tom
of G
irde
r (in
.)
Strain (x10-6 in./in.)
Concrete
FRP
0
5
10
15
20
25
30
-60 -40 -20 0 20 40 60
Hei
ght f
rom
Bot
tom
of G
irde
r (in
.)
Strain (x10-6 in./in.)
Concrete
FRP

318
Figure B.58: Strains—Girder 8—Section 1—A4
Figure B.59: Strains—Girder 8—Section 1—A5
0
5
10
15
20
25
30
-60 -40 -20 0 20 40 60
Hei
ght f
rom
Bot
tom
of G
irde
r (in
.)
Strain (x10-6 in./in.)
Concrete
FRP
0
5
10
15
20
25
30
-60 -40 -20 0 20 40 60
Hei
ght f
rom
Bot
tom
of G
irde
r (in
.)
Strain (x10-6 in./in.)
Concrete
FRP

319
Figure B.60: Strains—Girder 8—Section 1—A6
Figure B.61: Strains—Girder 8—Section 1—A7
0
5
10
15
20
25
30
-60 -40 -20 0 20 40 60
Hei
ght f
rom
Bot
tom
of G
irde
r (in
.)
Strain (x10-6 in./in.)
Concrete
FRP
0
5
10
15
20
25
30
-60 -40 -20 0 20 40 60
Hei
ght f
rom
Bot
tom
of G
irde
r (in
.)
Strain (x10-6 in./in.)
Concrete
FRP

320
Figure B.62: Strains—Girder 8—Section 1—A8
Figure B.63: Strains—Girder 8—Section 1—A9
0
5
10
15
20
25
30
-60 -40 -20 0 20 40 60
Hei
ght f
rom
Bot
tom
of G
irde
r (in
.)
Strain (x10-6 in./in.)
Concrete
FRP
0
5
10
15
20
25
30
-60 -40 -20 0 20 40 60
Hei
ght f
rom
Bot
tom
of G
irde
r (in
.)
Strain (x10-6 in./in.)
Concrete
FRP
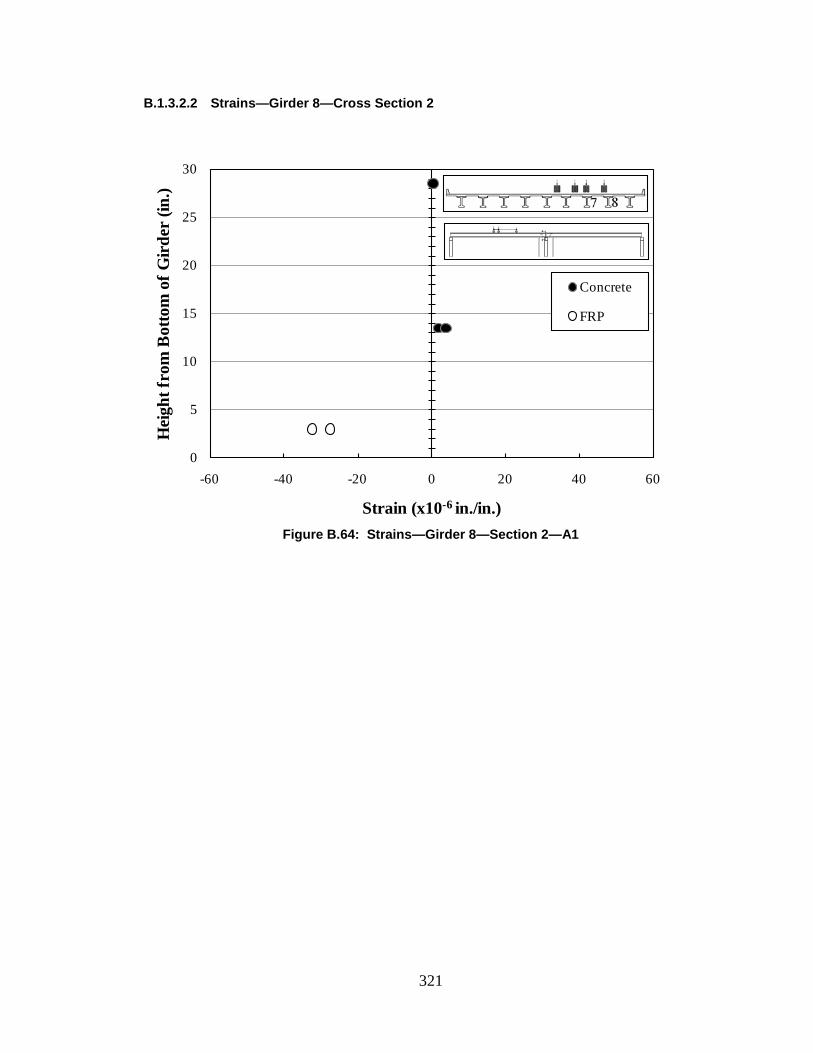
321
B.1.3.2.2 Strains—Girder 8—Cross Section 2
Figure B.64: Strains—Girder 8—Section 2—A1
0
5
10
15
20
25
30
-60 -40 -20 0 20 40 60
Hei
ght f
rom
Bot
tom
of G
irde
r (in
.)
Strain (x10-6 in./in.)
Concrete
FRP

322
Figure B.65: Strains—Girder 8—Section 2—A2
Figure B.66: Strains—Girder 8—Section 2—A3
0
5
10
15
20
25
30
-60 -40 -20 0 20 40 60
Hei
ght f
rom
Bot
tom
of G
irde
r (in
.)
Strain (x10-6 in./in.)
Concrete
FRP
0
5
10
15
20
25
30
-60 -40 -20 0 20 40 60
Hei
ght f
rom
Bot
tom
of G
irde
r (in
.)
Strain (x10-6 in./in.)
Concrete
FRP

323
Figure B.67: Strains—Girder 8—Section 2—A4
Figure B.68: Strains—Girder 8—Section 2—A5
0
5
10
15
20
25
30
-60 -40 -20 0 20 40 60
Hei
ght f
rom
Bot
tom
of G
irde
r (in
.)
Strain (x10-6 in./in.)
Concrete
FRP
0
5
10
15
20
25
30
-60 -40 -20 0 20 40 60
Hei
ght f
rom
Bot
tom
of G
irde
r (in
.)
Strain (x10-6 in./in.)
Concrete
FRP

324
Figure B.69: Strains—Girder 8—Section 2—A6
Figure B.70: Strains—Girder 8—Section 2—A7
0
5
10
15
20
25
30
-60 -40 -20 0 20 40 60
Hei
ght f
rom
Bot
tom
of G
irde
r (in
.)
Strain (x10-6 in./in.)
Concrete
FRP
0
5
10
15
20
25
30
-60 -40 -20 0 20 40 60
Hei
ght f
rom
Bot
tom
of G
irde
r (in
.)
Strain (x10-6 in./in.)
Concrete
FRP
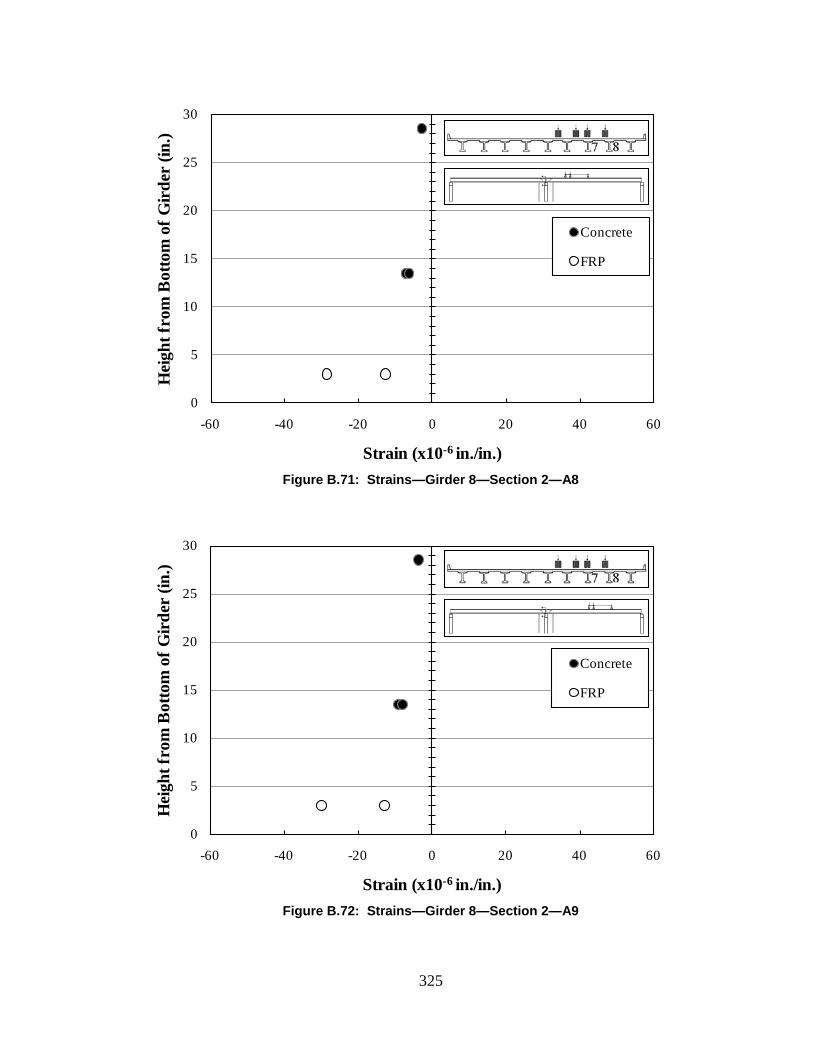
325
Figure B.71: Strains—Girder 8—Section 2—A8
Figure B.72: Strains—Girder 8—Section 2—A9
0
5
10
15
20
25
30
-60 -40 -20 0 20 40 60
Hei
ght f
rom
Bot
tom
of G
irde
r (in
.)
Strain (x10-6 in./in.)
Concrete
FRP
0
5
10
15
20
25
30
-60 -40 -20 0 20 40 60
Hei
ght f
rom
Bot
tom
of G
irde
r (in
.)
Strain (x10-6 in./in.)
Concrete
FRP
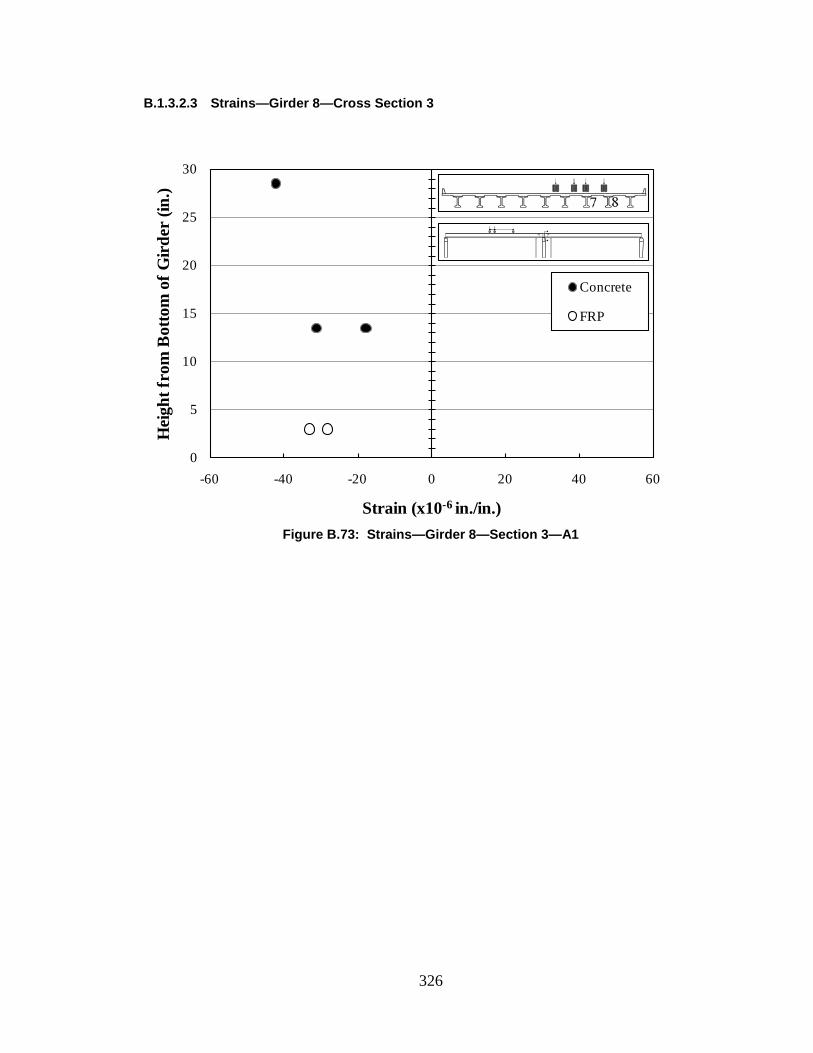
326
B.1.3.2.3 Strains—Girder 8—Cross Section 3
Figure B.73: Strains—Girder 8—Section 3—A1
0
5
10
15
20
25
30
-60 -40 -20 0 20 40 60
Hei
ght f
rom
Bot
tom
of G
irde
r (in
.)
Strain (x10-6 in./in.)
Concrete
FRP

327
Figure B.74: Strains—Girder 8—Section 3—A2
Figure B.75: Strains—Girder 8—Section 3—A3
0
5
10
15
20
25
30
-60 -40 -20 0 20 40 60
Hei
ght f
rom
Bot
tom
of G
irde
r (in
.)
Strain (x10-6 in./in.)
Concrete
FRP
0
5
10
15
20
25
30
-60 -40 -20 0 20 40 60
Hei
ght f
rom
Bot
tom
of G
irde
r (in
.)
Strain (x10-6 in./in.)
Concrete
FRP

328
Figure B.76: Strains—Girder 8—Section 3—A4
Figure B.77: Strains—Girder 8—Section 3—A5
0
5
10
15
20
25
30
-60 -40 -20 0 20 40 60
Hei
ght f
rom
Bot
tom
of G
irde
r (in
.)
Strain (x10-6 in./in.)
Concrete
FRP
0
5
10
15
20
25
30
-60 -40 -20 0 20 40 60
Hei
ght f
rom
Bot
tom
of G
irde
r (in
.)
Strain (x10-6 in./in.)
Concrete
FRP

329
Figure B.78: Strains—Girder 8—Section 3—A6
Figure B.79: Strains—Girder 8—Section 3—A7
0
5
10
15
20
25
30
-60 -40 -20 0 20 40 60
Hei
ght f
rom
Bot
tom
of G
irde
r (in
.)
Strain (x10-6 in./in.)
Concrete
FRP
0
5
10
15
20
25
30
-60 -40 -20 0 20 40 60
Hei
ght f
rom
Bot
tom
of G
irde
r (in
.)
Strain (x10-6 in./in.)
Concrete
FRP
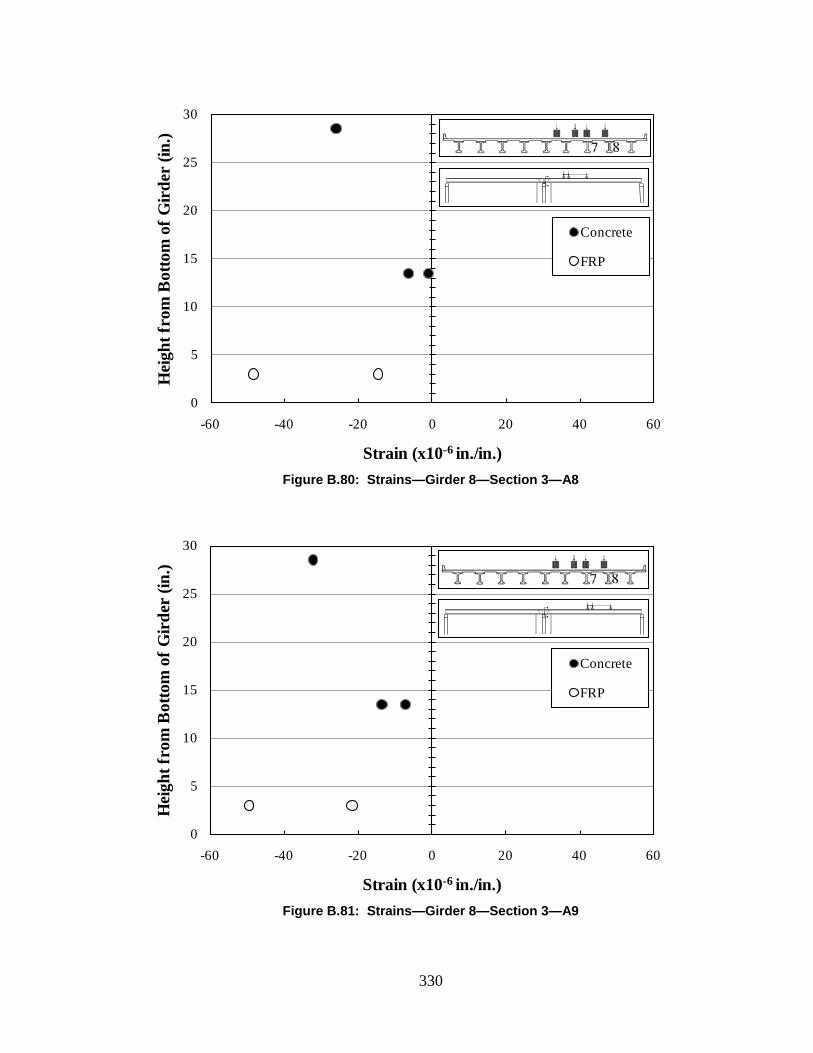
330
Figure B.80: Strains—Girder 8—Section 3—A8
Figure B.81: Strains—Girder 8—Section 3—A9
0
5
10
15
20
25
30
-60 -40 -20 0 20 40 60
Hei
ght f
rom
Bot
tom
of G
irde
r (in
.)
Strain (x10-6 in./in.)
Concrete
FRP
0
5
10
15
20
25
30
-60 -40 -20 0 20 40 60
Hei
ght f
rom
Bot
tom
of G
irde
r (in
.)
Strain (x10-6 in./in.)
Concrete
FRP
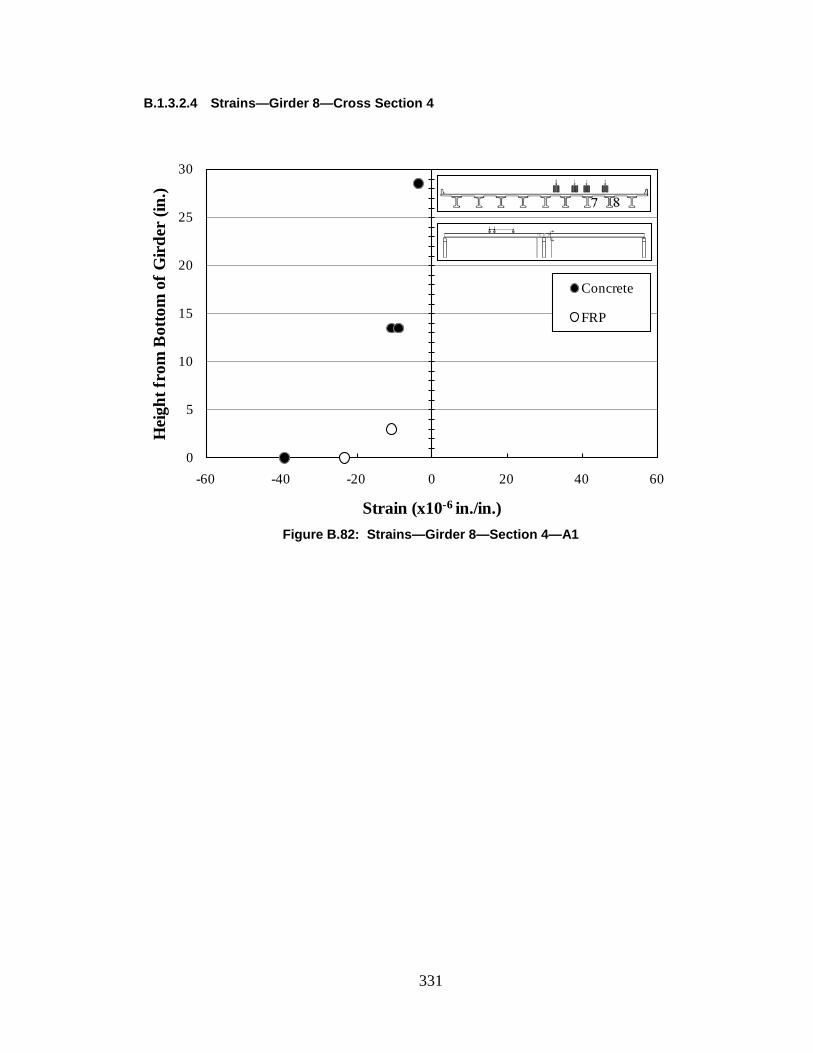
331
B.1.3.2.4 Strains—Girder 8—Cross Section 4
Figure B.82: Strains—Girder 8—Section 4—A1
0
5
10
15
20
25
30
-60 -40 -20 0 20 40 60
Hei
ght f
rom
Bot
tom
of G
irde
r (in
.)
Strain (x10-6 in./in.)
Concrete
FRP
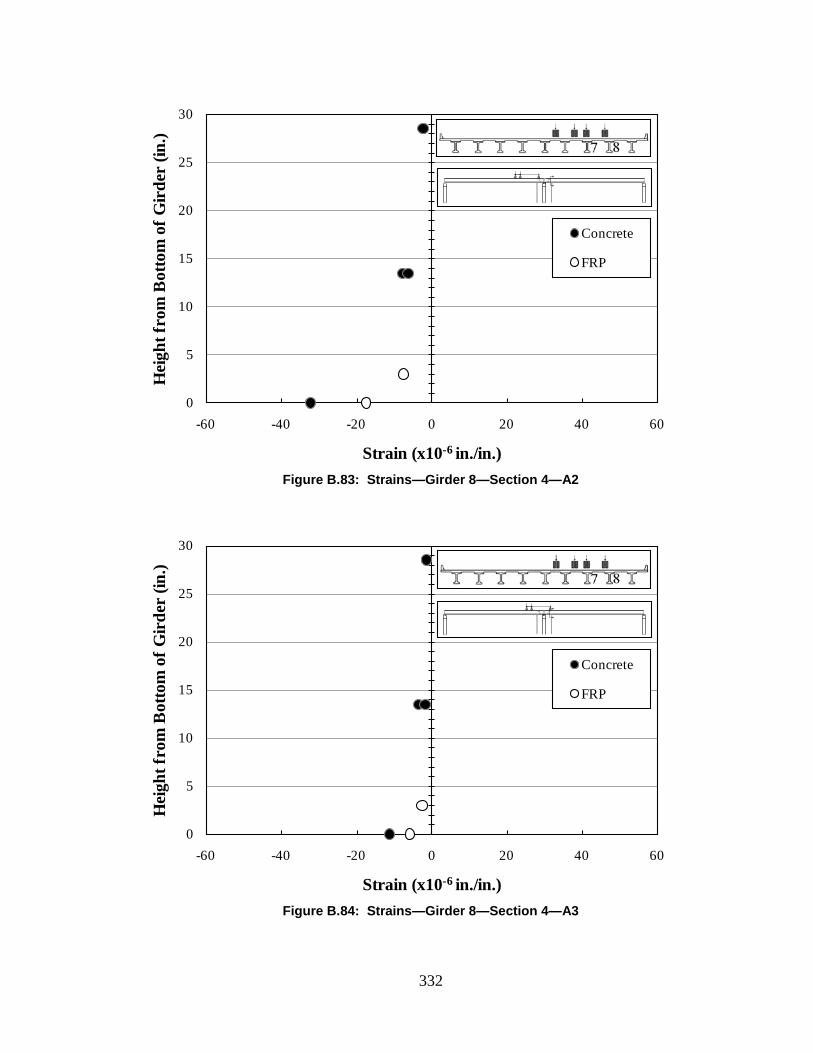
332
Figure B.83: Strains—Girder 8—Section 4—A2
Figure B.84: Strains—Girder 8—Section 4—A3
0
5
10
15
20
25
30
-60 -40 -20 0 20 40 60
Hei
ght f
rom
Bot
tom
of G
irde
r (in
.)
Strain (x10-6 in./in.)
Concrete
FRP
0
5
10
15
20
25
30
-60 -40 -20 0 20 40 60
Hei
ght f
rom
Bot
tom
of G
irde
r (in
.)
Strain (x10-6 in./in.)
Concrete
FRP

333
Figure B.85: Strains—Girder 8—Section 4—A4
Figure B.86: Strains—Girder 8—Section 4—A5
0
5
10
15
20
25
30
-60 -40 -20 0 20 40 60
Hei
ght f
rom
Bot
tom
of G
irde
r (in
.)
Strain (x10-6 in./in.)
Concrete
FRP
0
5
10
15
20
25
30
-60 -40 -20 0 20 40 60
Hei
ght f
rom
Bot
tom
of G
irde
r (in
.)
Strain (x10-6 in./in.)
Concrete
FRP

334
Figure B.87: Strains—Girder 8—Section 4—A6
Figure B.88: Strains—Girder 8—Section 4—A7
0
5
10
15
20
25
30
-60 -40 -20 0 20 40 60
Hei
ght f
rom
Bot
tom
of G
irde
r (in
.)
Strain (x10-6 in./in.)
Concrete
FRP
0
5
10
15
20
25
30
-60 -40 -20 0 20 40 60
Hei
ght f
rom
Bot
tom
of G
irde
r (in
.)
Strain (x10-6 in./in.)
Concrete
FRP

335
Figure B.89: Strains—Girder 8—Section 4—A8
Figure B.90: Strains—Girder 8—Section 4—A9
0
5
10
15
20
25
30
-60 -40 -20 0 20 40 60
Hei
ght f
rom
Bot
tom
of G
irde
r (in
.)
Strain (x10-6 in./in.)
Concrete
FRP
0
5
10
15
20
25
30
-60 -40 -20 0 20 40 60
Hei
ght f
rom
Bot
tom
of G
irde
r (in
.)
Strain (x10-6 in./in.)
Concrete
FRP

336
B.1.4 Bottom-Fiber Strains—Both Girders
Figure B.91: Bottom-fiber strains—A1
-240
-200
-160
-120
-80
-40
0
40
80
120
160
200
-900 -700 -500 -300 -100 100 300 500 700 900
Bot
tom
-Fib
er S
trai
n (x
10-6
in./i
n.)
Distance from Center of Continuity Diaphragm (in.)
G7 - Concrete
G8 - Concrete
G7 - FRP
G8 - FRP

337
Figure B.92: Bottom-fiber strains—A2
Figure B.93: Bottom-fiber strains—A3
-240
-200
-160
-120
-80
-40
0
40
80
120
160
200
-900 -700 -500 -300 -100 100 300 500 700 900
Bot
tom
-Fib
er S
trai
n (x
10-6
in./i
n.)
Distance from Center of Continuity Diaphragm (in.)
G7 - Concrete
G8 - Concrete
G7 - FRP
G8 - FRP
-240
-200
-160
-120
-80
-40
0
40
80
120
160
200
-900 -700 -500 -300 -100 100 300 500 700 900
Bot
tom
-Fib
er S
trai
n (x
10-6
in./i
n.)
Distance from Center of Continuity Diaphragm (in.)
G7 - Concrete
G8 - Concrete
G7 - FRP
G8 - FRP

338
Figure B.94: Bottom-fiber strains—A4
Figure B.95: Bottom-fiber strains—A5
-240
-200
-160
-120
-80
-40
0
40
80
120
160
200
-900 -700 -500 -300 -100 100 300 500 700 900
Bot
tom
-Fib
er S
trai
n (x
10-6
in./i
n.)
Distance from Center of Continuity Diaphragm (in.)
G7 - Concrete
G8 - Concrete
G7 - FRP
G8 - FRP
-240
-200
-160
-120
-80
-40
0
40
80
120
160
200
-900 -700 -500 -300 -100 100 300 500 700 900
Bot
tom
-Fib
er S
trai
n (x
10-6
in./i
n.)
Distance from Center of Continuity Diaphragm (in.)
G7 - Concrete
G8 - Concrete
G7 - FRP
G8 - FRP
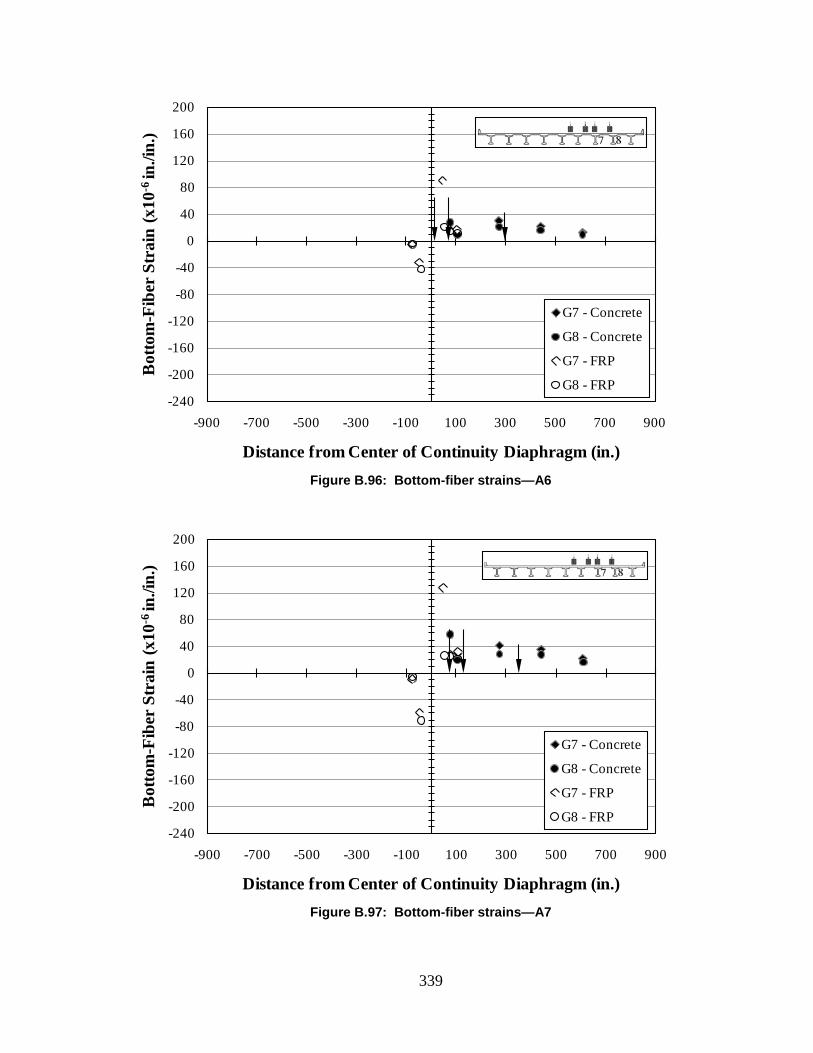
339
Figure B.96: Bottom-fiber strains—A6
Figure B.97: Bottom-fiber strains—A7
-240
-200
-160
-120
-80
-40
0
40
80
120
160
200
-900 -700 -500 -300 -100 100 300 500 700 900
Bot
tom
-Fib
er S
trai
n (x
10-6
in./i
n.)
Distance from Center of Continuity Diaphragm (in.)
G7 - Concrete
G8 - Concrete
G7 - FRP
G8 - FRP
-240
-200
-160
-120
-80
-40
0
40
80
120
160
200
-900 -700 -500 -300 -100 100 300 500 700 900
Bot
tom
-Fib
er S
trai
n (x
10-6
in./i
n.)
Distance from Center of Continuity Diaphragm (in.)
G7 - Concrete
G8 - Concrete
G7 - FRP
G8 - FRP
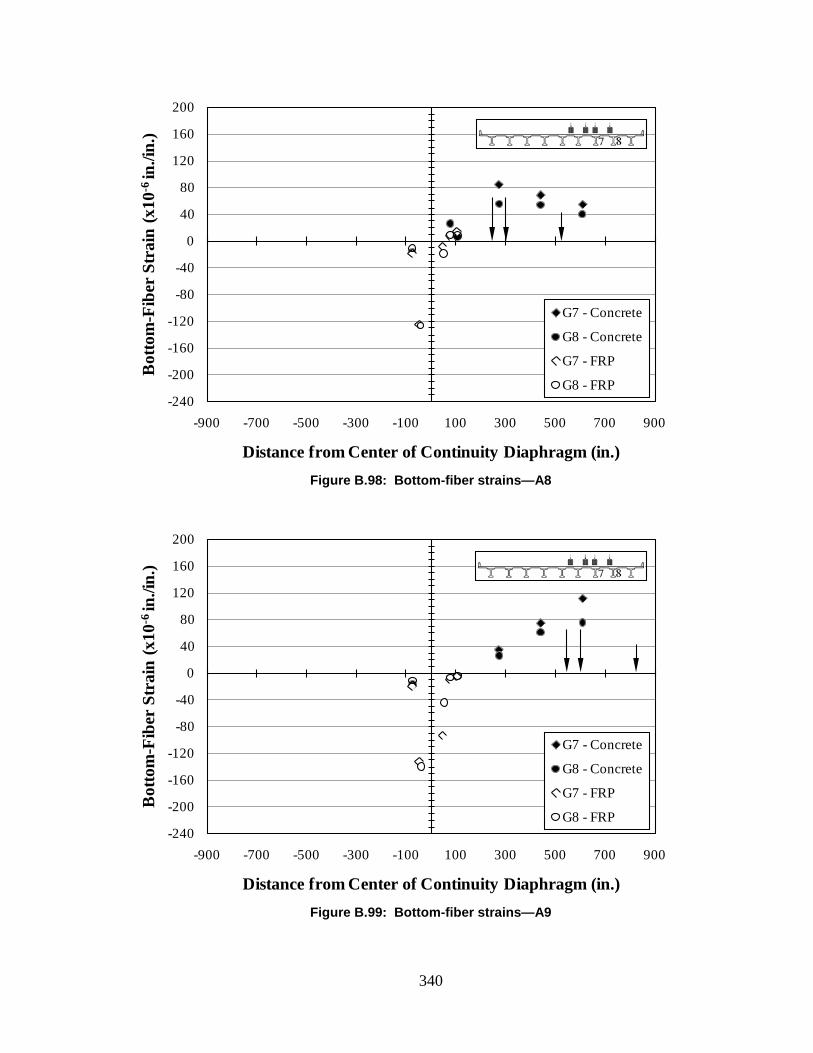
340
Figure B.98: Bottom-fiber strains—A8
Figure B.99: Bottom-fiber strains—A9
-240
-200
-160
-120
-80
-40
0
40
80
120
160
200
-900 -700 -500 -300 -100 100 300 500 700 900
Bot
tom
-Fib
er S
trai
n (x
10-6
in./i
n.)
Distance from Center of Continuity Diaphragm (in.)
G7 - Concrete
G8 - Concrete
G7 - FRP
G8 - FRP
-240
-200
-160
-120
-80
-40
0
40
80
120
160
200
-900 -700 -500 -300 -100 100 300 500 700 900
Bot
tom
-Fib
er S
trai
n (x
10-6
in./i
n.)
Distance from Center of Continuity Diaphragm (in.)
G7 - Concrete
G8 - Concrete
G7 - FRP
G8 - FRP

341
B.1.4.1 Bottom-Fiber Strains—Girder 7
Figure B.100: Bottom-fiber strains—Girder 7—A1
-240
-200
-160
-120
-80
-40
0
40
80
120
160
200
-900 -700 -500 -300 -100 100 300 500 700 900
Bot
tom
-Fib
er S
trai
n (x
10-6
in./i
n.)
Distance from Center of Continuity Diaphragm (in.)
G7 - Concrete
G7 - FRP

342
Figure B.101: Bottom-fiber strains—Girder 7—A2
Figure B.102: Bottom-fiber strains—Girder 7—A3
-240
-200
-160
-120
-80
-40
0
40
80
120
160
200
-900 -700 -500 -300 -100 100 300 500 700 900
Bot
tom
-Fib
er S
trai
n (x
10-6
in./i
n.)
Distance from Center of Continuity Diaphragm (in.)
G7 - Concrete
G7 - FRP
-240
-200
-160
-120
-80
-40
0
40
80
120
160
200
-900 -700 -500 -300 -100 100 300 500 700 900
Bot
tom
-Fib
er S
trai
n (x
10-6
in./i
n.)
Distance from Center of Continuity Diaphragm (in.)
G7 - Concrete
G7 - FRP

343
Figure B.103: Bottom-fiber strains—Girder 7—A4
Figure B.104: Bottom-fiber strains—Girder 7—A5
-240
-200
-160
-120
-80
-40
0
40
80
120
160
200
-900 -700 -500 -300 -100 100 300 500 700 900
Bot
tom
-Fib
er S
trai
n (x
10-6
in./i
n.)
Distance from Center of Continuity Diaphragm (in.)
G7 - Concrete
G7 - FRP
-240
-200
-160
-120
-80
-40
0
40
80
120
160
200
-900 -700 -500 -300 -100 100 300 500 700 900
Bot
tom
-Fib
er S
trai
n (x
10-6
in./i
n.)
Distance from Center of Continuity Diaphragm (in.)
G7 - Concrete
G7 - FRP

344
Figure B.105: Bottom-fiber strains—Girder 7—A6
Figure B.106: Bottom-fiber strains—Girder 7—A7
-240
-200
-160
-120
-80
-40
0
40
80
120
160
200
-900 -700 -500 -300 -100 100 300 500 700 900
Bot
tom
-Fib
er S
trai
n (x
10-6
in./i
n.)
Distance from Center of Continuity Diaphragm (in.)
G7 - Concrete
G7 - FRP
-240
-200
-160
-120
-80
-40
0
40
80
120
160
200
-900 -700 -500 -300 -100 100 300 500 700 900
Bot
tom
-Fib
er S
trai
n (x
10-6
in./i
n.)
Distance from Center of Continuity Diaphragm (in.)
G7 - Concrete
G7 - FRP
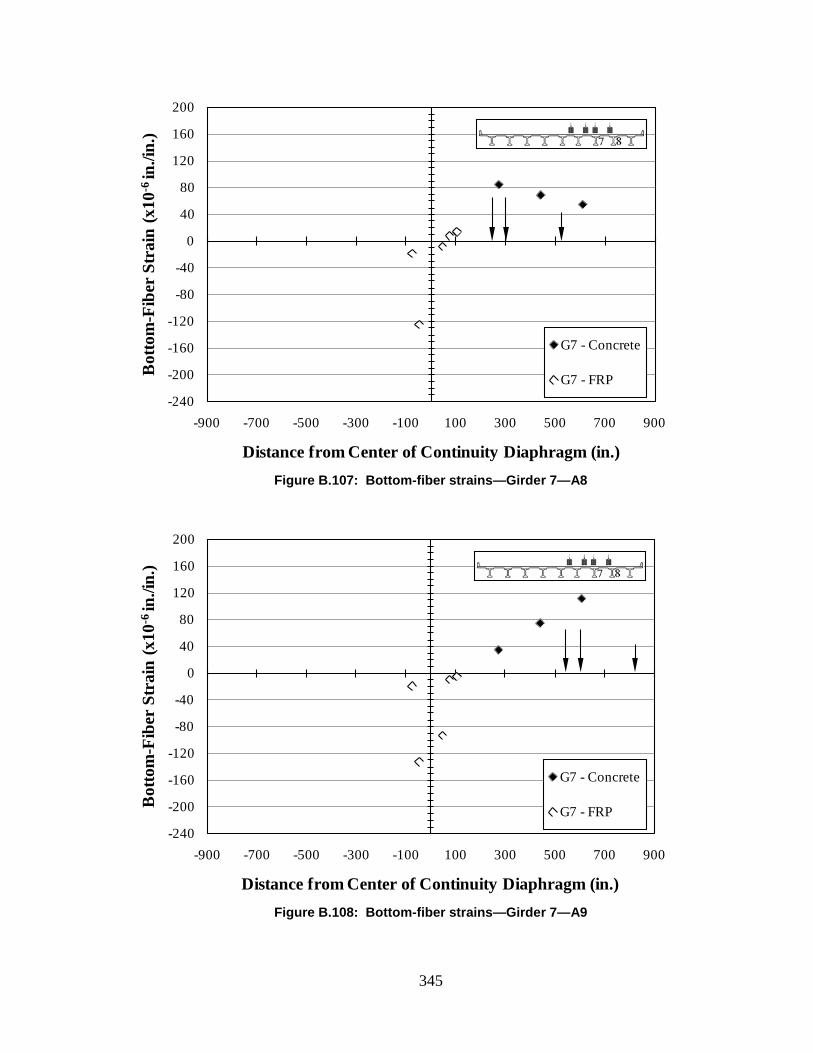
345
Figure B.107: Bottom-fiber strains—Girder 7—A8
Figure B.108: Bottom-fiber strains—Girder 7—A9
-240
-200
-160
-120
-80
-40
0
40
80
120
160
200
-900 -700 -500 -300 -100 100 300 500 700 900
Bot
tom
-Fib
er S
trai
n (x
10-6
in./i
n.)
Distance from Center of Continuity Diaphragm (in.)
G7 - Concrete
G7 - FRP
-240
-200
-160
-120
-80
-40
0
40
80
120
160
200
-900 -700 -500 -300 -100 100 300 500 700 900
Bot
tom
-Fib
er S
trai
n (x
10-6
in./i
n.)
Distance from Center of Continuity Diaphragm (in.)
G7 - Concrete
G7 - FRP
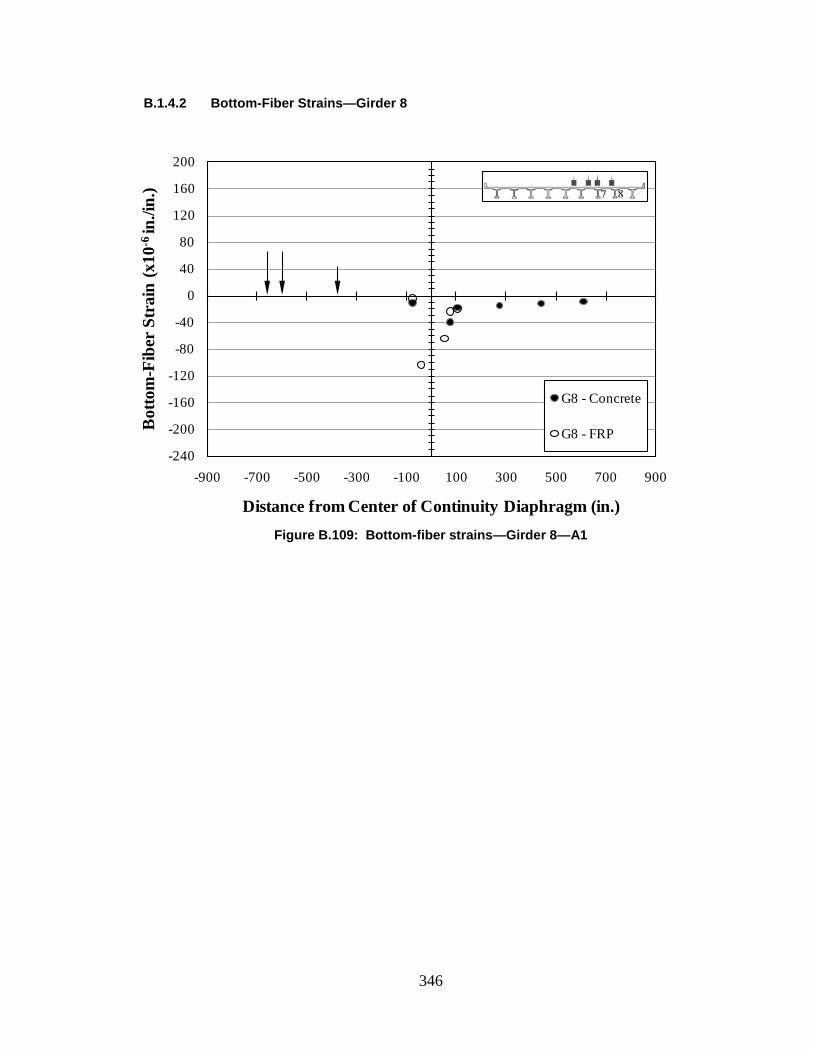
346
B.1.4.2 Bottom-Fiber Strains—Girder 8
Figure B.109: Bottom-fiber strains—Girder 8—A1
-240
-200
-160
-120
-80
-40
0
40
80
120
160
200
-900 -700 -500 -300 -100 100 300 500 700 900
Bot
tom
-Fib
er S
trai
n (x
10-6
in./i
n.)
Distance from Center of Continuity Diaphragm (in.)
G8 - Concrete
G8 - FRP
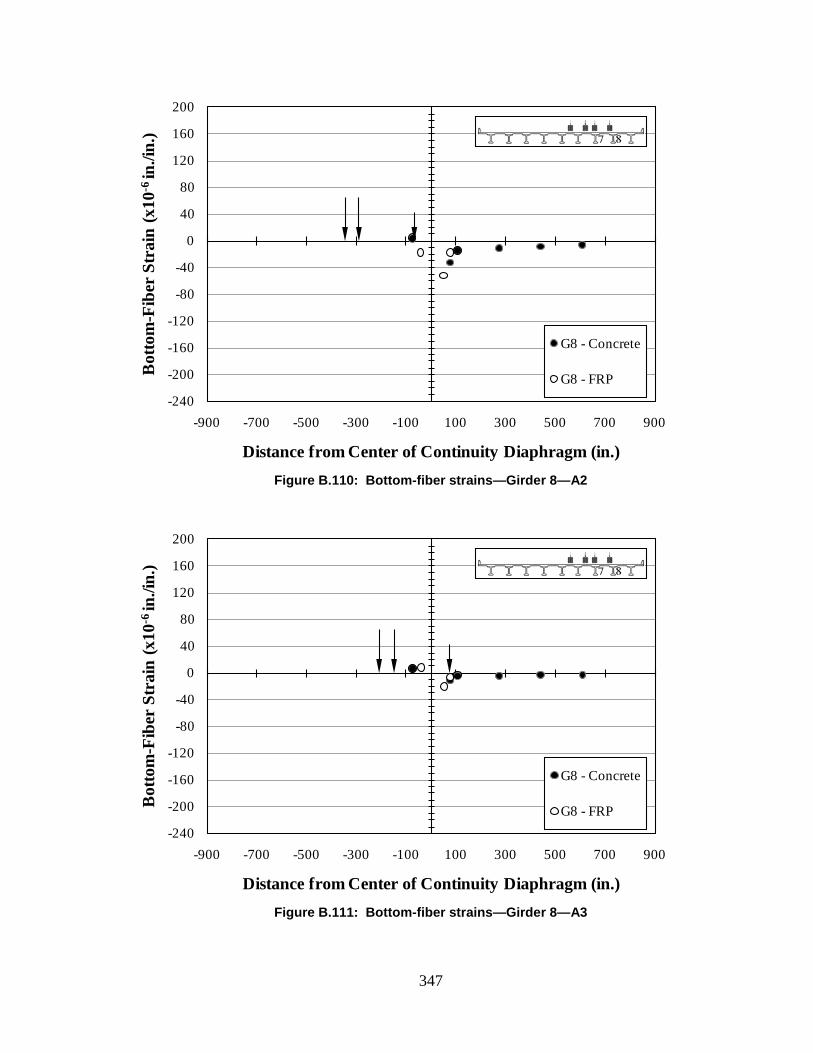
347
Figure B.110: Bottom-fiber strains—Girder 8—A2
Figure B.111: Bottom-fiber strains—Girder 8—A3
-240
-200
-160
-120
-80
-40
0
40
80
120
160
200
-900 -700 -500 -300 -100 100 300 500 700 900
Bot
tom
-Fib
er S
trai
n (x
10-6
in./i
n.)
Distance from Center of Continuity Diaphragm (in.)
G8 - Concrete
G8 - FRP
-240
-200
-160
-120
-80
-40
0
40
80
120
160
200
-900 -700 -500 -300 -100 100 300 500 700 900
Bot
tom
-Fib
er S
trai
n (x
10-6
in./i
n.)
Distance from Center of Continuity Diaphragm (in.)
G8 - Concrete
G8 - FRP

348
Figure B.112: Bottom-fiber strains—Girder 8—A4
Figure B.113: Bottom-fiber strains—Girder 8—A5
-240
-200
-160
-120
-80
-40
0
40
80
120
160
200
-900 -700 -500 -300 -100 100 300 500 700 900
Bot
tom
-Fib
er S
trai
n (x
10-6
in./i
n.)
Distance from Center of Continuity Diaphragm (in.)
G8 - Concrete
G8 - FRP
-240
-200
-160
-120
-80
-40
0
40
80
120
160
200
-900 -700 -500 -300 -100 100 300 500 700 900
Bot
tom
-Fib
er S
trai
n (x
10-6
in./i
n.)
Distance from Center of Continuity Diaphragm (in.)
G8 - Concrete
G8 - FRP

349
Figure B.114: Bottom-fiber strains—Girder 8—A6
Figure B.115: Bottom-fiber strains—Girder 8—A7
-240
-200
-160
-120
-80
-40
0
40
80
120
160
200
-900 -700 -500 -300 -100 100 300 500 700 900
Bot
tom
-Fib
er S
trai
n (x
10-6
in./i
n.)
Distance from Center of Continuity Diaphragm (in.)
G8 - Concrete
G8 - FRP
-240
-200
-160
-120
-80
-40
0
40
80
120
160
200
-900 -700 -500 -300 -100 100 300 500 700 900
Bot
tom
-Fib
er S
trai
n (x
10-6
in./i
n.)
Distance from Center of Continuity Diaphragm (in.)
G8 - Concrete
G8 - FRP
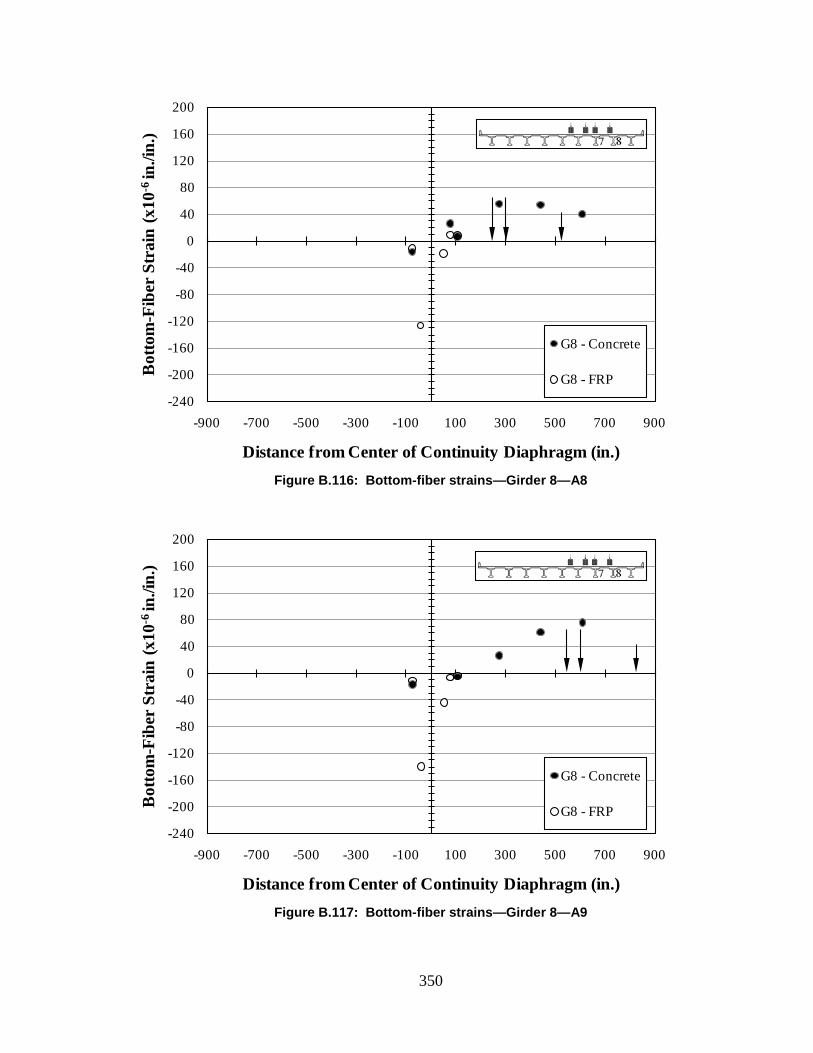
350
Figure B.116: Bottom-fiber strains—Girder 8—A8
Figure B.117: Bottom-fiber strains—Girder 8—A9
-240
-200
-160
-120
-80
-40
0
40
80
120
160
200
-900 -700 -500 -300 -100 100 300 500 700 900
Bot
tom
-Fib
er S
trai
n (x
10-6
in./i
n.)
Distance from Center of Continuity Diaphragm (in.)
G8 - Concrete
G8 - FRP
-240
-200
-160
-120
-80
-40
0
40
80
120
160
200
-900 -700 -500 -300 -100 100 300 500 700 900
Bot
tom
-Fib
er S
trai
n (x
10-6
in./i
n.)
Distance from Center of Continuity Diaphragm (in.)
G8 - Concrete
G8 - FRP
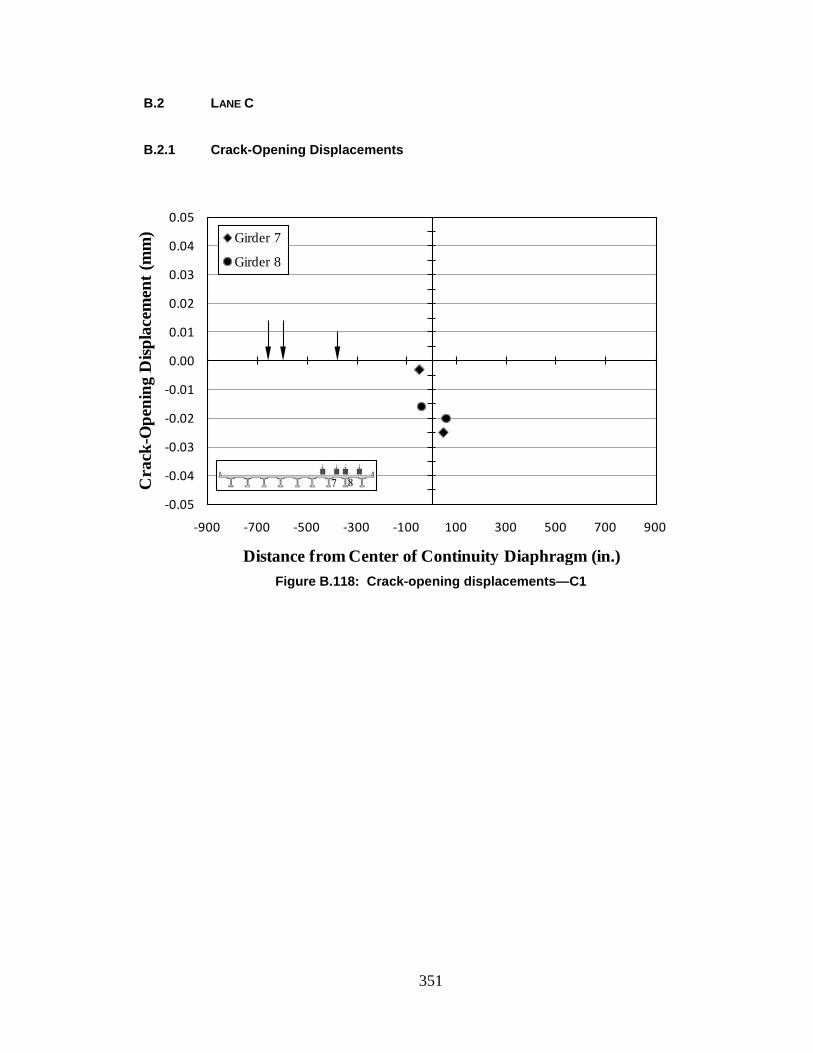
351
B.2 LANE C
B.2.1 Crack-Opening Displacements
Figure B.118: Crack-opening displacements—C1
-0.05
-0.04
-0.03
-0.02
-0.01
0.00
0.01
0.02
0.03
0.04
0.05
-900 -700 -500 -300 -100 100 300 500 700 900
Cra
ck-O
peni
ng D
ispla
cem
ent (
mm
)
Distance from Center of Continuity Diaphragm (in.)
Girder 7
Girder 8
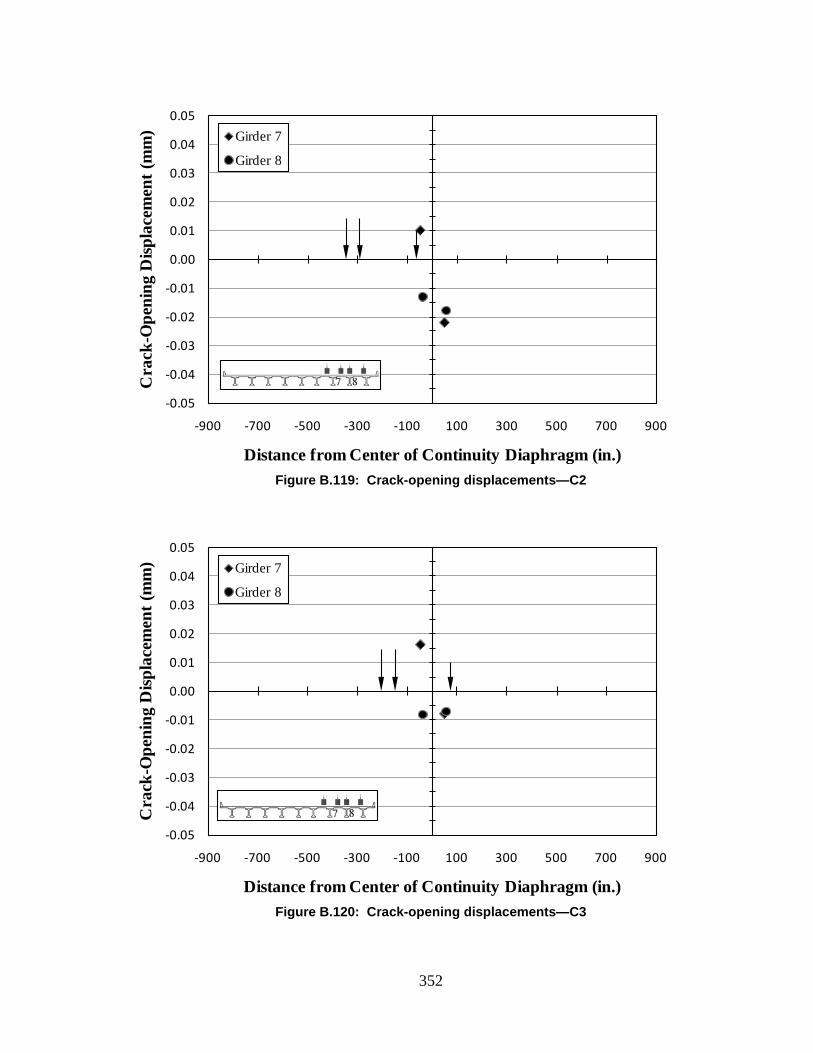
352
Figure B.119: Crack-opening displacements—C2
Figure B.120: Crack-opening displacements—C3
-0.05
-0.04
-0.03
-0.02
-0.01
0.00
0.01
0.02
0.03
0.04
0.05
-900 -700 -500 -300 -100 100 300 500 700 900
Cra
ck-O
peni
ng D
ispla
cem
ent (
mm
)
Distance from Center of Continuity Diaphragm (in.)
Girder 7
Girder 8
-0.05
-0.04
-0.03
-0.02
-0.01
0.00
0.01
0.02
0.03
0.04
0.05
-900 -700 -500 -300 -100 100 300 500 700 900
Cra
ck-O
peni
ng D
ispla
cem
ent (
mm
)
Distance from Center of Continuity Diaphragm (in.)
Girder 7
Girder 8

353
Figure B.121: Crack-opening displacements—C4
Figure B.122: Crack-opening displacements—C5
-0.05
-0.04
-0.03
-0.02
-0.01
0.00
0.01
0.02
0.03
0.04
0.05
-900 -700 -500 -300 -100 100 300 500 700 900
Cra
ck-O
peni
ng D
ispla
cem
ent (
mm
)
Distance from Center of Continuity Diaphragm (in.)
Girder 7
Girder 8
-0.05
-0.04
-0.03
-0.02
-0.01
0.00
0.01
0.02
0.03
0.04
0.05
-900 -700 -500 -300 -100 100 300 500 700 900
Cra
ck-O
peni
ng D
ispla
cem
ent (
mm
)
Distance from Center of Continuity Diaphragm (in.)
Girder 7
Girder 8
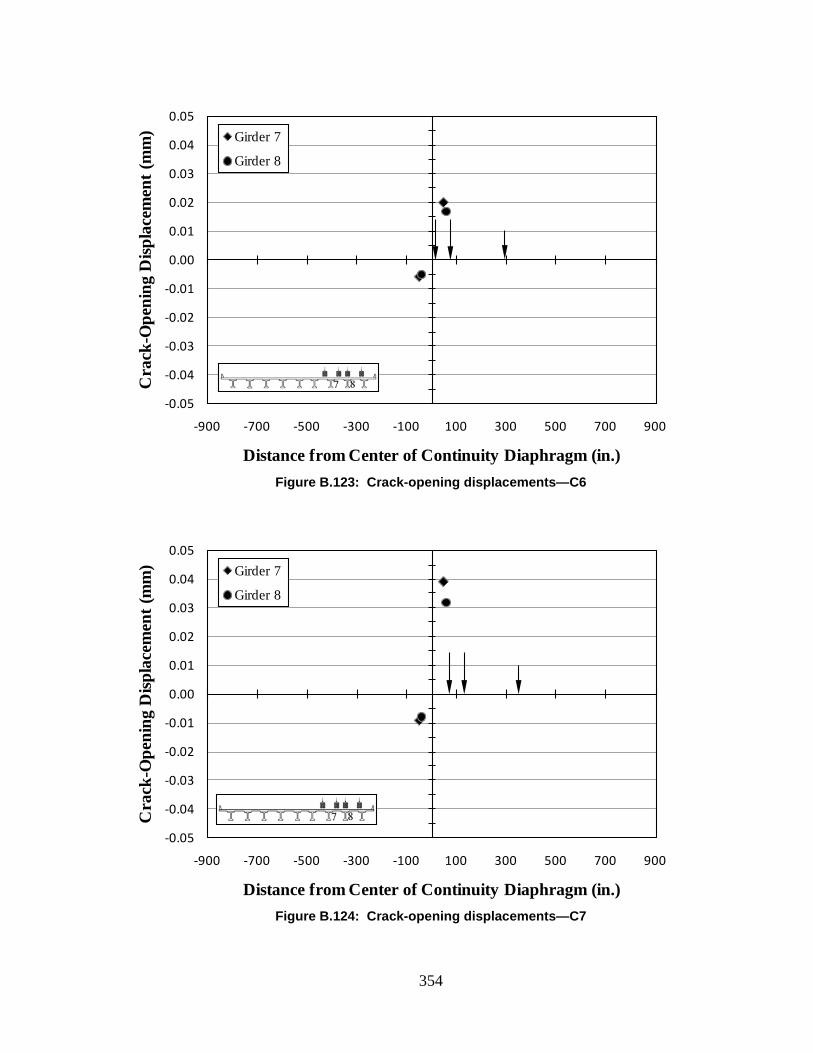
354
Figure B.123: Crack-opening displacements—C6
Figure B.124: Crack-opening displacements—C7
-0.05
-0.04
-0.03
-0.02
-0.01
0.00
0.01
0.02
0.03
0.04
0.05
-900 -700 -500 -300 -100 100 300 500 700 900
Cra
ck-O
peni
ng D
ispla
cem
ent (
mm
)
Distance from Center of Continuity Diaphragm (in.)
Girder 7
Girder 8
-0.05
-0.04
-0.03
-0.02
-0.01
0.00
0.01
0.02
0.03
0.04
0.05
-900 -700 -500 -300 -100 100 300 500 700 900
Cra
ck-O
peni
ng D
ispla
cem
ent (
mm
)
Distance from Center of Continuity Diaphragm (in.)
Girder 7
Girder 8
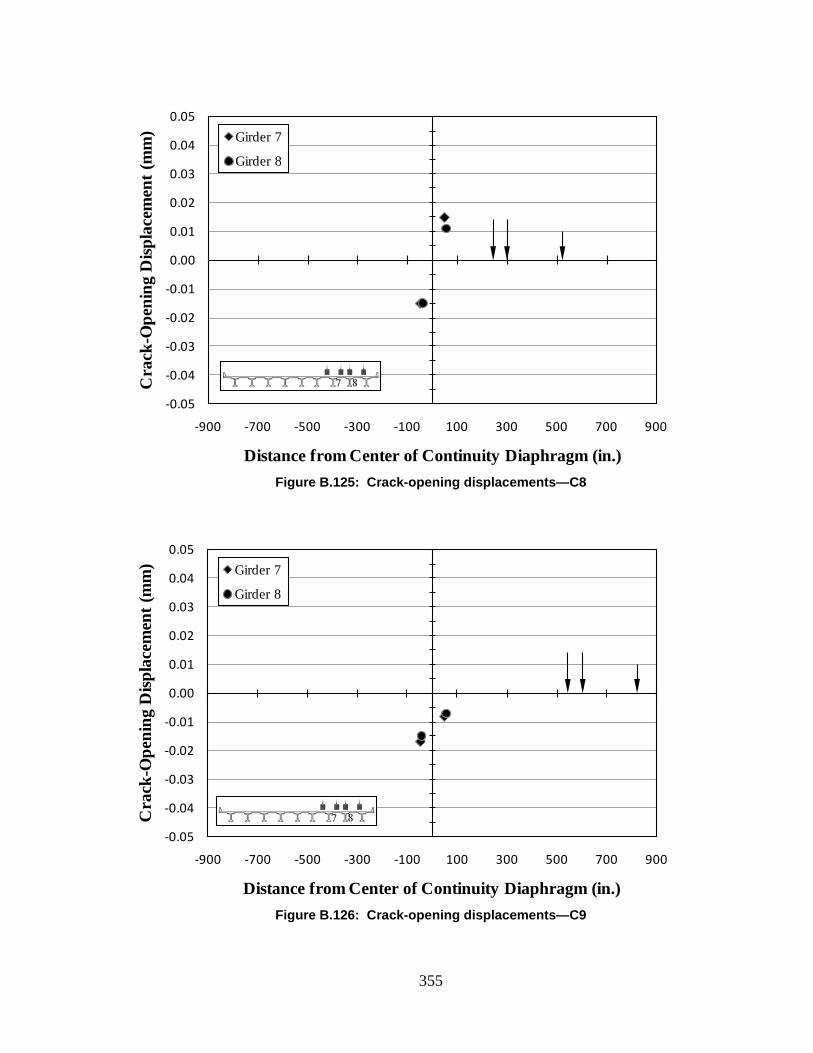
355
Figure B.125: Crack-opening displacements—C8
Figure B.126: Crack-opening displacements—C9
-0.05
-0.04
-0.03
-0.02
-0.01
0.00
0.01
0.02
0.03
0.04
0.05
-900 -700 -500 -300 -100 100 300 500 700 900
Cra
ck-O
peni
ng D
ispla
cem
ent (
mm
)
Distance from Center of Continuity Diaphragm (in.)
Girder 7
Girder 8
-0.05
-0.04
-0.03
-0.02
-0.01
0.00
0.01
0.02
0.03
0.04
0.05
-900 -700 -500 -300 -100 100 300 500 700 900
Cra
ck-O
peni
ng D
ispla
cem
ent (
mm
)
Distance from Center of Continuity Diaphragm (in.)
Girder 7
Girder 8

356
B.2.2 Deflections
Figure B.127: Deflections—C1
-0.4
-0.3
-0.2
-0.1
0.0
0.1-900 -700 -500 -300 -100 100 300 500 700 900
Bot
tom
-Fib
er D
efle
ctio
n (in
.)
Distance from Center of Continuity Diaphragm (in.)
Girder 7
Girder 8

357
Figure B.128: Deflections—C2
Figure B.129: Deflections—C3
-0.4
-0.3
-0.2
-0.1
0.0
0.1-900 -700 -500 -300 -100 100 300 500 700 900
Bot
tom
-Fib
er D
efle
ctio
n (in
.)
Distance from Center of Continuity Diaphragm (in.)
Girder 7
Girder 8
-0.4
-0.3
-0.2
-0.1
0.0
0.1-900 -700 -500 -300 -100 100 300 500 700 900
Bot
tom
-Fib
er D
efle
ctio
n (in
.)
Distance from Center of Continuity Diaphragm (in.)
Girder 7
Girder 8
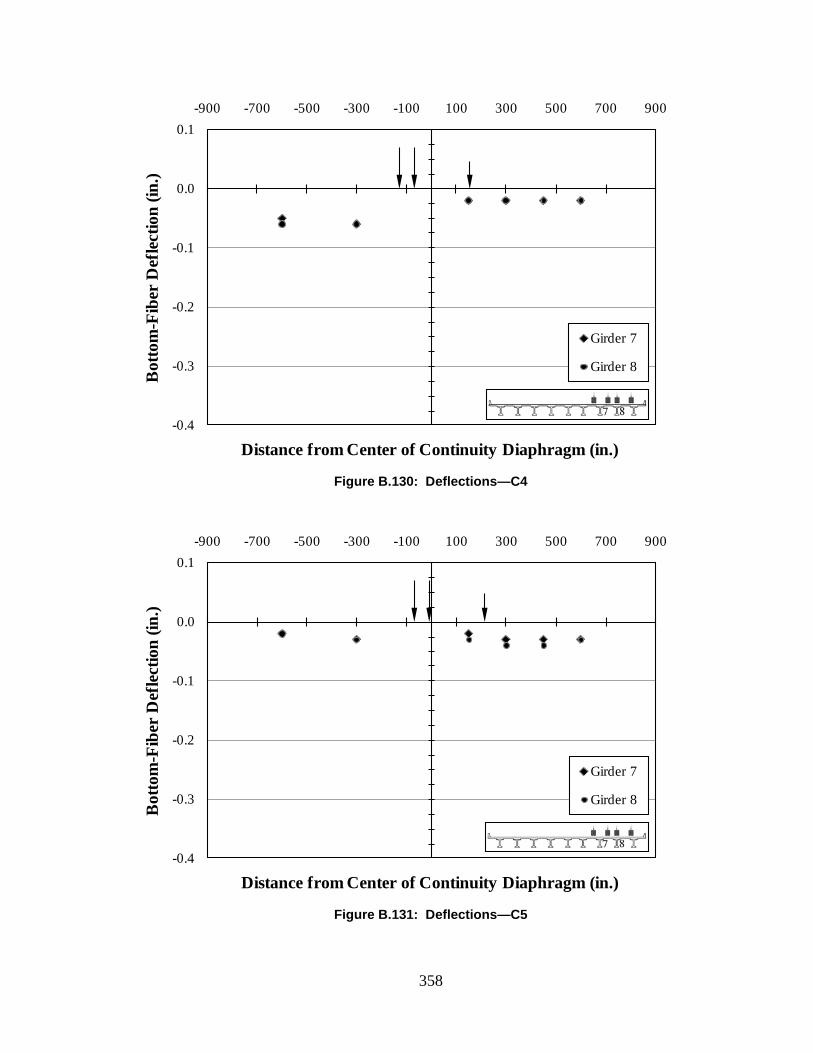
358
Figure B.130: Deflections—C4
Figure B.131: Deflections—C5
-0.4
-0.3
-0.2
-0.1
0.0
0.1-900 -700 -500 -300 -100 100 300 500 700 900
Bot
tom
-Fib
er D
efle
ctio
n (in
.)
Distance from Center of Continuity Diaphragm (in.)
Girder 7
Girder 8
-0.4
-0.3
-0.2
-0.1
0.0
0.1-900 -700 -500 -300 -100 100 300 500 700 900
Bot
tom
-Fib
er D
efle
ctio
n (in
.)
Distance from Center of Continuity Diaphragm (in.)
Girder 7
Girder 8
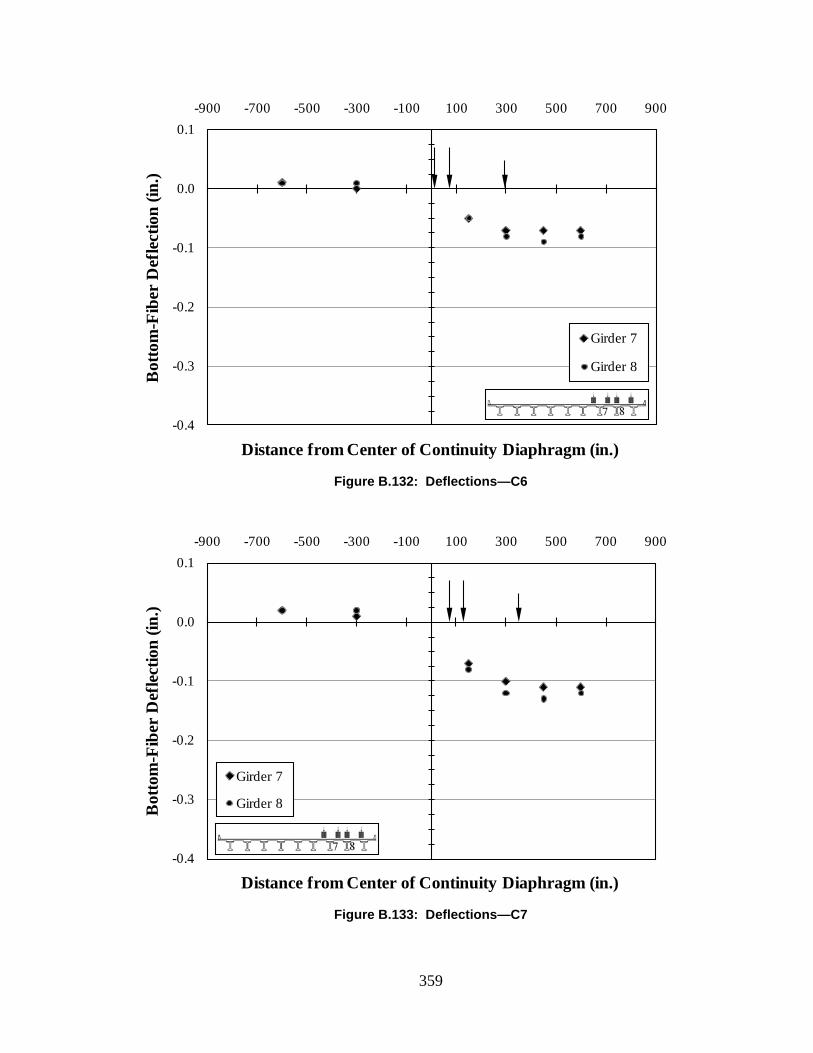
359
Figure B.132: Deflections—C6
Figure B.133: Deflections—C7
-0.4
-0.3
-0.2
-0.1
0.0
0.1-900 -700 -500 -300 -100 100 300 500 700 900
Bot
tom
-Fib
er D
efle
ctio
n (in
.)
Distance from Center of Continuity Diaphragm (in.)
Girder 7
Girder 8
-0.4
-0.3
-0.2
-0.1
0.0
0.1-900 -700 -500 -300 -100 100 300 500 700 900
Bot
tom
-Fib
er D
efle
ctio
n (in
.)
Distance from Center of Continuity Diaphragm (in.)
Girder 7
Girder 8
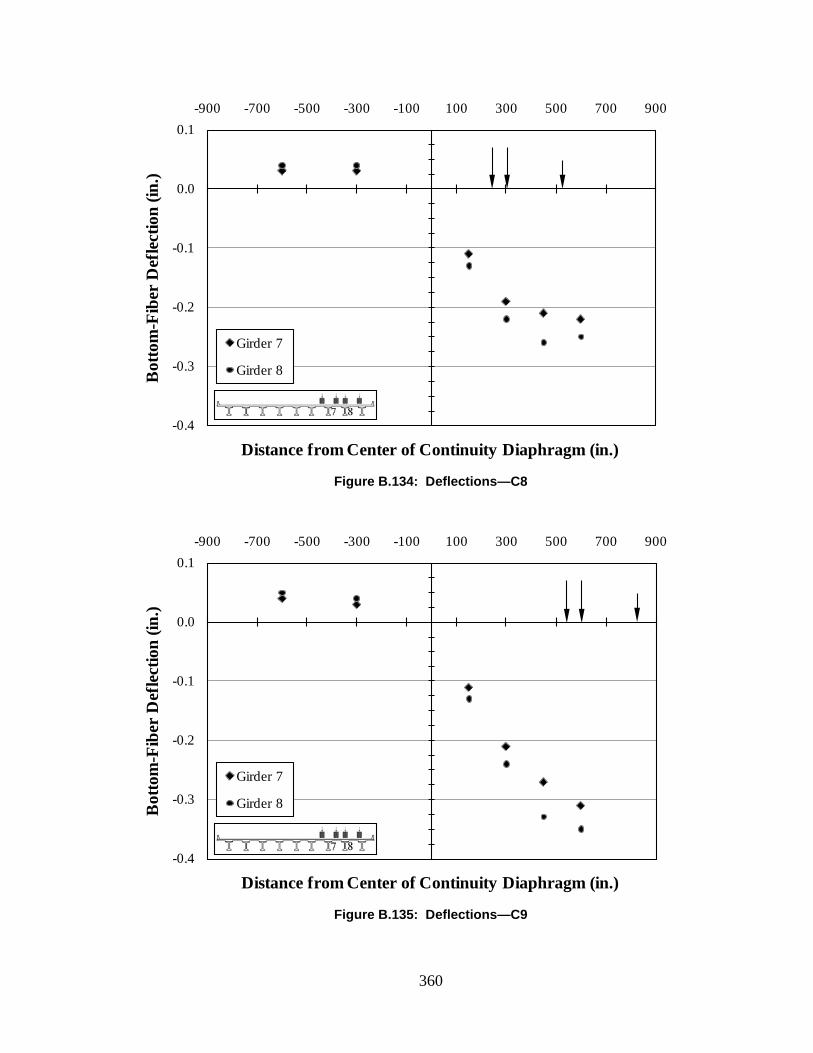
360
Figure B.134: Deflections—C8
Figure B.135: Deflections—C9
-0.4
-0.3
-0.2
-0.1
0.0
0.1-900 -700 -500 -300 -100 100 300 500 700 900
Bot
tom
-Fib
er D
efle
ctio
n (in
.)
Distance from Center of Continuity Diaphragm (in.)
Girder 7
Girder 8
-0.4
-0.3
-0.2
-0.1
0.0
0.1-900 -700 -500 -300 -100 100 300 500 700 900
Bot
tom
-Fib
er D
efle
ctio
n (in
.)
Distance from Center of Continuity Diaphragm (in.)
Girder 7
Girder 8
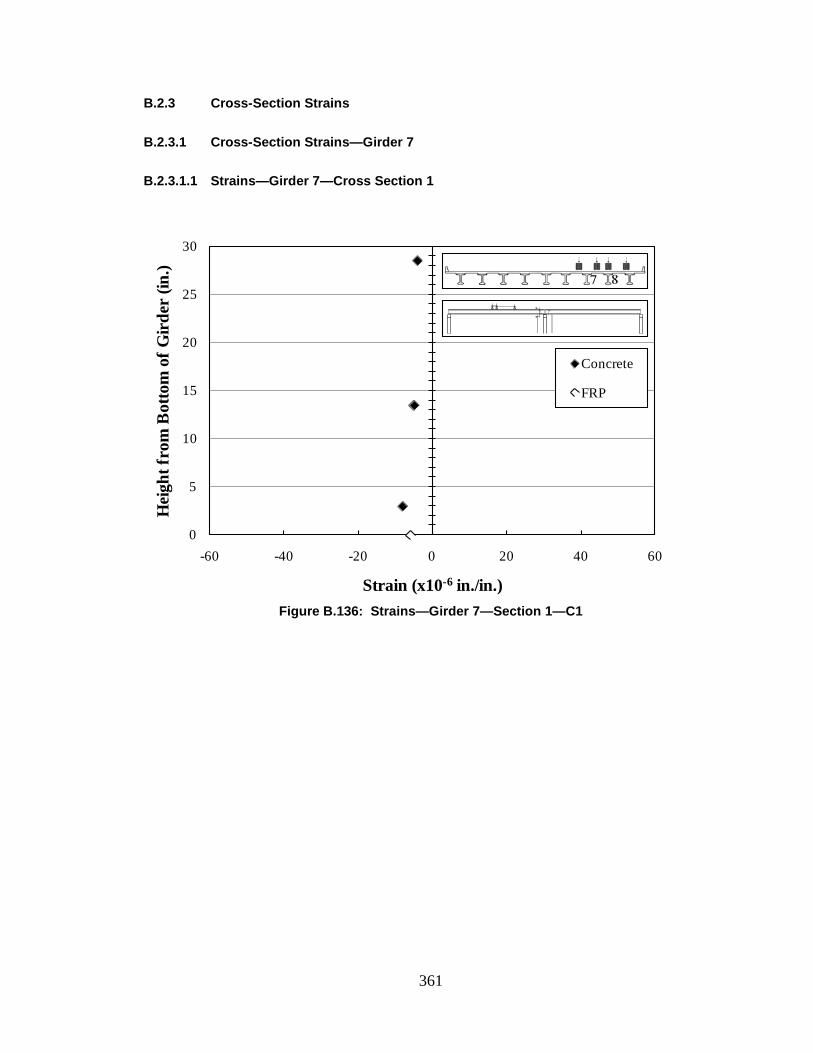
361
B.2.3 Cross-Section Strains
B.2.3.1 Cross-Section Strains—Girder 7
B.2.3.1.1 Strains—Girder 7—Cross Section 1
Figure B.136: Strains—Girder 7—Section 1—C1
0
5
10
15
20
25
30
-60 -40 -20 0 20 40 60
Hei
ght f
rom
Bot
tom
of G
irde
r (in
.)
Strain (x10-6 in./in.)
Concrete
FRP
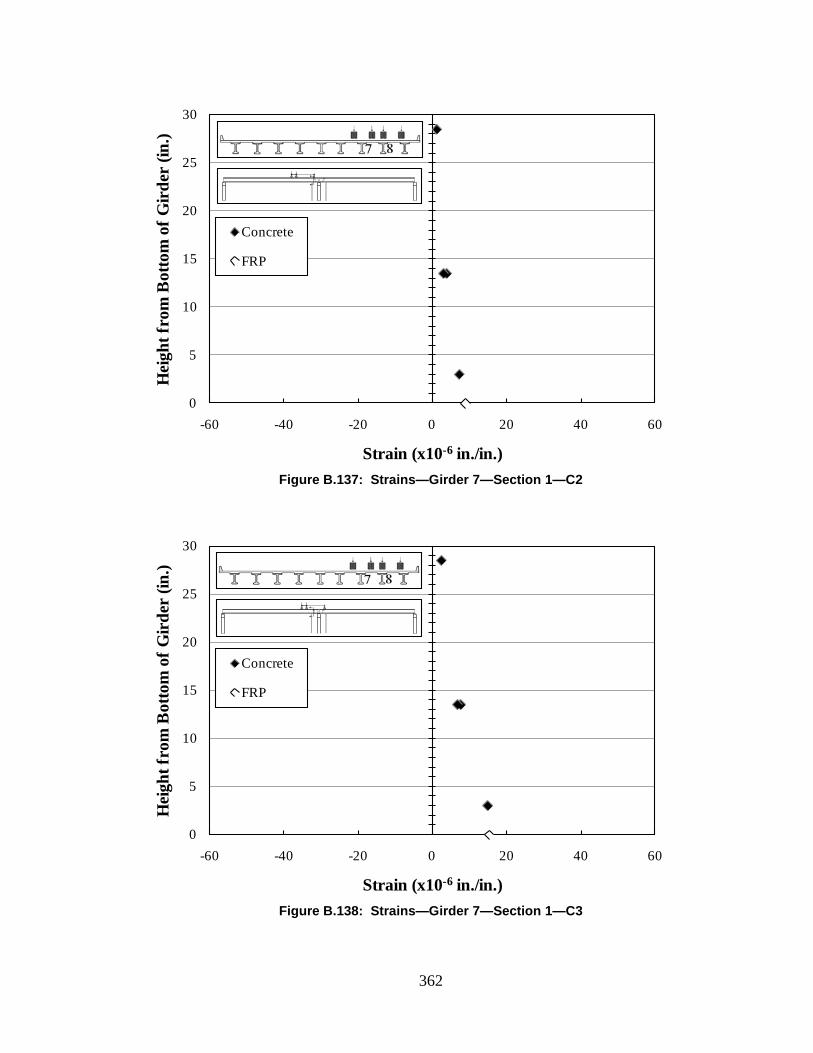
362
Figure B.137: Strains—Girder 7—Section 1—C2
Figure B.138: Strains—Girder 7—Section 1—C3
0
5
10
15
20
25
30
-60 -40 -20 0 20 40 60
Hei
ght f
rom
Bot
tom
of G
irde
r (in
.)
Strain (x10-6 in./in.)
Concrete
FRP
0
5
10
15
20
25
30
-60 -40 -20 0 20 40 60
Hei
ght f
rom
Bot
tom
of G
irde
r (in
.)
Strain (x10-6 in./in.)
Concrete
FRP
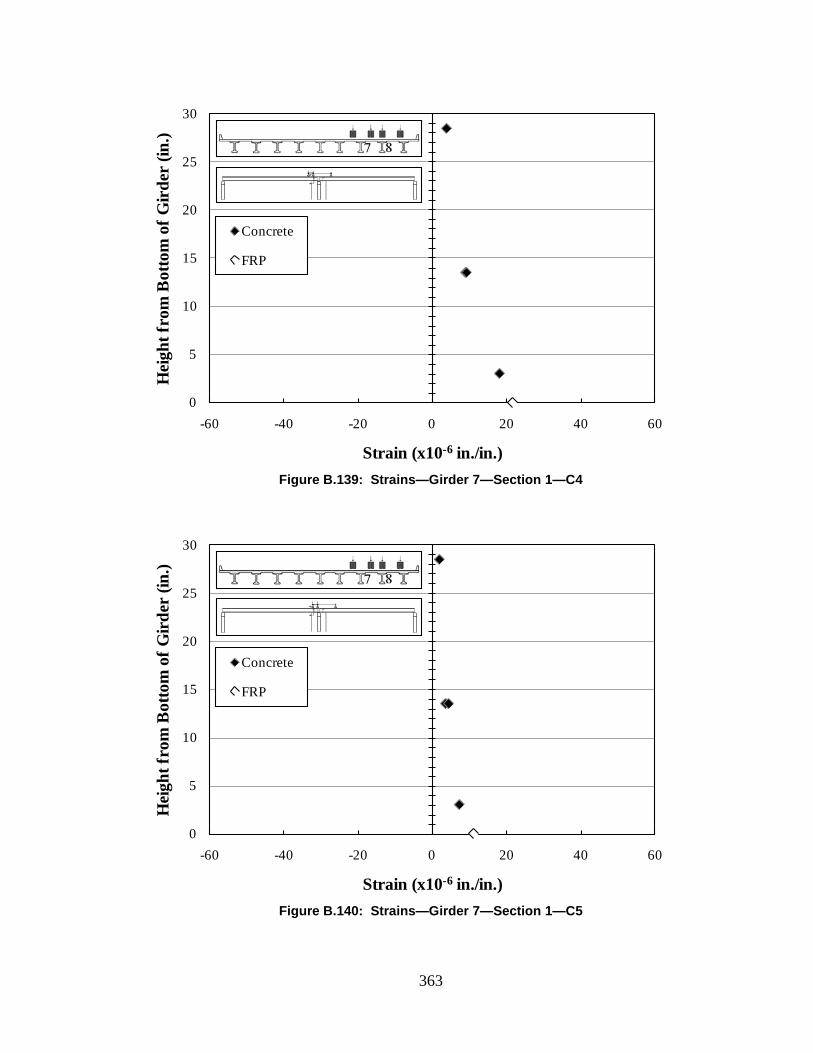
363
Figure B.139: Strains—Girder 7—Section 1—C4
Figure B.140: Strains—Girder 7—Section 1—C5
0
5
10
15
20
25
30
-60 -40 -20 0 20 40 60
Hei
ght f
rom
Bot
tom
of G
irde
r (in
.)
Strain (x10-6 in./in.)
Concrete
FRP
0
5
10
15
20
25
30
-60 -40 -20 0 20 40 60
Hei
ght f
rom
Bot
tom
of G
irde
r (in
.)
Strain (x10-6 in./in.)
Concrete
FRP

364
Figure B.141: Strains—Girder 7—Section 1—C6
Figure B.142: Strains—Girder 7—Section 1—C7
0
5
10
15
20
25
30
-60 -40 -20 0 20 40 60
Hei
ght f
rom
Bot
tom
of G
irde
r (in
.)
Strain (x10-6 in./in.)
Concrete
FRP
0
5
10
15
20
25
30
-60 -40 -20 0 20 40 60
Hei
ght f
rom
Bot
tom
of G
irde
r (in
.)
Strain (x10-6 in./in.)
Concrete
FRP
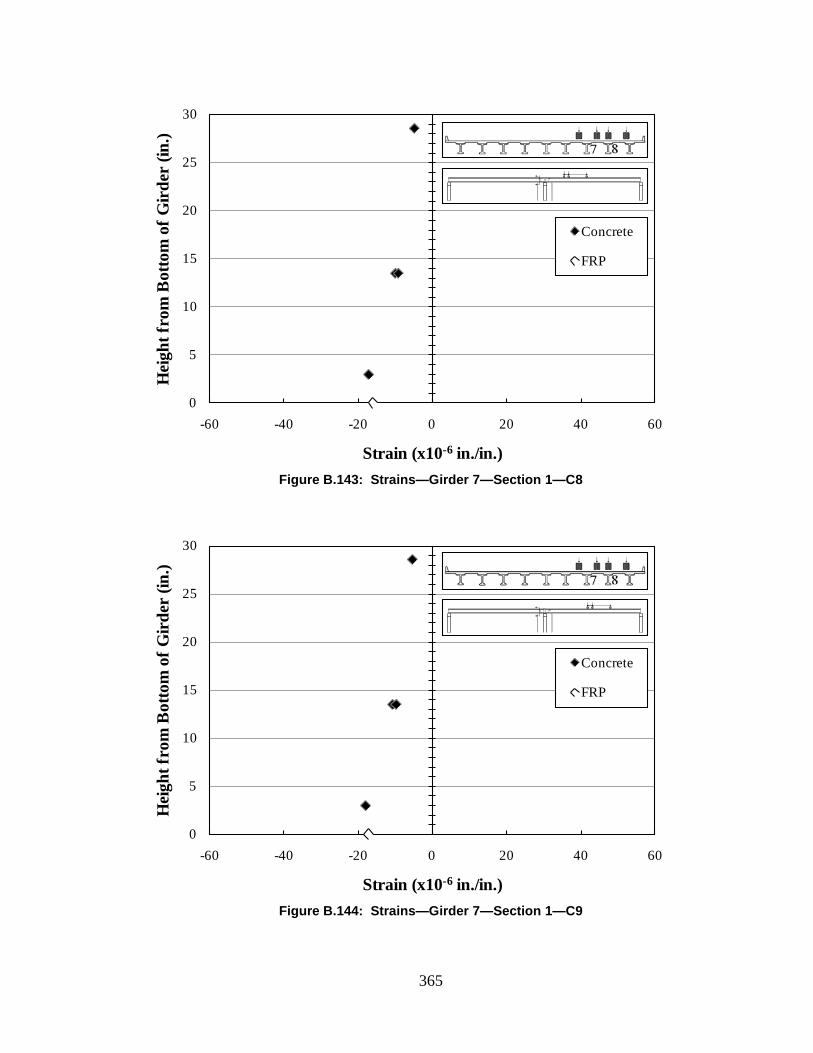
365
Figure B.143: Strains—Girder 7—Section 1—C8
Figure B.144: Strains—Girder 7—Section 1—C9
0
5
10
15
20
25
30
-60 -40 -20 0 20 40 60
Hei
ght f
rom
Bot
tom
of G
irde
r (in
.)
Strain (x10-6 in./in.)
Concrete
FRP
0
5
10
15
20
25
30
-60 -40 -20 0 20 40 60
Hei
ght f
rom
Bot
tom
of G
irde
r (in
.)
Strain (x10-6 in./in.)
Concrete
FRP
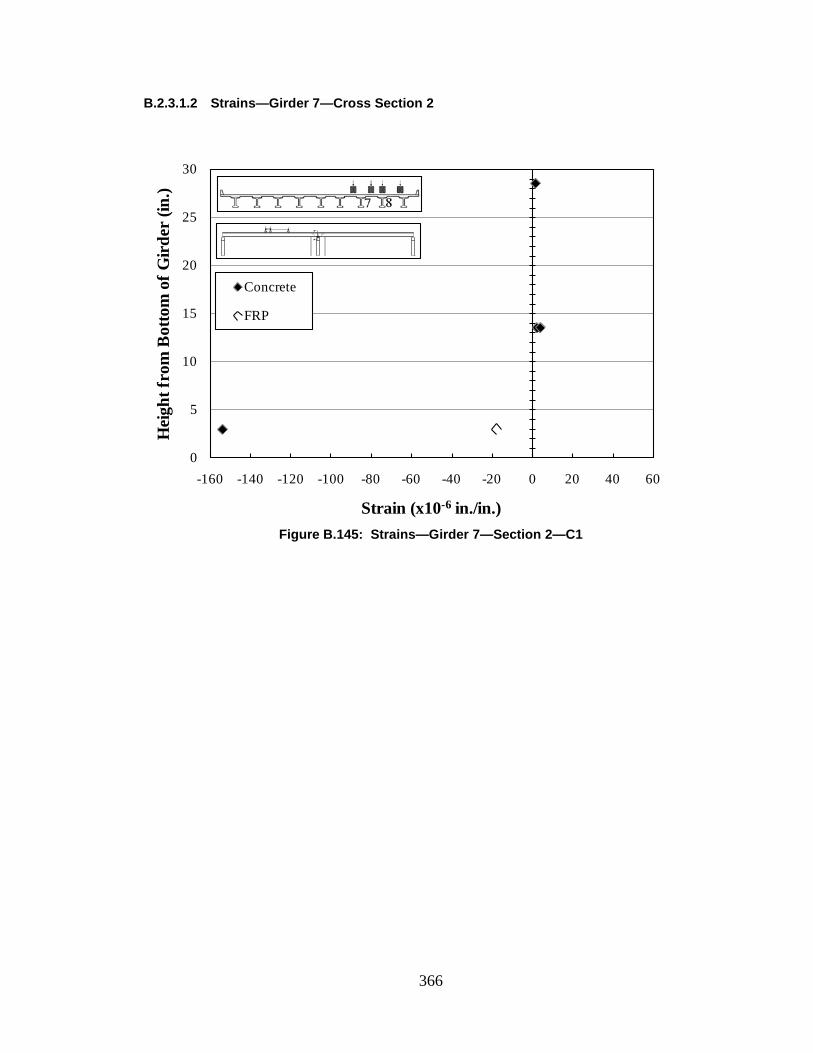
366
B.2.3.1.2 Strains—Girder 7—Cross Section 2
Figure B.145: Strains—Girder 7—Section 2—C1
0
5
10
15
20
25
30
-160 -140 -120 -100 -80 -60 -40 -20 0 20 40 60
Hei
ght f
rom
Bot
tom
of G
irde
r (in
.)
Strain (x10-6 in./in.)
Concrete
FRP
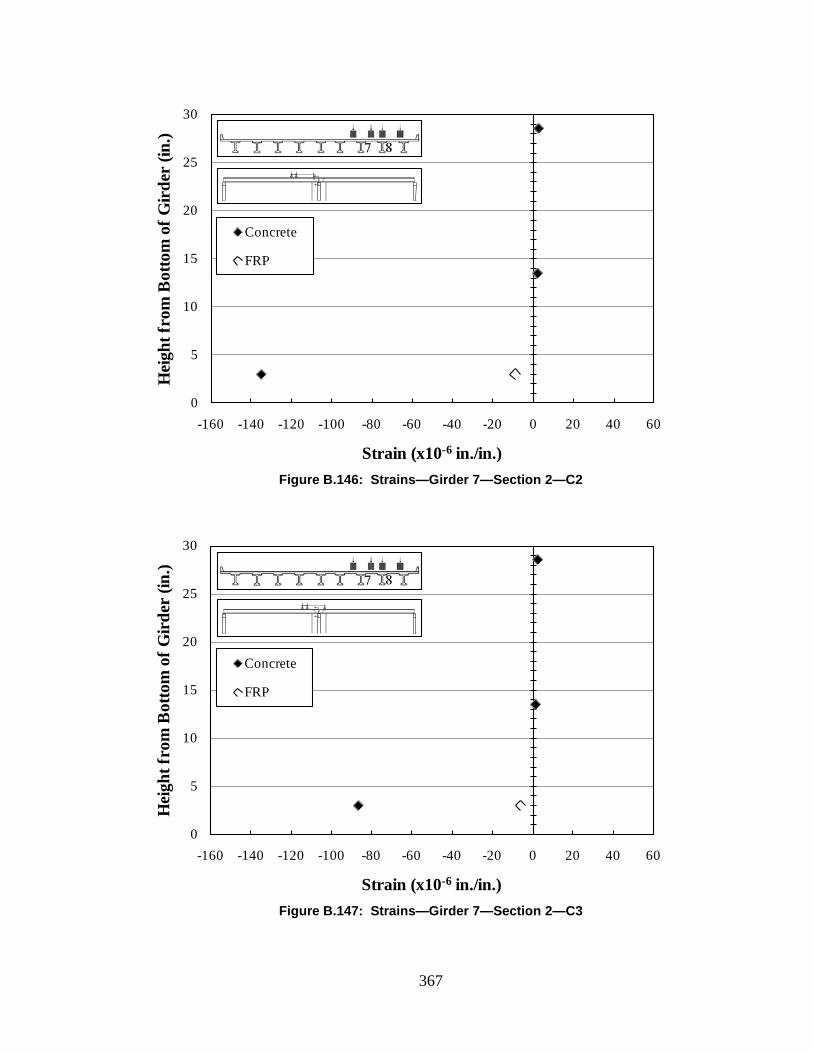
367
Figure B.146: Strains—Girder 7—Section 2—C2
Figure B.147: Strains—Girder 7—Section 2—C3
0
5
10
15
20
25
30
-160 -140 -120 -100 -80 -60 -40 -20 0 20 40 60
Hei
ght f
rom
Bot
tom
of G
irde
r (in
.)
Strain (x10-6 in./in.)
Concrete
FRP
0
5
10
15
20
25
30
-160 -140 -120 -100 -80 -60 -40 -20 0 20 40 60
Hei
ght f
rom
Bot
tom
of G
irde
r (in
.)
Strain (x10-6 in./in.)
Concrete
FRP
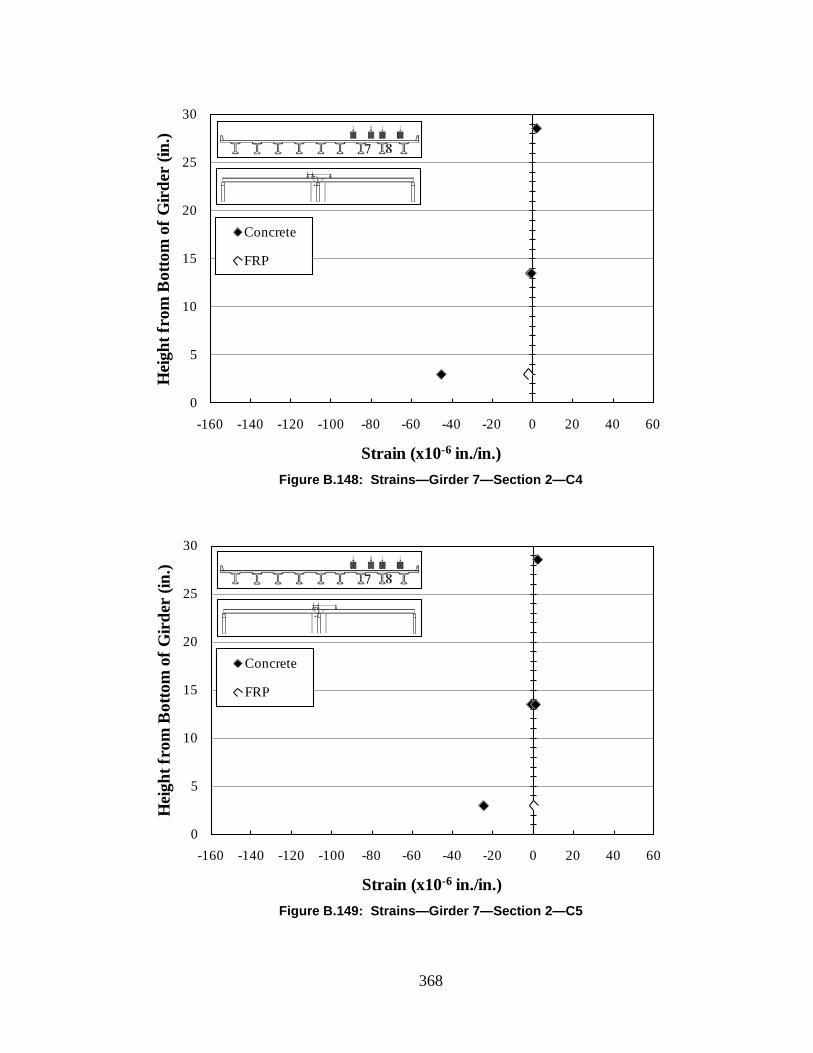
368
Figure B.148: Strains—Girder 7—Section 2—C4
Figure B.149: Strains—Girder 7—Section 2—C5
0
5
10
15
20
25
30
-160 -140 -120 -100 -80 -60 -40 -20 0 20 40 60
Hei
ght f
rom
Bot
tom
of G
irde
r (in
.)
Strain (x10-6 in./in.)
Concrete
FRP
0
5
10
15
20
25
30
-160 -140 -120 -100 -80 -60 -40 -20 0 20 40 60
Hei
ght f
rom
Bot
tom
of G
irde
r (in
.)
Strain (x10-6 in./in.)
Concrete
FRP
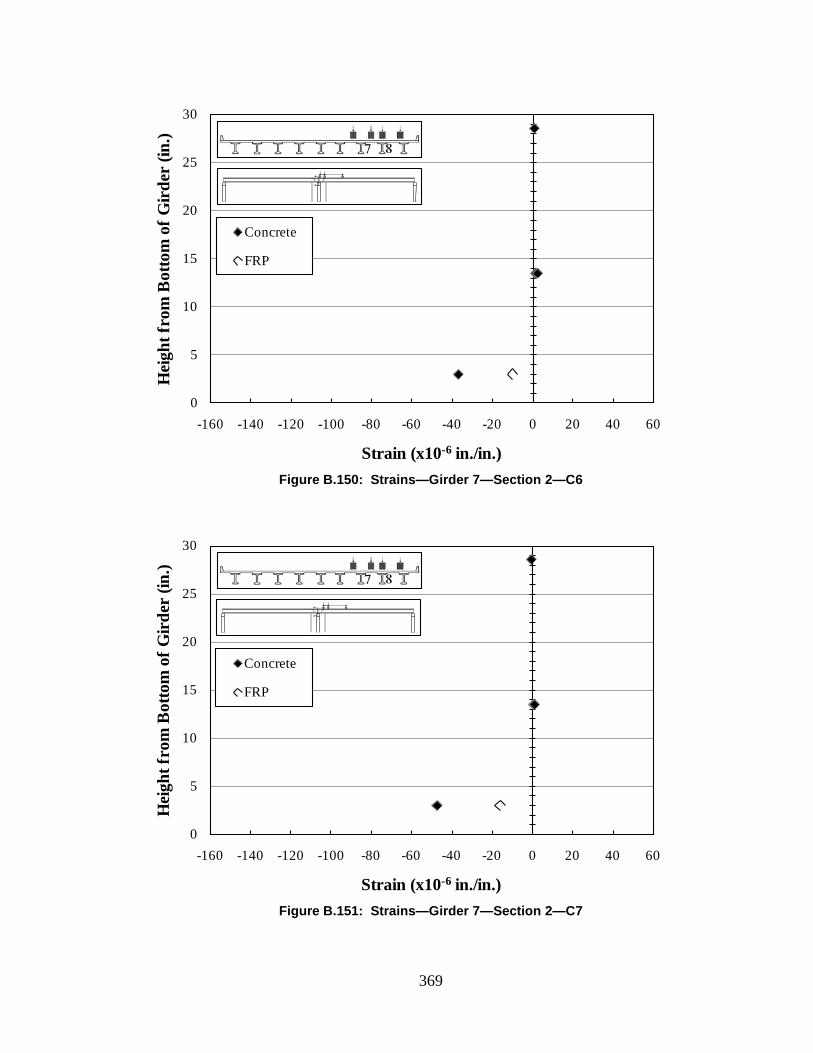
369
Figure B.150: Strains—Girder 7—Section 2—C6
Figure B.151: Strains—Girder 7—Section 2—C7
0
5
10
15
20
25
30
-160 -140 -120 -100 -80 -60 -40 -20 0 20 40 60
Hei
ght f
rom
Bot
tom
of G
irde
r (in
.)
Strain (x10-6 in./in.)
Concrete
FRP
0
5
10
15
20
25
30
-160 -140 -120 -100 -80 -60 -40 -20 0 20 40 60
Hei
ght f
rom
Bot
tom
of G
irde
r (in
.)
Strain (x10-6 in./in.)
Concrete
FRP
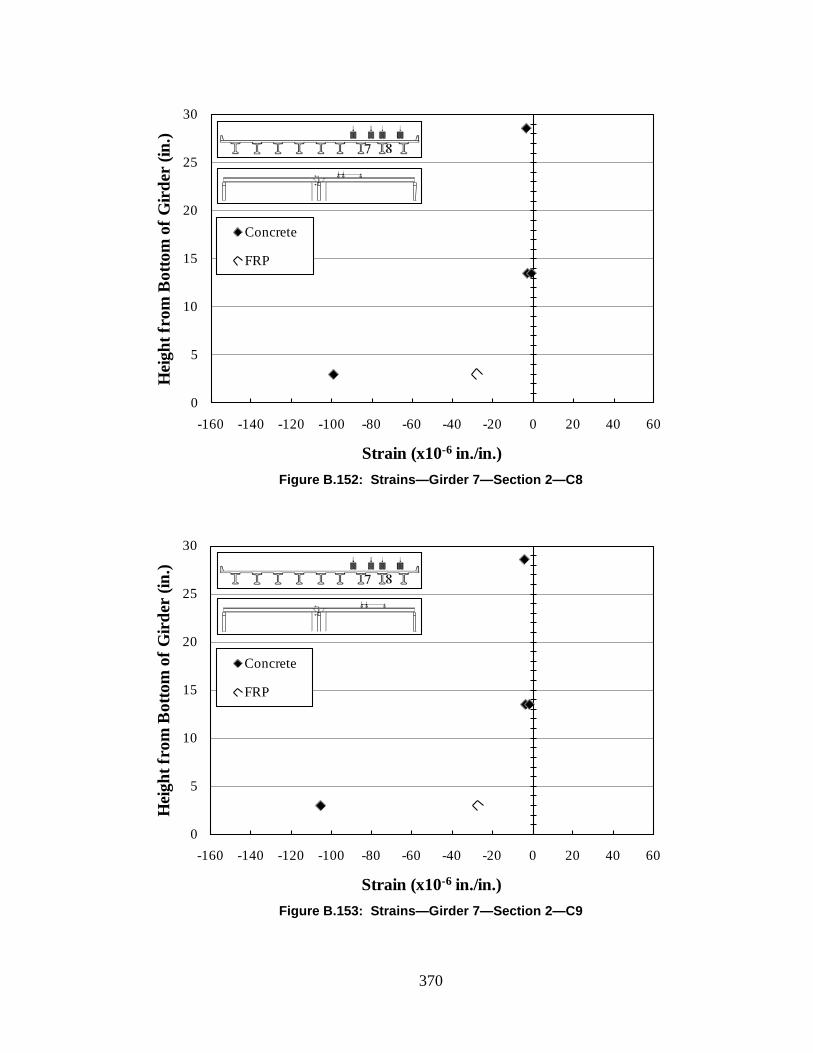
370
Figure B.152: Strains—Girder 7—Section 2—C8
Figure B.153: Strains—Girder 7—Section 2—C9
0
5
10
15
20
25
30
-160 -140 -120 -100 -80 -60 -40 -20 0 20 40 60
Hei
ght f
rom
Bot
tom
of G
irde
r (in
.)
Strain (x10-6 in./in.)
Concrete
FRP
0
5
10
15
20
25
30
-160 -140 -120 -100 -80 -60 -40 -20 0 20 40 60
Hei
ght f
rom
Bot
tom
of G
irde
r (in
.)
Strain (x10-6 in./in.)
Concrete
FRP
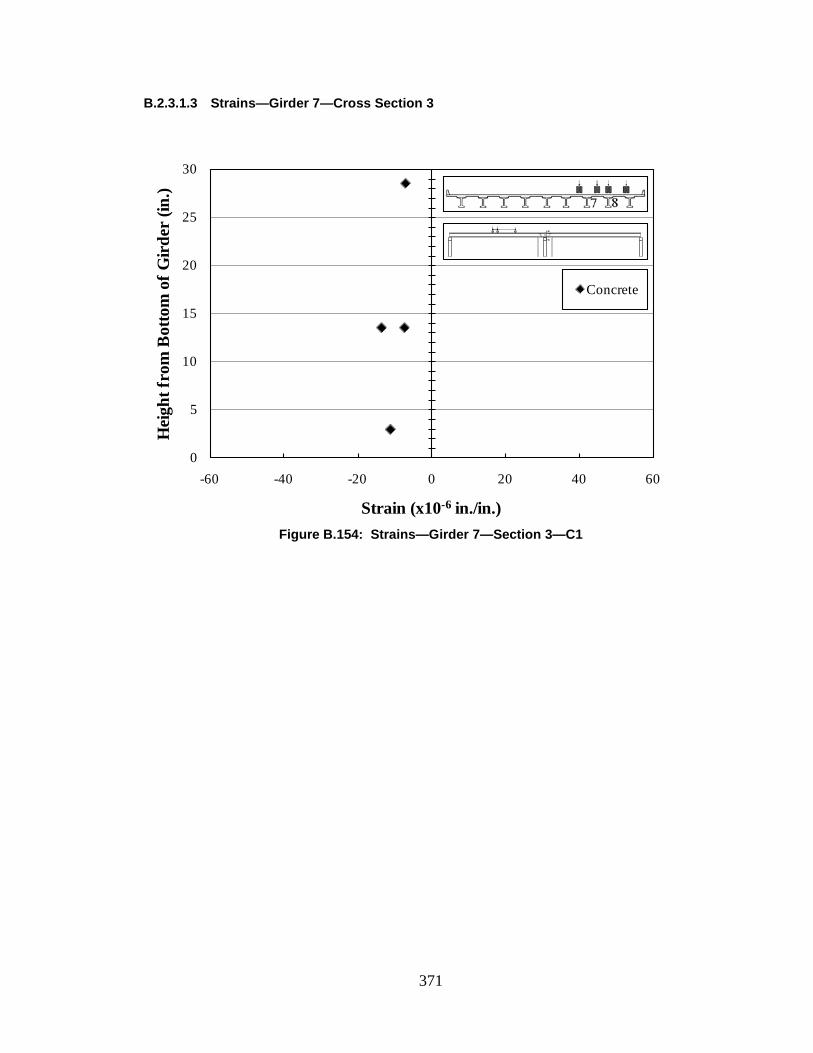
371
B.2.3.1.3 Strains—Girder 7—Cross Section 3
Figure B.154: Strains—Girder 7—Section 3—C1
0
5
10
15
20
25
30
-60 -40 -20 0 20 40 60
Hei
ght f
rom
Bot
tom
of G
irde
r (in
.)
Strain (x10-6 in./in.)
Concrete
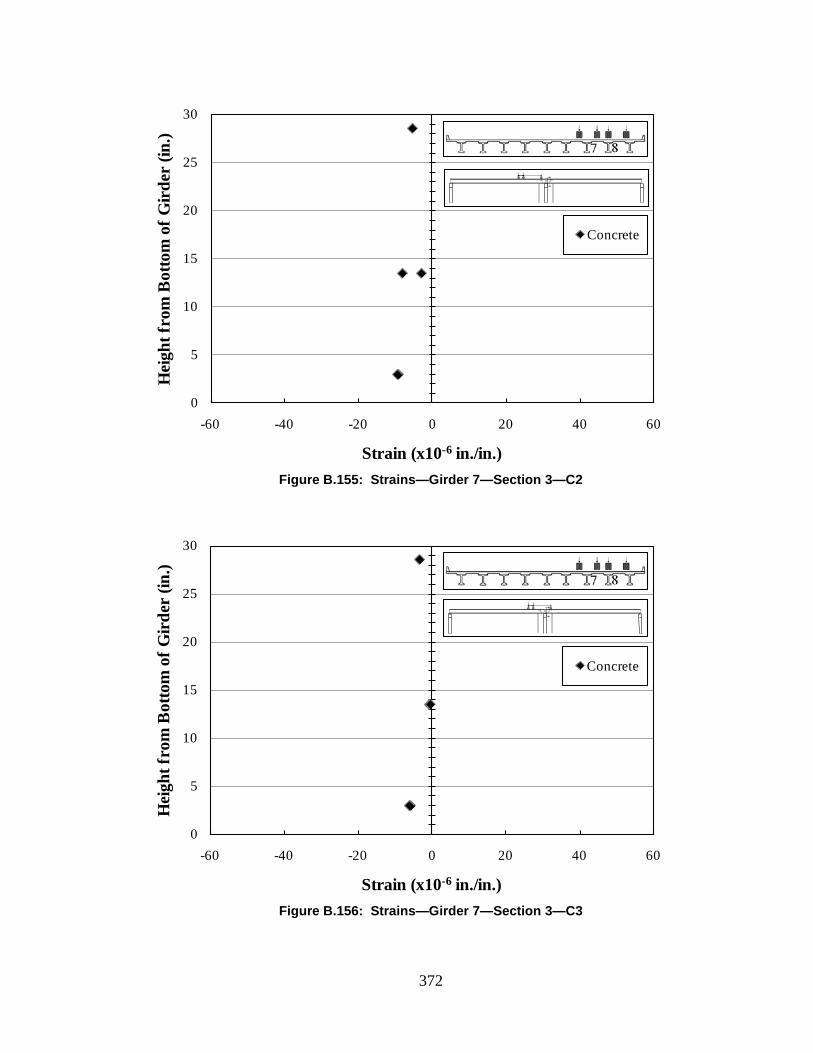
372
Figure B.155: Strains—Girder 7—Section 3—C2
Figure B.156: Strains—Girder 7—Section 3—C3
0
5
10
15
20
25
30
-60 -40 -20 0 20 40 60
Hei
ght f
rom
Bot
tom
of G
irde
r (in
.)
Strain (x10-6 in./in.)
Concrete
0
5
10
15
20
25
30
-60 -40 -20 0 20 40 60
Hei
ght f
rom
Bot
tom
of G
irde
r (in
.)
Strain (x10-6 in./in.)
Concrete

373
Figure B.157: Strains—Girder 7—Section 3—C4
Figure B.158: Strains—Girder 7—Section 3—C5
0
5
10
15
20
25
30
-60 -40 -20 0 20 40 60
Hei
ght f
rom
Bot
tom
of G
irde
r (in
.)
Strain (x10-6 in./in.)
Concrete
0
5
10
15
20
25
30
-60 -40 -20 0 20 40 60
Hei
ght f
rom
Bot
tom
of G
irde
r (in
.)
Strain (x10-6 in./in.)
Concrete
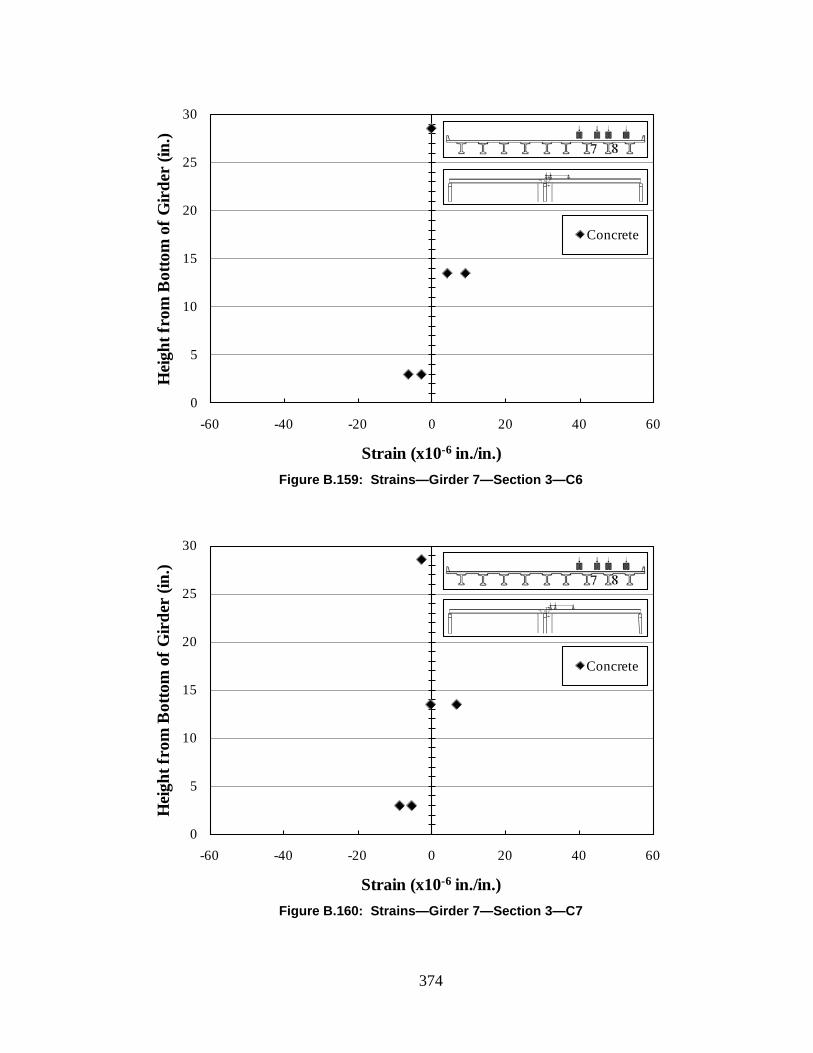
374
Figure B.159: Strains—Girder 7—Section 3—C6
Figure B.160: Strains—Girder 7—Section 3—C7
0
5
10
15
20
25
30
-60 -40 -20 0 20 40 60
Hei
ght f
rom
Bot
tom
of G
irde
r (in
.)
Strain (x10-6 in./in.)
Concrete
0
5
10
15
20
25
30
-60 -40 -20 0 20 40 60
Hei
ght f
rom
Bot
tom
of G
irde
r (in
.)
Strain (x10-6 in./in.)
Concrete

375
Figure B.161: Strains—Girder 7—Section 3—C8
Figure B.162: Strains—Girder 7—Section 3—C9
0
5
10
15
20
25
30
-60 -40 -20 0 20 40 60
Hei
ght f
rom
Bot
tom
of G
irde
r (in
.)
Strain (x10-6 in./in.)
Concrete
0
5
10
15
20
25
30
-60 -40 -20 0 20 40 60
Hei
ght f
rom
Bot
tom
of G
irde
r (in
.)
Strain (x10-6 in./in.)
Concrete
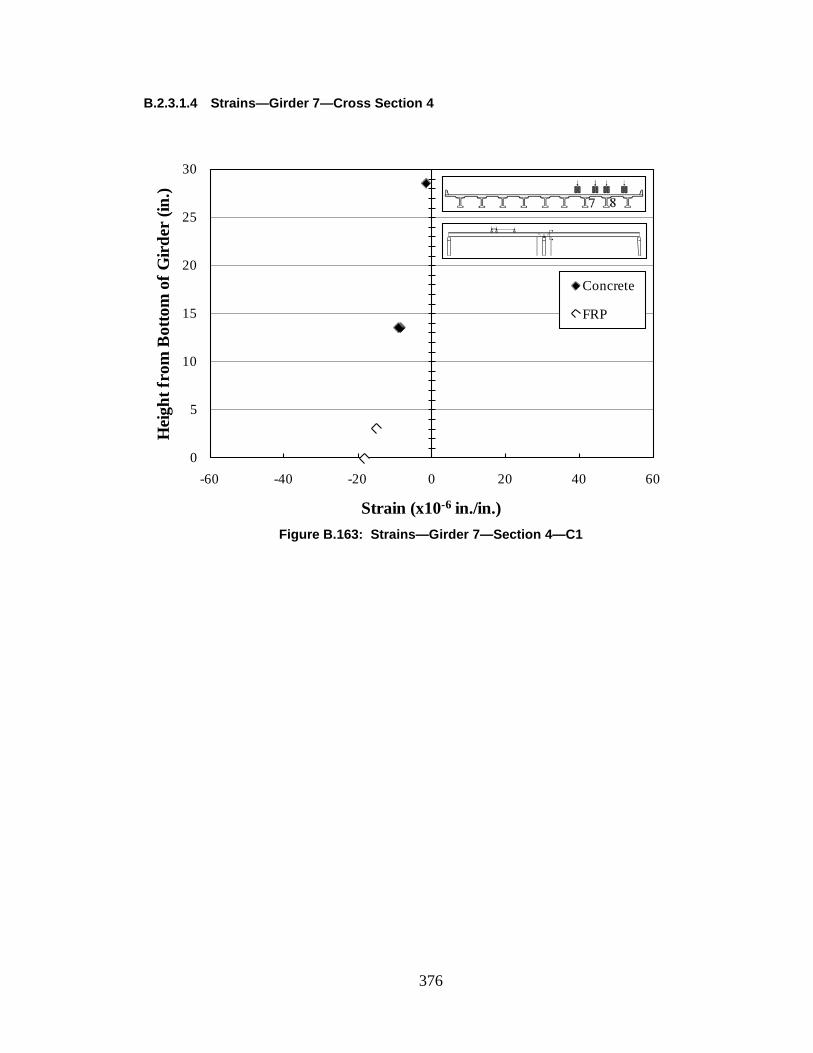
376
B.2.3.1.4 Strains—Girder 7—Cross Section 4
Figure B.163: Strains—Girder 7—Section 4—C1
0
5
10
15
20
25
30
-60 -40 -20 0 20 40 60
Hei
ght f
rom
Bot
tom
of G
irde
r (in
.)
Strain (x10-6 in./in.)
Concrete
FRP

377
Figure B.164: Strains—Girder 7—Section 4—C2
Figure B.165: Strains—Girder 7—Section 4—C3
0
5
10
15
20
25
30
-60 -40 -20 0 20 40 60
Hei
ght f
rom
Bot
tom
of G
irde
r (in
.)
Strain (x10-6 in./in.)
Concrete
FRP
0
5
10
15
20
25
30
-60 -40 -20 0 20 40 60
Hei
ght f
rom
Bot
tom
of G
irde
r (in
.)
Strain (x10-6 in./in.)
Concrete
FRP
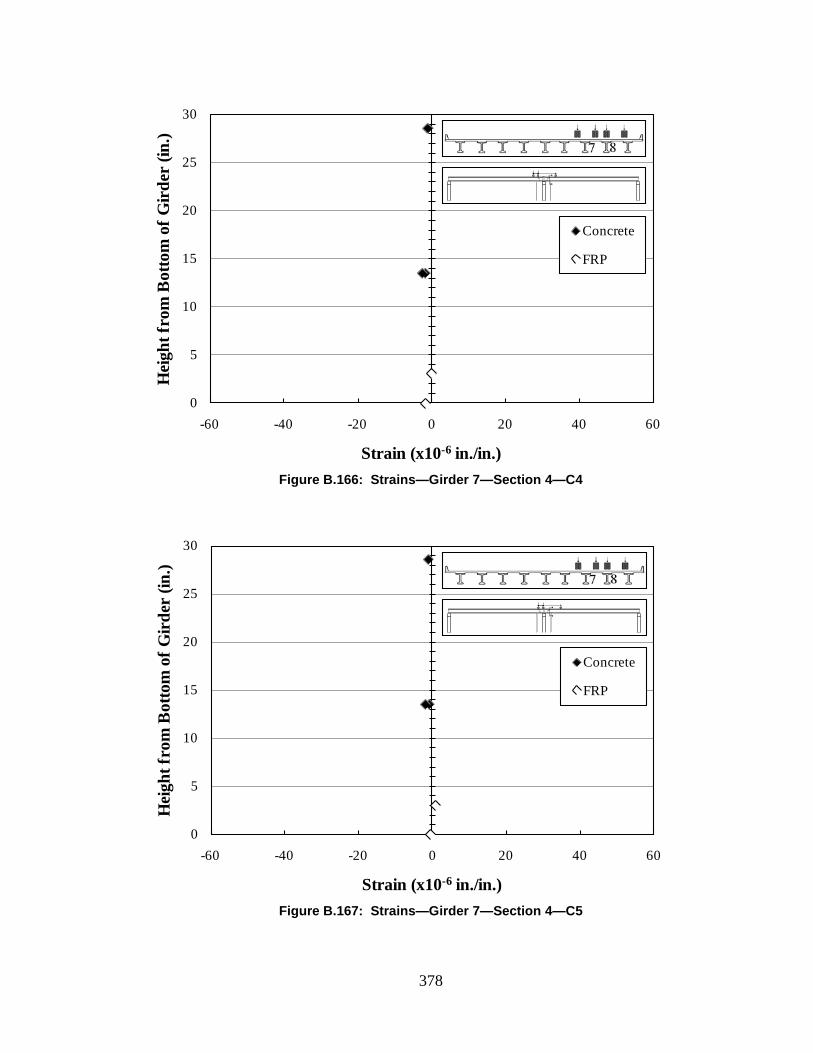
378
Figure B.166: Strains—Girder 7—Section 4—C4
Figure B.167: Strains—Girder 7—Section 4—C5
0
5
10
15
20
25
30
-60 -40 -20 0 20 40 60
Hei
ght f
rom
Bot
tom
of G
irde
r (in
.)
Strain (x10-6 in./in.)
Concrete
FRP
0
5
10
15
20
25
30
-60 -40 -20 0 20 40 60
Hei
ght f
rom
Bot
tom
of G
irde
r (in
.)
Strain (x10-6 in./in.)
Concrete
FRP
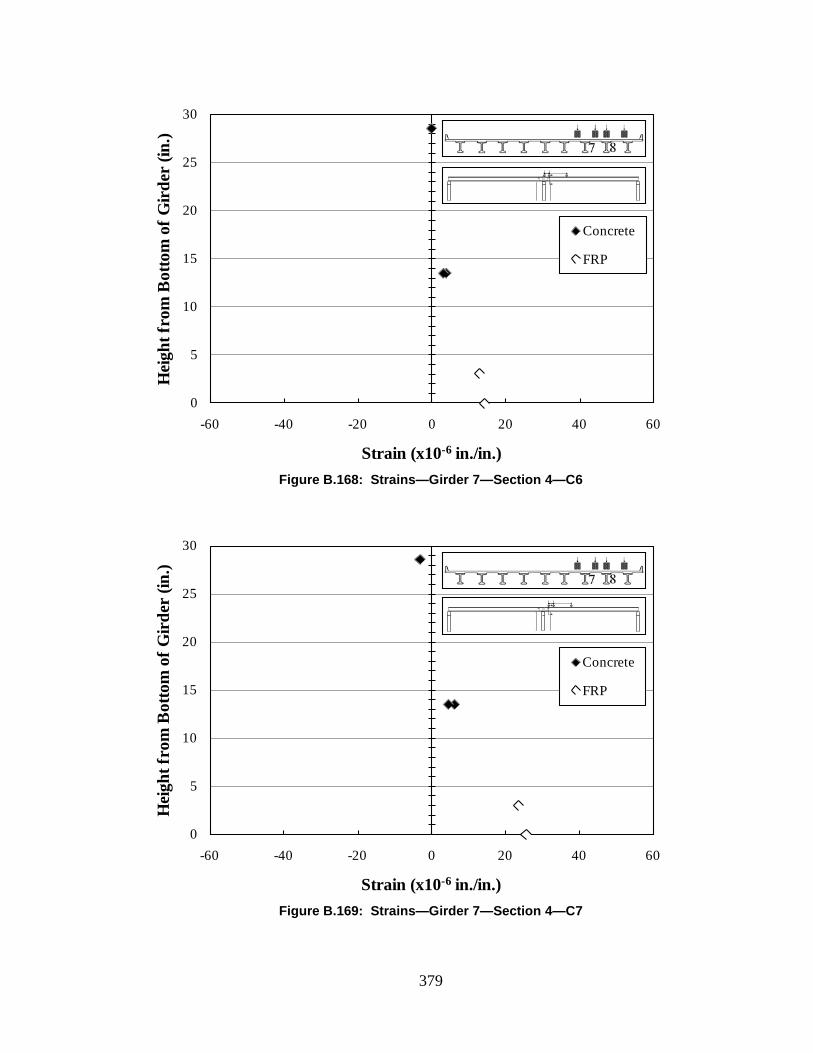
379
Figure B.168: Strains—Girder 7—Section 4—C6
Figure B.169: Strains—Girder 7—Section 4—C7
0
5
10
15
20
25
30
-60 -40 -20 0 20 40 60
Hei
ght f
rom
Bot
tom
of G
irde
r (in
.)
Strain (x10-6 in./in.)
Concrete
FRP
0
5
10
15
20
25
30
-60 -40 -20 0 20 40 60
Hei
ght f
rom
Bot
tom
of G
irde
r (in
.)
Strain (x10-6 in./in.)
Concrete
FRP
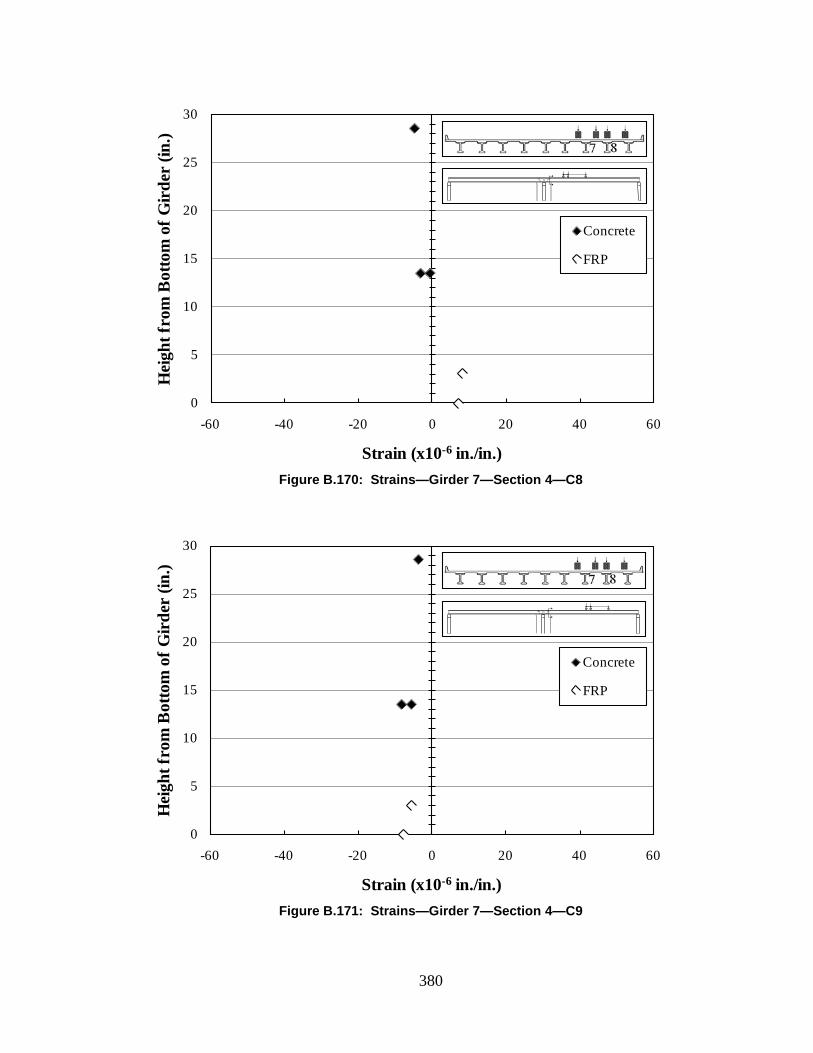
380
Figure B.170: Strains—Girder 7—Section 4—C8
Figure B.171: Strains—Girder 7—Section 4—C9
0
5
10
15
20
25
30
-60 -40 -20 0 20 40 60
Hei
ght f
rom
Bot
tom
of G
irde
r (in
.)
Strain (x10-6 in./in.)
Concrete
FRP
0
5
10
15
20
25
30
-60 -40 -20 0 20 40 60
Hei
ght f
rom
Bot
tom
of G
irde
r (in
.)
Strain (x10-6 in./in.)
Concrete
FRP
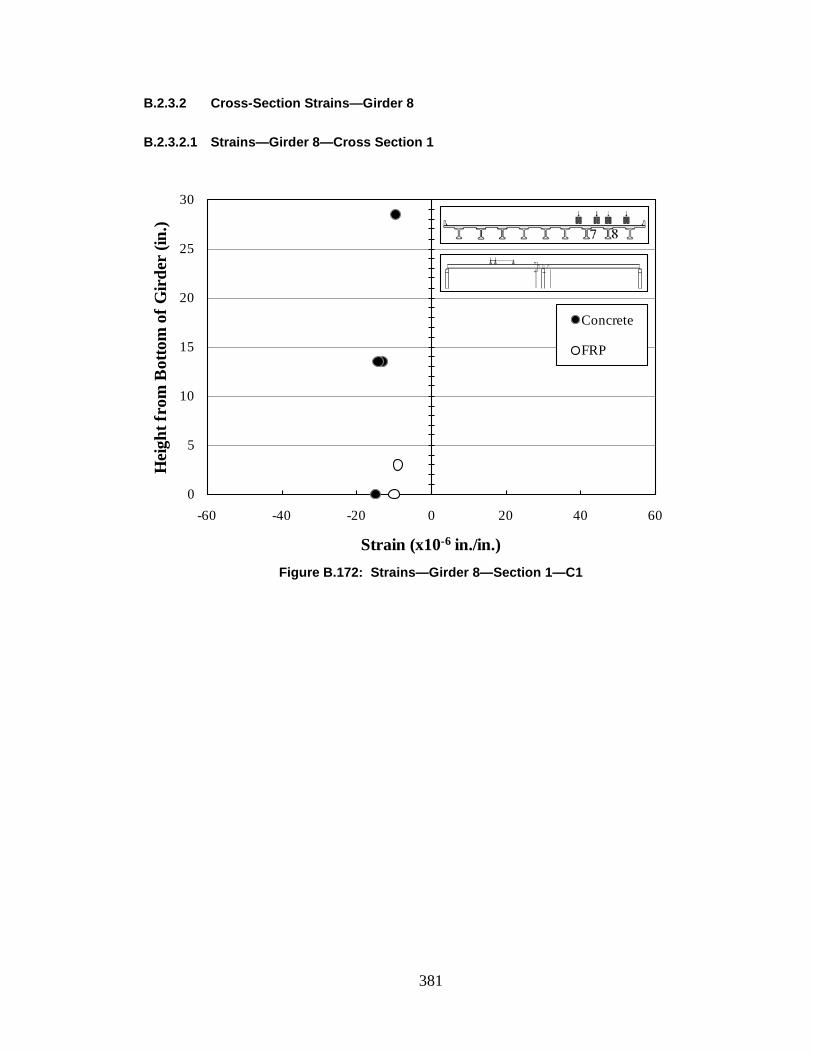
381
B.2.3.2 Cross-Section Strains—Girder 8
B.2.3.2.1 Strains—Girder 8—Cross Section 1
Figure B.172: Strains—Girder 8—Section 1—C1
0
5
10
15
20
25
30
-60 -40 -20 0 20 40 60
Hei
ght f
rom
Bot
tom
of G
irde
r (in
.)
Strain (x10-6 in./in.)
Concrete
FRP
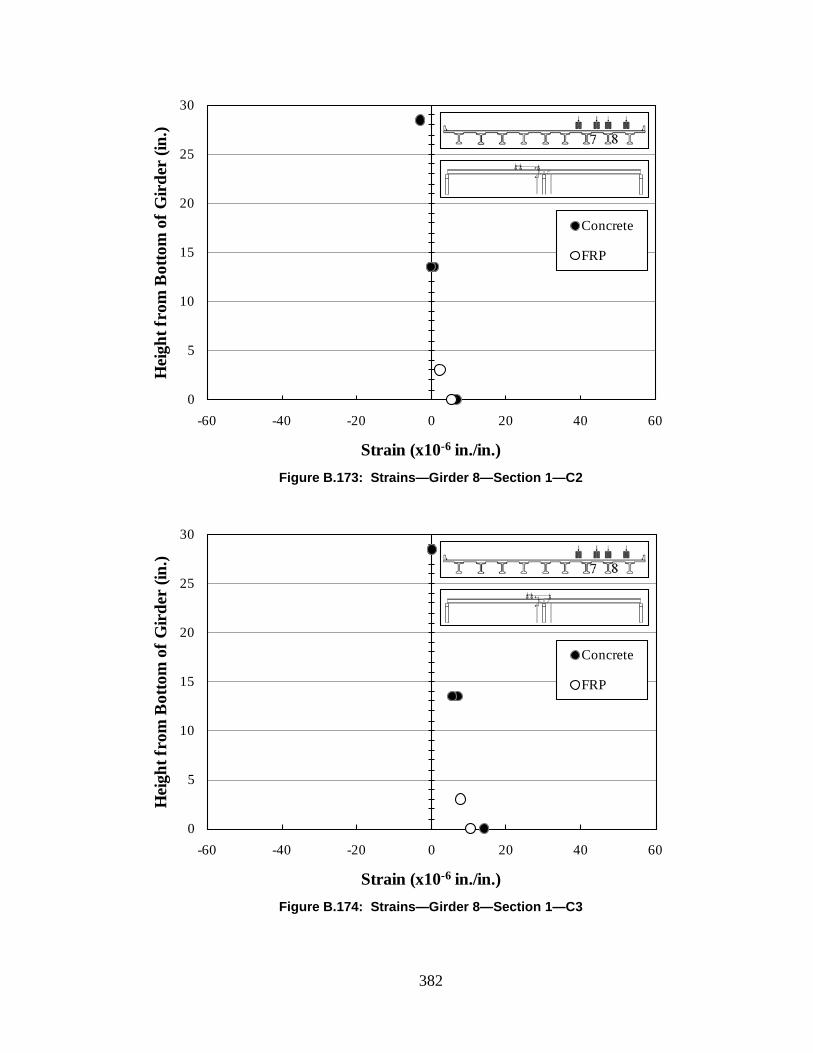
382
Figure B.173: Strains—Girder 8—Section 1—C2
Figure B.174: Strains—Girder 8—Section 1—C3
0
5
10
15
20
25
30
-60 -40 -20 0 20 40 60
Hei
ght f
rom
Bot
tom
of G
irde
r (in
.)
Strain (x10-6 in./in.)
Concrete
FRP
0
5
10
15
20
25
30
-60 -40 -20 0 20 40 60
Hei
ght f
rom
Bot
tom
of G
irde
r (in
.)
Strain (x10-6 in./in.)
Concrete
FRP
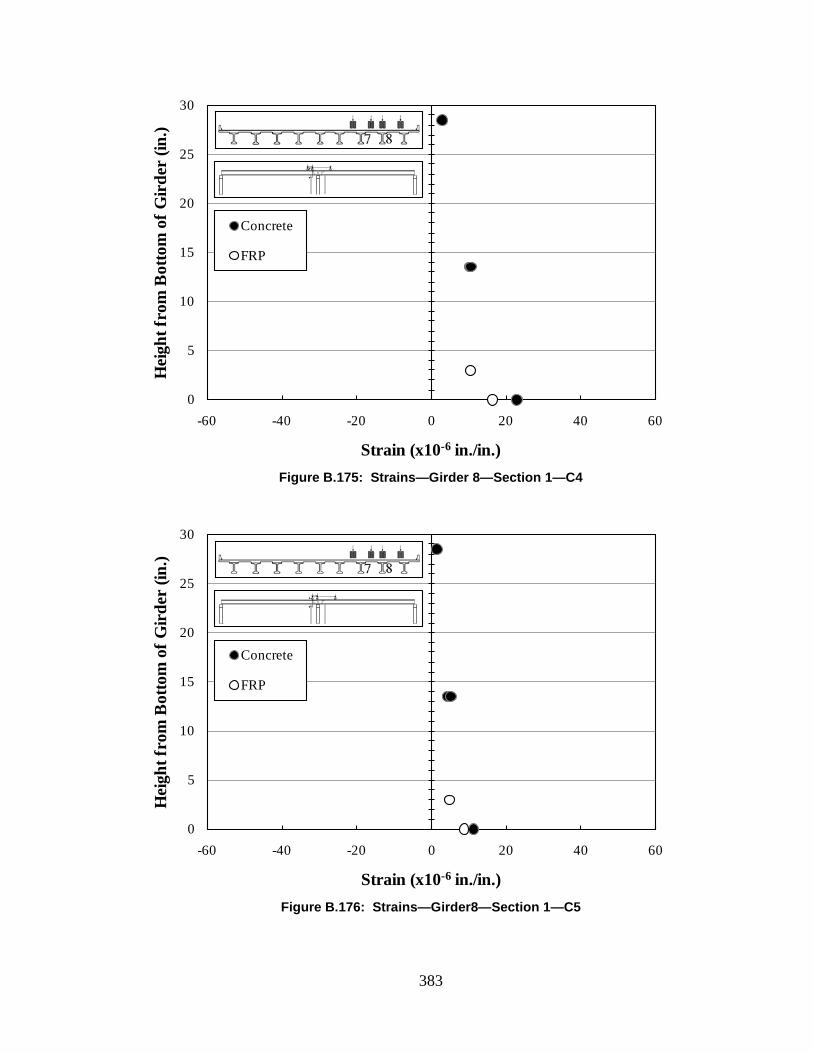
383
Figure B.175: Strains—Girder 8—Section 1—C4
Figure B.176: Strains—Girder8—Section 1—C5
0
5
10
15
20
25
30
-60 -40 -20 0 20 40 60
Hei
ght f
rom
Bot
tom
of G
irde
r (in
.)
Strain (x10-6 in./in.)
Concrete
FRP
0
5
10
15
20
25
30
-60 -40 -20 0 20 40 60
Hei
ght f
rom
Bot
tom
of G
irde
r (in
.)
Strain (x10-6 in./in.)
Concrete
FRP
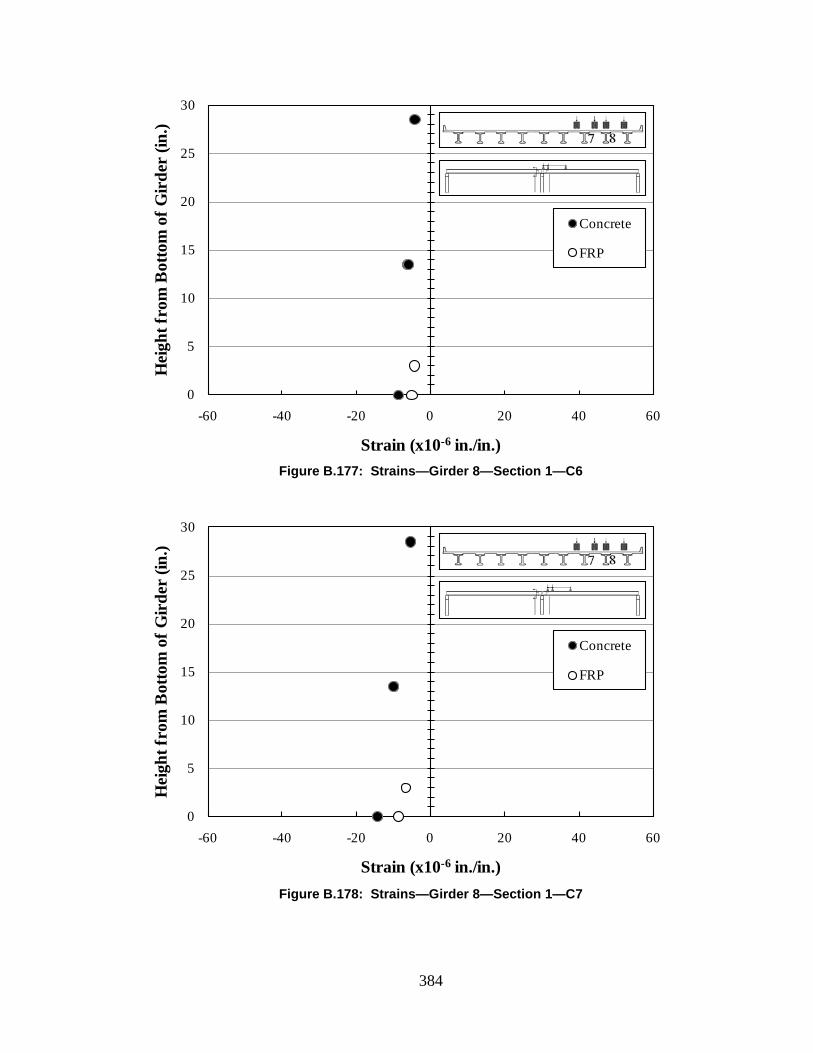
384
Figure B.177: Strains—Girder 8—Section 1—C6
Figure B.178: Strains—Girder 8—Section 1—C7
0
5
10
15
20
25
30
-60 -40 -20 0 20 40 60
Hei
ght f
rom
Bot
tom
of G
irde
r (in
.)
Strain (x10-6 in./in.)
Concrete
FRP
0
5
10
15
20
25
30
-60 -40 -20 0 20 40 60
Hei
ght f
rom
Bot
tom
of G
irde
r (in
.)
Strain (x10-6 in./in.)
Concrete
FRP
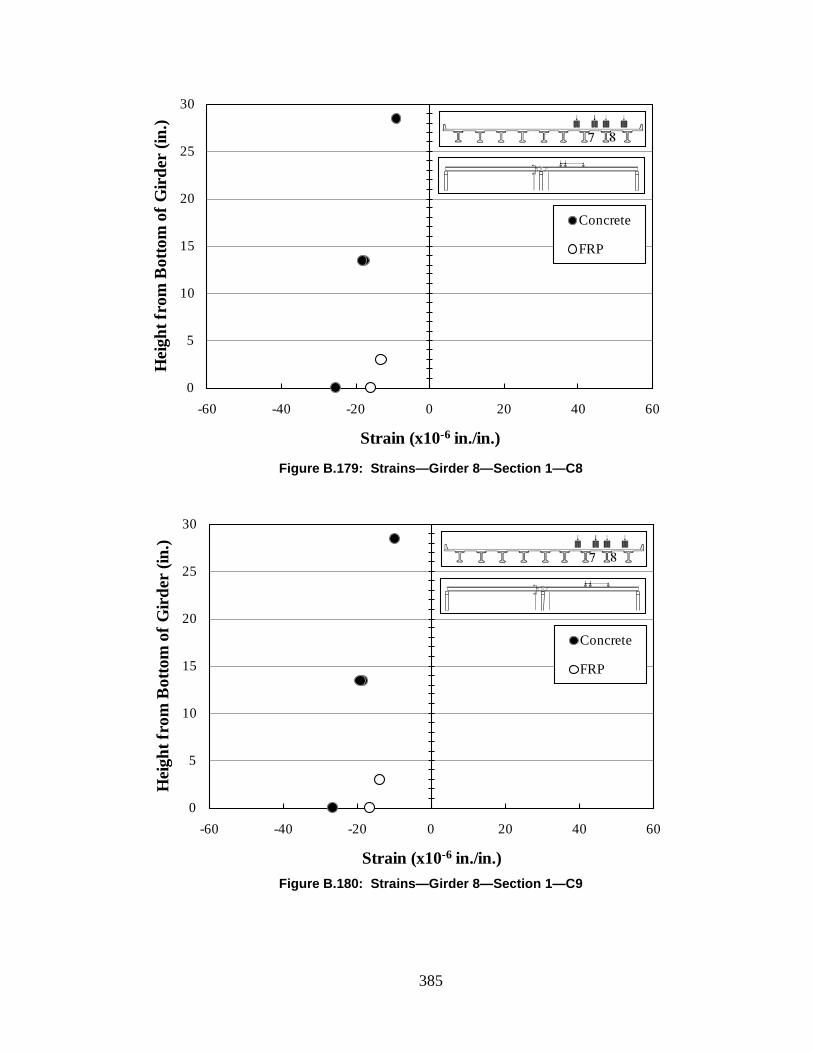
385
Figure B.179: Strains—Girder 8—Section 1—C8
Figure B.180: Strains—Girder 8—Section 1—C9
0
5
10
15
20
25
30
-60 -40 -20 0 20 40 60
Hei
ght f
rom
Bot
tom
of G
irde
r (in
.)
Strain (x10-6 in./in.)
Concrete
FRP
0
5
10
15
20
25
30
-60 -40 -20 0 20 40 60
Hei
ght f
rom
Bot
tom
of G
irde
r (in
.)
Strain (x10-6 in./in.)
Concrete
FRP
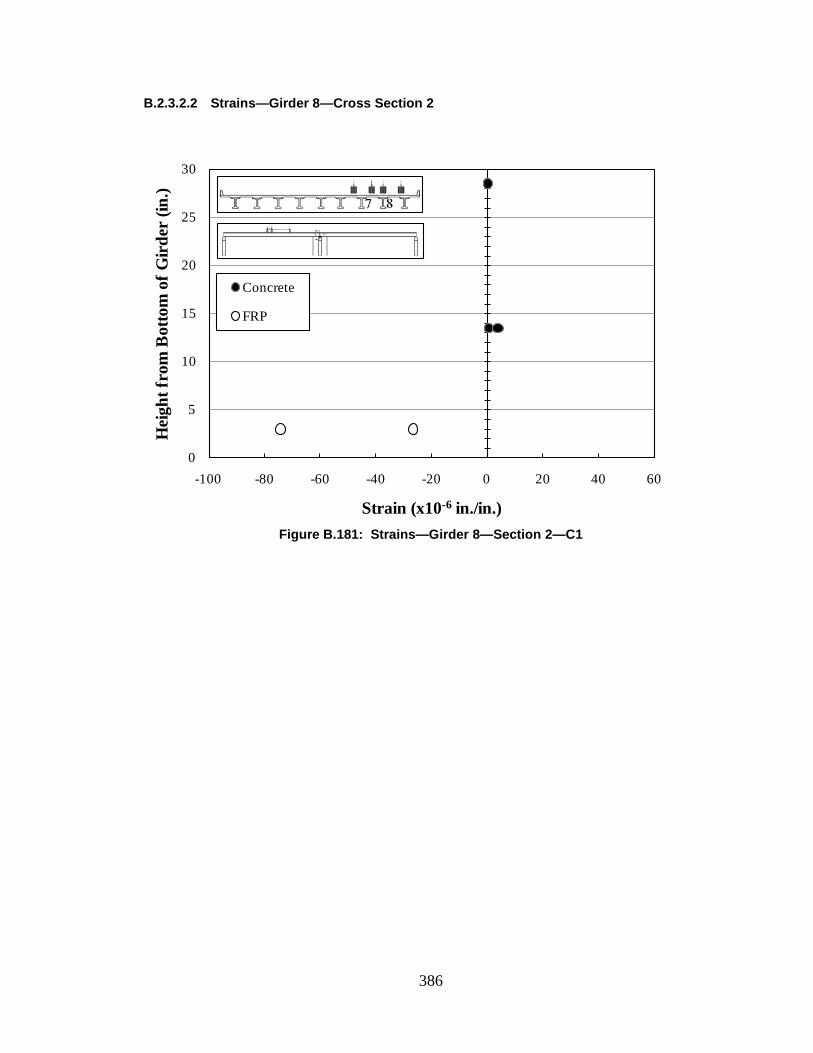
386
B.2.3.2.2 Strains—Girder 8—Cross Section 2
Figure B.181: Strains—Girder 8—Section 2—C1
0
5
10
15
20
25
30
-100 -80 -60 -40 -20 0 20 40 60
Hei
ght f
rom
Bot
tom
of G
irde
r (in
.)
Strain (x10-6 in./in.)
Concrete
FRP

387
Figure B.182: Strains—Girder 8—Section 2—C2
Figure B.183: Strains—Girder 8—Section 2—C3
0
5
10
15
20
25
30
-100 -80 -60 -40 -20 0 20 40 60
Hei
ght f
rom
Bot
tom
of G
irde
r (in
.)
Strain (x10-6 in./in.)
Concrete
FRP
0
5
10
15
20
25
30
-100 -80 -60 -40 -20 0 20 40 60
Hei
ght f
rom
Bot
tom
of G
irde
r (in
.)
Strain (x10-6 in./in.)
Concrete
FRP
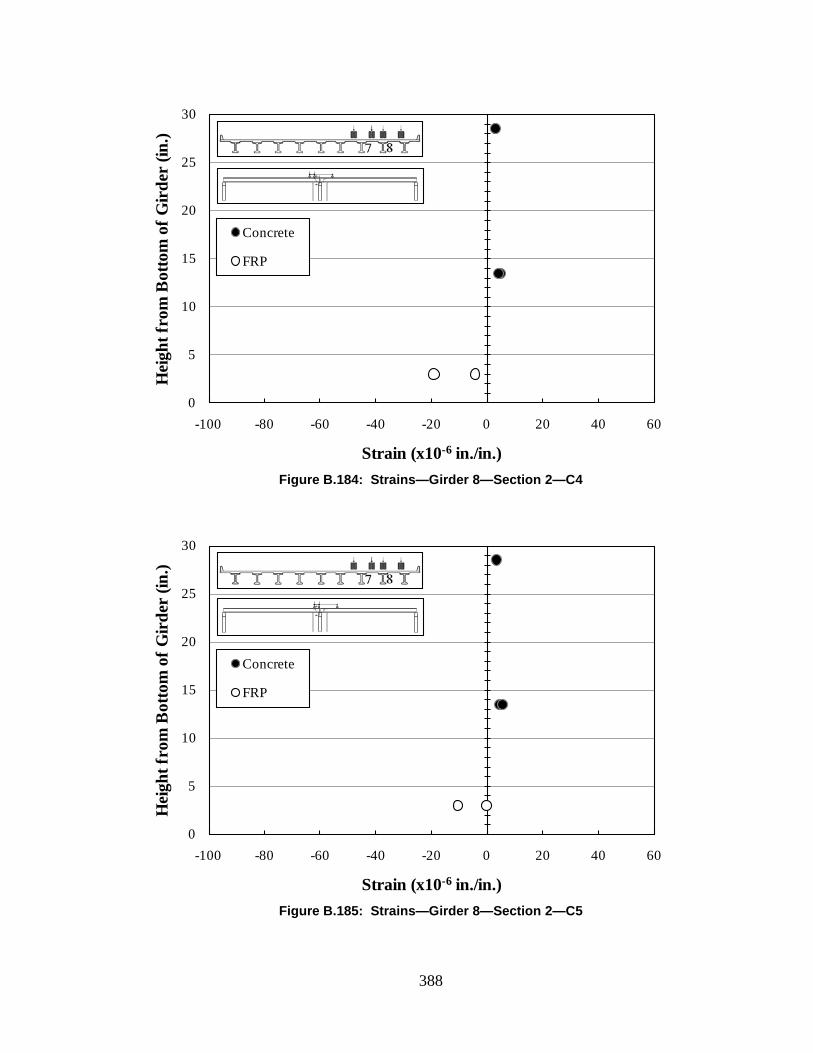
388
Figure B.184: Strains—Girder 8—Section 2—C4
Figure B.185: Strains—Girder 8—Section 2—C5
0
5
10
15
20
25
30
-100 -80 -60 -40 -20 0 20 40 60
Hei
ght f
rom
Bot
tom
of G
irde
r (in
.)
Strain (x10-6 in./in.)
Concrete
FRP
0
5
10
15
20
25
30
-100 -80 -60 -40 -20 0 20 40 60
Hei
ght f
rom
Bot
tom
of G
irde
r (in
.)
Strain (x10-6 in./in.)
Concrete
FRP
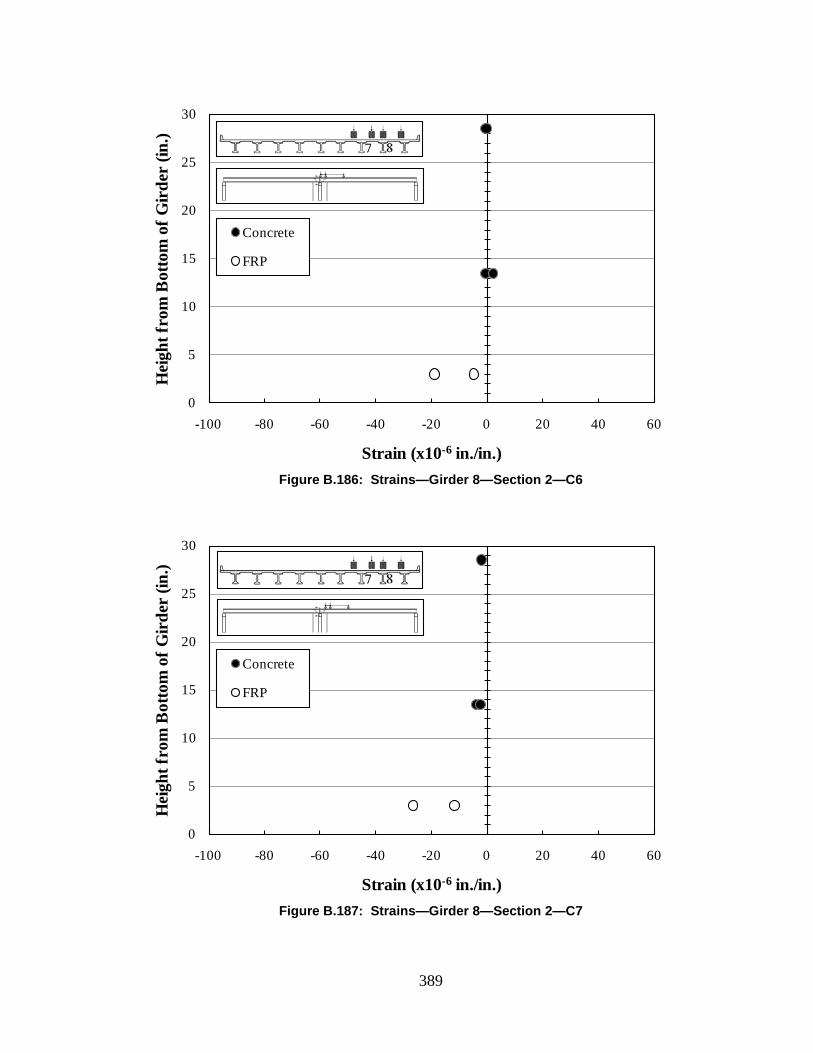
389
Figure B.186: Strains—Girder 8—Section 2—C6
Figure B.187: Strains—Girder 8—Section 2—C7
0
5
10
15
20
25
30
-100 -80 -60 -40 -20 0 20 40 60
Hei
ght f
rom
Bot
tom
of G
irde
r (in
.)
Strain (x10-6 in./in.)
Concrete
FRP
0
5
10
15
20
25
30
-100 -80 -60 -40 -20 0 20 40 60
Hei
ght f
rom
Bot
tom
of G
irde
r (in
.)
Strain (x10-6 in./in.)
Concrete
FRP
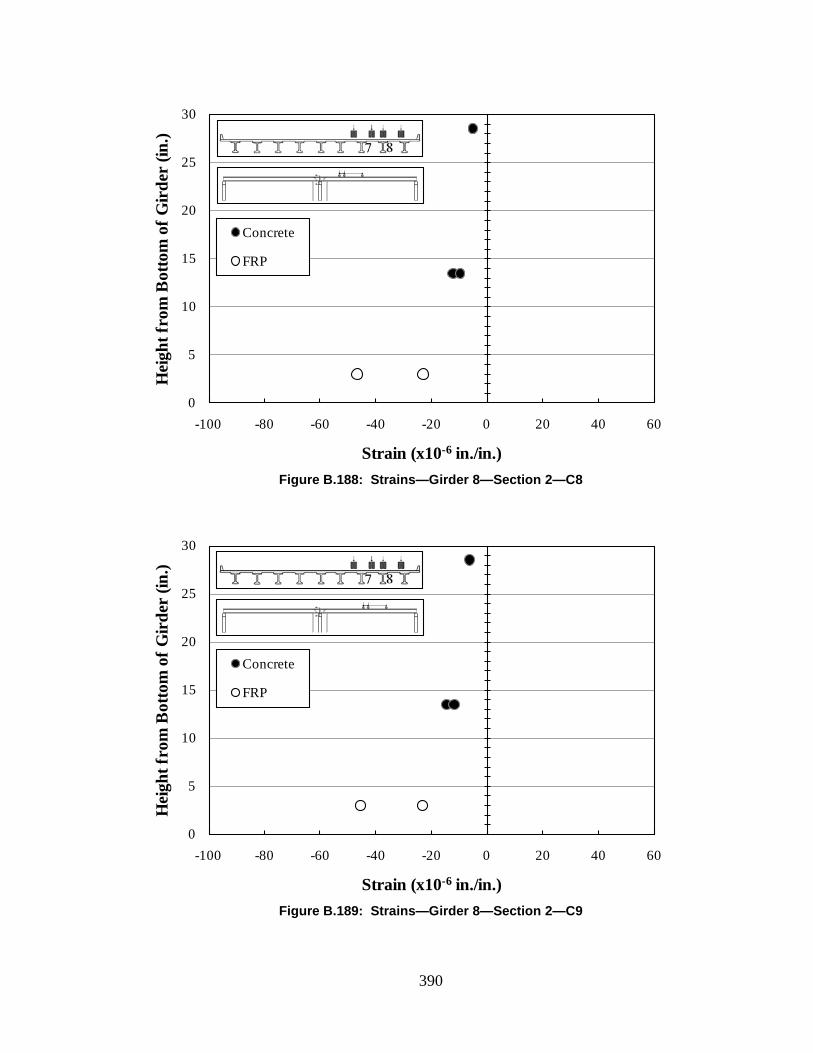
390
Figure B.188: Strains—Girder 8—Section 2—C8
Figure B.189: Strains—Girder 8—Section 2—C9
0
5
10
15
20
25
30
-100 -80 -60 -40 -20 0 20 40 60
Hei
ght f
rom
Bot
tom
of G
irde
r (in
.)
Strain (x10-6 in./in.)
Concrete
FRP
0
5
10
15
20
25
30
-100 -80 -60 -40 -20 0 20 40 60
Hei
ght f
rom
Bot
tom
of G
irde
r (in
.)
Strain (x10-6 in./in.)
Concrete
FRP
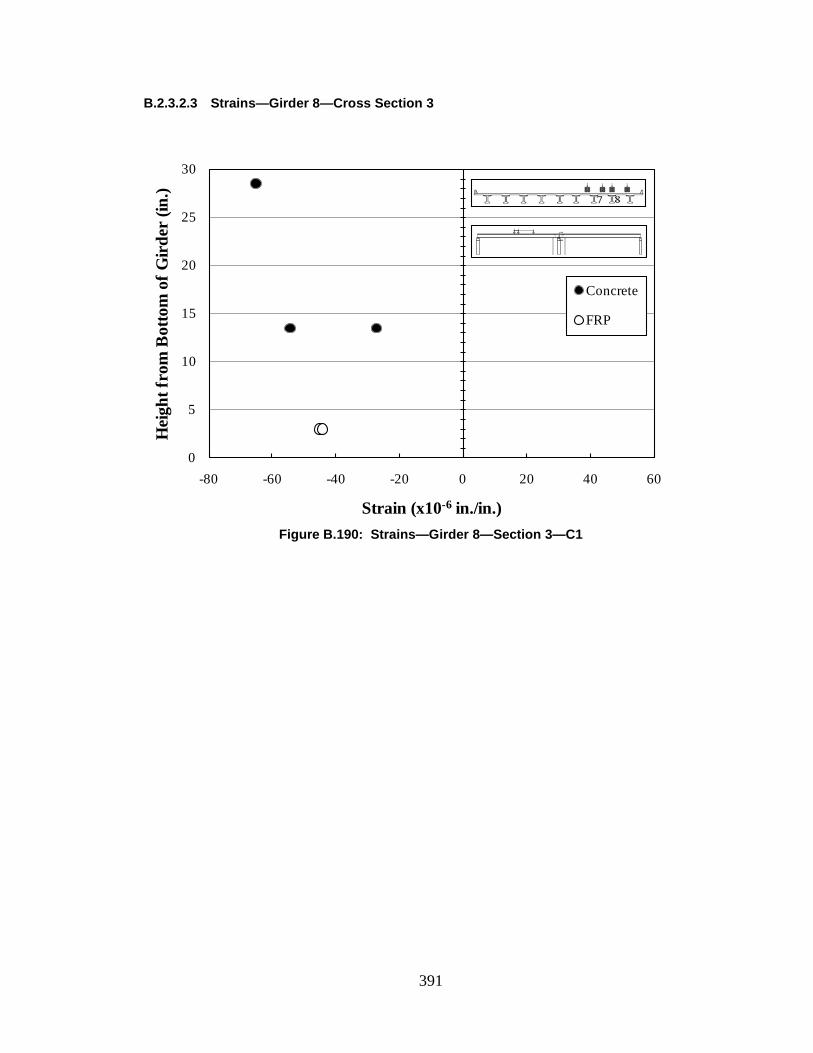
391
B.2.3.2.3 Strains—Girder 8—Cross Section 3
Figure B.190: Strains—Girder 8—Section 3—C1
0
5
10
15
20
25
30
-80 -60 -40 -20 0 20 40 60
Hei
ght f
rom
Bot
tom
of G
irde
r (in
.)
Strain (x10-6 in./in.)
Concrete
FRP

392
Figure B.191: Strains—Girder 8—Section 3—C2
Figure B.192: Strains—Girder 8—Section 3—C3
0
5
10
15
20
25
30
-80 -60 -40 -20 0 20 40 60
Hei
ght f
rom
Bot
tom
of G
irde
r (in
.)
Strain (x10-6 in./in.)
Concrete
FRP
0
5
10
15
20
25
30
-80 -60 -40 -20 0 20 40 60
Hei
ght f
rom
Bot
tom
of G
irde
r (in
.)
Strain (x10-6 in./in.)
Concrete
FRP
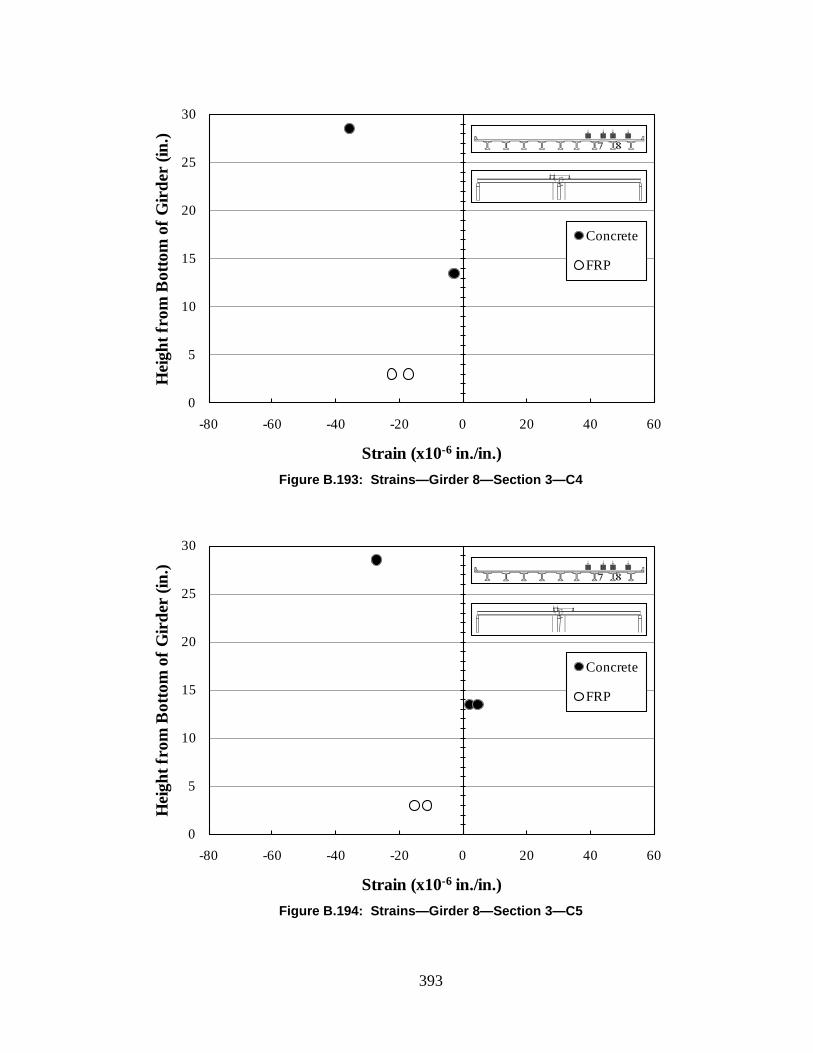
393
Figure B.193: Strains—Girder 8—Section 3—C4
Figure B.194: Strains—Girder 8—Section 3—C5
0
5
10
15
20
25
30
-80 -60 -40 -20 0 20 40 60
Hei
ght f
rom
Bot
tom
of G
irde
r (in
.)
Strain (x10-6 in./in.)
Concrete
FRP
0
5
10
15
20
25
30
-80 -60 -40 -20 0 20 40 60
Hei
ght f
rom
Bot
tom
of G
irde
r (in
.)
Strain (x10-6 in./in.)
Concrete
FRP
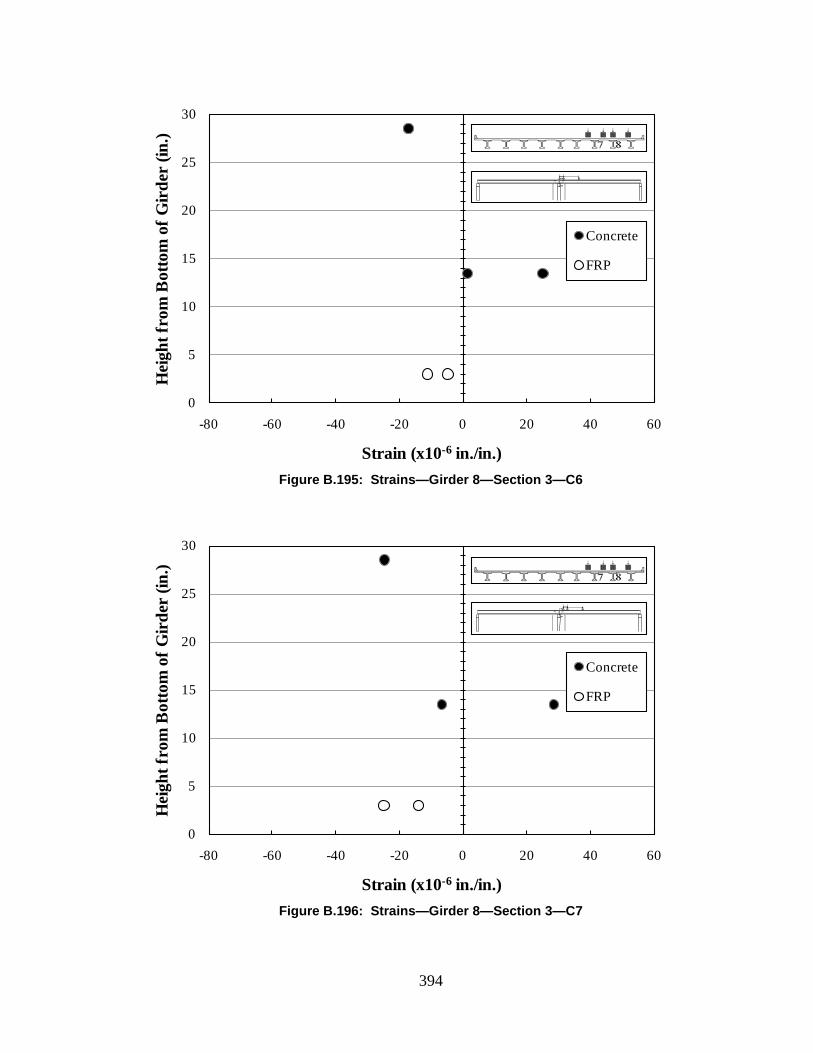
394
Figure B.195: Strains—Girder 8—Section 3—C6
Figure B.196: Strains—Girder 8—Section 3—C7
0
5
10
15
20
25
30
-80 -60 -40 -20 0 20 40 60
Hei
ght f
rom
Bot
tom
of G
irde
r (in
.)
Strain (x10-6 in./in.)
Concrete
FRP
0
5
10
15
20
25
30
-80 -60 -40 -20 0 20 40 60
Hei
ght f
rom
Bot
tom
of G
irde
r (in
.)
Strain (x10-6 in./in.)
Concrete
FRP
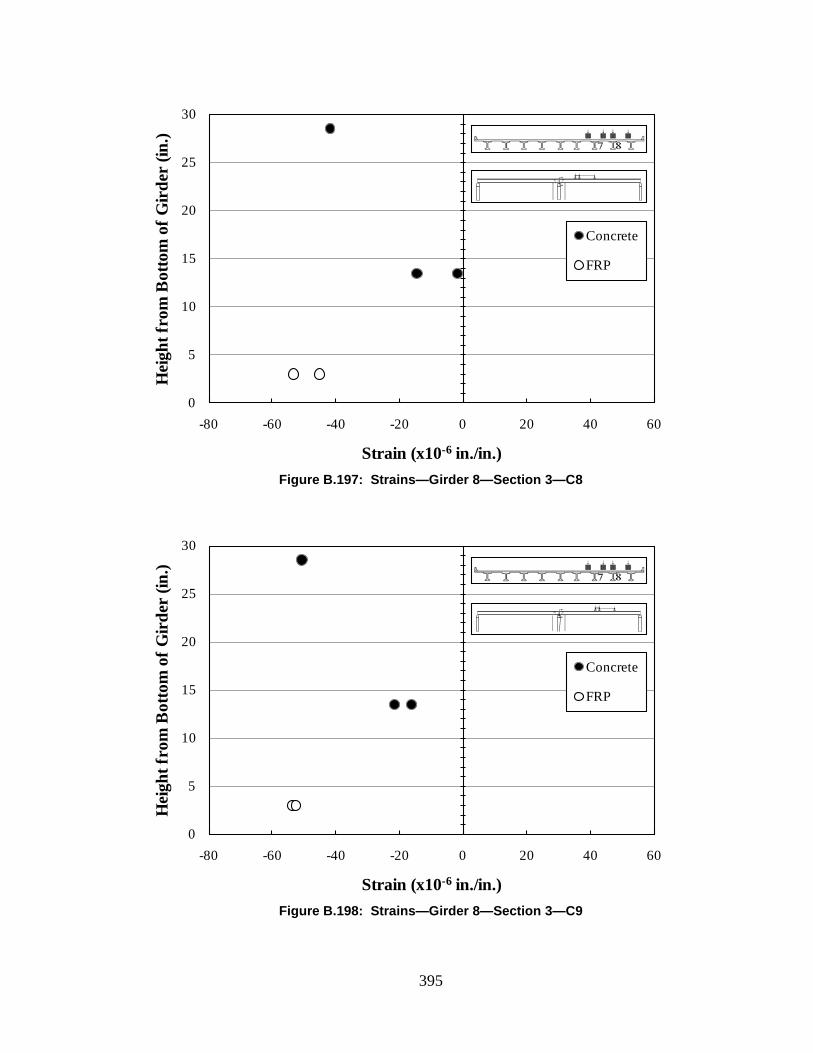
395
Figure B.197: Strains—Girder 8—Section 3—C8
Figure B.198: Strains—Girder 8—Section 3—C9
0
5
10
15
20
25
30
-80 -60 -40 -20 0 20 40 60
Hei
ght f
rom
Bot
tom
of G
irde
r (in
.)
Strain (x10-6 in./in.)
Concrete
FRP
0
5
10
15
20
25
30
-80 -60 -40 -20 0 20 40 60
Hei
ght f
rom
Bot
tom
of G
irde
r (in
.)
Strain (x10-6 in./in.)
Concrete
FRP
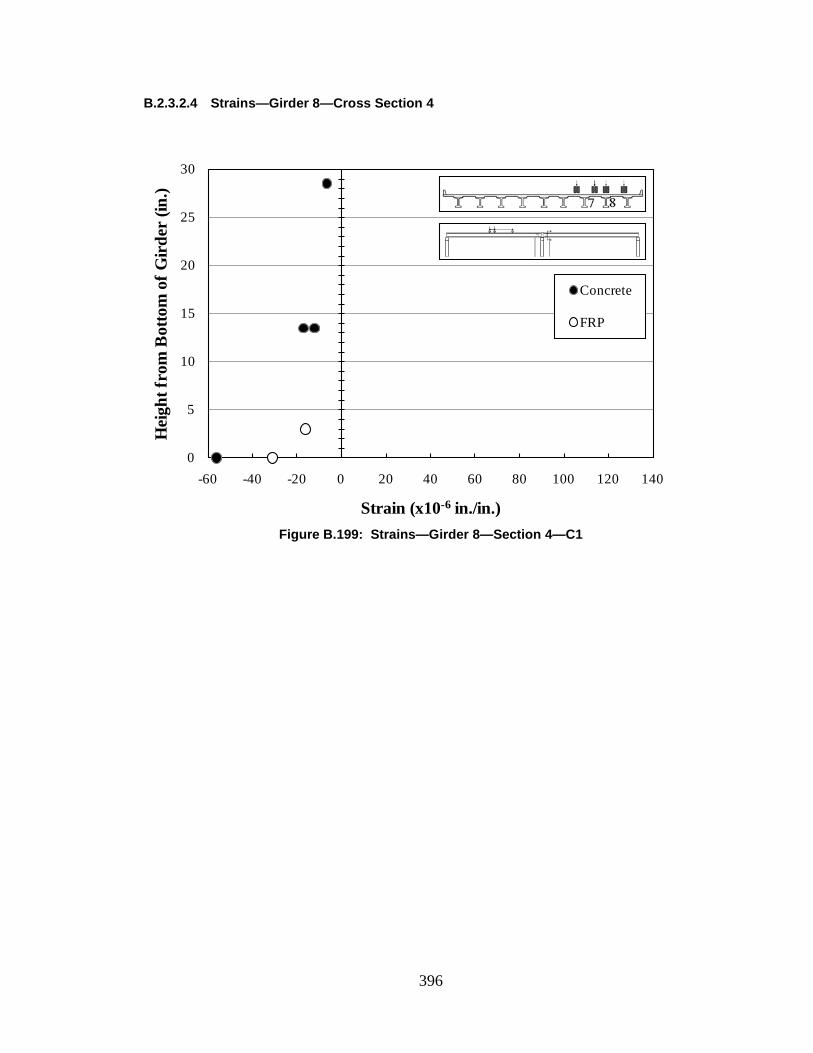
396
B.2.3.2.4 Strains—Girder 8—Cross Section 4
Figure B.199: Strains—Girder 8—Section 4—C1
0
5
10
15
20
25
30
-60 -40 -20 0 20 40 60 80 100 120 140
Hei
ght f
rom
Bot
tom
of G
irde
r (in
.)
Strain (x10-6 in./in.)
Concrete
FRP

397
Figure B.200: Strains—Girder 8—Section 4—C2
Figure B.201: Strains—Girder 8—Section 4—C3
0
5
10
15
20
25
30
-60 -40 -20 0 20 40 60 80 100 120 140
Hei
ght f
rom
Bot
tom
of G
irde
r (in
.)
Strain (x10-6 in./in.)
Concrete
FRP
0
5
10
15
20
25
30
-60 -40 -20 0 20 40 60 80 100 120 140
Hei
ght f
rom
Bot
tom
of G
irde
r (in
.)
Strain (x10-6 in./in.)
Concrete
FRP
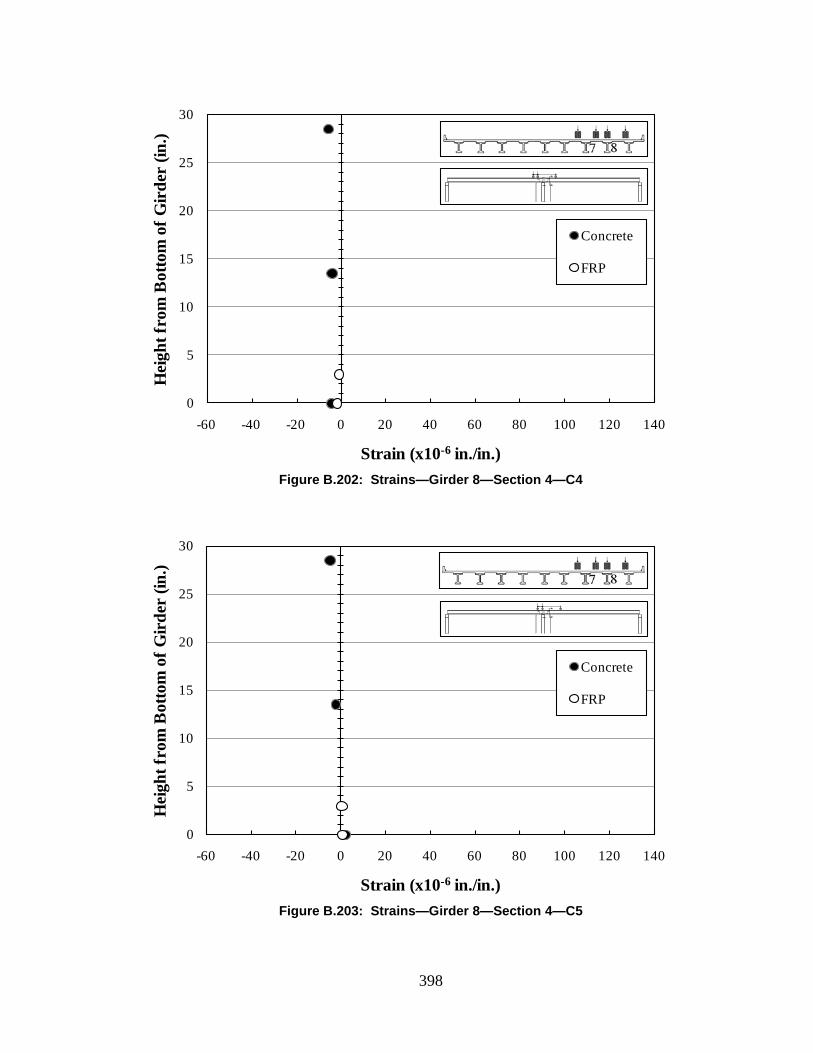
398
Figure B.202: Strains—Girder 8—Section 4—C4
Figure B.203: Strains—Girder 8—Section 4—C5
0
5
10
15
20
25
30
-60 -40 -20 0 20 40 60 80 100 120 140
Hei
ght f
rom
Bot
tom
of G
irde
r (in
.)
Strain (x10-6 in./in.)
Concrete
FRP
0
5
10
15
20
25
30
-60 -40 -20 0 20 40 60 80 100 120 140
Hei
ght f
rom
Bot
tom
of G
irde
r (in
.)
Strain (x10-6 in./in.)
Concrete
FRP
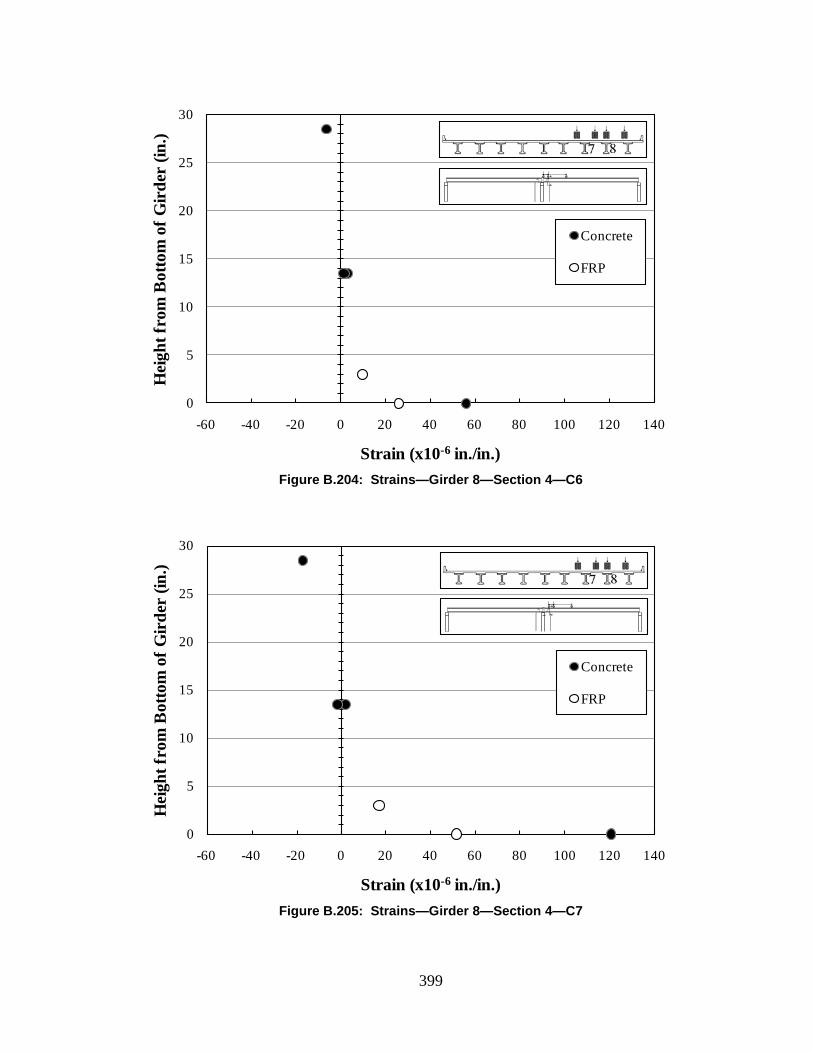
399
Figure B.204: Strains—Girder 8—Section 4—C6
Figure B.205: Strains—Girder 8—Section 4—C7
0
5
10
15
20
25
30
-60 -40 -20 0 20 40 60 80 100 120 140
Hei
ght f
rom
Bot
tom
of G
irde
r (in
.)
Strain (x10-6 in./in.)
Concrete
FRP
0
5
10
15
20
25
30
-60 -40 -20 0 20 40 60 80 100 120 140
Hei
ght f
rom
Bot
tom
of G
irde
r (in
.)
Strain (x10-6 in./in.)
Concrete
FRP

400
Figure B.206: Strains—Girder 8—Section 4—C8
Figure B.207: Strains—Girder 8—Section 4—C9
0
5
10
15
20
25
30
-60 -40 -20 0 20 40 60 80 100 120 140
Hei
ght f
rom
Bot
tom
of G
irde
r (in
.)
Strain (x10-6 in./in.)
Concrete
FRP
0
5
10
15
20
25
30
-60 -40 -20 0 20 40 60 80 100 120 140
Hei
ght f
rom
Bot
tom
of G
irde
r (in
.)
Strain (x10-6 in./in.)
Concrete
FRP
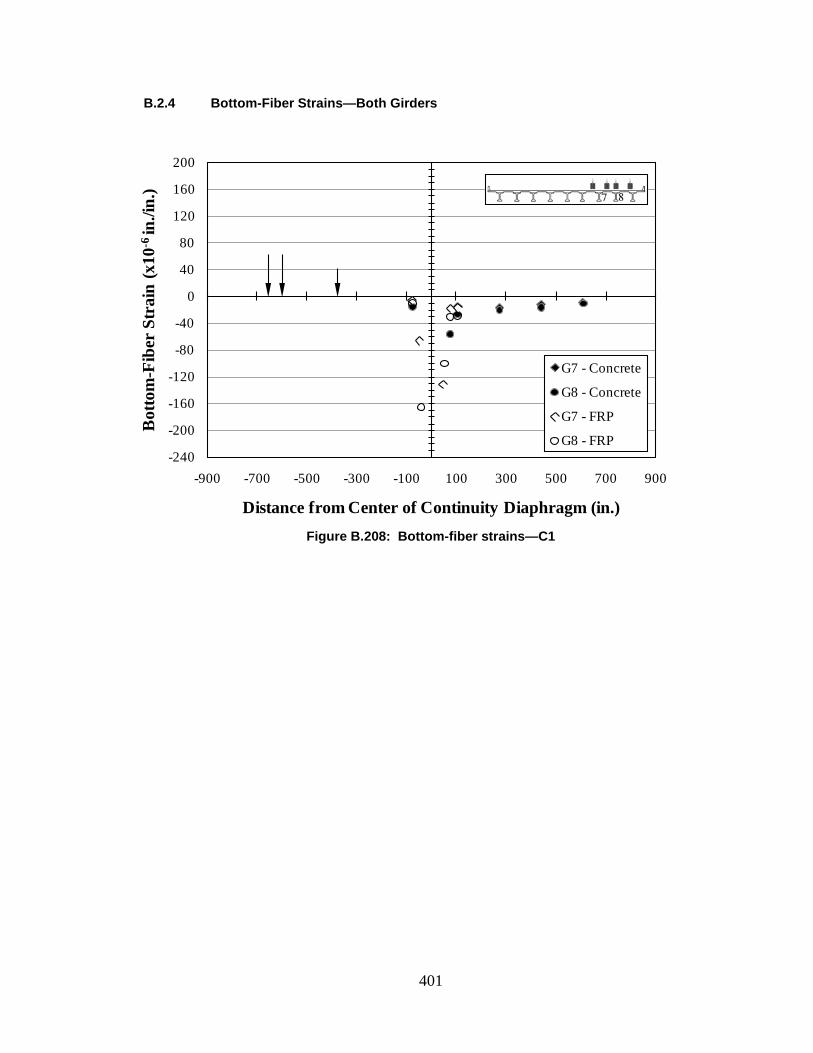
401
B.2.4 Bottom-Fiber Strains—Both Girders
Figure B.208: Bottom-fiber strains—C1
-240
-200
-160
-120
-80
-40
0
40
80
120
160
200
-900 -700 -500 -300 -100 100 300 500 700 900
Bot
tom
-Fib
er S
trai
n (x
10-6
in./i
n.)
Distance from Center of Continuity Diaphragm (in.)
G7 - Concrete
G8 - Concrete
G7 - FRP
G8 - FRP
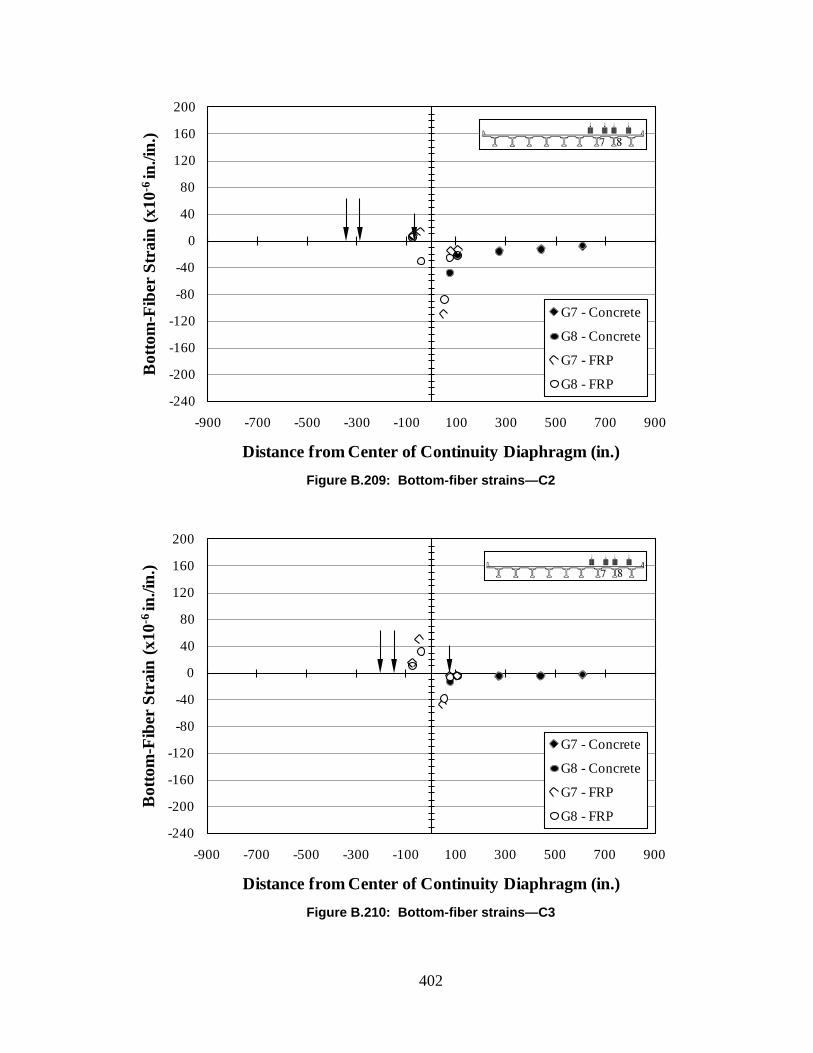
402
Figure B.209: Bottom-fiber strains—C2
Figure B.210: Bottom-fiber strains—C3
-240
-200
-160
-120
-80
-40
0
40
80
120
160
200
-900 -700 -500 -300 -100 100 300 500 700 900
Bot
tom
-Fib
er S
trai
n (x
10-6
in./i
n.)
Distance from Center of Continuity Diaphragm (in.)
G7 - Concrete
G8 - Concrete
G7 - FRP
G8 - FRP
-240
-200
-160
-120
-80
-40
0
40
80
120
160
200
-900 -700 -500 -300 -100 100 300 500 700 900
Bot
tom
-Fib
er S
trai
n (x
10-6
in./i
n.)
Distance from Center of Continuity Diaphragm (in.)
G7 - Concrete
G8 - Concrete
G7 - FRP
G8 - FRP

403
Figure B.211: Bottom-fiber strains—C4
Figure B.212: Bottom-fiber strains—C5
-240
-200
-160
-120
-80
-40
0
40
80
120
160
200
-900 -700 -500 -300 -100 100 300 500 700 900
Bot
tom
-Fib
er S
trai
n (x
10-6
in./i
n.)
Distance from Center of Continuity Diaphragm (in.)
G7 - Concrete
G8 - Concrete
G7 - FRP
G8 - FRP
-240
-200
-160
-120
-80
-40
0
40
80
120
160
200
-900 -700 -500 -300 -100 100 300 500 700 900
Bot
tom
-Fib
er S
trai
n (x
10-6
in./i
n.)
Distance from Center of Continuity Diaphragm (in.)
G7 - Concrete
G8 - Concrete
G7 - FRP
G8 - FRP

404
Figure B.213: Bottom-fiber strains—C6
Figure B.214: Bottom-fiber strains—C7
-240
-200
-160
-120
-80
-40
0
40
80
120
160
200
-900 -700 -500 -300 -100 100 300 500 700 900
Bot
tom
-Fib
er S
trai
n (x
10-6
in./i
n.)
Distance from Center of Continuity Diaphragm (in.)
G7 - Concrete
G8 - Concrete
G7 - FRP
G8 - FRP
-240
-200
-160
-120
-80
-40
0
40
80
120
160
200
-900 -700 -500 -300 -100 100 300 500 700 900
Bot
tom
-Fib
er S
trai
n (x
10-6
in./i
n.)
Distance from Center of Continuity Diaphragm (in.)
G7 - Concrete
G8 - Concrete
G7 - FRP
G8 - FRP
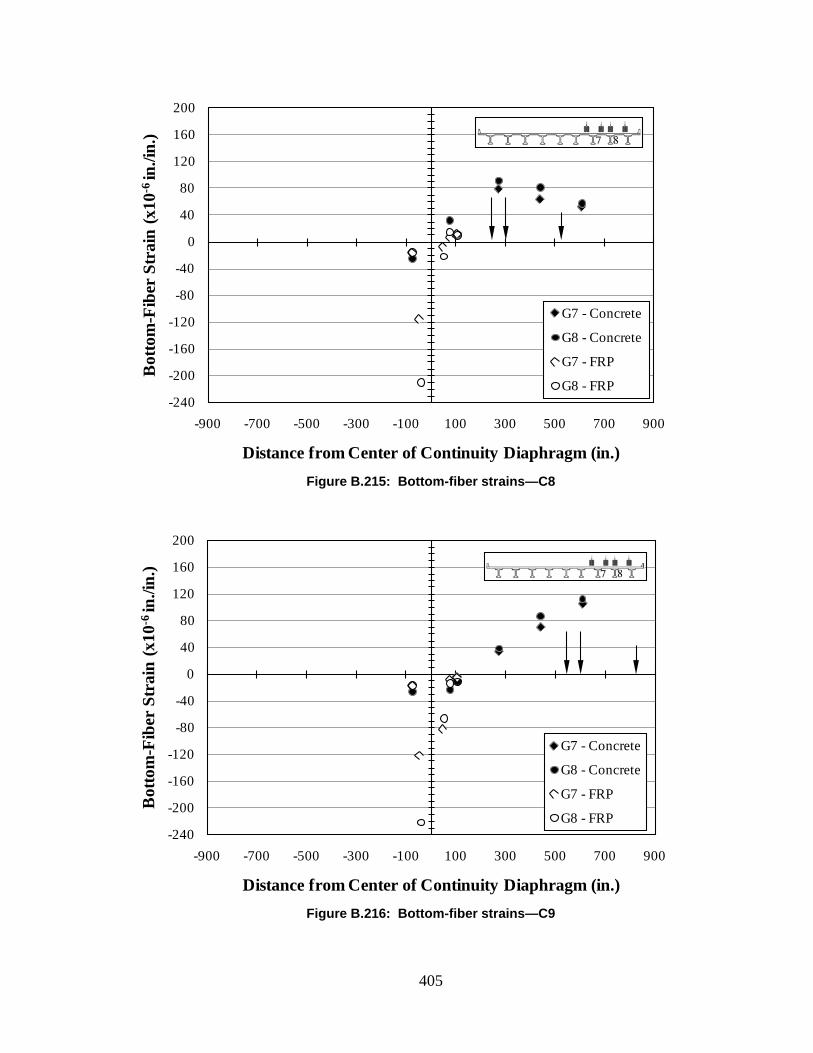
405
Figure B.215: Bottom-fiber strains—C8
Figure B.216: Bottom-fiber strains—C9
-240
-200
-160
-120
-80
-40
0
40
80
120
160
200
-900 -700 -500 -300 -100 100 300 500 700 900
Bot
tom
-Fib
er S
trai
n (x
10-6
in./i
n.)
Distance from Center of Continuity Diaphragm (in.)
G7 - Concrete
G8 - Concrete
G7 - FRP
G8 - FRP
-240
-200
-160
-120
-80
-40
0
40
80
120
160
200
-900 -700 -500 -300 -100 100 300 500 700 900
Bot
tom
-Fib
er S
trai
n (x
10-6
in./i
n.)
Distance from Center of Continuity Diaphragm (in.)
G7 - Concrete
G8 - Concrete
G7 - FRP
G8 - FRP

406
B.2.4.1 Bottom-Fiber Strains—Girder 7
Figure B.217: Bottom-fiber strains—Girder 7—C1
-240
-200
-160
-120
-80
-40
0
40
80
120
160
200
-900 -700 -500 -300 -100 100 300 500 700 900
Bot
tom
-Fib
er S
trai
n (x
10-6
in./i
n.)
Distance from Center of Continuity Diaphragm (in.)
G7 - Concrete
G7 - FRP
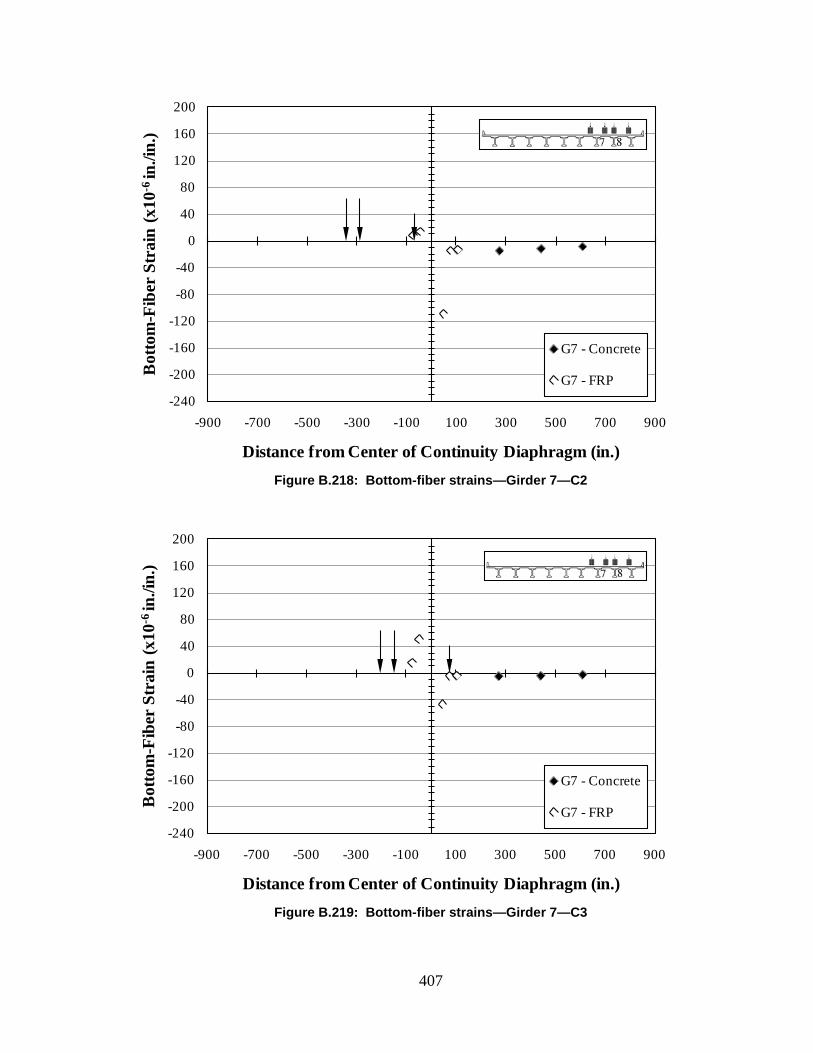
407
Figure B.218: Bottom-fiber strains—Girder 7—C2
Figure B.219: Bottom-fiber strains—Girder 7—C3
-240
-200
-160
-120
-80
-40
0
40
80
120
160
200
-900 -700 -500 -300 -100 100 300 500 700 900
Bot
tom
-Fib
er S
trai
n (x
10-6
in./i
n.)
Distance from Center of Continuity Diaphragm (in.)
G7 - Concrete
G7 - FRP
-240
-200
-160
-120
-80
-40
0
40
80
120
160
200
-900 -700 -500 -300 -100 100 300 500 700 900
Bot
tom
-Fib
er S
trai
n (x
10-6
in./i
n.)
Distance from Center of Continuity Diaphragm (in.)
G7 - Concrete
G7 - FRP

408
Figure B.220: Bottom-fiber strains—Girder 7—C4
Figure B.221: Bottom-fiber strains—Girder 7—C5
-240
-200
-160
-120
-80
-40
0
40
80
120
160
200
-900 -700 -500 -300 -100 100 300 500 700 900
Bot
tom
-Fib
er S
trai
n (x
10-6
in./i
n.)
Distance from Center of Continuity Diaphragm (in.)
G7 - Concrete
G7 - FRP
-240
-200
-160
-120
-80
-40
0
40
80
120
160
200
-900 -700 -500 -300 -100 100 300 500 700 900
Bot
tom
-Fib
er S
trai
n (x
10-6
in./i
n.)
Distance from Center of Continuity Diaphragm (in.)
G7 - Concrete
G7 - FRP

409
Figure B.222: Bottom-fiber strains—Girder 7—C6
Figure B.223: Bottom-fiber strains—Girder 7—C7
-240
-200
-160
-120
-80
-40
0
40
80
120
160
200
-900 -700 -500 -300 -100 100 300 500 700 900
Bot
tom
-Fib
er S
trai
n (x
10-6
in./i
n.)
Distance from Center of Continuity Diaphragm (in.)
G7 - Concrete
G7 - FRP
-240
-200
-160
-120
-80
-40
0
40
80
120
160
200
-900 -700 -500 -300 -100 100 300 500 700 900
Bot
tom
-Fib
er S
trai
n (x
10-6
in./i
n.)
Distance from Center of Continuity Diaphragm (in.)
G7 - Concrete
G7 - FRP
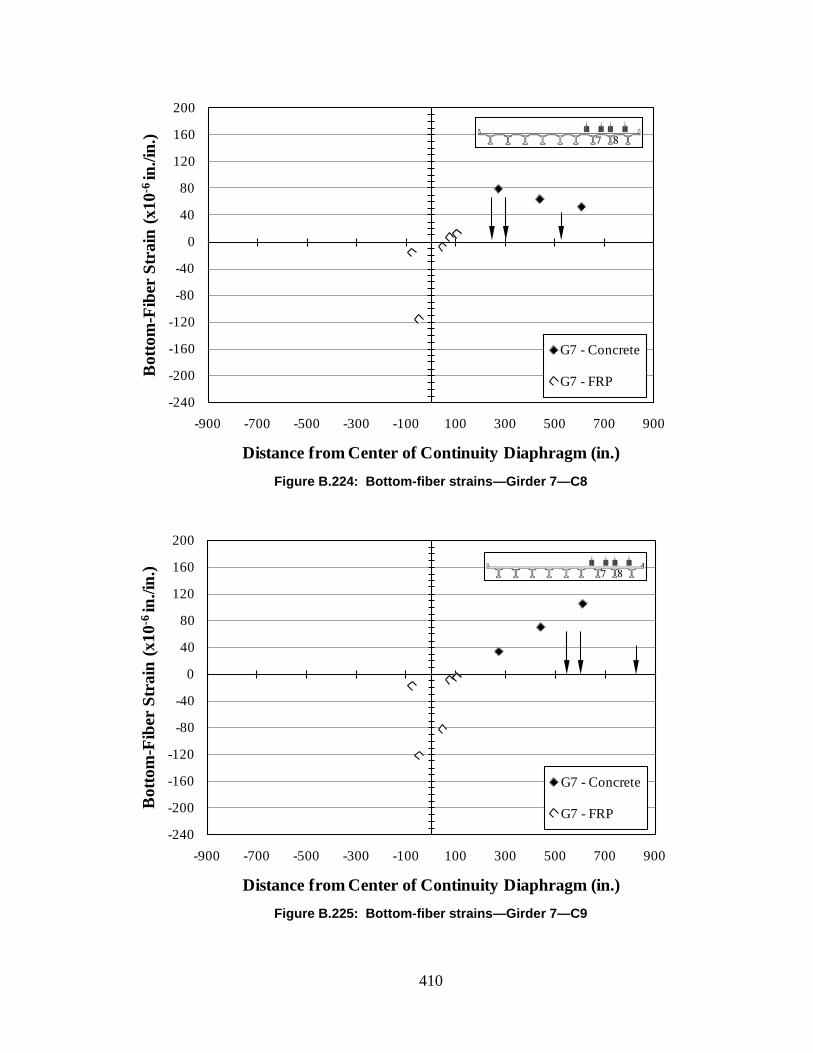
410
Figure B.224: Bottom-fiber strains—Girder 7—C8
Figure B.225: Bottom-fiber strains—Girder 7—C9
-240
-200
-160
-120
-80
-40
0
40
80
120
160
200
-900 -700 -500 -300 -100 100 300 500 700 900
Bot
tom
-Fib
er S
trai
n (x
10-6
in./i
n.)
Distance from Center of Continuity Diaphragm (in.)
G7 - Concrete
G7 - FRP
-240
-200
-160
-120
-80
-40
0
40
80
120
160
200
-900 -700 -500 -300 -100 100 300 500 700 900
Bot
tom
-Fib
er S
trai
n (x
10-6
in./i
n.)
Distance from Center of Continuity Diaphragm (in.)
G7 - Concrete
G7 - FRP
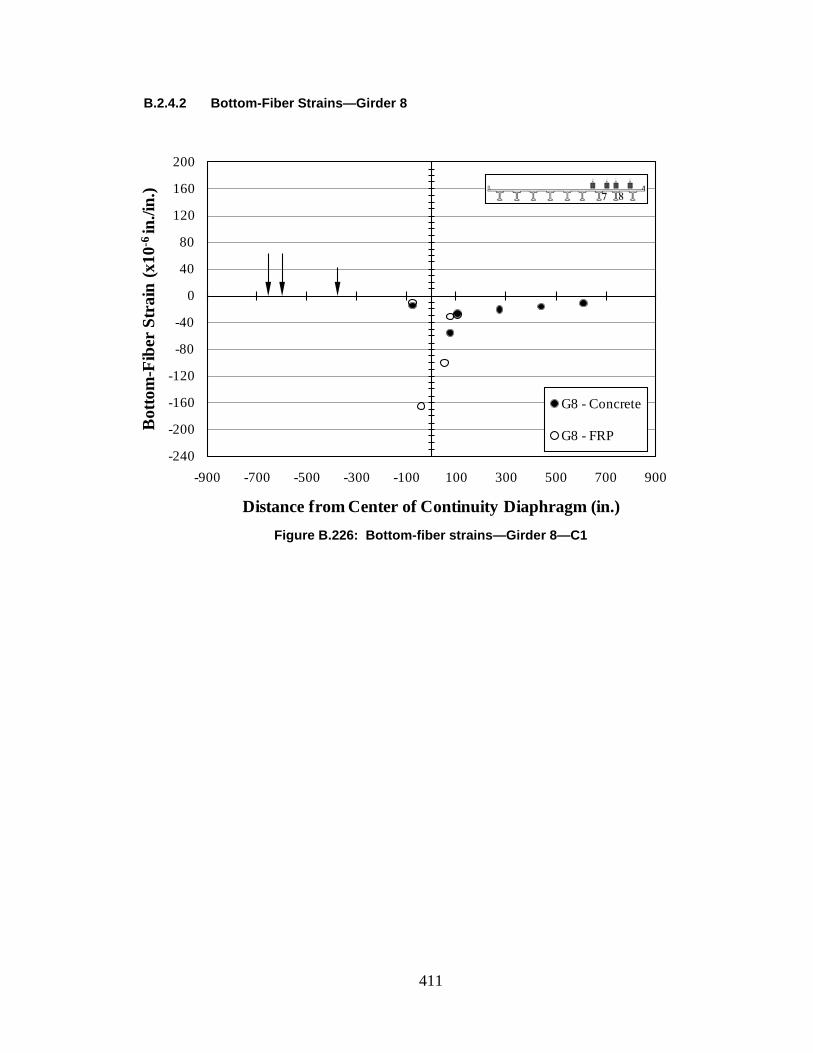
411
B.2.4.2 Bottom-Fiber Strains—Girder 8
Figure B.226: Bottom-fiber strains—Girder 8—C1
-240
-200
-160
-120
-80
-40
0
40
80
120
160
200
-900 -700 -500 -300 -100 100 300 500 700 900
Bot
tom
-Fib
er S
trai
n (x
10-6
in./i
n.)
Distance from Center of Continuity Diaphragm (in.)
G8 - Concrete
G8 - FRP

412
Figure B.227: Bottom-fiber strains—Girder 8—C2
Figure B.228: Bottom-fiber strains—Girder 8—C3
-240
-200
-160
-120
-80
-40
0
40
80
120
160
200
-900 -700 -500 -300 -100 100 300 500 700 900
Bot
tom
-Fib
er S
trai
n (x
10-6
in./i
n.)
Distance from Center of Continuity Diaphragm (in.)
G8 - Concrete
G8 - FRP
-240
-200
-160
-120
-80
-40
0
40
80
120
160
200
-900 -700 -500 -300 -100 100 300 500 700 900
Bot
tom
-Fib
er S
trai
n (x
10-6
in./i
n.)
Distance from Center of Continuity Diaphragm (in.)
G8 - Concrete
G8 - FRP

413
Figure B.229: Bottom-fiber strains—Girder 8—C4
Figure B.230: Bottom-fiber strains—Girder 8—C5
-240
-200
-160
-120
-80
-40
0
40
80
120
160
200
-900 -700 -500 -300 -100 100 300 500 700 900
Bot
tom
-Fib
er S
trai
n (x
10-6
in./i
n.)
Distance from Center of Continuity Diaphragm (in.)
G8 - Concrete
G8 - FRP
-240
-200
-160
-120
-80
-40
0
40
80
120
160
200
-900 -700 -500 -300 -100 100 300 500 700 900
Bot
tom
-Fib
er S
trai
n (x
10-6
in./i
n.)
Distance from Center of Continuity Diaphragm (in.)
G8 - Concrete
G8 - FRP

414
Figure B.231: Bottom-fiber strains—Girder 8—C6
Figure B.232: Bottom-fiber strains—Girder 8—C7
-240
-200
-160
-120
-80
-40
0
40
80
120
160
200
-900 -700 -500 -300 -100 100 300 500 700 900
Bot
tom
-Fib
er S
trai
n (x
10-6
in./i
n.)
Distance from Center of Continuity Diaphragm (in.)
G8 - Concrete
G8 - FRP
-240
-200
-160
-120
-80
-40
0
40
80
120
160
200
-900 -700 -500 -300 -100 100 300 500 700 900
Bot
tom
-Fib
er S
trai
n (x
10-6
in./i
n.)
Distance from Center of Continuity Diaphragm (in.)
G8 - Concrete
G8 - FRP
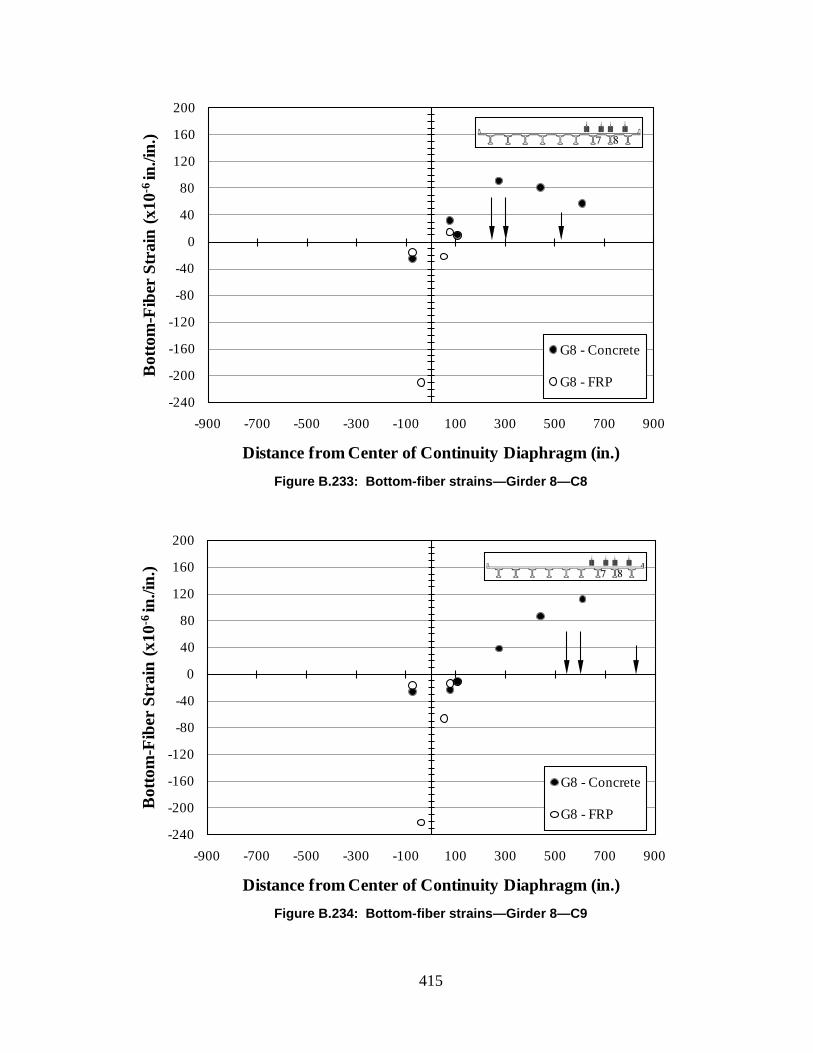
415
Figure B.233: Bottom-fiber strains—Girder 8—C8
Figure B.234: Bottom-fiber strains—Girder 8—C9
-240
-200
-160
-120
-80
-40
0
40
80
120
160
200
-900 -700 -500 -300 -100 100 300 500 700 900
Bot
tom
-Fib
er S
trai
n (x
10-6
in./i
n.)
Distance from Center of Continuity Diaphragm (in.)
G8 - Concrete
G8 - FRP
-240
-200
-160
-120
-80
-40
0
40
80
120
160
200
-900 -700 -500 -300 -100 100 300 500 700 900
Bot
tom
-Fib
er S
trai
n (x
10-6
in./i
n.)
Distance from Center of Continuity Diaphragm (in.)
G8 - Concrete
G8 - FRP

416
Appendix C
MULTIPOSITION LOAD TEST—MEASUREMENTS
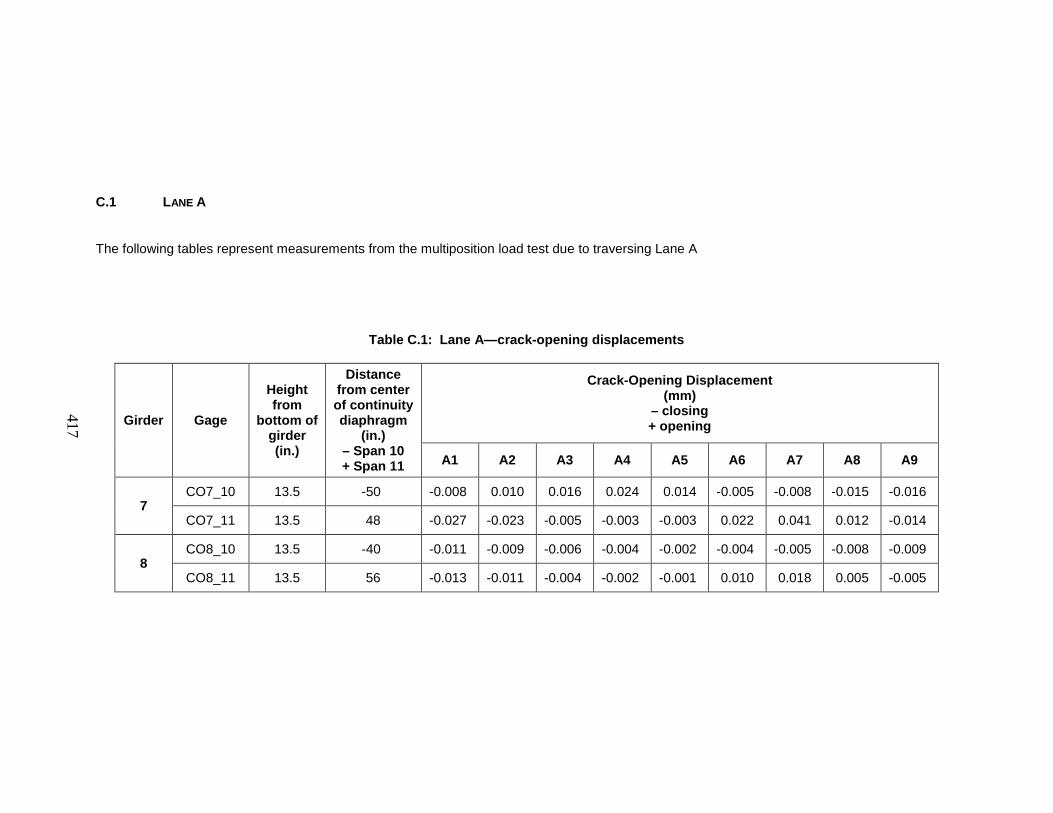
417
C.1 LANE A
The following tables represent measurements from the multiposition load test due to traversing Lane A
Table C.1: Lane A—crack-opening displacements
Girder Gage
Height from
bottom of girder (in.)
Distance from center of continuity diaphragm
(in.) – Span 10 + Span 11
Crack-Opening Displacement (mm)
– closing + opening
A1 A2 A3 A4 A5 A6 A7 A8 A9
7 CO7_10 13.5 -50 -0.008 0.010 0.016 0.024 0.014 -0.005 -0.008 -0.015 -0.016
CO7_11 13.5 48 -0.027 -0.023 -0.005 -0.003 -0.003 0.022 0.041 0.012 -0.014
8 CO8_10 13.5 -40 -0.011 -0.009 -0.006 -0.004 -0.002 -0.004 -0.005 -0.008 -0.009
CO8_11 13.5 56 -0.013 -0.011 -0.004 -0.002 -0.001 0.010 0.018 0.005 -0.005
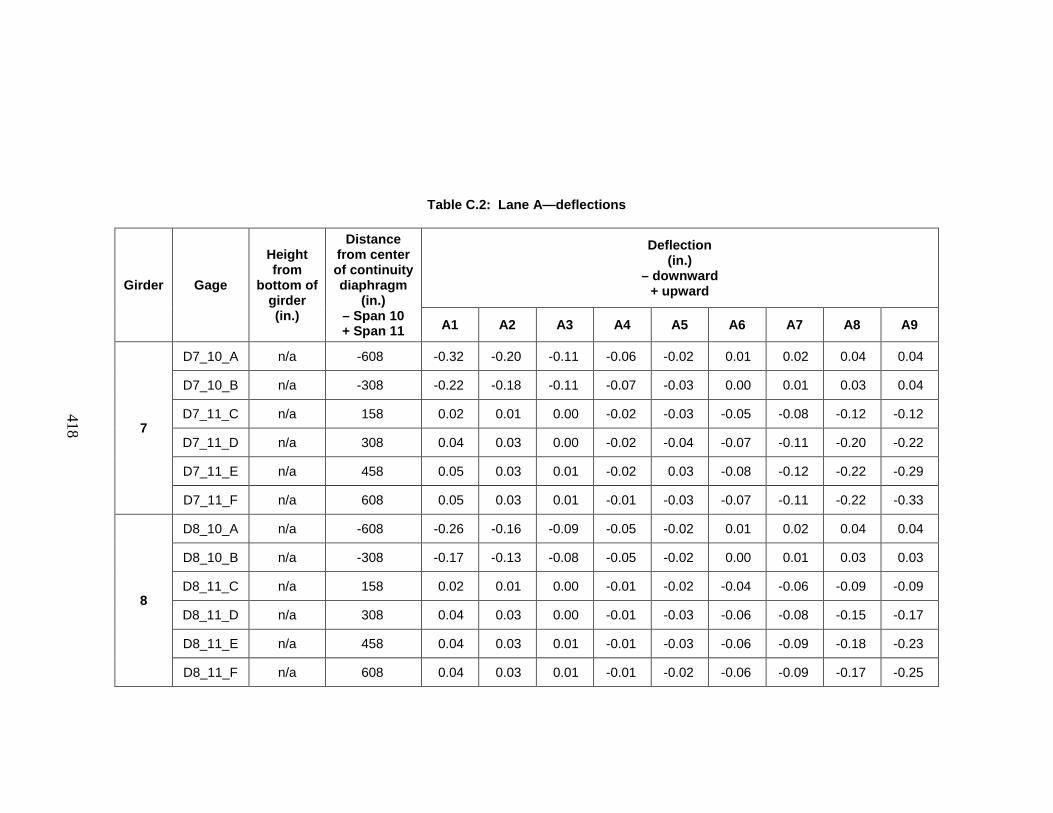
418
Table C.2: Lane A—deflections
Girder Gage
Height from
bottom of girder (in.)
Distance from center of continuity diaphragm
(in.) – Span 10 + Span 11
Deflection (in.)
– downward + upward
A1 A2 A3 A4 A5 A6 A7 A8 A9
7
D7_10_A n/a -608 -0.32 -0.20 -0.11 -0.06 -0.02 0.01 0.02 0.04 0.04
D7_10_B n/a -308 -0.22 -0.18 -0.11 -0.07 -0.03 0.00 0.01 0.03 0.04
D7_11_C n/a 158 0.02 0.01 0.00 -0.02 -0.03 -0.05 -0.08 -0.12 -0.12
D7_11_D n/a 308 0.04 0.03 0.00 -0.02 -0.04 -0.07 -0.11 -0.20 -0.22
D7_11_E n/a 458 0.05 0.03 0.01 -0.02 0.03 -0.08 -0.12 -0.22 -0.29
D7_11_F n/a 608 0.05 0.03 0.01 -0.01 -0.03 -0.07 -0.11 -0.22 -0.33
8
D8_10_A n/a -608 -0.26 -0.16 -0.09 -0.05 -0.02 0.01 0.02 0.04 0.04
D8_10_B n/a -308 -0.17 -0.13 -0.08 -0.05 -0.02 0.00 0.01 0.03 0.03
D8_11_C n/a 158 0.02 0.01 0.00 -0.01 -0.02 -0.04 -0.06 -0.09 -0.09
D8_11_D n/a 308 0.04 0.03 0.00 -0.01 -0.03 -0.06 -0.08 -0.15 -0.17
D8_11_E n/a 458 0.04 0.03 0.01 -0.01 -0.03 -0.06 -0.09 -0.18 -0.23
D8_11_F n/a 608 0.04 0.03 0.01 -0.01 -0.02 -0.06 -0.09 -0.17 -0.25
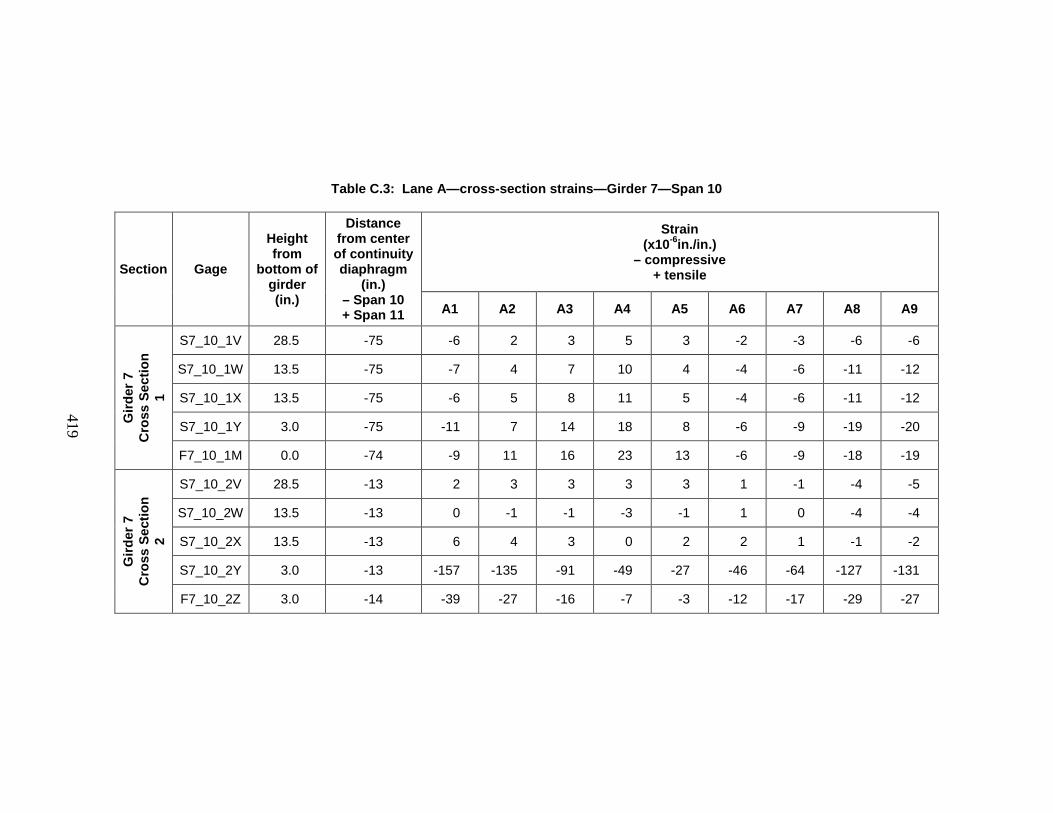
419
Table C.3: Lane A—cross-section strains—Girder 7—Span 10
Section Gage
Height from
bottom of girder (in.)
Distance from center of continuity diaphragm
(in.) – Span 10 + Span 11
Strain (x10-6in./in.)
– compressive + tensile
A1 A2 A3 A4 A5 A6 A7 A8 A9
Gird
er 7
C
ross
Sec
tion
1
S7_10_1V 28.5 -75 -6 2 3 5 3 -2 -3 -6 -6
S7_10_1W 13.5 -75 -7 4 7 10 4 -4 -6 -11 -12
S7_10_1X 13.5 -75 -6 5 8 11 5 -4 -6 -11 -12
S7_10_1Y 3.0 -75 -11 7 14 18 8 -6 -9 -19 -20
F7_10_1M 0.0 -74 -9 11 16 23 13 -6 -9 -18 -19
Gird
er 7
C
ross
Sec
tion
2
S7_10_2V 28.5 -13 2 3 3 3 3 1 -1 -4 -5
S7_10_2W 13.5 -13 0 -1 -1 -3 -1 1 0 -4 -4
S7_10_2X 13.5 -13 6 4 3 0 2 2 1 -1 -2
S7_10_2Y 3.0 -13 -157 -135 -91 -49 -27 -46 -64 -127 -131
F7_10_2Z 3.0 -14 -39 -27 -16 -7 -3 -12 -17 -29 -27
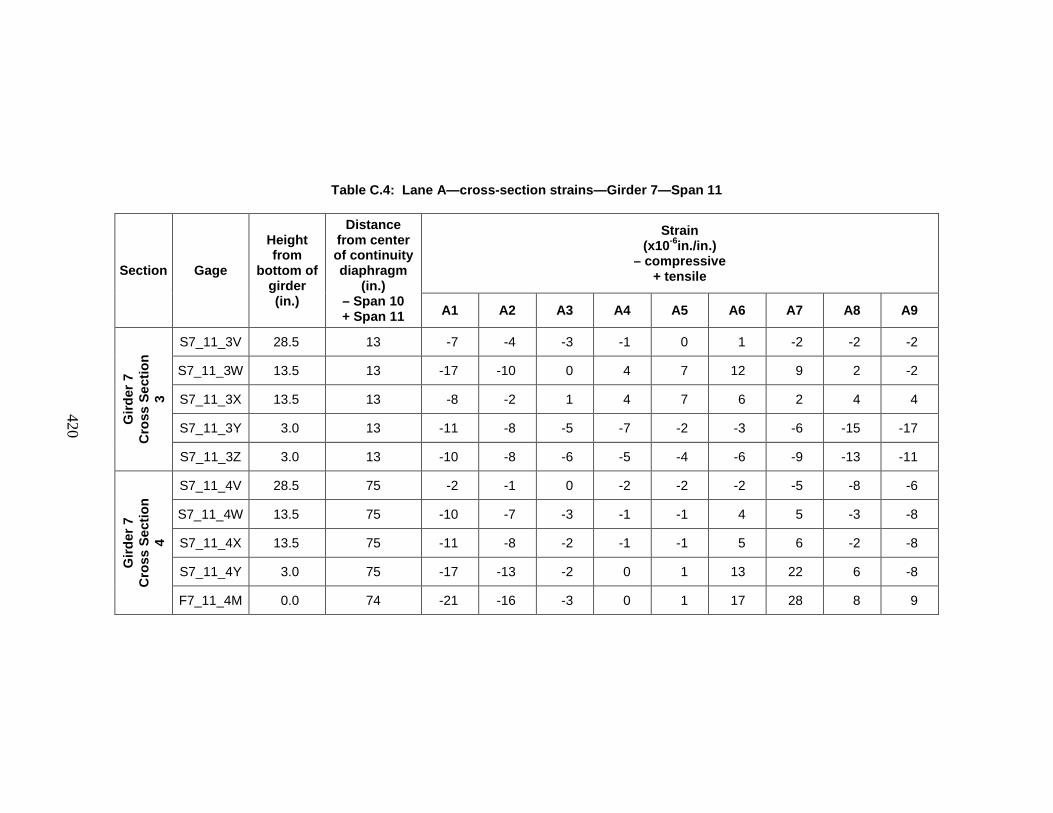
420
Table C.4: Lane A—cross-section strains—Girder 7—Span 11
Section Gage
Height from
bottom of girder (in.)
Distance from center of continuity diaphragm
(in.) – Span 10 + Span 11
Strain (x10-6in./in.)
– compressive + tensile
A1 A2 A3 A4 A5 A6 A7 A8 A9
Gird
er 7
C
ross
Sec
tion
3
S7_11_3V 28.5 13 -7 -4 -3 -1 0 1 -2 -2 -2
S7_11_3W 13.5 13 -17 -10 0 4 7 12 9 2 -2
S7_11_3X 13.5 13 -8 -2 1 4 7 6 2 4 4
S7_11_3Y 3.0 13 -11 -8 -5 -7 -2 -3 -6 -15 -17
S7_11_3Z 3.0 13 -10 -8 -6 -5 -4 -6 -9 -13 -11
Gird
er 7
C
ross
Sec
tion
4
S7_11_4V 28.5 75 -2 -1 0 -2 -2 -2 -5 -8 -6
S7_11_4W 13.5 75 -10 -7 -3 -1 -1 4 5 -3 -8
S7_11_4X 13.5 75 -11 -8 -2 -1 -1 5 6 -2 -8
S7_11_4Y 3.0 75 -17 -13 -2 0 1 13 22 6 -8
F7_11_4M 0.0 74 -21 -16 -3 0 1 17 28 8 9

421
Table C.5: Lane A—cross-section strains—Girder 8—Span 10
Section Gage
Height from
bottom of girder (in.)
Distance from center of continuity diaphragm
(in.) – Span 10 + Span 11
Strain (x10-6in./in.)
– compressive + tensile
A1 A2 A3 A4 A5 A6 A7 A8 A9
Gird
er 8
C
ross
Sec
tion
1
S8_10_1V 28.5 -75 -5 -2 -1 0 0 -3 -3 -5 -6
S8_10_1W 13.5 -75 -7 1 3 5 2 -4 -6 -11 -12
S8_10_1X 13.5 -75 -9 1 3 7 4 -4 -7 -12 -12
F8_10_1Y 3.0 -74 -5 1 2 3 1 -3 -4 -8 -8
S8_10_1M 0.0 -75 -11 4 7 13 7 -6 -9 -16 -17
F8_10_1M 0.0 -74 -4 5 6 10 5 -4 -6 -11 -11
Gird
er 8
C
ross
Sec
tion
2
S8_10_2V 28.5 -13 0 1 1 1 2 0 -1 -3 -4
S8_10_2W 13.5 -13 2 4 3 3 2 -1 -2 -7 -9
S8_10_2X 13.5 -13 4 6 5 3 4 1 -2 -6 -8
F8_10_2Y 3.0 -14 -32 -21 -14 -10 -7 -14 -18 -28 -30
F8_10_2Z 3.0 -14 -28 -19 -11 -5 -2 -4 -8 -13 -13
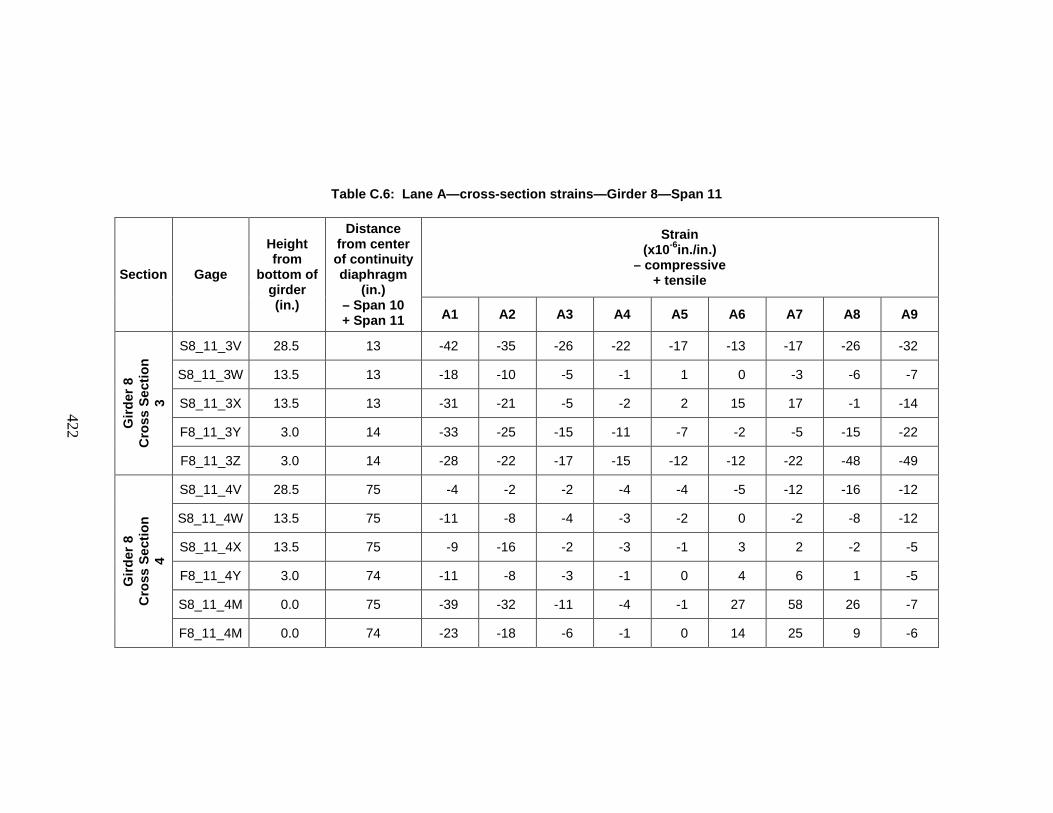
422
Table C.6: Lane A—cross-section strains—Girder 8—Span 11
Section Gage
Height from
bottom of girder (in.)
Distance from center of continuity diaphragm
(in.) – Span 10 + Span 11
Strain (x10-6in./in.)
– compressive + tensile
A1 A2 A3 A4 A5 A6 A7 A8 A9
Gird
er 8
C
ross
Sec
tion
3
S8_11_3V 28.5 13 -42 -35 -26 -22 -17 -13 -17 -26 -32
S8_11_3W 13.5 13 -18 -10 -5 -1 1 0 -3 -6 -7
S8_11_3X 13.5 13 -31 -21 -5 -2 2 15 17 -1 -14
F8_11_3Y 3.0 14 -33 -25 -15 -11 -7 -2 -5 -15 -22
F8_11_3Z 3.0 14 -28 -22 -17 -15 -12 -12 -22 -48 -49
Gird
er 8
C
ross
Sec
tion
4
S8_11_4V 28.5 75 -4 -2 -2 -4 -4 -5 -12 -16 -12
S8_11_4W 13.5 75 -11 -8 -4 -3 -2 0 -2 -8 -12
S8_11_4X 13.5 75 -9 -16 -2 -3 -1 3 2 -2 -5
F8_11_4Y 3.0 74 -11 -8 -3 -1 0 4 6 1 -5
S8_11_4M 0.0 75 -39 -32 -11 -4 -1 27 58 26 -7
F8_11_4M 0.0 74 -23 -18 -6 -1 0 14 25 9 -6
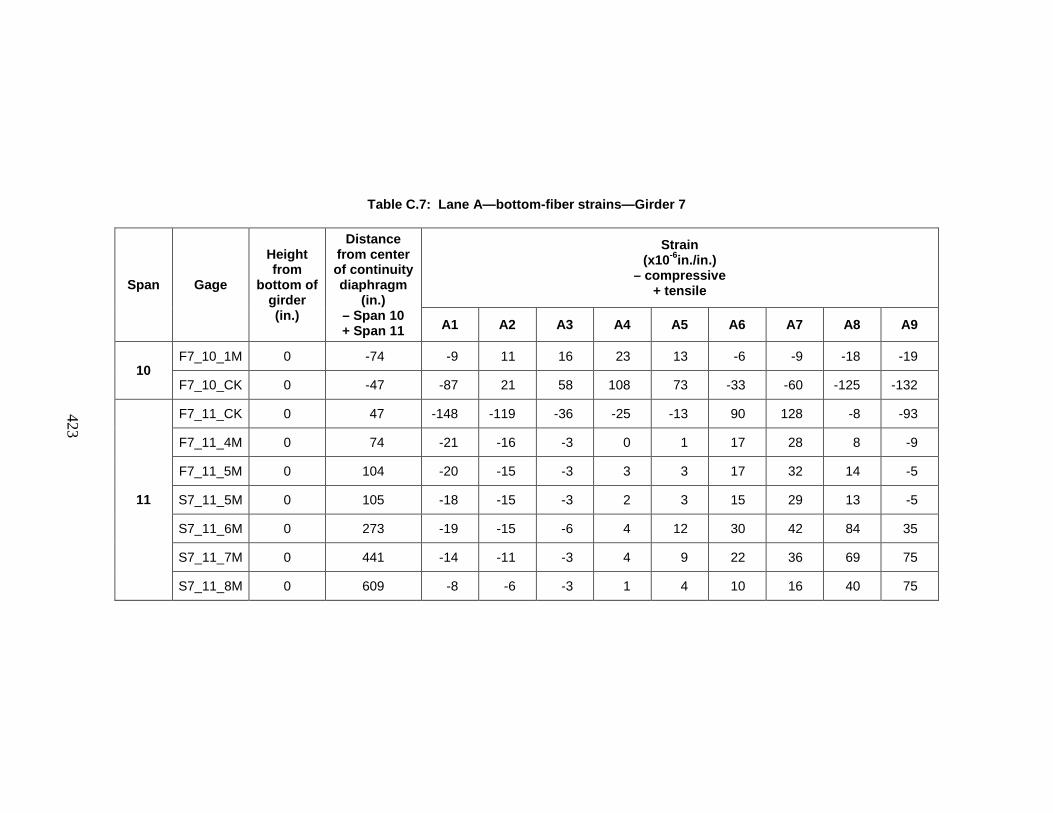
423
Table C.7: Lane A—bottom-fiber strains—Girder 7
Span Gage
Height from
bottom of girder (in.)
Distance from center of continuity diaphragm
(in.) – Span 10 + Span 11
Strain (x10-6in./in.)
– compressive + tensile
A1 A2 A3 A4 A5 A6 A7 A8 A9
10 F7_10_1M 0 -74 -9 11 16 23 13 -6 -9 -18 -19
F7_10_CK 0 -47 -87 21 58 108 73 -33 -60 -125 -132
11
F7_11_CK 0 47 -148 -119 -36 -25 -13 90 128 -8 -93
F7_11_4M 0 74 -21 -16 -3 0 1 17 28 8 -9
F7_11_5M 0 104 -20 -15 -3 3 3 17 32 14 -5
S7_11_5M 0 105 -18 -15 -3 2 3 15 29 13 -5
S7_11_6M 0 273 -19 -15 -6 4 12 30 42 84 35
S7_11_7M 0 441 -14 -11 -3 4 9 22 36 69 75
S7_11_8M 0 609 -8 -6 -3 1 4 10 16 40 75
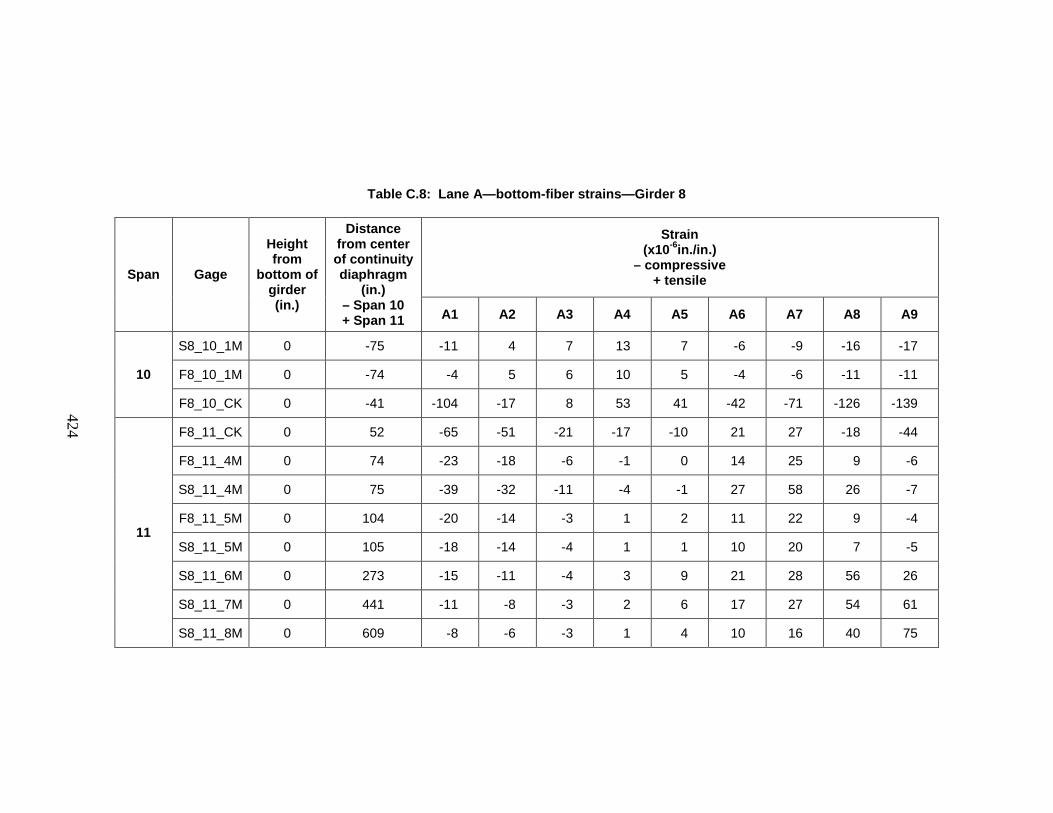
424
Table C.8: Lane A—bottom-fiber strains—Girder 8
Span Gage
Height from
bottom of girder (in.)
Distance from center of continuity diaphragm
(in.) – Span 10 + Span 11
Strain (x10-6in./in.)
– compressive + tensile
A1 A2 A3 A4 A5 A6 A7 A8 A9
10
S8_10_1M 0 -75 -11 4 7 13 7 -6 -9 -16 -17
F8_10_1M 0 -74 -4 5 6 10 5 -4 -6 -11 -11
F8_10_CK 0 -41 -104 -17 8 53 41 -42 -71 -126 -139
11
F8_11_CK 0 52 -65 -51 -21 -17 -10 21 27 -18 -44
F8_11_4M 0 74 -23 -18 -6 -1 0 14 25 9 -6
S8_11_4M 0 75 -39 -32 -11 -4 -1 27 58 26 -7
F8_11_5M 0 104 -20 -14 -3 1 2 11 22 9 -4
S8_11_5M 0 105 -18 -14 -4 1 1 10 20 7 -5
S8_11_6M 0 273 -15 -11 -4 3 9 21 28 56 26
S8_11_7M 0 441 -11 -8 -3 2 6 17 27 54 61
S8_11_8M 0 609 -8 -6 -3 1 4 10 16 40 75
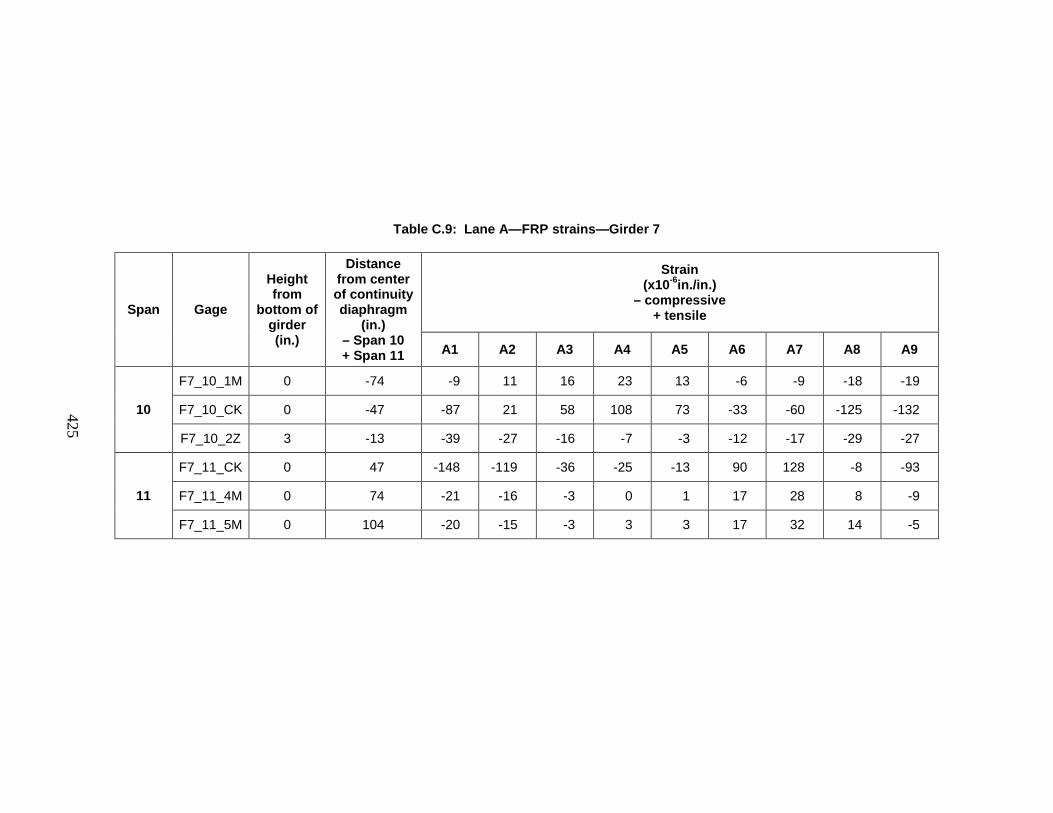
425
Table C.9: Lane A—FRP strains—Girder 7
Span Gage
Height from
bottom of girder (in.)
Distance from center of continuity diaphragm
(in.) – Span 10 + Span 11
Strain (x10-6in./in.)
– compressive + tensile
A1 A2 A3 A4 A5 A6 A7 A8 A9
10
F7_10_1M 0 -74 -9 11 16 23 13 -6 -9 -18 -19
F7_10_CK 0 -47 -87 21 58 108 73 -33 -60 -125 -132
F7_10_2Z 3 -13 -39 -27 -16 -7 -3 -12 -17 -29 -27
11
F7_11_CK 0 47 -148 -119 -36 -25 -13 90 128 -8 -93
F7_11_4M 0 74 -21 -16 -3 0 1 17 28 8 -9
F7_11_5M 0 104 -20 -15 -3 3 3 17 32 14 -5
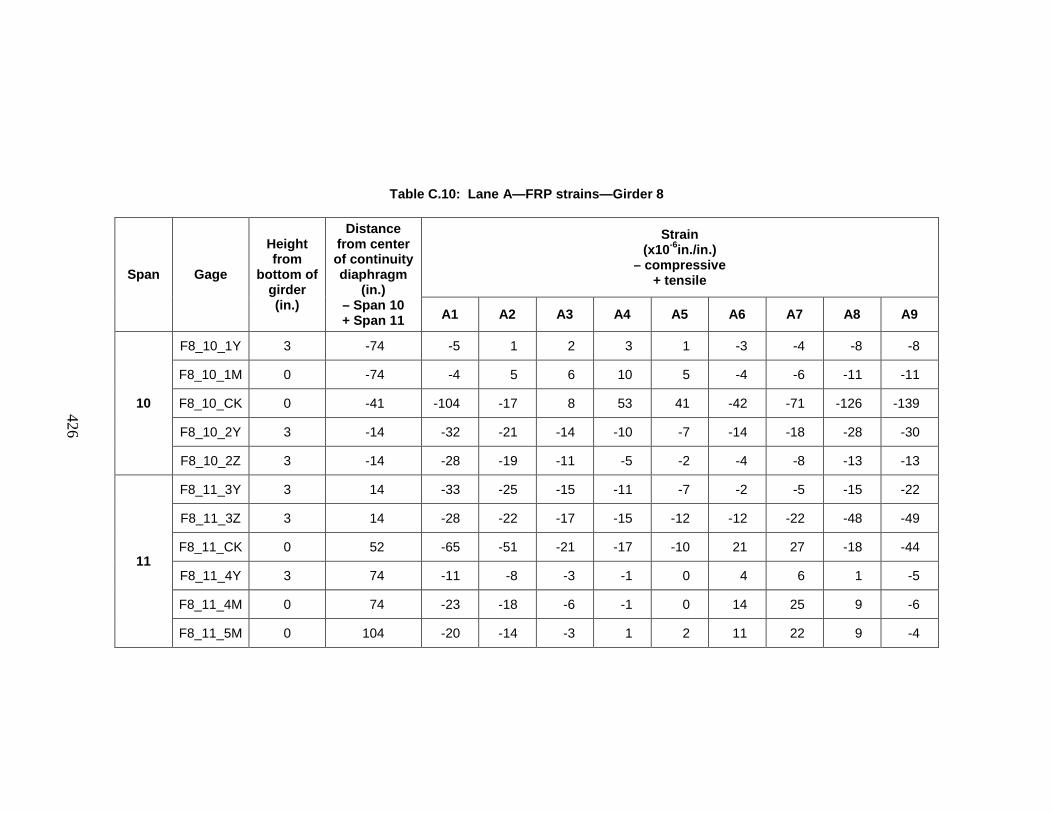
426
Table C.10: Lane A—FRP strains—Girder 8
Span Gage
Height from
bottom of girder (in.)
Distance from center of continuity diaphragm
(in.) – Span 10 + Span 11
Strain (x10-6in./in.)
– compressive + tensile
A1 A2 A3 A4 A5 A6 A7 A8 A9
10
F8_10_1Y 3 -74 -5 1 2 3 1 -3 -4 -8 -8
F8_10_1M 0 -74 -4 5 6 10 5 -4 -6 -11 -11
F8_10_CK 0 -41 -104 -17 8 53 41 -42 -71 -126 -139
F8_10_2Y 3 -14 -32 -21 -14 -10 -7 -14 -18 -28 -30
F8_10_2Z 3 -14 -28 -19 -11 -5 -2 -4 -8 -13 -13
11
F8_11_3Y 3 14 -33 -25 -15 -11 -7 -2 -5 -15 -22
F8_11_3Z 3 14 -28 -22 -17 -15 -12 -12 -22 -48 -49
F8_11_CK 0 52 -65 -51 -21 -17 -10 21 27 -18 -44
F8_11_4Y 3 74 -11 -8 -3 -1 0 4 6 1 -5
F8_11_4M 0 74 -23 -18 -6 -1 0 14 25 9 -6
F8_11_5M 0 104 -20 -14 -3 1 2 11 22 9 -4

427
C.2 LANE C
The following tables represent measurements from the multiposition load test due to traversing Lane C.
Table C.11: Lane C—crack-opening displacements
Girder Gage
Height from
bottom of girder (in.)
Distance from center of continuity diaphragm
(in.) – Span 10 + Span 11
Crack-Opening Displacement (mm)
– closing + opening
C1 C2 C3 C4 C5 C6 C7 C8 C9
7 CO7_10 13.5 -50 -0.003 0.010 0.016 0.022 0.011 -0.006 -0.009 -0.015 -0.017
CO7_11 13.5 48 -0.025 -0.022 -0.008 -0.006 -0.004 0.020 0.039 0.015 -0.008
8 CO8_10 13.5 -40 -0.016 -0.013 -0.008 -0.005 -0.002 -0.005 -0.008 -0.015 -0.015
CO8_11 13.5 56 -0.020 -0.018 -0.007 -0.004 -0.002 0.017 0.032 0.011 -0.007
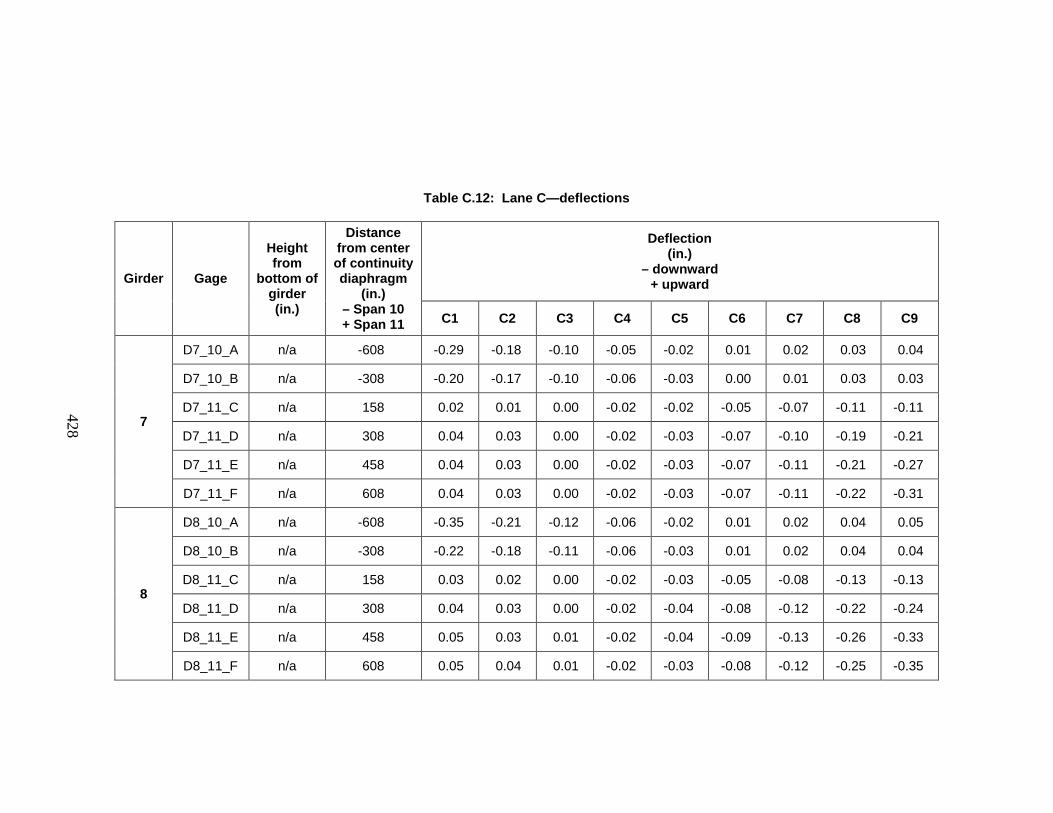
428
Table C.12: Lane C—deflections
Girder Gage
Height from
bottom of girder (in.)
Distance from center of continuity diaphragm
(in.) – Span 10 + Span 11
Deflection (in.)
– downward + upward
C1 C2 C3 C4 C5 C6 C7 C8 C9
7
D7_10_A n/a -608 -0.29 -0.18 -0.10 -0.05 -0.02 0.01 0.02 0.03 0.04
D7_10_B n/a -308 -0.20 -0.17 -0.10 -0.06 -0.03 0.00 0.01 0.03 0.03
D7_11_C n/a 158 0.02 0.01 0.00 -0.02 -0.02 -0.05 -0.07 -0.11 -0.11
D7_11_D n/a 308 0.04 0.03 0.00 -0.02 -0.03 -0.07 -0.10 -0.19 -0.21
D7_11_E n/a 458 0.04 0.03 0.00 -0.02 -0.03 -0.07 -0.11 -0.21 -0.27
D7_11_F n/a 608 0.04 0.03 0.00 -0.02 -0.03 -0.07 -0.11 -0.22 -0.31
8
D8_10_A n/a -608 -0.35 -0.21 -0.12 -0.06 -0.02 0.01 0.02 0.04 0.05
D8_10_B n/a -308 -0.22 -0.18 -0.11 -0.06 -0.03 0.01 0.02 0.04 0.04
D8_11_C n/a 158 0.03 0.02 0.00 -0.02 -0.03 -0.05 -0.08 -0.13 -0.13
D8_11_D n/a 308 0.04 0.03 0.00 -0.02 -0.04 -0.08 -0.12 -0.22 -0.24
D8_11_E n/a 458 0.05 0.03 0.01 -0.02 -0.04 -0.09 -0.13 -0.26 -0.33
D8_11_F n/a 608 0.05 0.04 0.01 -0.02 -0.03 -0.08 -0.12 -0.25 -0.35
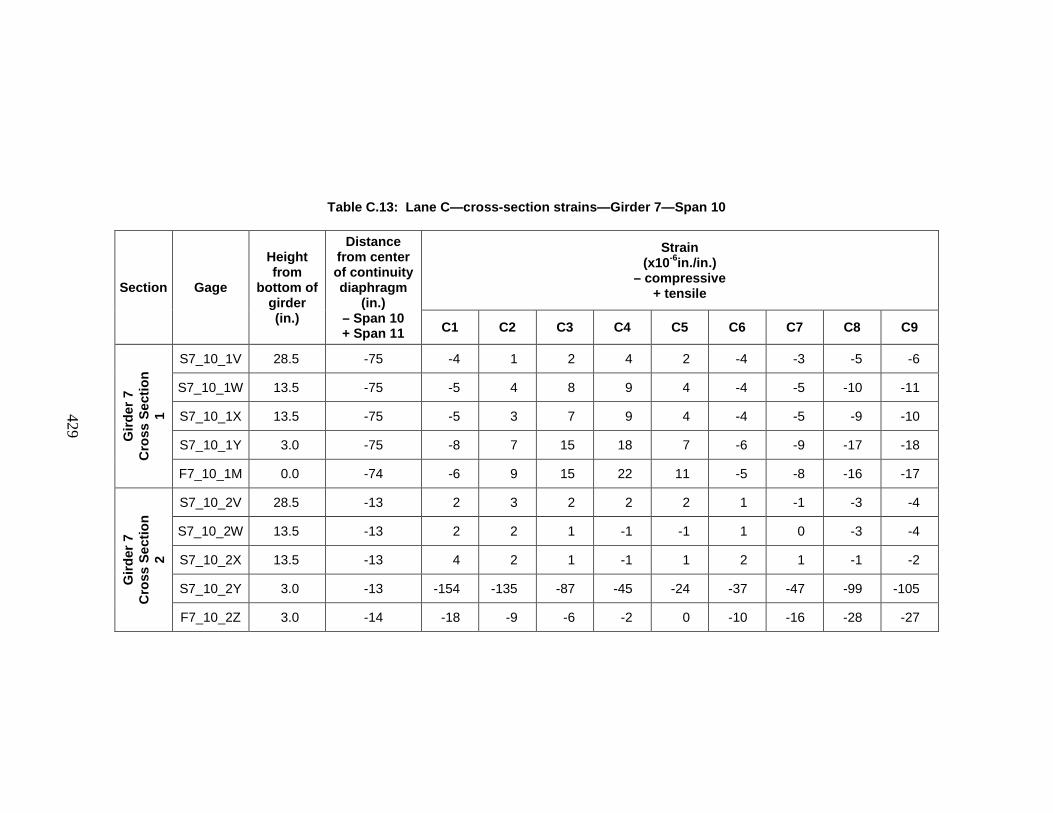
429
Table C.13: Lane C—cross-section strains—Girder 7—Span 10
Section Gage
Height from
bottom of girder (in.)
Distance from center of continuity diaphragm
(in.) – Span 10 + Span 11
Strain (x10-6in./in.)
– compressive + tensile
C1 C2 C3 C4 C5 C6 C7 C8 C9
Gird
er 7
C
ross
Sec
tion
1
S7_10_1V 28.5 -75 -4 1 2 4 2 -4 -3 -5 -6
S7_10_1W 13.5 -75 -5 4 8 9 4 -4 -5 -10 -11
S7_10_1X 13.5 -75 -5 3 7 9 4 -4 -5 -9 -10
S7_10_1Y 3.0 -75 -8 7 15 18 7 -6 -9 -17 -18
F7_10_1M 0.0 -74 -6 9 15 22 11 -5 -8 -16 -17
Gird
er 7
C
ross
Sec
tion
2
S7_10_2V 28.5 -13 2 3 2 2 2 1 -1 -3 -4
S7_10_2W 13.5 -13 2 2 1 -1 -1 1 0 -3 -4
S7_10_2X 13.5 -13 4 2 1 -1 1 2 1 -1 -2
S7_10_2Y 3.0 -13 -154 -135 -87 -45 -24 -37 -47 -99 -105
F7_10_2Z 3.0 -14 -18 -9 -6 -2 0 -10 -16 -28 -27
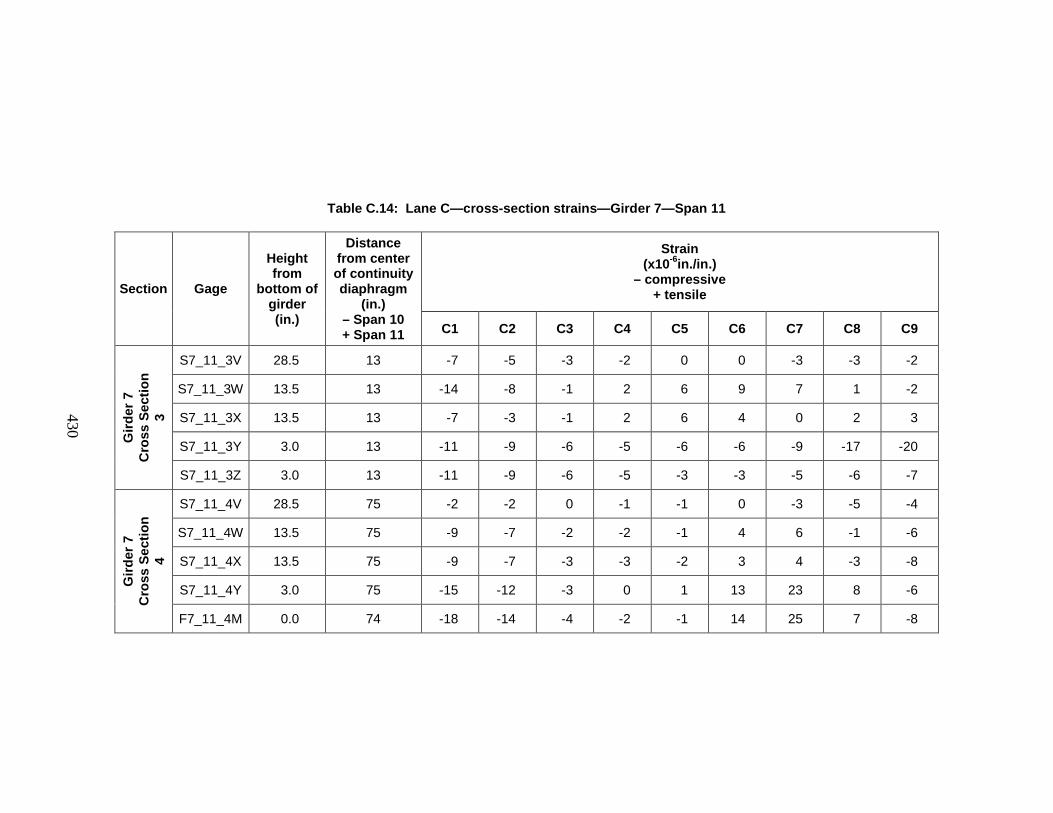
430
Table C.14: Lane C—cross-section strains—Girder 7—Span 11
Section Gage
Height from
bottom of girder (in.)
Distance from center of continuity diaphragm
(in.) – Span 10 + Span 11
Strain (x10-6in./in.)
– compressive + tensile
C1 C2 C3 C4 C5 C6 C7 C8 C9
Gird
er 7
C
ross
Sec
tion
3
S7_11_3V 28.5 13 -7 -5 -3 -2 0 0 -3 -3 -2
S7_11_3W 13.5 13 -14 -8 -1 2 6 9 7 1 -2
S7_11_3X 13.5 13 -7 -3 -1 2 6 4 0 2 3
S7_11_3Y 3.0 13 -11 -9 -6 -5 -6 -6 -9 -17 -20
S7_11_3Z 3.0 13 -11 -9 -6 -5 -3 -3 -5 -6 -7
Gird
er 7
C
ross
Sec
tion
4
S7_11_4V 28.5 75 -2 -2 0 -1 -1 0 -3 -5 -4
S7_11_4W 13.5 75 -9 -7 -2 -2 -1 4 6 -1 -6
S7_11_4X 13.5 75 -9 -7 -3 -3 -2 3 4 -3 -8
S7_11_4Y 3.0 75 -15 -12 -3 0 1 13 23 8 -6
F7_11_4M 0.0 74 -18 -14 -4 -2 -1 14 25 7 -8
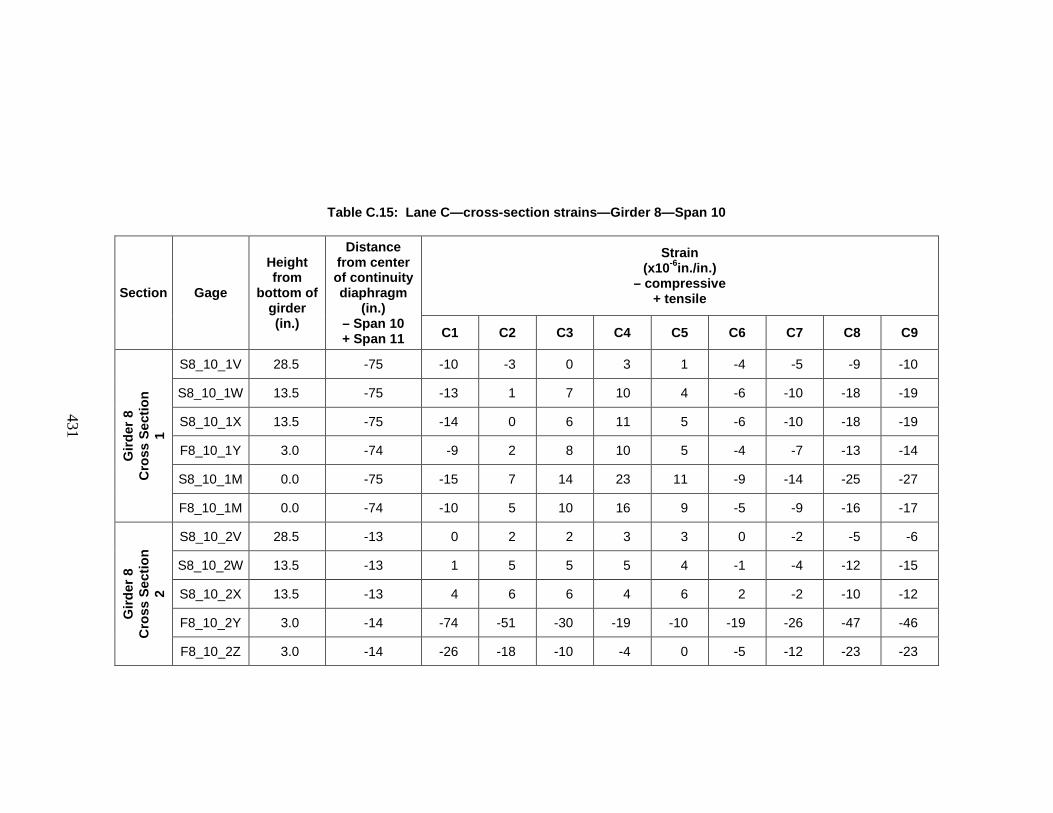
431
Table C.15: Lane C—cross-section strains—Girder 8—Span 10
Section Gage
Height from
bottom of girder (in.)
Distance from center of continuity diaphragm
(in.) – Span 10 + Span 11
Strain (x10-6in./in.)
– compressive + tensile
C1 C2 C3 C4 C5 C6 C7 C8 C9
Gird
er 8
C
ross
Sec
tion
1
S8_10_1V 28.5 -75 -10 -3 0 3 1 -4 -5 -9 -10
S8_10_1W 13.5 -75 -13 1 7 10 4 -6 -10 -18 -19
S8_10_1X 13.5 -75 -14 0 6 11 5 -6 -10 -18 -19
F8_10_1Y 3.0 -74 -9 2 8 10 5 -4 -7 -13 -14
S8_10_1M 0.0 -75 -15 7 14 23 11 -9 -14 -25 -27
F8_10_1M 0.0 -74 -10 5 10 16 9 -5 -9 -16 -17
Gird
er 8
C
ross
Sec
tion
2
S8_10_2V 28.5 -13 0 2 2 3 3 0 -2 -5 -6
S8_10_2W 13.5 -13 1 5 5 5 4 -1 -4 -12 -15
S8_10_2X 13.5 -13 4 6 6 4 6 2 -2 -10 -12
F8_10_2Y 3.0 -14 -74 -51 -30 -19 -10 -19 -26 -47 -46
F8_10_2Z 3.0 -14 -26 -18 -10 -4 0 -5 -12 -23 -23
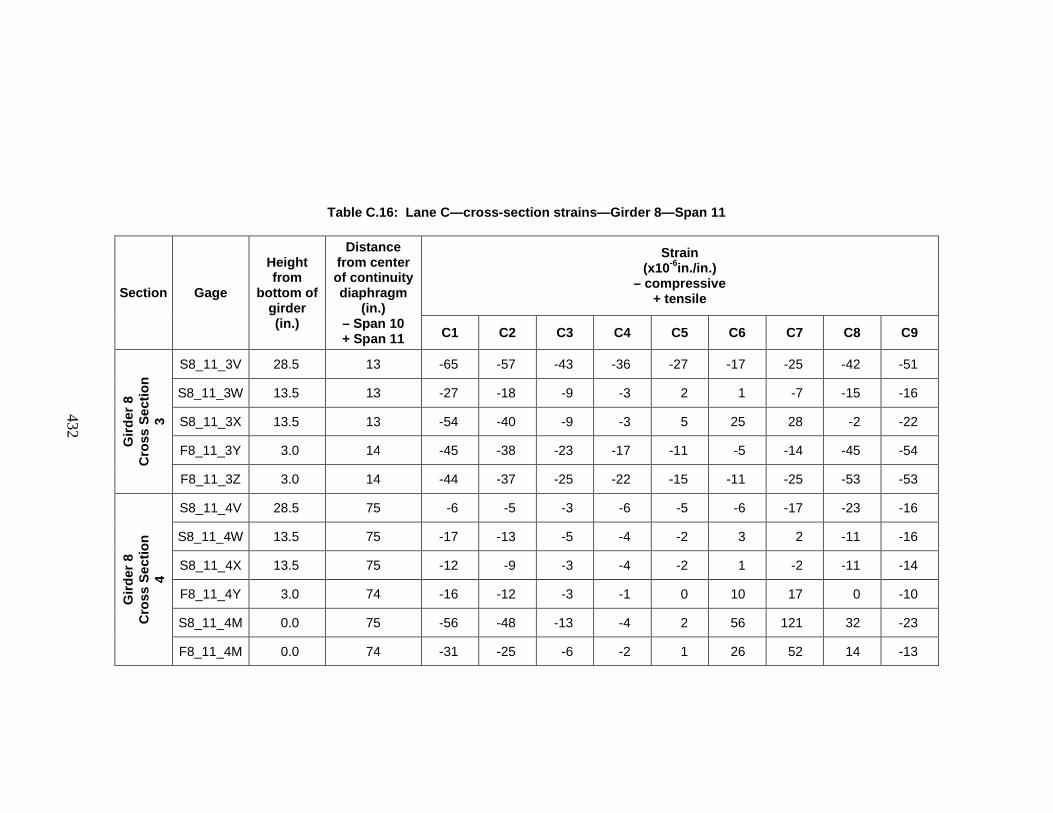
432
Table C.16: Lane C—cross-section strains—Girder 8—Span 11
Section Gage
Height from
bottom of girder (in.)
Distance from center of continuity diaphragm
(in.) – Span 10 + Span 11
Strain (x10-6in./in.)
– compressive + tensile
C1 C2 C3 C4 C5 C6 C7 C8 C9
Gird
er 8
C
ross
Sec
tion
3
S8_11_3V 28.5 13 -65 -57 -43 -36 -27 -17 -25 -42 -51
S8_11_3W 13.5 13 -27 -18 -9 -3 2 1 -7 -15 -16
S8_11_3X 13.5 13 -54 -40 -9 -3 5 25 28 -2 -22
F8_11_3Y 3.0 14 -45 -38 -23 -17 -11 -5 -14 -45 -54
F8_11_3Z 3.0 14 -44 -37 -25 -22 -15 -11 -25 -53 -53
Gird
er 8
C
ross
Sec
tion
4
S8_11_4V 28.5 75 -6 -5 -3 -6 -5 -6 -17 -23 -16
S8_11_4W 13.5 75 -17 -13 -5 -4 -2 3 2 -11 -16
S8_11_4X 13.5 75 -12 -9 -3 -4 -2 1 -2 -11 -14
F8_11_4Y 3.0 74 -16 -12 -3 -1 0 10 17 0 -10
S8_11_4M 0.0 75 -56 -48 -13 -4 2 56 121 32 -23
F8_11_4M 0.0 74 -31 -25 -6 -2 1 26 52 14 -13
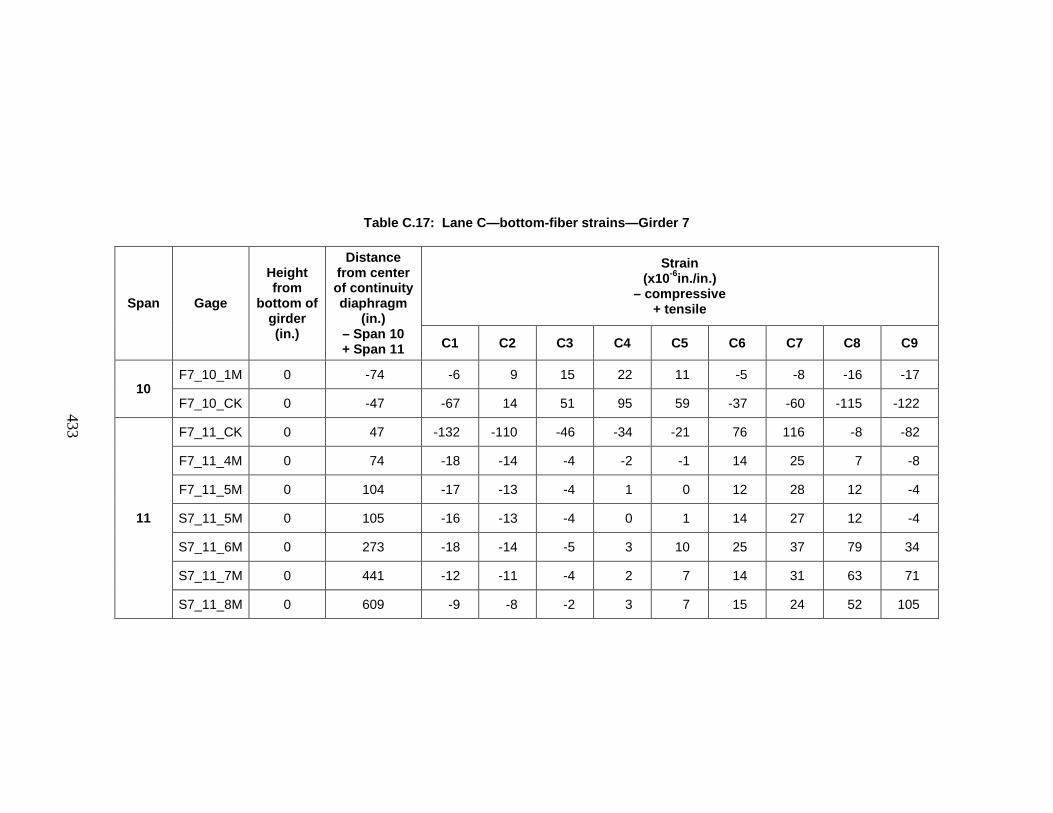
433
Table C.17: Lane C—bottom-fiber strains—Girder 7
Span Gage
Height from
bottom of girder (in.)
Distance from center of continuity diaphragm
(in.) – Span 10 + Span 11
Strain (x10-6in./in.)
– compressive + tensile
C1 C2 C3 C4 C5 C6 C7 C8 C9
10 F7_10_1M 0 -74 -6 9 15 22 11 -5 -8 -16 -17
F7_10_CK 0 -47 -67 14 51 95 59 -37 -60 -115 -122
11
F7_11_CK 0 47 -132 -110 -46 -34 -21 76 116 -8 -82
F7_11_4M 0 74 -18 -14 -4 -2 -1 14 25 7 -8
F7_11_5M 0 104 -17 -13 -4 1 0 12 28 12 -4
S7_11_5M 0 105 -16 -13 -4 0 1 14 27 12 -4
S7_11_6M 0 273 -18 -14 -5 3 10 25 37 79 34
S7_11_7M 0 441 -12 -11 -4 2 7 14 31 63 71
S7_11_8M 0 609 -9 -8 -2 3 7 15 24 52 105
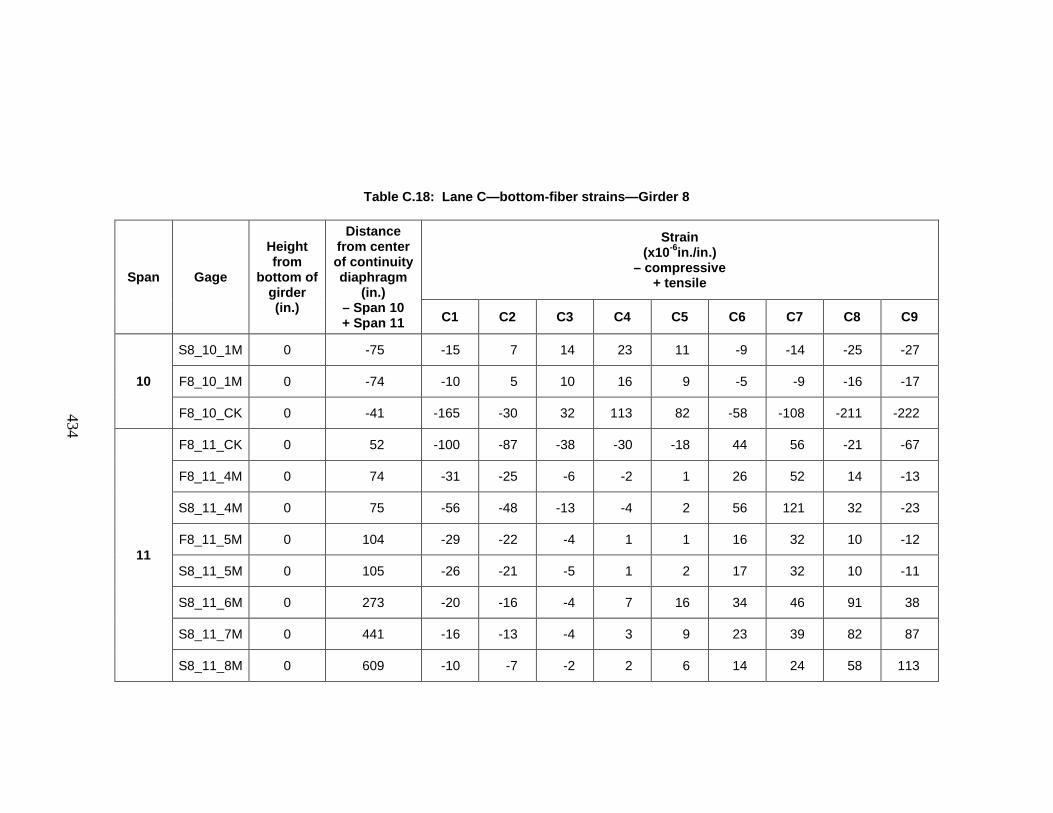
434
Table C.18: Lane C—bottom-fiber strains—Girder 8
Span Gage
Height from
bottom of girder (in.)
Distance from center of continuity diaphragm
(in.) – Span 10 + Span 11
Strain (x10-6in./in.)
– compressive + tensile
C1 C2 C3 C4 C5 C6 C7 C8 C9
10
S8_10_1M 0 -75 -15 7 14 23 11 -9 -14 -25 -27
F8_10_1M 0 -74 -10 5 10 16 9 -5 -9 -16 -17
F8_10_CK 0 -41 -165 -30 32 113 82 -58 -108 -211 -222
11
F8_11_CK 0 52 -100 -87 -38 -30 -18 44 56 -21 -67
F8_11_4M 0 74 -31 -25 -6 -2 1 26 52 14 -13
S8_11_4M 0 75 -56 -48 -13 -4 2 56 121 32 -23
F8_11_5M 0 104 -29 -22 -4 1 1 16 32 10 -12
S8_11_5M 0 105 -26 -21 -5 1 2 17 32 10 -11
S8_11_6M 0 273 -20 -16 -4 7 16 34 46 91 38
S8_11_7M 0 441 -16 -13 -4 3 9 23 39 82 87
S8_11_8M 0 609 -10 -7 -2 2 6 14 24 58 113
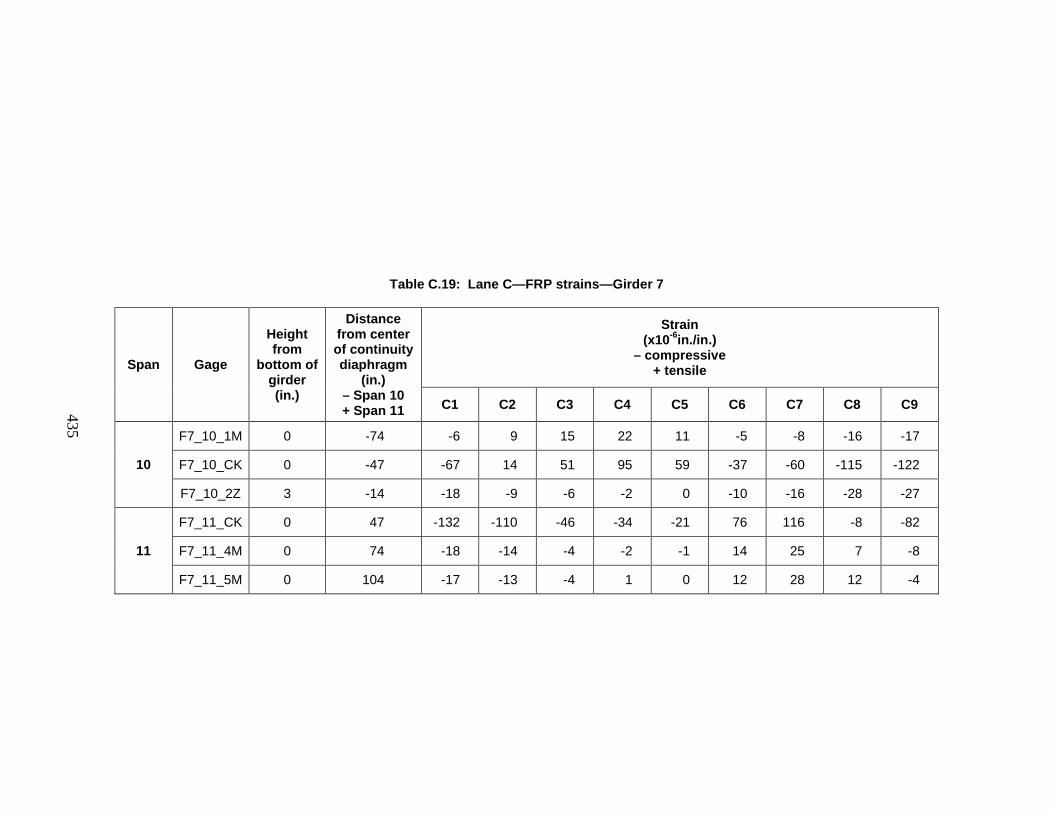
435
Table C.19: Lane C—FRP strains—Girder 7
Span Gage
Height from
bottom of girder (in.)
Distance from center of continuity diaphragm
(in.) – Span 10 + Span 11
Strain (x10-6in./in.)
– compressive + tensile
C1 C2 C3 C4 C5 C6 C7 C8 C9
10
F7_10_1M 0 -74 -6 9 15 22 11 -5 -8 -16 -17
F7_10_CK 0 -47 -67 14 51 95 59 -37 -60 -115 -122
F7_10_2Z 3 -14 -18 -9 -6 -2 0 -10 -16 -28 -27
11
F7_11_CK 0 47 -132 -110 -46 -34 -21 76 116 -8 -82
F7_11_4M 0 74 -18 -14 -4 -2 -1 14 25 7 -8
F7_11_5M 0 104 -17 -13 -4 1 0 12 28 12 -4

436
Table C.20: Lane C—FRP strains—Girder 8
Span Gage
Height from
bottom of girder (in.)
Distance from center of continuity diaphragm
(in.) – Span 10 + Span 11
Strain (x10-6in./in.)
– compressive + tensile
C1 C2 C3 C4 C5 C6 C7 C8 C9
10
F8_10_1Y 3 -74 -9 2 8 10 5 -4 -7 -13 -14
F8_10_1M 0 -74 -10 5 10 16 9 -5 -9 -16 -17
F8_10_CK 0 -41 -165 -30 32 113 82 -58 -108 -211 -222
F8_10_2Y 3 -14 -74 -51 -30 -19 -10 -19 -26 -47 -46
F8_10_2Z 3 -14 -26 -18 -10 -4 0 -5 -12 -23 -23
11
F8_11_3Y 3 14 -45 -38 -23 -17 -11 -5 -14 -45 -54
F8_11_3Z 3 14 -44 -37 -25 -22 -15 -11 -25 -53 -53
F8_11_CK 0 52 -100 -87 -38 -30 -18 44 56 -21 -67
F8_11_4Y 3 74 -16 -12 -3 -1 0 10 17 0 -10
F8_11_4M 0 74 -31 -25 -6 -2 1 26 52 14 -13
F8_11_5M 0 104 -29 -22 -4 1 1 16 32 10 -12

437
Appendix D
BRIDGE MONITORING—GRAPHICAL RESULTS
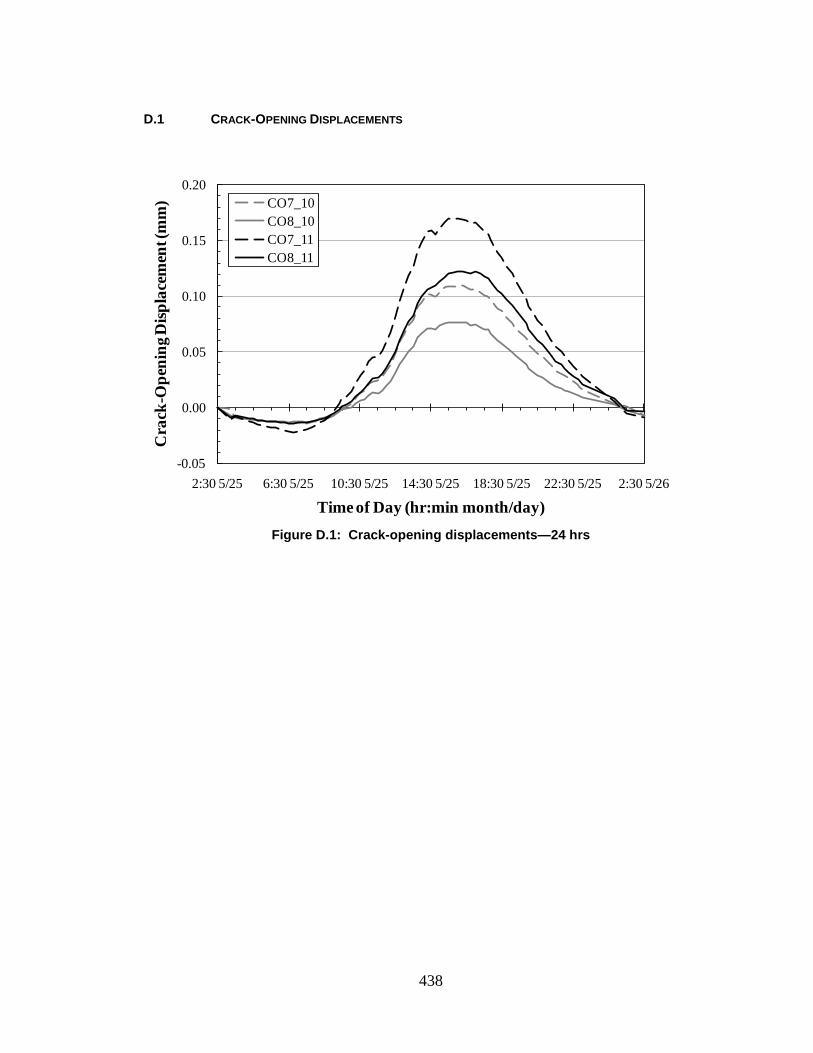
438
D.1 CRACK-OPENING DISPLACEMENTS
Figure D.1: Crack-opening displacements—24 hrs
-0.05
0.00
0.05
0.10
0.15
0.20
2:30 5/25 6:30 5/25 10:30 5/25 14:30 5/25 18:30 5/25 22:30 5/25 2:30 5/26
Cra
ck-O
peni
ng D
ispla
cem
ent (
mm
)
Time of Day (hr:min month/day)
CO7_10CO8_10CO7_11CO8_11
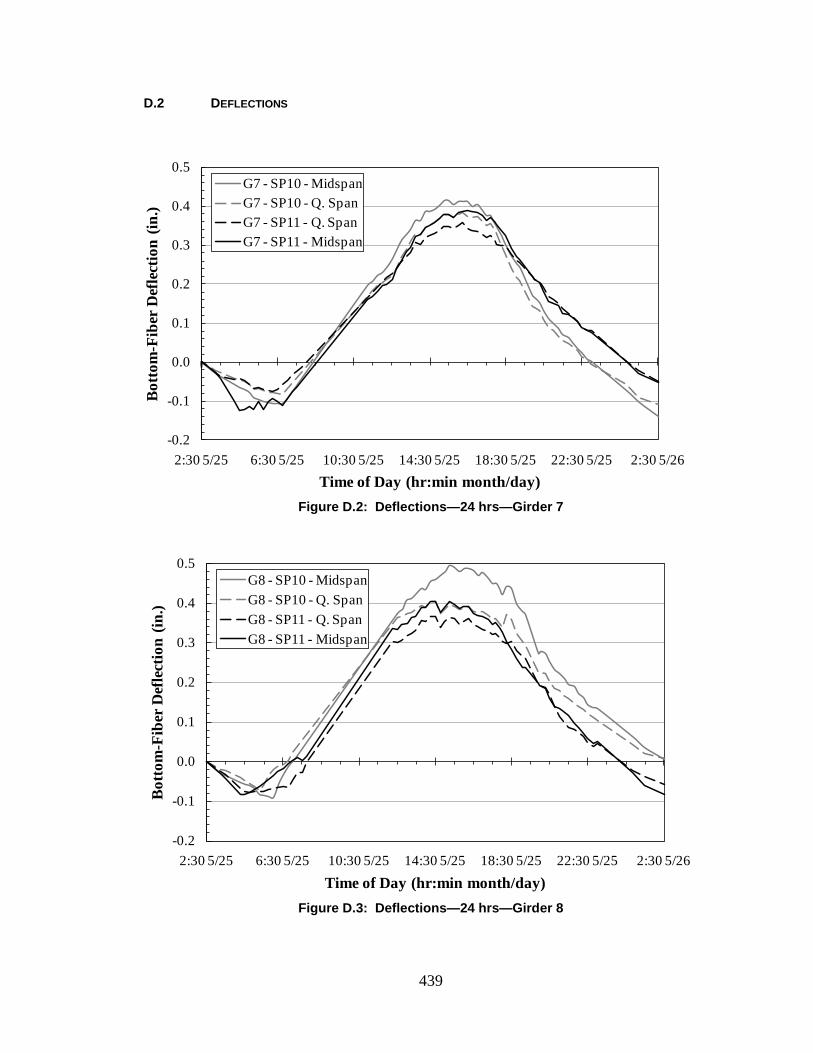
439
D.2 DEFLECTIONS
Figure D.2: Deflections—24 hrs—Girder 7
Figure D.3: Deflections—24 hrs—Girder 8
-0.2
-0.1
0.0
0.1
0.2
0.3
0.4
0.5
2:30 5/25 6:30 5/25 10:30 5/25 14:30 5/25 18:30 5/25 22:30 5/25 2:30 5/26
Bot
tom
-Fib
er D
efle
ctio
n (in
.)
Time of Day (hr:min month/day)
G7 - SP10 - MidspanG7 - SP10 - Q. SpanG7 - SP11 - Q. SpanG7 - SP11 - Midspan
-0.2
-0.1
0.0
0.1
0.2
0.3
0.4
0.5
2:30 5/25 6:30 5/25 10:30 5/25 14:30 5/25 18:30 5/25 22:30 5/25 2:30 5/26
Bot
tom
-Fib
er D
efle
ctio
n (in
.)
Time of Day (hr:min month/day)
G8 - SP10 - MidspanG8 - SP10 - Q. SpanG8 - SP11 - Q. SpanG8 - SP11 - Midspan
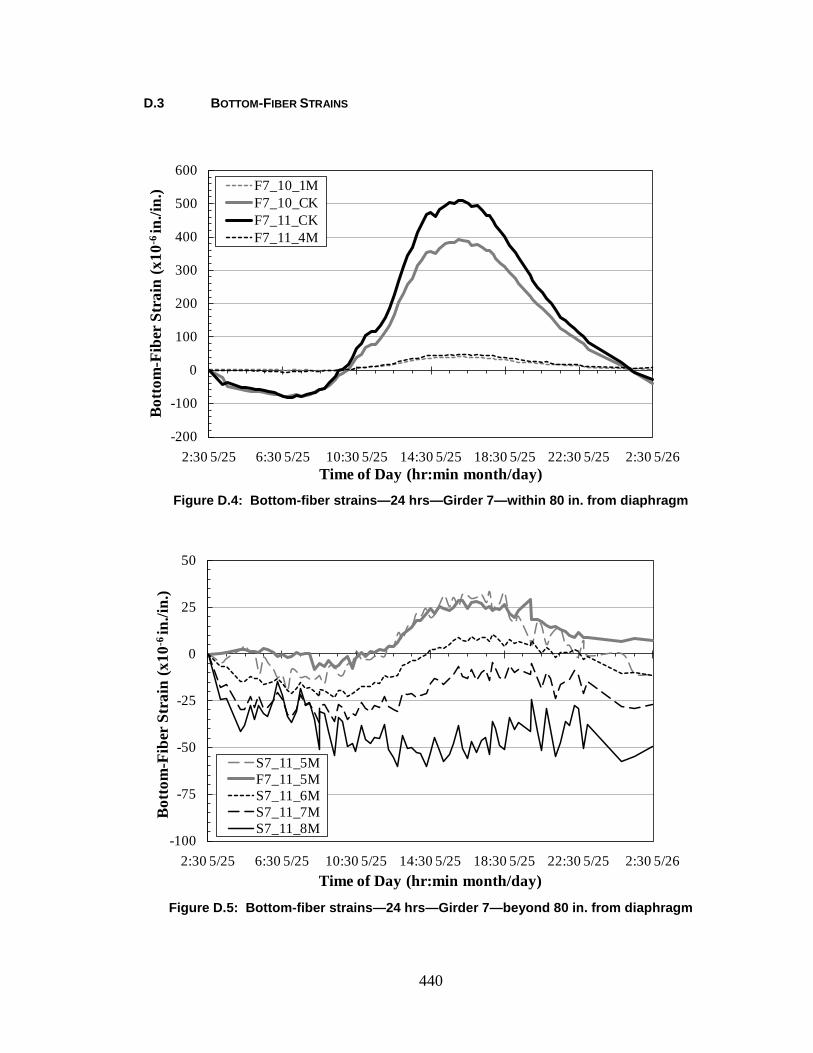
440
D.3 BOTTOM-FIBER STRAINS
Figure D.4: Bottom-fiber strains—24 hrs—Girder 7—within 80 in. from diaphragm
Figure D.5: Bottom-fiber strains—24 hrs—Girder 7—beyond 80 in. from diaphragm
-200
-100
0
100
200
300
400
500
600
2:30 5/25 6:30 5/25 10:30 5/25 14:30 5/25 18:30 5/25 22:30 5/25 2:30 5/26
Bot
tom
-Fib
er S
trai
n (x
10-6
in./i
n.)
Time of Day (hr:min month/day)
F7_10_1MF7_10_CKF7_11_CKF7_11_4M
-100
-75
-50
-25
0
25
50
2:30 5/25 6:30 5/25 10:30 5/25 14:30 5/25 18:30 5/25 22:30 5/25 2:30 5/26
Bot
tom
-Fib
er S
trai
n (x
10-6
in./i
n.)
Time of Day (hr:min month/day)
S7_11_5MF7_11_5MS7_11_6MS7_11_7MS7_11_8M
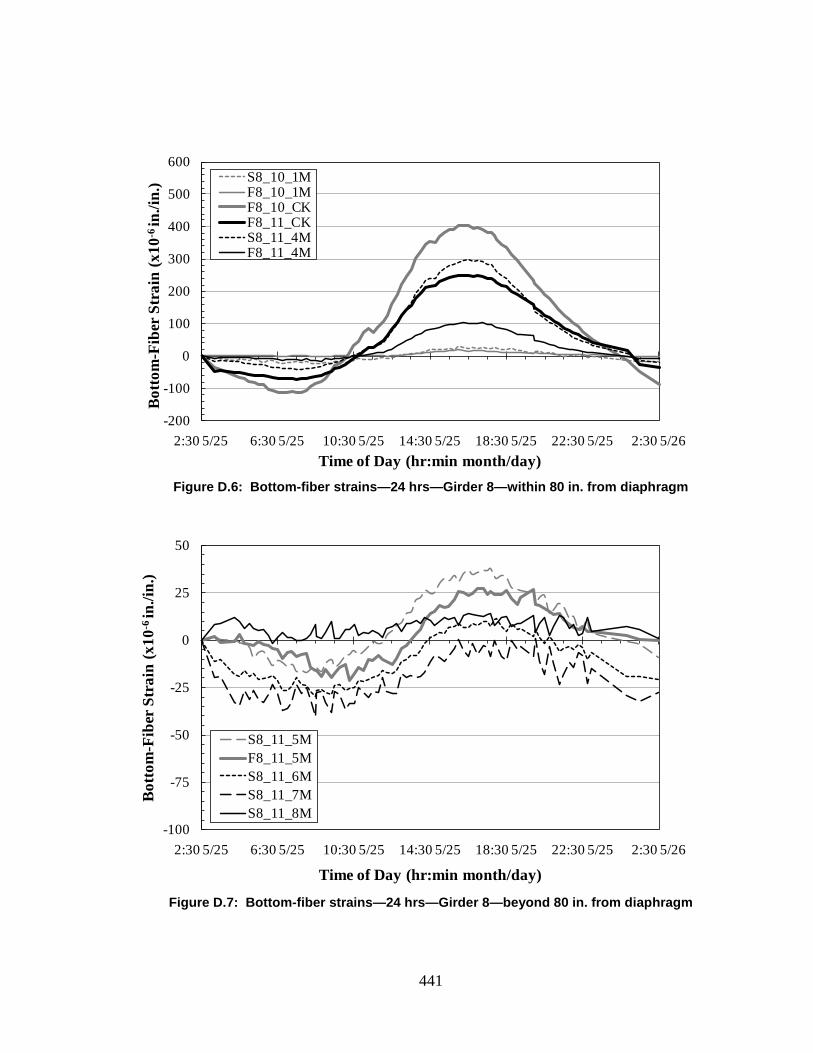
441
Figure D.6: Bottom-fiber strains—24 hrs—Girder 8—within 80 in. from diaphragm
Figure D.7: Bottom-fiber strains—24 hrs—Girder 8—beyond 80 in. from diaphragm
-200
-100
0
100
200
300
400
500
600
2:30 5/25 6:30 5/25 10:30 5/25 14:30 5/25 18:30 5/25 22:30 5/25 2:30 5/26
Bot
tom
-Fib
er S
trai
n (x
10-6
in./i
n.)
Time of Day (hr:min month/day)
S8_10_1MF8_10_1MF8_10_CKF8_11_CKS8_11_4MF8_11_4M
-100
-75
-50
-25
0
25
50
2:30 5/25 6:30 5/25 10:30 5/25 14:30 5/25 18:30 5/25 22:30 5/25 2:30 5/26
Bot
tom
-Fib
er S
trai
n (x
10-6
in./i
n.)
Time of Day (hr:min month/day)
S8_11_5MF8_11_5MS8_11_6MS8_11_7MS8_11_8M
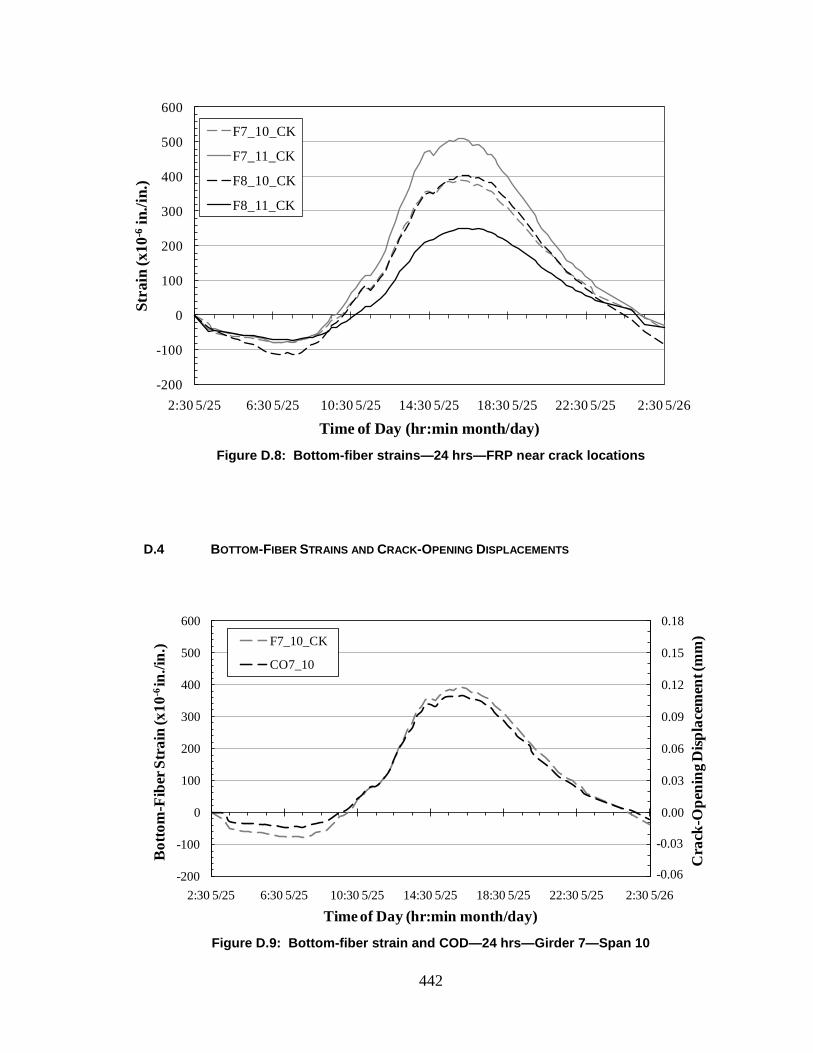
442
Figure D.8: Bottom-fiber strains—24 hrs—FRP near crack locations
D.4 BOTTOM-FIBER STRAINS AND CRACK-OPENING DISPLACEMENTS
Figure D.9: Bottom-fiber strain and COD—24 hrs—Girder 7—Span 10
-200
-100
0
100
200
300
400
500
600
2:30 5/25 6:30 5/25 10:30 5/25 14:30 5/25 18:30 5/25 22:30 5/25 2:30 5/26
Stra
in (x
10-6
in./i
n.)
Time of Day (hr:min month/day)
F7_10_CK
F7_11_CK
F8_10_CK
F8_11_CK
-0.06
-0.03
0.00
0.03
0.06
0.09
0.12
0.15
0.18
-200
-100
0
100
200
300
400
500
600
2:30 5/25 6:30 5/25 10:30 5/25 14:30 5/25 18:30 5/25 22:30 5/25 2:30 5/26
Cra
ck-O
peni
ng D
ispla
cem
ent (
mm
)
Bot
tom
-Fib
er S
trai
n (x
10-6
in./i
n.)
Time of Day (hr:min month/day)
F7_10_CK
CO7_10
-0.03
-0.06

443
Figure D.10: Bottom-fiber strain and COD—24 hrs—Girder 7—Span 11
Figure D.11: Bottom-fiber strain and COD—24 hrs—Girder 8—Span 10
-0.06
-0.03
0.00
0.03
0.06
0.09
0.12
0.15
0.18
-200
-100
0
100
200
300
400
500
600
2:30 5/25 6:30 5/25 10:30 5/25 14:30 5/25 18:30 5/25 22:30 5/25 2:30 5/26
Cra
ck-O
peni
ng D
ispla
cem
ent (
mm
)
Bot
tom
-Fib
er S
trai
n (x
10-6
in./i
n.)
Time of Day (hr:min month/day)
F7_11_CK
CO7_11
-0.03
-0.06
-0.06
-0.03
0.00
0.03
0.06
0.09
0.12
0.15
0.18
-200
-100
0
100
200
300
400
500
600
2:30 5/25 6:30 5/25 10:30 5/25 14:30 5/25 18:30 5/25 22:30 5/25 2:30 5/26
Cra
ck-O
peni
ng D
ispla
cem
ent (
mm
)
Bot
tom
-Fib
er S
trai
n (x
10-6
in./i
n.)
Time of Day (hr:min month/day)
F8_10_CK
CO8_10
-0.03
-0.06
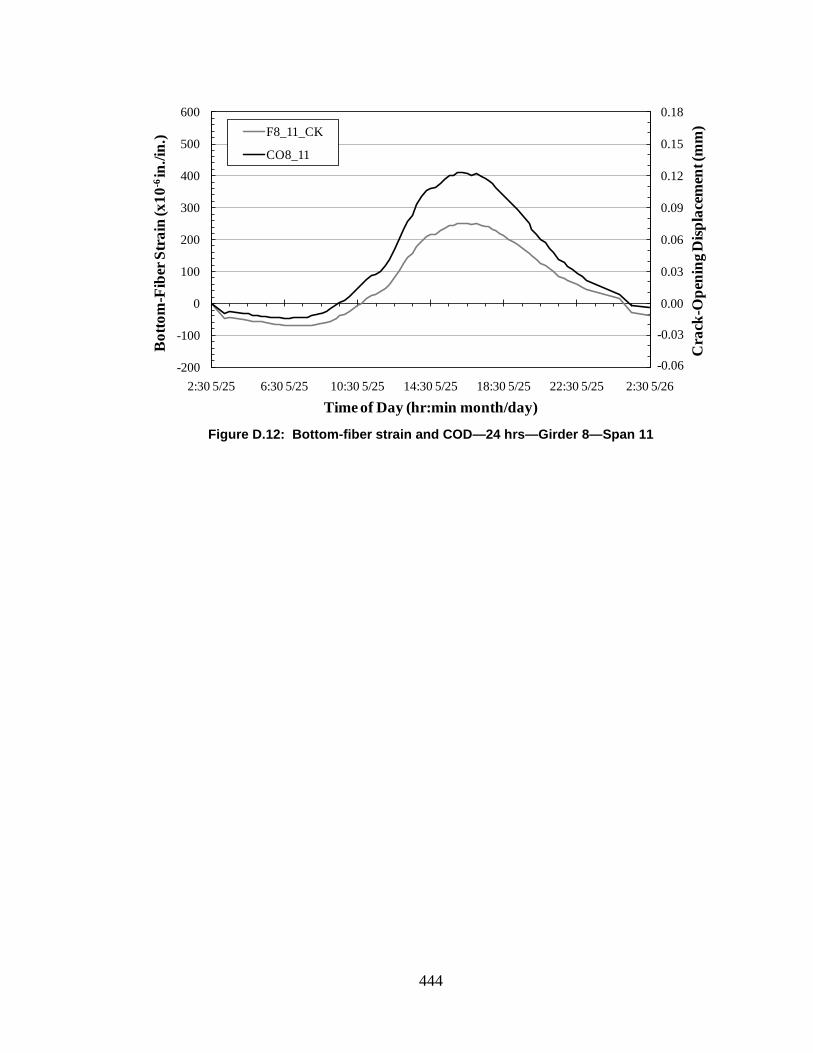
444
Figure D.12: Bottom-fiber strain and COD—24 hrs—Girder 8—Span 11
-0.06
-0.03
0.00
0.03
0.06
0.09
0.12
0.15
0.18
-200
-100
0
100
200
300
400
500
600
2:30 5/25 6:30 5/25 10:30 5/25 14:30 5/25 18:30 5/25 22:30 5/25 2:30 5/26
Cra
ck-O
peni
ng D
ispla
cem
ent (
mm
)
Bot
tom
-Fib
er S
trai
n (x
10-6
in./i
n.)
Time of Day (hr:min month/day)
F8_11_CK
CO8_11
-0.03
-0.06

445
Appendix E
BRIDGE MONITORING MEASUREMENTS
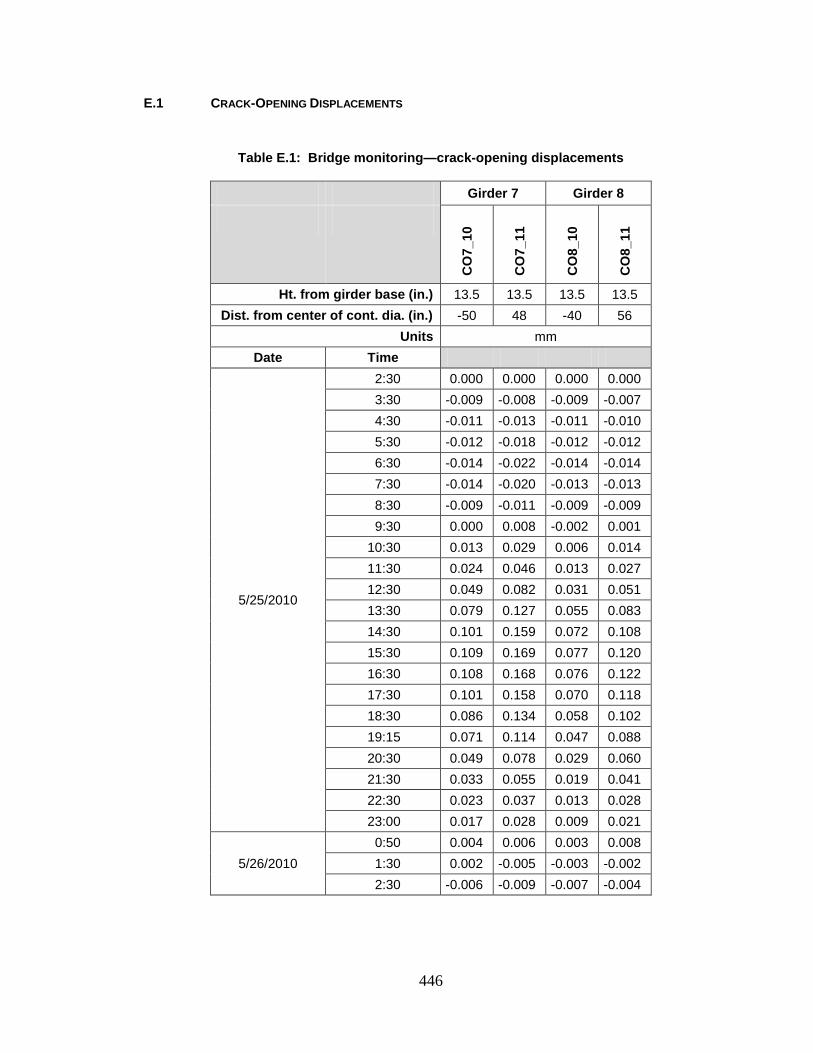
446
E.1 CRACK-OPENING DISPLACEMENTS
Table E.1: Bridge monitoring—crack-opening displacements
Girder 7 Girder 8
CO
7_10
CO
7_11
CO
8_10
CO
8_11
Ht. from girder base (in.) 13.5 13.5 13.5 13.5 Dist. from center of cont. dia. (in.) -50 48 -40 56
Units mm Date Time
5/25/2010
2:30 0.000 0.000 0.000 0.000 3:30 -0.009 -0.008 -0.009 -0.007 4:30 -0.011 -0.013 -0.011 -0.010 5:30 -0.012 -0.018 -0.012 -0.012 6:30 -0.014 -0.022 -0.014 -0.014 7:30 -0.014 -0.020 -0.013 -0.013 8:30 -0.009 -0.011 -0.009 -0.009 9:30 0.000 0.008 -0.002 0.001
10:30 0.013 0.029 0.006 0.014 11:30 0.024 0.046 0.013 0.027 12:30 0.049 0.082 0.031 0.051 13:30 0.079 0.127 0.055 0.083 14:30 0.101 0.159 0.072 0.108 15:30 0.109 0.169 0.077 0.120 16:30 0.108 0.168 0.076 0.122 17:30 0.101 0.158 0.070 0.118 18:30 0.086 0.134 0.058 0.102 19:15 0.071 0.114 0.047 0.088 20:30 0.049 0.078 0.029 0.060 21:30 0.033 0.055 0.019 0.041 22:30 0.023 0.037 0.013 0.028 23:00 0.017 0.028 0.009 0.021
5/26/2010 0:50 0.004 0.006 0.003 0.008 1:30 0.002 -0.005 -0.003 -0.002 2:30 -0.006 -0.009 -0.007 -0.004
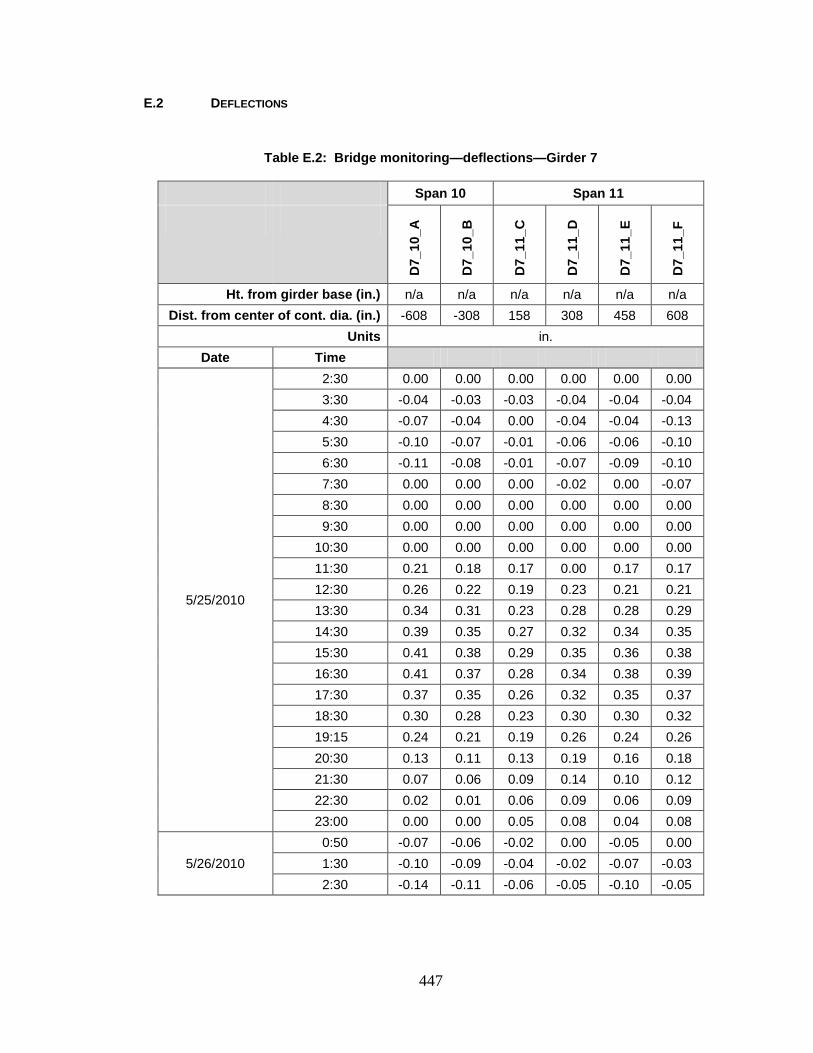
447
E.2 DEFLECTIONS
Table E.2: Bridge monitoring—deflections—Girder 7
Span 10 Span 11
D7_
10_A
D7_
10_B
D7_
11_C
D7_
11_D
D7_
11_E
D7_
11_F
Ht. from girder base (in.) n/a n/a n/a n/a n/a n/a Dist. from center of cont. dia. (in.) -608 -308 158 308 458 608
Units in. Date Time
5/25/2010
2:30 0.00 0.00 0.00 0.00 0.00 0.00 3:30 -0.04 -0.03 -0.03 -0.04 -0.04 -0.04 4:30 -0.07 -0.04 0.00 -0.04 -0.04 -0.13 5:30 -0.10 -0.07 -0.01 -0.06 -0.06 -0.10 6:30 -0.11 -0.08 -0.01 -0.07 -0.09 -0.10 7:30 0.00 0.00 0.00 -0.02 0.00 -0.07 8:30 0.00 0.00 0.00 0.00 0.00 0.00 9:30 0.00 0.00 0.00 0.00 0.00 0.00
10:30 0.00 0.00 0.00 0.00 0.00 0.00 11:30 0.21 0.18 0.17 0.00 0.17 0.17 12:30 0.26 0.22 0.19 0.23 0.21 0.21 13:30 0.34 0.31 0.23 0.28 0.28 0.29 14:30 0.39 0.35 0.27 0.32 0.34 0.35 15:30 0.41 0.38 0.29 0.35 0.36 0.38 16:30 0.41 0.37 0.28 0.34 0.38 0.39 17:30 0.37 0.35 0.26 0.32 0.35 0.37 18:30 0.30 0.28 0.23 0.30 0.30 0.32 19:15 0.24 0.21 0.19 0.26 0.24 0.26 20:30 0.13 0.11 0.13 0.19 0.16 0.18 21:30 0.07 0.06 0.09 0.14 0.10 0.12 22:30 0.02 0.01 0.06 0.09 0.06 0.09 23:00 0.00 0.00 0.05 0.08 0.04 0.08
5/26/2010 0:50 -0.07 -0.06 -0.02 0.00 -0.05 0.00 1:30 -0.10 -0.09 -0.04 -0.02 -0.07 -0.03 2:30 -0.14 -0.11 -0.06 -0.05 -0.10 -0.05
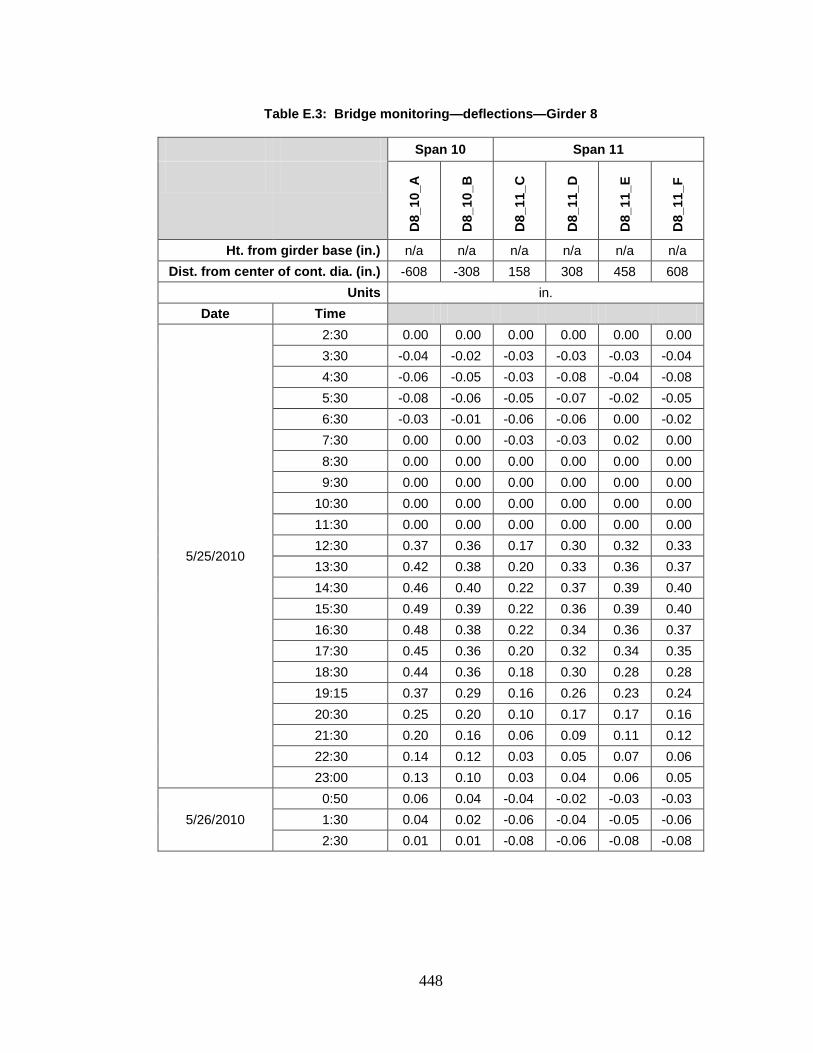
448
Table E.3: Bridge monitoring—deflections—Girder 8
Span 10 Span 11
D8_
10_A
D8_
10_B
D8_
11_C
D8_
11_D
D8_
11_E
D8_
11_F
Ht. from girder base (in.) n/a n/a n/a n/a n/a n/a Dist. from center of cont. dia. (in.) -608 -308 158 308 458 608
Units in. Date Time
5/25/2010
2:30 0.00 0.00 0.00 0.00 0.00 0.00 3:30 -0.04 -0.02 -0.03 -0.03 -0.03 -0.04 4:30 -0.06 -0.05 -0.03 -0.08 -0.04 -0.08 5:30 -0.08 -0.06 -0.05 -0.07 -0.02 -0.05 6:30 -0.03 -0.01 -0.06 -0.06 0.00 -0.02 7:30 0.00 0.00 -0.03 -0.03 0.02 0.00 8:30 0.00 0.00 0.00 0.00 0.00 0.00 9:30 0.00 0.00 0.00 0.00 0.00 0.00
10:30 0.00 0.00 0.00 0.00 0.00 0.00 11:30 0.00 0.00 0.00 0.00 0.00 0.00 12:30 0.37 0.36 0.17 0.30 0.32 0.33 13:30 0.42 0.38 0.20 0.33 0.36 0.37 14:30 0.46 0.40 0.22 0.37 0.39 0.40 15:30 0.49 0.39 0.22 0.36 0.39 0.40 16:30 0.48 0.38 0.22 0.34 0.36 0.37 17:30 0.45 0.36 0.20 0.32 0.34 0.35 18:30 0.44 0.36 0.18 0.30 0.28 0.28 19:15 0.37 0.29 0.16 0.26 0.23 0.24 20:30 0.25 0.20 0.10 0.17 0.17 0.16 21:30 0.20 0.16 0.06 0.09 0.11 0.12 22:30 0.14 0.12 0.03 0.05 0.07 0.06 23:00 0.13 0.10 0.03 0.04 0.06 0.05
5/26/2010 0:50 0.06 0.04 -0.04 -0.02 -0.03 -0.03 1:30 0.04 0.02 -0.06 -0.04 -0.05 -0.06 2:30 0.01 0.01 -0.08 -0.06 -0.08 -0.08
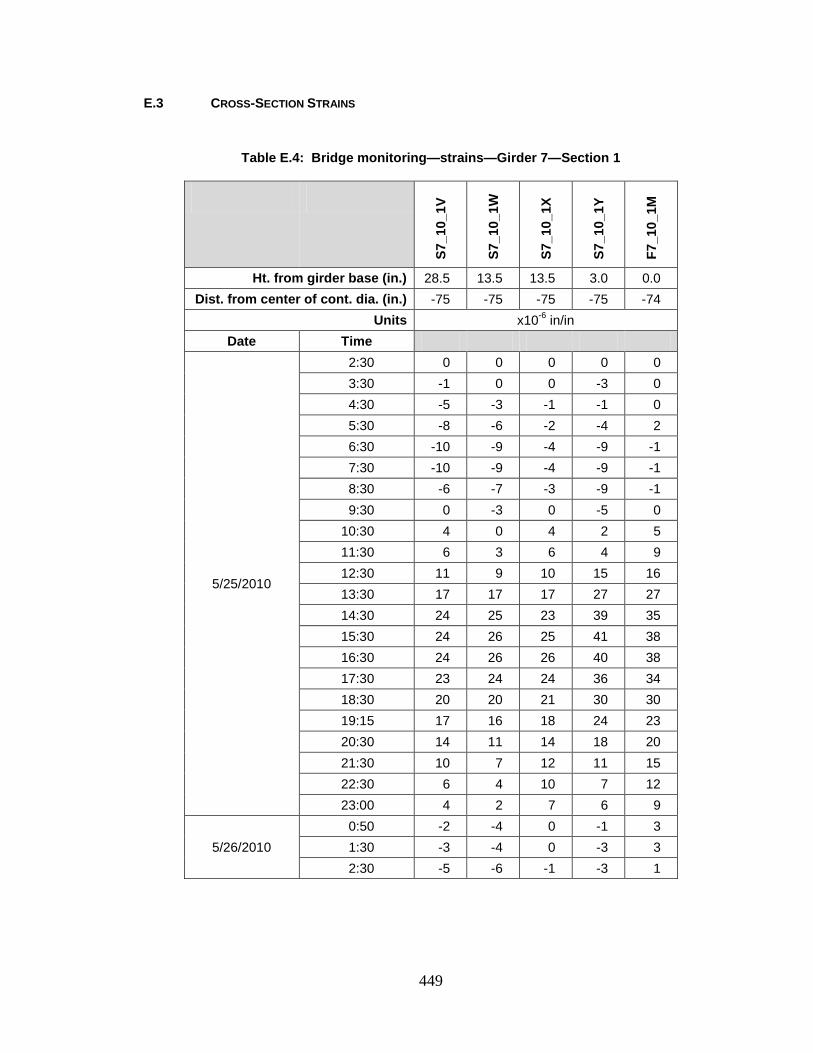
449
E.3 CROSS-SECTION STRAINS
Table E.4: Bridge monitoring—strains—Girder 7—Section 1
S7_1
0_1V
S7_1
0_1W
S7_1
0_1X
S7_1
0_1Y
F7_1
0_1M
Ht. from girder base (in.) 28.5 13.5 13.5 3.0 0.0 Dist. from center of cont. dia. (in.) -75 -75 -75 -75 -74
Units x10-6 in/in Date Time
5/25/2010
2:30 0 0 0 0 0 3:30 -1 0 0 -3 0 4:30 -5 -3 -1 -1 0 5:30 -8 -6 -2 -4 2 6:30 -10 -9 -4 -9 -1 7:30 -10 -9 -4 -9 -1 8:30 -6 -7 -3 -9 -1 9:30 0 -3 0 -5 0
10:30 4 0 4 2 5 11:30 6 3 6 4 9 12:30 11 9 10 15 16 13:30 17 17 17 27 27 14:30 24 25 23 39 35 15:30 24 26 25 41 38 16:30 24 26 26 40 38 17:30 23 24 24 36 34 18:30 20 20 21 30 30 19:15 17 16 18 24 23 20:30 14 11 14 18 20 21:30 10 7 12 11 15 22:30 6 4 10 7 12 23:00 4 2 7 6 9
5/26/2010 0:50 -2 -4 0 -1 3 1:30 -3 -4 0 -3 3 2:30 -5 -6 -1 -3 1
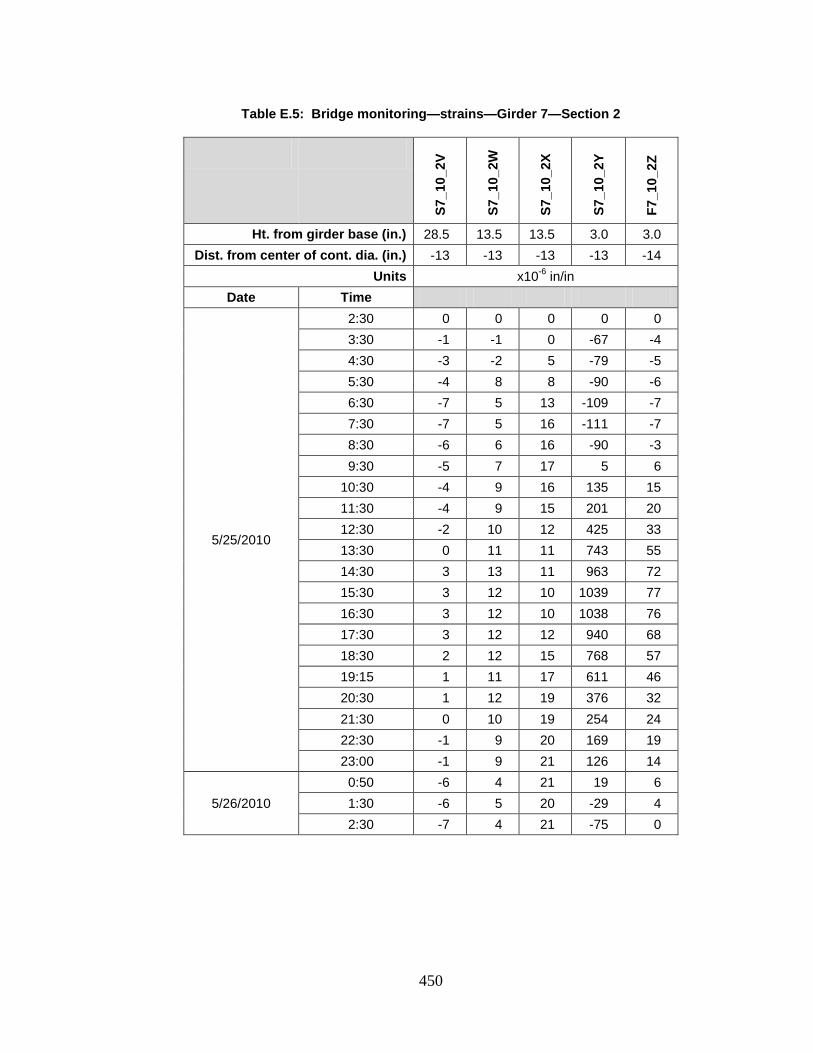
450
Table E.5: Bridge monitoring—strains—Girder 7—Section 2
S7_1
0_2V
S7_1
0_2W
S7_1
0_2X
S7_1
0_2Y
F7_1
0_2Z
Ht. from girder base (in.) 28.5 13.5 13.5 3.0 3.0 Dist. from center of cont. dia. (in.) -13 -13 -13 -13 -14
Units x10-6 in/in Date Time
5/25/2010
2:30 0 0 0 0 0 3:30 -1 -1 0 -67 -4 4:30 -3 -2 5 -79 -5 5:30 -4 8 8 -90 -6 6:30 -7 5 13 -109 -7 7:30 -7 5 16 -111 -7 8:30 -6 6 16 -90 -3 9:30 -5 7 17 5 6
10:30 -4 9 16 135 15 11:30 -4 9 15 201 20 12:30 -2 10 12 425 33 13:30 0 11 11 743 55 14:30 3 13 11 963 72 15:30 3 12 10 1039 77 16:30 3 12 10 1038 76 17:30 3 12 12 940 68 18:30 2 12 15 768 57 19:15 1 11 17 611 46 20:30 1 12 19 376 32 21:30 0 10 19 254 24 22:30 -1 9 20 169 19 23:00 -1 9 21 126 14
5/26/2010 0:50 -6 4 21 19 6 1:30 -6 5 20 -29 4 2:30 -7 4 21 -75 0
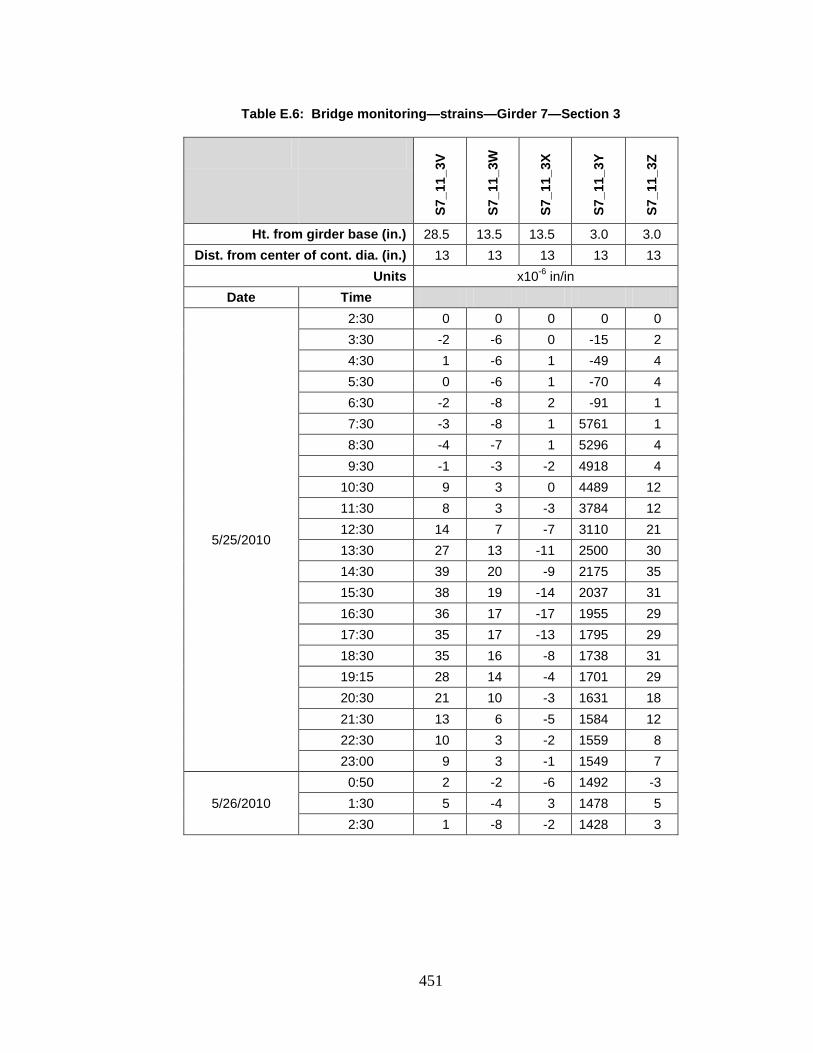
451
Table E.6: Bridge monitoring—strains—Girder 7—Section 3
S7_1
1_3V
S7_1
1_3W
S7_1
1_3X
S7_1
1_3Y
S7_1
1_3Z
Ht. from girder base (in.) 28.5 13.5 13.5 3.0 3.0 Dist. from center of cont. dia. (in.) 13 13 13 13 13
Units x10-6 in/in Date Time
5/25/2010
2:30 0 0 0 0 0 3:30 -2 -6 0 -15 2 4:30 1 -6 1 -49 4 5:30 0 -6 1 -70 4 6:30 -2 -8 2 -91 1 7:30 -3 -8 1 5761 1 8:30 -4 -7 1 5296 4 9:30 -1 -3 -2 4918 4
10:30 9 3 0 4489 12 11:30 8 3 -3 3784 12 12:30 14 7 -7 3110 21 13:30 27 13 -11 2500 30 14:30 39 20 -9 2175 35 15:30 38 19 -14 2037 31 16:30 36 17 -17 1955 29 17:30 35 17 -13 1795 29 18:30 35 16 -8 1738 31 19:15 28 14 -4 1701 29 20:30 21 10 -3 1631 18 21:30 13 6 -5 1584 12 22:30 10 3 -2 1559 8 23:00 9 3 -1 1549 7
5/26/2010 0:50 2 -2 -6 1492 -3 1:30 5 -4 3 1478 5 2:30 1 -8 -2 1428 3
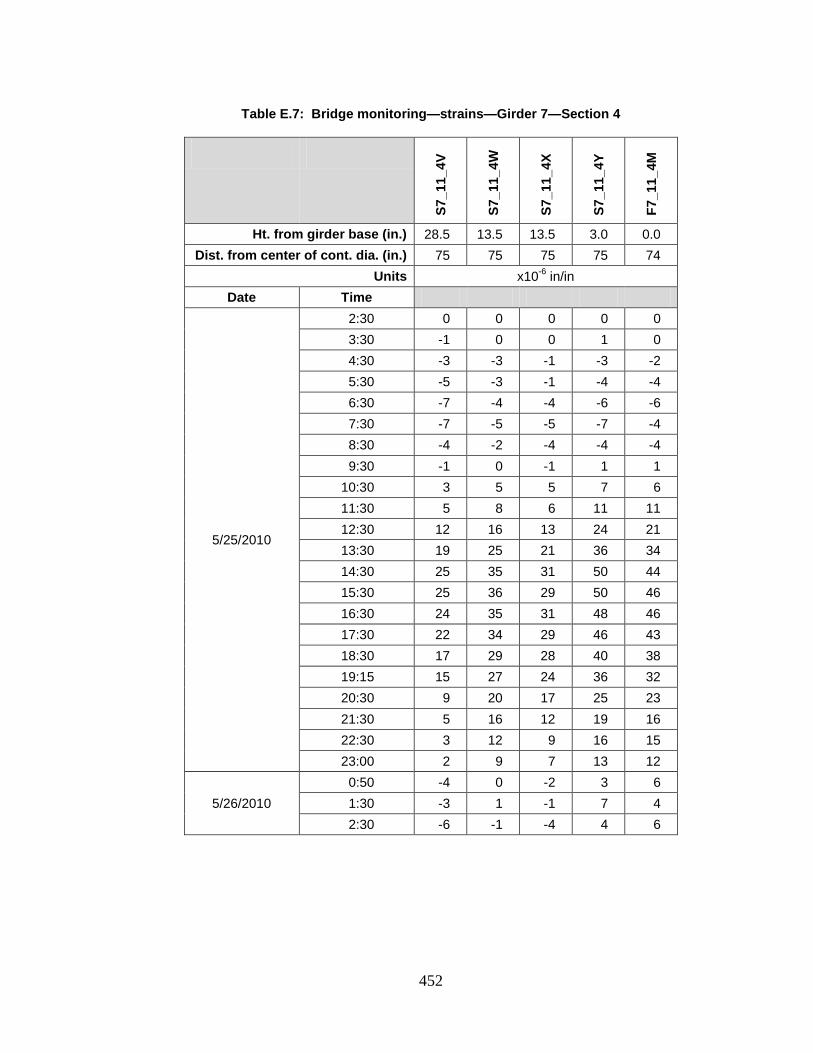
452
Table E.7: Bridge monitoring—strains—Girder 7—Section 4
S7_1
1_4V
S7_1
1_4W
S7_1
1_4X
S7_1
1_4Y
F7_1
1_4M
Ht. from girder base (in.) 28.5 13.5 13.5 3.0 0.0 Dist. from center of cont. dia. (in.) 75 75 75 75 74
Units x10-6 in/in Date Time
5/25/2010
2:30 0 0 0 0 0 3:30 -1 0 0 1 0 4:30 -3 -3 -1 -3 -2 5:30 -5 -3 -1 -4 -4 6:30 -7 -4 -4 -6 -6 7:30 -7 -5 -5 -7 -4 8:30 -4 -2 -4 -4 -4 9:30 -1 0 -1 1 1
10:30 3 5 5 7 6 11:30 5 8 6 11 11 12:30 12 16 13 24 21 13:30 19 25 21 36 34 14:30 25 35 31 50 44 15:30 25 36 29 50 46 16:30 24 35 31 48 46 17:30 22 34 29 46 43 18:30 17 29 28 40 38 19:15 15 27 24 36 32 20:30 9 20 17 25 23 21:30 5 16 12 19 16 22:30 3 12 9 16 15 23:00 2 9 7 13 12
5/26/2010 0:50 -4 0 -2 3 6 1:30 -3 1 -1 7 4 2:30 -6 -1 -4 4 6
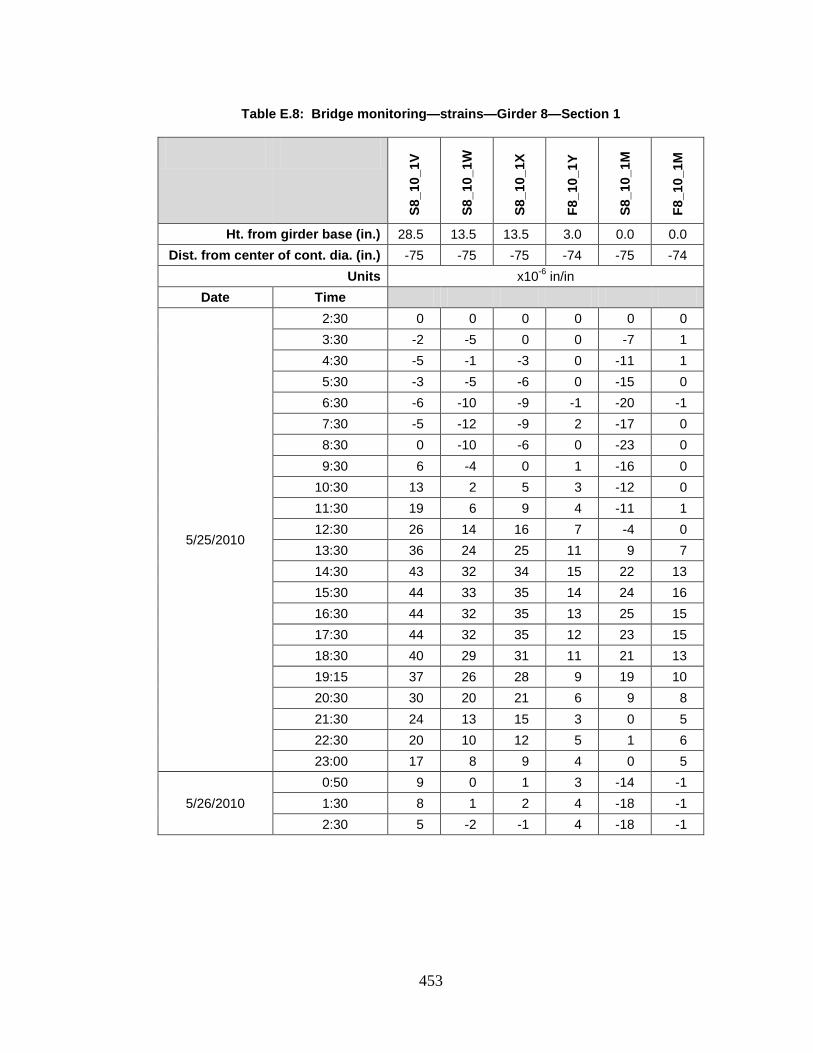
453
Table E.8: Bridge monitoring—strains—Girder 8—Section 1
S8_1
0_1V
S8_1
0_1W
S8_1
0_1X
F8_1
0_1Y
S8_1
0_1M
F8_1
0_1M
Ht. from girder base (in.) 28.5 13.5 13.5 3.0 0.0 0.0 Dist. from center of cont. dia. (in.) -75 -75 -75 -74 -75 -74
Units x10-6 in/in Date Time
5/25/2010
2:30 0 0 0 0 0 0 3:30 -2 -5 0 0 -7 1 4:30 -5 -1 -3 0 -11 1 5:30 -3 -5 -6 0 -15 0 6:30 -6 -10 -9 -1 -20 -1 7:30 -5 -12 -9 2 -17 0 8:30 0 -10 -6 0 -23 0 9:30 6 -4 0 1 -16 0
10:30 13 2 5 3 -12 0 11:30 19 6 9 4 -11 1 12:30 26 14 16 7 -4 0 13:30 36 24 25 11 9 7 14:30 43 32 34 15 22 13 15:30 44 33 35 14 24 16 16:30 44 32 35 13 25 15 17:30 44 32 35 12 23 15 18:30 40 29 31 11 21 13 19:15 37 26 28 9 19 10 20:30 30 20 21 6 9 8 21:30 24 13 15 3 0 5 22:30 20 10 12 5 1 6 23:00 17 8 9 4 0 5
5/26/2010 0:50 9 0 1 3 -14 -1 1:30 8 1 2 4 -18 -1 2:30 5 -2 -1 4 -18 -1
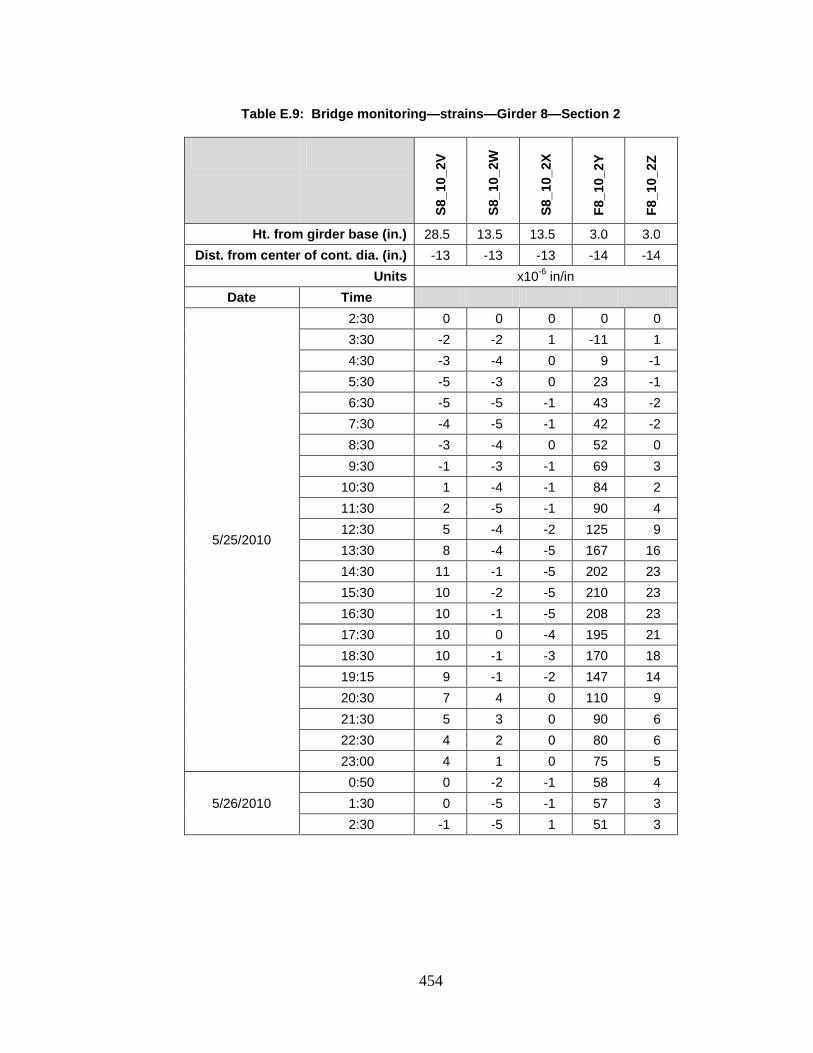
454
Table E.9: Bridge monitoring—strains—Girder 8—Section 2
S8_1
0_2V
S8_1
0_2W
S8_1
0_2X
F8_1
0_2Y
F8_1
0_2Z
Ht. from girder base (in.) 28.5 13.5 13.5 3.0 3.0 Dist. from center of cont. dia. (in.) -13 -13 -13 -14 -14
Units x10-6 in/in Date Time
5/25/2010
2:30 0 0 0 0 0 3:30 -2 -2 1 -11 1 4:30 -3 -4 0 9 -1 5:30 -5 -3 0 23 -1 6:30 -5 -5 -1 43 -2 7:30 -4 -5 -1 42 -2 8:30 -3 -4 0 52 0 9:30 -1 -3 -1 69 3
10:30 1 -4 -1 84 2 11:30 2 -5 -1 90 4 12:30 5 -4 -2 125 9 13:30 8 -4 -5 167 16 14:30 11 -1 -5 202 23 15:30 10 -2 -5 210 23 16:30 10 -1 -5 208 23 17:30 10 0 -4 195 21 18:30 10 -1 -3 170 18 19:15 9 -1 -2 147 14 20:30 7 4 0 110 9 21:30 5 3 0 90 6 22:30 4 2 0 80 6 23:00 4 1 0 75 5
5/26/2010 0:50 0 -2 -1 58 4 1:30 0 -5 -1 57 3 2:30 -1 -5 1 51 3

455
Table E.10: Bridge monitoring—strains—Girder 8—Section 3
S8_1
1_3V
S8_1
1_3W
S8_1
1_3X
F8_1
1_3Y
F8_1
1_3Z
Ht. from girder base (in.) 28.5 13.5 13.5 3.0 3.0 Dist. from center of cont. dia. (in.) 13 13 13 14 14
Units x10-6 in/in Date Time
5/25/2010
2:30 0 0 0 0 0 3:30 -21 -1 -11 -11 -13 4:30 -29 -5 -15 -18 -14 5:30 -40 -6 -17 -22 -16 6:30 -50 -8 -20 -26 -21 7:30 -52 -7 -21 -28 -21 8:30 -33 -4 -20 -18 -11 9:30 5 -3 -16 -5 -8
10:30 60 0 -9 10 5 11:30 101 2 -2 25 20 12:30 196 5 13 57 53 13:30 318 4 37 94 97 14:30 405 -2 69 119 130 15:30 430 0 84 125 140 16:30 429 2 85 126 142 17:30 409 7 83 118 132 18:30 365 8 72 101 112 19:15 320 9 65 87 91 20:30 228 7 46 57 58 21:30 167 4 34 36 35 22:30 126 1 28 22 20 23:00 109 -2 24 15 12
5/26/2010 0:50 75 -7 15 -1 3 1:30 -3 -7 -9 -9 -11 2:30 -29 -10 -19 -16 -12
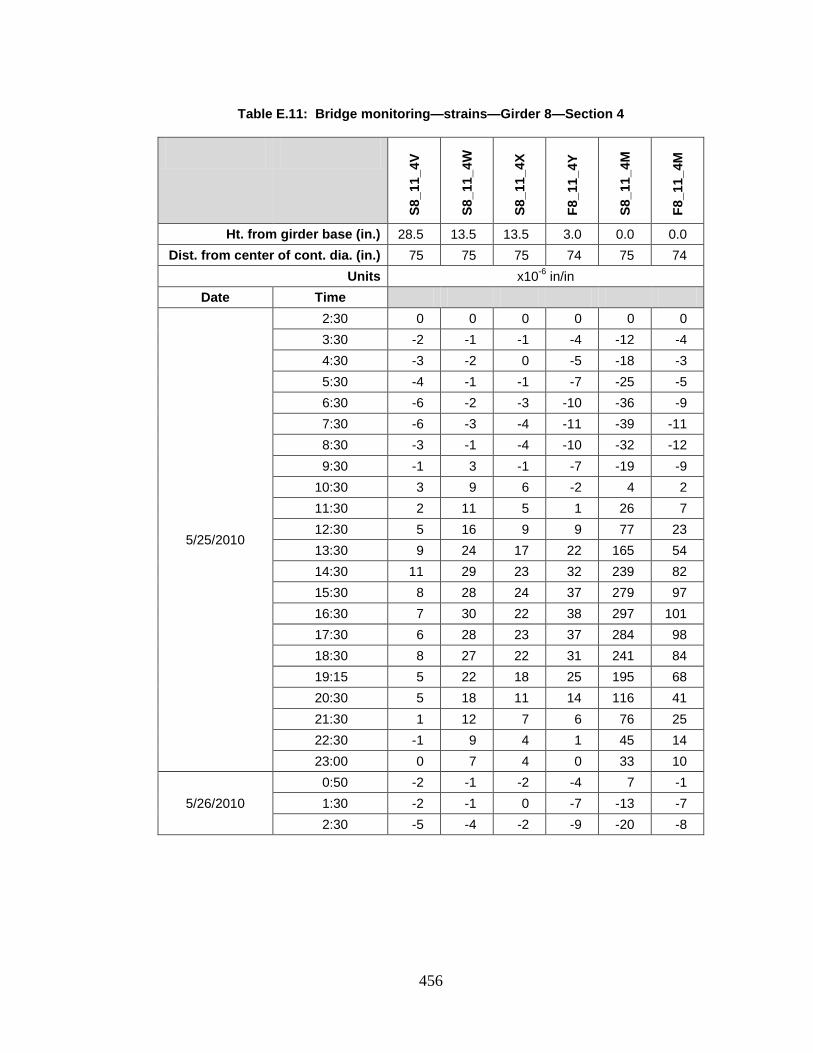
456
Table E.11: Bridge monitoring—strains—Girder 8—Section 4
S8_1
1_4V
S8_1
1_4W
S8_1
1_4X
F8_1
1_4Y
S8_1
1_4M
F8_1
1_4M
Ht. from girder base (in.) 28.5 13.5 13.5 3.0 0.0 0.0 Dist. from center of cont. dia. (in.) 75 75 75 74 75 74
Units x10-6 in/in Date Time
5/25/2010
2:30 0 0 0 0 0 0 3:30 -2 -1 -1 -4 -12 -4 4:30 -3 -2 0 -5 -18 -3 5:30 -4 -1 -1 -7 -25 -5 6:30 -6 -2 -3 -10 -36 -9 7:30 -6 -3 -4 -11 -39 -11 8:30 -3 -1 -4 -10 -32 -12 9:30 -1 3 -1 -7 -19 -9
10:30 3 9 6 -2 4 2 11:30 2 11 5 1 26 7 12:30 5 16 9 9 77 23 13:30 9 24 17 22 165 54 14:30 11 29 23 32 239 82 15:30 8 28 24 37 279 97 16:30 7 30 22 38 297 101 17:30 6 28 23 37 284 98 18:30 8 27 22 31 241 84 19:15 5 22 18 25 195 68 20:30 5 18 11 14 116 41 21:30 1 12 7 6 76 25 22:30 -1 9 4 1 45 14 23:00 0 7 4 0 33 10
5/26/2010 0:50 -2 -1 -2 -4 7 -1 1:30 -2 -1 0 -7 -13 -7 2:30 -5 -4 -2 -9 -20 -8
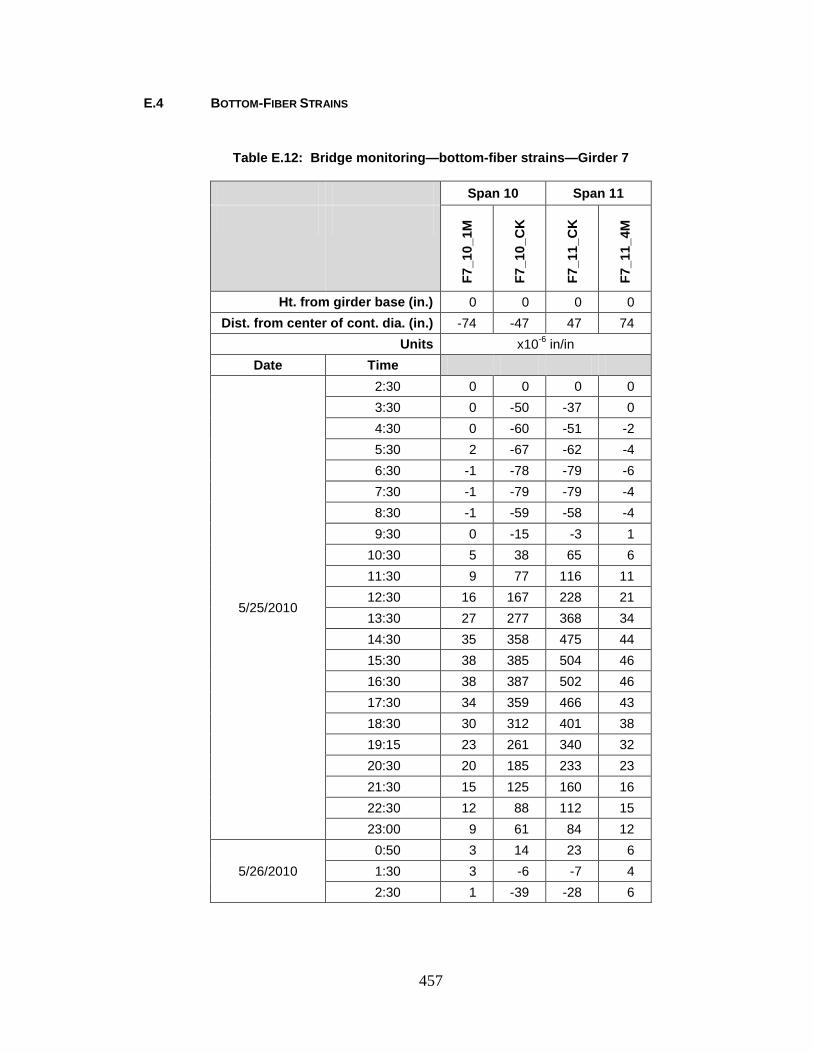
457
E.4 BOTTOM-FIBER STRAINS
Table E.12: Bridge monitoring—bottom-fiber strains—Girder 7
Span 10 Span 11
F7_1
0_1M
F7_1
0_C
K
F7_1
1_C
K
F7_1
1_4M
Ht. from girder base (in.) 0 0 0 0 Dist. from center of cont. dia. (in.) -74 -47 47 74
Units x10-6 in/in Date Time
5/25/2010
2:30 0 0 0 0 3:30 0 -50 -37 0 4:30 0 -60 -51 -2 5:30 2 -67 -62 -4 6:30 -1 -78 -79 -6 7:30 -1 -79 -79 -4 8:30 -1 -59 -58 -4 9:30 0 -15 -3 1
10:30 5 38 65 6 11:30 9 77 116 11 12:30 16 167 228 21 13:30 27 277 368 34 14:30 35 358 475 44 15:30 38 385 504 46 16:30 38 387 502 46 17:30 34 359 466 43 18:30 30 312 401 38 19:15 23 261 340 32 20:30 20 185 233 23 21:30 15 125 160 16 22:30 12 88 112 15 23:00 9 61 84 12
5/26/2010 0:50 3 14 23 6 1:30 3 -6 -7 4 2:30 1 -39 -28 6
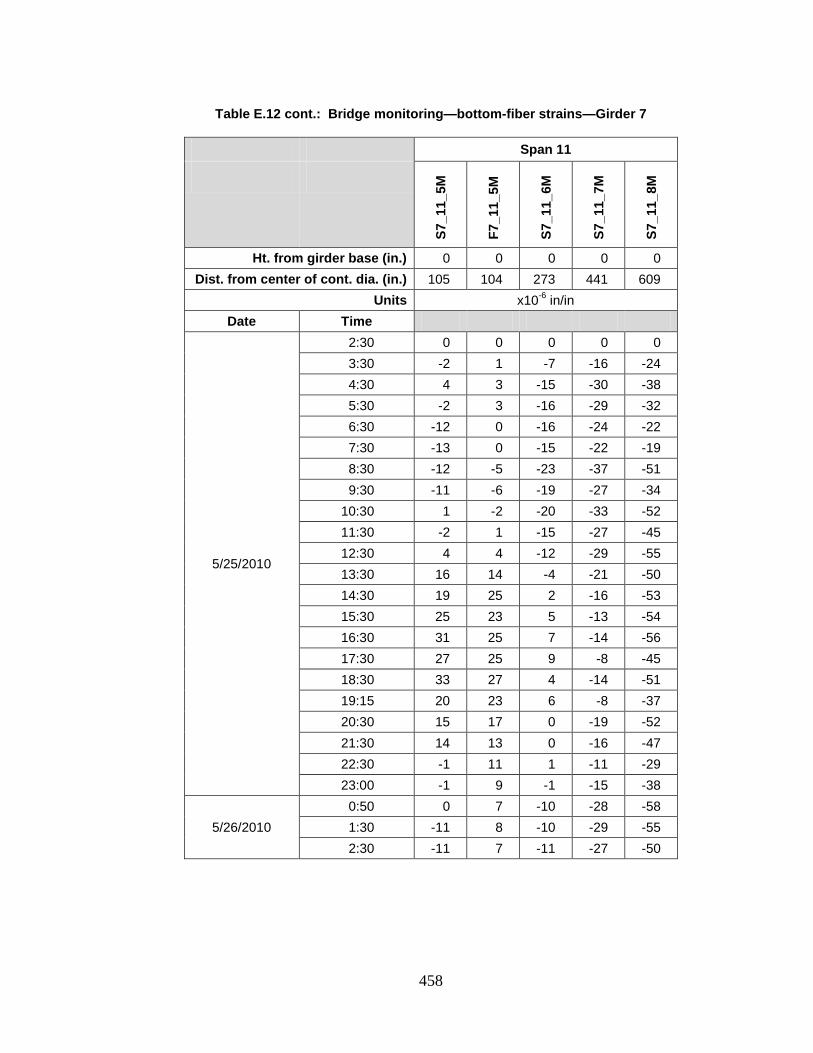
458
Table E.12 cont.: Bridge monitoring—bottom-fiber strains—Girder 7
Span 11
S7_1
1_5M
F7_1
1_5M
S7_1
1_6M
S7_1
1_7M
S7_1
1_8M
Ht. from girder base (in.) 0 0 0 0 0 Dist. from center of cont. dia. (in.) 105 104 273 441 609
Units x10-6 in/in Date Time
5/25/2010
2:30 0 0 0 0 0 3:30 -2 1 -7 -16 -24 4:30 4 3 -15 -30 -38 5:30 -2 3 -16 -29 -32 6:30 -12 0 -16 -24 -22 7:30 -13 0 -15 -22 -19 8:30 -12 -5 -23 -37 -51 9:30 -11 -6 -19 -27 -34
10:30 1 -2 -20 -33 -52 11:30 -2 1 -15 -27 -45 12:30 4 4 -12 -29 -55 13:30 16 14 -4 -21 -50 14:30 19 25 2 -16 -53 15:30 25 23 5 -13 -54 16:30 31 25 7 -14 -56 17:30 27 25 9 -8 -45 18:30 33 27 4 -14 -51 19:15 20 23 6 -8 -37 20:30 15 17 0 -19 -52 21:30 14 13 0 -16 -47 22:30 -1 11 1 -11 -29 23:00 -1 9 -1 -15 -38
5/26/2010 0:50 0 7 -10 -28 -58 1:30 -11 8 -10 -29 -55 2:30 -11 7 -11 -27 -50
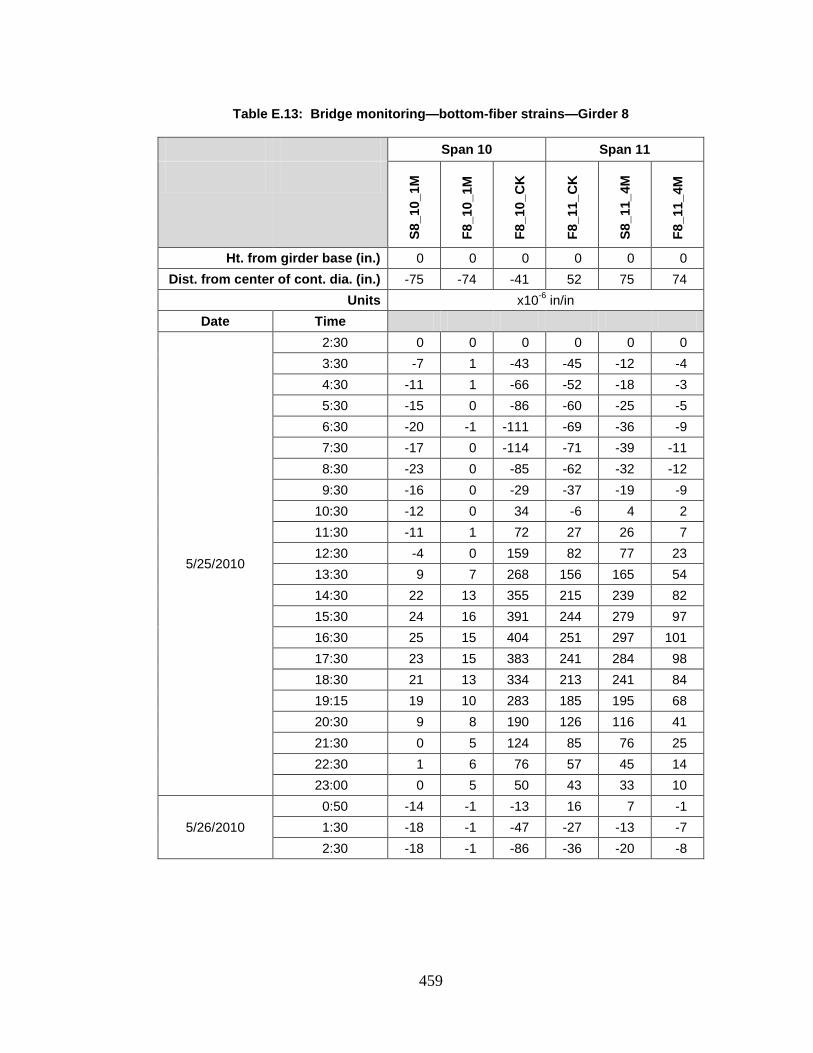
459
Table E.13: Bridge monitoring—bottom-fiber strains—Girder 8
Span 10 Span 11
S8_1
0_1M
F8_1
0_1M
F8_1
0_C
K
F8_1
1_C
K
S8_1
1_4M
F8_1
1_4M
Ht. from girder base (in.) 0 0 0 0 0 0 Dist. from center of cont. dia. (in.) -75 -74 -41 52 75 74
Units x10-6 in/in Date Time
5/25/2010
2:30 0 0 0 0 0 0 3:30 -7 1 -43 -45 -12 -4 4:30 -11 1 -66 -52 -18 -3 5:30 -15 0 -86 -60 -25 -5 6:30 -20 -1 -111 -69 -36 -9 7:30 -17 0 -114 -71 -39 -11 8:30 -23 0 -85 -62 -32 -12 9:30 -16 0 -29 -37 -19 -9
10:30 -12 0 34 -6 4 2 11:30 -11 1 72 27 26 7 12:30 -4 0 159 82 77 23 13:30 9 7 268 156 165 54 14:30 22 13 355 215 239 82 15:30 24 16 391 244 279 97 16:30 25 15 404 251 297 101 17:30 23 15 383 241 284 98 18:30 21 13 334 213 241 84 19:15 19 10 283 185 195 68 20:30 9 8 190 126 116 41 21:30 0 5 124 85 76 25 22:30 1 6 76 57 45 14 23:00 0 5 50 43 33 10
5/26/2010 0:50 -14 -1 -13 16 7 -1 1:30 -18 -1 -47 -27 -13 -7 2:30 -18 -1 -86 -36 -20 -8
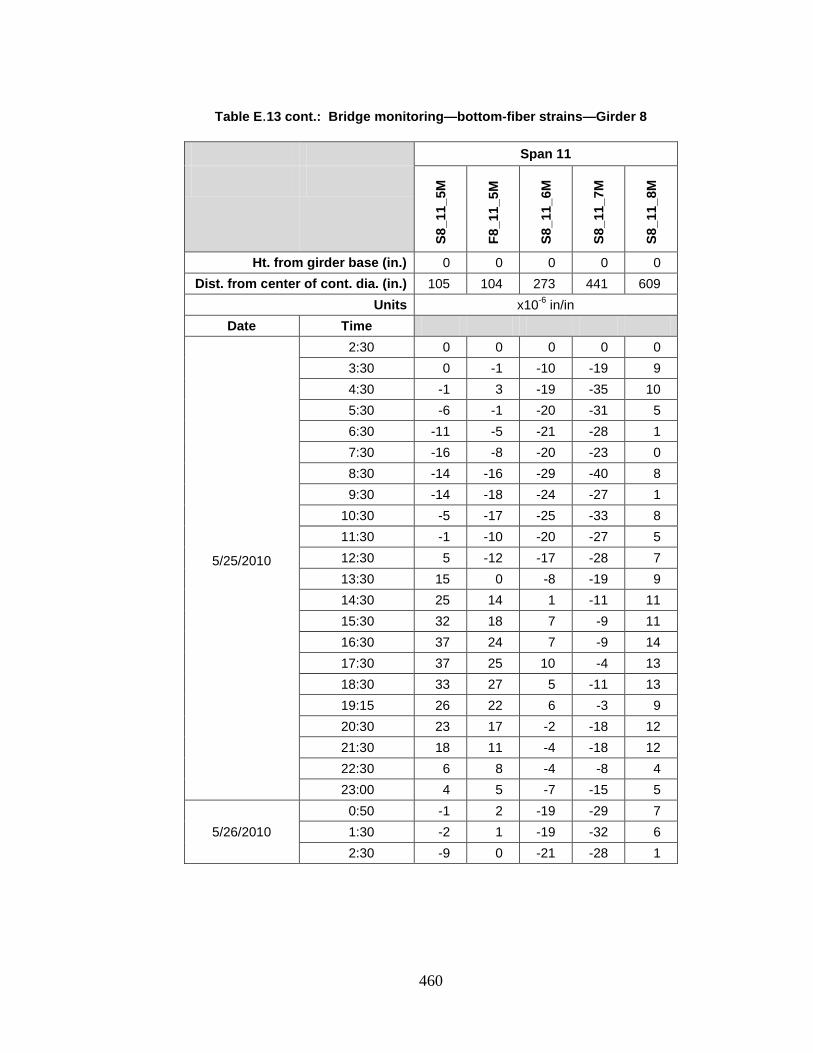
460
Table E.13 cont.: Bridge monitoring—bottom-fiber strains—Girder 8
Span 11
S8_1
1_5M
F8_1
1_5M
S8_1
1_6M
S8_1
1_7M
S8_1
1_8M
Ht. from girder base (in.) 0 0 0 0 0 Dist. from center of cont. dia. (in.) 105 104 273 441 609
Units x10-6 in/in Date Time
5/25/2010
2:30 0 0 0 0 0 3:30 0 -1 -10 -19 9 4:30 -1 3 -19 -35 10 5:30 -6 -1 -20 -31 5 6:30 -11 -5 -21 -28 1 7:30 -16 -8 -20 -23 0 8:30 -14 -16 -29 -40 8 9:30 -14 -18 -24 -27 1
10:30 -5 -17 -25 -33 8 11:30 -1 -10 -20 -27 5 12:30 5 -12 -17 -28 7 13:30 15 0 -8 -19 9 14:30 25 14 1 -11 11 15:30 32 18 7 -9 11 16:30 37 24 7 -9 14 17:30 37 25 10 -4 13 18:30 33 27 5 -11 13 19:15 26 22 6 -3 9 20:30 23 17 -2 -18 12 21:30 18 11 -4 -18 12 22:30 6 8 -4 -8 4 23:00 4 5 -7 -15 5
5/26/2010 0:50 -1 2 -19 -29 7 1:30 -2 1 -19 -32 6 2:30 -9 0 -21 -28 1
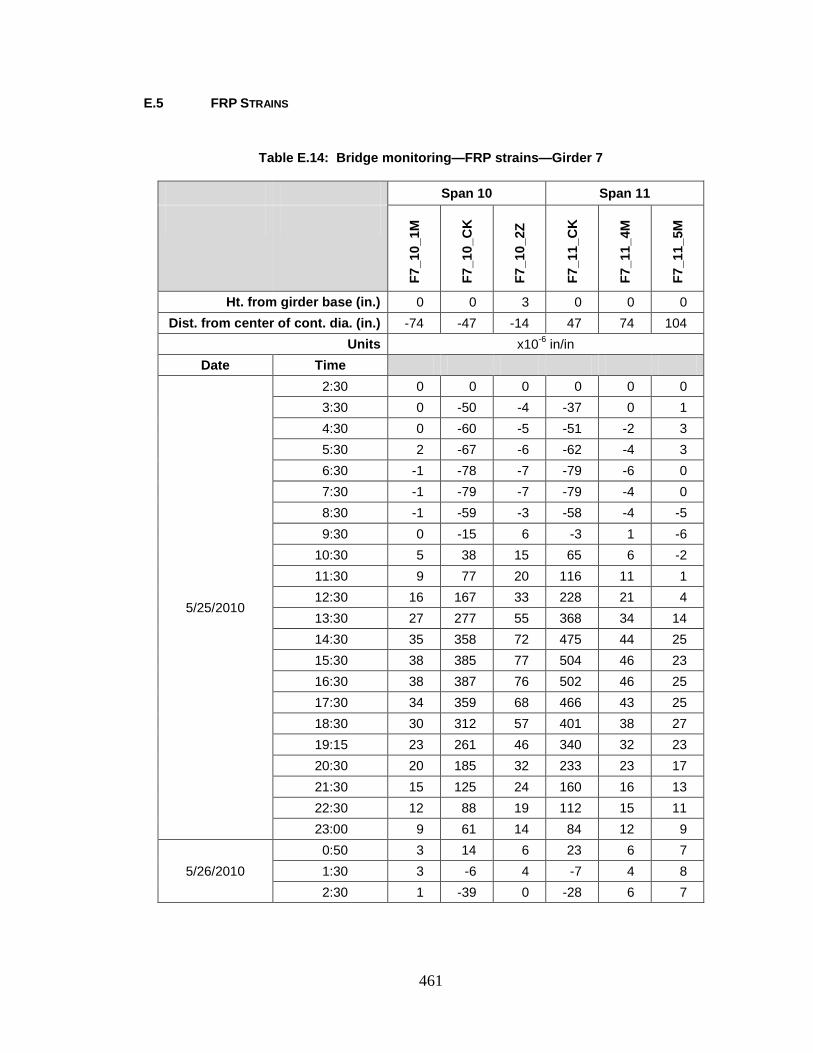
461
E.5 FRP STRAINS
Table E.14: Bridge monitoring—FRP strains—Girder 7
Span 10 Span 11
F7_1
0_1M
F7_1
0_C
K
F7_1
0_2Z
F7_1
1_C
K
F7_1
1_4M
F7_1
1_5M
Ht. from girder base (in.) 0 0 3 0 0 0 Dist. from center of cont. dia. (in.) -74 -47 -14 47 74 104
Units x10-6 in/in Date Time
5/25/2010
2:30 0 0 0 0 0 0 3:30 0 -50 -4 -37 0 1 4:30 0 -60 -5 -51 -2 3 5:30 2 -67 -6 -62 -4 3 6:30 -1 -78 -7 -79 -6 0 7:30 -1 -79 -7 -79 -4 0 8:30 -1 -59 -3 -58 -4 -5 9:30 0 -15 6 -3 1 -6
10:30 5 38 15 65 6 -2 11:30 9 77 20 116 11 1 12:30 16 167 33 228 21 4 13:30 27 277 55 368 34 14 14:30 35 358 72 475 44 25 15:30 38 385 77 504 46 23 16:30 38 387 76 502 46 25 17:30 34 359 68 466 43 25 18:30 30 312 57 401 38 27 19:15 23 261 46 340 32 23 20:30 20 185 32 233 23 17 21:30 15 125 24 160 16 13 22:30 12 88 19 112 15 11 23:00 9 61 14 84 12 9
5/26/2010 0:50 3 14 6 23 6 7 1:30 3 -6 4 -7 4 8 2:30 1 -39 0 -28 6 7
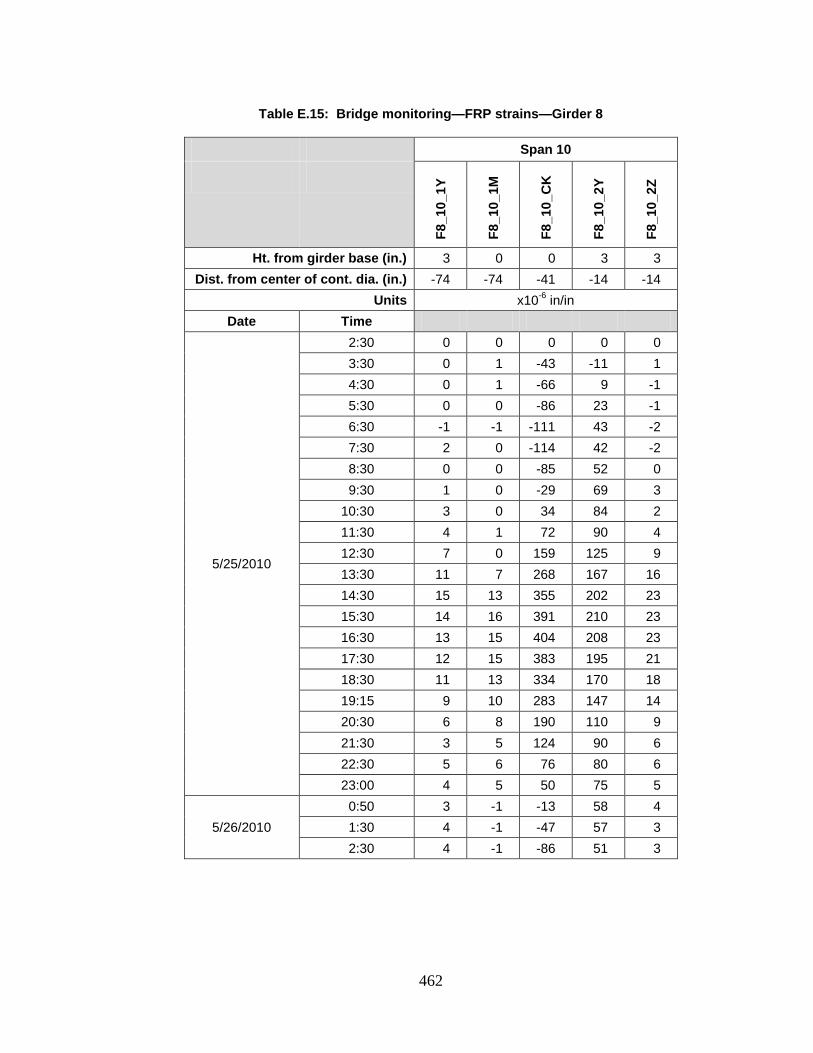
462
Table E.15: Bridge monitoring—FRP strains—Girder 8
Span 10
F8_1
0_1Y
F8_1
0_1M
F8_1
0_C
K
F8_1
0_2Y
F8_1
0_2Z
Ht. from girder base (in.) 3 0 0 3 3 Dist. from center of cont. dia. (in.) -74 -74 -41 -14 -14
Units x10-6 in/in Date Time
5/25/2010
2:30 0 0 0 0 0 3:30 0 1 -43 -11 1 4:30 0 1 -66 9 -1 5:30 0 0 -86 23 -1 6:30 -1 -1 -111 43 -2 7:30 2 0 -114 42 -2 8:30 0 0 -85 52 0 9:30 1 0 -29 69 3
10:30 3 0 34 84 2 11:30 4 1 72 90 4 12:30 7 0 159 125 9 13:30 11 7 268 167 16 14:30 15 13 355 202 23 15:30 14 16 391 210 23 16:30 13 15 404 208 23 17:30 12 15 383 195 21 18:30 11 13 334 170 18 19:15 9 10 283 147 14 20:30 6 8 190 110 9 21:30 3 5 124 90 6 22:30 5 6 76 80 6 23:00 4 5 50 75 5
5/26/2010 0:50 3 -1 -13 58 4 1:30 4 -1 -47 57 3 2:30 4 -1 -86 51 3
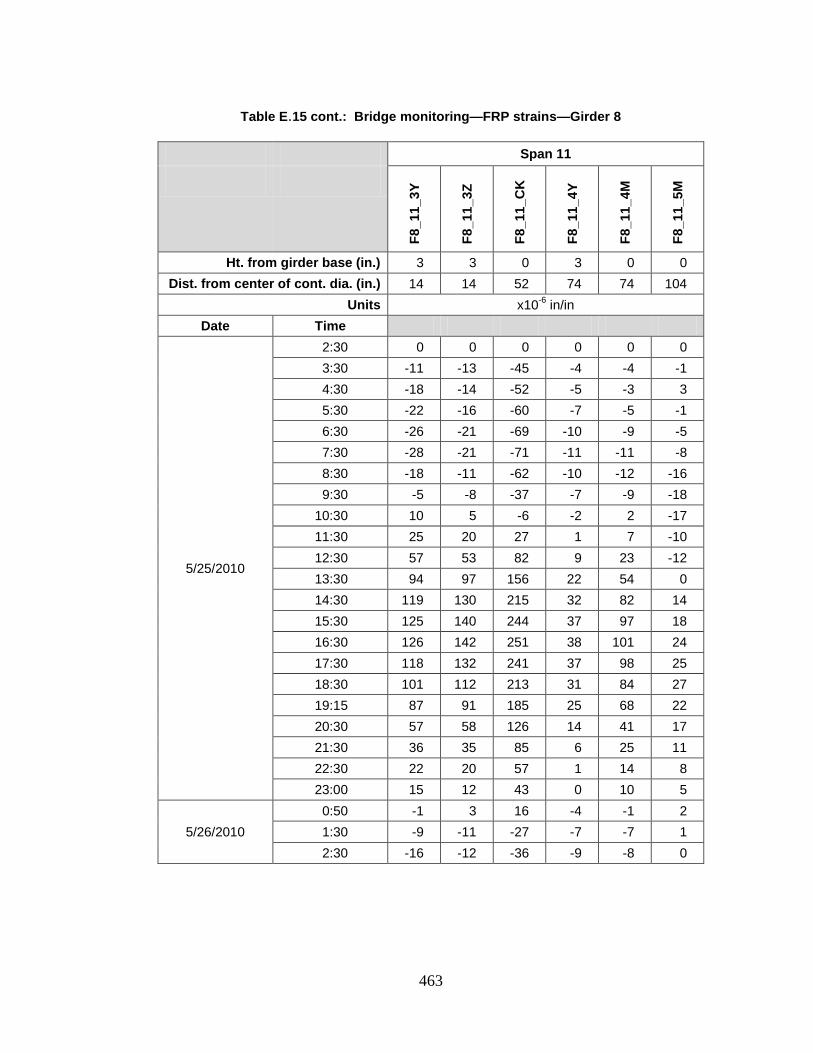
463
Table E.15 cont.: Bridge monitoring—FRP strains—Girder 8
Span 11
F8_1
1_3Y
F8_1
1_3Z
F8_1
1_C
K
F8_1
1_4Y
F8_1
1_4M
F8_1
1_5M
Ht. from girder base (in.) 3 3 0 3 0 0 Dist. from center of cont. dia. (in.) 14 14 52 74 74 104
Units x10-6 in/in Date Time
5/25/2010
2:30 0 0 0 0 0 0 3:30 -11 -13 -45 -4 -4 -1 4:30 -18 -14 -52 -5 -3 3 5:30 -22 -16 -60 -7 -5 -1 6:30 -26 -21 -69 -10 -9 -5 7:30 -28 -21 -71 -11 -11 -8 8:30 -18 -11 -62 -10 -12 -16 9:30 -5 -8 -37 -7 -9 -18
10:30 10 5 -6 -2 2 -17 11:30 25 20 27 1 7 -10 12:30 57 53 82 9 23 -12 13:30 94 97 156 22 54 0 14:30 119 130 215 32 82 14 15:30 125 140 244 37 97 18 16:30 126 142 251 38 101 24 17:30 118 132 241 37 98 25 18:30 101 112 213 31 84 27 19:15 87 91 185 25 68 22 20:30 57 58 126 14 41 17 21:30 36 35 85 6 25 11 22:30 22 20 57 1 14 8 23:00 15 12 43 0 10 5
5/26/2010 0:50 -1 3 16 -4 -1 2 1:30 -9 -11 -27 -7 -7 1 2:30 -16 -12 -36 -9 -8 0

464
Appendix F
BRIDGE MONITORING—MEASUREMENT ADJUSTMENTS

465
F.1 INCONSISTENT MEASUREMENTS
Sensors were balanced at the beginning of bridge monitoring. During the duration of the bridge
monitoring test, some of the instruments provided inconsistent measurements at different points
in time that may have had an effect on the remaining measurements. These inconsistent
measurements could be a result of electrical noise/interference or physical effects at the sensor
location. The sensors that were the most inconsistent were the deflectometers. The bottom-fiber
strain gage near the crack location of Girder 8 in Span 10 also measured inconsistencies. During
the analysis of bridge monitoring measurements, efforts were made to decrease the effects
associated with inconsistent sensor behavior.
F.2 DEFLECTOMETER BEHAVIOR
The deflectometers seemed to be sensitive to temporary direct sunlight on the aluminum bar
during the sunrise hours. An example of this type of sensitivity is evident during the morning
hours plotted in Figure F.1. Unexpected physical movement of a deflectometer could also have
an effect relative to the original baseline and cause a permanent data shift. Electrical noise or
interference could have also caused a momentary or permanent movement relative to the original
baseline. Instruments not returning to a similar measurement at the end of the test, in relation to
either the initial measurement of that sensor or the concluding measurements of other
comparable sensors, were the primary reason for deciding to adjust certain results. An example
of this type of offset can be readily observed in the response of Sensor D7_10_B in the early
afternoon in Figure F.1. Measurements that seemed to be inconsistent with the expected result
were inspected and adjustments were proposed and implemented when deemed appropriate.
F.3 DEFLECTION ADJUSTMENTS
Deflection measurements considered to be affected by deflectometers exposed to direct sunlight
were disregarded. When plotting the deflection results, a straight line was used to connect
measurements on either side of a discarded time interval during the sunrise period when this was
a particular problem.
Results that seemed to be inconsistent compared to adjacent time intervals were
disregarded and replaced with an estimated value based on the following procedure.
The estimated adjusted value was created by projecting a change in value over time from the
prior measurement. This projected change in value over time was based on the average of two
slopes bounding the time intervals to be replaced. All time intervals following the last adjusted
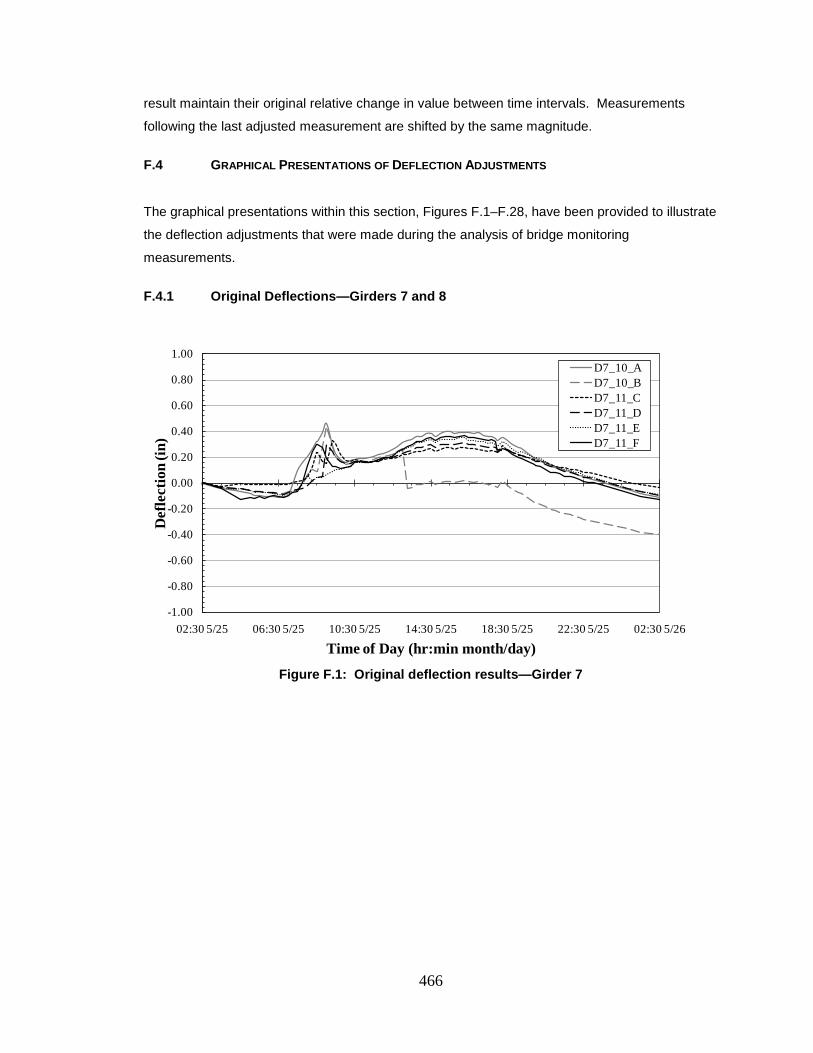
466
result maintain their original relative change in value between time intervals. Measurements
following the last adjusted measurement are shifted by the same magnitude.
F.4 GRAPHICAL PRESENTATIONS OF DEFLECTION ADJUSTMENTS
The graphical presentations within this section, Figures F.1–F.28, have been provided to illustrate
the deflection adjustments that were made during the analysis of bridge monitoring
measurements.
F.4.1 Original Deflections—Girders 7 and 8
Figure F.1: Original deflection results—Girder 7
-1.00
-0.80
-0.60
-0.40
-0.20
0.00
0.20
0.40
0.60
0.80
1.00
02:30 5/25 06:30 5/25 10:30 5/25 14:30 5/25 18:30 5/25 22:30 5/25 02:30 5/26
Def
lect
ion
(in)
Time of Day (hr:min month/day)
D7_10_AD7_10_BD7_11_CD7_11_DD7_11_ED7_11_F
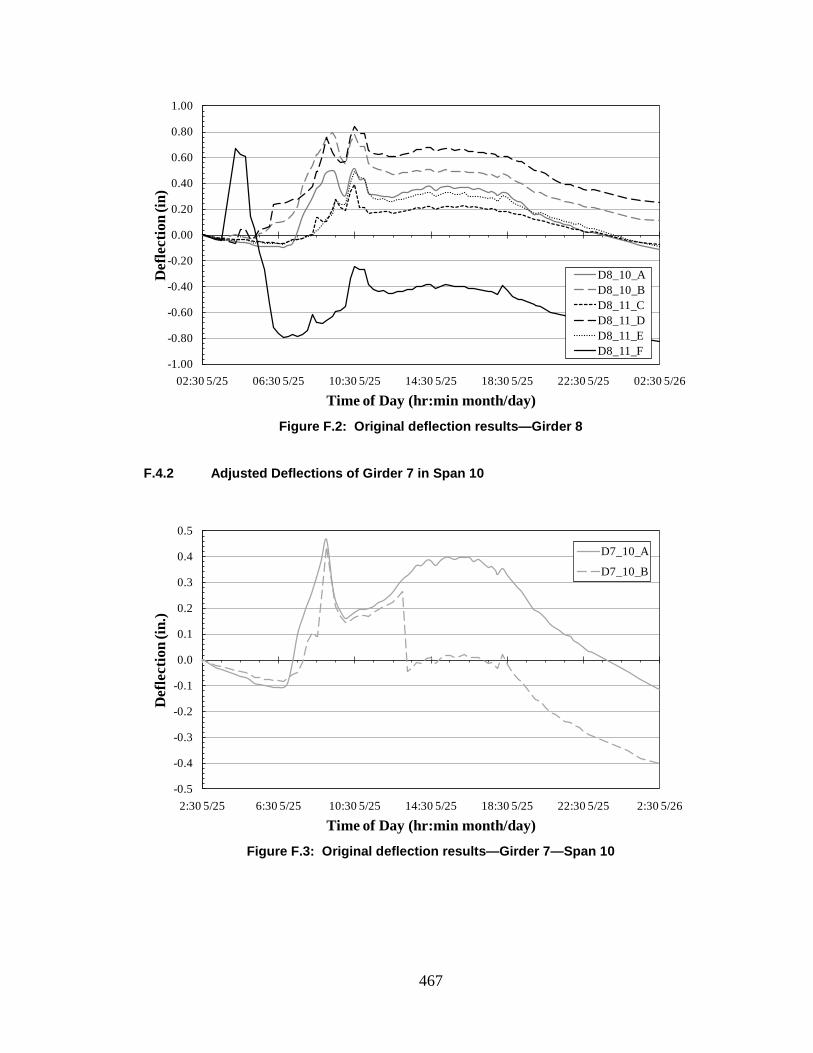
467
Figure F.2: Original deflection results—Girder 8
F.4.2 Adjusted Deflections of Girder 7 in Span 10
Figure F.3: Original deflection results—Girder 7—Span 10
-1.00
-0.80
-0.60
-0.40
-0.20
0.00
0.20
0.40
0.60
0.80
1.00
02:30 5/25 06:30 5/25 10:30 5/25 14:30 5/25 18:30 5/25 22:30 5/25 02:30 5/26
Def
lect
ion
(in)
Time of Day (hr:min month/day)
D8_10_AD8_10_BD8_11_CD8_11_DD8_11_ED8_11_F
-0.5
-0.4
-0.3
-0.2
-0.1
0.0
0.1
0.2
0.3
0.4
0.5
2:30 5/25 6:30 5/25 10:30 5/25 14:30 5/25 18:30 5/25 22:30 5/25 2:30 5/26
Def
lect
ion
(in.)
Time of Day (hr:min month/day)
D7_10_A
D7_10_B
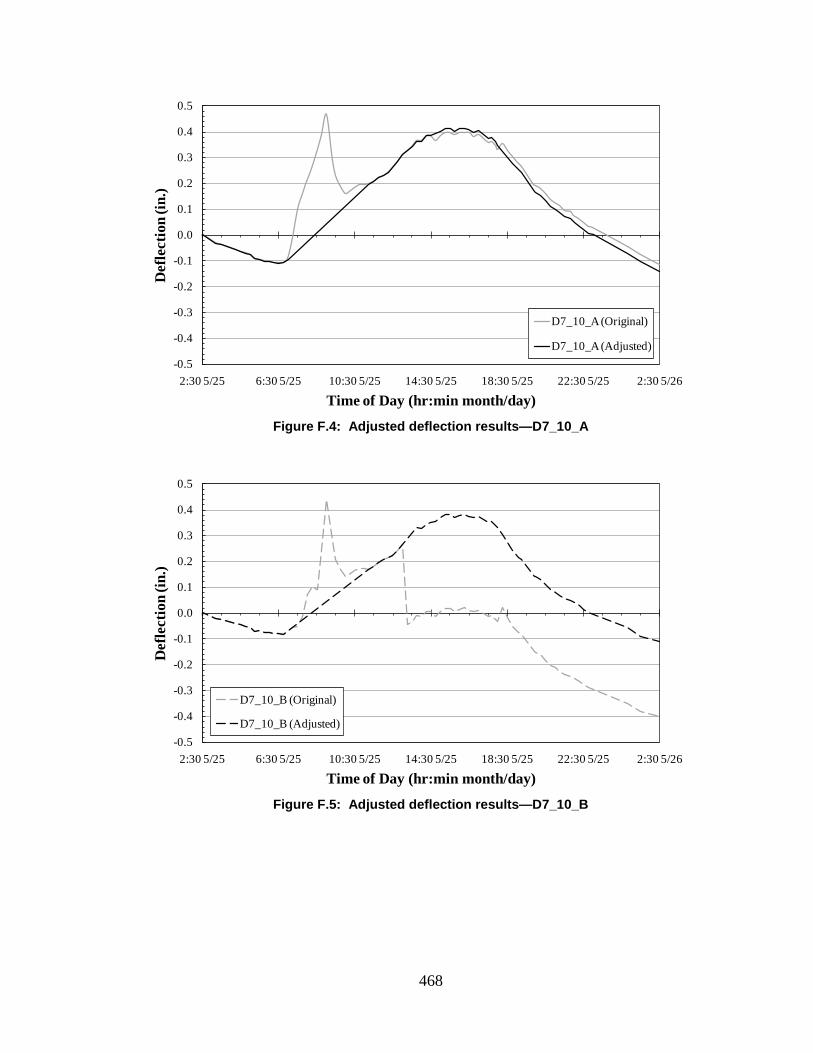
468
Figure F.4: Adjusted deflection results—D7_10_A
Figure F.5: Adjusted deflection results—D7_10_B
-0.5
-0.4
-0.3
-0.2
-0.1
0.0
0.1
0.2
0.3
0.4
0.5
2:30 5/25 6:30 5/25 10:30 5/25 14:30 5/25 18:30 5/25 22:30 5/25 2:30 5/26
Def
lect
ion
(in.)
Time of Day (hr:min month/day)
D7_10_A (Original)
D7_10_A (Adjusted)
-0.5
-0.4
-0.3
-0.2
-0.1
0.0
0.1
0.2
0.3
0.4
0.5
2:30 5/25 6:30 5/25 10:30 5/25 14:30 5/25 18:30 5/25 22:30 5/25 2:30 5/26
Def
lect
ion
(in.)
Time of Day (hr:min month/day)
D7_10_B (Original)
D7_10_B (Adjusted)
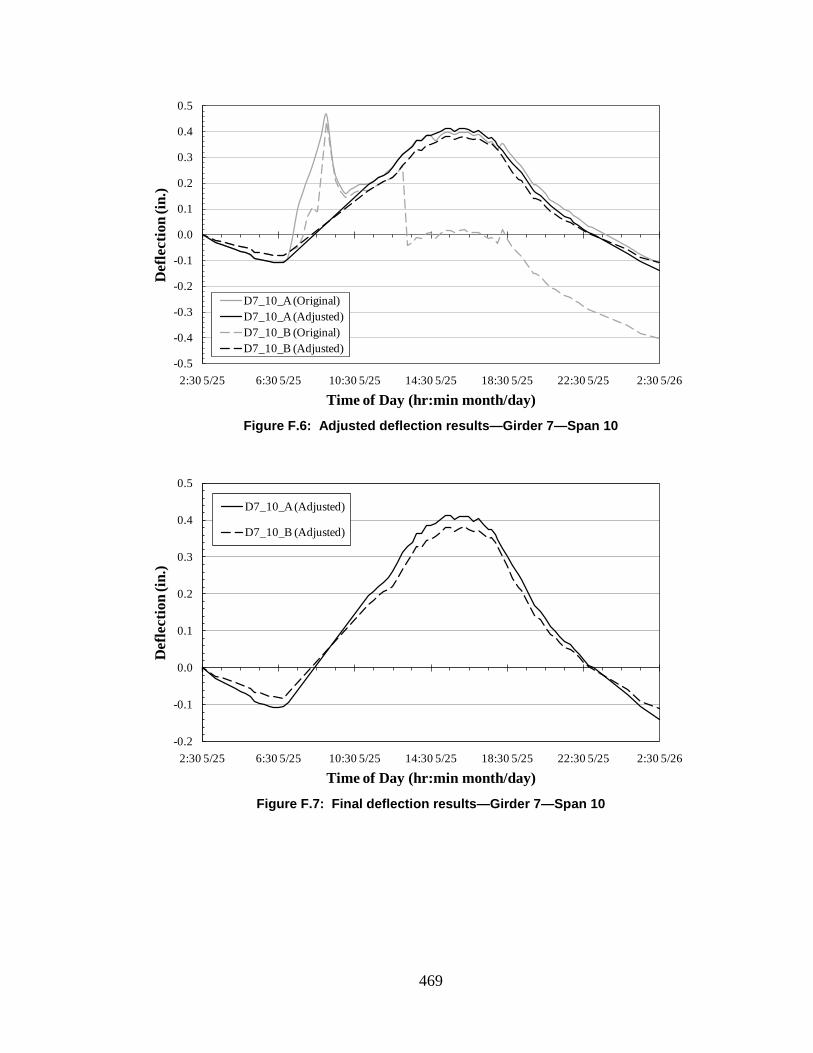
469
Figure F.6: Adjusted deflection results—Girder 7—Span 10
Figure F.7: Final deflection results—Girder 7—Span 10
-0.5
-0.4
-0.3
-0.2
-0.1
0.0
0.1
0.2
0.3
0.4
0.5
2:30 5/25 6:30 5/25 10:30 5/25 14:30 5/25 18:30 5/25 22:30 5/25 2:30 5/26
Def
lect
ion
(in.)
Time of Day (hr:min month/day)
D7_10_A (Original)D7_10_A (Adjusted)D7_10_B (Original)D7_10_B (Adjusted)
-0.2
-0.1
0.0
0.1
0.2
0.3
0.4
0.5
2:30 5/25 6:30 5/25 10:30 5/25 14:30 5/25 18:30 5/25 22:30 5/25 2:30 5/26
Def
lect
ion
(in.)
Time of Day (hr:min month/day)
D7_10_A (Adjusted)
D7_10_B (Adjusted)
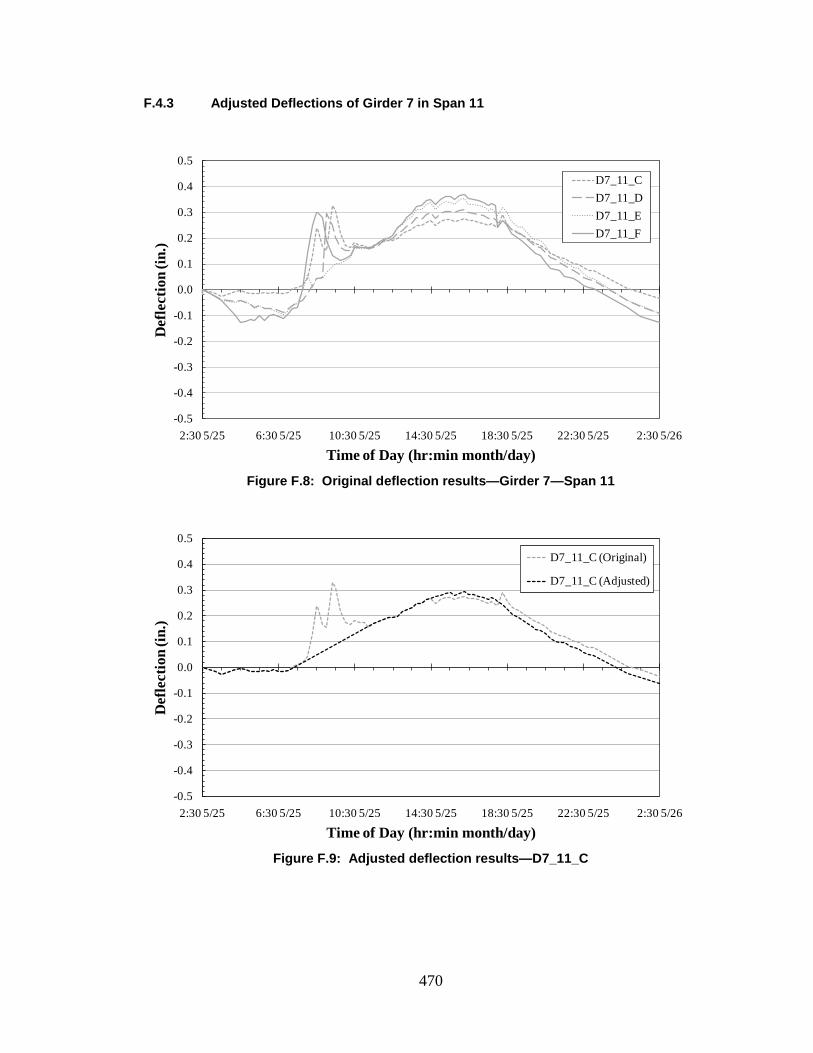
470
F.4.3 Adjusted Deflections of Girder 7 in Span 11
Figure F.8: Original deflection results—Girder 7—Span 11
Figure F.9: Adjusted deflection results—D7_11_C
-0.5
-0.4
-0.3
-0.2
-0.1
0.0
0.1
0.2
0.3
0.4
0.5
2:30 5/25 6:30 5/25 10:30 5/25 14:30 5/25 18:30 5/25 22:30 5/25 2:30 5/26
Def
lect
ion
(in.)
Time of Day (hr:min month/day)
D7_11_CD7_11_DD7_11_ED7_11_F
-0.5
-0.4
-0.3
-0.2
-0.1
0.0
0.1
0.2
0.3
0.4
0.5
2:30 5/25 6:30 5/25 10:30 5/25 14:30 5/25 18:30 5/25 22:30 5/25 2:30 5/26
Def
lect
ion
(in.)
Time of Day (hr:min month/day)
D7_11_C (Original)
D7_11_C (Adjusted)
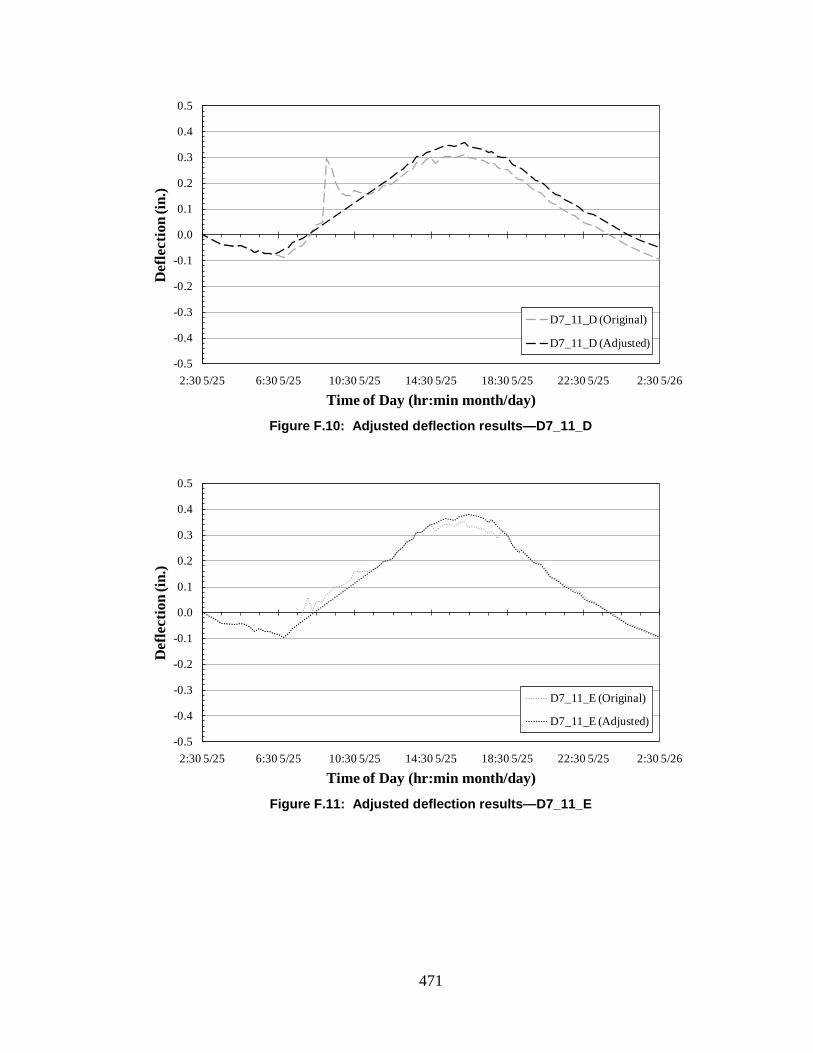
471
Figure F.10: Adjusted deflection results—D7_11_D
Figure F.11: Adjusted deflection results—D7_11_E
-0.5
-0.4
-0.3
-0.2
-0.1
0.0
0.1
0.2
0.3
0.4
0.5
2:30 5/25 6:30 5/25 10:30 5/25 14:30 5/25 18:30 5/25 22:30 5/25 2:30 5/26
Def
lect
ion
(in.)
Time of Day (hr:min month/day)
D7_11_D (Original)
D7_11_D (Adjusted)
-0.5
-0.4
-0.3
-0.2
-0.1
0.0
0.1
0.2
0.3
0.4
0.5
2:30 5/25 6:30 5/25 10:30 5/25 14:30 5/25 18:30 5/25 22:30 5/25 2:30 5/26
Def
lect
ion
(in.)
Time of Day (hr:min month/day)
D7_11_E (Original)
D7_11_E (Adjusted)
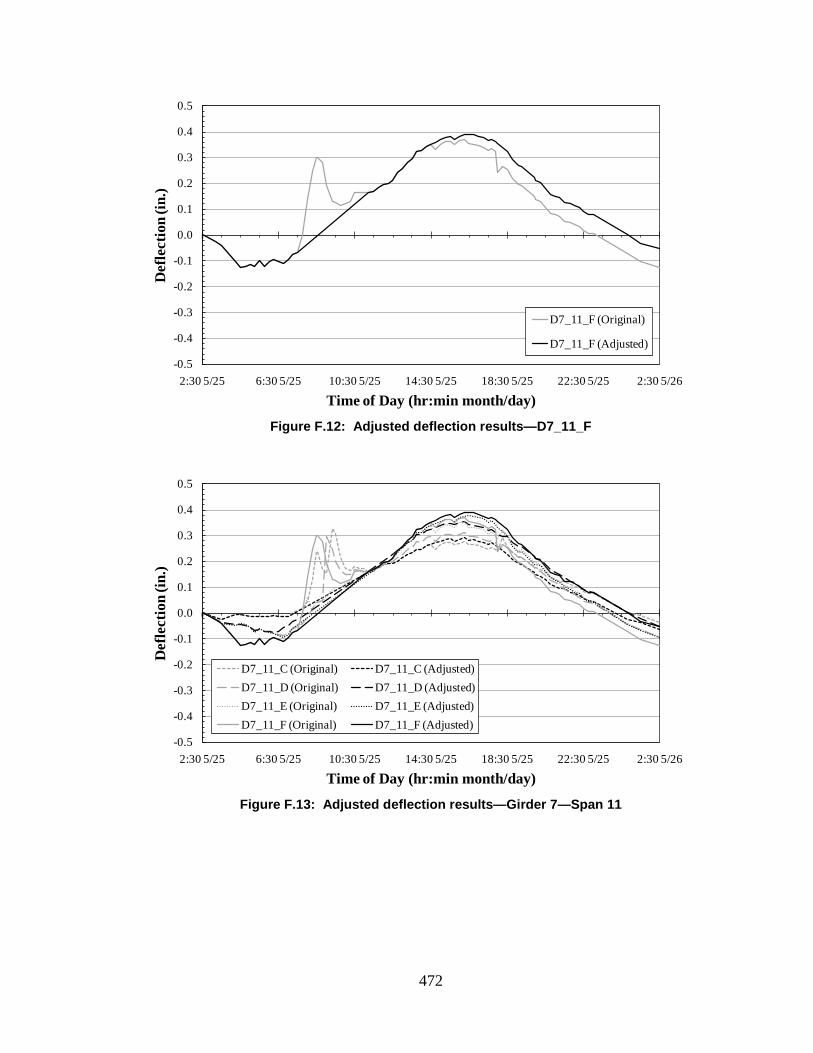
472
Figure F.12: Adjusted deflection results—D7_11_F
Figure F.13: Adjusted deflection results—Girder 7—Span 11
-0.5
-0.4
-0.3
-0.2
-0.1
0.0
0.1
0.2
0.3
0.4
0.5
2:30 5/25 6:30 5/25 10:30 5/25 14:30 5/25 18:30 5/25 22:30 5/25 2:30 5/26
Def
lect
ion
(in.)
Time of Day (hr:min month/day)
D7_11_F (Original)
D7_11_F (Adjusted)
-0.5
-0.4
-0.3
-0.2
-0.1
0.0
0.1
0.2
0.3
0.4
0.5
2:30 5/25 6:30 5/25 10:30 5/25 14:30 5/25 18:30 5/25 22:30 5/25 2:30 5/26
Def
lect
ion
(in.)
Time of Day (hr:min month/day)
D7_11_C (Original) D7_11_C (Adjusted)D7_11_D (Original) D7_11_D (Adjusted)D7_11_E (Original) D7_11_E (Adjusted)D7_11_F (Original) D7_11_F (Adjusted)
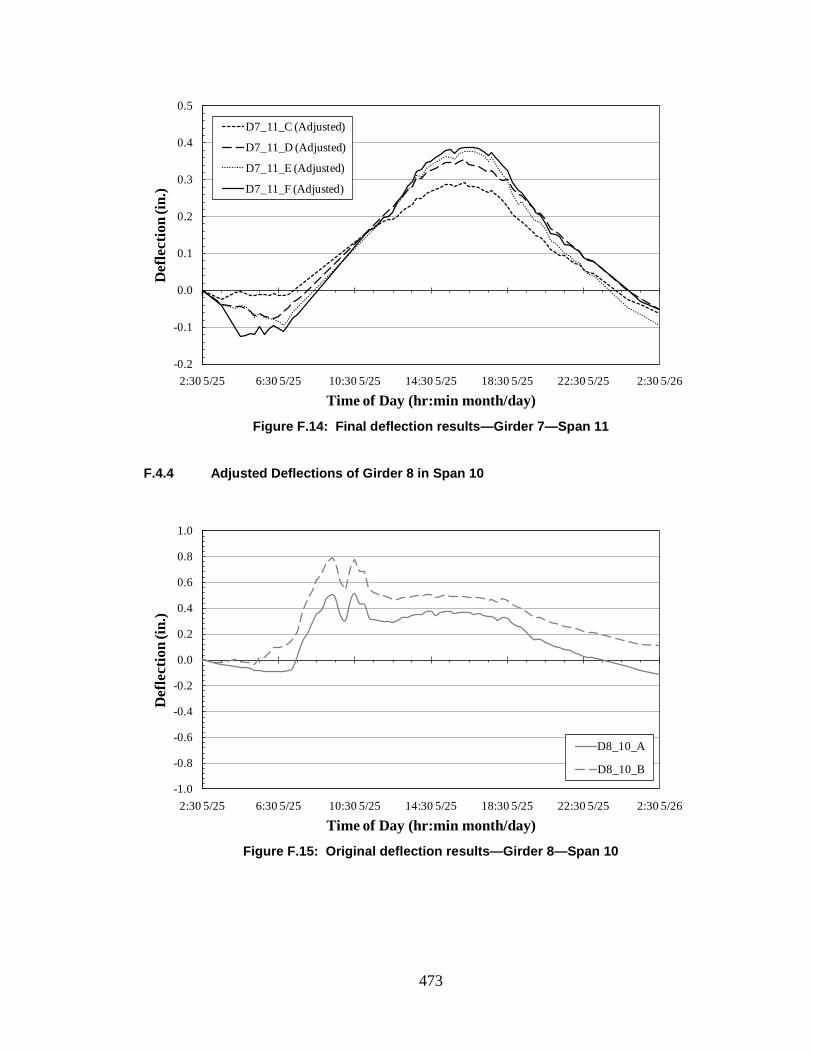
473
Figure F.14: Final deflection results—Girder 7—Span 11
F.4.4 Adjusted Deflections of Girder 8 in Span 10
Figure F.15: Original deflection results—Girder 8—Span 10
-0.2
-0.1
0.0
0.1
0.2
0.3
0.4
0.5
2:30 5/25 6:30 5/25 10:30 5/25 14:30 5/25 18:30 5/25 22:30 5/25 2:30 5/26
Def
lect
ion
(in.)
Time of Day (hr:min month/day)
D7_11_C (Adjusted)
D7_11_D (Adjusted)
D7_11_E (Adjusted)
D7_11_F (Adjusted)
-1.0
-0.8
-0.6
-0.4
-0.2
0.0
0.2
0.4
0.6
0.8
1.0
2:30 5/25 6:30 5/25 10:30 5/25 14:30 5/25 18:30 5/25 22:30 5/25 2:30 5/26
Def
lect
ion
(in.)
Time of Day (hr:min month/day)
D8_10_A
D8_10_B
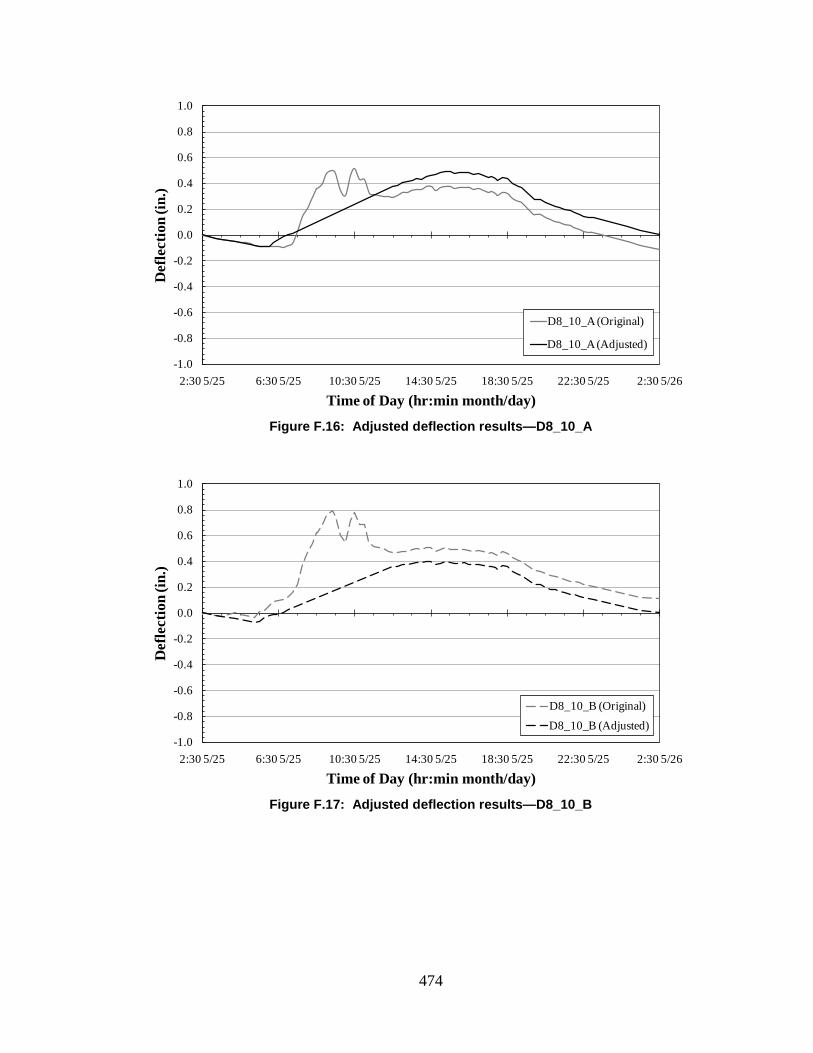
474
Figure F.16: Adjusted deflection results—D8_10_A
Figure F.17: Adjusted deflection results—D8_10_B
-1.0
-0.8
-0.6
-0.4
-0.2
0.0
0.2
0.4
0.6
0.8
1.0
2:30 5/25 6:30 5/25 10:30 5/25 14:30 5/25 18:30 5/25 22:30 5/25 2:30 5/26
Def
lect
ion
(in.)
Time of Day (hr:min month/day)
D8_10_A (Original)
D8_10_A (Adjusted)
-1.0
-0.8
-0.6
-0.4
-0.2
0.0
0.2
0.4
0.6
0.8
1.0
2:30 5/25 6:30 5/25 10:30 5/25 14:30 5/25 18:30 5/25 22:30 5/25 2:30 5/26
Def
lect
ion
(in.)
Time of Day (hr:min month/day)
D8_10_B (Original)
D8_10_B (Adjusted)
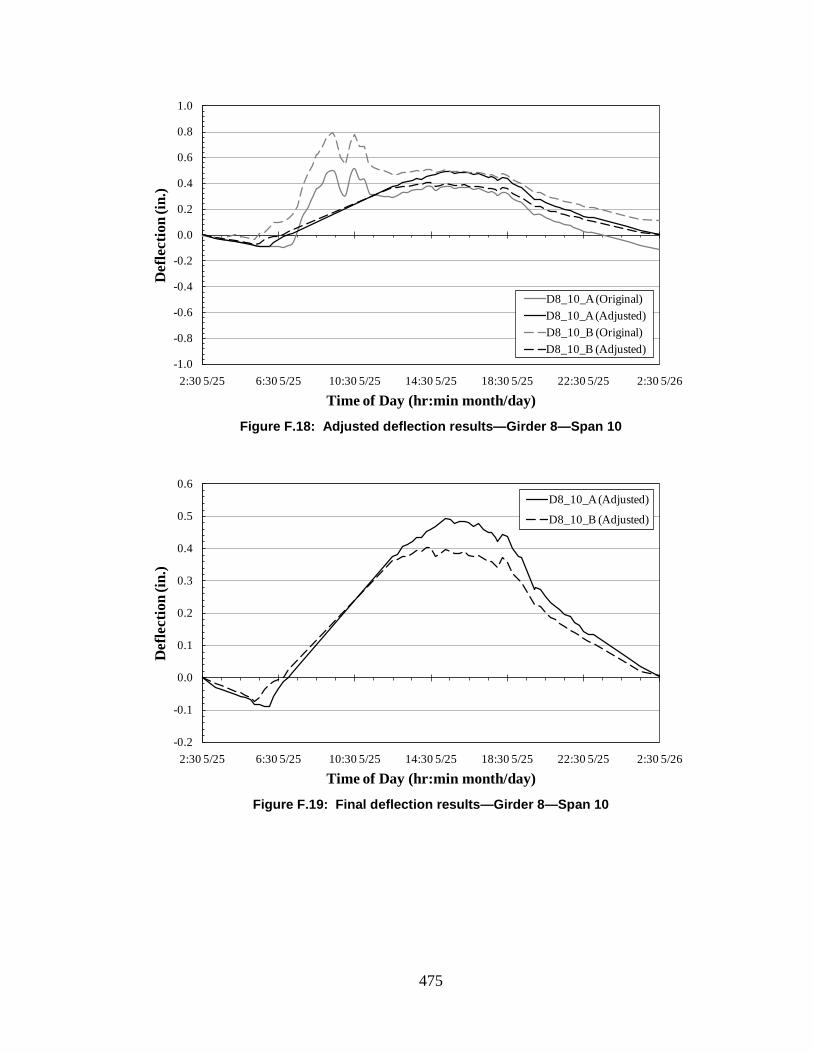
475
Figure F.18: Adjusted deflection results—Girder 8—Span 10
Figure F.19: Final deflection results—Girder 8—Span 10
-1.0
-0.8
-0.6
-0.4
-0.2
0.0
0.2
0.4
0.6
0.8
1.0
2:30 5/25 6:30 5/25 10:30 5/25 14:30 5/25 18:30 5/25 22:30 5/25 2:30 5/26
Def
lect
ion
(in.)
Time of Day (hr:min month/day)
D8_10_A (Original)D8_10_A (Adjusted)D8_10_B (Original)D8_10_B (Adjusted)
-0.2
-0.1
0.0
0.1
0.2
0.3
0.4
0.5
0.6
2:30 5/25 6:30 5/25 10:30 5/25 14:30 5/25 18:30 5/25 22:30 5/25 2:30 5/26
Def
lect
ion
(in.)
Time of Day (hr:min month/day)
D8_10_A (Adjusted)
D8_10_B (Adjusted)
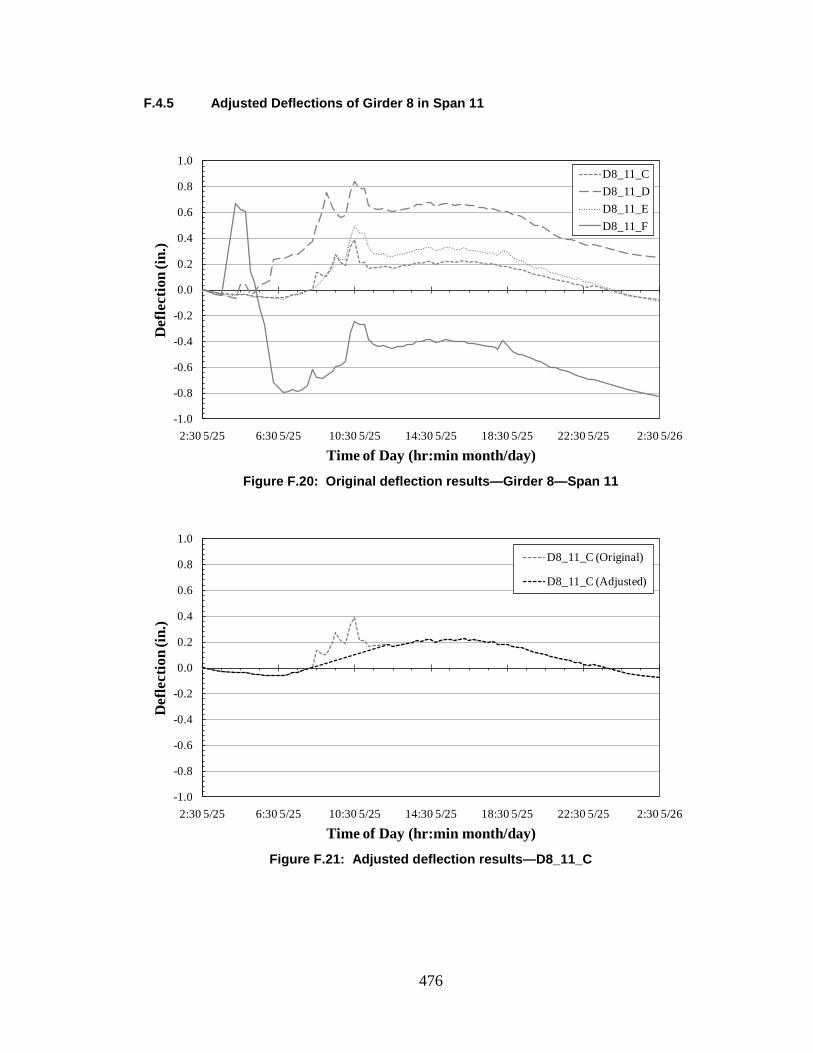
476
F.4.5 Adjusted Deflections of Girder 8 in Span 11
Figure F.20: Original deflection results—Girder 8—Span 11
Figure F.21: Adjusted deflection results—D8_11_C
-1.0
-0.8
-0.6
-0.4
-0.2
0.0
0.2
0.4
0.6
0.8
1.0
2:30 5/25 6:30 5/25 10:30 5/25 14:30 5/25 18:30 5/25 22:30 5/25 2:30 5/26
Def
lect
ion
(in.)
Time of Day (hr:min month/day)
D8_11_CD8_11_DD8_11_ED8_11_F
-1.0
-0.8
-0.6
-0.4
-0.2
0.0
0.2
0.4
0.6
0.8
1.0
2:30 5/25 6:30 5/25 10:30 5/25 14:30 5/25 18:30 5/25 22:30 5/25 2:30 5/26
Def
lect
ion
(in.)
Time of Day (hr:min month/day)
D8_11_C (Original)
D8_11_C (Adjusted)

477
Figure F.22: Adjusted deflection results—D8_11_D
Figure F.23: Adjusted deflection results—D8_11_E
-1.0
-0.8
-0.6
-0.4
-0.2
0.0
0.2
0.4
0.6
0.8
1.0
2:30 5/25 6:30 5/25 10:30 5/25 14:30 5/25 18:30 5/25 22:30 5/25 2:30 5/26
Def
lect
ion
(in.)
Time of Day (hr:min month/day)
D8_11_D (Original)
D8_11_D (Adjusted)
-1.0
-0.8
-0.6
-0.4
-0.2
0.0
0.2
0.4
0.6
0.8
1.0
2:30 5/25 6:30 5/25 10:30 5/25 14:30 5/25 18:30 5/25 22:30 5/25 2:30 5/26
Def
lect
ion
(in.)
Time of Day (hr:min month/day)
D8_11_E (Original)
D8_11_E (Adjusted)
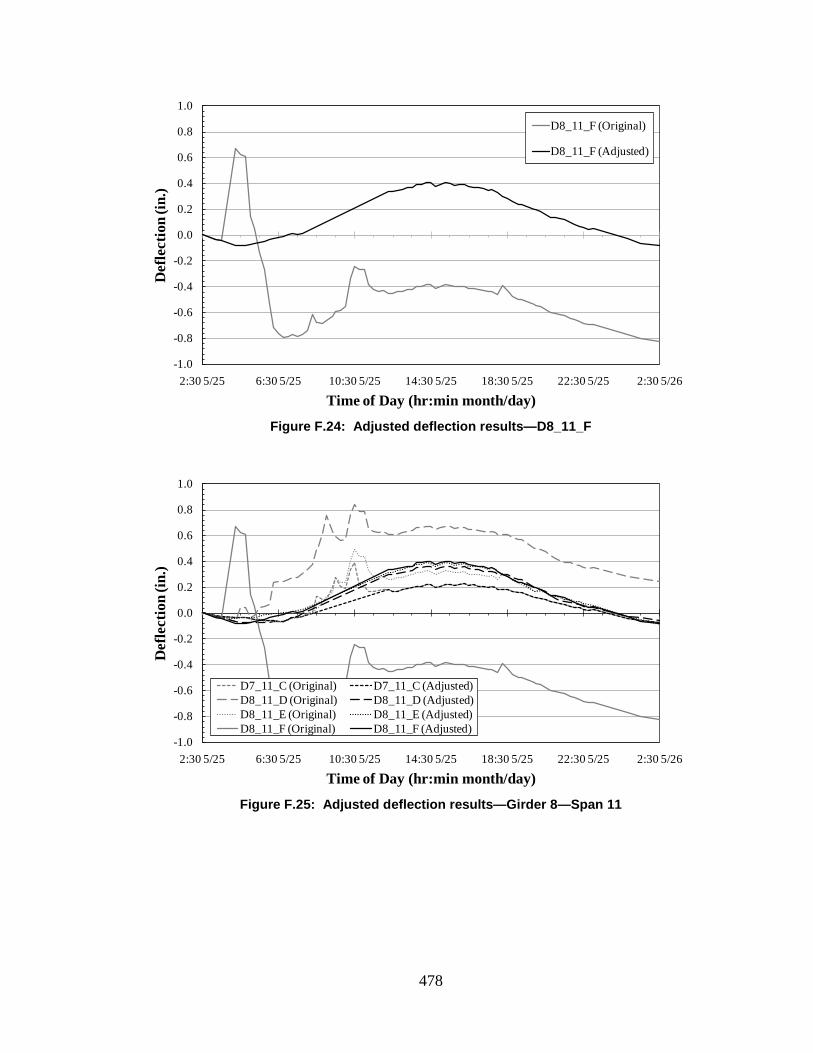
478
Figure F.24: Adjusted deflection results—D8_11_F
Figure F.25: Adjusted deflection results—Girder 8—Span 11
-1.0
-0.8
-0.6
-0.4
-0.2
0.0
0.2
0.4
0.6
0.8
1.0
2:30 5/25 6:30 5/25 10:30 5/25 14:30 5/25 18:30 5/25 22:30 5/25 2:30 5/26
Def
lect
ion
(in.)
Time of Day (hr:min month/day)
D8_11_F (Original)
D8_11_F (Adjusted)
-1.0
-0.8
-0.6
-0.4
-0.2
0.0
0.2
0.4
0.6
0.8
1.0
2:30 5/25 6:30 5/25 10:30 5/25 14:30 5/25 18:30 5/25 22:30 5/25 2:30 5/26
Def
lect
ion
(in.)
Time of Day (hr:min month/day)
D7_11_C (Original) D7_11_C (Adjusted)D8_11_D (Original) D8_11_D (Adjusted)D8_11_E (Original) D8_11_E (Adjusted)D8_11_F (Original) D8_11_F (Adjusted)
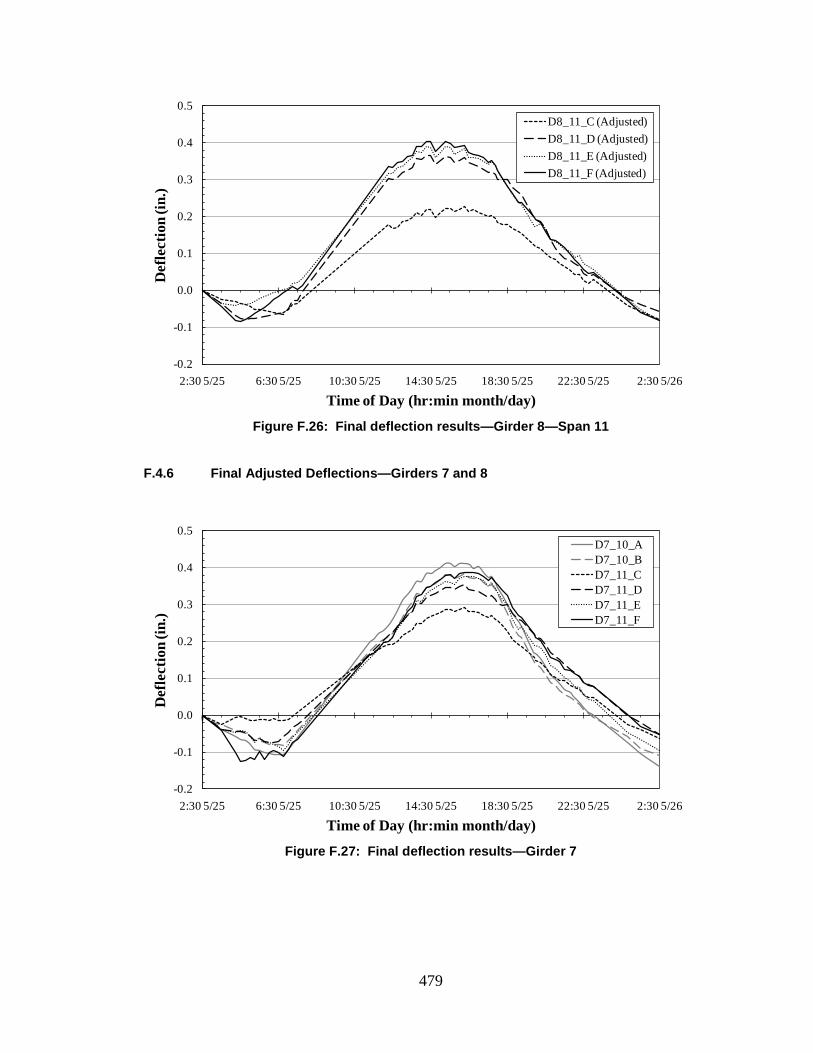
479
Figure F.26: Final deflection results—Girder 8—Span 11
F.4.6 Final Adjusted Deflections—Girders 7 and 8
Figure F.27: Final deflection results—Girder 7
-0.2
-0.1
0.0
0.1
0.2
0.3
0.4
0.5
2:30 5/25 6:30 5/25 10:30 5/25 14:30 5/25 18:30 5/25 22:30 5/25 2:30 5/26
Def
lect
ion
(in.)
Time of Day (hr:min month/day)
D8_11_C (Adjusted)D8_11_D (Adjusted)D8_11_E (Adjusted)D8_11_F (Adjusted)
-0.2
-0.1
0.0
0.1
0.2
0.3
0.4
0.5
2:30 5/25 6:30 5/25 10:30 5/25 14:30 5/25 18:30 5/25 22:30 5/25 2:30 5/26
Def
lect
ion
(in.)
Time of Day (hr:min month/day)
D7_10_AD7_10_BD7_11_CD7_11_DD7_11_ED7_11_F
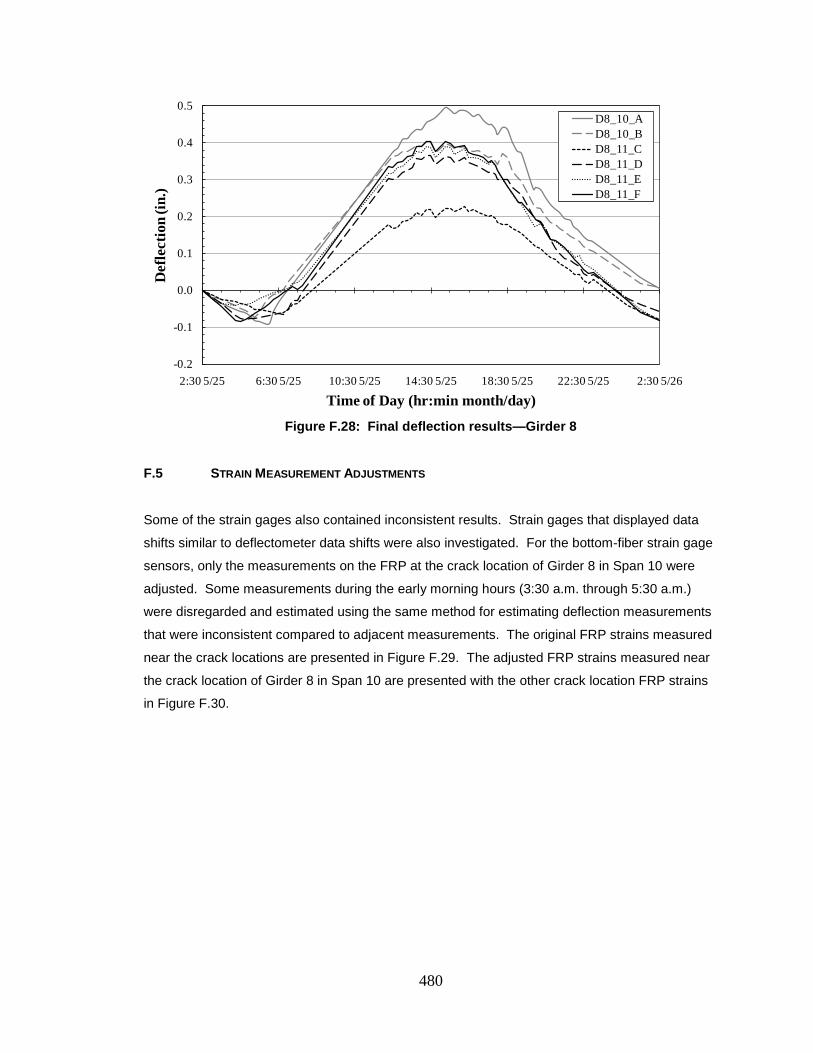
480
Figure F.28: Final deflection results—Girder 8
F.5 STRAIN MEASUREMENT ADJUSTMENTS
Some of the strain gages also contained inconsistent results. Strain gages that displayed data
shifts similar to deflectometer data shifts were also investigated. For the bottom-fiber strain gage
sensors, only the measurements on the FRP at the crack location of Girder 8 in Span 10 were
adjusted. Some measurements during the early morning hours (3:30 a.m. through 5:30 a.m.)
were disregarded and estimated using the same method for estimating deflection measurements
that were inconsistent compared to adjacent measurements. The original FRP strains measured
near the crack locations are presented in Figure F.29. The adjusted FRP strains measured near
the crack location of Girder 8 in Span 10 are presented with the other crack location FRP strains
in Figure F.30.
-0.2
-0.1
0.0
0.1
0.2
0.3
0.4
0.5
2:30 5/25 6:30 5/25 10:30 5/25 14:30 5/25 18:30 5/25 22:30 5/25 2:30 5/26
Def
lect
ion
(in.)
Time of Day (hr:min month/day)
D8_10_AD8_10_BD8_11_CD8_11_DD8_11_ED8_11_F
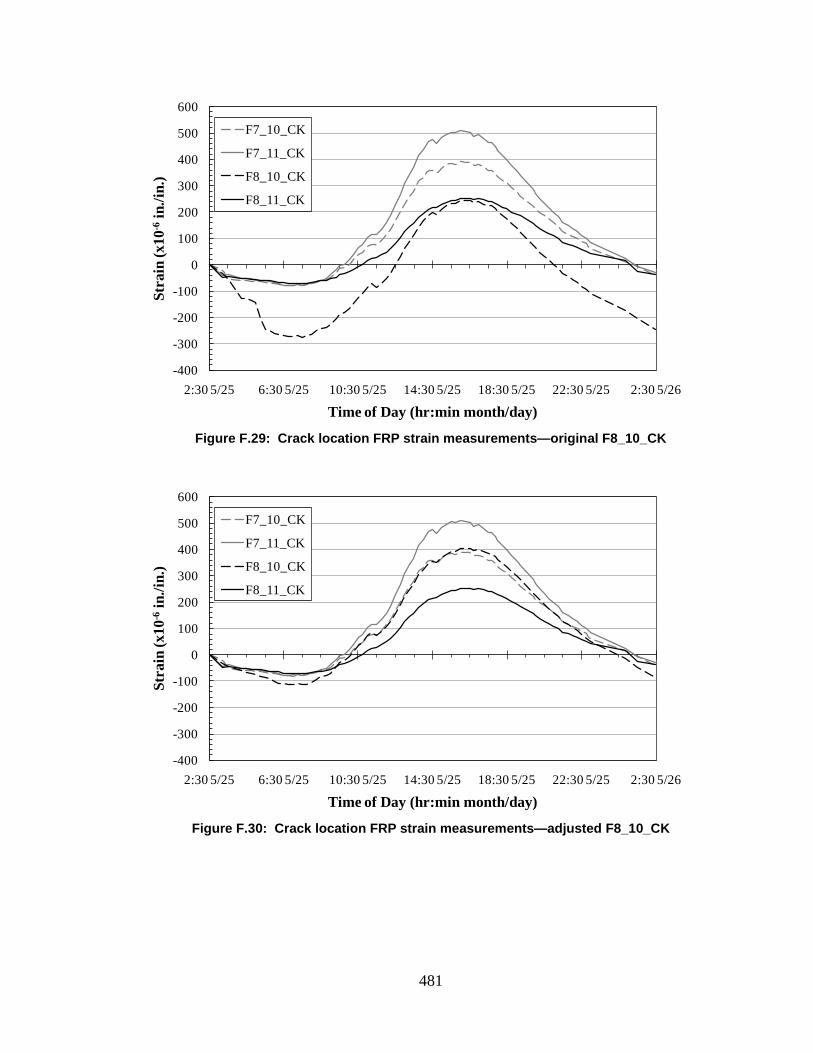
481
Figure F.29: Crack location FRP strain measurements—original F8_10_CK
Figure F.30: Crack location FRP strain measurements—adjusted F8_10_CK
-400
-300
-200
-100
0
100
200
300
400
500
600
2:30 5/25 6:30 5/25 10:30 5/25 14:30 5/25 18:30 5/25 22:30 5/25 2:30 5/26
Stra
in (x
10-6
in./i
n.)
Time of Day (hr:min month/day)
F7_10_CK
F7_11_CK
F8_10_CK
F8_11_CK
-400
-300
-200
-100
0
100
200
300
400
500
600
2:30 5/25 6:30 5/25 10:30 5/25 14:30 5/25 18:30 5/25 22:30 5/25 2:30 5/26
Stra
in (x
10-6
in./i
n.)
Time of Day (hr:min month/day)
F7_10_CK
F7_11_CK
F8_10_CK
F8_11_CK

482
Appendix G
SUPERPOSITION—GRAPHICAL RESULTS
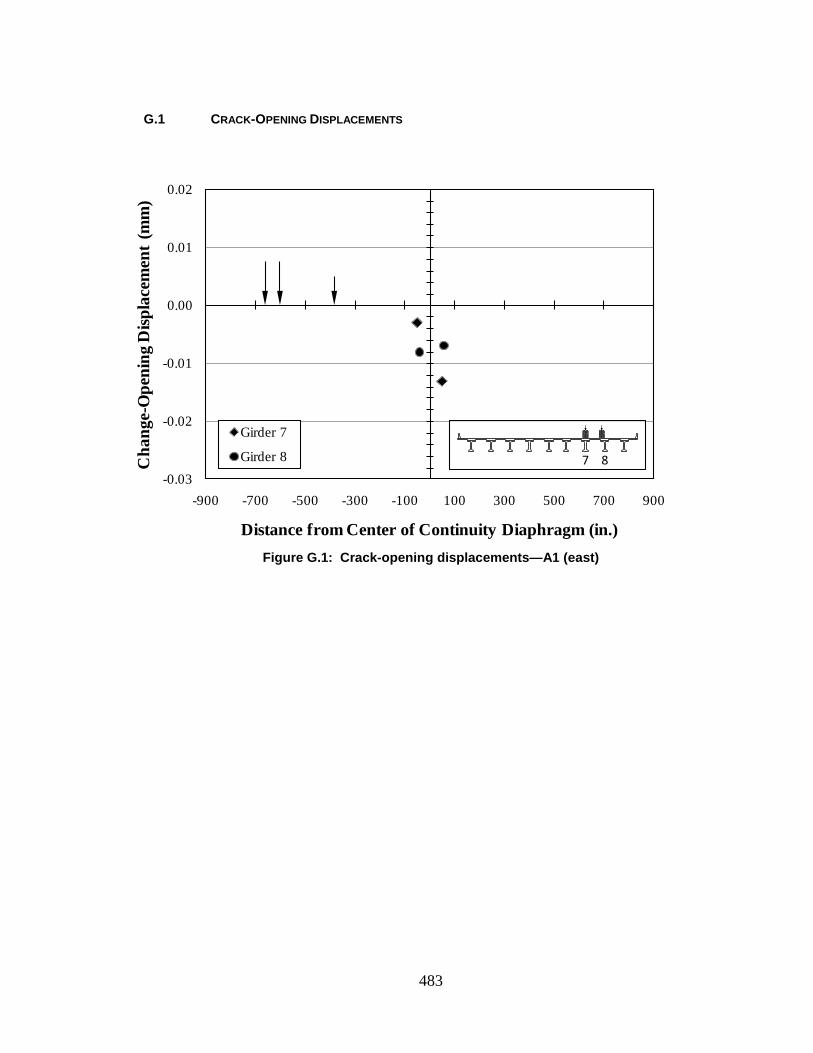
483
G.1 CRACK-OPENING DISPLACEMENTS
Figure G.1: Crack-opening displacements—A1 (east)
-0.03
-0.02
-0.01
0.00
0.01
0.02
-900 -700 -500 -300 -100 100 300 500 700 900
Cha
nge-
Ope
ning
Disp
lace
men
t (m
m)
Distance from Center of Continuity Diaphragm (in.)
Girder 7
Girder 8
7 8
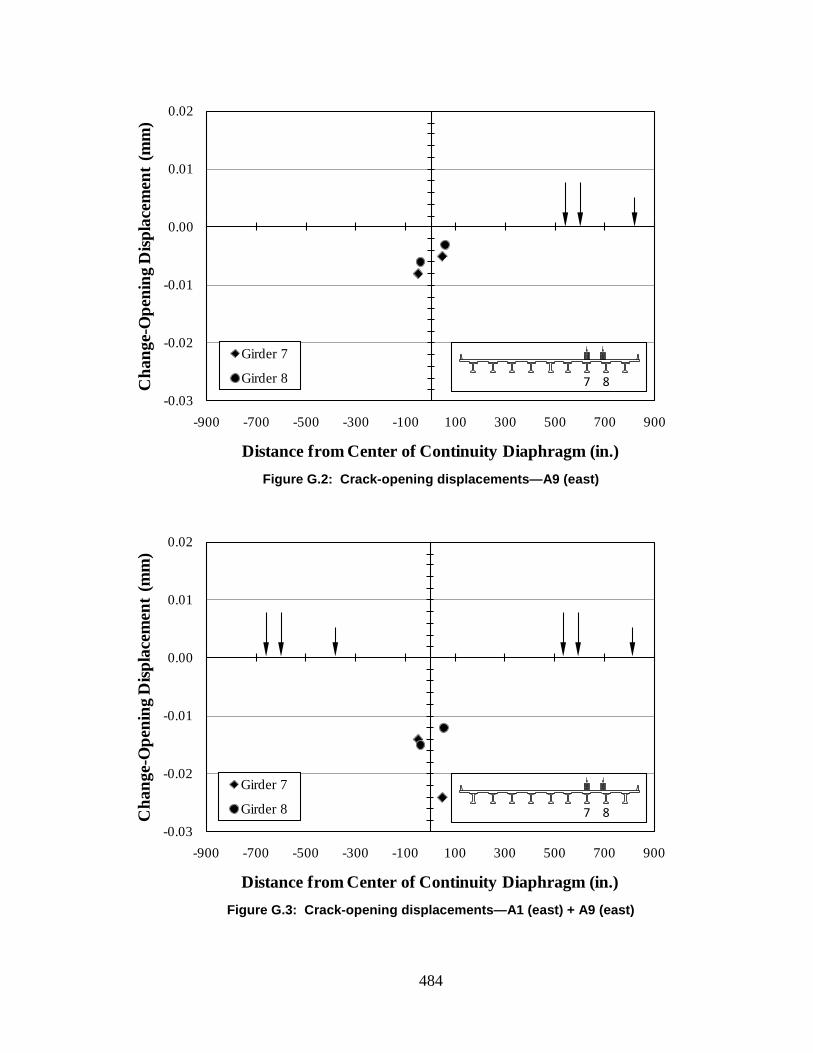
484
Figure G.2: Crack-opening displacements—A9 (east)
Figure G.3: Crack-opening displacements—A1 (east) + A9 (east)
-0.03
-0.02
-0.01
0.00
0.01
0.02
-900 -700 -500 -300 -100 100 300 500 700 900
Cha
nge-
Ope
ning
Disp
lace
men
t (m
m)
Distance from Center of Continuity Diaphragm (in.)
Girder 7
Girder 8
7 8
-0.03
-0.02
-0.01
0.00
0.01
0.02
-900 -700 -500 -300 -100 100 300 500 700 900
Cha
nge-
Ope
ning
Disp
lace
men
t (m
m)
Distance from Center of Continuity Diaphragm (in.)
Girder 7
Girder 8
7 8
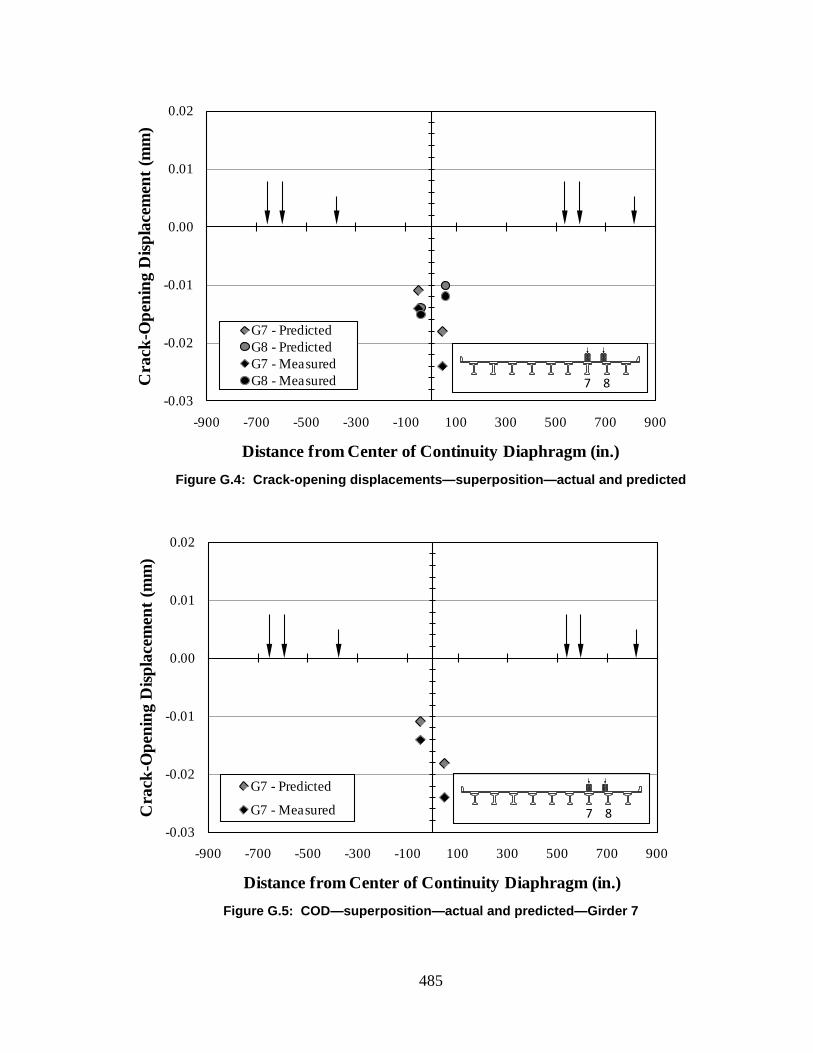
485
Figure G.4: Crack-opening displacements—superposition—actual and predicted
Figure G.5: COD—superposition—actual and predicted—Girder 7
-0.03
-0.02
-0.01
0.00
0.01
0.02
-900 -700 -500 -300 -100 100 300 500 700 900
Cra
ck-O
peni
ng D
ispla
cem
ent (
mm
)
Distance from Center of Continuity Diaphragm (in.)
G7 - PredictedG8 - PredictedG7 - MeasuredG8 - Measured
7 8
-0.03
-0.02
-0.01
0.00
0.01
0.02
-900 -700 -500 -300 -100 100 300 500 700 900
Cra
ck-O
peni
ng D
ispla
cem
ent (
mm
)
Distance from Center of Continuity Diaphragm (in.)
G7 - Predicted
G7 - Measured
7 8
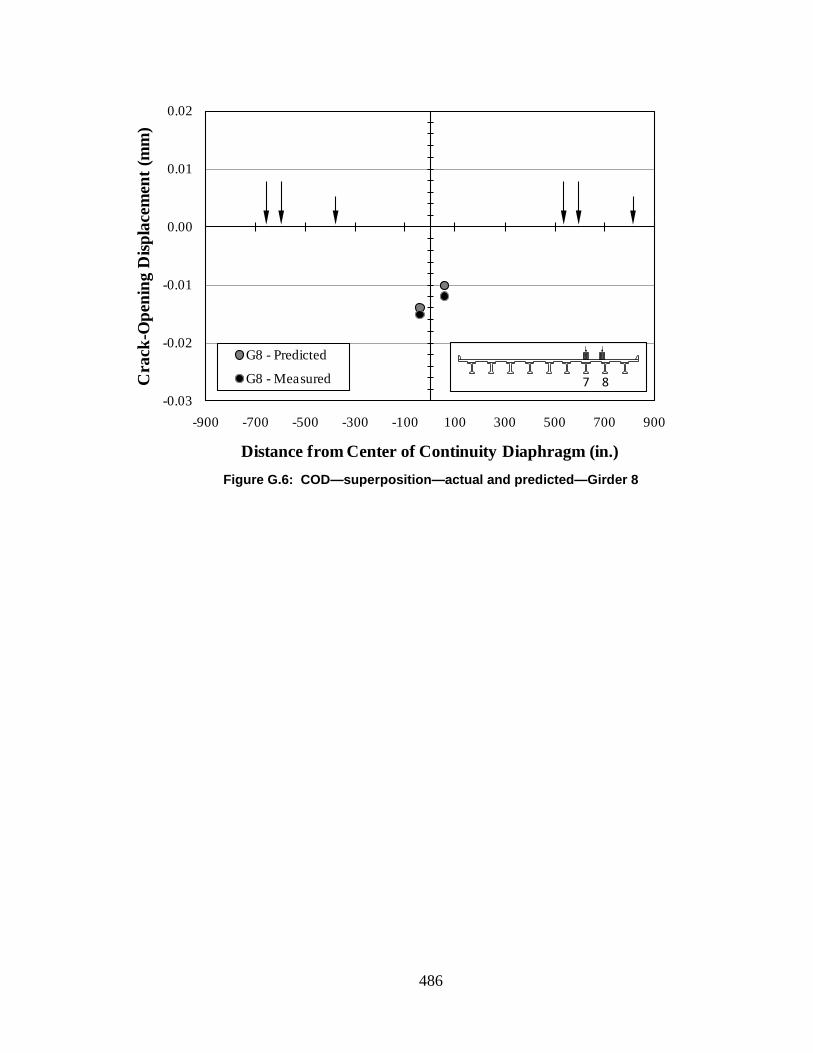
486
Figure G.6: COD—superposition—actual and predicted—Girder 8
-0.03
-0.02
-0.01
0.00
0.01
0.02
-900 -700 -500 -300 -100 100 300 500 700 900
Cra
ck-O
peni
ng D
ispla
cem
ent (
mm
)
Distance from Center of Continuity Diaphragm (in.)
G8 - Predicted
G8 - Measured
7 8
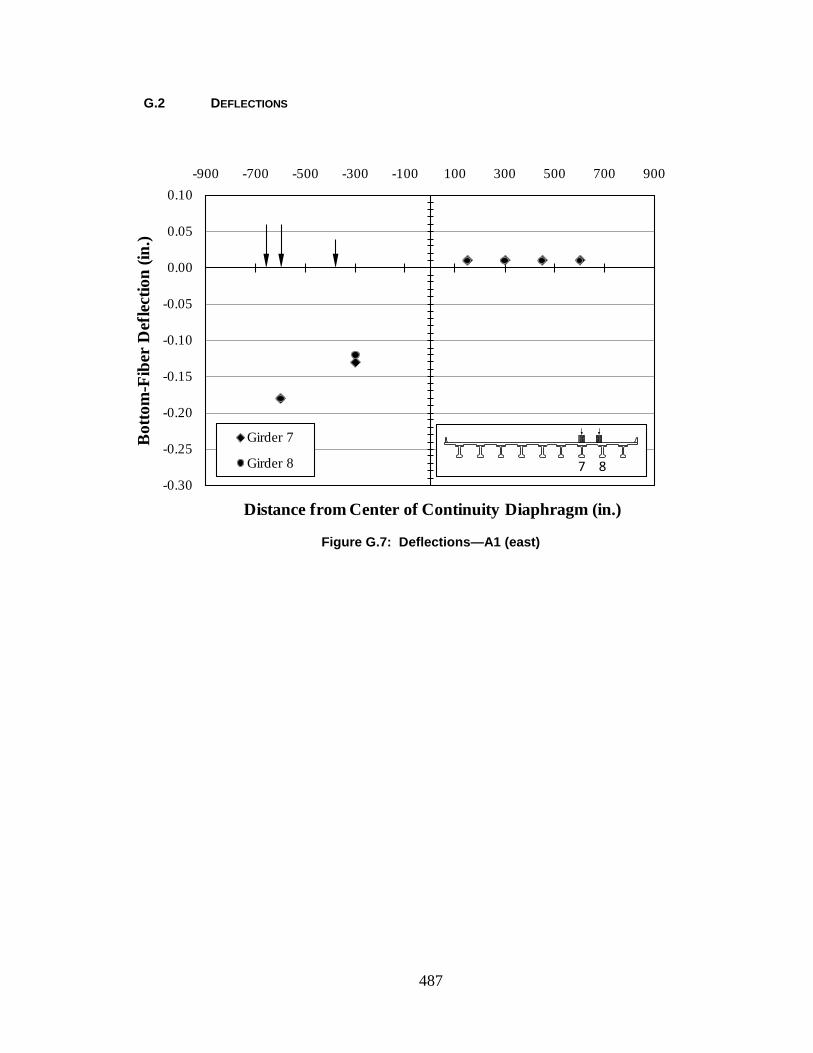
487
G.2 DEFLECTIONS
Figure G.7: Deflections—A1 (east)
-0.30
-0.25
-0.20
-0.15
-0.10
-0.05
0.00
0.05
0.10-900 -700 -500 -300 -100 100 300 500 700 900
Bot
tom
-Fib
er D
efle
ctio
n (in
.)
Distance from Center of Continuity Diaphragm (in.)
Girder 7
Girder 8
7 8
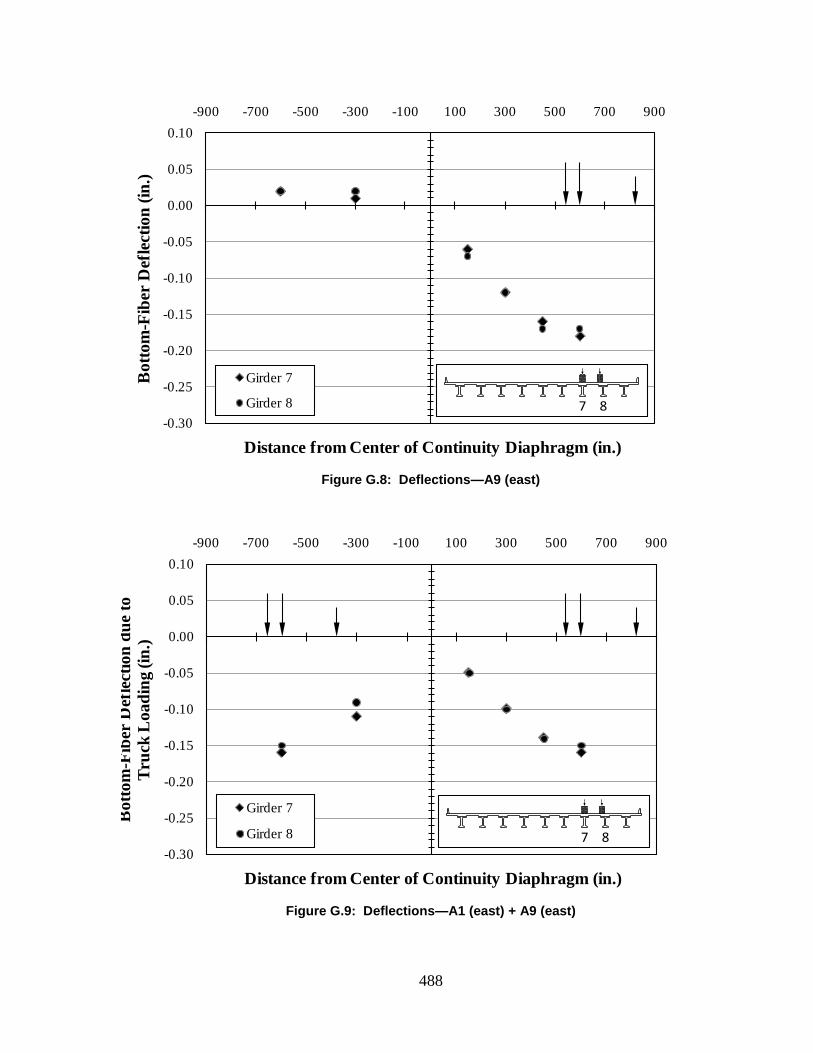
488
Figure G.8: Deflections—A9 (east)
Figure G.9: Deflections—A1 (east) + A9 (east)
-0.30
-0.25
-0.20
-0.15
-0.10
-0.05
0.00
0.05
0.10-900 -700 -500 -300 -100 100 300 500 700 900
Bot
tom
- Fib
er D
efle
ctio
n (in
.)
Distance from Center of Continuity Diaphragm (in.)
Girder 7
Girder 8
7 8
-0.30
-0.25
-0.20
-0.15
-0.10
-0.05
0.00
0.05
0.10-900 -700 -500 -300 -100 100 300 500 700 900
Bot
tom
-Fib
er D
efle
ctio
n du
e to
Tr
uck
Loa
ding
(in.
)
Distance from Center of Continuity Diaphragm (in.)
Girder 7
Girder 8
7 8
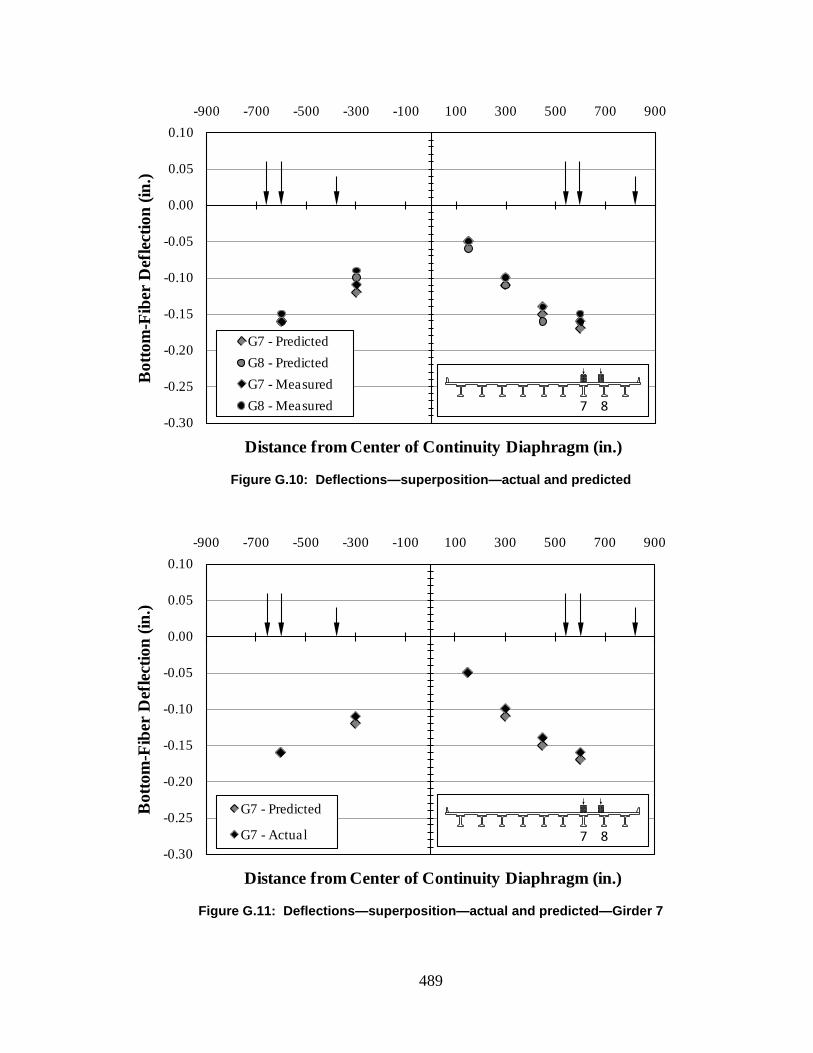
489
Figure G.10: Deflections—superposition—actual and predicted
Figure G.11: Deflections—superposition—actual and predicted—Girder 7
-0.30
-0.25
-0.20
-0.15
-0.10
-0.05
0.00
0.05
0.10-900 -700 -500 -300 -100 100 300 500 700 900
Bot
tom
-Fib
er D
efle
ctio
n (in
.)
Distance from Center of Continuity Diaphragm (in.)
G7 - PredictedG8 - PredictedG7 - MeasuredG8 - Measured
7 8
-0.30
-0.25
-0.20
-0.15
-0.10
-0.05
0.00
0.05
0.10-900 -700 -500 -300 -100 100 300 500 700 900
Bot
tom
-Fib
er D
efle
ctio
n (in
.)
Distance from Center of Continuity Diaphragm (in.)
G7 - Predicted
G7 - Actual
7 8
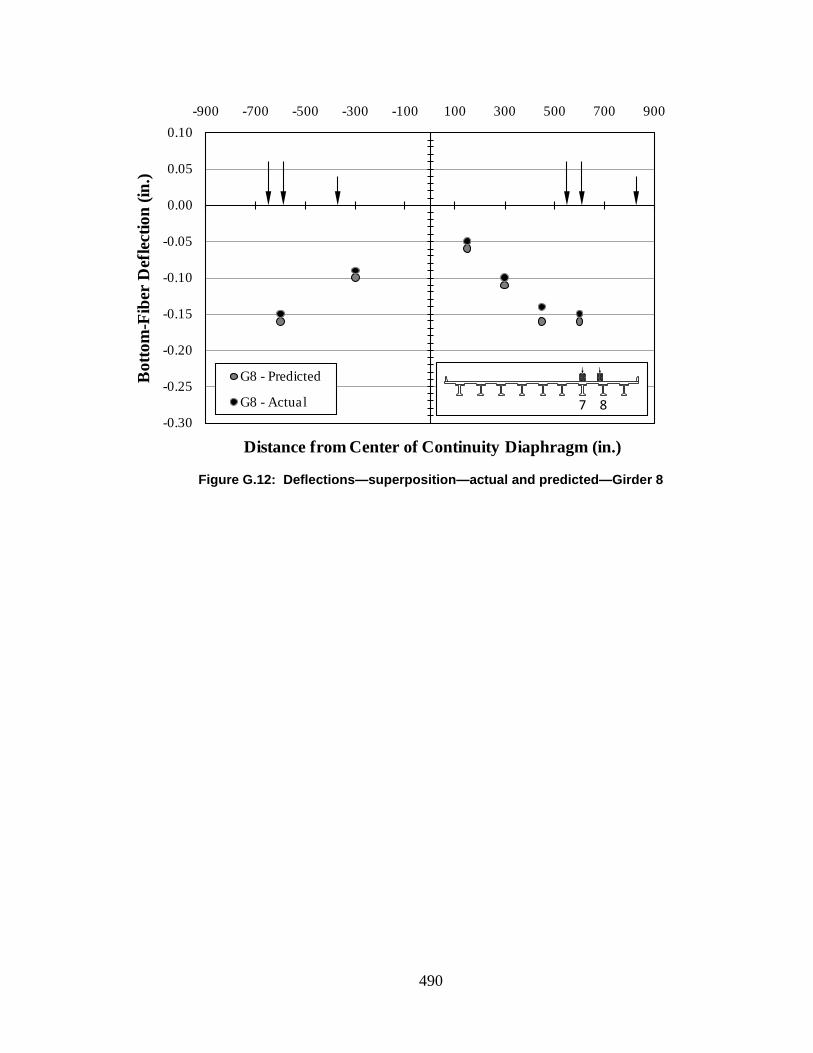
490
Figure G.12: Deflections—superposition—actual and predicted—Girder 8
-0.30
-0.25
-0.20
-0.15
-0.10
-0.05
0.00
0.05
0.10-900 -700 -500 -300 -100 100 300 500 700 900
Bot
tom
-Fib
er D
efle
ctio
n (in
.)
Distance from Center of Continuity Diaphragm (in.)
G8 - Predicted
G8 - Actual
7 8
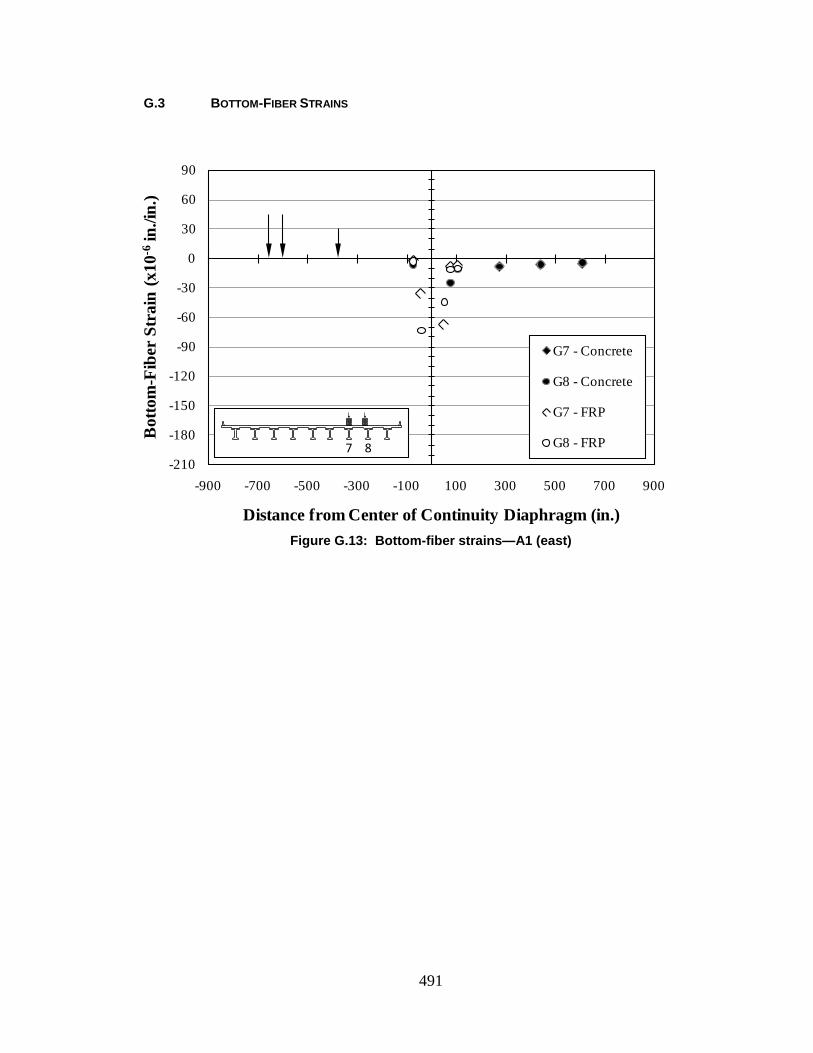
491
G.3 BOTTOM-FIBER STRAINS
Figure G.13: Bottom-fiber strains—A1 (east)
-210
-180
-150
-120
-90
-60
-30
0
30
60
90
-900 -700 -500 -300 -100 100 300 500 700 900
Bot
tom
-Fib
er S
trai
n (x
10-6
in./i
n.)
Distance from Center of Continuity Diaphragm (in.)
G7 - Concrete
G8 - Concrete
G7 - FRP
G8 - FRP
7 8
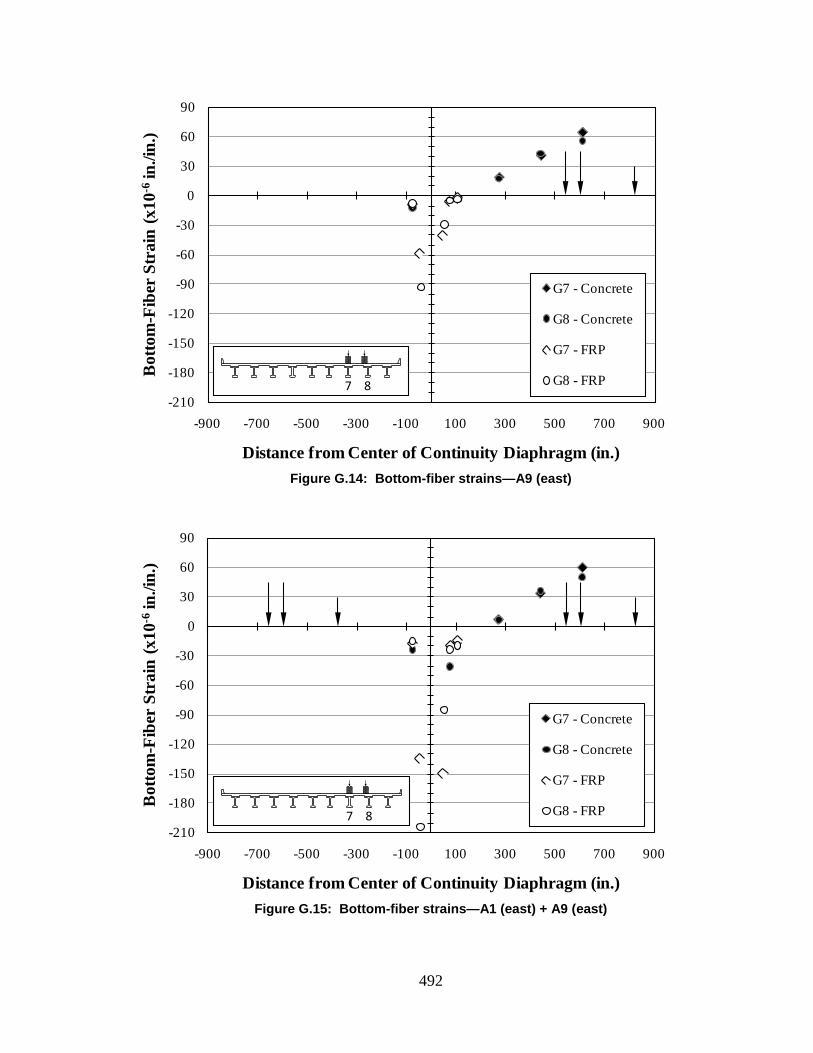
492
Figure G.14: Bottom-fiber strains—A9 (east)
Figure G.15: Bottom-fiber strains—A1 (east) + A9 (east)
-210
-180
-150
-120
-90
-60
-30
0
30
60
90
-900 -700 -500 -300 -100 100 300 500 700 900
Bot
tom
-Fib
er S
trai
n (x
10-6
in./i
n.)
Distance from Center of Continuity Diaphragm (in.)
G7 - Concrete
G8 - Concrete
G7 - FRP
G8 - FRP
7 8
-210
-180
-150
-120
-90
-60
-30
0
30
60
90
-900 -700 -500 -300 -100 100 300 500 700 900
Bot
tom
-Fib
er S
trai
n (x
10-6
in./i
n.)
Distance from Center of Continuity Diaphragm (in.)
G7 - Concrete
G8 - Concrete
G7 - FRP
G8 - FRP
7 8
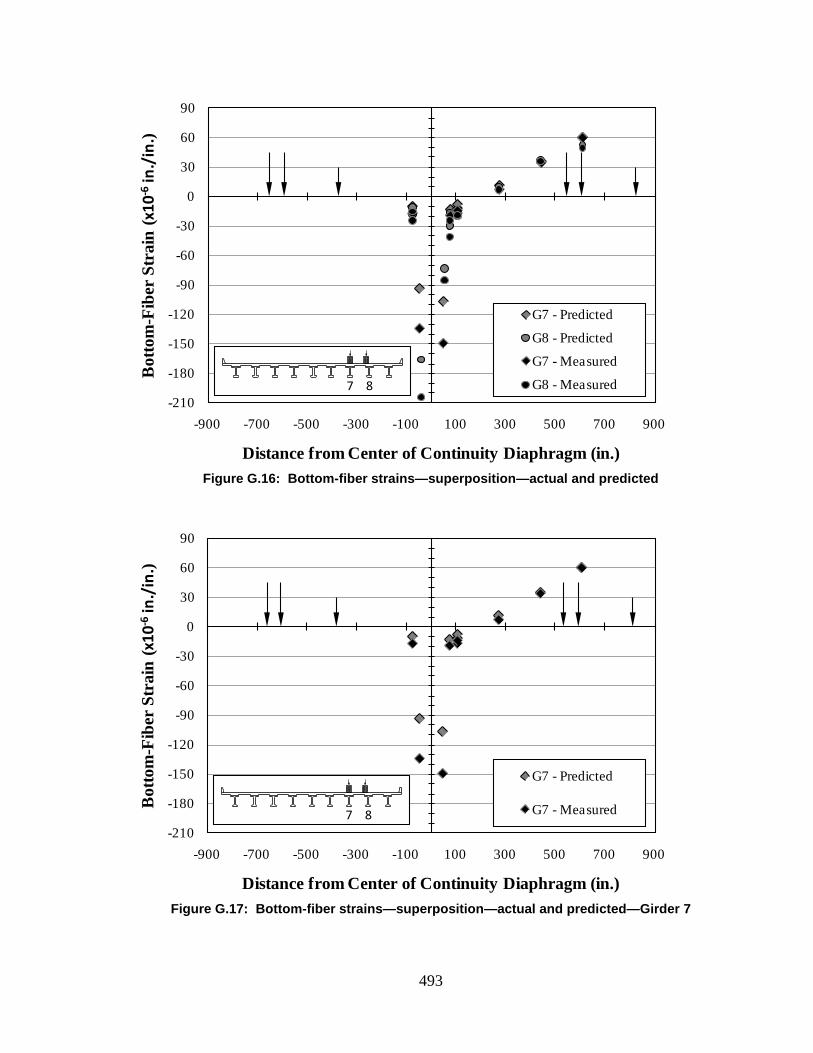
493
Figure G.16: Bottom-fiber strains—superposition—actual and predicted
Figure G.17: Bottom-fiber strains—superposition—actual and predicted—Girder 7
-210
-180
-150
-120
-90
-60
-30
0
30
60
90
-900 -700 -500 -300 -100 100 300 500 700 900
Bot
tom
-Fib
er S
trai
n (x
10-6
in./
in.)
Distance from Center of Continuity Diaphragm (in.)
G7 - Predicted
G8 - Predicted
G7 - Measured
G8 - Measured
7 8
-210
-180
-150
-120
-90
-60
-30
0
30
60
90
-900 -700 -500 -300 -100 100 300 500 700 900
Bot
tom
-Fib
er S
trai
n (x
10-6
in./
in.)
Distance from Center of Continuity Diaphragm (in.)
G7 - Predicted
G7 - Measured
7 8
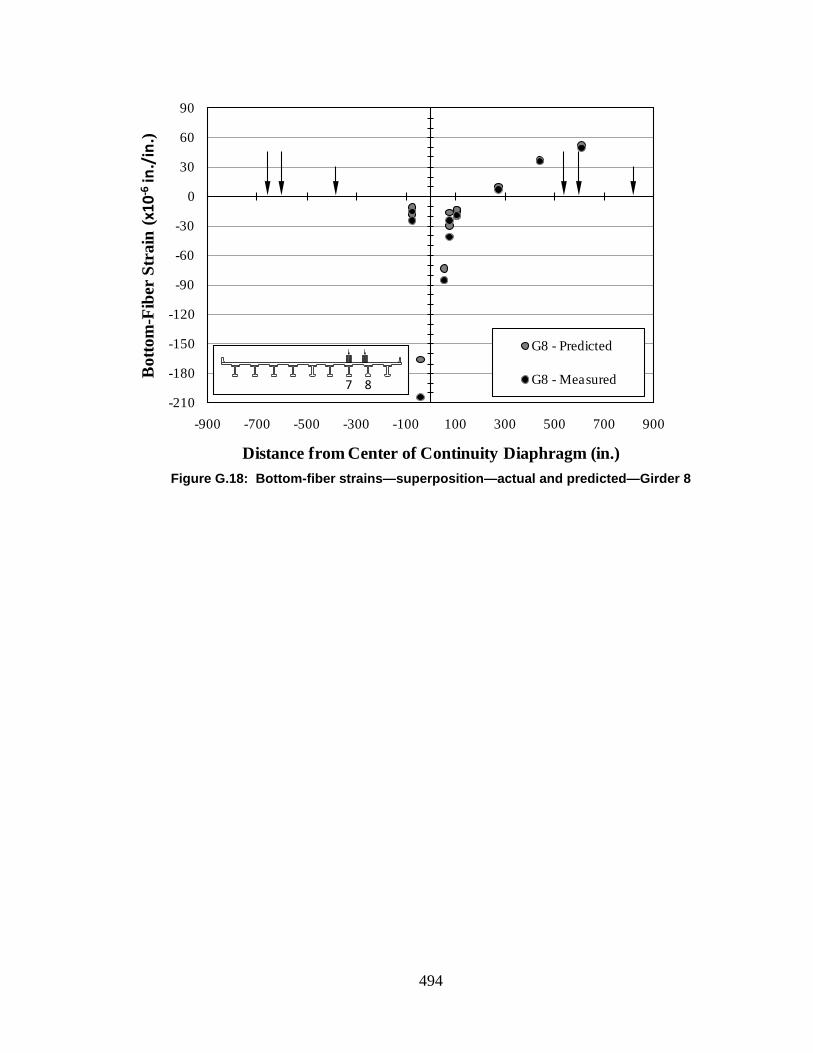
494
Figure G.18: Bottom-fiber strains—superposition—actual and predicted—Girder 8
-210
-180
-150
-120
-90
-60
-30
0
30
60
90
-900 -700 -500 -300 -100 100 300 500 700 900
Bot
tom
-Fib
er S
trai
n (x
10-6
in./
in.)
Distance from Center of Continuity Diaphragm (in.)
G8 - Predicted
G8 - Measured
7 8

495
Appendix H
SUPERPOSITION—MEASUREMENTS
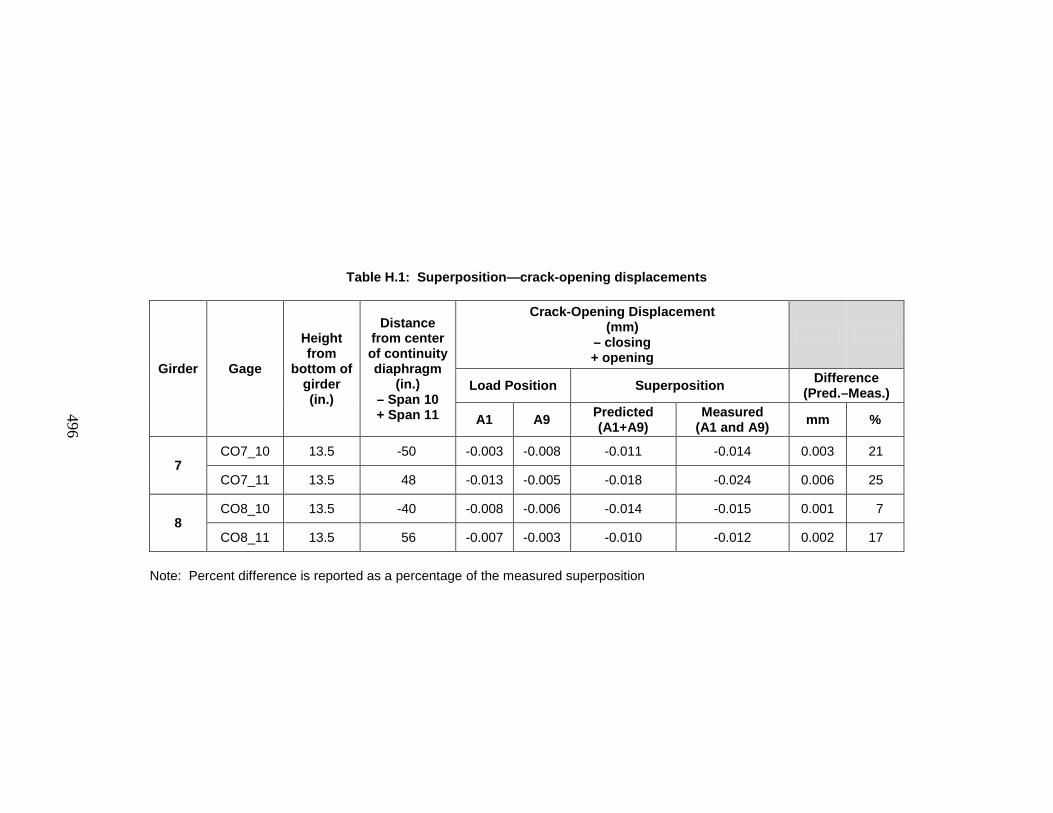
496
Table H.1: Superposition—crack-opening displacements
Girder Gage
Height from
bottom of girder (in.)
Distance from center of continuity diaphragm
(in.) – Span 10 + Span 11
Crack-Opening Displacement (mm)
– closing + opening
Load Position Superposition Difference (Pred.–Meas.)
A1 A9 Predicted (A1+A9)
Measured (A1 and A9) mm %
7 CO7_10 13.5 -50 -0.003 -0.008 -0.011 -0.014 0.003 21
CO7_11 13.5 48 -0.013 -0.005 -0.018 -0.024 0.006 25
8 CO8_10 13.5 -40 -0.008 -0.006 -0.014 -0.015 0.001 7
CO8_11 13.5 56 -0.007 -0.003 -0.010 -0.012 0.002 17
Note: Percent difference is reported as a percentage of the measured superposition
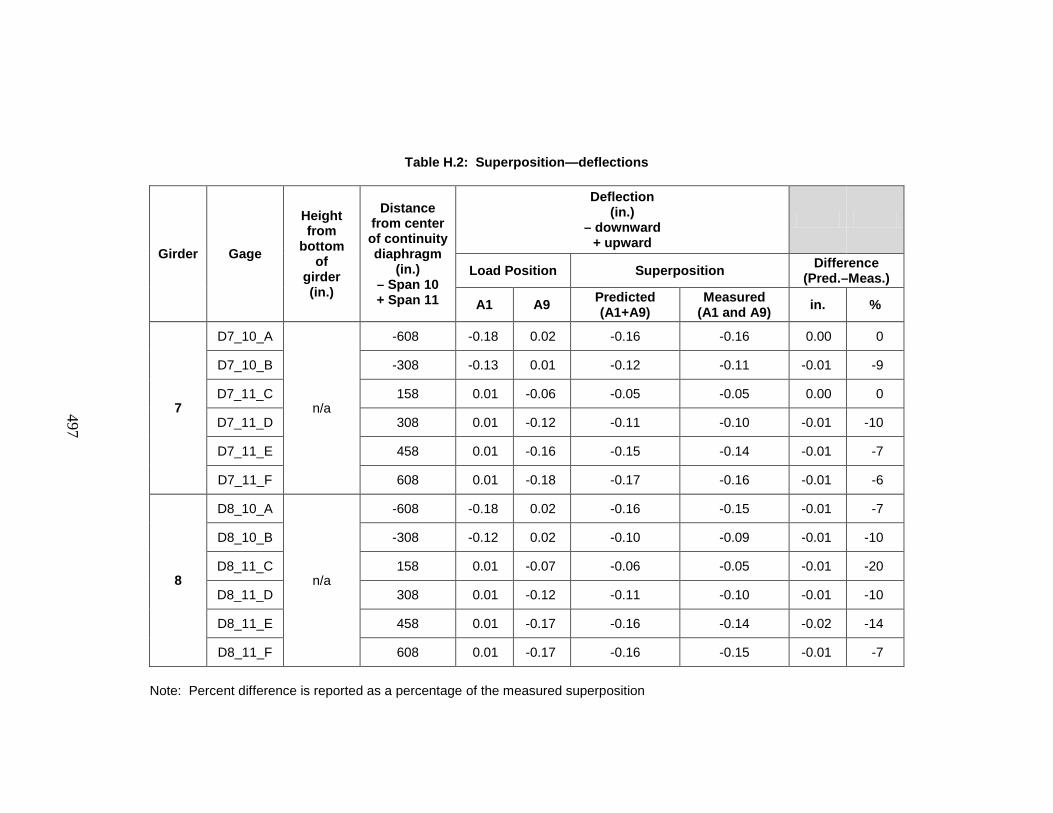
497
Table H.2: Superposition—deflections
Girder Gage
Height from
bottom of
girder (in.)
Distance from center of continuity diaphragm
(in.) – Span 10 + Span 11
Deflection (in.)
– downward + upward
Load Position Superposition Difference (Pred.–Meas.)
A1 A9 Predicted (A1+A9)
Measured (A1 and A9) in. %
7
D7_10_A
n/a
-608 -0.18 0.02 -0.16 -0.16 0.00 0
D7_10_B -308 -0.13 0.01 -0.12 -0.11 -0.01 -9
D7_11_C 158 0.01 -0.06 -0.05 -0.05 0.00 0
D7_11_D 308 0.01 -0.12 -0.11 -0.10 -0.01 -10
D7_11_E 458 0.01 -0.16 -0.15 -0.14 -0.01 -7
D7_11_F 608 0.01 -0.18 -0.17 -0.16 -0.01 -6
8
D8_10_A
n/a
-608 -0.18 0.02 -0.16 -0.15 -0.01 -7
D8_10_B -308 -0.12 0.02 -0.10 -0.09 -0.01 -10
D8_11_C 158 0.01 -0.07 -0.06 -0.05 -0.01 -20
D8_11_D 308 0.01 -0.12 -0.11 -0.10 -0.01 -10
D8_11_E 458 0.01 -0.17 -0.16 -0.14 -0.02 -14
D8_11_F 608 0.01 -0.17 -0.16 -0.15 -0.01 -7
Note: Percent difference is reported as a percentage of the measured superposition
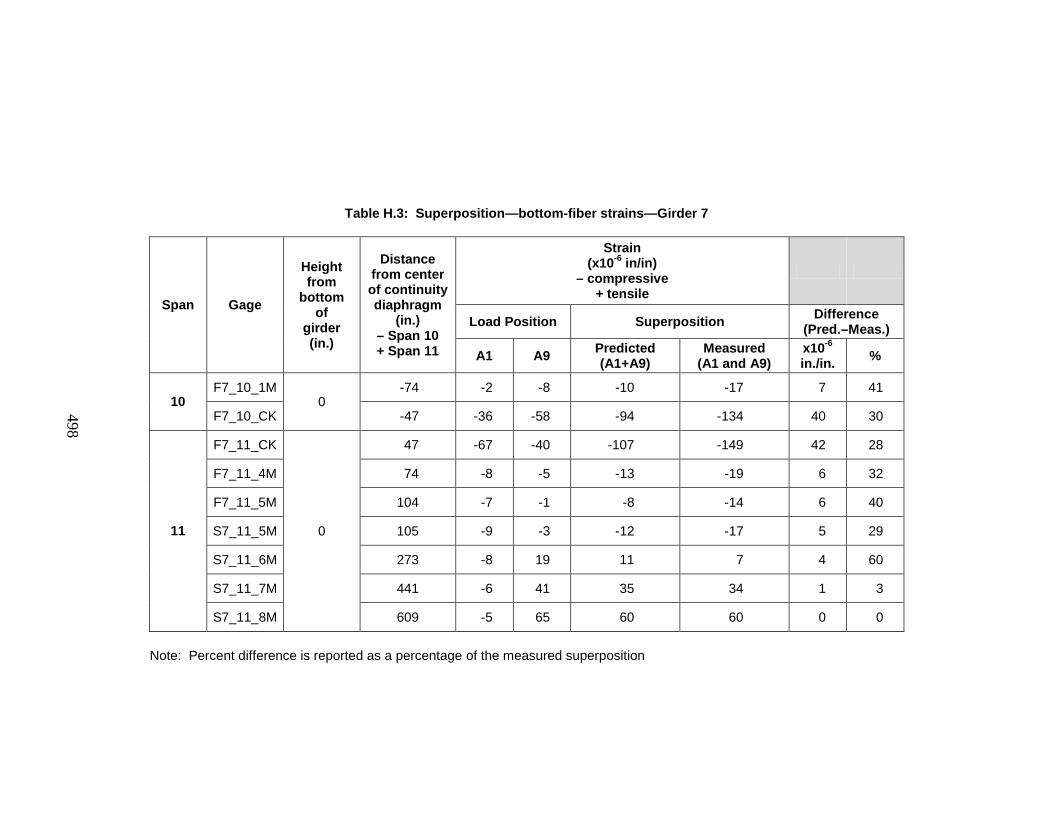
498
Table H.3: Superposition—bottom-fiber strains—Girder 7
Span Gage
Height from
bottom of
girder (in.)
Distance from center of continuity diaphragm
(in.) – Span 10 + Span 11
Strain (x10-6 in/in)
– compressive + tensile
Load Position Superposition Difference (Pred.–Meas.)
A1 A9 Predicted (A1+A9)
Measured (A1 and A9)
x10-6
in./in. %
10 F7_10_1M
0 -74 -2 -8 -10 -17 7 41
F7_10_CK -47 -36 -58 -94 -134 40 30
11
F7_11_CK
0
47 -67 -40 -107 -149 42 28
F7_11_4M 74 -8 -5 -13 -19 6 32
F7_11_5M 104 -7 -1 -8 -14 6 40
S7_11_5M 105 -9 -3 -12 -17 5 29
S7_11_6M 273 -8 19 11 7 4 60
S7_11_7M 441 -6 41 35 34 1 3
S7_11_8M 609 -5 65 60 60 0 0
Note: Percent difference is reported as a percentage of the measured superposition
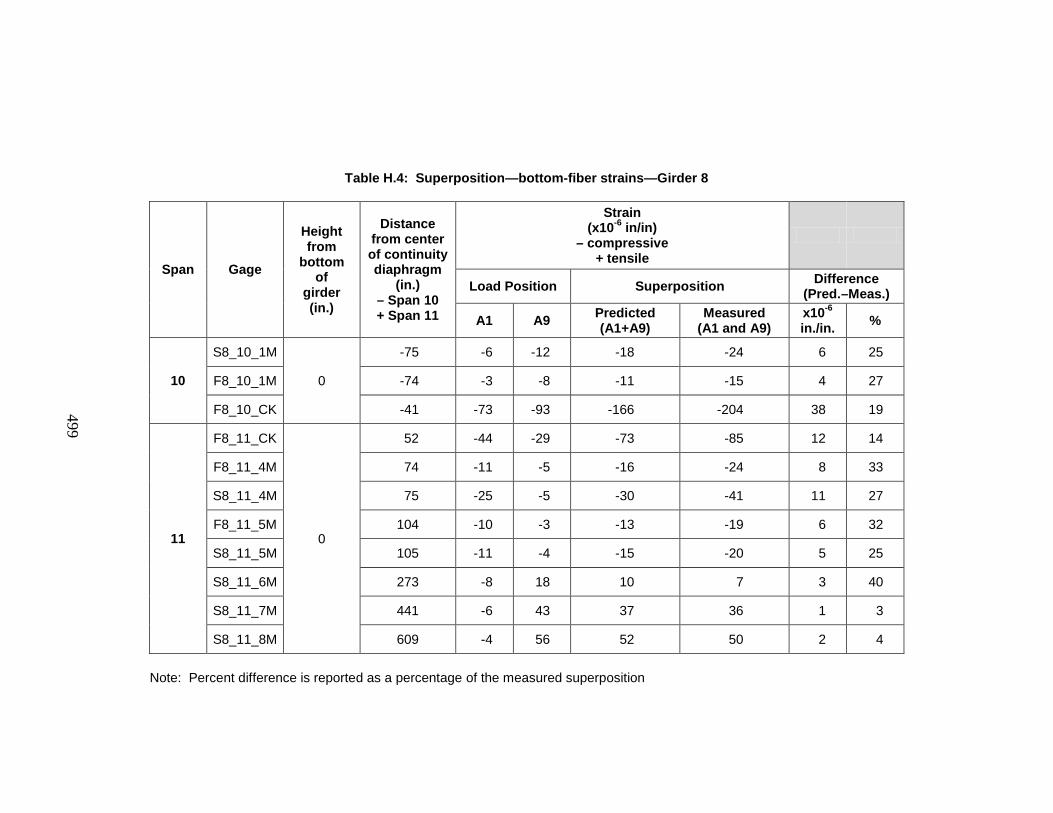
499
Table H.4: Superposition—bottom-fiber strains—Girder 8
Span Gage
Height from
bottom of
girder (in.)
Distance from center of continuity diaphragm
(in.) – Span 10 + Span 11
Strain (x10-6 in/in)
– compressive + tensile
Load Position Superposition Difference (Pred.–Meas.)
A1 A9 Predicted (A1+A9)
Measured (A1 and A9)
x10-6 in./in. %
10
S8_10_1M
0
-75 -6 -12 -18 -24 6 25
F8_10_1M -74 -3 -8 -11 -15 4 27
F8_10_CK -41 -73 -93 -166 -204 38 19
11
F8_11_CK
0
52 -44 -29 -73 -85 12 14
F8_11_4M 74 -11 -5 -16 -24 8 33
S8_11_4M 75 -25 -5 -30 -41 11 27
F8_11_5M 104 -10 -3 -13 -19 6 32
S8_11_5M 105 -11 -4 -15 -20 5 25
S8_11_6M 273 -8 18 10 7 3 40
S8_11_7M 441 -6 43 37 36 1 3
S8_11_8M 609 -4 56 52 50 2 4
Note: Percent difference is reported as a percentage of the measured superposition

500
Appendix I
AE STATIC POSITIONS—GRAPHICAL RESULTS
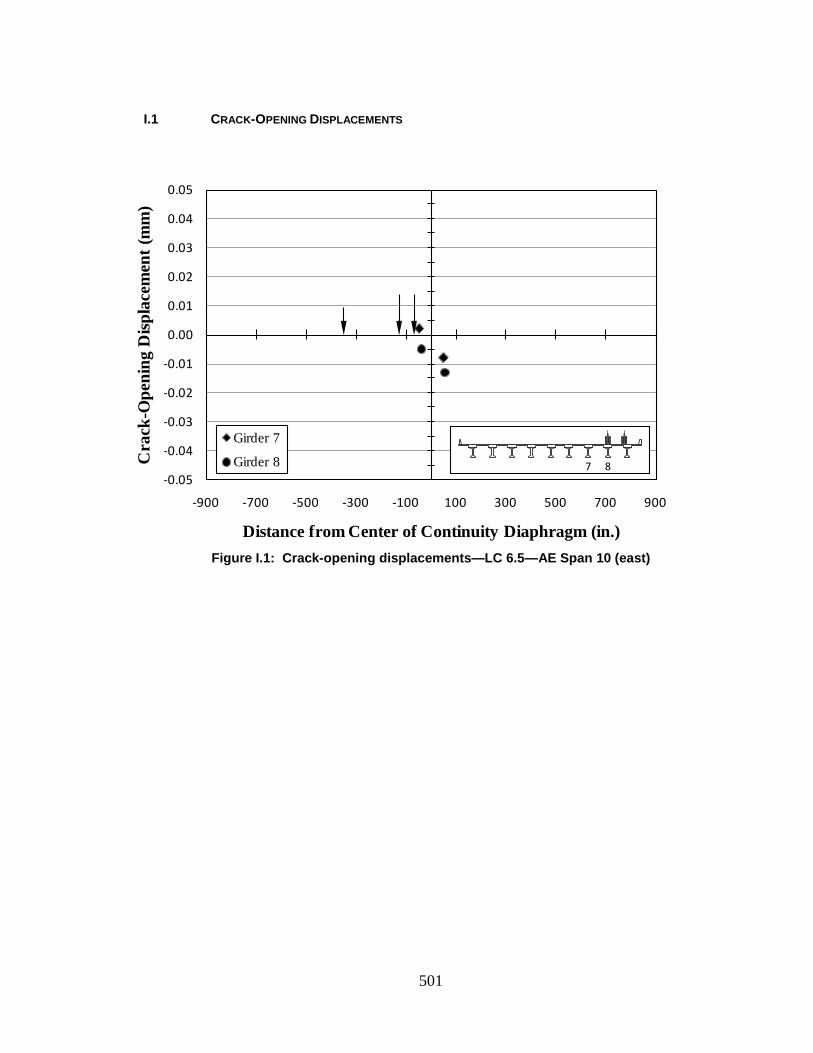
501
I.1 CRACK-OPENING DISPLACEMENTS
Figure I.1: Crack-opening displacements—LC 6.5—AE Span 10 (east)
-0.05
-0.04
-0.03
-0.02
-0.01
0.00
0.01
0.02
0.03
0.04
0.05
-900 -700 -500 -300 -100 100 300 500 700 900
Cra
ck-O
peni
ng D
ispla
cem
ent (
mm
)
Distance from Center of Continuity Diaphragm (in.)
Girder 7
Girder 8
7 8
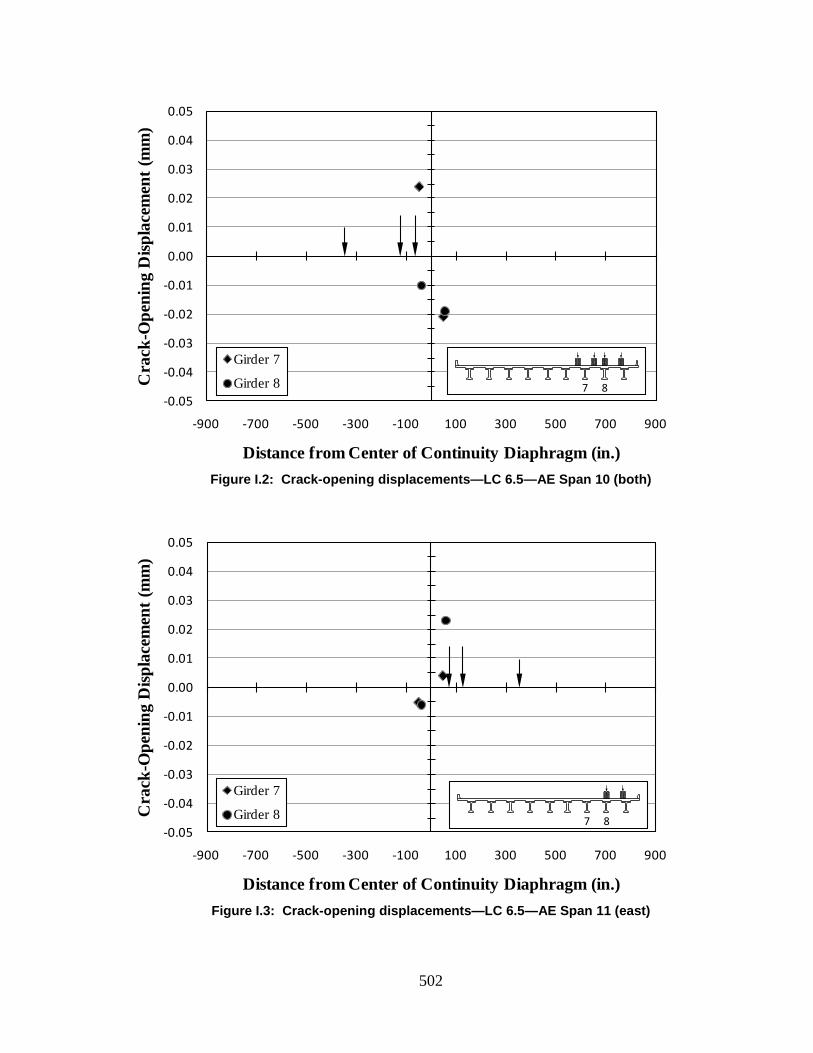
502
Figure I.2: Crack-opening displacements—LC 6.5—AE Span 10 (both)
Figure I.3: Crack-opening displacements—LC 6.5—AE Span 11 (east)
-0.05
-0.04
-0.03
-0.02
-0.01
0.00
0.01
0.02
0.03
0.04
0.05
-900 -700 -500 -300 -100 100 300 500 700 900
Cra
ck-O
peni
ng D
ispla
cem
ent (
mm
)
Distance from Center of Continuity Diaphragm (in.)
Girder 7
Girder 8
7 8
-0.05
-0.04
-0.03
-0.02
-0.01
0.00
0.01
0.02
0.03
0.04
0.05
-900 -700 -500 -300 -100 100 300 500 700 900
Cra
ck-O
peni
ng D
ispla
cem
ent (
mm
)
Distance from Center of Continuity Diaphragm (in.)
Girder 7
Girder 8
7 8
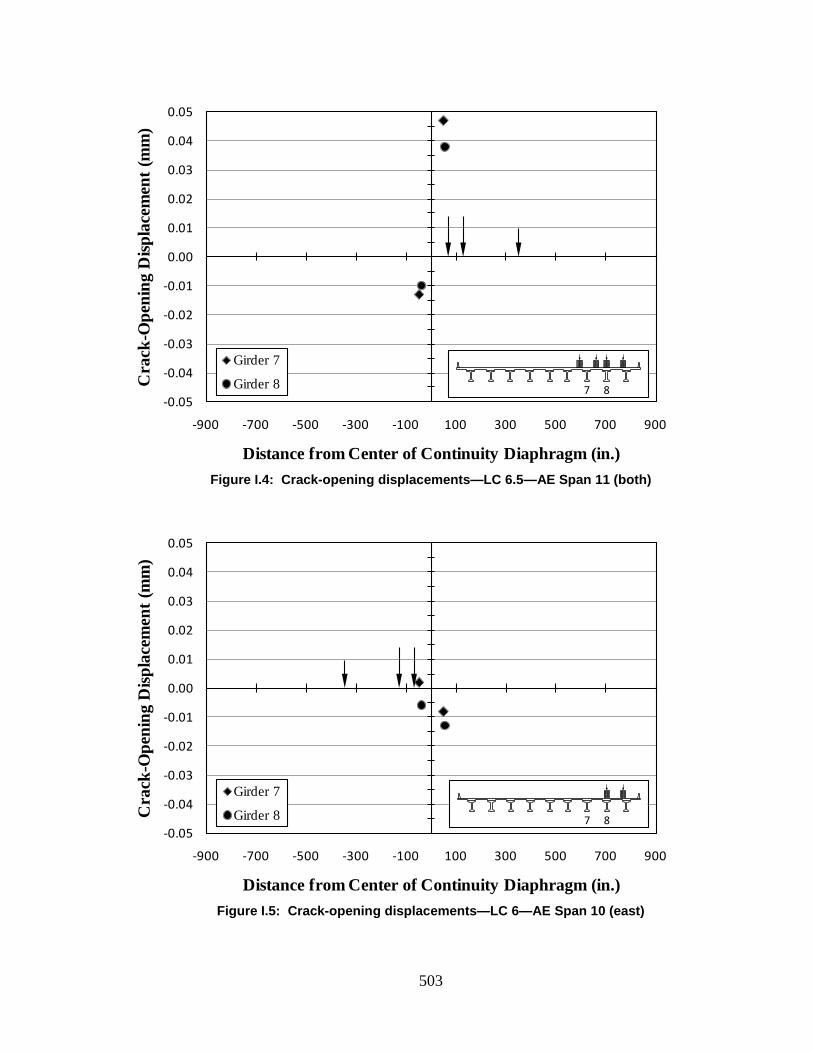
503
Figure I.4: Crack-opening displacements—LC 6.5—AE Span 11 (both)
Figure I.5: Crack-opening displacements—LC 6—AE Span 10 (east)
-0.05
-0.04
-0.03
-0.02
-0.01
0.00
0.01
0.02
0.03
0.04
0.05
-900 -700 -500 -300 -100 100 300 500 700 900
Cra
ck-O
peni
ng D
ispla
cem
ent (
mm
)
Distance from Center of Continuity Diaphragm (in.)
Girder 7
Girder 8
7 8
-0.05
-0.04
-0.03
-0.02
-0.01
0.00
0.01
0.02
0.03
0.04
0.05
-900 -700 -500 -300 -100 100 300 500 700 900
Cra
ck-O
peni
ng D
ispla
cem
ent (
mm
)
Distance from Center of Continuity Diaphragm (in.)
Girder 7
Girder 8
7 8
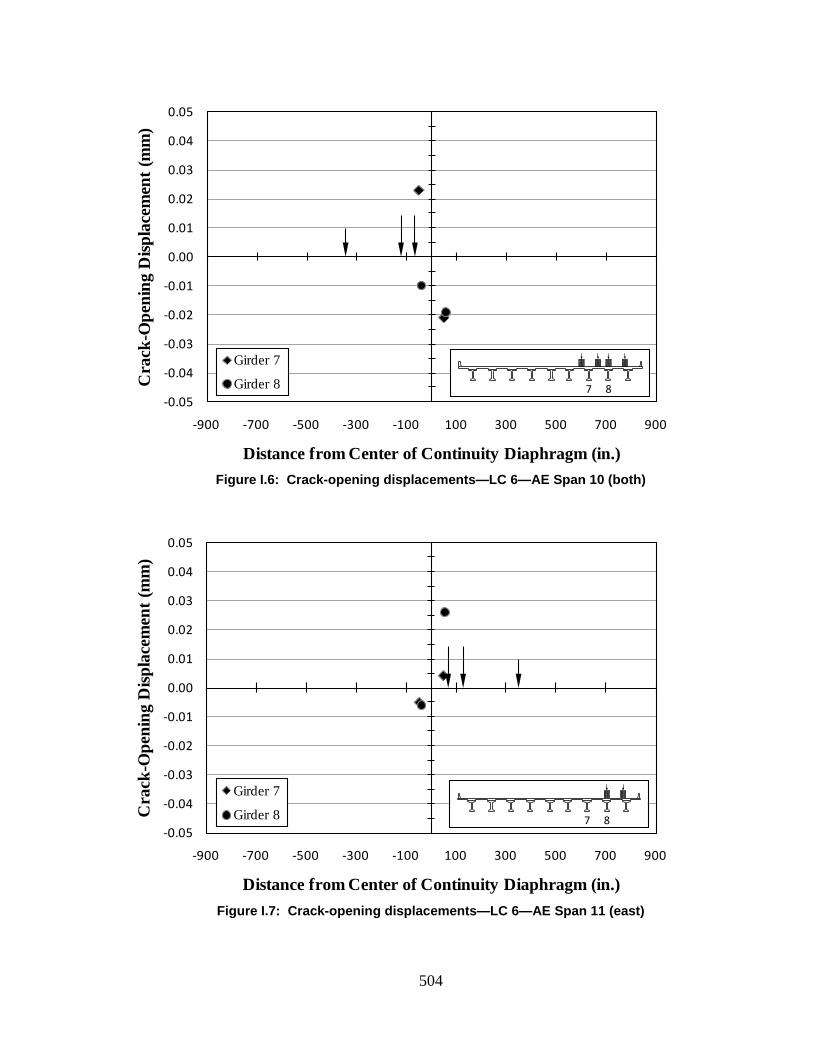
504
Figure I.6: Crack-opening displacements—LC 6—AE Span 10 (both)
Figure I.7: Crack-opening displacements—LC 6—AE Span 11 (east)
-0.05
-0.04
-0.03
-0.02
-0.01
0.00
0.01
0.02
0.03
0.04
0.05
-900 -700 -500 -300 -100 100 300 500 700 900
Cra
ck-O
peni
ng D
ispla
cem
ent (
mm
)
Distance from Center of Continuity Diaphragm (in.)
Girder 7
Girder 8
7 8
-0.05
-0.04
-0.03
-0.02
-0.01
0.00
0.01
0.02
0.03
0.04
0.05
-900 -700 -500 -300 -100 100 300 500 700 900
Cra
ck-O
peni
ng D
ispla
cem
ent (
mm
)
Distance from Center of Continuity Diaphragm (in.)
Girder 7
Girder 8
7 8
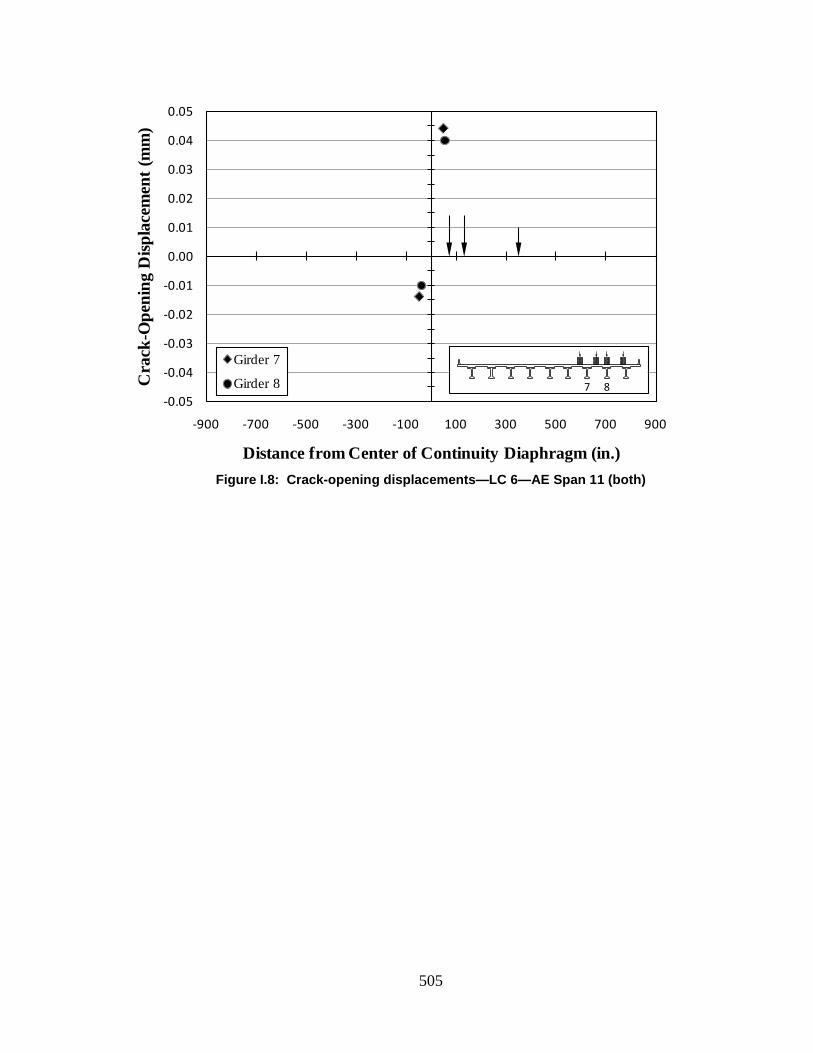
505
Figure I.8: Crack-opening displacements—LC 6—AE Span 11 (both)
-0.05
-0.04
-0.03
-0.02
-0.01
0.00
0.01
0.02
0.03
0.04
0.05
-900 -700 -500 -300 -100 100 300 500 700 900
Cra
ck-O
peni
ng D
ispla
cem
ent (
mm
)
Distance from Center of Continuity Diaphragm (in.)
Girder 7
Girder 8
7 8
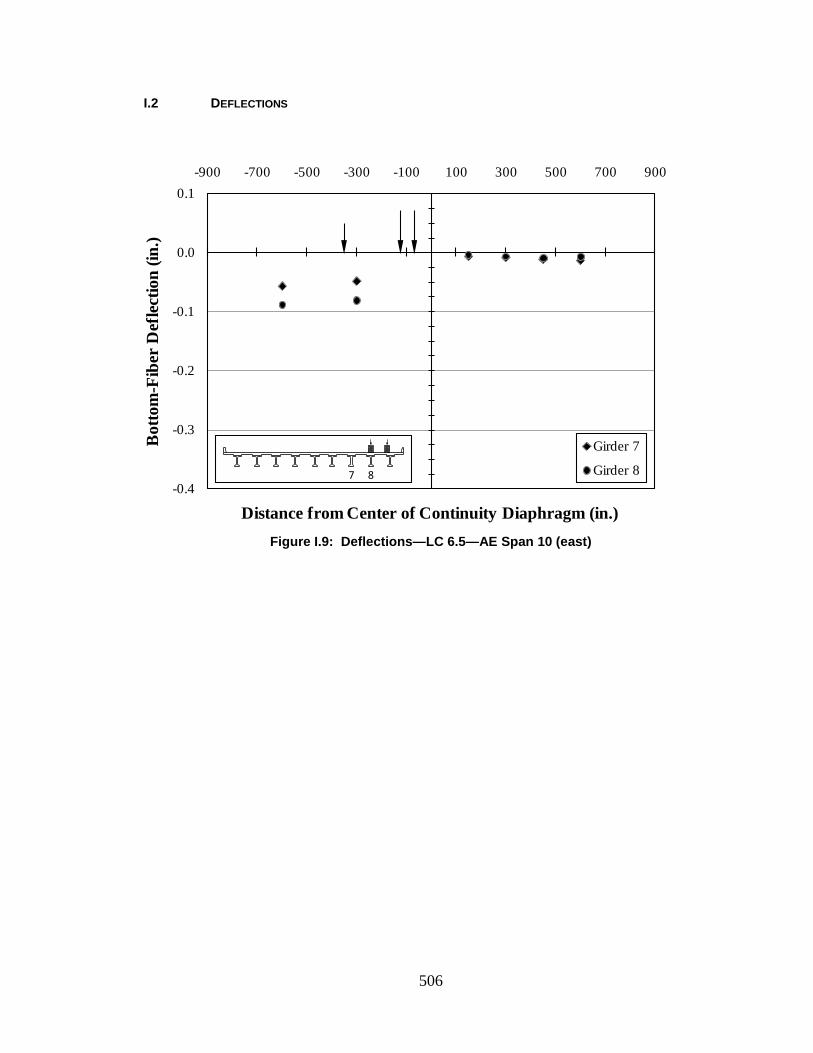
506
I.2 DEFLECTIONS
Figure I.9: Deflections—LC 6.5—AE Span 10 (east)
-0.4
-0.3
-0.2
-0.1
0.0
0.1-900 -700 -500 -300 -100 100 300 500 700 900
Bot
tom
-Fib
er D
efle
ctio
n (in
.)
Distance from Center of Continuity Diaphragm (in.)
Girder 7
Girder 8
7 8
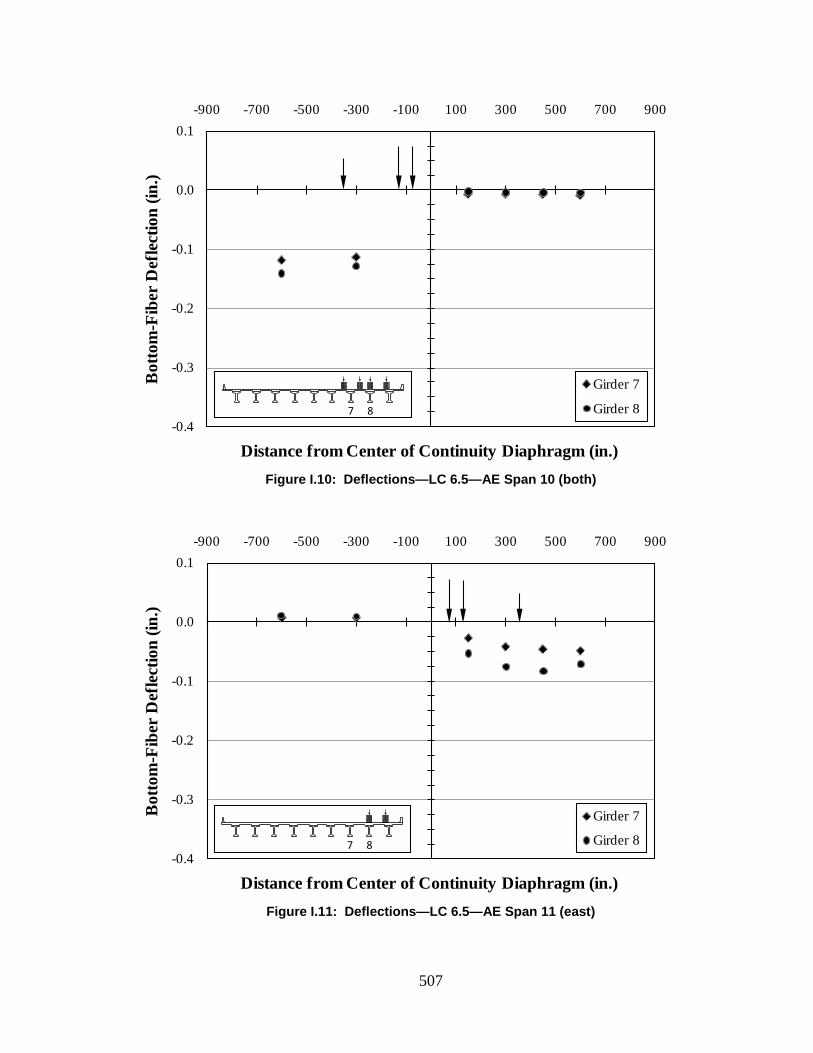
507
Figure I.10: Deflections—LC 6.5—AE Span 10 (both)
Figure I.11: Deflections—LC 6.5—AE Span 11 (east)
-0.4
-0.3
-0.2
-0.1
0.0
0.1-900 -700 -500 -300 -100 100 300 500 700 900
Bot
tom
-Fib
er D
efle
ctio
n (in
.)
Distance from Center of Continuity Diaphragm (in.)
Girder 7
Girder 8
7 8
-0.4
-0.3
-0.2
-0.1
0.0
0.1-900 -700 -500 -300 -100 100 300 500 700 900
Bot
tom
-Fib
er D
efle
ctio
n (in
.)
Distance from Center of Continuity Diaphragm (in.)
Girder 7
Girder 8
7 8
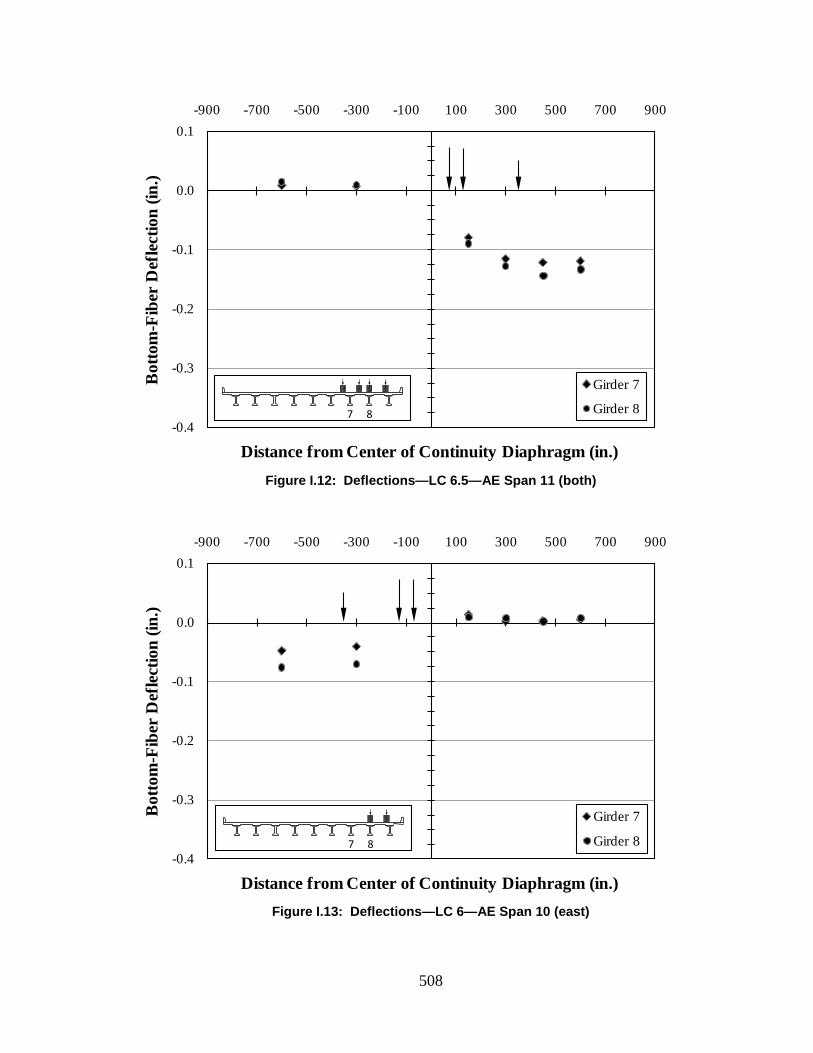
508
Figure I.12: Deflections—LC 6.5—AE Span 11 (both)
Figure I.13: Deflections—LC 6—AE Span 10 (east)
-0.4
-0.3
-0.2
-0.1
0.0
0.1-900 -700 -500 -300 -100 100 300 500 700 900
Bot
tom
-Fib
er D
efle
ctio
n (in
.)
Distance from Center of Continuity Diaphragm (in.)
Girder 7
Girder 8
7 8
-0.4
-0.3
-0.2
-0.1
0.0
0.1-900 -700 -500 -300 -100 100 300 500 700 900
Bot
tom
-Fib
er D
efle
ctio
n (in
.)
Distance from Center of Continuity Diaphragm (in.)
Girder 7
Girder 8
7 8

509
Figure I.14: Deflections—LC 6—AE Span 10 (both)
Figure I.15: Deflections—LC 6—AE Span 11 (east)
-0.4
-0.3
-0.2
-0.1
0.0
0.1-900 -700 -500 -300 -100 100 300 500 700 900
Bot
tom
-Fib
er D
efle
ctio
n (in
.)
Distance from Center of Continuity Diaphragm (in.)
Girder 7
Girder 8
7 8
-0.4
-0.3
-0.2
-0.1
0.0
0.1-900 -700 -500 -300 -100 100 300 500 700 900
Bot
tom
-Fib
er D
efle
ctio
n (in
.)
Distance from Center of Continuity Diaphragm (in.)
Girder 7
Girder 8
7 8
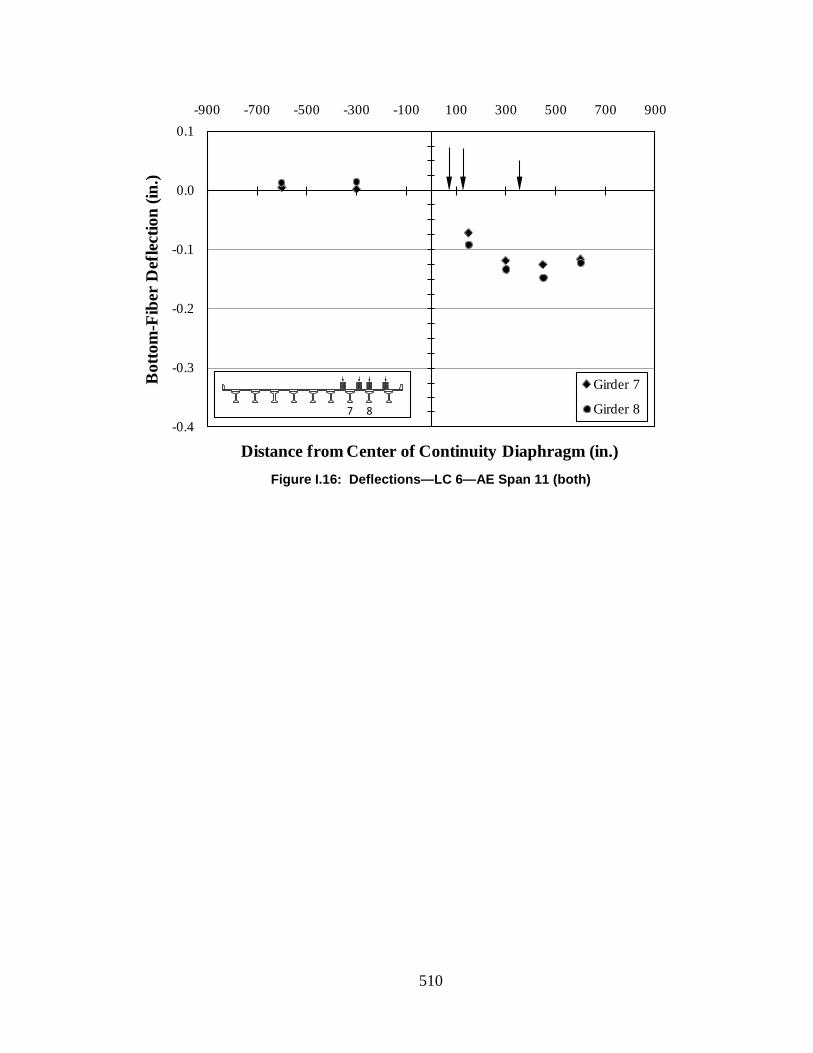
510
Figure I.16: Deflections—LC 6—AE Span 11 (both)
-0.4
-0.3
-0.2
-0.1
0.0
0.1-900 -700 -500 -300 -100 100 300 500 700 900
Bot
tom
-Fib
er D
efle
ctio
n (in
.)
Distance from Center of Continuity Diaphragm (in.)
Girder 7
Girder 8
7 8
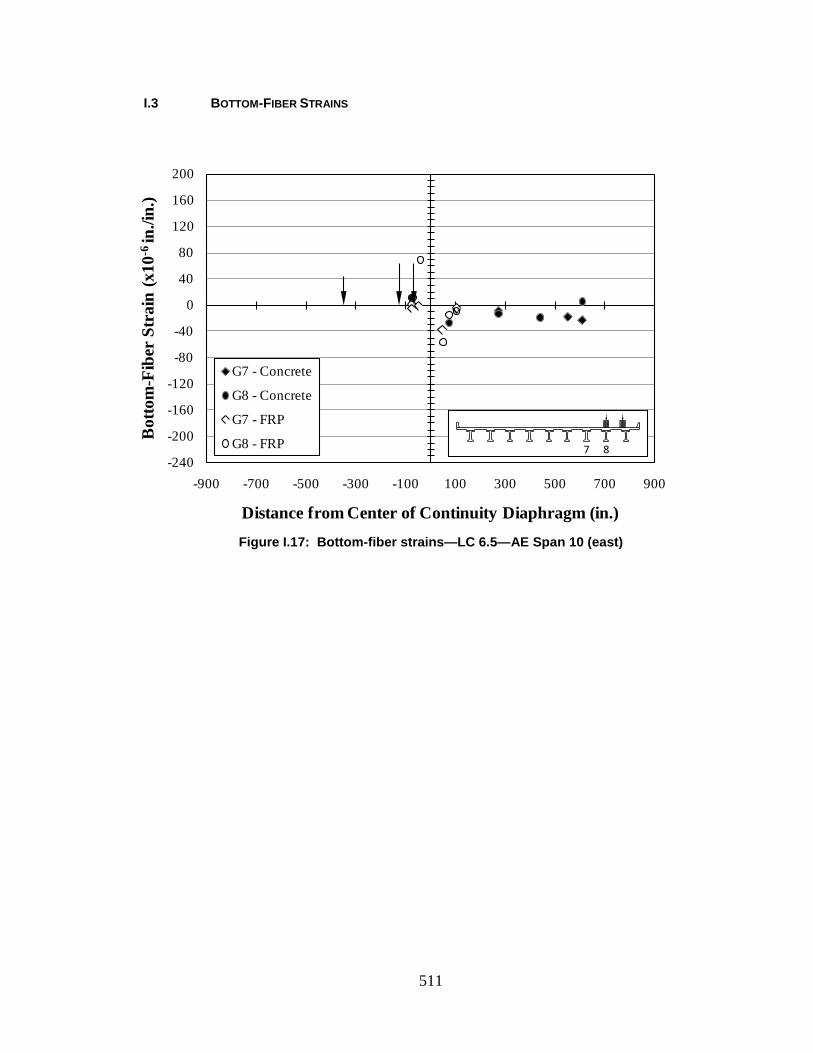
511
I.3 BOTTOM-FIBER STRAINS
Figure I.17: Bottom-fiber strains—LC 6.5—AE Span 10 (east)
-240
-200
-160
-120
-80
-40
0
40
80
120
160
200
-900 -700 -500 -300 -100 100 300 500 700 900
Bot
tom
-Fib
er S
trai
n (x
10-6
in./i
n.)
Distance from Center of Continuity Diaphragm (in.)
G7 - Concrete
G8 - Concrete
G7 - FRP
G8 - FRP
7 8

512
Figure I.18: Bottom-fiber strains—LC 6.5—AE Span 10 (both)
Figure I.19: Bottom-fiber strains—LC 6.5—AE Span 11 (east)
-240
-200
-160
-120
-80
-40
0
40
80
120
160
200
-900 -700 -500 -300 -100 100 300 500 700 900
Bot
tom
-Fib
er S
trai
n (x
10-6
in./i
n.)
Distance from Center of Continuity Diaphragm (in.)
G7 - Concrete
G8 - Concrete
G7 - FRP
G8 - FRP
7 8
-240
-200
-160
-120
-80
-40
0
40
80
120
160
200
-900 -700 -500 -300 -100 100 300 500 700 900
Bot
tom
-Fib
er S
trai
n (x
10-6
in./i
n.)
Distance from Center of Continuity Diaphragm (in.)
G7 - Concrete
G8 - Concrete
G7 - FRP
G8 - FRP
7 8
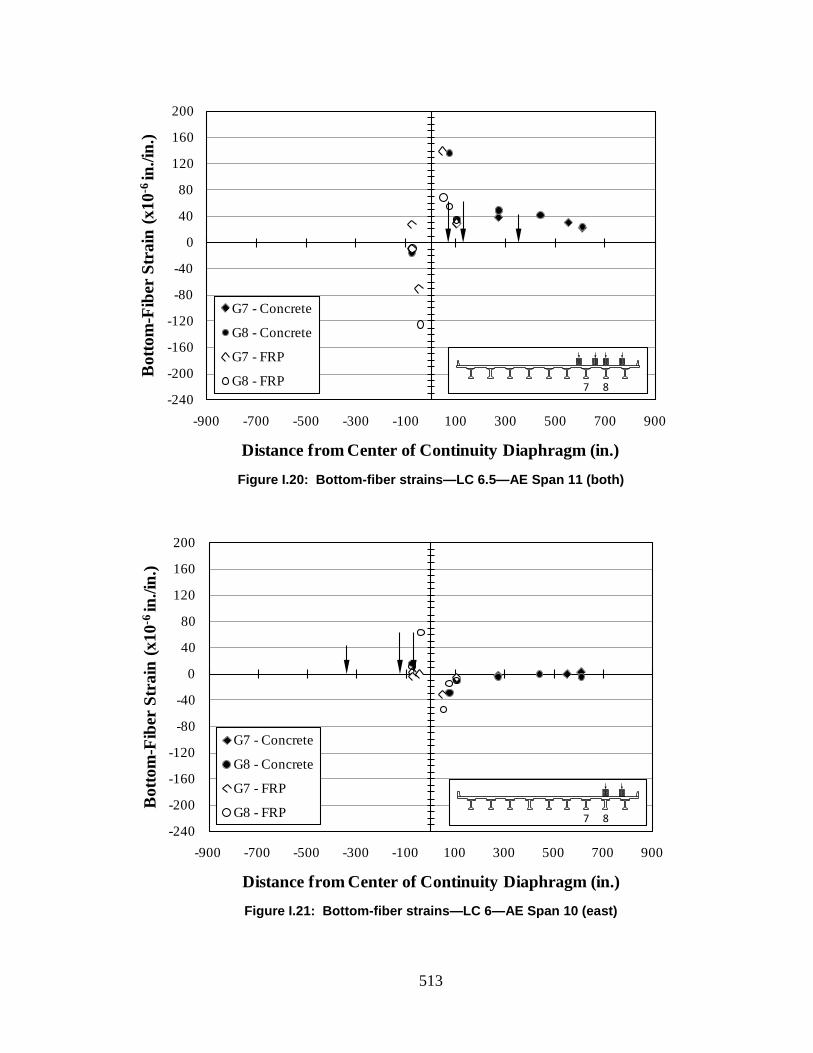
513
Figure I.20: Bottom-fiber strains—LC 6.5—AE Span 11 (both)
Figure I.21: Bottom-fiber strains—LC 6—AE Span 10 (east)
-240
-200
-160
-120
-80
-40
0
40
80
120
160
200
-900 -700 -500 -300 -100 100 300 500 700 900
Bot
tom
-Fib
er S
trai
n (x
10-6
in./i
n.)
Distance from Center of Continuity Diaphragm (in.)
G7 - Concrete
G8 - Concrete
G7 - FRP
G8 - FRP
7 8
-240
-200
-160
-120
-80
-40
0
40
80
120
160
200
-900 -700 -500 -300 -100 100 300 500 700 900
Bot
tom
-Fib
er S
trai
n (x
10-6
in./i
n.)
Distance from Center of Continuity Diaphragm (in.)
G7 - Concrete
G8 - Concrete
G7 - FRP
G8 - FRP
7 8
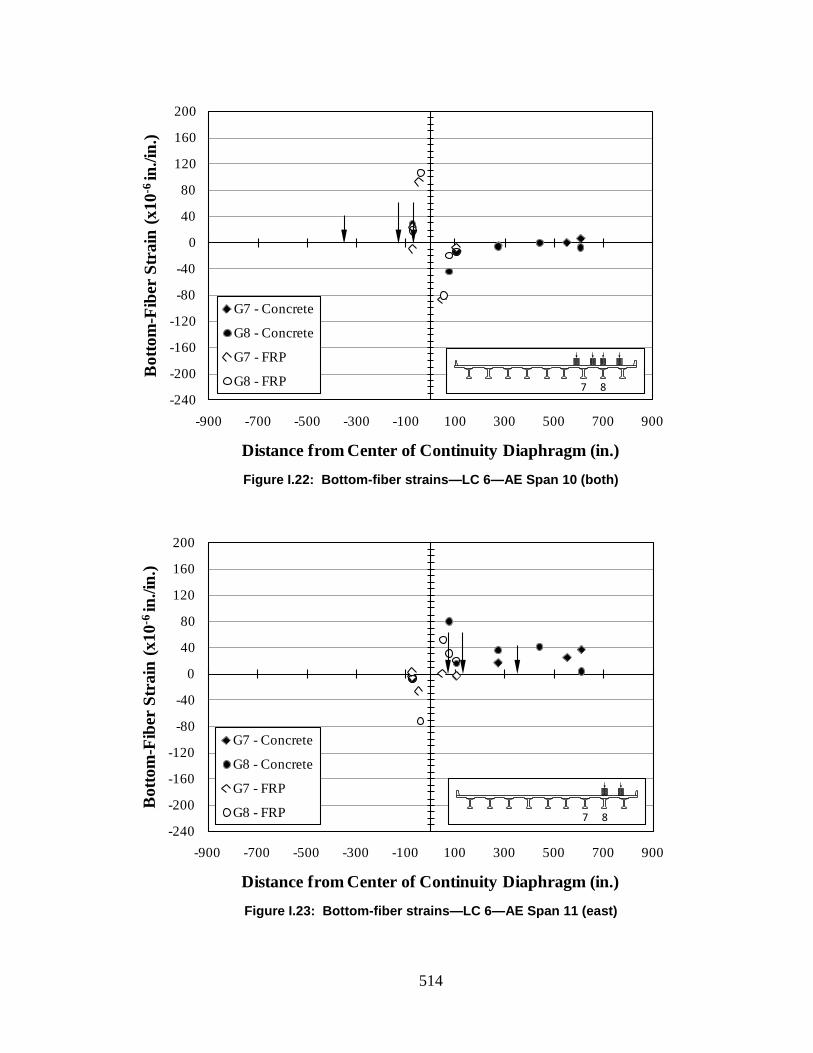
514
Figure I.22: Bottom-fiber strains—LC 6—AE Span 10 (both)
Figure I.23: Bottom-fiber strains—LC 6—AE Span 11 (east)
-240
-200
-160
-120
-80
-40
0
40
80
120
160
200
-900 -700 -500 -300 -100 100 300 500 700 900
Bot
tom
-Fib
er S
trai
n (x
10-6
in./i
n.)
Distance from Center of Continuity Diaphragm (in.)
G7 - Concrete
G8 - Concrete
G7 - FRP
G8 - FRP
7 8
-240
-200
-160
-120
-80
-40
0
40
80
120
160
200
-900 -700 -500 -300 -100 100 300 500 700 900
Bot
tom
-Fib
er S
trai
n (x
10-6
in./i
n.)
Distance from Center of Continuity Diaphragm (in.)
G7 - Concrete
G8 - Concrete
G7 - FRP
G8 - FRP
7 8
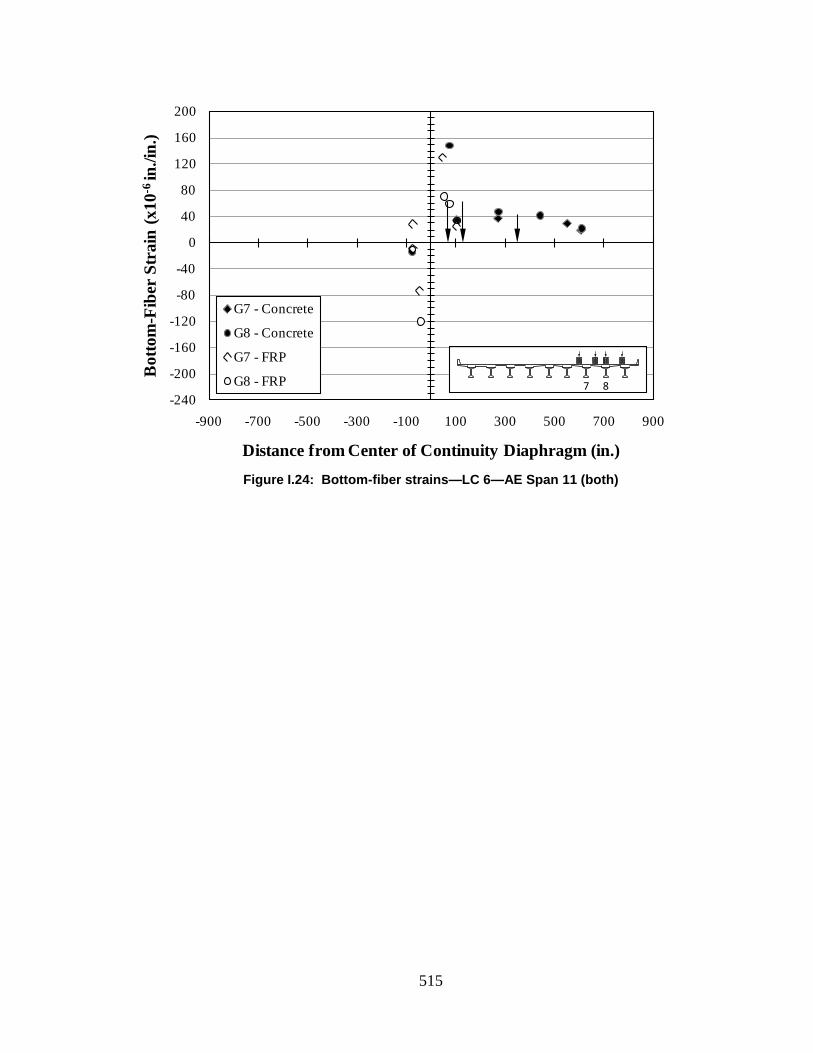
515
Figure I.24: Bottom-fiber strains—LC 6—AE Span 11 (both)
-240
-200
-160
-120
-80
-40
0
40
80
120
160
200
-900 -700 -500 -300 -100 100 300 500 700 900
Bot
tom
-Fib
er S
trai
n (x
10-6
in./i
n.)
Distance from Center of Continuity Diaphragm (in.)
G7 - Concrete
G8 - Concrete
G7 - FRP
G8 - FRP
7 8

516
I.3.1 Bottom-Fiber Strains—Girder 7
Figure I.25: Bottom-fiber strains—Girder 7—LC 6.5—AE Span 10 (east)
-240
-200
-160
-120
-80
-40
0
40
80
120
160
200
-900 -700 -500 -300 -100 100 300 500 700 900
Bot
tom
-Fib
er S
trai
n (x
10-6
in./i
n.)
Distance from Center of Continuity Diaphragm (in.)
G7 - ConcreteG7 - FRP
7 8

517
Figure I.26: Bottom-fiber strains—Girder 7—LC 6.5—AE Span 10 (both)
Figure I.27: Bottom-fiber strains—Girder 7—LC 6.5—AE Span 11 (east)
-240
-200
-160
-120
-80
-40
0
40
80
120
160
200
-900 -700 -500 -300 -100 100 300 500 700 900
Bot
tom
-Fib
er S
trai
n (x
10-6
in./i
n.)
Distance from Center of Continuity Diaphragm (in.)
G7 - ConcreteG7 - FRP
7 8
-240
-200
-160
-120
-80
-40
0
40
80
120
160
200
-900 -700 -500 -300 -100 100 300 500 700 900
Bot
tom
-Fib
er S
trai
n (x
10-6
in./i
n.)
Distance from Center of Continuity Diaphragm (in.)
G7 - ConcreteG7 - FRP
7 8

518
Figure I.28: Bottom-fiber strains—Girder 7—LC 6.5—AE Span 11 (both)
Figure I.29: Bottom-fiber strains—Girder 7—LC 6—AE Span 10 (east)
-240
-200
-160
-120
-80
-40
0
40
80
120
160
200
-900 -700 -500 -300 -100 100 300 500 700 900
Bot
tom
-Fib
er S
trai
n (x
10-6
in./i
n.)
Distance from Center of Continuity Diaphragm (in.)
G7 - ConcreteG7 - FRP
7 8
-240
-200
-160
-120
-80
-40
0
40
80
120
160
200
-900 -700 -500 -300 -100 100 300 500 700 900
Bot
tom
-Fib
er S
trai
n (x
10-6
in./i
n.)
Distance from Center of Continuity Diaphragm (in.)
G7 - ConcreteG7 - FRP
7 8
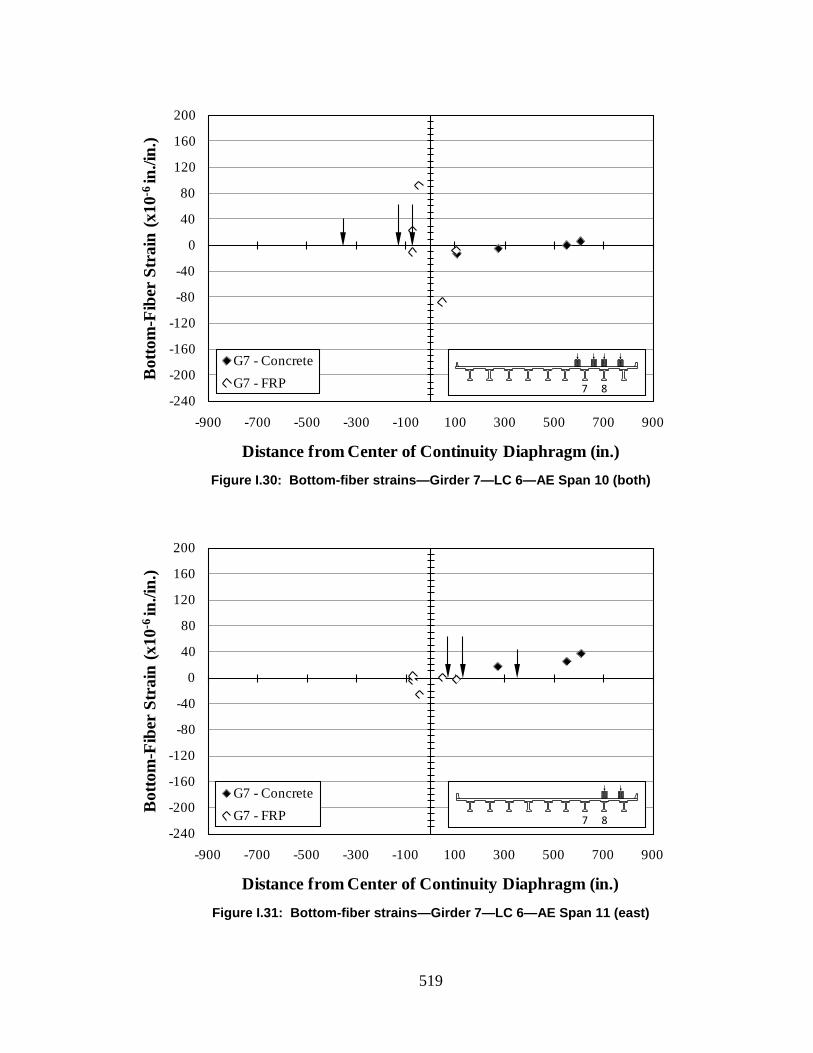
519
Figure I.30: Bottom-fiber strains—Girder 7—LC 6—AE Span 10 (both)
Figure I.31: Bottom-fiber strains—Girder 7—LC 6—AE Span 11 (east)
-240
-200
-160
-120
-80
-40
0
40
80
120
160
200
-900 -700 -500 -300 -100 100 300 500 700 900
Bot
tom
-Fib
er S
trai
n (x
10-6
in./i
n.)
Distance from Center of Continuity Diaphragm (in.)
G7 - ConcreteG7 - FRP
7 8
-240
-200
-160
-120
-80
-40
0
40
80
120
160
200
-900 -700 -500 -300 -100 100 300 500 700 900
Bot
tom
-Fib
er S
trai
n (x
10-6
in./i
n.)
Distance from Center of Continuity Diaphragm (in.)
G7 - ConcreteG7 - FRP
7 8
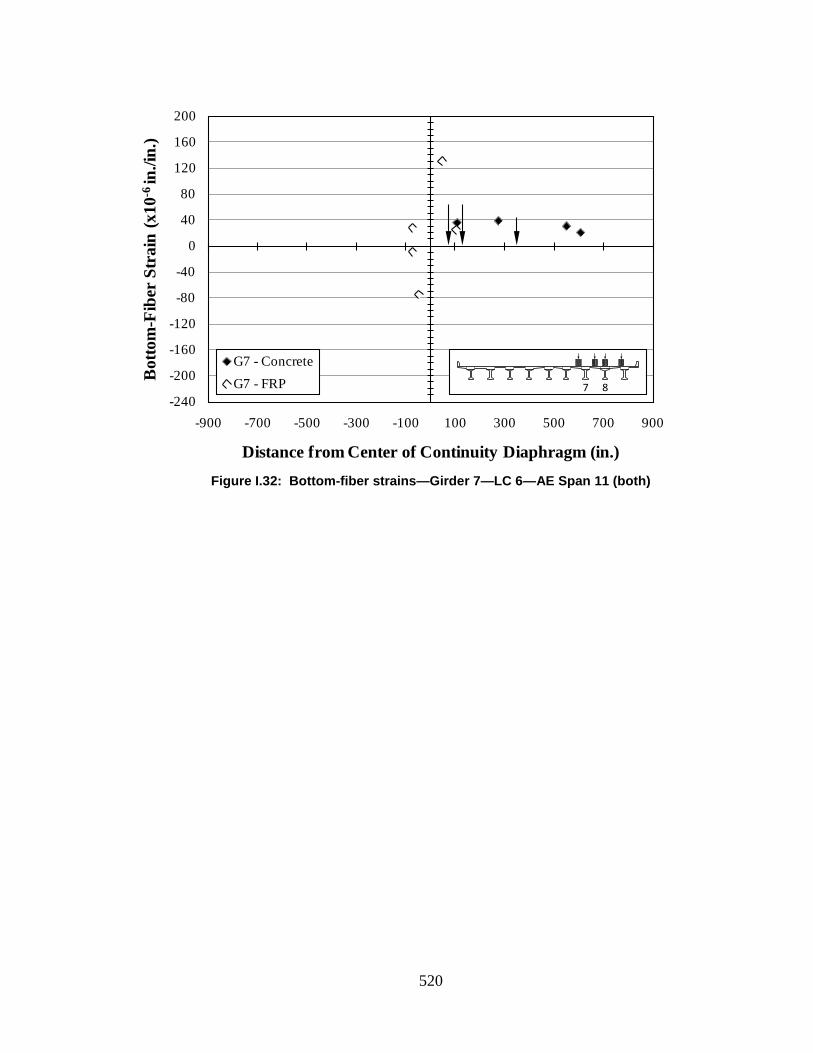
520
Figure I.32: Bottom-fiber strains—Girder 7—LC 6—AE Span 11 (both)
-240
-200
-160
-120
-80
-40
0
40
80
120
160
200
-900 -700 -500 -300 -100 100 300 500 700 900
Bot
tom
-Fib
er S
trai
n (x
10-6
in./i
n.)
Distance from Center of Continuity Diaphragm (in.)
G7 - ConcreteG7 - FRP
7 8
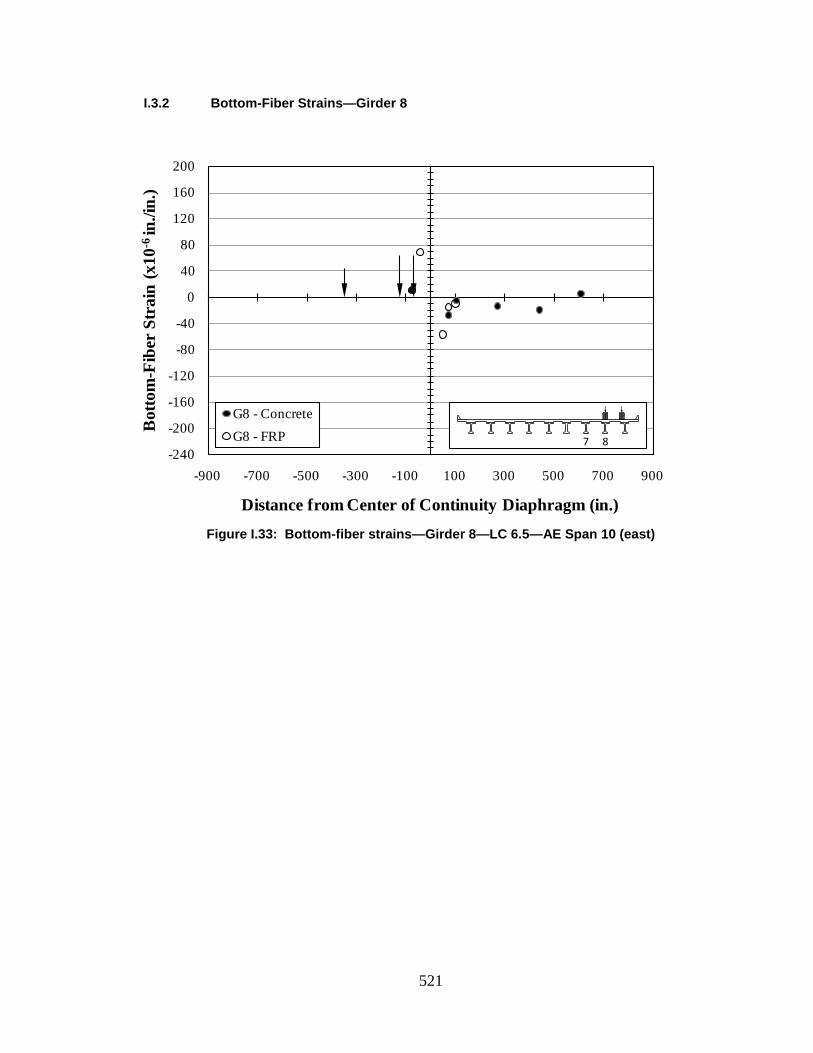
521
I.3.2 Bottom-Fiber Strains—Girder 8
Figure I.33: Bottom-fiber strains—Girder 8—LC 6.5—AE Span 10 (east)
-240
-200
-160
-120
-80
-40
0
40
80
120
160
200
-900 -700 -500 -300 -100 100 300 500 700 900
Bot
tom
-Fib
er S
trai
n (x
10-6
in./i
n.)
Distance from Center of Continuity Diaphragm (in.)
G8 - ConcreteG8 - FRP
7 8
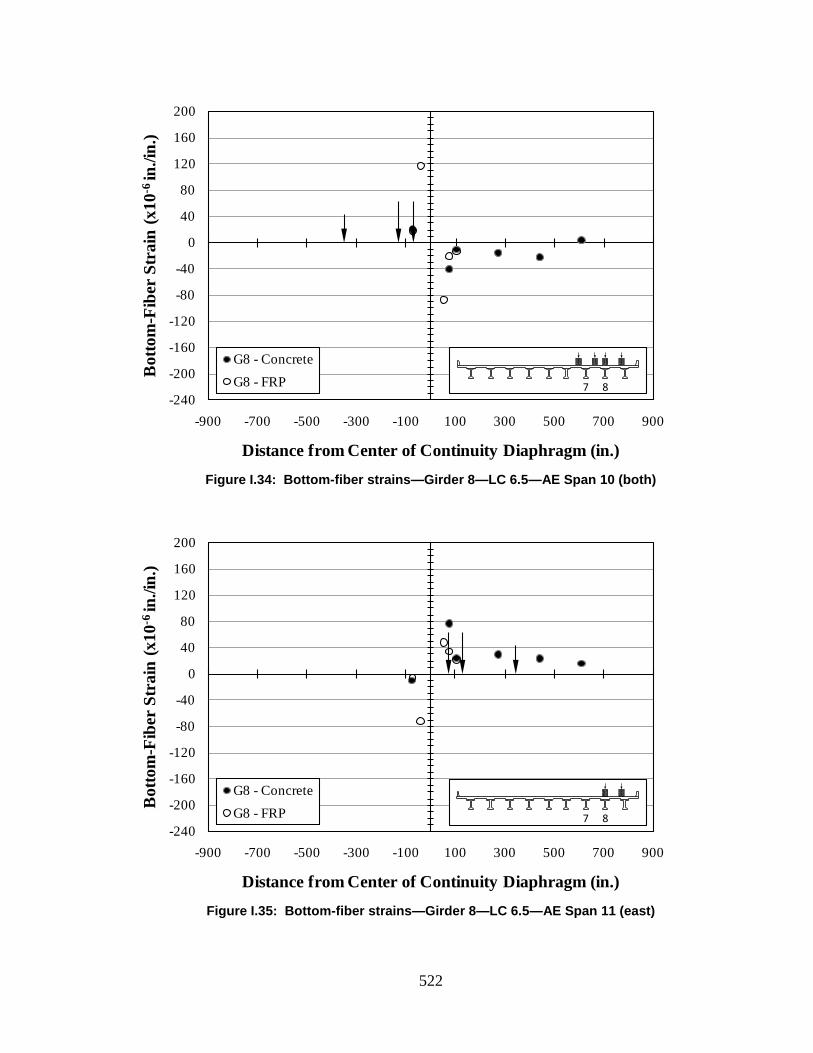
522
Figure I.34: Bottom-fiber strains—Girder 8—LC 6.5—AE Span 10 (both)
Figure I.35: Bottom-fiber strains—Girder 8—LC 6.5—AE Span 11 (east)
-240
-200
-160
-120
-80
-40
0
40
80
120
160
200
-900 -700 -500 -300 -100 100 300 500 700 900
Bot
tom
-Fib
er S
trai
n (x
10-6
in./i
n.)
Distance from Center of Continuity Diaphragm (in.)
G8 - ConcreteG8 - FRP
7 8
-240
-200
-160
-120
-80
-40
0
40
80
120
160
200
-900 -700 -500 -300 -100 100 300 500 700 900
Bot
tom
-Fib
er S
trai
n (x
10-6
in./i
n.)
Distance from Center of Continuity Diaphragm (in.)
G8 - ConcreteG8 - FRP
7 8
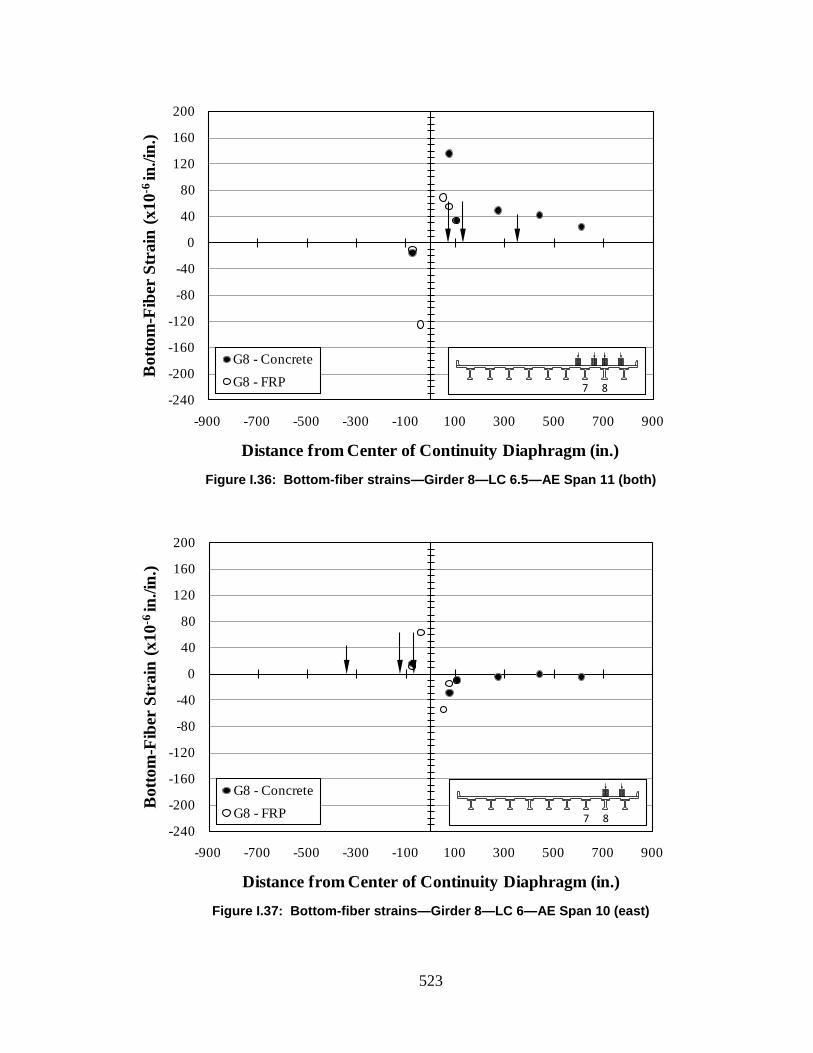
523
Figure I.36: Bottom-fiber strains—Girder 8—LC 6.5—AE Span 11 (both)
Figure I.37: Bottom-fiber strains—Girder 8—LC 6—AE Span 10 (east)
-240
-200
-160
-120
-80
-40
0
40
80
120
160
200
-900 -700 -500 -300 -100 100 300 500 700 900
Bot
tom
-Fib
er S
trai
n (x
10-6
in./i
n.)
Distance from Center of Continuity Diaphragm (in.)
G8 - ConcreteG8 - FRP
7 8
-240
-200
-160
-120
-80
-40
0
40
80
120
160
200
-900 -700 -500 -300 -100 100 300 500 700 900
Bot
tom
-Fib
er S
trai
n (x
10-6
in./i
n.)
Distance from Center of Continuity Diaphragm (in.)
G8 - ConcreteG8 - FRP
7 8
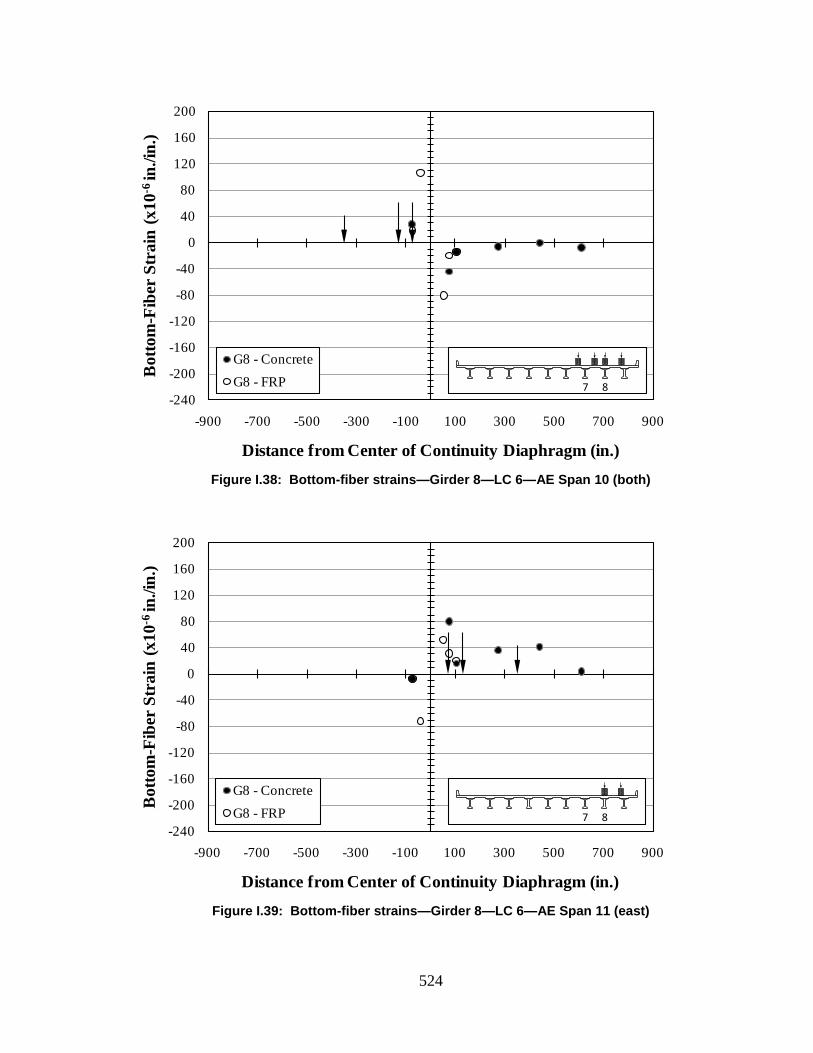
524
Figure I.38: Bottom-fiber strains—Girder 8—LC 6—AE Span 10 (both)
Figure I.39: Bottom-fiber strains—Girder 8—LC 6—AE Span 11 (east)
-240
-200
-160
-120
-80
-40
0
40
80
120
160
200
-900 -700 -500 -300 -100 100 300 500 700 900
Bot
tom
-Fib
er S
trai
n (x
10-6
in./i
n.)
Distance from Center of Continuity Diaphragm (in.)
G8 - ConcreteG8 - FRP
7 8
-240
-200
-160
-120
-80
-40
0
40
80
120
160
200
-900 -700 -500 -300 -100 100 300 500 700 900
Bot
tom
-Fib
er S
trai
n (x
10-6
in./i
n.)
Distance from Center of Continuity Diaphragm (in.)
G8 - ConcreteG8 - FRP
7 8
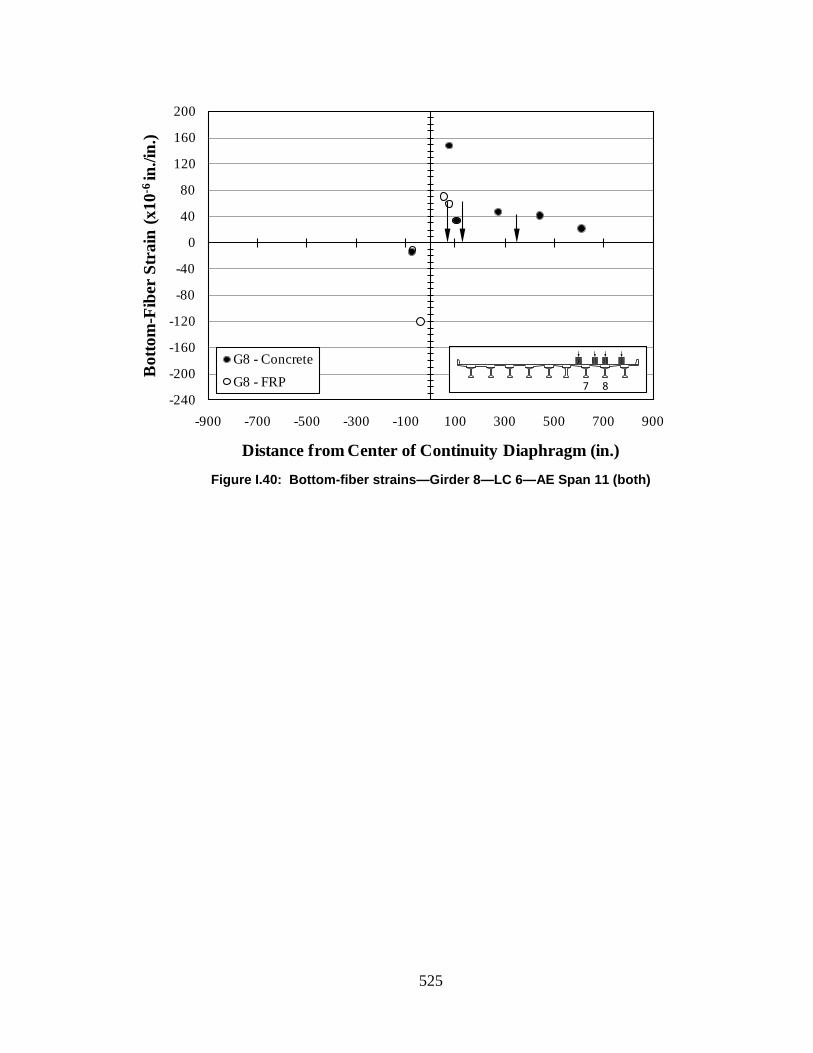
525
Figure I.40: Bottom-fiber strains—Girder 8—LC 6—AE Span 11 (both)
-240
-200
-160
-120
-80
-40
0
40
80
120
160
200
-900 -700 -500 -300 -100 100 300 500 700 900
Bot
tom
-Fib
er S
trai
n (x
10-6
in./i
n.)
Distance from Center of Continuity Diaphragm (in.)
G8 - ConcreteG8 - FRP
7 8

526
Appendix J
AE STATIC POSITIONS—MEASUREMENTS
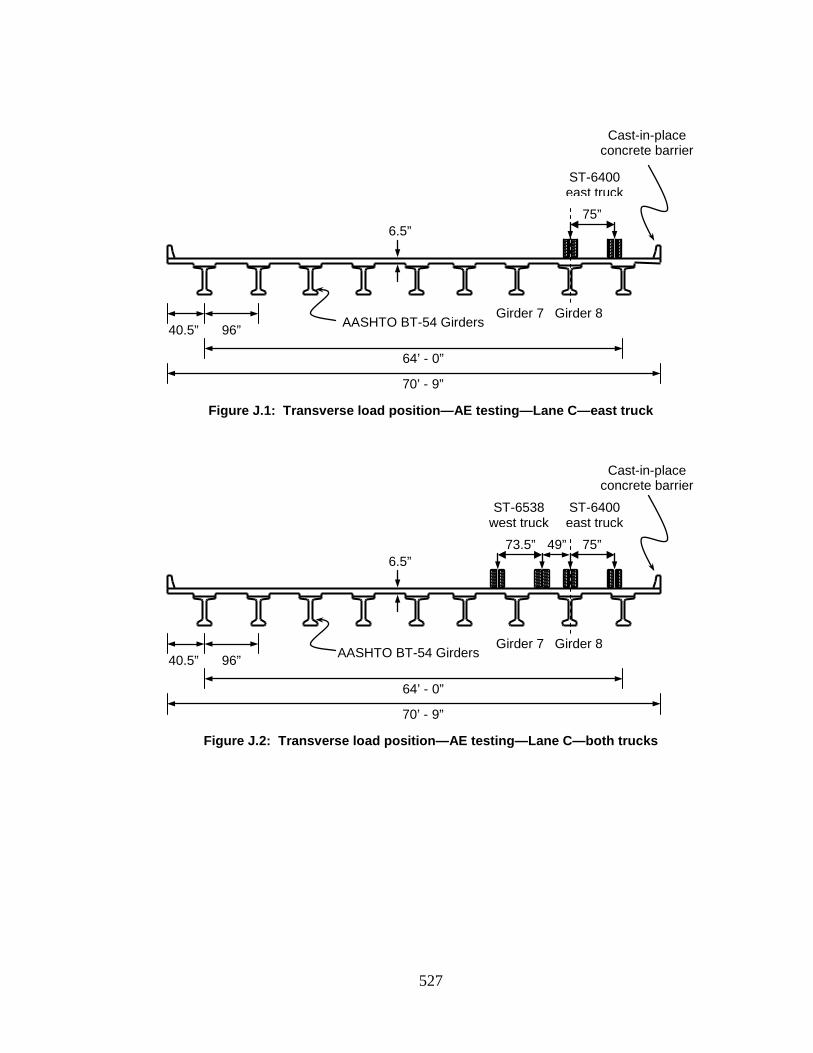
527
Figure J.1: Transverse load position—AE testing—Lane C—east truck
Figure J.2: Transverse load position—AE testing—Lane C—both trucks
40.5” 96”
Cast-in-place concrete barrier
64’ - 0”
70’ - 9”
6.5”
Girder 7 Girder 8
73.5” 75” 49”
ST-6538 west truck
ST-6400 east truck
AASHTO BT-54 Girders
40.5” 96”
Cast-in-place concrete barrier
64’ - 0”
70’ - 9”
6.5”
Girder 7 Girder 8
75”
ST-6400 east truck
AASHTO BT-54 Girders
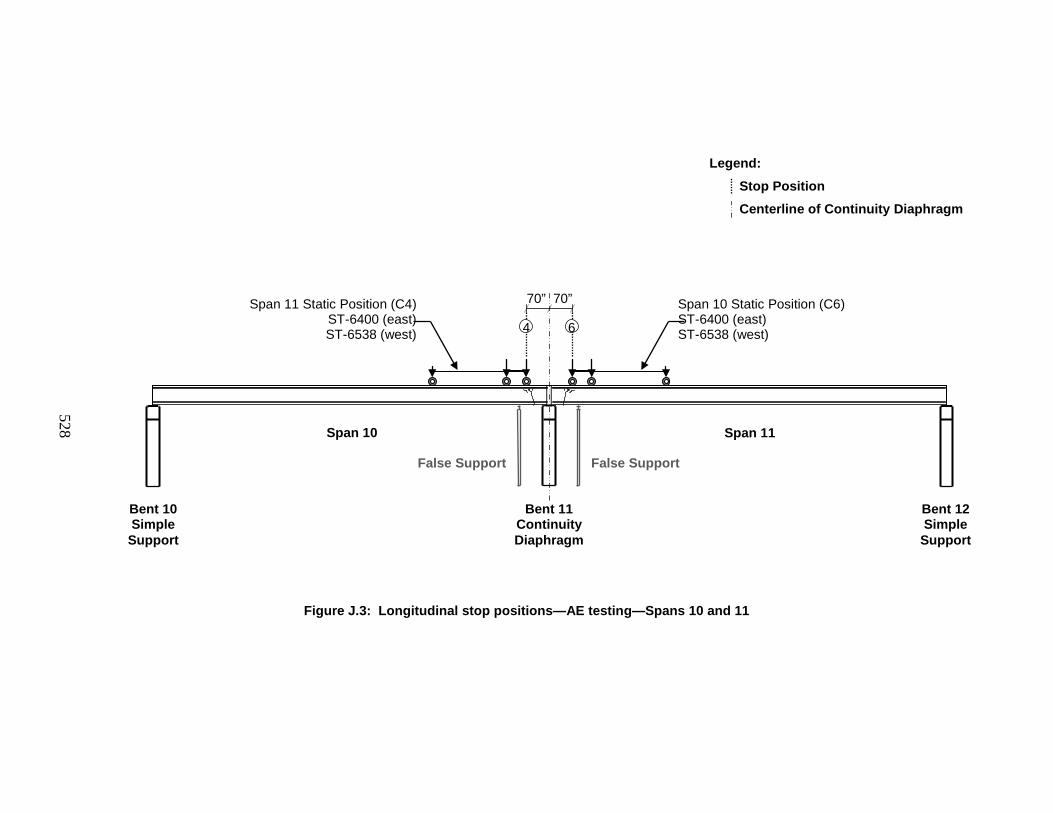
528
Figure J.3: Longitudinal stop positions—AE testing—Spans 10 and 11
70” 70”
Bent 10 Simple Support
Span 11
Bent 11
Continuity Diaphragm
Span 10
Bent 12 Simple Support
6 4
Span 10 Static Position (C6) ST-6400 (east) ST-6538 (west)
Span 11 Static Position (C4) ST-6400 (east) ST-6538 (west)
Legend: Stop Position Centerline of Continuity Diaphragm
False Support False Support
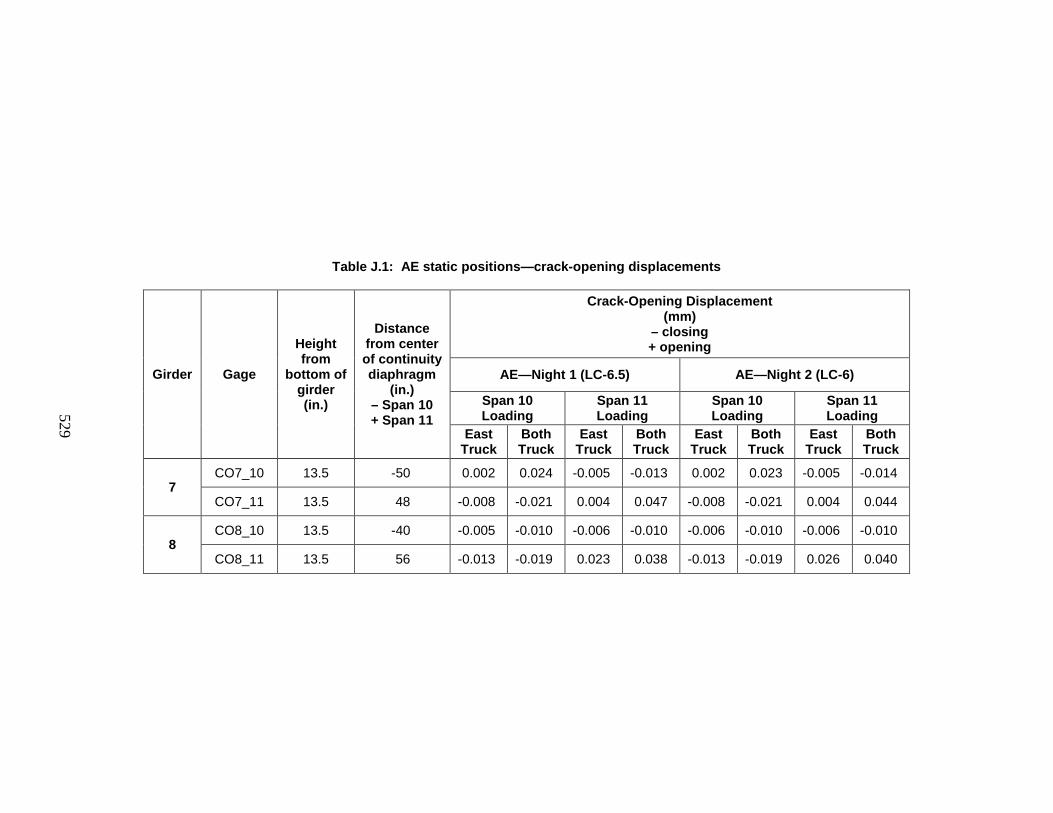
529
Table J.1: AE static positions—crack-opening displacements
Girder Gage
Height from
bottom of girder (in.)
Distance from center of continuity diaphragm
(in.) – Span 10 + Span 11
Crack-Opening Displacement (mm)
– closing + opening
AE—Night 1 (LC-6.5) AE—Night 2 (LC-6)
Span 10 Loading
Span 11 Loading
Span 10 Loading
Span 11 Loading
East Truck
Both Truck
East Truck
Both Truck
East Truck
Both Truck
East Truck
Both Truck
7 CO7_10 13.5 -50 0.002 0.024 -0.005 -0.013 0.002 0.023 -0.005 -0.014
CO7_11 13.5 48 -0.008 -0.021 0.004 0.047 -0.008 -0.021 0.004 0.044
8 CO8_10 13.5 -40 -0.005 -0.010 -0.006 -0.010 -0.006 -0.010 -0.006 -0.010
CO8_11 13.5 56 -0.013 -0.019 0.023 0.038 -0.013 -0.019 0.026 0.040
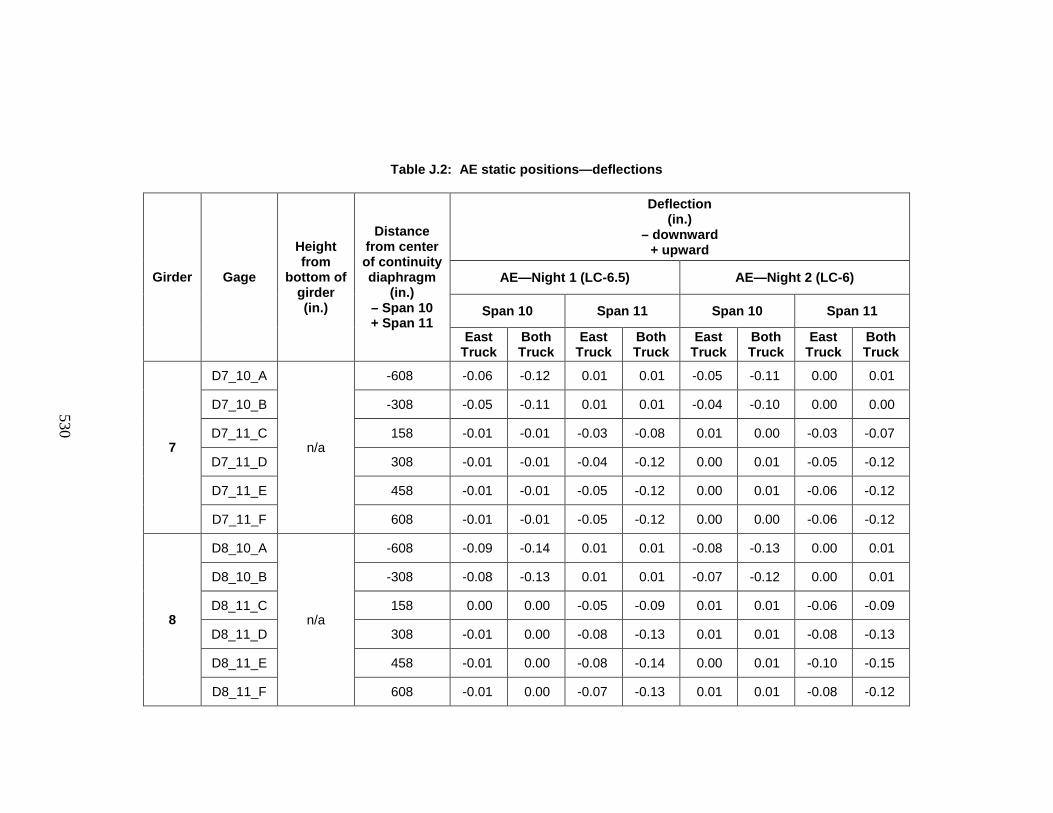
530
Table J.2: AE static positions—deflections
Girder Gage
Height from
bottom of girder (in.)
Distance from center of continuity diaphragm
(in.) – Span 10 + Span 11
Deflection (in.)
– downward + upward
AE—Night 1 (LC-6.5) AE—Night 2 (LC-6)
Span 10 Span 11 Span 10 Span 11
East Truck
Both Truck
East Truck
Both Truck
East Truck
Both Truck
East Truck
Both Truck
7
D7_10_A
n/a
-608 -0.06 -0.12 0.01 0.01 -0.05 -0.11 0.00 0.01
D7_10_B -308 -0.05 -0.11 0.01 0.01 -0.04 -0.10 0.00 0.00
D7_11_C 158 -0.01 -0.01 -0.03 -0.08 0.01 0.00 -0.03 -0.07
D7_11_D 308 -0.01 -0.01 -0.04 -0.12 0.00 0.01 -0.05 -0.12
D7_11_E 458 -0.01 -0.01 -0.05 -0.12 0.00 0.01 -0.06 -0.12
D7_11_F 608 -0.01 -0.01 -0.05 -0.12 0.00 0.00 -0.06 -0.12
8
D8_10_A
n/a
-608 -0.09 -0.14 0.01 0.01 -0.08 -0.13 0.00 0.01
D8_10_B -308 -0.08 -0.13 0.01 0.01 -0.07 -0.12 0.00 0.01
D8_11_C 158 0.00 0.00 -0.05 -0.09 0.01 0.01 -0.06 -0.09
D8_11_D 308 -0.01 0.00 -0.08 -0.13 0.01 0.01 -0.08 -0.13
D8_11_E 458 -0.01 0.00 -0.08 -0.14 0.00 0.01 -0.10 -0.15
D8_11_F 608 -0.01 0.00 -0.07 -0.13 0.01 0.01 -0.08 -0.12
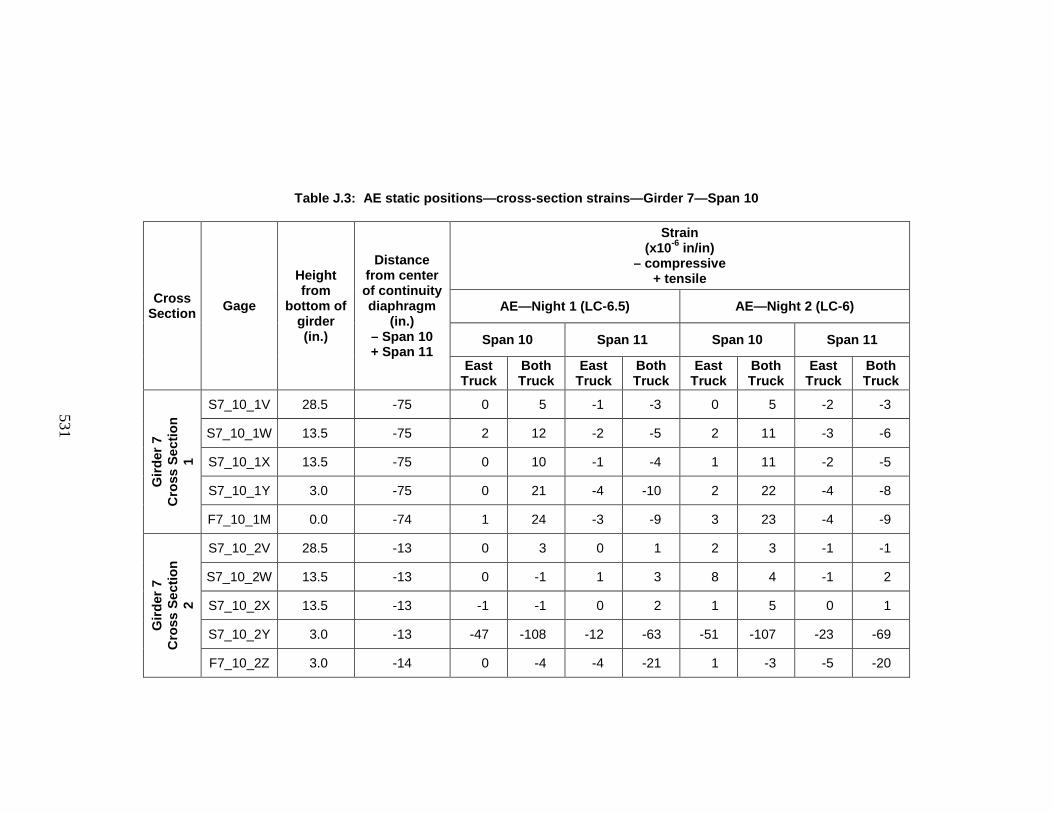
531
Table J.3: AE static positions—cross-section strains—Girder 7—Span 10
Cross Section Gage
Height from
bottom of girder (in.)
Distance from center of continuity diaphragm
(in.) – Span 10 + Span 11
Strain (x10-6 in/in)
– compressive + tensile
AE—Night 1 (LC-6.5) AE—Night 2 (LC-6)
Span 10 Span 11 Span 10 Span 11
East Truck
Both Truck
East Truck
Both Truck
East Truck
Both Truck
East Truck
Both Truck
Gird
er 7
C
ross
Sec
tion
1
S7_10_1V 28.5 -75 0 5 -1 -3 0 5 -2 -3
S7_10_1W 13.5 -75 2 12 -2 -5 2 11 -3 -6
S7_10_1X 13.5 -75 0 10 -1 -4 1 11 -2 -5
S7_10_1Y 3.0 -75 0 21 -4 -10 2 22 -4 -8
F7_10_1M 0.0 -74 1 24 -3 -9 3 23 -4 -9
Gird
er 7
C
ross
Sec
tion
2
S7_10_2V 28.5 -13 0 3 0 1 2 3 -1 -1
S7_10_2W 13.5 -13 0 -1 1 3 8 4 -1 2
S7_10_2X 13.5 -13 -1 -1 0 2 1 5 0 1
S7_10_2Y 3.0 -13 -47 -108 -12 -63 -51 -107 -23 -69
F7_10_2Z 3.0 -14 0 -4 -4 -21 1 -3 -5 -20
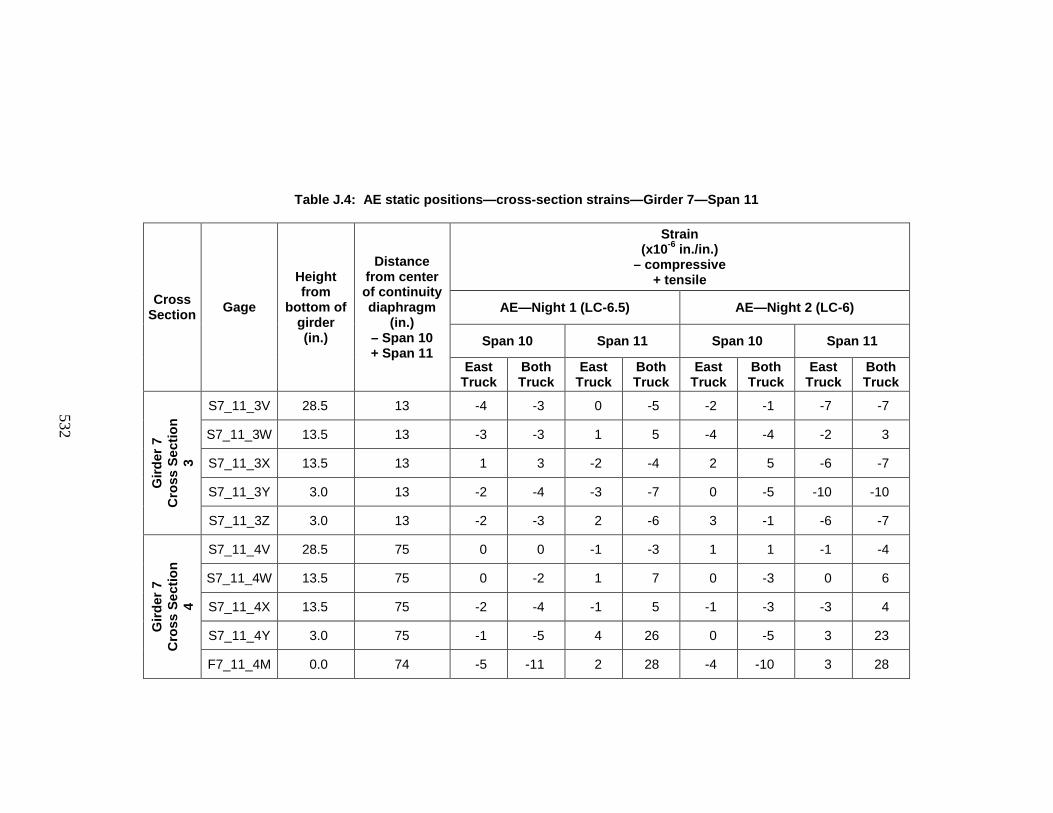
532
Table J.4: AE static positions—cross-section strains—Girder 7—Span 11
Cross Section Gage
Height from
bottom of girder (in.)
Distance from center of continuity diaphragm
(in.) – Span 10 + Span 11
Strain (x10-6 in./in.)
– compressive + tensile
AE—Night 1 (LC-6.5) AE—Night 2 (LC-6)
Span 10 Span 11 Span 10 Span 11
East Truck
Both Truck
East Truck
Both Truck
East Truck
Both Truck
East Truck
Both Truck
Gird
er 7
C
ross
Sec
tion
3
S7_11_3V 28.5 13 -4 -3 0 -5 -2 -1 -7 -7
S7_11_3W 13.5 13 -3 -3 1 5 -4 -4 -2 3
S7_11_3X 13.5 13 1 3 -2 -4 2 5 -6 -7
S7_11_3Y 3.0 13 -2 -4 -3 -7 0 -5 -10 -10
S7_11_3Z 3.0 13 -2 -3 2 -6 3 -1 -6 -7
Gird
er 7
C
ross
Sec
tion
4
S7_11_4V 28.5 75 0 0 -1 -3 1 1 -1 -4
S7_11_4W 13.5 75 0 -2 1 7 0 -3 0 6
S7_11_4X 13.5 75 -2 -4 -1 5 -1 -3 -3 4
S7_11_4Y 3.0 75 -1 -5 4 26 0 -5 3 23
F7_11_4M 0.0 74 -5 -11 2 28 -4 -10 3 28
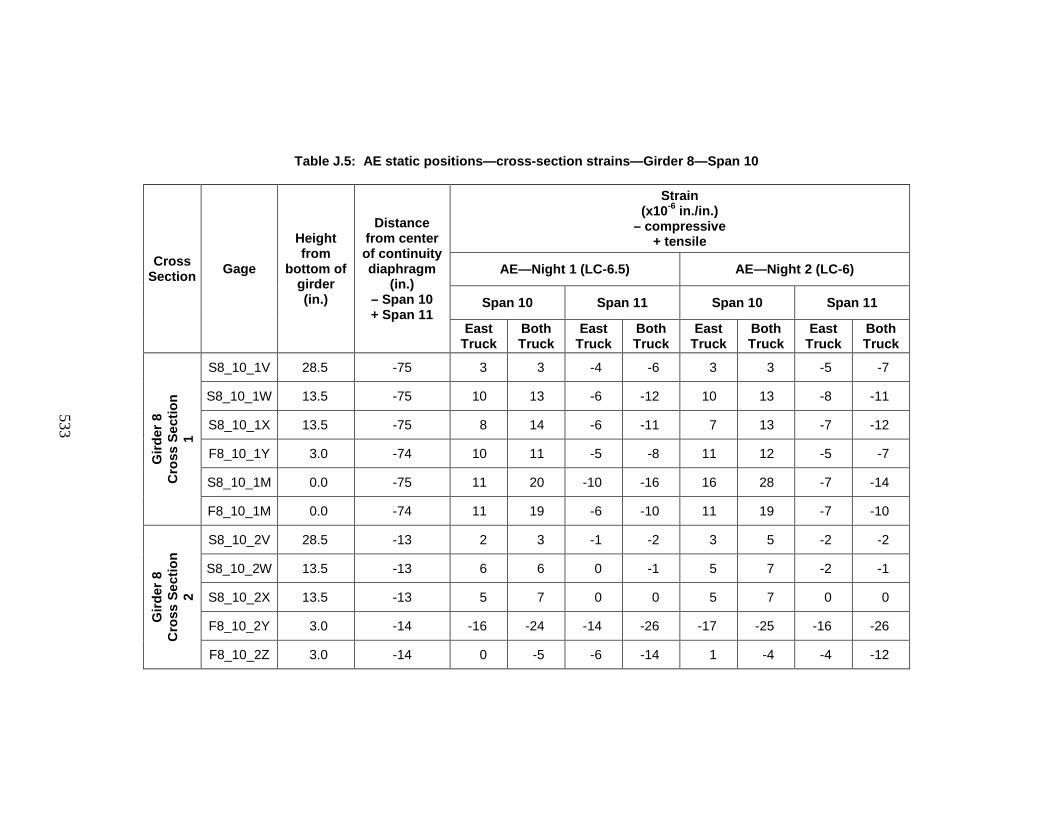
533
Table J.5: AE static positions—cross-section strains—Girder 8—Span 10
Cross Section Gage
Height from
bottom of girder (in.)
Distance from center of continuity diaphragm
(in.) – Span 10 + Span 11
Strain (x10-6 in./in.)
– compressive + tensile
AE—Night 1 (LC-6.5) AE—Night 2 (LC-6)
Span 10 Span 11 Span 10 Span 11
East Truck
Both Truck
East Truck
Both Truck
East Truck
Both Truck
East Truck
Both Truck
Gird
er 8
C
ross
Sec
tion
1
S8_10_1V 28.5 -75 3 3 -4 -6 3 3 -5 -7
S8_10_1W 13.5 -75 10 13 -6 -12 10 13 -8 -11
S8_10_1X 13.5 -75 8 14 -6 -11 7 13 -7 -12
F8_10_1Y 3.0 -74 10 11 -5 -8 11 12 -5 -7
S8_10_1M 0.0 -75 11 20 -10 -16 16 28 -7 -14
F8_10_1M 0.0 -74 11 19 -6 -10 11 19 -7 -10
Gird
er 8
C
ross
Sec
tion
2
S8_10_2V 28.5 -13 2 3 -1 -2 3 5 -2 -2
S8_10_2W 13.5 -13 6 6 0 -1 5 7 -2 -1
S8_10_2X 13.5 -13 5 7 0 0 5 7 0 0
F8_10_2Y 3.0 -14 -16 -24 -14 -26 -17 -25 -16 -26
F8_10_2Z 3.0 -14 0 -5 -6 -14 1 -4 -4 -12
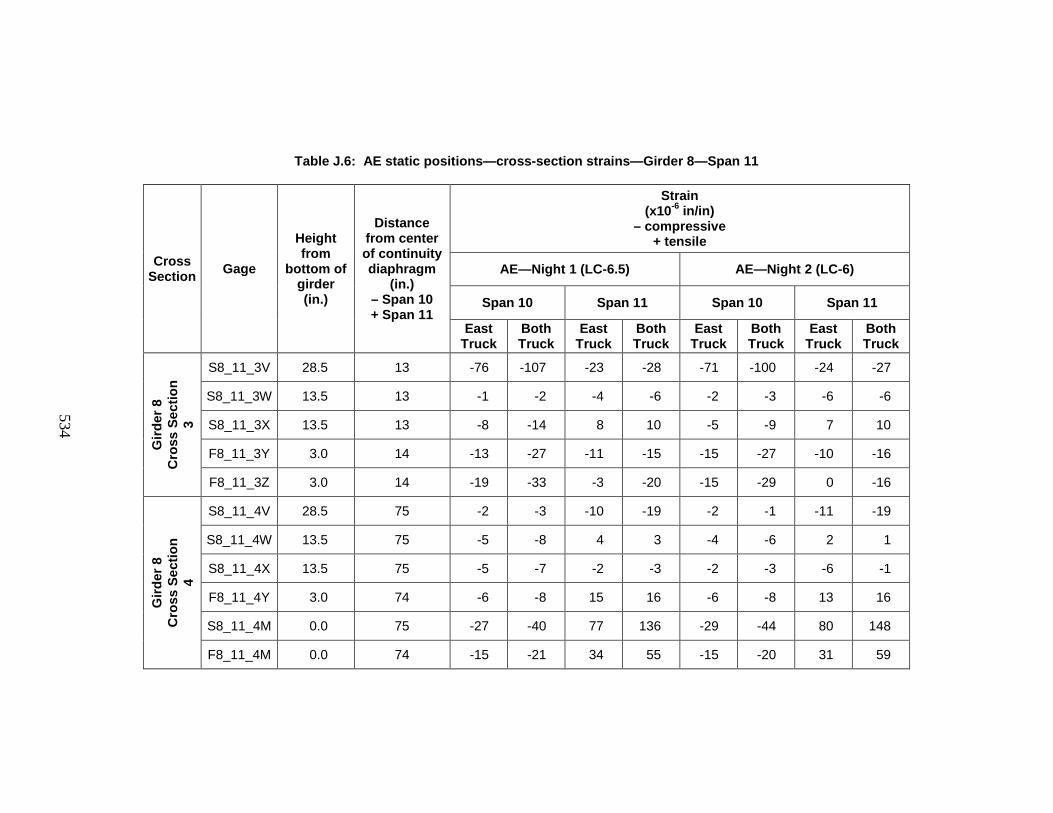
534
Table J.6: AE static positions—cross-section strains—Girder 8—Span 11
Cross Section Gage
Height from
bottom of girder (in.)
Distance from center of continuity diaphragm
(in.) – Span 10 + Span 11
Strain (x10-6 in/in)
– compressive + tensile
AE—Night 1 (LC-6.5) AE—Night 2 (LC-6)
Span 10 Span 11 Span 10 Span 11
East Truck
Both Truck
East Truck
Both Truck
East Truck
Both Truck
East Truck
Both Truck
Gird
er 8
C
ross
Sec
tion
3
S8_11_3V 28.5 13 -76 -107 -23 -28 -71 -100 -24 -27
S8_11_3W 13.5 13 -1 -2 -4 -6 -2 -3 -6 -6
S8_11_3X 13.5 13 -8 -14 8 10 -5 -9 7 10
F8_11_3Y 3.0 14 -13 -27 -11 -15 -15 -27 -10 -16
F8_11_3Z 3.0 14 -19 -33 -3 -20 -15 -29 0 -16
Gird
er 8
C
ross
Sec
tion
4
S8_11_4V 28.5 75 -2 -3 -10 -19 -2 -1 -11 -19
S8_11_4W 13.5 75 -5 -8 4 3 -4 -6 2 1
S8_11_4X 13.5 75 -5 -7 -2 -3 -2 -3 -6 -1
F8_11_4Y 3.0 74 -6 -8 15 16 -6 -8 13 16
S8_11_4M 0.0 75 -27 -40 77 136 -29 -44 80 148
F8_11_4M 0.0 74 -15 -21 34 55 -15 -20 31 59
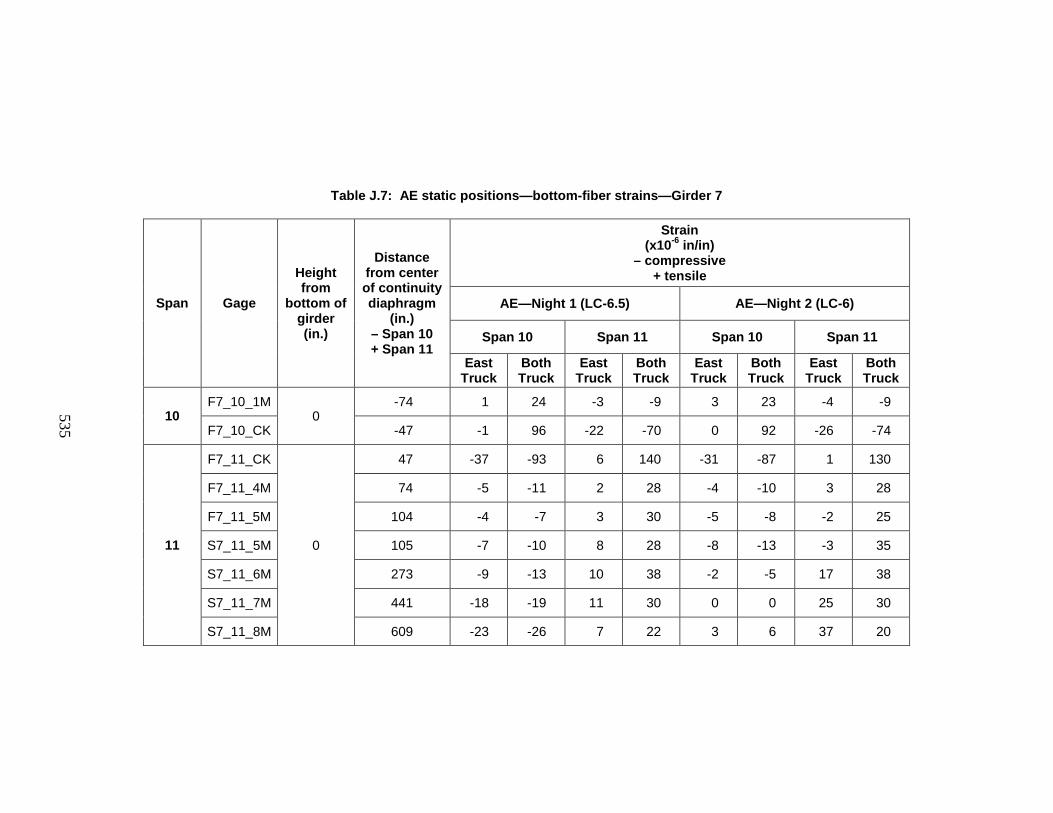
535
Table J.7: AE static positions—bottom-fiber strains—Girder 7
Span Gage
Height from
bottom of girder (in.)
Distance from center of continuity diaphragm
(in.) – Span 10 + Span 11
Strain (x10-6 in/in)
– compressive + tensile
AE—Night 1 (LC-6.5) AE—Night 2 (LC-6)
Span 10 Span 11 Span 10 Span 11
East Truck
Both Truck
East Truck
Both Truck
East Truck
Both Truck
East Truck
Both Truck
10 F7_10_1M
0 -74 1 24 -3 -9 3 23 -4 -9
F7_10_CK -47 -1 96 -22 -70 0 92 -26 -74
11
F7_11_CK
0
47 -37 -93 6 140 -31 -87 1 130
F7_11_4M 74 -5 -11 2 28 -4 -10 3 28
F7_11_5M 104 -4 -7 3 30 -5 -8 -2 25
S7_11_5M 105 -7 -10 8 28 -8 -13 -3 35
S7_11_6M 273 -9 -13 10 38 -2 -5 17 38
S7_11_7M 441 -18 -19 11 30 0 0 25 30
S7_11_8M 609 -23 -26 7 22 3 6 37 20
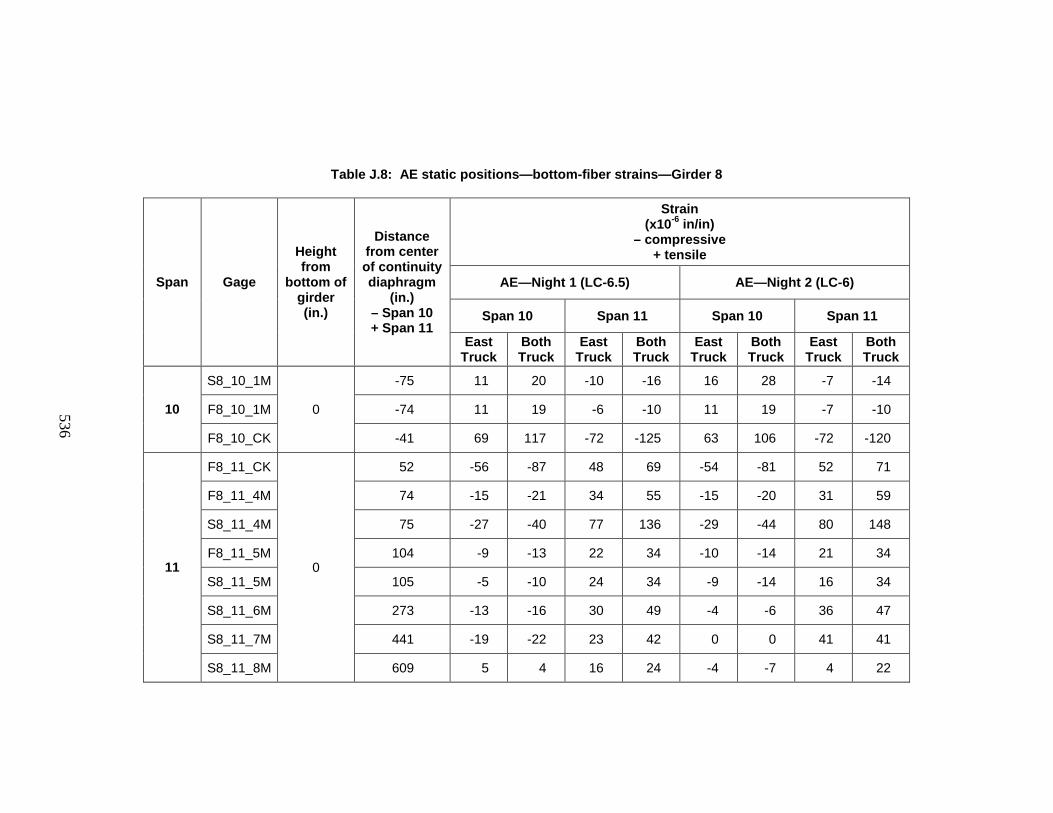
536
Table J.8: AE static positions—bottom-fiber strains—Girder 8
Span Gage
Height from
bottom of girder (in.)
Distance from center of continuity diaphragm
(in.) – Span 10 + Span 11
Strain (x10-6 in/in)
– compressive + tensile
AE—Night 1 (LC-6.5) AE—Night 2 (LC-6)
Span 10 Span 11 Span 10 Span 11
East Truck
Both Truck
East Truck
Both Truck
East Truck
Both Truck
East Truck
Both Truck
10
S8_10_1M
0
-75 11 20 -10 -16 16 28 -7 -14
F8_10_1M -74 11 19 -6 -10 11 19 -7 -10
F8_10_CK -41 69 117 -72 -125 63 106 -72 -120
11
F8_11_CK
0
52 -56 -87 48 69 -54 -81 52 71
F8_11_4M 74 -15 -21 34 55 -15 -20 31 59
S8_11_4M 75 -27 -40 77 136 -29 -44 80 148
F8_11_5M 104 -9 -13 22 34 -10 -14 21 34
S8_11_5M 105 -5 -10 24 34 -9 -14 16 34
S8_11_6M 273 -13 -16 30 49 -4 -6 36 47
S8_11_7M 441 -19 -22 23 42 0 0 41 41
S8_11_8M 609 5 4 16 24 -4 -7 4 22
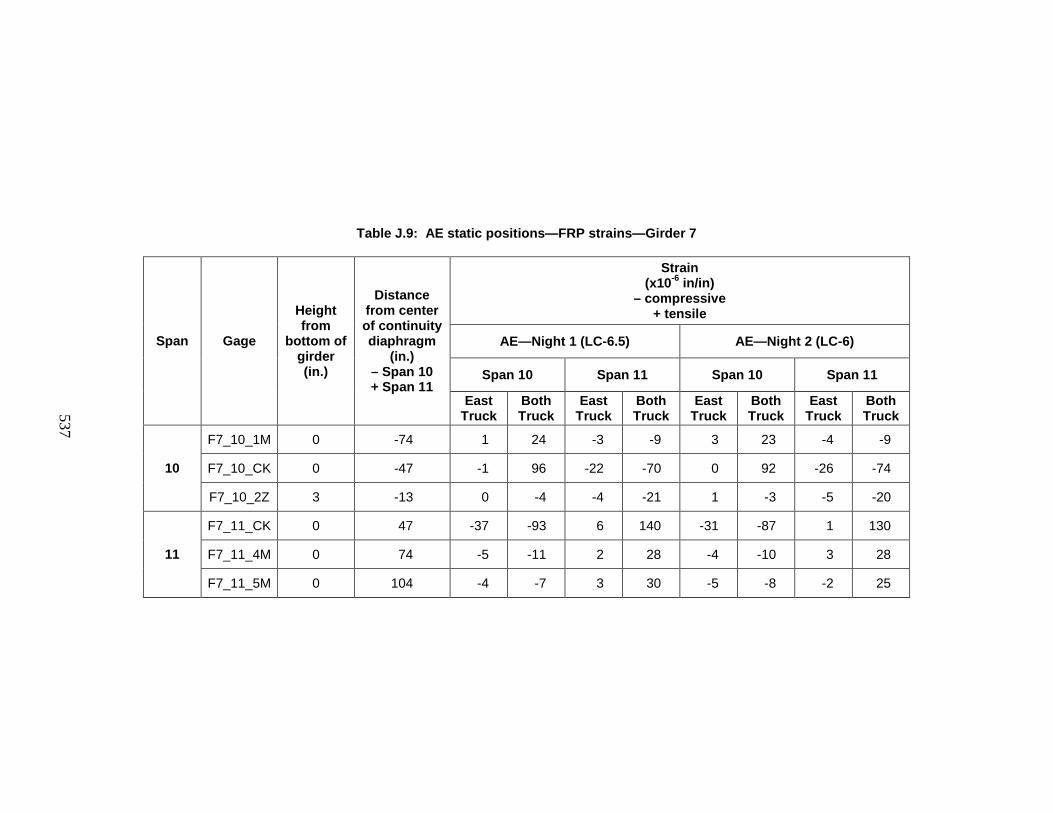
537
Table J.9: AE static positions—FRP strains—Girder 7
Span Gage
Height from
bottom of girder (in.)
Distance from center of continuity diaphragm
(in.) – Span 10 + Span 11
Strain (x10-6 in/in)
– compressive + tensile
AE—Night 1 (LC-6.5) AE—Night 2 (LC-6)
Span 10 Span 11 Span 10 Span 11
East Truck
Both Truck
East Truck
Both Truck
East Truck
Both Truck
East Truck
Both Truck
10
F7_10_1M 0 -74 1 24 -3 -9 3 23 -4 -9
F7_10_CK 0 -47 -1 96 -22 -70 0 92 -26 -74
F7_10_2Z 3 -13 0 -4 -4 -21 1 -3 -5 -20
11
F7_11_CK 0 47 -37 -93 6 140 -31 -87 1 130
F7_11_4M 0 74 -5 -11 2 28 -4 -10 3 28
F7_11_5M 0 104 -4 -7 3 30 -5 -8 -2 25
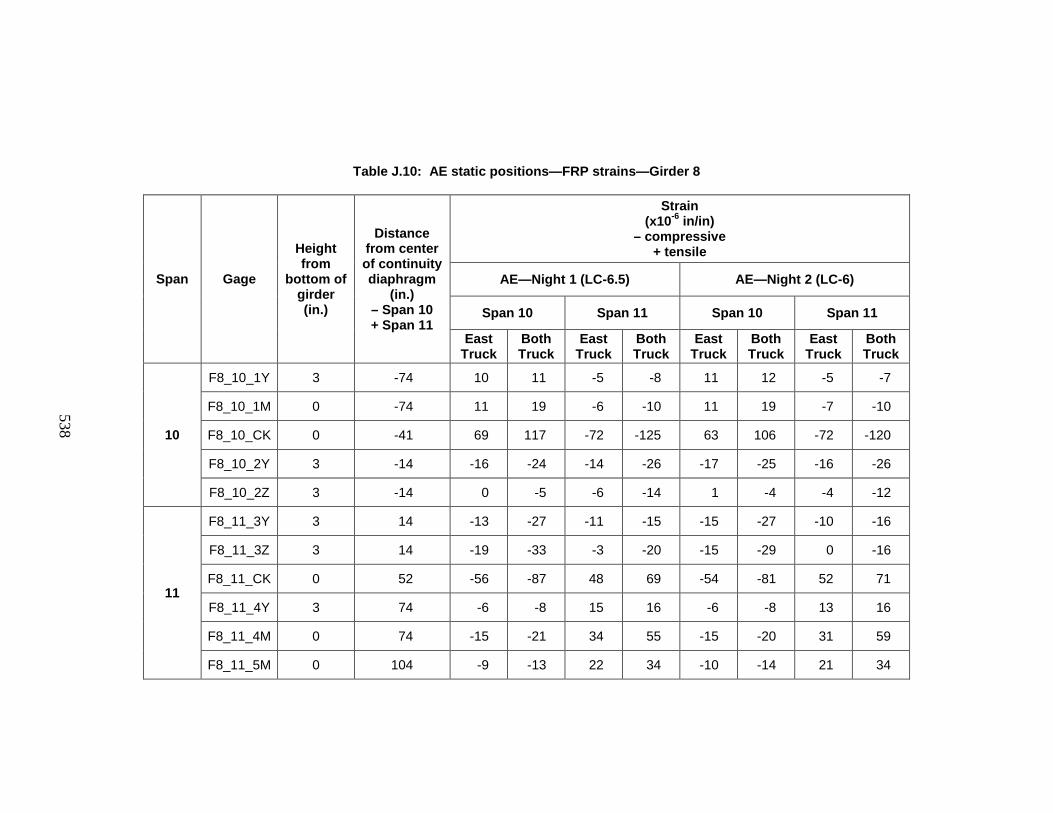
538
Table J.10: AE static positions—FRP strains—Girder 8
Span Gage
Height from
bottom of girder (in.)
Distance from center of continuity diaphragm
(in.) – Span 10 + Span 11
Strain (x10-6 in/in)
– compressive + tensile
AE—Night 1 (LC-6.5) AE—Night 2 (LC-6)
Span 10 Span 11 Span 10 Span 11
East Truck
Both Truck
East Truck
Both Truck
East Truck
Both Truck
East Truck
Both Truck
10
F8_10_1Y 3 -74 10 11 -5 -8 11 12 -5 -7
F8_10_1M 0 -74 11 19 -6 -10 11 19 -7 -10
F8_10_CK 0 -41 69 117 -72 -125 63 106 -72 -120
F8_10_2Y 3 -14 -16 -24 -14 -26 -17 -25 -16 -26
F8_10_2Z 3 -14 0 -5 -6 -14 1 -4 -4 -12
11
F8_11_3Y 3 14 -13 -27 -11 -15 -15 -27 -10 -16
F8_11_3Z 3 14 -19 -33 -3 -20 -15 -29 0 -16
F8_11_CK 0 52 -56 -87 48 69 -54 -81 52 71
F8_11_4Y 3 74 -6 -8 15 16 -6 -8 13 16
F8_11_4M 0 74 -15 -21 34 55 -15 -20 31 59
F8_11_5M 0 104 -9 -13 22 34 -10 -14 21 34
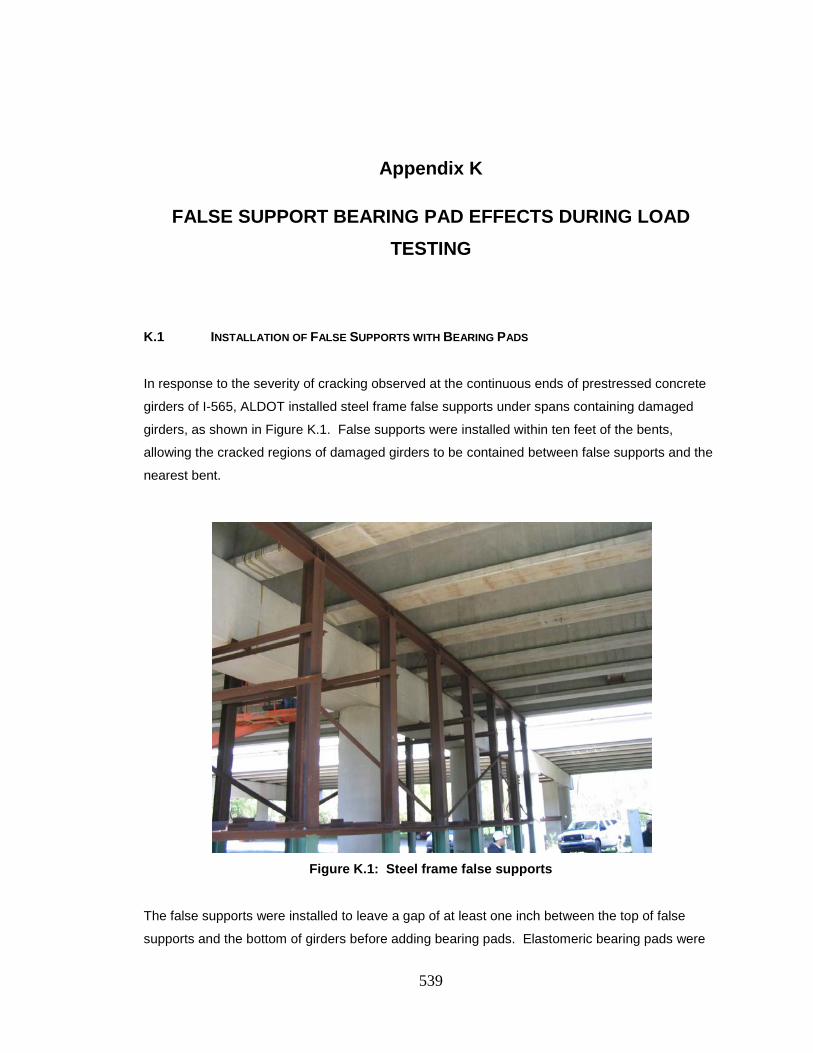
539
Appendix K
FALSE SUPPORT BEARING PAD EFFECTS DURING LOAD TESTING
K.1 INSTALLATION OF FALSE SUPPORTS WITH BEARING PADS
In response to the severity of cracking observed at the continuous ends of prestressed concrete
girders of I-565, ALDOT installed steel frame false supports under spans containing damaged
girders, as shown in Figure K.1. False supports were installed within ten feet of the bents,
allowing the cracked regions of damaged girders to be contained between false supports and the
nearest bent.
Figure K.1: Steel frame false supports
The false supports were installed to leave a gap of at least one inch between the top of false
supports and the bottom of girders before adding bearing pads. Elastomeric bearing pads were
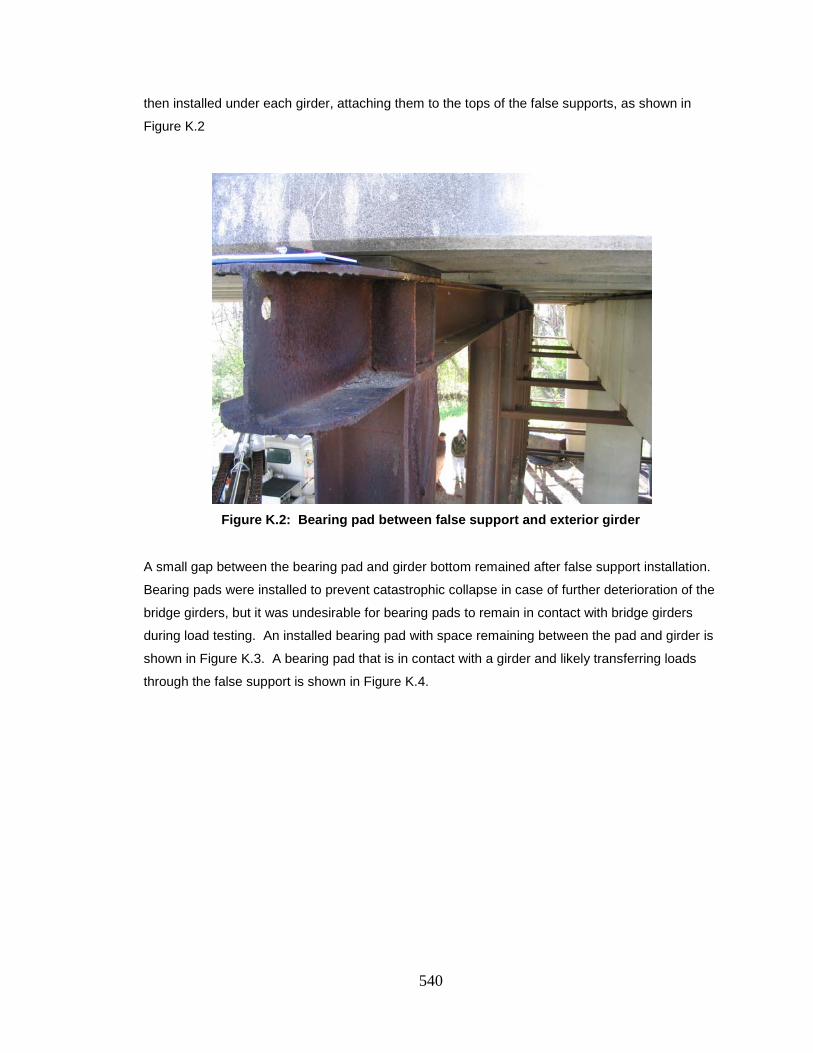
540
then installed under each girder, attaching them to the tops of the false supports, as shown in
Figure K.2
Figure K.2: Bearing pad between false support and exterior girder
A small gap between the bearing pad and girder bottom remained after false support installation.
Bearing pads were installed to prevent catastrophic collapse in case of further deterioration of the
bridge girders, but it was undesirable for bearing pads to remain in contact with bridge girders
during load testing. An installed bearing pad with space remaining between the pad and girder is
shown in Figure K.3. A bearing pad that is in contact with a girder and likely transferring loads
through the false support is shown in Figure K.4.

541
Figure K.3: Bearing pad location with space between the bearing pad and girder
Figure K.4: Bearing pad location without space between the bearing pad and girder
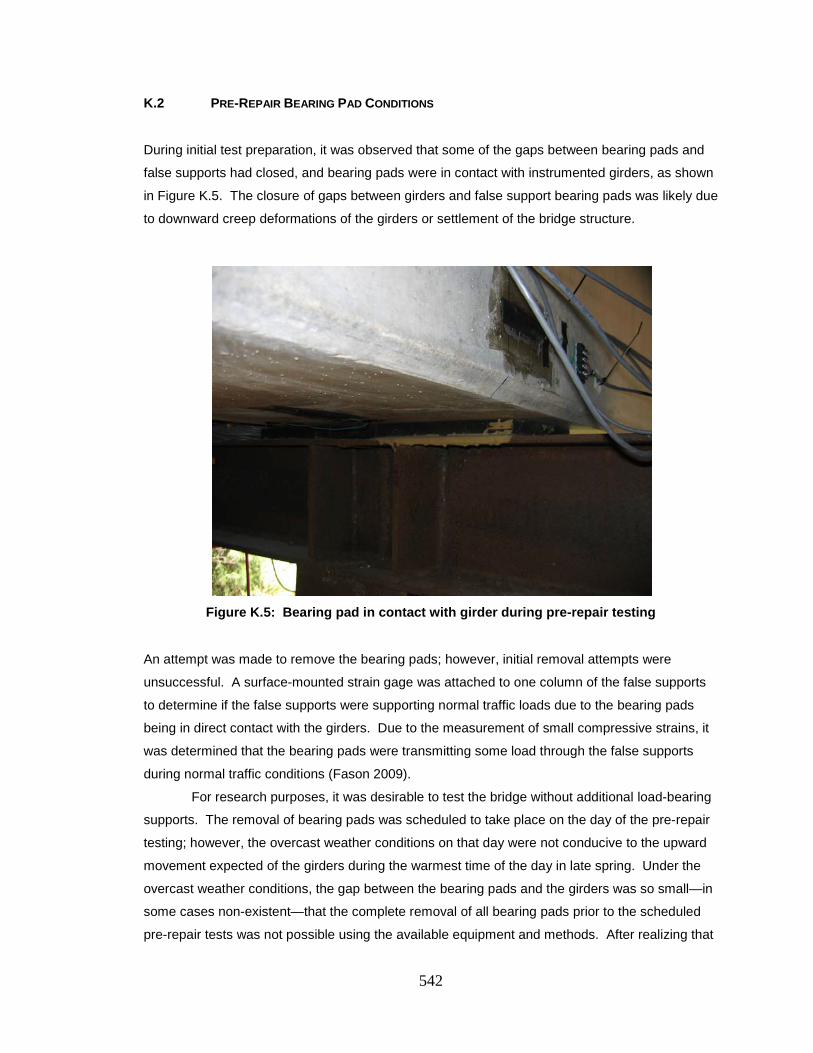
542
K.2 PRE-REPAIR BEARING PAD CONDITIONS
During initial test preparation, it was observed that some of the gaps between bearing pads and
false supports had closed, and bearing pads were in contact with instrumented girders, as shown
in Figure K.5. The closure of gaps between girders and false support bearing pads was likely due
to downward creep deformations of the girders or settlement of the bridge structure.
Figure K.5: Bearing pad in contact with girder during pre-repair testing
An attempt was made to remove the bearing pads; however, initial removal attempts were
unsuccessful. A surface-mounted strain gage was attached to one column of the false supports
to determine if the false supports were supporting normal traffic loads due to the bearing pads
being in direct contact with the girders. Due to the measurement of small compressive strains, it
was determined that the bearing pads were transmitting some load through the false supports
during normal traffic conditions (Fason 2009).
For research purposes, it was desirable to test the bridge without additional load-bearing
supports. The removal of bearing pads was scheduled to take place on the day of the pre-repair
testing; however, the overcast weather conditions on that day were not conducive to the upward
movement expected of the girders during the warmest time of the day in late spring. Under the
overcast weather conditions, the gap between the bearing pads and the girders was so small—in
some cases non-existent—that the complete removal of all bearing pads prior to the scheduled
pre-repair tests was not possible using the available equipment and methods. After realizing that
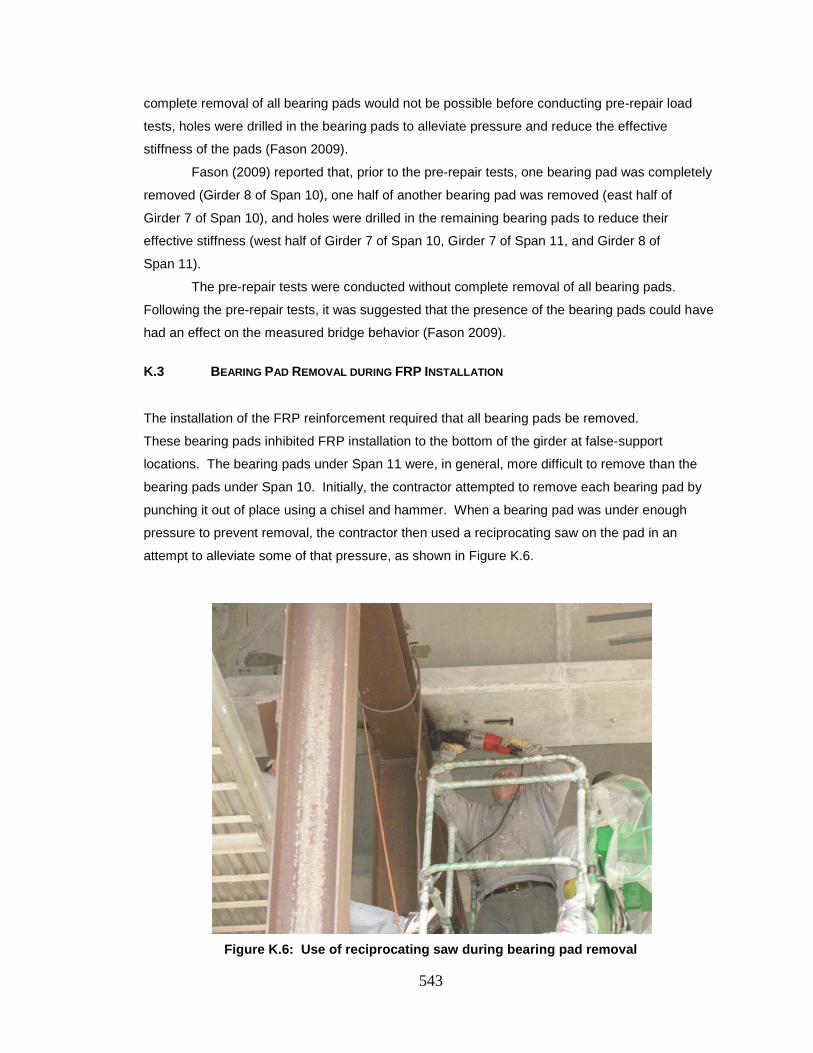
543
complete removal of all bearing pads would not be possible before conducting pre-repair load
tests, holes were drilled in the bearing pads to alleviate pressure and reduce the effective
stiffness of the pads (Fason 2009).
Fason (2009) reported that, prior to the pre-repair tests, one bearing pad was completely
removed (Girder 8 of Span 10), one half of another bearing pad was removed (east half of
Girder 7 of Span 10), and holes were drilled in the remaining bearing pads to reduce their
effective stiffness (west half of Girder 7 of Span 10, Girder 7 of Span 11, and Girder 8 of
Span 11).
The pre-repair tests were conducted without complete removal of all bearing pads.
Following the pre-repair tests, it was suggested that the presence of the bearing pads could have
had an effect on the measured bridge behavior (Fason 2009).
K.3 BEARING PAD REMOVAL DURING FRP INSTALLATION
The installation of the FRP reinforcement required that all bearing pads be removed.
These bearing pads inhibited FRP installation to the bottom of the girder at false-support
locations. The bearing pads under Span 11 were, in general, more difficult to remove than the
bearing pads under Span 10. Initially, the contractor attempted to remove each bearing pad by
punching it out of place using a chisel and hammer. When a bearing pad was under enough
pressure to prevent removal, the contractor then used a reciprocating saw on the pad in an
attempt to alleviate some of that pressure, as shown in Figure K.6.
Figure K.6: Use of reciprocating saw during bearing pad removal
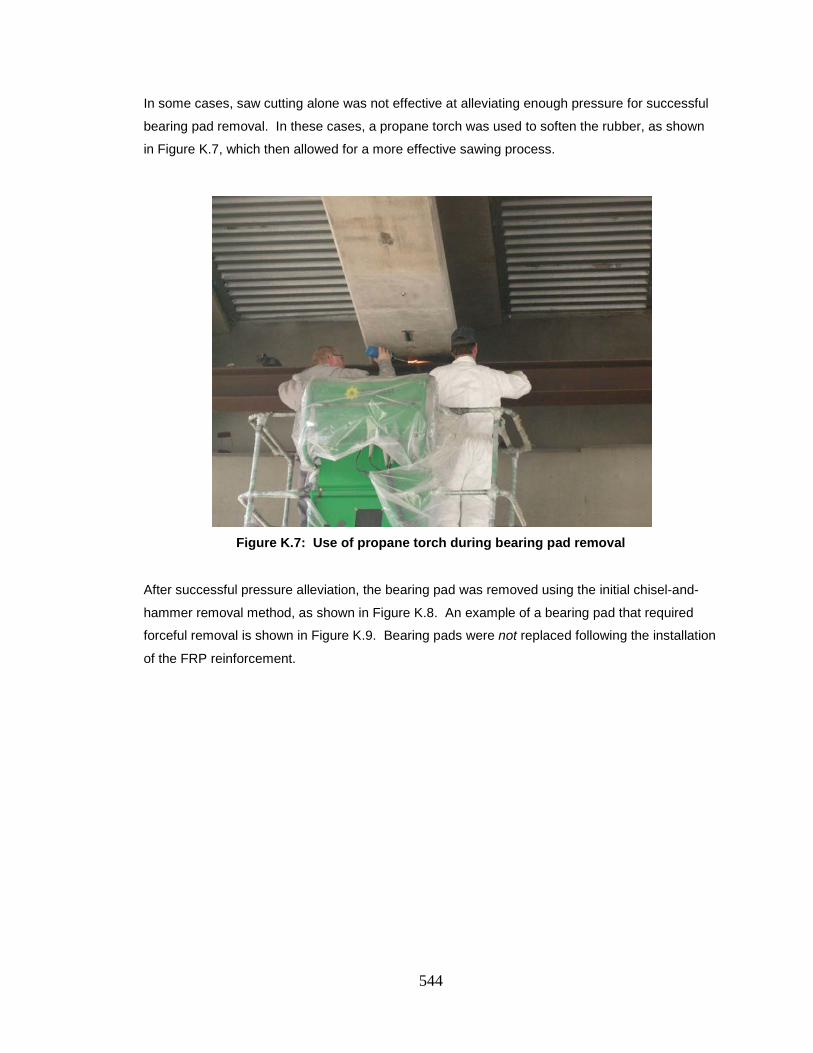
544
In some cases, saw cutting alone was not effective at alleviating enough pressure for successful
bearing pad removal. In these cases, a propane torch was used to soften the rubber, as shown
in Figure K.7, which then allowed for a more effective sawing process.
Figure K.7: Use of propane torch during bearing pad removal
After successful pressure alleviation, the bearing pad was removed using the initial chisel-and-
hammer removal method, as shown in Figure K.8. An example of a bearing pad that required
forceful removal is shown in Figure K.9. Bearing pads were not replaced following the installation
of the FRP reinforcement.
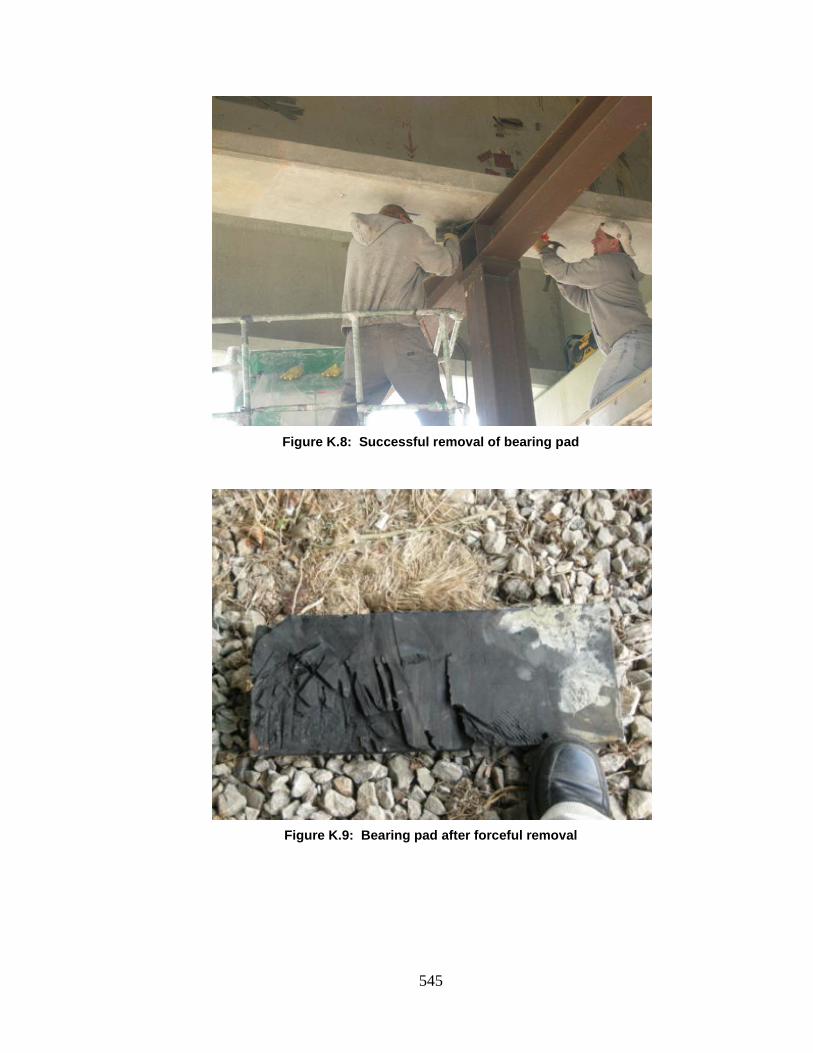
545
Figure K.8: Successful removal of bearing pad
Figure K.9: Bearing pad after forceful removal
546
K.4 POST-REPAIR BEARING PAD CONDITIONS
The post-repair tests were conducted without the presence of any bearing pads. Fason (2009)
indicated that direct relationships between structural behavior measured and observed during
pre-repair and post-repair load testing may be affected by the variation of support conditions.
K.5 ANALYSIS OF NUMERICAL RESULTS
The measurements of the pre- and post-repair tests were compared to better determine the
effects related to the presence of the bearing pads. These comparisons include: deflections,
crack opening displacements, and surface strains measured during multiposition load testing as
well as deflections measured during superposition testing.
K.5.1 Deflections—Multiposition Load Testing
Truck positions resulting in maximum downward deflections measured during pre- and post-repair
multiposition load testing have been analyzed to assess whether the bearing pads had an effect
on the pre-repair support conditions and general pre-repair bridge behavior. Pre- and post-repair
deflections measured in response to four midspan truck positions (A1, C1, A9, and C9) are
shown in Figures K.10–K.13. The arrows in the figures represent the position of the wheel loads
on the bridge. For each midspan truck position, the midspan and quarterspan deflection
measurements—and the differences between pre- and post-repair testing—are presented in
Tables K.1–K.4. For each midspan truck position, the table of measurements follows the figure
that illustrates the measured deflections.
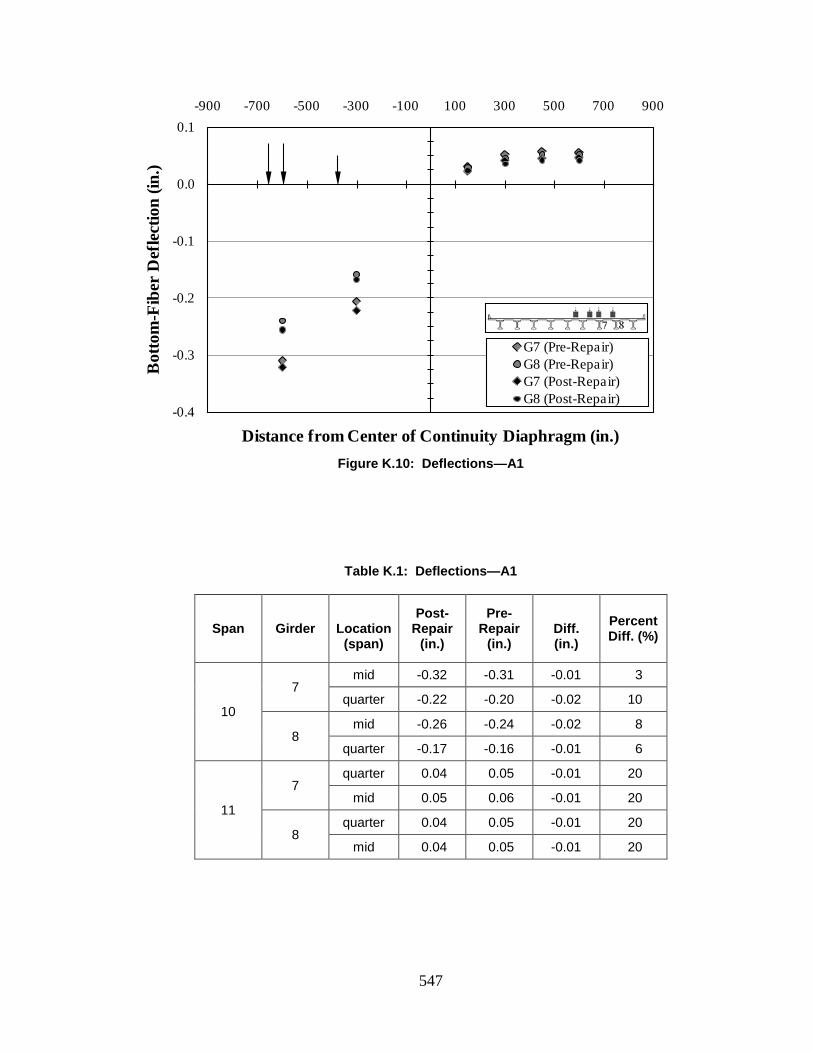
547
Figure K.10: Deflections—A1
Table K.1: Deflections—A1
Span Girder
Location (span)
Post- Repair
(in.)
Pre- Repair
(in.)
Diff. (in.)
Percent Diff. (%)
10
7 mid -0.32 -0.31 -0.01 3
quarter -0.22 -0.20 -0.02 10
8 mid -0.26 -0.24 -0.02 8
quarter -0.17 -0.16 -0.01 6
11
7 quarter 0.04 0.05 -0.01 20
mid 0.05 0.06 -0.01 20
8 quarter 0.04 0.05 -0.01 20
mid 0.04 0.05 -0.01 20
-0.4
-0.3
-0.2
-0.1
0.0
0.1-900 -700 -500 -300 -100 100 300 500 700 900
Bot
tom
-Fib
er D
efle
ctio
n (in
.)
Distance from Center of Continuity Diaphragm (in.)
G7 (Pre-Repair)G8 (Pre-Repair)G7 (Post-Repair)G8 (Post-Repair)

548
Figure K.11: Deflections—A9
Table K.2: Deflections—A9
Span Girder
Location (span)
Post- Repair
(in.)
Pre- Repair
(in.)
Diff. (in.)
Percent Diff. (%)
10
7 mid 0.04 0.05 -0.01 20
quarter 0.04 0.05 -0.01 20
8 mid 0.04 0.05 -0.01 20
quarter 0.03 0.04 -0.01 30
11
7 quarter -0.22 -0.20 -0.02 10
mid -0.33 -0.30 -0.03 10
8 quarter -0.17 -0.15 -0.02 13
mid -0.25 -0.23 -0.02 8
-0.4
-0.3
-0.2
-0.1
0.0
0.1-900 -700 -500 -300 -100 100 300 500 700 900
Bot
tom
-Fib
er D
efle
ctio
n (in
.)
Distance from Center of Continuity Diaphragm (in.)
G7 (Pre-Repair)G8 (Pre-Repair)G7 (Post-Repair)G8 (Post-Repair)
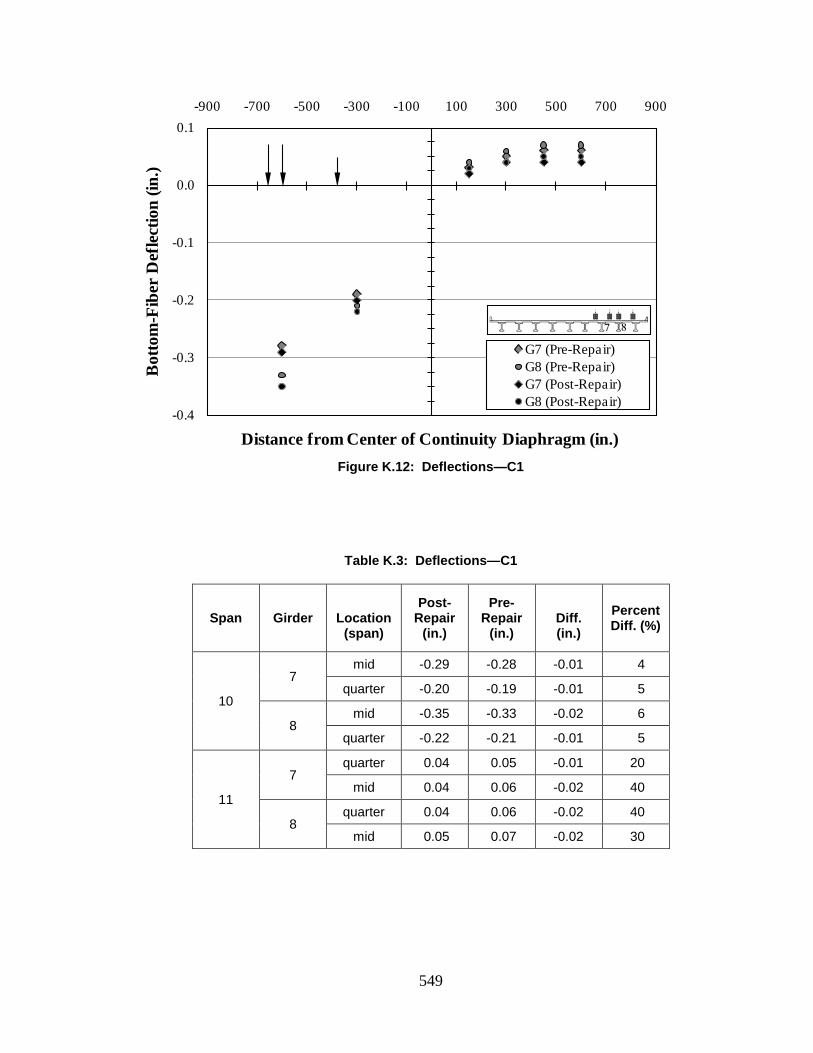
549
Figure K.12: Deflections—C1
Table K.3: Deflections—C1
Span Girder
Location (span)
Post- Repair
(in.)
Pre- Repair
(in.)
Diff. (in.)
Percent Diff. (%)
10
7 mid -0.29 -0.28 -0.01 4
quarter -0.20 -0.19 -0.01 5
8 mid -0.35 -0.33 -0.02 6
quarter -0.22 -0.21 -0.01 5
11
7 quarter 0.04 0.05 -0.01 20
mid 0.04 0.06 -0.02 40
8 quarter 0.04 0.06 -0.02 40
mid 0.05 0.07 -0.02 30
-0.4
-0.3
-0.2
-0.1
0.0
0.1-900 -700 -500 -300 -100 100 300 500 700 900
Bot
tom
-Fib
er D
efle
ctio
n (in
.)
Distance from Center of Continuity Diaphragm (in.)
G7 (Pre-Repair)G8 (Pre-Repair)G7 (Post-Repair)G8 (Post-Repair)
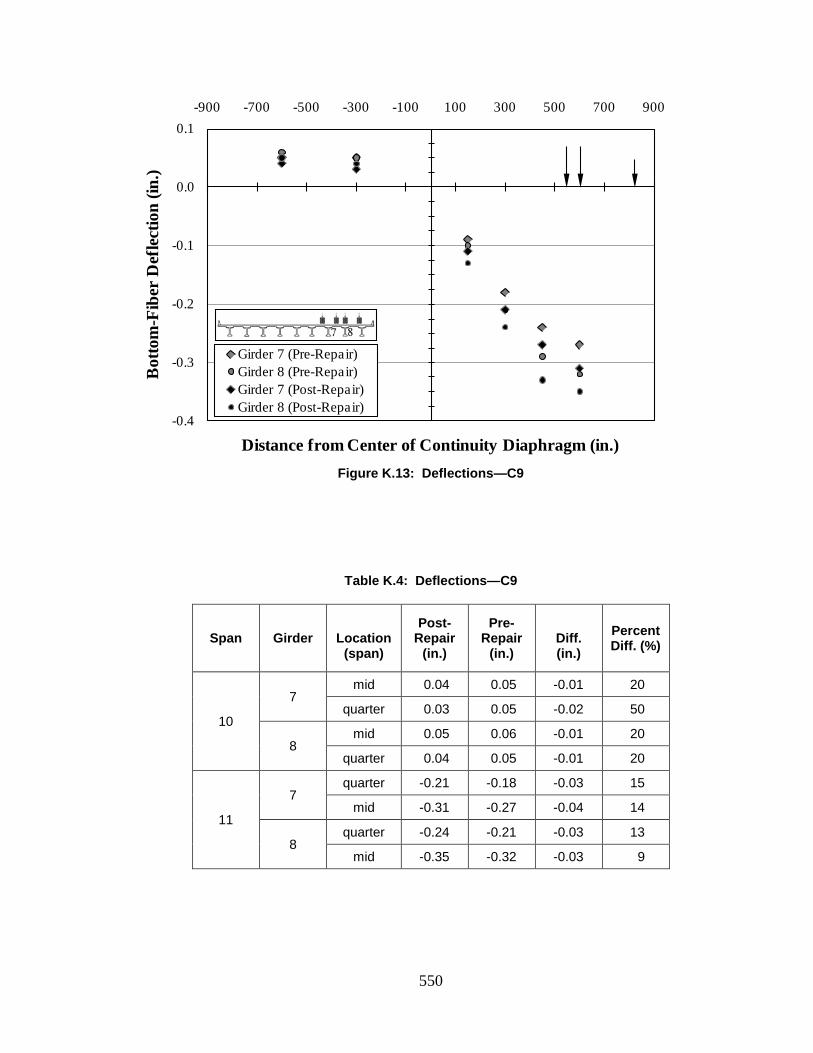
550
Figure K.13: Deflections—C9
Table K.4: Deflections—C9
Span Girder
Location (span)
Post- Repair
(in.)
Pre- Repair
(in.)
Diff. (in.)
Percent Diff. (%)
10
7 mid 0.04 0.05 -0.01 20
quarter 0.03 0.05 -0.02 50
8 mid 0.05 0.06 -0.01 20
quarter 0.04 0.05 -0.01 20
11
7 quarter -0.21 -0.18 -0.03 15
mid -0.31 -0.27 -0.04 14
8 quarter -0.24 -0.21 -0.03 13
mid -0.35 -0.32 -0.03 9
-0.4
-0.3
-0.2
-0.1
0.0
0.1-900 -700 -500 -300 -100 100 300 500 700 900
Bot
tom
-Fib
er D
efle
ctio
n (in
.)
Distance from Center of Continuity Diaphragm (in.)
Girder 7 (Pre-Repair)Girder 8 (Pre-Repair)Girder 7 (Post-Repair)Girder 8 (Post-Repair)
551
During the post-repair load tests, the measured downward deflections of the loaded span
were increased while the upward deflections of the unloaded span were decreased when
compared to pre-repair measurements. This behavior could be attributed to the false support of
the loaded span acting as an active load-bearing support during the pre-repair test but not during
the post-repair test. If the false supports were acting as load-bearing supports, the loaded span
would have a shorter effective span length. The post-repair downward deflections of the loaded
span could have been larger due to an increased effective span length causing a decrease in
apparent stiffness when compared to the pre-repair test conditions.
The post-repair upward deflections of the non-loaded span could have been smaller due
to the bent becoming the only active support during post-repair testing. If the false support acted
as an active support during pre-repair testing, that support could have shifted the inflection point
further from the main support, which could result in greater upward deflections being measured in
the non-loaded span, when compared to the post-repair conditions that had just one true support
condition at the bent.
K.5.2 Crack-Opening Displacements—Multiposition Load Testing
Truck positions that resulted in crack openings during pre- and post-repair multiposition load
testing were analyzed to assess bearing pad effects on pre-repair damaged region behavior.
Truck position locations are described in Section 4.4 of this report. During both pre- and post-
repair testing, Stop Position 4 had the greatest effect on the Span 10 crack openings, and Stop
Position 7 had the greatest effect on the Span 11 crack openings. The pre- and post-repair
crack-opening displacements measured for Stop Positions A4, A7, C4, and C7 are presented in
Figures K.14–K.17 and Table K.5. The arrows in the figures represent the position of the wheel
loads on the bridge.
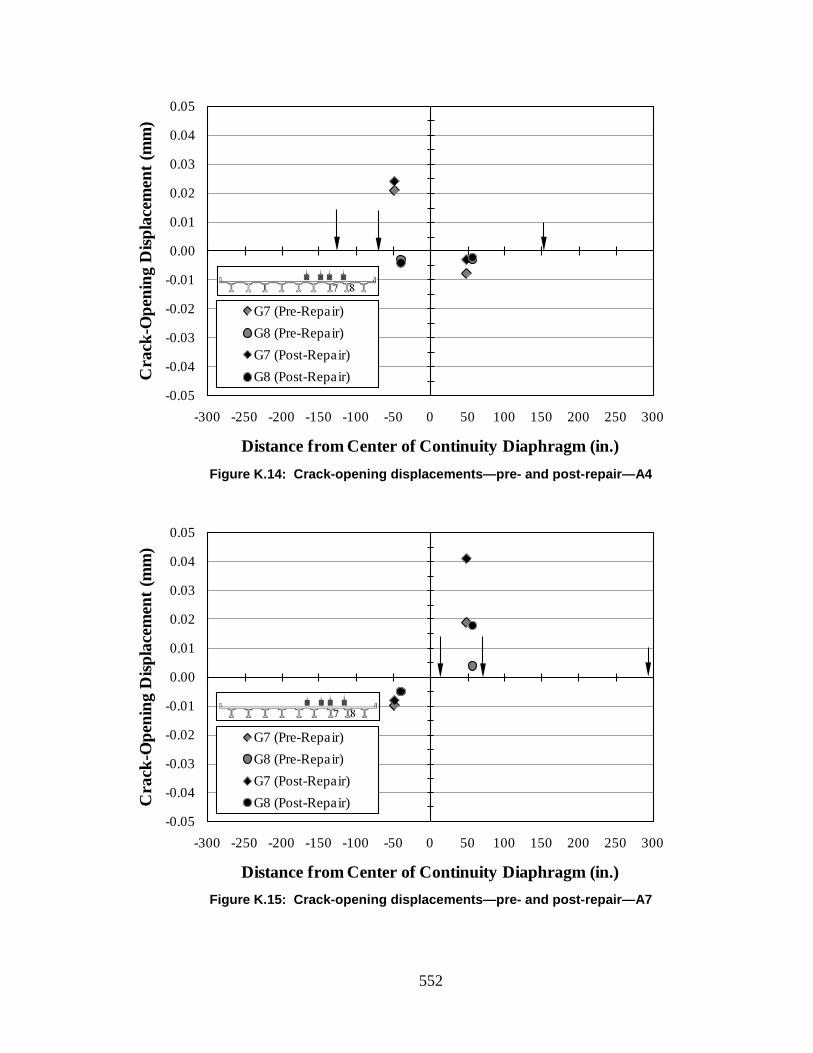
552
Figure K.14: Crack-opening displacements—pre- and post-repair—A4
Figure K.15: Crack-opening displacements—pre- and post-repair—A7
-0.05
-0.04
-0.03
-0.02
-0.01
0.00
0.01
0.02
0.03
0.04
0.05
-300 -250 -200 -150 -100 -50 0 50 100 150 200 250 300
Cra
ck-O
peni
ng D
ispla
cem
ent (
mm
)
Distance from Center of Continuity Diaphragm (in.)
G7 (Pre-Repair)G8 (Pre-Repair)G7 (Post-Repair)G8 (Post-Repair)
-0.05
-0.04
-0.03
-0.02
-0.01
0.00
0.01
0.02
0.03
0.04
0.05
-300 -250 -200 -150 -100 -50 0 50 100 150 200 250 300
Cra
ck-O
peni
ng D
ispla
cem
ent (
mm
)
Distance from Center of Continuity Diaphragm (in.)
G7 (Pre-Repair)G8 (Pre-Repair)G7 (Post-Repair)G8 (Post-Repair)
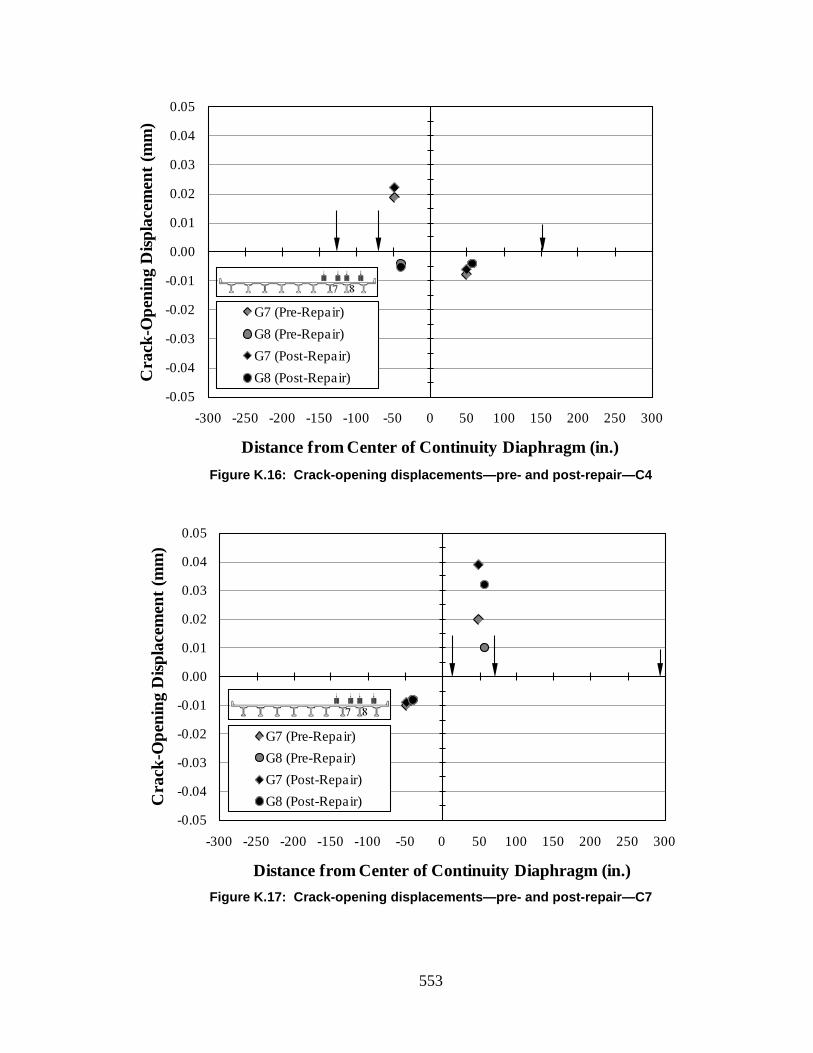
553
Figure K.16: Crack-opening displacements—pre- and post-repair—C4
Figure K.17: Crack-opening displacements—pre- and post-repair—C7
-0.05
-0.04
-0.03
-0.02
-0.01
0.00
0.01
0.02
0.03
0.04
0.05
-300 -250 -200 -150 -100 -50 0 50 100 150 200 250 300
Cra
ck-O
peni
ng D
ispla
cem
ent (
mm
)
Distance from Center of Continuity Diaphragm (in.)
G7 (Pre-Repair)G8 (Pre-Repair)G7 (Post-Repair)G8 (Post-Repair)
-0.05
-0.04
-0.03
-0.02
-0.01
0.00
0.01
0.02
0.03
0.04
0.05
-300 -250 -200 -150 -100 -50 0 50 100 150 200 250 300
Cra
ck-O
peni
ng D
ispla
cem
ent (
mm
)
Distance from Center of Continuity Diaphragm (in.)
G7 (Pre-Repair)G8 (Pre-Repair)G7 (Post-Repair)G8 (Post-Repair)
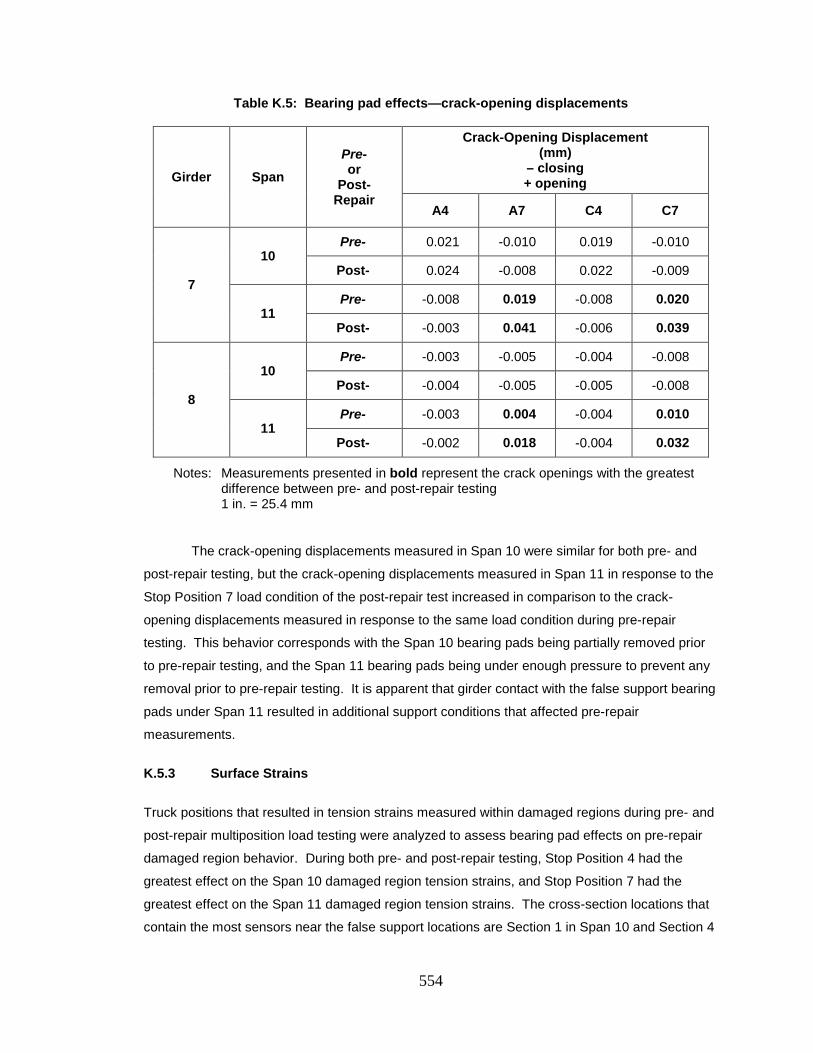
554
Table K.5: Bearing pad effects—crack-opening displacements
Girder Span Pre- or
Post- Repair
Crack-Opening Displacement (mm)
– closing + opening
A4 A7 C4 C7
7
10 Pre- 0.021 -0.010 0.019 -0.010
Post- 0.024 -0.008 0.022 -0.009
11 Pre- -0.008 0.019 -0.008 0.020
Post- -0.003 0.041 -0.006 0.039
8
10 Pre- -0.003 -0.005 -0.004 -0.008
Post- -0.004 -0.005 -0.005 -0.008
11 Pre- -0.003 0.004 -0.004 0.010
Post- -0.002 0.018 -0.004 0.032
Notes: Measurements presented in bold represent the crack openings with the greatest difference between pre- and post-repair testing
1 in. = 25.4 mm
The crack-opening displacements measured in Span 10 were similar for both pre- and
post-repair testing, but the crack-opening displacements measured in Span 11 in response to the
Stop Position 7 load condition of the post-repair test increased in comparison to the crack-
opening displacements measured in response to the same load condition during pre-repair
testing. This behavior corresponds with the Span 10 bearing pads being partially removed prior
to pre-repair testing, and the Span 11 bearing pads being under enough pressure to prevent any
removal prior to pre-repair testing. It is apparent that girder contact with the false support bearing
pads under Span 11 resulted in additional support conditions that affected pre-repair
measurements.
K.5.3 Surface Strains
Truck positions that resulted in tension strains measured within damaged regions during pre- and
post-repair multiposition load testing were analyzed to assess bearing pad effects on pre-repair
damaged region behavior. During both pre- and post-repair testing, Stop Position 4 had the
greatest effect on the Span 10 damaged region tension strains, and Stop Position 7 had the
greatest effect on the Span 11 damaged region tension strains. The cross-section locations that
contain the most sensors near the false support locations are Section 1 in Span 10 and Section 4
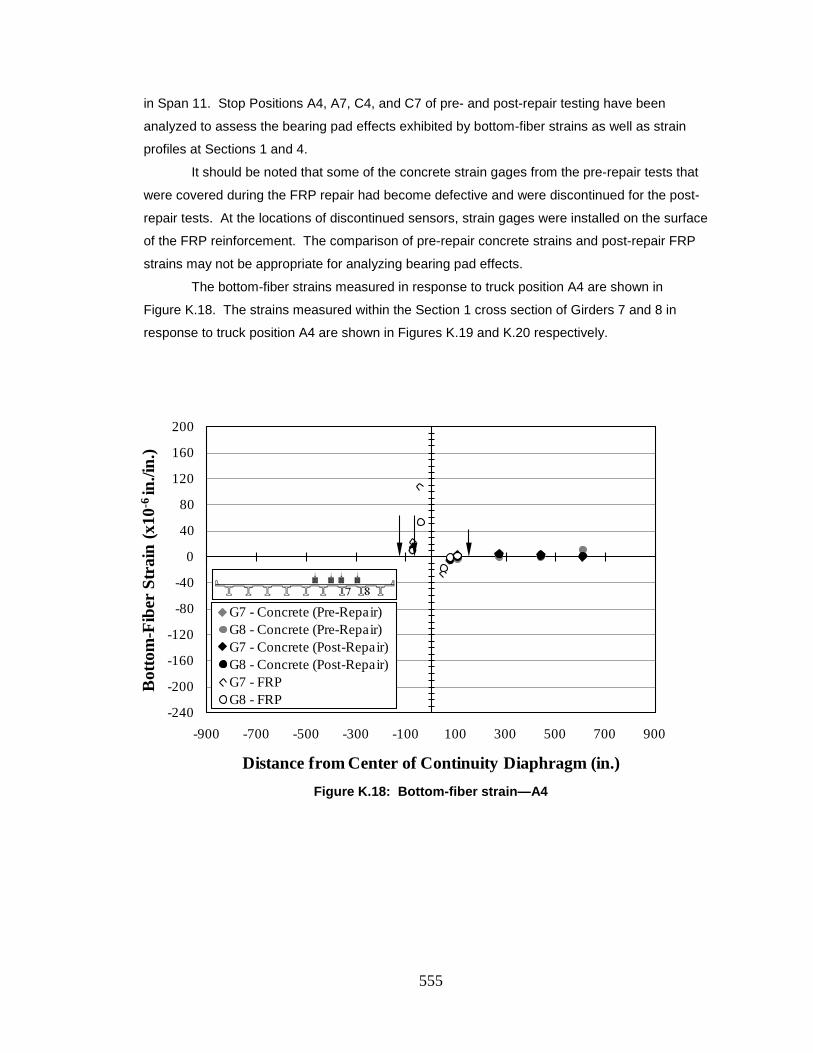
555
in Span 11. Stop Positions A4, A7, C4, and C7 of pre- and post-repair testing have been
analyzed to assess the bearing pad effects exhibited by bottom-fiber strains as well as strain
profiles at Sections 1 and 4.
It should be noted that some of the concrete strain gages from the pre-repair tests that
were covered during the FRP repair had become defective and were discontinued for the post-
repair tests. At the locations of discontinued sensors, strain gages were installed on the surface
of the FRP reinforcement. The comparison of pre-repair concrete strains and post-repair FRP
strains may not be appropriate for analyzing bearing pad effects.
The bottom-fiber strains measured in response to truck position A4 are shown in
Figure K.18. The strains measured within the Section 1 cross section of Girders 7 and 8 in
response to truck position A4 are shown in Figures K.19 and K.20 respectively.
Figure K.18: Bottom-fiber strain—A4
-240
-200
-160
-120
-80
-40
0
40
80
120
160
200
-900 -700 -500 -300 -100 100 300 500 700 900
Bot
tom
-Fib
er S
trai
n (x
10-6
in./i
n.)
Distance from Center of Continuity Diaphragm (in.)
G7 - Concrete (Pre-Repair)G8 - Concrete (Pre-Repair)G7 - Concrete (Post-Repair)G8 - Concrete (Post-Repair)G7 - FRPG8 - FRP
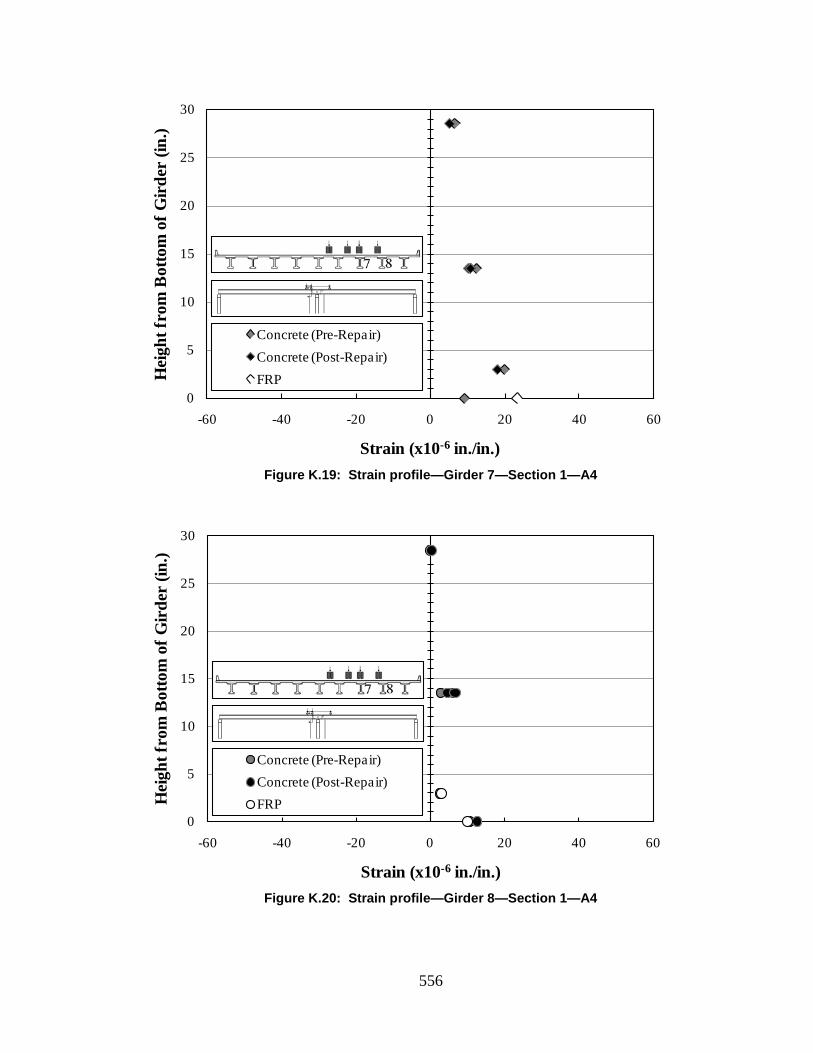
556
Figure K.19: Strain profile—Girder 7—Section 1—A4
Figure K.20: Strain profile—Girder 8—Section 1—A4
0
5
10
15
20
25
30
-60 -40 -20 0 20 40 60
Hei
ght f
rom
Bot
tom
of G
irde
r (in
.)
Strain (x10-6 in./in.)
Concrete (Pre-Repair)Concrete (Post-Repair)FRP
0
5
10
15
20
25
30
-60 -40 -20 0 20 40 60
Hei
ght f
rom
Bot
tom
of G
irde
r (in
.)
Strain (x10-6 in./in.)
Concrete (Pre-Repair)Concrete (Post-Repair)FRP
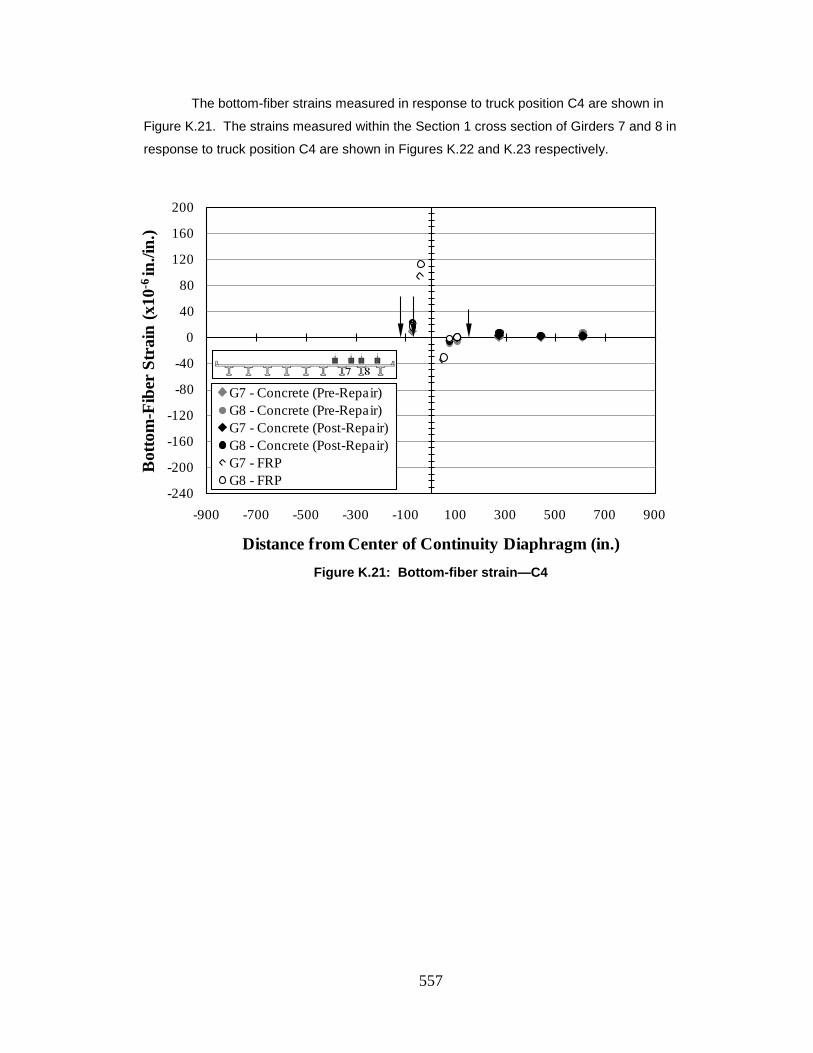
557
The bottom-fiber strains measured in response to truck position C4 are shown in
Figure K.21. The strains measured within the Section 1 cross section of Girders 7 and 8 in
response to truck position C4 are shown in Figures K.22 and K.23 respectively.
Figure K.21: Bottom-fiber strain—C4
-240
-200
-160
-120
-80
-40
0
40
80
120
160
200
-900 -700 -500 -300 -100 100 300 500 700 900
Bot
tom
-Fib
er S
trai
n (x
10-6
in./i
n.)
Distance from Center of Continuity Diaphragm (in.)
G7 - Concrete (Pre-Repair)G8 - Concrete (Pre-Repair)G7 - Concrete (Post-Repair)G8 - Concrete (Post-Repair)G7 - FRPG8 - FRP
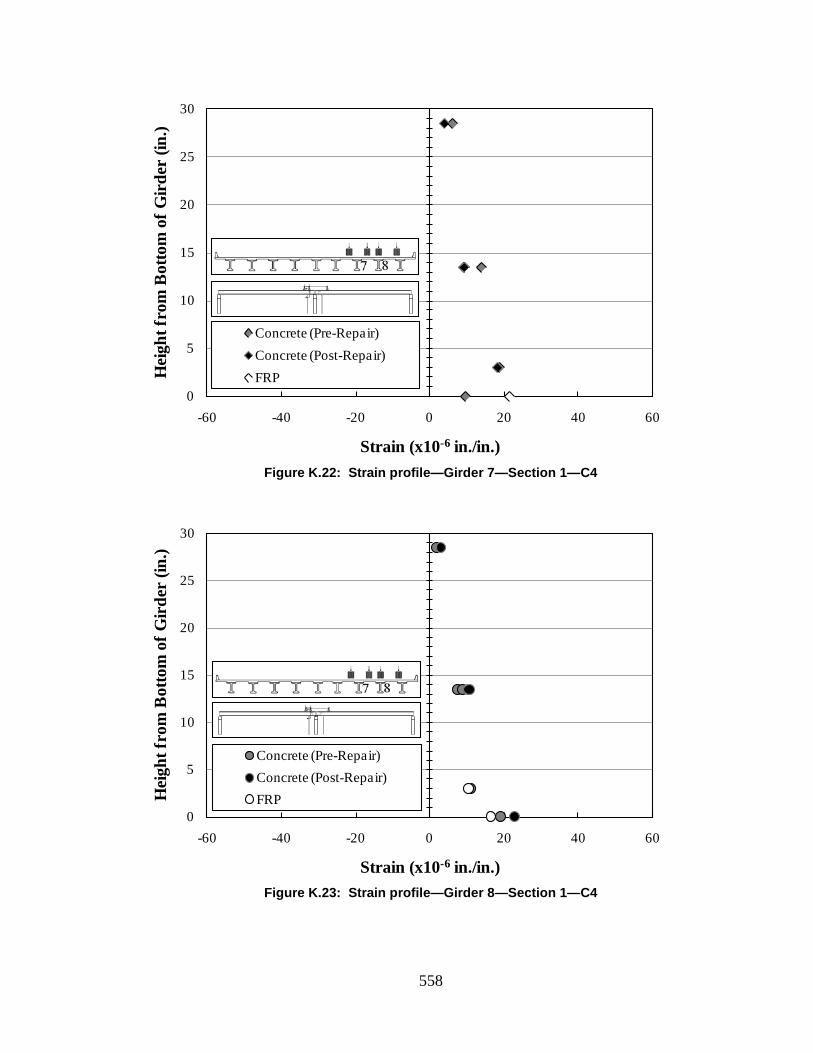
558
Figure K.22: Strain profile—Girder 7—Section 1—C4
Figure K.23: Strain profile—Girder 8—Section 1—C4
0
5
10
15
20
25
30
-60 -40 -20 0 20 40 60
Hei
ght f
rom
Bot
tom
of G
irde
r (in
.)
Strain (x10-6 in./in.)
Concrete (Pre-Repair)Concrete (Post-Repair)FRP
0
5
10
15
20
25
30
-60 -40 -20 0 20 40 60
Hei
ght f
rom
Bot
tom
of G
irde
r (in
.)
Strain (x10-6 in./in.)
Concrete (Pre-Repair)Concrete (Post-Repair)FRP
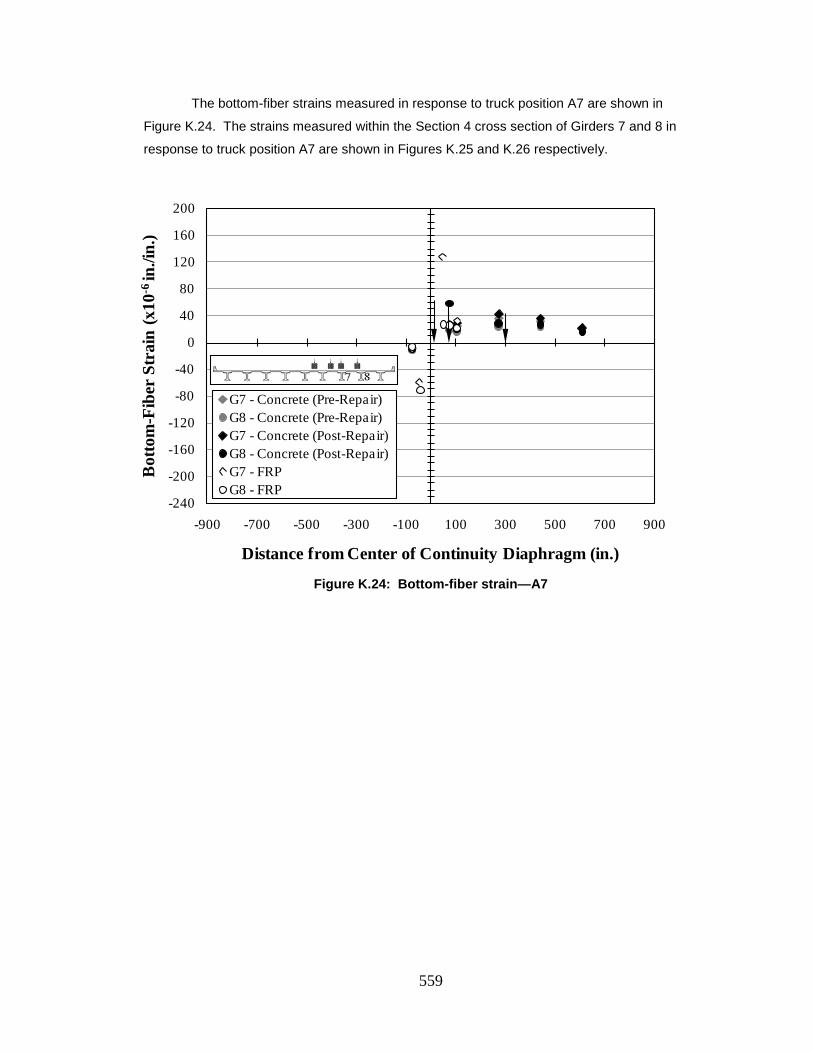
559
The bottom-fiber strains measured in response to truck position A7 are shown in
Figure K.24. The strains measured within the Section 4 cross section of Girders 7 and 8 in
response to truck position A7 are shown in Figures K.25 and K.26 respectively.
Figure K.24: Bottom-fiber strain—A7
-240
-200
-160
-120
-80
-40
0
40
80
120
160
200
-900 -700 -500 -300 -100 100 300 500 700 900
Bot
tom
-Fib
er S
trai
n (x
10-6
in./i
n.)
Distance from Center of Continuity Diaphragm (in.)
G7 - Concrete (Pre-Repair)G8 - Concrete (Pre-Repair)G7 - Concrete (Post-Repair)G8 - Concrete (Post-Repair)G7 - FRPG8 - FRP
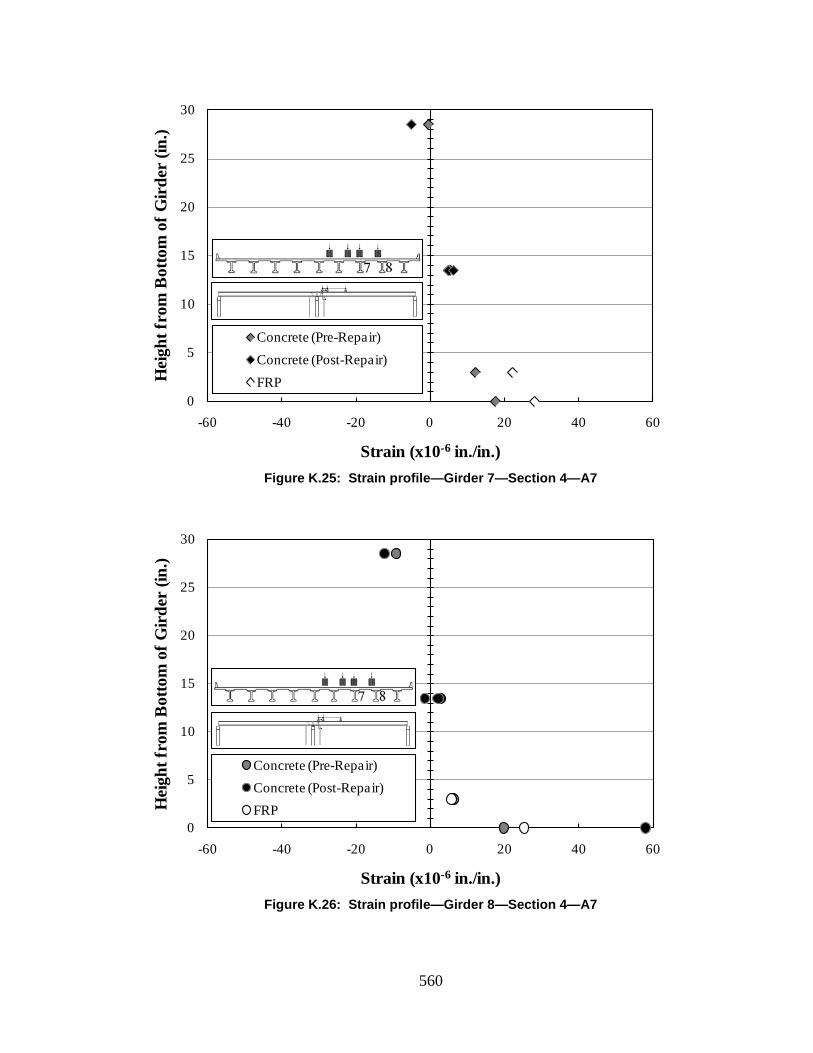
560
Figure K.25: Strain profile—Girder 7—Section 4—A7
Figure K.26: Strain profile—Girder 8—Section 4—A7
0
5
10
15
20
25
30
-60 -40 -20 0 20 40 60
Hei
ght f
rom
Bot
tom
of G
irde
r (in
.)
Strain (x10-6 in./in.)
Concrete (Pre-Repair)Concrete (Post-Repair)FRP
0
5
10
15
20
25
30
-60 -40 -20 0 20 40 60
Hei
ght f
rom
Bot
tom
of G
irde
r (in
.)
Strain (x10-6 in./in.)
Concrete (Pre-Repair)Concrete (Post-Repair)FRP
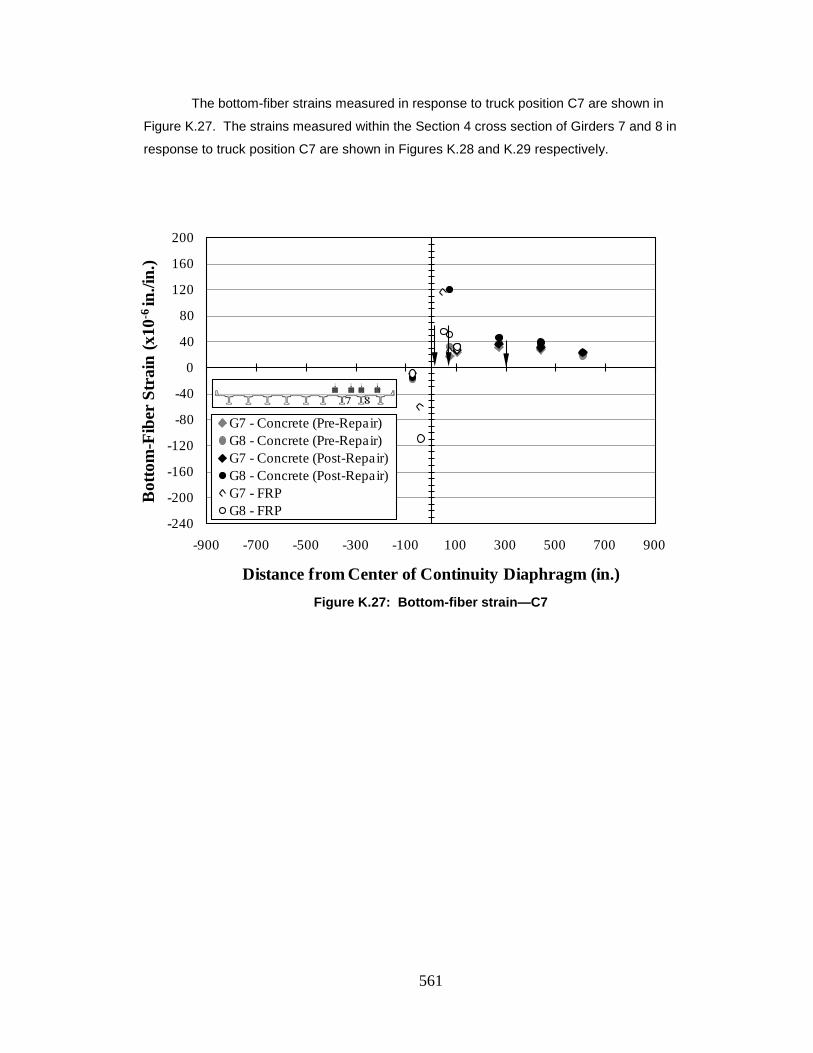
561
The bottom-fiber strains measured in response to truck position C7 are shown in
Figure K.27. The strains measured within the Section 4 cross section of Girders 7 and 8 in
response to truck position C7 are shown in Figures K.28 and K.29 respectively.
Figure K.27: Bottom-fiber strain—C7
-240
-200
-160
-120
-80
-40
0
40
80
120
160
200
-900 -700 -500 -300 -100 100 300 500 700 900
Bot
tom
-Fib
er S
trai
n (x
10-6
in./i
n.)
Distance from Center of Continuity Diaphragm (in.)
G7 - Concrete (Pre-Repair)G8 - Concrete (Pre-Repair)G7 - Concrete (Post-Repair)G8 - Concrete (Post-Repair)G7 - FRPG8 - FRP
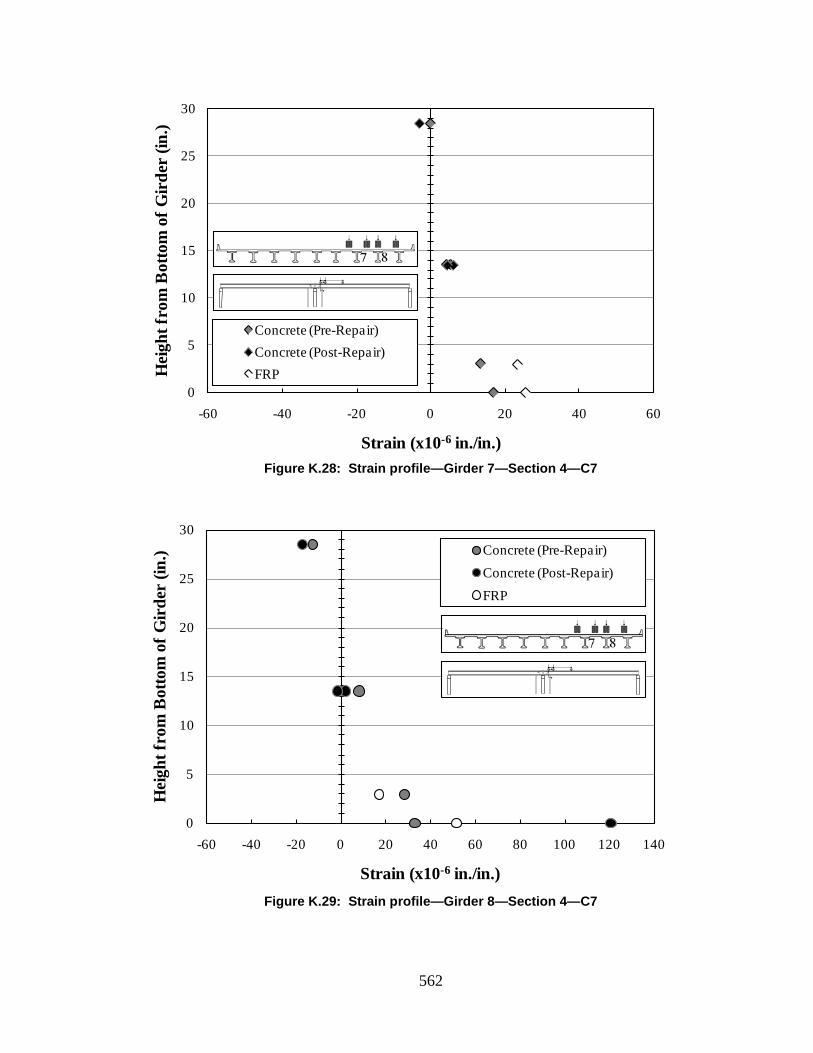
562
Figure K.28: Strain profile—Girder 7—Section 4—C7
Figure K.29: Strain profile—Girder 8—Section 4—C7
0
5
10
15
20
25
30
-60 -40 -20 0 20 40 60
Hei
ght f
rom
Bot
tom
of G
irde
r (in
.)
Strain (x10-6 in./in.)
Concrete (Pre-Repair)Concrete (Post-Repair)FRP
0
5
10
15
20
25
30
-60 -40 -20 0 20 40 60 80 100 120 140
Hei
ght f
rom
Bot
tom
of G
irde
r (in
.)
Strain (x10-6 in./in.)
Concrete (Pre-Repair)Concrete (Post-Repair)FRP
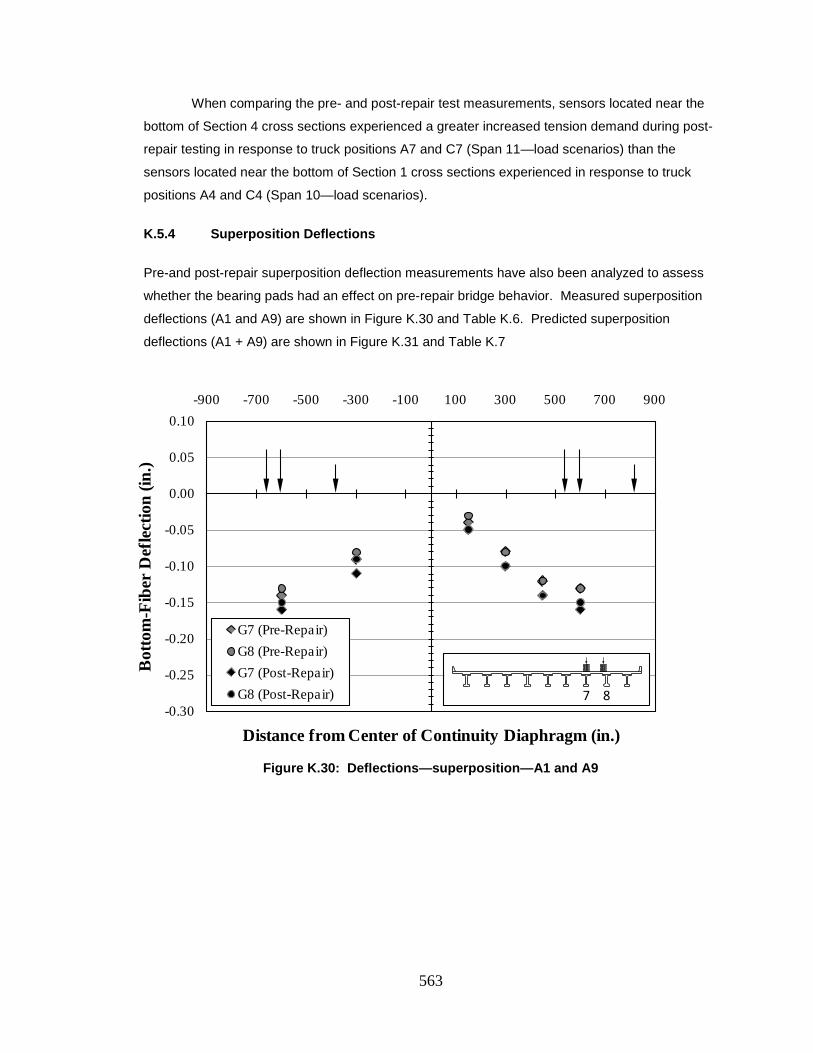
563
When comparing the pre- and post-repair test measurements, sensors located near the
bottom of Section 4 cross sections experienced a greater increased tension demand during post-
repair testing in response to truck positions A7 and C7 (Span 11—load scenarios) than the
sensors located near the bottom of Section 1 cross sections experienced in response to truck
positions A4 and C4 (Span 10—load scenarios).
K.5.4 Superposition Deflections
Pre-and post-repair superposition deflection measurements have also been analyzed to assess
whether the bearing pads had an effect on pre-repair bridge behavior. Measured superposition
deflections (A1 and A9) are shown in Figure K.30 and Table K.6. Predicted superposition
deflections (A1 + A9) are shown in Figure K.31 and Table K.7
Figure K.30: Deflections—superposition—A1 and A9
-0.30
-0.25
-0.20
-0.15
-0.10
-0.05
0.00
0.05
0.10-900 -700 -500 -300 -100 100 300 500 700 900
Bot
tom
-Fib
er D
efle
ctio
n (in
.)
Distance from Center of Continuity Diaphragm (in.)
G7 (Pre-Repair)G8 (Pre-Repair)G7 (Post-Repair)G8 (Post-Repair)
7 8
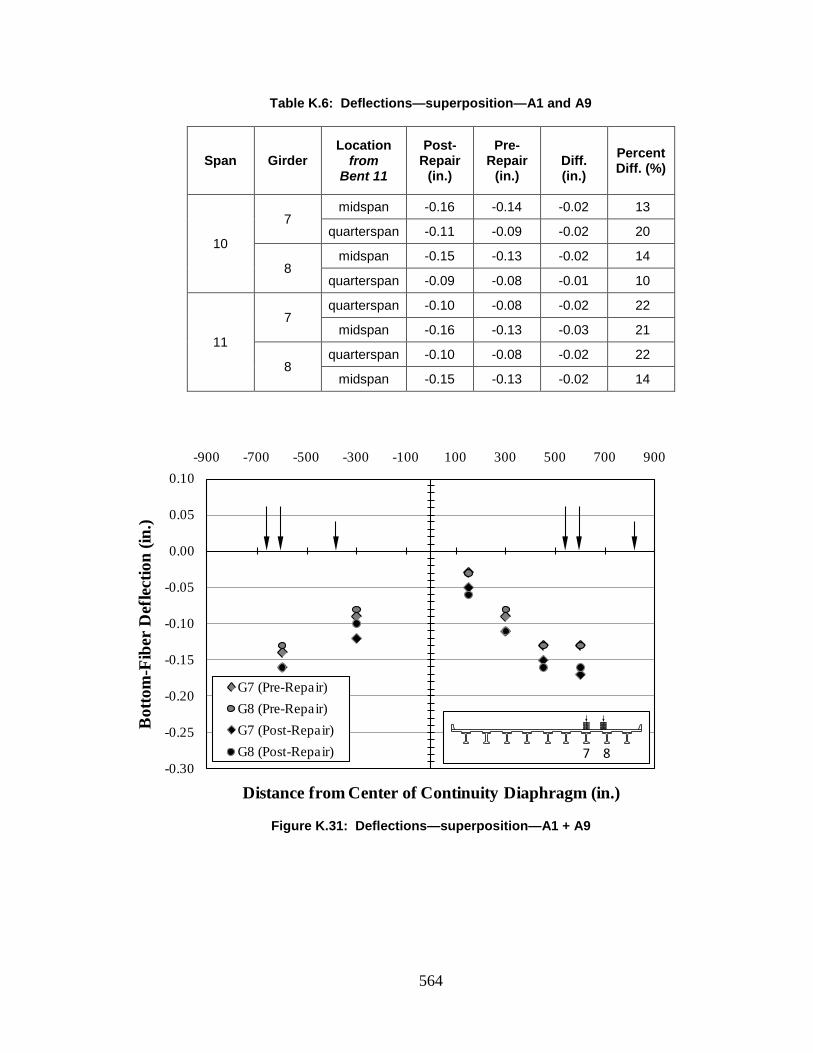
564
Table K.6: Deflections—superposition—A1 and A9
Span Girder Location
from Bent 11
Post- Repair
(in.)
Pre- Repair
(in.)
Diff. (in.)
Percent Diff. (%)
10
7 midspan -0.16 -0.14 -0.02 13
quarterspan -0.11 -0.09 -0.02 20
8 midspan -0.15 -0.13 -0.02 14
quarterspan -0.09 -0.08 -0.01 10
11
7 quarterspan -0.10 -0.08 -0.02 22
midspan -0.16 -0.13 -0.03 21
8 quarterspan -0.10 -0.08 -0.02 22
midspan -0.15 -0.13 -0.02 14
Figure K.31: Deflections—superposition—A1 + A9
-0.30
-0.25
-0.20
-0.15
-0.10
-0.05
0.00
0.05
0.10-900 -700 -500 -300 -100 100 300 500 700 900
Bot
tom
-Fib
er D
efle
ctio
n (in
.)
Distance from Center of Continuity Diaphragm (in.)
G7 (Pre-Repair)G8 (Pre-Repair)G7 (Post-Repair)G8 (Post-Repair)
7 8
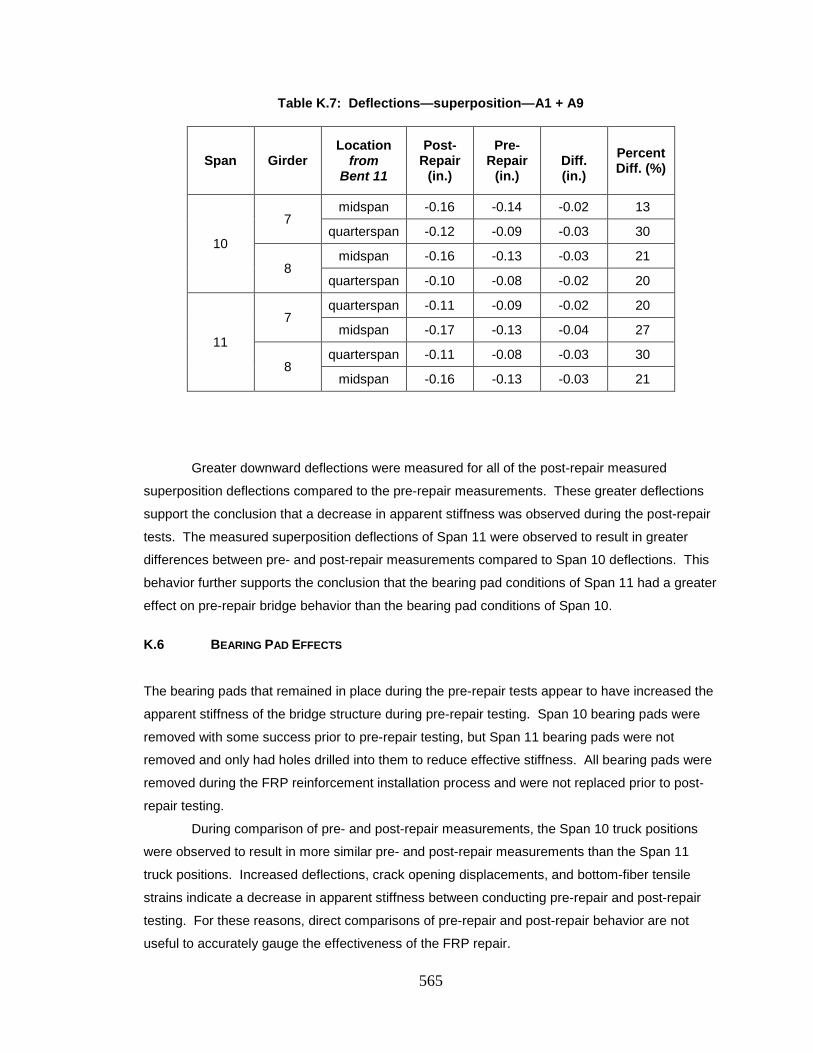
565
Table K.7: Deflections—superposition—A1 + A9
Span Girder Location
from Bent 11
Post- Repair
(in.)
Pre- Repair
(in.)
Diff. (in.)
Percent Diff. (%)
10
7 midspan -0.16 -0.14 -0.02 13
quarterspan -0.12 -0.09 -0.03 30
8 midspan -0.16 -0.13 -0.03 21
quarterspan -0.10 -0.08 -0.02 20
11
7 quarterspan -0.11 -0.09 -0.02 20
midspan -0.17 -0.13 -0.04 27
8 quarterspan -0.11 -0.08 -0.03 30
midspan -0.16 -0.13 -0.03 21
Greater downward deflections were measured for all of the post-repair measured
superposition deflections compared to the pre-repair measurements. These greater deflections
support the conclusion that a decrease in apparent stiffness was observed during the post-repair
tests. The measured superposition deflections of Span 11 were observed to result in greater
differences between pre- and post-repair measurements compared to Span 10 deflections. This
behavior further supports the conclusion that the bearing pad conditions of Span 11 had a greater
effect on pre-repair bridge behavior than the bearing pad conditions of Span 10.
K.6 BEARING PAD EFFECTS
The bearing pads that remained in place during the pre-repair tests appear to have increased the
apparent stiffness of the bridge structure during pre-repair testing. Span 10 bearing pads were
removed with some success prior to pre-repair testing, but Span 11 bearing pads were not
removed and only had holes drilled into them to reduce effective stiffness. All bearing pads were
removed during the FRP reinforcement installation process and were not replaced prior to post-
repair testing.
During comparison of pre- and post-repair measurements, the Span 10 truck positions
were observed to result in more similar pre- and post-repair measurements than the Span 11
truck positions. Increased deflections, crack opening displacements, and bottom-fiber tensile
strains indicate a decrease in apparent stiffness between conducting pre-repair and post-repair
testing. For these reasons, direct comparisons of pre-repair and post-repair behavior are not
useful to accurately gauge the effectiveness of the FRP repair.

566
Appendix L
DATA ACQUISITION CHANNEL LAYOUT
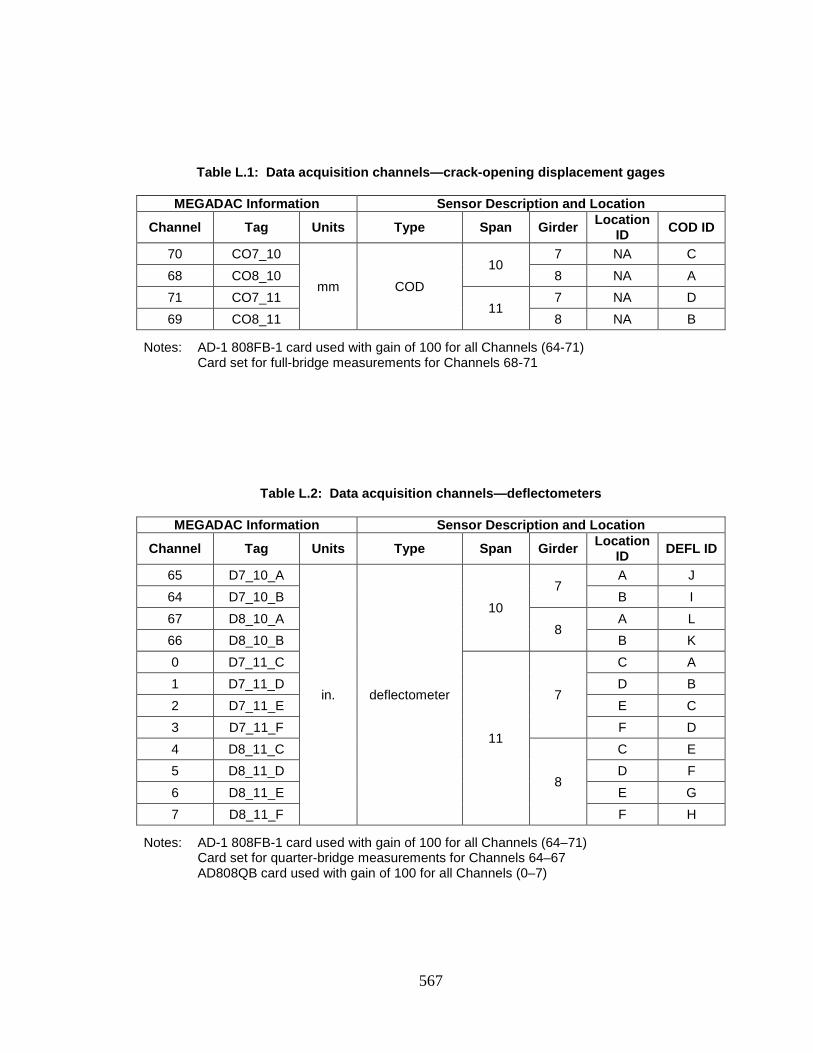
567
Table L.1: Data acquisition channels—crack-opening displacement gages
MEGADAC Information Sensor Description and Location
Channel Tag Units Type Span Girder Location ID COD ID
70 CO7_10
mm COD 10
7 NA C 68 CO8_10 8 NA A 71 CO7_11
11 7 NA D
69 CO8_11 8 NA B
Notes: AD-1 808FB-1 card used with gain of 100 for all Channels (64-71) Card set for full-bridge measurements for Channels 68-71
Table L.2: Data acquisition channels—deflectometers
MEGADAC Information Sensor Description and Location
Channel Tag Units Type Span Girder Location ID DEFL ID
65 D7_10_A
in. deflectometer
10 7
A J 64 D7_10_B B I 67 D8_10_A
8 A L
66 D8_10_B B K 0 D7_11_C
11
7
C A 1 D7_11_D D B 2 D7_11_E E C 3 D7_11_F F D 4 D8_11_C
8
C E 5 D8_11_D D F 6 D8_11_E E G 7 D8_11_F F H
Notes: AD-1 808FB-1 card used with gain of 100 for all Channels (64–71) Card set for quarter-bridge measurements for Channels 64–67 AD808QB card used with gain of 100 for all Channels (0–7)
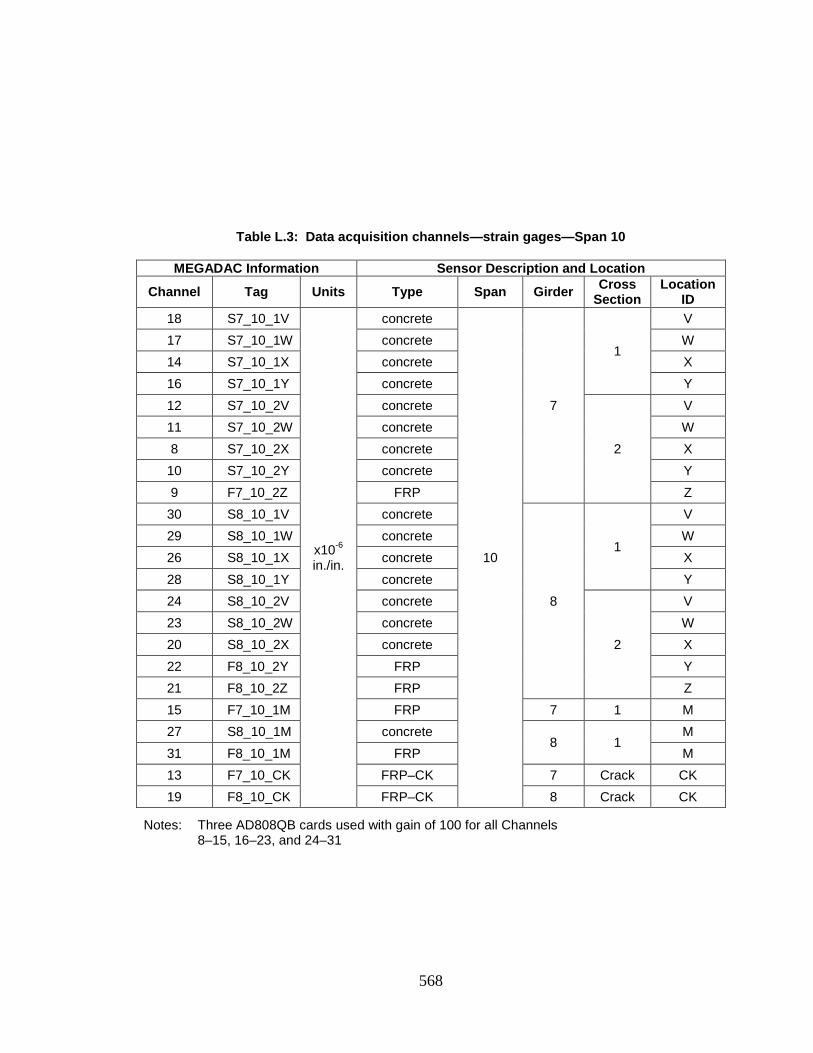
568
Table L.3: Data acquisition channels—strain gages—Span 10
MEGADAC Information Sensor Description and Location
Channel Tag Units Type Span Girder Cross Section
Location ID
18 S7_10_1V
x10-6
in./in.
concrete
10
7
1
V 17 S7_10_1W concrete W 14 S7_10_1X concrete X 16 S7_10_1Y concrete Y 12 S7_10_2V concrete
2
V 11 S7_10_2W concrete W 8 S7_10_2X concrete X
10 S7_10_2Y concrete Y 9 F7_10_2Z FRP Z
30 S8_10_1V concrete
8
1
V 29 S8_10_1W concrete W 26 S8_10_1X concrete X 28 S8_10_1Y concrete Y 24 S8_10_2V concrete
2
V 23 S8_10_2W concrete W 20 S8_10_2X concrete X 22 F8_10_2Y FRP Y 21 F8_10_2Z FRP Z 15 F7_10_1M FRP 7 1 M 27 S8_10_1M concrete
8 1 M
31 F8_10_1M FRP M 13 F7_10_CK FRP–CK 7 Crack CK 19 F8_10_CK FRP–CK 8 Crack CK
Notes: Three AD808QB cards used with gain of 100 for all Channels 8–15, 16–23, and 24–31
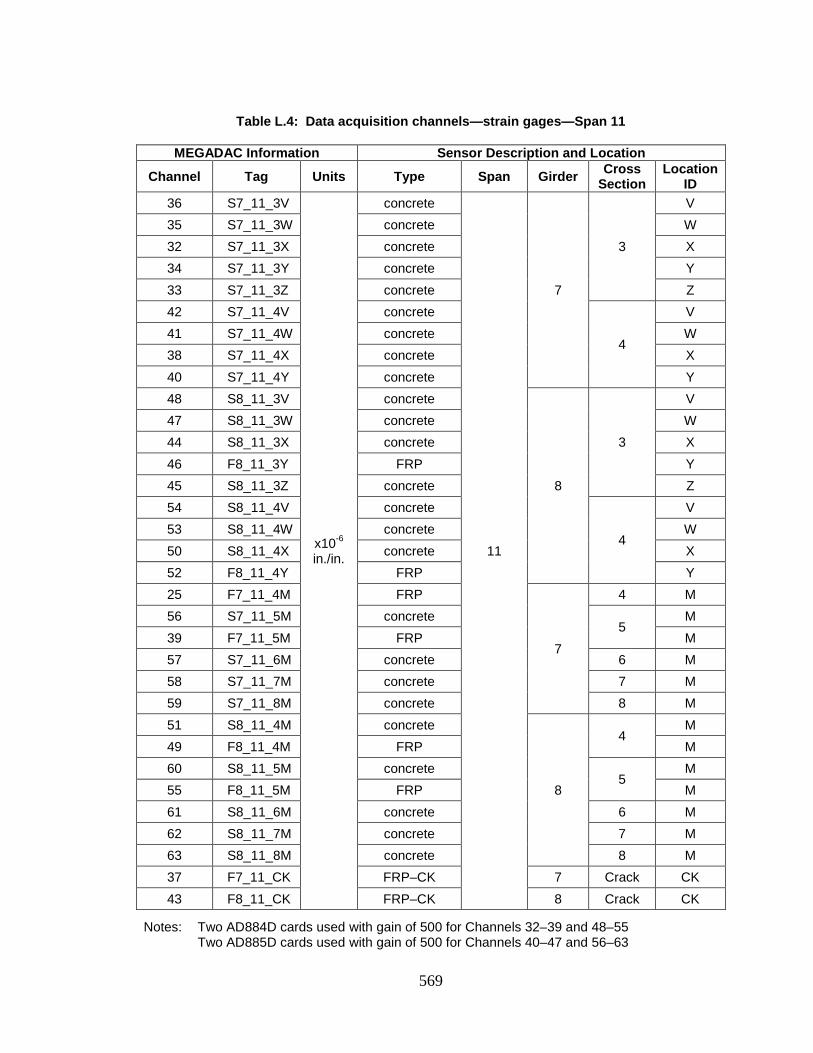
569
Table L.4: Data acquisition channels—strain gages—Span 11
MEGADAC Information Sensor Description and Location
Channel Tag Units Type Span Girder Cross Section
Location ID
36 S7_11_3V
x10-6
in./in.
concrete
11
7
3
V 35 S7_11_3W concrete W 32 S7_11_3X concrete X 34 S7_11_3Y concrete Y 33 S7_11_3Z concrete Z 42 S7_11_4V concrete
4
V 41 S7_11_4W concrete W 38 S7_11_4X concrete X 40 S7_11_4Y concrete Y 48 S8_11_3V concrete
8
3
V 47 S8_11_3W concrete W 44 S8_11_3X concrete X 46 F8_11_3Y FRP Y 45 S8_11_3Z concrete Z 54 S8_11_4V concrete
4
V 53 S8_11_4W concrete W 50 S8_11_4X concrete X 52 F8_11_4Y FRP Y 25 F7_11_4M FRP
7
4 M 56 S7_11_5M concrete
5 M
39 F7_11_5M FRP M 57 S7_11_6M concrete 6 M 58 S7_11_7M concrete 7 M 59 S7_11_8M concrete 8 M 51 S8_11_4M concrete
8
4 M
49 F8_11_4M FRP M 60 S8_11_5M concrete
5 M
55 F8_11_5M FRP M 61 S8_11_6M concrete 6 M 62 S8_11_7M concrete 7 M 63 S8_11_8M concrete 8 M 37 F7_11_CK FRP–CK 7 Crack CK 43 F8_11_CK FRP–CK 8 Crack CK
Notes: Two AD884D cards used with gain of 500 for Channels 32–39 and 48–55 Two AD885D cards used with gain of 500 for Channels 40–47 and 56–63

570
Appendix M
STRAIN GAGE INSTALLATION PROCEDURE—FRP REINFORCEMENT
571
Strain Gage Installation Procedure—FRP Reinforcement Composite Material Prepare FRP Surface
1. Mark area for gage. 2. Spray gaging area with degreaser. 3. Brush area with wire brush. 4. Smooth area with grinder if needed to remove irregularities, paint, or epoxy. 5. Continue to smooth with 220 grit sandpaper. 6. Blow loose dust from surface with compressed air. 7. Rinse area with isopropyl alcohol. 8. Sand lightly with 320 grit sandpaper. 9. Blow loose dust from surface with compressed air. 10. Rinse area with isopropyl alcohol. 11. Blot area with gauze sponges. 12. Rinse area thoroughly with clean water. 13. Blot area with gauze sponges. 14. Blow loose gauze from surface with compressed air. 15. Dry surface thoroughly (warming surface with heat gun may help).
Apply 100% solids epoxy 16. Place equal portions of PC-7 A and B on a flat surface using separate tools. 17. Mix PC-7 A and B together with putty knife. 18. Apply epoxy to gaging area, work into voids, and smooth with putty knife. 19. Allow epoxy to cure. 20. Sand surface initially with 220 grit sandpaper. 21. Blow loose particles from surface with compressed air. 22. Sand smooth with 320 grit sandpaper. 23. Blow loose particles from surface with compressed air. 24. Draw layout lines for gage location.
Apply Gage to Surface 1. Apply M-Prep A Conditioner with cotton. 2. Apply M-Prep 5A Neutralizer with cotton. 3. Dry surface thoroughly (warming surface with heat gun may help). 4. Carefully mount strain gage to glass plate with Cellophane Tape. 5. Remove the tape and gage from glass plate by lifting from gage side of tape 6. Tape gage at the desired location on FRP surface. 7. Peel tape and gage back to expose back of gage until clear of desired location by ½ in. 8. Apply 200 Catalyst-C to gage with a single stroke, allow to dry 1 minute 9. Apply M-Bond 200 just behind desired gage location 10. Apply gage to FRP surface, using thumb to spread M-Bond 200 the length of the gage. 11. Apply pressure for at least 1 minute 12. Wait at least 2 minutes to remove tape. 13. After at least 1 hour, apply M-Coat B Nitrile Rubber Coating and allow to dry. 14. Apply Mastic Tape. 15. Attach wire ends to mounted terminal strips.
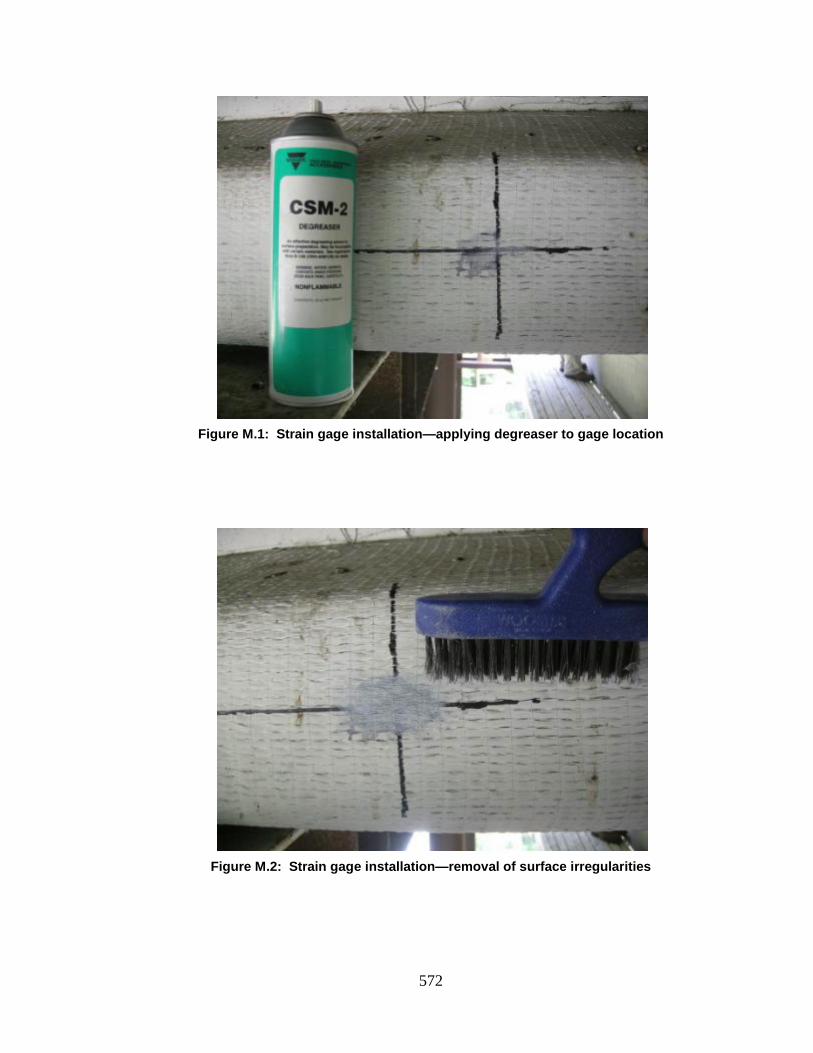
572
Figure M.1: Strain gage installation—applying degreaser to gage location
Figure M.2: Strain gage installation—removal of surface irregularities
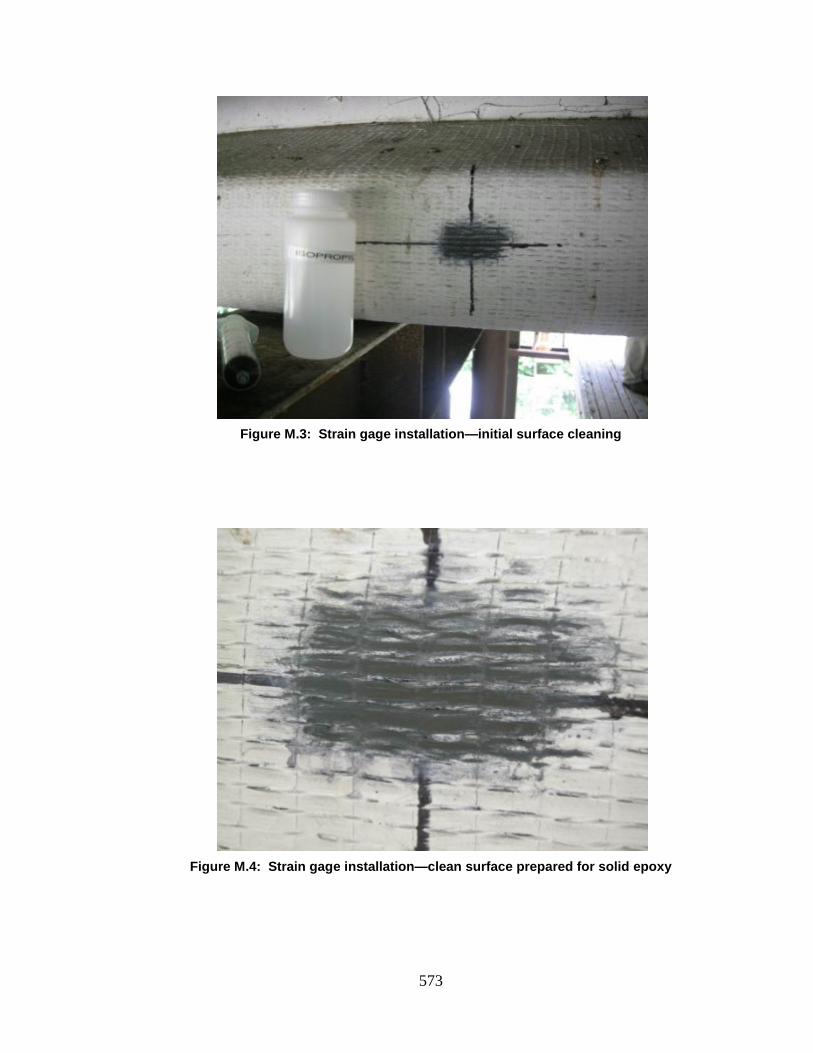
573
Figure M.3: Strain gage installation—initial surface cleaning
Figure M.4: Strain gage installation—clean surface prepared for solid epoxy
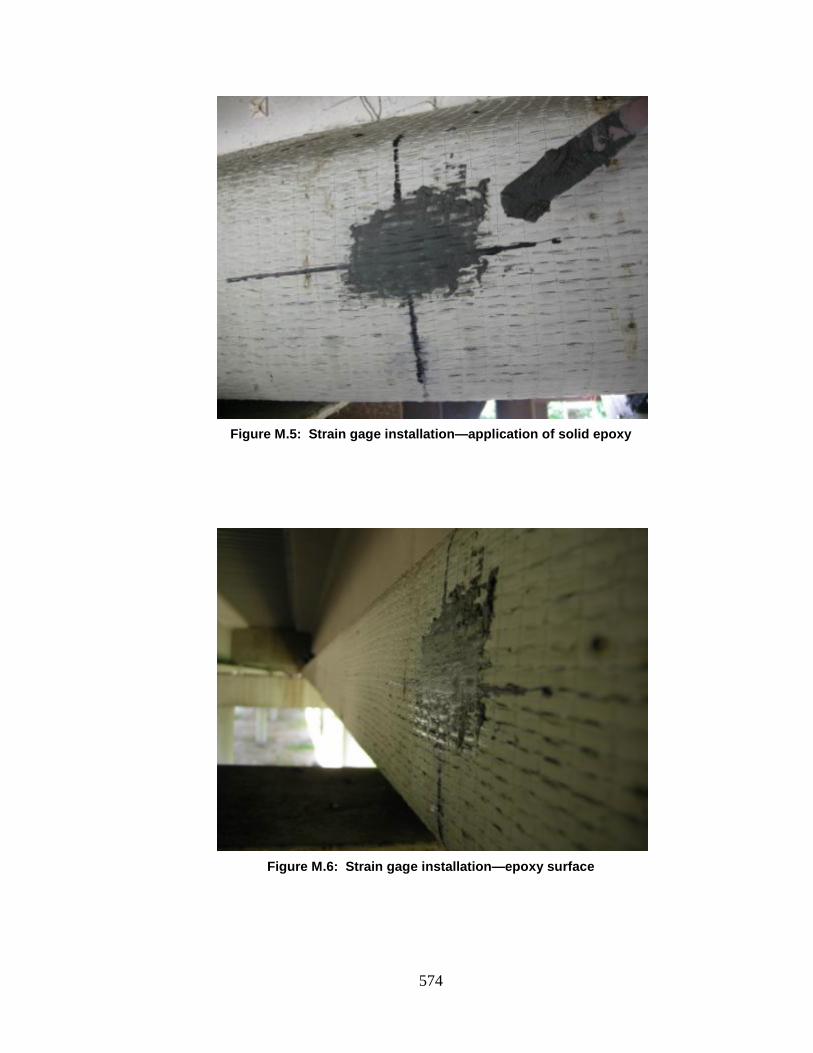
574
Figure M.5: Strain gage installation—application of solid epoxy
Figure M.6: Strain gage installation—epoxy surface
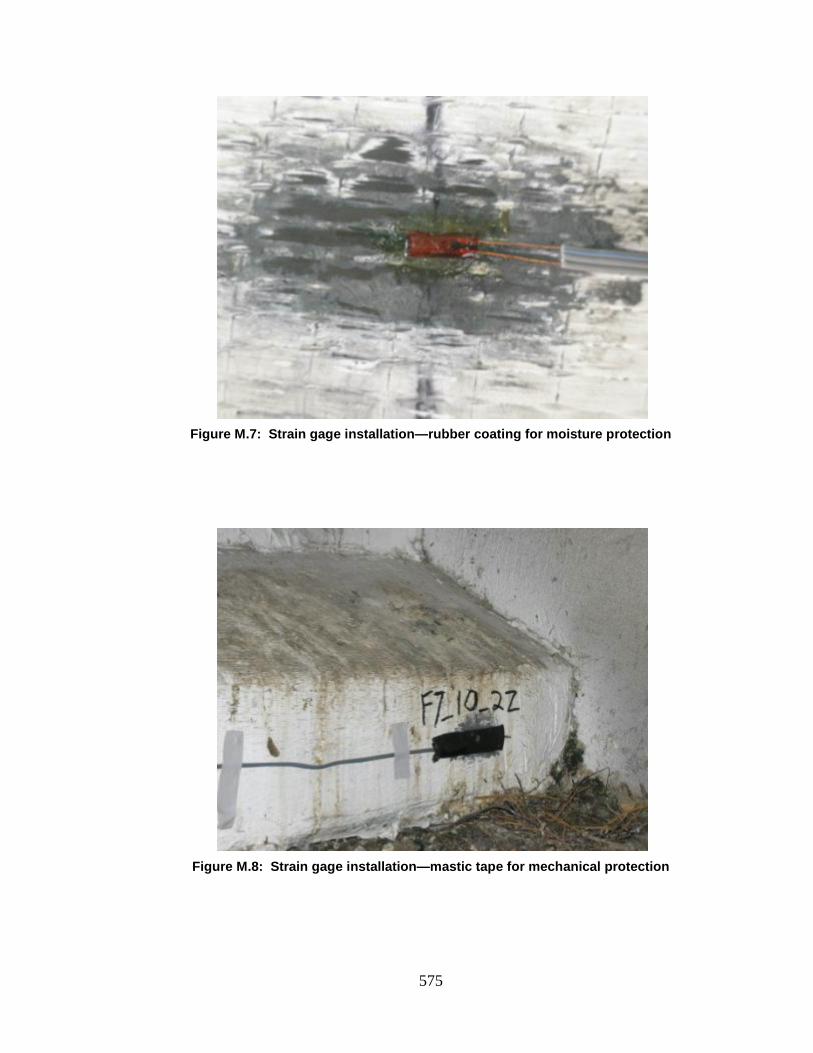
575
Figure M.7: Strain gage installation—rubber coating for moisture protection
Figure M.8: Strain gage installation—mastic tape for mechanical protection
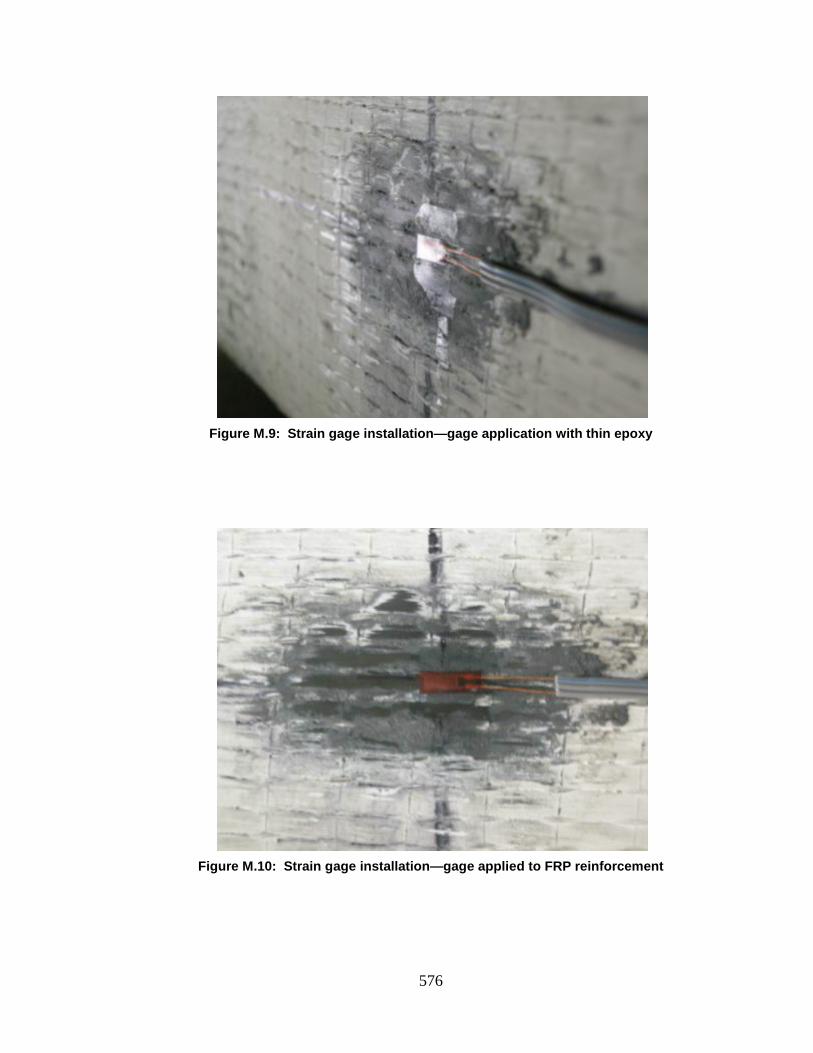
576
Figure M.9: Strain gage installation—gage application with thin epoxy
Figure M.10: Strain gage installation—gage applied to FRP reinforcement

577
Figure M.11: Strain gage installation—rubber coating for moisture protection
Figure M.12: Strain gage installation—mastic tape for mechanical protection

578
Appendix N
FRP REINFORCEMENT DESIGN EXAMPLE
N.1 INTRODUCTION
An FRP reinforcement design example is presented in this appendix based on the material and
dimensional properties of Northbound Spans 10 and 11 of I-565 and the FRP reinforcement
system proposed for girder repair.
N.2 PRODUCT SELECTION
The Auburn University Highway Research Center (AUHRC) selected the Tyfo SCH-41 FRP
laminate material (Fyfe 2010) as the reinforcement product for the proposed repair of Spans 10
and 11 on I-565 in Huntsville, Alabama. Material properties for this design are based on
properties documented by the manufacturer, but samples should be prepared by the contractor
responsible for the installation of the proposed reinforcement system for further testing to verify
documented product performance.
N.3 STRENGTH-LIMIT-STATE DESIGN
After selecting an FRP reinforcement material, a reinforcement system can be designed to satisfy
strength limit states with that material.
Strength-limit-state capacities and demands are determined in accordance with the
American Association of State Highway and Transportation Officials LRFD Bridge Design
Specification (AASHTO 2010), referred to as AASHTO LRFD within this report.
Limiting behavior expected of FRP reinforcement is determined in accordance with
provisions presented by the American Concrete Institute (ACI) Committee 440.2R-08 Guide for
the Design and Construction of Externally Bonded FRP Systems for Strengthening Concrete
Structures (ACI Committee 440 2008), referred to as ACI 440.2R-08 within this report.
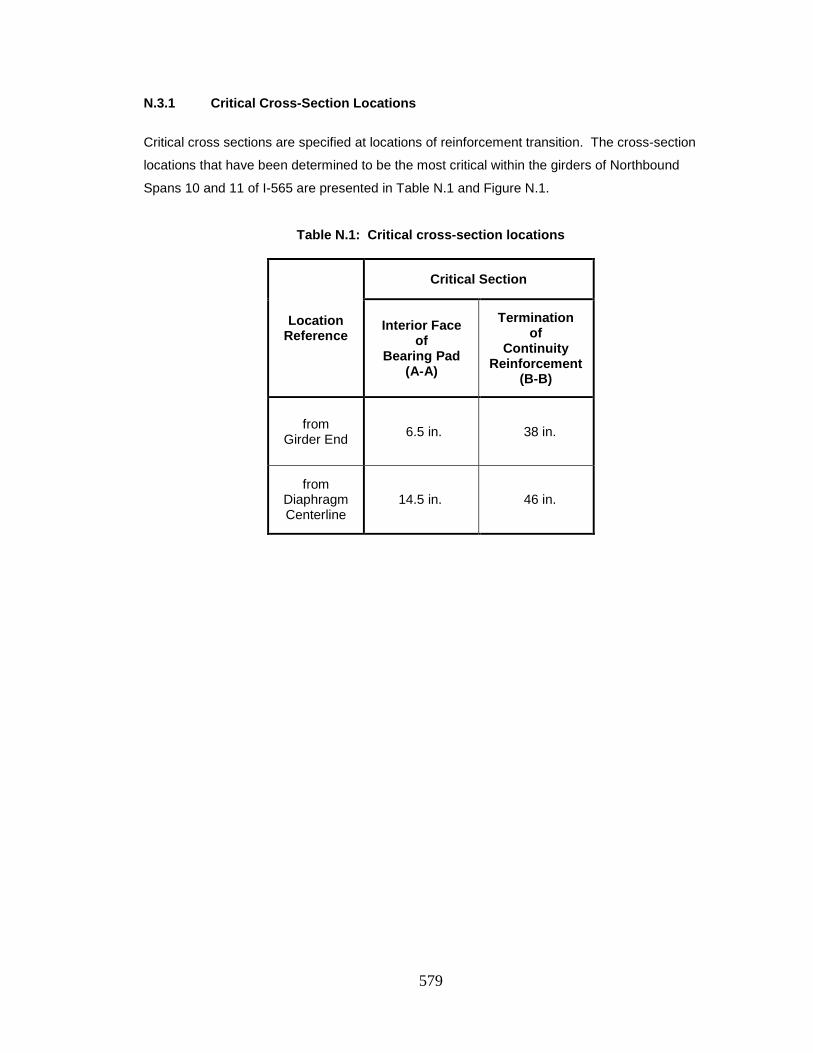
579
N.3.1 Critical Cross-Section Locations
Critical cross sections are specified at locations of reinforcement transition. The cross-section
locations that have been determined to be the most critical within the girders of Northbound
Spans 10 and 11 of I-565 are presented in Table N.1 and Figure N.1.
Table N.1: Critical cross-section locations
Location Reference
Critical Section
Interior Face of
Bearing Pad (A-A)
Termination of
Continuity Reinforcement
(B-B)
from Girder End 6.5 in. 38 in.
from Diaphragm Centerline
14.5 in. 46 in.
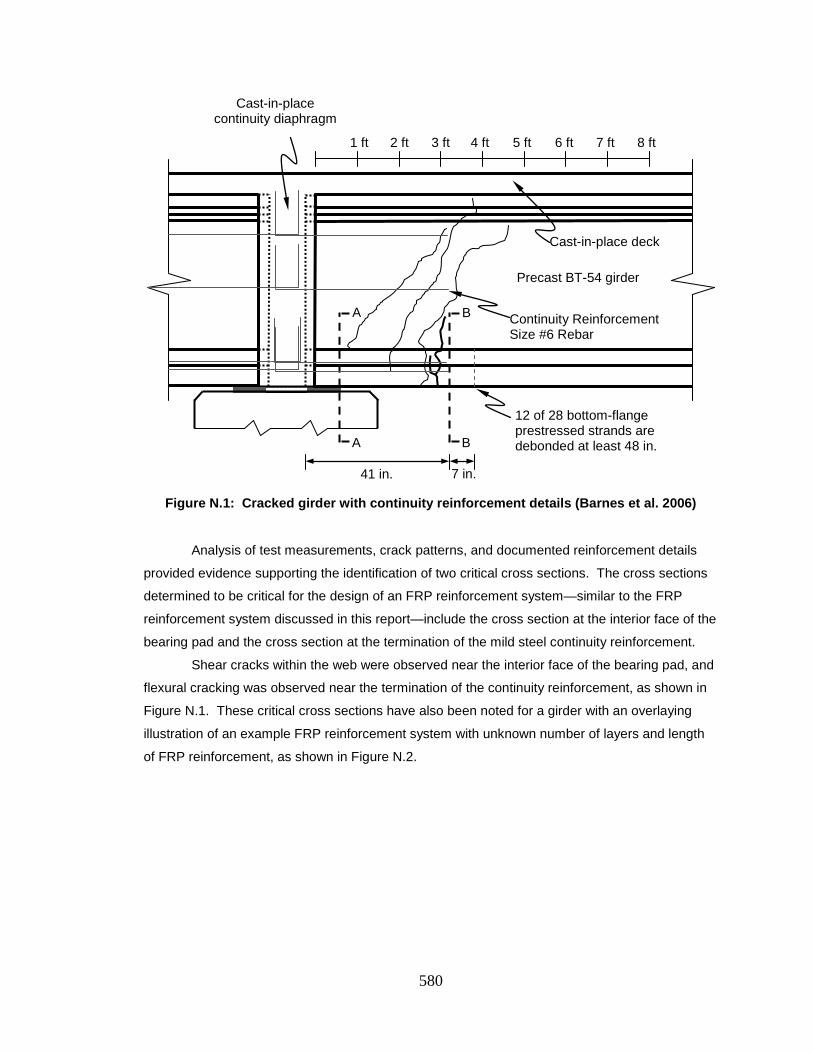
580
Figure N.1: Cracked girder with continuity reinforcement details (Barnes et al. 2006)
Analysis of test measurements, crack patterns, and documented reinforcement details
provided evidence supporting the identification of two critical cross sections. The cross sections
determined to be critical for the design of an FRP reinforcement system—similar to the FRP
reinforcement system discussed in this report—include the cross section at the interior face of the
bearing pad and the cross section at the termination of the mild steel continuity reinforcement.
Shear cracks within the web were observed near the interior face of the bearing pad, and
flexural cracking was observed near the termination of the continuity reinforcement, as shown in
Figure N.1. These critical cross sections have also been noted for a girder with an overlaying
illustration of an example FRP reinforcement system with unknown number of layers and length
of FRP reinforcement, as shown in Figure N.2.
A
A
B
B
7 in.
41 in.
Precast BT-54 girder
Cast-in-place deck
Cast-in-place continuity diaphragm
1 ft 2 ft 3 ft 4 ft 5 ft 6 ft 7 ft 8 ft
Continuity Reinforcement Size #6 Rebar
12 of 28 bottom-flange prestressed strands are debonded at least 48 in.
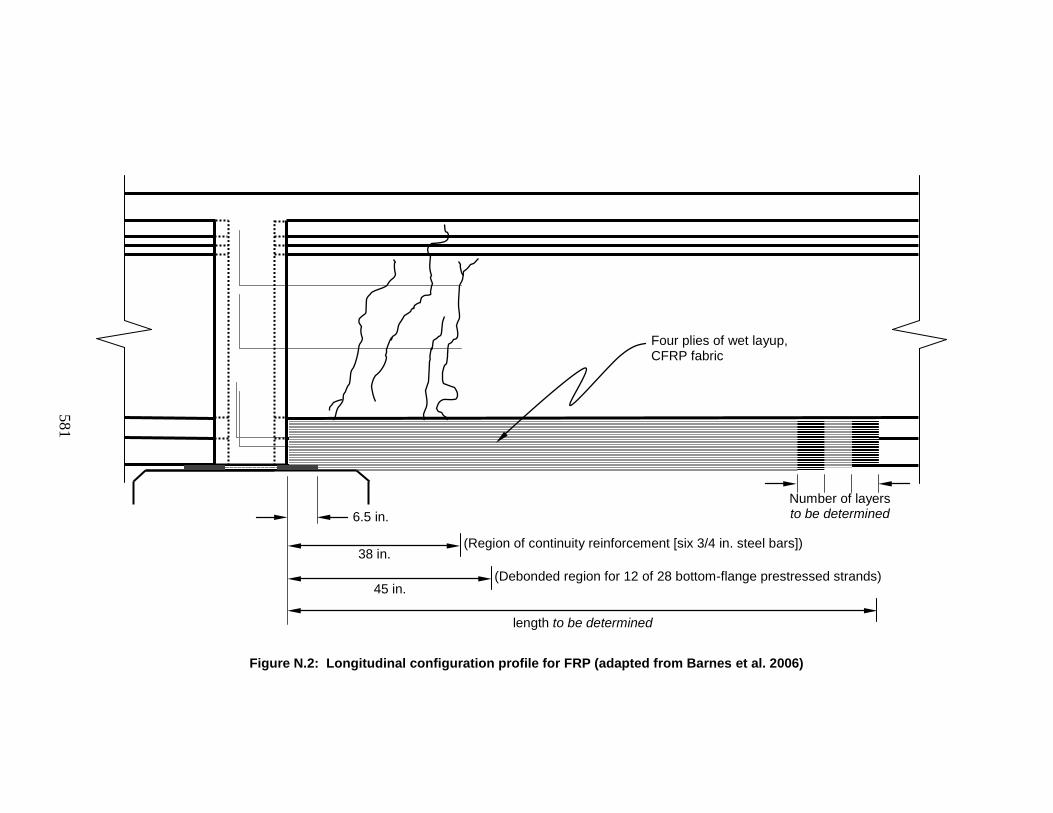
581
Figure N.2: Longitudinal configuration profile for FRP (adapted from Barnes et al. 2006)
6.5 in.
length to be determined
Number of layers to be determined
Four plies of wet layup, CFRP fabric
45 in.
38 in. (Region of continuity reinforcement [six 3/4 in. steel bars])
(Debonded region for 12 of 28 bottom-flange prestressed strands)
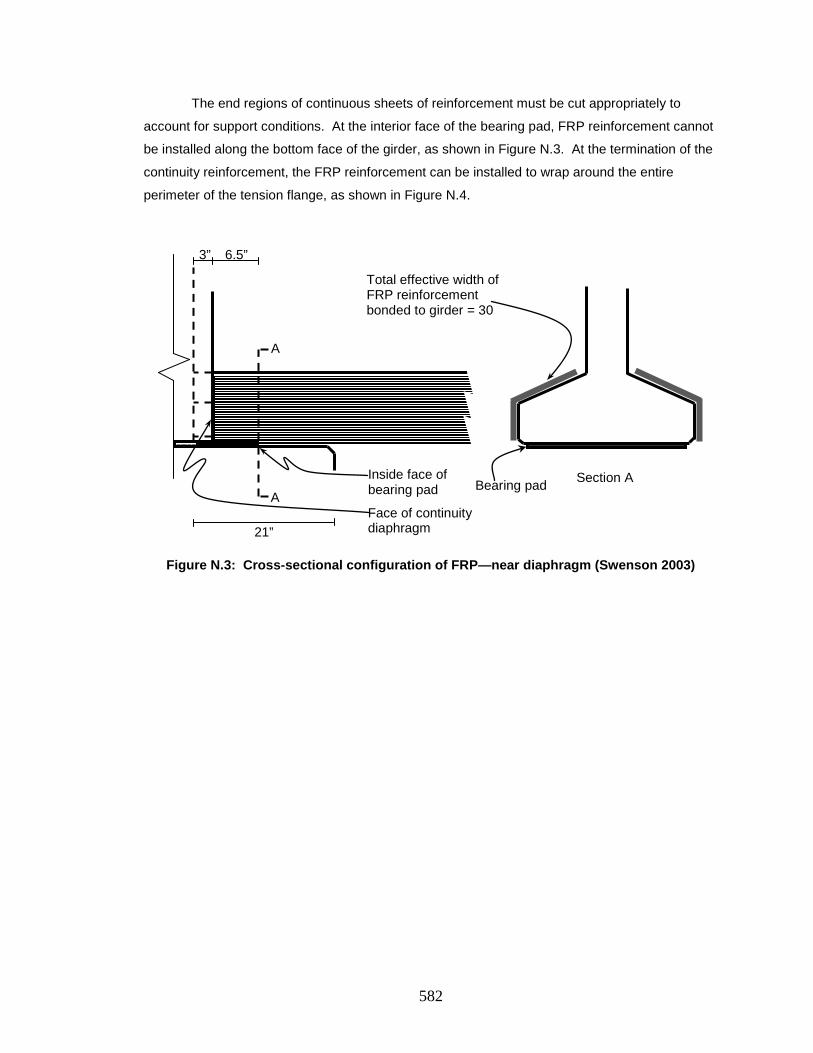
582
The end regions of continuous sheets of reinforcement must be cut appropriately to
account for support conditions. At the interior face of the bearing pad, FRP reinforcement cannot
be installed along the bottom face of the girder, as shown in Figure N.3. At the termination of the
continuity reinforcement, the FRP reinforcement can be installed to wrap around the entire
perimeter of the tension flange, as shown in Figure N.4.
Figure N.3: Cross-sectional configuration of FRP—near diaphragm (Swenson 2003)
21”
6.5”
A
A Section A
Total effective width of FRP reinforcement bonded to girder = 30
Bearing pad
3”
Inside face of bearing pad
Face of continuity diaphragm
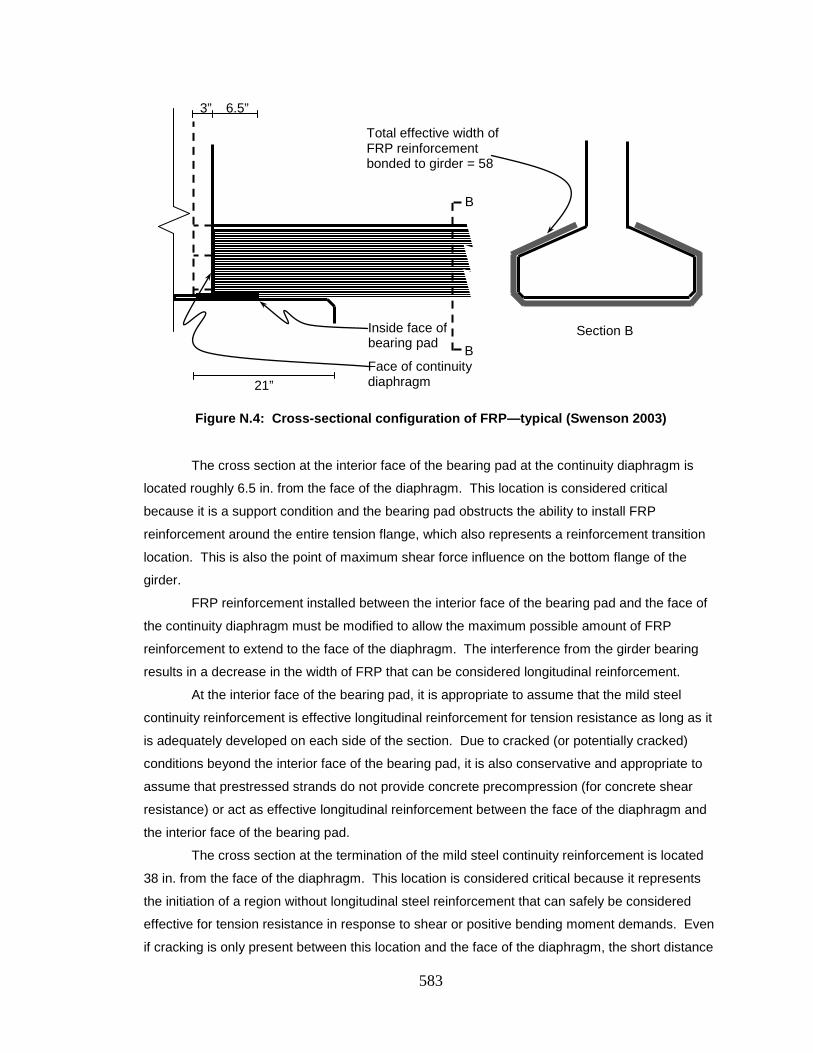
583
Figure N.4: Cross-sectional configuration of FRP—typical (Swenson 2003)
The cross section at the interior face of the bearing pad at the continuity diaphragm is
located roughly 6.5 in. from the face of the diaphragm. This location is considered critical
because it is a support condition and the bearing pad obstructs the ability to install FRP
reinforcement around the entire tension flange, which also represents a reinforcement transition
location. This is also the point of maximum shear force influence on the bottom flange of the
girder.
FRP reinforcement installed between the interior face of the bearing pad and the face of
the continuity diaphragm must be modified to allow the maximum possible amount of FRP
reinforcement to extend to the face of the diaphragm. The interference from the girder bearing
results in a decrease in the width of FRP that can be considered longitudinal reinforcement.
At the interior face of the bearing pad, it is appropriate to assume that the mild steel
continuity reinforcement is effective longitudinal reinforcement for tension resistance as long as it
is adequately developed on each side of the section. Due to cracked (or potentially cracked)
conditions beyond the interior face of the bearing pad, it is also conservative and appropriate to
assume that prestressed strands do not provide concrete precompression (for concrete shear
resistance) or act as effective longitudinal reinforcement between the face of the diaphragm and
the interior face of the bearing pad.
The cross section at the termination of the mild steel continuity reinforcement is located
38 in. from the face of the diaphragm. This location is considered critical because it represents
the initiation of a region without longitudinal steel reinforcement that can safely be considered
effective for tension resistance in response to shear or positive bending moment demands. Even
if cracking is only present between this location and the face of the diaphragm, the short distance
6.5”
Inside face of bearing pad
Face of continuity diaphragm
B
B Section B
Total effective width of FRP reinforcement bonded to girder = 58
3”
21”
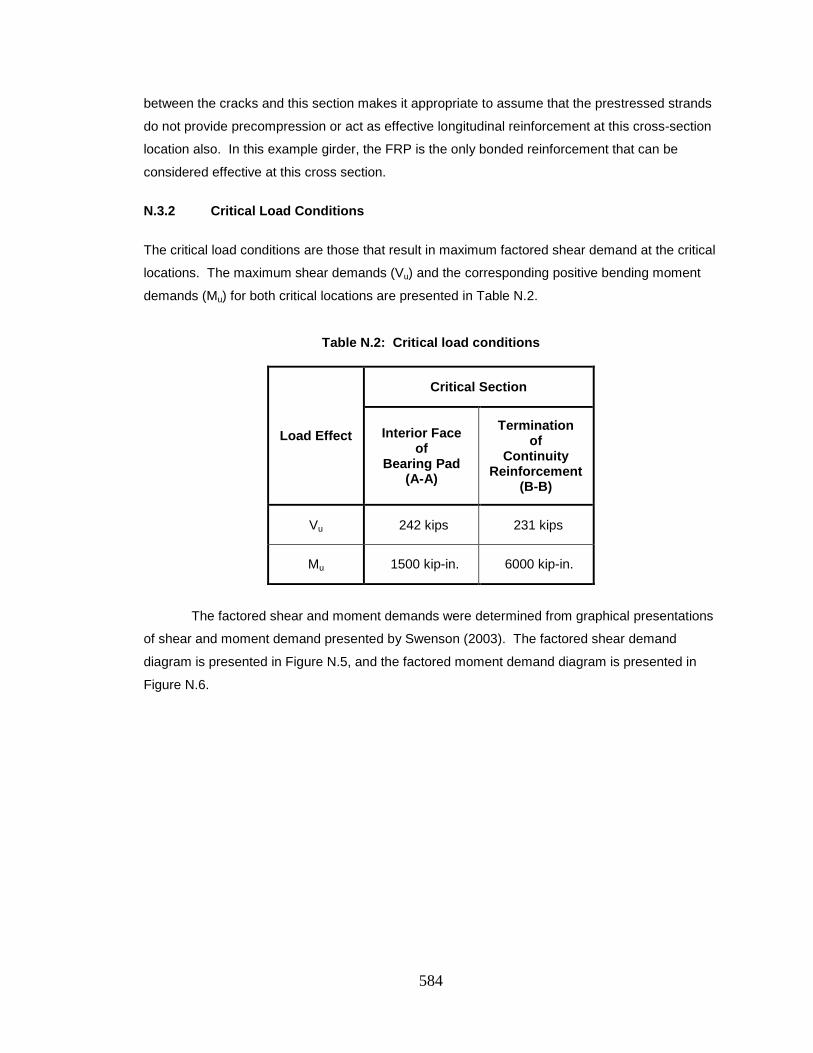
584
between the cracks and this section makes it appropriate to assume that the prestressed strands
do not provide precompression or act as effective longitudinal reinforcement at this cross-section
location also. In this example girder, the FRP is the only bonded reinforcement that can be
considered effective at this cross section.
N.3.2 Critical Load Conditions
The critical load conditions are those that result in maximum factored shear demand at the critical
locations. The maximum shear demands (Vu) and the corresponding positive bending moment
demands (Mu) for both critical locations are presented in Table N.2.
Table N.2: Critical load conditions
Load Effect
Critical Section
Interior Face of
Bearing Pad (A-A)
Termination of
Continuity Reinforcement
(B-B)
Vu 242 kips 231 kips
Mu 1500 kip-in. 6000 kip-in.
The factored shear and moment demands were determined from graphical presentations
of shear and moment demand presented by Swenson (2003). The factored shear demand
diagram is presented in Figure N.5, and the factored moment demand diagram is presented in
Figure N.6.
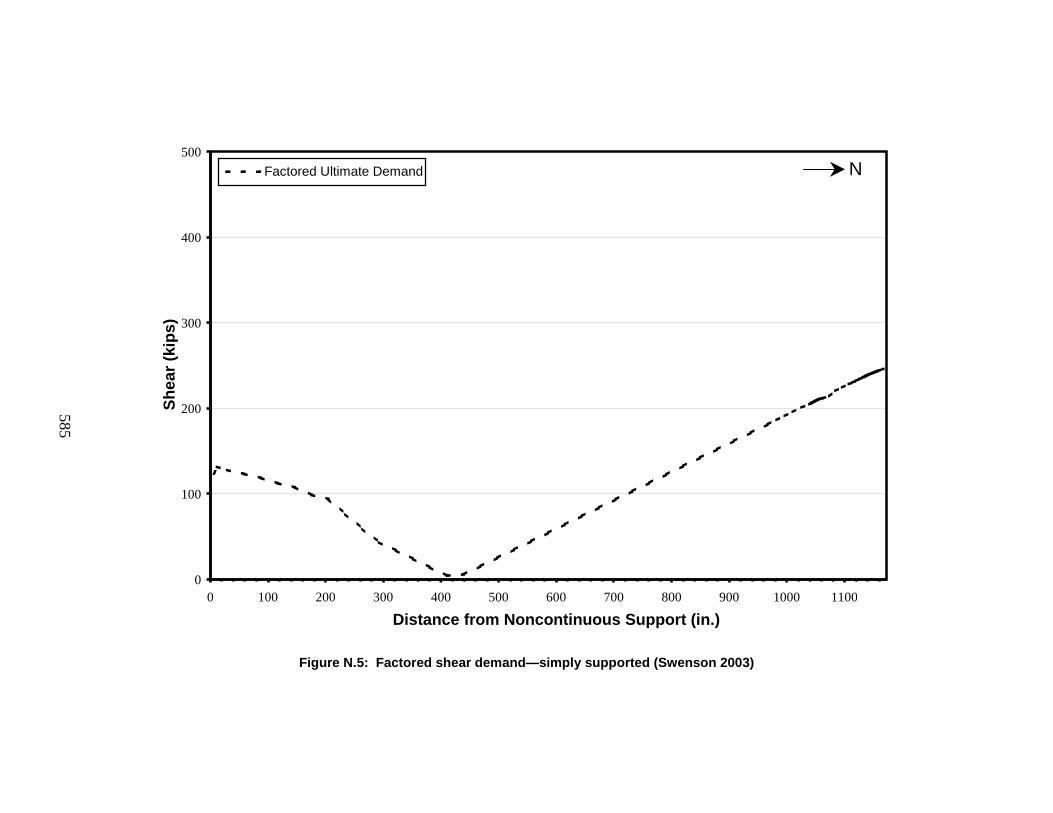
585
Figure N.5: Factored shear demand—simply supported (Swenson 2003)
0
100
200
300
400
500
0 100 200 300 400 500 600 700 800 900 1000 1100 Distance from Noncontinuous Support (in.)
Shea
r (ki
ps)
Factored Ultimate Demand N
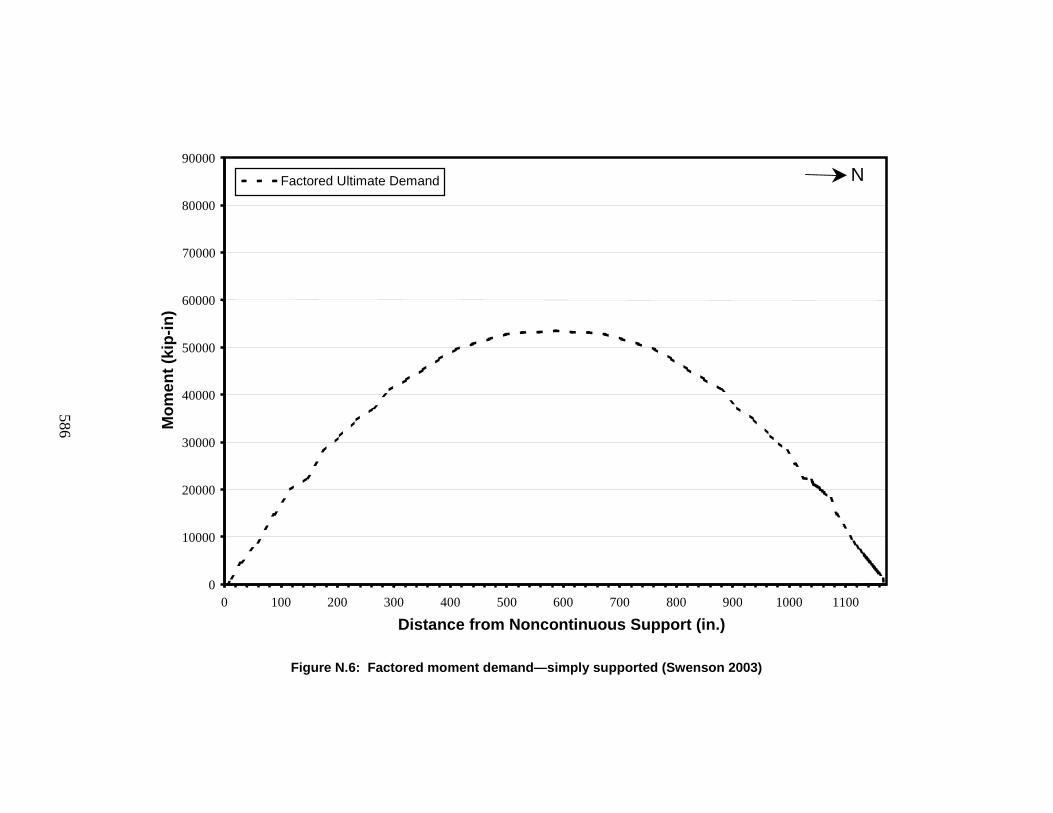
586
Figure N.6: Factored moment demand—simply supported (Swenson 2003)
0
10000
20000
30000
40000
50000
60000
70000
80000
90000
0 100 200 300 400 500 600 700 800 900 1000 1100
Distance from Noncontinuous Support (in.)
Factored Ultimate Demand N M
omen
t (ki
p-in
)
587
The shear and moment demand diagrams present maximum shear and moment
demands that consist of factored lane and truck live load effects (including impact forces, which
could have been disregarded as previously recommended) and factored dead load effects. It has
been recommended that the moment demand correspond with the load condition resulting in
maximum shear demand; however, these moment demands represent maximum moment
demands, which are of greater magnitude than those expected in response to the load conditions
resulting in maximum shear demand at the critical cross-section locations. It is recommended
that these demands be determined using bridge rating analysis software. Spans should be
modeled as simply supported during analysis. All demands associated with simply supported
behavior assumption should be satisfied along the entire length of the girder. This includes shear
and bending moment demands at midspan.
N.3.3 Material Properties
Relevant material properties for the girder concrete, deck concrete, steel reinforcement, and FRP
reinforcement are summarized in Table N.3. These properties include concrete design strength
(f ’c), longitudinal steel reinforcement modulus of elasticity (Es) and yield stress (fy), FRP
reinforcement modulus of elasticity (Ef) and nominal thickness (tf,n), and an initial lower bound
estimate of effective debonding strain (εfe,min).
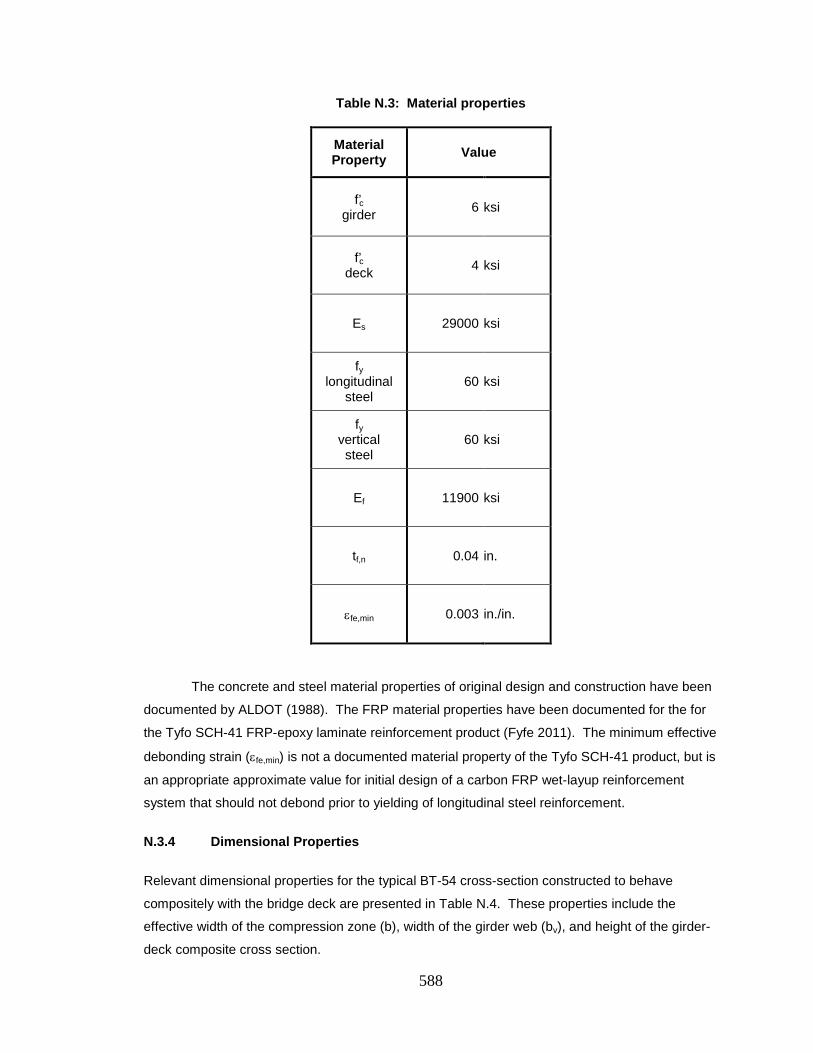
588
Table N.3: Material properties
Material Property Value
f’c girder 6 ksi
f’c deck 4 ksi
Es 29000 ksi
fy longitudinal
steel 60 ksi
fy vertical steel
60 ksi
Ef 11900 ksi
tf,n 0.04 in.
εfe,min 0.003 in./in.
The concrete and steel material properties of original design and construction have been
documented by ALDOT (1988). The FRP material properties have been documented for the for
the Tyfo SCH-41 FRP-epoxy laminate reinforcement product (Fyfe 2011). The minimum effective
debonding strain (εfe,min) is not a documented material property of the Tyfo SCH-41 product, but is
an appropriate approximate value for initial design of a carbon FRP wet-layup reinforcement
system that should not debond prior to yielding of longitudinal steel reinforcement.
N.3.4 Dimensional Properties
Relevant dimensional properties for the typical BT-54 cross-section constructed to behave
compositely with the bridge deck are presented in Table N.4. These properties include the
effective width of the compression zone (b), width of the girder web (bv), and height of the girder-
deck composite cross section.

589
Table N.4: Cross section dimensional properties
Dimensional Property Value
b 91 in.
bv 6 in.
h 64 in.
The typical BT-54 cross section constructed to behave compositely with the bridge deck is shown
in Figure N.7.
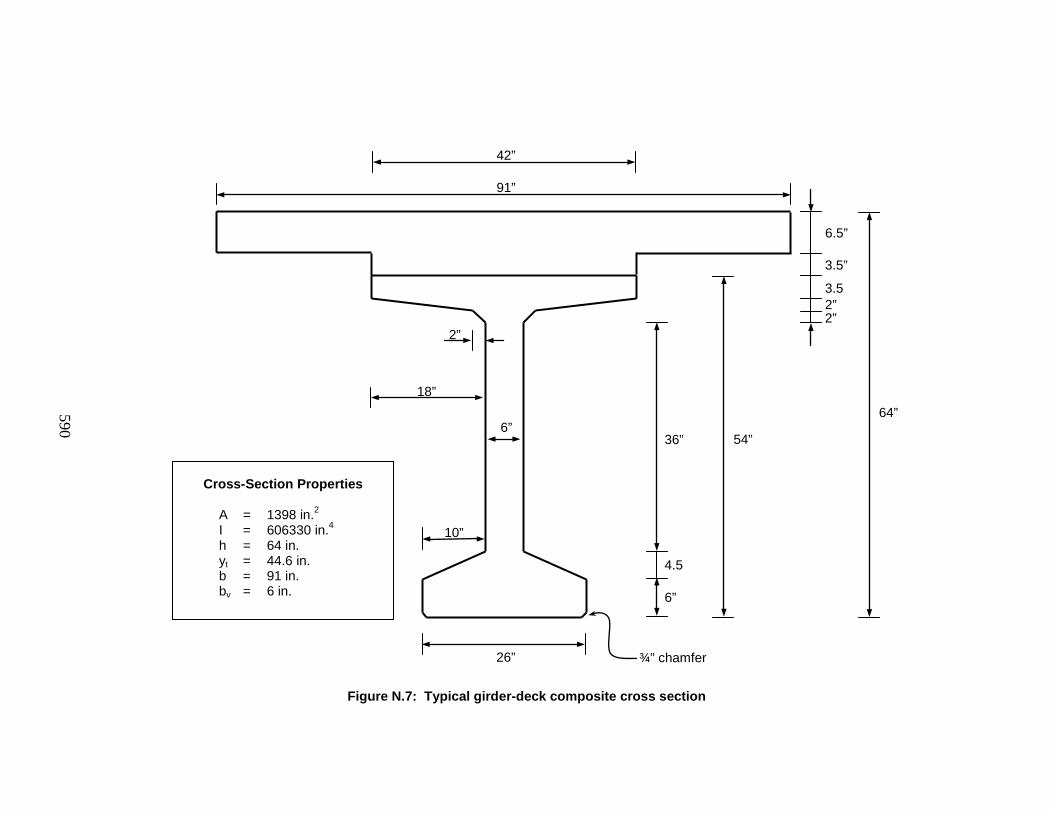
590
Figure N.7: Typical girder-deck composite cross section
3.5
2” 2”
36”
4.5
6”
26”
42”
18”
10”
2”
¾” chamfer
54” 6”
3.5”
6.5”
91”
Cross-Section Properties
A = 1398 in.2 I = 606330 in.4 h = 64 in. yt = 44.6 in. b = 91 in. bv = 6 in.
64”
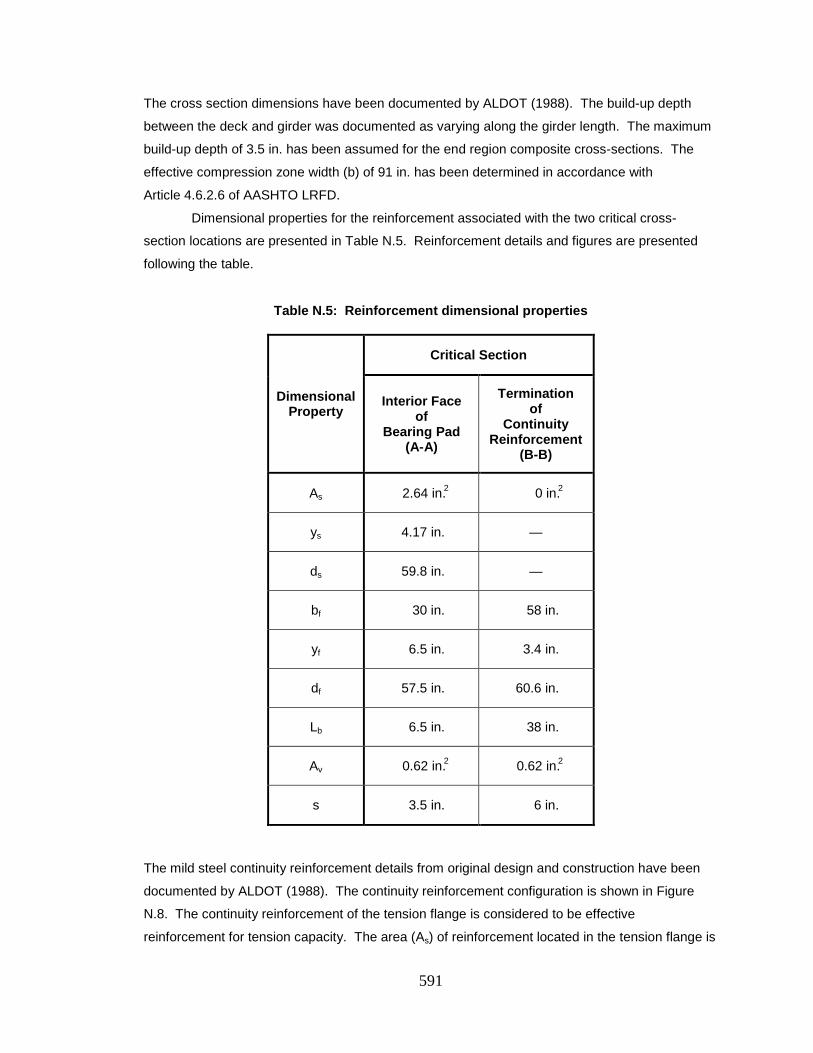
591
The cross section dimensions have been documented by ALDOT (1988). The build-up depth
between the deck and girder was documented as varying along the girder length. The maximum
build-up depth of 3.5 in. has been assumed for the end region composite cross-sections. The
effective compression zone width (b) of 91 in. has been determined in accordance with
Article 4.6.2.6 of AASHTO LRFD.
Dimensional properties for the reinforcement associated with the two critical cross-
section locations are presented in Table N.5. Reinforcement details and figures are presented
following the table.
Table N.5: Reinforcement dimensional properties
Dimensional Property
Critical Section
Interior Face of
Bearing Pad (A-A)
Termination of
Continuity Reinforcement
(B-B)
As 2.64 in.2 0 in.2
ys 4.17 in. —
ds 59.8 in. —
bf 30 in. 58 in.
yf 6.5 in. 3.4 in.
df 57.5 in. 60.6 in.
Lb 6.5 in. 38 in.
Av 0.62 in.2 0.62 in.2
s 3.5 in. 6 in.
The mild steel continuity reinforcement details from original design and construction have been
documented by ALDOT (1988). The continuity reinforcement configuration is shown in Figure
N.8. The continuity reinforcement of the tension flange is considered to be effective
reinforcement for tension capacity. The area (As) of reinforcement located in the tension flange is
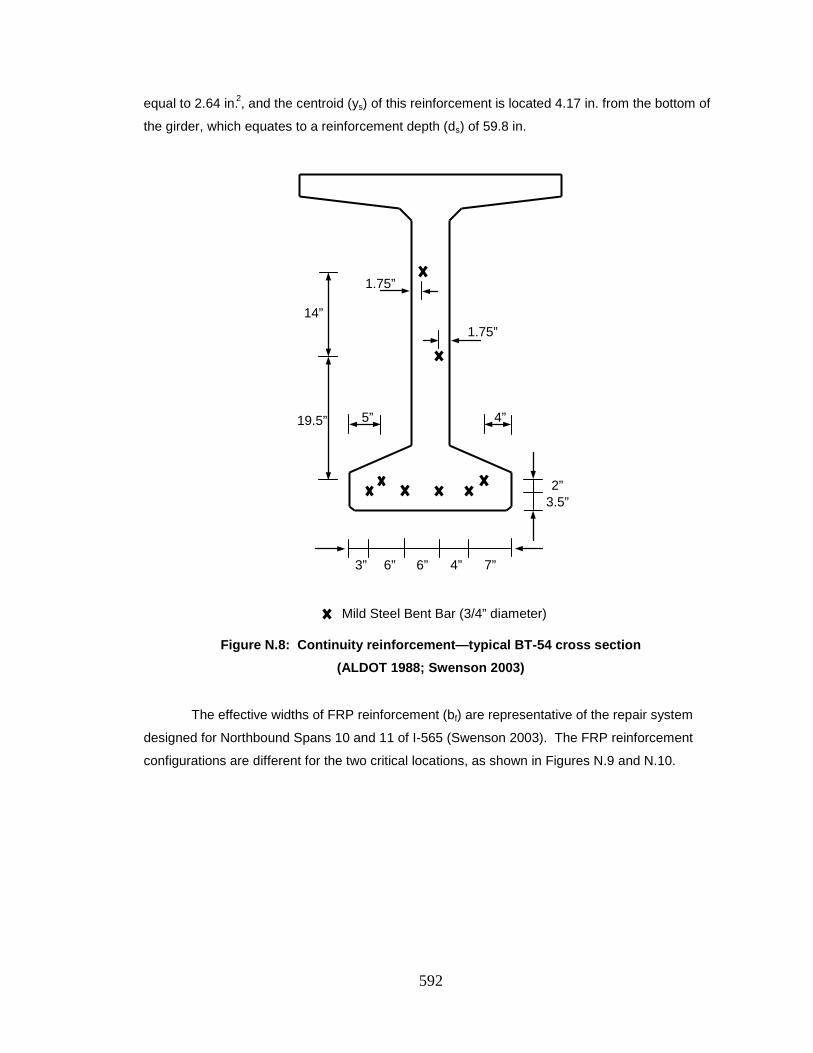
592
equal to 2.64 in.2, and the centroid (ys) of this reinforcement is located 4.17 in. from the bottom of
the girder, which equates to a reinforcement depth (ds) of 59.8 in.
Figure N.8: Continuity reinforcement—typical BT-54 cross section
(ALDOT 1988; Swenson 2003)
The effective widths of FRP reinforcement (bf) are representative of the repair system
designed for Northbound Spans 10 and 11 of I-565 (Swenson 2003). The FRP reinforcement
configurations are different for the two critical locations, as shown in Figures N.9 and N.10.
2” 3.5”
5”
1.75”
3” 6” 6” 4” 7”
4” 19.5”
14”
1.75”
Mild Steel Bent Bar (3/4” diameter)
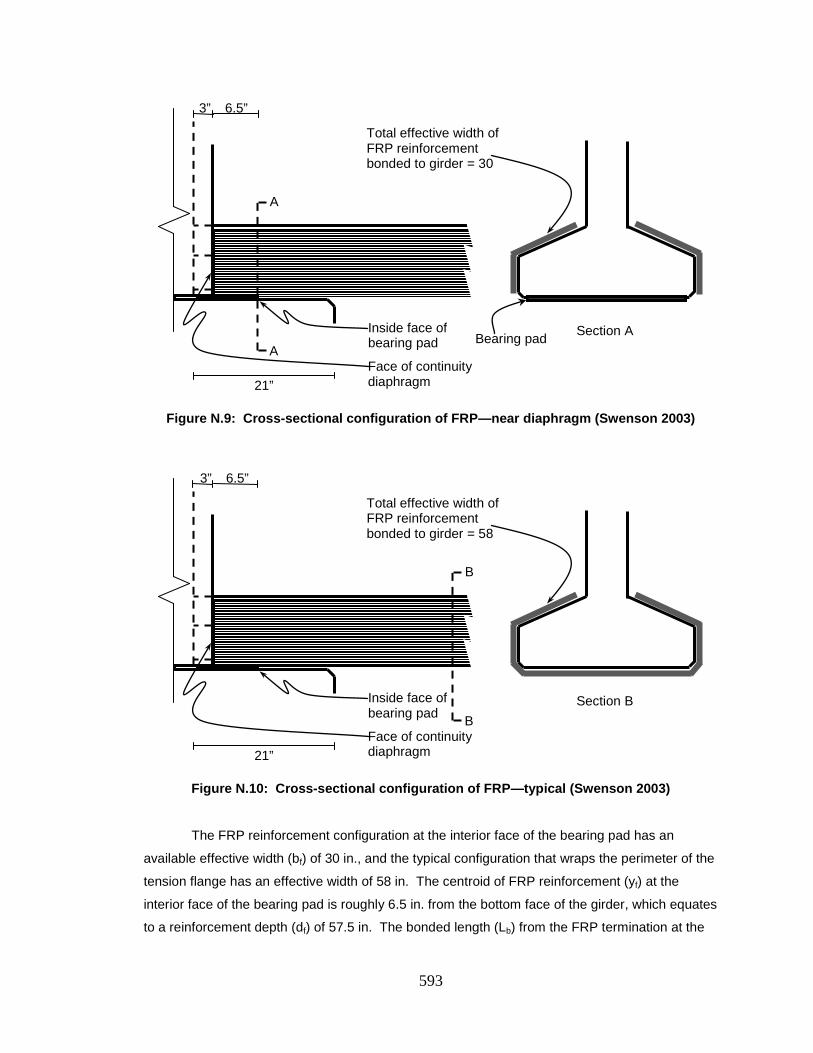
593
Figure N.9: Cross-sectional configuration of FRP—near diaphragm (Swenson 2003)
Figure N.10: Cross-sectional configuration of FRP—typical (Swenson 2003)
The FRP reinforcement configuration at the interior face of the bearing pad has an
available effective width (bf) of 30 in., and the typical configuration that wraps the perimeter of the
tension flange has an effective width of 58 in. The centroid of FRP reinforcement (yf) at the
interior face of the bearing pad is roughly 6.5 in. from the bottom face of the girder, which equates
to a reinforcement depth (df) of 57.5 in. The bonded length (Lb) from the FRP termination at the
6.5”
Inside face of bearing pad
Face of continuity diaphragm
B
B Section B
Total effective width of FRP reinforcement bonded to girder = 58
3”
21”
21”
6.5”
A
A Section A
Total effective width of FRP reinforcement bonded to girder = 30
Bearing pad
3”
Inside face of bearing pad
Face of continuity diaphragm

594
face of the continuity diaphragm to the face of the bearing pad is roughly 6.5 in. The centroid of
the typical FRP reinforcement configuration is roughly 3.4 in. from the bottom face of the girder,
which equates to depth of 60.6 in. The bonded length from the diaphragm is roughly 38 in.
The vertical reinforcement details vary along the length of the girder, and have been
documented by ALDOT (1988). The typical end region vertical reinforcement details are shown
in Figure N.11.
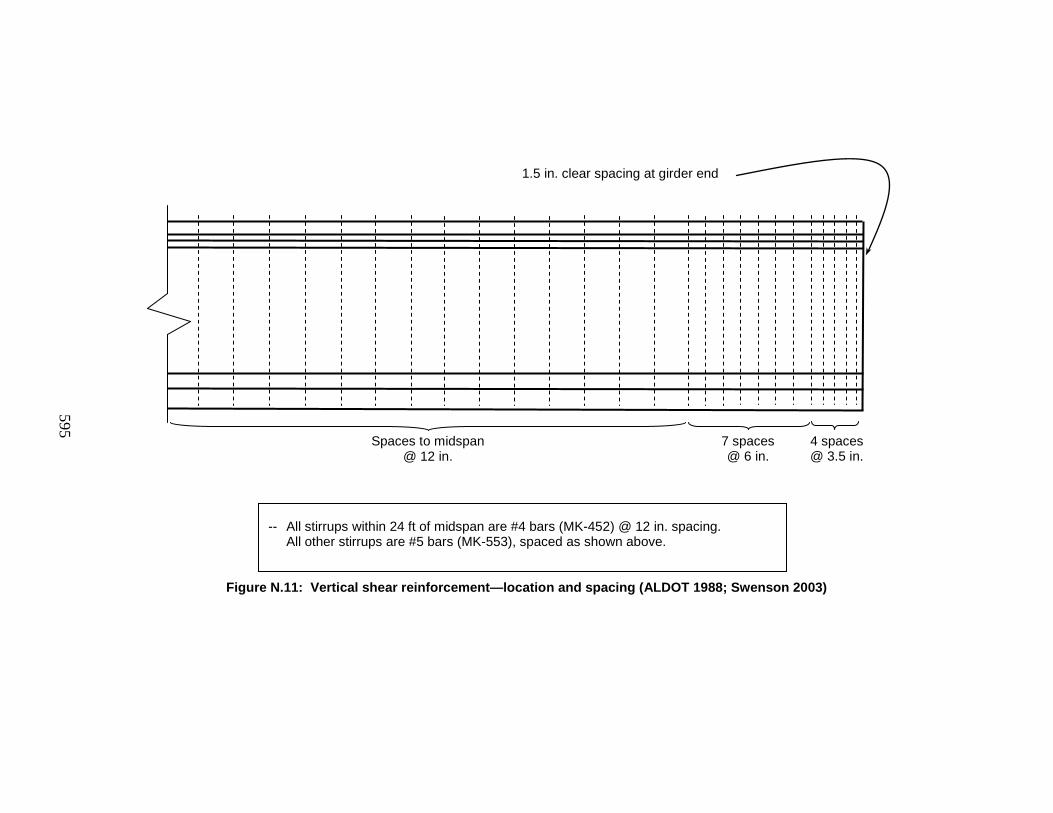
595
Figure N.11: Vertical shear reinforcement—location and spacing (ALDOT 1988; Swenson 2003)
4 spaces @ 3.5 in.
7 spaces @ 6 in.
Spaces to midspan @ 12 in.
-- All stirrups within 24 ft of midspan are #4 bars (MK-452) @ 12 in. spacing. All other stirrups are #5 bars (MK-553), spaced as shown above.
1.5 in. clear spacing at girder end
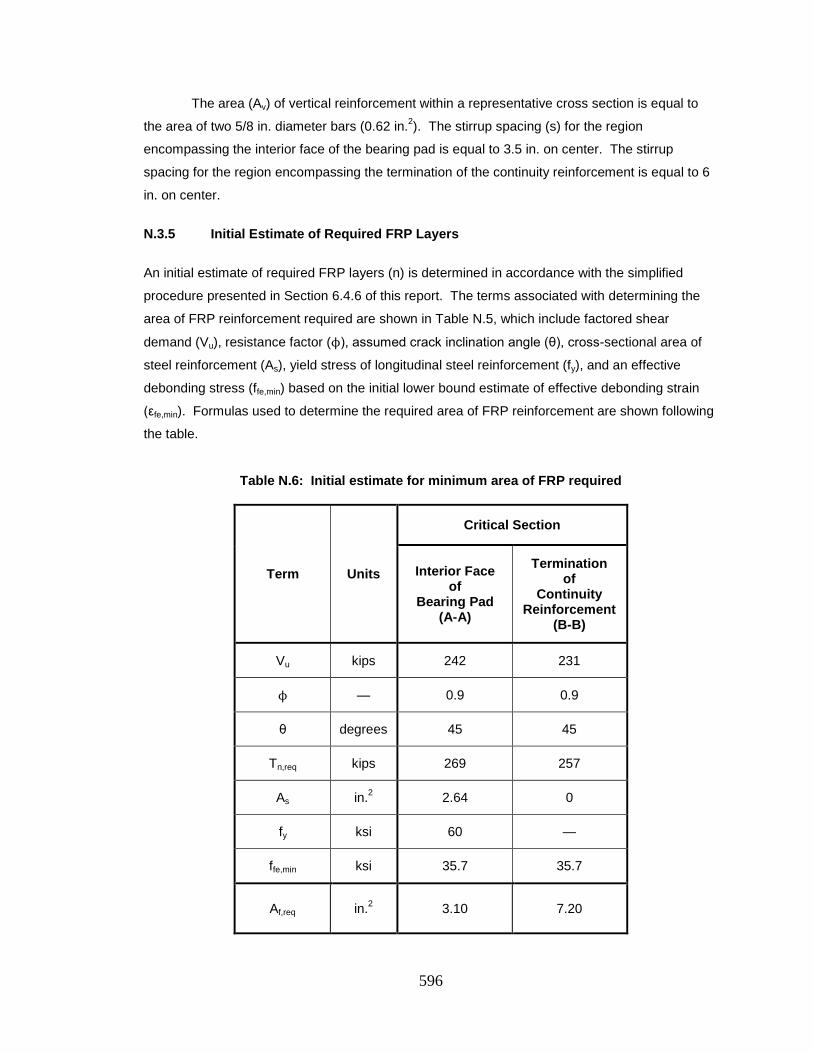
596
The area (Av) of vertical reinforcement within a representative cross section is equal to
the area of two 5/8 in. diameter bars (0.62 in.2). The stirrup spacing (s) for the region
encompassing the interior face of the bearing pad is equal to 3.5 in. on center. The stirrup
spacing for the region encompassing the termination of the continuity reinforcement is equal to 6
in. on center.
N.3.5 Initial Estimate of Required FRP Layers
An initial estimate of required FRP layers (n) is determined in accordance with the simplified
procedure presented in Section 6.4.6 of this report. The terms associated with determining the
area of FRP reinforcement required are shown in Table N.5, which include factored shear
demand (Vu), resistance factor (ϕ), assumed crack inclination angle (θ), cross-sectional area of
steel reinforcement (As), yield stress of longitudinal steel reinforcement (fy), and an effective
debonding stress (ffe,min) based on the initial lower bound estimate of effective debonding strain
(εfe,min). Formulas used to determine the required area of FRP reinforcement are shown following
the table.
Table N.6: Initial estimate for minimum area of FRP required
Term Units
Critical Section
Interior Face of
Bearing Pad (A-A)
Termination of
Continuity Reinforcement
(B-B)
Vu kips 242 231
ϕ — 0.9 0.9
θ degrees 45 45
Tn,req kips 269 257
As in.2 2.64 0
fy ksi 60 —
ffe,min ksi 35.7 35.7
Af,req in.2 3.10 7.20
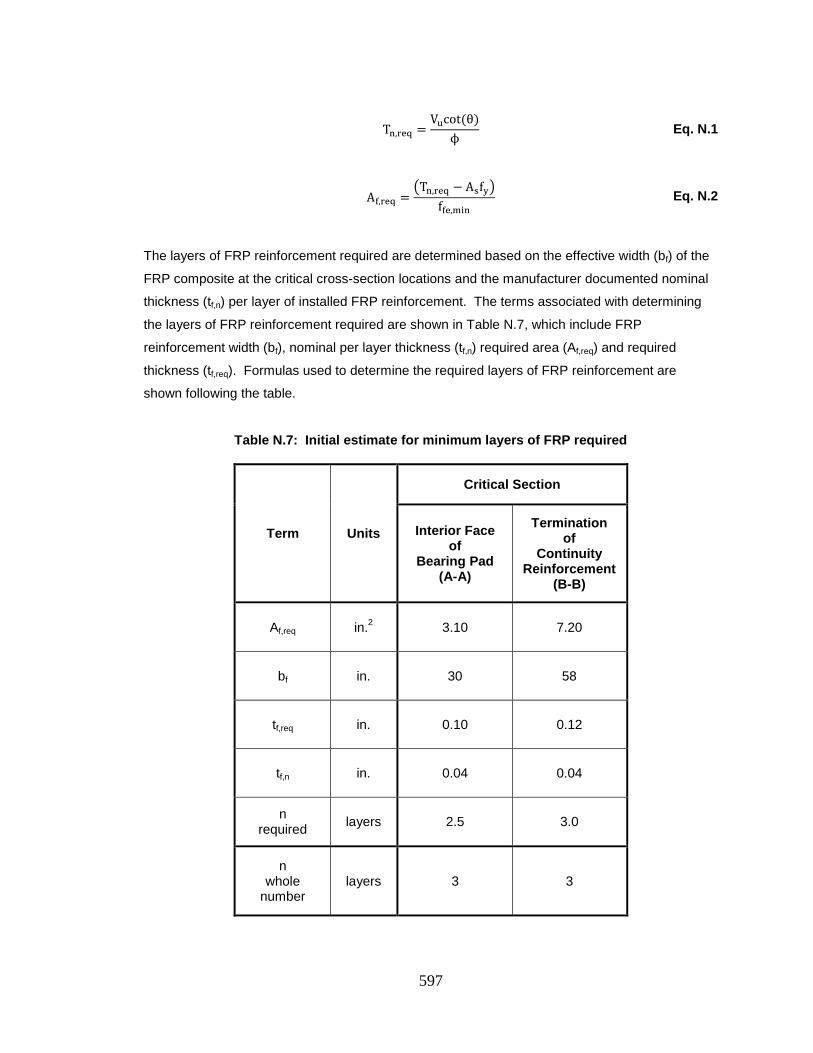
597
Tn,req =Vucot(θ)
ϕ Eq. N.1
Af,req =�Tn,req − Asfy�
ffe,min Eq. N.2
The layers of FRP reinforcement required are determined based on the effective width (bf) of the
FRP composite at the critical cross-section locations and the manufacturer documented nominal
thickness (tf,n) per layer of installed FRP reinforcement. The terms associated with determining
the layers of FRP reinforcement required are shown in Table N.7, which include FRP
reinforcement width (bf), nominal per layer thickness (tf,n) required area (Af,req) and required
thickness (tf,req). Formulas used to determine the required layers of FRP reinforcement are
shown following the table.
Table N.7: Initial estimate for minimum layers of FRP required
Term Units
Critical Section
Interior Face of
Bearing Pad (A-A)
Termination of
Continuity Reinforcement
(B-B)
Af,req in.2 3.10 7.20
bf in. 30 58
tf,req in. 0.10 0.12
tf,n in. 0.04 0.04
n required layers 2.5 3.0
n whole
number layers 3 3
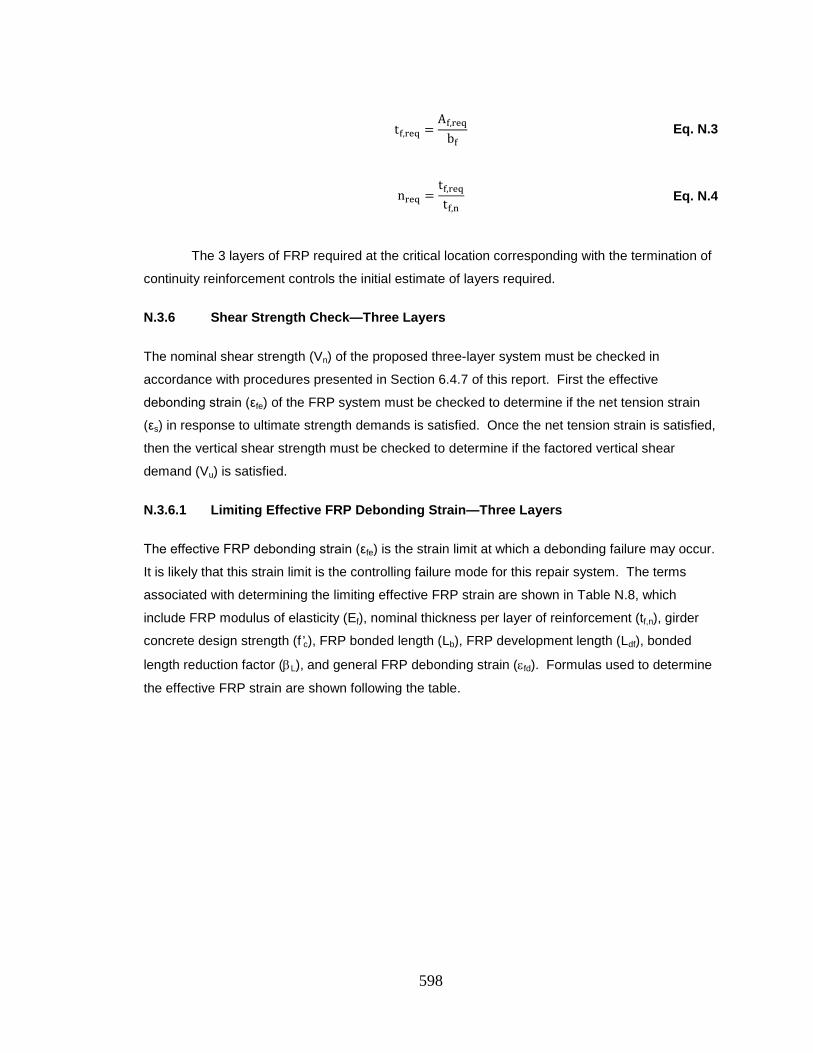
598
tf,req =Af,req
bf Eq. N.3
nreq =tf,reqtf,n
Eq. N.4
The 3 layers of FRP required at the critical location corresponding with the termination of
continuity reinforcement controls the initial estimate of layers required.
N.3.6 Shear Strength Check—Three Layers
The nominal shear strength (Vn) of the proposed three-layer system must be checked in
accordance with procedures presented in Section 6.4.7 of this report. First the effective
debonding strain (εfe) of the FRP system must be checked to determine if the net tension strain
(εs) in response to ultimate strength demands is satisfied. Once the net tension strain is satisfied,
then the vertical shear strength must be checked to determine if the factored vertical shear
demand (Vu) is satisfied.
N.3.6.1 Limiting Effective FRP Debonding Strain—Three Layers
The effective FRP debonding strain (εfe) is the strain limit at which a debonding failure may occur.
It is likely that this strain limit is the controlling failure mode for this repair system. The terms
associated with determining the limiting effective FRP strain are shown in Table N.8, which
include FRP modulus of elasticity (Ef), nominal thickness per layer of reinforcement (tf,n), girder
concrete design strength (f ’c), FRP bonded length (Lb), FRP development length (Ldf), bonded
length reduction factor (βL), and general FRP debonding strain (εfd). Formulas used to determine
the effective FRP strain are shown following the table.
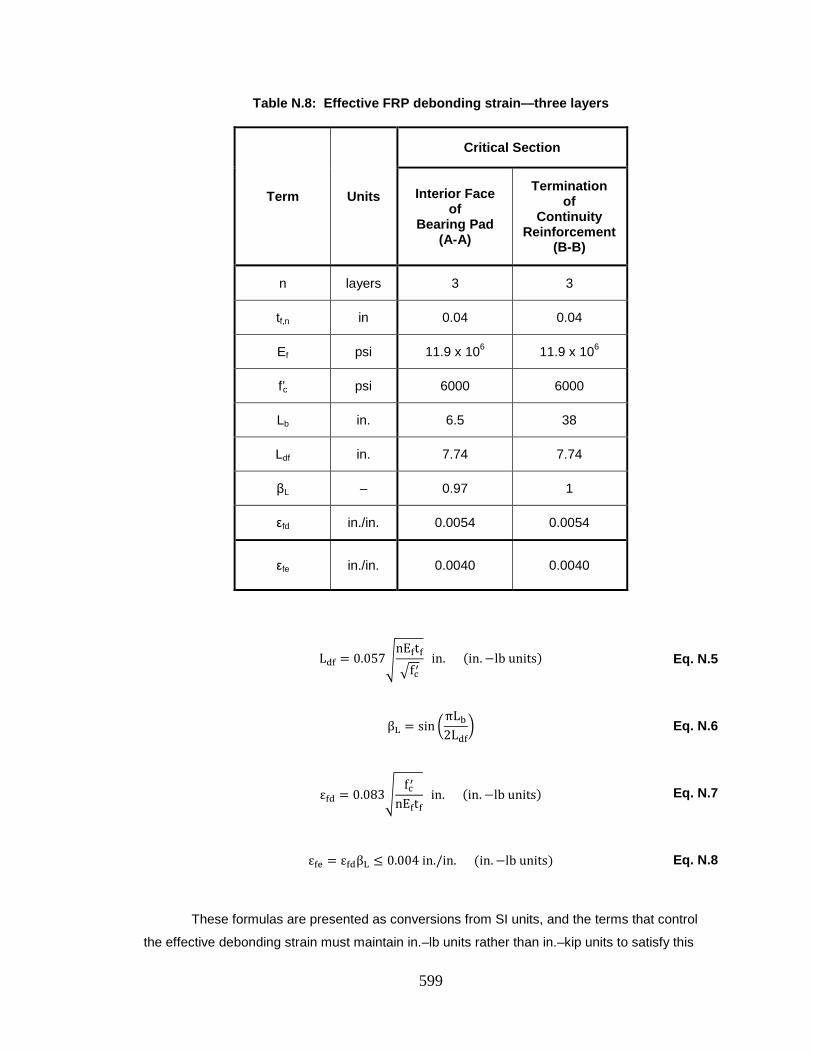
599
Table N.8: Effective FRP debonding strain—three layers
Term Units
Critical Section
Interior Face of
Bearing Pad (A-A)
Termination of
Continuity Reinforcement
(B-B)
n layers 3 3
tf,n in 0.04 0.04
Ef psi 11.9 x 10⁶ 11.9 x 10⁶
f’c psi 6000 6000
Lb in. 6.5 38
Ldf in. 7.74 7.74
βL – 0.97 1
εfd in./in. 0.0054 0.0054
εfe in./in. 0.0040 0.0040
Ldf = 0.057�nEftf�fc′
in. (in.−lb units) Eq. N.5
βL = sin �πLb2Ldf
� Eq. N.6
εfd = 0.083�fc′
nEftf in. (in.−lb units) Eq. N.7
εfe = εfdβL ≤ 0.004 in./in. (in.−lb units) Eq. N.8
These formulas are presented as conversions from SI units, and the terms that control
the effective debonding strain must maintain in.–lb units rather than in.–kip units to satisfy this
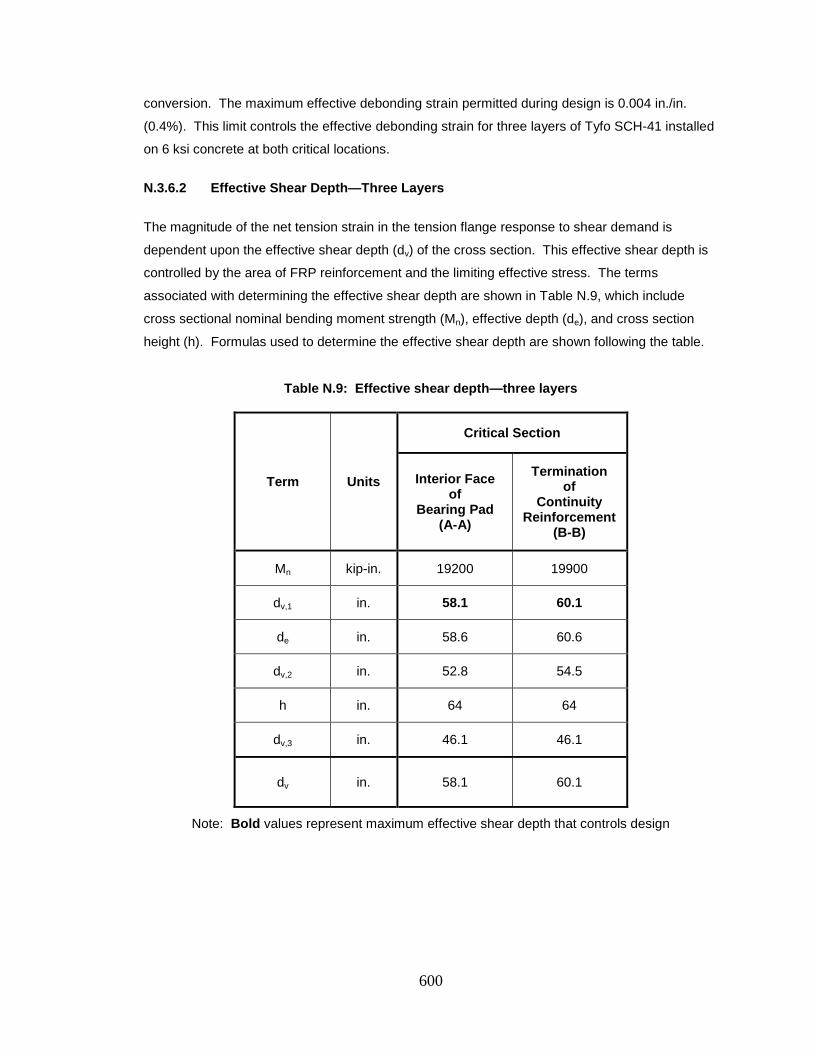
600
conversion. The maximum effective debonding strain permitted during design is 0.004 in./in.
(0.4%). This limit controls the effective debonding strain for three layers of Tyfo SCH-41 installed
on 6 ksi concrete at both critical locations.
N.3.6.2 Effective Shear Depth—Three Layers
The magnitude of the net tension strain in the tension flange response to shear demand is
dependent upon the effective shear depth (dv) of the cross section. This effective shear depth is
controlled by the area of FRP reinforcement and the limiting effective stress. The terms
associated with determining the effective shear depth are shown in Table N.9, which include
cross sectional nominal bending moment strength (Mn), effective depth (de), and cross section
height (h). Formulas used to determine the effective shear depth are shown following the table.
Table N.9: Effective shear depth—three layers
Term Units
Critical Section
Interior Face of
Bearing Pad (A-A)
Termination of
Continuity Reinforcement
(B-B)
Mn kip-in. 19200 19900
dv,1 in. 58.1 60.1
de in. 58.6 60.6
dv,2 in. 52.8 54.5
h in. 64 64
dv,3 in. 46.1 46.1
dv in. 58.1 60.1
Note: Bold values represent maximum effective shear depth that controls design
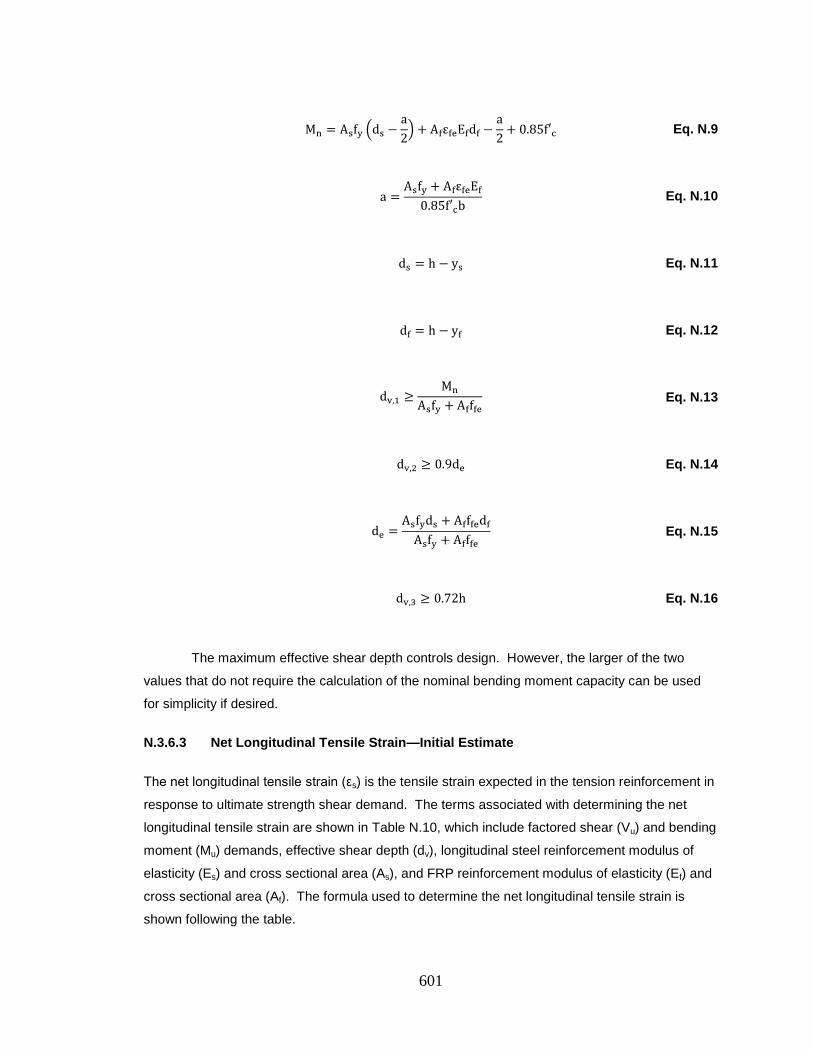
601
Mn = Asfy �ds −a2� + AfεfeEfdf −
a2
+ 0.85f′c Eq. N.9
a =Asfy + AfεfeEf
0.85f′cb Eq. N.10
ds = h − ys Eq. N.11
df = h − yf Eq. N.12
dv,1 ≥Mn
Asfy + Afffe Eq. N.13
dv,2 ≥ 0.9de Eq. N.14
de =Asfyds + Afffedf
Asfy + Afffe Eq. N.15
dv,3 ≥ 0.72h Eq. N.16
The maximum effective shear depth controls design. However, the larger of the two
values that do not require the calculation of the nominal bending moment capacity can be used
for simplicity if desired.
N.3.6.3 Net Longitudinal Tensile Strain—Initial Estimate
The net longitudinal tensile strain (εs) is the tensile strain expected in the tension reinforcement in
response to ultimate strength shear demand. The terms associated with determining the net
longitudinal tensile strain are shown in Table N.10, which include factored shear (Vu) and bending
moment (Mu) demands, effective shear depth (dv), longitudinal steel reinforcement modulus of
elasticity (Es) and cross sectional area (As), and FRP reinforcement modulus of elasticity (Ef) and
cross sectional area (Af). The formula used to determine the net longitudinal tensile strain is
shown following the table.
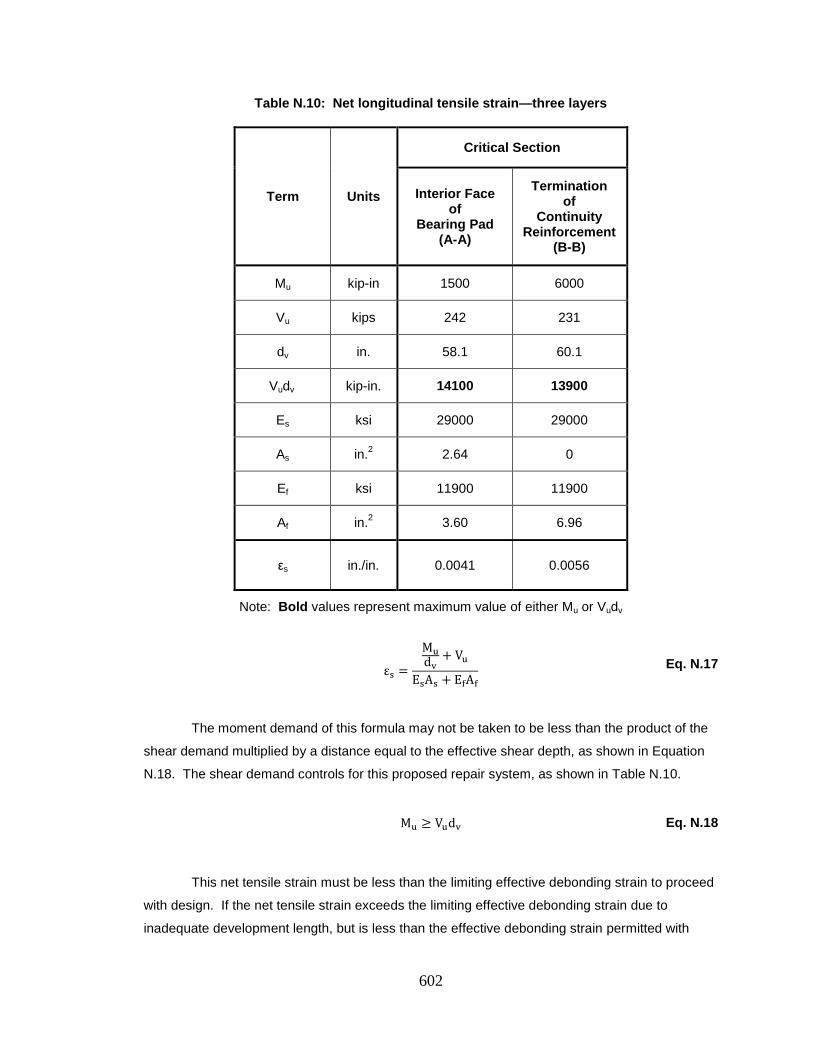
602
Table N.10: Net longitudinal tensile strain—three layers
Term Units
Critical Section
Interior Face of
Bearing Pad (A-A)
Termination of
Continuity Reinforcement
(B-B)
Mu kip-in 1500 6000
Vu kips 242 231
dv in. 58.1 60.1
Vudv kip-in. 14100 13900
Es ksi 29000 29000
As in.2 2.64 0
Ef ksi 11900 11900
Af in.2 3.60 6.96
εs in./in. 0.0041 0.0056
Note: Bold values represent maximum value of either Mu or Vudv
εs =
Mudv
+ VuEsAs + EfAf
Eq. N.17
The moment demand of this formula may not be taken to be less than the product of the
shear demand multiplied by a distance equal to the effective shear depth, as shown in Equation
N.18. The shear demand controls for this proposed repair system, as shown in Table N.10.
Mu ≥ Vudv Eq. N.18
This net tensile strain must be less than the limiting effective debonding strain to proceed
with design. If the net tensile strain exceeds the limiting effective debonding strain due to
inadequate development length, but is less than the effective debonding strain permitted with
603
adequate development length, supplemental anchorage solutions can be used to decrease the
required development length. If supplemental anchorage is required, proposed anchorage
solutions should be tested to verify desired performance. Supplemental anchorage may be
provided to decrease the required development length, but additional anchorage cannot be
considered to increase the limiting effective debonding strain.
If the net tensile strain exceeds the limiting effective debonding strain at a critical location
with adequate development length, then additional layers of FRP reinforcement are required.
Increasing the amount of tension reinforcement will decrease the corresponding net tensile strain.
A reiteration of the design checks are then required.
N.3.6.4 Layers Required to Satisfy Tensile Strain Demand
The tensile strain demand of the proposed three-layer repair system exceeds the limiting effective
debonding strain at both critical locations, which is controlled by the maximum appropriate
effective debonding strain limit of 0.004 in./in. Additional layers of FRP reinforcement are
therefore required to decrease the net tensile strain demand. The amount of reinforcement
required to satisfy the net tensile demand can be determined. The terms associated with
determining the layers of FRP reinforcement required to satisfy the net longitudinal tensile strain
demand are shown in Table N.11. The formula used to determine the required layers of FRP
reinforcement is shown following the table.
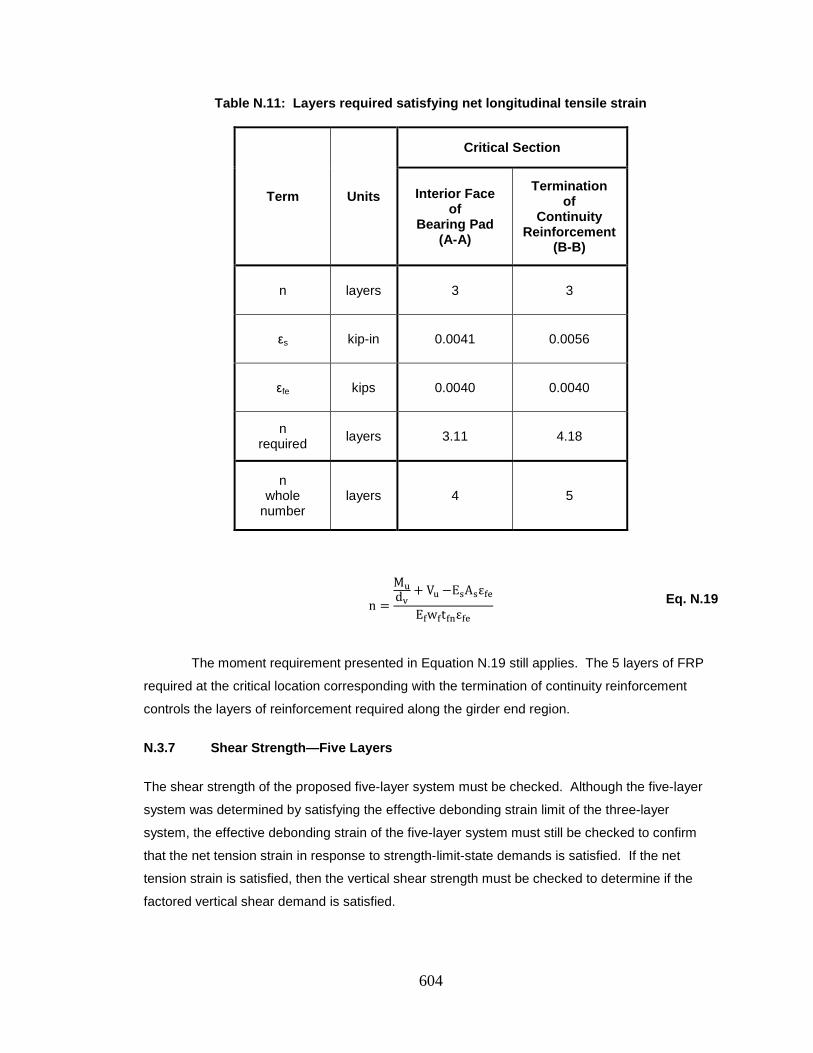
604
Table N.11: Layers required satisfying net longitudinal tensile strain
Term Units
Critical Section
Interior Face of
Bearing Pad (A-A)
Termination of
Continuity Reinforcement
(B-B)
n layers 3 3
εs kip-in 0.0041 0.0056
εfe kips 0.0040 0.0040
n required layers 3.11 4.18
n whole
number layers 4 5
n =
Mudv
+ Vu −EsAsεfeEfwftfnεfe
Eq. N.19
The moment requirement presented in Equation N.19 still applies. The 5 layers of FRP
required at the critical location corresponding with the termination of continuity reinforcement
controls the layers of reinforcement required along the girder end region.
N.3.7 Shear Strength—Five Layers
The shear strength of the proposed five-layer system must be checked. Although the five-layer
system was determined by satisfying the effective debonding strain limit of the three-layer
system, the effective debonding strain of the five-layer system must still be checked to confirm
that the net tension strain in response to strength-limit-state demands is satisfied. If the net
tension strain is satisfied, then the vertical shear strength must be checked to determine if the
factored vertical shear demand is satisfied.
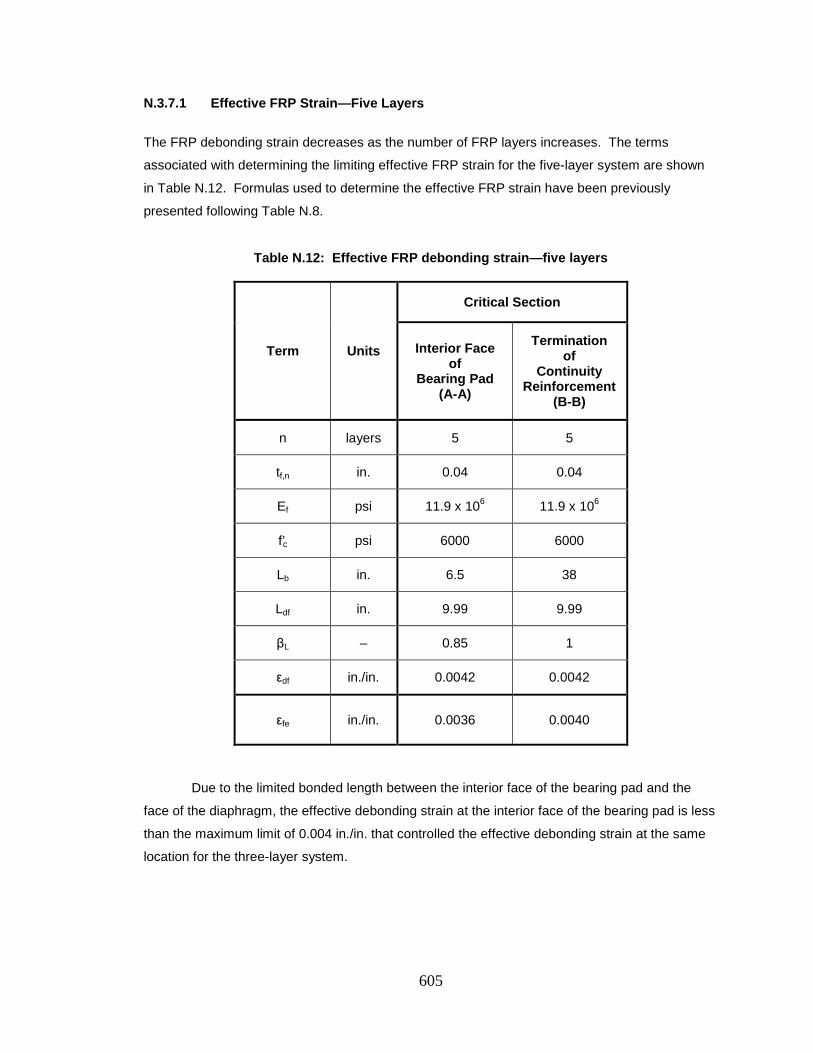
605
N.3.7.1 Effective FRP Strain—Five Layers
The FRP debonding strain decreases as the number of FRP layers increases. The terms
associated with determining the limiting effective FRP strain for the five-layer system are shown
in Table N.12. Formulas used to determine the effective FRP strain have been previously
presented following Table N.8.
Table N.12: Effective FRP debonding strain—five layers
Term Units
Critical Section
Interior Face of
Bearing Pad (A-A)
Termination of
Continuity Reinforcement
(B-B)
n layers 5 5
tf,n in. 0.04 0.04
Ef psi 11.9 x 10⁶ 11.9 x 10⁶
f’c psi 6000 6000
Lb in. 6.5 38
Ldf in. 9.99 9.99
βL – 0.85 1
εdf in./in. 0.0042 0.0042
εfe in./in. 0.0036 0.0040
Due to the limited bonded length between the interior face of the bearing pad and the
face of the diaphragm, the effective debonding strain at the interior face of the bearing pad is less
than the maximum limit of 0.004 in./in. that controlled the effective debonding strain at the same
location for the three-layer system.
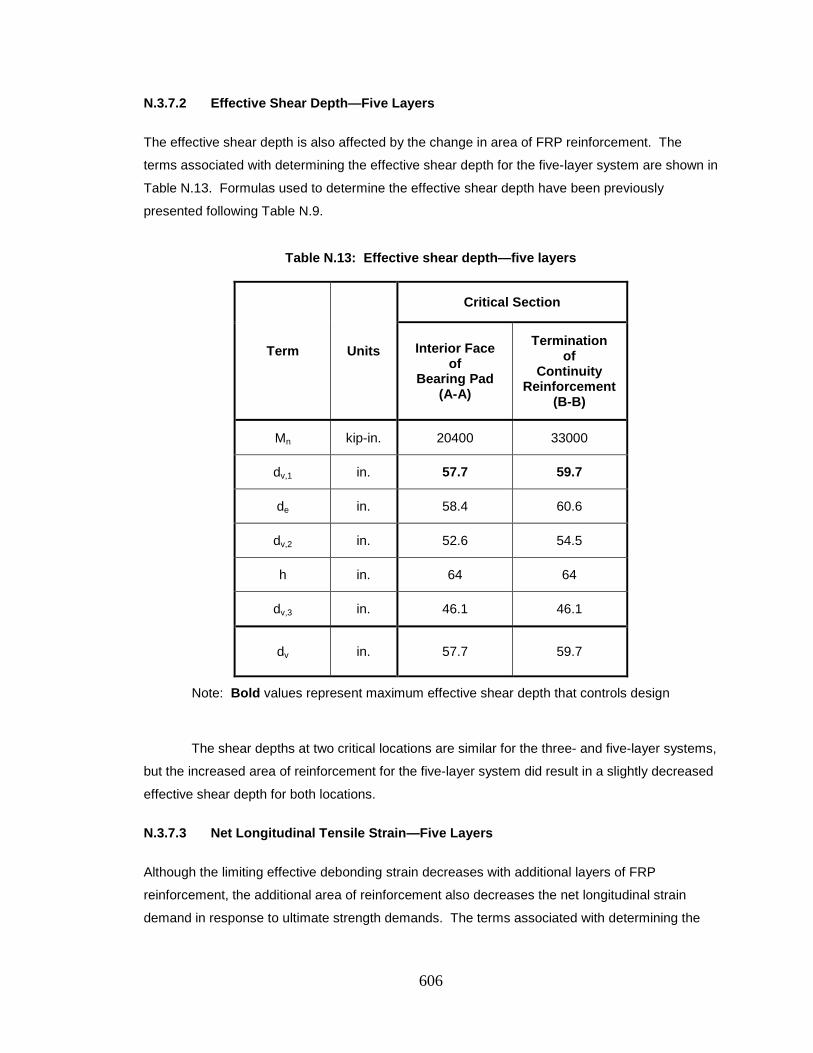
606
N.3.7.2 Effective Shear Depth—Five Layers
The effective shear depth is also affected by the change in area of FRP reinforcement. The
terms associated with determining the effective shear depth for the five-layer system are shown in
Table N.13. Formulas used to determine the effective shear depth have been previously
presented following Table N.9.
Table N.13: Effective shear depth—five layers
Term Units
Critical Section
Interior Face of
Bearing Pad (A-A)
Termination of
Continuity Reinforcement
(B-B)
Mn kip-in. 20400 33000
dv,1 in. 57.7 59.7
de in. 58.4 60.6
dv,2 in. 52.6 54.5
h in. 64 64
dv,3 in. 46.1 46.1
dv in. 57.7 59.7
Note: Bold values represent maximum effective shear depth that controls design
The shear depths at two critical locations are similar for the three- and five-layer systems,
but the increased area of reinforcement for the five-layer system did result in a slightly decreased
effective shear depth for both locations.
N.3.7.3 Net Longitudinal Tensile Strain—Five Layers
Although the limiting effective debonding strain decreases with additional layers of FRP
reinforcement, the additional area of reinforcement also decreases the net longitudinal strain
demand in response to ultimate strength demands. The terms associated with determining the
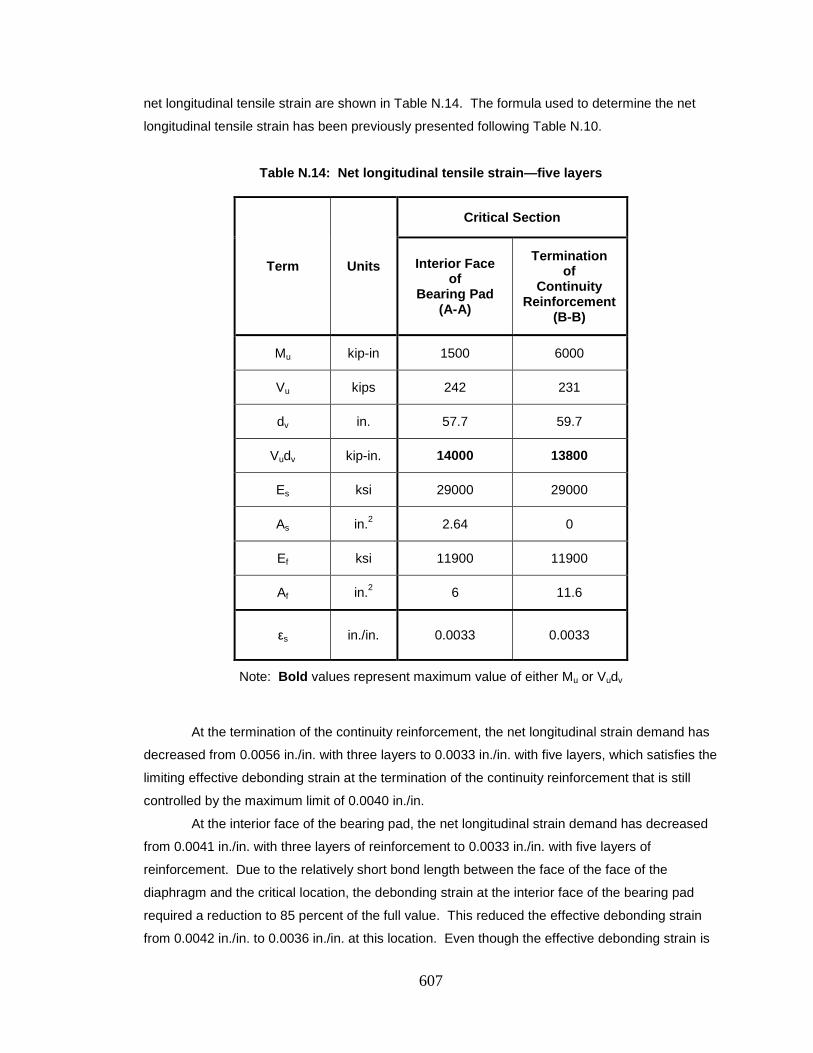
607
net longitudinal tensile strain are shown in Table N.14. The formula used to determine the net
longitudinal tensile strain has been previously presented following Table N.10.
Table N.14: Net longitudinal tensile strain—five layers
Term Units
Critical Section
Interior Face of
Bearing Pad (A-A)
Termination of
Continuity Reinforcement
(B-B)
Mu kip-in 1500 6000
Vu kips 242 231
dv in. 57.7 59.7
Vudv kip-in. 14000 13800
Es ksi 29000 29000
As in.2 2.64 0
Ef ksi 11900 11900
Af in.2 6 11.6
εs in./in. 0.0033 0.0033
Note: Bold values represent maximum value of either Mu or Vudv
At the termination of the continuity reinforcement, the net longitudinal strain demand has
decreased from 0.0056 in./in. with three layers to 0.0033 in./in. with five layers, which satisfies the
limiting effective debonding strain at the termination of the continuity reinforcement that is still
controlled by the maximum limit of 0.0040 in./in.
At the interior face of the bearing pad, the net longitudinal strain demand has decreased
from 0.0041 in./in. with three layers of reinforcement to 0.0033 in./in. with five layers of
reinforcement. Due to the relatively short bond length between the face of the face of the
diaphragm and the critical location, the debonding strain at the interior face of the bearing pad
required a reduction to 85 percent of the full value. This reduced the effective debonding strain
from 0.0042 in./in. to 0.0036 in./in. at this location. Even though the effective debonding strain is
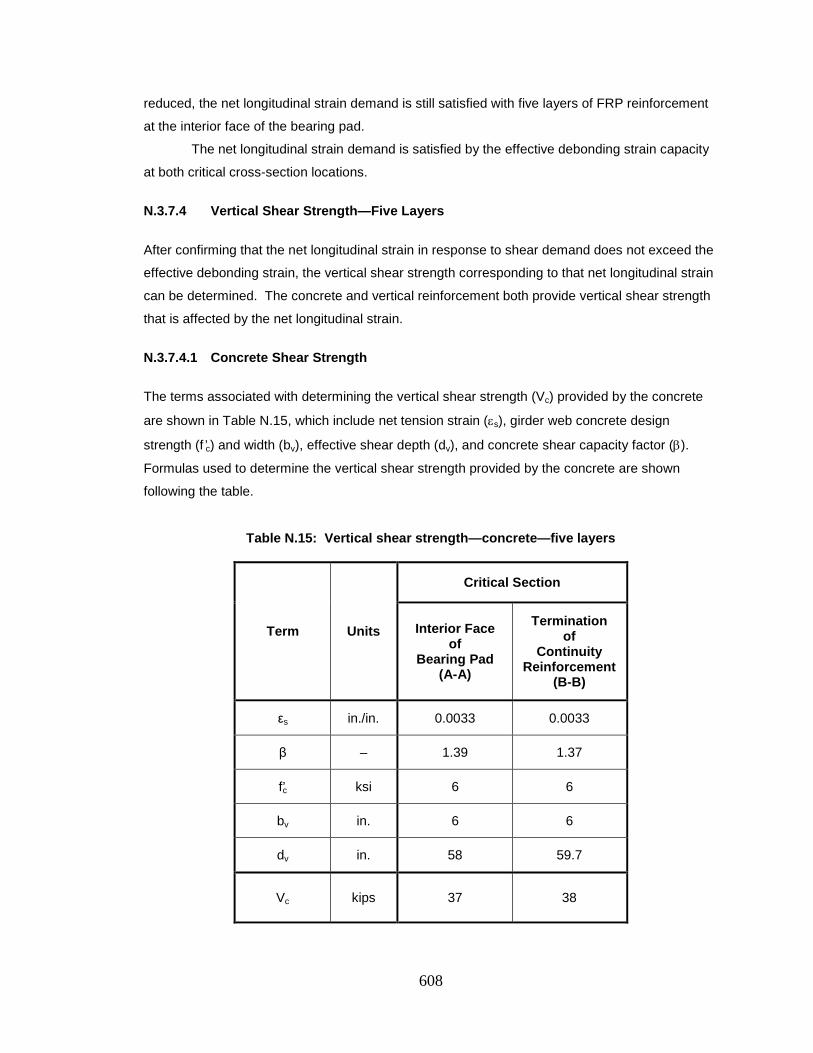
608
reduced, the net longitudinal strain demand is still satisfied with five layers of FRP reinforcement
at the interior face of the bearing pad.
The net longitudinal strain demand is satisfied by the effective debonding strain capacity
at both critical cross-section locations.
N.3.7.4 Vertical Shear Strength—Five Layers
After confirming that the net longitudinal strain in response to shear demand does not exceed the
effective debonding strain, the vertical shear strength corresponding to that net longitudinal strain
can be determined. The concrete and vertical reinforcement both provide vertical shear strength
that is affected by the net longitudinal strain.
N.3.7.4.1 Concrete Shear Strength
The terms associated with determining the vertical shear strength (Vc) provided by the concrete
are shown in Table N.15, which include net tension strain (εs), girder web concrete design
strength (f ’c) and width (bv), effective shear depth (dv), and concrete shear capacity factor (β).
Formulas used to determine the vertical shear strength provided by the concrete are shown
following the table.
Table N.15: Vertical shear strength—concrete—five layers
Term Units
Critical Section
Interior Face of
Bearing Pad (A-A)
Termination of
Continuity Reinforcement
(B-B)
εs in./in. 0.0033 0.0033
β – 1.39 1.37
f’c ksi 6 6
bv in. 6 6
dv in. 58 59.7
Vc kips 37 38
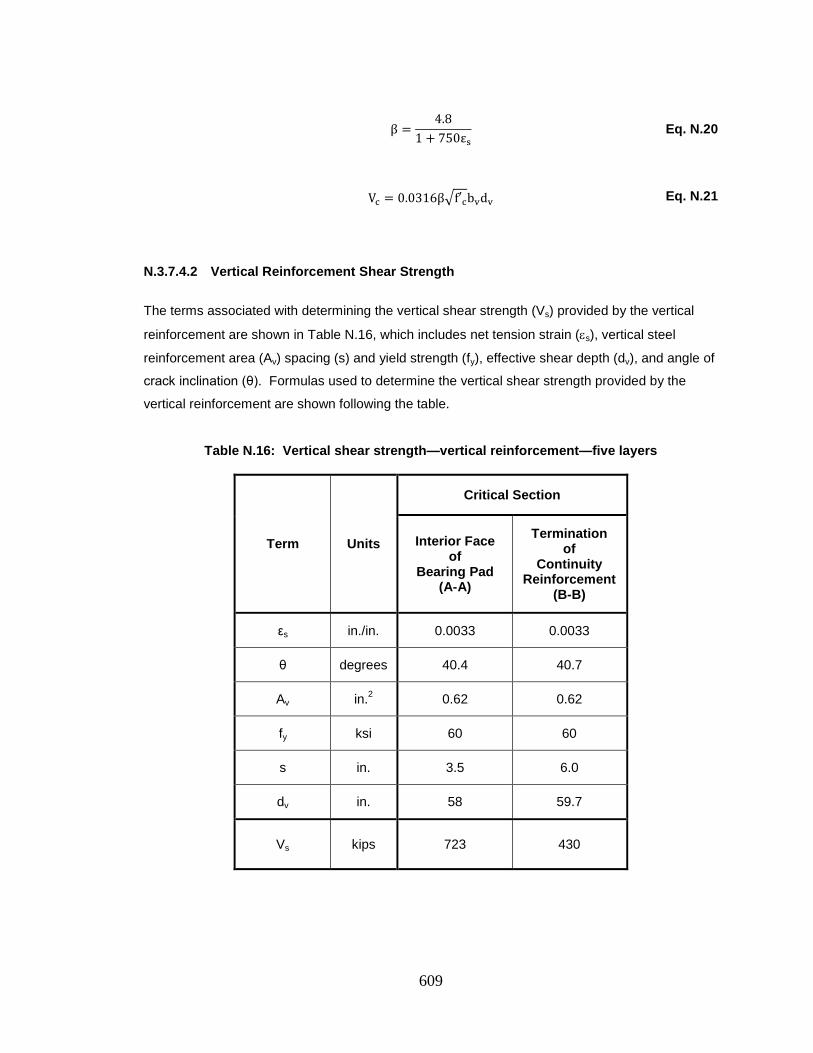
609
β =4.8
1 + 750εs Eq. N.20
Vc = 0.0316β�f′cbvdv Eq. N.21
N.3.7.4.2 Vertical Reinforcement Shear Strength
The terms associated with determining the vertical shear strength (Vs) provided by the vertical
reinforcement are shown in Table N.16, which includes net tension strain (εs), vertical steel
reinforcement area (Av) spacing (s) and yield strength (fy), effective shear depth (dv), and angle of
crack inclination (θ). Formulas used to determine the vertical shear strength provided by the
vertical reinforcement are shown following the table.
Table N.16: Vertical shear strength—vertical reinforcement—five layers
Term Units
Critical Section
Interior Face of
Bearing Pad (A-A)
Termination of
Continuity Reinforcement
(B-B)
εs in./in. 0.0033 0.0033
θ degrees 40.4 40.7
Av in.2 0.62 0.62
fy ksi 60 60
s in. 3.5 6.0
dv in. 58 59.7
Vs kips 723 430
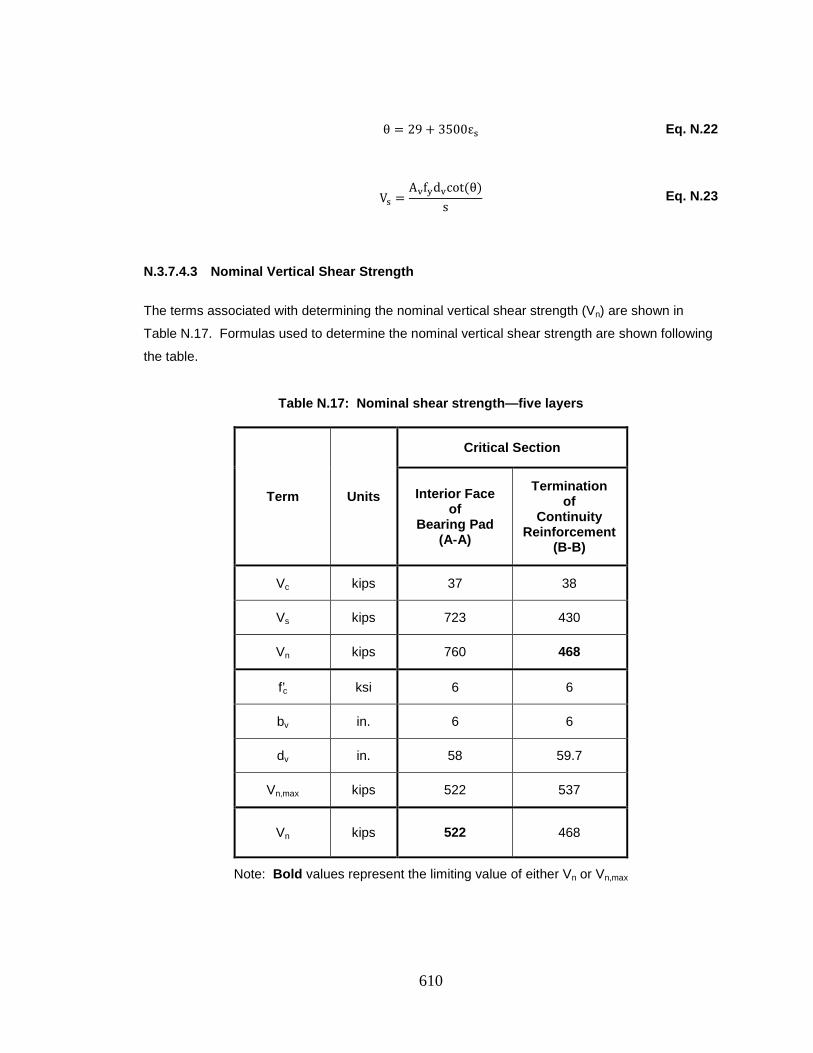
610
θ = 29 + 3500εs Eq. N.22
Vs =Avfydvcot(θ)
s Eq. N.23
N.3.7.4.3 Nominal Vertical Shear Strength
The terms associated with determining the nominal vertical shear strength (Vn) are shown in
Table N.17. Formulas used to determine the nominal vertical shear strength are shown following
the table.
Table N.17: Nominal shear strength—five layers
Term Units
Critical Section
Interior Face of
Bearing Pad (A-A)
Termination of
Continuity Reinforcement
(B-B)
Vc kips 37 38
Vs kips 723 430
Vn kips 760 468
f’c ksi 6 6
bv in. 6 6
dv in. 58 59.7
Vn,max kips 522 537
Vn kips 522 468
Note: Bold values represent the limiting value of either Vn or Vn,max
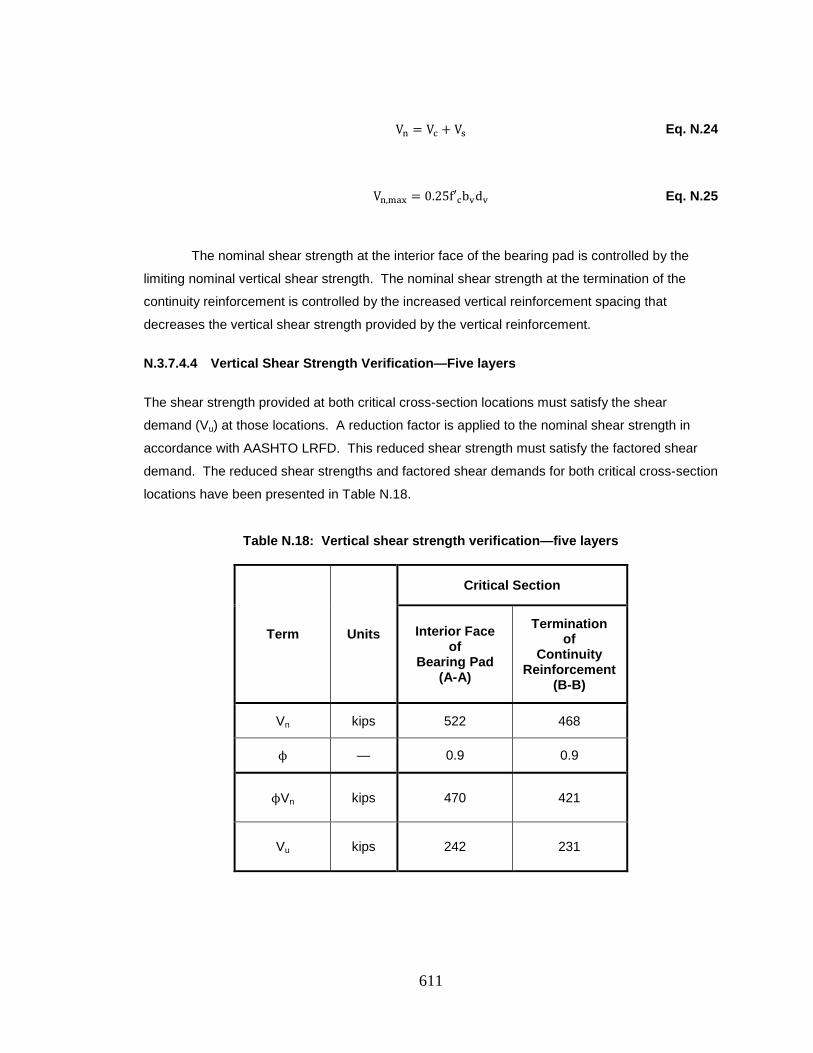
611
Vn = Vc + Vs Eq. N.24
Vn,max = 0.25f′cbvdv Eq. N.25
The nominal shear strength at the interior face of the bearing pad is controlled by the
limiting nominal vertical shear strength. The nominal shear strength at the termination of the
continuity reinforcement is controlled by the increased vertical reinforcement spacing that
decreases the vertical shear strength provided by the vertical reinforcement.
N.3.7.4.4 Vertical Shear Strength Verification—Five layers
The shear strength provided at both critical cross-section locations must satisfy the shear
demand (Vu) at those locations. A reduction factor is applied to the nominal shear strength in
accordance with AASHTO LRFD. This reduced shear strength must satisfy the factored shear
demand. The reduced shear strengths and factored shear demands for both critical cross-section
locations have been presented in Table N.18.
Table N.18: Vertical shear strength verification—five layers
Term Units
Critical Section
Interior Face of
Bearing Pad (A-A)
Termination of
Continuity Reinforcement
(B-B)
Vn kips 522 468
ϕ — 0.9 0.9
ϕVn kips 470 421
Vu kips 242 231
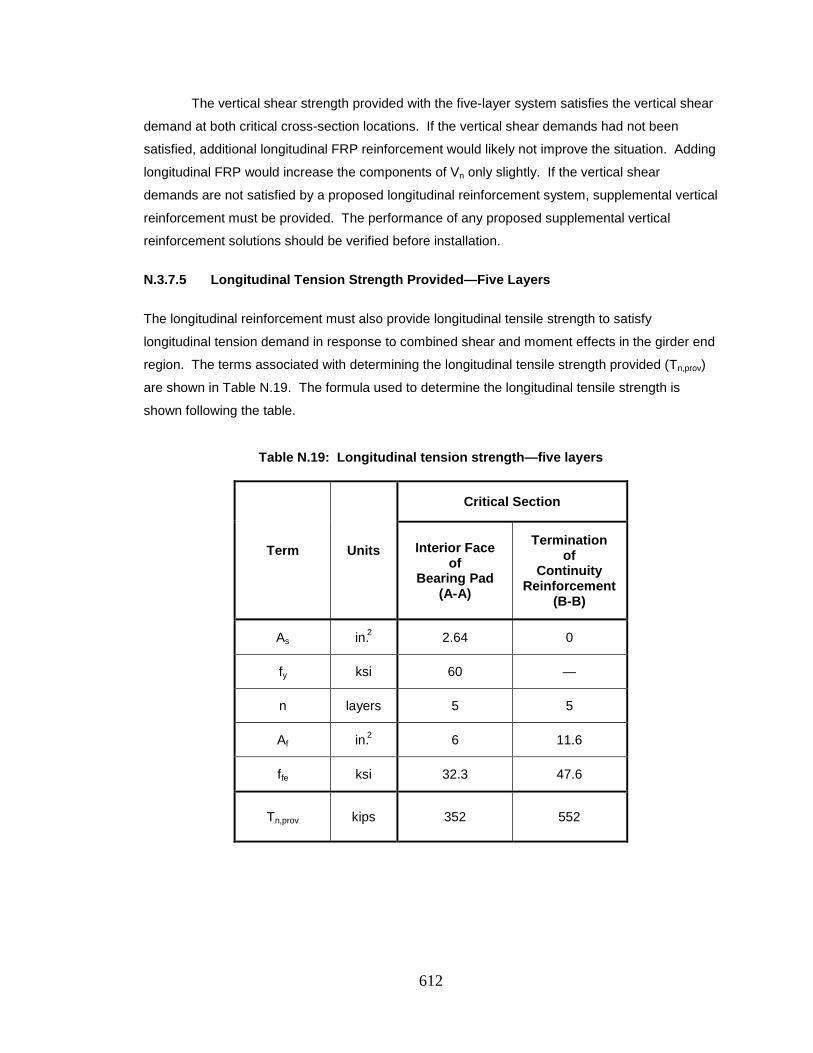
612
The vertical shear strength provided with the five-layer system satisfies the vertical shear
demand at both critical cross-section locations. If the vertical shear demands had not been
satisfied, additional longitudinal FRP reinforcement would likely not improve the situation. Adding
longitudinal FRP would increase the components of Vn only slightly. If the vertical shear
demands are not satisfied by a proposed longitudinal reinforcement system, supplemental vertical
reinforcement must be provided. The performance of any proposed supplemental vertical
reinforcement solutions should be verified before installation.
N.3.7.5 Longitudinal Tension Strength Provided—Five Layers
The longitudinal reinforcement must also provide longitudinal tensile strength to satisfy
longitudinal tension demand in response to combined shear and moment effects in the girder end
region. The terms associated with determining the longitudinal tensile strength provided (Tn,prov)
are shown in Table N.19. The formula used to determine the longitudinal tensile strength is
shown following the table.
Table N.19: Longitudinal tension strength—five layers
Term Units
Critical Section
Interior Face of
Bearing Pad (A-A)
Termination of
Continuity Reinforcement
(B-B)
As in.2 2.64 0
fy ksi 60 —
n layers 5 5
Af in.2 6 11.6
ffe ksi 32.3 47.6
Tn,prov kips 352 552
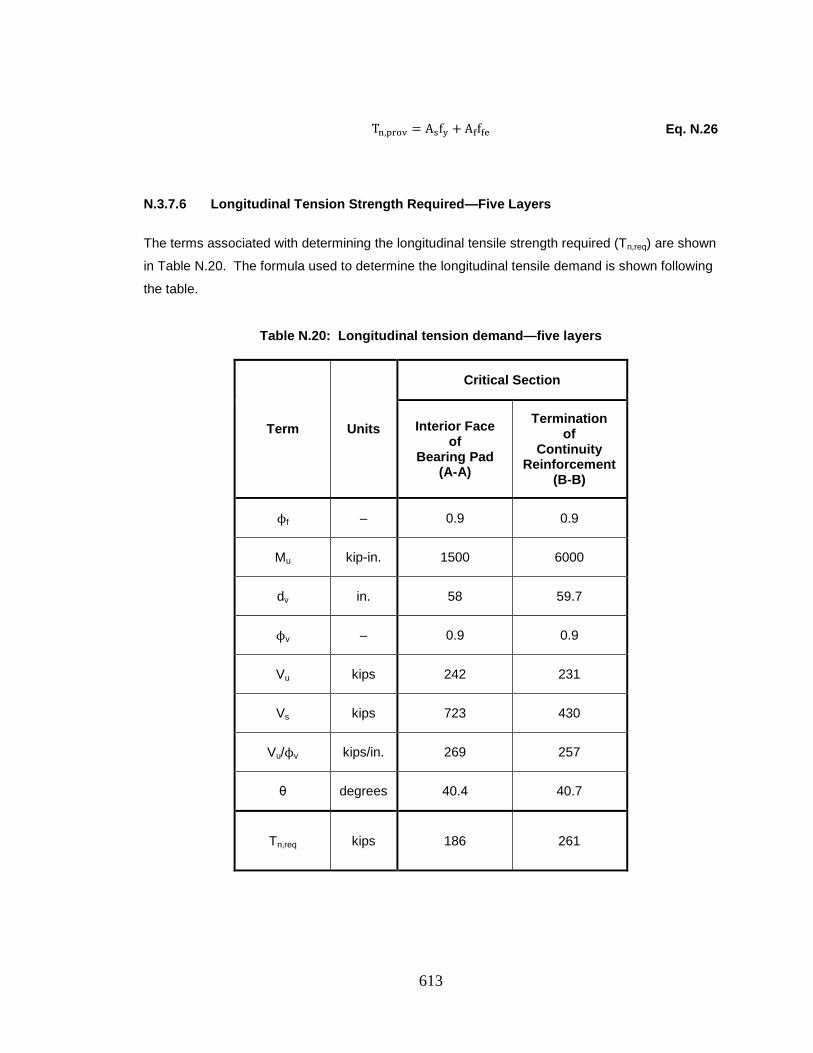
613
Tn,prov = Asfy + Afffe Eq. N.26
N.3.7.6 Longitudinal Tension Strength Required—Five Layers
The terms associated with determining the longitudinal tensile strength required (Tn,req) are shown
in Table N.20. The formula used to determine the longitudinal tensile demand is shown following
the table.
Table N.20: Longitudinal tension demand—five layers
Term Units
Critical Section
Interior Face of
Bearing Pad (A-A)
Termination of
Continuity Reinforcement
(B-B)
ϕf – 0.9 0.9
Mu kip-in. 1500 6000
dv in. 58 59.7
ϕv – 0.9 0.9
Vu kips 242 231
Vs kips 723 430
Vu/ϕv kips/in. 269 257
θ degrees 40.4 40.7
Tn,req kips 186 261
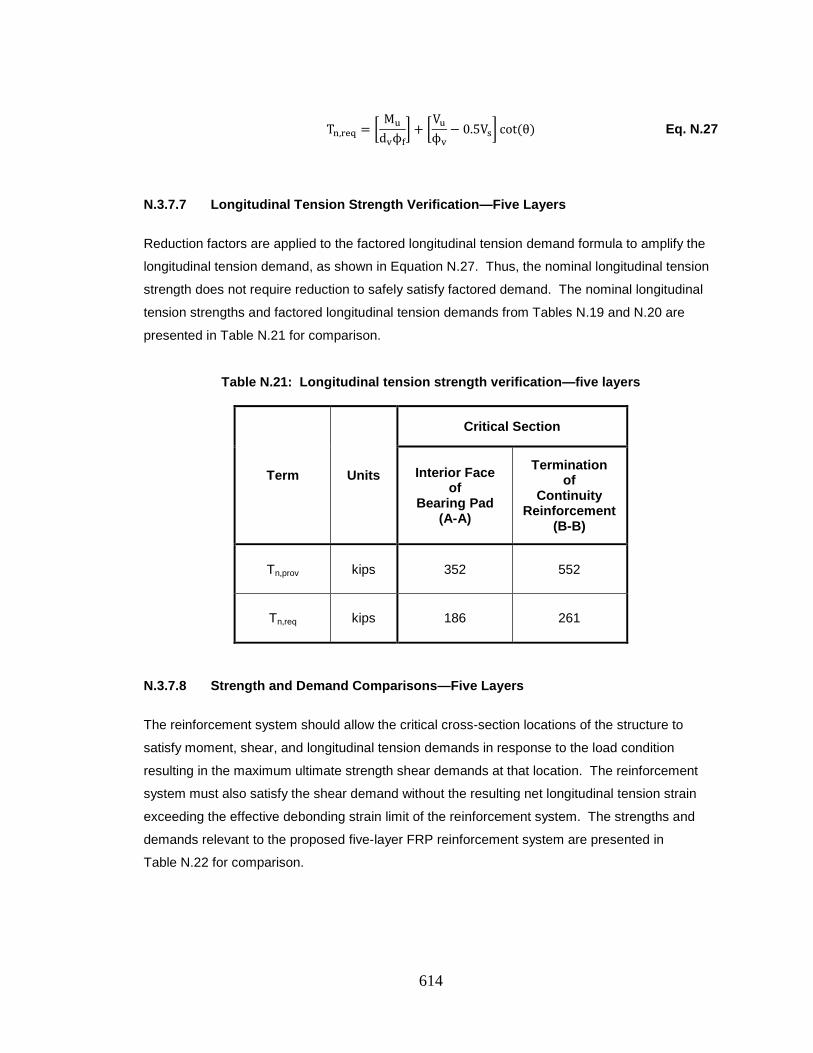
614
Tn,req = �Mu
dvϕf� + �
Vuϕv
− 0.5Vs� cot (θ) Eq. N.27
N.3.7.7 Longitudinal Tension Strength Verification—Five Layers
Reduction factors are applied to the factored longitudinal tension demand formula to amplify the
longitudinal tension demand, as shown in Equation N.27. Thus, the nominal longitudinal tension
strength does not require reduction to safely satisfy factored demand. The nominal longitudinal
tension strengths and factored longitudinal tension demands from Tables N.19 and N.20 are
presented in Table N.21 for comparison.
Table N.21: Longitudinal tension strength verification—five layers
Term Units
Critical Section
Interior Face of
Bearing Pad (A-A)
Termination of
Continuity Reinforcement
(B-B)
Tn,prov kips 352 552
Tn,req kips 186 261
N.3.7.8 Strength and Demand Comparisons—Five Layers
The reinforcement system should allow the critical cross-section locations of the structure to
satisfy moment, shear, and longitudinal tension demands in response to the load condition
resulting in the maximum ultimate strength shear demands at that location. The reinforcement
system must also satisfy the shear demand without the resulting net longitudinal tension strain
exceeding the effective debonding strain limit of the reinforcement system. The strengths and
demands relevant to the proposed five-layer FRP reinforcement system are presented in
Table N.22 for comparison.
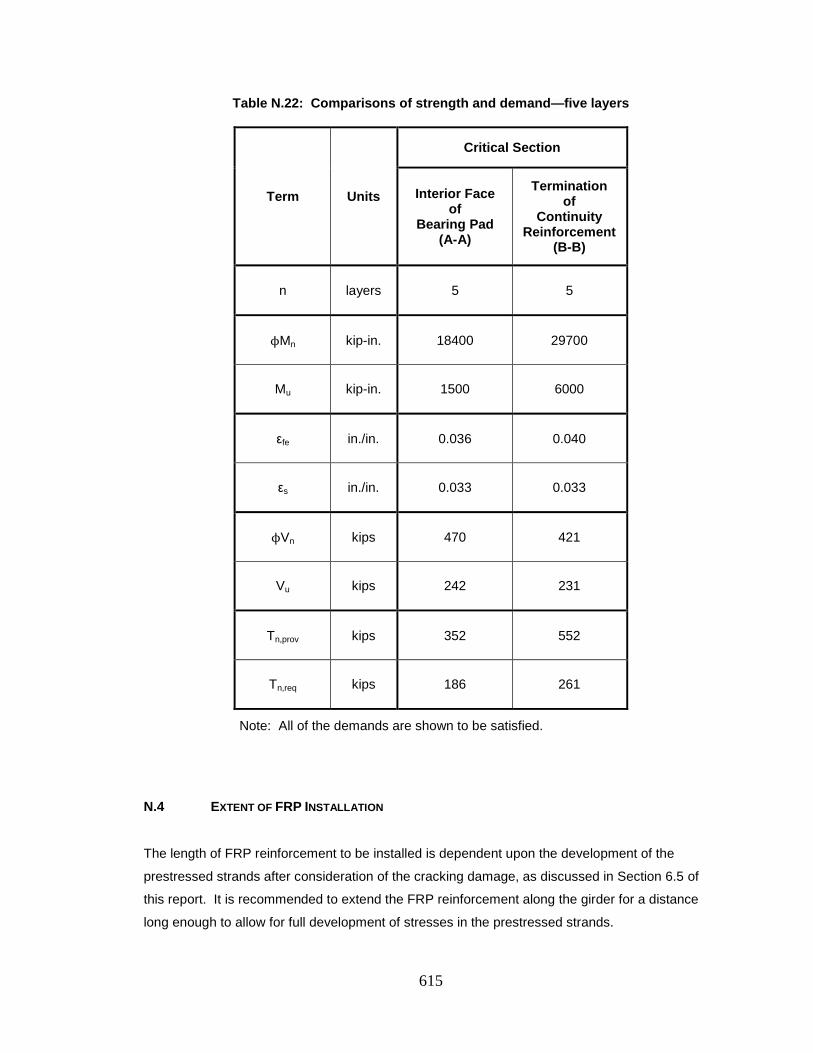
615
Table N.22: Comparisons of strength and demand—five layers
Term Units
Critical Section
Interior Face of
Bearing Pad (A-A)
Termination of
Continuity Reinforcement
(B-B)
n layers 5 5
ϕMn kip-in. 18400 29700
Mu kip-in. 1500 6000
εfe in./in. 0.036 0.040
εs in./in. 0.033 0.033
ϕVn kips 470 421
Vu kips 242 231
Tn,prov kips 352 552
Tn,req kips 186 261
Note: All of the demands are shown to be satisfied.
N.4 EXTENT OF FRP INSTALLATION
The length of FRP reinforcement to be installed is dependent upon the development of the
prestressed strands after consideration of the cracking damage, as discussed in Section 6.5 of
this report. It is recommended to extend the FRP reinforcement along the girder for a distance
long enough to allow for full development of stresses in the prestressed strands.
616
It was previously assumed that the prestressed strands are not safely considered to be
effective between the face of the end of the girder and the end of the initial region of debonded
strands. Thus, the FRP reinforcement should be extended for a distance of at least one
development length (d) of the prestressed strands from the end of the initial region of debonded
strands. The development length can be estimated using the approximation presented as
Equation 6.32 in Section 6.5 of this report, as shown below.
d = 180db Eq. N.28
db = 0.51 in.
d = 92 in.
The end of the initial region of debonded strands is located 45 in. from the face of the
diaphragm, as shown in Figure N.2. The first (longest) layer of FRP reinforcement installed
should extend from the face of the diaphragm to a distance of 137 in. from the face of the
diaphragm.
Each subsequently installed layer should extend a distance 6 in. less than its respective
underlying layer, as discussed in Section 6.5. Thus, the final (shortest) layer of FRP
reinforcement should extend to a distance of 113 in. from the face of the diaphragm. These
recommended lengths of FRP reinforcement for the five-layer FRP repair are shown in
Figure N.12.
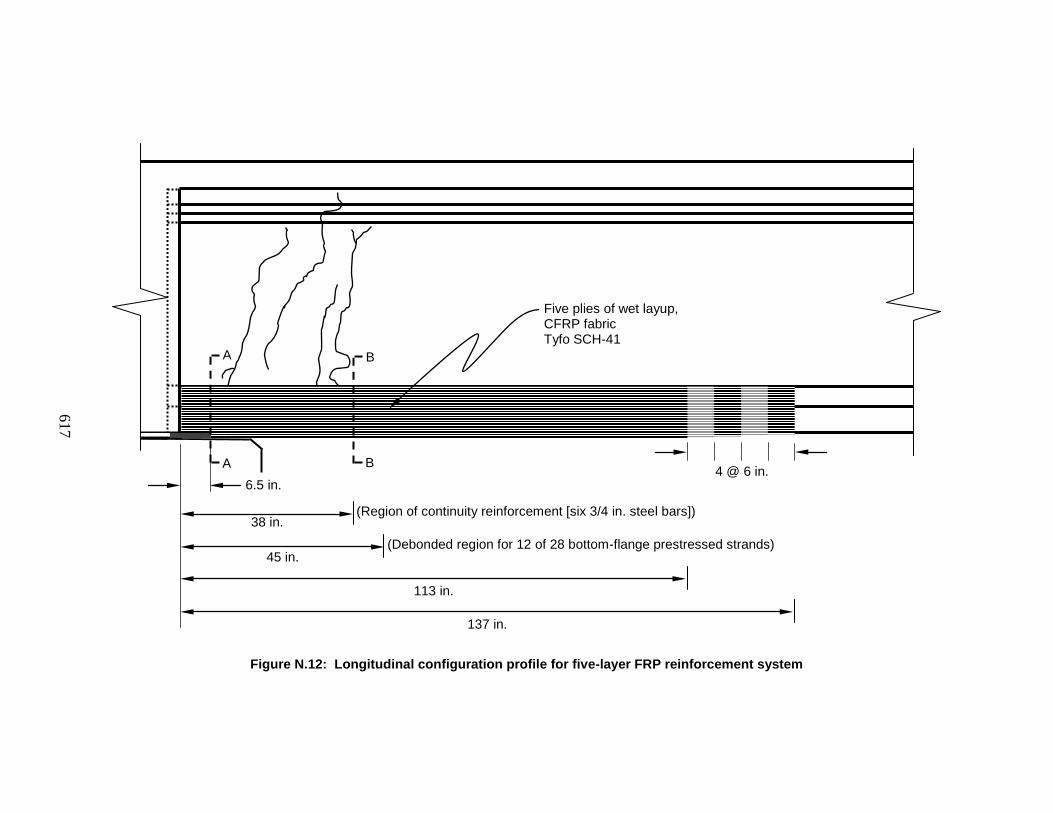
617
Figure N.12: Longitudinal configuration profile for five-layer FRP reinforcement system
A
A
B
B
6.5 in.
113 in.
4 @ 6 in.
Five plies of wet layup, CFRP fabric Tyfo SCH-41
45 in.
38 in. (Region of continuity reinforcement [six 3/4 in. steel bars])
(Debonded region for 12 of 28 bottom-flange prestressed strands)
137 in.
618
N.5 ANCHORAGE
The limiting effective debonding strain at the interior face of the bearing has been reduced to
reflect the bonded length available from the termination of reinforcement at the face of the
diaphragm, as shown in Table N.12. The reduced effective debonding strain at this location still
satisfies the net tension strain demand, as shown in Table N.22. Thus, the proposed five-layer
FRP reinforcement system does not require additional anchorage at the termination of
reinforcement at the face of the diaphragm. Supplemental anchorage may still be provided to
decrease the required development length, but a proposed method for providing additional
anchorage must be tested before implementation.
N.6 SERVICE-LIMIT-STATE VERIFICATION
It is appropriate to assume that the bridge structure will maintain partial continuity in response to
service loads, as discussed in Section 6.7 of this report. The assumption of simply supported
bridge behavior during strength-limit-state design results in FRP requirements that conservatively
satisfy service-limit-state demands for a bridge structure that maintains partial continuity.
The stress-induced strain resulting from expected diurnal temperature variation must be
checked with respect to the effective debonding strain of the FRP system. The formula for the
maximum stress-induced strain expected in response to ambient temperatures is presented as
Equation 6.33 in Section 6.7 of this report. This equation is also presented below with the values
for the concrete coefficient of thermal expansion and the maximum expected change in
temperature gradient that are presented in Section 5.4.2.2.2 of this report.
𝜀fe >32
[αTδ(∆Th)] Eq. N.29
αT = 6 x 10⁻⁶ (in./in. )/℉
δ(∆Th) = 60 ℉
32
[αTδ(∆Th)] = 0.0005 in./in.
𝜀fe = 0.0036 in./in.
A temperature gradient of 60 °F was selected to exceed measured temperature gradients as well
as temperature gradients recommended by AASHTO for design. The effective debonding strain
619
limit far exceeds the expected stress-induced FRP strain in response to restrained ambient
temperature changes.
N.7 DESIGN SUMMARY
The Tyfo SCH-41 FRP reinforcement product was selected for the proposed repair solution. Five
layers of this FRP reinforcement are required to satisfy ultimate strength demands. All first
installed (longest) layer must extend a distance of at least 137 in. from the face of the diaphragm
to allow for full development of stresses in prestressed strands. It has been determined that
supplemental anchorage is not necessary at the termination of FRP reinforcement at the face of
the diaphragm, but additional anchorage may be provided to further decrease the risk of
debonding failure, if an appropriate anchorage method has been verified. Also, the minimum
effective debonding strain of this five-layer system is shown to adequately satisfy the maximum
strain demand expected in response to ambient thermal conditions.
N.8 INSTALLATION RECOMMENDATIONS
Installation of the proposed five-layer FRP reinforcement system must adhere to the guidelines
presented in Section 6.9 of this report. These guidelines refer to standard procedures for surface
preparation and FRP reinforcement installation. Appropriate installation procedures are required
for the effects assumed of the designed FRP reinforcement system to remain valid.
N.9 COMPARISON OF DESIGN RECOMMENDATION AND PREVIOUSLY INSTALLED FRP
An FRP reinforcement system was designed by Auburn University researchers (Swenson 2003)
for the repair of Northbound Spans 10 and 11 of I-565 in Huntsville, Alabama—the same spans
considered for the design example in this appendix. The repair was designed to resist tension
forces that were predicted with strut-and-tie models. The reinforcement system was also
designed in accordance with the effective debonding strain (εfe) specifications of ACI 440.2R-02,
which have since been updated in ACI 440.2R-08 to reflect the findings of more recent research.
The FRP reinforcement system was installed in December 2007.
The installed FRP reinforcement consists of 4 layers of FRP, with the longest layer
extending 130 in. from the face of the continuity diaphragm. The FRP reinforcement design
presented in this appendix—for the repair of the same girders using the same FRP reinforcement
product—recommends an FRP reinforcement system consisting of 5 layers of FRP, with the
longest layer extending 137 in. from the face of the continuity diaphragm.
The updated limiting effective debonding strain (εfe < 0.004 in./in.) of ACI 440.2R-08 is the
primary reason for recommending 5 layers of reinforcement instead of the previously
620
recommended 4 layers. The longer recommended length of FRP reinforcement is due in part to
the recommendation that the FRP be extended one prestressed strand development length (d)
beyond the primary region of debonded strands as well as beyond the previously recommended
(Swenson 2003) assumed location of primary cracking. The updated design also recommends a
simplified and appropriately conservative formula for the approximation of prestressed strand
development length beginning at or beyond damaged regions within a girder.
Although the FRP reinforcement systems that were installed on Spans 10 and 11 in
December 2007 do not satisfy the updated design recommendation, installation of an additional
layer of reinforcement may not be absolutely necessary. The limiting effective debonding strain
(εfe < 0.004 in./in.) controls the recommendation of 5 layers of reinforcement instead of 4 layers.
The current installation of 4 layers satisfies strength requirements at the interior face of the
bearing pad, but the net tension strain at the termination of the continuity reinforcement in
response to factored AASHTO LRFD strength-limit-state shear demand is calculated to be
0.00418 in./in., which exceeds the limiting effective debonding strain of 0.004 in./in. by less than
5 percent. At sections like this one that are near a simple support—where there is minimal
positive bending moment—the net tension strain determined in accordance with AASHTO LRFD
specifications is a linear function of the factored shear demand. Therefore, the net tension strain
exceeding the limiting effective debonding strain by 0.00018 in./in. represents a strength
deficiency of less than 5 percent in response to factored shear demand at the termination of the
continuity reinforcement.
The length of FRP reinforcement has been conservatively estimated by the design
recommendation presented by Swenson (2003) and the slightly modified design recommendation
presented in this report. It is appropriate to assume that the prestressed strands have slipped,
but it is conservative to assume that this slip has resulted in the complete loss of effective
prestress forces between the cracked section and the end of the girder. The simplified and
appropriately conservative method for determining the required length of FRP reinforcement in
accordance with the design procedure of this report is recommended for the design of FRP
reinforcement systems for a general range of bridges that have experienced or are susceptible to
the type of damage exhibited in the I-565 structures. Based on the cracking observed thus far in
the life of this particular structure, it is appropriate to assume that the lengths of FRP
reinforcement currently installed on the girders of Northbound Spans 10 and 11 are acceptable.
The installed 4 layers of reinforcement nearly satisfy the requirements of the updated
design recommendations of this report. The small computed strength deficiency is based on full
strength-limit-state AASHTO LRFD design loads for new construction in conjunction with the
conservative limiting effective debonding strain of the FRP reinforcement. The length of FRP
reinforcement currently installed allows for adequate development of prestressed strands beyond
the primary crack locations in these particular spans. It is unknown if an additionally installed fifth

621
layer of reinforcement would perform as expected when bonded to previously installed FRP
reinforcement that has been fully cured. Surface preparation procedures required for proper
installation of additional FRP reinforcement may also be detrimental to the integrity of the existing
FRP reinforcement. Whether or not the computed strength discrepancy justifies the cost, effort,
and uncertainty associated with installation of an additional layer of FRP in Spans 10 and 11 is a
decision best left to the discretion of ALDOT after consideration of these factors in light of the
department’s established maintenance philosophy. On the other hand, FRP reinforcement
configurations for new repairs should be designed to satisfy the design recommendations
proposed within this report.
N.10 VARYING MODULUS OF ELASTICITY FOR FRP REINFORCEMENT
The design effective debonding strain in areas of short bonded lengths is very dependent upon
the modulus of elasticity (Ef) of the FRP reinforcement product. For design purposes, it is
recommended to assume the design modulus of elasticity of the FRP reinforcement product
reported by the manufacturer; however testing of representative samples may indicate that the
installed product exhibits more tensile stiffness than originally assumed during design.
An increased modulus of elasticity may affect the effective debonding strain for locations
with limited bonded length. Increasing the modulus of elasticity decreases the reinforcement
debonding strain and increases the required development length. Both of these factors
independently decrease the limiting effective debonding strain of the reinforcement system.
To better understand the ramifications of this issue, laboratory testing is recommended to
assess the effective debonding strain for FRP reinforcement products with varying modulus of
elasticity values determined in accordance with procedures (ASTM D3039 2008) recommended
for testing representative samples of installed FRP reinforcement systems.